UNITED STATES
SECURITIES AND EXCHANGE COMMISSION
Washington, D.C. 20549
FORM N-CSR
CERTIFIED SHAREHOLDER REPORT OF REGISTERED
MANAGEMENT INVESTMENT COMPANIES
Investment Company Act File Number: 811-07538
LORD ABBETT SECURITIES TRUST
(Exact name of Registrant as specified in charter)
90 Hudson Street, Jersey City, NJ 07302-3973
(Address of principal executive offices) (Zip code)
Lawrence B. Stoller, Esq.
Vice President, Secretary, and Chief Legal Officer
90 Hudson Street, Jersey City, New Jersey 07302-3973
(Name and address of agent for service)
Registrant’s telephone number, including area code: (888) 522-2388
Date of fiscal year end: 10/31
Date of reporting period: 10/31/2022
| Item 1: | Report(s) to Shareholders. |

LORD ABBETT
ANNUAL REPORT
| Lord Abbett | |
| Alpha Strategy Fund | Health Care Fund |
| Focused Growth Fund | International Equity Fund |
| Focused Large Cap Value Fund | International Opportunities Fund |
| Focused Small Cap Value Fund | International Value Fund |
| Fundamental Equity Fund | Micro Cap Growth Fund |
| Global Equity Fund | Value Opportunities Fund |
| Growth Leaders Fund | |
For the fiscal year ended October 31, 2022
Table of Contents
Lord Abbett Securities Trust
Lord Abbett Alpha Strategy Fund, Lord Abbett Focused Growth Fund, Lord Abbett Focused Large Cap Value Fund, Lord Abbett Focused Small Cap Value Fund, Lord Abbett Fundamental Equity Fund, Lord Abbett Global Equity Fund, Lord Abbett Growth Leaders Fund, Lord Abbett Health Care Fund, Lord Abbett International Equity Fund, Lord Abbett International Opportunities Fund, Lord Abbett International Value Fund, Lord Abbett Micro Cap Growth Fund, and Lord Abbett Value Opportunities Fund
Annual Report
For the fiscal year ended October 31, 2022

From left to right: James L.L. Tullis, Independent Chairman of the Lord Abbett Funds and Douglas B. Sieg, Trustee, President and Chief Executive Officer of the Lord Abbett Funds. | | Dear Shareholders: We are pleased to provide you with this overview of the performance of the Funds for the fiscal year ended October 31, 2022. On this page and the following pages, we discuss the major factors that influenced fiscal year performance. For detailed and timely information about the Funds, please visit our website at www.lordabbett.com, where you can also access the quarterly commentaries that provide updates on each Fund’s performance and other portfolio related updates. Thank you for investing in Lord Abbett mutual funds. We value the trust that you place in us and look forward to serving your investment needs in the years to come. Best regards, 
Douglas B. Sieg
Trustee, President and Chief Executive Officer |
| | | |
1
Lord Abbett Alpha Strategy Fund
For the fiscal year ended October 31, 2022, the Fund returned -24.25%, reflecting performance at the net asset value (NAV) of Class A shares with all distributions reinvested, compared to its benchmark, the Russell 2000® Index,1 which returned -18.54% over the same period.
U.S. markets faced many challenges throughout the twelve-month period ending October 31, 2022, including the emergence of the Omicron variant of COVID-19, supply chain dislocations, labor shortages, inflationary pressures, less accommodative fiscal and monetary policy, and Russia’s invasion of Ukraine. The Dow Jones Industrial Average and S&P 500® Index fell -6.74% and -14.61%, respectively, while the tech-heavy Nasdaq Composite lost -28.56%. Value stocks2 significantly outperformed growth stocks3 (-7.25% vs -24.67%), while large cap stocks4 outperformed small cap stocks5 (-16.38% vs -18.54%).
The period began with global markets grappling with the emergence of the newly discovered Omicron variant. In November 2021 the World Health Organization designated the mutation as a “variant of concern”, leading to one of the largest selloffs of U.S. risk assets since the start of the pandemic, as fears that the world would succumb to a new wave of infections emerged. U.S. cases hit the highest levels of the pandemic in December, rising above 580,000 new cases on the last week of the month and more than doubling the previous record high. Yet, the negative sentiment
regarding Omicron quickly reversed as cases proved to be generally less severe than prior strains. There was also increased positive market sentiment after the Center for Disease Control shortened its suggested isolation policy for those infected from 10 days to five.
Inflationary concerns began to take focus towards the end of 2021 before becoming a dominant headline throughout the period. Headline core consumer price index readings had hovered a little above 5% year-over-year for most of 2021, which led investors to question whether this period of rising prices would be more persistent than originally thought. However, this debate was intensified by November’s headline consumer price index rising 6.8% year-over-year, the fastest pace since 1982. The sharp increase in prices was generally due to an imbalance between supply and demand dynamics across multiple industries, led initially by energy, food, and used cars. Inflation readings continued to climb throughout the first half of 2022, peaking at 9.1% year-over-year in June.
Energy costs were the primary driver of inflation for the period, rising more than 30% year-over-year by the end of June. The energy sector, which had been subject to rising consumer demand as global economies reopened from lockdowns induced by COVID-19, faced added friction with Russia’s invasion of Ukraine. Investors were concerned about the secondary effects of the war, particularly from a commodity and supply chain standpoint. Russia has been a large global exporter of
2
oil and certain minerals, and the various sanctions set on Russia from Western nations led to a surge in commodity prices, with crude oil reaching over $100 per barrel for the first time since 2014.
The surge in prices forced the U.S. Federal Reserve (Fed) into a more aggressive approach to combating inflation. After remaining mostly consistent in its messaging around expectations that price pressures would be transitory, elevated and more persistent inflation pressures caused the Fed to move the target federal funds rate into more restrictive territory. This resulted in a 25-basis point (bps) hike in the federal funds rate at the March Federal Open Market Committee meeting, the first hike in more than three years. Five additional rate hikes of 50 bps, 75 bps, 75 bps, 75 bps, and 75 bps, respectively, followed in the succeeding months as inflation prints continued to come in hotter than expected, resulting in a federal funds rate of 4.00% by November 2, 2022, which was widely anticipated by the market as of the end of the fiscal year. Bond yields shot up in anticipation of this aggressive policy, leading to a bearish curve flattening trend and ultimately periods of brief yield curve inversion, as shorter-term yields moved higher than longer-term yields.
Separately, global markets were faced with increased geopolitical tensions due to the Russian invasion of Ukraine on February 23rd. Tensions remained elevated for the remainder of the twelve-month period, as Russia continued to weaponize energy flows, annexed four Ukrainian regions, and ratcheted up its nuclear
warnings. In addition, the rhetoric between the U.S. and China over Taiwan further heated up after U.S. House of Representatives Speaker Nancy Pelosi visited Taiwan in August. China responded to the trip with large-scale military drills, which led to a pledge by U.S. President Joe Biden to defend the democratically governed island.
Key macroeconomic indicators mostly continued to trend lower throughout the period, with the U.S. reporting negative gross domestic product of -1.6% in the first quarter of 2022 and -0.9% in the second quarter before returning to growth in the third quarter. Worries among investors that a recession was pending continued to grow, which ultimately led consumer sentiment to drop to levels worse than during the COVID-19 pandemic and the global financial crisis of 2008, as measured by The University of Michigan’s index of consumer sentiment.
Despite rising recessionary signs, select bright spots in the U.S. economy supported the idea that a potential recession would be shallow. For example, one of the most positive developments seemed to be the traction behind the peak inflation narrative, which included a 99 day stretch of declines in U.S. gasoline prices. In addition, apartment rents fell for the first time in nearly two years in July and lumber prices were off more than 70% from their March peak late in the third quarter, back to pre-COVID levels. Second quarter earnings season also generated many “better-than-feared” takeaways, including plenty of commentary about relatively
3
stable demand and pricing power continuing to protect margins. Capital return and capital expenditures were also mentioned as relative bright spots as companies flagged easing labor shortages and supply chain constraints. The U.S. labor market also remained strong over the period, with the national unemployment rate at 3.7% as of the end of October.
The Fund is a “fund of funds” that invests in affiliated mutual funds managed by Lord Abbett. Under normal conditions, through the underlying funds, the Fund indirectly invests in the equity securities of U.S. and foreign micro-cap, small, and mid-sized companies. The Fund uses a “blend” strategy to gain exposure to both growth and value stocks.
The Fund’s exposure to domestic small-cap growth stocks within the Lord Abbett Developing Growth Fund was the largest detractor from relative performance over the period. As a result of supply chain dislocations, labor shortages, inflationary pressures, restrictive fiscal and monetary policy, and geopolitical tensions surrounding Russia’s invasion of Ukraine, high innovation small and midcap companies, particularly those aggressively reinvesting in R&D to drive future revenues and earnings, underperformed lower growth, lower valuation names within the index as the market has largely expressed a technical preference for companies with positive earnings today, compared to larger growth potential in the future.
In addition, the Fund’s allocation to international small-cap stocks within the Lord Abbett International Opportunities
Fund was a notable detractor from relative performance, as international equity markets were less resilient against the aforementioned headwinds relative to domestic equities.
The Fund’s weightings in domestic small-cap value stocks within the Lord Abbett Focused Small Cap Value Fund and the Lord Abbett Small Cap Value Fund were the largest contributors to relative performance over the period. Both Funds employ a fundamental, bottom-up individual stock selection strategy that focuses on quality companies with compelling valuation over a long-term horizon. As such, the relative outperformance over the period was largely a result of the market expressing technical preference for higher quality, lower valuation names within the broader index.
Lord Abbett Focused Growth Fund
For the fiscal year ended October 31, 2022, the Fund returned -36.92%, reflecting performance at the net asset value (NAV) of Class A shares with all distributions reinvested, compared to its benchmark, the Russell 1000® Growth Index,6 which returned -24.60% over the same period.
U.S. markets faced many challenges throughout the twelve-month period ending October 31, 2022, including the emergence of the Omicron variant of COVID-19, supply chain dislocations, labor shortages, inflationary pressures, less accommodative fiscal and monetary policy, and Russia’s invasion of Ukraine. The Dow Jones Industrial
4
Average and S&P 500® Index fell -6.74% and -14.61%, respectively, while the tech-heavy Nasdaq Composite lost -28.56%. Value stocks2 significantly outperformed growth stocks3 (-7.25% vs -24.67%), while large cap stocks4 outperformed small cap stocks5 (-16.38% vs -18.54%).
The period began with global markets grappling with the emergence of the newly discovered Omicron variant. In November 2021 the World Health Organization designated the mutation as a “variant of concern”, leading to one of the largest selloffs of U.S. risk assets since the start of the pandemic, as fears that the world would succumb to a new wave of infections emerged. U.S. cases hit the highest levels of the pandemic in December, rising above 580,000 new cases on the last week of the month and more than doubling the previous record high. Yet, the negative sentiment regarding Omicron quickly reversed as cases proved to be generally less severe than prior strains. There was also increased positive market sentiment after the Center for Disease Control shortened its suggested isolation policy for those infected from 10 days to five.
Inflationary concerns began to take focus towards the end of 2021 before becoming a dominant headline throughout the period. Headline core consumer price index readings had hovered a little above 5% year-over-year for most of 2021, which led investors to question whether this period of rising prices would be more persistent than originally thought. However, this debate was intensified by November’s headline consumer price index
rising 6.8% year-over-year, the fastest pace since 1982. The sharp increase in prices was generally due to an imbalance between supply and demand dynamics across multiple industries, led initially by energy, food, and used cars. Inflation readings continued to climb throughout the first half of 2022, peaking at 9.1% year-over-year in June.
Energy costs were the primary driver of inflation for the period, rising more than 30% year-over-year by the end of June. The energy sector, which had been subject to rising consumer demand as global economies reopened from lockdowns induced by COVID-19, faced added friction with Russia’s invasion of Ukraine. Investors were concerned about the secondary effects of the war, particularly from a commodity and supply chain standpoint. Russia has been a large global exporter of oil and certain minerals, and the various sanctions set on Russia from Western nations led to a surge in commodity prices, with crude oil reaching over $100 per barrel for the first time since 2014.
The surge in prices forced the U.S. Federal Reserve (Fed) into a more aggressive approach to combating inflation. After remaining mostly consistent in its messaging around expectations that price pressures would be transitory, elevated and more persistent inflation pressures caused the Fed to move the target federal funds rate into more restrictive territory. This resulted in a 25-basis point (bps) hike in the federal funds rate at the March Federal Open Market Committee meeting, the first hike
5
in more than three years. Five additional rate hikes of 50 bps, 75 bps, 75 bps, 75 bps, and 75 bps, respectively, followed in the succeeding months as inflation prints continued to come in hotter than expected, resulting in a federal funds rate of 4.00% by November 2, 2022, which was widely anticipated by the market as of the end of the fiscal year. Bond yields shot up in anticipation of this aggressive policy, leading to a bearish curve flattening trend and ultimately periods of brief yield curve inversion, as shorter-term yields moved higher than longer-term yields.
Separately, global markets were faced with increased geopolitical tensions due to the Russian invasion of Ukraine on February 23rd. Tensions remained elevated for the remainder of the twelve-month period, as Russia continued to weaponize energy flows, annexed four Ukrainian regions, and ratcheted up its nuclear warnings. In addition, the rhetoric between the U.S. and China over Taiwan further heated up after U.S. House of Representatives Speaker Nancy Pelosi visited Taiwan in August. China responded to the trip with large-scale military drills, which led to a pledge by U.S. President Joe Biden to defend the democratically governed island.
Key macroeconomic indicators mostly continued to trend lower throughout the period, with the U.S. reporting negative gross domestic product of -1.6% in the first quarter of 2022 and -0.9% in the second quarter before returning to growth in the third quarter. Worries among
investors that a recession was pending continued to grow, which ultimately led consumer sentiment to drop to levels worse than during the COVID-19 pandemic and the global financial crisis of 2008, as measured by The University of Michigan’s index of consumer sentiment.
Despite rising recessionary signs, select bright spots in the U.S. economy supported the idea that a potential recession would be shallow. For example, one of the most positive developments seemed to be the traction behind the peak inflation narrative, which included a 99 day stretch of declines in U.S. gasoline prices. In addition, apartment rents fell for the first time in nearly two years in July and lumber prices were off more than 70% from their March peak late in the third quarter, back to pre-COVID levels. Second quarter earnings season also generated a lot of “better-than-feared” takeaways, including plenty of commentary about relatively stable demand and pricing power continuing to protect margins. Capital return and capital expenditures were also mentioned as relative bright spots as companies flagged easing labor shortages and supply chain constraints. The U.S. labor market also remained strong over the period, with the national unemployment rate at 3.7% as of the end of October.
From an industry standpoint, the portfolio’s allocation to stocks within the software industry was a primary drag on performance over the period. For example, the portfolio’s position in Atlassian Corporation, a developer of products for software developers, project managers and other software
6
development teams, was a notable detractor as many stocks within the industry suffered significant valuation compression as a result of supply chain dislocations, labor shortages, inflationary pressures, less accommodative fiscal and monetary policy, and heightened recessionary fears. That said, we view this largely as a price correction as many of these companies continue to exhibit strong operating momentum and possess bright futures.
The portfolio’s position in EPAM Systems, Inc., a developer of software products and digital platform engineering services, was the largest detractor from relative performance over the period. After sustained stock price appreciation since the beginning of the pandemic, EPAM stock quickly moved into a period of consolidation in the first quarter of 2022 as the high-growth and richly valued technology stock was adversely impacted by the rotation away from growth to value. Additionally, EPAM was also negatively impacted by the Russian invasion of Ukraine, as a large percentage of its workforce is based in Ukraine, Russia, and Belarus. We exited the position shortly after the invasion.
Conversely, not owning Meta Platforms, Inc., a technology company that engages in the development of social media applications, had the largest contribution to the portfolio’s relative performance over the period. The portfolio has maintained a zero weight in Meta stock since December 2021 as it has not aligned with our investment process. In regard to our decision to exit the position, we have been concerned about the
company’s inability to manage data privacy and controversial speech on its sites. The company has also acknowledged issues regarding Apple’s iOS privacy changes and advertiser challenges - citing supply chain and other macro issues as prominent headwinds. Lastly, we considered Facebook’s name change to Meta Platforms and quick pivot to the metaverse, a new and uncertain area, as a red flag, as we questioned the need for such a shift and concluded that the company must be concerned about the growth prospects of its existing business.
The portfolio’s position in Enphase Energy, Inc., an energy technology company that develops and manufactures solar micro-inverters, battery energy storage, and electric vehicle charging stations, was also a prominent contributor to relative performance over the period. Enphase has benefited greatly from increased demand for solar solutions in Europe as a result of persistent energy shortages. In the company’s most recent quarterly earnings report, management reported top- and bottom-line earnings results that exceeded consensus expectations. Notably, Enphase reported strong revenue growth driven by growth in microinverter and IQ Battery shipments. As of the end of the fiscal year, Enphase is one of the portfolio’s top active overweights.
Lord Abbett Focused Large Cap Fund
For the fiscal year ended October 31, 2022, the Fund returned -8.69%, reflecting performance at the net asset value (“NAV”) of Class A shares with all distributions
7
reinvested, compared to its benchmark, the Russell 1000® Value Index7, which returned -7.00% over the same period.
U.S. markets faced many challenges throughout the twelve-month period ending October 31, 2022, including the emergence of the Omicron variant of COVID-19, supply chain dislocations, labor shortages, inflationary pressures, less accommodative fiscal and monetary policy, and Russia’s invasion of Ukraine. The Dow Jones Industrial Average and S&P 500® Index fell -6.74% and -14.61%, respectively, while the tech-heavy Nasdaq Composite lost -28.56%. Value stocks2 significantly outperformed growth stocks3 (-7.25% vs -24.67%), while large cap stocks4 outperformed small cap stocks5 (-16.38% vs -18.54%).
The period began with global markets grappling with the emergence of the newly discovered Omicron variant. In November 2021 the World Health Organization designated the mutation as a “variant of concern”, leading to one of the largest selloffs of U.S. risk assets since the start of the pandemic, as fears that the world would succumb to a new wave of infections emerged. U.S. cases hit the highest levels of the pandemic in December, rising above 580,000 new cases on the last week of the month and more than doubling the previous record high. Yet, the negative sentiment regarding Omicron quickly reversed as cases proved to be generally less severe than prior strains. There was also increased positive market sentiment after the Center for Disease Control shortened its suggested isolation policy for those infected from 10 days to five.
Inflationary concerns began to take focus towards the end of 2021 before becoming a dominant headline throughout the period. Headline core consumer price index readings had hovered a little above 5% year-over-year for most of 2021, which led investors to question whether this period of rising prices would be more persistent than originally thought. However, this debate was intensified by November’s headline consumer price index rising 6.8% year-over-year, the fastest pace since 1982. The sharp increase in prices was generally due to an imbalance between supply and demand dynamics across multiple industries, led initially by energy, food, and used cars. Inflation readings continued to climb throughout the first half of 2022, peaking at 9.1% year-over-year in June.
Energy costs were the primary driver of inflation for the period, rising more than 30% year-over-year by the end of June. The energy sector, which had been subject to rising consumer demand as global economies reopened from lockdowns induced by COVID-19, faced added friction with Russia’s invasion of Ukraine. Investors were concerned about the secondary effects of the war, particularly from a commodity and supply chain standpoint. Russia has been a large global exporter of oil and certain minerals, and the various sanctions set on Russia from Western nations led to a surge in commodity prices, with crude oil reaching over $100 per barrel for the first time since 2014.
The surge in prices forced the U.S. Federal Reserve (Fed) into a more aggressive
8
approach to combating inflation. After remaining mostly consistent in its messaging around expectations that price pressures would be transitory, elevated and more persistent inflation pressures caused the Fed to move the target federal funds rate into more restrictive territory. This resulted in a 25-basis point (bps) hike in the federal funds rate at the March Federal Open Market Committee meeting, the first hike in more than three years. Five additional rate hikes of 50 bps, 75 bps, 75 bps, 75 bps, and 75 bps, respectively, followed in the succeeding months as inflation prints continued to come in hotter than expected, resulting in a federal funds rate of 4.00% by November 2, 2022, which was widely anticipated by the market as of the end of the fiscal year. Bond yields shot up in anticipation of this aggressive policy, leading to a bearish curve flattening trend and ultimately periods of brief yield curve inversion, as shorter-term yields moved higher than longer-term yields.
Separately, global markets were faced with increased geopolitical tensions due to the Russian invasion of Ukraine on February 23rd. Tensions remained elevated for the remainder of the twelve-month period, as Russia continued to weaponize energy flows, annexed four Ukrainian regions, and ratcheted up its nuclear warnings. In addition, the rhetoric between the U.S. and China over Taiwan further heated up after U.S. House of Representatives Speaker Nancy Pelosi visited Taiwan in August. China responded to the trip with large-scale military drills, which led to a pledge by U.S. President Joe Biden to defend the democratically governed island.
Key macroeconomic indicators mostly continued to trend lower throughout the period, with the U.S. reporting negative gross domestic product of -1.6% in the first quarter of 2022 and -0.9% in the second quarter before returning to growth in the third quarter. Worries among investors that a recession was pending continued to grow, which ultimately led consumer sentiment to drop to levels worse than during the COVID-19 pandemic and the global financial crisis of 2008, as measured by The University of Michigan’s index of consumer sentiment.
Despite rising recessionary signs, select bright spots in the U.S. economy supported the idea that a potential recession would be shallow. For example, one of the most positive developments seemed to be the traction behind the peak inflation narrative, which included a 99 day stretch of declines in U.S. gasoline prices. In addition, apartment rents fell for the first time in nearly two years in July and lumber prices were off more than 70% from their March peak late in the third quarter, back to pre-COVID levels. Second quarter earnings season also generated many “better-than-feared” takeaways, including plenty of commentary about relatively stable demand and pricing power continuing to protect margins. Capital return and capital expenditures were also mentioned as relative bright spots as companies flagged easing labor shortages and supply chain constraints. The U.S. labor market also remained strong over the period, with the national unemployment rate at 3.7% as of the end of October.
9
During the 12-month period ending October 31, 2022, the Fund’s position in Caesars Entertainment, a casino management company, detracted most from relative performance. Shares fell after the company reported that revenue was short of expectations in the first quarter. The company faced headwinds throughout the period as it had notable financial leverage. We believe the company should benefit from both the reduction of their overall leverage as well as the resumption of international travel. The Fund’s position in Organon & Co, a science-based global pharmaceutical company, also detracted from relative performance. Shares fell after the company lowered fiscal year guidance, including a reduction in adjusted EBITDA margin guidance. While shares have lagged over the last year, their legacy business has done better than expected following the spin-off from Merck & Co., Inc. We also believe the expansion of their women’s health business will be a significant opportunity for the company as they look to migrate the business to a higher growth segment which will in turn increase margins over time. The Fund’s position in KKR & Co., Inc, a leading alternatives investment firm, also detracted from relative performance. Amid the flattening of the yield curve, rate volatility, and skepticism around global growth prospects, the Financials sector came under pressure. In addition to the sector headwinds, shares of KKR & Co. were negatively impacted by its failure to close its acquisition of Telecom Italia. The company stands to benefit from increasing allocations to alternatives by
retail and institutional investors as well as a rising proportion of fee-related income.
Conversely, the largest contributor to relative performance during the 12-month period ending October 31, 2022, was T-Mobile US, Inc., an American wireless network operator. Shares of T-Mobile increased over the period as the company reported second quarter earnings that came in above expectations and simultaneously increased fiscal year guidance. The Fund’s position in Lockheed Martin Corp., a global security and aerospace company, also contributed to relative performance. The ongoing tensions between Russia and Ukraine have built up momentum in the defense sector and the U.S. government is Lockheed Martin’s largest customer. We believe the U.S. national defense budget could be larger than most are predicting, and the company should benefit from this. The Fund’s position in AbbVie, Inc., a research-based biopharmaceutical company, also contributed to relative performance. Shares rallied in the first half of the year, up almost 50% at the peak in early April. This was supported by the company reporting strong fourth quarter earnings and issuing fiscal year guidance above expectations.
Lord Abbett Focused Small Cap Value Fund
For the fiscal year ended October 31, 2022, the Fund returned -12.99%, reflecting performance at the net asset value (“NAV”) of Class A shares with all distributions reinvested, compared to its benchmark, the Russell 2000® Value Index8, which returned -10.73% over the same period.
10
U.S. markets faced many challenges throughout the twelve-month period ending October 31, 2022, including the emergence of the Omicron variant of COVID-19, supply chain dislocations, labor shortages, inflationary pressures, less accommodative fiscal and monetary policy, and Russia’s invasion of Ukraine. The Dow Jones Industrial Average and S&P 500® Index fell -6.74% and -14.61%, respectively, while the tech-heavy Nasdaq Composite lost -28.56%. Value stocks2 significantly outperformed growth stocks3 (-7.25% vs -24.67%), while large cap stocks4 outperformed small cap stocks5 (-16.38% vs -18.54%).
The period began with global markets grappling with the emergence of the newly discovered Omicron variant. In November 2021 the World Health Organization designated the mutation as a “variant of concern”, leading to one of the largest selloffs of U.S. risk assets since the start of the pandemic, as fears that the world would succumb to a new wave of infections emerged. U.S. cases hit the highest levels of the pandemic in December, rising above 580,000 new cases on the last week of the month and more than doubling the previous record high. Yet, the negative sentiment regarding Omicron quickly reversed as cases proved to be generally less severe than prior strains. There was also increased positive market sentiment after the Center for Disease Control shortened its suggested isolation policy for those infected from 10 days to five.
Inflationary concerns began to take focus towards the end of 2021 before becoming a dominant headline throughout the period. Headline core consumer price index readings had hovered a little above 5% year-over-year for most of 2021, which led investors to question whether this period of rising prices would be more persistent than originally thought. However, this debate was intensified by November’s headline consumer price index rising 6.8% year-over-year, the fastest pace since 1982. The sharp increase in prices was generally due to an imbalance between supply and demand dynamics across multiple industries, led initially by energy, food, and used cars. Inflation readings continued to climb throughout the first half of 2022, peaking at 9.1% year-over-year in June.
Energy costs were the primary driver of inflation for the period, rising more than 30% year-over-year by the end of June. The energy sector, which had been subject to rising consumer demand as global economies reopened from lockdowns induced by COVID-19, faced added friction with Russia’s invasion of Ukraine. Investors were concerned about the secondary effects of the war, particularly from a commodity and supply chain standpoint. Russia has been a large global exporter of oil and certain minerals, and the various sanctions set on Russia from Western nations led to a surge in commodity prices, with crude oil reaching over $100 per barrel for the first time since 2014.
The surge in prices forced the U.S. Federal Reserve (Fed) into a more aggressive
11
approach to combating inflation. After remaining mostly consistent in its messaging around expectations that price pressures would be transitory, elevated and more persistent inflation pressures caused the Fed to move the target federal funds rate into more restrictive territory. This resulted in a 25-basis point (bps) hike in the federal funds rate at the March Federal Open Market Committee meeting, the first hike in more than three years. Five additional rate hikes of 50 bps, 75 bps, 75 bps, 75 bps, and 75 bps, respectively, followed in the succeeding months as inflation prints continued to come in hotter than expected, resulting in a federal funds rate of 4.00% by November 2, 2022, which was widely anticipated by the market as of the end of the fiscal year. Bond yields shot up in anticipation of this aggressive policy, leading to a bearish curve flattening trend and ultimately periods of brief yield curve inversion, as shorter-term yields moved higher than longer-term yields.
Separately, global markets were faced with increased geopolitical tensions due to the Russian invasion of Ukraine on February 23rd. Tensions remained elevated for the remainder of the twelve-month period, as Russia continued to weaponize energy flows, annexed four Ukrainian regions, and ratcheted up its nuclear warnings. In addition, the rhetoric between the U.S. and China over Taiwan further heated up after U.S. House of Representatives Speaker Nancy Pelosi visited Taiwan in August. China responded to the trip with large-scale military drills, which led to a pledge by
U.S. President Joe Biden to defend the democratically governed island.
Key macroeconomic indicators mostly continued to trend lower throughout the period, with the U.S. reporting negative gross domestic product of -1.6% in the first quarter of 2022 and -0.9% in the second quarter before returning to growth in the third quarter. Worries among investors that a recession was pending continued to grow, which ultimately led consumer sentiment to drop to levels worse than during the COVID-19 pandemic and the global financial crisis of 2008, as measured by The University of Michigan’s index of consumer sentiment.
Despite rising recessionary signs, select bright spots in the U.S. economy supported the idea that a potential recession would be shallow. For example, one of the most positive developments seemed to be the traction behind the peak inflation narrative, which included a 99 day stretch of declines in U.S. gasoline prices. In addition, apartment rents fell for the first time in nearly two years in July and lumber prices were off more than 70% from their March peak late in the third quarter, back to pre-COVID levels. Second quarter earnings season also generated many “better-than-feared” takeaways, including plenty of commentary about relatively stable demand and pricing power continuing to protect margins. Capital return and capital expenditures were also mentioned as relative bright spots as companies flagged easing labor shortages and supply chain constraints. The U.S. labor market also remained strong over the
12
period, with the national unemployment rate at 3.7% as of the end of October.
During the 12-month period ending October 31, 2022, the Fund’s position in Spectrum Brands Holdings, Inc., a consumer products and home essentials company, detracted from relative performance. Shares fell after Assa Abloy, which engages in the provision of intelligent lock and security solutions, issued a statement regarding the U.S. DOJ’s blocking of Assa Abloys’s proposed acquisition of the hardware and home improvement division of Spectrum Brands. The Fund’s position in Masonite International Corp., a manufacturer of residential interior doors, also detracted from relative performance. Shares fell at the end of 2021 after the company lowered fiscal year guidance. Howard Heckes, President and CEO, stated “While our team has worked extremely hard to deliver continued growth in the face of a difficult operating environment, we expect the fourth quarter will continue to be affected by a tight labor market and logistics challenges and have updated our outlook to reflect their impact.” Despite the aforementioned headwinds, the company has been exhibiting pricing power and improving normalized returns as a result. The Fund’s position in Century Aluminum Co., a producer of aluminum and operator of aluminum reduction facilities, or smelters, in the United States and Iceland, detracted from relative performance. Shares fell as power costs increased early in the year, with the expectation that higher prices would continue through the summer. Electricity prices typically comprise approximately 1/3
of smelter costs. In addition to this, it became evident there was a much smaller global aluminum supply deficit than anticipated, largely due to weaker China demand and excess supply.
Conversely, the largest contributor to relative performance during the 12-month period ending October 31, 2022 was International Money Express, Inc, a leading money remittance services company. Shares rallied after the company reported fourth quarter earnings above expectations, followed by another strong first quarter earnings report. The company subsequently increased second quarter guidance. We believe their valuation remains attractive and they are well positioned for further growth. The Fund’s position in Cars.com, Inc., a leading automotive marketplace platform, contributed to relative performance. Shares rallied after the company reported strong second quarter earnings where revenue and adjusted EBITDA beat expectations. Subsequently, the company issued third quarter guidance stating they expect revenue growth to accelerate and projects growth of 6-8% year-over-year in the second half of 2022. The Fund’s position in Silicon Motion Technology, which engages in the development, manufacturing, and supply of semiconductor products for the electronics market, was the largest contributor within the sector. Silicon Motion Technology was a significant outperformer in the first half of the year. Shares rallied following the announcement that MaxLinear, which provides highly integrated radio-frequency
13
analog and mixed-signal semiconductor products for broadband communications applications, would acquire Silicon Motion Technology.
Lord Abbett Fundamental Equity Fund
For the fiscal year ended October 31, 2022, the Fund returned -6.81%, reflecting performance at the net asset value (“NAV”) of Class A shares with all distributions reinvested, compared to its benchmark, the Russell 1000® Value Index7, which returned -7.00% over the same period.
U.S. markets faced many challenges throughout the twelve-month period ending October 31, 2022, including the emergence of the Omicron variant of COVID-19, supply chain dislocations, labor shortages, inflationary pressures, less accommodative fiscal and monetary policy, and Russia’s invasion of Ukraine. The Dow Jones Industrial Average and S&P 500® Index fell -6.74% and -14.61%, respectively, while the tech-heavy Nasdaq Composite lost -28.56%. Value stocks2 significantly outperformed growth stocks3 (-7.25% vs -24.67%), while large cap stocks4 outperformed small cap stocks5 (-16.38% vs -18.54%).
The period began with global markets grappling with the emergence of the newly discovered Omicron variant. In November 2021 the World Health Organization designated the mutation as a “variant of concern”, leading to one of the largest selloffs of U.S. risk assets since the start of the pandemic, as fears that the world would succumb to a new wave of
infections emerged. U.S. cases hit the highest levels of the pandemic in December, rising above 580,000 new cases on the last week of the month and more than doubling the previous record high. Yet, the negative sentiment regarding Omicron quickly reversed as cases proved to be generally less severe than prior strains. There was also increased positive market sentiment after the Center for Disease Control shortened its suggested isolation policy for those infected from 10 days to five.
Inflationary concerns began to take focus towards the end of 2021 before becoming a dominant headline throughout the period. Headline core consumer price index readings had hovered a little above 5% year-over-year for most of 2021, which led investors to question whether this period of rising prices would be more persistent than originally thought. However, this debate was intensified by November’s headline consumer price index rising 6.8% year-over-year, the fastest pace since 1982. The sharp increase in prices was generally due to an imbalance between supply and demand dynamics across multiple industries, led initially by energy, food, and used cars. Inflation readings continued to climb throughout the first half of 2022, peaking at 9.1% year-over-year in June.
Energy costs were the primary driver of inflation for the period, rising more than 30% year-over-year by the end of June. The energy sector, which had been subject to rising consumer demand as global economies reopened from lockdowns induced by COVID-19, faced added friction
14
with Russia’s invasion of Ukraine. Investors were concerned about the secondary effects of the war, particularly from a commodity and supply chain standpoint. Russia has been a large global exporter of oil and certain minerals, and the various sanctions set on Russia from Western nations led to a surge in commodity prices, with crude oil reaching over $100 per barrel for the first time since 2014.
The surge in prices forced the U.S. Federal Reserve (Fed) into a more aggressive approach to combating inflation. After remaining mostly consistent in its messaging around expectations that price pressures would be transitory, elevated and more persistent inflation pressures caused the Fed to move the target federal funds rate into more restrictive territory. This resulted in a 25-basis point (bps) hike in the federal funds rate at the March Federal Open Market Committee meeting, the first hike in more than three years. Five additional rate hikes of 50 bps, 75 bps, 75 bps, 75 bps, and 75 bps, respectively, followed in the succeeding months as inflation prints continued to come in hotter than expected, resulting in a federal funds rate of 4.00% by November 2, 2022, which was widely anticipated by the market as of the end of the fiscal year. Bond yields shot up in anticipation of this aggressive policy, leading to a bearish curve flattening trend and ultimately periods of brief yield curve inversion, as shorter-term yields moved higher than longer-term yields.
Separately, global markets were faced with increased geopolitical tensions due to the Russian invasion of Ukraine on February 23rd.
Tensions remained elevated for the remainder of the twelve-month period, as Russia continued to weaponize energy flows, annexed four Ukrainian regions, and ratcheted up its nuclear warnings. In addition, the rhetoric between the U.S. and China over Taiwan further heated up after U.S. House of Representatives Speaker Nancy Pelosi visited Taiwan in August. China responded to the trip with large-scale military drills, which led to a pledge by U.S. President Joe Biden to defend the democratically governed island.
Key macroeconomic indicators mostly continued to trend lower throughout the period, with the U.S. reporting negative gross domestic product of -1.6% in the first quarter of 2022 and -0.9% in the second quarter before returning to growth in the third quarter. Worries among investors that a recession was pending continued to grow, which ultimately led consumer sentiment to drop to levels worse than during the COVID-19 pandemic and the global financial crisis of 2008, as measured by The University of Michigan’s index of consumer sentiment.
Despite rising recessionary signs, select bright spots in the U.S. economy supported the idea that a potential recession would be shallow. For example, one of the most positive developments seemed to be the traction behind the peak inflation narrative, which included a 99 day stretch of declines in U.S. gasoline prices. In addition, apartment rents fell for the first time in nearly two years in July and lumber prices were off more than 70% from their March peak late in the third quarter, back
15
to pre-COVID levels. Second quarter earnings season also generated many “better-than-feared” takeaways, including plenty of commentary about relatively stable demand and pricing power continuing to protect margins. Capital return and capital expenditures were also mentioned as relative bright spots as companies flagged easing labor shortages and supply chain constraints. The U.S. labor market also remained strong over the period, with the national unemployment rate at 3.7% as of the end of October.
During the 12-month period ending October 31, 2022, the Fund’s position in Caesars Entertainment, a casino management company, detracted most from relative performance. Shares fell after the company reported that revenue was short of expectations in the first quarter. The company faced headwinds throughout the period as it had notable financial leverage. We believe the company should benefit from both the reduction of their overall leverage as well as the resumption of international travel. The Fund’s position in Organon & Co, a science-based global pharmaceutical company, also detracted from relative performance. Shares fell after the company lowered fiscal year guidance, including a reduction in adjusted EBITDA margin guidance. While shares have lagged over the last year, their legacy business has done better than expected following the spin-off from Merck & Co., Inc. We also believe the expansion of their women’s health business will be a significant opportunity for the company as they look to migrate the business to a higher growth
segment which will in turn increase margins over time. The Fund’s position in Signature Bank, a commercial banking company, also detracted from relative performance. Banks were under pressure as the yield curve flattened and the possibility of slowing economic growth became evident. The 5-year and 30-year U.S. Treasury spread inverted for the first time since 2006, and the 2-year and 10-year Treasury spread inverted for the first time since 2019.
Conversely, the largest contributor to relative performance during the 12-month period ending October 31, 2022, was T-Mobile US, Inc, an American wireless network operator. Shares of T-Mobile increased over the period as the company reported strong second quarter earnings above expectations and simultaneously increased fiscal year guidance. The Fund’s position in Lockheed Martin Corp., a global security and aerospace company, also contributed to relative performance. The ongoing tensions between Russia and Ukraine have built up momentum in the defense sector and the U.S. government is Lockheed Martin’s largest customer. We believe the U.S. national defense budget could be larger than most are predicting, and the company should subsequently benefit from this. The Fund’s position in UnitedHealth Group, Inc., a health care coverage provider, also contributed to relative performance. Managed care companies such as UnitedHealth Group continued to see strong performance at the beginning of the year as investors expected that medical cost trends would remain subdued as the pandemic continued to
16
delay procedures. Shares of the company rose after reporting fourth quarter earnings, with revenue above expectations. Shares continued to rally after it was announced that LHC Group would be acquired by UnitedHealth for $5.4B cash.
Lord Abbett Global Equity Fund
For the fiscal year ended October 31, 2022, the Fund returned -20.30%, reflecting performance at the net asset value (“NAV”) of Class A Shares with all distributions reinvested, compared to its benchmark, the MSCI All Country World Index with Net Dividends,9 which returned -19.96% over the same period.
Global equities finished lower for the trailing twelve-month period as bearish sentiment overwhelmed markets. Looking closer, the fiscal year was defined by two distinct periods of economic activity. In the second half of 2021, U.S. markets were supported by continued central bank liquidity and corporate earnings surprises. Continued vaccine progress against the COVID-19 virus and momentum surrounding economic reopening in developed markets also provided a tailwind. Specifically, the U.S. economy showed signs of meaningful growth, with gross domestic product (GDP) growing 7.0% in the fourth quarter of 2021. Meanwhile, GDP growth in the Eurozone and China was 0.5% and 1.3%, respectively over the same period.
However, global markets were met with increasing headwinds towards the end of 2021, including the emergence of the newly discovered Omicron variant. In
November 2021 the World Health Organization designated the newly discovered mutation as a “variant of concern”, leading to one of the largest selloffs and worst one-day performance of U.S. risk assets since the start of the pandemic, as fears that the world would succumb to a new wave of infections emerged. U.S. cases hit the highest levels of the pandemic in December, rising above 580,000 new cases in the last week of the month and more than doubling the previous record high. Yet, the negative sentiment regarding Omicron quickly reversed as cases proved to be generally less severe than prior strains. In the U.S., there was also increased positive market sentiment after the Center for Disease Control shortened its suggested isolation policy for those infected from 10 days to five.
Moving into 2022, investor risk appetite shifted lower due primarily to a combination of higher and more persistent inflation. Inflationary pressures had built up in the fourth quarter of 2021 by an imbalance between supply and demand dynamics across multiple industries, exacerbated by COVID-19 labor issues. This became evident with the headline U.S. consumer price index (CPI) rising 6.8% year-on-year in November 2021, the fastest pace since 1982. Prices continued increasing throughout the first half of 2022, led by energy, food, and used cars. This surge in prices culminated in June 2022 as headline inflation came in at 9.1% year-on-year, the fastest annual increase in over 40 years. Meanwhile, inflation data outside the U.S. was also high, with
17
October 2022 inflation readings for Canada, the U.K., and Eurozone coming in at 6.9%, 11.1%, and 10.6%, respectively.
There were a number of developments indicating an increasing possibility of an approaching recession for global economies. The U.S. reported negative gross domestic product of -1.6% in the first quarter of 2022 and -0.9% in the second quarter before returning to growth in the third quarter. Worries of a pending recession continued to grow, causing consumer sentiment to drop to levels worse than during the COVID-19 pandemic and the global financial crisis of 2008, as measured by The University of Michigan’s index of consumer sentiment. There was a flurry of high-profile hiring freezes and layoff announcements. Second quarter earnings also provided some cautious takeaways, including lower guidance from retailers on general merchandise softness as a result of inflation, tech companies pointing to a continued deterioration in digital advertising and consumer electronics, and home builders commenting on a slowdown in housing demand.
In Europe, market sentiment deteriorated throughout the year, with the prospects of a recession increasing, in our view. Most economic data pointed to a slowdown in Europe, such as the euro area composite Purchasing Managers Index (PMI) business survey, which fell into contractionary territory and closed the twelve-month period with six straight months of falling private sector activity. Euro area consumer confidence dropped to an all-time low in September, as measured
by the European Commission’s consumer confidence indicator, in part due to the reduction in gas supplies coming from Russia, which drove prices up significantly and raised fears of outright shortages and rationing. Russia completely halted gas flows through the key Nord Stream 1 pipeline in September, which exacerbated many of those fears. This sparked officials to announce plans to tackle the energy crisis towards the end of the period, which included the first version of a price cap and a common purchases system. Germany also launched a jumbo fiscal package of €200bn to support households and firms.
Emerging markets equities meaningfully underperformed their developed market peers, as a strong U.S. dollar and rising oil prices proved to be major headwinds. Chinese equities were a notable underperformer, as the country continued to grapple the COVID-zero strategy, a moderation in exports, and a persistent property crisis. These headwinds led to consumer confidence, as measured by the National Bureau of Statistics of China, to fall to an all-time low in April and continue to hover in that range for the remainder of the fiscal year. As such, in September, the Asian Development Bank downgraded its growth estimate for China to 3.3% this year from a prior 4.0% estimate. It also forecasted that China’s economic growth would lag that of developing Asia for the first time in more than three decades.
Separately, global markets were faced with increased geopolitical tensions due to the Russian invasion of Ukraine on February 23rd. Tensions remained elevated
18
for the remainder of the twelve-month period, as Russia continued to weaponize energy flows, annexed four Ukrainian regions, and ratcheted up its nuclear warnings. In addition, the rhetoric between the U.S. and China over Taiwan further heated up after U.S. House of Representatives Speaker Nancy Pelosi visited Taiwan in August. China responded to the trip with large-scale military drills, which led to a pledge by U.S. President Joe Biden to defend the democratically governed island.
The surge in prices forced global central banks into a more aggressive approach to combating inflation. After remaining mostly consistent in its messaging around expectations that price pressures would be transitory, elevated and more persistent inflation pressures caused the U.S. Federal Reserve (Fed) to move the target federal funds rate into more restrictive territory. This resulted in a 25-basis point (bps) hike in the federal funds rate at the March Federal Open Market Committee meeting, the first hike in more than three years. Five additional rate hikes of 50 bps, 75 bps, 75 bps, 75 bps, and 75 bps, respectively, followed in the succeeding months as inflation prints continued to come in hotter than expected, resulting in a federal funds rate of 4.00% by November 2, 2022, which was widely anticipated by the market. Bond yields shot up in reaction to this shift in policy, exhibiting a bearish curve flattening trend and ultimately leading to periods of brief yield curve inversion, as shorter-term yields moved higher than longer-term yields. This trend was reflected in the 5-year and
30-year U.S. Treasury spread inverting for the first time since 2006, and the 2-year and 10-year Treasury spread inverting for the first time since 2019.
The European Central Bank (ECB) raised its three key interest rates by 50bp during its July 2022 meeting in an attempt to reduce inflationary pressures, ending eight years of negative rates with its first increase since 2011. The ECB then followed up with two 75bp rate hikes in September and October, bringing borrowing costs to the highest level since early 2009. Inflation in the Euro Area continued to march higher and break record rates, reaching double digits by October, and showing no signs of peaking. In total, ninety central banks globally have raised rates thus far in 2022, creating the most widespread rate rise in over two decades. That said, the Bank of Japan (BoJ) appeared undeterred and maintained its key short-term interest rate at -0.1% during its October meeting but raised its 2022 inflation forecast to 2.9% from the 2.3% made in July, citing surging prices of energy, food, and durable goods. The BoJ reiterated it will take extra easing measures if needed while continuing to buy unlimited amounts of bonds, as it has been doing since April. The People’s Bank of China also maintained accommodative monetary policy over the year amid subdued headline inflation and a rapid decline in the yuan.
In terms of Fund performance, stock selection within the information technology sector was a primary driver of relative underperformance over the period. Specifically, shares of NVIDIA Corporation,
19
a U.S.-based designer of graphics processing units that enhance the experience on computing platforms, slumped for most of the period amid declining demand for its gaming graphic processing units (GPUs). Management noted during the company’s most recent earnings report that as macroeconomic challenges started to affect consumers, the demand for high-quality gaming GPUs started to fall.
Within consumer discretionary, shares of Alibaba Group Holding Ltd., a Chinese online and mobile marketplace in retail and wholesale trade, fell meaningfully throughout the year. Entering the fiscal year, the company was already facing pressure of increased regulation from the State Administration for Market Regulation. In August 2021, the Chinese agency issued a comprehensive list of rules that forbade tech giants from illegally capturing and using customer data, as well as using technology to bar access to competitors’ products. Shares of Alibaba were also under pressure as a result of renewed fears of further COVID containment driven lockdowns in China. Previously strict lockdowns have reduced social engagement, which in turn has presented challenges in many areas of consumption.
Conversely, stock selection within the industrials and financials sectors contributed to relative performance during the period. Within industrials, the Fund’s position in Rheinmetall AG, a German defense equipment manufacturer, was the largest individual
contributor to relative performance. After Russia’s invasion of Ukraine, the German government enlisted Rheinmetall to improve the equipment of the armed forces of the Federal Republic of Germany, sending shares of the stock soaring.
Stock selection within the energy sector was also a primary contributor to relative performance during the period. Leading the way was the Fund’s position in Marathon Petroleum as they largely benefitted from higher oil and gas prices. Marathon refines crude oil and other feedstocks at its refineries in the Gulf Coast and Midwest regions of the U.S., with the former currently particularly advantaged in the current environment. European refining capacity has been disadvantaged by high gas prices, while US Gulf Coast refineries have enjoyed significant cost advantages due to cheaper input costs.
Within the heath care sector, the Fund’s position in Vertex Pharmaceuticals, Inc., a manufacturer of small molecule drugs for patients with serious diseases, also contributed to relative performance. Shares of the stock largely benefited throughout the year due to positive results for its drug, VX- 548, which treats acute pain. Most recently, in July, the company announced positive results from two Phase 2 proof-of-concept studies. As of the end of the fiscal year, Vertex is among the Fund’s top active overweights relative to the MSCI All Country World Index with Net Dividends.
20
Lord Abbett Growth Leaders Fund
For the fiscal year ended October 31, 2022, the Fund returned -38.05%, reflecting performance at the net asset value (NAV) of Class A shares with all distributions reinvested, compared to its benchmark, the Russell 1000® Growth Index,6 which returned -24.60% over the same period.
U.S. markets faced many challenges throughout the twelve-month period ending October 31, 2022, including the emergence of the Omicron variant of COVID-19, supply chain dislocations, labor shortages, inflationary pressures, less accommodative fiscal and monetary policy, and Russia’s invasion of Ukraine. The Dow Jones Industrial Average and S&P 500® Index fell -6.74% and -14.61%, respectively, while the tech-heavy Nasdaq Composite lost -28.56%. Value stocks2 significantly outperformed growth stocks3 (-7.25% vs -24.67%), while large cap stocks4 outperformed small cap stocks5 (-16.38% vs -18.54%).
The period began with global markets grappling with the emergence of the newly discovered Omicron variant. In November 2021 the World Health Organization designated the mutation as a “variant of concern”, leading to one of the largest selloffs of U.S. risk assets since the start of the pandemic, as fears that the world would succumb to a new wave of infections emerged. U.S. cases hit the highest levels of the pandemic in December, rising above 580,000 new cases
on the last week of the month and more than doubling the previous record high. Yet, the negative sentiment regarding Omicron quickly reversed as cases proved to be generally less severe than prior strains. There was also increased positive market sentiment after the Center for Disease Control shortened its suggested isolation policy for those infected from 10 days to five.
Inflationary concerns began to take focus towards the end of 2021 before becoming a dominant headline throughout the period. Headline core consumer price index readings had hovered a little above 5% year-over-year for most of 2021, which led investors to question whether this period of rising prices would be more persistent than originally thought. However, this debate was intensified by November’s headline consumer price index rising 6.8% year-over-year, the fastest pace since 1982. The sharp increase in prices was generally due to an imbalance between supply and demand dynamics across multiple industries, led initially by energy, food, and used cars. Inflation readings continued to climb throughout the first half of 2022, peaking at 9.1% year-over-year in June.
Energy costs were the primary driver of inflation for the period, rising more than 30% year-over-year by the end of June. The energy sector, which had been subject to rising consumer demand as global economies reopened from lockdowns induced by COVID-19, faced added friction with Russia’s invasion of Ukraine. Investors were concerned about the secondary
21
effects of the war, particularly from a commodity and supply chain standpoint. Russia has been a large global exporter of oil and certain minerals, and the various sanctions set on Russia from Western nations led to a surge in commodity prices, with crude oil reaching over $100 per barrel for the first time since 2014.
The surge in prices forced the U.S. Federal Reserve (Fed) into a more aggressive approach to combating inflation. After remaining mostly consistent in its messaging around expectations that price pressures would be transitory, elevated and more persistent inflation pressures caused the Fed to move the target federal funds rate into more restrictive territory. This resulted in a 25-basis point (bps) hike in the federal funds rate at the March Federal Open Market Committee meeting, the first hike in more than three years. Five additional rate hikes of 50 bps, 75 bps, 75 bps, 75 bps, and 75 bps, respectively, followed in the succeeding months as inflation prints continued to come in hotter than expected, resulting in a federal funds rate of 4.00% by November 2, 2022, which was widely anticipated by the market as of the end of the fiscal year. Bond yields shot up in anticipation of this aggressive policy, leading to a bearish curve flattening trend and ultimately periods of brief yield curve inversion, as shorter-term yields moved higher than longer-term yields.
Separately, global markets were faced with increased geopolitical tensions due to the Russian invasion of Ukraine on February 23rd. Tensions remained elevated
for the remainder of the twelve-month period, as Russia continued to weaponize energy flows, annexed four Ukrainian regions, and ratcheted up its nuclear warnings. In addition, the rhetoric between the U.S. and China over Taiwan further heated up after U.S. House of Representatives Speaker Nancy Pelosi visited Taiwan in August. China responded to the trip with large-scale military drills, which led to a pledge by U.S. President Joe Biden to defend the democratically governed island.
Key macroeconomic indicators mostly continued to trend lower throughout the period, with the U.S. reporting negative gross domestic product of -1.6% in the first quarter of 2022 and -0.9% in the second quarter before returning to growth in the third quarter. Worries among investors that a recession was pending continued to grow, which ultimately led consumer sentiment to drop to levels worse than during the COVID-19 pandemic and the global financial crisis of 2008, as measured by The University of Michigan’s index of consumer sentiment.
Despite rising recessionary signs, select bright spots in the U.S. economy supported the idea that a potential recession would be shallow. For example, one of the most positive developments seemed to be the traction behind the peak inflation narrative, which included a 99 day stretch of declines in U.S. gasoline prices. In addition, apartment rents fell for the first time in nearly two years in July and lumber prices were off more than 70% from their March peak late in the third quarter, back
22
to pre-COVID levels. Second quarter earnings season also generated a lot of “better-than-feared” takeaways, including plenty of commentary about relatively stable demand and pricing power continuing to protect margins. Capital return and capital expenditures were also mentioned as relative bright spots as companies flagged easing labor shortages and supply chain constraints. The U.S. labor market also remained strong over the period, with the national unemployment rate at 3.7% as of the end of October.
From an industry standpoint, the portfolio’s allocation to companies within the software industry was a primary drag on performance over the period. For example, the portfolio’s position in Atlassian Corporation, a developer of products for software developers, project managers and other software development teams, was a notable detractor as many stocks within the industry, and other industries, suffered significant valuation compression as a result of supply chain dislocations, labor shortages, inflationary pressures, less accommodative fiscal and monetary policy, and heightened recessionary fears. That said, we view this largely as a price correction as many of these companies continue to exhibit strong operating momentum and possess bright futures.
The portfolio’s position in EPAM Systems, Inc., a developer of software products and digital platform engineering services, was the largest detractor from relative performance over the period. After sustained stock price appreciation since
the beginning of the pandemic, EPAM stock quickly moved into a period of consolidation in the first quarter of 2022 as the high-growth and richly valued technology stock was adversely impacted by the rotation away from growth to value. Additionally, EPAM was negatively impacted by the Russian invasion of Ukraine, as a large percentage of its workforce is based in Ukraine, Russia, and Belarus. We exited the position shortly after the invasion.
Conversely, not owning Meta Platforms, Inc., a technology company that engages in the development of social media applications, had the largest contribution to the portfolio’s relative performance over the period. The portfolio has maintained a zero weight in Meta stock since December 2021 as it has not aligned with our investment process. In regard to our decision to exit the position, we have been concerned about the company’s inability to manage data privacy and controversial speech on its sites. The company has also acknowledged issues regarding Apple’s iOS privacy changes and advertiser challenges - citing supply chain and other macro issues as prominent headwinds. Lastly, we considered Facebook’s name change to Meta Platforms and quick pivot to the metaverse, a new and uncertain area, as a red flag, as we questioned the need for such a shift and concluded that the company must be concerned about the growth prospects of its existing business.
The portfolio’s position in in Enphase Energy, Inc., an energy technology company that develops and manufactures solar micro-inverters, battery energy
23
storage, and electric vehicle charging stations, was also a prominent contributor to relative performance over the period. Enphase has benefited greatly from increased demand for solar solutions in Europe as a result of persistent energy shortages. In the company’s most recent quarterly earnings report, management reported top- and bottom-line earnings results that exceeded consensus expectations. Notably, Enphase’s reported strong revenue growth driven by growth in microinverter and IQ Battery shipments. As of the end of the fiscal year, Enphase is one of the portfolio’s top active overweights.
Lord Abbett Health Care Fund
For the fiscal year ended October 31, 2022, the Fund returned -16.29%, reflecting performance at the net asset value (NAV) of Class A Shares with all distributions reinvested, compared to its benchmark, the MSCI ACWI Health Care Index with Net Dividends,10 which returned -7.61% over the same period.
U.S. markets faced many challenges throughout the twelve-month period ending October 31, 2022, including the emergence of the Omicron variant of COVID-19, supply chain dislocations, labor shortages, inflationary pressures, less accommodative fiscal and monetary policy, and Russia’s invasion of Ukraine. The Dow Jones Industrial Average and S&P 500® Index fell -6.74% and -14.61%, respectively, while the tech-heavy Nasdaq Composite lost -28.56%. Value stocks2 significantly outperformed growth stocks3
(-7.25% vs -24.67%), while large cap stocks4 outperformed small cap stocks5 (-16.38% vs -18.54%).
The period began with global markets grappling with the emergence of the newly discovered Omicron variant. In November 2021 the World Health Organization designated the mutation as a “variant of concern”, leading to one of the largest selloffs of U.S. risk assets since the start of the pandemic, as fears that the world would succumb to a new wave of infections emerged. U.S. cases hit the highest levels of the pandemic in December, rising above 580,000 new cases on the last week of the month and more than doubling the previous record high. Yet, the negative sentiment regarding Omicron quickly reversed as cases proved to be generally less severe than prior strains. There was also increased positive market sentiment after the Center for Disease Control shortened its suggested isolation policy for those infected from 10 days to five.
Inflationary concerns began to take focus towards the end of 2021 before becoming a dominant headline throughout the period. Headline core consumer price index readings had hovered a little above 5% year-over-year for most of 2021, which led investors to question whether this period of rising prices would be more persistent than originally thought. However, this debate was intensified by November’s headline consumer price index rising 6.8% year-over-year, the fastest pace since 1982. The sharp increase in prices was generally due to an imbalance
24
between supply and demand dynamics across multiple industries, led initially by energy, food, and used cars. Inflation readings continued to climb throughout the first half of 2022, peaking at 9.1% year-over-year in June.
Energy costs were the primary driver of inflation for the period, rising more than 30% year-over-year by the end of June. The energy sector, which had been subject to rising consumer demand as global economies reopened from lockdowns induced by COVID-19, faced added friction with Russia’s invasion of Ukraine. Investors were concerned about the secondary effects of the war, particularly from a commodity and supply chain standpoint. Russia has been a large global exporter of oil and certain minerals, and the various sanctions set on Russia from Western nations led to a surge in commodity prices, with crude oil reaching over $100 per barrel for the first time since 2014.
The surge in prices forced the U.S. Federal Reserve (Fed) into a more aggressive approach to combating inflation. After remaining mostly consistent in its messaging around expectations that price pressures would be transitory, elevated and more persistent inflation pressures caused the Fed to move the target federal funds rate into more restrictive territory. This resulted in a 25-basis point (bps) hike in the federal funds rate at the March Federal Open Market Committee meeting, the first hike in more than three years. Five additional rate hikes of 50 bps, 75 bps, 75 bps, 75 bps, and 75 bps, respectively, followed in the succeeding months as inflation prints continued to
come in hotter than expected, resulting in a federal funds rate of 4.00% by November 2, 2022, which was widely anticipated by the market as of the end of the fiscal year. Bond yields shot up in anticipation of this aggressive policy, leading to a bearish curve flattening trend and ultimately periods of brief yield curve inversion, as shorter-term yields moved higher than longer-term yields.
Separately, global markets were faced with increased geopolitical tensions due to the Russian invasion of Ukraine on February 23rd. Tensions remained elevated for the remainder of the twelve-month period, as Russia continued to weaponize energy flows, annexed four Ukrainian regions, and ratcheted up its nuclear warnings. In addition, the rhetoric between the U.S. and China over Taiwan further heated up after U.S. House of Representatives Speaker Nancy Pelosi visited Taiwan in August. China responded to the trip with large-scale military drills, which led to a pledge by U.S. President Joe Biden to defend the democratically governed island.
Key macroeconomic indicators mostly continued to trend lower throughout the period, with the U.S. reporting negative gross domestic product of -1.6% in the first quarter of 2022 and -0.9% in the second quarter before returning to growth in the third quarter. Worries among investors that a recession was pending continued to grow, which ultimately led consumer sentiment to drop to levels worse than during the COVID-19 pandemic and the global financial crisis of 2008, as
25
measured by The University of Michigan’s index of consumer sentiment.
Despite rising recessionary signs, select bright spots in the U.S. economy supported the idea that a potential recession would be shallow. For example, one of the most positive developments seemed to be the traction behind the peak inflation narrative, which included a 99 day stretch of declines in U.S. gasoline prices. In addition, apartment rents fell for the first time in nearly two years in July and lumber prices were off more than 70% from their March peak late in the third quarter, back to pre-COVID levels. Second quarter earnings season also generated many “better-than-feared” takeaways, including plenty of commentary about relatively stable demand and pricing power continuing to protect margins. Capital return and capital expenditures were also mentioned as relative bright spots as companies flagged easing labor shortages and supply chain constraints. The U.S. labor market also remained strong over the period, with the national unemployment rate at 3.7% as of the end of October.
In terms of Fund performance, an overweight to and security selection within the biotechnology industry was a primary detractor from relative performance during the period. Biotechnology faced a number of headwinds throughout the fiscal year after a strong 2020 and start to 2021. Many clinical trials experienced delays, largely as a result of the U.S. Food and Drug Administration (FDA) being constrained as they were forced to redirect resources to help combat the pandemic. Additionally,
the industry was negatively impacted by the general shift from investors into reopening stocks after COVID vaccines were approved. With that said, biotech showed some signs of life throughout the third quarter of 2022 as a string of high-profile clinical trial successes were announced, as well as several high-profile products that have already been launched continuing to do well.
The portfolio’s position in Natera, Inc., a clinical genetic testing company that primarily focuses on women’s health, was the largest individual detractor from relative performance over the period. Shares of the stock fell dramatically in the first quarter of 2022 after Hindenburg Research published a report that alleged that Natera has deceptive sales and billing practices. However, despite the slide, we maintain conviction in the stock as we believe the company is the leader in diagnostics with a first mover advantage in minimal residual disease testing. The company is expanding payor coverage in new cancer and transplant indications and increasing screening efforts which will drive long term value. Additionally, we see the potential for insurance reimbursement of the company’s microdeletions tests, which would provide a big revenue boost in the future.
Although security selection within the biotechnology industry was a primary detractor from relative performance over the period, the portfolios’ position in Vertex Pharmaceuticals, Inc., a manufacturer of small molecule drugs for patients with serious diseases, was a notable contributor.
26
Shares of the stock largely benefited throughout the year due to positive results for its drug, VX-548, which treats acute pain. Most recently, in July, the company announced positive results from two Phase 2 proof-of-concept studies. As of the end of the fiscal year, Vertex is among the portfolio’s top active overweights.
The portfolio’s position in Ventyx Biosciences, Inc., a clinical-stage biopharmaceutical company focused on advancing novel oral therapies for patients living with autoimmune and inflammatory disorders, was also a prominent contributor over the period. After treading water for most of the year, shares of the stock significantly rose in September after the company announced positive Phase 1 trial results for VTX958, a TYK2 inhibitor which has a role in a broad range of immune-mediated diseases. The stock was also positively impacted by the FDA’s approval of Bristol-Myers Squibb’s TYK inhibitor which, as a result, reduced regulatory risk for Ventyx and similar companies.
Lord Abbett International Equity Fund
For the fiscal year ended October 31, 2022, the Fund returned -25.75%, reflecting performance at the net asset value (NAV) of Class A Shares with all distributions reinvested, compared to its benchmark, the MSCI ACWI ex-U.S. Index with Net Dividends11, which returned -24.73% over the same period.
Global equities finished lower for the trailing twelve-month period as bearish sentiment overwhelmed markets. Looking
closer, the fiscal year was defined by two distinct periods of economic activity. In the second half of 2021, U.S. markets were supported by continued central bank liquidity and corporate earnings surprises. Continued vaccine progress against the COVID-19 virus and momentum surrounding economic reopening in developed markets also provided a tailwind. Specifically, the U.S. economy showed signs of meaningful growth, with gross domestic product (GDP) growing 7.0% in the fourth quarter of 2021. Meanwhile, GDP growth in the Eurozone and China was 0.5% and 1.3%, respectively over the same period.
However, global markets were met with increasing headwinds towards the end of 2021, including the emergence of the newly discovered Omicron variant. In November 2021 the World Health Organization designated the newly discovered mutation as a “variant of concern”, leading to one of the largest selloffs and worst one-day performance of U.S. risk assets since the start of the pandemic, as fears that the world would succumb to a new wave of infections emerged. U.S. cases hit the highest levels of the pandemic in December, rising above 580,000 new cases in the last week of the month and more than doubling the previous record high. Yet, the negative sentiment regarding Omicron quickly reversed as cases proved to be generally less severe than prior strains. In the U.S., there was also increased positive market sentiment after the Center for Disease Control shortened its suggested isolation policy for those infected from 10 days to five.
27
Moving into 2022, investor risk appetite shifted lower due primarily to a combination of higher and more persistent inflation. Inflationary pressures had built up in the fourth quarter of 2021 by an imbalance between supply and demand dynamics across multiple industries, exacerbated by COVID-19 labor issues. This became evident with the headline U.S. consumer price index (CPI) rising 6.8% year-on-year in November 2021, the fastest pace since 1982. Prices continued increasing throughout the first half of 2022, led by energy, food, and used cars. This surge in prices culminated in June 2022 as headline inflation came in at 9.1% year-on-year, the fastest annual increase in over 40 years. Meanwhile, inflation data outside the U.S. was also high, with October 2022 inflation readings for Canada, the U.K., and Eurozone coming in at 6.9%, 11.1%, and 10.6%, respectively.
There were a number of developments indicating an increasing possibility of an approaching recession for global economies. The U.S. reported negative gross domestic product of -1.6% in the first quarter of 2022 and -0.9% in the second quarter before returning to growth in the third quarter. Worries of a pending recession continued to grow, causing consumer sentiment to drop to levels worse than during the COVID-19 pandemic and the global financial crisis of 2008, as measured by The University of Michigan’s index of consumer sentiment. There was a flurry of high-profile hiring freezes and layoff announcements. Second quarter earnings also provided some cautious takeaways, including lower
guidance from retailers on general merchandise softness as a result of inflation, tech companies pointing to a continued deterioration in digital advertising and consumer electronics, and home builders commenting on a slowdown in housing demand.
In Europe, market sentiment deteriorated throughout the year, with the prospects of a recession increasing, in our view. Most economic data pointed to a slowdown in Europe, such as the euro area composite Purchasing Managers Index (PMI) business survey, which fell into contractionary territory and closed the twelve-month period with six straight months of falling private sector activity. Euro area consumer confidence dropped to an all-time low in September, as measured by the European Commission’s consumer confidence indicator, in part due to the reduction in gas supplies coming from Russia, which drove prices up significantly and raised fears of outright shortages and rationing. Russia completely halted gas flows through the key Nord Stream 1 pipeline in September, which exacerbated many of those fears. This sparked officials to announce plans to tackle the energy crisis towards the end of the period, which included the first version of a price cap and a common purchases system. Germany also launched a jumbo fiscal package of €200bn to support households and firms.
Emerging markets equities meaningfully underperformed their developed market peers, as a strong U.S. dollar and rising oil prices proved to be major headwinds. Chinese equities were a notable
28
underperformer, as the country continued to grapple the COVID-zero strategy, a moderation in exports, and a persistent property crisis. These headwinds led to consumer confidence, as measured by the National Bureau of Statistics of China, to fall to an all-time low in April and continue to hover in that range for the remainder of the fiscal year. As such, in September, the Asian Development Bank downgraded its growth estimate for China to 3.3% this year from a prior 4.0% estimate. It also forecasted that China’s economic growth would lag that of developing Asia for the first time in more than three decades.
Separately, global markets were faced with increased geopolitical tensions due to the Russian invasion of Ukraine on February 23rd. Tensions remained elevated for the remainder of the twelve-month period, as Russia continued to weaponize energy flows, annexed four Ukrainian regions, and ratcheted up its nuclear warnings. In addition, the rhetoric between the U.S. and China over Taiwan further heated up after U.S. House of Representatives Speaker Nancy Pelosi visited Taiwan in August. China responded to the trip with large-scale military drills, which led to a pledge by U.S. President Joe Biden to defend the democratically governed island.
The surge in prices forced global central banks into a more aggressive approach to combating inflation. After remaining mostly consistent in its messaging around expectations that price pressures would be transitory, elevated and more persistent inflation pressures caused the U.S. Federal
Reserve (Fed) to move the target federal funds rate into more restrictive territory. This resulted in a 25-basis point (bps) hike in the federal funds rate at the March Federal Open Market Committee meeting, the first hike in more than three years. Five additional rate hikes of 50 bps, 75 bps, 75 bps, 75 bps, and 75 bps, respectively, followed in the succeeding months as inflation prints continued to come in hotter than expected, resulting in a federal funds rate of 4.00% by November 2, 2022, which was widely anticipated by the market. Bond yields shot up in reaction to this shift in policy, exhibiting a bearish curve flattening trend and ultimately leading to periods of brief yield curve inversion, as shorter-term yields moved higher than longer-term yields. This trend was reflected in the 5-year and 30-year U.S. Treasury spread inverting for the first time since 2006, and the 2-year and 10-year Treasury spread inverting for the first time since 2019.
The European Central Bank (ECB) raised its three key interest rates by 50bp during its July 2022 meeting in an attempt to reduce inflationary pressures, ending eight years of negative rates with its first increase since 2011. The ECB then followed up with two 75bp rate hikes in September and October, bringing borrowing costs to the highest level since early 2009. Inflation in the Euro Area continued to march higher and break record rates, reaching double digits by October, and showing no signs of peaking. In total, ninety central banks globally have raised rates thus far in 2022, creating the most widespread rate rise in over two decades. That said, the Bank of
29
Japan (BoJ) appeared undeterred and maintained its key short-term interest rate at -0.1% during its October meeting but raised its 2022 inflation forecast to 2.9% from the 2.3% made in July, citing surging prices of energy, food, and durable goods. The BoJ reiterated it will take extra easing measures if needed while continuing to buy unlimited amounts of bonds, as it has been doing since April. The People’s Bank of China also maintained accommodative monetary policy over the year amid subdued headline inflation and a rapid decline in the yuan.
During the period, security selection within the consumer discretionary and communication services sectors were primary drivers of relative underperformance. Within consumer discretionary, shares of Alibaba Group Holding Ltd., a Chinese online and mobile marketplace in retail and wholesale trade, fell meaningfully throughout the year. Entering the fiscal year, the company was already facing pressure of increased regulation from the State Administration for Market Regulation. In August 2021, the Chinese agency issued a comprehensive list of rules that forbade tech giants from illegally capturing and using customer data, as well as using technology to bar access to competitors’ products. Shares of Alibaba also faced renewed fears of further COVID containment driven lockdowns in China. Previously strict lockdowns have reduced social engagement, which in turn has presented challenges in many areas of consumption.
Within communication services, the Fund’s positions in Tencent Holding, Ltd., and Sea, Ltd., were the primary detractors from relative performance. Tencent is a Chinese multinational technology and entertainment conglomerate that is one of the highest grossing multimedia companies in the world. Sea is an internet and mobile platform company that engages in the provision of online gaming services. It was originally the non-China subsidiary of Tencent before being separated into its own company, of which Tencent still owns a small stake. Both companies performed poorly largely as a result of high-multiple stocks being hit hard throughout the shift from the growth to value. Similar to Alibaba, Tencent has also been adversely impacted by increased regulation.
Conversely, stock selection within the financials sector was a primary contributor to relative performance over the period. Generally speaking, our preference in banking has been for asset-geared franchises with low complexity. Immediately following the Russian invasion of Ukraine, we reduced European financials exposure meaningfully expecting significant challenges as a result of slower European economic growth. Towards the end of the first quarter of 2022, after the sharp selloff in the sector, we were once again able to increase our positioning with a focus on banks that we believed would likely benefit from rising rates. Outside of Europe, relative performance was positively impacted by the Fund’s position in Bank Mandiri, which has benefited from
30
a general economic improvement in Indonesia, as well as increased economic activity as a result of China’s reopening.
Security selection in the health care sector also contributed to relative performance. Leading the way was the Fund’s position in Daiichi Sankyo. Daiichi focuses on oncology and is the second largest pharmaceutical company in Japan. In early 2019, the company entered into a global collaboration agreement with AstraZeneca to jointly develop and commercialize new cancer treatments. The shares of the stock performed well throughout the third quarter of 2022 following the release of treatment data that showed promising results. We believe that Daiichi holds strong economic upside in its partnership with AstraZeneca and it should be a good multi-year opportunity for the stock.
Lord Abbett International Opportunities Fund
For the fiscal year ended October 31, 2022, the Fund returned -29.03%, reflecting performance at the net asset value (“NAV”) of Class A Shares with all distributions reinvested, compared to its benchmark, the S&P Developed Ex-U.S. SmallCap® Index12, which returned -30.62% over the same period.
Global equities finished lower for the trailing twelve-month period as bearish sentiment overwhelmed markets. Looking closer, the fiscal year was defined by two distinct periods of economic activity. In the second half of 2021, U.S. markets were supported by continued central bank
liquidity and corporate earnings surprises. Continued vaccine progress against the COVID-19 virus and momentum surrounding economic reopening in developed markets also provided a tailwind. Specifically, the U.S. economy showed signs of meaningful growth, with gross domestic product (GDP) growing 7.0% in the fourth quarter of 2021. Meanwhile, GDP growth in the Eurozone and China was 0.5% and 1.3%, respectively over the same period.
However, global markets were met with increasing headwinds towards the end of 2021, including the emergence of the newly discovered Omicron variant. In November 2021 the World Health Organization designated the newly discovered mutation as a “variant of concern”, leading to one of the largest selloffs and worst one-day performance of U.S. risk assets since the start of the pandemic, as fears that the world would succumb to a new wave of infections emerged. U.S. cases hit the highest levels of the pandemic in December, rising above 580,000 new cases in the last week of the month and more than doubling the previous record high. Yet, the negative sentiment regarding Omicron quickly reversed as cases proved to be generally less severe than prior strains. In the U.S., there was also increased positive market sentiment after the Center for Disease Control shortened its suggested isolation policy for those infected from 10 days to five.
Moving into 2022, investor risk appetite shifted lower due primarily to a combination of higher and more persistent
31
inflation. Inflationary pressures had built up in the fourth quarter of 2021 by an imbalance between supply and demand dynamics across multiple industries, exacerbated by COVID-19 labor issues. This became evident with the headline U.S. consumer price index (CPI) rising 6.8% year-on-year in November 2021, the fastest pace since 1982. Prices continued increasing throughout the first half of 2022, led by energy, food, and used cars. This surge in prices culminated in June 2022 as headline inflation came in at 9.1% year-on-year, the fastest annual increase in over 40 years. Meanwhile, inflation data outside the U.S. was also high, with October 2022 inflation readings for Canada, the U.K., and Eurozone coming in at 6.9%, 11.1%, and 10.6%, respectively.
There were a number of developments indicating an increasing possibility of an approaching recession for global economies. The U.S. reported negative gross domestic product of -1.6% in the first quarter of 2022 and -0.9% in the second quarter before returning to growth in the third quarter. Worries of a pending recession continued to grow, causing consumer sentiment to drop to levels worse than during the COVID-19 pandemic and the global financial crisis of 2008, as measured by The University of Michigan’s index of consumer sentiment. There was a flurry of high-profile hiring freezes and layoff announcements. Second quarter earnings also provided some cautious takeaways, including lower guidance from retailers on general merchandise softness as a result of inflation, tech companies
pointing to a continued deterioration in digital advertising and consumer electronics, and home builders commenting on a slowdown in housing demand.
In Europe, market sentiment deteriorated throughout the year, with the prospects of a recession increasing, in our view. Most economic data pointed to a slowdown in Europe, such as the euro area composite Purchasing Managers Index (PMI) business survey, which fell into contractionary territory and closed the twelve-month period with six straight months of falling private sector activity. Euro area consumer confidence dropped to an all-time low in September, as measured by the European Commission’s consumer confidence indicator, in part due to the reduction in gas supplies coming from Russia, which drove prices up significantly and raised fears of outright shortages and rationing. Russia completely halted gas flows through the key Nord Stream 1 pipeline in September, which exacerbated many of those fears. This sparked officials to announce plans to tackle the energy crisis towards the end of the period, which included the first version of a price cap and a common purchases system. Germany also launched a jumbo fiscal package of €200bn to support households and firms.
Emerging markets equities meaningfully underperformed their developed market peers, as a strong U.S. dollar and rising oil prices proved to be major headwinds. Chinese equities were a notable underperformer, as the country continued to grapple the COVID-zero
32
strategy, a moderation in exports, and a persistent property crisis. These headwinds led to consumer confidence, as measured by the National Bureau of Statistics of China, to fall to an all-time low in April and continue to hover in that range for the remainder of the fiscal year. As such, in September, the Asian Development Bank downgraded its growth estimate for China to 3.3% this year from a prior 4.0% estimate. It also forecasted that China’s economic growth would lag that of developing Asia for the first time in more than three decades.
Separately, global markets were faced with increased geopolitical tensions due to the Russian invasion of Ukraine on February 23rd. Tensions remained elevated for the remainder of the twelve-month period, as Russia continued to weaponize energy flows, annexed four Ukrainian regions, and ratcheted up its nuclear warnings. In addition, the rhetoric between the U.S. and China over Taiwan further heated up after U.S. House of Representatives Speaker Nancy Pelosi visited Taiwan in August. China responded to the trip with large-scale military drills, which led to a pledge by U.S. President Joe Biden to defend the democratically governed island.
The surge in prices forced global central banks into a more aggressive approach to combating inflation. After remaining mostly consistent in its messaging around expectations that price pressures would be transitory, elevated and more persistent inflation pressures caused the U.S. Federal Reserve (Fed) to move the
target federal funds rate into more restrictive territory. This resulted in a 25-basis point (bps) hike in the federal funds rate at the March Federal Open Market Committee meeting, the first hike in more than three years. Five additional rate hikes of 50 bps, 75 bps, 75 bps, 75 bps, and 75 bps, respectively, followed in the succeeding months as inflation prints continued to come in hotter than expected, resulting in a federal funds rate of 4.00% by November 2, 2022, which was widely anticipated by the market. Bond yields shot up in reaction to this shift in policy, exhibiting a bearish curve flattening trend and ultimately leading to periods of brief yield curve inversion, as shorter-term yields moved higher than longer-term yields. This trend was reflected in the 5-year and 30-year U.S. Treasury spread inverting for the first time since 2006, and the 2-year and 10-year Treasury spread inverting for the first time since 2019.
The European Central Bank (ECB) raised its three key interest rates by 50bp during its July 2022 meeting in an attempt to reduce inflationary pressures, ending eight years of negative rates with its first increase since 2011. The ECB then followed up with two 75bp rate hikes in September and October, bringing borrowing costs to the highest level since early 2009. Inflation in the Euro Area continued to march higher and break record rates, reaching double digits by October, and showing no signs of peaking. In total, ninety central banks globally have raised rates thus far in 2022, creating the most widespread rate rise in over two decades. That said, the Bank of
33
Japan (BoJ) appeared undeterred and maintained its key short-term interest rate at -0.1% during its October meeting but raised its 2022 inflation forecast to 2.9% from the 2.3% made in July, citing surging prices of energy, food, and durable goods. The BoJ reiterated it will take extra easing measures if needed while continuing to buy unlimited amounts of bonds, as it has been doing since April. The People’s Bank of China also maintained accommodative monetary policy over the year amid subdued headline inflation and a rapid decline in the yuan.
Stock selection within the industrials and information technology sectors were primary drivers of relative outperformance during the period. Within industrials, the Fund’s position in Rheinmetall AG, a German defense equipment manufacturer, was the largest individual contributor to relative performance. After Russia’s invasion of Ukraine, the German government enlisted Rheinmetall to improve the equipment of the armed forces of the Federal Republic of Germany, sending shares of the stock soaring.
Within information technology, AT & S Austria Technologie & Systemtechnik AG, an Austrian company that develops printed circuit boards and integrated circuit substrates, also drove relative performance. Shares of the stock rose sharply on the back of continued strong momentum of the integrated circuit substrate market as well as positive developments in company financials. The complexity of packaging solutions has gone up significantly as a result of IoT (internet of things) and 5G
technologies. Shares of the stock benefitted as AT&S is the biggest player in this space in Europe and we believe they have strong pricing power.
Stock selection within the financials sector also contributed to relative performance. We reduced our overall bank exposure throughout the year. The war in Ukraine has led to a weakening growth backdrop in Europe, and the prospect of an economic downturn does not bode well for the sector within the Eurozone. European banks are mostly domestic facing cyclical businesses, so it was prudent to reduce our exposure there. However, we do remain generally constructive on developed markets banks with interest rate sensitivity, as the health of the global banking system remains strong, in our view.
While stock selection within the industrials sector was a net contributor to relative performance, the Fund’s position in Montana Aerospace AG., a Switzerland-based manufacturer of system components and complex assemblies for the aerospace industry, was a notable detractor. Shares of the stock tumbled following Russia’s invasion of Ukraine as investors called into question the company’s ability to offset the steep rise in commodity prices, as well as its dependency on external energy suppliers.
Lastly, several positions within the health care sector dragged on relative performance. The sector as a whole largely suffered throughout the fiscal year as market participants reset earnings expectations following the recent very high growth environment.
34
Lord Abbett International Value Fund
For the fiscal year ended October 31, 2022, the Fund returned -19.56%, reflecting performance at the net asset value (“NAV”) of Class A Shares with all distributions reinvested, compared to its benchmark, the MSCI EAFE Value Index with Net Dividends,13 which returned -16.35% over the same period.
Global equities finished lower for the trailing twelve-month period as bearish sentiment overwhelmed markets. Looking closer, the fiscal year was defined by two distinct periods of economic activity. In the second half of 2021, U.S. markets were supported by continued central bank liquidity and corporate earnings surprises. Continued vaccine progress against the COVID-19 virus and momentum surrounding economic reopening in developed markets also provided a tailwind. Specifically, the U.S. economy showed signs of meaningful growth, with gross domestic product (GDP) growing 7.0% in the fourth quarter of 2021. Meanwhile, GDP growth in the Eurozone and China was 0.5% and 1.3%, respectively over the same period.
However, global markets were met with increasing headwinds towards the end of 2021, including the emergence of the newly discovered Omicron variant. In November 2021 the World Health Organization designated the newly discovered mutation as a “variant of concern”, leading to one of the largest selloffs and worst one-day performance of
U.S. risk assets since the start of the pandemic, as fears that the world would succumb to a new wave of infections emerged. U.S. cases hit the highest levels of the pandemic in December, rising above 580,000 new cases in the last week of the month and more than doubling the previous record high. Yet, the negative sentiment regarding Omicron quickly reversed as cases proved to be generally less severe than prior strains. In the U.S., there was also increased positive market sentiment after the Center for Disease Control shortened its suggested isolation policy for those infected from 10 days to five.
Moving into 2022, investor risk appetite shifted lower due primarily to a combination of higher and more persistent inflation. Inflationary pressures had built up in the fourth quarter of 2021 by an imbalance between supply and demand dynamics across multiple industries, exacerbated by COVID-19 labor issues. This became evident with the headline U.S. consumer price index (CPI) rising 6.8% year-on-year in November 2021, the fastest pace since 1982. Prices continued increasing throughout the first half of 2022, led by energy, food, and used cars. This surge in prices culminated in June 2022 as headline inflation came in at 9.1% year-on-year, the fastest annual increase in over 40 years. Meanwhile, inflation data outside the U.S. was also high, with October 2022 inflation readings for Canada, the U.K., and Eurozone coming in at 6.9%, 11.1%, and 10.6%, respectively.
35
There were a number of developments indicating an increasing possibility of an approaching recession for global economies. The U.S. reported negative gross domestic product of -1.6% in the first quarter of 2022 and -0.9% in the second quarter before returning to growth in the third quarter. Worries of a pending recession continued to grow, causing consumer sentiment to drop to levels worse than during the COVID-19 pandemic and the global financial crisis of 2008, as measured by The University of Michigan’s index of consumer sentiment. There was a flurry of high-profile hiring freezes and layoff announcements. Second quarter earnings also provided some cautious takeaways, including lower guidance from retailers on general merchandise softness as a result of inflation, tech companies pointing to a continued deterioration in digital advertising and consumer electronics, and home builders commenting on a slowdown in housing demand.
In Europe, market sentiment deteriorated throughout the year, with the prospects of a recession increasing, in our view. Most economic data pointed to a slowdown in Europe, such as the euro area composite Purchasing Managers Index (PMI) business survey, which fell into contractionary territory and closed the twelve-month period with six straight months of falling private sector activity. Euro area consumer confidence dropped to an all-time low in September, as measured by the European Commission’s consumer confidence indicator, in part due to the
reduction in gas supplies coming from Russia, which drove prices up significantly and raised fears of outright shortages and rationing. Russia completely halted gas flows through the key Nord Stream 1 pipeline in September, which exacerbated many of those fears. This sparked officials to announce plans to tackle the energy crisis towards the end of the period, which included the first version of a price cap and a common purchases system. Germany also launched a jumbo fiscal package of €200bn to support households and firms.
Emerging markets equities meaningfully underperformed their developed market peers, as a strong U.S. dollar and rising oil prices proved to be major headwinds. Chinese equities were a notable underperformer, as the country continued to grapple the COVID-zero strategy, a moderation in exports, and a persistent property crisis. These headwinds led to consumer confidence, as measured by the National Bureau of Statistics of China, to fall to an all-time low in April and continue to hover in that range for the remainder of the fiscal year. As such, in September, the Asian Development Bank downgraded its growth estimate for China to 3.3% this year from a prior 4.0% estimate. It also forecasted that China’s economic growth would lag that of developing Asia for the first time in more than three decades.
Separately, global markets were faced with increased geopolitical tensions due to the Russian invasion of Ukraine on February 23rd. Tensions remained elevated for the remainder of the twelve-month
36
period, as Russia continued to weaponize energy flows, annexed four Ukrainian regions, and ratcheted up its nuclear warnings. In addition, the rhetoric between the U.S. and China over Taiwan further heated up after U.S. House of Representatives Speaker Nancy Pelosi visited Taiwan in August. China responded to the trip with large-scale military drills, which led to a pledge by U.S. President Joe Biden to defend the democratically governed island.
The surge in prices forced global central banks into a more aggressive approach to combating inflation. After remaining mostly consistent in its messaging around expectations that price pressures would be transitory, elevated and more persistent inflation pressures caused the U.S. Federal Reserve (Fed) to move the target federal funds rate into more restrictive territory. This resulted in a 25-basis point (bps) hike in the federal funds rate at the March Federal Open Market Committee meeting, the first hike in more than three years. Five additional rate hikes of 50 bps, 75 bps, 75 bps, 75 bps, and 75 bps, respectively, followed in the succeeding months as inflation prints continued to come in hotter than expected, resulting in a federal funds rate of 4.00% by November 2, 2022, which was widely anticipated by the market. Bond yields shot up in reaction to this shift in policy, exhibiting a bearish curve flattening trend and ultimately leading to periods of brief yield curve inversion, as shorter-term yields moved higher than longer-term yields. This trend was reflected in the
5-year and 30-year U.S. Treasury spread inverting for the first time since 2006, and the 2-year and 10-year Treasury spread inverting for the first time since 2019.
The European Central Bank (ECB) raised its three key interest rates by 50bp during its July 2022 meeting in an attempt to reduce inflationary pressures, ending eight years of negative rates with its first increase since 2011. The ECB then followed up with two 75bp rate hikes in September and October, bringing borrowing costs to the highest level since early 2009. Inflation in the Euro Area continued to march higher and break record rates, reaching double digits by October, and showing no signs of peaking. In total, ninety central banks globally have raised rates thus far in 2022, creating the most widespread rate rise in over two decades. That said, the Bank of Japan (BoJ) appeared undeterred and maintained its key short-term interest rate at -0.1% during its October meeting but raised its 2022 inflation forecast to 2.9% from the 2.3% made in July, citing surging prices of energy, food, and durable goods. The BoJ reiterated it will take extra easing measures if needed while continuing to buy unlimited amounts of bonds, as it has been doing since April. The People’s Bank of China also maintained accommodative monetary policy over the year amid subdued headline inflation and a rapid decline in the yuan.
During the period, the Fund’s underperformance relative to the benchmark was driven by stock selection within the consumer discretionary and information technology sectors. Within the
37
consumer discretionary sector, Persimmon Plc, a British housebuilding company, was among the largest individual detractors as the company has been greatly impacted by a steep drop in housing sales caused by higher mortgage costs.
Within the information technology sector, shares of Infineon Technologies AG, a German semiconductor manufacturer, also detracted from relative performance. After two years of record chip sales stemming from the COVID-19 pandemic, demand largely reversed in 2022. While semiconductor designers focused on the auto and industrial sectors, such as Infineon, have fared relatively better than other chip players, the holding was a detractor over the period.
Conversely, stock selection within the industrials and financials sectors contributed to relative performance. Within the industrials sector, shares of Thales Group, a manufacturer of electrical systems as well as devices and equipment for the aerospace, defense, transportation, and security sectors, soared in early March after the company reported record cashflow levels and higher-than-expected margins.
Within financials, Grupo Financiero Banorte, S.A.B. de C.V., a Mexican banking and financial services company, contributed to relative performance as the company benefitted from rising interest rates. In October, Banorte raised its forecast for its 2022 full-year net profit after a surge in quarterly earnings.
Lord Abbett Micro Cap Growth Fund
For the fiscal year ended October 31, 2022, the Fund returned -28.41%, reflecting performance at the net asset value (NAV) of Class A shares with all distributions reinvested, compared to its benchmark, the Russell Microcap® Growth Index,14 which returned -32.61% over the same period.
U.S. markets faced many challenges throughout the twelve-month period ending October 31, 2022, including the emergence of the Omicron variant of COVID-19, supply chain dislocations, labor shortages, inflationary pressures, less accommodative fiscal and monetary policy, and Russia’s invasion of Ukraine. The Dow Jones Industrial Average and S&P 500® Index fell -6.74% and -14.61%, respectively, while the tech-heavy Nasdaq Composite lost -28.56%. Value stocks2 significantly outperformed growth stocks3 (-7.25% vs -24.67%), while large cap stocks4 outperformed small cap stocks5 (-16.38% vs -18.54%).
The period began with global markets grappling with the emergence of the newly discovered Omicron variant. In November 2021 the World Health Organization designated the mutation as a “variant of concern”, leading to one of the largest selloffs of U.S. risk assets since the start of the pandemic, as fears that the world would succumb to a new wave of infections emerged. U.S. cases hit the highest levels of the pandemic in December, rising above 580,000 new cases on the last week of the month and more
38
than doubling the previous record high. Yet, the negative sentiment regarding Omicron quickly reversed as cases proved to be generally less severe than prior strains. There was also increased positive market sentiment after the Center for Disease Control shortened its suggested isolation policy for those infected from 10 days to five.
Inflationary concerns began to take focus towards the end of 2021 before becoming a dominant headline throughout the period. Headline core consumer price index readings had hovered a little above 5% year-over-year for most of 2021, which led investors to question whether this period of rising prices would be more persistent than originally thought. However, this debate was intensified by November’s headline consumer price index rising 6.8% year-over-year, the fastest pace since 1982. The sharp increase in prices was generally due to an imbalance between supply and demand dynamics across multiple industries, led initially by energy, food, and used cars. Inflation readings continued to climb throughout the first half of 2022, peaking at 9.1% year-over-year in June.
Energy costs were the primary driver of inflation for the period, rising more than 30% year-over-year by the end of June. The energy sector, which had been subject to rising consumer demand as global economies reopened from lockdowns induced by COVID-19, faced added friction with Russia’s invasion of Ukraine. Investors were concerned about the secondary effects of the war, particularly from a
commodity and supply chain standpoint. Russia has been a large global exporter of oil and certain minerals, and the various sanctions set on Russia from Western nations led to a surge in commodity prices, with crude oil reaching over $100 per barrel for the first time since 2014.
The surge in prices forced the U.S. Federal Reserve (Fed) into a more aggressive approach to combating inflation. After remaining mostly consistent in its messaging around expectations that price pressures would be transitory, elevated and more persistent inflation pressures caused the Fed to move the target federal funds rate into more restrictive territory. This resulted in a 25-basis point (bps) hike in the federal funds rate at the March Federal Open Market Committee meeting, the first hike in more than three years. Five additional rate hikes of 50 bps, 75 bps, 75 bps, 75 bps, and 75 bps, respectively, followed in the succeeding months as inflation prints continued to come in hotter than expected, resulting in a federal funds rate of 4.00% by November 2, 2022, which was widely anticipated by the market as of the end of the fiscal year. Bond yields shot up in anticipation of this aggressive policy, leading to a bearish curve flattening trend and ultimately periods of brief yield curve inversion, as shorter-term yields moved higher than longer-term yields.
Separately, global markets were faced with increased geopolitical tensions due to the Russian invasion of Ukraine on February 23rd. Tensions remained elevated for the remainder of the twelve-month period, as Russia continued to weaponize
39
energy flows, annexed four Ukrainian regions, and ratcheted up its nuclear warnings. In addition, the rhetoric between the U.S. and China over Taiwan further heated up after U.S. House of Representatives Speaker Nancy Pelosi visited Taiwan in August. China responded to the trip with large-scale military drills, which led to a pledge by U.S. President Joe Biden to defend the democratically governed island.
Key macroeconomic indicators mostly continued to trend lower throughout the period, with the U.S. reporting negative gross domestic product of -1.6% in the first quarter of 2022 and -0.9% in the second quarter before returning to growth in the third quarter. Worries among investors that a recession was pending continued to grow, which ultimately led consumer sentiment to drop to levels worse than during the COVID-19 pandemic and the global financial crisis of 2008, as measured by The University of Michigan’s index of consumer sentiment.
Despite rising recessionary signs, select bright spots in the U.S. economy supported the idea that a potential recession would be shallow. For example, one of the most positive developments seemed to be the traction behind the peak inflation narrative, which included a 99 day stretch of declines in U.S. gasoline prices. In addition, apartment rents fell for the first time in nearly two years in July and lumber prices were off more than 70% from their March peak late in the third quarter, back to pre-COVID levels. Second quarter earnings season also generated many
“better-than-feared” takeaways, including plenty of commentary about relatively stable demand and pricing power continuing to protect margins. Capital return and capital expenditures were also mentioned as relative bright spots as companies flagged easing labor shortages and supply chain constraints. The U.S. labor market also remained strong over the period, with the national unemployment rate at 3.7% as of the end of October.
In terms of Fund performance, from an industry standpoint, security selection within pharmaceuticals was a primary contributor to relative performance over the period. Leading the way was the portfolio’s position in Ventyx Biosciences, Inc., a clinical-stage biopharmaceutical company focused on advancing novel oral therapies for patients living with autoimmune and inflammatory disorders. After treading water for most of the year, shares of the stock significantly rose in September after the company announced positive Phase 1 trial results for VTX958, a TYK2 inhibitor which has a role in a broad range of immune-mediated diseases. The stock was also positively impacted by the FDA’s approval of Bristol-Myers Squibb’s TYK inhibitor which, as a result, reduced regulatory risk for Ventyx and similar companies. As of the end of the fiscal year, Ventyx is the portfolio’s top active overweight.
Also within the general health care sector, the portfolio’s position in Lantheus Holdings, Inc., a developer of innovative diagnostic and therapeutic agents, was another notable contributor to relative
40
performance. Shares of the stock were in an uptrend for most of the fiscal year, which was primarily driven by the accelerated market adoption of PYLARIFY, a diagnostic imaging agent for prostate cancer. Lantheus reported record-setting financial results for the first half of 2022 and closed out the twelve-month period with another strong quarterly earnings beat.
Conversely, having no exposure to oil, gas, and consumable fuel throughout most of the first quarter of 2022 was a primary detractor from relative performance. As mentioned above, global markets were faced with increased geopolitical tensions throughout the period that ultimately culminated in the Russian invasion of Ukraine in February. The invasion resulted in oil prices rising to nearly $100 per barrel amid fears of a supply shortage, which greatly benefited stock prices of many energy companies.
Security selection within software also detracted from performance. Specifically, the portfolio’s position in Sprout Social, Inc., a provider of online social media management tools for businesses, was among the largest individual detractors over the period. Sprout Social was one of the portfolio’s largest contributors to performance in 2021 and entered the fiscal year among the highest active overweights. However, despite reporting a string of solid quarterly earnings results, shares of the company largely sold off during the period as the market generally rotated away from high-multiple stocks amid concerns of rising inflation and interest rates.
Lord Abbett Value Opportunities Fund
For the fiscal year ended October 31, 2022, the Fund returned -19.11%, reflecting performance at the net asset value (“NAV”) of Class A shares with all distributions reinvested, compared to its benchmark, the Russell 2500™ Index15, which returned -17.58% over the same period.
U.S. markets faced many challenges throughout the twelve-month period ending October 31, 2022, including the emergence of the Omicron variant of COVID-19, supply chain dislocations, labor shortages, inflationary pressures, less accommodative fiscal and monetary policy, and Russia’s invasion of Ukraine. The Dow Jones Industrial Average and S&P 500® Index fell -6.74% and -14.61%, respectively, while the tech-heavy Nasdaq Composite lost -28.56%. Value stocks2 significantly outperformed growth stocks3 (-7.25% vs -24.67%), while large cap stocks4 outperformed small cap stocks5 (-16.38% vs -18.54%).
The period began with global markets grappling with the emergence of the newly discovered Omicron variant. In November 2021 the World Health Organization designated the mutation as a “variant of concern”, leading to one of the largest selloffs of U.S. risk assets since the start of the pandemic, as fears that the world would succumb to a new wave of infections emerged. U.S. cases hit the highest levels of the pandemic in December, rising above 580,000 new cases
41
on the last week of the month and more than doubling the previous record high. Yet, the negative sentiment regarding Omicron quickly reversed as cases proved to be generally less severe than prior strains. There was also increased positive market sentiment after the Center for Disease Control shortened its suggested isolation policy for those infected from 10 days to five.
Inflationary concerns began to take focus towards the end of 2021 before becoming a dominant headline throughout the period. Headline core consumer price index readings had hovered a little above 5% year-over-year for most of 2021, which led investors to question whether this period of rising prices would be more persistent than originally thought. However, this debate was intensified by November’s headline consumer price index rising 6.8% year-over-year, the fastest pace since 1982. The sharp increase in prices was generally due to an imbalance between supply and demand dynamics across multiple industries, led initially by energy, food, and used cars. Inflation readings continued to climb throughout the first half of 2022, peaking at 9.1% year-over-year in June.
Energy costs were the primary driver of inflation for the period, rising more than 30% year-over-year by the end of June. The energy sector, which had been subject to rising consumer demand as global economies reopened from lockdowns induced by COVID-19, faced added friction with Russia’s invasion of Ukraine. Investors were concerned about the secondary
effects of the war, particularly from a commodity and supply chain standpoint. Russia has been a large global exporter of oil and certain minerals, and the various sanctions set on Russia from Western nations led to a surge in commodity prices, with crude oil reaching over $100 per barrel for the first time since 2014.
The surge in prices forced the U.S. Federal Reserve (Fed) into a more aggressive approach to combating inflation. After remaining mostly consistent in its messaging around expectations that price pressures would be transitory, elevated and more persistent inflation pressures caused the Fed to move the target federal funds rate into more restrictive territory. This resulted in a 25-basis point (bps) hike in the federal funds rate at the March Federal Open Market Committee meeting, the first hike in more than three years. Five additional rate hikes of 50 bps, 75 bps, 75 bps, 75 bps, and 75 bps, respectively, followed in the succeeding months as inflation prints continued to come in hotter than expected, resulting in a federal funds rate of 4.00% by November 2, 2022, which was widely anticipated by the market as of the end of the fiscal year. Bond yields shot up in anticipation of this aggressive policy, leading to a bearish curve flattening trend and ultimately periods of brief yield curve inversion, as shorter-term yields moved higher than longer-term yields.
Separately, global markets were faced with increased geopolitical tensions due to the Russian invasion of Ukraine on February 23rd. Tensions remained elevated
42
for the remainder of the twelve-month period, as Russia continued to weaponize energy flows, annexed four Ukrainian regions, and ratcheted up its nuclear warnings. In addition, the rhetoric between the U.S. and China over Taiwan further heated up after U.S. House of Representatives Speaker Nancy Pelosi visited Taiwan in August. China responded to the trip with large-scale military drills, which led to a pledge by U.S. President Joe Biden to defend the democratically governed island.
Key macroeconomic indicators mostly continued to trend lower throughout the period, with the U.S. reporting negative gross domestic product of -1.6% in the first quarter of 2022 and -0.9% in the second quarter before returning to growth in the third quarter. Worries among investors that a recession was pending continued to grow, which ultimately led consumer sentiment to drop to levels worse than during the COVID-19 pandemic and the global financial crisis of 2008, as measured by The University of Michigan’s index of consumer sentiment.
Despite rising recessionary signs, select bright spots in the U.S. economy supported the idea that a potential recession would be shallow. For example, one of the most positive developments seemed to be the traction behind the peak inflation narrative, which included a 99 day stretch of declines in U.S. gasoline prices. In addition, apartment rents fell for the first time in nearly two years in July and lumber prices were off more than 70% from their March peak late in the third quarter, back
to pre-COVID levels. Second quarter earnings season also generated many “better-than-feared” takeaways, including plenty of commentary about relatively stable demand and pricing power continuing to protect margins. Capital return and capital expenditures were also mentioned as relative bright spots as companies flagged easing labor shortages and supply chain constraints. The U.S. labor market also remained strong over the period, with the national unemployment rate at 3.7% as of the end of October.
During the 12-month period ending October 31, 2022, the Fund’s position in Caesars Entertainment, a casino management company, detracted from relative performance. Shares fell after the company reported that revenue was short of expectations in the first quarter. The company faced headwinds throughout the period as it had notable financial leverage. We believe the company should benefit from both the reduction of their overall leverage as well as the resumption of international travel. The Fund’s position in Azenta, Inc., a provider of life sciences solutions, detracted from relative performance. The Information Technology sector, in particular, was under pressure as investors largely gravitated towards lower volatility names – prioritizing profitability and valuations. In addition to this, shares continued to fall after the company issued fourth quarter guidance below expectations. The Fund’s position in Generac Holdings Inc., a manufacturer of backup power generation products, was the largest detractor from relative returns.
43
Shares sold off after the company reported third quarter earnings where revenue fell short of expectations. While the commercial and industrial segments of their business performed as expected, residential product sales came under pressure during the quarter. They subsequently lowered full-year 2022 guidance.
Conversely, the largest contributor to relative performance during the 12-month period ending October 31, 2022, was Molina Healthcare, Inc., a managed care company. The company closed its acquisition of Cigna’s Texas Medicaid and later in the year announced it entered into a definitive agreement to acquire My Choice Wisconsin. Separately, the company reported fourth quarter earnings which were ahead of expectations, and it was added to the S&P 500® Index in the beginning of March. We remain confident in the company’s ability to continue to gain market share and execute on their acquisitions. The Fund’s position in Aspen Technologies, Inc., a provider of software and services for the process industries, contributed to relative performance. Aspen Technologies’ customer
base is largely made up of chemical and energy companies which rallied throughout the year, mostly attributable to the Russian-Ukrainian War. The company typically benefits when chemical/energy companies are performing well and have more money to allocate towards software. The Fund’s position in Silicon Motion Technology, which engages in the development, manufacturing, and supply of semiconductor products for the electronics market, was the largest contributor within the sector. Silicon Motion Technology was a significant outperformer in the first half of the year. Shares rallied following the announcement that MaxLinear, which provides highly integrated radio-frequency analog and mixed-signal semiconductor products for broadband communications applications, would acquire Silicon Motion Technology.
Each Fund’s portfolio is actively managed and, therefore, holdings and the weightings of a particular issuer or particular sector as a percentage of portfolio assets are subject to change. Sectors may include many industries.
1 The Russell 2000® Index measures the performance of the 2,000 smallest companies in the Russell 3000® Index, which represents approximately 10% of the total market capitalization of the Russell 3000® Index.
2 As represented by the Russell 3000® Value Index as of 10/31/2022.
3 As represented by the Russell 3000® Growth Index as of 10/31/2022.
4 As represented by the Russell 1000® Index as of 10/31/2022.
5 As represented by the Russell 2000® Index as of 10/31/2022.
6 The Russell 1000® Growth Index measures the performance of those Russell 1000® Index companies with higher price-to-book ratios and higher forecasted growth values.
7 The Russell 1000® Value Index measures the performance of those Russell 1000 companies with lower price-to-book ratios and lower forecasted growth values.
44
8 The Russell 2000 Value® Index measures the performance of those stocks of the Russell 2000 Index with lower price-to-book ratios and lower relative forecasted growth rates. Indexes are unmanaged, do not reflect the deduction of fees or expenses, and an investor cannot invest directly in an index.
9 The MSCI ACWI (All Country World Index) with Net Dividends is a free float-adjusted market capitalization weighted index that is designed to measure the equity market performance of developed and emerging markets. The MSCI ACWI Index with Net Dividends approximates the minimum possible dividend reinvestment. The dividend is reinvested after deduction of withholding tax, applying the rate to non-resident individuals who do not benefit from double taxation treaties. MSCI uses withholding tax rates applicable to Luxembourg holding companies, as Luxembourg applies the highest rates.
10 The MSCI ACWI Health Care Index includes large and mid cap securities across 23 Developed Markets (DM) and 26 Emerging Markets (EM) countries. All securities in the index are classified in the Health Care Sector as per the Global Industry Classification Standard.
11 The MSCI ACWI (All Country World Index) ex-USA® Index is a subset of the MSCI ACWI Index. The MSCI ACWI (All Country World Index) Index is a free float-adjusted market capitalization weighted index that is designed to measure the equity market performance of developed and emerging markets. The MSCI ACWI ex-U.S. Index with Gross Dividends approximates the maximum possible dividend reinvestment. The amount reinvested is the entire dividend distributed to individuals domiciled in the country of the company but does not include tax credits. The MSCI ACWI ex-U.S. Index with Net Dividends approximates the minimum possible dividend reinvestment. The dividend is reinvested after deduction of withholding tax, applying the rate to non-resident individuals who do not benefit from double taxation treaties. MSCI uses withholding tax rates applicable to Luxembourg holding companies, as Luxembourg applies the highest rates.
12 The S&P Developed Ex-U.S. SmallCap® Index captures the bottom 15% of companies domiciled in the developed markets (excluding the United States) within the S&P Global BMI with a float-adjusted market capitalization of at least US$100 million and a value traded of at least US$50 million for the past 12 months at the time of the annual reconstitution. Stocks are excluded if their market capitalization falls below US$75 million, or if the value traded is less than US$35 million at the time of reconstitution.
13 The MSCI EAFE Value Index captures large and mid-cap securities exhibiting overall value style characteristics across Developed Markets countries around the world, excluding the U.S. and Canada. Gross Dividends approximates the maximum possible dividend reinvestment. The amount reinvested is the entire dividend distributed to individuals resident in the country of the company, but does not include tax credits. Net Dividends approximates the minimum possible dividend reinvestment. The dividend is reinvested after deduction of withholding tax, applying the rate to non-resident individuals who do not benefit from double taxation treaties. MSCI uses withholding tax rates applicable to Luxembourg holding companies, as Luxembourg applies the highest rates.
14 The Russell Microcap® Growth Index measures the performance of those Russell Microcap companies with higher price-to-book ratios and higher forecasted growth values.
15 The Russell 2500™ Index is a market cap weighted index that includes the smallest 2,500 companies covered in the Russell 3000® Index universe of United States-based listed equities.
Unless otherwise specified, indexes reflect total return, with all dividends reinvested. Indexes are unmanaged, do not reflect the deduction of fees or expenses, and are not available for direct investment.
Important Performance and Other Information
Performance data quoted in the following pages reflect past performance and are no guarantee of future results. Current performance may be higher or lower than the performance quoted. The investment return and principal value of an investment in the Funds will fluctuate so that shares, on any given day or when redeemed, may be worth more or less than their original cost. You can obtain performance data current to the most recent month end by calling Lord Abbett at 888-522-2388 or referring to www.lordabbett.com.
Except where noted, comparative Fund performance does not account for the deduction of sales charges and would be different if sales charges were included. Each Fund offers classes of shares with distinct pricing options. For a full description of the differences in pricing alternatives, please see each Fund’s prospectus.
During certain periods shown, expense waivers and reimbursements were in place. Without such waivers and expense reimbursements, the Funds’ returns would have been lower.
45
The annual commentary above discusses the views of the Funds’ management and various portfolio holdings of the Funds as of October 31, 2022. These views and portfolio holdings may have changed after this date. Information provided in the commentary is not a recommendation to buy or sell securities. Because the Funds’ portfolios are actively managed and may change significantly, the Funds may no longer own the securities described above or may have otherwise changed their positions in the securities. For more recent information about the Funds’ portfolio holdings, please visit www.lordabbett.com.
A Note about Risk: See Notes to Financial Statements for a discussion of investment risks. For a more detailed discussion of the risks associated with each Fund, please see each Fund’s prospectus.
Mutual funds are not insured by the FDIC, are not deposits or other obligations of, or guaranteed by, banks, and are subject to investment risks including possible loss of principal amount invested.
46
Alpha Strategy Fund
Investment Comparison
Below is a comparison of a $10,000 investment in Class A shares with the same investment in the Russell 2000® Index, the 85% Russell 2000® Index/15% S&P Developed Ex-U.S. SmallCap Index and the Lipper Small-Cap Core Category Funds Average, assuming reinvestment of all dividends and distributions. The performance of other classes will be greater than or less than the performance shown in the graph below due to different sales loads and expenses applicable to such classes. The graph and performance table below do not reflect the deduction of taxes that a shareholder would pay on Fund distributions or the redemption of Fund shares. During certain periods, expenses of the Fund have been waived or reimbursed by Lord Abbett; without such waiver or reimbursement of expenses, the Fund’s returns would have been lower. Past performance is no guarantee of future results.
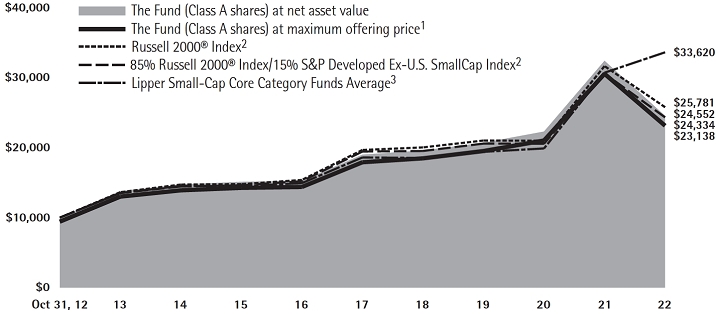
Average Annual Total Returns at Maximum Applicable
Sales Charge for the Periods Ended October 31, 2022
| | | 1 Year | | 5 Years | | 10 Years | | Life of Class | |
| Class A4 | | -28.60% | | 4.02% | | 8.75% | | – | |
| Class C5 | | -25.52% | | 4.46% | | 8.58% | | – | |
| Class F6 | | -24.10% | | 5.42% | | 9.57% | | – | |
| Class F37 | | -23.98% | | 5.61% | | – | | 7.33% | |
| Class I6 | | -24.04% | | 5.52% | | 9.67% | | – | |
| Class R26 | | -24.50% | | 4.89% | | 9.02% | | – | |
| Class R36 | | -24.41% | | 5.00% | | 9.13% | | – | |
| Class R48 | | -24.23% | | 5.25% | | – | | 5.86% | |
| Class R58 | | -24.04% | | 5.52% | | – | | 6.13% | |
| Class R68 | | -23.97% | | 5.62% | | – | | 6.20% | |
47
1 Reflects the deduction of the maximum initial sales charge of 5.75%.
2 Performance for each unmanaged index does not reflect any fees or expenses. The performance of each index is not necessarily representative of the Fund’s performance.
3 Source: Lipper Inc. The performance of the average is not necessarily representative of the Fund’s performance.
4 Total return, which is the percentage change in net asset value, after deduction of the maximum initial sales charge of 5.75% applicable to Class A shares, with all dividends and distributions reinvested for the periods shown ended October 31,
2022, is calculated using the SEC- required uniform method to compute such return.
5 The 1% CDSC for Class C shares normally applies before the first anniversary of the purchase date. Performance for other periods is at net asset value.
6 Performance is at net asset value.
7 Commenced operations and performance for the Class began on April 4, 2017. Performance is at its net asset value.
8 Commenced operations and performance for the classes began on June 30, 2015. Performance is at net asset value.
48
Focused Growth Fund
Investment Comparison
Below is a comparison of a $10,000 investment in Class A shares with the same investment in the Russell 1000® Growth Index, assuming reinvestment of all dividends and distributions. The performance of other classes will be greater than or less than the performance shown in the graph below due to different sales loads and expenses applicable to such classes. The graph and performance table below do not reflect the deduction of taxes that a shareholder would pay on Fund distributions or the redemption of Fund shares. During certain periods, expenses of the Fund have been waived or reimbursed by Lord Abbett; without such waiver or reimbursements of expense, the Fund’s returns would have been lower. Past performance is no guarantee of future results.

Average Annual Total Returns at Maximum Applicable
Sales Charge for the Period Ended October 31, 2022
| | | 1 Year | | Life of Class | |
| Class A3 | | -40.56% | | 12.00% | |
| Class C4 | | -37.94% | | 12.96% | |
| Class F5 | | -36.79% | | 14.08% | |
| Class F35 | | -36.74% | | 14.16% | |
| Class I5 | | -36.79% | | 14.08% | |
| Class R35 | | -37.11% | | 13.51% | |
| Class R45 | | -36.93% | | 13.81% | |
| Class R55 | | -36.79% | | 14.08% | |
| Class R65 | | -36.74% | | 14.16% | |
1 Reflects the deduction of the maximum initial sales charge of 5.75%.
2 Performance for the unmanaged index does not reflect any fees or expenses. The performance of the index is not necessarily representative of the Fund’s performance. Performance of the index begins on January 31, 2019.
3 Class A shares commenced operations on January 30, 2019 and performance for the Class began on January 31, 2019. Total return, which is the percentage change in net asset value, after deduction of the maximum initial sales charge of 5.75% applicable to Class A shares, with all dividends and distributions reinvested for the periods shown ended October 31, 2022, is calculated using the SEC-required uniform method to compute such return.
4 Class C shares commenced operations on January 30, 2019 and performance for the Class began on January 31, 2019. The 1% CDSC for Class C shares normally applies before the first anniversary of the purchase date.
5 Commenced operations on January 30, 2019 and performance for the Classes began on January 31, 2019. Performance is at net asset value.
49
Focused Large Cap Value Fund
Investment Comparison
Below is a comparison of a $10,000 investment in Class A shares with the same investment in the Russell 1000® Value Index, assuming reinvestment of all dividends and distributions. The performance of other classes will be greater than or less than the performance shown in the graph below due to different sales loads and expenses applicable to such classes. The graph and performance table below do not reflect the deduction of taxes that a shareholder would pay on Fund distributions or the redemption of Fund shares. During certain periods, expenses of the Fund have been waived or reimbursed by Lord Abbett; without such waiver or reimbursements of expense, the Fund’s returns would have been lower. Past performance is no guarantee of future results.
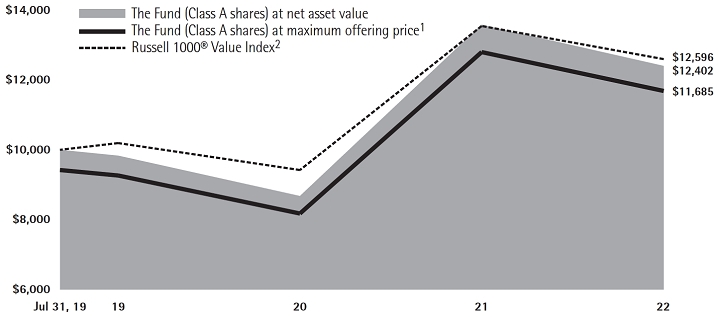
Average Annual Total Returns at Maximum Applicable
Sales Charge for the Period Ended October 31, 2022
| | | 1 Year | | Life of Class | |
| Class A3 | | -13.93% | | 4.91% | |
| Class C4 | | -10.09% | | 6.05% | |
| Class F5 | | -8.48% | | 7.07% | |
| Class F35 | | -8.48% | | 7.12% | |
| Class I5 | | -8.55% | | 7.09% | |
| Class R35 | | -8.88% | | 6.58% | |
| Class R45 | | -8.73% | | 6.82% | |
| Class R55 | | -8.49% | | 7.10% | |
| Class R65 | | -8.48% | | 7.13% | |
1 Reflects the deduction of the maximum initial sales charge of 5.75%.
2 Performance for the unmanaged index does not reflect any fees or expenses. The performance of the index is not necessarily representative of the Fund’s performance. Performance of the index begins on July 31, 2019.
3 Class A shares commenced operations on July 26, 2019 and performance for the Class began on July 31, 2019. Total return, which is the percentage change in net asset value, after deduction of the maximum initial sales charge of 5.75% applicable to Class A shares, with all dividends and distributions reinvested for the periods shown ended October 31, 2022, is calculated using the SEC required uniform method to compute such return.
4 Class C shares commenced operations on July 26, 2019 and performance for the Class began on July 31, 2019. The 1% CDSC for Class C shares normally applies before the first anniversary of the purchase date. Performance for other periods is at net asset value.
5 Commenced operations on July 26, 2019 and performance for the Classes began on July 31, 2019. Performance is at net asset value.
50
Focused Small Cap Value Fund
Investment Comparison
Below is a comparison of a $10,000 investment in Class A shares with the same investment in the Russell 2000® Value Index and the Russell 2000® Index, assuming reinvestment of all dividends and distributions. The performance of the other class will be greater than or less than the performance shown in the graph below due to different sales loads and expenses applicable to such class. The graph and performance table below do not reflect the deduction of taxes that a shareholder would pay on Fund distributions or the redemption of Fund shares. During certain periods, expenses of the Fund have been waived or reimbursed by Lord Abbett; without such waiver or reimbursement of expenses, the Fund’s returns would have been lower. Past performance is no guarantee of future results.
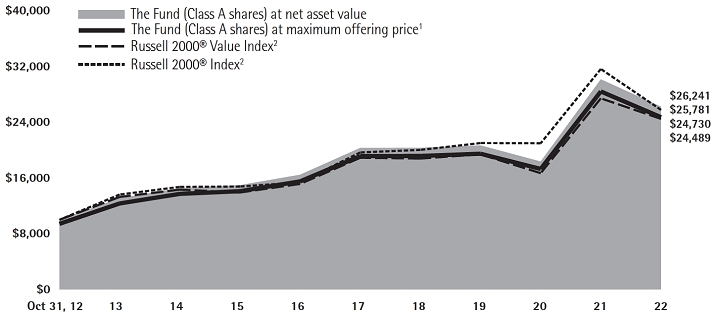
Average Annual Total Returns at Maximum Applicable
Sales Charge for the Periods Ended October 31, 2022
| | | 1 Year | | 5 Years | | 10 Years | | Life of Class | |
| Class A3 | | -18.00% | | 4.01% | | 9.48% | | – | |
| Class C4 | | -14.39% | | – | | – | | 5.84% | |
| Class F5 | | -12.77% | | – | | – | | 6.94% | |
| Class F35 | | -12.70% | | – | | – | | 7.01% | |
| Class I6 | | -12.76% | | 5.43% | | 10.23% | | – | |
| Class R55 | | -12.73% | | – | | – | | 6.95% | |
| Class R65 | | -12.73% | | – | | – | | 7.00% | |
1 Reflects the deduction of the maximum initial sales charge of 5.75%.
2 Performance for each unmanaged index does not reflect any fees or expenses. The performance of each index is not necessarily representative of the Fund’s performance.
3 Total return, which is the percentage change in net asset value, after deduction of the maximum initial sales charge of 5.75% applicable to Class A shares, with all dividends and distributions reinvested for the periods shown ended October 31, 2022, is calculated using the SEC required uniform method to compute such return.
4 Class C shares commenced operations on June 28, 2019 and performance for the Class began on July 1, 2019. The 1% CDSC for Class C shares normally applies before the first anniversary of the purchase date. Performance for other periods is at net asset value.
5 Commenced operations on June 28, 2019 and performance for the Class began on July 1, 2019. Performance is at net asset value.
6 Performance is at net asset value.
51
Fundamental Equity Fund
Investment Comparison
Below is a comparison of a $10,000 investment in Class A shares with the same investment in the Russell 1000® Value Index, Russell 3000® Value Index, Russell 3000® Index, and S&P 500® Index, assuming reinvestment of all dividends and distributions. The performance of other classes will be greater than or less than the performance shown in the graph below due to different sales loads and expenses applicable to such classes. The graph and performance table below do not reflect the deduction of taxes that a shareholder would pay on Fund distributions or the redemption of Fund shares. During certain periods, expenses of the Fund have been waived or reimbursed by Lord Abbett; without such waiver or reimbursement of expenses, the Fund’s returns would have been lower. Past performance is no guarantee of future results.
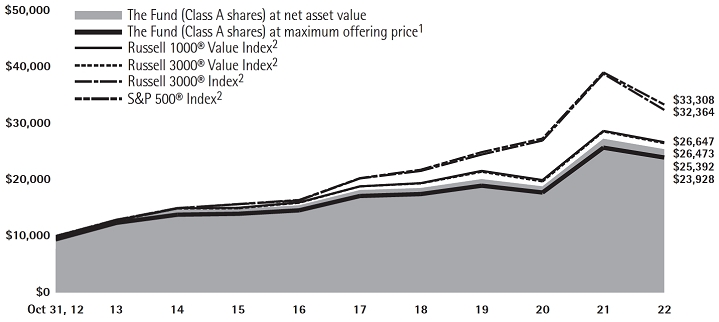
Average Annual Total Returns at Maximum Applicable
Sales Charge for the Periods Ended October 31, 2022
| | | 1 Year | | 5 Years | | 10 Years | | Life of Class | |
| Class A3 | | -12.18% | | 5.69% | | 9.12% | | – | |
| Class C4 | | -8.31% | | 6.14% | | 8.97% | | – | |
| Class F5 | | -6.75% | | 7.09% | | 9.95% | | – | |
| Class F36 | | -6.58% | | 7.29% | | – | | 7.75% | |
| Class I5 | | -6.65% | | 7.19% | | 10.06% | | – | |
| Class P5 | | -7.03% | | 6.72% | | 9.57% | | – | |
| Class R25 | | -7.17% | | 6.56% | | 9.40% | | – | |
| Class R35 | | -7.10% | | 6.65% | | 9.52% | | – | |
| Class R47 | | -6.80% | | 6.94% | | – | | 7.41% | |
| Class R57 | | -6.64% | | 7.20% | | – | | 7.67% | |
| Class R67 | | -6.57% | | 7.28% | | – | | 7.77% | |
1 Reflects the deduction of the maximum initial sales charge of 5.75%.
2 Performance for each unmanaged index does not reflect any fees or expenses. The performance of each index is not necessarily representative of the Fund’s performance.
3 Total return, which is the percentage change in net asset value, after deduction of the maximum initial sales charge of 5.75% applicable to Class A shares, with all dividends and distributions reinvested for the periods shown ended October 31, 2022, is calculated using the SEC-required uniform method to compute such return.
4 The 1% CDSC for Class C shares normally applies before the first anniversary of the purchase date. Performance for other periods is at net asset value.
5 Performance is at net asset value.
6 Commenced operations and performance for the Class began on April 4, 2017. Performance is at net asset value.
7 Commenced operations and performance for the classes began on June 30, 2015. Performance is at net asset value.
52
Global Equity Fund
Investment Comparison
Below is a comparison of a $10,000 investment in Class A shares with the same investment in the Morgan Stanley Capital International (MSCI) All Country World Index with Net Dividends and the MSCI All Country World Index with Gross Dividends, assuming reinvestment of all dividends and distributions. The MSCI All Country World Index with Net Dividends reflects a reduction in dividends after taking into account withholding of taxes by certain foreign countries represented in the MSCI All Country World Index. The performance of other classes will be greater than or less than the performance shown in the graph below due to different sales loads and expenses applicable to such classes. The graph and performance table below do not reflect the deduction of taxes that a shareholder would pay on Fund distributions or the redemption of Fund shares. During certain periods, expenses of the Fund have been waived or reimbursed by Lord Abbett; without such waiver or reimbursements of expense, the Fund’s returns would have been lower. Past performance is no guarantee of future results.
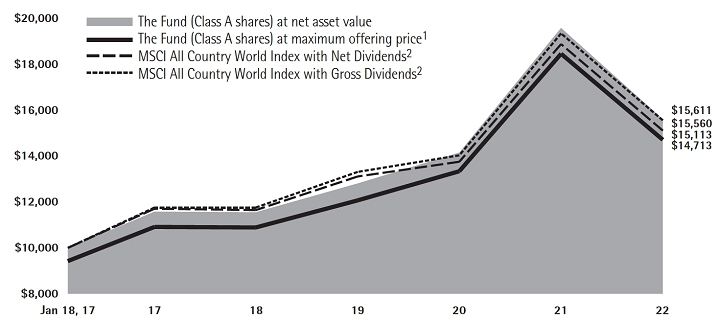
Average Annual Total Returns at Maximum Applicable
Sales Charge for the Periods Ended October 31, 2022
| | | 1 Year | | 5 Years | | Life of Class | |
| Class A3 | | -24.86% | | 4.90% | | 6.91% | |
| Class C4 | | -21.55% | | 5.35% | | 7.20% | |
| Class F5 | | -20.26% | | 6.29% | | 8.15% | |
| Class F36 | | -20.15% | | 6.44% | | 8.09% | |
| Class I5 | | -20.17% | | 6.39% | | 8.26% | |
| Class R35 | | -20.47% | | 5.86% | | 7.72% | |
| Class R45 | | -20.37% | | 6.14% | | 7.99% | |
| Class R55 | | -20.17% | | 6.39% | | 8.26% | |
| Class R65 | | -20.10% | | 6.45% | | 8.31% | |
1 Reflects the deduction of the maximum initial sales charge of 5.75%.
2 Performance for each unmanaged index does not reflect any fees or expenses. The performance of each index is not necessarily representative of the Fund’s performance. Performance of each index begins on January 18, 2017.
3 Class A shares commenced operations on January 17, 2017 and performance for the Class began on January 18, 2017. Total return, which is the percentage change in net asset value, after deduction of the maximum initial sales charge of 5.75% applicable to Class A shares, with all dividends and distributions reinvested for the periods shown ended October 31, 2022, is calculated using the SEC-required uniform method to compute such return.
4 Class C shares commenced operations on January 17, 2017 and performance for the Class began on January 18, 2017. The 1% CDSC for Class C shares normally applies before the first anniversary of the purchase date. Performance for other periods is at net asset value.
5 Commenced operations on January 17, 2017 and performance for the Class began on January 18, 2017. Performance is at net asset value.
6 Commenced operations and performance for the class began on April 4, 2017. Performance is at net asset value.
53
Growth Leaders Fund
Investment Comparison
Below is a comparison of a $10,000 investment in Class A shares with the same investment in the Russell 1000® Growth Index, Russell 3000® Growth Index, and S&P 500® Index, assuming reinvestment of all dividends and distributions. The performance of other classes will be greater than or less than the performance shown in the graph below due to different sales loads and expenses applicable to such classes. The graph and performance table below do not reflect the deduction of taxes that a shareholder would pay on Fund distributions or the redemption of Fund shares. During certain periods, expenses of the Fund have been waived or reimbursed by Lord Abbett; without such waiver or reimbursement of expenses, the Fund’s returns would have been lower. Past performance is no guarantee of future results.
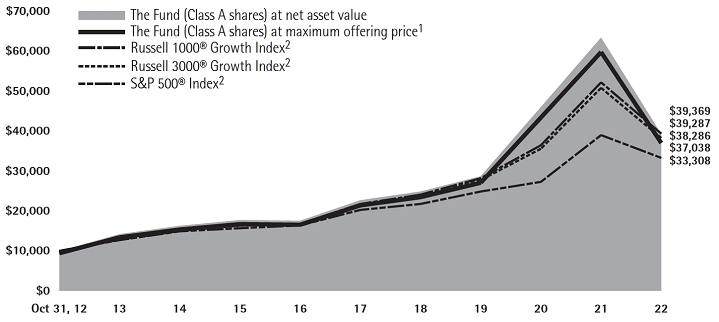
Average Annual Total Returns at Maximum Applicable
Sales Charge for the Periods Ended October 31, 2022
| | | 1 Year | | 5 Years | | 10 Years | | Life of Class | |
| Class A3 | | -41.62% | | 10.28% | | 13.99% | | – | |
| Class C4 | | -39.00% | | 10.77% | | 13.83% | | – | |
| Class F5 | | -37.89% | | 11.88% | | 14.92% | | – | |
| Class F36 | | -37.85% | | 11.95% | | – | | 14.12% | |
| Class I5 | | -37.89% | | 11.88% | | 14.97% | | – | |
| Class R25 | | -38.28% | | 11.21% | | 14.34% | | – | |
| Class R35 | | -38.20% | | 11.33% | | 14.39% | | – | |
| Class R47 | | -38.06% | | 11.60% | | – | | 11.65% | |
| Class R57 | | -37.91% | | 11.88% | | – | | 11.94% | |
| Class R67 | | -37.85% | | 11.95% | | – | | 12.02% | |
54
1 Reflects the deduction of the maximum initial sales charge of 5.75%.
2 Performance for each unmanaged index does not reflect any fees or expenses. The performance of each index is not necessarily representative of the Fund’s performance. Performance for each index begins on June 30, 2011.
3 Class A shares commenced operations on June 24, 2011 and performance for the Class began on June 30, 2011. Total return, which is the percentage change in net asset value, after deduction of the maximum initial sales charge of 5.75% applicable to Class A shares, with all dividends and distributions reinvested for the periods shown ended October 31, 2022, is calculated using the SEC-required uniform method to compute such return.
4 Class C shares commenced operations on June 24, 2011 and performance for the Class began on June 30, 2011. The 1% CDSC for Class C shares normally applies before the first anniversary of the purchase date. Performance for other periods is at net asset value.
5 Commenced operations on June 24, 2011 and performance for the Class began on June 30, 2011. Performance is at net asset value.
6 Commenced operations and performance for the Class began on April 4, 2017. Performance is at net asset value.
7 Commenced operations and performance for the classes began on June 30, 2015. Performance is at net asset value.
55
Health Care Fund
Investment Comparison
Below is a comparison of a $10,000 investment in Class A shares with the same investment in the Morgan Stanley Capital International (MSCI) All Country World Index (ACWI) Health Care Net Index and MSCI ACWI Health Care Gross Index, assuming reinvestment of all dividends and distributions. The performance of other classes will be greater than or less than the performance shown in the graph below due to different sales loads and expenses applicable to such classes. The graph and performance table below do not reflect the deduction of taxes that a shareholder would pay on Fund distributions or the redemption of Fund shares. During certain periods, expenses of the Fund have been waived or reimbursed by Lord Abbett; without such waiver or reimbursements of expense, the Fund’s returns would have been lower. Past performance is no guarantee of future results.

Average Annual Total Returns at Maximum Applicable
Sales Charge for the Period Ended October 31, 2022
| | | 1 Year | | Life of Class | |
| Class A3 | | -21.10% | | 8.47% | |
| Class C4 | | -17.68% | | 9.64% | |
| Class F5 | | -16.05% | | 10.74% | |
| Class F35 | | -15.96% | | 10.83% | |
| Class I5 | | -16.06% | | 10.74% | |
| Class R35 | | -16.50% | | 10.18% | |
| Class R45 | | -16.25% | | 10.47% | |
| Class R55 | | -16.06% | | 10.75% | |
| Class R65 | | -15.95% | | 10.84% | |
1 Reflects the deduction of the maximum initial sales charge of 5.75%.
2 Performance for the unmanaged index does not reflect any fees or expenses. The performance of the index is not necessarily representative of the Fund’s performance. Performance of the index begins on July 31, 2019.
3 Total return, which is the percentage change in net asset value, after deduction of the maximum initial sales charge of 5.75% applicable to Class A shares, with all dividends and distributions reinvested for the periods shown ended October 31, 2022, is calculated using the SEC required uniform method to compute such return.
4 The 1% CDSC for Class C shares normally applies before the first anniversary of the purchase date. Performance for other periods is at net asset value.
5 Performance is at net asset value.
56
International Equity Fund
Investment Comparison
Below is a comparison of a $10,000 investment in Class A shares with the same investment in the Morgan Stanley Capital International (MSCI) All Country World Index (ACWI) ex-USA® Index with Net Dividends and the MSCI ACWI ex-USA® Index with Gross Dividends, assuming reinvestment of all dividends and distributions. The MSCI ACWI ex-USA Index with Net Dividends reflects a reduction in dividends after taking into account withholding of taxes by certain foreign countries represented in the MSCI ACWI ex-USA Index. The performance of other classes will be greater than or less than the performance shown in the graph below due to different sales loads and expenses applicable to such classes. The graph and performance table below do not reflect the deduction of taxes that a shareholder would pay on Fund distributions or the redemption of Fund shares. During certain periods, expenses of the Fund have been waived or reimbursed by Lord Abbett; without such waiver or reimbursement of expenses, the Fund’s returns would have been lower. Past performance is no guarantee of future results.

Average Annual Total Returns at Maximum Applicable
Sales Charge for the Periods Ended October 31, 2022
| | | 1 Year | | 5 Years | | 10 Years | | Life of Class | |
| Class A3 | | -30.03% | | -1.28% | | 2.36% | | – | |
| Class C4 | | -26.92% | | -0.86% | | 2.24% | | – | |
| Class F5 | | -25.57% | | 0.10% | | 3.21% | | – | |
| Class F36 | | -25.50% | | 0.24% | | – | | 2.83% | |
| Class I5 | | -25.51% | | 0.21% | | 3.31% | | – | |
| Class P5 | | -25.89% | | -0.31% | | 2.79% | | – | |
| Class R25 | | -25.98% | | -0.45% | | 2.64% | | – | |
| Class R35 | | -25.88% | | -0.36% | | 2.75% | | – | |
| Class R47 | | -25.71% | | -0.10% | | – | | 1.47% | |
| Class R57 | | -25.56% | | 0.15% | | – | | 1.71% | |
| Class R67 | | -25.51% | | 0.22% | | – | | 1.83% | |
57
1 Reflects the deduction of the maximum initial sales charge of 5.75%.
2 Performance for each unmanaged index does not reflect any fees or expenses. The performance of each index is not necessarily representative of the Fund’s performance.
3 Total return, which is the percentage change in net asset value, after deduction of the maximum initial sales charge of 5.75% applicable to Class A shares, with all dividends and distributions reinvested for the periods shown ended October 31, 2022, is calculated using the SEC-required uniform method to compute such return.
4 The 1% CDSC for Class C shares normally applies before the first anniversary of the purchase date. Performance for other periods is at net asset value.
5 Performance is at net asset value.
6 Commenced operations and performance for the Class began on April 4, 2017. Performance is at net asset value.
7 Commenced operations and performance for the classes began on June 30, 2015. Performance is at net asset value.
58
International Opportunities Fund
Investment Comparison
Below is a comparison of a $10,000 investment in Class A shares with the same investment in the S&P Developed Ex-U.S. SmallCap® Index, assuming reinvestment of all dividends and distributions. The performance of other classes will be greater than or less than the performance shown in the graph below due to different sales loads and expenses applicable to such classes. The graph and performance table below do not reflect the deduction of taxes that a shareholder would pay on Fund distributions or the redemption of Fund shares. During certain periods, expenses of the Fund have been waived or reimbursed by Lord Abbett; without such waiver or reimbursement of expenses, the Fund’s returns would have been lower. Past performance is no guarantee of future results.

Average Annual Total Returns at Maximum Applicable
Sales Charge for the Periods Ended October 31, 2022
| | | 1 Year | | 5 Years | | 10 Years | | Life of Class | |
| Class A3 | | -33.10% | | -4.01% | | 3.88% | | – | |
| Class C4 | | -30.27% | | -3.60% | | 3.73% | | – | |
| Class F5 | | -28.93% | | -2.73% | | 4.66% | | – | |
| Class F36 | | -28.83% | | -2.56% | | – | | 1.12% | |
| Class I5 | | -28.85% | | -2.63% | | 4.77% | | – | |
| Class P5 | | -29.19% | | -3.07% | | 4.30% | | – | |
| Class R25 | | -29.28% | | -3.21% | | 4.14% | | – | |
| Class R35 | | -29.24% | | -3.11% | | 4.25% | | – | |
| Class R47 | | -29.02% | | -2.87% | | – | | 1.12% | |
| Class R57 | | -28.88% | | -2.63% | | – | | 1.37% | |
| Class R67 | | -28.83% | | -2.56% | | – | | 1.47% | |
1 Reflects the deduction of the maximum initial sales charge of 5.75%.
2 Performance for the unmanaged index does not reflect any fees or expenses. The performance of the index is not necessarily representative of the Fund’s performance.
3 Total return, which is the percentage change in net asset value, after deduction of the maximum initial sales charge of 5.75% applicable to Class A shares, with all dividends and distributions reinvested for the periods shown ended October 31, 2022, is calculated using the SEC-required uniform method to compute such return.
4 The 1% CDSC for Class C shares normally applies before the first anniversary of the purchase date. Performance is at net asset value.
5 Performance is at net asset value.
6 Commenced operations and performance for the Class began on April 4, 2017. Performance is at net asset value.
7 Commenced operations and performance for the classes began on June 30, 2015. Performance is at net asset value.
59
International Value Fund
Investment Comparison
Below is a comparison of a $10,000 investment in Class A shares with the same investment in the Morgan Stanley Capital International (MSCI) EAFE Value Index with Net Dividends and the MSCI EAFE Value Index with Gross Dividends, assuming reinvestment of all dividends and distributions. The MSCI EAFE Value Index with Net Dividends reflects a reduction in dividends after taking into account withholding of taxes by certain foreign countries represented in the MSCI EAFE Value Index. The performance of other classes will be greater than or less than the performance shown in the graph due to different sales loads and expenses applicable to such classes. The graph and performance table below do not reflect the deduction of taxes that a shareholder would pay on Fund distributions or the redemption of Fund shares. During certain periods, expenses of the Fund have been waived or reimbursed by Lord Abbett; without such waiver or reimbursements of expense, the Fund’s returns would have been lower. Past performance is no guarantee of future results.

Average Annual Total Returns at Maximum Applicable
Sales Charge for the Periods Ended October 31, 2022
| | | 1 Year | | 5 Years | | 10 Years | | Life of Class | |
| Class A3 | | -24.20% | | -2.40% | | 1.02% | | – | |
| Class C4 | | -20.95% | | -1.98% | | 0.87% | | – | |
| Class F5 | | -19.45% | | -1.04% | | 1.84% | | – | |
| Class F36 | | -19.32% | | -0.92% | | – | | 1.07% | |
| Class I5 | | -19.33% | | -0.96% | | 1.93% | | – | |
| Class R25 | | -19.92% | | -1.65% | | 1.24% | | – | |
| Class R35 | | -19.67% | | -1.47% | | 1.40% | | – | |
| Class R47 | | -19.62% | | -1.25% | | – | | -0.07% | |
| Class R57 | | -19.40% | | -0.99% | | – | | 0.19% | |
| Class R67 | | -19.32% | | -0.92% | | – | | 0.26% | |
1 Reflects the deduction of the maximum initial sales charge of 5.75%.
2 Performance for each unmanaged index does not reflect any fees or expenses. The performance of each index is not necessarily representative of the Fund’s performance.
3 Total return, which is the percentage change in net asset value, after deduction of the maximum initial sales charge of 5.75% applicable to Class A shares, with all dividends and distributions reinvested for the periods shown ended October 31, 2022, is calculated using the SEC-required uniform method to compute such return.
4 The 1% CDSC for Class C shares normally applies before the first anniversary of the purchase date. Performance for other periods is at net asset value.
5 Performance is at net asset value.
6 Commenced operations and performance for the Class began on April 4, 2017. Performance is at net asset value.
7 Commenced operations and performance for the classes began on June 30, 2015. Performance is at net asset value.
60
Micro Cap Growth Fund
Investment Comparison
Below is a comparison of a $10,000 investment in Class A shares with the same investment in the Russell Microcap® Growth Index and the Russell Microcap® Index, assuming reinvestment of all dividends and distributions. The performance of the other classes will be greater than or less than the performance shown in the graph below due to different sales loads and expenses applicable to such classes. The graph and performance table below do not reflect the deduction of taxes that a shareholder would pay on Fund distributions or the redemption of Fund shares. During certain periods, expenses of the Fund have been waived or reimbursed by Lord Abbett; without such waiver or reimbursement of expenses, the Fund’s returns would have been lower. Past performance is no guarantee of future results.
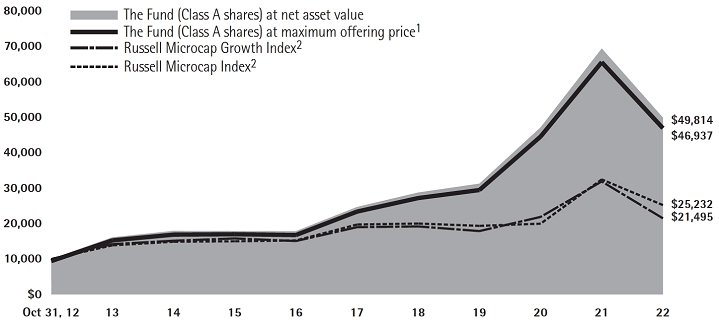
Average Annual Total Returns at Maximum Applicable
Sales Charge for the Periods Ended October 31, 2022
| | | 1 Year | | 5 Years | | 10 Years | | Life of Class | |
| Class A3 | | -32.52% | | 13.60% | | 16.72% | | – | |
| Class C4 | | -29.62% | | – | | – | | 2.34% | |
| Class F5 | | -28.19% | | – | | – | | 3.35% | |
| Class I6 | | -28.19% | | 15.10% | | 17.50% | | – | |
1 Reflects the deduction of the maximum initial sales charge of 5.75%.
2 Performance for each unmanaged index does not reflect any fees or expenses. The performance of each index is not necessarily representative of the Fund’s performance.
3 Total return, which is the percentage change in net asset value, after deduction of the maximum initial sales charge of 5.75% applicable to Class A shares, with all dividends and distributions reinvested for the periods shown ended
October 31, 2022, is calculated using the SEC required uniform method to compute such return.
4 Class C shares commenced operations and performance for the Class began on August 28, 2020. The 1% CDSC for Class C shares normally applies before the first anniversary of the purchase date. Performance is at net asset value.
5 Commenced operations and performance for the Class began on August 28, 2020. Performance is at net asset value.
6 Performance is at net asset value.
61
Value Opportunities Fund
Investment Comparison
Below is a comparison of a $10,000 investment in Class A shares with the same investment in the Russell 2500TM Index and the Russell 2500TM Value Index, assuming reinvestment of all dividends and distributions. The performance of other classes will be greater than or less than the performance shown in the graph below due to different sales loads and expenses applicable to such classes. The graph and performance table below do not reflect the deduction of taxes that a shareholder would pay on Fund distributions or the redemption of Fund shares. During certain periods, expenses of the Fund have been waived or reimbursed by Lord Abbett; without such waiver or reimbursement of expenses, the Fund’s returns would have been lower. Past performance is no guarantee of future results.
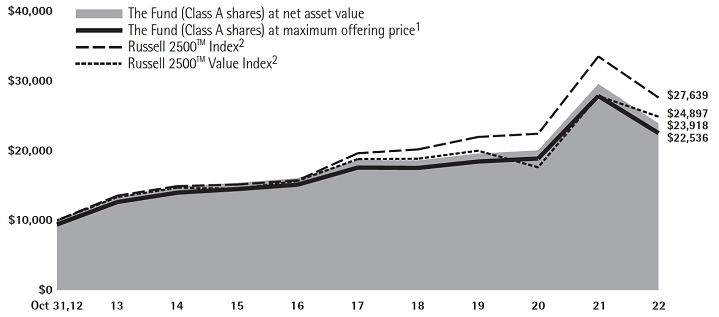
Average Annual Total Returns at Maximum Applicable
Sales Charge for the Periods Ended October 31, 2022
| | | 1 Year | | 5 Years | | 10 Years | | Life of Class | |
| Class A3 | | -23.78% | | 3.85% | | 8.46% | | – | |
| Class C4 | | -20.39% | | 4.31% | | 8.33% | | – | |
| Class F5 | | -19.01% | | 5.26% | | 9.31% | | – | |
| Class F36 | | -18.83% | | 5.47% | | – | | 6.16% | |
| Class I5 | | -18.88% | | 5.36% | | 9.42% | | – | |
| Class P5 | | -19.25% | | 4.89% | | 8.93% | | – | |
| Class R25 | | -19.38% | | 4.75% | | 8.77% | | – | |
| Class R35 | | -19.31% | | 4.84% | | 8.87% | | – | |
| Class R47 | | -19.09% | | 5.09% | | – | | 5.64% | |
| Class R57 | | -18.91% | | 5.36% | | – | | 5.91% | |
| Class R67 | | -18.80% | | 5.46% | | – | | 6.02% | |
1 Reflects the deduction of the maximum initial sales charge of 5.75%.
2 Performance for each unmanaged index does not reflect any fees or expenses. The performance of each index is not necessarily representative of the Fund’s performance.
3 Total return, which is the percentage change in net asset value, after deduction of the maximum initial sales charge of 5.75% applicable to Class A shares, with all dividends and distributions reinvested for the periods shown ended October 31, 2022, is calculated using the SEC-required uniform method to compute such return.
4 The 1% CDSC for Class C shares normally applies before the first anniversary of the purchase date. Performance for other periods is at net asset value.
5 Performance is at net asset value.
6 Commenced operations and performance for the Class began on April 4, 2017. Performance is at net asset value.
7 Commenced operations and performance for the classes began on June 30, 2015. Performance is at net asset value.
62
Expense Example
As a shareholder of a Fund, you incur two types of costs: (1) transaction costs, including sales charges (loads) on purchase payments (these charges vary among the share classes); and (2) ongoing costs, including management fees; distribution and service (12b-1) fees (these charges vary among the share classes); and other Fund expenses. This Example is intended to help you understand your ongoing costs (in dollars) of investing in each Fund and to compare these costs with the ongoing costs of investing in other mutual funds.
The Example is based on an investment of $1,000 invested at the beginning of the period and held for the entire period (May 1, 2022 through October 31, 2022).
Actual Expenses
For each class of each Fund, the first line of the applicable table on the following pages provides information about actual account values and actual expenses. You may use the information in this line, together with the amount you invested, to estimate the expenses that you paid over the period. Simply divide your account value by $1,000 (for example, an $8,600 account value divided by $1,000 = 8.6), then multiply the result by the number in the first line under the heading titled “Expenses Paid During Period 5/1/22 – 10/31/22” to estimate the expenses you paid on your account during this period.
Hypothetical Example for Comparison Purposes
For each class of each Fund, the second line of the applicable table on the following pages provides information about hypothetical account values and hypothetical expenses based on the Fund’s actual expense ratio and an assumed rate of return of 5% per year before expenses, which is not the Fund’s actual return. The hypothetical account values and expenses may not be used to estimate the actual ending account balance or expenses you paid for the period. You may use this information to compare the ongoing costs of investing in each Fund and other funds. To do so, compare this 5% hypothetical example with the 5% hypothetical examples that appear in the shareholder reports of the other funds.
63
Alpha Strategy Fund
Please note that the expenses shown in the table are meant to highlight your ongoing costs only and do not reflect any transactional costs, such as sales charges (loads). Therefore, the second line of the table is useful in comparing ongoing costs only, and will not help you determine the relative total costs of owning different funds. In addition, if these transactional costs were included, your costs would have been higher.
| | | Beginning
Account
Value | | Ending
Account
Value | | Expenses
Paid During
Period†# | |
| | | 5/1/22 | | 10/31/22 | | 5/1/22 –
10/31/22 | |
| Class A | | | | | | | |
| Actual | | $ | 1,000.00 | | | $ | 946.60 | | | $ | 2.16 | | |
| Hypothetical (5% Return Before Expenses) | | $ | 1,000.00 | | | $ | 1,022.99 | | | $ | 2.24 | | |
| Class C | | | | | | | | | | | | | |
| Actual | | $ | 1,000.00 | | | $ | 943.20 | | | $ | 5.88 | | |
| Hypothetical (5% Return Before Expenses) | | $ | 1,000.00 | | | $ | 1,019.16 | | | $ | 6.11 | | |
| Class F | | | | | | | | | | | | | |
| Actual | | $ | 1,000.00 | | | $ | 947.70 | | | $ | 1.47 | | |
| Hypothetical (5% Return Before Expenses) | | $ | 1,000.00 | | | $ | 1,023.69 | | | $ | 1.53 | | |
| Class F3 | | | | | | | | | | | | | |
| Actual | | $ | 1,000.00 | | | $ | 948.50 | | | $ | 0.49 | | |
| Hypothetical (5% Return Before Expenses) | | $ | 1,000.00 | | | $ | 1,024.70 | | | $ | 0.51 | | |
| Class I | | | | | | | | | | | | | |
| Actual | | $ | 1,000.00 | | | $ | 947.80 | | | $ | 0.93 | | |
| Hypothetical (5% Return Before Expenses) | | $ | 1,000.00 | | | $ | 1,024.25 | | | $ | 0.97 | | |
| Class R2 | | | | | | | | | | | | | |
| Actual | | $ | 1,000.00 | | | $ | 945.10 | | | $ | 3.87 | | |
| Hypothetical (5% Return Before Expenses) | | $ | 1,000.00 | | | $ | 1,021.22 | | | $ | 4.02 | | |
| Class R3 | | | | | | | | | | | | | |
| Actual | | $ | 1,000.00 | | | $ | 945.60 | | | $ | 3.38 | | |
| Hypothetical (5% Return Before Expenses) | | $ | 1,000.00 | | | $ | 1,021.73 | | | $ | 3.52 | | |
| Class R4 | | | | | | | | | | | | | |
| Actual | | $ | 1,000.00 | | | $ | 946.90 | | | $ | 2.16 | | |
| Hypothetical (5% Return Before Expenses) | | $ | 1,000.00 | | | $ | 1,022.99 | | | $ | 2.24 | | |
| Class R5 | | | | | | | | | | | | | |
| Actual | | $ | 1,000.00 | | | $ | 947.90 | | | $ | 0.93 | | |
| Hypothetical (5% Return Before Expenses) | | $ | 1,000.00 | | | $ | 1,024.25 | | | $ | 0.97 | | |
| Class R6 | | | | | | | | | | | | | |
| Actual | | $ | 1,000.00 | | | $ | 948.50 | | | $ | 0.49 | | |
| Hypothetical (5% Return Before Expenses) | | $ | 1,000.00 | | | $ | 1,024.70 | | | $ | 0.51 | | |
| † | For each class of the Fund, net expenses are equal to the annualized expense ratio for such class (0.44% for Class A, 1.20% for Class C, 0.30% for Class F, 0.10% for Class F3, 0.19% for Class I, 0.79% for Class R2, 0.69% for Class R3, 0.44% for Class R4, 0.19% for Class R5 and 0.10% for Class R6) multiplied by the average account value over the period, multiplied by 184/365 (to reflect one-half year period). |
| # | Does not include expenses of the Underlying Funds in which Alpha Strategy Fund invests. |
64
Portfolio Holdings Presented by Portfolio Allocation
October 31, 2022
| Underlying Fund Name | | %* |
| Lord Abbett Developing Growth Fund, Inc. - Class I | | | 19.90 | % |
| Lord Abbett Securities Trust-Focused Small Cap Value Fund - Class I | | | 10.12 | % |
| Lord Abbett Securities Trust-International Opportunities Fund - Class I | | | 19.49 | % |
| Lord Abbett Securities Trust-Micro Cap Growth Fund - Class I | | | 10.18 | % |
| Lord Abbett Research Fund, Inc.-Small Cap Value Fund - Class I | | | 20.19 | % |
| Lord Abbett Securities Trust-Value Opportunities Fund - Class I | | | 20.05 | % |
| Repurchase Agreements | | | 0.07 | % |
| Total | | | 100.00 | % |
| * | Represents percent of total investments, which excludes derivatives. |
65
Focused Growth Fund
Please note that the expenses shown in the table are meant to highlight your ongoing costs only and do not reflect any transactional costs, such as sales charges (loads). Therefore, the second line of the table is useful in comparing ongoing costs only, and will not help you determine the relative total costs of owning different funds. In addition, if these transactional costs were included, your costs would have been higher.
| | | Beginning
Account
Value | | Ending
Account
Value | | Expenses
Paid During
Period† | |
| | | 5/1/22 | | 10/31/22 | | 5/1/22 –
10/31/22 | |
| Class A | | | | | | | |
| Actual | | $ | 1,000.00 | | | $ | 890.00 | | | $ | 5.00 | | |
| Hypothetical (5% Return Before Expenses) | | $ | 1,000.00 | | | $ | 1,019.91 | | | $ | 5.35 | | |
| Class C | | | | | | | | | | | | | |
| Actual | | $ | 1,000.00 | | | $ | 886.80 | | | $ | 8.56 | | |
| Hypothetical (5% Return Before Expenses) | | $ | 1,000.00 | | | $ | 1,016.13 | | | $ | 9.15 | | |
| Class F | | | | | | | | | | | | | |
| Actual | | $ | 1,000.00 | | | $ | 891.10 | | | $ | 3.81 | | |
| Hypothetical (5% Return Before Expenses) | | $ | 1,000.00 | | | $ | 1,021.17 | | | $ | 4.08 | | |
| Class F3 | | | | | | | | | | | | | |
| Actual | | $ | 1,000.00 | | | $ | 891.80 | | | $ | 3.39 | | |
| Hypothetical (5% Return Before Expenses) | | $ | 1,000.00 | | | $ | 1,021.63 | | | $ | 3.62 | | |
| Class I | | | | | | | | | | | | | |
| Actual | | $ | 1,000.00 | | | $ | 891.10 | | | $ | 3.81 | | |
| Hypothetical (5% Return Before Expenses) | | $ | 1,000.00 | | | $ | 1,021.17 | | | $ | 4.08 | | |
| Class R3 | | | | | | | | | | | | | |
| Actual | | $ | 1,000.00 | | | $ | 888.90 | | | $ | 6.19 | | |
| Hypothetical (5% Return Before Expenses) | | $ | 1,000.00 | | | $ | 1,018.65 | | | $ | 6.61 | | |
| Class R4 | | | | | | | | | | | | | |
| Actual | | $ | 1,000.00 | | | $ | 890.00 | | | $ | 5.00 | | |
| Hypothetical (5% Return Before Expenses) | | $ | 1,000.00 | | | $ | 1,019.91 | | | $ | 5.35 | | |
| Class R5 | | | | | | | | | | | | | |
| Actual | | $ | 1,000.00 | | | $ | 891.10 | | | $ | 3.81 | | |
| Hypothetical (5% Return Before Expenses) | | $ | 1,000.00 | | | $ | 1,021.17 | | | $ | 4.08 | | |
| Class R6 | | | | | | | | | | | | | |
| Actual | | $ | 1,000.00 | | | $ | 891.40 | | | $ | 3.38 | | |
| Hypothetical (5% Return Before Expenses) | | $ | 1,000.00 | | | $ | 1,021.63 | | | $ | 3.62 | | |
| † | For each class of the Fund, net expenses are equal to the annualized expense ratio for such class (1.05% for Class A, 1.80% for Class C, 0.80% for Class F, 0.71% for Class F3, 0.80% for Class I, 1.30% for Class R3, 1.05% for Class R4, 0.80% for Class R5 and 0.71% for Class R6) multiplied by the average account value over the period, multiplied by 184/365 (to reflect one-half year period). |
66
Portfolio Holdings Presented by Sector
October 31, 2022
| Sector* | | %** |
| Communication Services | | | 8.69 | % |
| Consumer Discretionary | | | 16.39 | % |
| Consumer Staples | | | 2.40 | % |
| Energy | | | 3.15 | % |
| Health Care | | | 23.39 | % |
| Industrials | | | 2.43 | % |
| Information Technology | | | 39.09 | % |
| Repurchase Agreements | | | 4.46 | % |
| Total | | | 100.00 | % |
| * | | A sector may comprise several industries. |
| ** | | Represents percent of total investments, which excludes derivatives. |
67
Focused Large Cap Value Fund
Please note that the expenses shown in the table are meant to highlight your ongoing costs only and do not reflect any transactional costs, such as sales charges (loads). Therefore, the second line of the table is useful in comparing ongoing costs only, and will not help you determine the relative total costs of owning different funds. In addition, if these transactional costs were included, your costs would have been higher.
| | | Beginning
Account
Value | | Ending
Account
Value | | Expenses
Paid During
Period† | |
| | | 5/1/22 | | 10/31/22 | | 5/1/22 –
10/31/22 | |
| Class A | | | | | | | |
| Actual | | $ | 1,000.00 | | | $ | 976.30 | | | $ | 4.78 | | |
| Hypothetical (5% Return Before Expenses) | | $ | 1,000.00 | | | $ | 1,020.37 | | | $ | 4.89 | | |
| Class C | | | | | | | | | | | | | |
| Actual | | $ | 1,000.00 | | | $ | 972.60 | | | $ | 8.50 | | |
| Hypothetical (5% Return Before Expenses) | | $ | 1,000.00 | | | $ | 1,016.59 | | | $ | 8.69 | | |
| Class F | | | | | | | | | | | | | |
| Actual | | $ | 1,000.00 | | | $ | 977.30 | | | $ | 3.54 | | |
| Hypothetical (5% Return Before Expenses) | | $ | 1,000.00 | | | $ | 1,021.63 | | | $ | 3.62 | | |
| Class F3 | | | | | | | | | | | | | |
| Actual | | $ | 1,000.00 | | | $ | 977.10 | | | $ | 3.54 | | |
| Hypothetical (5% Return Before Expenses) | | $ | 1,000.00 | | | $ | 1,021.63 | | | $ | 3.62 | | |
| Class I | | | | | | | | | | | | | |
| Actual | | $ | 1,000.00 | | | $ | 977.10 | | | $ | 3.54 | | |
| Hypothetical (5% Return Before Expenses) | | $ | 1,000.00 | | | $ | 1,021.63 | | | $ | 3.62 | | |
| Class R3 | | | | | | | | | | | | | |
| Actual | | $ | 1,000.00 | | | $ | 975.50 | | | $ | 6.03 | | |
| Hypothetical (5% Return Before Expenses) | | $ | 1,000.00 | | | $ | 1,019.11 | | | $ | 6.16 | | |
| Class R4 | | | | | | | | | | | | | |
| Actual | | $ | 1,000.00 | | | $ | 975.60 | | | $ | 4.78 | | |
| Hypothetical (5% Return Before Expenses) | | $ | 1,000.00 | | | $ | 1,020.37 | | | $ | 4.89 | | |
| Class R5 | | | | | | | | | | | | | |
| Actual | | $ | 1,000.00 | | | $ | 977.10 | | | $ | 3.54 | | |
| Hypothetical (5% Return Before Expenses) | | $ | 1,000.00 | | | $ | 1,021.63 | | | $ | 3.62 | | |
| Class R6 | | | | | | | | | | | | | |
| Actual | | $ | 1,000.00 | | | $ | 977.10 | | | $ | 3.54 | | |
| Hypothetical (5% Return Before Expenses) | | $ | 1,000.00 | | | $ | 1,021.63 | | | $ | 3.62 | | |
| † | For each class of the Fund, net expenses are equal to the annualized expense ratio for such class (0.96% for Class A, 1.71% for Class C, 0.71% for Class F, 0.71% for Class F3, 0.71% for Class I, 1.21% for Class R3, 0.96% for Class R4, 0.71% for Class R5 and 0.71% for Class R6) multiplied by the average account value over the period, multiplied by 184/365 (to reflect one-half year period). |
68
Portfolio Holdings Presented by Sector
October 31, 2022
| Sector* | | %** |
| Communication Services | | | 5.43 | % |
| Consumer Discretionary | | | 8.11 | % |
| Consumer Staples | | | 4.14 | % |
| Energy | | | 9.48 | % |
| Financials | | | 23.67 | % |
| Health Care | | | 18.66 | % |
| Industrials | | | 12.54 | % |
| Information Technology | | | 6.69 | % |
| Materials | | | 5.60 | % |
| Utilities | | | 3.54 | % |
| Repurchase Agreements | | | 2.14 | % |
| Total | | | 100.00 | % |
| * | | A sector may comprise several industries. |
| ** | | Represents percent of total investments, which excludes derivatives. |
69
Focused Small Cap Value Fund
Please note that the expenses shown in the table are meant to highlight your ongoing costs only and do not reflect any transactional costs, such as sales charges (loads). Therefore, the second line of the table is useful in comparing ongoing costs only, and will not help you determine the relative total costs of owning different funds. In addition, if these transactional costs were included, your costs would have been higher.
| | | Beginning
Account
Value | | Ending
Account
Value | | Expenses
Paid During
Period† | |
| | | 5/1/22 | | 10/31/22 | | 5/1/22 –
10/31/22 | |
| Class A | | | | | | | |
| Actual | | $ | 1,000.00 | | | $ | 973.20 | | | $ | 6.37 | | |
| Hypothetical (5% Return Before Expenses) | | $ | 1,000.00 | | | $ | 1,018.75 | | | $ | 6.51 | | |
| Class C | | | | | | | | | | | | | |
| Actual | | $ | 1,000.00 | | | $ | 969.80 | | | $ | 10.08 | | |
| Hypothetical (5% Return Before Expenses) | | $ | 1,000.00 | | | $ | 1,014.97 | | | $ | 10.31 | | |
| Class F | | | | | | | | | | | | | |
| Actual | | $ | 1,000.00 | | | $ | 974.30 | | | $ | 5.13 | | |
| Hypothetical (5% Return Before Expenses) | | $ | 1,000.00 | | | $ | 1,020.01 | | | $ | 5.24 | | |
| Class F3 | | | | | | | | | | | | | |
| Actual | | $ | 1,000.00 | | | $ | 975.10 | | | $ | 4.83 | | |
| Hypothetical (5% Return Before Expenses) | | $ | 1,000.00 | | | $ | 1,020.32 | | | $ | 4.94 | | |
| Class I | | | | | | | | | | | | | |
| Actual | | $ | 1,000.00 | | | $ | 974.30 | | | $ | 5.13 | | |
| Hypothetical (5% Return Before Expenses) | | $ | 1,000.00 | | | $ | 1,020.01 | | | $ | 5.24 | | |
| Class R5 | | | | | | | | | | | | | |
| Actual | | $ | 1,000.00 | | | $ | 974.70 | | | $ | 5.13 | | |
| Hypothetical (5% Return Before Expenses) | | $ | 1,000.00 | | | $ | 1,020.01 | | | $ | 5.24 | | |
| Class R6 | | | | | | | | | | | | | |
| Actual | | $ | 1,000.00 | | | $ | 974.70 | | | $ | 4.98 | | |
| Hypothetical (5% Return Before Expenses) | | $ | 1,000.00 | | | $ | 1,020.16 | | | $ | 5.09 | | |
| † | For each class of the Fund, net expenses are equal to the annualized expense ratio for such class (1.28% for Class A, 2.03% for Class C, 1.03% for Class F, 0.97% for Class F3, 1.03% for Class I, 1.03% for Class R5 and 1.00% for Class R6) multiplied by the average account value over the period, multiplied by 184/365 (to reflect one-half year period). |
70
Portfolio Holdings Presented by Sector
October 31, 2022
| Sector* | | %** |
| Communication Services | | | 6.22 | % |
| Consumer Discretionary | | | 6.86 | % |
| Consumer Staples | | | 4.18 | % |
| Energy | | | 8.97 | % |
| Financials | | | 28.76 | % |
| Health Care | | | 5.92 | % |
| Industrials | | | 18.43 | % |
| Information Technology | | | 8.99 | % |
| Materials | | | 5.07 | % |
| Real Estate | | | 6.60 | % |
| Total | | | 100.00 | % |
| * | | A sector may comprise several industries. |
| ** | | Represents percent of total investments, which excludes derivatives. |
71
Fundamental Equity Fund
Please note that the expenses shown in the table are meant to highlight your ongoing costs only and do not reflect any transactional costs, such as sales charges (loads). Therefore, the second line of the table is useful in comparing ongoing costs only, and will not help you determine the relative total costs of owning different funds. In addition, if these transactional costs were included, your costs would have been higher.
| | | Beginning
Account
Value | | Ending
Account
Value | | Expenses
Paid During
Period† | |
| | | 5/1/22 | | 10/31/22 | | 5/1/22 –
10/31/22 | |
| Class A | | | | | | | |
| Actual | | $ | 1,000.00 | | | $ | 988.10 | | | $ | 4.81 | | |
| Hypothetical (5% Return Before Expenses) | | $ | 1,000.00 | | | $ | 1,020.37 | | | $ | 4.89 | | |
| Class C | | | | | | | | | | | | | |
| Actual | | $ | 1,000.00 | | | $ | 984.30 | | | $ | 8.60 | | |
| Hypothetical (5% Return Before Expenses) | | $ | 1,000.00 | | | $ | 1,016.53 | | | $ | 8.74 | | |
| Class F | | | | | | | | | | | | | |
| Actual | | $ | 1,000.00 | | | $ | 987.90 | | | $ | 4.11 | | |
| Hypothetical (5% Return Before Expenses) | | $ | 1,000.00 | | | $ | 1,021.07 | | | $ | 4.18 | | |
| Class F3 | | | | | | | | | | | | | |
| Actual | | $ | 1,000.00 | | | $ | 989.10 | | | $ | 3.16 | | |
| Hypothetical (5% Return Before Expenses) | | $ | 1,000.00 | | | $ | 1,022.03 | | | $ | 3.21 | | |
| Class I | | | | | | | | | | | | | |
| Actual | | $ | 1,000.00 | | | $ | 988.20 | | | $ | 3.56 | | |
| Hypothetical (5% Return Before Expenses) | | $ | 1,000.00 | | | $ | 1,021.63 | | | $ | 3.62 | | |
| Class P | | | | | | | | | | | | | |
| Actual | | $ | 1,000.00 | | | $ | 987.00 | | | $ | 5.86 | | |
| Hypothetical (5% Return Before Expenses) | | $ | 1,000.00 | | | $ | 1,019.31 | | | $ | 5.96 | | |
| Class R2 | | | | | | | | | | | | | |
| Actual | | $ | 1,000.00 | | | $ | 986.10 | | | $ | 6.56 | | |
| Hypothetical (5% Return Before Expenses) | | $ | 1,000.00 | | | $ | 1,018.60 | | | $ | 6.67 | | |
| Class R3 | | | | | | | | | | | | | |
| Actual | | $ | 1,000.00 | | | $ | 986.20 | | | $ | 6.11 | | |
| Hypothetical (5% Return Before Expenses) | | $ | 1,000.00 | | | $ | 1,019.06 | | | $ | 6.21 | | |
| Class R4 | | | | | | | | | | | | | |
| Actual | | $ | 1,000.00 | | | $ | 988.00 | | | $ | 4.81 | | |
| Hypothetical (5% Return Before Expenses) | | $ | 1,000.00 | | | $ | 1,020.37 | | | $ | 4.89 | | |
| Class R5 | | | | | | | | | | | | | |
| Actual | | $ | 1,000.00 | | | $ | 989.00 | | | $ | 3.56 | | |
| Hypothetical (5% Return Before Expenses) | | $ | 1,000.00 | | | $ | 1,021.63 | | | $ | 3.62 | | |
| Class R6 | | | | | | | | | | | | | |
| Actual | | $ | 1,000.00 | | | $ | 989.10 | | | $ | 3.16 | | |
| Hypothetical (5% Return Before Expenses) | | $ | 1,000.00 | | | $ | 1,022.03 | | | $ | 3.21 | | |
| † | For each class of the Fund, net expenses are equal to the annualized expense ratio for such class (0.96% for Class A, 1.72% for Class C, 0.82% for Class F, 0.63% for Class F3, 0.71% for Class I, 1.17% for Class P, 1.31% for Class R2, 1.22% for Class R3, 0.96% for Class R4, 0.71% for Class R5 and 0.63% for Class R6) multiplied by the average account value over the period, multiplied by 184/365 (to reflect one-half year period). |
72
Portfolio Holdings Presented by Sector
October 31, 2022
| Sector* | | %** |
| Communication Services | | | 5.10 | % |
| Consumer Discretionary | | | 7.29 | % |
| Consumer Staples | | | 5.14 | % |
| Energy | | | 9.04 | % |
| Financials | | | 21.03 | % |
| Health Care | | | 15.38 | % |
| Industrials | | | 13.62 | % |
| Information Technology | | | 11.06 | % |
| Materials | | | 4.32 | % |
| Real Estate | | | 3.36 | % |
| Utilities | | | 2.63 | % |
| Repurchase Agreements | | | 2.03 | % |
| Total | | | 100.00 | % |
| * | | A sector may comprise several industries. |
| ** | | Represents percent of total investments, which excludes derivatives. |
73
Global Equity Fund
Please note that the expenses shown in the table are meant to highlight your ongoing costs only and do not reflect any transactional costs, such as sales charges (loads). Therefore, the second line of the table is useful in comparing ongoing costs only, and will not help you determine the relative total costs of owning different funds. In addition, if these transactional costs were included, your costs would have been higher.
| | | Beginning
Account
Value | | Ending
Account
Value | | Expenses
Paid During
Period† | |
| | | 5/1/22 | | 10/31/22 | | 5/1/22 –
10/31/22 | |
| Class A | | | | | | | |
| Actual | | $ | 1,000.00 | | | $ | 925.10 | | | $ | 4.37 | | |
| Hypothetical (5% Return Before Expenses) | | $ | 1,000.00 | | | $ | 1,020.67 | | | $ | 4.58 | | |
| Class C | | | | | | | | | | | | | |
| Actual | | $ | 1,000.00 | | | $ | 921.90 | | | $ | 7.99 | | |
| Hypothetical (5% Return Before Expenses) | | $ | 1,000.00 | | | $ | 1,016.89 | | | $ | 8.39 | | |
| Class F | | | | | | | | | | | | | |
| Actual | | $ | 1,000.00 | | | $ | 925.30 | | | $ | 3.64 | | |
| Hypothetical (5% Return Before Expenses) | | $ | 1,000.00 | | | $ | 1,021.42 | | | $ | 3.82 | | |
| Class F3 | | | | | | | | | | | | | |
| Actual | | $ | 1,000.00 | | | $ | 926.10 | | | $ | 2.82 | | |
| Hypothetical (5% Return Before Expenses) | | $ | 1,000.00 | | | $ | 1,022.28 | | | $ | 2.96 | | |
| Class I | | | | | | | | | | | | | |
| Actual | | $ | 1,000.00 | | | $ | 926.10 | | | $ | 3.16 | | |
| Hypothetical (5% Return Before Expenses) | | $ | 1,000.00 | | | $ | 1,021.93 | | | $ | 3.31 | | |
| Class R3 | | | | | | | | | | | | | |
| Actual | | $ | 1,000.00 | | | $ | 924.50 | | | $ | 5.58 | | |
| Hypothetical (5% Return Before Expenses) | | $ | 1,000.00 | | | $ | 1,019.41 | | | $ | 5.85 | | |
| Class R4 | | | | | | | | | | | | | |
| Actual | | $ | 1,000.00 | | | $ | 925.10 | | | $ | 4.37 | | |
| Hypothetical (5% Return Before Expenses) | | $ | 1,000.00 | | | $ | 1,020.67 | | | $ | 4.58 | | |
| Class R5 | | | | | | | | | | | | | |
| Actual | | $ | 1,000.00 | | | $ | 926.10 | | | $ | 3.16 | | |
| Hypothetical (5% Return Before Expenses) | | $ | 1,000.00 | | | $ | 1,021.93 | | | $ | 3.31 | | |
| Class R6 | | | | | | | | | | | | | |
| Actual | | $ | 1,000.00 | | | $ | 926.10 | | | $ | 2.82 | | |
| Hypothetical (5% Return Before Expenses) | | $ | 1,000.00 | | | $ | 1,022.28 | | | $ | 2.96 | | |
| † | For each class of the Fund, net expenses are equal to the annualized expense ratio for such class (0.90% for Class A, 1.65% for Class C, 0.75% for Class F, 0.58% for Class F3, 0.65% for Class I, 1.15% for Class R3, 0.90% for Class R4, 0.65% for Class R5 and 0.58% for Class R6) multiplied by the average account value over the period, multiplied by 184/365 (to reflect one-half year period). |
74
Portfolio Holdings Presented by Sector
October 31, 2022
| Sector* | | %** |
| Communication Services | | | 4.32 | % |
| Consumer Discretionary | | | 9.61 | % |
| Consumer Staples | | | 7.08 | % |
| Energy | | | 7.47 | % |
| Financials | | | 17.30 | % |
| Health Care | | | 14.95 | % |
| Industrials | | | 9.88 | % |
| Information Technology | | | 18.46 | % |
| Materials | | | 2.24 | % |
| Real Estate | | | 2.03 | % |
| Utilities | | | 3.86 | % |
| Repurchase Agreements | | | 2.80 | % |
| Total | | | 100.00 | % |
| * | | A sector may comprise several industries. |
| ** | | Represents percent of total investments, which excludes derivatives. |
75
Growth Leaders Fund
Please note that the expenses shown in the table are meant to highlight your ongoing costs only and do not reflect any transactional costs, such as sales charges (loads). Therefore, the second line of the table is useful in comparing ongoing costs only, and will not help you determine the relative total costs of owning different funds. In addition, if these transactional costs were included, your costs would have been higher.
| | | Beginning
Account
Value | | Ending
Account
Value | | Expenses
Paid During
Period† | |
| | | 5/1/22 | | 10/31/22 | | 5/1/22 –
10/31/22 | |
| Class A | | | | | | | |
| Actual | | $ | 1,000.00 | | | $ | 878.20 | | | $ | 4.36 | | |
| Hypothetical (5% Return Before Expenses) | | $ | 1,000.00 | | | $ | 1,020.57 | | | $ | 4.69 | | |
| Class C | | | | | | | | | | | | | |
| Actual | | $ | 1,000.00 | | | $ | 875.00 | | | $ | 7.89 | | |
| Hypothetical (5% Return Before Expenses) | | $ | 1,000.00 | | | $ | 1,016.79 | | | $ | 8.49 | | |
| Class F | | | | | | | | | | | | | |
| Actual | | $ | 1,000.00 | | | $ | 879.40 | | | $ | 3.17 | | |
| Hypothetical (5% Return Before Expenses) | | $ | 1,000.00 | | | $ | 1,021.83 | | | $ | 3.41 | | |
| Class F3 | | | | | | | | | | | | | |
| Actual | | $ | 1,000.00 | | | $ | 879.50 | | | $ | 2.80 | | |
| Hypothetical (5% Return Before Expenses) | | $ | 1,000.00 | | | $ | 1,022.23 | | | $ | 3.01 | | |
| Class I | | | | | | | | | | | | | |
| Actual | | $ | 1,000.00 | | | $ | 879.30 | | | $ | 3.17 | | |
| Hypothetical (5% Return Before Expenses) | | $ | 1,000.00 | | | $ | 1,021.83 | | | $ | 3.41 | | |
| Class R2 | | | | | | | | | | | | | |
| Actual | | $ | 1,000.00 | | | $ | 876.60 | | | $ | 6.01 | | |
| Hypothetical (5% Return Before Expenses) | | $ | 1,000.00 | | | $ | 1,018.80 | | | $ | 6.46 | | |
| Class R3 | | | | | | | | | | | | | |
| Actual | | $ | 1,000.00 | | | $ | 877.20 | | | $ | 5.54 | | |
| Hypothetical (5% Return Before Expenses) | | $ | 1,000.00 | | | $ | 1,019.31 | | | $ | 5.96 | | |
| Class R4 | | | | | | | | | | | | | |
| Actual | | $ | 1,000.00 | | | $ | 878.20 | | | $ | 4.36 | | |
| Hypothetical (5% Return Before Expenses) | | $ | 1,000.00 | | | $ | 1,020.57 | | | $ | 4.69 | | |
| Class R5 | | | | | | | | | | | | | |
| Actual | | $ | 1,000.00 | | | $ | 879.30 | | | $ | 3.17 | | |
| Hypothetical (5% Return Before Expenses) | | $ | 1,000.00 | | | $ | 1,021.83 | | | $ | 3.41 | | |
| Class R6 | | | | | | | | | | | | | |
| Actual | | $ | 1,000.00 | | | $ | 879.50 | | | $ | 2.80 | | |
| Hypothetical (5% Return Before Expenses) | | $ | 1,000.00 | | | $ | 1,022.23 | | | $ | 3.01 | | |
| † | For each class of the Fund, net expenses are equal to the annualized expense ratio for such class (0.92% for Class A, 1.67% for Class C, 0.67% for Class F, 0.59% for Class F3, 0.67% for Class I, 1.27% for Class R2, 1.17% for Class R3, 0.92% for Class R4, 0.67% for Class R5 and 0.59% for Class R6) multiplied by the average account value over the period, multiplied by 184/365 (to reflect one-half year period). |
76
Portfolio Holdings Presented by Sector
October 31, 2022
| Sector* | | %** |
| Communication Services | | | 7.88 | % |
| Consumer Discretionary | | | 17.25 | % |
| Consumer Staples | | | 2.14 | % |
| Energy | | | 2.36 | % |
| Health Care | | | 23.47 | % |
| Industrials | | | 3.00 | % |
| Information Technology | | | 41.57 | % |
| Materials | | | 1.26 | % |
| Repurchase Agreements | | | 1.07 | % |
| Total | | | 100.00 | % |
| * | | A sector may comprise several industries. |
| ** | | Represents percent of total investments, which excludes derivatives. |
77
Health Care Fund
Please note that the expenses shown in the table are meant to highlight your ongoing costs only and do not reflect any transactional costs, such as sales charges (loads). Therefore, the second line of the table is useful in comparing ongoing costs only, and will not help you determine the relative total costs of owning different funds. In addition, if these transactional costs were included, your costs would have been higher.
| | | Beginning
Account
Value | | Ending
Account
Value | | Expenses
Paid During
Period† | |
| | | 5/1/22 | | 10/31/22 | | 5/1/22 –
10/31/22 | |
| Class A | | | | | | | |
| Actual | | $ | 1,000.00 | | | $ | 1,014.30 | | | $ | 5.23 | | |
| Hypothetical (5% Return Before Expenses) | | $ | 1,000.00 | | | $ | 1,020.01 | | | $ | 5.24 | | |
| Class C | | | | | | | | | | | | | |
| Actual | | $ | 1,000.00 | | | $ | 1,010.30 | | | $ | 9.02 | | |
| Hypothetical (5% Return Before Expenses) | | $ | 1,000.00 | | | $ | 1,016.23 | | | $ | 9.05 | | |
| Class F | | | | | | | | | | | | | |
| Actual | | $ | 1,000.00 | | | $ | 1,015.90 | | | $ | 3.96 | | |
| Hypothetical (5% Return Before Expenses) | | $ | 1,000.00 | | | $ | 1,021.27 | | | $ | 3.97 | | |
| Class F3 | | | | | | | | | | | | | |
| Actual | | $ | 1,000.00 | | | $ | 1,016.50 | | | $ | 3.35 | | |
| Hypothetical (5% Return Before Expenses) | | $ | 1,000.00 | | | $ | 1,021.88 | | | $ | 3.36 | | |
| Class I | | | | | | | | | | | | | |
| Actual | | $ | 1,000.00 | | | $ | 1,015.90 | | | $ | 3.96 | | |
| Hypothetical (5% Return Before Expenses) | | $ | 1,000.00 | | | $ | 1,021.27 | | | $ | 3.97 | | |
| Class R3 | | | | | | | | | | | | | |
| Actual | | $ | 1,000.00 | | | $ | 1,013.20 | | | $ | 6.50 | | |
| Hypothetical (5% Return Before Expenses) | | $ | 1,000.00 | | | $ | 1,018.75 | | | $ | 6.51 | | |
| Class R4 | | | | | | | | | | | | | |
| Actual | | $ | 1,000.00 | | | $ | 1,014.90 | | | $ | 5.23 | | |
| Hypothetical (5% Return Before Expenses) | | $ | 1,000.00 | | | $ | 1,020.01 | | | $ | 5.24 | | |
| Class R5 | | | | | | | | | | | | | |
| Actual | | $ | 1,000.00 | | | $ | 1,015.90 | | | $ | 3.96 | | |
| Hypothetical (5% Return Before Expenses) | | $ | 1,000.00 | | | $ | 1,021.27 | | | $ | 3.97 | | |
| Class R6 | | | | | | | | | | | | | |
| Actual | | $ | 1,000.00 | | | $ | 1,016.50 | | | $ | 3.35 | | |
| Hypothetical (5% Return Before Expenses) | | $ | 1,000.00 | | | $ | 1,021.88 | | | $ | 3.36 | | |
| † | For each class of the Fund, net expenses are equal to the annualized expense ratio for such class (1.03% for Class A, 1.78% for Class C, 0.78% for Class F, 0.66% for Class F3, 0.78% for Class I, 1.28% for Class R3, 1.03% for Class R4, 0.78% for Class R5 and 0.66% for Class R6) multiplied by the average account value over the period, multiplied by 184/365 (to reflect one-half year period). |
78
Portfolio Holdings Presented by Sector
October 31, 2022
| Sector* | | %** |
| Health Care | | | 96.45 | % |
| Repurchase Agreements | | | 2.35 | % |
| Money Market Funds(a) | | | 1.08 | % |
| Time Deposits(a) | | | 0.12 | % |
| Total | | | 100.00 | % |
| * | | A sector may comprise several industries. |
| ** | | Represents percent of total investments, which excludes derivatives. |
| (a) | | Securities were purchased with the cash collateral from loaned securities. |
79
International Equity Fund
Please note that the expenses shown in the table are meant to highlight your ongoing costs only and do not reflect any transactional costs, such as sales charges (loads). Therefore, the second line of the table is useful in comparing ongoing costs only, and will not help you determine the relative total costs of owning different funds. In addition, if these transactional costs were included, your costs would have been higher.
| | | Beginning
Account
Value | | Ending
Account
Value | | Expenses
Paid During
Period† | |
| | | 5/1/22 | | 10/31/22 | | 5/1/22 –
10/31/22 | |
| Class A | | | | | | | |
| Actual | | $ | 1,000.00 | | | $ | 878.20 | | | $ | 5.54 | | |
| Hypothetical (5% Return Before Expenses) | | $ | 1,000.00 | | | $ | 1,019.31 | | | $ | 5.96 | | |
| Class C | | | | | | | | | | | | | |
| Actual | | $ | 1,000.00 | | | $ | 874.90 | | | $ | 9.07 | | |
| Hypothetical (5% Return Before Expenses) | | $ | 1,000.00 | | | $ | 1,015.53 | | | $ | 9.75 | | |
| Class F | | | | | | | | | | | | | |
| Actual | | $ | 1,000.00 | | | $ | 879.20 | | | $ | 4.55 | | |
| Hypothetical (5% Return Before Expenses) | | $ | 1,000.00 | | | $ | 1,020.37 | | | $ | 4.89 | | |
| Class F3 | | | | | | | | | | | | | |
| Actual | | $ | 1,000.00 | | | $ | 879.30 | | | $ | 3.98 | | |
| Hypothetical (5% Return Before Expenses) | | $ | 1,000.00 | | | $ | 1,020.97 | | | $ | 4.28 | | |
| Class I | | | | | | | | | | | | | |
| Actual | | $ | 1,000.00 | | | $ | 879.70 | | | $ | 4.07 | | |
| Hypothetical (5% Return Before Expenses) | | $ | 1,000.00 | | | $ | 1,020.87 | | | $ | 4.38 | | |
| Class P | | | | | | | | | | | | | |
| Actual | | $ | 1,000.00 | | | $ | 877.10 | | | $ | 6.48 | | |
| Hypothetical (5% Return Before Expenses) | | $ | 1,000.00 | | | $ | 1,018.30 | | | $ | 6.97 | | |
| Class R2 | | | | | | | | | | | | | |
| Actual | | $ | 1,000.00 | | | $ | 877.00 | | | $ | 7.19 | | |
| Hypothetical (5% Return Before Expenses) | | $ | 1,000.00 | | | $ | 1,017.54 | | | $ | 7.73 | | |
| Class R3 | | | | | | | | | | | | | |
| Actual | | $ | 1,000.00 | | | $ | 877.00 | | | $ | 6.72 | | |
| Hypothetical (5% Return Before Expenses) | | $ | 1,000.00 | | | $ | 1,018.05 | | | $ | 7.22 | | |
| Class R4 | | | | | | | | | | | | | |
| Actual | | $ | 1,000.00 | | | $ | 878.30 | | | $ | 5.54 | | |
| Hypothetical (5% Return Before Expenses) | | $ | 1,000.00 | | | $ | 1,019.31 | | | $ | 5.96 | | |
| Class R5 | | | | | | | | | | | | | |
| Actual | | $ | 1,000.00 | | | $ | 878.90 | | | $ | 4.36 | | |
| Hypothetical (5% Return Before Expenses) | | $ | 1,000.00 | | | $ | 1,020.57 | | | $ | 4.69 | | |
| Class R6 | | | | | | | | | | | | | |
| Actual | | $ | 1,000.00 | | | $ | 879.20 | | | $ | 3.98 | | |
| Hypothetical (5% Return Before Expenses) | | $ | 1,000.00 | | | $ | 1,020.97 | | | $ | 4.28 | | |
| † | For each class of the Fund, net expenses are equal to the annualized expense ratio for such class (1.17% for Class A, 1.92% for Class C, 0.96% for Class F, 0.84% for Class F3, 0.86% for Class I, 1.37% for Class P, 1.52% for Class R2, 1.42% for Class R3, 1.17% for Class R4, 0.92% for Class R5 and 0.84% for Class R6) multiplied by the average account value over the period, multiplied by 184/365 (to reflect one-half year period). |
80
Portfolio Holdings Presented by Sector
October 31, 2022
| Sector* | | %** |
| Communication Services | | | 4.38 | % |
| Consumer Discretionary | | | 12.70 | % |
| Consumer Staples | | | 9.50 | % |
| Energy | | | 7.60 | % |
| Financials | | | 22.15 | % |
| Health Care | | | 10.87 | % |
| Industrials | | | 12.34 | % |
| Information Technology | | | 8.65 | % |
| Materials | | | 6.62 | % |
| Utilities | | | 1.54 | % |
| Repurchase Agreements | | | 3.65 | % |
| Total | | | 100.00 | % |
| * | | A sector may comprise several industries. |
| ** | | Represents percent of total investments, which excludes derivatives. |
81
International Opportunities Fund
Please note that the expenses shown in the table are meant to highlight your ongoing costs only and do not reflect any transactional costs, such as sales charges (loads). Therefore, the second line of the table is useful in comparing ongoing costs only, and will not help you determine the relative total costs of owning different funds. In addition, if these transactional costs were included, your costs would have been higher.
| | | Beginning
Account
Value | | Ending
Account
Value | | Expenses
Paid During
Period† | |
| | | 5/1/22 | | 10/31/22 | | 5/1/22 –
10/31/22 | |
| Class A | | | | | | | |
| Actual | | $ | 1,000.00 | | | $ | 853.00 | | | $ | 5.74 | | |
| Hypothetical (5% Return Before Expenses) | | $ | 1,000.00 | | | $ | 1,019.00 | | | $ | 6.26 | | |
| Class C | | | | | | | | | | | | | |
| Actual | | $ | 1,000.00 | | | $ | 850.00 | | | $ | 9.23 | | |
| Hypothetical (5% Return Before Expenses) | | $ | 1,000.00 | | | $ | 1,015.22 | | | $ | 10.06 | | |
| Class F | | | | | | | | | | | | | |
| Actual | | $ | 1,000.00 | | | $ | 853.40 | | | $ | 5.05 | | |
| Hypothetical (5% Return Before Expenses) | | $ | 1,000.00 | | | $ | 1,019.76 | | | $ | 5.50 | | |
| Class F3 | | | | | | | | | | | | | |
| Actual | | $ | 1,000.00 | | | $ | 854.20 | | | $ | 4.21 | | |
| Hypothetical (5% Return Before Expenses) | | $ | 1,000.00 | | | $ | 1,020.67 | | | $ | 4.58 | | |
| Class I | | | | | | | | | | | | | |
| Actual | | $ | 1,000.00 | | | $ | 854.40 | | | $ | 4.58 | | |
| Hypothetical (5% Return Before Expenses) | | $ | 1,000.00 | | | $ | 1,020.27 | | | $ | 4.99 | | |
| Class P | | | | | | | | | | | | | |
| Actual | | $ | 1,000.00 | | | $ | 852.30 | | | $ | 6.68 | | |
| Hypothetical (5% Return Before Expenses) | | $ | 1,000.00 | | | $ | 1,018.00 | | | $ | 7.27 | | |
| Class R2 | | | | | | | | | | | | | |
| Actual | | $ | 1,000.00 | | | $ | 851.80 | | | $ | 7.37 | | |
| Hypothetical (5% Return Before Expenses) | | $ | 1,000.00 | | | $ | 1,017.24 | | | $ | 8.03 | | |
| Class R3 | | | | | | | | | | | | | |
| Actual | | $ | 1,000.00 | | | $ | 851.70 | | | $ | 6.91 | | |
| Hypothetical (5% Return Before Expenses) | | $ | 1,000.00 | | | $ | 1,017.74 | | | $ | 7.53 | | |
| Class R4 | | | | | | | | | | | | | |
| Actual | | $ | 1,000.00 | | | $ | 853.40 | | | $ | 5.75 | | |
| Hypothetical (5% Return Before Expenses) | | $ | 1,000.00 | | | $ | 1,019.00 | | | $ | 6.26 | | |
| Class R5 | | | | | | | | | | | | | |
| Actual | | $ | 1,000.00 | | | $ | 853.80 | | | $ | 4.58 | | |
| Hypothetical (5% Return Before Expenses) | | $ | 1,000.00 | | | $ | 1,020.27 | | | $ | 4.99 | | |
| Class R6 | | | | | | | | | | | | | |
| Actual | | $ | 1,000.00 | | | $ | 854.20 | | | $ | 4.21 | | |
| Hypothetical (5% Return Before Expenses) | | $ | 1,000.00 | | | $ | 1,020.67 | | | $ | 4.58 | | |
| † | For each class of the Fund, net expenses are equal to the annualized expense ratio for such class (1.23% for Class A, 1.98% for Class C, 1.08% for Class F, 0.90% for Class F3, 0.98% for Class I, 1.43% for Class P, 1.58% for Class R2, 1.48% for Class R3, 1.23% for Class R4, 0.98% for Class R5 and 0.90% for Class R6) multiplied by the average account value over the period, multiplied by 184/365 (to reflect one-half year period). |
82
Portfolio Holdings Presented by Sector
October 31, 2022
| Sector* | | %** |
| Communication Services | | | 4.15 | % |
| Consumer Discretionary | | | 11.75 | % |
| Consumer Staples | | | 7.74 | % |
| Energy | | | 4.32 | % |
| Financials | | | 14.42 | % |
| Health Care | | | 5.39 | % |
| Industrials | | | 21.72 | % |
| Information Technology | | | 11.43 | % |
| Materials | | | 9.02 | % |
| Real Estate | | | 3.68 | % |
| Utilities | | | 4.73 | % |
| Money Market Funds(a) | | | 0.04 | % |
| Time Deposits(a) | | | 0.01 | % |
| Repurchase Agreements | | | 1.60 | % |
| Total | | | 100.00 | % |
| * | | A sector may comprise several industries. |
| ** | | Represents percent of total investments, which excludes derivatives. |
| (a) | | Securities were purchased with the cash collateral from loaned securities. |
83
International Value Fund
Please note that the expenses shown in the table are meant to highlight your ongoing costs only and do not reflect any transactional costs, such as sales charges (loads). Therefore, the second line of the table is useful in comparing ongoing costs only, and will not help you determine the relative total costs of owning different funds. In addition, if these transactional costs were included, your costs would have been higher.
| | | Beginning
Account
Value | | Ending
Account
Value | | Expenses
Paid During
Period† | |
| | | 5/1/22 | | 10/31/22 | | 5/1/22 –
10/31/22 | |
| Class A | | | | | | | |
| Actual | | $ | 1,000.00 | | | $ | 864.50 | | | $ | 5.26 | | |
| Hypothetical (5% Return Before Expenses) | | $ | 1,000.00 | | | $ | 1,019.56 | | | $ | 5.70 | | |
| Class C | | | | | | | | | | | | | |
| Actual | | $ | 1,000.00 | | | $ | 860.70 | | | $ | 8.77 | | |
| Hypothetical (5% Return Before Expenses) | | $ | 1,000.00 | | | $ | 1,015.78 | | | $ | 9.50 | | |
| Class F | | | | | | | | | | | | | |
| Actual | | $ | 1,000.00 | | | $ | 865.80 | | | $ | 4.33 | | |
| Hypothetical (5% Return Before Expenses) | | $ | 1,000.00 | | | $ | 1,020.57 | | | $ | 4.69 | | |
| Class F3 | | | | | | | | | | | | | |
| Actual | | $ | 1,000.00 | | | $ | 865.50 | | | $ | 3.81 | | |
| Hypothetical (5% Return Before Expenses) | | $ | 1,000.00 | | | $ | 1,021.12 | | | $ | 4.13 | | |
| Class I | | | | | | | | | | | | | |
| Actual | | $ | 1,000.00 | | | $ | 865.40 | | | $ | 3.86 | | |
| Hypothetical (5% Return Before Expenses) | | $ | 1,000.00 | | | $ | 1,021.07 | | | $ | 4.18 | | |
| Class R2 | | | | | | | | | | | | | |
| Actual | | $ | 1,000.00 | | | $ | 862.40 | | | $ | 6.90 | | |
| Hypothetical (5% Return Before Expenses) | | $ | 1,000.00 | | | $ | 1,017.80 | | | $ | 7.48 | | |
| Class R3 | | | | | | | | | | | | | |
| Actual | | $ | 1,000.00 | | | $ | 863.60 | | | $ | 6.44 | | |
| Hypothetical (5% Return Before Expenses) | | $ | 1,000.00 | | | $ | 1,018.30 | | | $ | 6.97 | | |
| Class R4 | | | | | | | | | | | | | |
| Actual | | $ | 1,000.00 | | | $ | 864.00 | | | $ | 5.26 | | |
| Hypothetical (5% Return Before Expenses) | | $ | 1,000.00 | | | $ | 1,019.56 | | | $ | 5.70 | | |
| Class R5 | | | | | | | | | | | | | |
| Actual | | $ | 1,000.00 | | | $ | 864.90 | | | $ | 4.09 | | |
| Hypothetical (5% Return Before Expenses) | | $ | 1,000.00 | | | $ | 1,020.82 | | | $ | 4.43 | | |
| Class R6 | | | | | | | | | | | | | |
| Actual | | $ | 1,000.00 | | | $ | 865.50 | | | $ | 3.81 | | |
| Hypothetical (5% Return Before Expenses) | | $ | 1,000.00 | | | $ | 1,021.12 | | | $ | 4.13 | | |
| † | For each class of the Fund, net expenses are equal to the annualized expense ratio for such class (1.12% for Class A, 1.87% for Class C, 0.92% for Class F, 0.81% for Class F3, 0.82% for Class I, 1.47% for Class R2, 1.37% for Class R3, 1.12% for Class R4, 0.87% for Class R5 and 0.81% for Class R6) multiplied by the average account value over the period, multiplied by 184/365 (to reflect one-half year period). |
84
Portfolio Holdings Presented by Sector
October 31, 2022
| Sector* | | %** |
| Communication Services | | | 3.67 | % |
| Consumer Discretionary | | | 8.66 | % |
| Consumer Staples | | | 12.97 | % |
| Energy | | | 9.31 | % |
| Financials | | | 24.53 | % |
| Health Care | | | 11.77 | % |
| Industrials | | | 14.20 | % |
| Information Technology | | | 3.32 | % |
| Materials | | | 6.41 | % |
| Real Estate | | | 0.75 | % |
| Utilities | | | 4.41 | % |
| Total | | | 100.00 | % |
| * | | A sector may comprise several industries. |
| ** | | Represents percent of total investments, which excludes derivatives. |
85
Micro Cap Growth Fund
Please note that the expenses shown in the table are meant to highlight your ongoing costs only and do not reflect any transactional costs, such as sales charges (loads). Therefore, the second line of the table is useful in comparing ongoing costs only, and will not help you determine the relative total costs of owning different funds. In addition, if these transactional costs were included, your costs would have been higher.
| | | Beginning
Account
Value | | Ending
Account
Value | | Expenses
Paid During
Period† | |
| | | 5/1/22 | | 10/31/22 | | 5/1/22 –
10/31/22 | |
| Class A | | | | | | | |
| Actual | | $ | 1,000.00 | | | $ | 1,046.80 | | | $ | 7.27 | | |
| Hypothetical (5% Return Before Expenses) | | $ | 1,000.00 | | | $ | 1,018.10 | | | $ | 7.17 | | |
| Class C | | | | | | | | | | | | | |
| Actual | | $ | 1,000.00 | | | $ | 1,043.10 | | | $ | 11.12 | | |
| Hypothetical (5% Return Before Expenses) | | $ | 1,000.00 | | | $ | 1,014.32 | | | $ | 10.97 | | |
| Class F | | | | | | | | | | | | | |
| Actual | | $ | 1,000.00 | | | $ | 1,048.50 | | | $ | 5.99 | | |
| Hypothetical (5% Return Before Expenses) | | $ | 1,000.00 | | | $ | 1,019.36 | | | $ | 5.90 | | |
| Class I | | | | | | | | | | | | | |
| Actual | | $ | 1,000.00 | | | $ | 1,048.50 | | | $ | 5.94 | | |
| Hypothetical (5% Return Before Expenses) | | $ | 1,000.00 | | | $ | 1,019.41 | | | $ | 5.85 | | |
| † | For each class of the Fund, net expenses are equal to the annualized expense ratio for such class (1.41% for Class A, 2.16% for Class C, 1.16% for Class F and 1.15% for Class I multiplied by the average account value over the period, multiplied by 184/365 (to reflect one-half year period). |
86
Portfolio Holdings Presented by Sector
October 31, 2022
| Sector* | | %** |
| Communication Services | | | 3.27 | % |
| Consumer Discretionary | | | 9.15 | % |
| Consumer Staples | | | 5.47 | % |
| Energy | | | 1.58 | % |
| Financials | | | 1.88 | % |
| Health Care | | | 36.50 | % |
| Industrials | | | 11.22 | % |
| Information Technology | | | 24.18 | % |
| Materials | | | 0.78 | % |
| Money Market Funds(a) | | | 4.26 | % |
| Time Deposits(a) | | | 0.47 | % |
| Repurchase Agreements | | | 1.24 | % |
| Total | | | 100.00 | % |
| * | | A sector may comprise several industries. |
| ** | | Represents percent of total investments, which excludes derivatives. |
| (a) | | Securities were purchased with the cash collateral from loaned securities. |
87
Value Opportunities Fund
Please note that the expenses shown in the table are meant to highlight your ongoing costs only and do not reflect any transactional costs, such as sales charges (loads). Therefore, the second line of the table is useful in comparing ongoing costs only, and will not help you determine the relative total costs of owning different funds. In addition, if these transactional costs were included, your costs would have been higher.
| | | Beginning
Account
Value | | Ending
Account
Value | | Expenses
Paid During
Period† | |
| | | 5/1/22 | | 10/31/22 | | 5/1/22 –
10/31/22 | |
| Class A | | | | | | | |
| Actual | | $ | 1,000.00 | | | $ | 942.10 | | | $ | 5.73 | | |
| Hypothetical (5% Return Before Expenses) | | $ | 1,000.00 | | | $ | 1,019.31 | | | $ | 5.96 | | |
| Class C | | | | | | | | | | | | | |
| Actual | | $ | 1,000.00 | | | $ | 938.60 | | | $ | 9.43 | | |
| Hypothetical (5% Return Before Expenses) | | $ | 1,000.00 | | | $ | 1,015.48 | | | $ | 9.80 | | |
| Class F | | | | | | | | | | | | | |
| Actual | | $ | 1,000.00 | | | $ | 942.70 | | | $ | 5.04 | | |
| Hypothetical (5% Return Before Expenses) | | $ | 1,000.00 | | | $ | 1,020.01 | | | $ | 5.24 | | |
| Class F3 | | | | | | | | | | | | | |
| Actual | | $ | 1,000.00 | | | $ | 943.70 | | | $ | 4.02 | | |
| Hypothetical (5% Return Before Expenses) | | $ | 1,000.00 | | | $ | 1,021.07 | | | $ | 4.18 | | |
| Class I | | | | | | | | | | | | | |
| Actual | | $ | 1,000.00 | | | $ | 943.70 | | | $ | 4.51 | | |
| Hypothetical (5% Return Before Expenses) | | $ | 1,000.00 | | | $ | 1,020.57 | | | $ | 4.69 | | |
| Class P | | | | | | | | | | | | | |
| Actual | | $ | 1,000.00 | | | $ | 941.40 | | | $ | 6.70 | | |
| Hypothetical (5% Return Before Expenses) | | $ | 1,000.00 | | | $ | 1,018.30 | | | $ | 6.97 | | |
| Class R2 | | | | | | | | | | | | | |
| Actual | | $ | 1,000.00 | | | $ | 940.40 | | | $ | 7.43 | | |
| Hypothetical (5% Return Before Expenses) | | $ | 1,000.00 | | | $ | 1,017.54 | | | $ | 7.73 | | |
| Class R3 | | | | | | | | | | | | | |
| Actual | | $ | 1,000.00 | | | $ | 941.00 | | | $ | 6.95 | | |
| Hypothetical (5% Return Before Expenses) | | $ | 1,000.00 | | | $ | 1,018.05 | | | $ | 7.22 | | |
| Class R4 | | | | | | | | | | | | | |
| Actual | | $ | 1,000.00 | | | $ | 942.00 | | | $ | 5.73 | | |
| Hypothetical (5% Return Before Expenses) | | $ | 1,000.00 | | | $ | 1,019.31 | | | $ | 5.96 | | |
| Class R5 | | | | | | | | | | | | | |
| Actual | | $ | 1,000.00 | | | $ | 943.20 | | | $ | 4.51 | | |
| Hypothetical (5% Return Before Expenses) | | $ | 1,000.00 | | | $ | 1,020.57 | | | $ | 4.69 | | |
| Class R6 | | | | | | | | | | | | | |
| Actual | | $ | 1,000.00 | | | $ | 944.20 | | | $ | 4.02 | | |
| Hypothetical (5% Return Before Expenses) | | $ | 1,000.00 | | | $ | 1,021.07 | | | $ | 4.18 | | |
| † | For each class of the Fund, net expenses are equal to the annualized expense ratio for such class (1.17% for Class A, 1.93% for Class C, 1.03% for Class F, 0.82% for Class F3, 0.92% for Class I, 1.37% for Class P, 1.52% for Class R2, 1.42% for Class R3, 1.17% for Class R4, 0.92% for Class R5 and 0.82% for Class R6) multiplied by the average account value over the period, multiplied by 184/365 (to reflect one-half year period). |
88
Portfolio Holdings Presented by Sector
October 31, 2022
| Sector* | | %** |
| Communication Services | | | 1.05 | % |
| Consumer Discretionary | | | 9.20 | % |
| Consumer Staples | | | 3.24 | % |
| Energy | | | 5.88 | % |
| Financials | | | 16.97 | % |
| Health Care | | | 13.69 | % |
| Industrials | | | 18.98 | % |
| Information Technology | | | 10.77 | % |
| Materials | | | 7.09 | % |
| Real Estate | | | 6.82 | % |
| Utilities | | | 3.07 | % |
| Money Market Funds(a) | | | 0.01 | % |
| Time Deposits(a) | | | 0.00 | %*** |
| Repurchase Agreements | | | 3.23 | % |
| Total | | | 100.00 | % |
| * | | A sector may comprise several industries. |
| ** | | Represents percent of total investments, which excludes derivatives. |
| *** | | Amount less than 0.01%. |
| (a) | | Securities were purchased with the cash collateral from loaned securities. |
89
Schedule of Investments
ALPHA STRATEGY FUND October 31, 2022
| Investments | | Shares | | | Fair
Value | |
| LONG-TERM INVESTMENTS 100.01% |
| | | | | | | | | |
| INVESTMENTS IN UNDERLYING FUNDS(a)(b) 100.01% |
| Lord Abbett Developing Growth Fund, Inc. – Class I*(c) | | | 5,511,178 | | | $ | 130,614,911 | |
| Lord Abbett Securities Trust-Focused Small Cap Value Fund – Class I*(d) | | | 2,541,420 | | | | 66,432,704 | |
| Lord Abbett Securities Trust – International Opportunities Fund – Class I(d) | | | 8,353,120 | | | | 127,886,274 | |
| Lord Abbett Securities Trust – Micro Cap Growth Fund – Class I*(d) | | | 3,912,808 | | | | 66,791,628 | |
| Lord Abbett Research Fund, Inc. – Small Cap Value Fund – Class I(d) | | | 7,682,532 | | | | 132,523,683 | |
| Lord Abbett Securities Trust-Value Opportunities Fund – Class I(d) | | | 7,338,972 | | | | 131,587,768 | |
Total Investments in Underlying Funds
(cost 721,051,447) | | | | | | | 655,836,968 | |
| Investments | | Principal
Amount | | | Fair
Value | |
| SHORT-TERM INVESTMENTS 0.07% |
| | | | | | | | | |
| Repurchase Agreements 0.07% |
Repurchase Agreement dated 10/31/2022, 1.30% due 11/1/2022 with Fixed Income Clearing Corp. collateralized by $496,300 of U.S. Treasury Note at 2.00% due 4/30/2024; value: $477,766; proceeds: $468,331
(cost $468,314) | | | $468,314 | | | $ | 468,314 | |
Total Investments in Securities 100.08%
(cost $721,519,761) | | | | | | | 656,305,282 | |
| Other Assets and Liabilities – Net (0.08)% | | | | | | | (531,188 | ) |
| Net Assets 100.00% | | | | | | $ | 655,774,094 | |
| * | | Non-income producing security. |
| (a) | | Affiliated issuer (see Note 13). |
| (b) | | These investments offer daily redemptions. |
| (c) | | Fund investment objective is long-term growth of capital through a diversified and actively managed portfolio consisting of developing growth companies, many of which are traded over the counter. |
| (d) | | Fund investment objective is long-term capital appreciation. |
The following is a summary of the inputs used as of October 31, 2022 in valuing the Fund’s investments carried at fair value(1):
| Investment Type(2) | | Level 1 | | | Level 2 | | | Level 3 | | | Total | |
| Long-Term Investments | | | | | | | | | | | | | | | | |
| Investments in Underlying Funds | | $ | 655,836,968 | | | $ | – | | | $ | – | | | $ | 655,836,968 | |
| Short-Term Investments | | | | | | | | | | | | | | | | |
| Repurchase Agreements | | | – | | | | 468,314 | | | | – | | | | 468,314 | |
| Total | | $ | 655,836,968 | | | $ | 468,314 | | | $ | – | | | $ | 656,305,282 | |
| (1) | | Refer to Note 2(l) for a description of fair value measurements and the three-tier hierarchy of inputs. |
| (2) | | See Schedule of Investments for fair values in each industry and identification of foreign issuers and/or geography. When applicable each Level 3 security is identified on the Schedule of Investments along with the valuation technique utilized. |
A reconciliation of Level 3 investments is presented when the Fund has a material amount of Level 3 investments at the beginning or end of the year in relation to the Fund’s net assets.
| 90 | See Notes to Financial Statements. | |
Schedule of Investments
FOCUSED GROWTH FUND October 31, 2022
| Investments | | Shares | | | Fair
Value | |
| LONG-TERM INVESTMENTS 95.64% |
| COMMON STOCKS 95.64% |
| | | | | | | | | |
| Aerospace & Defense 2.44% |
| Raytheon Technologies Corp. | | | 8,677 | | | $ | 822,753 | |
| | | | | | | | | |
| Automobiles 3.10% |
| Tesla, Inc.* | | | 4,596 | | | | 1,045,774 | |
| | | | | | | | | |
| Biotechnology 9.14% |
| Argenx SE ADR* | | | 2,416 | | | | 937,239 | |
| Cytokinetics, Inc.* | | | 9,987 | | | | 436,032 | |
| Sarepta Therapeutics, Inc.* | | | 4,173 | | | | 475,806 | |
| Vertex Pharmaceuticals, Inc.* | | | 3,973 | | | | 1,239,576 | |
| Total | | | | | | | 3,088,653 | |
| | | | | | | | | |
| Communications Equipment 5.47% |
| Arista Networks, Inc.* | | | 6,807 | | | | 822,694 | |
| Calix, Inc.* | | | 13,929 | | | | 1,025,732 | |
| Total | | | | | | | 1,848,426 | |
| | | | | | | | | |
| Entertainment 1.56% |
| Live Nation Entertainment, Inc.* | | | 6,606 | | | | 525,904 | |
| | | | | | | | | |
| Food & Staples Retailing 2.41% |
| Costco Wholesale Corp. | | | 1,621 | | | | 812,931 | |
| | | | | | | | | |
| Health Care Equipment & Supplies 7.09% |
| DexCom, Inc.* | | | 8,438 | | | | 1,019,142 | |
| Intuitive Surgical, Inc.* | | | 2,760 | | | | 680,257 | |
| Shockwave Medical, Inc.* | | | 2,375 | | | | 696,231 | |
| Total | | | | | | | 2,395,630 | |
| | | | | | | | | |
| Health Care Providers & Services 3.40% |
| UnitedHealth Group, Inc. | | | 2,071 | | | | 1,149,716 | |
| | | | | | | | | |
| Hotels, Restaurants & Leisure 4.62% |
| Airbnb, Inc. Class A* | | | 7,090 | | | | 757,992 | |
| Chipotle Mexican Grill, Inc.* | | | 535 | | | | 801,606 | |
| Total | | | | | | | 1,559,598 | |
| Investments | | Shares | | | Fair
Value | |
| Information Technology Services 5.17% |
| Mastercard, Inc. Class A | | | 3,958 | | | $ | 1,298,937 | |
| Snowflake, Inc. Class A* | | | 2,781 | | | | 445,794 | |
| Total | | | | | | | 1,744,731 | |
| | | | | | | | | |
| Interactive Media & Services 4.11% |
| Alphabet, Inc. Class A* | | | 14,676 | | | | 1,387,029 | |
| | | | | | | | | |
| Internet & Direct Marketing Retail 8.86% |
| Amazon.com, Inc.* | | | 11,394 | | | | 1,167,201 | |
| MercadoLibre, Inc. (Brazil)*(a) | | | 888 | | | | 800,639 | |
| Netflix, Inc.* | | | 3,513 | | | | 1,025,374 | |
| Total | | | | | | | 2,993,214 | |
| | | | | | | | | |
| Oil, Gas & Consumable Fuels 3.15% |
| Cheniere Energy, Inc. | | | 6,039 | | | | 1,065,340 | |
| | | | | | | | | |
| Pharmaceuticals 3.77% |
| Eli Lilly & Co. | | | 3,515 | | | | 1,272,746 | |
| | | | | | | | | |
| Semiconductors & Semiconductor Equipment 4.50% |
| Enphase Energy, Inc.* | | | 3,292 | | | | 1,010,644 | |
| Monolithic Power Systems, Inc. | | | 1,496 | | | | 507,817 | |
| Total | | | | | | | 1,518,461 | |
| | | | | | | | | |
| Software 14.48% |
| Atlassian Corp. Class A | | | 3,570 | | | | 723,746 | |
| Bill.com Holdings, Inc.* | | | 3,159 | | | | 421,284 | |
| Clear Secure, Inc. Class A* | | | 19,621 | | | | 530,160 | |
| Microsoft Corp. | | | 10,195 | | | | 2,366,565 | |
| Palo Alto Networks, Inc.* | | | 4,947 | | | | 848,856 | |
| Total | | | | | | | 4,890,611 | |
| | | | | | | | | |
| Technology Hardware, Storage & Peripherals 9.51% |
| Apple, Inc. | | | 20,955 | | | | 3,213,240 | |
| | | | | | | | | |
| Textiles, Apparel & Luxury Goods 2.86% |
| Lululemon Athletica, Inc. (Canada)*(a) | | | 2,939 | | | | 967,048 | |
Total Common Stocks
(cost $34,093,092) | | | | | | | 32,301,805 | |
| | See Notes to Financial Statements. | 91 |
Schedule of Investments (concluded)
FOCUSED GROWTH FUND October 31, 2022
| Investments | | Principal
Amount | | | Fair
Value | |
| SHORT-TERM INVESTMENTS 4.47% |
| | | | | | | | | |
| Repurchase Agreements 4.47% |
Repurchase Agreement dated 10/31/2022, 1.30% due 11/1/2022 with Fixed Income Clearing Corp. collateralized by $1,588,400 of U.S. Treasury Note at 2.125% due 3/31/2024; value: $1,538,473; proceeds: $1,508,317
(cost $1,508,262) | | $ | 1,508,262 | | | $ | 1,508,262 | |
Total Investments in Securities 100.11%
(cost $35,601,354) | | | | | | | 33,810,067 | |
| Other Assets and Liabilities – Net (0.11)% | | | | | | | (36,832 | ) |
| Net Assets 100.00% | | | | | | $ | 33,773,235 | |
| ADR | | American Depositary Receipt. |
| * | | Non-income producing security. |
| (a) | | Foreign security traded in U.S. dollars. |
The following is a summary of the inputs used as of October 31, 2022 in valuing the Fund’s investments carried at fair value(1):
| Investment Type(2) | | Level 1 | | | Level 2 | | | Level 3 | | | Total | |
| Long-Term Investments | | | | | | | | | | | | | | | | |
| Common Stocks | | $ | 32,301,805 | | | $ | – | | | $ | – | | | $ | 32,301,805 | |
| Short-Term Investments | | | | | | | | | | | | | | | | |
| Repurchase Agreements | | | – | | | | 1,508,262 | | | | – | | | | 1,508,262 | |
| Total | | $ | 32,301,805 | | | $ | 1,508,262 | | | $ | – | | | $ | 33,810,067 | |
| (1) | | Refer to Note 2(l) for a description of fair value measurements and the three-tier hierarchy of inputs. |
| (2) | | See Schedule of Investments for fair values in each industry and identification of foreign issuers and/or geography. When applicable each Level 3 security is identified on the Schedule of Investments along with the valuation technique utilized. |
A reconciliation of Level 3 investments is presented when the Fund has a material amount of Level 3 investments at the beginning or end of the year in relation to the Fund’s net assets.
| 92 | See Notes to Financial Statements. | |
Schedule of Investments
FOCUSED LARGE CAP VALUE FUND October 31, 2022
| Investments | | Shares | | | Fair
Value | |
| LONG-TERM INVESTMENTS 96.37% |
| COMMON STOCKS 96.37% |
| | | | | | | | | |
| Aerospace & Defense 4.17% |
| Raytheon Technologies Corp. | | | 8,450 | | | $ | 801,229 | |
| | | | | | | | | |
| Automobiles 2.79% |
| General Motors Co. | | | 13,650 | | | | 535,762 | |
| | | | | | | | | |
| Banks 8.99% |
| JPMorgan Chase & Co. | | | 4,540 | | | | 571,495 | |
| Popular, Inc. | | | 6,960 | | | | 492,211 | |
| Wells Fargo & Co. | | | 14,440 | | | | 664,096 | |
| Total | | | | | | | 1,727,802 | |
| | | | | | | | | |
| Biotechnology 6.30% |
| AbbVie, Inc. | | | 4,110 | | | | 601,704 | |
| Gilead Sciences, Inc. | | | 4,330 | | | | 339,732 | |
| Horizon Therapeutics plc* | | | 4,300 | | | | 267,976 | |
| Total | | | | | | | 1,209,412 | |
| | | | | | | | | |
| Building Products 2.16% |
| Masco Corp. | | | 8,950 | | | | 414,117 | |
| | | | | | | | | |
| Capital Markets 7.98% |
| Ameriprise Financial, Inc. | | | 2,730 | | | | 843,898 | |
| KKR & Co., Inc. | | | 14,180 | | | | 689,573 | |
| Total | | | | | | | 1,533,471 | |
| | | | | | | | | |
| Chemicals 2.24% |
| Valvoline, Inc. | | | 14,640 | | | | 429,830 | |
| | | | | | | | | |
| Construction Materials 2.49% |
| Eagle Materials, Inc. | | | 3,910 | | | | 478,232 | |
| | | | | | | | | |
| Electric: Utilities 3.48% |
| NRG Energy, Inc. | | | 15,070 | | | | 669,108 | |
| | | | | | | | | |
| Energy Equipment & Services 2.92% |
| Schlumberger NV | | | 10,790 | | | | 561,404 | |
| Investments | | Shares | | | Fair
Value | |
| Food & Staples Retailing 2.72% |
| BJ’s Wholesale Club Holdings, Inc.* | | | 6,760 | | | $ | 523,224 | |
| | | | | | | | | |
| Health Care Providers & Services 6.45% |
| Centene Corp.* | | | 6,660 | | | | 566,966 | |
| CVS Health Corp. | | | 7,100 | | | | 672,370 | |
| Total | | | | | | | 1,239,336 | |
| | | | | | | | | |
| Hotels, Restaurants & Leisure 2.43% |
| Caesars Entertainment, Inc.* | | | 10,670 | | | | 466,599 | |
| | | | | | | | | |
| Household Products 1.36% |
| Spectrum Brands Holdings, Inc. | | | 5,650 | | | | 260,691 | |
| | | | | | | | | |
| Information Technology Services 4.71% |
| Euronet Worldwide, Inc.* | | | 4,170 | | | | 350,322 | |
| Fiserv, Inc.* | | | 5,390 | | | | 553,768 | |
| Total | | | | | | | 904,090 | |
| | | | | | | | | |
| Insurance 6.33% |
| Allstate Corp. (The) | | | 6,390 | | | | 806,737 | |
| RenaissanceRe Holdings Ltd. | | | 2,650 | | | | 409,902 | |
| Total | | | | | | | 1,216,639 | |
| | | | | | | | | |
| Interactive Media & Services 2.01% |
| Alphabet, Inc. Class A* | | | 4,090 | | | | 386,546 | |
| | | | | | | | | |
| Machinery 3.15% |
| Parker-Hannifin Corp. | | | 2,080 | | | | 604,490 | |
| | | | | | | | | |
| Metals & Mining 0.79% |
| Alcoa Corp. | | | 3,890 | | | | 151,827 | |
| | | | | | | | | |
| Multi-Line Retail 2.77% |
| Target Corp. | | | 3,240 | | | | 532,170 | |
| | | | | | | | | |
| Oil, Gas & Consumable Fuels 6.41% |
| Chesapeake Energy Corp. | | | 5,608 | | | | 573,530 | |
| Pioneer Natural Resources Co. | | | 1,210 | | | | 310,256 | |
| Shell plc ADR | | | 6,260 | | | | 348,244 | |
| Total | | | | | | | 1,232,030 | |
| | See Notes to Financial Statements. | 93 |
Schedule of Investments (concluded)
FOCUSED LARGE CAP VALUE FUND October 31, 2022
| Investments | | Shares | | | Fair
Value | |
| Pharmaceuticals 5.63% |
| Organon & Co. | | | 20,940 | | | $ | 548,209 | |
| Pfizer, Inc. | | | 11,470 | | | | 533,929 | |
| Total | | | | | | | 1,082,138 | |
| | | | | | | | | |
| Semiconductors & Semiconductor Equipment 1.88% |
| Micron Technology, Inc. | | | 6,680 | | | | 361,388 | |
| | | | | | | | | |
| Trading Companies & Distributors 2.87% |
| AerCap Holdings NV (Ireland)*(a) | | | 10,340 | | | | 552,259 | |
| | | | | | | | | |
| Wireless Telecommunication Services 3.34% |
| T-Mobile US, Inc.* | | | 4,230 | | | | 641,099 | |
Total Common Stocks
(cost $18,236,400) | | | | | | | 18,514,893 | |
| Investments | | Principal
Amount | | | Fair
Value | |
| SHORT-TERM INVESTMENTS 2.11% |
| | | | | | | | | |
| Repurchase Agreements 2.11% |
Repurchase Agreement dated 10/31/2022, 1.30% due 11/1/2022 with Fixed Income Clearing Corp. collateralized by $429,200 of U.S. Treasury Note at 2.00% due 4/30/2024; value: $413,172; proceeds: $405,012
(cost $404,997) | | | $404,997 | | | $ | 404,997 | |
Total Investments in Securities 98.48%
(cost $18,641,397) | | | | | | | 18,919,890 | |
| Other Assets and Liabilities – Net 1.52% | | | | | | | 291,564 | |
| Net Assets 100.00% | | | | | | $ | 19,211,454 | |
| ADR | | American Depositary Receipt. |
| * | | Non-income producing security. |
| (a) | | Foreign security traded in U.S. dollars. |
The following is a summary of the inputs used as of October 31, 2022 in valuing the Fund’s investments carried at fair value(1):
| Investment Type(2) | | Level 1 | | | Level 2 | | | Level 3 | | | Total | |
| Long-Term Investments | | | | | | | | | | | | | | | | |
| Common Stocks | | $ | 18,514,893 | | | $ | – | | | $ | – | | | $ | 18,514,893 | |
| Short-Term Investments | | | | | | | | | | | | | | | | |
| Repurchase Agreements | | | – | | | | 404,997 | | | | – | | | | 404,997 | |
| Total | | $ | 18,514,893 | | | $ | 404,997 | | | $ | – | | | $ | 18,919,890 | |
| (1) | | Refer to Note 2(l) for a description of fair value measurements and the three-tier hierarchy of inputs. |
| (2) | | See Schedule of Investments for fair values in each industry and identification of foreign issuers and/or geography. When applicable each Level 3 security is identified on the Schedule of Investments along with the valuation technique utilized. |
A reconciliation of Level 3 investments is presented when the Fund has a material amount of Level 3 investments at the beginning or end of the year in relation to the Fund’s net assets.
| 94 | See Notes to Financial Statements. | |
Schedule of Investments
FOCUSED SMALL CAP VALUE FUND October 31, 2022
| Investments | | Shares | | | Fair
Value | |
| LONG-TERM INVESTMENTS 99.33% | | | | | | | | |
| COMMON STOCKS 99.33% | | | | | | | | |
| | | | | | | | | |
| Auto Components 1.40% | | | | | | | | |
| Dorman Products, Inc.* | | | 22,956 | | | $ | 1,873,669 | |
| | | | | | | | | |
| Banks 14.36% | | | | | | | | |
| Eastern Bankshares, Inc. | | | 188,552 | | | | 3,614,542 | |
| First BanCorp | | | 250,896 | | | | 3,961,648 | |
| Heritage Financial Corp. | | | 85,000 | | | | 2,863,650 | |
| Prosperity Bancshares, Inc. | | | 36,175 | | | | 2,589,045 | |
| SouthState Corp. | | | 31,229 | | | | 2,824,038 | |
| Wintrust Financial Corp. | | | 36,529 | | | | 3,419,845 | |
| Total | | | | | | | 19,272,768 | |
| | | | | | | | | |
| Building Products 2.68% | | | | | | | | |
| Masonite International Corp.* | | | 50,244 | | | | 3,593,953 | |
| | | | | | | | | |
| Capital Markets 5.74% | | | | | | | | |
| Bridge Investment Group Holdings, Inc. Class A | | | 222,278 | | | | 3,480,873 | |
| CI Financial Corp.(a) | | | 198,500 | | | | 1,987,404 | |
| Moelis & Co. Class A | | | 52,608 | | | | 2,233,736 | |
| Total | | | | | | | 7,702,013 | |
| | | | | | | | | |
| Chemicals 0.94% | | | | | | | | |
| Element Solutions, Inc. | | | 73,510 | | | | 1,264,372 | |
| | | | | | | | | |
| Commercial Services & Supplies 3.53% | | | | | | | | |
| SP Plus Corp.* | | | 127,818 | | | | 4,733,101 | |
| | | | | | | | | |
| Construction & Engineering 3.98% | | | | | | | | |
| EMCOR Group, Inc. | | | 37,814 | | | | 5,335,555 | |
| | | | | | | | | |
| Construction Materials 2.36% | | | | | | | | |
| Eagle Materials, Inc. | | | 25,888 | | | | 3,166,361 | |
| | | | | | | | | |
| Containers & Packaging 1.73% | | | | | | | | |
| Pactiv Evergreen, Inc. | | | 212,958 | | | | 2,323,372 | |
| | | | | | | | | |
| Electronic Equipment, Instruments & Components 3.45% | |
| Belden, Inc. | | | 66,421 | | | | 4,624,894 | |
| Investments | | Shares | | | Fair
Value | |
| Energy Equipment & Services 4.48% | | | | | | | | |
| NOV, Inc. | | | 122,764 | | | $ | 2,749,914 | |
| TechnipFMC PLC (United Kingdom)*(b) | | | 308,419 | | | | 3,266,157 | |
| Total | | | | | | | 6,016,071 | |
| | | | | | | | | |
| Entertainment 2.52% | | | | | | | | |
| Marcus Corp. (The) | | | 224,860 | | | | 3,381,894 | |
| | | | | | | | | |
| Equity Real Estate Investment Trusts 4.24% | | | | | | | | |
| Physicians Realty Trust | | | 182,899 | | | | 2,754,459 | |
| Sunstone Hotel Investors, Inc. | | | 263,461 | | | | 2,937,590 | |
| Total | | | | | | | 5,692,049 | |
| | | | | | | | | |
| Health Care Providers & Services 2.25% | | | | | | | | |
| Tenet Healthcare Corp.* | | | 67,982 | | | | 3,015,682 | |
| | | | | | | | | |
| Hotels, Restaurants & Leisure 1.73% | | | | | | | | |
| Dave & Buster’s Entertainment, Inc.* | | | 58,200 | | | | 2,319,270 | |
| | | | | | | | | |
| Household Products 4.16% | | | | | | | | |
| Reynolds Consumer Products, Inc. | | | 105,607 | | | | 3,225,238 | |
| Spectrum Brands Holdings, Inc. | | | 50,972 | | | | 2,351,848 | |
| Total | | | | | | | 5,577,086 | |
| | | | | | | | | |
| Information Technology Services 4.06% | | | | | | | | |
| International Money Express, Inc.* | | | 201,377 | | | | 5,443,220 | |
| | | | | | | | | |
| Insurance 8.46% | | | | | | | | |
| Kemper Corp. | | | 79,573 | | | | 3,793,245 | |
| RenaissanceRe Holdings Ltd. | | | 13,752 | | | | 2,127,159 | |
| Selective Insurance Group, Inc. | | | 36,757 | | | | 3,605,127 | |
| Stewart Information Services Corp. | | | 46,694 | | | | 1,819,198 | |
| Total | | | | | | | 11,344,729 | |
| | See Notes to Financial Statements. | 95 |
Schedule of Investments (concluded)
FOCUSED SMALL CAP VALUE FUND October 31, 2022
| Investments | | Shares | | | Fair
Value | |
| Interactive Media & Services 3.66% | | | | | | | | |
| Cars.com, Inc.* | | | 353,757 | | | $ | 4,910,147 | |
| | | | | | | | | |
| Machinery 2.83% | | | | | | | | |
| Columbus McKinnon Corp. | | | 133,366 | | | | 3,803,598 | |
| | | | | | | | | |
| Oil, Gas & Consumable Fuels 4.42% | | | | | | | | |
| Chesapeake Energy Corp. | | | 33,508 | | | | 3,426,863 | |
| MEG Energy Corp.*(a) | | | 167,600 | | | | 2,505,973 | |
| Total | | | | | | | 5,932,836 | |
| | | | | | | | | |
| Pharmaceuticals 3.64% | | | | | | | | |
| Organon & Co. | | | 186,417 | | | | 4,880,397 | |
| | | | | | | | | |
| Professional Services 2.38% | | | | | | | | |
| TrueBlue, Inc.* | | | 162,300 | | | | 3,190,818 | |
| | | | | | | | | |
| Real Estate Management & Development 2.31% | | | |
| Marcus & Millichap, Inc. | | | 84,191 | | | | 3,101,597 | |
| | | | | | | | | |
| Semiconductors & Semiconductor Equipment 1.42% | |
| FormFactor, Inc.* | | | 94,569 | | | | 1,911,240 | |
| Investments | | Shares | | | Fair
Value | |
| Specialty Retail 1.19% | | | | | | | | |
| Boot Barn Holdings, Inc.* | | | 28,029 | | | $ | 1,592,047 | |
| | | | | | | | | |
| Textiles, Apparel & Luxury Goods 2.50% | | | | | | | | |
| Deckers Outdoor Corp.* | | | 6,676 | | | | 2,336,133 | |
| Kontoor Brands, Inc. | | | 28,465 | | | | 1,016,200 | |
| Total | | | | | | | 3,352,333 | |
| | | | | | | | | |
| Trading Companies & Distributors 2.91% | | | | | | | | |
| MRC Global, Inc.* | | | 389,005 | | | | 3,901,720 | |
Total Investments in Securities 99.33%
(cost $132,072,067) | | | | | | | 133,256,792 | |
| Other Assets and Liabilities – Net 0.67% | | | | | | | 893,934 | |
| Net Assets 100.00% | | | | | | $ | 134,150,726 | |
| * | | Non-income producing security. |
| (a) | | Investment in non-U.S. dollar denominated securities. |
| (b) | | Foreign security traded in U.S. dollars. |
The following is a summary of the inputs used as of October 31, 2022 in valuing the Fund’s investments carried at fair value(1):
| Investment Type(2) | | Level 1 | | | Level 2 | | | Level 3 | | | Total | |
| Long-Term Investments | | | | | | | | | | | | | | | | | | |
| Common Stocks | | $ | 133,256,792 | | | | $ | – | | | | $ | – | | | $ | 133,256,792 | |
| Total | | $ | 133,256,792 | | | | $ | – | | | | $ | – | | | $ | 133,256,792 | |
| (1) | | Refer to Note 2(l) for a description of fair value measurements and the three-tier hierarchy of inputs. |
| (2) | | See Schedule of Investments for fair values in each industry and identification of foreign issuers and/or geography. When applicable each Level 3 security is identified on the Schedule of Investments along with the valuation technique utilized. |
A reconciliation of Level 3 investments is presented when the Fund has a material amount of Level 3 investments at the beginning or end of the year in relation to the Fund’s net assets.
| 96 | See Notes to Financial Statements. |
Schedule of Investments
FUNDAMENTAL EQUITY FUND October 31, 2022
| Investments | | Shares | | | Fair
Value | |
| LONG-TERM INVESTMENTS 98.01% | | | | | | | | |
| COMMON STOCKS 98.01% | | | | | | | | |
| | | | | | | | | |
| Aerospace & Defense 4.64% | | | | | | | | |
| Lockheed Martin Corp. | | | 80,830 | | | $ | 39,338,344 | |
| Raytheon Technologies Corp. | | | 542,820 | | | | 51,470,193 | |
| Total | | | | | | | 90,808,537 | |
| | | | | | | | | |
| Automobiles 1.70% | | | | | | | | |
| General Motors Co. | | | 845,310 | | | | 33,178,417 | |
| | | | | | | | | |
| Banks 5.94% | | | | | | | | |
| East West Bancorp, Inc. | | | 368,710 | | | | 26,388,575 | |
| JPMorgan Chase & Co. | | | 390,350 | | | | 49,137,258 | |
| Wells Fargo & Co. | | | 884,500 | | | | 40,678,155 | |
| Total | | | | | | | 116,203,988 | |
| | | | | | | | | |
| Biotechnology 2.02% | | | | | | | | |
| AbbVie, Inc. | | | 269,270 | | | | 39,421,128 | |
| | | | | | | | | |
| Building Products 1.22% | | | | | | | | |
| Masco Corp. | | | 514,400 | | | | 23,801,288 | |
| | | | | | | | | |
| Capital Markets 6.55% | | | | | | | | |
| Ameriprise Financial, Inc. | | | 139,340 | | | | 43,072,781 | |
| Charles Schwab Corp. (The) | | | 432,300 | | | | 34,441,341 | |
| KKR & Co., Inc. | | | 405,980 | | | | 19,742,807 | |
| Morgan Stanley | | | 373,700 | | | | 30,706,929 | |
| Total | | | | | | | 127,963,858 | |
| | | | | | | | | |
| Chemicals 1.96% | | | | | | | | |
| Dow, Inc. | | | 282,930 | | | | 13,224,148 | |
| Valvoline, Inc. | | | 853,725 | | | | 25,065,366 | |
| Total | | | | | | | 38,289,514 | |
| | | | | | | | | |
| Communications Equipment 0.55% | | | | | | | | |
| Cisco Systems, Inc. | | | 237,120 | | | | 10,772,362 | |
| Investments | | Shares | | | Fair
Value | |
| Construction & Engineering 2.62% | | | | | | | | |
| EMCOR Group, Inc. | | | 240,870 | | | $ | 33,986,757 | |
| Jacobs Solutions, Inc. | | | 150,270 | | | | 17,314,109 | |
| Total | | | | | | | 51,300,866 | |
| | | | | | | | | |
| Consumer Finance 1.41% | | | | | | | | |
| American Express Co. | | | 185,700 | | | | 27,567,165 | |
| | | | | | | | | |
| Containers & Packaging 1.03% | | | | | | | | |
| Avery Dennison Corp. | | | 119,000 | | | | 20,176,450 | |
| | | | | | | | | |
| Electric: Utilities 2.63% | | | | | | | | |
| NextEra Energy, Inc. | | | 343,970 | | | | 26,657,675 | |
| NRG Energy, Inc. | | | 559,470 | | | | 24,840,468 | |
| Total | | | | | | | 51,498,143 | |
| | | | | | | | | |
| Electronic Equipment, Instruments & Components 1.19% | |
| Teledyne Technologies, Inc.* | | | 58,380 | | | | 23,234,072 | |
| | | | | | | | | |
| Energy Equipment & Services 2.41% | | | | | | | | |
| Schlumberger NV | | | 904,101 | | | | 47,040,375 | |
| | | | | | | | | |
| Equity Real Estate Investment Trusts 3.36% | |
| American Homes 4 Rent Class A | | | 563,520 | | | | 17,998,829 | |
| Life Storage, Inc. | | | 197,120 | | | | 21,803,443 | |
| Prologis, Inc. | | | 234,510 | | | | 25,971,982 | |
| Total | | | | | | | 65,774,254 | |
| | | | | | | | | |
| Food & Staples Retailing 1.91% | | | | | | | | |
| BJ’s Wholesale Club Holdings, Inc.* | | | 481,900 | | | | 37,299,060 | |
| | | | | | | | | |
| Health Care Providers & Services 6.29% | | | | | | | | |
| CVS Health Corp. | | | 298,880 | | | | 28,303,936 | |
| McKesson Corp. | | | 86,290 | | | | 33,598,737 | |
| UnitedHealth Group, Inc. | | | 110,170 | | | | 61,160,876 | |
| Total | | | | | | | 123,063,549 | |
| | | | | | | | | |
| Hotels, Restaurants & Leisure 1.17% | | | | | | | | |
| Caesars Entertainment, Inc.* | | | 521,340 | | | | 22,798,198 | |
| | See Notes to Financial Statements. | 97 |
Schedule of Investments (continued)
FUNDAMENTAL EQUITY FUND October 31, 2022
| Investments | | Shares | | | Fair
Value | |
| Household Products 3.23% | | | | | | | | |
| Clorox Co. (The) | | | 134,320 | | | $ | 19,616,093 | |
| Procter & Gamble Co. (The) | | | 323,030 | | | | 43,502,450 | |
| Total | | | | | | | 63,118,543 | |
| | | | | | | | | |
| Information Technology Services 2.81% | | | | | | | | |
| Fiserv, Inc.* | | | 321,630 | | | | 33,044,266 | |
| PayPal Holdings, Inc.* | | | 261,460 | | | | 21,852,827 | |
| Total | | | | | | | 54,897,093 | |
| | | | | | | | | |
| Insurance 7.14% | | | | | | | | |
| Allstate Corp. (The) | | | 311,490 | | | | 39,325,613 | |
| Arch Capital Group Ltd.* | | | 487,770 | | | | 28,046,775 | |
| Arthur J Gallagher & Co. | | | 182,320 | | | | 34,108,426 | |
| Assurant, Inc. | | | 121,990 | | | | 16,573,561 | |
| RenaissanceRe Holdings Ltd. | | | 138,780 | | | | 21,466,490 | |
| Total | | | | | | | 139,520,865 | |
| | | | | | | | | |
| Interactive Media & Services 2.00% | | | | | | | | |
| Alphabet, Inc. Class A* | | | 413,800 | | | | 39,108,238 | |
| | | | | | | | | |
| Life Sciences Tools & Services 1.42% | | | | | | | | |
| Thermo Fisher Scientific, Inc. | | | 53,920 | | | | 27,713,262 | |
| | | | | | | | | |
| Machinery 1.89% | | | | | | | | |
| Parker-Hannifin Corp. | | | 127,370 | | | | 37,016,269 | |
| | | | | | | | | |
| Media 1.29% | | | | | | | | |
| Comcast Corp. Class A | | | 796,070 | | | | 25,267,262 | |
| | | | | | | | | |
| Metals & Mining 1.33% | | | | | | | | |
| Alcoa Corp. | | | 258,820 | | | | 10,101,745 | |
| Reliance Steel & Aluminum Co. | | | 78,990 | | | | 15,914,905 | |
| Total | | | | | | | 26,016,650 | |
| | | | | | | | | |
| Multi-Line Retail 1.64% | | | | | | | | |
| Target Corp. | | | 194,920 | | | | 32,015,610 | |
| Investments | | Shares | | | Fair
Value | |
| Oil, Gas & Consumable Fuels 6.64% | | | | | | | | |
| Chesapeake Energy Corp. | | | 430,599 | | | $ | 44,037,360 | |
| Pioneer Natural Resources Co. | | | 160,670 | | | | 41,197,394 | |
| Shell plc ADR | | | 801,330 | | | | 44,577,988 | |
| Total | | | | | | | 129,812,742 | |
| | | | | | | | | |
| Pharmaceuticals 5.66% | | | | | | | | |
| Eli Lilly & Co. | | | 60,750 | | | | 21,996,968 | |
| Organon & Co. | | | 1,356,360 | | | | 35,509,505 | |
| Pfizer, Inc. | | | 1,139,750 | | | | 53,055,362 | |
| Total | | | | | | | 110,561,835 | |
| | | | | | | | | |
| Road & Rail 1.49% | | | | | | | | |
| Norfolk Southern Corp. | | | 128,110 | | | | 29,218,048 | |
| | | | | | | | | |
| Semiconductors & Semiconductor Equipment 3.36% | |
| KLA Corp. | | | 59,420 | | | | 18,803,459 | |
| Micron Technology, Inc. | | | 389,670 | | | | 21,081,147 | |
| Texas Instruments, Inc. | | | 160,820 | | | | 25,832,517 | |
| Total | | | | | | | 65,717,123 | |
| | | | | | | | | |
| Software 1.66% | | | | | | | | |
| Microsoft Corp. | | | 139,990 | | | | 32,495,879 | |
| | | | | | | | | |
| Specialty Retail 2.79% | | | | | | | | |
| AutoZone, Inc.* | | | 8,840 | | | | 22,390,659 | |
| Lowe’s Cos., Inc. | | | 164,480 | | | | 32,065,376 | |
| Total | | | | | | | 54,456,035 | |
| | | | | | | | | |
| Technology Hardware, Storage & Peripherals 1.50% | |
| NetApp, Inc. | | | 422,240 | | | | 29,248,565 | |
| | | | | | | | | |
| Trading Companies & Distributors 1.75% | | |
| AerCap Holdings NV (Ireland)*(a) | | | 640,970 | | | | 34,234,208 | |
| | | | | | | | | |
| Wireless Telecommunication Services 1.81% | | |
| T-Mobile US, Inc.* | | | 233,220 | | | | 35,346,823 | |
Total Common Stocks
(cost $1,658,930,390) | | | | | | | 1,915,956,274 | |
| 98 | See Notes to Financial Statements. |
Schedule of Investments (concluded)
FUNDAMENTAL EQUITY FUND October 31, 2022
| Investments | | Principal
Amount | | | Fair
Value | |
| SHORT-TERM INVESTMENTS 2.03% | | | | | | | | |
| | | | | | | | | |
| Repurchase Agreements 2.03% | | | | | | | | |
Repurchase Agreement dated 10/31/2022, 1.30% due 11/1/2022 with Fixed Income Clearing Corp. collateralized by $42,030,100 of U.S. Treasury Note at 2.00% due 4/30/2024; value: $40,460,528; proceeds: $39,668,575
(cost $39,667,143) | | $ | 39,667,143 | | | $ | 39,667,143 | |
Total Investments in Securities 100.04%
(cost $1,698,597,533) | | | | | | | 1,955,623,417 | |
| Other Assets and Liabilities – Net (0.04)% | | | | | | | (800,964 | ) |
| Net Assets 100.00% | | | | | | $ | 1,954,822,453 | |
| ADR | | American Depositary Receipt. |
| * | | Non-income producing security. |
| (a) | | Foreign security traded in U.S. dollars. |
The following is a summary of the inputs used as of October 31, 2022 in valuing the Fund’s investments carried at fair value(1):
| Investment Type(2) | | Level 1 | | | Level 2 | | | Level 3 | | | Total | |
| Long-Term Investments | | | | | | | | | | | | | | | | | |
| Common Stocks | | $ | 1,915,956,274 | | | $ | – | | | | $ | – | | | $ | 1,915,956,274 | |
| Short-Term Investments | | | | | | | | | | | | | | | | | |
| Repurchase Agreements | | | – | | | | 39,667,143 | | | | | – | | | | 39,667,143 | |
| Total | | $ | 1,915,956,274 | | | $ | 39,667,143 | | | | $ | – | | | $ | 1,955,623,417 | |
| (1) | | Refer to Note 2(l) for a description of fair value measurements and the three-tier hierarchy of inputs. |
| (2) | | See Schedule of Investments for fair values in each industry and identification of foreign issuers and/or geography. When applicable each Level 3 security is identified on the Schedule of Investments along with the valuation technique utilized. |
A reconciliation of Level 3 investments is presented when the Fund has a material amount of Level 3 investments at the beginning or end of the year in relation to the Fund’s net assets.
| | See Notes to Financial Statements. | 99 |
Schedule of Investments
GLOBAL EQUITY FUND October 31, 2022
| Investments | | Shares | | | U.S. $
Fair Value | |
| LONG-TERM INVESTMENTS 96.93% | | | | | | | | |
| COMMON STOCKS 96.93% | | | | | | | | |
| | | | | | | | | |
| Australia 1.98% | | | | | | | | |
| | | | | | | | | |
| Equity Real Estate Investment Trusts 1.16% | | | | | |
| Charter Hall Group | | | 12,498 | | | $ | 103,744 | |
| | | | | | | | | |
| Metals & Mining 0.82% | | | | | | | | |
| BHP Group Ltd. | | | 3,045 | | | | 73,141 | |
| Total Australia | | | | | | | 176,885 | |
| | | | | | | | | |
| Austria 1.40% | | | | | | | | |
| | | | | | | | | |
| Banks | | | | | | | | |
| BAWAG Group AG† | | | 2,605 | | | | 125,758 | |
| | | | | | | | | |
| Brazil 0.97% | | | | | | | | |
| | | | | | | | | |
| Internet & Direct Marketing Retail | | | | | | | | |
| MercadoLibre, Inc.* | | | 96 | | | | 86,556 | |
| | | | | | | | | |
| Canada 3.45% | | | | | | | | |
| | | | | | | | | |
| Banks 1.70% | | | | | | | | |
| Royal Bank of Canada | | | 1,639 | | | | 151,647 | |
| | | | | | | | | |
| Specialty Retail 1.75% | | | | | | | | |
| Alimentation Couche-Tard, Inc. | | | 3,506 | | | | 156,983 | |
| Total Canada | | | | | | | 308,630 | |
| | | | | | | | | |
| China 2.83% | | | | | | | | |
| | | | | | | | | |
| Beverages 0.60% | | | | | | | | |
| Kweichow Moutai Co. Ltd. | | | | | | | | |
| Class A | | | 287 | | | | 53,196 | |
| | | | | | | | | |
| Gas Utilities 0.47% | | | | | | | | |
| ENN Energy Holdings Ltd. | | | 4,246 | | | | 42,214 | |
| | | | | | | | | |
| Interactive Media & Services 0.68% | | | | | | | | |
| Tencent Holdings Ltd. | | | 2,330 | | | | 61,225 | |
| Investments | | Shares | | | U.S. $
Fair Value | |
| China (continued) | | | | | | |
| | | | | | | |
| Internet & Direct Marketing Retail 1.08% | | | | | |
| Alibaba Group Holding Ltd.* | | | 7,331 | | | $ | 56,998 | |
| JD.com, Inc. Class A | | | 2,190 | | | | 39,881 | |
| | | | | | | | 96,879 | |
| Total China | | | | | | | 253,514 | |
| | | | | | | | | |
| Denmark 2.23% | | | | | | | | |
| | | | | | | | | |
| Biotechnology 1.17% | | | | | | | | |
| Genmab A/S* | | | 273 | | | | 105,162 | |
| | | | | | | | | |
| Pharmaceuticals 1.06% | | | | | | | | |
| Novo Nordisk A/S Class B | | | 870 | | | | 94,596 | |
| Total Denmark | | | | | | | 199,758 | |
| | | | | | | | | |
| France 4.18% | | | | | | | | |
| | | | | | | | | |
| Beverages 1.14% | | | | | | | | |
| Pernod Ricard SA | | | 583 | | | | 102,323 | |
| | | | | | | | | |
| Life Sciences Tools & Services 0.69% | | | | | |
| Sartorius Stedim Biotech | | | 195 | | | | 61,881 | |
| | | | | | | | | |
| Professional Services 0.56% | | | | | | | | |
| Teleperformance | | | 188 | | | | 50,371 | |
| | | | | | | | | |
| Textiles, Apparel & Luxury Goods 1.79% | | | | | |
| LVMH Moet Hennessy Louis Vuitton SE | | | 253 | | | | 159,642 | |
| Total France | | | | | | | 374,217 | |
| | | | | | | | | |
| Germany 0.54% | | | | | | | | |
| | | | | | | | | |
| Semiconductors & Semiconductor Equipment | | | |
| Infineon Technologies AG | | | 1,980 | | | | 48,046 | |
| | | | | | | | | |
| India 0.82% | | | | | | | | |
| | | | | | | | | |
| Banks | | | | | | | | |
| ICICI Bank Ltd. ADR | | | 3,351 | | | | 73,856 | |
| 100 | See Notes to Financial Statements. |
Schedule of Investments (continued)
GLOBAL EQUITY FUND October 31, 2022
| Investments | | Shares | | | U.S. $
Fair Value | |
| Japan 3.77% | | | | | | |
| | | | | | | |
| Electrical Equipment 0.58% | | | | | | | | |
| Fuji Electric Co. Ltd. | | | 1,357 | | | $ | 52,468 | |
| | | | | | | | | |
| Electronic Equipment, Instruments & Components 0.63% |
| Keyence Corp. | | | 149 | | | | 56,183 | |
| | | | | | | | | |
| Household Durables 0.63% | | | | | | | | |
| Sony Group Corp. | | | 838 | | | | 56,510 | |
| | | | | | | | | |
| Machinery 1.08% | | | | | | | | |
| Fujitec Co. Ltd. | | | 4,859 | | | | 96,516 | |
| | | | | | | | | |
| Professional Services 0.85% | | | | | | | | |
| TechnoPro Holdings, Inc. | | | 3,174 | | | | 76,146 | |
| Total Japan | | | | | | | 337,823 | |
| | | | | | | | | |
| Mexico 1.99% | | | | | | | | |
| | | | | | | | | |
| Banks | | | | | | | | |
| Grupo Financiero Banorte SAB de CV Class O | | | 21,929 | | | | 178,250 | |
| | | | | | | | | |
| Netherlands 5.19% | | | | | | | | |
| | | | | | | | | |
| Insurance 1.45% | | | | | | | | |
| NN Group NV | | | 3,072 | | | | 130,076 | |
| | | | | | | | | |
| Oil, Gas & Consumable Fuels 3.21% | | | | | | | | |
| Shell plc | | | 10,375 | | | | 287,404 | |
| | | | | | | | | |
| Semiconductors & Semiconductor Equipment 0.53% | |
| ASML Holding NV | | | 101 | | | | 47,378 | |
| Total Netherlands | | | | | | | 464,858 | |
| | | | | | | | | |
| South Korea 1.17% | | | | | | | | |
| | | | | | | | | |
| Technology Hardware, Storage & Peripherals | |
| Samsung Electronics Co. Ltd. | | | 2,506 | | | | 104,299 | |
| Investments | | Shares | | | U.S. $
Fair Value | |
| Spain 1.88% | | | | | | |
| | | | | | | | | |
| Electric: Utilities | | | | | | | | |
| Iberdrola SA | | | 16,534 | | | $ | 168,139 | |
| | | | | | | | | |
| Sweden 0.57% | | | | | | | | |
| | | | | | | | | |
| Electronic Equipment, Instruments & Components | |
| Hexagon AB B Shares | | | 5,167 | | | | 51,080 | |
| | | | | | | | | |
| Taiwan 1.01% | | | | | | | | |
| | | | | | | | | |
| Semiconductors & Semiconductor Equipment | |
| Taiwan Semiconductor Manufacturing Co. Ltd. | | | 7,537 | | | | 90,611 | |
| | | | | | | | | |
| United Kingdom 3.20% | | | | | | | | |
| | | | | | | | | |
| Capital Markets 0.86% | | | | | | | | |
| London Stock Exchange Group plc | | | 888 | | | | 76,974 | |
| | | | | | | | | |
| Multi-Line Retail 0.67% | | | | | | | | |
| Next plc | | | 1,060 | | | | 59,868 | |
| | | | | | | | | |
| Personal Products 1.67% | | | | | | | | |
| Unilever plc | | | 3,297 | | | | 149,863 | |
| Total United Kingdom | | | | | | | 286,705 | |
| | | | | | | | | |
| United States 59.75% | | | | | | | | |
| | | | | | | | | |
| Aerospace & Defense 2.04% | | | | | | | | |
| Northrop Grumman Corp. | | | 245 | | | | 134,507 | |
| TransDigm Group, Inc. | | | 84 | | | | 48,364 | |
| | | | | | | | 182,871 | |
| | | | | | | | | |
| Automobiles 0.79% | | | | | | | | |
| General Motors Co. | | | 1,806 | | | | 70,885 | |
| | | | | | | | | |
| Banks 1.37% | | | | | | | | |
| JPMorgan Chase & Co. | | | 971 | | | | 122,229 | |
| | | | | | | | | |
| Biotechnology 2.02% | | | | | | | | |
| Vertex Pharmaceuticals, Inc.* | | | 580 | | | | 180,960 | |
| | | | | | | | | |
| Building Products 0.78% | | | | | | | | |
| Carlisle Cos., Inc. | | | 293 | | | | 69,968 | |
| | See Notes to Financial Statements. | 101 |
Schedule of Investments (continued)
GLOBAL EQUITY FUND October 31, 2022
| Investments | | Shares | | | U.S. $
Fair Value | |
| United States (continued) | | | | | | | | |
| | | | | | | | | |
| Capital Markets 5.23% | | | | | | | | |
| Ameriprise Financial, Inc. | | | 590 | | | $ | 182,381 | |
| Cboe Global Markets, Inc. | | | 1,420 | | | | 176,790 | |
| Morgan Stanley | | | 1,330 | | | | 109,286 | |
| | | | | | | | 468,457 | |
| | | | | | | | | |
| Consumer Finance 0.54% | | | | | | | | |
| American Express Co. | | | 324 | | | | 48,098 | |
| | | | | | | | | |
| Containers & Packaging 1.42% | | | | | | | | |
| Avery Dennison Corp. | | | 748 | | | | 126,823 | |
| | | | | | | | | |
| Electric: Utilities 1.50% | | | | | | | | |
| NextEra Energy, Inc. | | | 1,734 | | | | 134,385 | |
| | | | | | | | | |
| Electrical Equipment 0.86% | | | | | | | | |
| AMETEK, Inc. | | | 592 | | | | 76,759 | |
| | | | | | | | | |
| Entertainment 0.38% | | | | | | | | |
| Live Nation Entertainment, Inc.* | | | 432 | | | | 34,391 | |
| | | | | | | | | |
| Equity Real Estate Investment Trusts 0.86% | |
| Prologis, Inc. | | | 697 | | | | 77,193 | |
| | | | | | | | | |
| Food & Staples Retailing 1.90% | | | | | | | | |
| BJ’s Wholesale Club Holdings, Inc.* | | | 1,708 | | | | 132,199 | |
| Walmart, Inc. | | | 263 | | | | 37,433 | |
| | | | | | | | 169,632 | |
| | | | | | | | | |
| Health Care Equipment & Supplies 1.66% | |
| DexCom, Inc.* | | | 737 | | | | 89,015 | |
| Intuitive Surgical, Inc.* | | | 240 | | | | 59,153 | |
| | | | | | | | 148,168 | |
| | | | | | | | | |
| Health Care Providers & Services 3.72% | |
| UnitedHealth Group, Inc. | | | 600 | | | | 333,090 | |
| | | | | | | | | |
| Hotels, Restaurants & Leisure 0.68% | |
| Airbnb, Inc. Class A* | | | 567 | | | | 60,618 | |
| Investments | | Shares | | | U.S. $
Fair Value | |
| United States (continued) | | | | | | | | |
| | | | | | | | | |
| Information Technology Services 3.94% | |
| Accenture plc Class A | | | 465 | | | $ | 132,014 | |
| EPAM Systems, Inc.* | | | 200 | | | | 70,000 | |
| Visa, Inc. Class A | | | 726 | | | | 150,398 | |
| | | | | | | | 352,412 | |
| | | | | | | | | |
| Insurance 1.89% | | | | | | | | |
| Allstate Corp. (The) | | | 853 | | | | 107,691 | |
| American Financial Group, Inc./OH | | | 426 | | | | 61,817 | |
| | | | | | | | 169,508 | |
| | | | | | | | | |
| Interactive Media & Services 2.80% | | | | | | | | |
| Alphabet, Inc. Class A* | | | 2,654 | | | | 250,830 | |
| | | | | | | | | |
| Internet & Direct Marketing Retail 1.82% | |
| Amazon.com, Inc.* | | | 1,592 | | | | 163,084 | |
| | | | | | | | | |
| Life Sciences Tools & Services 1.44% | |
| Thermo Fisher Scientific, Inc. | | | 250 | | | | 128,492 | |
| | | | | | | | | |
| Machinery 1.70% | | | | | | | | |
| Crane Holdings Co. | | | 1,293 | | | | 129,740 | |
| Fortive Corp. | | | 344 | | | | 21,981 | |
| | | | | | | | 151,721 | |
| | | | | | | | | |
| Oil, Gas & Consumable Fuels 4.23% | |
| Cheniere Energy, Inc. | | | 439 | | | | 77,444 | |
| Chesapeake Energy Corp. | | | 754 | | | | 77,112 | |
| Marathon Petroleum Corp. | | | 1,976 | | | | 224,513 | |
| | | | | | | | 379,069 | |
| | | | | | | | | |
| Pharmaceuticals 2.84% | | | | | | | | |
| Eli Lilly & Co. | | | 413 | | | | 149,543 | |
| Organon & Co. | | | 4,003 | | | | 104,799 | |
| | | | | | | | 254,342 | |
| | | | | | | | | |
| Road & Rail 1.40% | | | | | | | | |
| Norfolk Southern Corp. | | | 551 | | | | 125,667 | |
| | | | | | | | | |
| Semiconductors & Semiconductor Equipment 0.26% | |
| NVIDIA Corp. | | | 175 | | | | 23,620 | |
| 102 | See Notes to Financial Statements. |
Schedule of Investments (continued)
GLOBAL EQUITY FUND October 31, 2022
| Investments | | Shares | | | U.S. $
Fair Value | |
| United States (continued) | | | | | | | | |
| | | | | | | | | |
| Software 5.82% | | | | | | | | |
| Cadence Design Systems, Inc.* | | | 550 | | | $ | 83,265 | |
| Microsoft Corp. | | | 1,598 | | | | 370,944 | |
| Trade Desk, Inc. (The) Class A* | | | 735 | | | | 39,131 | |
| Veeva Systems, Inc. Class A* | | | 165 | | | | 27,710 | |
| | | | | | | | 521,050 | |
| | | | | | | | | |
| Specialty Retail 1.00% | | | | | | | | |
| Lowe’s Cos., Inc. | | | 460 | | | | 89,677 | |
| | | | | | | | | |
| Technology Hardware, Storage & Peripherals 4.70% | |
| Apple, Inc. | | | 2,743 | | | | 420,612 | |
| | | | | | | | | |
| Textiles, Apparel & Luxury Goods 0.16% | |
| NIKE, Inc. Class B | | | 158 | | | | 14,643 | |
| Total United States | | | | | | | 5,349,254 | |
Total Common Stocks
(cost $9,156,386) | | | | | | | 8,678,239 | |
| Investments | | Principal
Amount | | | U.S. $
Fair Value | |
| SHORT-TERM INVESTMENTS 2.79% | | | | | | | | |
| | | | | | | | | |
| Repurchase Agreements 2.79% | | | | | | | | |
Repurchase Agreement dated 10/31/2022, 1.30% due 11/1/2022 with Fixed Income Clearing Corp. collateralized by $265,100 of U.S. Treasury Note at 2.00% due 4/30/2024; value: $255,200; proceeds: $250,154
(cost $250,145) | | | $250,145 | | | $ | 250,145 | |
Total Investments in Securities 99.72%
(cost $9,406,531) | | | | 8,928,384 | |
| Other Assets and Liabilities – Net 0.28% | | | | 24,924 | |
| Net Assets 100.00% | | | | | | $ | 8,953,308 | |
| ADR | | American Depositary Receipt. |
| † | | Security was purchased pursuant to Rule 144A under the Securities Act of 1933 and, unless registered under such Act or exempted from registration, may only be resold to qualified institutional buyers. At October 31, 2022, the total value of Rule 144A securities was $125,758, which represents 1.40% of net assets. |
| * | | Non-income producing security. |
| | See Notes to Financial Statements. | 103 |
Schedule of Investments (concluded)
GLOBAL EQUITY FUND October 31, 2022
The following is a summary of the inputs used as of October 31, 2022 in valuing the Fund’s investments carried at fair value(1):
| Investment Type(2) | | Level 1 | | | Level 2 | | | Level 3 | | | Total | |
| Long-Term Investments | | | | | | | | | | | | | | | | |
| Common Stocks | | | | | | | | | | | | | | | | |
| Australia | | $ | – | | | $ | 176,885 | | | $ | – | | | $ | 176,885 | |
| Austria | | | – | | | | 125,758 | | | | – | | | | 125,758 | |
| China | | | – | | | | 253,514 | | | | – | | | | 253,514 | |
| Denmark | | | – | | | | 199,758 | | | | – | | | | 199,758 | |
| France | | | – | | | | 374,217 | | | | – | | | | 374,217 | |
| Germany | | | – | | | | 48,046 | | | | – | | | | 48,046 | |
| Japan | | | – | | | | 337,823 | | | | – | | | | 337,823 | |
| Netherlands | | | – | | | | 464,858 | | | | – | | | | 464,858 | |
| South Korea | | | – | | | | 104,299 | | | | – | | | | 104,299 | |
| Spain | | | – | | | | 168,139 | | | | – | | | | 168,139 | |
| Sweden | | | – | | | | 51,080 | | | | – | | | | 51,080 | |
| Taiwan | | | – | | | | 90,611 | | | | – | | | | 90,611 | |
| United Kingdom | | | – | | | | 286,705 | | | | – | | | | 286,705 | |
| Remaining Countries | | | 5,996,546 | | | | – | | | | – | | | | 5,996,546 | |
| Short-Term Investments | | | | | | | | | | | | | | | | |
| Repurchase Agreements | | | – | | | | 250,145 | | | | – | | | | 250,145 | |
| Total | | $ | 5,996,546 | | | $ | 2,931,838 | | | $ | – | | | $ | 8,928,384 | |
| (1) | | Refer to Note 2(l) for a description of fair value measurements and the three-tier hierarchy of inputs. |
| (2) | | See Schedule of Investments for fair values in each industry and identification of foreign issuer and/or geography. The table above is presented by Investment Type. Industries are presented within an Investment Type should such Investment Type include securities classified as two or more levels within the three-tier fair value hierarchy. When applicable each Level 3 security is identified on the Schedule of Investments along with the valuation technique utilized. |
A reconciliation of Level 3 investments is presented when the Fund has a material amount of Level 3 investments at the beginning or end of the year in relation to the Fund’s net assets.
| 104 | See Notes to Financial Statements. |
Schedule of Investments
GROWTH LEADERS FUND October 31, 2022
| Investments | | Shares | | | Fair
Value | |
| LONG-TERM INVESTMENTS 99.27% | |
| COMMON STOCKS 99.27% | |
| | | | | | | | | |
| Aerospace & Defense 1.41% | |
| Raytheon Technologies Corp. | | | 828,791 | | | $ | 78,585,963 | |
| | | | | | | | | |
| Automobiles 2.84% | | | | | | | | |
| Tesla, Inc.* | | | 695,760 | | | | 158,313,230 | |
| | | | | | | | | |
| Biotechnology 10.02% | | | | | | | | |
| Alnylam Pharmaceuticals, Inc.* | | | 371,579 | | | | 77,013,464 | |
| Argenx SE ADR* | | | 254,839 | | | | 98,859,693 | |
| Biogen, Inc.* | | | 154,280 | | | | 43,729,123 | |
| Cytokinetics, Inc.* | | | 2,021,412 | | | | 88,254,848 | |
| Karuna Therapeutics, Inc.* | | | 191,613 | | | | 42,028,395 | |
| Sarepta Therapeutics, Inc.* | | | 431,677 | | | | 49,219,812 | |
| Vertex Pharmaceuticals, Inc.* | | | 508,454 | | | | 158,637,648 | |
| Total | | | | | | | 557,742,983 | |
| | | | | | | | | |
| Chemicals 1.27% | | | | | | | | |
| Albemarle Corp. | | | 252,052 | | | | 70,541,793 | |
| | | | | | | | | |
| Communications Equipment 2.24% | |
| Arista Networks, Inc.* | | | 749,442 | | | | 90,577,560 | |
| Calix, Inc.* | | | 460,939 | | | | 33,943,548 | |
| Total | | | | | | | 124,521,108 | |
| | | | | | | | | |
| Entertainment 1.60% | | | | | | | | |
| Liberty Media Corp.- Liberty Formula One Class C* | | | 774,310 | | | | 44,700,916 | |
| Live Nation Entertainment, Inc.* | | | 559,976 | | | | 44,579,690 | |
| Total | | | | | | | 89,280,606 | |
| | | | | | | | | |
| Food & Staples Retailing 2.14% | | | | | | | | |
| Costco Wholesale Corp. | | | 237,733 | | | | 119,223,099 | |
| Investments | | Shares | | | Fair
Value | |
| Health Care Equipment & Supplies 6.21% | |
| | | | | | | | | |
| Axonics, Inc.* | | | 476,315 | | | $ | 34,837,679 | |
| DexCom, Inc.* | | | 696,794 | | | | 84,158,780 | |
| Insulet Corp.* | | | 242,925 | | | | 62,871,419 | |
| Intuitive Surgical, Inc.* | | | 295,713 | | | | 72,884,383 | |
| Lantheus Holdings, Inc.* | | | 400,530 | | | | 29,635,215 | |
| Shockwave Medical, Inc.* | | | 209,055 | | | | 61,284,473 | |
| Total | | | | | | | 345,671,949 | |
| | | | | | | | | |
| Health Care Providers & Services 2.73% | |
| UnitedHealth Group, Inc. | | | 273,273 | | | | 151,707,506 | |
| | | | | | | | | |
| Hotels, Restaurants & Leisure 6.60% | |
| Airbnb, Inc. Class A* | | | 751,483 | | | | 80,341,047 | |
| Chipotle Mexican Grill, Inc.* | | | 71,842 | | | | 107,643,024 | |
| Marriott International, Inc. Class A | | | 537,563 | | | | 86,069,212 | |
| Starbucks Corp. | | | 1,074,876 | | | | 93,073,513 | |
| Total | | | | | | | 367,126,796 | |
| | | | | | | | | |
| Information Technology Services 7.49% | |
| Cloudflare, Inc. Class A* | | | 445,366 | | | | 25,083,013 | |
| EPAM Systems, Inc.* | | | 118,970 | | | | 41,639,500 | |
| Mastercard, Inc. Class A | | | 380,857 | | | | 124,989,650 | |
| Shopify, Inc. Class A (Canada)*(a) | | | 1,424,010 | | | | 48,743,863 | |
| Snowflake, Inc.Class A* | | | 365,860 | | | | 58,647,358 | |
| Toast, Inc. Class A* | | | 1,266,270 | | | | 27,971,904 | |
| Visa, Inc. Class A | | | 434,250 | | | | 89,959,230 | |
| Total | | | | | | | 417,034,518 | |
| | | | | | | | | |
| Interactive Media & Services 4.12% | |
| Alphabet, Inc. Class A* | | | 2,423,706 | | | | 229,064,454 | |
| | | | | | | | | |
| Internet & Direct Marketing Retail 6.01% | |
| Amazon.com, Inc.* | | | 1,794,699 | | | | 183,848,965 | |
| MercadoLibre, Inc. (Uruguay)*(a) | | | 74,990 | | | | 67,612,484 | |
| Netflix, Inc.* | | | 284,942 | | | | 83,168,871 | |
| Total | | | | | | | 334,630,320 | |
| | See Notes to Financial Statements. | 105 |
Schedule of Investments (continued)
GROWTH LEADERS FUND October 31, 2022
| Investments | | Shares | | | Fair
Value | |
| Life Sciences Tools & Services 1.05% | |
| | | | | | | | | |
| Repligen Corp.* | | | 164,662 | | | $ | 30,049,168 | |
| Thermo Fisher Scientific, Inc. | | | 55,368 | | | | 28,457,491 | |
| Total | | | | | | | 58,506,659 | |
| | | | | | | | | |
| Machinery 0.75% | | | | | | | | |
| Deere & Co. | | | 105,786 | | | | 41,872,215 | |
| | | | | | | | | |
| Oil, Gas & Consumable Fuels 2.37% | |
| Cheniere Energy, Inc. | | | 747,958 | | | | 131,947,271 | |
| | | | | | | | | |
| Pharmaceuticals 3.54% | | | | | | | | |
| Eli Lilly & Co. | | | 424,621 | | | | 153,751,018 | |
| Novo Nordisk A/S ADR | | | 398,440 | | | | 43,366,209 | |
| Total | | | | | | | 197,117,227 | |
| | | | | | | | | |
| Professional Services 0.84% | | | | | | | | |
| CoStar Group, Inc.* | | | 566,507 | | | | 46,861,459 | |
| | | | | | | | | |
| Semiconductors & Semiconductor Equipment 5.52% | |
| Advanced Micro Devices, Inc.* | | | 709,474 | | | | 42,611,009 | |
| Enphase Energy, Inc.* | | | 436,564 | | | | 134,025,148 | |
| KLA Corp. | | | 184,451 | | | | 58,369,519 | |
| Monolithic Power Systems, Inc. | | | 128,282 | | | | 43,545,325 | |
| QUALCOMM, Inc. | | | 242,743 | | | | 28,561,141 | |
| Total | | | | | | | 307,112,142 | |
| | | | | | | | | |
| Software 16.55% | | | | | | | | |
| Aspen Technology, Inc.* | | | 300,024 | | | | 72,440,795 | |
| Atlassian Corp. Class A | | | 232,150 | | | | 47,063,769 | |
| Bill.com Holdings, Inc.* | | | 284,573 | | | | 37,950,655 | |
| Cadence Design Systems, Inc.* | | | 185,941 | | | | 28,149,608 | |
| Clear Secure, Inc. Class A* | | | 1,176,761 | | | | 31,796,082 | |
| Crowdstrike Holdings, Inc. Class A* | | | 321,358 | | | | 51,802,910 | |
| Datadog, Inc. Class A* | | | 287,141 | | | | 23,117,722 | |
| Intuit, Inc. | | | 198,431 | | | | 84,829,252 | |
| Microsoft Corp. | | | 1,683,747 | | | | 390,848,191 | |
| Investments | | Shares | | | Fair
Value | |
| Software (continued) | | | | | | | | |
| | | | | | | | | |
| Palo Alto Networks, Inc.* | | | 406,328 | | | $ | 69,721,822 | |
| Paylocity Holding Corp.* | | | 192,294 | | | | 44,571,826 | |
| Trade Desk, Inc. (The) Class A* | | | 730,003 | | | | 38,865,360 | |
| Total | | | | | | | 921,157,992 | |
| | | | | | | | | |
| Specialty Retail 0.80% | | | | | | | | |
| O’Reilly Automotive, Inc.* | | | 53,303 | | | | 44,623,673 | |
| | | | | | | | |
| Technology Hardware, Storage & Peripherals 10.62% | |
| Apple, Inc. | | | 3,855,478 | | | | 591,198,997 | |
| | | | | | | | | |
| Textiles, Apparel & Luxury Goods 2.55% | |
| Deckers Outdoor Corp.* | | | 114,317 | | | | 40,002,948 | |
| Lululemon Athletica, Inc. (Canada)*(a) | | | 310,342 | | | | 102,114,931 | |
| Total | | | | | | | 142,117,879 | |
Total Common Stocks
(cost $5,736,440,508) | | | | | | | 5,525,959,839 | |
| 106 | See Notes to Financial Statements. |
Schedule of Investments (concluded)
GROWTH LEADERS FUND October 31, 2022
| Investments | | | Principal
Amount | | | Fair
Value | |
| SHORT-TERM INVESTMENTS 1.07% | |
| | | | | | | | | |
| Repurchase Agreements 1.07% | |
Repurchase Agreement dated 10/31/2022, 1.30% due 11/1/2022 with Fixed Income Clearing Corp. collateralized by $59,116,700 of U.S. Treasury Floating Note at 3.925% due 4/30/2024; $1,896,200 of U.S. Treasury Note at 2.50% due 5/15/2024; value: $60,902,982; proceeds: $59,710,909
(cost $59,708,753) | | | $59,708,753 | | | $ | 59,708,753 | |
Total Investments in Securities 100.34%
(cost $5,796,149,261) | | 5,585,668,592 | |
| Other Assets and Liabilities – Net (0.34)% | | (18,834,502 | ) |
| Net Assets 100.00% | | | | | | $ | 5,566,834,090 | |
| ADR | | American Depositary Receipt. |
| * | | Non-income producing security. |
| (a) | | Foreign security traded in U.S. dollars. |
The following is a summary of the inputs used as of October 31, 2022 in valuing the Fund’s investments carried at fair value(1):
| Investment Type(2) | | Level 1 | | | Level 2 | | | Level 3 | | | Total | |
| Long-Term Investments | | | | | | | | | | | | | | | | | |
| Common Stocks | | $ | 5,525,959,839 | | | $ | – | | | | $ | – | | | $ | 5,525,959,839 | |
| Short-Term Investments | | | | | | | | | | | | | | | | | |
| Repurchase Agreements | | | – | | | | 59,708,753 | | | | | – | | | | 59,708,753 | |
| Total | | $ | 5,525,959,839 | | | $ | 59,708,753 | | | | $ | – | | | $ | 5,585,668,592 | |
| (1) | | Refer to Note 2(l) for a description of fair value measurements and the three-tier hierarchy of inputs. |
| (2) | | See Schedule of Investments for fair values in each industry and identification of foreign issuers and/or geography. When applicable each Level 3 security is identified on the Schedule of Investments along with the valuation technique utilized. |
A reconciliation of Level 3 investments is presented when the Fund has a material amount of Level 3 investments at the beginning or end of the year in relation to the Fund’s net assets.
| | See Notes to Financial Statements. | 107 |
Schedule of Investments
HEALTH CARE FUND October 31, 2022
| Investments | | Shares | | | U.S. $
Fair Value | |
| LONG-TERM INVESTMENTS 97.32% | | | | | | | | |
| COMMON STOCKS 97.32% | | | | | | | | |
| | | | | | | | | |
| Canada 2.24% | | | | | | | | |
| | | | | | | | | |
| Biotechnology | | | | | | | | |
| BELLUS Health, Inc.* | | | 7,372 | | | $ | 68,265 | |
| Xenon Pharmaceuticals, Inc.* | | | 2,076 | | | | 75,919 | |
| | | | | | | | 144,184 | |
| | | | | | | | | |
| Denmark 5.27% | | | | | | | | |
| | | | | | | | | |
| Biotechnology 1.56% | | | | | | | | |
| Genmab A/S* | | | 261 | | | | 100,539 | |
| | | | | | | | | |
| Pharmaceuticals 3.71% | | | | | | | | |
| Novo Nordisk A/S Class B | | | 2,194 | | | | 238,557 | |
| Total Denmark | | | | | | | 339,096 | |
| | | | | | | | | |
| Japan 2.11% | | | | | | | | |
| | | | | | | | | |
| Pharmaceuticals | | | | | | | | |
| Daiichi Sankyo Co. Ltd. | | | 3,115 | | | | 99,713 | |
| Eisai Co. Ltd. | | | 600 | | | | 36,182 | |
| | | | | | | | 135,895 | |
| | | | | | | | | |
| Netherlands 2.40% | | | | | | | | |
| | | | | | | | | |
| Biotechnology | | | | | | | | |
| Argenx SE* | | | 306 | | | | 118,805 | |
| Merus NV* | | | 1,745 | | | | 35,772 | |
| | | | | | | | 154,577 | |
| | | | | | | | | |
| Switzerland 2.15% | | | | | | | | |
| | | | | | | | | |
| Health Care Equipment & Supplies 0.94% | | | |
| Alcon, Inc. | | | 996 | | | | 60,437 | |
| | | | | | | | | |
| Life Sciences Tools & Services 1.21% | | | |
| Lonza Group AG Registered Shares | | | 151 | | | | 77,733 | |
| Total Switzerland | | | | | | | 138,170 | |
| | | | | | | | | |
| United Kingdom 3.92% | | | | | | | | |
| | | | | | | | | |
| Pharmaceuticals | | | | | | | | |
| AstraZeneca plc | | | 2,151 | | | | 252,381 | |
| Investments | | Shares | | | U.S. $
Fair Value | |
| United States 79.23% | | | | | | | | |
| | | | | | | | | |
| Biotechnology 17.46% | | | | | | | | |
| Alnylam Pharmaceuticals, Inc.* | | | 170 | | | $ | 35,234 | |
| Arcellx, Inc.* | | | 2,054 | | | | 48,228 | |
| Biogen, Inc.* | | | 294 | | | | 83,331 | |
| Cytokinetics, Inc.* | | | 1,970 | | | | 86,010 | |
| Day One Biopharmaceuticals, Inc.*(a) | | | 1,750 | | | | 36,995 | |
| Insmed, Inc.* | | | 2,540 | | | | 43,993 | |
| Karuna Therapeutics, Inc.* | | | 567 | | | | 124,366 | |
| Krystal Biotech, Inc.* | | | 1,235 | | | | 94,478 | |
| Legend Biotech Corp. ADR* | | | 770 | | | | 38,362 | |
| Mirati Therapeutics, Inc.* | | | 561 | | | | 37,767 | |
| Natera, Inc.* | | | 690 | | | | 32,402 | |
| Neurocrine Biosciences, Inc.* | | | 598 | | | | 68,842 | |
| Regeneron Pharmaceuticals, Inc.* | | | 91 | | | | 68,136 | |
| Rocket Pharmaceuticals, Inc.* | | | 2,303 | | | | 42,974 | |
| Sarepta Therapeutics, Inc.* | | | 819 | | | | 93,382 | |
| Vertex Pharmaceuticals, Inc.* | | | 606 | | | | 189,072 | |
| | | | | | | | 1,123,572 | |
| | | | | | | | | |
| Health Care Equipment & Supplies 18.02% | | | |
| Abbott Laboratories | | | 1,015 | | | | 100,424 | |
| Axonics, Inc.* | | | 662 | | | | 48,419 | |
| Cooper Cos., Inc. (The) | | | 228 | | | | 62,333 | |
| DexCom, Inc.* | | | 1,127 | | | | 136,119 | |
| Edwards Lifesciences Corp.* | | | 554 | | | | 40,126 | |
| Glaukos Corp.* | | | 900 | | | | 50,463 | |
| Inari Medical, Inc.* | | | 364 | | | | 28,003 | |
| Inspire Medical Systems, Inc.* | | | 302 | | | | 58,875 | |
| Insulet Corp.* | | | 372 | | | | 96,277 | |
| Intuitive Surgical, Inc.* | | | 446 | | | | 109,926 | |
| iRhythm Technologies, Inc.* | | | 365 | | | | 46,534 | |
| Lantheus Holdings, Inc.* | | | 960 | | | | 71,030 | |
| Pacific Biosciences of California, Inc.* | | | 3,800 | | | | 32,072 | |
| PROCEPT BioRobotics Corp.*(a) | | | 870 | | | | 39,524 | |
| Shockwave Medical, Inc.* | | | 323 | | | | 94,687 | |
| 108 | See Notes to Financial Statements. | |
Schedule of Investments (continued)
HEALTH CARE FUND October 31, 2022
| Investments | | Shares | | | U.S. $
Fair Value | |
| United States (continued) | | | | | | | | |
| | | | | | | | | |
| Health Care Equipment & Supplies (continued) | | | |
| Silk Road Medical, Inc.* | | | 750 | | | $ | 33,060 | |
| Stryker Corp. | | | 315 | | | | 72,211 | |
| TransMedics Group, Inc.* | | | 820 | | | | 39,540 | |
| | | | | | | | 1,159,623 | |
| | | | | | | | | |
| Health Care Providers & Services 13.84% | | | |
| AmerisourceBergen Corp. | | | 645 | | | | 101,407 | |
| Centene Corp.* | | | 1,307 | | | | 111,265 | |
| Elevance Health, Inc. | | | 137 | | | | 74,907 | |
| Humana, Inc. | | | 281 | | | | 156,820 | |
| Molina Healthcare, Inc.* | | | 209 | | | | 75,002 | |
| R1 RCM, Inc.* | | | 1,397 | | | | 24,671 | |
| UnitedHealth Group, Inc. | | | 624 | | | | 346,414 | |
| | | | | | | | 890,486 | |
| | | | | | | | | |
| Life Sciences Tools & Services 9.70% | | | |
| Agilent Technologies, Inc. | | | 624 | | | | 86,330 | |
| Danaher Corp. | | | 747 | | | | 187,998 | |
| Repligen Corp.* | | | 398 | | | | 72,631 | |
| Thermo Fisher Scientific, Inc. | | | 456 | | | | 234,370 | |
| West Pharmaceutical Services, Inc. | | | 188 | | | | 43,259 | |
| | | | | | | | 624,588 | |
| | | | | | | | | |
| Pharmaceuticals 20.21% | | | | | | | | |
| Eli Lilly & Co. | | | 987 | | | | 357,383 | |
| Intra-Cellular Therapies, Inc.* | | | 1,572 | | | | 71,793 | |
| Merck & Co., Inc. | | | 2,674 | | | | 270,609 | |
| Organon & Co. | | | 1,221 | | | | 31,966 | |
| Pfizer, Inc. | | | 3,927 | | | | 182,802 | |
| Pliant Therapeutics, Inc.* | | | 1,950 | | | | 48,497 | |
| Roche Holding AG | | | 454 | | | | 150,636 | |
| Ventyx Biosciences, Inc.* | | | 2,949 | | | | 95,459 | |
| Zoetis, Inc. | | | 607 | | | | 91,523 | |
| | | | | | | | 1,300,668 | |
| Total United States | | | | | | | 5,098,937 | |
Total Common Stocks
(cost $5,564,608) | | | | | | | 6,263,240 | |
| Investments | | Principal
Amount | | | U.S. $
Fair Value | |
| SHORT-TERM INVESTMENTS 3.58% | | | | | |
| | | | | | | | | |
| Repurchase Agreements 2.37% | | | | | | | | |
Repurchase Agreement dated 10/31/2022, 1.30% due 11/1/2022 with Fixed Income Clearing Corp. collateralized by $161,900 of U.S. Treasury Note at 2.00% due 4/30/2024; value: $155,854; proceeds: $152,791
(cost $152,785) | | | $152,785 | | | $ | 152,785 | |
| | | | | | | | | |
| | | | Shares | | | | | |
| Money Market Funds 1.09% | | | | | | | | |
Fidelity Government Portfolio(b)
(cost $70,133) | | | 70,133 | | | | 70,133 | |
| | | | | | | | | |
| Time Deposits 0.12% | | | | | | | | |
CitiBank N.A.(b)
(cost $7,793) | | | 7,793 | | | | 7,793 | |
Total Short-Term Investments
(cost $230,711) | | | | | | | 230,711 | |
Total Investments in Securities 100.90%
(cost $5,795,319) | | | | | | | 6,493,951 | |
| Other Assets and Liabilities – Net (0.90)% | | (58,239 | ) |
| Net Assets 100.00% | | | | | | $ | 6,435,712 | |
| | | |
| ADR | | American Depositary Receipt. |
| * | | Non-income producing security. |
| (a) | | All or a portion of these securities are temporarily on loan to unaffiliated broker/dealers. |
| (b) | | Security was purchased with the cash collateral from loaned securities. |
| | See Notes to Financial Statements. | 109 |
Schedule of Investments (concluded)
HEALTH CARE FUND October 31, 2022
The following is a summary of the inputs used as of October 31, 2022 in valuing the Fund’s investments carried at fair value(1):
| Investment Type(2) | | Level 1 | | | Level 2 | | | Level 3 | | | Total | |
| Long-Term Investments | | | | | | | | | | | | | | | | |
| Common Stocks | | | | | | | | | | | | | | | | |
| Denmark | | $ | – | | | $ | 339,096 | | | $ | – | | | $ | 339,096 | |
| Japan | | | – | | | | 135,895 | | | | – | | | | 135,895 | |
| Netherlands | | | 35,772 | | | | 118,805 | | | | – | | | | 154,577 | |
| Switzerland | | | 60,437 | | | | 77,733 | | | | – | | | | 138,170 | |
| United Kingdom | | | – | | | | 252,381 | | | | – | | | | 252,381 | |
| United States | | | 4,948,301 | | | | 150,636 | | | | – | | | | 5,098,937 | |
| Remaining Countries | | | 144,184 | | | | – | | | | – | | | | 144,184 | |
| Short-Term Investments | | | | | | | | | | | | | | | | |
| Repurchase Agreements | | | – | | | | 152,785 | | | | – | | | | 152,785 | |
| Money Market Funds | | | 70,133 | | | | – | | | | – | | | | 70,133 | |
| Time Deposits | | | – | | | | 7,793 | | | | – | | | | 7,793 | |
| Total | | $ | 5,258,827 | | | $ | 1,235,124 | | | $ | – | | | $ | 6,493,951 | |
| | | |
| (1) | | Refer to Note 2(l) for a description of fair value measurements and the three-tier hierarchy of inputs. |
| (2) | | See Schedule of Investments for fair values in each industry and identification of foreign issuer and/or geography. The table above is presented by Investment Type. Industries are presented within an Investment Type should such Investment Type include securities classified as two or more levels within the three- tier fair value hierarchy. When applicable each Level 3 security is identified on the Schedule of Investments along with the valuation technique utilized. |
A reconciliation of Level 3 investments is presented when the Fund has a material amount of Level 3 investments at the beginning or end of the year in relation to the Fund’s net assets.
| 110 | See Notes to Financial Statements. | |
Schedule of Investments
INTERNATIONAL EQUITY FUND October 31, 2022
| Investments | | Shares | | | U.S. $
Fair Value | |
| LONG-TERM INVESTMENTS 94.85% | | | | | | | | |
| COMMON STOCKS 94.85% | | | | | | | | |
| | | | | | | | | |
| Australia 1.51% | | | | | | | | |
| | | | | | | | | |
| Metals & Mining | | | | | | | | |
| BHP Group Ltd. | | | 175,199 | | | $ | 4,208,316 | |
| | | | | | | | | |
| Austria 0.90% | | | | | | | | |
| | | | | | | | | |
| Banks | | | | | | | | |
| BAWAG Group AG† | | | 52,107 | | | | 2,515,507 | |
| | | | | | | | | |
| Brazil 1.51% | | | | | | | | |
| | | | | | | | | |
| Insurance 0.98% | | | | | | | | |
| BB Seguridade Participacoes SA | | | 477,300 | | | | 2,743,401 | |
| | | | |
| Internet & Direct Marketing Retail 0.53% | | | |
| MercadoLibre, Inc.* | | | 1,624 | | | | 1,464,231 | |
| Total Brazil | | | | | | | 4,207,632 | |
| | | | | | | | | |
| Canada 3.50% | | | | | | | | |
| | | | | | | | | |
| Banks 0.92% | | | | | | | | |
| Royal Bank of Canada | | | 27,800 | | | | 2,572,166 | |
| | | | | | | | | |
| Insurance 0.83% | | | | | | | | |
| Intact Financial Corp. | | | 15,300 | | | | 2,324,845 | |
| | | | | | | | | |
| Oil, Gas & Consumable Fuels 0.96% | | | | | | | | |
| Pembina Pipeline Corp. | | | 81,219 | | | | 2,681,565 | |
| | | | | | | | | |
| Transportation Infrastructure 0.79% | | | | | | | | |
| Canadian Pacific Railway Ltd. | | | 29,500 | | | | 2,199,156 | |
| Total Canada | | | | | | | 9,777,732 | |
| | | | | | | | | |
| China 3.88% | | | | | | | | |
| | | | | | | | | |
| Automobiles 0.49% | | | | | | | | |
| BYD Co. Ltd. Class H | | | 60,500 | | | | 1,355,389 | |
| | | | | | | | | |
| Beverages 0.41% | | | | | | | | |
| Kweichow Moutai Co. Ltd. Class A | | | 6,200 | | | | 1,149,194 | |
| Investments | | Shares | | | U.S. $
Fair Value | |
| China (continued) | | | | | | | | |
| | | | | | | | | |
| Electrical Equipment 0.39% | | | | | | | | |
| Contemporary Amperex Technology Co. Ltd. Class A | | | 21,500 | | | $ | 1,103,374 | |
| | | | | | | | | |
| Interactive Media & Services 0.98% | | | | | | | | |
| Tencent Holdings Ltd. | | | 104,300 | | | | 2,740,668 | |
| | | | | | | | | |
| Internet & Direct Marketing Retail 1.61% | | | |
| Alibaba Group Holding Ltd.* | | | 347,600 | | | | 2,702,557 | |
| JD.com, Inc. Class A | | | 98,426 | | | | 1,792,388 | |
| | | | | | | | 4,494,945 | |
| Total China | | | | | | | 10,843,570 | |
| | | | | | | | | |
| Denmark 3.00% | | | | | | | | |
| | | | | | | | | |
| Biotechnology 0.74% | | | | | | | | |
| Genmab A/S* | | | 5,385 | | | | 2,074,342 | |
| | | | | | | | | |
| Pharmaceuticals 2.26% | | | | | | | | |
| Novo Nordisk A/S Class B | | | 57,917 | | | | 6,297,388 | |
| Total Denmark | | | | | | | 8,371,730 | |
| | | | | | | | | |
| Finland 1.53% | | | | | | | | |
| | | | | | | | | |
| Banks | | | | | | | | |
| Nordea Bank Abp | | | 446,882 | | | | 4,268,848 | |
| | | | | | | | | |
| France 13.84% | | | | | | | | |
| | | | | | | | | |
| Aerospace & Defense 1.63% | | | | | | | | |
| Airbus SE | | | 18,743 | | | | 2,028,062 | |
| Thales SA | | | 19,843 | | | | 2,523,631 | |
| | | | | | | | 4,551,693 | |
| | | | | | | | | |
| Auto Components 0.72% | | | | | | | | |
| Cie Generale des Etablissements Michelin SCA | | | 79,409 | | | | 2,023,663 | |
| | | | | | | | | |
| Beverages 1.08% | | | | | | | | |
| Pernod Ricard SA | | | 17,246 | | | | 3,026,866 | |
| | See Notes to Financial Statements. | 111 |
Schedule of Investments (continued)
INTERNATIONAL EQUITY FUND October 31, 2022
| Investments | | Shares | | | U.S. $
Fair Value | |
| France (continued) | | | | | | | | |
| | | | | | | | | |
| Chemicals 1.14% | | | | | | | | |
| Air Liquide SA | | | 24,283 | | | $ | 3,176,549 | |
| | | | | | | | | |
| Diversified Telecommunication Services 0.69% | | | |
| Orange SA | | | 201,877 | | | | 1,923,466 | |
| | | | | | | | | |
| Information Technology Services 0.88% | | | |
| Capgemini SE | | | 15,079 | | | | 2,471,308 | |
| | | | | | | | | |
| Insurance 1.12% | | | | | | | | |
| AXA SA | | | 126,764 | | | | 3,130,422 | |
| | | | |
| Oil, Gas & Consumable Fuels 1.47% | | | |
| TotalEnergies SE | | | 75,264 | | | | 4,105,903 | |
| | | | | | | | | |
| Personal Products 1.30% | | | | | | | | |
| L’Oreal SA | | | 11,578 | | | | 3,635,540 | |
| | | | | | | | | |
| Professional Services 0.79% | | | | | | | | |
| Teleperformance | | | 8,262 | | | | 2,213,636 | |
| | | | | | | | | |
| Textiles, Apparel & Luxury Goods 3.02% | | | |
| Hermes International | | | 2,028 | | | | 2,625,013 | |
| LVMH Moet Hennessy Louis Vuitton SE | | | 9,202 | | | | 5,806,412 | |
| | | | | | | | 8,431,425 | |
| Total France | | | | | | | 38,690,471 | |
| | | | | | | | | |
| Germany 2.06% | | | | | | | | |
| | | | | | | | | |
| Chemicals 1.18% | | | | | | | | |
| Covestro AG† | | | 19,433 | | | | 659,673 | |
| Symrise AG | | | 25,819 | | | | 2,635,410 | |
| | | | | | | | 3,295,083 | |
| | | | | | | | | |
| Semiconductors & Semiconductor Equipment 0.88% | | | |
| Aixtron SE | | | 41,377 | | | | 1,016,783 | |
| Infineon Technologies AG | | | 59,271 | | | | 1,438,238 | |
| | | | | | | | 2,455,021 | |
| Total Germany | | | | | | | 5,750,104 | |
| Investments | | Shares | | | U.S. $
Fair Value | |
| Hong Kong 0.98% | | | | | | | | |
| | | | | | | | | |
| Insurance | | | | | | | | |
| AIA Group Ltd. | | | 361,682 | | | $ | 2,739,665 | |
| | | | | | | | | |
| India 7.21% | | | | | | | | |
| | | | | | | | | |
| Automobiles 0.63% | | | | | | | | |
| Maruti Suzuki India Ltd. | | | 15,400 | | | | 1,775,471 | |
| | | | | | | | | |
| Banks 2.50% | | | | | | | | |
| Axis Bank Ltd. | | | 267,512 | | | | 2,933,664 | |
| ICICI Bank Ltd. ADR | | | 183,443 | | | | 4,043,084 | |
| | | | | | | | 6,976,748 | |
| | | | | | | | | |
| Chemicals 0.83% | | | | | | | | |
| Asian Paints Ltd. | | | 62,054 | | | | 2,335,902 | |
| | | | | | | | | |
| Oil, Gas & Consumable Fuels 1.25% | | | |
| Reliance Industries Ltd. | | | 112,954 | | | | 3,485,394 | |
| | | | | | | | | |
| Personal Products 0.85% | | | | | | | | |
| Hindustan Unilever Ltd. | | | 76,883 | | | | 2,372,119 | |
| | | | | | | | | |
| Wireless Telecommunication Services 1.15% | | | |
| Bharti Airtel Ltd. | | | 319,229 | | | | 3,210,419 | |
| Total India | | | | | | | 20,156,053 | |
| | | | | | | | | |
| Indonesia 1.68% | | | | | | | | |
| | | | | | | | | |
| Banks 0.88% | | | | | | | | |
| Bank Mandiri Persero | | | | | | | | |
| Tbk PT | | | 3,654,600 | | | | 2,468,876 | |
| | | | | | | | | |
| Diversified Telecommunication Services 0.80% | | | |
| Telkom Indonesia Persero Tbk PT ADR | | | 80,372 | | | | 2,235,949 | |
| Total Indonesia | | | | | | | 4,704,825 | |
| | | | | | | | | |
| Ireland 1.71% | | | | | | | | |
| | | | | | | | | |
| Banks 0.81% | | | | | | | | |
| Bank of Ireland Group plc | | | 313,558 | | | | 2,257,812 | |
| | | | | | | | | |
| Construction Materials 0.90% | | | | | | | | |
| CRH plc | | | 70,011 | | | | 2,514,981 | |
| Total Ireland | | | | | | | 4,772,793 | |
| 112 | See Notes to Financial Statements. | |
Schedule of Investments (continued)
INTERNATIONAL EQUITY FUND October 31, 2022
| Investments | | Shares | | | U.S. $
Fair Value | |
| Japan 15.97% | | | | | | | | |
| | | | | | | | | |
| Auto Components 1.38% | | | | | | | | |
| Bridgestone Corp. | | | 66,900 | | | $ | 2,419,535 | |
| Denso Corp. | | | 28,785 | | | | 1,428,194 | |
| | | | | | | | 3,847,729 | |
| | | | | | | | | |
| Automobiles 1.51% | | | | | | | | |
| Toyota Motor Corp. | | | 304,800 | | | | 4,228,978 | |
| | | | | | | | | |
| Banks 0.70% | | | | | | | | |
| Sumitomo Mitsui Financial Group, Inc. | | | 69,500 | | | | 1,951,668 | |
| | | | | | | | | |
| Beverages 0.70% | | | | | | | | |
| Asahi Group Holdings Ltd. | | | 69,525 | | | | 1,945,360 | |
| | | | | | | | | |
| Diversified Financial Services 0.64% | | | |
| ORIX Corp. | | | 121,500 | | | | 1,784,554 | |
| | | | | | | | | |
| Electrical Equipment 0.81% | | | | | | | | |
| Fuji Electric Co. Ltd. | | | 58,400 | | | | 2,258,034 | |
| | | | | | | | | |
| Electronic Equipment, Instruments & Components 1.25% |
| Keyence Corp. | | | 9,260 | | | | 3,491,622 | |
| | | | | | | | | |
| Health Care Equipment & Supplies 0.83% | | | |
| Hoya Corp. | | | 25,100 | | | | 2,333,330 | |
| | | | | | | | | |
| Household Durables 1.09% | | | | | | | | |
| Sony Group Corp. | | | 45,200 | | | | 3,048,046 | |
| | | | | | | | | |
| Industrial Conglomerates 0.82% | | | | | | | | |
| Hitachi Ltd. | | | 50,500 | | | | 2,291,377 | |
| | | | | | | | | |
| Information Technology Services 0.49% | | | |
| Obic Co. Ltd. | | | 9,200 | | | | 1,380,579 | |
| | | | | | | | | |
| Insurance 0.89% | | | | | | | | |
| Tokio Marine Holdings, Inc. | | | 138,000 | | | | 2,498,512 | |
| | | | | | | | | |
| Machinery 0.51% | | | | | | | | |
| Fujitec Co. Ltd. | | | 71,700 | | | | 1,424,205 | |
| Investments | | Shares | | | U.S. $
Fair Value | |
| Japan (continued) | | | | | | | | |
| | | | | | | | | |
| Pharmaceuticals 1.60% | | | | | | | | |
| Daiichi Sankyo Co. Ltd. | | | 139,400 | | | $ | 4,462,300 | |
| | | | | | | | | |
| Professional Services 0.75% | | | | | | | | |
| TechnoPro Holdings, Inc. | | | 86,900 | | | | 2,084,761 | |
| | | | | | | | | |
| Specialty Retail 0.89% | | | | | | | | |
| Fast Retailing Co. Ltd. | | | 4,450 | | | | 2,479,278 | |
| | | | | | | | | |
| Trading Companies & Distributors 1.11% | | | |
| ITOCHU Corp. | | | 120,600 | | | | 3,116,851 | |
| Total Japan | | | | | | | 44,627,184 | |
| | | | | | | | | |
| Mexico 1.85% | | | | | | | | |
| | | | | | | | | |
| Banks 1.02% | | | | | | | | |
| Grupo Financiero Banorte SAB de CV Class O | | 350,517 | | | | 2,849,178 | |
| | | | | | | | | |
| Transportation Infrastructure 0.83% | | | | | | | | |
| Grupo Aeroportuario del Pacifico SAB de CV ADR | | | 14,961 | | | | 2,319,853 | |
| Total Mexico | | | | | | | 5,169,031 | |
| | | | | | | | | |
| Netherlands 5.55% | | | | | | | | |
| | | | | | | | | |
| Information Technology Services 0.38% | | | |
| Adyen NV†* | | | 746 | | | | 1,064,989 | |
| | | | | | | | | |
| Insurance 1.26% | | | | | | | | |
| NN Group NV | | | 83,140 | | | | 3,520,350 | |
| | | | | | | | | |
| Oil, Gas & Consumable Fuels 2.26% | | | |
| Shell plc | | | 227,480 | | | | 6,301,556 | |
| | | | | | | | | |
| Semiconductors & Semiconductor Equipment 1.65% | |
| ASML Holding NV | | | 9,849 | | | | 4,620,034 | |
| Total Netherlands | | | | | | | 15,506,929 | |
| | See Notes to Financial Statements. | 113 |
Schedule of Investments (continued)
INTERNATIONAL EQUITY FUND October 31, 2022
| Investments | | Shares | | | U.S. $
Fair Value | |
| Norway 1.56% | | | | | | | | |
| | | | | | | | | |
| Oil, Gas & Consumable Fuels | | | | | | | | |
| Aker BP ASA | | | 47,772 | | | $ | 1,517,542 | |
| Equinor ASA | | | 77,770 | | | | 2,833,450 | |
| | | | | | | | 4,350,992 | |
| | | | | | | | | |
| Peru 0.89% | | | | | | | | |
| | | | | | | | | |
| Banks | | | | | | | | |
| Credicorp Ltd. | | | 17,083 | | | | 2,500,268 | |
| | | | | | | | | |
| Singapore 1.36% | | | | | | | | |
| | | | | | | | | |
| Banks | | | | | | | | |
| United Overseas Bank Ltd. | | | 194,200 | | | | 3,809,968 | |
| | | | | | | | | |
| South Africa 0.96% | | | | | | | | |
| | | | | | | | | |
| Metals & Mining | | | | | | | | |
| Anglo American plc | | | 89,447 | | | | 2,679,313 | |
| | | | | | | | | |
| South Korea 0.98% | | | | | | | | |
| | | | | | | | | |
| Technology Hardware, Storage & Peripherals | | | |
| Samsung Electronics Co. Ltd. | | | 66,026 | | | | 2,747,991 | |
| | | | | | | | | |
| Spain 2.73% | | | | | | | | |
| | | | | | | | | |
| Banks 1.29% | | | | | | | | |
| CaixaBank SA | | | 1,086,846 | | | | 3,604,028 | |
| | | | | | | | | |
| Electric: Utilities 0.80% | | | | | | | | |
| Iberdrola SA | | | 219,582 | | | | 2,232,989 | |
| | | | | | | | | |
| Textiles, Apparel & Luxury Goods 0.64% | | | |
| Industria de Diseno Textil SA | | | 78,420 | | | | 1,779,993 | |
| Total Spain | | | | | | | 7,617,010 | |
| | | | | | | | | |
| Sweden 1.01% | | | | | | | | |
| | | | | | | | | |
| Machinery | | | | | | | | |
| Atlas Copco AB A Shares | | | 263,909 | | | | 2,816,766 | |
| Investments | | Shares | | | U.S. $
Fair Value | |
| Switzerland 2.39% | | | | | | | | |
| | | | | | | | | |
| Capital Markets 0.84% | | | | | | | | |
| UBS Group AG Registered Shares | | | 148,295 | | | $ | 2,351,092 | |
| | | | | | | | | |
| Health Care Equipment & Supplies 0.75% | | | |
| Alcon, Inc. | | | 34,553 | | | | 2,103,771 | |
| | | | | | | | | |
| Life Sciences Tools & Services 0.80% | | | |
| Lonza Group AG Registered Shares | | | 4,346 | | | | 2,237,251 | |
| Total Switzerland | | | | | | | 6,692,114 | |
| | | | | | | | | |
| Taiwan 2.31% | | | | | | | | |
| | | | | | | | | |
| Electrical Equipment 0.32% | | | | | | | | |
| Voltronic Power Technology Corp. | | | 22,000 | | | | 891,971 | |
| | | | | | | | | |
| Electronic Equipment, Instruments & Components 0.66% |
| Delta Electronics, Inc. | | | 231,000 | | | | 1,838,023 | |
| | | | | | | | | |
| Semiconductors & Semiconductor Equipment 1.33% | | | |
| Taiwan Semiconductor Manufacturing Co. Ltd. | | | 309,230 | | | | 3,717,626 | |
| Total Taiwan | | | | | | | 6,447,620 | |
| | | | | | | | | |
| United Kingdom 8.80% | | | | | | | | |
| | | | | | | | | |
| Banks 0.79% | | | | | | | | |
| NatWest Group plc | | | 820,333 | | | | 2,209,404 | |
| | | | | | | | | |
| Beverages 1.37% | | | | | | | | |
| Diageo plc | | | 93,330 | | | | 3,840,759 | |
| | | | | | | | | |
| Capital Markets 0.66% | | | | | | | | |
| London Stock Exchange Group plc | | | 21,411 | | | | 1,855,948 | |
| | | | | | | | | |
| Commercial Services & Supplies 0.77% | | | |
| Rentokil Initial PLC | | | 343,894 | | | | 2,145,934 | |
| | | | | | | | | |
| Electric: Utilities 0.72% | | | | | | | | |
| SSE plc | | | 112,231 | | | | 2,005,667 | |
| 114 | See Notes to Financial Statements. | |
Schedule of Investments (continued)
INTERNATIONAL EQUITY FUND October 31, 2022
| Investments | | Shares | | | U.S. $
Fair Value | |
| United Kingdom (continued) | | | | | | | | |
| | | | | | | | | |
| Personal Products 1.35% | | | | | | | | |
| Unilever plc | | | 83,118 | | | $ | 3,778,074 | |
| | | | | | | | | |
| Pharmaceuticals 1.77% | | | | | | | | |
| AstraZeneca plc | | | 42,130 | | | | 4,943,202 | |
| | | | | | | | | |
| Tobacco 0.68% | | | | | | | | |
| Imperial Brands plc | | | 77,528 | | | | 1,888,510 | |
| | | | | | | | | |
| Wireless Telecommunication Services 0.69% | | | |
| Vodafone Group plc | | | 1,660,689 | | | | 1,938,691 | |
| Total United Kingdom | | | | | | | 24,606,189 | |
| | | | | | | | | |
| United States 5.18% | | | | | | | | |
| | | | | | | | | |
| Electrical Equipment 1.62% | | | | | | | | |
| Schneider Electric SE | | | 35,836 | | | | 4,531,688 | |
| | | | | | | | | |
| Food Products 1.61% | | | | | | | | |
| Nestle SA Registered Shares | | | 41,378 | | | | 4,504,359 | |
| | | | | | | | | |
| Pharmaceuticals 1.95% | | | | | | | | |
| Eli Lilly & Co. | | | 6,228 | | | | 2,255,097 | |
| Roche Holding AG | | | 9,619 | | | | 3,191,566 | |
| | | | | | | | 5,446,663 | |
| Total United States | | | | | | | 14,482,710 | |
Total Common Stocks
(cost $278,612,822) | | | | | | | 265,061,331 | |
| Investments | | Principal
Amount | | | U.S. $
Fair Value | |
| SHORT-TERM INVESTMENTS 3.59% | | | |
| | | | | | | | | |
| Repurchase Agreements 3.59% | | | |
Repurchase Agreement dated 10/31/2022, 1.30% due 11/1/2022 with Fixed Income Clearing Corp. collateralized by $10,634,800 of U.S. Treasury Note at 2.00% due 4/30/2024; value: $10,237,654; proceeds: $10,037,217
(cost $10,036,854) | | $ | 10,036,854 | | | $ | 10,036,854 | |
Total Investments in Securities 98.44%
(cost $288,649,676) | | | | 275,098,185 | |
| Other Assets and Liabilities – Net 1.56% | | | | 4,372,121 | |
| Net Assets 100.00% | | | | | | $ | 279,470,306 | |
| | | |
| ADR | | American Depositary Receipt. |
| † | | Security was purchased pursuant to Rule 144A under the Securities Act of 1933 and, unless registered under such Act or exempted from registration, may only be resold to qualified institutional buyers. At October 31, 2022, the total value of Rule 144A securities was $4,240,169, which represents 1.52% of net assets. |
| * | | Non-income producing security. |
| | See Notes to Financial Statements. | 115 |
Schedule of Investments (concluded)
INTERNATIONAL EQUITY FUND October 31, 2022
The following is a summary of the inputs used as of October 31, 2022 in valuing the Fund’s investments carried at fair value(1):
| Investment Type(2) | | Level 1 | | | Level 2 | | | Level 3 | | | Total | |
| Long-Term Investments | | | | | | | | | | | | | | | | |
| Common Stocks | | | | | | | | | | | | | | | | |
| Brazil | | $ | 4,207,632 | | | $ | – | | | $ | – | | | $ | 4,207,632 | |
| Canada | | | 9,777,732 | | | | – | | | | – | | | | 9,777,732 | |
| India | | | 4,043,084 | | | | 16,112,969 | | | | – | | | | 20,156,053 | |
| Indonesia | | | 2,235,949 | | | | 2,468,876 | | | | – | | | | 4,704,825 | |
| Mexico | | | 5,169,031 | | | | – | | | | – | | | | 5,169,031 | |
| Peru | | | 2,500,268 | | | | – | | | | – | | | | 2,500,268 | |
| United States | | | 2,255,097 | | | | 12,227,613 | | | | – | | | | 14,482,710 | |
| Remaining Countries | | | – | | | | 204,063,080 | | | | – | | | | 204,063,080 | |
| Short-Term Investments | | | | | | | | | | | | | | | | |
| Repurchase Agreements | | | – | | | | 10,036,854 | | | | – | | | | 10,036,854 | |
| Total | | $ | 30,188,793 | | | $ | 244,909,392 | | | $ | – | | | $ | 275,098,185 | |
| | | |
| (1) | | Refer to Note 2(l) for a description of fair value measurements and the three-tier hierarchy of inputs. |
| (2) | | See Schedule of Investments for fair values in each industry and identification of foreign issuers and/or geography. The table above is presented by Investment Type. Industries are presented within an Investment Type should such Investment Type include securities classified as two or more levels within the three-tier fair value hierarchy. When applicable each Level 3 security is identified on the Schedule of Investments along with the valuation technique utilized. |
A reconciliation of Level 3 investments is presented when the Fund has a material amount of Level 3 investments at the beginning or end of the year in relation to the Fund’s net assets.
The following is a reconciliation of investments with unobservable inputs (Level 3) that were used in determining fair value:
| Investment Type | | Common
Stocks | |
| Balance as of November 1, 2021 | | $ | 4,705,085 | |
| Accrued Discounts (Premiums) | | | – | |
| Realized Gain (Loss) | | | 1,458,876 | |
| Change in Unrealized Appreciation (Depreciation) | | | (2,036,040 | ) |
| Purchases | | | – | |
| Sales | | | (4,127,921 | ) |
| Transfers into Level 3 | | | – | |
| Transfers out of Level 3 | | | – | |
| Balance as of October 31, 2022 | | $ | – | |
| Change in unrealized appreciation/ depreciation for the period ended October 31, 2022, related to Level 3 investments held at October 31, 2022 | | $ | – | |
| | | |
| 116 | See Notes to Financial Statements. | |
Schedule of Investments
INTERNATIONAL OPPORTUNITIES FUND October 31, 2022
| Investments | | Shares | | | U.S. $
Fair Value | |
| LONG-TERM INVESTMENTS 94.82% | | | | | | |
| COMMON STOCKS 94.82% | | | | | | |
| | | | | | | |
| Australia 2.72% | | | | | | |
| | | | | | | |
| Auto Components 1.30% | | | | | | |
| GUD Holdings Ltd. | | | 788,089 | | | $ | 4,053,564 | |
| | | | | | | | | |
| Professional Services 1.42% | | | | | | | | |
| IPH Ltd. | | | 691,138 | | | | 4,395,504 | |
| Total Australia | | | | | | | 8,449,068 | |
| | | | | | | | | |
| Austria 3.47% | | | | | | | | |
| | | | | | | | | |
| Banks 1.04% | | | | | | | | |
| BAWAG Group AG† | | | 66,863 | | | | 3,227,865 | |
| | | | | | | | | |
| Machinery 2.43% | | | | | | | | |
| ANDRITZ AG | | | 162,461 | | | | 7,550,622 | |
| Total Austria | | | | | | | 10,778,487 | |
| | | | | | | | | |
| Canada 6.99% | | | | | | | | |
| | | | | | | | | |
| Capital Markets 1.08% | | | | | | | | |
| CI Financial Corp. | | | 336,900 | | | | 3,373,080 | |
| | | | | | | | | |
| Gas Utilities 2.63% | | | | | | | | |
| Brookfield Infrastructure Corp. Class A | | | 189,800 | | | | 8,189,117 | |
| | | | | | | | | |
| Metals & Mining 1.25% | | | | | | | | |
| Capstone Copper Corp.* | | | 1,669,400 | | | | 3,872,209 | |
| | | | | | | | | |
| Oil, Gas & Consumable Fuels 1.55% | | | | | | | | |
| MEG Energy Corp.* | | | 321,400 | | | | 4,805,607 | |
| | | | | | | | | |
| Paper & Forest Products 0.48% | | | | | | | | |
| Interfor Corp.* | | | 83,600 | | | | 1,485,022 | |
| Total Canada | | | | | | | 21,725,035 | |
| | | | | | | | | |
| Egypt 1.27% | | | | | | | | |
| | | | | | | | | |
| Oil, Gas & Consumable Fuels | | | | | | | | |
| Energean PLC | | | 239,685 | | | | 3,933,399 | |
| Investments | | Shares | | | U.S. $
Fair Value | |
| France 3.40% | | | | | | |
| | | | | | | |
| Construction Materials 0.77% | | | | | | |
| Vicat SA | | | 104,455 | | | $ | 2,394,447 | |
| | | | | | | | | |
| Oil, Gas & Consumable Fuels 1.35% | | | | | | | | |
| Gaztransport Et Technigaz SA | | | 36,003 | | | | 4,188,535 | |
| | | | | | | | | |
| Personal Products 0.92% | | | | | | | | |
| Interparfums SA | | | 59,337 | | | | 2,860,591 | |
| | | | | | | | | |
| Software 0.36% | | | | | | | | |
| Esker SA | | | 8,490 | | | | 1,113,968 | |
| Total France | | | | | | | 10,557,541 | |
| | | | | | | | | |
| Germany 7.31% | | | | | | | | |
| | | | | | | | | |
| Aerospace & Defense 1.64% | | | | | | | | |
| Montana Aerospace AG†* | | | 152,962 | | | | 1,753,920 | |
| Rheinmetall AG | | | 20,495 | | | | 3,331,496 | |
| | | | | | | | 5,085,416 | |
| | | | | | | | | |
| Health Care Providers & Services 0.20% | | | | | | | | |
| Medios AG*(a) | | | 33,611 | | | | 620,476 | |
| | | | | | | | | |
| Life Sciences Tools & Services 1.39% | | | | | | | | |
| Gerresheimer AG | | | 75,511 | | | | 4,325,921 | |
| | | | | | | | | |
| Media 1.00% | | | | | | | | |
| Stroeer SE & Co. KGaA | | | 76,136 | | | | 3,103,981 | |
| | | | | | | | | |
| Semiconductors & Semiconductor Equipment 1.61% | |
| Aixtron SE | | | 202,861 | | | | 4,985,030 | |
| | | | | | | | | |
| Specialty Retail 0.37% | | | | | | | | |
| MYT Netherlands Parent BV ADR* | | | 100,244 | | | | 1,145,789 | |
| | | | | | | | | |
| Wireless Telecommunication Services 1.10% | | | | | |
| Freenet AG | | | 174,319 | | | | 3,426,446 | |
| Total Germany | | | | | | | 22,693,059 | |
| | See Notes to Financial Statements. | 117 |
Schedule of Investments (continued)
INTERNATIONAL OPPORTUNITIES FUND October 31, 2022
| Investments | | Shares | | | U.S. $
Fair Value | |
| Hong Kong 1.05% | | | | | | | | |
| | | | | | | | | |
| Hotels, Restaurants & Leisure 0.32% | | | | | |
| Melco International Development Ltd.* | | | 1,894,000 | | | $ | 990,311 | |
| | | | | | | | | |
| Real Estate Management & Development 0.27% | | | | | |
| Kerry Properties Ltd. | | | 531,500 | | | | 840,772 | |
| | | | | | | | | |
| Textiles, Apparel & Luxury Goods 0.46% | | | | | |
| Stella International Holdings Ltd. | | | 1,486,932 | | | | 1,439,642 | |
| Total Hong Kong | | | | | | | 3,270,725 | |
| | | | | | | | | |
| Iceland 1.10% | | | | | | | | |
| | | | | | | | | |
| Machinery | | | | | | | | |
| Marel HF† | | | 948,142 | | | | 3,401,314 | |
| | | | | | | | | |
| India 3.13% | | | | | | | | |
| | | | | | | | | |
| Banks 1.39% | | | | | | | | |
| Federal Bank Ltd. | | | 2,719,388 | | | | 4,324,778 | |
| | | | | | | | | |
| Capital Markets 0.90% | | | | | | | | |
| UTI Asset Management Co. Ltd. | | | 328,332 | | | | 2,785,530 | |
| | | | | | | | | |
| Real Estate Management & Development 0.84% | | | | | |
| Phoenix Mills Ltd. (The) | | | 151,504 | | | | 2,614,397 | |
| Total India | | | | | | | 9,724,705 | |
| | | | | | | | | |
| Indonesia 1.23% | | | | | | | | |
| | | | | | | | | |
| Real Estate Management & Development | | | | | |
| Pakuwon Jati Tbk PT | | | 136,152,200 | | | | 3,825,389 | |
| | | | | | | | | |
| Israel 1.09% | | | | | | | | |
| | | | | | | | | |
| Capital Markets | | | | | | | | |
| Tel Aviv Stock Exchange Ltd. | | | 575,771 | | | | 3,393,089 | |
| | | | | | | | | |
| Italy 5.38% | | | | | | | | |
| | | | | | | | | |
| Auto Components 1.00% | | | | | | | | |
| Brembo SpA | | | 298,086 | | | | 3,116,306 | |
| Investments | | Shares | | | U.S. $
Fair Value | |
| Italy (continued) | | | | | | |
| | | | | | | |
| Construction Materials 0.38% | | | | | | |
| Buzzi Unicem SpA | | | 70,850 | | | $ | 1,175,881 | |
| | | | | | | | | |
| Diversified Financial Services 1.35% | | | | | | | | |
| Banca Mediolanum SpA | | | 558,911 | | | | 4,181,720 | |
| | | | | | | | | |
| Textiles, Apparel & Luxury Goods 2.65% | | | | | |
| Brunello Cucinelli SpA | | | 80,830 | | | | 4,685,383 | |
| Salvatore Ferragamo SpA | | | 242,181 | | | | 3,559,831 | |
| | | | | | | | 8,245,214 | |
| Total Italy | | | | | | | 16,719,121 | |
| | | | | | | | | |
| Japan 21.44% | | | | | | | | |
| | | | | | | | | |
| Auto Components 0.53% | | | | | | | | |
| FCC Co. Ltd. | | | 168,200 | | | | 1,635,397 | |
| | | | | | | | | |
| Banks 1.92% | | | | | | | | |
| Aozora Bank Ltd. | | | 86,500 | | | | 1,487,952 | |
| Resona Holdings, Inc. | | | 585,400 | | | | 2,206,344 | |
| Shizuoka Financial Group, Inc. | | | 357,700 | | | | 2,258,811 | |
| | | | | | | | 5,953,107 | |
| | | | | | | | | |
| Beverages 0.85% | | | | | | | | |
| Coca-Cola Bottlers Japan Holdings, Inc. | | | 291,500 | | | | 2,633,687 | |
| | | | | | | | | |
| Building Products 0.99% | | | | | | | | |
| Sanwa Holdings Corp. | | | 355,600 | | | | 3,063,179 | |
| | | | | | | | | |
| Chemicals 1.26% | | | | | | | | |
| Kansai Paint Co. Ltd. | | | 300,800 | | | | 3,925,196 | |
| | | | | | | | | |
| Construction & Engineering 1.95% | | | | | | | | |
| SHO-BOND Holdings Co. Ltd. | | | 140,300 | | | | 6,069,387 | |
| | | | | | | | | |
| Distributors 1.34% | | | | | | | | |
| PALTAC Corp. | | | 146,300 | | | | 4,155,771 | |
| | | | | | | | | |
| Food Products 0.49% | | | | | | | | |
| Nichirei Corp. | | | 98,900 | | | | 1,538,136 | |
| 118 | See Notes to Financial Statements. |
Schedule of Investments (continued)
INTERNATIONAL OPPORTUNITIES FUND October 31, 2022
| Investments | | Shares | | | U.S. $
Fair Value | |
| Japan (continued) | | | | | | |
| | | | | | | |
| Hotels, Restaurants & Leisure 0.49% | | | | | | |
| Saizeriya Co. Ltd. | | | 81,500 | | | $ | 1,520,551 | |
| | | | | | | | | |
| Information Technology Services 4.15% | | | | |
| NS Solutions Corp. | | | 150,400 | | | | 3,456,817 | |
| Simplex Holdings, Inc. | | | 230,300 | | | | 3,670,872 | |
| TIS, Inc. | | | 112,700 | | | | 3,038,587 | |
| Zuken, Inc. | | | 120,800 | | | | 2,722,965 | |
| | | | | | | | 12,889,241 | |
| Machinery 3.06% | | | | | | | | |
| DMG Mori Co. Ltd. | | | 275,200 | | | | 3,184,786 | |
| Fujitec Co. Ltd. | | | 128,200 | | | | 2,546,486 | |
| OSG Corp. | | | 297,300 | | | | 3,779,654 | |
| | | | | | | | 9,510,926 | |
| | | | | | | | | |
| Professional Services 1.25% | | | | | | | | |
| TechnoPro Holdings, Inc. | | | 162,600 | | | | 3,900,831 | |
| | | | | | | | | |
| Real Estate Management & Development 0.28% | | | | |
| CRE, Inc. | | | 95,000 | | | | 869,041 | |
| | | | | | | | | |
| Software 1.30% | | | | | | | | |
| Money Forward, Inc.* | | | 78,800 | | | | 2,229,335 | |
| OBIC Business Consultants Co. Ltd. | | | 62,600 | | | | 1,799,434 | |
| | | | | | | | 4,028,769 | |
| | | | | | | | | |
| Wireless Telecommunication Services 1.58% | | | | |
| Okinawa Cellular Telephone Co. | | | 259,600 | | | | 4,909,181 | |
| Total Japan | | | | | | | 66,602,400 | |
| | | | | | | | | |
| Mexico 1.11% | | | | | | | | |
| | | | | | | | | |
| Consumer Finance | | | | | | | | |
| Gentera SAB de CV | | | 3,360,320 | | | | 3,453,092 | |
| | | | | | | | | |
| New Zealand 0.51% | | | | | | | | |
| | | | | | | | | |
| Airlines | | | | | | | | |
| Air New Zealand Ltd.* | | | 3,499,055 | | | | 1,587,123 | |
| Investments | | Shares | | | U.S. $
Fair Value | |
| Norway 0.91% | | | | | | | | |
| | | | | | | | | |
| Semiconductors & Semiconductor Equipment 0.47% | | | |
| Nordic Semiconductor ASA* | | | 103,182 | | | $ | 1,456,652 | |
| | | | | | | | | |
| Software 0.44% | | | | | | | | |
| Crayon Group Holding ASA†* | | | 165,135 | | | | 1,369,068 | |
| Total Norway | | | | | | | 2,825,720 | |
| | | | | | | | | |
| Peru 0.71% | | | | | | | | |
| | | | | | | | | |
| Banks | | | | | | | | |
| Intercorp Financial Services, Inc. | | | 89,356 | | | | 2,198,158 | |
| | | | | | | | | |
| Portugal 1.93% | | | | | | | | |
| | | | | | | | | |
| Multi-Utilities | | | | | | | | |
| REN - Redes Energeticas Nacionais SGPS SA | | | 2,310,100 | | | | 5,979,045 | |
| | | | | | | | | |
| Singapore 0.35% | | | | | | | | |
| | | | | | | | | |
| Equity Real Estate Investment Trusts | | | | | | | | |
| Digital Core REIT Management Pte Ltd. | | | 2,190,900 | | | | 1,094,731 | |
| | | | | | | | | |
| South Korea 1.79% | | | | | | | | |
| | | | | | | | | |
| Chemicals 1.07% | | | | | | | | |
| Soulbrain Co. Ltd./New | | | 23,157 | | | | 3,320,153 | |
| | | | | | | | | |
| Semiconductors & Semiconductor Equipment 0.72% | | | |
| WONIK IPS Co. Ltd. | | | 116,798 | | | | 2,248,594 | |
| Total South Korea | | | | | | | 5,568,747 | |
| | | | | | | | | |
| Spain 2.81% | | | | | | | | |
| | | | | | | | | |
| Banks 0.85% | | | | | | | | |
| Banco de Sabadell SA | | | 3,358,713 | | | | 2,642,649 | |
| | | | | | | | | |
| Containers & Packaging 1.46% | | | | | | | | |
| Vidrala SA | | | 59,316 | | | | 4,534,168 | |
| | See Notes to Financial Statements. | 119 |
Schedule of Investments (continued)
INTERNATIONAL OPPORTUNITIES FUND October 31, 2022
| Investments | | Shares | | | U.S. $
Fair Value | |
| Spain (continued) | | | | | | |
| | | | | | | |
| Professional Services 0.50% | | | | | | |
| Applus Services SA | | | 260,637 | | | $ | 1,539,072 | |
| Total Spain | | | | | | | 8,715,889 | |
| | | | | | | | | |
| Sweden 5.32% | | | | | | | | |
| | | | | | | | | |
| Auto Components 0.91% | | | | | | | | |
| Autoliv, Inc. SDR | | | 35,136 | | | | 2,824,225 | |
| | | | | | | | | |
| Biotechnology 0.24% | | | | | | | | |
| Vitrolife AB | | | 45,317 | | | | 732,408 | |
| | | | | | | | | |
| Commercial Services & Supplies 1.77% | | | | | |
| Loomis AB | | | 195,906 | | | | 5,485,078 | |
| | | | | | | | | |
| Food & Staples Retailing 1.77% | | | | | | | | |
| Axfood AB | | | 222,267 | | | | 5,503,021 | |
| | | | | | | | | |
| Software 0.63% | | | | | | | | |
| Cint Group AB* | | | 372,853 | | | | 1,963,739 | |
| Total Sweden | | | | | | | 16,508,471 | |
| | | | | | | | | |
| Switzerland 3.74% | | | | | | | | |
| | | | | | | | | |
| Containers & Packaging 1.30% | | | | | | | | |
| SIG Group AG | | | 210,350 | | | | 4,043,573 | |
| | | | | | | | | |
| Health Care Equipment & Supplies 0.46% | | | | | |
| Medmix AG† | | | 81,189 | | | | 1,429,268 | |
| | | | | | | | | |
| Life Sciences Tools & Services 1.62% | | | | | | | | |
| Tecan Group AG Registered Shares | | | 13,721 | | | | 5,033,322 | |
| | | | | | | | | |
| Machinery 0.36% | | | | | | | | |
| Sulzer AG Registered Shares | | | 16,456 | | | | 1,097,528 | |
| Total Switzerland | | | | | | | 11,603,691 | |
| | | | | | | | | |
| Taiwan 0.49% | | | | | | | | |
| | | | | | | | | |
| Electrical Equipment | | | | | | | | |
| Bizlink Holding, Inc. | | | 201,000 | | | | 1,532,795 | |
| Investments | | Shares | | | U.S. $
Fair Value | |
| United Kingdom 15.57% | | | | | | | | |
| | | | | | | | | |
| Aerospace & Defense 1.96% | | | | | | | | |
| Chemring Group plc | | | 1,075,381 | | | $ | 3,727,954 | |
| Senior plc | | | 1,573,022 | | | | 2,345,123 | |
| | | | | | | | 6,073,077 | |
| | | | | | | | | |
| Banks 0.39% | | | | | | | | |
| Virgin Money UK plc | | | 773,180 | | | | 1,205,064 | |
| | | | | | | | | |
| Beverages 2.15% | | | | | | | | |
| Britvic plc | | | 800,712 | | | | 6,680,313 | |
| | | | | | | | | |
| Biotechnology 0.79% | | | | | | | | |
| Genus plc | | | 84,269 | | | | 2,462,806 | |
| | | | | | | | | |
| Capital Markets 1.32% | | | | | | | | |
| Man Group plc | | | 1,645,213 | | | | 4,092,643 | |
| | | | | | | | | |
| Communications Equipment 1.34% | | | | | | | | |
| Spirent Communications PLC | | | 1,402,022 | | | | 4,161,756 | |
| | | | | | | | | |
| Construction Materials 0.72% | | | | | | | | |
| Breedon Group plc | | | 3,736,324 | | | | 2,241,219 | |
| | | | | | | | | |
| Entertainment 0.32% | | | | | | | | |
| Frontier Developments plc* | | | 65,438 | | | | 994,365 | |
| | | | | | | | | |
| Equity Real Estate Investment Trusts 0.57% | | | | | |
| Big Yellow Group plc | | | 137,190 | | | | 1,765,300 | |
| | | | | | | | | |
| Food Products 1.28% | | | | | | | | |
| Tate & Lyle PLC | | | 494,447 | | | | 3,972,971 | |
| | | | | | | | | |
| Insurance 0.76% | | | | | | | | |
| Lancashire Holdings Ltd. | | | 415,796 | | | | 2,359,698 | |
| | | | | | | | | |
| Machinery 1.03% | | | | | | | | |
| Concentric AB | | | 193,053 | | | | 3,197,871 | |
| | | | | | | | | |
| Multi-Line Retail 1.15% | | | | | | | | |
| B&M European Value Retail SA | | | 966,605 | | | | 3,572,169 | |
| | | | | | | | | |
| Pharmaceuticals 0.49% | | | | | | | | |
| Dechra Pharmaceuticals plc | | | 50,992 | | | | 1,532,934 | |
| 120 | See Notes to Financial Statements. |
Schedule of Investments (continued)
INTERNATIONAL OPPORTUNITIES FUND October 31, 2022
| Investments | | Shares | | | U.S. $
Fair Value | |
| United Kingdom (continued) | | | | | | |
| | | | | | | |
| Specialty Retail 0.80% | | | | | | |
| WH Smith plc* | | | 184,058 | | | $ | 2,488,349 | |
| | | | | | | | | |
| Trading Companies & Distributors 0.50% | | | | | |
| Grafton Group plc | | | 197,334 | | | | 1,562,343 | |
| Total United Kingdom | | | | | | | 48,362,878 | |
Total Common Stocks
(cost $359,899,435) | | | | | | | 294,503,672 | |
| | | | | | | | | |
| | | Principal
Amount | | | | | |
| SHORT-TERM INVESTMENTS 1.59% | | | | | | | | |
| | | | | | | | | |
| Repurchase Agreements 1.55% | | | | | | | | |
Repurchase Agreement dated 10/31/2022, 1.30% due 11/1/2022 with Fixed Income Clearing Corp. collateralized by $5,025,600 of U.S. Treasury Note at 3.00% due 6/30/2024; value: $4,900,940; proceeds: $4,804,992
(cost $4,804,819) | | $ | 4,804,819 | | | | 4,804,819 | |
| Investments | | Shares | | | U.S. $
Fair Value | |
| Money Market Funds 0.04% | | | | | | | | |
Fidelity Government Portfolio(b)
(cost $131,355) | | | 131,355 | | | $ | 131,355 | |
| | | | | | | | | |
| Time Deposits 0.00% | | | | | | | | |
CitiBank N.A.(b)
(cost $14,595) | | | 14,595 | | | | 14,595 | |
Total Short-Term Investments
(cost $4,950,769) | | | | | | | 4,950,769 | |
Total Investments in Securities 96.41%
(cost $364,850,204) | | | | 299,454,441 | |
| Other Assets and Liabilities – Net 3.59% | | | | 11,146,148 | |
| Net Assets 100.00% | | | | | | $ | 310,600,589 | |
| ADR | | American Depositary Receipt. |
| SDR | | Swedish Depository Receipt. |
| † | | Security was purchased pursuant to Rule 144A under the Securities Act of 1933 and, unless registered under such Act or exempted from registration, may only be resold to qualified institutional buyers. At October 31, 2022, the total value of Rule 144A securities was $11,181,435, which represents 3.60% of net assets. |
| * | | Non-income producing security. |
| (a) | | All or a portion of this security is temporarily on loan to unaffiliated broker/dealers. |
| (b) | | Security was purchased with the cash collateral from loaned securities. |
| | See Notes to Financial Statements. | 121 |
Schedule of Investments (concluded)
INTERNATIONAL OPPORTUNITIES FUND October 31, 2022
The following is a summary of the inputs used as of October 31, 2022 in valuing the Fund’s investments carried at fair value(1):
| Investment Type(2) | | Level 1 | | | Level 2 | | | Level 3 | | | Total | |
| Long-Term Investments | | | | | | | | | | | | | | | | |
| Common Stocks | | | | | | | | | | | | | | | | |
| Canada | | $ | 21,725,035 | | | $ | – | | | $ | – | | | $ | 21,725,035 | |
| Egypt | | | 3,933,399 | | | | – | | | | – | | | | 3,933,399 | |
| Germany | | | 1,766,265 | | | | 20,926,794 | | | | – | | | | 22,693,059 | |
| Hong Kong | | | 1,439,642 | | | | 1,831,083 | | | | – | | | | 3,270,725 | |
| Iceland | | | 3,401,314 | | | | – | | | | – | | | | 3,401,314 | |
| Mexico | | | 3,453,092 | | | | – | | | | – | | | | 3,453,092 | |
| Peru | | | 2,198,158 | | | | – | | | | – | | | | 2,198,158 | |
| Singapore | | | 1,094,731 | | | | – | | | | – | | | | 1,094,731 | |
| United Kingdom | | | 9,025,436 | | | | 39,337,442 | | | | – | | | | 48,362,878 | |
| Remaining Countries | | | – | | | | 184,371,281 | | | | – | | | | 184,371,281 | |
| Short-Term Investments | | | | | | | | | | | | | | | | |
| Repurchase Agreements | | | – | | | | 4,804,819 | | | | – | | | | 4,804,819 | |
| Money Market Funds | | | 131,355 | | | | – | | | | – | | | | 131,355 | |
| Time Deposits | | | – | | | | 14,595 | | | | – | | | | 14,595 | |
| Total | | $ | 48,168,427 | | | $ | 251,286,014 | | | $ | – | | | $ | 299,454,441 | |
| (1) | | Refer to Note 2(l) for a description of fair value measurements and the three-tier hierarchy of inputs. |
| (2) | | See Schedule of Investments for fair values in each industry and identification of foreign issuers and/or geography. The table above is presented by Investment Type. Industries are presented within an Investment Type should such Investment Type include securities classified as two or more levels within the three-tier fair value hierarchy. When applicable each Level 3 security is identified on the Schedule of Investments along with the valuation technique utilized. |
A reconciliation of Level 3 investments is presented when the Fund has a material amount of Level 3 investments at the beginning or end of the year in relation to the Fund’s net assets.
| 122 | See Notes to Financial Statements. |
Schedule of Investments
INTERNATIONAL VALUE FUND October 31, 2022
| Investments | | Shares | | | U.S. $
Fair Value | |
| LONG-TERM INVESTMENTS 96.87% | | | | | | |
| COMMON STOCKS 96.87% | | | | | | |
| | | | | | | |
| Australia 2.86% | | | | | | |
| | | | | | | |
| Equity Real Estate Investment Trusts 0.73% | | | | |
| Goodman Group | | | 228,867 | | | $ | 2,490,234 | |
| | | | | | | | | |
| Metals & Mining 2.13% | | | | | | | | |
| BHP Group Ltd. | | | 305,571 | | | | 7,339,878 | |
| Total Australia | | | | | | | 9,830,112 | |
| | | | | | | | | |
| Austria 1.69% | | | | | | | | |
| | | | | | | | | |
| Banks | | | | | | | | |
| BAWAG Group AG† | | | 120,624 | | | | 5,823,220 | |
| | | | | | | | | |
| Canada 5.62% | | | | | | | | |
| | | | | | | | | |
| Insurance 1.10% | | | | | | | | |
| Manulife Financial Corp. | | | 229,100 | | | | 3,797,172 | |
| | | | | | | | | |
| Metals & Mining 0.33% | | | | | | | | |
| Capstone Copper Corp.* | | | 493,400 | | | | 1,144,452 | |
| | | | | | | | | |
| Multi-Utilities 1.15% | | | | | | | | |
| Algonquin Power & Utilities Corp. | | | 359,400 | | | | 3,978,238 | |
| | | | | | | | | |
| Oil, Gas & Consumable Fuels 1.72% | | | | | | | | |
| Pembina Pipeline Corp. | | | 179,033 | | | | 5,911,039 | |
| | | | | | | | | |
| Specialty Retail 1.32% | | | | | | | | |
| Alimentation Couche-Tard, Inc. | | | 101,200 | | | | 4,531,288 | |
| Total Canada | | | | | | | 19,362,189 | |
| | | | | | | | | |
| China 0.93% | | | | | | | | |
| | | | | | | | | |
| Internet & Direct Marketing Retail 0.47% | | | | | |
| Alibaba Group Holding Ltd.* | | | 208,800 | | | | 1,623,400 | |
| | | | | | | | | |
| Specialty Retail 0.46% | | | | | | | | |
| Topsports International Holdings Ltd.† | | | 3,103,000 | | | | 1,564,649 | |
| Total China | | | | | | | 3,188,049 | |
| Investments | | Shares | | | U.S. $
Fair Value | |
| Egypt 0.81% | | | | | | |
| | | | | | | |
| Oil, Gas & Consumable Fuels | | | | | | |
| Energean PLC | | | 169,145 | | | $ | 2,775,788 | |
| | | | | | | | | |
| Finland 1.94% | | | | | | | | |
| | | | | | | | | |
| Banks | | | | | | | | |
| Nordea Bank Abp | | | 699,515 | | | | 6,682,129 | |
| | | | | | | | | |
| France 12.53% | | | | | | | | |
| | | | | | | | | |
| Aerospace & Defense 3.29% | | | | | | | | |
| Airbus SE | | | 48,734 | | | | 5,273,200 | |
| Thales SA | | | 47,600 | | | | 6,053,763 | |
| | | | | | | | 11,326,963 | |
| | | | | | | | | |
| Diversified Telecommunication Services 2.26% | | | | | |
| Orange SA | | | 817,553 | | | | 7,789,573 | |
| | | | | | | | | |
| Gas Utilities 0.73% | | | | | | | | |
| Rubis SCA | | | 111,079 | | | | 2,522,530 | |
| | | | | | | | | |
| Information Technology Services 0.78% | | | | | |
| Capgemini SE | | | 16,485 | | | | 2,701,738 | |
| | | | | | | | | |
| Insurance 1.76% | | | | | | | | |
| AXA SA | | | 245,484 | | | | 6,062,197 | |
| | | | | | | | | |
| Pharmaceuticals 2.61% | | | | | | | | |
| Sanofi | | | 104,212 | | | | 8,968,255 | |
| | | | | | | | | |
| Textiles, Apparel & Luxury Goods 1.10% | | | | | |
| Kering SA | | | 8,234 | | | | 3,770,850 | |
| Total France | | | | | | | 43,142,106 | |
| | | | | | | | | |
| Germany 5.84% | | | | | | | | |
| | | | | | | | | |
| Air Freight & Logistics 1.27% | | | | | | | | |
| Deutsche Post AG Registered Shares Registered Shares | | | 124,084 | | | | 4,386,343 | |
| | | | | | | | | |
| Chemicals 0.74% | | | | | | | | |
| Covestro AG† | | | 74,929 | | | | 2,543,541 | |
| | See Notes to Financial Statements. | 123 |
Schedule of Investments (continued)
INTERNATIONAL VALUE FUND October 31, 2022
| Investments | | Shares | | | U.S. $
Fair Value | |
| Germany (continued) | | | | | | | | |
| | | | | | | | | |
| Insurance 1.70% | | | | | | | | |
| Allianz SE Registered Shares Registered Shares | | | 32,448 | | | $ | 5,837,539 | |
| | | | | | | | | |
| Pharmaceuticals 1.54% | | | | | | | | |
| Bayer AG Registered Shares | | | 100,854 | | | | 5,303,007 | |
| | | | | | | | | |
| Semiconductors & Semiconductor Equipment 0.59% |
| Infineon Technologies AG | | | 83,117 | | | | 2,016,872 | |
| Total Germany | | | | | | | 20,087,302 | |
| | | | | | | | | |
| Hong Kong 0.67% | | | | | | | | |
| | | | | | | | | |
| Insurance | | | | | | | | |
| Prudential plc | | | 247,685 | | | | 2,300,909 | |
| | | | | | | | | |
| India 1.77% | | | | | | | | |
| | | | | | | | | |
| Banks 1.21% | | | | | | | | |
| Federal Bank Ltd. | | | 2,624,650 | | | | 4,174,111 | |
| | | | | | | | | |
| Oil, Gas & Consumable Fuels 0.56% | | | | | |
| Petronet LNG Ltd. | | | 774,159 | | | | 1,923,161 | |
| Total India | | | | | | | 6,097,272 | |
| | | | | | | | | |
| Ireland 2.83% | | | | | | | | |
| | | | | | | | | |
| Banks 1.40% | | | | | | | | |
| Bank of Ireland Group plc | | | 666,476 | | | | 4,799,042 | |
| | | | | | | | | |
| Construction Materials 1.43% | | | | | | | | |
| CRH plc | | | 136,812 | | | | 4,927,670 | |
| Total Ireland | | | | | | | 9,726,712 | |
| | | | | | | | | |
| Italy 0.84% | | | | | | | | |
| | | | | | | | | |
| Electric: Utilities | | | | | | | | |
| Enel SpA | | | 649,251 | | | | 2,900,430 | |
| | | | | | | | | |
| Japan 16.70% | | | | | | | | |
| | | | | | | | | |
| Auto Components 0.90% | | | | | | | | |
| Denso Corp. | | | 62,500 | | | | 3,100,994 | |
| Investments | | Shares | | | U.S. $
Fair Value | |
| Japan (continued) | | | | | | |
| | | | | | | |
| Automobiles 2.56% | | | | | | |
| Toyota Motor Corp. | | | 634,800 | | | $ | 8,807,596 | |
| | | | | | | | | |
| Banks 1.98% | | | | | | | | |
| Sumitomo Mitsui Financial Group, Inc. | | | 242,200 | | | | 6,801,353 | |
| | | | | | | | | |
| Beverages 1.56% | | | | | | | | |
| Asahi Group Holdings Ltd. | | | 192,600 | | | | 5,389,087 | |
| | | | | | | | | |
| Building Products 0.72% | | | | | | | | |
| Sanwa Holdings Corp. | | | 288,600 | | | | 2,486,033 | |
| | | | | | | | | |
| Diversified Financial Services 1.25% | | | | | | | | |
| ORIX Corp. | | | 292,900 | | | | 4,302,025 | |
| | | | | | | | | |
| Electrical Equipment 1.33% | | | | | | | | |
| Fuji Electric Co. Ltd. | | | 118,500 | | | | 4,581,798 | |
| | | | | | | | | |
| Electronic Equipment, Instruments & Components 0.83% | |
| Murata Manufacturing Co., Ltd. | | | 60,700 | | | | 2,873,503 | |
| | | | | | | | | |
| Household Durables 0.90% | | | | | | | | |
| Sony Group Corp. | | | 45,900 | | | | 3,095,250 | |
| | | | | | | | | |
| Industrial Conglomerates 1.00% | | | | | | | | |
| Hitachi Ltd. | | | 76,000 | | | | 3,448,409 | |
| | | | | | | | | |
| Insurance 1.07% | | | | | | | | |
| Tokio Marine Holdings, Inc. 203,000 | | | | | | | 3,675,347 | |
| | | | | | | | | |
| Machinery 1.04% | | | | | | | | |
| Fujitec Co. Ltd. | | | 180,000 | | | | 3,575,410 | |
| | | | | | | | | |
| Trading Companies & Distributors 1.56% | | | | | |
| ITOCHU Corp. | | | 207,300 | | | | 5,357,572 | |
| Total Japan | | | | | | | 57,494,377 | |
| | | | | | | | | |
| Mexico 2.35% | | | | | | | | |
| | | | | | | | | |
| Banks 1.33% | | | | | | | | |
| Grupo Financiero Banorte SAB de CV Class O | | | 565,866 | | | | 4,599,643 | |
| 124 | See Notes to Financial Statements. |
Schedule of Investments (continued)
INTERNATIONAL VALUE FUND October 31, 2022
| Investments | | Shares | | | U.S. $
Fair Value | |
| Mexico (continued) | | | | | | | | |
| | | | | | | | | |
| Transportation Infrastructure 1.02% | | | | | | | | |
| Grupo Aeroportuario del Pacifico SAB de CV Class B | | | 226,100 | | | $ | 3,502,250 | |
| Total Mexico | | | | | | | 8,101,893 | |
| | | | | | | | | |
| Netherlands 6.32% | | | | | | | | |
| | | | | | | | | |
| Food & Staples Retailing 1.78% | | | | | | | | |
| Koninklijke Ahold Delhaize NV | | | 219,166 | | | | 6,112,160 | |
| | | | | | | | | |
| Oil, Gas & Consumable Fuels 4.54% | | | | | | | | |
| Shell plc ADR | | | 281,215 | | | | 15,643,990 | |
| Total Netherlands | | | | | | | 21,756,150 | |
| | | | | | | | | |
| Norway 1.39% | | | | | | | | |
| | | | | | | | | |
| Oil, Gas & Consumable Fuels | | | | | | | | |
| Aker BP ASA | | | 150,569 | | | | 4,783,027 | |
| | | | | | | | | |
| Singapore 1.99% | | | | | | | | |
| | | | | | | | | |
| Banks | | | | | | | | |
| United Overseas Bank Ltd. | | | 349,800 | | | | 6,862,651 | |
| | | | | | | | | |
| South Africa 1.57% | | | | | | | | |
| | | | | | | | | |
| Metals & Mining | | | | | | | | |
| Anglo American plc | | | 180,673 | | | | 5,411,915 | |
| | | | | | | | | |
| South Korea 1.01% | | | | | | | | |
| | | | | | | | | |
| Technology Hardware, Storage & Peripherals | | | | | |
| Samsung Electronics Co. Ltd. | | | 83,856 | | | | 3,490,072 | |
| | | | | | | | | |
| Sweden 2.48% | | | | | | | | |
| | | | | | | | | |
| Auto Components 1.24% | | | | | | | | |
| Autoliv, Inc. SDR | | | 53,016 | | | | 4,261,416 | |
| | | | | | | | | |
| Commercial Services & Supplies 1.24% | | | | | |
| Loomis AB | | | 152,468 | | | | 4,268,879 | |
| Total Sweden | | | | | | | 8,530,295 | |
| Investments | | Shares | | | U.S. $
Fair Value | |
| Switzerland 4.75% | | | | | | | | |
| | | | | | | | | |
| Capital Markets 1.71% | | | | | | | | |
| UBS Group AG Registered Shares | | | 372,102 | | | $ | 5,899,362 | |
| | | | | | | | | |
| Pharmaceuticals 3.04% | | | | | | | | |
| Novartis AG Registered Shares Registered Shares | | | 129,311 | | | | 10,460,058 | |
| Total Switzerland | | | | | | | 16,359,420 | |
| | | | | | | | | |
| Taiwan 0.47% | | | | | | | | |
| | | | | | | | | |
| Electrical Equipment | | | | | | | | |
| Bizlink Holding, Inc. | | | 211,000 | | | | 1,609,053 | |
| | | | | | | | | |
| United Kingdom 17.55% | | | | | | | | |
| | | | | | | | | |
| Banks 2.31% | | | | | | | | |
| Barclays plc | | | 1,635,863 | | | | 2,779,743 | |
| Standard Chartered plc | | | 867,985 | | | | 5,185,982 | |
| | | | | | | | 7,965,725 | |
| | | | | | | | | |
| Electric: Utilities 1.54% | | | | | | | | |
| SSE plc | | | 296,544 | | | | 5,299,501 | |
| | | | | | | | | |
| Food Products 1.53% | | | | | | | | |
| Tate & Lyle PLC | | | 655,989 | | | | 5,270,991 | |
| | | | | | | | | |
| Insurance 0.65% | | | | | | | | |
| Lancashire Holdings Ltd. | | | 391,771 | | | | 2,223,353 | |
| | | | | | | | | |
| Multi-Line Retail 0.78% | | | | | | | | |
| Next plc | | | 47,384 | | | | 2,676,230 | |
| | | | | | | | | |
| Personal Products 4.07% | | | | | | | | |
| Haleon PLC* | | | 958,101 | | | | 2,937,970 | |
| Unilever plc | | | 243,317 | | | | 11,059,814 | |
| | | | | | | | 13,997,784 | |
| | | | | | | | | |
| Pharmaceuticals 2.26% | | | | | | | | |
| AstraZeneca plc | | | 66,263 | | | | 7,774,778 | |
| | | | | | | | | |
| Tobacco 2.31% | | | | | | | | |
| Imperial Brands plc | | | 327,156 | | | | 7,969,216 | |
| | See Notes to Financial Statements. | 125 |
Schedule of Investments (concluded)
INTERNATIONAL VALUE FUND October 31, 2022
| Investments | | Shares | | | U.S. $
Fair Value | |
| United Kingdom (continued) | | | | | | |
| | | | | | | |
| Trading Companies & Distributors 0.81% | | | | |
| Ashtead Group plc | | | 53,815 | | | $ | 2,803,386 | |
| | | | | | | | | |
| Wireless Telecommunication Services 1.29% | | | | | |
| Vodafone Group plc | | | 3,809,514 | | | | 4,447,233 | |
| Total United Kingdom | | | | | | | 60,428,197 | |
| | | | | | | | | |
| United States 1.96% | | | | | | | | |
| | | | | | | | | |
| Pharmaceuticals | | | | | | | | |
| GSK PLC | | | 183,000 | | | | 2,997,737 | |
| Roche Holding AG | | | 11,300 | | | | 3,749,319 | |
| | | | | | | | 6,747,056 | |
| Investments | | Shares | | | U.S. $
Fair Value | |
Total Investments in Securities 96.87%
(cost $373,624,531) | | | | | | $ | 333,490,324 | |
| Other Assets and Liabilities – Net 3.13% | | | | 10,785,447 | |
| Net Assets 100.00% | | | | | | $ | 344,275,771 | |
| ADR | | American Depositary Receipt. |
| SDR | | Swedish Depository Receipt. |
| † | | Security was purchased pursuant to Rule 144A under the Securities Act of 1933 and, unless registered under such Act or exempted from registration, may only be resold to qualified institutional buyers. At October 31, 2022, the total value of Rule 144A securities was $9,931,410, which represents 2.88% of net assets. |
| * | | Non-income producing security. |
The following is a summary of the inputs used as of October 31, 2022 in valuing the Fund’s investments carried at fair value(1):
| Investment Type(2) | | Level 1 | | | Level 2 | | | Level 3 | | | Total | |
| Long-Term Investments | | | | | | | | | | | | | | | | |
| Common Stocks | | | | | | | | | | | | | | | | |
| Canada | | $ | 19,362,189 | | | $ | – | | | $ | – | | | $ | 19,362,189 | |
| Egypt | | | 2,775,788 | | | | – | | | | – | | | | 2,775,788 | |
| Mexico | | | 8,101,893 | | | | – | | | | – | | | | 8,101,893 | |
| Netherlands | | | 15,643,990 | | | | 6,112,160 | | | | – | | | | 21,756,150 | |
| Remaining Countries | | | – | | | | 281,494,304 | | | | – | | | | 281,494,304 | |
| Total | | $ | 45,883,860 | | | $ | 287,606,464 | | | $ | – | | | $ | 333,490,324 | |
| (1) | | Refer to Note 2(l) for a description of fair value measurements and the three-tier hierarchy of inputs. |
| (2) | | See Schedule of Investments for fair values in each industry and identification of foreign issuer and/or geography. The table above is presented by Investment Type. Industries are presented within an Investment Type should such Investment Type include securities classified as two or more levels within the three- tier fair value hierarchy. When applicable each Level 3 security is identified on the Schedule of Investments along with the valuation technique utilized. |
A reconciliation of Level 3 investments is presented when the Fund has a material amount of Level 3 investments at the beginning or end of the year in relation to the Fund’s net assets.
| 126 | See Notes to Financial Statements. |
Schedule of Investments
MICRO CAP GROWTH FUND October 31, 2022
| Investments | | Shares | | | Fair
Value | |
| LONG-TERM INVESTMENTS 98.42% |
| COMMON STOCKS 98.42% | | | | | | | | |
| | | | | | | | | |
| Aerospace & Defense 2.10% | | | | | | | | |
| AAR Corp.* | | | 35,907 | | | $ | 1,591,398 | |
| AeroVironment, Inc.* | | | 36,140 | | | | 3,306,810 | |
| Total | | | | | | | 4,898,208 | |
| | | | | | | | | |
| Banks 0.85% | | | | | | | | |
| Byline Bancorp, Inc. | | | 86,280 | | | | 1,994,794 | |
| | | | | | | | | |
| Beverages 2.00% | | | | | | | | |
| MGP Ingredients, Inc. | | | 26,523 | | | | 2,971,902 | |
| Vita Coco Co., Inc. (The)*(a) | | | 165,797 | | | | 1,701,077 | |
| Total | | | | | | | 4,672,979 | |
| | | | | | | | | |
| Biotechnology 17.64% | | | | | | | | |
| Arcellx, Inc.* | | | 203,902 | | | | 4,787,619 | |
| BELLUS Health, Inc. (Canada)*(b) | | | 406,101 | | | | 3,760,495 | |
| Cytek Biosciences, Inc.*(a) | | | 110,129 | | | | 1,709,202 | |
| Day One Biopharmaceuticals, Inc.* | | | 159,969 | | | | 3,381,745 | |
| Esperion Therapeutics, Inc.*(a) | | | 147,819 | | | | 1,201,769 | |
| Insmed, Inc.* | | | 66,318 | | | | 1,148,628 | |
| Karuna Therapeutics, Inc.* | | | 12,736 | | | | 2,793,514 | |
| Krystal Biotech, Inc.* | | | 77,334 | | | | 5,916,051 | |
| Merus NV (Netherlands)*(b) | | | 150,516 | | | | 3,085,578 | |
| Nkarta, Inc.*(a) | | | 158,684 | | | | 2,001,005 | |
| Rocket Pharmaceuticals, Inc.* | | | 169,367 | | | | 3,160,388 | |
| Syndax Pharmaceuticals, Inc.* | | | 102,643 | | | | 2,356,683 | |
| Xenon Pharmaceuticals, Inc. (Canada)*(b) | | | 161,254 | | | | 5,897,059 | |
| Total | | | | | | | 41,199,736 | |
| | | | | | | | | |
| Capital Markets 0.56% | | | | | | | | |
| Piper Sandler Cos. | | | 10,199 | | | | 1,305,166 | |
| Investments | | Shares | | | Fair
Value | |
| Commercial Services & Supplies 2.46% |
| Heritage-Crystal Clean, Inc.* | | | 131,851 | | | $ | 3,621,947 | |
| Montrose Environmental Group, Inc.* | | | 48,396 | | | | 2,118,777 | |
| Total | | | | | | | 5,740,724 | |
| | | | | | | | | |
| Communications Equipment 2.89% | | | | | | | | |
| Calix, Inc.* | | | 91,726 | | | | 6,754,703 | |
| | | | | | | | | |
| Construction & Engineering 2.81% | | | | | | | | |
| Ameresco, Inc. Class A* | | | 46,606 | | | | 2,818,731 | |
| NV5 Global, Inc.* | | | 25,833 | | | | 3,744,493 | |
| Total | | | | | | | 6,563,224 | |
| | | | | | | | | |
| Diversified Consumer Services 2.96% | | | | | | | | |
| PowerSchool Holdings, Inc. Class A* | | | 220,669 | | | | 4,413,380 | |
| Stride, Inc.* | | | 36,694 | | | | 1,229,616 | |
| Udemy, Inc.*(a) | | | 86,963 | | | | 1,265,312 | |
| Total | | | | | | | 6,908,308 | |
| | | | | | | | | |
| Diversified Telecommunication Services 1.32% |
| Ooma, Inc.* | | | 190,332 | | | | 3,089,088 | |
| | | | | | | | | |
| Electronic Equipment, Instruments & Components 2.95% |
| 908 Devices, Inc.*(a) | | | 78,693 | | | | 1,258,301 | |
| Napco Security Technologies, Inc.* | | | 145,633 | | | | 4,138,890 | |
| OSI Systems, Inc.* | | | 18,169 | | | | 1,493,128 | |
| Total | | | | | | | 6,890,319 | |
| | | | | | | | | |
| Food & Staples Retailing 2.09% | | | | | | | | |
| Chefs’ Warehouse, Inc. (The)* | | | 133,268 | | | | 4,881,607 | |
| | See Notes to Financial Statements. | 127 |
Schedule of Investments (continued)
MICRO CAP GROWTH FUND October 31, 2022
| Investments | | Shares | | | Fair
Value | |
| Health Care Equipment & Supplies 14.03% |
| Axonics, Inc.* | | | 47,974 | | | $ | 3,508,818 | |
| Figs, Inc. Class A* | | | 179,596 | | | | 1,325,418 | |
| Lantheus Holdings, Inc.* | | | 62,554 | | | | 4,628,370 | |
| OrthoPediatrics Corp.* | | | 78,284 | | | | 3,326,287 | |
| Pacific Biosciences of California, Inc.* | | | 207,370 | | | | 1,750,203 | |
| PROCEPT BioRobotics Corp.*(a) | | | 50,157 | | | | 2,278,633 | |
| Pulmonx Corp.* | | | 96,130 | | | | 1,284,297 | |
| SI-BONE, Inc.* | | | 123,441 | | | | 2,399,693 | |
| Silk Road Medical, Inc.* | | | 82,585 | | | | 3,640,347 | |
| TransMedics Group, Inc.* | | | 96,289 | | | | 4,643,056 | |
| Treace Medical Concepts, Inc.* | | | 163,361 | | | | 3,999,077 | |
| Total | | | | | | | 32,784,199 | |
| | | | | | | | | |
| Hotels, Restaurants & Leisure 5.05% |
| Kura Sushi USA, Inc. Class A* | | | 65,149 | | | | 5,148,726 | |
| Monarch Casino & Resort, Inc.* | | | 37,305 | | | | 2,962,390 | |
| Sweetgreen, Inc. Class A*(a) | | | 197,865 | | | | 3,680,289 | |
| Total | | | | | | | 11,791,405 | |
| | | | | | | | | |
| Information Technology Services 1.44% |
| International Money Express, Inc.* | | | 77,159 | | | | 2,085,608 | |
| NerdWallet, Inc. Class A*(a) | | | 109,740 | | | | 1,288,347 | |
| Total | | | | | | | 3,373,955 | |
| | | | | | | | | |
| Interactive Media & Services 0.45% | | | | | | | | |
| ZipRecruiter, Inc. Class A* | | | 62,791 | | | | 1,053,005 | |
| | | | | | | | | |
| Internet & Direct Marketing Retail 0.59% |
| Fiverr International Ltd. (Israel)*(b) | | | 44,671 | | | | 1,382,567 | |
| | | | | | | | | |
| Leisure Products 0.80% | | | | | | | | |
| Bowlero Corp.* | | | 128,050 | | | | 1,864,408 | |
| | | | | | | | | |
| Machinery 0.70% | | | | | | | | |
| Proto Labs, Inc.* | | | 42,685 | | | | 1,630,140 | |
| Investments | | Shares | | | Fair
Value | |
| Metals & Mining 0.82% | | | | | | |
| Carpenter Technology Corp. | | | 51,100 | | | $ | 1,911,140 | |
| | | | | | | | | |
| Oil, Gas & Consumable Fuels 1.65% |
| Golar LNG Ltd.* | | | 45,995 | | | | 1,279,581 | |
| Talos Energy, Inc.* | | | 121,178 | | | | 2,578,668 | |
| Total | | | | | | | 3,858,249 | |
| | | | | | | | | |
| Personal Products 1.63% | | | | | | | | |
| elf Beauty, Inc.* | | | 88,224 | | | | 3,816,570 | |
| | | | | | | | | |
| Pharmaceuticals 6.53% | | | | | | | | |
| Intra-Cellular Therapies, Inc.* | | | 75,359 | | | | 3,441,646 | |
| Pliant Therapeutics, Inc.* | | | 158,235 | | | | 3,935,304 | |
| Ventyx Biosciences, Inc.* | | | 243,238 | | | | 7,873,614 | |
| Total | | | | | | | 15,250,564 | |
| | | | | | | | | |
| Professional Services 4.75% | | | | | | | | |
| ICF International, Inc. | | | 57,135 | | | | 6,835,060 | |
| Remitly Global, Inc.* | | | 214,327 | | | | 2,490,480 | |
| Resources Connection, Inc. | | | 97,148 | | | | 1,774,894 | |
| Total | | | | | | | 11,100,434 | |
| | | | | | | | | |
| Semiconductors & Semiconductor Equipment 7.93% |
| CEVA, Inc.* | | | 69,010 | | | | 1,908,817 | |
| Impinj, Inc.* | | | 66,500 | | | | 7,622,895 | |
| indie Semiconductor, Inc. Class A*(a) | | | 495,168 | | | | 3,872,214 | |
| Rambus, Inc.* | | | 169,791 | | | | 5,120,896 | |
| Total | | | | | | | 18,524,822 | |
| | | | | | | | | |
| Software 6.70% | | | | | | | | |
| Agilysys, Inc.* | | | 97,495 | | | | 6,256,254 | |
| Arteris, Inc.* | | | 239,124 | | | | 1,324,747 | |
| AvidXchange Holdings, Inc.* | | | 414,496 | | | | 3,771,914 | |
| JFrog Ltd. (Israel)*(b) | | | 169,465 | | | | 4,304,411 | |
| Total | | | | | | | 15,657,326 | |
| | | | | | | | | |
| Specialty Retail 1.01% | | | | | | | | |
| Warby Parker, Inc. Class A*(a) | | | 146,478 | | | | 2,350,972 | |
| 128 | See Notes to Financial Statements. |
Schedule of Investments (concluded)
MICRO CAP GROWTH FUND October 31, 2022
| Investments | | Shares | | | Fair
Value | |
| Technology Hardware, Storage & Peripherals 0.99% |
| Avid Technology, Inc.* | | | 84,039 | | | $ | 2,310,232 | |
| | | | | | | | | |
| Textiles, Apparel & Luxury Goods 1.07% |
| Oxford Industries, Inc. | | | 24,497 | | | | 2,492,080 | |
| | | | | | | | | |
| Wireless Telecommunication Services 1.65% |
| Gogo, Inc.* | | | 271,577 | | | | 3,861,825 | |
Total Common Stocks
(cost $197,342,204) | | | | | | | 229,912,749 | |
| | | | | | | | | |
| | | | Principal
Amount | | | | | |
| SHORT-TERM INVESTMENTS 6.25% | | | | | | |
| Repurchase Agreements 1.29% | | | | | | | | |
Repurchase Agreement dated 10/31/2022, 1.30% due 11/1/2022 with Fixed Income Clearing Corp. collateralized by $3,202,800 of U.S. Treasury Note at 2.00% due 4/30/2024; value: $3,083,195; proceeds: $3,022,842
(cost $3,022,733) | | $ | 3,022,733 | | | $ | 3,022,733 | |
| Investments | | Shares | | | Fair
Value | |
| Money Market Funds 4.46% | | | | | | | | |
Fidelity Government Portfolio(c)
(cost $10,418,082) | | | 10,418,082 | | | $ | 10,418,082 | |
| | | | | | | | | |
| Time Deposits 0.50% | | | | | | | | |
CitiBank N.A.(c)
(cost $1,157,565) | | | 1,157,565 | | | | 1,157,565 | |
Total Short-Term Investments
(cost $14,598,380) | | | | 14,598,380 | |
Total Investments in Securities 104.67%
(cost $211,940,584) | | | | 244,511,129 | |
| Other Assets and Liabilities – Net (4.67)% | | | | (10,910,601 | ) |
| Net Assets 100.00% | | | | | | $ | 233,600,528 | |
| * | | Non-income producing security. |
| (a) | | All or a portion of these securities are temporarily on loan to unaffiliated broker/dealers. |
| (b) | | Foreign security traded in U.S. dollars. |
| (c) | | Security was purchased with the cash collateral from loaned securities. |
The following is a summary of the inputs used as of October 31, 2022 in valuing the Fund’s investments carried at fair value(1):
| Investment Type(2) | | Level 1 | | | Level 2 | | | Level 3 | | | Total | |
| Long-Term Investments | | | | | | | | | | | | | | | | |
| Common Stocks | | $ | 229,912,749 | | | $ | – | | | $ | – | | | $ | 229,912,749 | |
| Short-Term Investments | | | | | | | | | | | | | | | | |
| Repurchase Agreements | | | – | | | | 3,022,733 | | | | – | | | | 3,022,733 | |
| Money Market Funds | | | 10,418,082 | | | | – | | | | – | | | | 10,418,082 | |
| Time Deposits | | | – | | | | 1,157,565 | | | | – | | | | 1,157,565 | |
| Total | | $ | 240,330,831 | | | $ | 4,180,298 | | | $ | – | | | $ | 244,511,129 | |
| (1) | | Refer to Note 2(l) for a description of fair value measurements and the three-tier hierarchy of inputs. |
| (2) | | See Schedule of Investments for fair values in each industry and identification of foreign issuers and/or geography. When applicable each Level 3 security is identified on the Schedule of Investments along with the valuation technique utilized. |
A reconciliation of Level 3 investments is presented when the Fund has a material amount of Level 3 investments at the beginning or end of the year in relation to the Fund’s net assets.
| | See Notes to Financial Statements. | 129 |
Schedule of Investments
VALUE OPPORTUNITIES FUND October 31, 2022
| Investments | | Shares | | | Fair
Value | |
| LONG-TERM INVESTMENTS 96.83% |
| COMMON STOCKS 96.83% | | | | | | |
| | | | | | | |
| Aerospace & Defense 1.78% | | | | | | |
| Curtiss-Wright Corp. | | | 138,708 | | | $ | 23,279,364 | |
| | | | | | | | | |
| Auto Components 1.31% | | | | | | | | |
| Gentherm, Inc.* | | | 293,434 | | | | 17,142,414 | |
| | | | | | | | | |
| Banks 5.06% | | | | | | | | |
| East West Bancorp, Inc. | | | 270,735 | | | | 19,376,504 | |
| First BanCorp | | | 1,741,309 | | | | 27,495,269 | |
| Wintrust Financial Corp. | | | 205,356 | | | | 19,225,429 | |
| Total | | | | | | | 66,097,202 | |
| | | | | | | | | |
| Biotechnology 0.82% | | | | | | | | |
| Horizon Therapeutics plc* | | | 171,391 | | | | 10,681,087 | |
| | | | | | | | | |
| Building Products 4.12% | | | | | | | | |
| Allegion plc (Ireland)(a) | | | 201,387 | | | | 21,099,316 | |
| Carlisle Cos., Inc. | | | 63,788 | | | | 15,232,574 | |
| Masonite International Corp.* | | | 245,624 | | | | 17,569,485 | |
| Total | | | | | | | 53,901,375 | |
| | | | | | | | | |
| Capital Markets 4.71% | | | | | | | | |
| Cboe Global Markets, Inc. | | | 173,432 | | | | 21,592,284 | |
| Moelis & Co. Class A | | | 393,956 | | | | 16,727,372 | |
| TPG, Inc.(b) | | | 756,400 | | | | 23,259,300 | |
| Total | | | | | | | 61,578,956 | |
| | | | | | | | | |
| Chemicals 3.38% | | | | | | | | |
| Avient Corp. | | | 405,622 | | | | 13,989,903 | |
| Axalta Coating Systems Ltd.* | | | 412,858 | | | | 9,627,848 | |
| Valvoline, Inc. | | | 698,800 | | | | 20,516,768 | |
| Total | | | | | | | 44,134,519 | |
| | | | | | | | | |
| Communications Equipment 1.36% |
| F5, Inc.* | | | 124,635 | | | | 17,811,588 | |
| | | | | | | | | |
| Construction & Engineering 2.28% |
| EMCOR Group, Inc. | | | 211,202 | | | | 29,800,602 | |
| Investments | | Shares | | | Fair
Value | |
| Construction Materials 1.01% |
| Eagle Materials, Inc. | | | 108,339 | | | $ | 13,250,943 | |
| | | | | | | | | |
| Containers & Packaging 1.71% |
| Avery Dennison Corp. | | | 131,703 | | | | 22,330,244 | |
| | | | | | | | | |
| Electric: Utilities 3.08% |
| IDACORP, Inc. | | | 190,882 | | | | 19,985,345 | |
| Portland General Electric Co. | | | 449,867 | | | | 20,217,023 | |
| Total | | | | | | | 40,202,368 | |
| | | | | | | | | |
| Electronic Equipment, Instruments & Components 1.60% |
| Littelfuse, Inc. | | | 94,840 | | | | 20,888,510 | |
| | | | | | | | | |
| Energy Equipment & Services 1.73% |
| NOV, Inc. | | | 1,007,759 | | | | 22,573,802 | |
| | | | | | | | | |
| Equity Real Estate Investment Trusts 5.67% | | | | | |
| American Homes 4 Rent Class A | | | 543,113 | | | | 17,347,029 | |
| First Industrial Realty Trust, Inc. | | | 494,136 | | | | 23,535,698 | |
| National Storage Affiliates Trust | | | 438,894 | | | | 18,723,218 | |
| Sunstone Hotel Investors, Inc. | | | 1,303,600 | | | | 14,535,140 | |
| Total | | | | | | | 74,141,085 | |
| | | | | | | | | |
| Food & Staples Retailing 2.37% | | | | | | | | |
| BJ’s Wholesale Club Holdings, Inc.* | | | 400,793 | | | | 31,021,378 | |
| | | | | | | | | |
| Health Care Equipment & Supplies 3.98% |
| CONMED Corp. | | | 181,200 | | | | 14,447,076 | |
| Cooper Cos., Inc. (The) | | | 49,012 | | | | 13,399,390 | |
| STERIS plc | | | 139,784 | | | | 24,123,923 | |
| Total | | | | | | | 51,970,389 | |
| | | | | | | | | |
| Health Care Providers & Services 3.87% |
| Molina Healthcare, Inc.* | | | 102,751 | | | | 36,873,224 | |
| R1 RCM, Inc.* | | | 775,439 | | | | 13,694,253 | |
| Total | | | | | | | 50,567,477 | |
| 130 | See Notes to Financial Statements. |
Schedule of Investments (continued)
VALUE OPPORTUNITIES FUND October 31, 2022
| Investments | | Shares | | | Fair
Value | |
| Hotels, Restaurants & Leisure 5.95% |
| Caesars Entertainment, Inc.* | | | 392,900 | | | $ | 17,181,517 | |
| Choice Hotels International, Inc. | | | 185,333 | | | | 24,063,637 | |
| Dave & Buster’s Entertainment, Inc.* | | | 192,757 | | | | 7,681,366 | |
| SeaWorld Entertainment, Inc.* | | | 195,768 | | | | 11,385,867 | |
| Texas Roadhouse, Inc. | | | 176,140 | | | | 17,429,053 | |
| Total | | | | | | | 77,741,440 | |
| | | | | | | | | |
| Household Products 0.87% | | | | | | | | |
| Reynolds Consumer Products, Inc. | | | 373,400 | | | | 11,403,636 | |
| | | | | | | | | |
| Information Technology Services 1.00% |
| Euronet Worldwide, Inc.* | | | 155,304 | | | | 13,047,089 | |
| | | | | | | | | |
| Insurance 7.21% | | | | | | | | |
| American Financial Group, Inc./OH | | | 221,879 | | | | 32,196,862 | |
| Assurant, Inc. | | | 105,523 | | | | 14,336,355 | |
| RenaissanceRe Holdings Ltd. | | | 106,919 | | | | 16,538,231 | |
| Selective Insurance Group, Inc. | | | 213,050 | | | | 20,895,944 | |
| Stewart Information Services Corp. | | | 263,896 | | | | 10,281,388 | |
| Total | | | | | | | 94,248,780 | |
| | | | | | | | | |
| Life Sciences Tools & Services 3.74% |
| Bio-Techne Corp. | | | 54,737 | | | | 16,216,384 | |
| Charles River Laboratories International, Inc.* | | 77,394 | | | | 16,426,876 | |
| Repligen Corp.* | | | 89,126 | | | | 16,264,604 | |
| Total | | | | | | | 48,907,864 | |
| | | | | | | | | |
| Machinery 3.67% | | | | | | | | |
| Columbus McKinnon Corp. | | | 611,067 | | | | 17,427,631 | |
| Crane Holdings Co. | | | 303,895 | | | | 30,492,824 | |
| Total | | | | | | | 47,920,455 | |
| Investments | | Shares | | | Fair
Value | |
| Media 1.05% | | | | | | | | |
| Criteo SA ADR* | | | 536,384 | | | $ | 13,677,792 | |
| | | | | | | | | |
| Metals & Mining 0.99% | | | | | | | | |
| Reliance Steel & Aluminum Co. | | | 64,529 | | | | 13,001,303 | |
| | | | | | | | | |
| Oil, Gas & Consumable Fuels 4.16% |
| Chesapeake Energy Corp. | | | 357,538 | | | | 36,565,411 | |
| Permian Resources Corp. Class A* | | | 1,818,322 | | | | 17,765,006 | |
| Total | | | | | | | 54,330,417 | |
| | | | | | | | | |
| Pharmaceuticals 1.29% | | | | | | | | |
| Organon & Co. | | | 643,894 | | | | 16,857,145 | |
| | | | | | | | | |
| Professional Services 3.68% | | | | | | | | |
| Booz Allen Hamilton Holding Corp. | | | 303,461 | | | | 33,031,730 | |
| ICF International, Inc. | | | 125,738 | | | | 15,042,037 | |
| Total | | | | | | | 48,073,767 | |
| | | | | | | | | |
| Real Estate Management & Development 1.15% |
| Marcus & Millichap, Inc. | | | 408,400 | | | | 15,045,456 | |
| | | | | | | | | |
| Road & Rail 1.49% | | | | | | | | |
| Saia, Inc.* | | | 97,651 | | | | 19,418,878 | |
| | | | | | | | | |
| Semiconductors & Semiconductor Equipment 1.66% |
| Entegris, Inc. | | | 274,059 | | | | 21,743,841 | |
| | | | | | | | | |
| Software 5.16% | | | | | | | | |
| Aspen Technology, Inc.* | | | 50,516 | | | | 12,197,088 | |
| CommVault Systems, Inc.* | | | 379,580 | | | | 23,112,626 | |
| Descartes Systems Group, Inc. (The) (Canada)*(a) | | | 286,963 | | | | 19,820,534 | |
| Paylocity Holding Corp.* | | | 52,854 | | | | 12,251,029 | |
| Total | | | | | | | 67,381,277 | |
| | | | | | | | | |
| Specialty Retail 0.68% | | | | | | | | |
| Burlington Stores, Inc.* | | | 61,843 | | | | 8,841,075 | |
| | See Notes to Financial Statements. | 131 |
Schedule of Investments (concluded)
VALUE OPPORTUNITIES FUND October 31, 2022
| Investments | | Shares | | | Fair
Value | |
| Textiles, Apparel & Luxury Goods 1.27% |
| Deckers Outdoor Corp.* | | | 47,340 | | | $ | 16,565,686 | |
| | | | | | | | | |
| Trading Companies & Distributors 1.97% |
| AerCap Holdings NV (Ireland)*(a) | | | 481,797 | | | | 25,732,778 | |
Total Common Stocks
(cost $1,147,608,205) | | | | | | | 1,265,311,982 | |
| | | | | | | | | |
| | | Principal
Amount | | | | | |
| SHORT-TERM INVESTMENTS 3.24% | | | | | |
| | | | | | | | | |
| Repurchase Agreements 3.23% | | | | | | | | |
Repurchase Agreement dated 10/31/2022, 1.30% due 11/1/2022 with Fixed Income Clearing Corp. collateralized by $44,154,600 of U.S. Treasury Note at 3.00% due 6/30/2024; value: $43,059,345; proceeds: $42,216,516
(cost $42,214,992) | | $ | 42,214,992 | | | $ | 42,214,992 | |
| Investments | | Shares | | | Fair
Value | |
| Money Market Funds 0.01% | | | | | | |
Fidelity Government Portfolio(c)
(cost $179,438) | | | 179,438 | | | $ | 179,438 | |
| | | | | | | | | |
| Time Deposits 0.00% | | | | | | | | |
CitiBank N.A.(c)
(cost $19,938) | | | 19,938 | | | | 19,938 | |
Total Short-Term Investments
(cost $42,414,368) | | | | | | | 42,414,368 | |
Total Investments in Securities 100.07%
(cost $1,190,022,573) | | | | | | | 1,307,726,350 | |
| Other Assets and Liabilities – Net (0.07)% | | | | (949,727 | ) |
| Net Assets 100.00% | | | | | | $ | 1,306,776,623 | |
| ADR | | American Depositary Receipt. |
| * | | Non-income producing security. |
| (a) | | Foreign security traded in U.S. dollars. |
| (b) | | All or a portion of this security is temporarily on loan to unaffiliated broker/dealers. |
| (c) | | Security was purchased with the cash collateral from loaned securities. |
The following is a summary of the inputs used as of October 31, 2022 in valuing the Fund’s investments carried at fair value(1):
| Investment Type(2) | | Level 1 | | | Level 2 | | | Level 3 | | | Total | |
| Long-Term Investments | | | | | | | | | | | | | | | | |
| Common Stocks | | $ | 1,265,311,982 | | | $ | – | | | $ | – | | | $ | 1,265,311,982 | |
| Short-Term Investments | | | | | | | | | | | | | | | | |
| Repurchase Agreements | | | – | | | | 42,214,992 | | | | – | | | | 42,214,992 | |
| Money Market Funds | | | 179,438 | | | | – | | | | – | | | | 179,438 | |
| Time Deposits | | | – | | | | 19,938 | | | | – | | | | 19,938 | |
| Total | | $ | 1,265,491,420 | | | $ | 42,234,930 | | | $ | – | | | $ | 1,307,726,350 | |
| (1) | | Refer to Note 2(l) for a description of fair value measurements and the three-tier hierarchy of inputs. |
| (2) | | See Schedule of Investments for fair values in each industry and identification of foreign issuers and/or geography. When applicable each Level 3 security is identified on the Schedule of Investments along with the valuation technique utilized. |
A reconciliation of Level 3 investments is presented when the Fund has a material amount of Level 3 investments at the beginning or end of the year in relation to the Fund’s net assets.
| 132 | See Notes to Financial Statements. |
This page is intentionally left blank.
133
Statements of Assets and Liabilities
October 31, 2022
| | | Alpha
Strategy Fund | | | Focused
Growth Fund | | | Focused
Large Cap
Value Fund | |
| ASSETS: | | | | | | | | | | | | | | | |
| Investments in securities, at cost | | | $ | 468,314 | | | | $ | 35,601,354 | | | | $ | 18,641,397 | |
| Investments in Underlying Funds, at cost | | | | 721,051,447 | | | | | – | | | | | – | |
| Investments in securities, at fair value | | | $ | 468,314 | | | | $ | 33,810,067 | | | | $ | 18,919,890 | |
| Investments in Underlying Funds, at value | | | | 655,836,968 | | | | | – | | | | | – | |
| Cash | | | | – | | | | | – | | | | | – | |
| Foreign cash, at value (cost $0, $0, $267,701, $1, $0 and $45,075, respectively) | | | | – | | | | | – | | | | | 246,683 | |
| Receivables: | | | | | | | | | | | | | | | |
| Capital shares sold | | | | 568,783 | | | | | 170,021 | | | | | 51,885 | |
| Investment securities sold | | | | 351,759 | | | | | – | | | | | 448,170 | |
| From advisor (See Note 3) | | | | 19 | | | | | 16,627 | | | | | 12,993 | |
| Interest and dividends | | | | 17 | | | | | 3,453 | | | | | 143,350 | |
| Securities lending income receivable | | | | – | | | | | – | | | | | 358 | |
| Prepaid expenses and other assets | | | | 42,709 | | | | | 28,125 | | | | | 71,858 | |
| Total assets | | | | 657,268,569 | | | | | 34,028,293 | | | | | 19,895,187 | |
| LIABILITIES: | | | | | | | | | | | | | | | |
| Payables: | | | | | | | | | | | | | | | |
| Capital shares reacquired | | | | 988,535 | | | | | 124,979 | | | | | 3,909 | |
| Trustees’ fees | | | | 136,443 | | | | | 7,502 | | | | | 23,829 | |
| 12b-1 distribution plan | | | | 100,679 | | | | | 5,492 | | | | | 6,155 | |
| Fund administration | | | | 21,284 | | | | | 1,120 | | | | | 4,495 | |
| Investment securities purchased | | | | – | | | | | 55,678 | | | | | 496,219 | |
| Management fee | | | | – | | | | | 18,193 | | | | | 66,308 | |
| Foreign currency overdraft (cost $0, $0, $0, $0, $40 and $0, respectively) | | | | – | | | | | – | | | | | – | |
| Accrued expenses | | | | 247,534 | | | | | 42,094 | | | | | 82,818 | |
| Total liabilities | | | | 1,494,475 | | | | | 255,058 | | | | | 683,733 | |
| NET ASSETS | | | $ | 655,774,094 | | | | $ | 33,773,235 | | | | $ | 19,211,454 | |
| COMPOSITION OF NET ASSETS: | | | | | | | | | | | | | | | |
| Paid-in capital | | | $ | 715,036,255 | | | | $ | 42,750,323 | | | | $ | 19,463,887 | |
| Total distributable earnings (loss) | | | | (59,262,161 | ) | | | | (8,977,088 | ) | | | | (252,433 | ) |
| Net Assets | | | $ | 655,774,094 | | | | $ | 33,773,235 | | | | $ | 19,211,454 | |
| 134 | See Notes to Financial Statements. |
Focused
Small Cap
Value Fund | | | Fundamental
Equity Fund | | | Global
Equity Fund | |
| | | | | | | | | | | | | | |
| | $ | 132,072,067 | | | | $ | 1,698,597,533 | | | | $ | 9,406,531 | |
| | | – | | | | | – | | | | | – | |
| | $ | 133,256,792 | | | | $ | 1,955,623,417 | | | | $ | 8,928,384 | |
| | | – | | | | | – | | | | | – | |
| | | 68,758 | | | | | 1 | | | | | – | |
| | | | | | | | | | | | | | |
| | | 1 | | | | | – | | | | | 41,832 | |
| | | | | | | | | | | | | | |
| | | 106,769 | | | | | 330,689 | | | | | 217 | |
| | | 1,136,985 | | | | | 1,922,464 | | | | | 129,529 | |
| | | 2,437 | | | | | – | | | | | 38,603 | |
| | | – | | | | | 2,632,351 | | | | | 8,529 | |
| | | – | | | | | – | | | | | – | |
| | | 35,927 | | | | | 64,744 | | | | | 19,229 | |
| | | 134,607,669 | | | | | 1,960,573,666 | | | | | 9,166,323 | |
| | | | | | | | | | | | | | |
| | | 290,659 | | | | | 1,348,539 | | | | | 8,244 | |
| | | 19,728 | | | | | 523,943 | | | | | 874 | |
| | | 8,004 | | | | | 241,401 | | | | | 1,559 | |
| | | 4,390 | | | | | 60,401 | | | | | 298 | |
| | | – | | | | | 2,227,121 | | | | | 138,882 | |
| | | 87,793 | | | | | 835,703 | | | | | 3,347 | |
| | | | | | | | | | | | | | |
| | | – | | | | | 35 | | | | | – | |
| | | 46,369 | | | | | 514,070 | | | | | 59,811 | |
| | | 456,943 | | | | | 5,751,213 | | | | | 213,015 | |
| | $ | 134,150,726 | | | | $ | 1,954,822,453 | | | | $ | 8,953,308 | |
| | | | | | | | | | | | | | |
| | $ | 128,983,382 | | | | $ | 1,609,466,123 | | | | $ | 9,567,880 | |
| | | 5,167,344 | | | | | 345,356,330 | | | | | (614,572 | ) |
| | $ | 134,150,726 | | | | $ | 1,954,822,453 | | | | $ | 8,953,308 | |
| | See Notes to Financial Statements. | 135 |
Statements of Assets and Liabilities (continued)
October 31, 2022
| | | Alpha
Strategy Fund | | | Focused
Growth Fund | | | Focused
Large Cap
Value Fund | |
| Net assets by class: | | | | | | | | | | | | | | | |
| Class A Shares | | | $ | 420,589,012 | | | | $ | 14,420,497 | | | | $ | 11,465,533 | |
| Class C Shares | | | $ | 30,206,311 | | | | $ | 2,288,783 | | | | $ | 4,636,532 | |
| Class F Shares | | | $ | 27,275,424 | | | | $ | 7,020,620 | | | | $ | 1,404,527 | |
| Class F3 Shares | | | $ | 50,045,558 | | | | $ | 667,326 | | | | $ | 12,698 | |
| Class I Shares | | | $ | 101,366,382 | | | | $ | 4,595,419 | | | | $ | 243,337 | |
| Class P Shares | | | $ | – | | | | $ | – | | | | $ | – | |
| Class R2 Shares | | | $ | 928,082 | | | | $ | – | | | | $ | – | |
| Class R3 Shares | | | $ | 17,365,919 | | | | $ | 13,922 | | | | $ | 83,942 | |
| Class R4 Shares | | | $ | 3,859,336 | | | | $ | 13,164 | | | | $ | 9,110 | |
| Class R5 Shares | | | $ | 375,916 | | | | $ | 13,307 | | | | $ | 9,145 | |
| Class R6 Shares | | | $ | 3,762,154 | | | | $ | 4,740,197 | | | | $ | 1,346,630 | |
| Outstanding shares by class (unlimited number of authorized shares of beneficial interest): | | | | | | | | | | | | | | | |
| Class A Shares | | | | 19,272,802 | | | | | 730,601 | | | | | 844,281 | |
| Class C Shares | | | | 1,819,268 | | | | | 119,727 | | | | | 343,769 | |
| Class F Shares | | | | 1,235,010 | | | | | 351,682 | | | | | 101,966 | |
| Class F3 Shares | | | | 2,192,202 | | | | | 33,333 | | | | | 931 | |
| Class I Shares | | | | 4,463,004 | | | | | 230,184 | | | | | 17,849 | |
| Class P Shares | | | | – | | | | | – | | | | | – | |
| Class R2 Shares | | | | 44,927 | | | | | – | | | | | – | |
| Class R3 Shares | | | | 833,038 | | | | | 713 | | | | | 6,191 | |
| Class R4 Shares | | | | 177,368 | | | | | 667 | | | | | 670 | |
| Class R5 Shares | | | | 16,547 | | | | | 667 | | | | | 671 | |
| Class R6 Shares | | | | 164,742 | | | | | 236,764 | | | | | 98,639 | |
| Net Asset Value, offering and redemption price per share (Net assets divided by outstanding shares): | | | | | | | | | | | | | | | |
| Class A Shares-Net asset value | | | | $21.82 | | | | | $19.74 | | | | | $13.58 | |
| Class A Shares-Maximum offering price (Net asset value plus sales charge of 5.75%) | | | | $23.15 | | | | | $20.94 | | | | | $14.41 | |
| Class C Shares-Net asset value | | | | $16.60 | | | | | $19.12 | | | | | $13.49 | |
| Class F Shares-Net asset value | | | | $22.09 | | | | | $19.96 | | | | | $13.77 | |
| Class F3 Shares-Net asset value* | | | | $22.83 | | | | | $20.02 | | | | | $13.64 | |
| Class I Shares-Net asset value | | | | $22.71 | | | | | $19.96 | | | | | $13.63 | |
| Class P Shares-Net asset value | | | | $ – | | | | | $ – | | | | | $ – | |
| Class R2 Shares-Net asset value | | | | $20.66 | | | | | $ – | | | | | $ – | |
| Class R3 Shares-Net asset value | | | | $20.85 | | | | | $19.53 | | | | | $13.56 | |
| Class R4 Shares-Net asset value* | | | | $21.76 | | | | | $19.75 | | | | | $13.59 | |
| Class R5 Shares-Net asset value* | | | | $22.72 | | | | | $19.96 | | | | | $13.63 | |
| Class R6 Shares-Net asset value | | | | $22.84 | | | | | $20.02 | | | | | $13.65 | |
| | |
| * | Net asset value may not recalculate due to rounding of fractional shares. |
| 136 | See Notes to Financial Statements. |
Focused
Small Cap
Value Fund | | | Fundamental
Equity Fund | | | Global
Equity Fund | |
| | | | | | | | | | | | | | |
| | $ | 16,026,205 | | | | $ | 1,186,259,033 | | | | $ | 4,235,556 | |
| | $ | 3,624,004 | | | | $ | 38,197,018 | | | | $ | 391,856 | |
| | $ | 21,682,540 | | | | $ | 69,775,285 | | | | $ | 1,277,016 | |
| | $ | 11,244 | | | | $ | 18,158,951 | | | | $ | 12,576 | |
| | $ | 82,062,072 | | | | $ | 561,348,657 | | | | $ | 1,084,682 | |
| | $ | – | | | | $ | 4,074,466 | | | | $ | – | |
| | $ | – | | | | $ | 2,114,397 | | | | $ | – | |
| | $ | – | | | | $ | 63,110,299 | | | | $ | 506,201 | |
| | $ | – | | | | $ | 2,968,891 | | | | $ | 513,588 | |
| | $ | 272,362 | | | | $ | 776,158 | | | | $ | 12,906 | |
| | $ | 10,472,299 | | | | $ | 8,039,298 | | | | $ | 918,927 | |
| | | | | | | | | | | | | | |
| | | 668,657 | | | | | 95,388,374 | | | | | 372,531 | |
| | | 142,876 | | | | | 3,584,885 | | | | | 34,937 | |
| | | 828,536 | | | | | 5,689,368 | | | | | 112,073 | |
| | | 429 | | | | | 1,435,043 | | | | | 1,102 | |
| | | 3,139,248 | | | | | 44,721,063 | | | | | 95,110 | |
| | | – | | | | | 336,276 | | | | | – | |
| | | – | | | | | 175,045 | | | | | – | |
| | | – | | | | | 5,202,253 | | | | | 44,970 | |
| | | – | | | | | 240,101 | | | | | 45,174 | |
| | | 10,417 | | | | | 61,793 | | | | | 1,132 | |
| | | 399,650 | | | | | 634,896 | | | | | 80,502 | |
| | | | | | | | | | | | | | |
| | | $23.97 | | | | | $12.44 | | | | | $11.37 | |
| | | | | | | | | | | | | | |
| | | $25.43 | | | | | $13.20 | | | | | $12.06 | |
| | | $25.36 | | | | | $10.66 | | | | | $11.22 | |
| | | $26.17 | | | | | $12.26 | | | | | $11.39 | |
| | | $26.20 | | | | | $12.65 | | | | | $11.41 | |
| | | $26.14 | | | | | $12.55 | | | | | $11.40 | |
| | | $ – | | | | | $12.12 | | | | | $ – | |
| | | $ – | | | | | $12.08 | | | | | $ – | |
| | | $ – | | | | | $12.13 | | | | | $11.26 | |
| | | $ – | | | | | $12.37 | | | | | $11.37 | |
| | | $26.15 | | | | | $12.56 | | | | | $11.40 | |
| | | $26.20 | | | | | $12.66 | | | | | $11.41 | |
| | See Notes to Financial Statements. | 137 |
Statements of Assets and Liabilities (continued)
October 31, 2022
| | | Growth
Leaders Fund | | | Health Care
Fund | | | International
Equity Fund | |
| ASSETS: | | | | | | | | | | | | | | | |
| Investments in securities, at cost | | | $ | 5,796,149,261 | | | | $ | 5,795,319 | | | | $ | 288,649,676 | |
| Investments in securities, at fair value including $0, $75,730, $0, $138,454, $0 $11,172,648 and $196,185, respectively, of securities loaned | | | $ | 5,585,668,592 | | | | $ | 6,493,951 | | | | $ | 275,098,185 | |
| Cash | | | | – | | | | | – | | | | | – | |
| Foreign cash, at value (cost $0, $0, $4,485,534, $11,866,560, $10,894,848, $0 and $0, respectively) | | | | – | | | | | – | | | | | 4,410,102 | |
| Receivables: | | | | | | | | | | | | | | | |
| Capital shares sold | | | | 8,132,290 | | | | | 1,398 | | | | | 52,250 | |
| Interest and dividends | | | | 485,685 | | | | | 3,625 | | | | | 897,527 | |
| From advisor (See Note 3) | | | | 67,476 | | | | | 15,712 | | | | | 42,073 | |
| Investment securities sold | | | | – | | | | | – | | | | | 1,398,179 | |
| Securities lending income receivable | | | | – | | | | | 43 | | | | | – | |
| Prepaid expenses and other assets | | | | 57,156 | | | | | 54,494 | | | | | 31,746 | |
| Total assets | | | | 5,594,411,199 | | | | | 6,569,223 | | | | | 281,930,062 | |
| LIABILITIES: | | | | | | | | | | | | | | | |
| Payables: | | | | | | | | | | | | | | | |
| Investment securities purchased | | | | 13,352,552 | | | | | – | | | | | 1,122,328 | |
| Capital shares reacquired | | | | 8,481,732 | | | | | – | | | | | 83,118 | |
| Management fee | | | | 2,428,010 | | | | | 3,240 | | | | | 162,988 | |
| 12b-1 distribution plan | | | | 863,289 | | | | | 1,174 | | | | | 33,674 | |
| Trustees’ fees | | | | 492,682 | | | | | 3,073 | | | | | 96,769 | |
| To bank | | | | 290,014 | | | | | – | | | | | – | |
| Fund administration | | | | 187,446 | | | | | 209 | | | | | 9,314 | |
| Payable for collateral due to broker for securities lending | | | | – | | | | | 77,926 | | | | | – | |
| IRS compliance fee for foreign withholding tax claims (See Note 17) | | | | – | | | | | – | | | | | 684,970 | |
| Foreign capital gains taxes deferred | | | | – | | | | | – | | | | | 35,012 | |
| Foreign currency overdraft (cost $0, $35, $0, $0, $0, $0 and $0, respectively) | | | | – | | | | | 35 | | | | | – | |
| Accrued expenses and other liabilities | | | | 1,481,384 | | | | | 47,854 | | | | | 231,583 | |
| Total liabilities | | | | 27,577,109 | | | | | 133,511 | | | | | 2,459,756 | |
| NET ASSETS | | | $ | 5,566,834,090 | | | | $ | 6,435,712 | | | | $ | 279,470,306 | |
| COMPOSITION OF NET ASSETS: | | | | | | | | | | | | | | | |
| Paid-in capital | | | $ | 6,787,208,178 | | | | $ | 6,521,759 | | | | $ | 294,618,765 | |
| Total distributable earnings (loss) | | | | (1,220,374,088 | ) | | | | (86,047 | ) | | | | (15,148,459 | ) |
| Net Assets | | | $ | 5,566,834,090 | | | | $ | 6,435,712 | | | | $ | 279,470,306 | |
| 138 | See Notes to Financial Statements. |
International
Opportunities
Fund | | | International
Value Fund | | | Micro Cap
Growth Fund | | | Value
Opportunities
Fund | |
| | | | | | | | | | | | | | | | | | | |
| | $ | 364,850,204 | | | | $ | 373,624,531 | | | | $ | 211,940,584 | | | | $ | 1,190,022,573 | |
| | | | | | | | | | | | | | | | | | | |
| | $ | 299,454,441 | | | | $ | 333,490,324 | | | | $ | 244,511,129 | | | | $ | 1,307,726,350 | |
| | | 34 | | | | | – | | | | | 228 | | | | | – | |
| | | | | | | | | | | | | | | | | | | |
| | | 11,158,633 | | | | | 10,814,518 | | | | | – | | | | | – | |
| | | | | | | | | | | | | | | | | | | |
| | | 61,830 | | | | | 298,990 | | | | | 369,317 | | | | | 707,587 | |
| | | 889,882 | | | | | 2,001,572 | | | | | 10,329 | | | | | 109,818 | |
| | | – | | | | | 74,604 | | | | | 3,361 | | | | | – | |
| | | 797,750 | | | | | 3,215,154 | | | | | 1,101,698 | | | | | 3,404,448 | |
| | | 458 | | | | | – | | | | | 16,961 | | | | | 153 | |
| | | 63,688 | | | | | 18,308 | | | | | 16,226 | | | | | 76,421 | |
| | | 312,426,716 | | | | | 349,913,470 | | | | | 246,029,249 | | | | | 1,312,024,777 | |
| | | | | | | | | | | | | | | | | | | |
| | | 667,775 | | | | | 953,959 | | | | | 29,952 | | | | | 1,048,845 | |
| | | 382,895 | | | | | 392,895 | | | | | 495,440 | | | | | 2,255,163 | |
| | | 191,844 | | | | | 198,365 | | | | | 169,627 | | | | | 791,291 | |
| | | 19,398 | | | | | 42,087 | | | | | 16,272 | | | | | 134,680 | |
| | | 76,803 | | | | | 142,907 | | | | | 23,941 | | | | | 333,657 | |
| | | – | | | | | 102,170 | | | | | – | | | | | – | |
| | | 10,232 | | | | | 11,335 | | | | | 7,539 | | | | | 42,790 | |
| | | | | | | | | | | | | | | | | | | |
| | | 145,950 | | | | | – | | | | | 11,575,647 | | | | | 199,376 | |
| | | | | | | | | | | | | | | | | | | |
| | | – | | | | | 3,524,977 | | | | | – | | | | | – | |
| | | 136,684 | | | | | – | | | | | – | | | | | – | |
| | | | | | | | | | | | | | | | | | | |
| | | – | | | | | – | | | | | – | | | | | – | |
| | | 194,546 | | | | | 269,004 | | | | | 110,303 | | | | | 442,352 | |
| | | 1,826,127 | | | | | 5,637,699 | | | | | 12,428,721 | | | | | 5,248,154 | |
| | $ | 310,600,589 | | | | $ | 344,275,771 | | | | $ | 233,600,528 | | | | $ | 1,306,776,623 | |
| | | | | | | | | | | | | | | | | | | |
| | $ | 406,602,668 | | | | $ | 812,553,715 | | | | $ | 276,555,067 | | | | $ | 1,086,598,123 | |
| | | (96,002,079 | ) | | | | (468,277,944 | ) | | | | (42,954,539 | ) | | | | 220,178,500 | |
| | $ | 310,600,589 | | | | $ | 344,275,771 | | | | $ | 233,600,528 | | | | $ | 1,306,776,623 | |
| | See Notes to Financial Statements. | 139 |
Statements of Assets and Liabilities (concluded)
October 31, 2022
| | | Growth
Leaders Fund | | | Health Care
Fund | | | International
Equity Fund | |
| Net assets by class: | | | | | | | | | | | | | | | |
| Class A Shares | | | $ | 1,569,330,171 | | | | $ | 3,176,783 | | | | $ | 131,096,846 | |
| Class C Shares | | | $ | 543,043,300 | | | | $ | 607,034 | | | | $ | 4,161,259 | |
| Class F Shares | | | $ | 775,268,838 | | | | $ | 372,917 | | | | $ | 7,985,509 | |
| Class F3 Shares | | | $ | 430,492,011 | | | | $ | 31,463 | | | | $ | 5,986,597 | |
| Class I Shares | | | $ | 2,087,818,270 | | | | $ | 15,235 | | | | $ | 121,925,589 | |
| Class P Shares | | | $ | – | | | | $ | – | | | | $ | 9,323 | |
| Class R2 Shares | | | $ | 2,154,950 | | | | $ | – | | | | $ | 143,378 | |
| Class R3 Shares | | | $ | 13,621,267 | | | | $ | 11,276 | | | | $ | 4,202,659 | |
| Class R4 Shares | | | $ | 10,901,262 | | | | $ | 11,379 | | | | $ | 1,306,034 | |
| Class R5 Shares | | | $ | 9,706,498 | | | | $ | 11,477 | | | | $ | 13,980 | |
| Class R6 Shares | | | $ | 124,497,523 | | | | $ | 2,198,148 | | | | $ | 2,639,132 | |
| Outstanding shares by class (unlimited number of authorized shares of beneficial interest): | | | | | | | | | | | | | | | |
| Class A Shares | | | | 59,327,759 | | | | | 186,079 | | | | | 11,292,857 | |
| Class C Shares | | | | 23,733,010 | | | | | 36,539 | | | | | 360,768 | |
| Class F Shares | | | | 28,271,931 | | | | | 21,656 | | | | | 690,322 | |
| Class F3 Shares | | | | 15,434,653 | | | | | 1,826 | | | | | 507,390 | |
| Class I Shares | | | | 75,459,803 | | | | | 885 | | | | | 10,358,953 | |
| Class P Shares | | | | – | | | | | – | | | | | 802 | |
| Class R2 Shares | | | | 84,500 | | | | | – | | | | | 12,344 | |
| Class R3 Shares | | | | 534,007 | | | | | 667 | | | | | 368,509 | |
| Class R4 Shares | | | | 411,929 | | | | | 667 | | | | | 113,121 | |
| Class R5 Shares | | | | 350,622 | | | | | 667 | | | | | 1,196 | |
| Class R6 Shares | | | | 4,463,800 | | | | | 127,493 | | | | | 223,820 | |
| Net Asset Value, offering and redemption price per share (Net assets divided by outstanding shares): | | | | | | | | | | | | | | | |
| Class A Shares-Net asset value | | | | $26.45 | | | | | $17.07 | | | | | $11.61 | |
| Class A Shares-Maximum offering price (Net asset value plus sales charge of 5.75%) | | | | $28.06 | | | | | $18.11 | | | | | $12.32 | |
| Class C Shares-Net asset value | | | | $22.88 | | | | | $16.61 | | | | | $11.53 | |
| Class F Shares-Net asset value | | | | $27.42 | | | | | $17.22 | | | | | $11.57 | |
| Class F3 Shares-Net asset value | | | | $27.89 | | | | | $17.23 | | | | | $11.80 | |
| Class I Shares-Net asset value | | | | $27.67 | | | | | $17.21 | | | | | $11.77 | |
| Class P Shares-Net asset value* | | | | $ – | | | | | $ – | | | | | $11.63 | |
| Class R2 Shares-Net asset value | | | | $25.50 | | | | | $ – | | | | | $11.62 | |
| Class R3 Shares-Net asset value | | | | $25.51 | | | | | $16.91 | | | | | $11.40 | |
| Class R4 Shares-Net asset value* | | | | $26.46 | | | | | $17.07 | | | | | $11.55 | |
| Class R5 Shares-Net asset value | | | | $27.68 | | | | | $17.21 | | | | | $11.69 | |
| Class R6 Shares-Net asset value | | | | $27.89 | | | | | $17.24 | | | | | $11.79 | |
| | |
| * | Net asset value may not recalculate due to rounding of fractional shares. |
| 140 | See Notes to Financial Statements. |
International
Opportunities
Fund | | | International
Value Fund | | | Micro
Cap Growth
Fund | | | Value
Opportunities
Fund | |
| | | | | | | | | | | | | | | | | | | |
| | $ | 84,504,539 | | | | $ | 181,412,014 | | | | $ | 36,106,640 | | | | $ | 633,569,678 | |
| | $ | 7,226,448 | | | | $ | 5,037,143 | | | | $ | 6,827,431 | | | | $ | 45,211,254 | |
| | $ | 13,570,258 | | | | $ | 9,803,236 | | | | $ | 41,544,815 | | | | $ | 76,594,058 | |
| | $ | 25,731,730 | | | | $ | 22,938,186 | | | | $ | – | | | | $ | 194,437,062 | |
| | $ | 153,654,921 | | | | $ | 117,541,756 | | | | $ | 149,121,642 | | | | $ | 246,039,931 | |
| | $ | 112,691 | | | | $ | – | | | | $ | – | | | | $ | 12,662,906 | |
| | $ | 1,912,781 | | | | $ | 44,458 | | | | $ | – | | | | $ | 4,432,953 | |
| | $ | 4,128,947 | | | | $ | 6,002,917 | | | | $ | – | | | | $ | 31,103,805 | |
| | $ | 1,934,630 | | | | $ | 108,713 | | | | $ | – | | | | $ | 29,340,552 | |
| | $ | 1,877,433 | | | | $ | 13,708 | | | | $ | – | | | | $ | 1,246,766 | |
| | $ | 15,946,211 | | | | $ | 1,373,640 | | | | $ | – | | | | $ | 32,137,658 | |
| | | | | | | | | | | | | | | | | | | |
| | | 5,710,976 | | | | | 29,557,819 | | | | | 2,604,339 | | | | | 37,457,129 | |
| | | 533,838 | | | | | 826,803 | | | | | 408,899 | | | | | 3,288,140 | |
| | | 925,074 | | | | | 1,586,753 | | | | | 2,434,000 | | | | | 4,388,598 | |
| | | 1,669,884 | | | | | 3,705,815 | | | | | – | | | | | 10,735,360 | |
| | | 10,038,049 | | | | | 18,979,496 | | | | | 8,736,943 | | | | | 13,724,941 | |
| | | 7,424 | | | | | – | | | | | – | | | | | 773,212 | |
| | | 132,122 | | | | | 7,052 | | | | | – | | | | | 280,894 | |
| | | 285,321 | | | | | 965,748 | | | | | – | | | | | 1,931,670 | |
| | | 131,391 | | | | | 17,755 | | | | | – | | | | | 1,737,264 | |
| | | 122,705 | | | | | 2,224 | | | | | – | | | | | 69,494 | |
| | | 1,034,787 | | | | | 221,919 | | | | | – | | | | | 1,776,019 | |
| | | | | | | | | | | | | | | | | | | |
| | | $14.80 | | | | | $6.14 | | | | | $13.86 | | | | | $16.91 | |
| | | | | | | | | | | | | | | | | | | |
| | | $15.70 | | | | | $6.51 | | | | | $14.71 | | | | | $17.94 | |
| | | $13.54 | | | | | $6.09 | | | | | $16.70 | | | | | $13.75 | |
| | | $14.67 | | | | | $6.18 | | | | | $17.07 | | | | | $17.45 | |
| | | $15.41 | | | | | $6.19 | | | | | $ – | | | | | $18.11 | |
| | | $15.31 | | | | | $6.19 | | | | | $17.07 | | | | | $17.93 | |
| | | $15.18 | | | | | $ – | | | | | $ – | | | | | $16.38 | |
| | | $14.48 | | | | | $6.30 | | | | | $ – | | | | | $15.78 | |
| | | $14.47 | | | | | $6.22 | | | | | $ – | | | | | $16.10 | |
| | | $14.72 | | | | | $6.12 | | | | | $ – | | | | | $16.89 | |
| | | $15.30 | | | | | $6.16 | | | | | $ – | | | | | $17.94 | |
| | | $15.41 | | | | | $6.19 | | | | | $ – | | | | | $18.10 | |
| | See Notes to Financial Statements. | 141 |
Statements of Operations
For the Year Ended October 31, 2022
| | | Alpha
Strategy Fund | | | Focused
Growth Fund | | | Focused
Large Cap
Value Fund | |
| Investment income: | | | | | | | | | | | | | | | |
| Dividends (net of foreign withholding taxes of $0, $0, $63,774, $37,396, $137,365 and $8,087, respectively) | | | $ | 5,184,040 | | | | $ | 134,353 | | | | $ | 11,567,367 | |
| Securities lending net income | | | | – | | | | | – | | | | | 1,523 | |
| Interest and other | | | | 1,701 | | | | | 4,871 | | | | | 16,708 | |
| Interest earned from Interfund Lending (See Note 11) | | | | – | | | | | – | | | | | 161 | |
| Total investment income | | | | 5,185,741 | | | | | 139,224 | | | | | 11,585,759 | |
| Expenses: | | | | | | | | | | | | | | | |
| Management fee | | | | 738,784 | | | | | 270,866 | | | | | 3,154,540 | |
| 12b-1 distribution plan–Class A | | | | 1,164,175 | | | | | 39,906 | | | | | 26,813 | |
| 12b-1 distribution plan–Class C | | | | 409,356 | | | | | 25,776 | | | | | 49,056 | |
| 12b-1 distribution plan–Class F | | | | 81,274 | | | | | 12,666 | | | | | 1,740 | |
| 12b-1 distribution plan–Class P | | | | – | | | | | – | | | | | – | |
| 12b-1 distribution plan–Class R2 | | | | 6,218 | | | | | – | | | | | – | |
| 12b-1 distribution plan–Class R3 | | | | 102,626 | | | | | 84 | | | | | 275 | |
| 12b-1 distribution plan–Class R4 | | | | 10,264 | | | | | 40 | | | | | 25 | |
| Shareholder servicing | | | | 730,052 | | | | | 51,000 | | | | | 20,343 | |
| Fund administration | | | | 295,514 | | | | | 16,669 | | | | | 213,867 | |
| Registration | | | | 151,112 | | | | | 117,097 | | | | | 124,751 | |
| Reports to shareholders | | | | 55,688 | | | | | 4,732 | | | | | 7,518 | |
| Professional | | | | 54,920 | | | | | 42,734 | | | | | 52,854 | |
| Trustees’ fees | | | | 16,063 | | | | | 911 | | | | | 12,162 | |
| Custody | | | | 12,862 | | | | | 7,230 | | | | | 10,384 | |
| Other | | | | 18,954 | | | | | 16,074 | | | | | 100,477 | |
| Gross expenses | | | | 3,847,862 | | | | | 605,785 | | | | | 3,774,805 | |
| Expense reductions (See Note 9) | | | | (4,687 | ) | | | | (231 | ) | | | | (140 | ) |
| Fees waived and expenses reimbursed (See Note 3) | | | | (751,646 | ) | | | | (210,838 | ) | | | | (25,060 | ) |
| Net expenses | | | | 3,091,529 | | | | | 394,716 | | | | | 3,749,605 | |
| Net investment income (loss) | | | | 2,094,212 | | | | | (255,492 | ) | | | | 7,836,154 | |
| Net realized and unrealized gain (loss): | | | | | | | | | | | | | | | |
| Capital gain distributions received from Underlying Funds | | | | 63,676,165 | | | | | – | | | | | – | |
| Net realized gain (loss) on Investment in Underlying Funds | | | | (6,375,349 | ) | | | | – | | | | | – | |
| Net realized gain (loss) on investments | | | | – | | | | | (6,905,171 | ) | | | | 34,673,952 | |
| Net realized gain (loss) on futures contracts | | | | – | | | | | – | | | | | – | |
| Net realized gain (loss) on foreign currency related transactions | | | | – | | | | | – | | | | | 12,619 | |
| Net change in unrealized appreciation/depreciation in Underlying Funds | | | | (272,105,734 | ) | | | | – | | | | | – | |
| Net change in unrealized appreciation/depreciation on investments | | | | – | | | | | (13,228,715 | ) | | | | (113,009,131 | ) |
| 142 | See Notes to Financial Statements. | |
Focused
Small Cap
Value Fund | | | Fundamental
Equity Fund | | | Global
Equity Fund | |
| | | | | | | | | | | | | | |
| | $ | 2,496,231 | | | | $ | 39,810,616 | | | | $ | 170,668 | |
| | | 30,158 | | | | | 255 | | | | | – | |
| | | 5,959 | | | | | 154,866 | | | | | 1,032 | |
| | | – | | | | | 2,073 | | | | | – | |
| | | 2,532,348 | | | | | 39,967,810 | | | | | 171,700 | |
| | | | | | | | | | | | | | |
| | | 1,402,249 | | | | | 10,219,959 | | | | | 46,356 | |
| | | 46,632 | | | | | 3,177,103 | | | | | 11,357 | |
| | | 43,455 | | | | | 455,929 | | | | | 6,511 | |
| | | 44,837 | | | | | 108,666 | | | | | 1,700 | |
| | | – | | | | | 19,836 | | | | | – | |
| | | – | | | | | 14,119 | | | | | – | |
| | | – | | | | | 361,900 | | | | | 3,136 | |
| | | – | | | | | 7,203 | | | | | 769 | |
| | | 114,370 | | | | | 1,699,542 | | | | | 15,335 | |
| | | 70,112 | | | | | 741,597 | | | | | 4,121 | |
| | | 109,322 | | | | | 159,382 | | | | | 116,486 | |
| | | 12,058 | | | | | 86,225 | | | | | 1,072 | |
| | | 44,483 | | | | | 77,357 | | | | | 83,977 | |
| | | 3,885 | | | | | 38,590 | | | | | 478 | |
| | | 2,271 | | | | | 43,504 | | | | | 47,387 | |
| | | 40,577 | | | | | 92,982 | | | | | 8,355 | |
| | | 1,934,251 | | | | | 17,303,894 | | | | | 347,040 | |
| | | (486 | ) | | | | (11,144 | ) | | | | (66 | ) |
| | | (47,795 | ) | | | | (43,504 | ) | | | | (257,151 | ) |
| | | 1,885,970 | | | | | 17,249,246 | | | | | 89,823 | |
| | | 646,378 | | | | | 22,718,564 | | | | | 81,877 | |
| | | | | | | | | | | | | | |
| | | – | | | | | – | | | | | – | |
| | | | | | | | | | | | | | |
| | | – | | | | | – | | | | | – | |
| | | 5,413,556 | | | | | 89,659,966 | | | | | (120,056 | ) |
| | | – | | | | | – | | | | | (6,658 | ) |
| | | | | | | | | | | | | | |
| | | (9,625 | ) | | | | (1,711 | ) | | | | (2,720 | ) |
| | | | | | | | | | | | | | |
| | | – | | | | | – | | | | | – | |
| | | | | | | | | | | | | | |
| | | (31,562,664 | ) | | | | (228,849,383 | ) | | | | (2,368,022 | ) |
| | See Notes to Financial Statements. | 143 |
Statements of Operations (continued)
For the Year Ended October 31, 2022
| | | Alpha
Strategy Fund | | | Focused
Growth Fund | | | Focused
Large Cap
Value Fund | |
| Net realized and unrealized gain (loss): | | | | | | | | | | | | | | | |
| Net change in unrealized appreciation/depreciation on translation of assets and liabilities denominated in foreign currencies | | | | – | | | | | – | | | | | (23,429 | ) |
| Net realized and unrealized gain (loss) | | | | (214,804,918 | ) | | | | (20,133,886 | ) | | | | (78,345,989 | ) |
| Net Decrease in Net Assets Resulting From Operations | | | $ | (212,710,706 | ) | | | $ | (20,389,378 | ) | | | $ | (70,509,835 | ) |
| 144 | See Notes to Financial Statements. | |
Focused
Small Cap
Value Fund | | | Fundamental
Equity Fund | | | Global
Equity Fund | |
| | | | | | | | | | | | | | |
| | | – | | | | | (13,762 | ) | | | | (3,652 | ) |
| | | (26,158,733 | ) | | | | (139,204,890 | ) | | | | (2,501,108 | ) |
| | | | | | | | | | | | | | |
| | $ | (25,512,355 | ) | | | $ | (116,486,326 | ) | | | $ | (2,419,231 | ) |
| | See Notes to Financial Statements. | 145 |
Statements of Operations (continued)
For the Year Ended October 31, 2022
| | | Growth
Leaders Fund | | | Health Care
Fund | | | International
Equity Fund | |
| Investment income: | | | | | | | | | | | | | | | |
| Dividends (net of foreign withholding taxes of $103,687, $2,838, $951,221, $776,006, $2,090,029 and $4,565, respectively) | | | $ | 30,240,855 | | | | $ | 49,883 | | | | $ | 11,073,357 | |
| Securities lending net income | | | | 1,804 | | | | | 713 | | | | | 71,862 | |
| Interest and other | | | | 627,682 | | | | | 980 | | | | | 40,726 | |
| Interest earned from Interfund Lending (See Note 11) | | | | 2,405 | | | | | – | | | | | 651 | |
| IRS compliance fee for foreign withholding tax claims (See Note 17) | | | | – | | | | | – | | | | | (684,970 | ) |
| Total investment income | | | | 30,872,746 | | | | | 51,576 | | | | | 10,501,626 | |
| Expenses: | | | | | | | | | | | | | | | |
| Management fee | | | | 37,806,132 | | | | | 41,698 | | | | | 2,408,065 | |
| 12b-1 distribution plan–Class A | | | | 4,991,373 | | | | | 8,047 | | | | | 401,180 | |
| 12b-1 distribution plan–Class C | | | | 7,697,636 | | | | | 6,580 | | | | | 59,933 | |
| 12b-1 distribution plan–Class F | | | | 2,334,252 | | | | | 493 | | | | | 14,148 | |
| 12b-1 distribution plan–Class P | | | | – | | | | | – | | | | | 49 | |
| 12b-1 distribution plan–Class R2 | | | | 16,069 | | | | | – | | | | | 963 | |
| 12b-1 distribution plan–Class R3 | | | | 87,182 | | | | | 58 | | | | | 25,348 | |
| 12b-1 distribution plan–Class R4 | | | | 34,006 | | | | | 29 | | | | | 3,686 | |
| Shareholder servicing | | | | 5,707,418 | | | | | 8,042 | | | | | 340,228 | |
| Fund administration | | | | 2,944,491 | | | | | 2,690 | | | | | 137,604 | |
| Reports to shareholders | | | | 617,016 | | | | | 3,264 | | | | | 35,089 | |
| Registration | | | | 488,500 | | | | | 115,988 | | | | | 141,926 | |
| Trustees’ fees | | | | 165,942 | | | | | 476 | | | | | 7,522 | |
| Professional | | | | 150,234 | | | | | 47,860 | | | | | 65,579 | |
| Custody | | | | 110,628 | | | | | 24,101 | | | | | 69,777 | |
| Interest paid from Interfund Lending (See Note 11) | | | | – | | | | | – | | | | | – | |
| Other | | | | 140,649 | | | | | 10,982 | | | | | 125,060 | |
| Gross expenses | | | | 63,291,528 | | | | | 270,308 | | | | | 3,836,157 | |
| Expense reductions (See Note 9) | | | | (41,435 | ) | | | | (33 | ) | | | | (1,285 | ) |
| Fees waived and expenses reimbursed (See Note 3) | | | | (2,444,879 | ) | | | | (205,455 | ) | | | | (269,048 | ) |
| Net expenses | | | | 60,805,214 | | | | | 64,820 | | | | | 3,565,824 | |
| Net investment income (loss) | | | | (29,932,468 | ) | | | | (13,244 | ) | | | | 6,935,802 | |
| Net realized and unrealized gain (loss): | | | | | | | | | | | | | | | |
| Net realized gain (loss) on investments | | | | (974,635,511 | ) | | | | (757,851 | ) | | | | (4,473,370 | ) |
| Net realized gain (loss) on swap contracts | | | | – | | | | | – | | | | | – | |
| Net realized gain (loss) on foreign currency related transactions | | | | – | | | | | (76 | ) | | | | (162,312 | ) |
| Net change in unrealized appreciation/depreciation on investments | | | | (2,765,796,307 | ) | | | | (525,640 | ) | | | | (103,448,996 | ) |
| Net change in unrealized appreciation/depreciation on deferred foreign capital gains taxes | | | | – | | | | | – | | | | | (35,012 | ) |
| Net change in unrealized appreciation/depreciation on translation of assets and liabilities denominated in foreign currencies | | | | – | | | | | (298 | ) | | | | (163,002 | ) |
| Net realized and unrealized gain (loss) | | | | (3,740,431,818 | ) | | | | (1,283,865 | ) | | | | (108,282,692 | ) |
| Net Decrease in Net Assets Resulting From Operations | | | $ | (3,770,364,286 | ) | | | $ | (1,297,109 | ) | | | $ | (101,346,890 | ) |
| 146 | See Notes to Financial Statements. | |
International
Opportunities
Fund | | | International
Value Fund | | | Micro Cap
Growth Fund | |
| | | | | | | | | | | | | | |
| | $ | 8,748,540 | | | | $ | 29,817,059 | | | | $ | 881,527 | |
| | | 22,496 | | | | | 214,647 | | | | | 439,462 | |
| | | 37,508 | | | | | 18,887 | | | | | 15,733 | |
| | | 823 | | | | | 1,089 | | | | | – | |
| | | | | | | | | | | | | | |
| | | – | | | | | (3,524,977 | ) | | | | – | |
| | | 8,809,367 | | | | | 26,526,705 | | | | | 1,336,722 | |
| | | | | | | | | | | | | | |
| | | 2,862,512 | | | | | 3,785,917 | | | | | 2,470,470 | |
| | | 268,092 | | | | | 545,515 | | | | | 105,089 | |
| | | 105,580 | | | | | 80,272 | | | | | 89,150 | |
| | | 33,831 | | | | | 19,011 | | | | | 89,793 | |
| | | 573 | | | | | – | | | | | – | |
| | | 13,569 | | | | | 230 | | | | | – | |
| | | 26,652 | | | | | 34,432 | | | | | – | |
| | | 5,794 | | | | | 364 | | | | | – | |
| | | 297,802 | | | | | 402,221 | | | | | 271,104 | |
| | | 152,667 | | | | | 216,338 | | | | | 109,799 | |
| | | 33,599 | | | | | 39,553 | | | | | 71,018 | |
| | | 139,685 | | | | | 130,244 | | | | | 98,292 | |
| | | 8,339 | | | | | 11,846 | | | | | 6,315 | |
| | | 85,751 | | | | | 108,877 | | | | | 52,816 | |
| | | 141,546 | | | | | 75,372 | | | | | 18,107 | |
| | | – | | | | | 1,561 | | | | | – | |
| | | 68,235 | | | | | 180,846 | | | | | 61,554 | |
| | | 4,244,227 | | | | | 5,632,599 | | | | | 3,443,507 | |
| | | (1,235 | ) | | | | (1,868 | ) | | | | (1,283 | ) |
| | | (141,546 | ) | | | | (402,145 | ) | | | | (107,900 | ) |
| | | 4,101,446 | | | | | 5,228,586 | | | | | 3,334,324 | |
| | | 4,707,921 | | | | | 21,298,119 | | | | | (1,997,602 | ) |
| | | | | | | | | | | | | | |
| | | (17,374,234 | ) | | | | (22,441,877 | ) | | | | (60,372,383 | ) |
| | | 1,418,165 | | | | | – | | | | | – | |
| | | | | | | | | | | | | | |
| | | (783,381 | ) | | | | (1,447,682 | ) | | | | – | |
| | | | | | | | | | | | | | |
| | | (118,034,607 | ) | | | | (110,058,135 | ) | | | | (46,542,882 | ) |
| | | | | | | | | | | | | | |
| | | 337,044 | | | | | – | | | | | – | |
| | | | | | | | | | | | | | |
| | | (778,680 | ) | | | | (261,558 | ) | | | | – | |
| | | (135,215,693 | ) | | | | (134,209,252 | ) | | | | (106,915,265 | ) |
| | | | | | | | | | | | | | |
| | $ | (130,507,772 | ) | | | $ | (112,911,133 | ) | | | $ | (108,912,867 | ) |
| | See Notes to Financial Statements. | 147 |
Statements of Operations (concluded)
For the Year Ended October 31, 2022
| | | Value
Opportunities
Fund | |
| Investment income: | | | | | |
| Dividends (net of foreign withholding taxes of $76,445) | | | $ | 26,114,435 | |
| Securities lending net income | | | | 10,535 | |
| Interest and other | | | | 74,890 | |
| Interest earned from Interfund Lending (See Note 11) | | | | 2,224 | |
| Total investment income | | | | 26,202,084 | |
| Expenses: | | | | | |
| Management fee | | | | 11,391,731 | |
| 12b-1 distribution plan–Class A | | | | 1,828,141 | |
| 12b-1 distribution plan–Class C | | | | 585,100 | |
| 12b-1 distribution plan–Class F | | | | 130,910 | |
| 12b-1 distribution plan–Class P | | | | 65,956 | |
| 12b-1 distribution plan–Class R2 | | | | 30,834 | |
| 12b-1 distribution plan–Class R3 | | | | 180,466 | |
| 12b-1 distribution plan–Class R4 | | | | 86,678 | |
| Shareholder servicing | | | | 1,383,668 | |
| Fund administration | | | | 622,392 | |
| Reports to shareholders | | | | 138,717 | |
| Registration | | | | 161,519 | |
| Trustees’ fees | | | | 34,073 | |
| Professional | | | | 69,369 | |
| Other | | | | 90,027 | |
| Gross expenses | | | | 16,799,581 | |
| Expense reductions (See Note 9) | | | | (7,583 | ) |
| Net expenses | | | | 16,791,998 | |
| Net investment income | | | | 9,410,086 | |
| Net realized and unrealized gain (loss): | | | | | |
| Net realized gain (loss) on investments | | | | 120,080,030 | |
| Net change in unrealized appreciation/depreciation on investments | | | | (470,006,406 | ) |
| Net realized and unrealized gain (loss) | | | | (349,926,376 | ) |
| Net Decrease in Net Assets Resulting From Operations | | | $ | (340,516,290 | ) |
| 148 | See Notes to Financial Statements. | |
This page is intentionally left blank.
149
Statements of Changes in Net Assets
| | | Alpha Strategy Fund | |
| | | For the | | | For the | |
| | | Year Ended | | | Year Ended | |
| INCREASE (DECREASE) IN NET ASSETS | | October 31, 2022 | | | October 31, 2021 | |
| Operations: | | | | | | | | |
| Net investment income (loss) | | $ | 2,094,212 | | | $ | (511,845 | ) |
| Capital gain distributions received from Underlying Funds | | | 63,676,165 | | | | 35,492,244 | |
| Net realized gain (loss) on investments in Underlying Funds | | | (6,375,349 | ) | | | 6,759,279 | |
| Net realized gain (loss) on investments | | | – | | | | – | |
| Net change in unrealized appreciation/depreciation on investments in Underlying Funds | | | (272,105,734 | ) | | | 252,436,410 | |
| Net change in unrealized appreciation/depreciation on investments | | | – | | | | – | |
| Net increase (decrease) in net assets resulting from operations | | | (212,710,706 | ) | | | 294,176,088 | |
| Distributions to shareholders: | | | | | | | | |
| Class A | | | (27,355,292 | ) | | | (36,326,702 | ) |
| Class C | | | (3,117,383 | ) | | | (5,578,728 | ) |
| Class F | | | (7,349,675 | ) | | | (10,913,306 | ) |
| Class F3 | | | (2,959,332 | ) | | | (3,009,774 | ) |
| Class I | | | (2,175,051 | ) | | | (2,587,002 | ) |
| Class R2 | | | (58,000 | ) | | | (133,961 | ) |
| Class R3 | | | (1,260,398 | ) | | | (1,901,142 | ) |
| Class R4 | | | (228,467 | ) | | | (331,944 | ) |
| Class R5 | | | (26,825 | ) | | | (58,163 | ) |
| Class R6 | | | (274,765 | ) | | | (349,071 | ) |
| Total distributions to shareholders | | | (44,805,188 | ) | | | (61,189,793 | ) |
| Capital share transactions (Net of share conversions) (See Note 16): | | | | | | | | |
| Net proceeds from sales of shares | | | 192,165,716 | | | | 114,712,744 | |
| Reinvestment of distributions | | | 38,027,618 | | | | 51,990,922 | |
| Cost of shares reacquired | | | (197,529,081 | ) | | | (186,625,910 | ) |
| Net increase (decrease) in net assets resulting from capital share transactions | | | 32,664,253 | | | | (19,922,244 | ) |
| Net increase (decrease) in net assets | | | (224,851,641 | ) | | | 213,064,051 | |
| NET ASSETS: | | | | | | | | |
| Beginning of year | | $ | 880,625,735 | | | $ | 667,561,684 | |
| End of year | | $ | 655,774,094 | | | $ | 880,625,735 | |
| 150 | See Notes to Financial Statements. |
| Focused Growth Fund | | |
| For the | | | For the | | |
| Year Ended | | | Year Ended | | |
| October 31, 2022 | | | October 31, 2021 | | |
| | | | | | | | |
| $ | (255,492 | ) | | $ | (340,642 | ) | |
| | – | | | | – | | |
| | – | | | | – | | |
| | (6,905,171 | ) | | | 9,218,038 | | |
| | | | | | | | |
| | – | | | | – | | |
| | | | | | | | |
| | (13,228,715 | ) | | | 5,660,302 | | |
| | | | | | | | |
| | (20,389,378 | ) | | | 14,537,698 | | |
| | | | | | | | |
| | (2,567,142 | ) | | | (886,905 | ) | |
| | (378,405 | ) | | | (133,700 | ) | |
| | (2,509,277 | ) | | | (439,125 | ) | |
| | (162,364 | ) | | | (62,060 | ) | |
| | (757,292 | ) | | | (191,131 | ) | |
| | – | | | | – | | |
| | (3,252 | ) | | | (1,241 | ) | |
| | (3,247 | ) | | | (1,241 | ) | |
| | (3,247 | ) | | | (1,241 | ) | |
| | (849,495 | ) | | | (288,328 | ) | |
| | (7,233,721 | ) | | | (2,004,972 | ) | |
| | | | | | | | |
| | 22,040,099 | | | | 28,587,805 | | |
| | 6,168,589 | | | | 1,631,744 | | |
| | (19,130,869 | ) | | | (18,655,061 | ) | |
| | | | | | | | |
| | 9,077,819 | | | | 11,564,488 | | |
| | (18,545,280 | ) | | | 24,097,214 | | |
| | | | | | | | |
| $ | 52,318,515 | | | $ | 28,221,301 | | |
| $ | 33,773,235 | | | $ | 52,318,515 | | |
| | See Notes to Financial Statements. | 151 |
Statements of Changes in Net Assets (continued)
| | | Focused Large Cap Value Fund | |
| | | For the | | | For the | |
| | | Year Ended | | | Year Ended | |
| INCREASE (DECREASE) IN NET ASSETS | | October 31, 2022 | | | October 31, 2021 | |
| Operations: | | | | | | | | |
| Net investment income | | $ | 7,836,154 | | | $ | 13,861,610 | |
| Net realized gain (loss) on investments and foreign currency related transactions | | | 34,686,571 | | | | 183,466,341 | |
| Net change in unrealized appreciation/depreciation on investments and translation of assets and liabilities denominated in foreign currencies | | | (113,032,560 | ) | | | 87,931,950 | |
| Net increase (decrease) in net assets resulting from operations | | | (70,509,835 | ) | | | 285,259,901 | |
| Distributions to shareholders: | | | | | | | | |
| Class A | | | (1,832,383 | ) | | | (60,321 | ) |
| Class C | | | (824,722 | ) | | | (5,688 | ) |
| Class F | | | (516,992 | ) | | | (2,739 | ) |
| Class F3 | | | (4,009 | ) | | | (930 | ) |
| Class I | | | (148,160,810 | ) | | | (38,796,164 | ) |
| Class R3 | | | (2,986 | ) | | | (631 | ) |
| Class R4 | | | (2,856 | ) | | | (647 | ) |
| Class R5 | | | (2,890 | ) | | | (670 | ) |
| Class R6 | | | (337,911 | ) | | | (43,348 | ) |
| Total distributions to shareholders | | | (151,685,559 | ) | | | (38,911,138 | ) |
| Capital share transactions (Net of share conversions) (See Note 16): | | | | | | | | |
| Net proceeds from sales of shares | | | 170,411,753 | | | | 265,974,611 | |
| Reinvestment of distributions | | | 151,312,207 | | | | 38,863,410 | |
| Cost of shares reacquired | | | (752,521,176 | ) | | | (308,115,579 | ) |
| Net increase (decrease) in net assets resulting from capital share transactions | | | (430,797,216 | ) | | | (3,277,558 | ) |
| Net increase (decrease) in net assets | | | (652,992,610 | ) | | | 243,071,205 | |
| NET ASSETS: | | | | | | | | |
| Beginning of year | | $ | 672,204,064 | | | $ | 429,132,859 | |
| End of year | | $ | 19,211,454 | | | $ | 672,204,064 | |
| 152 | See Notes to Financial Statements. |
| Focused Small Cap Value Fund | | |
| For the | | | For the | | |
| Year Ended | | | Year Ended | | |
| October 31, 2022 | | | October 31, 2021 | | |
| | | | | | | | |
| $ | 646,378 | | | $ | 511,404 | | |
| | | | | | | | |
| | 5,403,931 | | | | 31,178,468 | | |
| | | | | | | | |
| | (31,562,664 | ) | | | 34,938,865 | | |
| | | | | | | | |
| | (25,512,355 | ) | | | 66,628,737 | | |
| |
| | (2,071,369 | ) | | | (28,973 | ) | |
| | (483,303 | ) | | | (754 | ) | |
| | (6,300,491 | ) | | | (30,291 | ) | |
| | (1,386 | ) | | | (106 | ) | |
| | (11,419,770 | ) | | | (812,033 | ) | |
| | – | | | | – | | |
| | – | | | | – | | |
| | (1,624 | ) | | | (106 | ) | |
| | (1,155,908 | ) | | | (22,082 | ) | |
| | (21,433,851 | ) | | | (894,345 | ) | |
| | | | | | | | |
| | 46,385,727 | | | | 212,502,734 | | |
| | 20,522,709 | | | | 837,976 | | |
| | (107,014,170 | ) | | | (133,436,361 | ) | |
| | | | | | | | |
| | (40,105,734 | ) | | | 79,904,349 | | |
| | (87,051,940 | ) | | | 145,638,741 | | |
| | | | | | | | |
| $ | 221,202,666 | | | $ | 75,563,925 | | |
| $ | 134,150,726 | | | $ | 221,202,666 | | |
| | See Notes to Financial Statements. | 153 |
Statements of Changes in Net Assets (continued)
| | | Fundamental Equity Fund | |
| | | For the | | | For the | |
| | | Year Ended | | | Year Ended | |
| INCREASE (DECREASE) IN NET ASSETS | | October 31, 2022 | | | October 31, 2021 | |
| Operations: | | | | | | | | |
| Net investment income | | $ | 22,718,564 | | | $ | 20,240,628 | |
| Net realized gain (loss) on investments, futures contracts and foreign currency related transactions | | | 89,658,255 | | | | 336,311,607 | |
| Net change in unrealized appreciation/depreciation on investments and translation of assets and liabilities denominated in foreign currencies | | | (228,863,145 | ) | | | 319,334,313 | |
| Net increase (decrease) in net assets resulting from operations | | | (116,486,326 | ) | | | 675,886,548 | |
| Distributions to shareholders: | | | | | | | | |
| Class A | | | (157,233,440 | ) | | | (21,213,472 | ) |
| Class C | | | (6,813,219 | ) | | | (572,357 | ) |
| Class F | | | (17,023,016 | ) | | | (2,559,816 | ) |
| Class F3 | | | (2,276,471 | ) | | | (344,061 | ) |
| Class I | | | (32,556,487 | ) | | | (5,925,825 | ) |
| Class P | | | (544,609 | ) | | | (66,114 | ) |
| Class R2 | | | (371,250 | ) | | | (52,157 | ) |
| Class R3 | | | (9,674,156 | ) | | | (1,331,556 | ) |
| Class R4 | | | (341,292 | ) | | | (42,824 | ) |
| Class R5 | | | (114,175 | ) | | | (20,468 | ) |
| Class R6 | | | (1,880,761 | ) | | | (254,289 | ) |
| Total distributions to shareholders | | | (228,828,876 | ) | | | (32,382,939 | ) |
| Capital share transactions (Net of share conversions) (See Note 16): | | | | | | | | |
| Net proceeds from sales of shares | | | 451,921,007 | | | | 115,386,860 | |
| Reinvestment of distributions | | | 220,273,728 | | | | 31,120,384 | |
| Cost of shares reacquired | | | (372,423,836 | ) | | | (409,122,438 | ) |
| Net increase (decrease) in net assets resulting from capital share transactions | | | 299,770,899 | | | | (262,615,194 | ) |
| Net increase (decrease) in net assets | | | (45,544,303 | ) | | | 380,888,415 | |
| NET ASSETS: | | | | | | | | |
| Beginning of year | | $ | 2,000,366,756 | | | $ | 1,619,478,341 | |
| End of year | | $ | 1,954,822,453 | | | $ | 2,000,366,756 | |
| 154 | See Notes to Financial Statements. |
| Global Equity Fund | | |
| For the | | | For the | | |
| Year Ended | | | Year Ended | | |
| October 31, 2022 | | October 31, 2021 | | |
| | | | | | | | |
| $ | 81,877 | | | $ | 90,683 | | |
| | | | | | | | |
| | (129,434 | ) | | | 1,628,853 | | |
| | | | | | | | |
| | (2,371,674 | ) | | | 1,065,019 | | |
| | | | | | | | |
| | (2,419,231 | ) | | | 2,784,555 | | |
| |
| | (706,818 | ) | | | (145,688 | ) | |
| | (110,829 | ) | | | (25,807 | ) | |
| | (299,857 | ) | | | (81,627 | ) | |
| | (2,578 | ) | | | (806 | ) | |
| | (256,979 | ) | | | (80,420 | ) | |
| | – | | | | – | | |
| | – | | | | – | | |
| | (64,811 | ) | | | (11,511 | ) | |
| | (2,575 | ) | | | (781 | ) | |
| | (2,638 | ) | | | (820 | ) | |
| | (179,196 | ) | | | (36,540 | ) | |
| | (1,626,281 | ) | | | (384,000 | ) | |
| | | | | | | | |
| | 2,624,771 | | | | 2,858,607 | | |
| | 906,874 | | | | 198,859 | | |
| | (2,098,737 | ) | | | (813,973 | ) | |
| | | | | | | | |
| | 1,432,908 | | | | 2,243,493 | | |
| | (2,612,604 | ) | | | 4,644,048 | | |
| | | | | | | | |
| $ | 11,565,912 | | | $ | 6,921,864 | | |
| $ | 8,953,308 | | | $ | 11,565,912 | | |
| | See Notes to Financial Statements. | 155 |
Statements of Changes in Net Assets (continued)
| | | Growth Leaders Fund | |
| | | For the | | | For the | |
| | | Year Ended | | | Year Ended | |
| INCREASE (DECREASE) IN NET ASSETS | | October 31, 2022 | | | October 31, 2021 | |
| Operations: | | | | | | | | |
| Net investment loss | | $ | (29,932,468 | ) | | $ | (48,494,763 | ) |
| Net realized gain (loss) on investments and foreign currency related transactions | | | (974,635,511 | ) | | | 2,288,838,895 | |
| Net change in unrealized appreciation/depreciation on investments and translation of assets and liabilities denominated in foreign currencies | | | (2,765,796,307 | ) | | | 474,533,430 | |
| Net increase (decrease) in net assets resulting from operations | | | (3,770,364,286 | ) | | | 2,714,877,562 | |
| Distributions to shareholders: | | | | | | | | |
| Class A | | | (516,166,233 | ) | | | (188,612,920 | ) |
| Class C | | | (240,453,284 | ) | | | (102,803,513 | ) |
| Class F | | | (799,350,013 | ) | | | (291,014,340 | ) |
| Class F3 | | | (128,196,756 | ) | | | (28,723,116 | ) |
| Class I | | | (234,268,629 | ) | | | (97,566,085 | ) |
| Class R2 | | | (636,674 | ) | | | (159,823 | ) |
| Class R3 | | | (4,314,020 | ) | | | (2,024,661 | ) |
| Class R4 | | | (3,353,679 | ) | | | (1,271,829 | ) |
| Class R5 | | | (3,558,947 | ) | | | (1,359,076 | ) |
| Class R6 | | | (33,119,570 | ) | | | (6,678,295 | ) |
| Total distributions to shareholders | | | (1,963,417,805 | ) | | | (720,213,658 | ) |
| Capital share transactions (Net of share conversions) (See Note 16): | | | | | | | | |
| Net proceeds from sales of shares | | | 4,067,529,922 | | | | 3,457,707,398 | |
| Reinvestment of distributions | | | 1,824,521,076 | | | | 665,061,830 | |
| Cost of shares reacquired | | | (5,003,566,690 | ) | | | (2,657,088,235 | ) |
| Net increase in net assets resulting from capital share transactions | | | 888,484,308 | | | | 1,465,680,993 | |
| Net increase (decrease) in net assets | | | (4,845,297,783 | ) | | | 3,460,344,897 | |
| NET ASSETS: | | | | | | | | |
| Beginning of year | | $ | 10,412,131,873 | | | $ | 6,951,786,976 | |
| End of year | | $ | 5,566,834,090 | | | $ | 10,412,131,873 | |
| 156 | See Notes to Financial Statements. |
| Health Care Fund | | |
| For the | | | For the | | |
| Year Ended | | | Year Ended | | |
| October 31, 2022 | | | October 31, 2021 | | |
| | | | | | | | |
| $ | (13,244 | ) | | $ | (30,281 | ) | |
| | | | | | | | |
| | (757,927 | ) | | | 616,318 | | |
| | | | | | | | |
| | (525,938 | ) | | | 796,283 | | |
| | | | | | | | |
| | (1,297,109 | ) | | | 1,382,320 | | |
| | | | | | | | |
| | (237,866 | ) | | | (273,120 | ) | |
| | (54,449 | ) | | | (58,883 | ) | |
| | (39,168 | ) | | | (13,072 | ) | |
| | (2,688 | ) | | | (4,262 | ) | |
| | (1,304 | ) | | | (2,047 | ) | |
| | – | | | | – | | |
| | (982 | ) | | | (1,541 | ) | |
| | (981 | ) | | | (1,541 | ) | |
| | (982 | ) | | | (1,546 | ) | |
| | (190,161 | ) | | | (145,457 | ) | |
| | (528,581 | ) | | | (501,469 | ) | |
| | | | | | | | |
| | 1,681,977 | | | | 4,699,933 | | |
| | 321,307 | | | | 299,070 | | |
| | (1,577,022 | ) | | | (1,782,577 | ) | |
| | | | | | | | |
| | 426,262 | | | | 3,216,426 | | |
| | (1,399,428 | ) | | | 4,097,277 | | |
| | | | | | | | |
| $ | 7,835,140 | | | $ | 3,737,863 | | |
| $ | 6,435,712 | | | $ | 7,835,140 | | |
| | See Notes to Financial Statements. | 157 |
Statements of Changes in Net Assets (continued)
| | | International Equity Fund | |
| | | For the | | | For the | |
| | | Year Ended | | | Year Ended | |
| INCREASE (DECREASE) IN NET ASSETS | | October 31, 2022 | | | October 31, 2021 | |
| Operations: | | | | | | | | |
| Net investment income | | $ | 6,935,802 | | | $ | 4,590,655 | |
| Net realized gain (loss) on investments, swaps and foreign currency related transactions | | | (4,635,682 | ) | | | 75,289,639 | |
| Net change in unrealized appreciation/depreciation on investments, deferred foreign capital gains taxes and translation of assets and liabilities denominated in foreign currencies | | | (103,647,010 | ) | | | 35,362,678 | |
| Net increase (decrease) in net assets resulting from operations | | | (101,346,890 | ) | | | 115,242,972 | |
| Distributions to shareholders: | | | | | | | | |
| Class A | | | (21,399,286 | ) | | | (1,991,486 | ) |
| Class C | | | (782,187 | ) | | | (19,196 | ) |
| Class F | | | (2,865,403 | ) | | | (147,298 | ) |
| Class F3 | | | (693,860 | ) | | | (69,008 | ) |
| Class I | | | (19,096,185 | ) | | | (2,805,314 | ) |
| Class P | | | (1,376 | ) | | | (278 | ) |
| Class R2 | | | (19,394 | ) | | | (914 | ) |
| Class R3 | | | (673,002 | ) | | | (51,482 | ) |
| Class R4 | | | (180,612 | ) | | | (15,302 | ) |
| Class R5 | | | (7,581 | ) | | | (1,028 | ) |
| Class R6 | | | (468,664 | ) | | | (34,250 | ) |
| Total distributions to shareholders | | | (46,187,550 | ) | | | (5,135,556 | ) |
| Capital share transactions (Net of share conversions) (See Note 16): | | | | | | | | |
| Net proceeds from sales of shares | | | 20,362,935 | | | | 33,002,179 | |
| Reinvestment of distributions | | | 45,341,230 | | | | 5,052,206 | |
| Cost of shares reacquired | | | (53,132,557 | ) | | | (98,186,274 | ) |
| Net increase (decrease) in net assets resulting from capital share transactions | | | 12,571,608 | | | | (60,131,889 | ) |
| Net increase (decrease) in net assets | | | (134,962,832 | ) | | | 49,975,527 | |
| NET ASSETS: | | | | | | | | |
| Beginning of year | | $ | 414,433,138 | | | $ | 364,457,611 | |
| End of year | | $ | 279,470,306 | | | $ | 414,433,138 | |
| 158 | See Notes to Financial Statements. |
| International Opportunities Fund | | |
| For the | | | For the | | |
| Year Ended | | | Year Ended | | |
| October 31, 2022 | | | October 31, 2021 | | |
| | | | | | | | |
| $ | 4,707,921 | | | $ | 5,084,769 | | |
| | | | | | | | |
| | (16,739,450 | ) | | | 92,262,626 | | |
| | | | | | | | |
| | (118,476,243 | ) | | | 39,062,330 | | |
| | | | | | | | |
| | (130,507,772 | ) | | | 136,409,725 | | |
| | | | | | | | |
| | (2,906,967 | ) | | | – | | |
| | (232,215 | ) | | | – | | |
| | (1,303,487 | ) | | | – | | |
| | (751,094 | ) | | | – | | |
| | (4,671,896 | ) | | | – | | |
| | (2,745 | ) | | | – | | |
| | (49,120 | ) | | | – | | |
| | (110,011 | ) | | | – | | |
| | (62,902 | ) | | | – | | |
| | (79,058 | ) | | | – | | |
| | (586,175 | ) | | | – | | |
| | (10,755,670 | ) | | | – | | |
| | | | | | | | |
| | 64,502,823 | | | | 71,129,338 | | |
| | 10,359,870 | | | | – | | |
| | (86,947,035 | ) | | | (130,656,497 | ) | |
| | | | | | | | |
| | (12,084,342 | ) | | | (59,527,159 | ) | |
| | (153,347,784 | ) | | | 76,882,566 | | |
| | | | | | | | |
| $ | 463,948,373 | | | $ | 387,065,807 | | |
| $ | 310,600,589 | | | $ | 463,948,373 | | |
| | See Notes to Financial Statements. | 159 |
Statements of Changes in Net Assets (continued)
| | | International Value Fund | |
| | | For the | | | For the | |
| | | Year Ended | | | Year Ended | |
| INCREASE (DECREASE) IN NET ASSETS | | October 31, 2022 | | | October 31, 2021 | |
| Operations: | | | | | | | | |
| Net investment income (loss) | | $ | 21,298,119 | | | $ | 17,777,227 | |
| Net realized gain (loss) on investments, forward foreign currency exchange contracts and foreign currency related transactions | | | (23,889,559 | ) | | | 63,007,688 | |
| Net change in unrealized appreciation/depreciation on investments and translation of assets and liabilities denominated in foreign currencies | | | (110,319,693 | ) | | | 78,100,054 | |
| Net increase (decrease) in net assets resulting from operations | | | (112,911,133 | ) | | | 158,884,969 | |
| Distributions to shareholders: | | | | | | | | |
| Class A | | | (9,846,255 | ) | | | (6,652,226 | ) |
| Class C | | | (290,372 | ) | | | (267,647 | ) |
| Class F | | | (853,274 | ) | | | (863,813 | ) |
| Class F3 | | | (1,177,508 | ) | | | (718,721 | ) |
| Class I | | | (12,554,506 | ) | | | (9,028,337 | ) |
| Class R2 | | | (1,692 | ) | | | (591 | ) |
| Class R3 | | | (288,403 | ) | | | (165,652 | ) |
| Class R4 | | | (6,611 | ) | | | (3,223 | ) |
| Class R5 | | | (602 | ) | | | (411 | ) |
| Class R6 | | | (74,661 | ) | | | (40,348 | ) |
| Total distributions to shareholders | | | (25,093,884 | ) | | | (17,740,969 | ) |
| Capital share transactions (Net of share conversions) (See Note 16): | | | | | | | | |
| Net proceeds from sales of shares | | | 53,131,933 | | | | 145,056,895 | |
| Reinvestment of distributions | | | 24,633,484 | | | | 17,417,073 | |
| Cost of shares reacquired | | | (246,207,849 | ) | | | (98,246,005 | ) |
| Net increase (decrease) in net assets resulting from capital share transactions | | | (168,442,432 | ) | | | 64,227,963 | |
| Net increase (decrease) in net assets | | | (306,447,449 | ) | | | 205,371,963 | |
| NET ASSETS: | | | | | | | | |
| Beginning of year | | $ | 650,723,220 | | | $ | 445,351,257 | |
| End of year | | $ | 344,275,771 | | | $ | 650,723,220 | |
| 160 | See Notes to Financial Statements. |
| Micro Cap Growth Fund | | |
| For the | | | For the | | |
| Year Ended | | | Year Ended | | |
| October 31, 2022 | | | October 31, 2021 | | |
| | | | | | | | |
| $ | (1,997,602 | ) | | $ | (3,963,904 | ) | |
| | | | | | | | |
| | (60,372,383 | ) | | | (8,607,312 | ) | |
| | | | | | | | |
| | (46,542,882 | ) | | | 45,629,143 | | |
| | | | | | | | |
| | (108,912,867 | ) | | | 33,057,927 | | |
| | | | | | | | |
| | – | | | | (3,732,335 | ) | |
| | – | | | | (305,530 | ) | |
| | – | | | | (3,797,520 | ) | |
| | – | | | | – | | |
| | – | | | | (22,252,242 | ) | |
| | – | | | | – | | |
| | – | | | | – | | |
| | – | | | | – | | |
| | – | | | | – | | |
| | – | | | | – | | |
| | – | | | | (30,087,627 | ) | |
| | | | | | | | |
| | 74,876,590 | | | | 422,163,379 | | |
| | – | | | | 24,252,834 | | |
| | (129,678,311 | ) | | | (167,481,227 | ) | |
| | | | | | | | |
| | (54,801,721 | ) | | | 278,934,986 | | |
| | (163,714,588 | ) | | | 281,905,286 | | |
| | | | | | | | |
| $ | 397,315,116 | | | $ | 115,409,830 | | |
| $ | 233,600,528 | | | $ | 397,315,116 | | |
| | See Notes to Financial Statements. | 161 |
Statements of Changes in Net Assets (concluded)
| | | Value Opportunities Fund | |
| | | For the | | | For the | |
| | | Year Ended | | | Year Ended | |
| INCREASE (DECREASE) IN NET ASSETS | | October 31, 2022 | | | October 31, 2021 | |
| Operations: | | | | | | | | |
| Net investment income | | $ | 9,410,086 | | | $ | 1,933,149 | |
| Net realized gain (loss) on investments | | | 120,080,030 | | | | 257,838,408 | |
| Net change in unrealized appreciation/depreciation on investments | | | (470,006,406 | ) | | | 371,649,199 | |
| Net increase (decrease) in net assets resulting from operations | | | (340,516,290 | ) | | | 631,420,756 | |
| Distributions to shareholders: | | | | | | | | |
| Class A | | | (102,999,131 | ) | | | (38,007,203 | ) |
| Class C | | | (10,928,764 | ) | | | (4,497,264 | ) |
| Class F | | | (22,556,721 | ) | | | (8,497,131 | ) |
| Class F3 | | | (29,456,770 | ) | | | (11,931,245 | ) |
| Class I | | | (48,314,870 | ) | | | (13,160,064 | ) |
| Class P | | | (2,111,678 | ) | | | (906,655 | ) |
| Class R2 | | | (749,624 | ) | | | (302,914 | ) |
| Class R3 | | | (5,298,619 | ) | | | (2,492,301 | ) |
| Class R4 | | | (5,145,203 | ) | | | (1,994,555 | ) |
| Class R5 | | | (239,327 | ) | | | (120,442 | ) |
| Class R6 | | | (5,158,092 | ) | | | (1,814,164 | ) |
| Total distributions to shareholders | | | (232,958,799 | ) | | | (83,723,938 | ) |
| Capital share transactions (Net of share conversions) (See Note 16): | | | | | | | | |
| Net proceeds from sales of shares | | | 213,811,313 | | | | 329,686,948 | |
| Reinvestment of distributions | | | 227,980,077 | | | | 81,622,220 | |
| Cost of shares reacquired | | | (500,789,144 | ) | | | (395,166,158 | ) |
| Net increase (decrease) in net assets resulting from capital share transactions | | | (58,997,754 | ) | | | 16,143,010 | |
| Net increase (decrease) in net assets | | | (632,472,843 | ) | | | 563,839,828 | |
| NET ASSETS: | | | | | | | | |
| Beginning of year | | $ | 1,939,249,466 | | | $ | 1,375,409,638 | |
| End of year | | $ | 1,306,776,623 | | | $ | 1,939,249,466 | |
| 162 | See Notes to Financial Statements. |
This page is intentionally left blank.
163
Financial Highlights
ALPHA STRATEGY FUND
| | | | | Per Share Operating Performance: |
| | | | | Investment Operations: | | Distributions to
shareholders from: |
| | | Net asset
value,
beginning
of period | | Net
invest-
ment
income
(loss)(b) | | Net
realized
and
unrealized
gain (loss) | | Total
from
invest-
ment
opera-
tions | | Net
investment
income | | Net
realized
gain | | Total
distri-
butions |
| Class A | | | | | | | | | | | | | | | | | | | | | | | | | | | | |
| 10/31/2022 | | | $30.39 | | | | $0.06 | | | | $(7.10 | ) | | | $ (7.04 | ) | | | $(0.41 | ) | | | $(1.12 | ) | | | $(1.53 | ) |
| 10/31/2021 | | | 22.60 | | | | (0.02 | ) | | | 9.90 | | | | 9.88 | | | | (0.36 | ) | | | (1.73 | ) | | | (2.09 | ) |
| 10/31/2020 | | | 24.04 | | | | 0.03 | | | | 1.82 | | | | 1.85 | | | | – | | | | (3.29 | ) | | | (3.29 | ) |
| 10/31/2019 | | | 26.62 | | | | (0.03 | ) | | | 0.87 | | | | 0.84 | | | | (0.26 | ) | | | (3.16 | ) | | | (3.42 | ) |
| 10/31/2018 | | | 28.92 | | | | (0.05 | ) | | | 0.93 | | | | 0.88 | | | | – | | | | (3.18 | ) | | | (3.18 | ) |
| Class C | | | | | | | | | | | | | | | | | | | | | | | | | | | | |
| 10/31/2022 | | | 23.47 | | | | (0.08 | ) | | | (5.45 | ) | | | (5.53 | ) | | | (0.22 | ) | | | (1.12 | ) | | | (1.34 | ) |
| 10/31/2021 | | | 17.82 | | | | (0.17 | ) | | | 7.74 | | | | 7.57 | | | | (0.19 | ) | | | (1.73 | ) | | | (1.92 | ) |
| 10/31/2020 | | | 19.73 | | | | (0.09 | ) | | | 1.47 | | | | 1.38 | | | | – | | | | (3.29 | ) | | | (3.29 | ) |
| 10/31/2019 | | | 22.43 | | | | (0.17 | ) | | | 0.66 | | | | 0.49 | | | | (0.03 | ) | | | (3.16 | ) | | | (3.19 | ) |
| 10/31/2018 | | | 25.03 | | | | (0.21 | ) | | | 0.79 | | | | 0.58 | | | | – | | | | (3.18 | ) | | | (3.18 | ) |
| Class F | | | | | | | | | | | | | | | | | | | | | | | | | | | | |
| 10/31/2022 | | | 30.73 | | | | 0.20 | | | | (7.27 | ) | | | (7.07 | ) | | | (0.45 | ) | | | (1.12 | ) | | | (1.57 | ) |
| 10/31/2021 | | | 22.82 | | | | 0.03 | | | | 10.01 | | | | 10.04 | | | | (0.40 | ) | | | (1.73 | ) | | | (2.13 | ) |
| 10/31/2020 | | | 24.22 | | | | 0.08 | | | | 1.81 | | | | 1.89 | | | | – | | | | (3.29 | ) | | | (3.29 | ) |
| 10/31/2019 | | | 26.80 | | | | 0.01 | | | | 0.87 | | | | 0.88 | | | | (0.30 | ) | | | (3.16 | ) | | | (3.46 | ) |
| 10/31/2018 | | | 29.06 | | | | – | (d) | | | 0.92 | | | | 0.92 | | | | – | | | | (3.18 | ) | | | (3.18 | ) |
| Class F3 | | | | | | | | | | | | | | | | | | | | | | | | | | | | |
| 10/31/2022 | | | 31.70 | | | | 0.14 | | | | (7.40 | ) | | | (7.26 | ) | | | (0.49 | ) | | | (1.12 | ) | | | (1.61 | ) |
| 10/31/2021 | | | 23.47 | | | | 0.07 | | | | 10.32 | | | | 10.39 | | | | (0.43 | ) | | | (1.73 | ) | | | (2.16 | ) |
| 10/31/2020 | | | 24.78 | | | | 0.10 | | | | 1.88 | | | | 1.98 | | | | – | | | | (3.29 | ) | | | (3.29 | ) |
| 10/31/2019 | | | 27.32 | | | | 0.05 | | | | 0.91 | | | | 0.96 | | | | (0.34 | ) | | | (3.16 | ) | | | (3.50 | ) |
| 10/31/2018 | | | 29.52 | | | | 0.05 | | | | 0.93 | | | | 0.98 | | | | – | | | | (3.18 | ) | | | (3.18 | ) |
| Class I | | | | | | | | | | | | | | | | | | | | | | | | | | | | |
| 10/31/2022 | | | 31.56 | | | | 0.04 | | | | (7.28 | ) | | | (7.24 | ) | | | (0.49 | ) | | | (1.12 | ) | | | (1.61 | ) |
| 10/31/2021 | | | 23.39 | | | | 0.05 | | | | 10.27 | | | | 10.32 | | | | (0.42 | ) | | | (1.73 | ) | | | (2.15 | ) |
| 10/31/2020 | | | 24.72 | | | | 0.11 | | | | 1.85 | | | | 1.96 | | | | – | | | | (3.29 | ) | | | (3.29 | ) |
| 10/31/2019 | | | 27.29 | | | | 0.03 | | | | 0.89 | | | | 0.92 | | | | (0.33 | ) | | | (3.16 | ) | | | (3.49 | ) |
| 10/31/2018 | | | 29.50 | | | | 0.02 | | | | 0.95 | | | | 0.97 | | | | – | | | | (3.18 | ) | | | (3.18 | ) |
| Class R2 | | | | | | | | | | | | | | | | | | | | | | | | | | | | |
| 10/31/2022 | | | 28.80 | | | | (0.02 | ) | | | (6.73 | ) | | | (6.75 | ) | | | (0.27 | ) | | | (1.12 | ) | | | (1.39 | ) |
| 10/31/2021 | | | 21.52 | | | | (0.09 | ) | | | 9.40 | | | | 9.31 | | | | (0.30 | ) | | | (1.73 | ) | | | (2.03 | ) |
| 10/31/2020 | | | 23.11 | | | | (0.04 | ) | | | 1.74 | | | | 1.70 | | | | – | | | | (3.29 | ) | | | (3.29 | ) |
| 10/31/2019 | | | 25.65 | | | | (0.10 | ) | | | 0.83 | | | | 0.73 | | | | (0.11 | ) | | | (3.16 | ) | | | (3.27 | ) |
| 10/31/2018 | | | 28.07 | | | | (0.13 | ) | | | 0.89 | | | | 0.76 | | | | – | | | | (3.18 | ) | | | (3.18 | ) |
| 164 | See Notes to Financial Statements. |
| | | | | Ratios to Average Net Assets:(a) | | Supplemental Data: |
| | | | | | | | | | | | | |
Net
asset
value,
end of
period | | Total
return(c)
(%) | | Total
expenses
after
waivers
and/or reim-
bursements
(%) | | Total
expenses
(%) | | Net
invest-
ment
income
(loss)
(%) | | Net
assets,
end of
period
(000) | | Portfolio
turnover
rate
(%) |
| | | | | | | | | | | | | | | | | | | | | | | | | | | |
| | $21.82 | | | | (24.25 | ) | | | 0.44 | | | | 0.54 | | | | 0.25 | | | | $420,589 | | | | 8 | |
| | 30.39 | | | | 45.31 | | | | 0.41 | | | | 0.52 | | | | (0.06 | ) | | | 542,197 | | | | 7 | |
| | 22.60 | | | | 7.72 | | | | 0.43 | | | | 0.53 | | | | 0.16 | | | | 400,088 | | | | 16 | |
| | 24.04 | | | | 5.65 | | | | 0.44 | | | | 0.54 | | | | (0.13 | ) | | | 482,675 | | | | 17 | |
| | 26.62 | | | | 3.11 | | | | 0.42 | | | | 0.52 | | | | (0.17 | ) | | | 508,472 | | | | 8 | |
| | | | | | | | | | | | | | | | | | | | | | | | | | | |
| | 16.60 | | | | (24.81 | ) | | | 1.19 | | | | 1.29 | | | | (0.40 | ) | | | 30,206 | | | | 8 | |
| | 23.47 | | | | 44.16 | | | | 1.16 | | | | 1.26 | | | | (0.77 | ) | | | 56,365 | | | | 7 | |
| | 17.82 | | | | 6.98 | | | | 1.18 | | | | 1.28 | | | | (0.52 | ) | | | 54,247 | | | | 16 | |
| | 19.73 | | | | 4.86 | | | | 1.19 | | | | 1.29 | | | | (0.85 | ) | | | 97,096 | | | | 17 | |
| | 22.43 | | | | 2.31 | | | | 1.17 | | | | 1.27 | | | | (0.87 | ) | | | 140,681 | | | | 8 | |
| | | | | | | | | | | | | | | | | | | | | | | | | | | |
| | 22.09 | | | | (24.10 | ) | | | 0.28 | | | | 0.39 | | | | 0.76 | | | | 27,275 | | | | 8 | |
| | 30.73 | | | | 45.53 | | | | 0.26 | | | | 0.37 | | | | 0.09 | | | | 144,742 | | | | 7 | |
| | 22.82 | | | | 7.89 | | | | 0.28 | | | | 0.38 | | | | 0.37 | | | | 120,797 | | | | 16 | |
| | 24.22 | | | | 5.81 | | | | 0.29 | | | | 0.39 | | | | 0.04 | | | | 176,784 | | | | 17 | |
| | 26.80 | | | | 3.25 | | | | 0.27 | | | | 0.37 | | | | (0.01 | ) | | | 204,245 | | | | 8 | |
| | | | | | | | | | | | | | | | | | | | | | | | | | | |
| | 22.83 | | | | (23.98 | ) | | | 0.09 | | | | 0.19 | | | | 0.57 | | | | 50,046 | | | | 8 | |
| | 31.70 | | | | 45.81 | | �� | | 0.08 | | | | 0.18 | | | | 0.25 | | | | 56,369 | | | | 7 | |
| | 23.47 | | | | 8.10 | | | | 0.09 | | | | 0.19 | | | | 0.44 | | | | 33,179 | | | | 16 | |
| | 24.78 | | | | 6.03 | | | | 0.10 | | | | 0.20 | | | | 0.20 | | | | 32,219 | | | | 17 | |
| | 27.32 | | | | 3.42 | | | | 0.08 | | | | 0.19 | | | | 0.17 | | | | 33,677 | | | | 8 | |
| | | | | | | | | | | | | | | | | | | | | | | | | | | |
| | 22.71 | | | | (24.04 | ) | | | 0.19 | | | | 0.29 | | | | 0.18 | | | | 101,366 | | | | 8 | |
| | 31.56 | | | | 45.64 | | | | 0.16 | | | | 0.27 | | | | 0.18 | | | | 43,112 | | | | 7 | |
| | 23.39 | | | | 8.02 | | | | 0.18 | | | | 0.28 | | | | 0.51 | | | | 28,481 | | | | 16 | |
| | 24.72 | | | | 5.88 | | | | 0.19 | | | | 0.29 | | | | 0.11 | | | | 92,448 | | | | 17 | |
| | 27.29 | | | | 3.38 | | | | 0.17 | | | | 0.27 | | | | 0.08 | | | | 87,441 | | | | 8 | |
| | | | | | | | | | | | | | | | | | | | | | | | | | | |
| | 20.66 | | | | (24.50 | ) | | | 0.79 | | | | 0.89 | | | | (0.09 | ) | | | 928 | | | | 8 | |
| | 28.80 | | | | 44.78 | | | | 0.76 | | | | 0.86 | | | | (0.34 | ) | | | 1,433 | | | | 7 | |
| | 21.52 | | | | 7.39 | | | | 0.78 | | | | 0.88 | | | | (0.19 | ) | | | 1,430 | | | | 16 | |
| | 23.11 | | | | 5.26 | | | | 0.79 | | | | 0.89 | | | | (0.45 | ) | | | 1,476 | | | | 17 | |
| | 25.65 | | | | 2.75 | | | | 0.77 | | | | 0.87 | | | | (0.49 | ) | | | 2,531 | | | | 8 | |
| | See Notes to Financial Statements. | 165 |
Financial Highlights (continued)
ALPHA STRATEGY FUND
| | | | | Per Share Operating Performance: |
| | | | | Investment Operations: | | Distributions to
shareholders from: |
| | | Net asset
value,
beginning
of period | | Net
invest-
ment
income
(loss)(b) | | Net
realized
and
unrealized
gain (loss) | | Total
from
invest-
ment
opera-
tions | | Net
investment
income | | Net
realized
gain | | Total
distri-
butions |
| Class R3 | | | | | | | | | | | | | | | | | | | | | | | | | | | | |
| 10/31/2022 | | | $29.09 | | | | $ 0.01 | | | | $(6.80 | ) | | | $(6.79 | ) | | | $(0.33 | ) | | | $(1.12 | ) | | | $(1.45 | ) |
| 10/31/2021 | | | 21.70 | | | | (0.08 | ) | | | 9.50 | | | | 9.42 | | | | (0.30 | ) | | | (1.73 | ) | | | (2.03 | ) |
| 10/31/2020 | | | 23.26 | | | | (0.01 | ) | | | 1.74 | | | | 1.73 | | | | – | | | | (3.29 | ) | | | (3.29 | ) |
| 10/31/2019 | | | 25.86 | | | | (0.09 | ) | | | 0.84 | | | | 0.75 | | | | (0.19 | ) | | | (3.16 | ) | | | (3.35 | ) |
| 10/31/2018 | | | 28.25 | | | | (0.11 | ) | | | 0.90 | | | | 0.79 | | | | – | | | | (3.18 | ) | | | (3.18 | ) |
| Class R4 | | | | | | | | | | | | | | | | | | | | | | | | | | | | |
| 10/31/2022 | | | 30.30 | | | | 0.05 | | | | (7.06 | ) | | | (7.01 | ) | | | (0.41 | ) | | | (1.12 | ) | | | (1.53 | ) |
| 10/31/2021 | | | 22.54 | | | | (0.01 | ) | | | 9.86 | | | | 9.85 | | | | (0.36 | ) | | | (1.73 | ) | | | (2.09 | ) |
| 10/31/2020 | | | 23.98 | | | | 0.02 | | | | 1.83 | | | | 1.85 | | | | – | | | | (3.29 | ) | | | (3.29 | ) |
| 10/31/2019 | | | 26.58 | | | | (0.04 | ) | | | 0.87 | | | | 0.83 | | | | (0.27 | ) | | | (3.16 | ) | | | (3.43 | ) |
| 10/31/2018 | | | 28.88 | | | | (0.06 | ) | | | 0.94 | | | | 0.88 | | | | – | | | | (3.18 | ) | | | (3.18 | ) |
| Class R5 | | | | | | | | | | | | | | | | | | | | | | | | | | | | |
| 10/31/2022 | | | 31.57 | | | | 0.13 | | | | (7.37 | ) | | | (7.24 | ) | | | (0.49 | ) | | | (1.12 | ) | | | (1.61 | ) |
| 10/31/2021 | | | 23.40 | | | | 0.10 | | | | 10.22 | | | | 10.32 | | | | (0.42 | ) | | | (1.73 | ) | | | (2.15 | ) |
| 10/31/2020 | | | 24.73 | | | | 0.03 | | | | 1.93 | | | | 1.96 | | | | – | | | | (3.29 | ) | | | (3.29 | ) |
| 10/31/2019 | | | 27.30 | | | | 0.03 | | | | 0.89 | | | | 0.92 | | | | (0.33 | ) | | | (3.16 | ) | | | (3.49 | ) |
| 10/31/2018 | | | 29.52 | | | | 0.02 | | | | 0.94 | | | | 0.96 | | | | – | | | | (3.18 | ) | | | (3.18 | ) |
| Class R6 | | | | | | | | | | | | | | | | | | | | | | | | | | | | |
| 10/31/2022 | | | 31.71 | | | | 0.16 | | | | (7.42 | ) | | | (7.26 | ) | | | (0.49 | ) | | | (1.12 | ) | | | (1.61 | ) |
| 10/31/2021 | | | 23.48 | | | | 0.08 | | | | 10.31 | | | | 10.39 | | | | (0.43 | ) | | | (1.73 | ) | | | (2.16 | ) |
| 10/31/2020 | | | 24.78 | | | | 0.10 | | | | 1.89 | | | | 1.99 | | | | – | | | | (3.29 | ) | | | (3.29 | ) |
| 10/31/2019 | | | 27.33 | | | | 0.05 | | | | 0.90 | | | | 0.95 | | | | (0.34 | ) | | | (3.16 | ) | | | (3.50 | ) |
| 10/31/2018 | | | 29.52 | | | | 0.05 | | | | 0.94 | | | | 0.99 | | | | – | | | | (3.18 | ) | | | (3.18 | ) |
| (a) | Does not include expenses of the Underlying Funds in which the Fund invests. |
| (b) | Calculated using average shares outstanding during the period. |
| (c) | Total return for Classes A and C does not consider the effects of sales loads and assumes the reinvestment of all distributions. Total return for all other classes assumes the reinvestment of all distributions. |
| (d) | Amount less than $0.01. |
| 166 | See Notes to Financial Statements. |
| | | | | Ratios to Average Net Assets: | | Supplemental Data: |
| | | | | | | |
Net
asset
value,
end of
period | | Total
return(c)
(%) | | Total
expenses
after
waivers
and/or reim-
bursements
(%) | | Total
expenses
(%) | | Net
invest-
ment
income
(loss)
(%) | | Net
assets,
end of
period
(000) | | Portfolio
turnover
rate
(%) |
| | | | | | | | | | | | | |
| | $20.85 | | | | (24.41 | ) | | | 0.69 | | | | 0.79 | | | | 0.04 | | | | $17,366 | | | | 8 | |
| | 29.09 | | | | 44.95 | | | | 0.66 | | | | 0.76 | | | | (0.30 | ) | | | 25,883 | | | | 7 | |
| | 21.70 | | | | 7.47 | | | | 0.68 | | | | 0.78 | | | | (0.07 | ) | | | 20,860 | | | | 16 | |
| | 23.26 | | | | 5.38 | | | | 0.69 | | | | 0.79 | | | | (0.38 | ) | | | 26,729 | | | | 17 | |
| | 25.86 | | | | 2.84 | | | | 0.67 | | | | 0.77 | | | | (0.40 | ) | | | 28,601 | | | | 8 | |
| | | | | | | | | | | | | | | | | | | | | | | | | | | |
| | 21.76 | | | | (24.23 | ) | | | 0.44 | | | | 0.54 | | | | 0.21 | | | | 3,859 | | | | 8 | |
| | 30.30 | | | | 45.25 | | | | 0.41 | | | | 0.52 | | | | (0.04 | ) | | | 4,621 | | | | 7 | |
| | 22.54 | | | | 7.79 | | | | 0.43 | | | | 0.53 | | | | 0.09 | | | | 3,715 | | | | 16 | |
| | 23.98 | | | | 5.61 | | | | 0.44 | | | | 0.54 | | | | (0.16 | ) | | | 3,461 | | | | 17 | |
| | 26.58 | | | | 3.12 | | | | 0.42 | | | | 0.52 | | | | (0.22 | ) | | | 3,236 | | | | 8 | |
| | | | | | | | | | | | | | | | | | | | | | | | | | | |
| | 22.72 | | | | (24.04 | ) | | | 0.19 | | | | 0.29 | | | | 0.53 | | | | 376 | | | | 8 | |
| | 31.57 | | | | 45.65 | | | | 0.16 | | | | 0.27 | | | | 0.33 | | | | 518 | | | | 7 | |
| | 23.40 | | | | 8.02 | | | | 0.18 | | | | 0.28 | | | | 0.14 | | | | 623 | | | | 16 | |
| | 24.73 | | | | 5.90 | | | | 0.19 | | | | 0.29 | | | | 0.13 | | | | 296 | | | | 17 | |
| | 27.30 | | | | 3.34 | | | | 0.17 | | | | 0.27 | | | | 0.06 | | | | 106 | | | | 8 | |
| | | | | | | | | | | | | | | | | | | | | | | | | | | |
| | 22.84 | | | | (23.97 | ) | | | 0.09 | | | | 0.19 | | | | 0.62 | | | | 3,762 | | | | 8 | |
| | 31.71 | | | | 45.79 | | | | 0.08 | | | | 0.18 | | | | 0.28 | | | | 5,386 | | | | 7 | |
| | 23.48 | | | | 8.14 | | | | 0.09 | | | | 0.19 | | | | 0.46 | | | | 4,143 | | | | 16 | |
| | 24.78 | | | | 5.98 | | | | 0.10 | | | | 0.20 | | | | 0.19 | | | | 4,266 | | | | 17 | |
| | 27.33 | | | | 3.45 | | | | 0.08 | | | | 0.19 | | | | 0.17 | | | | 3,619 | | | | 8 | |
| | See Notes to Financial Statements. | 167 |
Financial Highlights (continued)
FOCUSED GROWTH FUND
| | | | | Per Share Operating Performance: | | |
| | | | | Investment Operations: | | Distributions
to
shareholders
from: | | |
| | | Net asset
value,
beginning
of period | | Net
investment
(loss)(a) | | Net
realized and
unrealized
gain (loss) | | Total from
investment
operations | | Net
realized
gain | | Net asset
value,
end of
period |
| Class A | | | | | | | | | | | | | | | | | | | | | | | | |
| 10/31/2022 | | $ | 36.16 | | | $ | (0.17 | ) | | $ | (11.38 | ) | | $ | (11.55 | ) | | $ | (4.87 | ) | | $ | 19.74 | |
| 10/31/2021 | | | 26.90 | | | | (0.27 | ) | | | 11.39 | | | | 11.12 | | | | (1.86 | ) | | | 36.16 | |
| 10/31/2020 | | | 15.88 | | | | (0.17 | ) | | | 11.19 | | | | 11.02 | | | | – | | | | 26.90 | |
| 1/30/2019 to 10/31/2019(c)(d) | | | 15.00 | | | | (0.10 | ) | | | 0.98 | | | | 0.88 | | | | – | | | | 15.88 | |
| Class C | | | | | | | | | | | | | | | | | | | | | | | | |
| 10/31/2022 | | | 35.41 | | | | (0.33 | ) | | | (11.09 | ) | | | (11.42 | ) | | | (4.87 | ) | | | 19.12 | |
| 10/31/2021 | | | 26.56 | | | | (0.50 | ) | | | 11.21 | | | | 10.71 | | | | (1.86 | ) | | | 35.41 | |
| 10/31/2020 | | | 15.80 | | | | (0.37 | ) | | | 11.13 | | | | 10.76 | | | | – | | | | 26.56 | |
| 1/30/2019 to 10/31/2019(c)(d) | | | 15.00 | | | | (0.19 | ) | | | 0.99 | | | | 0.80 | | | | – | | | | 15.80 | |
| Class F | | | | | | | | | | | | | | | | | | | | | | | | |
| 10/31/2022 | | | 36.44 | | | | (0.12 | ) | | | (11.49 | ) | | | (11.61 | ) | | | (4.87 | ) | | | 19.96 | |
| 10/31/2021 | | | 27.03 | | | | (0.20 | ) | | | 11.47 | | | | 11.27 | | | | (1.86 | ) | | | 36.44 | |
| 10/31/2020 | | | 15.91 | | | | (0.13 | ) | | | 11.25 | | | | 11.12 | | | | – | | | | 27.03 | |
| 1/30/2019 to 10/31/2019(c)(d) | | | 15.00 | | | | (0.07 | ) | | | 0.98 | | | | 0.91 | | | | – | | | | 15.91 | |
| Class F3 | | | | | | | | | | | | | | | | | | | | | | | | |
| 10/31/2022 | | | 36.51 | | | | (0.10 | ) | | | (11.52 | ) | | | (11.62 | ) | | | (4.87 | ) | | | 20.02 | |
| 10/31/2021 | | | 27.06 | | | | (0.18 | ) | | | 11.49 | | | | 11.31 | | | | (1.86 | ) | | | 36.51 | |
| 10/31/2020 | | | 15.92 | | | | (0.09 | ) | | | 11.23 | | | | 11.14 | | | | – | | | | 27.06 | |
| 1/30/2019 to 10/31/2019(c)(d) | | | 15.00 | | | | (0.06 | ) | | | 0.98 | | | | 0.92 | | | | – | | | | 15.92 | |
| Class I | | | | | | | | | | | | | | | | | | | | | | | | |
| 10/31/2022 | | | 36.44 | | | | (0.11 | ) | | | (11.50 | ) | | | (11.61 | ) | | | (4.87 | ) | | | 19.96 | |
| 10/31/2021 | | | 27.03 | | | | (0.20 | ) | | | 11.47 | | | | 11.27 | | | | (1.86 | ) | | | 36.44 | |
| 10/31/2020 | | | 15.92 | | | | (0.11 | ) | | | 11.22 | | | | 11.11 | | | | – | | | | 27.03 | |
| 1/30/2019 to 10/31/2019(c)(d) | | | 15.00 | | | | (0.07 | ) | | | 0.99 | | | | 0.92 | | | | – | | | | 15.92 | |
| Class R3 | | | | | | | | | | | | | | | | | | | | | | | | |
| 10/31/2022 | | | 35.92 | | | | (0.23 | ) | | | (11.29 | ) | | | (11.52 | ) | | | (4.87 | ) | | | 19.53 | |
| 10/31/2021 | | | 26.79 | | | | (0.35 | ) | | | 11.34 | | | | 10.99 | | | | (1.86 | ) | | | 35.92 | |
| 10/31/2020 | | | 15.86 | | | | (0.21 | ) | | | 11.14 | | | | 10.93 | | | | – | | | | 26.79 | |
| 1/30/2019 to 10/31/2019(c)(d) | | | 15.00 | | | | (0.13 | ) | | | 0.99 | | | | 0.86 | | | | – | | | | 15.86 | |
| Class R4 | | | | | | | | | | | | | | | | | | | | | | | | |
| 10/31/2022 | | | 36.18 | | | | (0.17 | ) | | | (11.39 | ) | | | (11.56 | ) | | | (4.87 | ) | | | 19.75 | |
| 10/31/2021 | | | 26.91 | | | | (0.27 | ) | | | 11.40 | | | | 11.13 | | | | (1.86 | ) | | | 36.18 | |
| 10/31/2020 | | | 15.89 | | | | (0.16 | ) | | | 11.18 | | | | 11.02 | | | | – | | | | 26.91 | |
| 1/30/2019 to 10/31/2019(c)(d) | | | 15.00 | | | | (0.10 | ) | | | 0.99 | | | | 0.89 | | | | – | | | | 15.89 | |
| 168 | See Notes to Financial Statements. |
| | | Ratios to Average Net Assets: | | Supplemental Data: |
| | | | | |
Total
return(b)
(%) | | Total
expenses
after
waivers
and/or reim-
bursements
(%) | | Total
expenses
(%) | | Net
investment
(loss)
(%) | | Net assets,
end of
period
(000) | | Portfolio
turnover
rate
(%) |
| | | | | | | | | | | |
| | (36.92 | ) | | | 1.05 | | | | 1.54 | | | | (0.71 | ) | | $ | 14,420 | | | | 169 | |
| | 43.48 | | | | 1.05 | | | | 1.49 | | | | (0.87 | ) | | | 18,332 | | | | 166 | |
| | 69.40 | | | | 1.05 | | | | 2.25 | | | | (0.79 | ) | | | 12,485 | | | | 126 | |
| | 5.87 | (e) | | | 1.05 | (f) | | | 3.09 | (f) | | | (0.83 | )(f) | | | 4,889 | | | | 130 | (e) |
| | | | | | | | | | | | | | | | | | | | | | | |
| | (37.40 | ) | | | 1.80 | | | | 2.30 | | | | (1.46 | ) | | | 2,289 | | | | 169 | |
| | 42.43 | | | | 1.80 | | | | 2.24 | | | | (1.62 | ) | | | 2,701 | | | | 166 | |
| | 68.10 | | | | 1.78 | | | | 2.87 | | | | (1.61 | ) | | | 1,849 | | | | 126 | |
| | 5.33 | (e) | | | 1.80 | (f) | | | 4.10 | (f) | | | (1.55 | )(f) | | | 156 | | | | 130 | (e) |
| | | | | | | | | | | | | | | | | | | | | | | |
| | (36.79 | ) | | | 0.80 | | | | 1.37 | | | | (0.47 | ) | | | 7,021 | | | | 169 | |
| | 43.85 | | | | 0.80 | | | | 1.34 | | | | (0.63 | ) | | | 18,621 | | | | 166 | |
| | 69.89 | | | | 0.80 | | | | 2.03 | | | | (0.58 | ) | | | 5,821 | | | | 126 | |
| | 6.07 | (e) | | | 0.80 | (f) | | | 3.14 | (f) | | | (0.56 | )(f) | | | 1,005 | | | | 130 | (e) |
| | | | | | | | | | | | | | | | | | | | | | | |
| | (36.74 | ) | | | 0.73 | | | | 1.15 | | | | (0.40 | ) | | | 667 | | | | 169 | |
| | 43.95 | | | | 0.75 | | | | 1.16 | | | | (0.57 | ) | | | 1,217 | | | | 166 | |
| | 69.97 | | | | 0.72 | | | | 2.01 | | | | (0.44 | ) | | | 902 | | | | 126 | |
| | 6.13 | (e) | | | 0.73 | (f) | | | 3.07 | (f) | | | (0.48 | )(f) | | | 531 | | | | 130 | (e) |
| | | | | | | | | | | | | | | | | | | | | | | |
| | (36.79 | ) | | | 0.80 | | | | 1.30 | | | | (0.47 | ) | | | 4,595 | | | | 169 | |
| | 43.90 | | | | 0.80 | | | | 1.24 | | | | (0.62 | ) | | | 4,587 | | | | 166 | |
| | 69.72 | | | | 0.80 | | | | 2.04 | | | | (0.52 | ) | | | 2,712 | | | | 126 | |
| | 6.13 | (e) | | | 0.80 | (f) | | | 2.91 | (f) | | | (0.60 | )(f) | | | 1,492 | | | | 130 | (e) |
| | | | | | | | | | | | | | | | | | | | | | | |
| | (37.11 | ) | | | 1.30 | | | | 1.81 | | | | (0.97 | ) | | | 14 | | | | 169 | |
| | 43.15 | | | | 1.30 | | | | 1.73 | | | | (1.11 | ) | | | 24 | | | | 166 | |
| | 68.92 | | | | 1.30 | | | | 2.52 | | | | (1.01 | ) | | | 18 | | | | 126 | |
| | 5.73 | (e) | | | 1.30 | (f) | | | 3.64 | (f) | | | (1.06 | )(f) | | | 11 | | | | 130 | (e) |
| | | | | | | | | | | | | | | | | | | | | | | |
| | (36.93 | ) | | | 1.05 | | | | 1.54 | | | | (0.71 | ) | | | 13 | | | | 169 | |
| | 43.50 | | | | 1.05 | | | | 1.48 | | | | (0.86 | ) | | | 24 | | | | 166 | |
| | 69.35 | | | | 1.05 | | | | 2.27 | | | | (0.75 | ) | | | 18 | | | | 126 | |
| | 5.93 | (e) | | | 1.05 | (f) | | | 3.37 | (f) | | | (0.80 | )(f) | | | 11 | | | | 130 | (e) |
| | See Notes to Financial Statements. | 169 |
Financial Highlights (continued)
FOCUSED GROWTH FUND
| | | | | Per Share Operating Performance: | | |
| | | | | Investment Operations: | | Distributions
to
shareholders
from: | | | | |
| | | Net asset
value,
beginning
of period | | Net
investment
(loss)(a) | | Net
realized and
unrealized
gain (loss) | | Total from
investment
operations | | Net
realized
gain | | Net asset
value,
end of
period |
| Class R5 | | | | | | | | | | | | |
| 10/31/2022 | | | $36.44 | | | | $(0.12 | ) | | | $(11.49 | ) | | | $(11.61 | ) | | | $(4.87 | ) | | | $19.96 | |
| 10/31/2021 | | | 27.02 | | | | (0.20 | ) | | | 11.48 | | | | 11.28 | | | | (1.86 | ) | | | 36.44 | |
| 10/31/2020 | | | 15.91 | | | | (0.10 | ) | | | 11.21 | | | | 11.11 | | | | – | | | | 27.02 | |
| 1/30/2019 to 10/31/2019(c)(d) | | | 15.00 | | | | (0.07 | ) | | | 0.98 | | | | 0.91 | | | | – | | | | 15.91 | |
| Class R6 | | | | | | | | | | | | | | | | | | | | | | | | |
| 10/31/2022 | | | 36.51 | | | | (0.09 | ) | | | (11.53 | ) | | | (11.62 | ) | | | (4.87 | ) | | | 20.02 | |
| 10/31/2021 | | | 27.06 | | | | (0.18 | ) | | | 11.49 | | | | 11.31 | | | | (1.86 | ) | | | 36.51 | |
| 10/31/2020 | | | 15.92 | | | | (0.10 | ) | | | 11.24 | | | | 11.14 | | | | – | | | | 27.06 | |
| 1/30/2019 to 10/31/2019(c)(d) | | | 15.00 | | | | (0.06 | ) | | | 0.98 | | | | 0.92 | | | | – | | | | 15.92 | |
| (a) | Calculated using average shares outstanding during the period. |
| (b) | Total return for Classes A and C does not consider the effects of sales loads and assumes the reinvestment of all distributions. Total return for all other classes assumes the reinvestment of all distributions. |
| (c) | Commencement of operations was 1/30/2019, SEC effective date was 1/31/2019 and date shares first became available to the public was 2/1/2019. |
| (d) | Net investment income, net realized and unrealized gain amounted to less than $.01 for the period 1/30/2019 through 1/31/2019. |
| (e) | Not annualized. |
| (f) | Annualized. |
| 170 | See Notes to Financial Statements. |
| | | Ratios to Average Net Assets: | | Supplemental Data: |
| | | | | |
Total
return(b)
(%) | | Total
expenses
after
waivers
and/or reim-
bursements
(%) | | Total
expenses
(%) | | Net
investment
(loss)
(%) | | Net assets,
end of
period
(000) | | Portfolio
turnover
rate
(%) |
| | | | | | | | | | | |
| | (36.79 | ) | | | 0.80 | | | | 1.31 | | | | (0.48 | ) | | $ | 13 | | | | 169 | |
| | 43.90 | | | | 0.80 | | | | 1.25 | | | | (0.63 | ) | | | 24 | | | | 166 | |
| | 69.83 | | | | 0.80 | | | | 2.02 | | | | (0.49 | ) | | | 18 | | | | 126 | |
| | 6.07 | (e) | | | 0.80 | (f) | | | 3.12 | (f) | | | (0.55 | )(f) | | | 11 | | | | 130 | (e) |
| | | | | | | | | | | | | | | | | | | | | | | |
| | (36.74 | ) | | | 0.73 | | | | 1.16 | | | | (0.39 | ) | | | 4,740 | | | | 169 | |
| | 43.95 | | | | 0.75 | | | | 1.16 | | | | (0.57 | ) | | | 6,788 | | | | 166 | |
| | 69.97 | | | | 0.72 | | | | 1.99 | | | | (0.45 | ) | | | 4,400 | | | | 126 | |
| | 6.13 | (e) | | | 0.73 | (f) | | | 2.83 | (f) | | | (0.50 | )(f) | | | 1,821 | | | | 130 | (e) |
| | See Notes to Financial Statements. | 171 |
Financial Highlights (continued)
FOCUSED LARGE CAP VALUE FUND
| | | | | | Per Share Operating Performance: |
| | | | | | Investment Operations: | | Distributions to
shareholders from: |
| | | Net asset
value,
beginning
of period | | Net
invest-
ment
income(a) | | Net
realized
and
unrealized
gain (loss) | | Total
from
invest-
ment
opera-
tions | | Net
investment
income | | Net
realized
gain | | Total
distri-
butions |
| Class A | | | | | | | | | | | | | | | | | | | | | | | | | | | | |
| 10/31/2022 | | | $19.04 | | | | $0.16 | | | | $(1.34 | ) | | | $(1.18 | ) | | | $(0.35 | ) | | | $(3.93 | ) | | | $(4.28 | ) |
| 10/31/2021 | | | 12.95 | | | | 0.38 | | | | 6.68 | | | | 7.06 | | | | (0.16 | ) | | | (0.81 | ) | | | (0.97 | ) |
| 10/31/2020 | | | 14.75 | | | | 0.27 | | | | (1.99 | ) | | | (1.72 | ) | | | (0.08 | ) | | | – | | | | (0.08 | ) |
| 7/26/2019 to 10/31/2019(c)(d) | | | 15.00 | | | | 0.06 | | | | (0.31 | )(e) | | | (0.25 | ) | | | – | | | | – | | | | – | |
| Class C | | | | | | | | | | | | | | | | | | | | | | | | | | | | |
| 10/31/2022 | | | 18.97 | | | | 0.06 | | | | (1.35 | ) | | | (1.29 | ) | | | (0.26 | ) | | | (3.93 | ) | | | (4.19 | ) |
| 10/31/2021 | | | 12.87 | | | | 0.25 | | | | 6.66 | | | | 6.91 | | | | – | | | | (0.81 | ) | | | (0.81 | ) |
| 10/31/2020 | | | 14.72 | | | | 0.17 | | | | (1.98 | ) | | | (1.81 | ) | | | (0.04 | ) | | | – | | | | (0.04 | ) |
| 7/26/2019 to 10/31/2019(c)(d) | | | 15.00 | | | | 0.03 | | | | (0.31 | )(e) | | | (0.28 | ) | | | – | | | | – | | | | – | |
| Class F | | | | | | | | | | | | | | | | | | | | | | | | | | | | |
| 10/31/2022 | | | 19.22 | | | | 0.20 | | | | (1.36 | ) | | | (1.16 | ) | | | (0.36 | ) | | | (3.93 | ) | | | (4.29 | ) |
| 10/31/2021 | | | 12.98 | | | | 0.49 | | | | 6.64 | | | | 7.13 | | | | (0.08 | ) | | | (0.81 | ) | | | (0.89 | ) |
| 10/31/2020 | | | 14.76 | | | | 0.31 | | | | (2.00 | ) | | | (1.69 | ) | | | (0.09 | ) | | | – | | | | (0.09 | ) |
| 7/26/2019 to 10/31/2019(c)(d) | | | 15.00 | | | | 0.07 | | | | (0.31 | )(e) | | | (0.24 | ) | | | – | | | | – | | | | – | |
| Class F3 | | | | | | | | | | | | | | | | | | | | | | | | | | | | |
| 10/31/2022 | | | 19.10 | | | | 0.20 | | | | (1.35 | ) | | | (1.15 | ) | | | (0.38 | ) | | | (3.93 | ) | | | (4.31 | ) |
| 10/31/2021 | | | 12.98 | | | | 0.37 | | | | 6.75 | | | | 7.12 | | | | (0.19 | ) | | | (0.81 | ) | | | (1.00 | ) |
| 10/31/2020 | | | 14.76 | | | | 0.32 | | | | (2.00 | ) | | | (1.68 | ) | | | (0.10 | ) | | | – | | | | (0.10 | ) |
| 7/26/2019 to 10/31/2019(c)(d) | | | 15.00 | | | | 0.07 | | | | (0.31 | )(e) | | | (0.24 | ) | | | – | | | | – | | | | – | |
| Class I | | | | | | | | | | | | | | | | | | | | | | | | | | | | |
| 10/31/2022 | | | 19.10 | | | | 0.22 | | | | (1.38 | ) | | | (1.16 | ) | | | (0.38 | ) | | | (3.93 | ) | | | (4.31 | ) |
| 10/31/2021 | | | 12.99 | | | | 0.35 | | | | 6.76 | | | | 7.11 | | | | (0.19 | ) | | | (0.81 | ) | | | (1.00 | ) |
| 10/31/2020 | | | 14.76 | | | | 0.30 | | | | (1.97 | ) | | | (1.67 | ) | | | (0.10 | ) | | | – | | | | (0.10 | ) |
| 7/26/2019 to 10/31/2019(c)(d) | | | 15.00 | | | | 0.04 | | | | (0.28 | )(e) | | | (0.24 | ) | | | – | | | | – | | | | – | |
| Class R3 | | | | | | | | | | | | | | | | | | | | | | | | | | | | |
| 10/31/2022 | | | 18.99 | | | | 0.12 | | | | (1.33 | ) | | | (1.21 | ) | | | (0.29 | ) | | | (3.93 | ) | | | (4.22 | ) |
| 10/31/2021 | | | 12.92 | | | | 0.29 | | | | 6.71 | | | | 7.00 | | | | (0.12 | ) | | | (0.81 | ) | | | (0.93 | ) |
| 10/31/2020 | | | 14.74 | | | | 0.23 | | | | (1.99 | ) | | | (1.76 | ) | | | (0.06 | ) | | | – | | | | (0.06 | ) |
| 7/26/2019 to 10/31/2019(c)(d) | | | 15.00 | | | | 0.05 | | | | (0.31 | )(e) | | | (0.26 | ) | | | – | | | | – | | | | – | |
| Class R4 | | | | | | | | | | | | | | | | | | | | | | | | | | | | |
| 10/31/2022 | | | 19.04 | | | | 0.16 | | | | (1.35 | ) | | | (1.19 | ) | | | (0.33 | ) | | | (3.93 | ) | | | (4.26 | ) |
| 10/31/2021 | | | 12.95 | | | | 0.33 | | | | 6.73 | | | | 7.06 | | | | (0.16 | ) | | | (0.81 | ) | | | (0.97 | ) |
| 10/31/2020 | | | 14.75 | | | | 0.27 | | | | (1.99 | ) | | | (1.72 | ) | | | (0.08 | ) | | | – | | | | (0.08 | ) |
| 7/26/2019 to 10/31/2019(c)(d) | | | 15.00 | | | | 0.06 | | | | (0.31 | )(e) | | | (0.25 | ) | | | – | | | | – | | | | – | |
| 172 | See Notes to Financial Statements. |
| | | | | | | Ratios to Average Net Assets: | | Supplemental Data: |
| | | | | | | | | | | | | |
Net
asset
value,
end of
period | | Total
return(b)
(%) | | Total
expenses
after
waivers
and/or reim-
bursements
(%) | | Total
expenses
(%) | | Net
invest-
ment
income
(%) | | Net
assets,
end of
period
(000) | | Portfolio
turnover
rate
(%) |
| | | | | | | | | | | | | | | | | | | | |
| $13.58 | | | | (8.69 | ) | | | 0.96 | | | | 1.04 | | | | 1.12 | | | | $11,466 | | | | 100 | |
| | 19.04 | | | | 56.50 | | | | 0.93 | | | | 0.93 | | | | 2.08 | | | | 7,714 | | | | 99 | |
| | 12.95 | | | | (11.74 | ) | | | 0.96 | | | | 1.09 | | | | 2.08 | | | | 541 | | | | 128 | |
| | | | | | | | | | | | | | | | | | | | | | | | | | | |
| | 14.75 | | | | (1.67 | )(f) | | | 0.96 | (g) | | | 4.40 | (g) | | | 1.57 | (g) | | | 508 | | | | 16 | (f) |
| | | | | | | | | | | | | | | | | | | | | | | | | | | |
| | 13.49 | | | | (9.37 | ) | | | 1.71 | | | | 1.77 | | | | 0.40 | | | | 4,637 | | | | 100 | |
| | 18.97 | | | | 55.29 | | | | 1.67 | | | | 1.67 | | | | 1.36 | | | | 3,601 | | | | 99 | |
| | 12.87 | | | | (12.35 | ) | | | 1.71 | | | | 1.83 | | | | 1.32 | | | | 77 | | | | 128 | |
| | | | | | | | | | | | | | | | | | | | | | | | | | | |
| | 14.72 | | | | (1.87 | )(f) | | | 1.71 | (g) | | | 5.27 | (g) | | | 0.75 | (g) | | | 108 | | | | 16 | (f) |
| | | | | | | | | | | | | | | | | | | | | | | | | | | |
| | 13.77 | | | | (8.48 | ) | | | 0.71 | | | | 0.86 | | | | 1.35 | | | | 1,405 | | | | 100 | |
| | 19.22 | | | | 56.78 | | | | 0.68 | | | | 0.78 | | | | 2.60 | | | | 2,394 | | | | 99 | |
| | 12.98 | | | | (11.54 | ) | | | 0.71 | | | | 0.98 | | | | 2.33 | | | | 40 | | | | 128 | |
| | | | | | | | | | | | | | | | | | | | | | | | | | | |
| | 14.76 | | | | (1.60 | )(f) | | | 0.71 | (g) | | | 4.37 | (g) | | | 1.75 | (g) | | | 492 | | | | 16 | (f) |
| | | | | | | | | | | | | | | | | | | | | | | | | | | |
| | 13.64 | | | | (8.48 | ) | | | 0.70 | | | | 0.76 | | | | 1.37 | | | | 13 | | | | 100 | |
| | 19.10 | | | | 56.91 | | | | 0.67 | | | | 0.67 | | | | 2.13 | | | | 18 | | | | 99 | |
| | 12.98 | | | | (11.50 | ) | | | 0.63 | | | | 0.84 | | | | 2.40 | | | | 12 | | | | 128 | |
| | | | | | | | | | | | | | | | | | | | | | | | | | | |
| | 14.76 | | | | (1.60 | )(f) | | | 0.63 | (g) | | | 4.21 | (g) | | | 1.83 | (g) | | | 492 | | | | 16 | (f) |
| | | | | | | | | | | | | | | | | | | | | | | | | | | |
| | 13.63 | | | | (8.55 | ) | | | 0.69 | | | | 0.69 | | | | 1.49 | | | | 243 | | | | 100 | |
| | 19.10 | | | | 56.79 | | | | 0.68 | | | | 0.68 | | | | 1.99 | | | | 656,899 | | | | 99 | |
| | 12.99 | | | | (11.43 | ) | | | 0.71 | | | | 0.75 | | | | 2.34 | | | | 428,070 | | | | 128 | |
| | | | | | | | | | | | | | | | | | | | | | | | | | | |
| | 14.76 | | | | (1.60 | )(f) | | | 0.71 | (g) | | | 1.07 | (g) | | | 1.10 | (g) | | | 38,221 | | | | 16 | (f) |
| | | | | | | | | | | | | | | | | | | | | | | | | | | |
| | 13.56 | | | | (8.88 | ) | | | 1.21 | | | | 1.32 | | | | 0.86 | | | | 84 | | | | 100 | |
| | 18.99 | | | | 56.09 | | | | 1.15 | | | | 1.15 | | | | 1.65 | | | | 13 | | | | 99 | |
| | 12.92 | | | | (11.98 | ) | | | 1.21 | | | | 1.34 | | | | 1.75 | | | | 9 | | | | 128 | |
| | | | | | | | | | | | | | | | | | | | | | | | | | | |
| | 14.74 | | | | (1.73 | )(f) | | | 1.21 | (g) | | | 4.78 | (g) | | | 1.24 | (g) | | | 10 | | | | 16 | (f) |
| | | | | | | | | | | | | | | | | | | | | | | | | | | |
| | 13.59 | | | | (8.73 | ) | | | 0.96 | | | | 1.00 | | | | 1.10 | | | | 9 | | | | 100 | |
| | 19.04 | | | | 56.46 | | | | 0.90 | | | | 0.90 | | | | 1.89 | | | | 13 | | | | 99 | |
| | 12.95 | | | | (11.74 | ) | | | 0.96 | | | | 1.08 | | | | 2.00 | | | | 9 | | | | 128 | |
| | | | | | | | | | | | | | | | | | | | | | | | | | | |
| | 14.75 | | | | (1.67 | )(f) | | | 0.96 | (g) | | | 4.51 | (g) | | | 1.47 | (g) | | | 10 | | | | 16 | (f) |
| | See Notes to Financial Statements. | 173 |
Financial Highlights (continued)
FOCUSED LARGE CAP VALUE FUND
| | | | | | Per Share Operating Performance: |
| | | | | | Investment Operations: | | Distributions to
shareholders from: |
| | | Net asset
value,
beginning
of period | | Net
invest-
ment
income(a) | | Net
realized
and
unrealized
gain (loss) | | Total
from
invest-
ment
opera-
tions | | Net
investment
income | | Net
realized
gain | | Total
distri-
butions |
| Class R5 | | | | | | | | | | | | | | | | | | | | | | | | | | | | |
| 10/31/2022 | | | $19.09 | | | | $0.20 | | | | $(1.35 | ) | | | $(1.15 | ) | | | $(0.38 | ) | | | $(3.93 | ) | | | $(4.31 | ) |
| 10/31/2021 | | | 12.98 | | | | 0.38 | | | | 6.73 | | | | 7.11 | | | | (0.19 | ) | | | (0.81 | ) | | | (1.00 | ) |
| 10/31/2020 | | | 14.76 | | | | 0.30 | | | | (1.98 | ) | | | (1.68 | ) | | | (0.10 | ) | | | – | | | | (0.10 | ) |
| 7/26/2019 to 10/31/2019(c)(d) | | | 15.00 | | | | 0.07 | | | | (0.31 | )(e) | | | (0.24 | ) | | | – | | | | – | | | | – | |
| Class R6 | | | | | | | | | | | | | | | | | | | | | | | | | | | | |
| 10/31/2022 | | | 19.11 | | | | 0.20 | | | | (1.35 | ) | | | (1.15 | ) | | | (0.38 | ) | | | (3.93 | ) | | | (4.31 | ) |
| 10/31/2021 | | | 12.99 | | | | 0.39 | | | | 6.73 | | | | 7.12 | | | | (0.19 | ) | | | (0.81 | ) | | | (1.00 | ) |
| 10/31/2020 | | | 14.76 | | | | 0.32 | | | | (1.99 | ) | | | (1.67 | ) | | | (0.10 | ) | | | – | | | | (0.10 | ) |
| 7/26/2019 to 10/31/2019(c)(d) | | | 15.00 | | | | 0.07 | | | | (0.31 | )(e) | | | (0.24 | ) | | | – | | | | – | | | | – | |
| (a) | Calculated using average shares outstanding during the period. |
| (b) | Total return for Classes A and C does not consider the effects of sales loads and assumes the reinvestment of all distributions. Total return for all other classes assumes the reinvestment of all distributions. |
| (c) | Net investment income, net realized and unrealized gain amounted to less than $.01 for the period 7/26/2019 through 7/31/2019. |
| (d) | Commencement of operations was 7/26/2019, SEC effective date was 7/31/2019 and date shares first became available to the public was 8/1/2019. |
| (e) | Realized and unrealized gain (loss) per share does not correlate to the aggregate of the net realized and unrealized gain(loss) in the Statement of Operations for the period ended October 31, 2019, primarily due to the timing of the sales and repurchases of the Fund’s shares in relation to fluctuating market values of the Fund’s portfolio. |
| (f) | Not annualized. |
| (g) | Annualized. |
| 174 | See Notes to Financial Statements. |
| | | | | | | Ratios to Average Net Assets: | | | Supplemental Data: |
| | | | | | | | | | | | | | | | | | | | |
Net
asset
value,
end of
period | | Total
return(b)
(%) | | Total
expenses
after
waivers
and/or reim-
bursements
(%) | | Total
expenses
(%) | | Net
invest-
ment
income
(%) | | Net
assets,
end of
period
(000) | | Portfolio
turnover
rate
(%) |
| | | | | | | | | | | | | | | | | | | | |
| $13.63 | | | | (8.49 | ) | | | 0.71 | | | | 0.75 | | | | 1.37 | | | | $ 9 | | | | 100 | |
| | 19.09 | | | | 56.83 | | | | 0.65 | | | | 0.65 | | | | 2.14 | | | | 13 | | | | 99 | |
| | 12.98 | | | | (11.51 | ) | | | 0.71 | | | | 0.84 | | | | 2.24 | | | | 9 | | | | 128 | |
| | | | | | | | | | | | | | | | | | | | | | | | | | | |
| | 14.76 | | | | (1.60 | )(f) | | | 0.71 | (g) | | | 4.27 | (g) | | | 1.75 | (g) | | | 10 | | | | 16 | (f) |
| | | | | | | | | | | | | | | | | | | | | | | | | | | |
| | 13.65 | | | | (8.48 | ) | | | 0.70 | | | | 0.77 | | | | 1.36 | | | | 1,347 | | | | 100 | |
| | 19.11 | | | | 56.86 | | | | 0.68 | | | | 0.68 | | | | 2.17 | | | | 1,539 | | | | 99 | |
| | 12.99 | | | | (11.43 | ) | | | 0.63 | | | | 0.81 | | | | 2.38 | | | | 366 | | | | 128 | |
| | | | | | | | | | | | | | | | | | | | | | | | | | | |
| | 14.76 | | | | (1.60 | )(f) | | | 0.63 | (g) | | | 4.21 | (g) | | | 1.83 | (g) | | | 517 | | | | 16 | (f) |
| | See Notes to Financial Statements. | 175 |
Financial Highlights (continued)
FOCUSED SMALL CAP VALUE FUND
| | | | | | Per Share Operating Performance: |
| | | | | | Investment Operations: | | Distributions to
shareholders from: |
| | | Net asset
value,
beginning
of period | | Net
invest-
ment
income
(loss)(a) | | Net
realized
and
unrealized
gain (loss) | | Total
from
invest-
ment
opera-
tions | | Net
investment
income | | Net
realized
gain | | Total
distri-
butions |
| Class A | | | | | | | | | | | | | | | | | | | | | | | | | | | | |
| 10/31/2022 | | | $30.62 | | | | $0.05 | | | | $(3.54 | ) | | | $(3.49 | ) | | | $ – | | | | $(3.16 | ) | | | $(3.16 | ) |
| 10/31/2021 | | | 18.77 | | | | 0.01 | | | | 12.00 | | | | 12.01 | | | | (0.16 | ) | | | – | | | | (0.16 | ) |
| 10/31/2020 | | | 25.14 | | | | 0.14 | | | | (2.40 | ) | | | (2.26 | ) | | | – | | | | (4.11 | ) | | | (4.11 | ) |
| 10/31/2019 | | | 29.02 | | | | (0.04 | ) | | | 0.39 | | | | 0.35 | | | | – | | | | (4.23 | ) | | | (4.23 | ) |
| 10/31/2018 | | | 34.92 | | | | (0.32 | ) | | | 0.47 | | | | 0.15 | | | | – | | | | (6.05 | ) | | | (6.05 | ) |
| Class C | | | | | | | | | | | | | | | | | | | | | | | | | | | | |
| 10/31/2022 | | | 32.44 | | | | (0.15 | ) | | | (3.77 | ) | | | (3.92 | ) | | | – | | | | (3.16 | ) | | | (3.16 | ) |
| 10/31/2021 | | | 19.99 | | | | (0.30 | ) | | | 12.87 | | | | 12.57 | | | | (0.12 | ) | | | – | | | | (0.12 | ) |
| 10/31/2020 | | | 26.71 | | | | (0.08 | ) | | | (2.53 | ) | | | (2.61 | ) | | | – | | | | (4.11 | ) | | | (4.11 | ) |
| 6/28/2019 to 10/31/2019(c) | | | 27.39 | | | | (0.03 | ) | | | (0.65 | ) | | | (0.68 | ) | | | – | | | | – | | | | – | |
| Class F | | | | | | | | | | | | | | | | | | | | | | | | | | | | |
| 10/31/2022 | | | 33.11 | | | | 0.12 | | | | (3.86 | ) | | | (3.74 | ) | | | (0.04 | ) | | | (3.16 | ) | | | (3.20 | ) |
| 10/31/2021 | | | 20.30 | | | | 0.01 | | | | 13.04 | | | | 13.05 | | | | (0.24 | ) | | | – | | | | (0.24 | ) |
| 10/31/2020 | | | 26.80 | | | | 0.09 | | | | (2.48 | ) | | | (2.39 | ) | | | – | | | | (4.11 | ) | | | (4.11 | ) |
| 6/28/2019 to 10/31/2019(c) | | | 27.39 | | | | 0.06 | | | | (0.65 | ) | | | (0.59 | ) | | | – | | | | – | | | | – | |
| Class F3 | | | | | | | | | | | | | | | | | | | | | | | | | | | | |
| 10/31/2022 | | | 33.15 | | | | 0.14 | | | | (3.86 | ) | | | (3.72 | ) | | | (0.07 | ) | | | (3.16 | ) | | | (3.23 | ) |
| 10/31/2021 | | | 20.32 | | | | 0.11 | | | | 12.97 | | | | 13.08 | | | | (0.25 | ) | | | – | | | | (0.25 | ) |
| 10/31/2020 | | | 26.80 | | | | 0.19 | | | | (2.56 | ) | | | (2.37 | ) | | | – | | | | (4.11 | ) | | | (4.11 | ) |
| 6/28/2019 to 10/31/2019(c) | | | 27.39 | | | | 0.06 | | | | (0.65 | ) | | | (0.59 | ) | | | – | | | | – | | | | – | |
| Class I | | | | | | | | | | | | | | | | | | | | | | | | | | | | |
| 10/31/2022 | | | 33.10 | | | | 0.12 | | | | (3.85 | ) | | | (3.73 | ) | | | (0.07 | ) | | | (3.16 | ) | | | (3.23 | ) |
| 10/31/2021 | | | 20.30 | | | | 0.11 | | | | 12.94 | | | | 13.05 | | | | (0.25 | ) | | | – | | | | (0.25 | ) |
| 10/31/2020 | | | 26.80 | | | | 0.19 | | | | (2.58 | ) | | | (2.39 | ) | | | – | | | | (4.11 | ) | | | (4.11 | ) |
| 10/31/2019 | | | 30.64 | | | | (0.02 | ) | | | 0.41 | | | | 0.39 | | | | – | | | | (4.23 | ) | | | (4.23 | ) |
| 10/31/2018 | | | 36.53 | | | | (0.33 | ) | | | 0.49 | | | | 0.16 | | | | – | | | | (6.05 | ) | | | (6.05 | ) |
| Class R5 | | | | | | | | | | | | | | | | | | | | | | | | | | | | |
| 10/31/2022 | | | 33.10 | | | | 0.18 | | | | (3.90 | ) | | | (3.72 | ) | | | (0.07 | ) | | | (3.16 | ) | | | (3.23 | ) |
| 10/31/2021 | | | 20.29 | | | | 0.10 | | | | 12.96 | | | | 13.06 | | | | (0.25 | ) | | | – | | | | (0.25 | ) |
| 10/31/2020 | | | 26.80 | | | | 0.17 | | | | (2.57 | ) | | | (2.40 | ) | | | – | | | | (4.11 | ) | | | (4.11 | ) |
| 6/28/2019 to 10/31/2019(c) | | | 27.39 | | | | 0.05 | | | | (0.64 | ) | | | (0.59 | ) | | | – | | | | – | | | | – | |
| Class R6 | | | | | | | | | | | | | | | | | | | | | | | | | | | | |
| 10/31/2022 | | | 33.16 | | | | 0.14 | | | | (3.87 | ) | | | (3.73 | ) | | | (0.07 | ) | | | (3.16 | ) | | | (3.23 | ) |
| 10/31/2021 | | | 20.33 | | | | 0.07 | | | | 13.01 | | | | 13.08 | | | | (0.25 | ) | | | – | | | | (0.25 | ) |
| 10/31/2020 | | | 26.81 | | | | 0.18 | | | | (2.55 | ) | | | (2.37 | ) | | | – | | | | (4.11 | ) | | | (4.11 | ) |
| 6/28/2019 to 10/31/2019(c) | | | 27.39 | | | | 0.09 | | | | (0.67 | ) | | | (0.58 | ) | | | – | | | | – | | | | – | |
| (a) | Calculated using average shares outstanding during the period. |
| (b) | Total return for Classes A and C does not consider the effects of sales loads and assumes the reinvestment of all distributions. Total return for all other classes assumes the reinvestment of all distributions. |
| (c) | Commencement of operation was 6/28/2019 and date shares first became available to the public was 7/1/2019. |
| (d) | Not annualized. |
| (e) | Annualized. |
| 176 | See Notes to Financial Statements. |
| | | | | | | Ratios to Average Net Assets: | | Supplemental Data: |
| | | | | | | | | | | | | | | | | | | | |
Net
asset
value,
end of
period | | Total
return(b)
(%) | | Total
expenses
after
waivers
and/or reim-
bursements
(%) | | Total
expenses
(%) | | Net
investment
income
(loss)
(%) | | Net
assets,
end of
period
(000) | | Portfolio
turnover
rate
(%) |
| | | | | | | | | | | | | | | | | | | | | | | | | | | |
| $23.97 | | | | (12.99 | ) | | | 1.28 | | | | 1.29 | | | | 0.20 | | | | $16,026 | | | | 63 | |
| | 30.62 | | | | 64.27 | | | | 1.22 | | | | 1.22 | | | | 0.03 | | | | 19,525 | | | | 116 | |
| | 18.77 | | | | (11.21 | ) | | | 1.28 | | | | 1.40 | | | | 0.72 | | | | 3,253 | | | | 77 | |
| | 25.14 | | | | 1.68 | | | | 1.53 | | | | 1.58 | | | | (0.16 | ) | | | 5,729 | | | | 135 | |
| | 29.02 | | | | 0.11 | | | | 1.63 | | | | 1.63 | | | | (1.02 | ) | | | 6,382 | | | | 57 | |
| | | | | | | | | | | | | | | | | | | | | | | | | | | |
| | 25.36 | | | | (13.61 | ) | | | 2.03 | | | | 2.04 | | | | (0.56 | ) | | | 3,624 | | | | 63 | |
| | 32.44 | | | | 63.10 | | | | 1.96 | | | | 1.96 | | | | (0.95 | ) | | | 5,028 | | | | 116 | |
| | 19.99 | | | | (12.01 | ) | | | 2.03 | | | | 2.20 | | | | (0.42 | ) | | | 102 | | | | 77 | |
| | | | | | | | | | | | | | | | | | | | | | | | | | | |
| | 26.71 | | | | (2.48 | )(d) | | | 2.03 | (e) | | | 2.14 | (e) | | | (0.37 | )(e) | | | 10 | | | | 135 | |
| | | | | | | | | | | | | | | | | | | | | | | | | | | |
| | 26.17 | | | | (12.77 | ) | | | 1.03 | | | | 1.13 | | | | 0.41 | | | | 21,683 | | | | 63 | |
| | 33.11 | | | | 64.73 | | | | 0.97 | | | | 1.07 | | | | 0.04 | | | | 66,993 | | | | 116 | |
| | 20.30 | | | | (11.00 | ) | | | 1.03 | | | | 1.30 | | | | 0.43 | | | | 784 | | | | 77 | |
| | | | | | | | | | | | | | | | | | | | | | | | | | | |
| | 26.80 | | | | (2.15 | )(d) | | | 1.03 | (e) | | | 1.30 | (e) | | | 0.65 | (e) | | | 10 | | | | 135 | |
| | | | | | | | | | | | | | | | | | | | | | | | | | | |
| | 26.20 | | | | (12.70 | ) | | | 0.95 | | | | 0.95 | | | | 0.51 | | | | 11 | | | | 63 | |
| | 33.15 | | | | 64.72 | | | | 0.92 | | | | 0.92 | | | | 0.35 | | | | 14 | | | | 116 | |
| | 20.32 | | | | (10.88 | ) | | | 0.95 | | | | 1.14 | | | | 0.92 | | | | 9 | | | | 77 | |
| | | | | | | | | | | | | | | | | | | | | | | | | | | |
| | 26.80 | | | | (2.15 | )(d) | | | 0.95 | (e) | | | 1.15 | (e) | | | 0.71 | (e) | | | 10 | | | | 135 | |
| | | | | | | | | | | | | | | | | | | | | | | | | | | |
| | 26.14 | | | | (12.76 | ) | | | 1.03 | | | | 1.03 | | | | 0.41 | | | | 82,062 | | | | 63 | |
| | 33.10 | | | | 64.71 | | | | 0.95 | | | | 0.96 | | | | 0.35 | | | | 118,351 | | | | 116 | |
| | 20.30 | | | | (11.00 | ) | | | 1.03 | | | | 1.18 | | | | 0.92 | | | | 69,689 | | | | 77 | |
| | 26.80 | | | | 1.77 | | | | 1.45 | | | | 1.50 | | | | (0.07 | ) | | | 114,088 | | | | 135 | |
| | 30.64 | | | | 0.10 | | | | 1.63 | | | | 1.63 | | | | (1.02 | ) | | | 127,236 | | | | 57 | |
| | | | | | | | | | | | | | | | | | | | | | | | | | | |
| | 26.15 | | | | (12.73 | ) | | | 1.03 | | | | 1.05 | | | | 0.69 | | | | 272 | | | | 63 | |
| | 33.10 | | | | 64.71 | | | | 0.94 | | | | 0.94 | | | | 0.31 | | | | 17 | | | | 116 | |
| | 20.29 | | | | (11.00 | ) | | | 1.03 | | | | 1.16 | | | | 0.83 | | | | 9 | | | | 77 | |
| | | | | | | | | | | | | | | | | | | | | | | | | | | |
| | 26.80 | | | | (2.15 | )(d) | | | 1.03 | (e) | | | 1.15 | (e) | | | 0.62 | (e) | | | 10 | | | | 135 | |
| | | | | | | | | | | | | | | | | | | | | | | | | | | |
| | 26.20 | | | | (12.73 | ) | | | 0.98 | | | | 0.98 | | | | 0.50 | | | | 10,472 | | | | 63 | |
| | 33.16 | | | | 64.69 | | | | 0.94 | | | | 0.95 | | | | 0.22 | | | | 11,274 | | | | 116 | |
| | 20.33 | | | | (10.87 | ) | | | 0.95 | | | | 1.16 | | | | 0.90 | | | | 1,717 | | | | 77 | |
| | | | | | | | | | | | | | | | | | | | | | | | | | | |
| | 26.81 | | | | (2.12 | )(d) | | | 0.95 | (e) | | | 1.24 | (e) | | | 1.01 | (e) | | | 1,336 | | | | 135 | |
| | See Notes to Financial Statements. | 177 |
Financial Highlights (continued)
FUNDAMENTAL EQUITY FUND
| | | | | Per Share Operating Performance: |
| | | | | Investment Operations: | | Distributions to
shareholders from: |
| | | Net asset
value,
beginning of period | | Net
invest-
ment
income(a) | | Net
realized
and
unrealized
gain (loss) | | Total
from
invest-
ment
opera-
tions | | Net
investment
income | | Net
realized
gain | | Total
distri-
butions |
| Class A | | | | | | | | | | | | | | | | | | | | | | | | | | | | |
| 10/31/2022 | | $ | 15.04 | | | $ | 0.15 | | | $ | (1.03 | ) | | $ | (0.88 | ) | | $ | (0.14 | ) | | $ | (1.58 | ) | | $ | (1.72 | ) |
| 10/31/2021 | | | 10.56 | | | | 0.14 | | | | 4.55 | | | | 4.69 | | | | (0.21 | ) | | | – | | | | (0.21 | ) |
| 10/31/2020 | | | 12.53 | | | | 0.19 | | | | (0.88 | ) | | | (0.69 | ) | | | (0.19 | ) | | | (1.09 | ) | | | (1.28 | ) |
| 10/31/2019 | | | 12.64 | | | | 0.19 | | | | 0.79 | | | | 0.98 | | | | (0.18 | ) | | | (0.91 | ) | | | (1.09 | ) |
| 10/31/2018 | | | 13.99 | | | | 0.16 | | | | 0.10 | | | | 0.26 | | | | (0.18 | ) | | | (1.43 | ) | | | (1.61 | ) |
| Class C | | | | | | | | | | | | | | | | | | | | | | | | | | | | |
| 10/31/2022 | | | 13.10 | | | | 0.05 | | | | (0.88 | ) | | | (0.83 | ) | | | (0.03 | ) | | | (1.58 | ) | | | (1.61 | ) |
| 10/31/2021 | | | 9.19 | | | | 0.04 | | | | 3.96 | | | | 4.00 | | | | (0.09 | ) | | | – | | | | (0.09 | ) |
| 10/31/2020 | | | 11.04 | | | | 0.10 | | | | (0.77 | ) | | | (0.67 | ) | | | (0.09 | ) | | | (1.09 | ) | | | (1.18 | ) |
| 10/31/2019 | | | 11.22 | | | | 0.09 | | | | 0.69 | | | | 0.78 | | | | (0.05 | ) | | | (0.91 | ) | | | (0.96 | ) |
| 10/31/2018 | | | 12.58 | | | | 0.06 | | | | 0.08 | | | | 0.14 | | | | (0.07 | ) | | | (1.43 | ) | | | (1.50 | ) |
| Class F | | | | | | | | | | | | | | | | | | | | | | | | | | | | |
| 10/31/2022 | | | 14.85 | | | | 0.17 | | | | (1.02 | ) | | | (0.85 | ) | | | (0.16 | ) | | | (1.58 | ) | | | (1.74 | ) |
| 10/31/2021 | | | 10.44 | | | | 0.16 | | | | 4.48 | | | | 4.64 | | | | (0.23 | ) | | | – | | | | (0.23 | ) |
| 10/31/2020 | | | 12.40 | | | | 0.21 | | | | (0.87 | ) | | | (0.66 | ) | | | (0.21 | ) | | | (1.09 | ) | | | (1.30 | ) |
| 10/31/2019 | | | 12.52 | | | | 0.21 | | | | 0.78 | | | | 0.99 | | | | (0.20 | ) | | | (0.91 | ) | | | (1.11 | ) |
| 10/31/2018 | | | 13.87 | | | | 0.18 | | | | 0.10 | | | | 0.28 | | | | (0.20 | ) | | | (1.43 | ) | | | (1.63 | ) |
| Class F3 | | | | | | | | | | | | | | | | | | | | | | | | | | | | |
| 10/31/2022 | | | 15.26 | | | | 0.20 | | | | (1.05 | ) | | | (0.85 | ) | | | (0.18 | ) | | | (1.58 | ) | | | (1.76 | ) |
| 10/31/2021 | | | 10.71 | | | | 0.19 | | | | 4.60 | | | | 4.79 | | | | (0.24 | ) | | | – | | | | (0.24 | ) |
| 10/31/2020 | | | 12.69 | | | | 0.23 | | | | (0.90 | ) | | | (0.67 | ) | | | (0.22 | ) | | | (1.09 | ) | | | (1.31 | ) |
| 10/31/2019 | | | 12.78 | | | | 0.23 | | | | 0.80 | | | | 1.03 | | | | (0.21 | ) | | | (0.91 | ) | | | (1.12 | ) |
| 10/31/2018 | | | 14.12 | | | | 0.21 | | | | 0.09 | | | | 0.30 | | | | (0.21 | ) | | | (1.43 | ) | | | (1.64 | ) |
| Class I | | | | | | | | | | | | | | | | | | | | | | | | | | | | |
| 10/31/2022 | | | 15.16 | | | | 0.19 | | | | (1.04 | ) | | | (0.85 | ) | | | (0.18 | ) | | | (1.58 | ) | | | (1.76 | ) |
| 10/31/2021 | | | 10.65 | | | | 0.18 | | | | 4.57 | | | | 4.75 | | | | (0.24 | ) | | | – | | | | (0.24 | ) |
| 10/31/2020 | | | 12.63 | | | | 0.22 | | | | (0.89 | ) | | | (0.67 | ) | | | (0.22 | ) | | | (1.09 | ) | | | (1.31 | ) |
| 10/31/2019 | | | 12.73 | | | | 0.22 | | | | 0.80 | | | | 1.02 | | | | (0.21 | ) | | | (0.91 | ) | | | (1.12 | ) |
| 10/31/2018 | | | 14.09 | | | | 0.19 | | | | 0.09 | | | | 0.28 | | | | (0.21 | ) | | | (1.43 | ) | | | (1.64 | ) |
| Class P | | | | | | | | | | | | | | | | | | | | | | | | | | | | |
| 10/31/2022 | | | 14.69 | | | | 0.12 | | | | (1.00 | ) | | | (0.88 | ) | | | (0.11 | ) | | | (1.58 | ) | | | (1.69 | ) |
| 10/31/2021 | | | 10.33 | | | | 0.11 | | | | 4.44 | | | | 4.55 | | | | (0.19 | ) | | | – | | | | (0.19 | ) |
| 10/31/2020 | | | 12.28 | | | | 0.17 | | | | (0.86 | ) | | | (0.69 | ) | | | (0.17 | ) | | | (1.09 | ) | | | (1.26 | ) |
| 10/31/2019 | | | 12.40 | | | | 0.16 | | | | 0.77 | | | | 0.93 | | | | (0.14 | ) | | | (0.91 | ) | | | (1.05 | ) |
| 10/31/2018 | | | 13.74 | | | | 0.13 | | | | 0.09 | | | | 0.22 | | | | (0.13 | ) | | | (1.43 | ) | | | (1.56 | ) |
| Class R2 | | | | | | | | | | | | | | | | | | | | | | | | | | | | |
| 10/31/2022 | | | 14.64 | | | | 0.10 | | | | (0.99 | ) | | | (0.89 | ) | | | (0.09 | ) | | | (1.58 | ) | | | (1.67 | ) |
| 10/31/2021 | | | 10.30 | | | | 0.09 | | | | 4.43 | | | | 4.52 | | | | (0.18 | ) | | | – | | | | (0.18 | ) |
| 10/31/2020 | | | 12.24 | | | | 0.15 | | | | (0.86 | ) | | | (0.71 | ) | | | (0.14 | ) | | | (1.09 | ) | | | (1.23 | ) |
| 10/31/2019 | | | 12.33 | | | | 0.14 | | | | 0.78 | | | | 0.92 | | | | (0.10 | ) | | | (0.91 | ) | | | (1.01 | ) |
| 10/31/2018 | | | 13.68 | | | | 0.11 | | | | 0.10 | | | | 0.21 | | | | (0.13 | ) | | | (1.43 | ) | | | (1.56 | ) |
| 178 | See Notes to Financial Statements. |
| | | | | Ratios to Average Net Assets: | | Supplemental Data: |
| | | | | | | |
Net
asset
value,
end of
period | | Total
return(b)
(%) | | Total
expenses
after
waivers
and/or reim-
bursements
(%) | | Total
expenses
(%) | | Net
invest-
ment
income
(%) | | Net
assets,
end of
period
(000) | | Portfolio
turnover
rate
(%) |
| | | | | | | | | | | | | |
| $ | 12.44 | | | | (6.81 | ) | | | 0.96 | | | | 0.96 | | | | 1.19 | | | $ | 1,186,259 | | | | 50 | |
| | 15.04 | | | | 44.87 | | | | 0.96 | | | | 0.96 | | | | 1.06 | | | | 1,382,625 | | | | 73 | |
| | 10.56 | | | | (6.39 | ) | | | 0.94 | | | | 0.94 | | | | 1.79 | | | | 1,067,309 | | | | 59 | |
| | 12.53 | | | | 8.52 | | | | 0.99 | | | | 0.99 | | | | 1.57 | | | | 1,378,201 | | | | 88 | |
| | 12.64 | | | | 1.99 | | | | 0.96 | | | | 0.96 | | | | 1.22 | | | | 1,446,816 | | | | 92 | |
| | | | | | | | | | | | | | | | | | | | | | | | | | | |
| | 10.66 | | | | (7.50 | ) | | | 1.71 | | | | 1.71 | | | | 0.43 | | | | 38,197 | | | | 50 | |
| | 13.10 | | | | 43.75 | | | | 1.71 | | | | 1.71 | | | | 0.32 | | | | 55,600 | | | | 73 | |
| | 9.19 | | | | (7.07 | ) | | | 1.69 | | | | 1.69 | | | | 1.05 | | | | 60,191 | | | | 59 | |
| | 11.04 | | | | 7.71 | | | | 1.74 | | | | 1.74 | | | | 0.83 | | | | 157,803 | | | | 88 | |
| | 11.22 | | | | 1.21 | | | | 1.71 | | | | 1.71 | | | | 0.48 | | | | 232,937 | | | | 92 | |
| | | | | | | | | | | | | | | | | | | | | | | | | | | |
| | 12.26 | | | | (6.75 | ) | | | 0.81 | | | | 0.81 | | | | 1.32 | | | | 69,775 | | | | 50 | |
| | 14.85 | | | | 45.02 | | | | 0.81 | | | | 0.81 | | | | 1.21 | | | | 146,249 | | | | 73 | |
| | 10.44 | | | | (6.22 | ) | | | 0.79 | | | | 0.79 | | | | 1.93 | | | | 116,340 | | | | 59 | |
| | 12.40 | | | | 8.71 | | | | 0.84 | | | | 0.84 | | | | 1.73 | | | | 183,310 | | | | 88 | |
| | 12.52 | | | | 2.17 | | | | 0.81 | | | | 0.81 | | | | 1.38 | | | | 247,704 | | | | 92 | |
| | | | | | | | | | | | | | | | | | | | | | | | | | | |
| | 12.65 | | | | (6.58 | ) | | | 0.63 | | | | 0.63 | | | | 1.53 | | | | 18,159 | | | | 50 | |
| | 15.26 | | | | 45.36 | | | | 0.63 | | | | 0.63 | | | | 1.39 | | | | 19,916 | | | | 73 | |
| | 10.71 | | | | (6.11 | ) | | | 0.63 | | | | 0.63 | | | | 2.10 | | | | 15,378 | | | | 59 | |
| | 12.69 | | | | 8.92 | | | | 0.64 | | | | 0.64 | | | | 1.92 | | | | 20,698 | | | | 88 | |
| | 12.78 | | | | 2.36 | | | | 0.62 | | | | 0.62 | | | | 1.57 | | | | 20,270 | | | | 92 | |
| | | | | | | | | | | | | | | | | | | | | | | | | | | |
| | 12.55 | | | | (6.65 | ) | | | 0.71 | | | | 0.71 | | | | 1.48 | | | | 561,349 | | | | 50 | |
| | 15.16 | | | | 45.21 | | | | 0.71 | | | | 0.71 | | | | 1.32 | | | | 281,392 | | | | 73 | |
| | 10.65 | | | | (6.16 | ) | | | 0.69 | | | | 0.69 | | | | 2.06 | | | | 262,216 | | | | 59 | |
| | 12.63 | | | | 8.84 | | | | 0.74 | | | | 0.74 | | | | 1.79 | | | | 613,182 | | | | 88 | |
| | 12.73 | | | | 2.19 | | | | 0.71 | | | | 0.71 | | | | 1.48 | | | | 92,508 | | | | 92 | |
| | | | | | | | | | | | | | | | | | | | | | | | | | | |
| | 12.12 | | | | (7.03 | ) | | | 1.16 | | | | 1.16 | | | | 0.99 | | | | 4,074 | | | | 50 | |
| | 14.69 | | | | 44.55 | | | | 1.16 | | | | 1.16 | | | | 0.84 | | | | 4,881 | | | | 73 | |
| | 10.33 | | | | (6.54 | ) | | | 1.14 | | | | 1.14 | | | | 1.58 | | | | 3,614 | | | | 59 | |
| | 12.28 | | | | 8.30 | | | | 1.19 | | | | 1.19 | | | | 1.36 | | | | 5,117 | | | | 88 | |
| | 12.40 | | | | 1.77 | | | | 1.16 | | | | 1.16 | | | | 1.02 | | | | 5,648 | | | | 92 | |
| | | | | | | | | | | | | | | | | | | | | | | | | | | |
| | 12.08 | | | | (7.17 | ) | | | 1.31 | | | | 1.31 | | | | 0.82 | | | | 2,114 | | | | 50 | |
| | 14.64 | | | | 44.28 | | | | 1.31 | | | | 1.31 | | | | 0.72 | | | | 3,271 | | | | 73 | |
| | 10.30 | | | | (6.68 | ) | | | 1.29 | | | | 1.29 | | | | 1.44 | | | | 3,082 | | | | 59 | |
| | 12.24 | | | | 8.17 | | | | 1.34 | | | | 1.34 | | | | 1.20 | | | | 4,009 | | | | 88 | |
| | 12.33 | | | | 1.64 | | | | 1.31 | | | | 1.31 | | | | 0.88 | | | | 3,587 | | | | 92 | |
| | See Notes to Financial Statements. | 179 |
Financial Highlights (continued)
FUNDAMENTAL EQUITY FUND
| | | | | Per Share Operating Performance: |
| | | | | Investment Operations: | | Distributions to
shareholders from: |
| | | Net asset
value,
beginning
of period | | Net
invest-
ment
income(a) | | Net
realized
and
unrealized
gain (loss) | | Total
from
invest-
ment
opera-
tions | | Net
investment
income | | Net
realized
gain | | Total
distri-
butions |
| Class R3 | | | | | | | | | | | | | | | | | | | | | | | | | | | | |
| 10/31/2022 | | $ | 14.70 | | | $ | 0.12 | | | $ | (1.01 | ) | | $ | (0.89 | ) | | $ | (0.10 | ) | | $ | (1.58 | ) | | $ | (1.68 | ) |
| 10/31/2021 | | | 10.33 | | | | 0.11 | | | | 4.44 | | | | 4.55 | | | | (0.18 | ) | | | – | | | | (0.18 | ) |
| 10/31/2020 | | | 12.28 | | | | 0.16 | | | | (0.86 | ) | | | (0.70 | ) | | | (0.16 | ) | | | (1.09 | ) | | | (1.25 | ) |
| 10/31/2019 | | | 12.40 | | | | 0.16 | | | | 0.77 | | | | 0.93 | | | | (0.14 | ) | | | (0.91 | ) | | | (1.05 | ) |
| 10/31/2018 | | | 13.75 | | | | 0.12 | | | | 0.10 | | | | 0.22 | | | | (0.14 | ) | | | (1.43 | ) | | | (1.57 | ) |
| Class R4 | | | | | | | | | | | | | | | | | | | | | | | | | | | | |
| 10/31/2022 | | | 14.96 | | | | 0.15 | | | | (1.02 | ) | | | (0.87 | ) | | | (0.14 | ) | | | (1.58 | ) | | | (1.72 | ) |
| 10/31/2021 | | | 10.50 | | | | 0.14 | | | | 4.52 | | | | 4.66 | | | | (0.20 | ) | | | – | | | | (0.20 | ) |
| 10/31/2020 | | | 12.46 | | | | 0.19 | | | | (0.87 | ) | | | (0.68 | ) | | | (0.19 | ) | | | (1.09 | ) | | | (1.28 | ) |
| 10/31/2019 | | | 12.58 | | | | 0.19 | | | | 0.78 | | | | 0.97 | | | | (0.18 | ) | | | (0.91 | ) | | | (1.09 | ) |
| 10/31/2018 | | | 13.94 | | | | 0.16 | | | | 0.10 | | | | 0.26 | | | | (0.19 | ) | | | (1.43 | ) | | | (1.62 | ) |
| Class R5 | | | | | | | | | | | | | | | | | | | | | | | | | | | | |
| 10/31/2022 | | | 15.17 | | | | 0.18 | | | | (1.03 | ) | | | (0.85 | ) | | | (0.18 | ) | | | (1.58 | ) | | | (1.76 | ) |
| 10/31/2021 | | | 10.66 | | | | 0.18 | | | | 4.57 | | | | 4.75 | | | | (0.24 | ) | | | – | | | | (0.24 | ) |
| 10/31/2020 | | | 12.63 | | | | 0.22 | | | | (0.88 | ) | | | (0.66 | ) | | | (0.22 | ) | | | (1.09 | ) | | | (1.31 | ) |
| 10/31/2019 | | | 12.74 | | | | 0.22 | | | | 0.79 | | | | 1.01 | | | | (0.21 | ) | | | (0.91 | ) | | | (1.12 | ) |
| 10/31/2018 | | | 14.09 | | | | 0.19 | | | | 0.10 | | | | 0.29 | | | | (0.21 | ) | | | (1.43 | ) | | | (1.64 | ) |
| Class R6 | | | | | | | | | | | | | | | | | | | | | | | | | | | | |
| 10/31/2022 | | | 15.27 | | | | 0.19 | | | | (1.04 | ) | | | (0.85 | ) | | | (0.18 | ) | | | (1.58 | ) | | | (1.76 | ) |
| 10/31/2021 | | | 10.72 | | | | 0.19 | | | | 4.60 | | | | 4.79 | | | | (0.24 | ) | | | – | | | | (0.24 | ) |
| 10/31/2020 | | | 12.69 | | | | 0.23 | | | | (0.89 | ) | | | (0.66 | ) | | | (0.22 | ) | | | (1.09 | ) | | | (1.31 | ) |
| 10/31/2019 | | | 12.79 | | | | 0.23 | | | | 0.79 | | | | 1.02 | | | | (0.21 | ) | | | (0.91 | ) | | | (1.12 | ) |
| 10/31/2018 | | | 14.12 | | | | 0.21 | | | | 0.10 | | | | 0.31 | | | | (0.21 | ) | | | (1.43 | ) | | | (1.64 | ) |
| | |
| (a) | Calculated using average shares outstanding during the period. |
| (b) | Total return for Classes A and C does not consider the effects of sales loads and assumes the reinvestment of all distributions. Total return for all other classes assumes the reinvestment of all distributions. |
| 180 | See Notes to Financial Statements. |
| | | | | Ratios to Average Net Assets: | | Supplemental Data: |
| | | | | | | | | | | | | |
Net
asset
value,
end of
period | | Total
return(b)
(%) | | Total
expenses
after
waivers
and/or reim-
bursements
(%) | | Total
expenses
(%) | | Net
invest-
ment
income
(%) | | Net
assets,
end of
period
(000) | | Portfolio
turnover
rate
(%) |
| |
| $ | 12.13 | | | | (7.10 | ) | | | 1.21 | | | | 1.21 | | | | 0.93 | | | $ | 63,110 | | | | 50 | |
| | 14.70 | | | | 44.54 | | | | 1.21 | | | | 1.21 | | | | 0.81 | | | | 86,249 | | | | 73 | |
| | 10.33 | | | | (6.62 | ) | | | 1.19 | | | | 1.19 | | | | 1.54 | | | | 76,817 | | | | 59 | |
| | 12.28 | | | | 8.27 | | | | 1.24 | | | | 1.24 | | | | 1.32 | | | | 98,059 | | | | 88 | |
| | 12.40 | | | | 1.66 | | | | 1.21 | | | | 1.21 | | | | 0.97 | | | | 116,719 | | | | 92 | |
| | | | | | | | | | | | | | | | | | | | | | | | | | | |
| | 12.37 | | | | (6.80 | ) | | | 0.96 | | | | 0.96 | | | | 1.20 | | | | 2,969 | | | | 50 | |
| | 14.96 | | | | 44.80 | | | | 0.96 | | | | 0.96 | | | | 1.04 | | | | 2,988 | | | | 73 | |
| | 10.50 | | | | (6.35 | ) | | | 0.94 | | | | 0.94 | | | | 1.79 | | | | 2,228 | | | | 59 | |
| | 12.46 | | | | 8.51 | | | | 0.99 | | | | 0.99 | | | | 1.56 | | | | 4,880 | | | | 88 | |
| | 12.58 | | | | 2.00 | | | | 0.96 | | | | 0.96 | | | | 1.22 | | | | 5,164 | | | | 92 | |
| | | | | | | | | | | | | | | | | | | | | | | | | | | |
| | 12.56 | | | | (6.64 | ) | | | 0.71 | | | | 0.71 | | | | 1.42 | | | | 776 | | | | 50 | |
| | 15.17 | | | | 45.17 | | | | 0.71 | | | | 0.71 | | | | 1.31 | | | | 986 | | | | 73 | |
| | 10.66 | | | | (6.08 | ) | | | 0.69 | | | | 0.69 | | | | 2.07 | | | | 901 | | | | 59 | |
| | 12.63 | | | | 8.76 | | | | 0.74 | | | | 0.74 | | | | 1.80 | | | | 1,482 | | | | 88 | |
| | 12.74 | | | | 2.28 | | | | 0.71 | | | | 0.71 | | | | 1.45 | | | | 810 | | | | 92 | |
| | | | | | | | | | | | | | | | | | | | | | | | | | | |
| | 12.66 | | | | (6.57 | ) | | | 0.63 | | | | 0.63 | | | | 1.44 | | | | 8,039 | | | | 50 | |
| | 15.27 | | | | 45.31 | | | | 0.63 | | | | 0.63 | | | | 1.39 | | | | 16,209 | | | | 73 | |
| | 10.72 | | | | (6.03 | ) | | | 0.63 | | | | 0.63 | | | | 2.10 | | | | 11,403 | | | | 59 | |
| | 12.69 | | | | 8.83 | | | | 0.64 | | | | 0.64 | | | | 1.89 | | | | 21,815 | | | | 88 | |
| | 12.79 | | | | 2.36 | | | | 0.62 | | | | 0.62 | | | | 1.57 | | | | 16,864 | | | | 92 | |
| | See Notes to Financial Statements. | 181 |
Financial Highlights (continued)
GLOBAL EQUITY FUND
| | | | | Per Share Operating Performance: |
| | | | | Investment Operations: | | Distributions to
shareholders from: |
| | | Net asset
value,
beginning
of period | | Net
invest-
ment
income(a) | | Net
realized
and
unrealized
gain (loss) | | Total
from
invest-
ment
opera-
tions | | Net
investment
income | | Net
realized
gain | | Total
distri-
butions |
| Class A | | | | | | | | | | | | | | | | | | | | | | | | | | | | |
| 10/31/2022 | | $ | 16.61 | | | $ | 0.10 | | | $ | (3.04 | ) | | $ | (2.94 | ) | | $ | (0.12 | ) | | $ | (2.18 | ) | | $ | (2.30 | ) |
| 10/31/2021 | | | 12.59 | | | | 0.14 | | | | 4.57 | | | | 4.71 | | | | (0.18 | ) | | | (0.51 | ) | | | (0.69 | ) |
| 10/31/2020 | | | 11.52 | | | | 0.11 | | | | 1.09 | | | | 1.20 | | | | (0.13 | ) | | | – | | | | (0.13 | ) |
| 10/31/2019 | | | 10.93 | | | | 0.13 | | | | 0.97 | | | | 1.10 | | | | (0.09 | ) | | | (0.42 | ) | | | (0.51 | ) |
| 10/31/2018 | | | 11.58 | | | | 0.09 | | | | (0.11 | ) | | | (0.02 | ) | | | (0.11 | ) | | | (0.52 | ) | | | (0.63 | ) |
| Class C | | | | | | | | | | | | | | | | | | | | | | | | | | | | |
| 10/31/2022 | | | 16.41 | | | | – | (c) | | | (3.00 | ) | | | (3.00 | ) | | | (0.01 | ) | | | (2.18 | ) | | | (2.19 | ) |
| 10/31/2021 | | | 12.46 | | | | 0.02 | | | | 4.53 | | | | 4.55 | | | | (0.09 | ) | | | (0.51 | ) | | | (0.60 | ) |
| 10/31/2020 | | | 11.40 | | | | 0.02 | | | | 1.08 | | | | 1.10 | | | | (0.04 | ) | | | – | | | | (0.04 | ) |
| 10/31/2019 | | | 10.81 | | | | 0.05 | | | | 0.97 | | | | 1.02 | | | | (0.01 | ) | | | (0.42 | ) | | | (0.43 | ) |
| 10/31/2018 | | | 11.52 | | | | 0.01 | | | | (0.12 | ) | | | (0.11 | ) | | | (0.08 | ) | | | (0.52 | ) | | | (0.60 | ) |
| Class F | | | | | | | | | | | | | | | | | | | | | | | | | | | | |
| 10/31/2022 | | | 16.65 | | | | 0.11 | | | | (3.05 | ) | | | (2.94 | ) | | | (0.14 | ) | | | (2.18 | ) | | | (2.32 | ) |
| 10/31/2021 | | | 12.62 | | | | 0.16 | | | | 4.59 | | | | 4.75 | | | | (0.21 | ) | | | (0.51 | ) | | | (0.72 | ) |
| 10/31/2020 | | | 11.54 | | | | 0.12 | | | | 1.11 | | | | 1.23 | | | | (0.15 | ) | | | – | | | | (0.15 | ) |
| 10/31/2019 | | | 10.94 | | | | 0.15 | | | | 0.97 | | | | 1.12 | | | | (0.10 | ) | | | (0.42 | ) | | | (0.52 | ) |
| 10/31/2018 | | | 11.60 | | | | 0.11 | | | | (0.12 | ) | | | (0.01 | ) | | | (0.13 | ) | | | (0.52 | ) | | | (0.65 | ) |
| Class F3 | | | | | | | | | | | | | | | | | | | | | | | | | | | | |
| 10/31/2022 | | | 16.68 | | | | 0.13 | | | | (3.06 | ) | | | (2.93 | ) | | | (0.16 | ) | | | (2.18 | ) | | | (2.34 | ) |
| 10/31/2021 | | | 12.63 | | | | 0.19 | | | | 4.60 | | | | 4.79 | | | | (0.23 | ) | | | (0.51 | ) | | | (0.74 | ) |
| 10/31/2020 | | | 11.56 | | | | 0.14 | | | | 1.10 | | | | 1.24 | | | | (0.17 | ) | | | – | | | | (0.17 | ) |
| 10/31/2019 | | | 10.96 | | | | 0.16 | | | | 0.97 | | | | 1.13 | | | | (0.11 | ) | | | (0.42 | ) | | | (0.53 | ) |
| 10/31/2018 | | | 11.61 | | | | 0.12 | | | | (0.11 | ) | | | 0.01 | | | | (0.14 | ) | | | (0.52 | ) | | | (0.66 | ) |
| Class I | | | | | | | | | | | | | | | | | | | | | | | | | | | | |
| 10/31/2022 | | | 16.66 | | | | 0.12 | | | | (3.04 | ) | | | (2.92 | ) | | | (0.16 | ) | | | (2.18 | ) | | | (2.34 | ) |
| 10/31/2021 | | | 12.62 | | | | 0.18 | | | | 4.59 | | | | 4.77 | | | | (0.22 | ) | | | (0.51 | ) | | | (0.73 | ) |
| 10/31/2020 | | | 11.55 | | | | 0.14 | | | | 1.09 | | | | 1.23 | | | | (0.16 | ) | | | – | | | | (0.16 | ) |
| 10/31/2019 | | | 10.95 | | | | 0.16 | | | | 0.97 | | | | 1.13 | | | | (0.11 | ) | | | (0.42 | ) | | | (0.53 | ) |
| 10/31/2018 | | | 11.61 | | | | 0.12 | | | | (0.12 | ) | | | – | | | | (0.14 | ) | | | (0.52 | ) | | | (0.66 | ) |
| Class R3 | | | | | | | | | | | | | | | | | | | | | | | | | | | | |
| 10/31/2022 | | | 16.47 | | | | 0.08 | | | | (3.02 | ) | | | (2.94 | ) | | | (0.09 | ) | | | (2.18 | ) | | | (2.27 | ) |
| 10/31/2021 | | | 12.51 | | | | 0.11 | | | | 4.52 | | | | 4.63 | | | | (0.16 | ) | | | (0.51 | ) | | | (0.67 | ) |
| 10/31/2020 | | | 11.45 | | | | 0.08 | | | | 1.09 | | | | 1.17 | | | | (0.11 | ) | | | – | | | | (0.11 | ) |
| 10/31/2019 | | | 10.90 | | | | 0.11 | | | | 0.96 | | | | 1.07 | | | | (0.10 | ) | | | (0.42 | ) | | | (0.52 | ) |
| 10/31/2018 | | | 11.56 | | | | 0.03 | | | | (0.09 | ) | | | (0.06 | ) | | | (0.08 | ) | | | (0.52 | ) | | | (0.60 | ) |
| 182 | See Notes to Financial Statements. |
| | | | | Ratios to Average Net Assets: | | Supplemental Data: |
| | | | | | | | | | | | | |
Net
asset
value,
end of
period | | Total
return(b)
(%) | | Total
expenses
after
waivers
and/or reim-
bursements
(%) | | Total
expenses
(%) | | Net
invest-
ment
income
(loss)
(%) | | Net
assets,
end of
period
(000) | | Portfolio
turnover
rate
(%) |
| | | | | | | | | | | |
| $ | 11.37 | | | | (20.30 | ) | | | 0.90 | | | | 3.43 | | | | 0.79 | | | $ | 4,236 | | | | 70 | |
| | 16.61 | | | | 38.37 | | | | 0.90 | | | | 3.53 | | | | 0.88 | | | | 5,016 | | | | 87 | |
| | 12.59 | | | | 10.52 | | | | 0.90 | | | | 4.32 | | | | 0.92 | | | | 2,622 | | | | 141 | |
| | 11.52 | | | | 10.85 | | | | 0.90 | | | | 4.20 | | | | 1.24 | | | | 3,551 | | | | 65 | |
| | 10.93 | | | | (0.22 | ) | | | 0.95 | | | | 5.07 | | | | 0.79 | | | | 3,124 | | | | 108 | |
| | | | | | | | | | | | | | | | | | | | | | | | | | | |
| | 11.22 | | | | (20.87 | ) | | | 1.65 | | | | 4.05 | | | | (0.03 | ) | | | 392 | | | | 70 | |
| | 16.41 | | | | 37.27 | | | | 1.65 | | | | 4.29 | | | | 0.14 | | | | 826 | | | | 87 | |
| | 12.46 | | | | 9.75 | | | | 1.65 | | | | 5.12 | | | | 0.17 | | | | 537 | | | | 141 | |
| | 11.40 | | | | 10.05 | | | | 1.65 | | | | 4.96 | | | | 0.46 | | | | 581 | | | | 65 | |
| | 10.81 | | | | (1.07 | ) | | | 1.70 | | | | 5.76 | | | | 0.07 | | | | 699 | | | | 108 | |
| | | | | | | | | | | | | | | | | | | | | | | | | | | |
| | 11.39 | | | | (20.26 | ) | | | 0.75 | | | | 3.21 | | | | 0.86 | | | | 1,277 | | | | 70 | |
| | 16.65 | | | | 38.59 | | | | 0.75 | | | | 3.40 | | | | 1.07 | | | | 2,146 | | | | 87 | |
| | 12.62 | | | | 10.73 | | | | 0.75 | | | | 4.23 | | | | 1.06 | | | | 1,445 | | | | 141 | |
| | 11.54 | | | | 11.07 | | | | 0.75 | | | | 4.09 | | | | 1.37 | | | | 2,207 | | | | 65 | |
| | 10.94 | | | | (0.19 | ) | | | 0.82 | | | | 4.90 | | | | 0.94 | | | | 1,203 | | | | 108 | |
| | | | | | | | | | | | | | | | | | | | | | | | | | | |
| | 11.41 | | | | (20.15 | ) | | | 0.59 | | | | 2.99 | | | | 0.99 | | | | 13 | | | | 70 | |
| | 16.68 | | | | 38.90 | | | | 0.61 | | | | 3.20 | | | | 1.20 | | | | 18 | | | | 87 | |
| | 12.63 | | | | 10.78 | | | | 0.62 | | | | 4.09 | | | | 1.19 | | | | 14 | | | | 141 | |
| | 11.56 | | | | 11.22 | | | | 0.63 | | | | 3.88 | | | | 1.50 | | | | 13 | | | | 65 | |
| | 10.96 | | | | 0.01 | | | | 0.69 | | | | 4.80 | | | | 1.08 | | | | 11 | | | | 108 | |
| | | | | | | | | | | | | | | | | | | | | | | | | | | |
| | 11.40 | | | | (20.17 | ) | | | 0.65 | | | | 3.12 | | | | 0.93 | | | | 1,085 | | | | 70 | |
| | 16.66 | | | | 38.78 | | | | 0.65 | | | | 3.30 | | | | 1.16 | | | | 1,837 | | | | 87 | |
| | 12.62 | | | | 10.75 | | | | 0.65 | | | | 4.16 | | | | 1.18 | | | | 1,400 | | | | 141 | |
| | 11.55 | | | | 11.19 | | | | 0.65 | | | | 3.95 | | | | 1.49 | | | | 1,264 | | | | 65 | |
| | 10.95 | | | | (0.10 | ) | | | 0.72 | | | | 4.81 | | | | 1.03 | | | | 1,137 | | | | 108 | |
| | | | | | | | | | | | | | | | | | | | | | | | | | | |
| | 11.26 | | | | (20.47 | ) | | | 1.15 | | | | 3.67 | | | | 0.59 | | | | 506 | | | | 70 | |
| | 16.47 | | | | 37.85 | | | | 1.15 | | | | 3.78 | | | | 0.70 | | | | 470 | | | | 87 | |
| | 12.51 | | | | 10.25 | | | | 1.15 | | | | 4.67 | | | | 0.68 | | | | 241 | | | | 141 | |
| | 11.45 | | | | 10.63 | | | | 1.15 | | | | 4.46 | | | | 0.98 | | | | 200 | | | | 65 | |
| | 10.90 | | | | (0.56 | ) | | | 1.18 | | | | 5.98 | | | | 0.27 | | | | 165 | | | | 108 | |
| | See Notes to Financial Statements. | 183 |
Financial Highlights (continued)
GLOBAL EQUITY FUND
| | | | | Per Share Operating Performance: |
| | | | | Investment Operations: | | Distributions to
shareholders from: |
| | | Net asset
value,
beginning
of period | | Net
invest-
ment
income(a) | | Net
realized
and
unrealized
gain (loss) | | Total
from
invest-
ment
opera-
tions | | Net
investment
income | | Net
realized
gain | | Total
distri-
butions |
| Class R4 | | | | | | | | | | | | | | | | | | | | | | | | | | | | |
| 10/31/2022 | | $ | 16.62 | | | $ | 0.14 | | | $ | (3.09 | ) | | $ | (2.95 | ) | | $ | (0.12 | ) | | $ | (2.18 | ) | | $ | (2.30 | ) |
| 10/31/2021 | | | 12.60 | | | | 0.14 | | | | 4.58 | | | | 4.72 | | | | (0.19 | ) | | | (0.51 | ) | | | (0.70 | ) |
| 10/31/2020 | | | 11.53 | | | | 0.11 | | | | 1.10 | | | | 1.21 | | | | (0.14 | ) | | | – | | | | (0.14 | ) |
| 10/31/2019 | | | 10.93 | | | | 0.13 | | | | 0.97 | | | | 1.10 | | | | (0.08 | ) | | | (0.42 | ) | | | (0.50 | ) |
| 10/31/2018 | | | 11.58 | | | | 0.10 | | | | (0.12 | ) | | | (0.02 | ) | | | (0.11 | ) | | | (0.52 | ) | | | (0.63 | ) |
| Class R5 | | | | | | | | | | | | | | | | | | | | | | | | | | | | |
| 10/31/2022 | | | 16.66 | | | | 0.12 | | | | (3.04 | ) | | | (2.92 | ) | | | (0.16 | ) | | | (2.18 | ) | | | (2.34 | ) |
| 10/31/2021 | | | 12.62 | | | | 0.18 | | | | 4.59 | | | | 4.77 | | | | (0.22 | ) | | | (0.51 | ) | | | (0.73 | ) |
| 10/31/2020 | | | 11.55 | | | | 0.14 | | | | 1.09 | | | | 1.23 | | | | (0.16 | ) | | | – | | | | (0.16 | ) |
| 10/31/2019 | | | 10.95 | | | | 0.16 | | | | 0.97 | | | | 1.13 | | | | (0.11 | ) | | | (0.42 | ) | | | (0.53 | ) |
| 10/31/2018 | | | 11.61 | | | | 0.12 | | | | (0.12 | ) | | | – | | | | (0.14 | ) | | | (0.52 | ) | | | (0.66 | ) |
| Class R6 | | | | | | | | | | | | | | | | | | | | | | | | | | | | |
| 10/31/2022 | | | 16.67 | | | | 0.14 | | | | (3.06 | ) | | | (2.92 | ) | | | (0.16 | ) | | | (2.18 | ) | | | (2.34 | ) |
| 10/31/2021 | | | 12.63 | | | | 0.19 | | | | 4.59 | | | | 4.78 | | | | (0.23 | ) | | | (0.51 | ) | | | (0.74 | ) |
| 10/31/2020 | | | 11.56 | | | | 0.14 | | | | 1.10 | | | | 1.24 | | | | (0.17 | ) | | | – | | | | (0.17 | ) |
| 10/31/2019 | | | 10.96 | | | | 0.17 | | | | 0.96 | | | | 1.13 | | | | (0.11 | ) | | | (0.42 | ) | | | (0.53 | ) |
| 10/31/2018 | | | 11.61 | | | | 0.13 | | | | (0.12 | ) | | | 0.01 | | | | (0.14 | ) | | | (0.52 | ) | | | (0.66 | ) |
| | |
| (a) | Calculated using average shares outstanding during the period. |
| (b) | Total return for Classes A and C does not consider the effects of sales loads and assumes the reinvestment of all distributions. Total return for all other classes assumes the reinvestment of all distributions. |
| (c) | Amount is less than $0.01. |
| 184 | See Notes to Financial Statements. |
| | | | | Ratios to Average Net Assets: | | Supplemental Data: |
| | | | | | | | | | | | | |
Net
asset
value,
end of
period | | Total
return(b)
(%) | | Total
expenses
after
waivers
and/or reim-
bursements
(%) | | Total
expenses
(%) | | Net
invest-
ment
income
(loss)
(%) | | Net
assets,
end of
period
(000) | | Portfolio
turnover
rate
(%) |
| | | | | | | | | | | | | | | | | | | | | | | | | | | |
| $ | 11.37 | | | | (20.37 | ) | | | 0.90 | | | | 3.88 | | | | 1.17 | | | $ | 514 | | | | 70 | |
| | 16.62 | | | | 38.39 | | | | 0.90 | | | | 3.54 | | | | 0.92 | | | | 19 | | | | 87 | |
| | 12.60 | | | | 10.51 | | | | 0.90 | | | | 4.41 | | | | 0.92 | | | | 14 | | | | 141 | |
| | 11.53 | | | | 10.89 | | | | 0.90 | | | | 4.18 | | | | 1.24 | | | | 13 | | | | 65 | |
| | 10.93 | | | | (0.24 | ) | | | 0.97 | | | | 5.05 | | | | 0.83 | | | | 12 | | | | 108 | |
| | | | | | | | | | | | | | | | | | | | | | | | | | | |
| | 11.40 | | | | (20.17 | ) | | | 0.65 | | | | 3.14 | | | | 0.93 | | | | 13 | | | | 70 | |
| | 16.66 | | | | 38.78 | | | | 0.65 | | | | 3.29 | | | | 1.16 | | | | 19 | | | | 87 | |
| | 12.62 | | | | 10.75 | | | | 0.65 | | | | 4.15 | | | | 1.17 | | | | 14 | | | | 141 | |
| | 11.55 | | | | 11.19 | | | | 0.65 | | | | 3.93 | | | | 1.49 | | | | 13 | | | | 65 | |
| | 10.95 | | | | (0.10 | ) | | | 0.72 | | | | 4.80 | | | | 1.03 | | | | 12 | | | | 108 | |
| | | | | | | | | | | | | | | | | | | | | | | | | | | |
| | 11.41 | | | | (20.10 | ) | | | 0.59 | | | | 3.02 | | | | 1.06 | | | | 919 | | | | 70 | |
| | 16.67 | | | | 38.82 | | | | 0.61 | | | | 3.21 | | | | 1.21 | | | | 1,215 | | | | 87 | |
| | 12.63 | | | | 10.87 | | | | 0.62 | | | | 4.09 | | | | 1.21 | | | | 635 | | | | 141 | |
| | 11.56 | | | | 11.13 | | | | 0.63 | | | | 3.88 | | | | 1.56 | | | | 690 | | | | 65 | |
| | 10.96 | | | | 0.01 | | | | 0.63 | | | | 4.62 | | | | 1.12 | | | | 236 | | | | 108 | |
| | See Notes to Financial Statements. | 185 |
Financial Highlights (continued)
GROWTH LEADERS FUND
| | | | | Per Share Operating Performance: | | |
| | | | | Investment Operations: | | Distributions
to
shareholders
from: | | Net |
| | | Net asset
value,
beginning
of period | | Net
investment
(loss)(a) | | Net
realized and
unrealized
gain (loss) | | Total from
investment
operations | | Net
realized
gain | | asset
value,
end of
period |
| Class A | | | | | | | | | | | | | | | | | | | | | | | | |
| 10/31/2022 | | | $52.70 | | | | $(0.16 | ) | | | $(16.09 | ) | | | $(16.25 | ) | | | $(10.00 | ) | | | $26.45 | |
| 10/31/2021 | | | 42.25 | | | | (0.28 | ) | | | 15.10 | | | | 14.82 | | | | (4.37 | ) | | | 52.70 | |
| 10/31/2020 | | | 28.61 | | | | (0.19 | ) | | | 16.17 | | | | 15.98 | | | | (2.34 | ) | | | 42.25 | |
| 10/31/2019 | | | 29.82 | | | | (0.13 | ) | | | 3.57 | | | | 3.44 | | | | (4.65 | ) | | | 28.61 | |
| 10/31/2018 | | | 28.97 | | | | (0.14 | ) | | | 2.82 | | | | 2.68 | | | | (1.83 | ) | | | 29.82 | |
| Class C | | | | | | | | | | | | | | | | | | | | | | | | |
| 10/31/2022 | | | 47.22 | | | | (0.36 | ) | | | (13.98 | ) | | | (14.34 | ) | | | (10.00 | ) | | | 22.88 | |
| 10/31/2021 | | | 38.53 | | | | (0.57 | ) | | | 13.63 | | | | 13.06 | | | | (4.37 | ) | | | 47.22 | |
| 10/31/2020 | | | 26.47 | | | | (0.39 | ) | | | 14.79 | | | | 14.40 | | | | (2.34 | ) | | | 38.53 | |
| 10/31/2019 | | | 28.14 | | | | (0.31 | ) | | | 3.29 | | | | 2.98 | | | | (4.65 | ) | | | 26.47 | |
| 10/31/2018 | | | 27.63 | | | | (0.35 | ) | | | 2.69 | | | | 2.34 | | | | (1.83 | ) | | | 28.14 | |
| Class F | | | | | | | | | | | | | | | | | | | | | | | | |
| 10/31/2022 | | | 54.15 | | | | (0.08 | ) | | | (16.65 | ) | | | (16.73 | ) | | | (10.00 | ) | | | 27.42 | |
| 10/31/2021 | | | 43.20 | | | | (0.17 | ) | | | 15.49 | | | | 15.32 | | | | (4.37 | ) | | | 54.15 | |
| 10/31/2020 | | | 29.14 | | | | (0.11 | ) | | | 16.51 | | | | 16.40 | | | | (2.34 | ) | | | 43.20 | |
| 10/31/2019 | | | 30.21 | | | | (0.06 | ) | | | 3.64 | | | | 3.58 | | | | (4.65 | ) | | | 29.14 | |
| 10/31/2018 | | | 29.26 | | | | (0.07 | ) | | | 2.85 | | | | 2.78 | | | | (1.83 | ) | | | 30.21 | |
| Class F3 | | | | | | | | | | | | | | | | | | | | | | | | |
| 10/31/2022 | | | 54.88 | | | | (0.06 | ) | | | (16.93 | ) | | | (16.99 | ) | | | (10.00 | ) | | | 27.89 | |
| 10/31/2021 | | | 43.70 | | | | (0.15 | ) | | | 15.70 | | | | 15.55 | | | | (4.37 | ) | | | 54.88 | |
| 10/31/2020 | | | 29.43 | | | | (0.10 | ) | | | 16.71 | | | | 16.61 | | | | (2.34 | ) | | | 43.70 | |
| 10/31/2019 | | | 30.45 | | | | (0.05 | ) | | | 3.68 | | | | 3.63 | | | | (4.65 | ) | | | 29.43 | |
| 10/31/2018 | | | 29.46 | | | | (0.06 | ) | | | 2.88 | | | | 2.82 | | | | (1.83 | ) | | | 30.45 | |
| Class I | | | | | | | | | | | | | | | | | | | | | | | | |
| 10/31/2022 | | | 54.56 | | | | (0.08 | ) | | | (16.81 | ) | | | (16.89 | ) | | | (10.00 | ) | | | 27.67 | |
| 10/31/2021 | | | 43.49 | | | | (0.17 | ) | | | 15.61 | | | | 15.44 | | | | (4.37 | ) | | | 54.56 | |
| 10/31/2020 | | | 29.32 | | | | (0.11 | ) | | | 16.62 | | | | 16.51 | | | | (2.34 | ) | | | 43.49 | |
| 10/31/2019 | | | 30.37 | | | | (0.06 | ) | | | 3.66 | | | | 3.60 | | | | (4.65 | ) | | | 29.32 | |
| 10/31/2018 | | | 29.40 | | | | (0.07 | ) | | | 2.87 | | | | 2.80 | | | | (1.83 | ) | | | 30.37 | |
| Class R2 | | | | | | | | | | | | | | | | | | | | | | | | |
| 10/31/2022 | | | 51.32 | | | | (0.26 | ) | | | (15.56 | ) | | | (15.82 | ) | | | (10.00 | ) | | | 25.50 | |
| 10/31/2021 | | | 41.38 | | | | (0.44 | ) | | | 14.75 | | | | 14.31 | | | | (4.37 | ) | | | 51.32 | |
| 10/31/2020 | | | 28.15 | | | | (0.27 | ) | | | 15.84 | | | | 15.57 | | | | (2.34 | ) | | | 41.38 | |
| 10/31/2019 | | | 29.51 | | | | (0.22 | ) | | | 3.51 | | | | 3.29 | | | | (4.65 | ) | | | 28.15 | |
| 10/31/2018 | | | 28.78 | | | | (0.24 | ) | | | 2.80 | | | | 2.56 | | | | (1.83 | ) | | | 29.51 | |
| Class R3 | | | | | | | | | | | | | | | | | | | | | | | | |
| 10/31/2022 | | | 51.28 | | | | (0.23 | ) | | | (15.54 | ) | | | (15.77 | ) | | | (10.00 | ) | | | 25.51 | |
| 10/31/2021 | | | 41.31 | | | | (0.39 | ) | | | 14.73 | | | | 14.34 | | | | (4.37 | ) | | | 51.28 | |
| 10/31/2020 | | | 28.09 | | | | (0.26 | ) | | | 15.82 | | | | 15.56 | | | | (2.34 | ) | | | 41.31 | |
| 10/31/2019 | | | 29.43 | | | | (0.19 | ) | | | 3.50 | | | | 3.31 | | | | (4.65 | ) | | | 28.09 | |
| 10/31/2018 | | | 28.68 | | | | (0.21 | ) | | | 2.79 | | | | 2.58 | | | | (1.83 | ) | | | 29.43 | |
| 186 | See Notes to Financial Statements. |
| | | Ratios to Average Net Assets: | | Supplemental Data: |
| | | | | | | | | | | |
Total
return(b)
(%) | | Total
expenses
after
waivers and/or
reimburse-
ments
(%) | | Total
expenses
(%) | | Net
investment
(loss)
(%) | | Net
assets,
end of
period
(000) | | Portfolio
turnover
rate
(%) |
| | | | | | | | | | | | | | | | | | | | | | | |
| | (38.05 | ) | | | 0.91 | | | | 0.91 | | | | (0.49 | ) | | $ | 1,569,330 | | | | 146 | |
| | 37.77 | | | | 0.89 | | | | 0.89 | | | | (0.61 | ) | | | 2,713,887 | | | | 140 | |
| | 60.35 | | | | 0.90 | | | | 0.90 | | | | (0.56 | ) | | | 1,920,930 | | | | 93 | |
| | 15.32 | | | | 0.93 | | | | 0.93 | | | | (0.48 | ) | | | 1,001,973 | | | | 143 | |
| | 9.68 | | | | 0.91 | | | | 0.91 | | | | (0.47 | ) | | | 900,405 | | | | 161 | |
| | | | | | | | | | | | | | | | | | | | | | | |
| | (38.52 | ) | | | 1.66 | | | | 1.66 | | | | (1.24 | ) | | | 543,043 | | | | 146 | |
| | 36.75 | | | | 1.64 | | | | 1.64 | | | | (1.36 | ) | | | 1,142,002 | | | | 140 | |
| | 59.17 | | | | 1.65 | | | | 1.65 | | | | (1.29 | ) | | | 906,259 | | | | 93 | |
| | 14.45 | | | | 1.68 | | | | 1.68 | | | | (1.23 | ) | | | 631,400 | | | | 143 | |
| | 8.87 | | | | 1.65 | | | | 1.66 | | | | (1.21 | ) | | | 595,344 | | | | 161 | |
| | | | | | | | | | | | | | | | | | | | | | | |
| | (37.89 | ) | | | 0.66 | | | | 0.76 | | | | (0.23 | ) | | | 775,269 | | | | 146 | |
| | 38.13 | | | | 0.64 | | | | 0.74 | | | | (0.36 | ) | | | 4,331,228 | | | | 140 | |
| | 60.72 | | | | 0.65 | | | | 0.75 | | | | (0.31 | ) | | | 2,708,762 | | | | 93 | |
| | 15.63 | | | | 0.68 | | | | 0.78 | | | | (0.23 | ) | | | 1,444,533 | | | | 143 | |
| | 9.94 | | | | 0.66 | | | | 0.76 | | | | (0.22 | ) | | | 1,315,881 | | | | 161 | |
| | | | | | | | | | | | | | | | | | | | | | | |
| | (37.85 | ) | | | 0.59 | | | | 0.59 | | | | (0.17 | ) | | | 430,492 | | | | 146 | |
| | 38.23 | | | | 0.58 | | | | 0.58 | | | | (0.30 | ) | | | 697,858 | | | | 140 | |
| | 60.84 | | | | 0.59 | | | | 0.59 | | | | (0.29 | ) | | | 265,851 | | | | 93 | |
| | 15.68 | | | | 0.62 | | | | 0.62 | | | | (0.19 | ) | | | 74,378 | | | | 143 | |
| | 10.01 | | | | 0.60 | | | | 0.60 | | | | (0.18 | ) | | | 44,379 | | | | 161 | |
| | | | | | | | | | | | | | | | | | | | | | | |
| | (37.89 | ) | | | 0.66 | | | | 0.66 | | | | (0.25 | ) | | | 2,087,818 | | | | 146 | |
| | 38.13 | | | | 0.64 | | | | 0.64 | | | | (0.36 | ) | | | 1,282,161 | | | | 140 | |
| | 60.72 | | | | 0.65 | | | | 0.65 | | | | (0.31 | ) | | | 1,037,283 | | | | 93 | |
| | 15.62 | | | | 0.68 | | | | 0.68 | | | | (0.20 | ) | | | 520,195 | | | | 143 | |
| | 9.96 | | | | 0.66 | | | | 0.66 | | | | (0.21 | ) | | | 702,389 | | | | 161 | |
| | | | | | | | | | | | | | | | | | | | | | | |
| | (38.28 | ) | | | 1.26 | | | | 1.26 | | | | (0.84 | ) | | | 2,155 | | | | 146 | |
| | 37.32 | | | | 1.24 | | | | 1.24 | | | | (0.96 | ) | | | 3,275 | | | | 140 | |
| | 59.75 | | | | 1.25 | | | | 1.25 | | | | (0.84 | ) | | | 1,551 | | | | 93 | |
| | 14.94 | | | | 1.28 | | | | 1.28 | | | | (0.82 | ) | | | 1,153 | | | | 143 | |
| | 9.31 | | | | 1.26 | | | | 1.26 | | | | (0.79 | ) | | | 1,332 | | | | 161 | |
| | | | | | | | | | | | | | | | | | | | | | | |
| | (38.20 | ) | | | 1.16 | | | | 1.16 | | | | (0.74 | ) | | | 13,621 | | | | 146 | |
| | 37.44 | | | | 1.14 | | | | 1.14 | | | | (0.86 | ) | | | 21,928 | | | | 140 | |
| | 59.94 | | | | 1.15 | | | | 1.15 | | | | (0.79 | ) | | | 18,790 | | | | 93 | |
| | 15.03 | | | | 1.18 | | | | 1.18 | | | | (0.71 | ) | | | 13,610 | | | | 143 | |
| | 9.41 | | | | 1.16 | | | | 1.16 | | | | (0.71 | ) | | | 15,206 | | | | 161 | |
| | See Notes to Financial Statements. | 187 |
Financial Highlights (continued)
GROWTH LEADERS FUND
| | | | | Per Share Operating Performance: | | |
| | | | | Investment Operations: | | Distributions
to
shareholders
from: | | Net |
| | | Net asset
value,
beginning
of period | | Net
investment
(loss)(a) | | Net
realized and
unrealized
gain (loss) | | Total from
investment
operations | | Net
realized
gain | | asset
value,
end of
period |
| Class R4 | | | | | | | | | | | | | | | | | | | | | | | | |
| 10/31/2022 | | | $52.72 | | | | $(0.16 | ) | | | $(16.10 | ) | | | $(16.26 | ) | | | $(10.00 | ) | | | $26.46 | |
| 10/31/2021 | | | 42.26 | | | | (0.28 | ) | | | 15.11 | | | | 14.83 | | | | (4.37 | ) | | | 52.72 | |
| 10/31/2020 | | | 28.62 | | | | (0.18 | ) | | | 16.16 | | | | 15.98 | | | | (2.34 | ) | | | 42.26 | |
| 10/31/2019 | | | 29.82 | | | | (0.13 | ) | | | 3.58 | | | | 3.45 | | | | (4.65 | ) | | | 28.62 | |
| 10/31/2018 | | | 28.97 | | | | (0.15 | ) | | | 2.83 | | | | 2.68 | | | | (1.83 | ) | | | 29.82 | |
| Class R5 | | | | | | | | | | | | | | | | | | | | | | | | |
| 10/31/2022 | | | 54.58 | | | | (0.08 | ) | | | (16.82 | ) | | | (16.90 | ) | | | (10.00 | ) | | | 27.68 | |
| 10/31/2021 | | | 43.51 | | | | (0.17 | ) | | | 15.61 | | | | 15.44 | | | | (4.37 | ) | | | 54.58 | |
| 10/31/2020 | | | 29.33 | | | | (0.10 | ) | | | 16.62 | | | | 16.52 | | | | (2.34 | ) | | | 43.51 | |
| 10/31/2019 | | | 30.38 | | | | (0.06 | ) | | | 3.66 | | | | 3.60 | | | | (4.65 | ) | | | 29.33 | |
| 10/31/2018 | | | 29.41 | | | | (0.07 | ) | | | 2.87 | | | | 2.80 | | | | (1.83 | ) | | | 30.38 | |
| Class R6 | | | | | | | | | | | | | | | | | | | | | | | | |
| 10/31/2022 | | | 54.88 | | | | (0.06 | ) | | | (16.93 | ) | | | (16.99 | ) | | | (10.00 | ) | | | 27.89 | |
| 10/31/2021 | | | 43.70 | | | | (0.15 | ) | | | 15.70 | | | | 15.55 | | | | (4.37 | ) | | | 54.88 | |
| 10/31/2020 | | | 29.43 | | | | (0.08 | ) | | | 16.69 | | | | 16.61 | | | | (2.34 | ) | | | 43.70 | |
| 10/31/2019 | | | 30.45 | | | | (0.05 | ) | | | 3.68 | | | | 3.63 | | | | (4.65 | ) | | | 29.43 | |
| 10/31/2018 | | | 29.46 | | | | (0.05 | ) | | | 2.87 | | | | 2.82 | | | | (1.83 | ) | | | 30.45 | |
| (a) | Calculated using average shares outstanding during the period. |
| (b) | Total return for Classes A and C does not consider the effects of sales loads and assumes the reinvestment of all distributions. Total return for all other classes assumes the reinvestment of all distributions. |
| 188 | See Notes to Financial Statements. |
| | | Ratios to Average Net Assets: | | Supplemental Data: |
| | | | | | | | | | | |
Total
return(b)
(%) | | Total
expenses
after
waivers and/or
reimburse-
ments
(%) | | Total
expenses
(%) | | Net
investment
(loss)
(%) | | Net
assets,
end of
period
(000) | | Portfolio
turnover
rate
(%) |
| | | | | | | | | | | | | | | | | | | | | | | |
| | (38.06 | ) | | | 0.91 | | | | 0.91 | | | | (0.49 | ) | | $ | 10,901 | | | | 146 | |
| | 37.79 | | | | 0.89 | | | | 0.89 | | | | (0.61 | ) | | | 18,549 | | | | 140 | |
| | 60.33 | | | | 0.90 | | | | 0.90 | | | | (0.55 | ) | | | 12,667 | | | | 93 | |
| | 15.35 | | | | 0.93 | | | | 0.93 | | | | (0.47 | ) | | | 6,543 | | | | 143 | |
| | 9.68 | | | | 0.91 | | | | 0.91 | | | | (0.47 | ) | | | 6,345 | | | | 161 | |
| | | | | | | | | | | | | | | | | | | | | | | |
| | (37.91 | ) | | | 0.66 | | | | 0.66 | | | | (0.24 | ) | | | 9,706 | | | | 146 | |
| | 38.13 | | | | 0.64 | | | | 0.64 | | | | (0.36 | ) | | | 19,722 | | | | 140 | |
| | 60.74 | | | | 0.65 | | | | 0.65 | | | | (0.29 | ) | | | 14,216 | | | | 93 | |
| | 15.61 | | | | 0.68 | | | | 0.68 | | | | (0.22 | ) | | | 9,344 | | | | 143 | |
| | 9.96 | | | | 0.66 | | | | 0.66 | | | | (0.22 | ) | | | 8,598 | | | | 161 | |
| | | | | | | | | | | | | | | | | | | | | | | |
| | (37.85 | ) | | | 0.59 | | | | 0.59 | | | | (0.17 | ) | | | 124,498 | | | | 146 | |
| | 38.23 | | | | 0.58 | | | | 0.58 | | | | (0.30 | ) | | | 181,524 | | | | 140 | |
| | 60.84 | | | | 0.60 | | | | 0.60 | | | | (0.24 | ) | | | 65,478 | | | | 93 | |
| | 15.68 | | | | 0.62 | | | | 0.62 | | | | (0.18 | ) | | | 36,932 | | | | 143 | |
| | 10.01 | | | | 0.60 | | | | 0.60 | | | | (0.16 | ) | | | 25,657 | | | | 161 | |
| | See Notes to Financial Statements. | 189 |
Financial Highlights (continued)
HEALTH CARE FUND
| | | | | Per Share Operating Performance: |
| | | | | Investment Operations: | | Distributions to
shareholders from: |
| | | Net asset
value,
beginning
of period | | Net
invest-
ment
income
(loss)(a) | | Net
realized
and
unrealized
gain (loss) | | Total
from
invest-
ment
opera-
tions | | Net
investment
income | | Net
realized
gain | | Total
distri-
butions |
| Class A | | | | | | | | | | | | | | | | | | | | | | | | | | | | |
| 10/31/2022 | | | $21.96 | | | | $(0.05 | ) | | | $(3.37 | ) | | | $(3.42 | ) | | $ | – | | | | $(1.47 | ) | | | $(1.47 | ) |
| 10/31/2021 | | | 19.27 | | | | (0.10 | ) | | | 5.10 | | | | 5.00 | | | | – | | | | (2.31 | ) | | | (2.31 | ) |
| 10/31/2020 | | | 14.48 | | | | (0.06 | ) | | | 4.85 | | | | 4.79 | | | | – | | | | – | | | | – | |
| 7/26/2019 to 10/31/2019(c)(d) | | | 15.00 | | | | (0.01 | ) | | | (0.51 | ) | | | (0.52 | ) | | | – | | | | – | | | | – | |
| Class C | | | | | | | | | | | | | | | | | | | | | | | | | | | | |
| 10/31/2022 | | | 21.56 | | | | (0.17 | ) | | | (3.31 | ) | | | (3.48 | ) | | | – | | | | (1.47 | ) | | | (1.47 | ) |
| 10/31/2021 | | | 19.09 | | | | (0.25 | ) | | | 5.03 | | | | 4.78 | | | | – | | | | (2.31 | ) | | | (2.31 | ) |
| 10/31/2020 | | | 14.45 | | | | (0.19 | ) | | | 4.83 | | | | 4.64 | | | | – | | | | – | | | | – | |
| 7/26/2019 to 10/31/2019(c)(d) | | | 15.00 | | | | (0.04 | ) | | | (0.51 | ) | | | (0.55 | ) | | | – | | | | – | | | | – | |
| Class F | | | | | | | | | | | | | | | | | | | | | | | | | | | | |
| 10/31/2022 | | | 22.08 | | | | – | (g) | | | (3.39 | ) | | | (3.39 | ) | | | – | | | | (1.47 | ) | | | (1.47 | ) |
| 10/31/2021 | | | 19.32 | | | | (0.05 | ) | | | 5.12 | | | | 5.07 | | | | – | | | | (2.31 | ) | | | (2.31 | ) |
| 10/31/2020 | | | 14.49 | | | | – | (g) | | | 4.83 | | | | 4.83 | | | | – | (g) | | | – | | | | – | |
| 7/26/2019 to 10/31/2019(c)(d) | | | 15.00 | | | | (0.01 | ) | | | (0.50 | ) | | | (0.51 | ) | | | – | | | | – | | | | – | |
| Class F3 | | | | | | | | | | | | | | | | | | | | | | | | | | | | |
| 10/31/2022 | | | 22.07 | | | | 0.02 | | | | (3.39 | ) | | | (3.37 | ) | | | – | | | | (1.47 | ) | | | (1.47 | ) |
| 10/31/2021 | | | 19.33 | | | | (0.04 | ) | | | 5.11 | | | | 5.07 | | | | (0.02 | ) | | | (2.31 | ) | | | (2.33 | ) |
| 10/31/2020 | | | 14.49 | | | | 0.02 | | | | 4.83 | | | | 4.85 | | | | (0.01 | ) | | | – | | | | (0.01 | ) |
| 7/26/2019 to 10/31/2019(c)(d) | | | 15.00 | | | | – | (g) | | | (0.51 | ) | | | (0.51 | ) | | | – | | | | – | | | | – | |
| Class I | | | | | | | | | | | | | | | | | | | | | | | | | | | | |
| 10/31/2022 | | | 22.07 | | | | – | (g) | | | (3.39 | ) | | | (3.39 | ) | | | – | | | | (1.47 | ) | | | (1.47 | ) |
| 10/31/2021 | | | 19.32 | | | | (0.05 | ) | | | 5.11 | | | | 5.06 | | | | – | | | | (2.31 | ) | | | (2.31 | ) |
| 10/31/2020 | | | 14.49 | | | | – | (g) | | | 4.84 | | | | 4.84 | | | | (0.01 | ) | | | – | | | | (0.01 | ) |
| 7/26/2019 to 10/31/2019(c)(d) | | | 15.00 | | | | (0.01 | ) | | | (0.50 | ) | | | (0.51 | ) | | | – | | | | – | | | | – | |
| Class R3 | | | | | | | | | | | | | | | | | | | | | | | | | | | | |
| 10/31/2022 | | | 21.82 | | | | (0.09 | ) | | | (3.35 | ) | | | (3.44 | ) | | | – | | | | (1.47 | ) | | | (1.47 | ) |
| 10/31/2021 | | | 19.21 | | | | (0.15 | ) | | | 5.07 | | | | 4.92 | | | | – | | | | (2.31 | ) | | | (2.31 | ) |
| 10/31/2020 | | | 14.47 | | | | (0.10 | ) | | | 4.84 | | | | 4.74 | | | | – | | | | – | | | | – | |
| 7/26/2019 to 10/31/2019(c)(d) | | | 15.00 | | | | (0.02 | ) | | | (0.51 | ) | | | (0.53 | ) | | | – | | | | – | | | | – | |
| Class R4 | | | | | | | | | | | | | | | | | | | | | | | | | | | | |
| 10/31/2022 | | | 21.95 | | | | (0.04 | ) | | | (3.37 | ) | | | (3.41 | ) | | | – | | | | (1.47 | ) | | | (1.47 | ) |
| 10/31/2021 | | | 19.27 | | | | (0.10 | ) | | | 5.09 | | | | 4.99 | | | | – | | | | (2.31 | ) | | | (2.31 | ) |
| 10/31/2020 | | | 14.48 | | | | (0.05 | ) | | | 4.84 | | | | 4.79 | | | | – | | | | – | | | | – | |
| 7/26/2019 to 10/31/2019(c)(d) | | | 15.00 | | | | (0.01 | ) | | | (0.51 | ) | | | (0.52 | ) | | | – | | | | – | | | | – | |
| 190 | See Notes to Financial Statements. |
| | | | | Ratios to Average Net Assets: | | Supplemental Data: |
| | | | | | | |
Net
asset
value,
end of
period | | Total
return(b)
(%) | | Total
expenses
after
waivers
and/or reim-
bursements
(%) | | Total
expenses
(%) | | Net
invest-
ment
income
(loss)
(%) | | Net
assets,
end of
period
(000) | | Portfolio
turnover
rate
(%) |
| | | | | | | | | | | | | | | | | | | | | | | | | | | |
| $17.07 | | | | (16.29 | ) | | | 1.03 | | | | 4.11 | | | | (0.26 | ) | | $ | 3,177 | | | | 49 | |
| | 21.96 | | | | 28.56 | | | | 1.03 | | | | 3.90 | | | | (0.50 | ) | | | 3,507 | | | | 59 | |
| | 19.27 | | | | 33.08 | | | | 1.03 | | | | 6.30 | | | | (0.34 | ) | | | 2,022 | | | | 114 | |
| | | | | | | | | | | | | | | | | | | | | | | | | | | |
| | 14.48 | | | | (3.47 | )(e) | | | 1.03 | (f) | | | 9.00 | (f) | | | (0.36 | )(f) | | | 906 | | | | 16 | (e) |
| | | | | | | | | | | | | | | | | | | | | | | | | | | |
| | 16.61 | | | | (16.91 | ) | | | 1.78 | | | | 4.85 | | | | (1.02 | ) | | | 607 | | | | 49 | |
| | 21.56 | | | | 27.57 | | | | 1.78 | | | | 4.62 | | | | (1.25 | ) | | | 786 | | | | 59 | |
| | 19.09 | | | | 32.11 | | | | 1.78 | | | | 7.05 | | | | (1.11 | ) | | | 328 | | | | 114 | |
| | | | | | | | | | | | | | | | | | | | | | | | | | | |
| | 14.45 | | | | (3.67 | )(e) | | | 1.78 | (f) | | | 9.84 | (f) | | | (1.17 | )(f) | | | 129 | | | | 16 | (e) |
| | | | | | | | | | | | | | | | | | | | | | | | | | | |
| | 17.22 | | | | (16.05 | ) | | | 0.78 | | | | 3.97 | | | | 0.01 | | | | 373 | | | | 49 | |
| | 22.08 | | | | 28.88 | | | | 0.78 | | | | 3.63 | | | | (0.23 | ) | | | 587 | | | | 59 | |
| | 19.32 | | | | 33.34 | | | | 0.78 | | | | 5.73 | | | | – | (h) | | | 109 | | | | 114 | |
| | | | | | | | | | | | | | | | | | | | | | | | | | | |
| | 14.49 | | | | (3.40 | )(e) | | | 0.78 | (f) | | | 8.95 | (f) | | | (0.16 | )(f) | | | 483 | | | | 16 | (e) |
| | | | | | | | | | | | | | | | | | | | | | | | | | | |
| | 17.23 | | | | (15.96 | ) | | | 0.68 | | | | 3.69 | | | | 0.09 | | | | 31 | | | | 49 | |
| | 22.07 | | | | 28.91 | | | | 0.71 | | | | 3.55 | | | | (0.18 | ) | | | 40 | | | | 59 | |
| | 19.33 | | | | 33.49 | | | | 0.70 | | | | 5.37 | | | | 0.11 | | | | 35 | | | | 114 | |
| | | | | | | | | | | | | | | | | | | | | | | | | | | |
| | 14.49 | | | | (3.40 | )(e) | | | 0.70 | (f) | | | 8.72 | (f) | | | (0.08 | )(f) | | | 483 | | | | 16 | (e) |
| | | | | | | | | | | | | | | | | | | | | | | | | | | |
| | 17.21 | | | | (16.06 | ) | | | 0.78 | | | | 3.85 | | | | (0.03 | ) | | | 15 | | | | 49 | |
| | 22.07 | | | | 28.82 | | | | 0.78 | | | | 3.66 | | | | (0.25 | ) | | | 20 | | | | 59 | |
| | 19.32 | | | | 33.40 | | | | 0.78 | | | | 5.53 | | | | 0.02 | | | | 17 | | | | 114 | |
| | | | | | | | | | | | | | | | | | | | | | | | | | | |
| | 14.49 | | | | (3.40 | )(e) | | | 0.78 | (f) | | | 8.85 | (f) | | | (0.16 | )(f) | | | 106 | | | | 16 | (e) |
| | | | | | | | | | | | | | | | | | | | | | | | | | | |
| | 16.91 | | | | (16.50 | ) | | | 1.28 | | | | 4.35 | | | | (0.52 | ) | | | 11 | | | | 49 | |
| | 21.82 | | | | 28.19 | | | | 1.28 | | | | 4.17 | | | | (0.75 | ) | | | 15 | | | | 59 | |
| | 19.21 | | | | 32.76 | | | | 1.28 | | | | 6.53 | | | | (0.57 | ) | | | 13 | | | | 114 | |
| | | | | | | | | | | | | | | | | | | | | | | | | | | |
| | 14.47 | | | | (3.53 | )(e) | | | 1.28 | (f) | | | 9.36 | (f) | | | (0.64 | )(f) | | | 10 | | | | 16 | (e) |
| | | | | | | | | | | | | | | | | | | | | | | | | | | |
| | 17.07 | | | | (16.25 | ) | | | 1.03 | | | | 4.10 | | | | (0.26 | ) | | | 11 | | | | 49 | |
| | 21.95 | | | | 28.50 | | | | 1.03 | | | | 3.92 | | | | (0.50 | ) | | | 15 | | | | 59 | |
| | 19.27 | | | | 33.08 | | | | 1.03 | | | | 6.27 | | | | (0.31 | ) | | | 13 | | | | 114 | |
| | | | | | | | | | | | | | | | | | | | | | | | | | | |
| | 14.48 | | | | (3.47 | )(e) | | | 1.03 | (f) | | | 9.12 | (f) | | | (0.40 | )(f) | | | 10 | | | | 16 | (e) |
| | See Notes to Financial Statements. | 191 |
Financial Highlights (continued)
HEALTH CARE FUND
| | | | | Per Share Operating Performance: |
| | | | | Investment Operations: | | Distributions to
shareholders from: |
| | | Net asset
value,
beginning
of period | | Net
invest-
ment
income
(loss)(a) | | Net
realized
and
unrealized
gain (loss) | | Total
from
invest-
ment
opera-
tions | | Net
investment
income | | Net
realized
gain | | Total
distri-
butions |
| Class R5 | | | | | | | | | | | | | | | | | | | | | | | | | | | | |
| 10/31/2022 | | | $22.07 | | | $ | – | (g) | | | $(3.39 | ) | | | $(3.39 | ) | | $ | – | | | | $(1.47 | ) | | | $(1.47 | ) |
| 10/31/2021 | | | 19.32 | | | | (0.05 | ) | | | 5.12 | | | | 5.07 | | | | (0.01 | ) | | | (2.31 | ) | | | (2.32 | ) |
| 10/31/2020 | | | 14.49 | | | | (0.01 | ) | | | 4.85 | | | | 4.84 | | | | (0.01 | ) | | | – | | | | (0.01 | ) |
| 7/26/2019 to 10/31/2019(c)(d) | | | 15.00 | | | | (0.01 | ) | | | (0.50 | ) | | | (0.51 | ) | | | – | | | | – | | | | – | |
| Class R6 | | | | | | | | | | | | | | | | | | | | | | | | | | | | |
| 10/31/2022 | | | 22.08 | | | | 0.01 | | | | (3.38 | ) | | | (3.37 | ) | | | – | | | | (1.47 | ) | | | (1.47 | ) |
| 10/31/2021 | | | 19.34 | | | | (0.04 | ) | | | 5.11 | | | | 5.07 | | | | (0.02 | ) | | | (2.31 | ) | | | (2.33 | ) |
| 10/31/2020 | | | 14.49 | | | | 0.01 | | | | 4.85 | | | | 4.86 | | | | (0.01 | ) | | | – | | | | (0.01 | ) |
| 7/26/2019 to 10/31/2019(c)(d) | | | 15.00 | | | | – | (g) | | | (0.51 | ) | | | (0.51 | ) | | | – | | | | – | | | | – | |
| (a) | Calculated using average shares outstanding during the period. |
| (b) | Total return for Classes A and C does not consider the effects of sales loads and assumes the reinvestment of all distributions. Total return for all other classes assumes the reinvestment of all distributions. |
| (c) | Commencement of operations was 7/26/2019, SEC effective date was 7/31/2019 and date shares first became available to the public was 8/1/2019. |
| (d) | Net investment income, net realized and unrealized gain amounted to less than $.01 for the period 7/26/2019 through 7/31/2019. |
| (e) | Not annualized. |
| (f) | Annualized. |
| (g) | Amount less than $0.01. |
| (h) | Amount is less than 0.01%. |
| 192 | See Notes to Financial Statements. |
| | | | | Ratios to Average Net Assets: | | Supplemental Data: |
| | | | | | | |
Net
asset
value,
end of
period | | Total
return(b)
(%) | | Total
expenses
after
waivers
and/or reim-
bursements
(%) | | Total
expenses
(%) | | Net
invest-
ment
income
(loss)
(%) | | Net
assets,
end of
period
(000) | | Portfolio
turnover
rate
(%) |
| | | | | | | | | | | | | | | | | | | | | | | | | | | |
| $17.21 | | | | (16.06 | ) | | | 0.78 | | | | 3.84 | | | | (0.01 | ) | | $ | 11 | | | | 49 | |
| | 22.07 | | | | 28.86 | | | | 0.78 | | | | 3.67 | | | | (0.24 | ) | | | 15 | | | | 59 | |
| | 19.32 | | | | 33.39 | | | | 0.78 | | | | 6.02 | | | | (0.06 | ) | | | 13 | | | | 114 | |
| | | | | | | | | | | | | | | | | | | | | | | | | | | |
| | 14.49 | | | | (3.40 | )(e) | | | 0.78 | (f) | | | 8.83 | (f) | | | (0.16 | )(f) | | | 10 | | | | 16 | (e) |
| | | | | | | | | | | | | | | | | | | | | | | | | | | |
| | 17.24 | | | | (15.95 | ) | | | 0.68 | | | | 3.68 | | | | 0.08 | | | | 2,198 | | | | 49 | |
| | 22.08 | | | | 28.89 | | | | 0.70 | | | | 3.48 | | | | (0.17 | ) | | | 2,851 | | | | 59 | |
| | 19.34 | | | | 33.56 | | | | 0.70 | | | | 5.83 | | | | 0.07 | | | | 1,188 | | | | 114 | |
| | | | | | | | | | | | | | | | | | | | | | | | | | | |
| | 14.49 | | | | (3.40 | )(e) | | | 0.70 | (f) | | | 8.72 | (f) | | | (0.08 | )(f) | | | 484 | | | | 16 | (e) |
| | See Notes to Financial Statements. | 193 |
Financial Highlights (continued)
INTERNATIONAL EQUITY FUND
| | | | | | Per Share Operating Performance: |
| | | | | | Investment Operations: | | | Distributions to
shareholders from: |
| | | Net asset
value,
beginning
of period | | Net
invest-
ment
income(a) | | Net
realized
and
unrealized
gain (loss) | | Total
from
invest-
ment
opera-
tions | | Net
investment
income | | Net
realized
gain | | Total
distri-
butions |
| Class A | | | | | | | | | | | | | | | | | | | | | | | | | | | | |
| 10/31/2022 | | | $17.67 | | | | $0.26 | | | | $(4.35 | ) | | | $(4.09 | ) | | | $(0.22 | ) | | | $(1.75 | ) | | | $(1.97 | ) |
| 10/31/2021 | | | 13.41 | | | | 0.17 | | | | 4.27 | | | | 4.44 | | | | (0.18 | ) | | | – | | | | (0.18 | ) |
| 10/31/2020 | | | 13.19 | | | | 0.12 | | | | 0.30 | | | | 0.42 | | | | (0.20 | ) | | | – | | | | (0.20 | ) |
| 10/31/2019 | | | 12.18 | | | | 0.18 | | | | 1.08 | | | | 1.26 | | | | (0.25 | ) | | | – | | | | (0.25 | ) |
| 10/31/2018 | | | 14.10 | | | | 0.19 | | | | (1.83 | ) | | | (1.64 | ) | | | (0.28 | ) | | | – | | | | (0.28 | ) |
| Class C | | | | | | | | | | | | | | | | | | | | | | | | | | | | |
| 10/31/2022 | | | 17.54 | | | | 0.15 | | | | (4.34 | ) | | | (4.19 | ) | | | (0.07 | ) | | | (1.75 | ) | | | (1.82 | ) |
| 10/31/2021 | | | 13.31 | | | | 0.05 | | | | 4.22 | | | | 4.27 | | | | (0.04 | ) | | | – | | | | (0.04 | ) |
| 10/31/2020 | | | 13.08 | | | | 0.02 | | | | 0.30 | | | | 0.32 | | | | (0.09 | ) | | | – | | | | (0.09 | ) |
| 10/31/2019 | | | 12.02 | | | | 0.08 | | | | 1.08 | | | | 1.16 | | | | (0.10 | ) | | | – | | | | (0.10 | ) |
| 10/31/2018 | | | 13.92 | | | | 0.09 | | | | (1.82 | ) | | | (1.73 | ) | | | (0.17 | ) | | | – | | | | (0.17 | ) |
| Class F | | | | | | | | | | | | | | | | | | | | | | | | | | | | |
| 10/31/2022 | | | 17.61 | | | | 0.25 | | | | (4.29 | ) | | | (4.04 | ) | | | (0.25 | ) | | | (1.75 | ) | | | (2.00 | ) |
| 10/31/2021 | | | 13.36 | | | | 0.22 | | | | 4.22 | | | | 4.44 | | | | (0.19 | ) | | | – | | | | (0.19 | ) |
| 10/31/2020 | | | 13.13 | | | | 0.10 | | | | 0.35 | | | | 0.45 | | | | (0.22 | ) | | | – | | | | (0.22 | ) |
| 10/31/2019 | | | 12.12 | | | | 0.20 | | | | 1.08 | | | | 1.28 | | | | (0.27 | ) | | | – | | | | (0.27 | ) |
| 10/31/2018 | | | 14.02 | | | | 0.22 | | | | (1.82 | ) | | | (1.60 | ) | | | (0.30 | ) | | | – | | | | (0.30 | ) |
| Class F3 | | | | | | | | | | | | | | | | | | | | | | | | | | | | |
| 10/31/2022 | | | 17.92 | | | | 0.33 | | | | (4.44 | ) | | | (4.11 | ) | | | (0.26 | ) | | | (1.75 | ) | | | (2.01 | ) |
| 10/31/2021 | | | 13.59 | | | | 0.23 | | | | 4.32 | | | | 4.55 | | | | (0.22 | ) | | | – | | | | (0.22 | ) |
| 10/31/2020 | | | 13.36 | | | | 0.16 | | | | 0.30 | | | | 0.46 | | | | (0.23 | ) | | | – | | | | (0.23 | ) |
| 10/31/2019 | | | 12.32 | | | | 0.22 | | | | 1.11 | | | | 1.33 | | | | (0.29 | ) | | | – | | | | (0.29 | ) |
| 10/31/2018 | | | 14.25 | | | | 0.24 | | | | (1.86 | ) | | | (1.62 | ) | | | (0.31 | ) | | | – | | | | (0.31 | ) |
| Class I | | | | | | | | | | | | | | | | | | | | | | | | | | | | |
| 10/31/2022 | | | 17.88 | | | | 0.31 | | | | (4.41 | ) | | | (4.10 | ) | | | (0.26 | ) | | | (1.75 | ) | | | (2.01 | ) |
| 10/31/2021 | | | 13.56 | | | | 0.21 | | | | 4.32 | | | | 4.53 | | | | (0.21 | ) | | | – | | | | (0.21 | ) |
| 10/31/2020 | | | 13.33 | | | | 0.16 | | | | 0.30 | | | | 0.46 | | | | (0.23 | ) | | | – | | | | (0.23 | ) |
| 10/31/2019 | | | 12.30 | | | | 0.23 | | | | 1.08 | | | | 1.31 | | | | (0.28 | ) | | | – | | | | (0.28 | ) |
| 10/31/2018 | | | 14.23 | | | | 0.25 | | | | (1.87 | ) | | | (1.62 | ) | | | (0.31 | ) | | | – | | | | (0.31 | ) |
| Class P | | | | | | | | | | | | | | | | | | | | | | | | | | | | |
| 10/31/2022 | | | 17.69 | | | | 0.24 | | | | (4.37 | ) | | | (4.13 | ) | | | (0.18 | ) | | | (1.75 | ) | | | (1.93 | ) |
| 10/31/2021 | | | 13.42 | | | | 0.09 | | | | 4.31 | | | | 4.40 | | | | (0.13 | ) | | | – | | | | (0.13 | ) |
| 10/31/2020 | | | 13.20 | | | | 0.09 | | | | 0.30 | | | | 0.39 | | | | (0.17 | ) | | | – | | | | (0.17 | ) |
| 10/31/2019 | | | 12.17 | | | | 0.16 | | | | 1.09 | | | | 1.25 | | | | (0.22 | ) | | | – | | | | (0.22 | ) |
| 10/31/2018 | | | 14.10 | | | | 0.14 | | | | (1.82 | ) | | | (1.68 | ) | | | (0.25 | ) | | | – | | | | (0.25 | ) |
| Class R2 | | | | | | | | | | | | | | | | | | | | | | | | | | | | |
| 10/31/2022 | | | 17.67 | | | | 0.22 | | | | (4.37 | ) | | | (4.15 | ) | | | (0.15 | ) | | | (1.75 | ) | | | (1.90 | ) |
| 10/31/2021 | | | 13.39 | | | | 0.12 | | | | 4.25 | | | | 4.37 | | | | (0.09 | ) | | | – | | | | (0.09 | ) |
| 10/31/2020 | | | 13.17 | | | | 0.06 | | | | 0.32 | | | | 0.38 | | | | (0.16 | ) | | | – | | | | (0.16 | ) |
| 10/31/2019 | | | 12.13 | | | | 0.14 | | | | 1.08 | | | | 1.22 | | | | (0.18 | ) | | | – | | | | (0.18 | ) |
| 10/31/2018 | | | 14.05 | | | | 0.13 | | | | (1.83 | ) | | | (1.70 | ) | | | (0.22 | ) | | | – | | | | (0.22 | ) |
| 194 | See Notes to Financial Statements. | |
| | | | | | | Ratios to Average Net Assets: | | Supplemental Data: |
| | | | | | | | | | | | | |
Net
asset
value,
end of
period | | Total
return(b)
(%) | | Total
expenses
after
waivers
and/or reim-
bursements
(%) | | Total
expenses
(%) | | Net
invest-
ment
income
(%) | | Net
assets,
end of
period
(000) | | Portfolio
turnover
rate
(%) |
| | | | | | | | | | | | | | | | | | | | | | | | | | | |
| | $11.61 | | | | (25.75 | ) | | | 1.17 | | | | 1.22 | | | | 1.89 | | | | $131,097 | | | | 87 | |
| | 17.67 | | | | 33.15 | | | | 1.17 | | | | 1.19 | | | | 1.04 | | | | 193,680 | | | | 58 | |
| | 13.41 | | | | 3.23 | | | | 1.17 | | | | 1.21 | | | | 0.90 | | | | 154,161 | | | | 77 | |
| | 13.19 | | | | 10.64 | | | | 1.17 | | | | 1.17 | | | | 1.43 | | | | 178,701 | | | | 88 | |
| | 12.18 | | | | (11.91 | ) | | | 1.15 | | | | 1.16 | | | | 1.34 | | | | 194,360 | | | | 124 | |
| | | | | | | | | | | | | | | | | | | | | | | | | | | |
| | 11.53 | | | | (26.26 | ) | | | 1.92 | | | | 1.97 | | | | 1.09 | | | | 4,161 | | | | 87 | |
| | 17.54 | | | | 32.20 | | | | 1.92 | | | | 1.94 | | | | 0.28 | | | | 7,622 | | | | 58 | |
| | 13.31 | | | | 2.27 | | | | 1.92 | | | | 2.00 | | | | 0.17 | | | | 6,676 | | | | 77 | |
| | 13.08 | | | | 9.88 | | | | 1.92 | | | | 1.92 | | | | 0.68 | | | | 10,652 | | | | 88 | |
| | 12.02 | | | | (12.59 | ) | | | 1.90 | | | | 1.92 | | | | 0.65 | | | | 12,821 | | | | 124 | |
| | | | | | | | | | | | | | | | | | | | | | | | | | | |
| | 11.57 | | | | (25.57 | ) | | | 0.96 | | | | 1.06 | | | | 1.76 | | | | 7,986 | | | | 87 | |
| | 17.61 | | | | 33.43 | | | | 0.96 | | | | 1.04 | | | | 1.30 | | | | 24,909 | | | | 58 | |
| | 13.36 | | | | 3.39 | | | | 0.96 | | | | 1.03 | | | | 0.77 | | | | 10,435 | | | | 77 | |
| | 13.13 | | | | 10.90 | | | | 0.96 | | | | 1.02 | | | | 1.64 | | | | 48,782 | | | | 88 | |
| | 12.12 | | | | (11.77 | ) | | | 0.92 | | | | 1.01 | | | | 1.63 | | | | 58,347 | | | | 124 | |
| | | | | | | | | | | | | | | | | | | | | | | | | | | |
| | 11.80 | | | | (25.50 | ) | | | 0.84 | | | | 0.89 | | | | 2.39 | | | | 5,987 | | | | 87 | |
| | 17.92 | | | | 33.57 | | | | 0.84 | | | | 0.86 | | | | 1.38 | | | | 5,928 | | | | 58 | |
| | 13.59 | | | | 3.53 | | | | 0.84 | | | | 0.86 | | | | 1.23 | | | | 4,489 | | | | 77 | |
| | 13.36 | | | | 11.13 | | | | 0.84 | | | | 0.85 | | | | 1.76 | | | | 4,527 | | | | 88 | |
| | 12.32 | | | | (11.62 | ) | | | 0.78 | | | | 0.85 | | | | 1.73 | | | | 5,083 | | | | 124 | |
| | | | | | | | | | | | | | | | | | | | | | | | | | | |
| | 11.77 | | | | (25.51 | ) | | | 0.86 | | | | 0.97 | | | | 2.23 | | | | 121,926 | | | | 87 | |
| | 17.88 | | | | 33.55 | | | | 0.86 | | | | 0.94 | | | | 1.24 | | | | 170,044 | | | | 58 | |
| | 13.56 | | | | 3.52 | | | | 0.86 | | | | 0.94 | | | | 1.20 | | | | 179,796 | | | | 77 | |
| | 13.33 | | | | 11.04 | | | | 0.86 | | | | 0.92 | | | | 1.82 | | | | 198,368 | | | | 88 | |
| | 12.30 | | | | (11.65 | ) | | | 0.82 | | | | 0.91 | | | | 1.78 | | | | 277,141 | | | | 124 | |
| | | | | | | | | | | | | | | | | | | | | | | | | | | |
| | 11.63 | | | | (25.89 | ) | | | 1.37 | | | | 1.39 | | | | 1.71 | | | | 9 | | | | 87 | |
| | 17.69 | | | | 32.90 | | | | 1.37 | | | | 1.39 | | | | 0.53 | | | | 13 | | | | 58 | |
| | 13.42 | | | | 2.96 | | | | 1.37 | | | | 1.40 | | | | 0.72 | | | | 38 | | | | 77 | |
| | 13.20 | | | | 10.50 | | | | 1.37 | | | | 1.37 | | | | 1.25 | | | | 42 | | | | 88 | |
| | 12.17 | | | | (12.14 | ) | | | 1.35 | | | | 1.36 | | | | 1.02 | | | | 40 | | | | 124 | |
| | | | | | | | | | | | | | | | | | | | | | | | | | | |
| | 11.62 | | | | (25.98 | ) | | | 1.52 | | | | 1.58 | | | | 1.60 | | | | 143 | | | | 87 | |
| | 17.67 | | | | 32.70 | | | | 1.52 | | | | 1.54 | | | | 0.70 | | | | 178 | | | | 58 | |
| | 13.39 | | | | 2.86 | | | | 1.52 | | | | 1.54 | | | | 0.46 | | | | 137 | | | | 77 | |
| | 13.17 | | | | 10.32 | | | | 1.52 | | | | 1.52 | | | | 1.09 | | | | 451 | | | | 88 | |
| | 12.13 | | | | (12.28 | ) | | | 1.50 | | | | 1.52 | | | | 0.93 | | | | 375 | | | | 124 | |
| | See Notes to Financial Statements. | 195 |
Financial Highlights (continued)
INTERNATIONAL EQUITY FUND
| | | | | | Per Share Operating Performance: |
| | | | | | Investment Operations: | | Distributions to
shareholders from: |
| | | Net asset
value,
beginning
of period | | Net
invest-
ment
income(a) | | Net
realized
and
unrealized
gain (loss) | | Total
from
invest-
ment
opera-
tions | | Net
investment
income | | Net
realized
gain | | Total
distri-
butions |
| Class R3 | | | | | | | | | | | | | | | | | | | | | | | | | | | | |
| 10/31/2022 | | | $17.38 | | | | $0.22 | | | | $(4.28 | ) | | | $(4.06 | ) | | | $(0.17 | ) | | | $(1.75 | ) | | | $(1.92 | ) |
| 10/31/2021 | | | 13.20 | | | | 0.13 | | | | 4.18 | | | | 4.31 | | | | (0.13 | ) | | | – | | | | (0.13 | ) |
| 10/31/2020 | | | 12.98 | | | | 0.08 | | | | 0.30 | | | | 0.38 | | | | (0.16 | ) | | | – | | | | (0.16 | ) |
| 10/31/2019 | | | 11.98 | | | | 0.15 | | | | 1.06 | | | | 1.21 | | | | (0.21 | ) | | | – | | | | (0.21 | ) |
| 10/31/2018 | | | 13.87 | | | | 0.14 | | | | (1.79 | ) | | | (1.65 | ) | | | (0.24 | ) | | | – | | | | (0.24 | ) |
| Class R4 | | | | | | | | | | | | | | | | | | | | | | | | | | | | |
| 10/31/2022 | | | 17.58 | | | | 0.26 | | | | (4.33 | ) | | | (4.07 | ) | | | (0.21 | ) | | | (1.75 | ) | | | (1.96 | ) |
| 10/31/2021 | | | 13.35 | | | | 0.18 | | | | 4.23 | | | | 4.41 | | | | (0.18 | ) | | | – | | | | (0.18 | ) |
| 10/31/2020 | | | 13.14 | | | | 0.11 | | | | 0.30 | | | | 0.41 | | | | (0.20 | ) | | | – | | | | (0.20 | ) |
| 10/31/2019 | | | 12.13 | | | | 0.18 | | | | 1.09 | | | | 1.27 | | | | (0.26 | ) | | | – | | | | (0.26 | ) |
| 10/31/2018 | | | 14.07 | | | | 0.19 | | | | (1.83 | ) | | | (1.64 | ) | | | (0.30 | ) | | | – | | | | (0.30 | ) |
| Class R5 | | | | | | | | | | | | | | | | | | | | | | | | | | | | |
| 10/31/2022 | | | 17.78 | | | | 0.21 | | | | (4.29 | ) | | | (4.08 | ) | | | (0.26 | ) | | | (1.75 | ) | | | (2.01 | ) |
| 10/31/2021 | | | 13.50 | | | | 0.22 | | | | 4.27 | | | | 4.49 | | | | (0.21 | ) | | | – | | | | (0.21 | ) |
| 10/31/2020 | | | 13.27 | | | | 0.15 | | | | 0.31 | | | | 0.46 | | | | (0.23 | ) | | | – | | | | (0.23 | ) |
| 10/31/2019 | | | 12.26 | | | | 0.21 | | | | 1.08 | | | | 1.29 | | | | (0.28 | ) | | | – | | | | (0.28 | ) |
| 10/31/2018 | | | 14.19 | | | | 0.22 | | | | (1.84 | ) | | | (1.62 | ) | | | (0.31 | ) | | | – | | | | (0.31 | ) |
| Class R6 | | | | | | | | | | | | | | | | | | | | | | | | | | | | |
| 10/31/2022 | | | 17.91 | | | | 0.31 | | | | (4.42 | ) | | | (4.11 | ) | | | (0.26 | ) | | | (1.75 | ) | | | (2.01 | ) |
| 10/31/2021 | | | 13.58 | | | | 0.23 | | | | 4.32 | | | | 4.55 | | | | (0.22 | ) | | | – | | | | (0.22 | ) |
| 10/31/2020 | | | 13.35 | | | | 0.16 | | | | 0.30 | | | | 0.46 | | | | (0.23 | ) | | | – | | | | (0.23 | ) |
| 10/31/2019 | | | 12.32 | | | | 0.22 | | | | 1.10 | | | | 1.32 | | | | (0.29 | ) | | | – | | | | (0.29 | ) |
| 10/31/2018 | | | 14.24 | | | | 0.24 | | | | (1.85 | ) | | | (1.61 | ) | | | (0.31 | ) | | | – | | | | (0.31 | ) |
| (a) | Calculated using average shares outstanding during the period. |
| (b) | Total return for Classes A and C does not consider the effects of sales loads and assumes the reinvestment of all distributions. Total return for all other classes assumes the reinvestment of all distributions. |
| 196 | See Notes to Financial Statements. | |
| | | | | | | Ratios to Average Net Assets: | | Supplemental Data: |
| | | | | | | | | | | | | |
Net
asset
value,
end of
period | | Total
return(b)
(%) | | Total
expenses
after
waivers
and/or reim-
bursements
(%) | | Total
expenses
(%) | | Net
invest-
ment
income
(%) | | Net
assets,
end of
period
(000) | | Portfolio
turnover
rate
(%) |
| | | | | | | | | | | | | | | | | | | | | | | | | | | |
| | $11.40 | | | | (25.88 | ) | | | 1.42 | | | | 1.47 | | | | 1.63 | | | | $4,203 | | | | 87 | |
| | 17.38 | | | | 32.81 | | | | 1.42 | | | | 1.44 | | | | 0.80 | | | | 6,114 | | | | 58 | |
| | 13.20 | | | | 2.92 | | | | 1.42 | | | | 1.46 | | | | 0.67 | | | | 5,354 | | | | 77 | |
| | 12.98 | | | | 10.39 | | | | 1.42 | | | | 1.42 | | | | 1.21 | | | | 7,208 | | | | 88 | |
| | 11.98 | | | | (12.18 | ) | | | 1.40 | | | | 1.41 | | | | 1.05 | | | | 8,954 | | | | 124 | |
| | | | | | | | | | | | | | | | | | | | | | | | | | | |
| | 11.55 | | | | (25.71 | ) | | | 1.17 | | | | 1.23 | | | | 1.93 | | | | 1,306 | | | | 87 | |
| | 17.58 | | | | 33.11 | | | | 1.17 | | | | 1.19 | | | | 1.06 | | | | 1,685 | | | | 58 | |
| | 13.35 | | | | 3.17 | | | | 1.17 | | | | 1.20 | | | | 0.90 | | | | 1,165 | | | | 77 | |
| | 13.14 | | | | 10.77 | | | | 1.17 | | | | 1.17 | | | | 1.46 | | | | 1,180 | | | | 88 | |
| | 12.13 | | | | (11.96 | ) | | | 1.15 | | | | 1.16 | | | | 1.36 | | | | 948 | | | | 124 | |
| | | | | | | | | | | | | | | | | | | | | | | | | | | |
| | 11.69 | | | | (25.56 | ) | | | 0.92 | | | | 0.96 | | | | 1.42 | | | | 14 | | | | 87 | |
| | 17.78 | | | | 33.50 | | | | 0.92 | | | | 0.94 | | | | 1.30 | | | | 81 | | | | 58 | |
| | 13.50 | | | | 3.39 | | | | 0.92 | | | | 0.94 | | | | 1.18 | | | | 64 | | | | 77 | |
| | 13.27 | | | | 11.00 | | | | 0.92 | | | | 0.92 | | | | 1.68 | | | | 81 | | | | 88 | |
| | 12.26 | | | | (11.68 | ) | | | 0.90 | | | | 0.91 | | | | 1.61 | | | | 69 | | | | 124 | |
| | | | | | | | | | | | | | | | | | | | | | | | | | | |
| | 11.79 | | | | (25.51 | ) | | | 0.84 | | | | 0.88 | | | | 2.21 | | | | 2,639 | | | | 87 | |
| | 17.91 | | | | 33.60 | | | | 0.84 | | | | 0.86 | | | | 1.36 | | | | 4,180 | | | | 58 | |
| | 13.58 | | | | 3.53 | | | | 0.84 | | | | 0.86 | | | | 1.23 | | | | 2,143 | | | | 77 | |
| | 13.35 | | | | 11.04 | | | | 0.84 | | | | 0.85 | | | | 1.78 | | | | 2,489 | | | | 88 | |
| | 12.32 | | | | (11.62 | ) | | | 0.78 | | | | 0.85 | | | | 1.73 | | | | 2,667 | | | | 124 | |
| | See Notes to Financial Statements. | 197 |
Financial Highlights (continued)
INTERNATIONAL OPPORTUNITIES FUND
| | | | | | Per Share Operating Performance: |
| | | | | | Investment Operations: | | Distributions to
shareholders from: |
| | | Net asset
value,
beginning
of period | | Net
invest-
ment
income(a) | | Net
realized
and
unrealized
gain (loss) | | Total
from
invest-
ment
opera-
tions | | Net
investment
income | | Net
realized
gain | | Total
distri-
butions |
| Class A | | | | | | | | | | | | | | | | | | | | | | | | | | | | |
| 10/31/2022 | | | $21.36 | | | | $0.19 | | | | $(6.27 | ) | | | $(6.08 | ) | | | $(0.48 | ) | | | $ – | | | | $(0.48 | ) |
| 10/31/2021 | | | 15.69 | | | | 0.20 | | | | 5.47 | | | | 5.67 | | | | – | | | | – | | | | – | |
| 10/31/2020 | | | 16.02 | | | | 0.06 | | | | (0.18 | ) | | | (0.12 | ) | | | (0.21 | ) | | | – | | | | (0.21 | ) |
| 10/31/2019 | | | 16.84 | | | | 0.16 | | | | 0.77 | | | | 0.93 | | | | (0.17 | ) | | | (1.58 | ) | | | (1.75 | ) |
| 10/31/2018 | | | 20.88 | | | | 0.14 | | | | (3.28 | ) | | | (3.14 | ) | | | (0.17 | ) | | | (0.73 | ) | | | (0.90 | ) |
| Class C | | | | | | | | | | | | | | | | | | | | | | | | | | | | |
| 10/31/2022 | | | 19.57 | | | | 0.05 | | | | (5.76 | ) | | | (5.71 | ) | | | (0.32 | ) | | | – | | | | (0.32 | ) |
| 10/31/2021 | | | 14.47 | | | | 0.04 | | | | 5.06 | | | | 5.10 | | | | – | | | | – | | | | – | |
| 10/31/2020 | | | 14.78 | | | | (0.05 | ) | | | (0.19 | ) | | | (0.24 | ) | | | (0.07 | ) | | | – | | | | (0.07 | ) |
| 10/31/2019 | | | 15.61 | | | | 0.04 | | | | 0.71 | | | | 0.75 | | | | – | (c) | | | (1.58 | ) | | | (1.58 | ) |
| 10/31/2018 | | | 19.46 | | | | – | (c) | | | (3.05 | ) | | | (3.05 | ) | | | (0.07 | ) | | | (0.73 | ) | | | (0.80 | ) |
| Class F | | | | | | | | | | | | | | | | | | | | | | | | | | | | |
| 10/31/2022 | | | 21.19 | | | | 0.22 | | | | (6.23 | ) | | | (6.01 | ) | | | (0.51 | ) | | | – | | | | (0.51 | ) |
| 10/31/2021 | | | 15.53 | | | | 0.23 | | | | 5.43 | | | | 5.66 | | | | – | | | | – | | | | – | |
| 10/31/2020 | | | 15.86 | | | | 0.07 | | | | (0.17 | ) | | | (0.10 | ) | | | (0.23 | ) | | | – | | | | (0.23 | ) |
| 10/31/2019 | | | 16.70 | | | | 0.18 | | | | 0.76 | | | | 0.94 | | | | (0.20 | ) | | | (1.58 | ) | | | (1.78 | ) |
| 10/31/2018 | | | 20.70 | | | | 0.18 | | | | (3.25 | ) | | | (3.07 | ) | | | (0.20 | ) | | | (0.73 | ) | | | (0.93 | ) |
| Class F3 | | | | | | | | | | | | | | | | | | | | | | | | | | | | |
| 10/31/2022 | | | 22.22 | | | | 0.27 | | | | (6.54 | ) | | | (6.27 | ) | | | (0.54 | ) | | | – | | | | (0.54 | ) |
| 10/31/2021 | | | 16.26 | | | | 0.29 | | | | 5.67 | | | | 5.96 | | | | – | | | | – | | | | – | |
| 10/31/2020 | | | 16.59 | | | | 0.12 | | | | (0.20 | ) | | | (0.08 | ) | | | (0.25 | ) | | | – | | | | (0.25 | ) |
| 10/31/2019 | | | 17.38 | | | | 0.22 | | | | 0.80 | | | | 1.02 | | | | (0.23 | ) | | | (1.58 | ) | | | (1.81 | ) |
| 10/31/2018 | | | 21.49 | | | | 0.23 | | | | (3.39 | ) | | | (3.16 | ) | | | (0.22 | ) | | | (0.73 | ) | | | (0.95 | ) |
| Class I | | | | | | | | | | | | | | | | | | | | | | | | | | | | |
| 10/31/2022 | | | 22.08 | | | | 0.24 | | | | (6.48 | ) | | | (6.24 | ) | | | (0.53 | ) | | | – | | | | (0.53 | ) |
| 10/31/2021 | | | 16.17 | | | | 0.26 | | | | 5.65 | | | | 5.91 | | | | – | | | | – | | | | – | |
| 10/31/2020 | | | 16.51 | | | | 0.10 | | | | (0.19 | ) | | | (0.09 | ) | | | (0.25 | ) | | | – | | | | (0.25 | ) |
| 10/31/2019 | | | 17.32 | | | | 0.21 | | | | 0.79 | | | | 1.00 | | | | (0.23 | ) | | | (1.58 | ) | | | (1.81 | ) |
| 10/31/2018 | | | 21.44 | | | | 0.19 | | | | (3.37 | ) | | | (3.18 | ) | | | (0.21 | ) | | | (0.73 | ) | | | (0.94 | ) |
| Class P | | | | | | | | | | | | | | | | | | | | | | | | | | | | |
| 10/31/2022 | | | 21.89 | | | | 0.17 | | | | (6.45 | ) | | | (6.28 | ) | | | (0.43 | ) | | | – | | | | (0.43 | ) |
| 10/31/2021 | | | 16.10 | | | | 0.17 | | | | 5.62 | | | | 5.79 | | | | – | | | | – | | | | – | |
| 10/31/2020 | | | 16.43 | | | | 0.05 | | | | (0.22 | ) | | | (0.17 | ) | | | (0.16 | ) | | | – | | | | (0.16 | ) |
| 10/31/2019 | | | 17.18 | | | | 0.14 | | | | 0.79 | | | | 0.93 | | | | (0.10 | ) | | | (1.58 | ) | | | (1.68 | ) |
| 10/31/2018 | | | 21.26 | | | | 0.10 | | | | (3.33 | ) | | | (3.23 | ) | | | (0.12 | ) | | | (0.73 | ) | | | (0.85 | ) |
| Class R2 | | | | | | | | | | | | | | | | | | | | | | | | | | | | |
| 10/31/2022 | | | 20.89 | | | | 0.13 | | | | (6.15 | ) | | | (6.02 | ) | | | (0.39 | ) | | | – | | | | (0.39 | ) |
| 10/31/2021 | | | 15.39 | | | | 0.12 | | | | 5.38 | | | | 5.50 | | | | – | | | | – | | | | – | |
| 10/31/2020 | | | 15.72 | | | | 0.01 | | | | (0.20 | ) | | | (0.19 | ) | | | (0.14 | ) | | | – | | | | (0.14 | ) |
| 10/31/2019 | | | 16.54 | | | | 0.11 | | | | 0.75 | | | | 0.86 | | | | (0.10 | ) | | | (1.58 | ) | | | (1.68 | ) |
| 10/31/2018 | | | 20.53 | | | | 0.06 | | | | (3.21 | ) | | | (3.15 | ) | | | (0.11 | ) | | | (0.73 | ) | | | (0.84 | ) |
| 198 | See Notes to Financial Statements. | |
| | | | | | | Ratios to Average Net Assets: | | Supplemental Data: |
| | | | | | | | | | | | | |
Net
asset
value,
end of
period | | Total
return(b)
(%) | | Total
expenses
after
waivers
and/or reim-
bursements
(%) | | Total
expenses
(%) | | Net
invest-
ment
income
(loss)
(%) | | Net
assets,
end of
period
(000) | | Portfolio
turnover
rate
(%) |
| | | | | | | | | | | | | | | | | | | | | | | | | | | |
| | $14.80 | | | | (29.03 | ) | | | 1.22 | | | | 1.26 | | | | 1.10 | | | $ | 84,505 | | | | 70 | |
| | 21.36 | | | | 36.14 | | | | 1.19 | | | | 1.21 | | | | 1.00 | | | | 130,088 | | | | 74 | |
| | 15.69 | | | | (0.84 | ) | | | 1.21 | | | | 1.24 | | | | 0.41 | | | | 96,338 | | | | 55 | |
| | 16.02 | | | | 7.05 | | | | 1.25 | | | | 1.25 | | | | 1.04 | | | | 126,700 | | | | 58 | |
| | 16.84 | | | | (15.72 | ) | | | 1.20 | | | | 1.20 | | | | 0.73 | | | | 172,940 | | | | 81 | |
| | | | | | | | | | | | | | | | | | | | | | | | | | | |
| | 13.54 | | | | (29.58 | ) | | | 1.97 | | | | 2.00 | | | | 0.30 | | | | 7,226 | | | | 70 | |
| | 19.57 | | | | 35.25 | | | | 1.95 | | | | 1.96 | | | | 0.22 | | | | 14,488 | | | | 74 | |
| | 14.47 | | | | (1.63 | ) | | | 1.97 | | | | 1.99 | | | | (0.38 | ) | | | 12,840 | | | | 55 | |
| | 14.78 | | | | 6.23 | | | | 2.00 | | | | 2.00 | | | | 0.29 | | | | 22,450 | | | | 58 | |
| | 15.61 | | | | (16.34 | ) | | | 1.95 | | | | 1.95 | | | | – | (d) | | | 33,874 | | | | 81 | |
| | | | | | | | | | | | | | | | | | | | | | | | | | | |
| | 14.67 | | | | (28.93 | ) | | | 1.07 | | | | 1.10 | | | | 1.22 | | | | 13,570 | | | | 70 | |
| | 21.19 | | | | 36.38 | | | | 1.05 | | | | 1.06 | | | | 1.13 | | | | 54,601 | | | | 74 | |
| | 15.53 | | | | (0.72 | ) | | | 1.07 | | | | 1.09 | | | | 0.44 | | | | 43,222 | | | | 55 | |
| | 15.86 | | | | 7.19 | | | | 1.09 | | | | 1.09 | | | | 1.20 | | | | 91,019 | | | | 58 | |
| | 16.70 | | | | (15.58 | ) | | | 1.05 | | | | 1.05 | | | | 0.91 | | | | 206,400 | | | | 81 | |
| | | | | | | | | | | | | | | | | | | | | | | | | | | |
| | 15.41 | | | | (28.83 | ) | | | 0.89 | | | | 0.93 | | | | 1.47 | | | | 25,732 | | | | 70 | |
| | 22.22 | | | | 36.65 | | | | 0.86 | | | | 0.88 | | | | 1.36 | | | | 30,504 | | | | 74 | |
| | 16.26 | | | | (0.54 | ) | | | 0.89 | | | | 0.91 | | | | 0.75 | | | | 17,579 | | | | 55 | |
| | 16.59 | | | | 7.43 | | | | 0.91 | | | | 0.91 | | | | 1.40 | | | | 19,153 | | | | 58 | |
| | 17.38 | | | | (15.46 | ) | | | 0.87 | | | | 0.87 | | | | 1.11 | | | | 22,158 | | | | 81 | |
| | | | | | | | | | | | | | | | | | | | | | | | | | | |
| | 15.31 | | | | (28.85 | ) | | | 0.97 | | | | 1.01 | | | | 1.34 | | | | 153,655 | | | | 70 | |
| | 22.08 | | | | 36.55 | | | | 0.95 | | | | 0.96 | | | | 1.24 | | | | 193,183 | | | | 74 | |
| | 16.17 | | | | (0.62 | ) | | | 0.97 | | | | 0.99 | | | | 0.66 | | | | 146,416 | | | | 55 | |
| | 16.51 | | | | 7.24 | | | | 1.00 | | | | 1.00 | | | | 1.32 | | | | 221,455 | | | | 58 | |
| | 17.32 | | | | (15.46 | ) | | | 0.95 | | | | 0.95 | | | | 0.94 | | | | 235,952 | | | | 81 | |
| | | | | | | | | | | | | | | | | | | | | | | | | | | |
| | 15.18 | | | | (29.19 | ) | | | 1.42 | | | | 1.46 | | | | 0.93 | | | | 113 | | | | 70 | |
| | 21.89 | | | | 35.96 | | | | 1.39 | | | | 1.41 | | | | 0.80 | | | | 140 | | | | 74 | |
| | 16.10 | | | | (1.08 | ) | | | 1.41 | | | | 1.43 | | | | 0.30 | | | | 119 | | | | 55 | |
| | 16.43 | | | | 6.80 | | | | 1.45 | | | | 1.45 | | | | 0.91 | | | | 96 | | | | 58 | |
| | 17.18 | | | | (15.87 | ) | | | 1.40 | | | | 1.40 | | | | 0.50 | | | | 132 | | | | 81 | |
| | | | | | | | | | | | | | | | | | | | | | | | | | | |
| | 14.48 | | | | (29.28 | ) | | | 1.57 | | | | 1.61 | | | | 0.72 | | | | 1,913 | | | | 70 | |
| | 20.89 | | | | 35.74 | | | | 1.55 | | | | 1.56 | | | | 0.63 | | | | 2,771 | | | | 74 | |
| | 15.39 | | | | (1.24 | ) | | | 1.57 | | | | 1.59 | | | | 0.06 | | | | 2,522 | | | | 55 | |
| | 15.72 | | | | 6.67 | | | | 1.60 | | | | 1.60 | | | | 0.72 | | | | 3,318 | | | | 58 | |
| | 16.54 | | | | (16.00 | ) | | | 1.55 | | | | 1.55 | | | | 0.32 | | | | 3,476 | | | | 81 | |
| | See Notes to Financial Statements. | 199 |
Financial Highlights (continued)
INTERNATIONAL OPPORTUNITIES FUND
| | | | | | Per Share Operating Performance: |
| | | | | | Investment Operations: | | Distributions to
shareholders from: |
| | | Net asset
value,
beginning
of period | | Net
invest-
ment
income
(loss)(a) | | Net
realized
and
unrealized
gain (loss) | | Total
from
invest-
ment
opera-
tions | | Net
investment
income | | Net
realized
gain | | Total
distri-
butions |
| Class R3 | | | | | | | | | | | | | | | | | | | | | | | | | | | | |
| 10/31/2022 | | | $20.82 | | | | $0.15 | | | | $(6.15 | ) | | | $(6.00 | ) | | | $(0.35 | ) | | | $ – | | | | $(0.35 | ) |
| 10/31/2021 | | | 15.32 | | | | 0.10 | | | | 5.40 | | | | 5.50 | | | | – | | | | – | | | | – | |
| 10/31/2020 | | | 15.64 | | | | 0.02 | | | | (0.19 | ) | | | (0.17 | ) | | | (0.15 | ) | | | – | | | | (0.15 | ) |
| 10/31/2019 | | | 16.53 | | | | 0.09 | | | | 0.77 | | | | 0.86 | | | | (0.17 | ) | | | (1.58 | ) | | | (1.75 | ) |
| 10/31/2018 | | | 20.49 | | | | 0.10 | | | | (3.21 | ) | | | (3.11 | ) | | | (0.12 | ) | | | (0.73 | ) | | | (0.85 | ) |
| Class R4 | | | | | | | | | | | | | | | | | | | | | | | | | | | | |
| 10/31/2022 | | | 21.26 | | | | 0.19 | | | | (6.25 | ) | | | (6.06 | ) | | | (0.48 | ) | | | – | | | | (0.48 | ) |
| 10/31/2021 | | | 15.61 | | | | 0.18 | | | | 5.47 | | | | 5.65 | | | | – | | | | – | | | | – | |
| 10/31/2020 | | | 15.95 | | | | 0.07 | | | | (0.19 | ) | | | (0.12 | ) | | | (0.22 | ) | | | – | | | | (0.22 | ) |
| 10/31/2019 | | | 16.79 | | | | 0.14 | | | | 0.78 | | | | 0.92 | | | | (0.18 | ) | | | (1.58 | ) | | | (1.76 | ) |
| 10/31/2018 | | | 20.82 | | | | 0.16 | | | | (3.28 | ) | | | (3.12 | ) | | | (0.18 | ) | | | (0.73 | ) | | | (0.91 | ) |
| Class R5 | | | | | | | | | | | | | | | | | | | | | | | | | | | | |
| 10/31/2022 | | | 22.07 | | | | 0.24 | | | | (6.48 | ) | | | (6.24 | ) | | | (0.53 | ) | | | – | | | | (0.53 | ) |
| 10/31/2021 | | | 16.17 | | | | 0.14 | | | | 5.76 | | | | 5.90 | | | | – | | | | – | | | | – | |
| 10/31/2020 | | | 16.50 | | | | 0.08 | | | | (0.16 | ) | | | (0.08 | ) | | | (0.25 | ) | | | – | | | | (0.25 | ) |
| 10/31/2019 | | | 17.32 | | | | 0.16 | | | | 0.83 | | | | 0.99 | | | | (0.23 | ) | | | (1.58 | ) | | | (1.81 | ) |
| 10/31/2018 | | | 21.43 | | | | 0.21 | | | | (3.38 | ) | | | (3.17 | ) | | | (0.21 | ) | | | (0.73 | ) | | | (0.94 | ) |
| Class R6 | | | | | | | | | | | | | | | | | | | | | | | | | | | | |
| 10/31/2022 | | | 22.22 | | | | 0.26 | | | | (6.53 | ) | | | (6.27 | ) | | | (0.54 | ) | | | – | | | | (0.54 | ) |
| 10/31/2021 | | | 16.26 | | | | 0.24 | | | | 5.72 | | | | 5.96 | | | | – | | | | – | | | | – | |
| 10/31/2020 | | | 16.59 | | | | 0.11 | | | | (0.19 | ) | | | (0.08 | ) | | | (0.25 | ) | | | – | | | | (0.25 | ) |
| 10/31/2019 | | | 17.39 | | | | 0.21 | | | | 0.80 | | | | 1.01 | | | | (0.23 | ) | | | (1.58 | ) | | | (1.81 | ) |
| 10/31/2018 | | | 21.49 | | | | 0.21 | | | | (3.36 | ) | | | (3.15 | ) | | | (0.22 | ) | | | (0.73 | ) | | | (0.95 | ) |
| (a) | Calculated using average shares outstanding during the period. |
| (b) | Total return for Classes A and C does not consider the effects of sales loads and assumes the reinvestment of all distributions. Total return for all other classes assumes the reinvestment of all distributions. |
| (c) | Amount less than $0.01. |
| (d) | Amount is less than 0.01%. |
| 200 | See Notes to Financial Statements. | |
| | | | | | | Ratios to Average Net Assets: | | Supplemental Data: |
| | | | | | | | | | | | | |
Net
asset
value,
end of
period | | Total
return(b)
(%) | | Total
expenses
after
waivers
and/or reim-
bursements
(%) | | Total
expenses
(%) | | Net
invest-
ment
income
(loss)
(%) | | Net
assets,
end of
period
(000) | | Portfolio
turnover
rate
(%) |
| | | | | | | | | | | | | | | | | | | | | | | | | | | |
| | $14.47 | | | | (29.24 | ) | | | 1.47 | | | | 1.51 | | | | 0.84 | | | | $ 4,129 | | | | 70 | |
| | 20.82 | | | | 35.90 | | | | 1.45 | | | | 1.47 | | | | 0.51 | | | | 6,838 | | | | 74 | |
| | 15.32 | | | | (1.17 | ) | | | 1.46 | | | | 1.49 | | | | 0.10 | | | | 15,313 | | | | 55 | |
| | 15.64 | | | | 6.77 | | | | 1.50 | | | | 1.50 | | | | 0.58 | | | | 19,568 | | | | 58 | |
| | 16.53 | | | | (15.87 | ) | | | 1.46 | | | | 1.46 | | | | 0.54 | | | | 35,677 | | | | 81 | |
| | | | | | | | | | | | | | | | | | | | | | | | | | | |
| | 14.72 | | | | (29.02 | ) | | | 1.22 | | | | 1.26 | | | | 1.10 | | | | 1,935 | | | | 70 | |
| | 21.26 | | | | 36.19 | | | | 1.20 | | | | 1.22 | | | | 0.91 | | | | 2,869 | | | | 74 | |
| | 15.61 | | | | (0.90 | ) | | | 1.21 | | | | 1.24 | | | | 0.44 | | | | 4,889 | | | | 55 | |
| | 15.95 | | | | 7.06 | | | | 1.25 | | | | 1.25 | | | | 0.93 | | | | 6,293 | | | | 58 | |
| | 16.79 | | | | (15.70 | ) | | | 1.20 | | | | 1.20 | | | | 0.80 | | | | 5,606 | | | | 81 | |
| | | | | | | | | | | | | | | | | | | | | | | | | | | |
| | 15.30 | | | | (28.88 | ) | | | 0.97 | | | | 1.00 | | | | 1.33 | | | | 1,877 | | | | 70 | |
| | 22.07 | | | | 36.49 | | | | 0.95 | | | | 0.97 | | | | 0.70 | | | | 3,283 | | | | 74 | |
| | 16.17 | | | | (0.56 | ) | | | 0.96 | | | | 0.99 | | | | 0.47 | | | | 15,842 | | | | 55 | |
| | 16.50 | | | | 7.25 | | | | 1.00 | | | | 1.00 | | | | 1.00 | | | | 17,765 | | | | 58 | |
| | 17.32 | | | | (15.47 | ) | | | 0.97 | | | | 0.97 | | | | 1.06 | | | | 39,621 | | | | 81 | |
| | | | | | | | | | | | | | | | | | | | | | | | | | | |
| | 15.41 | | | | (28.83 | ) | | | 0.89 | | | | 0.93 | | | | 1.42 | | | | 15,946 | | | | 70 | |
| | 22.22 | | | | 36.65 | | | | 0.87 | | | | 0.89 | | | | 1.14 | | | | 25,184 | | | | 74 | |
| | 16.26 | | | | (0.54 | ) | | | 0.89 | | | | 0.91 | | | | 0.72 | | | | 31,986 | | | | 55 | |
| | 16.59 | | | | 7.37 | | | | 0.91 | | | | 0.91 | | | | 1.30 | | | | 33,183 | | | | 58 | |
| | 17.39 | | | | (15.41 | ) | | | 0.87 | | | | 0.87 | | | | 1.04 | | | | 34,281 | | | | 81 | |
| | See Notes to Financial Statements. | 201 |
Financial Highlights (continued)
INTERNATIONAL VALUE FUND
| | | | | | Per Share Operating Performance: | | | | |
| | | | | | Investment Operations: | | Distributions
to
shareholders
from: | | |
| | | Net asset
value,
beginning
of period | | Net
investment
income(a) | | Net
realized and
unrealized
gain (loss) | | Total from
investment
operations | | Net
investment
income | | Net asset
value,
end of
period |
| Class A | | | | | | | | | | | | | | | | | | | | | | | | |
| 10/31/2022 | | | $8.00 | | | | $0.26 | | | | $(1.79 | ) | | | $(1.53 | ) | | | $(0.33 | ) | | | $6.14 | |
| 10/31/2021 | | | 6.03 | | | | 0.21 | | | | 1.98 | | | | 2.19 | | | | (0.22 | ) | | | 8.00 | |
| 10/31/2020 | | | 6.98 | | | | 0.12 | | | | (0.94 | ) | | | (0.82 | ) | | | (0.13 | ) | | | 6.03 | |
| 10/31/2019 | | | 6.73 | | | | 0.20 | | | | 0.26 | | | | 0.46 | | | | (0.21 | ) | | | 6.98 | |
| 10/31/2018 | | | 7.63 | | | | 0.22 | | | | (0.89 | ) | | | (0.67 | ) | | | (0.23 | ) | | | 6.73 | |
| Class C | | | | | | | | | | | | | | | | | | | | | | | | |
| 10/31/2022 | | | 7.93 | | | | 0.22 | | | | (1.79 | ) | | | (1.57 | ) | | | (0.27 | ) | | | 6.09 | |
| 10/31/2021 | | | 5.98 | | | | 0.15 | | | | 1.96 | | | | 2.11 | | | | (0.16 | ) | | | 7.93 | |
| 10/31/2020 | | | 6.92 | | | | 0.07 | | | | (0.94 | ) | | | (0.87 | ) | | | (0.07 | ) | | | 5.98 | |
| 10/31/2019 | | | 6.67 | | | | 0.15 | | | | 0.25 | | | | 0.40 | | | | (0.15 | ) | | | 6.92 | |
| 10/31/2018 | | | 7.56 | | | | 0.16 | | | | (0.88 | ) | | | (0.72 | ) | | | (0.17 | ) | | | 6.67 | |
| Class F | | | | | | | | | | | | | | | | | | | | | | | | |
| 10/31/2022 | | | 8.04 | | | | 0.31 | | | | (1.83 | ) | | | (1.52 | ) | | | (0.34 | ) | | | 6.18 | |
| 10/31/2021 | | | 6.06 | | | | 0.23 | | | | 1.98 | | | | 2.21 | | | | (0.23 | ) | | | 8.04 | |
| 10/31/2020 | | | 7.01 | | | | 0.13 | | | | (0.94 | ) | | | (0.81 | ) | | | (0.14 | ) | | | 6.06 | |
| 10/31/2019 | | | 6.76 | | | | 0.21 | | | | 0.26 | | | | 0.47 | | | | (0.22 | ) | | | 7.01 | |
| 10/31/2018 | | | 7.66 | | | | 0.23 | | | | (0.89 | ) | | | (0.66 | ) | | | (0.24 | ) | | | 6.76 | |
| Class F3 | | | | | | | | | | | | | | | | | | | | | | | | |
| 10/31/2022 | | | 8.06 | | | | 0.28 | | | | (1.80 | ) | | | (1.52 | ) | | | (0.35 | ) | | | 6.19 | |
| 10/31/2021 | | | 6.07 | | | | 0.24 | | | | 1.99 | | | | 2.23 | | | | (0.24 | ) | | | 8.06 | |
| 10/31/2020 | | | 7.02 | | | | 0.14 | | | | (0.95 | ) | | | (0.81 | ) | | | (0.14 | ) | | | 6.07 | |
| 10/31/2019 | | | 6.77 | | | | 0.22 | | | | 0.26 | | | | 0.48 | | | | (0.23 | ) | | | 7.02 | |
| 10/31/2018 | | | 7.67 | | | | 0.24 | | | | (0.89 | ) | | | (0.65 | ) | | | (0.25 | ) | | | 6.77 | |
| Class I | | | | | | | | | | | | | | | | | | | | | | | | |
| 10/31/2022 | | | 8.06 | | | | 0.32 | | | | (1.84 | ) | | | (1.52 | ) | | | (0.35 | ) | | | 6.19 | |
| 10/31/2021 | | | 6.07 | | | | 0.25 | | | | 1.98 | | | | 2.23 | | | | (0.24 | ) | | | 8.06 | |
| 10/31/2020 | | | 7.03 | | | | 0.15 | | | | (0.97 | ) | | | (0.82 | ) | | | (0.14 | ) | | | 6.07 | |
| 10/31/2019 | | | 6.77 | | | | 0.23 | | | | 0.25 | | | | 0.48 | | | | (0.22 | ) | | | 7.03 | |
| 10/31/2018 | | | 7.68 | | | | 0.23 | | | | (0.89 | ) | | | (0.66 | ) | | | (0.25 | ) | | | 6.77 | |
| Class R2 | | | | | | | | | | | | | | | | | | | | | | | | |
| 10/31/2022 | | | 8.21 | | | | 0.21 | | | | (1.81 | ) | | | (1.60 | ) | | | (0.31 | ) | | | 6.30 | |
| 10/31/2021 | | | 6.18 | | | | 0.19 | | | | 2.03 | | | | 2.22 | | | | (0.19 | ) | | | 8.21 | |
| 10/31/2020 | | | 7.14 | | | | 0.07 | | | | (0.96 | ) | | | (0.89 | ) | | | (0.07 | ) | | | 6.18 | |
| 10/31/2019 | | | 6.88 | | | | 0.18 | | | | 0.26 | | | | 0.44 | | | | (0.18 | ) | | | 7.14 | |
| 10/31/2018 | | | 7.80 | | | | 0.18 | | | | (0.90 | ) | | | (0.72 | ) | | | (0.20 | ) | | | 6.88 | |
| Class R3 | | | | | | | | | | | | | | | | | | | | | | | | |
| 10/31/2022 | | | 8.09 | | | | 0.24 | | | | (1.80 | ) | | | (1.56 | ) | | | (0.31 | ) | | | 6.22 | |
| 10/31/2021 | | | 6.10 | | | | 0.20 | | | | 1.99 | | | | 2.19 | | | | (0.20 | ) | | | 8.09 | |
| 10/31/2020 | | | 7.05 | | | | 0.11 | | | | (0.95 | ) | | | (0.84 | ) | | | (0.11 | ) | | | 6.10 | |
| 10/31/2019 | | | 6.80 | | | | 0.18 | | | | 0.26 | | | | 0.44 | | | | (0.19 | ) | | | 7.05 | |
| 10/31/2018 | | | 7.71 | | | | 0.19 | | | | (0.89 | ) | | | (0.70 | ) | | | (0.21 | ) | | | 6.80 | |
| 202 | See Notes to Financial Statements. |
| | | | Ratios to Average Net Assets: | | Supplemental Data: |
| | | | | | | | | | | | | | | | | |
Total return(b) (%) | | Total expenses after waivers and/or reim- bursements (%) | | Total expenses (%) | | Net investment income (%) | | Net assets, end of period (000) | | Portfolio turnover rate (%) |
| | | | | | | | | | | | | | | | | | | | | | | |
| | (19.56 | ) | | | 1.12 | | | | 1.18 | | | | 3.66 | | | | $181,412 | | | | 67 | |
| | 36.44 | | | | 1.12 | | | | 1.14 | | | | 2.73 | | | | 242,422 | | | | 61 | |
| | (11.89 | ) | | | 1.12 | | | | 1.18 | | | | 1.91 | | | | 186,426 | | | | 71 | |
| | 6.91 | | | | 1.12 | | | | 1.16 | | | | 2.97 | | | | 256,381 | | | | 62 | |
| | (9.05 | ) | | | 1.12 | | | | 1.14 | | | | 2.85 | | | | 290,289 | | | | 74 | |
| | | | | | | | | | | | | | | | | | | | | | | |
| | (20.19 | ) | | | 1.87 | | | | 1.93 | | | | 3.00 | | | | 5,037 | | | | 67 | |
| | 35.37 | | | | 1.87 | | | | 1.89 | | | | 1.88 | | | | 10,707 | | | | 61 | |
| | (12.58 | ) | | | 1.87 | | | | 1.93 | | | | 1.09 | | | | 13,027 | | | | 71 | |
| | 6.12 | | | | 1.87 | | | | 1.91 | | | | 2.17 | | | | 32,274 | | | | 62 | |
| | (9.71 | ) | | | 1.87 | | | | 1.89 | | | | 2.07 | | | | 45,888 | | | | 74 | |
| | | | | | | | | | | | | | | | | | | | | | | |
| | (19.45 | ) | | | 0.92 | | | | 1.02 | | | | 4.11 | | | | 9,803 | | | | 67 | |
| | 36.78 | | | | 0.92 | | | | 0.99 | | | | 2.93 | | | | 29,094 | | | | 61 | |
| | (11.69 | ) | | | 0.92 | | | | 1.03 | | | | 2.06 | | | | 23,560 | | | | 71 | |
| | 7.04 | | | | 0.92 | | | | 1.01 | | | | 3.10 | | | | 37,857 | | | | 62 | |
| | (8.87 | ) | | | 0.91 | | | | 0.99 | | | | 3.06 | | | | 54,167 | | | | 74 | |
| | | | | | | | | | | | | | | | | | | | | | | |
| | (19.32 | ) | | | 0.80 | | | | 0.87 | | | | 3.92 | | | | 22,938 | | | | 67 | |
| | 36.87 | | | | 0.79 | | | | 0.83 | | | | 3.06 | | | | 25,103 | | | | 61 | |
| | (11.57 | ) | | | 0.80 | | | | 0.85 | | | | 2.24 | | | | 18,311 | | | | 71 | |
| | 7.15 | | | | 0.81 | | | | 0.84 | | | | 3.28 | | | | 24,764 | | | | 62 | |
| | (8.76 | ) | | | 0.82 | | | | 0.83 | | | | 3.21 | | | | 26,911 | | | | 74 | |
| | | | | | | | | | | | | | | | | | | | | | | |
| | (19.33 | ) | | | 0.82 | | | | 0.91 | | | | 4.23 | | | | 117,542 | | | | 67 | |
| | 36.86 | | | | 0.82 | | | | 0.89 | | | | 3.14 | | | | 334,988 | | | | 61 | |
| | (11.71 | ) | | | 0.82 | | | | 0.93 | | | | 2.26 | | | | 197,616 | | | | 71 | |
| | 7.29 | | | | 0.82 | | | | 0.91 | | | | 3.35 | | | | 219,764 | | | | 62 | |
| | (8.89 | ) | | | 0.81 | | | | 0.89 | | | | 3.05 | | | | 310,984 | | | | 74 | |
| | | | | | | | | | | | | | | | | | | | | | | |
| | (19.92 | ) | | | 1.47 | | | | 1.55 | | | | 2.95 | | | | 44 | | | | 67 | |
| | 36.04 | | | | 1.47 | | | | 1.49 | | | | 2.37 | | | | 27 | | | | 61 | |
| | (12.47 | ) | | | 1.47 | | | | 1.55 | | | | 0.99 | | | | 20 | | | | 71 | |
| | 6.54 | | | | 1.47 | | | | 1.51 | | | | 2.64 | | | | 449 | | | | 62 | |
| | (9.44 | ) | | | 1.47 | | | | 1.49 | | | | 2.35 | | | | 369 | | | | 74 | |
| | | | | | | | | | | | | | | | | | | | | | | |
| | (19.67 | ) | | | 1.37 | | | | 1.43 | | | | 3.36 | | | | 6,003 | | | | 67 | |
| | 36.00 | | | | 1.37 | | | | 1.39 | | | | 2.50 | | | | 6,840 | | | | 61 | |
| | (12.00 | ) | | | 1.37 | | | | 1.43 | | | | 1.69 | | | | 5,394 | | | | 71 | |
| | 6.56 | | | | 1.37 | | | | 1.41 | | | | 2.70 | | | | 7,029 | | | | 62 | |
| | (9.35 | ) | | | 1.37 | | | | 1.39 | | | | 2.41 | | | | 7,801 | | | | 74 | |
| | See Notes to Financial Statements. | 203 |
Financial Highlights (continued)
INTERNATIONAL VALUE FUND
| | | | | | Per Share Operating Performance: | | | | |
| | | | | | Investment Operations: | | Distributions
to
shareholders
from: | | |
| | | Net asset
value,
beginning
of period | | Net
investment
income
(loss)(a) | | Net
realized and
unrealized
gain (loss) | | Total from
investment
operations | | Net
investment
income | | Net asset
value,
end of
period |
| Class R4 | | | | | | | | | | | | | | | | | | | | | | | | |
| 10/31/2022 | | | $7.98 | | | | $0.27 | | | | $(1.80 | ) | | | $(1.53 | ) | | | $(0.33 | ) | | | $6.12 | |
| 10/31/2021 | | | 6.01 | | | | 0.24 | | | | 1.95 | | | | 2.19 | | | | (0.22 | ) | | | 7.98 | |
| 10/31/2020 | | | 6.97 | | | | 0.13 | | | | (0.96 | ) | | | (0.83 | ) | | | (0.13 | ) | | | 6.01 | |
| 10/31/2019 | | | 6.72 | | | | 0.20 | | | | 0.26 | | | | 0.46 | | | | (0.21 | ) | | | 6.97 | |
| 10/31/2018 | | | 7.62 | | | | 0.20 | | | | (0.87 | ) | | | (0.67 | ) | | | (0.23 | ) | | | 6.72 | |
| Class R5 | | | | | | | | | | | | | | | | | | | | | | | | |
| 10/31/2022 | | | 8.03 | | | | 0.27 | | | | (1.79 | ) | | | (1.52 | ) | | | (0.35 | ) | | | 6.16 | |
| 10/31/2021 | | | 6.05 | | | | 0.24 | | | | 1.98 | | | | 2.22 | | | | (0.24 | ) | | | 8.03 | |
| 10/31/2020 | | | 7.01 | | | | 0.14 | | | | (0.96 | ) | | | (0.82 | ) | | | (0.14 | ) | | | 6.05 | |
| 10/31/2019 | | | 6.76 | | | | 0.23 | | | | 0.25 | | | | 0.48 | | | | (0.23 | ) | | | 7.01 | |
| 10/31/2018 | | | 7.66 | | | | 0.24 | | | | (0.89 | ) | | | (0.65 | ) | | | (0.25 | ) | | | 6.76 | |
| Class R6 | | | | | | | | | | | | | | | | | | | | | | | | |
| 10/31/2022 | | | 8.06 | | | | 0.29 | | | | (1.81 | ) | | | (1.52 | ) | | | (0.35 | ) | | | 6.19 | |
| 10/31/2021 | | | 6.07 | | | | 0.24 | | | | 1.99 | | | | 2.23 | | | | (0.24 | ) | | | 8.06 | |
| 10/31/2020 | | | 7.02 | | | | 0.14 | | | | (0.95 | ) | | | (0.81 | ) | | | (0.14 | ) | | | 6.07 | |
| 10/31/2019 | | | 6.77 | | | | 0.22 | | | | 0.26 | | | | 0.48 | | | | (0.23 | ) | | | 7.02 | |
| 10/31/2018 | | | 7.67 | | | | 0.24 | | | | (0.89 | ) | | | (0.65 | ) | | | (0.25 | ) | | | 6.77 | |
| (a) | Calculated using average shares outstanding during the period. |
| (b) | Total return for Classes A and C does not consider the effects of sales loads and assumes the reinvestment of all distributions. Total return for all other classes assumes the reinvestment of all distributions. |
| 204 | See Notes to Financial Statements. |
| | | | Ratios to Average Net Assets: | | Supplemental Data: |
| | | | | | | | | | | | | | | | | |
Total
return(b)
(%) | | Total
expenses
after
waivers
and/or reim-
bursements
(%) | | Total
expenses
(%) | | Net
investment
income
(loss)
(%) | | Net assets,
end of
period
(000) | | Portfolio
turnover
rate
(%) |
| | | | | | | | | | | | | | | | | | | | | | | |
| | (19.62 | ) | | | 1.12 | | | | 1.18 | | | | 3.70 | | | $ | 109 | | | | 67 | |
| | 36.35 | | | | 1.12 | | | | 1.14 | | | | 2.98 | | | | 153 | | | | 61 | |
| | (11.90 | ) | | | 1.12 | | | | 1.17 | | | | 2.05 | | | | 36 | | | | 71 | |
| | 6.92 | | | | 1.12 | | | | 1.17 | | | | 2.99 | | | | 36 | | | | 62 | |
| | (9.06 | ) | | | 1.12 | | | | 1.13 | | | | 2.67 | | | | 40 | | | | 74 | |
| | | | | | | | | | | | | | | | | | | | | | | |
| | (19.40 | ) | | | 0.87 | | | | 0.93 | | | | 3.69 | | | | 14 | | | | 67 | |
| | 36.82 | | | | 0.87 | | | | 0.88 | | | | 3.09 | | | | 15 | | | | 61 | |
| | (11.74 | ) | | | 0.87 | | | | 0.91 | | | | 2.20 | | | | 9 | | | | 71 | |
| | 7.16 | | | | 0.87 | | | | 0.89 | | | | 3.36 | | | | 10 | | | | 62 | |
| | (8.78 | ) | | | 0.86 | | | | 0.86 | | | | 3.12 | | | | 10 | | | | 74 | |
| | | | | | | | | | | | | | | | | | | | | | | |
| | (19.32 | ) | | | 0.80 | | | | 0.87 | | | | 3.97 | | | | 1,374 | | | | 67 | |
| | 36.87 | | | | 0.79 | | | | 0.83 | | | | 3.06 | | | | 1,375 | | | | 61 | |
| | (11.57 | ) | | | 0.80 | | | | 0.85 | | | | 2.17 | | | | 952 | | | | 71 | |
| | 7.15 | | | | 0.81 | | | | 0.84 | | | | 3.22 | | | | 1,507 | | | | 62 | |
| | (8.76 | ) | | | 0.82 | | | | 0.83 | | | | 3.17 | | | | 1,758 | | | | 74 | |
| | See Notes to Financial Statements. | 205 |
Financial Highlights (continued)
MICRO CAP GROWTH FUND
| | | | | | Per Share Operating Performance: | | | | |
| | | | | | Investment Operations: | | Distributions
to
shareholders
from: | | |
| | | Net asset
value,
beginning
of period | | Net
investment
(loss)(a) | | Net
realized and
unrealized
gain (loss) | | Total from
investment
operations | | Net
realized
gain | | Net asset
value,
end of
period |
| Class A | | | | | | | | | | | | | | | | | | | | | | | | |
| 10/31/2022 | | | $19.36 | | | | $(0.13 | ) | | | $(5.37 | ) | | | $(5.50 | ) | | | $ – | | | | $13.86 | |
| 10/31/2021 | | | 17.51 | | | | (0.25 | ) | | | 7.18 | | | | 6.93 | | | | (5.08 | ) | | | 19.36 | |
| 10/31/2020 | | | 13.83 | | | | (0.18 | ) | | | 6.23 | | | | 6.05 | | | | (2.37 | ) | | | 17.51 | |
| 10/31/2019 | | | 18.05 | | | | (0.21 | ) | | | 0.98 | | | | 0.77 | | | | (4.99 | ) | | | 13.83 | |
| 10/31/2018 | | | 18.26 | | | | (0.26 | ) | | | 2.75 | | | | 2.49 | | | | (2.70 | ) | | | 18.05 | |
| Class C | | | | | | | | | | | | | | | | | | | | | | | | |
| 10/31/2022 | | | 23.49 | | | | (0.30 | ) | | | (6.49 | ) | | | (6.79 | ) | | | – | | | | 16.70 | |
| 10/31/2021 | | | 20.44 | | | | (0.49 | ) | | | 8.62 | | | | 8.13 | | | | (5.08 | ) | | | 23.49 | |
| 8/28/2020 to 10/31/2020(c) | | | 20.16 | | | | (0.07 | ) | | | 0.35 | | | | 0.28 | | | | – | | | | 20.44 | |
| Class F | | | | | | | | | | | | | | | | | | | | | | | | |
| 10/31/2022 | | | 23.77 | | | | (0.12 | ) | | | (6.58 | ) | | | (6.70 | ) | | | – | | | | 17.07 | |
| 10/31/2021 | | | 20.47 | | | | (0.25 | ) | | | 8.63 | | | | 8.38 | | | | (5.08 | ) | | | 23.77 | |
| 8/28/2020 to 10/31/2020(c) | | | 20.16 | | | | (0.04 | ) | | | 0.35 | | | | 0.31 | | | | – | | | | 20.47 | |
| Class I | | | | | | | | | | | | | | | | | | | | | | | | |
| 10/31/2022 | | | 23.77 | | | | (0.12 | ) | | | (6.58 | ) | | | (6.70 | ) | | | – | | | | 17.07 | |
| 10/31/2021 | | | 20.47 | | | | (0.24 | ) | | | 8.62 | | | | 8.38 | | | | (5.08 | ) | | | 23.77 | |
| 10/31/2020 | | | 15.77 | | | | (0.19 | ) | | | 7.26 | | | | 7.07 | | | | (2.37 | ) | | | 20.47 | |
| 10/31/2019 | | | 19.84 | | | | (0.24 | ) | | | 1.16 | | | | 0.92 | | | | (4.99 | ) | | | 15.77 | |
| 10/31/2018 | | | 19.80 | | | | (0.29 | ) | | | 3.03 | | | | 2.74 | | | | (2.70 | ) | | | 19.84 | |
| (a) | Calculated using average shares outstanding during the period. |
| (b) | Total return for Classes A and C does not consider the effects of sales loads and assumes the reinvestment of all distributions. Total return for all other classes assumes the reinvestment of all distributions. |
| (c) | Commenced on August 28, 2020. |
| (d) | Not annualized. |
| (e) | Annualized. |
| 206 | See Notes to Financial Statements. |
| | | | Ratios to Average Net Assets: | | Supplemental Data: |
| | | | | | | | | | | | | | | | | |
Total return(b) (%) | | Total expenses after waivers and/or reim- bursements (%) | | Total expenses (%) | | Net investment (loss) (%) | | Net assets, end of period (000) | | Portfolio turnover rate (%) |
| | | | | | | | | | | | | | | | | | | | | | | |
| | (28.41 | ) | | | 1.40 | | | | 1.41 | | | | (0.91 | ) | | | $36,107 | | | | 87 | |
| | 47.12 | | | | 1.36 | | | | 1.37 | | | | (1.29 | ) | | | 61,063 | | | | 102 | |
| | 51.19 | | | | 1.56 | | | | 1.56 | | | | (1.32 | ) | | | 11,747 | | | | 115 | |
| | 8.33 | | | | 1.66 | | | | 1.66 | | | | (1.48 | ) | | | 12,590 | | | | 94 | |
| | 16.32 | | | | 1.63 | | | | 1.63 | | | | (1.43 | ) | | | 11,616 | | | | 73 | |
| | | | | | | | | | | | | | | | | | | | | | | |
| | (28.91 | ) | | | 2.15 | | | | 2.16 | | | | (1.66 | ) | | | 6,827 | | | | 87 | |
| | 46.03 | | | | 2.12 | | | | 2.13 | | | | (2.05 | ) | | | 13,532 | | | | 102 | |
| | | | | | | | | | | | | | | | | | | | | | | |
| | 1.29 | (d) | | | 2.03 | (e) | | | 2.05 | (e) | | | (1.91 | )(e) | | | 849 | | | | 115 | (d) |
| | | | | | | | | | | | | | | | | | | | | | | |
| | (28.19 | ) | | | 1.15 | | | | 1.25 | | | | (0.63 | ) | | | 41,545 | | | | 87 | |
| | 47.39 | | | | 1.12 | | | | 1.22 | | | | (1.05 | ) | | | 167,300 | | | | 102 | |
| | | | | | | | | | | | | | | | | | | | | | | |
| | 1.49 | (d) | | | 1.10 | (e) | | | 1.20 | (e) | | | (0.97 | )(e) | | | 12,089 | | | | 115 | (d) |
| | | | | | | | | | | | | | | | | | | | | | | |
| | (28.19 | ) | | | 1.15 | | | | 1.16 | | | | (0.68 | ) | | | 149,122 | | | | 87 | |
| | 47.39 | | | | 1.11 | | | | 1.12 | | | | (1.03 | ) | | | 155,420 | | | | 102 | |
| | 51.47 | | | | 1.44 | | | | 1.45 | | | | (1.19 | ) | | | 90,725 | | | | 115 | |
| | 8.34 | | | | 1.66 | | | | 1.66 | | | | (1.48 | ) | | | 119,822 | | | | 94 | |
| | 16.31 | | | | 1.63 | | | | 1.63 | | | | (1.43 | ) | | | 133,719 | | | | 73 | |
| | See Notes to Financial Statements. | 207 |
Financial Highlights (continued)
VALUE OPPORTUNITIES FUND
| | | | | | Per Share Operating Performance: |
| | | | | | | Investment Operations: | | Distributions to
shareholders from: |
| | | Net asset value,
beginning
of period | | Net
invest-
ment
income
(loss)(a) | | Net
realized and unrealized
gain (loss) | | Total
from
invest-
ment
opera-
tions | | Net
investment
income | | Net
realized
gain | | Total
distri-
butions |
| Class A | | | | | | | | | | | | | | | | | | | | | | | | | | | | |
| 10/31/2022 | | | $23.70 | | | | $0.10 | | | | $(4.01 | ) | | | $(3.91 | ) | | | $ – | | | | $(2.88 | ) | | | $(2.88 | ) |
| 10/31/2021 | | | 16.98 | | | | 0.01 | | | | 7.76 | | | | 7.77 | | | | (0.05 | ) | | | (1.00 | ) | | | (1.05 | ) |
| 10/31/2020 | | | 18.62 | | | | 0.05 | | | | 0.39 | | | | 0.44 | | | | (0.07 | ) | | | (2.01 | ) | | | (2.08 | ) |
| 10/31/2019 | | | 19.50 | | | | 0.05 | | | | 0.84 | | | | 0.89 | | | | (0.01 | ) | | | (1.76 | ) | | | (1.77 | ) |
| 10/31/2018 | | | 20.80 | | | | 0.01 | | | | (0.06 | ) | | | (0.05 | ) | | | – | | | | (1.25 | ) | | | (1.25 | ) |
| Class C | | | | | | | | | | | | | | | | | | | | | | | | | | | | |
| 10/31/2022 | | | 19.92 | | | | (0.03 | ) | | | (3.26 | ) | | | (3.29 | ) | | | – | | | | (2.88 | ) | | | (2.88 | ) |
| 10/31/2021 | | | 14.47 | | | | (0.13 | ) | | | 6.58 | | | | 6.45 | | | | – | | | | (1.00 | ) | | | (1.00 | ) |
| 10/31/2020 | | | 16.22 | | | | (0.06 | ) | | | 0.32 | | | | 0.26 | | | | – | | | | (2.01 | ) | | | (2.01 | ) |
| 10/31/2019 | | | 17.32 | | | | (0.07 | ) | | | 0.73 | | | | 0.66 | | | | – | | | | (1.76 | ) | | | (1.76 | ) |
| 10/31/2018 | | | 18.75 | | | | (0.12 | ) | | | (0.06 | ) | | | (0.18 | ) | | | – | | | | (1.25 | ) | | | (1.25 | ) |
| Class F | | | | | | | | | | | | | | | | | | | | | | | | | | | | |
| 10/31/2022 | | | 24.37 | | | | 0.14 | | | | (4.15 | ) | | | (4.01 | ) | | | (0.03 | ) | | | (2.88 | ) | | | (2.91 | ) |
| 10/31/2021 | | | 17.42 | | | | 0.04 | | | | 7.98 | | | | 8.02 | | | | (0.07 | ) | | | (1.00 | ) | | | (1.07 | ) |
| 10/31/2020 | | | 19.06 | | | | 0.07 | | | | 0.39 | | | | 0.46 | | | | (0.09 | ) | | | (2.01 | ) | | | (2.10 | ) |
| 10/31/2019 | | | 19.92 | | | | 0.08 | | | | 0.86 | | | | 0.94 | | | | (0.04 | ) | | | (1.76 | ) | | | (1.80 | ) |
| 10/31/2018 | | | 21.18 | | | | 0.04 | | | | (0.04 | ) | | | – | | | | (0.01 | ) | | | (1.25 | ) | | | (1.26 | ) |
| Class F3 | | | | | | | | | | | | | | | | | | | | | | | | | | | | |
| 10/31/2022 | | | 25.16 | | | | 0.18 | | | | (4.29 | ) | | | (4.11 | ) | | | (0.06 | ) | | | (2.88 | ) | | | (2.94 | ) |
| 10/31/2021 | | | 17.95 | | | | 0.09 | | | | 8.21 | | | | 8.30 | | | | (0.09 | ) | | | (1.00 | ) | | | (1.09 | ) |
| 10/31/2020 | | | 19.56 | | | | 0.11 | | | | 0.41 | | | | 0.52 | | | | (0.12 | ) | | | (2.01 | ) | | | (2.13 | ) |
| 10/31/2019 | | | 20.38 | | | | 0.12 | | | | 0.88 | | | | 1.00 | | | | (0.06 | ) | | | (1.76 | ) | | | (1.82 | ) |
| 10/31/2018 | | | 21.65 | | | | 0.08 | | | | (0.05 | ) | | | 0.03 | | | | (0.05 | ) | | | (1.25 | ) | | | (1.30 | ) |
| Class I | | | | | | | | | | | | | | | | | | | | | | | | | | | | |
| 10/31/2022 | | | 24.95 | | | | 0.15 | | | | (4.24 | ) | | | (4.09 | ) | | | (0.05 | ) | | | (2.88 | ) | | | (2.93 | ) |
| 10/31/2021 | | | 17.82 | | | | 0.06 | | | | 8.16 | | | | 8.22 | | | | (0.09 | ) | | | (1.00 | ) | | | (1.09 | ) |
| 10/31/2020 | | | 19.45 | | | | 0.09 | | | | 0.41 | | | | 0.50 | | | | (0.12 | ) | | | (2.01 | ) | | | (2.13 | ) |
| 10/31/2019 | | | 20.29 | | | | 0.10 | | | | 0.88 | | | | 0.98 | | | | (0.06 | ) | | | (1.76 | ) | | | (1.82 | ) |
| 10/31/2018 | | | 21.59 | | | | 0.06 | | | | (0.06 | ) | | | – | | | | (0.05 | ) | | | (1.25 | ) | | | (1.30 | ) |
| Class P | | | | | | | | | | | | | | | | | | | | | | | | | | | | |
| 10/31/2022 | | | 23.08 | | | | 0.06 | | | | (3.88 | ) | | | (3.82 | ) | | | – | | | | (2.88 | ) | | | (2.88 | ) |
| 10/31/2021 | | | 16.55 | | | | (0.03 | ) | | | 7.56 | | | | 7.53 | | | | – | (c) | | | (1.00 | ) | | | (1.00 | ) |
| 10/31/2020 | | | 18.20 | | | | 0.02 | | | | 0.37 | | | | 0.39 | | | | (0.03 | ) | | | (2.01 | ) | | | (2.04 | ) |
| 10/31/2019 | | | 19.13 | | | | 0.01 | | | | 0.82 | | | | 0.83 | | | | – | | | | (1.76 | ) | | | (1.76 | ) |
| 10/31/2018 | | | 20.46 | | | | (0.03 | ) | | | (0.05 | ) | | | (0.08 | ) | | | – | | | | (1.25 | ) | | | (1.25 | ) |
| Class R2 | | | | | | | | | | | | | | | | | | | | | | | | | | | | |
| 10/31/2022 | | | 22.37 | | | | 0.03 | | | | (3.74 | ) | | | (3.71 | ) | | | – | | | | (2.88 | ) | | | (2.88 | ) |
| 10/31/2021 | | | 16.09 | | | | (0.06 | ) | | | 7.34 | | | | 7.28 | | | | – | | | | (1.00 | ) | | | (1.00 | ) |
| 10/31/2020 | | | 17.75 | | | | (0.01 | ) | | | 0.37 | | | | 0.36 | | | | (0.01 | ) | | | (2.01 | ) | | | (2.02 | ) |
| 10/31/2019 | | | 18.72 | | | | (0.01 | ) | | | 0.80 | | | | 0.79 | | | | – | | | | (1.76 | ) | | | (1.76 | ) |
| 10/31/2018 | | | 20.06 | | | | (0.06 | ) | | | (0.03 | ) | | | (0.09 | ) | | | – | | | | (1.25 | ) | | | (1.25 | ) |
| 208 | See Notes to Financial Statements. |
| | | | | | | Ratios to Average Net Assets: | | Supplemental Data: |
| | | | | | | | | | | | | | | | | | | | |
Net
asset
value,
end of
period | | Total
return(b)
(%) | | Total
expenses after
waivers
and/or reim-
bursements
(%) | | Total
expenses
(%) | | Net
invest-
ment
income
(loss)
(%) | | Net
assets,
end of
period
(000) | | Portfolio
turnover
rate
(%) |
| | | | | | | | | | | | | | | | | | | | | | | | | | | |
| $16.91 | | | | (19.11 | ) | | | 1.16 | | | | 1.16 | | | | 0.53 | | | | $633,570 | | | | 40 | |
| | 23.70 | | | | 47.52 | | | | 1.15 | | | | 1.15 | | | | 0.04 | | | | 851,298 | | | | 56 | |
| | 16.98 | | | | 2.35 | | | | 1.18 | | | | 1.18 | | | | 0.29 | | | | 625,448 | | | | 36 | |
| | 18.62 | | | | 5.22 | | | | 1.18 | | | | 1.18 | | | | 0.29 | | | | 775,746 | | | | 51 | |
| | 19.50 | | | | (0.28 | ) | | | 1.11 | | | | 1.11 | | | | 0.06 | | | | 922,813 | | | | 54 | |
| | | | | | | | | | | | | | | | | | | | | | | | | | | |
| | 13.75 | | | | (19.70 | ) | | | 1.91 | | | | 1.91 | | | | (0.22 | ) | | | 45,211 | | | | 40 | |
| | 19.92 | | | | 46.42 | | | | 1.90 | | | | 1.90 | | | | (0.70 | ) | | | 76,310 | | | | 56 | |
| | 14.47 | | | | 1.57 | | | | 1.93 | | | | 1.93 | | | | (0.45 | ) | | | 63,709 | | | | 36 | |
| | 16.22 | | | | 4.48 | | | | 1.93 | | | | 1.93 | | | | (0.46 | ) | | | 142,020 | | | | 51 | |
| | 17.32 | | | | (1.05 | ) | | | 1.87 | | | | 1.87 | | | | (0.69 | ) | | | 225,551 | | | | 54 | |
| | | | | | | | | | | | | | | | | | | | | | | | | | | |
| | 17.45 | | | | (19.01 | ) | | | 1.01 | | | | 1.01 | | | | 0.71 | | | | 76,594 | | | | 40 | |
| | 24.37 | | | | 47.76 | | | | 1.00 | | | | 1.00 | | | | 0.19 | | | | 189,251 | | | | 56 | |
| | 17.42 | | | | 2.50 | | | | 1.03 | | | | 1.03 | | | | 0.44 | | | | 138,870 | | | | 36 | |
| | 19.06 | | | | 5.38 | | | | 1.03 | | | | 1.03 | | | | 0.45 | | | | 210,350 | | | | 51 | |
| | 19.92 | | | | (0.03 | ) | | | 0.97 | | | | 0.97 | | | | 0.22 | | | | 390,627 | | | | 54 | |
| | | | | | | | | | | | | | | | | | | | | | | | | | | |
| | 18.11 | | | | (18.83 | ) | | | 0.82 | | | | 0.82 | | | | 0.87 | | | | 194,437 | | | | 40 | |
| | 25.16 | | | | 48.05 | | | | 0.81 | | | | 0.81 | | | | 0.38 | | | | 255,539 | | | | 56 | |
| | 17.95 | | | | 2.69 | | | | 0.83 | | | | 0.83 | | | | 0.64 | | | | 200,055 | | | | 36 | |
| | 19.56 | | | | 5.61 | | | | 0.83 | | | | 0.83 | | | | 0.64 | | | | 260,948 | | | | 51 | |
| | 20.38 | | | | 0.13 | | | | 0.78 | | | | 0.78 | | | | 0.39 | | | | 331,176 | | | | 54 | |
| | | | | | | | | | | | | | | | | | | | | | | | | | | |
| | 17.93 | | | | (18.88 | ) | | | 0.91 | | | | 0.91 | | | | 0.75 | | | | 246,040 | | | | 40 | |
| | 24.95 | | | | 47.93 | | | | 0.89 | | | | 0.89 | | | | 0.28 | | | | 412,964 | | | | 56 | |
| | 17.82 | | | | 2.58 | | | | 0.93 | | | | 0.93 | | | | 0.54 | | | | 218,137 | | | | 36 | |
| | 19.45 | | | | 5.51 | | | | 0.93 | | | | 0.93 | | | | 0.54 | | | | 292,610 | | | | 51 | |
| | 20.29 | | | | (0.02 | ) | | | 0.86 | | | | 0.86 | | | | 0.30 | | | | 450,720 | | | | 54 | |
| | | | | | | | | | | | | | | | | | | | | | | | | | | |
| | 16.38 | | | | (19.25 | ) | | | 1.36 | | | | 1.36 | | | | 0.33 | | | | 12,663 | | | | 40 | |
| | 23.08 | | | | 47.19 | | | | 1.35 | | | | 1.35 | | | | (0.16 | ) | | | 17,141 | | | | 56 | |
| | 16.55 | | | | 2.18 | | | | 1.38 | | | | 1.38 | | | | 0.10 | | | | 16,560 | | | | 36 | |
| | 18.20 | | | | 5.05 | | | | 1.38 | | | | 1.38 | | | | 0.08 | | | | 22,113 | | | | 51 | |
| | 19.13 | | | | (0.49 | ) | | | 1.31 | | | | 1.31 | | | | (0.14 | ) | | | 25,501 | | | | 54 | |
| | | | | | | | | | | | | | | | | | | | | | | | | | | |
| | 15.78 | | | | (19.38 | ) | | | 1.51 | | | | 1.51 | | | | 0.19 | | | | 4,433 | | | | 40 | |
| | 22.37 | | | | 47.03 | | | | 1.50 | | | | 1.50 | | | | (0.30 | ) | | | 5,845 | | | | 56 | |
| | 16.09 | | | | 1.96 | | | | 1.53 | | | | 1.53 | | | | (0.06 | ) | | | 4,879 | | | | 36 | |
| | 17.75 | | | | 4.88 | | | | 1.53 | | | | 1.53 | | | | (0.07 | ) | | | 6,483 | | | | 51 | |
| | 18.72 | | | | (0.50 | ) | | | 1.46 | | | | 1.46 | | | | (0.29 | ) | | | 7,339 | | | | 54 | |
| | See Notes to Financial Statements. | 209 |
Financial Highlights (concluded)
VALUE OPPORTUNITIES FUND
| | | | | Per Share Operating Performance: |
| | | | | | Investment Operations: | | Distributions to
shareholders from: |
| | | Net asset
value,
beginning
of period | | Net
invest-
ment
income
(loss)(a) | | Net
realized
and
unrealized
gain (loss) | | Total
from
invest-
ment
opera-
tions | | Net
investment
income | | Net
realized
gain | | Total
distri-
butions |
| Class R3 | | | | | | | | | | | | | | | | | | | | | | | | | | | | |
| 10/31/2022 | | | $22.75 | | | | $0.05 | | | | $(3.82 | ) | | | $(3.77 | ) | | | $ – | | | | $(2.88 | ) | | | $(2.88 | ) |
| 10/31/2021 | | | 16.33 | | | | (0.04 | ) | | | 7.46 | | | | 7.42 | | | | – | | | | (1.00 | ) | | | (1.00 | ) |
| 10/31/2020 | | | 17.97 | | | | 0.01 | | | | 0.37 | | | | 0.38 | | | | (0.01 | ) | | | (2.01 | ) | | | (2.02 | ) |
| 10/31/2019 | | | 18.92 | | | | 0.01 | | | | 0.80 | | | | 0.81 | | | | – | | | | (1.76 | ) | | | (1.76 | ) |
| 10/31/2018 | | | 20.25 | | | | (0.04 | ) | | | (0.04 | ) | | | (0.08 | ) | | | – | | | | (1.25 | ) | | | (1.25 | ) |
| Class R4 | | | | | | | | | | | | | | | | | | | | | | | | | | | | |
| 10/31/2022 | | | 23.67 | | | | 0.10 | | | | (4.00 | ) | | | (3.90 | ) | | | – | | | | (2.88 | ) | | | (2.88 | ) |
| 10/31/2021 | | | 16.95 | | | | 0.01 | | | | 7.75 | | | | 7.76 | | | | (0.04 | ) | | | (1.00 | ) | | | (1.04 | ) |
| 10/31/2020 | | | 18.60 | | | | 0.05 | | | | 0.37 | | | | 0.42 | | | | (0.06 | ) | | | (2.01 | ) | | | (2.07 | ) |
| 10/31/2019 | | | 19.47 | | | | 0.05 | | | | 0.85 | | | | 0.90 | | | | (0.01 | ) | | | (1.76 | ) | | | (1.77 | ) |
| 10/31/2018 | | | 20.79 | | | | 0.01 | | | | (0.06 | ) | | | (0.05 | ) | | | (0.02 | ) | | | (1.25 | ) | | | (1.27 | ) |
| Class R5 | | | | | | | | | | | | | | | | | | | | | | | | | | | | |
| 10/31/2022 | | | 24.97 | | | | 0.16 | | | | (4.26 | ) | | | (4.10 | ) | | | (0.05 | ) | | | (2.88 | ) | | | (2.93 | ) |
| 10/31/2021 | | | 17.83 | | | | 0.06 | | | | 8.17 | | | | 8.23 | | | | (0.09 | ) | | | (1.00 | ) | | | (1.09 | ) |
| 10/31/2020 | | | 19.46 | | | | 0.09 | | | | 0.41 | | | | 0.50 | | | | (0.12 | ) | | | (2.01 | ) | | | (2.13 | ) |
| 10/31/2019 | | | 20.30 | | | | 0.10 | | | | 0.88 | | | | 0.98 | | | | (0.06 | ) | | | (1.76 | ) | | | (1.82 | ) |
| 10/31/2018 | | | 21.59 | | | | 0.07 | | | | (0.07 | ) | | | – | | | | (0.04 | ) | | | (1.25 | ) | | | (1.29 | ) |
| Class R6 | | | | | | | | | | | | | | | | | | | | | | | | | | | | |
| 10/31/2022 | | | 25.14 | | | | 0.18 | | | | (4.28 | ) | | | (4.10 | ) | | | (0.06 | ) | | | (2.88 | ) | | | (2.94 | ) |
| 10/31/2021 | | | 17.93 | | | | 0.09 | | | | 8.21 | | | | 8.30 | | | | (0.09 | ) | | | (1.00 | ) | | | (1.09 | ) |
| 10/31/2020 | | | 19.55 | | | | 0.11 | | | | 0.40 | | | | 0.51 | | | | (0.12 | ) | | | (2.01 | ) | | | (2.13 | ) |
| 10/31/2019 | | | 20.37 | | | | 0.12 | | | | 0.88 | | | | 1.00 | | | | (0.06 | ) | | | (1.76 | ) | | | (1.82 | ) |
| 10/31/2018 | | | 21.65 | | | | 0.08 | | | | (0.06 | ) | | | 0.02 | | | | (0.05 | ) | | | (1.25 | ) | | | (1.30 | ) |
| (a) | Calculated using average shares outstanding during the period. |
| (b) | Total return for Classes A and C does not consider the effects of sales loads and assumes the reinvestment of all distributions. Total return for all other classes assumes the reinvestment of all distributions. |
| (c) | Amount less than $0.01. |
| 210 | See Notes to Financial Statements. |
| | | | | | | Ratios to Average Net Assets: | | Supplemental Data: |
| | | | | | | | | |
Net
asset
value,
end of
period | | Total
return(b)
(%) | | Total
expenses
after
waivers
and/or reim-
bursements
(%) | | Total
expenses
(%) | | Net
invest-
ment
income
(loss)
(%) | | Net
assets,
end of
period
(000) | | Portfolio
turnover
rate
(%) |
| | | | | | | | | | | | | | | | | | | | | | | | | | | |
| $16.10 | | | | (19.31 | ) | | | 1.41 | | | | 1.41 | | | | 0.28 | | | | $31,104 | | | | 40 | |
| | 22.75 | | | | 47.20 | | | | 1.40 | | | | 1.40 | | | | (0.20 | ) | | | 42,047 | | | | 56 | |
| | 16.33 | | | | 2.09 | | | | 1.43 | | | | 1.43 | | | | 0.05 | | | | 41,390 | | | | 36 | |
| | 17.97 | | | | 4.94 | | | | 1.43 | | | | 1.43 | | | | 0.04 | | | | 56,855 | | | | 51 | |
| | 18.92 | | | | (0.45 | ) | | | 1.36 | | | | 1.36 | | | | (0.19 | ) | | | 77,440 | | | | 54 | |
| | | | | | | | | | | | | | | | | | | | | | | | | | | |
| | 16.89 | | | | (19.09 | ) | | | 1.16 | | | | 1.16 | | | | 0.53 | | | | 29,341 | | | | 40 | |
| | 23.67 | | | | 47.50 | | | | 1.15 | | | | 1.15 | | | | 0.04 | | | | 42,666 | | | | 56 | |
| | 16.95 | | | | 2.34 | | | | 1.18 | | | | 1.18 | | | | 0.29 | | | | 34,990 | | | | 36 | |
| | 18.60 | | | | 5.27 | | | | 1.18 | | | | 1.18 | | | | 0.29 | | | | 43,879 | | | | 51 | |
| | 19.47 | | | | (0.30 | ) | | | 1.11 | | | | 1.11 | | | | 0.06 | | | | 54,408 | | | | 54 | |
| | | | | | | | | | | | | | | | | | | | | | | | | | | |
| | 17.94 | | | | (18.91 | ) | | | 0.91 | | | | 0.91 | | | | 0.77 | | | | 1,247 | | | | 40 | |
| | 24.97 | | | | 47.87 | | | | 0.90 | | | | 0.90 | | | | 0.28 | | | | 2,066 | | | | 56 | |
| | 17.83 | | | | 2.58 | | | | 0.93 | | | | 0.93 | | | | 0.55 | | | | 1,971 | | | | 36 | |
| | 19.46 | | | | 5.55 | | | | 0.93 | | | | 0.93 | | | | 0.52 | | | | 2,599 | | | | 51 | |
| | 20.30 | | | | (0.01 | ) | | | 0.87 | | | | 0.87 | | | | 0.31 | | | | 1,927 | | | | 54 | |
| | | | | | | | | | | | | | | | | | | | | | | | | | | |
| | 18.10 | | | | (18.80 | ) | | | 0.82 | | | | 0.82 | | | | 0.88 | | | | 32,138 | | | | 40 | |
| | 25.14 | | | | 48.02 | | | | 0.81 | | | | 0.81 | | | | 0.39 | | | | 44,123 | | | | 56 | |
| | 17.93 | | | | 2.69 | | | | 0.83 | | | | 0.83 | | | | 0.64 | | | | 29,402 | | | | 36 | |
| | 19.55 | | | | 5.62 | | | | 0.83 | | | | 0.83 | | | | 0.66 | | | | 40,149 | | | | 51 | |
| | 20.37 | | | | 0.08 | | | | 0.78 | | | | 0.78 | | | | 0.39 | | | | 93,784 | | | | 54 | |
| | See Notes to Financial Statements. | 211 |
Notes to Financial Statements
Lord Abbett Securities Trust (the “Trust”) is registered under the Investment Company Act of 1940, as amended (the “Act”), as an open-end management investment company and was organized as a Delaware statutory trust on February 26, 1993.
All funds are diversified except Lord Abbett Focused Growth Fund and Lord Abbett Focused Large Cap Value Fund. This report covers the following thirteen funds (separately, a “Fund” and collectively, the “Funds”) and their respective active share classes:
| Funds | | Classes |
| Lord Abbett Alpha Strategy Fund (“Alpha Strategy Fund”) | | A, C, F, F3, I, R2, R3, R4, R5 and R6 |
| Lord Abbett Focused Growth Fund (“Focused Growth Fund”) | | A, C, F, F3, I, R3, R4, R5 and R6 |
| Lord Abbett Focused Large Cap Value Fund (“Focused Large Cap Value Fund”) | | A, C, F, F3, I, R3, R4, R5 and R6 |
| Lord Abbett Focused Small Cap Value Fund (“Focused Small Cap Value Fund”) | | A, C, F, F3, I, R5 and R6 |
| Lord Abbett Fundamental Equity Fund (“Fundamental Equity Fund”) | | A, C, F, F3 I, P, R2, R3, R4, R5 and R6 |
| Lord Abbett Global Equity Fund (“Global Equity Fund”) | | A, C, F, F3, I, R3, R4, R5 and R6 |
| Lord Abbett Growth Leaders Fund (“Growth Leaders Fund”) | | A, C, F, F3, I, R2, R3, R4, R5 and R6 |
| Lord Abbett Health Care Fund (“Health Care Fund”) | | A, C, F, F3, I, R3, R4, R5 and R6 |
| Lord Abbett International Equity Fund (“International Equity Fund”) | | A, C, F, F3, I, P, R2, R3, R4, R5 and R6 |
| Lord Abbett International Opportunities Fund (“International Opportunities Fund”) | | A, C, F, F3, I, P, R2, R3, R4, R5 and R6 |
| Lord Abbett International Value Fund (“International Value Fund”) | | A, C, F, F3, I, R2, R3, R4, R5 and R6 |
| Lord Abbett Micro-Cap Growth Fund (“Micro Cap Growth Fund”) | | A, C, F and I |
| Lord Abbett Value Opportunities Fund (“Value Opportunities Fund”) | | A, C, F, F3, I, P, R2, R3, R4, R5 and R6 |
The Funds’ Class P shares are closed to substantially all investors, with certain exceptions as set forth in the Funds’ prospectus.
Each of Focused Large Cap Value Fund’s, Global Equity Fund’s, Health Care Fund’s and International Equity Fund’s investment objective is to seek long-term capital appreciation. Alpha Strategy Fund’s, Focused Small Cap Value Fund’s, International Opportunities Fund’s, Micro Cap Growth Fund’s and Value Opportunities Fund’s investment objective is long-term capital appreciation. Alpha Strategy Fund invests principally in other funds (“Underlying Funds”) managed by Lord, Abbett & Co. LLC (“Lord Abbett”). Fundamental Equity Fund’s investment objective is long-term growth of capital and income without excessive fluctuations in market value. Growth Leaders Fund’s and Focused Growth Fund’s investment objective is to seek capital appreciation. International Value Fund’s investment objective is to seek a high level of total return.
Each class of shares has different expenses and dividends. A front-end sales charge is normally added to the net asset value (“NAV”) for Class A shares. There is no front-end sales charge in the case of Class C, F, F3, I, P, R2, R3, R4, R5 and R6 shares, although there may be a contingent deferred sales charge (“CDSC”) in certain cases as follows: Class A shares purchased without a sales charge and redeemed before the first day of the month in which the one-year anniversary of the purchase falls (subject to certain exceptions as set forth in each Fund’s prospectus); and Class C shares redeemed before the first anniversary of purchase. Class C shares automatically convert to Class A shares on the 25th day of the month (or, if the 25th day is not a business day, the next business day thereafter) following the eighth anniversary of the month on which the purchase order was accepted, provided that the Fund or financial intermediary through which a shareholder purchased Class C shares has records verifying that the C shares have been held at least eight years.
212
Notes to Financial Statements (continued)
The preparation of the financial statements in conformity with accounting principles generally accepted in the United States of America (“U.S. GAAP”) requires management to make certain estimates and assumptions that affect the reported amounts of assets and liabilities and disclosure of contingent assets and liabilities at the date of the financial statements and the reported amounts of increases and decreases in net assets from operations during the reporting period. Actual results could differ from those estimates. These Funds are considered investment companies under U.S. GAAP and follow the accounting and reporting guidance applicable to investment companies.
| 2. | SIGNIFICANT ACCOUNTING POLICIES |
| (a) | Investment Valuation–Under procedures approved by the Funds’ Board of Trustees (the “Board”), the Board has designated the determination of fair value of the Funds’ portfolio investments to Lord Abbett, as valuation designee. Accordingly, Lord Abbett is responsible for, among other things, assessing and managing valuation risks, establishing, applying and testing fair value methodologies, and evaluating pricing services. Lord Abbett has formed a Pricing Committee that performs these responsibilities on behalf of Lord Abbett, administers the pricing and valuation of portfolio investments, and ensures that prices utilized reasonably reflect fair value. Among other things, these procedures allow Lord Abbett, subject to Board oversight, to utilize independent pricing services, quotations from securities and financial instrument dealers and other market sources to determine fair value. |
| | |
| | Securities actively traded on any recognized U.S. or non-U.S. exchange or on The NASDAQ Stock Market LLC are valued at the last sale price or official closing price on the exchange or system on which they are principally traded. Events occurring after the close of trading on non-U.S. exchanges may result in adjustments to the valuation of foreign securities to reflect their fair value as of the close of regular trading on the New York Stock Exchange (“NYSE”). When valuing foreign equity securities that meet certain criteria, the Board has approved the use of an independent fair valuation service that values such securities to reflect market trading that occurs after the close of the applicable foreign markets of comparable securities or other instruments that correlate to the fair-valued securities. Unlisted equity securities are valued at the last quoted sale price or, if no sale price is available, at the mean between the most recently quoted bid and ask prices. Exchange traded options and futures contracts are valued at the last quoted sale price in the market where they are principally traded. If no sale has occurred, the mean between the most recently quoted bid and ask prices is used. Swaps are valued daily using independent pricing services or quotations from broker/dealers to the extent available. Investments in the Underlying Funds are valued at their NAV each business day at the close of regular trading on the NYSE, normally 4:00 p.m. Eastern time. |
| | |
| | Securities for which prices are not readily available are valued at fair value as determined by the Pricing Committee. The Pricing Committee considers a number of factors, including observable and unobservable inputs, when arriving at fair value. The Pricing Committee may use related or comparable assets or liabilities, recent transactions, market multiples, book values, and other relevant information to determine the fair value of portfolio investments. The Board or a designated committee thereof periodically reviews reports that may include fair value determinations made by the Pricing Committee, related market activity, inputs and assumptions, and retrospective comparison of prices of subsequent purchases and sales transactions to fair value determinations made by the Pricing Committee. |
213
Notes to Financial Statements (continued)
| | Investments in open-end money market mutual funds are valued at their NAV as of the close of each business day. Short-term securities with 60 days or less remaining to maturity are valued using the amortized cost method, which approximates fair value. |
| | |
| (b) | Security Transactions–Security transactions are recorded as of the date that the securities are purchased or sold (trade date). Realized gains and losses on sales of portfolio securities are calculated using the identified-cost method. Realized and unrealized gains (losses) are allocated to each class of shares based upon the relative proportion of net assets at the beginning of the day. |
| | |
| (c) | Investment Income–Dividend income is recorded on the ex-dividend date. Interest income is recorded on the accrual basis as earned. Discounts are accreted and premiums are amortized using the effective interest method and are included in Interest and other, if applicable, on the Statements of Operations. Withholding taxes on foreign dividends have been provided for in accordance with the applicable country’s tax rules and rates. Investment income is allocated to each class of shares based upon the relative proportion of net assets at the beginning of the day. |
| | |
| (d) | Income Taxes–It is the policy of each Fund to meet the requirements of Subchapter M of the Internal Revenue Code applicable to regulated investment companies and to distribute substantially all taxable income and capital gains to its shareholders. Therefore, no income tax provision is required. |
| | |
| | Each Fund files U.S. federal and various state and local tax returns. No income tax returns are currently under examination. The statute of limitations on each Fund’s filed U.S. federal tax returns remains open for the fiscal years ended October 31, 2019 through October 31, 2022. The statutes of limitations on the Trust’s state and local tax returns may remain open for an additional year depending upon the jurisdiction. |
| | |
| (e) | Expenses–Expenses incurred by the Trust that do not specifically relate to an individual fund are generally allocated to the Funds within the Trust on a pro rata basis by relative net assets. Expenses, excluding class-specific expenses, are allocated to each class of shares based upon the relative proportion of net assets at the beginning of the day. In addition, Class F3 and R6 bear only their class-specific shareholder servicing expenses. Class A, C, F, P, R2, R3 and R4 shares bear their class-specific share of all expenses and fees relating to the Funds’ 12b-1 Distribution Plan. |
| | |
| (f) | Foreign Transactions–The books and records of each Fund are maintained in U.S. dollars and transactions denominated in foreign currencies are recorded in each Fund’s records at the rate prevailing when earned or recorded. Asset and liability accounts that are denominated in foreign currencies are adjusted daily to reflect current exchange rates and any unrealized gain (loss), if applicable, is included in Net change in unrealized appreciation/depreciation on translation of assets and liabilities denominated in foreign currencies on each Fund’s Statement of Operations. The resultant exchange gains and losses upon settlement of such transactions, if applicable, are included in Net realized gain (loss) on foreign currency related transactions in each Fund’s Statement of Operations. The Funds do not isolate that portion of the results of operations arising as a result of changes in the foreign exchange rates from the changes in market prices of the securities. |
| | |
| | Each Fund uses foreign currency exchange contracts to facilitate transactions in foreign-denominated securities. Losses from these transactions may arise from changes in the value of the foreign currency or if the counterparties do not perform under the contracts’ terms. |
214
Notes to Financial Statements (continued)
| (g) | Forward Foreign Currency Exchange Contracts–Each Fund may enter into forward foreign currency exchange contracts in order to reduce exposure to changes in foreign currency exchange rates on foreign portfolio holdings, or gain or reduce exposure to foreign currency solely for investment purposes. A forward foreign currency exchange contract is a commitment to purchase or sell a foreign currency at a future date at a negotiated rate. The contracts are valued daily at forward exchange rates and any unrealized gain (loss), if applicable, is included in Net change in unrealized appreciation/depreciation on forward foreign currency exchange contracts in each Fund’s Statement of Operations. The gain (loss) arising from the difference between the U.S. dollar cost of the original contract and the value of the forward foreign currency in U.S. dollars upon closing of such contracts is included, if applicable, in Net realized gain (loss) on forward foreign currency exchange contracts in each Fund’s Statement of Operations. |
| | |
| (h) | Futures Contracts–Each Fund may purchase and sell futures contracts to enhance returns, to attempt to economically hedge some of its investment risk, or as a substitute position in lieu of holding the underlying asset on which the instrument is based. At the time of entering into a futures transaction, an investor is required to deposit and maintain a specified amount of cash or eligible securities called “initial margin.” Subsequent payments made or received by the Fund called “variation margin” are made on a daily basis as the market price of the futures contract fluctuates. Each Fund will record an unrealized gain (loss) based on the amount of variation margin. When a contract is closed, a realized gain (loss) is recorded equal to the difference between the opening and closing value of the contract. |
| | |
| (i) | Repurchase Agreements–Each Fund may enter into repurchase agreements with respect to securities. A repurchase agreement is a transaction in which a fund acquires a security and simultaneously commits to resell that security to the seller (a bank or securities dealer) at an agreed-upon price on an agreed-upon date. Each Fund requires at all times that the repurchase agreement be collateralized by cash, or by securities of the U.S. Government, its agencies, its instrumentalities, or U.S. Government sponsored enterprises having a value equal to, or in excess of, the value of the repurchase agreement (including accrued interest). If the seller of the agreement defaults on its obligation to repurchase the underlying securities at a time when the fair value of these securities has declined, a Fund may incur a loss upon disposition of the securities. |
| | |
| (j) | When-Issued or Forward Transactions–Each Fund may purchase portfolio securities on a when-issued or forward basis. When-issued or forward transactions involve a commitment by a Fund to purchase securities, with payment and delivery (“settlement”) to take place in the future, in order to secure what is considered to be an advantageous price or yield at the time of entering into the transaction. During the period between purchase and settlement, the fair value of the securities will fluctuate and assets consisting of cash and/or marketable securities (normally short-term U.S. Government or U.S. Government sponsored enterprise securities) marked to market daily in an amount sufficient to make payment at settlement will be segregated at each Fund’s custodian in order to pay for the commitment. At the time each Fund makes the commitment to purchase a security on a when-issued basis, it will record the transaction and reflect the liability for the purchase and fair value of the security in determining its NAV. Each Fund, generally, has the ability to close out a purchase obligation on or before the settlement date rather than take delivery of the security. Under no circumstances will settlement for such securities take place more than 120 days after the purchase date. |
215
Notes to Financial Statements (continued)
| (k) | Total Return Swaps–Each Fund may enter into total return swap agreements to obtain exposure to a security or market without owning such security or investing directly in that market. Each Fund may agree to make payments that are the equivalent of interest in exchange for the right to receive payments equivalent to any appreciation in the value of an underlying security, index or other asset, as well as receive payments equivalent to any distributions made on that asset, over the term of the swap. If the value of the asset underlying a total return swap declines over the term of the swap, each Fund also may be required to pay an amount equal to that decline in value to their counterparty. |
| | |
| (l) | Fair Value Measurements–Fair value is defined as the price that each Fund would receive upon selling an investment or transferring a liability in an orderly transaction to an independent buyer in the principal or most advantageous market of the investment. A three-tier hierarchy is used to maximize the use of observable market data and minimize the use of unobservable inputs and to establish classification of fair value measurements for disclosure purposes. Inputs refer broadly to the assumptions that market participants would use in pricing the asset or liability, including assumptions about risk - for example, the risk inherent in a particular valuation technique used to measure fair value (such as a pricing model) and/or the risk inherent in the inputs to the valuation technique. Inputs may be observable or unobservable. Observable inputs reflect the assumptions market participants would use in pricing the asset or liability. Observable inputs are based on market data obtained from sources independent of the reporting entity. Unobservable inputs reflect the reporting entity’s own assumptions about the assumptions market participants would use in pricing the asset or liability. Unobservable inputs are based on the best information available in the circumstances. The three-tier hierarchy classification is determined based on the lowest level of inputs that is significant to the fair value measurement, and is summarized in the three broad Levels listed below: |
| | • | Level 1 – | unadjusted quoted prices in active markets for identical investments; |
| | | | |
| | • | Level 2 – | other significant observable inputs (including quoted prices for similar investments, interest rates, prepayment speeds, credit risk, etc.); and |
| | | | |
| | • | Level 3 – | significant unobservable inputs (including each Fund’s own assumptions in determining the fair value of investments). |
| | A summary of inputs used in valuing each Fund’s investments and other financial instruments as of October 31, 2022 and, if applicable, Level 3 rollforwards for the fiscal year then ended is included in each Fund’s Schedule of Investments. |
| | |
| | Changes in valuation techniques may result in transfers into or out of an assigned level within the three-tier hierarchy. The inputs or methodology used for valuing securities are not necessarily an indication of the risk associated with investing in those securities. |
| | |
| (m) | Foreign Taxes–The Funds may be subject to foreign taxes (a portion of which may be reclaimable) on income, stock dividend, capital gains on investments, or certain foreign currency transactions. All foreign taxes are recorded in accordance with the applicable foreign tax regulations and rates that exist in foreign jurisdictions in which each Fund invests. These foreign taxes, if any, are paid by each Fund and are reflected in its Statement of Operations as follows: foreign taxes withheld at source are presented as a reduction of income, foreign taxes on securities lending income are presented as a reduction of securities lending income, foreign taxes on stock dividends are presented as a reduction of dividends, and foreign taxes on gains |
216
Notes to Financial Statements (continued)
| | from sales of investments and foreign taxes on foreign currency transactions are included in their respective net realized gain (loss) categories. Foreign taxes payable or deferred as of October 31, 2022, if any, are disclosed on the Statements of Assets and Liabilities. |
| | |
| | The Funds file withholding tax reclaims in certain jurisdictions to recover a portion of amounts previously withheld. The Funds may record a reclaim receivable based on collectability, which includes factors such as the jurisdictions applicable laws, payment history and market convention. The Statements of Operations include tax reclaims recorded as well as professional and other fees, if any, associated with recovery of foreign withholding taxes. |
| 3. | MANAGEMENT FEE AND OTHER TRANSACTIONS WITH AFFILIATES |
Management Fee
The Trust has a management agreement with Lord Abbett, pursuant to which Lord Abbett provides each Fund with investment management services and executive and other personnel, provides office space and pays for ordinary and necessary office and clerical expenses relating to research and statistical work and supervision of each Fund’s investment portfolio. The management fee is accrued daily and payable monthly.
The management fee is based on each Fund’s average daily net assets at the following annual rates:
| * | | Lord Abbett is voluntarily waiving the entire management fee of .10%. Lord Abbett may discontinue the voluntary waiver at any time without notice. |
| Focused Growth Fund | |
| | |
| First $1 billion | .65% |
| Next $1 billion | .63% |
| Next $5 billion | .60% |
| Over $7 billion | .59% |
| | |
| Focused Large Cap Value Fund | |
| | |
| First $1 billion | .59% |
| Over $1 billion | .53% |
| | |
| Focused Small Cap Value Fund | .80% |
| | |
| Fundamental Equity Fund | |
| | |
| First $200 million | .75% |
| Next $300 million | .65% |
| Over $500 million | .50% |
| | |
| Global Equity Fund | |
| | |
| First $1 billion | .45% |
| Next $2 billion | .43% |
| Over $3 billion | .41% |
| | |
| Growth Leaders Fund | |
| | |
| First $2 billion | .55% |
| Over $2 billion | .50% |
| | |
| Health Care Fund | |
| | |
| First $1 billion | .62% |
| Over $1 billion | .51% |
217
Notes to Financial Statements (continued)
| International Equity Fund(1) | |
| | |
| First $1 billion | .70% |
| Next $1 billion | .65% |
| Over $2 billion | .60% |
| | |
| International Opportunities Fund | |
| | |
| First $1 billion | .75% |
| Next $1 billion | .70% |
| Over $2 billion | .65% |
| | |
| International Value Fund(2) | |
| | |
| First $1 billion | .70% |
| Next $1 billion | .65% |
| Over $2 billion | .60% |
| | |
| Micro Cap Growth Fund | .90% |
| | |
| Value Opportunities Fund | |
| | |
| First $1 billion | .75% |
| Next $1 billion | .70% |
| Next $3 billion | .65% |
| Over $5 billion | .58% |
| (1) | Effective December 9, 2022, the management fee is based on the Fund’s average daily net assets at the following annual rate: |
| | First $1 billion | .45% | |
| | Over $1 billion | .40% | |
| | | | |
| (2) | Effective December 9, 2022, the management fee is based on the Fund’s average daily net assets at the following annual rates: |
| | First $1 billion | .50% | |
| | Over $1 billion | .48% | |
For the fiscal year ended October 31, 2022, the effective management fee, net of any applicable waivers, was at the following annualized rate of each Fund’s average daily net assets:
| | Net Effective
Management Fee | |
| | | |
| Alpha Strategy Fund | .00% | |
| Focused Growth Fund | .19% | |
| Focused Large Cap Value Fund | .59% | |
| Focused Small Cap Value Fund | .80% | |
| Fundamental Equity Fund | .55% | |
| Global Equity Fund | .00% | |
| Growth Leaders Fund | .51% | |
| Health Care Fund | .00% | |
| International Equity Fund | .64% | |
| International Opportunities Fund | .75% | |
| International Value Fund | .64% | |
| Micro Cap Growth Fund | .90% | |
| Value Opportunities Fund | .73% | |
218
Notes to Financial Statements (continued)
In addition, Lord Abbett provides certain administrative services to each Fund pursuant to an Administrative Services Agreement in return for a fee at an annual rate of 0.04% of each Fund’s average daily net assets. The fund administration fee is accrued daily and payable monthly. Lord Abbett voluntarily waived the following fund administration fees for the fiscal year ended October 31, 2022:
| Fund | Fund
Administration Fee | |
| Alpha Strategy Fund | $ | 12,862 | |
| Focused Growth Fund | | 7,230 | |
| Focused Large Cap Value Fund | | 10,384 | |
| Focused Small Cap Value Fund | | 2,271 | |
| Fundamental Equity Fund | | 43,504 | |
| Global Equity Fund | | 47,387 | |
| Growth Leaders Fund | | 110,628 | |
| Health Care Fund | | 24,101 | |
| International Equity Fund | | 69,777 | |
| International Opportunities Fund | | 141,546 | |
| International Value Fund | | 75,372 | |
| Micro Cap Growth Fund | | 18,107 | |
| Value Opportunities Fund | | — | |
For the fiscal year ended October 31, 2022 and continuing through February 28, 2023, for Funds mentioned in the table below except Global Equity Fund and continuing through February 29, 2024 for Global Equity Fund, Lord Abbett has contractually agreed to waive its fees and reimburse expenses to the extent necessary to limit total net annual operating expenses, excluding certain of the Funds’ expenses to the following annual rates:
| | | Effective March 1, 2022 | | Prior to March 1, 2022 |
| | | Classes | | Classes |
| Fund | | A, C, P, R2, R3,
R4 and R5 | | F and I | | F3 and R6 | | A, C, P, R2, R3,
R4 and R5 | | F and I | | F3 and R6 |
| Focused Growth Fund | | | .80 | % | | | .80 | % | | | .71 | % | | | .80 | % | | | .80 | % | | | .76 | % |
| Focused Large Cap Value Fund | | | .71 | % | | | .71 | % | | | .71 | % | | | .71 | % | | | .71 | % | | | .70 | % |
| Focused Small Cap Value Fund | | | 1.03 | % | | | 1.03 | % | | | 1.01 | % | | | 1.03 | % | | | 1.03 | % | | | 1.00 | % |
| Global Equity Fund | | | .65 | % | | | .65 | % | | | .58 | % | | | .65 | % | | | .65 | % | | | .61 | % |
| Health Care Fund | | | .78 | % | | | .78 | % | | | .66 | % | | | .78 | % | | | .78 | % | | | .71 | % |
| International Equity Fund | | | .92 | % | | | .86 | % | | | .84 | % | | | .92 | % | | | .86 | % | | | .84 | % |
| International Value Fund | | | .87 | % | | | .82 | % | | | .81 | % | | | .87 | % | | | .82 | % | | | .79 | % |
All contractual fee waivers and expense reimbursement agreements between the Funds and Lord Abbett may be terminated only upon the approval of the Board.
219
Notes to Financial Statements (continued)
12b-1 Distribution Plan
Each Fund has adopted a distribution plan with respect to Class A, C, F, P, R2, R3 and R4 shares pursuant to Rule 12b-1 under the Act, which provides for the payment of ongoing distribution and service fees to Lord Abbett Distributor LLC (the “Distributor”) an affiliate of Lord Abbett. The distribution and service fees are accrued daily and payable monthly. The following annual rates have been authorized by the Board pursuant to the plan:
| Fees* | | Class A | | Class C | | Class F | (1)(2) | | Class P(3) | | Class R2 | | Class R3 | | Class R4 |
| Service | | .25% | | .25% | | – | | | .25% | | .25% | | .25% | | .25% |
| Distribution | | – | | .75% | | .10% | | | .20% | | .35% | | .25% | | – |
| * | | The Funds may designate a portion of the aggregate fee as attributable to service activities for purposes of calculating Financial Industry Regulatory Authority, Inc. sales charge limitations. |
| (1) | | The Class F share Rule 12b-1 fee may be designated as a service fee in limited circumstances as described in the Funds’ prospectus. |
| (2) | | For the fiscal year ended October 31, 2022 and continuing through February 28, 2023 the Distributor has contractually agreed to waive Focused Growth Fund’s, Focused Large Cap Value Fund’s, Focused Small Cap Value Fund’s, Growth Leaders Fund’s, Health Care Fund’s and Micro Cap Growth Fund’s 0.10% 12b-1 fee for Class F shares. These agreements may be terminated only by the Fund’s Board. |
| (3) | | Fundamental Equity Fund, International Equity Fund, International Opportunities Fund and Value Opportunities Fund only. |
Class F3, Class I, Class R5 and Class R6 shares do not have a distribution plan.
Commissions
Distributor received the following commissions on sales of shares of the Funds, after concessions were paid to authorized dealers, for the fiscal year ended October 31, 2022:
| | | Distributor
Commissions | | | Dealers’
Concessions | |
| Alpha Strategy Fund | | $ | 41,420 | | | $ | 226,230 | |
| Focused Growth Fund | | | 8,138 | | | | 44,279 | |
| Focused Large Cap Value Fund | | | 8,862 | | | | 47,951 | |
| Focused Small Cap Value Fund | | | 9,301 | | | | 52,483 | |
| Fundamental Equity Fund | | | 66,411 | | | | 359,105 | |
| Global Equity Fund | | | 1,031 | | | | 5,795 | |
| Growth Leaders Fund | | | 545,289 | | | | 3,045,131 | |
| Health Care Fund | | | 2,549 | | | | 14,082 | |
| International Equity Fund | | | 11,874 | | | | 62,573 | |
| International Opportunities Fund | | | 15,363 | | | | 80,521 | |
| International Value Fund | | | 30,172 | | | | 157,826 | |
| Micro Cap Growth Fund | | | 5,352 | | | | 28,397 | |
| Value Opportunities Fund | | | 73,694 | | | | 390,880 | |
Distributor received the following amount of CDSCs for the fiscal year ended October 31, 2022:
| | | Class A | | | Class C | |
| Alpha Strategy Fund | | $ | 647 | | | $ | 1,046 | |
| Focused Growth Fund | | | 4 | | | | – | |
| Focused Large Cap Value Fund | | | – | | | | 193 | |
| Focused Small Cap Value Fund | | | 2,192 | | | | 569 | |
| Fundamental Equity Fund | | | 1,057 | | | | 1,027 | |
| Global Equity Fund | | | – | | | | 40 | |
| Growth Leaders Fund | | | 53,196 | | | | 69,988 | |
| Health Care Fund | | | – | | | | 68 | |
| International Equity Fund | | | 267 | | | | 59 | |
| International Opportunities Fund | | | 1,124 | | | | 1,037 | |
| International Value Fund | | | 170 | | | | 112 | |
| Micro Cap Growth Fund | | | 637 | | | | 3,047 | |
| Value Opportunities Fund | | | 811 | | | | 4,784 | |
220
Notes to Financial Statements (continued)
One Trustee and certain of the Trust’s officers have an interest in Lord Abbett.
Other Related Parties
As of October 31, 2022, the percentage of Focused Small Cap Value Fund’s, Fundamental Equity Fund’s, Growth Leaders Fund’s, International Equity Fund’s, International Opportunities Fund’s, International Value Fund’s, Micro Cap Growth Fund’s and Value Opportunities Fund’s outstanding shares owned by each Fund of Funds were as follows:
| Fund of Funds | | Focused
Small Cap
Value Fund | | Funda-
mental
Equity
Fund | | Growth
Leaders
Fund | | Inter-
national
Equity
Fund | | Inter-
national
Oppor-
tunities
Fund | | Inter-
national
Value
Fund | | Micro
Cap
Growth
Fund | | Value
Oppor-
tunities
Fund |
| Alpha Strategy Fund | | 48.97% | | – | | – | | – | | 40.57% | | – | | 27.59% | | 9.64% |
| Multi-Asset Balanced Opportunity Fund | | – | | 17.99% | | 2.41% | | 27.46% | | – | | 19.01% | | – | | – |
| Multi-Asset Income Fund | | – | | 5.44% | | 0.52% | | 13.96% | | – | | 8.94% | | – | | – |
| 4. | DISTRIBUTIONS AND CAPITAL LOSS CARRYFORWARDS |
Dividends from net investment income, if any, are declared and paid quarterly for International Value Fund and annually for Alpha Strategy Fund, Focused Growth Fund, Focused Large Cap Value Fund, Focused Small Cap Value Fund, Fundamental Equity Fund, Global Equity Fund, Growth Leaders Fund, Health Care Fund, International Equity Fund, International Opportunities Fund, Micro Cap Growth Fund and Value Opportunities Fund. Taxable net realized gains from investment transactions, reduced by allowable capital loss carryforwards, if any, are declared and distributed to shareholders at least annually. The capital loss carryforward amount, if any, is available to offset future net capital gains. Dividends and distributions to shareholders are recorded on the ex-dividend date. The amounts of dividends and distributions from net investment income and net realized capital gains are determined in accordance with federal income tax regulations, which may differ from U.S. GAAP. These book/tax differences are either considered temporary or permanent in nature. To the extent these differences are permanent in nature, such amounts are reclassified within the components of net assets based on their federal tax basis treatment; temporary differences do not require reclassification. Dividends and distributions, which exceed earnings and profits for tax purposes, are reported as a tax return of capital.
The tax character of distributions paid during the fiscal year ended October 31, 2022 and fiscal year ended October 31, 2021 was as follows:
| | | Alpha Strategy Fund | | | Focused Growth Fund | |
| | | Year Ended
10/31/2022 | | | Year Ended
10/31/2021 | | | Year Ended
10/31/2022 | | | Year Ended
10/31/2021 | |
| Distributions paid from: | | | | | | | | | | | | |
| Ordinary income | | $ | 12,006,583 | | | $ | 10,405,649 | | | $ | 5,658,041 | | | $ | 1,864,114 | |
| Net long-term capital gains | | | 32,798,605 | | | | 50,784,144 | | | | 1,575,680 | | | | 140,858 | |
| Total distributions paid | | $ | 44,805,188 | | | $ | 61,189,793 | | | $ | 7,233,721 | | | $ | 2,004,972 | |
221
Notes to Financial Statements (continued)
| | | Focused Large Cap Value Fund | | | Focused Small Cap Value Fund | |
| | | Year Ended
10/31/2022 | | | Year Ended
10/31/2021 | | | Year Ended
10/31/2022 | | | Year Ended
10/31/2021 | |
| Distributions paid from: | | | | | | | | | | | | |
| Ordinary income | | $ | 126,421,078 | | | $ | 38,911,138 | | | $ | 13,325,327 | | | $ | 894,345 | |
| Net long-term capital gains | | | 25,264,481 | | | | – | | | | 8,108,524 | | | | – | |
| Total distributions paid | | $ | 151,685,559 | | | $ | 38,911,138 | | | $ | 21,433,851 | | | $ | 894,345 | |
| | | | | | | | | |
| | | | Fundamental Equity Fund | | | | Global Equity Fund | |
| | | | Year Ended
10/31/2022 | | | | Year Ended
10/31/2021 | | | | Year Ended
10/31/2022 | | | | Year Ended
10/31/2021 | |
| Distributions paid from: | | | | | | | | | | | | | | | | |
| Ordinary income | | $ | 19,219,878 | | | $ | 32,382,939 | | | $ | 965,362 | | | $ | 105,849 | |
| Net long-term capital gains | | | 209,608,998 | | | | – | | | | 660,919 | | | | 278,151 | |
| Total distributions paid | | $ | 228,828,876 | | | $ | 32,382,939 | | | $ | 1,626,281 | | | $ | 384,000 | |
| | | | | | | | | |
| | | | Growth Leaders Fund | | | | Health Care Fund | |
| | | | Year Ended
10/31/2022 | | | | Year Ended
10/31/2021 | | | | Year Ended
10/31/2022 | | | | Year Ended
10/31/2021 | |
| Distributions paid from: | | | | | | | | | | | | | | | | |
| Ordinary income | | $ | 684,518,562 | | | $ | 392,566,629 | | | $ | 143,097 | | | $ | 493,359 | |
| Net long-term capital gains | | | 1,278,899,243 | | | | 327,647,029 | | | | 385,484 | | | | 8,110 | |
| Total distributions paid | | $ | 1,963,417,805 | | | $ | 720,213,658 | | | $ | 528,581 | | | $ | 501,469 | |
| | | | | |
| | International Equity Fund | | International Opportunities Fund | |
| | | | Year Ended
10/31/2022 | | | | Year Ended
10/31/2021 | | | | Year Ended
10/31/2022 | | | | Year Ended
10/31/2021 | |
| Distributions paid from: | | | | | | | | | | | | | | | | |
| Ordinary income | | $ | 5,415,746 | | | $ | 5,135,556 | | | $ | 10,755,670 | | | $ | – | |
| Net long-term capital gains | | | 40,771,804 | | | | – | | | | – | | | | – | |
| Total distributions paid | | $ | 46,187,550 | | | $ | 5,135,556 | | | $ | 10,755,670 | | | $ | – | |
| | | | | | | | | |
| | | | International Value Fund | | | | Micro Cap Growth Fund | |
| | | | Year Ended
10/31/2022 | | | | Year Ended
10/31/2021 | | | | Year Ended
10/31/2022 | | | | Year Ended
10/31/2021 | |
| Distributions paid from: | | | | | | | | | | | | | | | | |
| Ordinary income | | $ | 25,093,884 | | | $ | 17,740,969 | | | $ | – | | | $ | 13,473,195 | |
| Net long-term capital gains | | | – | | | | – | | | | – | | | | 16,614,432 | |
| Total distributions paid | | $ | 25,093,884 | | | $ | 17,740,969 | | | $ | – | | | $ | 30,087,627 | |
| | | | | | | | | | | | | |
| | | | Value Opportunities Fund | | | | | | | | | |
| | | | Year Ended
10/31/2022 | | | | Year Ended
10/31/2021 | | | | | | | | | |
| Distributions paid from: | | | | | | | | | | | | | | | | |
| Ordinary income | | $ | 27,557,855 | | | $ | 4,614,398 | | | | | | | | | |
| Net long-term capital gains | | | 205,400,944 | | | | 79,109,540 | | | | | | | | | |
| Total distributions paid | | $ | 232,958,799 | | | $ | 83,723,938 | | | | | | | | | |
222
Notes to Financial Statements (continued)
As of October 31, 2022, the components of accumulated gains (losses) on a tax-basis were as follows:
| | | Alpha
Strategy Fund | | | Focused
Growth Fund | | Focused Large
Cap Value Fund | |
| Undistributed ordinary income – net | | $ | – | | | $ | – | | | $ | – | |
| Undistributed long-term capital gains | | | 39,368,518 | | | | – | | | | – | |
| Total undistributed earnings | | | 39,368,518 | | | | – | | | | – | |
| Capital loss carryforwards* | | | – | | | | (6,696,934 | ) | | | – | |
| Temporary differences | | | (1,781,313 | ) | | | (192,828 | ) | | | (23,829 | ) |
| Unrealized gains (losses) – net | | | (96,849,366 | ) | | | (2,087,326 | ) | | | (228,604 | ) |
| Total accumulated gains (losses) – net | | $ | (59,262,161 | ) | | $ | (8,977,088 | ) | | $ | (252,433 | ) |
| | | | | | | | | | | | | |
| | | Focused Small
Cap Value Fund | | | Fundamental
Equity Fund | | | Global Equity
Fund | |
| Undistributed ordinary income – net | | $ | 403,048 | | | $ | 19,221,680 | | | $ | 58,000 | |
| Undistributed long-term capital gains | | | 4,263,823 | | | | 79,919,869 | | | | 3,481 | |
| Total undistributed earnings | | | 4,666,871 | | | | 99,141,549 | | | | 61,481 | |
| Capital loss carryforwards* | | | – | | | | – | | | | – | |
| Temporary differences | | | (19,728 | ) | | | (523,943 | ) | | | (874 | ) |
| Unrealized gains (losses) – net | | | 520,201 | | | | 246,738,724 | | | | (675,179 | ) |
| Total accumulated gains (losses) – net | | $ | 5,167,344 | | | $ | 345,356,330 | | | $ | (614,572 | ) |
| | | | | | | | | | | | | |
| | | Growth Leaders
Fund | | | | Health Care
Fund | | | International
Equity Fund | |
| Undistributed ordinary income – net | | $ | – | | | $ | 6,127 | | | $ | 6,139,850 | |
| Undistributed long-term capital gains | | | – | | | | – | | | | – | |
| Total undistributed earnings | | | – | | | | 6,127 | | | | 6,139,850 | |
| Capital loss carryforwards* | | | (940,969,073 | ) | | | (769,440 | ) | | | (3,203,219 | ) |
| Temporary differences | | | (21,593,962 | ) | | | (3,073 | ) | | | (96,769 | ) |
| Unrealized gains (losses) – net | | | (257,811,053 | ) | | | 680,339 | | | | (17,988,321 | ) |
| Total accumulated gains (losses) – net | | $ | (1,220,374,088 | ) | | $ | (86,047 | ) | | $ | (15,148,459 | ) |
| | | | | | | | | | | | | |
| | | International
Opportunities
Fund | | | International
Value Fund | | | Micro Cap
Growth Fund | |
| Undistributed ordinary income – net | | $ | 5,154,589 | | | $ | 958,136 | | | $ | – | |
| Undistributed long-term capital gains | | | – | | | | – | | | | – | |
| Total undistributed earnings | | | 5,154,589 | | | | 958,136 | | | | – | |
| Capital loss carryforwards* | | | (30,956,850 | ) | | | (407,584,116 | ) | | | (71,214,351 | ) |
| Temporary differences | | | (76,803 | ) | | | (142,907 | ) | | | (1,510,168 | ) |
| Unrealized gains (losses) – net | | | (70,123,015 | ) | | | (61,509.057 | ) | | | 29,769,980 | |
| Total accumulated gains (losses) – net | | $ | (96,002,079 | ) | | $ | (468,277,944 | ) | | $ | (42,954,539 | ) |
| | | | | | | | | | | | | |
| | | Value
Opportunities
Fund | | | | | | | | | |
| Undistributed ordinary income – net | | $ | 5,786,539 | | | | | | | | | |
| Undistributed long-term capital gains | | | 100,780,285 | | | | | | | | | |
| Total undistributed earnings | | | 106,566,824 | | | | | | | | | |
| Capital loss carryforwards* | | | – | | | | | | | | | |
| Temporary differences | | | (333,657 | ) | | | | | | | | |
| Unrealized gains (losses) – net | | | 113,945,333 | | | | | | | | | |
| Total accumulated gains (losses) – net | | $ | 220,178,500 | | | | | | | | | |
| | | |
| * | | The capital losses will carry forward indefinitely. |
223
Notes to Financial Statements (continued)
At the Fund’s election, certain losses incurred within the taxable year (“Qualified Late-Year Losses”) are deemed to arise on the first business day of the Fund’s next taxable year. The following Funds incurred and will elect to defer late-year ordinary losses during the fiscal year ended October 31, 2022.
| Alpha Strategy Fund | | $ | 1,644,870 | |
| Focused Growth Fund | | | 185,326 | |
| Growth Leaders Fund | | | 21,101,280 | |
| Micro Cap Growth Fund | | | 1,486,227 | |
As of October 31, 2022, the aggregate unrealized security gains and losses on investments and other financial instruments based on cost for U.S. federal income tax purposes were as follows:
| | | Alpha
Strategy Fund | | | Focused
Growth Fund | | | Focused
Large Cap
Value Fund | |
| Tax cost | | $ | 753,154,648 | | | $ | 35,897,393 | | | $ | 19,125,065 | |
| Gross unrealized gain | | | 4,811,288 | | | | 1,629,434 | | | | 1,387,502 | |
| Gross unrealized loss | | | (101,660,654 | ) | | | (3,716,760 | ) | | | (1,592,677 | ) |
| Net unrealized security gain (loss) | | $ | (96,849,366 | ) | | $ | (2,087,326 | ) | | $ | (205,175 | ) |
| | | | | | | | | | | | | |
Focused Small
Cap Value Fund | | | Fundamental
Equity Fund | | | Global
Equity Fund | |
| Tax cost | | $ | 132,736,591 | | | $ | 1,708,867,373 | | | $ | 9,599,958 | |
| Gross unrealized gain | | | 17,032,523 | | | | 347,661,725 | | | | 594,783 | |
| Gross unrealized loss | | | (16,512,322 | ) | | | (100,905,681 | ) | | | (1,266,357 | ) |
| Net unrealized security gain (loss) | | $ | 520,201 | | | $ | 246,756,044 | | | $ | (671,574 | ) |
| | | | | | | | | | | | | |
| | Growth
Leaders Fund | | | | Health
Care Fund | | | International
Equity Fund | |
| Tax cost | | $ | 5,843,479,645 | | | $ | 5,813,361 | | | $ | 292,901,722 | |
| Gross unrealized gain | | | 316,249,683 | | | | 988,273 | | | | 15,069,872 | |
| Gross unrealized loss | | | (574,060,736 | ) | | | (307,683 | ) | | | (32,873,409 | ) |
| Net unrealized security gain (loss) | | $ | (257,811,053 | ) | | $ | 680,590 | | | $ | (17,803,537 | ) |
| | | | | | | | | | | | | |
| | International
Opportunities Fund | | | International
Value Fund | | | Micro Cap
Growth Fund | |
| Tax cost | | $ | 368,647,928 | | | $ | 394,752,692 | | | $ | 214,741,149 | |
| Gross unrealized gain | | | 10,697,249 | | | | 11,504,570 | | | | 47,039,770 | |
| Gross unrealized loss | | | (79,890,736 | ) | | | (72,766,938 | ) | | | (17,269,790 | ) |
| Net unrealized security gain (loss) | | $ | (69,193,487 | ) | | $ | (61,262,368 | ) | | $ | 29,769,980 | |
| | | | | | | | | | | | | |
Value
Opportunities
Fund | | | | | | | | | |
| Tax cost | | $ | 1,193,781,017 | | | | | | | | | |
| Gross unrealized gain | | | 229,227,741 | | | | | | | | | |
| Gross unrealized loss | | | (115,282,408 | ) | | | | | | | | |
| Net unrealized security gain (loss) | | $ | 113,945,333 | | | | | | | | | |
The difference between book-basis and tax-basis unrealized gains (losses) is attributable to the tax treatment of certain securities, certain distributions, other financial instruments and wash sales.
224
Notes to Financial Statements (continued)
Permanent items identified during the fiscal year ended October 31, 2022 have been reclassified among the components of net assets based on their tax basis treatment as follows:
| | | Paid-in capital | | | Total Distributable
Earnings (Loss | ) |
| Alpha Strategy Fund | | $ | 6,878,048 | | | $ | (6,878,048 | ) |
| Focused Growth Fund | | | (64,466 | ) | | | 64,466 | |
| Focused Large Cap Value Fund | | | 39,447,048 | | | | (39,447,048 | ) |
| Focused Small Cap Value Fund | | | 343,804 | | | | (343,804 | ) |
| Fundamental Equity Fund | | | 8,347,356 | | | | (8,347,356 | ) |
| Global Equity Fund | | | 52,616 | | | | (52,616 | ) |
| Growth Leaders Fund | | | (9,447,037 | ) | | | 9,447,037 | |
| International Equity Fund | | | 253 | | | | (253 | ) |
| Micro Growth Fund | | | (1,578,362 | ) | | | 1,578,362 | |
| Value Opportunities Fund | | | 20,490,103 | | | | (20,490,103 | ) |
The permanent differences are attributable to the tax treatment of net investment loss and certain distributions.
| 5. | PORTFOLIO SECURITIES TRANSACTIONS |
Purchases and sales of investment securities (excluding short-term investments) for the fiscal year ended October 31, 2022 were as follows:
| | | Purchases | | | Sales | |
| Alpha Strategy Fund | | $ | 115,439,586 | | | $ | 62,107,795 | |
| Focused Growth Fund | | | 70,227,967 | | | | 68,690,999 | |
| Focused Large Cap Value Fund | | | 513,777,618 | | | | 1,078,402,411 | |
| Focused Small Cap Value Fund | | | 107,150,332 | | | | 163,952,618 | |
| Fundamental Equity Fund | | | 978,367,811 | | | | 914,839,559 | |
| Global Equity Fund | | | 7,016,744 | | | | 7,129,160 | |
| Growth Leaders Fund | | | 10,614,205,321 | | | | 11,642,593,000 | |
| Health Care Fund | | | 3,198,707 | | | | 3,179,933 | |
| International Equity Fund | | | 288,718,930 | | | | 319,282,375 | |
| International Opportunities Fund | | | 254,986,629 | | | | 277,160,267 | |
| International Value Fund | | | 345,257,269 | | | | 508,404,495 | |
| Micro Cap Growth Fund | | | 236,644,516 | | | | 291,287,787 | |
| Value Opportunities Fund | | | 614,073,003 | | | | 912,395,792 | |
There were no purchases or sales of U.S. Government securities for the fiscal year ended October 31, 2022.
The Funds are permitted to purchase and sell securities (“cross-trade”) from and to other Lord Abbett funds or client accounts pursuant to procedures approved by the Board in compliance with Rule 17a-7 under the Act (the “Rule”). Each cross-trade is executed at a fair market price in compliance with provisions of the Rule. For the fiscal year ended October 31, 2022, the following Funds engaged in cross trades:
| Fund | | Purchases | | | Sales | | | Gain (Loss | ) |
| Focused Growth Fund | | $ | 29,790 | | | $ | 254,671 | | | $ | 51,777 | |
| Focused Large Cap Value Fund | | | 14,997,167 | | | | 139,766,676 | | | | (4,925,065 | ) |
| Fundamental Equity Fund | | | 135,695,393 | | | | – | | | | – | |
| Growth Leaders Fund | | | 2,659,279 | | | | 15,657,279 | | | | 12,112,847 | |
| Micro Cap Growth Fund | | | 2,465,515 | | | | – | | | | – | |
| Value Opportunities Fund | | | – | | | | 13,011,661 | | | | 512,807 | |
225
Notes to Financial Statements (continued)
| 6. | DISCLOSURES ABOUT DERIVATIVE INSTRUMENTS AND HEDGING ACTIVITIES |
Global Equity Fund entered into E-Mini S&P Index futures contracts for the fiscal year ended October 31, 2022 (as described in Note 2(h)) to manage cash. The Fund bears the risk that the underlying index will move unexpectedly, in which case the Fund may realize a loss. There is minimal counterparty credit risk to the Fund since futures are exchange traded and the exchange’s clearinghouse, as counterparty to all exchange traded futures, guarantees futures against default.
International Opportunities Fund entered into total return swaps on indexes for the fiscal year ended October 31, 2022 (as described in Note 2(k)) to hedge credit risk. The Fund may enter into total return swap agreements to obtain exposure to a security or market without owning such security or investing directly in that market. The Fund may agree to make payments that are the equivalent of interest in exchange for the right to receive payments equivalent to any appreciation in the value of an underlying security, index or other asset, as well as receive payments equivalent to any distributions made on that asset, over the term of the swap. If the value of the asset underlying a total return swap declines over the term of the swap, the Fund also may be required to pay an amount equal to that decline in value to their counterparty.
Transactions in derivative instruments for the fiscal year ended October 31, 2022, were as follows:
| Global Equity Fund | |
| | | Equity
Contracts | |
| Net Realized Gain (Loss) | | | | | |
| Futures Contracts(1) | | | $ | (6,658 | ) |
| Average Number of Contracts/Notional Amounts* | | | | | |
| Futures Contracts | | | | – | (2) |
| | | | | | |
| International Opportunities Fund | |
| | | | Equity
Contracts | |
| Net Realized Gain (Loss) | | | | | |
| Total Return Swap Contracts(3) | | | $ | 1,418,165 | |
| Average Number of Contracts/Notional Amounts* | | | | | |
| Total Return Swap Contracts(4) | | | $ | 11,074,517 | |
| * | Calculated based on the number of contracts or notional amounts for the fiscal year ended October 31, 2022. |
| (1) | Statements of Operations location: Net realized gain (loss) on futures contracts. |
| (2) | Contracts less than 1. |
| (3) | Statements of Operations location: Net realized gain (loss) on swap contracts. |
| (4) | Amount represents notional amounts in U.S. dollars. |
| 7. | DISCLOSURES ABOUT OFFSETTING ASSETS AND LIABILITIES |
The Financial Accounting Standards Board requires disclosures intended to help better assess the effect or potential effect of offsetting arrangements on a fund’s financial position. The following tables illustrate gross and net information about recognized assets and liabilities eligible for offset in the Statements of Assets and Liabilities; and disclose such amounts subject to an enforceable master netting agreement or similar agreement, by the counterparty. A master netting agreement is an agreement between a fund and the counterparty which provides for the net settlement of amounts owed under all contracts traded under that agreement, as well as cash collateral, through a single payment by one party to the other in the event of default on or termination of any one contract. The Funds’ accounting policy with respect to balance sheet offsetting is that, absent an
226
Notes to Financial Statements (continued)
event of default by the counterparty or a termination of the agreement, the master netting agreement does not result in an offset of reported amounts of financial assets and liabilities in the Statements of Assets and Liabilities across transactions between the Funds and the applicable counterparty:
| | | | | | Alpha Strategy Fund | |
| Description | | Gross Amounts of
Recognized Assets | | | Gross Amounts
Offset in the
Statement of Assets
and Liabilities | | | Net Amounts of
Assets Presented
in the Statement of
Assets and Liabilities | |
| Repurchase Agreements | | $ | 468,314 | | | $ | – | | | $ | 468,314 | |
| Total | | $ | 468,314 | | | $ | – | | | $ | 468,314 | |
| | | Net Amount
of Assets
Presented in | | | Amounts Not Offset in the
Statement of Assets and Liabilities | | | |
| Counterparty | | the Statement
of Assets and
Liabilities | | | Financial
Instruments | | | Cash
Collateral
Received(a) | | | Securities
Collateral
Received(a) | | | Net
Amount(b) | |
| Fixed Income Clearing Corp. | | $ | 468,314 | | | $ | – | | | $ | – | | | $ | (468,314 | ) | | $ | – | |
| Total | | $ | 468,314 | | | $ | – | | | $ | – | | | $ | (468,314 | ) | | $ | – | |
| | | | | | Focused Growth Fund | |
| Description | | Gross Amounts of
Recognized Assets | | | Gross Amounts
Offset in the
Statement of Assets
and Liabilities | | | Net Amounts of
Assets Presented
in the Statement of
Assets and Liabilities | |
| Repurchase Agreements | | $ | 1,508,262 | | | $ | – | | | $ | 1,508,262 | |
| Total | | $ | 1,508,262 | | | $ | – | | | $ | 1,508,262 | |
| | | Net Amount
of Assets
Presented in | | | Amounts Not Offset in the
Statement of Assets and Liabilities | | | | |
| Counterparty | | the Statement
of Assets and
Liabilities | | | Financial
Instruments | | | Cash
Collateral
Received(a) | | | Securities
Collateral
Received(a) | | | Net
Amount(b) | |
| Fixed Income Clearing Corp. | | $ | 1,508,262 | | | $ | – | | | $ | – | | | $ | (1,508,262 | ) | | $ | – | |
| Total | | $ | 1,508,262 | | | $ | – | | | $ | – | | | $ | (1,508,262 | ) | | $ | – | |
| | | | | | Focused Large Cap Value Fund | |
| Description | | Gross Amounts of
Recognized Assets | | | Gross Amounts
Offset in the
Statement of Assets
and Liabilities | | | Net Amounts of
Assets Presented
in the Statement of
Assets and Liabilities | |
| Repurchase Agreements | | $ | 404,997 | | | $ | – | | | $ | 404,997 | |
| Total | | $ | 404,997 | | | $ | – | | | $ | 404,997 | |
| | | Net Amount
of Assets
Presented in | | | Amounts Not Offset in the
Statement of Assets and Liabilities | | | | |
| Counterparty | | the Statement
of Assets and
Liabilities | | | Financial
Instruments | | | Cash
Collateral
Received(a) | | | Securities
Collateral
Received(a) | | | Net
Amount(b) | |
| Fixed Income Clearing Corp. | | $ | 404,997 | | | $ | – | | | $ | – | | | $ | (404,997 | ) | | $ | – | |
| Total | | $ | 404,997 | | | $ | – | | | $ | – | | | $ | (404,997 | ) | | $ | – | |
227
Notes to Financial Statements (continued)
| | | | | | Fundamental Equity Fund | |
| Description | | Gross Amounts of
Recognized Assets | | | Gross Amounts
Offset in the
Statement of Assets
and Liabilities | | | Net Amounts of
Assets Presented
in the Statement of
Assets and Liabilities | |
| Repurchase Agreements | | $ | 39,667,143 | | | $ | – | | | $ | 39,667,143 | |
| Total | | $ | 39,667,143 | | | $ | – | | | $ | 39,667,143 | |
| | | Net Amount
of Assets
Presented in | | | Amounts Not Offset in the
Statement of Assets and Liabilities | | | | |
| Counterparty | | the Statement
of Assets and
Liabilities | | | Financial
Instruments | | | Cash
Collateral
Received(a) | | | Securities
Collateral
Received(a) | | | Net
Amount(b) | |
| Fixed Income Clearing Corp. | | $ | 39,667,143 | | | $ | – | | | $ | – | | | $ | (39,667,143 | ) | | $ | – | |
| Total | | $ | 39,667,143 | | | $ | – | | | $ | – | | | $ | (39,667,143 | ) | | $ | – | |
| | | | | | Global Equity Fund | |
| Description | | Gross Amounts of
Recognized Assets | | | Gross Amounts
Offset in the
Statement of Assets
and Liabilities | | | Net Amounts of
Assets Presented
in the Statement of
Assets and Liabilities | |
| Repurchase Agreements | | $ | 250,145 | | | $ | – | | | $ | 250,145 | |
| Total | | $ | 250,145 | | | $ | – | | | $ | 250,145 | |
| | | Net Amount
of Assets
Presented in | | | Amounts Not Offset in the
Statement of Assets and Liabilities | | | | |
| Counterparty | | the Statement
of Assets and
Liabilities | | | Financial
Instruments | | | Cash
Collateral
Received(a) | | | Securities
Collateral
Received(a) | | | Net
Amount(b) | |
| Fixed Income Clearing Corp. | | $ | 250,145 | | | $ | – | | | $ | – | | | $ | (250,145 | ) | | $ | – | |
| Total | | $ | 250,145 | | | $ | – | | | $ | – | | | $ | (250,145 | ) | | $ | – | |
| | | | | | Growth Leaders Fund | |
| Description | | Gross Amounts of
Recognized Assets | | | Gross Amounts
Offset in the
Statement of Assets
and Liabilities | | | Net Amounts of
Assets Presented
in the Statement of
Assets and Liabilities | |
| Repurchase Agreements | | $ | 59,708,753 | | | $ | – | | | $ | 59,708,753 | |
| Total | | $ | 59,708,753 | | | $ | – | | | $ | 59,708,753 | |
| | | Net Amount
of Assets
Presented in | | | Amounts Not Offset in the
Statement of Assets and Liabilities | | | | |
| Counterparty | | the Statement
of Assets and
Liabilities | | | Financial
Instruments | | | Cash
Collateral
Received(a) | | | Securities
Collateral
Received(a) | | | Net
Amount(b) | |
| Fixed Income Clearing Corp. | | $ | 59,708,753 | | | $ | – | | | $ | – | | | $ | (59,708,753 | ) | | $ | – | |
| Total | | $ | 59,708,753 | | | $ | – | | | $ | – | | | $ | (59,708,753 | ) | | $ | – | |
228
Notes to Financial Statements (continued)
| | | | | | Health Care Fund | |
| Description | | Gross Amounts of
Recognized Assets | | | Gross Amounts
Offset in the
Statement of Assets
and Liabilities | | | Net Amounts of
Assets Presented
in the Statement of
Assets and Liabilities | |
| Repurchase Agreements | | $ | 152,785 | | | $ | – | | | $ | 152,785 | |
| Total | | $ | 152,785 | | | $ | – | | | $ | 152,785 | |
| | | Net Amount
of Assets
Presented in | | | Amounts Not Offset in the
Statement of Assets and Liabilities | | | | |
| Counterparty | | the Statement
of Assets and
Liabilities | | | Financial
Instruments | | | Cash
Collateral
Received(a) | | | Securities
Collateral
Received(a) | | | Net
Amount(b) | |
| Fixed Income Clearing Corp. | | $ | 152,785 | | | $ | – | | | $ | – | | | $ | (152,785 | ) | | $ | – | |
| Total | | $ | 152,785 | | | $ | – | | | $ | – | | | $ | (152,785 | ) | | $ | – | |
| | | | | | International Equity Fund | |
| Description | | Gross Amounts of
Recognized Assets | | | Gross Amounts
Offset in the
Statement of Assets
and Liabilities | | | Net Amounts of
Assets Presented
in the Statement of
Assets and Liabilities | |
| Repurchase Agreements | | $ | 10,036,854 | | | $ | – | | | $ | 10,036,854 | |
| Total | | $ | 10,036,854 | | | $ | – | | | $ | 10,036,854 | |
| | | Net Amount
of Assets
Presented in | | | Amounts Not Offset in the
Statement of Assets and Liabilities | | | | |
| Counterparty | | the Statement
of Assets and
Liabilities | | | Financial
Instruments | | | Cash
Collateral
Received(a) | | | Securities
Collateral
Received(a) | | | Net
Amount(b) | |
| Fixed Income Clearing Corp. | | $ | 10,036,854 | | | $ | – | | | $ | – | | | $ | (10,036,854 | ) | | $ | – | |
| Total | | $ | 10,036,854 | | | $ | – | | | $ | – | | | $ | (10,036,854 | ) | | $ | – | |
| | | | | | International Opportunities Fund | |
| Description | | Gross Amounts of
Recognized Assets | | | Gross Amounts
Offset in the
Statement of Assets
and Liabilities | | | Net Amounts of
Assets Presented
in the Statement of
Assets and Liabilities | |
| Repurchase Agreements | | $ | 4,804,819 | | | $ | – | | | $ | 4,804,819 | |
| Total | | $ | 4,804,819 | | | $ | – | | | $ | 4,804,819 | |
| | | Net Amount
of Assets
Presented in | | | Amounts Not Offset in the
Statement of Assets and Liabilities | | | | |
| Counterparty | | the Statement
of Assets and
Liabilities | | | Financial
Instruments | | | Cash
Collateral
Received(a) | | | Securities
Collateral
Received(a) | | | Net
Amount(b) | |
| Fixed Income Clearing Corp. | | $ | 4,804,819 | | | $ | – | | | $ | – | | | $ | (4,804,819 | ) | | $ | – | |
| Total | | $ | 4,804,819 | | | $ | – | | | $ | – | | | $ | (4,804,819 | ) | | $ | – | |
229
Notes to Financial Statements (continued)
| | | | | | Micro Cap Growth Fund | |
| Description | | Gross Amounts of
Recognized Assets | | | Gross Amounts
Offset in the
Statement of Assets
and Liabilities | | | Net Amounts of
Assets Presented
in the Statement of
Assets and Liabilities | |
| Repurchase Agreements | | $ | 3,022,733 | | | $ | – | | | $ | 3,022,733 | |
| Total | | $ | 3,022,733 | | | $ | – | | | $ | 3,022,733 | |
| | | Net Amount
of Assets
Presented in | | | Amounts Not Offset in the
Statement of Assets and Liabilities | | | | |
| Counterparty | | the Statement
of Assets and
Liabilities | | | Financial
Instruments | | | Cash
Collateral
Received(a) | | | Securities
Collateral
Received(a) | | | Net
Amount(b) | |
| Fixed Income Clearing Corp. | | $ | 3,022,733 | | | $ | – | | | $ | – | | | $ | (3,022,733 | ) | | $ | – | |
| Total | | $ | 3,022,733 | | | $ | – | | | $ | – | | | $ | (3,022,733 | ) | | $ | – | |
| | | | | | Value Opportunities Fund | |
| Description | | Gross Amounts of
Recognized Assets | | | Gross Amounts
Offset in the
Statement of Assets
and Liabilities | | | Net Amounts of
Assets Presented
in the Statement of
Assets and Liabilities | |
| Repurchase Agreements | | $ | 42,214,992 | | | $ | – | | | $ | 42,214,992 | |
| Total | | $ | 42,214,992 | | | $ | – | | | $ | 42,214,992 | |
| | | Net Amount
of Assets
Presented in | | | Amounts Not Offset in the
Statement of Assets and Liabilities | | | | |
| Counterparty | | the Statement
of Assets and
Liabilities | | | Financial
Instruments | | | Cash
Collateral
Received(a) | | | Securities
Collateral
Received(a) | | | Net
Amount(b) | |
| Fixed Income Clearing Corp. | | $ | 42,214,992 | | | $ | – | | | $ | – | | | $ | (42,214,992 | ) | | $ | – | |
| Total | | $ | 42,214,992 | | | $ | – | | | $ | – | | | $ | (42,214,992 | ) | | $ | – | |
| (a) | Collateral disclosed is limited to an amount not to exceed 100% of the net amount of assets (liabilities) presented in the Statements of Assets and Liabilities, for each respective counterparty. |
| (b) | Net amount represents the amount owed to the Fund by the counterparty as of October 31, 2022. |
The Trust’s officers and one Trustee, who are associated with Lord Abbett, do not receive any compensation from the Trust for serving in such capacities. Independent Trustees’ fees are allocated among all Lord Abbett-sponsored funds based on the net assets of each fund. There is an equity-based plan available to all Independent Trustees under which Independent Trustees may elect to defer receipt of a portion of Trustees’ fees. The deferred amounts are treated as though equivalent dollar amounts had been invested in the Funds. Such amounts and earnings accrued thereon are included in Trustees’ fees on the Statements of Operations and in Trustees’ fees payable on the Statements of Assets and Liabilities and are not deductible for U.S. federal income tax purposes until such amounts are paid.
230
Notes to Financial Statements (continued)
The Trust has entered into an arrangement with its transfer agent and custodian, whereby credits realized as a result of uninvested cash balances are used to reduce a portion of each Fund’s expenses.
For the period ended August 3, 2022, the Funds (except Alpha Strategy Fund), and certain other funds managed by Lord Abbett (collectively, the “Participating Funds”) entered into a syndicated line of credit facility with various lenders for $1.275 billion (the “Syndicated Facility”) whereas State Street Bank and Trust Company (“SSB”) participated as a lender and as agent for the lenders. The Participating Funds were subject to graduated borrowing limits of one-third of fund net assets (if fund net assets are less than $750 million), $250 million, $300 million, $700 million, or $1 billion, based on past borrowings and likelihood of future borrowings, among other factors.
Effective August 4, 2022, the Participating Funds (except Alpha Strategy Fund) entered into a Syndicated Facility with various lenders for $1.625 billion whereas SSB participates as a lender and as agent for the lenders. The Participating Funds are subject to graduated borrowing limits of one-third of fund net assets (if fund net assets are less than $750 million), $250 million, $300 million, $700 million, or $1 billion, based on past borrowings and likelihood of future borrowings, among other factors.
For the period ended August 3, 2022, the Participating Funds (except Alpha Strategy Fund) were party to an additional line of credit facility with SSB for $330 million (the “Bilateral Facility”), $250 million committed and $80 million uncommitted. Under the Bilateral Facility, the Participating Funds were subject to graduated borrowing limits of one-third of fund net assets (if net assets are less than $750 million), $250 million, $300 million, or $330 million, based on past borrowings and likelihood of future borrowings, among other factors.
Effective August 4, 2022, the Participating Funds (except Alpha Strategy Fund) are party to an additional uncommitted line of credit facility with SSB for $330 million. Under the Bilateral Facility, the Participating Funds are subject to borrowing limits of one-third of fund net assets (if net assets are less than $750 million), or $250 million, based on past borrowings and likelihood of future borrowings, among other factors.
The Syndicated Facility and the Bilateral Facility are to be used for temporary or emergency purposes as additional sources of liquidity to satisfy redemptions.
Focused Large Cap Value Fund utilized the Bilateral Facility on December 27, 2021 with an average borrowing amount of $10,104,790. The average interest rate was 1.33% and total interest paid amounted to $373. The other Funds did not utilize the Syndicated Facility or Bilateral Facility.
| 11. | INTERFUND LENDING PROGRAM | |
Pursuant to an exemptive order issued by the U.S. Securities and Exchange Commission (“SEC exemptive order”) certain registered open-end management investment companies managed by Lord Abbett, including each Fund, participate in a joint lending and borrowing program (the “Interfund Lending Program”). The SEC exemptive order allows the funds that participate in the Interfund Lending Program to borrow money from and lend money to each other for temporary or emergency purposes subject to the limitations and conditions.
231
Notes to Financial Statements (continued)
For the fiscal year ended October 31, 2022, the following Funds participated as a lender in the Interfund Lending Program. For the period which the loan was outstanding, the average amount loaned, interest rate and interest income were as follows:
| Fund | | Average
Amount Loaned | | Average
Interest Rate | | Interest
Income |
| Focused Large Cap Value Fund | | $ 10,801,748 | | 0.55% | | $ 161 |
| Fundamental Equity Fund | | 15,612,968 | | 1.06% | | 2,073 |
| Growth Leaders Fund | | 20,308,426 | | 1.06% | | 2,405 |
| International Equity Fund | | 10,261,663 | | 0.58% | | 651 |
| International Opportunities Fund | | 11,318,112 | | 0.65% | | 823 |
| International Value Fund | | 17,942,400 | | 0.58% | | 1,089 |
| Value Opportunities Fund | | 26,883,533 | | 0.93% | | 2,224 |
For the fiscal year ended October 31, 2022, the following Fund participated as a borrower in the Interfund Lending Program. For the period in which the loan was outstanding, the average amount borrowed, interest rate and interest expense was as follows:
| Fund | | Average
Amount Borrowed | | Average
Interest Rate | | Interest
Expense |
| International Value Fund | | $18,143,570 | | 1.57% | | $1,561 |
| 12. | CUSTODIAN AND ACCOUNTING AGENT |
SSB is the Trust’s custodian and accounting agent. SSB performs custodial, accounting and recordkeeping functions relating to portfolio transactions and calculating each Fund’s NAV.
| 13. | TRANSACTIONS WITH AFFILIATED ISSUERS | |
An affiliated issuer is one in which a Fund has ownership of at least 5% of the outstanding voting securities of the underlying issuer at any point during the fiscal year or any company which is under common ownership or control. Alpha Strategy Fund had the following transactions with affiliated issuers (i.e. the Underlying Funds) during the fiscal year ended October 31, 2022:
Affiliated Issuer | | | Value at
10/31/2021 | | | | Purchases
at Cost | | | | Proceeds From Sales | | | | Net
Realized
Gain (Loss) | | | | Change in
Appreciation
(Depreciation | ) | | | Value at
10/31/2022 | | | | Shares
as of
10/31/2022 | | | Dividend
Income | |
| Lord Abbett Developing Growth Fund, Inc. – Class I | | $ | 175,650,188 | | | | 45,199,355 | | | | (7,355,445 | ) | | $ | 16,052,084 | (a) | | $ | (84,805,681 | ) | | $ | 130,614,911 | | | | 5,511,178 | | | $ | – | |
| Lord Abbett Securities Trust – Focused Small Cap Value Fund – Class I | | | 90,235,170 | | | | 8,760,540 | | | | (12,998,280 | ) | | | 5,955,836 | (b) | | | (16,943,269 | ) | | | 66,432,704 | | | | 2,541,420 | | | | 183,248 | |
| Lord Abbett Securities Trust – International Opportunities Fund – Class I | | | 170,753,580 | | | | 12,537,035 | | | | (2,026,883 | ) | | | (13,973 | ) | | | (53,363,485 | ) | | | 127,886,274 | | | | 8,353,120 | | | | 4,130,841 | |
| Lord Abbett Securities Trust – Micro Cap Growth Fund – Class I | | | 85,447,699 | | | | 7,099,425 | | | | (1,657,070 | ) | | | 252,562 | | | | (24,350,988 | ) | | | 66,791,628 | | | | 3,912,808 | | | | – | |
| Lord Abbett Research Fund, Inc. – Small-Cap Value Fund – Class I | | | 178,800,321 | | | | 20,842,471 | | | | (21,793,731 | ) | | | 14,318,979 | (c) | | | (39,285,070 | ) | | | 132,523,683 | | | | 7,682,532 | | | | 483,184 | |
| Lord Abbett Securities Trust – Value Opportunities Fund – Class I | | | 180,099,301 | | | | 21,000,762 | | | | (16,276,387 | ) | | | 20,735,328 | (d) | | | (53,357,241 | ) | | | 131,587,768 | | | | 7,338,972 | | | | 386,767 | |
| Total | | | | | | | | | | | | | | $ | 57,300,816 | | | $ | (272,105,734 | ) | | $ | 655,836,968 | | | | | | | $ | 5,184,040 | |
232
Notes to Financial Statements (continued)
| (a) | Includes $14,125,590 of distributed capital gains. |
| (b) | Includes $8,577,293 of distributed capital gains. |
| (c) | Includes $20,359,287 of distributed capital gains. |
| (d) | Includes $20,613,995 of distributed capital gains. |
| 14. | SECURITIES LENDING AGREEMENT | |
The Funds have established a securities lending agreement with Citibank, N.A. for the lending of securities to qualified brokers in exchange for securities or cash collateral equal to at least the market value of securities loaned, plus interest, if applicable. Cash collateral is invested in an approved money market fund. In accordance with the Funds’ securities lending agreement, the market value of securities on loan is determined each day at the close of business and any additional collateral required to cover the value of securities on loan is delivered to the Funds on the next business day. As with other extensions of credit, the Funds may experience a delay in the recovery of their securities or incur a loss should the borrower of the securities breach its agreement with the Funds or the borrower becomes insolvent at a time when the collateral is insufficient to cover the cost of repurchasing securities on loan. Any income earned from securities lending is included in Securities lending net income on each Fund’s Statement of Operations.
The initial collateral received by the Funds is required to have a value equal to at least 100% of the market value of the securities loaned. The collateral must be marked-to-market daily to cover increases in the market value of the securities loaned (or potentially a decline in the value of the collateral). In general, the risk of borrower default will be borne by Citibank, N.A.; the Funds will bear the risk of loss with respect to the investment of the cash collateral. The advantage of such loans is that the Funds continue to receive income on loaned securities while receiving a portion of any securities lending fees and earning returns on the cash amounts which may be reinvested for the purchase of investments in securities.
As of October 31, 2022 the market value of securities loaned and collateral received for the Funds were as follows:
| Funds | | Market Value of
Securities Loaned | | | Collateral Received(1) |
| Health Care Fund | | $ | 75,730 | | | $ | 77,926 | |
| International Opportunities Fund | | | 138,454 | | | | 145,950 | |
| Micro Cap Growth Fund | | | 11,172,648 | | | | 11,575,647 | |
| Value Opportunities Fund | | | 196,185 | | | | 199,376 | |
| (1) | Statements of Assets and Liabilities location: Payable for collateral due to broker for securities lending. |
Each Fund is subject to the general risks and considerations associated with equity investing. The value of the Funds’ investments will fluctuate in response to movements in the equity securities markets in general and to the changing prospects of individual companies in which the Funds invest. If a Fund’s assessment of a company’s value or prospects for exceeding earnings expectations or market conditions is wrong, the Fund could suffer losses or produce poor performance relative to other funds, even in a favorable market.
Large company stocks, in which Focused Growth Fund, Focused Large Cap Value Fund, Fundamental Equity Fund, Global Equity Fund, Growth Leaders Fund, International Equity Fund and International Value Fund invest, may perform differently than the market as a whole and other types of stocks, such as small company stocks. Small and mid-sized company stocks, in which Alpha Strategy Fund,
233
Notes to Financial Statements (continued)
Focused Small Cap Value Fund, Focused Growth Fund, Fundamental Equity Fund, Growth Leaders Fund, International Equity Fund, International Opportunities Fund and Value Opportunities Fund invest, may be less able to weather economic shifts or other adverse developments than those of larger, more established companies.
In general, Focused Growth Fund and Growth Leaders Fund employ a growth investing style, Global Equity Fund employs a blended growth investing and value investing style, and Focused Large Cap Value Fund, Focused Small Cap Value Fund, Fundamental Equity Fund, International Value Fund and Value Opportunities Fund employ a value investing style. Growth stocks generally are more volatile than value stocks. The price of value stocks may lag the market for long periods of time.
Global Equity Fund, International Equity Fund, International Opportunities Fund and International Value Fund are subject to the risks of investing in foreign securities. Foreign securities may pose greater risks than domestic securities, including greater price fluctuations, economic, political, and social instability and subject to less government supervision, lack of transparency, inadequate regulatory and accounting standards, foreign taxes, and higher transaction costs. Foreign investments also may be affected by changes in currency rates or currency controls. These risks are generally greater for securities issued by companies in emerging market companies. Similarly, due to their investments in multinational and foreign companies, Alpha Strategy Fund, Focused Growth Fund, Focused Large Cap Value Fund, Focused Small Cap Value Fund, Fundamental Equity Fund, Growth Leaders Fund, Health Care Fund, and Value Opportunities Fund are subject to the risks of investing in foreign securities and similarly may experience increased market, liquidity, currency, political, informational, and other risks.
Health Care Fund is subject to the risks of investing in the health care sector, including changes in government regulations, dependence on patents and intellectual property rights, expenses and losses from litigation based on product liability and similar claims, industry competition, extensive research and development, marketing, and sales costs, and rapid technological change and potential for product obsolescence. Health Care Fund is also subject to the risks of investing in structured securities. As a result, Health Care Fund is subject to the same risks associated with direct investments in the underlying securities or other instruments they seek to replicate, as well as liquidity risk and the risk that the issuer and/or the counterparty of the structured security may be unable to perform under the terms of the instrument, or may disagree as to the meaning or application of such terms.
International Value Fund is subject to the risks of investing in dividend paying stocks. Dividend paying stocks may be sensitive to changes in market interest rates, and the prices of such stocks may decline as rates rise. There is no guarantee that companies that currently pay dividends will continue to do so. International Value Fund may be subject to the volatility of stocks that have high dividends per share due to recent decreases in their share prices.
Alpha Strategy Fund’s investments are concentrated in the Underlying Funds and, as a result, the Fund’s performance is directly related to their performance and subject to their risks. In addition, the Fund is exposed to the same risks as the Underlying Funds in direct proportion to the allocation of its assets among the Underlying Funds.
Alpha Strategy Fund, Global Equity Fund, Health Care Fund, International Equity Fund, International Opportunities Fund and International Value Fund are subject to the risks associated with derivatives, which may be different from and greater than the risks associated with investing directly in securities and other investments. Derivatives may be subject to risks such as liquidity risk, leveraging risk, interest rate risk, market risk, and credit risk. Illiquid securities may lower the Funds’ returns since the Funds may be unable to sell these securities at their desired time or price.
234
Notes to Financial Statements (continued)
Derivatives also may involve the risk of mispricing or improper valuation and the risk that changes in the value of the derivative may not correlate perfectly with the value of the underlying asset, rate or index. Whether a Fund’s use of derivatives is successful will depend on, among other things, the Fund’s ability to correctly forecast market movements, changes in foreign exchange and interest rates, and other factors. If a Fund incorrectly forecasts these and other factors, its performance could suffer. A Fund’s use of derivatives could result in a loss exceeding the amount of the Fund’s investment in these instruments.
Health Care Fund, Focused Large Cap Value Fund and Focused Small Cap Value Fund are subject to the general risks and considerations associated with investing in fixed income securities. The value of an investment will change as interest rates fluctuate and in response to market movements. When interest rates rise, the prices of fixed income securities are likely to decline; when interest rates fall, such prices tend to rise. Longer-term securities are usually more sensitive to interest rate changes. There is also the risk that an issuer of a fixed income security will fail to make timely payments of principal and/or interest to a Fund, a risk that is greater with high-yield bonds (sometimes called “junk bonds”) in which one or more of the Funds may invest. Some issuers, particularly of high-yield bonds, may default as to principal and/or interest payments after a Fund purchases their securities. A default, or concerns in the market about an increase in risk of default, may result in losses to each Fund. High-yield bonds are subject to greater price fluctuations and increased liquidity risk, as well as additional risks.
Focused Growth Fund and Focused Large Cap Value Fund are non-diversified mutual funds under the Act. The value of each Fund’s investments may be more adversely affected by a single economic, political or regulatory event than the value of the investments of a diversified mutual fund.
Focused Growth Fund, Focused Large Cap Value Fund, Global Equity Fund and Health Care Fund are newly organized and there can be no assurance that any of these Funds will reach or maintain a sufficient asset size to effectively implement its investment strategy. A Fund’s gross expense ratio may fluctuate during its initial operating period because of the Fund’s relatively smaller asset size and, until the Fund achieves sufficient scale, a Fund shareholder may experience proportionally higher Fund expenses than would be experienced by shareholders of a fund with a larger asset base.
Geopolitical and other events (e.g., wars, terrorism, natural disasters, epidemics or pandemics, such as the COVID-19 outbreak which began in late 2019) may disrupt securities markets and adversely affect global economies and markets, thereby decreasing the value of each Fund’s investments. Market disruptions can also prevent the Funds from implementing their investment strategies and achieving their investment objectives.
The transmission of COVID-19 and efforts to contain its spread have resulted in, among other things, border closings and other significant travel restrictions and disruptions, significant disruptions to business operations, supply chains and customer activity, lower consumer demand for goods and services, event cancellations and restrictions, service cancellations, reductions and other changes, significant challenges in healthcare service preparation and delivery, and prolonged quarantines, as well as general concern and uncertainty. The impact of the COVID-19 outbreak has, and could again, negatively affect the global economy, the economies of individual countries, and the financial performance of individual issuers, sectors, industries, asset classes, and markets in significant and unforeseen ways. The COVID-19 pandemic and its effects may last for an extended period of time. Although the long-term economic fallout of COVID-19 is difficult to predict, it has contributed to, and is likely to continue to contribute to, market volatility, inflation and systemic economic weakness. The foregoing could disrupt the operations of each Fund and its service providers, adversely affect the value and liquidity of each Fund’s investments, and negatively impact each Fund’s performance and your investment in each Fund.
These factors, and others, can affect each Fund’s performance.
235
Notes to Financial Statements (continued)
| 16. | SUMMARY OF CAPITAL TRANSACTIONS |
Transactions in shares of beneficial interest were as follows:
| Alpha Strategy Fund | | Year Ended
October 31, 2022 | | | Year Ended
October 31, 2021 | |
| Class A Shares | | Shares | | | Amount | | | Shares | | | Amount | |
| Shares sold | | | 2,656,452 | | | $ | 65,635,985 | | | | 1,577,648 | | | $ | 45,220,318 | |
| Converted from Class C* | | | 360,113 | | | | 8,781,931 | | | | 373,268 | | | | 10,849,172 | |
| Reinvestment of distributions | | | 854,256 | | | | 23,799,563 | | | | 1,198,333 | | | | 31,252,535 | |
| Shares reacquired | | | (2,439,016 | ) | | | (59,400,885 | ) | | | (3,015,003 | ) | | | (86,005,823 | ) |
| Increase | | | 1,431,805 | | | $ | 38,816,594 | | | | 134,246 | | | $ | 1,316,202 | |
| | | | | | | | | | | | | | | | | |
| Class C Shares | | | | | | | | | | | | | | | | |
| Shares sold | | | 141,499 | | | $ | 2,724,217 | | | | 258,243 | | | $ | 5,763,669 | |
| Reinvestment of distributions | | | 137,888 | | | | 2,941,152 | | | | 260,342 | | | | 5,277,141 | |
| Shares reacquired | | | (390,244 | ) | | | (7,270,719 | ) | | | (680,695 | ) | | | (15,066,444 | ) |
| Converted to Class A* | | | (471,111 | ) | | | (8,781,931 | ) | | | (481,239 | ) | | | (10,849,172 | ) |
| Decrease | | | (581,968 | ) | | $ | (10,387,281 | ) | | | (643,349 | ) | | $ | (14,874,806 | ) |
| | | | | | | | | | | | | | | | | |
| Class F Shares | | | | | | | | | | | | | | | | |
| Shares sold | | | 420,593 | | | $ | 11,092,347 | | | | 1,160,187 | | | $ | 33,279,687 | |
| Reinvestment of distributions | | | 173,839 | | | | 4,893,568 | | | | 290,792 | | | | 7,656,554 | |
| Shares reacquired | | | (4,069,903 | ) | | | (97,297,008 | ) | | | (2,033,224 | ) | | | (59,074,811 | ) |
| Decrease | | | (3,475,471 | ) | | $ | (81,311,093 | ) | | | (582,245 | ) | | $ | (18,138,570 | ) |
| | | | | | | | | | | | | | | | | |
| Class F3 Shares | | | | | | | | | | | | | | | | |
| Shares sold | | | 774,631 | | | $ | 19,864,073 | | | | 660,493 | | | $ | 19,999,580 | |
| Reinvestment of distributions | | | 101,791 | | | | 2,958,048 | | | | 110,980 | | | | 3,009,774 | |
| Shares reacquired | | | (462,639 | ) | | | (11,557,617 | ) | | | (406,560 | ) | | | (12,126,926 | ) |
| Increase | | | 413,783 | | | $ | 11,264,504 | | | | 364,913 | | | $ | 10,882,428 | |
| | | | | | | | | | | | | | | | | |
| Class I Shares | | | | | | | | | | | | | | | | |
| Shares sold | | | 3,701,667 | | | $ | 89,286,348 | | | | 180,777 | | | $ | 5,505,880 | |
| Reinvestment of distributions | | | 60,169 | | | | 1,740,705 | | | | 82,792 | | | | 2,237,040 | |
| Shares reacquired | | | (664,760 | ) | | | (15,948,273 | ) | | | (115,206 | ) | | | (3,409,355 | ) |
| Increase | | | 3,097,076 | | | $ | 75,078,780 | | | | 148,363 | | | $ | 4,333,565 | |
| | | | | | | | | | | | | | | | | |
| Class R2 Shares | | | | | | | | | | | | | | | | |
| Shares sold | | | 6,219 | | | $ | 131,828 | | | | 4,782 | | | $ | 128,775 | |
| Reinvestment of distributions | | | 2,172 | | | | 57,439 | | | | 4,691 | | | | 116,299 | |
| Shares reacquired | | | (13,237 | ) | | | (338,631 | ) | | | (26,161 | ) | | | (698,573 | ) |
| Decrease | | | (4,846 | ) | | $ | (149,364 | ) | | | (16,688 | ) | | $ | (453,499 | ) |
| | | | | | | | | | | | | | | | | |
| Class R3 Shares | | | | | | | | | | | | | | | | |
| Shares sold | | | 81,558 | | | $ | 1,895,361 | | | | 93,216 | | | $ | 2,573,701 | |
| Reinvestment of distributions | | | 47,259 | | | | 1,260,398 | | | | 76,015 | | | | 1,901,142 | |
| Shares reacquired | | | (185,565 | ) | | | (4,388,762 | ) | | | (240,531 | ) | | | (6,568,862 | ) |
| Decrease | | | (56,748 | ) | | $ | (1,233,003 | ) | | | (71,300 | ) | | $ | (2,094,019 | ) |
236
Notes to Financial Statements (continued)
| Alpha Strategy Fund | | Year Ended
October 31, 2022 | | | Year Ended
October 31, 2021 | |
| Class R4 Shares | | Shares | | | Amount | | | Shares | | | Amount | |
| Shares sold | | | 43,237 | | | $ | 1,055,358 | | | | 34,574 | | | $ | 971,847 | |
| Reinvestment of distributions | | | 7,709 | | | | 214,155 | | | | 12,105 | | | | 314,743 | |
| Shares reacquired | | | (26,068 | ) | | | (644,269 | ) | | | (59,024 | ) | | | (1,668,467 | ) |
| Increase (decrease) | | | 24,878 | | | $ | 625,244 | | | | (12,345 | ) | | $ | (381,877 | ) |
| | | | | | | | | | | | | | | | | |
| Class R5 Shares | | | | | | | | | | | | | | | | |
| Shares sold | | | 1,403 | | | $ | 36,326 | | | | 2,244 | | | $ | 62,291 | |
| Reinvestment of distributions | | | 927 | | | | 26,825 | | | | 2,152 | | | | 58,163 | |
| Shares reacquired | | | (2,200 | ) | | | (55,978 | ) | | | (14,588 | ) | | | (427,373 | ) |
| Increase (decrease) | | | 130 | | | $ | 7,173 | | | | (10,192 | ) | | $ | (306,919 | ) |
| | | | | | | | | | | | | | | | | |
| Class R6 Shares | | | | | | | | | | | | | | | | |
| Shares sold | | | 16,553 | | | $ | 443,873 | | | | 41,717 | | | $ | 1,206,996 | |
| Reinvestment of distributions | | | 4,670 | | | | 135,765 | | | | 6,175 | | | | 167,531 | |
| Shares reacquired | | | (26,343 | ) | | | (626,939 | ) | | | (54,466 | ) | | | (1,579,276 | ) |
| Decrease | | | (5,120 | ) | | $ | (47,301 | ) | | | (6,574 | ) | | $ | (204,749 | ) |
| | | | | | | | | | | | | | | | | |
| Focused Growth Fund | | Year Ended
October 31, 2022 | | | Year Ended
October 31, 2021 | |
| Class A Shares | | | Shares | | | | Amount | | | | Shares | | | | Amount | |
| Shares sold | | | 396,135 | | | $ | 9,771,309 | | | | 227,205 | | | $ | 6,974,750 | |
| Converted from Class C* | | | 1,432 | | | | 31,345 | | | | 2,801 | | | | 82,690 | |
| Reinvestment of distributions | | | 81,357 | | | | 2,549,714 | | | | 31,858 | | | | 880,243 | |
| Shares reacquired | | | (255,242 | ) | | | (5,856,512 | ) | | | (219,094 | ) | | | (6,735,424 | ) |
| Increase | | | 223,682 | | | $ | 6,495,856 | | | | 42,770 | | | $ | 1,202,259 | |
| | | | | | | | | | | | | | | | | |
| Class C Shares | | | | | | | | | | | | | | | | |
| Shares sold | | | 74,249 | | | $ | 1,781,015 | | | | 25,353 | | | $ | 772,258 | |
| Reinvestment of distributions | | | 11,210 | | | | 342,685 | | | | 4,406 | | | | 120,046 | |
| Shares reacquired | | | (40,527 | ) | | | (872,229 | ) | | | (25,955 | ) | | | (612,243 | ) |
| Converted to Class A* | | | (1,475 | ) | | | (31,345 | ) | | | 2,845 | | | | (82,690 | ) |
| Increase | | | 43,457 | | | $ | 1,220,126 | | | | 6,649 | | | $ | 197,371 | |
| | | | | | | | | | | | | | | | | |
| Class F Shares | | | | | | | | | | | | | | | | |
| Shares sold | | | 166,061 | | | $ | 4,167,826 | | | | 566,618 | | | $ | 17,517,555 | |
| Reinvestment of distributions | | | 79,309 | | | | 2,507,767 | | | | 15,807 | | | | 439,126 | |
| Shares reacquired | | | (404,634 | ) | | | (9,462,265 | ) | | | (286,846 | ) | | | (9,271,791 | ) |
| Increase (decrease) | | | (159,264 | ) | | $ | (2,786,672 | ) | | | 295,579 | | | $ | 8,684,890 | |
| | | | | | | | | | | | | | | | | |
| Class I Shares | | | | | | | | | | | | | | | | |
| Shares sold | | | 163,892 | | | $ | 4,072,166 | | | | 32,702 | | | $ | 1,016,191 | |
| Reinvestment of distributions | | | 23,950 | | | | 757,292 | | | | 6,880 | | | | 191,131 | |
| Shares reacquired | | | (83,546 | ) | | | (2,077,283 | ) | | | (14,031 | ) | | | (432,144 | ) |
| Increase | | | 104,296 | | | $ | 2,752,175 | | | | 25,551 | | | $ | 775,178 | |
| | | | | | | | | | | | | | | | | |
| Class R3 Shares | | | | | | | | | | | | | | | | |
| Shares sold | | | 49 | | | $ | 1,298 | | | | – | | | $ | 18 | |
| Reinvestment of distributions | | | – | | | | 5 | | | | – | | | | – | |
| Shares reacquired | | | (3 | ) | | | (67 | ) | | | – | | | | – | |
| Increase | | | 46 | | | $ | 1,236 | | | | – | | | $ | 18 | |
237
Notes to Financial Statements (continued)
| Focused Growth Fund | | Year Ended
October 31, 2022 | | | Year Ended
October 31, 2021 | |
| Class R6 Shares | | Shares | | | Amount | | | Shares | | | Amount | |
| Shares sold | | | 79,659 | | | $ | 2,246,485 | | | | 74,408 | | | $ | 2,307,033 | |
| Reinvestment of distributions | | | 351 | | | | 11,126 | | | | 43 | | | | 1,198 | |
| Shares reacquired | | | (29,183 | ) | | | (862,513 | ) | | | (51,112 | ) | | | (1,603,459 | ) |
| Increase | | | 50,827 | | | $ | 1,395,098 | | | | 23,339 | | | $ | 704,772 | |
| | | | | | | | | | | | | | | | | |
| Focused Large Cap Value Fund | | Year Ended
October 31, 2022 | | | Year Ended
October 31, 2021 | |
| Class A Shares | | | Shares | | | | Amount | | | | Shares | | | | Amount | |
| Shares sold | | | 522,859 | | | $ | 7,806,341 | | | | 468,989 | | | $ | 8,408,017 | |
| Converted from Class C* | | | 2,720 | | | | 45,779 | | | | – | | | | – | |
| Reinvestment of distributions | | | 119,788 | | | | 1,829,167 | | | | 4,008 | | | | 60,322 | |
| Shares reacquired | | | (206,267 | ) | | | (2,943,377 | ) | | | (109,618 | ) | | | (1,958,950 | ) |
| Increase | | | 439,100 | | | $ | 6,737,910 | | | | 363,379 | | | $ | 6,509,389 | |
| | | | | | | | | | | | | | | | | |
| Class C Shares | | | | | | | | | | | | | | | | |
| Shares sold | | | 294,709 | | | $ | 4,374,887 | | | | 230,080 | | | $ | 4,169,543 | |
| Reinvestment of distributions | | | 53,064 | | | | 810,290 | | | | 332 | | | | 5,009 | |
| Shares reacquired | | | (191,143 | ) | | | (2,576,365 | ) | | | (46,492 | ) | | | (847,693 | ) |
| Converted to Class A* | | | (2,728 | ) | | | (45,779 | ) | | | – | | | | – | |
| Increase | | | 153,902 | | | $ | 2,563,033 | | | | 183,920 | | | $ | 3,326,859 | |
| | | | | | | | | | | | | | | | | |
| Class F Shares | | | | | | | | | | | | | | | | |
| Shares sold | | | 44,804 | | | $ | 674,669 | | | | 372,465 | | | $ | 6,925,879 | |
| Reinvestment of distributions | | | 33,125 | | | | 511,778 | | | | 126 | | | | 1,909 | |
| Shares reacquired | | | (100,527 | ) | | | (1,516,121 | ) | | | (251,099 | ) | | | (4,759,311 | ) |
| Increase (decrease) | | | (22,598 | ) | | $ | (329,674 | ) | | | 121,492 | | | $ | 2,168,477 | |
| | | | | | | | | | | | | | | | | |
| Class I Shares | | | | | | | | | | | | | | | | |
| Shares sold | | | 10,544,245 | | | $ | 156,870,840 | | | | 14,993,191 | | | $ | 245,204,603 | |
| Reinvestment of distributions | | | 9,683,713 | | | | 148,160,810 | | | | 2,576,106 | | | | 38,796,164 | |
| Shares reacquired | | | (54,608,514 | ) | | | (745,176,296 | ) | | | (16,135,630 | ) | | | (300,086,544 | ) |
| Increase (decrease) | | | (34,380,556 | ) | | $ | (440,144,646 | ) | | | 1,433,667 | | | $ | (16,085,777 | ) |
| | | | | | | | | | | | | | | | | |
| Class R3 Shares | | | | | | | | | | | | | | | | |
| Shares sold | | | 5,555 | | | $ | 84,189 | | | | 31 | | | $ | 533 | |
| Reinvestment of distributions | | | 11 | | | | 162 | | | | – | | | | 6 | |
| Shares reacquired | | | (81 | ) | | | (1,030 | ) | | | – | | | | – | |
| Increase | | | 5,485 | | | $ | 83,321 | | | | 31 | | | $ | 539 | |
| | | | | | | | | | | | | | | | | |
| Class R6 Shares | | | | | | | | | | | | | | | | |
| Shares sold | | | 39,545 | | | $ | 600,827 | | | | 77,715 | | | $ | 1,266,036 | |
| Shares reacquired | | | (21,457 | ) | | | (307,987 | ) | | | (25,361 | ) | | | (463,081 | ) |
| Increase | | | 18,088 | | | $ | 292,840 | | | | 52,354 | | | $ | 802,955 | |
238
Notes to Financial Statements (continued)
| Focused Small Cap Value Fund | | Year Ended
October 31, 2022 | | | Year Ended
October 31, 2021 | |
| Class A Shares | | Shares | | | Amount | | | Shares | | | Amount | |
| Shares sold | | | 360,517 | | | $ | 9,451,949 | | | | 845,956 | | | $ | 23,174,025 | |
| Converted from Class C* | | | 3,945 | | | | 98,743 | | | | – | | | | – | |
| Reinvestment of distributions | | | 73,104 | | | | 2,071,275 | | | | 1,225 | | | | 28,969 | |
| Shares reacquired | | | (406,631 | ) | | | (9,997,848 | ) | | | (382,795 | ) | | | (11,610,984 | ) |
| Increase | | | 30,935 | | | $ | 1,624,119 | | | | 464,386 | | | $ | 11,592,010 | |
| | | | | | | | | | | | | | | | | |
| Class C Shares | | | | | | | | | | | | | | | | |
| Shares sold | | | 39,091 | | | $ | 1,158,476 | | | | 175,936 | | | $ | 5,508,892 | |
| Reinvestment of distributions | | | 16,003 | | | | 483,303 | | | | 27 | | | | 673 | |
| Shares reacquired | | | (63,479 | ) | | | (1,726,368 | ) | | | (26,111 | ) | | | (813,509 | ) |
| Converted to Class A* | | | (3,715 | ) | | | (98,743 | ) | | | – | | | | – | |
| Increase (decrease) | | | (12,100 | ) | | $ | (183,332 | ) | | | 149,852 | | | $ | 4,696,056 | |
| | | | | | | | | | | | | | | | | |
| Class F Shares | | | | | | | | | | | | | | | | |
| Shares sold | | | 597,553 | | | $ | 17,996,358 | | | | 3,317,447 | | | $ | 106,261,107 | |
| Reinvestment of distributions | | | 203,787 | | | | 6,291,383 | | | | 904 | | | | 23,071 | |
| Shares reacquired | | | (1,996,037 | ) | | | (56,161,721 | ) | | | (1,333,770 | ) | | | (42,228,342 | ) |
| Increase (decrease) | | | (1,194,697 | ) | | $ | (31,873,980 | ) | | | 1,984,581 | | | $ | 64,055,836 | |
| | | | | | | | | | | | | | | | | |
| Class I Shares | | | | | | | | | | | | | | | | |
| Shares sold | | | 525,655 | | | $ | 13,927,860 | | | | 2,471,662 | | | $ | 64,816,148 | |
| Reinvestment of distributions | | | 358,589 | | | | 11,058,876 | | | | 30,795 | | | | 785,263 | |
| Shares reacquired | | | (1,320,013 | ) | | | (36,962,298 | ) | | | (2,361,182 | ) | | | (74,138,893 | ) |
| Increase (decrease) | | | (435,769 | ) | | $ | (11,975,562 | ) | | | 141,275 | | | $ | (8,537,482 | ) |
| | | | | | | | | | | | | | | | | |
| Class R5 Shares | | | | | | | | | | | | | | | | |
| Shares sold | | | 11,339 | | | $ | 324,585 | | | | 74 | | | $ | 2,415 | |
| Reinvestment of distributions | | | 8 | | | | 239 | | | | – | | | | – | |
| Shares reacquired | | | (1,433 | ) | | | (39,360 | ) | | | – | | | | – | |
| Increase | | | 9,914 | | | $ | 285,464 | | | | 74 | | | $ | 2,415 | |
| | | | | | | | | | | | | | | | | |
| Class R6 Shares | | | | | | | | | | | | | | | | |
| Shares sold | | | 117,432 | | | $ | 3,526,499 | | | | 397,673 | | | $ | 12,740,147 | |
| Reinvestment of distributions | | | 19,995 | | | | 617,633 | | | | – | | | | – | |
| Shares reacquired | | | (77,778 | ) | | | (2,126,575 | ) | | | (142,154 | ) | | | (4,644,633 | ) |
| Increase | | | 59,649 | | | $ | 2,017,557 | | | | 255,519 | | | $ | 8,095,514 | |
| | | | | | | | | | | | | | | | | |
| Fundamental Equity Fund | | Year Ended
October 31, 2022 | | | Year Ended
October 31, 2021 | |
| Class A Shares | | | Shares | | | | Amount | | | | Shares | | | | Amount | |
| Shares sold | | | 4,566,647 | | | $ | 59,486,639 | | | | 2,676,009 | | | $ | 35,640,102 | |
| Converted from Class C* | | | 1,070,128 | | | | 13,891,875 | | | | 1,390,056 | | | | 18,865,411 | |
| Reinvestment of distributions | | | 10,960,284 | | | | 149,498,278 | | | | 1,687,369 | | | | 20,096,561 | |
| Shares reacquired | | | (13,165,392 | ) | | | (169,779,056 | ) | | | (14,828,200 | ) | | | (193,764,334 | ) |
| Increase (decrease) | | | 3,431,667 | | | $ | 53,097,736 | | | | (9,074,766 | ) | | $ | (119,162,260 | ) |
239
Notes to Financial Statements (continued)
| Fundamental Equity Fund | | Year Ended
October 31, 2022 | | | Year Ended
October 31, 2021 | |
| Class C Shares | | Shares | | | Amount | | | Shares | | | Amount | |
| Shares sold | | | 570,172 | | | $ | 6,312,421 | | | | 445,808 | | | $ | 5,156,014 | |
| Reinvestment of distributions | | | 577,042 | | | | 6,791,781 | | | | 54,080 | | | | 565,135 | |
| Shares reacquired | | | (561,772 | ) | | | (6,197,137 | ) | | | (1,216,486 | ) | | | (13,961,855 | ) |
| Converted to Class A* | | | (1,243,752 | ) | | | (13,891,875 | ) | | | (1,589,677 | ) | | | (18,865,411 | ) |
| Decrease | | | (658,310 | ) | | $ | (6,984,810 | ) | | | (2,306,275 | ) | | $ | (27,106,117 | ) |
| | | | | | | | | | | | | | | | | |
| Class F Shares | | | | | | | | | | | | | | | | |
| Shares sold | | | 751,749 | | | $ | 9,711,281 | | | | 1,246,981 | | | $ | 16,078,637 | |
| Reinvestment of distributions | | | 1,245,581 | | | | 16,740,603 | | | | 213,893 | | | | 2,513,246 | |
| Shares reacquired | | | (6,154,861 | ) | | | (77,191,656 | ) | | | (2,761,188 | ) | | | (35,756,240 | ) |
| Decrease | | | (4,157,531 | ) | | $ | (50,739,772 | ) | | | (1,300,314 | ) | | $ | (17,164,357 | ) |
| | | | | | | | | | | | | | | | | |
| Class F3 Shares | | | | | | | | | | | | | | | | |
| Shares sold | | | 241,135 | | | $ | 3,190,729 | | | | 208,976 | | | $ | 2,855,973 | |
| Reinvestment of distributions | | | 164,485 | | | | 2,276,471 | | | | 28,553 | | | | 344,061 | |
| Shares reacquired | | | (275,582 | ) | | | (3,618,522 | ) | | | (368,288 | ) | | | (4,913,026 | ) |
| Increase (decrease) | | | 130,038 | | | $ | 1,848,678 | | | | (130,759 | ) | | $ | (1,712,992 | ) |
| | | | | | | | | | | | | | | | | |
| Class I Shares | | | | | | | | | | | | | | | | |
| Shares sold | | | 28,953,306 | | | $ | 353,649,201 | | | | 2,920,077 | | | $ | 40,739,479 | |
| Reinvestment of distributions | | | 2,368,365 | | | | 32,541,337 | | | | 493,649 | | | | 5,913,918 | |
| Shares reacquired | | | (5,158,276 | ) | | | (69,470,598 | ) | | | (9,477,972 | ) | | | (122,050,051 | ) |
| Increase (decrease) | | | 26,163,395 | | | $ | 316,719,940 | | | | (6,064,246 | ) | | $ | (75,396,654 | ) |
| | | | | | | | | | | | | | | | | |
| Class P Shares | | | | | | | | | | | | | | | | |
| Shares sold | | | 25,663 | | | $ | 322,003 | | | | 124,281 | | | $ | 1,712,500 | |
| Reinvestment of distributions | | | 40,887 | | | | 544,609 | | | | 5,670 | | | | 66,114 | |
| Shares reacquired | | | (62,550 | ) | | | (799,006 | ) | | | (147,627 | ) | | | (1,945,316 | ) |
| Increase (decrease) | | | 4,000 | | | $ | 67,606 | | | | (17,676 | ) | | $ | (166,702 | ) |
| | | | | | | | | | | | | | | | | |
| Class R2 Shares | | | | | | | | | | | | | | | | |
| Shares sold | | | 25,458 | | | $ | 312,357 | | | | 32,455 | | | $ | 430,641 | |
| Reinvestment of distributions | | | 27,914 | | | | 371,250 | | | | 3,723 | | | | 43,336 | |
| Shares reacquired | | | (101,687 | ) | | | (1,328,416 | ) | | | (112,128 | ) | | | (1,489,358 | ) |
| Decrease | | | (48,315 | ) | | $ | (644,809 | ) | | | (75,950 | ) | | $ | (1,015,381 | ) |
| | | | | | | | | | | | | | | | | |
| Class R3 Shares | | | | | | | | | | | | | | | | |
| Shares sold | | | 641,604 | | | $ | 8,068,438 | | | | 669,634 | | | $ | 8,680,825 | |
| Reinvestment of distributions | | | 725,199 | | | | 9,674,156 | | | | 114,003 | | | | 1,331,556 | |
| Shares reacquired | | | (2,031,052 | ) | | | (25,963,618 | ) | | | (2,350,779 | ) | | | (30,566,662 | ) |
| Decrease | | | (664,249 | ) | | $ | (8,221,024 | ) | | | (1,567,142 | ) | | $ | (20,554,281 | ) |
| | | | | | | | | | | | | | | | | |
| Class R4 Shares | | | | | | | | | | | | | | | | |
| Shares sold | | | 58,639 | | | $ | 755,938 | | | | 81,998 | | | $ | 1,132,180 | |
| Reinvestment of distributions | | | 25,150 | | | | 341,292 | | | | 2,821 | | | | 33,433 | |
| Shares reacquired | | | (43,509 | ) | | | (570,329 | ) | | | (97,206 | ) | | | (1,336,153 | ) |
| Increase (decrease) | | | 40,280 | | | $ | 526,901 | | | | (12,387 | ) | | $ | (170,540 | ) |
240
Notes to Financial Statements (continued)
| Fundamental Equity Fund | | Year Ended
October 31, 2022 | | | Year Ended
October 31, 2021 | |
| Class R5 Shares | | Shares | | | Amount | | | Shares | | | Amount | |
| Shares sold | | | 14,077 | | | $ | 178,959 | | | | 28,735 | | | $ | 393,931 | |
| Reinvestment of distributions | | | 8,304 | | | | 114,175 | | | | 1,707 | | | | 20,468 | |
| Shares reacquired | | | (25,572 | ) | | | (345,160 | ) | | | (49,981 | ) | | | (674,551 | ) |
| Decrease | | | (3,191 | ) | | $ | (52,026 | ) | | | (19,539 | ) | | $ | (260,152 | ) |
| | | | | | | | | | | | | | | | | |
| Class R6 Shares | | | | | | | | | | | | | | | | |
| Shares sold | | | 745,885 | | | $ | 9,933,041 | | | | 187,199 | | | $ | 2,566,578 | |
| Reinvestment of distributions | | | 99,623 | | | | 1,379,776 | | | | 15,967 | | | | 192,556 | |
| Shares reacquired | | | (1,272,178 | ) | | | (17,160,338 | ) | | | (205,674 | ) | | | (2,664,892 | ) |
| Increase (decrease) | | | (426,670 | ) | | $ | (5,847,521 | ) | | | (2,508 | ) | | $ | 94,242 | |
| | | | | | | | | | | | | | | | | |
| Global Equity Fund | | Year Ended
October 31, 2022 | | | Year Ended
October 31, 2021 | |
| Class A Shares | | | Shares | | | | Amount | | | | Shares | | | | Amount | |
| Shares sold | | | 80,620 | | | $ | 1,080,825 | | | | 103,176 | | | $ | 1,557,336 | |
| Converted from Class C* | | | 5,792 | | | | 74,458 | | | | 1,862 | | | | 27,152 | |
| Reinvestment of distributions | | | 49,363 | | | | 689,106 | | | | 11,222 | | | | 158,567 | |
| Shares reacquired | | | (65,323 | ) | | | (890,584 | ) | | | (22,473 | ) | | | (336,424 | ) |
| Increase | | | 70,452 | | | $ | 953,805 | | | | 93,787 | | | $ | 1,406,631 | |
| | | | | | | | | | | | | | | | | |
| Class C Shares | | | | | | | | | | | | | | | | |
| Shares sold | | | 8,390 | | | $ | 102,070 | | | | 9,030 | | | $ | 136,360 | |
| Reinvestment of distributions | | | 7,990 | | | | 110,825 | | | | 1,848 | | | | 25,985 | |
| Shares reacquired | | | (25,907 | ) | | | (309,405 | ) | | | (1,802 | ) | | | (27,094 | ) |
| Converted to Class A* | | | (5,849 | ) | | | (74,458 | ) | | | (1,873 | ) | | | (27,152 | ) |
| Increase (decrease) | | | (15,376 | ) | | $ | (170,968 | ) | | | 7,203 | | | $ | 108,099 | |
| | | | | | | | | | | | | | | | | |
| Class F Shares | | | | | | | | | | | | | | | | |
| Shares sold | | | 8,446 | | | $ | 111,681 | | | | 23,396 | | | $ | 366,257 | |
| Reinvestment of distributions | | | 3,121 | | | | 43,660 | | | | 198 | | | | 2,796 | |
| Shares reacquired | | | (28,375 | ) | | | (325,895 | ) | | | (9,212 | ) | | | (136,295 | ) |
| Increase (decrease) | | | (16,808 | ) | | $ | (170,554 | ) | | | 14,382 | | | $ | 232,758 | |
| | | | | | | | | | | | | | | | | |
| Class I Shares | | | | | | | | | | | | | | | | |
| Shares reacquired | | | (15,129 | ) | | $ | (164,000 | ) | | | (670 | ) | | $ | (10,000 | ) |
| Decrease | | | (15,129 | ) | | $ | (164,000 | ) | | | (670 | ) | | $ | (10,000 | ) |
| | | | | | | | | | | | | | | | | |
| Class R3 Shares | | | | | | | | | | | | | | | | |
| Shares sold | | | 27,632 | | | $ | 393,703 | | | | 28,939 | | | $ | 437,198 | |
| Reinvestment of distributions | | | 4,566 | | | | 63,283 | | | | 818 | | | | 11,511 | |
| Shares reacquired | | | (15,776 | ) | | | (183,248 | ) | | | (20,440 | ) | | | (299,203 | ) |
| Increase | | | 16,422 | | | $ | 273,738 | | | | 9,317 | | | $ | 149,506 | |
| | | | | | | | | | | | | | | | | |
| Class R4 Shares | | | | | | | | | | | | | | | | |
| Shares sold | | | 44,130 | | | $ | 596,813 | | | | – | | | $ | – | |
| Shares reacquired | | | (79 | ) | | | (943 | ) | | | – | | | | – | |
| Increase | | | 44,051 | | | $ | 595,870 | | | | – | | | $ | – | |
| | | | | | | | | | | | | | | | | |
| Class R6 Shares | | | | | | | | | | | | | | | | |
| Shares sold | | | 23,651 | | | $ | 339,679 | | | | 22,941 | | | $ | 361,456 | |
| Shares reacquired | | | (16,012 | ) | | | (224,662 | ) | | | (358 | ) | | | (4,957 | ) |
| Increase | | | 7,639 | | | $ | 115,017 | | | | 22,583 | | | $ | 356,499 | |
241
Notes to Financial Statements (continued)
| Growth Leaders Fund | | Year Ended
October 31, 2022 | | | Year Ended
October 31, 2021 | |
| Class A Shares | | Shares | | | Amount | | | Shares | | | Amount | |
| Shares sold | | | 10,338,714 | | | $ | 353,041,641 | | | | 12,618,737 | | | $ | 583,012,996 | |
| Converted from Class C* | | | 3,086,385 | | | | 102,434,587 | | | | 1,575,362 | | | | 74,374,788 | |
| Reinvestment of distributions | | | 11,264,076 | | | | 480,863,383 | | | | 4,198,551 | | | | 175,541,399 | |
| Shares reacquired | | | (16,855,393 | ) | | | (552,710,672 | ) | | | (12,365,757 | ) | | | (566,553,743 | ) |
| Increase | | | 7,833,782 | | | $ | 383,628,939 | | | | 6,026,893 | | | $ | 266,375,440 | |
| | | | | | | | | | | | | | | | | |
| Class C Shares | | | | | | | | | | | | | | | | |
| Shares sold | | | 3,270,784 | | | $ | 98,246,996 | | | | 4,528,845 | | | $ | 188,073,952 | |
| Reinvestment of distributions | | | 6,190,529 | | | | 230,225,777 | | | | 2,592,659 | | | | 97,795,114 | |
| Shares reacquired | | | (6,360,362 | ) | | | (182,079,564 | ) | | | (4,706,111 | ) | | | (194,784,763 | ) |
| Converted to Class A* | | | (3,551,528 | ) | | | (102,434,587 | ) | | | (1,751,967 | ) | | | (74,374,788 | ) |
| Increase (decrease) | | | (450,577 | ) | | $ | 43,958,622 | | | | 663,426 | | | $ | 16,709,515 | |
| | | | | | | | | | | | | | | | | |
| Class F Shares | | | | | | | | | | | | | | | | |
| Shares sold | | | 27,783,993 | | | $ | 992,176,037 | | | | 37,605,038 | | | $ | 1,779,963,107 | |
| Reinvestment of distributions | | | 16,227,132 | | | | 716,427,881 | | | | 6,025,591 | | | | 258,256,825 | |
| Shares reacquired | | | (95,719,769 | ) | | | (3,072,794,593 | ) | | | (26,348,047 | ) | | | (1,246,249,512 | ) |
| Increase (decrease) | | | (51,708,644 | ) | | $ | (1,364,190,675 | ) | | | 17,282,582 | | | $ | 791,970,420 | |
| | | | | | | | | | | | | | | | | |
| Class F3 Shares | | | | | | | | | | | | | | | | |
| Shares sold | | | 6,006,983 | | | $ | 208,833,101 | | | | 8,538,984 | | | $ | 411,256,288 | |
| Reinvestment of distributions | | | 2,856,896 | | | | 128,188,907 | | | | 661,604 | | | | 28,720,216 | |
| Shares reacquired | | | (6,145,599 | ) | | | (212,693,470 | ) | | | (2,567,381 | ) | | | (123,713,803 | ) |
| Increase | | | 2,718,280 | | | $ | 124,328,538 | | | | 6,633,207 | | | $ | 316,262,701 | |
| | | | | | | | | | | | | | | | | |
| Class I Shares | | | | | | | | | | | | | | | | |
| Shares sold | | | 76,152,248 | | | $ | 2,342,464,611 | | | | 7,523,038 | | | $ | 361,849,545 | |
| Reinvestment of distributions | | | 5,228,281 | | | | 232,919,899 | | | | 2,243,922 | | | | 96,892,532 | |
| Shares reacquired | | | (29,422,402 | ) | | | (928,610,855 | ) | | | (10,114,172 | ) | | | (474,476,907 | ) |
| Increase (decrease) | | | 51,958,127 | | | $ | 1,646,773,655 | | | | (347,212 | ) | | $ | (15,734,830 | ) |
| | | | | | | | | | | | | | | | | |
| Class R2 Shares | | | | | | | | | | | | | | | | |
| Shares sold | | | 39,421 | | | $ | 1,263,951 | | | | 57,980 | | | $ | 2,630,122 | |
| Reinvestment of distributions | | | 14,439 | | | | 596,203 | | | | 3,327 | | | | 135,853 | |
| Shares reacquired | | | (33,178 | ) | | | (983,712 | ) | | | (34,978 | ) | | | (1,607,330 | ) |
| Increase | | | 20,682 | | | $ | 876,442 | | | | 26,329 | | | $ | 1,158,645 | |
| | | | | | | | | | | | | | | | | |
| Class R3 Shares | | | | | | | | | | | | | | | | |
| Shares sold | | | 199,861 | | | $ | 6,245,685 | | | | 127,159 | | | $ | 5,737,355 | |
| Reinvestment of distributions | | | 104,557 | | | | 4,314,020 | | | | 49,580 | | | | 2,021,888 | |
| Shares reacquired | | | (197,986 | ) | | | (5,722,139 | ) | | | (203,986 | ) | | | (9,264,032 | ) |
| Increase (decrease) | | | 106,432 | | | $ | 4,837,566 | | | | (27,247 | ) | | $ | (1,504,789 | ) |
| | | | | | | | | | | | | | | | | |
| Class R4 Shares | | | | | | | | | | | | | | | | |
| Shares sold | | | 139,359 | | | $ | 4,820,502 | | | | 131,947 | | | $ | 6,088,231 | |
| Reinvestment of distributions | | | 48,603 | | | | 2,075,821 | | | | 18,437 | | | | 771,054 | |
| Shares reacquired | | | (127,849 | ) | | | (4,480,967 | ) | | | (98,280 | ) | | | (4,540,228 | ) |
| Increase | | | 60,113 | | | $ | 2,415,356 | | | | 52,104 | | | $ | 2,319,057 | |
242
Notes to Financial Statements (continued)
| Growth Leaders Fund | | Year Ended
October 31, 2022 | | | Year Ended
October 31, 2021 | |
| Class R5 Shares | | Shares | | | Amount | | | Shares | | | Amount | |
| Shares sold | | | 90,988 | | | $ | 3,018,150 | | | | 202,881 | | | $ | 9,556,872 | |
| Reinvestment of distributions | | | 79,851 | | | | 3,558,947 | | | | 31,460 | | | | 1,359,076 | |
| Shares reacquired | | | (181,553 | ) | | | (6,313,507 | ) | | | (199,722 | ) | | | (9,546,091 | ) |
| Increase (decrease) | | | (10,714 | ) | | $ | 263,590 | | | | 34,619 | | | $ | 1,369,857 | |
| | | | | | | | | | | | | | | | | |
| Class R6 Shares | | | | | | | | | | | | | | | | |
| Shares sold | | | 1,594,060 | | | $ | 57,419,248 | | | | 2,274,302 | | | $ | 109,538,930 | |
| Reinvestment of distributions | | | 564,971 | | | | 25,350,238 | | | | 82,190 | | | | 3,567,873 | |
| Shares reacquired | | | (1,003,005 | ) | | | (37,177,211 | ) | | | (547,006 | ) | | | (26,351,826 | ) |
| Increase | | | 1,156,026 | | | $ | 45,592,275 | | | | 1,809,486 | | | $ | 86,754,977 | |
| | | | | | | | | | | | | | | | | |
| Health Care Fund | | Year Ended
October 31, 2022 | | | Year Ended
October 31, 2021 | |
| Class A Shares | | | Shares | | | | Amount | | | | Shares | | | | Amount | |
| Shares sold | | | 65,718 | | | $ | 1,176,184 | | | | 93,469 | | | $ | 1,888,394 | |
| Converted from Class C* | | | 715 | | | | 12,881 | | | | 1,078 | | | | 20,376 | |
| Reinvestment of distributions | | | 12,293 | | | | 235,294 | | | | 13,407 | | | | 242,002 | |
| Shares reacquired | | | (52,363 | ) | | | (907,352 | ) | | | (53,158 | ) | | | (1,062,543 | ) |
| Increase | | | 26,363 | | | $ | 517,007 | | | | 54,796 | | | $ | 1,088,229 | |
| | | | | | | | | | | | | | | | | |
| Class C Shares | | | | | | | | | | | | | | | | |
| Shares sold | | | 5,723 | | | $ | 105,182 | | | | 42,736 | | | $ | 851,529 | |
| Reinvestment of distributions | | | 2,622 | | | | 49,195 | | | | 2,699 | | | | 48,170 | |
| Shares reacquired | | | (7,534 | ) | | | (128,034 | ) | | | (25,051 | ) | | | (504,667 | ) |
| Converted to Class A* | | | (731 | ) | | | (12,881 | ) | | | (1,093 | ) | | | (20,376 | ) |
| Increase | | | 80 | | | $ | 13,462 | | | | 19,291 | | | $ | 374,656 | |
| | | | | | | | | | | | | | | | | |
| Class F Shares | | | | | | | | | | | | | | | | |
| Shares sold | | | 9,247 | | | $ | 162,678 | | | | 23,496 | | | $ | 473,930 | |
| Reinvestment of distributions | | | 1,895 | | | | 36,509 | | | | 491 | | | | 8,898 | |
| Shares reacquired | | | (16,088 | ) | | | (280,513 | ) | | | (3,040 | ) | | | (61,905 | ) |
| Increase (decrease) | | | (4,946 | ) | | $ | (81,326 | ) | | | 20,947 | | | $ | 420,923 | |
| | | | | | | | | | | | | | | | | |
| Class R6 Shares | | | | | | | | | | | | | | | | |
| Shares sold | | | 12,669 | | | $ | 237,933 | | | | 75,313 | | | $ | 1,486,080 | |
| Reinvestment of distributions | | | 16 | | | | 309 | | | | – | | | | – | |
| Shares reacquired | | | (14,296 | ) | | | (261,123 | ) | | | (7,643 | ) | | | (153,462 | ) |
| Increase (decrease) | | | (1,611 | ) | | $ | (22,881 | ) | | | 67,670 | | | $ | 1,332,618 | |
| | | | | | | | | | | | | | | | | |
| International Equity Fund | | Year Ended
October 31, 2022 | | | Year Ended
October 31, 2021 | |
| Class A Shares | | | Shares | | | | Amount | | | | Shares | | | | Amount | |
| Shares sold | | | 605,346 | | | $ | 8,476,787 | | | | 866,494 | | | $ | 14,280,450 | |
| Converted from Class C* | | | 43,821 | | | | 584,888 | | | | 33,029 | | | | 558,425 | |
| Reinvestment of distributions | | | 1,380,863 | | | | 20,892,453 | | | | 125,034 | | | | 1,944,287 | |
| Shares reacquired | | | (1,700,637 | ) | | | (23,347,163 | ) | | | (1,553,164 | ) | | | (25,640,612 | ) |
| Increase (decrease) | | | 329,393 | | | $ | 6,606,965 | | | | (528,607 | ) | | $ | (8,857,450 | ) |
243
Notes to Financial Statements (continued)
| International Equity Fund | | Year Ended
October 31, 2022 | | | Year Ended
October 31, 2021 | |
| Class C Shares | | Shares | | | Amount | | | Shares | | | Amount | |
| Shares sold | | | 20,602 | | | $ | 285,153 | | | | 52,720 | | | $ | 859,771 | |
| Reinvestment of distributions | | | 51,685 | | | | 781,993 | | | | 1,234 | | | | 19,178 | |
| Shares reacquired | | | (102,120 | ) | | | (1,304,589 | ) | | | (87,845 | ) | | | (1,453,229 | ) |
| Converted to Class A* | | | (43,962 | ) | | | (584,888 | ) | | | (33,171 | ) | | | (558,425 | ) |
| Decrease | | | (73,795 | ) | | $ | (822,331 | ) | | | (67,062 | ) | | $ | (1,132,705 | ) |
| | | | | | | | | | | | | | | | | |
| Class F Shares | | | | | | | | | | | | | | | | |
| Shares sold | | | 135,834 | | | $ | 1,971,941 | | | | 757,577 | | | $ | 12,936,223 | |
| Reinvestment of distributions | | | 187,027 | | | | 2,814,751 | | | | 9,333 | | | | 144,479 | |
| Shares reacquired | | | (1,046,704 | ) | | | (14,998,501 | ) | | | (133,899 | ) | | | (2,239,606 | ) |
| Increase (decrease) | | | (723,843 | ) | | $ | (10,211,809 | ) | | | 633,011 | | | $ | 10,841,096 | |
| | | | | | | | | | | | | | | | | |
| Class F3 Shares | | | | | | | | | | | | | | | | |
| Shares sold | | | 240,527 | | | $ | 3,369,781 | | | | 80,444 | | | $ | 1,368,799 | |
| Reinvestment of distributions | | | 45,022 | | | | 690,193 | | | | 4,387 | | | | 69,008 | |
| Shares reacquired | | | (109,028 | ) | | | (1,475,564 | ) | | | (84,279 | ) | | | (1,411,344 | ) |
| Increase | | | 176,521 | | | $ | 2,584,410 | | | | 552 | | | $ | 26,463 | |
| | | | | | | | | | | | | | | | | |
| Class I Shares | | | | | | | | | | | | | | | | |
| Shares sold | | | 354,432 | | | $ | 4,704,078 | | | | 30,175 | | | $ | 521,302 | |
| Reinvestment of distributions | | | 1,248,929 | | | | 19,096,120 | | | | 178,682 | | | | 2,805,307 | |
| Shares reacquired | | | (755,216 | ) | | | (9,822,369 | ) | | | (3,953,549 | ) | | | (64,868,896 | ) |
| Increase (decrease) | | | 848,145 | | | $ | 13,977,829 | | | | (3,744,692 | ) | | $ | (61,542,287 | ) |
| | | | | | | | | | | | | | | | | |
| Class P Shares | | | | | | | | | | | | | | | | |
| Shares sold | | | – | | | $ | 5 | | | | 7 | | | $ | 103 | |
| Reinvestment of distributions | | | 91 | | | | 1,376 | | | | 18 | | | | 278 | |
| Shares reacquired | | | (2 | ) | | | (27 | ) | | | (2,120 | ) | | | (33,178 | ) |
| Increase (decrease) | | | 89 | | | $ | 1,354 | | | | (2,095 | ) | | $ | (32,797 | ) |
| | | | | | | | | | | | | | | | | |
| Class R2 Shares | | | | | | | | | | | | | | | | |
| Shares sold | | | 2,018 | | | $ | 26,451 | | | | 1,510 | | | $ | 25,044 | |
| Reinvestment of distributions | | | 1,278 | | | | 19,394 | | | | 59 | | | | 914 | |
| Shares reacquired | | | (1,013 | ) | | | (13,072 | ) | | | (1,723 | ) | | | (29,536 | ) |
| Increase (decrease) | | | 2,283 | | | $ | 32,773 | | | | (154 | ) | | $ | (3,578 | ) |
| | | | | | | | | | | | | | | | | |
| Class R3 Shares | | | | | | | | | | | | | | | | |
| Shares sold | | | 61,286 | | | $ | 804,890 | | | | 60,283 | | | $ | 986,472 | |
| Reinvestment of distributions | | | 45,198 | | | | 673,002 | | | | 3,356 | | | | 51,482 | |
| Shares reacquired | | | (89,703 | ) | | | (1,195,534 | ) | | | (117,485 | ) | | | (1,908,756 | ) |
| Increase (decrease) | | | 16,781 | | | $ | 282,358 | | | | (53,846 | ) | | $ | (870,802 | ) |
| | | | | | | | | | | | | | | | | |
| Class R4 Shares | | | | | | | | | | | | | | | | |
| Shares sold | | | 22,879 | | | $ | 313,462 | | | | 22,758 | | | $ | 374,708 | |
| Reinvestment of distributions | | | 12,009 | | | | 180,612 | | | | 988 | | | | 15,301 | |
| Shares reacquired | | | (17,590 | ) | | | (252,827 | ) | | | (15,169 | ) | | | (250,732 | ) |
| Increase | | | 17,298 | | | $ | 241,247 | | | | 8,577 | | | $ | 139,277 | |
244
Notes to Financial Statements (continued)
| International Equity Fund | | Year Ended
October 31, 2022 | | | Year Ended
October 31, 2021 | |
| Class R5 Shares | | Shares | | | Amount | | | Shares | | | Amount | |
| Shares sold | | | 1,361 | | | $ | 19,378 | | | | 528 | | | $ | 8,854 | |
| Reinvestment of distributions | | | 499 | | | | 7,581 | | | | 54 | | | | 848 | |
| Shares reacquired | | | (5,202 | ) | | | (79,784 | ) | | | (800 | ) | | | (13,844 | ) |
| Decrease | | | (3,342 | ) | | $ | (52,825 | ) | | | (218 | ) | | $ | (4,142 | ) |
| | | | | | | | | | | | | | | | | |
| Class R6 Shares | | | | | | | | | | | | | | | | |
| Shares sold | | | 26,358 | | | $ | 391,009 | | | | 95,921 | | | $ | 1,640,453 | |
| Reinvestment of distributions | | | 11,994 | | | | 183,755 | | | | 71 | | | | 1,124 | |
| Shares reacquired | | | (47,931 | ) | | | (643,127 | ) | | | (20,345 | ) | | | (336,541 | ) |
| Increase (decrease) | | | (9,579 | ) | | $ | (68,363 | ) | | | 75,647 | | | $ | 1,305,036 | |
| | | | | | | | | | | | | | | | | |
| International Opportunities Fund | | Year Ended
October 31, 2022 | | | Year Ended
October 31, 2021 | |
| Class A Shares | | | Shares | | | | Amount | | | | Shares | | | | Amount | |
| Shares sold | | | 540,543 | | | $ | 9,823,193 | | | | 1,020,365 | | | $ | 20,734,426 | |
| Converted from Class C* | | | 87,314 | | | | 1,535,005 | | | | 56,486 | | | | 1,157,283 | |
| Reinvestment of distributions | | | 143,264 | | | | 2,819,436 | | | | – | | | | – | |
| Shares reacquired | | | (1,149,008 | ) | | | (20,011,960 | ) | | | (1,129,310 | ) | | | (22,544,684 | ) |
| Decrease | | | (377,887 | ) | | $ | (5,834,326 | ) | | | (52,459 | ) | | $ | (652,975 | ) |
| | | | | | | | | | | | | | | | | |
| Class C Shares | | | | | | | | | | | | | | | | |
| Shares sold | | | 45,141 | | | $ | 751,483 | | | | 98,943 | | | $ | 1,805,973 | |
| Reinvestment of distributions | | | 12,065 | | | | 218,612 | | | | – | | | | – | |
| Shares reacquired | | | (168,632 | ) | | | (2,746,186 | ) | | | (184,163 | ) | | | (3,387,765 | ) |
| Converted to Class A* | | | (95,135 | ) | | | (1,535,005 | ) | | | (61,458 | ) | | | (1,157,283 | ) |
| Decrease | | | (206,561 | ) | | $ | (3,311,096 | ) | | | (146,678 | ) | | $ | (2,739,075 | ) |
| | | | | | | | | | | | | | | | | |
| Class F Shares | �� | | | | | | | | | | | | | | | |
| Shares sold | | | 280,053 | | | $ | 5,075,588 | | | | 603,623 | | | $ | 11,596,436 | |
| Reinvestment of distributions | | | 60,590 | | | | 1,180,901 | | | | – | | | | – | |
| Shares reacquired | | | (1,992,900 | ) | | | (34,508,744 | ) | | | (809,112 | ) | | | (15,871,515 | ) |
| Decrease | | | (1,652,257 | ) | | $ | (28,252,255 | ) | | | (205,489 | ) | | $ | (4,275,079 | ) |
| | | | | | | | | | | | | | | | | |
| Class F3 Shares | | | | | | | | | | | | | | | | |
| Shares sold | | | 647,248 | | | $ | 12,087,069 | | | | 568,476 | | | $ | 12,066,160 | |
| Reinvestment of distributions | | | 36,746 | | | | 751,094 | | | | – | | | | – | |
| Shares reacquired | | | (387,143 | ) | | | (6,987,281 | ) | | | (276,690 | ) | | | (5,795,476 | ) |
| Increase | | | 296,851 | | | $ | 5,850,882 | | | | 291,786 | | | $ | 6,270,684 | |
| | | | | | | | | | | | | | | | | |
| Class I Shares | | | | | | | | | | | | | | | | |
| Shares sold | | | 1,816,657 | | | $ | 31,183,216 | | | | 509,328 | | | $ | 10,221,845 | |
| Reinvestment of distributions | | | 229,563 | | | | 4,664,717 | | | | – | | | | – | |
| Shares reacquired | | | (755,805 | ) | | | (13,319,894 | ) | | | (814,010 | ) | | | (17,506,626 | ) |
| Increase (decrease) | | | 1,290,415 | | | $ | 22,528,039 | | | | (304,682 | ) | | $ | (7,284,781 | ) |
| | | | | | | | | | | | | | | | | |
| Class P Shares | | | | | | | | | | | | | | | | |
| Shares sold | | | 889 | | | $ | 16,507 | | | | 310 | | | $ | 6,474 | |
| Reinvestment of distributions | | | 136 | | | | 2,744 | | | | – | | | | – | |
| Shares reacquired | | | (3 | ) | | | (57 | ) | | | (1,318 | ) | | | (28,552 | ) |
| Increase (decrease) | | | 1,022 | | | $ | 19,194 | | | | (1,008 | ) | | $ | (22,078 | ) |
245
Notes to Financial Statements (continued)
| International Opportunities Fund | | Year Ended
October 31, 2022 | | | Year Ended
October 31, 2021 | |
| Class R2 Shares | | Shares | | | Amount | | | Shares | | | Amount | |
| Shares sold | | | 29,317 | | | $ | 515,255 | | | | 19,444 | | | $ | 387,386 | |
| Reinvestment of distributions | | | 2,535 | | | | 48,946 | | | | – | | | | – | |
| Shares reacquired | | | (32,345 | ) | | | (582,538 | ) | | | (50,635 | ) | | | (1,000,966 | ) |
| Decrease | | | (493 | ) | | $ | (18,337 | ) | | | (31,191 | ) | | $ | (613,580 | ) |
| | | | | | | | | | | | | | | | | |
| Class R3 Shares | | | | | | | | | | | | | | | | |
| Shares sold | | | 52,180 | | | $ | 892,532 | | | | 98,606 | | | $ | 1,906,895 | |
| Reinvestment of distributions | | | 5,703 | | | | 110,011 | | | | – | | | | – | |
| Shares reacquired | | | (100,979 | ) | | | (1,759,227 | ) | | | (769,436 | ) | | | (15,146,837 | ) |
| Decrease | | | (43,096 | ) | | $ | (756,684 | ) | | | (670,830 | ) | | $ | (13,239,942 | ) |
| | | | | | | | | | | | | | | | | |
| Class R4 Shares | | | | | | | | | | | | | | | | |
| Shares sold | | | 17,158 | | | $ | 297,506 | | | | 38,326 | | | $ | 767,766 | |
| Reinvestment of distributions | | | 2,323 | | | | 45,479 | | | | – | | | | – | |
| Shares reacquired | | | (23,025 | ) | | | (425,375 | ) | | | (216,539 | ) | | | (3,983,010 | ) |
| Decrease | | | (3,544 | ) | | $ | (82,390 | ) | | | (178,213 | ) | | $ | (3,215,244 | ) |
| | | | | | | | | | | | | | | | | |
| Class R5 Shares | | | | | | | | | | | | | | | | |
| Shares sold | | | 17,487 | | | $ | 318,955 | | | | 40,176 | | | $ | 803,376 | |
| Reinvestment of distributions | | | 3,892 | | | | 79,057 | | | | – | | | | – | |
| Shares reacquired | | | (47,417 | ) | | | (830,360 | ) | | | (871,351 | ) | | | (17,560,650 | ) |
| Decrease | | | (26,038 | ) | | $ | (432,348 | ) | | | (831,175 | ) | | $ | (16,757,274 | ) |
| | | | | | | | | | | | | | | | | |
| Class R6 Shares | | | | | | | | | | | | | | | | |
| Shares sold | | | 189,120 | | | $ | 3,541,519 | | | | 540,028 | | | $ | 10,832,601 | |
| Reinvestment of distributions | | | 21,471 | | | | 438,873 | | | | – | | | | – | |
| Shares reacquired | | | (309,336 | ) | | | (5,775,413 | ) | | | (1,373,932 | ) | | | (27,830,416 | ) |
| Decrease | | | (98,745 | ) | | $ | (1,795,021 | ) | | | (833,904 | ) | | $ | (16,997,815 | ) |
| | | | | | | | | | | | | | | | | |
| International Value Fund | | Year Ended
October 31, 2022 | | | Year Ended
October 31, 2021 | |
| Class A Shares | | | Shares | | | | Amount | | | | Shares | | | | Amount | |
| Shares sold | | | 2,510,051 | | | $ | 18,393,145 | | | | 3,061,134 | | | $ | 23,907,213 | |
| Converted from Class C* | | | 387,293 | | | | 2,769,843 | | | | 606,743 | | | | 4,752,785 | |
| Reinvestment of distributions | | | 1,381,895 | | | | 9,614,061 | | | | 831,708 | | | | 6,490,509 | |
| Shares reacquired | | | (5,029,245 | ) | | | (35,692,616 | ) | | | (5,124,680 | ) | | | (39,688,743 | ) |
| Decrease | | | (750,006 | ) | | $ | (4,915,567 | ) | | | (625,095 | ) | | $ | (4,538,236 | ) |
| | | | | | | | | | | | | | | | | |
| Class C Shares | | | | | | | | | | | | | | | | |
| Shares sold | | | 76,027 | | | $ | 576,170 | | | | 69,931 | | | $ | 547,796 | |
| Reinvestment of distributions | | | 40,599 | | | | 283,865 | | | | 33,787 | | | | 260,067 | |
| Shares reacquired | | | (248,880 | ) | | | (1,786,583 | ) | | | (321,117 | ) | | | (2,473,707 | ) |
| Converted to Class A* | | | (390,520 | ) | | | (2,769,843 | ) | | | (611,906 | ) | | | (4,752,785 | ) |
| Decrease | | | (522,774 | ) | | $ | (3,696,391 | ) | | | (829,305 | ) | | $ | (6,418,629 | ) |
| | | | | | | | | | | | | | | | | |
| Class F Shares | | | | | | | | | | | | | | | | |
| Shares sold | | | 298,843 | | | $ | 2,203,821 | | | | 447,227 | | | $ | 3,520,651 | |
| Reinvestment of distributions | | | 108,363 | | | | 775,738 | | | | 95,359 | | | | 748,699 | |
| Shares reacquired | | | (2,436,869 | ) | | | (18,196,242 | ) | | | (815,451 | ) | | | (6,336,462 | ) |
| Decrease | | | (2,029,663 | ) | | $ | (15,216,683 | ) | | | (272,865 | ) | | $ | (2,067,112 | ) |
246
Notes to Financial Statements (continued)
| International Value Fund | | Year Ended
October 31, 2022 | | | Year Ended
October 31, 2021 | |
| Class F3 Shares | | Shares | | | Amount | | | Shares | | | Amount | |
| Shares sold | | | 1,192,368 | | | $ | 8,683,417 | | | | 739,152 | | | $ | 5,894,112 | |
| Reinvestment of distributions | | | 168,914 | | | | 1,177,485 | | | | 91,373 | | | | 718,721 | |
| Shares reacquired | | | (769,911 | ) | | | (5,562,192 | ) | | | (733,863 | ) | | | (5,776,493 | ) |
| Increase | | | 591,371 | | | $ | 4,298,710 | | | | 96,662 | | | $ | 836,340 | |
| | | | | | | | | | | | | | | | | |
| Class I Shares | | | | | | | | | | | | | | | | |
| Shares sold | | | 2,440,075 | | | $ | 17,754,791 | | | | 13,551,374 | | | $ | 109,805,842 | |
| Reinvestment of distributions | | | 1,734,831 | | | | 12,464,851 | | | | 1,142,639 | | | | 9,028,328 | |
| Shares reacquired | | | (26,735,085 | ) | | | (180,669,051 | ) | | | (5,696,989 | ) | | | (42,372,150 | ) |
| Increase (decrease) | | | (22,560,179 | ) | | $ | (150,449,409 | ) | | | 8,997,024 | | | $ | 76,462,020 | |
| | | | | | | | | | | | | | | | | |
| Class R2 Shares | | | | | | | | | | | | | | | | |
| Shares sold | | | 5,210 | | | $ | 39,418 | | | | 1,002 | | | $ | 8,031 | |
| Reinvestment of distributions | | | 242 | | | | 1,692 | | | | 74 | | | | 591 | |
| Shares reacquired | | | (1,742 | ) | | | (13,611 | ) | | | (988 | ) | | | (7,800 | ) |
| Increase | | | 3,710 | | | $ | 27,499 | | | | 88 | | | $ | 822 | |
| | | | | | | | | | | | | | | | | |
| Class R3 Shares | | | | | | | | | | | | | | | | |
| Shares sold | | | 553,597 | | | $ | 4,422,777 | | | | 131,877 | | | $ | 1,063,380 | |
| Reinvestment of distributions | | | 41,155 | | | | 288,400 | | | | 20,973 | | | | 165,652 | |
| Shares reacquired | | | (474,190 | ) | | | (3,618,398 | ) | | | (192,616 | ) | | | (1,485,389 | ) |
| Increase (decrease) | | | 120,562 | | | $ | 1,092,779 | | | | (39,766 | ) | | $ | (256,357 | ) |
| | | | | | | | | | | | | | | | | |
| Class R4 Shares | | | | | | | | | | | | | | | | |
| Shares sold | | | 3,802 | | | $ | 28,056 | | | | 15,394 | | | $ | 117,905 | |
| Reinvestment of distributions | | | 949 | | | | 6,611 | | | | 408 | | | | 3,223 | |
| Shares reacquired | | | (6,105 | ) | | | (41,740 | ) | | | (2,743 | ) | | | (20,780 | ) |
| Increase (decrease) | | | (1,354 | ) | | $ | (7,073 | ) | | | 13,059 | | | $ | 100,348 | |
| | | | | | | | | | | | | | | | | |
| Class R5 Shares | | | | | | | | | | | | | | | | |
| Shares sold | | | 779 | | | $ | 5,118 | | | | 515 | | | $ | 4,185 | |
| Reinvestment of distributions | | | 12 | | | | 81 | | | | 7 | | | | 53 | |
| Shares reacquired | | | (488 | ) | | | (3,832 | ) | | | (102 | ) | | | (849 | ) |
| Increase | | | 303 | | | $ | 1,367 | | | | 420 | | | $ | 3,389 | |
| | | | | | | | | | | | | | | | | |
| Class R6 Shares | | | | | | | | | | | | | | | | |
| Shares sold | | | 130,461 | | | $ | 1,025,220 | | | | 24,459 | | | $ | 187,780 | |
| Reinvestment of distributions | | | 3,018 | | | | 20,700 | | | | 154 | | | | 1,230 | |
| Shares reacquired | | | (82,065 | ) | | | (623,584 | ) | | | (10,950 | ) | | | (83,632 | ) |
| Increase | | | 51,414 | | | $ | 422,336 | | | | 13,663 | | | $ | 105,378 | |
| | | | | | | | | | | | | | | | | |
| Micro Cap Growth Fund | | Year Ended
October 31, 2022 | | | Year Ended
October 31, 2021 | |
| Class A Shares | | | Shares | | | | Amount | | | | Shares | | | | Amount | |
| Shares sold | | | 407,517 | | | $ | 6,122,999 | | | | 3,899,533 | | | $ | 79,008,714 | |
| Converted from Class C* | | | 4,470 | | | | 64,278 | | | | 2,848 | | | | 55,236 | |
| Reinvestment of distributions | | | – | | | | – | | | | 216,420 | | | | 3,339,369 | |
| Shares reacquired | | | (962,163 | ) | | | (14,689,692 | ) | | | (1,635,265 | ) | | | (31,860,611 | ) |
| Increase (decrease) | | | (550,176 | ) | | $ | (8,502,415 | ) | | | 2,483,536 | | | $ | 50,542,708 | |
247
Notes to Financial Statements (continued)
| Micro Cap Growth Fund | | Year Ended
October 31, 2022 | | | Year Ended
October 31, 2021 | |
| Class C Shares | | Shares | | | Amount | | | Shares | | | Amount | |
| Shares sold | | | 24,972 | | | $ | 453,379 | | | | 610,825 | | | $ | 15,046,196 | |
| Reinvestment of distributions | | | – | | | | – | | | | 16,075 | | | | 303,011 | |
| Shares reacquired | | | (188,507 | ) | | | (3,305,036 | ) | | | (89,983 | ) | | | (2,091,787 | ) |
| Converted to Class A* | | | (3,698 | ) | | | (64,278 | ) | | | (2,341 | ) | | | (55,236 | ) |
| Increase (decrease) | | | (167,233 | ) | | $ | (2,915,935 | ) | | | 534,576 | | | $ | 13,202,184 | |
| | | | | | | | | | | | | | | | | |
| Class F Shares | | | | | | | | | | | | | | | | |
| Shares sold | | | 700,866 | | | $ | 13,252,990 | | | | 10,540,463 | | | $ | 266,716,166 | |
| Reinvestment of distributions | | | – | | | | – | | | | 199,630 | | | | 3,773,009 | |
| Shares reacquired | | | (5,305,389 | ) | | | (91,358,721 | ) | | | (4,292,107 | ) | | | (101,849,880 | ) |
| Increase (decrease) | | | (4,604,523 | ) | | $ | (78,105,731 | ) | | | 6,447,986 | | | $ | 168,639,295 | |
| | | | | | | | | | | | | | | | | |
| Class I Shares | | | | | | | | | | | | | | | | |
| Shares sold | | | 3,395,449 | | | $ | 55,047,222 | | | | 2,545,959 | | | $ | 61,392,303 | |
| Reinvestment of distributions | | | – | | | | – | | | | 890,870 | | | | 16,837,445 | |
| Shares reacquired | | | (1,197,112 | ) | | | (20,324,862 | ) | | | (1,330,048 | ) | | | (31,678,949 | ) |
| Increase | | | 2,198,337 | | | $ | 34,722,360 | | | | 2,106,781 | | | $ | 46,550,799 | |
| | | | | | | | | | | | | | | | | |
| Value Opportunities Fund | | Year Ended
October 31, 2022 | | | Year Ended
October 31, 2021 | |
| Class A Shares | | | Shares | | | | Amount | | | | Shares | | | | Amount | |
| Shares sold | | | 3,241,657 | | | $ | 62,191,619 | | | | 3,005,986 | | | $ | 64,495,583 | |
| Converted from Class C* | | | 403,054 | | | | 7,570,153 | | | | 505,585 | | | | 11,030,413 | |
| Reinvestment of distributions | | | 4,619,163 | | | | 99,450,571 | | | | 1,967,336 | | | | 36,454,708 | |
| Shares reacquired | | | (6,719,096 | ) | | | (126,038,106 | ) | | | (6,408,852 | ) | | | (134,991,512 | ) |
| Increase (decrease) | | | 1,544,778 | | | $ | 43,174,237 | | | | (929,945 | ) | | $ | (23,010,808 | ) |
| | | | | | | | | | | | | | | | | |
| Class C Shares | | | | | | | | | | | | | | | | |
| Shares sold | | | 290,112 | | | $ | 4,562,011 | | | | 644,345 | | | $ | 11,394,166 | |
| Reinvestment of distributions | | | 614,919 | | | | 10,834,876 | | | | 284,339 | | | | 4,458,433 | |
| Shares reacquired | | | (953,511 | ) | | | (14,741,355 | ) | | | (900,371 | ) | | | (16,016,634 | ) |
| Converted to Class A* | | | (493,715 | ) | | | (7,570,153 | ) | | | (599,570 | ) | | | (11,030,413 | ) |
| Decrease | | | (542,195 | ) | | $ | (6,914,621 | ) | | | (571,257 | ) | | $ | (11,194,448 | ) |
| | | | | | | | | | | | | | | | | |
| Class F Shares | | | | | | | | | | | | | | | | |
| Shares sold | | | 973,884 | | | $ | 19,644,829 | | | | 1,797,604 | | | $ | 37,847,528 | |
| Reinvestment of distributions | | | 1,001,710 | | | | 22,217,936 | | | | 439,721 | | | | 8,363,493 | |
| Shares reacquired | | | (5,353,637 | ) | | | (101,507,414 | ) | | | (2,441,356 | ) | | | (51,421,396 | ) |
| Decrease | | | (3,378,043 | ) | | $ | (59,644,649 | ) | | | (204,031 | ) | | $ | (5,210,375 | ) |
| | | | | | | | | | | | | | | | | |
| Class F3 Shares | | | | | | | | | | | | | | | | |
| Shares sold | | | 1,390,675 | | | $ | 28,001,791 | | | | 1,596,849 | | | $ | 36,558,401 | |
| Reinvestment of distributions | | | 1,280,669 | | | | 29,429,775 | | | | 608,403 | | | | 11,930,790 | |
| Shares reacquired | | | (2,091,701 | ) | | | (42,524,914 | ) | | | (3,195,857 | ) | | | (71,397,694 | ) |
| Increase (decrease) | | | 579,643 | | | $ | 14,906,652 | | | | (990,605 | ) | | $ | (22,908,503 | ) |
| | | | | | | | | | | | | | | | | |
| Class I Shares | | | | | | | | | | | | | | | | |
| Shares sold | | | 4,207,306 | | | $ | 80,562,563 | | | | 6,520,855 | | | $ | 152,442,751 | |
| Reinvestment of distributions | | | 2,122,183 | | | | 48,300,878 | | | | 675,691 | | | | 13,148,938 | |
| Shares reacquired | | | (9,155,084 | ) | | | (183,438,438 | ) | | | (2,888,534 | ) | | | (63,604,654 | ) |
| Increase (decrease) | | | (2,825,595 | ) | | $ | (54,574,997 | ) | | | 4,308,012 | | | $ | 101,987,035 | |
248
Notes to Financial Statements (concluded)
| Value Opportunities Fund | | Year Ended
October 31, 2022 | | | Year Ended
October 31, 2021 | |
| Class P Shares | | Shares | | | Amount | | | Shares | | | Amount | |
| Shares sold | | | 94,269 | | | $ | 1,776,909 | | | | 79,069 | | | $ | 1,623,649 | |
| Reinvestment of distributions | | | 101,102 | | | | 2,111,009 | | | | 50,134 | | | | 906,422 | |
| Shares reacquired | | | (164,771 | ) | | | (3,005,063 | ) | | | (387,193 | ) | | | (7,742,666 | ) |
| Increase (decrease) | | | 30,600 | | | $ | 882,855 | | | | (257,990 | ) | | $ | (5,212,595 | ) |
| | | | | | | | | | | | | | | | | |
| Class R2 Shares | | | | | | | | | | | | | | | | |
| Shares sold | | | 68,239 | | | $ | 1,247,978 | | | | 31,406 | | | $ | 644,725 | |
| Reinvestment of distributions | | | 36,753 | | | | 740,566 | | | | 16,949 | | | | 297,456 | |
| Shares reacquired | | | (85,347 | ) | | | (1,510,262 | ) | | | (90,409 | ) | | | (1,814,660 | ) |
| Increase (decrease) | | | 19,645 | | | $ | 478,282 | | | | (42,054 | ) | | $ | (872,479 | ) |
| | | | | | | | | | | | | | | | | |
| Class R3 Shares | | | | | | | | | | | | | | | | |
| Shares sold | | | 234,054 | | | $ | 4,297,300 | | | | 392,875 | | | $ | 8,002,976 | |
| Reinvestment of distributions | | | 257,856 | | | | 5,296,366 | | | | 139,781 | | | | 2,492,301 | |
| Shares reacquired | | | (408,430 | ) | | | (7,379,086 | ) | | | (1,219,492 | ) | | | (24,413,278 | ) |
| Increase (decrease) | | | 83,480 | | | $ | 2,214,580 | | | | (686,836 | ) | | $ | (13,918,001 | ) |
| | | | | | | | | | | | | | | | | |
| Class R4 Shares | | | | | | | | | | | | | | | | |
| Shares sold | | | 288,149 | | | $ | 5,446,860 | | | | 289,822 | | | $ | 6,215,019 | |
| Reinvestment of distributions | | | 236,131 | | | | 5,076,819 | | | | 106,339 | | | | 1,968,337 | |
| Shares reacquired | | | (589,324 | ) | | | (11,285,136 | ) | | | (657,886 | ) | | | (13,558,997 | ) |
| Decrease | | | (65,044 | ) | | $ | (761,457 | ) | | | (261,725 | ) | | $ | (5,375,641 | ) |
| | | | | | | | | | | | | | | | | |
| Class R5 Shares | | | | | | | | | | | | | | | | |
| Shares sold | | | 21,351 | | | $ | 380,491 | | | | 20,489 | | | $ | 459,253 | |
| Reinvestment of distributions | | | 9,868 | | | | 224,797 | | | | 5,925 | | | | 115,427 | |
| Shares reacquired | | | (44,461 | ) | | | (921,109 | ) | | | (54,178 | ) | | | (1,187,542 | ) |
| Decrease | | | (13,242 | ) | | $ | (315,821 | ) | | | (27,764 | ) | | $ | (612,862 | ) |
| | | | | | | | | | | | | | | | | |
| Class R6 Shares | | | | | | | | | | | | | | | | |
| Shares sold | | | 272,372 | | | $ | 5,698,962 | | | | 438,800 | | | $ | 10,002,897 | |
| Reinvestment of distributions | | | 187,129 | | | | 4,296,484 | | | | 75,851 | | | | 1,485,915 | |
| Shares reacquired | | | (438,448 | ) | | | (8,438,261 | ) | | | (399,116 | ) | | | (9,017,125 | ) |
| Increase | | | 21,053 | | | $ | 1,557,185 | | | | 115,535 | | | $ | 2,471,687 | |
| | |
| * | Automatic conversion of Class C shares occurs on the 25th day of the month (or, if the 25th day was not a business day, the next business day thereafter) following the eighth anniversary of the month on which the purchase order was accepted. |
| 17. | Foreign Witholding Tax Claims |
The International Equity and International Value Funds have made additional filings with several foreign governments for potential reclaims to recover foreign withholding taxes paid in prior years in addition to reclaims regularly filed under statutory reclaimable taxes. The total amount of such additional tax claims received by International Equity Fund and International Value Fund during the year ended October 31, 2022 were $2,426,196 and $8,560,072, respectively, and are included within Dividends on the Statements of Operations. International Equity Fund and International Value Fund are expected to seek closing agreements with the Internal Revenue Service (“IRS”) to address any prior years’ U.S. income tax liabilities attributable to shareholders resulting from these recoveries of foreign taxes paid. The closing agreements would result in paying a compliance fee to the IRS, on behalf of shareholders, representing the estimated tax savings generated from foreign tax credits claimed by shareholders on their tax returns in prior years. The International Equity and International Value Funds have accrued a liability for the estimated IRS compliance fees related to foreign withholding tax claims, which is disclosed in the Statements of Assets and Liabilities, in the amount of $684,970 and $3,524,977, respectively. The actual IRS compliance fees may differ from the estimates and those differences may be material.
249
Report of Independent Registered Public Accounting Firm
To the shareholders and the Board of Trustees of Lord Abbett Securities Trust
Opinion on the Financial Statements and Financial Highlights
We have audited the accompanying statements of assets and liabilities of Lord Abbett Securities Trust comprising the Lord Abbett Alpha Strategy Fund, Lord Abbett Focused Growth Fund, Lord Abbett Focused Large Cap Value Fund, Lord Abbett Focused Small Cap Value Fund, Lord Abbett Fundamental Equity Fund, Lord Abbett Global Equity Fund, Lord Abbett Growth Leaders Fund, Lord Abbett Health Care Fund, Lord Abbett International Equity Fund, Lord Abbett International Opportunities Fund, Lord Abbett International Value Fund, Lord Abbett Micro-Cap Growth Fund, and Lord Abbett Value Opportunities Fund (the “Funds”), including the schedules of investments, as of October 31, 2022, the related statements of operations for the year then ended, the statements of changes in net assets for each of the two years in the period then ended, the financial highlights for each of the five years in the period then ended for the Funds, except for the funds listed in the table below; the financial highlights for the periods indicated in the table below for the funds listed in the table below; and the related notes. In our opinion, the financial statements and financial highlights present fairly, in all material respects, the financial position of each of the funds listed above constituting Lord Abbett Securities Trust as of October 31, 2022, and the results of their operations for the year then ended, the changes in their net assets for each of the two years in the period then ended, and the financial highlights for each of the five years in the period then ended (or for the period listed in the table below), in conformity with accounting principles generally accepted in the United States of America.
Individual Funds Comprising
Lord Abbett Securities Trust | Financial Highlights |
| Lord Abbett Focused Growth Fund | For the years ended October 31, 2022, 2021 and 2020, and the period from January 30, 2019 (commencement of operations) through October 31, 2019 |
| Lord Abbett Focused Large Cap Value Fund | For the years ended October 31, 2022, 2021 and 2020, and the period from July 26, 2019 (commencement of operations) through October 31, 2019 |
| Lord Abbett Health Care Fund | For the years ended October 31, 2022, 2021 and 2020, and the period from July 26, 2019 (commencement of operations) through October 31, 2019 |
Basis for Opinion
These financial statements and financial highlights are the responsibility of the Funds’ management. Our responsibility is to express an opinion on the Funds’ financial statements and financial highlights based on our audits. We are a public accounting firm registered with the Public Company Accounting Oversight Board (United States) (PCAOB) and are required to be independent with respect to the Funds in accordance with the U.S. federal securities laws and the applicable rules and regulations of the Securities and Exchange Commission and the PCAOB.
We conducted our audits in accordance with the standards of the PCAOB. Those standards require that we plan and perform the audit to obtain reasonable assurance about whether the financial statements and financial highlights are free of material misstatement, whether due to error or fraud. The Funds are not required to have, nor were we engaged to perform, an audit of their internal control over financial reporting. As part of our audits we are required to obtain an
250
understanding of internal control over financial reporting but not for the purpose of expressing an opinion on the effectiveness of the Funds’ internal control over financial reporting. Accordingly, we express no such opinion.
Our audits included performing procedures to assess the risks of material misstatement of the financial statements and financial highlights, whether due to error or fraud, and performing procedures that respond to those risks. Such procedures included examining, on a test basis, evidence regarding the amounts and disclosures in the financial statements and financial highlights. Our audits also included evaluating the accounting principles used and significant estimates made by management, as well as evaluating the overall presentation of the financial statements and financial highlights. Our procedures included confirmation of securities owned as of October 31, 2022, by correspondence with the custodian and brokers; when replies were not received from brokers, we performed other auditing procedures. We believe that our audits provide a reasonable basis for our opinion.
DELOITTE & TOUCHE LLP
New York, New York
December 22, 2022
We have served as the auditor of one or more Lord Abbett Family of Funds’ investment companies since 1932.
251
Investments in Underlying Funds (unaudited)
Alpha Strategy Fund invests in Underlying Funds managed by Lord Abbett. As of October 31, 2022, Alpha Strategy Fund’s long-term investments were allocated among the Underlying Funds as follows:
Alpha Strategy Fund’s Investments:
| Underlying Fund Name | % |
| Lord Abbett Developing Growth Fund, Inc. - Class I | 19.92% |
| Lord Abbett Securities Trust-Focused Small Cap Value Fund - Class I | 10.13% |
| Lord Abbett Securities Trust-International Opportunities Fund - Class I | 19.50% |
| Lord Abbett Securities Trust-Micro Cap Growth Fund - Class I | 10.18% |
| Lord Abbett Research Fund, Inc.-Small Cap Value Fund - Class I | 20.21% |
| Lord Abbett Securities Trust-Value Opportunities Fund - Class I | 20.06% |
| Total | 100.00% |
Lord Abbett Developing Growth Fund, Inc.
| Ten Largest Holdings | % of Investments |
| Calix, Inc. | 2.96% |
| Shockwave Medical, Inc. | 2.14% |
| Lantheus Holdings, Inc. | 2.12% |
| Krystal Biotech, Inc. | 2.11% |
| Chart Industries, Inc. | 2.11% |
| Livent Corp. | 2.07% |
| Karuna Therapeutics, Inc. | 2.01% |
| Cytokinetics, Inc. | 1.99% |
| Sarepta Therapeutics, Inc. | 1.95% |
| HealthEquity, Inc. | 1.89% |
| | |
| Holdings by Sector | % of Investments |
| Communication Services | 2.77% |
| Consumer Discretionary | 9.12% |
| Consumer Staples | 2.31% |
| Energy | 2.64% |
| Financials | 1.51% |
| Health Care | 31.61% |
| Industrials | 20.42% |
| Information Technology | 22.50% |
| Materials | 4.28% |
| Money Market Funds | 1.09% |
| Time Deposits | 0.12% |
| Repurchase Agreements | 1.63% |
| Total | 100.00% |
252
Investments in Underlying Funds (unaudited) (continued)
Lord Abbett Securities Trust - Focused Small Cap Value Fund
| Ten Largest Holdings | % of Investments |
| International Money Express, Inc. | 4.09% |
| EMCOR Group, Inc. | 4.00% |
| Cars.com, Inc. | 3.68% |
| Organon & Co. | 3.66% |
| SP Plus Corp. | 3.55% |
| Belden, Inc. | 3.47% |
| First BanCorp | 2.97% |
| MRC Global, Inc. | 2.93% |
| Columbus McKinnon Corp. | 2.85% |
| Kemper Corp. | 2.85% |
| | |
| Holdings by Sector | % of Investments |
| Communication Services | 6.22% |
| Consumer Discretionary | 6.86% |
| Consumer Staples | 4.18% |
| Energy | 8.97% |
| Financials | 28.76% |
| Health Care | 5.92% |
| Industrials | 18.43% |
| Information Technology | 8.99% |
| Materials | 5.07% |
| Real Estate | 6.60% |
| Total | 100.00% |
Lord Abbett Securities Trust - International Opportunities Fund
| Ten Largest Holdings | % of Investments |
| Brookfield Infrastructure Corp. | 2.73% |
| ANDRITZ AG | 2.52% |
| Britvic plc | 2.23% |
| SHO-BOND Holdings Co. Ltd. | 2.03% |
| REN - Redes Energeticas Nacionais SGPS SA | 2.00% |
| Axfood AB | 1.84% |
| Loomis AB | 1.83% |
| Tecan Group AG | 1.68% |
| Aixtron SE | 1.67% |
| Okinawa Cellular Telephone Co. | 1.64% |
| | |
| Holdings by Sector | % of Investments |
| Communication Services | 4.15% |
| Consumer Discretionary | 11.75% |
| Consumer Staples | 7.75% |
| Energy | 4.32% |
| Financials | 14.42% |
| Health Care | 5.39% |
| Industrials | 21.72% |
| Information Technology | 11.43% |
| Materials | 9.02% |
| Real Estate | 3.68% |
| Utilities | 4.73% |
| Money Market Funds | 0.04% |
| Time Deposits | 0.00% |
| Repurchase Agreements | 1.60% |
| Total | 100.00% |
253
Investments in Underlying Funds (unaudited) (continued)
Lord Abbett Securities Trust - Micro Cap Growth Fund
| Ten Largest Holdings | % of Investments |
| Fidelity Government Portfolio | 4.26% |
| Ventyx Biosciences, Inc. | 3.22% |
| Impinj, Inc. | 3.12% |
| ICF International, Inc. | 2.80% |
| Calix, Inc. | 2.76% |
| Agilysys, Inc. | 2.56% |
| Krystal Biotech, Inc. | 2.42% |
| Xenon Pharmaceuticals, Inc. | 2.41% |
| Kura Sushi USA, Inc. | 2.11% |
| Rambus, Inc. | 2.09% |
| | |
| Holdings by Sector | % of Investments |
| Communication Services | 3.27% |
| Consumer Discretionary | 9.15% |
| Consumer Staples | 5.47% |
| Energy | 1.58% |
| Financials | 1.88% |
| Health Care | 36.50% |
| Industrials | 11.22% |
| Information Technology | 24.18% |
| Materials | 0.78% |
| Money Market Funds | 4.26% |
| Time Deposits | 0.47% |
| Repurchase Agreeements | 1.24% |
| Total | 100.00% |
Lord Abbett Research Fund, Inc. - Small Cap Value Fund
| Ten Largest Holdings | % of Investments |
| International Money Express, Inc. | 2.70% |
| First BanCorp | 2.69% |
| Cars.com, Inc. | 2.19% |
| EMCOR Group, Inc. | 2.18% |
| Permian Resources Corp. | 2.09% |
| Belden, Inc. | 2.08% |
| Heritage Financial Corp. | 2.06% |
| Applied Industrial Technologies, Inc. | 2.01% |
| Crane Holdings Co. | 1.99% |
| Curtiss-Wright Corp. | 1.95% |
254
Investments in Underlying Funds (unaudited) (concluded)
| Holdings by Sector | % of Investments |
| Communication Services | 4.74% |
| Consumer Discretionary | 7.18% |
| Consumer Staples | 5.98% |
| Energy | 6.85% |
| Financials | 24.22% |
| Health Care | 6.06% |
| Industrials | 20.79% |
| Information Technology | 9.45% |
| Materials | 5.88% |
| Real Estate | 6.10% |
| Utilities | 2.22% |
| Repurchase Agreements | 0.53% |
| Total | 100.00% |
Lord Abbett Securities Trust - Value Opportunities Fund
| Ten Largest Holdings | % of Investments |
| Molina Healthcare, Inc. | 2.82% |
| Chesapeake Energy Corp. | 2.80% |
| Booz Allen Hamilton Holding Corp. | 2.53% |
| American Financial Group, Inc./OH | 2.46% |
| BJ’s Wholesale Club Holdings, Inc. | 2.37% |
| Crane Holdings Co. | 2.33% |
| EMCOR Group, Inc. | 2.28% |
| First BanCorp | 2.10% |
| AerCap Holdings NV | 1.97% |
| STERIS plc | 1.84% |
| | |
| Holdings by Sector | % of Investments |
| Communication Services | 1.05% |
| Consumer Discretionary | 9.20% |
| Consumer Staples | 3.24% |
| Energy | 5.88% |
| Financials | 16.97% |
| Health Care | 13.69% |
| Industrials | 18.98% |
| Information Technology | 10.77% |
| Materials | 7.09% |
| Real Estate | 6.82% |
| Utilities | 3.08% |
| Repurchase Agreements | 3.23% |
| Total | 100.00% |
255
Basic Information About Management
The Board is responsible for the management of the business and affairs of the Fund in accordance with the laws of the state of organization. The Board elects officers who are responsible for the day-to-day operations of the Fund and who execute policies authorized by the Board. The Board also approves an investment adviser to the Fund and continues to monitor the cost and quality of the services the investment adviser provides, and annually considers whether to renew the contract with the investment adviser. Generally, each Board member holds office until his/her successor is elected and qualified or until his/her earlier resignation or removal, as provided in the Fund’s organizational documents.
Lord, Abbett & Co. LLC (“Lord Abbett”), a Delaware limited liability company, is the Fund’s investment adviser. Designated Lord Abbett personnel are responsible for the day-to-day management of the Fund.
Independent Board Members
The following Independent Board Members also are board members of each of the 14 investment companies in the Lord Abbett Family of Funds, which consist of 62 investment portfolios.
Name, Address and
Year of Birth | | Current Position and
Length of Service
with the Fund | | Principal Occupation and Other Directorships
During the Past Five Years |
Evelyn E. Guernsey
Lord, Abbett & Co. LLC
c/o Legal Dept.
90 Hudson Street
Jersey City, NJ 07302
(1955) | | Board member since 2011 | | Principal Occupation: None. Other Directorships: None. |
Julie A. Hill
Lord, Abbett & Co. LLC
c/o Legal Dept.
90 Hudson Street
Jersey City, NJ 07302
(1946) | | Board member since 2004 | | Principal Occupation: Owner and CEO of The Hill Company, a business consulting firm (since 1998). Other Directorships: Previously served as director of Anthem, Inc., a health benefits company (1994–2021). |
Kathleen M. Lutito
Lord, Abbett & Co. LLC
c/o Legal Dept.
90 Hudson Street
Jersey City, NJ 07302
(1963) | | Board member since 2017 | | Principal Occupation: President and Chief Investment Officer of CenturyLink Investment Management Company (since 2006). Other Directorships: None. |
James M. McTaggart
Lord, Abbett & Co. LLC
c/o Legal Dept.
90 Hudson Street
Jersey City, NJ 07302
(1947) | | Board member since 2012 | | Principal Occupation: Owner of McTaggart LLC (since 2011). Other Directorships: None. |
Charles O. Prince
Lord, Abbett & Co. LLC
c/o Legal Dept.
90 Hudson Street
Jersey City, NJ 07302
(1950) | | Board member since 2019 | | Principal Occupation: None. Formerly Chairman and Chief Executive Officer, Citigroup, Inc. (Retired 2007). Other Directorships: Previously served as director of Johnson & Johnson (2005–2022). Previously served as director of Xerox Corporation (2007–2018). |
256
Basic Information About Management (continued)
Name, Address and
Year of Birth | | Current Position and
Length of Service
with the Fund | | Principal Occupation and Other Directorships
During the Past Five Years |
Karla M. Rabusch
Lord, Abbett & Co. LLC
c/o Legal Dept.
90 Hudson Street
Jersey City, NJ 07302
(1959) | | Board member since 2017 | | Principal Occupation: President and Director of Wells Fargo Funds Management, LLC (2003–2017); President of Wells Fargo Funds (2003–2016). Other Directorships: None. |
Lorin Patrick Taylor Radtke
Lord, Abbett & Co. LLC
c/o Legal Dept.
90 Hudson Street
Jersey City, NJ 07302
(1968) | | Board member since 2021 | | Principal Occupation: Partner and Co-Founder of M Seven 8 Partners LLC, a venture capital firm (since 2016). Formerly Partner, Goldman Sachs (1992–2016). Other Directorships: Currently serves as director of Assured Guaranty (2021–Present), Virtual Combine (2018–Present), and Mariposa Family Learning Center (2021–Present). Previously served as director of SummerMoon Coffee (2022). |
Leah Song Richardson
Lord, Abbett & Co. LLC
c/o Legal Dept.
90 Hudson Street
Jersey City, NJ 07302
(1966) | | Board member since 2021 | | Principal Occupation: President of Colorado College (since 2021) and was formerly Dean at University of California, Irvine–School of Law (2017–2021) and formerly Professor of Law at University of California, Irvine (2014–2017). Other Directorships: None. |
Mark A. Schmid
Lord, Abbett & Co. LLC
c/o Legal Dept.
90 Hudson Street
Jersey City, NJ 07302
(1959) | | Board member since 2016 | | Principal Occupation: Vice President and Chief Investment Officer of the University of Chicago (2009–2021). Other Directorships: None. |
James L.L. Tullis
Lord, Abbett & Co. LLC
c/o Legal Dept.
90 Hudson Street
Jersey City, NJ 07302
(1947) | | Board member since 2006; Chairman since 2017 | | Principal Occupation: Chairman of Tullis Health Investors–FL LLC (since 2018); CEO of Tullis-Dickerson and Co. Inc., a venture capital management firm (1990–2016). Other Directorships: Currently serves as Chairman of Crane Co. (since 2020, director since 1998), Director of Alphatec Spine (since 2018), and Director of Exagen Inc. (since 2019). Previously served as director of electroCore, Inc. (2018–2020). |
Interested Board Members
Mr. Sieg is affiliated with Lord Abbett and is an “interested person” of the Fund as defined in the Act. Mr. Sieg is a board member of each of the 14 investment companies in the Lord Abbett Family of Funds, which consist of 62 investment portfolios. Mr. Sieg is an officer of the Lord Abbett Family of Funds.
Name, Address and
Year of Birth | | Current Position and
Length of Service
with the Fund | | Principal Occupation and Other Directorships
During the Past Five Years |
Douglas B. Sieg
Lord, Abbett & Co. LLC
90 Hudson Street
Jersey City, NJ 07302
(1969) | | Board member since 2016 | | Principal Occupation: Managing Partner of Lord Abbett (since 2018) and was formerly Head of Client Services, joined Lord Abbett in 1994. Other Directorships: None. |
257
Basic Information About Management (continued)
Officers
None of the officers listed below have received compensation from the Fund. All of the officers of the Fund also may be officers of the other Lord Abbett Funds and maintain offices at 90 Hudson Street, Jersey City, NJ 07302. Unless otherwise indicated, the position(s) and title(s) listed under the “Principal Occupation During the Past Five Years” column indicate each officer’s position(s) and title(s) with Lord Abbett. Each officer serves for an indefinite term (i.e., until his or her death, resignation, retirement, or removal).
Name and
Year of Birth | | Current Position
with the Fund | | Length of Service
of Current Position | | Principal Occupation
During the Past Five Years |
Douglas B. Sieg
(1969) | | President and Chief Executive Officer | | Elected as President and Chief Executive Officer in 2018 | | Managing Partner of Lord Abbett (since 2018) and was formerly Head of Client Services, joined Lord Abbett in 1994. |
Jackson C. Chan
(1964) | | AML Compliance Officer | | Elected in 2018 | | Deputy Chief Compliance Officer and Director of Regulatory Affairs, joined Lord Abbett in 2014. |
Nicholas D. Emguschowa
(1986) | | Data Protection Officer | | Elected in 2022 | | Assistant General Counsel, joined Lord Abbett in 2018 and was formerly Associate at Shearman & Sterling (2014–2018). |
Michael J. Hebert
(1976) | | Chief Financial Officer and Treasurer | | Elected as Chief Financial Officer and Treasurer in 2021 | | Head of Global Fund Finance, joined Lord Abbett in 2021 and was formerly Vice President at Eaton Vance Management (EVM) (2014–2021) and Calvert Research & Management (CRM) (2016–2021), and Assistant Treasurer of registered investment companies managed, advised or administered by EVM and CRM during such years. |
Jennifer C. Karam
(1970) | | Vice President and Assistant Secretary | | Elected in 2022 | | Partner and Senior Deputy General Counsel, joined Lord Abbett in 2012. |
Joseph M. McGill
(1962) | | Chief Compliance Officer | | Elected in 2014 | | Partner and Chief Compliance Officer, joined Lord Abbett in 2014. |
258
Basic Information About Management (concluded)
Name and
Year of Birth | | Current Position
with the Fund | | Length of Service
of Current Position | | Principal Occupation
During the Past Five Years |
Lawrence B. Stoller
(1963) | | Vice President, Secretary and Chief Legal Officer | | Elected as Vice President and Secretary in 2007 and Chief Legal Officer in 2019 | | Partner and General Counsel, joined Lord Abbett in 2007. |
Victoria Zozulya
(1983) | | Vice President and Assistant Secretary | | Elected in 2022 | | Counsel, joined Lord Abbett in 2022 and was formerly Senior Director and Counsel at Equitable (2018–2022) and Assistant General Counsel at Neuberger Berman (2014–2018). |
Please call 888-522-2388 for a copy of the statement of additional information, which contains further information about the Fund’s Board members. It is available free upon request.
259
Liquidity Risk Management Program
Pursuant to Rule 22e-4 under the 1940 Act, the Fund has adopted a Liquidity Risk Management Program and Policy (“Program”). The Program is designed to assess, manage and periodically review the Fund’s liquidity risk. Liquidity risk is defined under Rule 22e-4 as the risk that each Fund could not meet redemption requests without significant dilution of remaining investors’ interests in the Fund. The Board has appointed Lord Abbett as the administrator for the Fund’s Program. At the May 17-18, 2022 meeting, Lord Abbett provided the Board with a report addressing the operation of the Program and assessing its adequacy and effectiveness of implementation for the period April 1, 2021 through March 31, 2022. Lord Abbett reported that the Program operated effectively during the period. In particular, Lord Abbett reported that: no Fund breached its 15% limit on illiquid investments at any point during the period and all regulatory reporting related to Rule 22e-4 was completed on time and without issue during the period. There can be no assurance that the Program will achieve its objectives in the future. Please refer to the Funds’ prospectus for more information regarding the Fund’s exposure to liquidity risk and other principal risks to which an investment in the Fund may be subject.
Householding
The Trust has adopted a policy that allows it to send only one copy of each Fund’s prospectus, proxy material, annual report and semiannual report (or related notice of internet availability of annual report and semiannual report) to certain shareholders residing at the same “household.” This reduces Fund expenses, which benefits you and other shareholders. If you need additional copies or do not want your mailings to be “householded,” please call Lord Abbett at 888-522-2388 or send a written request with your name, the name of your fund or funds and your account number or numbers to Lord Abbett Family of Funds, P.O. Box 219336, Kansas City, MO 64121.
Proxy Voting Policies, Procedures and Records
A description of the policies and procedures that Lord Abbett uses to vote proxies related to each Fund’s portfolio securities, and information on how Lord Abbett voted each Fund’s proxies during the 12-month period ended June 30 are available without charge, upon request, (i) by calling 888-522-2388; (ii) on Lord Abbett’s website at www.lordabbett.com; and (iii) on the Securities and Exchange Commission’s (“SEC”) website at www.sec.gov.
Shareholder Reports and Quarterly Portfolio Disclosure
The Funds are required to file their complete schedule of portfolio holdings with the SEC for their first and third fiscal quarters as an attachment to Form N-PORT. Copies of the filings are available without charge, upon request on the SEC’s website at www.sec.gov and may be available by calling Lord Abbett at 888-522-2388.
260
Tax Information (unaudited)
The percentages below reflect the portion of ordinary income distributions that are eligible for the corporate dividend received deduction (DRD) and qualified dividend income (QDI) for individual shareholders:
| Fund Name | | DRD | | QDI | |
| Alpha Strategy Fund | | 42% | | 68% | |
| Focused Growth Fund | | 2% | | 2% | |
| Focused Large Cap Value Fund | | 14% | | 14% | |
| Focused Small Cap Value Fund | | 18% | | 18% | |
| Fundamental Equity Fund | | 100% | | 100% | |
| Global Equity Fund | | 6% | | 13% | |
| Growth Leaders Fund | | 4% | | 4% | |
| Health Care Fund | | 16% | | 26% | |
| International Equity Fund | | – | | 100% | |
| International Opportunities Fund | | 5% | | 78% | |
| International Value Fund | | 98% | | 1% | |
| Value Opportunities Fund | | 70% | | 70% | |
Additionally, of the distributions paid to the shareholders during the fiscal year ended October 31, 2022, the following amounts represent short-term and long-term capital gains:
| Fund Name | | Short-Term
Capital Gains | | Long-Term
Capital Gains | |
| Alpha Strategy Fund | | $ – | | $32,798,605 | |
| Focused Growth Fund | | 5,658,041 | | 1,575,680 | |
| Focused Large Cap Value Fund | | 113,048,516 | | 25,264,481 | |
| Focused Small Cap Value Fund | | 12,980,044 | | 8,108,524 | |
| Fundamental Equity Fund | | – | | 209,608,998 | |
| Global Equity Fund | | 865,414 | | 660,919 | |
| Growth Leaders Fund | | 684,515,296 | | 1,278,899,243 | |
| Health Care Fund | | 142,937 | | 385,484 | |
| International Equity Fund | | – | | 40,771,804 | |
| Value Opportunities Fund | | 25,755,286 | | 205,400,944 | |
The Funds listed below intend to pass through foreign source income and foreign taxes as follows:
| Fund Name | | Foreign
Source Income | | Foreign Taxes | |
| Alpha Strategy Fund | | $2,671,230 | | $91,686 | |
| International Opportunities Fund | | 4,795,520 | | 715,370 | |
261
 | | | |
 |
| | | | |
| | | | |
| | | | |
| | | | |

This report, when not used for the general information of shareholders of the Fund, is to be distributed only if preceded or accompanied by a current fund prospectus. Lord Abbett mutual fund shares are distributed by
LORD ABBETT DISTRIBUTOR LLC. | | Lord Abbett Securities Trust Lord Abbett Alpha Strategy Fund Lord Abbett Focused Growth Fund Lord Abbett Focused Large Cap Value Fund Lord Abbett Focused Small Cap Value Fund Lord Abbett Fundamental Equity Fund Lord Abbett Global Equity Fund Lord Abbett Growth Leaders Fund Lord Abbett Health Care Fund Lord Abbett International Equity Fund Lord Abbett International Opportunities Fund Lord Abbett International Value Fund Lord Abbett Micro-Cap Growth Fund Lord Abbett Value Opportunities Fund | LST-2
(12/22) |
| (a) | In accordance with applicable requirements, the Registrant adopted a Sarbanes-Oxley Code of Ethics on June 19, 2003 that applies to the principal executive officer and senior financial officers of the Registrant (“Code of Ethics”). The Code of Ethics was in effect during the fiscal year ended October 31, 2022 (the “Period”). |
| (c) | The Registrant has not amended the Code of Ethics as described in Form N-CSR during the Period. |
| (d) | The Registrant has not granted any waiver, including an implicit waiver, from a provision of the Code of Ethics as described in Form N-CSR during the Period. |
| (f) | See Item 13(a)(1) concerning the filing of the Code of Ethics. |
| Item 3: | Audit Committee Financial Expert. |
| | The Registrant’s board of trustees has determined that each of the following independent trustees who are members of the audit committee is an audit committee financial expert: Evelyn E. Guernsey, Karla M. Rabusch and Mark A. Schmid. Each of these persons is independent within the meaning of the Form N-CSR. |
| Item 4: | Principal Accountant Fees and Services. |
In response to sections (a), (b), (c) and (d) of Item 4, the aggregate fees billed to the Registrant for the fiscal years ended October 31, 2022 and 2021 by the Registrant’s principal accounting firm, Deloitte & Touche LLP, the member firms of Deloitte Touche Tohmatsu and their respective affiliates (collectively, “Deloitte”) were as follows:
| | | Fiscal year ended: | |
| | | 2022 | | 2021 | |
| Audit Fees {a} | | $ | 558,000 | | | $ | 560,000 | |
| Audit-Related Fees | | | - 0 - | | | | - 0 - | |
| Total audit and audit-related fees | | | 558,000 | | | | 560,000 | |
| | | | | | | | | |
| Tax Fees {b} | | | 0 | | | | 82,337 | |
| All Other Fees | | | - 0 - | | | | - 0 - | |
| | | | | | | | | |
| Total Fees | | $ | 558,000 | | | $ | 642,337 | |
{a} Consists of fees for audits of the Registrant’s annual financial statements.
{b} Fees for the fiscal year ended October 31, 2022 and 2021 consist of fees for preparing the U.S. Income Tax Return for Regulated Investment Companies, New Jersey Corporation Business Tax Return, New Jersey Annual Report Form, U.S. Return of Excise Tax on Undistributed Income of Investment Companies, IRS Forms 1099-MISC and 1096 Annual Summary and Transmittal of U.S. Information Returns.
(e) (1) Pursuant to Rule 2-01(c) (7) of Regulation S-X, the Registrant’s Audit Committee has adopted pre-approval policies and procedures. Such policies and procedures generally provide that the Audit Committee must pre-approve:
| · | any audit, audit-related, tax, and other services to be provided to the Lord Abbett Funds, including the Registrant, and |
| · | any audit-related, tax, and other services to be provided to the Registrant’s investment adviser and any entity controlling, controlled by or under common control with the investment adviser that provides ongoing services to one or more Funds comprising the Registrant if the engagement relates directly to operations and financial reporting of a Fund, by the independent auditor to assure that the provision of such services does not impair the auditor’s independence. |
The Audit Committee has delegated pre-approval authority to its Chairman, subject to a fee limit of $10,000 per event, and not to exceed $25,000 annually. The Chairman will report any pre-approval decisions to the Audit Committee at its next scheduled meeting. Unless a type of service to be provided by the independent auditor has received general pre-approval, it must be pre-approved by the Audit Committee. Any proposed services exceeding pre-approved cost levels will require specific pre-approval by the Audit Committee.
(e) (2) With respect to the services described in paragraphs (b) through (d) of this Item 4, no amount was approved by the Audit Committee pursuant to paragraph (c)(7)(i)(C) of Rule 2-01 of Regulation S-X.
(f) Not applicable.
(g) The aggregate non-audit fees billed by Deloitte for services rendered to the Registrant are shown above in the response to Item 4 (a), (b), (c) and (d) as “All Other Fees”.
The aggregate non-audit fees billed by Deloitte for services rendered to the Registrant’s investment adviser, Lord, Abbett & Co. LLC (“Lord Abbett”), for the fiscal years ended October 31, 2022 and 2021 were:
| | | Fiscal year ended: | |
| | | | |
| | | 2022 | | 2021 | |
| | | | | | |
| All Other Fees {a} | | $ | 270,000 | | | $ | 220,000 | |
{a} Consist of fees for Independent Services Auditors’ Report on Controls Placed in Operation and Tests of Operating Effectiveness related to Lord Abbett’s Asset Management Services (“SOC-1 Report”).
The aggregate non-audit fees billed by Deloitte for services rendered to entities under the common control of Lord Abbett for the fiscal years ended October 31, 2022 and 2021 were:
| | | Fiscal year ended: | |
| | | | |
| | | 2022 | | 2021 | |
| | | | | | |
| All Other Fees | | $ | - 0 - | | | $ | - 0- | |
(h) The Registrant’s Audit Committee has considered the provision of non-audit services that were rendered to the Registrant’s investment adviser, and any entity controlling, controlled by or under common control with the investment adviser that provides ongoing services to the Registrant, that were not pre-approved pursuant to Rule 2-01 (c)(7)(ii) of Regulation S-X and has determined that the provision of such services is compatible with maintaining Deloitte’s independence.
(i) Not applicable.
(j) Not applicable.
| Item 5: | Audit Committee of Listed Registrants. |
| Item 6: | Schedule of Investments. |
| Item 7: | Disclosure of Proxy Voting Policies and Procedures for Closed-End Management Investment Companies. |
| Item 8: | Portfolio Managers of Closed-End Management Investment Companies. |
| Item 9: | Purchases of Equity Securities by Closed-End Management Investment Company and Affiliated Purchasers. |
| Item 10: | Submission of Matters to a Vote of Security Holders. |
| Item 11: | Controls and Procedures. |
| (a) | The principal executive officer and principal financial & accounting officer have concluded as of a date within 90 days of the filing date of this report, based on their evaluation of the Registrant’s disclosure controls and procedures (as defined in Rule 30a-3(c) under the Investment Company Act of 1940), that the design of such procedures is effective to provide reasonable assurance that material information required to be disclosed by the Registrant on Form N-CSR is recorded, processed, summarized and reported within the time periods specified in the Commission’s rules and forms. |
| (b) | There were no changes in the Registrant’s internal control over financial reporting (as defined in Rule 30a-3(d) under the Investment Company Act of 1940) that occurred during the period covered by this report that have materially affected, or are reasonably likely to materially affect, the Registrant’s internal control over financial reporting. |
| Item 12: | Disclosure of Securities Lending Activities for Closed-End Management Investment Companies. |
SIGNATURES
Pursuant to the requirements of the Securities Exchange Act of 1934 and the Investment Company Act of 1940, the Registrant has duly caused this report to be signed on its behalf by the undersigned, thereunto duly authorized.
LORD ABBETT SECURITIES TRUST
| | By: | /s/ Douglas B. Sieg |
| | | Douglas B. Sieg |
| | | President and Chief Executive Officer |
Date: December 22, 2022
Pursuant to the requirements of the Securities Exchange Act of 1934 and the Investment Company Act of 1940, this report has been signed below by the following persons on behalf of the Registrant and in the capacities and on the dates indicated.
| | By: | /s/ Douglas B. Sieg |
| | | Douglas B. Sieg |
| | | President and Chief Executive Officer |
Date: December 22, 2022
| | | By: /s/ Michael J. Hebert |
| | | Michael J. Hebert |
| | | Chief Financial Officer and Treasurer |
Date: December 22, 2022