6.30.2015
Guggenheim Funds Semi-Annual Report
Guggenheim Alternative Fund |
Guggenheim Multi-Hedge Strategies Fund | | |
Rydex Specialty Fund |
Rydex Commodities Strategy Fund | | |
RDXSGIALT-SEMI-0615x1215 | guggenheiminvestments.com |
DEAR SHAREHOLDER | 2 |
ECONOMIC AND MARKET OVERVIEW | 3 |
ABOUT SHAREHOLDERS’ FUND EXPENSES | 5 |
ALTERNATIVE FUND | |
MULTI-HEDGE STRATEGIES FUND | 8 |
SPECIALTY FUND | |
COMMODITIES STRATEGY FUND | 39 |
NOTES TO CONSOLIDATED FINANCIAL STATEMENTS | 49 |
OTHER INFORMATION | 72 |
INFORMATION ON BOARD OF TRUSTEES AND OFFICERS | 77 |
GUGGENHEIM INVESTMENTS PRIVACY POLICIES | 82 |
| | THE GUGGENHEIM FUNDS SEMI-ANNUAL REPORT | 1 |
Dear Shareholder:
Security Investors, LLC (the “Investment Adviser”) is pleased to present the semi-annual shareholder report for Funds that are part of the Rydex Series Funds. This report covers performance of the Funds for the semi-annual period ended June 30, 2015.
The Investment Adviser is part of Guggenheim Investments, which represents the investment management businesses of Guggenheim Partners, LLC (“Guggenheim”), a global, diversified financial services firm.
Guggenheim Funds Distributors, LLC is the distributor of the Funds. Guggenheim Funds Distributors, LLC is affiliated with Guggenheim and the Investment Adviser.
We encourage you to read the Economic and Market Overview section of the report, which follows this letter.
We are committed to providing innovative investment solutions and appreciate the trust you place in us.
Sincerely,

Donald C. Cacciapaglia
President
July 31, 2015
Read a prospectus and summary prospectus (if available) carefully before investing. It contains the investment objectives, risks, charges, expenses and other information, which should be considered carefully before investing. Obtain a prospectus and summary prospectus (if available) at guggenheiminvestments.com or call 800.820.0888.
The Funds may not be suitable for all investors. Investing involves risks, including the entire loss of principal amount invested. Certain Funds may be affected by risks that include those associated with sector concentration, international investing, investing in small and/or medium size companies, and/or the Funds’ possible use of investment techniques and strategies such as leverage, derivatives and short sales of securities. Please see each Fund’s prospectus for more information.
2 | THE GUGGENHEIM FUNDS SEMI-ANNUAL REPORT | |
ECONOMIC AND MARKET OVERVIEW (Unaudited) | June 30, 2015 |
The U.S. economy rebounded in the second quarter of 2015 after a poor first quarter, with recent positive employment, retail sales, and housing data. Data from the Bureau of Labor Statistics showed a 280,000 increase in employment in May. Also in May, building permits rose 11.8%, better than the 3.5% decline forecast by economists. Among the most positive surprises was the return of the consumer, with the May retail sales report showing a 1.2% jump, which should contribute to a positive second-quarter GDP growth rate. Summer retail sales are a little bumpy so far, but the likelihood that the U.S. economy will suffer a recession in the next year or two appears now to be remote.
In Europe, the immediate risk of a Greek exit has lessened, although the solution is far from clear or concrete. Global markets calmed after a tentative deal on Greece, but China may pose a bigger problem. Following a dramatic equity market selloff, Chinese leaders have implemented an aggressive set of reforms and rescue operations to halt the slide. In the near term, these measures appear to have had success, but there is still significant downside risk in the equity market and the Chinese economy.
As for developments at the U.S. Federal Reserve (the “Fed”), we still expect the Fed to raise interest rates in September, which may cause further deterioration in prices. September is not a date set in stone, but the bottom line is that a rate hike is coming. It is worth noting that historical tightening cycles with slow and anticipated rate rises can actually result in significant risk asset rallies.
The combination of higher rate volatility, relative value opportunities, and strong U.S. economic data has allowed risk assets, including equities, high-yield bonds, and bank loans, to outperform less risky Treasuries and investment-grade corporate bonds through June 2015. Yet, despite the fact that risky assets are leading the pack in performance, tepid year-to-date returns of less than 3% across all risk assets including equities, preferreds, bank loans, and high-yield bonds, suggest that markets may be fully priced.
Before the mid-year, there was a high level of complacency in the market and it was evidenced by stocks trading around their highs and low dispersion among analysts’ year-end predictions, which indicated a worrying lack of uncertainty. In July, after the period end, the market has faced a rocky patch, with large swings triggered by global concerns. These concerns have not completely abated, and we could see additional turbulence ahead.
For the six-month period ended June 30, 2015, the Standard & Poor’s 500® (“S&P 500”) Index* returned 1.23%. The Morgan Stanley Capital International (“MSCI”) Europe-Australasia-Far East (“EAFE”) Index* returned 5.52%. The return of the MSCI Emerging Markets Index* was 2.95%.
| | THE GUGGENHEIM FUNDS SEMI-ANNUAL REPORT | 3 |
ECONOMIC AND MARKET OVERVIEW (Unaudited)(concluded) | June 30, 2015 |
In the bond market, the Barclays U.S. Aggregate Bond Index* posted a -0.10% return for the period, while the Barclays U.S. Corporate High Yield Index* returned 2.53%. The return of the Bank of America Merrill Lynch 3-Month U.S. Treasury Bill Index* was 0.01% for the six-month period.
The opinions and forecasts expressed may not actually come to pass. This information is subject to change at any time, based on market and other conditions, and should not be construed as a recommendation of any specific security or strategy.
*Index Definitions:
The following indices are referenced throughout this report. Indices are unmanaged and not available for direct investment. Index performance does not reflect transaction costs, fees, or expenses.
Barclays U.S. Aggregate Bond Index is a broad-based benchmark that measures the investment grade, U.S. dollar denominated, fixed-rate taxable bond market, including U.S. Treasuries, government-related and corporate securities, MBS (agency fixed-rate and hybrid ARM pass-throughs), ABS, and CMBS.
Barclays U.S. Corporate High Yield Index measures the market of U.S. dollar denominated, non-investment grade, fixed-rate, taxable corporate bonds. Securities are classified as high yield if the middle rating of Moody’s, Fitch, and S&P is Ba1/BB+/BB+ or below.
Bank of America (“BofA”) Merrill Lynch 3-Month U.S. Treasury Bill Index is an unmanaged market index of U.S. Treasury securities maturing in 90 days that assumes reinvestment of all income.
MSCI EAFE Index is a free float-adjusted market capitalization index that is designed to measure the equity market performance of developed markets, excluding the U.S. & Canada.
MSCI Emerging Markets Index is a free float-adjusted market capitalization weighted index that is designed to measure equity market performance in the global emerging markets.
S&P 500® Index is a capitalization-weighted index of 500 stocks designed to measure the performance of the broad economy, representing all major industries and is considered a representation of the U.S. stock market.
4 | THE GUGGENHEIM FUNDS SEMI-ANNUAL REPORT | |
ABOUT SHAREHOLDERS’ FUND EXPENSES (Unaudited) |
All mutual funds have operating expenses and it is important for our shareholders to understand the impact of costs on their investments. Shareholders of a Fund incur two types of costs: (i) transaction costs, including sales charges (loads) on purchase payments, reinvested dividends, or other distributions; and exchange fees; and (ii) ongoing costs, including management fees, administrative services, and shareholder reports, among others. These ongoing costs, or operating expenses, are deducted from a fund’s gross income and reduce the investment return of the fund.
A fund’s expenses are expressed as a percentage of its average net assets, which is known as the expense ratio. The following examples are intended to help investors understand the ongoing costs (in dollars) of investing in a Fund and to compare these costs with the ongoing costs of investing in other mutual funds.
The examples are based on an investment of $1,000 made at the beginning of the period and held for the entire six-month period beginning December 31, 2014 and ending June 30, 2015.
The following tables illustrate a Fund’s costs in two ways:
Table 1. Based on actual Fund return. This section helps investors estimate the actual expenses paid over the period. The “Ending Account Value” shown is derived from the Fund’s actual return, and the fourth column shows the dollar amount that would have been paid by an investor who started with $1,000 in the Fund. Investors may use the information here, together with the amount invested, to estimate the expenses paid over the period. Simply divide the Fund’s account value by $1,000 (for example, an $8,600 account value divided by $1,000 = 8.6), then multiply the result by the number provided under the heading “Expenses Paid During Period.”
Table 2. Based on hypothetical 5% return. This section is intended to help investors compare a Fund’s cost with those of other mutual funds. The table provides information about hypothetical account values and hypothetical expenses based on the Fund’s actual expense ratio and an assumed rate of return of 5% per year before expenses, which is not the Fund’s actual return. The hypothetical account values and expenses may not be used to estimate the actual ending account balance or expenses paid during the period. The example is useful in making comparisons because the U.S. Securities and Exchange Commission (the “SEC”) requires all mutual funds to calculate expenses based on the 5% return. Investors can assess a Fund’s costs by comparing this hypothetical example with the hypothetical examples that appear in shareholder reports of other funds.
| | THE GUGGENHEIM FUNDS SEMI-ANNUAL REPORT | 5 |
ABOUT SHAREHOLDERS’ FUND EXPENSES (Unaudited)(continued) |
The calculations illustrated above assume no shares were bought or sold during the period. Actual costs may have been higher or lower, depending on the amount of investment and the timing of any purchases or redemptions.
Please note that the expenses shown in the table are meant to highlight your ongoing costs only and do not reflect any transactional costs, such as sales charges (loads) on purchase payments, and contingent deferred sales charges (“CDSC”) on redemptions, if any. Therefore, the second table is useful in comparing ongoing costs only, and will not help you determine the relative total costs of owning different funds. In addition, if these transactional costs were included, your costs would have been higher.
More information about a Fund’s expenses, including annual expense ratios for the past five years, can be found in the Financial Highlights section of this report. For additional information on operating expenses and other shareholder costs, please refer to the appropriate Fund prospectus.
6 | THE GUGGENHEIM FUNDS SEMI-ANNUAL REPORT | |
ABOUT SHAREHOLDERS’ FUND EXPENSES (Unaudited)(concluded) |
| Expense
Ratio1 | Fund
Return | Beginning
Account Value
December 31,
2014 | Ending
Account Value
June 30,
2015 | Expenses
Paid During
Period2 |
Table 1. Based on actual Fund return3 | |
Multi-Hedge Strategies Fund | | | | | |
A-Class | 2.73% | 0.17% | $ 1,000.00 | $ 1,001.70 | $ 13.55 |
C-Class | 3.49% | (0.22%) | 1,000.00 | 997.80 | 17.29 |
P-Class | 2.75% | 0.13% | 1,000.00 | 1,001.30 | 13.65 |
Institutional Class | 2.49% | 0.29% | 1,000.00 | 1,002.90 | 12.37 |
Commodities Strategy Fund | | | | | |
A-Class | 1.59% | (1.01%) | 1,000.00 | 989.90 | 7.84 |
C-Class | 2.39% | (1.42%) | 1,000.00 | 985.80 | 11.77 |
H-Class | 1.60% | (1.11%) | 1,000.00 | 988.90 | 7.89 |
|
Table 2. Based on hypothetical 5% return (before expenses) |
Multi-Hedge Strategies Fund | | | | | |
A-Class | 2.73% | 5.00% | $ 1,000.00 | $ 1,011.26 | $ 13.61 |
C-Class | 3.49% | 5.00% | 1,000.00 | 1,007.49 | 17.37 |
P-Class | 2.75% | 5.00% | 1,000.00 | 1,011.16 | 13.71 |
Institutional Class | 2.49% | 5.00% | 1,000.00 | 1,012.45 | 12.42 |
Commodities Strategy Fund | | | | | |
A-Class | 1.59% | 5.00% | 1,000.00 | 1,016.91 | 7.95 |
C-Class | 2.39% | 5.00% | 1,000.00 | 1,012.94 | 11.93 |
H-Class | 1.60% | 5.00% | 1,000.00 | 1,016.86 | 8.00 |
1 | Annualized and excludes expenses of the underlying funds in which the Funds invest. This ratio represents net expenses, which include interest and dividend expenses related to securities sold short. Excluding short interest and dividend expenses, the operating expense ratio of the Multi-Hedge Strategies Fund would be 1.44%, 2.19%, 1.44% and 1.19% for the A-Class, C-Class, P-Class and Institutional Class, respectively. |
2 | Expenses are equal to the Fund’s annualized expense ratio, net of any applicable fee waivers, multiplied by the average account value over the period, multiplied by 181/365 (to reflect the one-half year period). |
3 | Actual cumulative return at net asset value for the period December 31, 2014 to June 30, 2015. |
| | THE GUGGENHEIM FUNDS SEMI-ANNUAL REPORT | 7 |
FUND PROFILE (Unaudited) | June 30, 2015 |
MULTI-HEDGE STRATEGIES FUND
OBJECTIVE: Seeks long-term capital appreciation with less risk than traditional equity funds.
Consolidated Holdings Diversification (Market Exposure as % of Net Assets)
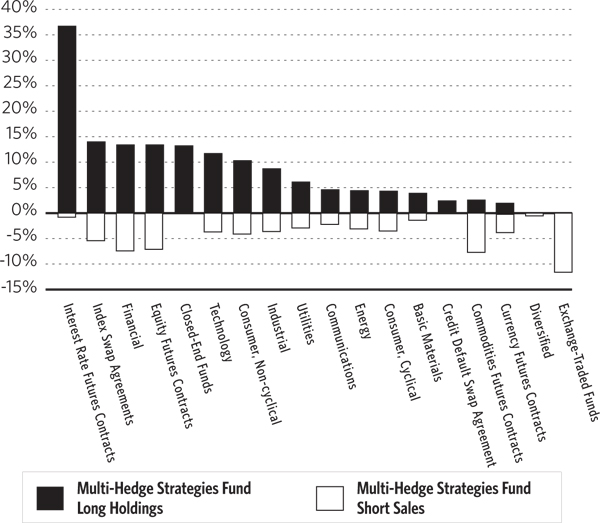
“Consolidated Holdings Diversification (Market Exposure as % of Net Assets)” excludes any temporary cash investments or investments in Guggenheim Strategy Funds Trust mutual funds. Investments in those Funds do not provide “market exposure” to meet the Fund’s investment objective, but will significantly increase the portfolio’s exposure to certain other asset categories (and their associated risks), which may cause the Fund to deviate from its principal investment strategy, including: (i) high yield, high risk debt securities rated below the top four long-term rating categories by a nationally recognized statistical rating organization (also known as “junk bonds”); (ii) securities issued by the U.S. Government or its agencies and instrumentalities; (iii) CLOs and similar investments; and (iv) other short-term fixed income securities.
8 | THE GUGGENHEIM FUNDS SEMI-ANNUAL REPORT | |
FUND PROFILE (Unaudited)(concluded) | June 30, 2015 |
Inception Dates: |
A-Class | September 19, 2005 |
C-Class | September 19, 2005 |
P-Class | September 19, 2005 |
Institutional Class | May 3, 2010 |
Ten Largest Long Holdings (% of Total Net Assets) |
Sigma-Aldrich Corp. | 2.5% |
Cleco Corp. | 2.4% |
Catamaran Corp. | 2.4% |
IGATE Corp. | 2.4% |
Omnicare, Inc. | 2.3% |
Polypore International, Inc. | 2.2% |
Pall Corp. | 2.1% |
Orbitz Worldwide, Inc. | 2.0% |
Broadcom Corp. — Class A | 1.9% |
City National Corp. | 1.9% |
Top Ten Total | 22.1% |
| | |
“Ten Largest Long Holdings” exclude any temporary cash or derivative investments. |
| | THE GUGGENHEIM FUNDS SEMI-ANNUAL REPORT | 9 |
CONSOLIDATED SCHEDULE OF INVESTMENTS (Unaudited) | June 30, 2015 |
MULTI-HEDGE STRATEGIES FUND | |
| |
Shares
| | | Value | |
| | | | | | | |
COMMON STOCKS† - 67.4% | |
| | | | | | | |
Financial - 13.5% | |
City National Corp.1 | | | 21,879 | | | $ | 1,977,644 | |
Susquehanna Bancshares, Inc.1 | | | 120,406 | | | | 1,700,133 | |
Home Properties, Inc. | | | 19,985 | | | | 1,459,905 | |
HCC Insurance Holdings, Inc.1 | | | 13,499 | | | | 1,037,263 | |
Excel Trust, Inc.1 | | | 65,211 | | | | 1,028,377 | |
Associated Estates Realty Corp.1 | | | 18,308 | | | | 524,159 | |
Hudson City Bancorp, Inc.1 | | | 44,150 | | | | 436,202 | |
Square 1 Financial, Inc. — Class A*,1 | | | 12,544 | | | | 343,078 | |
Montpelier Re Holdings Ltd.1 | | | 6,738 | | | | 266,151 | |
Hudson Valley Holding Corp.1 | | | 6,464 | | | | 182,349 | |
Interactive Brokers Group, Inc. — Class A1 | | | 4,120 | | | | 171,227 | |
Meadowbrook Insurance Group, Inc.1 | | | 19,701 | | | | 169,429 | |
Hanover Insurance Group, Inc.1 | | | 2,207 | | | | 163,385 | |
JPMorgan Chase & Co.1 | | | 2,379 | | | | 161,201 | |
Huntington Bancshares, Inc.1 | | | 14,222 | | | | 160,851 | |
Voya Financial, Inc.1 | | | 3,457 | | | | 160,646 | |
Everest Re Group Ltd.1 | | | 882 | | | | 160,533 | |
Reinsurance Group of America, Inc. — Class A1 | | | 1,692 | | | | 160,520 | |
Hartford Financial Services Group, Inc.1 | | | 3,850 | | | | 160,045 | |
Goldman Sachs Group, Inc. | | | 760 | | | | 158,680 | |
Citigroup, Inc.1 | | | 2,844 | | | | 157,103 | |
PNC Financial Services Group, Inc.1 | | | 1,642 | | | | 157,057 | |
Lincoln National Corp.1 | | | 2,648 | | | | 156,815 | |
Berkshire Hathaway, Inc. — Class B*,1 | | | 1,152 | | | | 156,799 | |
Ameriprise Financial, Inc.1 | | | 1,251 | | | | 156,287 | |
Chimera Investment Corp.1 | | | 11,398 | | | | 156,267 | |
Allstate Corp.1 | | | 2,403 | | | | 155,883 | |
Bank of New York Mellon Corp.1 | | | 3,703 | | | | 155,415 | |
Taubman Centers, Inc.1 | | | 2,231 | | | | 155,054 | |
Air Lease Corp. — Class A1 | | | 4,561 | | | | 154,618 | |
MFA Financial, Inc.1 | | | 20,892 | | | | 154,392 | |
CBL & Associates Properties, Inc.1 | | | 9,465 | | | | 153,333 | |
Navient Corp.1 | | | 8,362 | | | | 152,272 | |
Macerich Co.1 | | | 2,011 | | | | 150,021 | |
American Capital Agency Corp.1 | | | 8,166 | | | | 150,009 | |
NASDAQ OMX Group, Inc.1 | | | 3,016 | | | | 147,211 | |
Capital One Financial Corp.1 | | | 1,569 | | | | 138,025 | |
Assured Guaranty Ltd.1 | | | 5,615 | | | | 134,704 | |
Popular, Inc.*,1 | | | 4,659 | | | | 134,459 | |
CoreLogic, Inc.*,1 | | | 3,016 | | | | 119,705 | |
Travelers Companies, Inc.1 | | | 785 | | | | 75,878 | |
Synovus Financial Corp.1 | | | 1,251 | | | | 38,556 | |
ACE Ltd.1 | | | 368 | | | | 37,418 | |
BioMed Realty Trust, Inc.1 | | | 1,545 | | | | 29,880 | |
Morgan Stanley1 | | | 760 | | | | 29,480 | |
Wells Fargo & Co.1 | | | 417 | | | | 23,452 | |
Jones Lang LaSalle, Inc.1 | | | 74 | | | | 12,654 | |
Total Financial | | | | | | | 13,824,525 | |
| | | | | | | | | |
Technology - 11.7% | |
IGATE Corp.*,1 | | | 50,915 | | | | 2,428,135 | |
Broadcom Corp. — Class A1 | | | 38,780 | | | | 1,996,781 | |
Advent Software, Inc.1 | | | 39,374 | | | | 1,740,725 | |
Altera Corp. | | | 25,283 | | | | 1,294,490 | |
Freescale Semiconductor Ltd.*,1 | | | 27,494 | | | | 1,098,935 | |
Dealertrack Technologies, Inc.* | | | 10,954 | | | | 687,802 | |
Micrel, Inc.1 | | | 18,576 | | | | 258,206 | |
Rally Software Development Corp.*,1 | | | 10,853 | | | | 211,091 | |
DST Systems, Inc.1 | | | 1,324 | | | | 166,798 | |
Brocade Communications Systems, Inc.1 | | | 13,216 | | | | 157,006 | |
Activision Blizzard, Inc.1 | | | 6,449 | | | | 156,129 | |
Intel Corp.1 | | | 5,124 | | | | 155,846 | |
Microsoft Corp.1 | | | 3,507 | | | | 154,834 | |
10 | THE GUGGENHEIM FUNDS SEMI-ANNUAL REPORT | SEE NOTES TO FINANCIAL STATEMENTS. |
CONSOLIDATED SCHEDULE OF INVESTMENTS (Unaudited)(continued) | June 30, 2015 |
MULTI-HEDGE STRATEGIES FUND | |
| |
Shares
| | | Value | |
| | | | | | | |
Xerox Corp.1 | | | 14,345 | | | $ | 152,631 | |
CA, Inc. | | | 5,198 | | | | 152,249 | |
Lam Research Corp.1 | | | 1,667 | | | | 135,610 | |
Apple, Inc.1 | | | 1,079 | | | | 135,334 | |
Oracle Corp.1 | | | 3,335 | | | | 134,401 | |
Western Digital Corp.1 | | | 1,471 | | | | 115,356 | |
Fidelity National Information Services, Inc.1 | | | 1,741 | | | | 107,594 | |
OmniVision Technologies, Inc.*,1 | | | 3,136 | | | | 82,148 | |
NVIDIA Corp. | | | 4,071 | | | | 81,868 | |
Micron Technology, Inc.*,1 | | | 4,316 | | | | 81,313 | |
Electronic Arts, Inc.*,1 | | | 907 | | | | 60,316 | |
Synopsys, Inc.*,1 | | | 1,177 | | | | 59,615 | |
Broadridge Financial Solutions, Inc.1 | | | 1,079 | | | | 53,961 | |
Akamai Technologies, Inc.*,1 | | | 686 | | | | 47,897 | |
Shanda Games Ltd. ADR*,1 | | | 6,500 | | | | 44,720 | |
Skyworks Solutions, Inc.1 | | | 270 | | | | 28,107 | |
Hewlett-Packard Co.1 | | | 932 | | | | 27,969 | |
ON Semiconductor Corp.*,1 | | | 1,324 | | | | 15,478 | |
Rackspace Hosting, Inc.*,1 | | | 343 | | | | 12,756 | |
Cerner Corp.*,1 | | | 99 | | | | 6,837 | |
Total Technology | | | | | | | 12,042,938 | |
| | | | | | | | | |
Consumer, Non-cyclical - 10.3% | |
Catamaran Corp.*,1 | | | 39,845 | | | | 2,433,732 | |
Omnicare, Inc.1 | | | 24,901 | | | | 2,346,919 | |
Hospira, Inc.*,1 | | | 22,161 | | | | 1,965,902 | |
Pinnacle Foods, Inc.1 | | | 3,850 | | | | 175,328 | |
Kroger Co.1 | | | 2,256 | | | | 163,583 | |
Spectrum Brands Holdings, Inc.1 | | | 1,569 | | | | 160,023 | |
Ingredion, Inc.1 | | | 1,986 | | | | 158,503 | |
Amgen, Inc.1 | | | 1,021 | | | | 156,744 | |
Molson Coors Brewing Co. — Class B1 | | | 2,231 | | | | 155,746 | |
Bunge Ltd.1 | | | 1,766 | | | | 155,055 | |
Pilgrim’s Pride Corp.2 | | | 6,719 | | | | 154,335 | |
Archer-Daniels-Midland Co.1 | | | 3,114 | | | | 150,157 | |
ADT Corp.1 | | | 4,414 | | | | 148,178 | |
Western Union Co.1 | | | 6,253 | | | | 127,123 | |
Hill-Rom Holdings, Inc.1 | | | 2,231 | | | | 121,210 | |
DENTSPLY International, Inc.1 | | | 2,330 | | | | 120,112 | |
Cooper Companies, Inc.1 | | | 662 | | | | 117,816 | |
Dr Pepper Snapple Group, Inc.1 | | | 1,545 | | | | 112,630 | |
Pfizer, Inc.1 | | | 3,237 | | | | 108,536 | |
Edwards Lifesciences Corp.*,1 | | | 760 | | | | 108,247 | |
Graham Holdings Co. — Class B1 | | | 99 | | | | 106,430 | |
DaVita HealthCare Partners, Inc.*,1 | | | 1,324 | | | | 105,218 | |
Charles River Laboratories International, Inc.*,1 | | | 1,471 | | | | 103,470 | |
Anthem, Inc.1 | | | 613 | | | | 100,618 | |
Lumenis Ltd. — Class B* | | | 6,147 | | | | 84,337 | |
UnitedHealth Group, Inc.1 | | | 638 | | | | 77,836 | |
United Therapeutics Corp.*,1 | | | 442 | | | | 76,886 | |
Humana, Inc.1 | | | 392 | | | | 74,982 | |
Universal Health Services, Inc. — Class B1 | | | 490 | | | | 69,629 | |
United Rentals, Inc.*,1 | | | 785 | | | | 68,782 | |
Health Net, Inc.*,1 | | | 1,055 | | | | 67,647 | |
Cintas Corp.1 | | | 760 | | | | 64,288 | |
Gilead Sciences, Inc.1 | | | 515 | | | | 60,296 | |
Mallinckrodt plc* | | | 490 | | | | 57,683 | |
Constellation Brands, Inc. — Class A1 | | | 442 | | | | 51,281 | |
Aetna, Inc.1 | | | 392 | | | | 49,964 | |
Herbalife Ltd.*,2 | | | 809 | | | | 44,568 | |
Centene Corp.*,1 | | | 515 | | | | 41,406 | |
Myriad Genetics, Inc.* | | | 1,006 | | | | 34,194 | |
ManpowerGroup, Inc.1 | | | 245 | | | | 21,898 | |
Cigna Corp.1 | | | 122 | | | | 19,764 | |
Vantiv, Inc. — Class A*,1 | | | 417 | | | | 15,925 | |
VCA, Inc.*,1 | | | 245 | | | | 13,329 | |
Medivation, Inc.*,1 | | | 99 | | | | 11,306 | |
Total System Services, Inc.1 | | | 245 | | | | 10,234 | |
AbbVie, Inc.1 | | | 49 | | | | 3,265 | |
RR Donnelley & Sons Co.1 | | | 49 | | | | 854 | |
Total Consumer, Non-cyclical | | | | 10,575,969 | |
SEE NOTES TO FINANCIAL STATEMENTS. | THE GUGGENHEIM FUNDS SEMI-ANNUAL REPORT | 11 |
CONSOLIDATED SCHEDULE OF INVESTMENTS (Unaudited)(continued) | June 30, 2015 |
MULTI-HEDGE STRATEGIES FUND | |
| |
Shares
| | | Value | |
| | | | | | | |
Industrial - 8.7% | |
Polypore International, Inc.*,1 | | | 37,111 | | | $ | 2,222,207 | |
Pall Corp.1 | | | 17,431 | | | | 2,169,288 | |
MeadWestvaco Corp.1 | | | 16,920 | | | | 798,455 | |
RTI International Metals, Inc.*,1 | | | 16,597 | | | | 523,137 | |
Quality Distribution, Inc.*,1 | | | 22,069 | | | | 341,187 | |
AGCO Corp.1 | | | 3,114 | | | | 176,813 | |
Deere & Co.1 | | | 1,741 | | | | 168,964 | |
AMERCO1 | | | 490 | | | | 160,186 | |
Stanley Black & Decker, Inc.1 | | | 1,520 | | | | 159,965 | |
Northrop Grumman Corp.1 | | | 1,006 | | | | 159,582 | |
FedEx Corp.1 | | | 932 | | | | 158,813 | |
Republic Services, Inc. — Class A1 | | | 3,997 | | | | 156,562 | |
Masco Corp.1 | | | 5,836 | | | | 155,646 | |
Cummins, Inc.1 | | | 1,177 | | | | 154,411 | |
Sonoco Products Co.1 | | | 3,580 | | | | 153,439 | |
Ryder System, Inc.1 | | | 1,716 | | | | 149,927 | |
GATX Corp.1 | | | 2,820 | | | | 149,883 | |
L-3 Communications Holdings, Inc.1 | | | 1,299 | | | | 147,281 | |
CSX Corp.1 | | | 4,291 | | | | 140,101 | |
Corning, Inc.1 | | | 6,204 | | | | 122,405 | |
Energizer Holdings, Inc.*,1 | | | 785 | | | | 103,267 | |
Huntington Ingalls Industries, Inc.1 | | | 859 | | | | 96,715 | |
Arrow Electronics, Inc.*,1 | | | 1,398 | | | | 78,008 | |
Packaging Corporation of America1 | | | 1,177 | | | | 73,551 | |
Spirit AeroSystems Holdings, Inc. — Class A*,1 | | | 956 | | | | 52,685 | |
Trinity Industries, Inc.1 | | | 1,520 | | | | 40,174 | |
Jabil Circuit, Inc.1 | | | 1,839 | | | | 39,152 | |
Caterpillar, Inc.1 | | | 392 | | | | 33,249 | |
Snap-on, Inc.1 | | | 196 | | | | 31,213 | |
Norfolk Southern Corp.1 | | | 122 | | | | 10,658 | |
Ball Corp.1 | | | 147 | | | | 10,312 | |
Waste Management, Inc.1 | | | 122 | | | | 5,655 | |
General Dynamics Corp. | | | 25 | | | | 3,542 | |
Orbital ATK, Inc. | | | 25 | | | | 1,834 | |
Total Industrial | | | | | | | 8,948,267 | |
| | | | | | | | | |
Utilities - 6.1% | |
Cleco Corp.1 | | | 45,644 | | | | 2,457,928 | |
WEC Energy Group, Inc. | | | 35,164 | | | | 1,581,337 | |
Pepco Holdings, Inc.1 | | | 32,639 | | | | 879,295 | |
Consolidated Edison, Inc.1 | | | 2,796 | | | | 161,832 | |
American Electric Power Company, Inc.1 | | | 2,991 | | | | 158,433 | |
Public Service Enterprise Group, Inc.1 | | | 4,021 | | | | 157,945 | |
PG&E Corp.1 | | | 3,212 | | | | 157,709 | |
Edison International | | | 2,820 | | | | 156,736 | |
Xcel Energy, Inc.1 | | | 4,242 | | | | 136,508 | |
Atmos Energy Corp.1 | | | 2,648 | | | | 135,790 | |
UGI Corp.1 | | | 3,383 | | | | 116,545 | |
FirstEnergy Corp.1 | | | 2,722 | | | | 88,601 | |
Entergy Corp.1 | | | 711 | | | | 50,126 | |
Pinnacle West Capital Corp.1 | | | 539 | | | | 30,664 | |
Total Utilities | | | | | | | 6,269,449 | |
| | | | | | | | | |
Communications - 4.6% | |
Orbitz Worldwide, Inc.*,1 | | | 179,596 | | | | 2,050,987 | |
Time Warner Cable, Inc.1 | | | 7,483 | | | | 1,333,247 | |
Thomson Reuters Corp.1 | | | 4,143 | | | | 157,724 | |
Yahoo!, Inc.*,1 | | | 3,972 | | | | 156,060 | |
Symantec Corp.1 | | | 6,498 | | | | 151,078 | |
TEGNA, Inc. | | | 4,561 | | | | 146,271 | |
Telephone & Data Systems, Inc.1 | | | 4,781 | | | | 140,562 | |
Frontier Communications Corp.1 | | | 24,496 | | | | 121,255 | |
Walt Disney Co.1 | | | 956 | | | | 109,118 | |
Cisco Systems, Inc.1 | | | 2,844 | | | | 78,097 | |
Time Warner, Inc.1 | | | 785 | | | | 68,617 | |
CenturyLink, Inc. | | | 1,619 | | | | 47,566 | |
Liberty Media Corp. — Class A*,1 | | | 1,226 | | | | 44,185 | |
eBay, Inc.*,1 | | | 662 | | | | 39,879 | |
Gannett Company, Inc.*,1 | | | 2,281 | | | | 31,904 | |
John Wiley & Sons, Inc. — Class A1 | | | 318 | | | | 17,290 | |
12 | THE GUGGENHEIM FUNDS SEMI-ANNUAL REPORT | SEE NOTES TO FINANCIAL STATEMENTS. |
CONSOLIDATED SCHEDULE OF INVESTMENTS (Unaudited)(continued) | June 30, 2015 |
MULTI-HEDGE STRATEGIES FUND | |
| |
Shares
| | | Value | |
| | | | | | | |
VeriSign, Inc.*,1 | | | 99 | | | $ | 6,110 | |
Total Communications | | | | | | | 4,699,950 | |
| | | | | | | | | |
Energy - 4.3% | |
Baker Hughes, Inc.1 | | | 21,661 | | | | 1,336,483 | |
Dresser-Rand Group, Inc.*,1 | | | 12,024 | | | | 1,024,203 | |
Williams Partners, LP1 | | | 8,763 | | | | 424,392 | |
Rosetta Resources, Inc.*,1 | | | 15,246 | | | | 352,793 | |
Valero Energy Corp.1 | | | 2,722 | | | | 170,397 | |
Chevron Corp.1 | | | 1,496 | | | | 144,320 | |
Murphy USA, Inc.*,1 | | | 2,501 | | | | 139,606 | |
Hess Corp.1 | | | 1,986 | | | | 132,824 | |
ConocoPhillips1 | | | 2,059 | | | | 126,443 | |
Murphy Oil Corp.1 | | | 2,967 | | | | 123,338 | |
Newfield Exploration Co.*,1 | | | 3,090 | | | | 111,611 | |
Devon Energy Corp.1 | | | 1,520 | | | | 90,425 | |
Marathon Petroleum Corp. | | | 1,716 | | | | 89,764 | |
Tesoro Corp.1 | | | 662 | | | | 55,879 | |
Superior Energy Services, Inc.1 | | | 2,158 | | | | 45,404 | |
National Oilwell Varco, Inc.1 | | | 809 | | | | 39,059 | |
Atwood Oceanics, Inc.1 | | | 1,471 | | | | 38,893 | |
Diamond Offshore Drilling, Inc. | | | 539 | | | | 13,912 | |
Denbury Resources, Inc.1 | | | 1,348 | | | | 8,573 | |
Unit Corp.*,1 | | | 147 | | | | 3,987 | |
Marathon Oil Corp.1 | | | 147 | | | | 3,901 | |
Total Energy | | | | | | | 4,476,207 | |
| | | | | | | | | |
Consumer, Cyclical - 4.3% | |
Office Depot, Inc.*,1 | | | 111,994 | | | | 969,867 | |
Family Dollar Stores, Inc.1 | | | 10,780 | | | | 849,571 | |
Foot Locker, Inc.1 | | | 2,575 | | | | 172,551 | |
Carnival Corp.1 | | | 3,408 | | | | 168,321 | |
CVS Health Corp.1 | | | 1,569 | | | | 164,557 | |
Royal Caribbean Cruises Ltd.1 | | | 2,084 | | | | 163,990 | |
Kohl’s Corp.1 | | | 2,600 | | | | 162,786 | |
PACCAR, Inc.1 | | | 2,476 | | | | 157,994 | |
Liberty Interactive Corporation QVC Group — Class A*,1 | | | 5,688 | | | | 157,842 | |
Lear Corp.1 | | | 1,398 | | | | 156,940 | |
Best Buy Company, Inc.1 | | | 4,757 | | | | 155,126 | |
Whirlpool Corp.1 | | | 859 | | | | 148,650 | |
CST Brands, Inc.1 | | | 3,556 | | | | 138,898 | |
PulteGroup, Inc.1 | | | 5,517 | | | | 111,167 | |
Wyndham Worldwide Corp.1 | | | 1,349 | | | | 110,497 | |
Alaska Air Group, Inc.1 | | | 1,496 | | | | 96,387 | |
Wendy’s Co.1 | | | 7,332 | | | | 82,705 | |
Goodyear Tire & Rubber Co.1 | | | 2,280 | | | | 68,742 | |
Southwest Airlines Co.1 | | | 2,035 | | | | 67,338 | |
Macy’s, Inc.1 | | | 686 | | | | 46,284 | |
Dick’s Sporting Goods, Inc.1 | | | 809 | | | | 41,882 | |
Dillard’s, Inc. — Class A1 | | | 294 | | | | 30,926 | |
Leggett & Platt, Inc.1 | | | 564 | | | | 27,456 | |
United Continental Holdings, Inc.*,1 | | | 490 | | | | 25,975 | |
Ford Motor Co.1 | | | 1,692 | | | | 25,397 | |
GameStop Corp. — Class A | | | 442 | | | | 18,988 | |
Lowe’s Companies, Inc.1 | | | 270 | | | | 18,082 | |
General Motors Co.1 | | | 490 | | | | 16,332 | |
Lennar Corp. — Class A1 | | | 221 | | | | 11,280 | |
Big Lots, Inc.1 | | | 196 | | | | 8,818 | |
Norwegian Cruise Line Holdings Ltd.*,1 | | | 122 | | | | 6,837 | |
Walgreens Boots Alliance, Inc. | | | 25 | | | | 2,111 | |
Total Consumer, Cyclical | | | | | | | 4,384,297 | |
| | | | | | | | | |
Basic Materials - 3.9% | |
Sigma-Aldrich Corp.1 | | | 18,293 | | | | 2,549,129 | |
OM Group, Inc. | | | 8,828 | | | | 296,621 | |
Celanese Corp. — Class A1 | | | 2,280 | | | | 163,887 | |
Newmont Mining Corp.1 | | | 6,890 | | | | 160,950 | |
Dow Chemical Co.1 | | | 3,114 | | | | 159,343 | |
CF Industries Holdings, Inc.1 | | | 2,450 | | | | 157,486 | |
Steel Dynamics, Inc.1 | | | 7,528 | | | | 155,943 | |
Mosaic Co.1 | | | 2,575 | | | | 120,639 | |
Domtar Corp.1 | | | 1,863 | | | | 77,128 | |
Ashland, Inc.1 | | | 515 | | | | 62,779 | |
LyondellBasell Industries N.V. — Class A1 | | | 490 | | | | 50,725 | |
United States Steel Corp.1 | | | 1,299 | | | | 26,785 | |
SEE NOTES TO FINANCIAL STATEMENTS. | THE GUGGENHEIM FUNDS SEMI-ANNUAL REPORT | 13 |
CONSOLIDATED SCHEDULE OF INVESTMENTS (Unaudited)(continued) | June 30, 2015 |
MULTI-HEDGE STRATEGIES FUND | |
| |
Shares
| | | Value | |
| | | | | | | |
Westlake Chemical Corp.1 | | | 172 | | | $ | 11,797 | |
Total Basic Materials | | | | | | | 3,993,212 | |
| | | | | | | | | |
Total Common Stocks | | | | | | | | |
(Cost $66,973,640) | | | | | | | 69,214,814 | |
| | | | | | | | | |
MUTUAL FUNDS† - 0.0% | |
Guggenheim Strategy Fund I*,3 | | | 793 | | | | 19,764 | |
Guggenheim Strategy Fund II*,3 | | | 236 | | | | 5,891 | |
Total Mutual Funds | | | | | | | | |
(Cost $25,655) | | | | | | | 25,655 | |
| | | | | | | | | |
CLOSED-END FUNDS† - 13.2% | |
Adams Diversified Equity Fund, Inc.1 | | | 33,556 | | | | 468,776 | |
Western Asset/Claymore Inflation-Linked Opportunities & Income Fund1,3 | | | 41,168 | | | | 460,669 | |
Tri-Continental Corp.1 | | | 19,594 | | | | 415,196 | |
Cohen & Steers REIT and Preferred Income Fund, Inc.1 | | | 23,421 | | | | 409,633 | |
AllianzGI Equity & Convertible Income Fund1 | | | 19,904 | | | | 383,152 | |
Nuveen Dividend Advantage Municipal Income Fund1 | | | 26,636 | | | | 361,184 | |
Nuveen Maryland Premium Income Municipal Fund1 | | | 29,027 | | | | 355,581 | |
BlackRock Enhanced Equity Dividend Trust1 | | | 44,484 | | | | 354,982 | |
Alpine Total Dynamic Dividend Fund1 | | | 40,707 | | | | 351,708 | |
Morgan Stanley Emerging Markets Debt Fund, Inc.1 | | | 37,830 | | | | 340,848 | |
Western Asset/Claymore Inflation-Linked Securities & Income Fund1,3 | | | 27,690 | | | | 312,066 | |
BlackRock Core Bond Trust1 | | | 24,578 | | | | 311,403 | |
Zweig Total Return Fund, Inc.1 | | | 22,046 | | | | 285,275 | |
GDL Fund1 | | | 27,115 | | | | 276,302 | |
Neuberger Berman Real Estate Securities Income Fund, Inc.1 | | | 54,836 | | | | 259,923 | |
Boulder Growth & Income Fund, Inc.1 | | | 29,391 | | | | 248,060 | |
General American Investors Company, Inc.1 | | | 6,957 | | | | 242,312 | |
BlackRock Credit Allocation Income Trust1 | | | 18,038 | | | | 228,541 | |
First Trust High Income Long/Short Fund1 | | | 13,673 | | | | 213,846 | |
Swiss Helvetia Fund, Inc.1 | | | 16,893 | | | | 197,648 | |
Clough Global Allocation Fund1 | | | 12,325 | | | | 181,671 | |
Zweig Fund, Inc.1 | | | 12,201 | | | | 179,355 | |
BlackRock Resources & Commodities Strategy Trust1 | | | 19,546 | | | | 178,260 | |
Gabelli Healthcare & WellnessRx Trust1 | | | 15,327 | | | | 172,275 | |
Western Asset Worldwide Income Fund, Inc.1 | | | 15,781 | | | | 171,066 | |
Advent Claymore Convertible Securities and Income Fund II1,3 | | | 25,768 | | | | 165,173 | |
BlackRock MuniYield Michigan Quality Fund II, Inc.1 | | | 11,807 | | | | 147,233 | |
Western Asset Emerging Markets Income Fund, Inc.1 | | | 13,164 | | | | 141,250 | |
Nuveen Credit Strategies Income Fund1 | | | 16,234 | | | | 139,775 | |
Madison Covered Call & Equity Strategy Fund1 | | | 17,412 | | | | 138,948 | |
Nuveen Build America Bond Fund1 | | | 6,498 | | | | 125,736 | |
Ellsworth Growth and Income Fund Ltd.1 | | | 13,101 | | | | 115,682 | |
Source Capital, Inc.1 | | | 1,580 | | | | 114,929 | |
First Trust Enhanced Equity Income Fund1 | | | 7,698 | | | | 110,543 | |
Bancroft Fund Ltd.1 | | | 5,176 | | | | 109,628 | |
14 | THE GUGGENHEIM FUNDS SEMI-ANNUAL REPORT | SEE NOTES TO FINANCIAL STATEMENTS. |
CONSOLIDATED SCHEDULE OF INVESTMENTS (Unaudited)(continued) | June 30, 2015 |
MULTI-HEDGE STRATEGIES FUND | |
| |
Shares
| | | Value | |
| | | | | | | |
Western Asset High Yield Defined Opportunity Fund, Inc.1 | | | 6,927 | | | $ | 106,676 | |
Central Securities Corp.1 | | | 4,993 | | | | 105,602 | |
BlackRock Limited Duration Income Trust1 | | | 6,969 | | | | 105,580 | |
New Ireland Fund, Inc.1 | | | 7,559 | | | | 103,936 | |
China Fund, Inc.1 | | | 5,204 | | | | 103,403 | |
Nuveen Diversified Dividend & Income Fund1 | | | 8,995 | | | | 103,353 | |
Morgan Stanley Income Securities, Inc.1 | | | 5,778 | | | | 99,439 | |
Nuveen New Jersey Dividend Advantage Municipal Fund1 | | | 7,694 | | | | 98,868 | |
Western Asset Emerging Markets Debt Fund, Inc.1 | | | 6,130 | | | | 91,705 | |
Korea Equity Fund, Inc.1 | | | 10,806 | | | | 86,232 | |
Putnam High Income Securities Fund1 | | | 10,854 | | | | 84,553 | |
Eaton Vance Tax-Advantaged Dividend Income Fund1 | | | 4,178 | | | | 82,724 | |
MFS Multimarket Income Trust1 | | | 12,954 | | | | 78,631 | |
Franklin Limited Duration Income Trust1 | | | 6,722 | | | | 78,311 | |
Cohen & Steers Quality Income Realty Fund, Inc.1 | | | 7,166 | | | | 76,605 | |
First Trust Aberdeen Global Opportunity Income Fund1 | | | 6,898 | | | | 75,326 | |
Advent/Claymore Enhanced Growth & Income Fund1,3 | | | 8,279 | | | | 75,091 | |
Delaware Enhanced Global Dividend & Income Fund1 | | | 6,910 | | | | 74,697 | |
Duff & Phelps Global Utility Income Fund, Inc.1 | | | 4,209 | | | | 74,583 | |
Strategic Global Income Fund, Inc.1 | | | 8,966 | | | | 74,149 | |
BlackRock Debt Strategies Fund, Inc.1 | | | 20,071 | | | | 72,657 | |
Templeton Emerging Markets Income Fund1 | | | 6,768 | | | | 72,485 | |
Royce Value Trust, Inc.1 | | | 5,176 | | | | 71,377 | |
Duff & Phelps Utility and Corporate Bond Trust, Inc.1 | | | 7,583 | | | | 71,053 | |
John Hancock Premium Dividend Fund1 | | | 5,365 | | | | 70,282 | |
BlackRock Corporate High Yield Fund, Inc.1 | | | 6,508 | | | | 70,221 | |
RMR Real Estate Income Fund1 | | | 3,752 | | | | 69,562 | |
BlackRock Multi-Sector Income Trust1 | | | 4,195 | | | | 69,553 | |
CBRE Clarion Global Real Estate Income Fund1 | | | 8,669 | | | | 69,005 | |
Eaton Vance Limited Duration Income Fund1 | | | 5,074 | | | | 68,347 | |
Liberty All Star Equity Fund1 | | | 11,666 | | | | 67,080 | |
Lazard Global Total Return and Income Fund, Inc.1 | | | 4,301 | | | | 66,149 | �� |
AllianceBernstein Income Fund, Inc.1 | | | 8,877 | | | | 66,045 | |
Ares Dynamic Credit Allocation Fund, Inc.1 | | | 4,216 | | | | 64,631 | |
MFS Charter Income Trust1 | | | 7,578 | | | | 64,186 | |
Cohen & Steers Closed-End Opportunity Fund, Inc.1 | | | 5,249 | | | | 63,460 | |
Wells Fargo Advantage Multi-Sector Income Fund1 | | | 4,988 | | | | 63,148 | |
Ivy High Income Opportunities Fund1 | | | 4,124 | | | | 61,613 | |
Western Asset Managed High Income Fund, Inc.1 | | | 11,639 | | | | 57,497 | |
Asia Tigers Fund, Inc.1 | | | 4,916 | | | | 54,273 | |
Deutsche Global High Income Fund, Inc.1 | | | 6,572 | | | | 53,496 | |
Nuveen Quality Preferred Income Fund 31 | | | 6,526 | | | | 53,187 | |
LMP Real Estate Income Fund, Inc.1 | | | 4,499 | | | | 52,638 | |
Delaware Investments National Municipal Income Fund1 | | | 4,050 | | | | 51,233 | |
SEE NOTES TO FINANCIAL STATEMENTS. | THE GUGGENHEIM FUNDS SEMI-ANNUAL REPORT | 15 |
CONSOLIDATED SCHEDULE OF INVESTMENTS (Unaudited)(continued) | June 30, 2015 |
MULTI-HEDGE STRATEGIES FUND | |
| |
Shares
| | | Value | |
| | | | | | | |
Western Asset Global Corporate Defined Opportunity Fund, Inc.1 | | | 2,779 | | | $ | 47,660 | |
Virtus Global Multi-Sector Income Fund1 | | | 2,928 | | | | 45,911 | |
Cohen & Steers Infrastructure Fund, Inc.1 | | | 2,140 | | | | 44,983 | |
Macquarie Global Infrastructure Total Return Fund, Inc.1 | | | 1,914 | | | | 44,673 | |
First Trust Dividend and Income Fund1 | | | 5,266 | | | | 44,603 | |
Madison Strategic Sector Premium Fund1 | | | 3,708 | | | | 43,421 | |
New America High Income Fund, Inc.1 | | | 4,832 | | | | 42,377 | |
Global High Income Fund, Inc.1 | | | 4,879 | | | | 41,423 | |
Royce Micro-Capital Trust, Inc.1 | | | 4,236 | | | | 39,056 | |
Clough Global Opportunities Fund1 | | | 3,226 | | | | 38,873 | |
Central Europe Russia and Turkey Fund, Inc.1 | | | 1,853 | | | | 38,654 | |
Fort Dearborn Income Securities, Inc.1 | | | 2,774 | | | | 38,281 | |
LMP Capital and Income Fund, Inc.1 | | | 2,385 | | | | 35,966 | |
Eaton Vance Risk-Managed Diversified Equity Income Fund1 | | | 3,309 | | | | 35,770 | |
Nuveen Dividend Advantage Municipal Fund 31 | | | 2,658 | | | | 35,511 | |
Nuveen S&P 500 Dynamic Overwrite Fund1 | | | 2,589 | | | | 35,418 | |
First Trust Strategic High Income Fund II1 | | | 2,634 | | | | 34,848 | |
Aberdeen Singapore Fund, Inc.1 | | | 3,057 | | | | 33,810 | |
Western Asset Income Fund1 | | | 2,556 | | | | 33,509 | |
Aberdeen Greater China Fund, Inc.1 | | | 2,962 | | | | 30,005 | |
Sprott Focus Trust, Inc.1 | | | 4,218 | | | | 29,863 | |
John Hancock Income Securities Trust1 | | | 1,969 | | | | 27,389 | |
Deutsche High Income Trust1 | | | 2,977 | | | | 25,364 | |
BlackRock Global Opportunities Equity Trust1 | | | 1,801 | | | | 24,764 | |
First Trust Aberdeen Emerging Opportunity Fund1 | | | 1,476 | | | | 23,454 | |
Blackstone / GSO Strategic Credit Fund1 | | | 1,490 | | | | 23,289 | |
Voya Emerging Markets High Income Dividend Equity Fund1 | | | 2,312 | | | | 22,773 | |
Gabelli Global Utility & Income Trust1 | | | 1,254 | | | | 22,735 | |
Alpine Global Dynamic Dividend Fund1 | | | 2,264 | | | | 22,414 | |
Cohen & Steers Total Return Realty Fund, Inc.1 | | | 1,808 | | | | 21,985 | |
Nuveen Multi-Market Income Fund, Inc.1 | | | 2,922 | | | | 21,068 | |
Templeton Dragon Fund, Inc.1 | | | 830 | | | | 20,584 | |
Japan Smaller Capitalization Fund, Inc.1 | | | 1,884 | | | | 20,328 | |
MFS Intermediate High Income Fund1 | | | 7,428 | | | | 19,758 | |
European Equity Fund, Inc.1 | | | 2,276 | | | | 19,369 | |
Dividend and Income Fund1 | | | 1,310 | | | | 18,523 | |
Deutsche Strategic Income Trust1 | | | 1,598 | | | | 17,754 | |
Nuveen S&P 500 Buy-Write Income Fund1 | | | 1,262 | | | | 16,179 | |
Morgan Stanley Asia-Pacific Fund, Inc.1 | | | 998 | | | | 15,619 | |
Deutsche Multi-Market Income Trust1 | | | 1,898 | | | | 15,393 | |
Nuveen Flexible Investment Income Fund1 | | | 869 | | | | 14,095 | |
Nuveen Build America Bond Opportunity Fund1 | | | 691 | | | | 13,599 | |
Franklin Universal Trust1 | | | 2,080 | | | | 13,416 | |
16 | THE GUGGENHEIM FUNDS SEMI-ANNUAL REPORT | SEE NOTES TO FINANCIAL STATEMENTS. |
CONSOLIDATED SCHEDULE OF INVESTMENTS (Unaudited)(continued) | June 30, 2015 |
MULTI-HEDGE STRATEGIES FUND | |
| |
Shares
| | | Value | |
| | | | | | | |
Delaware Investments Dividend & Income Fund, Inc.1 | | | 1,352 | | | $ | 13,385 | |
PIMCO Dynamic Credit Income Fund1 | | | 660 | | | | 13,319 | |
ASA Gold and Precious Metals Ltd.1 | | | 1,288 | | | | 12,506 | |
Transamerica Income Shares, Inc. — Class E1 | | | 627 | | | | 12,471 | |
Nuveen Short Duration Credit Opportunities Fund1 | | | 726 | | | | 11,964 | |
JPMorgan China Region Fund, Inc.1 | | | 633 | | | | 11,856 | |
Managed High Yield Plus Fund, Inc.1 | | | 6,616 | | | | 11,843 | |
Neuberger Berman High Yield Strategies Fund, Inc.1 | | | 998 | | | | 11,756 | |
Aberdeen Emerging Markets Smaller Company Opportunities Fund, Inc.1 | | | 897 | | | | 11,455 | |
BlackRock Income Trust, Inc.1 | | | 1,644 | | | | 10,390 | |
MFS Intermediate Income Trust1 | | | 2,037 | | | | 9,411 | |
AllianceBernstein Global High Income Fund, Inc.1 | | | 678 | | | | 8,150 | |
BlackRock Utility and Infrastructure Trust1 | | | 441 | | | | 8,004 | |
Nuveen Global Equity Income Fund1 | | | 614 | | | | 7,669 | |
Morgan Stanley Emerging Markets Fund, Inc.1 | | | 512 | | | | 7,598 | |
Cohen & Steers Limited Duration Preferred and Income Fund, Inc.1 | | | 330 | | | | 7,590 | |
Asia Pacific Fund, Inc.*,1 | | | 512 | | | | 6,554 | |
KKR Income Opportunities Fund1 | | | 415 | | | | 6,540 | |
Western Asset Global Partners Income Fund, Inc.1 | | | 705 | | | | 6,465 | |
Advent Claymore Convertible Securities and Income Fund1,3 | | | 389 | | | | 6,345 | |
New Germany Fund, Inc.1 | | | 349 | | | | 5,263 | |
First Trust Intermediate Duration Preferred & Income Fund1 | | | 230 | | | | 4,954 | |
Invesco High Income Trust II1 | | | 341 | | | | 4,887 | |
Nuveen Floating Rate Income Fund1 | | | 431 | | | | 4,629 | |
India Fund, Inc.1 | | | 170 | | | | 4,503 | |
Korea Fund, Inc.*,1 | | | 107 | | | | 4,344 | |
John Hancock Hedged Equity & Income Fund1 | | | 232 | | | | 3,703 | |
Taiwan Fund, Inc.1 | | | 199 | | | | 3,540 | |
Invesco Bond Fund1 | | | 198 | | | | 3,441 | |
Alliance California Municipal Income Fund, Inc.1 | | | 220 | | | | 2,959 | |
Eaton Vance Municipal Bond Fund1 | | | 240 | | | | 2,921 | |
Nuveen Tax-Advantaged Dividend Growth Fund1 | | | 179 | | | | 2,837 | |
Clough Global Equity Fund1 | | | 189 | | | | 2,799 | |
Montgomery Street Income Securities, Inc.1 | | | 159 | | | | 2,606 | |
Western Asset High Income Opportunity Fund, Inc.1 | | | 470 | | | | 2,421 | |
Nuveen Pennsylvania Investment Quality Municipal Fund1 | | | 181 | | | | 2,380 | |
Voya Global Equity Dividend and Premium Opportunity Fund1 | | | 289 | | | | 2,361 | |
Nuveen Preferred Income Opportunities Fund1 | | | 253 | | | | 2,317 | |
Mexico Equity & Income Fund, Inc.1 | | | 184 | | | | 2,260 | |
Tortoise Energy Independence Fund, Inc.1 | | | 113 | | | | 2,075 | |
Morgan Stanley India Investment Fund, Inc.*,1 | | | 74 | | | | 2,032 | |
SEE NOTES TO FINANCIAL STATEMENTS. | THE GUGGENHEIM FUNDS SEMI-ANNUAL REPORT | 17 |
CONSOLIDATED SCHEDULE OF INVESTMENTS (Unaudited)(continued) | June 30, 2015 |
MULTI-HEDGE STRATEGIES FUND | |
| |
Shares
| | | Value | |
| | | | | | | |
Nuveen Massachusetts Premium Income Municipal Fund1 | | | 142 | | | $ | 1,883 | |
Legg Mason BW Global Income Opportunities Fund, Inc.1 | | | 117 | | | | 1,665 | |
BlackRock MuniHoldings New Jersey Quality Fund, Inc.1 | | | 125 | | | | 1,656 | |
Cutwater Select Income Fund1 | | | 68 | | | | 1,248 | |
Stone Harbor Emerging Markets Total Income Fund1 | | | 75 | | | | 1,052 | |
Nuveen Ohio Quality Income Municipal Fund1 | | | 62 | | | | 888 | |
Aberdeen Latin America Equity Fund, Inc.1 | | | 41 | | | | 854 | |
Western Asset Global High Income Fund, Inc.1 | | | 72 | | | | 744 | |
Latin American Discovery Fund, Inc.1 | | | 70 | | | | 720 | |
Calamos Global Dynamic Income Fund1 | | | 67 | | | | 570 | |
Pacholder High Yield Fund, Inc.1 | | | 73 | | | | 506 | |
Aberdeen Japan Equity Fund, Inc.1 | | | 47 | | | | 388 | |
Wells Fargo Advantage Global Dividend Opportunity Fund1 | | | 51 | | | | 353 | |
Credit Suisse Asset Management Income Fund, Inc.1 | | | 105 | | | | 336 | |
Liberty All Star Growth Fund, Inc.1 | | | 61 | | | | 314 | |
Tortoise Pipeline & Energy Fund, Inc. | | | 12 | | | | 307 | |
Cushing Renaissance Fund | | | 15 | | | | 287 | |
Total Closed-End Funds | | | | | | | | |
(Cost $13,462,100) | | | | | | | 13,524,012 | |
| | Face
Amount | | | | |
| | | | | | | |
REPURCHASE AGREEMENTS††,4 - 8.6% | |
HSBC Group
issued 06/30/15 at 0.04%
due 07/01/15 | | $ | 4,960,275 | | | | 4,960,275 | |
RBC Capital Markets
issued 06/30/15 at 0.04%
due 07/01/15 | | | 2,467,698 | | | | 2,467,698 | |
UMB Financial Corp.
issued 06/30/15 at 0.04%
due 07/01/15 | | | 1,424,933 | | | | 1,424,933 | |
Total Repurchase Agreements | | | | | |
(Cost $8,852,906) | | | | | | | 8,852,906 | |
| | | | | | | | | |
SECURITIES LENDING COLLATERAL††,5 - 0.2% | |
Repurchase Agreements | | | | | | | | |
HSBC Securities, Inc.
issued 06/30/15 at 0.09%
due 07/01/15 | | | 158,068 | | | | 158,068 | |
BNP Paribas Securities Corp.
issued 06/30/15 at 0.09%
due 07/01/15 | | | 25,291 | | | | 25,291 | |
Barclays Capital, Inc.
issued 06/30/15 at 0.11%
due 07/01/15 | | | 10,274 | | | | 10,274 | |
Merrill Lynch, Pierce, Fenner &
Smith, Inc.
issued 06/30/15 at 0.11%
due 07/01/15 | | | 3,952 | | | | 3,952 | |
Total Securities Lending Collateral | | | | | |
(Cost $197,585) | | | | | | | 197,585 | |
| | | | | | | | | |
Total Investments - 89.4% | | | | | | | | |
(Cost $89,511,886) | | | | | | $ | 91,814,972 | |
18 | THE GUGGENHEIM FUNDS SEMI-ANNUAL REPORT | SEE NOTES TO FINANCIAL STATEMENTS. |
CONSOLIDATED SCHEDULE OF INVESTMENTS (Unaudited)(continued) | June 30, 2015 |
MULTI-HEDGE STRATEGIES FUND | |
| |
Shares
| | | Value | |
| | | | | | | |
COMMON STOCKS SOLD SHORT† - (32.0)% | |
| | | | | | | |
Diversified - (0.1)% | |
Leucadia National Corp. | | | 3,997 | | | $ | (97,047 | ) |
| | | | | | | | | |
Basic Materials - (1.4)% | |
Carpenter Technology Corp. | | | 99 | | | | (3,829 | ) |
NewMarket Corp. | | | 25 | | | | (11,097 | ) |
Freeport-McMoRan, Inc. | | | 810 | | | | (15,082 | ) |
Albemarle Corp. | | | 343 | | | | (18,958 | ) |
Royal Gold, Inc. | | | 490 | | | | (30,179 | ) |
PPG Industries, Inc. | | | 392 | | | | (44,970 | ) |
Tahoe Resources, Inc. | | | 6,719 | | | | (81,501 | ) |
Platform Specialty Products Corp.* | | | 3,360 | | | | (85,949 | ) |
Monsanto Co. | | | 834 | | | | (88,896 | ) |
Allegheny Technologies, Inc. | | | 2,967 | | | | (89,603 | ) |
FMC Corp. | | | 1,716 | | | | (90,176 | ) |
Ecolab, Inc. | | | 809 | | | | (91,474 | ) |
RPM International, Inc. | | | 1,913 | | | | (93,680 | ) |
Praxair, Inc. | | | 785 | | | | (93,847 | ) |
WR Grace & Co.* | | | 956 | | | | (95,887 | ) |
Alcoa, Inc. | | | 46,994 | | | | (523,983 | ) |
Total Basic Materials | | | | | | | (1,459,111 | ) |
| | | | | | | | | |
Communications - (2.2)% | |
Clear Channel Outdoor Holdings, Inc. — Class A | | | 99 | | | | (1,003 | ) |
United States Cellular Corp.* | | | 343 | | | | (12,921 | ) |
Netflix, Inc.* | | | 25 | | | | (16,424 | ) |
DISH Network Corp. — Class A* | | | 318 | | | | (21,532 | ) |
Palo Alto Networks, Inc.* | | | 245 | | | | (42,802 | ) |
LinkedIn Corp. — Class A* | | | 221 | | | | (45,665 | ) |
HomeAway, Inc.* | | | 1,741 | | | | (54,180 | ) |
Groupon, Inc. — Class A* | | | 12,334 | | | | (62,040 | ) |
Yelp, Inc. — Class A* | | | 1,447 | | | | (62,265 | ) |
Twitter, Inc.* | | | 1,937 | | | | (70,158 | ) |
Pandora Media, Inc.* | | | 5,027 | | | | (78,120 | ) |
Splunk, Inc.* | | | 1,128 | | | | (78,531 | ) |
FireEye, Inc.* | | | 1,619 | | | | (79,185 | ) |
Discovery Communications, Inc. — Class A* | | | 2,476 | | | | (82,352 | ) |
JDS Uniphase Corp.* | | | 7,332 | | | | (84,905 | ) |
Amazon.com, Inc.* | | | 196 | | | | (85,082 | ) |
CBS Corp. — Class B | | | 1,594 | | | | (88,467 | ) |
Verizon Communications, Inc. | | | 1,913 | | | | (89,165 | ) |
Juniper Networks, Inc. | | | 3,507 | | | | (91,077 | ) |
Sprint Corp.* | | | 20,941 | | | | (95,491 | ) |
Motorola Solutions, Inc. | | | 1,667 | | | | (95,586 | ) |
AMC Networks, Inc. — Class A* | | | 1,251 | | | | (102,394 | ) |
TripAdvisor, Inc.* | | | 1,275 | | | | (111,103 | ) |
Charter Communications, Inc. — Class A* | | | 4,047 | | | | (693,049 | ) |
Total Communications | | | | | | | (2,243,497 | ) |
| | | | | | | | | |
Utilities - (2.9)% | |
Duke Energy Corp. | | | 122 | | | | (8,616 | ) |
NRG Energy, Inc. | | | 466 | | | | (10,662 | ) |
PPL Corp. | | | 466 | | | | (13,733 | ) |
Exelon Corp. | | | 932 | | | | (29,283 | ) |
Eversource Energy | | | 1,888 | | | | (85,734 | ) |
National Fuel Gas Co. | | | 1,520 | | | | (89,513 | ) |
Calpine Corp.* | | | 4,978 | | | | (89,554 | ) |
CenterPoint Energy, Inc. | | | 4,708 | | | | (89,593 | ) |
Sempra Energy | | | 907 | | | | (89,739 | ) |
Aqua America, Inc. | | | 3,795 | | | | (92,940 | ) |
NiSource, Inc. | | | 2,059 | | | | (93,870 | ) |
MDU Resources Group, Inc. | | | 4,823 | | | | (94,193 | ) |
OGE Energy Corp. | | | 3,310 | | | | (94,567 | ) |
ITC Holdings Corp. | | | 2,943 | | | | (94,706 | ) |
Questar Corp. | | | 4,537 | | | | (94,869 | ) |
Southern Co. | | | 2,280 | | | | (95,532 | ) |
Dominion Resources, Inc. | | | 1,438 | | | | (96,159 | ) |
NextEra Energy, Inc. | | | 981 | | | | (96,167 | ) |
WEC Energy Group, Inc. | | | 35,132 | | | | (1,579,886 | ) |
Total Utilities | | | | | | | (2,939,316 | ) |
| | | | | | | | | |
Energy - (3.1)% | |
Kosmos Energy Ltd.* | | | 2,844 | | | | (23,975 | ) |
CONSOL Energy, Inc. | | | 1,128 | | | | (24,523 | ) |
MRC Global, Inc.* | | | 1,937 | | | | (29,907 | ) |
Continental Resources, Inc.* | | | 711 | | | | (30,139 | ) |
RPC, Inc. | | | 2,575 | | | | (35,612 | ) |
Cheniere Energy, Inc.* | | | 686 | | | | (47,512 | ) |
SEE NOTES TO FINANCIAL STATEMENTS. | THE GUGGENHEIM FUNDS SEMI-ANNUAL REPORT | 19 |
CONSOLIDATED SCHEDULE OF INVESTMENTS (Unaudited)(continued) | June 30, 2015 |
MULTI-HEDGE STRATEGIES FUND | |
| |
Shares
| | | Value | |
| | | | | | | |
Oceaneering International, Inc. | | | 1,055 | | | $ | (49,152 | ) |
Gulfport Energy Corp.* | | | 1,299 | | | | (52,285 | ) |
Antero Resources Corp.* | | | 1,840 | | | | (63,186 | ) |
Rice Energy, Inc.* | | | 3,212 | | | | (66,906 | ) |
FMC Technologies, Inc.* | | | 1,766 | | | | (73,271 | ) |
Pioneer Natural Resources Co. | | | 539 | | | | (74,754 | ) |
ONEOK, Inc. | | | 1,962 | | | | (77,460 | ) |
Range Resources Corp. | | | 1,594 | | | | (78,712 | ) |
Anadarko Petroleum Corp. | | | 1,079 | | | | (84,227 | ) |
Dril-Quip, Inc.* | | | 1,177 | | | | (88,569 | ) |
Cobalt International Energy, Inc.* | | | 9,220 | | | | (89,526 | ) |
Cabot Oil & Gas Corp. — Class A | | | 2,844 | | | | (89,700 | ) |
Equities Corp. | | | 1,103 | | | | (89,718 | ) |
SunEdison, Inc.* | | | 3,237 | | | | (96,819 | ) |
Noble Energy, Inc. | | | 8,263 | | | | (352,665 | ) |
Williams Companies, Inc. | | | 9,770 | | | | (560,700 | ) |
Halliburton Co. | | | 24,260 | | | | (1,044,878 | ) |
Total Energy | | | | | | | (3,224,196 | ) |
| | | | | | | | | |
Consumer, Cyclical - (3.5)% | |
Domino’s Pizza, Inc. | | | 49 | | | | (5,557 | ) |
GNC Holdings, Inc. — Class A | | | 171 | | | | (7,606 | ) |
Coach, Inc. | | | 221 | | | | (7,649 | ) |
Nordstrom, Inc. | | | 122 | | | | (9,089 | ) |
Regal Entertainment Group — Class A | | | 490 | | | | (10,246 | ) |
Michael Kors Holdings Ltd.* | | | 246 | | | | (10,354 | ) |
Visteon Corp.* | | | 99 | | | | (10,393 | ) |
Taylor Morrison Home Corp. — Class A* | | | 539 | | | | (10,974 | ) |
Johnson Controls, Inc. | | | 318 | | | | (15,751 | ) |
Mattel, Inc. | | | 809 | | | | (20,783 | ) |
Wynn Resorts Ltd. | | | 245 | | | | (24,174 | ) |
DSW, Inc. — Class A | | | 1,006 | | | | (33,570 | ) |
Choice Hotels International, Inc. | | | 638 | | | | (34,612 | ) |
Dollar General Corp. | | | 490 | | | | (38,093 | ) |
Cabela’s, Inc.* | | | 785 | | | | (39,234 | ) |
CarMax, Inc.* | | | 613 | | | | (40,587 | ) |
Costco Wholesale Corp. | | | 318 | | | | (42,949 | ) |
Chipotle Mexican Grill, Inc. — Class A* | | | 74 | | | | (44,769 | ) |
SeaWorld Entertainment, Inc. | | | 3,016 | | | | (55,615 | ) |
Ulta Salon Cosmetics & Fragrance, Inc.* | | | 442 | | | | (68,267 | ) |
MSC Industrial Direct Company, Inc. — Class A | | | 1,006 | | | | (70,189 | ) |
Kate Spade & Co.* | | | 3,531 | | | | (76,058 | ) |
McDonald’s Corp. | | | 809 | | | | (76,912 | ) |
Spirit Airlines, Inc.* | | | 1,299 | | | | (80,668 | ) |
WW Grainger, Inc. | | | 352 | | | | (83,301 | ) |
Navistar International Corp.* | | | 3,825 | | | | (86,560 | ) |
Scotts Miracle-Gro Co. — Class A | | | 1,496 | | | | (88,578 | ) |
Tupperware Brands Corp. | | | 1,373 | | | | (88,613 | ) |
Panera Bread Co. — Class A* | | | 515 | | | | (90,007 | ) |
BorgWarner, Inc. | | | 1,594 | | | | (90,603 | ) |
Toro Co. | | | 1,373 | | | | (93,062 | ) |
Copart, Inc.* | | | 2,623 | | | | (93,064 | ) |
Sally Beauty Holdings, Inc.* | | | 2,967 | | | | (93,698 | ) |
Signet Jewelers Ltd. | | | 735 | | | | (94,256 | ) |
Gaming and Leisure Properties, Inc. | | | 2,575 | | | | (94,400 | ) |
Tiffany & Co. | | | 1,030 | | | | (94,554 | ) |
Yum! Brands, Inc. | | | 1,055 | | | | (95,034 | ) |
Fastenal Co. | | | 2,280 | | | | (96,170 | ) |
Tractor Supply Co. | | | 1,079 | | | | (97,045 | ) |
JC Penney Company, Inc.* | | | 11,525 | | | | (97,617 | ) |
Lions Gate Entertainment Corp. | | | 2,648 | | | | (98,108 | ) |
Tesla Motors, Inc.* | | | 368 | | | | (98,720 | ) |
Starbucks Corp. | | | 1,863 | | | | (99,885 | ) |
HD Supply Holdings, Inc.* | | | 2,844 | | | | (100,052 | ) |
LKQ Corp.* | | | 3,310 | | | | (100,111 | ) |
Tempur Sealy International, Inc.* | | | 1,520 | | | | (100,168 | ) |
Dunkin’ Brands Group, Inc. | | | 1,840 | | | | (101,199 | ) |
Dollar Tree, Inc.* | | | 2,678 | | | | (211,535 | ) |
20 | THE GUGGENHEIM FUNDS SEMI-ANNUAL REPORT | SEE NOTES TO FINANCIAL STATEMENTS. |
CONSOLIDATED SCHEDULE OF INVESTMENTS (Unaudited)(continued) | June 30, 2015 |
MULTI-HEDGE STRATEGIES FUND | |
| |
Shares
| | | Value | |
| | | | | | | |
Staples, Inc. | | | 24,504 | | | $ | (375,156 | ) |
Total Consumer, Cyclical | | | | | | | (3,595,595 | ) |
| | | | | | | | | |
Industrial - (3.6)% | |
Vulcan Materials Co. | | | 74 | | | | (6,211 | ) |
Crane Co. | | | 147 | | | | (8,633 | ) |
Fortune Brands Home & Security, Inc. | | | 196 | | | | (8,981 | ) |
Roper Technologies, Inc. | | | 74 | | | | (12,762 | ) |
Teekay Corp. | | | 318 | | | | (13,617 | ) |
Sealed Air Corp. | | | 294 | | | | (15,106 | ) |
Babcock & Wilcox Co. | | | 490 | | | | (16,072 | ) |
Rockwell Collins, Inc. | | | 221 | | | | (20,409 | ) |
Kirby Corp.* | | | 294 | | | | (22,538 | ) |
Wabtec Corp. | | | 245 | | | | (23,089 | ) |
Tyco International plc | | | 613 | | | | (23,588 | ) |
Boeing Co. | | | 172 | | | | (23,860 | ) |
Martin Marietta Materials, Inc. | | | 172 | | | | (24,340 | ) |
Clean Harbors, Inc.* | | | 539 | | | | (28,966 | ) |
Garmin Ltd. | | | 686 | | | | (30,136 | ) |
Hexcel Corp. | | | 638 | | | | (31,734 | ) |
Colfax Corp.* | | | 809 | | | | (37,335 | ) |
Acuity Brands, Inc. | | | 221 | | | | (39,776 | ) |
SPX Corp. | | | 564 | | | | (40,829 | ) |
Emerson Electric Co. | | | 760 | | | | (42,127 | ) |
Kennametal, Inc. | | | 1,423 | | | | (48,553 | ) |
Waters Corp.* | | | 417 | | | | (53,534 | ) |
National Instruments Corp. | | | 2,280 | | | | (67,169 | ) |
Eagle Materials, Inc. | | | 932 | | | | (71,139 | ) |
Kansas City Southern | | | 785 | | | | (71,592 | ) |
Graco, Inc. | | | 1,128 | | | | (80,122 | ) |
Precision Castparts Corp. | | | 417 | | | | (83,346 | ) |
CH Robinson Worldwide, Inc. | | | 1,349 | | | | (84,164 | ) |
SunPower Corp. — Class A* | | | 2,992 | | | | (85,003 | ) |
J.B. Hunt Transport Services, Inc. | | | 1,055 | | | | (86,605 | ) |
Trimble Navigation Ltd.* | | | 3,800 | | | | (89,148 | ) |
Nordson Corp. | | | 1,152 | | | | (89,729 | ) |
Owens-Illinois, Inc.* | | | 3,948 | | | | (90,567 | ) |
Middleby Corp.* | | | 809 | | | | (90,794 | ) |
Manitowoc Company, Inc. | | | 4,659 | | | | (91,316 | ) |
Expeditors International of Washington, Inc. | | | 1,986 | | | | (91,565 | ) |
Donaldson Company, Inc. | | | 2,575 | | | | (92,185 | ) |
United Parcel Service, Inc. — Class B | | | 956 | | | | (92,646 | ) |
Armstrong World Industries, Inc.* | | | 1,741 | | | | (92,760 | ) |
TransDigm Group, Inc.* | | | 417 | | | | (93,687 | ) |
AptarGroup, Inc. | | | 1,471 | | | | (93,806 | ) |
B/E Aerospace, Inc. | | | 1,716 | | | | (94,208 | ) |
Landstar System, Inc. | | | 1,414 | | | | (94,554 | ) |
Stericycle, Inc.* | | | 711 | | | | (95,210 | ) |
FLIR Systems, Inc. | | | 3,090 | | | | (95,234 | ) |
KBR, Inc. | | | 4,905 | | | | (95,549 | ) |
SBA Communications Corp. — Class A* | | | 834 | | | | (95,885 | ) |
USG Corp.* | | | 3,531 | | | | (98,127 | ) |
Rock-Tenn Co. — Class A | | | 13,198 | | | | (794,520 | ) |
Total Industrial | | | | | | | (3,672,826 | ) |
| | | | | | | | | |
Technology - (3.7)% | |
Lexmark International, Inc. — Class A | | | 122 | | | | (5,392 | ) |
International Business Machines Corp. | | | 99 | | | | (16,103 | ) |
Veeva Systems, Inc. — Class A* | | | 809 | | | | (22,676 | ) |
Linear Technology Corp. | | | 589 | | | | (26,051 | ) |
athenahealth, Inc.* | | | 270 | | | | (30,937 | ) |
IHS, Inc. — Class A* | | | 270 | | | | (34,730 | ) |
Nuance Communications, Inc.* | | | 2,501 | | | | (43,793 | ) |
Allscripts Healthcare Solutions, Inc.* | | | 4,193 | | | | (57,360 | ) |
Cree, Inc.* | | | 2,379 | | | | (61,925 | ) |
Informatica Corp.* | | | 1,380 | | | | (66,889 | ) |
Jack Henry & Associates, Inc. | | | 1,202 | | | | (77,769 | ) |
MSCI, Inc. — Class A | | | 1,447 | | | | (89,063 | ) |
Solera Holdings, Inc. | | | 2,011 | | | | (89,610 | ) |
Workday, Inc. — Class A* | | | 1,177 | | | | (89,911 | ) |
VeriFone Systems, Inc.* | | | 2,673 | | | | (90,775 | ) |
VMware, Inc. — Class A* | | | 1,079 | | | | (92,513 | ) |
SEE NOTES TO FINANCIAL STATEMENTS. | THE GUGGENHEIM FUNDS SEMI-ANNUAL REPORT | 21 |
CONSOLIDATED SCHEDULE OF INVESTMENTS (Unaudited)(continued) | June 30, 2015 |
MULTI-HEDGE STRATEGIES FUND | |
| |
Shares
| | | Value | |
| | | | | | | |
Diebold, Inc. | | | 2,648 | | | $ | (92,680 | ) |
ServiceNow, Inc.* | | | 1,251 | | | | (92,962 | ) |
Paychex, Inc. | | | 1,986 | | | | (93,104 | ) |
Zynga, Inc. — Class A* | | | 32,761 | | | | (93,696 | ) |
Salesforce.com, Inc.* | | | 1,349 | | | | (93,931 | ) |
NCR Corp.* | | | 3,164 | | | | (95,237 | ) |
NetSuite, Inc.* | | | 1,055 | | | | (96,796 | ) |
Atmel Corp. | | | 9,882 | | | | (97,388 | ) |
Advanced Micro Devices, Inc.* | | | 42,176 | | | | (101,222 | ) |
NXP Semiconductor N.V.* | | | 9,679 | | | | (950,477 | ) |
Avago Technologies Ltd. | | | 8,488 | | | | (1,128,310 | ) |
Total Technology | | | | | | | (3,831,300 | ) |
| | | | | | | | | |
Consumer, Non-cyclical - (4.1)% | |
Coty, Inc. — Class A* | | | 25 | | | | (799 | ) |
Aaron’s, Inc. | | | 97 | | | | (3,512 | ) |
ConAgra Foods, Inc. | | | 221 | | | | (9,662 | ) |
Clorox Co. | | | 99 | | | | (10,298 | ) |
H&R Block, Inc. | | | 392 | | | | (11,623 | ) |
Moody’s Corp. | | | 122 | | | | (13,171 | ) |
Incyte Corp.* | | | 171 | | | | (17,820 | ) |
WhiteWave Foods Co. — Class A* | | | 662 | | | | (32,359 | ) |
Alnylam Pharmaceuticals, Inc.* | | | 270 | | | | (32,365 | ) |
Endo International plc* | | | 417 | | | | (33,214 | ) |
FleetCor Technologies, Inc.* | | | 222 | | | | (34,645 | ) |
Jazz Pharmaceuticals plc* | | | 245 | | | | (43,137 | ) |
Hain Celestial Group, Inc.* | | | 662 | | | | (43,599 | ) |
Whole Foods Market, Inc. | | | 1,177 | | | | (46,421 | ) |
Illumina, Inc.* | | | 221 | | | | (48,258 | ) |
Monster Beverage Corp.* | | | 368 | | | | (49,319 | ) |
AmerisourceBergen Corp. — Class A | | | 466 | | | | (49,554 | ) |
Avis Budget Group, Inc.* | | | 1,128 | | | | (49,722 | ) |
Vertex Pharmaceuticals, Inc.* | | | 442 | | | | (54,578 | ) |
Avon Products, Inc. | | | 9,318 | | | | (58,331 | ) |
Stryker Corp. | | | 613 | | | | (58,584 | ) |
Intuitive Surgical, Inc.* | | | 122 | | | | (59,109 | ) |
CoStar Group, Inc.* | | | 318 | | | | (64,001 | ) |
Hertz Global Holdings, Inc.* | | | 4,316 | | | | (78,207 | ) |
Patterson Companies, Inc. | | | 1,667 | | | | (81,100 | ) |
Intercept Pharmaceuticals, Inc.* | | | 343 | | | | (82,793 | ) |
Sysco Corp. | | | 2,354 | | | | (84,979 | ) |
Estee Lauder Companies, Inc. — Class A | | | 981 | | | | (85,013 | ) |
Campbell Soup Co. | | | 1,790 | | | | (85,294 | ) |
Keurig Green Mountain, Inc. | | | 1,152 | | | | (88,278 | ) |
Mead Johnson Nutrition Co. — Class A | | | 981 | | | | (88,506 | ) |
Flowers Foods, Inc. | | | 4,328 | | | | (91,537 | ) |
Live Nation Entertainment, Inc.* | | | 3,335 | | | | (91,678 | ) |
Brookdale Senior Living, Inc. — Class A* | | | 2,648 | | | | (91,886 | ) |
CR Bard, Inc. | | | 539 | | | | (92,007 | ) |
Philip Morris International, Inc. | | | 1,152 | | | | (92,356 | ) |
Gartner, Inc.* | | | 1,079 | | | | (92,557 | ) |
McGraw Hill Financial, Inc. | | | 932 | | | | (93,620 | ) |
Hershey Co. | | | 1,055 | | | | (93,716 | ) |
Kraft Foods Group, Inc. | | | 1,103 | | | | (93,909 | ) |
IDEXX Laboratories, Inc.* | | | 1,470 | | | | (94,286 | ) |
Verisk Analytics, Inc. — Class A* | | | 1,299 | | | | (94,515 | ) |
Sprouts Farmers Market, Inc.* | | | 3,507 | | | | (94,619 | ) |
Bruker Corp.* | | | 4,659 | | | | (95,090 | ) |
Coca-Cola Co. | | | 2,427 | | | | (95,211 | ) |
Colgate-Palmolive Co. | | | 1,463 | | | | (95,695 | ) |
Kimberly-Clark Corp. | | | 907 | | | | (96,115 | ) |
Bristol-Myers Squibb Co. | | | 1,447 | | | | (96,283 | ) |
MasterCard, Inc. — Class A | | | 1,030 | | | | (96,284 | ) |
Align Technology, Inc.* | | | 1,545 | | | | (96,887 | ) |
Brown-Forman Corp. — Class B | | | 968 | | | | (96,974 | ) |
Morningstar, Inc. | | | 1,226 | | | | (97,528 | ) |
Envision Healthcare Holdings, Inc.* | | | 2,476 | | | | (97,752 | ) |
Premier, Inc. — Class A* | | | 2,550 | | | | (98,073 | ) |
Kellogg Co. | | | 1,569 | | | | (98,376 | ) |
McCormick & Company, Inc. | | | 1,226 | | | | (99,245 | ) |
Seattle Genetics, Inc.* | | | 2,084 | | | | (100,866 | ) |
22 | THE GUGGENHEIM FUNDS SEMI-ANNUAL REPORT | SEE NOTES TO FINANCIAL STATEMENTS. |
CONSOLIDATED SCHEDULE OF INVESTMENTS (Unaudited)(continued) | June 30, 2015 |
MULTI-HEDGE STRATEGIES FUND | |
| |
Shares
| | | Value | |
| | | | | | | |
Rollins, Inc. | | | 3,629 | | | $ | (103,535 | ) |
Tenet Healthcare Corp.* | | | 1,815 | | | | (105,052 | ) |
Total Consumer, Non-cyclical | | | | (4,183,903 | ) |
| | | | | | | | | |
Financial - (7.4)% | |
DDR Corp. | | | 197 | | | | (3,046 | ) |
Prologis, Inc. | | | 99 | | | | (3,673 | ) |
First Niagara Financial Group, Inc. | | | 467 | | | | (4,408 | ) |
Liberty Property Trust | | | 147 | | | | (4,736 | ) |
Forest City Enterprises, Inc. — Class A* | | | 246 | | | | (5,437 | ) |
Apartment Investment & Management Co. — Class A | | | 221 | | | | (8,162 | ) |
Realty Income Corp. | | | 270 | | | | (11,985 | ) |
WP Carey, Inc. | | | 270 | | | | (15,914 | ) |
Cincinnati Financial Corp. | | | 393 | | | | (19,721 | ) |
Douglas Emmett, Inc. | | | 956 | | | | (25,755 | ) |
Unum Group | | | 882 | | | | (31,532 | ) |
Progressive Corp. | | | 1,202 | | | | (33,452 | ) |
Kilroy Realty Corp. | | | 564 | | | | (37,872 | ) |
Zions Bancorporation | | | 1,423 | | | | (45,159 | ) |
Visa, Inc. — Class A | | | 686 | | | | (46,065 | ) |
Healthcare Trust of America, Inc. — Class A | | | 2,330 | | | | (55,804 | ) |
Charles Schwab Corp. | | | 1,863 | | | | (60,827 | ) |
MBIA, Inc.* | | | 10,274 | | | | (61,747 | ) |
Simon Property Group, Inc. | | | 368 | | | | (63,671 | ) |
TFS Financial Corp. | | | 4,341 | | | | (73,016 | ) |
White Mountains Insurance Group Ltd. | | | 122 | | | | (79,903 | ) |
Genworth Financial, Inc. — Class A* | | | 10,568 | | | | (80,000 | ) |
Senior Housing Properties Trust | | | 4,585 | | | | (80,466 | ) |
Franklin Resources, Inc. | | | 1,642 | | | | (80,507 | ) |
American Tower Corp. — Class A | | | 882 | | | | (82,282 | ) |
Signature Bank* | | | 589 | | | | (86,224 | ) |
Aflac, Inc. | | | 1,398 | | | | (86,956 | ) |
Intercontinental Exchange, Inc. | | | 392 | | | | (87,655 | ) |
Loews Corp. | | | 2,280 | | | | (87,803 | ) |
Eaton Vance Corp. | | | 2,280 | | | | (89,216 | ) |
Aon plc | | | 907 | | | | (90,410 | ) |
SLM Corp.* | | | 9,171 | | | | (90,518 | ) |
Crown Castle International Corp. | | | 1,128 | | | | (90,578 | ) |
American Homes 4 Rent — Class A | | | 5,713 | | | | (91,637 | ) |
SVB Financial Group* | | | 638 | | | | (91,859 | ) |
Tanger Factory Outlet Centers, Inc. | | | 2,918 | | | | (92,501 | ) |
State Street Corp. | | | 1,202 | | | | (92,554 | ) |
Waddell & Reed Financial, Inc. — Class A | | | 1,962 | | | | (92,822 | ) |
Alliance Data Systems Corp.* | | | 318 | | | | (92,837 | ) |
TD Ameritrade Holding Corp. | | | 2,526 | | | | (93,007 | ) |
Marsh & McLennan Companies, Inc. | | | 1,642 | | | | (93,101 | ) |
American Express Co. | | | 1,202 | | | | (93,419 | ) |
First Republic Bank | | | 1,496 | | | | (94,293 | ) |
Plum Creek Timber Company, Inc. | | | 2,330 | | | | (94,528 | ) |
Rayonier, Inc. | | | 3,703 | | | | (94,612 | ) |
Howard Hughes Corp.* | | | 662 | | | | (95,023 | ) |
Arthur J Gallagher & Co. | | | 2,011 | | | | (95,120 | ) |
T. Rowe Price Group, Inc. | | | 1,226 | | | | (95,297 | ) |
CBOE Holdings, Inc. | | | 1,667 | | | | (95,386 | ) |
LPL Financial Holdings, Inc. | | | 2,059 | | | | (95,723 | ) |
Commerce Bancshares, Inc. | | | 2,048 | | | | (95,785 | ) |
Brown & Brown, Inc. | | | 2,926 | | | | (96,149 | ) |
Bank of Hawaii Corp. | | | 1,447 | | | | (96,486 | ) |
Assurant, Inc. | | | 1,447 | | | | (96,949 | ) |
Old Republic International Corp. | | | 6,253 | | | | (97,734 | ) |
BankUnited, Inc. | | | 2,722 | | | | (97,801 | ) |
Cullen/Frost Bankers, Inc. | | | 1,251 | | | | (98,304 | ) |
ProAssurance Corp. | | | 2,133 | | | | (98,566 | ) |
BOK Financial Corp. | | | 1,423 | | | | (99,012 | ) |
Sterling Bancorp | | | 12,445 | | | | (182,942 | ) |
Endurance Specialty Holdings Ltd. | | | 3,180 | | | | (208,926 | ) |
SEE NOTES TO FINANCIAL STATEMENTS. | THE GUGGENHEIM FUNDS SEMI-ANNUAL REPORT | 23 |
CONSOLIDATED SCHEDULE OF INVESTMENTS (Unaudited)(continued) | June 30, 2015 |
MULTI-HEDGE STRATEGIES FUND | |
| |
Shares
| | | Value | |
| | | | | | | |
PacWest Bancorp | | | 7,522 | | | $ | (351,729 | ) |
M&T Bank Corp. | | | 3,710 | | | | (463,490 | ) |
Royal Bank of Canada | | | 16,338 | | | | (999,069 | ) |
BB&T Corp. | | | 30,464 | | | | (1,228,000 | ) |
Total Financial | | | | | | | (7,629,161 | ) |
| | | | | | | | | |
Total Common Stocks Sold Short | | | | | |
(Proceeds $33,919,639) | | | | | | | (32,875,952 | ) |
| | | | | | | | | |
EXCHANGE-TRADED FUNDS SOLD SHORT† - (11.5)% | |
iShares MSCI Mexico Capped ETF | | | 1,027 | | | | (58,652 | ) |
iShares MSCI Taiwan ETF | | | 4,527 | | | | (71,436 | ) |
iShares MSCI Emerging Markets ETF | | | 1,859 | | | | (73,654 | ) |
Market Vectors Gold Miners ETF | | | 4,763 | | | | (84,591 | ) |
iShares MSCI Australia ETF | | | 4,094 | | | | (86,097 | ) |
iShares MSCI Japan ETF | | | 7,823 | | | | (100,213 | ) |
iShares MSCI Malaysia ETF | | | 8,696 | | | | (105,309 | ) |
iShares 7-10 Year Treasury Bond ETF | | | 1,226 | | | | (128,742 | ) |
iShares MSCI South Korea Capped ETF | | | 2,573 | | | | (141,798 | ) |
iShares China Large-Capital ETF | | | 3,321 | | | | (153,098 | ) |
iShares MSCI United Kingdom ETF | | | 10,499 | | | | (191,607 | ) |
Powershares QQQ Trust Series 1 | | | 1,949 | | | | (208,679 | ) |
iShares iBoxx $ High Yield Corporate Bond ETF | | | 2,693 | | | | (239,138 | ) |
iShares MSCI Canada ETF | | | 9,541 | | | | (254,458 | ) |
iShares 20+ Year Treasury Bond ETF | | | 3,124 | | | | (366,945 | ) |
iShares iBoxx $ Investment Grade Corporate Bond ETF | | | 3,588 | | | | (415,203 | ) |
iShares MSCI EAFE ETF | | | 7,668 | | | | (486,841 | ) |
iShares Russell 2000 Index ETF | | | 4,473 | | | | (558,499 | ) |
iShares TIPS Bond ETF | | | 6,918 | | | | (775,162 | ) |
iShares US Real Estate ETF | | | 13,476 | | | | (960,839 | ) |
iShares Core U.S. Aggregate Bond ETF | | | 9,682 | | | | (1,053,208 | ) |
iShares Russell 1000 Value ETF | | | 11,047 | | | | (1,139,498 | ) |
SPDR Barclays High Yield Bond ETF | | | 46,005 | | | | (1,767,972 | ) |
SPDR S&P 500 ETF Trust | | | 11,800 | | | | (2,429,030 | ) |
Total Exchange-Traded Funds Sold Short | |
(Proceeds $11,180,824) | | | | | | | (11,850,669 | ) |
| | | | | | | | | |
Total Securities Sold Short- (43.5)% | | | | | |
(Proceeds $45,100,463) | | | | | | $ | (44,726,621 | ) |
Other Assets & Liabilities, net - 54.1% | | | | 55,574,724 | |
Total Net Assets - 100.0% | | | | | | $ | 102,663,075 | |
| | Contracts | | | Unrealized
Gain | |
| | | | | | | | | |
INTEREST RATE FUTURES CONTRACTS PURCHASED† | |
September 2015 Japanese
Government 10 Year Bond
Futures Contracts††
(Aggregate Value of
Contracts $16,804,117) | | | 14 | | | $ | 21,492 | |
September 2015 Canadian
Government 10 Year Bond
Futures Contracts††
(Aggregate Value of
Contracts $2,349,419) | | | 21 | | | | 17,954 | |
September 2015 Euro - Bund
Futures Contracts††
(Aggregate Value of
Contracts $1,357,819) | | | 8 | | | | 11,124 | |
September 2015 U.S. Treasury
5 Year Note
Futures Contracts
(Aggregate Value of
Contracts $4,051,844) | | | 34 | | | | 8,507 | |
24 | THE GUGGENHEIM FUNDS SEMI-ANNUAL REPORT | SEE NOTES TO FINANCIAL STATEMENTS. |
CONSOLIDATED SCHEDULE OF INVESTMENTS (Unaudited)(continued) | June 30, 2015 |
MULTI-HEDGE STRATEGIES FUND | |
| | Contracts | | | Unrealized
Gain (Loss) | |
| | | | | | | |
September 2015 Australian
Government 3 Year Bond
Futures Contracts††
(Aggregate Value of
Contracts $4,894,634) | | | 57 | | | $ | 6,011 | |
September 2015 Euro - Schatz
Futures Contracts††
(Aggregate Value of
Contracts $6,451,803) | | | 52 | | | | 4,240 | |
September 2015 Euro - Bobl
Futures Contracts††
(Aggregate Value of
Contracts $1,300,853) | | | 9 | | | | 3,990 | |
September 2015 U.S. Treasury
10 Year Note
Futures Contracts
(Aggregate Value of
Contracts $504,000) | | | 4 | | | | 1,619 | |
(Total Aggregate Value of Contracts $37,714,489) | | | | | | $ | 74,937 | |
| | | | | | | | | |
COMMODITY FUTURES CONTRACTS PURCHASED† | |
September 2015 Wheat
Futures Contracts
(Aggregate Value of
Contracts $339,213) | | | 11 | | | $ | 35,222 | |
November 2015 Soybean
Futures Contracts
(Aggregate Value of
Contracts $103,525) | | | 2 | | | | 3,692 | |
August 2015 Gasoline RBOB
Futures Contracts
(Aggregate Value of
Contracts $85,869) | | | 1 | | | | 999 | |
December 2015 Cotton #2
Futures Contracts
(Aggregate Value of
Contracts $101,805) | | | 3 | | | | 649 | |
August 2015 New York Harbor
Ultra-Low Sulfur Diesel
Futures Contracts
(Aggregate Value of
Contracts $79,283) | | | 1 | | | | 462 | |
August 2015 WTI Crude
Futures Contracts
(Aggregate Value of
Contracts $237,240) | | | 4 | | | | (4,339 | ) |
August 2015 Live Cattle
Futures Contracts
(Aggregate Value of
Contracts $1,480,501) | | | 25 | | | | (18,348 | ) |
(Total Aggregate Value of Contracts $2,427,436) | | | | | | $ | 18,337 | |
| | | | | | | | | |
CURRENCY FUTURES CONTRACTS PURCHASED† | |
September 2015 British Pound
Futures Contracts
(Aggregate Value of
Contracts $1,570,500) | | | 16 | | | $ | 3,137 | |
September 2015
Canadian Dollar
Futures Contracts
(Aggregate Value of
Contracts $239,910) | | | 3 | | | | (2,970 | ) |
(Total Aggregate Value of Contracts $1,810,410) | | | | | | $ | 167 | |
| | | | | | | | | |
EQUITY FUTURES CONTRACTS PURCHASED† | |
November 2015 CBOE
Volatility Index
Futures Contracts
(Aggregate Value of
Contracts $825,700) | | | 46 | | | $ | 22,678 | |
September 2015
Russell 2000 Index
Mini Futures Contracts
(Aggregate Value of
Contracts $1,497,960) | | | 12 | | | | 1,488 | |
September 2015 Nikkei 225
(OSE) Index
Futures Contracts††
(Aggregate Value of
Contracts $1,981,357) | | | 12 | | | | 271 | |
SEE NOTES TO FINANCIAL STATEMENTS. | THE GUGGENHEIM FUNDS SEMI-ANNUAL REPORT | 25 |
CONSOLIDATED SCHEDULE OF INVESTMENTS (Unaudited)(continued) | June 30, 2015 |
MULTI-HEDGE STRATEGIES FUND | |
| | Contracts | | | Unrealized
Gain (Loss) | |
| | | | | | | |
September 2015
S&P MidCap 400 Index
Mini Futures Contracts
(Aggregate Value of
Contracts $449,040) | | | 3 | | | $ | (3,541 | ) |
July 2015 H-Shares Index
Futures Contracts††
(Aggregate Value of
Contracts $82,847) | | | 1 | | | | (4,440 | ) |
July 2015 IBEX 35 Index
Futures Contracts††
(Aggregate Value of
Contracts $120,011) | | | 1 | | | | (5,466 | ) |
September 2015 Dow Jones
Industrial Average Index
Mini Futures Contracts
(Aggregate Value of
Contracts $962,500) | | | 11 | | | | (10,344 | ) |
September 2015 Topix Index
Futures Contracts††
(Aggregate Value of
Contracts $1,992,471) | | | 15 | | | | (10,978 | ) |
July 2015 Amsterdam Index
Futures Contracts††
(Aggregate Value of
Contracts $845,359) | | | 8 | | | | (13,344 | ) |
September 2015
NASDAQ-100 Index
Mini Futures Contracts
(Aggregate Value of
Contracts $1,841,385) | | | 21 | | | | (15,345 | ) |
September 2015
FTSE 100 Index
Futures Contracts††
(Aggregate Value of
Contracts $815,148) | | | 8 | | | | (20,446 | ) |
July 2015 Hang Seng Index
Futures Contracts††
(Aggregate Value of
Contracts $505,423) | | | 3 | | | | (22,402 | ) |
August 2015
CBOE Volatility Index
Futures Contracts
(Aggregate Value of
Contracts $1,840,400) | | | 107 | | | | (29,839 | ) |
(Total Aggregate Value of Contracts $13,759,601) | | | | | | $ | (111,708 | ) |
| | | | | | | | | |
COMMODITY FUTURES CONTRACTS SOLD SHORT† | |
August 2015 Lean Hogs
Futures Contracts
(Aggregate Value of
Contracts $1,248,660) | | | 42 | | | $ | 66,080 | |
August 2015 LME Nickel
Futures Contracts
(Aggregate Value of
Contracts $430,434) | | | 6 | | | | 36,606 | |
August 2015
LME Primary Aluminum
Futures Contracts
(Aggregate Value of
Contracts $753,975) | | | 18 | | | | 35,532 | |
September 2015 Brent Crude
Futures Contracts
(Aggregate Value of
Contracts $896,560) | | | 14 | | | | 33,992 | |
August 2015 LME Zinc
Futures Contracts
(Aggregate Value of
Contracts $648,424) | | | 13 | | | | 25,863 | |
September 2015 Copper
Futures Contracts
(Aggregate Value of
Contracts $392,925) | | | 6 | | | | 19,617 | |
August 2015 Natural Gas
Futures Contracts
(Aggregate Value of
Contracts $338,760) | | | 12 | | | | 11,724 | |
August 2015
Low Sulphur Gasoil
Futures Contracts
(Aggregate Value of
Contracts $407,225) | | | 7 | | | | 11,192 | |
26 | THE GUGGENHEIM FUNDS SEMI-ANNUAL REPORT | SEE NOTES TO FINANCIAL STATEMENTS. |
CONSOLIDATED SCHEDULE OF INVESTMENTS (Unaudited)(continued) | June 30, 2015 |
MULTI-HEDGE STRATEGIES FUND | |
| | Contracts | | | Unrealized
Gain (Loss) | |
| | | | | | | |
September 2015 Silver
Futures Contracts
(Aggregate Value of
Contracts $313,700) | | | 4 | | | $ | 10,301 | |
August 2015 LME Lead
Futures Contracts
(Aggregate Value of
Contracts $131,531) | | | 3 | | | | 5,072 | |
September 2015 Coffee ‘C’
Futures Contracts
(Aggregate Value of
Contracts $98,063) | | | 2 | | | | 1,072 | |
August 2015 Gold 100 oz.
Futures Contracts
(Aggregate Value of
Contracts $351,540) | | | 3 | | | | 858 | |
October 2015 Sugar #11
Futures Contracts
(Aggregate Value of
Contracts $1,063,149) | | | 76 | | | | (14,582 | ) |
September 2015 Corn
Futures Contracts
(Aggregate Value of
Contracts $211,000) | | | 10 | | | | (25,160 | ) |
September 2015 Hard Red
Winter Wheat
Futures Contracts
(Aggregate Value of
Contracts $578,550) | | | 19 | | | | (48,036 | ) |
(Total Aggregate Value of Contracts $7,864,496) | | | | | | $ | 170,131 | |
| | | | | | | | | |
EQUITY FUTURES CONTRACTS SOLD SHORT† | |
September 2015
S&P 500 Index
Mini Futures Contracts
(Aggregate Value of
Contracts $3,076,124) | | | 30 | | | $ | 65,040 | |
September 2015 SPI 200 Index
Futures Contracts††
(Aggregate Value of
Contracts $517,454) | | | 5 | | | | 14,219 | |
July 2015 MSCI Taiwan
Stock Index
Futures Contracts
(Aggregate Value of
Contracts $1,192,240) | | | 35 | | | | 13,662 | |
September 2015 DAX Index
Futures Contracts††
(Aggregate Value of
Contracts $306,601) | | | 1 | | | | 331 | |
July 2015 CAC40 10 Euro Index
Futures Contracts††
(Aggregate Value of
Contracts $107,131) | | | 2 | | | | 64 | |
September 2015 CBOE
Volatility Index
Futures Contracts
(Aggregate Value of
Contracts $1,013,840) | | | 58 | | | | (6,223 | ) |
July 2015 CBOE Volatility Index
Futures Contracts
(Aggregate Value of
Contracts $1,032,000) | | | 60 | | | | (67,773 | ) |
(Total Aggregate Value of Contracts $7,245,390) | | | | | | $ | 19,320 | |
| | | | | | | | | |
INTEREST RATE FUTURES CONTRACTS SOLD SHORT† | |
September 2015
U.S. Treasury Long Bond
Futures Contracts
(Aggregate Value of
Contracts $601,375) | | | 4 | | | $ | 1,965 | |
September 2015 Long Gilt
Futures Contracts††
(Aggregate Value of
Contracts $181,725) | | | 1 | | | | 72 | |
(Total Aggregate Value of Contracts $783,100) | | | | | | $ | 2,037 | |
SEE NOTES TO FINANCIAL STATEMENTS. | THE GUGGENHEIM FUNDS SEMI-ANNUAL REPORT | 27 |
CONSOLIDATED SCHEDULE OF INVESTMENTS (Unaudited)(continued) | June 30, 2015 |
MULTI-HEDGE STRATEGIES FUND | |
| | Contracts | | | Unrealized
Gain (Loss) | |
| | | | | | | |
CURRENCY FUTURES CONTRACTS SOLD SHORT† | |
September 2015 Swiss Franc
Futures Contracts
(Aggregate Value of
Contracts $670,313) | | | 5 | | | $ | 2,161 | |
September 2015
Australian Dollar
Futures Contracts
(Aggregate Value of
Contracts $307,360) | | | 4 | | | | 2,107 | |
September 2015 Japanese Yen
Futures Contracts
(Aggregate Value of
Contracts $2,760,243) | | | 27 | | | | (25,572 | ) |
(Total Aggregate Value of Contracts $3,737,916) | | | | | | $ | (21,304 | ) |
| | Units | | | | |
| | | | | | | |
OTC EQUITY INDEX SWAP AGREEMENTS †† | |
Goldman Sachs International
September 2015
Goldman Sachs
Multi-Hedge Strategies
Short Index Swap,
Terminating 09/14/156
(Notional Value $5,591,596) | | | 47,004 | | | $ | 149,082 | |
Goldman Sachs International
September 2015
Goldman Sachs
Multi-Hedge Strategies
Long Index Swap,
Terminating 09/14/157
(Notional Value $14,347,625) | | | 106,650 | | | | (78,006 | ) |
(Total Notional value $19,939,221) | | | | | | $ | 71,076 | |
CENTRALLY CLEARED CREDIT DEFAULT SWAPS AGREEMENT PROTECTION PURCHASED†† | |
Index | Counterparty | | Protection
Premium
Rate | | Maturity
Date | | Notional
Principal | | | Notional
Value | | | Upfront
Premiums
Paid | | | Unrealized
Depreciation | |
CDX EM-23 Index | Barclays Bank plc | | 1.00 | % | 06/20/20 | | $ | 2,700,000 | | | $ | 2,451,387 | | | $ | 253,352 | | | $ | (4,739 | ) |
28 | THE GUGGENHEIM FUNDS SEMI-ANNUAL REPORT | SEE NOTES TO FINANCIAL STATEMENTS. |
CONSOLIDATED SCHEDULE OF INVESTMENTS (Unaudited)(concluded) | June 30, 2015 |
MULTI-HEDGE STRATEGIES FUND | |
SECTOR DIVERSIFICATION
Goldman Sachs Multi-Hedge Strategies Short Index Swap6
Sector | % of Index |
Industrials | 22.9% |
Financials | 14.4% |
Energy | 13.7% |
Consumer Discretionary | 13.1% |
Technology | 11.9% |
Communications | 8.2% |
Consumer Staples | 7.7% |
Materials | 5.5% |
Health Care | 2.6% |
Total | 100.0% |
Goldman Sachs Multi-Hedge Strategies Long Index Swap7
Sector | % of Index |
Financials | 24.3% |
Health Care | 19.5% |
Technology | 17.3% |
Consumer Discretionary | 16.1% |
Consumer Staples | 6.0% |
Materials | 5.5% |
Communications | 5.1% |
Energy | 3.8% |
Industrials | 2.1% |
Utilities | 0.3% |
Total | 100.0% |
* | Non-income producing security. |
† | Value determined based on Level 1 inputs, unless otherwise noted — See Note 4. |
†† | Value determined based on Level 2 inputs — See Note 4. |
1 | All or a portion of this security is pledged as short security collateral at June 30, 2015. |
2 | All or portion of this security is on loan at June 30, 2015 — See Note 6. |
3 | Affiliated issuer — See Note 11. |
4 | Repurchase Agreements — See Note 5. |
5 | Securities lending collateral — See Note 6. |
6 | Customized basket of 160 exchange-traded equity securities. Total Return based on Goldman Sachs Multi-Hedge Strategies Short Index +/- financing at a variable rate. |
7 | Customized basket of 216 exchange-traded equity securities. Total Return based on Goldman Sachs Multi-Hedge Strategies Long Index +/- financing at a variable rate. |
| | ADR — American Depositary Receipt |
| | plc — Public Limited Company |
| | REIT — Real Estate Investment Trust |
SEE NOTES TO FINANCIAL STATEMENTS. | THE GUGGENHEIM FUNDS SEMI-ANNUAL REPORT | 29 |
CONSOLIDATED STATEMENT OF ASSETS AND LIABILITIES (Unaudited) |
MULTI-HEDGE STRATEGIES FUND |
June 30, 2015
Assets: | |
Investments in unaffiliated issuers, at value - including $196,110 of securities loaned (cost $79,291,778) | | $ | 81,719,482 | |
Investments in affiliated issuers, at value (cost $1,169,617) | | | 1,044,999 | |
Repurchase agreements, at value (cost $9,050,491) | | | 9,050,491 | |
Total investments (cost $89,511,886) | | | 91,814,972 | |
Segregated cash with broker | | | 55,162,486 | |
Cash | | | 1,086,059 | |
Unamortized upfront premiums paid on credit default swaps | | | 253,352 | |
Unrealized appreciation on swap agreements | | | 149,082 | |
Receivables: | |
Securities sold | | | 1,396,816 | |
Fund shares sold | | | 138,768 | |
Dividends | | | 89,498 | |
Securities lending income | | | 646 | |
Total assets | | | 150,091,679 | |
| | | | | |
Liabilities: | |
Securities sold short, at value (proceeds $45,100,463) | | | 44,726,621 | |
Segregated cash from broker | | | 122,667 | |
Foreign currency, at value (Cost $87,855) | | | 87,855 | |
Unrealized depreciation on swap agreements | | | 82,745 | |
Payable for: | |
Securities purchased | | | 1,696,490 | |
Return of securities loaned | | | 203,256 | |
Variation margin | | | 197,139 | |
Fund shares redeemed | | | 105,590 | |
Management fees | | | 98,112 | |
Distribution and service fees | | | 18,425 | |
Miscellaneous | | | 89,704 | |
Total liabilities | | | 47,428,604 | |
Commitments and contingent liabilities (Note 13) | | | — | |
Net assets | | $ | 102,663,075 | |
| | | | | |
Net assets consist of: | |
Paid in capital | | $ | 145,397,904 | |
Accumulated net investment loss | | | (3,417,031 | ) |
Accumulated net realized loss on investments | | | (42,212,910 | ) |
Net unrealized appreciation on investments | | | 2,895,112 | |
Net assets | | $ | 102,663,075 | |
| | | | | |
A-Class: | |
Net assets | | $ | 11,851,559 | |
Capital shares outstanding | | | 494,459 | |
Net asset value per share | | $ | 23.97 | |
Maximum offering price per share (Net asset value divided by 95.25%) | | $ | 25.17 | |
| | | | | |
C-Class: | |
Net assets | | $ | 9,000,337 | |
Capital shares outstanding | | | 404,803 | |
Net asset value per share | | $ | 22.23 | |
| | | | | |
P-Class: | |
Net assets | | $ | 40,850,986 | |
Capital shares outstanding | | | 1,703,155 | |
Net asset value per share | | $ | 23.99 | |
| | | | | |
Institutional Class: | |
Net assets | | $ | 40,960,193 | |
Capital shares outstanding | | | 1,685,777 | |
Net asset value per share | | $ | 24.30 | |
30 | THE GUGGENHEIM FUNDS SEMI-ANNUAL REPORT | SEE NOTES TO FINANCIAL STATEMENTS. |
CONSOLIDATED STATEMENT OF OPERATIONS (Unaudited) |
MULTI-HEDGE STRATEGIES FUND |
Period Ended June 30, 2015
Investment Income: | |
Dividends from securities of unaffiliated issuers | | $ | 980,766 | |
Dividends from securities of affiliated issuers | | | 22,465 | |
Income from securities lending, net | | | 3,726 | |
Interest | | | 1,782 | |
Total investment income | | | 1,008,739 | |
| | | | | |
Expenses: | |
Management fees | | | 642,394 | |
Distribution and service fees: | |
A-Class | | | 16,967 | |
C-Class | | | 46,677 | |
P-Class** | | | 52,105 | |
Short sales dividend expense | | | 540,960 | |
Prime broker interest expense | | | 141,416 | |
Trustees’ fees* | | | 3,645 | |
Custodian fees | | | 158 | |
Miscellaneous | | | 20,649 | |
Total expenses | | | 1,464,971 | |
Less: | |
Expenses waived by Adviser | | | (36,801 | ) |
Net expenses | | | 1,428,170 | |
Net investment loss | | | (419,431 | ) |
| | | | | |
Net Realized and Unrealized Gain (Loss): | |
Net realized gain (loss) on: | |
Investments in unaffiliated issuers | | $ | 4,008,595 | |
Investments in affiliated issuers | | | (5,381 | ) |
Swap agreements | | | 590,120 | |
Futures contracts | | | 1,742,142 | |
Foreign currency | | | 2,145 | |
Securities sold short | | | (3,289,306 | ) |
Net realized gain | | | 3,048,315 | |
Net change in unrealized appreciation (depreciation) on: | |
Investments in unaffiliated issuers | | | (3,633,033 | ) |
Investments in affiliated issuers | | | (124,618 | ) |
Securities sold short | | | 2,869,459 | |
Swap agreements | | | (231,667 | ) |
Futures contracts | | | (1,469,295 | ) |
Foreign currency | | | 107 | |
Net change in unrealized appreciation (depreciation) | | | (2,589,047 | ) |
Net realized and unrealized gain | | | 459,268 | |
Net increase in net assets resulting from operations | | $ | 39,837 | |
* | Relates to Trustees not deemed “interested persons” within the meaning of Section 2(a)(19) of the 1940 Act. |
** | H-Class shares redesignated as P-Class shares effective following the close of business on April 30, 2015 — See Note 14. |
SEE NOTES TO FINANCIAL STATEMENTS. | THE GUGGENHEIM FUNDS SEMI-ANNUAL REPORT | 31 |
CONSOLIDATED STATEMENTS OF CHANGES IN NET ASSETS |
MULTI-HEDGE STRATEGIES FUND | |
| | Period Ended
June 30,
2015
(Unaudited) | | | Year Ended
December 31,
2014 | |
Increase (Decrease) in Net Assets from Operations: | | | | | | |
Net investment loss | | $ | (419,431 | ) | | $ | (1,167,230 | ) |
Net realized gain on investments | | | 3,048,315 | | | | 4,004,144 | |
Net change in unrealized appreciation (depreciation) on investments | | | (2,589,047 | ) | | | 2,150,638 | |
Net increase in net assets resulting from operations | | | 39,837 | | | | 4,987,552 | |
| | | | | | | | | |
Distributions to shareholders from: | | | | | | | | |
Net investment income | | | | | | | | |
A-Class | | | — | | | | (88,690 | ) |
C-Class | | | — | | | | (79,610 | ) |
P-Class* | | | — | | | | (298,563 | ) |
Institutional Class | | | — | | | | (333,912 | ) |
Total distributions to shareholders | | | — | | | | (800,775 | ) |
| | | | | | | | | |
Capital share transactions: | | | | | | | | |
Proceeds from sale of shares | | | | | | | | |
A-Class | | | 7,711,761 | | | | 3,310,696 | |
C-Class | | | 667,745 | | | | 593,454 | |
P-Class* | | | 21,716,473 | | | | 10,267,963 | |
Institutional Class | | | 6,942,702 | | | | 30,581,943 | |
Distributions reinvested | | | | | | | | |
A-Class | | | — | | | | 83,254 | |
C-Class | | | — | | | | 66,457 | |
P-Class* | | | — | | | | 276,480 | |
Institutional Class | | | — | | | | 333,762 | |
Cost of shares redeemed | | | | | | | | |
A-Class | | | (7,469,830 | ) | | | (10,563,094 | ) |
C-Class | | | (1,282,488 | ) | | | (4,016,782 | ) |
P-Class* | | | (17,235,384 | ) | | | (26,531,348 | ) |
Institutional Class | | | (8,290,501 | ) | | | (16,163,978 | ) |
Net increase (decrease) from capital share transactions | | | 2,760,478 | | | | (11,761,193 | ) |
Net increase (decrease) in net assets | | | 2,800,315 | | | | (7,574,416 | ) |
| | | | | | | | | |
Net assets: | | | | | | | | |
Beginning of period | | | 99,862,760 | | | | 107,437,176 | |
End of period | | $ | 102,663,075 | | | $ | 99,862,760 | |
Accumulated net investment loss at end of period | | $ | (3,417,031 | ) | | $ | (2,997,600 | ) |
32 | THE GUGGENHEIM FUNDS SEMI-ANNUAL REPORT | SEE NOTES TO FINANCIAL STATEMENTS. |
CONSOLIDATED STATEMENTS OF CHANGES IN NET ASSETS (concluded) |
MULTI-HEDGE STRATEGIES FUND | |
| | Period Ended
June 30,
2015
(Unaudited) | | | Year Ended
December 31,
2014 | |
Capital share activity: | | | | | | |
Shares sold | | | | | | |
A-Class | | | 316,332 | | | | 142,495 | |
C-Class | | | 29,669 | | | | 27,363 | |
P-Class* | | | 890,892 | | | | 445,101 | |
Institutional Class | | | 281,509 | | | | 1,321,595 | |
Shares issued from reinvestment of distributions | | | | | | | | |
A-Class | | | — | | | | 3,522 | |
C-Class | | | — | | | | 3,018 | |
P-Class* | | | — | | | | 11,691 | |
Institutional Class | | | — | | | | 13,947 | |
Shares redeemed | | | | | | | | |
A-Class | | | (307,271 | ) | | | (455,620 | ) |
C-Class | | | (56,786 | ) | | | (186,245 | ) |
P-Class* | | | (707,615 | ) | | | (1,149,657 | ) |
Institutional Class | | | (336,960 | ) | | | (688,008 | ) |
Net increase (decrease) in shares | | | 109,770 | | | | (510,798 | ) |
* | H-Class shares redesignated as P-Class shares effective following the close of business on April 30, 2015 — See Note 14. |
SEE NOTES TO FINANCIAL STATEMENTS. | THE GUGGENHEIM FUNDS SEMI-ANNUAL REPORT | 33 |
CONSOLIDATED FINANCIAL HIGHLIGHTS |
MULTI-HEDGE STRATEGIES FUND | |
This table is presented to show selected data for a share outstanding throughout each period and to assist shareholders in evaluating a Fund’s performance for the periods presented.
A-Class | | Period Ended
June 30,
2015a | | | Year Ended
Dec. 31,
2014 | | | Year Ended
Dec. 31,
2013 | | | Year Ended
Dec. 31,
2012 | | | Year Ended
Dec. 31,
2011 | | | Year Ended
Dec. 31,
2010 | |
Per Share Data | | | | | | | | | | | | | | | | | | |
Net asset value, beginning of period | | $ | 23.94 | | | $ | 23.03 | | | $ | 22.68 | | | $ | 22.21 | | | $ | 21.66 | | | $ | 20.57 | |
Income (loss) from investment operations: | |
Net investment income (loss)b | | | (.10 | ) | | | (.26 | ) | | | (.18 | ) | | | (.35 | ) | | | (.27 | ) | | | (.40 | ) |
Net gain (loss) on investments (realized and unrealized) | | | .13 | | | | 1.36 | | | | .53 | | | | .82 | | | | .98 | | | | 1.49 | |
Total from investment operations | | | .03 | | | | 1.10 | | | | .35 | | | | .47 | | | | .71 | | | | 1.09 | |
Less distributions from: | |
Net investment income | | | — | | | | (.19 | ) | | | — | | | | — | | | | (.16 | ) | | | — | |
Total distributions | | | — | | | | (.19 | ) | | | — | | | | — | | | | (.16 | ) | | | — | |
Redemption fees collected | | | — | | | | — | | | | — | | | | — | | | | — | | | | — | c |
Net asset value, end of period | | $ | 23.97 | | | $ | 23.94 | | | $ | 23.03 | | | $ | 22.68 | | | $ | 22.21 | | | $ | 21.66 | |
| |
Total Returnd | | | 0.17 | % | | | 4.73 | % | | | 1.54 | % | | | 2.02 | % | | | 3.39 | % | | | 5.30 | % |
Ratios/Supplemental Data | |
Net assets, end of period (in thousands) | | $ | 11,852 | | | $ | 11,620 | | | $ | 18,307 | | | $ | 27,700 | | | $ | 24,832 | | | $ | 14,073 | |
Ratios to average net assets: | |
Net investment income (loss) | | | (0.83 | %) | | | (1.13 | %) | | | (0.79 | %) | | | (1.54 | %) | | | (1.23 | %) | | | (1.97 | %) |
Total expensese | | | 2.80 | % | | | 2.86 | % | | | 2.74 | % | | | 3.09 | % | | | 2.77 | % | | | 3.56 | % |
Net expensesf,g | | | 2.73 | % | | | 2.81 | % | | | 2.69 | % | | | 3.05 | % | | | 2.65 | % | | | 3.40 | % |
Portfolio turnover rate | | | 132 | % | | | 304 | % | | | 302 | % | | | 465 | % | | | 433 | % | | | 993 | % |
34 | THE GUGGENHEIM FUNDS SEMI-ANNUAL REPORT | SEE NOTES TO FINANCIAL STATEMENTS. |
CONSOLIDATED FINANCIAL HIGHLIGHTS (continued) |
MULTI-HEDGE STRATEGIES FUND | |
This table is presented to show selected data for a share outstanding throughout each period and to assist shareholders in evaluating a Fund’s performance for the periods presented.
C-Class | | Period Ended
June 30,
2015a | | | Year Ended
Dec. 31,
2014 | | | Year Ended
Dec. 31,
2013 | | | Year Ended
Dec. 31,
2012 | | | Year Ended
Dec. 31,
2011 | | | Year Ended
Dec. 31,
2010 | |
Per Share Data | | | | | | | | | | | | | | | | | | |
Net asset value, beginning of period | | $ | 22.29 | | | $ | 21.62 | | | $ | 21.45 | | | $ | 21.17 | | | $ | 20.80 | | | $ | 19.90 | |
Income (loss) from investment operations: | |
Net investment income (loss)b | | | (.18 | ) | | | (.40 | ) | | | (.35 | ) | | | (.50 | ) | | | (.42 | ) | | | (.55 | ) |
Net gain (loss) on investments (realized and unrealized) | | | .12 | | | | 1.26 | | | | .52 | | | | .78 | | | | .95 | | | | 1.45 | |
Total from investment operations | | | (.06 | ) | | | .86 | | | | .17 | | | | .28 | | | | .53 | | | | .90 | |
Less distributions from: | |
Net investment income | | | — | | | | (.19 | ) | | | — | | | | — | | | | (.16 | ) | | | — | |
Total distributions | | | — | | | | (.19 | ) | | | — | | | | — | | | | (.16 | ) | | | — | |
Redemption fees collected | | | — | | | | — | | | | — | | | | — | | | | — | | | | — | c |
Net asset value, end of period | | $ | 22.23 | | | $ | 22.29 | | | $ | 21.62 | | | $ | 21.45 | | | $ | 21.17 | | | $ | 20.80 | |
| |
Total Returnd | | | (0.22 | %) | | | 3.97 | % | | | 0.79 | % | | | 1.23 | % | | | 2.62 | % | | | 4.52 | % |
Ratios/Supplemental Data | |
Net assets, end of period (in thousands) | | $ | 9,000 | | | $ | 9,627 | | | $ | 12,705 | | | $ | 16,780 | | | $ | 13,322 | | | $ | 15,194 | |
Ratios to average net assets: | |
Net investment income (loss) | | | (1.58 | %) | | | (1.84 | %) | | | (1.60 | %) | | | (2.33 | %) | | | (1.99 | %) | | | (2.79 | %) |
Total expensese | | | 3.56 | % | | | 3.62 | % | | | 3.50 | % | | | 3.85 | % | | | 3.52 | % | | | 4.41 | % |
Net expensesf,g | | | 3.49 | % | | | 3.57 | % | | | 3.45 | % | | | 3.81 | % | | | 3.39 | % | | | 4.26 | % |
Portfolio turnover rate | | | 132 | % | | | 304 | % | | | 302 | % | | | 465 | % | | | 432 | % | | | 993 | % |
SEE NOTES TO FINANCIAL STATEMENTS. | THE GUGGENHEIM FUNDS SEMI-ANNUAL REPORT | 35 |
CONSOLIDATED FINANCIAL HIGHLIGHTS (continued) |
MULTI-HEDGE STRATEGIES FUND |
This table is presented to show selected data for a share outstanding throughout each period and to assist shareholders in evaluating a Fund’s performance for the periods presented.
P-Class* | | Period Ended
June 30,
2015a | | | Year Ended
Dec. 31,
2014 | | | Year Ended
Dec. 31,
2013 | | | Year Ended
Dec. 31,
2012 | | | Year Ended
Dec. 31,
2011 | | | Year Ended
Dec. 31,
2010 | |
Per Share Data | | | | | | | | | | | | | | | | | | |
Net asset value, beginning of period | | $ | 23.96 | | | $ | 23.04 | | | $ | 22.69 | | | $ | 22.23 | | | $ | 21.67 | | | $ | 20.58 | |
Income (loss) from investment operations: | |
Net investment income (loss)b | | | (.10 | ) | | | (.25 | ) | | | (.19 | ) | | | (.36 | ) | | | (.27 | ) | | | (.43 | ) |
Net gain (loss) on investments (realized and unrealized) | | | .13 | | | | 1.36 | | | | .54 | | | | .82 | | | | .99 | | | | 1.52 | |
Total from investment operations | | | .03 | | | | 1.11 | | | | .35 | | | | .46 | | | | .72 | | | | 1.09 | |
Less distributions from: | |
Net investment income | | | — | | | | (.19 | ) | | | — | | | | — | | | | (.16 | ) | | | — | |
Total distributions | | | — | | | | (.19 | ) | | | — | | | | — | | | | (.16 | ) | | | — | |
Redemption fees collected | | | — | | | | — | | | | — | | | | — | | | | — | | | | — | c |
Net asset value, end of period | | $ | 23.99 | | | $ | 23.96 | | | $ | 23.04 | | | $ | 22.69 | | | $ | 22.23 | | | $ | 21.67 | |
| |
Total Returnd | | | 0.13 | % | | | 4.77 | % | | | 1.54 | % | | | 2.02 | % | | | 3.39 | % | | | 5.30 | % |
Ratios/Supplemental Data | |
Net assets, end of period (in thousands) | | $ | 40,851 | | | $ | 36,411 | | | $ | 50,990 | | | $ | 66,818 | | | $ | 66,161 | | | $ | 44,421 | |
Ratios to average net assets: | |
Net investment income (loss) | | | (0.82 | %) | | | (1.09 | %) | | | (0.82 | %) | | | (1.59 | %) | | | (1.25 | %) | | | (2.08 | %) |
Total expensese | | | 2.82 | % | | | 2.87 | % | | | 2.75 | % | | | 3.07 | % | | | 2.78 | % | | | 3.69 | % |
Net expensesf,g | | | 2.75 | % | | | 2.82 | % | | | 2.71 | % | | | 3.03 | % | | | 2.65 | % | | | 3.54 | % |
Portfolio turnover rate | | | 132 | % | | | 304 | % | | | 302 | % | | | 465 | % | | | 433 | % | | | 993 | % |
36 | THE GUGGENHEIM FUNDS SEMI-ANNUAL REPORT | SEE NOTES TO FINANCIAL STATEMENTS. |
CONSOLIDATED FINANCIAL HIGHLIGHTS (continued) |
MULTI-HEDGE STRATEGIES FUND |
This table is presented to show selected data for a share outstanding throughout each period and to assist shareholders in evaluating a Fund’s performance for the periods presented.
Institutional Class | | Period Ended
June 30,
2015a | | | Year Ended
Dec. 31,
2014 | | | Year Ended
Dec. 31,
2013 | | | Year Ended
Dec. 31,
2012 | | | Year Ended
Dec. 31,
2011 | | | Period Ended
Dec. 31,
2010h | |
Per Share Data | | | | | | | | | | | | | | | | | | |
Net asset value, beginning of period | | $ | 24.24 | | | $ | 23.26 | | | $ | 22.84 | | | $ | 22.32 | | | $ | 21.71 | | | $ | 20.61 | |
Income (loss) from investment operations: | |
Net investment income (loss)b | | | (.07 | ) | | | (.18 | ) | | | (.13 | ) | | | (.33 | ) | | | (.22 | ) | | | (.43 | ) |
Net gain (loss) on investments (realized and unrealized) | | | .13 | | | | 1.35 | | | | .55 | | | | .85 | | | | .99 | | | | 1.53 | |
Total from investment operations | | | .06 | | | | 1.17 | | | | .42 | | | | .52 | | | | .77 | | | | 1.10 | |
Less distributions from: | |
Net investment income | | | — | | | | (.19 | ) | | | — | | | | — | | | | (.16 | ) | | | — | |
Total distributions | | | — | | | | (.19 | ) | | | — | | | | — | | | | (.16 | ) | | | — | |
Redemption fees collected | | | — | | | | — | | | | — | | | | — | | | | — | | | | — | c |
Net asset value, end of period | | $ | 24.30 | | | $ | 24.24 | | | $ | 23.26 | | | $ | 22.84 | | | $ | 22.32 | | | $ | 21.71 | |
| |
Total Returnd | | | 0.29 | % | | | 4.98 | % | | | 1.84 | % | | | 2.28 | % | | | 3.61 | % | | | 5.34 | % |
Ratios/Supplemental Data | |
Net assets, end of period (in thousands) | | $ | 40,960 | | | $ | 42,204 | | | $ | 25,435 | | | $ | 14,130 | | | $ | 807 | | | $ | 296 | |
Ratios to average net assets: | |
Net investment income (loss) | | | (0.58 | %) | | | (0.79 | %) | | | (0.54 | %) | | | (1.46 | %) | | | (0.99 | %) | | | (3.10 | %) |
Total expensese | | | 2.56 | % | | | 2.67 | % | | | 2.56 | % | | | 3.05 | % | | | 2.52 | % | | | 5.13 | % |
Net expensesf,g | | | 2.49 | % | | | 2.62 | % | | | 2.51 | % | | | 3.01 | % | | | 2.40 | % | | | 4.98 | % |
Portfolio turnover rate | | | 132 | % | | | 304 | % | | | 302 | % | | | 465 | % | | | 433 | % | | | 993 | % |
SEE NOTES TO FINANCIAL STATEMENTS. | THE GUGGENHEIM FUNDS SEMI-ANNUAL REPORT | 37 |
CONSOLIDATED FINANCIAL HIGHLIGHTS (concluded) |
MULTI-HEDGE STRATEGIES FUND |
a | Unaudited figures for the period ended June 30, 2015. Percentage amounts for the period, except total return and portfolio turnover rate, have been annualized. |
b | Net investment income (loss) per share was computed using average shares outstanding throughout the period. |
c | Redemption fees collected are less than $0.01 per share. |
d | Total return does not reflect the impact of any applicable sales charges and has not been annualized. |
e | Does not include expenses of the underlying funds in which the Fund invests. |
f | Net expense information reflects the expense ratios after expense waivers. |
g | Excluding interest and dividend expense related to short sales, the operating expense ratios for the period ended June 30, 2015 and years ended December 31 would be: |
| | | 06/30/15 | 12/31/14 | 12/31/13 | 12/31/12 | 12/31/11 | 12/31/10 |
| | A-Class | 1.44% | 1.42% | 1.40% | 1.40% | 1.41% | 1.41% |
| | C-Class | 2.19% | 2.17% | 2.15% | 2.15% | 2.15% | 2.15% |
| | P-Class* | 1.44% | 1.42% | 1.40% | 1.40% | 1.41% | 1.41% |
| | Institutional Class | 1.19% | 1.17% | 1.15% | 1.15% | 1.16% | 1.17% |
h | Since commencement of operations: May 3, 2010. Percentage amounts for the period, except total return and portfolio turnover rate, have been annualized. |
* | H-Class shares redesignated as P-Class shares effective following the close of business on April 30, 2015 — See Note 14. |
38 | THE GUGGENHEIM FUNDS SEMI-ANNUAL REPORT | SEE NOTES TO FINANCIAL STATEMENTS. |
FUND PROFILE (Unaudited) | June 30, 2015 |
COMMODITIES STRATEGY FUND
OBJECTIVE: Seeks to provide investment results that correlate, before fees and expenses, to the performance of a benchmark for commodities. The Fund’s current benchmark is the S&P GSCITM Commodity Index (the “underlying index”).
Holdings Diversification (Market Exposure as % of Net Assets)
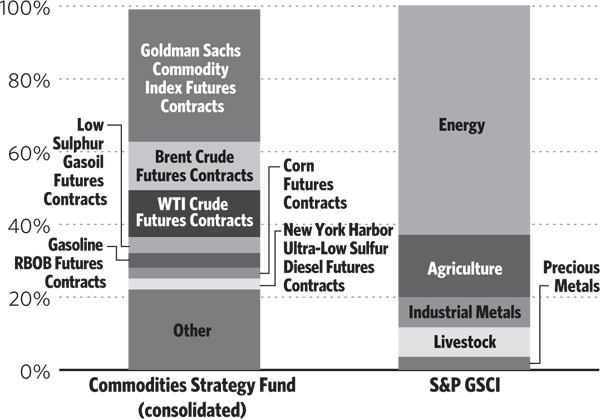
“Holdings Diversification (Market Exposure as % of Net Assets)” excludes any temporary cash investments or investments in Guggenheim Strategy Funds Trust mutual funds. Investments in those Funds do not provide “market exposure” to meet the Fund’s investment objective, but will significantly increase the portfolio’s exposure to certain other asset categories (and their associated risks), which may cause the Fund to deviate from its principal investment strategy, including: (i) high yield, high risk debt securities rated below the top four long-term rating categories by a nationally recognized statistical rating organization (also known as “junk bonds”); (ii) securities issued by the U.S. Government or its agencies and instrumentalities; (iii) CLOs and similar investments; and (iv) other short-term fixed income securities.
| | THE GUGGENHEIM FUNDS SEMI-ANNUAL REPORT | 39 |
FUND PROFILE (Unaudited)(concluded) | June 30, 2015 |
Inception Dates: |
A-Class | May 25, 2005 |
C-Class | May 25, 2005 |
H-Class | May 25, 2005 |
The Fund invests principally in derivative investments such as commodity-linked futures contracts.
Largest Holdings (% of Total Net Assets) |
Guggenheim Strategy Fund I | 21.1% |
Guggenheim Strategy Fund II | 16.8% |
Total | 37.9% |
| | |
“Largest Holdings” exclude any temporary cash or derivative investments. |
40 | THE GUGGENHEIM FUNDS SEMI-ANNUAL REPORT | |
CONSOLIDATED SCHEDULE OF INVESTMENTS (Unaudited) | June 30, 2015 |
COMMODITIES STRATEGY FUND | |
| |
Shares
| | | Value | |
| | | | | | | |
MUTUAL FUNDS† - 37.9% | |
Guggenheim Strategy Fund I1 | | | 89,679 | | | $ | 2,234,812 | |
Guggenheim Strategy Fund II1 | | | 71,794 | | | | 1,788,379 | |
Total Mutual Funds | | | | | | | | |
(Cost $4,017,003) | | | | | | | 4,023,191 | |
| | | Face
Amount | | | | |
| | | | | | | |
REPURCHASE AGREEMENTS††,2 - 23.2% | |
HSBC Group
issued 06/30/15 at 0.04%
due 07/01/15 | | $ | 2,239,085 | | | | 2,239,085 | |
RBC Capital Markets
issued 06/30/15 at 0.04%
due 07/01/15 | | | 138,557 | | | | 138,557 | |
UMB Financial Corp.
issued 06/30/15 at 0.04%
due 07/01/15 | | | 80,008 | | | | 80,008 | |
Total Repurchase Agreements | | | | | |
(Cost $2,457,650) | | | | | | | 2,457,650 | |
| | | | | | | | | |
Total Investments - 61.1% | | | | | | | | |
(Cost $6,474,653) | | | | | | $ | 6,480,841 | |
Other Assets & Liabilities, net - 38.9% | | | | 4,127,704 | |
Total Net Assets - 100.0% | | | | | | $ | 10,608,545 | |
| | Contracts | | | Unrealized
Gain | |
| | | | | | | |
COMMODITY FUTURES CONTRACTS PURCHASED† | |
September 2015 Corn
Futures Contracts
(Aggregate Value of
Contracts $316,500) | | | 15 | | | $ | 37,160 | |
September 2015 Wheat
Futures Contracts
(Aggregate Value of
Contracts $277,538) | | | 9 | | | | 35,977 | |
November 2015 Soybean
Futures Contracts
(Aggregate Value of
Contracts $207,050) | | | 4 | | | | 22,611 | |
July 2015 Goldman Sachs
Commodity Index
Futures Contracts
(Aggregate Value of
Contracts $3,856,999) | | | 35 | | | | 8,095 | |
September 2015 Hard Red
Winter Wheat
Futures Contracts
(Aggregate Value of
Contracts $60,900) | | | 2 | | | | 5,106 | |
December 2015 Cotton #2
Futures Contracts
(Aggregate Value of
Contracts $67,870) | | | 2 | | | | 2,184 | |
September 2015 Cocoa
Futures Contracts
(Aggregate Value of
Contracts $32,510) | | | 1 | | | | 1,506 | |
August 2015 Feeder Cattle
Futures Contracts
(Aggregate Value of
Contracts $107,463) | | | 1 | | | | 1,496 | |
October 2015 Sugar #11
Futures Contracts
(Aggregate Value of
Contracts $97,922) | | | 7 | | | | 300 | |
August 2015 Gasoline RBOB
Futures Contracts
(Aggregate Value of
Contracts $429,345) | | | 5 | | | | 94 | |
SEE NOTES TO FINANCIAL STATEMENTS. | THE GUGGENHEIM FUNDS SEMI-ANNUAL REPORT | 41 |
CONSOLIDATED SCHEDULE OF INVESTMENTS (Unaudited)(concluded) | June 30, 2015 |
COMMODITIES STRATEGY FUND | |
| | Contracts | | | Unrealized
Loss | |
| | | | | | | |
August 2015 Live Cattle
Futures Contracts
(Aggregate Value of
Contracts $296,100) | | | 5 | | | $ | (768 | ) |
August 2015 Gold 100 oz.
Futures Contracts
(Aggregate Value of
Contracts $234,360) | | | 2 | | | | (2,226 | ) |
September 2015 Coffee ‘C’
Futures Contracts
(Aggregate Value of
Contracts $49,031) | | | 1 | | | | (2,872 | ) |
August 2015 Natural Gas
Futures Contracts
(Aggregate Value of
Contracts $197,610) | | | 7 | | | | (3,881 | ) |
August 2015 LME Zinc
Futures Contracts
(Aggregate Value of
Contracts $49,879) | | | 1 | | | | (4,041 | ) |
August 2015 LME Lead
Futures Contracts
(Aggregate Value of
Contracts $43,844) | | | 1 | | | | (4,339 | ) |
August 2015
LME Primary Aluminum
Futures Contracts
(Aggregate Value of
Contracts $125,663) | | | 3 | | | | (5,291 | ) |
August 2015 New York Harbor
Ultra-Low Sulfur Diesel
Futures Contracts
(Aggregate Value of
Contracts $317,134) | | | 4 | | | | (8,320 | ) |
August 2015 LME Nickel
Futures Contracts
(Aggregate Value of
Contracts $71,739) | | | 1 | | | | (9,175 | ) |
August 2015 LME Copper
Futures Contracts
(Aggregate Value of
Contracts $288,050) | | | 2 | | | | (10,090 | ) |
August 2015 Lean Hogs
Futures Contracts
(Aggregate Value of
Contracts $148,650) | | | 5 | | | | (11,298 | ) |
August 2015
Low Sulphur Gasoil
Futures Contracts
(Aggregate Value of
Contracts $465,400) | | | 8 | | | | (11,913 | ) |
August 2015 WTI Crude
Futures Contracts
(Aggregate Value of
Contracts $1,364,129) | | | 23 | | | | (32,421 | ) |
September 2015 Brent Crude
Futures Contracts
(Aggregate Value of
Contracts $1,408,879) | | | 22 | | | | (52,065 | ) |
(Total Aggregate Value of Contracts $10,514,565) | | | | | | $ | (44,171 | ) |
† | Value determined based on Level 1 inputs — See Note 4. |
†† | Value determined based on Level 2 inputs — See Note 4. |
1 | Affiliated issuer — See Note 11. |
2 | Repurchase Agreements — See Note 5. |
42 | THE GUGGENHEIM FUNDS SEMI-ANNUAL REPORT | SEE NOTES TO FINANCIAL STATEMENTS. |
CONSOLIDATED STATEMENT OF ASSETS AND LIABILITIES (Unaudited) |
COMMODITIES STRATEGY FUND |
June 30, 2015
Assets: | |
Investments in affiliated issuers, at value (cost $4,017,003) | | $ | 4,023,191 | |
Repurchase agreements, at value (cost $2,457,650) | | | 2,457,650 | |
Total investments (cost $6,474,653) | | | 6,480,841 | |
Segregated cash with broker | | | 693,418 | |
Receivables: | |
Fund shares sold | | | 3,361,933 | |
Variation margin | | | 144,827 | |
Dividends | | | 4,016 | |
Interest | | | 3 | |
Total assets | | | 10,685,038 | |
| | | | | |
Liabilities: | |
Segregated cash from broker | | | 28,427 | |
Payable for: | |
Fund shares redeemed | | | 32,786 | |
Management fees | | | 4,787 | |
Securities purchased | | | 4,016 | |
Distribution and service fees | | | 2,199 | |
Transfer agent and administrative fees | | | 1,596 | |
Portfolio accounting fees | | | 638 | |
Miscellaneous | | | 2,044 | |
Total liabilities | | | 76,493 | |
Commitments and contingent liabilities (Note 13) | | | — | |
Net assets | | $ | 10,608,545 | |
| | | | | |
Net assets consist of: | |
Paid in capital | | $ | 34,781,801 | |
Accumulated net investment loss | | | (2,810,069 | ) |
Accumulated net realized loss on investments | | | (21,325,204 | ) |
Net unrealized depreciation on investments | | | (37,983 | ) |
Net assets | | $ | 10,608,545 | |
| | | | | |
A-Class: | |
Net assets | | $ | 945,425 | |
Capital shares outstanding | | | 96,801 | |
Net asset value per share | | $ | 9.77 | |
Maximum offering price per share (Net asset value divided by 95.25%) | | $ | 10.26 | |
| | | | | |
C-Class: | |
Net assets | | $ | 941,473 | |
Capital shares outstanding | | | 104,383 | |
Net asset value per share | | $ | 9.02 | |
| | | | | |
H-Class: | |
Net assets | | $ | 8,721,647 | |
Capital shares outstanding | | | 891,977 | |
Net asset value per share | | $ | 9.78 | |
SEE NOTES TO FINANCIAL STATEMENTS. | THE GUGGENHEIM FUNDS SEMI-ANNUAL REPORT | 43 |
CONSOLIDATED STATEMENT OF OPERATIONS (Unaudited) |
COMMODITIES STRATEGY FUND |
Period Ended June 30, 2015
Investment Income: | |
Dividends from securities of affiliated issuers | | $ | 19,037 | |
Interest | | | 453 | |
Total investment income | | | 19,490 | |
| | | | | |
Expenses: | |
Management fees | | | 30,569 | |
Transfer agent and administrative fees | | | 8,647 | |
Distribution and service fees: | |
A-Class | | | 1,494 | |
C-Class | | | 5,037 | |
H-Class | | | 5,894 | |
Portfolio accounting fees | | | 3,459 | |
Registration fees | | | 5,798 | |
Legal fees | | | 5,267 | |
Trustees’ fees* | | | 446 | |
Custodian fees | | | 422 | |
Miscellaneous | | | (3,213 | ) |
Total expenses | | | 63,820 | |
Less: | |
Expenses waived by Adviser | | | (4,478 | ) |
Net expenses | | | 59,342 | |
Net investment loss | | | (39,852 | ) |
| | | | | |
Net Realized and Unrealized Gain (Loss): | |
Net realized gain (loss) on: | |
Investments in affiliated issuers | | | (2,217 | ) |
Futures contracts | | | (1,418,393 | ) |
Net realized loss | | | (1,420,610 | ) |
Net change in unrealized appreciation (depreciation) on: | |
Investments in affiliated issuers | | | 6,188 | |
Investments in unaffiliated issuers | | | 3,305 | |
Futures contracts | | | 508,238 | |
Net change in unrealized appreciation (depreciation) | | | 517,731 | |
Net realized and unrealized loss | | | (902,879 | ) |
Net decrease in net assets resulting from operations | | $ | (942,731 | ) |
* | Relates to Trustees not deemed “interested persons” within the meaning of Section 2(a)(19) of the 1940 Act. |
44 | THE GUGGENHEIM FUNDS SEMI-ANNUAL REPORT | SEE NOTES TO FINANCIAL STATEMENTS. |
CONSOLIDATED STATEMENTS OF CHANGES IN NET ASSETS |
COMMODITIES STRATEGY FUND | |
| | Period Ended
June 30,
2015
(Unaudited) | | | Year Ended
December 31,
2014 | |
Increase (Decrease) in Net Assets from Operations: | | | | | | |
Net investment loss | | $ | (39,852 | ) | | $ | (220,015 | ) |
Net realized loss on investments | | | (1,420,610 | ) | | | (6,379,296 | ) |
Net change in unrealized appreciation (depreciation) on investments | | | 517,731 | | | | (635,572 | ) |
Net decrease in net assets resulting from operations | | | (942,731 | ) | | | (7,234,883 | ) |
| | | | | | | | | |
Capital share transactions: | | | | | | | | |
Proceeds from sale of shares | | | | | | | | |
A-Class | | | 6,725,996 | | | | 22,549,472 | |
C-Class | | | 110,243 | | | | 260,844 | |
H-Class | | | 50,119,834 | | | | 85,991,591 | |
Cost of shares redeemed | | | | | | | | |
A-Class | | | (9,040,666 | ) | | | (19,190,403 | ) |
C-Class | | | (281,193 | ) | | | (444,139 | ) |
H-Class | | | (48,797,009 | ) | | | (85,196,491 | ) |
Net increase (decrease) from capital share transactions | | | (1,162,795 | ) | | | 3,970,874 | |
Net decrease in net assets | | | (2,105,526 | ) | | | (3,264,009 | ) |
| | | | | | | | | |
Net assets: | | | | | | | | |
Beginning of period | | | 12,714,071 | | | | 15,978,080 | |
End of period | | $ | 10,608,545 | | | $ | 12,714,071 | |
Accumulated net investment loss at end of period | | $ | (2,810,069 | ) | | $ | (2,770,217 | ) |
| | | | | | | | | |
Capital share activity: | | | | | | | | |
Shares sold | | | | | | | | |
A-Class | | | 744,259 | | | | 1,645,908 | |
C-Class | | | 12,278 | | | | 19,526 | |
H-Class | | | 5,279,982 | | | | 6,272,794 | |
Shares redeemed | | | | | | | | |
A-Class | | | (993,801 | ) | | | (1,432,812 | ) |
C-Class | | | (31,996 | ) | | | (35,150 | ) |
H-Class | | | (5,213,069 | ) | | | (6,253,169 | ) |
Net increase (decrease) in shares | | | (202,347 | ) | | | 217,097 | |
SEE NOTES TO FINANCIAL STATEMENTS. | THE GUGGENHEIM FUNDS SEMI-ANNUAL REPORT | 45 |
CONSOLIDATED FINANCIAL HIGHLIGHTS |
COMMODITIES STRATEGY FUND | |
This table is presented to show selected data for a share outstanding throughout each period and to assist shareholders in evaluating a Fund’s performance for the periods presented.
A-Class | | Period Ended
June 30,
2015a | | | Year Ended
Dec. 31,
2014 | | | Year Ended
Dec. 31,
2013 | | | Year Ended
Dec. 31,
2012 | | | Year Ended
Dec. 31,
2011 | | | Year Ended
Dec. 31,
2010 | |
Per Share Data | | | | | | | | | | | | | | | | | | |
Net asset value, beginning of period | | $ | 9.87 | | | $ | 14.93 | | | $ | 15.49 | | | $ | 16.18 | | | $ | 17.33 | | | $ | 16.39 | |
Income (loss) from investment operations: | |
Net investment income (loss)b | | | (.05 | ) | | | (.15 | ) | | | (.23 | ) | | | (.23 | ) | | | (.26 | ) | | | (.22 | ) |
Net gain (loss) on investments (realized and unrealized) | | | (.05 | ) | | | (4.91 | ) | | | (.33 | ) | | | (.05 | ) | | | (.36 | ) | | | 1.16 | |
Total from investment operations | | | (.10 | ) | | | (5.06 | ) | | | (.56 | ) | | | (.28 | ) | | | (.62 | ) | | | .94 | |
Less distributions from: | |
Net investment income | | | — | | | | — | | | | — | | | | (.41 | ) | | | (.53 | ) | | | — | |
Total distributions | | | — | | | | — | | | | — | | | | (.41 | ) | | | (.53 | ) | | | — | |
Redemption fees collected | | | — | | | | — | | | | — | | | | — | | | | — | | | | — | c |
Net asset value, end of period | | $ | 9.77 | | | $ | 9.87 | | | $ | 14.93 | | | $ | 15.49 | | | $ | 16.18 | | | $ | 17.33 | |
| |
Total Returnd | | | (1.01 | %) | | | (33.89 | %) | | | (3.62 | %) | | | (1.63 | %) | | | (3.61 | %) | | | 5.74 | % |
Ratios/Supplemental Data | |
Net assets, end of period (in thousands) | | $ | 945 | | | $ | 3,419 | | | $ | 1,990 | | | $ | 5,840 | | | $ | 5,223 | | | $ | 7,192 | |
Ratios to average net assets: | |
Net investment income (loss) | | | (1.01 | %) | | | (1.03 | %) | | | (1.50 | %) | | | (1.40 | %) | | | (1.47 | %) | | | (4.22 | %) |
Total expensese | | | 1.72 | % | | | 1.64 | % | | | 1.63 | % | | | 1.59 | % | | | 1.66 | % | | | 1.65 | % |
Net expensesf | | | 1.59 | % | | | 1.56 | % | | | 1.53 | % | | | 1.49 | % | | | 1.55 | % | | | 1.56 | % |
Portfolio turnover rate | | | 159 | % | | | 238 | % | | | — | | | | — | | | | — | | | | 200 | % |
46 | THE GUGGENHEIM FUNDS SEMI-ANNUAL REPORT | SEE NOTES TO FINANCIAL STATEMENTS. |
CONSOLIDATED FINANCIAL HIGHLIGHTS (continued) |
COMMODITIES STRATEGY FUND | |
This table is presented to show selected data for a share outstanding throughout each period and to assist shareholders in evaluating a Fund’s performance for the periods presented.
C-Class | | Period Ended
June 30,
2015a | | | Year Ended
Dec. 31,
2014 | | | Year Ended
Dec. 31,
2013 | | | Year Ended
Dec. 31,
2012 | | | Year Ended
Dec. 31,
2011 | | | Year Ended
Dec. 31,
2010 | |
Per Share Data | | | | | | | | | | | | | | | | | | |
Net asset value, beginning of period | | $ | 9.15 | | | $ | 13.93 | | | $ | 14.56 | | | $ | 15.34 | | | $ | 16.58 | | | $ | 15.80 | |
Income (loss) from investment operations: | |
Net investment income (loss)b | | | (.08 | ) | | | (.23 | ) | | | (.32 | ) | | | (.33 | ) | | | (.37 | ) | | | (.32 | ) |
Net gain (loss) on investments (realized and unrealized) | | | (.05 | ) | | | (4.55 | ) | | | (.31 | ) | | | (.04 | ) | | | (.34 | ) | | | 1.10 | |
Total from investment operations | | | (.13 | ) | | | (4.78 | ) | | | (.63 | ) | | | (.37 | ) | | | (.71 | ) | | | .78 | |
Less distributions from: | |
Net investment income | | | — | | | | — | | | | — | | | | (.41 | ) | | | (.53 | ) | | | — | |
Total distributions | | | — | | | | — | | | | — | | | | (.41 | ) | | | (.53 | ) | | | — | |
Redemption fees collected | | | — | | | | — | | | | — | | | | — | | | | — | | | | — | c |
Net asset value, end of period | | $ | 9.02 | | | $ | 9.15 | | | $ | 13.93 | | | $ | 14.56 | | | $ | 15.34 | | | $ | 16.58 | |
| |
Total Returnd | | | (1.42 | %) | | | (34.31 | %) | | | (4.33 | %) | | | (2.38 | %) | | | (4.32 | %) | | | 4.94 | % |
Ratios/Supplemental Data | |
Net assets, end of period (in thousands) | | $ | 941 | | | $ | 1,135 | | | $ | 1,947 | | | $ | 2,575 | | | $ | 3,558 | | | $ | 4,857 | |
Ratios to average net assets: | |
Net investment income (loss) | | | (1.78 | %) | | | (1.77 | %) | | | (2.25 | %) | | | (2.15 | %) | | | (2.22 | %) | | | (2.17 | %) |
Total expensese | | | 2.52 | % | | | 2.39 | % | | | 2.39 | % | | | 2.34 | % | | | 2.41 | % | | | 2.39 | % |
Net expensesf | | | 2.39 | % | | | 2.32 | % | | | 2.28 | % | | | 2.24 | % | | | 2.30 | % | | | 2.30 | % |
Portfolio turnover rate | | | 159 | % | | | 238 | % | | | — | | | | — | | | | — | | | | 200 | % |
SEE NOTES TO FINANCIAL STATEMENTS. | THE GUGGENHEIM FUNDS SEMI-ANNUAL REPORT | 47 |
CONSOLIDATED FINANCIAL HIGHLIGHTS (concluded) |
COMMODITIES STRATEGY FUND |
This table is presented to show selected data for a share outstanding throughout each period and to assist shareholders in evaluating a Fund’s performance for the periods presented.
H-Class | | Period Ended
June 30,
2015a | | | Year Ended
Dec. 31,
2014 | | | Year Ended
Dec. 31,
2013 | | | Year Ended
Dec. 31,
2012 | | | Year Ended
Dec. 31,
2011 | | | Year Ended
Dec. 31,
2010 | |
Per Share Data | | | | | | | | | | | | | | | | | | |
Net asset value, beginning of period | | $ | 9.89 | | | $ | 14.95 | | | $ | 15.50 | | | $ | 16.18 | | | $ | 17.33 | | | $ | 16.39 | |
Income (loss) from investment operations: | |
Net investment income (loss)b | | | (.05 | ) | | | (.15 | ) | | | (.23 | ) | | | (.23 | ) | | | (.27 | ) | | | (.22 | ) |
Net gain (loss) on investments (realized and unrealized) | | | (.06 | ) | | | (4.91 | ) | | | (.32 | ) | | | (.04 | ) | | | (.35 | ) | | | 1.16 | |
Total from investment operations | | | (.11 | ) | | | (5.06 | ) | | | (.55 | ) | | | (.27 | ) | | | (.62 | ) | | | .94 | |
Less distributions from: | |
Net investment income | | | — | | | | — | | | | — | | | | (.41 | ) | | | (.53 | ) | | | — | |
Total distributions | | | — | | | | — | | | | — | | | | (.41 | ) | | | (.53 | ) | | | — | |
Redemption fees collected | | | — | | | | — | | | | — | | | | — | | | | — | | | | — | c |
Net asset value, end of period | | $ | 9.78 | | | $ | 9.89 | | | $ | 14.95 | | | $ | 15.50 | | | $ | 16.18 | | | $ | 17.33 | |
| |
Total Returnd | | | (1.11 | %) | | | (33.85 | %) | | | (3.55 | %) | | | (1.57 | %) | | | (3.67 | %) | | | 5.74 | % |
Ratios/Supplemental Data | |
Net assets, end of period (in thousands) | | $ | 8,722 | | | $ | 8,160 | | | $ | 12,042 | | | $ | 23,671 | | | $ | 14,982 | | | $ | 32,290 | |
Ratios to average net assets: | |
Net investment income (loss) | | | (1.05 | %) | | | (1.05 | %) | | | (1.50 | %) | | | (1.40 | %) | | | (1.47 | %) | | | (1.42 | %) |
Total expensese | | | 1.73 | % | | | 1.65 | % | | | 1.63 | % | | | 1.60 | % | | | 1.66 | % | | | 1.65 | % |
Net expensesf | | | 1.60 | % | | | 1.57 | % | | | 1.53 | % | | | 1.49 | % | | | 1.56 | % | | | 1.56 | % |
Portfolio turnover rate | | | 159 | % | | | 238 | % | | | — | | | | — | | | | — | | | | 200 | % |
a | Unaudited figures for the period ended June 30, 2015. Percentage amounts for the period, except total return and portfolio turnover rate, have been annualized. |
b | Net investment income (loss) per share was computed using average shares outstanding throughout the period. |
c | Redemption fees collected are less than $0.01 per share. |
d | Total return does not reflect the impact of any applicable sales charges and has not been annualized. |
e | Does not include expenses of the underlying funds in which the Fund invests. |
f | Net expense information reflects the expense ratios after expense waivers. |
48 | THE GUGGENHEIM FUNDS SEMI-ANNUAL REPORT | SEE NOTES TO FINANCIAL STATEMENTS. |
NOTES TO CONSOLIDATED FINANCIAL STATEMENTS (Unaudited) |
1. Organization, Consolidation of Subsidiary and Significant Accounting Policies
Organization
The Rydex Series Funds (the “Trust”), a Delaware business trust, is registered with the SEC under the Investment Company Act of 1940 (“1940 Act”), as a non-diversified, open-ended investment company of the series type. Each series, in effect, is representing a separate Fund. The Trust is authorized to issue an unlimited number of no par value shares. The Trust accounts for the assets of each fund separately.
The Trust offers a combination of nine separate classes of shares: Investor Class shares, Advisor Class shares, A-Class shares, C-Class shares, H-Class shares, P-Class shares, Y-Class shares, Institutional Class shares and Money Market Class shares. Sales of shares of each Class are made without a front-end sales charge at the net asset value per share (“NAV”), with the exception of A-Class shares. A-Class shares are sold at the NAV, plus the applicable front-end sales charge. The sales charge varies depending on the amount purchased, but will not exceed 4.75%. A-Class share purchases of $1 million or more are exempt from the front-end sales charge but have a 1% contingent deferred sales charge (“CDSC”) if shares are redeemed within 12 months of purchase. C-Class shares have a 1% CDSC if shares are redeemed within 12 months of purchase. Institutional Class shares are offered primarily for direct investment by institutions such as pension and profit sharing plans, endowments, foundations and corporations. Institutional Class shares have a minimum initial investment of $2 million and a minimum account balance of $1 million. At June 30, 2015, the Trust consisted of fifty-two funds.
This report covers the Multi-Hedge Strategies Fund and Commodities Strategy Fund (the “Funds”). Only A-Class, C-Class, H-Class, P-Class and Institutional Class had been issued by the Funds.
Guggenheim Investments (“GI”) provides advisory services, and Rydex Fund Services, LLC (“RFS”) provides transfer agent, administrative and accounting services to the Trust. Guggenheim Funds Distributors, LLC (“GFD”) acts as principal underwriter for the Trust. GI, RFS and GFD are affiliated entities.
Consolidation of Subsidiary
Each of the consolidated financial statements of the Funds includes the accounts of a wholly-owned and controlled Cayman Islands subsidiary (the “Subsidiary”). Significant inter-company accounts and transactions have been eliminated in consolidation for the Funds.
| | THE GUGGENHEIM FUNDS SEMI-ANNUAL REPORT | 49 |
NOTES TO CONSOLIDATED FINANCIAL STATEMENTS (Unaudited)(continued) |
Each Fund may invest up to 25% of its total assets in its Subsidiary which acts as an investment vehicle in order to effect certain investments consistent with the Fund’s investment objectives and policies.
A summary of each Fund’s investment in its respective Subsidiary is as follows:
Fund | Inception
Date of
Subsidiary | | Subsidiary
Net Assets at
June 30, 2015 | | | % of Net Assets
of the Fund at
June 30, 2015 | |
Multi-Hedge Strategies Fund | 09/18/09 | | $ | 6,063,227 | | | | 5.9 | % |
Commodities Strategy Fund | 09/08/09 | | | 1,306,607 | | | | 12.3 | % |
Significant Accounting Policies
The Funds operate as investment companies and accordingly follow the investment company accounting and reporting guidance of the Financial Accounting Standards Board (“FASB”) Accounting Standards Codification Topic 946 Financial Services – Investment Companies.
The following significant accounting policies are in conformity with U.S. generally accepted accounting principles (“U.S. GAAP”) and are consistently followed by the Trust. This requires management to make estimates and assumptions that affect the reported amount of assets and liabilities and disclosure of contingent assets and liabilities at the date of the financial statements and the reported amounts of revenues and expenses during the reporting period. Actual results could differ from these estimates. All time references are based on Eastern Time.
The NAV of each Class of the Funds is calculated by dividing the market value of the Fund’s securities and other assets, less all liabilities, attributable to the Class by the number of outstanding shares of the Class.
A. The Board of Trustees of the Funds (the “Board”) has adopted policies and procedures for the valuation of the Funds’ investments (the “Valuation Procedures”). Pursuant to the Valuation Procedures, the Board has delegated to a valuation committee, consisting of representatives from Guggenheim’s investment management, fund administration, legal and compliance departments (the “Valuation Committee”), the day-to-day responsibility for implementing the Valuation Procedures, including, under most circumstances, the responsibility for determining the fair value of the Funds’ securities or other assets.
Valuations of the Funds’ securities are supplied primarily by pricing services appointed pursuant to the processes set forth in the Valuation Procedures. The Valuation Committee convenes monthly, or more frequently as needed and will review the valuation of all assets which have been fair valued for reasonableness.
50 | THE GUGGENHEIM FUNDS SEMI-ANNUAL REPORT | |
NOTES TO CONSOLIDATED FINANCIAL STATEMENTS (Unaudited)(continued) |
The Funds’ officers, through the Valuation Committee and consistent with the monitoring and review responsibilities set forth in the Valuation Procedures, regularly review procedures used by, and valuations provided by, the pricing services.
If the pricing service cannot or does not provide a valuation for a particular investment or such valuation is deemed unreliable, such investment is fair valued by the Valuation Committee.
Equity securities listed on an exchange (New York Stock Exchange (“NYSE”) or American Stock Exchange) are valued at the last quoted sales price as of the close of business on the NYSE, usually 4:00 p.m. on the valuation date. Equity securities listed on the NASDAQ market system are valued at the NASDAQ Official Closing Price on the valuation date, which may not necessarily represent the last sale price. If there has been no sale on such exchange or NASDAQ on a given day, the security is valued at the closing bid price on that day.
Generally, trading in foreign securities markets is substantially completed each day at various times prior to the close of the NYSE. The values of foreign securities are determined as of the close of such foreign markets or the close of the NYSE, if earlier. All investments quoted in foreign currency are valued in U.S. dollars on the basis of the foreign currency exchange rates prevailing at the close of business. Investments in foreign securities may involve risks not present in domestic investments. The Valuation Committee will determine the current value of such foreign securities by taking into consideration certain factors which may include those discussed above, as well as the following factors, among others: the value of the securities traded on other foreign markets, ADR trading, closed-end fund trading, foreign currency exchange activity, and the trading prices of financial products that are tied to foreign securities such as World Equity Benchmark Securities. In addition, the Board of Trustees has authorized the Valuation Committee and GI to use prices and other information supplied by a third party pricing vendor in valuing foreign securities.
Open-end investment companies (“Mutual Funds”) are valued at their NAV as of the close of business, on the valuation date. Exchange-traded funds (“ETFs”) and closed-end investment companies (“CEFs”) are valued at the last quoted sales price.
Repurchase agreements are valued at amortized cost, which approximates market value.
The value of futures contracts is accounted for using the unrealized gain or loss on the contracts that is determined by marking the contracts to their current realized settlement prices. Financial futures contracts are valued at the 4:00 p.m.
| | THE GUGGENHEIM FUNDS SEMI-ANNUAL REPORT | 51 |
NOTES TO CONSOLIDATED FINANCIAL STATEMENTS (Unaudited)(continued) |
price on the valuation date. In the event that the exchange for a specific futures contract closes earlier than 4:00 p.m., the futures contract is valued at the Official Settlement Price of the exchange. However, the underlying securities from which the futures contract value is derived are monitored until 4:00 p.m. to determine if fair valuation would provide a more accurate valuation.
The value of OTC swap agreements and credit default swap agreements entered into by a Fund is accounted for using the unrealized gain or loss on the agreements that is determined by marking the agreements to the last quoted value of the index that the swap pertains to at the close of the NYSE. The swap’s value is then adjusted to include dividends accrued, and financing charges and/or interest associated with the swap agreements.
Investments for which market quotations are not readily available are fair valued as determined in good faith by GI under the direction of the Board of Trustees using methods established or ratified by the Board of Trustees. Valuations in accordance with these methods are intended to reflect each security’s (or asset’s) “fair value.” Each such determination is based on a consideration of all relevant factors, which are likely to vary from one pricing context to another. Examples of such factors may include, but are not limited to: (i) the type of security, (ii) the initial cost of the security, (iii) the existence of any contractual restrictions on the security’s disposition, (iv) the price and extent of public trading in similar securities of the issuer or of comparable companies, (v) quotations or evaluated prices from broker-dealers and/or pricing services, (vi) information obtained from the issuer, analysts, and/or the appropriate stock exchange (for exchange-traded securities), (vii) an analysis of the company’s financial statements, and (viii) an evaluation of the forces that influence the issuer and the market(s) in which the security is purchased and sold (e.g. the existence of of pending merger activity, public offerings or tender offers that might affect the value of the security). In connection with futures contracts and other derivative investments, such factors may include obtaining information as to how (a) these contracts and other derivative investments trade in the futures or other derivative markets, respectively, and (b) the securities underlying these contracts and other derivative investments trade in the cash market.
B. When a Fund engages in a short sale of a security, an amount equal to the proceeds is reflected as an asset and an equivalent liability. The amount of the liability is subsequently marked-to-market to reflect the market value of the short sale. The Fund maintains a segregated account of cash and/or securities as collateral for short sales.
52 | THE GUGGENHEIM FUNDS SEMI-ANNUAL REPORT | |
NOTES TO CONSOLIDATED FINANCIAL STATEMENTS (Unaudited)(continued) |
Fees, if any, paid to brokers to borrow securities in connection with short sales are recorded as interest expense. In addition, the Fund must pay out the dividend rate of the equity or coupon rate of the obligation to the lender and record this as an expense. Short dividend or interest expense is a cost associated with the investment objective of short sales transactions, rather than an operational cost associated with the day-to-day management of any mutual fund. The Funds may also receive rebate income from the broker resulting from the investment of the proceeds from securities sold short.
C. Upon entering into a futures contract, a Fund deposits and maintains as collateral such initial margin as required by the exchange on which the transaction is affected. Pursuant to the contract, the Fund agrees to receive from or pay to the broker an amount of cash equal to the daily fluctuation in value of the contract. Such receipts or payments are known as variation margin and are recorded by the Fund as unrealized gains or losses. When the contract is closed, the Fund records a realized gain or loss equal to the difference between the value of the contract at the time it was opened and the value at the time it was closed.
D. Swap agreements are marked-to-market daily and the change, if any, is recorded as unrealized gain or loss. Payments received or made as a result of an agreement or termination of the agreement are recognized as realized gains or losses.
Credit default swap agreements are marked-to-market daily and the change, if any, is recorded as unrealized gain or loss. Upfront payments received or made by a Fund on credit default swap agreements are amortized over the expected life of the agreement. Periodic payments received or made as a result of a credit event or termination of the contract are recognized, net of a proportional amount of the upfront payment, as realized gains or losses.
E. The accounting records of the Fund are maintained in U.S. dollars. All assets and liabilities initially expressed in foreign currencies are converted into U.S. dollars at prevailing exchange rates. Purchases and sales of investment securities, dividend and interest income, and certain expenses are translated at the rates of exchange prevailing on the respective dates of such transactions. Changes in the relationship of these foreign currencies to the U.S. dollar can significantly affect the value of the investments and earnings of the Funds. Foreign investments may also subject the Funds to foreign government exchange restrictions, expropriation, taxation or other political, social or economic developments, all of which could affect the market and/or credit risk of the investments.
| | THE GUGGENHEIM FUNDS SEMI-ANNUAL REPORT | 53 |
NOTES TO CONSOLIDATED FINANCIAL STATEMENTS (Unaudited)(continued) |
The Funds do not isolate that portion of the results of operations resulting from changes in the foreign exchange rates on investments from the fluctuations arising from changes in the market prices of securities held. Such fluctuations are included with the net realized and unrealized gain or loss on investments.
Reported net realized foreign exchange gains and losses arise from sales of foreign currencies and currency gains or losses realized between the trade and settlement dates on investment transactions. Net unrealized exchange gains and losses arise from changes in the fair values of assets and liabilities other than investments in securities at the fiscal period end, resulting from changes in exchange rates.
F. Security transactions are recorded on the trade date for financial reporting purposes. Realized gains and losses from securities transactions are recorded using the identified cost basis. Proceeds from lawsuits related to investment holdings are recorded as realized gains in the respective Fund. Dividend income is recorded on the ex-dividend date, net of applicable taxes withheld by foreign countries. Taxable non-cash dividends are recorded as dividend income. Interest income, including amortization of premiums and accretion of discounts, is accrued on a daily basis. Dividend income from REITs is recorded based on the income included in the distributions received from the REIT investments using published REIT classifications, including some management estimates when actual amounts are not available. Distributions received in excess of this estimated amount are recorded as a reduction of the cost of investments or reclassified to capital gains. The actual amounts of income, return of capital, and capital gains are only determined by each REIT after its fiscal year-end, and may differ from the estimated amounts.
G. Distributions of net investment income and net realized gains, if any, are declared and paid at least annually. Dividends are reinvested in additional shares unless shareholders request payment in cash. Distributions are recorded on the ex-dividend date and are determined in accordance with income tax regulations which may differ from U.S. GAAP.
H. Interest and dividend income, most expenses, all realized gains and losses, and all unrealized gains and losses are allocated to the classes based upon the value of the outstanding shares in each Class. Certain costs, such as distribution and service fees are charged directly to specific classes. In addition, certain expenses have been allocated to the individual Funds in the Trust on a pro rata basis upon the respective aggregate net assets of each Fund included in the Trust.
54 | THE GUGGENHEIM FUNDS SEMI-ANNUAL REPORT | |
NOTES TO CONSOLIDATED FINANCIAL STATEMENTS (Unaudited)(continued) |
I. The Funds may leave cash overnight in their cash account with the custodian. Periodically, a Fund may have cash due to the custodian bank as an overdraft balance. A fee is incurred on this overdraft, calculated by multiplying the overdraft by a rate based on the federal funds rate.
J. Under the Funds’ organizational documents, their Trustees and Officers are indemnified against certain liabilities arising out of the performance of their duties to the Trust. In addition, throughout the normal course of business, the Funds enter into contracts that contain a variety of representations and warranties which provide general indemnifications. The Funds’ maximum exposure under these arrangements is unknown, as this would involve future claims that may be made against the Funds and/or their affiliates that have not yet occurred. However, based on experience, the Funds expect the risk of loss to be remote.
2. Financial Instruments
As part of their investment strategy, the Funds utilize short sales and a variety of derivative instruments. These investments involve, to varying degrees, elements of market risk and risks in excess of the amounts recognized in the Statements of Assets and Liabilities.
A short sale is a transaction in which a Fund sells a security it does not own. If the security sold short decreases in price between the time the Fund sells the security and closes its short position, that Fund will realize a gain on the transaction. Conversely, if the security increases in price during the period, that Fund will realize a loss on the transaction. The risk of such price increases is the principal risk of engaging in short sales.
A futures contract is an agreement to purchase (long) or sell (short) an agreed amount of securities or other instruments at a set price for delivery at a future date. There are significant risks associated with a Fund’s use of futures contracts, including (i) there may be an imperfect or no correlation between the changes in market value of the underlying asset and the prices of futures contracts; (ii) there may not be a liquid secondary market for a futures contract; (iii) trading restrictions or limitations may be imposed by an exchange; and (iv) government regulations may restrict trading in futures contracts. When investing in futures, there is minimal counterparty credit risk to the Fund because futures are exchange-traded and the exchange’s clearinghouse, as counterparty to all exchange-traded futures, guarantees against default. Cash deposits are shown as segregated cash with broker on the Statement of Assets and Liabilities; securities held as collateral are noted on the Schedule of Investments.
| | THE GUGGENHEIM FUNDS SEMI-ANNUAL REPORT | 55 |
NOTES TO CONSOLIDATED FINANCIAL STATEMENTS (Unaudited)(continued) |
A swap is an agreement that obligates two parties to exchange a series of cash flows at specified intervals based upon or calculated by reference to changes in specified prices or rates for a specified amount of an underlying asset. A Fund utilizing OTC swaps bears the risk of loss of the amount expected to be received under a swap agreement in the event of the default or bankruptcy of a swap agreement counterparty. Additionally, there is no guarantee that a Fund or an underlying fund could eliminate its exposure under an outstanding swap agreement by entering into an offsetting swap agreement with the same or another party.
A credit default swap enables a Fund to buy or sell protection against a defined credit event of an issuer or a basket of securities. Generally, the seller of credit protection against an issuer or basket of securities receives a periodic payment from the buyer to compensate against potential default events. If a default event occurs, the seller must pay the buyer the full notional value of the reference obligation in exchange for the reference obligation. If no default occurs, the counterparty will pay the stream of payments and have no further obligations to the Fund selling the credit protection. A Fund bears the risk of loss of the amount expected to be received under a swap agreement in the event of the default or bankruptcy of a swap agreement counterparty, or in the case of a credit default swap in which the Fund is selling credit protection, the default of a third party issuer.
In conjunction with the use of short sales and derivative instruments, the Funds are required to maintain collateral in various forms. The Funds use, where appropriate, depending on the financial instrument utilized and the broker involved, margin deposits at the broker, cash and/or securities segregated at the custodian bank, discount notes or the repurchase agreements allocated to each Fund.
The Trust has established counterparty credit guidelines and enters into transactions only with financial institutions of investment grade or better. The Trust monitors the counterparty credit risk.
3. Fees and Other Transactions with Affiliates
Under the terms of an investment advisory contract, the Funds and each Subsidiary pay GI investment advisory fees calculated at their annualized rates below, based on the average daily net assets:
Fund | Management Fees
(as a % of Net Assets) |
Multi-Hedge Strategies Fund | 1.15% |
Commodities Strategy Fund | 0.75% |
56 | THE GUGGENHEIM FUNDS SEMI-ANNUAL REPORT | |
NOTES TO CONSOLIDATED FINANCIAL STATEMENTS (Unaudited)(continued) |
GI has contractually agreed to waive the management fee it receives from the Subsidiary in an amount equal to the management fee paid to GI by the Subsidiary. This undertaking will continue in effect for so long as the Funds invest in the Subsidiary, and may not be terminated by GI unless GI obtains the prior approval of the Funds’ Board of Trustees for such termination.
As part of its agreement with the Trust, GI will pay all expenses of the Multi-Hedge Strategies Fund, including the cost of transfer agency, custody, fund administration, legal, audit and other services, except interest expense, taxes (expected to be de minimis), brokerage commissions and other expenses connected with execution of portfolio transactions, short dividend expenses, subsidiary expenses and extraordinary expenses.
RFS provides transfer agent and administrative services to the Commodities Strategy Fund for fees calculated at the annualized rate of 0.25% based on the average daily net assets of the Fund.
RFS also provides accounting services to the Commodities Strategy Fund for fees calculated at annualized rates below, based on the average daily net assets of the Fund.
Fund Accounting Fees | (as a % of Net Assets) |
On the first $250 million | 0.10% |
On the next $250 million | 0.075% |
On the next $250 million | 0.05% |
Over $750 million | 0.03% |
RFS engages external service providers to perform other necessary services for the Trust, such as audit and accounting related services, legal services, custody, printing and mailing, etc., on a pass-through basis. Such expenses are allocated to various Funds within the complex based on relative net assets.
The Trust has adopted a Distribution Plan applicable to A-Class shares, H-Class shares and P-Class shares for which GFD and other firms that provide distribution and/or shareholder services (“Service Providers”) may receive compensation. If a Service Provider provides distribution services, the Funds will pay distribution fees to GFD at an annual rate not to exceed 0.25% of average daily net assets, pursuant to Rule 12b-1 of the 1940 Act. GFD, in turn, will pay the Service Provider out of its fees. GFD may, at its discretion, retain a portion of such payments to compensate itself for distribution services.
The Trust has adopted a separate Distribution and Shareholder Services Plan applicable to its C-Class shares that allows the Funds to pay annual distribution and service fees of 1.00% of the Funds’ C-Class shares average daily net assets.
| | THE GUGGENHEIM FUNDS SEMI-ANNUAL REPORT | 57 |
NOTES TO CONSOLIDATED FINANCIAL STATEMENTS (Unaudited)(continued) |
The annual 0.25% service fee compensates a shareholder’s financial adviser for providing ongoing services to the shareholder. The annual distribution fee of 0.75% reimburses GFD for paying the shareholder’s financial adviser an ongoing sales commission. GFD advances the first year’s service and distribution fees to the financial adviser. GFD retains the service and distribution fees on accounts with no authorized dealer of record.
If a Fund invests in an affiliated fund, the investing Fund’s Adviser has agreed to waive fees at the investing fund level through February 1, 2016. Fee waivers will be calculated at the investing Fund level without regard to any expense cap, if any, in effect for the investing Fund. Fees waived under this arrangement are not subject to reimbursement to GI.
During the period ended June 30, 2015, the following fund waived advisory fees related to investments in the affiliated funds.
Fund | | Amount | |
Multi-Hedge Strategies Fund | | $ | 3 | |
For the period ended June 30, 2015, GFD retained sales charges of $200,122 relating to sales of A-Class shares of the Trust.
Certain trustees and officers of the Trust are also officers of GI, RFS and GFD.
4. Fair Value Measurement
In accordance with U.S. GAAP, fair value is defined as the price that the Funds would receive to sell an investment or pay to transfer a liability in an orderly transaction with an independent buyer in the principal market, or in the absence of a principal market, the most advantageous market for the investment or liability. U.S. GAAP establishes a three-tier fair value hierarchy based on the types of inputs used to value assets and liabilities and requires corresponding disclosure. The hierarchy and the corresponding inputs are summarized below:
Level 1 — | quoted prices in active markets for identical assets or liabilities. |
Level 2 — | significant other observable inputs (for example quoted prices for securities that are similar based on characteristics such as interest rates, prepayment speeds, credit risk, etc.). |
Level 3 — | significant unobservable inputs based on the best information available under the circumstances, to the extent observable inputs are not available, which may include assumptions. |
58 | THE GUGGENHEIM FUNDS SEMI-ANNUAL REPORT | |
NOTES TO CONSOLIDATED FINANCIAL STATEMENTS (Unaudited)(continued) |
The types of inputs available depend on a variety of factors, such as the type of security and the characteristics of the markets in which it trades, if any. Fair valuation determinations that rely on fewer or no observable inputs require greater judgment. Accordingly, fair value determinations for Level 3 securities require the greatest amount of judgment.
The following table summarizes the inputs used to value the Funds’ investments at June 30, 2015:
| | Level 1
Investments
In Securities | | | Level 1
Other Financial
Instruments* | | | Level 2
Investments
In Securities | | | Level 2
Other Financial
Instruments* | | | Level 3
Investments
In Securities | | | Total | |
Assets | | | | | | | | | | | | | | | | | | |
Multi-Hedge Strategies Fund | | $ | 82,764,481 | | | $ | 421,297 | | | $ | 9,050,491 | | | $ | 228,850 | | | $ | — | | | $ | 92,465,119 | |
Commodities Strategy Fund | | | 4,023,191 | | | | 114,529 | | | | 2,457,650 | | | | — | | | | — | | | | 6,595,370 | |
| |
Liabilities | | | | | | | | | | | | | | | | | | | | | | | | |
Multi-Hedge Strategies Fund | | $ | 44,726,621 | | | $ | 272,072 | | | $ | — | | | $ | 159,821 | | | $ | — | | | $ | 45,158,514 | |
Commodities Strategy Fund | | | — | | | | 158,700 | | | | — | | | | — | | | | — | | | | 158,700 | |
* | Other financial instruments may include futures contracts and/or swaps, which are reported as unrealized gain/loss at period end. |
For the period ended June 30, 2015, there were no transfers between levels.
The inputs or methodologies used for valuing securities are not necessarily an indication of the risk associated with investing in those securities. The suitability of the techniques and sources employed to determine fair valuation are regularly monitored and subject to change.
5. Repurchase Agreements
The Funds transfer uninvested cash balances into a single joint account, the daily aggregate balance of which is invested in one or more repurchase agreements collateralized by obligations of the U.S. Treasury and U.S. Government Agencies. The collateral is in the possession of the Funds’ custodian and is evaluated to ensure that its market value exceeds, at a minimum, 102% of the original face amount of the repurchase agreements. Each Fund holds a pro rata share of the collateral based on the dollar amount of the repurchase agreement entered into by each Fund.
| | THE GUGGENHEIM FUNDS SEMI-ANNUAL REPORT | 59 |
NOTES TO CONSOLIDATED FINANCIAL STATEMENTS (Unaudited)(continued) |
At June 30, 2015, the repurchase agreements in the joint account were as follows:
Counterparty and
Terms of Agreement | | Face
Value | | | Repurchase Price | | Collateral | | Par
Value | | | Fair
Value |
HSBC Group | | | | | | | U.S. Treasury Strips | | | | | |
0.04% | | | | | | | 0.00% | | | | | |
Due 07/01/15 | $ | 250,551,232 | | $ | 250,551,510 | | 11/15/28 - 02/15/44 | $ | 614,648,800 | | $ | 255,562,354 |
| | | | | | | | | | | | | |
RBC Capital Markets | | | | | | | U.S. TIP Bond | | | | | |
0.04% | | | | | | | 3.88% | | | | | |
Due 07/01/15 | | 116,812,087 | | | 116,812,217 | | 04/15/29 | | 41,000,000 | | | 84,582,306 |
| | | | | | | | U.S. TIP Note | | | | | |
| | | | | | | | 0.13% | | | | | |
| | | | | | | | 04/15/16 | | 32,108,700 | | | 34,566,039 |
| | | | | | | | | | | | | |
UMB Financial Corp. | | | | | | | U.S. Treasury Notes | | | | | |
0.04% | | | | | | | 3.13% - 3.25% | | | | | |
Due 07/01/15 | | 67,451,288 | | | 67,451,363 | | 10/31/16 - 12/31/16 | | 66,110,600 | | | 68,800,331 |
In the event of counterparty default, the Funds have the right to collect the collateral to offset losses incurred. There is potential loss to the Funds in the event the Funds are delayed or prevented from exercising their rights to dispose of the collateral securities, including the risk of a possible decline in the value of the underlying securities during the period while the Funds seek to assert their rights. The Funds’ investment adviser, acting under the supervision of the Board of Trustees, reviews the value of the collateral and the creditworthiness of those banks and dealers with which the Funds enter into repurchase agreements to evaluate potential risks.
6. Portfolio Securities Loaned
The Funds may lend their securities to approved brokers to earn additional income. Security lending income shown on the Statements of Operations is shown net of rebates paid to the borrowers and earnings on cash collateral investments shared with the lending agent. Within this arrangement, the Funds act as the lender, Credit Suisse acts as the lending agent, and other approved registered broker dealers act as the borrowers. The Funds receive cash collateral, valued at 102% of the value of the securities on loan. Under the terms of the Funds’ securities lending agreement with Credit Suisse, cash collateral is invested in one or more joint repurchase agreements collateralized by obligations of the U.S. Treasury or Government Agencies and cash. The Funds bear the risk of loss on cash collateral investments. Collateral is maintained over the life of the loan in an amount not less than the value of loaned securities, as determined at the close of fund business each day; any additional collateral required due to changes in security values is delivered to the Funds the next business day. Although the collateral mitigates the
60 | THE GUGGENHEIM FUNDS SEMI-ANNUAL REPORT | |
NOTES TO CONSOLIDATED FINANCIAL STATEMENTS (Unaudited)(continued) |
risk, the Funds could experience a delay in recovering its securities and a possible loss of income or value if the borrower fails to return the securities. The Funds have the right under the securities lending agreement to recover the securities from the borrower on demand.
At June 30, 2015, the Funds participated in securities lending as follows:
Fund | | Value of
Securities
Loaned | | | Cash
Collateral
Received | |
Multi-Hedge Strategies Fund | | $ | 196,110 | | | $ | 203,256 | |
Cash collateral received was invested in the following joint repurchase agreements at June 30, 2015:
Counterparty and
Terms of Agreement | | Face
Value | | | Repurchase
Price | | Collateral | | Par
Value | | | Fair
Value |
HSBC Securities, Inc. | | | | | | | Federal Home Loan Bank | | | | | |
0.09% | | | | | | | 0.88% - 2.88% | | | | | |
Due 07/01/15 | $ | 158,068 | | $ | 158,068 | | 06/09/17 - 03/14/25 | $ | 57,162 | | $ | 57,166 |
| | | | | | | | Federal Farm Credit Bank | | | | | |
| | | | | | | | 2.40% | | | | | |
| | | | | | | | 06/17/22 | | 27,376 | | | 27,617 |
| | | | | | | | Freddie Mac Notes/Bonds | | | | | |
| | | | | | | | 1.00% - 6.75% | | | | | |
| | | | | | | | 08/07/17 - 07/15/32 | | 27,297 | | | 31,485 |
| | | | | | | | Fannie Mae Interest Strips | | | | | |
| | | | | | | | 0.00% | | | | | |
| | | | | | | | 07/15/15 - 07/15/27 | | 21,048 | | | 18,907 |
| | | | | | | | U.S. Treasury Note | | | | | |
| | | | | | | | 2.13% | | | | | |
| | | | | | | | 06/30/22 | | 17,300 | | | 17,373 |
| | | | | | | | Freddie Mac Coupon Strips | | | | | |
| | | | | | | | 0.00% | | | | | |
| | | | | | | | 07/15/19 - 09/15/30 | | 11,337 | | | 8,695 |
| | | | | | | | | | | | | |
BNP Paribas Securities Corp. | | | | | | | U.S. Treasury Notes | | | | | |
0.09% | | | | | | | 1.13% - 3.25% | | | | | |
Due 07/01/15 | | 25,291 | | | 25,291 | | 05/31/16 - 06/15/18 | | 22,474 | | | 23,026 |
| | | | | | | | U.S. TIP Bond | | | | | |
| | | | | | | | 0.13% | | | | | |
| | | | | | | | 04/15/20 | | 2,723 | | | 2,772 |
| | THE GUGGENHEIM FUNDS SEMI-ANNUAL REPORT | 61 |
NOTES TO CONSOLIDATED FINANCIAL STATEMENTS (Unaudited)(continued) |
Counterparty and
Terms of Agreement | | Face
Value | | | Repurchase
Price | | Collateral | | | Par
Value | | | Fair
Value |
| | | | | | | | U.S. Treasury Floating Rate Note | | | | | | |
| | | | | | | | 0.09% | | | | | | |
| | | | | | | | 07/31/16 | | $ | 1 | | $ | 1 |
| | | | | | | | | | | | | | |
Barclays Capital, Inc. | | | | | | | U.S. Treasury Note | | | | | | |
0.11% | | | | | | | 2.00% | | | | | | |
Due 07/01/15 | $ | 10,274 | | $ | 10,274 | | 08/31/21 | | | 10,376 | | | 10,481 |
| | | | | | | | U.S. Treasury Principal Strip | | | | | | |
| | | | | | | | 0.00% | | | | | | |
| | | | | | | | 02/15/26 | | | 1 | | | 1 |
| | | | | | | | | | | | | | |
Merrill Lynch, Pierce, Fenner & Smith, Inc. | | | | | | | U.S. Treasury Note | | | | | | |
0.11% | | | | | | | 1.38% | | | | | | |
Due 07/01/15 | | 3,952 | | | 3,952 | | 01/31/20 | | | 4,039 | | | 4,031 |
There is also $5,671 in segregated cash held as collateral.
In the event of counterparty default, the Funds have the right to collect the collateral to offset losses incurred. There is potential loss to the Funds in the event the Funds are delayed or prevented from exercising their rights to dispose of the collateral securities, including the risk of a possible decline in the value of the underlying securities during the period while the Funds seek to assert their rights. The Funds’ investment adviser, acting under the supervision of the Board of Trustees, reviews the value of the collateral and the creditworthiness of those banks and dealers with which the Funds enter into repurchase agreements to evaluate potential risks.
7. Derivative Investment Holdings Categorized by Risk Exposure
U.S. GAAP requires disclosures to enable investors to better understand how and why the Funds use derivative instruments, how these derivative instruments are accounted for and their effects on the Funds’ financial position and results of operations.
The following Funds utilized derivatives for the following purposes:
Fund | Index Exposure | Liquidity | Hedging | Income | Speculation |
Multi-Hedge Strategies Fund | — | — | x | x | x |
Commodities Strategy Fund | x | x | — | — | — |
62 | THE GUGGENHEIM FUNDS SEMI-ANNUAL REPORT | |
NOTES TO CONSOLIDATED FINANCIAL STATEMENTS (Unaudited)(continued) |
The following table represents the notional amount of derivative instruments outstanding as an approximate percentage of the Funds’ net assets on a quarterly basis.
| | Approximate percentage of Fund's Net Assets on a quarterly basis |
Fund | Long | Short |
Multi-Hedge Strategies Fund | 100% | 70% |
Commodities Strategy Fund | 105% | 5% |
The following is a summary of the location of derivative investments on the Funds’ Statements of Assets and Liabilities as of June 30, 2015:
Derivative Investment Type | Asset Derivatives | Liability Derivatives |
Equity/Currency/Interest Rate/Commodity contracts | Variation margin | Variation margin |
Equity/Credit contracts | Unrealized appreciation on swap agreements | Unrealized depreciation on swap agreements |
The following table sets forth the fair value of the Funds’ derivative investments categorized by primary risk exposure at June 30, 2015:
Asset Derivative Investments Value | |
Fund | | Futures Equity Contracts* | | | Swaps Equity Contracts | | | Futures Currency Contracts* | | | Futures Interest Rate Contracts* | | | Futures Commodity Contracts* | | | Swaps Credit Default Contracts | | | Total
Value at June 30, 2015 | |
Multi-Hedge Strategies Fund | | $ | 117,753 | | | $ | 149,082 | | | $ | 7,405 | | | $ | 76,974 | | | $ | 298,933 | | | $ | — | | | $ | 650,147 | |
Commodities Strategy Fund | | | — | | | | — | | | | — | | | | — | | | | 114,529 | | | | — | | | | 114,529 | |
Liability Derivative Investments Value | |
Fund | | Futures Equity Contracts* | | | Swaps Equity Contracts | | | Futures Currency Contracts* | | | Futures Interest Rate Contracts* | | | Futures Commodity Contracts* | | | Swaps Credit Default Contracts | | | Total
Value at June 30, 2015 | |
Multi-Hedge Strategies Fund | | $ | 210,141 | | | $ | 78,006 | | | $ | 28,542 | | | $ | — | | | $ | 110,465 | | | $ | 4,739 | | | $ | 431,893 | |
Commodities Strategy Fund | | | — | | | | — | | | | — | | | | — | | | | 158,700 | | | | — | | | | 158,700 | |
* | Includes cumulative appreciation (depreciation) of futures contracts as reported on the Schedules of Investments. Only current day’s variation margin is reported within the Statements of Assets and Liabilities. |
| | THE GUGGENHEIM FUNDS SEMI-ANNUAL REPORT | 63 |
NOTES TO CONSOLIDATED FINANCIAL STATEMENTS (Unaudited)(continued) |
The following is a summary of the location of derivative investments on the Funds’ Statements of Operations for the period ended June 30, 2015:
Derivative Investment Type | Location of Gain (Loss) on Derivatives |
Equity/Currency/Interest Rate/Commodity contracts | Net realized gain (loss) on futures contracts |
| Net change in unrealized appreciation (depreciation) on futures contracts |
Equity/Credit contracts | Net realized gain (loss) on swap agreements |
| Net change in unrealized appreciation (depreciation) on swap agreements |
The following is a summary of the Funds’ realized gain (loss) and change in unrealized appreciation (depreciation) on derivative investments recognized on the Statements of Operations categorized by primary risk exposure for the period ended June 30, 2015:
Realized Gain (Loss) on Derivative Investments Recognized on the Statements of Operations | |
Fund | | Futures Equity Contracts | | | Swaps Equity Contracts | | | Futures Currency Contracts | | | Futures Interest Rate Contracts | | | Futures Commodity Contracts | | | Swaps Credit Default Contracts | | | Total | |
Multi-Hedge Strategies Fund | | $ | 1,364,612 | | | $ | 541,398 | | | $ | 71,689 | | | $ | 263,737 | | | $ | 42,104 | | | $ | 48,722 | | | $ | 2,332,262 | |
Commodities Strategy Fund | | | — | | | | — | | | | — | | | | — | | | | (1,418,393 | ) | | | — | | | | (1,418,393 | ) |
Change in Unrealized Appreciation (Depreciation) on Derivative Investments Recognized on the Statements of Operations | |
Fund | | Futures Equity Contracts | | | Swaps Equity Contracts | | | Futures Currency Contracts | | | Futures Interest Rate Contracts | | | Futures Commodity Contracts | | | Swaps Credit Default Contracts | | | Total | |
Multi-Hedge Strategies Fund | | $ | (408,284 | ) | | $ | (166,052 | ) | | $ | (90,662 | ) | | $ | (708,204 | ) | | $ | (262,145 | ) | | $ | (65,615 | ) | | $ | (1,700,962 | ) |
Commodities Strategy Fund | | | — | | | | — | | | | — | | | | — | | | | 508,238 | | | | — | | | | 508,238 | |
8. Offsetting
In the normal course of business, the Funds enter into transactions subject to enforceable master netting arrangements or other similar arrangements. Generally, the right to offset in those agreements allows the Funds to counteract the exposure to a specific counterparty with collateral received or delivered to that counterparty based on the terms of the arrangements. These arrangements provide for the right to liquidate upon the occurrence of an event of default, credit event upon merger or additional termination event.
64 | THE GUGGENHEIM FUNDS SEMI-ANNUAL REPORT | |
NOTES TO CONSOLIDATED FINANCIAL STATEMENTS (Unaudited)(continued) |
In order to better define their contractual rights and to secure rights that will help the Funds mitigate their counterparty risk, the Funds may enter into an International Swaps and Derivatives Association, Inc. Master Agreement (“ISDA Master Agreement”) or similar agreement with their derivative contract counterparties. An ISDA Master Agreement is a bilateral agreement between a Fund and a counterparty that governs OTC derivatives, including foreign exchange contracts, and typically contains, among other things, collateral posting terms and netting provisions in the event of a default and/or termination event. The provisions of the ISDA Master Agreement typically permit a single net payment in the event of a default (close-out netting) or similar event, including the bankruptcy or insolvency of the counterparty.
For derivatives traded under an ISDA Master Agreement, the collateral requirements are typically calculated by netting the mark to market amount for each transaction under such agreement and comparing that amount to the value of any collateral currently pledged by the Funds and the counterparty. For financial reporting purposes, cash collateral that has been pledged to cover obligations of the Funds and cash collateral received from the counterparty, if any, is reported separately on the Statements of Assets and Liabilities as segregated cash with broker/receivable for variation margin, or payable for swap settlement/variation margin. Generally, the amount of collateral due from or to a counterparty must exceed a minimum transfer amount threshold (e.g., $300,000) before a transfer is required to be made. To the extent amounts due to the Funds from their counterparties are not fully collateralized, contractually or otherwise, the Funds bear the risk of loss from counterparty nonperformance. The Funds attempt to mitigate counterparty risk by only entering into agreements with counterparties that they believe to be of good standing and by monitoring the financial stability of those counterparties.
For financial reporting purposes, the Funds do not offset derivative assets and derivative liabilities that are subject to netting arrangements in the Statements of Assets and Liabilities.
| | THE GUGGENHEIM FUNDS SEMI-ANNUAL REPORT | 65 |
NOTES TO CONSOLIDATED FINANCIAL STATEMENTS (Unaudited)(continued) |
The following tables present derivative financial instruments and secured financing transactions that are subject to enforceable netting arrangements and offset in the Statement of Assets and Liabilities in conformity with U.S. GAAP.
| | | | | | | | | | | | | Gross Amounts Not Offset
in the Statement of
Assets and Liabilities | | | | |
Fund | Instrument | | Gross Amounts of Recognized Assets1 | | | Gross Amounts Offset In the Statement of Assets and Liabilities | | | Net Amount of Assets Presented on the Statement of Assets and Liabilities | | | Financial
Instruments | | | Cash
Collateral
Received | | | Net
Amount | |
Multi-Hedge Strategies Fund | Swap equity contracts | | $ | 149,082 | | | $ | — | | | $ | 149,082 | | | $ | — | | | $ | — | | | $ | 149,082 | |
| | | | | | | | | | | | | Gross Amounts Not Offset in the Statement of
Assets and Liabilities | | | | |
Fund | Instrument | | Gross Amounts of Recognized Liabilities1 | | | Gross Amounts Offset in the Statement of Assets and Liabilities | | | Net Amount of Liabilities Presented on the Statement of Assets and Liabilities | | | Financial
Instruments | | | Cash
Collateral
Pledged | | | Net
Amount | |
Multi-Hedge Strategies Fund | Swap equity contracts | | $ | 78,006 | | | $ | — | | | $ | 78,006 | | | $ | — | | | $ | 78,006 | | | $ | — | |
1 | Exchange-traded futures and centrally cleared swaps are excluded from these reported amounts. |
9. Federal Income Tax Information
The Funds intend to comply with the provisions of Subchapter M of the Internal Revenue Code applicable to regulated investment companies and will distribute substantially all taxable net investment income and capital gains sufficient to relieve the Funds from all, or substantially all, federal income, excise and state income taxes. Therefore, no provision for federal or state income tax is required.
Tax positions taken or expected to be taken in the course of preparing the Funds’ tax returns are evaluated to determine whether the tax positions are “more-likely-than-not” of being sustained by the applicable tax authority. Tax positions not deemed to meet the more-likely-than-not threshold would be recorded as a tax benefit or expense in the current year. Management has analyzed the Funds’ tax positions taken, or to be taken, on Federal income tax returns for all open tax
66 | THE GUGGENHEIM FUNDS SEMI-ANNUAL REPORT | |
NOTES TO CONSOLIDATED FINANCIAL STATEMENTS (Unaudited)(continued) |
years, and has concluded that no provision for income tax is required in the Funds’ financial statements. The Funds’ federal tax returns are subject to examination by the Internal Revenue Service for a period of three years after they are filed.
The Funds intend to invest up to 25% of their assets in the Subsidiary which is expected to provide the Funds with exposure to the commodities markets within the limitations of the federal tax requirements under Subchapter M of the Internal Revenue Code. The Funds have received a private letter ruling from the IRS that concludes that the income the Funds receive from the Subsidiary will constitute qualifying income for purposes of Subchapter M of the Internal Revenue Code. The Subsidiary will be classified as a corporation for U.S. federal income tax purposes. A foreign corporation, such as the Subsidiary, will generally not be subject to U.S. federal income taxation unless it is deemed to be engaged in a U.S. trade or business.
At June 30, 2015, the cost of securities for Federal income tax purposes, the aggregate gross unrealized gain for all securities for which there was an excess of value over tax cost and the aggregate gross unrealized loss for all securities for which there was an excess of tax cost over value, were as follows:
Fund | | Tax
Cost | | | Tax
Unrealized
Gain | | | Tax
Unrealized
Loss | | | Net
Unrealized Gain (Loss) | |
Multi-Hedge Strategies Fund | | $ | 89,569,627 | | | $ | 4,491,397 | | | $ | (2,246,052 | ) | | $ | 2,245,345 | |
Commodities Strategy Fund | | | 13,889,099 | | | | — | | | | (7,408,258 | ) | | | (7,408,258 | ) |
10. Securities Transactions
For the period ended June 30, 2015, the cost of purchases and proceeds from sales of investment securities, excluding government securities, short-term investments and derivatives, were as follows:
Fund | | Purchases | | | Sales | |
Multi-Hedge Strategies Fund | | $ | 55,881,672 | | | $ | 42,615,223 | |
Commodities Strategy Fund | | | 4,329,816 | | | | 8,580,000 | |
11. Affiliated Transactions
Investments representing 5% or more of the outstanding voting shares of a portfolio company of a fund, or control of or by, or common control under GI, result in that portfolio company being considered an affiliated company of such fund, as defined in the 1940 Act.
| | THE GUGGENHEIM FUNDS SEMI-ANNUAL REPORT | 67 |
NOTES TO CONSOLIDATED FINANCIAL STATEMENTS (Unaudited)(continued) |
The Funds may invest in the Guggenheim Strategy Funds Trust consisting of Guggenheim Strategy Fund I, Guggenheim Strategy Fund II, Guggenheim Strategy Fund III, and Guggenheim Variable Insurance Strategy Fund III (collectively, the “Cash Management Funds”), open-end management investment companies managed by GI. The Cash Management Funds, which launched on March 11, 2014, are offered as cash management options only to mutual funds, trusts, and other accounts managed by GI and/or its affiliates, and are not available to the public. The Cash Management Funds pay no investment management fees. The Cash Management Funds’ annual report on Form N-CSR dated September 30, 2014 is available publicly or upon request. This information is available from the EDGAR database on the SEC’s website at http://www.sec.gov.
Transactions during the period ended June 30, 2015 in which the portfolio company is an “affiliated person” are as follows:
Affiliated issuers
by Fund | | Value
12/31/14 | | | Additions | | | Reductions | | | Value
06/30/15 | | | Shares
06/30/15 | | | Investment
Income | | | Realized
Loss | |
Multi-Hedge Strategies Fund | | | | | | | | | | |
Advent Claymore Convertible Securities and Income Fund | | $ | — | | | $ | 6,299 | | | $ | — | | | $ | 6,345 | | | | 389 | | | $ | 219 | | | $ | — | |
Advent Claymore Convertible Securities and Income Fund II | | | — | | | | — | | | | (7,853 | ) | | | 165,173 | | | | 25,768 | | | | 7,267 | | | | (1,025 | ) |
Advent/Claymore Enhanced Growth & Income Fund | | | — | | | | 39,147 | | | | — | | | | 75,091 | | | | 8,279 | | | | 3,477 | | | | — | |
Guggenheim Strategy Fund I | | | — | | | | 122 | | | | — | | | | 19,764 | | | | 793 | | | | 123 | | | | — | |
Guggenheim Strategy Fund II | | | — | | | | 44 | | | | — | | | | 5,891 | | | | 236 | | | | 44 | | | | — | |
Western Asset/Claymore Inflation-Linked Opportunities & Income Fund | | | — | | | | — | | | | (20,834 | ) | | | 460,669 | | | | 41,168 | | | | 6,905 | | | | (2,635 | ) |
Western Asset/Claymore Inflation-Linked Securities & Income Fund | | | — | | | | — | | | | (10,859 | ) | | | 312,066 | | | | 27,690 | | | | 4,430 | | | | (1,721 | ) |
| | | $ | — | | | $ | 45,612 | | | $ | (39,546 | ) | | $ | 1,044,999 | | | | | | | $ | 22,465 | | | $ | (5,381 | ) |
| | | | | | | | | | | | | | | | | | | | | | | | | | | | | |
Commodities Strategy Fund | |
Guggenheim Strategy Fund I | | $ | — | | | $ | 2,008,664 | | | $ | (2,000,000 | ) | | $ | 2,234,812 | | | | 89,679 | | | $ | 8,707 | | | $ | (1,143 | ) |
Guggenheim Strategy Fund II | | | — | | | | 1,010,281 | | | | (800,000 | ) | | | 1,788,379 | | | | 71,794 | | | | 10,330 | | | | (1,074 | ) |
| | | $ | — | | | $ | 3,018,945 | | | $ | (2,800,000 | ) | | $ | 4,023,191 | | | | | | | $ | 19,037 | | | $ | (2,217 | ) |
68 | THE GUGGENHEIM FUNDS SEMI-ANNUAL REPORT | |
NOTES TO CONSOLIDATED FINANCIAL STATEMENTS (Unaudited)(continued) |
12. Line of Credit
The Trust, along with other affiliated trusts, secured an uncommitted, $75,000,000 line of credit from U.S. Bank, N.A., which expires June 12, 2016. This line of credit is reserved for emergency or temporary purposes. Borrowings, if any, under this arrangement bear interest equal to the Prime Rate, minus 2%, which shall be paid monthly, averaging 1.25% for the period ended June 30, 2015. The Funds did not have any borrowings under this agreement at June 30, 2015, and did not participate in borrowing during the period.
13. Legal Proceedings
Tribune Company
Rydex Series Funds has been named as a defendant and a putative member of the proposed defendant class of shareholders in the case entitled Kirschner v. FitzSimons, No. 12-2652 (S.D.N.Y.) (formerly Official Committee of Unsecured Creditors of Tribune Co. v. FitzSimons, Adv. Pro. No. 10-54010 (Bankr. D. Del.)) (the “FitzSimons action”), as a result of ownership by certain series of the Rydex Series Funds of shares in the Tribune Company (“Tribune”) in 2007, when Tribune effected a leveraged buyout transaction (“LBO”) by which Tribune converted to a privately-held company. In his complaint, the plaintiff has alleged that, in connection with the LBO, Tribune insiders and shareholders were overpaid for their Tribune stock using financing that the insiders knew would, and ultimately did, leave the Tribune Company insolvent. The plaintiff has asserted claims against certain insiders, major shareholders, professional advisers, and others involved in the LBO. The plaintiff is also attempting to obtain from former Tribune shareholders, including the Rydex Series Funds, the proceeds they received in connection with the LBO.
In June 2011, a group of Tribune creditors filed multiple actions against former Tribune shareholders involving state law constructive fraudulent conveyance claims arising out of the 2007 LBO (the “SLCFC actions”). Rydex Series Funds has been named as a defendant in one of the SLCFC actions: Deutsche Bank Trust Co. Americas v. McGurn, No. 11-1510 (S.D.N.Y.). In those actions, the creditors seek to recover from Tribune’s former shareholders the proceeds received in connection with the 2007 LBO.
The FitzSimons action and the SLCFC actions have been consolidated with the majority of the other Tribune LBO-related lawsuits in a multidistrict litigation proceeding captioned In re Tribune Company Fraudulent Conveyance Litig., No. 11-md-2696 (S.D.N.Y.) (the “MDL Proceeding”).
| | THE GUGGENHEIM FUNDS SEMI-ANNUAL REPORT | 69 |
NOTES TO CONSOLIDATED FINANCIAL STATEMENTS (Unaudited)(continued) |
On September 23, 2013, the District Court granted the defendants’ omnibus motion to dismiss the SLCFC actions, on the basis that the creditors lacked standing. On September 30, 2013, the creditors filed a notice of appeal of the September 23 order. On October 28, 2013, the defendants filed a joint notice of cross-appeal of that same order.
The SLCFC appeals have been fully briefed, and oral argument in front of the U.S. Court of Appeals for the Second Circuit occurred on November 5, 2014. The Court has not yet issued a decision on the appeals.
On May 23, 2014, the defendants filed motions to dismiss the FitzSimons action, including a global motion to dismiss Count I, which is the claim brought against former Tribune shareholders for intentional fraudulent conveyance under U.S. federal law. The Court has not yet issued a decision on any of these motions.
None of these lawsuits alleges any wrongdoing on the part of Rydex Series Funds. The following series of Rydex Series Funds held shares of Tribune and tendered these shares as part of Tribune’s LBO: Nova Fund, S&P 500® Pure Value Fund, Multi-Cap Core Equity Fund, S&P 500® Fund, Multi-Hedge Strategies Fund and Hedged Equity Fund (the “Funds”). The value of the proceeds received by the foregoing Funds was $28,220, $109,242, $9,860, $3,400, $1,181,160, and $10,880, respectively. At this stage of the proceedings, Rydex Series Funds is not able to make a reliable predication as to the outcome of these lawsuits or the effect, if any, on a Fund’s net asset value.
Lyondell Chemical Company
In December 2011, Rydex Series Funds was named as a defendant in Weisfelner, as Trustee of the LB Creditor Trust, v. Fund 1 (In re Lyondell Chemical Co.), Adv. Pro. No. 10-4609 (Bankr. S.D.N.Y.) (the “Creditor Trust action”).
Similar to the claims made in the Tribune matter, the Weisfelner complaint seeks to have set aside and recovered as fraudulent transfers from former Lyondell Chemical Company (“Lyondell”) shareholders the consideration paid to them pursuant to the cash out merger of Lyondell shareholders in connection with the combination of Lyondell and Basell AF in 2007. Lyondell filed for bankruptcy in 2008.
On April 7, 2014, the plaintiff filed a Third Amended Complaint. In the related action entitled Weisfelner, as Trustee of the LB Litigation Trust v. A. Holmes & H. Holmes TTEE (In re Lyondell Co.), Adversary Proceeding No. 10-5525 (Bankr. S.D.N.Y.) (the “Litigation Trust action”), the plaintiff also filed a Second Amended Complaint that alleges a claim against the former Lyondell shareholders under federal law for intentional fraudulent transfer. A third related action against the
70 | THE GUGGENHEIM FUNDS SEMI-ANNUAL REPORT | |
NOTES TO CONSOLIDATED FINANCIAL STATEMENTS (Unaudited)(concluded) |
former Lyondell shareholders, Weisfelner, as Trustee of the LB Creditor Trust v. Reichman, Adversary Proceeding No. 12-1570 (Bankr. S.D.N.Y.) (the “Reichman action”), is pending as well.
On May 8, 2014, the plaintiff in the Litigation Trust action filed a motion to certify a defendant class generally comprised of all former Lyondell shareholders that received proceeds in exchange for their shares in the 2007 merger transaction.
On July 30, 2014, the defendants filed a motion to dismiss these lawsuits. The Court held oral argument on the motions to dismiss and on the motion for class certification on January 14 and January 15, 2015. The Court has not yet issued decisions on these motions. Discovery has commenced in these lawsuits .
These lawsuits do not allege any wrongdoing on the part of Rydex Series Funds. The following series of Rydex Series Funds received cash proceeds from the cash out merger in the following amounts: Basic Materials Fund - $1,725,168; Long Short Equity Fund f/k/a U.S. Long Short Momentum Fund - $2,193,600; Global 130/30 Strategy Fund - $37,920; Hedged Equity Fund - $1,440; and Multi-Hedge Strategies Fund - $1,116,480. At this stage of the proceedings, Rydex Series Funds is not able to make a reliable predication as to the outcome of these lawsuits or the effect, if any, on a Fund’s net asset value.
14. H-Class Shares
Effective following the close of business on April 30, 2015, (the “Redesignation Date”), all outstanding H-Class shares of the Guggenheim Multi-Hedge Strategies Fund, which is a separate series of Rydex Series Funds, were redesignated as P-Class shares, and the Fund will no longer offer H-Class shares.
15. New Accounting Pronouncement
In June 2014, the Financial Accounting Standards Board (“FASB”) issued an Accounting Standards Update (“ASU”) No. 2014-11, Transfers and Servicing, which addresses concerns about current accounting and disclosures for repurchase agreements and similar transactions. The new disclosure is effective for Funds whose annual periods begin on or after December 31, 2014 and for interim periods beginning on or after March 31, 2015. Management is evaluating the impact of this update on its current disclosures.
| | THE GUGGENHEIM FUNDS SEMI-ANNUAL REPORT | 71 |
OTHER INFORMATION (Unaudited) |
Proxy Voting Information
A description of the policies and procedures that the Trust uses to determine how to vote proxies relating to securities held in the Funds’ portfolios is available, without charge and upon request, by calling 800.820.0888. This information is also available from the EDGAR database on the SEC’s website at http://www.sec.gov.
Information regarding how the Funds voted proxies relating to portfolio securities during the most recent 12-month period ended June 30 is available without charge, upon request, by calling 800.820.0888. This information is also available from the EDGAR database on the SEC’s website at http://www.sec.gov.
Quarterly Portfolio Schedules Information
The Trust files its complete schedule of portfolio holdings with the SEC for the first and third quarters of each fiscal year on Form N-Q; which are available on the SEC’s website at http://www.sec.gov. The Funds’ Forms N-Q may be reviewed and copied at the SEC’s Public Reference Room in Washington, DC, and that information on the operation of the Public Reference Room may be obtained by calling 800-SEC-0330. Copies of the portfolio holdings are also available to shareholders, without charge and upon request, by calling 800.820.0888.
Board Considerations in Approving the Investment Advisory Agreement
The Board of Trustees (the “Board”) of the Rydex Series Funds (the “Trust”), including the Trustees who are not “interested persons,” as defined by the Investment Company Act of 1940, of the Trust (“Independent Trustees”), at an in-person meeting held on May 18, 2015, called for the purpose of, among other things, consideration of, and voting on, the approval and continuation of the investment advisory agreement (the “Investment Advisory Agreement”) between the Trust and Security Investors, LLC (the “Adviser”) applicable to each series of the Trust (each, a “Fund” and collectively, the “Funds”), unanimously approved the continuation of the Investment Advisory Agreement for an additional one-year period, based on the Board’s review of qualitative and quantitative information provided by the Adviser. The Board had previously considered information pertaining to the renewal of the Investment Advisory Agreement at an in-person meeting held on April 28, 2015 (together, with the May 18 meeting, the “Meetings”).
In reaching the conclusion to approve the continuation of the Investment Advisory Agreement, the Independent Trustees requested and obtained from the Adviser such information as the Independent Trustees deemed reasonably necessary to evaluate the Investment Advisory Agreement. The Independent Trustees carefully evaluated this information and were advised with respect to
72 | THE GUGGENHEIM FUNDS SEMI-ANNUAL REPORT | |
OTHER INFORMATION (Unaudited)(continued) |
their deliberations by independent legal counsel, who attended both Meetings. In addition, the Board also received a memorandum from Fund counsel regarding the responsibilities of the Board for the approval of investment advisory agreements, and the Independent Trustees participated in question and answer sessions with representatives of the Adviser.
In considering the approval of the Investment Advisory Agreement, the Board determined that the agreement would enable shareholders of the Funds to continue to obtain high quality services at a cost that was appropriate, reasonable, and in the best interests of their shareholders. The Board, including the Independent Trustees, unanimously approved the Investment Advisory Agreement. In reaching their decision, the Trustees carefully considered information that they had received throughout the year as part of their regular oversight of the Funds, including, in particular, information from the Adviser that the Board had received relating to the Investment Advisory Agreement at the Meetings. The Board noted that, at the Meetings, they had obtained and reviewed a wide variety of information, including FUSE reports (described below) that provide comparative information regarding each Fund’s fees, expenses, and performance relative to the fees, expenses, and performance of other comparable funds.
As a part of their consideration of the approval of the Investment Advisory Agreement at the Meetings, the Board, including the Independent Trustees, had evaluated a number of considerations, including among others: (a) the nature, extent and quality of the Adviser’s investment advisory and other services; (b) the Adviser’s investment management personnel; (c) the Adviser’s operations and financial condition; (d) the Adviser’s brokerage practices (including any soft dollar arrangements) and the variety and complexity of its investment strategies; (e) a comparison of the Funds’ advisory fees to the fees charged to comparable funds or accounts, paying special attention to economies of scale and the absence of breakpoints in these fees and the Adviser’s rationale for not including breakpoints; (f) each Fund’s overall fees and operating expenses compared with those of peer funds; (g) the Adviser’s profitability from its Fund-related operations; (h) the Adviser’s compliance systems; (i) the Adviser’s policies and compliance procedures; (j) the Adviser’s reputation, expertise and resources in the financial markets; and (k) Fund performance compared with that of peer funds and/or appropriate benchmarks. In its deliberations, the Board did not identify any single piece of information that was all-important or controlling. Based on the Board’s deliberations at the Meetings, the Board, including all of the Independent Trustees, unanimously: (a) concluded that terms of the Investment Advisory Agreement were fair and reasonable; (b) concluded that the Adviser’s fees were reasonable
| | THE GUGGENHEIM FUNDS SEMI-ANNUAL REPORT | 73 |
OTHER INFORMATION (Unaudited)(continued) |
in light of the services that it provides to the Funds; and (c) agreed to approve and continue the Investment Advisory Agreement based upon the following considerations, among others:
| | ● | Nature, Extent and Quality of Services Provided by the Adviser. At the Meetings, the Board evaluated, among other things, the Adviser’s business, financial resources, quality and quantity of personnel, experience, past performance, the variety and complexity of its investment strategies, brokerage practices, and the adequacy of its compliance systems. The Board reviewed the scope of services to be provided by the Adviser under the Investment Advisory Agreement and noted that there would be no significant differences between the scope of services required to be provided by the Adviser for the past year and the scope of services required to be provided during the upcoming year. The Board also considered the Adviser’s representations to the Board that the Adviser would continue to provide investment and related services that were of materially the same quality and quantity as services provided to the Funds in the past, and that these services are appropriate in scope and extent in light of the Funds’ operations, the competitive landscape of the investment company business and investor needs. |
| | ● | Fund Expenses and Performance of the Funds and the Adviser. At the Meetings, the Board reviewed statistical information provided by the Adviser regarding the expense ratio components and performance of each Fund. The Adviser engaged FUSE Research Network LLC (“FUSE”), an independent, third party research provider, to prepare advisory contract renewal reports to help the Board compare the Funds’ fees, expenses and total return performance with those of a peer group and peer universe of funds selected by FUSE. Each Fund’s expense ratio components, including actual advisory fees, waivers/reimbursements, and gross and net total expenses, are compared to those of other funds with shared key characteristics (e.g., asset size, fee structure, sector or industry) determined by FUSE to comprise a Fund’s applicable peer group. The Board also considered the Adviser’s representation that it found the peer groups compiled by FUSE to be appropriate. The statistical information related to the performance of each Fund included three month and one-, three-, and five-year performance for the Fund compared to its peers. |
| | ● | Costs of Services Provided to the Funds and Profits Realized by the Adviser and its Affiliates. At the Meetings, the Board reviewed information about the profitability of the Funds to the Adviser based on the advisory fees payable under the current Investment Advisory Agreement for the last calendar year. At the Meetings, the Board also analyzed the Funds’ |
74 | THE GUGGENHEIM FUNDS SEMI-ANNUAL REPORT | |
OTHER INFORMATION (Unaudited)(continued) |
| expenses, including the investment advisory fees paid to the Adviser, and reviewed reports prepared by FUSE comparing the expense ratios of the Funds to those of other comparable funds. The Board also reviewed information regarding the direct revenue received by the Adviser and ancillary revenue received by the Adviser and/ or its affiliates in connection with the services provided to the Funds by the Adviser and/or its affiliates. The Board also discussed the Adviser’s profit margin, including the methodology used, as reflected in the Adviser’s profitability analysis. |
| | ● | Economies of Scale. In connection with its review of the Funds’ profitability analysis at the Meetings, the Board considered the absence of breakpoints in the Adviser’s fee schedule and reviewed information regarding the extent to which economies of scale or other efficiencies may result from increases in the Funds’ asset levels. In light of the relatively small size of many of the Funds and the fact that the size of individual Funds in the complex increases and decreases significantly from time to time due to unlimited trading that is permitted among most of the Funds in the complex, the Board concluded that the Funds have not yet achieved sufficient asset levels to realize significant economies of scale. |
| | ● | Other Benefits to the Adviser and/or its Affiliates. In addition to evaluating the Adviser’s services, the Board considered the nature, extent, quality and cost of certain administrative, distribution, and shareholder services performed by the Adviser’s affiliates under separate agreements and the Distribution and Shareholders Services Plan pursuant to Rule 12b-1 of the 1940 Act. |
On the basis of the information provided to it and its evaluation of that information, the Board, including the Independent Trustees, concluded that the terms of the Investment Advisory Agreement were reasonable, and that approval of the Investment Advisory Agreement was in the best interests of the Funds.
| | THE GUGGENHEIM FUNDS SEMI-ANNUAL REPORT | 75 |
OTHER INFORMATION (Unaudited)(concluded) |
P-Class Share Information
P-Class shares of the Funds are offered primarily through broker/dealers and other financial intermediaries with which Guggenheim Funds Distributors, LLC has an agreement for the use of P-Class shares of the Funds in investment products, programs or accounts. P-Class shares do not have a minimum initial investment amount, subsequent investment amount or a minimum account balance. The Funds reserves the right to modify their minimum investment amount and account balance requirements at any time, with or without prior notice to you.
Following the redesignation of outstanding H-Class shares, H-Class shareholders who currently have accounts held directly at Guggenheim Investments will not be permitted to purchase additional P-Class shares or exchange their P-Class shares for P-Class shares or any other share class of other Guggenheim Funds. Guggenheim Investments will be separately notifying these shareholders of their redemption and exchange options should they decide they do not want to hold P-Class shares upon the redesignation of their H-Class shares. H-Class shareholders should contact Guggenheim Investments Client Services at 800.820.0888 or 301.296.5100 with any questions about the redesignation of their H-Class shares.
No action is required of H-Class shareholders to effect the redesignation of their current H-Class shares.
For more information, or to request copies of the Funds’ prospectuses, call Client Services at 800.820.0888 or visiting guggenheiminvestments.com.
76 | THE GUGGENHEIM FUNDS SEMI-ANNUAL REPORT | |
INFORMATION ON BOARD OF TRUSTEES AND OFFICERS (Unaudited) |
A Board of Trustees oversees the Trust, as well as other trusts of GI, in which its members have no stated term of service, and continue to serve after election until resignation. The Statement of Additional Information includes further information about Fund Trustees and Officers, and can be obtained without charge by visiting guggenheiminvestments.com or by calling 800.820.0888.
Name, Address* and Year of Birth of Trustee | Position(s) Held with the Trust, Term of Office and Length of Time Served | Principal Occupation(s) During Past
5 Years | Number of Portfolios in Fund Complex Overseen by Trustee*** | Other Directorships Held by
Trustee |
INTERESTED TRUSTEE | | | |
Donald C. Cacciapaglia** (1951) | Trustee from 2012 to present. | Current: President and CEO, certain other funds in the Fund Complex (2012-present); Vice Chairman, Guggenheim Investments (2010-present). Former: Chairman and CEO, Channel Capital Group, Inc. (2002-2010). | 221 | Clear Spring Life Insurance Company (2015-present); Guggenheim Partners Japan, Ltd. (2014-present); Delaware Life (2013-present); Guggenheim Life and Annuity Company (2011-present); Paragon Life Insurance Company of Indiana (2011-present). |
INDEPENDENT TRUSTEES | | | |
Corey A. Colehour (1945) | Trustee and Member of the Audit, Governance, Nominating, and Investment and Performance Committees from 1998 to present. | Retired. | 133 | None. |
| | THE GUGGENHEIM FUNDS SEMI-ANNUAL REPORT | 77 |
INFORMATION ON BOARD OF TRUSTEES AND OFFICERS (Unaudited)(continued) |
Name, Address* and Year of Birth of Trustee | Position(s) Held with the
Trust, Term of Office and
Length of Time Served | Principal Occupation(s)
During Past
5 Years | Number of Portfolios in Fund Complex Overseen by Trustee*** | Other
Directorships
Held by
Trustee |
INDEPENDENT TRUSTEES - continued |
J. Kenneth Dalton (1941) | Trustee, Member and Chairman of the Audit Committee, and Member of the Governance and Nominating Committees from 1998 to present; and Member of the Risk Oversight Committee from 2010 to present. | Retired. | 133 | Epiphany Funds (4) (2009-present). |
John O. Demaret (1940) | Vice Chairman of the Board of Trustees from 2014 to present; Trustee from 1998 to present and Chairman of the Board from 2006 to 2014; Member and Chairman of the Audit Committee from 1998 to present; and Member of the Risk Oversight Committee from 2010 to present. | Retired. | 133 | None. |
Werner E. Keller (1940) | Chairman of the Board from 2014 to present; Trustee and Member of the Audit, Governance, and Nominating Committees from 2005 to present; and Chairman and Member of the Risk Oversight Committee from 2010 to present. | Current: Founder and President, Keller Partners, LLC (investment research firm) (2005-present). | 133 | None. |
78 | THE GUGGENHEIM FUNDS SEMI-ANNUAL REPORT | |
INFORMATION ON BOARD OF TRUSTEES AND OFFICERS (Unaudited)(continued) |
Name, Address* and Year of Birth of Trustee | Position(s) Held with the
Trust, Term of Office and
Length of Time Served | Principal Occupation(s)
During Past
5 Years | Number of Portfolios in Fund Complex Overseen by Trustee*** | Other
Directorships
Held by
Trustee |
INDEPENDENT TRUSTEES - concluded |
Thomas F. Lydon, Jr. (1960) | Trustee and Member of the Audit, Governance, and Nominating Committees from 2005 to present. | Current: President, Global Trends Investments (registered investment adviser) (1996-present). | 133 | US Global Investors (GROW) (1995-present). |
Patrick T. McCarville (1942) | Trustee, Member of the Audit Committee, and Chairman and Member of the Governance and Nominating Committees from 1998 to present. | Retired. Former: Chief Executive Officer, Par Industries, Inc., d/b/a Par Leasing (1977-2010). | 133 | None. |
Name, Address* and Year of Birth | Position(s) Held with the
Trust, Term of Office and
Length of Time Served | Principal Occupation(s)
During Past 5 Years |
OFFICERS | | |
Donald C. Cacciapaglia (1951) | President (2012-present). | Current: President and CEO, certain other funds in the Fund Complex (2012-present); Vice Chairman, Guggenheim Investments (2010-present). Former: Chairman and CEO, Channel Capital Group Inc. (2002-2010). |
| | THE GUGGENHEIM FUNDS SEMI-ANNUAL REPORT | 79 |
INFORMATION ON BOARD OF TRUSTEES AND OFFICERS (Unaudited)(continued) |
Name, Address* and Year of Birth | Position(s) Held with the
Trust, Term of Office and
Length of Time Served | Principal Occupation(s)
During Past 5 Years |
OFFICERS - continued | |
Michael P. Byrum (1970) | Vice President (1999-present). | Current: Senior Vice President, Security Investors, LLC (2010-present); President and Chief Investment Officer, Rydex Holdings, LLC (2008-present); Director and Chairman, Advisory Research Center, Inc. (2006-present); Manager, Guggenheim Specialized Products, LLC (2005-present). Former: Vice President, Guggenheim Distributors, LLC (2009); Director (2009-2010) and Secretary (2002-2010), Rydex Fund Services, LLC; Director (2008-2010), Chief Investment Officer (2006-2010), President (2004-2010) and Secretary (2002-2010), Rydex Advisors, LLC; Director (2008-2010), Chief Investment Officer (2006-2010), President (2004-2010) and Secretary (2002-2010), Rydex Advisors II, LLC. |
Nikolaos Bonos (1963) | Vice President and Treasurer (2003-present). | Current: Senior Vice President, Security Investors, LLC (2010-present); Chief Executive Officer, Guggenheim Specialized Products, LLC (2009-present); Chief Executive Officer & President, Rydex Fund Services, LLC (2009-present); Vice President, Rydex Holdings, LLC (2008-present). Former: Senior Vice President, Security Global Investors, LLC (2010-2011); and Senior Vice President, Rydex Advisors, LLC and Rydex Advisors II, LLC (2006-2011). |
Elisabeth Miller (1968) | Chief Compliance Officer (2012-present). | Current: CCO, certain other funds in the Fund Complex (2012-present); CCO, Security Investors, LLC (2012-present); CCO, Guggenheim Funds Investment Advisors, LLC (2012-present); Managing Director, Guggenheim Investments (2012-present); Vice President, Guggenheim Funds Distributors, LLC (March 2014-present). Former: CCO, Guggenheim Distributors, LLC (2009-March 2014); Senior Manager, Security Investors, LLC (2004-2009); Senior Manager, Guggenheim Distributors, LLC (2004-2009). |
80 | THE GUGGENHEIM FUNDS SEMI-ANNUAL REPORT | |
INFORMATION ON BOARD OF TRUSTEES AND OFFICERS (Unaudited)(concluded) |
Name, Address* and Year of Birth | Position(s) Held with the
Trust, Term of Office and
Length of Time Served | Principal Occupation(s)
During Past 5 Years |
OFFICERS - concluded | |
Joseph M. Arruda (1966) | Assistant Treasurer (2006-present). | Current: Assistant Treasurer, certain other funds in the Fund Complex (2006-present); Vice President, Security Investors, LLC (2010-present); CFO and Manager, Guggenheim Specialized Products, LLC (2009-present). Former: Vice President, Security Global Investors, LLC (2010-2011); Vice President, Rydex Advisors, LLC (2010); Vice President, Rydex Advisors II, LLC (2010). |
Paul J. Davio (1972) | Assistant Treasurer (2014-present). | Current: Assistant Treasurer, certain other funds in the Fund Complex (2014-present); Director, Guggenheim Investments (2006-present). Former: Manager, Mutual Fund Administration, Guggenheim Investments (2003-2006). |
Amy J. Lee (1961) | Vice President (2009-present) and Secretary (2012-present). | Current: Chief Legal Officer, certain other funds in the Fund Complex (2013-present); Senior Managing Director, Guggenheim Investments (2012-present). Former: Vice President, Associate General Counsel and Assistant Secretary, Security Benefit Life Insurance Company and Security Benefit Corporation (2004-2012). |
* | All Trustees and Officers may be reached c/o Guggenheim Investments, 805 King Farm Boulevard, Suite 600, Rockville, MD 20850. |
** | Mr. Cacciapaglia is an “interested” person of the Trust, as that term is defined in the 1940 Act by virtue of his affiliation with the Adviser’s parent company. |
*** | The “Fund Complex” includes all closed-end and open-end funds (including all of their portfolios) advised by the Adviser and any funds that have an investment adviser or servicing agent that is an affiliated person of the Adviser. Information provided is as of the date of this report. |
| | THE GUGGENHEIM FUNDS SEMI-ANNUAL REPORT | 81 |
GUGGENHEIM INVESTMENTS PRIVACY POLICIES (Unaudited) |
Rydex Funds, Guggenheim Funds, Rydex Investments, Guggenheim Funds Distributors, LLC, Security Investors, LLC, Security Distributors, Inc., Guggenheim Partners Investment Managers, LLC, and Rydex Advisory Services (Collectively “Guggenheim Investments”).
Our Commitment to You
When you become a Guggenheim Investments investor, you entrust us with not only your hard-earned money but also with personal and financial information about you. We recognize that your relationship with us is based on trust and that you expect us to act responsibly and in your best interests. Because we have access to this private information about you, we hold ourselves to the highest standards in its safekeeping and use. This means, most importantly, that we do not sell client information to anyone—whether it is your personal information or if you are a current or former Guggenheim Investments client.
The Information We Collect About You
In the course of doing business with shareholders and investors, we collect nonpublic personal information about you. You typically provide personal information when you complete a Guggenheim Investments account application or when you request a transaction that involves Rydex and Guggenheim Investments funds or one of the Guggenheim Investments affiliated companies. “Nonpublic personal information” is personally identifiable private information about you. For example, it includes information regarding your name and address, Social Security or taxpayer identification number, assets, income, account balance, bank account information and investment activity (e.g., purchase and redemption history).
How We Handle Your Personal Information
As emphasized above, we do not sell information about current or former clients or their accounts to third parties. Nor do we share such information, except when necessary to complete transactions at your request or to make you aware of related investment products and services that we offer. Additional details about how we handle your personal information are provided below. To complete certain transactions or account changes that you direct, it may be necessary to provide identifying information to companies, individuals or groups that are not affiliated with Guggenheim Investments. For example, if you ask to transfer assets from another financial institution to Guggenheim Investments, we will need to provide certain information about you to that company to complete the transaction. To alert you to other Guggenheim Investments investment products and services, we may share your information within the Guggenheim Investments family of affiliated companies. This would include, for example, sharing your information within Guggenheim Investments so we can make you aware of
82 | THE GUGGENHEIM FUNDS SEMI-ANNUAL REPORT | |
GUGGENHEIM INVESTMENTS PRIVACY POLICIES (Unaudited)(continued) |
new Rydex and Guggenheim Investments funds or the services offered through another Guggenheim Investments affiliated company. In certain instances, we may contract with nonaffiliated companies to perform services for us. Where necessary, we will disclose information we have about you to these third parties. In all such cases, we provide the third party with only the information necessary to carry out its assigned responsibilities and only for that purpose. And we require these third parties to treat your private information with the same high degree of confidentiality that we do. In certain instances, we may share information with other financial institutions regarding individuals and entities in response to the U.S.A. Patriot Act. Finally, we will release information about you if you direct us to do so, if we are compelled by law to do so or in other circumstances permitted by law.
Opt Out Provisions
We do not sell your personal information to anyone. The law allows you to “opt out” of only certain kinds of information sharing with third parties. The firm does not share personal information about you with any third parties that triggers this opt-out right. This means YOU ARE ALREADY OPTED OUT.
How We Protect Privacy Online
Our concern for the privacy of our shareholders also extends to those who use our web site, guggenheiminvestments.com. Our web site uses some of the most secure forms of online communication available, including encryption technology, Secure Socket Layer (SSL) protocol, firewalls and user names and passwords. These technologies provide a high level of security and privacy when you access your account information or initiate online transactions. The Guggenheim Investments web site offers customized features that require our use of “http cookies”—tiny pieces of information that we ask your browser to store. However, we make very limited use of these cookies. We only use cookies for session management and security features on the Guggenheim Investments web site. We do not use them to pull data from your hard drive, to learn your email address, or to view data in cookies created by other web sites. We will not share the information in our cookies or give others access to it. See the legal information area on our web site for more details about web site security and privacy features.
How We Safeguard Your Personal Information
We restrict access to nonpublic personal information about shareholders to our employees and in some cases to third parties (for example, the service providers described above) as permitted by law. We maintain strict physical, electronic and procedural safeguards that comply with federal standards to guard your nonpublic personal information.
| | THE GUGGENHEIM FUNDS SEMI-ANNUAL REPORT | 83 |
GUGGENHEIM INVESTMENTS PRIVACY POLICIES (Unaudited)(concluded) |
We’ll Keep You Informed
As required by federal law, we will notify shareholders of our privacy policy annually. We reserve the right to modify this policy at any time, but rest assured that if we do change it, we will tell you promptly. You will also be able to access our privacy policy from our web site at guggenheiminvestments.com. Should you have any questions regarding our privacy policy, contact us at 800.820.0888 or 301.296.5100.
84 | THE GUGGENHEIM FUNDS SEMI-ANNUAL REPORT | |
This page intentionally left blank.
6.30.2015
Guggenheim Funds Semi-Annual Report
Guggenheim Alternative Fund |
Guggenheim Managed Futures Strategy Fund | | |
RMFSF-SEMI-0615x1215 | guggenheiminvestments.com |

DEAR SHAREHOLDER | 2 |
ECONOMIC AND MARKET OVERVIEW | 3 |
ABOUT SHAREHOLDERS’ FUND EXPENSES | 5 |
MANAGED FUTURES STRATEGY FUND | 8 |
NOTES TO CONSOLIDATED FINANCIAL STATEMENTS | 23 |
OTHER INFORMATION | 40 |
INFORMATION ON BOARD OF TRUSTEES AND OFFICERS | 45 |
GUGGENHEIM INVESTMENTS PRIVACY POLICIES | 50 |
| | THE GUGGENHEIM FUNDS SEMI-ANNUAL REPORT | 1 |
Dear Shareholder:
Security Investors, LLC (the “Investment Adviser”) is pleased to present the semi-annual shareholder report for a Fund that is part of the Rydex Series Funds. This report covers performance of the Fund for the semi-annual period ended June 30, 2015.
The Investment Adviser is part of Guggenheim Investments, which represents the investment management businesses of Guggenheim Partners, LLC (“Guggenheim”) a global, diversified financial services firm.
Guggenheim Funds Distributors, LLC is the distributor of the Fund. Guggenheim Funds Distributors, LLC is affiliated with Guggenheim and the Investment Adviser.
We encourage you to read the Economic and Market Overview section of the report, which follows this letter.
We are committed to providing innovative investment solutions and appreciate the trust you place in us.
Sincerely,
Donald C. Cacciapaglia
President
July 31, 2015
Read a prospectus and summary prospectus (if available) carefully before investing. It contains the investment objectives, risks, charges, expenses and other information, which should be considered carefully before investing. Obtain a prospectus and summary prospectus (if available) at guggenheiminvestments.com or call 800.820.0888.
The Fund may not be suitable for all investors. Investing involves risks, including the entire loss of principal amount invested. Certain Funds may be affected by risks that include those associated with sector concentration, international investing, investing in small and/or medium size companies, and/or the Funds’ possible use of investment techniques and strategies such as leverage, derivatives and short sales of securities. Please see each Fund’s prospectus for more information.
2 | THE GUGGENHEIM FUNDS SEMI-ANNUAL REPORT | |
ECONOMIC AND MARKET OVERVIEW (Unaudited) | June 30, 2015 |
The U.S. economy rebounded in the second quarter of 2015 after a poor first quarter, with recent positive employment, retail sales, and housing data. Data from the Bureau of Labor Statistics showed a 280,000 increase in employment in May. Also in May, building permits rose 11.8%, better than the 3.5% decline forecast by economists. Among the most positive surprises was the return of the consumer, with the May retail sales report showing a 1.2% jump, which should contribute to a positive second-quarter GDP growth rate. Summer retail sales are a little bumpy so far, but the likelihood that the U.S. economy will suffer a recession in the next year or two appears now to be remote.
In Europe, the immediate risk of a Greek exit has lessened, although the solution is far from clear or concrete. Global markets calmed after a tentative deal on Greece, but China may pose a bigger problem. Following a dramatic equity market selloff, Chinese leaders have implemented an aggressive set of reforms and rescue operations to halt the slide. In the near term, these measures appear to have had success, but there is still significant downside risk in the equity market and the Chinese economy.
As for developments at the U.S. Federal Reserve (the “Fed”), we still expect the Fed to raise interest rates in September, which may cause further deterioration in prices. September is not a date set in stone, but the bottom line is that a rate hike is coming. It is worth noting that historical tightening cycles with slow and anticipated rate rises can actually result in significant risk asset rallies.
The combination of higher rate volatility, relative value opportunities, and strong U.S. economic data has allowed risk assets, including equities, high-yield bonds, and bank loans, to outperform less risky Treasuries and investment-grade corporate bonds through June 2015. Yet, despite the fact that risky assets are leading the pack in performance, tepid year-to-date returns of less than 3% across all risk assets including equities, preferreds, bank loans, and high-yield bonds, suggest that markets may be fully priced.
Before the mid-year, there was a high level of complacency in the market and it was evidenced by stocks trading around their highs and low dispersion among analysts’ year-end predictions, which indicated a worrying lack of uncertainty. In July, after the period end, the market has faced a rocky patch, with large swings triggered by global concerns. These concerns have not completely abated, and we could see additional turbulence ahead.
For the six-month period ended June 30, 2015, the Standard & Poor’s 500® (“S&P 500”) Index* returned 1.23%. The Morgan Stanley Capital International (“MSCI”) Europe-Australasia-Far East (“EAFE”) Index* returned 5.52%. The return of the MSCI Emerging Markets Index* was 2.95%.
| | THE GUGGENHEIM FUNDS SEMI-ANNUAL REPORT | 3 |
ECONOMIC AND MARKET OVERVIEW (Unaudited)(concluded) | June 30, 2015 |
In the bond market, the Barclays U.S. Aggregate Bond Index* posted a -0.10% return for the period, while the Barclays U.S. Corporate High Yield Index* returned 2.53%. The return of the Bank of America Merrill Lynch 3-Month U.S. Treasury Bill Index* was 0.01% for the six-month period.
The opinions and forecasts expressed may not actually come to pass. This information is subject to change at any time, based on market and other conditions, and should not be construed as a recommendation of any specific security or strategy.
*Index Definitions:
The following indices are referenced throughout this report. Indices are unmanaged and not available for direct investment. Index performance does not reflect transaction costs, fees, or expenses.
Barclays U.S. Aggregate Bond Index is a broad-based benchmark that measures the investment grade, U.S. dollar denominated, fixed-rate taxable bond market, including U.S. Treasuries, government-related and corporate securities, MBS (agency fixed-rate and hybrid ARM pass-throughs), ABS, and CMBS.
Barclays U.S. Corporate High Yield Index measures the market of U.S. dollar denominated, non-investment grade, fixed-rate, taxable corporate bonds. Securities are classified as high yield if the middle rating of Moody’s, Fitch, and S&P is Ba1/BB+/BB+ or below.
Bank of America (“BofA”) Merrill Lynch 3-Month U.S. Treasury Bill Index is an unmanaged market index of U.S. Treasury securities maturing in 90 days that assumes reinvestment of all income.
MSCI EAFE Index is a free float-adjusted market capitalization index that is designed to measure the equity market performance of developed markets, excluding the U.S. & Canada.
MSCI Emerging Markets Index is a free float-adjusted market capitalization weighted index that is designed to measure equity market performance in the global emerging markets.
S&P 500® Index is a capitalization-weighted index of 500 stocks designed to measure the performance of the broad economy, representing all major industries and is considered a representation of the U.S. stock market.
4 | THE GUGGENHEIM FUNDS SEMI-ANNUAL REPORT | |
ABOUT SHAREHOLDERS’ FUND EXPENSES (Unaudited) |
All mutual funds have operating expenses and it is important for our shareholders to understand the impact of costs on their investments. Shareholders of a Fund incur two types of costs: (i) transaction costs, including sales charges (loads) on purchase payments, reinvested dividends, or other distributions; and exchange fees; and (ii) ongoing costs, including management fees, administrative services, and shareholder reports, among others. These ongoing costs, or operating expenses, are deducted from a fund’s gross income and reduce the investment return of the fund.
A fund’s expenses are expressed as a percentage of its average net assets, which is known as the expense ratio. The following examples are intended to help investors understand the ongoing costs (in dollars) of investing in a Fund and to compare these costs with the ongoing costs of investing in other mutual funds.
The examples are based on an investment of $1,000 made at the beginning of the period and held for the entire six-month period beginning December 31, 2014 and ending June 30, 2015.
The following tables illustrate a Fund’s costs in two ways:
Table 1. Based on actual Fund return. This section helps investors estimate the actual expenses paid over the period. The “Ending Account Value” shown is derived from the Fund’s actual return, and the fourth column shows the dollar amount that would have been paid by an investor who started with $1,000 in the Fund. Investors may use the information here, together with the amount invested, to estimate the expenses paid over the period. Simply divide the Fund’s account value by $1,000 (for example, an $8,600 account value divided by $1,000 = 8.6), then multiply the result by the number provided under the heading “Expenses Paid During Period.”
Table 2. Based on hypothetical 5% return. This section is intended to help investors compare a Fund’s cost with those of other mutual funds. The table provides information about hypothetical account values and hypothetical expenses based on the Fund’s actual expense ratio and an assumed rate of return of 5% per year before expenses, which is not the Fund’s actual return. The hypothetical account values and expenses may not be used to estimate the actual ending account balance or expenses paid during the period. The example is useful in making comparisons because the U.S. Securities and Exchange Commission (the “SEC”) requires all mutual funds to calculate expenses based on the 5% return. Investors can assess a Fund’s costs by comparing this hypothetical example with the hypothetical examples that appear in shareholder reports of other funds.
| | THE GUGGENHEIM FUNDS SEMI-ANNUAL REPORT | 5 |
ABOUT SHAREHOLDERS’ FUND EXPENSES (Unaudited)(continued) |
The calculations illustrated above assume no shares were bought or sold during the period. Actual costs may have been higher or lower, depending on the amount of investment and the timing of any purchases or redemptions.
Please note that the expenses shown in the table are meant to highlight your ongoing costs only and do not reflect any transactional costs, such as sales charges (loads) on purchase payments, and contingent deferred sales charges (“CDSC”) on redemptions, if any. Therefore, the second table is useful in comparing ongoing costs only, and will not help you determine the relative total costs of owning different funds. In addition, if these transactional costs were included, your costs would have been higher.
More information about a Fund’s expenses, including annual expense ratios for the past five years, can be found in the Financial Highlights section of this report. For additional information on operating expenses and other shareholder costs, please refer to the appropriate Fund prospectus.
6 | THE GUGGENHEIM FUNDS SEMI-ANNUAL REPORT | |
ABOUT SHAREHOLDERS’ FUND EXPENSES (Unaudited)(concluded) |
| Expense
Ratio1 | Fund
Return | Beginning
Account Value
December 31,
2014 | Ending
Account Value
June 30,
2015 | Expenses
Paid During
Period2 |
Table 1. Based on actual Fund return3 | |
Managed Futures Strategy Fund | | | | | |
A-Class | 1.67% | 0.25% | $ 1,000.00 | $ 1,002.50 | $ 8.29 |
C-Class | 2.42% | (0.13%) | 1,000.00 | 998.70 | 11.99 |
P-Class | 1.67% | 0.25% | 1,000.00 | 1,002.50 | 8.29 |
Institutional Class | 1.42% | 0.37% | 1,000.00 | 1,003.70 | 7.05 |
|
Table 2. Based on hypothetical 5% return (before expenses) |
Managed Futures Strategy Fund | | | | | |
A-Class | 1.67% | 5.00% | $ 1,000.00 | $ 1,016.51 | $ 8.35 |
C-Class | 2.42% | 5.00% | 1,000.00 | 1,012.79 | 12.08 |
P-Class | 1.67% | 5.00% | 1,000.00 | 1,016.51 | 8.35 |
Institutional Class | 1.42% | 5.00% | 1,000.00 | 1,017.75 | 7.10 |
1 | Annualized and excludes expenses of the underlying funds in which the Fund invests. |
2 | Expenses are equal to the Fund’s annualized expense ratio, net of any applicable fee waivers, multiplied by the average account value over the period, multiplied by 181/365 (to reflect the one-half year period). |
3 | Actual cumulative return at net asset value for the period December 31, 2014 to June 30, 2015. |
| | THE GUGGENHEIM FUNDS SEMI-ANNUAL REPORT | 7 |
FUND PROFILE (Unaudited) | June 30, 2015 |
MANAGED FUTURES STRATEGY FUND
OBJECTIVE: Seeks to achieve absolute returns.
Consolidated Holdings Diversification (Market Exposure as % of Net Assets)
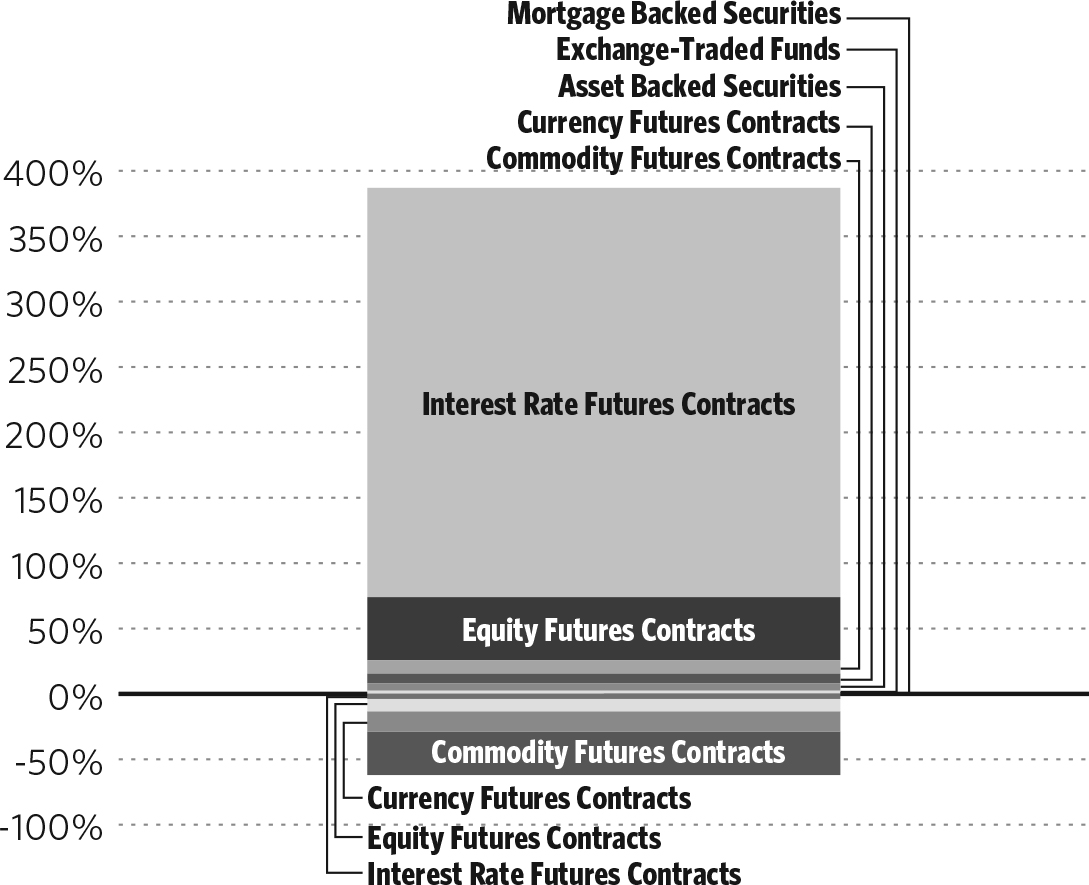
“Consolidated Holdings Diversification (Market Exposure as % of Net Assets)” excludes any temporary cash investments or investments in Guggenheim Strategy Funds Trust mutual funds. Investments in those Funds do not provide “market exposure” to meet the Fund’s investment objective, but will significantly increase the portfolio’s exposure to certain other asset categories (and their associated risks), which may cause the Fund to deviate from its principal investment strategy, including: (i) high yield, high risk debt securities rated below the top four long-term rating categories by a nationally recognized statistical rating organization (also known as “junk bonds”); (ii) securities issued by the U.S. Government or its agencies and instrumentalities; (iii) CLOs and similar investments; and (iv) other short-term fixed income securities.
8 | THE GUGGENHEIM FUNDS SEMI-ANNUAL REPORT | |
FUND PROFILE (Unaudited)(concluded) | June 30, 2015 |
Inception Dates: |
A-Class | March 2, 2007 |
C-Class | March 2, 2007 |
P-Class | March 2, 2007 |
Institutional Class | May 3, 2010 |
The Fund invests principally in derivative investments such as futures contracts.
Ten Largest Holdings (% of Total Net Assets) |
Guggenheim Strategy Fund I | 28.0% |
Guggenheim Strategy Fund II | 24.4% |
Guggenheim Strategy Fund III | 18.1% |
Guggenheim Enhanced Short Duration ETF | 2.3% |
Brentwood CLO Corp. 2006-1A | 1.4% |
Duane Street CLO IV Ltd. 2007-4A | 1.2% |
N-Star REL CDO VIII Ltd. 2006-8A | 1.0% |
Morgan Stanley Reremic Trust 2012-10 | 0.9% |
Black Diamond CLO 2005-1 Delaware Corp. 2005-1A | 0.6% |
Foothill CLO Ltd. 2007-1A | 0.4% |
Top Ten Total | 78.3% |
| | |
“Ten Largest Holdings” exclude any temporary cash or derivative investments. |
| | THE GUGGENHEIM FUNDS SEMI-ANNUAL REPORT | 9 |
CONSOLIDATED SCHEDULE OF INVESTMENTS (Unaudited) | June 30, 2015 |
MANAGED FUTURES STRATEGY FUND | |
| |
Shares
| | | Value | |
| | | | | | | |
EXCHANGE-TRADED FUNDS† - 2.3% | |
Guggenheim Enhanced Short Duration ETF1 | | | 108,400 | | | $ | 5,428,672 | |
Total Exchange-Traded Funds | | | | | |
(Cost $5,429,550) | | | | | | | 5,428,672 | |
| | | | | | | | | |
MUTUAL FUNDS† - 70.5% | |
Guggenheim Strategy Fund I1 | | | 2,625,136 | | | | 65,418,394 | |
Guggenheim Strategy Fund II1 | | | 2,288,089 | | | | 56,996,306 | |
Guggenheim Strategy Fund III1 | | | 1,690,972 | | | | 42,206,651 | |
Total Mutual Funds | | | | | | | | |
(Cost $164,757,192) | | | | | | | 164,621,351 | |
| | | | | | | | | |
| | | Face
Amount | | | | | |
| | | | | | | | | |
ASSET BACKED SECURITIES†† - 5.8% | |
Brentwood CLO Corp. | | | | | | | | |
2006-1A, 0.55% due 02/01/222,3 | | $ | 3,397,780 | | | | 3,355,647 | |
Duane Street CLO IV Ltd. | | | | | | | | |
2007-4A, 0.51% due 11/14/212,3 | | | 2,755,329 | | | | 2,707,387 | |
N-Star REL CDO VIII Ltd. | | | | | | | | |
2006-8A, 0.48% due 02/01/412,3 | | | 2,335,875 | | | | 2,258,324 | |
Morgan Stanley Reremic Trust | | | | | | | | |
2012-IO, 1.00% due 03/27/513 | | | 2,058,198 | | | | 2,036,381 | |
Black Diamond CLO 2005-1 Delaware Corp. | | | | | | | | |
2005-1A, 2.18% due 06/20/172,3 | | | 1,500,000 | | | | 1,473,600 | |
Foothill CLO Ltd. | | | | | | | | |
2007-1A, 0.53% due 02/22/212,3 | | | 981,322 | | | | 975,924 | |
Cornerstone CLO Ltd. | | | | | | | | |
2007-1A, 0.50% due 07/15/212,3 | | | 661,365 | | | | 653,363 | |
Gleneagles CLO Ltd. | | | | | | |
2005-1A, 0.55% due 11/01/172,3 | | | 10,546 | | | | 10,532 | |
Total Asset Backed Securities | | | | | |
(Cost $13,342,364) | | | | | | | 13,471,158 | |
| | | | | | | | | |
FEDERAL AGENCY DISCOUNT NOTES†† - 5.5% | |
Federal Home Loan Bank4 | | | | | | | | |
0.07% due 09/18/15 | | | 6,600,000 | | | | 6,599,116 | |
0.08% due 09/23/15 | | | 6,300,000 | | | | 6,299,105 | |
Total Federal Home Loan Bank | | | | | | | 12,898,221 | |
Total Federal Agency Discount Notes | | | | | |
(Cost $12,897,767) | | | | | | | 12,898,221 | |
| | | | | | | | | |
MORTGAGE BACKED SECURITIES†† - 0.1% | |
SRERS-2011 Funding Ltd. | | | | | | | | |
2011-RS,0.43% due 05/09/462,3 | | | 273,796 | | | | 264,843 | |
Total Mortgage Backed Securities | | | | | |
(Cost $244,460) | | | | | | | 264,843 | |
| | | | | | | | | |
REPURCHASE AGREEMENTS††,5 - 5.9% | |
HSBC Group
issued 06/30/15 at 0.04%
due 07/01/15 | | | 7,688,765 | | | | 7,688,765 | |
RBC Capital Markets
issued 06/30/15 at 0.04%
due 07/01/15 | | | 3,825,100 | | | | 3,825,100 | |
UMB Financial Corp.
issued 06/30/15 at 0.04%
due 07/01/15 | | | 2,208,743 | | | | 2,208,743 | |
Total Repurchase Agreements | | | | | |
(Cost $13,722,608) | | | | | | | 13,722,608 | |
| | | | | | | | | |
Total Investments - 90.1% | | | | | | | | |
(Cost $210,393,941) | | | | | | $ | 210,406,853 | |
Other Assets & Liabilities, net - 9.9% | | | | 23,153,456 | |
Total Net Assets - 100.0% | | | | | | $ | 233,560,309 | |
10 | THE GUGGENHEIM FUNDS SEMI-ANNUAL REPORT | SEE NOTES TO FINANCIAL STATEMENTS. |
CONSOLIDATED SCHEDULE OF INVESTMENTS (Unaudited)(continued) | June 30, 2015 |
MANAGED FUTURES STRATEGY FUND | |
| | Contracts | | | Unrealized
Gain (Loss) | |
| | | | | | | |
INTEREST RATE FUTURES CONTRACTS PURCHASED† | |
September 2015 Euro - Schatz
Futures Contracts††
(Aggregate Value of
Contracts $439,218,932) | | | 3,540 | | | $ | 271,639 | |
September 2015 Canadian Government 10 Year Bond
Futures Contracts††
(Aggregate Value of
Contracts $22,822,925) | | | 204 | | | | 176,664 | |
September 2015 Euro - Bobl
Futures Contracts††
(Aggregate Value of
Contracts $40,037,364) | | | 277 | | | | 150,515 | |
September 2015 Japanese Government 10 Year Bond
Futures Contracts††
(Aggregate Value of
Contracts $96,023,530) | | | 80 | | | | 127,287 | |
September 2015 Euro - Bund
Futures Contracts††
(Aggregate Value of
Contracts $12,559,826) | | | 74 | | | | 120,078 | |
September 2015 U.S. Treasury 5 Year Note
Futures Contracts
(Aggregate Value of
Contracts $60,300,969) | | | 506 | | | | 109,733 | |
September 2015 U.S. Treasury 10 Year Note
Futures Contracts
(Aggregate Value of
Contracts $4,158,000) | | | 33 | | | | 22,248 | |
September 2015 Australian Government 10 Year Bond
Futures Contracts††
(Aggregate Value of
Contracts $96,486) | | | 1 | | | | 967 | |
September 2015 U.S. Treasury Ultra Long Bond
Futures Contracts
(Aggregate Value of
Contracts $307,000) | | | 2 | | | | (1,024 | ) |
September 2015 Australian Government 3 Year Bond
Futures Contracts††
(Aggregate Value of
Contracts $55,386,654) | | | 645 | | | | (5,475 | ) |
(Total Aggregate Value of Contracts $730,911,686) | | | | | | $ | 972,632 | |
| | | | | | | | | |
COMMODITY FUTURES CONTRACTS PURCHASED† | |
September 2015 Wheat
Futures Contracts
(Aggregate Value of
Contracts $3,268,775) | | | 106 | | | $ | 384,940 | |
November 2015 Soybean
Futures Contracts
(Aggregate Value of
Contracts $1,345,825) | | | 26 | | | | 48,817 | |
August 2015 Gasoline RBOB
Futures Contracts
(Aggregate Value of
Contracts $858,690) | | | 10 | | | | 10,985 | |
December 2015 Cotton #2
Futures Contracts
(Aggregate Value of
Contracts $1,085,920) | | | 32 | | | | 7,555 | |
August 2015 New York Harbor Ultra-Low Sulfur Diesel
Futures Contracts
(Aggregate Value of
Contracts $396,417) | | | 5 | | | | 3,313 | |
August 2015 WTI Crude
Futures Contracts
(Aggregate Value of
Contracts $2,313,090) | | | 39 | | | | (29,488 | ) |
August 2015 Live Cattle
Futures Contracts
(Aggregate Value of
Contracts $14,686,561) | | | 248 | | | | (142,329 | ) |
(Total Aggregate Value of Contracts $23,955,278) | | | | | | $ | 283,793 | |
SEE NOTES TO FINANCIAL STATEMENTS. | THE GUGGENHEIM FUNDS SEMI-ANNUAL REPORT | 11 |
CONSOLIDATED SCHEDULE OF INVESTMENTS (Unaudited)(continued) | June 30, 2015 |
MANAGED FUTURES STRATEGY FUND | |
| | Contracts | | | Unrealized
Gain (Loss) | |
| | | | | | | |
CURRENCY FUTURES CONTRACTS PURCHASED† | |
September 2015 British Pound
Futures Contracts
(Aggregate Value of
Contracts $14,919,750) | | | 152 | | | $ | 68,371 | |
September 2015
Canadian Dollar
Futures Contracts
(Aggregate Value of
Contracts $2,159,190) | | | 27 | | | | (26,733 | ) |
(Total Aggregate Value of Contracts $17,078,940) | | | | | | $ | 41,638 | |
| | | | | | | | | |
EQUITY FUTURES CONTRACTS PURCHASED† | |
September 2015 Nikkei 225 (OSE) Index
Futures Contracts††
(Aggregate Value of
Contracts $19,978,687) | | | 121 | | | $ | 44,266 | |
September 2015
Russell 2000 Index
Mini Futures Contracts
(Aggregate Value of
Contracts $14,480,280) | | | 116 | | | | 22,612 | |
July 2015 H-Shares Index
Futures Contracts††
(Aggregate Value of
Contracts $745,619) | | | 9 | | | | (31,852 | ) |
September 2015 S&P MidCap 400 Index
Mini Futures Contracts
(Aggregate Value of
Contracts $4,640,080) | | | 31 | | | | (36,998 | ) |
July 2015 IBEX 35 Index
Futures Contracts††
(Aggregate Value of
Contracts $2,040,195) | | | 17 | | | | (78,761 | ) |
September 2015 Dow Jones Industrial Average Index
Mini Futures Contracts
(Aggregate Value of
Contracts $9,712,500) | | | 111 | | | | (97,975 | ) |
September 2015 Topix Index
Futures Contracts††
(Aggregate Value of
Contracts $21,518,689) | | | 162 | | | | (108,815 | ) |
July 2015 Amsterdam Index
Futures Contracts††
(Aggregate Value of
Contracts $8,664,927) | | | 82 | | | | (118,428 | ) |
September 2015
NASDAQ-100 Index
Mini Futures Contracts
(Aggregate Value of
Contracts $17,887,740) | | | 204 | | | | (152,373 | ) |
September 2015
FTSE 100 Index
Futures Contracts††
(Aggregate Value of
Contracts $7,642,010) | | | 75 | | | | (172,462 | ) |
July 2015 Hang Seng Index
Futures Contracts††
(Aggregate Value of
Contracts $5,391,182) | | | 32 | | | | (214,381 | ) |
(Total Aggregate Value of Contracts $112,701,909) | | | | | | $ | (945,167 | ) |
| | | | | | | | | |
COMMODITY FUTURES CONTRACTS SOLD SHORT† | |
August 2015 Lean Hogs
Futures Contracts
(Aggregate Value of
Contracts $12,308,220) | | | 414 | | | $ | 699,445 | |
August 2015 LME Nickel
Futures Contracts
(Aggregate Value of
Contracts $3,945,645) | | | 55 | | | | 396,728 | |
September 2015 Brent Crude
Futures Contracts
(Aggregate Value of
Contracts $9,029,640) | | | 141 | | | | 382,730 | |
August 2015 LME Primary Aluminum
Futures Contracts
(Aggregate Value of
Contracts $7,414,088) | | | 177 | | | | 349,398 | |
12 | THE GUGGENHEIM FUNDS SEMI-ANNUAL REPORT | SEE NOTES TO FINANCIAL STATEMENTS. |
CONSOLIDATED SCHEDULE OF INVESTMENTS (Unaudited)(continued) | June 30, 2015 |
MANAGED FUTURES STRATEGY FUND | |
| | Contracts | | | Unrealized
Gain (Loss) | |
| | | | | | | |
August 2015 LME Zinc
Futures Contracts
(Aggregate Value of
Contracts $6,583,995) | | | 132 | | | $ | 276,923 | |
September 2015 Copper
Futures Contracts
(Aggregate Value of
Contracts $3,667,300) | | | 56 | | | | 183,093 | |
August 2015 Natural Gas
Futures Contracts
(Aggregate Value of
Contracts $3,105,300) | | | 110 | | | | 107,740 | |
August 2015
Low Sulphur Gasoil
Futures Contracts
(Aggregate Value of
Contracts $3,897,725) | | | 67 | | | | 107,123 | |
September 2015 Silver
Futures Contracts
(Aggregate Value of
Contracts $3,137,000) | | | 40 | | | | 104,405 | |
August 2015 LME Lead
Futures Contracts
(Aggregate Value of
Contracts $1,271,469) | | | 29 | | | | 45,590 | |
September 2015 Coffee ‘C’
Futures Contracts
(Aggregate Value of
Contracts $882,563) | | | 18 | | | | 18,099 | |
August 2015 Gold 100 oz.
Futures Contracts
(Aggregate Value of
Contracts $3,163,860) | | | 27 | | | | 9,658 | |
October 2015 Sugar #11
Futures Contracts
(Aggregate Value of
Contracts $10,743,398) | | | 768 | | | | (98,108 | ) |
September 2015 Corn
Futures Contracts
(Aggregate Value of
Contracts $2,954,000) | | | 140 | | | | (323,614 | ) |
September 2015 Hard Red Winter Wheat
Futures Contracts
(Aggregate Value of
Contracts $5,541,900) | | | 182 | | | | (460,132 | ) |
(Total Aggregate Value of Contracts $77,646,103) | | | | | | $ | 1,799,078 | |
| | | | | | | | | |
EQUITY FUTURES CONTRACTS SOLD SHORT† | |
July 2015 MSCI Taiwan
Stock Index
Futures Contracts
(Aggregate Value of
Contracts $12,739,936) | | | 374 | | | $ | 145,993 | |
September 2015 SPI 200 Index
Futures Contracts††
(Aggregate Value of
Contracts $5,278,033) | | | 51 | | | | 134,167 | |
July 2015 CAC40 10 Euro Index
Futures Contracts††
(Aggregate Value of
Contracts $803,479) | | | 15 | | | | 8,525 | |
September 2015 DAX Index
Futures Contracts††
(Aggregate Value of
Contracts $2,146,206) | | | 7 | | | | 5,073 | |
September 2015
S&P 500 Index
Mini Futures Contracts
(Aggregate Value of
Contracts $1,127,913) | | | 11 | | | | 1,404 | |
(Total Aggregate Value of Contracts $22,095,567) | | | | | | $ | 295,162 | |
SEE NOTES TO FINANCIAL STATEMENTS. | THE GUGGENHEIM FUNDS SEMI-ANNUAL REPORT | 13 |
CONSOLIDATED SCHEDULE OF INVESTMENTS (Unaudited)(concluded) | June 30, 2015 |
MANAGED FUTURES STRATEGY FUND | |
| | Contracts | | | Unrealized
Gain (Loss) | |
| | | | | | | |
INTEREST RATE FUTURES CONTRACTS SOLD SHORT† | |
September 2015 U.S. Treasury Long Bond
Futures Contracts
(Aggregate Value of
Contracts $6,013,750) | | | 40 | | | $ | 34,249 | |
September 2015 Long Gilt
Futures Contracts††
(Aggregate Value of
Contracts $2,907,605) | | | 16 | | | | 1,144 | |
(Total Aggregate Value of Contracts $8,921,355) | | | | | | $ | 35,393 | |
| | | | | | | | | |
CURRENCY FUTURES CONTRACTS SOLD SHORT† | |
September 2015 Swiss Franc
Futures Contracts
(Aggregate Value of
Contracts $6,300,938) | | | 47 | | | $ | 34,521 | |
September 2015
Australian Dollar
Futures Contracts
(Aggregate Value of
Contracts $2,689,400) | | | 35 | | | | 26,851 | |
September 2015 Euro FX
Futures Contracts
(Aggregate Value of
Contracts $279,000) | | | 2 | | | | 15 | |
September 2015 Japanese Yen
Futures Contracts
(Aggregate Value of
Contracts $26,886,818) | | | 263 | | | | (194,001 | ) |
(Total Aggregate Value of Contracts $36,156,156) | | | | | | $ | (132,614 | ) |
† | Value determined based on Level 1 inputs, unless otherwise noted — See Note 4. |
†† | Value determined based on Level 2 inputs — See Note 4. |
1 | Affiliated issuer — See Note 9. |
2 | Variable rate security. Rate indicated is rate effective at June 30, 2015. |
3 | Security is a 144A or Section 4(a)(2) security. The total market value of 144A or Section 4(a)(2) securities is $13,736,001 (cost $13,586,824), or 5.9% of total net assets. These securities have been determined to be liquid under guidelines established by the Board of Trustees. |
4 | The issuer operates under a Congressional charter; its securities are neither issued nor guaranteed by the U.S. Government. |
5 | Repurchase Agreements — See Note 5. |
14 | THE GUGGENHEIM FUNDS SEMI-ANNUAL REPORT | SEE NOTES TO FINANCIAL STATEMENTS. |
CONSOLIDATED STATEMENT OF ASSETS AND LIABILITIES (Unaudited) |
MANAGED FUTURES STRATEGY FUND |
June 30, 2015
Assets: | |
Investments in unaffiliated issuers, at value (cost $26,484,591) | | $ | 26,634,222 | |
Investments in affiliated issuers, at value (cost $170,186,742) | | | 170,050,023 | |
Repurchase agreements, at value (cost $13,722,608) | | | 13,722,608 | |
Total investments (cost $210,393,941) | | | 210,406,853 | |
Segregated cash with broker | | | 25,663,554 | |
Cash | | | 806,179 | |
Receivables: | |
Fund shares sold | | | 421,357 | |
Dividends | | | 189,958 | |
Interest | | | 9,841 | |
Securities lending income | | | 36 | |
Total assets | | | 237,497,778 | |
| | | | | |
Liabilities: | |
Foreign currency, at value | | | 953,656 | |
Payable for: | |
Variation margin | | | 1,838,016 | |
Fund shares redeemed | | | 528,769 | |
Securities purchased | | | 189,958 | |
Management fees | | | 176,769 | |
Distribution and service fees | | | 61,846 | |
Transfer agent and administrative fees | | | 49,334 | |
Portfolio accounting fees | | | 19,740 | |
Miscellaneous | | | 119,381 | |
Total liabilities | | | 3,937,469 | |
Commitments and contingent liabilities (Note 11) | | | — | |
Net assets | | $ | 233,560,309 | |
| | | | | |
Net assets consist of: | |
Paid in capital | | $ | 299,165,819 | |
Accumulated net investment loss | | | (5,665,896 | ) |
Accumulated net realized loss on investments | | | (62,301,932 | ) |
Net unrealized appreciation on investments | | | 2,362,318 | |
Net assets | | $ | 233,560,309 | |
| | | | | |
A-Class: | |
Net assets | | $ | 28,241,737 | |
Capital shares outstanding | | | 1,169,248 | |
Net asset value per share | | $ | 24.15 | |
Maximum offering price per share (Net asset value divided by 95.25%) | | $ | 25.35 | |
| | | | | |
C-Class: | |
Net assets | | $ | 23,518,321 | |
Capital shares outstanding | | | 1,037,721 | |
Net asset value per share | | $ | 22.66 | |
| | | | | |
P-Class: | |
Net assets | | $ | 171,244,349 | |
Capital shares outstanding | | | 7,090,624 | |
Net asset value per share | | $ | 24.15 | |
| | | | | |
Institutional Class: | |
Net assets | | $ | 10,555,902 | |
Capital shares outstanding | | | 431,214 | |
Net asset value per share | | $ | 24.48 | |
SEE NOTES TO FINANCIAL STATEMENTS. | THE GUGGENHEIM FUNDS SEMI-ANNUAL REPORT | 15 |
CONSOLIDATED STATEMENT OF OPERATIONS (Unaudited) |
MANAGED FUTURES STRATEGY FUND |
Period Ended June 30, 2015
Investment Income: | |
Dividends from securities of affiliated issuers | | $ | 1,214,724 | |
Interest | | | 297,554 | |
Income from securities lending, net | | | 5,568 | |
Total investment income | | | 1,517,846 | |
| | | | | |
Expenses: | |
Management fees | | | 1,220,280 | |
Transfer agent and administrative fees: | | | | |
A-Class | | | 36,443 | |
C-Class | | | 30,625 | |
P-Class*** | | | 234,778 | |
Institutional Class | | | 14,143 | |
Y-Class** | | | 538 | |
Distribution and service fees: | |
A-Class | | | 36,443 | |
C-Class | | | 122,501 | |
P-Class*** | | | 234,778 | |
Portfolio accounting fees | | | 125,639 | |
Custodian fees | | | 14,873 | |
Trustees’ fees* | | | 8,149 | |
Miscellaneous | | | 196,711 | |
Total expenses | | | 2,275,901 | |
Less: | |
Expenses waived by Adviser | | | (86,755 | ) |
Net expenses | | | 2,189,146 | |
Net investment loss | | | (671,300 | ) |
| | | | | |
Net Realized and Unrealized Gain (Loss): | |
Net realized gain (loss) on: | |
Investments in unaffiliated issuers | | | 244,117 | |
Investments in affiliated issuers | | | (60,823 | ) |
Futures contracts | | | 10,026,315 | |
Foreign currency | | | (65,511 | ) |
Net realized gain | | | 10,144,098 | |
Net change in unrealized appreciation (depreciation) on: | |
Investments in unaffiliated issuers | | | (221,030 | ) |
Investments in affiliated issuers | | | 568,856 | |
Futures contracts | | | (8,827,705 | ) |
Foreign currency | | | 2,369 | |
Net change in unrealized appreciation (depreciation) | | | (8,477,510 | ) |
Net realized and unrealized gain | | | 1,666,588 | |
Net increase in net assets resulting from operations | | $ | 995,288 | |
* | Relates to Trustees not deemed “interested persons” within the meaning of Section 2(a)(19) of the 1940 Act. |
** | Y-Class closed on June 26, 2015 — See Note 12. |
*** | H-Class shares redesignated as P-Class shares effective following the close of business on April 30, 2015 — See Note 13. |
16 | THE GUGGENHEIM FUNDS SEMI-ANNUAL REPORT | SEE NOTES TO FINANCIAL STATEMENTS. |
CONSOLIDATED STATEMENTS OF CHANGES IN NET ASSETS |
MANAGED FUTURES STRATEGY FUND | |
| | Period Ended
June 30,
2015
(Unaudited) | | | Year Ended
December 31,
2014 | |
Increase (Decrease) in Net Assets from Operations: | | | | | | |
Net investment loss | | $ | (671,300 | ) | | $ | (105,410 | ) |
Net realized gain on investments and foreign currency | | | 10,144,098 | | | | 27,332,335 | |
Net change in unrealized appreciation (depreciation) on investments and foreign currency | | | (8,477,510 | ) | | | (6,809,456 | ) |
Net increase in net assets resulting from operations | | | 995,288 | | | | 20,417,469 | |
| | | | | | | | | |
Distributions to shareholders from: | | | | | | | | |
Net investment income | | | | | | | | |
A-Class | | | — | | | | (313,785 | ) |
C-Class | | | — | | | | (299,361 | ) |
P-Class* | | | (169 | ) | | | (2,130,001 | ) |
Institutional Class | | | — | | | | (125,944 | ) |
Y-Class** | | | — | | | | (7,829 | ) |
Total distributions to shareholders | | | (169 | ) | | | (2,876,920 | ) |
| | | | | | | | | |
Capital share transactions: | | | | | | | | |
Proceeds from sale of shares | | | | | | | | |
A-Class | | | 7,588,442 | | | | 8,716,439 | |
C-Class | | | 1,997,634 | | | | 3,028,191 | |
P-Class* | | | 65,385,485 | | | | 60,160,173 | |
Institutional Class | | | 1,796,670 | | | | 10,474,033 | |
Y-Class** | | | 8 | | | | 20,000 | |
Distributions reinvested | | | | | | | | |
A-Class | | | — | | | | 276,172 | |
C-Class | | | — | | | | 289,334 | |
P-Class* | | | — | | | | 2,043,559 | |
Institutional Class | | | — | | | | 124,839 | |
Y-Class** | | | — | | | | 3,281 | |
Cost of shares redeemed | | | | | | | | |
A-Class | | | (6,873,129 | ) | | | (60,395,444 | ) |
C-Class | | | (2,515,964 | ) | | | (10,427,970 | ) |
P-Class* | | | (75,939,809 | ) | | | (85,798,345 | ) |
Institutional Class | | | (2,319,854 | ) | | | (3,000,585 | ) |
Y-Class** | | | (623,373 | ) | | | (2,411,478 | ) |
Net decrease from capital share transactions | | | (11,503,890 | ) | | | (76,897,801 | ) |
Net decrease in net assets | | | (10,508,771 | ) | | | (59,357,252 | ) |
| | | | | | | | | |
Net assets: | | | | | | | | |
Beginning of period | | | 244,069,080 | | | | 303,426,332 | |
End of period | | $ | 233,560,309 | | | $ | 244,069,080 | |
Accumulated net investment loss at end of period | | $ | (5,665,896 | ) | | $ | (4,994,427 | ) |
SEE NOTES TO FINANCIAL STATEMENTS. | THE GUGGENHEIM FUNDS SEMI-ANNUAL REPORT | 17 |
CONSOLIDATED STATEMENTS OF CHANGES IN NET ASSETS (concluded) |
MANAGED FUTURES STRATEGY FUND | |
| | Period Ended
June 30,
2015
(Unaudited) | | | Year Ended
December 31,
2014 | |
Capital share activity: | | | | | | |
Shares sold | | | | | | |
A-Class | | | 300,543 | | | | 395,808 | |
C-Class | | | 84,606 | | | | 144,551 | |
P-Class* | | | 2,606,835 | | | | 2,724,699 | |
Institutional Class | | | 71,230 | | | | 468,393 | |
Y-Class** | | | — | | | | 895 | |
Shares issued from reinvestment of distributions | | | | | | | | |
A-Class | | | — | | | | 11,848 | |
C-Class | | | — | | | | 13,175 | |
P-Class* | | | — | | | | 87,665 | |
Institutional Class | | | — | | | | 5,292 | |
Y-Class** | | �� | — | | | | 139 | |
Shares redeemed | | | | | | | | |
A-Class | | | (272,238 | ) | | | (2,738,853 | ) |
C-Class | | | (106,489 | ) | | | (506,997 | ) |
P-Class* | | | (3,017,338 | ) | | | (3,952,748 | ) |
Institutional Class | | | (90,914 | ) | | | (132,954 | ) |
Y-Class** | | | (24,965 | ) | | | (111,163 | ) |
Net decrease in shares | | | (448,730 | ) | | | (3,590,250 | ) |
* | H-Class shares redesignated as P-Class shares effective following the close of business on April 30, 2015 — See Note 13. |
** | Y-Class shares closed on June 26, 2015 — See Note 12. |
18 | THE GUGGENHEIM FUNDS SEMI-ANNUAL REPORT | SEE NOTES TO FINANCIAL STATEMENTS. |
CONSOLIDATED FINANCIAL HIGHLIGHTS |
MANAGED FUTURES STRATEGY FUND | |
This table is presented to show selected data for a share outstanding throughout each period and to assist shareholders in evaluating a Fund’s performance for the periods presented.
A-Class | | Period Ended
June 30,
2015a | | | Year Ended
Dec. 31,
2014 | | | Year Ended
Dec. 31,
2013 | | | Year Ended
Dec. 31,
2012 | | | Year Ended
Dec. 31,
2011 | | | Year Ended
Dec. 31,
2010 | |
Per Share Data | | | | | | | | | | | | | | | | | | |
Net asset value, beginning of period | | $ | 24.12 | | | $ | 22.15 | | | $ | 21.23 | | | $ | 23.95 | | | $ | 25.78 | | | $ | 26.81 | |
Income (loss) from investment operations: | |
Net investment income (loss)b | | | (.06 | ) | | | .02 | | | | (.19 | ) | | | (.39 | ) | | | (.44 | ) | | | (.41 | ) |
Net gain (loss) on investments (realized and unrealized) | | | .09 | | | | 2.23 | | | | 1.11 | | | | (2.33 | ) | | | (1.39 | ) | | | (.62 | ) |
Total from investment operations | | | .03 | | | | 2.25 | | | | .92 | | | | (2.72 | ) | | | (1.83 | ) | | | (1.03 | ) |
Less distributions from: | |
Net investment income | | | — | | | | (.28 | ) | | | — | | | | — | | | | — | | | | — | |
Total distributions | | | — | | | | (.28 | ) | | | — | | | | — | | | | — | | | | — | |
Redemption fees collected | | | — | | | | — | | | | — | | | | — | | | | — | | | | — | d |
Net asset value, end of period | | $ | 24.15 | | | $ | 24.12 | | | $ | 22.15 | | | $ | 21.23 | | | $ | 23.95 | | | $ | 25.78 | |
| |
Total Returne | | | 0.25 | % | | | 10.06 | % | | | 4.33 | % | | | (11.32 | %) | | | (7.14 | %) | | | (3.84 | %) |
Ratios/Supplemental Data | |
Net assets, end of period (in thousands) | | $ | 28,242 | | | $ | 27,514 | | | $ | 76,900 | | | $ | 145,950 | | | $ | 733,469 | | | $ | 657,317 | |
Ratios to average net assets: | |
Net investment income (loss) | | | (0.47 | %) | | | 0.07 | % | | | (0.89 | %) | | | (1.71 | %) | | | (1.76 | %) | | | (1.66 | %) |
Total expensesf | | | 1.74 | % | | | 1.74 | % | | | 1.74 | % | | | 1.96 | % | | | 2.05 | % | | | 2.04 | % |
Net expensesg | | | 1.67 | % | | | 1.68 | % | | | 1.67 | % | | | 1.89 | % | | | 1.97 | % | | | 1.97 | % |
Portfolio turnover rate | | | 10 | % | | | 83 | % | | | 102 | % | | | 172 | % | | | 72 | % | | | 148 | % |
SEE NOTES TO FINANCIAL STATEMENTS. | THE GUGGENHEIM FUNDS SEMI-ANNUAL REPORT | 19 |
CONSOLIDATED FINANCIAL HIGHLIGHTS (continued) |
MANAGED FUTURES STRATEGY FUND | |
This table is presented to show selected data for a share outstanding throughout each period and to assist shareholders in evaluating a Fund’s performance for the periods presented.
C-Class | | Period Ended
June 30,
2015a | | | Year Ended
Dec. 31,
2014 | | | Year Ended
Dec. 31,
2013 | | | Year Ended
Dec. 31,
2012 | | | Year Ended
Dec. 31,
2011 | | | Year Ended
Dec. 31,
2010 | |
Per Share Data | | | | | | | | | | | | | | | | | | |
Net asset value, beginning of period | | $ | 22.71 | | | $ | 21.04 | | | $ | 20.31 | | | $ | 23.09 | | | $ | 25.04 | | | $ | 26.24 | |
Income (loss) from investment operations: | |
Net investment income (loss)b | | | (.14 | ) | | | (.15 | ) | | | (.33 | ) | | | (.53 | ) | | | (.61 | ) | | | (.59 | ) |
Net gain (loss) on investments (realized and unrealized) | | | .09 | | | | 2.10 | | | | 1.06 | | | | (2.25 | ) | | | (1.34 | ) | | | (.61 | ) |
Total from investment operations | | | (.05 | ) | | | 1.95 | | | | .73 | | | | (2.78 | ) | | | (1.95 | ) | | | (1.20 | ) |
Less distributions from: | |
Net investment income | | | — | | | | (.28 | ) | | | — | | | | — | | | | — | | | | — | |
Total distributions | | | — | | | | (.28 | ) | | | — | | | | — | | | | — | | | | — | |
Redemption fees collected | | | — | | | | — | | | | — | | | | — | | | | — | | | | — | d |
Net asset value, end of period | | $ | 22.66 | | | $ | 22.71 | | | $ | 21.04 | | | $ | 20.31 | | | $ | 23.09 | | | $ | 25.04 | |
| |
Total Returne | | | (0.13 | %) | | | 9.22 | % | | | 3.59 | % | | | (12.04 | %) | | | (7.79 | %) | | | (4.57 | %) |
Ratios/Supplemental Data | |
Net assets, end of period (in thousands) | | $ | 23,518 | | | $ | 24,066 | | | $ | 29,637 | | | $ | 49,378 | | | $ | 96,647 | | | $ | 158,628 | |
Ratios to average net assets: | |
Net investment income (loss) | | | (1.22 | %) | | | (0.72 | %) | | | (1.63 | %) | | | (2.45 | %) | | | (2.50 | %) | | | (2.41 | %) |
Total expensesf | | | 2.49 | % | | | 2.50 | % | | | 2.48 | % | | | 2.70 | % | | | 2.80 | % | | | 2.79 | % |
Net expensesg | | | 2.42 | % | | | 2.43 | % | | | 2.42 | % | | | 2.64 | % | | | 2.72 | % | | | 2.72 | % |
Portfolio turnover rate | | | 10 | % | | | 83 | % | | | 102 | % | | | 172 | % | | | 72 | % | | | 148 | % |
20 | THE GUGGENHEIM FUNDS SEMI-ANNUAL REPORT | SEE NOTES TO FINANCIAL STATEMENTS. |
CONSOLIDATED FINANCIAL HIGHLIGHTS (concluded) |
MANAGED FUTURES STRATEGY FUND |
This table is presented to show selected data for a share outstanding throughout each period and to assist shareholders in evaluating a Fund’s performance for the periods presented.
P-Class* | | Period Ended
June 30,
2015a | | | Year Ended
Dec. 31,
2014 | | | Year Ended
Dec. 31,
2013 | | | Year Ended
Dec. 31,
2012 | | | Year Ended
Dec. 31,
2011 | | | Year Ended
Dec. 31,
2010 | |
Per Share Data | | | | | | | | | | | | | | | | | | |
Net asset value, beginning of period | | $ | 24.11 | | | $ | 22.15 | | | $ | 21.23 | | | $ | 23.95 | | | $ | 25.78 | | | $ | 26.81 | |
Income (loss) from investment operations: | |
Net investment income (loss)b | | | (.06 | ) | | | — | c | | | (.20 | ) | | | (.38 | ) | | | (.44 | ) | | | (.42 | ) |
Net gain (loss) on investments (realized and unrealized) | | | .10 | | | | 2.24 | | | | 1.12 | | | | (2.34 | ) | | | (1.39 | ) | | | (.61 | ) |
Total from investment operations | | | .04 | | | | 2.24 | | | | .92 | | | | (2.72 | ) | | | (1.83 | ) | | | (1.03 | ) |
Less distributions from: | |
Net investment income | | | — | | | | (.28 | ) | | | — | | | | — | | | | — | | | | — | |
Total distributions | | | — | | | | (.28 | ) | | | — | | | | — | | | | — | | | | — | |
Redemption fees collected | | | — | | | | — | | | | — | | | | — | | | | — | | | | — | d |
Net asset value, end of period | | $ | 24.15 | | | $ | 24.11 | | | $ | 22.15 | | | $ | 21.23 | | | $ | 23.95 | | | $ | 25.78 | |
| |
Total Returne | | | 0.25 | % | | | 10.06 | % | | | 4.33 | % | | | (11.32 | %) | | | (7.14 | %) | | | (3.84 | %) |
Ratios/Supplemental Data | |
Net assets, end of period (in thousands) | | $ | 171,244 | | | $ | 180,872 | | | $ | 191,400 | | | $ | 501,109 | | | $ | 1,059,988 | | | $ | 1,199,718 | |
Ratios to average net assets: | |
Net investment income (loss) | | | (0.47 | %) | | | 0.01 | % | | | (0.94 | %) | | | (1.70 | %) | | | (1.75 | %) | | | (1.66 | %) |
Total expensesf | | | 1.74 | % | | | 1.75 | % | | | 1.75 | % | | | 1.95 | % | | | 2.05 | % | | | 2.04 | % |
Net expensesg | | | 1.67 | % | | | 1.68 | % | | | 1.68 | % | | | 1.89 | % | | | 1.97 | % | | | 1.97 | % |
Portfolio turnover rate | | | 10 | % | | | 83 | % | | | 102 | % | | | 172 | % | | | 72 | % | | | 148 | % |
SEE NOTES TO FINANCIAL STATEMENTS. | THE GUGGENHEIM FUNDS SEMI-ANNUAL REPORT | 21 |
CONSOLIDATED FINANCIAL HIGHLIGHTS (continued) |
MANAGED FUTURES STRATEGY FUND |
This table is presented to show selected data for a share outstanding throughout each period and to assist shareholders in evaluating a Fund’s performance for the periods presented.
Institutional Class | | Period Ended
June 30,
2015a | | | Year Ended
Dec. 31,
2014 | | | Year Ended
Dec. 31,
2013 | | | Year Ended
Dec. 31,
2012 | | | Year Ended
Dec. 31,
2011 | | | Period Ended
Dec. 31,
2010h | |
Per Share Data | | | | | | | | | | | | | | | | | | |
Net asset value, beginning of period | | $ | 24.41 | | | $ | 22.36 | | | $ | 21.38 | | | $ | 24.06 | | | $ | 25.84 | | | $ | 25.58 | |
Income (loss) from investment operations: | |
Net investment income (loss)b | | | (.03 | ) | | | .05 | | | | (.19 | ) | | | (.33 | ) | | | (.38 | ) | | | (.23 | ) |
Net gain (loss) on investments (realized and unrealized) | | | .10 | | | | 2.28 | | | | 1.17 | | | | (2.35 | ) | | | (1.40 | ) | | | .49 | |
Total from investment operations | | | .07 | | | | 2.33 | | | | .98 | | | | (2.68 | ) | | | (1.78 | ) | | | .26 | |
Less distributions from: | |
Net investment income | | | — | | | | (.28 | ) | | | — | | | | — | | | | — | | | | — | |
Total distributions | | | — | | | | (.28 | ) | | | — | | | | — | | | | — | | | | — | |
Redemption fees collected | | | — | | | | — | | | | — | | | | — | | | | — | | | | — | d |
Net asset value, end of period | | $ | 24.48 | | | $ | 24.41 | | | $ | 22.36 | | | $ | 21.38 | | | $ | 24.06 | | | $ | 25.84 | |
| |
Total Returne | | | 0.37 | % | | | 10.28 | % | | | 4.63 | % | | | (11.14 | %) | | | (6.85 | %) | | | 0.98 | % |
Ratios/Supplemental Data | |
Net assets, end of period (in thousands) | | $ | 10,556 | | | $ | 11,007 | | | $ | 2,464 | | | $ | 45,700 | | | $ | 101,549 | | | $ | 134,733 | |
Ratios to average net assets: | |
Net investment income (loss) | | | (0.22 | %) | | | 0.21 | % | | | (0.86 | %) | | | (1.45 | %) | | | (1.50 | %) | | | (1.41 | %) |
Total expensesf | | | 1.49 | % | | | 1.50 | % | | | 1.52 | % | | | 1.70 | % | | | 1.80 | % | | | 1.78 | % |
Net expensesg | | | 1.42 | % | | | 1.44 | % | | | 1.45 | % | | | 1.64 | % | | | 1.72 | % | | | 1.72 | % |
Portfolio turnover rate | | | 10 | % | | | 83 | % | | | 102 | % | | | 172 | % | | | 72 | % | | | 148 | % |
a | Unaudited figures for the period ended June 30, 2015. Percentage amounts for the period, except total return and portfolio turnover rate, have been annualized. |
b | Net investment income (loss) per share was computed using average shares outstanding throughout the period. |
c | Net investment income (loss) is less than $0.01 per share. |
d | Redemption fees collected are less than $0.01 per share. |
e | Total return does not reflect the impact of any applicable sales charges and has not been annualized. |
f | Does not include expenses of the underlying funds in which the Fund invests. |
g | Net expense information reflects the expense ratios after expense waivers. |
h | Since commencement of operations: May 3, 2010. Percentage amounts for the period, except total return and portfolio turnover rate, have been annualized. |
* | H-Class shares redesignated as P-Class shares effective following the close of business on April 30, 2015 — See Note 13. |
22 | THE GUGGENHEIM FUNDS SEMI-ANNUAL REPORT | SEE NOTES TO FINANCIAL STATEMENTS. |
NOTES TO CONSOLIDATED FINANCIAL STATEMENTS (Unaudited) |
1. Organization, Consolidation of Subsidiary and Significant Accounting Policies
Organization
The Rydex Series Funds (the “Trust”), a Delaware business trust, is registered with the SEC under the Investment Company Act of 1940 (“1940 Act”), as a non-diversified, open-ended investment company of the series type. Each series, in effect, is representing a separate Fund. The Trust is authorized to issue an unlimited number of no par value shares. The Trust accounts for the assets of each fund separately.
The Trust offers a combination of nine separate classes of shares: Investor Class shares, Advisor Class shares, A-Class shares, C-Class shares, H-Class shares, Y-Class shares, Institutional Class shares, P-Class shares and Money Market Class shares. Sales of shares of each Class are made without a front-end sales charge at the net asset value per share (“NAV”), with the exception of A-Class shares. A-Class shares are sold at the NAV, plus the applicable front-end sales charge. The sales charge varies depending on the amount purchased, but will not exceed 4.75%. A-Class share purchases of $1 million or more are exempt from the front-end sales charge but have a 1% contingent deferred sales charge (“CDSC”) if shares are redeemed within 12 months of purchase. C-Class shares have a 1% CDSC if shares are redeemed within 12 months of purchase. Institutional Class shares are offered primarily for direct investment by institutions such as pension and profit sharing plans, endowments, foundations and corporations. Institutional Class shares have a minimum initial investment of $2 million and a minimum account balance of $1 million. At June 30, 2015, the Trust consisted of fifty-two funds (the “Funds”).
This report covers the Managed Futures Strategy Fund (the “Fund”). Only A-Class, C-Class, P-Class, Institutional Class and Y-Class shares had been issued by the Fund.
Guggenheim Investments (“GI”) provides advisory services, and Rydex Fund Services, LLC (“RFS”) provides transfer agent, administrative and accounting services to the Trust. Guggenheim Funds Distributors, LLC (“GFD”) acts as principal underwriter for the Trust. GI, RFS and GFD are affiliated entities.
Consolidation of Subsidiary
The consolidated financial statements of the Fund include the accounts of a wholly-owned and controlled Cayman Islands subsidiary (the “Subsidiary”). Significant inter-company accounts and transactions have been eliminated in consolidation for the Fund.
| | THE GUGGENHEIM FUNDS SEMI-ANNUAL REPORT | 23 |
NOTES TO CONSOLIDATED FINANCIAL STATEMENTS (Unaudited)(continued) |
The Fund may invest up to 25% of its total assets in its Subsidiary which acts as an investment vehicle in order to effect certain investments consistent with the Fund’s investment objectives and policies.
A summary of the Fund’s investment in its Subsidiary is as follows:
Fund | Inception
Date of
Subsidiary | Subsidiary
Net Assets at June 30, 2015 | % of Net Assets of the Fund at June 30, 2015 |
Managed Futures Strategy Fund | 05/01/08 | $ 15,481,916 | 6.6% |
Significant Accounting Policies
The Fund operates as an investment company and accordingly follow the investment company accounting and reporting guidance of the Financial Accounting Standards Board (“FASB”) Accounting Standards Codification Topic 946 Financial Services – Investment Companies.
The following significant accounting policies are in conformity with U.S. generally accepted accounting principles (“U.S. GAAP”) and are consistently followed by the Trust. This requires management to make estimates and assumptions that affect the reported amount of assets and liabilities and disclosure of contingent assets and liabilities at the date of the financial statements and the reported amounts of revenues and expenses during the reporting period. Actual results could differ from these estimates. All time references are based on Eastern Time.
The NAV of each Class of the Fund is calculated by dividing the market value of the Fund’s securities and other assets, less all liabilities, attributable to the Class by the number of outstanding shares of the Class.
A. The Board of Trustees of the Fund (the “Board”) has adopted policies and procedures for the valuation of the Fund’s investments (the “Valuation Procedures”). Pursuant to the Valuation Procedures, the Board has delegated to a valuation committee, consisting of representatives from Guggenheim’s investment management, fund administration, legal and compliance departments (the “Valuation Committee”), the day-to-day responsibility for implementing the Valuation Procedures, including, under most circumstances, the responsibility for determining the fair value of the Fund’s securities or other assets.
Valuations of the Fund’s securities are supplied primarily by pricing services appointed pursuant to the processes set forth in the Valuation Procedures. The Valuation Committee convenes monthly, or more frequently as needed and will review the valuation of all assets which have been fair valued for reasonableness. The Fund’s officers, through the Valuation Committee and consistent with the
24 | THE GUGGENHEIM FUNDS SEMI-ANNUAL REPORT | |
NOTES TO CONSOLIDATED FINANCIAL STATEMENTS (Unaudited)(continued) |
monitoring and review responsibilities set forth in the Valuation Procedures, regularly review procedures used by, and valuations provided by, the pricing services.
If the pricing service cannot or does not provide a valuation for a particular investment or such valuation is deemed unreliable, such investment is fair valued by the Valuation Committee.
Open-end investment companies (“Mutual Funds”) are valued at their NAV as of the close of business, on the valuation date. Exchange-traded funds (“ETFs”) and closed-end investment companies (“CEFs”) are valued at the last quoted sales price.
Debt securities with a maturity of greater than 60 days at acquisition are valued at prices that reflect broker/dealer supplied valuations or are obtained from independent pricing services, which may consider the trade activity, treasury spreads, yields or price of bonds of comparable quality, coupon, maturity, and type, as well as prices quoted by dealers who make markets in such securities. Short-term debt securities with a maturity of 60 days or less at acquisition are valued at amortized cost, provided such amount approximates market value.
Repurchase agreements are valued at amortized cost, which approximates market value.
The value of futures contracts is accounted for using the unrealized gain or loss on the contracts that is determined by marking the contracts to their current realized settlement prices. Financial futures contracts are valued at the 4:00 p.m. price on the valuation date. In the event that the exchange for a specific futures contract closes earlier than 4:00 p.m., the futures contract is valued at the Official Settlement Price of the exchange. However, the underlying securities from which the futures contract value is derived are monitored until 4:00 p.m. to determine if fair valuation would provide a more accurate valuation.
Investments for which market quotations are not readily available are fair valued as determined in good faith by GI under the direction of the Board of Trustees using methods established or ratified by the Board of Trustees. Valuations in accordance with these methods are intended to reflect each security’s (or asset’s) “fair value.” Each such determination is based on a consideration of all relevant factors, which are likely to vary from one pricing context to another. Examples of such factors may include, but are not limited to: (i) the type of security, (ii) the initial cost of the security, (iii) the existence of any contractual restrictions on the security’s disposition, (iv) the price and extent of public trading in similar securities of the issuer or of comparable companies, (v) quotations or evaluated prices from broker-dealers and/or pricing services, (vi) information obtained from the issuer,
| | THE GUGGENHEIM FUNDS SEMI-ANNUAL REPORT | 25 |
NOTES TO CONSOLIDATED FINANCIAL STATEMENTS (Unaudited)(continued) |
analysts, and/or the appropriate stock exchange (for exchange-traded securities), (vii) an analysis of the company’s financial statements, and (viii) an evaluation of the forces that influence the issuer and the market(s) in which the security is purchased and sold (e.g. the existence of pending merger activity, public offerings or tender offers that might affect the value of the security).
B. Certain U.S. Government and Agency Obligations are traded on a discount basis; the interest rates shown on the Schedule of Investments reflect the effective rates paid at the time of purchase by the Fund. Other securities bear interest at the rates shown, payable at fixed dates through maturity.
C. The Fund may purchase and sell interests in securities on a when-issued and delayed delivery basis, with payment and delivery scheduled for a future date. No income accrues to the Fund on such interests or securities in connection with such transactions prior to the date the Fund actually take delivery of such interests or securities. These transactions are subject to market fluctuations and are subject to the risk that the value at delivery may be more or less than the trade date purchase price. Although the Fund will generally purchase these securities with the intention of acquiring such securities, they may sell such securities before the settlement date.
D. Upon entering into a futures contract, the Fund deposits and maintains as collateral such initial margin as required by the exchange on which the transaction is affected. Pursuant to the contract, the Fund agrees to receive from or pay to the broker an amount of cash equal to the daily fluctuation in value of the contract. Such receipts or payments are known as variation margin and are recorded by the Fund as unrealized gains or losses. When the contract is closed, the Fund records a realized gain or loss equal to the difference between the value of the contract at the time it was opened and the value at the time it was closed.
E. The accounting records of the Fund are maintained in U.S. dollars. All assets and liabilities initially expressed in foreign currencies are converted into U.S. dollars at prevailing exchange rates. Purchases and sales of investment securities, dividend and interest income, and certain expenses are translated at the rates of exchange prevailing on the respective dates of such transactions. Changes in the relationship of these foreign currencies to the U.S. dollar can significantly affect the value of the investments and earnings of the Funds. Foreign investments may also subject the Funds to foreign government exchange restrictions, expropriation, taxation or other political, social or economic developments, all of which could affect the market and/or credit risk of the investments.
26 | THE GUGGENHEIM FUNDS SEMI-ANNUAL REPORT | |
NOTES TO CONSOLIDATED FINANCIAL STATEMENTS (Unaudited)(continued) |
The Funds do not isolate that portion of the results of operations resulting from changes in the foreign exchange rates on investments from the fluctuations arising from changes in the market prices of securities held. Such fluctuations are included with the net realized and unrealized gain or loss on investments.
Reported net realized foreign exchange gains and losses arise from sales of foreign currencies and currency gains or losses realized between the trade and settlement dates on investment transactions. Net unrealized exchange gains and losses arise from changes in the fair values of assets and liabilities other than investments in securities at the fiscal period end, resulting from changes in exchange rates.
F. Security transactions are recorded on the trade date for financial reporting purposes. Realized gains and losses from securities transactions are recorded using the identified cost basis. Proceeds from lawsuits related to investment holdings are recorded as realized gains in the Fund. Dividend income is recorded on the ex-dividend date, net of applicable taxes withheld by foreign countries. Taxable non-cash dividends are recorded as dividend income. Interest income, including amortization of premiums and accretion of discounts, is accrued on a daily basis. Dividend income from REITs is recorded based on the income included in the distributions received from the REIT investments using published REIT classifications, including some management estimates when actual amounts are not available. Distributions received in excess of this estimated amount are recorded as a reduction of the cost of investments or reclassified to capital gains. The actual amounts of income, return of capital, and capital gains are only determined by each REIT after its fiscal year-end, and may differ from the estimated amounts.
G. Distributions of net investment income and net realized gains, if any, are declared and paid at least annually. Dividends are reinvested in additional shares unless shareholders request payment in cash. Distributions are recorded on the ex-dividend date and are determined in accordance with income tax regulations which may differ from U.S. GAAP.
H. Interest and dividend income, most expenses, all realized gains and losses, and all unrealized gains and losses are allocated to the classes based upon the value of the outstanding shares in each Class. Certain costs, such as distribution and service fees are charged directly to specific classes. In addition, certain expenses have been allocated to the individual Funds in the Trust on a pro rata basis upon the respective aggregate net assets of each Fund included in the Trust.
| | THE GUGGENHEIM FUNDS SEMI-ANNUAL REPORT | 27 |
NOTES TO CONSOLIDATED FINANCIAL STATEMENTS (Unaudited)(continued) |
I. The Fund may leave cash overnight in its cash account with the custodian. Periodically, the Fund may have cash due to the custodian bank as an overdraft balance. A fee is incurred on this overdraft, calculated by multiplying the overdraft by a rate based on the federal funds rate.
J. Under the Fund’s organizational documents, its Trustees and Officers are indemnified against certain liabilities arising out of the performance of their duties to the Trust. In addition, throughout the normal course of business, the Fund enters into contracts that contain a variety of representations and warranties which provide general indemnifications. The Fund’s maximum exposure under these arrangements is unknown, as this would involve future claims that may be made against the Fund and/or its affiliates that have not yet occurred. However, based on experience, the Fund expects the risk of loss to be remote.
2. Financial Instruments
As part of its investment strategy, the Fund utilizes a variety of derivative instruments. These investments involve, to varying degrees, elements of market risk and risks in excess of the amounts recognized in the Statement of Assets and Liabilities.
A futures contract is an agreement to purchase (long) or sell (short) an agreed amount of securities or other instruments at a set price for delivery at a future date. There are significant risks associated with a Fund’s use of futures contracts, including (i) there may be an imperfect or no correlation between the changes in market value of the underlying asset and the prices of futures contracts; (ii) there may not be a liquid secondary market for a futures contract; (iii) trading restrictions or limitations may be imposed by an exchange; and (iv) government regulations may restrict trading in futures contracts. When investing in futures, there is minimal counterparty credit risk to the Fund because futures are exchange-traded and the exchange’s clearinghouse, as counterparty to all exchange-traded futures, guarantees against default. Cash deposits are shown as segregated cash with broker on the Statement of Assets and Liabilities; securities held as collateral are noted on the Schedule of Investments.
The Fund’s use of derivative instruments provides leveraged exposure. In addition, as investment in derivative instruments generally requires a small investment relative to the amount of investment exposure assumed, this creates an opportunity for increased net income but, at the same time, additional leverage risk. The Fund’s use of leverage, through borrowings or instruments such as derivatives, may cause the Fund to be more volatile and riskier than if they had not been leveraged.
28 | THE GUGGENHEIM FUNDS SEMI-ANNUAL REPORT | |
NOTES TO CONSOLIDATED FINANCIAL STATEMENTS (Unaudited)(continued) |
In conjunction with the use of derivative instruments, the Fund is required to maintain collateral in various forms. The Fund uses, where appropriate, depending on the financial instrument utilized and the broker involved, margin deposits at the broker, cash and/or securities segregated at the custodian bank, discount notes or the repurchase agreements allocated to the Fund.
The Trust has established counterparty credit guidelines and enters into transactions only with financial institutions of investment grade or better. The Trust monitors the counterparty credit risk.
3. Fees and Other Transactions with Affiliates
Under the terms of an investment advisory contract, the Fund and the Subsidiary pay GI investment advisory fees calculated at an annualized rate of 0.90% of their average daily net assets.
GI has contractually agreed to waive the management fee it receives from the Subsidiary in an amount equal to the management fee paid to GI by the Subsidiary. This undertaking will continue in effect for so long as the Fund invests in the Subsidiary, and may not be terminated by GI unless GI obtains the prior approval of the Fund’s Board of Trustees for such termination.
RFS provides transfer agent and administrative services to the Fund calculated at the annualized rate of 0.20% of the average daily net assets of the Y-Class and 0.25% of the average daily net assets of the remaining classes, respectively.
RFS also provides accounting services to the Fund for fees calculated at annualized rates below, based on the average daily net assets of the Fund.
Fund Accounting Fees | (as a % of Net Assets) |
On the first $250 million | 0.10% |
On the next $250 million | 0.075% |
On the next $250 million | 0.05% |
Over $750 million | 0.03% |
RFS engages external service providers to perform other necessary services for the Trust, such as audit and accounting related services, legal services, custody, printing and mailing, etc., on a pass-through basis. Such expenses are allocated to various Funds within the complex based on relative net assets.
The Trust has adopted a Distribution Plan applicable to A-Class shares and P-Class shares for which GFD and other firms that provide distribution and/or shareholder services (“Service Providers”) may receive compensation. If a Service Provider provides distribution services, the Fund will pay distribution fees to GFD at an annual rate not to exceed 0.25% of average daily net assets, pursuant to Rule 12b-1
| | THE GUGGENHEIM FUNDS SEMI-ANNUAL REPORT | 29 |
NOTES TO CONSOLIDATED FINANCIAL STATEMENTS (Unaudited)(continued) |
of the 1940 Act. GFD, in turn, will pay the Service Provider out of its fees. GFD may, at its discretion, retain a portion of such payments to compensate itself for distribution services.
The Trust has adopted a separate Distribution and Shareholder Services Plan applicable to its C-Class shares that allows the Fund to pay annual distribution and service fees of 1.00% of the Fund’s C-Class shares average daily net assets. The annual 0.25% service fee compensates a shareholder’s financial adviser for providing ongoing services to the shareholder. The annual distribution fee of 0.75% reimburses GFD for paying the shareholder’s financial adviser an ongoing sales commission. GFD advances the first year’s service and distribution fees to the financial adviser. GFD retains the service and distribution fees on accounts with no authorized dealer of record.
If a Fund invests in an affiliated fund, the investing Fund’s Adviser will determine whether to waive fees at the investing fund level. Fee waivers will be calculated at the investing Fund level without regard to any expense cap, if any, in effect for the investing Fund. Fees waived under this arrangement are not subject to reimbursement to GI. For the period June 30, 2015, the Fund waived $5,377 related to investments in affiliated funds.
For the period ended June 30, 2015, GFD retained sales charges of $200,122 relating to sales of A-Class shares of the Trust.
Certain trustees and officers of the Trust are also officers of GI, RFS and GFD.
4. Fair Value Measurement
In accordance with U.S. GAAP, fair value is defined as the price that the Fund would receive to sell an investment or pay to transfer a liability in an orderly transaction with an independent buyer in the principal market, or in the absence of a principal market, the most advantageous market for the investment or liability. U.S. GAAP establishes a three-tier fair value hierarchy based on the types of inputs used to value assets and liabilities and requires corresponding disclosure. The hierarchy and the corresponding inputs are summarized below:
Level 1 — | quoted prices in active markets for identical assets or liabilities. |
Level 2 — | significant other observable inputs (for example quoted prices for securities that are similar based on characteristics such as interest rates, prepayment speeds, credit risk, etc.). |
Level 3 — | significant unobservable inputs based on the best information available under the circumstances, to the extent observable inputs are not available, which may include assumptions. |
30 | THE GUGGENHEIM FUNDS SEMI-ANNUAL REPORT | |
NOTES TO CONSOLIDATED FINANCIAL STATEMENTS (Unaudited)(continued) |
The types of inputs available depend on a variety of factors, such as the type of security and the characteristics of the markets in which it trades, if any. Fair valuation determinations that rely on fewer or no observable inputs require greater judgment. Accordingly, fair value determinations for Level 3 securities require the greatest amount of judgment.
The following table summarizes the inputs used to value the Fund’s investments at June 30, 2015:
| | Level 1
Investments
In Securities | | | Level 1
Other Financial
Instruments* | | | Level 2
Investments
In Securities | | | Level 2
Other Financial
Instruments* | | | Level 3
Investments
In Securities | | | Total | |
Assets | | | | | | | | | | | | | | | | | | |
Managed Futures Strategy Fund | | $ | 170,050,023 | | | $ | 3,602,539 | | | $ | 40,356,830 | | | $ | 1,040,325 | | | $ | — | | | $ | 215,049,717 | |
|
Liabilities | | | | | | | | | | | | | | | | | | | | | | | | |
Managed Futures Strategy Fund | | $ | — | | | $ | 1,562,775 | | | $ | — | | | $ | 730,174 | | | $ | — | | | $ | 2,292,949 | |
* | Other financial instruments may include futures contracts, which are reported as unrealized gain/loss at period end. |
For the period ended June 30, 2015, there were no transfers between levels.
The inputs or methodologies used for valuing securities are not necessarily an indication of the risk associated with investing in those securities. The suitability of the techniques and sources employed to determine fair valuation are regularly monitored and subject to change.
5. Repurchase Agreements
The Funds transfer uninvested cash balances into a single joint account, the daily aggregate balance of which is invested in one or more repurchase agreements collateralized by obligations of the U.S. Treasury and U.S. Government Agencies. The collateral is in the possession of the Funds’ custodian and is evaluated to ensure that its market value exceeds, at a minimum, 102% of the original face amount of the repurchase agreements. Each Fund holds a pro rata share of the collateral based on the dollar amount of the repurchase agreement entered into by each Fund.
| | THE GUGGENHEIM FUNDS SEMI-ANNUAL REPORT | 31 |
NOTES TO CONSOLIDATED FINANCIAL STATEMENTS (Unaudited)(continued) |
At June 30, 2015, the repurchase agreements in the joint account were as follows:
Counterparty and
Terms of Agreement | | | Face
Value | | | | Repurchase
Price | | Collateral | | | Par
Value | | | | Fair
Value |
HSBC Group | | | | | | | | | U.S. Treasury Strips | | | | | | | |
0.04% | | | | | | | | | 0.00% | | | | | | | |
Due 07/01/15 | | $ | 250,551,232 | | | $ | 250,551,510 | | 11/15/28 - 02/15/44 | | $ | 614,648,800 | | | $ | 255,562,354 |
| | | | | | | | | | | | | | | | | |
RBC Capital Markets | | | | | | | | | U.S. TIP Bond | | | | | | | |
0.04% | | | | | | | | | 3.88% | | | | | | | |
Due 07/01/15 | | | 116,812,087 | | | | 116,812,217 | | 04/15/29 | | | 41,000,000 | | | | 84,582,306 |
| | | | | | | | | | U.S. TIP Note | | | | | | | |
| | | | | | | | | | 0.13% | | | | | | | |
| | | | | | | | | | 04/15/16 | | | 32,108,700 | | | | 34,566,039 |
| | | | | | | | | | | | | | | | | |
UMB Financial Corp. | | | | | | | | | U.S. Treasury Notes | | | | | | | |
0.04% | | | | | | | | | 3.13% - 3.25% | | | | | | | |
Due 07/01/15 | | | 67,451,288 | | | | 67,451,363 | | 10/31/16 - 12/31/16 | | | 66,110,600 | | | | 68,800,331 |
In the event of counterparty default, the Funds have the right to collect the collateral to offset losses incurred. There is potential loss to the Funds in the event the Funds are delayed or prevented from exercising their rights to dispose of the collateral securities, including the risk of a possible decline in the value of the underlying securities during the period while the Funds seek to assert their rights. The Funds’ investment adviser, acting under the supervision of the Board of Trustees, reviews the value of the collateral and the creditworthiness of those banks and dealers with which the Funds enter into repurchase agreements to evaluate potential risks.
6. Derivative Investment Holdings Categorized by Risk Exposure
U.S. GAAP requires disclosures to enable investors to better understand how and why the Fund uses derivative instruments, how these derivative instruments are accounted for and their effects on the Fund’s financial position and results of operations.
The Fund utilized derivatives for the following purposes:
Fund | Index Exposure | Liquidity | Leverage |
Managed Futures Strategy Fund | x | x | x |
32 | THE GUGGENHEIM FUNDS SEMI-ANNUAL REPORT | |
NOTES TO CONSOLIDATED FINANCIAL STATEMENTS (Unaudited)(continued) |
The following table represents the notional amount of derivative instruments outstanding as an approximate percentage of the Fund’s net assets on a quarterly basis.
| | Approximate percentage of Fund’s Net Assets on a quarterly basis |
Fund | Long | Short |
Managed Futures Strategy Fund | 415% | 80% |
The following is a summary of the location of derivative investments on the Fund’s Statement of Assets and Liabilities as of June 30, 2015:
Derivative Investment Type | Asset Derivatives | Liability Derivatives |
Equity/Interest Rate/Currency/Commodity contracts | Variation margin | Variation margin |
The following table sets forth the fair value of the Fund’s derivative investments categorized by primary risk exposure at June 30, 2015:
Asset Derivative Investments Value | |
Fund | | Futures
Equity
Contracts* | | | Futures Currency Contracts* | | | Futures
Interest Rate
Contracts* | | | Futures
Commodity
Contracts* | | | Total Value at
June 30,
2015 | |
Managed Futures Strategy Fund | | $ | 362,040 | | | $ | 129,758 | | | $ | 1,014,524 | | | $ | 3,136,542 | | | $ | 4,642,864 | |
Liability Derivative Investments Value | |
Fund | | Futures
Equity
Contracts* | | | Futures Currency Contracts* | | | Futures
Interest Rate
Contracts* | | | Futures
Commodity
Contracts* | | | Total Value at
June 30,
2015 | |
Managed Futures Strategy Fund | | $ | 1,012,045 | | | $ | 220,734 | | | $ | 6,499 | | | $ | 1,053,671 | | | $ | 2,292,949 | |
* | Includes cumulative appreciation (depreciation) of futures contracts as reported on the Schedule of Investments. Only current day’s variation margin is reported within the Statement of Assets and Liabilities. |
| | THE GUGGENHEIM FUNDS SEMI-ANNUAL REPORT | 33 |
NOTES TO CONSOLIDATED FINANCIAL STATEMENTS (Unaudited)(continued) |
The following is a summary of the location of derivative investments on the Fund’s Statement of Operations for the period ended June 30, 2015:
Derivative Investment Type | Location of Gain (Loss) on Derivatives |
Equity/Interest Rate/Currency/Commodity contracts | Net realized gain (loss) on futures contracts |
| Net change in unrealized appreciation (depreciation) on futures contracts |
The following is a summary of the Fund’s realized gain (loss) and change in unrealized appreciation (depreciation) on derivative investments recognized on the Statement of Operations categorized by primary risk exposure for the period ended June 30, 2015:
Realized Gain (Loss) on Derivative Investments Recognized on the Statement of Operations | |
Fund | | Futures
Equity
Contracts | | | Futures
Currency
Contracts | | | Futures
Interest Rate
Contracts | | | Futures
Commodity
Contracts | | | Total | |
Managed Futures Strategy Fund | | $ | 9,746,413 | | | $ | 556,130 | | | $ | (247,873 | ) | | $ | (28,355 | ) | | $ | 10,026,315 | |
Change in Unrealized Appreciation (Depreciation) on Derivative Investments Recognized on the Statement of Operations | |
Fund | | Futures
Equity
Contracts | | | Futures
Currency
Contracts | | | Futures
Interest Rate
Contracts | | | Futures
Commodity
Contracts | | | Total | |
Managed Futures Strategy Fund | | $ | (1,388,515 | ) | | $ | (734,052 | ) | | $ | (4,542,295 | ) | | $ | (2,162,843 | ) | | $ | (8,827,705 | ) |
7. Federal Income Tax Information
The Fund intends to comply with the provisions of Subchapter M of the Internal Revenue Code applicable to regulated investment companies and will distribute substantially all taxable net investment income and capital gains sufficient to relieve the Fund from all, or substantially all, federal income, excise and state income taxes. Therefore, no provision for federal or state income tax is required.
Tax positions taken or expected to be taken in the course of preparing the Fund’s tax returns are evaluated to determine whether the tax positions are “more-likely-than-not” of being sustained by the applicable tax authority. Tax positions not deemed to meet the more-likely-than-not threshold would be recorded as a tax benefit or expense in the current year. Management has analyzed the Fund’s tax positions taken, or to be taken, on Federal income tax returns for all open tax
34 | THE GUGGENHEIM FUNDS SEMI-ANNUAL REPORT | |
NOTES TO CONSOLIDATED FINANCIAL STATEMENTS (Unaudited)(continued) |
years, and has concluded that no provision for income tax is required in the Fund’s financial statements. The Fund’s federal tax returns are subject to examination by the Internal Revenue Service for a period of three years after they are filed.
The Fund intends to invest up to 25% of its assets in the Subsidiary which is expected to provide the Fund with exposure to the commodities markets within the limitations of the federal tax requirements under Subchapter M of the Internal Revenue Code. The Fund has received a private letter ruling from the IRS that concludes that the income the Fund receives from the Subsidiary will constitute qualifying income for purposes of Subchapter M of the Internal Revenue Code. The Subsidiary will be classified as a corporation for U.S. federal income tax purposes. A foreign corporation, such as the Subsidiary, will generally not be subject to U.S. federal income taxation unless it is deemed to be engaged in a U.S. trade or business.
At June 30, 2015, the cost of securities for Federal income tax purposes, the aggregate gross unrealized gain for all securities for which there was an excess of value over tax cost and the aggregate gross unrealized loss for all securities for which there was an excess of tax cost over value, were as follows:
Fund | | Tax
Cost | | | Tax
Unrealized
Gain | | | Tax
Unrealized
Loss | | | Net
Unrealized
Loss | |
Managed Futures Strategy Fund | | $ | 278,975,575 | | | $ | — | | | $ | (68,568,722 | ) | | $ | (68,568,722 | ) |
8. Securities Transactions
For the period ended June 30, 2015, the cost of purchases and proceeds from sales of investment securities, excluding government securities, short-term investments and derivatives, were as follows:
Fund | | Purchases | | | Sales | |
Managed Futures Strategy Fund | | $ | 19,409,711 | | | $ | 35,793,211 | |
9. Affiliated Transactions
Investments representing 5% or more of the outstanding voting shares of a portfolio company of a fund, or control of or by, or common control under GI, result in that portfolio company being considered an affiliated company of such fund, as defined in the 1940 Act.
The Fund may invest in the Guggenheim Strategy Funds Trust consisting of Guggenheim Strategy Fund I, Guggenheim Strategy Fund II, Guggenheim Strategy Fund III, and Guggenheim Variable Insurance Strategy Fund III (collectively, the “Cash Management Funds”), open-end management investment companies managed by GI.
| | THE GUGGENHEIM FUNDS SEMI-ANNUAL REPORT | 35 |
NOTES TO CONSOLIDATED FINANCIAL STATEMENTS (Unaudited)(continued) |
The Cash Management Funds, which launched on March 11, 2014, are offered as cash management options only to mutual funds, trusts, and other accounts managed by GI and/or its affiliates, and are not available to the public. The Cash Management Funds pay no investment management fees. The Cash Management Funds’ annual report on Form N-CSR dated September 30, 2014 is available publicly or upon request. This information is available from the EDGAR database on the SEC’s website at http://www.sec.gov.
Transactions during the period ended June 30, 2015 in which the portfolio company is an “affiliated person” are as follows:
Affiliated issuers | | Value
12/31/14 | | | Additions | | | Reductions | | | Value
06/30/15 | | | Shares
06/30/15 | | | Investment
Income | | | Realized
Loss | |
Managed Futures Strategy Fund | | | | | | | | | | |
Guggenheim Enhanced Short Duration ETF | | $ | — | | | $ | — | | | $ | — | | | $ | 5,428,672 | | | | 108,400 | | | $ | 27,414 | | | $ | — | |
Guggenheim Strategy Fund I | | | 57,871,940 | | | | 14,365,616 | | | | (7,000,000 | ) | | | 65,418,394 | | | | 2,625,136 | | | | 367,704 | | | | (24,218 | ) |
Guggenheim Strategy Fund II | | | 59,459,690 | | | | 4,410,062 | | | | (7,000,000 | ) | | | 56,996,306 | | | | 2,288,089 | | | | 412,368 | | | | (36,605 | ) |
Guggenheim
Strategy Fund III | | | 41,599,972 | | | | 405,160 | | | | — | | | | 42,206,651 | | | | 1,690,972 | | | | 407,238 | | | | — | |
| | | $ | 158,931,602 | | | $ | 19,180,838 | | | $ | (14,000,000 | ) | | $ | 170,050,023 | | | | | | | $ | 1,214,724 | | | $ | (60,823 | ) |
10. Line of Credit
The Trust, along with other affiliated trusts, secured an uncommitted, $75,000,000 line of credit from U.S. Bank, N.A., which expires June 12, 2016. This line of credit is reserved for emergency or temporary purposes. Borrowings, if any, under this arrangement bear interest equal to the Prime Rate, minus 2%, which shall be paid monthly, averaging 1.25% for the period ended June 30, 2015. The Fund did not have any borrowings under this agreement at June 30, 2015, and did not participate in borrowing during the period.
11. Legal Proceedings
Tribune Company
Rydex Series Funds has been named as a defendant and a putative member of the proposed defendant class of shareholders in the case entitled Kirschner v. FitzSimons, No. 12-2652 (S.D.N.Y.) (formerly Official Committee of Unsecured Creditors of Tribune Co. v. FitzSimons, Adv. Pro. No. 10-54010 (Bankr. D. Del.)) (the “FitzSimons action”), as a result of ownership by certain series of the Rydex Series Funds of shares in the Tribune Company (“Tribune”) in 2007, when Tribune effected a leveraged buyout transaction (“LBO”) by which Tribune converted to a privately-held company. In his complaint,
36 | THE GUGGENHEIM FUNDS SEMI-ANNUAL REPORT | |
NOTES TO CONSOLIDATED FINANCIAL STATEMENTS (Unaudited)(continued) |
the plaintiff has alleged that, in connection with the LBO, Tribune insiders and shareholders were overpaid for their Tribune stock using financing that the insiders knew would, and ultimately did, leave the Tribune Company insolvent. The plaintiff has asserted claims against certain insiders, major shareholders, professional advisers, and others involved in the LBO. The plaintiff is also attempting to obtain from former Tribune shareholders, including the Rydex Series Funds, the proceeds they received in connection with the LBO.
In June 2011, a group of Tribune creditors filed multiple actions against former Tribune shareholders involving state law constructive fraudulent conveyance claims arising out of the 2007 LBO (the “SLCFC actions”). Rydex Series Funds has been named as a defendant in one of the SLCFC actions: Deutsche Bank Trust Co. Americas v. McGurn, No. 11-1510 (S.D.N.Y.). In those actions, the creditors seek to recover from Tribune’s former shareholders the proceeds received in connection with the 2007 LBO.
The FitzSimons action and the SLCFC actions have been consolidated with the majority of the other Tribune LBO-related lawsuits in a multidistrict litigation proceeding captioned In re Tribune Company Fraudulent Conveyance Litig., No. 11-md-2696 (S.D.N.Y.) (the “MDL Proceeding”).
On September 23, 2013, the District Court granted the defendants’ omnibus motion to dismiss the SLCFC actions, on the basis that the creditors lacked standing. On September 30, 2013, the creditors filed a notice of appeal of the September 23 order. On October 28, 2013, the defendants filed a joint notice of cross-appeal of that same order.
The SLCFC appeals have been fully briefed, and oral argument in front of the U.S. Court of Appeals for the Second Circuit occurred on November 5, 2014. The Court has not yet issued a decision on the appeals.
On May 23, 2014, the defendants filed motions to dismiss the FitzSimons action, including a global motion to dismiss Count I, which is the claim brought against former Tribune shareholders for intentional fraudulent conveyance under U.S. federal law. The Court has not yet issued a decision on any of these motions.
None of these lawsuits alleges any wrongdoing on the part of Rydex Series Funds. The following series of Rydex Series Funds held shares of Tribune and tendered these shares as part of Tribune’s LBO: Nova Fund, S&P 500® Pure Value Fund, Multi-Cap Core Equity Fund, S&P 500® Fund, Multi-Hedge Strategies Fund and Hedged Equity Fund (the “Funds”). The value of the proceeds received by the foregoing Funds was $28,220, $109,242, $9,860, $3,400, $1,181,160, and $10,880,
| | THE GUGGENHEIM FUNDS SEMI-ANNUAL REPORT | 37 |
NOTES TO CONSOLIDATED FINANCIAL STATEMENTS (Unaudited)(continued) |
respectively. At this stage of the proceedings, Rydex Series Funds is not able to make a reliable predication as to the outcome of these lawsuits or the effect, if any, on a Fund’s net asset value.
Lyondell Chemical Company
In December 2011, Rydex Series Funds was named as a defendant in Weisfelner, as Trustee of the LB Creditor Trust, v. Fund 1 (In re Lyondell Chemical Co.), Adv. Pro. No. 10-4609 (Bankr. S.D.N.Y.) (the “Creditor Trust action”).
Similar to the claims made in the Tribune matter, the Weisfelner complaint seeks to have set aside and recovered as fraudulent transfers from former Lyondell Chemical Company (“Lyondell”) shareholders the consideration paid to them pursuant to the cash out merger of Lyondell shareholders in connection with the combination of Lyondell and Basell AF in 2007. Lyondell filed for bankruptcy in 2008.
On April 7, 2014, the plaintiff filed a Third Amended Complaint. In the related action entitled Weisfelner, as Trustee of the LB Litigation Trust v. A. Holmes & H. Holmes TTEE (In re Lyondell Co.), Adversary Proceeding No. 10-5525 (Bankr. S.D.N.Y.) (the “Litigation Trust action”), the plaintiff also filed a Second Amended Complaint that alleges a claim against the former Lyondell shareholders under federal law for intentional fraudulent transfer. A third related action against the former Lyondell shareholders, Weisfelner, as Trustee of the LB Creditor Trust v. Reichman, Adversary Proceeding No. 12-1570 (Bankr. S.D.N.Y.) (the “Reichman action”), is pending as well.
On May 8, 2014, the plaintiff in the Litigation Trust action filed a motion to certify a defendant class generally comprised of all former Lyondell shareholders that received proceeds in exchange for their shares in the 2007 merger transaction.
On July 30, 2014, the defendants filed a motion to dismiss these lawsuits. The Court held oral argument on the motions to dismiss and on the motion for class certification on January 14 and January 15, 2015. The Court has not yet issued decisions on these motions. Discovery has commenced in these lawsuits .
These lawsuits do not allege any wrongdoing on the part of Rydex Series Funds. The following series of Rydex Series Funds received cash proceeds from the cash out merger in the following amounts: Basic Materials Fund - $1,725,168; Long Short Equity Fund f/k/a U.S. Long Short Momentum Fund - $2,193,600; Global 130/30 Strategy Fund - $37,920; Hedged Equity Fund - $1,440; and Multi-Hedge Strategies Fund - $1,116,480. At this stage of the proceedings, Rydex Series Funds is not able to make a reliable predication as to the outcome of these lawsuits or the effect, if any, on a Fund’s net asset value.
38 | THE GUGGENHEIM FUNDS SEMI-ANNUAL REPORT | |
NOTES TO CONSOLIDATED FINANCIAL STATEMENTS (Unaudited)(concluded) |
12. Y-Class Share Information
At a meeting of the Board of Trustees (the “Board”) of Rydex Series Funds (the “Trust”) held on May 18, 2015, Security Investors, LLC, the investment adviser to the Managed Futures Strategy Fund (the “Fund”), recommended, and the Board approved, the closing and subsequent liquidation of the Fund’s Class Y shares (the “Liquidation”). Accordingly, the Fund’s Class Y shares ceased operations, liquidated their assets, and distributed the liquidation proceeds to Class Y shareholders of record on June 26, 2015 (the “Liquidation Date”).
13. H-Class Shares to be Redesignated P-Class Shares
Effective following the close of business on April 30, 2015, (the “Redesignation Date”), all outstanding H-Class shares of the Guggenheim Managed Futures Strategy Fund, which is a separate series of Rydex Series Funds, were redesignated as P-Class shares, and the Fund will no longer offer H-Class shares.
14. New Accounting Pronouncement
In June 2014, the Financial Accounting Standards Board (“FASB”) issued an Accounting Standards Update (“ASU”) No. 2014-11, Transfers and Servicing, which addresses concerns about current accounting and disclosures for repurchase agreements and similar transactions. The new disclosure is effective for Funds whose annual periods begin on or after December 31, 2014 and for interim periods beginning on or after March 31, 2015. Management is evaluating the impact of this update on its current disclosures.
| | THE GUGGENHEIM FUNDS SEMI-ANNUAL REPORT | 39 |
OTHER INFORMATION (Unaudited) |
Proxy Voting Information
A description of the policies and procedures that the Trust uses to determine how to vote proxies relating to securities held in the Funds’ portfolios is available, without charge and upon request, by calling 800.820.0888. This information is also available from the EDGAR database on the SEC’s website at http://www.sec.gov.
Information regarding how the Funds voted proxies relating to portfolio securities during the most recent 12-month period ended June 30 is available without charge, upon request, by calling 800.820.0888. This information is also available from the EDGAR database on the SEC’s website at http://www.sec.gov.
Quarterly Portfolio Schedules Information
The Trust files its complete schedule of portfolio holdings with the SEC for the first and third quarters of each fiscal year on Form N-Q; which are available on the SEC’s website at http://www.sec.gov. The Funds’ Forms N-Q may be reviewed and copied at the SEC’s Public Reference Room in Washington, DC, and that information on the operation of the Public Reference Room may be obtained by calling 800-SEC-0330. Copies of the portfolio holdings are also available to shareholders, without charge and upon request, by calling 800.820.0888.
Board Considerations in Approving the Investment Advisory Agreement
The Board of Trustees (the “Board”) of the Rydex Series Funds (the “Trust”), including the Trustees who are not “interested persons,” as defined by the Investment Company Act of 1940, of the Trust (“Independent Trustees”), at an in-person meeting held on May 18, 2015, called for the purpose of, among other things, consideration of, and voting on, the approval and continuation of the investment advisory agreement (the “Investment Advisory Agreement”) between the Trust and Security Investors, LLC (the “Adviser”) applicable to each series of the Trust (each, a “Fund” and collectively, the “Funds”), unanimously approved the continuation of the Investment Advisory Agreement for an additional one-year period, based on the Board’s review of qualitative and quantitative information provided by the Adviser. The Board had previously considered information pertaining to the renewal of the Investment Advisory Agreement at an in-person meeting held on April 28, 2015 (together, with the May 18 meeting, the “Meetings”).
In reaching the conclusion to approve the continuation of the Investment Advisory Agreement, the Independent Trustees requested and obtained from the Adviser such information as the Independent Trustees deemed reasonably necessary to evaluate the Investment Advisory Agreement. The Independent Trustees carefully evaluated this information and were advised with respect to their deliberations by independent legal counsel, who attended both Meetings. In addition, the Board also received
40 | THE GUGGENHEIM FUNDS SEMI-ANNUAL REPORT | |
OTHER INFORMATION (Unaudited)(continued) |
a memorandum from Fund counsel regarding the responsibilities of the Board for the approval of investment advisory agreements, and the Independent Trustees participated in question and answer sessions with representatives of the Adviser.
In considering the approval of the Investment Advisory Agreement, the Board determined that the agreement would enable shareholders of the Funds to continue to obtain high quality services at a cost that was appropriate, reasonable, and in the best interests of their shareholders. The Board, including the Independent Trustees, unanimously approved the Investment Advisory Agreement. In reaching their decision, the Trustees carefully considered information that they had received throughout the year as part of their regular oversight of the Funds, including, in particular, information from the Adviser that the Board had received relating to the Investment Advisory Agreement at the Meetings. The Board noted that, at the Meetings, they had obtained and reviewed a wide variety of information, including FUSE reports (described below) that provide comparative information regarding each Fund’s fees, expenses, and performance relative to the fees, expenses, and performance of other comparable funds.
As a part of their consideration of the approval of the Investment Advisory Agreement at the Meetings, the Board, including the Independent Trustees, had evaluated a number of considerations, including among others: (a) the nature, extent and quality of the Adviser’s investment advisory and other services; (b) the Adviser’s investment management personnel; (c) the Adviser’s operations and financial condition; (d) the Adviser’s brokerage practices (including any soft dollar arrangements) and the variety and complexity of its investment strategies; (e) a comparison of the Funds’ advisory fees to the fees charged to comparable funds or accounts, paying special attention to economies of scale and the absence of breakpoints in these fees and the Adviser’s rationale for not including breakpoints; (f) each Fund’s overall fees and operating expenses compared with those of peer funds; (g) the Adviser’s profitability from its Fund-related operations; (h) the Adviser’s compliance systems; (i) the Adviser’s policies and compliance procedures; (j) the Adviser’s reputation, expertise and resources in the financial markets; and (k) Fund performance compared with that of peer funds and/or appropriate benchmarks. In its deliberations, the Board did not identify any single piece of information that was all-important or controlling. Based on the Board’s deliberations at the Meetings, the Board, including all of the Independent Trustees, unanimously: (a) concluded that terms of the Investment Advisory Agreement were fair and reasonable; (b) concluded that the Adviser’s fees were reasonable in light of the services that it provides to the Funds; and (c) agreed to approve and continue the Investment Advisory Agreement based upon the following considerations, among others:
| | THE GUGGENHEIM FUNDS SEMI-ANNUAL REPORT | 41 |
OTHER INFORMATION (Unaudited)(continued) |
| | ● | Nature, Extent and Quality of Services Provided by the Adviser. At the Meetings, the Board evaluated, among other things, the Adviser’s business, financial resources, quality and quantity of personnel, experience, past performance, the variety and complexity of its investment strategies, brokerage practices, and the adequacy of its compliance systems. The Board reviewed the scope of services to be provided by the Adviser under the Investment Advisory Agreement and noted that there would be no significant differences between the scope of services required to be provided by the Adviser for the past year and the scope of services required to be provided during the upcoming year. The Board also considered the Adviser’s representations to the Board that the Adviser would continue to provide investment and related services that were of materially the same quality and quantity as services provided to the Funds in the past, and that these services are appropriate in scope and extent in light of the Funds’ operations, the competitive landscape of the investment company business and investor needs. |
| | ● | Fund Expenses and Performance of the Funds and the Adviser. At the Meetings, the Board reviewed statistical information provided by the Adviser regarding the expense ratio components and performance of each Fund. The Adviser engaged FUSE Research Network LLC (“FUSE”), an independent, third party research provider, to prepare advisory contract renewal reports to help the Board compare the Funds’ fees, expenses and total return performance with those of a peer group and peer universe of funds selected by FUSE. Each Fund’s expense ratio components, including actual advisory fees, waivers/reimbursements, and gross and net total expenses, are compared to those of other funds with shared key characteristics (e.g., asset size, fee structure, sector or industry) determined by FUSE to comprise a Fund’s applicable peer group. The Board also considered the Adviser’s representation that it found the peer groups compiled by FUSE to be appropriate. The statistical information related to the performance of each Fund included three month and one-, three-, and five-year performance for the Fund compared to its peers. |
| | ● | Costs of Services Provided to the Funds and Profits Realized by the Adviser and its Affiliates. At the Meetings, the Board reviewed information about the profitability of the Funds to the Adviser based on the advisory fees payable under the current Investment Advisory Agreement for the last calendar year. At the Meetings, the Board also analyzed the Funds’ expenses, including the investment advisory fees paid to the Adviser, and reviewed reports prepared by FUSE comparing the expense ratios of the Funds to those of other comparable funds. The Board also reviewed information regarding the direct revenue received |
42 | THE GUGGENHEIM FUNDS SEMI-ANNUAL REPORT | |
OTHER INFORMATION (Unaudited)(continued) |
| by the Adviser and ancillary revenue received by the Adviser and/ or its affiliates in connection with the services provided to the Funds by the Adviser and/or its affiliates. The Board also discussed the Adviser’s profit margin, including the methodology used, as reflected in the Adviser’s profitability analysis. |
| | ● | Economies of Scale. In connection with its review of the Funds’ profitability analysis at the Meetings, the Board considered the absence of breakpoints in the Adviser’s fee schedule and reviewed information regarding the extent to which economies of scale or other efficiencies may result from increases in the Funds’ asset levels. In light of the relatively small size of many of the Funds and the fact that the size of individual Funds in the complex increases and decreases significantly from time to time due to unlimited trading that is permitted among most of the Funds in the complex, the Board concluded that the Funds have not yet achieved sufficient asset levels to realize significant economies of scale. |
| | ● | Other Benefits to the Adviser and/or its Affiliates. In addition to evaluating the Adviser’s services, the Board considered the nature, extent, quality and cost of certain administrative, distribution, and shareholder services performed by the Adviser’s affiliates under separate agreements and the Distribution and Shareholders Services Plan pursuant to Rule 12b-1 of the 1940 Act. |
On the basis of the information provided to it and its evaluation of that information, the Board, including the Independent Trustees, concluded that the terms of the Investment Advisory Agreement were reasonable, and that approval of the Investment Advisory Agreement was in the best interests of the Funds.
P-Class Share Information
P-Class shares of the Funds are offered primarily through broker/dealers and other financial intermediaries with which Guggenheim Funds Distributors, LLC has an agreement for the use of P-Class shares of the Funds in investment products, programs or accounts. P-Class shares do not have a minimum initial investment amount, subsequent investment amount or a minimum account balance. The Funds reserves the right to modify their minimum investment amount and account balance requirements at any time, with or without prior notice to you.
Following the redesignation of outstanding H-Class shares, H-Class shareholders who currently have accounts held directly at Guggenheim Investments will not be permitted to purchase additional P-Class shares or exchange their P-Class shares for P-Class shares or any other share class of other Guggenheim Funds. Guggenheim Investments will be separately notifying these shareholders of their redemption and exchange options should they decide they do not want to hold P-Class shares
| | THE GUGGENHEIM FUNDS SEMI-ANNUAL REPORT | 43 |
OTHER INFORMATION (Unaudited)(concluded) |
upon the redesignation of their H-Class shares. H-Class shareholders should contact Guggenheim Investments Client Services at 800.820.0888 or 301.296.5100 with any questions about the redesignation of their H-Class shares.
No action is required of H-Class shareholders to effect the redesignation of their current H-Class shares.
For more information, or to request copies of the Funds’ prospectuses, call Client Services at 800.820.0888 or visiting guggenheiminvestments.com.
44 | THE GUGGENHEIM FUNDS SEMI-ANNUAL REPORT | |
INFORMATION ON BOARD OF TRUSTEES AND OFFICERS (Unaudited) |
A Board of Trustees oversees the Trust, as well as other trusts of GI, in which its members have no stated term of service, and continue to serve after election until resignation. The Statement of Additional Information includes further information about Fund Trustees and Officers, and can be obtained without charge by visiting guggenheiminvestments.com or by calling 800.820.0888.
Name, Address* and Year of Birth of Trustee | Position(s) Held with the Trust, Term of Office and Length of Time Served | Principal Occupation(s) During Past
5 Years | Number of Portfolios in Fund Complex Overseen by Trustee*** | Other Directorships Held by
Trustee |
INTERESTED TRUSTEE | | | |
Donald C. Cacciapaglia** (1951) | Trustee from 2012 to present. | Current: President and CEO, certain other funds in the Fund Complex (2012-present); Vice Chairman, Guggenheim Investments (2010-present). Former: Chairman and CEO, Channel Capital Group, Inc. (2002-2010). | 221 | Clear Spring Life Insurance Company (2015-present); Guggenheim Partners Japan, Ltd. (2014-present); Delaware Life (2013-present); Guggenheim Life and Annuity Company (2011-present); Paragon Life Insurance Company of Indiana (2011-present). |
INDEPENDENT TRUSTEES | | | |
Corey A. Colehour (1945) | Trustee and Member of the Audit, Governance, Nominating, and Investment and Performance Committees from 1998 to present. | Retired. | 133 | None. |
| | THE GUGGENHEIM FUNDS SEMI-ANNUAL REPORT | 45 |
INFORMATION ON BOARD OF TRUSTEES AND OFFICERS (Unaudited)(continued) |
Name, Address* and Year of Birth of Trustee | Position(s) Held with the
Trust, Term of Office and
Length of Time Served | Principal Occupation(s)
During Past
5 Years | Number of Portfolios in Fund Complex Overseen by Trustee*** | Other
Directorships
Held by
Trustee |
INDEPENDENT TRUSTEES - continued |
J. Kenneth Dalton (1941) | Trustee, Member and Chairman of the Audit Committee, and Member of the Governance and Nominating Committees from 1998 to present; and Member of the Risk Oversight Committee from 2010 to present. | Retired. | 133 | Epiphany Funds (4) (2009-present). |
John O. Demaret (1940) | Vice Chairman of the Board of Trustees from 2014 to present; Trustee from 1998 to present and Chairman of the Board from 2006 to 2014; Member and Chairman of the Audit Committee from 1998 to present; and Member of the Risk Oversight Committee from 2010 to present. | Retired. | 133 | None. |
Werner E. Keller (1940) | Chairman of the Board from 2014 to present; Trustee and Member of the Audit, Governance, and Nominating Committees from 2005 to present; and Chairman and Member of the Risk Oversight Committee from 2010 to present. | Current: Founder and President, Keller Partners, LLC (investment research firm) (2005-present). | 133 | None. |
46 | THE GUGGENHEIM FUNDS SEMI-ANNUAL REPORT | |
INFORMATION ON BOARD OF TRUSTEES AND OFFICERS (Unaudited)(continued) |
Name, Address* and Year of Birth of Trustee | Position(s) Held with the
Trust, Term of Office and
Length of Time Served | Principal Occupation(s)
During Past
5 Years | Number of Portfolios in Fund Complex Overseen by Trustee*** | Other
Directorships
Held by
Trustee |
INDEPENDENT TRUSTEES - concluded |
Thomas F. Lydon, Jr. (1960) | Trustee and Member of the Audit, Governance, and Nominating Committees from 2005 to present. | Current: President, Global Trends Investments (registered investment adviser) (1996-present). | 133 | US Global Investors (GROW) (1995-present). |
Patrick T. McCarville (1942) | Trustee, Member of the Audit Committee, and Chairman and Member of the Governance and Nominating Committees from 1998 to present. | Retired. Former: Chief Executive Officer, Par Industries, Inc., d/b/a Par Leasing (1977-2010). | 133 | None. |
Name, Address* and Year of Birth | Position(s) Held with the
Trust, Term of Office and
Length of Time Served | Principal Occupation(s)
During Past 5 Years |
OFFICERS | | |
Donald C. Cacciapaglia (1951) | President (2012-present). | Current: President and CEO, certain other funds in the Fund Complex (2012-present); Vice Chairman, Guggenheim Investments (2010-present). Former: Chairman and CEO, Channel Capital Group Inc. (2002-2010). |
| | THE GUGGENHEIM FUNDS SEMI-ANNUAL REPORT | 47 |
INFORMATION ON BOARD OF TRUSTEES AND OFFICERS (Unaudited)(continued) |
Name, Address* and Year of Birth | Position(s) Held
with the
Trust, Term of
Office and
Length of Time
Served | Principal Occupation(s)
During Past 5 Years |
OFFICERS - continued | |
Michael P. Byrum (1970) | Vice President (1999-present). | Current: Senior Vice President, Security Investors, LLC (2010-present); President and Chief Investment Officer, Rydex Holdings, LLC (2008-present); Director and Chairman, Advisory Research Center, Inc. (2006-present); Manager, Guggenheim Specialized Products, LLC (2005-present). Former: Vice President, Guggenheim Distributors, LLC (2009); Director (2009-2010) and Secretary (2002-2010), Rydex Fund Services, LLC; Director (2008-2010), Chief Investment Officer (2006-2010), President (2004-2010) and Secretary (2002-2010), Rydex Advisors, LLC; Director (2008-2010), Chief Investment Officer (2006-2010), President (2004-2010) and Secretary (2002-2010), Rydex Advisors II, LLC. |
Nikolaos Bonos (1963) | Vice President and Treasurer (2003-present). | Current: Senior Vice President, Security Investors, LLC (2010-present); Chief Executive Officer, Guggenheim Specialized Products, LLC (2009-present); Chief Executive Officer & President, Rydex Fund Services, LLC (2009-present); Vice President, Rydex Holdings, LLC (2008-present). Former: Senior Vice President, Security Global Investors, LLC (2010-2011); and Senior Vice President, Rydex Advisors, LLC and Rydex Advisors II, LLC (2006-2011). |
Elisabeth Miller (1968) | Chief Compliance Officer (2012-present). | Current: CCO, certain other funds in the Fund Complex (2012-present); CCO, Security Investors, LLC (2012-present); CCO, Guggenheim Funds Investment Advisors, LLC (2012-present); Managing Director, Guggenheim Investments (2012-present); Vice President, Guggenheim Funds Distributors, LLC (March 2014-present). Former: CCO, Guggenheim Distributors, LLC (2009-March 2014); Senior Manager, Security Investors, LLC (2004-2009); Senior Manager, Guggenheim Distributors, LLC (2004-2009). |
48 | THE GUGGENHEIM FUNDS SEMI-ANNUAL REPORT | |
INFORMATION ON BOARD OF TRUSTEES AND OFFICERS (Unaudited)(concluded) |
Name, Address*
and Year of Birth | Position(s) Held
with the
Trust, Term of
Office and
Length of Time
Served | Principal Occupation(s)
During Past 5 Years |
OFFICERS - concluded | |
Joseph M. Arruda (1966) | Assistant Treasurer (2006-present). | Current: Assistant Treasurer, certain other funds in the Fund Complex (2006-present); Vice President, Security Investors, LLC (2010-present); CFO and Manager, Guggenheim Specialized Products, LLC (2009-present). Former: Vice President, Security Global Investors, LLC (2010-2011); Vice President, Rydex Advisors, LLC (2010); Vice President, Rydex Advisors II, LLC (2010). |
Paul J. Davio (1972) | Assistant Treasurer (2014-present). | Current: Assistant Treasurer, certain other funds in the Fund Complex (2014-present); Director, Guggenheim Investments (2006-present). Former: Manager, Mutual Fund Administration, Guggenheim Investments (2003-2006). |
Amy J. Lee (1961) | Vice President (2009-present) and Secretary (2012-present). | Current: Chief Legal Officer, certain other funds in the Fund Complex (2013-present); Senior Managing Director, Guggenheim Investments (2012-present). Former: Vice President, Associate General Counsel and Assistant Secretary, Security Benefit Life Insurance Company and Security Benefit Corporation (2004-2012). |
* | All Trustees and Officers may be reached c/o Guggenheim Investments, 805 King Farm Boulevard, Suite 600, Rockville, MD 20850. |
** | Mr. Cacciapaglia is an “interested” person of the Trust, as that term is defined in the 1940 Act by virtue of his affiliation with the Adviser’s parent company. |
*** | The “Fund Complex” includes all closed-end and open-end funds (including all of their portfolios) advised by the Adviser and any funds that have an investment adviser or servicing agent that is an affiliated person of the Adviser. Information provided is as of the date of this report. |
| | THE GUGGENHEIM FUNDS SEMI-ANNUAL REPORT | 49 |
GUGGENHEIM INVESTMENTS PRIVACY POLICIES (Unaudited) |
Rydex Funds, Guggenheim Funds, Rydex Investments, Guggenheim Funds Distributors, LLC, Security Investors, LLC, Security Distributors, Inc., Guggenheim Partners Investment Managers, LLC, and Rydex Advisory Services (Collectively “Guggenheim Investments”).
Our Commitment to You
When you become a Guggenheim Investments investor, you entrust us with not only your hard-earned money but also with personal and financial information about you. We recognize that your relationship with us is based on trust and that you expect us to act responsibly and in your best interests. Because we have access to this private information about you, we hold ourselves to the highest standards in its safekeeping and use. This means, most importantly, that we do not sell client information to anyone—whether it is your personal information or if you are a current or former Guggenheim Investments client.
The Information We Collect About You
In the course of doing business with shareholders and investors, we collect nonpublic personal information about you. You typically provide personal information when you complete a Guggenheim Investments account application or when you request a transaction that involves Rydex and Guggenheim Investments funds or one of the Guggenheim Investments affiliated companies. “Nonpublic personal information” is personally identifiable private information about you. For example, it includes information regarding your name and address, Social Security or taxpayer identification number, assets, income, account balance, bank account information and investment activity (e.g., purchase and redemption history).
How We Handle Your Personal Information
As emphasized above, we do not sell information about current or former clients or their accounts to third parties. Nor do we share such information, except when necessary to complete transactions at your request or to make you aware of related investment products and services that we offer. Additional details about how we handle your personal information are provided below. To complete certain transactions or account changes that you direct, it may be necessary to provide identifying information to companies, individuals or groups that are not affiliated with Guggenheim Investments. For example, if you ask to transfer assets from another financial institution to Guggenheim Investments, we will need to provide certain information about you to that company to complete the transaction. To alert you to other Guggenheim Investments investment products and services, we may share your information within the Guggenheim Investments family of affiliated companies. This would include, for example, sharing your information within Guggenheim Investments so we can make you aware of new Rydex and Guggenheim Investments
50 | THE GUGGENHEIM FUNDS SEMI-ANNUAL REPORT | |
GUGGENHEIM INVESTMENTS PRIVACY POLICIES (Unaudited)(continued) |
funds or the services offered through another Guggenheim Investments affiliated company. In certain instances, we may contract with nonaffiliated companies to perform services for us. Where necessary, we will disclose information we have about you to these third parties. In all such cases, we provide the third party with only the information necessary to carry out its assigned responsibilities and only for that purpose. And we require these third parties to treat your private information with the same high degree of confidentiality that we do. In certain instances, we may share information with other financial institutions regarding individuals and entities in response to the U.S.A. Patriot Act. Finally, we will release information about you if you direct us to do so, if we are compelled by law to do so or in other circumstances permitted by law.
Opt Out Provisions
We do not sell your personal information to anyone. The law allows you to “opt out” of only certain kinds of information sharing with third parties. The firm does not share personal information about you with any third parties that triggers this opt-out right. This means YOU ARE ALREADY OPTED OUT.
How We Protect Privacy Online
Our concern for the privacy of our shareholders also extends to those who use our web site, guggenheiminvestments.com. Our web site uses some of the most secure forms of online communication available, including encryption technology, Secure Socket Layer (SSL) protocol, firewalls and user names and passwords. These technologies provide a high level of security and privacy when you access your account information or initiate online transactions. The Guggenheim Investments web site offers customized features that require our use of “http cookies”—tiny pieces of information that we ask your browser to store. However, we make very limited use of these cookies. We only use cookies for session management and security features on the Guggenheim Investments web site. We do not use them to pull data from your hard drive, to learn your email address, or to view data in cookies created by other web sites. We will not share the information in our cookies or give others access to it. See the legal information area on our web site for more details about web site security and privacy features.
How We Safeguard Your Personal Information
We restrict access to nonpublic personal information about shareholders to our employees and in some cases to third parties (for example, the service providers described above) as permitted by law. We maintain strict physical, electronic and procedural safeguards that comply with federal standards to guard your nonpublic personal information.
| | THE GUGGENHEIM FUNDS SEMI-ANNUAL REPORT | 51 |
GUGGENHEIM INVESTMENTS PRIVACY POLICIES (Unaudited)(concluded) |
We’ll Keep You Informed
As required by federal law, we will notify shareholders of our privacy policy annually. We reserve the right to modify this policy at any time, but rest assured that if we do change it, we will tell you promptly. You will also be able to access our privacy policy from our web site at guggenheiminvestments.com. Should you have any questions regarding our privacy policy, contact us at 800.820.0888 or 301.296.5100.
52 | THE GUGGENHEIM FUNDS SEMI-ANNUAL REPORT | |
This page intentionally left blank.
Item 2. Code of Ethics.
Not applicable at this time.
Item 3. Audit Committee Financial Expert.
Not applicable at this time.
Item 4. Principal Accountant Fees and Services.
Not applicable at this time.
Item 5. Audit Committee of Listed Registrants.
Not applicable.
Item 6. Investments.
The Schedule of Investments is included as part of the report to shareholders filed under Item 1 of this form.
Item 7. Disclosure of Proxy Voting Policies and Procedures for Closed-End Management Investment Companies.
Not applicable.
Item 8. Portfolio Managers of Closed-End Management Investment Companies.
Not applicable.
Item 9. Purchases of Equity Securities by Closed-End Management Investment Company and Affiliated Purchasers.
Not applicable.
Item 10. Submission of Matters to a Vote of Security Holders.
The registrant has not made any material changes to the procedures by which shareholders may recommend nominees to the registrant’s Board of Trustees.
Item 11. Controls and Procedures.
| (a) | The registrant’s President (principal executive officer) and Treasurer (principal financial officer) have evaluated the registrant’s disclosure controls and procedures within 90 days of this filing and have concluded that the registrant’s disclosure controls and procedures were effective as of that date in ensuring that information required to be disclosed by the registrant in this Form N-CSR was recorded, processed, summarized, and reported timely. |
| (b) | The registrant’s principal executive officer and principal financial officer are aware of no change in the registrant’s internal control over financial reporting that occurred during the registrant’s second fiscal quarter covered by this report that has materially affected, or is reasonably likely to materially affect, the registrant’s internal control over financial reporting. |
Item 12. Exhibits.
| (a)(2) | Separate certifications by the President (principal executive officer) and Treasurer (principal financial officer) of the registrant as required by Rule 30a-2(a) under the Act (17 CFR 270.30a-2(a)) are attached. |
| (b) | A certification by the registrant’s President (principal executive officer) and Treasurer (principal financial officer) as required by Rule 30a-2(b) under the Act (17 CFR 270.30a-2(b)) is attached. |
SIGNATURES
Pursuant to the requirements of the Securities Exchange Act of 1934 and the Investment Company Act of 1940, the registrant has duly caused this report to be signed on its behalf by the undersigned, thereunto duly authorized.
| (Registrant) | Rydex Series Funds | |
| | | |
By (Signature and Title)* | /s/ Donald C. Cacciapaglia | |
| Donald C. Cacciapaglia, President and Chief Executive Officer | |
| | | |
| Date | September 09, 2015 | |
Pursuant to the requirements of the Securities Exchange Act of 1934 and the Investment Company Act of 1940, this report has been signed below by the following persons on behalf of the registrant and in the capacities and on the dates indicated.
| By (Signature and Title)* | /s/ Donald C. Cacciapaglia | |
| Donald C. Cacciapaglia, President and Chief Executive Officer | |
| | | |
| Date | September 09, 2015 | |
| | | |
| By (Signature and Title)* | /s/ Nikolaos Bonos | |
| | Nikolaos Bonos, Vice President and Treasurer | |
| | | |
| Date | September 09, 2015 | |
* | Print the name and title of each signing officer under his or her signature. |
