UNITED STATES
SECURITIES AND EXCHANGE COMMISSION
Washington, D.C. 20549
FORMN-CSR
CERTIFIED SHAREHOLDER REPORT OF REGISTERED
MANAGEMENT INVESTMENT COMPANIES
Investment Company Act file number:811-07704
Schwab Capital Trust – Schwab Fundamental Global Real Estate Index Fund
(Exact name of registrant as specified in charter)
211 Main Street, San Francisco, California 94105
(Address of principal executive offices) (Zip code)
Jonathan de St. Paer
Schwab Capital Trust
211 Main Street, San Francisco, California 94105
(Name and address of agent for service)
Registrant’s telephone number, including area code: (415)636-7000
Date of fiscal year end: February 28
Date of reporting period: February 28, 2019
| Item 1: | Report(s) to Shareholders. |
Annual Report | February 28, 2019
Schwab Fundamental Global Real Estate Index Fund
| New Notice Regarding Shareholder Report Delivery Options |
| Beginning on January 1, 2021, paper copies of a fund’s shareholder reports will no longer be sent by mail, unless you specifically request paper copies of the reports from a fund or from your financial intermediary (such as a bank or broker-dealer). Instead, the reports will be made available on a fund’s websitewww.schwabfunds.com/schwabfunds_prospectus, and you will be notified by mail each time a report is posted and the mailing will provide a website link to access the report. You will continue to receive other fund regulatory documents (such as prospectuses or supplements) in paper unless you have elected to receive all fund documents electronically as described below. |
| If you would like to continue to receive a fund’s future shareholder reports in paper free of charge after January 1, 2021, you can make that request: (1) by contacting your financial intermediary, if you invest through a financial intermediary; or (2) if you invest directly with a fund, by calling 1-800-407-0256. |
| If you already receive shareholder reports and other fund documents electronically, you will not be affected by this change and you need not take any action. If you do not receive shareholder reports and other fund documents electronically but would like to do so, contact your financial intermediary or, if you invest directly with the funds, call 1-800-407-0256. |
This page is intentionally left blank.
Fund investment adviser: Charles Schwab Investment Management, Inc. (CSIM)
Distributor: Charles Schwab & Co., Inc. (Schwab)
The Sector/Industry classifications in this report use the Global Industry Classification Standard (GICS), which was developed by and is the exclusive property of MSCI Inc. (MSCI) and Standard & Poor’s (S&P). GICS is a service mark of MSCI and S&P and has been licensed for use by Schwab.
Schwab Fundamental Global Real Estate Index Fund | Annual Report
Schwab Fundamental Global Real Estate Index Fund
The performance data quoted represents past performance. Past performance does not guarantee future results. Investment returns and principal value of an investment will fluctuate so that an investor’s shares may be worth more or less than their original cost. Current performance may be lower or higher than performance data quoted. To obtain performance information current to the most recent month end, please visitwww.schwabfunds.com/schwabfunds_prospectus.
| Total Returns for the 12 Months Ended February 28, 2019 |
| Schwab Fundamental Global Real Estate Index Fund (Ticker Symbol: SFREX) | 6.91%1 |
| Russell RAFITM Global Select Real Estate Index (Net)2 | 6.35% |
| FTSE EPRA Nareit Global Index (Net)2 | 9.53% |
| Fund Category: Morningstar Global Real Estate3 | 8.22% |
| Performance Details | pages 8-10 |
All total returns on this page assume dividends and distributions were reinvested. Index figures do not include trading and management costs, which would lower performance. Indices are unmanaged and cannot be invested in directly. Performance results less than one year are not annualized.
The first index listed for the fund is the fund’s primary benchmark, as shown in the prospectus. Additional indices shown are provided for comparative purposes.
For index definitions, please see the Glossary.
Performance does not reflect the deduction of taxes that a shareholder would pay on fund distributions or on the redemption of fund shares.
Index ownership – The Schwab Fundamental Global Real Estate Index Fund is not in any way sponsored, endorsed, sold or promoted by Frank Russell Company (Russell), by the London Stock Exchange Group companies (LSEG), or by Research Affiliates LLC (RA) (collectively the Licensor Parties), and none of the Licensor Parties make any warranty or representation whatsoever, expressly or impliedly, either as to the results to be obtained from the use of the Russell RAFI™ Global Select Real Estate Index (the Index) or otherwise. The Index is compiled and calculated by Russell in conjunction with RA. None of the Licensor Parties shall be liable (whether in negligence or otherwise) to any person for any error in the Index and none of the Licensor Parties shall be under any obligation to advise any person of any error therein. “Russell®” is a trademark of Russell. The trade names “Research Affiliates®”, “Fundamental Index®” and “RAFI®” are registered trademarks of RA. CSIM has obtained full license from Russell to use the Index. For full disclaimer please see the fund’s statement of additional information.
| 1 | Total return for the report period presented in the table differs from the return in the Financial Highlights. The total return presented in the above table is calculated based on the net asset value (NAV) at which shareholder transactions were processed. The total return presented in the Financial Highlights section of the report is calculated in the same manner, but also takes into account certain adjustments that are necessary under generally accepted accounting principles required in the annual and semiannual reports. |
| 2 | The net version of the index reflects reinvested dividends net of withholding taxes, but reflects no deductions for expenses or other taxes. |
| 3 | Source for category information: Morningstar, Inc. The Morningstar Category return represents all active and index mutual funds within the category as of the report date. |
Schwab Fundamental Global Real Estate Index Fund | Annual Report
Schwab Fundamental Global Real Estate Index Fund
Jonathan de St. Paer
President and CEO of
Charles Schwab Investment
Management, Inc. and the
fund covered in this report.
Dear Shareholder,
In a period that was not easy for most investors, global real estate securities provided a relative bright spot during the 12 months ended February 28, 2019, outpacing broader equity markets and generating positive returns. A generally stable global economy, as well as steady office leasing activity and increases in rental values, supported the overall real estate market. Global monetary policy also remained mostly accommodative despite the Federal Reserve raising interest rates four times during the period. While U.S. and international stocks experienced significant turbulence during the period, global real estate securities generally performed better, demonstrating how different asset classes don’t always move in lockstep—a key reason why it’s important to hold a mix of investments in your portfolio.
At Charles Schwab Investment Management, we often talk about the importance of diversification. But, we also recognize that maintaining a long-term perspective and setting emotions aside can be tough when overall market conditions become challenging. We seek to provide the products that investors can use to achieve their long-term financial goals—and to help weather the market volatility that may come along the way.
The Schwab Fundamental Global Real Estate Index Fund is an important part of that approach. Since real estate values tend to be influenced by a different combination of factors than stocks and bonds, the fund offers the potential for differentiated performance and a convenient way to capture the performance of the global real estate market. Also, by weighting fund holdings based on objective financial measures of company size, Fundamental Index strategies tend to have different risk exposures than traditional market-cap index products that use market capitalization to weight the same set of securities—providing investors the added potential for more attractive risk-adjusted returns across various market cycles.
Recently, the fund gained recognition for its performance relative to its peers. In March, we were honored to receive three Lipper Fund Awards. One was for the Schwab Fundamental Global Real Estate Index Fund, which was recognized for consistent investment returns over the three-year period ended November 30, 2018. The fund was named best-in-class among 41 global real estate funds over that time.1
| 1 | The Thomson Reuters Lipper Fund Awards, granted annually, highlight funds and fund companies that have excelled in delivering consistently strong risk-adjusted performance relative to their peers. The Lipper Fund Awards are based on the Lipper Leader for Consistent Return rating, which is a risk-adjusted performance measure calculated over 36, 60 and 120 months. The fund with the highest Lipper Leader for Consistent Return (Effective Return) value in each eligible classification wins the Lipper Fund Award. For more information, see www.lipperfundawards.com. Although Lipper makes reasonable efforts to ensure the accuracy and reliability of the data contained herein, the accuracy is not guaranteed by Lipper. |
Schwab Fundamental Global Real Estate Index Fund | Annual Report
Schwab Fundamental Global Real Estate Index Fund
From the President(continued)
“In March, we were honored to receive three Lipper Fund Awards. One was for the Schwab Fundamental Global Real Estate Index Fund, which was recognized for consistent investment returns over the three-year period ended November 30, 2018.”
On April 1, 2019, I transitioned into the role of Chief Executive Officer of Charles Schwab Investment Management, replacing Marie Chandoha upon her retirement. Looking back at how Charles Schwab Investment Management has grown into the market leader it is today, I believe Marie deserves particular credit. As Chief Executive Officer for over eight years, Marie provided the vision and leadership that has helped us stay focused on the goal of providing cost-effective funds to support investors in meeting their investment objectives. It’s been my privilege to be part of the great team Marie built.
I look forward to furthering our organization’s important mission. As we encounter ups and downs in the investment environment, it becomes even more important to serve our investors to the best of our ability. At Charles Schwab Investment Management, we seek to offer high quality products that help investors build portfolios that serve their needs, even during the more difficult stretches in the market.
Thank you for investing with Charles Schwab Investment Management. For more information about the Schwab Fundamental Global Real Estate Index Fund, please continue reading this report. In addition, you can find further details about this fund by visiting our website at www.schwabfunds.com. We are also happy to hear from you at 1-877-824-5615.
Sincerely,
Fundamental Index is a registered trademark of Research Affiliates LLC.
Past performance cannot guarantee future results.
Diversification and asset allocation strategies do not ensure a profit and cannot protect against losses in a declining market.
Management views may have changed since the report date.
Schwab Fundamental Global Real Estate Index Fund | Annual Report
Schwab Fundamental Global Real Estate Index Fund
The Investment Environment
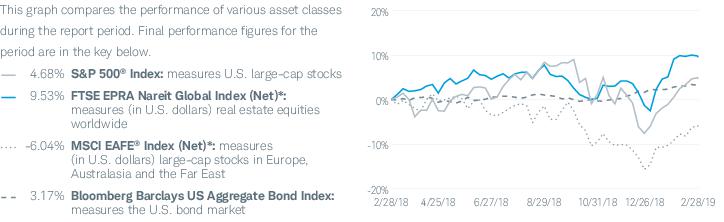
For the 12-month reporting period ended February 28, 2019, global real estate securities generated positive returns. Despite signs of slower growth, a generally stable global economy supported the overall real estate market, as did mostly flexible monetary policies and solid fundamentals such as stable office leasing activity and steady increases in rental values. U.S. real estate securities were particularly strong, with double-digit positive results coming from all sub-industries. Global real estate securities also outpaced the broader equity markets, primarily due to steep equity declines during the third quarter of 2018 and strong performance of real estate securities in January and February. In this environment, the FTSE EPRA Nareit Global Index (Net)*, representing general trends in eligible real estate securities worldwide, returned 9.53% for the reporting period, while U.S. REITs, represented by the Dow Jones U.S. Select REIT IndexTM, returned 20.90%. The overall U.S. stock market, as measured by the S&P 500® Index, returned 4.68%. Outside the U.S., the MSCI EAFE® Index (Net)*, a broad measure of developed international equity performance, and the MSCI Emerging Markets Index (Net)*, returned –6.04% and –9.89%, respectively.
The U.S. economy exhibited stable growth for most of the reporting period as it entered its tenth year of expansion, buoyed by a combination of tax reform early in the reporting period, strong corporate earnings, and still-positive financial conditions, but toward the end of 2018 showed signs of slowing. U.S. gross domestic product (GDP) grew at an annual rate of 2.2% in the fourth quarter of 2018, down from 4.2% and 3.4% in the second and third quarters, respectively. Even amid a tight labor market and growing economy, inflation remained in check, while pressure on wage growth began to rise toward the end of 2018. Consumer confidence, which hit an 18-year high in October, the highest since 2000, fell for the subsequent three months before rebounding in February against the backdrop of the market’s rally and the end of the 35-day partial government shutdown that began in late December and extended through late January.
In the U.S., despite continuing low levels of inflation, the Federal Reserve (Fed) raised the federal funds rate by 0.25% four times over the reporting period—in March, June, September and December. Fed rates ended the reporting period in a target range of 2.25% to 2.50%, bringing them closer to what the Fed considers a neutral level, according to Fed Chairman Jerome Powell. In January, he stated that “the case for raising rates has weakened somewhat,” and that the Fed had “the luxury of patience” regarding possible future rate hikes, easing investors’ concerns about the likelihood and pace of future rate hikes.
Asset Class Performance Comparison % returns during the 12 months ended February 28, 2019
Index figures assume dividends and distributions were reinvested. Index figures do not include trading and management costs, which would lower performance. Indices are unmanaged and cannot be invested in directly. Performance results less than one year are not annualized. Past performance is not an indication of future results.
For index definitions, please see the Glossary.
Data source: Index provider websites and CSIM.
Nothing in this report represents a recommendation of a security by the investment adviser.
Management views may have changed since the report date.
| * | The net version of the index reflects reinvested dividends net of withholding taxes, but reflects no deductions for expenses or other taxes. |
Schwab Fundamental Global Real Estate Index Fund | Annual Report
Schwab Fundamental Global Real Estate Index Fund
The Investment Environment(continued)
Outside the U.S., most central banks maintained accommodative monetary policies or, in some cases, in the face of signs of rising inflation, tightened their policies. The European Central Bank has held interest rates unchanged since March 2016 and in December reiterated that it would likely maintain those rates through the summer of 2019, but ended its monthly asset purchase program in December. In January, the Bank of Japan upheld its short-term interest rate target of –0.1%, also unchanged since 2016, and maintained its pledge to keep interest rates extremely low for an extended period. After raising its key official bank rate in August amid rising inflation projections and higher energy and import prices, the Bank of England maintained its rate of 0.75% during the reporting period despite ongoing uncertainties over the United Kingdom economy’s wider direction and intensifying uncertainties surrounding the impact of Brexit. Central banks in key emerging market economies—including India, Indonesia, Mexico, Turkey, and Russia—raised their policy rates during the reporting period in response to inflation and exchange-rate pressures. In February, however, India subsequently lowered its policy rate, and in December, the People’s Bank of China (PBOC) maintained its prudent, but no longer neutral, policy stance, indicating it would place a greater focus on flexibility as its economy faces continued headwinds.
Throughout most of the reporting period, the environment for real estate investment trusts (REITs) was mostly solid, with both demand and supply drivers favorable, and the Fed’s change in stance regarding the pace of future rate hikes eased investor concerns about continued interest rate hikes. After a lackluster beginning to 2018, the U.S. REIT industry rebounded in March and continued its positive trend until December, when the stock market experienced its steepest slide in nearly a decade. Although U.S. REITs declined along with other equities, their relative strength earlier in the reporting period, along with their subsequent strong recovery in January and February, helped them outperform other equities for the reporting period.
Real estate markets outside the U.S. were mixed amid slowing economic growth in several regions. On a country basis, REITs in Sweden were among the strongest performers as investors sought investments in countries with lower perceived risk. REITs in Canada performed well, driven by strong residential and industrial demand. Returns among most Asian REITs were weaker but still positive, reflecting declining growth across many emerging markets. Japan’s real estate market turned positive by the end of the period after having lost ground earlier in the period. REITs in China and India posted negative returns, reflective of the slowing growth in those countries along with trade-related concerns. Turkey’s real estate market posted the weakest return, down 53%, reflecting the country’s economic woes relating primarily to its troubled currency and runaway inflation.
Schwab Fundamental Global Real Estate Index Fund | Annual Report
Schwab Fundamental Global Real Estate Index Fund
 | Christopher Bliss, CFA, Vice President and Head of the Passive Equity Team, leads the portfolio management team for Schwab’s passive equity mutual funds and ETFs. He also has overall responsibility for all aspects of the management of the fund. Prior to joining CSIM in 2016, Mr. Bliss spent 12 years at BlackRock (formerly Barclays Global Investors) managing and leading institutional index teams, most recently as a Managing Director and Head of Americas Institutional Index team. Prior to BlackRock, he worked as an equity analyst and portfolio manager for Harris Bretall and before that, as a research analyst for JP Morgan. |
 | Chuck Craig, CFA, Senior Portfolio Manager, is responsible for the day-to-day co-management of the fund. Prior to joining CSIM in 2012, Mr. Craig worked at Guggenheim Funds (formerly Claymore Group), where he spent more than five years as a managing director of portfolio management and supervision, and three years as vice president of product research and development. Prior to that, he worked as an equity research analyst at First Trust Portfolios (formerly Niké Securities), and a trader and analyst at PMA Securities, Inc. |
 | Jane Qin, Portfolio Manager, is responsible for the day-to-day co-management of the fund. Prior to joining CSIM in 2012, Ms. Qin spent more than four years at The Bank of New York Mellon Corporation. During that time, Ms. Qin spent more than two years as an associate equity portfolio manager and nearly two years as a performance analyst. She also worked at Wells Fargo Funds Management as a mutual fund analyst and at CIGNA Reinsurance in the Risk Management group as a risk analyst. |
 | David Rios, Portfolio Manager, is responsible for the day-to-day co-management of the fund. He joined CSIM in 2008 and became a Portfolio Manager in 2014. Prior to this role, Mr. Rios served as an Associate Portfolio Manager on the Schwab Equity Index Strategies team for four years. His first role with CSIM was as a trade operation specialist. He also previously worked as a senior fund accountant at Investors Bank & Trust (subsequently acquired by State Street Corporation). |
Schwab Fundamental Global Real Estate Index Fund | Annual Report
Schwab Fundamental Global Real Estate Index Fundas of February 28, 2019
The Schwab Fundamental Global Real Estate Index Fund (the fund) seeks investment results that correspond generally (before fees and expenses) to the total return of the Russell RAFITM Global Select Real Estate Index (Net) (the index). The index measures the performance of real estate companies, including real estate investment trusts (REITs), in U.S. and non-U.S. markets, including developed and emerging markets. To pursue its investment objective, the fund invests in a representative sample of the securities included in the index which, when taken together, are expected to perform similarly to the index as a whole. Due to the use of sampling techniques, the fund may not hold all of the securities in the index. For more information concerning the fund’s investment objective, strategies, and risks, please see the fund’s prospectus.
Market Highlights. Global real estate securities generated positive returns for the reporting period. U.S. real estate securities were particularly strong, with double-digit positive results coming from all sub-industries. Although U.S. REITs declined along with other equities in December, their relative strength earlier in the reporting period, along with their subsequent strong recovery in January and February, helped them outperform other equities for the reporting period. Real estate markets outside the U.S. were mixed amid slowing economic growth in several regions.
Performance. The fund closely tracked the index for the 12-month reporting period ended February 28, 2019. The fund returned 6.91%,1 while the index returned 6.35%2 for the reporting period. Fair valuation of the fund’s holdings and income, primarily due to tax rate differences between the fund and the index, contributed to the fund’s performance.
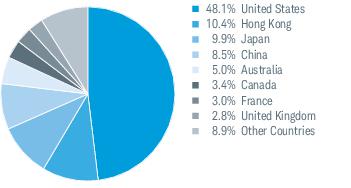
Contributors and Detractors. Real estate securities from the U.S. were the biggest contributor to the total return of both the index and the fund. U.S. securities represented an average weight of approximately 47% of the fund’s investments and had a return of approximately 19% for the reporting period. One example from this market is Welltower, Inc., a REIT that invests mostly in seniors housing, assisted living communities, and medical office buildings. The fund’s holdings of Welltower, Inc. returned approximately 49% for the reporting period.
Real estate securities in Hong Kong also contributed to the index and the fund, representing an average weight of approximately 13% of the fund’s investments and returning approximately 4% in U.S. dollar terms for the reporting period.
Real estate securities from the Netherlands were among the largest detractors from the total return of the index and the fund. Real estate securities from the Netherlands represented an average weight of approximately 1.6% of the fund’s investments and returned approximately -23% in U.S. dollar terms for the reporting period. One example from this market is Unibail-Rodamco-Westfield, a commercial real estate company. The fund’s holdings of Unibail-Rodamco-Westfield returned approximately -28% for the reporting period.
Real estate securities from Japan also detracted from the total return of the index and the fund. Japanese real estate securities represented an average weight of approximately 11% of the fund’s investments and returned approximately -5% in U.S. dollar terms for the reporting period.
Management views and portfolio holdings may have changed since the report date.
| 1 | Total return for the report period above differs from the return in the Financial Highlights. The total return presented above is calculated based on the net asset value (NAV) at which shareholder transactions were processed. The total return presented in the Financial Highlights section of the report is calculated in the same manner, but also takes into account certain adjustments that are necessary under generally accepted accounting principles required in the annual and semiannual reports. |
| 2 | The net version of the index reflects reinvested dividends net of withholding taxes, but reflects no deductions for expenses or other taxes. |
Schwab Fundamental Global Real Estate Index Fund | Annual Report
Schwab Fundamental Global Real Estate Index Fund
Performance and Fund Factsas of February 28, 2019
The performance data quoted represents past performance. Past performance does not guarantee future results. Investment returns and principal value of an investment will fluctuate so that an investor’s shares may be worth more or less than their original cost. Current performance may be lower or higher than performance data quoted. To obtain performance information current to the most recent month end, please visitwww.schwabfunds.com/schwabfunds_prospectus.
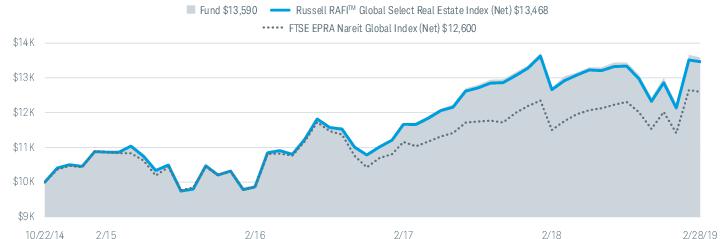
Performance of Hypothetical $10,000 Investment (October 22, 2014 – February 28, 2019)1
Average Annual Total Returns1
| Fund and Inception Date | 1 Year | 3 Years | Since Inception |
| Fund: Schwab Fundamental Global Real Estate Index Fund (10/22/14) | 6.91%2 | 11.22% | 7.30% |
| Russell RAFITM Global Select Real Estate Index (Net)3 | 6.35% | 10.93% | 7.07% |
| FTSE EPRA Nareit Global Index (Net)3 | 9.53% | 8.55% | 5.45% |
| Fund Category: Morningstar Global Real Estate4 | 8.22% | 8.15% | N/A |
| Fund Expense Ratio5: 0.39% |
All total returns on this page assume dividends and distributions were reinvested. Index figures do not include trading and management costs, which would lower performance. Indices are unmanaged and cannot be invested in directly. Performance results less than one year are not annualized.
The first index listed for the fund is the fund’s primary benchmark, as shown in the prospectus. Additional indices shown are provided for comparative purposes.
For index definitions, please see the Glossary.
The fund’s performance relative to the index may be affected by fair value pricing, see financial note 2 for more information.
Small-company stocks are subject to greater volatility than many other asset classes.
International investing may involve risk of capital loss from unfavorable fluctuations in currency values, from differences in generally accepted accounting principles, or from economic or political instability in other nations. Investing in emerging markets may accentuate these risks.
The fund is subject to risks associated with the direct ownership of real estate securities and an investment in the fund will be closely linked to the performance of the real estate markets.
Index ownership – The Schwab Fundamental Global Real Estate Index Fund is not in any way sponsored, endorsed, sold or promoted by Frank Russell Company (Russell), by the London Stock Exchange Group companies (LSEG), or by Research Affiliates LLC (RA) (collectively the Licensor Parties), and none of the Licensor Parties make any warranty or representation whatsoever, expressly or impliedly, either as to the results to be obtained from the use of the Russell RAFITM Global Select Real Estate Index (the Index) or otherwise. The Index is compiled and calculated by Russell in conjunction with RA. None of the Licensor Parties shall be liable (whether in negligence or otherwise) to any person for any error in the Index and none of the Licensor Parties shall be under any obligation to advise any person of any error therein. “Russell®” is a trademark of Russell. The trade names “Research Affiliates®”, “Fundamental Index®” and “RAFI®” are registered trademarks of RA. CSIM has obtained full license from Russell to use the Index. For full disclaimer please see the fund’s statement of additional information.
| 1 | Performance does not reflect the deduction of taxes that a shareholder would pay on fund distributions or on the redemption of fund shares. |
| 2 | Total return for the report period presented in the table differs from the return in the Financial Highlights. The total return presented in the above table is calculated based on the net asset value (NAV) at which shareholder transactions were processed. The total return presented in the Financial Highlights section of the report is calculated in the same manner, but also takes into account certain adjustments that are necessary under generally accepted accounting principles required in the annual and semiannual reports. |
| 3 | The net version of the index reflects reinvested dividends net of withholding taxes, but reflects no deductions for expenses or other taxes. |
| 4 | Source for category information: Morningstar, Inc. The Morningstar Category return represents all active and index mutual funds within the category as of the report date. |
| 5 | As stated in the prospectus. |
Schwab Fundamental Global Real Estate Index Fund | Annual Report
Schwab Fundamental Global Real Estate Index Fund
Performance and Fund Factsas of February 28, 2019 (continued)
| Number of Holdings | 315 |
| Weighted Average Market Cap (millions) | $16,407 |
| Price/Earnings Ratio (P/E) | 13.0 |
| Price/Book Ratio (P/B) | 1.3 |
| Portfolio Turnover Rate | 16% |
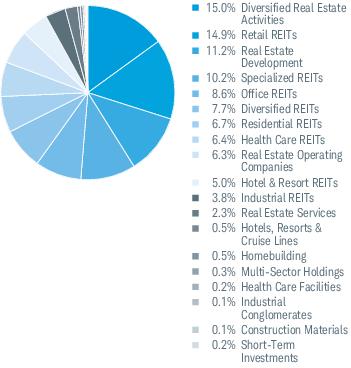
Industry Weightings % of Investments1
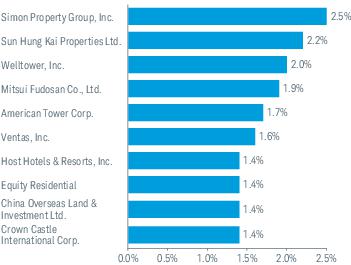
Top Holdings % of Net Assets2
Country Weightings % of Investments3
Portfolio holdings may have changed since the report date.
An index is a statistical composite of a specified financial market or sector. Unlike the fund, an index does not actually hold a portfolio of securities and its return is not inclusive of trading and management costs incurred by the fund.
Source of Sector Classification: S&P and MSCI.
| 1 | Excludes derivatives. |
| 2 | This list is not a recommendation of any security by the investment adviser. |
| 3 | The percentage may differ from the Portfolio Holdings because the above calculation is based on a percentage of total investments, excluding derivatives, whereas the calculation in the Portfolio Holdings is based on a percentage of net assets. |
Schwab Fundamental Global Real Estate Index Fund | Annual Report
Schwab Fundamental Global Real Estate Index Fund
Examples for a $1,000 Investment
As a fund shareholder, you may incur two types of costs: (1) transaction costs; and (2) ongoing costs, including management fees.
The expense examples below are intended to help you understand your ongoing cost (in dollars) of investing in the fund and to compare this cost with the ongoing cost of investing in other mutual funds. These examples are based on an investment of $1,000 invested for six months beginning September 1, 2018 and held through February 28, 2019.
Actual Return line in the table below provides information about actual account values and actual expenses. You may use this information, together with the amount you invested, to estimate the expenses that you paid over the period. To do so, simply divide your account value by $1,000 (for example, an $8,600 account value ÷ $1,000 = 8.6), then multiply the result by the number given for your fund under the heading entitled “Expenses Paid During Period.”
Hypothetical Return line in the table below provides information about hypothetical account values and hypothetical expenses based on the fund’s actual expense ratio and an assumed return of 5% per year before expenses. Because the return used is not an actual return, it may not be used to estimate the actual ending account value or expenses you paid for the period.
You may use this information to compare the ongoing costs of investing in the fund and other funds. To do so, compare this 5% hypothetical example with the 5% hypothetical examples that appear in the shareholder reports of the other funds.
Please note that the expenses shown in the table are meant to highlight your ongoing costs only, and do not reflect any transactional costs. Therefore, the hypothetical return lines of the table are useful in comparing ongoing costs only, and will not help you determine the relative total costs of owning different funds. In addition, if these transactional costs were included, your costs would have been higher.
| | Expense Ratio
(Annualized)1 | Beginning
Account Value
at 9/1/18 | Ending
Account Value
(Net of Expenses)
at 2/28/19 | Expenses Paid
During Period
9/1/18-2/28/192 |
| Schwab Fundamental Global Real Estate Index Fund | | | | |
| Actual Return | 0.39% | $1,000.00 | $1,011.90 | $1.95 |
| Hypothetical 5% Return | 0.39% | $1,000.00 | $1,022.87 | $1.96 |
| 1 | Based on the most recent six-month expense ratio; may differ from the expense ratio provided in the Financial Highlights which covers a 12-month period. |
| 2 | Expenses for the fund are equal to its annualized expense ratio, multiplied by the average account value over the period, multiplied by the 181 days of the period, and divided by the 365 days of the fiscal year. |
Schwab Fundamental Global Real Estate Index Fund | Annual Report
Schwab Fundamental Global Real Estate Index Fund
Financial Statements
Financial Highlights
| | 3/1/18–
2/28/19 | 3/1/17–
2/28/18 | 3/1/16–
2/28/17 | 3/1/15–
2/29/16 | 10/22/141–
2/28/15 | |
| Per-Share Data |
| Net asset value at beginning of period | $11.24 | $10.73 | $9.53 | $10.74 | $10.00 | |
| Income (loss) from investment operations: | | | | | | |
| Net investment income (loss)2 | 0.37 | 0.34 | 0.29 | 0.27 | 0.10 | |
| Net realized and unrealized gains (losses) | 0.38 | 0.59 | 1.42 | (1.21) | 0.75 | |
| Total from investment operations | 0.75 | 0.93 | 1.71 | (0.94) | 0.85 | |
| Less distributions: | | | | | | |
| Distributions from net investment income | (0.44) | (0.39) | (0.43) | (0.27) | (0.11) | |
| Distributions from net realized gains | (0.12) | (0.03) | (0.08) | — | (0.00)3 | |
| Total distributions | (0.56) | (0.42) | (0.51) | (0.27) | (0.11) | |
| Net asset value at end of period | $11.43 | $11.24 | $10.73 | $9.53 | $10.74 | |
| Total return | 7.00% | 8.69% | 18.26% | (8.91%) | 8.57%4 | |
| Ratios/Supplemental Data |
| Ratios to average net assets: | | | | | | |
| Total expenses | 0.39% | 0.43%5 | 0.91% | 0.89% | 2.58%6 | |
| Net operating expenses | N/A7 | 0.41%5 | 0.49% | 0.50%8 | 0.13%6,9 | |
| Net investment income (loss) | 3.32% | 3.01% | 2.72% | 2.65% | 2.62%6 | |
| Portfolio turnover rate | 16% | 13% | 23% | 26% | 4%4 | |
| Net assets, end of period (x 1,000,000) | $190 | $158 | $93 | $84 | $105 | |
| |
1
Commencement of operations.
2
Calculated based on the average shares outstanding during the period.
3
Per-share amount was less than $0.005.
4
Not annualized.
5
Effective June 1, 2017, the annual operating expense ratio was reduced. The ratio presented for the period ended 2/28/18 is a blended ratio.
6
Annualized (except for offering costs on the gross operating expenses ratio).
7
Effective June 1, 2017, the fund instituted a new fee structure and the contractual expense limitation was terminated.
8
The ratio of net operating expenses would have been 0.49%, if certain non-routine expenses had not been incurred.
9
The ratio presented for period ended 2/28/15 is a blended ratio.
Schwab Fundamental Global Real Estate Index Fund | Annual Report
Schwab Fundamental Global Real Estate Index Fund
Portfolio Holdings as of February 28, 2019
This section shows all the securities in the fund’s portfolio and their values as of the report date.
The fund files its complete schedule of portfolio holdings with the U.S. Securities and Exchange Commission (SEC) for the first and third quarters of each fiscal year on Form N-Q. The fund’s Form N-Q is available on the SEC’s website atwww.sec.gov. The fund also makes available its complete schedule of portfolio holdings 15 to 20 days after the end of the month on the fund’s website atwww.schwabfunds.com/schwabfunds_prospectus.
| Security | Number
of Shares | Value ($) |
| Common Stock99.5% of net assets |
| |
| Australia 4.9% |
| Charter Hall Retail REIT | 46,717 | 150,773 |
| Cromwell Property Group | 220,872 | 173,277 |
| Dexus | 93,794 | 800,621 |
| Goodman Group | 121,724 | 1,107,159 |
| LendLease Group | 162,889 | 1,488,815 |
| Mirvac Group | 684,453 | 1,250,879 |
| Scentre Group | 651,898 | 1,792,995 |
| Stockland | 542,234 | 1,348,564 |
| The GPT Group | 169,576 | 704,227 |
| Vicinity Centres | 306,580 | 535,692 |
| | | 9,353,002 |
| |
| Austria 0.4% |
| CA Immobilien Anlagen AG | 5,765 | 194,624 |
| IMMOFINANZ AG * | 14,083 | 348,961 |
| S IMMO AG | 9,030 | 170,891 |
| | | 714,476 |
| |
| Belgium 0.3% |
| Befimmo S.A. | 2,782 | 151,242 |
| Cofinimmo S.A. | 2,782 | 361,373 |
| | | 512,615 |
| |
| Brazil 0.5% |
| BR Malls Participacoes S.A. | 132,022 | 470,635 |
| Cyrela Brazil Realty S.A. Empreendimentos e Participacoes | 118,989 | 541,701 |
| | | 1,012,336 |
| |
| Canada 3.4% |
| Allied Properties Real Estate Investment Trust | 8,050 | 293,689 |
| Artis Real Estate Investment Trust | 40,353 | 326,577 |
| Boardwalk Real Estate Investment Trust | 8,280 | 259,043 |
| Canadian Apartment Properties REIT | 11,241 | 429,241 |
| Chartwell Retirement Residences | 25,600 | 291,804 |
| Choice Properties Real Estate Investment Trust | 14,100 | 144,756 |
| Colliers International Group, Inc. | 2,369 | 161,858 |
| Cominar Real Estate Investment Trust | 52,893 | 481,521 |
| Crombie Real Estate Investment Trust | 21,300 | 224,824 |
| Dream Global Real Estate Investment Trust | 15,977 | 164,511 |
| Dream Office Real Estate Investment Trust | 28,469 | 537,600 |
| First Capital Realty, Inc. | 21,385 | 348,088 |
| FirstService Corp. | 2,500 | 217,049 |
| Granite Real Estate Investment Trust | 4,748 | 222,436 |
| H&R Real Estate Investment Trust | 53,171 | 917,598 |
| Northview Apartment Real Estate Investment Trust | 5,900 | 124,416 |
| Security | Number
of Shares | Value ($) |
| RioCan Real Estate Investment Trust | 47,449 | 906,469 |
| SmartCentres Real Estate Investment Trust | 18,289 | 469,195 |
| | | 6,520,675 |
| |
| China 8.4% |
| Agile Group Holdings Ltd. | 473,000 | 591,066 |
| BBMG Corp., Class H | 461,000 | 169,221 |
| Beijing Capital Land Ltd., Class H | 246,000 | 103,080 |
| China Aoyuan Property Group Ltd. | 185,000 | 145,278 |
| China Evergrande Group | 364,000 | 1,123,054 |
| China Jinmao Holdings Group Ltd. | 1,214,000 | 589,124 |
| China Overseas Grand Oceans Group Ltd. | 284,000 | 111,679 |
| China Overseas Land & Investment Ltd. | 726,000 | 2,674,684 |
| China Resources Land Ltd. | 462,000 | 1,723,528 |
| China SCE Group Holdings Ltd. | 279,000 | 109,833 |
| China South City Holdings Ltd. | 1,194,000 | 199,140 |
| China Vanke Co., Ltd., Class H | 191,100 | 724,717 |
| CIFI Holdings Group Co., Ltd. | 470,000 | 306,198 |
| Country Garden Holdings Co., Ltd. | 696,000 | 915,579 |
| Country Garden Services Holdings Co., Ltd. * | 31,264 | 51,358 |
| Fantasia Holdings Group Co., Ltd. | 726,000 | 113,627 |
| Future Land Development Holdings Ltd. | 230,000 | 197,831 |
| Greentown China Holdings Ltd. | 320,000 | 272,033 |
| Guangzhou R&F Properties Co., Ltd., Class H | 397,800 | 743,787 |
| Hopson Development Holdings Ltd. | 172,000 | 159,039 |
| KWG Property Holdings Ltd. * | 244,500 | 229,941 |
| Logan Property Holdings Co., Ltd. | 116,000 | 164,853 |
| Longfor Group Holdings Ltd. | 220,500 | 653,644 |
| Poly Property Group Co., Ltd. | 867,000 | 326,701 |
| Powerlong Real Estate Holdings Ltd. | 447,000 | 208,598 |
| Shenzhen Investment Ltd. | 1,032,000 | 385,060 |
| Shimao Property Holdings Ltd. | 363,000 | 857,304 |
| Sino-Ocean Group Holding Ltd. | 1,156,500 | 540,816 |
| SOHO China Ltd. * | 978,000 | 417,711 |
| Sunac China Holdings Ltd. | 125,000 | 522,057 |
| Yuexiu Property Co., Ltd. | 2,392,000 | 551,303 |
| Yuzhou Properties Co., Ltd. | 327,503 | 159,872 |
| | | 16,041,716 |
| |
| France 3.0% |
| Covivio | 5,122 | 518,515 |
| Gecina S.A. | 3,554 | 526,291 |
| ICADE | 6,194 | 527,346 |
| Klepierre S.A. | 24,620 | 858,882 |
| Mercialys S.A. | 11,908 | 173,841 |
| Nexity S.A. | 9,530 | 464,815 |
| Unibail-Rodamco-Westfield | 16,542 | 2,663,329 |
| | | 5,733,019 |
| |
Schwab Fundamental Global Real Estate Index Fund | Annual Report
Schwab Fundamental Global Real Estate Index Fund
Portfolio Holdings as of February 28, 2019 (continued)
| Security | Number
of Shares | Value ($) |
| Germany 1.8% |
| Deutsche Euroshop AG | 4,498 | 133,342 |
| Deutsche Wohnen SE | 15,469 | 719,886 |
| LEG Immobilien AG | 5,003 | 557,815 |
| TAG Immobilien AG | 13,686 | 318,270 |
| TLG Immobilien AG | 5,421 | 157,355 |
| Vonovia SE | 32,708 | 1,583,113 |
| | | 3,469,781 |
| |
| Hong Kong 10.4% |
| CK Asset Holdings Ltd. | 297,500 | 2,468,371 |
| Great Eagle Holdings Ltd. | 52,493 | 260,233 |
| Hang Lung Group Ltd. | 210,000 | 659,899 |
| Hang Lung Properties Ltd. | 325,000 | 767,336 |
| Henderson Land Development Co., Ltd. | 126,697 | 716,352 |
| Hongkong Land Holdings Ltd. | 129,741 | 930,574 |
| Hopewell Holdings Ltd. | 46,000 | 211,562 |
| Hysan Development Co., Ltd. | 51,500 | 271,957 |
| K Wah International Holdings Ltd. | 311,000 | 167,537 |
| Kerry Properties Ltd. | 152,000 | 635,026 |
| Link REIT | 120,500 | 1,362,996 |
| New World Development Co., Ltd. | 1,466,842 | 2,341,909 |
| Road King Infrastructure Ltd. | 67,000 | 128,079 |
| Shui On Land Ltd. | 875,000 | 218,535 |
| Sino Land Co., Ltd. | 426,063 | 793,205 |
| Sun Hung Kai Properties Ltd. | 250,000 | 4,144,938 |
| Swire Properties Ltd. | 104,000 | 417,474 |
| The Wharf Holdings Ltd. | 426,000 | 1,332,612 |
| Wharf Real Estate Investment Co., Ltd. | 98,200 | 689,483 |
| Wheelock & Co., Ltd. | 181,000 | 1,226,537 |
| | | 19,744,615 |
| |
| Japan 9.8% |
| Activia Properties, Inc. | 37 | 154,189 |
| Advance Residence Investment Corp. | 96 | 266,995 |
| Aeon Mall Co., Ltd. | 23,400 | 381,547 |
| Daito Trust Construction Co., Ltd. | 15,980 | 2,214,608 |
| Daiwa House REIT Investment Corp. | 48 | 107,009 |
| Frontier Real Estate Investment Corp. | 40 | 165,110 |
| GLP J-REIT | 173 | 180,587 |
| Hulic Co., Ltd. | 29,000 | 267,051 |
| Japan Excellent, Inc. | 127 | 175,547 |
| Japan Hotel REIT Investment Corp. | 157 | 121,214 |
| Japan Prime Realty Investment Corp. | 68 | 266,840 |
| Japan Real Estate Investment Corp. | 102 | 590,601 |
| Japan Retail Fund Investment Corp. | 303 | 611,226 |
| Kenedix Office Investment Corp. | 37 | 246,916 |
| Leopalace21 Corp. | 132,700 | 287,677 |
| Mitsubishi Estate Co., Ltd. | 148,400 | 2,549,257 |
| Mitsui Fudosan Co., Ltd. | 152,500 | 3,618,955 |
| Nippon Accommodations Fund, Inc. | 39 | 193,917 |
| Nippon Building Fund, Inc. | 109 | 709,740 |
| Nippon Prologis REIT, Inc. | 97 | 206,305 |
| Nomura Real Estate Holdings, Inc. | 36,100 | 684,148 |
| Nomura Real Estate Master Fund, Inc. | 236 | 323,304 |
| Open House Co., Ltd. | 2,300 | 81,402 |
| Orix JREIT, Inc. | 144 | 236,042 |
| Relo Group, Inc. | 7,200 | 188,508 |
| Starts Corp., Inc. | 7,800 | 170,188 |
| Sumitomo Realty & Development Co., Ltd. | 54,500 | 2,039,942 |
| Tokyo Tatemono Co., Ltd. | 38,700 | 449,846 |
| Security | Number
of Shares | Value ($) |
| Tokyu Fudosan Holdings Corp. | 145,000 | 802,530 |
| United Urban Investment Corp. | 230 | 356,733 |
| | | 18,647,934 |
| |
| Netherlands 0.3% |
| Eurocommercial Properties N.V. CVA | 6,968 | 203,533 |
| NSI N.V. | 3,684 | 153,577 |
| Wereldhave N.V. | 6,465 | 188,433 |
| | | 545,543 |
| |
| Philippines 0.4% |
| Ayala Land, Inc. | 481,100 | 409,215 |
| SM Prime Holdings, Inc. | 453,600 | 335,990 |
| | | 745,205 |
| |
| Singapore 1.9% |
| Ascendas Real Estate Investment Trust | 226,900 | 469,511 |
| CapitaLand Commercial Trust | 122,700 | 175,962 |
| CapitaLand Ltd. | 392,700 | 991,993 |
| CapitaLand Mall Trust | 233,400 | 414,172 |
| Fortune Real Estate Investment Trust | 135,400 | 168,954 |
| Mapletree Commercial Trust | 91,900 | 120,193 |
| Mapletree Industrial Trust | 118,305 | 175,094 |
| Mapletree Logistics Trust | 183,640 | 187,391 |
| Mapletree North Asia Commercial Trust | 194,600 | 179,648 |
| Suntec Real Estate Investment Trust | 128,100 | 182,447 |
| UOL Group Ltd. | 66,080 | 323,640 |
| Yanlord Land Group Ltd. | 233,500 | 239,612 |
| | | 3,628,617 |
| |
| South Africa 0.6% |
| Growthpoint Properties Ltd. | 345,738 | 598,300 |
| Redefine Properties Ltd. | 591,258 | 406,533 |
| Vukile Property Fund Ltd. | 99,434 | 141,950 |
| | | 1,146,783 |
| |
| Sweden 0.9% |
| Castellum AB | 23,670 | 431,025 |
| Fabege AB | 18,835 | 252,879 |
| Hemfosa Fastigheter AB | 16,368 | 139,794 |
| Kungsleden AB | 15,481 | 115,613 |
| LE Lundbergfortagen AB, B Shares | 19,899 | 613,390 |
| Nyfosa AB * | 16,248 | 93,818 |
| Wihlborgs Fastigheter AB | 14,852 | 197,005 |
| | | 1,843,524 |
| |
| Switzerland 0.9% |
| Allreal Holding AG * | 2,321 | 372,930 |
| Mobimo Holding AG | 934 | 221,813 |
| PSP Swiss Property AG | 3,039 | 309,122 |
| Swiss Prime Site AG | 9,294 | 783,460 |
| | | 1,687,325 |
| |
| Taiwan 0.5% |
| Farglory Land Development Co., Ltd. | 134,000 | 160,264 |
| Highwealth Construction Corp. | 266,700 | 412,672 |
| Huaku Development Co., Ltd. | 68,000 | 153,668 |
| Ruentex Development Co., Ltd. | 116,280 | 182,842 |
| | | 909,446 |
| |
Schwab Fundamental Global Real Estate Index Fund | Annual Report
Schwab Fundamental Global Real Estate Index Fund
Portfolio Holdings as of February 28, 2019 (continued)
| Security | Number
of Shares | Value ($) |
| United Arab Emirates 0.3% |
| Aldar Properties PJSC | 388,974 | 188,322 |
| Emaar Properties PJSC | 262,080 | 350,111 |
| | | 538,433 |
| |
| United Kingdom 2.8% |
| Derwent London plc | 6,415 | 277,996 |
| Etalon Group plc | 63,697 | 140,133 |
| Grainger plc | 57,197 | 187,382 |
| Great Portland Estates plc | 12,976 | 130,986 |
| Hammerson plc | 89,916 | 455,504 |
| Hansteen Holdings plc | 79,493 | 103,327 |
| Intu Properties plc | 270,880 | 411,171 |
| Land Securities Group plc | 109,063 | 1,302,491 |
| McCarthy & Stone plc | 132,731 | 217,595 |
| Savills plc | 31,557 | 372,174 |
| Segro plc | 60,879 | 533,927 |
| St. Modwen Properties plc | 29,979 | 162,327 |
| The British Land Co., plc | 97,731 | 782,185 |
| The Unite Group plc | 17,187 | 208,644 |
| | | 5,285,842 |
| |
| United States 48.0% |
| Acadia Realty Trust | 6,577 | 187,379 |
| Alexander & Baldwin, Inc. * | 5,763 | 132,146 |
| Alexandria Real Estate Equities, Inc. | 5,332 | 724,565 |
| American Campus Communities, Inc. | 14,934 | 672,926 |
| American Homes 4 Rent, Class A | 9,049 | 197,630 |
| American Tower Corp. | 18,390 | 3,239,398 |
| Apartment Investment & Management Co., Class A | 15,739 | 770,109 |
| Apple Hospitality REIT, Inc. | 34,854 | 574,394 |
| Ashford Hospitality Trust, Inc. | 47,512 | 254,664 |
| AvalonBay Communities, Inc. | 9,522 | 1,853,267 |
| Boston Properties, Inc. | 17,352 | 2,302,437 |
| Brandywine Realty Trust | 28,688 | 450,975 |
| Brixmor Property Group, Inc. | 57,684 | 1,007,163 |
| Camden Property Trust | 8,769 | 860,151 |
| CBL & Associates Properties, Inc. | 156,479 | 334,865 |
| CBRE Group, Inc., Class A * | 29,952 | 1,490,412 |
| Chesapeake Lodging Trust | 9,300 | 280,116 |
| Colony Capital, Inc. | 22,918 | 127,424 |
| Columbia Property Trust, Inc. | 24,748 | 535,299 |
| CoreCivic, Inc. | 49,548 | 1,049,427 |
| CorePoint Lodging, Inc. | 4,617 | 64,499 |
| Corporate Office Properties Trust | 14,886 | 386,887 |
| Cousins Properties, Inc. | 14,560 | 138,611 |
| Crown Castle International Corp. | 22,507 | 2,672,706 |
| CubeSmart | 11,238 | 344,332 |
| CyrusOne, Inc. | 4,151 | 206,886 |
| DiamondRock Hospitality Co. | 38,895 | 415,788 |
| Digital Realty Trust, Inc. | 13,814 | 1,562,640 |
| Douglas Emmett, Inc. | 11,944 | 461,038 |
| Duke Realty Corp. | 31,842 | 941,568 |
| EastGroup Properties, Inc. | 2,270 | 239,848 |
| EPR Properties | 5,770 | 423,980 |
| Equinix, Inc. | 3,172 | 1,343,342 |
| Equity Commonwealth | 14,571 | 475,743 |
| Equity LifeStyle Properties, Inc. | 5,365 | 582,854 |
| Equity Residential | 36,589 | 2,696,243 |
| Essex Property Trust, Inc. | 3,695 | 1,034,009 |
| Extra Space Storage, Inc. | 6,476 | 621,307 |
| Federal Realty Investment Trust | 5,374 | 717,913 |
| First Industrial Realty Trust, Inc. | 7,745 | 259,612 |
| Franklin Street Properties Corp. | 26,510 | 191,932 |
| Security | Number
of Shares | Value ($) |
| Gaming & Leisure Properties, Inc. | 13,640 | 496,223 |
| HCP, Inc. | 77,054 | 2,370,952 |
| Healthcare Realty Trust, Inc. | 12,205 | 386,288 |
| Healthcare Trust of America, Inc., Class A | 13,590 | 387,179 |
| Hersha Hospitality Trust | 9,359 | 176,417 |
| Highwoods Properties, Inc. | 11,783 | 545,671 |
| Hospitality Properties Trust | 42,375 | 1,147,091 |
| Host Hotels & Resorts, Inc. | 138,686 | 2,719,632 |
| Hudson Pacific Properties, Inc. | 6,755 | 224,401 |
| Investors Real Estate Trust | 3,215 | 194,122 |
| Invitation Homes, Inc. | 6,461 | 148,603 |
| Iron Mountain, Inc. | 55,718 | 1,973,532 |
| Jones Lang LaSalle, Inc. | 7,158 | 1,181,929 |
| Kennedy-Wilson Holdings, Inc. | 6,196 | 128,753 |
| Kilroy Realty Corp. | 6,367 | 469,312 |
| Kimco Realty Corp. | 60,291 | 1,060,519 |
| Kite Realty Group Trust | 12,757 | 200,795 |
| Lamar Advertising Co., Class A | 9,361 | 726,133 |
| Lexington Realty Trust | 42,082 | 390,942 |
| Liberty Property Trust | 16,595 | 785,441 |
| Life Storage, Inc. | 3,549 | 346,382 |
| Mack-Cali Realty Corp. | 22,009 | 462,409 |
| Medical Properties Trust, Inc. | 22,685 | 413,548 |
| Mid-America Apartment Communities, Inc. | 7,738 | 801,502 |
| National Health Investors, Inc. | 2,193 | 171,120 |
| National Retail Properties, Inc. | 10,012 | 521,625 |
| New Senior Investment Group, Inc. | 30,725 | 158,541 |
| Office Properties Income Trust | 7,385 | 225,316 |
| Omega Healthcare Investors, Inc. | 17,705 | 635,610 |
| Outfront Media, Inc. | 37,875 | 849,915 |
| Paramount Group, Inc. | 22,825 | 327,767 |
| Park Hotels & Resorts, Inc. | 23,122 | 722,331 |
| Pebblebrook Hotel Trust | 22,476 | 719,457 |
| Pennsylvania Real Estate Investment Trust | 23,426 | 144,070 |
| Piedmont Office Realty Trust, Inc., Class A | 30,362 | 621,510 |
| Prologis, Inc. | 36,253 | 2,539,885 |
| PS Business Parks, Inc. | 1,681 | 247,393 |
| Public Storage | 9,130 | 1,930,904 |
| QTS Realty Trust, Inc., Class A | 2,986 | 124,606 |
| Realogy Holdings Corp. | 44,182 | 600,875 |
| Realty Income Corp. | 15,269 | 1,056,004 |
| Regency Centers Corp. | 7,792 | 508,428 |
| Retail Opportunity Investments Corp. | 5,890 | 101,131 |
| Retail Properties of America, Inc., Class A | 45,013 | 560,862 |
| Retail Value, Inc. | 4,049 | 126,045 |
| RLJ Lodging Trust | 29,119 | 540,740 |
| RPT Realty | 14,459 | 183,340 |
| Ryman Hospitality Properties, Inc. | 5,440 | 440,586 |
| Sabra Health Care REIT, Inc. | 12,394 | 224,579 |
| SBA Communications Corp. * | 3,640 | 657,238 |
| Senior Housing Properties Trust | 52,744 | 683,035 |
| Seritage Growth Properties, Class A | 2,627 | 115,982 |
| Simon Property Group, Inc. | 26,076 | 4,723,928 |
| SITE Centers Corp. | 40,285 | 537,805 |
| SL Green Realty Corp. | 10,731 | 973,516 |
| Spirit MTA REIT | 5,526 | 40,616 |
| Spirit Realty Capital, Inc. | 11,972 | 462,598 |
| STAG Industrial, Inc. | 4,386 | 121,404 |
| STORE Capital Corp. | 6,697 | 217,452 |
| Summit Hotel Properties, Inc. | 12,886 | 146,772 |
| Sun Communities, Inc. | 4,202 | 477,221 |
| Sunstone Hotel Investors, Inc. | 36,564 | 550,288 |
Schwab Fundamental Global Real Estate Index Fund | Annual Report
Schwab Fundamental Global Real Estate Index Fund
Portfolio Holdings as of February 28, 2019 (continued)
| Security | Number
of Shares | Value ($) |
| Tanger Factory Outlet Centers, Inc. | 14,852 | 320,655 |
| Taubman Centers, Inc. | 9,978 | 532,626 |
| The GEO Group, Inc. | 26,281 | 597,104 |
| The Howard Hughes Corp. * | 1,291 | 143,792 |
| The Macerich Co. | 18,101 | 789,204 |
| Tier REIT, Inc. | 8,140 | 197,395 |
| UDR, Inc. | 21,170 | 940,371 |
| Uniti Group, Inc. | 23,876 | 230,165 |
| Urban Edge Properties | 9,597 | 186,374 |
| Ventas, Inc. | 47,649 | 2,989,975 |
| VEREIT, Inc. | 119,992 | 956,336 |
| Vornado Realty Trust | 20,826 | 1,401,798 |
| Washington Prime Group, Inc. | 99,979 | 577,879 |
| Washington Real Estate Investment Trust | 10,289 | 272,556 |
| Weingarten Realty Investors | 16,474 | 474,616 |
| Welltower, Inc. | 51,341 | 3,815,150 |
| WP Carey, Inc. | 10,491 | 774,970 |
| Wyndham Destinations, Inc. | 22,573 | 1,016,462 |
| Xenia Hotels & Resorts, Inc. | 27,234 | 531,880 |
| | | 91,304,064 |
| Total Common Stock |
| (Cost $176,336,661) | | 189,384,951 |
|
| Rights0.0% of net assets |
| |
| China 0.0% |
China Aoyuan Group Ltd.
expires 03/04/19 *(a) | 2,176 | — |
| Total Rights |
| (Cost $—) | | — |
Security
Rate, Maturity Date | Face Amount
Local Currency | Value ($) |
| Short-Term Investments0.2% of net assets |
| |
| Time Deposits 0.2% |
| BNP Paribas |
| Euro | | |
| (0.57%), 03/01/19(b) | 17,085 | 19,433 |
| Brown Brothers Harriman |
| Australian Dollar | | |
| 0.76%, 03/01/19(b) | 118,002 | 83,705 |
| Canadian Dollar | | |
| 0.82%, 03/01/19(b) | 7,493 | 5,694 |
Security
Rate, Maturity Date | Face Amount
Local Currency | Value ($) |
| Hong Kong Dollar | | |
| 0.36%, 03/01/19(b) | 66,995 | 8,535 |
| Pound Sterling | | |
| 0.36%, 03/01/19(b) | 67 | 88 |
| Singapore Dollar | | |
| 0.80%, 03/01/19(b) | 13,539 | 10,014 |
| South African Rand | | |
| 5.14%, 03/01/19(b) | 198,259 | 14,067 |
| Swedish Krona | | |
| (0.55%), 03/01/19(b) | 1,612 | 175 |
| Swiss Franc | | |
| (1.44%), 03/01/19(b) | 215 | 215 |
| JPMorgan Chase Bank |
| U.S. Dollar | | |
| 1.75%, 03/01/19(b) | 32,414 | 32,414 |
| Sumitomo Mitsui Banking Corp. |
| Japanese Yen | | |
| (0.27%), 03/01/19(b) | 20,899,633 | 187,500 |
| Total Short-Term Investments |
| (Cost $361,840) | | 361,840 |
| | Number of
Contracts | Notional
Amount
($) | Current Value/
Unrealized
Appreciation
(Depreciation)
($) |
| Futures Contracts | |
| Long | |
| S&P 500 Index, e-mini, expires 03/15/19 | 2 | 278,470 | 744 |
| MSCI Emerging Markets Index, expires 03/15/19 | 4 | 209,340 | (4,628) |
| MSCI EAFE Index, expires 03/15/19 | 2 | 186,900 | (484) |
| Net Unrealized Depreciation | (4,368) |
| * | Non-income producing security. |
| (a) | Fair-valued by management using significant unobservable inputs in accordance with procedures approved by fund’s Board of Trustees. |
| (b) | The rate shown is the current daily overnight rate. |
| | |
| CVA — | Dutch Certificate |
| REIT — | Real Estate Investment Trust |
Schwab Fundamental Global Real Estate Index Fund | Annual Report
Schwab Fundamental Global Real Estate Index Fund
Portfolio Holdings as of February 28, 2019 (continued)
The following is a summary of the inputs used to value the fund’s investments as of February 28, 2019 (see financial note 2(a) for additional information):
| Description | Quoted Prices in
Active Markets for
Identical Assets
(Level 1) | Other Significant
Observable Inputs
(Level 2) | Significant
Unobservable Inputs
(Level 3) | Total | |
| Assets | | | | | |
| Common Stock1 | $98,837,075 | $— | $— | $98,837,075 | |
| Australia | — | 9,353,002 | — | 9,353,002 | |
| Austria | 194,624 | 519,852 | — | 714,476 | |
| Belgium | 361,373 | 151,242 | — | 512,615 | |
| China | — | 16,041,716 | — | 16,041,716 | |
| France | 518,515 | 5,214,504 | — | 5,733,019 | |
| Germany | — | 3,469,781 | — | 3,469,781 | |
| Hong Kong | — | 19,744,615 | — | 19,744,615 | |
| Japan | — | 18,647,934 | — | 18,647,934 | |
| Netherlands | 357,110 | 188,433 | — | 545,543 | |
| Philippines | — | 745,205 | — | 745,205 | |
| Singapore | 168,954 | 3,459,663 | — | 3,628,617 | |
| South Africa | 141,950 | 1,004,833 | — | 1,146,783 | |
| Sweden | 93,818 | 1,749,706 | — | 1,843,524 | |
| Switzerland | — | 1,687,325 | — | 1,687,325 | |
| Taiwan | — | 909,446 | — | 909,446 | |
| United Arab Emirates | — | 538,433 | — | 538,433 | |
| United Kingdom | 648,437 | 4,637,405 | — | 5,285,842 | |
| Rights1 | | | | | |
| China | — | — | —* | — | |
| Short-Term Investments1 | — | 361,840 | — | 361,840 | |
| Futures Contracts2 | 744 | — | — | 744 | |
| Liabilities | | | | | |
| Futures Contracts2 | (5,112) | — | — | (5,112) | |
| Total | $101,317,488 | $88,424,935 | $— | $189,742,423 | |
| * | Level 3 amount shown includes securities determined to have no value at February 28, 2019. |
| 1 | As categorized in Portfolio Holdings. |
| 2 | Futures contracts are valued at unrealized appreciation or depreciation. |
Schwab Fundamental Global Real Estate Index Fund | Annual Report
Schwab Fundamental Global Real Estate Index Fund
Statement of Assets and Liabilities
As of February 28, 2019
| Assets |
| Investments in unaffiliated issuers, at value (cost $176,698,501) | | $189,746,791 |
| Foreign currency, at value (cost $34,422) | | 34,411 |
| Deposit with broker for futures contracts | | 85,600 |
| Receivables: | | |
| Investments sold | | 333,064 |
| Dividends | | 211,942 |
| Fund shares sold | | 183,701 |
| Foreign tax reclaims | | 35,011 |
| Prepaid expenses | + | 16,151 |
| Total assets | | 190,646,671 |
| Liabilities |
| Payables: | | |
| Investments bought | | 259,536 |
| Investment adviser fees | | 56,814 |
| Fund shares redeemed | | 91,087 |
| Variation margin on futures contracts | + | 5,161 |
| Total liabilities | | 412,598 |
| Net Assets |
| Total assets | | 190,646,671 |
| Total liabilities | – | 412,598 |
| Net assets | | $190,234,073 |
| Net Assets by Source | | |
| Capital received from investors | | 180,714,808 |
| Total distributable earnings1 | | 9,519,265 |
| Net Asset Value (NAV) |
| Net Assets | ÷ | Shares
Outstanding | = | NAV |
| $190,234,073 | | 16,649,287 | | $11.43 |
| | | | | |
| 1 | The SEC eliminated the requirement to disclose total distributable earnings (loss) by each of its components as previously disclosed as the previous presentation did not provide insight into the tax implications of distributions (see financial note 9 for additional information). |
Schwab Fundamental Global Real Estate Index Fund | Annual Report
Schwab Fundamental Global Real Estate Index Fund
Statement of Operations
For the period March 1, 2018 through February 28, 2019
| Investment Income |
| Dividends (net of foreign withholding tax of $296,229) | | $6,534,478 |
| Interest | + | 9,661 |
| Total investment income | | 6,544,139 |
| Expenses |
| Investment adviser fees | | 687,810 |
| Total expenses | – | 687,810 |
| Net investment income | | 5,856,329 |
| Realized and Unrealized Gains (Losses) |
| Net realized losses on investments | | (434,962) |
| Net realized losses on futures contracts | | (11,693) |
| Net realized losses on foreign currency transactions | + | (12,230) |
| Net realized losses | | (458,885) |
| Net change in unrealized appreciation (depreciation) on investments (net of change in foreign capital gains tax of ($1,371)) | | 5,774,127 |
| Net change in unrealized appreciation (depreciation) on futures contracts | | 12,506 |
| Net change in unrealized appreciation (depreciation) on foreign currency translations | + | (7,551) |
| Net change in unrealized appreciation (depreciation) | + | 5,779,082 |
| Net realized and unrealized gains | | 5,320,197 |
| Increase in net assets resulting from operations | | $11,176,526 |
Schwab Fundamental Global Real Estate Index Fund | Annual Report
Schwab Fundamental Global Real Estate Index Fund
Statement of Changes in Net Assets
For the current and prior report periods
| Operations | |
| | 3/1/18-2/28/19 | 3/1/17-2/28/18 |
| Net investment income | | $5,856,329 | $3,420,714 |
| Net realized gains (losses) | | (458,885) | 2,056,339 |
| Net change in unrealized appreciation (depreciation) | + | 5,779,082 | 2,023,137 |
| Increase in net assets from operations | | 11,176,526 | 7,500,190 |
| Distributions to Shareholders1 | |
| Total distributions | | ($8,781,234) | ($4,174,000) |
| Transactions in Fund Shares | | | |
| | | 3/1/18-2/28/19 | 3/1/17-2/28/18 |
| | | SHARES | VALUE | SHARES | VALUE |
| Shares sold | | 6,151,264 | $69,415,729 | 7,075,682 | $80,763,586 |
| Shares reinvested | | 630,628 | 6,879,385 | 280,696 | 3,217,737 |
| Shares redeemed | + | (4,222,676) | (46,815,739) | (1,899,092) | (21,552,849) |
| Net transactions in fund shares | | 2,559,216 | $29,479,375 | 5,457,286 | $62,428,474 |
| Shares Outstanding and Net Assets | | | |
| | | 3/1/18-2/28/19 | 3/1/17-2/28/18 |
| | | SHARES | NET ASSETS | SHARES | NET ASSETS |
| Beginning of period | | 14,090,071 | $158,359,406 | 8,632,785 | $92,604,742 |
| Total increase | + | 2,559,216 | 31,874,667 | 5,457,286 | 65,754,664 |
| End of period2 | | 16,649,287 | $190,234,073 | 14,090,071 | $158,359,406 |
| 1 | For the period ended February 28, 2018, the fund distributed to shareholders $3,812,190 from net investment income and $361,810 from net realized gains. The SEC eliminated the requirement to disclose distributions to shareholders from net investment income and from net realized gains in 2018 (see financial note 9 for additional information). |
| 2 | End of period - Net assets include distributions in excess of net investment income of ($1,056,494) at February 28, 2018. The SEC eliminated the requirement to disclose undistributed net investment income in 2018. |
Schwab Fundamental Global Real Estate Index Fund | Annual Report
Schwab Fundamental Global Real Estate Index Fund
1. Business Structure of the Fund:
Schwab Fundamental Global Real Estate Index Fund is a series of Schwab Capital Trust (the trust), a no-load, open-end management investment company. The trust is organized as a Massachusetts business trust and is registered under the Investment Company Act of 1940, as amended (the 1940 Act). The list below shows all the funds in the trust as of the end of the period, including the fund discussed in this report, which is highlighted:
| SCHWAB CAPITAL TRUST (ORGANIZED MAY 7, 1993) |
| Schwab Fundamental Global Real Estate Index Fund | Schwab Target 2010 Fund |
| Schwab Fundamental US Large Company Index Fund | Schwab Target 2015 Fund |
| Schwab Fundamental US Small Company Index Fund | Schwab Target 2020 Fund |
| Schwab Fundamental International Large Company Index Fund | Schwab Target 2025 Fund |
| Schwab Fundamental International Small Company Index Fund | Schwab Target 2030 Fund |
| Schwab Fundamental Emerging Markets Large Company Index Fund | Schwab Target 2035 Fund |
| Schwab S&P 500 Index Fund | Schwab Target 2040 Fund |
| Schwab Small-Cap Index Fund | Schwab Target 2045 Fund |
| Schwab Total Stock Market Index Fund | Schwab Target 2050 Fund |
| Schwab U.S. Large-Cap Growth Index Fund | Schwab Target 2055 Fund |
| Schwab U.S. Large-Cap Value Index Fund | Schwab Target 2060 Fund |
| Schwab U.S. Mid-Cap Index Fund | Schwab Monthly Income Fund — Moderate Payout |
| Schwab International Index Fund | Schwab Monthly Income Fund — Enhanced Payout |
| Schwab MarketTrack All Equity Portfolio™ | Schwab Monthly Income Fund — Maximum Payout |
| Schwab MarketTrack Growth Portfolio™ | Schwab Target 2010 Index Fund |
| Schwab MarketTrack Balanced Portfolio™ | Schwab Target 2015 Index Fund |
| Schwab MarketTrack Conservative Portfolio™ | Schwab Target 2020 Index Fund |
| Laudus International MarketMasters Fund™ | Schwab Target 2025 Index Fund |
| Schwab Balanced Fund | Schwab Target 2030 Index Fund |
| Schwab Core Equity Fund | Schwab Target 2035 Index Fund |
| Schwab Dividend Equity Fund | Schwab Target 2040 Index Fund |
| Schwab Large-Cap Growth Fund | Schwab Target 2045 Index Fund |
| Schwab Small-Cap Equity Fund | Schwab Target 2050 Index Fund |
| Schwab Hedged Equity Fund | Schwab Target 2055 Index Fund |
| Schwab Health Care Fund | Schwab Target 2060 Index Fund |
| Schwab International Core Equity Fund | |
Schwab Fundamental Global Real Estate Index Fund offers one share class. Shares are bought and sold at closing net asset value per share (NAV), which is the price for all outstanding shares of the fund. Each share has a par value of 1/1,000 of a cent, and the fund’s Board of Trustees (the Board) may authorize the issuance of as many shares as necessary.
The fund maintains its own account for purposes of holding assets and accounting, and is considered a separate entity for tax purposes. Within its account, the fund may also keep certain assets in segregated accounts, as required by securities law.
2. Significant Accounting Policies:
The following is a summary of the significant accounting policies the fund uses in its preparation of financial statements. The fund follows the investment company accounting and reporting guidance of the Financial Accounting Standards Board (FASB) Accounting Standard CodificationTopic 946 Financial Services — Investment Companies. The accounting policies are in conformity with accounting principles generally accepted in the United States of America (GAAP).
The fund may invest in certain other investment companies (underlying funds). For more information about the underlying funds’ operations and policies, please refer to those funds’ semiannual and annual reports, which are filed with the U.S. Securities and Exchange Commission (SEC).
Effective November 5, 2018, the fund adopted SEC Regulation S-X disclosure requirement changes. The adopted changes are reflected throughout this report.
Schwab Fundamental Global Real Estate Index Fund | Annual Report
Schwab Fundamental Global Real Estate Index Fund
Financial Notes(continued)
2. Significant Accounting Policies (continued):
(a) Security Valuation:
Under procedures approved by the Board, the investment adviser has formed a Pricing Committee to administer the pricing and valuation of portfolio securities and other assets and to ensure that prices used for internal purposes or provided by third parties reasonably reflect fair market value. Among other things, these procedures allow the fund to utilize independent pricing services, quotations from securities and financial instrument dealers and other market sources to determine fair value.
The fund values the securities in its portfolio every business day. The fund uses the following policies to value various types of securities:
• Securities traded on an exchange or over-the-counter:Traded securities are valued at the closing value for the day, or, on days when no closing value has been reported, at the mean of the most recent bid and ask quotes. Securities that are primarily traded on foreign exchanges are valued at the official closing price or the last sales price on the exchange where the securities are principally traded with these values then translated into U.S. dollars at the current exchange rate, unless these securities are fair valued as discussed below.
• Securities for which no quoted value is available:The Board has adopted procedures to fair value the fund’s securities when market prices are not “readily available” or are unreliable. For example, the fund may fair value a security when it is de-listed or its trading is halted or suspended; when a security’s primary pricing source is unable or unwilling to provide a price; or when a security’s primary trading market is closed during regular market hours. The fund makes fair value determinations in good faith in accordance with the fund’s valuation procedures. The Pricing Committee considers a number of factors, including unobservable market inputs when arriving at fair value. The Pricing Committee may employ techniques such as the review of related or comparable assets or liabilities, related market activities, recent transactions, market multiples, book values, transactional back-testing, disposition analysis and other relevant information. The Pricing Committee regularly reviews these inputs and assumptions to calibrate the valuations. Due to the subjective and variable nature of fair value pricing, there can be no assurance that the fund could obtain the fair value assigned to the security upon the sale of such security. The Board convenes on a regular basis to review fair value determinations made by the fund pursuant to the valuation procedures.
• Foreign equity security fair valuation:The Board has adopted procedures to fair value foreign equity securities that are traded in markets that close prior to the fund valuing its holdings. By fair valuing securities whose prices may have been affected by events occurring after the close of trading, the fund seeks to establish prices that investors might expect to realize upon the current sales of these securities. This methodology is designed to deter “arbitrage” market timers, who seek to exploit delays between the change in the value of the fund’s portfolio holdings and the NAV of the fund’s shares, and seeks to help ensure that the prices at which the fund’s shares are purchased and redeemed are fair and do not result in dilution of shareholder interest or other harm to shareholders. When fair value pricing is used at the open or close of a reporting period, it may cause a temporary divergence between the return of the fund and that of its comparative index or benchmark. The Board regularly reviews fair value determinations made by the fund pursuant to these procedures.
• Futures contracts:Futures contracts are valued at their settlement prices as of the close of their exchanges.
In accordance with the authoritative guidance on fair value measurements and disclosures under GAAP, the fund discloses the fair value of its investments in a hierarchy that prioritizes the significant inputs to valuation techniques used to measure the fair value. The hierarchy gives the highest priority to valuations based upon unadjusted quoted prices in active markets for identical assets or liabilities (Level 1 measurements) and the lowest priority to valuations based upon unobservable inputs that are significant to the valuation (Level 3 measurements). If inputs used to measure the financial instruments fall within different levels of the hierarchy, the categorization is based on the lowest level input that is significant to the valuation. If the fund determines that either the volume and/or level of activity for an asset or liability has significantly decreased (from normal conditions for that asset or liability) or price quotations or observable inputs are not associated with orderly transactions, increased analysis and management judgment will be required to estimate fair value.
The three levels of the fair value hierarchy are as follows:
• Level 1—quoted prices in active markets for identical securities—Investments whose values are based on quoted market prices in active markets, and whose values are therefore classified as Level 1 prices, include active listed equities and futures contracts.
• Level 2—other significant observable inputs (including quoted prices for similar securities, interest rates, prepayment speeds, credit risk, etc.)—Investments that trade in markets that are not considered to be active, but whose values are based on quoted market prices, dealer quotations or valuations provided by alternative pricing sources supported by observable inputs are classified as Level 2 prices. These generally include U.S. government and sovereign obligations, most government agency
Schwab Fundamental Global Real Estate Index Fund | Annual Report
Schwab Fundamental Global Real Estate Index Fund
Financial Notes(continued)
2. Significant Accounting Policies (continued):
securities, investment-grade corporate bonds, certain mortgage products, less liquid listed equities, and state, municipal and provincial obligations. In addition, international securities whose markets close hours before the fund values its holdings may require fair valuations due to significant movement in the U.S. markets occurring after the daily close of the foreign markets. The Board has approved a vendor that calculates fair valuations of international equity securities based on a number of factors that appear to correlate to the movements in the U.S. markets.
• Level 3—significant unobservable inputs (including the fund’s own assumptions in determining the fair value of investments)—Investments whose values are classified as Level 3 prices have significant unobservable inputs, as they may trade infrequently or not at all. When observable prices are not available for these securities, the fund uses one or more valuation techniques for which sufficient and reliable data is available. The inputs used by the fund in estimating the value of Level 3 prices may include the original transaction price, quoted prices for similar securities or assets in active markets, completed or pending third-party transactions in the underlying investment or comparable issuers, and changes in financial ratios or cash flows. Level 3 prices may also be adjusted to reflect illiquidity and/or non-transferability, with the amount of such discount estimated by the fund in the absence of market information. Assumptions used by the fund due to the lack of observable inputs may significantly impact the resulting fair value and therefore the fund’s results of operations.
The inputs or methodology used for valuing securities are not necessarily an indication of the risk associated with investing in those securities.
The levels associated with valuing the fund’s investments as of February 28, 2019 are disclosed in the Portfolio Holdings.
(b) Accounting Policies for certain Portfolio Investments (if held):
Futures Contracts: Futures contracts are instruments that represent an agreement between two parties that obligates one party to buy, and the other party to sell, specific instruments at an agreed upon price on a stipulated future date. The fund must give the broker a deposit of cash and/or securities (initial margin) whenever it enters into a futures contract. The amount of the deposit may vary from one contract to another. Subsequent payments (variation margin) are made or received by the fund depending on the daily fluctuations in the value of the futures contract and are accounted for as unrealized appreciation or depreciation until the contract is closed, at which time the gains or losses are realized. Futures contracts are traded publicly on exchanges, and their market value may change daily.
Cash Management Transactions: The fund may subscribe to the Brown Brothers Harriman & Co. (BBH) Cash Management Service Sweep (CMS Sweep). The BBH CMS Sweep is an investment product that automatically sweeps the fund’s cash balances into overnight offshore time deposits with either the BBH Grand Cayman branch or a branch of a pre-approved commercial bank. This fully automated program allows the fund to earn interest on cash balances. Excess cash invested with deposit institutions domiciled outside of the U.S., as with any offshore deposit, may be subject to sovereign actions in the jurisdiction of the deposit institution including, but not limited to, freeze, seizure or diminution. The fund bears the risk associated with the repayment of principal and payment of interest on such instruments by the institution with which the deposit is ultimately placed. Balances in the CMS Sweep are accounted for on a cost basis, which approximates market value.
Passive Foreign Investment Companies: The fund may own shares in certain foreign corporations that meet the Internal Revenue Code definition of a passive foreign investment company (PFIC). The fund may elect for tax purposes to mark-to-market annually the shares of each PFIC lot held and would be required to distribute as ordinary income to shareholders any such marked-to-market gains (as well as any gains realized on sale).
(c) Security Transactions:
Security transactions are recorded as of the date the order to buy or sell the security is executed. Realized gains and losses from security transactions are based on the identified costs of the securities involved.
Assets and liabilities denominated in foreign currencies are reported in U.S. dollars. For assets and liabilities held on a given date, the dollar value is based on market exchange rates in effect on that date. Transactions involving foreign currencies, including purchases, sales, income receipts and expense payments, are calculated using exchange rates in effect on the transaction date. Realized foreign exchange gains or losses arise from sales of foreign currencies, currency gains or losses realized between the trade and settlement dates on securities transactions and the differences between the recorded amounts of dividends, interest, and foreign withholding taxes and the U.S. dollar equivalent of the amounts actually received or paid. Net unrealized foreign exchange appreciation or depreciation arises from changes in foreign exchange rates on foreign denominated assets and liabilities other than investments in securities held at the end of the reporting period. These realized and unrealized foreign exchange gains or losses are
Schwab Fundamental Global Real Estate Index Fund | Annual Report
Schwab Fundamental Global Real Estate Index Fund
Financial Notes(continued)
2. Significant Accounting Policies (continued):
reported in foreign currency transactions or translations on the Statement of Operations. The fund does not isolate the portion of the fluctuations on investments resulting from changes in foreign currency exchange rates from the fluctuations in market prices of investments held. Such fluctuations are included with the net realized and unrealized gain or loss from investments.
Gains realized by the fund on the sale of securities in certain foreign countries may be subject to non-U.S. taxes. In those instances, the fund records a liability based on unrealized gains to provide for potential non-U.S. taxes payable upon the sale of these securities.
When the fund closes out a futures contract position, it calculates the difference between the value of the position at the beginning and at the end of the contract, and records a realized gain or loss accordingly.
The fund invests in real estate investment trusts (REITs) which report information on the source of their distributions annually. The fund’s policy is to record all REIT distributions initially as dividend income on the ex-dividend date and then re-designate them as return of capital and/or capital gain distributions at the end of the reporting period based on information provided annually by each REIT, and management estimates such re-designations when actual information has not yet been reported.
(d) Investment Income:
Interest income is recorded as it accrues. Dividends and distributions from portfolio securities are recorded on the date they are effective (the ex-dividend date), although the fund records certain foreign security dividends on the day it learns of the ex-dividend date.
Income received from foreign sources may result in withholding tax. Withholding taxes are accrued at the same time as the related income if the tax rate is fixed and known, unless a tax withheld is reclaimable from the local tax authorities in which case it is recorded as receivable. If the tax rate is not known or estimable, such expense or reclaim receivable is recorded when the net proceeds are received.
(e) Expenses:
Pursuant to an Amended and Restated Investment Advisory and Administration Agreement (Advisory Agreement) between Charles Schwab Investment Management, Inc. (CSIM or the investment adviser) and the fund, CSIM pays the operating expenses of the fund, excluding acquired fund fees and expenses, taxes, any brokerage expenses, and extraordinary or non-routine expenses. Taxes, any brokerage expenses and extraordinary or non-routine expenses that are specific to the fund are charged directly to the fund.
(f) Distributions to Shareholders:
The fund generally makes distributions from net investment income, if any, quarterly and from net realized capital gains, if any, once a year.
(g) Accounting Estimates:
The accounting policies described in this report conform to GAAP. Notwithstanding this, shareholders should understand that in order to follow these principles, fund management has to make estimates and assumptions that affect the information reported in the financial statements. It’s possible that once the results are known, they may turn out to be different from these estimates and these differences may be material.
(h) Federal Income Taxes:
The fund intends to meet federal income and excise tax requirements for regulated investment companies under subchapter M of the Internal Revenue Code, as amended. Accordingly, the fund distributes substantially all of its net investment income and net realized capital gains, if any, to its respective shareholders each year. As long as the fund meets the tax requirements, it is not required to pay federal income tax.
(i) Foreign Taxes:
The fund may be subject to foreign taxes (a portion of which may be reclaimable) on income, corporate events, foreign currency exchanges and capital gains on investments. All foreign taxes are recorded in accordance with the applicable foreign tax regulations and rates that exist in foreign markets in which the fund invests. These foreign taxes, if any, are paid by the fund and are disclosed in the Statement of Operations. Foreign taxes payable as of February 28, 2019, if any, are reflected in the fund’s Statement of Assets and Liabilities.
Schwab Fundamental Global Real Estate Index Fund | Annual Report
Schwab Fundamental Global Real Estate Index Fund
Financial Notes(continued)
2. Significant Accounting Policies (continued):
(j) Indemnification:
Under the fund’s organizational documents, the officers and trustees are indemnified against certain liabilities arising out of the performance of their duties to the fund. In addition, in the normal course of business the fund enters into contracts with its vendors and others that provide general indemnifications. The fund’s maximum exposure under these arrangements is unknown as this would involve future claims that may be made against the fund. However, based on experience, the fund expects the risk of loss attributable to these arrangements to be remote.
(k) Recent Accounting Standards:
In August 2018, the FASB issued Accounting Standards Update “Fair Value Measurement (Topic 820)” (ASU 2018-13) which modifies the disclosure requirements for fair value measurement by removing, modifying, or adding certain disclosures. The amendments are effective for annual periods beginning after December 15, 2019, and interim periods within those annual periods. The fund is permitted to early adopt any removed or modified disclosures upon issuance of this update and delay adoption of the additional disclosures until their effective date. The fund has early adopted certain removed or modified disclosures, including the amount of and reasons for transfers between Level 1 and Level 2 of the fair value hierarchy and the policy for timing of transfers between levels upon issuance of ASU 2018-13, and has delayed adoption of the additional disclosures until their effective date. At this time, management is currently evaluating the impact that the adoption of the additional disclosures will have on the fund’s financial statements.
3. Risk Factors:
Investing in the fund may involve certain risks, as discussed in the fund’s prospectus, including, but not limited to, those described below. Any of these risks could cause an investor to lose money.
Market Risk. Financial markets rise and fall in response to a variety of factors, sometimes rapidly and unpredictably. As with any investment whose performance is tied to these markets, the value of an investment in the fund will fluctuate, which means that an investor could lose money over short or long periods.
Equity Risk. The prices of equity securities rise and fall daily. These price movements may result from factors affecting individual companies, industries or the securities market as a whole. In addition, equity markets tend to move in cycles, which may cause stock prices to fall over short or extended periods of time.
Investment Style Risk.The fund is an index fund. Therefore, the fund follows the securities included in the index during upturns as well as downturns. Because of its indexing strategy, the fund does not take steps to reduce market exposure or to lessen the effects of a declining market. In addition, because of the fund’s expenses, the fund’s performance may be below that of the index.
Market Capitalization Risk. Securities issued by companies of different market capitalizations tend to go in and out of favor based on market and economic conditions. During a period when securities of a particular market capitalization fall behind other types of investments, the fund’s performance could be impacted.
Mid-Cap Company Risk. Mid-cap companies may be more vulnerable to adverse business or economic events than larger, more established companies and the value of securities issued by these companies may move sharply.
Small-Cap Company Risk.Securities issued by small-cap companies may be riskier than those issued by larger companies, and their prices may move sharply, especially during market upturns and downturns.
Real Estate Investment Risk. Due to the composition of the index, the fund will concentrate its investments in real estate companies and companies related to the real estate industry. As such, the fund is subject to risks associated with the direct ownership of real estate securities and an investment in the fund will be closely linked to the performance of the real estate markets. These risks include, among others: declines in the value of real estate; risks related to general and local economic conditions; possible lack of availability of mortgage funds or other limits to accessing the credit or capital markets; defaults by borrowers or tenants, particularly during an economic downturn; and changes in interest rates.
REITs Risk. In addition to the risks associated with investing in securities of real estate companies and real estate related companies, REITs are subject to certain additional risks. Equity REITs may be affected by changes in the value of the underlying properties owned by the trusts. Further, REITs are dependent upon specialized management skills and cash flows, and may have their investments in relatively few properties, or in a small geographic area or a single property type. Failure of a company to qualify as a REIT under federal tax law may have adverse consequences to the fund. In addition, REITs have their own expenses, and the fund will bear a proportionate share of those expenses.
Schwab Fundamental Global Real Estate Index Fund | Annual Report
Schwab Fundamental Global Real Estate Index Fund
Financial Notes(continued)
3. Risk Factors (continued):
Foreign Investment Risk. The fund’s investments in securities of foreign issuers involve certain risks that may be greater than those associated with investments in securities of U.S. issuers. These include risks of adverse changes in foreign economic, political, regulatory and other conditions; changes in currency exchange rates or exchange control regulations (including limitations on currency movements and exchanges); the imposition of economic sanctions or other government restrictions; differing accounting, auditing, financial reporting and legal standards and practices; differing securities market structures; and higher transaction costs. These risks may negatively impact the value or liquidity of the fund’s investments, and could impair the fund’s ability to meet its investment objective or invest in accordance with its investment strategy. There is a risk that investments in securities denominated in, and/or receiving revenues in, foreign currencies will decline in value relative to the U.S. dollar. Foreign securities also include American Depositary receipts (ADRs), Global Depositary receipts (GDRs) and European Depositary receipts (EDRs), which are receipts issued by U.S. and foreign banks that represent shares of foreign-based corporations. Investments in ADRs, GDRs, and EDRs may be less liquid than the underlying shares in their primary trading market and GDRs, many of which are issued by companies in emerging markets, may be more volatile. To the extent the fund’s investments in a single country or a limited number of countries represent a large percentage of the fund’s assets, the fund’s performance may be adversely affected by the economic, political, regulatory and social conditions in those countries, and the fund’s price may be more volatile than the price of a fund that is geographically diversified.
Emerging Markets Risk. Emerging market countries may be more likely to experience political turmoil or rapid changes in market or economic conditions than more developed countries. Emerging market countries often have less uniformity in accounting and reporting requirements and greater risk associated with the custody of securities. In addition, the financial stability of issuers (including governments) in emerging market countries may be more precarious than in developed countries. As a result, there may be an increased risk of illiquidity and price volatility associated with the fund’s investments in emerging market countries, which may be magnified by currency fluctuations relative to the U.S. dollar, and, at times, it may be difficult to value such investments.
Sampling Index Tracking Risk. The fund may not fully replicate the index and may hold securities not included in the index. As a result, the fund is subject to the risk that the investment adviser’s investment management strategy, the implementation of which is subject to a number of constraints, may not produce the intended results. Because the fund utilizes a sampling approach, it may not track the return of the index as well as it would if the fund purchased all of the securities in the index.
Tracking Error Risk.As an index fund, the fund seeks to track the performance of the index, although it may not be successful in doing so. The divergence between the performance of the fund and the index, positive or negative, is called “tracking error.” Tracking error can be caused by many factors and it may be significant.
Concentration Risk. To the extent that the fund’s or the index’s portfolio is concentrated in the securities of issuers in a particular market, industry, group of industries, sector, country, or asset class (including the real estate industry, as described above), the fund may be adversely affected by the performance of those securities, may be subject to increased price volatility and may be more vulnerable to adverse economic, market, political or regulatory occurrences affecting that market, industry, group of industries, sector, country, or asset class.
Derivatives Risk. The fund may use derivatives to enhance returns or hedge against market declines. Examples of derivatives are options, futures, options on futures and swaps. An option is the right to buy or sell an instrument at a specific price before a specific date. A future is an agreement to buy or sell a financial instrument at a specific price on a specific day. A swap is an agreement whereby two parties agree to exchange payment streams calculated in relation to a rate, index, instrument or certain securities and a predetermined amount. The fund’s use of derivatives that are subject to regulation by the Commodity Futures Trading Commission (CFTC) could cause the fund to become a commodity pool, which would require the fund to comply with certain CFTC rules.
The fund’s use of derivative instruments involves risks different from, or possibly greater than, the risks associated with investing directly in securities and other traditional investments. Certain of these risks, such as liquidity risk, leverage risk, and market risk, are discussed elsewhere in this section. The fund’s use of derivatives is also subject to lack of availability risk, credit risk, valuation risk, correlation risk and tax risk. Lack of availability risk is the risk that suitable derivative transactions may not be available in all circumstances for risk management or other purposes. Credit risk is the risk that the counterparty to a derivatives transaction may not fulfill its obligations. Valuation risk is the risk that a particular derivative may be valued incorrectly. Correlation risk is the risk that changes in the value of the derivative may not correlate perfectly with the underlying asset, rate or index. Tax risk is the risk that the use of derivatives may cause the fund to realize higher amounts of short-term capital gains. The fund’s use of derivatives could reduce the fund’s performance, increase the fund’s volatility, and could cause the fund to lose more than the initial amount invested.
Schwab Fundamental Global Real Estate Index Fund | Annual Report
Schwab Fundamental Global Real Estate Index Fund
Financial Notes(continued)
3. Risk Factors (continued):
Leverage Risk.Certain fund transactions, such as derivatives transactions, may give rise to a form of leverage and may expose the fund to greater risk. Leverage tends to magnify the effect of any decrease or increase in the value of the fund’s portfolio securities. The use of leverage may cause the fund to liquidate portfolio positions when it would not be advantageous to do so in order to satisfy its obligations.
ETF Risk. The fund may purchase shares of ETFs to gain exposure to a particular portion of the market while awaiting an opportunity to purchase securities directly. When the fund invests in an ETF, in addition to directly bearing the expenses associated with its own operation, it will bear a proportionate share of the ETF’s expenses. Therefore, it may be more costly to own an ETF than to own the underlying securities directly. In addition, while the risks of owning shares of an ETF generally reflect the risks of owning the underlying securities the ETF holds, lack of liquidity in the market for an ETF’s shares can result in its value being more volatile than the underlying portfolio of securities.
Liquidity Risk. The fund may be unable to sell certain securities, such as illiquid securities, readily at a favorable time or price, or the fund may have to sell them at a loss.
Please refer to the fund’s prospectus for a more complete description of the principal risks of investing in the fund.
4. Affiliates and Affiliated Transactions:
Investment Adviser
CSIM, a wholly owned subsidiary of The Charles Schwab Corporation, serves as the fund’s investment adviser and administrator pursuant to the Advisory Agreement between CSIM and the trust.
For its advisory and administrative services to the fund, CSIM is entitled to receive an annual fee, payable monthly, equal to 0.39% of the fund’s average daily net assets.
Other Affiliated Transactions
CSIM has a licensing agreement with the Frank Russell Company to use certain Russell indices and trademarks in connection with the offering and operation of certain registered investment companies. The fund entered into a sublicense agreement with CSIM pursuant to which CSIM has agreed to sublicense certain Russell indices and trademarks to the fund. CSIM pays all applicable licensing fees for the fund.
Interfund Transactions
The fund may engage in transactions with certain other funds in the Fund Complex (for definition refer to Trustees and Officers section) when permitted by applicable law. When one fund is seeking to sell a security that another is seeking to buy, an interfund transaction can allow both funds to benefit by reducing transaction costs. This practice is limited to funds that share the same investment adviser, trustees and/or officers. For the period ended February 28, 2019, the fund’s total aggregate security transactions with other funds in the Fund Complex was $8,155,548 and includes realized losses of ($210,060).
Interfund Borrowing and Lending
Pursuant to an exemptive order issued by the SEC, the fund may enter into interfund borrowing and lending transactions with other funds in the Fund Complex. All loans are for temporary or emergency purposes and the interest rate to be charged will be the average of the overnight repurchase agreement rate and the short-term bank loan rate. All loans are subject to numerous conditions designed to ensure fair and equitable treatment of all participating funds. The interfund lending facility is subject to the oversight and periodic review by the Board. The fund had no interfund borrowing or lending activity during the period.
5. Board of Trustees:
The Board may include people who are officers and/or directors of CSIM or its affiliates. Federal securities law limits the percentage of such “interested persons” who may serve on a trust’s board, and the trust was in compliance with these limitations throughout the report period. The fund does not pay any interested or non-interested (independent) trustees. The independent trustees are paid by CSIM. For information regarding the trustees, please refer to the Trustees and Officers table at the end of this report.
Schwab Fundamental Global Real Estate Index Fund | Annual Report
Schwab Fundamental Global Real Estate Index Fund
Financial Notes(continued)
6. Borrowing from Banks:
During the period, the fund was a participant with other U.S. registered investment companies managed by CSIM in a joint, syndicated, committed $605 million line of credit (the Syndicated Credit Facility), which matured on October 4, 2018. On October 4, 2018, the Syndicated Credit Facility was amended to run for a new 364 day period with an increased line of $750 million, maturing on October 3, 2019. Under the terms of the Syndicated Credit Facility, in addition to CSIM paying the interest charged on any borrowings by a fund, CSIM paid a commitment fee of 0.15% per annum on the fund’s proportionate share of the unused portion of the Syndicated Credit Facility.
During the period, the fund was a participant with other U.S. registered investment companies managed by CSIM in a joint, unsecured, uncommitted $500 million line of credit (the Uncommitted Credit Facility), with State Street Bank and Trust Company, which matured on November 30, 2018. On November 30, 2018, the Uncommitted Credit Facility was amended to run for a new 364 day period, maturing on November 29, 2019. Under the terms of the Uncommitted Credit Facility, CSIM pays interest on the amount the fund borrows. There were no borrowings from either line of credit during the period.
The fund also has access to custodian overdraft facilities. The fund may have utilized the overdraft facility and incurred an interest expense, which is paid by CSIM. The interest expense is determined based on a negotiated rate above the current Federal Funds Rate.
7. Derivatives:
The fund entered into equity index futures contracts during the report period. The fund invested in futures contracts to equitize available cash. The current value and variation margin for futures contracts held at February 28, 2019 are presented on the Portfolio Holdings and Statement of Assets and Liabilities, respectively. The net realized and change in unrealized gains (losses) on futures contracts are presented on the Statement of Operations, if any. Refer to financial note 2(b) for the fund’s accounting policies with respect to futures contracts and financial note 3 for disclosures concerning the risks of investing in futures contracts. During the period ended February 28, 2019, the month-end average notional amounts of futures contracts held by the fund was $1,490,880 and the month-end average number of contracts held was 17.
8. Purchases and Sales of Investment Securities:
For the period ended February 28, 2019, purchases and sales of securities (excluding short-term obligations) were as follows:
Purchases
of Securities | Sales
of Securities |
| $61,095,427 | $28,872,115 |
9. Federal Income Taxes:
As of February 28, 2019, the tax basis cost of the fund’s investments and gross unrealized appreciation and depreciation were as follows:
| Tax cost | $182,488,286 |
| Gross unrealized appreciation | $17,804,568 |
| Gross unrealized depreciation | (10,550,431) |
| Net unrealized appreciation (depreciation) | $7,254,137 |
As of February 28, 2019, the components of distributable earnings on a tax basis were as follows:
| Undistributed ordinary income | $1,783,269 |
| Undistributed long-term capital gains | 487,567 |
| Net unrealized appreciation (depreciation) on investments | 7,254,137 |
| Net other unrealized appreciation (depreciation) | (5,708) |
| Total | $9,519,265 |
Schwab Fundamental Global Real Estate Index Fund | Annual Report
Schwab Fundamental Global Real Estate Index Fund
Financial Notes(continued)
9. Federal Income Taxes (continued):
The primary differences between book basis and tax basis unrealized appreciation or unrealized depreciation of investments are the tax deferral of losses on wash sales, realization for tax purposes of unrealized gains (losses) on futures contracts and the realization for tax purposes of unrealized appreciation on investments in PFICs and partnership investments. The tax cost of the fund’s investments, disclosed above, have been adjusted from its book amounts to reflect these unrealized appreciation or depreciation differences, as applicable.
Capital loss carryforwards may be used to offset future realized capital gains for federal income tax purposes. As of February 28, 2019, the fund had no capital loss carryforwards available to offset future net capital gains.
The tax basis components of distributions paid during the current and prior fiscal years were as follows:
| Current period distributions | |
| Ordinary income | $6,879,644 |
| Long-term capital gains | 1,901,590 |
| Prior period distributions | |
| Ordinary income | $3,812,190 |
| Long-term capital gains | 361,810 |
Distributions paid to shareholders are based on net investment income and net realized gains determined on a tax basis, which may differ from net investment income and net realized gains for financial reporting purposes. These differences reflect the differing character of certain income items and net realized gains and losses for financial statement and tax purposes, and may result in reclassification among certain capital accounts on the financial statements.
Permanent book and tax basis differences may result in reclassifications between components of net assets as required. The adjustments will have no impact on net assets or the results of operations.
As of February 28, 2019, management has reviewed the tax positions for open periods (for federal purposes, three years from the date of filing and for state purposes, four years from the date of filing) as applicable to the fund, and has determined that no provision for income tax is required in the fund’s financial statements. The fund recognizes interest and penalties, if any, related to unrecognized tax benefits as income tax expense in the Statement of Operations. During the period ended February 28, 2019, the fund did not incur any interest or penalties.
10. Subsequent Events:
Management has determined there are no subsequent events or transactions through the date the financial statements were issued that would have materially impacted the financial statements as presented.
Schwab Fundamental Global Real Estate Index Fund | Annual Report
Schwab Fundamental Global Real Estate Index Fund
Report of Independent Registered Public Accounting Firm
To the Board of Trustees of Schwab Capital Trust and Shareholders of Schwab Fundamental Global Real Estate Index Fund
Opinion on the Financial Statements
We have audited the accompanying statement of assets and liabilities, including the portfolio holdings, of Schwab Fundamental Global Real Estate Index Fund (one of the funds constituting Schwab Capital Trust, referred to hereafter as the “Fund”) as of February 28, 2019, the related statement of operations for the year ended February 28, 2019, the statement of changes in net assets for each of the two years in the period ended February 28, 2019, including the related notes, and the financial highlights for each of the periods indicated therein (collectively referred to as the “financial statements”). In our opinion, the financial statements present fairly, in all material respects, the financial position of the Fund as of February 28, 2019, the results of its operations for the year then ended, the changes in its net assets for each of the two years in the period ended February 28, 2019 and the financial highlights for each of the periods indicated therein in conformity with accounting principles generally accepted in the United States of America.
Basis for Opinion
These financial statements are the responsibility of the Fund’s management. Our responsibility is to express an opinion on the Fund’s financial statements based on our audits. We are a public accounting firm registered with the Public Company Accounting Oversight Board (United States) (PCAOB) and are required to be independent with respect to the Fund in accordance with the U.S. federal securities laws and the applicable rules and regulations of the Securities and Exchange Commission and the PCAOB.
We conducted our audits of these financial statements in accordance with the standards of the PCAOB. Those standards require that we plan and perform the audit to obtain reasonable assurance about whether the financial statements are free of material misstatement, whether due to error or fraud.
Our audits included performing procedures to assess the risks of material misstatement of the financial statements, whether due to error or fraud, and performing procedures that respond to those risks. Such procedures included examining, on a test basis, evidence regarding the amounts and disclosures in the financial statements. Our audits also included evaluating the accounting principles used and significant estimates made by management, as well as evaluating the overall presentation of the financial statements. Our procedures included confirmation of securities owned as of February 28, 2019 by correspondence with the custodian and brokers; when replies were not received from brokers, we performed other auditing procedures. We believe that our audits provide a reasonable basis for our opinion.
/s/ PricewaterhouseCoopers LLP
San Francisco, California
April 16, 2019
We have served as the auditor of one or more investment companies in the Schwab Funds Complex since 1989.
Schwab Fundamental Global Real Estate Index Fund | Annual Report
Schwab Fundamental Global Real Estate Index Fund
Other Federal Tax Information (unaudited)
The fund may elect to pass on the benefits of the foreign tax credit of $261,267 to its shareholders for the period ended February 28, 2019. The respective foreign source income of the fund is $3,792,598.
For the period ended February 28, 2019, the fund designated $825,248 of the dividend distributions as qualified dividends for the purpose of the maximum rate under section 1(h)(11) of the Internal Revenue Code. Shareholders will be notified in January 2020 via IRS Form 1099 of the amounts for use in preparing their 2019 income tax return.
For corporate shareholders, 0.26% of the fund’s dividend distributions paid during the fiscal year ended February 28, 2019, qualify for the corporate dividends received deduction.
Under section 852(b)(3)(C) of the Internal Revenue Code, the fund hereby designates $1,901,590 as long-term capital gain dividends for the fiscal year ended February 28, 2019.
For the period ended February 28, 2019, the fund designates $2,181,459 as dividends eligible for the 20% qualified business income deduction under section 199A of the Internal Revenue Code. Shareholders will be notified in January 2020 via IRS form 1099 of the amounts for use in preparing their 2019 income tax return.
Schwab Fundamental Global Real Estate Index Fund | Annual Report
Schwab Fundamental Global Real Estate Index Fund
Trustees and Officers
The tables below give information about the trustees and officers of Schwab Capital Trust, which includes the fund covered in this report. The “Fund Complex” includes The Charles Schwab Family of Funds, Schwab Capital Trust, Schwab Investments, Schwab Annuity Portfolios, Schwab Strategic Trust and Laudus Trust. The Fund Complex includes 98 funds.
The address for all trustees and officers is 211 Main Street, San Francisco, CA 94105. You can find more information about the trustees and officers in the Statement of Additional Information, which is available free by calling 1-877-824-5615.
| Independent Trustees |
Name, Year of Birth, and
Position(s) with the trust
(Terms of office, and
length of Time Served1) | Principal Occupations
During the Past Five Years | Number of
Portfolios in
Fund Complex
Overseen by
the Trustee | Other Directorships |
Robert W. Burns
1959
Trustee
(Trustee of Schwab Strategic Trust since 2009; The Charles Schwab Family of Funds, Schwab Investments, Schwab Capital Trust, Schwab Annuity Portfolios and Laudus Trust since 2016) | Retired/Private Investor (Jan. 2009 – present). Formerly, Managing Director, Pacific Investment Management Company, LLC (PIMCO) (investment management firm) and President, PIMCO Funds. | 98 | None |
John F. Cogan
1947
Trustee
(Trustee of The Charles Schwab Family of Funds, Schwab Investments, Schwab Capital Trust and Schwab Annuity Portfolios since 2008; Laudus Trust since 2010; Schwab Strategic Trust since 2016) | Senior Fellow (Oct. 1979 – present), The Hoover Institution at Stanford University (public policy think tank); Senior Fellow (2000 – present), Stanford Institute for Economic Policy Research; Professor of Public Policy (1994 – 2015), Stanford University. | 98 | Director (2005 – present), Gilead Sciences, Inc. |
Nancy F. Heller
1956
Trustee
(Trustee of The Charles Schwab Family of Funds, Schwab Investments, Schwab Capital Trust, Schwab Annuity Portfolios, Schwab Strategic Trust and Laudus Trust since 2018) | President and Chairman (2014 – 2016), TIAA Charitable (financial services); Senior Managing Director (2003 – 2016), TIAA (financial services). | 98 | None |
Stephen Timothy Kochis
1946
Trustee
(Trustee of Schwab Strategic Trust since 2012; The Charles Schwab Family of Funds, Schwab Investments, Schwab Capital Trust, Schwab Annuity Portfolios and Laudus Trust since 2016) | CEO and Owner (May 2012 – present), Kochis Global (wealth management consulting). | 98 | None |
Schwab Fundamental Global Real Estate Index Fund | Annual Report
Schwab Fundamental Global Real Estate Index Fund
| Independent Trustees (continued) |
Name, Year of Birth, and
Position(s) with the trust
(Terms of office, and
length of Time Served1) | Principal Occupations
During the Past Five Years | Number of
Portfolios in
Fund Complex
Overseen by
the Trustee | Other Directorships |
David L. Mahoney
1954
Trustee
(Trustee of The Charles Schwab Family of Funds, Schwab Investments, Schwab Capital Trust, Schwab Annuity Portfolios and Laudus Trust since 2011; Schwab Strategic Trust since 2016) | Private Investor. | 98 | Director (2003 – present), Symantec Corporation
Director (2004 – present), Corcept Therapeutics Incorporated
Director (2009 – present), Adamas Pharmaceuticals, Inc. |
Jane P. Moncreiff
1961
Trustee
(Trustee of The Charles Schwab Family of Funds, Schwab Investments, Schwab Capital Trust, Schwab Annuity Portfolios, Schwab Strategic Trust and Laudus Trust since 2019) | Chief Investment Officer (2009-2017), CareGroup Healthcare System, Inc. (healthcare). | 98 | None |
Kiran M. Patel
1948
Trustee
(Trustee of The Charles Schwab Family of Funds, Schwab Investments, Schwab Capital Trust, Schwab Annuity Portfolios and Laudus Trust since 2011; Schwab Strategic Trust since 2016) | Retired. Executive Vice President and General Manager of Small Business Group (Dec. 2008 – Sept. 2013), Intuit, Inc. (financial software and services firm for consumers and small businesses). | 98 | Director (2008 – present), KLA-Tencor Corporation |
Kimberly S. Patmore
1956
Trustee
(Trustee of The Charles Schwab Family of Funds, Schwab Investments, Schwab Capital Trust, Schwab Annuity Portfolios, Schwab Strategic Trust and Laudus Trust since 2016) | Consultant (2008 – present), Patmore Management Consulting (management consulting). | 98 | None |
Gerald B. Smith
1950
Trustee
(Trustee of The Charles Schwab Family of Funds, Schwab Investments, Schwab Capital Trust and Schwab Annuity Portfolios since 2000; Laudus Trust since 2010; Schwab Strategic Trust since 2016) | Chairman, Chief Executive Officer and Founder (Mar. 1990 – present), Smith Graham & Co. (investment advisors). | 98 | Director (2012 – present), Eaton |
Schwab Fundamental Global Real Estate Index Fund | Annual Report
Schwab Fundamental Global Real Estate Index Fund
| Interested Trustees |
Name, Year of Birth, and
Position(s) with the trust
(Terms of office, and
length of Time Served1) | Principal Occupations
During the Past Five Years | Number of
Portfolios in
Fund Complex
Overseen by
the Trustee | Other Directorships |
Walter W. Bettinger II2
1960
Chairman and Trustee
(Trustee of The Charles Schwab Family of Funds, Schwab Investments, Schwab Capital Trust and Schwab Annuity Portfolios since 2008; Schwab Strategic Trust since 2009; Laudus Trust since 2010) | Director, President and Chief Executive Officer (Oct. 2008 – present), The Charles Schwab Corporation; President and Chief Executive Officer (Oct. 2008 – present) and Director (May 2008 – present), Charles Schwab & Co., Inc.; Director (Apr. 2006 – present), Charles Schwab Bank; Director (Nov. 2017 – present), Charles Schwab Premier Bank; Director (May 2008 – present) and President and Chief Executive Officer (Aug. 2017 – present), Schwab Holdings, Inc.; Director (July 2016 – present), Charles Schwab Investment Management, Inc. | 98 | Director (2008 – present), The Charles Schwab Corporation |
Jonathan de St. Paer2
1973
Trustee
(Trustee of The Charles Schwab Family of Funds, Schwab Investments, Schwab Capital Trust, Schwab Annuity Portfolios, Schwab Strategic Trust and Laudus Trust since 2019) | Director and Chief Executive Officer (Apr. 2019 – present) and President (Oct. 2018 – present) Charles Schwab Investment Management, Inc.; Trustee and Chief Executive Officer (Apr. 2019 – present) and President (Nov. 2018 – present), Schwab Funds, Laudus Funds and Schwab ETFs; Director (Apr. 2019 – present), Charles Schwab Worldwide Funds plc and Charles Schwab Asset Management (Ireland) Limited; Senior Vice President (Apr. 2019 – present), Senior Vice President – Strategy and Product Development (CSIM) (Jan. 2014 – Mar. 2019), and Vice President (Jan. 2009 – Dec. 2013), Charles Schwab & Co., Inc. | 98 | None |
Joseph R. Martinetto2
1962
Trustee
(Trustee of The Charles Schwab Family of Funds, Schwab Investments, Schwab Capital Trust, Schwab Annuity Portfolios, Schwab Strategic Trust and Laudus Trust since 2016) | Chief Operating Officer (Feb. 2018 – present) and Senior Executive Vice President (July 2015 – Feb. 2018), The Charles Schwab Corporation; Senior Executive Vice President (July 2015 – present), Charles Schwab & Co., Inc.; Chief Financial Officer (July 2015 – Aug. 2017) and Executive Vice President and Chief Financial Officer (May 2007 – July 2015), The Charles Schwab Corporation and Charles Schwab & Co., Inc.; Director (May 2007 – present), Charles Schwab & Co., Inc.; Director (Apr. 2010 – present) and Chief Executive Officer (July 2013 – Apr. 2015), Charles Schwab Bank; Director (Nov. 2017 – present), Charles Schwab Premier Bank; Director (May 2007 – present), Chief Financial Officer (May 2007 – Aug. 2017), Senior Executive Vice President (Feb. 2016 – present), and Executive Vice President (May 2007 – Feb. 2016), Schwab Holdings, Inc. | 98 | None |
| Officers of the Trust |
Name, Year of Birth, and Position(s) with the trust
(Terms of office, and length of Time Served3) | Principal Occupations During the Past Five Years |
Jonathan de St. Paer
1973
President and Chief Executive Officer
(Officer of The Charles Schwab Family of Funds, Schwab Investments, Schwab Capital Trust, Schwab Annuity Portfolios, Schwab Strategic Trust and Laudus Trust since 2018) | Director and Chief Executive Officer (Apr. 2019 – present) and President (Oct. 2018 – present) Charles Schwab Investment Management, Inc.; Trustee and Chief Executive Officer (Apr. 2019 – present) and President (Nov. 2018 – present), Schwab Funds, Laudus Funds and Schwab ETFs; Director (Apr. 2019 – present), Charles Schwab Worldwide Funds plc and Charles Schwab Asset Management (Ireland) Limited; Senior Vice President (Apr. 2019 – present), Senior Vice President – Strategy and Product Development (CSIM) (Jan. 2014 – Mar. 2019), and Vice President (Jan. 2009 – Dec. 2013), Charles Schwab & Co., Inc. |
Schwab Fundamental Global Real Estate Index Fund | Annual Report
Schwab Fundamental Global Real Estate Index Fund
| Officers of the Trust (continued) |
Name, Year of Birth, and Position(s) with the trust
(Terms of office, and length of Time Served3) | Principal Occupations During the Past Five Years |
Mark Fischer
1970
Treasurer and Chief Financial Officer
(Officer of The Charles Schwab Family of Funds, Schwab Investments, Schwab Capital Trust, Schwab Annuity Portfolios, Schwab Strategic Trust and Laudus Trust since 2013) | Treasurer and Chief Financial Officer (Jan. 2016 – present), Schwab Funds, Laudus Funds and Schwab ETFs; Assistant Treasurer (Dec. 2013 – Dec. 2015), Schwab Funds and Laudus Funds; Assistant Treasurer (Nov. 2013 – Dec. 2015), Schwab ETFs; Vice President (Oct. 2013 – present), Charles Schwab Investment Management, Inc.; Executive Director (Apr. 2011 – Sept. 2013), J.P. Morgan Investor Services; Assistant Treasurer (May 2005 – Mar. 2011), Massachusetts Financial Service Investment Management. |
George Pereira
1964
Senior Vice President and Chief Operating Officer
(Officer of The Charles Schwab Family of Funds, Schwab Investments, Schwab Capital Trust and Schwab Annuity Portfolios since 2004; Laudus Trust since 2006; Schwab Strategic Trust since 2009) | Senior Vice President and Chief Financial Officer (Nov. 2004 – present) and Chief Operating Officer (Jan. 2011 – present), Charles Schwab Investment Management, Inc.; Senior Vice President and Chief Operating Officer (Jan. 2016 – present), Schwab Funds, Laudus Funds and Schwab ETFs; Treasurer and Chief Financial Officer (June 2006 – Dec. 2015), Laudus Funds; Treasurer and Principal Financial Officer (Nov. 2004 – Dec. 2015), Schwab Funds; Treasurer and Principal Financial Officer (Oct. 2009 – Dec. 2015), Schwab ETFs; Director (Apr. 2005 – present), Charles Schwab Worldwide Funds plc and Charles Schwab Asset Management (Ireland) Limited. |
Omar Aguilar
1970
Senior Vice President and Chief Investment Officer – Equities and Multi-Asset Strategies
(Officer of The Charles Schwab Family of Funds, Schwab Investments, Schwab Capital Trust, Schwab Annuity Portfolios, Schwab Strategic Trust and Laudus Trust since 2011) | Senior Vice President and Chief Investment Officer – Equities and Multi-Asset Strategies (Apr. 2011 – present), Charles Schwab Investment Management, Inc.; Senior Vice President and Chief Investment Officer – Equities and Multi-Asset Strategies (June 2011 – present), Schwab Funds, Laudus Funds and Schwab ETFs; Head of the Portfolio Management Group and Vice President of Portfolio Management (May 2009 – Apr. 2011), Financial Engines, Inc. (investment management firm); Head of Quantitative Equity (July 2004 – Jan. 2009), ING Investment Management. |
Brett Wander
1961
Senior Vice President and Chief Investment Officer – Fixed Income
(Officer of The Charles Schwab Family of Funds, Schwab Investments, Schwab Capital Trust, Schwab Annuity Portfolios, Schwab Strategic Trust and Laudus Trust since 2011) | Senior Vice President and Chief Investment Officer – Fixed Income (Apr. 2011 – present), Charles Schwab Investment Management, Inc.; Senior Vice President and Chief Investment Officer – Fixed Income (June 2011 – present), Schwab Funds, Laudus Funds and Schwab ETFs; Senior Managing Director, Global Head of Active Fixed-Income Strategies (Jan. 2008 – Oct. 2010), State Street Global Advisors; Director of Alpha Strategies (Apr. 2006 – Jan. 2008), Loomis, Sayles & Company (investment management firm). |
David Lekich
1964
Chief Legal Officer and Secretary, Schwab Funds and Schwab ETFs
Vice President and Assistant Clerk, Laudus Funds
(Officer of The Charles Schwab Family of Funds, Schwab Investments, Schwab Capital Trust, Schwab Annuity Portfolios, Schwab Strategic Trust and Laudus Trust since 2011) | Senior Vice President (Sept. 2011 – present) and Vice President (Mar. 2004 – Sept. 2011), Charles Schwab & Co., Inc.; Senior Vice President and Chief Counsel (Sept. 2011 – present) and Vice President (Jan. 2011 – Sept. 2011), Charles Schwab Investment Management, Inc.; Secretary (Apr. 2011 – present) and Chief Legal Officer (Dec. 2011 – present), Schwab Funds; Vice President and Assistant Clerk (Apr. 2011 – present), Laudus Funds; Secretary (May 2011 – present) and Chief Legal Officer (Nov. 2011 – present), Schwab ETFs. |
Catherine MacGregor
1964
Vice President and Assistant Secretary, Schwab Funds and Schwab ETFs
Chief Legal Officer, Vice President and Clerk, Laudus Funds
(Officer of The Charles Schwab Family of Funds, Schwab Investments, Schwab Capital Trust, Schwab Annuity Portfolios and Laudus Trust since 2005; Schwab Strategic Trust since 2009) | Vice President (July 2005 – present), Charles Schwab & Co., Inc.; Vice President (Sept. 2005 – present), Charles Schwab Investment Management, Inc.; Vice President (Dec. 2005 – present) and Chief Legal Officer and Clerk (Mar. 2007 – present), Laudus Funds; Vice President (Nov. 2005 – present) and Assistant Secretary (June 2007 – present), Schwab Funds; Vice President and Assistant Secretary (Oct. 2009 – present), Schwab ETFs. |
| 1 | Each Trustee shall hold office until the election and qualification of his or her successor, or until he or she dies, resigns or is removed. The retirement policy requires that each independent trustee retire by December 31 of the year in which the Trustee turns 74 or the Trustee’s twentieth year of service as an independent trustee on any trust in the Fund Complex, whichever occurs first. |
| 2 | Mr. Bettinger, Mr. de St. Paer and Mr. Martinetto are Interested Trustees. Mr. Bettinger is an Interested Trustee because he owns stock of The Charles Schwab Corporation (CSC), the parent company of Charles Schwab Investment Management, Inc. (CSIM), the investment adviser for the trusts in the Fund Complex, is an employee and director of Charles Schwab & Co., Inc. (CS&Co), the principal underwriter for The Charles Schwab Family of Funds, Schwab Investments, Schwab Capital Trust, Schwab Annuity Portfolios and Laudus Trust, and is a director of CSIM. Mr. de St. Paer is an Interested Trustee because he owns stock of CSC and is an employee and director of CSIM. Mr. Martinetto is an Interested Trustee because he owns stock of CSC and is an employee and director of CS&Co. |
| 3 | The President, Treasurer and Secretary/Clerk hold office until their respective successors are chosen and qualified or until he or she sooner dies, resigns, is removed or becomes disqualified. Each of the other officers serves at the pleasure of the Board. |
Schwab Fundamental Global Real Estate Index Fund | Annual Report
Schwab Fundamental Global Real Estate Index Fund
asset allocation The practice of dividing a portfolio among different asset classes, with each asset class assigned a particular percentage.
asset class A group of securities with similar structure and basic characteristics. Stocks, bonds and cash are the three main examples of asset classes.
beta A historical measure of an investment’s volatility relative to a market index (usually the S&P 500®). The index is defined as having a beta of 1.00. Investments with a beta higher than 1.00 have been more volatile than the index; those with a beta of less than 1.00 have been less volatile.
Bloomberg Barclays US Aggregate Bond Index An index that is a broad-based benchmark measuring the performance of the U.S. investment grade, taxable bond market, including U.S. Treasuries, government-related and corporate bonds, mortgage pass-through securities, commercial mortgage-backed securities, and asset-backed securities that are publicly available for sale in the United States. To be eligible for inclusion in the index, securities must be fixed rate, non-convertible, U.S. dollar denominated with at least $300 million or more of outstanding face value and have one or more years remaining to maturity. The index excludes certain types of securities, including tax-exempt state and local government series bonds, structured notes embedded with swaps or other special features, private placements, floating rate securities, inflation-linked bonds and Eurobonds. The index is market capitalization weighted and the securities in the index are updated on the last business day of each month.
bond A security representing a loan from the investor to the issuer. A bond typically pays interest at a fixed rate (the coupon rate) until a specified date (the maturity date), at which time the issuer returns the money borrowed (principal or face value) to the bondholder. Because of their structure, bonds are sometimes called “fixed income securities” or “debt securities.”
An individual bond is subject to the credit risk of the issuer. Changes in interest rates can affect a bond’s market value prior to call or maturity. There is no guarantee that a bond’s yield to call or maturity will provide a positive return over the rate of inflation.
cap, capitalization See “market cap.”
capital gain, capital loss The difference between the amount paid for an investment and its value at a later time. If the investment has been sold, the capital gain or loss is considered a realized gain or loss. If the investment is still held, the gain or loss is still “on paper” and is considered unrealized.
Dow Jones U.S. Select REIT Index An index that is a float-adjusted market-capitalization weighted index comprising of income-producing commercial and/or residential real estate investment trusts (REITs). The index excludes mortgage REITs, net-lease REITs, real estate finance companies, mortgage brokers and bankers, commercial and residential real estate brokers and estate agents, homebuilders, large landowners and sub dividers of unimproved land, hybrid REITs, timber REITs and companies that have more than 25% of their assets in direct mortgage investments.
earnings growth rate For a mutual fund, the average yearly rate at which the earnings of the companies in the fund’s portfolio have grown, measured over the past five years.
earnings per share (EPS) A company’s earnings, or net income, for the past 12 months, divided by the number of shares outstanding.
expense ratio The amount that is taken from a mutual fund’s assets each year to cover the fund’s operating expenses. An expense ratio of 0.50% means that a fund’s expenses amount to half of one percent of its average net assets a year.
FTSE EPRA Nareit Global Index (Net) An index that provides a diverse representation of publicly traded equity real estate investment trusts (REITs) and listed property companies worldwide. The index constituents are free-float adjusted, and screened on liquidity, size and revenue. The index is comprised of countries in developed and emerging markets. The Net of Tax Index is calculated based on the maximum withholding tax rates applicable to dividends received by institutional investors who are not resident in the same country as the remitting company and who do not benefit from double taxation treaties.
market cap, market capitalization The value of a company as determined by the total value of all shares of its stock outstanding.
median market cap The midpoint of the range of market caps of the stocks held by a fund. There are different ways of calculating median market cap. With a simple median, half of the stocks in the fund’s portfolio would be larger than the median, and half would be smaller. With a weighted median (the type that is calculated for these funds), half of the fund’s assets are invested in stocks that are larger than the median market cap, and half in stocks that are smaller.
MSCI EAFE Index (Net) A free float-adjusted market capitalization index that is designed to measure the equity market performance of developed markets in Europe, Australasia, and the Far East. The Net version of the index reflects reinvested dividends net of withholding taxes, but reflects no deductions for expenses or other taxes; returns are calculated applying dividend withholding rates applicable to non-resident persons who do not benefit from double taxation treaties.
MSCI Emerging Markets Index (Net) A free float-adjusted market capitalization weighted index that is designed to measure equity market performance in the global emerging markets. This series approximates the minimum possible dividend reinvestment. The returns are calculated applying dividend withholding rates applicable to non-resident persons who do not benefit from double taxation treaties.
net asset value (NAV) The value of one share of a mutual fund. NAV is calculated by taking the fund’s total assets, subtracting liabilities, and dividing by the number of shares outstanding.
outstanding shares, shares outstanding When speaking of a company or mutual fund, indicates all shares currently held by investors.
price-to-book ratio (P/B) The market price of a company’s stock compared with its “book value.” A mutual fund’s P/B is the weighted average of the P/B of all stocks in the fund’s portfolio.
price-to-earnings ratio (P/E) The market price of a company’s stock compared with earnings over the past year. A mutual fund’s P/E is the weighted average of the P/E of all stocks in the fund’s portfolio.
real estate investment trust (REIT) Real estate companies that own and commonly operate income producing commercial and/or residential real estate.
real estate operating companies (REOC) Real estate companies that engage in the development, management or financing of real estate.
return on equity (ROE) The average yearly rate of return for each dollar of investors’ money, measured over the past five years.
Schwab Fundamental Global Real Estate Index Fund | Annual Report
Schwab Fundamental Global Real Estate Index Fund
rights and warrants Rights and warrants are types of securities that entitle the holder to purchase a proportionate amount of common stock at a specified price for a specific period of time. Rights allow a shareholder to buy more shares directly from the company, usually at a price somewhat lower than the current market price of the outstanding shares. Warrants are usually issued with bonds and preferred stock. Rights and warrants can trade on the market separately from the company’s stock. The prices of rights and warrants do not necessarily move parallel to the prices of the underlying common stock. Rights usually expire within a few weeks of issuance, while warrants may not expire for several years. If a right or warrant is not exercised within the specified time period, it will become worthless and a fund will lose the purchase price it paid for the right or warrant and the right to purchase the underlying security.
Russell RAFI Global Select Real Estate Index (Net) An index that is derived from constituents of the Russell RAFI Global Index that are classified as real estate or real estate investment trusts (REITs) according to the Russell Global Sectors classification scheme. Fundamental methodology ranks and weights global real estate securities by three fundamental measures of company size adjusted sales, retained operating cash flow and dividends plus buybacks rather than by market capitalization. Mortgage and timber REITs are excluded. Securities are ranked by each fundamental factor, and individual factor
weights are averaged to determine overall fundamental weights. The index uses a partial quarterly reconstitution methodology in which the index is split into four equal segments at the annual reconstitution and each segment is then rebalanced on a rolling quarterly basis. The Russell RAFI Global Index is composed of the Russell 3000 Index, which captures 98% of the U.S. equity universe, and the largest 98% of the rest of the global equity universe. The Russell 3000 Index measures the performance of the largest 3,000 U.S. companies representing approximately 98% of the investable U.S. equity market.
S&P 500 Index An index that is designed to measure the performance of 500 leading publicly traded companies from a broad range of industries.
stock A share of ownership, or equity, in the issuing company.
total return The percentage that an investor would have earned or lost on an investment in the fund assuming dividends and distributions were reinvested.
weighted average For mutual funds, an average that gives the same weight to each security as the security represents in the fund’s portfolio.
yield The income paid out by an investment, expressed as a percentage of the investment’s market value.
Schwab Fundamental Global Real Estate Index Fund | Annual Report
Schwab Fundamental Global Real Estate Index Fund
PRIVACY NOTICE
THIS IS NOT PART OF THE SHAREHOLDER REPORT
A Commitment to Your Privacy
Your Privacy Is Not for Sale
We do not and will not sell your personal information to anyone, for any reason.
We are committed to protecting the privacy of information we maintain about you. Below are details about our commitment, including the types of information we collect and how we use and share that information. This Privacy Notice applies to you only if you are an individual who invests directly in the funds by placing orders through the funds’ transfer agent. If you place orders through your brokerage account at Charles Schwab & Co., Inc. or an account with another broker-dealer, investment advisor, 401(k) plan, employee benefit plan, administrator, bank or other financial intermediary, you are covered by the privacy policies of that financial institution and should consult those policies.
How We Collect Information About You
We collect personal information about you in a number of ways.
• APPLICATION AND REGISTRATION
INFORMATION.
We collect personal information from you when you open an account or utilize one of our services. We may also collect information about you from third parties such as consumer reporting agencies to verify your identity. The information we collect may include personal information, including your Social Security number, as well as details about your interests, investments and investment experience.
• TRANSACTION AND EXPERIENCE INFORMATION.
Once your account has been opened, we collect and maintain personal information about your account activity, including your transactions, balances, positions and history. This information allows us to administer your account and provide the services you have requested.
• WEBSITE USAGE.
When you visit our websites, we may use devices known as “cookies,” graphic interchange format files (GIFs), or other similar web tools to enhance your web experience. These tools help us to recognize you, maintain your web session, and provide a more personalized experience. To learn more, please go to www.schwab.com/privacy.
How We Share and Use Your Information
We provide access to information about you to our affiliated companies, outside companies and other third parties in certain limited circumstances, including:
• to help us process transactions for your account;
• when we use other companies to provide services for us, such as printing and mailing your account statements;
• when we believe that disclosure is required or permitted under law (for example, to cooperate with regulators or law enforcement, resolve consumer disputes, perform credit/authentication checks, or for risk control).
State Laws
We will comply with state laws that apply to the disclosure or use of information about you.
Safeguarding Your Information — Security Is a Partnership
We take precautions to ensure the information we collect about you is protected and is accessed only by authorized individuals or organizations.
Companies we use to provide support services are not allowed to use information about our shareholders for their own purposes and are contractually obligated to maintain strict confidentiality. We limit their use of information to the performance of the specific services we have requested.
We restrict access to personal information by our employees and agents. Our employees are trained about privacy and are required to safeguard personal information.
We maintain physical, electronic and procedural safeguards that comply with federal standards to guard your nonpublic personal information.
Contact Us
To provide us with updated information, report suspected fraud or identity theft, or for any other questions, please call the number below.
Schwab Funds® direct investors: 1-800-407-0256
© 2018 Schwab Funds. All rights reserved.
Schwab Fundamental Global Real Estate Index Fund | Annual Report
Schwab Fundamental Global Real Estate Index Fund
Charles Schwab Investment Management
With a straightforward lineup of core products and solutions for building the foundation of a portfolio, Charles Schwab Investment Management advocates for investors of all sizes with a steadfast focus on lowering costs and reducing unnecessary complexity. The list below shows all currently available Schwab Funds.
Investors should carefully consider information contained in the prospectus, or if available, the summary prospectus, including investment objectives, risks, charges and expenses before investing. Please call 1-877-824-5615 for a prospectus for any Schwab Fund. Please read the prospectus carefully before you invest. This report must be preceded or accompanied by a current prospectus.
Proxy Voting Policies, Procedures and Results
A description of the proxy voting policies and procedures used to determine how to vote proxies on behalf of the funds is available without charge, upon request, by visiting the Schwab Funds’ website atwww.schwabfunds.com/schwabfunds_prospectus, the SEC’s website atwww.sec.gov, or by contacting Schwab Funds at 1-877-824-5615.
Information regarding how a fund voted proxies relating to portfolio securities during the most recent twelve-month period ended June 30 is available, without charge, by visiting the fund’s website atwww.schwabfunds.com/schwabfunds_prospectus or the SEC’s website atwww.sec.gov.
Equity Funds
Schwab Core Equity Fund
Schwab Dividend Equity Fund
Schwab Large-Cap Growth Fund
Schwab Small-Cap Equity Fund
Schwab Hedged Equity Fund
Schwab Health Care Fund
Schwab International Core Equity Fund
Schwab Fundamental US Large Company Index Fund
Schwab Fundamental US Small Company Index Fund
Schwab Fundamental International Large Company Index Fund
Schwab Fundamental International Small Company Index Fund
Schwab Fundamental Emerging Markets Large Company Index Fund
Schwab Fundamental Global Real Estate Index Fund
Schwab Global Real Estate Fund
Schwab S&P 500 Index Fund
Schwab 1000 Index® Fund
Schwab Small-Cap Index Fund®
Schwab Total Stock Market Index Fund®
Schwab U.S. Large-Cap Growth Index Fund
Schwab U.S. Large-Cap Value Index Fund
Schwab U.S. Mid-Cap Index Fund
Schwab International Index Fund®
Asset Allocation Funds
Schwab Balanced Fund
Schwab MarketTrack Portfolios®
Schwab Target Funds
Schwab Target Index Funds
Schwab Monthly Income Funds
Bond Funds
Schwab Treasury Inflation Protected Securities Index Fund
Schwab U.S. Aggregate Bond Index Fund
Schwab Short-Term Bond Index Fund
Schwab Tax-Free Bond Fund1
Schwab California Tax-Free Bond Fund1
Schwab Money Funds2
Schwab provides a broad choice of taxable and tax-exempt money market funds for both retail and institutional client types.
Investment Adviser
Charles Schwab Investment Management, Inc.
211 Main Street, San Francisco, CA 94105
Funds
Schwab Funds®
1-877-824-5615
© 2019 Charles Schwab & Co., Inc. All rights reserved.
Member SIPC®
Printed on recycled paper.
| ¹ | State, local, and the Federal Alternative Minimum Tax may apply. Capital gains are not exempt from Federal Taxation. |
| ² | You could lose money by investing in the Schwab Money Funds. All Schwab Money Funds with the exception of Schwab Variable Share Price Money Fund seek to preserve the value of your investment at $1.00 per share, but cannot guarantee they will do so. Because the share price of Schwab Variable Share Price Money Fund will fluctuate, when you sell your shares they may be worth more or less than what you originally paid for them. All Schwab Money Funds with the exception of Schwab Government Money Fund, Schwab Retirement Government Money Fund, Schwab U.S. Treasury Money Fund, Schwab Treasury Obligations Money Fund and Schwab Government Money Market Portfolio may impose a fee upon the sale of your shares or may temporarily suspend your ability to sell shares if the Fund’s liquidity falls below required minimums because of market conditions or other factors. An investment in the Schwab Money Funds is not insured or guaranteed by the Federal Deposit Insurance Corporation or any other government agency. The Schwab Money Funds’ sponsor has no legal obligation to provide financial support to the Funds, and you should not expect that the sponsor will provide financial support to the Funds at any time. |
This page is intentionally left blank.
| (a) | Registrant has adopted a code of ethics that applies to its principal executive officer, principal financial officer, and any other persons who perform a similar function, regardless of whether these individuals are employed by Registrant or a third party. |
| (c) | During the period covered by the report, no amendments were made to the provisions of this code of ethics. |
| (d) | During the period covered by the report, Registrant did not grant any waivers, including implicit waivers, from the provisions of this code of ethics. |
| (f)(1) | Registrant has filed this code of ethics as an exhibit pursuant to Item 12(a)(1) of FormN-CSR. |
| Item 3: | Audit Committee Financial Expert. |
Registrant’s Board of Trustees has determined that Kiran M. Patel and Kimberly S. Patmore, each currently serving on its audit, compliance and valuation committee, are each an “audit committee financial expert,” as such term is defined in Item 3 of FormN-CSR. Each member of Registrant’s audit, compliance and valuation committee is “independent” under the standards set forth in Item 3 of FormN-CSR.
The designation of each of Mr. Patel and Ms. Patmore as an “audit committee financial expert” pursuant to Item 3 of FormN-CSR does not (i) impose upon such individual any duties, obligations, or liability that are greater than the duties, obligations and liability imposed upon such individual as a member of Registrant’s audit, compliance and valuation committee or Board of Trustees in the absence of such designation; and (ii) affect the duties, obligations or liability of any other member of Registrant’s audit, compliance and valuation committee or Board of Trustees.
| Item 4: | Principal Accountant Fees and Services. |
Registrant is composed offifty-one operational series. One series has a fiscalyear-end of February 28, whose annual financial statements are reported in Item 1, eleven series have a fiscalyear-end of March 31,thirty-six series have a fiscalyear-end of October 31, and three series have a fiscalyear-end of December 31. Principal accountant fees disclosed in Items 4(a)-(d) and
4(g) include fees billed for services rendered tofifty-two operational series during 2018/2019 and forty-nine operational series during 2017/2018, based on their respective 2018/2019 and 2017/2018 fiscal years, as applicable.
The following table presents fees billed by the principal accountant in each of the last two fiscal years for the services rendered to the Funds:
| | | | | | | | | | | | | | | | | | | | | | | | | | | | |
| (a) Audit Fees | | | (b) Audit-Related Fees1 | | | (c) Tax Fees2 | | | (d) All Other Fees3 | |
Fiscal Year
2018/2019 | | Fiscal Year
2017/2018 | | | Fiscal Year
2018/2019 | | | Fiscal Year
2017/2018 | | | Fiscal Year
2018/2019 | | | Fiscal Year
2017/2018 | | | Fiscal Year
2018/2019 | | | Fiscal Year
2017/2018 | |
| $1,473,405 | | $ | 1,404,027 | | | $ | 84,840 | | | $ | 90,000 | | | $ | 190,626 | | | $ | 169,346 | | | $ | 0 | | | $ | 0 | |
| 1 | The nature of the services includes assurance and related services reasonably related to the performance of the audit of financial statements not included in Audit Fees. |
| 2 | The nature of the services includes tax compliance, tax advice and tax planning. |
| 3 | The nature of the services include agreed upon procedures relating to Charles Schwab Investment Management., Inc.’s, (“CSIM”) expenses for purposes of Section 15(c) of the Investment Company Act of 1940. |
| | | | |
| (e) | | (1) | | Registrant’s audit, compliance and valuation committee does not havepre-approval policies and procedures as described in paragraph (c)(7) of Rule2-01 of RegulationS-X. |
| | |
| | (2) | | There were no services described in each of paragraphs (b) through (d) above (including services required to be approved by Registrant’s audit, compliance and valuation committee pursuant to paragraph (c)(7)(ii) of Rule2-01 of RegulationS-X) that were approved by Registrant’s audit, compliance and valuation committee pursuant to paragraph (c)(7)(i)(C) of Rule2-01 of RegulationS-X. |
(f) Not applicable.
(g) Below are the aggregatenon-audit fees billed in each of the last two fiscal years by Registrant’s principal accountant for services rendered to Registrant, to Registrant’s investment adviser, and to any entity controlling, controlled by, or under common control with Registrant’s investment adviser that provides ongoing services to Registrant.
2018/2019: $275,466 2017/2018: $259,346
| (h) | During the past fiscal year, allnon-audit services provided by Registrant’s principal accountant to either Registrant’s investment adviser or to any entity controlling, controlled by, or under common control with Registrant’s investment adviser that provides ongoing services to Registrant werepre-approved. Included in the audit, compliance and valuation committee’spre-approval was the review and consideration as to whether the provision of thesenon-audit services is compatible with maintaining the principal accountant’s independence. |
| Item 5: | Audit Committee of Listed Registrants. |
Not applicable.
| Item 6: | Schedule of Investments. |
The schedule of investments is included as part of the report to shareholders filed under Item 1 of this Form.
| Item 7: | Disclosure of Proxy Voting Policies and Procedures forClosed-End Management Investment Companies. |
Not applicable.
| Item 8: | Portfolio Managers ofClosed-End Management Investment Companies. |
Not applicable.
| Item 9: | Purchases of Equity Securities byClosed-End Management Investment Company and Affiliated Purchasers. |
Not applicable.
| Item 10: | Submission of Matters to a Vote of Security Holders. |
Not applicable.
| Item 11: | Controls and Procedures. |
| (a) | Based on their evaluation of Registrant’s disclosure controls and procedures, as of a date within 90 days of the filing date, Registrant’s Chief Executive Officer, Jonathan de St. Paer and Registrant’s Chief Financial Officer, Mark Fischer, have concluded that Registrant’s disclosure controls and procedures are: (i) reasonably designed to ensure that information required to be disclosed in this report is appropriately communicated to Registrant’s officers to allow timely decisions regarding disclosures required in this report; (ii) reasonably designed to ensure that information required to be disclosed in this report is recorded, processed, summarized and reported in a timely manner; and (iii) are effective in achieving the goals described in (i) and (ii) above. |
| (b) | During the period covered by this report, there have been no changes in Registrant’s internal control over financial reporting that the above officers believe to have materially affected, or to be reasonably likely to materially affect, Registrant’s internal control over financial reporting. |
| (a) | (1) Registrant’s code of ethics (that is the subject of the disclosure required by Item 2(a)) is attached. |
| | (2) | Separate certifications for Registrant’s principal executive officer and principal financial officer, as required by Rule30a-2(a) under the 1940 Act, are attached. |
| (b) | A certification for Registrant’s principal executive officer and principal financial officer, as required by Rule30a-2(b) under the 1940 Act, is attached. This certification is being furnished to the Securities and Exchange Commission solely pursuant to 18 U.S.C. section 1350 and is not being filed as part of the FormN-CSR with the Commission. |
Pursuant to the requirements of the Securities Exchange Act of 1934 and the Investment Company Act of 1940, the registrant has duly caused this report to be signed on its behalf by the undersigned, thereunto duly authorized.
(Registrant)Schwab Capital Trust
| | |
| By: | | /s/ Jonathan de St. Paer |
| | Jonathan de St. Paer |
| | Chief Executive Officer |
| |
| Date: | | April 16, 2019 |
Pursuant to the requirements of the Securities Exchange Act of 1934 and the Investment Company Act of 1940, this report has been signed below by the following persons on behalf of the registrant and in the capacities and on the dates indicated.
| | |
| By: | | /s/ Jonathan de St. Paer |
| | Jonathan de St. Paer |
| | Chief Executive Officer |
| |
| Date: | | April 16, 2019 |
| |
| By: | | /s/ Mark Fischer |
| | Mark Fischer |
| | Chief Financial Officer |
| |
| Date: | | April 16, 2019 |