UNITED STATES
SECURITIES AND EXCHANGE COMMISSION
Washington, D.C. 20549
FORMN-CSR
CERTIFIED SHAREHOLDER REPORT OF REGISTERED
MANAGEMENT INVESTMENT COMPANIES
Investment Company Act file number:811-07704
Schwab Capital Trust – Target Index Funds
(Exact name of registrant as specified in charter)
211 Main Street, San Francisco, California 94105
(Address of principal executive offices) (Zip code)
Jonathan de St. Paer
Schwab Capital Trust
211 Main Street, San Francisco, California 94105
(Name and address of agent for service)
Registrant’s telephone number, including area code: (415)636-7000
Date of fiscal year end: March 31
Date of reporting period: March 31, 2019
Item 1: Report(s) to Shareholders.
Annual Report | March 31, 2019
Schwab Target Index Funds
Schwab Target 2010 Index Fund
Schwab Target 2015 Index Fund
Schwab Target 2020 Index Fund
Schwab Target 2025 Index Fund
Schwab Target 2030 Index Fund
Schwab Target 2035 Index Fund
Schwab Target 2040 Index Fund
Schwab Target 2045 Index Fund
Schwab Target 2050 Index Fund
Schwab Target 2055 Index Fund
Schwab Target 2060 Index Fund
| New Notice Regarding Shareholder Report Delivery Options |
| Beginning on January 1, 2021, paper copies of a fund’s shareholder reports will no longer be sent by mail, unless you specifically request paper copies of the reports from a fund or from your financial intermediary (such as a bank or broker-dealer). Instead, the reports will be made available on a fund’s websitewww.schwabfunds.com/schwabfunds_prospectus, and you will be notified by mail each time a report is posted and the mailing will provide a website link to access the report. You will continue to receive other fund regulatory documents (such as prospectuses or supplements) in paper unless you have elected to receive all fund documents electronically as described below. |
| If you would like to continue to receive a fund’s future shareholder reports in paper free of charge after January 1, 2021, you can make that request: (1) by contacting your financial intermediary, if you invest through a financial intermediary; or (2) if you invest directly with a fund, by calling 1-800-407-0256. |
| If you already receive shareholder reports and other fund documents electronically, you will not be affected by this change and you need not take any action. If you do not receive shareholder reports and other fund documents electronically but would like to do so, contact your financial intermediary or, if you invest directly with the funds, call 1-800-407-0256. |
This page is intentionally left blank.
Schwab Target Index Funds
Fund investment adviser: Charles Schwab Investment Management, Inc. (CSIM)
Distributor: Charles Schwab & Co., Inc. (Schwab)
Schwab Target Index Funds | Annual Report
Schwab Target Index Funds
The performance data quoted represents past performance. Past performance does not guarantee future results. Investment returns and principal value of an investment will fluctuate so that an investor’s shares may be worth more or less than their original cost. Current performance may be lower or higher than performance data quoted. To obtain performance information current to the most recent month end, please visitwww.schwabfunds.com/schwabfunds_prospectus.
| Total Returns For the 12 Months Ended March 31, 2019 |
| Schwab Target 2010 Index Fund (Ticker Symbol: SWYAX) | 4.81% |
| Target 2010 Passive Composite Index | 4.82% |
| Fund Category: Morningstar Target-Date 2000-20101 | 3.36% |
| Performance Details | pages 9-11 |
| |
| Schwab Target 2015 Index Fund (Ticker Symbol: SWYBX) | 4.74% |
| Target 2015 Passive Composite Index | 4.85% |
| Fund Category: Morningstar Target-Date 20151 | 3.48% |
| Performance Details | pages 12-14 |
| |
| Schwab Target 2020 Index Fund (Ticker Symbol: SWYLX) | 4.73% |
| Target 2020 Passive Composite Index | 4.81% |
| Fund Category: Morningstar Target-Date 20201 | 3.38% |
| Performance Details | pages 15-17 |
| |
| Schwab Target 2025 Index Fund (Ticker Symbol: SWYDX) | 4.79% |
| Target 2025 Passive Composite Index | 4.95% |
| Fund Category: Morningstar Target-Date 20251 | 3.38% |
| Performance Details | pages 18-20 |
| |
| Schwab Target 2030 Index Fund (Ticker Symbol: SWYEX) | 4.76% |
| Target 2030 Passive Composite Index | 4.96% |
| Fund Category: Morningstar Target-Date 20301 | 3.31% |
| Performance Details | pages 21-23 |
| |
| Schwab Target 2035 Index Fund (Ticker Symbol: SWYFX) | 4.68% |
| Target 2035 Passive Composite Index | 4.89% |
| Fund Category: Morningstar Target-Date 20351 | 3.17% |
| Performance Details | pages 24-26 |
All total returns on this page assume dividends and distributions were reinvested. Index figures do not include trading and management costs, which would lower performance. Indices are unmanaged and cannot be invested in directly. Performance results less than one year are not annualized.
The components that make up each of the composite indices may vary over time. For index definitions, please see the Glossary.
Fund expenses may have been partially absorbed by CSIM and its affiliates. Without these reductions, a fund’s total return would have been lower. Performance does not reflect the deduction of taxes that a shareholder would pay on fund distributions or on the redemption of fund shares.
| 1 | Source for category information: Morningstar, Inc. The Morningstar Category return represents all active and index mutual funds within the category as of the report date. |
| | |
Schwab Target Index Funds | Annual Report
Schwab Target Index Funds
Performance at a Glance(continued)
| Total Returns For the 12 Months Ended March 31, 2019 |
| Schwab Target 2040 Index Fund (Ticker Symbol: SWYGX) | 4.49% |
| Target 2040 Passive Composite Index | 4.77% |
| Fund Category: Morningstar Target-Date 20401 | 3.04% |
| Performance Details | pages 27-29 |
| |
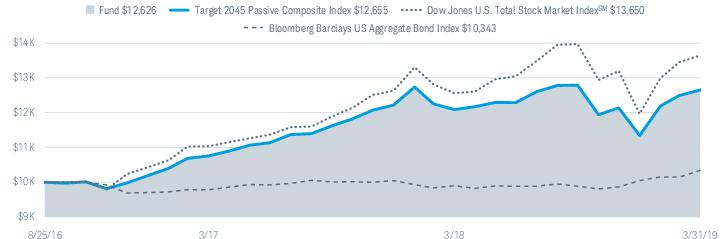
| Schwab Target 2045 Index Fund (Ticker Symbol: SWYHX) | 4.33% |
| Target 2045 Passive Composite Index | 4.67% |
| Fund Category: Morningstar Target-Date 20451 | 2.94% |
| Performance Details | pages 30-32 |
| |
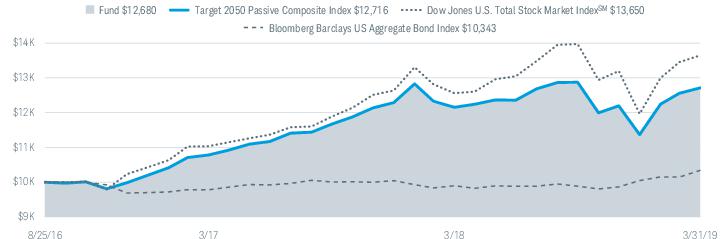
| Schwab Target 2050 Index Fund (Ticker Symbol: SWYMX) | 4.23% |
| Target 2050 Passive Composite Index | 4.60% |
| Fund Category: Morningstar Target-Date 20501 | 2.87% |
| Performance Details | pages 33-35 |
| |
| Schwab Target 2055 Index Fund (Ticker Symbol: SWYJX) | 4.15% |
| Target 2055 Passive Composite Index | 4.53% |
| Fund Category: Morningstar Target-Date 20551 | 2.84% |
| Performance Details | pages 36-38 |
| |
| Schwab Target 2060 Index Fund (Ticker Symbol: SWYNX) | 4.23% |
| Target 2060 Passive Composite Index | 4.50% |
| Fund Category: Morningstar Target-Date 2060+1 | 2.99% |
| Performance Details | pages 39-41 |
All total returns on this page assume dividends and distributions were reinvested. Index figures do not include trading and management costs, which would lower performance. Indices are unmanaged and cannot be invested in directly. Performance results less than one year are not annualized.
The components that make up each of the composite indices may vary over time. For index definitions, please see the Glossary.
Fund expenses may have been partially absorbed by CSIM and its affiliates. Without these reductions, a fund’s total return would have been lower. Performance does not reflect the deduction of taxes that a shareholder would pay on fund distributions or on the redemption of fund shares.
| 1 | Source for category information: Morningstar, Inc. The Morningstar Category return represents all active and index mutual funds within the category as of the report date. |
Schwab Target Index Funds | Annual Report
Schwab Target Index Funds
Jonathan de St. Paer
President and CEO of
Charles Schwab Investment
Management, Inc. and the
funds covered in this report.
Dear Shareholder,
Recent months provided a stark reminder that market trends can reverse quickly. The declines in stocks that dominated headlines in the late stages of 2018 became a backstory this year to a broad-based recovery that saw most equity positions not only make up lost ground, but deliver solid returns over the 12 months ended March 31, 2019. Similarly, fixed income lost value in September and October but then rallied in November as expectations on interest rates shifted, and many bond investments also ended the period with positive returns.
At Charles Schwab Investment Management, we often talk about the importance of diversification, creating a long-term investing plan, and sticking to it. This is because trying to time the markets can be a losing strategy for most investors. However, we also recognize it can be tempting to veer from that plan when markets fluctuate. We believe that for most investors it is better to hold a portfolio that’s diversified and rebalanced regularly so that they can stay focused on their long-term financial goals. That’s why we seek to provide straightforward products that can help you keep that focus and weather the market volatility that may come along the way.
The Schwab Target Index Funds play an important role in fulfilling this objective. With their mix of domestic and international equities, fixed income, real estate, and cash, the funds provide an all-in-one portfolio solution. They incorporate the diversification and regular rebalancing that can help cushion a portfolio from market turbulence. This provides investors an opportunity for better results, and potentially less volatility, as compared with a self-directed asset allocation.
The asset weights in the Schwab Target Index Funds are shifted to become more conservative over time, adjusting your portfolio mix as you get closer to retirement. This asset allocation approach creates greater opportunity for growth when your target retirement date is far in the future, and shifts toward income and capital preservation as it gets closer. This provides investors with a straightforward way to stay aligned with their long-term goals—and not be distracted by any sudden turns in the markets.
Charles Schwab Investment Management has become one of the largest and most experienced asset managers in the industry not by offering more choices than our competitors, but by providing carefully developed products, like the Schwab Target Index Funds, that can help simplify decision-making. This is a cornerstone of our investing philosophy—and will continue to be.
Schwab Target Index Funds | Annual Report
Schwab Target Index Funds
From the President(continued)
“On April 1, 2019, I transitioned into the role of Chief Executive Officer of Charles Schwab Investment Management, replacing Marie Chandoha upon her retirement.”
On April 1, 2019, I transitioned into the role of Chief Executive Officer of Charles Schwab Investment Management, replacing Marie Chandoha upon her retirement. Looking back at how Charles Schwab Investment Management has grown into the market leader it is today, I believe Marie deserves particular credit. As CEO for over eight years, Marie provided the vision and leadership that has helped us stay focused on the goal of providing cost-effective funds to support investors in meeting their investment objectives. It’s been my privilege to be part of the great team Marie built.
I look forward to furthering our organization’s important mission. As we encounter ups and downs in the investment environment, it becomes even more important to serve our investors to the best of our ability. At Charles Schwab Investment Management we seek to offer products that help investors build portfolios that serve their needs, even during the more difficult stretches in the market.
Thank you for investing with Charles Schwab Investment Management. For more information about the Schwab Target Index Funds, please continue reading this report. In addition, you can find further details about these funds by visiting our website at www.schwabfunds.com. We are also happy to hear from you at 1-877-824-5615.
Sincerely,
Diversification and asset allocation strategies do not ensure a profit and cannot protect against losses in a declining market.
Management views may have changed since the report date.
Schwab Target Index Funds | Annual Report
Schwab Target Index Funds
The Investment Environment
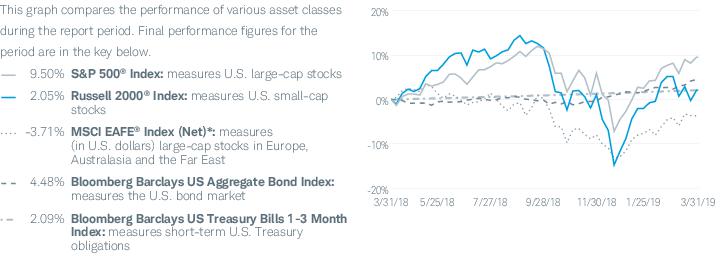
For the 12-month reporting period ended March 31, 2019, global equity markets were mixed. In the U.S., stable economic growth, solid corporate earnings, and robust consumer spending helped propel U.S. stock markets to record highs in late September and early October, despite escalating trade tensions and rising interest rates. During the fourth quarter of 2018, volatility spiked and stocks fell steeply, particularly in December, more than erasing the period’s earlier gains and driving major indices to near–bear market territory as investor anxiety rose amid concerns about the pace of future interest rate hikes despite low inflation, falling oil prices, slowing international growth, and concerns about trade negotiations with China. However, as the Federal Reserve (Fed) put interest rate hikes on hold, a strong rebound in the first quarter of 2019 brought U.S. stocks back above their early-December levels, albeit below their previous October highs. Outside the U.S., equity markets were notably weaker as economic momentum slowed due to uncertainties from several fronts, including trade, inflation, and geopolitical concerns. Over the period, the U.S. dollar strengthened against a basket of foreign currencies, generally reducing the returns on overseas investments in U.S. dollar terms. In this environment, the S&P 500® Index, a bellwether for the overall U.S. stock market, returned 9.50% for the reporting period. U.S. large-cap-cap stocks outperformed small-caps, with the Russell RAFI™ US Large Company Index and the Russell 2000® Index returning 7.10% and 2.05%, respectively. The MSCI EAFE® Index (Net)*, a broad measure of developed international equity performance, returned -3.71%, and the MSCI Emerging Markets Index (Net)* returned -7.41%. The Bloomberg Barclays US Aggregate Bond Index, representing the broad U.S. fixed-income market, returned 4.48%.
The U.S. economy exhibited stable growth for much of the reporting period as it entered its tenth year of expansion, buoyed by a combination of tax reform early in the reporting period, strong corporate earnings, and still-positive financial conditions. Toward the end of 2018 the U.S. economy showed signs of slowing. U.S. gross domestic product (GDP) grew at an annual rate of 2.2% in the fourth quarter of 2018, down from 4.2% and 3.4% in the second and third quarters, respectively. Seasonally adjusted nonfarm payrolls were steady, and unemployment remained low. Even amid a tight labor market and growing economy, inflation fell during the period, primarily due to lower energy prices, and wage growth remained in check. Consumer confidence, which hit an 18-year high in October, the highest since 2000,
Asset Class Performance Comparison % returns during the 12 months ended March 31, 2019
Index figures assume dividends and distributions were reinvested. Index figures do not include trading and management costs, which would lower performance. Indices are unmanaged and cannot be invested in directly. Performance results less than one year are not annualized. Past performance is not an indication of future results.
For index definitions, please see the Glossary.
Data source: Index provider websites and CSIM.
Nothing in this report represents a recommendation of a security by the investment adviser.
Management views may have changed since the report date.
| * | The net version of the index reflects reinvested dividends net of withholding taxes, but reflects no deductions for expenses or other taxes. |
Schwab Target Index Funds | Annual Report
Schwab Target Index Funds
The Investment Environment(continued)
fell for the subsequent three months before rebounding in February and March against the backdrop of the market’s rally and the end of the 35-day partial government shutdown that began in late December and extended through late January.
Outside the U.S., conditions continued to soften. After reaching a nearly three-year high in October, global oil prices fell precipitously over the last three months of 2018, ending the year down 25% amid concerns of economic slowing and a global oil glut. Prices rebounded somewhat in the first quarter of 2019 as major exporters sought to curb supply and central banks took steps to ease growth-related fears. In the final quarter of 2018, the eurozone economy expanded by 0.2%, down from 0.7% a year earlier, subdued by political tensions as well as a sharp decline in the manufacturing sector’s new export orders. Japan’s economy contracted in the third quarter of 2018 but grew in the second and fourth quarters. The United Kingdom’s economy grew modestly in the second and third quarters of 2018 but contracted in the fourth quarter amid ongoing Brexit-related economic and political uncertainty as well as rapidly growing wage pressures. Several Asian economies, including China and India, also exhibited signs of slowing but still outpaced many developed economies. During much of the period, trade issues dominated headlines—particularly between the U.S. and China. Following the implementation of a series of tariffs on goods and services from both sides, as of the end of the period, negotiations are underway between the two countries to resolve the underlying issues.
Monetary policy measures remained generally accommodative during the reporting period. In the U.S., despite continuing low levels of inflation, the Fed raised the federal funds rate by 0.25% three times over the reporting period—in June, September, and December. At its January and March meetings, the Fed left rates unchanged and dialed back its projections for further rate hikes in 2019 as growth slowed and inflation remained in check. Fed interest rates ended the reporting period in a target range of 2.25% to 2.50%. Over the reporting period, the Fed continued its program to reduce the size of its balance sheet, although in March it indicated its intention to slow the reduction. As of the end of the reporting period, the Fed’s balance sheet stood at just under $4 trillion, down from $4.5 trillion when the program was announced in June 2017.
Outside the U.S., most central banks maintained accommodative monetary policies or, in some cases, in the face of signs of rising inflation, tightened their policies. The European Central Bank has held interest rates unchanged since early 2016 and in March announced that it would likely maintain those rates at least through the end of 2019, but ended its monthly asset purchase program in December. Also in March, the Bank of Japan upheld its short-term interest rate target of –0.1%, also unchanged since 2016, and maintained its pledge to keep interest rates extremely low for an extended period. After raising its key official bank rate in August amid rising inflation projections and higher energy and import prices, the Bank of England maintained its rate of 0.75% during the reporting period despite ongoing uncertainties over the United Kingdom economy’s wider direction and intensifying uncertainties surrounding the impact of Brexit. Central banks in several emerging market economies—including India, Indonesia, Mexico, and Turkey—raised policy rates during the reporting period in response to inflation and exchange-rate pressures. In February, however, India subsequently lowered its policy rate and in December, the People’s Bank of China maintained its prudent, but no longer neutral, policy stance, indicating it would place a greater focus on flexibility as its economy faces continued headwinds.
Over the reporting period, the U.S. Treasury yield curve slope (the spread between rates on 2-year and 10-year Treasuries) generally flattened, as short-term yields, which typically respond to changes in the federal funds rate, rose more quickly than longer-term yields, which are influenced more by economic growth and inflation expectations. In May and again in September, 10-year yields pushed above 3.00%, relieving some pressure on the yield curve, but as equity markets tumbled at the end of 2018 and signs of slowing economic growth intensified, investors flocked to longer-term bonds, driving prices higher and yields lower for most of the remainder of the period. (Bond yields and bond prices move in opposite directions). In late March, parts of the yield curve inverted for several days, raising recession concerns for some, but it quickly reverted as the likelihood of an imminent recession appeared low. The 2-year Treasury yield began and ended the reporting period at 2.27% and the 10-year Treasury yield ended the period at 2.41%, down from 2.74% at the beginning of the period.
Schwab Target Index Funds | Annual Report
Schwab Target Index Funds
 | Zifan Tang, Ph.D., CFA, Senior Portfolio Manager, is responsible for the co-management of the funds. She has served as portfolio manager of the funds since August 2016. Prior to joining CSIM in 2012, Ms. Tang was a product manager at Thomson Reuters and, from 1997 to 2009, worked as a portfolio manager at Barclays Global Investors, which was subsequently acquired by BlackRock. |
 | Patrick Kwok, CFA, Portfolio Manager, is responsible for the co-management of the funds. He has served as portfolio manager of the funds since July 2018. Prior to joining CSIM in 2008, Mr. Kwok spent two years as an asset operations specialist at Charles Schwab Trust Company. He also previously worked for one year at State Street Bank & Trust as a portfolio accountant and pricing specialist. |
Schwab Target Index Funds | Annual Report
Schwab Target 2010 Index Fundas of March 31, 2019
The Schwab Target 2010 Index Fund (the fund) seeks to provide capital appreciation and income consistent with its current asset allocation, and seeks to achieve its investment objective by investing primarily in affiliated Schwab exchange-traded funds (ETFs). The fund may also invest in affiliated Schwab Funds and Laudus Funds and unaffiliated third party ETFs and mutual funds. The target asset allocation is adjusted annually based on the adviser’s asset allocation strategy; as of the last annual adjustment at the end of January 2019, the fund’s asset allocation was approximately 35.9% equity securities, 56.8% fixed-income securities, and 7.3% cash and cash equivalents (including money market funds). (For portfolio allocations as of the end of this reporting period, please see the fund’s Portfolio Holdings included in this report.)
Market Highlights. For the 12-month reporting period ended March 31, 2019, global equity markets were mixed. In the U.S., stable economic growth, solid corporate earnings, and robust consumer spending helped propel U.S. stock markets to record highs in late September and early October, despite escalating trade tensions and rising interest rates. During the fourth quarter of 2018, however, investor anxiety rose amid concerns about the pace of future interest rate hikes despite low inflation, falling oil prices, slowing international growth, and concerns about trade negotiations with China. Volatility spiked and stocks fell steeply, particularly in December, more than erasing the period’s earlier gains. However, as the Federal Reserve put interest rates on hold, a strong rebound in the first quarter of 2019 brought U.S. stocks back above their early-December levels, albeit below their previous October highs. Outside the U.S., equity markets were notably weaker as economic momentum slowed due to uncertainties from several fronts, including trade, inflation, and geopolitical concerns. The U.S. Treasury yield curve slope (the spread between rates on 2-year and 10-year Treasuries) generally flattened, as short-term yields, which typically respond to changes in the federal funds rate, rose more quickly than longer-term yields, which are influenced more by economic growth and inflation expectations.
Performance. For the 12-month reporting period ended March 31, 2019, the fund returned 4.81%. The fund’s internally calculated comparative index, the Target 2010 Passive Composite Index (the composite index), returned 4.82% for the same period.
Positioning and Strategies.1 The fund’s asset allocations were generally in line with those of the composite index over the reporting period.
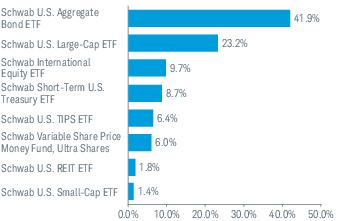
The fund’s overall fixed-income allocation provided the greatest contribution to total return. The Schwab U.S. Aggregate Bond ETF, the fund’s intermediate-term bond component, returned approximately 4.6%, while the Schwab Short-Term U.S. Treasury ETF returned approximately 2.7% and slightly underperformed the fund’s short-term bond comparative index, the Bloomberg Barclays US Treasury 1-3 Year Index. The fund’s U.S. TIPS fixed-income exposure also contributed to total return, with the Schwab U.S. TIPS ETF returning approximately 2.8%.
The fund’s equity exposure also contributed to total return, particularly the fund’s U.S. large-cap holding. The top contributor to the total return of the fund was the Schwab U.S. Large-Cap ETF, which returned approximately 9.3%. The fund’s U.S. small-cap holding, the Schwab U.S. Small-Cap ETF, also contributed slightly, returning approximately 2.5%. The international equity component, however, was the only detractor from total return. The Schwab International Equity ETF returned approximately -4.4%.
The fund’s real estate allocation contributed to the fund’s total return. The Schwab U.S. REIT ETF returned approximately 19.7%, tracking its comparative index, the Dow Jones U.S. Select REIT Index.
Management views and portfolio holdings may have changed since the report date.
| 1 | ETF performance can be expressed on a market price or NAV basis. The returns cited in this section are Market Price Returns. The ETF’s per share NAV is the value of one share of the ETF. NAV is calculated by taking the ETF’s total assets (including the market value of securities owned), subtracting liabilities, and dividing by the number of shares outstanding. The NAV Return is based on the NAV of the ETF, and the Market Price Return is based on the market price per share of the ETF. The price used to calculate market return (Market Price) is determined using the Official Closing Price on the primary stock exchange (generally, 4:00 p.m. Eastern time). NAV is used as a proxy for purposes of calculating Market Price Return on inception date. Market Price and NAV returns assume that dividends and capital gain distributions have been reinvested in the ETF at Market Price and NAV, respectively. |
Schwab Target Index Funds | Annual Report
Schwab Target 2010 Index Fund
Performance and Fund Factsas of March 31, 2019
The performance data quoted represents past performance. Past performance does not guarantee future results. Investment returns and principal value of an investment will fluctuate so that an investor’s shares may be worth more or less than their original cost. Current performance may be lower or higher than performance data quoted. To obtain performance information current to the most recent month end, please visitwww.schwabfunds.com/schwabfunds_prospectus.
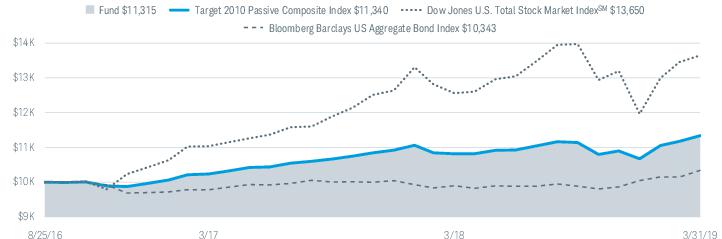
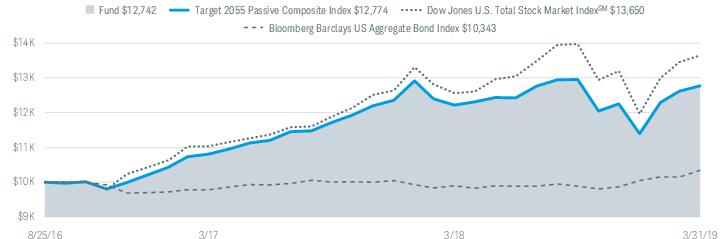
Performance of Hypothetical $10,000 Investment (August 25, 2016 – March 31, 2019)1,2
Average Annual Total Returns1,2
| Fund and Inception Date | 1 Year | Since Inception |
| Schwab Target 2010 Index Fund (8/25/16) | 4.81% | 4.87% |
| Target 2010 Passive Composite Index | 4.82% | 4.97% |
| Dow Jones U.S. Total Stock Market IndexSM | 8.66% | 12.74% |
| Bloomberg Barclays US Aggregate Bond Index | 4.48% | 1.31% |
| Fund Category: Morningstar Target-Date 2000-20103 | 3.36% | N/A |
| Fund Expense Ratios4: Net 0.08%; Gross 0.13% |
All total returns on this page assume dividends and distributions were reinvested. Index figures do not include trading and management costs, which would lower performance. Indices are unmanaged and cannot be invested in directly. Performance results less than one year are not annualized.
The first index listed for the fund is the fund’s primary benchmark, as shown in the prospectus. Additional indices shown are provided for comparative purposes.
For index definitions, please see the Glossary.
| 1 | Fund expenses may have been partially absorbed by CSIM and its affiliates. Without these reductions, the fund’s returns would have been lower. These returns do not reflect the deduction of taxes that a shareholder would pay on fund distributions or the redemption of fund shares. |
| 2 | On July 24, 2017, the Investor Share class and Institutional Share class of the fund were consolidated into a single class of shares of the fund. The performance and financial history of the fund is that of the fund’s former Institutional Shares. Accordingly, the past performance shown is that of the fund’s former Institutional Shares. |
| 3 | Source for category information: Morningstar, Inc. The Morningstar Category return represents all active and index mutual funds within the category as of the report date. |
| 4 | As stated in the prospectus. Includes 0.05% of acquired fund fees and expenses, which are indirect expenses incurred by the fund through its investments in the underlying funds. Net Expense: Expenses reduced by a contractual fee waiver in effect for so long as CSIM serves as the investment adviser to the fund. Gross Expense: Does not reflect the effect of contractual fee waivers. For actual ratios during the period, refer to the financial highlights section of the financial statements. |
Schwab Target Index Funds | Annual Report
Schwab Target 2010 Index Fund
Performance and Fund Factsas of March 31, 2019 (continued)
| Number of Holdings | 9 |
| Portfolio Turnover Rate | 30% |
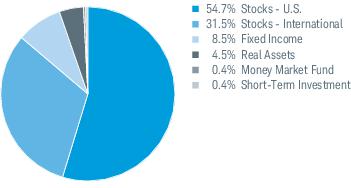
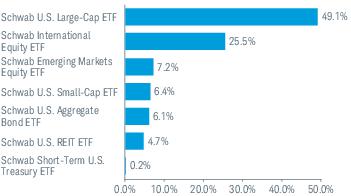
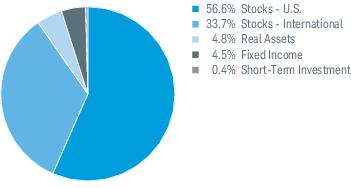
Asset Class Weightings % of Investments1,2
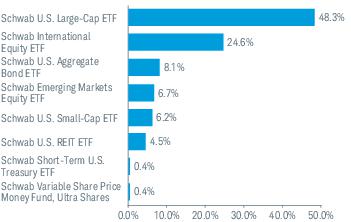
Top Holdings % of Net Assets3,4
Portfolio holdings may have changed since the report date.
| 1 | The percentage may differ from the Portfolio Holdings because the above calculation is based on a percentage of total investments, whereas the calculation in the Portfolio Holdings is based on a percentage of net assets. |
| 2 | The fund intends to primarily invest in affiliated Schwab ETFs and may also invest in affiliated Schwab and Laudus mutual funds and unaffiliated third party ETFs and mutual funds (all such ETFs and mutual funds referred to as “underlying funds”). |
| 3 | This list is not a recommendation of any security by the investment adviser. |
| 4 | The holdings listed exclude any temporary liquidity investments. |
Schwab Target Index Funds | Annual Report
Schwab Target 2015 Index Fundas of March 31, 2019
The Schwab Target 2015 Index Fund (the fund) seeks to provide capital appreciation and income consistent with its current asset allocation, and seeks to achieve its investment objective by investing primarily in affiliated Schwab exchange-traded funds (ETFs). The fund may also invest in affiliated Schwab Funds and Laudus Funds and unaffiliated third party ETFs and mutual funds. The target asset allocation is adjusted annually based on the adviser’s asset allocation strategy; as of the last annual adjustment at the end of January 2019, the fund’s asset allocation was approximately 38.5% equity securities, 54.7% fixed-income securities, and 6.8% cash and cash equivalents (including money market funds). (For portfolio allocations as of the end of this reporting period, please see the fund’s Portfolio Holdings included in this report.)
Market Highlights. For the 12-month reporting period ended March 31, 2019, global equity markets were mixed. In the U.S., stable economic growth, solid corporate earnings, and robust consumer spending helped propel U.S. stock markets to record highs in late September and early October, despite escalating trade tensions and rising interest rates. During the fourth quarter of 2018, however, investor anxiety rose amid concerns about the pace of future interest rate hikes despite low inflation, falling oil prices, slowing international growth, and concerns about trade negotiations with China. Volatility spiked and stocks fell steeply, particularly in December, more than erasing the period’s earlier gains. However, as the Federal Reserve put interest rates on hold, a strong rebound in the first quarter of 2019 brought U.S. stocks back above their early-December levels, albeit below their previous October highs. Outside the U.S., equity markets were notably weaker as economic momentum slowed due to uncertainties from several fronts, including trade, inflation, and geopolitical concerns. The U.S. Treasury yield curve slope (the spread between rates on 2-year and 10-year Treasuries) generally flattened, as short-term yields, which typically respond to changes in the federal funds rate, rose more quickly than longer-term yields, which are influenced more by economic growth and inflation expectations.
Performance. For the 12-month reporting period ended March 31, 2019, the fund returned 4.74%. The fund’s internally calculated comparative index, the Target 2015 Passive Composite Index (the composite index), returned 4.85% for the same period.
Positioning and Strategies.1 The fund’s asset allocations were broadly in line with those of the composite index over the reporting period.
The fund’s overall fixed-income allocation provided the greatest contribution to total return. The Schwab U.S. Aggregate Bond ETF, the fund’s intermediate-term bond component, returned approximately 4.6%, while the Schwab Short-Term U.S. Treasury ETF returned approximately 2.7% and slightly underperformed the fund’s short-term bond comparative index, the Bloomberg Barclays US Treasury 1-3 Year Index. The fund’s U.S. TIPS fixed-income exposure also contributed to total return, with the Schwab U.S. TIPS ETF returning approximately 2.8%.
The fund’s equity exposure also contributed to total return, particularly the fund’s U.S. large-cap holding. The top contributor to the total return of the fund was the Schwab U.S. Large-Cap ETF, which returned approximately 9.3%. The fund’s U.S. small-cap holding, the Schwab U.S. Small-Cap ETF, also contributed slightly, returning approximately 2.5%. The international equity component, however, was the only detractor from total return. The Schwab International Equity ETF returned approximately -4.4%.
The fund’s real estate allocation contributed to the fund’s total return. The Schwab U.S. REIT ETF returned approximately 19.7%, tracking its comparative index, the Dow Jones U.S. Select REIT Index.
Management views and portfolio holdings may have changed since the report date.
| 1 | ETF performance can be expressed on a market price or NAV basis. The returns cited in this section are Market Price Returns. The ETF’s per share NAV is the value of one share of the ETF. NAV is calculated by taking the ETF’s total assets (including the market value of securities owned), subtracting liabilities, and dividing by the number of shares outstanding. The NAV Return is based on the NAV of the ETF, and the Market Price Return is based on the market price per share of the ETF. The price used to calculate market return (Market Price) is determined using the Official Closing Price on the primary stock exchange (generally, 4:00 p.m. Eastern time). NAV is used as a proxy for purposes of calculating Market Price Return on inception date. Market Price and NAV returns assume that dividends and capital gain distributions have been reinvested in the ETF at Market Price and NAV, respectively. |
Schwab Target Index Funds | Annual Report
Schwab Target 2015 Index Fund
Performance and Fund Factsas of March 31, 2019
The performance data quoted represents past performance. Past performance does not guarantee future results. Investment returns and principal value of an investment will fluctuate so that an investor’s shares may be worth more or less than their original cost. Current performance may be lower or higher than performance data quoted. To obtain performance information current to the most recent month end, please visitwww.schwabfunds.com/schwabfunds_prospectus.
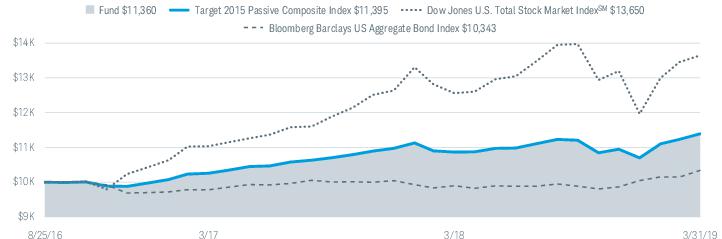
Performance of Hypothetical $10,000 Investment (August 25, 2016 – March 31, 2019)1,2
Average Annual Total Returns1,2
| Fund and Inception Date | 1 Year | Since Inception |
| Schwab Target 2015 Index Fund (8/25/16) | 4.74% | 5.03% |
| Target 2015 Passive Composite Index | 4.85% | 5.16% |
| Dow Jones U.S. Total Stock Market IndexSM | 8.66% | 12.74% |
| Bloomberg Barclays US Aggregate Bond Index | 4.48% | 1.31% |
| Fund Category: Morningstar Target-Date 20153 | 3.48% | N/A |
| Fund Expense Ratios4: Net 0.08%; Gross 0.13% |
All total returns on this page assume dividends and distributions were reinvested. Index figures do not include trading and management costs, which would lower performance. Indices are unmanaged and cannot be invested in directly. Performance results less than one year are not annualized.
The first index listed for the fund is the fund’s primary benchmark, as shown in the prospectus. Additional indices shown are provided for comparative purposes.
For index definitions, please see the Glossary.
| 1 | Fund expenses may have been partially absorbed by CSIM and its affiliates. Without these reductions, the fund’s returns would have been lower. These returns do not reflect the deduction of taxes that a shareholder would pay on fund distributions or the redemption of fund shares. |
| 2 | On July 24, 2017, the Investor Share class and Institutional Share class of the fund were consolidated into a single class of shares of the fund. The performance and financial history of the fund is that of the fund’s former Institutional Shares. Accordingly, the past performance shown is that of the fund’s former Institutional Shares. |
| 3 | Source for category information: Morningstar, Inc. The Morningstar Category return represents all active and index mutual funds within the category as of the report date. |
| 4 | As stated in the prospectus. Includes 0.05% of acquired fund fees and expenses, which are indirect expenses incurred by the fund through its investments in the underlying funds. Net Expense: Expenses reduced by a contractual fee waiver in effect for so long as CSIM serves as the investment adviser to the fund. Gross Expense: Does not reflect the effect of contractual fee waivers. For actual ratios during the period, refer to the financial highlights section of the financial statements. |
Schwab Target Index Funds | Annual Report
Schwab Target 2015 Index Fund
Performance and Fund Factsas of March 31, 2019 (continued)
| Number of Holdings | 9 |
| Portfolio Turnover Rate | 29% |
Asset Class Weightings % of Investments1,2
Top Holdings % of Net Assets3,4
Portfolio holdings may have changed since the report date.
| 1 | The percentage may differ from the Portfolio Holdings because the above calculation is based on a percentage of total investments, whereas the calculation in the Portfolio Holdings is based on a percentage of net assets. |
| 2 | The fund intends to primarily invest in affiliated Schwab ETFs and may also invest in affiliated Schwab and Laudus mutual funds and unaffiliated third party ETFs and mutual funds (all such ETFs and mutual funds referred to as “underlying funds”). |
| 3 | This list is not a recommendation of any security by the investment adviser. |
| 4 | The holdings listed exclude any temporary liquidity investments. |
Schwab Target Index Funds | Annual Report
Schwab Target 2020 Index Fundas of March 31, 2019
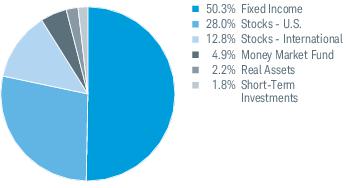
The Schwab Target 2020 Index Fund (the fund) seeks to provide capital appreciation and income consistent with its current asset allocation, and seeks to achieve its investment objective by investing primarily in affiliated Schwab exchange-traded funds (ETFs). The fund may also invest in affiliated Schwab Funds and Laudus Funds and unaffiliated third party ETFs and mutual funds. The target asset allocation is adjusted annually based on the adviser’s asset allocation strategy; as of the last annual adjustment at the end of January 2019, the fund’s asset allocation was approximately 43.3% equity securities, 50.6% fixed-income securities, and 6.1% cash and cash equivalents (including money market funds). (For portfolio allocations as of the end of this reporting period, please see the fund’s Portfolio Holdings included in this report.)
Market Highlights. For the 12-month reporting period ended March 31, 2019, global equity markets were mixed. In the U.S., stable economic growth, solid corporate earnings, and robust consumer spending helped propel U.S. stock markets to record highs in late September and early October, despite escalating trade tensions and rising interest rates. During the fourth quarter of 2018, however, investor anxiety rose amid concerns about the pace of future interest rate hikes despite low inflation, falling oil prices, slowing international growth, and concerns about trade negotiations with China. Volatility spiked and stocks fell steeply, particularly in December, more than erasing the period’s earlier gains. However, as the Federal Reserve put interest rates on hold, a strong rebound in the first quarter of 2019 brought U.S. stocks back above their early-December levels, albeit below their previous October highs. Outside the U.S., equity markets were notably weaker as economic momentum slowed due to uncertainties from several fronts, including trade, inflation, and geopolitical concerns. The U.S. Treasury yield curve slope (the spread between rates on 2-year and 10-year Treasuries) generally flattened, as short-term yields, which typically respond to changes in the federal funds rate, rose more quickly than longer-term yields, which are influenced more by economic growth and inflation expectations.
Performance. For the 12-month reporting period ended March 31, 2019, the fund returned 4.73%. The fund’s internally calculated comparative index, the Target 2020 Passive Composite Index (the composite index), returned 4.81% for the same period.
Positioning and Strategies.1 The fund’s asset allocations were generally in line with those of the composite index over the reporting period.
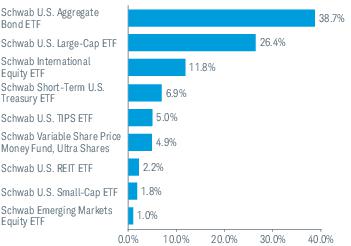
The fund’s equity exposure provided the greatest contribution to total return, particularly the fund’s U.S. large-cap holding. The top contributor to the total return of the fund was the Schwab U.S. Large-Cap ETF, which returned approximately 9.3%. The fund’s U.S. small-cap holding, the Schwab U.S. Small-Cap ETF, also contributed slightly, returning approximately 2.5%. The international equity and emerging markets components, however, detracted from total return. The Schwab International Equity ETF and Schwab Emerging Markets Equity ETF returned approximately -4.4% and -7.0%, respectively.
The fund’s overall fixed-income allocation also contributed to total return. The Schwab U.S. Aggregate Bond ETF, the fund’s intermediate-term bond component, returned approximately 4.6%, while the Schwab Short-Term U.S. Treasury ETF returned approximately 2.7% and slightly underperformed the fund’s short-term bond comparative index, the Bloomberg Barclays US Treasury 1-3 Year Index. The fund’s U.S. TIPS fixed-income exposure also contributed to total return, with the Schwab U.S. TIPS ETF returning approximately 2.8%.
The fund’s real estate allocation contributed to the fund’s total return. The Schwab U.S. REIT ETF returned approximately 19.7%, tracking its comparative index, the Dow Jones U.S. Select REIT Index.
Management views and portfolio holdings may have changed since the report date.
| 1 | ETF performance can be expressed on a market price or NAV basis. The returns cited in this section are Market Price Returns. The ETF’s per share NAV is the value of one share of the ETF. NAV is calculated by taking the ETF’s total assets (including the market value of securities owned), subtracting liabilities, and dividing by the number of shares outstanding. The NAV Return is based on the NAV of the ETF, and the Market Price Return is based on the market price per share of the ETF. The price used to calculate market return (Market Price) is determined using the Official Closing Price on the primary stock exchange (generally, 4:00 p.m. Eastern time). NAV is used as a proxy for purposes of calculating Market Price Return on inception date. Market Price and NAV returns assume that dividends and capital gain distributions have been reinvested in the ETF at Market Price and NAV, respectively. |
Schwab Target Index Funds | Annual Report
Schwab Target 2020 Index Fund
Performance and Fund Factsas of March 31, 2019
The performance data quoted represents past performance. Past performance does not guarantee future results. Investment returns and principal value of an investment will fluctuate so that an investor’s shares may be worth more or less than their original cost. Current performance may be lower or higher than performance data quoted. To obtain performance information current to the most recent month end, please visitwww.schwabfunds.com/schwabfunds_prospectus.
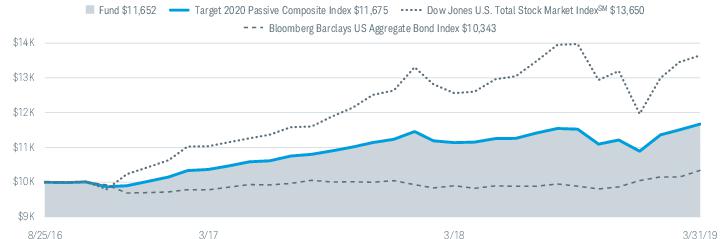
Performance of Hypothetical $10,000 Investment (August 25, 2016 – March 31, 2019)1,2
Average Annual Total Returns1,2
| Fund and Inception Date | 1 Year | Since Inception |
| Schwab Target 2020 Index Fund (8/25/16) | 4.73% | 6.07% |
| Target 2020 Passive Composite Index | 4.81% | 6.15% |
| Dow Jones U.S. Total Stock Market IndexSM | 8.66% | 12.74% |
| Bloomberg Barclays US Aggregate Bond Index | 4.48% | 1.31% |
| Fund Category: Morningstar Target-Date 20203 | 3.38% | N/A |
| Fund Expense Ratios4: Net 0.08%; Gross 0.13% |
All total returns on this page assume dividends and distributions were reinvested. Index figures do not include trading and management costs, which would lower performance. Indices are unmanaged and cannot be invested in directly. Performance results less than one year are not annualized.
The first index listed for the fund is the fund’s primary benchmark, as shown in the prospectus. Additional indices shown are provided for comparative purposes.
For index definitions, please see the Glossary.
| 1 | Fund expenses may have been partially absorbed by CSIM and its affiliates. Without these reductions, the fund’s returns would have been lower. These returns do not reflect the deduction of taxes that a shareholder would pay on fund distributions or the redemption of fund shares. |
| 2 | On July 24, 2017, the Investor Share class and Institutional Share class of the fund were consolidated into a single class of shares of the fund. The performance and financial history of the fund is that of the fund’s former Institutional Shares. Accordingly, the past performance shown is that of the fund’s former Institutional Shares. |
| 3 | Source for category information: Morningstar, Inc. The Morningstar Category return represents all active and index mutual funds within the category as of the report date. |
| 4 | As stated in the prospectus. Includes 0.05% of acquired fund fees and expenses, which are indirect expenses incurred by the fund through its investments in the underlying funds. Net Expense: Expenses reduced by a contractual fee waiver in effect for so long as CSIM serves as the investment adviser to the fund. Gross Expense: Does not reflect the effect of contractual fee waivers. For actual ratios during the period, refer to the financial highlights section of the financial statements. |
Schwab Target Index Funds | Annual Report
Schwab Target 2020 Index Fund
Performance and Fund Factsas of March 31, 2019 (continued)
| Number of Holdings | 12 |
| Portfolio Turnover Rate | 13% |
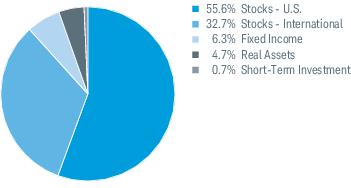
Asset Class Weightings % of Investments1,2
Top Holdings % of Net Assets3,4
Portfolio holdings may have changed since the report date.
| 1 | The percentage may differ from the Portfolio Holdings because the above calculation is based on a percentage of total investments, whereas the calculation in the Portfolio Holdings is based on a percentage of net assets. |
| 2 | The fund intends to primarily invest in affiliated Schwab ETFs and may also invest in affiliated Schwab and Laudus mutual funds and unaffiliated third party ETFs and mutual funds (all such ETFs and mutual funds referred to as “underlying funds”). |
| 3 | This list is not a recommendation of any security by the investment adviser. |
| 4 | The holdings listed exclude any temporary liquidity investments. |
Schwab Target Index Funds | Annual Report
Schwab Target 2025 Index Fundas of March 31, 2019
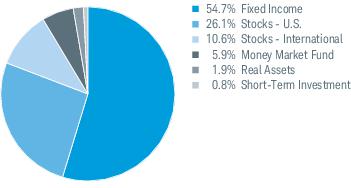
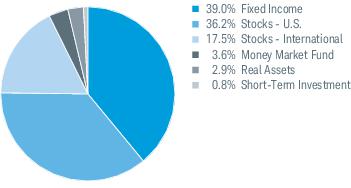
The Schwab Target 2025 Index Fund (the fund) seeks to provide capital appreciation and income consistent with its current asset allocation, and seeks to achieve its investment objective by investing primarily in affiliated Schwab exchange-traded funds (ETFs). The fund may also invest in affiliated Schwab Funds and Laudus Funds and unaffiliated third party ETFs and mutual funds. The target asset allocation is adjusted annually based on the adviser’s asset allocation strategy; as of the last annual adjustment at the end of January 2019, the fund’s asset allocation was approximately 56.8% equity securities, 38.7% fixed-income securities, and 4.4% cash and cash equivalents (including money market funds).1 (For portfolio allocations as of the end of this reporting period, please see the fund’s Portfolio Holdings included in this report.)
Market Highlights. For the 12-month reporting period ended March 31, 2019, global equity markets were mixed. In the U.S., stable economic growth, solid corporate earnings, and robust consumer spending helped propel U.S. stock markets to record highs in late September and early October, despite escalating trade tensions and rising interest rates. During the fourth quarter of 2018, however, investor anxiety rose amid concerns about the pace of future interest rate hikes despite low inflation, falling oil prices, slowing international growth, and concerns about trade negotiations with China. Volatility spiked and stocks fell steeply, particularly in December, more than erasing the period’s earlier gains. However, as the Federal Reserve put interest rates on hold, a strong rebound in the first quarter of 2019 brought U.S. stocks back above their early-December levels, albeit below their previous October highs. Outside the U.S., equity markets were notably weaker as economic momentum slowed due to uncertainties from several fronts, including trade, inflation, and geopolitical concerns. The U.S. Treasury yield curve slope (the spread between rates on 2-year and 10-year Treasuries) generally flattened, as short-term yields, which typically respond to changes in the federal funds rate, rose more quickly than longer-term yields, which are influenced more by economic growth and inflation expectations.
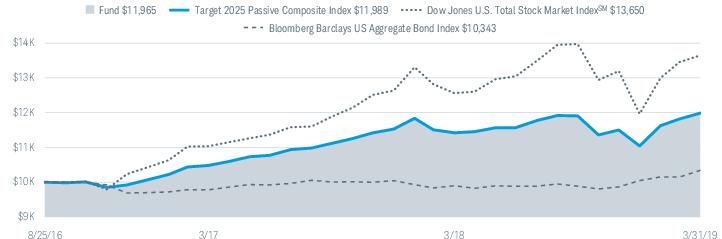
Performance. For the 12-month reporting period ended March 31, 2019, the fund returned 4.79%. The fund’s internally calculated comparative index, the Target 2025 Passive Composite Index (the composite index), returned 4.95% for the same period.
Positioning and Strategies.2 The fund’s asset allocations were generally in line with those of the composite index over the reporting period.
The fund’s equity exposure provided the greatest contribution to total return, particularly the fund’s U.S. large-cap holding. The top contributor to the total return of the fund was the Schwab U.S. Large-Cap ETF, which returned approximately 9.3%. The fund’s U.S. small-cap holding, the Schwab U.S. Small-Cap ETF, also contributed slightly, returning approximately 2.5%. The international equity and emerging markets components, however, detracted from total return. The Schwab International Equity ETF and Schwab Emerging Markets Equity ETF returned approximately -4.4% and -7.0%, respectively.
The fund’s overall fixed-income allocation also contributed to total return. The Schwab U.S. Aggregate Bond ETF, the fund’s intermediate-term bond component, returned approximately 4.6%, while the Schwab Short-Term U.S. Treasury ETF returned approximately 2.7% and slightly underperformed the fund’s short-term bond comparative index, the Bloomberg Barclays US Treasury 1-3 Year Index. The fund’s U.S. TIPS fixed-income exposure also contributed to total return, with the Schwab U.S. TIPS ETF returning approximately 2.8%.
The fund’s real estate allocation contributed to the fund’s total return. The Schwab U.S. REIT ETF returned approximately 19.7%, tracking its comparative index, the Dow Jones U.S. Select REIT Index.
Management views and portfolio holdings may have changed since the report date.
| 1 | Percentages may not add up to 100% due to rounding. |
| 2 | ETF performance can be expressed on a market price or NAV basis. The returns cited in this section are Market Price Returns. The ETF’s per share NAV is the value of one share of the ETF. NAV is calculated by taking the ETF’s total assets (including the market value of securities owned), subtracting liabilities, and dividing by the number of shares outstanding. The NAV Return is based on the NAV of the ETF, and the Market Price Return is based on the market price per share of the ETF. The price used to calculate market return (Market Price) is determined using the Official Closing Price on the primary stock exchange (generally, 4:00 p.m. Eastern time). NAV is used as a proxy for purposes of calculating Market Price Return on inception date. Market Price and NAV returns assume that dividends and capital gain distributions have been reinvested in the ETF at Market Price and NAV, respectively. |
Schwab Target Index Funds | Annual Report
Schwab Target 2025 Index Fund
Performance and Fund Factsas of March 31, 2019
The performance data quoted represents past performance. Past performance does not guarantee future results. Investment returns and principal value of an investment will fluctuate so that an investor’s shares may be worth more or less than their original cost. Current performance may be lower or higher than performance data quoted. To obtain performance information current to the most recent month end, please visitwww.schwabfunds.com/schwabfunds_prospectus.
Performance of Hypothetical $10,000 Investment (August 25, 2016 – March 31, 2019)1,2
Average Annual Total Returns1,2
| Fund and Inception Date | 1 Year | Since Inception |
| Schwab Target 2025 Index Fund (8/25/16) | 4.79% | 7.15% |
| Target 2025 Passive Composite Index | 4.95% | 7.24% |
| Dow Jones U.S. Total Stock Market IndexSM | 8.66% | 12.74% |
| Bloomberg Barclays US Aggregate Bond Index | 4.48% | 1.31% |
| Fund Category: Morningstar Target-Date 20253 | 3.38% | N/A |
| Fund Expense Ratios4: Net 0.08%; Gross 0.12% |
All total returns on this page assume dividends and distributions were reinvested. Index figures do not include trading and management costs, which would lower performance. Indices are unmanaged and cannot be invested in directly. Performance results less than one year are not annualized.
The first index listed for the fund is the fund’s primary benchmark, as shown in the prospectus. Additional indices shown are provided for comparative purposes.
For index definitions, please see the Glossary.
| 1 | Fund expenses may have been partially absorbed by CSIM and its affiliates. Without these reductions, the fund’s returns would have been lower. These returns do not reflect the deduction of taxes that a shareholder would pay on fund distributions or the redemption of fund shares. |
| 2 | On July 24, 2017, the Investor Share class and Institutional Share class of the fund were consolidated into a single class of shares of the fund. The performance and financial history of the fund is that of the fund’s former Institutional Shares. Accordingly, the past performance shown is that of the fund’s former Institutional Shares. |
| 3 | Source for category information: Morningstar, Inc. The Morningstar Category return represents all active and index mutual funds within the category as of the report date. |
| 4 | As stated in the prospectus. Includes 0.04% of acquired fund fees and expenses, which are indirect expenses incurred by the fund through its investments in the underlying funds. Net Expense: Expenses reduced by a contractual fee waiver in effect for so long as CSIM serves as the investment adviser to the fund. Gross Expense: Does not reflect the effect of contractual fee waivers. For actual ratios during the period, refer to the financial highlights section of the financial statements. |
Schwab Target Index Funds | Annual Report
Schwab Target 2025 Index Fund
Performance and Fund Factsas of March 31, 2019 (continued)
| Number of Holdings | 10 |
| Portfolio Turnover Rate | 13% |
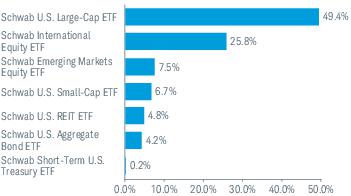
Asset Class Weightings % of Investments1,2
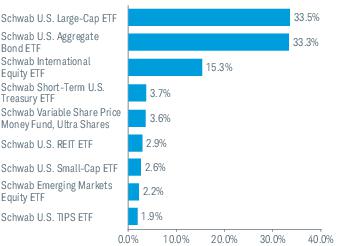
Top Holdings % of Net Assets3,4
Portfolio holdings may have changed since the report date.
| 1 | The percentage may differ from the Portfolio Holdings because the above calculation is based on a percentage of total investments, whereas the calculation in the Portfolio Holdings is based on a percentage of net assets. |
| 2 | The fund intends to primarily invest in affiliated Schwab ETFs and may also invest in affiliated Schwab and Laudus mutual funds and unaffiliated third party ETFs and mutual funds (all such ETFs and mutual funds referred to as “underlying funds”). |
| 3 | This list is not a recommendation of any security by the investment adviser. |
| 4 | The holdings listed exclude any temporary liquidity investments. |
Schwab Target Index Funds | Annual Report
Schwab Target 2030 Index Fundas of March 31, 2019
The Schwab Target 2030 Index Fund (the fund) seeks to provide capital appreciation and income consistent with its current asset allocation, and seeks to achieve its investment objective by investing primarily in affiliated Schwab exchange-traded funds (ETFs). The fund may also invest in affiliated Schwab Funds and Laudus Funds and unaffiliated third party ETFs and mutual funds. The target asset allocation is adjusted annually based on the adviser’s asset allocation strategy; as of the last annual adjustment at the end of January 2019, the fund’s asset allocation was approximately 66.7% equity securities, 29.9% fixed-income securities, and 3.3% cash and cash equivalents (including money market funds).1 (For portfolio allocations as of the end of this reporting period, please see the fund’s Portfolio Holdings included in this report.)
Market Highlights. For the 12-month reporting period ended March 31, 2019, global equity markets were mixed. In the U.S., stable economic growth, solid corporate earnings, and robust consumer spending helped propel U.S. stock markets to record highs in late September and early October, despite escalating trade tensions and rising interest rates. During the fourth quarter of 2018, however, investor anxiety rose amid concerns about the pace of future interest rate hikes despite low inflation, falling oil prices, slowing international growth, and concerns about trade negotiations with China. Volatility spiked and stocks fell steeply, particularly in December, more than erasing the period’s earlier gains. However, as the Federal Reserve put interest rates on hold, a strong rebound in the first quarter of 2019 brought U.S. stocks back above their early-December levels, albeit below their previous October highs. Outside the U.S., equity markets were notably weaker as economic momentum slowed due to uncertainties from several fronts, including trade, inflation, and geopolitical concerns. The U.S. Treasury yield curve slope (the spread between rates on 2-year and 10-year Treasuries) generally flattened, as short-term yields, which typically respond to changes in the federal funds rate, rose more quickly than longer-term yields, which are influenced more by economic growth and inflation expectations.
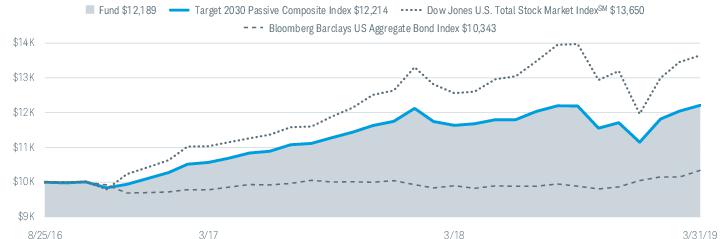
Performance. For the 12-month reporting period ended March 31, 2019, the fund returned 4.76%. The fund’s internally calculated comparative index, the Target 2030 Passive Composite Index (the composite index), returned 4.96% for the same period.
Positioning and Strategies.2 The fund’s asset allocations were generally in line with those of the composite index over the reporting period.
The fund’s equity exposure provided the greatest contribution to total return, particularly the fund’s U.S. large-cap holding. The top contributor to the total return of the fund was the Schwab U.S. Large-Cap ETF, which returned approximately 9.3%. The fund’s U.S. small-cap holding, the Schwab U.S. Small-Cap ETF, also contributed slightly, returning approximately 2.5%. The international equity and emerging markets components, however, detracted from total return. The Schwab International Equity ETF and Schwab Emerging Markets Equity ETF returned approximately -4.4% and -7.0%, respectively.
The fund’s overall fixed-income allocation also contributed to total return. The Schwab U.S. Aggregate Bond ETF, the fund’s intermediate-term bond component, returned approximately 4.6%, while the Schwab Short-Term U.S. Treasury ETF returned approximately 2.7% and slightly underperformed the fund’s short-term bond comparative index, the Bloomberg Barclays US Treasury 1-3 Year Index.
The fund’s real estate allocation contributed to the fund’s total return. The Schwab U.S. REIT ETF returned approximately 19.7%, tracking its comparative index, the Dow Jones U.S. Select REIT Index.
Management views and portfolio holdings may have changed since the report date.
| 1 | Percentages may not add up to 100% due to rounding. |
| 2 | ETF performance can be expressed on a market price or NAV basis. The returns cited in this section are Market Price Returns. The ETF’s per share NAV is the value of one share of the ETF. NAV is calculated by taking the ETF’s total assets (including the market value of securities owned), subtracting liabilities, and dividing by the number of shares outstanding. The NAV Return is based on the NAV of the ETF, and the Market Price Return is based on the market price per share of the ETF. The price used to calculate market return (Market Price) is determined using the Official Closing Price on the primary stock exchange (generally, 4:00 p.m. Eastern time). NAV is used as a proxy for purposes of calculating Market Price Return on inception date. Market Price and NAV returns assume that dividends and capital gain distributions have been reinvested in the ETF at Market Price and NAV, respectively. |
Schwab Target Index Funds | Annual Report
Schwab Target 2030 Index Fund
Performance and Fund Factsas of March 31, 2019
The performance data quoted represents past performance. Past performance does not guarantee future results. Investment returns and principal value of an investment will fluctuate so that an investor’s shares may be worth more or less than their original cost. Current performance may be lower or higher than performance data quoted. To obtain performance information current to the most recent month end, please visitwww.schwabfunds.com/schwabfunds_prospectus.
Performance of Hypothetical $10,000 Investment (August 25, 2016 – March 31, 2019)1,2
Average Annual Total Returns1,2
| Fund and Inception Date | 1 Year | Since Inception |
| Schwab Target 2030 Index Fund (8/25/16) | 4.76% | 7.92% |
| Target 2030 Passive Composite Index | 4.96% | 8.01% |
| Dow Jones U.S. Total Stock Market IndexSM | 8.66% | 12.74% |
| Bloomberg Barclays US Aggregate Bond Index | 4.48% | 1.31% |
| Fund Category: Morningstar Target-Date 20303 | 3.31% | N/A |
| Fund Expense Ratios4: Net 0.08%; Gross 0.12% |
All total returns on this page assume dividends and distributions were reinvested. Index figures do not include trading and management costs, which would lower performance. Indices are unmanaged and cannot be invested in directly. Performance results less than one year are not annualized.
The first index listed for the fund is the fund’s primary benchmark, as shown in the prospectus. Additional indices shown are provided for comparative purposes.
For index definitions, please see the Glossary.
| 1 | Fund expenses may have been partially absorbed by CSIM and its affiliates. Without these reductions, the fund’s returns would have been lower. These returns do not reflect the deduction of taxes that a shareholder would pay on fund distributions or the redemption of fund shares. |
| 2 | On July 24, 2017, the Investor Share class and Institutional Share class of the fund were consolidated into a single class of shares of the fund. The performance and financial history of the fund is that of the fund’s former Institutional Shares. Accordingly, the past performance shown is that of the fund’s former Institutional Shares. |
| 3 | Source for category information: Morningstar, Inc. The Morningstar Category return represents all active and index mutual funds within the category as of the report date. |
| 4 | As stated in the prospectus. Includes 0.04% of acquired fund fees and expenses, which are indirect expenses incurred by the fund through its investments in the underlying funds. Net Expense: Expenses reduced by a contractual fee waiver in effect for so long as CSIM serves as the investment adviser to the fund. Gross Expense: Does not reflect the effect of contractual fee waivers. For actual ratios during the period, refer to the financial highlights section of the financial statements. |
Schwab Target Index Funds | Annual Report
Schwab Target 2030 Index Fund
Performance and Fund Factsas of March 31, 2019 (continued)
| Number of Holdings | 9 |
| Portfolio Turnover Rate | 8% |
Asset Class Weightings % of Investments1,2
Top Holdings % of Net Assets3,4
Portfolio holdings may have changed since the report date.
| 1 | The percentage may differ from the Portfolio Holdings because the above calculation is based on a percentage of total investments, whereas the calculation in the Portfolio Holdings is based on a percentage of net assets. |
| 2 | The fund intends to primarily invest in affiliated Schwab ETFs and may also invest in affiliated Schwab and Laudus mutual funds and unaffiliated third party ETFs and mutual funds (all such ETFs and mutual funds referred to as “underlying funds”). |
| 3 | This list is not a recommendation of any security by the investment adviser. |
| 4 | The holdings listed exclude any temporary liquidity investments. |
Schwab Target Index Funds | Annual Report
Schwab Target 2035 Index Fundas of March 31, 2019
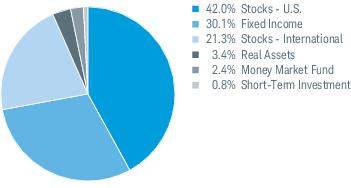
The Schwab Target 2035 Index Fund (the fund) seeks to provide capital appreciation and income consistent with its current asset allocation, and seeks to achieve its investment objective by investing primarily in affiliated Schwab exchange-traded funds (ETFs). The fund may also invest in affiliated Schwab Funds and Laudus Funds and unaffiliated third party ETFs and mutual funds. The target asset allocation is adjusted annually based on the adviser’s asset allocation strategy; as of the last annual adjustment at the end of January 2019, the fund’s asset allocation was approximately 74.6% equity securities, 22.8% fixed-income securities, and 2.5% cash and cash equivalents (including money market funds).1 (For portfolio allocations as of the end of this reporting period, please see the fund’s Portfolio Holdings included in this report.)
Market Highlights. For the 12-month reporting period ended March 31, 2019, global equity markets were mixed. In the U.S., stable economic growth, solid corporate earnings, and robust consumer spending helped propel U.S. stock markets to record highs in late September and early October, despite escalating trade tensions and rising interest rates. During the fourth quarter of 2018, however, investor anxiety rose amid concerns about the pace of future interest rate hikes despite low inflation, falling oil prices, slowing international growth, and concerns about trade negotiations with China. Volatility spiked and stocks fell steeply, particularly in December, more than erasing the period’s earlier gains. However, as the Federal Reserve put interest rates on hold, a strong rebound in the first quarter of 2019 brought U.S. stocks back above their early-December levels, albeit below their previous October highs. Outside the U.S., equity markets were notably weaker as economic momentum slowed due to uncertainties from several fronts, including trade, inflation, and geopolitical concerns. The U.S. Treasury yield curve slope (the spread between rates on 2-year and 10-year Treasuries) generally flattened, as short-term yields, which typically respond to changes in the federal funds rate, rose more quickly than longer-term yields, which are influenced more by economic growth and inflation expectations.
Performance. For the 12-month reporting period ended March 31, 2019, the fund returned 4.68%. The fund’s internally calculated comparative index, the Target 2035 Passive Composite Index (the composite index), returned 4.89% for the same period.
Positioning and Strategies.2 The fund’s asset allocations were generally in line with those of the composite index over the reporting period.
The fund’s equity exposure provided the greatest contribution to total return, particularly the fund’s U.S. large-cap holding. The top contributor to the total return of the fund was the Schwab U.S. Large-Cap ETF, which returned approximately 9.3%. The fund’s U.S. small-cap holding, the Schwab U.S. Small-Cap ETF, also contributed slightly, returning approximately 2.5%. The international equity and emerging markets components, however, detracted from total return. The Schwab International Equity ETF and Schwab Emerging Markets Equity ETF returned approximately -4.4% and -7.0%, respectively.
The fund’s overall fixed-income allocation also contributed to total return. The Schwab U.S. Aggregate Bond ETF, the fund’s intermediate-term bond component, returned approximately 4.6%, while the Schwab Short-Term U.S. Treasury ETF returned approximately 2.7% and slightly underperformed the fund’s short-term bond comparative index, the Bloomberg Barclays US Treasury 1-3 Year Index.
The fund’s real estate allocation contributed to the fund’s total return. The Schwab U.S. REIT ETF returned approximately 19.7%, tracking its comparative index, the Dow Jones U.S. Select REIT Index.
Management views and portfolio holdings may have changed since the report date.
| 1 | Percentages may not add up to 100% due to rounding. |
| 2 | ETF performance can be expressed on a market price or NAV basis. The returns cited in this section are Market Price Returns. The ETF’s per share NAV is the value of one share of the ETF. NAV is calculated by taking the ETF’s total assets (including the market value of securities owned), subtracting liabilities, and dividing by the number of shares outstanding. The NAV Return is based on the NAV of the ETF, and the Market Price Return is based on the market price per share of the ETF. The price used to calculate market return (Market Price) is determined using the Official Closing Price on the primary stock exchange (generally, 4:00 p.m. Eastern time). NAV is used as a proxy for purposes of calculating Market Price Return on inception date. Market Price and NAV returns assume that dividends and capital gain distributions have been reinvested in the ETF at Market Price and NAV, respectively. |
Schwab Target Index Funds | Annual Report
Schwab Target 2035 Index Fund
Performance and Fund Factsas of March 31, 2019
The performance data quoted represents past performance. Past performance does not guarantee future results. Investment returns and principal value of an investment will fluctuate so that an investor’s shares may be worth more or less than their original cost. Current performance may be lower or higher than performance data quoted. To obtain performance information current to the most recent month end, please visitwww.schwabfunds.com/schwabfunds_prospectus.
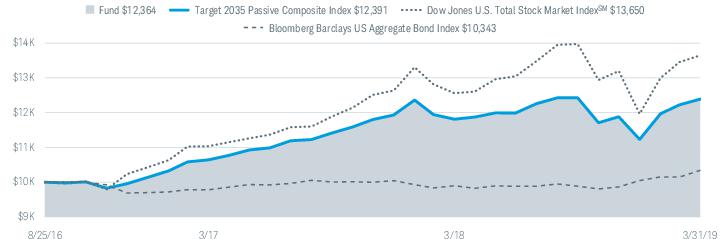
Performance of Hypothetical $10,000 Investment (August 25, 2016 – March 31, 2019)1,2
Average Annual Total Returns1,2
| Fund and Inception Date | 1 Year | Since Inception |
| Schwab Target 2035 Index Fund (8/25/16) | 4.68% | 8.51% |
| Target 2035 Passive Composite Index | 4.89% | 8.61% |
| Dow Jones U.S. Total Stock Market IndexSM | 8.66% | 12.74% |
| Bloomberg Barclays US Aggregate Bond Index | 4.48% | 1.31% |
| Fund Category: Morningstar Target-Date 20353 | 3.17% | N/A |
| Fund Expense Ratios4: Net 0.08%; Gross 0.12% |
All total returns on this page assume dividends and distributions were reinvested. Index figures do not include trading and management costs, which would lower performance. Indices are unmanaged and cannot be invested in directly. Performance results less than one year are not annualized.
The first index listed for the fund is the fund’s primary benchmark, as shown in the prospectus. Additional indices shown are provided for comparative purposes.
For index definitions, please see the Glossary.
| 1 | Fund expenses may have been partially absorbed by CSIM and its affiliates. Without these reductions, the fund’s returns would have been lower. These returns do not reflect the deduction of taxes that a shareholder would pay on fund distributions or the redemption of fund shares. |
| 2 | On July 24, 2017, the Investor Share class and Institutional Share class of the fund were consolidated into a single class of shares of the fund. The performance and financial history of the fund is that of the fund’s former Institutional Shares. Accordingly, the past performance shown is that of the fund’s former Institutional Shares. |
| 3 | Source for category information: Morningstar, Inc. The Morningstar Category return represents all active and index mutual funds within the category as of the report date. |
| 4 | As stated in the prospectus. Includes 0.04% of acquired fund fees and expenses, which are indirect expenses incurred by the fund through its investments in the underlying funds. Net Expense: Expenses reduced by a contractual fee waiver in effect for so long as CSIM serves as the investment adviser to the fund. Gross Expense: Does not reflect the effect of contractual fee waivers. For actual ratios during the period, refer to the financial highlights section of the financial statements. |
Schwab Target Index Funds | Annual Report
Schwab Target 2035 Index Fund
Performance and Fund Factsas of March 31, 2019 (continued)
| Number of Holdings | 9 |
| Portfolio Turnover Rate | 6% |
Asset Class Weightings % of Investments1,2
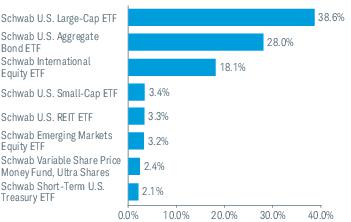
Top Holdings % of Net Assets3,4
Portfolio holdings may have changed since the report date.
| 1 | The percentage may differ from the Portfolio Holdings because the above calculation is based on a percentage of total investments, whereas the calculation in the Portfolio Holdings is based on a percentage of net assets. |
| 2 | The fund intends to primarily invest in affiliated Schwab ETFs and may also invest in affiliated Schwab and Laudus mutual funds and unaffiliated third party ETFs and mutual funds (all such ETFs and mutual funds referred to as “underlying funds”). |
| 3 | This list is not a recommendation of any security by the investment adviser. |
| 4 | The holdings listed exclude any temporary liquidity investments. |
Schwab Target Index Funds | Annual Report
Schwab Target 2040 Index Fundas of March 31, 2019
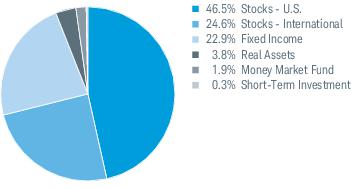
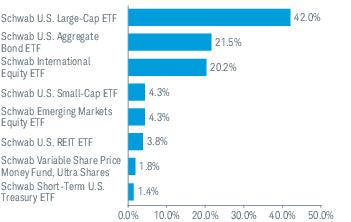
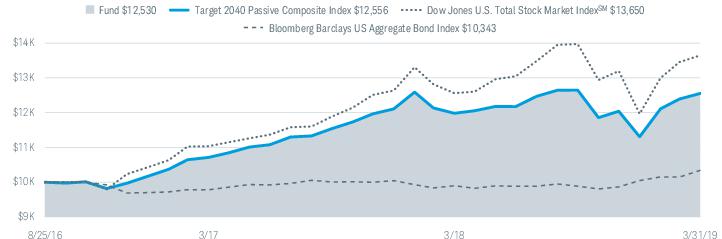
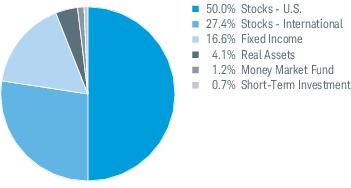
The Schwab Target 2040 Index Fund (the fund) seeks to provide capital appreciation and income consistent with its current asset allocation, and seeks to achieve its investment objective by investing primarily in affiliated Schwab exchange-traded funds (ETFs). The fund may also invest in affiliated Schwab Funds and Laudus Funds and unaffiliated third party ETFs and mutual funds. The target asset allocation is adjusted annually based on the adviser’s asset allocation strategy; as of the last annual adjustment at the end of January 2019, the fund’s asset allocation was approximately 81.6% equity securities, 16.6% fixed-income securities, and 1.8% cash and cash equivalents (including money market funds). (For portfolio allocations as of the end of this reporting period, please see the fund’s Portfolio Holdings included in this report.)
Market Highlights. For the 12-month reporting period ended March 31, 2019, global equity markets were mixed. In the U.S., stable economic growth, solid corporate earnings, and robust consumer spending helped propel U.S. stock markets to record highs in late September and early October, despite escalating trade tensions and rising interest rates. During the fourth quarter of 2018, however, investor anxiety rose amid concerns about the pace of future interest rate hikes despite low inflation, falling oil prices, slowing international growth, and concerns about trade negotiations with China. Volatility spiked and stocks fell steeply, particularly in December, more than erasing the period’s earlier gains. However, as the Federal Reserve put interest rates on hold, a strong rebound in the first quarter of 2019 brought U.S. stocks back above their early-December levels, albeit below their previous October highs. Outside the U.S., equity markets were notably weaker as economic momentum slowed due to uncertainties from several fronts, including trade, inflation, and geopolitical concerns. The U.S. Treasury yield curve slope (the spread between rates on 2-year and 10-year Treasuries) generally flattened, as short-term yields, which typically respond to changes in the federal funds rate, rose more quickly than longer-term yields, which are influenced more by economic growth and inflation expectations.
Performance. For the 12-month reporting period ended March 31, 2019, the fund returned 4.49%. The fund’s internally calculated comparative index, the Target 2040 Passive Composite Index (the composite index), returned 4.77% for the same period.
Positioning and Strategies.1 The fund’s asset allocations were generally in line with those of the composite index over the reporting period.
The fund’s equity exposure provided the greatest contribution to total return, particularly the fund’s U.S. large-cap holding. The top contributor to the total return of the fund was the Schwab U.S. Large-Cap ETF, which returned approximately 9.3%. The fund’s U.S. small-cap holding, the Schwab U.S. Small-Cap ETF, also contributed slightly, returning approximately 2.5%. The international equity and emerging markets components, however, detracted from total return. The Schwab International Equity ETF and Schwab Emerging Markets Equity ETF returned approximately -4.4% and -7.0%, respectively.
The fund’s overall fixed-income allocation also contributed to total return. The Schwab U.S. Aggregate Bond ETF, the fund’s intermediate-term bond component, returned approximately 4.6%, while the Schwab Short-Term U.S. Treasury ETF returned approximately 2.7% and slightly underperformed the fund’s short-term bond comparative index, the Bloomberg Barclays US Treasury 1-3 Year Index.
The fund’s real estate allocation contributed to the fund’s total return. The Schwab U.S. REIT ETF returned approximately 19.7%, tracking its comparative index, the Dow Jones U.S. Select REIT Index.
Management views and portfolio holdings may have changed since the report date.
| 1 | ETF performance can be expressed on a market price or NAV basis. The returns cited in this section are Market Price Returns. The ETF’s per share NAV is the value of one share of the ETF. NAV is calculated by taking the ETF’s total assets (including the market value of securities owned), subtracting liabilities, and dividing by the number of shares outstanding. The NAV Return is based on the NAV of the ETF, and the Market Price Return is based on the market price per share of the ETF. The price used to calculate market return (Market Price) is determined using the Official Closing Price on the primary stock exchange (generally, 4:00 p.m. Eastern time). NAV is used as a proxy for purposes of calculating Market Price Return on inception date. Market Price and NAV returns assume that dividends and capital gain distributions have been reinvested in the ETF at Market Price and NAV, respectively. |
Schwab Target Index Funds | Annual Report
Schwab Target 2040 Index Fund
Performance and Fund Factsas of March 31, 2019
The performance data quoted represents past performance. Past performance does not guarantee future results. Investment returns and principal value of an investment will fluctuate so that an investor’s shares may be worth more or less than their original cost. Current performance may be lower or higher than performance data quoted. To obtain performance information current to the most recent month end, please visitwww.schwabfunds.com/schwabfunds_prospectus.
Performance of Hypothetical $10,000 Investment (August 25, 2016 – March 31, 2019)1,2
Average Annual Total Returns1,2
| Fund and Inception Date | 1 Year | Since Inception |
| Schwab Target 2040 Index Fund (8/25/16) | 4.49% | 9.07% |
| Target 2040 Passive Composite Index | 4.77% | 9.17% |
| Dow Jones U.S. Total Stock Market IndexSM | 8.66% | 12.74% |
| Bloomberg Barclays US Aggregate Bond Index | 4.48% | 1.31% |
| Fund Category: Morningstar Target-Date 20403 | 3.04% | N/A |
| Fund Expense Ratios4: Net 0.08%; Gross 0.12% |
All total returns on this page assume dividends and distributions were reinvested. Index figures do not include trading and management costs, which would lower performance. Indices are unmanaged and cannot be invested in directly. Performance results less than one year are not annualized.
The first index listed for the fund is the fund’s primary benchmark, as shown in the prospectus. Additional indices shown are provided for comparative purposes.
For index definitions, please see the Glossary.
| 1 | Fund expenses may have been partially absorbed by CSIM and its affiliates. Without these reductions, the fund’s returns would have been lower. These returns do not reflect the deduction of taxes that a shareholder would pay on fund distributions or the redemption of fund shares. |
| 2 | On July 24, 2017, the Investor Share class and Institutional Share class of the fund were consolidated into a single class of shares of the fund. The performance and financial history of the fund is that of the fund’s former Institutional Shares. Accordingly, the past performance shown is that of the fund’s former Institutional Shares. |
| 3 | Source for category information: Morningstar, Inc. The Morningstar Category return represents all active and index mutual funds within the category as of the report date. |
| 4 | As stated in the prospectus. Includes 0.04% of acquired fund fees and expenses, which are indirect expenses incurred by the fund through its investments in the underlying funds. Net Expense: Expenses reduced by a contractual fee waiver in effect for so long as CSIM serves as the investment adviser to the fund. Gross Expense: Does not reflect the effect of contractual fee waivers. For actual ratios during the period, refer to the financial highlights section of the financial statements. |
Schwab Target Index Funds | Annual Report
Schwab Target 2040 Index Fund
Performance and Fund Factsas of March 31, 2019 (continued)
| Number of Holdings | 9 |
| Portfolio Turnover Rate | 2% |
Asset Class Weightings % of Investments1,2
Top Holdings % of Net Assets3,4
Portfolio holdings may have changed since the report date.
| 1 | The percentage may differ from the Portfolio Holdings because the above calculation is based on a percentage of total investments, whereas the calculation in the Portfolio Holdings is based on a percentage of net assets. |
| 2 | The fund intends to primarily invest in affiliated Schwab ETFs and may also invest in affiliated Schwab and Laudus mutual funds and unaffiliated third party ETFs and mutual funds (all such ETFs and mutual funds referred to as “underlying funds”). |
| 3 | This list is not a recommendation of any security by the investment adviser. |
| 4 | The holdings listed exclude any temporary liquidity investments. |
Schwab Target Index Funds | Annual Report
Schwab Target 2045 Index Fundas of March 31, 2019
The Schwab Target 2045 Index Fund (the fund) seeks to provide capital appreciation and income consistent with its current asset allocation, and seeks to achieve its investment objective by investing primarily in affiliated Schwab exchange-traded funds (ETFs). The fund may also invest in affiliated Schwab Funds and Laudus Funds and unaffiliated third party ETFs and mutual funds. The target asset allocation is adjusted annually based on the adviser’s asset allocation strategy; as of the last annual adjustment at the end of January 2019, the fund’s asset allocation was approximately 87.3% equity securities, 11.4% fixed-income securities, and 1.3% cash and cash equivalents (including money market funds). (For portfolio allocations as of the end of this reporting period, please see the fund’s Portfolio Holdings included in this report.)
Market Highlights. For the 12-month reporting period ended March 31, 2019, global equity markets were mixed. In the U.S., stable economic growth, solid corporate earnings, and robust consumer spending helped propel U.S. stock markets to record highs in late September and early October, despite escalating trade tensions and rising interest rates. During the fourth quarter of 2018, however, investor anxiety rose amid concerns about the pace of future interest rate hikes despite low inflation, falling oil prices, slowing international growth, and concerns about trade negotiations with China. Volatility spiked and stocks fell steeply, particularly in December, more than erasing the period’s earlier gains. However, as the Federal Reserve put interest rates on hold, a strong rebound in the first quarter of 2019 brought U.S. stocks back above their early-December levels, albeit below their previous October highs. Outside the U.S., equity markets were notably weaker as economic momentum slowed due to uncertainties from several fronts, including trade, inflation, and geopolitical concerns. The U.S. Treasury yield curve slope (the spread between rates on 2-year and 10-year Treasuries) generally flattened, as short-term yields, which typically respond to changes in the federal funds rate, rose more quickly than longer-term yields, which are influenced more by economic growth and inflation expectations.
Performance. For the 12-month reporting period ended March 31, 2019, the fund returned 4.33%. The fund’s internally calculated comparative index, the Target 2045 Passive Composite Index (the composite index), returned 4.67% for the same period.
Positioning and Strategies.1 The fund’s asset allocations were generally in line with those of the composite index over the reporting period.
The fund’s equity exposure provided the greatest contribution to total return, particularly the fund’s U.S. large-cap holding. The top contributor to the total return of the fund was the Schwab U.S. Large-Cap ETF, which returned approximately 9.3%. The fund’s U.S. small-cap holding, the Schwab U.S. Small-Cap ETF, also contributed slightly, returning approximately 2.5%. The international equity and emerging markets components, however, detracted from total return. The Schwab International Equity ETF and Schwab Emerging Markets Equity ETF returned approximately -4.4% and -7.0%, respectively.
The fund’s overall fixed-income allocation also contributed to total return. The Schwab U.S. Aggregate Bond ETF, the fund’s intermediate-term bond component, returned approximately 4.6%, while the Schwab Short-Term U.S. Treasury ETF returned approximately 2.7% and slightly underperformed the fund’s short-term bond comparative index, the Bloomberg Barclays US Treasury 1-3 Year Index.
The fund’s real estate allocation contributed to the fund’s total return. The Schwab U.S. REIT ETF returned approximately 19.7%, tracking its comparative index, the Dow Jones U.S. Select REIT Index.
Management views and portfolio holdings may have changed since the report date.
| 1 | ETF performance can be expressed on a market price or NAV basis. The returns cited in this section are Market Price Returns. The ETF’s per share NAV is the value of one share of the ETF. NAV is calculated by taking the ETF’s total assets (including the market value of securities owned), subtracting liabilities, and dividing by the number of shares outstanding. The NAV Return is based on the NAV of the ETF, and the Market Price Return is based on the market price per share of the ETF. The price used to calculate market return (Market Price) is determined using the Official Closing Price on the primary stock exchange (generally, 4:00 p.m. Eastern time). NAV is used as a proxy for purposes of calculating Market Price Return on inception date. Market Price and NAV returns assume that dividends and capital gain distributions have been reinvested in the ETF at Market Price and NAV, respectively. |
Schwab Target Index Funds | Annual Report
Schwab Target 2045 Index Fund
Performance and Fund Factsas of March 31, 2019
The performance data quoted represents past performance. Past performance does not guarantee future results. Investment returns and principal value of an investment will fluctuate so that an investor’s shares may be worth more or less than their original cost. Current performance may be lower or higher than performance data quoted. To obtain performance information current to the most recent month end, please visitwww.schwabfunds.com/schwabfunds_prospectus.
Performance of Hypothetical $10,000 Investment (August 25, 2016 – March 31, 2019)1,2
Average Annual Total Returns1,2
| Fund and Inception Date | 1 Year | Since Inception |
| Schwab Target 2045 Index Fund (8/25/16) | 4.33% | 9.39% |
| Target 2045 Passive Composite Index | 4.67% | 9.50% |
| Dow Jones U.S. Total Stock Market IndexSM | 8.66% | 12.74% |
| Bloomberg Barclays US Aggregate Bond Index | 4.48% | 1.31% |
| Fund Category: Morningstar Target-Date 20453 | 2.94% | N/A |
| Fund Expense Ratios4: Net 0.08%; Gross 0.13% |
All total returns on this page assume dividends and distributions were reinvested. Index figures do not include trading and management costs, which would lower performance. Indices are unmanaged and cannot be invested in directly. Performance results less than one year are not annualized.
The first index listed for the fund is the fund’s primary benchmark, as shown in the prospectus. Additional indices shown are provided for comparative purposes.
For index definitions, please see the Glossary.
| 1 | Fund expenses may have been partially absorbed by CSIM and its affiliates. Without these reductions, the fund’s returns would have been lower. These returns do not reflect the deduction of taxes that a shareholder would pay on fund distributions or the redemption of fund shares. |
| 2 | On July 24, 2017, the Investor Share class and Institutional Share class of the fund were consolidated into a single class of shares of the fund. The performance and financial history of the fund is that of the fund’s former Institutional Shares. Accordingly, the past performance shown is that of the fund’s former Institutional Shares. |
| 3 | Source for category information: Morningstar, Inc. The Morningstar Category return represents all active and index mutual funds within the category as of the report date. |
| 4 | As stated in the prospectus. Includes 0.05% of acquired fund fees and expenses, which are indirect expenses incurred by the fund through its investments in the underlying funds. Net Expense: Expenses reduced by a contractual fee waiver in effect for so long as CSIM serves as the investment adviser to the fund. Gross Expense: Does not reflect the effect of contractual fee waivers. For actual ratios during the period, refer to the financial highlights section of the financial statements. |
Schwab Target Index Funds | Annual Report
Schwab Target 2045 Index Fund
Performance and Fund Factsas of March 31, 2019 (continued)
| Number of Holdings | 9 |
| Portfolio Turnover Rate | 7% |
Asset Class Weightings % of Investments1,2
Top Holdings % of Net Assets3,4
Portfolio holdings may have changed since the report date.
| 1 | The percentage may differ from the Portfolio Holdings because the above calculation is based on a percentage of total investments, whereas the calculation in the Portfolio Holdings is based on a percentage of net assets. |
| 2 | The fund intends to primarily invest in affiliated Schwab ETFs and may also invest in affiliated Schwab and Laudus mutual funds and unaffiliated third party ETFs and mutual funds (all such ETFs and mutual funds referred to as “underlying funds”). |
| 3 | This list is not a recommendation of any security by the investment adviser. |
| 4 | The holdings listed exclude any temporary liquidity investments. |
Schwab Target Index Funds | Annual Report
Schwab Target 2050 Index Fundas of March 31, 2019
The Schwab Target 2050 Index Fund (the fund) seeks to provide capital appreciation and income consistent with its current asset allocation, and seeks to achieve its investment objective by investing primarily in affiliated Schwab exchange-traded funds (ETFs). The fund may also invest in affiliated Schwab Funds and Laudus Funds and unaffiliated third party ETFs and mutual funds. The target asset allocation is adjusted annually based on the adviser’s asset allocation strategy; as of the last annual adjustment at the end of January 2019, the fund’s asset allocation was approximately 90.5% equity securities, 8.6% fixed-income securities, and 1.0% cash and cash equivalents (including money market funds).1 (For portfolio allocations as of the end of this reporting period, please see the fund’s Portfolio Holdings included in this report.)
Market Highlights. For the 12-month reporting period ended March 31, 2019, global equity markets were mixed. In the U.S., stable economic growth, solid corporate earnings, and robust consumer spending helped propel U.S. stock markets to record highs in late September and early October, despite escalating trade tensions and rising interest rates. During the fourth quarter of 2018, however, investor anxiety rose amid concerns about the pace of future interest rate hikes despite low inflation, falling oil prices, slowing international growth, and concerns about trade negotiations with China. Volatility spiked and stocks fell steeply, particularly in December, more than erasing the period’s earlier gains. However, as the Federal Reserve put interest rates on hold, a strong rebound in the first quarter of 2019 brought U.S. stocks back above their early-December levels, albeit below their previous October highs. Outside the U.S., equity markets were notably weaker as economic momentum slowed due to uncertainties from several fronts, including trade, inflation, and geopolitical concerns. The U.S. Treasury yield curve slope (the spread between rates on 2-year and 10-year Treasuries) generally flattened, as short-term yields, which typically respond to changes in the federal funds rate, rose more quickly than longer-term yields, which are influenced more by economic growth and inflation expectations.
Performance. For the 12-month reporting period ended March 31, 2019, the fund returned 4.23%. The fund’s internally calculated comparative index, the Target 2050 Passive Composite Index (the composite index), returned 4.60% for the same period.
Positioning and Strategies.2 The fund’s asset allocations were generally in line with those of the composite index over the reporting period.
The fund’s equity exposure provided the greatest contribution to total return, particularly the fund’s U.S. large-cap holding. The top contributor to the total return of the fund was the Schwab U.S. Large-Cap ETF, which returned approximately 9.3%. The fund’s U.S. small-cap holding, the Schwab U.S. Small-Cap ETF, also contributed slightly, returning approximately 2.5%. The international equity and emerging markets components, however, detracted from total return. The Schwab International Equity ETF and Schwab Emerging Markets Equity ETF returned approximately -4.4% and -7.0%, respectively.
The fund’s overall fixed-income allocation also contributed to total return. The Schwab U.S. Aggregate Bond ETF, the fund’s intermediate-term bond component, returned approximately 4.6%, while the Schwab Short-Term U.S. Treasury ETF returned approximately 2.7% and slightly underperformed the fund’s short-term bond comparative index, the Bloomberg Barclays US Treasury 1-3 Year Index.
The fund’s real estate allocation contributed to the fund’s total return. The Schwab U.S. REIT ETF returned approximately 19.7%, tracking its comparative index, the Dow Jones U.S. Select REIT Index.
Management views and portfolio holdings may have changed since the report date.
| 1 | Percentages may not add up to 100% due to rounding. |
| 2 | ETF performance can be expressed on a market price or NAV basis. The returns cited in this section are Market Price Returns. The ETF’s per share NAV is the value of one share of the ETF. NAV is calculated by taking the ETF’s total assets (including the market value of securities owned), subtracting liabilities, and dividing by the number of shares outstanding. The NAV Return is based on the NAV of the ETF, and the Market Price Return is based on the market price per share of the ETF. The price used to calculate market return (Market Price) is determined using the Official Closing Price on the primary stock exchange (generally, 4:00 p.m. Eastern time). NAV is used as a proxy for purposes of calculating Market Price Return on inception date. Market Price and NAV returns assume that dividends and capital gain distributions have been reinvested in the ETF at Market Price and NAV, respectively. |
Schwab Target Index Funds | Annual Report
Schwab Target 2050 Index Fund
Performance and Fund Factsas of March 31, 2019
The performance data quoted represents past performance. Past performance does not guarantee future results. Investment returns and principal value of an investment will fluctuate so that an investor’s shares may be worth more or less than their original cost. Current performance may be lower or higher than performance data quoted. To obtain performance information current to the most recent month end, please visitwww.schwabfunds.com/schwabfunds_prospectus.
Performance of Hypothetical $10,000 Investment (August 25, 2016 – March 31, 2019)1,2
Average Annual Total Returns1,2
| Fund and Inception Date | 1 Year | Since Inception |
| Schwab Target 2050 Index Fund (8/25/16) | 4.23% | 9.57% |
| Target 2050 Passive Composite Index | 4.60% | 9.70% |
| Dow Jones U.S. Total Stock Market IndexSM | 8.66% | 12.74% |
| Bloomberg Barclays US Aggregate Bond Index | 4.48% | 1.31% |
| Fund Category: Morningstar Target-Date 20503 | 2.87% | N/A |
| Fund Expense Ratios4: Net 0.08%; Gross 0.13% |
All total returns on this page assume dividends and distributions were reinvested. Index figures do not include trading and management costs, which would lower performance. Indices are unmanaged and cannot be invested in directly. Performance results less than one year are not annualized.
The first index listed for the fund is the fund’s primary benchmark, as shown in the prospectus. Additional indices shown are provided for comparative purposes.
For index definitions, please see the Glossary.
| 1 | Fund expenses may have been partially absorbed by CSIM and its affiliates. Without these reductions, the fund’s returns would have been lower. These returns do not reflect the deduction of taxes that a shareholder would pay on fund distributions or the redemption of fund shares. |
| 2 | On July 24, 2017, the Investor Share class and Institutional Share class of the fund were consolidated into a single class of shares of the fund. The performance and financial history of the fund is that of the fund’s former Institutional Shares. Accordingly, the past performance shown is that of the fund’s former Institutional Shares. |
| 3 | Source for category information: Morningstar, Inc. The Morningstar Category return represents all active and index mutual funds within the category as of the report date. |
| 4 | As stated in the prospectus. Includes 0.05% of acquired fund fees and expenses, which are indirect expenses incurred by the fund through its investments in the underlying funds. Net Expense: Expenses reduced by a contractual fee waiver in effect for so long as CSIM serves as the investment adviser to the fund. Gross Expense: Does not reflect the effect of contractual fee waivers. For actual ratios during the period, refer to the financial highlights section of the financial statements. |
Schwab Target Index Funds | Annual Report
Schwab Target 2050 Index Fund
Performance and Fund Factsas of March 31, 2019 (continued)
| Number of Holdings | 9 |
| Portfolio Turnover Rate | 0%1 |
Asset Class Weightings % of Investments2,3
Top Holdings % of Net Assets4,5
Portfolio holdings may have changed since the report date.
| 1 | Less than 0.5%. |
| 2 | The percentage may differ from the Portfolio Holdings because the above calculation is based on a percentage of total investments, whereas the calculation in the Portfolio Holdings is based on a percentage of net assets. |
| 3 | The fund intends to primarily invest in affiliated Schwab ETFs and may also invest in affiliated Schwab and Laudus mutual funds and unaffiliated third party ETFs and mutual funds (all such ETFs and mutual funds referred to as “underlying funds”). |
| 4 | This list is not a recommendation of any security by the investment adviser. |
| 5 | The holdings listed exclude any temporary liquidity investments. |
Schwab Target Index Funds | Annual Report
Schwab Target 2055 Index Fundas of March 31, 2019
The Schwab Target 2055 Index Fund (the fund) seeks to provide capital appreciation and income consistent with its current asset allocation, and seeks to achieve its investment objective by investing primarily in affiliated Schwab exchange-traded funds (ETFs). The fund may also invest in affiliated Schwab Funds and Laudus Funds and unaffiliated third party ETFs and mutual funds. The target asset allocation is adjusted annually based on the adviser’s asset allocation strategy; as of the last annual adjustment at the end of January 2019, the fund’s asset allocation was approximately 93.0% equity securities, 6.3% fixed-income securities, and 0.7% cash and cash equivalents (including money market funds). (For portfolio allocations as of the end of this reporting period, please see the fund’s Portfolio Holdings included in this report.)
Market Highlights. For the 12-month reporting period ended March 31, 2019, global equity markets were mixed. In the U.S., stable economic growth, solid corporate earnings, and robust consumer spending helped propel U.S. stock markets to record highs in late September and early October, despite escalating trade tensions and rising interest rates. During the fourth quarter of 2018, however, investor anxiety rose amid concerns about the pace of future interest rate hikes despite low inflation, falling oil prices, slowing international growth, and concerns about trade negotiations with China. Volatility spiked and stocks fell steeply, particularly in December, more than erasing the period’s earlier gains. However, as the Federal Reserve put interest rates on hold, a strong rebound in the first quarter of 2019 brought U.S. stocks back above their early-December levels, albeit below their previous October highs. Outside the U.S., equity markets were notably weaker as economic momentum slowed due to uncertainties from several fronts, including trade, inflation, and geopolitical concerns. The U.S. Treasury yield curve slope (the spread between rates on 2-year and 10-year Treasuries) generally flattened, as short-term yields, which typically respond to changes in the federal funds rate, rose more quickly than longer-term yields, which are influenced more by economic growth and inflation expectations.
Performance. For the 12-month reporting period ended March 31, 2019, the fund returned 4.15%. The fund’s internally calculated comparative index, the Target 2055 Passive Composite Index (the composite index), returned 4.53% for the same period.
Positioning and Strategies.1 The fund’s asset allocations were generally in line with those of the composite index over the reporting period.
The fund’s equity exposure provided the greatest contribution to total return, particularly the fund’s U.S. large-cap holding. The top contributor to the total return of the fund was the Schwab U.S. Large-Cap ETF, which returned approximately 9.3%. The fund’s U.S. small-cap holding, the Schwab U.S. Small-Cap ETF, also contributed slightly, returning approximately 2.5%. The international equity and emerging markets components, however, detracted from total return. The Schwab International Equity ETF and Schwab Emerging Markets Equity ETF returned approximately -4.4% and -7.0%, respectively.
The fund’s overall fixed-income allocation also contributed to total return. The Schwab U.S. Aggregate Bond ETF, the fund’s intermediate-term bond component, returned approximately 4.6%, while the Schwab Short-Term U.S. Treasury ETF returned approximately 2.7% and slightly underperformed the fund’s short-term bond comparative index, the Bloomberg Barclays US Treasury 1-3 Year Index.
The fund’s real estate allocation contributed to the fund’s total return. The Schwab U.S. REIT ETF returned approximately 19.7%, tracking its comparative index, the Dow Jones U.S. Select REIT Index.
Management views and portfolio holdings may have changed since the report date.
| 1 | ETF performance can be expressed on a market price or NAV basis. The returns cited in this section are Market Price Returns. The ETF’s per share NAV is the value of one share of the ETF. NAV is calculated by taking the ETF’s total assets (including the market value of securities owned), subtracting liabilities, and dividing by the number of shares outstanding. The NAV Return is based on the NAV of the ETF, and the Market Price Return is based on the market price per share of the ETF. The price used to calculate market return (Market Price) is determined using the Official Closing Price on the primary stock exchange (generally, 4:00 p.m. Eastern time). NAV is used as a proxy for purposes of calculating Market Price Return on inception date. Market Price and NAV returns assume that dividends and capital gain distributions have been reinvested in the ETF at Market Price and NAV, respectively. |
Schwab Target Index Funds | Annual Report
Schwab Target 2055 Index Fund
Performance and Fund Factsas of March 31, 2019
The performance data quoted represents past performance. Past performance does not guarantee future results. Investment returns and principal value of an investment will fluctuate so that an investor’s shares may be worth more or less than their original cost. Current performance may be lower or higher than performance data quoted. To obtain performance information current to the most recent month end, please visitwww.schwabfunds.com/schwabfunds_prospectus.
Performance of Hypothetical $10,000 Investment (August 25, 2016 – March 31, 2019)1,2
Average Annual Total Returns1,2
| Fund and Inception Date | 1 Year | Since Inception |
| Schwab Target 2055 Index Fund (8/25/16) | 4.15% | 9.78% |
| Target 2055 Passive Composite Index | 4.53% | 9.89% |
| Dow Jones U.S. Total Stock Market IndexSM | 8.66% | 12.74% |
| Bloomberg Barclays US Aggregate Bond Index | 4.48% | 1.31% |
| Fund Category: Morningstar Target-Date 20553 | 2.84% | N/A |
| Fund Expense Ratios4: Net 0.08%; Gross 0.13% |
All total returns on this page assume dividends and distributions were reinvested. Index figures do not include trading and management costs, which would lower performance. Indices are unmanaged and cannot be invested in directly. Performance results less than one year are not annualized.
The first index listed for the fund is the fund’s primary benchmark, as shown in the prospectus. Additional indices shown are provided for comparative purposes.
For index definitions, please see the Glossary.
| 1 | Fund expenses may have been partially absorbed by CSIM and its affiliates. Without these reductions, the fund’s returns would have been lower. These returns do not reflect the deduction of taxes that a shareholder would pay on fund distributions or the redemption of fund shares. |
| 2 | On July 24, 2017, the Investor Share class and Institutional Share class of the fund were consolidated into a single class of shares of the fund. The performance and financial history of the fund is that of the fund’s former Institutional Shares. Accordingly, the past performance shown is that of the fund’s former Institutional Shares. |
| 3 | Source for category information: Morningstar, Inc. The Morningstar Category return represents all active and index mutual funds within the category as of the report date. |
| 4 | As stated in the prospectus. Includes 0.05% of acquired fund fees and expenses, which are indirect expenses incurred by the fund through its investments in the underlying funds. Net Expense: Expenses reduced by a contractual fee waiver in effect for so long as CSIM serves as the investment adviser to the fund. Gross Expense: Does not reflect the effect of contractual fee waivers. For actual ratios during the period, refer to the financial highlights section of the financial statements. |
Schwab Target Index Funds | Annual Report
Schwab Target 2055 Index Fund
Performance and Fund Factsas of March 31, 2019 (continued)
| Number of Holdings | 8 |
| Portfolio Turnover Rate | 6% |
Asset Class Weightings % of Investments1,2
Top Holdings % of Net Assets3,4
Portfolio holdings may have changed since the report date.
| 1 | The percentage may differ from the Portfolio Holdings because the above calculation is based on a percentage of total investments, whereas the calculation in the Portfolio Holdings is based on a percentage of net assets. |
| 2 | The fund intends to primarily invest in affiliated Schwab ETFs and may also invest in affiliated Schwab and Laudus mutual funds and unaffiliated third party ETFs and mutual funds (all such ETFs and mutual funds referred to as “underlying funds”). |
| 3 | This list is not a recommendation of any security by the investment adviser. |
| 4 | The holdings listed exclude any temporary liquidity investments. |
Schwab Target Index Funds | Annual Report
Schwab Target 2060 Index Fundas of March 31, 2019
The Schwab Target 2060 Index Fund (the fund) seeks to provide capital appreciation and income consistent with its current asset allocation, and seeks to achieve its investment objective by investing primarily in affiliated Schwab exchange-traded funds (ETFs). The fund may also invest in affiliated Schwab Funds and Laudus Funds and unaffiliated third party ETFs and mutual funds. The target asset allocation is adjusted annually based on the adviser’s asset allocation strategy; as of the last annual adjustment at the end of January 2019, the fund’s asset allocation was approximately 95.0% equity securities, 4.5% fixed-income securities, and 0.5% cash and cash equivalents (including money market funds). (For portfolio allocations as of the end of this reporting period, please see the fund’s Portfolio Holdings included in this report.)
Market Highlights. For the 12-month reporting period ended March 31, 2019, global equity markets were mixed. In the U.S., stable economic growth, solid corporate earnings, and robust consumer spending helped propel U.S. stock markets to record highs in late September and early October, despite escalating trade tensions and rising interest rates. During the fourth quarter of 2018, however, investor anxiety rose amid concerns about the pace of future interest rate hikes despite low inflation, falling oil prices, slowing international growth, and concerns about trade negotiations with China. Volatility spiked and stocks fell steeply, particularly in December, more than erasing the period’s earlier gains. However, as the Federal Reserve put interest rates on hold, a strong rebound in the first quarter of 2019 brought U.S. stocks back above their early-December levels, albeit below their previous October highs. Outside the U.S., equity markets were notably weaker as economic momentum slowed due to uncertainties from several fronts, including trade, inflation, and geopolitical concerns. The U.S. Treasury yield curve slope (the spread between rates on 2-year and 10-year Treasuries) generally flattened, as short-term yields, which typically respond to changes in the federal funds rate, rose more quickly than longer-term yields, which are influenced more by economic growth and inflation expectations.
Performance. For the 12-month reporting period ended March 31, 2019, the fund returned 4.23%. The fund’s internally calculated comparative index, the Target 2060 Passive Composite Index (the composite index), returned 4.50% for the same period.
Positioning and Strategies.1 The fund’s asset allocations were generally in line with those of the composite index over the reporting period.
The fund’s equity exposure provided the greatest contribution to total return, particularly the fund’s U.S. large-cap holding. The top contributor to the total return of the fund was the Schwab U.S. Large-Cap ETF, which returned approximately 9.3%. The fund’s U.S. small-cap holding, the Schwab U.S. Small-Cap ETF, also contributed slightly, returning approximately 2.5%. The international equity and emerging markets components, however, detracted from total return. The Schwab International Equity ETF and Schwab Emerging Markets Equity ETF returned approximately -4.4% and -7.0%, respectively.
The fund’s overall fixed-income allocation also contributed to total return. The Schwab U.S. Aggregate Bond ETF, the fund’s intermediate-term bond component, returned approximately 4.6%, while the Schwab Short-Term U.S. Treasury ETF returned approximately 2.7% and slightly underperformed the fund’s short-term bond comparative index, the Bloomberg Barclays US Treasury 1-3 Year Index.
The fund’s real estate allocation contributed to the fund’s total return. The Schwab U.S. REIT ETF returned approximately 19.7%, tracking its comparative index, the Dow Jones U.S. Select REIT Index.
Management views and portfolio holdings may have changed since the report date.
| 1 | ETF performance can be expressed on a market price or NAV basis. The returns cited in this section are Market Price Returns. The ETF’s per share NAV is the value of one share of the ETF. NAV is calculated by taking the ETF’s total assets (including the market value of securities owned), subtracting liabilities, and dividing by the number of shares outstanding. The NAV Return is based on the NAV of the ETF, and the Market Price Return is based on the market price per share of the ETF. The price used to calculate market return (Market Price) is determined using the Official Closing Price on the primary stock exchange (generally, 4:00 p.m. Eastern time). NAV is used as a proxy for purposes of calculating Market Price Return on inception date. Market Price and NAV returns assume that dividends and capital gain distributions have been reinvested in the ETF at Market Price and NAV, respectively. |
Schwab Target Index Funds | Annual Report
Schwab Target 2060 Index Fund
Performance and Fund Factsas of March 31, 2019
The performance data quoted represents past performance. Past performance does not guarantee future results. Investment returns and principal value of an investment will fluctuate so that an investor’s shares may be worth more or less than their original cost. Current performance may be lower or higher than performance data quoted. To obtain performance information current to the most recent month end, please visitwww.schwabfunds.com/schwabfunds_prospectus.
Performance of Hypothetical $10,000 Investment (August 25, 2016 – March 31, 2019)1,2
Average Annual Total Returns1,2
| Fund and Inception Date | 1 Year | Since Inception |
| Schwab Target 2060 Index Fund (8/25/16) | 4.23% | 9.83% |
| Target 2060 Passive Composite Index | 4.50% | 9.94% |
| Dow Jones U.S. Total Stock Market IndexSM | 8.66% | 12.74% |
| Bloomberg Barclays US Aggregate Bond Index | 4.48% | 1.31% |
| Fund Category: Morningstar Target-Date 2060+3 | 2.99% | N/A |
| Fund Expense Ratios4: Net 0.08%; Gross 0.13% |
All total returns on this page assume dividends and distributions were reinvested. Index figures do not include trading and management costs, which would lower performance. Indices are unmanaged and cannot be invested in directly. Performance results less than one year are not annualized.
The first index listed for the fund is the fund’s primary benchmark, as shown in the prospectus. Additional indices shown are provided for comparative purposes.
For index definitions, please see the Glossary.
| 1 | Fund expenses may have been partially absorbed by CSIM and its affiliates. Without these reductions, the fund’s returns would have been lower. These returns do not reflect the deduction of taxes that a shareholder would pay on fund distributions or the redemption of fund shares. |
| 2 | On July 24, 2017, the Investor Share class and Institutional Share class of the fund were consolidated into a single class of shares of the fund. The performance and financial history of the fund is that of the fund’s former Institutional Shares. Accordingly, the past performance shown is that of the fund’s former Institutional Shares. |
| 3 | Source for category information: Morningstar, Inc. The Morningstar Category return represents all active and index mutual funds within the category as of the report date. |
| 4 | As stated in the prospectus. Includes 0.05% of acquired fund fees and expenses, which are indirect expenses incurred by the fund through its investments in the underlying funds. Net Expense: Expenses reduced by a contractual fee waiver in effect for so long as CSIM serves as the investment adviser to the fund. Gross Expense: Does not reflect the effect of contractual fee waivers. For actual ratios during the period, refer to the financial highlights section of the financial statements. |
Schwab Target Index Funds | Annual Report
Schwab Target 2060 Index Fund
Performance and Fund Factsas of March 31, 2019 (continued)
| Number of Holdings | 8 |
| Portfolio Turnover Rate | 2% |
Asset Class Weightings % of Investments1,2
Top Holdings % of Net Assets3,4
Portfolio holdings may have changed since the report date.
| 1 | The percentage may differ from the Portfolio Holdings because the above calculation is based on a percentage of total investments, whereas the calculation in the Portfolio Holdings is based on a percentage of net assets. |
| 2 | The fund intends to primarily invest in affiliated Schwab ETFs and may also invest in affiliated Schwab and Laudus mutual funds and unaffiliated third party ETFs and mutual funds (all such ETFs and mutual funds referred to as “underlying funds”). |
| 3 | This list is not a recommendation of any security by the investment adviser. |
| 4 | The holdings listed exclude any temporary liquidity investments. |
Schwab Target Index Funds | Annual Report
Schwab Target Index Funds
Examples for a $1,000 Investment
As a fund shareholder, you may incur two types of costs: (1) transaction costs; and (2) ongoing costs, including management fees.
The expense examples below are intended to help you understand your ongoing cost (in dollars) of investing in a fund and to compare this cost with the ongoing cost of investing in other mutual funds. These examples are based on an investment of $1,000 invested for six months beginning October 1, 2018 and held through March 31, 2019.
Actual Return lines in the table below provide information about actual account values and actual expenses. You may use this information, together with the amount you invested, to estimate the expenses that you paid over the period. To do so, simply divide your account value by $1,000 (for example, an $8,600 account value ÷ $1,000 = 8.6), then multiply the result by the number given for your fund under the heading entitled “Expenses Paid During Period.”
Hypothetical Return lines in the table below provide information about hypothetical account values and hypothetical expenses based on a fund’s actual expense ratio and an assumed return of 5% per year before expenses. Because the return used is not an actual return, it may not be used to estimate the actual ending account value or expenses you paid for the period.
You may use this information to compare the ongoing costs of investing in a fund and other funds. To do so, compare this 5% hypothetical example with the 5% hypothetical examples that appear in the shareholder reports of the other funds.
Please note that the expenses shown in the table are meant to highlight your ongoing costs only, and do not reflect any transactional costs. Therefore, the hypothetical return lines of the table are useful in comparing ongoing costs only, and will not help you determine the relative total costs of owning different funds. In addition, if these transactional costs were included, your costs would have been higher.
| | Expense Ratio
(Annualized)1,2 | Effective
Expense Ratio
(Annualized)3,4 | Beginning
Account Value
at 10/1/18 | Ending
Account Value
(Net of Expenses)
at 3/31/192 | Expenses Paid
During Period
10/1/18-3/31/192,5 | Effective
Expenses Paid
During Period
10/1/18-3/31/194,5 |
| Schwab Target 2010 Index Fund | | | | | | |
| Actual Return | 0.03% | 0.08% | $1,000.00 | $1,018.30 | $0.15 | $0.40 |
| Hypothetical 5% Return | 0.03% | 0.08% | $1,000.00 | $1,024.75 | $0.15 | $0.40 |
| Schwab Target 2015 Index Fund | | | | | | |
| Actual Return | 0.03% | 0.08% | $1,000.00 | $1,015.80 | $0.15 | $0.40 |
| Hypothetical 5% Return | 0.03% | 0.08% | $1,000.00 | $1,024.75 | $0.15 | $0.40 |
| Schwab Target 2020 Index Fund | | | | | | |
| Actual Return | 0.03% | 0.08% | $1,000.00 | $1,012.10 | $0.15 | $0.40 |
| Hypothetical 5% Return | 0.03% | 0.08% | $1,000.00 | $1,024.75 | $0.15 | $0.40 |
| Schwab Target 2025 Index Fund | | | | | | |
| Actual Return | 0.03% | 0.08% | $1,000.00 | $1,006.50 | $0.15 | $0.40 |
| Hypothetical 5% Return | 0.03% | 0.08% | $1,000.00 | $1,024.75 | $0.15 | $0.40 |
| Schwab Target 2030 Index Fund | | | | | | |
| Actual Return | 0.03% | 0.08% | $1,000.00 | $1,001.80 | $0.15 | $0.40 |
| Hypothetical 5% Return | 0.03% | 0.08% | $1,000.00 | $1,024.75 | $0.15 | $0.40 |
| Schwab Target 2035 Index Fund | | | | | | |
| Actual Return | 0.03% | 0.08% | $1,000.00 | $996.70 | $0.15 | $0.40 |
| Hypothetical 5% Return | 0.03% | 0.08% | $1,000.00 | $1,024.75 | $0.15 | $0.40 |
| Schwab Target 2040 Index Fund | | | | | | |
| Actual Return | 0.03% | 0.08% | $1,000.00 | $992.30 | $0.15 | $0.40 |
| Hypothetical 5% Return | 0.03% | 0.08% | $1,000.00 | $1,024.75 | $0.15 | $0.40 |
| Schwab Target 2045 Index Fund | | | | | | |
| Actual Return | 0.03% | 0.08% | $1,000.00 | $988.80 | $0.15 | $0.40 |
| Hypothetical 5% Return | 0.03% | 0.08% | $1,000.00 | $1,024.75 | $0.15 | $0.40 |
| Schwab Target 2050 Index Fund | | | | | | |
| Actual Return | 0.03% | 0.08% | $1,000.00 | $987.30 | $0.15 | $0.40 |
| Hypothetical 5% Return | 0.03% | 0.08% | $1,000.00 | $1,024.75 | $0.15 | $0.40 |
| Schwab Target 2055 Index Fund | | | | | | |
| Actual Return | 0.03% | 0.08% | $1,000.00 | $985.30 | $0.15 | $0.40 |
| Hypothetical 5% Return | 0.03% | 0.08% | $1,000.00 | $1,024.75 | $0.15 | $0.40 |
| Schwab Target 2060 Index Fund | | | | | | |
| Actual Return | 0.03% | 0.08% | $1,000.00 | $986.00 | $0.15 | $0.40 |
| Hypothetical 5% Return | 0.03% | 0.08% | $1,000.00 | $1,024.75 | $0.15 | $0.40 |
| 1 | Based on the most recent six-month expense ratio; may differ from the expense ratio provided in the Financial Highlights which covers a 12-month period. |
| 2 | Excludes acquired fund fees and expenses, which are indirect expenses incurred by the fund through its investments in underlying funds. |
| 3 | Based on the most recent six-month acquired fund fees and expense ratio; may differ from the acquired fund fees and expenses ratios in the prospectus. |
| 4 | Includes acquired fund fees and expenses, which are indirect expenses incurred by the fund through its investments in underlying funds. |
| 5 | Expenses for each fund are equal to its annualized expense ratio, multiplied by the average account value over the period, multiplied by the 182 days of the period, and divided by the 365 days of the fiscal year. |
Schwab Target Index Funds | Annual Report
Schwab Target 2010 Index Fund
Financial Statements
Financial Highlights
| | 4/1/18–
3/31/19 | 4/1/17–
3/31/181 | 8/25/162–
3/31/17 | | | |
| Per-Share Data |
| Net asset value at beginning of period | $10.59 | $10.15 | $10.00 | | | |
| Income (loss) from investment operations: | | | | | | |
| Net investment income (loss)3 | 0.27 | 0.22 | 0.12 | | | |
| Net realized and unrealized gains (losses) | 0.23 | 0.34 | 0.10 | | | |
| Total from investment operations | 0.50 | 0.56 | 0.22 | | | |
| Less distributions: | | | | | | |
| Distributions from net investment income | (0.20) | (0.12) | (0.07) | | | |
| Distributions from net realized gains | (0.01) | (0.00)4 | — | | | |
| Total distributions | (0.21) | (0.12) | (0.07) | | | |
| Net asset value at end of period | $10.88 | $10.59 | $10.15 | | | |
| Total return | 4.81% | 5.57% | 2.26%5 | | | |
| Ratios/Supplemental Data |
| Ratios to average net assets: | | | | | | |
| Net operating expenses6 | 0.03% | 0.03% | 0.02%7 | | | |
| Gross operating expenses6 | 0.08% | 0.08% | 0.08%7 | | | |
| Net investment income (loss) | 2.53% | 2.11% | 1.99%7 | | | |
| Portfolio turnover rate | 30% | 28% | 2%5 | | | |
| Net assets, end of period (x 1,000) | $25,391 | $14,185 | $955 | | | |
| |
1
Effective July 24, 2017, the Investor Share class and the Institutional Share class were consolidated into a single class of shares of the fund. The financial history as shown in the financial highlights is that of the former Institutional Shares.
2
Commencement of operations.
3
Calculated based on the average shares outstanding during the period.
4
Per-share amount was less than $0.005.
5
Not annualized.
6
The expenses incurred by the underlying funds in which the fund invests are not included in these ratios. If the expenses incurred by the underlying funds were included in these ratios they would have increased by 0.05%, 0.05% and 0.06% (annualized), respectively, for the periods ended March 31, 2019, March 31, 2018 and March 31, 2017 (see financial note 4).
7
Annualized.
Schwab Target Index Funds | Annual Report
Schwab Target 2010 Index Fund
Portfolio Holdings as of March 31, 2019
This section shows all the securities in the fund’s portfolio and their values as of the report date.
The fund files its complete schedule of portfolio holdings with the U.S. Securities and Exchange Commission (SEC) for the first and third quarters of each fiscal year on Form N-Q. The fund’s Form N-Q is available on the SEC’s website atwww.sec.gov. The fund also makes available its complete schedule of portfolio holdings 15 to 20 days after the end of the month on the fund’s website atwww.schwabfunds.com/schwabfunds_prospectus.
| Security | Number
of Shares | Value ($) |
| Affiliated Underlying Funds99.1% of net assets |
| |
| U.S. Stocks 24.6% |
| Large-Cap 23.2% |
| Schwab U.S. Large-Cap ETF | 87,160 | 5,892,888 |
| Small-Cap 1.4% |
| Schwab U.S. Small-Cap ETF | 5,056 | 353,566 |
| | | 6,246,454 |
| |
| International Stocks 9.7% |
| Developed-Market Large-Cap 9.7% |
| Schwab International Equity ETF | 78,157 | 2,447,096 |
| |
| Real Assets 1.8% |
| Real Estate 1.8% |
| Schwab U.S. REIT ETF | 10,338 | 459,317 |
| |
| Fixed Income 57.0% |
| Inflation-Protected Bond 6.4% |
| Schwab U.S. TIPS ETF | 29,621 | 1,629,155 |
| Intermediate-Term Bond 41.9% |
| Schwab U.S. Aggregate Bond ETF | 204,963 | 10,633,480 |
| Treasury Bond 8.7% |
| Schwab Short-Term U.S. Treasury ETF | 44,105 | 2,213,630 |
| | | 14,476,265 |
| |
| Security | Number
of Shares | Value ($) |
| Money Market Fund 6.0% |
| Schwab Variable Share Price Money Fund, Ultra Shares 2.45%(a) | 1,518,301 | 1,518,757 |
| Total Affiliated Underlying Funds |
| (Cost $24,219,452) | | 25,147,889 |
Issuer
Rate, Maturity Date | Face
Amount ($) | Value ($) |
| Short-Term Investment0.9% of net assets |
| |
| Time Deposit 0.9% |
| Barclays Capital, Inc. |
| 1.78%, 04/01/19(b) | 235,605 | 235,605 |
| Total Short-Term Investment |
| (Cost $235,605) | | 235,605 |
| (a) | The rate shown is the 7-day yield. |
| (b) | The rate shown is the current daily overnight rate. |
| | |
| ETF — | Exchange-traded fund |
| REIT — | Real Estate Investment Trust |
| TIPS — | Treasury Inflation Protected Securities |
Below is a summary of the fund’s transactions with its affiliated underlying funds during the period ended March 31, 2019:
| Affiliated Underlying Funds | Balance
of Shares
Held at
03/31/18 | Gross
Purchases | Gross
Sales | Balance
of Shares
Held at
03/31/19 | Market
Value at
03/31/19 | Net Change
in Unrealized
Appreciation
(depreciation) | Realized
Gains (Losses) | Distributions
Received* |
| Schwab International Equity ETF | 41,250 | 53,450 | (16,543) | 78,157 | $2,447,096 | ($45,897) | ($54,274) | $66,205 |
| Schwab Short-Term U.S. Treasury ETF | 24,566 | 24,022 | (4,483) | 44,105 | 2,213,630 | 21,698 | (2,643) | 31,358 |
| Schwab U.S. Aggregate Bond ETF | 115,205 | 119,475 | (29,717) | 204,963 | 10,633,480 | 301,379 | (53,304) | 216,193 |
| Schwab U.S. Large-Cap ETF | 52,422 | 59,876 | (25,138) | 87,160 | 5,892,888 | 379,489 | (24,552) | 93,516 |
| Schwab U.S. REIT ETF | 6,822 | 5,433 | (1,917) | 10,338 | 459,317 | 53,962 | 375 | 10,667 |
| Schwab U.S. Small-Cap ETF | 2,960 | 3,036 | (940) | 5,056 | 353,566 | 10,388 | (3,849) | 4,025 |
| Schwab U.S. TIPS ETF | 16,444 | 15,614 | (2,437) | 29,621 | 1,629,155 | 23,691 | (4,427) | 27,986 |
| Schwab Variable Share Price Money Fund, Ultra Shares | 820,069 | 2,077,891 | (1,379,659) | 1,518,301 | 1,518,757 | 333 | (42) | 24,494 |
| Total | | | | | $25,147,889 | $745,043 | ($142,716) | $474,444 |
| * | Distributions received include distributions from net investment income and capital gains, if any, from the underlying funds. |
| | |
Schwab Target Index Funds | Annual Report
Schwab Target 2010 Index Fund
Portfolio Holdings as of March 31, 2019 (continued)
The following is a summary of the inputs used to value the fund’s investments as of March 31, 2019 (see financial note 2(a) for additional information):
| Description | Quoted Prices in
Active Markets for
Identical Assets
(Level 1) | Other Significant
Observable Inputs
(Level 2) | Significant
Unobservable Inputs
(Level 3) | Total | |
| Assets | | | | | |
| Affiliated Underlying Funds1 | $25,147,889 | $— | $— | $25,147,889 | |
| Short-Term Investment1 | — | 235,605 | — | 235,605 | |
| Total | $25,147,889 | $235,605 | $— | $25,383,494 | |
| 1 | As categorized in Portfolio Holdings. |
Fund investments in underlying mutual funds and ETFs are classified as Level 1, without consideration to the classification level of the investments held by the underlying mutual funds and ETFs, which could be Level 1, Level 2 or Level 3.
Schwab Target Index Funds | Annual Report
Schwab Target 2010 Index Fund
Statement of Assets and Liabilities
As of March 31, 2019
| Assets |
| Investments in affiliated underlying funds, at value (cost $24,219,452) | | $25,147,889 |
| Investments in unaffiliated issuers, at value (cost $235,605) | | 235,605 |
| Receivables: | | |
| Investments sold | | 60,057 |
| Fund shares sold | | 33,655 |
| Dividends | | 1,730 |
| Interest | + | 34 |
| Total assets | | 25,478,970 |
| Liabilities |
| Payables: | | |
| Investment adviser fees | | 609 |
| Fund shares redeemed | + | 87,851 |
| Total liabilities | | 88,460 |
| Net Assets |
| Total assets | | 25,478,970 |
| Total liabilities | – | 88,460 |
| Net assets | | $25,390,510 |
| Net Assets by Source | | |
| Capital received from investors | | 24,540,379 |
| Total distributable earnings1 | | 850,131 |
| Net Asset Value (NAV) |
| Net Assets | ÷ | Shares
Outstanding | = | NAV |
| $25,390,510 | | 2,332,849 | | $10.88 |
| | | | | |
| 1 | The SEC eliminated the requirement to disclose total distributable earnings (loss) by each of its components as previously disclosed as the previous presentation did not provide insight into the tax implications of distributions (see financial note 8 for additional information). |
Schwab Target Index Funds | Annual Report
Schwab Target 2010 Index Fund
Statement of Operations
For the period April 1, 2018 through March 31, 2019
| Investment Income |
| Dividends received from affiliated underlying funds | | $474,444 |
| Interest | + | 3,130 |
| Total investment income | | 477,574 |
| Expenses |
| Investment adviser and administrator fees | + | 14,939 |
| Total expenses | | 14,939 |
| Expense reduction by CSIM and its affiliates | – | 9,520 |
| Net expenses | – | 5,419 |
| Net investment income | | 472,155 |
| Realized and Unrealized Gains (Losses) |
| Net realized losses on sales of affiliated underlying funds | | (142,716) |
| Net change in unrealized appreciation (depreciation) on affiliated underlying funds | + | 745,043 |
| Net realized and unrealized gains | | 602,327 |
| Increase in net assets resulting from operations | | $1,074,482 |
Schwab Target Index Funds | Annual Report
Schwab Target 2010 Index Fund
Statement of Changes in Net Assets
For the current and prior report periods
| Operations | |
| | 4/1/18-3/31/19 | 4/1/17-3/31/18 |
| Net investment income | | $472,155 | $172,010 |
| Net realized losses | | (142,716) | (8,436) |
| Net change in unrealized appreciation (depreciation) | + | 745,043 | 136,211 |
| Increase in net assets from operations | | 1,074,482 | 299,785 |
| Distributions to Shareholders1,2 | |
| Total distributions | | ($441,923) | ($135,570) |
| Transactions in Fund Shares1 | | | |
| | | 4/1/18-3/31/19 | 4/1/17-3/31/18 |
| | | SHARES | VALUE | SHARES | VALUE |
| Shares Sold | | | | | |
| Investor Shares | | — | $— | 1,772 | $18,525 |
| Institutional Shares | + | 1,576,468 | 16,790,499 | 1,491,874 | 15,732,146 |
| Total shares sold | | 1,576,468 | $16,790,499 | 1,493,646 | $15,750,671 |
| Shares Reinvested | | | | | |
| Investor Shares | | — | $— | — | $— |
| Institutional Shares | + | 41,815 | 426,508 | 12,301 | 131,502 |
| Total shares reinvested | | 41,815 | $426,508 | 12,301 | $131,502 |
| Shares Redeemed | | | | | |
| Investor Shares | | — | $— | (267,381) | ($2,752,301) |
| Institutional Shares | + | (624,853) | (6,643,659) | (258,845) | (2,760,402) |
| Total shares redeemed | | (624,853) | ($6,643,659) | (526,226) | ($5,512,703) |
| Net transactions in fund shares | | 993,430 | $10,573,348 | 979,721 | $10,369,470 |
| Shares Outstanding and Net Assets | | | |
| | | 4/1/18-3/31/19 | 4/1/17-3/31/18 |
| | | SHARES | NET ASSETS | SHARES | NET ASSETS |
| Beginning of period | | 1,339,419 | $14,184,603 | 359,698 | $3,650,918 |
| Total increase | + | 993,430 | 11,205,907 | 979,721 | 10,533,685 |
| End of period3 | | 2,332,849 | $25,390,510 | 1,339,419 | $14,184,603 |
| 1 | Effective July 24, 2017, there were no outstanding Investor Shares and the Investor Share class was consolidated into the Institutional Share class, resulting in a single class of shares of the fund. |
| 2 | For the period ended March 31, 2018, the Institutional Share class of the fund distributed to shareholders $134,173 from net investment income and $1,397 from net realized gains. The SEC eliminated the requirement to disclose distributions to shareholders from net investment income and from net realized gains in 2018 (see financial note 8 for additional information). |
| 3 | End of period - Net assets include net investment income not yet distributed of $51,052 at March 31, 2018. The SEC eliminated the requirement to disclose undistributed net investment income in 2018. |
Schwab Target Index Funds | Annual Report
Schwab Target 2015 Index Fund
Financial Statements
Financial Highlights
| | 4/1/18–
3/31/19 | 4/1/17–
3/31/181 | 8/25/162–
3/31/17 | | | |
| Per-Share Data |
| Net asset value at beginning of period | $10.61 | $10.17 | $10.00 | | | |
| Income (loss) from investment operations: | | | | | | |
| Net investment income (loss)3 | 0.27 | 0.22 | 0.13 | | | |
| Net realized and unrealized gains (losses) | 0.22 | 0.38 | 0.12 | | | |
| Total from investment operations | 0.49 | 0.60 | 0.25 | | | |
| Less distributions: | | | | | | |
| Distributions from net investment income | (0.17) | (0.15) | (0.08) | | | |
| Distributions from net realized gains | (0.01) | (0.01) | — | | | |
| Total distributions | (0.18) | (0.16) | (0.08) | | | |
| Net asset value at end of period | $10.92 | $10.61 | $10.17 | | | |
| Total return | 4.74% | 5.83% | 2.49%4 | | | |
| Ratios/Supplemental Data |
| Ratios to average net assets: | | | | | | |
| Net operating expenses5 | 0.03% | 0.03% | 0.02%6 | | | |
| Gross operating expenses5 | 0.08% | 0.08% | 0.08%6 | | | |
| Net investment income (loss) | 2.54% | 2.06% | 2.15%6 | | | |
| Portfolio turnover rate | 29% | 47% | 15%4 | | | |
| Net assets, end of period (x 1,000) | $45,688 | $20,229 | $797 | | | |
| |
1
Effective July 24, 2017, the Investor Share class and the Institutional Share class were consolidated into a single class of shares of the fund. The financial history as shown in the financial highlights is that of the former Institutional Shares.
2
Commencement of operations.
3
Calculated based on the average shares outstanding during the period.
4
Not annualized.
5
The expenses incurred by the underlying funds in which the fund invests are not included in these ratios. If the expenses incurred by the underlying funds were included in these ratios they would have increased by 0.05%, 0.05% and 0.06% (annualized), respectively, for the periods ended March 31, 2019, March 31, 2018 and March 31, 2017 (see financial note 4).
6
Annualized.
Schwab Target Index Funds | Annual Report
Schwab Target 2015 Index Fund
Portfolio Holdings as of March 31, 2019
This section shows all the securities in the fund’s portfolio and their values as of the report date.
The fund files its complete schedule of portfolio holdings with the U.S. Securities and Exchange Commission (SEC) for the first and third quarters of each fiscal year on Form N-Q. The fund’s Form N-Q is available on the SEC’s website atwww.sec.gov. The fund also makes available its complete schedule of portfolio holdings 15 to 20 days after the end of the month on the fund’s website atwww.schwabfunds.com/schwabfunds_prospectus.
| Security | Number
of Shares | Value ($) |
| Affiliated Underlying Funds99.2% of net assets |
| |
| U.S. Stocks 26.1% |
| Large-Cap 24.5% |
| Schwab U.S. Large-Cap ETF | 165,123 | 11,163,966 |
| Small-Cap 1.6% |
| Schwab U.S. Small-Cap ETF | 10,576 | 739,580 |
| | | 11,903,546 |
| |
| International Stocks 10.6% |
| Developed-Market Large-Cap 10.6% |
| Schwab International Equity ETF | 155,203 | 4,859,406 |
| |
| Real Assets 1.9% |
| Real Estate 1.9% |
| Schwab U.S. REIT ETF | 19,676 | 874,204 |
| |
| Fixed Income 54.7% |
| Inflation-Protected Bond 6.2% |
| Schwab U.S. TIPS ETF | 51,359 | 2,824,745 |
| Intermediate-Term Bond 40.3% |
| Schwab U.S. Aggregate Bond ETF | 354,773 | 18,405,623 |
| Treasury Bond 8.2% |
| Schwab Short-Term U.S. Treasury ETF | 74,728 | 3,750,598 |
| | | 24,980,966 |
| |
| Security | Number
of Shares | Value ($) |
| Money Market Fund 5.9% |
| Schwab Variable Share Price Money Fund, Ultra Shares 2.45%(a) | 2,686,220 | 2,687,026 |
| Total Affiliated Underlying Funds |
| (Cost $43,672,395) | | 45,305,148 |
Issuer
Rate, Maturity Date | Face
Amount ($) | Value ($) |
| Short-Term Investment0.8% of net assets |
| |
| Time Deposit 0.8% |
| Barclays Capital, Inc. |
| 1.78%, 04/01/19(b) | 382,731 | 382,731 |
| Total Short-Term Investment |
| (Cost $382,731) | | 382,731 |
| (a) | The rate shown is the 7-day yield. |
| (b) | The rate shown is the current daily overnight rate. |
| | |
| ETF — | Exchange-traded fund |
| REIT — | Real Estate Investment Trust |
| TIPS — | Treasury Inflation Protected Securities |
Below is a summary of the fund’s transactions with its affiliated underlying funds during the period ended March 31, 2019:
| Affiliated Underlying Funds | Balance
of Shares
Held at
03/31/18 | Gross
Purchases | Gross
Sales | Balance
of Shares
Held at
03/31/19 | Market
Value at
03/31/19 | Net Change
in Unrealized
Appreciation
(depreciation) | Realized
Gains (Losses) | Distributions
Received* |
| Schwab International Equity ETF | 64,837 | 108,642 | (18,276) | 155,203 | $4,859,406 | ($88,395) | ($48,697) | $118,250 |
| Schwab Short-Term U.S. Treasury ETF | 32,941 | 47,550 | (5,763) | 74,728 | 3,750,598 | 35,141 | (3,736) | 46,149 |
| Schwab U.S. Aggregate Bond ETF | 159,635 | 235,732 | (40,594) | 354,773 | 18,405,623 | 528,749 | (68,506) | 324,936 |
| Schwab U.S. Large-Cap ETF | 79,509 | 118,151 | (32,537) | 165,123 | 11,163,966 | 688,339 | (57,229) | 154,729 |
| Schwab U.S. REIT ETF | 10,250 | 10,892 | (1,466) | 19,676 | 874,204 | 96,805 | 379 | 18,160 |
| Schwab U.S. Small-Cap ETF | 4,561 | 7,892 | (1,877) | 10,576 | 739,580 | 20,367 | (3,828) | 7,040 |
| Schwab U.S. TIPS ETF | 22,373 | 32,544 | (3,558) | 51,359 | 2,824,745 | 48,169 | (5,582) | 39,690 |
| Schwab Variable Share Price Money Fund, Ultra Shares | 1,033,458 | 4,752,022 | (3,099,260) | 2,686,220 | 2,687,026 | 197 | 107 | 35,745 |
| Total | | | | | $45,305,148 | $1,329,372 | ($187,092) | $744,699 |
| * | Distributions received include distributions from net investment income and capital gains, if any, from the underlying funds. |
| | |
Schwab Target Index Funds | Annual Report
Schwab Target 2015 Index Fund
Portfolio Holdings as of March 31, 2019 (continued)
The following is a summary of the inputs used to value the fund’s investments as of March 31, 2019 (see financial note 2(a) for additional information):
| Description | Quoted Prices in
Active Markets for
Identical Assets
(Level 1) | Other Significant
Observable Inputs
(Level 2) | Significant
Unobservable Inputs
(Level 3) | Total | |
| Assets | | | | | |
| Affiliated Underlying Funds1 | $45,305,148 | $— | $— | $45,305,148 | |
| Short-Term Investment1 | — | 382,731 | — | 382,731 | |
| Total | $45,305,148 | $382,731 | $— | $45,687,879 | |
| 1 | As categorized in Portfolio Holdings. |
Fund investments in underlying mutual funds and ETFs are classified as Level 1, without consideration to the classification level of the investments held by the underlying mutual funds and ETFs, which could be Level 1, Level 2 or Level 3.
Schwab Target Index Funds | Annual Report
Schwab Target 2015 Index Fund
Statement of Assets and Liabilities
As of March 31, 2019
| Assets |
| Investments in affiliated underlying funds, at value (cost $43,672,395) | | $45,305,148 |
| Investments in unaffiliated issuers, at value (cost $382,731) | | 382,731 |
| Receivables: | | |
| Investments sold | | 87,081 |
| Fund shares sold | | 146,506 |
| Dividends | | 3,061 |
| Interest | + | 57 |
| Total assets | | 45,924,584 |
| Liabilities |
| Payables: | | |
| Investments bought | | 156,298 |
| Investment adviser fees | | 1,060 |
| Fund shares redeemed | + | 79,157 |
| Total liabilities | | 236,515 |
| Net Assets |
| Total assets | | 45,924,584 |
| Total liabilities | – | 236,515 |
| Net assets | | $45,688,069 |
| Net Assets by Source | | |
| Capital received from investors | | 44,171,381 |
| Total distributable earnings1 | | 1,516,688 |
| Net Asset Value (NAV) |
| Net Assets | ÷ | Shares
Outstanding | = | NAV |
| $45,688,069 | | 4,185,803 | | $10.92 |
| | | | | |
| 1 | The SEC eliminated the requirement to disclose total distributable earnings (loss) by each of its components as previously disclosed as the previous presentation did not provide insight into the tax implications of distributions (see financial note 8 for additional information). |
Schwab Target Index Funds | Annual Report
Schwab Target 2015 Index Fund
Statement of Operations
For the period April 1, 2018 through March 31, 2019
| Investment Income |
| Dividends received from affiliated underlying funds | | $744,699 |
| Interest | + | 5,844 |
| Total investment income | | 750,543 |
| Expenses |
| Investment adviser and administrator fees | + | 23,352 |
| Total expenses | | 23,352 |
| Expense reduction by CSIM and its affiliates | – | 14,668 |
| Net expenses | – | 8,684 |
| Net investment income | | 741,859 |
| Realized and Unrealized Gains (Losses) |
| Net realized losses on sales of affiliated underlying funds | | (187,092) |
| Net change in unrealized appreciation (depreciation) on affiliated underlying funds | + | 1,329,372 |
| Net realized and unrealized gains | | 1,142,280 |
| Increase in net assets resulting from operations | | $1,884,139 |
Schwab Target Index Funds | Annual Report
Schwab Target 2015 Index Fund
Statement of Changes in Net Assets
For the current and prior report periods
| Operations | |
| | 4/1/18-3/31/19 | 4/1/17-3/31/18 |
| Net investment income | | $741,859 | $222,034 |
| Net realized losses | | (187,092) | (50,535) |
| Net change in unrealized appreciation (depreciation) | + | 1,329,372 | 210,888 |
| Increase in net assets from operations | | 1,884,139 | 382,387 |
| Distributions to Shareholders1,2 | |
| Total distributions | | ($659,622) | ($188,670) |
| Transactions in Fund Shares1 | | | |
| | | 4/1/18-3/31/19 | 4/1/17-3/31/18 |
| | | SHARES | VALUE | SHARES | VALUE |
| Shares Sold | | | | | |
| Investor Shares | | — | $— | 2,735 | $29,447 |
| Institutional Shares | + | 3,213,105 | 34,246,433 | 2,377,325 | 25,104,047 |
| Total shares sold | | 3,213,105 | $34,246,433 | 2,380,060 | $25,133,494 |
| Shares Reinvested | | | | | |
| Investor Shares | | — | $— | — | $— |
| Institutional Shares | + | 62,181 | 634,864 | 17,169 | 183,880 |
| Total shares reinvested | | 62,181 | $634,864 | 17,169 | $183,880 |
| Shares Redeemed | | | | | |
| Investor Shares | | — | $— | (481,541) | ($4,967,260) |
| Institutional Shares | + | (996,074) | (10,646,987) | (566,228) | (5,983,115) |
| Total shares redeemed | | (996,074) | ($10,646,987) | (1,047,769) | ($10,950,375) |
| Net transactions in fund shares | | 2,279,212 | $24,234,310 | 1,349,460 | $14,366,999 |
| Shares Outstanding and Net Assets | | | |
| | | 4/1/18-3/31/19 | 4/1/17-3/31/18 |
| | | SHARES | NET ASSETS | SHARES | NET ASSETS |
| Beginning of period | | 1,906,591 | $20,229,242 | 557,131 | $5,668,526 |
| Total increase | + | 2,279,212 | 25,458,827 | 1,349,460 | 14,560,716 |
| End of period3 | | 4,185,803 | $45,688,069 | 1,906,591 | $20,229,242 |
| 1 | Effective July 24, 2017, all outstanding Investor Shares (23,628 shares valued at $247,966) were consolidated into the Institutional Shares, resulting in a single class of shares of the fund. |
| 2 | For the period ended March 31, 2018, the Institutional Share class of the fund distributed to shareholders $178,617 from net investment income and $10,053 from net realized gains. The SEC eliminated the requirement to disclose distributions to shareholders from net investment income and from net realized gains in 2018 (see financial note 8 for additional information). |
| 3 | End of period - Net assets includes net investment income not yet distributed of $58,482 at March 31, 2018. The SEC eliminated the requirement to disclose undistributed net investment income in 2018. |
Schwab Target Index Funds | Annual Report
Schwab Target 2020 Index Fund
Financial Statements
Financial Highlights
| | 4/1/18–
3/31/19 | 4/1/17–
3/31/181 | 8/25/162–
3/31/17 | | | |
| Per-Share Data |
| Net asset value at beginning of period | $10.92 | $10.30 | $10.00 | | | |
| Income (loss) from investment operations: | | | | | | |
| Net investment income (loss)3 | 0.27 | 0.23 | 0.16 | | | |
| Net realized and unrealized gains (losses) | 0.22 | 0.52 | 0.21 | | | |
| Total from investment operations | 0.49 | 0.75 | 0.37 | | | |
| Less distributions: | | | | | | |
| Distributions from net investment income | (0.23) | (0.13) | (0.07) | | | |
| Distributions from net realized gains | (0.00)4 | (0.00)4 | — | | | |
| Total distributions | (0.23) | (0.13) | (0.07) | | | |
| Net asset value at end of period | $11.18 | $10.92 | $10.30 | | | |
| Total return | 4.73% | 7.30% | 3.69%5 | | | |
| Ratios/Supplemental Data |
| Ratios to average net assets: | | | | | | |
| Net operating expenses6 | 0.03% | 0.03% | 0.03%7 | | | |
| Gross operating expenses6 | 0.08% | 0.08% | 0.08%7 | | | |
| Net investment income (loss) | 2.48% | 2.15% | 2.68%7 | | | |
| Portfolio turnover rate | 13% | 21% | 17%5 | | | |
| Net assets, end of period (x 1,000) | $129,760 | $70,841 | $5,455 | | | |
| |
1
Effective July 24, 2017, the Investor Share class and the Institutional Share class were consolidated into a single class of shares of the fund. The financial history as shown in the financial highlights is that of the former Institutional Shares.
2
Commencement of operations.
3
Calculated based on the average shares outstanding during the period.
4
Per-share amount was less than $0.005.
5
Not annualized.
6
The expenses incurred by the underlying funds in which the fund invests are not included in these ratios. If the expenses incurred by the underlying funds were included in these ratios they would have increased by 0.05%, 0.05% and 0.05% (annualized), respectively, for the periods ended March 31, 2019, March 31, 2018 and March 31, 2017 (see financial note 4).
7
Annualized.
Schwab Target Index Funds | Annual Report
Schwab Target 2020 Index Fund
Portfolio Holdings as of March 31, 2019
This section shows all the securities in the fund’s portfolio and their values as of the report date.
The fund files its complete schedule of portfolio holdings with the U.S. Securities and Exchange Commission (SEC) for the first and third quarters of each fiscal year on Form N-Q. The fund’s Form N-Q is available on the SEC’s website atwww.sec.gov. The fund also makes available its complete schedule of portfolio holdings 15 to 20 days after the end of the month on the fund’s website atwww.schwabfunds.com/schwabfunds_prospectus.
| Security | Number
of Shares | Value ($) |
| Affiliated Underlying Funds98.7% of net assets |
| |
| U.S. Stocks 28.2% |
| Large-Cap 26.4% |
| Schwab U.S. Large-Cap ETF | 506,093 | 34,216,948 |
| Small-Cap 1.8% |
| Schwab U.S. Small-Cap ETF | 33,772 | 2,361,676 |
| | | 36,578,624 |
| |
| International Stocks 12.8% |
| Developed-Market Large-Cap 11.8% |
| Schwab International Equity ETF | 488,171 | 15,284,634 |
| Emerging-Market 1.0% |
| Schwab Emerging Markets Equity ETF | 53,622 | 1,394,708 |
| | | 16,679,342 |
| |
| Real Assets 2.2% |
| Real Estate 2.2% |
| Schwab U.S. REIT ETF | 63,795 | 2,834,412 |
| |
| Fixed Income 50.6% |
| Inflation-Protected Bond 5.0% |
| Schwab U.S. TIPS ETF | 118,682 | 6,527,510 |
| Intermediate-Term Bond 38.7% |
| Schwab U.S. Aggregate Bond ETF | 967,938 | 50,216,623 |
| Treasury Bond 6.9% |
| Schwab Short-Term U.S. Treasury ETF | 177,503 | 8,908,876 |
| | | 65,653,009 |
| |
| Security | Number
of Shares | Value ($) |
| Money Market Fund 4.9% |
| Schwab Variable Share Price Money Fund, Ultra Shares 2.45%(a) | 6,352,491 | 6,354,397 |
| Total Affiliated Underlying Funds |
| (Cost $124,187,072) | | 128,099,784 |
Issuer
Rate, Maturity Date | Face
Amount ($) | Value ($) |
| Short-Term Investments1.9% of net assets |
| |
| Time Deposits 1.9% |
| Barclays Capital, Inc. |
| 1.78%, 04/01/19(b) | 981,046 | 981,046 |
| BNP Paribas |
| 1.78%, 04/01/19(b) | 1,284,894 | 1,284,894 |
| Sumitomo Mitsui Banking Corp. |
| 1.78%, 04/01/19(b) | 122,960 | 122,960 |
| Total Short-Term Investments |
| (Cost $2,388,900) | | 2,388,900 |
| (a) | The rate shown is the 7-day yield. |
| (b) | The rate shown is the current daily overnight rate. |
| | |
| ETF — | Exchange-traded fund |
| REIT — | Real Estate Investment Trust |
| TIPS — | Treasury Inflation Protected Securities |
Below is a summary of the fund’s transactions with its affiliated underlying funds during the period ended March 31, 2019:
| Affiliated Underlying Funds | Balance
of Shares
Held at
03/31/18 | Gross
Purchases | Gross
Sales | Balance
of Shares
Held at
03/31/19 | Market
Value at
03/31/19 | Net Change
in Unrealized
Appreciation
(depreciation) | Realized
Gains (Losses) | Distributions
Received* |
| Schwab Emerging Markets Equity ETF | 29,508 | 26,739 | (2,625) | 53,622 | $1,394,708 | ($62,211) | ($11,262) | $31,857 |
| Schwab International Equity ETF | 264,485 | 277,194 | (53,508) | 488,171 | 15,284,634 | (690,178) | (158,952) | 381,663 |
| Schwab Short-Term U.S. Treasury ETF | 86,024 | 95,896 | (4,417) | 177,503 | 8,908,876 | 67,218 | (2,729) | 117,595 |
| Schwab U.S. Aggregate Bond ETF | 527,041 | 502,239 | (61,342) | 967,938 | 50,216,623 | 1,122,044 | (110,826) | 1,025,626 |
| Schwab U.S. Large-Cap ETF | 313,673 | 265,280 | (72,860) | 506,093 | 34,216,948 | 2,095,835 | (193,896) | 563,664 |
| Schwab U.S. REIT ETF | 43,224 | 23,033 | (2,462) | 63,795 | 2,834,412 | 332,632 | 3,859 | 69,454 |
| Schwab U.S. Small-Cap ETF | 20,125 | 14,816 | (1,169) | 33,772 | 2,361,676 | 12,966 | 2,518 | 26,768 |
| Schwab U.S. TIPS ETF | 54,639 | 64,044 | (1) | 118,682 | 6,527,510 | 63,581 | (2) | 96,200 |
| Schwab Variable Share Price Money Fund, Ultra Shares | 3,106,284 | 5,745,457 | (2,499,250) | 6,352,491 | 6,354,397 | 725 | 120 | 102,307 |
| Total | | | | | $128,099,784 | $2,942,612 | ($471,170) | $2,415,134 |
| * | Distributions received include distributions from net investment income and capital gains, if any, from the underlying funds. |
| | |
Schwab Target Index Funds | Annual Report
Schwab Target 2020 Index Fund
Portfolio Holdings as of March 31, 2019 (continued)
The following is a summary of the inputs used to value the fund’s investments as of March 31, 2019 (see financial note 2(a) for additional information):
| Description | Quoted Prices in
Active Markets for
Identical Assets
(Level 1) | Other Significant
Observable Inputs
(Level 2) | Significant
Unobservable Inputs
(Level 3) | Total | |
| Assets | | | | | |
| Affiliated Underlying Funds1 | $128,099,784 | $— | $— | $128,099,784 | |
| Short-Term Investments1 | — | 2,388,900 | — | 2,388,900 | |
| Total | $128,099,784 | $2,388,900 | $— | $130,488,684 | |
| 1 | As categorized in Portfolio Holdings. |
Fund investments in underlying mutual funds and ETFs are classified as Level 1, without consideration to the classification level of the investments held by the underlying mutual funds and ETFs, which could be Level 1, Level 2 or Level 3.
Schwab Target Index Funds | Annual Report
Schwab Target 2020 Index Fund
Statement of Assets and Liabilities
As of March 31, 2019
| Assets |
| Investments in affiliated underlying funds, at value (cost $124,187,072) | | $128,099,784 |
| Investments in unaffiliated issuers, at value (cost $2,388,900) | | 2,388,900 |
| Receivables: | | |
| Investments sold | | 396,325 |
| Fund shares sold | | 139,045 |
| Dividends | | 7,239 |
| Interest | + | 350 |
| Total assets | | 131,031,643 |
| Liabilities |
| Payables: | | |
| Investments bought | | 1,264,693 |
| Investment adviser fees | | 3,153 |
| Fund shares redeemed | + | 3,918 |
| Total liabilities | | 1,271,764 |
| Net Assets |
| Total assets | | 131,031,643 |
| Total liabilities | – | 1,271,764 |
| Net assets | | $129,759,879 |
| Net Assets by Source | | |
| Capital received from investors | | 126,016,902 |
| Total distributable earnings1 | | 3,742,977 |
| Net Asset Value (NAV) |
| Net Assets | ÷ | Shares
Outstanding | = | NAV |
| $129,759,879 | | 11,603,658 | | $11.18 |
| | | | | |
| 1 | The SEC eliminated the requirement to disclose total distributable earnings (loss) by each of its components as previously disclosed as the previous presentation did not provide insight into the tax implications of distributions (see financial note 8 for additional information). |
Schwab Target Index Funds | Annual Report
Schwab Target 2020 Index Fund
Statement of Operations
For the period April 1, 2018 through March 31, 2019
| Investment Income |
| Dividends received from affiliated underlying funds | | $2,415,134 |
| Interest | + | 15,449 |
| Total investment income | | 2,430,583 |
| Expenses |
| Investment adviser and administrator fees | + | 77,477 |
| Total expenses | | 77,477 |
| Expense reduction by CSIM and its affiliates | – | 48,396 |
| Net expenses | – | 29,081 |
| Net investment income | | 2,401,502 |
| Realized and Unrealized Gains (Losses) |
| Net realized losses on sales of affiliated underlying funds | | (471,170) |
| Net change in unrealized appreciation (depreciation) on affiliated underlying funds | + | 2,942,612 |
| Net realized and unrealized gains | | 2,471,442 |
| Increase in net assets resulting from operations | | $4,872,944 |
Schwab Target Index Funds | Annual Report
Schwab Target 2020 Index Fund
Statement of Changes in Net Assets
For the current and prior report periods
| Operations | |
| | 4/1/18-3/31/19 | 4/1/17-3/31/18 |
| Net investment income | | $2,401,502 | $773,484 |
| Net realized losses | | (471,170) | (18,038) |
| Net change in unrealized appreciation (depreciation) | + | 2,942,612 | 760,903 |
| Increase in net assets from operations | | 4,872,944 | 1,516,349 |
| Distributions to Shareholders1,2 | |
| Total distributions | | ($2,276,055) | ($593,229) |
| Transactions in Fund Shares1 | | | |
| | | 4/1/18-3/31/19 | 4/1/17-3/31/18 |
| | | SHARES | VALUE | SHARES | VALUE |
| Shares Sold | | | | | |
| Investor Shares | | — | $— | 57,291 | $591,174 |
| Institutional Shares | + | 7,424,366 | 81,835,438 | 7,178,794 | 77,999,442 |
| Total shares sold | | 7,424,366 | $81,835,438 | 7,236,085 | $78,590,616 |
| Shares Reinvested | | | | | |
| Investor Shares | | — | $— | — | $— |
| Institutional Shares | + | 208,381 | 2,165,079 | 52,267 | 575,987 |
| Total shares reinvested | | 208,381 | $2,165,079 | 52,267 | $575,987 |
| Shares Redeemed | | | | | |
| Investor Shares | | — | $— | (839,148) | ($8,769,109) |
| Institutional Shares | + | (2,514,304) | (27,678,930) | (1,275,631) | (13,980,383) |
| Total shares redeemed | | (2,514,304) | ($27,678,930) | (2,114,779) | ($22,749,492) |
| Net transactions in fund shares | | 5,118,443 | $56,321,587 | 5,173,573 | $56,417,111 |
| Shares Outstanding and Net Assets | | | |
| | | 4/1/18-3/31/19 | 4/1/17-3/31/18 |
| | | SHARES | NET ASSETS | SHARES | NET ASSETS |
| Beginning of period | | 6,485,215 | $70,841,403 | 1,311,642 | $13,501,172 |
| Total increase | + | 5,118,443 | 58,918,476 | 5,173,573 | 57,340,231 |
| End of period3 | | 11,603,658 | $129,759,879 | 6,485,215 | $70,841,403 |
| 1 | Effective July 24, 2017, all outstanding Investor Shares (20,500 shares valued at $218,839) were consolidated into the Institutional Shares, resulting in a single class of shares of the fund. |
| 2 | For the period ended March 31, 2018, the Institutional Share class of the fund distributed to shareholders $590,557 from net investment income and $2,672 from net realized gains. The SEC eliminated the requirement to disclose distributions to shareholders from net investment income and from net realized gains in 2018 (see financial note 8 for additional information). |
| 3 | End of period - Net assets includes net investment income not yet distributed of $275,138 at March 31, 2018. The SEC eliminated the requirement to disclose undistributed net investment income in 2018. |
Schwab Target Index Funds | Annual Report
Schwab Target 2025 Index Fund
Financial Statements
Financial Highlights
| | 4/1/18–
3/31/19 | 4/1/17–
3/31/181 | 8/25/162–
3/31/17 | | | |
| Per-Share Data |
| Net asset value at beginning of period | $11.18 | $10.40 | $10.00 | | | |
| Income (loss) from investment operations: | | | | | | |
| Net investment income (loss)3 | 0.28 | 0.25 | 0.14 | | | |
| Net realized and unrealized gains (losses) | 0.23 | 0.68 | 0.34 | | | |
| Total from investment operations | 0.51 | 0.93 | 0.48 | | | |
| Less distributions: | | | | | | |
| Distributions from net investment income | (0.23) | (0.15) | (0.08) | | | |
| Distributions from net realized gains | (0.00)4 | (0.00)4 | — | | | |
| Total distributions | (0.23) | (0.15) | (0.08) | | | |
| Net asset value at end of period | $11.46 | $11.18 | $10.40 | | | |
| Total return | 4.79% | 8.93% | 4.82%5 | | | |
| Ratios/Supplemental Data |
| Ratios to average net assets: | | | | | | |
| Net operating expenses6 | 0.03% | 0.04% | 0.03%7 | | | |
| Gross operating expenses6 | 0.08% | 0.08% | 0.08%7 | | | |
| Net investment income (loss) | 2.46% | 2.22% | 2.41%7 | | | |
| Portfolio turnover rate | 13% | 14% | 6%5 | | | |
| Net assets, end of period (x 1,000) | $154,328 | $84,235 | $1,649 | | | |
| |
1
Effective July 24, 2017, the Investor Share class and the Institutional Share class were consolidated into a single class of shares of the fund. The financial history as shown in the financial highlights is that of the former Institutional Shares.
2
Commencement of operations.
3
Calculated based on the average shares outstanding during the period.
4
Per-share amount was less than $0.005.
5
Not annualized.
6
The expenses incurred by the underlying funds in which the fund invests are not included in these ratios. If the expenses incurred by the underlying funds were included in these ratios they would have increased by 0.05%, 0.04% and 0.05% (annualized), respectively, for the periods ended March 31, 2019, March 31, 2018 and March 31, 2017 (see financial note 4).
7
Annualized.
Schwab Target Index Funds | Annual Report
Schwab Target 2025 Index Fund
Portfolio Holdings as of March 31, 2019
This section shows all the securities in the fund’s portfolio and their values as of the report date.
The fund files its complete schedule of portfolio holdings with the U.S. Securities and Exchange Commission (SEC) for the first and third quarters of each fiscal year on Form N-Q. The fund’s Form N-Q is available on the SEC’s website atwww.sec.gov. The fund also makes available its complete schedule of portfolio holdings 15 to 20 days after the end of the month on the fund’s website atwww.schwabfunds.com/schwabfunds_prospectus.
| Security | Number
of Shares | Value ($) |
| Affiliated Underlying Funds99.0% of net assets |
| |
| U.S. Stocks 36.1% |
| Large-Cap 33.5% |
| Schwab U.S. Large-Cap ETF | 764,598 | 51,694,471 |
| Small-Cap 2.6% |
| Schwab U.S. Small-Cap ETF | 58,085 | 4,061,884 |
| | | 55,756,355 |
| |
| International Stocks 17.5% |
| Developed-Market Large-Cap 15.3% |
| Schwab International Equity ETF | 755,989 | 23,670,016 |
| Emerging-Market 2.2% |
| Schwab Emerging Markets Equity ETF | 128,748 | 3,348,735 |
| | | 27,018,751 |
| |
| Real Assets 2.9% |
| Real Estate 2.9% |
| Schwab U.S. REIT ETF | 100,260 | 4,454,552 |
| |
| Fixed Income 38.9% |
| Inflation-Protected Bond 1.9% |
| Schwab U.S. TIPS ETF | 52,135 | 2,867,425 |
| Intermediate-Term Bond 33.3% |
| Schwab U.S. Aggregate Bond ETF | 991,668 | 51,447,736 |
| Security | Number
of Shares | Value ($) |
| Treasury Bond 3.7% |
| Schwab Short-Term U.S. Treasury ETF | 113,798 | 5,711,521 |
| | | 60,026,682 |
| |
| Money Market Fund 3.6% |
| Schwab Variable Share Price Money Fund, Ultra Shares 2.45%(a) | 5,466,322 | 5,467,962 |
| Total Affiliated Underlying Funds |
| (Cost $147,080,637) | | 152,724,302 |
Issuer
Rate, Maturity Date | Face
Amount ($) | Value ($) |
| Short-Term Investment0.8% of net assets |
| |
| Time Deposit 0.8% |
| Barclays Capital, Inc. |
| 1.78%, 04/01/19(b) | 1,270,675 | 1,270,675 |
| Total Short-Term Investment |
| (Cost $1,270,675) | | 1,270,675 |
| (a) | The rate shown is the 7-day yield. |
| (b) | The rate shown is the current daily overnight rate. |
| | |
| ETF — | Exchange-traded fund |
| REIT — | Real Estate Investment Trust |
| TIPS — | Treasury Inflation Protected Securities |
Below is a summary of the fund’s transactions with its affiliated underlying funds during the period ended March 31, 2019:
| Affiliated Underlying Funds | Balance
of Shares
Held at
03/31/18 | Gross
Purchases | Gross
Sales | Balance
of Shares
Held at
03/31/19 | Market
Value at
03/31/19 | Net Change
in Unrealized
Appreciation
(depreciation) | Realized
Gains (Losses) | Distributions
Received* |
| Schwab Emerging Markets Equity ETF | 68,852 | 70,892 | (10,996) | 128,748 | $3,348,735 | ($137,304) | ($47,687) | $76,351 |
| Schwab International Equity ETF | 400,683 | 408,621 | (53,315) | 755,989 | 23,670,016 | (1,113,688) | (145,103) | 581,206 |
| Schwab Short-Term U.S. Treasury ETF | 55,539 | 63,677 | (5,418) | 113,798 | 5,711,521 | 47,831 | (3,699) | 76,253 |
| Schwab U.S. Aggregate Bond ETF | 532,374 | 536,918 | (77,624) | 991,668 | 51,447,736 | 1,213,136 | (159,298) | 1,045,951 |
| Schwab U.S. Large-Cap ETF | 462,658 | 374,566 | (72,626) | 764,598 | 51,694,471 | 2,978,485 | (187,101) | 835,847 |
| Schwab U.S. REIT ETF | 65,882 | 43,339 | (8,961) | 100,260 | 4,454,552 | 533,767 | 5,807 | 104,364 |
| Schwab U.S. Small-Cap ETF | 34,018 | 24,067 | — | 58,085 | 4,061,884 | 10,159 | — | 45,551 |
| Schwab U.S. TIPS ETF | 21,465 | 30,671 | (1) | 52,135 | 2,867,425 | 31,944 | (3) | 39,471 |
| Schwab Variable Share Price Money Fund, Ultra Shares | 2,549,930 | 6,915,422 | (3,999,030) | 5,466,322 | 5,467,962 | 852 | (245) | 81,686 |
| Total | | | | | $152,724,302 | $3,565,182 | ($537,329) | $2,886,680 |
| * | Distributions received include distributions from net investment income and capital gains, if any, from the underlying funds. |
| | |
Schwab Target Index Funds | Annual Report
Schwab Target 2025 Index Fund
Portfolio Holdings as of March 31, 2019 (continued)
The following is a summary of the inputs used to value the fund’s investments as of March 31, 2019 (see financial note 2(a) for additional information):
| Description | Quoted Prices in
Active Markets for
Identical Assets
(Level 1) | Other Significant
Observable Inputs
(Level 2) | Significant
Unobservable Inputs
(Level 3) | Total | |
| Assets | | | | | |
| Affiliated Underlying Funds1 | $152,724,302 | $— | $— | $152,724,302 | |
| Short-Term Investment1 | — | 1,270,675 | — | 1,270,675 | |
| Total | $152,724,302 | $1,270,675 | $— | $153,994,977 | |
| 1 | As categorized in Portfolio Holdings. |
Fund investments in underlying mutual funds and ETFs are classified as Level 1, without consideration to the classification level of the investments held by the underlying mutual funds and ETFs, which could be Level 1, Level 2 or Level 3.
Schwab Target Index Funds | Annual Report
Schwab Target 2025 Index Fund
Statement of Assets and Liabilities
As of March 31, 2019
| Assets |
| Investments in affiliated underlying funds, at value (cost $147,080,637) | | $152,724,302 |
| Investments in unaffiliated issuers, at value (cost $1,270,675) | | 1,270,675 |
| Receivables: | | |
| Fund shares sold | | 813,760 |
| Dividends | | 6,229 |
| Interest | + | 186 |
| Total assets | | 154,815,152 |
| Liabilities |
| Payables: | | |
| Investments bought | | 480,251 |
| Investment adviser fees | | 4,022 |
| Fund shares redeemed | + | 3,254 |
| Total liabilities | | 487,527 |
| Net Assets |
| Total assets | | 154,815,152 |
| Total liabilities | – | 487,527 |
| Net assets | | $154,327,625 |
| Net Assets by Source | | |
| Capital received from investors | | 148,792,115 |
| Total distributable earnings1 | | 5,535,510 |
| Net Asset Value (NAV) |
| Net Assets | ÷ | Shares
Outstanding | = | NAV |
| $154,327,625 | | 13,465,929 | | $11.46 |
| | | | | |
| 1 | The SEC eliminated the requirement to disclose total distributable earnings (loss) by each of its components as previously disclosed as the previous presentation did not provide insight into the tax implications of distributions (see financial note 8 for additional information). |
Schwab Target Index Funds | Annual Report
Schwab Target 2025 Index Fund
Statement of Operations
For the period April 1, 2018 through March 31, 2019
| Investment Income |
| Dividends received from affiliated underlying funds | | $2,886,680 |
| Interest | + | 18,577 |
| Total investment income | | 2,905,257 |
| Expenses |
| Investment adviser and administrator fees | + | 93,188 |
| Total expenses | | 93,188 |
| Expense reduction by CSIM and its affiliates | – | 55,929 |
| Net expenses | – | 37,259 |
| Net investment income | | 2,867,998 |
| Realized and Unrealized Gains (Losses) |
| Net realized losses on sales of affiliated underlying funds | | (537,329) |
| Net change in unrealized appreciation (depreciation) on affiliated underlying funds | + | 3,565,182 |
| Net realized and unrealized gains | | 3,027,853 |
| Increase in net assets resulting from operations | | $5,895,851 |
Schwab Target Index Funds | Annual Report
Schwab Target 2025 Index Fund
Statement of Changes in Net Assets
For the current and prior report periods
| Operations | |
| | 4/1/18-3/31/19 | 4/1/17-3/31/18 |
| Net investment income | | $2,867,998 | $1,025,684 |
| Net realized losses | | (537,329) | (18,655) |
| Net change in unrealized appreciation (depreciation) | + | 3,565,182 | 1,604,188 |
| Increase in net assets from operations | | 5,895,851 | 2,611,217 |
| Distributions to Shareholders1,2 | |
| Total distributions | | ($2,681,038) | ($805,306) |
| Transactions in Fund Shares1 | | | |
| | | 4/1/18-3/31/19 | 4/1/17-3/31/18 |
| | | SHARES | VALUE | SHARES | VALUE |
| Shares Sold | | | | | |
| Investor Shares | | — | $— | 109,399 | $1,139,955 |
| Institutional Shares | + | 8,934,324 | 100,921,266 | 8,791,335 | 96,907,954 |
| Total shares sold | | 8,934,324 | $100,921,266 | 8,900,734 | $98,047,909 |
| Shares Reinvested | | | | | |
| Investor Shares | | — | $— | — | $— |
| Institutional Shares | + | 247,528 | 2,601,517 | 69,443 | 784,018 |
| Total shares reinvested | | 247,528 | $2,601,517 | 69,443 | $784,018 |
| Shares Redeemed | | | | | |
| Investor Shares | | — | $— | (1,763,810) | ($18,662,584) |
| Institutional Shares | + | (3,247,879) | (36,644,542) | (1,487,331) | (16,597,009) |
| Total shares redeemed | | (3,247,879) | ($36,644,542) | (3,251,141) | ($35,259,593) |
| Net transactions in fund shares | | 5,933,973 | $66,878,241 | 5,719,036 | $63,572,334 |
| Shares Outstanding and Net Assets | | | |
| | | 4/1/18-3/31/19 | 4/1/17-3/31/18 |
| | | SHARES | NET ASSETS | SHARES | NET ASSETS |
| Beginning of period | | 7,531,956 | $84,234,571 | 1,812,920 | $18,856,326 |
| Total increase | + | 5,933,973 | 70,093,054 | 5,719,036 | 65,378,245 |
| End of period3 | | 13,465,929 | $154,327,625 | 7,531,956 | $84,234,571 |
| 1 | Effective July 24, 2017, all outstanding Investor Shares (20,628 shares valued at $223,890) were consolidated into the Institutional Shares, resulting in a single class of shares of the fund. |
| 2 | For the period ended March 31, 2018, the Institutional Share class of the fund distributed to shareholders $803,159 from net investment income and $2,147 from net realized gains. The SEC eliminated the requirement to disclose distributions to shareholders from net investment income and from net realized gains in 2018 (see financial note 8 for additional information). |
| 3 | End of period - Net assets includes net investment income not yet distributed of $322,596 at March 31, 2018. The SEC eliminated the requirement to disclose undistributed net investment income in 2018. |
Schwab Target Index Funds | Annual Report
Schwab Target 2030 Index Fund
Financial Statements
Financial Highlights
| | 4/1/18–
3/31/19 | 4/1/17–
3/31/181 | 8/25/162–
3/31/17 | | | |
| Per-Share Data |
| Net asset value at beginning of period | $11.37 | $10.46 | $10.00 | | | |
| Income (loss) from investment operations: | | | | | | |
| Net investment income (loss)3 | 0.28 | 0.26 | 0.15 | | | |
| Net realized and unrealized gains (losses) | 0.24 | 0.80 | 0.41 | | | |
| Total from investment operations | 0.52 | 1.06 | 0.56 | | | |
| Less distributions: | | | | | | |
| Distributions from net investment income | (0.24) | (0.15) | (0.10) | | | |
| Distributions from net realized gains | — | (0.00)4 | — | | | |
| Total distributions | (0.24) | (0.15) | (0.10) | | | |
| Net asset value at end of period | $11.65 | $11.37 | $10.46 | | | |
| Total return | 4.76% | 10.12% | 5.66%5 | | | |
| Ratios/Supplemental Data |
| Ratios to average net assets: | | | | | | |
| Net operating expenses6 | 0.03% | 0.04% | 0.03%7 | | | |
| Gross operating expenses6 | 0.08% | 0.08% | 0.08%7 | | | |
| Net investment income (loss) | 2.46% | 2.30% | 2.49%7 | | | |
| Portfolio turnover rate | 8% | 8% | 7%5 | | | |
| Net assets, end of period (x 1,000) | $201,250 | $109,554 | $3,258 | | | |
| |
1
Effective July 24, 2017, the Investor Share class and the Institutional Share class were consolidated into a single class of shares of the fund. The financial history as shown in the financial highlights is that of the former Institutional Shares.
2
Commencement of operations.
3
Calculated based on the average shares outstanding during the period.
4
Per-share amount was less than $0.005.
5
Not annualized.
6
The expenses incurred by the underlying funds in which the fund invests are not included in these ratios. If the expenses incurred by the underlying funds were included in these ratios they would have increased by 0.05%, 0.04% and 0.05% (annualized), respectively, for the periods ended March 31, 2019, March 31, 2018 and March 31, 2017 (see financial note 4).
7
Annualized.
Schwab Target Index Funds | Annual Report
Schwab Target 2030 Index Fund
Portfolio Holdings as of March 31, 2019
This section shows all the securities in the fund’s portfolio and their values as of the report date.
The fund files its complete schedule of portfolio holdings with the U.S. Securities and Exchange Commission (SEC) for the first and third quarters of each fiscal year on Form N-Q. The fund’s Form N-Q is available on the SEC’s website atwww.sec.gov. The fund also makes available its complete schedule of portfolio holdings 15 to 20 days after the end of the month on the fund’s website atwww.schwabfunds.com/schwabfunds_prospectus.
| Security | Number
of Shares | Value ($) |
| Affiliated Underlying Funds99.1% of net assets |
| |
| U.S. Stocks 42.0% |
| Large-Cap 38.6% |
| Schwab U.S. Large-Cap ETF | 1,148,705 | 77,663,945 |
| Small-Cap 3.4% |
| Schwab U.S. Small-Cap ETF | 97,927 | 6,848,035 |
| | | 84,511,980 |
| |
| International Stocks 21.3% |
| Developed-Market Large-Cap 18.1% |
| Schwab International Equity ETF | 1,158,809 | 36,282,310 |
| Emerging-Market 3.2% |
| Schwab Emerging Markets Equity ETF | 248,911 | 6,474,175 |
| | | 42,756,485 |
| |
| Real Assets 3.3% |
| Real Estate 3.3% |
| Schwab U.S. REIT ETF | 151,528 | 6,732,389 |
| |
| Fixed Income 30.1% |
| Intermediate-Term Bond 28.0% |
| Schwab U.S. Aggregate Bond ETF | 1,083,718 | 56,223,290 |
| Treasury Bond 2.1% |
| Schwab Short-Term U.S. Treasury ETF | 84,941 | 4,263,189 |
| | | 60,486,479 |
| |
| Security | Number
of Shares | Value ($) |
| Money Market Fund 2.4% |
| Schwab Variable Share Price Money Fund, Ultra Shares 2.45%(a) | 4,913,313 | 4,914,787 |
| Total Affiliated Underlying Funds |
| (Cost $192,495,634) | | 199,402,120 |
Issuer
Rate, Maturity Date | Face
Amount ($) | Value ($) |
| Short-Term Investment0.8% of net assets |
| |
| Time Deposit 0.8% |
| Barclays Capital, Inc. |
| 1.78%, 04/01/19(b) | 1,634,140 | 1,634,140 |
| Total Short-Term Investment |
| (Cost $1,634,140) | | 1,634,140 |
| (a) | The rate shown is the 7-day yield. |
| (b) | The rate shown is the current daily overnight rate. |
| | |
| ETF — | Exchange-traded fund |
| REIT — | Real Estate Investment Trust |
Below is a summary of the fund’s transactions with its affiliated underlying funds during the period ended March 31, 2019:
| Affiliated Underlying Funds | Balance
of Shares
Held at
03/31/18 | Gross
Purchases | Gross
Sales | Balance
of Shares
Held at
03/31/19 | Market
Value at
03/31/19 | Net Change
in Unrealized
Appreciation
(depreciation) | Realized
Gains (Losses) | Distributions
Received* |
| Schwab Emerging Markets Equity ETF | 130,246 | 118,665 | — | 248,911 | $6,474,175 | ($330,034) | $— | $139,098 |
| Schwab International Equity ETF | 604,015 | 588,539 | (33,745) | 1,158,809 | 36,282,310 | (1,622,611) | (147,257) | 849,954 |
| Schwab Short-Term U.S. Treasury ETF | 41,080 | 43,861 | — | 84,941 | 4,263,189 | 30,444 | — | 55,696 |
| Schwab U.S. Aggregate Bond ETF | 564,261 | 569,224 | (49,767) | 1,083,718 | 56,223,290 | 1,222,027 | (106,958) | 1,107,552 |
| Schwab U.S. Large-Cap ETF | 682,954 | 542,567 | (76,816) | 1,148,705 | 77,663,945 | 4,645,979 | (336,877) | 1,217,271 |
| Schwab U.S. REIT ETF | 99,945 | 63,397 | (11,814) | 151,528 | 6,732,389 | 809,604 | 6,128 | 154,480 |
| Schwab U.S. Small-Cap ETF | 56,564 | 43,847 | (2,484) | 97,927 | 6,848,035 | 65,798 | (17,502) | 73,230 |
| Schwab Variable Share Price Money Fund, Ultra Shares | 2,142,501 | 5,870,192 | (3,099,380) | 4,913,313 | 4,914,787 | 708 | (123) | 75,648 |
| Total | | | | | $199,402,120 | $4,821,915 | ($602,589) | $3,672,929 |
| * | Distributions received include distributions from net investment income and capital gains, if any, from the underlying funds. |
| | |
Schwab Target Index Funds | Annual Report
Schwab Target 2030 Index Fund
Portfolio Holdings as of March 31, 2019 (continued)
The following is a summary of the inputs used to value the fund’s investments as of March 31, 2019 (see financial note 2(a) for additional information):
| Description | Quoted Prices in
Active Markets for
Identical Assets
(Level 1) | Other Significant
Observable Inputs
(Level 2) | Significant
Unobservable Inputs
(Level 3) | Total | |
| Assets | | | | | |
| Affiliated Underlying Funds1 | $199,402,120 | $— | $— | $199,402,120 | |
| Short-Term Investment1 | — | 1,634,140 | — | 1,634,140 | |
| Total | $199,402,120 | $1,634,140 | $— | $201,036,260 | |
| 1 | As categorized in Portfolio Holdings. |
Fund investments in underlying mutual funds and ETFs are classified as Level 1, without consideration to the classification level of the investments held by the underlying mutual funds and ETFs, which could be Level 1, Level 2 or Level 3.
Schwab Target Index Funds | Annual Report
Schwab Target 2030 Index Fund
Statement of Assets and Liabilities
As of March 31, 2019
| Assets |
| Investments in affiliated underlying funds, at value (cost $192,495,634) | | $199,402,120 |
| Investments in unaffiliated issuers, at value (cost $1,634,140) | | 1,634,140 |
| Receivables: | | |
| Fund shares sold | | 321,177 |
| Dividends | | 5,599 |
| Interest | + | 240 |
| Total assets | | 201,363,276 |
| Liabilities |
| Payables: | | |
| Investment adviser fees | | 5,408 |
| Fund shares redeemed | + | 107,536 |
| Total liabilities | | 112,944 |
| Net Assets |
| Total assets | | 201,363,276 |
| Total liabilities | – | 112,944 |
| Net assets | | $201,250,332 |
| Net Assets by Source | | |
| Capital received from investors | | 194,339,860 |
| Total distributable earnings1 | | 6,910,472 |
| Net Asset Value (NAV) |
| Net Assets | ÷ | Shares
Outstanding | = | NAV |
| $201,250,332 | | 17,270,777 | | $11.65 |
| | | | | |
| 1 | The SEC eliminated the requirement to disclose total distributable earnings (loss) by each of its components as previously disclosed as the previous presentation did not provide insight into the tax implications of distributions (see financial note 8 for additional information). |
Schwab Target Index Funds | Annual Report
Schwab Target 2030 Index Fund
Statement of Operations
For the period April 1, 2018 through March 31, 2019
| Investment Income |
| Dividends received from affiliated underlying funds | | $3,672,929 |
| Interest | + | 21,921 |
| Total investment income | | 3,694,850 |
| Expenses |
| Investment adviser and administrator fees | + | 118,670 |
| Total expenses | | 118,670 |
| Expense reduction by CSIM and its affiliates | – | 70,628 |
| Net expenses | – | 48,042 |
| Net investment income | | 3,646,808 |
| Realized and Unrealized Gains (Losses) |
| Net realized losses on sales of affiliated underlying funds | | (602,589) |
| Net change in unrealized appreciation (depreciation) on affiliated underlying funds | + | 4,821,915 |
| Net realized and unrealized gains | | 4,219,326 |
| Increase in net assets resulting from operations | | $7,866,134 |
Schwab Target Index Funds | Annual Report
Schwab Target 2030 Index Fund
Statement of Changes in Net Assets
For the current and prior report periods
| Operations | |
| | 4/1/18-3/31/19 | 4/1/17-3/31/18 |
| Net investment income | | $3,646,808 | $1,187,065 |
| Net realized gains (losses) | | (602,589) | 6,675 |
| Net change in unrealized appreciation (depreciation) | + | 4,821,915 | 1,696,429 |
| Increase in net assets from operations | | 7,866,134 | 2,890,169 |
| Distributions to Shareholders1,2 | |
| Total distributions | | ($3,355,176) | ($904,232) |
| Transactions in Fund Shares1 | | | |
| | | 4/1/18-3/31/19 | 4/1/17-3/31/18 |
| | | SHARES | VALUE | SHARES | VALUE |
| Shares Sold | | | | | |
| Investor Shares | | — | $— | 71,813 | $750,279 |
| Institutional Shares | + | 10,165,033 | 116,401,157 | 10,095,576 | 113,294,038 |
| Total shares sold | | 10,165,033 | $116,401,157 | 10,167,389 | $114,044,317 |
| Shares Reinvested | | | | | |
| Investor Shares | | — | $— | — | $— |
| Institutional Shares | + | 310,617 | 3,286,331 | 77,310 | 887,531 |
| Total shares reinvested | | 310,617 | $3,286,331 | 77,310 | $887,531 |
| Shares Redeemed | | | | | |
| Investor Shares | | — | $— | (1,322,798) | ($14,088,148) |
| Institutional Shares | + | (2,843,780) | (32,502,120) | (845,497) | (9,618,551) |
| Total shares redeemed | | (2,843,780) | ($32,502,120) | (2,168,295) | ($23,706,699) |
| Net transactions in fund shares | | 7,631,870 | $87,185,368 | 8,076,404 | $91,225,149 |
| Shares Outstanding and Net Assets | | | |
| | | 4/1/18-3/31/19 | 4/1/17-3/31/18 |
| | | SHARES | NET ASSETS | SHARES | NET ASSETS |
| Beginning of period | | 9,638,907 | $109,554,006 | 1,562,503 | $16,342,920 |
| Total increase | + | 7,631,870 | 91,696,326 | 8,076,404 | 93,211,086 |
| End of period3 | | 17,270,777 | $201,250,332 | 9,638,907 | $109,554,006 |
| 1 | Effective July 24, 2017, there were no outstanding Investor Shares and the Investor Share class was consolidated into the Institutional Share class, resulting in a single class of shares of the fund. |
| 2 | For the period ended March 31, 2018, the Institutional Share class of the fund distributed to shareholders $903,629 from net investment income and $603 from net realized gains. The SEC eliminated the requirement to disclose distributions to shareholders from net investment income and from net realized gains in 2018 (see financial note 8 for additional information). |
| 3 | End of period - Net assets include net investment income not yet distributed of $350,501 at March 31, 2018. The SEC eliminated the requirement to disclose undistributed net investment income in 2018. |
Schwab Target Index Funds | Annual Report
Schwab Target 2035 Index Fund
Financial Statements
Financial Highlights
| | 4/1/18–
3/31/19 | 4/1/17–
3/31/181 | 8/25/162–
3/31/17 | | | |
| Per-Share Data |
| Net asset value at beginning of period | $11.53 | $10.54 | $10.00 | | | |
| Income (loss) from investment operations: | | | | | | |
| Net investment income (loss)3 | 0.29 | 0.26 | 0.12 | | | |
| Net realized and unrealized gains (losses) | 0.22 | 0.90 | 0.52 | | | |
| Total from investment operations | 0.51 | 1.16 | 0.64 | | | |
| Less distributions: | | | | | | |
| Distributions from net investment income | (0.22) | (0.17) | (0.10) | | | |
| Distributions from net realized gains | (0.00)4 | (0.00)4 | — | | | |
| Total distributions | (0.22) | (0.17) | (0.10) | | | |
| Net asset value at end of period | $11.82 | $11.53 | $10.54 | | | |
| Total return | 4.68% | 10.96% | 6.44%5 | | | |
| Ratios/Supplemental Data |
| Ratios to average net assets: | | | | | | |
| Net operating expenses6 | 0.03% | 0.04% | 0.03%7 | | | |
| Gross operating expenses6 | 0.08% | 0.08% | 0.08%7 | | | |
| Net investment income (loss) | 2.49% | 2.29% | 2.04%7 | | | |
| Portfolio turnover rate | 6% | 14% | 13%5 | | | |
| Net assets, end of period (x 1,000) | $126,200 | $62,526 | $1,904 | | | |
| |
1
Effective July 24, 2017, the Investor Share class and the Institutional Share class were consolidated into a single class of shares of the fund. The financial history as shown in the financial highlights is that of the former Institutional Shares.
2
Commencement of operations.
3
Calculated based on the average shares outstanding during the period.
4
Per-share amount was less than $0.005.
5
Not annualized.
6
The expenses incurred by the underlying funds in which the fund invests are not included in these ratios. If the expenses incurred by the underlying funds were included in these ratios they would have increased by 0.05%, 0.04% and 0.05% (annualized), respectively, for the periods ended March 31, 2019, March 31, 2018 and March 31, 2017 (see financial note 4).
7
Annualized.
Schwab Target Index Funds | Annual Report
Schwab Target 2035 Index Fund
Portfolio Holdings as of March 31, 2019
This section shows all the securities in the fund’s portfolio and their values as of the report date.
The fund files its complete schedule of portfolio holdings with the U.S. Securities and Exchange Commission (SEC) for the first and third quarters of each fiscal year on Form N-Q. The fund’s Form N-Q is available on the SEC’s website atwww.sec.gov. The fund also makes available its complete schedule of portfolio holdings 15 to 20 days after the end of the month on the fund’s website atwww.schwabfunds.com/schwabfunds_prospectus.
| Security | Number
of Shares | Value ($) |
| Affiliated Underlying Funds99.3% of net assets |
| |
| U.S. Stocks 46.3% |
| Large-Cap 42.0% |
| Schwab U.S. Large-Cap ETF | 784,525 | 53,041,735 |
| Small-Cap 4.3% |
| Schwab U.S. Small-Cap ETF | 77,620 | 5,427,967 |
| | | 58,469,702 |
| |
| International Stocks 24.5% |
| Developed-Market Large-Cap 20.2% |
| Schwab International Equity ETF | 815,244 | 25,525,289 |
| Emerging-Market 4.3% |
| Schwab Emerging Markets Equity ETF | 206,367 | 5,367,606 |
| | | 30,892,895 |
| |
| Real Assets 3.8% |
| Real Estate 3.8% |
| Schwab U.S. REIT ETF | 107,129 | 4,759,741 |
| |
| Fixed Income 22.9% |
| Intermediate-Term Bond 21.5% |
| Schwab U.S. Aggregate Bond ETF | 522,992 | 27,132,825 |
| Treasury Bond 1.4% |
| Schwab Short-Term U.S. Treasury ETF | 33,945 | 1,703,700 |
| | | 28,836,525 |
| |
| Security | Number
of Shares | Value ($) |
| Money Market Fund 1.8% |
| Schwab Variable Share Price Money Fund, Ultra Shares 2.45%(a) | 2,329,670 | 2,330,369 |
| Total Affiliated Underlying Funds |
| (Cost $120,555,880) | | 125,289,232 |
Issuer
Rate, Maturity Date | Face
Amount ($) | Value ($) |
| Short-Term Investment0.3% of net assets |
| |
| Time Deposit 0.3% |
| Barclays Capital, Inc. |
| 1.78%, 04/01/19(b) | 370,374 | 370,374 |
| Total Short-Term Investment |
| (Cost $370,374) | | 370,374 |
| (a) | The rate shown is the 7-day yield. |
| (b) | The rate shown is the current daily overnight rate. |
| | |
| ETF — | Exchange-traded fund |
| REIT — | Real Estate Investment Trust |
Below is a summary of the fund’s transactions with its affiliated underlying funds during the period ended March 31, 2019:
| Affiliated Underlying Funds | Balance
of Shares
Held at
03/31/18 | Gross
Purchases | Gross
Sales | Balance
of Shares
Held at
03/31/19 | Market
Value at
03/31/19 | Net Change
in Unrealized
Appreciation
(depreciation) | Realized
Gains (Losses) | Distributions
Received* |
| Schwab Emerging Markets Equity ETF | 96,159 | 119,173 | (8,965) | 206,367 | $5,367,606 | ($175,869) | ($46,451) | $113,776 |
| Schwab International Equity ETF | 383,351 | 450,882 | (18,989) | 815,244 | 25,525,289 | (1,131,096) | (60,067) | 607,308 |
| Schwab Short-Term U.S. Treasury ETF | 15,244 | 18,704 | (3) | 33,945 | 1,703,700 | 13,345 | (2) | 21,462 |
| Schwab U.S. Aggregate Bond ETF | 251,499 | 283,945 | (12,452) | 522,992 | 27,132,825 | 607,282 | (23,437) | 516,434 |
| Schwab U.S. Large-Cap ETF | 421,385 | 401,927 | (38,787) | 784,525 | 53,041,735 | 2,874,733 | (120,550) | 811,329 |
| Schwab U.S. REIT ETF | 62,299 | 55,148 | (10,318) | 107,129 | 4,759,741 | 555,755 | 2,240 | 106,086 |
| Schwab U.S. Small-Cap ETF | 40,161 | 37,459 | — | 77,620 | 5,427,967 | 13,391 | — | 55,915 |
| Schwab Variable Share Price Money Fund, Ultra Shares | 870,098 | 2,759,262 | (1,299,690) | 2,329,670 | 2,330,369 | 230 | (80) | 32,105 |
| Total | | | | | $125,289,232 | $2,757,771 | ($248,347) | $2,264,415 |
| * | Distributions received include distributions from net investment income and capital gains, if any, from the underlying funds. |
| | |
Schwab Target Index Funds | Annual Report
Schwab Target 2035 Index Fund
Portfolio Holdings as of March 31, 2019 (continued)
The following is a summary of the inputs used to value the fund’s investments as of March 31, 2019 (see financial note 2(a) for additional information):
| Description | Quoted Prices in
Active Markets for
Identical Assets
(Level 1) | Other Significant
Observable Inputs
(Level 2) | Significant
Unobservable Inputs
(Level 3) | Total | |
| Assets | | | | | |
| Affiliated Underlying Funds1 | $125,289,232 | $— | $— | $125,289,232 | |
| Short-Term Investment1 | — | 370,374 | — | 370,374 | |
| Total | $125,289,232 | $370,374 | $— | $125,659,606 | |
| 1 | As categorized in Portfolio Holdings. |
Fund investments in underlying mutual funds and ETFs are classified as Level 1, without consideration to the classification level of the investments held by the underlying mutual funds and ETFs, which could be Level 1, Level 2 or Level 3.
Schwab Target Index Funds | Annual Report
Schwab Target 2035 Index Fund
Statement of Assets and Liabilities
As of March 31, 2019
| Assets |
| Investments in affiliated underlying funds, at value (cost $120,555,880) | | $125,289,232 |
| Investments in unaffiliated issuers, at value (cost $370,374) | | 370,374 |
| Receivables: | | |
| Investments sold | | 145,157 |
| Fund shares sold | | 402,756 |
| Dividends | | 2,655 |
| Interest | + | 54 |
| Total assets | | 126,210,228 |
| Liabilities |
| Payables: | | |
| Investment adviser fees | | 3,377 |
| Fund shares redeemed | + | 6,440 |
| Total liabilities | | 9,817 |
| Net Assets |
| Total assets | | 126,210,228 |
| Total liabilities | – | 9,817 |
| Net assets | | $126,200,411 |
| Net Assets by Source | | |
| Capital received from investors | | 121,379,485 |
| Total distributable earnings1 | | 4,820,926 |
| Net Asset Value (NAV) |
| Net Assets | ÷ | Shares
Outstanding | = | NAV |
| $126,200,411 | | 10,678,348 | | $11.82 |
| | | | | |
| 1 | The SEC eliminated the requirement to disclose total distributable earnings (loss) by each of its components as previously disclosed as the previous presentation did not provide insight into the tax implications of distributions (see financial note 8 for additional information). |
Schwab Target Index Funds | Annual Report
Schwab Target 2035 Index Fund
Statement of Operations
For the period April 1, 2018 through March 31, 2019
| Investment Income |
| Dividends received from affiliated underlying funds | | $2,264,415 |
| Interest | + | 12,123 |
| Total investment income | | 2,276,538 |
| Expenses |
| Investment adviser and administrator fees | + | 72,194 |
| Total expenses | | 72,194 |
| Expense reduction by CSIM and its affiliates | – | 42,936 |
| Net expenses | – | 29,258 |
| Net investment income | | 2,247,280 |
| Realized and Unrealized Gains (Losses) |
| Net realized losses on sales of affiliated underlying funds | | (248,347) |
| Net change in unrealized appreciation (depreciation) on affiliated underlying funds | + | 2,757,771 |
| Net realized and unrealized gains | | 2,509,424 |
| Increase in net assets resulting from operations | | $4,756,704 |
Schwab Target Index Funds | Annual Report
Schwab Target 2035 Index Fund
Statement of Changes in Net Assets
For the current and prior report periods
| Operations | |
| | 4/1/18-3/31/19 | 4/1/17-3/31/18 |
| Net investment income | | $2,247,280 | $746,893 |
| Net realized gains (losses) | | (248,347) | 169 |
| Net change in unrealized appreciation (depreciation) | + | 2,757,771 | 1,558,505 |
| Increase in net assets from operations | | 4,756,704 | 2,305,567 |
| Distributions to Shareholders1,2 | |
| Total distributions | | ($2,075,616) | ($604,017) |
| Transactions in Fund Shares1 | | | |
| | | 4/1/18-3/31/19 | 4/1/17-3/31/18 |
| | | SHARES | VALUE | SHARES | VALUE |
| Shares Sold | | | | | |
| Investor Shares | | — | $— | 24,754 | $257,871 |
| Institutional Shares | + | 6,790,501 | 79,065,998 | 5,972,493 | 67,489,185 |
| Total shares sold | | 6,790,501 | $79,065,998 | 5,997,247 | $67,747,056 |
| Shares Reinvested | | | | | |
| Investor Shares | | — | $— | — | $— |
| Institutional Shares | + | 190,311 | 2,028,716 | 50,896 | 593,447 |
| Total shares reinvested | | 190,311 | $2,028,716 | 50,896 | $593,447 |
| Shares Redeemed | | | | | |
| Investor Shares | | — | $— | (1,108,058) | ($11,891,649) |
| Institutional Shares | + | (1,724,281) | (20,101,834) | (782,276) | (8,934,987) |
| Total shares redeemed | | (1,724,281) | ($20,101,834) | (1,890,334) | ($20,826,636) |
| Net transactions in fund shares | | 5,256,531 | $60,992,880 | 4,157,809 | $47,513,867 |
| Shares Outstanding and Net Assets | | | |
| | | 4/1/18-3/31/19 | 4/1/17-3/31/18 |
| | | SHARES | NET ASSETS | SHARES | NET ASSETS |
| Beginning of period | | 5,421,817 | $62,526,443 | 1,264,008 | $13,311,026 |
| Total increase | + | 5,256,531 | 63,673,968 | 4,157,809 | 49,215,417 |
| End of period3 | | 10,678,348 | $126,200,411 | 5,421,817 | $62,526,443 |
| 1 | Effective July 24, 2017, there were no outstanding Investor Shares and the Investor Share class was consolidated into the Institutional Share class, resulting in a single class of shares of the fund. |
| 2 | For the period ended March 31, 2018, the Institutional Share class of the fund distributed to shareholders $600,404 from net investment income and $3,613 from net realized gains. The SEC eliminated the requirement to disclose distributions to shareholders from net investment income and from net realized gains in 2018 (see financial note 8 for additional information). |
| 3 | End of period - Net assets includes net investment income not yet distributed of $208,673 at March 31, 2018. The SEC eliminated the requirement to disclose undistributed net investment income in 2018. |
Schwab Target Index Funds | Annual Report
Schwab Target 2040 Index Fund
Financial Statements
Financial Highlights
| | 4/1/18–
3/31/19 | 4/1/17–
3/31/181 | 8/25/162–
3/31/17 | | | |
| Per-Share Data |
| Net asset value at beginning of period | $11.69 | $10.59 | $10.00 | | | |
| Income (loss) from investment operations: | | | | | | |
| Net investment income (loss)3 | 0.29 | 0.27 | 0.15 | | | |
| Net realized and unrealized gains (losses) | 0.21 | 1.00 | 0.55 | | | |
| Total from investment operations | 0.50 | 1.27 | 0.70 | | | |
| Less distributions: | | | | | | |
| Distributions from net investment income | (0.24) | (0.17) | (0.11) | | | |
| Distributions from net realized gains | — | (0.00)4 | — | | | |
| Total distributions | (0.24) | (0.17) | (0.11) | | | |
| Net asset value at end of period | $11.95 | $11.69 | $10.59 | | | |
| Total return | 4.49% | 11.97% | 7.09%5 | | | |
| Ratios/Supplemental Data |
| Ratios to average net assets: | | | | | | |
| Net operating expenses6 | 0.03% | 0.04% | 0.03%7 | | | |
| Gross operating expenses6 | 0.08% | 0.08% | 0.08%7 | | | |
| Net investment income (loss) | 2.48% | 2.33% | 2.48%7 | | | |
| Portfolio turnover rate | 2% | 15% | 8%5 | | | |
| Net assets, end of period (x 1,000) | $143,404 | $72,830 | $1,514 | | | |
| |
1
Effective July 24, 2017, the Investor Share class and the Institutional Share class were consolidated into a single class of shares of the fund. The financial history as shown in the financial highlights is that of the former Institutional Shares.
2
Commencement of operations.
3
Calculated based on the average shares outstanding during the period.
4
Per-share amount was less than $0.005.
5
Not annualized.
6
The expenses incurred by the underlying funds in which the fund invests are not included in these ratios. If the expenses incurred by the underlying funds were included in these ratios they would have increased by 0.05%, 0.04% and 0.05% (annualized), respectively, for the periods ended March 31, 2019, March 31, 2018 and March 31, 2017 (see financial note 4).
7
Annualized.
Schwab Target Index Funds | Annual Report
Schwab Target 2040 Index Fund
Portfolio Holdings as of March 31, 2019
This section shows all the securities in the fund’s portfolio and their values as of the report date.
The fund files its complete schedule of portfolio holdings with the U.S. Securities and Exchange Commission (SEC) for the first and third quarters of each fiscal year on Form N-Q. The fund’s Form N-Q is available on the SEC’s website atwww.sec.gov. The fund also makes available its complete schedule of portfolio holdings 15 to 20 days after the end of the month on the fund’s website atwww.schwabfunds.com/schwabfunds_prospectus.
| Security | Number
of Shares | Value ($) |
| Affiliated Underlying Funds98.9% of net assets |
| |
| U.S. Stocks 49.8% |
| Large-Cap 44.7% |
| Schwab U.S. Large-Cap ETF | 947,978 | 64,092,792 |
| Small-Cap 5.1% |
| Schwab U.S. Small-Cap ETF | 104,362 | 7,298,035 |
| | | 71,390,827 |
| |
| International Stocks 27.3% |
| Developed-Market Large-Cap 22.1% |
| Schwab International Equity ETF | 1,011,096 | 31,657,416 |
| Emerging-Market 5.2% |
| Schwab Emerging Markets Equity ETF | 288,976 | 7,516,266 |
| | | 39,173,682 |
| |
| Real Assets 4.1% |
| Real Estate 4.1% |
| Schwab U.S. REIT ETF | 131,573 | 5,845,788 |
| |
| Fixed Income 16.5% |
| Intermediate-Term Bond 15.7% |
| Schwab U.S. Aggregate Bond ETF | 435,155 | 22,575,842 |
| Treasury Bond 0.8% |
| Schwab Short-Term U.S. Treasury ETF | 22,979 | 1,153,316 |
| | | 23,729,158 |
| |
| Security | Number
of Shares | Value ($) |
| Money Market Fund 1.2% |
| Schwab Variable Share Price Money Fund, Ultra Shares 2.45%(a) | 1,670,783 | 1,671,284 |
| Total Affiliated Underlying Funds |
| (Cost $136,677,755) | | 141,810,739 |
Issuer
Rate, Maturity Date | Face
Amount ($) | Value ($) |
| Short-Term Investment0.6% of net assets |
| |
| Time Deposit 0.6% |
| Barclays Capital, Inc. |
| 1.78%, 04/01/19(b) | 935,732 | 935,732 |
| Total Short-Term Investment |
| (Cost $935,732) | | 935,732 |
| (a) | The rate shown is the 7-day yield. |
| (b) | The rate shown is the current daily overnight rate. |
| | |
| ETF — | Exchange-traded fund |
| REIT — | Real Estate Investment Trust |
Below is a summary of the fund’s transactions with its affiliated underlying funds during the period ended March 31, 2019:
| Affiliated Underlying Funds | Balance
of Shares
Held at
03/31/18 | Gross
Purchases | Gross
Sales | Balance
of Shares
Held at
03/31/19 | Market
Value at
03/31/19 | Net Change
in Unrealized
Appreciation
(depreciation) | Realized
Gains (Losses) | Distributions
Received* |
| Schwab Emerging Markets Equity ETF | 138,813 | 154,438 | (4,275) | 288,976 | $7,516,266 | ($324,149) | ($20,564) | $156,184 |
| Schwab International Equity ETF | 490,213 | 525,816 | (4,933) | 1,011,096 | 31,657,416 | (1,509,918) | (21,411) | 751,129 |
| Schwab Short-Term U.S. Treasury ETF | 10,935 | 12,044 | — | 22,979 | 1,153,316 | 8,669 | — | 15,315 |
| Schwab U.S. Aggregate Bond ETF | 208,398 | 236,640 | (9,883) | 435,155 | 22,575,842 | 472,769 | (13,524) | 423,064 |
| Schwab U.S. Large-Cap ETF | 523,634 | 437,939 | (13,595) | 947,978 | 64,092,792 | 3,408,635 | (54,171) | 984,034 |
| Schwab U.S. REIT ETF | 78,789 | 56,597 | (3,813) | 131,573 | 5,845,788 | 667,387 | 464 | 131,119 |
| Schwab U.S. Small-Cap ETF | 55,195 | 49,167 | — | 104,362 | 7,298,035 | 31,804 | — | 76,171 |
| Schwab Variable Share Price Money Fund, Ultra Shares | 450,766 | 1,319,997 | (99,980) | 1,670,783 | 1,671,284 | 56 | (10) | 22,029 |
| Total | | | | | $141,810,739 | $2,755,253 | ($109,216) | $2,559,045 |
| * | Distributions received include distributions from net investment income and capital gains, if any, from the underlying funds. |
| | |
Schwab Target Index Funds | Annual Report
Schwab Target 2040 Index Fund
Portfolio Holdings as of March 31, 2019 (continued)
The following is a summary of the inputs used to value the fund’s investments as of March 31, 2019 (see financial note 2(a) for additional information):
| Description | Quoted Prices in
Active Markets for
Identical Assets
(Level 1) | Other Significant
Observable Inputs
(Level 2) | Significant
Unobservable Inputs
(Level 3) | Total | |
| Assets | | | | | |
| Affiliated Underlying Funds1 | $141,810,739 | $— | $— | $141,810,739 | |
| Short-Term Investment1 | — | 935,732 | — | 935,732 | |
| Total | $141,810,739 | $935,732 | $— | $142,746,471 | |
| 1 | As categorized in Portfolio Holdings. |
Fund investments in underlying mutual funds and ETFs are classified as Level 1, without consideration to the classification level of the investments held by the underlying mutual funds and ETFs, which could be Level 1, Level 2 or Level 3.
Schwab Target Index Funds | Annual Report
Schwab Target 2040 Index Fund
Statement of Assets and Liabilities
As of March 31, 2019
| Assets |
| Investments in affiliated underlying funds, at value (cost $136,677,755) | | $141,810,739 |
| Investments in unaffiliated issuers, at value (cost $935,732) | | 935,732 |
| Receivables: | | |
| Fund shares sold | | 917,890 |
| Dividends | | 1,904 |
| Interest | + | 137 |
| Total assets | | 143,666,402 |
| Liabilities |
| Payables: | | |
| Investments bought | | 157,145 |
| Investment adviser fees | | 3,776 |
| Fund shares redeemed | + | 101,183 |
| Total liabilities | | 262,104 |
| Net Assets |
| Total assets | | 143,666,402 |
| Total liabilities | – | 262,104 |
| Net assets | | $143,404,298 |
| Net Assets by Source | | |
| Capital received from investors | | 138,024,691 |
| Total distributable earnings1 | | 5,379,607 |
| Net Asset Value (NAV) |
| Net Assets | ÷ | Shares
Outstanding | = | NAV |
| $143,404,298 | | 11,998,048 | | $11.95 |
| | | | | |
| 1 | The SEC eliminated the requirement to disclose total distributable earnings (loss) by each of its components as previously disclosed as the previous presentation did not provide insight into the tax implications of distributions (see financial note 8 for additional information). |
Schwab Target Index Funds | Annual Report
Schwab Target 2040 Index Fund
Statement of Operations
For the period April 1, 2018 through March 31, 2019
| Investment Income |
| Dividends received from affiliated underlying funds | | $2,559,045 |
| Interest | + | 13,633 |
| Total investment income | | 2,572,678 |
| Expenses |
| Investment adviser and administrator fees | + | 82,073 |
| Total expenses | | 82,073 |
| Expense reduction by CSIM and its affiliates | – | 48,996 |
| Net expenses | – | 33,077 |
| Net investment income | | 2,539,601 |
| Realized and Unrealized Gains (Losses) |
| Net realized losses on sales of affiliated underlying funds | | (109,216) |
| Net change in unrealized appreciation (depreciation) on affiliated underlying funds | + | 2,755,253 |
| Net realized and unrealized gains | | 2,646,037 |
| Increase in net assets resulting from operations | | $5,185,638 |
Schwab Target Index Funds | Annual Report
Schwab Target 2040 Index Fund
Statement of Changes in Net Assets
For the current and prior report periods
| Operations | |
| | 4/1/18-3/31/19 | 4/1/17-3/31/18 |
| Net investment income | | $2,539,601 | $853,957 |
| Net realized losses | | (109,216) | (28,436) |
| Net change in unrealized appreciation (depreciation) | + | 2,755,253 | 1,970,174 |
| Increase in net assets from operations | | 5,185,638 | 2,795,695 |
| Distributions to Shareholders1,2 | |
| Total distributions | | ($2,349,510) | ($687,787) |
| Transactions in Fund Shares1 | | | |
| | | 4/1/18-3/31/19 | 4/1/17-3/31/18 |
| | | SHARES | VALUE | SHARES | VALUE |
| Shares Sold | | | | | |
| Investor Shares | | — | $— | 27,967 | $294,780 |
| Institutional Shares | + | 7,011,105 | 82,572,627 | 6,948,851 | 79,414,617 |
| Total shares sold | | 7,011,105 | $82,572,627 | 6,976,818 | $79,709,397 |
| Shares Reinvested | | | | | |
| Investor Shares | | — | $— | — | $— |
| Institutional Shares | + | 216,494 | 2,318,649 | 57,916 | 684,569 |
| Total shares reinvested | | 216,494 | $2,318,649 | 57,916 | $684,569 |
| Shares Redeemed | | | | | |
| Investor Shares | | — | $— | (1,136,256) | ($12,267,078) |
| Institutional Shares | + | (1,457,852) | (17,153,200) | (921,426) | (10,656,441) |
| Total shares redeemed | | (1,457,852) | ($17,153,200) | (2,057,682) | ($22,923,519) |
| Net transactions in fund shares | | 5,769,747 | $67,738,076 | 4,977,052 | $57,470,447 |
| Shares Outstanding and Net Assets | | | |
| | | 4/1/18-3/31/19 | 4/1/17-3/31/18 |
| | | SHARES | NET ASSETS | SHARES | NET ASSETS |
| Beginning of period | | 6,228,301 | $72,830,094 | 1,251,249 | $13,251,739 |
| Total increase | + | 5,769,747 | 70,574,204 | 4,977,052 | 59,578,355 |
| End of period3 | | 11,998,048 | $143,404,298 | 6,228,301 | $72,830,094 |
| 1 | Effective July 24, 2017, all outstanding Investor Shares (20,887 shares valued at $223,165) were consolidated into the Institutional Shares, resulting in a single class of shares of the fund. |
| 2 | For the period ended March 31, 2018, the Institutional Share class of the fund distributed to shareholders $684,942 from net investment income and $2,845 from net realized gains. The SEC eliminated the requirement to disclose distributions to shareholders from net investment income and from net realized gains in 2018 (see financial note 8 for additional information). |
| 3 | End of period - Net assets includes net investment income not yet distributed of $215,455 at March 31, 2018. The SEC eliminated the requirement to disclose undistributed net investment income in 2018. |
Schwab Target Index Funds | Annual Report
Schwab Target 2045 Index Fund
Financial Statements
Financial Highlights
| | 4/1/18–
3/31/19 | 4/1/17–
3/31/181 | 8/25/162–
3/31/17 | | | |
| Per-Share Data |
| Net asset value at beginning of period | $11.81 | $10.64 | $10.00 | | | |
| Income (loss) from investment operations: | | | | | | |
| Net investment income (loss)3 | 0.29 | 0.28 | 0.10 | | | |
| Net realized and unrealized gains (losses) | 0.19 | 1.06 | 0.65 | | | |
| Total from investment operations | 0.48 | 1.34 | 0.75 | | | |
| Less distributions: | | | | | | |
| Distributions from net investment income | (0.24) | (0.17) | (0.11) | | | |
| Distributions from net realized gains | (0.00)4 | (0.00)4 | — | | | |
| Total distributions | (0.24) | (0.17) | (0.11) | | | |
| Net asset value at end of period | $12.05 | $11.81 | $10.64 | | | |
| Total return | 4.33% | 12.57% | 7.51%5 | | | |
| Ratios/Supplemental Data |
| Ratios to average net assets: | | | | | | |
| Net operating expenses6 | 0.03% | 0.03% | 0.02%7 | | | |
| Gross operating expenses6 | 0.08% | 0.08% | 0.08%7 | | | |
| Net investment income (loss) | 2.43% | 2.39% | 1.68%7 | | | |
| Portfolio turnover rate | 7% | 11% | 8%5 | | | |
| Net assets, end of period (x 1,000) | $84,790 | $44,817 | $1,261 | | | |
| |
1
Effective July 24, 2017, the Investor Share class and the Institutional Share class were consolidated into a single class of shares of the fund. The financial history as shown in the financial highlights is that of the former Institutional Shares.
2
Commencement of operations.
3
Calculated based on the average shares outstanding during the period.
4
Per-share amount was less than $0.005.
5
Not annualized.
6
The expenses incurred by the underlying funds in which the fund invests are not included in these ratios. If the expenses incurred by the underlying funds were included in these ratios they would have increased by 0.05%, 0.05% and 0.06% (annualized), respectively, for the periods ended March 31, 2019, March 31, 2018 and March 31, 2017 (see financial note 4).
7
Annualized.
Schwab Target Index Funds | Annual Report
Schwab Target 2045 Index Fund
Portfolio Holdings as of March 31, 2019
This section shows all the securities in the fund’s portfolio and their values as of the report date.
The fund files its complete schedule of portfolio holdings with the U.S. Securities and Exchange Commission (SEC) for the first and third quarters of each fiscal year on Form N-Q. The fund’s Form N-Q is available on the SEC’s website atwww.sec.gov. The fund also makes available its complete schedule of portfolio holdings 15 to 20 days after the end of the month on the fund’s website atwww.schwabfunds.com/schwabfunds_prospectus.
| Security | Number
of Shares | Value ($) |
| Affiliated Underlying Funds98.9% of net assets |
| |
| U.S. Stocks 52.6% |
| Large-Cap 46.9% |
| Schwab U.S. Large-Cap ETF | 587,478 | 39,719,387 |
| Small-Cap 5.7% |
| Schwab U.S. Small-Cap ETF | 69,219 | 4,840,485 |
| | | 44,559,872 |
| |
| International Stocks 29.8% |
| Developed-Market Large-Cap 23.7% |
| Schwab International Equity ETF | 643,102 | 20,135,524 |
| Emerging-Market 6.1% |
| Schwab Emerging Markets Equity ETF | 198,552 | 5,164,337 |
| | | 25,299,861 |
| |
| Real Assets 4.4% |
| Real Estate 4.4% |
| Schwab U.S. REIT ETF | 83,118 | 3,692,933 |
| |
| Fixed Income 11.4% |
| Intermediate-Term Bond 10.9% |
| Schwab U.S. Aggregate Bond ETF | 178,459 | 9,258,453 |
| Treasury Bond 0.5% |
| Schwab Short-Term U.S. Treasury ETF | 8,973 | 450,355 |
| | | 9,708,808 |
| |
| Security | Number
of Shares | Value ($) |
| Money Market Fund 0.7% |
| Schwab Variable Share Price Money Fund, Ultra Shares 2.45%(a) | 565,440 | 565,609 |
| Total Affiliated Underlying Funds |
| (Cost $80,471,664) | | 83,827,083 |
Issuer
Rate, Maturity Date | Face
Amount ($) | Value ($) |
| Short-Term Investment0.4% of net assets |
| |
| Time Deposit 0.4% |
| Barclays Capital, Inc. |
| 1.78%, 04/01/19(b) | 364,989 | 364,989 |
| Total Short-Term Investment |
| (Cost $364,989) | | 364,989 |
| (a) | The rate shown is the 7-day yield. |
| (b) | The rate shown is the current daily overnight rate. |
| | |
| ETF — | Exchange-traded fund |
| REIT — | Real Estate Investment Trust |
Below is a summary of the fund’s transactions with its affiliated underlying funds during the period ended March 31, 2019:
| Affiliated Underlying Funds | Balance
of Shares
Held at
03/31/18 | Gross
Purchases | Gross
Sales | Balance
of Shares
Held at
03/31/19 | Market
Value at
03/31/19 | Net Change
in Unrealized
Appreciation
(depreciation) | Realized
Gains (Losses) | Distributions
Received* |
| Schwab Emerging Markets Equity ETF | 97,243 | 112,415 | (11,106) | 198,552 | $5,164,337 | ($199,706) | ($47,642) | $106,910 |
| Schwab International Equity ETF | 320,306 | 339,098 | (16,302) | 643,102 | 20,135,524 | (943,555) | (43,523) | 466,041 |
| Schwab Short-Term U.S. Treasury ETF | 3,713 | 5,260 | — | 8,973 | 450,355 | 3,605 | — | 5,456 |
| Schwab U.S. Aggregate Bond ETF | 90,058 | 96,575 | (8,174) | 178,459 | 9,258,453 | 206,055 | (17,787) | 178,263 |
| Schwab U.S. Large-Cap ETF | 337,491 | 277,892 | (27,905) | 587,478 | 39,719,387 | 2,209,120 | (79,311) | 612,908 |
| Schwab U.S. REIT ETF | 53,143 | 37,342 | (7,367) | 83,118 | 3,692,933 | 438,650 | (965) | 82,013 |
| Schwab U.S. Small-Cap ETF | 37,963 | 33,191 | (1,935) | 69,219 | 4,840,485 | 27,187 | (8,141) | 50,501 |
| Schwab Variable Share Price Money Fund, Ultra Shares | — | 1,315,255 | (749,815) | 565,440 | 565,609 | (56) | (40) | 6,350 |
| Total | | | | | $83,827,083 | $1,741,300 | ($197,409) | $1,508,442 |
| * | Distributions received include distributions from net investment income and capital gains, if any, from the underlying funds. |
| | |
Schwab Target Index Funds | Annual Report
Schwab Target 2045 Index Fund
Portfolio Holdings as of March 31, 2019 (continued)
The following is a summary of the inputs used to value the fund’s investments as of March 31, 2019 (see financial note 2(a) for additional information):
| Description | Quoted Prices in
Active Markets for
Identical Assets
(Level 1) | Other Significant
Observable Inputs
(Level 2) | Significant
Unobservable Inputs
(Level 3) | Total | |
| Assets | | | | | |
| Affiliated Underlying Funds1 | $83,827,083 | $— | $— | $83,827,083 | |
| Short-Term Investment1 | — | 364,989 | — | 364,989 | |
| Total | $83,827,083 | $364,989 | $— | $84,192,072 | |
| 1 | As categorized in Portfolio Holdings. |
Fund investments in underlying mutual funds and ETFs are classified as Level 1, without consideration to the classification level of the investments held by the underlying mutual funds and ETFs, which could be Level 1, Level 2 or Level 3.
Schwab Target Index Funds | Annual Report
Schwab Target 2045 Index Fund
Statement of Assets and Liabilities
As of March 31, 2019
| Assets |
| Investments in affiliated underlying funds, at value (cost $80,471,664) | | $83,827,083 |
| Investments in unaffiliated issuers, at value (cost $364,989) | | 364,989 |
| Receivables: | | |
| Fund shares sold | | 876,210 |
| Dividends | | 644 |
| Interest | + | 54 |
| Total assets | | 85,068,980 |
| Liabilities |
| Payables: | | |
| Investments bought | | 275,164 |
| Investment adviser fees | | 2,229 |
| Fund shares redeemed | + | 1,831 |
| Total liabilities | | 279,224 |
| Net Assets |
| Total assets | | 85,068,980 |
| Total liabilities | – | 279,224 |
| Net assets | | $84,789,756 |
| Net Assets by Source | | |
| Capital received from investors | | 81,433,021 |
| Total distributable earnings1 | | 3,356,735 |
| Net Asset Value (NAV) |
| Net Assets | ÷ | Shares
Outstanding | = | NAV |
| $84,789,756 | | 7,035,530 | | $12.05 |
| | | | | |
| 1 | The SEC eliminated the requirement to disclose total distributable earnings (loss) by each of its components as previously disclosed as the previous presentation did not provide insight into the tax implications of distributions (see financial note 8 for additional information). |
Schwab Target Index Funds | Annual Report
Schwab Target 2045 Index Fund
Statement of Operations
For the period April 1, 2018 through March 31, 2019
| Investment Income |
| Dividends received from affiliated underlying funds | | $1,508,442 |
| Interest | + | 7,431 |
| Total investment income | | 1,515,873 |
| Expenses |
| Investment adviser and administrator fees | + | 49,313 |
| Total expenses | | 49,313 |
| Expense reduction by CSIM and its affiliates | – | 29,571 |
| Net expenses | – | 19,742 |
| Net investment income | | 1,496,131 |
| Realized and Unrealized Gains (Losses) |
| Net realized losses on sales of affiliated underlying funds | | (197,409) |
| Net change in unrealized appreciation (depreciation) on affiliated underlying funds | + | 1,741,300 |
| Net realized and unrealized gains | | 1,543,891 |
| Increase in net assets resulting from operations | | $3,040,022 |
Schwab Target Index Funds | Annual Report
Schwab Target 2045 Index Fund
Statement of Changes in Net Assets
For the current and prior report periods
| Operations | |
| | 4/1/18-3/31/19 | 4/1/17-3/31/18 |
| Net investment income | | $1,496,131 | $533,128 |
| Net realized losses | | (197,409) | (3,964) |
| Net change in unrealized appreciation (depreciation) | + | 1,741,300 | 1,322,616 |
| Increase in net assets from operations | | 3,040,022 | 1,851,780 |
| Distributions to Shareholders1,2 | |
| Total distributions | | ($1,405,947) | ($435,414) |
| Transactions in Fund Shares1 | | | |
| | | 4/1/18-3/31/19 | 4/1/17-3/31/18 |
| | | SHARES | VALUE | SHARES | VALUE |
| Shares Sold | | | | | |
| Investor Shares | | — | $— | 70,062 | $748,563 |
| Institutional Shares | + | 4,266,684 | 50,692,490 | 3,955,636 | 45,583,166 |
| Total shares sold | | 4,266,684 | $50,692,490 | 4,025,698 | $46,331,729 |
| Shares Reinvested | | | | | |
| Investor Shares | | — | $— | — | $— |
| Institutional Shares | + | 126,299 | 1,356,451 | 36,340 | 433,529 |
| Total shares reinvested | | 126,299 | $1,356,451 | 36,340 | $433,529 |
| Shares Redeemed | | | | | |
| Investor Shares | | — | $— | (768,157) | ($8,347,681) |
| Institutional Shares | + | (1,153,341) | (13,710,070) | (314,609) | (3,702,897) |
| Total shares redeemed | | (1,153,341) | ($13,710,070) | (1,082,766) | ($12,050,578) |
| Net transactions in fund shares | | 3,239,642 | $38,338,871 | 2,979,272 | $34,714,680 |
| Shares Outstanding and Net Assets | | | |
| | | 4/1/18-3/31/19 | 4/1/17-3/31/18 |
| | | SHARES | NET ASSETS | SHARES | NET ASSETS |
| Beginning of period | | 3,795,888 | $44,816,810 | 816,616 | $8,685,764 |
| Total increase | + | 3,239,642 | 39,972,946 | 2,979,272 | 36,131,046 |
| End of period3 | | 7,035,530 | $84,789,756 | 3,795,888 | $44,816,810 |
| 1 | Effective July 24, 2017, all outstanding Investor Shares (38,619 shares valued at $433,875) were consolidated into the Institutional Shares, resulting in a single class of shares of the fund. |
| 2 | For the period ended March 31, 2018, the Institutional Share class of the fund distributed to shareholders $434,386 from net investment income and $1,028 from net realized gains. The SEC eliminated the requirement to disclose distributions to shareholders from net investment income and from net realized gains in 2018 (see financial note 8 for additional information). |
| 3 | End of period - Net assets includes net investment income not yet distributed of $130,761 at March 31, 2018. The SEC eliminated the requirement to disclose undistributed net investment income in 2018. |
Schwab Target Index Funds | Annual Report
Schwab Target 2050 Index Fund
Financial Statements
Financial Highlights
| | 4/1/18–
3/31/19 | 4/1/17–
3/31/181 | 8/25/162–
3/31/17 | | | |
| Per-Share Data |
| Net asset value at beginning of period | $11.85 | $10.65 | $10.00 | | | |
| Income (loss) from investment operations: | | | | | | |
| Net investment income (loss)3 | 0.29 | 0.28 | 0.15 | | | |
| Net realized and unrealized gains (losses) | 0.18 | 1.09 | 0.62 | | | |
| Total from investment operations | 0.47 | 1.37 | 0.77 | | | |
| Less distributions: | | | | | | |
| Distributions from net investment income | (0.23) | (0.17) | (0.12) | | | |
| Distributions from net realized gains | — | (0.00)4 | — | | | |
| Total distributions | (0.23) | (0.17) | (0.12) | | | |
| Net asset value at end of period | $12.09 | $11.85 | $10.65 | | | |
| Total return | 4.23% | 12.85% | 7.80%5 | | | |
| Ratios/Supplemental Data |
| Ratios to average net assets: | | | | | | |
| Net operating expenses6 | 0.03% | 0.03% | 0.02%7 | | | |
| Gross operating expenses6 | 0.08% | 0.08% | 0.08%7 | | | |
| Net investment income (loss) | 2.48% | 2.37% | 2.54%7 | | | |
| Portfolio turnover rate | 0%8 | 15% | 4%5 | | | |
| Net assets, end of period (x 1,000) | $88,727 | $37,619 | $793 | | | |
| |
1
Effective July 24, 2017, the Investor Share class and the Institutional Share class were consolidated into a single class of shares of the fund. The financial history as shown in the financial highlights is that of the former Institutional Shares.
2
Commencement of operations.
3
Calculated based on the average shares outstanding during the period.
4
Per-share amount was less than $0.005.
5
Not annualized.
6
The expenses incurred by the underlying funds in which the fund invests are not included in these ratios. If the expenses incurred by the underlying funds were included in these ratios they would have increased by 0.05%, 0.05% and 0.06% (annualized), respectively, for the periods ended March 31, 2019, March 31, 2018 and March 31, 2017 (see financial note 4).
7
Annualized.
8
Less than 0.5%
Schwab Target Index Funds | Annual Report
Schwab Target 2050 Index Fund
Portfolio Holdings as of March 31, 2019
This section shows all the securities in the fund’s portfolio and their values as of the report date.
The fund files its complete schedule of portfolio holdings with the U.S. Securities and Exchange Commission (SEC) for the first and third quarters of each fiscal year on Form N-Q. The fund’s Form N-Q is available on the SEC’s website atwww.sec.gov. The fund also makes available its complete schedule of portfolio holdings 15 to 20 days after the end of the month on the fund’s website atwww.schwabfunds.com/schwabfunds_prospectus.
| Security | Number
of Shares | Value ($) |
| Affiliated Underlying Funds99.2% of net assets |
| |
| U.S. Stocks 54.5% |
| Large-Cap 48.3% |
| Schwab U.S. Large-Cap ETF | 633,861 | 42,855,342 |
| Small-Cap 6.2% |
| Schwab U.S. Small-Cap ETF | 78,484 | 5,488,386 |
| | | 48,343,728 |
| |
| International Stocks 31.3% |
| Developed-Market Large-Cap 24.6% |
| Schwab International Equity ETF | 696,932 | 21,820,941 |
| Emerging-Market 6.7% |
| Schwab Emerging Markets Equity ETF | 230,979 | 6,007,764 |
| | | 27,828,705 |
| |
| Real Assets 4.5% |
| Real Estate 4.5% |
| Schwab U.S. REIT ETF | 90,386 | 4,015,850 |
| |
| Fixed Income 8.5% |
| Intermediate-Term Bond 8.1% |
| Schwab U.S. Aggregate Bond ETF | 139,000 | 7,211,320 |
| Treasury Bond 0.4% |
| Schwab Short-Term U.S. Treasury ETF | 6,881 | 345,357 |
| | | 7,556,677 |
| |
| Security | Number
of Shares | Value ($) |
| Money Market Fund 0.4% |
| Schwab Variable Share Price Money Fund, Ultra Shares 2.45%(a) | 333,509 | 333,609 |
| Total Affiliated Underlying Funds |
| (Cost $85,424,257) | | 88,078,569 |
Issuer
Rate, Maturity Date | Face
Amount ($) | Value ($) |
| Short-Term Investment0.4% of net assets |
| |
| Time Deposit 0.4% |
| Barclays Capital, Inc. |
| 1.78%, 04/01/19(b) | 333,212 | 333,212 |
| Total Short-Term Investment |
| (Cost $333,212) | | 333,212 |
| (a) | The rate shown is the 7-day yield. |
| (b) | The rate shown is the current daily overnight rate. |
| | |
| ETF — | Exchange-traded fund |
| REIT — | Real Estate Investment Trust |
Below is a summary of the fund’s transactions with its affiliated underlying funds during the period ended March 31, 2019:
| Affiliated Underlying Funds | Balance
of Shares
Held at
03/31/18 | Gross
Purchases | Gross
Sales | Balance
of Shares
Held at
03/31/19 | Market
Value at
03/31/19 | Net Change
in Unrealized
Appreciation
(depreciation) | Realized
Gains (Losses) | Distributions
Received* |
| Schwab Emerging Markets Equity ETF | 88,901 | 142,078 | — | 230,979 | $6,007,764 | ($215,153) | $— | $115,736 |
| Schwab International Equity ETF | 278,260 | 418,804 | (132) | 696,932 | 21,820,941 | (911,412) | (231) | 478,882 |
| Schwab Short-Term U.S. Treasury ETF | 2,734 | 4,148 | (1) | 6,881 | 345,357 | 2,426 | (1) | 3,742 |
| Schwab U.S. Aggregate Bond ETF | 57,561 | 81,439 | — | 139,000 | 7,211,320 | 151,444 | — | 130,189 |
| Schwab U.S. Large-Cap ETF | 288,072 | 345,789 | — | 633,861 | 42,855,342 | 2,167,719 | — | 620,847 |
| Schwab U.S. REIT ETF | 45,467 | 44,919 | — | 90,386 | 4,015,850 | 440,163 | — | 84,116 |
| Schwab U.S. Small-Cap ETF | 33,895 | 44,589 | — | 78,484 | 5,488,386 | 11,066 | — | 53,835 |
| Schwab Variable Share Price Money Fund, Ultra Shares | — | 433,489 | (99,980) | 333,509 | 333,609 | (23) | (10) | 4,022 |
| Total | | | | | $88,078,569 | $1,646,230 | ($242) | $1,491,369 |
| * | Distributions received include distributions from net investment income and capital gains, if any, from the underlying funds. |
| | |
Schwab Target Index Funds | Annual Report
Schwab Target 2050 Index Fund
Portfolio Holdings as of March 31, 2019 (continued)
The following is a summary of the inputs used to value the fund’s investments as of March 31, 2019 (see financial note 2(a) for additional information):
| Description | Quoted Prices in
Active Markets for
Identical Assets
(Level 1) | Other Significant
Observable Inputs
(Level 2) | Significant
Unobservable Inputs
(Level 3) | Total | |
| Assets | | | | | |
| Affiliated Underlying Funds1 | $88,078,569 | $— | $— | $88,078,569 | |
| Short-Term Investment1 | — | 333,212 | — | 333,212 | |
| Total | $88,078,569 | $333,212 | $— | $88,411,781 | |
| 1 | As categorized in Portfolio Holdings. |
Fund investments in underlying mutual funds and ETFs are classified as Level 1, without consideration to the classification level of the investments held by the underlying mutual funds and ETFs, which could be Level 1, Level 2 or Level 3.
Schwab Target Index Funds | Annual Report
Schwab Target 2050 Index Fund
Statement of Assets and Liabilities
As of March 31, 2019
| Assets |
| Investments in affiliated underlying funds, at value (cost $85,424,257) | | $88,078,569 |
| Investments in unaffiliated issuers, at value (cost $333,212) | | 333,212 |
| Receivables: | | |
| Fund shares sold | | 319,680 |
| Dividends | | 380 |
| Interest | + | 49 |
| Total assets | | 88,731,890 |
| Liabilities |
| Payables: | | |
| Investment adviser fees | | 2,302 |
| Fund shares redeemed | + | 2,580 |
| Total liabilities | | 4,882 |
| Net Assets |
| Total assets | | 88,731,890 |
| Total liabilities | – | 4,882 |
| Net assets | | $88,727,008 |
| Net Assets by Source | | |
| Capital received from investors | | 85,858,094 |
| Total distributable earnings1 | | 2,868,914 |
| Net Asset Value (NAV) |
| Net Assets | ÷ | Shares
Outstanding | = | NAV |
| $88,727,008 | | 7,337,173 | | $12.09 |
| | | | | |
| 1 | The SEC eliminated the requirement to disclose total distributable earnings (loss) by each of its components as previously disclosed as the previous presentation did not provide insight into the tax implications of distributions (see financial note 8 for additional information). |
Schwab Target Index Funds | Annual Report
Schwab Target 2050 Index Fund
Statement of Operations
For the period April 1, 2018 through March 31, 2019
| Investment Income |
| Dividends received from affiliated underlying funds | | $1,491,369 |
| Interest | + | 6,572 |
| Total investment income | | 1,497,941 |
| Expenses |
| Investment adviser and administrator fees | + | 47,766 |
| Total expenses | | 47,766 |
| Expense reduction by CSIM and its affiliates | – | 28,877 |
| Net expenses | – | 18,889 |
| Net investment income | | 1,479,052 |
| Realized and Unrealized Gains (Losses) |
| Net realized losses on sales of affiliated underlying funds | | (242) |
| Net change in unrealized appreciation (depreciation) on affiliated underlying funds | + | 1,646,230 |
| Net realized and unrealized gains | | 1,645,988 |
| Increase in net assets resulting from operations | | $3,125,040 |
Schwab Target Index Funds | Annual Report
Schwab Target 2050 Index Fund
Statement of Changes in Net Assets
For the current and prior report periods
| Operations | |
| | 4/1/18-3/31/19 | 4/1/17-3/31/18 |
| Net investment income | | $1,479,052 | $394,092 |
| Net realized losses | | (242) | (14,466) |
| Net change in unrealized appreciation (depreciation) | + | 1,646,230 | 803,919 |
| Increase in net assets from operations | | 3,125,040 | 1,183,545 |
| Distributions to Shareholders1,2 | |
| Total distributions | | ($1,342,563) | ($312,886) |
| Transactions in Fund Shares1 | | | |
| | | 4/1/18-3/31/19 | 4/1/17-3/31/18 |
| | | SHARES | VALUE | SHARES | VALUE |
| Shares Sold | | | | | |
| Investor Shares | | — | $— | 39,004 | $420,083 |
| Institutional Shares | + | 5,016,544 | 59,703,635 | 3,463,797 | 40,274,493 |
| Total shares sold | | 5,016,544 | $59,703,635 | 3,502,801 | $40,694,576 |
| Shares Reinvested | | | | | |
| Investor Shares | | — | $— | — | $— |
| Institutional Shares | + | 121,931 | 1,310,755 | 25,736 | 308,064 |
| Total shares reinvested | | 121,931 | $1,310,755 | 25,736 | $308,064 |
| Shares Redeemed | | | | | |
| Investor Shares | | — | $— | (577,713) | ($6,279,065) |
| Institutional Shares | + | (977,064) | (11,689,203) | (388,252) | (4,501,719) |
| Total shares redeemed | | (977,064) | ($11,689,203) | (965,965) | ($10,780,784) |
| Net transactions in fund shares | | 4,161,411 | $49,325,187 | 2,562,572 | $30,221,856 |
| Shares Outstanding and Net Assets | | | |
| | | 4/1/18-3/31/19 | 4/1/17-3/31/18 |
| | | SHARES | NET ASSETS | SHARES | NET ASSETS |
| Beginning of period | | 3,175,762 | $37,619,344 | 613,190 | $6,526,829 |
| Total increase | + | 4,161,411 | 51,107,664 | 2,562,572 | 31,092,515 |
| End of period3 | | 7,337,173 | $88,727,008 | 3,175,762 | $37,619,344 |
| 1 | Effective July 24, 2017, all outstanding Investor Shares (25,350 shares valued at $285,263) were consolidated into the Institutional Shares, resulting in a single class of shares of the fund. |
| 2 | For the period ended March 31, 2018, the Institutional Share class of the fund distributed to shareholders $311,235 from net investment income and $1,651 from net realized gains. The SEC eliminated the requirement to disclose distributions to shareholders from net investment income and from net realized gains in 2018 (see financial note 8 for additional information). |
| 3 | End of period - Net assets includes net investment income not yet distributed of $96,398 at March 31, 2018. The SEC eliminated the requirement to disclose undistributed net investment income in 2018. |
Schwab Target Index Funds | Annual Report
Schwab Target 2055 Index Fund
Financial Statements
Financial Highlights
| | 4/1/18–
3/31/19 | 4/1/17–
3/31/181 | 8/25/162–
3/31/17 | | | |
| Per-Share Data |
| Net asset value at beginning of period | $11.91 | $10.67 | $10.00 | | | |
| Income (loss) from investment operations: | | | | | | |
| Net investment income (loss)3 | 0.31 | 0.27 | 0.15 | | | |
| Net realized and unrealized gains (losses) | 0.15 | 1.15 | 0.65 | | | |
| Total from investment operations | 0.46 | 1.42 | 0.80 | | | |
| Less distributions: | | | | | | |
| Distributions from net investment income | (0.23) | (0.18) | (0.13) | | | |
| Distributions from net realized gains | — | (0.00)4 | — | | | |
| Total distributions | (0.23) | (0.18) | (0.13) | | | |
| Net asset value at end of period | $12.14 | $11.91 | $10.67 | | | |
| Total return | 4.15% | 13.25% | 8.03%5 | | | |
| Ratios/Supplemental Data |
| Ratios to average net assets: | | | | | | |
| Net operating expenses6 | 0.03% | 0.03% | 0.02%7 | | | |
| Gross operating expenses6 | 0.08% | 0.08% | 0.08%7 | | | |
| Net investment income (loss) | 2.60% | 2.33% | 2.53%7 | | | |
| Portfolio turnover rate | 6% | 23% | 14%5 | | | |
| Net assets, end of period (x 1,000) | $50,403 | $17,713 | $147 | | | |
| |
1
Effective July 24, 2017, the Investor Share class and the Institutional Share class were consolidated into a single class of shares of the fund. The financial history as shown in the financial highlights is that of the former Institutional Shares.
2
Commencement of operations.
3
Calculated based on the average shares outstanding during the period.
4
Per-share amount was less than $0.005.
5
Not annualized.
6
The expenses incurred by the underlying funds in which the fund invests are not included in these ratios. If the expenses incurred by the underlying funds were included in these ratios they would have increased by 0.05%, 0.05% and 0.06% (annualized), respectively, for the periods ended March 31, 2019, March 31, 2018 and March 31, 2017 (see financial note 4).
7
Annualized.
Schwab Target Index Funds | Annual Report
Schwab Target 2055 Index Fund
Portfolio Holdings as of March 31, 2019
This section shows all the securities in the fund’s portfolio and their values as of the report date.
The fund files its complete schedule of portfolio holdings with the U.S. Securities and Exchange Commission (SEC) for the first and third quarters of each fiscal year on Form N-Q. The fund’s Form N-Q is available on the SEC’s website atwww.sec.gov. The fund also makes available its complete schedule of portfolio holdings 15 to 20 days after the end of the month on the fund’s website atwww.schwabfunds.com/schwabfunds_prospectus.
| Security | Number
of Shares | Value ($) |
| Affiliated Underlying Funds99.2% of net assets |
| |
| U.S. Stocks 55.5% |
| Large-Cap 49.1% |
| Schwab U.S. Large-Cap ETF | 365,854 | 24,735,389 |
| Small-Cap 6.4% |
| Schwab U.S. Small-Cap ETF | 46,648 | 3,262,095 |
| | | 27,997,484 |
| |
| International Stocks 32.7% |
| Developed-Market Large-Cap 25.5% |
| Schwab International Equity ETF | 410,647 | 12,857,357 |
| Emerging-Market 7.2% |
| Schwab Emerging Markets Equity ETF | 138,593 | 3,604,804 |
| | | 16,462,161 |
| |
| Real Assets 4.7% |
| Real Estate 4.7% |
| Schwab U.S. REIT ETF | 53,664 | 2,384,292 |
| |
| Fixed Income 6.3% |
| Intermediate-Term Bond 6.1% |
| Schwab U.S. Aggregate Bond ETF | 58,724 | 3,046,601 |
| Security | Number
of Shares | Value ($) |
| Treasury Bond 0.2% |
| Schwab Short-Term U.S. Treasury ETF | 2,311 | 115,989 |
| | | 3,162,590 |
| Total Affiliated Underlying Funds |
| (Cost $48,305,873) | | 50,006,527 |
Issuer
Rate, Maturity Date | Face
Amount ($) | Value ($) |
| Short-Term Investment0.7% of net assets |
| |
| Time Deposit 0.7% |
| Barclays Capital, Inc. |
| 1.78%, 04/01/19(a) | 342,342 | 342,342 |
| Total Short-Term Investment |
| (Cost $342,342) | | 342,342 |
| (a) | The rate shown is the current daily overnight rate. |
| | |
| ETF — | Exchange-traded fund |
| REIT — | Real Estate Investment Trust |
Below is a summary of the fund’s transactions with its affiliated underlying funds during the period ended March 31, 2019:
| Affiliated Underlying Funds | Balance
of Shares
Held at
03/31/18 | Gross
Purchases | Gross
Sales | Balance
of Shares
Held at
03/31/19 | Market
Value at
03/31/19 | Net Change
in Unrealized
Appreciation
(depreciation) | Realized
Gains (Losses) | Distributions
Received* |
| Schwab Emerging Markets Equity ETF | 45,056 | 101,067 | (7,530) | 138,593 | $3,604,804 | ($45,339) | ($52,309) | $69,534 |
| Schwab International Equity ETF | 134,706 | 295,328 | (19,387) | 410,647 | 12,857,357 | (384,905) | (114,360) | 275,073 |
| Schwab Short-Term U.S. Treasury ETF | 704 | 1,607 | — | 2,311 | 115,989 | 1,051 | — | 1,323 |
| Schwab U.S. Aggregate Bond ETF | 19,710 | 41,613 | (2,599) | 58,724 | 3,046,601 | 70,926 | (5,178) | 48,287 |
| Schwab U.S. Large-Cap ETF | 138,325 | 241,017 | (13,488) | 365,854 | 24,735,389 | 1,112,238 | (97,324) | 337,259 |
| Schwab U.S. REIT ETF | 21,966 | 34,271 | (2,573) | 53,664 | 2,384,292 | 233,054 | (3,672) | 45,150 |
| Schwab U.S. Small-Cap ETF | 16,723 | 30,790 | (865) | 46,648 | 3,262,095 | (18,722) | (7,746) | 30,661 |
| Total | | | | | $50,006,527 | $968,303 | ($280,589) | $807,287 |
| * | Distributions received include distributions from net investment income and capital gains, if any, from the underlying funds. |
| | |
Schwab Target Index Funds | Annual Report
Schwab Target 2055 Index Fund
Portfolio Holdings as of March 31, 2019 (continued)
The following is a summary of the inputs used to value the fund’s investments as of March 31, 2019 (see financial note 2(a) for additional information):
| Description | Quoted Prices in
Active Markets for
Identical Assets
(Level 1) | Other Significant
Observable Inputs
(Level 2) | Significant
Unobservable Inputs
(Level 3) | Total | |
| Assets | | | | | |
| Affiliated Underlying Funds1 | $50,006,527 | $— | $— | $50,006,527 | |
| Short-Term Investment1 | — | 342,342 | — | 342,342 | |
| Total | $50,006,527 | $342,342 | $— | $50,348,869 | |
| 1 | As categorized in Portfolio Holdings. |
Fund investments in underlying ETFs are classified as Level 1, without consideration to the classification level of the investments held by the underlying ETFs, which could be Level 1, Level 2 or Level 3.
Schwab Target Index Funds | Annual Report
Schwab Target 2055 Index Fund
Statement of Assets and Liabilities
As of March 31, 2019
| Assets |
| Investments in affiliated underlying funds, at value (cost $48,305,873) | | $50,006,527 |
| Investments in unaffiliated issuers, at value (cost $342,342) | | 342,342 |
| Receivables: | | |
| Fund shares sold | | 220,534 |
| Interest | + | 50 |
| Total assets | | 50,569,453 |
| Liabilities |
| Payables: | | |
| Investments bought | | 107,111 |
| Investment adviser fees | | 1,298 |
| Fund shares redeemed | + | 57,955 |
| Total liabilities | | 166,364 |
| Net Assets |
| Total assets | | 50,569,453 |
| Total liabilities | – | 166,364 |
| Net assets | | $50,403,089 |
| Net Assets by Source | | |
| Capital received from investors | | 48,917,567 |
| Total distributable earnings1 | | 1,485,522 |
| Net Asset Value (NAV) |
| Net Assets | ÷ | Shares
Outstanding | = | NAV |
| $50,403,089 | | 4,151,924 | | $12.14 |
| | | | | |
| 1 | The SEC eliminated the requirement to disclose total distributable earnings (loss) by each of its components as previously disclosed as the previous presentation did not provide insight into the tax implications of distributions (see financial note 8 for additional information). |
Schwab Target Index Funds | Annual Report
Schwab Target 2055 Index Fund
Statement of Operations
For the period April 1, 2018 through March 31, 2019
| Investment Income |
| Dividends received from affiliated underlying funds | | $807,287 |
| Interest | + | 3,706 |
| Total investment income | | 810,993 |
| Expenses |
| Investment adviser and administrator fees | + | 24,618 |
| Total expenses | | 24,618 |
| Expense reduction by CSIM and its affiliates | – | 14,903 |
| Net expenses | – | 9,715 |
| Net investment income | | 801,278 |
| Realized and Unrealized Gains (Losses) |
| Net realized losses on sales of affiliated underlying funds | | (280,589) |
| Net change in unrealized appreciation (depreciation) on affiliated underlying funds | + | 968,303 |
| Net realized and unrealized gains | | 687,714 |
| Increase in net assets resulting from operations | | $1,488,992 |
Schwab Target Index Funds | Annual Report
Schwab Target 2055 Index Fund
Statement of Changes in Net Assets
For the current and prior report periods
| Operations | |
| | 4/1/18-3/31/19 | 4/1/17-3/31/18 |
| Net investment income | | $801,278 | $206,373 |
| Net realized losses | | (280,589) | (58,924) |
| Net change in unrealized appreciation (depreciation) | + | 968,303 | 544,463 |
| Increase in net assets from operations | | 1,488,992 | 691,912 |
| Distributions to Shareholders1,2 | |
| Total distributions | | ($719,620) | ($168,327) |
| Transactions in Fund Shares1 | | | |
| | | 4/1/18-3/31/19 | 4/1/17-3/31/18 |
| | | SHARES | VALUE | SHARES | VALUE |
| Shares Sold | | | | | |
| Investor Shares | | — | $— | 17,867 | $192,529 |
| Institutional Shares | + | 3,163,692 | 37,868,864 | 1,686,862 | 19,680,707 |
| Total shares sold | | 3,163,692 | $37,868,864 | 1,704,729 | $19,873,236 |
| Shares Reinvested | | | | | |
| Investor Shares | | — | $— | — | $— |
| Institutional Shares | + | 64,898 | 698,954 | 13,482 | 162,317 |
| Total shares reinvested | | 64,898 | $698,954 | 13,482 | $162,317 |
| Shares Redeemed | | | | | |
| Investor Shares | | — | $— | (356,382) | ($3,887,407) |
| Institutional Shares | + | (564,085) | (6,647,372) | (226,707) | (2,717,640) |
| Total shares redeemed | | (564,085) | ($6,647,372) | (583,089) | ($6,605,047) |
| Net transactions in fund shares | | 2,664,505 | $31,920,446 | 1,135,122 | $13,430,506 |
| Shares Outstanding and Net Assets | | | |
| | | 4/1/18-3/31/19 | 4/1/17-3/31/18 |
| | | SHARES | NET ASSETS | SHARES | NET ASSETS |
| Beginning of period | | 1,487,419 | $17,713,271 | 352,297 | $3,759,180 |
| Total increase | + | 2,664,505 | 32,689,818 | 1,135,122 | 13,954,091 |
| End of period3 | | 4,151,924 | $50,403,089 | 1,487,419 | $17,713,271 |
| 1 | Effective July 24, 2017, there were no outstanding Investor Shares and the Investor Share class was consolidated into the Institutional Share class, resulting in a single class of shares of the fund. |
| 2 | For the period ended March 31, 2018, the Institutional Share class of the fund distributed to shareholders $167,658 from net investment income and $669 from net realized gains. The SEC eliminated the requirement to disclose distributions to shareholders from net investment income and from net realized gains in 2018 (see financial note 8 for additional information). |
| 3 | End of period - Net assets includes net investment income not yet distributed of $47,048 at March 31, 2018. The SEC eliminated the requirement to disclose undistributed net investment income in 2018. |
Schwab Target Index Funds | Annual Report
Schwab Target 2060 Index Fund
Financial Statements
Financial Highlights
| | 4/1/18–
3/31/19 | 4/1/17–
3/31/181 | 8/25/162–
3/31/17 | | | |
| Per-Share Data |
| Net asset value at beginning of period | $11.92 | $10.68 | $10.00 | | | |
| Income (loss) from investment operations: | | | | | | |
| Net investment income (loss)3 | 0.30 | 0.29 | 0.18 | | | |
| Net realized and unrealized gains (losses) | 0.17 | 1.12 | 0.62 | | | |
| Total from investment operations | 0.47 | 1.41 | 0.80 | | | |
| Less distributions: | | | | | | |
| Distributions from net investment income | (0.23) | (0.17) | (0.12) | | | |
| Distributions from net realized gains | (0.00)4 | (0.00)4 | — | | | |
| Total distributions | (0.23) | (0.17) | (0.12) | | | |
| Net asset value at end of period | $12.16 | $11.92 | $10.68 | | | |
| Total return | 4.23% | 13.22% | 8.11%5 | | | |
| Ratios/Supplemental Data |
| Ratios to average net assets: | | | | | | |
| Net operating expenses6 | 0.03% | 0.03% | 0.02%7 | | | |
| Gross operating expenses6 | 0.08% | 0.08% | 0.08%7 | | | |
| Net investment income (loss) | 2.50% | 2.43% | 2.94%7 | | | |
| Portfolio turnover rate | 2% | 19% | 0%5 | | | |
| Net assets, end of period (x 1,000) | $58,895 | $24,224 | $166 | | | |
| |
1
Effective July 24, 2017, the Investor Share class and the Institutional Share class were consolidated into a single class of shares of the fund. The financial history as shown in the financial highlights is that of the former Institutional Shares.
2
Commencement of operations.
3
Calculated based on the average shares outstanding during the period.
4
Per-share amount was less than $0.005.
5
Not annualized.
6
The expenses incurred by the underlying funds in which the fund invests are not included in these ratios. If the expenses incurred by the underlying funds were included in these ratios they would have increased by 0.05%, 0.05% and 0.06% (annualized), respectively, for the periods ended March 31, 2019, March 31, 2018 and March 31, 2017 (see financial note 4).
7
Annualized.
Schwab Target Index Funds | Annual Report
Schwab Target 2060 Index Fund
Portfolio Holdings as of March 31, 2019
This section shows all the securities in the fund’s portfolio and their values as of the report date.
The fund files its complete schedule of portfolio holdings with the U.S. Securities and Exchange Commission (SEC) for the first and third quarters of each fiscal year on Form N-Q. The fund’s Form N-Q is available on the SEC’s website atwww.sec.gov. The fund also makes available its complete schedule of portfolio holdings 15 to 20 days after the end of the month on the fund’s website atwww.schwabfunds.com/schwabfunds_prospectus.
| Security | Number
of Shares | Value ($) |
| Affiliated Underlying Funds98.6% of net assets |
| |
| U.S. Stocks 56.1% |
| Large-Cap 49.4% |
| Schwab U.S. Large-Cap ETF | 429,822 | 29,060,265 |
| Small-Cap 6.7% |
| Schwab U.S. Small-Cap ETF | 56,698 | 3,964,891 |
| | | 33,025,156 |
| |
| International Stocks 33.3% |
| Developed-Market Large-Cap 25.8% |
| Schwab International Equity ETF | 485,890 | 15,213,216 |
| Emerging-Market 7.5% |
| Schwab Emerging Markets Equity ETF | 169,891 | 4,418,865 |
| | | 19,632,081 |
| |
| Real Assets 4.8% |
| Real Estate 4.8% |
| Schwab U.S. REIT ETF | 63,280 | 2,811,530 |
| |
| Fixed Income 4.4% |
| Intermediate-Term Bond 4.2% |
| Schwab U.S. Aggregate Bond ETF | 48,397 | 2,510,837 |
| Security | Number
of Shares | Value ($) |
| Treasury Bond 0.2% |
| Schwab Short-Term U.S. Treasury ETF | 1,965 | 98,623 |
| | | 2,609,460 |
| Total Affiliated Underlying Funds |
| (Cost $56,101,968) | | 58,078,227 |
Issuer
Rate, Maturity Date | Face
Amount ($) | Value ($) |
| Short-Term Investment0.4% of net assets |
| |
| Time Deposit 0.4% |
| Barclays Capital, Inc. |
| 1.78%, 04/01/19(a) | 255,050 | 255,050 |
| Total Short-Term Investment |
| (Cost $255,050) | | 255,050 |
| (a) | The rate shown is the current daily overnight rate. |
| | |
| ETF — | Exchange-traded fund |
| REIT — | Real Estate Investment Trust |
Below is a summary of the fund’s transactions with its affiliated underlying funds during the period ended March 31, 2019:
| Affiliated Underlying Funds | Balance
of Shares
Held at
03/31/18 | Gross
Purchases | Gross
Sales | Balance
of Shares
Held at
03/31/19 | Market
Value at
03/31/19 | Net Change
in Unrealized
Appreciation
(depreciation) | Realized
Gains (Losses) | Distributions
Received* |
| Schwab Emerging Markets Equity ETF | 63,815 | 108,944 | (2,868) | 169,891 | $4,418,865 | ($122,711) | ($14,096) | $84,023 |
| Schwab International Equity ETF | 187,735 | 306,713 | (8,558) | 485,890 | 15,213,216 | (562,249) | (24,521) | 325,667 |
| Schwab Short-Term U.S. Treasury ETF | 750 | 1,215 | — | 1,965 | 98,623 | 739 | — | 1,195 |
| Schwab U.S. Aggregate Bond ETF | 20,623 | 27,774 | — | 48,397 | 2,510,837 | 52,880 | — | 46,061 |
| Schwab U.S. Large-Cap ETF | 190,996 | 246,211 | (7,385) | 429,822 | 29,060,265 | 1,456,009 | (1,978) | 416,196 |
| Schwab U.S. REIT ETF | 30,149 | 34,165 | (1,034) | 63,280 | 2,811,530 | 298,942 | (37) | 57,099 |
| Schwab U.S. Small-Cap ETF | 23,761 | 33,359 | (422) | 56,698 | 3,964,891 | 1,560 | 389 | 38,122 |
| Total | | | | | $58,078,227 | $1,125,170 | ($40,243) | $968,363 |
| * | Distributions received include distributions from net investment income and capital gains, if any, from the underlying funds. |
| | |
Schwab Target Index Funds | Annual Report
Schwab Target 2060 Index Fund
Portfolio Holdings as of March 31, 2019 (continued)
The following is a summary of the inputs used to value the fund’s investments as of March 31, 2019 (see financial note 2(a) for additional information):
| Description | Quoted Prices in
Active Markets for
Identical Assets
(Level 1) | Other Significant
Observable Inputs
(Level 2) | Significant
Unobservable Inputs
(Level 3) | Total | |
| Assets | | | | | |
| Affiliated Underlying Funds1 | $58,078,227 | $— | $— | $58,078,227 | |
| Short-Term Investment1 | — | 255,050 | — | 255,050 | |
| Total | $58,078,227 | $255,050 | $— | $58,333,277 | |
| 1 | As categorized in Portfolio Holdings. |
Fund investments in underlying ETFs are classified as Level 1, without consideration to the classification level of the investments held by the underlying ETFs, which could be Level 1, Level 2 or Level 3.
Schwab Target Index Funds | Annual Report
Schwab Target 2060 Index Fund
Statement of Assets and Liabilities
As of March 31, 2019
| Assets |
| Investments in affiliated underlying funds, at value (cost $56,101,968) | | $58,078,227 |
| Investments in unaffiliated issuers, at value (cost $255,050) | | 255,050 |
| Receivables: | | |
| Fund shares sold | | 722,057 |
| Interest | + | 38 |
| Total assets | | 59,055,372 |
| Liabilities |
| Payables: | | |
| Investments bought | | 120,105 |
| Investment adviser fees | | 1,495 |
| Fund shares redeemed | + | 38,888 |
| Total liabilities | | 160,488 |
| Net Assets |
| Total assets | | 59,055,372 |
| Total liabilities | – | 160,488 |
| Net assets | | $58,894,884 |
| Net Assets by Source | | |
| Capital received from investors | | 56,851,462 |
| Total distributable earnings1 | | 2,043,422 |
| Net Asset Value (NAV) |
| Net Assets | ÷ | Shares
Outstanding | = | NAV |
| $58,894,884 | | 4,843,988 | | $12.16 |
| | | | | |
| 1 | The SEC eliminated the requirement to disclose total distributable earnings (loss) by each of its components as previously disclosed as the previous presentation did not provide insight into the tax implications of distributions (see financial note 8 for additional information). |
Schwab Target Index Funds | Annual Report
Schwab Target 2060 Index Fund
Statement of Operations
For the period April 1, 2018 through March 31, 2019
| Investment Income |
| Dividends received from affiliated underlying funds | | $968,363 |
| Interest | + | 3,370 |
| Total investment income | | 971,733 |
| Expenses |
| Investment adviser and administrator fees | + | 30,721 |
| Total expenses | | 30,721 |
| Expense reduction by CSIM and its affiliates | – | 18,751 |
| Net expenses | – | 11,970 |
| Net investment income | | 959,763 |
| Realized and Unrealized Gains (Losses) |
| Net realized losses on sales of affiliated underlying funds | | (40,243) |
| Net change in unrealized appreciation (depreciation) on affiliated underlying funds | + | 1,125,170 |
| Net realized and unrealized gains | | 1,084,927 |
| Increase in net assets resulting from operations | | $2,044,690 |
Schwab Target Index Funds | Annual Report
Schwab Target 2060 Index Fund
Statement of Changes in Net Assets
For the current and prior report periods
| Operations | |
| | 4/1/18-3/31/19 | 4/1/17-3/31/18 |
| Net investment income | | $959,763 | $267,713 |
| Net realized losses | | (40,243) | (35,269) |
| Net change in unrealized appreciation (depreciation) | + | 1,125,170 | 613,517 |
| Increase in net assets from operations | | 2,044,690 | 845,961 |
| Distributions to Shareholders1,2 | |
| Total distributions | | ($877,604) | ($218,728) |
| Transactions in Fund Shares1 | | | |
| | | 4/1/18-3/31/19 | 4/1/17-3/31/18 |
| | | SHARES | VALUE | SHARES | VALUE |
| Shares Sold | | | | | |
| Investor Shares | | — | $— | 24,825 | $268,264 |
| Institutional Shares | + | 3,551,607 | 42,513,767 | 2,376,464 | 27,814,838 |
| Total shares sold | | 3,551,607 | $42,513,767 | 2,401,289 | $28,083,102 |
| Shares Reinvested | | | | | |
| Investor Shares | | — | $— | — | $— |
| Institutional Shares | + | 77,722 | 837,066 | 17,393 | 209,765 |
| Total shares reinvested | | 77,722 | $837,066 | 17,393 | $209,765 |
| Shares Redeemed | | | | | |
| Investor Shares | | — | $— | (480,678) | ($5,239,087) |
| Institutional Shares | + | (817,989) | (9,846,664) | (376,711) | (4,491,147) |
| Total shares redeemed | | (817,989) | ($9,846,664) | (857,389) | ($9,730,234) |
| Net transactions in fund shares | | 2,811,340 | $33,504,169 | 1,561,293 | $18,562,633 |
| Shares Outstanding and Net Assets | | | |
| | | 4/1/18-3/31/19 | 4/1/17-3/31/18 |
| | | SHARES | NET ASSETS | SHARES | NET ASSETS |
| Beginning of period | | 2,032,648 | $24,223,629 | 471,355 | $5,033,763 |
| Total increase | + | 2,811,340 | 34,671,255 | 1,561,293 | 19,189,866 |
| End of period3 | | 4,843,988 | $58,894,884 | 2,032,648 | $24,223,629 |
| 1 | Effective July 24, 2017, all outstanding Investor Shares (21,010 shares valued at $237,542) were consolidated into the Institutional Shares, resulting in a single class of shares of the fund. |
| 2 | For the period ended March 31, 2018, the Institutional Share class of the fund distributed to shareholders $216,720 from net investment income and $2,008 from net realized gains. The SEC eliminated the requirement to disclose distributions to shareholders from net investment income and from net realized gains in 2018 (see financial note 8 for additional information). |
| 3 | End of period - Net assets includes net investment income not yet distributed of $63,184 at March 31, 2018. The SEC eliminated the requirement to disclose undistributed net investment income in 2018. |
Schwab Target Index Funds | Annual Report
Schwab Target Index Funds
1. Business Structure of the Funds:
Each of the funds in this report is a series of Schwab Capital Trust (the trust), a no-load, open-end management investment company. The trust is organized as a Massachusetts business trust and is registered under the Investment Company Act of 1940, as amended (the 1940 Act). The list below shows all the funds in the trust as of the end of the period, including the funds discussed in this report, which are highlighted:
| SCHWAB CAPITAL TRUST (ORGANIZED MAY 7, 1993) |
| Schwab Target 2010 Index Fund | Schwab Large-Cap Growth Fund |
| Schwab Target 2015 Index Fund | Schwab Small-Cap Equity Fund |
| Schwab Target 2020 Index Fund | Schwab Hedged Equity Fund |
| Schwab Target 2025 Index Fund | Schwab Health Care Fund |
| Schwab Target 2030 Index Fund | Schwab International Core Equity Fund |
| Schwab Target 2035 Index Fund | Schwab Target 2010 Fund |
| Schwab Target 2040 Index Fund | Schwab Target 2015 Fund |
| Schwab Target 2045 Index Fund | Schwab Target 2020 Fund |
| Schwab Target 2050 Index Fund | Schwab Target 2025 Fund |
| Schwab Target 2055 Index Fund | Schwab Target 2030 Fund |
| Schwab Target 2060 Index Fund | Schwab Target 2035 Fund |
| Schwab S&P 500 Index Fund | Schwab Target 2040 Fund |
| Schwab Small-Cap Index Fund® | Schwab Target 2045 Fund |
| Schwab Total Stock Market Index Fund® | Schwab Target 2050 Fund |
| Schwab U.S. Large-Cap Growth Index Fund | Schwab Target 2055 Fund |
| Schwab U.S. Large-Cap Value Index Fund | Schwab Target 2060 Fund |
| Schwab U.S. Mid-Cap Index Fund | Schwab Fundamental US Large Company Index Fund |
| Schwab International Index Fund® | Schwab Fundamental US Small Company Index Fund |
| Schwab MarketTrack All Equity Portfolio™ | Schwab Fundamental International Large Company Index Fund |
| Schwab MarketTrack Growth Portfolio™ | Schwab Fundamental International Small Company Index Fund |
| Schwab MarketTrack Balanced Portfolio™ | Schwab Fundamental Emerging Markets Large Company Index Fund |
| Schwab MarketTrack Conservative Portfolio™ | Schwab Fundamental Global Real Estate Index Fund |
| Laudus International MarketMasters Fund™ | Schwab Monthly Income Fund - Moderate Payout |
| Schwab Balanced Fund | Schwab Monthly Income Fund - Enhanced Payout |
| Schwab Core Equity Fund | Schwab Monthly Income Fund - Maximum Payout |
| Schwab Dividend Equity Fund | |
The Schwab Target Index Funds are “funds of funds.” Each of the funds seeks to achieve its investment objective by investing primarily in affiliated Schwab exchange-traded funds (ETFs). The funds may also invest in affiliated Schwab Funds and Laudus Funds and unaffiliated third-party ETFs and mutual funds (all such ETFs and mutual funds referred to as underlying funds), in accordance with their target portfolio allocation. Each fund may also invest directly in equity and fixed-income securities, cash and cash equivalents, including money market securities.
Each fund in this report offers one share class. Shares are bought and sold at closing net asset value per share (NAV), which is the price for all outstanding shares of a fund. Each share has a par value of 1/1,000 of a cent, and the funds’ Board of Trustees (the Board) may authorize the issuance of as many shares as necessary.
Each fund maintains its own account for purposes of holding assets and accounting, and is considered a separate entity for tax purposes. Within its account, each fund may also keep certain assets in segregated accounts, as required by securities law.
2. Significant Accounting Policies:
The following is a summary of the significant accounting policies the funds use in their preparation of financial statements. The funds follow the investment company accounting and reporting guidance of the Financial Accounting Standards Board (FASB) Accounting Standard CodificationTopic 946 Financial Services — Investment Companies. The accounting policies are in conformity with accounting principles generally accepted in the United States of America (GAAP).
The financial statements of the funds should be read in conjunction with the underlying funds’ financial statements. For more information about the underlying funds’ operations and policies, please refer to those funds’ semiannual and annual reports, which are filed with the U.S. Securities and Exchange Commission (SEC) and are available on the SEC’s website at www.sec.gov.
Effective November 5, 2018, the funds adopted SEC Regulation S-X disclosure requirement changes. The adopted changes are reflected throughout this report.
Schwab Target Index Funds | Annual Report
Schwab Target Index Funds
Financial Notes(continued)
2. Significant Accounting Policies (continued):
(a) Security Valuation:
Under procedures approved by the Board, the investment adviser has formed a Pricing Committee to administer the pricing and valuation of portfolio securities and other assets and to ensure that prices used for internal purposes or provided by third parties reasonably reflect fair market value. Among other things, these procedures allow the funds to utilize independent pricing services, quotations from securities and financial instrument dealers and other market sources to determine fair value.
The funds value the securities in their portfolios every business day. The funds use the following policies to value various types of securities:
• Underlying funds:Mutual funds are valued at their respective NAVs. ETFs traded on a recognized securities exchange are valued at the last reported sale price that day or the official closing price, if applicable.
• Securities for which no quoted value is available:The Board has adopted procedures to fair value each fund’s securities when market prices are not “readily available” or are unreliable. For example, a fund may fair value a security when it is de-listed or its trading is halted or suspended; when a security’s primary pricing source is unable or unwilling to provide a price; or when a security’s primary trading market is closed during regular market hours. Each fund makes fair value determinations in good faith in accordance with the fund’s valuation procedures. The Pricing Committee considers a number of factors, including unobservable market inputs when arriving at fair value. The Pricing Committee may employ techniques such as the review of related or comparable assets or liabilities, related market activities, recent transactions, market multiples, book values, transactional back-testing, disposition analysis and other relevant information. The Pricing Committee regularly reviews these inputs and assumptions to calibrate the valuations. Due to the subjective and variable nature of fair value pricing, there can be no assurance that a fund could obtain the fair value assigned to the security upon the sale of such security. The Board convenes on a regular basis to review fair value determinations made by the funds pursuant to the valuation procedures.
In accordance with the authoritative guidance on fair value measurements and disclosures under GAAP, the funds disclose the fair value of their investments in a hierarchy that prioritizes the significant inputs to valuation techniques used to measure the fair value. The hierarchy gives the highest priority to valuations based upon unadjusted quoted prices in active markets for identical assets or liabilities (Level 1 measurements) and the lowest priority to valuations based upon unobservable inputs that are significant to the valuation (Level 3 measurements). If inputs used to measure the financial instruments fall within different levels of the hierarchy, the categorization is based on the lowest level input that is significant to the valuation. If the funds determine that either the volume and/or level of activity for an asset or liability has significantly decreased (from normal conditions for that asset or liability) or price quotations or observable inputs are not associated with orderly transactions, increased analysis and management judgment will be required to estimate fair value.
The three levels of the fair value hierarchy are as follows:
• Level 1—quoted prices in active markets for identical securities—Investments whose values are based on quoted market prices in active markets, and whose values are therefore classified as Level 1 prices, include active listed equities and ETFs. Investments in mutual funds are valued daily at their NAVs, and investments in ETFs are valued daily at the last reported sale price or the official closing price, which are classified as Level 1 prices, without consideration to the classification level of the specific investments held by an underlying fund.
• Level 2—other significant observable inputs (including quoted prices for similar securities, interest rates, prepayment speeds, credit risk, etc.)—Investments that trade in markets that are not considered to be active, but whose values are based on quoted market prices, dealer quotations or valuations provided by alternative pricing sources supported by observable inputs are classified as Level 2 prices. These generally include U.S. government and sovereign obligations, most government agency securities, investment-grade corporate bonds, certain mortgage products, less liquid listed equities, and state, municipal and provincial obligations.
• Level 3—significant unobservable inputs (including the funds’ own assumptions in determining the fair value of investments)—Investments whose values are classified as Level 3 prices have significant unobservable inputs, as they may trade infrequently or not at all. When observable prices are not available for these securities, the funds use one or more valuation techniques for which sufficient and reliable data is available. The inputs used by the funds in estimating the value of Level 3 prices may include the original transaction price, quoted prices for similar securities or assets in active markets, completed or pending third-party transactions in the underlying investment or comparable issuers, and changes in financial ratios or cash flows. Level 3 prices may also be adjusted to reflect illiquidity and/or non-transferability, with the amount of such discount estimated by the funds in the absence of market information. Assumptions used by the funds due to the lack of observable inputs may significantly impact the resulting fair value and therefore the funds’ results of operations.
The inputs or methodology used for valuing securities are not necessarily an indication of the risk associated with investing in those securities.
Schwab Target Index Funds | Annual Report
Schwab Target Index Funds
Financial Notes(continued)
2. Significant Accounting Policies (continued):
The levels associated with valuing the funds’ investments as of March 31, 2019 are disclosed in the Portfolio Holdings.
(b) Accounting Policies for certain Portfolio Investments (if held):
Cash Management Transactions: The funds may subscribe to the Brown Brothers Harriman & Co. (BBH) Cash Management Service Sweep (CMS Sweep). The BBH CMS Sweep is an investment product that automatically sweeps the funds’ cash balances into overnight offshore time deposits with either the BBH Grand Cayman branch or a branch of a pre-approved commercial bank. This fully automated program allows the funds to earn interest on cash balances. Excess cash invested with deposit institutions domiciled outside of the U.S., as with any offshore deposit, may be subject to sovereign actions in the jurisdiction of the deposit institution including, but not limited to, freeze, seizure or diminution. The funds bear the risk associated with the repayment of principal and payment of interest on such instruments by the institution with which the deposit is ultimately placed. Balances in the CMS Sweep are accounted for on a cost basis, which approximates market value.
(c) Security Transactions:
Security transactions are recorded as of the date the order to buy or sell the security is executed. Realized gains and losses from security transactions are based on the identified costs of the securities involved.
(d) Investment Income:
Interest income is recorded as it accrues. Dividends and distributions from portfolio securities and underlying funds are recorded on the date they are effective (the ex-dividend date), although the funds record certain foreign security dividends on the day they learn of the ex-dividend date. Any distributions from underlying funds are recorded in accordance with the character of the distributions as designated by the underlying funds.
(e) Expenses:
Pursuant to the Amended and Restated Advisory Agreement (Advisory Agreement) between Charles Schwab Investment Management, Inc. (CSIM or the investment adviser) and the funds, the investment adviser will pay the operating expenses of each fund, including the cost of transfer agency, custody, fund administration, legal, audit and other services, but excluding shareholder servicing fees, acquired fund fees and expenses, taxes, any brokerage expenses and extraordinary or non-routine expenses.
(f) Distributions to Shareholders:
The funds make distributions from net investment income and net realized capital gains, if any, once a year.
(g) Accounting Estimates:
The accounting policies described in this report conform to GAAP. Notwithstanding this, shareholders should understand that in order to follow these principles, fund management has to make estimates and assumptions that affect the information reported in the financial statements. It’s possible that once the results are known, they may turn out to be different from these estimates and these differences may be material.
(h) Federal Income Taxes:
The funds intend to meet federal income and excise tax requirements for regulated investment companies under subchapter M of the Internal Revenue Code, as amended. Accordingly, the funds distribute substantially all of their net investment income and net realized capital gains, if any, to their respective shareholders each year. As long as a fund meets the tax requirements, it is not required to pay federal income tax.
(i) Indemnification:
Under the funds’ organizational documents, the officers and trustees are indemnified against certain liabilities arising out of the performance of their duties to the funds. In addition, in the normal course of business the funds enter into contracts with their vendors and others that provide general indemnifications. The funds’ maximum exposure under these arrangements is unknown as this would involve future claims that may be made against the funds. However, based on experience, the funds expect the risk of loss attributable to these arrangements to be remote.
(j) Recent Accounting Standards:
In August 2018, the FASB issued Accounting Standards Update “Fair Value Measurement (Topic 820)” (ASU 2018-13) which modifies the disclosure requirements for fair value measurement by removing, modifying, or adding certain disclosures. The amendments are effective for annual periods beginning after December 15, 2019, and interim periods within those annual periods. The funds are permitted to early adopt any removed or modified disclosures upon issuance of this update and delay adoption of the
Schwab Target Index Funds | Annual Report
Schwab Target Index Funds
Financial Notes(continued)
2. Significant Accounting Policies (continued):
additional disclosures until their effective date. The funds have early adopted certain removed or modified disclosures, including the amount of and reasons for transfers between Level 1 and Level 2 of the fair value hierarchy and the policy for timing of transfers between levels upon issuance of ASU 2018-13, and have delayed adoption of the additional disclosures until their effective date. At this time, management is currently evaluating the impact that the adoption of the additional disclosures will have on the funds’ financial statements.
3. Risk Factors:
Investing in the funds may involve certain risks, as discussed in the funds’ prospectus, including, but not limited to, those described below. Any of these risks could cause an investor to lose money.
Asset Allocation Risk. The funds are subject to the risk that the selection of the underlying funds and the allocation of a fund’s assets among the various asset classes and market segments may cause the fund to underperform other funds with a similar investment objective.
Conflicts of Interest Risk. The investment adviser’s authority to select and substitute underlying funds from a variety of affiliated and unaffiliated mutual funds and ETFs may create a conflict of interest because the fees paid to it and its affiliates by some underlying funds are higher than the fees paid by other underlying funds. The investment adviser also may have an incentive to select an affiliated underlying fund for other reasons, including to increase assets under management or to support new investment strategies. In addition, other conflicts of interest may exist where the best interests of the affiliated underlying fund may not be aligned with those of the fund. However, the investment adviser is a fiduciary to the fund and is legally obligated to act in the fund’s best interests when selecting underlying funds.
Market Risk.Financial markets rise and fall in response to a variety of factors, sometimes rapidly and unpredictably. As with any investment whose performance is tied to these markets, the value of an investment in the funds will fluctuate, which means that you could lose money over short or long periods.
ETF Risk.When a fund invests in an ETF, it will bear a proportionate share of the ETF’s expenses. Therefore, it may be more costly to own an ETF than to own underlying securities directly. In addition, while the risks of owning shares of an ETF generally reflect the risks of owning the underlying securities the ETF holds, lack of liquidity in the market for an ETF’s shares can result in its value being more volatile than the underlying portfolio of securities. Although ETFs are listed on national securities exchanges, there can be no assurance that an active trading market for such ETF shares will develop or be maintained. If an active market is not maintained, the fund may experience difficulty in buying or selling ETF shares. In addition, the market price of ETF shares may deviate, sometimes significantly, from net asset value, particularly during periods of market volatility. Certain ETFs that seek to track the performance of their benchmark indices may not fully replicate their index and may hold securities not included in the index, which may not produce the intended results.
Direct Investment Risk.The funds may invest directly in cash, cash equivalents and equity and fixed-income securities, including money market securities, to maintain their asset allocations. A fund’s direct investment in these securities is subject to the same or similar risks as an underlying fund’s investment in the same securities.
Underlying Fund Investment Risk.Before investing in the funds, investors should assess the risks associated with the underlying funds in which the funds may invest, which include any combination of the risks described below.
• Investment Risk.The funds may experience losses with respect to their investment in an underlying fund. Further, there is no guarantee that an underlying fund will be able to achieve its objective.
• Fixed Income Risk.Interest rates rise and fall over time, which will affect an underlying fund’s yield and share price. A change in a central bank’s monetary policy or improving economic conditions may result in an increase in interest rates. A rise in interest rates could cause an underlying fund’s shares price to fall. The credit quality of a portfolio investment could also cause an underlying fund’s share price to fall. An underlying fund could lose money if the issuer or guarantor of a portfolio investment or the counterparty to a derivatives contract fails to make timely principal or interest payments or otherwise honor its obligations. Fixed income securities may be paid off earlier or later than expected. Either situation could cause an underlying fund to hold securities paying lower-than-market rates of interest, which could hurt the fund’s yield or share price. Below investment-grade bonds (junk bonds) involve greater credit risk, are more volatile, involve greater risk of price declines and may be more susceptible to economic downturns than investment-grade securities.
• Equity Risk.The prices of equity securities rise and fall daily. These price movements may result from factors affecting individual companies, industries or the securities market as a whole. In addition, equity markets tend to move in cycles, which may cause stock prices to fall over short or extended periods of time.
Schwab Target Index Funds | Annual Report
Schwab Target Index Funds
Financial Notes(continued)
3. Risk Factors (continued):
• Market Capitalization Risk. Securities issued by companies of different market capitalizations tend to go in and out of favor based on market and economic conditions. During a period when securities of a particular market capitalization fall behind other types of investments, an underlying fund’s performance could be impacted.
• Money Market Fund Risk. The funds may invest in underlying money market funds that either seek to maintain a stable $1 net asset value (“stable share price money market funds”) or that have a share price that fluctuates (“variable share price money market funds”). Although an underlying stable share price money market fund seeks to maintain a stable $1 net asset value, it is possible to lose money by investing in such a money market fund. Because the share price of an underlying variable share price money market fund will fluctuate, when the fund sells the shares it owns they may be worth more or less than what the fund originally paid for them. In addition, neither type of money market fund is designed to offer capital appreciation. Certain underlying money market funds may impose a fee upon the sale of shares or may temporarily suspend the ability to sell shares if such fund’s liquidity falls below required minimums.
• Foreign Investment Risk. An underlying fund’s investments in securities of foreign issuers may involve certain risks that may be greater than those associated with investments in securities of U.S. issuers. These include risks of adverse changes in foreign economic, political, regulatory and other conditions; changes in currency exchange rates or exchange control regulations (including limitations on currency movements and exchanges); the imposition of economic sanctions or other government restrictions; differing accounting, auditing, financial reporting and legal standards and practices; differing securities market structures; and higher transaction costs. These risks may negatively impact the value or liquidity of an underlying fund’s investments, and could impair the underlying fund’s ability to meet its investment objective or invest in accordance with its investment strategy. There is a risk that investments in securities denominated in, and/or receiving revenues in, foreign currencies will decline in value relative to the U.S. dollar.
• Emerging Markets Risk.Emerging market countries may be more likely to experience political turmoil or rapid changes in market or economic conditions than more developed countries. Emerging market countries often have less uniformity in accounting and reporting requirements and greater risk associated with the custody of securities. In addition, the financial stability of issuers (including governments) in emerging market countries may be more precarious than in developed countries. As a result, there may be an increased risk of illiquidity and price volatility associated with an underlying fund’s investments in emerging market countries, which may be magnified by currency fluctuations relative to the U.S. dollar, and, at times, it may be difficult to value such investments.
• Derivatives Risk. An underlying fund may use derivatives to enhance returns or hedge against market declines. Examples of derivatives are options, futures, options on futures and swaps. An option is the right to buy or sell an instrument at a specific price before a specific date. A future is an agreement to buy or sell a financial instrument at a specific price on a specific day. A swap is an agreement whereby two parties agree to exchange payment streams calculated in relation to a rate, index, instrument or certain securities and a predetermined amount. A credit default swap is an agreement in which the seller agrees to make a payment to the buyer in the event of a specified credit event in exchange for a fixed payment or series of fixed payments.
An underlying fund’s use of derivative instruments involves risks different from or possibly greater than the risks associated with investing directly in securities and other traditional investments. Certain of these risks, such as credit risk, leverage risk, liquidity risk, market risk and management risk, are discussed elsewhere in this section. An underlying fund’s use of derivatives is also subject to lack of availability risk, valuation risk, correlation risk and tax risk. Lack of availability risk is the risk that suitable derivative transactions may not be available in all circumstances for risk management or other purposes. Valuation risk is the risk that a particular derivative may be valued incorrectly. Correlation risk is the risk that changes in the value of the derivative may not correlate perfectly with the underlying asset, rate or index. Tax risk is the risk that the use of derivatives may cause an underlying fund to realize higher amounts of short-term capital gains. An underlying fund’s use of derivatives could reduce the underlying fund’s performance, increase its volatility, and could cause the fund to lose more than the initial amount invested. The use of derivatives that are subject to regulation by the Commodity Futures Trading Commission (CFTC) by an underlying fund could cause a fund to become a commodity pool, which would require the fund to comply with certain CFTC rules.
• Leverage Risk.Certain underlying fund transactions, such as derivatives transactions, short sales, reverse repurchase agreements, and mortgage dollar rolls, may give rise to a form of leverage and may expose an underlying fund to greater risk. Leverage tends to magnify the effect of any decrease or increase in the value of an underlying fund’s portfolio securities, which means even a small amount of leverage can have a disproportionately large impact on the underlying fund.
• Concentration Risk. To the extent that an underlying fund’s portfolio is concentrated in the securities of issuers in a particular market, industry, group of industries, sector or asset class, the underlying fund may be adversely affected by the performance of those securities, may be subject to increased price volatility and may be more vulnerable to adverse economic, market, political or regulatory occurrences affecting that market, industry, group of industries, sector or asset class.
Schwab Target Index Funds | Annual Report
Schwab Target Index Funds
Financial Notes(continued)
3. Risk Factors (continued):
• Investment Style Risk. Certain underlying funds seek to track the performance of various segments of the stock market, as measured by their respective indices. Such underlying funds follow these stocks during upturns as well as downturns. Because of their indexing strategy, these underlying funds do not take steps to reduce market exposure or to lessen the effects of a declining market. In addition, because of an underlying fund’s expenses, the underlying fund’s performance is normally below that of the index.
• Liquidity Risk.An underlying fund may be unable to sell certain securities, such as illiquid securities, readily at a favorable time or price, or an underlying fund may have to sell them at a loss.
• Portfolio Turnover Risk.Certain of the underlying funds may buy and sell portfolio securities actively. If they do, their portfolio turnover rate and transaction costs will rise, which may lower the underlying fund’s performance and may increase the likelihood of capital gains distributions.
Please refer to the funds’ prospectus for a more complete description of the principal risks of investing in the funds.
4. Affiliates and Affiliated Transactions:
Investment Adviser
Charles Schwab Investment Management, Inc.(CSIM or the investment adviser), a wholly owned subsidiary of The Charles Schwab Corporation, serves as each fund’s investment adviser pursuant to the Advisory Agreement between CSIM and the trust.
For its advisory and administrative services to the funds, CSIM is entitled to receive an annual fee of 0.08%, payable monthly, based on a percentage of each fund’s average daily net assets.
Contractual Expense Limitations
CSIM and its affiliates have made an additional agreement with the funds, for so long as CSIM serves as the investment adviser to the funds, which may only be amended or terminated with the approval of the Board, to maintain the “net operating expenses” of each of the funds (including acquired fund fees and expenses, but excluding taxes and certain non-routine expenses) at 0.08%.
In the above agreement, CSIM and its affiliates have contractually agreed to waive acquired fund fees and expenses of the underlying funds in which the funds invest.
Investments in Affiliates
The funds may engage in certain transactions involving related parties. Pursuant to an exemptive order issued by the SEC, the funds may invest in other related funds. As of March 31, 2019, each Schwab Target Index Fund’s ownership percentages of other related funds’ shares are:
| Underlying Funds | Schwab
Target
2010
Index
Fund | Schwab
Target
2015
Index
Fund | Schwab
Target
2020
Index
Fund | Schwab
Target
2025
Index
Fund | Schwab
Target
2030
Index
Fund | Schwab
Target
2035
Index
Fund | Schwab
Target
2040
Index
Fund | Schwab
Target
2045
Index
Fund | Schwab
Target
2050
Index
Fund | Schwab
Target
2055
Index
Fund | Schwab
Target
2060
Index
Fund |
| Schwab Emerging Markets Equity ETF | —% | —% | 0.0%* | 0.1% | 0.1% | 0.1% | 0.1% | 0.1% | 0.1% | 0.1% | 0.1% |
| Schwab International Equity ETF | 0.0%* | 0.0%* | 0.1% | 0.1% | 0.2% | 0.1% | 0.2% | 0.1% | 0.1% | 0.1% | 0.1% |
| Schwab Short-Term U.S. Treasury ETF | 0.0%* | 0.1% | 0.2% | 0.1% | 0.1% | 0.0%* | 0.0%* | 0.0%* | 0.0%* | 0.0%* | 0.0%* |
| Schwab U.S. Aggregate Bond ETF | 0.2% | 0.3% | 0.8% | 0.9% | 0.9% | 0.5% | 0.4% | 0.2% | 0.1% | 0.1% | 0.0%* |
| Schwab U.S. Large-Cap ETF | 0.0%* | 0.1% | 0.2% | 0.3% | 0.5% | 0.3% | 0.4% | 0.3% | 0.3% | 0.2% | 0.2% |
| Schwab U.S. REIT ETF | 0.0%* | 0.0%* | 0.1% | 0.1% | 0.1% | 0.1% | 0.1% | 0.1% | 0.1% | 0.0%* | 0.1% |
| Schwab U.S. Small-Cap ETF | 0.0%* | 0.0%* | 0.0%* | 0.1% | 0.1% | 0.1% | 0.1% | 0.1% | 0.1% | 0.0%* | 0.0%* |
| Schwab U.S. TIPS ETF | 0.0%* | 0.0%* | 0.1% | 0.0%* | —% | —% | —% | —% | —% | —% | —% |
| Schwab Variable Share Price Money Fund, Ultra Shares | 0.0%* | 0.1% | 0.1% | 0.1% | 0.1% | 0.1% | 0.0%* | 0.0%* | 0.0%* | —% | —% |
Schwab Target Index Funds | Annual Report
Schwab Target Index Funds
Financial Notes(continued)
4. Affiliates and Affiliated Transactions (continued):
Interfund Borrowing and Lending
Pursuant to an exemptive order issued by the SEC, the funds may enter into interfund borrowing and lending transactions with other funds in the Fund Complex (for definition refer to Trustees and Officers section). All loans are for temporary or emergency purposes and the interest rate to be charged will be the average of the overnight repurchase agreement rate and the short-term bank loan rate. All loans are subject to numerous conditions designed to ensure fair and equitable treatment of all participating funds. The interfund lending facility is subject to the oversight and periodic review by the Board. The funds had no interfund borrowing or lending activity during the period.
5. Board of Trustees:
The Board may include people who are officers and/or directors of CSIM or its affiliates. Federal securities law limits the percentage of such “interested persons” who may serve on a trust’s board, and the trust was in compliance with these limitations throughout the report period. The funds do not pay any interested or non-interested trustees (independent trustees). The independent trustees are paid by CSIM. For information regarding the trustees, please refer to the Trustees and Officers table at the end of this report.
6. Borrowing from Banks:
During the period, the funds were participants with other U.S. registered investment companies managed by CSIM in a joint, syndicated, committed $605 million line of credit (the Syndicated Credit Facility), which matured on October 4, 2018. On October 4, 2018, the Syndicated Credit Facility was amended to run for a new 364 day period with an increased line of $750 million, maturing on October 3, 2019. Under the terms of the Syndicated Credit Facility, in addition to CSIM paying the interest charged on any borrowings by a fund, CSIM paid a commitment fee of 0.15% per annum on the funds’ proportionate share of the unused portion of the Syndicated Credit Facility.
During the period, the funds were participants with other U.S. registered investment companies managed by CSIM in a joint, unsecured, uncommitted $500 million line of credit (the Uncommitted Credit Facility), with State Street Bank and Trust Company, which matured on November 30, 2018. On November 30, 2018, the Uncommitted Credit Facility was amended to run for a new 364 day period, maturing on November 29, 2019. Under the terms of the Uncommitted Credit Facility, CSIM pays interest on the amount a fund borrows. There were no borrowings from either line of credit during the period.
The funds also have access to custodian overdraft facilities. A fund may have utilized the overdraft facility and incurred an interest expense, which is paid by CSIM. The interest expense is determined based on a negotiated rate above the current Federal Funds Rate.
7. Purchases and Sales of Investment Securities:
For the period ended March 31, 2019, purchases and sales of securities (excluding short-term obligations) were as follows:
| | Purchases
of Securities | Sales
of Securities |
| Schwab Target 2010 Index Fund | $16,097,673 | $5,539,355 |
| Schwab Target 2015 Index Fund | 32,772,892 | 8,566,085 |
| Schwab Target 2020 Index Fund | 68,349,290 | 12,596,489 |
| Schwab Target 2025 Index Fund | 81,851,582 | 15,352,003 |
| Schwab Target 2030 Index Fund | 99,609,700 | 12,318,613 |
| Schwab Target 2035 Index Fund | 66,657,237 | 5,761,425 |
| Schwab Target 2040 Index Fund | 69,089,381 | 1,913,397 |
| Schwab Target 2045 Index Fund | 42,250,443 | 4,275,049 |
| Schwab Target 2050 Index Fund | 49,278,672 | 104,462 |
| Schwab Target 2055 Index Fund | 33,604,358 | 1,877,131 |
| Schwab Target 2060 Index Fund | 33,841,047 | 941,104 |
Schwab Target Index Funds | Annual Report
Schwab Target Index Funds
Financial Notes(continued)
8. Federal Income Taxes:
As of March 31, 2019, the tax basis cost of the funds’ investments and gross unrealized appreciation and depreciation were as follows:
| | Schwab
Target
2010
Index Fund | | Schwab
Target
2015
Index Fund | | Schwab
Target
2020
Index Fund | | Schwab
Target
2025
Index Fund | | Schwab
Target
2030
Index Fund | | Schwab
Target
2035
Index Fund | | Schwab
Target
2040
Index Fund |
| Tax cost | $24,628,170 | | $44,332,858 | | $127,190,069 | | $148,982,951 | | $194,775,848 | | $121,230,205 | | $137,781,534 |
| Gross unrealized appreciation | $755,324 | | $1,355,021 | | $3,694,429 | | $5,580,381 | | $7,558,560 | | $5,111,033 | | $6,049,643 |
| Gross unrealized depreciation | — | | — | | (395,814) | | (568,355) | | (1,298,148) | | (681,632) | | (1,084,706) |
| Net unrealized appreciation (depreciation) | $755,324 | | $1,355,021 | | $3,298,615 | | $5,012,026 | | $6,260,412 | | $4,429,401 | | $4,964,937 |
| | Schwab
Target
2045
Index Fund | | Schwab
Target
2050
Index Fund | | Schwab
Target
2055
Index Fund | | Schwab
Target
2060
Index Fund |
| Tax cost | $81,072,973 | | $85,775,855 | | $48,997,387 | | $56,436,467 |
| Gross unrealized appreciation | $3,747,269 | | $3,442,421 | | $1,556,877 | | $2,312,672 |
| Gross unrealized depreciation | (628,170) | | (806,495) | | (205,395) | | (415,862) |
| Net unrealized appreciation (depreciation) | $3,119,099 | | $2,635,926 | | $1,351,482 | | $1,896,810 |
As of March 31, 2019, the components of distributable earnings on a tax basis were as follows:
| | Schwab
Target
2010
Index Fund | | Schwab
Target
2015
Index Fund | | Schwab
Target
2020
Index Fund | | Schwab
Target
2025
Index Fund | | Schwab
Target
2030
Index Fund | | Schwab
Target
2035
Index Fund | | Schwab
Target
2040
Index Fund |
| Undistributed ordinary income | $92,046 | | $161,667 | | $444,362 | | $521,219 | | $642,133 | | $389,960 | | $414,670 |
| Undistributed long-term capital gains | 2,761 | | — | | — | | 2,265 | | 7,927 | | 1,565 | | — |
| Net unrealized appreciation (depreciation) on investments | 755,324 | | 1,355,021 | | 3,298,615 | | 5,012,026 | | 6,260,412 | | 4,429,401 | | 4,964,937 |
| Total | $850,131 | | $1,516,688 | | $3,742,977 | | $5,535,510 | | $6,910,472 | | $4,820,926 | | $5,379,607 |
| | Schwab
Target
2045
Index Fund | | Schwab
Target
2050
Index Fund | | Schwab
Target
2055
Index Fund | | Schwab
Target
2060
Index Fund |
| Undistributed ordinary income | $234,762 | | $232,988 | | $134,040 | | $146,612 |
| Undistributed long-term capital gains | 2,874 | | — | | — | | — |
| Net unrealized appreciation (depreciation) on investments | 3,119,099 | | 2,635,926 | | 1,351,482 | | 1,896,810 |
| Total | $3,356,735 | | $2,868,914 | | $1,485,522 | | $2,043,422 |
The primary difference between book basis and tax basis unrealized appreciation or unrealized depreciation of investments is the tax deferral of losses on wash sales. The tax cost of the funds’ investments, disclosed above, have been adjusted from their book amounts to reflect these unrealized appreciation or depreciation differences, as applicable.
Capital loss carryforwards may be used to offset future realized capital gains for federal income tax purposes. As of March 31, 2019, the funds had no capital loss carryforwards available to offset future net capital gains.
Schwab Target Index Funds | Annual Report
Schwab Target Index Funds
Financial Notes(continued)
8. Federal Income Taxes (continued):
The tax basis components of distributions paid during the current and prior fiscal years were as follows:
| | Schwab
Target
2010
Index Fund | Schwab
Target
2015
Index Fund | Schwab
Target
2020
Index Fund | Schwab
Target
2025
Index Fund | Schwab
Target
2030
Index Fund | Schwab
Target
2035
Index Fund | Schwab
Target
2040
Index Fund |
| Current period distributions | | | | | | | |
| Ordinary income | $441,923 | $659,128 | $2,272,279 | $2,681,038 | $3,355,176 | $2,075,616 | $2,349,510 |
| Long-term capital gains | — | 494 | 3,776 | — | — | — | — |
| Prior period distributions | | | | | | | |
| Ordinary income | $135,570 | $188,670 | $593,229 | $805,306 | $904,232 | $604,017 | $687,787 |
| Long-term capital gains | — | — | — | — | — | — | — |
| | Schwab
Target
2045
Index Fund | Schwab
Target
2050
Index Fund | Schwab
Target
2055
Index Fund | Schwab
Target
2060
Index Fund |
| Current period distributions | | | | |
| Ordinary income | $1,405,947 | $1,342,563 | $719,620 | $877,604 |
| Long-term capital gains | — | — | — | — |
| Prior period distributions | | | | |
| Ordinary income | $435,414 | $312,886 | $168,327 | $218,728 |
| Long-term capital gains | — | — | — | — |
Distributions paid to shareholders are based on net investment income and net realized gains determined on a tax basis, which may differ from net investment income and net realized gains for financial reporting purposes. These differences reflect the differing character of certain income items and net realized gains and losses for financial statement and tax purposes, and may result in reclassification among certain capital accounts on the financial statements.
Permanent book and tax basis differences may result in reclassifications between components of net assets as required. The adjustments will have no impact on net assets or the results of operations.
As of March 31, 2019, management has reviewed the tax positions for open periods (for federal purposes, three years from the date of filing and for state purposes, four years from the date of filing) as applicable to the funds, and has determined that no provision for income tax is required in the funds’ financial statements. The funds recognize interest and penalties, if any, related to unrecognized tax benefits as income tax expense in the Statement of Operations. During the period ended March 31, 2019, the funds did not incur any interest or penalties.
9. Subsequent Events:
Management has determined there are no subsequent events or transactions through the date the financial statements were issued that would have materially impacted the financial statements as presented.
Schwab Target Index Funds | Annual Report
Schwab Target Index Funds
Report of Independent Registered Public Accounting Firm
To the Board of Trustees of Schwab Capital Trust and Shareholders of Schwab Target 2010 Index Fund, Schwab Target 2015 Index Fund, Schwab Target 2020 Index Fund, Schwab Target 2025 Index Fund, Schwab Target 2030 Index Fund, Schwab Target 2035 Index Fund, Schwab Target 2040 Index Fund, Schwab Target 2045 Index Fund, Schwab Target 2050 Index Fund, Schwab Target 2055 Index Fund and Schwab Target 2060 Index Fund
Opinions on the Financial Statements
We have audited the accompanying statements of assets and liabilities, including the portfolio holdings, of Schwab Target 2010 Index Fund, Schwab Target 2015 Index Fund, Schwab Target 2020 Index Fund, Schwab Target 2025 Index Fund, Schwab Target 2030 Index Fund, Schwab Target 2035 Index Fund, Schwab Target 2040 Index Fund, Schwab Target 2045 Index Fund, Schwab Target 2050 Index Fund, Schwab Target 2055 Index Fund and Schwab Target 2060 Index Fund (eleven of the funds constituting Schwab Capital Trust, hereafter collectively referred to as the “Funds”) as of March 31, 2019, the related statements of operations for the year ended March 31, 2019, the statements of changes in net assets for each of the two years in the period ended March 31, 2019, including the related notes, and the financial highlights for each of the periods indicated therein (collectively referred to as the “financial statements”). In our opinion, the financial statements present fairly, in all material respects, the financial position of each of the Funds as of March 31, 2019, the results of each of their operations for the year then ended, the changes in each of their net assets for each of the two years in the period ended March 31, 2019 and each of the financial highlights for each of the periods indicated therein in conformity with accounting principles generally accepted in the United States of America.
Basis for Opinions
These financial statements are the responsibility of the Funds’ management. Our responsibility is to express an opinion on the Funds’ financial statements based on our audits. We are a public accounting firm registered with the Public Company Accounting Oversight Board (United States) (PCAOB) and are required to be independent with respect to the Funds in accordance with the U.S. federal securities laws and the applicable rules and regulations of the Securities and Exchange Commission and the PCAOB.
We conducted our audits of these financial statements in accordance with the standards of the PCAOB. Those standards require that we plan and perform the audit to obtain reasonable assurance about whether the financial statements are free of material misstatement, whether due to error or fraud.
Our audits included performing procedures to assess the risks of material misstatement of the financial statements, whether due to error or fraud, and performing procedures that respond to those risks. Such procedures included examining, on a test basis, evidence regarding the amounts and disclosures in the financial statements. Our audits also included evaluating the accounting principles used and significant estimates made by management, as well as evaluating the overall presentation of the financial statements. Our procedures included confirmation of securities owned as of March 31, 2019 by correspondence with the custodian, transfer agent and brokers; when replies were not received from brokers, we performed other auditing procedures. We believe that our audits provide a reasonable basis for our opinions.
/s/ PricewaterhouseCoopers LLP
San Francisco, California
May 17, 2019
We have served as the auditor of one or more investment companies in Schwab Funds Complex since 1989.
Schwab Target Index Funds | Annual Report
Schwab Target Index Funds
Other Federal Tax Information (unaudited)
The funds may elect to pass on the benefits of the foreign tax credit to their shareholders for the period ended March 31, 2019. The foreign tax credit and the foreign source income amounts are as follows:
| | Foreign Tax Credit | Foreign Source Income |
| Schwab Target 2010 Index Fund | $6,651 | $65,854 |
| Schwab Target 2015 Index Fund | 11,879 | 117,623 |
| Schwab Target 2020 Index Fund | 45,932 | 411,249 |
| Schwab Target 2025 Index Fund | 76,580 | 653,881 |
| Schwab Target 2030 Index Fund | 118,530 | 983,464 |
| Schwab Target 2035 Index Fund | 88,120 | 716,979 |
| Schwab Target 2040 Index Fund | 112,978 | 902,115 |
| Schwab Target 2045 Index Fund | 72,293 | 569,648 |
| Schwab Target 2050 Index Fund | 75,687 | 591,179 |
| Schwab Target 2055 Index Fund | 43,736 | 342,607 |
| Schwab Target 2060 Index Fund | 52,738 | 407,310 |
For corporate shareholders, the following percentage of the funds’ dividend distributions paid during the fiscal year ended March 31, 2019, qualify for the corporate dividends received deduction:
| | Percentage |
| Schwab Target 2010 Index Fund | 18.15 |
| Schwab Target 2015 Index Fund | 19.00 |
| Schwab Target 2020 Index Fund | 21.71 |
| Schwab Target 2025 Index Fund | 27.17 |
| Schwab Target 2030 Index Fund | 31.08 |
| Schwab Target 2035 Index Fund | 33.33 |
| Schwab Target 2040 Index Fund | 35.92 |
| Schwab Target 2045 Index Fund | 37.64 |
| Schwab Target 2050 Index Fund | 38.95 |
| Schwab Target 2055 Index Fund | 38.80 |
| Schwab Target 2060 Index Fund | 40.09 |
For the fiscal year ended March 31, 2019, the funds designate the following amounts of the dividend distributions as qualified dividends for the purpose of the maximum rate under section 1(h)(11) of the Internal Revenue Code. Shareholders will be notified in January 2020 via IRS Form 1099 of the amounts for use in preparing their 2019 income tax return.
| | |
| Schwab Target 2010 Index Fund | $140,248 |
| Schwab Target 2015 Index Fund | 227,976 |
| Schwab Target 2020 Index Fund | 880,855 |
| Schwab Target 2025 Index Fund | 1,335,279 |
| Schwab Target 2030 Index Fund | 1,948,691 |
| Schwab Target 2035 Index Fund | 1,343,973 |
| Schwab Target 2040 Index Fund | 1,667,291 |
| Schwab Target 2045 Index Fund | 1,053,819 |
| Schwab Target 2050 Index Fund | 1,054,073 |
| Schwab Target 2055 Index Fund | 580,703 |
| Schwab Target 2060 Index Fund | 719,182 |
Schwab Target Index Funds | Annual Report
Schwab Target Index Funds
Other Federal Tax Information (unaudited)(continued)
Under section 852(b)(3)(C) of the Internal Revenue Code, the funds hereby designate the following amounts as long-term capital gain dividends for the fiscal year ended March 31, 2019:
| | |
| Schwab Target 2010 Index Fund | $— |
| Schwab Target 2015 Index Fund | 494 |
| Schwab Target 2020 Index Fund | 3,776 |
| Schwab Target 2025 Index Fund | — |
| Schwab Target 2030 Index Fund | — |
| Schwab Target 2035 Index Fund | — |
| Schwab Target 2040 Index Fund | — |
| Schwab Target 2045 Index Fund | — |
| Schwab Target 2050 Index Fund | — |
| Schwab Target 2055 Index Fund | — |
| Schwab Target 2060 Index Fund | — |
Schwab Target Index Funds | Annual Report
Schwab Target Index Funds
Trustees and Officers
The tables below give information about the trustees and officers of Schwab Capital Trust, which includes the funds covered in this report. The “Fund Complex” includes The Charles Schwab Family of Funds, Schwab Capital Trust, Schwab Investments, Schwab Annuity Portfolios, Schwab Strategic Trust and Laudus Trust. The Fund Complex includes 98 funds.
The address for all trustees and officers is 211 Main Street, San Francisco, CA 94105. You can find more information about the trustees and officers in the funds’ Statement of Additional Information, which is available free by calling 1-877-824-5615.
| Independent Trustees |
Name, Year of Birth, and
Position(s) with the trust
(Terms of office, and
length of Time Served1) | Principal Occupations
During the Past Five Years | Number of
Portfolios in
Fund Complex
Overseen by
the Trustee | Other Directorships |
Robert W. Burns
1959
Trustee
(Trustee of Schwab Strategic Trust since 2009; The Charles Schwab Family of Funds, Schwab Investments, Schwab Capital Trust, Schwab Annuity Portfolios and Laudus Trust since 2016) | Retired/Private Investor (Jan. 2009 – present). Formerly, Managing Director, Pacific Investment Management Company, LLC (PIMCO) (investment management firm) and President, PIMCO Funds. | 98 | None |
John F. Cogan
1947
Trustee
(Trustee of The Charles Schwab Family of Funds, Schwab Investments, Schwab Capital Trust and Schwab Annuity Portfolios since 2008; Laudus Trust since 2010; Schwab Strategic Trust since 2016) | Senior Fellow (Oct. 1979 – present), The Hoover Institution at Stanford University (public policy think tank); Senior Fellow (2000 – present), Stanford Institute for Economic Policy Research; Professor of Public Policy (1994 – 2015), Stanford University. | 98 | Director (2005 – present), Gilead Sciences, Inc. |
Nancy F. Heller
1956
Trustee
(Trustee of The Charles Schwab Family of Funds, Schwab Investments, Schwab Capital Trust, Schwab Annuity Portfolios, Schwab Strategic Trust and Laudus Trust since 2018) | President and Chairman (2014 – 2016), TIAA Charitable (financial services); Senior Managing Director (2003 – 2016), TIAA (financial services). | 98 | None |
Stephen Timothy Kochis
1946
Trustee
(Trustee of Schwab Strategic Trust since 2012; The Charles Schwab Family of Funds, Schwab Investments, Schwab Capital Trust, Schwab Annuity Portfolios and Laudus Trust since 2016) | CEO and Owner (May 2012 – present), Kochis Global (wealth management consulting). | 98 | None |
Schwab Target Index Funds | Annual Report
Schwab Target Index Funds
| Independent Trustees (continued) |
Name, Year of Birth, and
Position(s) with the trust
(Terms of office, and
length of Time Served1) | Principal Occupations
During the Past Five Years | Number of
Portfolios in
Fund Complex
Overseen by
the Trustee | Other Directorships |
David L. Mahoney
1954
Trustee
(Trustee of The Charles Schwab Family of Funds, Schwab Investments, Schwab Capital Trust, Schwab Annuity Portfolios and Laudus Trust since 2011; Schwab Strategic Trust since 2016) | Private Investor. | 98 | Director (2003 – present), Symantec Corporation
Director (2004 – present), Corcept Therapeutics Incorporated
Director (2009 – present), Adamas Pharmaceuticals, Inc. |
Jane P. Moncreiff
1961
Trustee
(Trustee of The Charles Schwab Family of Funds, Schwab Investments, Schwab Capital Trust, Schwab Annuity Portfolios, Schwab Strategic Trust and Laudus Trust since 2019) | Chief Investment Officer (2009-2017), CareGroup Healthcare System, Inc. (healthcare). | 98 | None |
Kiran M. Patel
1948
Trustee
(Trustee of The Charles Schwab Family of Funds, Schwab Investments, Schwab Capital Trust, Schwab Annuity Portfolios and Laudus Trust since 2011; Schwab Strategic Trust since 2016) | Retired. Executive Vice President and General Manager of Small Business Group (Dec. 2008 – Sept. 2013), Intuit, Inc. (financial software and services firm for consumers and small businesses). | 98 | Director (2008 – present), KLA-Tencor Corporation |
Kimberly S. Patmore
1956
Trustee
(Trustee of The Charles Schwab Family of Funds, Schwab Investments, Schwab Capital Trust, Schwab Annuity Portfolios, Schwab Strategic Trust and Laudus Trust since 2016) | Consultant (2008 – present), Patmore Management Consulting (management consulting). | 98 | None |
Gerald B. Smith
1950
Trustee
(Trustee of The Charles Schwab Family of Funds, Schwab Investments, Schwab Capital Trust and Schwab Annuity Portfolios since 2000; Laudus Trust since 2010; Schwab Strategic Trust since 2016) | Chairman, Chief Executive Officer and Founder (Mar. 1990 – present), Smith Graham & Co. (investment advisors). | 98 | Director (2012 – present), Eaton |
Schwab Target Index Funds | Annual Report
Schwab Target Index Funds
| Interested Trustees |
Name, Year of Birth, and
Position(s) with the trust
(Terms of office, and
length of Time Served1) | Principal Occupations
During the Past Five Years | Number of
Portfolios in
Fund Complex
Overseen by
the Trustee | Other Directorships |
Walter W. Bettinger II2
1960
Chairman and Trustee
(Trustee of The Charles Schwab Family of Funds, Schwab Investments, Schwab Capital Trust and Schwab Annuity Portfolios since 2008; Schwab Strategic Trust since 2009; Laudus Trust since 2010) | Director, President and Chief Executive Officer (Oct. 2008 – present), The Charles Schwab Corporation; President and Chief Executive Officer (Oct. 2008 – present) and Director (May 2008 – present), Charles Schwab & Co., Inc.; Director (Apr. 2006 – present), Charles Schwab Bank; Director (Nov. 2017 – present), Charles Schwab Premier Bank; Director (May 2008 – present) and President and Chief Executive Officer (Aug. 2017 – present), Schwab Holdings, Inc.; Director (July 2016 – present), Charles Schwab Investment Management, Inc. | 98 | Director (2008 – present), The Charles Schwab Corporation |
Jonathan de St. Paer2
1973
Trustee
(Trustee of The Charles Schwab Family of Funds, Schwab Investments, Schwab Capital Trust, Schwab Annuity Portfolios, Schwab Strategic Trust and Laudus Trust since 2019) | Director and Chief Executive Officer (Apr. 2019 – present) and President (Oct. 2018 – present) Charles Schwab Investment Management, Inc.; Trustee and Chief Executive Officer (Apr. 2019 – present) and President (Nov. 2018 – present), Schwab Funds, Laudus Funds and Schwab ETFs; Director (Apr. 2019 – present), Charles Schwab Worldwide Funds plc and Charles Schwab Asset Management (Ireland) Limited; Senior Vice President (Apr. 2019 – present), Senior Vice President – Strategy and Product Development (CSIM) (Jan. 2014 – Mar. 2019), and Vice President (Jan. 2009 – Dec. 2013), Charles Schwab & Co., Inc. | 98 | None |
Joseph R. Martinetto2
1962
Trustee
(Trustee of The Charles Schwab Family of Funds, Schwab Investments, Schwab Capital Trust, Schwab Annuity Portfolios, Schwab Strategic Trust and Laudus Trust since 2016) | Chief Operating Officer (Feb. 2018 – present) and Senior Executive Vice President (July 2015 – Feb. 2018), The Charles Schwab Corporation; Senior Executive Vice President (July 2015 – present), Charles Schwab & Co., Inc.; Chief Financial Officer (July 2015 – Aug. 2017) and Executive Vice President and Chief Financial Officer (May 2007 – July 2015), The Charles Schwab Corporation and Charles Schwab & Co., Inc.; Director (May 2007 – present), Charles Schwab & Co., Inc.; Director (Apr. 2010 – present) and Chief Executive Officer (July 2013 – Apr. 2015), Charles Schwab Bank; Director (Nov. 2017 – present), Charles Schwab Premier Bank; Director (May 2007 – present), Chief Financial Officer (May 2007 – Aug. 2017), Senior Executive Vice President (Feb. 2016 – present), and Executive Vice President (May 2007 – Feb. 2016), Schwab Holdings, Inc. | 98 | None |
| Officers of the Trust |
Name, Year of Birth, and Position(s) with the trust
(Terms of office, and length of Time Served3) | Principal Occupations During the Past Five Years |
Jonathan de St. Paer
1973
President and Chief Executive Officer
(Officer of The Charles Schwab Family of Funds, Schwab Investments, Schwab Capital Trust, Schwab Annuity Portfolios, Schwab Strategic Trust and Laudus Trust since 2018) | Director and Chief Executive Officer (Apr. 2019 – present) and President (Oct. 2018 – present) Charles Schwab Investment Management, Inc.; Trustee and Chief Executive Officer (Apr. 2019 – present) and President (Nov. 2018 – present), Schwab Funds, Laudus Funds and Schwab ETFs; Director (Apr. 2019 – present), Charles Schwab Worldwide Funds plc and Charles Schwab Asset Management (Ireland) Limited; Senior Vice President (Apr. 2019 – present), Senior Vice President – Strategy and Product Development (CSIM) (Jan. 2014 – Mar. 2019), and Vice President (Jan. 2009 – Dec. 2013), Charles Schwab & Co., Inc. |
Schwab Target Index Funds | Annual Report
Schwab Target Index Funds
| Officers of the Trust (continued) |
Name, Year of Birth, and Position(s) with the trust
(Terms of office, and length of Time Served3) | Principal Occupations During the Past Five Years |
Mark Fischer
1970
Treasurer and Chief Financial Officer
(Officer of The Charles Schwab Family of Funds, Schwab Investments, Schwab Capital Trust, Schwab Annuity Portfolios, Schwab Strategic Trust and Laudus Trust since 2013) | Treasurer and Chief Financial Officer (Jan. 2016 – present), Schwab Funds, Laudus Funds and Schwab ETFs; Assistant Treasurer (Dec. 2013 – Dec. 2015), Schwab Funds and Laudus Funds; Assistant Treasurer (Nov. 2013 – Dec. 2015), Schwab ETFs; Vice President (Oct. 2013 – present), Charles Schwab Investment Management, Inc.; Executive Director (Apr. 2011 – Sept. 2013), J.P. Morgan Investor Services; Assistant Treasurer (May 2005 – Mar. 2011), Massachusetts Financial Service Investment Management. |
George Pereira
1964
Senior Vice President and Chief Operating Officer
(Officer of The Charles Schwab Family of Funds, Schwab Investments, Schwab Capital Trust and Schwab Annuity Portfolios since 2004; Laudus Trust since 2006; Schwab Strategic Trust since 2009) | Senior Vice President and Chief Financial Officer (Nov. 2004 – present) and Chief Operating Officer (Jan. 2011 – present), Charles Schwab Investment Management, Inc.; Senior Vice President and Chief Operating Officer (Jan. 2016 – present), Schwab Funds, Laudus Funds and Schwab ETFs; Treasurer and Chief Financial Officer (June 2006 – Dec. 2015), Laudus Funds; Treasurer and Principal Financial Officer (Nov. 2004 – Dec. 2015), Schwab Funds; Treasurer and Principal Financial Officer (Oct. 2009 – Dec. 2015), Schwab ETFs; Director (Apr. 2005 – present), Charles Schwab Worldwide Funds plc and Charles Schwab Asset Management (Ireland) Limited. |
Omar Aguilar
1970
Senior Vice President and Chief Investment Officer – Equities and Multi-Asset Strategies
(Officer of The Charles Schwab Family of Funds, Schwab Investments, Schwab Capital Trust, Schwab Annuity Portfolios, Schwab Strategic Trust and Laudus Trust since 2011) | Senior Vice President and Chief Investment Officer – Equities and Multi-Asset Strategies (Apr. 2011 – present), Charles Schwab Investment Management, Inc.; Senior Vice President and Chief Investment Officer – Equities and Multi-Asset Strategies (June 2011 – present), Schwab Funds, Laudus Funds and Schwab ETFs; Head of the Portfolio Management Group and Vice President of Portfolio Management (May 2009 – Apr. 2011), Financial Engines, Inc. (investment management firm); Head of Quantitative Equity (July 2004 – Jan. 2009), ING Investment Management. |
Brett Wander
1961
Senior Vice President and Chief Investment Officer – Fixed Income
(Officer of The Charles Schwab Family of Funds, Schwab Investments, Schwab Capital Trust, Schwab Annuity Portfolios, Schwab Strategic Trust and Laudus Trust since 2011) | Senior Vice President and Chief Investment Officer – Fixed Income (Apr. 2011 – present), Charles Schwab Investment Management, Inc.; Senior Vice President and Chief Investment Officer – Fixed Income (June 2011 – present), Schwab Funds, Laudus Funds and Schwab ETFs; Senior Managing Director, Global Head of Active Fixed-Income Strategies (Jan. 2008 – Oct. 2010), State Street Global Advisors; Director of Alpha Strategies (Apr. 2006 – Jan. 2008), Loomis, Sayles & Company (investment management firm). |
David Lekich
1964
Chief Legal Officer and Secretary, Schwab Funds and Schwab ETFs
Vice President and Assistant Clerk, Laudus Funds
(Officer of The Charles Schwab Family of Funds, Schwab Investments, Schwab Capital Trust, Schwab Annuity Portfolios, Schwab Strategic Trust and Laudus Trust since 2011) | Senior Vice President (Sept. 2011 – present) and Vice President (Mar. 2004 – Sept. 2011), Charles Schwab & Co., Inc.; Senior Vice President and Chief Counsel (Sept. 2011 – present) and Vice President (Jan. 2011 – Sept. 2011), Charles Schwab Investment Management, Inc.; Secretary (Apr. 2011 – present) and Chief Legal Officer (Dec. 2011 – present), Schwab Funds; Vice President and Assistant Clerk (Apr. 2011 – present), Laudus Funds; Secretary (May 2011 – present) and Chief Legal Officer (Nov. 2011 – present), Schwab ETFs. |
Catherine MacGregor
1964
Vice President and Assistant Secretary, Schwab Funds and Schwab ETFs
Chief Legal Officer, Vice President and Clerk, Laudus Funds
(Officer of The Charles Schwab Family of Funds, Schwab Investments, Schwab Capital Trust, Schwab Annuity Portfolios and Laudus Trust since 2005; Schwab Strategic Trust since 2009) | Vice President (July 2005 – present), Charles Schwab & Co., Inc.; Vice President (Sept. 2005 – present), Charles Schwab Investment Management, Inc.; Vice President (Dec. 2005 – present) and Chief Legal Officer and Clerk (Mar. 2007 – present), Laudus Funds; Vice President (Nov. 2005 – present) and Assistant Secretary (June 2007 – present), Schwab Funds; Vice President and Assistant Secretary (Oct. 2009 – present), Schwab ETFs. |
| 1 | Each Trustee shall hold office until the election and qualification of his or her successor, or until he or she dies, resigns or is removed. The retirement policy requires that each independent trustee retire by December 31 of the year in which the Trustee turns 74 or the Trustee’s twentieth year of service as an independent trustee on any trust in the Fund Complex, whichever occurs first. |
| 2 | Mr. Bettinger, Mr. de St. Paer and Mr. Martinetto are Interested Trustees. Mr. Bettinger is an Interested Trustee because he owns stock of The Charles Schwab Corporation (CSC), the parent company of Charles Schwab Investment Management, Inc. (CSIM), the investment adviser for the trusts in the Fund Complex, is an employee and director of Charles Schwab & Co., Inc. (CS&Co), the principal underwriter for The Charles Schwab Family of Funds, Schwab Investments, Schwab Capital Trust, Schwab Annuity Portfolios and Laudus Trust, and is a director of CSIM. Mr. de St. Paer is an Interested Trustee because he owns stock of CSC and is an employee and director of CSIM. Mr. Martinetto is an Interested Trustee because he owns stock of CSC and is an employee and director of CS&Co. |
| 3 | The President, Treasurer and Secretary/Clerk hold office until their respective successors are chosen and qualified or until he or she sooner dies, resigns, is removed or becomes disqualified. Each of the other officers serves at the pleasure of the Board. |
Schwab Target Index Funds | Annual Report
Schwab Target Index Funds
asset allocation The practice of dividing a portfolio among different asset classes, with each asset class assigned a particular percentage.
asset class A group of securities with similar structure and basic characteristics. Stocks, bonds and cash are the three main examples of asset classes.
Bloomberg Barclays US Aggregate Bond Index An index that is a broad-based benchmark measuring the performance of the U.S. investment grade, taxable bond market, including U.S. Treasuries, government-related and corporate bonds, mortgage pass-through securities, commercial mortgage-backed securities, and asset-backed securities that are publicly available for sale in the United States. To be eligible for inclusion in the index, securities must be fixed rate, non-convertible, U.S. dollar denominated with at least $300 million or more of outstanding face value and have one or more years remaining to maturity. The index excludes certain types of securities, including tax-exempt state and local government series bonds, structured notes embedded with swaps or other special features, private placements, floating rate securities, inflation-linked bonds and Eurobonds. The index is market capitalization weighted and the securities in the index are updated on the last business day of each month.
Bloomberg Barclays US Treasury 1–3 Year Index An index which includes all publicly-issued U.S. Treasury securities that have a remaining maturity of greater than or equal to one year and less than three years, are rated investment grade, and have $250 million or more of outstanding face value. The securities in the index must be denominated in U.S. dollars and must be fixed-rate and non-convertible. The index excludes state and local government series bonds and coupon issues that have been stripped from bonds. The index is market capitalization weighted and the securities in the index are updated on the last business day of each month.
Bloomberg Barclays US Treasury Bills 1–3 Month Index An index that includes all publicly issued zero-coupon U.S. Treasury Bills that have a remaining maturity of less than 3 months but more than 1 month, are rated investment grade and have $250 million or more of outstanding face value. It excludes zero-coupon STRIPS.
Bloomberg Barclays US Treasury Inflation-Linked Bond Index (Series-L) An index which includes all publicly-issued U.S. Treasury Inflation-Protected Securities (TIPS) that have at least one year remaining to maturity, are rated investment grade and have $250 million or more of outstanding face value. The TIPS in the index must be denominated in U.S. dollars and must be fixed-rate and non-convertible. The index is market capitalization weighted and the TIPS in the index are updated on the last business day of each month. TIPS are publicly issued, dollar denominated U.S. Government securities issued by the U.S. Treasury that have principal and interest payments linked to an official inflation measure (as measured by the Consumer Price Index, or CPI) and their payments are supported by the full faith and credit of the United States.
bond A security representing a loan from the investor to the issuer. A bond typically pays interest at a fixed rate (the coupon rate) until a specified date (the maturity date), at which time the issuer returns the money borrowed (principal or face value) to the bondholder. Because of their structure, bonds are sometimes called “fixed income securities” or “debt securities.”
An individual bond is subject to the credit risk of the issuer. Changes in interest rates can affect a bond’s market value prior to call or maturity. There is no guarantee that a bond’s yield to call or maturity will provide a positive return over the rate of inflation.
bond fund A bond fund is subject to the same credit, interest rate, and inflation risks as bonds. In addition, a bond fund incurs ongoing fees and expenses. A bond fund’s net asset value will fluctuate with the price of the underlying bonds and the portfolio turnover activity; return of principal is not guaranteed.
cap, capitalization See “market cap.”
capital gain, capital loss the difference between the amount paid for an investment and its value at a later time. If the investment has been sold, the capital gain or loss is considered a realized gain or loss. If the investment is still held, the capital gain or loss is considered unrealized appreciation or depreciation.
Dow Jones U.S. Large-Cap Total Stock Market Index An index that is a subset of the Dow Jones U.S. Total Stock Market Index, and is designed to measure the performance of large-cap U.S. equity securities. The index is a float-adjusted market capitalization weighted index.
Dow Jones U.S. Select REIT Index An index that is a float-adjusted market-capitalization weighted index comprising of income-producing commercial and/or residential real estate investment trusts (REITs). The index excludes mortgage REITs, net-lease REITs, real estate finance companies, mortgage brokers and bankers, commercial and residential real estate brokers and estate agents, homebuilders, large landowners and sub dividers of unimproved land, hybrid REITs, timber REITs and companies that have more than 25% of their assets in direct mortgage investments.
Dow Jones U.S. Small-Cap Total Stock Market Index An index that is a subset of the Dow Jones U.S. Total Stock Market Index, and is designed to measure the performance of small-cap U.S. equity securities. The index is a float-adjusted market capitalization weighted index.
Dow Jones U.S. Total Stock Market Index An index which includes all publicly traded stocks of companies headquartered in the United States for which pricing information is readily available. The index is a float-adjusted market capitalization weighted index that reflects the shares of securities actually available to investors in the marketplace.
expense ratio The amount that is taken from a mutual fund’s assets each year to cover the fund’s operating expenses. An expense ratio of 0.50% means that a fund’s expenses amount to half of one percent of its average net assets a year.
FTSE Developed ex US Index (Net) An index that is comprised of large- and mid-capitalization companies in developed countries outside the United States, as defined by the index provider. The index defines the large- and mid-capitalization universe as approximately the top 90% of the eligible universe. The Net version of the index reflects reinvested dividends net of withholding taxes, but reflects no deductions for expenses or other taxes.
FTSE Emerging Index (Net) An index that is comprised of large- and mid-capitalization companies in emerging market countries, as defined by the index provider. The index defines the large- and mid-capitalization universe as approximately the top 90% of the eligible universe. The Net version of the index reflects reinvested dividends net of withholding taxes, but reflects no deductions for expenses or other taxes.
market cap, market capitalization The value of a company as determined by the total value of all shares of its stock outstanding.
Schwab Target Index Funds | Annual Report
Schwab Target Index Funds
MSCI EAFE Index (Net) A free float-adjusted market capitalization index that is designed to measure the equity market performance of developed markets in Europe, Australasia, and the Far East. The Net version of the index reflects reinvested dividends net of withholding taxes, but reflects no deductions for expenses or other taxes; returns are calculated applying dividend withholding rates applicable to non-resident persons who do not benefit from double taxation treaties.
net asset value (NAV) The value of one share of a mutual fund. NAV is calculated by taking the fund’s total assets, subtracting liabilities, and dividing by the number of shares outstanding.
outstanding shares, shares outstanding When speaking of a company or mutual fund, indicates all shares currently held by investors.
Russell 2000 Index An index that measures the performance of the 2,000 smallest companies in the Russell 3000 Index. The Russell 3000 Index measures the performance of the largest 3,000 U.S. companies representing approximately 98% of the investable U.S. equity market.
S&P 500 Index An index that is designed to measure the performance of 500 leading publicly traded companies from a broad range of industries.
stock A share of ownership, or equity, in the issuing company.
Target 2010 Passive Composite Index A custom blended index developed by CSIM based on the Target 2010 Index Fund’s asset allocation glide schedule and will become more conservative as time elapses. Effective February 1, 2019, the composite is derived using the following portion allocations: 23.1% Dow Jones U.S. Large-Cap Total Stock Market Index, 1.5% Dow Jones U.S. Small-Cap Total Stock Market Index, 9.6% FTSE Developed ex US Index (Net), 1.8% Dow Jones U.S. Select REIT Index, 8.7% Bloomberg Barclays US Treasury 1-3 Year Index, 41.7% Bloomberg Barclays US Aggregate Bond Index, 6.4% Bloomberg Barclays US Treasury Inflation-Linked Bond Index (Series-L), and 7.3% Bloomberg Barclays US Treasury Bills 1-3 Month Index. The components that make up the composite index may vary over time. The composite index represents target allocations for 2019. Percentages listed may not total to 100% due to rounding.
Target 2015 Passive Composite Index A custom blended index developed by CSIM based on the Target 2015 Index Fund’s asset allocation glide schedule and will become more conservative as time elapses. Effective February 1, 2019, the composite is derived using the following portion allocations: 24.4% Dow Jones U.S. Large-Cap Total Stock Market Index, 1.6% Dow Jones U.S. Small-Cap Total Stock Market Index, 10.6% FTSE Developed ex US Index (Net), 1.9% Dow Jones U.S. Select REIT Index, 8.2% Bloomberg Barclays US Treasury 1-3 Year Index, 40.3% Bloomberg Barclays US Aggregate Bond Index, 6.2% Bloomberg Barclays US Treasury Inflation-Linked Bond Index (Series-L), and 6.8% Bloomberg Barclays US Treasury Bills 1-3 Month Index. The components that make up the composite index may vary over time. The composite index represents target allocations for 2019. Percentages listed may not total to 100% due to rounding.
Target 2020 Passive Composite Index A custom blended index developed by CSIM based on the Target 2020 Index Fund’s asset allocation glide schedule and will become more conservative as time elapses. Effective February 1, 2019, the composite is derived using the following portion allocations: 26.5% Dow Jones U.S. Large-Cap Total Stock Market Index, 1.8% Dow Jones U.S. Small-Cap Total Stock Market Index, 11.7% FTSE Developed ex US Index (Net), 1.1% FTSE Emerging Index (Net), 2.2% Dow Jones U.S. Select REIT Index, 6.9% Bloomberg Barclays US Treasury 1-3 Year Index, 38.7% Bloomberg Barclays US Aggregate Bond Index, 5.1% Bloomberg Barclays US
Treasury Inflation-Linked Bond Index (Series-L), and 6.1% Bloomberg Barclays US Treasury Bills 1-3 Month Index. The components that make up the composite index may vary over time. The composite index represents target allocations for 2019. Percentages listed may not total to 100% due to rounding.
Target 2025 Passive Composite Index A custom blended index developed by CSIM based on the Target 2025 Index Fund’s asset allocation glide schedule and will become more conservative as time elapses. Effective February 1, 2019, the composite is derived using the following portion allocations: 33.6% Dow Jones U.S. Large-Cap Total Stock Market Index, 2.7% Dow Jones U.S. Small-Cap Total Stock Market Index, 15.5% FTSE Developed ex US Index (Net), 2.2% FTSE Emerging Index (Net), 2.8% Dow Jones U.S. Select REIT Index, 3.7% Bloomberg Barclays US Treasury 1-3 Year Index, 33.2% Bloomberg Barclays US Aggregate Bond Index, 1.9% Bloomberg Barclays US Treasury Inflation-Linked Bond Index (Series-L), and 4.5% Bloomberg Barclays US Treasury Bills 1-3 Month Index. The components that make up the composite index may vary over time. The composite index represents target allocations for 2019. Percentages listed may not total to 100% due to rounding.
Target 2030 Passive Composite Index A custom blended index developed by CSIM based on the Target 2030 Index Fund’s asset allocation glide schedule and will become more conservative as time elapses. Effective February 1, 2019, the composite is derived using the following portion allocations: 38.5% Dow Jones U.S. Large-Cap Total Stock Market Index, 3.5% Dow Jones U.S. Small-Cap Total Stock Market Index, 18.2% FTSE Developed ex US Index (Net), 3.2% FTSE Emerging Index (Net), 3.3% Dow Jones U.S. Select REIT Index, 2.1% Bloomberg Barclays US Treasury 1-3 Year Index, 27.8% Bloomberg Barclays US Aggregate Bond Index, and 3.3% Bloomberg Barclays US Treasury Bills 1-3 Month Index. The components that make up the composite index may vary over time. The composite index represents target allocations for 2019. Percentages listed may not total to 100% due to rounding.
Target 2035 Passive Composite Index A custom blended index developed by CSIM based on the Target 2035 Index Fund’s asset allocation glide schedule and will become more conservative as time elapses. Effective February 1, 2019, the composite is derived using the following portion allocations: 42.0% Dow Jones U.S. Large-Cap Total Stock Market Index, 4.3% Dow Jones U.S. Small-Cap Total Stock Market Index, 20.4% FTSE Developed ex US Index (Net), 4.2% FTSE Emerging Index (Net), 3.7% Dow Jones U.S. Select REIT Index, 1.3% Bloomberg Barclays US Treasury 1-3 Year Index, 21.5% Bloomberg Barclays US Aggregate Bond Index, and 2.5% Bloomberg Barclays US Treasury Bills 1-3 Month Index. The components that make up the composite index may vary over time. The composite index represents target allocations for 2019. Percentages listed may not total to 100% due to rounding.
Target 2040 Passive Composite Index A custom blended index developed by CSIM based on the Target 2040 Index Fund’s asset allocation glide schedule and will become more conservative as time elapses. Effective February 1, 2019, the composite is derived using the following portion allocations: 44.9% Dow Jones U.S. Large-Cap Total Stock Market Index, 5.1% Dow Jones U.S. Small-Cap Total Stock Market Index, 22.3% FTSE Developed ex US Index (Net), 5.2% FTSE Emerging Index (Net), 4.1% Dow Jones U.S. Select REIT Index, 0.8% Bloomberg Barclays US Treasury 1-3 Year Index, 15.7% Bloomberg Barclays US Aggregate Bond Index, and 1.8% Bloomberg Barclays US Treasury Bills 1-3 Month Index. The components that make up the composite index may vary over time. The composite index represents target allocations for 2019. Percentages listed may not total to 100% due to rounding.
Schwab Target Index Funds | Annual Report
Schwab Target Index Funds
Target 2045 Passive Composite Index A custom blended index developed by CSIM based on the Target 2045 Index Fund’s asset allocation glide schedule and will become more conservative as time elapses. Effective February 1, 2019, the composite is derived using the following portion allocations: 47.1% Dow Jones U.S. Large-Cap Total Stock Market Index, 5.8% Dow Jones U.S. Small-Cap Total Stock Market Index, 23.9% FTSE Developed ex US Index (Net), 6.2% FTSE Emerging Index (Net), 4.4% Dow Jones U.S. Select REIT Index, 0.5% Bloomberg Barclays US Treasury 1-3 Year Index, 10.9% Bloomberg Barclays US Aggregate Bond Index, and 1.3% Bloomberg Barclays US Treasury Bills 1-3 Month Index. The components that make up the composite index may vary over time. The composite index represents target allocations for 2019. Percentages listed may not total to 100% due to rounding.
Target 2050 Passive Composite Index A custom blended index developed by CSIM based on the Target 2050 Index Fund’s asset allocation glide schedule and will become more conservative as time elapses. Effective February 1, 2019, the composite is derived using the following portion allocations: 48.3% Dow Jones U.S. Large-Cap Total Stock Market Index, 6.2% Dow Jones U.S. Small-Cap Total Stock Market Index, 24.8% FTSE Developed ex US Index (Net), 6.7% FTSE Emerging Index (Net), 4.5% Dow Jones U.S. Select REIT Index, 0.4% Bloomberg Barclays US Treasury 1-3 Year Index, 8.2% Bloomberg Barclays US Aggregate Bond Index, and 1.0% Bloomberg Barclays US Treasury Bills 1-3 Month Index. The components that make up the composite index may vary over time. The composite index represents target allocations for 2019. Percentages listed may not total to 100% due to rounding.
Target 2055 Passive Composite Index A custom blended index developed by CSIM based on the Target 2055 Index Fund’s asset allocation glide schedule and will become more conservative as time elapses. Effective February 1, 2019, the composite is derived using the following portion allocations: 49.1% Dow Jones U.S. Large-Cap Total
Stock Market Index, 6.5% Dow Jones U.S. Small-Cap Total Stock Market Index, 25.5% FTSE Developed ex US Index (Net), 7.2% FTSE Emerging Index (Net), 4.7% Dow Jones U.S. Select REIT Index, 0.3% Bloomberg Barclays US Treasury 1-3 Year Index, 6.1% Bloomberg Barclays US Aggregate Bond Index, and 0.7% Bloomberg Barclays US Treasury Bills 1-3 Month Index. The components that make up the composite index may vary over time. The composite index represents target allocations for 2019. Percentages listed may not total to 100% due to rounding.
Target 2060 Passive Composite IndexA custom blended index developed by CSIM based on the Target 2060 Index Fund’s asset allocation glide schedule and will become more conservative as time elapses. Effective February 1, 2019, the composite is derived using the following portion allocations: 49.8% Dow Jones U.S. Large-Cap Total Stock Market Index, 6.8% Dow Jones U.S. Small-Cap Total Stock Market Index, 26.1% FTSE Developed ex US Index (Net), 7.5% FTSE Emerging Index (Net), 4.8% Dow Jones U.S. Select REIT Index, 0.2% Bloomberg Barclays US Treasury 1-3 Year Index, 4.3% Bloomberg Barclays US Aggregate Bond Index, and 0.5% Bloomberg Barclays US Treasury Bills 1-3 Month Index. The components that make up the composite index may vary over time. The composite index represents target allocations for 2019. Percentages listed may not total to 100% due to rounding.
total return The percentage that an investor would have earned or lost on an investment in the fund assuming dividends and distributions were reinvested.
weighted average For mutual funds, an average that gives the same weight to each security as the security represents in the fund’s portfolio.
yield The income paid out by an investment, expressed as a percentage of the investment’s market value.
Schwab Target Index Funds | Annual Report
Schwab Target Index Funds
PRIVACY NOTICE
THIS IS NOT PART OF THE SHAREHOLDER REPORT
A Commitment to Your Privacy
Your Privacy Is Not for Sale
We do not and will not sell your personal information to anyone, for any reason.
We are committed to protecting the privacy of information we maintain about you. Below are details about our commitment, including the types of information we collect and how we use and share that information. This Privacy Notice applies to you only if you are an individual who invests directly in the funds by placing orders through the funds’ transfer agent. If you place orders through your brokerage account at Charles Schwab & Co., Inc. or an account with another broker-dealer, investment advisor, 401(k) plan, employee benefit plan, administrator, bank or other financial intermediary, you are covered by the privacy policies of that financial institution and should consult those policies.
How We Collect Information About You
We collect personal information about you in a number of ways.
• APPLICATION AND REGISTRATION
INFORMATION.
We collect personal information from you when you open an account or utilize one of our services. We may also collect information about you from third parties such as consumer reporting agencies to verify your identity. The information we collect may include personal information, including your Social Security number, as well as details about your interests, investments and investment experience.
• TRANSACTION AND EXPERIENCE
INFORMATION.
Once your account has been opened, we collect and maintain personal information about your account activity, including your transactions, balances, positions and history. This information allows us to administer your account and provide the services you have requested.
• WEBSITE USAGE.
When you visit our websites, we may use devices known as “cookies,” graphic interchange format files (GIFs), or other similar web tools to enhance your web experience. These tools help us to recognize you, maintain your web session, and provide a more personalized experience. To learn more, please go to www.schwab.com/privacy.
How We Share and Use Your Information
We provide access to information about you to our affiliated companies, outside companies and other third parties in certain limited circumstances, including:
• to help us process transactions for your account;
• when we use other companies to provide services for us, such as printing and mailing your account statements;
• when we believe that disclosure is required or permitted under law (for example, to cooperate with regulators or law enforcement, resolve consumer disputes, perform credit/authentication checks, or for risk control).
State Laws
We will comply with state laws that apply to the disclosure or use of information about you.
Safeguarding Your Information — Security Is a
Partnership
We take precautions to ensure the information we collect about you is protected and is accessed only by authorized individuals or organizations.
Companies we use to provide support services are not allowed to use information about our shareholders for their own purposes and are contractually obligated to maintain strict confidentiality. We limit their use of information to the performance of the specific services we have requested.
We restrict access to personal information by our employees and agents. Our employees are trained about privacy and are required to safeguard personal information.
We maintain physical, electronic and procedural safeguards that comply with federal standards to guard your nonpublic personal information.
Contact Us
To provide us with updated information, report suspected fraud or identity theft, or for any other questions, please call the number below.
Schwab Funds® direct investors: 1-800-407-0256
© 2018 Schwab Funds. All rights reserved.
Schwab Target Index Funds | Annual Report
Schwab Target Index Funds
Charles Schwab Investment Management
With a straightforward lineup of core products and solutions for building the foundation of a portfolio, Charles Schwab Investment Management advocates for investors of all sizes with a steadfast focus on lowering costs and reducing unnecessary complexity. The list below shows all currently available Schwab Funds.
Investors should carefully consider information contained in the prospectus, or if available, the summary prospectus, including investment objectives, risks, charges and expenses before investing. Please call 1-877-824-5615 for a prospectus for any Schwab Fund. Please read the prospectus carefully before you invest. This report must be preceded or accompanied by a current prospectus.
Proxy Voting Policies, Procedures and Results
A description of the proxy voting policies and procedures used to determine how to vote proxies on behalf of the funds is available without charge, upon request, by visiting the Schwab Funds’ website atwww.schwabfunds.com/schwabfunds_prospectus, the SEC’s website atwww.sec.gov, or by contacting Schwab Funds at 1-877-824-5615.
Information regarding how a fund voted proxies relating to portfolio securities during the most recent twelve-month period ended June 30 is available, without charge, by visiting the fund’s website atwww.schwabfunds.com/schwabfunds_prospectus or the SEC’s website atwww.sec.gov.
Equity Funds
Schwab Core Equity Fund
Schwab Dividend Equity Fund
Schwab Large-Cap Growth Fund
Schwab Small-Cap Equity Fund
Schwab Hedged Equity Fund
Schwab Health Care Fund
Schwab International Core Equity Fund
Schwab Fundamental US Large Company Index Fund
Schwab Fundamental US Small Company Index Fund
Schwab Fundamental International Large Company Index Fund
Schwab Fundamental International Small Company Index Fund
Schwab Fundamental Emerging Markets Large Company Index Fund
Schwab Fundamental Global Real Estate Index Fund
Schwab Global Real Estate Fund
Schwab S&P 500 Index Fund
Schwab 1000 Index® Fund
Schwab Small-Cap Index Fund®
Schwab Total Stock Market Index Fund®
Schwab U.S. Large-Cap Growth Index Fund
Schwab U.S. Large-Cap Value Index Fund
Schwab U.S. Mid-Cap Index Fund
Schwab International Index Fund®
Asset Allocation Funds
Schwab Balanced Fund
Schwab MarketTrack Portfolios®
Schwab Target Funds
Schwab Target Index Funds
Schwab Monthly Income Funds
Bond Funds
Schwab Treasury Inflation Protected Securities Index Fund
Schwab U.S. Aggregate Bond Index Fund
Schwab Short-Term Bond Index Fund
Schwab Tax-Free Bond Fund1
Schwab California Tax-Free Bond Fund1
Schwab Money Funds2
Schwab provides a broad choice of taxable and tax-exempt money market funds for both retail and institutional client types.
Investment Adviser
Charles Schwab Investment Management, Inc.
211 Main Street, San Francisco, CA 94105
Funds
Schwab Funds®
1-877-824-5615
© 2019 Charles Schwab & Co., Inc. All rights reserved.
Member SIPC®
Printed on recycled paper.
| ¹ | State, local, and the Federal Alternative Minimum Tax may apply. Capital gains are not exempt from Federal Taxation. |
| ² | You could lose money by investing in the Schwab Money Funds. All Schwab Money Funds with the exception of Schwab Variable Share Price Money Fund seek to preserve the value of your investment at $1.00 per share, but cannot guarantee they will do so. Because the share price of Schwab Variable Share Price Money Fund will fluctuate, when you sell your shares they may be worth more or less than what you originally paid for them. All Schwab Money Funds with the exception of Schwab Government Money Fund, Schwab Retirement Government Money Fund, Schwab U.S. Treasury Money Fund, Schwab Treasury Obligations Money Fund and Schwab Government Money Market Portfolio may impose a fee upon the sale of your shares or may temporarily suspend your ability to sell shares if the Fund’s liquidity falls below required minimums because of market conditions or other factors. An investment in the Schwab Money Funds is not insured or guaranteed by the Federal Deposit Insurance Corporation or any other government agency. The Schwab Money Funds’ sponsor has no legal obligation to provide financial support to the Funds, and you should not expect that the sponsor will provide financial support to the Funds at any time. |
Item 2: Code of Ethics.
| (a) | Registrant has adopted a code of ethics that applies to its principal executive officer, principal financial officer, and any other persons who perform a similar function, regardless of whether these individuals are employed by Registrant or a third party. |
| (c) | During the period covered by the report, no amendments were made to the provisions of this code of ethics. |
| (d) | During the period covered by the report, Registrant did not grant any waivers, including implicit waivers, from the provisions of this code of ethics. |
| (f)(1) | Registrant has filed this code of ethics as an exhibit pursuant to Item 12(a)(1) of FormN-CSR. |
Item 3: Audit Committee Financial Expert.
Registrant’s Board of Trustees has determined that Kiran M. Patel and Kimberly S. Patmore, each currently serving on its audit, compliance and valuation committee, are each an “audit committee financial expert,” as such term is defined in Item 3 of FormN-CSR. Each member of Registrant’s audit, compliance and valuation committee is “independent” under the standards set forth in Item 3 of FormN-CSR.
The designation of each of Mr. Patel and Ms. Patmore as an “audit committee financial expert” pursuant to Item 3 of FormN-CSR does not (i) impose upon such individual any duties, obligations, or liability that are greater than the duties, obligations and liability imposed upon such individual as a member of Registrant’s audit, compliance and valuation committee or Board of Trustees in the absence of such designation; and (ii) affect the duties, obligations or liability of any other member of Registrant’s audit, compliance and valuation committee or Board of Trustees.
Item 4: Principal Accountant Fees and Services.
Registrant is composed offifty-one series. Eleven series have a fiscalyear-end of March 31, whose annual financial statements are reported in Item 1, three series have a fiscalyear-end of December 31,thirty-six series have a fiscalyear-end of October 31, and one series has a fiscalyear-end of February 28. Principal accountant fees disclosed in Items 4(a)-(d) and 4(g) include fees billed for services rendered tofifty-two operational series during 2018/2019 and forty-nine operational series during 2017/2018, based on their respective 2018/2019 and 2017/2018 fiscal years, as applicable.
The following table presents fees billed by the principal accountant in each of the last two fiscal years for the services rendered to the Funds:
| | | | | | | | | | | | | | |
(a) Audit Fees | | (b) Audit-Related Fees1 | | (c) Tax Fees2 | | (d) All Other Fees3 |
Fiscal Year 2018/2019 | | Fiscal Year 2017/ 2018 | | Fiscal Year
2018/2019 | | Fiscal Year
2017/2018 | | Fiscal Year
2018/2019 | | Fiscal Year
2017/2018 | | Fiscal Year
2018/2019 | | Fiscal Year
2017/2018 |
| | | | | | | | | | | | | | |
$1,504,317 | | $1,468,821 | | $84,840 | | $90,000 | | $190,626 | | $169,346 | | $0 | | $0 |
| 1 | The nature of the services includes assurance and related services reasonably related to the performance of the audit of financial statements not included in Audit Fees. |
| 2 | The nature of the services includes tax compliance, tax advice and tax planning. |
| 3 | The nature of the services include agreed upon procedures relating to Charles Schwab Investment Management., Inc.’s, (“CSIM”) expenses for purposes of Section 15(c) of the Investment Company Act of 1940. |
(e) (1) Registrant’s audit, compliance and valuation committee does not havepre-approval policies and procedures as described in paragraph (c)(7) of Rule2-01 of RegulationS-X.
(2) There were no services described in each of paragraphs (b) through (d) above (including services required to be approved by Registrant’s audit, compliance and valuation committee pursuant to paragraph (c)(7)(ii) of Rule2-01 of RegulationS-X) that were approved by Registrant’s audit, compliance and valuation committee pursuant to paragraph (c)(7)(i)(C) of Rule2-01 of RegulationS-X.
(f)Not applicable.
(g)Below are the aggregatenon-audit fees billed in each of the last two fiscal years by Registrant’s principal accountant for services rendered to Registrant, to Registrant’s investment adviser, and to any entity controlling, controlled by, or under common control with Registrant’s investment adviser that provides ongoing services to Registrant.
| | | | |
| | | | | |
2018/2019: $275,466 | | 2017/2018: $259,346 |
(h)During the past fiscal year, allnon-audit services provided by Registrant’s principal accountant to either Registrant’s investment adviser or to any entity controlling, controlled by, or under common control with Registrant’s investment adviser that provides ongoing services to Registrant werepre-approved. Included in the audit, compliance and valuation committee’spre-approval was the review and consideration as to whether the provision of thesenon-audit services is compatible with maintaining the principal accountant’s independence.
Item 5: Audit Committee of Listed Registrants.
Not applicable.
Item 6: Schedule of Investments.
The schedules of investments are included as part of the report to shareholders filed under Item 1 of this Form.
Item 7: Disclosure of Proxy Voting Policies and Procedures forClosed-End Management Investment Companies.
Not applicable.
Item 8: Portfolio Managers ofClosed-End Management Investment Companies.
Not applicable.
Item 9: Purchases of Equity Securities byClosed-End Management Investment Company and Affiliated Purchasers.
Not applicable.
Item 10: Submission of Matters to a Vote of Security Holders.
Not applicable.
Item 11: Controls and Procedures.
| (a) | Based on their evaluation of Registrant’s disclosure controls and procedures, as of a date within 90 days of the filing date, Registrant’s Chief Executive Officer, Jonathan de St. Paer and Registrant’s Chief Financial Officer, Mark Fischer, have concluded that Registrant’s disclosure controls and procedures are: (i) reasonably designed to ensure that information required to be disclosed in this report is appropriately communicated to Registrant’s officers to allow timely decisions regarding disclosures required in this report; (ii) reasonably designed to ensure that information required to be disclosed in this report is recorded, processed, summarized and reported in a timely manner; and (iii) are effective in achieving the goals described in (i) and (ii) above. |
| (b) | During the period covered by this report, there have been no changes in Registrant’s internal control over financial reporting that the above officers believe to have materially affected, or to be reasonably likely to materially affect, Registrant’s internal control over financial reporting. |
Item 12: Exhibits.
| | | | |
| (a) | | (1) | | Registrant’s code of ethics (that is the subject of the disclosure required by Item 2(a)) is attached. |
| | |
| | (2) | | Separate certifications for Registrant’s principal executive officer and principal financial officer, as required by Rule30a-2(a) under the 1940 Act, are attached. |
| | |
| | (3) | | Not applicable. |
| |
| (b) | | A certification for Registrant’s principal executive officer and principal financial officer, as required by Rule30a-2(b) under the 1940 Act, is attached. This certification is being furnished to the Securities and Exchange Commission solely pursuant to 18 U.S.C. section 1350 and is not being filed as part of the FormN-CSR with the Commission. |
Pursuant to the requirements of the Securities Exchange Act of 1934 and the Investment Company Act of 1940, the registrant has duly caused this report to be signed on its behalf by the undersigned, thereunto duly authorized.
(Registrant) Schwab Capital Trust
| | |
| By: | | /s/ Jonathan de St. Paer |
| | Jonathan de St. Paer |
| | Chief Executive Officer |
Date: May 17, 2019
Pursuant to the requirements of the Securities Exchange Act of 1934 and the Investment Company Act of 1940, this report has been signed below by the following persons on behalf of the registrant and in the capacities and on the dates indicated.
| | |
| By: | | /s/ Jonathan de St. Paer |
| | Jonathan de St. Paer |
| | Chief Executive Officer |
Date: May 17, 2019
| | |
| By: | | /s/ Mark Fischer |
| | Mark Fischer |
| | Chief Financial Officer |
Date: May 17, 2019