UNITED STATES
SECURITIES AND EXCHANGE COMMISSION
Washington, D.C. 20549
FORMN-CSR
CERTIFIED SHAREHOLDER REPORT OF REGISTERED
MANAGEMENT INVESTMENT COMPANIES
Investment Company Act file number:811-7704
Schwab Capital Trust
(Exact name of registrant as specified in charter)
211 Main Street, San Francisco, California 94105
(Address of principal executive offices) (Zip code)
Jonathan de St. Paer
Schwab Capital Trust
211 Main Street, San Francisco, California 94105
(Name and address of agent for service)
Registrant’s telephone number, including area code: (415)636-7000
Date of fiscal year end: October 31
Date of reporting period: October 31, 2019
Item 1: Report(s) to Shareholders.
Annual Report | October 31, 2019
Laudus International MarketMasters Fund™
| New Notice Regarding Shareholder Report Delivery Options |
| Beginning on January 1, 2021, paper copies of a fund’s shareholder reports will no longer be sent by mail, unless you specifically request paper copies of the reports from a fund or from your financial intermediary (such as a bank or broker-dealer). Instead, the reports will be made available on a fund’s websitewww.schwabfunds.com/laudusfunds_prospectus, and you will be notified by mail each time a report is posted and the mailing will provide a website link to access the report. You will continue to receive other fund regulatory documents (such as prospectuses or supplements) in paper unless you have elected to receive all fund documents electronically. |
| If you would like to receive a fund’s future shareholder reports in paper free of charge after January 1, 2021, you can make that request: |
| • If you invest through Charles Schwab & Co, Inc. (broker-dealer), by calling 1-866-345-5954 and using the unique identifier attached to this mailing; |
| • If you invest through another financial intermediary (such as a bank or broker-dealer) by contacting them directly; or |
| • If owned directly through a fund by calling 1-800-407-0256. |
| If you already receive shareholder reports and other fund documents electronically, you will not be affected by this change and you need not take any action. |
Laudus International MarketMasters Fund
Fund investment adviser: Charles Schwab Investment Management, Inc. (CSIM)
Distributor: Charles Schwab & Co., Inc. (Schwab)
The Sector/Industry classifications in this report use the Global Industry Classification Standard (GICS), which was developed by, and is the exclusive property of, MSCI Inc. (MSCI) and Standard & Poor’s (S&P). GICS is a service mark of MSCI and S&P and has been licensed for use by Schwab. The Industry classifications used in the schedules of Portfolio Holdings are sub-categories of Sector classifications.
Laudus International MarketMasters Fund | Annual Report
Laudus International MarketMasters Fund
The performance data quoted represents past performance. Past performance does not guarantee future results. Investment returns and principal value of an investment will fluctuate so that an investor’s shares may be worth more or less than their original cost. Current performance may be lower or higher than performance data quoted. To obtain performance information current to the most recent month end, please visitwww.schwabfunds.com/laudusfunds_prospectus.
| Total Return for the 12 Months Ended October 31, 2019 |
| Laudus International MarketMasters Fund1,2 (Ticker Symbol: SWMIX) | 10.50% |
| MSCI EAFE® Index (Net)3 | 11.04% |
| Fund Category: Morningstar Foreign Large Growth4 | 14.78% |
| Performance Details | pages 7-9 |
All total returns on this page assume dividends and distributions were reinvested. Index figures do not include trading and management costs, which would lower performance. Indices are unmanaged and cannot be invested in directly. Performance results less than one year are not annualized.
For index definitions, please see the Glossary.
Fund expenses may have been partially absorbed by CSIM and its affiliates. Without these reductions, the fund’s total return would have been lower. Performance does not reflect the deduction of taxes that a shareholder would pay on fund distributions or on the redemption of fund shares.
Foreign securities can involve risks such as political and economic instability and currency risk. These risks may be greater in emerging markets.
| 1 | On February 26, 2019, the Investor Share class and Select Share class of the fund were consolidated into a single class of shares of the fund. The performance and financial history of the fund is that of the fund’s former Select Shares. Accordingly, the past performance shown is that of the fund’s former Select Shares. |
| 2 | The fund’s performance relative to the index may be affected by fair-value pricing and timing differences in foreign exchange calculations. See financial note 2 for more information. |
| 3 | The net version of the index reflects reinvested dividends net of withholding taxes, but reflects no deductions for expenses or other taxes. |
| 4 | Source for category information: Morningstar, Inc. The Morningstar Category return represents all active and index mutual funds within the category as of the report date. |
Laudus International MarketMasters Fund | Annual Report
Laudus International MarketMasters Fund
Jonathan de St. Paer
President of Charles Schwab
Investment Management, Inc.
and the fund covered
in this report.
Dear Shareholder,
At the crux of every investment decision, one consideration that may be top of mind is your risk tolerance. It may seem like a straightforward consideration, but it’s often not. Most of us are risk-averse by nature. This can sometimes lead us to make decisions that may get in the way of the performance of our investments. Risk aversion can also sometimes prompt us to focus our assets in areas we deem to be safer, resulting in an increased exposure to potential losses through overconcentration.
One example of how a desire to avoid risk might actually elevate it is a tendency called “home bias.” Investors tend to have an innate predisposition toward the familiar, and this can often lead us to focus primarily on domestic stocks which could leave us more vulnerable to market volatility here at home. Building a portfolio that has an allocation to both U.S. and international stocks may be a better strategy to counteract the home bias tendency. In addition to almost doubling the available universe of stock market opportunities, regions and countries often go through economic cycles at different times and are exposed to different market influences. This can lead to meaningful differences in the performance of international companies.
The Laudus International MarketMasters Fund plays a role in our goal to provide investors with a diverse variety of investment choices. The fund provides exposure to international developed and emerging markets, large- and small-capitalization, and growth and value stocks. Each of several subadvisers is analyzed based on their investment style and consistency of returns, as well as their measures for managing risk. We believe this offers the opportunity for investors to gain access to the collective expertise of multiple managers in a diversified, one-stop solution.
The Laudus International MarketMasters Fund is just one example of our commitment to providing products and solutions that can help investors build well-diversified portfolios. It’s important to have a long-term investing plan and a portfolio based on your individual goals and risk tolerance. It can at times be tough to maintain that discipline in the face of day-to-day uncertainty. We aim to offer products with clear objectives, straightforward pricing, and a consistent approach to investing to help simplify investing decisions, so investors can focus on their long-term goals without unnecessary complexity.
Thank you for investing with Charles Schwab Investment Management, and for trusting us to help you achieve your financial goals. For more information about the Laudus International MarketMasters Fund, please continue reading this report. In addition, you can find further details about this fund by visiting our website at www.schwabfunds.com. We are also happy to hear from you at 1-877-824-5615.
Sincerely,
“Investors tend to have an innate predisposition toward the familiar, and this can often lead us to focus primarily on domestic stocks which could leave us more vulnerable to market volatility here at home.”
Diversification and asset allocation strategies do not ensure a profit and cannot protect against losses in a declining market.
Management views may have changed since the report date.
Laudus International MarketMasters Fund | Annual Report
Laudus International MarketMasters Fund
The Investment Environment
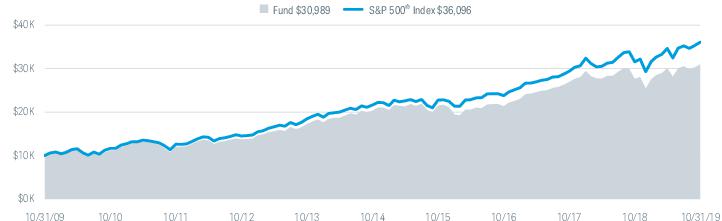
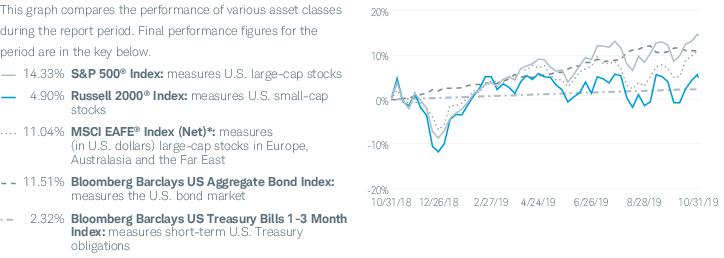
For the 12-month reporting period ended October 31, 2019, global equity markets generated positive returns. The final two months of 2018 were marked by significant market volatility and steep declines across global equity markets, driven by concerns about slowing international growth, a trade war between the U.S. and China, falling oil prices, the waning strength of the U.S. economy, and the pace of future interest rate hikes despite low inflation. By late December, major market indices had fallen to near-bear market territory. However, as the Federal Reserve (Fed) put interest rate hikes on hold, stocks, particularly in the U.S., staged a strong recovery in the first four months of 2019, which generally continued through the end of the reporting period despite several setbacks. Over the period, the U.S. dollar strengthened slightly against a basket of foreign currencies, generally reducing the returns on overseas investments in U.S. dollar terms. For the reporting period, the S&P 500® Index, a bellwether for the overall U.S. stock market, returned 14.33%. Despite headwinds, markets outside the U.S. also rose, particularly toward the end of the reporting period with the MSCI EAFE® Index (Net)*, a broad measure of developed international equity performance, returning 11.04%.
Economic growth around the globe was uneven over the reporting period, largely as a result of manufacturing weakness in developed international markets. Despite escalating trade tensions with China, the U.S. maintained its steady growth in its tenth year of expansion, although at a declining pace. In the last two months of 2018, economies around the globe showed increasing signs of weakness, but many regained economic momentum in the first six months of 2019, demonstrating resilient growth despite lingering uncertainties on various fronts. As the year progressed, signs of slowing growth increased amid a weakening global economy, waning manufacturing activity, and the ongoing U.S.-China trade war. However, toward the end of the period, prospects of a partial trade resolution relieved some of the pressure. U.S. gross domestic product (GDP) grew at an annual rate of 2.1% in the third quarter of 2019, up slightly from 2.0% in the second quarter, but down from 3.1% in the first quarter of 2019. Unemployment declined in September 2019 to a 50-year low. While, consumer confidence edged lower in October to hit a four-month low, it remained a stable source of GDP growth in the U.S. Inflation remained benign.
Asset Class Performance Comparison % returns during the 12 months ended October 31, 2019
Index figures assume dividends and distributions were reinvested. Index figures do not include trading and management costs, which would lower performance. Indices are unmanaged and cannot be invested in directly. Performance results less than one year are not annualized. Past performance is not an indication of future results.
For index definitions, please see the Glossary.
Data source: Index provider websites and CSIM.
Nothing in this report represents a recommendation of a security by the investment adviser.
Management views may have changed since the report date.
| * | The net version of the index reflects reinvested dividends net of withholding taxes, but reflects no deductions for expenses or other taxes. |
Laudus International MarketMasters Fund | Annual Report
Laudus International MarketMasters Fund
The Investment Environment(continued)
Outside the U.S., conditions continued to soften, dampened by trade issues, slowing economic output, and geopolitical concerns. Oil prices, which had fallen steeply in the fourth quarter of 2018, recovered through the first four months of 2019, as major exporters sought to curb supply and central banks took steps to ease growth-related fears, before dipping in May when trade concerns escalated. Oil prices remained volatile through period end. In the eurozone, growth slowed in the second and third quarters of 2019, down slightly from the first quarter. Growth was subdued by tepid wage growth and constrained consumer spending. The United Kingdom’s economy contracted in the second quarter of 2019 amid growing Brexit-related economic and political uncertainty that dampened industrial output, construction, and services sectors. Japan’s economy, however, experienced growth in recent quarters after contracting sharply in the third quarter of 2018.
In response to the economic environment and flat or inverted yield curves around the world, to bolster growth, and to ensure stability given ongoing trade tensions, a number of central banks reduced their policy rates, including the U.S., while others maintained their generally low—and for some international central banks, negative—interest rates. In the U.S., after raising interest rates four times in 2018, the Fed held rates unchanged through the first half of 2019. But amid growing signs of global economic weakness that threatened to dampen U.S. economic growth, along with continued low inflation and weakness in manufacturing, the Fed enacted three interest rate cuts by the end of the period—in July, September, and October. Following the October interest rate cut, the Fed signaled that subsequent interest rate cuts would be put on hold provided the economy continues to expand moderately and the labor market remains strong. The federal funds rate ended the reporting period in a range of 1.50% to 1.75%. Outside the U.S., the European Central Bank held interest rates steady and launched an asset-purchase program to help stimulate the economy. The Bank of Japan maintained its short-term interest rate target of –0.1% throughout the period. Despite growing Brexit-related division, the Bank of England maintained its key official bank rate at 0.75% throughout the period, where it has remained since August 2018. Central banks in several key emerging market economies—including India, Thailand, and China—lowered their policy rates in response to inflation and trade-related pressures.
Laudus International MarketMasters Fund | Annual Report
Laudus International MarketMasters Fund
 | Omar Aguilar, Ph.D., Senior Vice President and Chief Investment Officer of Equities and Multi-Asset Strategies, has overall responsibility for all aspects of the management of the fund. Prior to joining CSIM in 2011, Mr. Aguilar was with Financial Engines, where he was responsible for managing assets from leading retirement plan sponsors in the defined contribution market. Prior to joining Financial Engines in 2009, Mr. Aguilar was the head of quantitative equity for ING Investment Management, where he was responsible for building and developing the firm’s quantitative equity group. He joined ING in 2004 from Lehman Brothers, where he served as the head of quantitative research for its alternative investment management business. Prior to that, he was a director of quantitative research and portfolio manager with Merrill Lynch Investment Management and Bankers Trust. |
 | Jane Shi, Portfolio Manager, is responsible for the day-to-day co-management of the fund. Prior to joining CSIM in 2011, Ms. Shi was a vice president investment analyst at Bailard, Inc. since 2006, where she developed quantitative models for domestic equity and tactical asset allocation strategies, and was also responsible for performance measurement and attribution. Prior to that, she was a treasury analyst at Sun Microsystems, Inc. |
Laudus International MarketMasters Fund | Annual Report
Laudus International MarketMasters Fund
TheLaudus International MarketMasters Fund (the fund) uses a multi-manager strategy. Charles Schwab Investment Management, Inc. (CSIM)—the fund’s investment adviser—selects investment subadvisers with strong long-term track records to manage a portion of the fund’s assets. In addition to selecting investment subadvisers and allocating assets among them, CSIM is responsible for monitoring and coordinating the overall management of the fund. Each subadviser manages its respective portfolio relative to a comparative index that reflects its individual process and philosophy. The subadviser comparative indices may differ from the fund’s comparative index.
Market Highlights. Over the reporting period, international equity markets generated positive returns. The final two months of 2018 were marked by significant market volatility and steep declines across global equity markets, driven by concerns about slowing international economic growth, a trade war between the U.S. and China, falling oil prices, the waning strength of the U.S. economy, and the pace of future interest rate hikes. However, stocks staged a recovery in the first four months of 2019, which generally continued through the end of the reporting period. A number of central banks reduced their policy rates, including the U.S., while others maintained their generally low—and for some international central banks, negative—interest rates. Over the period, the U.S. dollar strengthened slightly against a basket of foreign currencies, generally reducing the returns on overseas investments in U.S. dollar terms.
Performance. For the 12-month period ended October 31, 2019, the fund returned 10.50%, underperforming the fund’s comparative index, the MSCI EAFE® Index (Net) (the index), which returned 11.04%.
Positioning and Strategies. Over the 12-month reporting period, all four of the fund’s active subadvisers posted positive returns and outperformed their comparative indices. Underperformance of the fund was a result of allocation across subadvisers.
Among the fund’s four active subadvisers, William Blair Investment Management, LLC posted the strongest total return and outperformed its international multi-cap growth comparative index, contributing to the fund’s relative performance. Stock selection was strongest in the industrials and consumer discretionary sectors and weakest in the information technology and communications services sectors. From a sector allocation standpoint, William Blair’s overweight to the financials and information technology sectors also contributed to relative performance, while an overweight to the energy and health care sectors detracted from relative performance. From a geographic perspective, stock selection in Japan and the United Kingdom contributed, while stock selection in France and the United States detracted.
Harris Associates L.P. posted a positive return and outperformed its comparative index. Harris’s stock selection contributed positively to its performance relative to its comparative index, primarily due to selection in the financials and information technology sectors, and within Japan and the United Kingdom. Harris’s allocation across country segments and sectors also contributed positively to relative performance, most notably in the United States and South Korea and in the energy and industrials sectors.
American Century Investment Management, Inc., which focuses on international small-cap growth, also posted a positive return and outperformed it comparative index. Stock selection contributed to performance relative to the comparative index, primarily due to selection in the information technology and financials sectors, and within Hong Kong and Germany. American Century’s allocation across sectors and country segments detracted from performance relative to the comparative index, most notably in the energy and communication services sectors and in China and Hong Kong.
Mondrian Investment Partners Limited, with its international small-cap value focus, also posted a positive total return and outperformed its comparative index. From a sector allocation perspective, an underweight to the energy sector and an overweight to the utilities sector contributed to performance relative to the comparative index and an underweight to the real estate sector and an overweight to the consumer staples sector detracted. Stock selection in the industrials and information technology sectors contributed, while stock selection in the materials and communications services sectors detracted. From a geographic perspective, stock selection in Canada and France contributed to relative performance, while stock selection in the Netherlands and Switzerland detracted.
Mellon Investment Corporation seeks to track the performance of the fund’s index by employing a strategic trading approach to minimize transaction costs and preserve value. Over the 12-month reporting period, the fund’s allocation to Mellon performed in line with this objective, slightly outperforming the fund’s index.
The fund made no active adjustments to its investment manager exposures over the reporting period.
Management views may have changed since the report date.
Laudus International MarketMasters Fund | Annual Report
Laudus International MarketMasters Fund
Performance and Fund Factsas of October 31, 2019
The performance data quoted represents past performance. Past performance does not guarantee future results. Investment returns and principal value of an investment will fluctuate so that an investor’s shares may be worth more or less than their original cost. Current performance may be lower or higher than performance data quoted. To obtain performance information current to the most recent month end, please visitwww.schwabfunds.com/laudusfunds_prospectus.
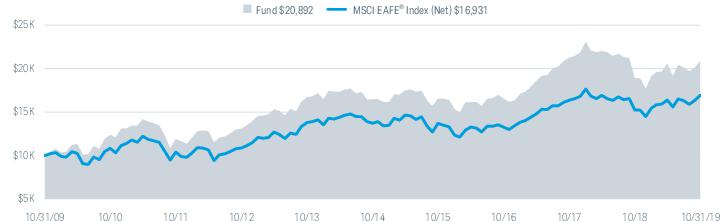
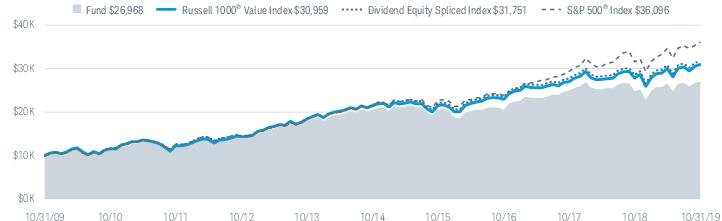
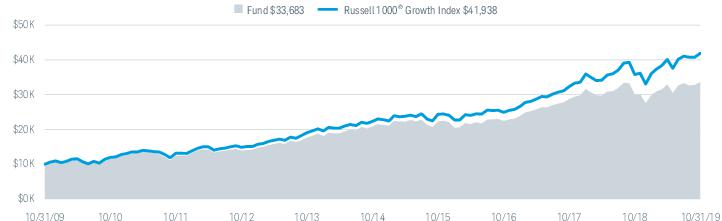
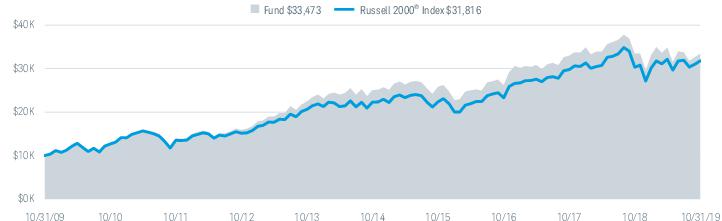
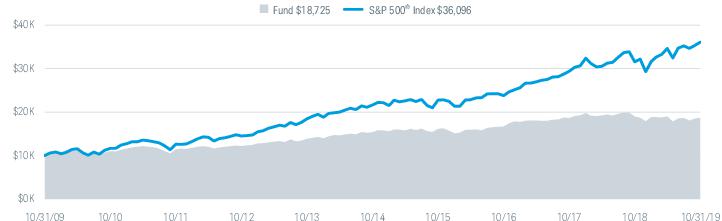
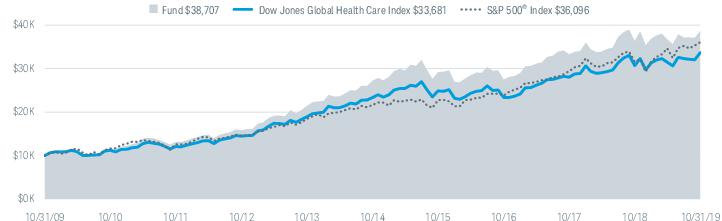
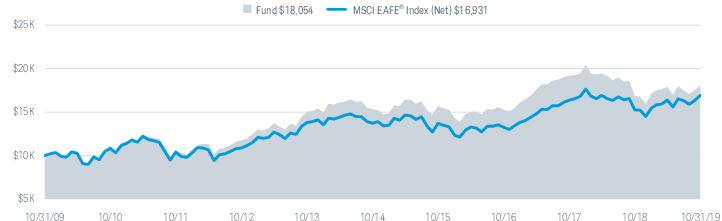
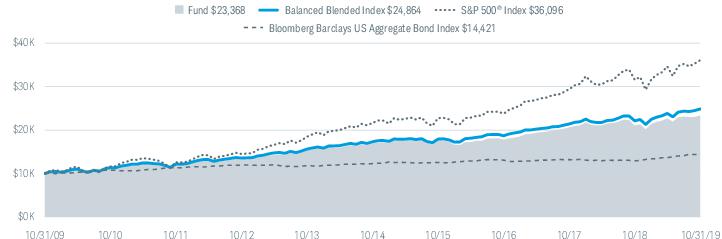
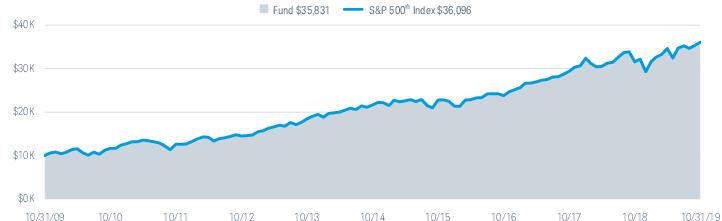
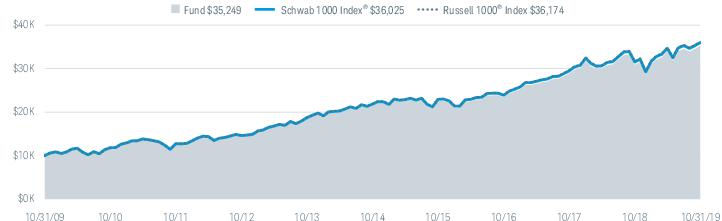
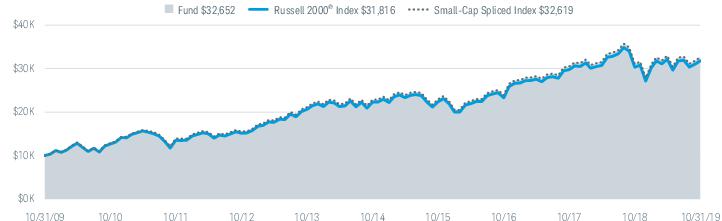
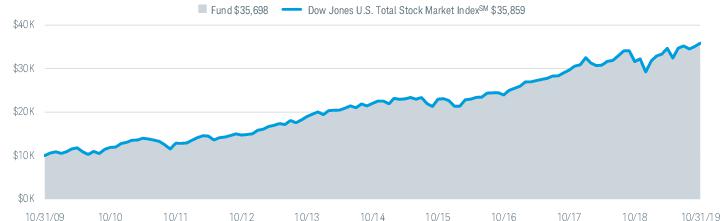
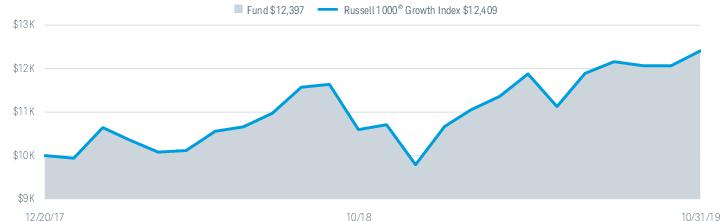
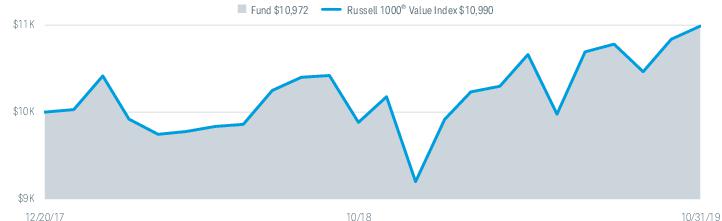
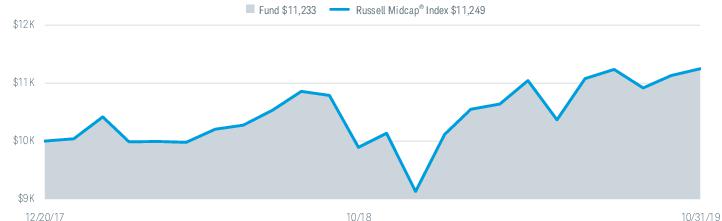
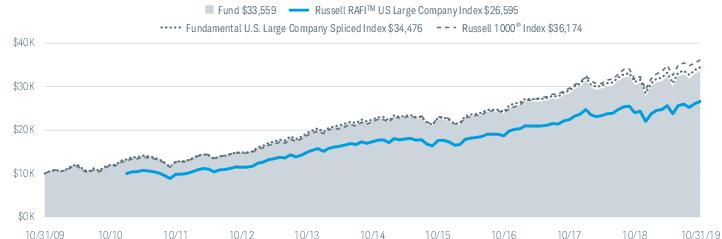
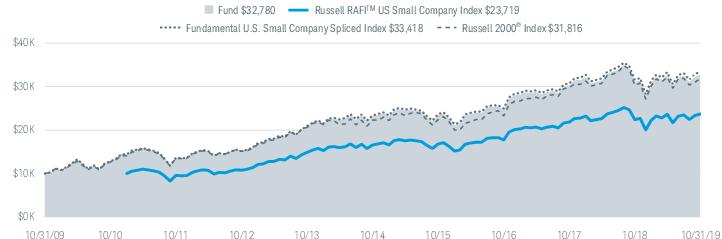
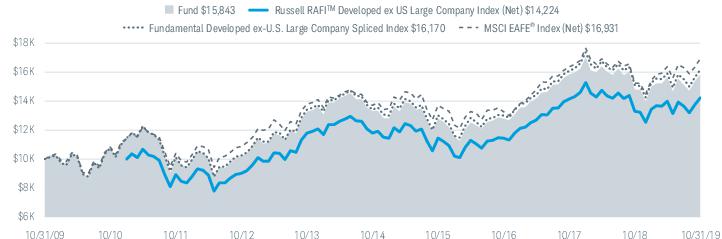
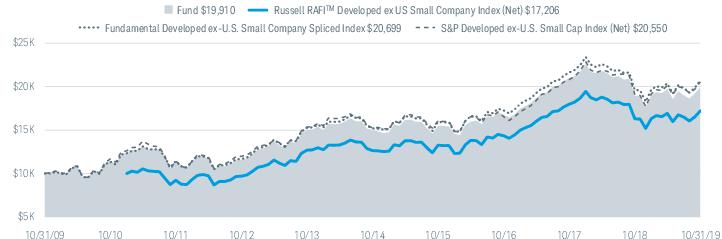
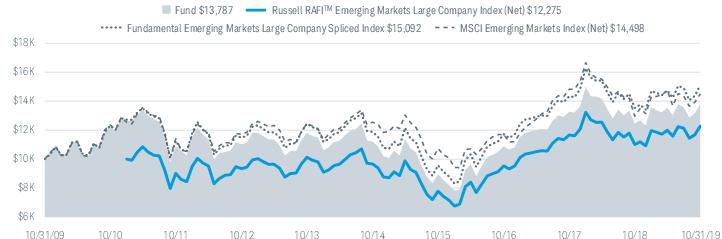
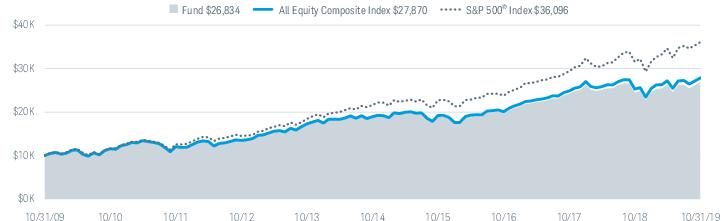
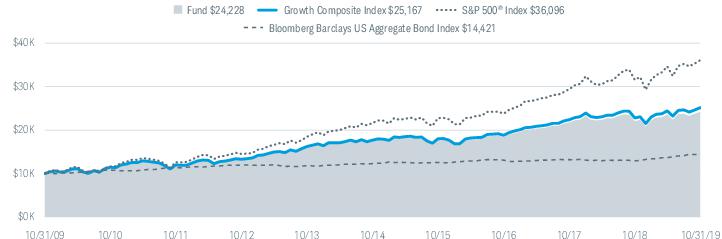
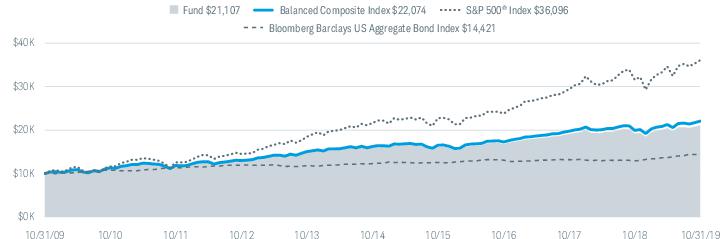
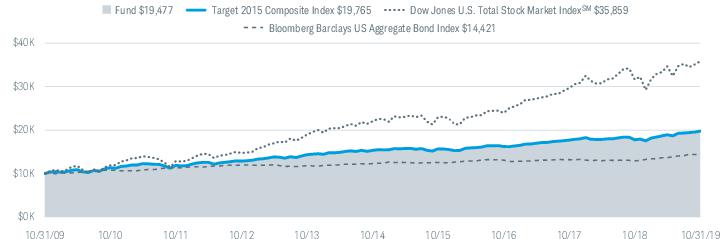
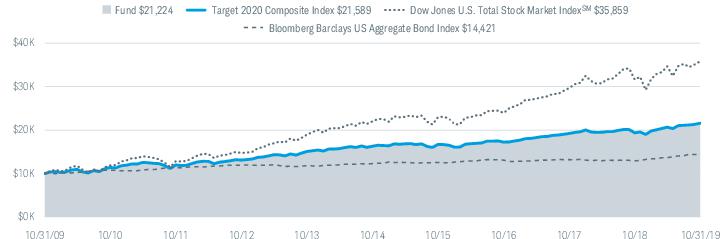
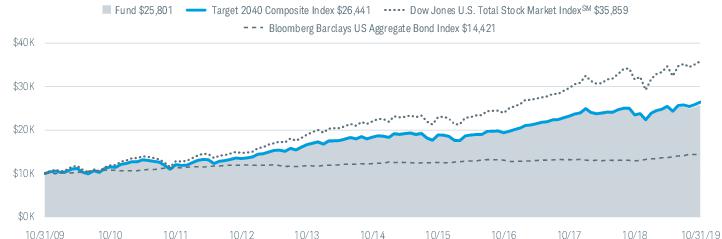
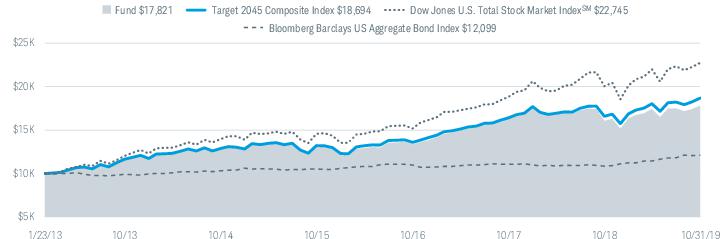
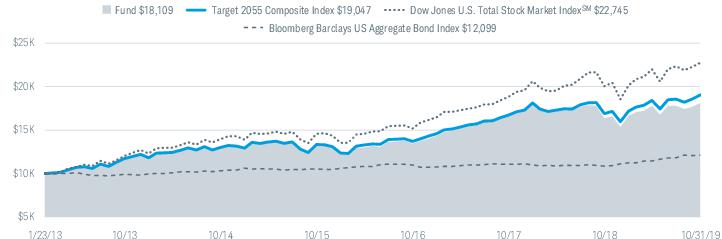
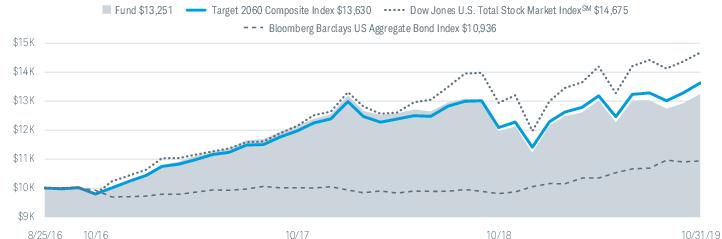
Performance of Hypothetical $10,000 Investment (October 31, 2009 – October 31, 2019)1,2
Average Annual Total Returns1,2
| Fund and Inception Date | 1 Year | 5 Years | 10 Years |
| Fund: Laudus International MarketMasters Fund (4/2/04) | 10.50% | 4.88% | 7.65% |
| MSCI EAFE® Index (Net)3 | 11.04% | 4.31% | 5.41% |
| Fund Category: Morningstar Foreign Large Growth4 | 14.78% | 5.56% | 6.84% |
| Fund Expense Ratios5: Net 1.25%; Gross 1.51% |
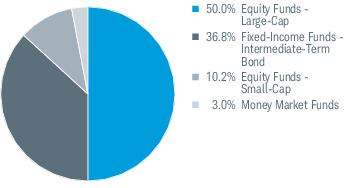
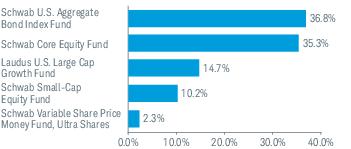
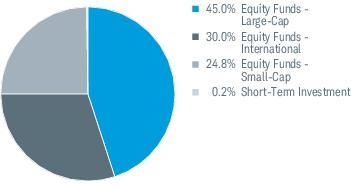
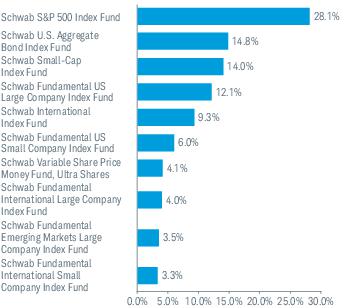
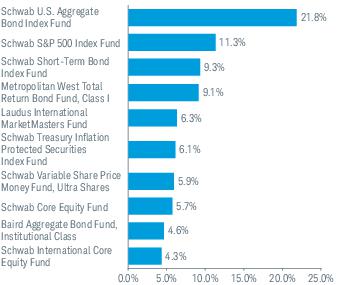
Investment Managers and Allocations6
| Investment Managers | Investment Style | % of
Net Assets |
| William Blair Investment Management, LLC | International Multi-Cap Growth | 26.2% |
| American Century Investment Management, Inc. | International Small-Cap Growth | 22.4% |
| Mondrian Investment Partners Limited | International Small-Cap Value | 22.2% |
| Harris Associates L.P. | International Large-Cap Value | 19.9% |
| Mellon Investment Corporation | International Blend | 6.6% |
| Cash & other assets | | 2.7% |
All total returns on this page assume dividends and distributions were reinvested. Index figures do not include trading and management costs, which would lower performance. Indices are unmanaged and cannot be invested in directly. Performance results less than one year are not annualized.
For index definitions, please see the Glossary.
The fund’s performance relative to the index may be affected by fair-value pricing. See financial note 2 for more information.
| 1 | Fund expenses may have been partially absorbed by CSIM and its affiliates. Without these reductions, the fund’s returns would have been lower. These returns do not reflect the deduction of taxes that a shareholder would pay on fund distributions or the redemption of fund shares. |
| 2 | On February 26, 2019, the Investor Share class and Select Share class of the fund were consolidated into a single class of shares of the fund. The performance and financial history of the fund is that of the fund’s former Select Shares. Accordingly, the past performance shown is that of the fund’s former Select Shares. |
| 3 | The net version of the index reflects reinvested dividends net of withholding taxes, but reflects no deductions for expenses or other taxes. |
| 4 | Source for category information: Morningstar, Inc. The Morningstar Category return represents all active and index mutual funds within the category as of the report date. |
| 5 | As stated in the prospectus. Net Expense: Expenses reduced by a contractual fee waiver in effect for so long as CSIM serves as the investment adviser to the fund. Gross Expense: Does not reflect the effect of contractual fee waivers. For actual expense ratios during the period, refer to the financial highlights section of the financial statements. |
| 6 | For more information about each of the investment manager’s investment styles, refer to the fund’s prospectus. |
Laudus International MarketMasters Fund | Annual Report
Laudus International MarketMasters Fund
Performance and Fund Factsas of October 31, 2019 (continued)
| Number of Holdings | 1,222 |
| Weighted Average Market Cap (millions) | $31,954 |
| Price/Earnings Ratio (P/E) | 20.1 |
| Price/Book Ratio (P/B) | 2.4 |
| Portfolio Turnover Rate | 54% |
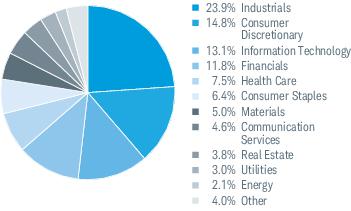
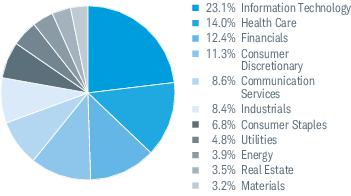
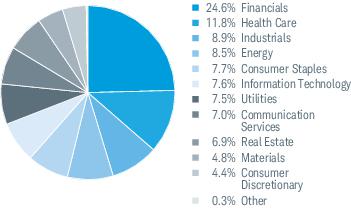
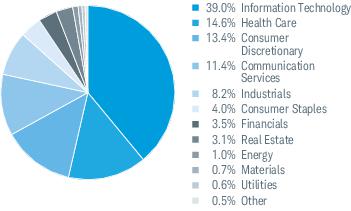
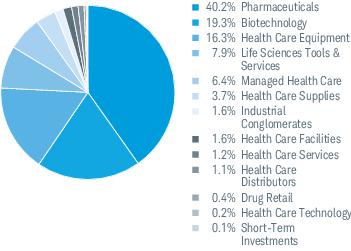
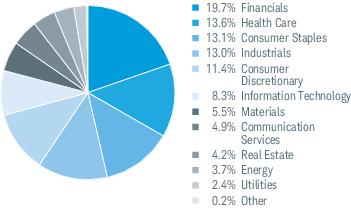
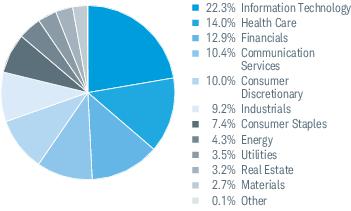
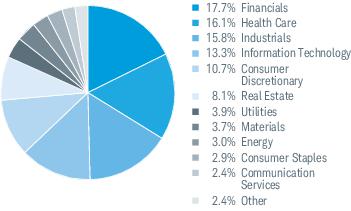
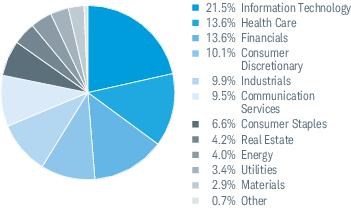
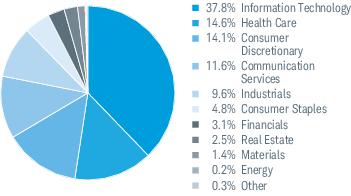
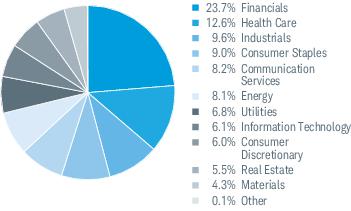
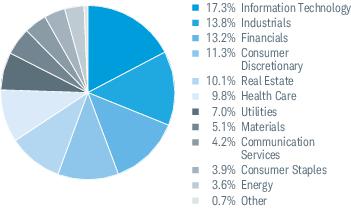
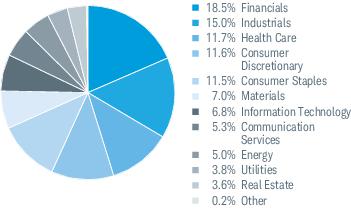
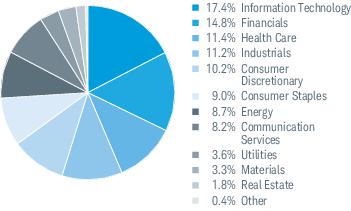
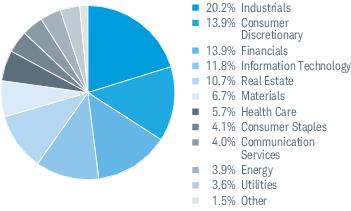
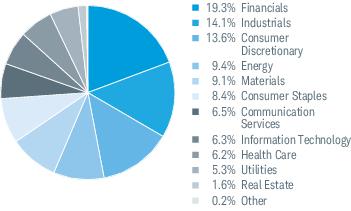
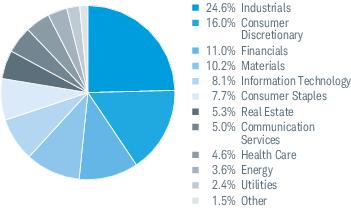
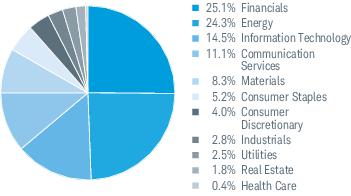
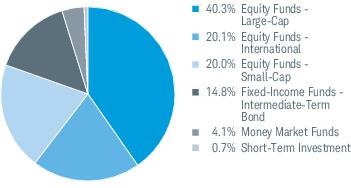
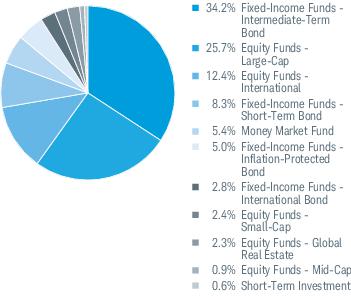
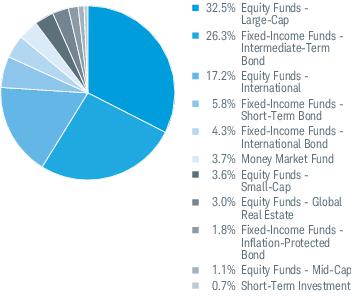
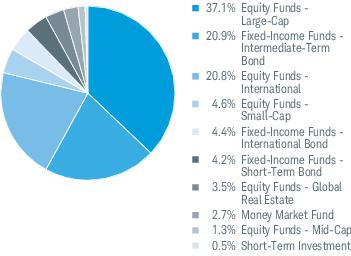
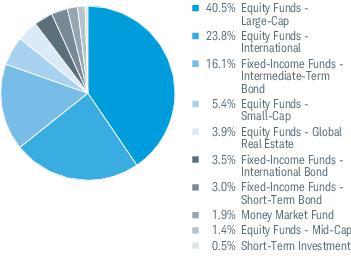
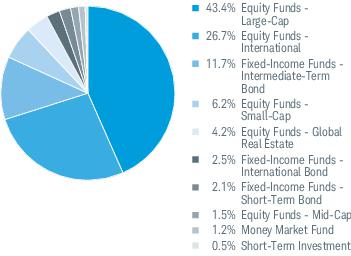
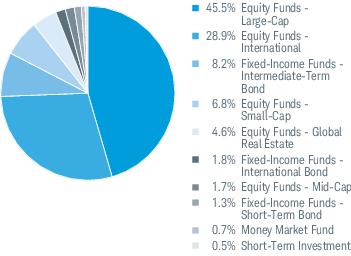
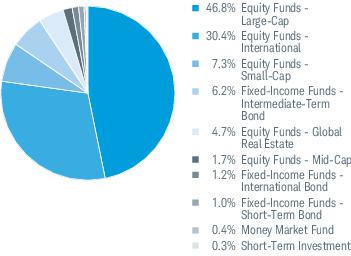
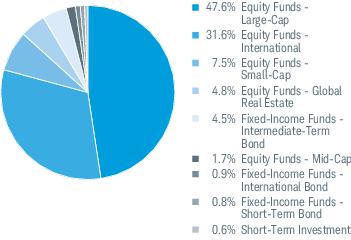
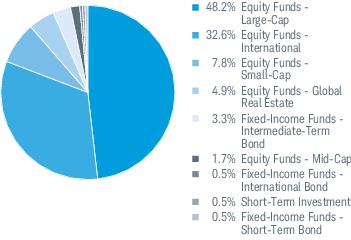
Sector Weightings % of Investments1
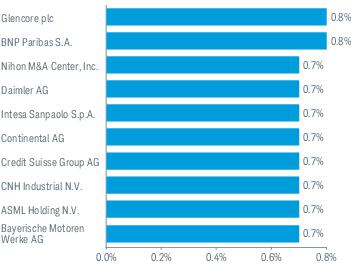
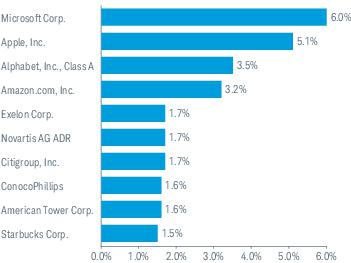
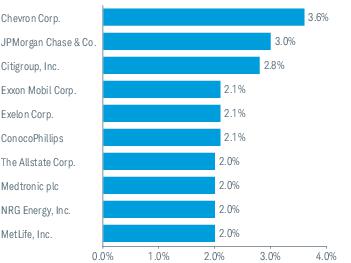
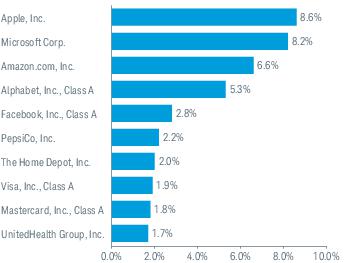
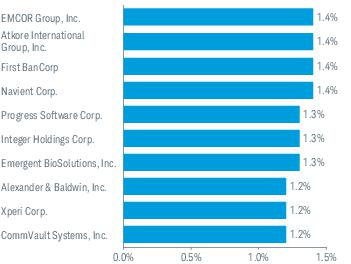
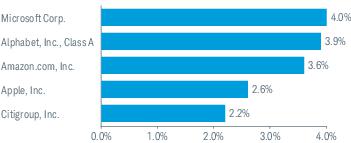
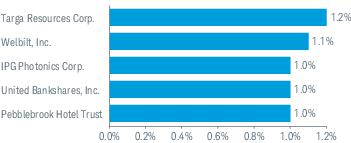
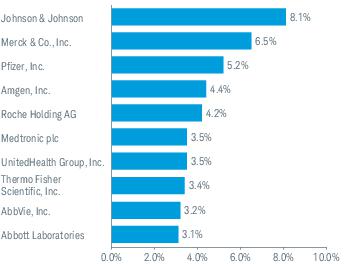
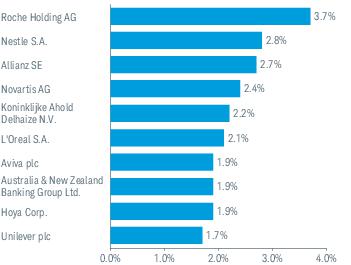
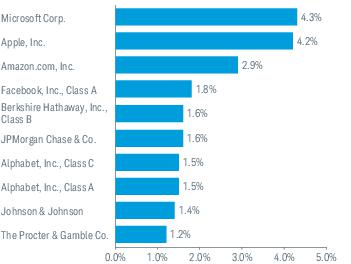
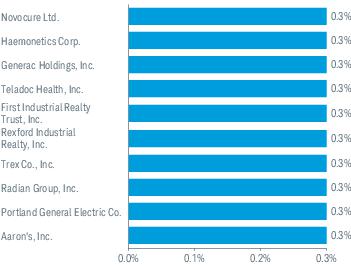
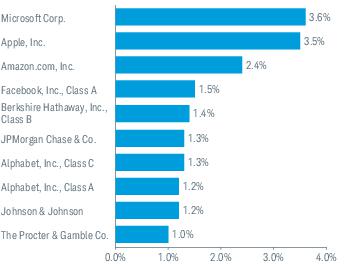
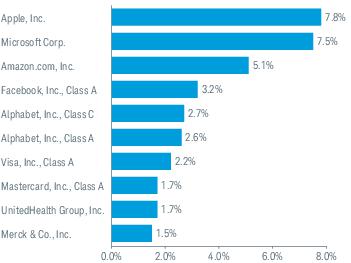
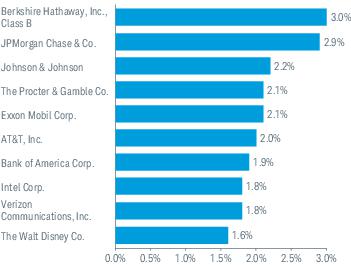
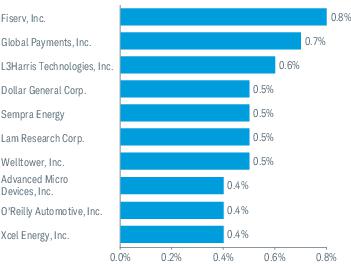
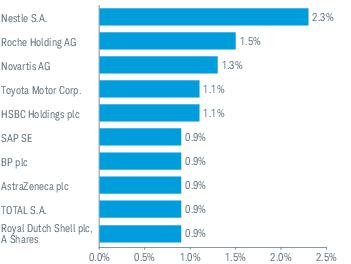
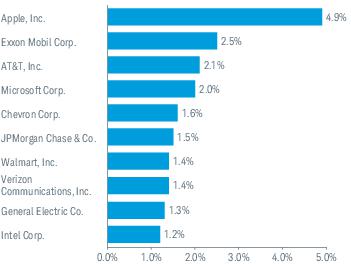
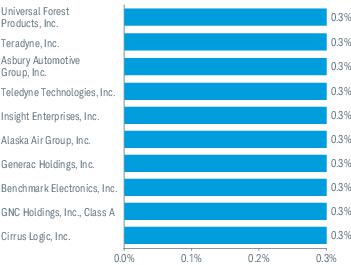
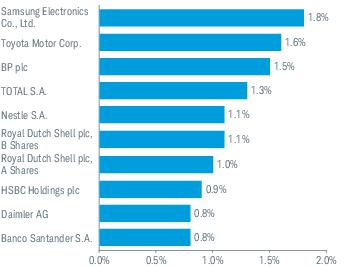
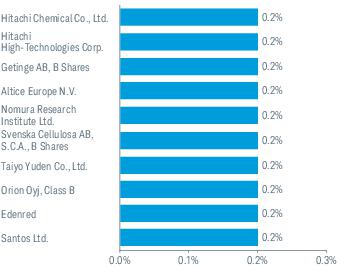
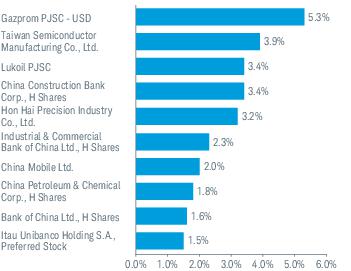
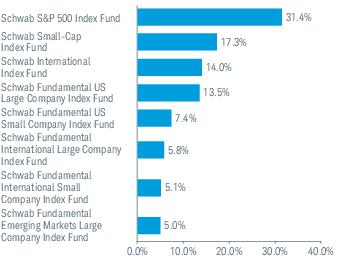
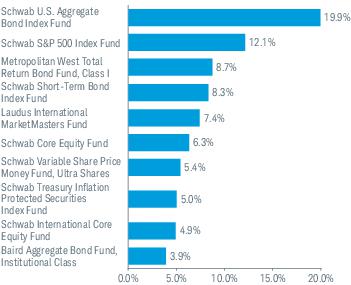
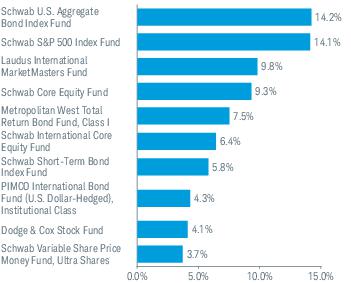
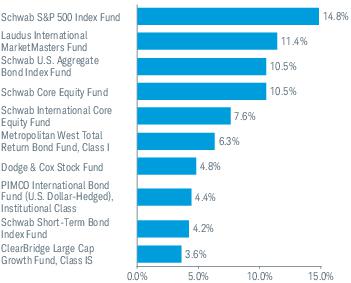
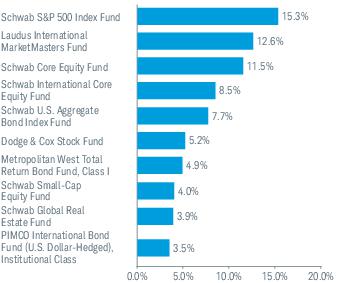
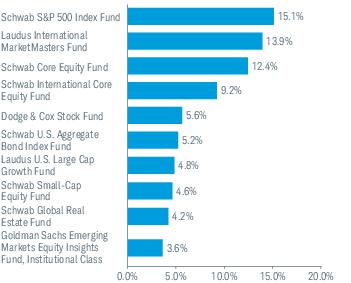
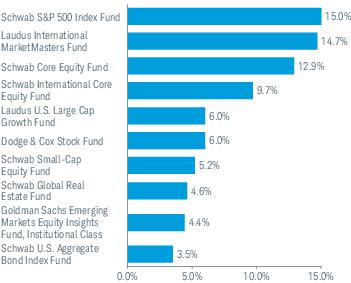
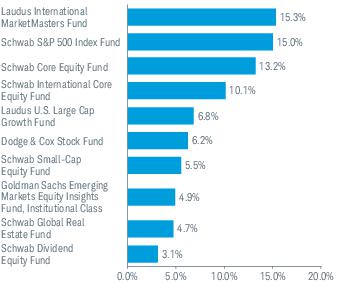
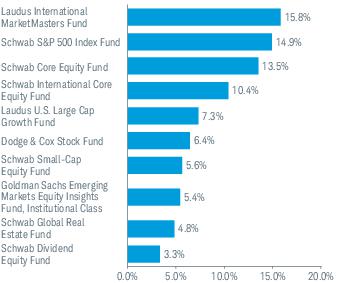
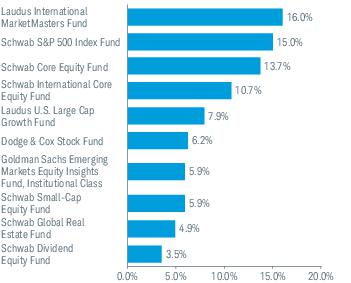
Top Equity Holdings % of Net Assets2
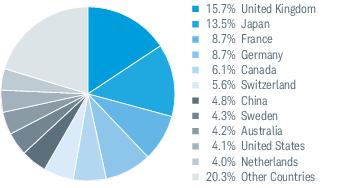
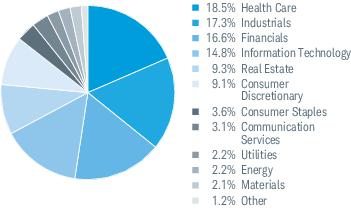
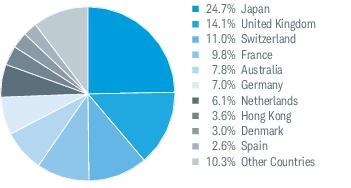
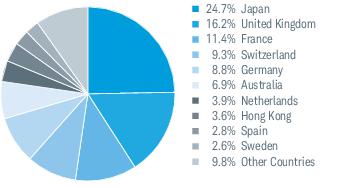
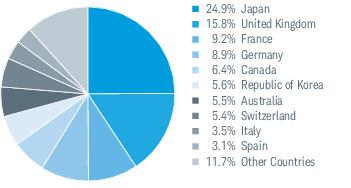
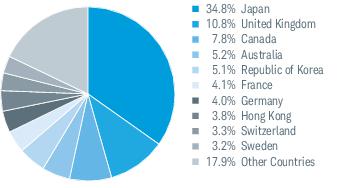
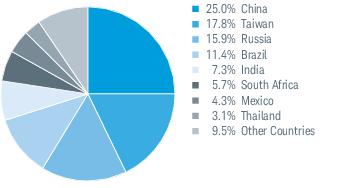
Top Country Weightings % of Investments3
Portfolio holdings may have changed since the report date.
Source of Sector Classification: S&P and MSCI.
International investments are subject to additional risks such as currency fluctuation, geopolitical risk and the potential for illiquid markets. Investing in emerging markets may accentuate these risks.
| 1 | Excludes derivatives. |
| 2 | This list is not a recommendation of any security by the investment adviser. |
| 3 | The percentage may differ from the Portfolio Holdings because the above calculation is based on a percentage of total investments, excluding derivatives, whereas the calculation in the Portfolio Holdings is based on a percentage of net assets. |
Laudus International MarketMasters Fund | Annual Report
Laudus International MarketMasters Fund
Examples for a $1,000 Investment
As a fund shareholder, you may incur two types of costs: (1) transaction costs; and (2) ongoing costs, including management fees, transfer agent and shareholder services fees, and other fund expenses.
The expense examples below are intended to help you understand your ongoing cost (in dollars) of investing in a fund and to compare this cost with the ongoing cost of investing in other mutual funds. These examples are based on an investment of $1,000 invested for six months beginning May 1, 2019 and held through October 31, 2019.
Actual Return lines in the table below provide information about actual account values and actual expenses. You may use this information, together with the amount you invested, to estimate the expenses that you paid over the period. To do so, simply divide your account value by $1,000 (for example, an $8,600 account value ÷ $1,000 = 8.6), then multiply the result by the number given for your fund under the heading entitled “Expenses Paid During Period.”
Hypothetical Return lines in the table below provide information about hypothetical account values and hypothetical expenses based on a fund’s or share class’ actual expense ratio and an assumed return of 5% per year before expenses. Because the return used is not an actual return, it may not be used to estimate the actual ending account value or expenses you paid for the period.
You may use this information to compare the ongoing costs of investing in a fund and other funds. To do so, compare this 5% hypothetical example with the 5% hypothetical examples that appear in the shareholder reports of the other funds.
Please note that the expenses shown in the table are meant to highlight your ongoing costs only, and do not reflect any transactional costs. Therefore, the hypothetical return lines of the table are useful in comparing ongoing costs only, and will not help you determine the relative total costs of owning different funds. In addition, if these transactional costs were included, your costs would have been higher.
| | Expense Ratio
(Annualized)1 | Beginning
Account Value
at 5/1/19 | Ending
Account Value
(Net of Expenses)
at 10/31/19 | Expenses Paid
During Period
5/1/19-10/31/192 |
| Laudus International MarketMasters Fund | | | | |
| Actual Return | 1.25% | $1,000.00 | $1,015.50 | $6.35 |
| Hypothetical 5% Return | 1.25% | $1,000.00 | $1,018.90 | $6.36 |
| 1 | Based on the most recent six-month expense ratio. |
| 2 | Expenses for each fund are equal to its annualized expense ratio, multiplied by the average account value over the period, multiplied by the 184 days of the period, and divided by the 365 days of the fiscal year. |
Laudus International MarketMasters Fund | Annual Report
Laudus International MarketMasters Fund
Financial Statements
Financial Highlights
| | 11/1/18–
10/31/191 | 11/1/17–
10/31/18 | 11/1/16–
10/31/17 | 11/1/15–
10/31/16 | 11/1/14–
10/31/15 | |
| Per-Share Data |
| Net asset value at beginning of period | $22.89 | $26.96 | $21.16 | $22.71 | $22.95 | |
| Income (loss) from investment operations: | | | | | | |
| Net investment income (loss)2 | 0.31 | 0.24 | 0.22 | 0.19 | 0.21 | |
| Net realized and unrealized gains (losses) | 1.74 | (3.09) | 5.76 | (0.23) | (0.10) | |
| Total from investment operations | 2.05 | (2.85) | 5.98 | (0.04) | 0.11 | |
| Less distributions: | | | | | | |
| Distributions from net investment income | (0.29) | (0.36) | (0.18) | (0.31) | (0.35) | |
| Distributions from net realized gains | (1.76) | (0.86) | — | (1.20) | — | |
| Total distributions | (2.05) | (1.22) | (0.18) | (1.51) | (0.35) | |
| Net asset value at end of period | $22.89 | $22.89 | $26.96 | $21.16 | $22.71 | |
| Total return | 10.50% | (11.09%) | 28.52% | 0.00%3 | 0.56% | |
| Ratios/Supplemental Data |
| Ratios to average net assets: | | | | | | |
| Net operating expenses | 1.25% | 1.25% | 1.25% | 1.25% | 1.25% | |
| Gross operating expenses | 1.50% | 1.51% | 1.53% | 1.54% | 1.50% | |
| Net investment income (loss) | 1.43% | 0.92% | 0.92% | 0.93% | 0.91% | |
| Portfolio turnover rate | 54% | 69% | 71% | 69% | 72% | |
| Net assets, end of period (x 1,000,000) | $1,413 | $1,127 | $1,229 | $1,063 | $1,395 | |
| |
1
Effective February 26, 2019, the Investor Share class, and the Select Share class were consolidated into a single class of shares of the fund. The financial history as shown in the financial highlights is that of the former Select Shares (see financial note 1).
2
Calculated based on the average shares outstanding during the period.
3
Less than 0.005%.
Laudus International MarketMasters Fund | Annual Report
Laudus International MarketMasters Fund
Portfolio Holdings as of October 31, 2019
This section shows all the securities in the fund’s portfolio and their values as of the report date.
The fund files its complete schedule of portfolio holdings with the U.S. Securities and Exchange Commission (SEC) for the first and third quarters of each fiscal year on Form N-Q. Effective March 31, 2019, Form N-PORT Part F has replaced Form N-Q. The fund’s Form N-Q and Form N-PORT Part F are available on the SEC’s website atwww.sec.gov. The fund also makes available its complete schedule of portfolio holdings 15-20 days after calendar quarters on the fund’s website atwww.schwabfunds.com/laudusfunds_prospectus.
| Security | Number
of Shares | Value ($) |
| Common Stock95.4% of net assets |
| |
| Argentina 0.2% |
| Globant S.A. * | 26,981 | 2,516,248 |
| |
| Australia 4.1% |
| Afterpay Touch Group Ltd. * | 108,738 | 2,158,669 |
| AGL Energy Ltd. | 4,261 | 58,165 |
| Altium Ltd. | 148,007 | 3,276,458 |
| Alumina Ltd. | 15,839 | 24,726 |
| AMP Ltd. | 1,701,165 | 2,149,490 |
| APA Group | 7,395 | 59,399 |
| Aristocrat Leisure Ltd. | 74,124 | 1,616,276 |
| ASX Ltd. | 1,258 | 71,406 |
| Aurizon Holdings Ltd. | 12,602 | 51,268 |
| AusNet Services | 12,875 | 16,446 |
| Australia & New Zealand Banking Group Ltd. | 18,435 | 338,782 |
| Bank of Queensland Ltd. | 2,609 | 16,283 |
| Bendigo & Adelaide Bank Ltd. | 3,165 | 23,228 |
| BHP Group Ltd. | 19,113 | 468,506 |
| BHP Group plc | 13,723 | 291,072 |
| BlueScope Steel Ltd. | 3,488 | 31,930 |
| Boral Ltd. | 7,551 | 26,216 |
| Brambles Ltd. | 200,683 | 1,659,056 |
| Breville Group Ltd. | 80,743 | 855,116 |
| Caltex Australia Ltd. | 1,678 | 31,544 |
| Challenger Ltd. | 3,544 | 19,438 |
| Charter Hall Retail REIT | 1,534,530 | 4,662,316 |
| CIMIC Group Ltd. | 621 | 14,152 |
| Cleanaway Waste Management Ltd. | 609,757 | 774,997 |
| Coca-Cola Amatil Ltd. | 3,342 | 23,453 |
| Cochlear Ltd. | 361 | 52,666 |
| Coles Group Ltd. | 7,158 | 74,077 |
| Commonwealth Bank of Australia | 11,481 | 622,501 |
| Computershare Ltd. | 3,120 | 34,056 |
| Costa Group Holdings Ltd. | 867,548 | 1,706,202 |
| Crown Resorts Ltd. | 2,402 | 20,635 |
| CSL Ltd. | 25,987 | 4,582,970 |
| Dexus | 7,099 | 58,542 |
| Flight Centre Travel Group Ltd. | 408 | 11,986 |
| Fortescue Metals Group Ltd. | 8,954 | 54,804 |
| Goodman Group | 154,136 | 1,530,456 |
| Harvey Norman Holdings Ltd. | 4,438 | 12,522 |
| Incitec Pivot Ltd. | 10,881 | 25,891 |
| Inghams Group Ltd. | 1,305,797 | 2,795,599 |
| Insurance Australia Group Ltd. | 14,962 | 81,978 |
| InvoCare Ltd. | 262,325 | 2,370,969 |
| James Hardie Industries plc | 2,769 | 47,555 |
| LendLease Group | 3,658 | 47,282 |
| Macquarie Group Ltd. | 35,483 | 3,276,408 |
| Magellan Financial Group Ltd. | 559 | 18,541 |
| Medibank Pvt Ltd. | 17,679 | 41,205 |
| Mirvac Group | 25,906 | 57,405 |
| National Australia Bank Ltd. | 18,049 | 354,286 |
| Newcrest Mining Ltd. | 4,954 | 108,138 |
| Northern Star Resources Ltd. | 250,478 | 1,697,819 |
| Security | Number
of Shares | Value ($) |
| Orica Ltd. | 168,079 | 2,656,270 |
| Origin Energy Ltd. | 11,450 | 62,076 |
| Pact Group Holdings Ltd. * | 888,151 | 1,482,753 |
| QBE Insurance Group Ltd. | 8,427 | 73,318 |
| Ramsay Health Care Ltd. | 877 | 41,439 |
| REA Group Ltd. | 335 | 25,142 |
| Rio Tinto Ltd. | 2,393 | 149,641 |
| Santos Ltd. | 11,532 | 64,504 |
| Saracen Mineral Holdings Ltd. * | 1,569,479 | 4,060,893 |
| Scentre Group | 33,702 | 89,046 |
| SEEK Ltd. | 2,153 | 33,695 |
| Seven Group Holdings Ltd. | 350,150 | 4,525,780 |
| Shopping Centres Australasia Property Group | 2,102,971 | 3,900,848 |
| Sonic Healthcare Ltd. | 2,841 | 55,953 |
| South32 Ltd. | 32,113 | 56,196 |
| Stockland | 15,262 | 51,524 |
| Suncorp Group Ltd. | 7,985 | 74,137 |
| Sydney Airport | 6,843 | 41,444 |
| Tabcorp Holdings Ltd. | 12,868 | 42,640 |
| Telstra Corp., Ltd. | 27,061 | 65,175 |
| The GPT Group | 12,852 | 52,754 |
| TPG Telecom Ltd. | 2,733 | 12,318 |
| Transurban Group | 17,171 | 175,864 |
| Treasury Wine Estates Ltd. | 4,455 | 54,009 |
| Unibail-Rodamco-Westfield | 887 | 137,162 |
| Vicinity Centres | 20,665 | 38,039 |
| Washington H Soul Pattinson & Co., Ltd. | 769 | 11,495 |
| Wesfarmers Ltd. | 7,305 | 200,704 |
| Westpac Banking Corp. | 22,382 | 434,557 |
| WiseTech Global Ltd. | 62,228 | 1,117,537 |
| Woodside Petroleum Ltd. | 6,038 | 133,823 |
| Woolworths Group Ltd. | 8,456 | 218,047 |
| Worley Ltd. | 2,205 | 20,697 |
| | | 58,562,365 |
| |
| Austria 0.0% |
| ANDRITZ AG | 478 | 21,494 |
| Erste Group Bank AG * | 1,952 | 69,038 |
| OMV AG | 913 | 53,375 |
| Raiffeisen Bank International AG | 918 | 22,619 |
| Verbund AG | 468 | 25,354 |
| voestalpine AG | 710 | 17,816 |
| | | 209,696 |
| |
| Belgium 1.1% |
| Ageas | 1,168 | 67,359 |
| Anheuser-Busch InBev S.A./N.V. | 4,947 | 399,309 |
| Argenx SE * | 20,446 | 2,489,690 |
| Barco N.V. | 6,648 | 1,447,831 |
| Colruyt S.A. | 383 | 21,290 |
| Galapagos N.V. * | 12,586 | 2,317,294 |
| Groupe Bruxelles Lambert S.A. | 500 | 50,228 |
| KBC Group N.V. | 1,589 | 111,729 |
| Melexis N.V. | 49,243 | 3,455,373 |
| Proximus | 943 | 28,979 |
| Shurgard Self Storage S.A. | 128,163 | 4,338,234 |
Laudus International MarketMasters Fund | Annual Report
Laudus International MarketMasters Fund
Portfolio Holdings as of October 31, 2019 (continued)
| Security | Number
of Shares | Value ($) |
| Solvay S.A. | 459 | 49,905 |
| Telenet Group Holding N.V. * | 355 | 17,442 |
| UCB S.A. | 822 | 66,252 |
| Umicore S.A. | 1,298 | 53,582 |
| Warehouses De Pauw CVA | 4,174 | 773,704 |
| | | 15,688,201 |
| |
| Brazil 1.1% |
| Azul S.A. * | 65,914 | 2,569,328 |
| B3 S.A. - Brasil Bolsa Balcao | 151,400 | 1,826,389 |
| Cia de Locacao das Americas | 707,800 | 3,046,161 |
| CVC Brasil Operadora e Agencia de Viagens S.A. | 43,700 | 558,222 |
| IRB Brasil Resseguros S.A. | 116,100 | 1,093,983 |
| Localiza Rent a Car S.A. | 73,900 | 795,662 |
| Lojas Renner S.A. | 60,830 | 769,760 |
| Magazine Luiza S.A. | 104,800 | 1,166,506 |
| Notre Dame Intermedica Participacoes S.A. | 291,300 | 4,358,060 |
| | | 16,184,071 |
| |
| Canada 6.1% |
| Alimentation Couche-Tard, Inc., Class B | 89,436 | 2,682,197 |
| ATS Automation Tooling Systems, Inc. * | 94,575 | 1,283,882 |
| Badger Daylighting Ltd. | 55,095 | 1,632,228 |
| Boralex, Inc., Class A | 374,439 | 6,197,533 |
| Brookfield Asset Management, Inc., Class A | 91,873 | 5,075,983 |
| BRP, Inc. | 54,304 | 2,436,279 |
| CAE, Inc. | 173,546 | 4,352,156 |
| Canada Goose Holdings, Inc. * | 67,418 | 2,820,095 |
| Canadian National Railway Co. | 46,445 | 4,153,991 |
| Canadian Pacific Railway Ltd. | 12,883 | 2,928,435 |
| Cenovus Energy, Inc. | 445,825 | 3,797,856 |
| Cineplex, Inc. | 287,695 | 4,903,768 |
| ECN Capital Corp. | 436,433 | 1,441,412 |
| FirstService Corp. | 27,270 | 2,380,198 |
| Gibson Energy, Inc. | 168,910 | 2,944,479 |
| Innergex Renewable Energy, Inc. | 547,767 | 6,837,210 |
| Kirkland Lake Gold Ltd. | 60,585 | 2,845,025 |
| lululemon Athletica, Inc. * | 8,200 | 1,675,014 |
| Northview Apartment Real Estate Investment Trust | 173,458 | 3,800,773 |
| Open Text Corp. | 37,200 | 1,503,139 |
| Parkland Fuel Corp. | 15,578 | 517,453 |
| Ritchie Bros. Auctioneers, Inc. | 94,375 | 3,882,910 |
| TFI International, Inc. | 64,504 | 2,055,450 |
| The Descartes Systems Group, Inc. * | 63,971 | 2,489,191 |
| The Toronto-Dominion Bank | 59,074 | 3,373,286 |
| Toromont Industries Ltd. | 10,986 | 567,275 |
| WSP Global, Inc. | 114,686 | 7,155,793 |
| | | 85,733,011 |
| |
| China 4.8% |
| A-Living Services Co., Ltd., H Shares | 1,548,500 | 4,686,052 |
| Aier Eye Hospital Group Co. Ltd | 169,000 | 947,451 |
| Alibaba Group Holding Ltd. ADR * | 39,890 | 7,047,366 |
| Baidu, Inc. ADR * | 33,190 | 3,380,402 |
| Baozun, Inc. ADR * | 23,664 | 1,029,857 |
| Bosideng International Holdings Ltd. | 3,684,000 | 1,905,032 |
| Centre Testing International Group Co., Ltd., Class A | 480,000 | 952,877 |
| China Mengniu Dairy Co., Ltd. * | 316,000 | 1,259,811 |
| China Merchants Bank Co., Ltd., H Shares | 806,500 | 3,846,384 |
| Security | Number
of Shares | Value ($) |
| Country Garden Services Holdings Co., Ltd. | 282,000 | 955,521 |
| GDS Holdings Ltd. ADR * | 107,905 | 4,497,480 |
| GSX Techedu, Inc. * | 126,230 | 2,163,582 |
| Huazhu Group Ltd. ADR | 21,037 | 796,461 |
| Kweichow Moutai Co., Ltd., Class A | 11,600 | 1,939,200 |
| Li Ning Co., Ltd. | 2,072,500 | 7,027,473 |
| Microport Scientific Corp. | 1,829,513 | 1,878,737 |
| NetEase, Inc. ADR | 9,819 | 2,806,859 |
| Nexteer Automotive Group Ltd. | 1,877,288 | 1,749,669 |
| Ping An Insurance Group Co. of China Ltd., H Shares | 441,000 | 5,089,925 |
| Shenzhou International Group Holdings Ltd. | 100,000 | 1,381,865 |
| Tencent Holdings Ltd. | 164,100 | 6,656,374 |
| Tencent Music Entertainment Group ADR * | 35,809 | 495,597 |
| Trip.Com Group Ltd. * | 19,684 | 649,375 |
| Vitasoy International Holdings Ltd. | 106,000 | 431,029 |
| Zhongsheng Group Holdings Ltd. | 1,269,500 | 4,208,667 |
| | | 67,783,046 |
| |
| Denmark 1.3% |
| AP Moeller - Maersk A/S, Series A | 23 | 27,629 |
| AP Moeller - Maersk A/S, Series B | 41 | 52,300 |
| Carlsberg A/S, Class B | 691 | 97,309 |
| Chr. Hansen Holding A/S | 17,143 | 1,316,165 |
| Coloplast A/S, Class B | 21,515 | 2,590,318 |
| Danske Bank A/S | 4,339 | 62,007 |
| Demant A/S * | 724 | 19,125 |
| DSV PANALPINA A/S | 35,526 | 3,452,740 |
| Genmab A/S * | 10,681 | 2,333,740 |
| H. Lundbeck A/S | 432 | 14,762 |
| ISS A/S | 1,052 | 27,543 |
| Novo Nordisk A/S, Class B | 65,685 | 3,611,932 |
| Novozymes A/S, B Shares | 1,402 | 66,090 |
| Orsted A/S | 33,659 | 2,954,307 |
| Pandora A/S | 697 | 34,297 |
| Royal Unibrew A/S | 9,506 | 779,864 |
| Tryg A/S | 18,847 | 526,793 |
| Vestas Wind Systems A/S | 1,269 | 103,383 |
| | | 18,070,304 |
| |
| Faeroe Islands 0.3% |
| Bakkafrost P/F | 60,739 | 3,803,534 |
| |
| Finland 0.7% |
| Elisa Oyj | 894 | 48,827 |
| Fortum Oyj | 2,890 | 70,625 |
| Kone Oyj, Class B | 2,217 | 141,169 |
| Metso Oyj | 691 | 26,159 |
| Neste Oyj | 89,141 | 3,220,883 |
| Nokia Oyj | 36,750 | 134,910 |
| Nokian Renkaat Oyj | 758 | 21,663 |
| Nordea Bank Abp | 19,705 | 144,227 |
| Orion Oyj, Class B | 691 | 30,656 |
| Sampo Oyj, A Shares | 2,863 | 117,325 |
| Stora Enso Oyj, R Shares | 3,711 | 48,212 |
| UPM-Kymmene Oyj | 74,176 | 2,415,871 |
| Valmet Oyj | 143,372 | 3,208,739 |
| Wartsila Oyj Abp | 2,751 | 29,064 |
| | | 9,658,330 |
| |
Laudus International MarketMasters Fund | Annual Report
Laudus International MarketMasters Fund
Portfolio Holdings as of October 31, 2019 (continued)
| Security | Number
of Shares | Value ($) |
| France 8.7% |
| Accor S.A. | 125,563 | 5,400,915 |
| Aeroports de Paris | 184 | 34,995 |
| Air Liquide S.A. | 3,067 | 407,792 |
| Airbus SE | 50,589 | 7,257,409 |
| Alstom S.A. | 1,258 | 54,425 |
| Alten S.A. | 27,314 | 3,004,594 |
| Amundi S.A. | 375 | 26,800 |
| Arkema S.A. | 423 | 43,289 |
| Atos SE | 610 | 47,340 |
| AXA S.A. | 12,608 | 333,749 |
| BioMerieux | 257 | 21,045 |
| BNP Paribas S.A. | 207,012 | 10,818,352 |
| Bollore S.A. | 5,540 | 24,001 |
| Bollore S.A. New * | 32 | 136 |
| Bouygues S.A. | 1,435 | 60,870 |
| Bureau Veritas S.A. | 98,679 | 2,522,883 |
| Capgemini SE | 31,509 | 3,552,014 |
| Carrefour S.A. | 3,950 | 67,251 |
| Casino Guichard Perrachon S.A. | 375 | 20,230 |
| Cie Plastic Omnium S.A. | 67,602 | 1,846,649 |
| CNP Assurances | 1,064 | 21,120 |
| Coface S.A. * | 261,103 | 2,853,839 |
| Compagnie de Saint-Gobain | 3,150 | 128,293 |
| Compagnie Generale des Etablissements Michelin | 1,102 | 134,176 |
| Covivio | 322 | 36,466 |
| Credit Agricole S.A. | 7,533 | 98,293 |
| Danone S.A. | 4,006 | 331,862 |
| Dassault Aviation S.A. | 15 | 20,837 |
| Dassault Systemes SE | 19,764 | 3,001,692 |
| Edenred | 1,588 | 83,700 |
| Eiffage S.A. | 508 | 54,562 |
| Electricite de France S.A. | 3,980 | 41,117 |
| Engie S.A. | 11,911 | 199,447 |
| EssilorLuxottica S.A. | 17,636 | 2,692,917 |
| Eurazeo SE | 263 | 18,352 |
| Eurofins Scientific SE | 71 | 35,997 |
| Eutelsat Communications S.A. | 1,152 | 21,853 |
| Faurecia SE | 471 | 21,981 |
| Gaztransport Et Technigaz S.A. | 54,922 | 5,010,997 |
| Gecina S.A. | 285 | 48,926 |
| Getlink SE | 2,938 | 49,214 |
| Hermes International | 2,185 | 1,573,970 |
| ICADE | 213 | 20,858 |
| Iliad S.A. | 164 | 16,996 |
| Imerys S.A. | 228 | 8,807 |
| Ingenico Group S.A. | 29,592 | 3,164,304 |
| Ipsen S.A. | 6,240 | 665,107 |
| JCDecaux S.A. | 477 | 13,039 |
| Kering S.A. | 6,391 | 3,636,455 |
| Klepierre S.A. | 1,267 | 47,228 |
| Korian S.A. | 173,020 | 7,337,249 |
| L'Oreal S.A. | 14,631 | 4,273,154 |
| Legrand S.A. | 1,746 | 136,405 |
| LISI | 82,862 | 2,912,602 |
| LVMH Moet Hennessy Louis Vuitton SE | 13,971 | 5,966,394 |
| Natixis S.A. | 5,834 | 26,803 |
| Orange S.A. | 12,999 | 209,212 |
| Orpea | 8,510 | 1,024,971 |
| Pernod-Ricard S.A. | 1,381 | 255,116 |
| Peugeot S.A. | 3,724 | 94,315 |
| Publicis Groupe S.A. | 127,918 | 5,505,402 |
| Remy Cointreau S.A. | 146 | 19,538 |
| Renault S.A. | 1,217 | 62,139 |
| Rubis SCA | 136,740 | 7,929,227 |
| Safran S.A. | 33,611 | 5,323,642 |
| Security | Number
of Shares | Value ($) |
| Sanofi | 7,282 | 671,306 |
| Sartorius Stedim Biotech | 190 | 28,464 |
| Schneider Electric SE | 3,538 | 328,823 |
| SCOR SE | 1,034 | 43,613 |
| SEB S.A. | 140 | 21,273 |
| SES S.A. | 2,289 | 44,372 |
| Societe BIC S.A. | 181 | 12,566 |
| Societe Generale S.A. | 4,933 | 140,289 |
| Sodexo S.A. | 561 | 61,692 |
| SOITEC * | 42,997 | 4,742,613 |
| STMicroelectronics N.V. | 4,431 | 100,567 |
| Suez | 2,318 | 36,155 |
| Teleperformance | 8,828 | 2,002,927 |
| Thales S.A. | 24,003 | 2,346,524 |
| TOTAL S.A. | 15,413 | 814,858 |
| UbiSoft Entertainment S.A. * | 545 | 32,209 |
| Valeo S.A. | 167,856 | 6,251,072 |
| Veolia Environnement S.A. | 3,483 | 91,686 |
| Verallia SASU * | 105,956 | 3,072,490 |
| Vinci S.A. | 3,304 | 370,696 |
| Vivendi S.A. | 5,942 | 165,470 |
| Wendel S.A. | 182 | 25,807 |
| Worldline S.A. * | 14,197 | 863,849 |
| | | 122,942,634 |
| |
| Germany 8.6% |
| 1&1 Drillisch AG | 329 | 8,812 |
| adidas AG | 1,171 | 361,570 |
| Allianz SE | 25,498 | 6,227,186 |
| Axel Springer SE * | 308 | 21,470 |
| BASF SE | 5,964 | 453,378 |
| Bayer AG | 108,579 | 8,423,143 |
| Bayerische Motoren Werke AG | 120,034 | 9,191,566 |
| Beiersdorf AG | 654 | 77,426 |
| Brenntag AG | 958 | 48,015 |
| Carl Zeiss Meditec AG, Class B | 9,381 | 1,022,567 |
| Commerzbank AG | 6,528 | 39,062 |
| Continental AG | 70,156 | 9,396,750 |
| Covestro AG | 1,124 | 53,977 |
| Daimler AG | 177,805 | 10,393,210 |
| Delivery Hero SE * | 714 | 33,503 |
| Deutsche Bank AG | 12,653 | 91,756 |
| Deutsche Boerse AG | 1,239 | 191,871 |
| Deutsche Lufthansa AG | 1,461 | 25,309 |
| Deutsche Post AG | 6,345 | 224,772 |
| Deutsche Telekom AG | 21,651 | 380,961 |
| Deutsche Wohnen SE | 2,367 | 89,242 |
| Duerr AG | 70,225 | 2,071,888 |
| E.ON SE | 14,197 | 143,169 |
| Evonik Industries AG | 1,185 | 31,229 |
| Evotec SE * | 81,747 | 1,872,470 |
| Fielmann AG | 113,567 | 8,758,480 |
| Fraport AG Frankfurt Airport Services Worldwide | 258 | 21,564 |
| Fresenius Medical Care AG & Co. KGaA | 1,398 | 100,907 |
| Fresenius SE & Co. KGaA | 2,682 | 141,221 |
| GEA Group AG | 1,089 | 33,291 |
| Gerresheimer AG | 48,804 | 3,935,804 |
| GRENKE AG | 6,655 | 629,784 |
| Hannover Rueck SE | 393 | 69,641 |
| HeidelbergCement AG | 965 | 71,543 |
| HelloFresh SE * | 202,608 | 3,529,630 |
| Henkel AG & Co. KGaA | 6,275 | 603,767 |
| HOCHTIEF AG | 166 | 20,740 |
| Hugo Boss AG | 399 | 16,823 |
| Infineon Technologies AG | 7,993 | 154,815 |
| Isra Vision AG | 35,052 | 1,657,918 |
Laudus International MarketMasters Fund | Annual Report
Laudus International MarketMasters Fund
Portfolio Holdings as of October 31, 2019 (continued)
| Security | Number
of Shares | Value ($) |
| JOST Werke AG | 75,313 | 2,116,713 |
| KION Group AG | 10,232 | 680,814 |
| Knorr-Bremse AG | 294 | 29,671 |
| LANXESS AG | 546 | 35,479 |
| Merck KGaA | 818 | 97,560 |
| METRO AG | 1,216 | 19,857 |
| MorphoSys AG * | 20,460 | 2,233,319 |
| MTU Aero Engines AG | 15,984 | 4,274,617 |
| Muenchener Rueckversicherungs-Gesellschaft AG | 973 | 270,338 |
| Nemetschek SE | 84,003 | 4,286,034 |
| Norma Group SE | 72,633 | 2,666,365 |
| Puma SE | 17,040 | 1,281,867 |
| QIAGEN N.V. *(a) | 1,504 | 45,239 |
| QIAGEN N.V. *(a) | 50,470 | 1,504,511 |
| Rheinmetall AG | 20,009 | 2,413,217 |
| RTL Group S.A. | 247 | 12,551 |
| RWE AG | 3,496 | 106,539 |
| SAP SE | 36,054 | 4,777,207 |
| Siemens AG | 4,962 | 572,615 |
| Siemens Healthineers AG | 930 | 39,513 |
| Sixt SE | 22,966 | 2,245,875 |
| Stabilus S.A. | 56,742 | 3,185,591 |
| Stroeer SE & Co. KGaA | 38,176 | 3,075,778 |
| Symrise AG | 823 | 79,096 |
| Teamviewer AG * | 25,491 | 672,656 |
| Telefonica Deutschland Holding AG | 5,662 | 17,966 |
| ThyssenKrupp AG | 400,901 | 5,717,082 |
| TUI AG | 2,731 | 35,728 |
| Uniper SE | 1,248 | 38,896 |
| United Internet AG | 762 | 23,004 |
| Varta AG * | 30,112 | 3,403,857 |
| Volkswagen AG | 201 | 37,997 |
| Vonovia SE | 80,790 | 4,302,459 |
| Wirecard AG | 768 | 97,164 |
| Zalando SE * | 797 | 34,556 |
| | | 121,051,961 |
| |
| Hong Kong 1.6% |
| AIA Group Ltd. | 736,600 | 7,335,223 |
| ASM Pacific Technology Ltd. | 217,500 | 3,036,915 |
| Ausnutria Dairy Corp., Ltd. * | 985,000 | 1,469,135 |
| BeiGene Ltd. ADR * | 218 | 30,158 |
| BOC Hong Kong (Holdings) Ltd. | 24,000 | 82,455 |
| Budweiser Brewing Co. APAC Ltd. * | 6,600 | 24,131 |
| CK Asset Holdings Ltd. | 16,538 | 115,067 |
| CK Hutchison Holdings Ltd. | 17,538 | 161,930 |
| CK Infrastructure Holdings Ltd. | 4,074 | 29,319 |
| CLP Holdings Ltd. | 10,500 | 109,047 |
| Dairy Farm International Holdings Ltd. | 2,200 | 13,266 |
| Fortune REIT | 1,156,000 | 1,356,116 |
| Galaxy Entertainment Group Ltd. | 291,000 | 2,003,720 |
| Hang Lung Properties Ltd. | 13,000 | 28,577 |
| Hang Seng Bank Ltd. | 4,900 | 102,239 |
| Henderson Land Development Co., Ltd. | 9,687 | 48,382 |
| HK Electric Investments & HK Electric Investments Ltd. | 17,000 | 16,965 |
| HKBN Ltd. | 2,128,983 | 3,799,586 |
| HKT Trust & HKT Ltd. | 25,120 | 39,078 |
| Hong Kong & China Gas Co., Ltd. | 65,381 | 126,898 |
| Hong Kong Exchanges & Clearing Ltd. | 7,745 | 241,288 |
| Hongkong Land Holdings Ltd. | 7,300 | 40,102 |
| Hysan Development Co., Ltd. | 4,000 | 15,765 |
| Kerry Properties Ltd. | 4,000 | 12,935 |
| Link REIT | 13,500 | 147,034 |
| Melco International Development Ltd. | 319,000 | 845,460 |
| Melco Resorts & Entertainment Ltd. ADR | 1,346 | 28,993 |
| Security | Number
of Shares | Value ($) |
| MGM China Holdings Ltd. | 6,000 | 9,501 |
| MTR Corp., Ltd. | 10,249 | 58,766 |
| New World Development Co., Ltd. | 39,113 | 55,949 |
| NWS Holdings Ltd. | 9,572 | 14,246 |
| PCCW Ltd. | 27,000 | 16,036 |
| Power Assets Holdings Ltd. | 9,000 | 64,225 |
| Sands China Ltd. | 15,600 | 76,840 |
| Shangri-La Asia Ltd. | 8,000 | 8,211 |
| Sino Land Co., Ltd. | 22,000 | 32,887 |
| SJM Holdings Ltd. | 12,683 | 13,548 |
| Sun Hung Kai Properties Ltd. | 10,202 | 154,594 |
| Swire Pacific Ltd., Class A | 3,500 | 33,363 |
| Swire Properties Ltd. | 7,200 | 22,644 |
| Techtronic Industries Co., Ltd. | 9,000 | 70,335 |
| The Bank of East Asia Ltd. | 8,057 | 19,408 |
| The Wharf Holdings Ltd. | 7,349 | 16,677 |
| WH Group Ltd. | 61,000 | 64,388 |
| Wharf Real Estate Investment Co., Ltd. | 8,349 | 49,107 |
| Wheelock & Co., Ltd. | 5,000 | 30,923 |
| Wynn Macau Ltd. | 9,600 | 20,833 |
| Yue Yuen Industrial Holdings Ltd. | 5,000 | 14,091 |
| | | 22,106,356 |
| |
| India 1.1% |
| Axis Bank Ltd. | 173,724 | 1,799,980 |
| Bata India Ltd. | 106,298 | 2,705,517 |
| HDFC Bank Ltd. | 104,602 | 1,812,364 |
| Hexaware Technologies Ltd. | 90,689 | 425,452 |
| Hindustan Unilever Ltd. | 46,297 | 1,419,013 |
| Maruti Suzuki India Ltd. | 11,163 | 1,189,403 |
| Pidilite Industries Ltd. | 34,498 | 681,209 |
| Titan Co., Ltd. | 48,713 | 913,918 |
| WNS Holdings Ltd. ADR * | 76,497 | 4,730,574 |
| | | 15,677,430 |
| |
| Indonesia 0.6% |
| Bank Tabungan Pensiunan Nasional Syariah Tbk PT * | 8,607,800 | 2,354,100 |
| PT Bank Central Asia Tbk | 1,905,500 | 4,265,133 |
| PT Bank Mandiri (Persero) Tbk | 4,035,500 | 2,017,221 |
| | | 8,636,454 |
| |
| Ireland 1.5% |
| AIB Group plc | 5,047 | 16,166 |
| Bank of Ireland Group plc | 5,995 | 28,896 |
| CRH plc | 5,266 | 191,734 |
| DCC plc | 624 | 58,518 |
| Flutter Entertainment plc | 524 | 54,129 |
| Glanbia plc | 375,289 | 4,181,412 |
| Grafton Group plc | 279,719 | 2,832,503 |
| ICON plc * | 13,710 | 2,013,999 |
| Kerry Group plc, Class A | 19,315 | 2,335,154 |
| Kingspan Group plc | 37,980 | 1,968,003 |
| Ryanair Holdings plc ADR * | 105,021 | 7,838,768 |
| Smurfit Kappa Group plc | 1,397 | 46,656 |
| | | 21,565,938 |
| |
| Israel 0.6% |
| Azrieli Group Ltd. | 277 | 21,351 |
| Bank Hapoalim B.M. | 7,230 | 57,866 |
| Bank Leumi Le-Israel B.M. | 9,560 | 69,637 |
| Check Point Software Technologies Ltd. * | 23,402 | 2,630,619 |
| CyberArk Software Ltd. * | 4,418 | 448,780 |
| Elbit Systems Ltd. | 157 | 25,741 |
Laudus International MarketMasters Fund | Annual Report
Laudus International MarketMasters Fund
Portfolio Holdings as of October 31, 2019 (continued)
| Security | Number
of Shares | Value ($) |
| Israel Chemicals Ltd. | 4,649 | 20,665 |
| Israel Discount Bank Ltd., Class A | 7,084 | 32,373 |
| Kornit Digital Ltd. * | 108,549 | 3,689,581 |
| Mizrahi Tefahot Bank Ltd. | 937 | 23,248 |
| Nice Ltd. * | 403 | 63,569 |
| Teva Pharmaceutical Industries Ltd. ADR * | 6,938 | 56,545 |
| Wix.com Ltd. * | 8,260 | 1,008,298 |
| | | 8,148,273 |
| |
| Italy 2.0% |
| Amplifon S.p.A. | 129,060 | 3,245,642 |
| Assicurazioni Generali S.p.A. | 7,074 | 143,443 |
| Atlantia S.p.A. | 3,210 | 79,306 |
| Autogrill S.p.A. | 192,493 | 1,903,135 |
| Banca Generali S.p.A. | 27,546 | 899,279 |
| Davide Campari-Milano S.p.A. | 3,600 | 33,020 |
| Enel S.p.A. | 311,690 | 2,415,709 |
| Eni S.p.A. | 16,547 | 251,034 |
| Ferrari N.V. | 12,574 | 2,013,813 |
| Fiat Chrysler Automobiles N.V. | 7,019 | 108,926 |
| FinecoBank Banca Fineco S.p.A. | 144,288 | 1,626,607 |
| Interpump Group S.p.A. | 136,170 | 3,732,868 |
| Intesa Sanpaolo S.p.A. | 4,129,962 | 10,348,959 |
| Leonardo S.p.A. | 2,641 | 30,682 |
| Mediobanca Banca di Credito Finanziario S.p.A. | 3,892 | 46,281 |
| Moncler S.p.A. | 17,631 | 680,358 |
| Pirelli & C S.p.A. | 2,479 | 14,331 |
| Poste Italiane S.p.A | 3,238 | 39,330 |
| Prysmian S.p.A. | 1,491 | 34,490 |
| Recordati S.p.A. | 663 | 27,862 |
| Snam S.p.A. | 13,465 | 69,128 |
| Technogym S.p.A. | 45,028 | 496,781 |
| Telecom Italia S.p.A. * | 59,665 | 34,922 |
| Terna - Rete Elettrica Nationale S.p.A. | 9,165 | 60,575 |
| UniCredit S.p.A. | 12,886 | 163,485 |
| | | 28,499,966 |
| |
| Japan 13.5% |
| ABC-Mart, Inc. | 200 | 13,713 |
| Acom Co., Ltd. | 2,600 | 10,446 |
| Advantest Corp. | 1,300 | 59,161 |
| Aeon Co., Ltd. | 4,200 | 84,505 |
| AEON Financial Service Co., Ltd. | 600 | 9,144 |
| Aeon Mall Co., Ltd. | 800 | 12,799 |
| AGC, Inc. | 1,200 | 42,192 |
| Air Water, Inc. | 978 | 18,309 |
| Aisin Seiki Co., Ltd. | 1,000 | 39,910 |
| Ajinomoto Co., Inc. | 2,878 | 54,717 |
| Alfresa Holdings Corp. | 1,200 | 26,795 |
| Alps Alpine Co., Ltd. | 1,400 | 30,014 |
| Amada Holdings Co., Ltd. | 2,226 | 25,350 |
| ANA Holdings, Inc. | 740 | 25,410 |
| Anritsu Corp. | 196,100 | 3,739,678 |
| Aozora Bank Ltd. | 800 | 20,527 |
| Ariake Japan Co., Ltd. | 87,100 | 6,761,383 |
| Aruhi Corp. | 110,300 | 2,479,757 |
| Asahi Group Holdings Ltd. | 2,300 | 115,178 |
| Asahi Intecc Co., Ltd. | 61,800 | 1,700,451 |
| Asahi Kasei Corp. | 8,163 | 90,620 |
| Astellas Pharma, Inc. | 12,300 | 211,101 |
| Bandai Namco Holdings, Inc. | 1,300 | 79,936 |
| Benefit One, Inc. | 42,100 | 852,208 |
| Benesse Holdings, Inc. | 500 | 13,385 |
| Bridgestone Corp. | 3,700 | 153,735 |
| Brother Industries Ltd. | 1,400 | 26,312 |
| Security | Number
of Shares | Value ($) |
| Calbee, Inc. | 500 | 16,713 |
| Canon, Inc. | 6,465 | 177,398 |
| Casio Computer Co., Ltd. | 1,336 | 21,688 |
| Central Japan Railway Co. | 900 | 184,621 |
| Chubu Electric Power Co., Inc. | 4,131 | 61,974 |
| Chugai Pharmaceutical Co., Ltd. | 1,500 | 126,234 |
| Coca-Cola Bottlers Japan Holdings, Inc. | 800 | 18,163 |
| Concordia Financial Group Ltd. | 6,900 | 28,138 |
| Cosmos Pharmaceutical Corp. | 13,400 | 2,767,245 |
| Credit Saison Co., Ltd. | 1,111 | 16,088 |
| CyberAgent, Inc. | 600 | 19,501 |
| Dai Nippon Printing Co., Ltd. | 1,600 | 42,734 |
| Dai-ichi Life Holdings, Inc. | 7,100 | 115,726 |
| Daicel Corp. | 1,700 | 15,197 |
| Daifuku Co., Ltd. | 700 | 37,143 |
| Daiichi Sankyo Co., Ltd. | 3,700 | 243,289 |
| Daikin Industries Ltd. | 28,700 | 4,016,840 |
| Daito Trust Construction Co., Ltd. | 500 | 66,260 |
| Daiwa House Industry Co., Ltd. | 3,600 | 123,930 |
| Daiwa House REIT Investment Corp. | 12 | 34,942 |
| Daiwa Securities Group, Inc. | 10,000 | 44,948 |
| Denso Corp. | 2,800 | 130,004 |
| Dentsu, Inc. | 1,400 | 50,050 |
| Digital Arts, Inc. | 28,200 | 1,655,838 |
| Disco Corp. | 200 | 43,647 |
| East Japan Railway Co. | 2,038 | 185,012 |
| Eisai Co., Ltd. | 1,600 | 115,822 |
| Electric Power Development Co., Ltd. | 1,000 | 24,280 |
| en-Japan, Inc. | 176,700 | 7,478,962 |
| F.C.C. Co., Ltd. | 118,200 | 2,445,598 |
| FamilyMart Co., Ltd. | 1,600 | 39,690 |
| Fancl Corp. | 68,500 | 1,935,743 |
| FANUC Corp. | 1,299 | 256,227 |
| Fast Retailing Co., Ltd. | 330 | 203,508 |
| Fuji Electric Co., Ltd. | 800 | 25,425 |
| Fuji Soft, Inc. | 48,900 | 2,130,130 |
| FUJIFILM Holdings Corp. | 2,300 | 100,975 |
| Fujitsu Ltd. | 1,300 | 115,218 |
| Fukuoka Financial Group, Inc. | 1,000 | 19,277 |
| GMO Payment Gateway, Inc. | 45,600 | 3,360,680 |
| Hakuhodo DY Holdings, Inc. | 1,500 | 22,384 |
| Hamamatsu Photonics K.K. | 900 | 34,946 |
| Hankyu Hanshin Holdings, Inc. | 1,500 | 60,025 |
| Harmonic Drive Systems, Inc. | 51,100 | 2,369,850 |
| Hikari Tsushin, Inc. | 100 | 21,920 |
| Hino Motors Ltd. | 1,700 | 16,072 |
| Hirose Electric Co., Ltd. | 205 | 25,824 |
| Hisamitsu Pharmaceutical Co., Inc. | 300 | 13,962 |
| Hitachi Chemical Co., Ltd. | 700 | 23,044 |
| Hitachi Construction Machinery Co., Ltd. | 700 | 18,069 |
| Hitachi High-Technologies Corp. | 500 | 31,108 |
| Hitachi Ltd. | 6,264 | 233,788 |
| Hitachi Metals Ltd. | 1,200 | 15,060 |
| Honda Motor Co., Ltd. | 10,607 | 286,962 |
| Hoshizaki Corp. | 400 | 34,001 |
| Hoya Corp. | 52,700 | 4,657,479 |
| Hulic Co., Ltd. | 1,900 | 20,628 |
| Idemitsu Kosan Co., Ltd. | 1,392 | 40,918 |
| IHI Corp. | 900 | 22,179 |
| Iida Group Holdings Co., Ltd. | 1,013 | 16,874 |
| Infomart Corp. | 310,400 | 4,673,275 |
| Inpex Corp. | 6,500 | 60,089 |
| Isetan Mitsukoshi Holdings Ltd. | 2,221 | 17,713 |
| Isuzu Motors Ltd. | 3,600 | 41,832 |
| ITOCHU Corp. | 8,629 | 180,414 |
| Itochu Techno-Solutions Corp. | 600 | 16,158 |
| J. Front Retailing Co., Ltd. | 1,500 | 19,074 |
| Japan Airlines Co., Ltd. | 700 | 21,813 |
Laudus International MarketMasters Fund | Annual Report
Laudus International MarketMasters Fund
Portfolio Holdings as of October 31, 2019 (continued)
| Security | Number
of Shares | Value ($) |
| Japan Airport Terminal Co., Ltd. | 300 | 14,819 |
| Japan Exchange Group, Inc. | 3,200 | 52,827 |
| Japan Post Bank Co., Ltd. | 2,500 | 24,869 |
| Japan Post Holdings Co., Ltd. | 10,000 | 91,792 |
| Japan Prime Realty Investment Corp. | 5 | 24,030 |
| Japan Real Estate Investment Corp. | 9 | 61,432 |
| Japan Retail Fund Investment Corp. | 17 | 39,670 |
| Japan Tobacco, Inc. | 7,700 | 174,041 |
| JFE Holdings, Inc. | 3,100 | 38,774 |
| JGC Holdings Corp. | 1,400 | 20,249 |
| JSR Corp. | 1,300 | 24,406 |
| JTEKT Corp. | 1,400 | 17,856 |
| JXTG Holdings, Inc. | 20,585 | 96,219 |
| Kajima Corp. | 3,000 | 41,228 |
| Kakaku.com, Inc. | 900 | 20,898 |
| Kamigumi Co., Ltd. | 700 | 15,828 |
| Kaneka Corp. | 267 | 8,888 |
| Kansai Paint Co., Ltd. | 1,173 | 28,252 |
| Kao Corp. | 3,200 | 257,276 |
| Kawasaki Heavy Industries Ltd. | 900 | 21,598 |
| KDDI Corp. | 11,400 | 315,451 |
| Keihan Holdings Co., Ltd. | 625 | 29,511 |
| Keikyu Corp. | 1,400 | 27,868 |
| Keio Corp. | 700 | 43,304 |
| Keisei Electric Railway Co., Ltd. | 833 | 34,058 |
| Keyence Corp. | 9,700 | 6,133,275 |
| KH Neochem Co., Ltd. | 63,700 | 1,551,218 |
| Kikkoman Corp. | 914 | 43,966 |
| Kintetsu Group Holdings Co., Ltd. | 1,100 | 59,957 |
| Kirin Holdings Co., Ltd. | 5,400 | 114,557 |
| Kobayashi Pharmaceutical Co., Ltd. | 300 | 23,988 |
| Kobe Bussan Co., Ltd. | 101,800 | 3,012,340 |
| Kobe Steel Ltd. | 1,700 | 9,140 |
| Koito Manufacturing Co., Ltd. | 685 | 35,835 |
| Komatsu Ltd. | 209,900 | 4,914,789 |
| Konami Holdings Corp. | 600 | 26,339 |
| Konica Minolta, Inc. | 3,000 | 22,019 |
| Kose Corp. | 200 | 35,459 |
| Kubota Corp. | 6,700 | 106,418 |
| Kuraray Co., Ltd. | 2,100 | 24,984 |
| Kurita Water Industries Ltd. | 700 | 20,151 |
| Kyocera Corp. | 2,100 | 137,774 |
| Kyowa Kirin Co., Ltd. | 1,600 | 29,440 |
| Kyudenko Corp. | 138,600 | 4,528,980 |
| Kyushu Electric Power Co., Inc. | 2,500 | 24,984 |
| Kyushu Railway Co. | 1,083 | 35,780 |
| Lasertec Corp. | 47,900 | 3,443,341 |
| Lawson, Inc. | 329 | 18,150 |
| LINE Corp. * | 500 | 18,393 |
| Lion Corp. | 1,500 | 31,391 |
| LIXIL Group Corp. | 1,700 | 31,616 |
| M3, Inc. | 2,700 | 64,701 |
| Makita Corp. | 1,400 | 47,083 |
| Marubeni Corp. | 10,145 | 71,401 |
| Marui Group Co., Ltd. | 1,300 | 28,899 |
| Maruichi Steel Tube Ltd. | 400 | 10,923 |
| Matsumotokiyoshi Holdings Co., Ltd. | 91,700 | 3,230,061 |
| Mazda Motor Corp. | 3,600 | 33,049 |
| McDonald's Holdings Co., Ltd. | 400 | 20,077 |
| Mebuki Financial Group, Inc. | 5,510 | 13,999 |
| Medipal Holdings Corp. | 1,100 | 25,132 |
| MEIJI Holdings Co., Ltd. | 800 | 57,662 |
| Meitec Corp. | 8,000 | 417,042 |
| Mercari, Inc. * | 500 | 11,273 |
| Minebea Mitsumi, Inc. | 2,387 | 45,333 |
| MISUMI Group, Inc. | 185,730 | 4,669,018 |
| Mitsubishi Chemical Holdings Corp. | 8,100 | 61,732 |
| Mitsubishi Corp. | 8,749 | 222,526 |
| Security | Number
of Shares | Value ($) |
| Mitsubishi Electric Corp. | 11,800 | 168,592 |
| Mitsubishi Estate Co., Ltd. | 7,587 | 147,304 |
| Mitsubishi Gas Chemical Co., Inc. | 1,100 | 15,518 |
| Mitsubishi Heavy Industries Ltd. | 2,100 | 84,986 |
| Mitsubishi Materials Corp. | 704 | 20,244 |
| Mitsubishi Motors Corp. | 4,200 | 19,176 |
| Mitsubishi Tanabe Pharma Corp. | 1,600 | 19,149 |
| Mitsubishi UFJ Financial Group, Inc. | 79,900 | 414,225 |
| Mitsubishi UFJ Lease & Finance Co., Ltd. | 2,600 | 15,961 |
| Mitsui & Co., Ltd. | 10,600 | 182,044 |
| Mitsui Chemicals, Inc. | 1,200 | 28,538 |
| Mitsui Fudosan Co., Ltd. | 5,800 | 148,380 |
| Mitsui O.S.K. Lines Ltd. | 800 | 21,791 |
| Mizuho Financial Group, Inc. | 157,100 | 243,894 |
| MonotaRO Co., Ltd. | 29,700 | 897,254 |
| MS&AD Insurance Group Holdings, Inc. | 3,010 | 97,197 |
| Murata Manufacturing Co., Ltd. | 3,672 | 199,934 |
| Musashi Seimitsu Industry Co., Ltd. | 200,800 | 2,789,404 |
| Nabtesco Corp. | 214,500 | 6,828,565 |
| Nagoya Railroad Co., Ltd. | 1,200 | 38,145 |
| NEC Corp. | 1,600 | 63,409 |
| Nexon Co., Ltd. * | 3,100 | 35,924 |
| NGK Insulators Ltd. | 1,700 | 26,117 |
| NGK Spark Plug Co., Ltd. | 1,000 | 20,274 |
| NH Foods Ltd. | 604 | 25,378 |
| Nidec Corp. | 1,500 | 220,839 |
| Nifco, Inc. | 312,600 | 8,251,353 |
| Nihon Kohden Corp. | 99,500 | 2,976,809 |
| Nihon M&A Center, Inc. | 343,000 | 10,428,940 |
| Nikon Corp. | 2,000 | 25,501 |
| Nintendo Co., Ltd. | 700 | 256,751 |
| Nippon Building Fund, Inc. | 9 | 68,279 |
| Nippon Electric Glass Co., Ltd. | 500 | 11,263 |
| Nippon Express Co., Ltd. | 500 | 28,528 |
| Nippon Gas Co., Ltd. | 63,500 | 1,797,399 |
| Nippon Paint Holdings Co., Ltd. | 900 | 49,014 |
| Nippon Prologis REIT, Inc. | 12 | 33,519 |
| Nippon Steel Corp. | 5,100 | 74,437 |
| Nippon Telegraph & Telephone Corp. | 4,200 | 208,500 |
| Nippon Yusen K.K. | 1,000 | 17,965 |
| Nissan Chemical Corp. | 800 | 32,846 |
| Nissan Motor Co., Ltd. | 15,200 | 95,921 |
| Nisshin Seifun Group, Inc. | 1,300 | 25,771 |
| Nissin Foods Holdings Co., Ltd. | 400 | 30,215 |
| Nitori Holdings Co., Ltd. | 7,705 | 1,172,786 |
| Nitto Denko Corp. | 1,000 | 55,326 |
| Nomura Holdings, Inc. | 21,900 | 99,535 |
| Nomura Real Estate Holdings, Inc. | 800 | 18,959 |
| Nomura Real Estate Master Fund, Inc. | 25 | 47,789 |
| Nomura Research Institute Ltd. | 83,080 | 1,763,847 |
| NS Solutions Corp. | 16,400 | 557,569 |
| NSK Ltd. | 2,300 | 21,386 |
| NTT Data Corp. | 4,200 | 55,150 |
| NTT DOCOMO, Inc. | 8,700 | 238,511 |
| Obayashi Corp. | 4,100 | 42,195 |
| Obic Co., Ltd. | 400 | 50,082 |
| Odakyu Electric Railway Co., Ltd. | 1,900 | 46,250 |
| Oji Holdings Corp. | 5,500 | 28,436 |
| Olympus Corp. | 121,500 | 1,653,175 |
| Omron Corp. | 10,100 | 590,868 |
| Ono Pharmaceutical Co., Ltd. | 2,400 | 45,208 |
| Oracle Corp., Japan | 300 | 26,369 |
| Oriental Land Co., Ltd. | 1,300 | 190,581 |
| ORIX Corp. | 8,700 | 136,720 |
| Orix JREIT, Inc. | 1,403 | 3,172,348 |
| Osaka Gas Co., Ltd. | 2,500 | 48,887 |
| Otsuka Corp. | 700 | 28,223 |
| Otsuka Holdings Co., Ltd. | 2,500 | 104,226 |
Laudus International MarketMasters Fund | Annual Report
Laudus International MarketMasters Fund
Portfolio Holdings as of October 31, 2019 (continued)
| Security | Number
of Shares | Value ($) |
| Pan Pacific International Holdings Corp. | 2,800 | 44,076 |
| Panasonic Corp. | 14,200 | 119,342 |
| Park24 Co., Ltd. | 700 | 16,532 |
| PeptiDream, Inc. * | 600 | 30,116 |
| Persol Holdings Co., Ltd. | 40,700 | 781,766 |
| Pigeon Corp. | 700 | 34,173 |
| Pola Orbis Holdings, Inc. | 600 | 13,539 |
| Pressance Corp. | 154,000 | 2,516,566 |
| Rakuten, Inc. | 5,600 | 53,387 |
| Recruit Holdings Co., Ltd. | 8,600 | 285,813 |
| Renesas Electronics Corp. * | 5,200 | 35,202 |
| Resona Holdings, Inc. | 13,900 | 60,445 |
| Resorttrust, Inc. | 278,700 | 4,447,531 |
| Ricoh Co., Ltd. | 4,200 | 37,404 |
| Rinnai Corp. | 200 | 14,701 |
| Rohm Co., Ltd. | 600 | 47,537 |
| Ryohin Keikaku Co., Ltd. | 2,000 | 44,525 |
| Sankyo Co., Ltd. | 300 | 10,499 |
| Santen Pharmaceutical Co., Ltd. | 2,300 | 40,741 |
| SBI Holdings, Inc. | 1,536 | 33,405 |
| SCSK Corp. | 53,500 | 2,723,382 |
| Secom Co., Ltd. | 1,400 | 129,729 |
| Sega Sammy Holdings, Inc. | 1,100 | 15,480 |
| Seibu Holdings, Inc. | 1,500 | 26,475 |
| Seiko Epson Corp. | 1,800 | 25,454 |
| Sekisui Chemical Co., Ltd. | 2,382 | 41,532 |
| Sekisui House Ltd. | 4,055 | 87,444 |
| Seven & i Holdings Co., Ltd. | 4,900 | 185,123 |
| Seven Bank Ltd. | 3,800 | 11,017 |
| SG Holdings Co., Ltd. | 900 | 22,287 |
| Sharp Corp. | 1,300 | 14,913 |
| SHIFT, Inc. * | 27,500 | 1,568,630 |
| Shimadzu Corp. | 37,500 | 1,001,478 |
| Shimamura Co., Ltd. | 142 | 12,028 |
| Shimano, Inc. | 445 | 74,071 |
| Shimizu Corp. | 3,800 | 35,424 |
| Shin-Etsu Chemical Co., Ltd. | 2,324 | 259,129 |
| Shinsei Bank Ltd. | 900 | 14,031 |
| Shionogi & Co., Ltd. | 1,800 | 108,041 |
| Shiseido Co., Ltd. | 51,600 | 4,254,311 |
| SHO-BOND Holdings Co., Ltd. | 65,900 | 2,557,608 |
| Showa Denko K.K. | 900 | 25,251 |
| SMC Corp. | 8,537 | 3,688,333 |
| Softbank Corp. | 10,800 | 148,147 |
| SoftBank Group Corp. | 10,662 | 410,129 |
| Sohgo Security Services Co., Ltd. | 500 | 27,159 |
| Sompo Holdings, Inc. | 2,200 | 86,473 |
| Sony Corp. | 8,300 | 505,214 |
| Sony Financial Holdings, Inc. | 1,100 | 23,665 |
| Stanley Electric Co., Ltd. | 900 | 24,906 |
| Subaru Corp. | 3,900 | 111,764 |
| Sumco Corp. | 1,500 | 24,916 |
| Sumitomo Chemical Co., Ltd. | 9,500 | 43,457 |
| Sumitomo Corp. | 7,600 | 123,442 |
| Sumitomo Dainippon Pharma Co., Ltd. | 1,000 | 17,453 |
| Sumitomo Electric Industries Ltd. | 5,000 | 68,569 |
| Sumitomo Heavy Industries Ltd. | 700 | 21,743 |
| Sumitomo Metal Mining Co., Ltd. | 1,500 | 50,175 |
| Sumitomo Mitsui Financial Group, Inc. | 8,600 | 305,327 |
| Sumitomo Mitsui Trust Holdings, Inc. | 2,100 | 76,535 |
| Sumitomo Realty & Development Co., Ltd. | 2,195 | 79,675 |
| Sumitomo Rubber Industries Ltd. | 1,100 | 14,579 |
| Sundrug Co., Ltd. | 500 | 16,545 |
| Suntory Beverage & Food Ltd. | 900 | 38,476 |
| Sushiro Global Holdings Ltd. | 7,900 | 543,148 |
| Suzuken Co., Ltd. | 500 | 26,697 |
| Suzuki Motor Corp. | 2,400 | 113,314 |
| Sysmex Corp. | 1,100 | 71,773 |
| Security | Number
of Shares | Value ($) |
| T&D Holdings, Inc. | 3,500 | 38,982 |
| Taiheiyo Cement Corp. | 800 | 22,631 |
| Taisei Corp. | 1,300 | 51,263 |
| Taisho Pharmaceutical Holdings Co., Ltd. | 300 | 21,352 |
| Taiyo Nippon Sanso Corp. | 829 | 19,407 |
| Takeda Pharmaceutical Co., Ltd. | 9,637 | 348,214 |
| TDK Corp. | 900 | 88,806 |
| TechnoPro Holdings, Inc. | 15,700 | 965,642 |
| Teijin Ltd. | 1,200 | 24,046 |
| Terumo Corp. | 116,400 | 3,798,915 |
| The Bank of Kyoto Ltd. | 300 | 11,874 |
| The Chiba Bank Ltd. | 3,800 | 20,654 |
| The Chugoku Electric Power Co., Inc. | 1,800 | 23,979 |
| The Kansai Electric Power Co., Inc. | 4,400 | 51,331 |
| The Shizuoka Bank Ltd. | 2,954 | 22,447 |
| The Yokohama Rubber Co., Ltd. | 800 | 17,868 |
| THK Co., Ltd. | 800 | 23,004 |
| TIS, Inc. | 25,300 | 1,534,028 |
| Tobu Railway Co., Ltd. | 1,200 | 40,044 |
| Toho Co., Ltd. | 700 | 28,270 |
| Toho Gas Co., Ltd. | 466 | 18,150 |
| Tohoku Electric Power Co., Inc. | 2,700 | 27,750 |
| Tokio Marine Holdings, Inc. | 4,200 | 227,075 |
| Tokyo Century Corp. | 300 | 13,853 |
| Tokyo Electric Power Co. Holdings, Inc. * | 9,700 | 44,922 |
| Tokyo Electron Ltd. | 1,000 | 202,599 |
| Tokyo Gas Co., Ltd. | 2,500 | 61,028 |
| Tokyu Corp. | 3,300 | 62,415 |
| Tokyu Fudosan Holdings Corp. | 3,900 | 25,868 |
| Toppan Printing Co., Ltd. | 1,630 | 30,147 |
| Toray Industries, Inc. | 9,000 | 63,604 |
| Toshiba Corp. | 3,600 | 123,106 |
| Tosoh Corp. | 1,700 | 23,277 |
| TOTO Ltd. | 900 | 36,743 |
| Toyo Seikan Group Holdings Ltd. | 900 | 14,223 |
| Toyo Suisan Kaisha Ltd. | 565 | 23,789 |
| Toyoda Gosei Co., Ltd. | 400 | 9,358 |
| Toyota Industries Corp. | 914 | 54,842 |
| Toyota Motor Corp. | 79,577 | 5,521,123 |
| Toyota Tsusho Corp. | 1,400 | 48,298 |
| Trend Micro, Inc. | 800 | 40,379 |
| Trust Tech, Inc. | 183,400 | 2,324,553 |
| Tsuruha Holdings, Inc. | 300 | 33,747 |
| Unicharm Corp. | 2,600 | 88,116 |
| United Urban Investment Corp. | 19 | 38,331 |
| USS Co., Ltd. | 1,400 | 27,115 |
| UT Group Co., Ltd. | 155,500 | 3,862,555 |
| Welcia Holdings Co., Ltd. | 300 | 17,238 |
| West Japan Railway Co. | 1,041 | 90,453 |
| Yakult Honsha Co., Ltd. | 800 | 45,848 |
| Yamada Denki Co., Ltd. | 4,200 | 20,301 |
| Yamaha Corp. | 900 | 41,912 |
| Yamaha Motor Co., Ltd. | 1,700 | 33,274 |
| Yamato Holdings Co., Ltd. | 1,900 | 31,868 |
| Yamazaki Baking Co., Ltd. | 800 | 13,639 |
| Yaskawa Electric Corp. | 1,521 | 57,855 |
| Yokogawa Electric Corp. | 1,500 | 27,484 |
| Z Holdings Corp. | 17,800 | 54,801 |
| Zenkoku Hosho Co., Ltd. | 15,500 | 647,109 |
| ZOZO, Inc. | 1,300 | 30,281 |
| | | 190,389,611 |
| |
Laudus International MarketMasters Fund | Annual Report
Laudus International MarketMasters Fund
Portfolio Holdings as of October 31, 2019 (continued)
| Security | Number
of Shares | Value ($) |
| Luxembourg 0.1% |
| Aroundtown S.A. | 5,251 | 44,385 |
| Millicom International Cellular S.A. SDR | 419 | 19,101 |
| Tenaris S.A. | 76,255 | 773,598 |
| | | 837,084 |
| |
| Mexico 0.3% |
| Grupo Aeroportuario del Sureste S.A.B. de C.V. ADR | 4,168 | 682,510 |
| Grupo Televisa S.A.B. ADR | 277,300 | 3,064,165 |
| | | 3,746,675 |
| |
| Netherlands 4.0% |
| ABN AMRO Group N.V. CVA | 2,752 | 51,297 |
| Adyen N.V. * | 2,652 | 1,867,048 |
| Aegon N.V. | 12,422 | 53,891 |
| AerCap Holdings N.V. * | 843 | 48,793 |
| Akzo Nobel N.V. | 7,926 | 730,725 |
| ArcelorMittal | 4,202 | 62,479 |
| ASML Holding N.V. | 35,318 | 9,257,353 |
| B&S Group Sarl | 360,038 | 4,384,929 |
| Boskalis Westminster N.V. | 178,005 | 3,918,079 |
| Euronext N.V. | 55,550 | 4,481,335 |
| EXOR N.V. | 81,372 | 6,238,304 |
| Heineken Holding N.V. | 748 | 71,371 |
| Heineken N.V. | 1,670 | 170,539 |
| IMCD N.V. | 4,521 | 353,018 |
| ING Groep N.V. | 25,306 | 286,552 |
| InterXion Holding N.V. * | 48,275 | 4,258,820 |
| Koninklijke Ahold Delhaize N.V. | 7,608 | 189,592 |
| Koninklijke DSM N.V. | 1,193 | 141,595 |
| Koninklijke KPN N.V. | 22,835 | 70,888 |
| Koninklijke Philips N.V. | 89,281 | 3,917,121 |
| Koninklijke Vopak N.V. | 447 | 24,556 |
| Marel Hf * | 677,764 | 3,144,585 |
| NN Group N.V. | 2,091 | 79,786 |
| NXP Semiconductors N.V. | 1,923 | 218,607 |
| Prosus N.V. * | 32,234 | 2,222,824 |
| Randstad N.V. | 738 | 40,957 |
| Royal Dutch Shell plc, A Shares | 141,827 | 4,119,660 |
| Takeaway.com N.V. * | 33,264 | 2,713,291 |
| Unilever N.V. | 9,455 | 558,854 |
| Wolters Kluwer N.V. | 42,033 | 3,095,856 |
| | | 56,772,705 |
| |
| New Zealand 0.7% |
| a2 Milk Co., Ltd. * | 4,711 | 39,112 |
| Auckland International Airport Ltd. | 915,119 | 5,453,947 |
| Fisher & Paykel Healthcare Corp., Ltd. | 3,686 | 45,209 |
| Fletcher Building Ltd. | 5,581 | 16,398 |
| Mercury NZ Ltd. | 1,597,190 | 5,079,038 |
| Meridian Energy Ltd. | 8,588 | 25,315 |
| Ryman Healthcare Ltd. | 2,648 | 21,886 |
| Spark New Zealand Ltd. | 11,900 | 34,137 |
| | | 10,715,042 |
| |
| Norway 0.5% |
| Aker BP A.S.A. | 670 | 18,584 |
| DNB A.S.A. | 6,180 | 112,521 |
| Elkem A.S.A. | 913,207 | 2,170,449 |
| Equinor A.S.A. | 6,529 | 121,215 |
| Gjensidige Forsikring A.S.A. | 1,275 | 23,836 |
| Mowi A.S.A. | 2,853 | 69,647 |
| Security | Number
of Shares | Value ($) |
| Norsk Hydro A.S.A. | 8,336 | 29,456 |
| Orkla A.S.A. | 5,053 | 48,569 |
| Schibsted A.S.A., B Shares | 669 | 18,666 |
| Subsea 7 S.A. | 153,220 | 1,439,458 |
| Telenor A.S.A. | 4,753 | 88,956 |
| TGS NOPEC Geophysical Co., A.S.A. | 102,026 | 2,649,748 |
| Yara International A.S.A. | 1,178 | 45,890 |
| | | 6,836,995 |
| |
| Papua New Guinea 0.0% |
| Oil Search Ltd. | 8,500 | 41,950 |
| |
| Peru 0.1% |
| Credicorp Ltd. | 10,316 | 2,208,037 |
| |
| Poland 0.2% |
| Dino Polska S.A. * | 68,781 | 2,680,394 |
| |
| Portugal 0.1% |
| Banco Espirito Santo S.A. *(b) | 42,176 | — |
| EDP - Energias de Portugal S.A. | 16,652 | 68,593 |
| Galp Energia, SGPS, S.A. | 3,107 | 49,696 |
| Jeronimo Martins, SGPS, S.A. | 1,560 | 26,214 |
| NOS SGPS, S.A. | 267,120 | 1,588,094 |
| | | 1,732,597 |
| |
| Republic of Korea 1.1% |
| Douzone Bizon Co., Ltd. | 42,524 | 2,682,750 |
| Fila Korea Ltd. | 15,736 | 776,459 |
| Kakao Corp. | 6,454 | 783,208 |
| NAVER Corp. | 42,200 | 5,950,050 |
| Samsung Electronics Co., Ltd. | 90,600 | 3,915,718 |
| Samsung SDI Co., Ltd. | 6,482 | 1,264,934 |
| Studio Dragon Corp. * | 12,505 | 838,360 |
| | | 16,211,479 |
| |
| Russia 0.1% |
| Yandex N.V., Class A * | 40,174 | 1,341,410 |
| |
| Singapore 1.3% |
| Ascendas Real Estate Investment Trust | 1,359,033 | 3,165,257 |
| CapitaLand Commercial Trust | 17,860 | 26,897 |
| CapitaLand Ltd. | 15,900 | 42,027 |
| CapitaLand Mall Trust | 1,631,600 | 3,044,311 |
| City Developments Ltd. | 3,127 | 24,763 |
| ComfortDelGro Corp., Ltd. | 14,100 | 23,810 |
| DBS Group Holdings Ltd. | 11,516 | 219,505 |
| Genting Singapore Ltd. | 37,500 | 25,872 |
| Golden Agri-Resources Ltd. | 34,700 | 5,209 |
| Jardine Cycle & Carriage Ltd. | 611 | 14,690 |
| Jardine Matheson Holdings Ltd. | 1,409 | 80,329 |
| Jardine Strategic Holdings Ltd. | 1,400 | 45,209 |
| Keppel Corp., Ltd. | 9,000 | 45,318 |
| Oversea-Chinese Banking Corp., Ltd. | 21,516 | 172,972 |
| SATS Ltd. | 1,857,000 | 6,886,627 |
| Sembcorp Industries Ltd. | 7,100 | 11,920 |
| Sheng Siong Group Ltd. | 5,481,700 | 4,711,828 |
| Singapore Airlines Ltd. | 3,331 | 23,023 |
| Singapore Exchange Ltd. | 5,200 | 34,141 |
| Singapore Press Holdings Ltd. | 10,600 | 17,250 |
| Singapore Technologies Engineering Ltd. | 9,900 | 29,001 |
| Singapore Telecommunications Ltd. | 53,400 | 129,308 |
Laudus International MarketMasters Fund | Annual Report
Laudus International MarketMasters Fund
Portfolio Holdings as of October 31, 2019 (continued)
| Security | Number
of Shares | Value ($) |
| Suntec Real Estate Investment Trust | 14,224 | 19,432 |
| United Overseas Bank Ltd. | 8,141 | 160,275 |
| UOL Group Ltd. | 3,400 | 19,468 |
| Venture Corp., Ltd. | 1,800 | 20,879 |
| Wilmar International Ltd. | 11,900 | 32,719 |
| Yangzijiang Shipbuilding Holdings Ltd. | 16,800 | 11,761 |
| | | 19,043,801 |
| |
| South Africa 0.4% |
| Bid Corp., Ltd. | 26,434 | 616,684 |
| Mr. Price Group Ltd. | 35,798 | 378,522 |
| Naspers Ltd., N Shares | 26,145 | 3,699,740 |
| RMB Holdings Ltd. | 166,265 | 875,244 |
| The Bidvest Group Ltd. | 26,434 | 360,846 |
| | | 5,931,036 |
| |
| Spain 0.8% |
| ACS Actividades de Construccion y Servicios S.A. | 54,021 | 2,192,071 |
| Aena SME S.A. | 437 | 80,217 |
| Amadeus IT Group S.A. | 61,727 | 4,566,455 |
| Applus Services S.A. | 133,604 | 1,614,525 |
| Banco Bilbao Vizcaya Argentaria S.A. | 43,398 | 228,570 |
| Banco De Sabadell S.A. | 34,878 | 38,339 |
| Banco Santander S.A. | 108,809 | 436,900 |
| Bankia S.A. | 7,649 | 14,593 |
| Bankinter S.A. | 4,179 | 28,943 |
| CaixaBank S.A. | 22,717 | 65,143 |
| Cellnex Telecom S.A. * | 1,294 | 55,835 |
| Cellnex Telecom S.A., Interim Shares *(b) | 369 | 15,922 |
| Enagas S.A. | 1,426 | 35,286 |
| Endesa S.A. | 2,109 | 57,438 |
| Ferrovial S.A. | 3,153 | 93,023 |
| Grifols S.A. | 1,977 | 63,779 |
| Iberdrola S.A. | 38,710 | 397,900 |
| Industria de Diseno Textil S.A. | 7,106 | 221,429 |
| Mapfre S.A. | 6,681 | 18,647 |
| Naturgy Energy Group S.A. | 1,958 | 53,346 |
| Red Electrica Corp. S.A. | 2,817 | 56,615 |
| Repsol S.A. | 9,490 | 156,392 |
| Siemens Gamesa Renewable Energy S.A. | 1,478 | 20,347 |
| Telefonica S.A. | 30,410 | 233,527 |
| | | 10,745,242 |
| |
| Sweden 4.3% |
| AAK AB | 414,218 | 7,347,832 |
| AF POYRY AB | 179,260 | 3,816,097 |
| Alfa Laval AB | 2,005 | 46,406 |
| Assa Abloy AB, Class B | 6,469 | 153,628 |
| Atlas Copco AB, A Shares | 143,361 | 5,060,142 |
| Atlas Copco AB, B Shares | 2,535 | 78,657 |
| Boliden AB | 1,695 | 45,710 |
| Bravida Holding AB | 241,224 | 2,222,780 |
| Electrolux AB, B Shares | 1,513 | 39,779 |
| Elekta AB, B Shares | 149,472 | 2,082,268 |
| Embracer Group AB * | 198,670 | 1,351,801 |
| Epiroc AB, Class A | 4,162 | 46,894 |
| Epiroc AB, Class B | 2,419 | 26,346 |
| Essity AB, Class B | 3,969 | 123,994 |
| Evolution Gaming Group AB | 38,458 | 919,827 |
| Fabege AB | 272,406 | 4,068,235 |
| Fastighets AB Balder, B Shares * | 82,819 | 3,212,087 |
| Hennes & Mauritz AB, B Shares | 293,187 | 6,145,053 |
| Hexagon AB, B Shares | 48,035 | 2,459,291 |
| Husqvarna AB, B Shares | 2,726 | 20,884 |
| Security | Number
of Shares | Value ($) |
| ICA Gruppen AB | 543 | 24,029 |
| Industrivarden AB, C Shares | 1,099 | 23,812 |
| Indutrade AB | 22,841 | 704,252 |
| Investor AB, B Shares | 2,941 | 150,886 |
| Kinnevik AB, Class B | 1,583 | 43,323 |
| LE Lundbergfortagen AB, B Shares | 513 | 19,335 |
| Lifco AB, B Shares | 13,541 | 675,389 |
| Lindab International AB | 176,588 | 1,975,200 |
| Loomis AB, Class B | 128,597 | 4,979,201 |
| Lundin Petroleum AB | 1,160 | 38,417 |
| Nibe Industrier AB, B Shares | 42,061 | 575,917 |
| Nolato AB, B Shares | 11,968 | 670,564 |
| Sandvik AB | 7,380 | 130,385 |
| Securitas AB, B Shares | 2,025 | 32,425 |
| Skandinaviska Enskilda Banken AB, A Shares | 10,296 | 98,752 |
| Skanska AB, B Shares | 2,137 | 45,533 |
| SKF AB, B Shares | 265,573 | 4,808,504 |
| Svenska Handelsbanken AB, A Shares | 9,661 | 96,956 |
| Swedbank AB, A Shares | 5,726 | 80,240 |
| Swedish Match AB | 1,127 | 52,945 |
| Tele2 AB, B Shares | 3,118 | 44,635 |
| Telefonaktiebolaget LM Ericsson, B Shares | 20,029 | 175,029 |
| Telia Co. AB | 17,826 | 78,415 |
| Vitrolife AB | 22,229 | 346,829 |
| Volvo AB, B Shares | 345,572 | 5,178,660 |
| | | 60,317,344 |
| |
| Switzerland 5.6% |
| ABB Ltd. | 11,995 | 251,895 |
| Adecco Group AG | 1,008 | 59,922 |
| Alcon, Inc. * | 30,658 | 1,813,057 |
| Baloise Holding AG | 306 | 56,596 |
| Barry Callebaut AG | 14 | 29,586 |
| Belimo Holding AG | 325 | 2,038,567 |
| Burckhardt Compression Holding AG | 17,580 | 4,187,836 |
| Chocoladefabriken Lindt & Spruengli AG | 1 | 81,906 |
| Chocoladefabriken Lindt & Spruengli AG - Participation Certificates | 7 | 52,012 |
| Cie Financiere Richemont S.A. | 47,094 | 3,700,701 |
| Clariant AG * | 1,256 | 25,764 |
| Credit Suisse Group AG * | 756,015 | 9,357,850 |
| Daetwyler Holding AG | 10,880 | 1,875,063 |
| Dufry AG * | 272 | 23,657 |
| EMS-Chemie Holding AG | 51 | 31,951 |
| Geberit AG | 238 | 120,925 |
| Georg Fischer AG | 2,304 | 2,200,438 |
| Givaudan S.A. | 60 | 176,276 |
| Glencore plc * | 3,662,235 | 11,054,011 |
| Julius Baer Group Ltd. * | 1,454 | 64,388 |
| Kuehne & Nagel International AG | 12,625 | 2,039,659 |
| LafargeHolcim Ltd. * | 78,732 | 4,064,025 |
| Landis+Gyr Group AG * | 26,355 | 2,447,147 |
| Logitech International S.A. | 29,063 | 1,192,951 |
| Lonza Group AG * | 16,856 | 6,075,449 |
| Nestle S.A. | 21,137 | 2,261,264 |
| Novartis AG | 14,006 | 1,223,777 |
| Pargesa Holding S.A. | 245 | 19,367 |
| Partners Group Holding AG | 3,933 | 3,073,487 |
| Roche Holding AG | 4,552 | 1,369,951 |
| Schindler Holding AG | 125 | 29,602 |
| Schindler Holding AG - Participation Certificates | 265 | 64,924 |
| SGS S.A. | 34 | 88,676 |
| SIG Combibloc Group AG * | 55,707 | 772,359 |
| Sika AG | 25,635 | 4,406,823 |
| Sonova Holding AG | 360 | 82,612 |
Laudus International MarketMasters Fund | Annual Report
Laudus International MarketMasters Fund
Portfolio Holdings as of October 31, 2019 (continued)
| Security | Number
of Shares | Value ($) |
| Straumann Holding AG | 67 | 59,863 |
| Swiss Life Holding AG | 217 | 108,677 |
| Swiss Prime Site AG * | 484 | 49,887 |
| Swiss Re AG | 1,970 | 206,631 |
| Swisscom AG | 168 | 85,931 |
| Tecan Group AG | 14,722 | 3,482,919 |
| Temenos AG * | 15,332 | 2,193,563 |
| The Swatch Group AG | 346 | 18,575 |
| The Swatch Group AG - Bearer Shares | 9,516 | 2,638,578 |
| u-blox Holding AG * | 22,875 | 1,854,190 |
| UBS Group AG * | 25,072 | 296,731 |
| VAT Group AG * | 5,759 | 846,755 |
| Vifor Pharma AG | 282 | 44,409 |
| Zurich Insurance Group AG | 984 | 385,433 |
| | | 78,686,616 |
| |
| Taiwan 1.9% |
| Accton Technology Corp. | 250,000 | 1,487,169 |
| Airtac International Group | 143,000 | 1,943,465 |
| Chailease Holding Co., Ltd. | 765,918 | 3,451,241 |
| Eclat Textile Co., Ltd. | 45,000 | 603,388 |
| Globalwafers Co. Ltd. | 57,000 | 680,082 |
| Macronix International Co., Ltd. | 1,993,000 | 2,023,184 |
| MediaTek, Inc. | 178,000 | 2,377,163 |
| Merida Industry Co., Ltd. | 585,000 | 3,385,275 |
| Nien Made Enterprise Co., Ltd. | 175,000 | 1,587,450 |
| Taiwan Semiconductor Manufacturing Co., Ltd. | 258,000 | 2,528,348 |
| Taiwan Semiconductor Manufacturing Co., Ltd. ADR | 141,717 | 7,316,849 |
| | | 27,383,614 |
| |
| Thailand 0.1% |
| Airports of Thailand PCL | 309,700 | 805,148 |
| Tisco Financial Group PCL | 240,800 | 777,546 |
| | | 1,582,694 |
| |
| Turkey 0.1% |
| Ulker Biskuvi Sanayi AS * | 441,867 | 1,421,513 |
| |
| United Arab Emirates 0.1% |
| First Abu Dhabi Bank PJSC | 210,636 | 871,775 |
| NMC Health plc | 645 | 18,284 |
| | | 890,059 |
| |
| United Kingdom 15.6% |
| 3i Group plc | 122,952 | 1,796,683 |
| Abcam plc | 132,511 | 1,997,984 |
| Admiral Group plc | 1,267 | 33,160 |
| Anglo American plc | 6,792 | 174,806 |
| Antofagasta plc | 2,444 | 27,526 |
| Ashtead Group plc | 173,296 | 5,276,138 |
| Associated British Foods plc | 2,311 | 66,706 |
| AstraZeneca plc | 8,397 | 818,852 |
| Auto Trader Group plc | 6,193 | 45,124 |
| Avast plc | 824,670 | 4,427,986 |
| AVEVA Group plc | 76,346 | 4,136,786 |
| Aviva plc | 25,137 | 135,490 |
| BAE Systems plc | 20,568 | 153,637 |
| Barclays plc | 109,758 | 238,073 |
| Barratt Developments plc | 6,350 | 51,929 |
| BBA Aviation plc | 868,978 | 3,418,676 |
| Beazley plc | 117,677 | 894,383 |
| Security | Number
of Shares | Value ($) |
| Bellway plc | 29,082 | 1,190,309 |
| Big Yellow Group plc | 57,353 | 848,810 |
| BP plc | 131,316 | 832,722 |
| British American Tobacco plc | 14,884 | 520,581 |
| BT Group plc | 53,948 | 143,170 |
| Bunzl plc | 2,187 | 56,894 |
| Burberry Group plc | 2,593 | 68,758 |
| Burford Capital Ltd. | 21,601 | 245,931 |
| Carnival plc | 1,127 | 45,099 |
| Centrica plc | 37,101 | 34,915 |
| Cineworld Group plc | 1,665,702 | 4,799,835 |
| CNH Industrial N.V. | 855,321 | 9,312,436 |
| Coats Group plc | 4,192,795 | 3,872,401 |
| Coca-Cola European Partners plc | 1,513 | 80,961 |
| Coca-Cola HBC AG * | 1,335 | 40,649 |
| Compass Group plc | 204,498 | 5,444,573 |
| ContourGlobal plc | 1,991,578 | 5,430,460 |
| Croda International plc | 24,555 | 1,532,028 |
| Dechra Pharmaceuticals plc | 71,806 | 2,449,417 |
| Diageo plc | 122,467 | 5,012,694 |
| Diploma plc | 195,388 | 4,047,003 |
| Direct Line Insurance Group plc | 8,637 | 30,452 |
| easyJet plc | 985 | 15,801 |
| Electrocomponents plc | 421,134 | 3,715,713 |
| Elementis plc | 1,781,726 | 3,428,739 |
| Equiniti Group plc | 2,165,756 | 6,050,430 |
| Evraz plc | 3,074 | 14,669 |
| Experian plc | 143,368 | 4,519,146 |
| Ferguson plc | 41,134 | 3,512,569 |
| Fevertree Drinks plc | 53,749 | 1,295,140 |
| Fresnillo plc | 1,370 | 12,657 |
| G4S plc | 1,027,293 | 2,755,138 |
| GlaxoSmithKline plc | 32,202 | 737,585 |
| Greggs plc | 52,813 | 1,214,762 |
| GVC Holdings plc | 3,713 | 42,836 |
| Halma plc | 81,171 | 1,969,649 |
| Hargreaves Lansdown plc | 1,854 | 42,574 |
| Hikma Pharmaceuticals plc | 108,217 | 2,818,272 |
| Hill & Smith Holdings plc | 208,080 | 3,530,928 |
| Hiscox Ltd. | 70,800 | 1,367,211 |
| HomeServe plc | 209,230 | 3,141,193 |
| HSBC Holdings plc | 129,939 | 981,703 |
| IMI plc | 108,175 | 1,406,725 |
| Imperial Brands plc | 6,146 | 134,815 |
| Informa plc | 8,232 | 82,742 |
| InterContinental Hotels Group plc | 1,117 | 67,595 |
| Intermediate Capital Group plc | 370,980 | 7,139,773 |
| Intertek Group plc | 16,650 | 1,154,441 |
| Investec plc | 4,335 | 24,577 |
| ITV plc | 22,456 | 38,956 |
| J. Sainsbury plc | 10,861 | 28,622 |
| John Wood Group plc | 4,352 | 19,108 |
| Johnson Matthey plc | 1,200 | 47,672 |
| Kingfisher plc | 13,393 | 35,928 |
| Land Securities Group plc | 4,828 | 58,808 |
| Legal & General Group plc | 38,469 | 131,500 |
| Liberty Global plc, Class A * | 112,100 | 2,819,315 |
| Liberty Global plc, Class C * | 99,539 | 2,375,996 |
| Lloyds Banking Group plc | 12,013,675 | 8,837,332 |
| London Stock Exchange Group plc | 40,808 | 3,677,569 |
| M&G plc * | 16,845 | 46,652 |
| Marks & Spencer Group plc | 12,513 | 29,478 |
| Meggitt plc | 108,254 | 875,919 |
| Melrose Industries plc | 630,945 | 1,743,734 |
| Merlin Entertainments plc | 4,701 | 27,696 |
| Micro Focus International plc | 2,266 | 31,101 |
| Mondi plc | 2,937 | 60,895 |
| Moneysupermarket.com Group plc | 356,111 | 1,584,572 |
Laudus International MarketMasters Fund | Annual Report
Laudus International MarketMasters Fund
Portfolio Holdings as of October 31, 2019 (continued)
| Security | Number
of Shares | Value ($) |
| National Grid plc | 23,057 | 269,589 |
| Network International Holdings plc * | 247,913 | 1,737,336 |
| Next plc | 889 | 75,820 |
| Nomad Foods Ltd. * | 140,095 | 2,733,253 |
| Ocado Group plc * | 3,031 | 52,243 |
| Pearson plc | 5,092 | 44,970 |
| Persimmon plc | 1,976 | 58,285 |
| Prudential plc | 16,845 | 294,229 |
| Reckitt Benckiser Group plc | 29,896 | 2,313,401 |
| RELX plc | 134,741 | 3,243,937 |
| Renishaw plc | 13,319 | 654,731 |
| Rentokil Initial plc | 387,576 | 2,280,960 |
| Rio Tinto plc | 7,400 | 385,257 |
| Rolls-Royce Holdings plc * | 689,575 | 6,345,296 |
| Rotork plc | 619,005 | 2,417,321 |
| Royal Bank of Scotland Group plc | 1,728,726 | 4,778,611 |
| Royal Dutch Shell plc, A Shares | 28,493 | 825,957 |
| Royal Dutch Shell plc, B Shares | 24,283 | 699,345 |
| RSA Insurance Group plc | 6,831 | 46,214 |
| Schroders plc | 155,971 | 6,252,785 |
| Schroders plc, Non-Voting Shares | 1,100 | 33,021 |
| Segro plc | 234,994 | 2,570,671 |
| Severn Trent plc | 1,484 | 43,348 |
| Smith & Nephew plc | 5,726 | 122,917 |
| Smiths Group plc | 114,853 | 2,400,845 |
| Softcat plc | 45,655 | 556,416 |
| Spectris plc | 123,627 | 3,832,639 |
| Spirax-Sarco Engineering plc | 52,684 | 5,406,630 |
| SSE plc | 6,643 | 110,513 |
| SSP Group plc | 83,859 | 691,512 |
| St. James's Place plc | 123,685 | 1,668,271 |
| Standard Chartered plc | 17,990 | 163,240 |
| Standard Life Aberdeen plc | 16,394 | 64,456 |
| Taylor Wimpey plc | 20,520 | 44,009 |
| Tesco plc | 63,078 | 192,549 |
| The Berkeley Group Holdings plc | 805 | 45,885 |
| The British Land Co., plc | 5,786 | 46,520 |
| The Sage Group plc | 7,051 | 65,716 |
| The Unite Group plc | 253,674 | 3,694,679 |
| The Weir Group plc | 1,655 | 28,908 |
| Trainline plc * | 390,712 | 2,107,943 |
| Ultra Electronics Holdings plc | 199,866 | 5,048,183 |
| Unilever plc | 7,207 | 431,548 |
| United Utilities Group plc | 4,279 | 48,317 |
| Victrex plc | 219,257 | 6,228,759 |
| Vodafone Group plc | 173,783 | 354,642 |
| WH Smith plc | 30,857 | 874,409 |
| Whitbread plc | 941 | 49,531 |
| WM Morrison Supermarkets plc | 15,116 | 39,050 |
| WPP plc | 391,661 | 4,887,756 |
| | | 220,744,696 |
| |
| United States 0.1% |
| Willis Towers Watson plc | 4,616 | 862,730 |
| Total Common Stock |
| (Cost $1,133,810,785) | | 1,347,961,142 |
|
| Preferred Stock0.3% of net assets |
| |
| Brazil 0.2% |
| Randon SA Implementos e Participacoes | 986,900 | 2,546,918 |
| |
| Security | Number
of Shares | Value ($) |
| Germany 0.1% |
| Bayerische Motoren Werke AG | 357 | 21,975 |
| Fuchs Petrolub SE | 457 | 19,470 |
| Henkel AG & Co. KGaA | 9,167 | 952,201 |
| Porsche Automobil Holding SE | 995 | 73,262 |
| Sartorius AG | 229 | 44,500 |
| Volkswagen AG | 1,209 | 229,837 |
| | | 1,341,245 |
| |
| Italy 0.0% |
| Telecom Italia S.p.A. - RSP | 41,648 | 24,106 |
| |
| United Kingdom 0.0% |
| Rolls-Royce Holdings plc *(b) | 30,809,972 | 39,910 |
| Total Preferred Stock |
| (Cost $3,830,588) | | 3,952,179 |
|
| Other Investment Companies4.0% of net assets |
| |
| Equity Funds 0.0% |
| iShares MSCI EAFE ETF | 4,864 | 327,931 |
| |
| Money Market Fund 4.0% |
| State Street Institutional U.S. Government Money Market Fund, Premier Class 1.75%(c) | 56,151,564 | 56,151,564 |
| Total Other Investment Companies |
| (Cost $56,461,106) | | 56,479,495 |
|
| Rights0.0% of net assets |
| |
| Australia 0.0% |
| Costa Group Holdings Ltd. * | 216,887 | 100,172 |
| Total Rights |
| (Cost $—) | | 100,172 |
Security
Rate, Maturity Date | Face
Amount ($) | Value ($) |
| Short-Term Investment0.0% of net assets |
| |
| U.S. Treasury Obligation 0.0% |
| United States Treasury Bill |
| 1.88%, 12/12/19(d)(e) | 35,000 | 34,926 |
| Total Short-Term Investment |
| (Cost $34,926) | | 34,926 |
| | Number of
Contracts | Notional
Amount
($) | Current Value/
Unrealized
Appreciation
($) |
| Futures Contracts | |
| Long | |
| MSCI Emerging Markets Index, expires 12/20/19 | 775 | 40,354,250 | 1,914,124 |
| MSCI EAFE Index, expires 12/20/19 | 5 | 489,300 | 12,511 |
| Net Unrealized Appreciation | 1,926,635 |
Laudus International MarketMasters Fund | Annual Report
Laudus International MarketMasters Fund
Portfolio Holdings as of October 31, 2019 (continued)
Expiration
Date | Counterparty | Currency
to be
Received | Amount of
Currency
to be
Received | Currency
to be
Delivered | Amount of
Currency
to be
Delivered | Unrealized
Appreciation
($) |
| Forward Foreign Currency Exchange Contract | | | | | | |
| 12/18/2019 | State Street Bank & Trust Co. | USD | 3,144,583 | CHF | 3,076,000 | 15,610 |
| * | Non-income producing security. |
| (a) | Securities are traded on separate exchanges for the same entity. |
| (b) | Fair-valued by management using significant unobservable inputs in accordance with procedures approved by fund’s Board of Trustees. |
| (c) | The rate shown is the 7-day yield. |
| (d) | All or a portion of this security is held as collateral for open futures contracts. |
| (e) | The rate shown is the purchase yield. |
| | |
| ADR — | American Depositary Receipt |
| CVA — | Dutch Certificate |
| ETF — | Exchange-traded fund |
| REIT — | Real Estate Investment Trust |
| RSP — | Risparmio (Convertible Savings Shares) |
| SDR — | Swedish Depositary Receipt |
| |
| CHF — | Swiss franc |
| USD — | U.S. dollar |
The following is a summary of the inputs used to value the fund’s investments as of October 31, 2019 (see financial note 2(a) for additional information):
| Description | Quoted Prices in
Active Markets for
Identical Assets
(Level 1) | Other Significant
Observable Inputs
(Level 2) | Significant
Unobservable Inputs
(Level 3) | Total | |
| Assets | | | | | |
| Common Stock1 | $— | $167,935,172 | $— | $167,935,172 | |
| Argentina | 2,516,248 | — | — | 2,516,248 | |
| Australia | 137,162 | 58,425,203 | — | 58,562,365 | |
| Belgium | 5,133,228 | 10,554,973 | — | 15,688,201 | |
| Brazil | 16,184,071 | — | — | 16,184,071 | |
| Canada | 85,733,011 | — | — | 85,733,011 | |
| China | 22,866,979 | 44,916,067 | — | 67,783,046 | |
| Finland | 48,827 | 9,609,503 | — | 9,658,330 | |
| France | 6,041,811 | 116,900,823 | — | 122,942,634 | |
| Germany | 20,721,829 | 100,330,132 | — | 121,051,961 | |
| Hong Kong | 113,513 | 21,992,843 | — | 22,106,356 | |
| India | 5,156,026 | 10,521,404 | — | 15,677,430 | |
| Ireland | 18,407,631 | 3,158,307 | — | 21,565,938 | |
| Israel | 7,833,823 | 314,450 | — | 8,148,273 | |
| Japan | 63,700 | 190,325,911 | — | 190,389,611 | |
| Mexico | 3,746,675 | — | — | 3,746,675 | |
| Netherlands | 14,278,558 | 42,494,147 | — | 56,772,705 | |
| Peru | 2,208,037 | — | — | 2,208,037 | |
| Portugal | — | 1,732,597 | —* | 1,732,597 | |
| Republic of Korea | 838,360 | 15,373,119 | — | 16,211,479 | |
| Russia | 1,341,410 | — | — | 1,341,410 | |
| Spain | — | 10,729,320 | 15,922 | 10,745,242 | |
| Switzerland | 4,321,754 | 74,364,862 | — | 78,686,616 | |
Laudus International MarketMasters Fund | Annual Report
Laudus International MarketMasters Fund
Portfolio Holdings as of October 31, 2019 (continued)
| Description | Quoted Prices in
Active Markets for
Identical Assets
(Level 1) | Other Significant
Observable Inputs
(Level 2) | Significant
Unobservable Inputs
(Level 3) | Total | |
| Taiwan | $7,316,849 | $20,066,765 | $— | $27,383,614 | |
| Thailand | 1,582,694 | — | — | 1,582,694 | |
| United Kingdom | 33,964,773 | 186,779,923 | — | 220,744,696 | |
| United States | 862,730 | — | — | 862,730 | |
| Preferred Stock1 | — | 1,365,351 | — | 1,365,351 | |
| Brazil | 2,546,918 | — | — | 2,546,918 | |
| United Kingdom | — | — | 39,910 | 39,910 | |
| Other Investment Companies1 | 56,479,495 | — | — | 56,479,495 | |
| Rights1 | 100,172 | — | — | 100,172 | |
| Short-Term Investment1 | — | 34,926 | — | 34,926 | |
| Futures Contracts2 | 1,926,635 | — | — | 1,926,635 | |
| Forward Foreign Currency Exchange Contracts2 | — | 15,610 | — | 15,610 | |
| Total | $322,472,919 | $1,087,941,408 | $55,832 | $1,410,470,159 | |
| * | Level 3 amount shown includes securities determined to have no value at October 31, 2019. |
| 1 | As categorized in Portfolio Holdings. |
| 2 | Futures contracts and forward foreign currency exchange contracts are valued at unrealized appreciation or depreciation. |
Fund investments in underlying mutual funds and ETFs are classified as Level 1, without consideration to the classification level of the investments held by the underlying mutual funds and ETFs, which could be Level 1, Level 2 or Level 3.
Laudus International MarketMasters Fund | Annual Report
Laudus International MarketMasters Fund
Statement of Assets and Liabilities
As of October 31, 2019
| Assets |
| Investments in unaffiliated issuers, at value (cost $1,194,137,405) | | $1,408,527,914 |
| Foreign currency, at value (cost $833,712) | | 836,668 |
| Deposit with broker for futures contracts | | 478,871 |
| Receivables: | | |
| Investments sold | | 5,076,609 |
| Variation margin on futures contracts | | 1,928,171 |
| Dividends | | 1,808,421 |
| Foreign tax reclaims | | 970,392 |
| Fund shares sold | | 207,895 |
| Unrealized appreciation on forward foreign currency exchange contracts | | 15,610 |
| Prepaid expenses | + | 18,012 |
| Total assets | | 1,419,868,563 |
| Liabilities |
| Payables: | | |
| Investments bought | | 3,342,760 |
| Investment adviser and administrator fees | | 1,070,411 |
| Shareholder service fees | | 197,308 |
| Independent trustees’ fees | | 11 |
| Fund shares redeemed | | 1,930,111 |
| Accrued expenses | + | 429,686 |
| Total liabilities | | 6,970,287 |
| Net Assets |
| Total assets | | 1,419,868,563 |
| Total liabilities | – | 6,970,287 |
| Net assets | | $1,412,898,276 |
| Net Assets by Source | | |
| Capital received from investors | | 1,204,989,773 |
| Total distributable earnings | | 207,908,503 |
| Net Asset Value (NAV) |
| Net Assets | ÷ | Shares
Outstanding | = | NAV |
| $1,412,898,276 | | 61,724,690 | | $22.89 |
| | | | | |
Laudus International MarketMasters Fund | Annual Report
Laudus International MarketMasters Fund
Statement of Operations
For the period November 1, 2018 through October 31, 2019
| Investment Income |
| Dividends (net of foreign withholding tax of $3,432,350) | | $36,568,887 |
| Expenses |
| Investment adviser and administrator fees | | 18,225,664 |
| Shareholder service fees: | | |
| Investor Shares1 | | 290,453 |
| Select Shares1 | | 2,123,549 |
| Custodian fees | | 420,104 |
| Portfolio accounting fees | | 175,127 |
| Professional fees | | 87,253* |
| Registration fees | | 77,852 |
| Transfer agent fees | | 44,526 |
| Shareholder reports | | 39,646 |
| Independent trustees’ fees | | 15,311 |
| Other expenses | + | 77,029 |
| Total expenses | | 21,576,514 |
| Expense reduction by CSIM and its affiliates | – | 3,502,987 |
| Net expenses | – | 18,073,527 |
| Net investment income | | 18,495,360 |
| Realized and Unrealized Gains (Losses) |
| Net realized gains on investments | | 480,831 |
| Net realized losses on futures contracts | | (6,078,253) |
| Net realized losses on foreign currency transactions | | (248,516) |
| Net realized gains on forward foreign currency exchange contracts | + | 253,359 |
| Net realized losses | | (5,592,579) |
| Net change in unrealized appreciation (depreciation) on investments | | 119,694,117 |
| Net change in unrealized appreciation (depreciation) on futures contracts | | 5,468,859 |
| Net change in unrealized appreciation (depreciation) on foreign currency translations | | 73,818 |
| Net change in unrealized appreciation (depreciation) on forward foreign currency exchange contracts | + | (236,764) |
| Net change in unrealized appreciation (depreciation) | + | 125,000,030 |
| Net realized and unrealized gains | | 119,407,451 |
| Increase in net assets resulting from operations | | $137,902,811 |
| * | Includes professional fees of $27,425 associated with the filing of tax claims in the European Union deemed to be non-routine expenses of the fund. See financial notes 2(d) and 4 for additional information. |
| 1 | Effective February 26, 2019, all outstanding Investor Shares were consolidated into the Select Shares, resulting in a single class of shares of the fund (see financial note 1). |
Laudus International MarketMasters Fund | Annual Report
Laudus International MarketMasters Fund
Statement of Changes in Net Assets
For the current and prior report periods
| Operations | |
| | 11/1/18-10/31/19 | 11/1/17-10/31/18 |
| Net investment income | | $18,495,360 | $15,385,341 |
| Net realized gains (losses) | | (5,592,579) | 124,600,348 |
| Net change in unrealized appreciation (depreciation) | + | 125,000,030 | (331,028,701) |
| Increase (decrease) in net assets from operations | | 137,902,811 | (191,043,012) |
| Distributions to Shareholders1 | |
| Investor Shares | | (34,719,762) | (22,191,896) |
| Select Shares | + | (99,317,431) | (55,540,940) |
| Total distributions | | ($134,037,193) | ($77,732,836) |
| Transactions in Fund Shares1 | | | |
| | | 11/1/18-10/31/19 | 11/1/17-10/31/18 |
| | | SHARES | VALUE | SHARES | VALUE |
| Shares Sold | | | | | |
| Investor Shares | | 103,775 | $2,181,854 | 768,475 | $20,559,616 |
| Select Shares | + | 21,106,679 | 454,485,861 | 6,716,472 | 175,934,966 |
| Total shares sold | | 21,210,454 | $456,667,715 | 7,484,947 | $196,494,582 |
| Shares Reinvested | | | | | |
| Investor Shares | | 1,583,820 | $30,947,842 | 766,583 | $19,831,502 |
| Select Shares | + | 3,532,129 | 68,841,189 | 1,345,695 | 34,745,855 |
| Total shares reinvested | | 5,115,949 | $99,789,031 | 2,112,278 | $54,577,357 |
| Shares Redeemed | | | | | |
| Investor Shares | | (19,296,537) | ($416,594,739) | (2,912,352) | ($76,864,136) |
| Select Shares | + | (12,155,331) | (261,429,704) | (4,410,948) | (116,250,573) |
| Total shares redeemed | | (31,451,868) | ($678,024,443) | (7,323,300) | ($193,114,709) |
| Net transactions in fund shares | | (5,125,465) | ($121,567,697) | 2,273,925 | $57,957,230 |
| Shares Outstanding and Net Assets | | | |
| | | 11/1/18-10/31/19 | 11/1/17-10/31/18 |
| | | SHARES | NET ASSETS | SHARES | NET ASSETS |
| Beginning of period | | 66,850,155 | $1,530,600,355 | 64,576,230 | $1,741,418,973 |
| Total increase or decrease | + | (5,125,465) | (117,702,079) | 2,273,925 | (210,818,618) |
| End of period | | 61,724,690 | $1,412,898,276 | 66,850,155 | $1,530,600,355 |
| 1 | Effective February 26, 2019, all outstanding Investor Shares (17,685,944 shares valued at $382,997,961) were consolidated into the Select Shares, resulting in a single class of shares of the fund (see financial note 1). |
Laudus International MarketMasters Fund | Annual Report
Laudus International MarketMasters Fund
1. Business Structure of the Fund:
Laudus International MarketMasters Fund is a series of Schwab Capital Trust (the trust), a no-load, open-end management investment company. The trust is organized as a Massachusetts business trust and is registered under the Investment Company Act of 1940, as amended (the 1940 Act). The list below shows all the funds in the trust as of the end of the period, including the fund discussed in this report, which is highlighted:
| SCHWAB CAPITAL TRUST (ORGANIZED MAY 7, 1993) |
| Laudus International MarketMasters Fund | Schwab Target 2040 Fund |
| Schwab S&P 500 Index Fund | Schwab Target 2045 Fund |
| Schwab Small-Cap Index Fund® | Schwab Target 2050 Fund |
| Schwab Total Stock Market Index Fund® | Schwab Target 2055 Fund |
| Schwab U.S. Large-Cap Growth Index Fund | Schwab Target 2060 Fund |
| Schwab U.S. Large-Cap Value Index Fund | Schwab Fundamental US Large Company Index Fund |
| Schwab U.S. Mid-Cap Index Fund | Schwab Fundamental US Small Company Index Fund |
| Schwab International Index Fund® | Schwab Fundamental International Large Company Index Fund |
| Schwab MarketTrack All Equity Portfolio™ | Schwab Fundamental International Small Company Index Fund |
| Schwab MarketTrack Growth Portfolio™ | Schwab Fundamental Emerging Markets Large Company Index Fund |
| Schwab MarketTrack Balanced Portfolio™ | Schwab Fundamental Global Real Estate Index Fund |
| Schwab MarketTrack Conservative Portfolio™ | Schwab Target 2010 Index Fund |
| Schwab Balanced Fund | Schwab Target 2015 Index Fund |
| Schwab Core Equity Fund | Schwab Target 2020 Index Fund |
| Schwab Dividend Equity Fund | Schwab Target 2025 Index Fund |
| Schwab Large-Cap Growth Fund | Schwab Target 2030 Index Fund |
| Schwab Small-Cap Equity Fund | Schwab Target 2035 Index Fund |
| Schwab Hedged Equity Fund | Schwab Target 2040 Index Fund |
| Schwab Health Care Fund | Schwab Target 2045 Index Fund |
| Schwab International Core Equity Fund | Schwab Target 2050 Index Fund |
| Schwab Target 2010 Fund | Schwab Target 2055 Index Fund |
| Schwab Target 2015 Fund | Schwab Target 2060 Index Fund |
| Schwab Target 2020 Fund | Schwab Monthly Income Fund - Moderate Payout |
| Schwab Target 2025 Fund | Schwab Monthly Income Fund - Enhanced Payout |
| Schwab Target 2030 Fund | Schwab Monthly Income Fund - Maximum Payout |
| Schwab Target 2035 Fund | |
Prior to February 26, 2019, the fund offered two share classes: Investor Shares and Select Shares®. Shares of each class represented an interest in the same portfolio, but each class had different expenses and investment minimums.
Effective February 26, 2019, the Investor Shares and Select Shares were consolidated into a single share class and the fund no longer offers separate share classes. Shares are bought and sold at closing net asset value per share (NAV), which is the price for all outstanding shares of the fund. Each share has a par value of 1/1,000 of a cent, and the fund’s Board of Trustees (the Board) may authorize the issuance of as many shares as necessary.
The fund maintains its own account for purposes of holding assets and accounting, and is considered a separate entity for tax purposes. Within its account, the fund may also keep certain assets in segregated accounts, as required by securities law.
2. Significant Accounting Policies:
The following is a summary of the significant accounting policies the fund uses in its preparation of financial statements. The fund follows the investment company accounting and reporting guidance of the Financial Accounting Standards Board (FASB) Accounting Standard CodificationTopic 946 Financial Services — Investment Companies. The accounting policies are in conformity with accounting principles generally accepted in the United States of America (GAAP).
The fund invests in certain other investment companies (underlying funds). For more information about the underlying funds’ operations and policies, please refer to those funds’ semiannual and annual reports, which are filed with the U.S. Securities and Exchange Commission (SEC) and are available on the SEC’s website at www.sec.gov.
Laudus International MarketMasters Fund | Annual Report
Laudus International MarketMasters Fund
Financial Notes(continued)
2. Significant Accounting Policies (continued):
(a) Security Valuation:
Under procedures approved by the Board, the investment adviser has formed a Pricing Committee to administer the pricing and valuation of portfolio securities and other assets and to ensure that prices used for internal purposes or provided by third parties reasonably reflect fair market value. Among other things, these procedures allow the fund to utilize independent pricing services, quotations from securities and financial instrument dealers and other market sources to determine fair value.
The fund values the securities in its portfolio every business day. The fund uses the following policies to value various types of securities:
• Securities traded on an exchange or over-the-counter:Traded securities are valued at the closing value for the day, or, on days when no closing value has been reported, at the mean of the most recent bid and ask quotes. Securities that are primarily traded on foreign exchanges are valued at the official closing price or the last sales price on the exchange where the securities are principally traded with these values then translated into U.S. dollars at the current exchange rate, unless these securities are fair valued as discussed below.
• Securities for which no quoted value is available:The Board has adopted procedures to fair value the fund’s securities when market prices are not “readily available” or are unreliable. For example, the fund may fair value a security when it is de-listed or its trading is halted or suspended; when a security’s primary pricing source is unable or unwilling to provide a price; or when a security’s primary trading market is closed during regular market hours. The fund makes fair value determinations in good faith in accordance with the fund’s valuation procedures. The Pricing Committee considers a number of factors, including unobservable market inputs when arriving at fair value. The Pricing Committee may employ techniques such as the review of related or comparable assets or liabilities, related market activities, recent transactions, market multiples, book values, transactional back-testing, disposition analysis and other relevant information. The Pricing Committee regularly reviews these inputs and assumptions to calibrate the valuations. Due to the subjective and variable nature of fair value pricing, there can be no assurance that the fund could obtain the fair value assigned to the security upon the sale of such security. The Board convenes on a regular basis to review fair value determinations made by the fund pursuant to the valuation procedures.
• Foreign equity security fair valuation:The Board has adopted procedures to fair value foreign equity securities that are traded in markets that close prior to the fund valuing its holdings. By fair valuing securities whose prices may have been affected by events occurring after the close of trading, the fund seeks to establish prices that investors might expect to realize upon the current sales of these securities. This methodology is designed to deter “arbitrage” market timers, who seek to exploit delays between the change in the value of the fund’s portfolio holdings and the NAV of the fund’s shares, and seeks to help ensure that the prices at which the fund’s shares are purchased and redeemed are fair and do not result in dilution of shareholder interest or other harm to shareholders. When fair value pricing is used at the open or close of a reporting period, it may cause a temporary divergence between the return of the fund and that of its comparative index or benchmark. The Board regularly reviews fair value determinations made by the fund pursuant to these procedures.
• Futures contracts and forward foreign currency exchange contracts (forwards):Futures contracts are valued at their settlement prices as of the close of their exchanges. Forwards are valued based on that day’s forward exchange rates or by using an interpolated forward exchange rate for contracts with interim settlement dates.
• Short-term securities (60 days or less to maturity):Securities with remaining maturities of 60 days or less are generally valued at an evaluated price; however, such securities may be valued at their amortized cost if it approximates the security’s market value.
• Underlying funds:Mutual funds are valued at their respective NAVs. Exchange-traded funds (ETFs) traded on a recognized securities exchange are valued at the last reported sale price that day or the official closing price, if applicable.
In accordance with the authoritative guidance on fair value measurements and disclosures under GAAP, the fund discloses the fair value of its investments in a hierarchy that prioritizes the significant inputs to valuation techniques used to measure the fair value. The hierarchy gives the highest priority to valuations based upon unadjusted quoted prices in active markets for identical assets or liabilities (Level 1 measurements) and the lowest priority to valuations based upon unobservable inputs that are significant to the valuation (Level 3 measurements). If inputs used to measure the financial instruments fall within different levels of the hierarchy, the categorization is based on the lowest level input that is significant to the valuation. If the fund determines that either the volume and/or level of activity for an asset or liability has significantly decreased (from normal conditions for that asset or liability) or price quotations or observable inputs are not associated with orderly transactions, increased analysis and management judgment will be required to estimate fair value.
Laudus International MarketMasters Fund | Annual Report
Laudus International MarketMasters Fund
Financial Notes(continued)
2. Significant Accounting Policies (continued):
The three levels of the fair value hierarchy are as follows:
• Level 1—quoted prices in active markets for identical securities—Investments whose values are based on quoted market prices in active markets, and whose values are therefore classified as Level 1 prices, include active listed equities, ETFs and futures contracts. Investments in mutual funds are valued daily at their NAVs, and investments in ETFs are valued daily at the last reported sale price or the official closing price, which are classified as Level 1 prices, without consideration to the classification level of the specific investments held by an underlying fund.
• Level 2—other significant observable inputs (including quoted prices for similar securities, interest rates, prepayment speeds, credit risk, etc.)—Investments that trade in markets that are not considered to be active, but whose values are based on quoted market prices, dealer quotations or valuations provided by alternative pricing sources supported by observable inputs are classified as Level 2 prices. These generally include U.S. government and sovereign obligations, most government agency securities, investment-grade corporate bonds, certain mortgage products, less liquid listed equities, and state, municipal and provincial obligations. In addition, international securities whose markets close hours before the fund values its holdings may require fair valuations due to significant movement in the U.S. markets occurring after the daily close of the foreign markets. The Board has approved a vendor that calculates fair valuations of international equity securities based on a number of factors that appear to correlate to the movements in the U.S. markets.
• Level 3—significant unobservable inputs (including the fund’s own assumptions in determining the fair value of investments)—Investments whose values are classified as Level 3 prices have significant unobservable inputs, as they may trade infrequently or not at all. When observable prices are not available for these securities, the fund uses one or more valuation techniques for which sufficient and reliable data is available. The inputs used by the fund in estimating the value of Level 3 prices may include the original transaction price, quoted prices for similar securities or assets in active markets, completed or pending third-party transactions in the underlying investment or comparable issuers, and changes in financial ratios or cash flows. Level 3 prices may also be adjusted to reflect illiquidity and/or non-transferability, with the amount of such discount estimated by the fund in the absence of market information. Assumptions used by the fund due to the lack of observable inputs may significantly impact the resulting fair value and therefore the fund’s results of operations.
The inputs or methodology used for valuing securities are not necessarily an indication of the risk associated with investing in those securities.
The levels associated with valuing the fund’s investments as of October 31, 2019 are disclosed in the Portfolio Holdings.
(b) Accounting Policies for certain Portfolio Investments (if held):
Futures Contracts: Futures contracts are instruments that represent an agreement between two parties that obligates one party to buy, and the other party to sell, specific instruments at an agreed upon price on a stipulated future date. The fund must give the broker a deposit of cash and/or securities (initial margin) whenever it enters into a futures contract. The amount of the deposit may vary from one contract to another. Subsequent payments (variation margin) are made or received by the fund depending on the daily fluctuations in the value of the futures contract and are accounted for as unrealized appreciation or depreciation until the contract is closed, at which time the gains or losses are realized. Futures contracts are traded publicly on exchanges, and their market value may change daily.
Forward Foreign Currency Exchange Contracts: Forwards are contracts to buy and sell a currency at a set price on a future date. The value of the forwards is accounted for as unrealized appreciation or depreciation until the contracts settle, at which time the gains or losses are realized.
(c) Security Transactions:
Security transactions are recorded as of the date the order to buy or sell the security is executed. Realized gains and losses from security transactions are based on the identified costs of the securities involved.
Assets and liabilities denominated in foreign currencies are reported in U.S. dollars. For assets and liabilities held on a given date, the dollar value is based on market exchange rates in effect on that date. Transactions involving foreign currencies, including purchases, sales, income receipts and expense payments, are calculated using exchange rates in effect on the transaction date. Realized foreign exchange gains or losses arise from sales of foreign currencies, currency gains or losses realized between the trade and settlement dates on securities transactions and the differences between the recorded amounts of dividends, interest, and foreign withholding taxes and the U.S. dollar equivalent of the amounts actually received or paid. Net unrealized foreign exchange appreciation or depreciation arises from changes in foreign exchange rates on foreign denominated assets and liabilities other than investments in securities held at the end of the reporting period. These realized and unrealized foreign exchange gains or losses are
Laudus International MarketMasters Fund | Annual Report
Laudus International MarketMasters Fund
Financial Notes(continued)
2. Significant Accounting Policies (continued):
reported in foreign currency transactions or translations in the Statement of Operations. The fund does not isolate the portion of the fluctuations on investments resulting from changes in foreign currency exchange rates from the fluctuations in market prices of investments held. Such fluctuations are included with the net realized and unrealized gain or loss from investments.
Gains realized by the fund on the sale of securities in certain foreign countries may be subject to non-U.S. taxes. In those instances, the fund records a liability based on unrealized appreciation to provide for potential non-U.S. taxes payable upon the sale of these securities.
When the fund closes out a futures contract position, it calculates the difference between the value of the position at the beginning and at the end of the contract, and records a realized gain or loss accordingly.
(d) Investment Income:
Interest income is recorded as it accrues. Dividends, in the form of cash or non-cash income such as in the form of additional securities, and distributions from portfolio securities and underlying funds are recorded on the date they are effective (the ex-dividend date), although the fund records certain foreign security dividends on the day they learn of the ex-dividend date. Any distributions from underlying funds are recorded in accordance with the character of the distributions as designated by the underlying funds.
Income received from foreign sources may result in withholding tax. Withholding taxes are accrued at the same time as the related income if the tax rate is fixed and known, unless a tax withheld is reclaimable from the local tax authorities in which case it is recorded as receivable. If the tax rate is not known or estimable, such expense or reclaim receivable is recorded when the net proceeds are received.
The Laudus International MarketMasters Fund filed claims to recover taxes previously withheld in certain European Union countries on the basis that those countries had purportedly violated certain provisions in the Treaty on the Functioning of the European Union. These filings are subject to various administrative and judicial proceedings within these countries, and all professional fees associated with these filings have been paid by the investment adviser.
(e) Expenses:
Expenses that are specific to the fund are charged directly to the fund. Expenses that are common to more than one fund in the trusts generally are allocated among those funds in proportion to their average daily net assets.
(f) Distributions to Shareholders:
The fund makes distributions from net investment income and net realized capital gains, if any, once a year.
(g) Accounting Estimates:
The accounting policies described in this report conform to GAAP. Notwithstanding this, shareholders should understand that in order to follow these principles, fund management has to make estimates and assumptions that affect the information reported in the financial statements. It’s possible that once the results are known, they may turn out to be different from these estimates and these differences may be material.
(h) Federal Income Taxes:
The fund intends to meet federal income and excise tax requirements for regulated investment companies under subchapter M of the Internal Revenue Code, as amended. Accordingly, the fund distributes substantially all of its net investment income and net realized capital gains, if any, to its respective shareholders each year. As long as the fund meets the tax requirements, it is not required to pay federal income tax.
(i) Foreign Taxes:
The fund may be subject to foreign taxes (a portion of which may be reclaimable) on income, corporate events, foreign currency exchanges and capital gains on investments. All foreign taxes are recorded in accordance with the applicable foreign tax regulations and rates that exist in foreign markets in which the fund invests. These foreign taxes, if any, are paid by the fund and are disclosed in the Statement of Operations. Foreign taxes payable as of October 31, 2019, if any, are reflected in the fund’s Statement of Assets and Liabilities.
Laudus International MarketMasters Fund | Annual Report
Laudus International MarketMasters Fund
Financial Notes(continued)
2. Significant Accounting Policies (continued):
(j) Indemnification:
Under the fund’s organizational documents, the officers and trustees are indemnified against certain liabilities arising out of the performance of their duties to the fund. In addition, in the normal course of business the fund enters into contracts with its vendors and others that provide general indemnifications. The fund’s maximum exposure under these arrangements is unknown as this would involve future claims that may be made against the fund. However, based on experience, the fund expects the risk of loss attributable to these arrangements to be remote.
(k) Recent Accounting Standards:
In August 2018, the FASB issued Accounting Standards Update “Fair Value Measurement (Topic 820)” (ASU 2018-13) which modifies the disclosure requirements for fair value measurement by removing, modifying, or adding certain disclosures. The amendments are effective for annual periods beginning after December 15, 2019, and interim periods within those annual periods. The fund is permitted to early adopt any removed or modified disclosures upon issuance of this update and delay adoption of the additional disclosures until their effective date. The fund has early adopted certain removed or modified disclosures, including the amount of and reasons for transfers between Level 1 and Level 2 of the fair value hierarchy and the policy for timing of transfers between levels upon issuance of ASU 2018-13, and has delayed adoption of the additional disclosures until their effective date. At this time, management is currently evaluating the impact that the adoption of the additional disclosures will have on the fund’s financial statements.
3. Risk Factors:
Investing in the fund may involve certain risks, as discussed in the fund’s prospectus, including, but not limited to, those described below. Any of these risks could cause an investor to lose money.
Market Risk. Financial markets rise and fall in response to a variety of factors, sometimes rapidly and unpredictably. As with any investment whose performance is tied to these markets, the value of an investment in the fund will fluctuate, which means that an investor could lose money over short or long periods.
Equity Risk. The prices of equity securities rise and fall daily. These price movements may result from factors affecting individual companies, industries or the securities market as a whole. In addition, equity markets tend to move in cycles, which may cause stock prices to fall over short or extended periods of time.
Investment Style Risk. The fund’s investment managers attempt to reduce the impact of the performance of any given investment style by investing in both value and growth style stocks. But whenever value stocks fall out of favor with investors, they may underperform growth stocks, and vice versa.
Market Capitalization Risk.Securities issued by companies of different market capitalizations tend to go in and out of favor based on market and economic conditions. During a period when securities of a particular market capitalization fall behind other types of investments, the fund’s performance could be impacted.
Small-Cap Company Risk. Securities issued by small-cap companies may be riskier than those issued by larger companies, and their prices may move sharply, especially during market upturns and downturns.
Large-Cap Company Risk. Large-cap companies are generally more mature and the securities issued by these companies may not be able to reach the same levels of growth as the securities issued by small- or mid-cap companies.
Mid-Cap Company Risk. Mid-cap companies may be more vulnerable to adverse business or economic events than larger, more established companies and the value of securities issued by these companies may move sharply.
Management Risk. As with all actively managed funds, the fund is subject to the risk that its investment adviser and investment managers will select investments or allocate assets in a manner that could cause the fund to underperform or otherwise not meet its objective. Poor stock selection or a focus on securities in a particular sector may cause the fund to underperform its benchmark or other funds with a similar investment objective.
Foreign Investment Risk. The fund’s investments in securities of foreign issuers involve certain risks that may be greater than those associated with investments in securities of U.S. issuers. These include risks of adverse changes in foreign economic, political, regulatory and other conditions; changes in currency exchange rates or exchange control regulations (including limitations on currency movements and exchanges); the imposition of economic sanctions or other government restrictions; differing accounting, auditing, financial reporting and legal standards and practices; differing securities market structures; and higher transaction costs. These risks may negatively impact the value or liquidity of the fund’s investments, and could impair the fund’s ability to meet its
Laudus International MarketMasters Fund | Annual Report
Laudus International MarketMasters Fund
Financial Notes(continued)
3. Risk Factors (continued):
investment objective or invest in accordance with its investment strategy. There is a risk that investments in securities denominated in, and/or receiving revenues in, foreign currencies will decline in value relative to the U.S. dollar or, in the case of hedging positions, that the U.S. dollar will decline in value relative to the currency hedged, resulting in the dollar value of the fund’s investment being adversely affected. To the extent the fund’s investments in a single country or a limited number of countries represent a large percentage of the fund’s assets, the fund’s performance may be adversely affected by the economic, political, regulatory and social conditions in those countries, and the fund’s price may be more volatile than the price of a fund that is geographically diversified.
Emerging Markets Risk. Emerging market countries may be more likely to experience political turmoil or rapid changes in market or economic conditions than more developed countries. Emerging market countries often have less uniformity in accounting and reporting requirements and greater risk associated with the custody of securities. In addition, the financial stability of issuers (including governments) in emerging market countries may be more precarious than in developed countries. As a result, there may be an increased risk of illiquidity and price volatility associated with the fund’s investments in emerging market countries, which may be magnified by currency fluctuations relative to the U.S. dollar, and, at times, it may be difficult to value such investments.
Currency Risk. As a result of the fund’s investments in securities denominated in, and/or receiving revenues in, foreign currencies, the fund will be subject to currency risk. This is the risk that those currencies will decline in value relative to the U.S. dollar. If such an event occurs, the dollar value of an investment in the fund would be adversely affected.
Derivatives Risk. The fund’s use of derivative instruments involves risks different from, or possibly greater than the risks associated with investing directly in securities and other traditional investments. Certain of these risks, such as liquidity risk, market risk and management risk, are discussed elsewhere in this section. The fund’s use of derivatives is also subject to credit risk, leverage risk, lack of availability risk, valuation risk, correlation risk and tax risk. Lack of availability risk is the risk that suitable derivative transactions may not be available in all circumstances for risk management or other purposes. Credit risk is the risk that the counterparty to a derivatives transaction may not fulfill its obligations. Leverage risk is the risk that a small percentage of assets invested in derivatives can have a disproportionately large impact on the fund. Valuation risk is the risk that a particular derivative may be valued incorrectly. Correlation risk is the risk that changes in the value of the derivative may not correlate perfectly with the underlying asset, rate or index. Tax risk is the risk that the use of derivatives may cause the fund to realize higher amounts of short-term capital gains. The fund’s use of derivatives could reduce the fund’s performance, increase its volatility, and could cause the fund to lose more than the initial amount invested. The use of derivatives, that are subject to regulation by the Commodity Futures Trading Commission (CFTC), could cause the fund to become a commodity pool, which would require the fund to comply with certain CFTC rules.
Multi-Manager Risk. Although CSIM monitors and coordinates the overall management of the fund, each investment manager makes investment decisions independently, and it is possible that the investment styles of the investment managers may not complement one another. As a result, the fund’s exposure to a given stock, industry or investment style could unintentionally be smaller or larger than if the fund had a single manager.
Liquidity Risk. The fund may be unable to sell certain securities, such as illiquid securities, readily at a favorable time or price, or the fund may have to sell them at a loss.
Please refer to the fund’s prospectus for a more complete description of the principal risks of investing in the fund.
4. Affiliates and Affiliated Transactions:
Investment Adviser
Charles Schwab Investment Management, Inc. (CSIM or the investment adviser), a wholly owned subsidiary of The Charles Schwab Corporation, serves as the fund’s investment adviser and administrator pursuant to an Investment Advisory and Administration Agreement between CSIM and the trust.
For its advisory and administrative services to the fund, CSIM is entitled to receive an annual fee, payable monthly, based on a percentage of the fund’s average daily net assets as follows:
| First $500 million | 1.29% |
| $500 million to $1 billion | 1.275% |
| Over $1 billion | 1.25% |
For the period ended October 31, 2019, the aggregate advisory fees paid to CSIM by the fund was 1.27% as a percentage of the fund’s average daily net assets.
Laudus International MarketMasters Fund | Annual Report
Laudus International MarketMasters Fund
Financial Notes(continued)
4. Affiliates and Affiliated Transactions (continued):
Shareholder Servicing
The Board has adopted a Shareholder Servicing Plan (the Plan) on behalf of the fund. The Plan enables the fund to bear expenses relating to the provision by financial intermediaries, including Charles Schwab & Co., Inc. (Schwab), a broker-dealer affiliate of CSIM, (together, “service providers”), of certain shareholder services to the current shareholders of the fund.
Pursuant to the Plan, the fund’s shares are subject to an annual shareholder servicing fee of up to 0.20%. The shareholder servicing fee paid to a particular service provider is made pursuant to its written agreement with Schwab, as distributor of the fund (or, in the case of payments made to Schwab acting as a service provider, pursuant to Schwab’s written agreement with the fund), and the fund will pay no more than 0.20% of the average annual daily net asset value of the fund shares owned by shareholders holding shares through such service provider. Payments under the Plan are made as described above without regard to whether the fee is more or less than the service provider’s actual cost of providing the services, and if more, such excess may be retained as profit by the service provider.
Prior to February 26, 2019, the fund’s shares were subject to an annual shareholder servicing fee up to 0.20% for Select Shares and 0.25% for Investor Shares.
Expense Limitation
Although these agreements specify certain fees for these services, CSIM and its affiliates have made an additional agreement with the fund, for so long as CSIM serves as the investment adviser to the fund, which may only be amended or terminated with the approval of the Board, to limit the total annual fund operating expenses charged, excluding interest, taxes and certain non-routine expenses to 1.25% as a continuation of the Select Shares agreement.
Prior to February 26, 2019, CSIM and its affiliates had an agreement with the fund to limit the total annual fund operating expenses charged, excluding interest, taxes and certain non-routine expenses at 1.40% for Investor Shares and 1.25% for Select Shares.
Investments from Affiliates
Certain funds in the Fund Complex (for definition refer to Trustees and Officers section) may own shares of other funds in the Fund Complex. The table below reflects the percentage of shares of the fund in this report that are owned by other funds in the Fund Complex as of October 31, 2019, as applicable:
| | Underlying Fund |
| Schwab Monthly Income Fund - Enhanced Payout | 0.5% |
| Schwab Monthly Income Fund - Maximum Payout | 0.2% |
| Schwab Monthly Income Fund - Moderate Payout | 0.4% |
| Schwab Target 2010 Fund | 0.2% |
| Schwab Target 2015 Fund | 0.4% |
| Schwab Target 2020 Fund | 2.9% |
| Schwab Target 2025 Fund | 4.0% |
| Schwab Target 2030 Fund | 8.1% |
| Schwab Target 2035 Fund | 4.3% |
| Schwab Target 2040 Fund | 9.9% |
| Schwab Target 2045 Fund | 1.7% |
| Schwab Target 2050 Fund | 1.7% |
| Schwab Target 2055 Fund | 1.0% |
| Schwab Target 2060 Fund | 0.2% |
Other Affiliated Transactions
The professional fees related to foreign withholding tax claims discussed in financial note 2 were non-routine expenses. The investment adviser agreed to pay these professional fees for this reporting period, subject to reimbursement by the fund to the extent the fund is able to successfully recover taxes withheld in the future.
As of October 31, 2019, the balance of professional fees related to foreign withholding tax subject to future reimbursement by the fund to the investment adviser was $27,425.
Laudus International MarketMasters Fund | Annual Report
Laudus International MarketMasters Fund
Financial Notes(continued)
4. Affiliates and Affiliated Transactions (continued):
No other amounts for additional tax reclaims are reflected in the financial statements due to the uncertainty surrounding the ultimate resolution of proceedings, the likelihood of receipt of these claims, and the potential timing of payment.
Interfund Borrowing and Lending
Pursuant to an exemptive order issued by the SEC, the fund may enter into interfund borrowing and lending transactions with other funds in the Fund Complex. All loans are for temporary or emergency purposes and the interest rate to be charged will be the average of the overnight repurchase agreement rate and the short-term bank loan rate. All loans are subject to numerous conditions designed to ensure fair and equitable treatment of all participating funds. The interfund lending facility is subject to the oversight and periodic review by the Board. The fund had no interfund borrowing or lending activity during the period.
5. Board of Trustees:
The Board may include people who are officers and/or directors of CSIM or its affiliates. Federal securities law limits the percentage of such “interested persons” who may serve on a trust’s board, and the trust was in compliance with these limitations throughout the report period. The trust did not pay any of these interested persons for their services as trustees, but it did pay non-interested persons (independent trustees), as noted on the fund’s Statement of Operations. For information regarding the trustees, please refer to the Trustees and Officers table at the end of this report.
6. Borrowing from Banks:
During the period, the fund was a participant with other U.S. registered investment companies managed by CSIM in a joint, syndicated, committed $750 million line of credit (the Syndicated Credit Facility), which matured on October 3, 2019. On October 3, 2019, the Syndicated Credit Facility was amended to run for a new 364 day period with the line of credit amount remaining unchanged, maturing on October 1, 2020. Under the terms of the Syndicated Credit Facility, in addition to the interest charged on any borrowings by a fund, the fund paid a commitment fee of 0.15% per annum on the fund’s proportionate share of the unused portion of the Syndicated Credit Facility.
During the period, the fund was a participant with other U.S. registered investment companies managed by CSIM in a joint, unsecured, uncommitted $500 million line of credit (the Uncommitted Credit Facility), with State Street Bank and Trust Company, which matured on November 30, 2018. On November 30, 2018, the Uncommitted Credit Facility was amended to run for a new 364 day period with the line of credit amount remaining unchanged, maturing on November 29, 2019. Under the terms of the Uncommitted Credit Facility, the fund pays interest on the amount it borrows. There were no borrowings from either line of credit during the period.
The fund also has access to custodian overdraft facilities. The fund may have utilized the overdraft facility and incurred an interest expense, which is disclosed on the fund’s Statement of Operations, if any. The interest expense is determined based on a negotiated rate above the current Federal Funds Rate.
7. Purchases and Sales of Investment Securities:
For the period ended October 31, 2019, purchases and sales of securities (excluding short-term obligations) were as follows:
| | Purchases
of Securities | Sales
of Securities |
| | $744,250,176 | $955,833,523 |
8. Derivatives:
The fund entered into equity index futures contracts during the report period. The fund invested in futures contracts to equitize available cash. The current value and variation margin for futures contracts held at October 31, 2019 are presented on the Portfolio Holdings and Statement of Assets and Liabilities, respectively. The net realized and change in unrealized gains (losses) on futures contracts are presented on the Statement of Operations. Refer to financial note 2(b) for the fund’s accounting policies with respect
Laudus International MarketMasters Fund | Annual Report
Laudus International MarketMasters Fund
Financial Notes(continued)
8. Derivatives (continued):
to futures contracts and financial note 3 for disclosures concerning the risks of investing in futures contracts. During the period ended October 31, 2019, the month-end average notional amounts of futures contracts held by the fund and the month-end average number of contracts held were as follows:
| | Notional Amounts | Number of Contracts |
| | $34,384,308 | 550 |
The fund invested in forwards in connection with the purchase and sale of portfolio securities to minimize the uncertainty of changes in future foreign currency exchange rates and to hedge exposure to certain currencies. Refer to financial note 2(b) for the fund’s accounting policies with respect to forwards and financial note 3 for disclosures concerning the risks of investing in forwards. During the period ended October 31, 2019, the month-end average forward foreign currency notional amount and the month-end average unrealized appreciation were $5,656,589 and $165,192, respectively.
As of October 31, 2019, the derivatives contracts held by the fund, categorized by primary risk exposure, were:
| Asset Derivatives | Fair Value |
| Equity Index Futures Contracts1 | $1,926,635 |
| Forward Foreign Currency Exchange Contracts2 | 15,610 |
| Liability Derivatives | Fair Value |
| Equity Index Futures Contracts3 | $— |
| Forward Foreign Currency Exchange Contracts4 | — |
| 1 | Includes cumulative unrealized appreciation of futures contracts as reported in the Schedule of Portfolio Holdings. Only current day’s variation margin is reported within the Statement of Assets and Liabilities. |
| 2 | Statement of Assets and Liabilities location: Unrealized appreciation on forward foreign currency exchange contracts. |
| 3 | Includes cumulative unrealized depreciation of futures contracts as reported in the Schedule of Portfolio Holdings. Only current day’s variation margin is reported within the Statement of Assets and Liabilities. |
| 4 | Statement of Assets and Liabilities location: Unrealized depreciation on forward foreign currency exchange contracts. |
The effects of the derivatives held by the fund in the Statement of Operations for the period ended October 31, 2019 were:
| Equity Index Futures Contracts | |
| Realized losses1 | ($6,078,253) |
| Net change in unrealized appreciation (depreciation)2 | 5,468,859 |
| Forward Foreign Currency Exchange Contracts | |
| Realized gains1 | $253,359 |
| Net change in unrealized appreciation (depreciation)2 | (236,764) |
| 1 | Statement of Operations location: Net realized losses on futures contracts and net realized gains on forward foreign currency exchange contracts. |
| 2 | Statement of Operations location: Net change in unrealized appreciation (depreciation) on futures contracts and net change in unrealized appreciation (depreciation) on forward foreign currency exchange contracts. |
The fund’s forwards are entered into pursuant to International Swaps and Derivatives Association, Inc. (ISDA) agreements which govern certain terms of derivative transactions. ISDA agreements typically contain, among other things, master netting provisions in the event of a default or other termination event. Master netting provisions allow the fund and the counterparty, in the event of a default or other termination event, to offset payable and receivable amounts for each party related to derivative contracts to one net amount payable by either the fund or the counterparty. The fund’s forwards, which are reported gross in the Statement of Assets
Laudus International MarketMasters Fund | Annual Report
Laudus International MarketMasters Fund
Financial Notes(continued)
8. Derivatives (continued):
and Liabilities, are presented in the table below. The following table presents the fund’s forwards, net of amounts available for offset under a master netting agreement and net of any related collateral received by the fund for assets and pledged by the fund for liabilities as of October 31, 2019.
| | | | Gross Amounts Not Offset in the
Statement of Assets & Liabilities |
| Counterparty | Net Amounts of Assets
Presented in the
Statement of Assets and Liabilities | | Financial
Instruments | | Cash Collateral
Received | | Net
Amounts(a) |
| State Street Bank & Trust Co. | $15,610 | | $— | | $— | | $15,610 |
| Total | $15,610 | | $— | | $— | | $15,610 |
| a | Represents the net amount due from the counterparty in the event of default. |
9. Federal Income Taxes:
As of October 31, 2019, the tax basis cost of the fund’s investments and gross unrealized appreciation and depreciation were as follows:
| Tax cost | $1,229,886,193 |
| Gross unrealized appreciation | $247,779,184 |
| Gross unrealized depreciation | (67,195,218) |
| Net unrealized appreciation (depreciation) | $180,583,966 |
As of October 31, 2019, the components of distributable earnings on a tax basis were as follows:
| Undistributed ordinary income | $24,921,676 |
| Undistributed long-term capital gains | 2,391,067 |
| Net unrealized appreciation (depreciation) on investments | 180,583,966 |
| Net other unrealized appreciation (depreciation) | 11,794 |
| Total | $207,908,503 |
The primary differences between book basis and tax basis unrealized appreciation or unrealized depreciation of investments are the tax deferral of losses on wash sales, realization for tax purposes of unrealized gains (losses) on futures contracts and the realization for tax purposes of unrealized appreciation on investments in Passive Foreign Investment Companies (PFIC) and partnership investments. The tax cost of the funds’ investments, disclosed above, have been adjusted from their book amounts to reflect these unrealized appreciation or depreciation differences, as applicable.
Capital loss carryforwards may be used to offset future realized capital gains for federal income tax purposes. As of October 31, 2019, the fund had no capital loss carryforwards available to offset future net capital gains.
The tax basis components of distributions paid during the current and prior fiscal years were as follows:
| Current period distributions | |
| Ordinary income | $18,404,188 |
| Long-term capital gains | 115,633,005 |
| Prior period distributions | |
| Ordinary income | $35,462,454 |
| Long-term capital gains | 42,270,382 |
Distributions paid to shareholders are based on net investment income and net realized gains determined on a tax basis, which may differ from net investment income and net realized gains for financial reporting purposes. These differences reflect the differing character of certain income items and net realized gains and losses for financial statement and tax purposes, and may result in reclassification among certain capital accounts on the financial statements.
Laudus International MarketMasters Fund | Annual Report
Laudus International MarketMasters Fund
Financial Notes(continued)
9. Federal Income Taxes (continued):
Permanent book and tax basis differences may result in reclassifications between components of net assets as required. The adjustments will have no impact on net assets or the results of operations.
As of October 31, 2019, management has reviewed the tax positions for open periods (for federal purposes, three years from the date of filing and for state purposes, four years from the date of filing) as applicable to the fund, and has determined that no provision for income tax is required in the fund’s financial statements. The fund recognizes interest and penalties, if any, related to unrecognized tax benefits as income tax expense in the Statement of Operations. During the fiscal year ended October 31, 2019, the fund did not incur any interest or penalties.
10. Subsequent Events:
On December 12, 2019, the Board of Trustees for Schwab Capital Trust approved the hiring of Baillie Gifford Overseas Limited (Baillie Gifford) as a new investment manager to the fund. Baillie Gifford will begin managing fund assets on or around January 31, 2020.
Other than the investment manager change to the fund as discussed above, management has determined there are no other subsequent events or transactions through the date the financial statements were issued that would have materially impacted the financial statements as presented.
Laudus International MarketMasters Fund | Annual Report
Laudus International MarketMasters Fund
Report of Independent Registered Public Accounting Firm
To the Board of Trustees of Schwab Capital Trust and Shareholders of Laudus International MarketMasters Fund
Opinion on the Financial Statements
We have audited the accompanying statement of assets and liabilities, including the portfolio holdings, of Laudus International MarketMasters Fund (one of the funds constituting Schwab Capital Trust, referred to hereafter as the “Fund”) as of October 31, 2019, the related statement of operations for the year ended October 31, 2019, the statement of changes in net assets for each of the two years in the period ended October 31, 2019, including the related notes, and the financial highlights for each of the five years in the period ended October 31, 2019 (collectively referred to as the “financial statements”). In our opinion, the financial statements present fairly, in all material respects, the financial position of the Fund as of October 31, 2019, the results of its operations for the year then ended, the changes in its net assets for each of the two years in the period ended October 31, 2019 and the financial highlights for each of the five years in the period ended October 31, 2019 in conformity with accounting principles generally accepted in the United States of America.
Basis for Opinion
These financial statements are the responsibility of the Fund’s management. Our responsibility is to express an opinion on the Fund’s financial statements based on our audits. We are a public accounting firm registered with the Public Company Accounting Oversight Board (United States) (PCAOB) and are required to be independent with respect to the Fund in accordance with the U.S. federal securities laws and the applicable rules and regulations of the Securities and Exchange Commission and the PCAOB.
We conducted our audits of these financial statements in accordance with the standards of the PCAOB. Those standards require that we plan and perform the audit to obtain reasonable assurance about whether the financial statements are free of material misstatement, whether due to error or fraud.
Our audits included performing procedures to assess the risks of material misstatement of the financial statements, whether due to error or fraud, and performing procedures that respond to those risks. Such procedures included examining, on a test basis, evidence regarding the amounts and disclosures in the financial statements. Our audits also included evaluating the accounting principles used and significant estimates made by management, as well as evaluating the overall presentation of the financial statements. Our procedures included confirmation of securities owned as of October 31, 2019 by correspondence with the custodian and brokers; when replies were not received from the brokers, we performed other auditing procedures. We believe that our audits provide a reasonable basis for our opinion.
/s/ PricewaterhouseCoopers LLP
San Francisco, California
December 16, 2019
We have served as the auditor of one or more investment companies in the Schwab Funds Complex since 1989.
Laudus International MarketMasters Fund | Annual Report
Laudus International MarketMasters Fund
Other Federal Tax Information (unaudited)
The Laudus International MarketMasters Fund elects to pass through, under section 853 of the Internal Revenue Code, the foreign tax credit of $3,357,229 to its shareholders for the fiscal year ended October 31, 2019. The respective foreign source income on the fund is $23,675,483.
For the fiscal year ended October 31, 2019, the fund designates $21,761,417 of the dividend distributions as qualified dividends for the purposes of the maximum rate under section 1(h)(11) of the Internal Revenue Code. Shareholders will be notified in January 2020 via IRS Form 1099 of the amounts for use in preparing their 2019 income tax return.
Under section 852(b)(3)(C) of the Internal Revenue Code, the fund hereby designates $115,633,005 as long-term capital gain dividends for the fiscal year ended October 31, 2019.
Laudus International MarketMasters Fund | Annual Report
Laudus International MarketMasters Fund
Investment Advisory and Sub-Advisory Agreement Approval
The Investment Company Act of 1940, as amended, requires that the continuation of a fund’s investment advisory agreement must be specifically approved (1) by the vote of the trustees or by a vote of the shareholders of the fund, and (2) by the vote of a majority of the trustees who are not parties to the investment advisory agreement or “interested persons” of any party (the Independent Trustees), cast in person at a meeting called for the purpose of voting on such approval. In connection with such approvals, the fund’s trustees must request and evaluate, and the investment adviser is required to furnish, such information as may be reasonably necessary to evaluate the terms of the investment advisory agreement.
The Board of Trustees (the Board or the Trustees, as appropriate) calls and holds one or more meetings each year that are dedicated, in whole or in part, to considering whether to renew the investment advisory and administration agreement between Schwab Capital Trust (the Trust) and Charles Schwab Investment Management, Inc. (CSIM) with respect to the existing funds in the Trust, including Laudus International MarketMasters Fund (the Fund), and the individual sub-advisory agreements between CSIM and American Century Investment Management, Inc., Harris Associates L.P. (Harris), Mellon Investments Corporation (formerly BNY Mellon Asset Management North America Corporation), Mondrian Investment Partners Limited (Mondrian) and William Blair Investment Management, LLC, relating to Laudus International MarketMasters Fund (each, a Sub-Adviser and collectively, the Sub-Advisers). Such investment advisory and administration agreement and sub-advisory agreements are collectively referred to herein as the Agreements. The Trustees also review certain other agreements pursuant to which CSIM provides investment advisory services to certain other registered investment companies. In preparation for the meeting(s), the Board requests and reviews a wide variety of materials provided by CSIM and the Sub-Advisers, including information about their affiliates, personnel, business goals and priorities, profitability, third-party oversight, corporate structure and operations. As part of the renewal process, the Independent Trustees’ legal counsel sends an information request letter to CSIM and CSIM sends an information request letter to each of the Sub-Advisers seeking certain relevant information. The responses by CSIM and the Sub-Advisers are provided to the Trustees for their review prior to their meeting, and the Trustees are provided with the opportunity to request any additional materials. The Board also receives data provided by an independent provider of investment company data. This information is in addition to the detailed information about the Fund that the Board reviews during the course of each year, including information that relates to the Fund’s operations and performance, legal and compliance matters, risk management, portfolio turnover, and sales and marketing activity. The
Independent Trustees receive advice from Independent Trustees’ legal counsel, including a memorandum regarding the responsibilities of trustees for the approval of investment advisory agreements. In addition, the Independent Trustees meet in executive session outside the presence of Fund management and participate in question and answer sessions with representatives of CSIM. The Board also discusses with CSIM the Fund’s operations and CSIM’s ability, consistent with the “manager of managers” structure of the Fund, to (i) identify and recommend to the Trustees sub-advisers for the Fund, (ii) monitor and oversee the performance and investment capabilities of each Sub-Adviser, and (iii) recommend the replacement of a Sub-Adviser when appropriate.
The Board, including a majority of the Independent Trustees, considered information specifically relating to the continuance of the Agreements with respect to the Fund at meetings held on May 13, 2019 and June 4, 2019, and approved the renewal of the Agreements with respect to the Fund for an additional one-year term at the June 4, 2019 in person meeting called for the purpose of voting on such approval.
The Board’s approval of the Agreements with respect to the Fund was based on consideration and evaluation of a variety of specific factors discussed at these meetings and at prior meetings, including:
| 1. | the nature, extent and quality of the services provided to the Fund under the Agreements, including the resources of CSIM and its affiliates, and the Sub-Advisers, dedicated to the Fund; |
| 2. | the Fund’s investment performance and how it compared to that of certain other comparable mutual funds and benchmark data; |
| 3. | the Fund’s expenses and how those expenses compared to those of certain other similar mutual funds; |
| 4. | the profitability of CSIM and its affiliates, including Charles Schwab & Co., Inc. (Schwab), with respect to the Fund, including both direct and indirect benefits accruing to CSIM and its affiliates, as well as the profitability of the Sub-Advisers; and |
| 5. | the extent to which economies of scale would be realized as the Fund grows and whether fee levels in the Agreements reflect those economies of scale for the benefit of Fund investors. |
Nature, Extent and Quality of Services.The Board considered the nature, extent and quality of the services provided by CSIM to the Fund and the resources of CSIM and its affiliates dedicated to the Fund. In this regard, the Trustees evaluated, among other things, CSIM’s experience, track record, compliance program, resources dedicated to hiring and
Laudus International MarketMasters Fund | Annual Report
Laudus International MarketMasters Fund
retaining skilled personnel and specialized talent, and information security resources. The Trustees also considered information provided by CSIM and the Sub-Advisers relating to the Fund’s portfolio management team, portfolio strategy, and internal investment guidelines, as well as trading infrastructure, liquidity management, product design and analysis, shareholder communications, securities valuation, fund accounting and custody, and vendor and risk oversight. The Trustees also considered investments CSIM has made in its infrastructure, including modernizing CSIM’s technology and use of data, increasing expertise in key areas (including portfolio management and trade operations), and improving business continuity, cybersecurity, due diligence, risk management processes, and information security programs, which are designed to provide enhanced services to the Fund and its shareholders. The Trustees also considered that many of the Fund’s shareholders are also brokerage clients of Schwab and considered Schwab’s wide range of products, services, and channel alternatives such as investment research tools and an array of account features that benefit the Fund and shareholders who are brokerage clients of Schwab. The Trustees also considered Schwab’s reputation as a full service brokerage firm and the firm’s overall financial condition. The Board also considered the nature, extent and quality of the sub-advisory services provided by the Sub-Advisers to the Fund and the resources each dedicates to the Fund. Following such evaluation, the Board concluded, within the context of its full deliberations, that the nature, extent and quality of services provided by CSIM and the Sub-Advisers to the Fund and the resources of CSIM, its affiliates, and the Sub-Advisers dedicated to the Fund supported renewal of the Agreements with respect to the Fund.
Fund Performance. The Board considered the Fund’s performance in determining whether to renew the Agreements with respect to the Fund. Specifically, the Trustees considered the Fund’s performance relative to a peer category of other mutual funds and an applicable benchmark index, in light of total return, and market trends, as well as in consideration of the Fund’s investment style and strategy attributes and disclosures. As part of this review, the Trustees considered the composition of the peer category, selection criteria and the reputation of the independent provider of investment company data who prepared the peer category analysis. In addition, the Trustees considered whether irrespective of relative performance, each Sub-Adviser’s absolute performance was consistent with expectations for such Sub-Adviser’s unique investment methodology. The Trustees further considered the level of Fund performance in the context of their review of Fund expenses and adviser and Sub-Adviser profitability discussed below and also noted that performance is reviewed throughout the year by a designated committee of the Board and by the Board. Following such evaluation, the Board concluded, within the context of its full deliberations, that the performance of the Fund supported renewal of the Agreements with respect to the Fund.
Fund Expenses. With respect to the Fund’s expenses, the Trustees considered the rate of compensation called for by the Agreement, and the Fund’s net operating expense ratio, in each case, in comparison to those of other similar mutual funds, such peer groups and comparisons having been selected and calculated by an independent provider of investment company data. CSIM reported to the Board, and the Board took into account, the risk assumed by CSIM in the development of products and provision of services as well as the competitive marketplace for financial products. When applicable, the Trustees considered the effects of CSIM’s and Schwab’s practice of voluntarily waiving management and other fees to prevent total Fund expenses from exceeding a specified cap. The Trustees also considered CSIM’s contractual commitment to keep the Fund’s expense cap for so long as CSIM serves as the adviser to the Fund. The Trustees also considered fees charged by CSIM and the Sub-Advisers to other mutual funds and to other types of accounts, but, with respect to such other types of accounts, accorded less weight to such comparisons due to the different legal, regulatory, compliance and operating features of mutual funds as compared to these other types of accounts, and any differences in the nature and scope of the services CSIM provides to these other accounts, as well as differences in the market for these types of accounts. Following such evaluation, the Board concluded, within the context of its full deliberations, that the expenses of the Fund are reasonable and supported renewal of the Agreement with respect to the Fund.
Profitability.The Trustees considered the compensation flowing to CSIM and its affiliates, directly or indirectly and reviewed profitability on a pre-tax basis, without regard to distribution expenses. In this connection, the Trustees reviewed management’s profitability analyses. The Trustees also reviewed profitability of CSIM relating to the Schwab fund complex as a whole, noting the benefit to Fund shareholders of being part of the Schwab fund complex, including the allocations of certain fixed costs across other funds in the complex. The Trustees also considered any other benefits derived by CSIM from its relationship with the Fund, such as whether, by virtue of its management of the Fund, CSIM obtains investment information or other research resources that aid it in providing advisory services to other clients. With respect to CSIM, the Trustees considered whether the varied levels of compensation and profitability with respect to the Fund under the Agreements and other service agreements were reasonable and justified in light of the quality of all services rendered to the Fund by CSIM, and its respective affiliates. The Trustees noted that CSIM continues to invest substantial sums in its business in order to provide enhanced research capabilities, services, and systems to benefit the Fund. The Trustees also considered the compensation flowing to the Sub-Advisers, directly or indirectly. The Trustees also considered any other benefits derived by the Sub-Advisers from their relationship with the Fund, such as whether, by virtue of its management of the Fund, any Sub-Adviser obtains
Laudus International MarketMasters Fund | Annual Report
Laudus International MarketMasters Fund
investment information or other research resources that aid it in providing advisory services to other clients. With respect to the Sub-Advisers, the Trustees considered whether the varied levels of compensation and profitability under the Agreement and other service agreements were reasonable and justified in light of the quality of all services rendered to the Fund by the Sub-Advisers, and their respective affiliates. The Board also considered the profitability of the Sub-Advisers with respect to the sub-advisory services they provide to the Fund, although, when doing so, the Board took into account the fact that the Sub-Advisers are compensated by CSIM, and not by the Fund directly, and such compensation with respect to any Sub-Adviser reflects an arms-length negotiation between the Sub-Adviser and CSIM. Based on this evaluation, the Board concluded, within the context of its full deliberations, that the profitability of CSIM and the Sub-Advisers is reasonable and supported renewal of the Agreements with respect to the Fund.
Economies of Scale. Although the Trustees recognized the difficulty of determining economies of scale with precision, the Trustees considered the potential existence of any economies of scale and whether those are passed along to the Fund’s shareholders through (i) the enhancement of services provided to the Fund in return for fees paid, including through investments by CSIM in CSIM’s infrastructure, including modernizing CSIM’s technology and use of data, increasing expertise and capabilities in key areas (including portfolio and trade operations), and improving business continuity, cybersecurity, due diligence, and information security programs, which are designed to provide enhanced services to the Fund and its shareholders; (ii) graduated investment advisory fee schedule, fee waivers, or expense caps by CSIM and its affiliates for those funds in the Schwab Funds complex with such features; and (iii) pricing a fund to scale and keeping overall expenses down as the fund grows. The Trustees acknowledged that, in addition, CSIM has shared any economies of scale with the Fund by investing in CSIM’s infrastructure, as discussed above, over time and that CSIM’s internal costs of providing investment management, technology, administrative, legal and compliance services to the Fund continues to increase as a result of regulatory or other developments. The Trustees considered that CSIM and its affiliates may employ contractual expense caps to protect shareholders from high fees when fund assets are relatively small, for example, in the case of newer funds or funds with investment strategies that are from time to time out of favor, because, among other reasons, shareholders may benefit from the continued availability of such funds at subsidized expense levels. Based on this evaluation, the Board concluded, within the context of its full deliberations, that the Fund obtains reasonable benefits from economies of scale.
In the course of their deliberations, the Trustees may have accorded different weights to various factors and did not identify any particular information or factor that was all important or controlling. Based on the Trustees’ deliberation and their evaluation of the information described above, the Board, including all of the Independent Trustees, approved the continuation of the Agreements with respect to the Fund and concluded that the compensation under the Agreements with respect to the Fund is fair and reasonable in light of such services and expenses and such other matters as the Trustees have considered to be relevant in the exercise of their reasonable judgment.
Approval of Amendments to Certain Sub-Advisory Agreements
At a meeting held on February 26, 2019, the Board, including a majority of the Independent Trustees, approved (1) an amendment to the sub-advisory agreement with Harris relating to the Fund to ensure that the rate paid by CSIM to Harris for services rendered to the Fund remains in line with the rate paid to Harris for similar services that Harris provides to other mutual funds; and (2) an amendment to the sub-advisory agreement with Mondrian relating to the Fund to reflect a change to the graduated sub-advisory fee schedule that provides for potential future savings for CSIM. The Board reviewed materials provided at its February 26, 2019 meeting and also took into account the detailed information that the Board reviewed at the April 26, 2018 and June 5, 2018 meetings during the course of its consideration and approval of the renewal of the sub-advisory agreements between CSIM and each of Harris and Mondrian. The Board considered the potential future savings to CSIM and the fact that and CSIM does not anticipate lowering its management fee.
Based on the Trustees’ deliberation and their evaluation of the information described above, the Board, including a majority of the Independent Trustees, approved (1) an amendment to the sub-advisory agreement with Harris relating to the Fund to reflect and ensure that the rate paid by CSIM to Harris for services rendered to the Fund remains in line with the rate paid to Harris for similar services that Harris provides to other mutual funds and concluded that the change would not result in any reduction in the nature or quality of services provided by Harris under the sub-advisory agreement between CSIM and Harris; (2) an amendment to the sub-advisory agreement with Mondrian relating to the Fund to reflect a change to the graduated sub-advisory fee schedule that provides for potential future savings for CSIM and concluded that the change would not result in any reduction in the nature or quality of services provided by Mondrian under the sub-advisory agreement between CSIM and Mondrian.
Laudus International MarketMasters Fund | Annual Report
Laudus International MarketMasters Fund
Trustees and Officers
The tables below give information about the trustees and officers of Schwab Capital Trust, which includes the fund covered in this report. The “Fund Complex” includes The Charles Schwab Family of Funds, Schwab Capital Trust, Schwab Investments, Schwab Annuity Portfolios, Schwab Strategic Trust and Laudus Trust. The Fund Complex includes 101 funds.
The address for all trustees and officers is 211 Main Street, San Francisco, CA 94105. You can find more information about the trustees and officers in the fund’s Statement of Additional Information, which is available free by calling 1-877-824-5615.
| Independent Trustees |
Name, Year of Birth, and
Position(s) with the trust
(Terms of office, and
length of Time Served1) | Principal Occupations
During the Past Five Years | Number of
Portfolios in
Fund Complex
Overseen by
the Trustee | Other Directorships |
Robert W. Burns
1959
Trustee
(Trustee of Schwab Strategic Trust since 2009; The Charles Schwab Family of Funds, Schwab Investments, Schwab Capital Trust, Schwab Annuity Portfolios and Laudus Trust since 2016) | Retired/Private Investor (Jan. 2009 – present). Formerly, Managing Director, Pacific Investment Management Company, LLC (PIMCO) (investment management firm) and President, PIMCO Funds. | 101 | None |
John F. Cogan
1947
Trustee
(Trustee of The Charles Schwab Family of Funds, Schwab Investments, Schwab Capital Trust and Schwab Annuity Portfolios since 2008; Laudus Trust since 2010; Schwab Strategic Trust since 2016) | Senior Fellow (Oct. 1979 – present), The Hoover Institution at Stanford University (public policy think tank); Senior Fellow (2000 – present), Stanford Institute for Economic Policy Research; Professor of Public Policy (1994 – 2015), Stanford University. | 101 | Director (2005 – present), Gilead Sciences, Inc. |
Nancy F. Heller
1956
Trustee
(Trustee of The Charles Schwab Family of Funds, Schwab Investments, Schwab Capital Trust, Schwab Annuity Portfolios, Schwab Strategic Trust and Laudus Trust since 2018) | President and Chairman (2014 – 2016), TIAA Charitable (financial services); Senior Managing Director (2003 – 2016), TIAA (financial services). | 101 | None |
Stephen Timothy Kochis
1946
Trustee
(Trustee of Schwab Strategic Trust since 2012; The Charles Schwab Family of Funds, Schwab Investments, Schwab Capital Trust, Schwab Annuity Portfolios and Laudus Trust since 2016) | CEO and Owner (May 2012 – present), Kochis Global (wealth management consulting). | 101 | None |
Laudus International MarketMasters Fund | Annual Report
Laudus International MarketMasters Fund
| Independent Trustees (continued) |
Name, Year of Birth, and
Position(s) with the trust
(Terms of office, and
length of Time Served1) | Principal Occupations
During the Past Five Years | Number of
Portfolios in
Fund Complex
Overseen by
the Trustee | Other Directorships |
David L. Mahoney
1954
Trustee
(Trustee of The Charles Schwab Family of Funds, Schwab Investments, Schwab Capital Trust, Schwab Annuity Portfolios and Laudus Trust since 2011; Schwab Strategic Trust since 2016) | Private Investor. | 101 | Director (2003 – present), Symantec Corporation
Director (2004 – present), Corcept Therapeutics Incorporated
Director (2009 – present), Adamas Pharmaceuticals, Inc. |
Jane P. Moncreiff
1961
Trustee
(Trustee of The Charles Schwab Family of Funds, Schwab Investments, Schwab Capital Trust, Schwab Annuity Portfolios, Schwab Strategic Trust and Laudus Trust since 2019) | Chief Investment Officer (2009-2017), CareGroup Healthcare System, Inc. (healthcare). | 101 | None |
Kiran M. Patel
1948
Trustee
(Trustee of The Charles Schwab Family of Funds, Schwab Investments, Schwab Capital Trust, Schwab Annuity Portfolios and Laudus Trust since 2011; Schwab Strategic Trust since 2016) | Retired. Executive Vice President and General Manager of Small Business Group (Dec. 2008 – Sept. 2013), Intuit, Inc. (financial software and services firm for consumers and small businesses). | 101 | Director (2008 – present), KLA-Tencor Corporation |
Kimberly S. Patmore
1956
Trustee
(Trustee of The Charles Schwab Family of Funds, Schwab Investments, Schwab Capital Trust, Schwab Annuity Portfolios, Schwab Strategic Trust and Laudus Trust since 2016) | Consultant (2008 – present), Patmore Management Consulting (management consulting). | 101 | None |
Gerald B. Smith
1950
Trustee
(Trustee of The Charles Schwab Family of Funds, Schwab Investments, Schwab Capital Trust and Schwab Annuity Portfolios since 2000; Laudus Trust since 2010; Schwab Strategic Trust since 2016) | Chairman, Chief Executive Officer and Founder (Mar. 1990 – present), Smith Graham & Co. (investment advisors). | 101 | Director (2012 – present), Eaton Corporation plc |
Laudus International MarketMasters Fund | Annual Report
Laudus International MarketMasters Fund
| Interested Trustees |
Name, Year of Birth, and
Position(s) with the trust
(Terms of office, and
length of Time Served1) | Principal Occupations
During the Past Five Years | Number of
Portfolios in
Fund Complex
Overseen by
the Trustee | Other Directorships |
Walter W. Bettinger II2
1960
Chairman and Trustee
(Trustee of The Charles Schwab Family of Funds, Schwab Investments, Schwab Capital Trust and Schwab Annuity Portfolios since 2008; Schwab Strategic Trust since 2009; Laudus Trust since 2010) | Director, President and Chief Executive Officer (Oct. 2008 – present), The Charles Schwab Corporation; President and Chief Executive Officer (Oct. 2008 – present) and Director (May 2008 – present), Charles Schwab & Co., Inc.; Director (Apr. 2006 – present), Charles Schwab Bank; Director (Nov. 2017 – present), Charles Schwab Premier Bank; Director (May 2008 – present) and President and Chief Executive Officer (Aug. 2017 – present), Schwab Holdings, Inc.; Director (July 2016 – present), Charles Schwab Investment Management, Inc. | 101 | Director (2008 – present), The Charles Schwab Corporation |
Jonathan de St. Paer2
1973
Trustee
(Trustee of The Charles Schwab Family of Funds, Schwab Investments, Schwab Capital Trust, Schwab Annuity Portfolios, Schwab Strategic Trust and Laudus Trust since 2019) | Director (Apr. 2019 – present), President (Oct. 2018 – present), and Chief Executive Officer (Apr. 2019 – Nov. 2019), Charles Schwab Investment Management, Inc.; Trustee and Chief Executive Officer (Apr. 2019 – present) and President (Nov. 2018 – present), Schwab Funds, Laudus Funds and Schwab ETFs; Director (Apr. 2019 – present), Charles Schwab Worldwide Funds plc and Charles Schwab Asset Management (Ireland) Limited; Senior Vice President (Apr. 2019 – present), Senior Vice President – Strategy and Product Development (CSIM) (Jan. 2014 – Mar. 2019), and Vice President (Jan. 2009 – Dec. 2013), Charles Schwab & Co., Inc. | 101 | None |
Joseph R. Martinetto2
1962
Trustee
(Trustee of The Charles Schwab Family of Funds, Schwab Investments, Schwab Capital Trust, Schwab Annuity Portfolios, Schwab Strategic Trust and Laudus Trust since 2016) | Chief Operating Officer (Feb. 2018 – present) and Senior Executive Vice President (July 2015 – Feb. 2018), The Charles Schwab Corporation; Senior Executive Vice President (July 2015 – present), Charles Schwab & Co., Inc.; Chief Financial Officer (July 2015 – Aug. 2017) and Executive Vice President and Chief Financial Officer (May 2007 – July 2015), The Charles Schwab Corporation and Charles Schwab & Co., Inc.; Director (May 2007 – present), Charles Schwab & Co., Inc.; Director (Apr. 2010 – present) and Chief Executive Officer (July 2013 – Apr. 2015), Charles Schwab Bank; Director (Nov. 2017 – present), Charles Schwab Premier Bank; Director (May 2007 – present), Chief Financial Officer (May 2007 – Aug. 2017), Senior Executive Vice President (Feb. 2016 – present), and Executive Vice President (May 2007 – Feb. 2016), Schwab Holdings, Inc. | 101 | None |
| Officers of the Trust |
Name, Year of Birth, and Position(s) with the trust
(Terms of office, and length of Time Served3) | Principal Occupations During the Past Five Years |
Jonathan de St. Paer
1973
President and Chief Executive Officer
(Officer of The Charles Schwab Family of Funds, Schwab Investments, Schwab Capital Trust, Schwab Annuity Portfolios, Schwab Strategic Trust and Laudus Trust since 2018) | Director (Apr. 2019 – present), President (Oct. 2018 – present), and Chief Executive Officer (Apr. 2019 – Nov. 2019), Charles Schwab Investment Management, Inc.; Trustee and Chief Executive Officer (Apr. 2019 – present) and President (Nov. 2018 – present), Schwab Funds, Laudus Funds and Schwab ETFs; Director (Apr. 2019 – present), Charles Schwab Worldwide Funds plc and Charles Schwab Asset Management (Ireland) Limited; Senior Vice President (Apr. 2019 – present), Senior Vice President – Strategy and Product Development (CSIM) (Jan. 2014 – Mar. 2019), and Vice President (Jan. 2009 – Dec. 2013), Charles Schwab & Co., Inc. |
Laudus International MarketMasters Fund | Annual Report
Laudus International MarketMasters Fund
| Officers of the Trust (continued) |
Name, Year of Birth, and Position(s) with the trust
(Terms of office, and length of Time Served3) | Principal Occupations During the Past Five Years |
Mark Fischer
1970
Treasurer and Chief Financial Officer
(Officer of The Charles Schwab Family of Funds, Schwab Investments, Schwab Capital Trust, Schwab Annuity Portfolios, Schwab Strategic Trust and Laudus Trust since 2013) | Treasurer and Chief Financial Officer (Jan. 2016 – present), Schwab Funds, Laudus Funds and Schwab ETFs; Assistant Treasurer (Dec. 2013 – Dec. 2015), Schwab Funds and Laudus Funds; Assistant Treasurer (Nov. 2013 – Dec. 2015), Schwab ETFs; Vice President (Oct. 2013 – present), Charles Schwab Investment Management, Inc.; Executive Director (Apr. 2011 – Sept. 2013), J.P. Morgan Investor Services; Assistant Treasurer (May 2005 – Mar. 2011), Massachusetts Financial Service Investment Management. |
George Pereira
1964
Senior Vice President and Chief Operating Officer
(Officer of The Charles Schwab Family of Funds, Schwab Investments, Schwab Capital Trust and Schwab Annuity Portfolios since 2004; Laudus Trust since 2006; Schwab Strategic Trust since 2009) | Senior Vice President and Chief Financial Officer (Nov. 2004 – present) and Chief Operating Officer (Jan. 2011 – present), Charles Schwab Investment Management, Inc.; Senior Vice President and Chief Operating Officer (Jan. 2016 – present), Schwab Funds, Laudus Funds and Schwab ETFs; Treasurer and Chief Financial Officer (June 2006 – Dec. 2015), Laudus Funds; Treasurer and Principal Financial Officer (Nov. 2004 – Dec. 2015), Schwab Funds; Treasurer and Principal Financial Officer (Oct. 2009 – Dec. 2015), Schwab ETFs; Director (Apr. 2005 – present), Charles Schwab Worldwide Funds plc and Charles Schwab Asset Management (Ireland) Limited. |
Omar Aguilar
1970
Senior Vice President and Chief Investment Officer – Equities and Multi-Asset Strategies
(Officer of The Charles Schwab Family of Funds, Schwab Investments, Schwab Capital Trust, Schwab Annuity Portfolios, Schwab Strategic Trust and Laudus Trust since 2011) | Senior Vice President and Chief Investment Officer (Apr. 2011 – present), Charles Schwab Investment Management, Inc.; Senior Vice President and Chief Investment Officer – Equities and Multi-Asset Strategies (June 2011 – present), Schwab Funds, Laudus Funds and Schwab ETFs; Head of the Portfolio Management Group and Vice President of Portfolio Management (May 2009 – Apr. 2011), Financial Engines, Inc. (investment management firm); Head of Quantitative Equity (July 2004 – Jan. 2009), ING Investment Management. |
Brett Wander
1961
Senior Vice President and Chief Investment Officer – Fixed Income
(Officer of The Charles Schwab Family of Funds, Schwab Investments, Schwab Capital Trust, Schwab Annuity Portfolios, Schwab Strategic Trust and Laudus Trust since 2011) | Senior Vice President and Chief Investment Officer (Apr. 2011 – present), Charles Schwab Investment Management, Inc.; Senior Vice President and Chief Investment Officer – Fixed Income (June 2011 – present), Schwab Funds, Laudus Funds and Schwab ETFs; Senior Managing Director and Global Head of Active Fixed-Income Strategies (Jan. 2008 – Oct. 2010), State Street Global Advisors; Director of Alpha Strategies (Apr. 2006 – Jan. 2008), Loomis, Sayles & Company (investment management firm). |
David Lekich
1964
Chief Legal Officer and Secretary, Schwab Funds and Schwab ETFs
Vice President and Assistant Clerk, Laudus Funds
(Officer of The Charles Schwab Family of Funds, Schwab Investments, Schwab Capital Trust, Schwab Annuity Portfolios, Schwab Strategic Trust and Laudus Trust since 2011) | Senior Vice President (Sept. 2011 – present) and Vice President (Mar. 2004 – Sept. 2011), Charles Schwab & Co., Inc.; Senior Vice President and Chief Counsel (Sept. 2011 – present) and Vice President (Jan. 2011 – Sept. 2011), Charles Schwab Investment Management, Inc.; Secretary (Apr. 2011 – present) and Chief Legal Officer (Dec. 2011 – present), Schwab Funds; Vice President and Assistant Clerk (Apr. 2011 – present), Laudus Funds; Secretary (May 2011 – present) and Chief Legal Officer (Nov. 2011 – present), Schwab ETFs. |
Catherine MacGregor
1964
Vice President and Assistant Secretary, Schwab Funds and Schwab ETFs
Chief Legal Officer, Vice President and Clerk, Laudus Funds
(Officer of The Charles Schwab Family of Funds, Schwab Investments, Schwab Capital Trust, Schwab Annuity Portfolios and Laudus Trust since 2005; Schwab Strategic Trust since 2009) | Vice President (July 2005 – present), Charles Schwab & Co., Inc.; Vice President (Sept. 2005 – present), Charles Schwab Investment Management, Inc.; Vice President (Dec. 2005 – present) and Chief Legal Officer and Clerk (Mar. 2007 – present), Laudus Funds; Vice President (Nov. 2005 – present) and Assistant Secretary (June 2007 – present), Schwab Funds; Vice President and Assistant Secretary (Oct. 2009 – present), Schwab ETFs. |
| 1 | Each Trustee shall hold office until the election and qualification of his or her successor, or until he or she dies, resigns or is removed. The retirement policy requires that each independent trustee retire by December 31 of the year in which the Trustee turns 74 or the Trustee’s twentieth year of service as an independent trustee on any trust in the Fund Complex, whichever occurs first. |
| 2 | Mr. Bettinger, Mr. de St. Paer and Mr. Martinetto are Interested Trustees. Mr. Bettinger is an Interested Trustee because he owns stock of The Charles Schwab Corporation (CSC), the parent company of Charles Schwab Investment Management, Inc. (CSIM), the investment adviser for the trusts in the Fund Complex, is an employee and director of Charles Schwab & Co., Inc. (CS&Co), the principal underwriter for The Charles Schwab Family of Funds, Schwab Investments, Schwab Capital Trust, Schwab Annuity Portfolios and Laudus Trust, and is a director of CSIM. Mr. de St. Paer is an Interested Trustee because he owns stock of CSC and is an employee and director of CSIM. Mr. Martinetto is an Interested Trustee because he owns stock of CSC and is an employee and director of CS&Co. |
| 3 | The President, Treasurer and Secretary/Clerk hold office until their respective successors are chosen and qualified or until he or she sooner dies, resigns, is removed or becomes disqualified. Each of the other officers serves at the pleasure of the Board. |
Laudus International MarketMasters Fund | Annual Report
Laudus International MarketMasters Fund
asset allocation The practice of dividing a portfolio among different asset classes, with each asset class assigned a particular percentage.
asset class A group of securities with similar structure and basic characteristics. Stocks, bonds and cash are the three main examples of asset classes.
Bloomberg Barclays US Aggregate Bond Index An index that is a broad-based benchmark measuring the performance of the U.S. investment grade, taxable bond market, including U.S. Treasuries, government-related and corporate bonds, mortgage pass-through securities, commercial mortgage-backed securities, and asset-backed securities that are publicly available for sale in the United States. To be eligible for inclusion in the index, securities must be fixed rate, non-convertible, U.S. dollar denominated with at least $300 million or more of outstanding face value and have one or more years remaining to maturity. The index excludes certain types of securities, including tax-exempt state and local government series bonds, structured notes embedded with swaps or other special features, private placements, floating rate securities, inflation-linked bonds and Eurobonds. The index is market capitalization weighted and the securities in the index are updated on the last business day of each month.
Bloomberg Barclays US Treasury Bills 1–3 Month Index An index that includes all publicly issued zero-coupon U.S. Treasury Bills that have a remaining maturity of less than 3 months but more than 1 month, are rated investment grade and have $300 million or more of outstanding face value. It excludes zero-coupon STRIPS.
bond A security representing a loan from the investor to the issuer. A bond typically pays interest at a fixed rate (the coupon rate) until a specified date (the maturity date), at which time the issuer returns the money borrowed (principal or face value) to the bondholder. Because of their structure, bonds are sometimes called “fixed income securities” or “debt securities.”
An individual bond is subject to the credit risk of the issuer. Changes in interest rates can affect a bond’s market value prior to call or maturity. There is no guarantee that a bond’s yield to call or maturity will provide a positive return over the rate of inflation.
bond fund A bond fund is subject to the same credit, interest rate, and inflation risks as bonds. In addition, a bond fund incurs ongoing fees and expenses. A bond fund’s net asset value will fluctuate with the price of the underlying bonds and the portfolio turnover activity; return of principal is not guaranteed.
cap, capitalization See “market cap.”
capital gain, capital loss the difference between the amount paid for an investment and its value at a later time. If the investment has been sold, the capital gain or loss is considered a realized gain or loss. If the investment is still held, the capital gain or loss is considered unrealized appreciation or depreciation.
expense ratio The amount that is taken from a mutual fund’s assets each year to cover the fund’s operating expenses. An expense ratio of 0.50% means that a fund’s expenses amount to half of one percent of its average net assets a year.
market cap, market capitalization The value of a company as determined by the total value of all shares of its stock outstanding.
MSCI EAFE Index (Net) A free float-adjusted market capitalization index that is designed to measure the equity market performance of developed markets in Europe, Australasia, and the Far East. The Net version of the index reflects reinvested dividends net of withholding taxes, but reflects no deductions for expenses or other taxes; returns are calculated applying dividend withholding rates applicable to non-resident persons who do not benefit from double taxation treaties.
net asset value (NAV) The value of one share of a mutual fund. NAV is calculated by taking the fund’s total assets, subtracting liabilities, and dividing by the number of shares outstanding.
outstanding shares, shares outstanding When speaking of a company or mutual fund, indicates all shares currently held by investors.
price-to-book ratio (P/B) The market price of a company’s stock compared with its “book value.” A mutual fund’s P/B is the weighted average of the P/B of all stocks in the fund’s portfolio.
price-to-earnings ratio (P/E) The market price of a company’s stock compared with earnings over the past year. A mutual fund’s P/E is the weighted average of the P/E of all stocks in the fund’s portfolio.
restricted and illiquid securities Restricted securities are securities that are subject to legal restrictions on their sale. Restricted securities generally can be sold in privately negotiated transactions, pursuant to an exemption from registration under the Securities Act of 1933 (the 1933 Act), or in a registered public offering. Certain restricted securities, such as Section 4(a)(2) commercial paper and Rule 144A securities under the 1933 Act, may be considered to be liquid if they meet the criteria for liquidity established by the Board. Illiquid securities generally are any securities that cannot be disposed of promptly and in the ordinary course of business at approximately the amount at which a fund has valued the instruments. The liquidity of a fund’s investments is monitored under the supervision and direction of the Board. Investments currently not considered liquid include repurchase agreements not maturing within seven days and certain restricted securities.
return on equity (ROE) The average yearly rate of return for each dollar of investors’ money, measured over the past five years.
Russell 2000 Index An index that measures the performance of the 2,000 smallest companies in the Russell 3000 Index. The Russell 3000 Index measures the performance of the largest 3,000 U.S. companies representing approximately 98% of the investable U.S. equity market.
S&P 500 Index An index that is designed to measure the performance of 500 leading publicly traded companies from a broad range of industries.
stock A share of ownership, or equity, in the issuing company.
total return The percentage that an investor would have earned or lost on an investment in the fund assuming dividends and distributions were reinvested.
weighted average For mutual funds, an average that gives the same weight to each security as the security represents in the fund’s portfolio.
yield The income paid out by an investment, expressed as a percentage of the investment’s market value.
Laudus International MarketMasters Fund | Annual Report
Laudus International MarketMasters Fund
PRIVACY NOTICE
THIS IS NOT PART OF THE SHAREHOLDER REPORT
A Commitment to Your Privacy
Your Privacy Is Not for Sale
We do not and will not sell your personal information to anyone, for any reason.
We are committed to protecting the privacy of information we maintain about you. Below are details about our commitment, including the types of information we collect and how we use and share that information. This Privacy Notice applies to you only if you are an individual who invests directly in the funds by placing orders through the funds’ transfer agent. If you place orders through your brokerage account at Charles Schwab & Co., Inc. or an account with another broker-dealer, investment advisor, 401(k) plan, employee benefit plan, administrator, bank or other financial intermediary, you are covered by the privacy policies of that financial institution and should consult those policies.
How We Collect Information About You
We collect personal information about you in a number of ways.
• APPLICATION AND REGISTRATION
INFORMATION.
We collect personal information from you when you open an account or utilize one of our services. We may also collect information about you from third parties such as consumer reporting agencies to verify your identity. The information we collect may include personal information, including your Social Security number, as well as details about your interests, investments and investment experience.
• TRANSACTION AND EXPERIENCE
INFORMATION.
Once your account has been opened, we collect and maintain personal information about your account activity, including your transactions, balances, positions and history. This information allows us to administer your account and provide the services you have requested.
• WEBSITE USAGE.
When you visit our websites, we may use devices known as “cookies,” graphic interchange format files (GIFs), or other similar web tools to enhance your web experience. These tools help us to recognize you, maintain your web session, and
provide a more personalized experience. To learn more, please go to www.schwab.com/privacy.
How We Share and Use Your Information
We provide access to information about you to our affiliated companies, outside companies and other third parties in certain limited circumstances, including:
• to help us process transactions for your account;
• when we use other companies to provide services for us, such as printing and mailing your account statements; and
• when we believe that disclosure is required or permitted under law (for example, to cooperate with regulators or law enforcement, resolve consumer disputes, perform credit/authentication checks, or for risk control).
State Laws
We will comply with state laws that apply to the disclosure or use of information about you.
Safeguarding Your Information — Security Is a Partnership
We take precautions to ensure the information we collect about you is protected and is accessed only by authorized individuals or organizations.
Companies we use to provide support services are not allowed to use information about our shareholders for their own purposes and are contractually obligated to maintain strict confidentiality. We limit their use of information to the performance of the specific services we have requested.
We restrict access to personal information by our employees and agents. Our employees are trained about privacy and are required to safeguard personal information.
We maintain physical, electronic and procedural safeguards that comply with federal standards to guard your nonpublic personal information.
Contact Us
To provide us with updated information, report suspected fraud or identity theft, or for any other questions, please call the number below.
Schwab Funds® direct investors: 1-800-407-0256
© 2019 Schwab Funds. All rights reserved.
Laudus International MarketMasters Fund | Annual Report
Laudus International MarketMasters Fund
Laudus Funds®
Laudus Funds offer investors access to some of the world’s leading investment managers. With a rigorous manager selection process and ongoing oversight by Charles Schwab Investment Management, Laudus Funds offer single and multi-manager strategies as a complement to other funds managed by Charles Schwab Investment Management. The list below shows all currently available Laudus Funds.
An investor should consider a fund’s investment objectives, risks, charges and expenses carefully before investing or sending money. This and other important information can be found in the fund’s prospectus or, if available, the summary prospectus. Please call 1-877-824-5615 for a prospectus for any Laudus Fund. Please read the prospectus carefully before you invest. This report must be preceded or accompanied by a current prospectus.
Proxy Voting Policies, Procedures and Results
A description of the proxy voting policies and procedures used to determine how to vote proxies on behalf of the funds is available without charge, upon request, by visiting the Laudus Funds’ website atwww.schwabfunds.com/laudusfunds_prospectus, the SEC’s website atwww.sec.gov, or by contacting Laudus Funds at 1-877-824-5615.
Information regarding how a fund voted proxies relating to portfolio securities during the most recent twelve-month period ended June 30 is available, without charge, by visiting the fund’s website atwww.schwabfunds.com/laudusfunds_prospectus or the SEC’s website atwww.sec.gov.
Laudus® U.S. Large Cap Growth Fund
Laudus International MarketMasters Fund™
Investment Adviser
Charles Schwab Investment Management, Inc.
211 Main Street, San Francisco, CA 94105
Fund
Laudus International MarketMasters Fund
1-877-824-5615
Printed on recycled paper.
This page is intentionally left blank.
Annual Report | October 31, 2019
Schwab Active Equity Funds
Schwab Core Equity Fund
Schwab Dividend Equity Fund
Schwab Large-Cap Growth Fund
Schwab Small-Cap Equity Fund
Schwab Hedged Equity Fund
Schwab Health Care Fund
Schwab International Core Equity Fund
| New Notice Regarding Shareholder Report Delivery Options |
| Beginning on January 1, 2021, paper copies of a fund’s shareholder reports will no longer be sent by mail, unless you specifically request paper copies of the reports from a fund or from your financial intermediary (such as a bank or broker-dealer). Instead, the reports will be made available on a fund’s websitewww.schwabfunds.com/schwabfunds_prospectus, and you will be notified by mail each time a report is posted and the mailing will provide a website link to access the report. You will continue to receive other fund regulatory documents (such as prospectuses or supplements) in paper unless you have elected to receive all fund documents electronically. |
| If you would like to receive a fund’s future shareholder reports in paper free of charge after January 1, 2021, you can make that request: |
| • If you invest through Charles Schwab & Co, Inc. (broker-dealer), by calling 1-866-345-5954 and using the unique identifier attached to this mailing; |
| • If you invest through another financial intermediary (such as a bank or broker-dealer) by contacting them directly; or |
| • If owned directly through a fund by calling 1-800-407-0256. |
| If you already receive shareholder reports and other fund documents electronically, you will not be affected by this change and you need not take any action. |
This page is intentionally left blank.
Schwab Active Equity Funds
Fund investment adviser: Charles Schwab Investment Management, Inc. (CSIM)
Distributor: Charles Schwab & Co., Inc. (Schwab)
The Sector/Industry classifications in this report use the Global Industry Classification Standard (GICS), which was developed by, and is the exclusive property of, MSCI Inc. (MSCI) and Standard & Poor’s (S&P). GICS is a service mark of MSCI and S&P and has been licensed for use by Schwab. The Industry classifications used in the schedules of Portfolio Holdings are sub-categories of Sector classifications.
Schwab Active Equity Funds | Annual Report
Schwab Active Equity Funds
The performance data quoted represents past performance. Past performance does not guarantee future results. Investment returns and principal value of an investment will fluctuate so that an investor’s shares may be worth more or less than their original cost. Current performance may be lower or higher than performance data quoted. To obtain performance information current to the most recent month end, please visitwww.schwabfunds.com/schwabfunds_prospectus.
| Total Return for the 12 Months Ended October 31, 2019 |
Schwab Core Equity Fund
(Ticker Symbol: SWANX) | 12.02% |
| S&P 500® Index | 14.33% |
| Fund Category: Morningstar Large Blend1 | 12.66% |
| Performance Details | pages 7-9 |
| |
Schwab Dividend Equity Fund
(Ticker Symbol: SWDSX) | 8.78% |
| Russell 1000® Value Index | 11.21% |
| Fund Category: Morningstar Large Value1 | 9.63% |
| Performance Details | pages 10-12 |
| |
Schwab Large-Cap Growth Fund
(Ticker Symbol: SWLSX) | 12.18% |
| Russell 1000® Growth Index | 17.10% |
| Fund Category: Morningstar Large Growth1 | 14.51% |
| Performance Details | pages 13-15 |
| |
Schwab Small-Cap Equity Fund
(Ticker Symbol: SWSCX) | 0.08% |
| Russell 2000® Index | 4.90% |
| Fund Category: Morningstar Small Blend1 | 4.42% |
| Performance Details | pages 16-18 |
| Total Return for the 12 Months Ended October 31, 2019 |
Schwab Hedged Equity Fund
(Ticker Symbol: SWHEX) | -1.31% |
| S&P 500® Index | 14.33% |
| Fund Category: Morningstar Long-Short Equity1 | 3.57% |
| Performance Details | pages 19-21 |
| |
Schwab Health Care Fund2
(Ticker Symbol: SWHFX) | 6.51% |
| Dow Jones Global Health Care Index | 9.73% |
| Fund Category: Morningstar Health1 | 4.98% |
| Performance Details | pages 22-24 |
| |
Schwab International Core Equity Fund2
(Ticker Symbol: SICNX) | 7.08% |
| MSCI EAFE® Index (Net)3 | 11.04% |
| Fund Category: Morningstar Foreign Large Blend1 | 10.26% |
| Performance Details | pages 25-27 |
All total returns on this page assume dividends and distributions were reinvested. Index figures do not include trading and management costs, which would lower performance. Indices are unmanaged and cannot be invested in directly. Performance results less than one year are not annualized.
For index definitions, please see the Glossary.
Fund expenses may have been partially absorbed by CSIM and its affiliates. Without these reductions, a fund’s total return would have been lower. Performance does not reflect the deduction of taxes that a shareholder would pay on fund distributions or on the redemption of fund shares.
| 1 | Source for category information: Morningstar, Inc. The Morningstar Category return represents all active and index mutual funds within the category as of the report date. |
| 2 | The fund’s performance relative to the index may be affected by fair-value pricing and timing differences in foreign exchange calculations. See financial note 2 for more information. |
| 3 | The net version of the index reflects reinvested dividends net of withholding taxes, but reflects no deductions for expenses or other taxes. |
Schwab Active Equity Funds | Annual Report
Schwab Active Equity Funds
Jonathan de St. Paer
President of Charles Schwab
Investment Management, Inc.
and the funds covered
in this report.
Dear Shareholder,
At the crux of every investment decision, one consideration that may be top of mind is your risk tolerance. It may seem like a straightforward consideration, but it’s often not. Most of us are risk-averse by nature and as investors, the fear of a significant market decline is ever-present in our minds. This can sometimes lead us to make decisions that may get in the way of the performance of our investments. Our feelings about risk are also fluid, impacted by changes in market conditions and our progress toward our financial goals. For example, some investors may have been prompted to rethink their risk appetite as a result of the latest bout of market volatility.
At Charles Schwab Investment Management, we provide a range of foundational products that are designed to suit a variety of risk appetites and help investors remain focused on their long-term investment plans despite market volatility. One way we do this is through actively managed strategies, such as the Schwab Active Equity Funds, which take on the job of sifting through the latest market developments and researching company fundamentals, identifying trends that could impact valuations, and factoring that analysis into investment decisions.
The Schwab Active Equity Funds’ investment team uses an integrated investment process that combines quantitative and qualitative research and analysis through a bottom-up approach to stock selection. The investment team seeks consistent, long-term returns by systematically investing in high-quality companies with attractive valuations and favorable sentiment. The team also continually assesses risks related to volatility, valuation, momentum, specific securities, and overweighted and underweighted positions to an industry or country to determine whether those risks are balanced relative to the possible rewards. When assessed risks fall outside the team’s desired parameters, they will consider a change, potentially scaling back the position or exiting it altogether. During the 12 month reporting period ended October 31, 2019, most active managers struggled and each of the Schwab Active Equity Funds underperformed their respective indices.
When it comes to investing, it’s important to have a long-term investing plan and a portfolio based on your individual goals and risk tolerance. It can at times be tough to maintain that discipline in the face of day-to-day uncertainty. We aim to offer products with clear objectives, straightforward pricing, and a consistent approach to investing to help simplify investing decisions, so investors can focus on their long-term goals without unnecessary complexity.
Thank you for investing with Charles Schwab Investment Management, and for trusting us to help you achieve your financial goals. For more information about the Schwab Active Equity Funds, including performance during the 12 months ended October 31, 2019, please continue reading this report. In addition, you can find further details about these funds by visiting our website at www.schwabfunds.com. We are also happy to hear from you at 1-877-824-5615.
Sincerely,
“During the 12 month reporting period ended October 31, 2019, most active managers struggled and each of the Schwab Active Equity Funds underperformed their respective indices.”
Management views may have changed since the report date.
Schwab Active Equity Funds | Annual Report
Schwab Active Equity Funds
The Investment Environment
For the 12-month reporting period ended October 31, 2019, both U.S. and international equity markets generated positive returns. The final two months of 2018 were marked by significant market volatility and steep declines across global equity markets, driven by concerns about slowing international growth, a trade war between the U.S. and China, falling oil prices, the waning strength of the U.S. economy, and the pace of future interest rate hikes despite low inflation. By late December, major market indices had fallen to near-bear market territory. However, as the Federal Reserve (Fed) put interest rate hikes on hold, stocks, particularly in the U.S., staged a strong recovery in the first four months of 2019, which generally continued through the end of the reporting period despite several setbacks. Over the period, the U.S. dollar strengthened slightly against a basket of foreign currencies, generally reducing the returns on overseas investments in U.S. dollar terms. For the reporting period, the S&P 500® Index, a bellwether for the overall U.S. stock market, returned 14.33% and the Russell 2000® Index, a measure of U.S. small-cap stocks, returned 4.90%. Despite headwinds, markets outside the U.S. also rose, particularly toward the end of the reporting period with the MSCI EAFE® Index (Net)*, a broad measure of developed international equity performance, returning 11.04%.
Economic growth around the globe was uneven over the reporting period, largely as a result of manufacturing weakness in developed international markets. Despite escalating trade tensions with China, the U.S. maintained its steady growth in its tenth year of expansion, although at a declining pace. In the last two months of 2018, economies around the globe showed increasing signs of weakness, but many regained economic momentum in the first six months of 2019, demonstrating resilient growth despite lingering uncertainties on various fronts. As the year progressed, signs of slowing growth increased amid a weakening global economy, waning manufacturing activity, and the ongoing U.S.-China trade war. However, toward the end of the period, prospects of a partial trade resolution relieved some of the pressure. U.S. gross domestic product (GDP) grew at an annual rate of 2.1% in the third quarter of 2019, up slightly from 2.0% in the second quarter, but down from 3.1% in the first quarter of 2019. Unemployment declined in September 2019 to a 50-year low. While consumer confidence edged lower in October to hit a four-month low, it remained a stable source of GDP growth in the U.S. Inflation remained benign.
Asset Class Performance Comparison % returns during the 12 months ended October 31, 2019
Index figures assume dividends and distributions were reinvested. Index figures do not include trading and management costs, which would lower performance. Indices are unmanaged and cannot be invested in directly. Performance results less than one year are not annualized. Past performance is not an indication of future results.
For index definitions, please see the Glossary.
Data source: Index provider websites and CSIM.
Nothing in this report represents a recommendation of a security by the investment adviser.
Management views may have changed since the report date.
| * | The net version of the index reflects reinvested dividends net of withholding taxes, but reflects no deductions for expenses or other taxes. |
Schwab Active Equity Funds | Annual Report
Schwab Active Equity Funds
The Investment Environment(continued)
Outside the U.S., conditions continued to soften, dampened by trade issues, slowing economic output, and geopolitical concerns. Oil prices, which had fallen steeply in the fourth quarter of 2018, recovered through the first four months of 2019, as major exporters sought to curb supply and central banks took steps to ease growth-related fears, before dipping in May when trade concerns escalated. Oil prices remained volatile through period end. In the eurozone, growth slowed in the second and third quarters of 2019, down slightly from the first quarter. Growth was subdued by tepid wage growth and constrained consumer spending. The United Kingdom’s economy contracted in the second quarter of 2019 amid growing Brexit-related economic and political uncertainty that dampened industrial output, construction, and services sectors. Japan’s economy, however, experienced growth in recent quarters after contracting sharply in the third quarter of 2018.
In response to the economic environment and flat or inverted yield curves around the world, to bolster growth, and to ensure stability given ongoing trade tensions, a number of central banks reduced their policy rates, including the U.S., while others maintained their generally low—and for some international central banks, negative—interest rates. In the U.S., after raising interest rates four times in 2018, the Fed held rates unchanged through the first half of 2019. But amid growing signs of global economic weakness that threatened to dampen U.S. economic growth, along with continued low inflation and weakness in manufacturing, the Fed enacted three interest rate cuts by the end of the period—in July, September, and October. Following the October interest rate cut, the Fed signaled that subsequent interest rate cuts would be put on hold provided the economy continues to expand moderately and the labor market remains strong. The federal funds rate ended the reporting period in a range of 1.50% to 1.75%. Outside the U.S., the European Central Bank held interest rates steady and launched an asset-purchase program to help stimulate the economy. The Bank of Japan maintained its short-term interest rate target of –0.1% throughout the period. Despite growing Brexit-related division, the Bank of England maintained its key official bank rate at 0.75% throughout the period, where it has remained since August 2018.
Schwab Active Equity Funds | Annual Report
Schwab Active Equity Funds
 | Jonas Svallin, CFA, Vice President and Head of Active Equities, has overall responsibility for all aspects of the management of the funds and leads the Active Equities portfolio management and research team. Prior to joining CSIM in 2012, Mr. Svallin spent nearly three years as a partner and a director of quantitative analytics and research at Fiduciary Research & Consulting, where he provided oversight of quantitative analytics and risk management efforts. From 2003 to 2009, Mr. Svallin was a principal and head portfolio manager at Algert Coldiron Investors LLC (now known as Algert Global). Prior to joining Algert, Mr. Svallin worked as a quantitative research associate at RCM Capital Management (now known as Allianz Global Investors) and a senior consultant at FactSet Research Systems. |
 | Wei Li, Ph.D., CFA, Senior Portfolio Manager, is responsible for the day-to-day co-management of the funds. Prior to joining CSIM in 2012, Ms. Li spent more than ten years at Barclays Global Investors (now known as BlackRock, Inc), where she held a number of positions. From 2001 to 2009, she worked in various roles in the global advanced active group, including portfolio management and quantitative research for both U.S. and international equity markets. After 2009, she worked in the defined contribution research and product development area for almost two years. |
 | Iain Clayton, CFA, FRM, Senior Portfolio Manager, is responsible for the day-to-day co-management of the Schwab Core Equity Fund, Schwab International Core Equity Fund and Schwab Health Care Fund. Prior to joining CSIM in 2013, Mr. Clayton spent more than five years at SSI Investment Management, where he was a portfolio manager and director of quantitative research. In these roles, Mr. Clayton co-managed multiple investment strategies and developed quantitative models and valuation approaches. From 2004 to 2008, he worked as a portfolio manager and director at RCM Capital Management (now known as Allianz Global Investors) and helped manage various equity portfolios and developed fundamental-based stock selection models. Prior to that, he was a vice president at Eureka Investment Advisors for almost three years and also served as a senior quantitative analyst and assistant portfolio manager. He has also worked as a quantitative research analyst at RCM Capital Management. |
 | Holly Emerson, CFA, Portfolio Manager, is responsible for the day-to-day co-management of the Schwab Large-Cap Growth Fund and the Schwab Dividend Equity Fund. Previously, she served as an Associate Portfolio Manager supporting the Schwab Active Equity Funds. Prior to joining CSIM in 2014, Ms. Emerson spent nearly ten years at Algert Coldiron Investors (now known as Algert Global), a quantitative market neutral hedge fund manager, where she held a number of positions, including assistant portfolio manager and macroeconomic research analyst. In her various roles, she supported both U.S. and International funds and acted as the lead portfolio manager for the Canadian fund. |
Schwab Active Equity Funds | Annual Report
Schwab Core Equity Fundas of October 31, 2019
The Schwab Core Equity Fund(the fund) seeks long-term capital growth. To pursue its investment objective, the fund invests primarily in U.S. stocks. The fund expects to hold the common stocks of U.S. companies that have market capitalizations of approximately $500 million or more. To aid its stock selection, the fund uses Schwab Equity Ratings®. For more information concerning the fund’s investment objective, strategies, and risks, please see the fund’s prospectus.
Market Highlights.Over the reporting period, the U.S. equity market generated positive returns. The final two months of 2018 were marked by significant market volatility and steep declines, driven by concerns about slowing international growth, a trade war between the U.S. and China, falling oil prices, the waning strength of the U.S. economy, and the pace of future interest rate hikes despite low inflation. However, as the Federal Reserve (Fed) put interest rate hikes on hold, stocks, particularly in the U.S., staged a strong recovery in the first four months of 2019, which generally continued through the end of the reporting period. After raising interest rates four times in 2018, the Fed enacted three interest rate cuts by the end of the period—in July, September, and October.
Performance.The fund returned 12.02% for the 12-month reporting period ended October 31, 2019, underperforming the S&P 500® Index (the index), which the fund uses for performance comparisons. The index returned 14.33% for the reporting period.
Positioning and Strategies. The fund’s overweight investment in oil and gas company ConocoPhillips weighed on the fund’s relative performance. The fund’s holdings of ConocoPhillips returned approximately -19% for the reporting period, in line with its peers in the energy sector. A supply and demand imbalance has helped keep crude oil prices down.
Viacom, Inc., which produces media entertainment content, was another detractor from the fund’s relative performance over the reporting period. The fund’s Class B holdings of Viacom returned approximately -20% for the reporting period, as the company struggled in an increasingly tough, competitive landscape.
The fund’s performance relative to the index was enhanced by an overweight to Masco Corp., a manufacturer of home improvement and building products. The fund’s holdings of Masco returned approximately 56% for the reporting period. Masco benefitted from a recovery in residential construction as a result of a healthy labor market and lower interest rates.
The fund’s underweight position in oil and gas company Exxon Mobile Corp. was another contributor to the fund’s relative performance as Exxon Mobile suffered amid lower energy prices. The return of fund’s holding of this company was flat for the reporting period.
Management views and portfolio holdings may have changed since the report date.
Schwab Active Equity Funds | Annual Report
Performance and Fund Factsas of October 31, 2019
The performance data quoted represents past performance. Past performance does not guarantee future results. Investment returns and principal value of an investment will fluctuate so that an investor’s shares may be worth more or less than their original cost. Current performance may be lower or higher than performance data quoted. To obtain performance information current to the most recent month end, please visitwww.schwabfunds.com/schwabfunds_prospectus.
Performance of Hypothetical $10,000 Investment (October 31, 2009 – October 31, 2019)1,2
Average Annual Total Returns1,2
| Fund and Inception Date | 1 Year | 5 Years | 10 Years |
| Fund: Schwab Core Equity Fund (7/1/96) | 12.02% | 8.78% | 11.97% |
| S&P 500® Index | 14.33% | 10.78% | 13.70% |
| Fund Category: Morningstar Large Blend3 | 12.66% | 8.94% | 12.22% |
| Fund Expense Ratio4: 0.73% |
All total returns on this page assume dividends and distributions were reinvested. Index figures do not include trading and management costs, which would lower performance. Indices are unmanaged and cannot be invested in directly. Performance results less than one year are not annualized.
For index definitions, please see the Glossary.
| 1 | Fund expenses may have been partially absorbed by CSIM and its affiliates. Without these reductions, the fund’s returns would have been lower. These returns do not reflect the deduction of taxes that a shareholder would pay on fund distributions or the redemption of fund shares. |
| 2 | On September 7, 2012, the Schwab Premier Equity Fund merged into the fund. |
| 3 | Source for category information: Morningstar, Inc. The Morningstar Category return represents all active and index mutual funds within the category as of the report date. |
| 4 | As stated in the prospectus. Reflects the total annual fund operating expenses without contractual fee waivers. For actual expense ratios during the period, refer to the financial highlights section of the financial statements. |
Schwab Active Equity Funds | Annual Report
Performance and Fund Factsas of October 31, 2019 (continued)
| Number of Holdings | 136 |
| Weighted Average Market Cap (millions) | $257,239 |
| Price/Earnings Ratio (P/E) | 18.1 |
| Price/Book Ratio (P/B) | 3.1 |
| Portfolio Turnover Rate | 98% |
Sector Weightings % of Investments1
Top Equity Holdings % of Net Assets2
Portfolio holdings may have changed since the report date.
Source of Sector Classification: S& P and MSCI.
| 1 | The percentage may differ from the Portfolio Holdings because the above calculation is based on a percentage of total investments, whereas the calculation in the Portfolio Holdings is based on a percentage of net assets. |
| 2 | This list is not a recommendation of any security by the investment adviser. |
Schwab Active Equity Funds | Annual Report
Schwab Dividend Equity Fundas of October 31, 2019
The Schwab Dividend Equity Fund(the fund) seeks current income and capital appreciation. Under normal circumstances, the fund invests at least 80% of its net assets (including, for this purpose, any borrowings for investment purposes) in dividend paying common and preferred stocks. To aid its stock selection, the fund uses Schwab Equity Ratings®. For more information concerning the fund’s investment objective, strategies, and risks, please see the fund’s prospectus.
Market Highlights.Over the reporting period, the U.S. equity market generated positive returns. The final two months of 2018 were marked by significant market volatility and steep declines, driven by concerns about slowing international growth, a trade war between the U.S. and China, falling oil prices, the waning strength of the U.S. economy, and the pace of future interest rate hikes despite low inflation. However, as the Federal Reserve (Fed) put interest rate hikes on hold, stocks, particularly in the U.S., staged a strong recovery in the first four months of 2019, which generally continued through the end of the reporting period. After raising interest rates four times in 2018, the Fed enacted three interest rate cuts by the end of the period—in July, September, and October. Growth stocks generally outperformed value, leading to the underperformance of high dividend-paying stocks compared to the broader stock market. Stocks that paid moderate dividends performed the best as the market rewarded stability.
Performance.The fund returned 8.78% for the 12-month reporting period ended October 31, 2019, underperforming the Russell 1000® Value Index (the index), which the fund uses for performance comparisons. The index returned 11.21% for the reporting period.
As of October 31, 2019, the fund’s dividend yield was 2.60%, in line with the 2.60% dividend yield of the index. As of October 31, 2019, the fund’s 30-Day SEC yield was 1.67%.
Positioning and Strategies. The fund’s overweight position in oil and gas company ConocoPhillips weighed on the fund’s relative performance. The fund’s holdings of ConocoPhillips returned approximately -19% for the reporting period, in line with its peers in the energy sector. A supply and demand imbalance has kept crude oil prices down.
Affiliated Managers Group, Inc., a global asset management company, was another detractor from the fund’s relative performance. The fund’s holdings of Affiliated Managers Group returned approximately -29% for the reporting period. Affiliated Managers Group experienced outflows as their funds continued to underperform during the period.
The fund’s performance relative to the index was enhanced by an overweight investment in Masco Corp., a manufacturer of home improvement and building products. The fund’s holdings of Masco returned approximately 56% for the reporting period. Masco benefitted from a recovery in residential construction as a result of a healthy labor market and lower interest rates.
Tyson Foods, Inc. was another contributor to relative performance. Tyson Foods produces, distributes, and markets chicken, beef, pork, prepared foods, and related products. The fund’s Class A holdings of Tyson Foods returned approximately 41% for the reporting period, driven by rising protein prices as swine flu drove up pork prices around the world.
Management views and portfolio holdings may have changed since the report date.
Schwab Active Equity Funds | Annual Report
Schwab Dividend Equity Fund
Performance and Fund Factsas of October 31, 2019
The performance data quoted represents past performance. Past performance does not guarantee future results. Investment returns and principal value of an investment will fluctuate so that an investor’s shares may be worth more or less than their original cost. Current performance may be lower or higher than performance data quoted. To obtain performance information current to the most recent month end, please visitwww.schwabfunds.com/schwabfunds_prospectus.
Performance of Hypothetical $10,000 Investment (October 31, 2009 – October 31, 2019)1
Average Annual Total Returns1
| Fund and Inception Date | 1 Year | 5 Years | 10 Years |
| Fund: Schwab Dividend Equity Fund (9/2/03) | 8.78% | 5.63% | 10.43% |
| Russell 1000® Value Index | 11.21% | 7.61% | 11.96% |
| Dividend Equity Spliced Index | 11.21% | 7.97% | 12.25% |
| S&P 500® Index | 14.33% | 10.78% | 13.70% |
| Fund Category: Morningstar Large Value2 | 9.63% | 7.22% | 11.07% |
| Fund Expense Ratio3: 0.88% |
All total returns on this page assume dividends and distributions were reinvested. Index figures do not include trading and management costs, which would lower performance. Indices are unmanaged and cannot be invested in directly. Performance results less than one year are not annualized.
The first index listed for the fund is the fund’s primary benchmark, as shown in the prospectus. Additional indices shown are provided for comparative purposes.
For index definitions, please see the Glossary.
| 1 | Fund expenses may have been partially absorbed by CSIM and its affiliates. Without these reductions, the fund’s returns would have been lower. These returns do not reflect the deduction of taxes that a shareholder would pay on fund distributions or the redemption of fund shares. |
| 2 | Source for category information: Morningstar, Inc. The Morningstar Category return represents all active and index mutual funds within the category as of the report date. |
| 3 | As stated in the prospectus. Reflects the total annual fund operating expenses without contractual fee waivers. For actual expense ratios during the period, refer to the financial highlights section of the financial statements. |
Schwab Active Equity Funds | Annual Report
Schwab Dividend Equity Fund
Performance and Fund Factsas of October 31, 2019 (continued)
| Number of Holdings | 146 |
| Weighted Average Market Cap (millions) | $107,095 |
| Price/Earnings Ratio (P/E) | 14.5 |
| Price/Book Ratio (P/B) | 2.0 |
| Portfolio Turnover Rate | 70% |
Sector Weightings % of Investments1
Top Equity Holdings % of Net Assets2
Portfolio holdings may have changed since the report date.
Source of Sector Classification: S& P and MSCI.
| 1 | The percentage may differ from the Portfolio Holdings because the above calculation is based on a percentage of total investments, whereas the calculation in the Portfolio Holdings is based on a percentage of net assets. |
| 2 | This list is not a recommendation of any security by the investment adviser. |
Schwab Active Equity Funds | Annual Report
Schwab Large-Cap Growth Fundas of October 31, 2019
The Schwab Large-Cap Growth Fund(the fund) seeks long-term capital growth. To pursue its investment objective, the fund invests primarily in U.S. common stocks. Under normal circumstances, the fund invests at least 80% of its net assets (including, for this purpose, any borrowings for investment purposes) in large-cap stocks of U.S. companies. To aid its stock selection, the fund uses Schwab Equity Ratings®. For more information concerning the fund’s investment objective, strategies, and risks, please see the fund’s prospectus.
Market Highlights.Over the reporting period, the U.S. equity market generated positive returns with growth stocks outperforming value stocks. The final two months of 2018 were marked by significant market volatility and steep declines, driven by concerns about slowing international growth, a trade war between the U.S. and China, falling oil prices, the waning strength of the U.S. economy, and the pace of future interest rate hikes despite low inflation. However, as the Federal Reserve (Fed) put interest rate hikes on hold, stocks, particularly in the U.S., staged a strong recovery in the first four months of 2019, which generally continued through the end of the reporting period. After raising interest rates four times in 2018, the Fed enacted three interest rate cuts by the end of the period—in July, September, and October.
Performance.The fund returned 12.18% for the 12-month reporting period ended October 31, 2019, underperforming the Russell 1000® Growth Index (the index), which the fund uses for performance comparisons. The index returned 17.10% for the reporting period.
Positioning and Strategies. The fund’s investment in biopharmaceutical company Regeneron Pharmaceuticals, Inc. weighed on the fund’s relative performance. The fund’s holdings of Regeneron returned approximately -28% for the reporting period, driven by higher than expected expenses.
Alexion Pharmaceuticals, Inc., a biopharmaceutical company that researches and develops proprietary compounds for the treatment of autoimmune and cardiovascular diseases, was another detractor from the fund’s relative performance. The fund’s holdings of Alexion returned approximately -12% for the reporting period. Alexion suffered as a result of the U.S. Patent Trial and Appeal Board agreeing to review a challenge to patents on one of Alexion’s rare disease drugs.
The fund’s performance relative to the index was enhanced by Lam Research Corp., which manufactures, markets, and services semiconductor processing equipment used in the making of integrated circuits. The fund’s holdings of Lam Research returned approximately 96% for the reporting period, benefitting from a rebound in semiconductor demand and strong earnings.
Cadence Design Systems, Inc., which provides software technology, design, and consulting services and technology, was another contributor to relative performance. The fund’s holdings of Cadence Design Systems returned approximately 47% for the reporting period, driven by contract wins for the company.
Management views and portfolio holdings may have changed since the report date.
Schwab Active Equity Funds | Annual Report
Schwab Large-Cap Growth Fund
Performance and Fund Factsas of October 31, 2019
The performance data quoted represents past performance. Past performance does not guarantee future results. Investment returns and principal value of an investment will fluctuate so that an investor’s shares may be worth more or less than their original cost. Current performance may be lower or higher than performance data quoted. To obtain performance information current to the most recent month end, please visitwww.schwabfunds.com/schwabfunds_prospectus.
Performance of Hypothetical $10,000 Investment (October 31, 2009 – October 31, 2019)1
Average Annual Total Returns1
| Fund and Inception Date | 1 Year | 5 Years | 10 Years |
| Fund: Schwab Large-Cap Growth Fund (10/3/05) | 12.18% | 10.06% | 12.91% |
| Russell 1000® Growth Index | 17.10% | 13.43% | 15.41% |
| Fund Category: Morningstar Large Growth2 | 14.51% | 11.00% | 13.63% |
| Fund Expense Ratios3: Net 0.99%; Gross 1.02% |
All total returns on this page assume dividends and distributions were reinvested. Index figures do not include trading and management costs, which would lower performance. Indices are unmanaged and cannot be invested in directly. Performance results less than one year are not annualized.
For index definitions, please see the Glossary.
| 1 | Fund expenses may have been partially absorbed by CSIM and its affiliates. Without these reductions, the fund’s returns would have been lower. These returns do not reflect the deduction of taxes that a shareholder would pay on fund distributions or the redemption of fund shares. |
| 2 | Source for category information: Morningstar, Inc. The Morningstar Category return represents all active and index mutual funds within the category as of the report date. |
| 3 | As stated in the prospectus. Net Expense: Expenses reduced by a contractual fee waiver in effect for so long as CSIM serves as the investment adviser to the fund. Gross Expense: Does not reflect the effect of contractual fee waivers. For actual expense ratios during the period, refer to the financial highlights section of the financial statements. |
Schwab Active Equity Funds | Annual Report
Schwab Large-Cap Growth Fund
Performance and Fund Factsas of October 31, 2019 (continued)
| Number of Holdings | 112 |
| Weighted Average Market Cap (millions) | $366,931 |
| Price/Earnings Ratio (P/E) | 22.7 |
| Price/Book Ratio (P/B) | 5.8 |
| Portfolio Turnover Rate | 67% |
Sector Weightings % of Investments1
Top Equity Holdings % of Net Assets2
Portfolio holdings may have changed since the report date.
Source of Sector Classification: S& P and MSCI.
| 1 | The percentage may differ from the Portfolio Holdings because the above calculation is based on a percentage of total investments, whereas the calculation in the Portfolio Holdings is based on a percentage of net assets. |
| 2 | This list is not a recommendation of any security by the investment adviser. |
Schwab Active Equity Funds | Annual Report
Schwab Small-Cap Equity Fundas of October 31, 2019
The Schwab Small-Cap Equity Fund(the fund) seeks long-term capital growth. Under normal circumstances, the fund invests at least 80% of its net assets (including, for this purpose, any borrowings for investment purposes) in small-cap equity securities. To aid its stock selection, the fund uses Schwab Equity Ratings®. For more information concerning the fund’s investment objective, strategies, and risks, please see the fund’s prospectus.
Market Highlights.Over the reporting period, the U.S. equity market generated positive returns with large-cap stocks outperforming small-cap stocks. The final two months of 2018 were marked by significant market volatility and steep declines, driven by concerns about slowing international growth, a trade war between the U.S. and China, falling oil prices, the waning strength of the U.S. economy, and the pace of future interest rate hikes despite low inflation. However, as the Federal Reserve (Fed) put interest rate hikes on hold, stocks, particularly in the U.S., staged a strong recovery in the first four months of 2019, which generally continued through the end of the reporting period. After raising interest rates four times in 2018, the Fed enacted three interest rate cuts by the end of the period—in July, September, and October.
Performance.The fund returned 0.08% for the 12-month reporting period ended October 31, 2019, underperforming the Russell 2000® Index (the index), which the fund uses for performance comparisons. The index returned 4.90% for the reporting period.
Positioning and Strategies.The fund’s investments in Tailored Brands, Inc., a retail holding company for various men’s apparel stores, weighed on the fund’s relative performance. The fund’s holdings of Tailored Brands returned approximately -75% for the reporting period as a result of weak retail trends.
CONSUL Energy, Inc., an energy company with interests in coal, was another detractor from the fund’s relative performance over the reporting period. The fund’s overweight position in CONSUL Energy returned approximately -67% over the reporting period, driven by declining coal prices that are tied to oil and natural gas prices.
In contrast, the fund’s overweight position in Atkore International Group, Inc. enhanced the fund’s relative performance. The fund’s holdings in Atkore International Group, a manufacturer and supplier of metal products and electrical raceway solutions, returned approximately 80% for the reporting period, as a result of growth in the company’s end markets. The company was also able to shift business to higher margin products driving free cash flow conversion.
Progress Software Corp. was another contributor to the fund’s relative performance. Progress Software develops, markets, and distributes applications. The fund’s investment in Progress Software returned approximately 26% for the reporting period. Progress Software reported strong earnings over the period, with a healthy core business and well-executed acquisitions.
Management views and portfolio holdings may have changed since the report date.
Schwab Active Equity Funds | Annual Report
Schwab Small-Cap Equity Fund
Performance and Fund Factsas of October 31, 2019
The performance data quoted represents past performance. Past performance does not guarantee future results. Investment returns and principal value of an investment will fluctuate so that an investor’s shares may be worth more or less than their original cost. Current performance may be lower or higher than performance data quoted. To obtain performance information current to the most recent month end, please visitwww.schwabfunds.com/schwabfunds_prospectus.
Performance of Hypothetical $10,000 Investment (October 31, 2009 – October 31, 2019)1
Average Annual Total Returns1
| Fund and Inception Date | 1 Year | 5 Years | 10 Years |
| Fund: Schwab Small-Cap Equity Fund (7/1/03) | 0.08% | 5.95% | 12.84% |
| Russell 2000® Index | 4.90% | 7.37% | 12.27% |
| Fund Category: Morningstar Small Blend2 | 4.42% | 6.20% | 11.55% |
| Fund Expense Ratio3: 1.09% |
All total returns on this page assume dividends and distributions were reinvested. Index figures do not include trading and management costs, which would lower performance. Indices are unmanaged and cannot be invested in directly. Performance results less than one year are not annualized.
For index definitions, please see the Glossary.
| 1 | Fund expenses may have been partially absorbed by CSIM and its affiliates. Without these reductions, the fund’s returns would have been lower. These returns do not reflect the deduction of taxes that a shareholder would pay on fund distributions or the redemption of fund shares. |
| 2 | Source for category information: Morningstar, Inc. The Morningstar Category return represents all active and index mutual funds within the category as of the report date. |
| 3 | As stated in the prospectus. Reflects the total annual fund operating expenses without contractual fee waivers. For actual expense ratios during the period, refer to the financial highlights section of the financial statements. |
Schwab Active Equity Funds | Annual Report
Schwab Small-Cap Equity Fund
Performance and Fund Factsas of October 31, 2019 (continued)
| Number of Holdings | 272 |
| Weighted Average Market Cap (millions) | $2,218 |
| Price/Earnings Ratio (P/E) | 15.7 |
| Price/Book Ratio (P/B) | 2.0 |
| Portfolio Turnover Rate | 117% |
Sector Weightings % of Investments1
Top Equity Holdings % of Net Assets2
Portfolio holdings may have changed since the report date.
Source of Sector Classification: S& P and MSCI.
Small-company stocks are subject to greater volatility than many other asset classes.
| 1 | The percentage may differ from the Portfolio Holdings because the above calculation is based on a percentage of total investments, whereas the calculation in the Portfolio Holdings is based on a percentage of net assets. |
| 2 | This list is not a recommendation of any security by the investment adviser. |
Schwab Active Equity Funds | Annual Report
Schwab Hedged Equity Fundas of October 31, 2019
The Schwab Hedged Equity Fund(the fund) seeks long-term capital appreciation over market cycles with lower volatility than the broad equity market. To pursue its investment objective, the fund establishes long and short positions in equity securities issued by U.S. companies. The fund typically purchases or sells short stocks of companies that have market capitalizations of $1 billion or more at the time the stock is purchased or sold short. To aid its stock selection, the fund uses Schwab Equity Ratings®. For more information concerning the fund’s investment objective, strategies, and risks, please see the fund’s prospectus.
Market Highlights.Over the reporting period, the U.S. equity market generated positive returns. The final two months of 2018 were marked by significant market volatility and steep declines, driven by concerns about slowing international growth, a trade war between the U.S. and China, falling oil prices, the waning strength of the U.S. economy, and the pace of future interest rate hikes despite low inflation. However, as the Federal Reserve (Fed) put interest rate hikes on hold, stocks, particularly in the U.S., staged a strong recovery in the first four months of 2019, which generally continued through the end of the reporting period. After raising interest rates four times in 2018, the Fed enacted three interest rate cuts by the end of the period—in July, September, and October.
Performance.The fund returned -1.31% for the 12-month reporting period ended October 31, 2019, underperforming the S&P 500® Index (the index), which the fund uses for performance comparisons. The index returned 14.33% for the reporting period.
Positioning and Strategies.Over the reporting period, stock selection within sectors detracted from the fund’s performance relative to the index. Allocation across sectors also detracted.
From a sector standpoint, the fund’s short positions in the information technology and real estate sectors and long positions in the energy sector detracted from relative performance. Short positions in the energy and health care sectors and long positions in the real estate sector, however, contributed to the fund’s relative performance.
Looking at stock selection, long positions in the consumer discretionary and consumer staples sectors and short positions in the industrials sector detracted from relative performance. Long positions in the information technology and health care sectors and short positions in the communication services sector, however, contributed to the fund’s relative performance.
At the security level, the fund’s largest detractor from total return was the fund’s short position in ViaSat, Inc., a company that provides advanced broadband digital satellite communications and other wireless networking and signal processing equipment and services. ViaSat returned approximately 8% for the reporting period. In contrast, the fund’s long position in software company Microsoft Corp. contributed the most to the fund’s total return. The fund’s holdings of Microsoft returned approximately 36% for the reporting period.
Management views and portfolio holdings may have changed since the report date.
Schwab Active Equity Funds | Annual Report
Schwab Hedged Equity Fund
Performance and Fund Factsas of October 31, 2019
The performance data quoted represents past performance. Past performance does not guarantee future results. Investment returns and principal value of an investment will fluctuate so that an investor’s shares may be worth more or less than their original cost. Current performance may be lower or higher than performance data quoted. To obtain performance information current to the most recent month end, please visitwww.schwabfunds.com/schwabfunds_prospectus.
Performance of Hypothetical $10,000 Investment (October 31, 2009 – October 31, 2019)1
Average Annual Total Returns1
| Fund and Inception Date | 1 Year | 5 Years | 10 Years |
| Fund: Schwab Hedged Equity Fund (9/3/02) | -1.31% | 4.02% | 6.47% |
| S&P 500® Index | 14.33% | 10.78% | 13.70% |
| Fund Category: Morningstar Long-Short Equity2 | 3.57% | 2.70% | 5.32% |
| Fund Expense Ratio3: 1.67% |
All total returns on this page assume dividends and distributions were reinvested. Index figures do not include trading and management costs, which would lower performance. Indices are unmanaged and cannot be invested in directly. Performance results less than one year are not annualized.
For index definitions, please see the Glossary.
The Schwab Hedged Equity Fund’s long positions can decline in value at the same time the value of its shorted stocks increases, thereby increasing the potential for loss. The potential loss associated with short positions is much greater than the original value of the securities sold. The use of borrowing and short sales may cause the fund to have higher expenses than those of equity funds that do not use such techniques.
| 1 | Fund expenses may have been partially absorbed by CSIM and its affiliates. Without these reductions, the fund’s returns would have been lower. These returns do not reflect the deduction of taxes that a shareholder would pay on fund distributions or the redemption of fund shares. |
| 2 | Source for category information: Morningstar, Inc. The Morningstar Category return represents all active and index mutual funds within the category as of the report date. |
| 3 | As stated in the prospectus. Reflects the total annual fund operating expenses without contractual fee waivers. For actual expense ratios during the period, refer to the financial highlights section of the financial statements. |
Schwab Active Equity Funds | Annual Report
Schwab Hedged Equity Fund
Performance and Fund Factsas of October 31, 2019 (continued)
| Number of Holdings | |
| Long Holdings | 199 |
| Short Holdings | 110 |
| Weighted Average Market Cap (millions) | |
| Long Holdings | $191,526 |
| Short Holdings | $15,043 |
| Price/Earnings Ratio (P/E) | |
| Long Holdings | 16.9 |
| Short Holdings | 17.5 |
| Price/Book Ratio (P/B) | |
| Long Holdings | 2.5 |
| Short Holdings | 2.2 |
| Portfolio Turnover Rate including short sales | 176% |
| Portfolio Turnover Rate excluding short sales | 96% |
Top Equity Long Holdings % of Net Assets1
Top Equity Short Holdings % of Net Assets1
Portfolio holdings may have changed since the report date.
| 1 | This list is not a recommendation of any security by the investment adviser. |
Schwab Active Equity Funds | Annual Report
Schwab Health Care Fundas of October 31, 2019
The Schwab Health Care Fund(the fund) seeks long-term capital growth. To pursue its goal, the fund primarily invests in equity securities issued by companies in the health care sector. The fund uses Schwab Equity Ratings® to aid its U.S. stock selection and Schwab’s proprietary international stock research to aid its international stock selection. For more information concerning the fund’s investment objective, strategies, and risks, please see the fund’s prospectus.
Market Highlights.Over the reporting period, the U.S. equity market generated positive returns. The final two months of 2018 were marked by significant market volatility and steep declines, driven by concerns about slowing international growth, a trade war between the U.S. and China, falling oil prices, the waning strength of the U.S. economy, and the pace of future interest rate hikes despite low inflation. However, as the Federal Reserve (Fed) put interest rate hikes on hold, stocks, particularly in the U.S., staged a strong recovery in the first four months of 2019, which generally continued through the end of the reporting period. After raising interest rates four times in 2018, the Fed enacted three interest rate cuts by the end of the period—in July, September, and October. Over the period, the U.S. dollar strengthened slightly against a basket of foreign currencies, generally reducing the returns on overseas investments in U.S. dollar terms. U.S. health care stocks performed well over the reporting period, though lagged the broader U.S. stock market.
Performance.The fund returned 6.51% for the 12-month reporting period ended October 31, 2019, underperforming the Dow Jones Global Health Care Index (the index), which the fund uses for performance comparisons. The index returned 9.73% for the reporting period.
Positioning and Strategies. The fund’s overweight investment in Johnson & Johnson, which manufactures health care products and provides related services for the consumer, pharmaceutical, and medical devices and diagnostics markets, weighed on the fund’s performance. The fund’s holdings of Johnson & Johnson returned approximately -3% for the reporting period, driven by high profile lawsuits and legal verdicts.
Pharmaceutical company Pfizer, Inc. was another detractor from the fund’s relative performance over the reporting period. The fund’s holdings of Pfizer returned approximately -8%, hindered by an ongoing reorganization, merger and acquisition activity, and a poor growth outlook.
The fund’s performance relative to the index was enhanced by an overweight position in Hoya Corp., a Japanese manufacturer of electro-optics products. The fund’s holdings of Hoya returned approximately 58% for the reporting period, driven by strong demand that boosted earnings and sales.
Zoetis, Inc. was another contributor to the fund’s relative performance. The fund’s holdings of Zoetis, a company that discovers, develops, manufactures, and commercializes animal health medicines and vaccines, returned approximately 43% for the reporting period. Zoetis benefited as a result of its strong companion animal, or pet, business, particularly in the U.S.
Management views and portfolio holdings may have changed since the report date.
Schwab Active Equity Funds | Annual Report
Performance and Fund Factsas of October 31, 2019
The performance data quoted represents past performance. Past performance does not guarantee future results. Investment returns and principal value of an investment will fluctuate so that an investor’s shares may be worth more or less than their original cost. Current performance may be lower or higher than performance data quoted. To obtain performance information current to the most recent month end, please visitwww.schwabfunds.com/schwabfunds_prospectus.
Performance of Hypothetical $10,000 Investment (October 31, 2009 – October 31, 2019)1
Average Annual Total Returns1
| Fund and Inception Date | 1 Year | 5 Years | 10 Years |
| Fund: Schwab Health Care Fund (7/3/00) | 6.51% | 7.30% | 14.49% |
| Dow Jones Global Health Care Index | 9.73% | 7.60% | 12.91% |
| S&P 500® Index | 14.33% | 10.78% | 13.70% |
| Fund Category: Morningstar Health2 | 4.98% | 6.99% | 14.93% |
| Fund Expense Ratio3: 0.80% |
All total returns on this page assume dividends and distributions were reinvested. Index figures do not include trading and management costs, which would lower performance. Indices are unmanaged and cannot be invested in directly. Performance results less than one year are not annualized.
The first index listed for the fund is the fund’s primary benchmark, as shown in the prospectus. Additional indices shown are provided for comparative purposes.
For index definitions, please see the Glossary.
The fund’s performance relative to the index may be affected by fair-value pricing, see financial note 2 for more information.
Since the Schwab Health Care Fund focuses its investments on companies involved in a specific sector, this fund may involve a greater degree of risk than an investment in mutual funds that do not concentrate their investments.
| 1 | Fund expenses may have been partially absorbed by CSIM and its affiliates. Without these reductions, the fund’s returns would have been lower. These returns do not reflect the deduction of taxes that a shareholder would pay on fund distributions or the redemption of fund shares. |
| 2 | Source for category information: Morningstar, Inc. The Morningstar Category return represents all active and index mutual funds within the category as of the report date. |
| 3 | As stated in the prospectus. Reflects the total annual fund operating expenses without contractual fee waivers. For actual expense ratios during the period, refer to the financial highlights section of the financial statements. |
Schwab Active Equity Funds | Annual Report
Performance and Fund Factsas of October 31, 2019 (continued)
| Number of Holdings | 83 |
| Weighted Average Market Cap (millions) | $127,676 |
| Price/Earnings Ratio (P/E) | 22.1 |
| Price/Book Ratio (P/B) | 4.9 |
| Portfolio Turnover Rate | 45% |
Industry Weightings % of Investments
Top Equity Holdings % of Net Assets1
Portfolio holdings may have changed since the report date.
Source of Industry Classification: S&P and MSCI.
| 1 | This list is not a recommendation of any security by the investment adviser. |
Schwab Active Equity Funds | Annual Report
Schwab International Core Equity Fundas of October 31, 2019
The Schwab International Core EquityFund (the fund) seeks long-term capital growth. To pursue its investment objective, the fund invests primarily in the stocks of publicly traded companies located in developed market countries excluding the U.S. To aid its stock selection, the fund uses Schwab’s proprietary international stock research. For more information concerning the fund’s investment objective, strategies, and risks, please see the fund’s prospectus.
Market Highlights.Over the reporting period, international equity markets generated positive returns. The final two months of 2018 were marked by significant market volatility and steep declines across global equity markets, driven by concerns about slowing international economic growth, a trade war between the U.S. and China, falling oil prices, the waning strength of the U.S. economy, and the pace of future interest rate hikes. However, stocks staged a recovery in the first four months of 2019, which generally continued through the end of the reporting period. A number of central banks reduced their policy rates, including the U.S., while others maintained their generally low—and for some international central banks, negative—interest rates. Over the period, the U.S. dollar strengthened slightly against a basket of foreign currencies, generally reducing the returns on overseas investments in U.S. dollar terms.
Performance.The fund returned 7.08% for the 12-month reporting period ended October 31, 2019, underperforming the MSCI EAFE® Index (Net) (the index), which the fund uses for performance comparisons. The index returned 11.04% for the reporting period.
Positioning and Strategies. The fund’s overweight position in Covestro AG weighed on the fund’s relative performance. The fund’s holdings of Covestro, a German-based company engaged in the manufacture of plastic materials, retuned approximately -24% for the reporting period. A decline in global economic activity and fears over increased Chinese supply contributed to a decline in earnings for Covestro.
The fund’s underweight to ASML Holding NV was another detractor from the fund’s relative performance as ASML, a Dutch semiconductor manufacturer, benefitted from demand for semiconductor capital equipment driven by the buildout of 5G networks. ASML returned approximately 20% over the reporting period.
The fund’s performance relative to the index was enhanced by an overweight position in Hoya Corp., a Japanese manufacturer of electro-optics products. The fund’s holdings of Hoya returned approximately 58% for the reporting period, driven by strong demand that boosted earnings and sales.
Invincible Investment Corp. was another contributor to the fund’s relative performance. The fund’s holdings of Invincible Investment, a Japanese-based real estate investment trust company, returned approximately 63% for the reporting period, benefitting from strong tourism in Japan related to the Rugby World Cup.
Management views and portfolio holdings may have changed since the report date.
Schwab Active Equity Funds | Annual Report
Schwab International Core Equity Fund
Performance and Fund Factsas of October 31, 2019
The performance data quoted represents past performance. Past performance does not guarantee future results. Investment returns and principal value of an investment will fluctuate so that an investor’s shares may be worth more or less than their original cost. Current performance may be lower or higher than performance data quoted. To obtain performance information current to the most recent month end, please visitwww.schwabfunds.com/schwabfunds_prospectus.
Performance of Hypothetical $10,000 Investment (October 31, 2009 – October 31, 2019)1,2
Average Annual Total Returns1,2
| Fund and Inception Date | 1 Year | 5 Years | 10 Years |
| Fund: Schwab International Core Equity Fund (5/30/08) | 7.08% | 3.30% | 6.09% |
| MSCI EAFE® Index (Net)3 | 11.04% | 4.31% | 5.41% |
| Fund Category: Morningstar Foreign Large Blend4 | 10.26% | 3.74% | 5.13% |
| Fund Expense Ratios5: Net 0.86%; Gross 0.89% |
All total returns on this page assume dividends and distributions were reinvested. Index figures do not include trading and management costs, which would lower performance. Indices are unmanaged and cannot be invested in directly. Performance results less than one year are not annualized.
For index definitions, please see the Glossary.
The fund’s performance relative to the index may be affected by fair-value pricing, see financial note 2 for more information.
| 1 | Fund expenses may have been partially absorbed by CSIM and its affiliates. Without these reductions, the fund’s returns would have been lower. These returns do not reflect the deduction of taxes that a shareholder would pay on fund distributions or the redemption of fund shares. |
| 2 | On December 3, 2009, the Laudus Rosenberg International Equity Fund merged into the fund. |
| 3 | The net version of the index reflects reinvested dividends net of withholding taxes, but reflects no deductions for expenses or other taxes. |
| 4 | Source for category information: Morningstar, Inc. The Morningstar Category return represents all active and index mutual funds within the category as of the report date. |
| 5 | As stated in the prospectus. Net Expense: Expenses reduced by a contractual fee waiver in effect for so long as CSIM serves as the investment adviser to the fund. Gross Expense: Does not reflect the effect of contractual fee waivers. For actual expense ratios during the period, refer to the financial highlights section of the financial statements. |
Schwab Active Equity Funds | Annual Report
Schwab International Core Equity Fund
Performance and Fund Factsas of October 31, 2019 (continued)
| Number of Holdings | 178 |
| Weighted Average Market Cap (millions) | $64,472 |
| Price/Earnings Ratio (P/E) | 13.6 |
| Price/Book Ratio (P/B) | 1.8 |
| Portfolio Turnover Rate | 91% |
Sector Weightings % of Investments
Top Equity Holdings % of Net Assets1
Top Country Weightings % of Investments2
Portfolio holdings may have changed since the report date.
Source of Sector Classification: S&P and MSCI.
International investments are subject to additional risks such as currency fluctuation, geopolitical risk and the potential for illiquid markets.
| 1 | This list is not a recommendation of any security by the investment adviser. |
| 2 | The percentage may differ from the Portfolio Holdings because the above calculation is based on a percentage of total investments, whereas the calculation in the Portfolio Holdings is based on a percentage of net assets. |
Schwab Active Equity Funds | Annual Report
Schwab Active Equity Funds
Examples for a $1,000 Investment
As a fund shareholder, you may incur two types of costs: (1) transaction costs; and (2) ongoing costs, including management fees, transfer agent and shareholder services fees, and other fund expenses.
The expense examples below are intended to help you understand your ongoing cost (in dollars) of investing in a fund and to compare this cost with the ongoing cost of investing in other mutual funds. These examples are based on an investment of $1,000 invested for six months beginning May 1, 2019 and held through October 31, 2019.
Actual Return lines in the table below provide information about actual account values and actual expenses. You may use this information, together with the amount you invested, to estimate the expenses that you paid over the period. To do so, simply divide your account value by $1,000 (for example, an $8,600 account value ÷ $1,000 = 8.6), then multiply the result by the number given for your fund under the heading entitled “Expenses Paid During Period.”
Hypothetical Return lines in the table below provide information about hypothetical account values and hypothetical expenses based on a fund’s actual expense ratio and an assumed return of 5% per year before expenses. Because the return used is not an actual return, it may not be used to estimate the actual ending account value or expenses you paid for the period.
You may use this information to compare the ongoing costs of investing in a fund and other funds. To do so, compare this 5% hypothetical example with the 5% hypothetical examples that appear in the shareholder reports of the other funds.
Please note that the expenses shown in the table are meant to highlight your ongoing costs only, and do not reflect any transactional costs. Therefore, the hypothetical return lines of the table are useful in comparing ongoing costs only, and will not help you determine the relative total costs of owning different funds. In addition, if these transactional costs were included, your costs would have been higher.
| | Expense Ratio
(Annualized)1 | Beginning
Account Value
at 5/1/19 | Ending
Account Value
(Net of Expenses)
at 10/31/19 | Expenses Paid
During Period
5/1/19-10/31/192 |
| Schwab Core Equity Fund | | | | |
| Actual Return | 0.73% | $1,000.00 | $1,029.20 | $3.73 |
| Hypothetical 5% Return | 0.73% | $1,000.00 | $1,021.52 | $3.72 |
| Schwab Dividend Equity Fund | | | | |
| Actual Return | 0.89% | $1,000.00 | $1,015.10 | $4.52 |
| Hypothetical 5% Return | 0.89% | $1,000.00 | $1,020.71 | $4.53 |
| Schwab Large-Cap Growth Fund | | | | |
| Actual Return | 0.99% | $1,000.00 | $1,021.50 | $5.04 |
| Hypothetical 5% Return | 0.99% | $1,000.00 | $1,020.21 | $5.04 |
| Schwab Small-Cap Equity Fund | | | | |
| Actual Return | 1.09% | $1,000.00 | $959.70 | $5.38 |
| Hypothetical 5% Return | 1.09% | $1,000.00 | $1,019.71 | $5.55 |
| Schwab Hedged Equity Fund3 | | | | |
| Actual Return | 2.01% | $1,000.00 | $985.40 | $10.06 |
| Hypothetical 5% Return | 2.01% | $1,000.00 | $1,015.07 | $10.21 |
| Schwab Health Care Fund | | | | |
| Actual Return | 0.80% | $1,000.00 | $1,052.50 | $4.14 |
| Hypothetical 5% Return | 0.80% | $1,000.00 | $1,021.17 | $4.08 |
| Schwab International Core Equity Fund | | | | |
| Actual Return | 0.86% | $1,000.00 | $1,008.00 | $4.35 |
| Hypothetical 5% Return | 0.86% | $1,000.00 | $1,020.86 | $4.38 |
| 1 | Based on the most recent six-month expense ratio; may differ from the expense ratio provided in the Financial Highlights. |
| 2 | Expenses for each fund are equal to its annualized expense ratio, multiplied by the average account value over the period, multiplied by 184 days of the period, and divided by 365 days of the fiscal year. |
| 3 | Schwab Hedged Equity Fund’s expense ratio includes non-recurring interest expense and dividend expenses paid on securities sold short. |
Schwab Active Equity Funds | Annual Report
Financial Statements
Financial Highlights
| | 11/1/18–
10/31/19 | 11/1/17–
10/31/18 | 11/1/16–
10/31/17 | 11/1/15–
10/31/16 | 11/1/14–
10/31/15 | |
| Per-Share Data |
| Net asset value at beginning of period | $22.40 | $24.36 | $19.65 | $23.10 | $25.48 | |
| Income (loss) from investment operations: | | | | | | |
| Net investment income (loss)1 | 0.21 | 0.26 | 0.34 | 0.38 | 0.30 | |
| Net realized and unrealized gains (losses) | 1.99 | 0.41 | 4.71 | (0.52) | 1.05 | |
| Total from investment operations | 2.20 | 0.67 | 5.05 | (0.14) | 1.35 | |
| Less distributions: | | | | | | |
| Distributions from net investment income | (0.27) | (0.34) | (0.34) | (0.36) | (0.33) | |
| Distributions from net realized gains | (2.46) | (2.29) | — | (2.95) | (3.40) | |
| Total distributions | (2.73) | (2.63) | (0.34) | (3.31) | (3.73) | |
| Net asset value at end of period | $21.87 | $22.40 | $24.36 | $19.65 | $23.10 | |
| Total return | 12.02% | 2.71% | 26.00% | (0.50%) | 5.61% | |
| Ratios/Supplemental Data |
| Ratios to average net assets: | | | | | | |
| Net operating expenses | 0.73% | 0.73% | 0.73% | 0.73% | 0.74% | |
| Gross operating expenses | 0.73% | 0.73% | 0.74% | 0.73% | 0.74% | |
| Net investment income (loss) | 1.01% | 1.12% | 1.53% | 1.93% | 1.29% | |
| Portfolio turnover rate | 98% | 101% | 86% | 80% | 81% | |
| Net assets, end of period (x 1,000,000) | $2,182 | $2,138 | $2,353 | $2,075 | $2,363 | |
| |
1
Calculated based on the average shares outstanding during the period.
Schwab Active Equity Funds | Annual Report
Portfolio Holdings as of October 31, 2019
This section shows all the securities in the fund’s portfolio and their values as of the report date.
The fund files its complete schedule of portfolio holdings with the U.S. Securities and Exchange Commission (SEC) for the first and third quarters of each fiscal year on Form N-Q. Effective March 31, 2019, Form N-PORT Part F has replaced Form N-Q. The fund’s Form N-Q and Form N-PORT Part F are available on the SEC’s website atwww.sec.gov. The fund also makes available its complete schedule of portfolio holdings 15 to 20 days after calendar quarters on the fund’s website atwww.schwabfunds.com/schwabfunds_prospectus.
| Security | Number
of Shares | Value ($) |
| Common Stock99.8% of net assets |
| |
| Automobiles & Components 0.2% |
| Lear Corp. | 39,169 | 4,612,933 |
| |
| Banks 4.2% |
| Bank of America Corp. | 461,564 | 14,433,106 |
| Citigroup, Inc. | 505,047 | 36,292,677 |
| Fifth Third Bancorp | 95,621 | 2,780,659 |
| JPMorgan Chase & Co. | 138,211 | 17,265,318 |
| MGIC Investment Corp. | 240,001 | 3,290,414 |
| Regions Financial Corp. | 667,615 | 10,748,602 |
| The PNC Financial Services Group, Inc. | 19,566 | 2,870,332 |
| Wells Fargo & Co. | 89,533 | 4,622,589 |
| | | 92,303,697 |
| |
| Capital Goods 7.1% |
| Allison Transmission Holdings, Inc. | 695,390 | 30,325,958 |
| AMETEK, Inc. | 173,614 | 15,911,723 |
| Caterpillar, Inc. | 19,774 | 2,724,857 |
| Dover Corp. | 184,818 | 19,200,742 |
| Eaton Corp. plc | 91,851 | 8,001,141 |
| HEICO Corp. | 66,591 | 8,213,334 |
| Honeywell International, Inc. | 37,016 | 6,393,774 |
| L3Harris Technologies, Inc. | 78,140 | 16,121,063 |
| Lockheed Martin Corp. | 14,634 | 5,512,335 |
| Masco Corp. | 322,190 | 14,901,287 |
| Oshkosh Corp. | 197,499 | 16,862,465 |
| Spirit AeroSystems Holdings, Inc., Class A | 52,407 | 4,287,941 |
| Teledyne Technologies, Inc. * | 16,664 | 5,492,454 |
| | | 153,949,074 |
| |
| Commercial & Professional Services 0.8% |
| Robert Half International, Inc. | 321,243 | 18,397,587 |
| |
| Consumer Durables & Apparel 1.4% |
| LVMH Moet Hennessy Louis Vuitton SE ADR | 84,504 | 7,212,417 |
| NIKE, Inc., Class B | 87,227 | 7,811,178 |
| PulteGroup, Inc. | 391,089 | 15,346,332 |
| | | 30,369,927 |
| |
| Consumer Services 3.1% |
| Darden Restaurants, Inc. | 94,898 | 10,654,199 |
| Hilton Worldwide Holdings, Inc. | 141,129 | 13,683,868 |
| Starbucks Corp. | 397,895 | 33,646,001 |
| Wyndham Destinations, Inc. | 219,693 | 10,195,952 |
| | | 68,180,020 |
| |
| Diversified Financials 5.0% |
| Ameriprise Financial, Inc. | 195,031 | 29,428,228 |
| Capital One Financial Corp. | 269,781 | 25,157,078 |
| Discover Financial Services | 143,175 | 11,491,225 |
| E*TRADE Financial Corp. | 60,993 | 2,548,897 |
| Security | Number
of Shares | Value ($) |
| LPL Financial Holdings, Inc. | 85,695 | 6,927,584 |
| Morgan Stanley | 385,874 | 17,769,498 |
| Synchrony Financial | 339,745 | 12,016,781 |
| T. Rowe Price Group, Inc. | 39,138 | 4,532,180 |
| | | 109,871,471 |
| |
| Energy 3.9% |
| Cabot Oil & Gas Corp. | 276,031 | 5,145,218 |
| Chevron Corp. | 259,780 | 30,170,849 |
| ConocoPhillips | 626,433 | 34,579,102 |
| Valero Energy Corp. | 151,424 | 14,685,099 |
| | | 84,580,268 |
| |
| Food & Staples Retailing 2.0% |
| Casey's General Stores, Inc. | 79,655 | 13,605,870 |
| Sysco Corp. | 262,069 | 20,931,451 |
| Walmart, Inc. | 71,514 | 8,385,732 |
| | | 42,923,053 |
| |
| Food, Beverage & Tobacco 4.1% |
| Campbell Soup Co. | 372,165 | 17,234,961 |
| General Mills, Inc. | 150,353 | 7,646,954 |
| Nestle S.A. ADR | 136,034 | 14,577,403 |
| PepsiCo, Inc. | 205,727 | 28,219,573 |
| The JM Smucker Co. | 57,058 | 6,029,889 |
| Tyson Foods, Inc., Class A | 201,086 | 16,647,910 |
| | | 90,356,690 |
| |
| Health Care Equipment & Services 6.8% |
| Anthem, Inc. | 48,873 | 13,150,747 |
| Cardinal Health, Inc. | 196,671 | 9,725,381 |
| HCA Healthcare, Inc. | 126,581 | 16,903,627 |
| Hill-Rom Holdings, Inc. | 282,113 | 29,534,410 |
| Hologic, Inc. * | 434,420 | 20,986,830 |
| McKesson Corp. | 172,939 | 23,000,887 |
| Medtronic plc | 177,139 | 19,290,437 |
| Molina Healthcare, Inc. * | 74,422 | 8,755,004 |
| UnitedHealth Group, Inc. | 24,400 | 6,165,880 |
| | | 147,513,203 |
| |
| Household & Personal Products 0.7% |
| Kimberly-Clark Corp. | 22,919 | 3,045,477 |
| The Procter & Gamble Co. | 45,183 | 5,625,735 |
| Unilever N.V. | 102,824 | 6,091,294 |
| | | 14,762,506 |
| |
| Insurance 3.1% |
| Loews Corp. | 366,309 | 17,949,141 |
| MetLife, Inc. | 634,341 | 29,680,815 |
| The Allstate Corp. | 183,711 | 19,550,525 |
| | | 67,180,481 |
| |
Schwab Active Equity Funds | Annual Report
Portfolio Holdings as of October 31, 2019 (continued)
| Security | Number
of Shares | Value ($) |
| Materials 3.2% |
| Berry Global Group, Inc. * | 191,739 | 7,959,086 |
| BHP Group plc ADR | 200,849 | 8,520,015 |
| Celanese Corp. | 66,090 | 8,006,803 |
| CF Industries Holdings, Inc. | 123,038 | 5,579,773 |
| Reliance Steel & Aluminum Co. | 238,243 | 27,645,718 |
| The Sherwin-Williams Co. | 22,448 | 12,847,439 |
| | | 70,558,834 |
| |
| Media & Entertainment 7.7% |
| Activision Blizzard, Inc. | 177,420 | 9,940,843 |
| Alphabet, Inc., Class A * | 61,329 | 77,200,945 |
| Alphabet, Inc., Class C * | 9,569 | 12,057,993 |
| Altice USA, Inc., Class A * | 207,516 | 6,422,620 |
| Discovery, Inc., Class A * | 279,411 | 7,531,524 |
| Facebook, Inc., Class A * | 161,776 | 31,004,370 |
| Live Nation Entertainment, Inc. * | 190,061 | 13,399,300 |
| Tencent Holdings Ltd. ADR | 134,940 | 5,465,070 |
| Zynga, Inc., Class A * | 995,777 | 6,143,944 |
| | | 169,166,609 |
| |
| Pharmaceuticals, Biotechnology & Life Sciences 7.3% |
| Agilent Technologies, Inc. | 71,961 | 5,451,046 |
| Alexion Pharmaceuticals, Inc. * | 253,575 | 26,726,805 |
| Amgen, Inc. | 43,428 | 9,261,021 |
| Biogen, Inc. * | 62,801 | 18,759,287 |
| Gilead Sciences, Inc. | 231,999 | 14,780,656 |
| Jazz Pharmaceuticals plc * | 88,893 | 11,167,628 |
| Johnson & Johnson | 147,135 | 19,427,705 |
| Merck & Co., Inc. | 101,324 | 8,780,738 |
| Novartis AG ADR | 425,360 | 37,193,478 |
| Novo Nordisk A/S ADR | 48,612 | 2,684,355 |
| Roche Holding AG ADR | 114,207 | 4,296,467 |
| | | 158,529,186 |
| |
| Real Estate 3.5% |
| American Tower Corp. | 157,143 | 34,269,745 |
| Boston Properties, Inc. | 222,818 | 30,570,630 |
| Medical Properties Trust, Inc. | 252,385 | 5,231,941 |
| PS Business Parks, Inc. | 29,221 | 5,275,852 |
| | | 75,348,168 |
| |
| Retailing 6.5% |
| Amazon.com, Inc. * | 39,203 | 69,650,402 |
| AutoZone, Inc. * | 23,552 | 26,952,438 |
| Booking Holdings, Inc. * | 4,218 | 8,641,712 |
| eBay, Inc. | 247,283 | 8,716,726 |
| Expedia Group, Inc. | 94,790 | 12,954,001 |
| Target Corp. | 55,109 | 5,891,703 |
| The Home Depot, Inc. | 40,247 | 9,441,141 |
| | | 142,248,123 |
| |
| Semiconductors & Semiconductor Equipment 2.6% |
| Intel Corp. | 500,189 | 28,275,684 |
| Lam Research Corp. | 67,714 | 18,353,203 |
| Qorvo, Inc. * | 86,416 | 6,987,598 |
| Xilinx, Inc. | 35,072 | 3,182,433 |
| | | 56,798,918 |
| |
| Security | Number
of Shares | Value ($) |
| Software & Services 13.8% |
| Accenture plc, Class A | 47,355 | 8,780,564 |
| Akamai Technologies, Inc. * | 176,498 | 15,267,077 |
| Amdocs Ltd. | 111,418 | 7,264,454 |
| Automatic Data Processing, Inc. | 40,802 | 6,619,309 |
| Booz Allen Hamilton Holding Corp. | 195,625 | 13,766,131 |
| Cadence Design Systems, Inc. * | 167,141 | 10,922,664 |
| Genpact Ltd. | 158,319 | 6,201,355 |
| Mastercard, Inc., Class A | 55,148 | 15,265,518 |
| MAXIMUS, Inc. | 174,789 | 13,413,308 |
| Microsoft Corp. | 909,805 | 130,438,743 |
| Oracle Corp. | 177,066 | 9,648,326 |
| PayPal Holdings, Inc. * | 169,623 | 17,657,754 |
| VeriSign, Inc. * | 142,258 | 27,031,865 |
| Visa, Inc., Class A | 105,461 | 18,862,755 |
| | | 301,139,823 |
| |
| Technology Hardware & Equipment 6.6% |
| Apple, Inc. | 450,694 | 112,114,640 |
| CDW Corp. | 48,285 | 6,176,134 |
| HP, Inc. | 230,008 | 3,995,239 |
| Jabil, Inc. | 271,150 | 9,983,743 |
| Keysight Technologies, Inc. * | 118,899 | 11,998,098 |
| | | 144,267,854 |
| |
| Telecommunication Services 0.9% |
| AT&T, Inc. | 256,157 | 9,859,483 |
| Verizon Communications, Inc. | 156,526 | 9,465,127 |
| | | 19,324,610 |
| |
| Transportation 0.5% |
| Norfolk Southern Corp. | 15,832 | 2,881,424 |
| United Airlines Holdings, Inc. * | 77,851 | 7,071,985 |
| | | 9,953,409 |
| |
| Utilities 4.8% |
| Exelon Corp. | 827,830 | 37,657,987 |
| IDACORP, Inc. | 114,857 | 12,360,910 |
| NRG Energy, Inc. | 703,293 | 28,216,115 |
| Portland General Electric Co. | 284,854 | 16,202,495 |
| UGI Corp. | 207,331 | 9,883,469 |
| | | 104,320,976 |
| Total Common Stock |
| (Cost $1,703,725,390) | | 2,176,657,420 |
|
| Other Investment Company0.0% of net assets |
| |
| Money Market Fund 0.0% |
| State Street Institutional U.S. Government Money Market Fund, Premier Class 1.75%(a) | 879,481 | 879,481 |
| Total Other Investment Company |
| (Cost $879,481) | | 879,481 |
| * | Non-income producing security. |
| (a) | The rate shown is the 7-day yield. |
| | |
| ADR — | American Depositary Receipt |
Schwab Active Equity Funds | Annual Report
Portfolio Holdings as of October 31, 2019 (continued)
The following is a summary of the inputs used to value the fund’s investments as of October 31, 2019 (see financial note 2(a) for additional information):
| Description | Quoted Prices in
Active Markets for
Identical Assets
(Level 1) | Other Significant
Observable Inputs
(Level 2) | Significant
Unobservable Inputs
(Level 3) | Total | |
| Assets | | | | | |
| Common Stock1 | $2,176,657,420 | $— | $— | $2,176,657,420 | |
| Other Investment Company1 | 879,481 | — | — | 879,481 | |
| Total | $2,177,536,901 | $— | $— | $2,177,536,901 | |
| 1 | As categorized in Portfolio Holdings. |
Fund investments in underlying mutual funds are classified as Level 1, without consideration to the classification level of the investments held by the underlying mutual funds, which could be Level 1, Level 2 or Level 3.
Schwab Active Equity Funds | Annual Report
Statement of Assets and Liabilities
As of October 31, 2019
| Assets |
| Investments in unaffiliated issuers, at value (cost $1,704,604,871) | | $2,177,536,901 |
| Deposit with broker for futures contracts | | 3,300,000 |
| Receivables: | | |
| Investments sold | | 4,340,436 |
| Dividends | | 1,266,261 |
| Fund shares sold | | 97,357 |
| Foreign tax reclaims | | 6,638 |
| Prepaid expenses | + | 19,143 |
| Total assets | | 2,186,566,736 |
| Liabilities |
| Payables: | | |
| Investments bought | | 1,982,421 |
| Investment adviser and administrator fees | | 853,143 |
| Shareholder service fees | | 444,600 |
| Independent trustees’ fees | | 14 |
| Fund shares redeemed | | 1,095,405 |
| Accrued expenses | + | 147,040 |
| Total liabilities | | 4,522,623 |
| Net Assets |
| Total assets | | 2,186,566,736 |
| Total liabilities | – | 4,522,623 |
| Net assets | | $2,182,044,113 |
| Net Assets by Source | | |
| Capital received from investors | | 1,650,628,660 |
| Total distributable earnings | | 531,415,453 |
| Net Asset Value (NAV) |
| Net Assets | ÷ | Shares
Outstanding | = | NAV |
| $2,182,044,113 | | 99,795,452 | | $21.87 |
| | | | | |
Schwab Active Equity Funds | Annual Report
Statement of Operations
For the period November 1, 2018 through October 31, 2019
| Investment Income |
| Dividends (net of foreign withholding tax of $22,335) | | $37,171,483 |
| Securities on loan, net | + | 44,251 |
| Total investment income | | 37,215,734 |
| Expenses |
| Investment adviser and administrator fees | | 10,055,962 |
| Shareholder service fees | | 5,221,155 |
| Portfolio accounting fees | | 77,139 |
| Custodian fees | | 52,913 |
| Shareholder reports | | 45,572 |
| Transfer agent fees | | 40,861 |
| Professional fees | | 38,549 |
| Registration fees | | 36,423 |
| Independent trustees’ fees | | 18,842 |
| Other expenses | + | 35,339 |
| Total expenses | | 15,622,755 |
| Expense reduction by CSIM and its affiliates | – | 40,861 |
| Net expenses | – | 15,581,894 |
| Net investment income | | 21,633,840 |
| Realized and Unrealized Gains (Losses) |
| Net realized gains on investments | | 44,492,163 |
| Net realized gains on futures contracts | + | 1,136,930 |
| Net realized gains | | 45,629,093 |
| Net change in unrealized appreciation (depreciation) on investments | + | 179,996,703 |
| Net realized and unrealized gains | | 225,625,796 |
| Increase in net assets resulting from operations | | $247,259,636 |
Schwab Active Equity Funds | Annual Report
Statement of Changes in Net Assets
For the current and prior report periods
| Operations | |
| | 11/1/18-10/31/19 | 11/1/17-10/31/18 |
| Net investment income | | $21,633,840 | $26,089,047 |
| Net realized gains | | 45,629,093 | 232,323,847 |
| Net change in unrealized appreciation (depreciation) | + | 179,996,703 | (184,772,120) |
| Increase in net assets from operations | | 247,259,636 | 73,640,774 |
| Distributions to Shareholders | |
| Total distributions | | ($258,813,892) | ($252,002,689) |
| Transactions in Fund Shares | | | |
| | | 11/1/18-10/31/19 | 11/1/17-10/31/18 |
| | | SHARES | VALUE | SHARES | VALUE |
| Shares sold | | 11,415,378 | $217,630,660 | 5,037,106 | $115,966,940 |
| Shares reinvested | | 10,439,291 | 193,753,240 | 8,268,646 | 186,127,214 |
| Shares redeemed | + | (17,535,305) | (356,277,403) | (14,419,212) | (338,357,426) |
| Net transactions in fund shares | | 4,319,364 | $55,106,497 | (1,113,460) | ($36,263,272) |
| Shares Outstanding and Net Assets | | | |
| | | 11/1/18-10/31/19 | 11/1/17-10/31/18 |
| | | SHARES | NET ASSETS | SHARES | NET ASSETS |
| Beginning of period | | 95,476,088 | $2,138,491,872 | 96,589,548 | $2,353,117,059 |
| Total increase or decrease | + | 4,319,364 | 43,552,241 | (1,113,460) | (214,625,187) |
| End of period | | 99,795,452 | $2,182,044,113 | 95,476,088 | $2,138,491,872 |
Schwab Active Equity Funds | Annual Report
Schwab Dividend Equity Fund
Financial Statements
Financial Highlights
| | 11/1/18–
10/31/19 | 11/1/17–
10/31/18 | 11/1/16–
10/31/17 | 11/1/15–
10/31/16 | 11/1/14–
10/31/15 | |
| Per-Share Data |
| Net asset value at beginning of period | $15.43 | $17.21 | $14.39 | $16.43 | $19.17 | |
| Income (loss) from investment operations: | | | | | | |
| Net investment income (loss)1 | 0.23 | 0.22 | 0.29 | 0.31 | 0.29 | |
| Net realized and unrealized gains (losses) | 0.93 | (0.27) | 2.75 | (0.29) | (0.21) | |
| Total from investment operations | 1.16 | (0.05) | 3.04 | 0.02 | 0.08 | |
| Less distributions: | | | | | | |
| Distributions from net investment income | (0.24) | (0.30) | (0.22) | (0.32) | (0.27) | |
| Distributions from net realized gains | (1.28) | (1.43) | — | (1.74) | (2.55) | |
| Total distributions | (1.52) | (1.73) | (0.22) | (2.06) | (2.82) | |
| Net asset value at end of period | $15.07 | $15.43 | $17.21 | $14.39 | $16.43 | |
| Total return | 8.78% | (0.63%) | 21.19% | 0.26% | 0.12% | |
| Ratios/Supplemental Data |
| Ratios to average net assets: | | | | | | |
| Net operating expenses | 0.89% | 0.88% | 0.88% | 0.88% | 0.88% | |
| Gross operating expenses | 0.89% | 0.88% | 0.88% | 0.89% | 0.88% | |
| Net investment income (loss) | 1.58% | 1.36% | 1.78% | 2.18% | 1.71% | |
| Portfolio turnover rate | 70% | 79% | 70% | 74% | 73% | |
| Net assets, end of period (x 1,000,000) | $847 | $1,249 | $1,469 | $1,560 | $1,872 | |
| |
1
Calculated based on the average shares outstanding during the period.
Schwab Active Equity Funds | Annual Report
Schwab Dividend Equity Fund
Portfolio Holdings as of October 31, 2019
This section shows all the securities in the fund’s portfolio and their values as of the report date.
The fund files its complete schedule of portfolio holdings with the U.S. Securities and Exchange Commission (SEC) for the first and third quarters of each fiscal year on Form N-Q. Effective March 31, 2019, Form N-PORT Part F has replaced Form N-Q. The fund’s Form N-Q and Form N-PORT Part F are available on the SEC’s website atwww.sec.gov. The fund also makes available its complete schedule of portfolio holdings 15 to 20 days after calendar quarters on the fund’s website atwww.schwabfunds.com/schwabfunds_prospectus.
| Security | Number
of Shares | Value ($) |
| Common Stock99.8% of net assets |
| |
| Banks 10.8% |
| Bank of America Corp. | 76,267 | 2,384,869 |
| CIT Group, Inc. | 176,428 | 7,566,997 |
| Citigroup, Inc. | 330,136 | 23,723,573 |
| JPMorgan Chase & Co. | 206,173 | 25,755,131 |
| MGIC Investment Corp. | 488,053 | 6,691,207 |
| Popular, Inc. | 15,000 | 816,900 |
| Regions Financial Corp. | 911,618 | 14,677,050 |
| The PNC Financial Services Group, Inc. | 64,826 | 9,509,974 |
| | | 91,125,701 |
| |
| Capital Goods 6.7% |
| Allison Transmission Holdings, Inc. | 321,049 | 14,000,947 |
| Builders FirstSource, Inc. * | 232,890 | 5,265,643 |
| Cummins, Inc. | 12,597 | 2,172,730 |
| Dover Corp. | 80,358 | 8,348,392 |
| Illinois Tool Works, Inc. | 5,715 | 963,435 |
| L3Harris Technologies, Inc. | 7,870 | 1,623,660 |
| Lockheed Martin Corp. | 9,138 | 3,442,102 |
| Masco Corp. | 281,183 | 13,004,714 |
| Parker-Hannifin Corp. | 13,385 | 2,456,014 |
| Spirit AeroSystems Holdings, Inc., Class A | 25,424 | 2,080,192 |
| W.W. Grainger, Inc. | 9,960 | 3,076,046 |
| | | 56,433,875 |
| |
| Commercial & Professional Services 1.4% |
| ManpowerGroup, Inc. | 98,455 | 8,951,528 |
| Nielsen Holdings plc | 60,000 | 1,209,600 |
| Robert Half International, Inc. | 27,474 | 1,573,436 |
| | | 11,734,564 |
| |
| Consumer Durables & Apparel 0.9% |
| Hanesbrands, Inc. | 112,318 | 1,708,357 |
| PulteGroup, Inc. | 73,551 | 2,886,141 |
| Whirlpool Corp. | 21,501 | 3,270,732 |
| | | 7,865,230 |
| |
| Consumer Services 3.0% |
| Hilton Worldwide Holdings, Inc. | 38,410 | 3,724,233 |
| International Game Technology plc | 343,004 | 4,541,373 |
| Starbucks Corp. | 144,677 | 12,233,887 |
| Wyndham Destinations, Inc. | 97,809 | 4,539,316 |
| | | 25,038,809 |
| |
| Diversified Financials 8.8% |
| Affiliated Managers Group, Inc. | 57,973 | 4,630,883 |
| Ameriprise Financial, Inc. | 69,650 | 10,509,489 |
| Berkshire Hathaway, Inc., Class B * | 44,855 | 9,535,276 |
| Capital One Financial Corp. | 171,838 | 16,023,893 |
| Discover Financial Services | 37,254 | 2,990,006 |
| Evercore, Inc., Class A | 42,004 | 3,093,175 |
| Security | Number
of Shares | Value ($) |
| Legg Mason, Inc. | 41,777 | 1,556,611 |
| Morgan Stanley | 226,119 | 10,412,780 |
| MSCI, Inc. | 4,168 | 977,646 |
| Navient Corp. | 274,260 | 3,776,560 |
| Synchrony Financial | 253,852 | 8,978,745 |
| T. Rowe Price Group, Inc. | 15,396 | 1,782,857 |
| | | 74,267,921 |
| |
| Energy 8.5% |
| Chevron Corp. | 259,600 | 30,149,944 |
| ConocoPhillips | 320,755 | 17,705,676 |
| CVR Energy, Inc. | 57,086 | 2,707,018 |
| Exxon Mobil Corp. | 268,269 | 18,126,936 |
| Helmerich & Payne, Inc. | 10,995 | 412,313 |
| Patterson-UTI Energy, Inc. | 13,402 | 111,505 |
| Valero Energy Corp. | 32,396 | 3,141,764 |
| | | 72,355,156 |
| |
| Food & Staples Retailing 0.4% |
| Koninklijke Ahold Delhaize N.V. ADR | 79,065 | 1,967,928 |
| Walmart, Inc. | 14,480 | 1,697,925 |
| | | 3,665,853 |
| |
| Food, Beverage & Tobacco 5.1% |
| Campbell Soup Co. | 153,815 | 7,123,173 |
| Coca-Cola Consolidated, Inc. | 6,012 | 1,649,452 |
| Flowers Foods, Inc. | 207,041 | 4,496,930 |
| Ingredion, Inc. | 43,937 | 3,471,023 |
| Nestle S.A. ADR | 41,817 | 4,481,110 |
| PepsiCo, Inc. | 85,246 | 11,693,194 |
| Philip Morris International, Inc. | 42,441 | 3,456,395 |
| The JM Smucker Co. | 47,367 | 5,005,744 |
| Tyson Foods, Inc., Class A | 22,243 | 1,841,498 |
| | | 43,218,519 |
| |
| Health Care Equipment & Services 4.9% |
| Cardinal Health, Inc. | 99,501 | 4,920,325 |
| HCA Healthcare, Inc. | 53,906 | 7,198,607 |
| Hill-Rom Holdings, Inc. | 29,138 | 3,050,457 |
| Hologic, Inc. * | 17,402 | 840,691 |
| McKesson Corp. | 65,604 | 8,725,332 |
| Medtronic plc | 156,129 | 17,002,448 |
| | | 41,737,860 |
| |
| Household & Personal Products 2.2% |
| Kimberly-Clark Corp. | 57,201 | 7,600,869 |
| The Procter & Gamble Co. | 85,905 | 10,696,031 |
| | | 18,296,900 |
| |
| Insurance 5.1% |
| Allianz SE ADR | 79,896 | 1,950,261 |
| First American Financial Corp. | 42,059 | 2,598,405 |
| Loews Corp. | 96,409 | 4,724,041 |
Schwab Active Equity Funds | Annual Report
Schwab Dividend Equity Fund
Portfolio Holdings as of October 31, 2019 (continued)
| Security | Number
of Shares | Value ($) |
| MetLife, Inc. | 358,458 | 16,772,250 |
| The Allstate Corp. | 162,809 | 17,326,134 |
| | | 43,371,091 |
| |
| Materials 4.8% |
| Axalta Coating Systems Ltd. * | 90,295 | 2,662,800 |
| BHP Group plc ADR | 99,711 | 4,229,741 |
| Celanese Corp. | 40,003 | 4,846,363 |
| CF Industries Holdings, Inc. | 28,039 | 1,271,569 |
| NewMarket Corp. | 23,311 | 11,317,257 |
| PPG Industries, Inc. | 43,318 | 5,419,948 |
| Reliance Steel & Aluminum Co. | 49,126 | 5,700,581 |
| Steel Dynamics, Inc. | 109,032 | 3,310,211 |
| The Sherwin-Williams Co. | 2,987 | 1,709,520 |
| | | 40,467,990 |
| |
| Media & Entertainment 4.1% |
| Activision Blizzard, Inc. | 16,225 | 909,087 |
| Alphabet, Inc., Class A * | 1,843 | 2,319,968 |
| Altice USA, Inc., Class A * | 182,269 | 5,641,225 |
| Cinemark Holdings, Inc. | 98,391 | 3,601,111 |
| Comcast Corp., Class A | 56,035 | 2,511,489 |
| Discovery, Inc., Class A * | 120,308 | 3,242,902 |
| Live Nation Entertainment, Inc. * | 34,096 | 2,403,768 |
| Meredith Corp. | 23,708 | 893,792 |
| Sinclair Broadcast Group, Inc., Class A | 47,819 | 1,905,109 |
| The Interpublic Group of Cos., Inc. | 286,905 | 6,240,184 |
| Viacom, Inc., Class B | 231,015 | 4,980,683 |
| | | 34,649,318 |
| |
| Pharmaceuticals, Biotechnology & Life Sciences 6.9% |
| Alexion Pharmaceuticals, Inc. * | 24,547 | 2,587,254 |
| Amgen, Inc. | 13,108 | 2,795,281 |
| Biogen, Inc. * | 11,028 | 3,294,174 |
| Gilead Sciences, Inc. | 91,816 | 5,849,597 |
| GlaxoSmithKline plc ADR | 9,841 | 450,718 |
| Johnson & Johnson | 115,725 | 15,280,329 |
| Novartis AG ADR | 24,356 | 2,129,689 |
| Novo Nordisk A/S ADR | 50,771 | 2,803,574 |
| Pfizer, Inc. | 183,778 | 7,051,562 |
| Regeneron Pharmaceuticals, Inc. * | 9,204 | 2,819,001 |
| Roche Holding AG ADR | 348,632 | 13,115,536 |
| | | 58,176,715 |
| |
| Real Estate 6.9% |
| Alexander & Baldwin, Inc. | 144,845 | 3,405,306 |
| American Tower Corp. | 69,667 | 15,192,979 |
| Boston Properties, Inc. | 73,706 | 10,112,463 |
| Brandywine Realty Trust | 324,769 | 4,962,470 |
| Colony Capital, Inc. | 245,021 | 1,372,118 |
| EPR Properties | 21,000 | 1,633,590 |
| Equity LifeStyle Properties, Inc. | 39,974 | 2,795,782 |
| First Industrial Realty Trust, Inc. | 46,784 | 1,970,074 |
| Gaming & Leisure Properties, Inc. | 30,880 | 1,246,317 |
| Outfront Media, Inc. | 21,422 | 563,613 |
| Park Hotels & Resorts, Inc. | 85,641 | 1,991,153 |
| PS Business Parks, Inc. | 60,970 | 11,008,134 |
| Retail Properties of America, Inc., Class A | 36,696 | 504,937 |
| VEREIT, Inc. | 173,547 | 1,707,702 |
| | | 58,466,638 |
| |
| Security | Number
of Shares | Value ($) |
| Retailing 0.5% |
| Best Buy Co., Inc. | 34,440 | 2,473,825 |
| Target Corp. | 15,026 | 1,606,430 |
| | | 4,080,255 |
| |
| Semiconductors & Semiconductor Equipment 2.1% |
| Broadcom, Inc. | 11,549 | 3,382,125 |
| Intel Corp. | 262,105 | 14,816,795 |
| | | 18,198,920 |
| |
| Software & Services 2.2% |
| Amdocs Ltd. | 32,321 | 2,107,329 |
| International Business Machines Corp. | 6,356 | 849,988 |
| MAXIMUS, Inc. | 12,542 | 962,473 |
| Microsoft Corp. | 25,988 | 3,725,900 |
| VeriSign, Inc. * | 57,295 | 10,887,196 |
| | | 18,532,886 |
| |
| Technology Hardware & Equipment 3.3% |
| Apple, Inc. | 15,331 | 3,813,739 |
| Cisco Systems, Inc. | 258,919 | 12,301,242 |
| HP, Inc. | 390,361 | 6,780,571 |
| Jabil, Inc. | 47,671 | 1,755,246 |
| Keysight Technologies, Inc. * | 26,997 | 2,724,267 |
| Sanmina Corp. * | 23,667 | 727,287 |
| | | 28,102,352 |
| |
| Telecommunication Services 2.9% |
| AT&T, Inc. | 243,366 | 9,367,157 |
| BT Group plc | 190,720 | 506,143 |
| CenturyLink, Inc. | 251,622 | 3,255,989 |
| Telephone & Data Systems, Inc. | 28,040 | 731,564 |
| Verizon Communications, Inc. | 174,248 | 10,536,777 |
| | | 24,397,630 |
| |
| Transportation 0.8% |
| Delta Air Lines, Inc. | 65,717 | 3,619,692 |
| Southwest Airlines Co. | 61,107 | 3,429,936 |
| | | 7,049,628 |
| |
| Utilities 7.5% |
| AES Corp. | 106,354 | 1,813,336 |
| Exelon Corp. | 394,296 | 17,936,525 |
| IDACORP, Inc. | 48,280 | 5,195,894 |
| NRG Energy, Inc. | 421,582 | 16,913,870 |
| Portland General Electric Co. | 285,239 | 16,224,394 |
| UGI Corp. | 115,893 | 5,524,619 |
| | | 63,608,638 |
| Total Common Stock |
| (Cost $721,563,424) | | 844,842,449 |
Schwab Active Equity Funds | Annual Report
Schwab Dividend Equity Fund
Portfolio Holdings as of October 31, 2019 (continued)
Security
Rate, Maturity Date | Face
Amount ($) | Value ($) |
| Short-Term Investment0.3% of net assets |
| |
| Time Deposit 0.3% |
| Citibank |
| 1.18%, 11/01/19(a) | 2,904,772 | 2,904,772 |
| Total Short-Term Investment |
| (Cost $2,904,772) | | 2,904,772 |
| * | Non-income producing security. |
| (a) | The rate shown is the current daily overnight rate. |
| | |
| ADR — | American Depositary Receipt |
The following is a summary of the inputs used to value the fund’s investments as of October 31, 2019 (see financial note 2(a) for additional information):
| Description | Quoted Prices in
Active Markets for
Identical Assets
(Level 1) | Other Significant
Observable Inputs
(Level 2) | Significant
Unobservable Inputs
(Level 3) | Total | |
| Assets | | | | | |
| Common Stock1 | $820,444,819 | $— | $— | $820,444,819 | |
| Telecommunication Services | 23,891,487 | 506,143 | — | 24,397,630 | |
| Short-Term Investment1 | — | 2,904,772 | — | 2,904,772 | |
| Total | $844,336,306 | $3,410,915 | $— | $847,747,221 | |
| 1 | As categorized in Portfolio Holdings. |
Schwab Active Equity Funds | Annual Report
Schwab Dividend Equity Fund
Statement of Assets and Liabilities
As of October 31, 2019
| Assets |
| Investments in unaffiliated issuers, at value (cost $724,468,196) | | $847,747,221 |
| Receivables: | | |
| Dividends | | 733,313 |
| Fund shares sold | | 556,887 |
| Foreign tax reclaims | | 15,019 |
| Income from securities on loan | | 94 |
| Interest | | 83 |
| Prepaid expenses | + | 19,228 |
| Total assets | | 849,071,845 |
| Liabilities |
| Payables: | | |
| Investments bought | | 1,047,123 |
| Investment adviser and administrator fees | | 441,458 |
| Shareholder service fees | | 170,546 |
| Independent trustees’ fees | | 9 |
| Fund shares redeemed | | 353,834 |
| Accrued expenses | + | 104,170 |
| Total liabilities | | 2,117,140 |
| Net Assets |
| Total assets | | 849,071,845 |
| Total liabilities | – | 2,117,140 |
| Net assets | | $846,954,705 |
| Net Assets by Source | | |
| Capital received from investors | | 679,823,303 |
| Total distributable earnings | | 167,131,402 |
| Net Asset Value (NAV) |
| Net Assets | ÷ | Shares
Outstanding | = | NAV |
| $846,954,705 | | 56,193,727 | | $15.07 |
| | | | | |
Schwab Active Equity Funds | Annual Report
Schwab Dividend Equity Fund
Statement of Operations
For the period November 1, 2018 through October 31, 2019
| Investment Income |
| Dividends (net of foreign withholding tax of $19,668) | | $23,246,124 |
| Interest | | 55,187 |
| Securities on loan, net | + | 1,660 |
| Total investment income | | 23,302,971 |
| Expenses |
| Investment adviser and administrator fees | | 5,850,081 |
| Shareholder service fees | | 2,268,274 |
| Portfolio accounting fees | | 69,504 |
| Custodian fees | | 40,060 |
| Professional fees | | 37,156 |
| Registration fees | | 30,364 |
| Transfer agent fees | | 25,201 |
| Shareholder reports | | 24,757 |
| Independent trustees’ fees | | 12,924 |
| Other expenses | + | 25,445 |
| Total expenses | | 8,383,766 |
| Expense reduction by CSIM and its affiliates | – | 25,201 |
| Net expenses | – | 8,358,565 |
| Net investment income | | 14,944,406 |
| Realized and Unrealized Gains (Losses) |
| Net realized gains on investments | | 41,885,822 |
| Net realized gains on futures contracts | + | 1,770,698 |
| Net realized gains | | 43,656,520 |
| Net change in unrealized appreciation (depreciation) on investments | + | 7,941,778 |
| Net realized and unrealized gains | | 51,598,298 |
| Increase in net assets resulting from operations | | $66,542,704 |
Schwab Active Equity Funds | Annual Report
Schwab Dividend Equity Fund
Statement of Changes in Net Assets
For the current and prior report periods
| Operations | |
| | 11/1/18-10/31/19 | 11/1/17-10/31/18 |
| Net investment income | | $14,944,406 | $19,019,115 |
| Net realized gains | | 43,656,520 | 100,779,824 |
| Net change in unrealized appreciation (depreciation) | + | 7,941,778 | (119,244,775) |
| Increase in net assets from operations | | 66,542,704 | 554,164 |
| Distributions to Shareholders | |
| Total distributions | | ($116,674,245) | ($146,370,393) |
| Transactions in Fund Shares | | | |
| | | 11/1/18-10/31/19 | 11/1/17-10/31/18 |
| | | SHARES | VALUE | SHARES | VALUE |
| Shares sold | | 4,035,151 | $55,294,907 | 4,465,871 | $72,752,175 |
| Shares reinvested | | 5,687,633 | 76,661,106 | 5,882,999 | 95,048,975 |
| Shares redeemed | + | (34,473,540) | (483,993,577) | (14,759,098) | (242,239,003) |
| Net transactions in fund shares | | (24,750,756) | ($352,037,564) | (4,410,228) | ($74,437,853) |
| Shares Outstanding and Net Assets | | | |
| | | 11/1/18-10/31/19 | 11/1/17-10/31/18 |
| | | SHARES | NET ASSETS | SHARES | NET ASSETS |
| Beginning of period | | 80,944,483 | $1,249,123,810 | 85,354,711 | $1,469,377,892 |
| Total decrease | + | (24,750,756) | (402,169,105) | (4,410,228) | (220,254,082) |
| End of period | | 56,193,727 | $846,954,705 | 80,944,483 | $1,249,123,810 |
Schwab Active Equity Funds | Annual Report
Schwab Large-Cap Growth Fund
Financial Statements
Financial Highlights
| | 11/1/18–
10/31/19 | 11/1/17–
10/31/18 | 11/1/16–
10/31/17 | 11/1/15–
10/31/16 | 11/1/14–
10/31/15 | |
| Per-Share Data |
| Net asset value at beginning of period | $18.04 | $18.65 | $15.20 | $17.68 | $18.38 | |
| Income (loss) from investment operations: | | | | | | |
| Net investment income (loss)1 | 0.06 | 0.06 | 0.08 | 0.20 | 0.13 | |
| Net realized and unrealized gains (losses) | 1.79 | 0.75 | 4.04 | (0.12) | 1.08 | |
| Total from investment operations | 1.85 | 0.81 | 4.12 | 0.08 | 1.21 | |
| Less distributions: | | | | | | |
| Distributions from net investment income | (0.07) | (0.07) | (0.17) | (0.20) | (0.09) | |
| Distributions from net realized gains | (1.75) | (1.35) | (0.50) | (2.36) | (1.82) | |
| Total distributions | (1.82) | (1.42) | (0.67) | (2.56) | (1.91) | |
| Net asset value at end of period | $18.07 | $18.04 | $18.65 | $15.20 | $17.68 | |
| Total return | 12.18% | 4.46% | 28.10% | 0.54% | 7.00% | |
| Ratios/Supplemental Data |
| Ratios to average net assets: | | | | | | |
| Net operating expenses | 0.99% | 0.99% | 0.99% | 1.00%2 | 0.99% | |
| Gross operating expenses | 1.03% | 1.02% | 1.04% | 1.04% | 1.03% | |
| Net investment income (loss) | 0.34% | 0.30% | 0.48% | 1.32% | 0.75% | |
| Portfolio turnover rate | 67% | 88% | 81% | 84% | 90% | |
| Net assets, end of period (x 1,000,000) | $181 | $243 | $257 | $219 | $251 | |
| |
1
Calculated based on the average shares outstanding during the period.
2
The ratio of net operating expenses would have been 0.99%, if certain non-routine expenses had not been incurred.
Schwab Active Equity Funds | Annual Report
Schwab Large-Cap Growth Fund
Portfolio Holdings as of October 31, 2019
This section shows all the securities in the fund’s portfolio and their values as of the report date.
The fund files its complete schedule of portfolio holdings with the U.S. Securities and Exchange Commission (SEC) for the first and third quarters of each fiscal year on Form N-Q. Effective March 31, 2019, Form N-PORT Part F has replaced Form N-Q. The fund’s Form N-Q and Form N-PORT Part F are available on the SEC’s website atwww.sec.gov. The fund also makes available its complete schedule of portfolio holdings 15 to 20 days after calendar quarters on the fund’s website atwww.schwabfunds.com/schwabfunds_prospectus.
| Security | Number
of Shares | Value ($) |
| Common Stock99.7% of net assets |
| |
| Banks 1.1% |
| Essent Group Ltd. | 3,223 | 167,886 |
| MGIC Investment Corp. | 107,752 | 1,477,280 |
| Regions Financial Corp. | 24,104 | 388,075 |
| | | 2,033,241 |
| |
| Capital Goods 6.2% |
| Allison Transmission Holdings, Inc. | 68,015 | 2,966,134 |
| Dover Corp. | 11,198 | 1,163,360 |
| Honeywell International, Inc. | 4,917 | 849,313 |
| Lockheed Martin Corp. | 4,578 | 1,724,441 |
| Masco Corp. | 25,611 | 1,184,509 |
| MasTec, Inc. * | 20,533 | 1,292,347 |
| Oshkosh Corp. | 15,639 | 1,335,258 |
| Spirit AeroSystems Holdings, Inc., Class A | 8,307 | 679,679 |
| | | 11,195,041 |
| |
| Commercial & Professional Services 0.7% |
| Robert Half International, Inc. | 13,890 | 795,480 |
| Waste Management, Inc. | 4,159 | 466,682 |
| | | 1,262,162 |
| |
| Consumer Durables & Apparel 0.6% |
| NIKE, Inc., Class B | 6,613 | 592,194 |
| Sony Corp. ADR | 8,976 | 546,010 |
| | | 1,138,204 |
| |
| Consumer Services 2.5% |
| Darden Restaurants, Inc. | 6,229 | 699,330 |
| Hilton Worldwide Holdings, Inc. | 12,979 | 1,258,444 |
| Starbucks Corp. | 31,103 | 2,630,069 |
| | | 4,587,843 |
| |
| Diversified Financials 2.4% |
| Ameriprise Financial, Inc. | 5,266 | 794,587 |
| E*TRADE Financial Corp. | 20,759 | 867,519 |
| Evercore, Inc., Class A | 6,050 | 445,522 |
| MSCI, Inc. | 2,842 | 666,619 |
| Synchrony Financial | 5,248 | 185,622 |
| T. Rowe Price Group, Inc. | 11,395 | 1,319,541 |
| | | 4,279,410 |
| |
| Energy 1.0% |
| Chevron Corp. | 3,597 | 417,755 |
| ConocoPhillips | 25,028 | 1,381,546 |
| | | 1,799,301 |
| |
| Security | Number
of Shares | Value ($) |
| Food, Beverage & Tobacco 3.8% |
| Campbell Soup Co. | 20,481 | 948,475 |
| Flowers Foods, Inc. | 56,207 | 1,220,816 |
| Nestle S.A. ADR | 6,618 | 709,185 |
| PepsiCo, Inc. | 28,588 | 3,921,416 |
| | | 6,799,892 |
| |
| Health Care Equipment & Services 7.2% |
| Cardinal Health, Inc. | 8,800 | 435,160 |
| Edwards Lifesciences Corp. * | 2,198 | 523,959 |
| HCA Healthcare, Inc. | 4,666 | 623,098 |
| Hill-Rom Holdings, Inc. | 18,000 | 1,884,420 |
| Hologic, Inc. * | 51,114 | 2,469,317 |
| McKesson Corp. | 5,742 | 763,686 |
| Medtronic plc | 11,067 | 1,205,196 |
| Omnicell, Inc. * | 5,483 | 385,948 |
| Steris plc | 3,801 | 538,108 |
| The Cooper Cos., Inc. | 2,229 | 648,639 |
| UnitedHealth Group, Inc. | 12,186 | 3,079,402 |
| Veeva Systems, Inc., Class A * | 3,397 | 481,797 |
| | | 13,038,730 |
| |
| Household & Personal Products 0.3% |
| Unilever N.V. | 8,839 | 523,622 |
| |
| Materials 0.7% |
| Berry Global Group, Inc. * | 19,491 | 809,071 |
| CF Industries Holdings, Inc. | 9,313 | 422,345 |
| | | 1,231,416 |
| |
| Media & Entertainment 11.4% |
| Alphabet, Inc., Class A * | 7,673 | 9,658,773 |
| Altice USA, Inc., Class A * | 45,215 | 1,399,404 |
| Comcast Corp., Class A | 19,328 | 866,281 |
| Discovery, Inc., Class A * | 31,269 | 842,856 |
| Facebook, Inc., Class A * | 26,851 | 5,145,994 |
| Live Nation Entertainment, Inc. * | 14,548 | 1,025,634 |
| Netflix, Inc. * | 2,213 | 636,038 |
| Nintendo Co. Ltd | 7,275 | 338,433 |
| Tencent Holdings Ltd. ADR | 17,936 | 726,408 |
| | | 20,639,821 |
| |
| Pharmaceuticals, Biotechnology & Life Sciences 7.4% |
| Agilent Technologies, Inc. | 8,760 | 663,570 |
| Alexion Pharmaceuticals, Inc. * | 25,918 | 2,731,757 |
| Amgen, Inc. | 5,305 | 1,131,291 |
| Biogen, Inc. * | 5,303 | 1,584,059 |
| Charles River Laboratories International, Inc. * | 2,478 | 322,091 |
| Jazz Pharmaceuticals plc * | 3,368 | 423,122 |
| Novartis AG ADR | 18,757 | 1,640,112 |
| Novo Nordisk A/S ADR | 20,913 | 1,154,816 |
| PRA Health Sciences, Inc. * | 7,932 | 775,036 |
Schwab Active Equity Funds | Annual Report
Schwab Large-Cap Growth Fund
Portfolio Holdings as of October 31, 2019 (continued)
| Security | Number
of Shares | Value ($) |
| Regeneron Pharmaceuticals, Inc. * | 2,915 | 892,806 |
| Roche Holding AG ADR | 53,720 | 2,020,946 |
| | | 13,339,606 |
| |
| Real Estate 3.1% |
| American Tower Corp. | 10,290 | 2,244,043 |
| Boston Properties, Inc. | 13,844 | 1,899,397 |
| Equinix, Inc. | 655 | 371,241 |
| PS Business Parks, Inc. | 6,199 | 1,119,229 |
| | | 5,633,910 |
| |
| Retailing 10.3% |
| Amazon.com, Inc. * | 6,762 | 12,013,775 |
| AutoZone, Inc. * | 1,198 | 1,370,967 |
| Best Buy Co., Inc. | 14,403 | 1,034,568 |
| Expedia Group, Inc. | 4,110 | 561,673 |
| The Home Depot, Inc. | 15,328 | 3,595,642 |
| | | 18,576,625 |
| |
| Semiconductors & Semiconductor Equipment 3.7% |
| Broadcom, Inc. | 2,686 | 786,595 |
| Lam Research Corp. | 7,641 | 2,071,017 |
| NVIDIA Corp. | 4,051 | 814,332 |
| Teradyne, Inc. | 7,901 | 483,699 |
| Texas Instruments, Inc. | 16,794 | 1,981,524 |
| Xilinx, Inc. | 6,196 | 562,225 |
| | | 6,699,392 |
| |
| Software & Services 24.6% |
| Accenture plc, Class A | 6,380 | 1,182,980 |
| Adobe, Inc. * | 5,978 | 1,661,466 |
| Akamai Technologies, Inc. * | 18,618 | 1,610,457 |
| Amdocs Ltd. | 10,891 | 710,093 |
| Autodesk, Inc. * | 5,852 | 862,351 |
| Booz Allen Hamilton Holding Corp. | 25,574 | 1,799,642 |
| Cadence Design Systems, Inc. * | 23,444 | 1,532,065 |
| Citrix Systems, Inc. | 2,013 | 219,135 |
| Genpact Ltd. | 14,987 | 587,041 |
| Intuit, Inc. | 5,029 | 1,294,968 |
| j2 Global, Inc. | 5,792 | 550,008 |
| Mastercard, Inc., Class A | 11,525 | 3,190,235 |
| MAXIMUS, Inc. | 15,763 | 1,209,653 |
| Microsoft Corp. | 103,916 | 14,898,437 |
| Nuance Communications, Inc. * | 32,123 | 524,247 |
| Oracle Corp. | 17,656 | 962,075 |
| Security | Number
of Shares | Value ($) |
| PayPal Holdings, Inc. * | 23,779 | 2,475,394 |
| Proofpoint, Inc. * | 3,022 | 348,648 |
| ServiceNow, Inc. * | 3,818 | 944,039 |
| SS&C Technologies Holdings, Inc. | 22,872 | 1,189,573 |
| Synopsys, Inc. * | 4,749 | 644,677 |
| VeriSign, Inc. * | 14,565 | 2,767,641 |
| Visa, Inc., Class A | 18,825 | 3,367,039 |
| | | 44,531,864 |
| |
| Technology Hardware & Equipment 10.8% |
| Apple, Inc. | 62,503 | 15,548,247 |
| Cisco Systems, Inc. | 43,969 | 2,088,967 |
| Jabil, Inc. | 17,605 | 648,216 |
| Keysight Technologies, Inc. * | 11,368 | 1,147,145 |
| | | 19,432,575 |
| |
| Transportation 1.3% |
| Southwest Airlines Co. | 11,999 | 673,504 |
| Union Pacific Corp. | 10,096 | 1,670,484 |
| | | 2,343,988 |
| |
| Utilities 0.6% |
| Exelon Corp. | 13,746 | 625,306 |
| NRG Energy, Inc. | 13,037 | 523,044 |
| | | 1,148,350 |
| Total Common Stock |
| (Cost $123,392,518) | | 180,234,993 |
Security
Rate, Maturity Date | Face
Amount ($) | Value ($) |
| Short-Term Investment0.5% of net assets |
| |
| Time Deposit 0.5% |
| JPMorgan Chase Bank |
| 1.18%, 11/01/19(a) | 903,413 | 903,413 |
| Total Short-Term Investment |
| (Cost $903,413) | | 903,413 |
| * | Non-income producing security. |
| (a) | The rate shown is the current daily overnight rate. |
| | |
| ADR — | American Depositary Receipt |
The following is a summary of the inputs used to value the fund’s investments as of October 31, 2019 (see financial note 2(a) for additional information):
| Description | Quoted Prices in
Active Markets for
Identical Assets
(Level 1) | Other Significant
Observable Inputs
(Level 2) | Significant
Unobservable Inputs
(Level 3) | Total | |
| Assets | | | | | |
| Common Stock1 | $180,234,993 | $— | $— | $180,234,993 | |
| Short-Term Investment1 | — | 903,413 | — | 903,413 | |
| Total | $180,234,993 | $903,413 | $— | $181,138,406 | |
| 1 | As categorized in Portfolio Holdings. |
Schwab Active Equity Funds | Annual Report
Schwab Large-Cap Growth Fund
Statement of Assets and Liabilities
As of October 31, 2019
| Assets |
| Investments in unaffiliated issuers, at value (cost $124,295,931) | | $181,138,406 |
| Receivables: | | |
| Investments sold | | 90,702 |
| Fund shares sold | | 300,725 |
| Dividends | | 50,741 |
| Foreign tax reclaims | | 1,432 |
| Interest | | 30 |
| Prepaid expenses | + | 14,631 |
| Total assets | | 181,596,667 |
| Liabilities |
| Payables: | | |
| Investments bought | | 498,212 |
| Investment adviser and administrator fees | | 103,080 |
| Shareholder service fees | | 36,164 |
| Independent trustees’ fees | | 7 |
| Fund shares redeemed | | 100,529 |
| Accrued expenses | + | 49,933 |
| Total liabilities | | 787,925 |
| Net Assets |
| Total assets | | 181,596,667 |
| Total liabilities | – | 787,925 |
| Net assets | | $180,808,742 |
| Net Assets by Source | | |
| Capital received from investors | | 114,495,291 |
| Total distributable earnings | | 66,313,451 |
| Net Asset Value (NAV) |
| Net Assets | ÷ | Shares
Outstanding | = | NAV |
| $180,808,742 | | 10,004,676 | | $18.07 |
| | | | | |
Schwab Active Equity Funds | Annual Report
Schwab Large-Cap Growth Fund
Statement of Operations
For the period November 1, 2018 through October 31, 2019
| Investment Income |
| Dividends (net of foreign withholding tax of $2,996) | | $2,269,090 |
| Interest | | 23,956 |
| Securities on loan, net | + | 256,462 |
| Total investment income | | 2,549,508 |
| Expenses |
| Investment adviser and administrator fees | | 1,374,929 |
| Shareholder service fees | | 457,748 |
| Professional fees | | 36,104 |
| Portfolio accounting fees | | 27,245 |
| Registration fees | | 27,228 |
| Custodian fees | | 14,381 |
| Shareholder reports | | 11,598 |
| Transfer agent fees | | 9,543 |
| Independent trustees’ fees | | 8,926 |
| Other expenses | + | 7,394 |
| Total expenses | | 1,975,096 |
| Expense reduction by CSIM and its affiliates | – | 84,017 |
| Net expenses | – | 1,891,079 |
| Net investment income | | 658,429 |
| Realized and Unrealized Gains (Losses) |
| Net realized gains on investments | | 9,087,973 |
| Net realized gains on futures contracts | + | 178,599 |
| Net realized gains | | 9,266,572 |
| Net change in unrealized appreciation (depreciation) on investments | | 8,596,113 |
| Net change in unrealized appreciation (depreciation) on futures contracts | + | 90,126 |
| Net change in unrealized appreciation (depreciation) | + | 8,686,239 |
| Net realized and unrealized gains | | 17,952,811 |
| Increase in net assets resulting from operations | | $18,611,240 |
Schwab Active Equity Funds | Annual Report
Schwab Large-Cap Growth Fund
Statement of Changes in Net Assets
For the current and prior report periods
| Operations | |
| | 11/1/18-10/31/19 | 11/1/17-10/31/18 |
| Net investment income | | $658,429 | $787,740 |
| Net realized gains | | 9,266,572 | 23,386,823 |
| Net change in unrealized appreciation (depreciation) | + | 8,686,239 | (12,202,184) |
| Increase in net assets from operations | | 18,611,240 | 11,972,379 |
| Distributions to Shareholders | |
| Total distributions | | ($24,256,179) | ($19,458,886) |
| Transactions in Fund Shares | | | |
| | | 11/1/18-10/31/19 | 11/1/17-10/31/18 |
| | | SHARES | VALUE | SHARES | VALUE |
| Shares sold | | 1,083,640 | $17,768,963 | 1,778,882 | $33,172,055 |
| Shares reinvested | | 1,033,263 | 15,729,023 | 679,342 | 12,058,316 |
| Shares redeemed | + | (5,570,871) | (89,814,641) | (2,772,143) | (51,802,580) |
| Net transactions in fund shares | | (3,453,968) | ($56,316,655) | (313,919) | ($6,572,209) |
| Shares Outstanding and Net Assets | | | |
| | | 11/1/18-10/31/19 | 11/1/17-10/31/18 |
| | | SHARES | NET ASSETS | SHARES | NET ASSETS |
| Beginning of period | | 13,458,644 | $242,770,336 | 13,772,563 | $256,829,052 |
| Total decrease | + | (3,453,968) | (61,961,594) | (313,919) | (14,058,716) |
| End of period | | 10,004,676 | $180,808,742 | 13,458,644 | $242,770,336 |
Schwab Active Equity Funds | Annual Report
Schwab Small-Cap Equity Fund
Financial Statements
Financial Highlights
| | 11/1/18–
10/31/19 | 11/1/17–
10/31/18 | 11/1/16–
10/31/17 | 11/1/15–
10/31/16 | 11/1/14–
10/31/15 | |
| Per-Share Data |
| Net asset value at beginning of period | $20.87 | $23.58 | $18.81 | $21.19 | $25.11 | |
| Income (loss) from investment operations: | | | | | | |
| Net investment income (loss)1 | 0.02 | 0.01 | (0.00)2 | 0.07 | 0.05 | |
| Net realized and unrealized gains (losses) | (0.35)3 | 0.32 | 4.86 | 0.12 | 0.63 | |
| Total from investment operations | (0.33) | 0.33 | 4.86 | 0.19 | 0.68 | |
| Less distributions: | | | | | | |
| Distributions from net investment income | (0.01) | — | (0.09) | (0.04) | (0.02) | |
| Distributions from net realized gains | (3.85) | (3.04) | — | (2.53) | (4.58) | |
| Total distributions | (3.86) | (3.04) | (0.09) | (2.57) | (4.60) | |
| Net asset value at end of period | $16.68 | $20.87 | $23.58 | $18.81 | $21.19 | |
| Total return | 0.08% | 1.37% | 25.87% | 1.47% | 3.01% | |
| Ratios/Supplemental Data |
| Ratios to average net assets: | | | | | | |
| Net operating expenses | 1.09% | 1.09% | 1.10% | 1.09% | 1.09% | |
| Gross operating expenses | 1.09% | 1.09% | 1.10% | 1.10% | 1.09% | |
| Net investment income (loss) | 0.09% | 0.06% | (0.01%) | 0.37% | 0.22% | |
| Portfolio turnover rate | 117% | 111% | 99% | 85% | 95% | |
| Net assets, end of period (x 1,000,000) | $579 | $573 | $645 | $571 | $630 | |
| |
1
Calculated based on the average shares outstanding during the period.
2
Per-share amount was less than $0.005.
3
The per share amount does not accord with the change in aggregate gains and losses in securities during the period because of the timing of sales and repurchases of fund shares in relation to fluctuating market values.
Schwab Active Equity Funds | Annual Report
Schwab Small-Cap Equity Fund
Portfolio Holdings as of October 31, 2019
This section shows all the securities in the fund’s portfolio and their values as of the report date.
The fund files its complete schedule of portfolio holdings with the U.S. Securities and Exchange Commission (SEC) for the first and third quarters of each fiscal year on Form N-Q. Effective March 31, 2019, Form N-PORT Part F has replaced Form N-Q. The fund’s Form N-Q and Form N-PORT Part F are available on the SEC’s website atwww.sec.gov. The fund also makes available its complete schedule of portfolio holdings 15 to 20 days after calendar quarters on the fund’s website atwww.schwabfunds.com/schwabfunds_prospectus.
| Security | Number
of Shares | Value ($) |
| Common Stock99.5% of net assets |
| |
| Automobiles & Components 2.3% |
| American Axle & Manufacturing Holdings, Inc. * | 125,634 | 1,050,300 |
| Cooper Tire & Rubber Co. | 94,887 | 2,679,609 |
| Dana, Inc. | 343,800 | 5,579,874 |
| Gentherm, Inc. * | 94,670 | 3,954,366 |
| Superior Industries International, Inc. | 118,420 | 307,892 |
| | | 13,572,041 |
| |
| Banks 10.8% |
| 1st Source Corp. | 37,837 | 1,936,498 |
| Amalgamated Bank, Class A | 49,487 | 901,158 |
| BancFirst Corp. | 17,652 | 1,021,874 |
| Banner Corp. | 43,681 | 2,357,900 |
| Boston Private Financial Holdings, Inc. | 30,955 | 348,244 |
| Century Bancorp, Inc., Class A | 1,365 | 118,769 |
| Customers Bancorp, Inc. * | 96,559 | 2,276,861 |
| Essent Group Ltd. | 83,194 | 4,333,575 |
| Financial Institutions, Inc. | 113,439 | 3,565,388 |
| First BanCorp | 763,062 | 8,027,412 |
| First Defiance Financial Corp. | 49,862 | 1,541,733 |
| First Financial Corp. | 68,377 | 2,999,699 |
| First Foundation, Inc. | 49,449 | 791,678 |
| Flagstar Bancorp, Inc. | 56,559 | 2,055,354 |
| Great Southern Bancorp, Inc. | 12,741 | 769,811 |
| Hilltop Holdings, Inc. | 182,670 | 4,267,171 |
| International Bancshares Corp. | 148,697 | 6,090,629 |
| MGIC Investment Corp. | 283,970 | 3,893,229 |
| MMA Capital Holdings, Inc. * | 7,320 | 232,996 |
| NMI Holdings, Inc., Class A * | 96,821 | 2,832,014 |
| OFG Bancorp | 226,091 | 4,591,908 |
| Peapack-Gladstone Financial Corp. | 7,023 | 205,072 |
| Radian Group, Inc. | 225,579 | 5,662,033 |
| Republic Bancorp, Inc., Class A | 36,826 | 1,637,652 |
| Sierra Bancorp | 6,698 | 182,454 |
| Timberland Bancorp, Inc. | 7,071 | 187,382 |
| | | 62,828,494 |
| |
| Capital Goods 11.6% |
| Albany International Corp., Class A | 44,463 | 3,734,003 |
| Astronics Corp. * | 43,296 | 1,252,986 |
| Atkore International Group, Inc. * | 232,309 | 8,061,122 |
| AZZ, Inc. | 22,522 | 873,628 |
| Builders FirstSource, Inc. * | 116,550 | 2,635,196 |
| Columbus McKinnon Corp. | 15,323 | 574,919 |
| Commercial Vehicle Group, Inc. * | 145,429 | 1,060,177 |
| EMCOR Group, Inc. | 94,297 | 8,270,790 |
| Encore Wire Corp. | 54,000 | 3,034,800 |
| EnerSys | 13,649 | 912,572 |
| Federal Signal Corp. | 35,355 | 1,146,916 |
| Foundation Building Materials, Inc. * | 67,977 | 1,263,692 |
| Generac Holdings, Inc. * | 22,020 | 2,126,692 |
| General Finance Corp. * | 14,423 | 141,057 |
| GMS, Inc. * | 34,481 | 1,033,051 |
| Security | Number
of Shares | Value ($) |
| Great Lakes Dredge & Dock Corp. * | 306,870 | 3,298,852 |
| Hillenbrand, Inc. | 116,717 | 3,593,716 |
| MasTec, Inc. * | 20,420 | 1,285,235 |
| Moog, Inc., Class A | 57,967 | 4,852,418 |
| Mueller Industries, Inc. | 85,560 | 2,632,681 |
| Navistar International Corp. * | 24,702 | 772,679 |
| Park-Ohio Holdings Corp. | 29,706 | 913,757 |
| PGT Innovations, Inc. * | 68,383 | 1,207,644 |
| Powell Industries, Inc. | 11,653 | 456,331 |
| Regal Beloit Corp. | 13,430 | 994,492 |
| Rexnord Corp. * | 130,551 | 3,693,288 |
| SPX Corp. * | 45,192 | 2,058,044 |
| Universal Forest Products, Inc. | 17,787 | 895,753 |
| Vectrus, Inc. * | 5,624 | 257,073 |
| Watts Water Technologies, Inc., Class A | 46,630 | 4,348,247 |
| | | 67,381,811 |
| |
| Commercial & Professional Services 4.0% |
| Barrett Business Services, Inc. | 55,530 | 4,871,647 |
| Heidrick & Struggles International, Inc. | 25,597 | 728,491 |
| Herman Miller, Inc. | 32,904 | 1,530,036 |
| Insperity, Inc. | 28,611 | 3,022,180 |
| Kelly Services, Inc., Class A | 65,787 | 1,579,546 |
| Kimball International, Inc., Class B | 114,701 | 2,335,312 |
| Knoll, Inc. | 14,599 | 390,377 |
| McGrath RentCorp | 29,071 | 2,218,408 |
| Steelcase, Inc., Class A | 26,203 | 457,766 |
| Tetra Tech, Inc. | 14,126 | 1,235,601 |
| TriNet Group, Inc. * | 73,998 | 3,921,154 |
| UniFirst Corp. | 4,876 | 979,296 |
| | | 23,269,814 |
| |
| Consumer Durables & Apparel 2.8% |
| Crocs, Inc. * | 11,257 | 393,883 |
| Deckers Outdoor Corp. * | 6,258 | 956,848 |
| Installed Building Products, Inc. * | 71,682 | 4,675,100 |
| M/I Homes, Inc. * | 43,247 | 1,910,653 |
| Malibu Boats, Inc., Class A * | 114,402 | 3,731,793 |
| Rocky Brands, Inc. | 19,595 | 544,937 |
| Taylor Morrison Home Corp. * | 80,308 | 2,011,715 |
| TopBuild Corp. * | 12,644 | 1,314,091 |
| YETI Holdings, Inc. *(a) | 27,214 | 906,498 |
| | | 16,445,518 |
| |
| Consumer Services 2.4% |
| Bloomin' Brands, Inc. | 65,442 | 1,296,406 |
| Boyd Gaming Corp. | 78,720 | 2,145,120 |
| Collectors Universe, Inc. | 79,572 | 2,280,534 |
| Cracker Barrel Old Country Store, Inc. | 2,245 | 349,097 |
| Everi Holdings, Inc. * | 65,843 | 662,381 |
| International Game Technology plc | 39,637 | 524,794 |
| K12, Inc. * | 172,134 | 3,406,532 |
| Red Robin Gourmet Burgers, Inc. * | 26,855 | 819,077 |
Schwab Active Equity Funds | Annual Report
Schwab Small-Cap Equity Fund
Portfolio Holdings as of October 31, 2019 (continued)
| Security | Number
of Shares | Value ($) |
| SeaWorld Entertainment, Inc. * | 64,722 | 1,709,955 |
| The Habit Restaurants, Inc., Class A * | 52,901 | 555,990 |
| | | 13,749,886 |
| |
| Diversified Financials 3.0% |
| Enova International, Inc. * | 195,223 | 4,585,788 |
| Navient Corp. | 577,406 | 7,950,881 |
| On Deck Capital, Inc. * | 486,112 | 2,168,059 |
| Regional Management Corp. * | 92,218 | 2,667,867 |
| | | 17,372,595 |
| |
| Energy 2.2% |
| Arch Coal, Inc., Class A | 7,564 | 596,724 |
| Archrock, Inc. | 141,196 | 1,361,129 |
| CONSOL Energy, Inc. * | 158,631 | 2,098,688 |
| CVR Energy, Inc. | 31,175 | 1,478,318 |
| Dorian LPG Ltd. * | 42,331 | 527,021 |
| Evolution Petroleum Corp. | 103,627 | 582,384 |
| Matrix Service Co. * | 219,935 | 4,125,981 |
| World Fuel Services Corp. | 43,254 | 1,806,720 |
| | | 12,576,965 |
| |
| Food & Staples Retailing 0.1% |
| Natural Grocers by Vitamin Cottage, Inc. * | 65,010 | 570,138 |
| |
| Food, Beverage & Tobacco 2.5% |
| Coca-Cola Consolidated, Inc. | 13,403 | 3,677,247 |
| Darling Ingredients, Inc. * | 25,216 | 486,669 |
| John B. Sanfilippo & Son, Inc. | 22,424 | 2,379,635 |
| Lancaster Colony Corp. | 2,970 | 413,365 |
| The Boston Beer Co., Inc., Class A * | 3,962 | 1,483,610 |
| The Simply Good Foods Co. * | 146,950 | 3,606,153 |
| Universal Corp. | 41,166 | 2,255,897 |
| | | 14,302,576 |
| |
| Health Care Equipment & Services 5.0% |
| Accuray, Inc. * | 336,951 | 876,073 |
| CONMED Corp. | 11,452 | 1,259,949 |
| Haemonetics Corp. * | 5,149 | 621,639 |
| HMS Holdings Corp. * | 56,302 | 1,840,512 |
| Integer Holdings Corp. * | 95,305 | 7,380,419 |
| Invacare Corp. | 57,447 | 443,491 |
| Lantheus Holdings, Inc. * | 95,277 | 1,986,525 |
| Natus Medical, Inc. * | 134,929 | 4,544,409 |
| NextGen Healthcare, Inc. * | 26,328 | 445,075 |
| Novocure Ltd. * | 11,188 | 801,508 |
| NuVasive, Inc. * | 14,354 | 1,012,531 |
| Surmodics, Inc. * | 21,419 | 1,017,617 |
| Tactile Systems Technology, Inc. * | 22,219 | 1,009,187 |
| Tandem Diabetes Care, Inc. * | 49,094 | 3,023,209 |
| Varex Imaging Corp. * | 82,694 | 2,481,647 |
| | | 28,743,791 |
| |
| Household & Personal Products 1.1% |
| Inter Parfums, Inc. | 24,110 | 1,866,837 |
| Lifevantage Corp. * | 38,360 | 520,162 |
| Medifast, Inc. | 34,215 | 3,795,812 |
| | | 6,182,811 |
| |
| Security | Number
of Shares | Value ($) |
| Insurance 2.9% |
| American Equity Investment Life Holding Co. | 80,749 | 1,992,885 |
| Argo Group International Holdings Ltd. | 32,979 | 2,040,411 |
| Crawford & Co., Class B | 15,928 | 148,130 |
| Employers Holdings, Inc. | 30,735 | 1,301,320 |
| MBIA, Inc. * | 92,064 | 855,275 |
| National General Holdings Corp. | 122,573 | 2,613,256 |
| National Western Life Group, Inc., Class A | 16,598 | 4,524,615 |
| Selective Insurance Group, Inc. | 48,199 | 3,331,515 |
| | | 16,807,407 |
| |
| Materials 2.2% |
| Cabot Corp. | 15,591 | 679,612 |
| Domtar Corp. | 18,741 | 681,985 |
| Hawkins, Inc. | 6,815 | 291,341 |
| Innospec, Inc. | 20,481 | 1,871,144 |
| Materion Corp. | 14,049 | 798,545 |
| Minerals Technologies, Inc. | 16,360 | 809,002 |
| Orion Engineered Carbons S.A. | 94,393 | 1,563,148 |
| PolyOne Corp. | 34,579 | 1,108,257 |
| Ryerson Holding Corp. * | 268,936 | 2,337,054 |
| Trinseo S.A. | 8,936 | 379,780 |
| Tronox Holdings plc, Class A * | 234,592 | 1,991,686 |
| | | 12,511,554 |
| |
| Media & Entertainment 2.0% |
| AMC Networks, Inc., Class A * | 14,903 | 649,026 |
| IMAX Corp. * | 28,798 | 614,837 |
| Liberty Latin America Ltd., Class A * | 244,402 | 4,567,873 |
| Meredith Corp. | 28,227 | 1,064,158 |
| Sinclair Broadcast Group, Inc., Class A | 106,394 | 4,238,737 |
| Yelp, Inc. * | 15,314 | 528,486 |
| | | 11,663,117 |
| |
| Pharmaceuticals, Biotechnology & Life Sciences 13.6% |
| Affimed N.V. * | 180,950 | 531,993 |
| Agenus, Inc. * | 110,381 | 285,887 |
| Akcea Therapeutics, Inc. *(a) | 19,043 | 349,058 |
| ANI Pharmaceuticals, Inc. * | 41,544 | 3,245,002 |
| Anika Therapeutics, Inc. * | 35,165 | 2,475,264 |
| Arena Pharmaceuticals, Inc. * | 43,551 | 2,121,587 |
| Arrowhead Pharmaceuticals, Inc. * | 30,367 | 1,216,198 |
| BioDelivery Sciences International, Inc. * | 306,861 | 1,773,657 |
| BioSpecifics Technologies Corp. * | 27,843 | 1,348,437 |
| CareDx, Inc. * | 29,892 | 783,469 |
| Collegium Pharmaceutical, Inc. * | 142,530 | 1,710,360 |
| Eagle Pharmaceuticals, Inc. * | 53,366 | 3,346,048 |
| Emergent BioSolutions, Inc. * | 127,728 | 7,300,932 |
| Enanta Pharmaceuticals, Inc. * | 9,525 | 579,882 |
| Endo International plc * | 166,873 | 765,947 |
| Esperion Therapeutics, Inc. * | 84,923 | 3,377,388 |
| FibroGen, Inc. * | 64,321 | 2,518,167 |
| Halozyme Therapeutics, Inc. * | 120,979 | 1,853,398 |
| Harvard Bioscience, Inc. * | 13,450 | 37,660 |
| Horizon Therapeutics plc * | 184,116 | 5,322,794 |
| Lannett Co., Inc. * | 69,361 | 824,702 |
| Ligand Pharmaceuticals, Inc. * | 26,764 | 2,912,191 |
| Medpace Holdings, Inc. * | 63,635 | 4,685,445 |
| Myriad Genetics, Inc. * | 24,011 | 808,450 |
| Pacira BioSciences, Inc. * | 80,395 | 3,255,194 |
| PDL BioPharma, Inc. * | 758,380 | 2,138,632 |
| Prestige Consumer Healthcare, Inc. * | 57,330 | 2,032,922 |
| Puma Biotechnology, Inc. * | 152,814 | 1,039,135 |
| Radius Health, Inc. * | 81,099 | 2,306,456 |
Schwab Active Equity Funds | Annual Report
Schwab Small-Cap Equity Fund
Portfolio Holdings as of October 31, 2019 (continued)
| Security | Number
of Shares | Value ($) |
| Repligen Corp. * | 57,756 | 4,591,024 |
| Retrophin, Inc. * | 71,159 | 853,908 |
| Seres Therapeutics, Inc. * | 100,245 | 350,858 |
| Supernus Pharmaceuticals, Inc. * | 89,398 | 2,484,370 |
| Syneos Health, Inc. * | 78,830 | 3,953,325 |
| Vanda Pharmaceuticals, Inc. * | 180,359 | 2,436,650 |
| Veracyte, Inc. * | 77,329 | 1,773,154 |
| Vericel Corp. * | 45,406 | 720,593 |
| Voyager Therapeutics, Inc. * | 54,418 | 837,493 |
| | | 78,947,630 |
| |
| Real Estate 9.3% |
| Alexander & Baldwin, Inc. | 306,106 | 7,196,552 |
| Brandywine Realty Trust | 399,498 | 6,104,329 |
| CareTrust REIT, Inc. | 30,558 | 740,726 |
| Cedar Realty Trust, Inc. | 361,978 | 1,209,007 |
| Colony Capital, Inc. | 557,986 | 3,124,722 |
| Columbia Property Trust, Inc. | 275,026 | 5,643,534 |
| CoreCivic, Inc. | 203,418 | 3,104,159 |
| CorEnergy Infrastructure Trust, Inc. | 50,691 | 2,441,785 |
| Essential Properties Realty Trust, Inc. | 23,682 | 607,680 |
| First Industrial Realty Trust, Inc. | 106,157 | 4,470,271 |
| Hannon Armstrong Sustainable Infrastructure Capital, Inc. | 79,717 | 2,380,350 |
| Lexington Realty Trust | 336,663 | 3,662,893 |
| Marcus & Millichap, Inc. * | 21,823 | 779,518 |
| Office Properties Income Trust | 14,473 | 461,399 |
| Paramount Group, Inc. | 271,134 | 3,652,175 |
| Piedmont Office Realty Trust, Inc., Class A | 183,642 | 4,120,926 |
| PS Business Parks, Inc. | 11,179 | 2,018,368 |
| RE/MAX Holdings, Inc., Class A | 48,596 | 1,625,536 |
| The RMR Group, Inc., Class A | 13,832 | 669,469 |
| | | 54,013,399 |
| |
| Retailing 1.6% |
| 1-800-Flowers.com, Inc., Class A * | 119,511 | 1,704,227 |
| America's Car-Mart, Inc. * | 20,218 | 1,839,636 |
| Funko, Inc., Class A * | 48,089 | 865,602 |
| Lithia Motors, Inc., Class A | 10,851 | 1,708,815 |
| Sally Beauty Holdings, Inc. * | 98,614 | 1,528,517 |
| Tailored Brands, Inc.(a) | 408,800 | 1,896,832 |
| | | 9,543,629 |
| |
| Semiconductors & Semiconductor Equipment 2.6% |
| Diodes, Inc. * | 43,638 | 2,035,713 |
| Enphase Energy, Inc. *(a) | 43,872 | 852,433 |
| Inphi Corp. * | 29,258 | 2,103,065 |
| NeoPhotonics Corp. * | 307,193 | 2,021,330 |
| Synaptics, Inc. * | 16,760 | 705,764 |
| Xperi Corp. | 347,122 | 7,048,312 |
| | | 14,766,617 |
| |
| Software & Services 9.9% |
| ACI Worldwide, Inc. * | 12,892 | 404,680 |
| Agilysys, Inc. * | 54,288 | 1,367,515 |
| Alarm.com Holdings, Inc. * | 13,779 | 680,683 |
| Box, Inc., Class A * | 89,294 | 1,510,855 |
| CACI International, Inc., Class A * | 24,263 | 5,428,846 |
| Cardtronics plc, Class A * | 37,921 | 1,299,173 |
| ChannelAdvisor Corp. * | 76,481 | 719,686 |
| CommVault Systems, Inc. * | 138,559 | 6,882,226 |
| Cornerstone OnDemand, Inc. * | 106,455 | 6,235,069 |
| Digital Turbine, Inc. * | 31,154 | 217,766 |
| eGain Corp. * | 50,455 | 379,674 |
| Security | Number
of Shares | Value ($) |
| EVERTEC, Inc. | 134,287 | 4,107,839 |
| j2 Global, Inc. | 39,000 | 3,703,440 |
| MAXIMUS, Inc. | 23,957 | 1,838,460 |
| MobileIron, Inc. * | 435,546 | 2,726,518 |
| Perspecta, Inc. | 32,519 | 863,054 |
| Progress Software Corp. | 187,092 | 7,461,229 |
| Qualys, Inc. * | 23,465 | 2,002,268 |
| SPS Commerce, Inc. * | 14,006 | 739,097 |
| Synchronoss Technologies, Inc. *(a) | 214,556 | 1,287,336 |
| Telenav, Inc. * | 240,827 | 1,134,295 |
| Verint Systems, Inc. * | 72,254 | 3,279,609 |
| Workiva, Inc. * | 70,186 | 2,924,651 |
| | | 57,193,969 |
| |
| Technology Hardware & Equipment 2.5% |
| AstroNova, Inc. | 11,736 | 186,133 |
| Ciena Corp. * | 141,884 | 5,266,734 |
| Extreme Networks, Inc. * | 334,150 | 2,151,926 |
| KEMET Corp. | 5,912 | 128,527 |
| Plantronics, Inc. | 32,669 | 1,287,812 |
| Sanmina Corp. * | 109,634 | 3,369,053 |
| Viavi Solutions, Inc. * | 96,705 | 1,543,412 |
| Vishay Precision Group, Inc. * | 11,488 | 391,166 |
| | | 14,324,763 |
| |
| Telecommunication Services 1.1% |
| Consolidated Communications Holdings, Inc. | 100,105 | 400,420 |
| Shenandoah Telecommunications Co. | 52,866 | 1,700,170 |
| Telephone & Data Systems, Inc. | 142,031 | 3,705,589 |
| United States Cellular Corp. * | 20,226 | 752,812 |
| | | 6,558,991 |
| |
| Transportation 1.8% |
| Controladora Vuela Cia de Aviacion S.A.B. de C.V. ADR * | 140,726 | 1,525,470 |
| Grupo Aeroportuario del Centro Norte S.A.B. de C.V. ADR | 103,038 | 5,739,217 |
| Mesa Air Group, Inc. * | 96,033 | 731,771 |
| Radiant Logistics, Inc. * | 402,319 | 2,168,499 |
| SkyWest, Inc. | 5,329 | 317,342 |
| | | 10,482,299 |
| |
| Utilities 2.2% |
| AquaVenture Holdings Ltd. * | 109,292 | 2,144,309 |
| Atlantic Power Corp. * | 893,829 | 2,082,622 |
| Avista Corp. | 27,616 | 1,326,396 |
| Consolidated Water Co., Ltd. | 90,546 | 1,588,177 |
| Spark Energy, Inc., Class A | 301,355 | 2,883,967 |
| Unitil Corp. | 44,380 | 2,763,543 |
| | | 12,789,014 |
| Total Common Stock |
| (Cost $544,289,717) | | 576,598,829 |
|
| Other Investment Company0.7% of net assets |
| |
| Securities Lending Collateral 0.7% |
| Wells Fargo Government Money Market Fund, Select Class 1.75%(b) | 4,026,334 | 4,026,334 |
| Total Other Investment Company |
| (Cost $4,026,334) | | 4,026,334 |
Schwab Active Equity Funds | Annual Report
Schwab Small-Cap Equity Fund
Portfolio Holdings as of October 31, 2019 (continued)
Security
Rate, Maturity Date | Face
Amount ($) | Value ($) |
| Short-Term Investment0.5% of net assets |
| |
| Time Deposits 0.5% |
| JPMorgan Chase Bank |
| 1.18%, 11/01/19(c) | 2,717,728 | 2,717,728 |
| Total Short-Term Investment |
| (Cost $2,717,728) | | 2,717,728 |
| * | Non-income producing security. |
| (a) | All or a portion of this security is on loan. Securities on loan were valued at $3,862,897. |
| (b) | The rate shown is the 7-day yield. |
| (c) | The rate shown is the current daily overnight rate. |
| | |
| ADR — | American Depositary Receipt |
| REIT — | Real Estate Investment Trust |
The following is a summary of the inputs used to value the fund’s investments as of October 31, 2019 (see financial note 2(a) for additional information):
| Description | Quoted Prices in
Active Markets for
Identical Assets
(Level 1) | Other Significant
Observable Inputs
(Level 2) | Significant
Unobservable Inputs
(Level 3) | Total | |
| Assets | | | | | |
| Common Stock1 | $576,598,829 | $— | $— | $576,598,829 | |
| Other Investment Company1 | 4,026,334 | — | — | 4,026,334 | �� |
| Short-Term Investment1 | — | 2,717,728 | — | 2,717,728 | |
| Total | $580,625,163 | $2,717,728 | $— | $583,342,891 | |
| 1 | As categorized in Portfolio Holdings. |
Fund investments in underlying mutual funds are classified as Level 1, without consideration to the classification level of the investments held by the underlying mutual funds, which could be Level 1, Level 2 or Level 3.
Schwab Active Equity Funds | Annual Report
Schwab Small-Cap Equity Fund
Statement of Assets and Liabilities
As of October 31, 2019
| Assets |
| Investments in unaffiliated issuers, at value (cost $547,007,445) including securities on loan of $3,862,897 | | $579,316,557 |
| Collateral invested for securities on loan, at value (cost $4,026,334) | | 4,026,334 |
| Receivables: | | |
| Investments sold | | 237,472 |
| Fund shares sold | | 300,062 |
| Dividends | | 82,442 |
| Income from securities on loan | | 8,527 |
| Interest | | 91 |
| Prepaid expenses | + | 14,953 |
| Total assets | | 583,986,438 |
| Liabilities |
| Collateral held for securities on loan | | 4,026,334 |
| Payables: | | |
| Investment adviser and administrator fees | | 389,853 |
| Shareholder service fees | | 117,208 |
| Independent trustees’ fees | | 8 |
| Fund shares redeemed | | 221,985 |
| Accrued expenses | + | 88,291 |
| Total liabilities | | 4,843,679 |
| Net Assets |
| Total assets | | 583,986,438 |
| Total liabilities | – | 4,843,679 |
| Net assets | | $579,142,759 |
| Net Assets by Source | | |
| Capital received from investors | | 588,393,213 |
| Total distributable loss | | (9,250,454) |
| Net Asset Value (NAV) |
| Net Assets | ÷ | Shares
Outstanding | = | NAV |
| $579,142,759 | | 34,716,667 | | $16.68 |
| | | | | |
Schwab Active Equity Funds | Annual Report
Schwab Small-Cap Equity Fund
Statement of Operations
For the period November 1, 2018 through October 31, 2019
| Investment Income |
| Dividends (net of foreign withholding tax of $21,064) | | $6,546,820 |
| Interest | | 58,887 |
| Securities on loan, net | + | 277,530 |
| Total investment income | | 6,883,237 |
| Expenses |
| Investment adviser and administrator fees | | 4,720,018 |
| Shareholder service fees | | 1,418,126 |
| Portfolio accounting fees | | 58,451 |
| Custodian fees | | 47,318 |
| Professional fees | | 35,713 |
| Registration fees | | 32,952 |
| Shareholder reports | | 24,861 |
| Transfer agent fees | | 15,579 |
| Independent trustees’ fees | | 10,938 |
| Other expenses | + | 13,003 |
| Total expenses | | 6,376,959 |
| Expense reduction by CSIM and its affiliates | – | 15,579 |
| Net expenses | – | 6,361,380 |
| Net investment income | | 521,857 |
| Realized and Unrealized Gains (Losses) |
| Net realized losses on investments | | (42,448,740) |
| Net realized gains on futures contracts | + | 1,536,744 |
| Net realized losses | | (40,911,996) |
| Net change in unrealized appreciation (depreciation) on investments | + | 43,145,274 |
| Net realized and unrealized gains | | 2,233,278 |
| Increase in net assets resulting from operations | | $2,755,135 |
Schwab Active Equity Funds | Annual Report
Schwab Small-Cap Equity Fund
Statement of Changes in Net Assets
For the current and prior report periods
| Operations | |
| | 11/1/18-10/31/19 | 11/1/17-10/31/18 |
| Net investment income | | $521,857 | $389,215 |
| Net realized gains (losses) | | (40,911,996) | 104,146,024 |
| Net change in unrealized appreciation (depreciation) | + | 43,145,274 | (92,914,743) |
| Increase in net assets from operations | | 2,755,135 | 11,620,496 |
| Distributions to Shareholders | |
| Total distributions | | ($105,061,725) | ($82,566,358) |
| Transactions in Fund Shares | | | |
| | | 11/1/18-10/31/19 | 11/1/17-10/31/18 |
| | | SHARES | VALUE | SHARES | VALUE |
| Shares sold | | 8,709,089 | $139,266,609 | 2,529,047 | $55,468,967 |
| Shares reinvested | | 5,236,122 | 80,112,670 | 2,938,036 | 61,434,349 |
| Shares redeemed | + | (6,703,704) | (111,336,125) | (5,346,501) | (117,486,079) |
| Net transactions in fund shares | | 7,241,507 | $108,043,154 | 120,582 | ($582,763) |
| Shares Outstanding and Net Assets | | | |
| | | 11/1/18-10/31/19 | 11/1/17-10/31/18 |
| | | SHARES | NET ASSETS | SHARES | NET ASSETS |
| Beginning of period | | 27,475,160 | $573,406,195 | 27,354,578 | $644,934,820 |
| Total increase or decrease | + | 7,241,507 | 5,736,564 | 120,582 | (71,528,625) |
| End of period | | 34,716,667 | $579,142,759 | 27,475,160 | $573,406,195 |
Schwab Active Equity Funds | Annual Report
Schwab Hedged Equity Fund
Financial Statements
Financial Highlights
| | 11/1/18–
10/31/19 | 11/1/17–
10/31/18 | 11/1/16–
10/31/17 | 11/1/15–
10/31/16 | 11/1/14–
10/31/15 | |
| Per-Share Data |
| Net asset value at beginning of period | $16.89 | $17.65 | $16.25 | $17.46 | $19.02 | |
| Income (loss) from investment operations: | | | | | | |
| Net investment income (loss)1 | 0.07 | 0.08 | 0.03 | 0.03 | (0.01) | |
| Net realized and unrealized gains (losses) | (0.34) | 0.24 | 1.85 | 0.49 | 0.89 | |
| Total from investment operations | (0.27) | 0.32 | 1.88 | 0.52 | 0.88 | |
| Less distributions: | | | | | | |
| Distributions from net investment income | (0.08) | (0.01) | — | (0.12) | — | |
| Distributions from net realized gains | (1.05) | (1.07) | (0.48) | (1.61) | (2.44) | |
| Total distributions | (1.13) | (1.08) | (0.48) | (1.73) | (2.44) | |
| Net asset value at end of period | $15.49 | $16.89 | $17.65 | $16.25 | $17.46 | |
| Total return | (1.31%) | 1.75% | 11.71% | 3.55% | 4.84% | |
| Ratios/Supplemental Data |
| Ratios to average net assets: | | | | | | |
| Net operating expenses (including dividend expense on short sales) | 1.93% | 1.66% | 1.64% | 1.85% | 1.82% | |
| Net operating expenses (excluding dividend expense on short sales) | 1.34%2 | 1.33% | 1.33% | 1.57%3 | 1.54%3 | |
| Gross operating expenses | 1.95% | 1.67% | 1.65% | 1.87% | 1.84% | |
| Net investment income (loss) | 0.46% | 0.43% | 0.16% | 0.22% | (0.06%) | |
| Portfolio turnover rate | 176% | 180% | 163% | 142% | 146% | |
| Net assets, end of period (x 1,000,000) | $182 | $300 | $252 | $204 | $212 | |
| |
1
Calculated based on the average shares outstanding during the period.
2
The ratio of net operating expenses would have been 1.33%, if interest expense had not been incurred.
3
The ratios of net operating expenses would have been 1.33%, if stock loan fees on short sales had not been incurred.
Schwab Active Equity Funds | Annual Report
Schwab Hedged Equity Fund
Portfolio Holdings as of October 31, 2019
This section shows all the securities in the fund’s portfolio and their values as of the report date.
The fund files its complete schedule of portfolio holdings with the U.S. Securities and Exchange Commission (SEC) for the first and third quarters of each fiscal year on Form N-Q. Effective March 31, 2019, Form N-PORT Part F has replaced Form N-Q. The fund’s Form N-Q and Form N-PORT Part F are available on the SEC’s website atwww.sec.gov. The fund also makes available its complete schedule of portfolio holdings 15 to 20 days after calendar quarters on the fund’s website atwww.schwabfunds.com/schwabfunds_prospectus.
| Security | Number
of Shares | Value ($) |
| Common Stock99.5% of net assets |
| |
| Automobiles & Components 0.9% |
| Dana, Inc. | 82,787 | 1,343,633 |
| Tenneco, Inc., Class A | 18,585 | 233,985 |
| | | 1,577,618 |
| |
| Banks 6.3% |
| Bank of America Corp.(a) | 20,285 | 634,312 |
| CIT Group, Inc. | 9,236 | 396,132 |
| Citigroup, Inc.(a) | 55,689 | 4,001,812 |
| First BanCorp(a) | 197,147 | 2,073,986 |
| Flagstar Bancorp, Inc. | 9,065 | 329,422 |
| MGIC Investment Corp. | 45,154 | 619,061 |
| Popular, Inc. | 26,005 | 1,416,232 |
| Radian Group, Inc. | 62,952 | 1,580,095 |
| TCF Financial Corp. | 12,096 | 478,881 |
| | | 11,529,933 |
| |
| Capital Goods 9.1% |
| Advanced Drainage Systems, Inc.(a) | 8,132 | 301,047 |
| Allison Transmission Holdings, Inc.(a) | 72,161 | 3,146,941 |
| BMC Stock Holdings, Inc. * | 9,756 | 263,314 |
| Builders FirstSource, Inc. * | 36,837 | 832,885 |
| Cummins, Inc. | 6,077 | 1,048,161 |
| Dover Corp.(a) | 23,130 | 2,402,976 |
| Eaton Corp. plc | 14,573 | 1,269,454 |
| Gibraltar Industries, Inc. * | 14,570 | 775,561 |
| HD Supply Holdings, Inc. * | 2,959 | 116,999 |
| HEICO Corp. | 9,829 | 1,212,309 |
| ITT, Inc. | 20,037 | 1,191,200 |
| Lockheed Martin Corp. | 3,886 | 1,463,778 |
| Masco Corp. | 6,714 | 310,522 |
| Masonite International Corp. * | 5,889 | 361,643 |
| Moog, Inc., Class A | 4,118 | 344,718 |
| Oshkosh Corp. | 1,802 | 153,855 |
| Parker-Hannifin Corp. | 2,113 | 387,714 |
| Patrick Industries, Inc. * | 6,091 | 300,956 |
| Spirit AeroSystems Holdings, Inc., Class A | 7,886 | 645,233 |
| | | 16,529,266 |
| |
| Commercial & Professional Services 1.9% |
| ASGN, Inc. * | 12,815 | 814,906 |
| Clean Harbors, Inc. * | 2,724 | 224,621 |
| Korn Ferry | 20,811 | 763,556 |
| McGrath RentCorp | 2,904 | 221,604 |
| RELX plc ADR | 18,199 | 440,234 |
| Robert Half International, Inc. | 13,508 | 773,603 |
| TriNet Group, Inc. * | 6,096 | 323,027 |
| | | 3,561,551 |
| |
| Security | Number
of Shares | Value ($) |
| Consumer Durables & Apparel 0.8% |
| Sony Corp. ADR | 2,115 | 128,655 |
| Tempur Sealy International, Inc. * | 15,149 | 1,377,802 |
| | | 1,506,457 |
| |
| Consumer Services 2.5% |
| Boyd Gaming Corp. | 38,010 | 1,035,773 |
| Career Education Corp. * | 29,615 | 419,348 |
| Darden Restaurants, Inc. | 5,746 | 645,104 |
| K12, Inc. *(a) | 69,675 | 1,378,868 |
| Starbucks Corp. | 12,611 | 1,066,386 |
| | | 4,545,479 |
| |
| Diversified Financials 5.7% |
| Affiliated Managers Group, Inc.(a) | 5,921 | 472,970 |
| Ameriprise Financial, Inc. | 8,488 | 1,280,754 |
| Capital One Financial Corp.(a) | 27,321 | 2,547,683 |
| E*TRADE Financial Corp. | 12,510 | 522,793 |
| Evercore, Inc., Class A | 17,285 | 1,272,867 |
| LPL Financial Holdings, Inc. | 5,566 | 449,955 |
| Macquarie Group Ltd | 3,412 | 315,235 |
| Morgan Stanley | 5,559 | 255,992 |
| MSCI, Inc. | 1,398 | 327,915 |
| Navient Corp. | 63,989 | 881,129 |
| OneMain Holdings, Inc. | 6,877 | 275,080 |
| Synchrony Financial(a) | 43,370 | 1,533,997 |
| T. Rowe Price Group, Inc. | 1,673 | 193,733 |
| | | 10,330,103 |
| |
| Energy 6.1% |
| Cabot Oil & Gas Corp. | 18,248 | 340,143 |
| Chevron Corp. | 11,877 | 1,379,395 |
| ConocoPhillips(a) | 56,045 | 3,093,684 |
| Continental Resources, Inc. *(a) | 34,028 | 1,002,805 |
| CVR Energy, Inc. | 27,477 | 1,302,959 |
| Exxon Mobil Corp. | 14,025 | 947,669 |
| Helmerich & Payne, Inc. | 12,595 | 472,313 |
| HollyFrontier Corp. | 10,133 | 556,707 |
| NexTier Oilfield Solutions, Inc. * | 47,974 | 207,248 |
| Patterson-UTI Energy, Inc. | 34,335 | 285,667 |
| Phillips 66(a) | 13,411 | 1,566,673 |
| | | 11,155,263 |
| |
| Food & Staples Retailing 1.3% |
| Casey's General Stores, Inc. | 2,864 | 489,200 |
| Koninklijke Ahold Delhaize N.V. ADR | 28,638 | 712,800 |
| Performance Food Group Co. * | 6,344 | 270,318 |
| Walmart, Inc.(a) | 7,499 | 879,332 |
| | | 2,351,650 |
| |
| Food, Beverage & Tobacco 2.3% |
| Cia Cervecerias Unidas S.A. ADR(a) | 57,445 | 1,140,283 |
| Coca-Cola Consolidated, Inc. | 2,073 | 568,748 |
Schwab Active Equity Funds | Annual Report
Schwab Hedged Equity Fund
Portfolio Holdings as of October 31, 2019 (continued)
| Security | Number
of Shares | Value ($) |
| Darling Ingredients, Inc. * | 75,613 | 1,459,331 |
| Flowers Foods, Inc. | 38,539 | 837,067 |
| Philip Morris International, Inc. | 2,640 | 215,002 |
| | | 4,220,431 |
| |
| Health Care Equipment & Services 5.1% |
| Anthem, Inc. | 3,009 | 809,662 |
| CVS Health Corp.(a) | 25,460 | 1,690,289 |
| HCA Healthcare, Inc. | 8,776 | 1,171,947 |
| Hill-Rom Holdings, Inc. | 12,247 | 1,282,138 |
| HMS Holdings Corp. * | 8,204 | 268,189 |
| Hologic, Inc. *(a) | 28,335 | 1,368,864 |
| Medtronic plc | 8,088 | 880,783 |
| Natus Medical, Inc. * | 10,496 | 353,505 |
| Steris plc | 4,418 | 625,456 |
| Varian Medical Systems, Inc. * | 3,724 | 449,897 |
| Veeva Systems, Inc., Class A * | 2,709 | 384,218 |
| | | 9,284,948 |
| |
| Household & Personal Products 1.3% |
| Kimberly-Clark de Mexico SAB de CV | 5,816 | 57,985 |
| Medifast, Inc.(a) | 13,884 | 1,540,291 |
| The Procter & Gamble Co. | 2,903 | 361,453 |
| Unilever N.V. | 8,190 | 485,176 |
| | | 2,444,905 |
| |
| Insurance 1.9% |
| American National Insurance Co.(a) | 3,873 | 464,683 |
| Loews Corp.(a) | 35,773 | 1,752,877 |
| MetLife, Inc. | 15,775 | 738,112 |
| The Allstate Corp.(a) | 4,021 | 427,915 |
| | | 3,383,587 |
| |
| Materials 2.3% |
| Alcoa Corp. *(a) | 22,004 | 457,463 |
| Axalta Coating Systems Ltd. * | 12,936 | 381,483 |
| Domtar Corp. | 9,902 | 360,334 |
| H.B. Fuller Co. | 11,279 | 550,415 |
| Innospec, Inc. | 8,057 | 736,087 |
| Kraton Corp. * | 4,593 | 102,975 |
| NewMarket Corp. | 1,463 | 710,272 |
| Reliance Steel & Aluminum Co. | 6,547 | 759,714 |
| Tronox Holdings plc, Class A * | 19,561 | 166,073 |
| | | 4,224,816 |
| |
| Media & Entertainment 8.4% |
| Alphabet, Inc., Class A *(a) | 5,645 | 7,105,926 |
| Altice USA, Inc., Class A * | 4,502 | 139,337 |
| AMC Networks, Inc., Class A *(a) | 13,634 | 593,761 |
| Comcast Corp., Class A | 24,937 | 1,117,676 |
| Discovery, Inc., Class A *(a) | 43,769 | 1,179,793 |
| Facebook, Inc., Class A *(a) | 12,674 | 2,428,972 |
| Live Nation Entertainment, Inc. * | 13,247 | 933,914 |
| Sinclair Broadcast Group, Inc., Class A | 14,240 | 567,322 |
| The Interpublic Group of Cos., Inc. | 18,439 | 401,048 |
| Viacom, Inc., Class B | 38,243 | 824,519 |
| | | 15,292,268 |
| |
| Pharmaceuticals, Biotechnology & Life Sciences 5.5% |
| AbbVie, Inc.(a) | 5,626 | 447,548 |
| Alkermes plc * | 19,292 | 376,773 |
| Astellas Pharma, Inc. | 10,507 | 181,351 |
| Security | Number
of Shares | Value ($) |
| Biogen, Inc. *(a) | 5,244 | 1,566,435 |
| Dicerna Pharmaceuticals, Inc. * | 12,749 | 210,231 |
| Emergent BioSolutions, Inc. * | 22,166 | 1,267,009 |
| Esperion Therapeutics, Inc. * | 5,125 | 203,821 |
| FibroGen, Inc. * | 1,401 | 54,849 |
| Incyte Corp. * | 14,917 | 1,251,835 |
| Invitae Corp. * | 5,621 | 90,554 |
| Jazz Pharmaceuticals plc * | 1,167 | 146,610 |
| Johnson & Johnson(a) | 12,127 | 1,601,249 |
| Novartis AG ADR | 16,935 | 1,480,796 |
| Novo Nordisk A/S ADR | 9,692 | 535,192 |
| Regeneron Pharmaceuticals, Inc. * | 466 | 142,727 |
| Vertex Pharmaceuticals, Inc. * | 2,893 | 565,524 |
| | | 10,122,504 |
| |
| Real Estate 5.8% |
| Alexander & Baldwin, Inc.(a) | 62,766 | 1,475,629 |
| American Tower Corp.(a) | 9,584 | 2,090,079 |
| Boston Properties, Inc.(a) | 26,722 | 3,666,258 |
| Brandywine Realty Trust | 27,413 | 418,871 |
| Colony Capital, Inc.(a) | 60,047 | 336,263 |
| Columbia Property Trust, Inc. | 12,792 | 262,492 |
| CoreCivic, Inc. | 34,648 | 528,728 |
| Paramount Group, Inc. | 75,572 | 1,017,955 |
| PS Business Parks, Inc. | 4,704 | 849,307 |
| | | 10,645,582 |
| |
| Retailing 7.4% |
| Amazon.com, Inc. *(a) | 3,690 | 6,555,876 |
| AutoZone, Inc. * | 493 | 564,179 |
| Best Buy Co., Inc.(a) | 13,302 | 955,483 |
| Expedia Group, Inc. | 8,909 | 1,217,504 |
| LKQ Corp. * | 5,376 | 182,730 |
| Lowe's Cos., Inc. | 6,066 | 677,026 |
| O'Reilly Automotive, Inc. * | 2,370 | 1,032,159 |
| Tailored Brands, Inc. | 56,761 | 263,371 |
| Target Corp. | 1,242 | 132,782 |
| The Home Depot, Inc. | 2,180 | 511,384 |
| The TJX Cos., Inc.(a) | 23,649 | 1,363,365 |
| | | 13,455,859 |
| |
| Semiconductors & Semiconductor Equipment 2.8% |
| Inphi Corp. * | 4,095 | 294,349 |
| Intel Corp.(a) | 21,248 | 1,201,149 |
| Lam Research Corp. | 2,937 | 796,044 |
| NXP Semiconductors N.V. | 4,444 | 505,194 |
| Qorvo, Inc. * | 13,810 | 1,116,676 |
| Xilinx, Inc. | 7,066 | 641,169 |
| Xperi Corp. | 28,448 | 577,637 |
| | | 5,132,218 |
| |
| Software & Services 11.4% |
| Accenture plc, Class A(a) | 5,197 | 963,628 |
| Akamai Technologies, Inc. *(a) | 16,216 | 1,402,684 |
| Atlassian Corp. plc, Class A * | 885 | 106,899 |
| Booz Allen Hamilton Holding Corp. | 5,011 | 352,624 |
| Bottomline Technologies (de), Inc. * | 799 | 32,719 |
| CACI International, Inc., Class A * | 6,324 | 1,414,995 |
| Cadence Design Systems, Inc. *(a) | 18,866 | 1,232,893 |
| Cerence, Inc. * | 8,152 | 126,356 |
| CommVault Systems, Inc. * | 7,693 | 382,111 |
| Cornerstone OnDemand, Inc. * | 11,079 | 648,897 |
| Fortinet, Inc. * | 4,787 | 390,428 |
| Intuit, Inc.(a) | 1,987 | 511,653 |
Schwab Active Equity Funds | Annual Report
Schwab Hedged Equity Fund
Portfolio Holdings as of October 31, 2019 (continued)
| Security | Number
of Shares | Value ($) |
| Mastercard, Inc., Class A | 3,074 | 850,914 |
| Microsoft Corp.(a) | 51,489 | 7,381,978 |
| Nuance Communications, Inc. *(a) | 65,220 | 1,064,391 |
| Oracle Corp.(a) | 12,419 | 676,711 |
| PayPal Holdings, Inc. * | 9,971 | 1,037,981 |
| Progress Software Corp.(a) | 13,299 | 530,364 |
| Synopsys, Inc. * | 992 | 134,664 |
| VeriSign, Inc. * | 1,745 | 331,585 |
| Visa, Inc., Class A | 6,934 | 1,240,215 |
| | | 20,814,690 |
| |
| Technology Hardware & Equipment 5.7% |
| Apple, Inc.(a) | 19,252 | 4,789,127 |
| CDW Corp. | 4,622 | 591,200 |
| Ciena Corp. * | 14,568 | 540,764 |
| Cisco Systems, Inc.(a) | 57,839 | 2,747,931 |
| Jabil, Inc. | 4,569 | 168,231 |
| Keysight Technologies, Inc. * | 5,343 | 539,162 |
| Plantronics, Inc. | 26,054 | 1,027,049 |
| | | 10,403,464 |
| |
| Telecommunication Services 1.4% |
| CenturyLink, Inc. | 37,507 | 485,341 |
| Telefonica S.A. ADR | 60,383 | 463,138 |
| Telekomunikasi Indonesia Persero Tbk PT | 20,942 | 604,805 |
| Verizon Communications, Inc. | 15,686 | 948,532 |
| | | 2,501,816 |
| |
| Transportation 0.5% |
| United Airlines Holdings, Inc. *(a) | 10,597 | 962,631 |
| |
| Utilities 3.1% |
| Ameren Corp. | 3,288 | 255,477 |
| California Water Service Group | 5,867 | 328,376 |
| CenterPoint Energy, Inc. | 5,458 | 158,664 |
| DTE Energy Co. | 7,346 | 935,293 |
| Exelon Corp. | 30,425 | 1,384,033 |
| NextEra Energy, Inc. | 564 | 134,424 |
| NRG Energy, Inc. | 38,109 | 1,528,933 |
| Vistra Energy Corp.(a) | 31,594 | 853,986 |
| | | 5,579,186 |
| Total Common Stock |
| (Cost $166,065,663) | | 181,556,225 |
Schwab Active Equity Funds | Annual Report
Schwab Hedged Equity Fund
Portfolio Holdings as of October 31, 2019 (continued)
In addition to the above, the fund had the following short sale positions at October 31, 2019:
| Security | Number
of Shares | Value ($) |
| Short Sales (39.6%) of net assets |
| |
| Automobiles & Components (2.1%) |
| Dorman Products, Inc. | 17,325 | (1,246,534) |
| Tesla, Inc. | 4,746 | (1,494,610) |
| Visteon Corp. | 11,226 | (1,044,243) |
| | | (3,785,387) |
| |
| Banks (2.6%) |
| BancorpSouth Bank | 21,739 | (666,735) |
| Home BancShares, Inc. | 26,888 | (496,890) |
| PennyMac Financial Services, Inc. | 12,330 | (383,833) |
| Prosperity Bancshares, Inc. | 6,330 | (436,897) |
| TFS Financial Corp. | 52,152 | (1,004,447) |
| United Bankshares, Inc. | 44,528 | (1,760,637) |
| | | (4,749,439) |
| |
| Capital Goods (5.5%) |
| AAON, Inc. | 7,662 | (372,833) |
| Air Lease Corp. | 14,263 | (627,287) |
| Aircastle Ltd. | 46,701 | (1,271,201) |
| Axon Enterprise, Inc. | 5,751 | (294,049) |
| BWX Technologies, Inc. | 5,099 | (296,252) |
| Cubic Corp. | 13,536 | (998,145) |
| Generac Holdings, Inc. | 983 | (94,938) |
| SiteOne Landscape Supply, Inc. | 7,595 | (668,816) |
| Sunrun, Inc. | 15,568 | (241,927) |
| Trex Co., Inc. | 8,056 | (708,042) |
| Trinity Industries, Inc. | 62,962 | (1,245,388) |
| Univar Solutions, Inc. | 39,809 | (854,301) |
| Watsco, Inc. | 1,665 | (293,539) |
| Welbilt, Inc. | 105,416 | (1,998,687) |
| | | (9,965,405) |
| |
| Commercial & Professional Services (1.7%) |
| Equifax, Inc. | 11,974 | (1,636,965) |
| Stericycle, Inc. | 26,838 | (1,545,869) |
| | | (3,182,834) |
| |
| Consumer Durables & Apparel (0.9%) |
| Callaway Golf Co. | 37,398 | (756,187) |
| Capri Holdings Ltd. | 20,467 | (635,910) |
| LGI Homes, Inc. | 2,937 | (230,496) |
| | | (1,622,593) |
| |
| Consumer Services (0.5%) |
| Domino's Pizza, Inc. | 361 | (98,055) |
| Papa John's International, Inc. | 2,871 | (168,097) |
| Shake Shack, Inc., Class A | 7,623 | (627,220) |
| | | (893,372) |
| |
| Diversified Financials (3.1%) |
| Eaton Vance Corp. | 27,262 | (1,243,147) |
| Federated Investors, Inc., Class B | 32,662 | (1,043,224) |
| FirstCash, Inc. | 3,282 | (276,968) |
| Invesco Ltd. | 65,509 | (1,101,862) |
| Moelis & Co., Class A | 9,374 | (334,464) |
| Security | Number
of Shares | Value ($) |
| Virtu Financial, Inc. | 76,922 | (1,304,597) |
| WisdomTree Investments, Inc. | 59,332 | (303,187) |
| | | (5,607,449) |
| |
| Energy (2.7%) |
| Antero Midstream Corp. | 13,081 | (84,242) |
| Callon Petroleum Co. | 48,028 | (182,506) |
| Cimarex Energy Co. | 5,655 | (238,754) |
| CNX Resources Corp. | 43,748 | (368,796) |
| Concho Resources, Inc. | 2,836 | (191,487) |
| Dril-Quip, Inc. | 12,778 | (524,154) |
| Matador Resources Co. | 65,456 | (910,493) |
| Murphy Oil Corp. | 8,169 | (168,526) |
| Targa Resources Corp. | 57,799 | (2,247,225) |
| | | (4,916,183) |
| |
| Food, Beverage & Tobacco (0.4%) |
| Cal-Maine Foods, Inc. | 15,894 | (634,012) |
| National Beverage Corp. | 1,976 | (86,865) |
| | | (720,877) |
| |
| Health Care Equipment & Services (1.2%) |
| Acadia Healthcare Co., Inc. | 26,667 | (799,743) |
| Addus HomeCare Corp. | 2,148 | (180,883) |
| Avanos Medical, Inc. | 10,582 | (466,031) |
| Cantel Medical Corp. | 8,009 | (583,776) |
| Nevro Corp. | 1,597 | (137,662) |
| | | (2,168,095) |
| |
| Insurance (0.3%) |
| Everest Re Group Ltd. | 1,199 | (308,251) |
| WR Berkley Corp. | 3,574 | (249,822) |
| | | (558,073) |
| |
| Materials (2.2%) |
| Linde plc | 5,548 | (1,100,446) |
| Louisiana-Pacific Corp. | 52,719 | (1,540,976) |
| Owens-Illinois, Inc. | 49,063 | (417,036) |
| Royal Gold, Inc. | 2,424 | (279,827) |
| The Chemours Co. | 41,813 | (686,151) |
| | | (4,024,436) |
| |
| Media & Entertainment (2.0%) |
| Charter Communications, Inc. | 1,347 | (630,208) |
| Netflix, Inc. | 3,418 | (982,367) |
| The Walt Disney Co. | 9,867 | (1,281,921) |
| Zillow Group, Inc., Class A | 20,911 | (677,307) |
| | | (3,571,803) |
| |
| Pharmaceuticals, Biotechnology & Life Sciences (0.3%) |
| Bluebird Bio, Inc. | 3,249 | (263,169) |
| Sage Therapeutics, Inc. | 2,723 | (369,375) |
| | | (632,544) |
| |
| Real Estate (2.6%) |
| Agree Realty Corp. | 12,316 | (970,131) |
| Pebblebrook Hotel Trust | 67,945 | (1,746,866) |
| Redfin Corp. | 24,283 | (422,281) |
Schwab Active Equity Funds | Annual Report
Schwab Hedged Equity Fund
Portfolio Holdings as of October 31, 2019 (continued)
| Security | Number
of Shares | Value ($) |
| Washington Real Estate Investment Trust | 22,579 | (700,401) |
| WP Carey, Inc. | 9,448 | (869,783) |
| | | (4,709,462) |
| |
| Retailing (2.4%) |
| Five Below, Inc. | 4,348 | (543,978) |
| GrubHub, Inc. | 9,149 | (311,615) |
| Ollie's Bargain Outlet Holdings, Inc. | 4,409 | (281,647) |
| The Gap, Inc. | 59,552 | (968,316) |
| Tiffany & Co. | 4,414 | (549,587) |
| Urban Outfitters, Inc. | 13,335 | (382,714) |
| Wayfair, Inc., Class A | 16,105 | (1,324,314) |
| | | (4,362,171) |
| |
| Semiconductors & Semiconductor Equipment (2.1%) |
| Advanced Energy Industries, Inc. | 13,480 | (796,668) |
| Brooks Automation, Inc. | 7,030 | (298,564) |
| First Solar, Inc. | 19,335 | (1,001,360) |
| Marvell Technology Group Ltd. | 17,036 | (415,508) |
| NVIDIA Corp. | 2,257 | (453,702) |
| Skyworks Solutions, Inc. | 10,115 | (921,072) |
| | | (3,886,874) |
| |
| Software & Services (3.4%) |
| 8x8, Inc. | 22,013 | (425,291) |
| Alliance Data Systems Corp. | 1,774 | (177,400) |
| Appian Corp. | 7,852 | (350,513) |
| Envestnet, Inc. | 11,946 | (746,506) |
| Guidewire Software, Inc. | 11,452 | (1,291,099) |
| LivePerson, Inc. | 15,559 | (638,697) |
| LiveRamp Holdings, Inc. | 31,818 | (1,243,766) |
| Nutanix, Inc. | 3,088 | (90,231) |
| Rapid7, Inc. | 1,199 | (60,058) |
| Twilio, Inc., Class A | 7,074 | (683,065) |
| Varonis Systems, Inc. | 8,193 | (586,209) |
| | | (6,292,835) |
| |
| Security | Number
of Shares | Value ($) |
| Technology Hardware & Equipment (2.0%) |
| CommScope Holding Co., Inc. | 40,191 | (450,139) |
| IPG Photonics Corp. | 13,258 | (1,780,284) |
| Knowles Corp. | 4,458 | (96,204) |
| Littelfuse, Inc. | 526 | (92,350) |
| ViaSat, Inc. | 6,119 | (421,232) |
| Western Digital Corp. | 15,579 | (804,655) |
| | | (3,644,864) |
| |
| Telecommunication Services (0.5%) |
| Bandwidth, Inc. | 4,287 | (240,715) |
| Iridium Communications, Inc. | 7,000 | (171,290) |
| Vonage Holdings Corp. | 53,696 | (524,610) |
| | | (936,615) |
| |
| Transportation (0.6%) |
| Copa Holdings S.A., Class A | 4,728 | (481,027) |
| Knight-Swift Transportation Holdings, Inc. | 15,133 | (551,749) |
| | | (1,032,776) |
| |
| Utilities (0.5%) |
| Aqua America, Inc. | 4,125 | (186,986) |
| Avangrid, Inc. | 5,046 | (252,552) |
| Pattern Energy Group, Inc. | 17,529 | (491,338) |
| | | (930,876) |
| Total Short Sales |
| (Proceeds $73,852,784) | | (72,194,963) |
| * | Non-income producing security. |
| (a) | All or a portion of this security is held as collateral for short sales. |
| | |
| ADR — | American Depositary Receipt |
The following is a summary of the inputs used to value the fund’s investments as of October 31, 2019 (see financial note 2(a) for additional information):
| Description | Quoted Prices in
Active Markets for
Identical Assets
(Level 1) | Other Significant
Observable Inputs
(Level 2) | Significant
Unobservable Inputs
(Level 3) | Total | |
| Assets | | | | | |
| Common Stock1 | $181,556,225 | $— | $— | $181,556,225 | |
| Liabilities | | | | | |
| Short Sales1 | (72,194,963) | — | — | (72,194,963) | |
| Total | $109,361,262 | $— | $— | $109,361,262 | |
| 1 | As categorized in Portfolio Holdings. |
Schwab Active Equity Funds | Annual Report
Schwab Hedged Equity Fund
Statement of Assets and Liabilities
As of October 31, 2019
| Assets |
| Investments in unaffiliated issuers, at value (cost $166,065,663) | | $181,556,225 |
| Deposit with broker for short sales | | 73,032,381 |
| Receivables: | | |
| Investments sold | | 2,654,165 |
| Fund shares sold | | 122,688 |
| Dividends | | 101,195 |
| Foreign tax reclaims | | 1,169 |
| Prepaid expenses | + | 15,907 |
| Total assets | | 257,483,730 |
| Liabilities |
| Securities sold short, at value (proceeds $73,852,784) | | 72,194,963 |
| Payables: | | |
| Investments bought | | 2,161,716 |
| Investment adviser and administrator fees | | 160,316 |
| Shareholder service fees | | 33,151 |
| Independent trustees’ fees | | 7 |
| Fund shares redeemed | | 286,568 |
| Due to custodian | | 181,263 |
| Dividends on short sales | | 66,843 |
| Accrued expenses | + | 10,125 |
| Total liabilities | | 75,094,952 |
| Net Assets |
| Total assets | | 257,483,730 |
| Total liabilities | – | 75,094,952 |
| Net assets | | $182,388,778 |
| Net Assets by Source | | |
| Capital received from investors | | 180,360,193 |
| Total distributable earnings | | 2,028,585 |
| Net Asset Value (NAV) |
| Net Assets | ÷ | Shares
Outstanding | = | NAV |
| $182,388,778 | | 11,774,285 | | $15.49 |
| | | | | |
Schwab Active Equity Funds | Annual Report
Schwab Hedged Equity Fund
Statement of Operations
For the period November 1, 2018 through October 31, 2019
| Investment Income |
| Dividends (net of foreign withholding tax of $23,488) | | $3,816,922 |
| Rebates on short sales, net of fees | + | 1,878,415 |
| Total investment income | | 5,695,337 |
| Expenses |
| Investment adviser and administrator fees | | 2,503,857 |
| Shareholder service fees | | 498,186 |
| Dividends on short sales | | 1,409,752 |
| Portfolio accounting fees | | 58,112 |
| Custodian fees | | 42,028 |
| Professional fees | | 38,350 |
| Registration fees | | 35,752 |
| Transfer agent fees | | 15,061 |
| Interest expense | | 13,097 |
| Shareholder reports | | 11,775 |
| Independent trustees’ fees | | 9,211 |
| Other expenses | + | 7,143 |
| Total expenses | | 4,642,324 |
| Expense reduction by CSIM and its affiliates | – | 47,922 |
| Net expenses | – | 4,594,402 |
| Net investment income | | 1,100,935 |
| Realized and Unrealized Gains (Losses) |
| Net realized losses on investments | | (9,942,343) |
| Net realized gains on futures contracts | | 83,499 |
| Net realized losses on short sales | + | (5,953,841) |
| Net realized losses | | (15,812,685) |
| Net change in unrealized appreciation (depreciation) on investments | | 16,749,612 |
| Net change in unrealized appreciation (depreciation) on futures contracts | | 27,930 |
| Net change in unrealized appreciation (depreciation) on short sales | + | (8,857,963) |
| Net change in unrealized appreciation (depreciation) | + | 7,919,579 |
| Net realized and unrealized losses | | (7,893,106) |
| Decrease in net assets resulting from operations | | ($6,792,171) |
Schwab Active Equity Funds | Annual Report
Schwab Hedged Equity Fund
Statement of Changes in Net Assets
For the current and prior report periods
| Operations | |
| | 11/1/18-10/31/19 | 11/1/17-10/31/18 |
| Net investment income | | $1,100,935 | $1,176,893 |
| Net realized gains (losses) | | (15,812,685) | 18,114,481 |
| Net change in unrealized appreciation (depreciation) | + | 7,919,579 | (16,574,229) |
| Increase (decrease) in net assets from operations | | (6,792,171) | 2,717,145 |
| Distributions to Shareholders | |
| Total distributions | | ($19,341,478) | ($15,243,329) |
| Transactions in Fund Shares | | | |
| | | 11/1/18-10/31/19 | 11/1/17-10/31/18 |
| | | SHARES | VALUE | SHARES | VALUE |
| Shares sold | | 3,932,131 | $60,687,628 | 6,194,796 | $107,567,531 |
| Shares reinvested | | 1,047,501 | 15,597,289 | 728,755 | 12,461,727 |
| Shares redeemed | + | (10,987,256) | (168,052,659) | (3,400,784) | (58,925,303) |
| Net transactions in fund shares | | (6,007,624) | ($91,767,742) | 3,522,767 | $61,103,955 |
| Shares Outstanding and Net Assets | | | |
| | | 11/1/18-10/31/19 | 11/1/17-10/31/18 |
| | | SHARES | NET ASSETS | SHARES | NET ASSETS |
| Beginning of period | | 17,781,909 | $300,290,169 | 14,259,142 | $251,712,398 |
| Total increase or decrease | + | (6,007,624) | (117,901,391) | 3,522,767 | 48,577,771 |
| End of period | | 11,774,285 | $182,388,778 | 17,781,909 | $300,290,169 |
Schwab Active Equity Funds | Annual Report
Financial Statements
Financial Highlights
| | 11/1/18–
10/31/19 | 11/1/17–
10/31/18 | 11/1/16–
10/31/17 | 11/1/15–
10/31/16 | 11/1/14–
10/31/15 | |
| Per-Share Data |
| Net asset value at beginning of period | $25.85 | $25.44 | $21.56 | $26.68 | $28.19 | |
| Income (loss) from investment operations: | | | | | | |
| Net investment income (loss)1 | 0.26 | 0.23 | 0.21 | 0.19 | 0.14 | |
| Net realized and unrealized gains (losses) | 1.27 | 1.96 | 4.24 | (1.52) | 1.78 | |
| Total from investment operations | 1.53 | 2.19 | 4.45 | (1.33) | 1.92 | |
| Less distributions: | | | | | | |
| Distributions from net investment income | (0.24) | (0.24) | (0.20) | (0.16) | (0.21) | |
| Distributions from net realized gains | (2.06) | (1.54) | (0.37) | (3.63) | (3.22) | |
| Total distributions | (2.30) | (1.78) | (0.57) | (3.79) | (3.43) | |
| Net asset value at end of period | $25.08 | $25.85 | $25.44 | $21.56 | $26.68 | |
| Total return | 6.51% | 9.13% | 21.10% | (5.78%) | 7.26% | |
| Ratios/Supplemental Data |
| Ratios to average net assets: | | | | | | |
| Net operating expenses | 0.80% | 0.80% | 0.81% | 0.80% | 0.79% | |
| Gross operating expenses | 0.80% | 0.80% | 0.81% | 0.80% | 0.80% | |
| Net investment income (loss) | 1.05% | 0.91% | 0.89% | 0.82% | 0.52% | |
| Portfolio turnover rate | 45% | 45% | 42% | 54% | 75% | |
| Net assets, end of period (x 1,000,000) | $779 | $826 | $853 | $853 | $1,118 | |
| |
1
Calculated based on the average shares outstanding during the period.
Schwab Active Equity Funds | Annual Report
Portfolio Holdings as of October 31, 2019
This section shows all the securities in the fund’s portfolio and their values as of the report date.
The fund files its complete schedule of portfolio holdings with the U.S. Securities and Exchange Commission (SEC) for the first and third quarters of each fiscal year on Form N-Q. Effective March 31, 2019, Form N-PORT Part F has replaced Form N-Q. The fund’s Form N-Q and Form N-PORT Part F are available on the SEC’s website atwww.sec.gov. The fund also makes available its complete schedule of portfolio holdings 15 to 20 days after calendar quarters on the fund’s website atwww.schwabfunds.com/schwabfunds_prospectus.
| Security | Number
of Shares | Value ($) |
| Common Stock99.6% of net assets |
| |
| Australia 0.7% |
| Cochlear Ltd. | 35,715 | 5,210,461 |
| |
| Denmark 3.0% |
| Coloplast A/S, Class B | 29,012 | 3,492,926 |
| Novo Nordisk A/S, Class B | 354,426 | 19,489,423 |
| | | 22,982,349 |
| |
| France 0.2% |
| Sanofi | 17,110 | 1,577,321 |
| |
| Germany 0.3% |
| Eckert & Ziegler AG | 6,977 | 1,222,887 |
| Fresenius SE & Co. KGaA | 15,284 | 804,783 |
| | | 2,027,670 |
| |
| Hong Kong 0.6% |
| China Medical System Holdings Ltd. | 2,476,000 | 3,357,762 |
| Consun Pharmaceutical Group Ltd. | 774,000 | 463,301 |
| Livzon Pharmaceutical Group, Inc., Class H | 254,000 | 741,765 |
| | | 4,562,828 |
| |
| Ireland 5.3% |
| Horizon Therapeutics plc * | 216,927 | 6,271,359 |
| ICON plc * | 7,390 | 1,085,591 |
| Medtronic plc | 252,433 | 27,489,954 |
| Steris plc | 48,135 | 6,814,472 |
| | | 41,661,376 |
| |
| Italy 0.0% |
| DiaSorin S.p.A. | 3,424 | 386,059 |
| |
| Japan 4.2% |
| Hoya Corp. | 191,600 | 16,933,074 |
| Mani, Inc. | 53,100 | 1,401,868 |
| Mochida Pharmaceutical Co., Ltd. | 13,700 | 546,738 |
| NichiiGakkan Co., Ltd. | 199,800 | 3,387,502 |
| PeptiDream, Inc. * | 14,400 | 722,789 |
| Shionogi & Co., Ltd. | 114,800 | 6,890,626 |
| Ship Healthcare Holdings, Inc. | 8,000 | 340,974 |
| Takara Bio, Inc. | 98,000 | 1,998,539 |
| Torii Pharmaceutical Co., Ltd. | 15,000 | 400,277 |
| | | 32,622,387 |
| |
| Sweden 0.3% |
| Vitrolife AB | 167,777 | 2,617,748 |
| |
| Security | Number
of Shares | Value ($) |
| Switzerland 9.0% |
| Lonza Group AG * | 26,108 | 9,410,170 |
| Novartis AG | 275,104 | 24,037,266 |
| Roche Holding AG | 107,777 | 32,436,113 |
| Sonova Holding AG | 19,634 | 4,505,577 |
| | | 70,389,126 |
| |
| United Kingdom 1.5% |
| GlaxoSmithKline plc | 360,307 | 8,252,809 |
| Smith & Nephew plc | 167,055 | 3,586,071 |
| | | 11,838,880 |
| |
| United States 74.5% |
| Abbott Laboratories | 287,700 | 24,054,597 |
| AbbVie, Inc. | 309,631 | 24,631,146 |
| Agilent Technologies, Inc. | 232,231 | 17,591,498 |
| Alexion Pharmaceuticals, Inc. * | 112,440 | 11,851,176 |
| Amedisys, Inc. * | 20,282 | 2,606,643 |
| Amgen, Inc. | 159,852 | 34,088,439 |
| AMN Healthcare Services, Inc. * | 13,344 | 784,093 |
| Anthem, Inc. | 54,591 | 14,689,346 |
| Baxter International, Inc. | 104,929 | 8,048,054 |
| Bio-Techne Corp. | 34,013 | 7,080,486 |
| Biogen, Inc. * | 73,662 | 22,003,576 |
| Bristol-Myers Squibb Co. | 290,238 | 16,650,954 |
| Celgene Corp. * | 72,423 | 7,823,857 |
| Chemed Corp. | 3,243 | 1,277,450 |
| Cigna Corp. * | 4,439 | 792,184 |
| CVS Health Corp. | 41,046 | 2,725,044 |
| Danaher Corp. | 89,857 | 12,384,092 |
| DENTSPLY SIRONA, Inc. | 86,525 | 4,739,840 |
| Edwards Lifesciences Corp. * | 20,836 | 4,966,886 |
| Eli Lilly & Co. | 164,358 | 18,728,594 |
| Exelixis, Inc. * | 117,105 | 1,809,272 |
| Gilead Sciences, Inc. | 349,829 | 22,287,606 |
| HCA Healthcare, Inc. | 78,904 | 10,536,840 |
| Hill-Rom Holdings, Inc. | 80,506 | 8,428,173 |
| Hologic, Inc. * | 274,754 | 13,273,366 |
| IDEXX Laboratories, Inc. * | 10,008 | 2,852,380 |
| Incyte Corp. * | 139,152 | 11,677,636 |
| Integer Holdings Corp. * | 4,744 | 367,375 |
| Jazz Pharmaceuticals plc * | 40,400 | 5,075,452 |
| Johnson & Johnson | 480,164 | 63,400,855 |
| Lantheus Holdings, Inc. * | 14,212 | 296,320 |
| McKesson Corp. | 61,878 | 8,229,774 |
| Merck & Co., Inc. | 584,714 | 50,671,315 |
| Meridian Bioscience, Inc. | 11,131 | 108,973 |
| Molina Healthcare, Inc. * | 66,320 | 7,801,885 |
| Perrigo Co., plc | 6,993 | 370,769 |
| Pfizer, Inc. | 1,045,481 | 40,115,106 |
| Regeneron Pharmaceuticals, Inc. * | 2,576 | 788,977 |
| Repligen Corp. * | 7,000 | 556,430 |
| Stryker Corp. | 60,075 | 12,992,420 |
| Teleflex, Inc. | 3,446 | 1,197,175 |
| Tenet Healthcare Corp. * | 71,527 | 1,812,494 |
| The Cooper Cos., Inc. | 5,293 | 1,540,263 |
Schwab Active Equity Funds | Annual Report
Portfolio Holdings as of October 31, 2019 (continued)
| Security | Number
of Shares | Value ($) |
| Thermo Fisher Scientific, Inc. | 87,504 | 26,424,458 |
| UnitedHealth Group, Inc. | 107,731 | 27,223,624 |
| Varex Imaging Corp. * | 13,307 | 399,343 |
| Veeva Systems, Inc., Class A * | 8,564 | 1,214,632 |
| Veracyte, Inc. * | 41,655 | 955,149 |
| Vertex Pharmaceuticals, Inc. * | 35,715 | 6,981,568 |
| Zoetis, Inc. | 101,824 | 13,025,326 |
| | | 579,932,911 |
| Total Common Stock |
| (Cost $534,266,449) | | 775,809,116 |
Security
Rate, Maturity Date | Face Amount
Local Currency | Value ($) |
| Short-Term Investments0.1% of net assets |
| |
| Time Deposits 0.1% |
| Brown Brothers Harriman |
| New Zealand Dollar | | |
| 0.50%, 11/01/19(a) | 3 | 2 |
| Hong Kong Dollar | | |
| 2.30%, 11/01/19(a) | 9 | 1 |
Security
Rate, Maturity Date | Face Amount
Local Currency | Value ($) |
| Sumitomo Mitsui Banking Corp. |
| U.S. Dollar | | |
| 1.18%, 11/01/19(a) | 864,791 | 864,791 |
| Total Short-Term Investments |
| (Cost $864,794) | | 864,794 |
| * | Non-income producing security. |
| (a) | The rate shown is the current daily overnight rate. |
The following is a summary of the inputs used to value the fund’s investments as of October 31, 2019 (see financial note 2(a) for additional information):
| Description | Quoted Prices in
Active Markets for
Identical Assets
(Level 1) | Other Significant
Observable Inputs
(Level 2) | Significant
Unobservable Inputs
(Level 3) | Total | |
| Assets | | | | | |
| Common Stock1 | $621,594,287 | $— | $— | $621,594,287 | |
| Australia | — | 5,210,461 | — | 5,210,461 | |
| Denmark | — | 22,982,349 | — | 22,982,349 | |
| France | — | 1,577,321 | — | 1,577,321 | |
| Germany | — | 2,027,670 | — | 2,027,670 | |
| Hong Kong | — | 4,562,828 | — | 4,562,828 | |
| Italy | — | 386,059 | — | 386,059 | |
| Japan | — | 32,622,387 | — | 32,622,387 | |
| Sweden | — | 2,617,748 | — | 2,617,748 | |
| Switzerland | — | 70,389,126 | — | 70,389,126 | |
| United Kingdom | — | 11,838,880 | — | 11,838,880 | |
| Short-Term Investments1 | — | 864,794 | — | 864,794 | |
| Total | $621,594,287 | $155,079,623 | $— | $776,673,910 | |
| 1 | As categorized in Portfolio Holdings. |
Schwab Active Equity Funds | Annual Report
Statement of Assets and Liabilities
As of October 31, 2019
| Assets |
| Investments in unaffiliated issuers, at value (cost $535,131,243) | | $776,673,910 |
| Deposit with broker for futures contracts | | 462,000 |
| Receivables: | | |
| Investments sold | | 7,303,360 |
| Foreign tax reclaims | | 1,276,303 |
| Dividends | | 706,999 |
| Fund shares sold | | 394,498 |
| Interest | | 29 |
| Prepaid expenses | + | 13,749 |
| Total assets | | 786,830,848 |
| Liabilities |
| Payables: | | |
| Investments bought | | 7,175,078 |
| Investment adviser and administrator fees | | 340,821 |
| Shareholder service fees | | 151,170 |
| Independent trustees’ fees | | 9 |
| Fund shares redeemed | | 310,773 |
| Accrued expenses | + | 99,719 |
| Total liabilities | | 8,077,570 |
| Net Assets |
| Total assets | | 786,830,848 |
| Total liabilities | – | 8,077,570 |
| Net assets | | $778,753,278 |
| Net Assets by Source | | |
| Capital received from investors | | 504,062,828 |
| Total distributable earnings | | 274,690,450 |
| Net Asset Value (NAV) |
| Net Assets | ÷ | Shares
Outstanding | = | NAV |
| $778,753,278 | | 31,047,209 | | $25.08 |
| | | | | |
Schwab Active Equity Funds | Annual Report
Statement of Operations
For the period November 1, 2018 through October 31, 2019
| Investment Income |
| Dividends (net of foreign withholding tax of $407,173) | | $14,702,600 |
| Interest | | 62,521 |
| Securities on loan, net | + | 48,503 |
| Total investment income | | 14,813,624 |
| Expenses |
| Investment adviser and administrator fees | | 4,246,107 |
| Shareholder service fees | | 1,877,813 |
| Portfolio accounting fees | | 88,423 |
| Custodian fees | | 45,671 |
| Shareholder reports | | 37,016 |
| Professional fees | | 32,737 |
| Registration fees | | 32,416 |
| Transfer agent fees | | 32,292 |
| Independent trustees’ fees | | 12,038 |
| Other expenses | + | 21,898 |
| Total expenses | | 6,426,411 |
| Expense reduction by CSIM and its affiliates | – | 32,292 |
| Net expenses | – | 6,394,119 |
| Net investment income | | 8,419,505 |
| Realized and Unrealized Gains (Losses) |
| Net realized gains on investments | | 25,743,292 |
| Net realized gains on futures contracts | | 299,969 |
| Net realized losses on foreign currency transactions | + | (37,789) |
| Net realized gains | | 26,005,472 |
| Net change in unrealized appreciation (depreciation) on investments | | 14,453,288 |
| Net change in unrealized appreciation (depreciation) on foreign currency translations | + | 18,438 |
| Net change in unrealized appreciation (depreciation) | + | 14,471,726 |
| Net realized and unrealized gains | | 40,477,198 |
| Increase in net assets resulting from operations | | $48,896,703 |
Schwab Active Equity Funds | Annual Report
Statement of Changes in Net Assets
For the current and prior report periods
| Operations | |
| | 11/1/18-10/31/19 | 11/1/17-10/31/18 |
| Net investment income | | $8,419,505 | $7,705,996 |
| Net realized gains | | 26,005,472 | 66,847,299 |
| Net change in unrealized appreciation (depreciation) | + | 14,471,726 | (1,223,836) |
| Increase in net assets from operations | | 48,896,703 | 73,329,459 |
| Distributions to Shareholders | |
| Total distributions | | ($73,744,967) | ($58,703,388) |
| Transactions in Fund Shares | | | |
| | | 11/1/18-10/31/19 | 11/1/17-10/31/18 |
| | | SHARES | VALUE | SHARES | VALUE |
| Shares sold | | 2,837,228 | $69,277,171 | 2,353,386 | $60,438,285 |
| Shares reinvested | | 2,764,704 | 64,998,182 | 2,159,882 | 51,772,373 |
| Shares redeemed | + | (6,495,890) | (156,442,620) | (6,109,931) | (154,310,987) |
| Net transactions in fund shares | | (893,958) | ($22,167,267) | (1,596,663) | ($42,100,329) |
| Shares Outstanding and Net Assets | | | |
| | | 11/1/18-10/31/19 | 11/1/17-10/31/18 |
| | | SHARES | NET ASSETS | SHARES | NET ASSETS |
| Beginning of period | | 31,941,167 | $825,768,809 | 33,537,830 | $853,243,067 |
| Total decrease | + | (893,958) | (47,015,531) | (1,596,663) | (27,474,258) |
| End of period | | 31,047,209 | $778,753,278 | 31,941,167 | $825,768,809 |
Schwab Active Equity Funds | Annual Report
Schwab International Core Equity Fund
Financial Statements
Financial Highlights
| | 11/1/18–
10/31/19 | 11/1/17–
10/31/18 | 11/1/16–
10/31/17 | 11/1/15–
10/31/16 | 11/1/14–
10/31/15 | |
| Per-Share Data |
| Net asset value at beginning of period | $9.64 | $11.27 | $9.20 | $9.62 | $9.77 | |
| Income (loss) from investment operations: | | | | | | |
| Net investment income (loss)1 | 0.24 | 0.24 | 0.22 | 0.22 | 0.19 | |
| Net realized and unrealized gains (losses) | 0.41 | (1.58) | 2.08 | (0.45) | (0.01) | |
| Total from investment operations | 0.65 | (1.34) | 2.30 | (0.23) | 0.18 | |
| Less distributions: | | | | | | |
| Distributions from net investment income | (0.25) | (0.26) | (0.23) | (0.19) | (0.15) | |
| Distributions from net realized gains | — | (0.03) | — | — | (0.18) | |
| Total distributions | (0.25) | (0.29) | (0.23) | (0.19) | (0.33) | |
| Net asset value at end of period | $10.04 | $9.64 | $11.27 | $9.20 | $9.62 | |
| Total return | 7.08% | (12.18%) | 25.58% | (2.41%) | 2.05% | |
| Ratios/Supplemental Data |
| Ratios to average net assets: | | | | | | |
| Net operating expenses | 0.86% | 0.86% | 0.86% | 0.86% | 0.86% | |
| Gross operating expenses | 0.87% | 0.89% | 0.90% | 0.91% | 0.92% | |
| Net investment income (loss) | 2.44% | 2.22% | 2.15% | 2.40% | 2.02% | |
| Portfolio turnover rate | 91% | 98% | 85% | 90% | 87% | |
| Net assets, end of period (x 1,000,000) | $976 | $1,166 | $1,227 | $772 | $679 | |
| |
1
Calculated based on the average shares outstanding during the period.
Schwab Active Equity Funds | Annual Report
Schwab International Core Equity Fund
Portfolio Holdings as of October 31, 2019
This section shows all the securities in the fund’s portfolio and their values as of the report date.
The fund files its complete schedule of portfolio holdings with the U.S. Securities and Exchange Commission (SEC) for the first and third quarters of each fiscal year on Form N-Q. Effective March 31, 2019, Form N-PORT Part F has replaced Form N-Q. The fund’s Form N-Q and Form N-PORT Part F are available on the SEC’s website atwww.sec.gov. The fund also makes available its complete schedule of portfolio holdings 15 to 20 days after calendar quarters on the fund’s website atwww.schwabfunds.com/schwabfunds_prospectus.
| Security | Number
of Shares | Value ($) |
| Common Stock99.5% of net assets |
| |
| Australia 7.8% |
| Altium Ltd. | 47,725 | 1,056,497 |
| ASX Ltd. | 48,345 | 2,744,150 |
| Australia & New Zealand Banking Group Ltd. | 1,025,282 | 18,841,717 |
| Beach Energy Ltd. | 3,918,861 | 6,164,285 |
| Bravura Solutions Ltd. | 603,655 | 1,698,243 |
| Coca-Cola Amatil Ltd. | 1,735,581 | 12,179,695 |
| Cochlear Ltd. | 11,401 | 1,663,292 |
| Jumbo Interactive Ltd | 63,641 | 972,937 |
| Macquarie Group Ltd. | 105,073 | 9,702,169 |
| Magellan Financial Group Ltd. | 95,984 | 3,183,591 |
| QBE Insurance Group Ltd. | 741,103 | 6,447,880 |
| Sandfire Resources NL | 438,881 | 1,752,852 |
| Santos Ltd. | 532,667 | 2,979,480 |
| Service Stream Ltd. | 1,012,938 | 1,800,305 |
| Telstra Corp., Ltd. | 2,105,203 | 5,070,264 |
| | | 76,257,357 |
| |
| Austria 0.7% |
| Erste Group Bank AG * | 89,644 | 3,170,516 |
| Wienerberger AG | 146,810 | 3,976,434 |
| | | 7,146,950 |
| |
| Brazil 0.2% |
| YDUQS Part * | 169,800 | 1,661,800 |
| |
| Canada 0.7% |
| Air Canada * | 100,193 | 3,567,726 |
| Kirkland Lake Gold Ltd. | 73,530 | 3,452,912 |
| | | 7,020,638 |
| |
| Denmark 3.0% |
| Novo Nordisk A/S, Class B | 296,665 | 16,313,221 |
| Pandora A/S | 43,775 | 2,153,994 |
| SimCorp A/S | 103,999 | 9,305,597 |
| Topdanmark A/S | 28,518 | 1,277,154 |
| | | 29,049,966 |
| |
| Finland 0.4% |
| Fortum Oyj | 154,066 | 3,765,006 |
| |
| France 9.8% |
| Air Liquide S.A. | 32,266 | 4,290,121 |
| Arkema S.A. | 16,419 | 1,680,286 |
| Christian Dior SE | 21,114 | 10,429,424 |
| Credit Agricole S.A. | 114,232 | 1,490,539 |
| Faurecia SE | 46,246 | 2,158,215 |
| Gaztransport Et Technigaz S.A. | 70,219 | 6,406,671 |
| Kering S.A. | 7,783 | 4,428,498 |
| L'Oreal S.A. | 71,696 | 20,939,653 |
| LVMH Moet Hennessy Louis Vuitton SE | 10,048 | 4,291,055 |
| Security | Number
of Shares | Value ($) |
| Peugeot S.A. | 526,234 | 13,327,461 |
| Sanofi | 24,446 | 2,253,605 |
| Schneider Electric SE | 30,022 | 2,790,255 |
| Societe Generale S.A. | 229,039 | 6,513,618 |
| TOTAL S.A. | 217,287 | 11,487,571 |
| Veolia Environnement S.A. | 104,591 | 2,753,228 |
| | | 95,240,200 |
| |
| Germany 7.0% |
| adidas AG | 45,076 | 13,918,149 |
| Allianz SE | 108,446 | 26,484,958 |
| CompuGroup Medical SE | 18,705 | 1,197,461 |
| Deutsche Boerse AG | 16,960 | 2,626,419 |
| Deutsche Pfandbriefbank AG | 227,186 | 3,104,795 |
| Deutsche Telekom AG | 373,641 | 6,574,422 |
| HOCHTIEF AG | 25,424 | 3,176,548 |
| Hugo Boss AG | 59,726 | 2,518,197 |
| KION Group AG | 21,818 | 1,451,720 |
| MTU Aero Engines AG | 25,401 | 6,793,015 |
| | | 67,845,684 |
| |
| Greece 0.4% |
| Hellenic Telecommunications Organization S.A. | 277,984 | 4,216,014 |
| |
| Hong Kong 3.6% |
| Anhui Conch Cement Co., Ltd., H Shares(a) | 205,000 | 1,225,229 |
| CITIC Ltd. | 5,780,259 | 7,603,836 |
| Lenovo Group Ltd. | 8,631,000 | 6,017,039 |
| Longfor Group Holdings Ltd. | 2,039,500 | 8,464,228 |
| Sunac China Holdings Ltd. | 645,000 | 2,925,583 |
| Tencent Holdings Ltd. | 135,506 | 5,496,518 |
| Weichai Power Co., Ltd., H Shares(a) | 822,000 | 1,293,844 |
| Yuexiu Property Co., Ltd. | 9,504,000 | 2,093,374 |
| | | 35,119,651 |
| |
| Italy 2.2% |
| Assicurazioni Generali S.p.A. | 148,167 | 3,004,454 |
| Fiat Chrysler Automobiles N.V. | 62,882 | 975,851 |
| Italgas S.p.A. | 1,699,030 | 10,937,844 |
| Moncler S.p.A. | 33,219 | 1,281,880 |
| Unipol Gruppo S.p.A. | 883,049 | 4,928,352 |
| | | 21,128,381 |
| |
| Japan 24.6% |
| Advantest Corp. | 57,300 | 2,607,635 |
| Akatsuki, Inc.(b) | 44,000 | 2,452,072 |
| Astellas Pharma, Inc. | 281,200 | 4,826,147 |
| Bandai Namco Holdings, Inc. | 66,300 | 4,076,731 |
| Daiwabo Holdings Co., Ltd. | 162,900 | 7,118,094 |
| DMG Mori Co., Ltd. | 136,000 | 2,201,863 |
| Heiwa Real Estate REIT, Inc. | 392 | 518,359 |
| Hitachi Ltd. | 214,500 | 8,005,663 |
| Hosiden Corp. | 707,200 | 7,429,227 |
Schwab Active Equity Funds | Annual Report
Schwab International Core Equity Fund
Portfolio Holdings as of October 31, 2019 (continued)
| Security | Number
of Shares | Value ($) |
| Hoya Corp. | 211,263 | 18,670,835 |
| Invincible Investment Corp. | 20,693 | 13,066,665 |
| Japan Airlines Co., Ltd. | 142,700 | 4,446,830 |
| Japan Aviation Electronics Industry Ltd. | 113,000 | 2,105,055 |
| Kanamoto Co., Ltd. | 148,800 | 3,978,033 |
| Kenedix Office Investment Corp. | 412 | 3,227,632 |
| Kenedix, Inc. | 234,500 | 1,276,418 |
| Makino Milling Machine Co., Ltd. | 72,000 | 3,579,779 |
| MCUBS MidCity Investment Corp. | 1,699 | 1,970,436 |
| Meitec Corp. | 49,000 | 2,554,384 |
| Mitsubishi Electric Corp. | 67,000 | 957,259 |
| Mitsubishi Heavy Industries Ltd. | 216,000 | 8,741,377 |
| Mitsubishi UFJ Financial Group, Inc. | 3,144,400 | 16,301,476 |
| Mitsubishi UFJ Lease & Finance Co., Ltd. | 960,800 | 5,898,336 |
| Modec, Inc. | 32,000 | 877,769 |
| Morinaga & Co., Ltd. | 92,900 | 4,589,213 |
| Nihon Unisys Ltd. | 74,452 | 2,457,620 |
| Nishi-Nippon Financial Holdings, Inc. | 85,800 | 635,797 |
| Riso Kyoiku Co. Ltd | 107,400 | 412,328 |
| Round One Corp. | 78,000 | 1,005,778 |
| Sankyu, Inc. | 180,380 | 9,170,733 |
| Seino Holdings Co., Ltd. | 420,000 | 5,400,355 |
| Shin-Etsu Chemical Co., Ltd. | 61,400 | 6,846,174 |
| Shionogi & Co., Ltd. | 166,419 | 9,988,947 |
| Showa Corp. | 198,600 | 4,149,672 |
| Showa Denko K.K. | 65,000 | 1,823,701 |
| Softbank Corp. | 100,000 | 1,371,731 |
| Sony Corp. | 264,298 | 16,087,593 |
| Sumco Corp. | 98,200 | 1,631,187 |
| Sumitomo Mitsui Financial Group, Inc. | 206,500 | 7,331,404 |
| Sumitomo Mitsui Trust Holdings, Inc. | 87,000 | 3,170,750 |
| Takuma Co., Ltd. | 462,000 | 5,497,759 |
| TOKAI Holdings Corp. | 70,500 | 691,425 |
| Tokuyama Corp. | 257,700 | 6,884,193 |
| Tokyo Electron Ltd. | 46,500 | 9,420,834 |
| Tokyo Gas Co., Ltd. | 37,000 | 903,208 |
| Tokyo Steel Manufacturing Co., Ltd. | 624,153 | 5,024,877 |
| Tomy Co., Ltd. | 307,000 | 3,329,193 |
| Toyota Motor Corp. | 74,600 | 5,175,814 |
| | | 239,888,361 |
| |
| Mexico 0.2% |
| Grupo Aeroportuario del Centro Norte S.A.B. de C.V. | 252,500 | 1,750,626 |
| |
| Netherlands 6.0% |
| Airbus SE | 39,374 | 5,648,525 |
| ASM International N.V. | 47,464 | 4,785,404 |
| Heineken Holding N.V. | 148,783 | 14,196,199 |
| Koninklijke Ahold Delhaize N.V. | 854,299 | 21,289,177 |
| Koninklijke Philips N.V. | 39,680 | 1,740,923 |
| Signify N.V. | 89,962 | 2,635,892 |
| Unilever N.V. | 50,311 | 2,973,716 |
| Wolters Kluwer N.V. | 75,209 | 5,539,368 |
| | | 58,809,204 |
| |
| New Zealand 0.6% |
| Spark New Zealand Ltd. | 2,117,559 | 6,074,566 |
| |
| Norway 0.5% |
| DNO A.S.A. | 2,189,781 | 2,661,072 |
| TGS NOPEC Geophysical Co., A.S.A. | 93,161 | 2,419,513 |
| | | 5,080,585 |
| |
| Security | Number
of Shares | Value ($) |
| Portugal 0.2% |
| Sonae SGPS, S.A. | 1,400,000 | 1,412,513 |
| |
| Republic of Korea 0.3% |
| Samsung Electronics Co., Ltd. | 71,239 | 3,078,939 |
| |
| Singapore 0.7% |
| Singapore Exchange Ltd. | 716,500 | 4,704,209 |
| United Overseas Bank Ltd. | 100,000 | 1,968,743 |
| | | 6,672,952 |
| |
| Spain 2.6% |
| ACS Actividades de Construccion y Servicios S.A. | 343,780 | 13,949,948 |
| Banco Bilbao Vizcaya Argentaria S.A. | 532,634 | 2,805,291 |
| Industria de Diseno Textil S.A. | 185,576 | 5,782,699 |
| Telefonica S.A. | 415,915 | 3,193,927 |
| | | 25,731,865 |
| |
| Sweden 2.2% |
| Bravida Holding AB | 156,273 | 1,439,992 |
| Evolution Gaming Group AB | 131,277 | 3,139,843 |
| Hemfosa Fastigheter AB | 534,865 | 5,508,904 |
| Investor AB, B Shares | 67,251 | 3,450,274 |
| Mycronic AB | 115,678 | 1,925,481 |
| Sandvik AB | 182,339 | 3,221,442 |
| Volvo AB, B Shares | 201,550 | 3,020,381 |
| | | 21,706,317 |
| |
| Switzerland 11.0% |
| ABB Ltd. | 115,042 | 2,415,880 |
| BKW AG | 30,377 | 2,242,094 |
| Cembra Money Bank AG | 53,185 | 5,640,026 |
| Forbo Holding AG | 2,723 | 4,339,074 |
| Kardex AG | 4,922 | 715,261 |
| Nestle S.A. | 258,834 | 27,690,401 |
| Novartis AG | 270,840 | 23,664,698 |
| Pargesa Holding S.A. | 36,775 | 2,907,014 |
| Roche Holding AG | 120,388 | 36,231,467 |
| UBS Group AG * | 131,740 | 1,559,164 |
| | | 107,405,079 |
| |
| Taiwan 0.7% |
| Catcher Technology Co., Ltd. | 296,000 | 2,508,929 |
| Chicony Electronics Co., Ltd. | 795,000 | 2,469,856 |
| Radiant Opto-Electronics Corp. | 554,000 | 2,199,533 |
| | | 7,178,318 |
| |
| United Kingdom 14.1% |
| Ashmore Group plc | 511,713 | 3,086,483 |
| Ashtead Group plc | 210,574 | 6,411,097 |
| Auto Trader Group plc | 904,916 | 6,593,480 |
| Avast plc | 543,069 | 2,915,957 |
| Aviva plc | 3,525,961 | 19,005,090 |
| BHP Group plc | 767,528 | 16,279,685 |
| Compass Group plc | 54,320 | 1,446,221 |
| Diageo plc | 132,478 | 5,422,454 |
| Direct Line Insurance Group plc | 664,181 | 2,341,736 |
| Drax Group plc | 638,991 | 2,456,536 |
| Dunelm Group plc | 345,643 | 3,534,818 |
Schwab Active Equity Funds | Annual Report
Schwab International Core Equity Fund
Portfolio Holdings as of October 31, 2019 (continued)
| Security | Number
of Shares | Value ($) |
| GlaxoSmithKline plc | 543,117 | 12,440,060 |
| Halma plc | 67,102 | 1,628,259 |
| HSBC Holdings plc | 725,391 | 5,480,407 |
| Legal & General Group plc | 1,159,043 | 3,962,001 |
| Man Group plc | 2,289,490 | 4,261,141 |
| Paragon Banking Group plc | 215,165 | 1,402,590 |
| Prudential plc | 138,461 | 2,418,476 |
| RELX plc | 182,649 | 4,397,340 |
| Rightmove plc | 323,997 | 2,514,925 |
| Royal Dutch Shell plc, A Shares | 98,077 | 2,843,064 |
| Segro plc | 197,136 | 2,156,531 |
| Smith & Nephew plc | 158,503 | 3,402,490 |
| Unilever plc | 282,089 | 16,891,191 |
| Vodafone Group plc | 1,852,888 | 3,781,224 |
| | | 137,073,256 |
| Total Common Stock |
| (Cost $881,287,172) | | 970,314,228 |
| Security | Number
of Shares | Value ($) |
| Other Investment Company0.2% of net assets |
| |
| Securities Lending Collateral 0.2% |
| Wells Fargo Government Money Market Fund, Select Class 1.75%(c) | 2,434,850 | 2,434,850 |
| Total Other Investment Company |
| (Cost $2,434,850) | | 2,434,850 |
| * | Non-income producing security. |
| (a) | Represents a China based company which is listed on the Hong Kong exchange and traded in Hong Kong dollars. |
| (b) | All or a portion of this security is on loan. Securities on loan were valued at $2,329,469. |
| (c) | The rate shown is the 7-day yield. |
| | |
| REIT — | Real Estate Investment Trust |
The following is a summary of the inputs used to value the fund’s investments as of October 31, 2019 (see financial note 2(a) for additional information):
| Description | Quoted Prices in
Active Markets for
Identical Assets
(Level 1) | Other Significant
Observable Inputs
(Level 2) | Significant
Unobservable Inputs
(Level 3) | Total | |
| Assets | | | | | |
| Common Stock1 | $— | $464,317,580 | $— | $464,317,580 | |
| Brazil | 1,661,800 | — | — | 1,661,800 | |
| Canada | 7,020,638 | — | — | 7,020,638 | |
| Denmark | 1,277,154 | 27,772,812 | — | 29,049,966 | |
| Germany | 15,115,610 | 52,730,074 | — | 67,845,684 | |
| Japan | 3,745,991 | 236,142,370 | — | 239,888,361 | |
| Mexico | 1,750,626 | — | — | 1,750,626 | |
| Sweden | 5,508,904 | 16,197,413 | — | 21,706,317 | |
| United Kingdom | 3,534,818 | 133,538,438 | — | 137,073,256 | |
| Other Investment Company1 | 2,434,850 | — | — | 2,434,850 | |
| Total | $42,050,391 | $930,698,687 | $— | $972,749,078 | |
| 1 | As categorized in Portfolio Holdings. |
Fund investments in underlying mutual funds are classified as Level 1, without consideration to the classification level of the investments held by the underlying mutual funds, which could be Level 1, Level 2 or Level 3.
Schwab Active Equity Funds | Annual Report
Schwab International Core Equity Fund
Statement of Assets and Liabilities
As of October 31, 2019
| Assets |
| Investments in unaffiliated issuers, at value (cost $881,287,172) including securities on loan of $2,329,469 | | $970,314,228 |
| Collateral invested for securities on loan, at value (cost $2,434,850) | | 2,434,850 |
| Foreign currency, at value (cost $15,715) | | 15,719 |
| Deposit with broker for futures contracts | | 315,000 |
| Receivables: | | |
| Investments sold | | 22,857,550 |
| Dividends | | 2,705,508 |
| Foreign tax reclaims | | 1,718,180 |
| Fund shares sold | | 430,649 |
| Income from securities on loan | | 14,282 |
| Prepaid expenses | + | 16,885 |
| Total assets | | 1,000,822,851 |
| Liabilities |
| Collateral held for securities on loan | | 2,434,850 |
| Payables: | | |
| Investments bought | | 18,745,647 |
| Investment adviser and administrator fees | | 487,374 |
| Shareholder service fees | | 189,776 |
| Independent trustees’ fees | | 10 |
| Due to custodian | | 2,325,635 |
| Fund shares redeemed | | 880,542 |
| Accrued expenses | + | 247,965 |
| Total liabilities | | 25,311,799 |
| Net Assets |
| Total assets | | 1,000,822,851 |
| Total liabilities | – | 25,311,799 |
| Net assets | | $975,511,052 |
| Net Assets by Source | | |
| Capital received from investors | | 989,666,726 |
| Total distributable loss | | (14,155,674) |
| Net Asset Value (NAV) |
| Net Assets | ÷ | Shares
Outstanding | = | NAV |
| $975,511,052 | | 97,158,889 | | $10.04 |
| | | | | |
Schwab Active Equity Funds | Annual Report
Schwab International Core Equity Fund
Statement of Operations
For the period November 1, 2018 through October 31, 2019
| Investment Income |
| Dividends (net of foreign withholding tax of $3,664,267) | | $34,729,651 |
| Securities on loan, net | + | 64,311 |
| Total investment income | | 34,793,962 |
| Expenses |
| Investment adviser and administrator fees | | 6,108,800 |
| Shareholder service fees | | 2,555,247 |
| Custodian fees | | 166,541 |
| Portfolio accounting fees | | 92,456 |
| Professional fees | | 67,813* |
| Registration fees | | 56,644 |
| Transfer agent fees | | 42,838 |
| Shareholder reports | | 33,981 |
| Independent trustees’ fees | | 13,402 |
| Other expenses | + | 48,437 |
| Total expenses | | 9,186,159 |
| Expense reduction by CSIM and its affiliates | – | 108,836* |
| Net expenses | – | 9,077,323 |
| Net investment income | | 25,716,639 |
| Realized and Unrealized Gains (Losses) |
| Net realized losses on investments | | (113,139,631) |
| Net realized losses on futures contracts | | (75,869) |
| Net realized losses on foreign currency transactions | + | (7,998) |
| Net realized losses | | (113,223,498) |
| Net change in unrealized appreciation (depreciation) on investments | | 154,363,573 |
| Net change in unrealized appreciation (depreciation) on foreign currency translations | + | 84,926 |
| Net change in unrealized appreciation (depreciation) | + | 154,448,499 |
| Net realized and unrealized gains | | 41,225,001 |
| Increase in net assets resulting from operations | | $66,941,640 |
| * | Includes professional fees of $19,171 associated with the filing of tax claims in the European Union deemed to be non-routine expenses of the fund. See financial notes 2(d) and 4 for additional information. |
Schwab Active Equity Funds | Annual Report
Schwab International Core Equity Fund
Statement of Changes in Net Assets
For the current and prior report periods
| Operations | |
| | 11/1/18-10/31/19 | 11/1/17-10/31/18 |
| Net investment income | | $25,716,639 | $30,286,755 |
| Net realized losses | | (113,223,498) | (5,255,760) |
| Net change in unrealized appreciation (depreciation) | + | 154,448,499 | (202,582,332) |
| Increase (decrease) in net assets from operations | | 66,941,640 | (177,551,337) |
| Distributions to Shareholders | |
| Total distributions | | ($29,979,566) | ($32,281,172) |
| Transactions in Fund Shares | | | |
| | | 11/1/18-10/31/19 | 11/1/17-10/31/18 |
| | | SHARES | VALUE | SHARES | VALUE |
| Shares sold | | 16,140,498 | $153,928,560 | 43,839,389 | $487,710,481 |
| Shares reinvested | | 2,751,748 | 24,710,692 | 2,423,051 | 26,411,257 |
| Shares redeemed | + | (42,745,841) | (406,370,048) | (34,071,759) | (364,936,798) |
| Net transactions in fund shares | | (23,853,595) | ($227,730,796) | 12,190,681 | $149,184,940 |
| Shares Outstanding and Net Assets | | | |
| | | 11/1/18-10/31/19 | 11/1/17-10/31/18 |
| | | SHARES | NET ASSETS | SHARES | NET ASSETS |
| Beginning of period | | 121,012,484 | $1,166,279,774 | 108,821,803 | $1,226,927,343 |
| Total increase or decrease | + | (23,853,595) | (190,768,722) | 12,190,681 | (60,647,569) |
| End of period | | 97,158,889 | $975,511,052 | 121,012,484 | $1,166,279,774 |
Schwab Active Equity Funds | Annual Report
Schwab Active Equity Funds
1. Business Structure of the Funds:
Each of the funds in this report is a series of Schwab Capital Trust (the trust), a no-load, open-end management investment company. The trust is organized as a Massachusetts business trust and is registered under the Investment Company Act of 1940, as amended (the 1940 Act). The list below shows all the funds in the trust as of the end of the period, including the funds discussed in this report, which are highlighted:
| SCHWAB CAPITAL TRUST (ORGANIZED MAY 7, 1993) |
| Schwab Core Equity Fund | Schwab Target 2040 Fund |
| Schwab Dividend Equity Fund | Schwab Target 2045 Fund |
| Schwab Large-Cap Growth Fund | Schwab Target 2050 Fund |
| Schwab Small-Cap Equity Fund | Schwab Target 2055 Fund |
| Schwab Hedged Equity Fund | Schwab Target 2060 Fund |
| Schwab Health Care Fund | Schwab Fundamental US Large Company Index Fund |
| Schwab International Core Equity Fund | Schwab Fundamental US Small Company Index Fund |
| Schwab S&P 500 Index Fund | Schwab Fundamental International Large Company Index Fund |
| Schwab Small-Cap Index Fund® | Schwab Fundamental International Small Company Index Fund |
| Schwab Total Stock Market Index Fund® | Schwab Fundamental Emerging Markets Large Company Index Fund |
| Schwab U.S. Large-Cap Growth Index Fund | Schwab Fundamental Global Real Estate Index Fund |
| Schwab U.S. Large-Cap Value Index Fund | Schwab Target 2010 Index Fund |
| Schwab U.S. Mid-Cap Index Fund | Schwab Target 2015 Index Fund |
| Schwab International Index Fund® | Schwab Target 2020 Index Fund |
| Schwab MarketTrack All Equity Portfolio™ | Schwab Target 2025 Index Fund |
| Schwab MarketTrack Growth Portfolio™ | Schwab Target 2030 Index Fund |
| Schwab MarketTrack Balanced Portfolio™ | Schwab Target 2035 Index Fund |
| Schwab MarketTrack Conservative Portfolio™ | Schwab Target 2040 Index Fund |
| Laudus International MarketMasters Fund™ | Schwab Target 2045 Index Fund |
| Schwab Balanced Fund | Schwab Target 2050 Index Fund |
| Schwab Target 2010 Fund | Schwab Target 2055 Index Fund |
| Schwab Target 2015 Fund | Schwab Target 2060 Index Fund |
| Schwab Target 2020 Fund | Schwab Monthly Income Fund - Moderate Payout |
| Schwab Target 2025 Fund | Schwab Monthly Income Fund - Enhanced Payout |
| Schwab Target 2030 Fund | Schwab Monthly Income Fund - Maximum Payout |
| Schwab Target 2035 Fund | |
Each fund in this report offers one share class. Shares are bought and sold at closing net asset value per share (NAV), which is the price for all outstanding shares of a fund. Each share has a par value of 1/1,000 of a cent, and the funds’ Board of Trustees (the Board) may authorize the issuance of as many shares as necessary.
Each fund maintains its own account for purposes of holding assets and accounting, and is considered a separate entity for tax purposes. Within its account, each fund may also keep certain assets in segregated accounts, as required by securities law.
2. Significant Accounting Policies:
The following is a summary of the significant accounting policies the funds use in their preparation of financial statements. The funds follow the investment company accounting and reporting guidance of the Financial Accounting Standards Board (FASB) Accounting Standard CodificationTopic 946 Financial Services — Investment Companies. The accounting policies are in conformity with accounting principles generally accepted in the United States of America (GAAP).
The funds invest in certain other investment companies (underlying funds). For more information about the underlying funds’ operations and policies, please refer to those funds’ semiannual and annual reports, which are filed with the U.S. Securities and Exchange Commission (SEC) and are available on the SEC’s website at www.sec.gov.
(a) Security Valuation:
Under procedures approved by the Board, the investment adviser has formed a Pricing Committee to administer the pricing and valuation of portfolio securities and other assets and to ensure that prices used for internal purposes or provided by third parties reasonably reflect fair market value. Among other things, these procedures allow the funds to utilize independent pricing services, quotations from securities and financial instrument dealers and other market sources to determine fair value.
Schwab Active Equity Funds | Annual Report
Schwab Active Equity Funds
Financial Notes(continued)
2. Significant Accounting Policies (continued):
The funds value the securities in their portfolios every business day. The funds use the following policies to value various types of securities:
• Securities traded on an exchange or over-the-counter:Traded securities are valued at the closing value for the day, or, on days when no closing value has been reported, at the mean of the most recent bid and ask quotes. Securities that are primarily traded on foreign exchanges are valued at the official closing price or the last sales price on the exchange where the securities are principally traded with these values then translated into U.S. dollars at the current exchange rate, unless these securities are fair valued as discussed below.
• Securities for which no quoted value is available:The Board has adopted procedures to fair value each fund’s securities when market prices are not “readily available” or are unreliable. For example, a fund may fair value a security when it is de-listed or its trading is halted or suspended; when a security’s primary pricing source is unable or unwilling to provide a price; or when a security’s primary trading market is closed during regular market hours. Each fund makes fair value determinations in good faith in accordance with the fund’s valuation procedures. The Pricing Committee considers a number of factors, including unobservable market inputs when arriving at fair value. The Pricing Committee may employ techniques such as the review of related or comparable assets or liabilities, related market activities, recent transactions, market multiples, book values, transactional back-testing, disposition analysis and other relevant information. The Pricing Committee regularly reviews these inputs and assumptions to calibrate the valuations. Due to the subjective and variable nature of fair value pricing, there can be no assurance that a fund could obtain the fair value assigned to the security upon the sale of such security. The Board convenes on a regular basis to review fair value determinations made by the funds pursuant to the valuation procedures.
• Foreign equity security fair valuation:The Board has adopted procedures to fair value foreign equity securities that are traded in markets that close prior to the funds valuing their holdings. By fair valuing securities whose prices may have been affected by events occurring after the close of trading, each fund seeks to establish prices that investors might expect to realize upon the current sales of these securities. This methodology is designed to deter “arbitrage” market timers, who seek to exploit delays between the change in the value of a fund’s portfolio holdings and the NAV of the fund’s shares, and seeks to help ensure that the prices at which the fund’s shares are purchased and redeemed are fair and do not result in dilution of shareholder interest or other harm to shareholders. When fair value pricing is used at the open or close of a reporting period, it may cause a temporary divergence between the return of a fund and that of its comparative index or benchmark. The Board regularly reviews fair value determinations made by the funds pursuant to these procedures.
• Futures contracts:Futures contracts are valued at their settlement prices as of the close of their exchanges.
• Underlying funds:Mutual funds are valued at their respective NAVs.
• Cash management sweep time deposits: Balances held in cash management sweep time deposits are accounted for on a cost basis, which approximates market value.
In accordance with the authoritative guidance on fair value measurements and disclosures under GAAP, the funds disclose the fair value of their investments in a hierarchy that prioritizes the significant inputs to valuation techniques used to measure the fair value. The hierarchy gives the highest priority to valuations based upon unadjusted quoted prices in active markets for identical assets or liabilities (Level 1 measurements) and the lowest priority to valuations based upon unobservable inputs that are significant to the valuation (Level 3 measurements). If inputs used to measure the financial instruments fall within different levels of the hierarchy, the categorization is based on the lowest level input that is significant to the valuation. If the funds determine that either the volume and/or level of activity for an asset or liability has significantly decreased (from normal conditions for that asset or liability) or price quotations or observable inputs are not associated with orderly transactions, increased analysis and management judgment will be required to estimate fair value.
The three levels of the fair value hierarchy are as follows:
• Level 1—quoted prices in active markets for identical securities—Investments whose values are based on quoted market prices in active markets, and whose values are therefore classified as Level 1 prices, include active listed equities and futures contracts. Investments in mutual funds are valued daily at their NAVs, which are classified as Level 1 prices, without consideration to the classification level of the specific investments held by an underlying fund.
• Level 2—other significant observable inputs (including quoted prices for similar securities, interest rates, prepayment speeds, credit risk, etc.)—Investments that trade in markets that are not considered to be active, but whose values are based on quoted market prices, dealer quotations or valuations provided by alternative pricing sources supported by observable inputs are classified as Level 2 prices. These generally include U.S. government and sovereign obligations, most government agency
Schwab Active Equity Funds | Annual Report
Schwab Active Equity Funds
Financial Notes(continued)
2. Significant Accounting Policies (continued):
securities, investment-grade corporate bonds, certain mortgage products, less liquid listed equities, and state, municipal and provincial obligations. In addition, international securities whose markets close hours before the funds value their holdings may require fair valuations due to significant movement in the U.S. markets occurring after the daily close of the foreign markets. The Board has approved a vendor that calculates fair valuations of international equity securities based on a number of factors that appear to correlate to the movements in the U.S. markets.
• Level 3—significant unobservable inputs (including the funds’ own assumptions in determining the fair value of investments)—Investments whose values are classified as Level 3 prices have significant unobservable inputs, as they may trade infrequently or not at all. When observable prices are not available for these securities, the funds use one or more valuation techniques for which sufficient and reliable data is available. The inputs used by the funds in estimating the value of Level 3 prices may include the original transaction price, quoted prices for similar securities or assets in active markets, completed or pending third-party transactions in the underlying investment or comparable issuers, and changes in financial ratios or cash flows. Level 3 prices may also be adjusted to reflect illiquidity and/or non-transferability, with the amount of such discount estimated by the funds in the absence of market information. Assumptions used by the funds due to the lack of observable inputs may significantly impact the resulting fair value and therefore the funds’ results of operations.
The inputs or methodology used for valuing securities are not necessarily an indication of the risk associated with investing in those securities.
The levels associated with valuing the funds’ investments as of October 31, 2019 are disclosed in the Portfolio Holdings.
(b) Accounting Policies for certain Portfolio Investments (if held):
Futures Contracts: Futures contracts are instruments that represent an agreement between two parties that obligates one party to buy, and the other party to sell, specific instruments at an agreed upon price on a stipulated future date. A fund must give the broker a deposit of cash and/or securities (initial margin) whenever it enters into a futures contract. The amount of the deposit may vary from one contract to another. Subsequent payments (variation margin) are made or received by a fund depending on the daily fluctuations in the value of the futures contract and are accounted for as unrealized appreciation or depreciation until the contract is closed, at which time the gains or losses are realized. Futures contracts are traded publicly on exchanges, and their market value may change daily.
Securities Lending: Under the trust’s Securities Lending Program, a fund (lender) may make short-term loans of its securities to another party (borrower) to generate additional revenue for the fund. The borrower pledges collateral in the form of cash, securities issued or fully guaranteed by the U.S. government or foreign governments, or letters of credit issued by a bank. Collateral at the individual loan level is required to be maintained on a daily marked-to-market basis in an amount at least equal to the current value of the securities loaned. The lending agent provides a fund with indemnification against borrower default (the borrower fails to return the security on loan) reducing the risk of loss as a result of default. The cash collateral of securities loaned is currently invested in money market portfolios operating under Rule 2a-7 of the 1940 Act. Each fund bears the risk of loss with respect to the investment of cash collateral. The terms of the securities lending agreement allow the funds or the lending agent to terminate any loan at any given time and the securities must be returned within the earlier of the standard trade settlement period or the specified time period under the relevant securities lending agreement. Securities lending income, as disclosed in each fund’s Statement of Operations, if applicable, represents the income earned from the investment of the cash collateral plus any fees paid by borrowers, less the fees paid to the lending agent and broker rebates which are subject to adjustments pursuant to the securities lending agreement. On loans not collateralized by cash, a fee is received from the borrower, and is allocated between a fund and the lending agent. The aggregate market value of securities loaned will not at any time exceed one-third of the total assets of a fund, including collateral received from the loan. Securities lending fees paid to the unaffiliated lending agents start at 10% of gross lending revenue, with subsequent breakpoints to a low of 7.5%. In this context, the gross lending revenue equals the income received from the investment of cash collateral and fees paid by borrowers less any rebates paid to the borrowers. Any expenses charged by the cash collateral fund are in addition to these fees. All remaining revenue is retained by the fund, as applicable. No portion of lending revenue is paid to or retained by Charles Schwab Investment Management, Inc. (CSIM or the investment adviser) or any affiliate of CSIM.
As of October 31, 2019, the funds had securities on loan, all of which were classified as common stocks. The value of the securities on loan and the related collateral as of October 31, 2019, if any, are disclosed in each fund’s Portfolio Holdings. The value of the securities on loan and the investment of cash collateral are also disclosed in each fund’s Statement of Assets and Liabilities.
Cash Management Transactions: The funds may subscribe to the Brown Brothers Harriman & Co. (BBH) Cash Management Service Sweep (CMS Sweep). The BBH CMS Sweep is an investment product that automatically sweeps the funds’ cash balances into overnight offshore time deposits with either the BBH Grand Cayman branch or a branch of a pre-approved commercial bank. This
Schwab Active Equity Funds | Annual Report
Schwab Active Equity Funds
Financial Notes(continued)
2. Significant Accounting Policies (continued):
fully automated program allows the funds to earn interest on cash balances. Excess cash invested with deposit institutions domiciled outside of the U.S., as with any offshore deposit, may be subject to sovereign actions in the jurisdiction of the deposit institution including, but not limited to, freeze, seizure or diminution. The funds bear the risk associated with the repayment of principal and payment of interest on such instruments by the institution with which the deposit is ultimately placed.
Short Sales: Dividends declared on short positions are recorded on the ex-date as an expense. When a fund sells securities short (sells securities it does not own), the fund identifies assets worth at least 100% of the value of the short securities as collateral. If the market value of the short securities subsequently falls, the fund can realize a gain by closing the short position. However, if the value rises, the fund typically would have to add to its collateral or close out its short position at a loss. The potential for losses associated with short positions is much greater than the original value of the securities sold short and may exceed amounts recorded in the Statement of Assets and Liabilities.
(c) Security Transactions:
Security transactions are recorded as of the date the order to buy or sell the security is executed. Realized gains and losses from security transactions are based on the identified costs of the securities involved.
Assets and liabilities denominated in foreign currencies are reported in U.S. dollars. For assets and liabilities held on a given date, the dollar value is based on market exchange rates in effect on that date. Transactions involving foreign currencies, including purchases, sales, income receipts and expense payments, are calculated using exchange rates in effect on the transaction date. Realized foreign exchange gains or losses arise from sales of foreign currencies, currency gains or losses realized between the trade and settlement dates on securities transactions and the differences between the recorded amounts of dividends, interest, and foreign withholding taxes and the U.S. dollar equivalent of the amounts actually received or paid. Net unrealized foreign exchange appreciation or depreciation arises from changes in foreign exchange rates on foreign denominated assets and liabilities other than investments in securities held at the end of the reporting period. These realized and unrealized foreign exchange gains or losses are reported in foreign currency transactions or translations in the Statement of Operations. The funds do not isolate the portion of the fluctuations on investments resulting from changes in foreign currency exchange rates from the fluctuations in market prices of investments held. Such fluctuations are included with the net realized and unrealized gain or loss from investments.
If a fund sells securities short, it records the proceeds received as an asset and the obligation to buy back the securities as a liability. At the time a short sale is initiated, the asset and liability are of equal value and effectively cancel each other out. Subsequently, the fund values the liability side of the transaction according to the market price of the securities sold short, and values the asset side according to the value of the proceeds. When a fund closes out a short position (buys the security), it records the outcome as a realized gain or loss. Dividends accrued on securities sold short are recorded as an expense on a fund’s records and presented in the Statement of Operations. A fund may also incur stock loan fees which represent the cost of borrowing securities used for short sale transactions. A fund may also earn rebates as an element of the broker arrangement, which are recorded as an offset to stock loan fees on short sales transactions. The stock loan fees on short sales are recognized on the Statement of Operations. In the event that rebates exceed the stock loan fees on short sales, the net rebates are recognized as a component of investment income on the Statement of Operations.
Gains realized by the funds on the sale of securities in certain foreign countries may be subject to non-U.S. taxes. In those instances, the funds record a liability based on unrealized appreciation to provide for potential non-U.S. taxes payable upon the sale of these securities.
When a fund closes out a futures contract or forward position, it calculates the difference between the value of the position at the beginning and at the end of the contract, and records a realized gain or loss accordingly.
(d) Investment Income:
Interest income is recorded as it accrues. Dividends, in the form of cash or non-cash income such as in the form of additional securities, and distributions from portfolio securities and underlying funds are recorded on the date they are effective (the ex-dividend date), although the funds record certain foreign security dividends on the day they learn of the ex-dividend date. Any distributions from underlying funds are recorded in accordance with the character of the distributions as designated by the underlying funds.
Income received from foreign sources may result in withholding tax. Withholding taxes are accrued at the same time as the related income if the tax rate is fixed and known, unless a tax withheld is reclaimable from the local tax authorities in which case it is recorded as receivable. If the tax rate is not known or estimable, such expense or reclaim receivable is recorded when the net proceeds are received.
Schwab Active Equity Funds | Annual Report
Schwab Active Equity Funds
Financial Notes(continued)
2. Significant Accounting Policies (continued):
The Schwab International Core Equity Fund filed claims to recover taxes previously withheld in certain European Union countries on the basis that those countries had purportedly violated certain provisions in the Treaty on the Functioning of the European Union. These filings are subject to various administrative and judicial proceedings within these countries, and all professional fees associated with these filings have been paid by the investment adviser.
(e) Expenses:
Expenses that are specific to a fund are charged directly to the fund. Expenses that are common to all funds within the trust generally are allocated among the funds in proportion to their average daily net assets.
(f) Distributions to Shareholders:
The funds make distributions from net investment income, if any, once a year, with the exception of Schwab Dividend Equity Fund which typically pays quarterly dividends. The funds make distributions from net realized capital gains, if any, once a year.
(g) Accounting Estimates:
The accounting policies described in this report conform to GAAP. Notwithstanding this, shareholders should understand that in order to follow these principles, fund management has to make estimates and assumptions that affect the information reported in the financial statements. It’s possible that once the results are known, they may turn out to be different from these estimates and these differences may be material.
(h) Federal Income Taxes:
The funds intend to meet federal income and excise tax requirements for regulated investment companies under subchapter M of the Internal Revenue Code, as amended. Accordingly, the funds distribute substantially all of their net investment income and net realized capital gains, if any, to their respective shareholders each year. As long as a fund meets the tax requirements, it is not required to pay federal income tax.
(i) Foreign Taxes:
The funds may be subject to foreign taxes (a portion of which may be reclaimable) on income, corporate events, foreign currency exchanges and capital gains on investments. All foreign taxes are recorded in accordance with the applicable foreign tax regulations and rates that exist in foreign markets in which the funds invest. These foreign taxes, if any, are paid by the funds and are disclosed in the Statement of Operations. Foreign taxes payable as of October 31, 2019, if any, are reflected in each fund’s Statement of Assets and Liabilities.
(j) Indemnification:
Under the funds’ organizational documents, the officers and trustees are indemnified against certain liabilities arising out of the performance of their duties to the funds. In addition, in the normal course of business the funds enter into contracts with their vendors and others that provide general indemnifications. The funds’ maximum exposure under these arrangements is unknown as this would involve future claims that may be made against the funds. However, based on experience, the funds expect the risk of loss attributable to these arrangements to be remote.
(k) Recent Accounting Standards:
In August 2018, the FASB issued Accounting Standards Update “Fair Value Measurement (Topic 820)” (ASU 2018-13) which modifies the disclosure requirements for fair value measurement by removing, modifying, or adding certain disclosures. The amendments are effective for annual periods beginning after December 15, 2019, and interim periods within those annual periods. The funds are permitted to early adopt any removed or modified disclosures upon issuance of this update and delay adoption of the additional disclosures until their effective date. The funds have early adopted certain removed or modified disclosures, including the amount of and reasons for transfers between Level 1 and Level 2 of the fair value hierarchy and the policy for timing of transfers between levels upon issuance of ASU 2018-13, and have delayed adoption of the additional disclosures until their effective date. At this time, management is currently evaluating the impact that the adoption of the additional disclosures will have on the funds’ financial statements.
Schwab Active Equity Funds | Annual Report
Schwab Active Equity Funds
Financial Notes(continued)
3. Risk Factors:
Investing in the funds may involve certain risks, as discussed in the funds’ prospectus, including, but not limited to, those described below. Any of these risks could cause an investor to lose money.
Market Risk. Financial markets rise and fall in response to a variety of factors, sometimes rapidly and unpredictably. As with any investment whose performance is tied to these markets, the value of an investment in a fund will fluctuate, which means that an investor could lose money over short or long periods.
Equity Risk. The prices of equity securities rise and fall daily. These price movements may result from factors affecting individual companies, industries or the securities market as a whole. In addition, equity markets tend to move in cycles, which may cause stock prices to fall over short or extended periods of time.
Management Risk. The funds’ investment adviser makes investment decisions for the funds using a strategy based largely on historical information. There is no guarantee that a strategy based on historical information will produce the desired results in the future. In addition, the portfolio optimization process used by each fund to assist in constructing the fund’s portfolio does not assure successful investment. Securities selected with the assistance of the process may be negatively impacted by factors or events not foreseen in developing the process. As a result, a fund may have a lower return than if it were managed using another process or strategy.
Market Capitalization Risk.Securities issued by companies of different market capitalizations tend to go in and out of favor based on market and economic conditions. During a period when securities of a particular market capitalization fall behind other types of investments, a fund’s performance could be impacted.
Large-Cap Company Risk.Large-cap companies are generally more mature and the securities issued by these companies may not be able to reach the same levels of growth as the securities issued by small- or mid-cap companies.
Mid-Cap Company Risk. Mid-cap companies may be more vulnerable to adverse business or economic events than larger, more established companies and the value of securities issued by these companies may move sharply.
Small-Cap Company Risk. Securities issued by small-cap companies may be riskier than those issued by larger companies, and their prices may move sharply, especially during market upturns and downturns.
Growth Investing Risk. Growth stocks can be volatile. Growth companies usually invest a high portion of earnings in their businesses and may lack the dividends of value stocks that can cushion stock prices in a falling market. The prices of growth stocks are based largely on projections of the issuer’s future earnings and revenues. If a company’s earnings or revenues fall short of expectations, its stock price may fall dramatically. Growth stocks may also be more expensive relative to their earnings or assets compared to value or other stocks.
Dividend Paying Stock Risk.To the extent that a fund invests in dividend paying stocks, the fund’s performance will correlate with the performance of the dividend paying stock segment of the stock market, and the fund may underperform funds that do not limit their investments to dividend paying stocks. If stocks held by a fund reduce or stop paying dividends, the fund’s ability to generate income may be affected.
Derivatives Risk. The principal type of derivative used by a fund is a futures contract. A futures contract is an agreement to buy or sell a financial instrument at a specific price on a specific day. The use of derivatives that are subject to regulation by the Commodity Futures Trading Commission (CFTC), could cause a fund to become a commodity pool, which would require the fund to comply with certain CFTC rules. A fund’s use of derivative instruments involves risks different from, or possibly greater than, the risks associated with investing directly in securities and other traditional investments. Certain of these risks, such as liquidity risk, market risk and management risk, are discussed elsewhere in this section. A fund’s use of derivatives is also subject to lack of availability risk, credit risk, leverage risk, valuation risk, correlation risk and tax risk. Lack of availability risk is the risk that suitable derivative transactions may not be available in all circumstances for risk management or other purposes. Credit risk is the risk that the counterparty to a derivatives transaction may not fulfill its obligations. Leverage risk is the risk that a small percentage of assets invested in derivatives can have a disproportionately large impact on a fund. Valuation risk is the risk that a particular derivative may be valued incorrectly. Correlation risk is the risk that changes in the value of the derivative may not correlate perfectly with the underlying asset, rate or index. Tax risk is the risk that the use of derivatives may cause a fund to realize higher amounts of short-term capital gains. A fund’s use of derivatives could reduce the fund’s performance, increase its volatility, and could cause the fund to lose more than the initial amount invested.
Liquidity Risk. A fund may be unable to sell certain securities, such as illiquid securities, readily at a favorable time or price, or the fund may have to sell them at a loss.
Schwab Active Equity Funds | Annual Report
Schwab Active Equity Funds
Financial Notes(continued)
3. Risk Factors (continued):
Exchange-Traded Fund (ETF) Risk.When a fund invests in an ETF, it will bear a proportionate share of the ETF’s expenses. In addition, lack of liquidity in the market for an ETF’s shares can result in its value being more volatile than the underlying portfolio of securities.
REITs Risk. A fund’s investments in real estate investment trusts (REITs) will be subject to the risks associated with the direct ownership of real estate, including fluctuations in the value of underlying properties, defaults by borrowers or tenants, changes in interest rates and risks related to general or local economic conditions. REITs are also subject to certain additional risks; for example, REITs are dependent upon specialized management skills and cash flows, and may have their investments in relatively few properties, a small geographic area or a single property type. Failure of a company to qualify as a REIT under federal tax law may have adverse consequences on a fund. In addition, REITs have their own expenses, and a fund will bear a proportionate share of those expenses.
Short Sales Risk. To the extent a fund establishes both long and short positions in equity securities the fund’s long positions could decline in value at the same time that the value of the stocks sold short increase, thereby increasing the fund’s overall potential for loss. The price of a borrowed security in a short sale transaction may be more or less than the price at which the security was sold by the fund. A fund’s short sales may result in a loss if the prices of the borrowed securities rise and it costs more to replace the borrowed securities. In contrast to a fund’s long positions, the potential loss on the fund’s short positions is unlimited. In addition, the lender of the borrowed securities may require a fund to return the securities on short notice, which may require the fund to purchase the borrowed securities at an unfavorable price and could result in a loss to the fund.
Foreign Investment Risk. A fund’s investments in securities of foreign issuers involve certain risks that may be greater than those associated with investments in securities of U.S. issuers. These include risks of adverse changes in foreign economic, political, regulatory and other conditions; changes in currency exchange rates or exchange control regulations (including limitations on currency movements and exchanges); the imposition of economic sanctions or other government restrictions; differing accounting, auditing, financial reporting and legal standards and practices; differing securities market structures; and higher transaction costs. These risks may negatively impact the value or liquidity of a fund’s investments, and could impair the fund’s ability to meet its investment objective or invest in accordance with its investment strategy. There is a risk that investments in securities denominated in, and/or receiving revenues in, foreign currencies will decline in value relative to the U.S. dollar. To the extent a fund’s investments in a single country or a limited number of countries represent a large percentage of the fund’s assets, the fund’s performance may be adversely affected by the economic, political, regulatory and social conditions in those countries, and the fund’s price may be more volatile than the price of a fund that is geographically diversified.
Emerging Markets Risk. Emerging market countries may be more likely to experience political turmoil or rapid changes in market or economic conditions than more developed countries. Emerging market countries often have less uniformity in accounting and reporting requirements and greater risk associated with the custody of securities. In addition, the financial stability of issuers (including governments) in emerging market countries may be more precarious than in developed countries. As a result, there may be an increased risk of illiquidity and price volatility associated with a fund’s investments in emerging market countries, which may be magnified by currency fluctuations relative to the U.S. dollar, and, at times, it may be difficult to value such investments.
Concentration Risk. The investments of certain funds are concentrated in issuers doing business in the same sector, and therefore, the companies in which a fund invests will be affected by many of the same factors, such as legislative or regulatory changes, intense competition for market share and other competitive challenges. In addition, a fund is subject to the risks that stocks of these companies may underperform other segments of the equity market or stock market as a whole and are likely to have above-average volatility.
Securities Lending Risk. Securities lending involves the risk of loss of rights in, or delay in recovery of, the loaned securities if the borrower fails to return the security loaned or becomes insolvent.
Please refer to the funds’ prospectus for a more complete description of the principal risks of investing in the funds.
4. Affiliates and Affiliated Transactions:
Investment Adviser
Charles Schwab Investment Management, Inc. (CSIM or the investment adviser), a wholly owned subsidiary of The Charles Schwab Corporation, serves as each fund’s investment adviser and administrator pursuant to an Investment Advisory and Administration Agreement between CSIM and the trust.
Schwab Active Equity Funds | Annual Report
Schwab Active Equity Funds
Financial Notes(continued)
4. Affiliates and Affiliated Transactions (continued):
For its advisory and administrative services to the funds, CSIM is entitled to receive an annual fee, payable monthly, based on a percentage of each fund’s average daily net assets as follows:
| % of Average Daily Net Assets | Schwab
Core
Equity Fund | Schwab
Dividend
Equity Fund | Schwab
Large-Cap
Growth Fund | Schwab
Small-Cap
Equity Fund | Schwab
Hedged
Equity Fund | Schwab
International
Core
Equity Fund |
| Flat rate | 0.47% | 0.62% | 0.72% | 0.81% | 1.05% | 0.58% |
| % of Average Daily Net Assets | Schwab
Health Care
Fund |
| First $500 million | 0.54% |
| $500 million to $1 billion | 0.515% |
| Over $1 billion | 0.49% |
For the period ended October 31, 2019, the aggregate advisory fee paid to CSIM by the Schwab Health Care Fund was 0.53%, as a percentage of the fund’s average daily net assets.
Shareholder Servicing
The Board has adopted a Shareholder Servicing Plan (the Plan) on behalf of the funds. The Plan enables each fund to bear expenses relating to the provision by financial intermediaries, including Charles Schwab & Co., Inc. (Schwab), a broker-dealer affiliate of CSIM (together, service providers), of certain shareholder services to the current shareholders of the funds.
Pursuant to the Plan, each fund’s shares are subject to an annual shareholder servicing fee up to 0.25%. The shareholder servicing fee paid to a particular service provider is made pursuant to its written agreement with Schwab, as distributor of the funds (or, in the case of payments made to Schwab acting as a service provider, pursuant to Schwab’s written agreement with the funds), and a fund will pay no more than 0.25% of the average annual daily net asset value of the fund shares owned by shareholders holding shares through such service provider. Payments under the Plan are made as described above without regard to whether the fee is more or less than the service provider’s actual cost of providing the services, and if more, such excess may be retained as profit by the service provider.
Expense Limitation
Although these agreements specify certain fees for these services, CSIM and its affiliates have made an additional agreement with the funds, for so long as CSIM serves as the investment adviser to the funds, which may only be amended or terminated with the approval of the Board, to limit the total annual fund operating expenses charged, excluding interest, taxes and certain non-routine expenses (expense limitation). The expense limitation as a percentage of average daily net assets is as follows:
Schwab
Core
Equity Fund | Schwab
Dividend
Equity Fund | Schwab
Large-Cap
Growth Fund | Schwab
Small-Cap
Equity Fund | Schwab
Hedged
Equity Fund | Schwab
Health Care
Fund | Schwab
International
Core Equity Fund |
| 0.75% | 0.89% | 0.99% | 1.12% | 1.33%* | 0.82% | 0.86% |
| * | Excludes dividend expenses and stock loan fees paid on securities sold short. |
Schwab Active Equity Funds | Annual Report
Schwab Active Equity Funds
Financial Notes(continued)
4. Affiliates and Affiliated Transactions (continued):
Investments from Affiliates
Certain funds in the Fund Complex (for definition refer to Trustees and Officers section) may own shares of other funds in the Fund Complex. The table below reflects the percentages of shares of each fund in this report that are owned by other funds in the Fund Complex as of October 31, 2019, as applicable:
| | Underlying Funds | | | |
| | Schwab
Core
Equity Fund | Schwab
Dividend
Equity Fund | Schwab
Small-Cap
Equity Fund | Schwab
International Core
Equity Fund |
| Schwab Balanced Fund | 8.5% | —% | 9.2% | —% |
| Schwab Monthly Income Fund - Enhanced Payout | —% | 1.9% | —% | —% |
| Schwab Monthly Income Fund - Maximum Payout | —% | 0.7% | —% | —% |
| Schwab Monthly Income Fund - Moderate Payout | —% | 1.5% | —% | —% |
| Schwab Target 2010 Fund | 0.1% | 0.0%* | 0.1% | 0.2% |
| Schwab Target 2015 Fund | 0.2% | 0.0%* | 0.2% | 0.4% |
| Schwab Target 2020 Fund | 1.6% | 0.2% | 1.7% | 2.8% |
| Schwab Target 2025 Fund | 2.5% | 0.2% | 2.7% | 3.8% |
| Schwab Target 2030 Fund | 4.8% | 1.3% | 5.9% | 7.8% |
| Schwab Target 2035 Fund | 2.5% | 1.0% | 3.4% | 4.2% |
| Schwab Target 2040 Fund | 5.7% | 2.7% | 8.1% | 9.5% |
| Schwab Target 2045 Fund | 1.0% | 0.5% | 1.4% | 1.6% |
| Schwab Target 2050 Fund | 1.0% | 0.6% | 1.5% | 1.7% |
| Schwab Target 2055 Fund | 0.6% | 0.4% | 0.9% | 1.0% |
| Schwab Target 2060 Fund | 0.1% | 0.1% | 0.2% | 0.2% |
Other Affiliated Transactions
The professional fees related to foreign withholding tax claims discussed in financial note 2 were non-routine expenses. The investment adviser agreed to pay these professional fees for this reporting period, subject to reimbursement by the Schwab International Core Equity Fund to the extent the fund is able to successfully recover taxes withheld in the future.
As of October 31, 2019, the balance of professional fees related to foreign withholding tax subject to future reimbursement by the fund to the investment adviser was $19,171 for Schwab International Core Equity Fund.
No other amounts for additional tax reclaims are reflected in the financial statements due to the uncertainty surrounding the ultimate resolution of proceedings, the likelihood of receipt of these claims, and the potential timing of payment.
Interfund Borrowing and Lending
Pursuant to an exemptive order issued by the SEC, the funds may enter into interfund borrowing and lending transactions with other funds in the Fund Complex. All loans are for temporary or emergency purposes and the interest rate to be charged will be the average of the overnight repurchase agreement rate and the short-term bank loan rate. All loans are subject to numerous conditions designed to ensure fair and equitable treatment of all participating funds. The interfund lending facility is subject to the oversight and periodic review by the Board. The funds had no interfund borrowing or lending activity during the period.
5. Board of Trustees:
The Board may include people who are officers and/or directors of CSIM or its affiliates. Federal securities law limits the percentage of such “interested persons” who may serve on a trust’s board, and the trust was in compliance with these limitations throughout the report period. The trust did not pay any of these interested persons for their services as trustees, but it did pay non-interested persons (independent trustees), as noted on each fund’s Statement of Operations. For information regarding the trustees, please refer to the Trustees and Officers table at the end of this report.
Schwab Active Equity Funds | Annual Report
Schwab Active Equity Funds
Financial Notes(continued)
6. Borrowing from Banks:
During the period, the funds were participants with other U.S. registered investment companies managed by CSIM in a joint, syndicated, committed $750 million line of credit (the Syndicated Credit Facility), which matured on October 3, 2019. On October 3, 2019, the Syndicated Credit Facility was amended to run for a new 364 day period with the line of credit amount remaining unchanged, maturing on October 1, 2020. Under the terms of the Syndicated Credit Facility, in addition to the interest charged on any borrowings by a fund, each fund paid a commitment fee of 0.15% per annum on the funds’ proportionate share of the unused portion of the Syndicated Credit Facility.
During the period, the funds were participants with other U.S. registered investment companies managed by CSIM in a joint, unsecured, uncommitted $500 million line of credit (the Uncommitted Credit Facility), with State Street Bank and Trust Company, which matured on November 30, 2018. On November 30, 2018, the Uncommitted Credit Facility was amended to run for a new 364 day period with the line of credit amount remaining unchanged, maturing November 29, 2019. Under the terms of the Uncommitted Credit Facility, each fund pays interest on the amount a fund borrows. There were no borrowings from either line of credit during the period.
The funds also have access to custodian overdraft facilities. A fund may have utilized the overdraft facility and incurred an interest expense, which is disclosed on the fund’s Statement of Operations, if any. The interest expense is determined based on a negotiated rate above the current Federal Funds Rate.
7. Purchases and Sales of Investment Securities:
For the period ended October 31, 2019, purchases and sales of securities (excluding short-term obligations) were as follows:
| | Purchases
of Securities | Sales
of Securities |
| Schwab Core Equity Fund | $2,086,706,309 | $2,258,430,744 |
| Schwab Dividend Equity Fund | 659,881,610 | 1,102,179,188 |
| Schwab Large-Cap Growth Fund | 127,790,847 | 205,859,671 |
| Schwab Small-Cap Equity Fund | 684,919,014 | 679,799,167 |
| Schwab Hedged Equity Fund* | 417,325,733 | 470,531,713 |
| Schwab Health Care Fund | 357,456,758 | 436,777,342 |
| Schwab International Core Equity Fund | 953,919,162 | 1,184,561,141 |
| * | Including securities sold short. |
8. Derivatives:
Certain funds entered into equity index futures contracts during the report period. The funds invested in futures contracts to equitize available cash. The current value and variation margin for futures contracts held at October 31, 2019 are presented on the Portfolio Holdings and Statement of Assets and Liabilities, respectively. The net realized and change in unrealized gains (losses) on futures contracts are presented on the Statement of Operations. Refer to financial note 2(b) for the funds’ accounting policies with respect to futures contracts and financial note 3 for disclosures concerning the risks of investing in futures contracts. During the period ended October 31, 2019, the month-end average notional amounts of futures contracts held by the funds and the month-end average number of contracts held were as follows:
| | Notional Amounts | Number of Contracts |
| Schwab Core Equity Fund | $2,226,510 | 17 |
| Schwab Dividend Equity Fund | 19,621,615* | 150* |
| Schwab Large-Cap Growth Fund | 543,710 | 4 |
| Schwab Small-Cap Equity Fund | 4,188,787 | 56 |
| Schwab Hedged Equity Fund | 281,537 | 2 |
| Schwab Health Care Fund | 1,273,298 | 9 |
| Schwab International Core Equity Fund | 287,785 | 3 |
| * | During the period, the fund did not hold futures contracts at any month-end. The average notional amounts and number of contracts were calculated by aggregating the highest daily values held each month during the period. |
Schwab Active Equity Funds | Annual Report
Schwab Active Equity Funds
Financial Notes(continued)
9. Federal Income Taxes:
As of October 31, 2019, the tax basis cost of the funds’ investments and gross unrealized appreciation and depreciation were as follows:
| | Schwab
Core
Equity Fund | | Schwab
Dividend
Equity Fund | | Schwab
Large-Cap
Growth Fund | | Schwab
Small-Cap
Equity Fund | | Schwab
Hedged
Equity Fund | | Schwab
Health Care
Fund | | Schwab
International
Core
Equity Fund |
| Tax cost | $1,705,660,637 | | $724,755,785 | | $124,372,271 | | $551,864,275 | | $92,299,477 | | $536,066,543 | | $892,300,824 |
| Gross unrealized appreciation | $498,772,486 | | $144,452,799 | | $59,887,181 | | $75,870,698 | | $32,339,419 | | $247,150,721 | | $99,913,468 |
| Gross unrealized depreciation | (26,896,222) | | (21,461,363) | | (3,121,046) | | (44,392,082) | | (15,277,634) | | (6,543,354) | | (19,465,214) |
| Net unrealized appreciation (depreciation) | $471,876,264 | | $122,991,436 | | $56,766,135 | | $31,478,616 | | $17,061,785 | | $240,607,367 | | $80,448,254 |
As of October 31, 2019, the components of distributable earnings on a tax basis were as follows:
| | Schwab
Core
Equity Fund | | Schwab
Dividend
Equity Fund | | Schwab
Large-Cap
Growth Fund | | Schwab
Small-Cap
Equity Fund | | Schwab
Hedged
Equity Fund |
| Undistributed ordinary income | $15,452,132 | | $— | | $128,168 | | $520,604 | | $841,356 |
| Undistributed long-term capital gains | 44,087,057 | | 44,139,966 | | 9,419,148 | | — | | — |
| Net unrealized appreciation (depreciation) on investments | 471,876,264 | | 122,991,436 | | 56,766,135 | | 31,478,616 | | 17,061,785 |
| Total | $531,415,453 | | $167,131,402 | | $66,313,451 | | $31,999,220 | | $17,903,141 |
| | Schwab
Health Care
Fund | | Schwab
International
Core
Equity Fund |
| Undistributed ordinary income | $7,104,923 | | $32,545,509 |
| Undistributed long-term capital gains | 26,992,356 | | — |
| Net unrealized appreciation (depreciation) on investments | 240,607,367 | | 80,448,254 |
| Net other unrealized appreciation (depreciation) | (14,196) | | (4,384) |
| Total | $274,690,450 | | $112,989,379 |
The primary differences between book basis and tax basis unrealized appreciation or unrealized depreciation of investments are the tax deferral of losses on wash sales, realization for tax purposes of unrealized gains (losses) on futures contracts and the realization for tax purposes of unrealized appreciation on investments in Passive Foreign Investment Companies (PFIC) and partnership investments. The tax cost of the funds’ investments, disclosed above, have been adjusted from their book amounts to reflect these unrealized appreciation or depreciation differences, as applicable.
Capital loss carryforwards may be used to offset future realized capital gains for federal income tax purposes. As of October 31, 2019, the funds had capital loss carryforwards available to offset future net capital gains as follows:
| Expiration Date | Schwab
Core
Equity Fund | | Schwab
Dividend
Equity Fund | | Schwab
Large-Cap
Growth Fund | | Schwab
Small-Cap
Equity Fund | | Schwab
Hedged
Equity Fund |
| No expiration | $— | | $— | | $— | | $41,249,674 | | $15,795,438 |
| Total | $— | | $— | | $— | | $41,249,674 | | $15,795,438 |
| Expiration Date | Schwab
Health Care
Fund | | Schwab
International
Core
Equity Fund |
| No expiration | $— | | $127,145,053 |
| Total | $— | | $127,145,053 |
For the fiscal year ended October 31, 2019, the Schwab Hedged Equity Fund had other accumulated losses of $79,118.
Schwab Active Equity Funds | Annual Report
Schwab Active Equity Funds
Financial Notes(continued)
9. Federal Income Taxes (continued):
The tax basis components of distributions paid during the current and prior fiscal years were as follows:
| | Schwab
Core
Equity Fund | Schwab
Dividend
Equity Fund | Schwab
Large-Cap
Growth Fund | Schwab
Small-Cap
Equity Fund | Schwab
Hedged
Equity Fund |
| Current period distributions | | | | | |
| Ordinary income | $50,106,445 | $17,703,109 | $6,863,262 | $47,742,964 | $2,154,010 |
| Long-term capital gains | 208,707,447 | 98,971,136 | 17,392,917 | 57,318,761 | 17,187,468 |
| Prior period distributions | | | | | |
| Ordinary income | $106,313,933 | $66,835,738 | $8,808,544 | $20,943,065 | $125,442 |
| Long-term capital gains | 145,688,756 | 79,534,655 | 10,650,342 | 61,623,293 | 15,117,887 |
| | Schwab
Health Care
Fund | Schwab
International
Core
Equity Fund |
| Current period distributions | | |
| Ordinary income | $13,608,829 | $29,979,566 |
| Long-term capital gains | 60,136,138 | — |
| Prior period distributions | | |
| Ordinary income | $14,878,678 | $28,754,784 |
| Long-term capital gains | 43,824,710 | 3,526,388 |
Distributions paid to shareholders are based on net investment income and net realized gains determined on a tax basis, which may differ from net investment income and net realized gains for financial reporting purposes. These differences reflect the differing character of certain income items and net realized gains and losses for financial statement and tax purposes, and may result in reclassification among certain capital accounts on the financial statements.
Permanent book and tax basis differences may result in reclassifications between components of net assets as required. The adjustments will have no impact on net assets or the results of operations.
As of October 31, 2019, management has reviewed the tax positions for open periods (for federal purposes, three years from the date of filing and for state purposes, four years from the date of filing) as applicable to the funds, and has determined that no provision for income tax is required in the funds’ financial statements. The funds recognize interest and penalties, if any, related to unrecognized tax benefits as income tax expense in the Statement of Operations. During the fiscal year ended October 31, 2019, the funds did not incur any interest or penalties.
10. Subsequent Events:
Management has determined there are no subsequent events or transactions through the date the financial statements were issued that would have materially impacted the financial statements as presented.
Schwab Active Equity Funds | Annual Report
Schwab Active Equity Funds
Report of Independent Registered Public Accounting Firm
To the Board of Trustees of Schwab Capital Trust and Shareholders of Schwab Core Equity Fund, Schwab Dividend Equity Fund, Schwab Large-Cap Growth Fund, Schwab Small-Cap Equity Fund, Schwab Hedged Equity Fund, Schwab Health Care Fund and Schwab International Core Equity Fund
Opinions on the Financial Statements
We have audited the accompanying statements of assets and liabilities, including the portfolio holdings, of Schwab Core Equity Fund, Schwab Dividend Equity Fund, Schwab Large-Cap Growth Fund, Schwab Small-Cap Equity Fund, Schwab Hedged Equity Fund, Schwab Health Care Fund and Schwab International Core Equity Fund (seven of the funds constituting Schwab Capital Trust, hereafter collectively referred to as the “Funds”) as of October 31, 2019, the related statements of operations for the year ended October 31, 2019, the statements of changes in net assets for each of the two years in the period ended October 31, 2019, including the related notes, and the financial highlights for each of the five years in the period ended October 31, 2019 (collectively referred to as the “financial statements”). In our opinion, the financial statements present fairly, in all material respects, the financial position of each of the Funds as of October 31, 2019, the results of each of their operations for the year then ended, the changes in each of their net assets for each of the two years in the period ended October 31, 2019 and each of the financial highlights for each of the five years in the period ended October 31, 2019 in conformity with accounting principles generally accepted in the United States of America.
Basis for Opinions
These financial statements are the responsibility of the Funds’ management. Our responsibility is to express an opinion on the Funds’ financial statements based on our audits. We are a public accounting firm registered with the Public Company Accounting Oversight Board (United States) (PCAOB) and are required to be independent with respect to the Funds in accordance with the U.S. federal securities laws and the applicable rules and regulations of the Securities and Exchange Commission and the PCAOB.
We conducted our audits of these financial statements in accordance with the standards of the PCAOB. Those standards require that we plan and perform the audit to obtain reasonable assurance about whether the financial statements are free of material misstatement, whether due to error or fraud.
Our audits included performing procedures to assess the risks of material misstatement of the financial statements, whether due to error or fraud, and performing procedures that respond to those risks. Such procedures included examining, on a test basis, evidence regarding the amounts and disclosures in the financial statements. Our audits also included evaluating the accounting principles used and significant estimates made by management, as well as evaluating the overall presentation of the financial statements. Our procedures included confirmation of securities owned as of October 31, 2019 by correspondence with the custodian and brokers; when replies were not received from brokers, we performed other auditing procedures. We believe that our audits provide a reasonable basis for our opinions.
/s/ PricewaterhouseCoopers LLP
San Francisco, California
December 16, 2019
We have served as the auditor of one or more investment companies in the Schwab Funds Complex since 1989.
Schwab Active Equity Funds | Annual Report
Schwab Active Equity Funds
Other Federal Tax Information (unaudited)
Schwab International Core Equity Fund elects to pass through under section 853 of the Internal Revenue Code foreign tax credit of $3,557,334 to its shareholders for the fiscal year ended October 31, 2019. The respective foreign source income on the fund is $38,315,279.
For corporate shareholders, the following percentage of the funds’ dividend distributions paid during the fiscal year ended October 31, 2019, qualify for the corporate dividends received deduction:
| | Percentage |
| Schwab Core Equity Fund | 79.13 |
| Schwab Dividend Equity Fund | 100.00 |
| Schwab Large-Cap Growth Fund | 49.12 |
| Schwab Small-Cap Equity Fund | 8.91 |
| Schwab Hedged Equity Fund | 100.00 |
| Schwab Health Care Fund | 76.57 |
| Schwab International Core Equity Fund | — |
For the fiscal year ended October 31, 2019, the funds designate the following amounts of the dividend distributions as qualified dividends for the purpose of the maximum rate under section 1(h)(11) of the Internal Revenue Code. Shareholders will be notified in January 2020 via IRS Form 1099 of the amounts for use in preparing their 2019 income tax return.
| | |
| Schwab Core Equity Fund | $40,630,992 |
| Schwab Dividend Equity Fund | 17,703,109 |
| Schwab Large-Cap Growth Fund | 3,459,591 |
| Schwab Small-Cap Equity Fund | 4,502,335 |
| Schwab Hedged Equity Fund | 2,154,010 |
| Schwab Health Care Fund | 13,608,829 |
| Schwab International Core Equity Fund | 32,975,452 |
Under section 852(b)(3)(C) of the Internal Revenue Code, the funds hereby designate the following amounts as long-term capital gain dividends for the fiscal year ended October 31, 2019:
| | |
| Schwab Core Equity Fund | $208,707,447 |
| Schwab Dividend Equity Fund | 98,971,136 |
| Schwab Large-Cap Growth Fund | 17,392,917 |
| Schwab Small-Cap Equity Fund | 57,318,761 |
| Schwab Hedged Equity Fund | 17,187,468 |
| Schwab Health Care Fund | 60,136,138 |
| Schwab International Core Equity Fund | — |
Schwab Active Equity Funds | Annual Report
Schwab Active Equity Funds
Investment Advisory Agreement Approval
The Investment Company Act of 1940, as amended, requires that the continuation of a fund’s investment advisory agreement must be specifically approved (1) by the vote of the trustees or by a vote of the shareholders of the fund, and (2) by the vote of a majority of the trustees who are not parties to the investment advisory agreement or “interested persons” of any party (the Independent Trustees), cast in person at a meeting called for the purpose of voting on such approval. In connection with such approvals, the fund’s trustees must request and evaluate, and the investment adviser is required to furnish, such information as may be reasonably necessary to evaluate the terms of the investment advisory agreement.
The Board of Trustees (the Board or the Trustees, as appropriate) calls and holds one or more meetings each year that are dedicated, in whole or in part, to considering whether to renew the investment advisory and administration agreement (the Agreement) between Schwab Capital Trust (the Trust) and Charles Schwab Investment Management, Inc. (CSIM) with respect to the existing funds in the Trust, including Schwab Core Equity Fund, Schwab Dividend Equity Fund, Schwab Large-Cap Growth Fund, Schwab Small-Cap Equity Fund, Schwab Hedged Equity Fund, Schwab Health Care Fund and Schwab International Core Equity Fund (each, a Fund and collectively, the Funds), and to review certain other agreements pursuant to which CSIM provides investment advisory services to certain other registered investment companies. In preparation for the meeting(s), the Board requests and reviews a wide variety of materials provided by CSIM, including information about CSIM’s affiliates, personnel, business goals and priorities, profitability, third-party oversight, corporate structure and operations. As part of the renewal process, the Independent Trustees’ legal counsel sends an information request letter to CSIM seeking certain relevant information. The responses by CSIM are provided to the Trustees for their review prior to their meeting, and the Trustees are provided with the opportunity to request any additional materials. The Board also receives data provided by an independent provider of investment company data. This information is in addition to the detailed information about the Funds that the Board reviews during the course of each year, including information that relates to the Funds’ operations and performance, legal and compliance matters, risk management, portfolio turnover, and sales and marketing activity. The Independent Trustees receive advice from Independent Trustees’ legal counsel, including a memorandum regarding the responsibilities of trustees for the approval of investment advisory agreements. In addition, the Independent Trustees meet in executive session outside the presence of Fund management and participate in question and answer sessions with representatives of CSIM.
The Board, including a majority of the Independent Trustees, considered information specifically relating to the continuance
of the Agreement with respect to the Funds at meetings held on May 13, 2019 and June 4, 2019, and approved the renewal of the Agreement with respect to the Funds for an additional one-year term at the June 4, 2019 in person meeting called for the purpose of voting on such approval.
The Board’s approval of the continuance of the Agreement with respect to the Funds was based on consideration and evaluation of a variety of specific factors discussed at these meetings and at prior meetings, including:
| 1. | the nature, extent and quality of the services provided to the Funds under the Agreement, including the resources of CSIM and its affiliates dedicated to the Funds; |
| 2. | each Fund’s investment performance and how it compared to that of certain other comparable mutual funds and benchmark data; |
| 3. | each Fund’s expenses and how those expenses compared to those of certain other similar mutual funds; |
| 4. | the profitability of CSIM and its affiliates, including Charles Schwab & Co., Inc. (Schwab), with respect to each Fund, including both direct and indirect benefits accruing to CSIM and its affiliates; and |
| 5. | the extent to which economies of scale would be realized as the Funds grow and whether fee levels in the Agreement reflect those economies of scale for the benefit of Fund investors. |
Nature, Extent and Quality of Services. The Board considered the nature, extent and quality of the services provided by CSIM to the Funds and the resources of CSIM and its affiliates dedicated to the Funds. In this regard, the Trustees evaluated, among other things, CSIM’s experience, track record, compliance program, resources dedicated to hiring and retaining skilled personnel and specialized talent, and information security resources. The Trustees also considered information provided by CSIM relating to services and support provided with respect to each Fund’s portfolio management team, portfolio strategy, and internal investment guidelines, as well as trading infrastructure, liquidity management, product design and analysis, shareholder communications, securities valuation, fund accounting and custody, and vendor and risk oversight. The Trustees also considered investments CSIM has made in its infrastructure, including modernizing CSIM’s technology and use of data, increasing expertise in key areas (including portfolio management and trade operations), and improving business continuity, cybersecurity, due diligence, risk management processes, and information security programs, which are designed to provide enhanced services to the Funds and their shareholders. The Trustees also considered that many of the Funds’ shareholders are also brokerage clients of Schwab and considered Schwab’s wide range of products,
Schwab Active Equity Funds | Annual Report
Schwab Active Equity Funds
services, and channel alternatives such as investment research tools and an array of account features that benefit the Funds and shareholders who are brokerage clients of Schwab. Finally, the Trustees also considered Schwab’s reputation as a full service brokerage firm and its overall financial condition. Following such evaluation, the Board concluded, within the context of its full deliberations, that the nature, extent and quality of services provided by CSIM to the Funds and the resources of CSIM and its affiliates dedicated to the Funds supported renewal of the Agreement with respect to the Funds.
Fund Performance. The Board considered the Funds’ performance in determining whether to renew the Agreement with respect to the Funds. Specifically, the Trustees considered each Fund’s performance relative to a peer category of other mutual funds and applicable indices/benchmarks, in light of total return, yield, if applicable, and market trends, as well as in consideration of each Fund’s investment style and strategy attributes and disclosures. As part of this review, the Trustees considered the composition of the peer category, selection criteria and the reputation of the independent provider of investment company data who prepared the peer category analysis. The Trustees further considered the level of Fund performance in the context of their review of Fund expenses and adviser profitability discussed below and also noted that performance is reviewed throughout the year by a designated committee of the Board and by the Board. Following such evaluation, the Board concluded, within the context of its full deliberations, that the performance of the Funds supported renewal of the Agreement with respect to the Funds.
Fund Expenses. With respect to the Funds’ expenses, the Trustees considered the rate of compensation called for by the Agreement, and each Fund’s net operating expense ratio, in each case, in comparison to those of other similar mutual funds, such peer groups and comparisons having been selected and calculated by an independent provider of investment company data. CSIM reported to the Board, and the Board took into account, the risk assumed by CSIM in the development of products and provision of services as well as the competitive marketplace for financial products. When applicable, the Trustees considered the effects of CSIM’s and Schwab’s practice of waiving certain fees to prevent total annual operating expenses of certain Funds from exceeding a specified cap. The Trustees also considered CSIM’s contractual commitment to keep the expense cap for so long as CSIM serves as the adviser to such Fund. The Trustees also considered fees charged by CSIM to other mutual funds and to other types of accounts, but, with respect to such other types of accounts, accorded less weight to such comparisons due to the different legal, regulatory, compliance and operating features of mutual funds as compared to these other types of accounts, and any differences in the nature and scope of the services CSIM provides to these other accounts, as well as differences in the market for these types of accounts. Following such evaluation, the Board concluded, within the
context of its full deliberations, that the expenses of the Funds are reasonable and supported renewal of the Agreement with respect to the Funds.
Profitability. The Trustees considered the compensation flowing to CSIM and its affiliates, directly or indirectly and reviewed profitability on a pre-tax basis, without regard to distribution expenses. In this connection, the Trustees reviewed management’s profitability analyses. The Trustees also reviewed profitability of CSIM relating to the Schwab fund complex as a whole, noting the benefit to Fund shareholders of being part of the Schwab fund complex, including the allocations of certain fixed costs across other funds in the complex. The Trustees also considered any other benefits derived by CSIM from its relationship with the Funds, such as whether, by virtue of its management of the Funds, CSIM obtains investment information or other research resources that aid it in providing advisory services to other clients. The Trustees considered whether the compensation and profitability with respect to the Funds under the Agreement and other service agreements were reasonable and justified in light of the quality of all services rendered to each Fund by CSIM and its affiliates. The Trustees noted that CSIM continues to invest substantial sums in its business in order to provide enhanced research capabilities, services, and systems to benefit the Funds. Based on this evaluation, the Board concluded, within the context of its full deliberations, that the profitability of CSIM is reasonable and supported renewal of the Agreement with respect to the Funds.
Economies of Scale. Although the Trustees recognized the difficulty of determining economies of scale with precision, the Trustees considered the potential existence of any economies of scale and whether those are passed along to a Fund’s shareholders through (i) the enhancement of services provided to the Funds in return for fees paid, including through investments by CSIM in CSIM’s infrastructure, including modernizing CSIM’s technology and use of data, increasing expertise and capabilities in key areas (including portfolio and trade operations), and improving business continuity, cybersecurity, due diligence, and information security programs, which are designed to provide enhanced services to the Funds and their shareholders; (ii) graduated investment advisory fee schedules, fee waivers, or expense caps by CSIM and its affiliates for those funds in the Schwab Funds complex with such features; and (iii) pricing a fund to scale and keeping overall expenses down as the fund grows. The Trustees acknowledged that CSIM has shared any economies of scale with the Funds by investing in CSIM’s infrastructure, as discussed above, over time and that CSIM’s internal costs of providing investment management, technology, administrative, legal and compliance services to the Funds continues to increase as a result of regulatory or other developments. The Trustees considered that CSIM and its affiliates may employ contractual expense caps to protect shareholders from high fees when fund assets are relatively small, for example, in the case of newer funds or funds with investment strategies that
Schwab Active Equity Funds | Annual Report
Schwab Active Equity Funds
are from time to time out of favor, because, among other reasons, shareholders may benefit from the continued availability of such funds at subsidized expense levels. Based on this evaluation, the Board concluded, within the context of its full deliberations, that the Funds obtain reasonable benefits from economies of scale.
In the course of their deliberations, the Trustees may have accorded different weights to various factors and did not identify any particular information or factor that was all
important or controlling. Based on the Trustees’ deliberation and their evaluation of the information described above, the Board, including all of the Independent Trustees, approved the continuation of the Agreement with respect to the Funds and concluded that the compensation under the Agreement with respect to the Funds is fair and reasonable in light of such services and expenses and such other matters as the Trustees have considered to be relevant in the exercise of their reasonable judgment.
Schwab Active Equity Funds | Annual Report
Schwab Active Equity Funds
Trustees and Officers
The tables below give information about the trustees and officers of Schwab Capital Trust, which includes the funds covered in this report. The “Fund Complex” includes The Charles Schwab Family of Funds, Schwab Capital Trust, Schwab Investments, Schwab Annuity Portfolios, Schwab Strategic Trust and Laudus Trust. The Fund Complex includes 101 funds.
The address for all trustees and officers is 211 Main Street, San Francisco, CA 94105. You can find more information about the trustees and officers in the funds’ Statement of Additional Information, which is available free by calling 1-877-824-5615.
| Independent Trustees |
Name, Year of Birth, and
Position(s) with the trust
(Terms of office, and
length of Time Served1) | Principal Occupations
During the Past Five Years | Number of
Portfolios in
Fund Complex
Overseen by
the Trustee | Other Directorships |
Robert W. Burns
1959
Trustee
(Trustee of Schwab Strategic Trust since 2009; The Charles Schwab Family of Funds, Schwab Investments, Schwab Capital Trust, Schwab Annuity Portfolios and Laudus Trust since 2016) | Retired/Private Investor (Jan. 2009 – present). Formerly, Managing Director, Pacific Investment Management Company, LLC (PIMCO) (investment management firm) and President, PIMCO Funds. | 101 | None |
John F. Cogan
1947
Trustee
(Trustee of The Charles Schwab Family of Funds, Schwab Investments, Schwab Capital Trust and Schwab Annuity Portfolios since 2008; Laudus Trust since 2010; Schwab Strategic Trust since 2016) | Senior Fellow (Oct. 1979 – present), The Hoover Institution at Stanford University (public policy think tank); Senior Fellow (2000 – present), Stanford Institute for Economic Policy Research; Professor of Public Policy (1994 – 2015), Stanford University. | 101 | Director (2005 – present), Gilead Sciences, Inc. |
Nancy F. Heller
1956
Trustee
(Trustee of The Charles Schwab Family of Funds, Schwab Investments, Schwab Capital Trust, Schwab Annuity Portfolios, Schwab Strategic Trust and Laudus Trust since 2018) | President and Chairman (2014 – 2016), TIAA Charitable (financial services); Senior Managing Director (2003 – 2016), TIAA (financial services). | 101 | None |
Stephen Timothy Kochis
1946
Trustee
(Trustee of Schwab Strategic Trust since 2012; The Charles Schwab Family of Funds, Schwab Investments, Schwab Capital Trust, Schwab Annuity Portfolios and Laudus Trust since 2016) | CEO and Owner (May 2012 – present), Kochis Global (wealth management consulting). | 101 | None |
Schwab Active Equity Funds | Annual Report
Schwab Active Equity Funds
| Independent Trustees (continued) |
Name, Year of Birth, and
Position(s) with the trust
(Terms of office, and
length of Time Served1) | Principal Occupations
During the Past Five Years | Number of
Portfolios in
Fund Complex
Overseen by
the Trustee | Other Directorships |
David L. Mahoney
1954
Trustee
(Trustee of The Charles Schwab Family of Funds, Schwab Investments, Schwab Capital Trust, Schwab Annuity Portfolios and Laudus Trust since 2011; Schwab Strategic Trust since 2016) | Private Investor. | 101 | Director (2003 – present), Symantec Corporation
Director (2004 – present), Corcept Therapeutics Incorporated
Director (2009 – present), Adamas Pharmaceuticals, Inc. |
Jane P. Moncreiff
1961
Trustee
(Trustee of The Charles Schwab Family of Funds, Schwab Investments, Schwab Capital Trust, Schwab Annuity Portfolios, Schwab Strategic Trust and Laudus Trust since 2019) | Chief Investment Officer (2009-2017), CareGroup Healthcare System, Inc. (healthcare). | 101 | None |
Kiran M. Patel
1948
Trustee
(Trustee of The Charles Schwab Family of Funds, Schwab Investments, Schwab Capital Trust, Schwab Annuity Portfolios and Laudus Trust since 2011; Schwab Strategic Trust since 2016) | Retired. Executive Vice President and General Manager of Small Business Group (Dec. 2008 – Sept. 2013), Intuit, Inc. (financial software and services firm for consumers and small businesses). | 101 | Director (2008 – present), KLA-Tencor Corporation |
Kimberly S. Patmore
1956
Trustee
(Trustee of The Charles Schwab Family of Funds, Schwab Investments, Schwab Capital Trust, Schwab Annuity Portfolios, Schwab Strategic Trust and Laudus Trust since 2016) | Consultant (2008 – present), Patmore Management Consulting (management consulting). | 101 | None |
Gerald B. Smith
1950
Trustee
(Trustee of The Charles Schwab Family of Funds, Schwab Investments, Schwab Capital Trust and Schwab Annuity Portfolios since 2000; Laudus Trust since 2010; Schwab Strategic Trust since 2016) | Chairman, Chief Executive Officer and Founder (Mar. 1990 – present), Smith Graham & Co. (investment advisors). | 101 | Director (2012 – present), Eaton Corporation plc |
Schwab Active Equity Funds | Annual Report
Schwab Active Equity Funds
| Interested Trustees |
Name, Year of Birth, and
Position(s) with the trust
(Terms of office, and
length of Time Served1) | Principal Occupations
During the Past Five Years | Number of
Portfolios in
Fund Complex
Overseen by
the Trustee | Other Directorships |
Walter W. Bettinger II2
1960
Chairman and Trustee
(Trustee of The Charles Schwab Family of Funds, Schwab Investments, Schwab Capital Trust and Schwab Annuity Portfolios since 2008; Schwab Strategic Trust since 2009; Laudus Trust since 2010) | Director, President and Chief Executive Officer (Oct. 2008 – present), The Charles Schwab Corporation; President and Chief Executive Officer (Oct. 2008 – present) and Director (May 2008 – present), Charles Schwab & Co., Inc.; Director (Apr. 2006 – present), Charles Schwab Bank; Director (Nov. 2017 – present), Charles Schwab Premier Bank; Director (May 2008 – present) and President and Chief Executive Officer (Aug. 2017 – present), Schwab Holdings, Inc.; Director (July 2016 – present), Charles Schwab Investment Management, Inc. | 101 | Director (2008 – present), The Charles Schwab Corporation |
Jonathan de St. Paer2
1973
Trustee
(Trustee of The Charles Schwab Family of Funds, Schwab Investments, Schwab Capital Trust, Schwab Annuity Portfolios, Schwab Strategic Trust and Laudus Trust since 2019) | Director (Apr. 2019 – present), President (Oct. 2018 – present), and Chief Executive Officer (Apr. 2019 – Nov. 2019), Charles Schwab Investment Management, Inc.; Trustee and Chief Executive Officer (Apr. 2019 – present) and President (Nov. 2018 – present), Schwab Funds, Laudus Funds and Schwab ETFs; Director (Apr. 2019 – present), Charles Schwab Worldwide Funds plc and Charles Schwab Asset Management (Ireland) Limited; Senior Vice President (Apr. 2019 – present), Senior Vice President – Strategy and Product Development (CSIM) (Jan. 2014 – Mar. 2019), and Vice President (Jan. 2009 – Dec. 2013), Charles Schwab & Co., Inc. | 101 | None |
Joseph R. Martinetto2
1962
Trustee
(Trustee of The Charles Schwab Family of Funds, Schwab Investments, Schwab Capital Trust, Schwab Annuity Portfolios, Schwab Strategic Trust and Laudus Trust since 2016) | Chief Operating Officer (Feb. 2018 – present) and Senior Executive Vice President (July 2015 – Feb. 2018), The Charles Schwab Corporation; Senior Executive Vice President (July 2015 – present), Charles Schwab & Co., Inc.; Chief Financial Officer (July 2015 – Aug. 2017) and Executive Vice President and Chief Financial Officer (May 2007 – July 2015), The Charles Schwab Corporation and Charles Schwab & Co., Inc.; Director (May 2007 – present), Charles Schwab & Co., Inc.; Director (Apr. 2010 – present) and Chief Executive Officer (July 2013 – Apr. 2015), Charles Schwab Bank; Director (Nov. 2017 – present), Charles Schwab Premier Bank; Director (May 2007 – present), Chief Financial Officer (May 2007 – Aug. 2017), Senior Executive Vice President (Feb. 2016 – present), and Executive Vice President (May 2007 – Feb. 2016), Schwab Holdings, Inc. | 101 | None |
| Officers of the Trust |
Name, Year of Birth, and Position(s) with the trust
(Terms of office, and length of Time Served3) | Principal Occupations During the Past Five Years |
Jonathan de St. Paer
1973
President and Chief Executive Officer
(Officer of The Charles Schwab Family of Funds, Schwab Investments, Schwab Capital Trust, Schwab Annuity Portfolios, Schwab Strategic Trust and Laudus Trust since 2018) | Director (Apr. 2019 – present), President (Oct. 2018 – present), and Chief Executive Officer (Apr. 2019 – Nov. 2019), Charles Schwab Investment Management, Inc.; Trustee and Chief Executive Officer (Apr. 2019 – present) and President (Nov. 2018 – present), Schwab Funds, Laudus Funds and Schwab ETFs; Director (Apr. 2019 – present), Charles Schwab Worldwide Funds plc and Charles Schwab Asset Management (Ireland) Limited; Senior Vice President (Apr. 2019 – present), Senior Vice President – Strategy and Product Development (CSIM) (Jan. 2014 – Mar. 2019), and Vice President (Jan. 2009 – Dec. 2013), Charles Schwab & Co., Inc. |
Schwab Active Equity Funds | Annual Report
Schwab Active Equity Funds
| Officers of the Trust (continued) |
Name, Year of Birth, and Position(s) with the trust
(Terms of office, and length of Time Served3) | Principal Occupations During the Past Five Years |
Mark Fischer
1970
Treasurer and Chief Financial Officer
(Officer of The Charles Schwab Family of Funds, Schwab Investments, Schwab Capital Trust, Schwab Annuity Portfolios, Schwab Strategic Trust and Laudus Trust since 2013) | Treasurer and Chief Financial Officer (Jan. 2016 – present), Schwab Funds, Laudus Funds and Schwab ETFs; Assistant Treasurer (Dec. 2013 – Dec. 2015), Schwab Funds and Laudus Funds; Assistant Treasurer (Nov. 2013 – Dec. 2015), Schwab ETFs; Vice President (Oct. 2013 – present), Charles Schwab Investment Management, Inc.; Executive Director (Apr. 2011 – Sept. 2013), J.P. Morgan Investor Services; Assistant Treasurer (May 2005 – Mar. 2011), Massachusetts Financial Service Investment Management. |
George Pereira
1964
Senior Vice President and Chief Operating Officer
(Officer of The Charles Schwab Family of Funds, Schwab Investments, Schwab Capital Trust and Schwab Annuity Portfolios since 2004; Laudus Trust since 2006; Schwab Strategic Trust since 2009) | Senior Vice President and Chief Financial Officer (Nov. 2004 – present) and Chief Operating Officer (Jan. 2011 – present), Charles Schwab Investment Management, Inc.; Senior Vice President and Chief Operating Officer (Jan. 2016 – present), Schwab Funds, Laudus Funds and Schwab ETFs; Treasurer and Chief Financial Officer (June 2006 – Dec. 2015), Laudus Funds; Treasurer and Principal Financial Officer (Nov. 2004 – Dec. 2015), Schwab Funds; Treasurer and Principal Financial Officer (Oct. 2009 – Dec. 2015), Schwab ETFs; Director (Apr. 2005 – present), Charles Schwab Worldwide Funds plc and Charles Schwab Asset Management (Ireland) Limited. |
Omar Aguilar
1970
Senior Vice President and Chief Investment Officer – Equities and Multi-Asset Strategies
(Officer of The Charles Schwab Family of Funds, Schwab Investments, Schwab Capital Trust, Schwab Annuity Portfolios, Schwab Strategic Trust and Laudus Trust since 2011) | Senior Vice President and Chief Investment Officer (Apr. 2011 – present), Charles Schwab Investment Management, Inc.; Senior Vice President and Chief Investment Officer – Equities and Multi-Asset Strategies (June 2011 – present), Schwab Funds, Laudus Funds and Schwab ETFs; Head of the Portfolio Management Group and Vice President of Portfolio Management (May 2009 – Apr. 2011), Financial Engines, Inc. (investment management firm); Head of Quantitative Equity (July 2004 – Jan. 2009), ING Investment Management. |
Brett Wander
1961
Senior Vice President and Chief Investment Officer – Fixed Income
(Officer of The Charles Schwab Family of Funds, Schwab Investments, Schwab Capital Trust, Schwab Annuity Portfolios, Schwab Strategic Trust and Laudus Trust since 2011) | Senior Vice President and Chief Investment Officer (Apr. 2011 – present), Charles Schwab Investment Management, Inc.; Senior Vice President and Chief Investment Officer – Fixed Income (June 2011 – present), Schwab Funds, Laudus Funds and Schwab ETFs; Senior Managing Director and Global Head of Active Fixed-Income Strategies (Jan. 2008 – Oct. 2010), State Street Global Advisors; Director of Alpha Strategies (Apr. 2006 – Jan. 2008), Loomis, Sayles & Company (investment management firm). |
David Lekich
1964
Chief Legal Officer and Secretary, Schwab Funds and Schwab ETFs
Vice President and Assistant Clerk, Laudus Funds
(Officer of The Charles Schwab Family of Funds, Schwab Investments, Schwab Capital Trust, Schwab Annuity Portfolios, Schwab Strategic Trust and Laudus Trust since 2011) | Senior Vice President (Sept. 2011 – present) and Vice President (Mar. 2004 – Sept. 2011), Charles Schwab & Co., Inc.; Senior Vice President and Chief Counsel (Sept. 2011 – present) and Vice President (Jan. 2011 – Sept. 2011), Charles Schwab Investment Management, Inc.; Secretary (Apr. 2011 – present) and Chief Legal Officer (Dec. 2011 – present), Schwab Funds; Vice President and Assistant Clerk (Apr. 2011 – present), Laudus Funds; Secretary (May 2011 – present) and Chief Legal Officer (Nov. 2011 – present), Schwab ETFs. |
Catherine MacGregor
1964
Vice President and Assistant Secretary, Schwab Funds and Schwab ETFs
Chief Legal Officer, Vice President and Clerk, Laudus Funds
(Officer of The Charles Schwab Family of Funds, Schwab Investments, Schwab Capital Trust, Schwab Annuity Portfolios and Laudus Trust since 2005; Schwab Strategic Trust since 2009) | Vice President (July 2005 – present), Charles Schwab & Co., Inc.; Vice President (Sept. 2005 – present), Charles Schwab Investment Management, Inc.; Vice President (Dec. 2005 – present) and Chief Legal Officer and Clerk (Mar. 2007 – present), Laudus Funds; Vice President (Nov. 2005 – present) and Assistant Secretary (June 2007 – present), Schwab Funds; Vice President and Assistant Secretary (Oct. 2009 – present), Schwab ETFs. |
| 1 | Each Trustee shall hold office until the election and qualification of his or her successor, or until he or she dies, resigns or is removed. The retirement policy requires that each independent trustee retire by December 31 of the year in which the Trustee turns 74 or the Trustee’s twentieth year of service as an independent trustee on any trust in the Fund Complex, whichever occurs first. |
| 2 | Mr. Bettinger, Mr. de St. Paer and Mr. Martinetto are Interested Trustees. Mr. Bettinger is an Interested Trustee because he owns stock of The Charles Schwab Corporation (CSC), the parent company of Charles Schwab Investment Management, Inc. (CSIM), the investment adviser for the trusts in the Fund Complex, is an employee and director of Charles Schwab & Co., Inc. (CS&Co), the principal underwriter for The Charles Schwab Family of Funds, Schwab Investments, Schwab Capital Trust, Schwab Annuity Portfolios and Laudus Trust, and is a director of CSIM. Mr. de St. Paer is an Interested Trustee because he owns stock of CSC and is an employee and director of CSIM. Mr. Martinetto is an Interested Trustee because he owns stock of CSC and is an employee and director of CS&Co. |
| 3 | The President, Treasurer and Secretary/Clerk hold office until their respective successors are chosen and qualified or until he or she sooner dies, resigns, is removed or becomes disqualified. Each of the other officers serves at the pleasure of the Board. |
Schwab Active Equity Funds | Annual Report
Schwab Active Equity Funds
asset allocation The practice of dividing a portfolio among different asset classes, with each asset class assigned a particular percentage.
asset class A group of securities with similar structure and basic characteristics. Stocks, bonds and cash are the three main examples of asset classes.
Bloomberg Barclays US Aggregate Bond Index An index that is a broad-based benchmark measuring the performance of the U.S. investment grade, taxable bond market, including U.S. Treasuries, government-related and corporate bonds, mortgage pass-through securities, commercial mortgage-backed securities, and asset-backed securities that are publicly available for sale in the United States. To be eligible for inclusion in the index, securities must be fixed rate, non-convertible, U.S. dollar denominated with at least $300 million or more of outstanding face value and have one or more years remaining to maturity. The index excludes certain types of securities, including tax-exempt state and local government series bonds, structured notes embedded with swaps or other special features, private placements, floating rate securities, inflation-linked bonds and Eurobonds. The index is market capitalization weighted and the securities in the index are updated on the last business day of each month.
Bloomberg Barclays US Treasury Bills 1–3 Month Index An index that includes all publicly issued zero-coupon U.S. Treasury Bills that have a remaining maturity of less than 3 months but more than 1 month, are rated investment grade and have $300 million or more of outstanding face value. It excludes zero-coupon STRIPS.
bond A security representing a loan from the investor to the issuer. A bond typically pays interest at a fixed rate (the coupon rate) until a specified date (the maturity date), at which time the issuer returns the money borrowed (principal or face value) to the bondholder. Because of their structure, bonds are sometimes called “fixed income securities” or “debt securities.”
An individual bond is subject to the credit risk of the issuer. Changes in interest rates can affect a bond’s market value prior to call or maturity. There is no guarantee that a bond’s yield to call or maturity will provide a positive return over the rate of inflation.
bond fund A bond fund is subject to the same credit, interest rate, and inflation risks as bonds. In addition, a bond fund incurs ongoing fees and expenses. A bond fund’s net asset value will fluctuate with the price of the underlying bonds and the portfolio turnover activity; return of principal is not guaranteed.
cap, capitalization See “market cap.”
capital gain, capital loss the difference between the amount paid for an investment and its value at a later time. If the investment has been sold, the capital gain or loss is considered a realized gain or loss. If the investment is still held, the capital gain or loss is considered unrealized appreciation or depreciation.
Dividend Equity Spliced Index An internally calculated index, comprised of the S&P 500 Index from inception of the Schwab Dividend Equity Fund until the close of business on February 27, 2015, and the Russell 1000 Value Index thereafter.
Dow Jones Global Health Care Index An index that measures the performance of healthcare providers, researchers, and supplies producers around the world. The index is quoted in U.S. dollars.
expense ratio The amount that is taken from a mutual fund’s assets each year to cover the fund’s operating expenses. An expense ratio of 0.50% means that a fund’s expenses amount to half of one percent of its average net assets a year.
market cap, market capitalization The value of a company as determined by the total value of all shares of its stock outstanding.
MSCI EAFE Index (Net) A free float-adjusted market capitalization index that is designed to measure the equity market performance of developed markets in Europe, Australasia, and the Far East. The Net version of the index reflects reinvested dividends net of withholding taxes, but reflects no deductions for expenses or other taxes; returns are calculated applying dividend withholding rates applicable to non-resident persons who do not benefit from double taxation treaties.
net asset value (NAV) The value of one share of a mutual fund. NAV is calculated by taking the fund’s total assets, subtracting liabilities, and dividing by the number of shares outstanding.
outstanding shares, shares outstanding When speaking of a company or mutual fund, indicates all shares currently held by investors.
price-to-book ratio (P/B) The market price of a company’s stock compared with its “book value.” A mutual fund’s P/B is the weighted average of the P/B of all stocks in the fund’s portfolio.
price-to-earnings ratio (P/E) The market price of a company’s stock compared with earnings over the past year. A mutual fund’s P/E is the weighted average of the P/E of all stocks in the fund’s portfolio.
return on equity (ROE) The average yearly rate of return for each dollar of investors’ money, measured over the past five years.
Russell 1000 Growth Index An index that measures the performance of those Russell 1000 Index companies with higher price-to-book ratios and higher forecasted growth values.
Russell 1000 Index An index that measures the performance of the 1,000 largest companies in the Russell 3000 Index, and represents approximately 92% of the total market capitalization of the Russell 3000 Index. The Russell 3000 Index measures the performance of the largest 3,000 U.S. companies representing approximately 98% of the investable U.S. equity market.
Russell 1000 Value Index An index that measures the performance of the large-cap value segment of the U.S. equity universe. It includes those Russell 1000 Index companies with lower price-to-book ratios and lower expected growth values.
Russell 2000 Index An index that measures the performance of the 2,000 smallest companies in the Russell 3000 Index. The Russell 3000 Index measures the performance of the largest 3,000 U.S. companies representing approximately 98% of the investable U.S. equity market.
S&P 500 Index An index that is designed to measure the performance of 500 leading publicly traded companies from a broad range of industries.
stock A share of ownership, or equity, in the issuing company.
total return The percentage that an investor would have earned or lost on an investment in the fund assuming dividends and distributions were reinvested.
weighted average For mutual funds, an average that gives the same weight to each security as the security represents in the fund’s portfolio.
yield The income paid out by an investment, expressed as a percentage of the investment’s market value.
Schwab Active Equity Funds | Annual Report
Schwab Active Equity Funds
PRIVACY NOTICE
THIS IS NOT PART OF THE SHAREHOLDER REPORT
A Commitment to Your Privacy
Your Privacy Is Not for Sale
We do not and will not sell your personal information to anyone, for any reason.
We are committed to protecting the privacy of information we maintain about you. Below are details about our commitment, including the types of information we collect and how we use and share that information. This Privacy Notice applies to you only if you are an individual who invests directly in the funds by placing orders through the funds’ transfer agent. If you place orders through your brokerage account at Charles Schwab & Co., Inc. or an account with another broker-dealer, investment advisor, 401(k) plan, employee benefit plan, administrator, bank or other financial intermediary, you are covered by the privacy policies of that financial institution and should consult those policies.
How We Collect Information About You
We collect personal information about you in a number of ways.
• APPLICATION AND REGISTRATION
INFORMATION.
We collect personal information from you when you open an account or utilize one of our services. We may also collect information about you from third parties such as consumer reporting agencies to verify your identity. The information we collect may include personal information, including your Social Security number, as well as details about your interests, investments and investment experience.
• TRANSACTION AND EXPERIENCE
INFORMATION.
Once your account has been opened, we collect and maintain personal information about your account activity, including your transactions, balances, positions and history. This information allows us to administer your account and provide the services you have requested.
• WEBSITE USAGE.
When you visit our websites, we may use devices known as “cookies,” graphic interchange format files (GIFs), or other similar web tools to enhance your web experience. These tools help us to recognize you, maintain your web session, and
provide a more personalized experience. To learn more, please go to www.schwab.com/privacy.
How We Share and Use Your Information
We provide access to information about you to our affiliated companies, outside companies and other third parties in certain limited circumstances, including:
• to help us process transactions for your account;
• when we use other companies to provide services for us, such as printing and mailing your account statements; and
• when we believe that disclosure is required or permitted under law (for example, to cooperate with regulators or law enforcement, resolve consumer disputes, perform credit/authentication checks, or for risk control).
State Laws
We will comply with state laws that apply to the disclosure or use of information about you.
Safeguarding Your Information — Security Is a Partnership
We take precautions to ensure the information we collect about you is protected and is accessed only by authorized individuals or organizations.
Companies we use to provide support services are not allowed to use information about our shareholders for their own purposes and are contractually obligated to maintain strict confidentiality. We limit their use of information to the performance of the specific services we have requested.
We restrict access to personal information by our employees and agents. Our employees are trained about privacy and are required to safeguard personal information.
We maintain physical, electronic and procedural safeguards that comply with federal standards to guard your nonpublic personal information.
Contact Us
To provide us with updated information, report suspected fraud or identity theft, or for any other questions, please call the number below.
Schwab Funds® direct investors: 1-800-407-0256
© 2019 Schwab Funds. All rights reserved.
Schwab Active Equity Funds | Annual Report
Schwab Active Equity Funds
Charles Schwab Investment Management
With a straightforward lineup of core products and solutions for building the foundation of a portfolio, Charles Schwab Investment Management advocates for investors of all sizes with a steadfast focus on lowering costs and reducing unnecessary complexity. The list below shows all currently available Schwab Funds®.
Investors should carefully consider information contained in the prospectus, or if available, the summary prospectus, including investment objectives, risks, charges and expenses before investing. Please call 1-877-824-5615 for a prospectus for any Schwab Fund. Please read the prospectus carefully before you invest. This report must be preceded or accompanied by a current prospectus.
Proxy Voting Policies, Procedures and Results
A description of the proxy voting policies and procedures used to determine how to vote proxies on behalf of the funds is available without charge, upon request, by visiting the Schwab Funds’ website atwww.schwabfunds.com/schwabfunds_prospectus, the SEC’s website atwww.sec.gov, or by contacting Schwab Funds at 1-877-824-5615.
Information regarding how a fund voted proxies relating to portfolio securities during the most recent twelve-month period ended June 30 is available, without charge, by visiting the fund’s website atwww.schwabfunds.com/schwabfunds_prospectus or the SEC’s website atwww.sec.gov.
Equity Funds
Schwab Core Equity Fund
Schwab Dividend Equity Fund
Schwab Large-Cap Growth Fund
Schwab Small-Cap Equity Fund
Schwab Hedged Equity Fund
Schwab Health Care Fund
Schwab International Core Equity Fund
Schwab Fundamental US Large Company Index Fund
Schwab Fundamental US Small Company Index Fund
Schwab Fundamental International Large Company Index Fund
Schwab Fundamental International Small Company Index Fund
Schwab Fundamental Emerging Markets Large Company Index Fund
Schwab Fundamental Global Real Estate Index Fund
Schwab Global Real Estate Fund
Schwab S&P 500 Index Fund
Schwab 1000 Index® Fund
Schwab Small-Cap Index Fund®
Schwab Total Stock Market Index Fund®
Schwab U.S. Large-Cap Growth Index Fund
Schwab U.S. Large-Cap Value Index Fund
Schwab U.S. Mid-Cap Index Fund
Schwab International Index Fund®
Asset Allocation Funds
Schwab Balanced Fund
Schwab MarketTrack Portfolios®
Schwab Target Funds
Schwab Target Index Funds
Schwab Monthly Income Funds
Bond Funds
Schwab Treasury Inflation Protected Securities Index Fund
Schwab U.S. Aggregate Bond Index Fund
Schwab Short-Term Bond Index Fund
Schwab Tax-Free Bond Fund1
Schwab California Tax-Free Bond Fund1
Schwab Money Funds2
Schwab provides a broad choice of taxable and tax-exempt money market funds for both retail and institutional client types.
Investment Adviser
Charles Schwab Investment Management, Inc.
211 Main Street, San Francisco, CA 94105
Funds
Schwab Funds
1-877-824-5615
© 2019 Charles Schwab & Co., Inc. All rights reserved.
Member SIPC®
Printed on recycled paper.
| ¹ | State, local, and the Federal Alternative Minimum Tax may apply. Capital gains are not exempt from Federal Taxation. |
| ² | You could lose money by investing in the Schwab Money Funds. All Schwab Money Funds with the exception of Schwab Variable Share Price Money Fund seek to preserve the value of your investment at $1.00 per share, but cannot guarantee they will do so. Because the share price of Schwab Variable Share Price Money Fund will fluctuate, when you sell your shares they may be worth more or less than what you originally paid for them. All Schwab Money Funds with the exception of Schwab Government Money Fund, Schwab Retirement Government Money Fund, Schwab U.S. Treasury Money Fund, Schwab Treasury Obligations Money Fund and Schwab Government Money Market Portfolio may impose a fee upon the sale of your shares or may temporarily suspend your ability to sell shares if the Fund’s liquidity falls below required minimums because of market conditions or other factors. An investment in the Schwab Money Funds is not insured or guaranteed by the Federal Deposit Insurance Corporation or any other government agency. The Schwab Money Funds’ sponsor has no legal obligation to provide financial support to the Funds, and you should not expect that the sponsor will provide financial support to the Funds at any time. |
This page is intentionally left blank.
Annual Report | October 31, 2019
Schwab Balanced Fund
| New Notice Regarding Shareholder Report Delivery Options |
| Beginning on January 1, 2021, paper copies of a fund’s shareholder reports will no longer be sent by mail, unless you specifically request paper copies of the reports from a fund or from your financial intermediary (such as a bank or broker-dealer). Instead, the reports will be made available on a fund’s websitewww.schwabfunds.com/schwabfunds_prospectus, and you will be notified by mail each time a report is posted and the mailing will provide a website link to access the report. You will continue to receive other fund regulatory documents (such as prospectuses or supplements) in paper unless you have elected to receive all fund documents electronically. |
| If you would like to receive a fund’s future shareholder reports in paper free of charge after January 1, 2021, you can make that request: |
| • If you invest through Charles Schwab & Co, Inc. (broker-dealer), by calling 1-866-345-5954 and using the unique identifier attached to this mailing; |
| • If you invest through another financial intermediary (such as a bank or broker-dealer) by contacting them directly; or |
| • If owned directly through a fund by calling 1-800-407-0256. |
| If you already receive shareholder reports and other fund documents electronically, you will not be affected by this change and you need not take any action. |
Fund investment adviser: Charles Schwab Investment Management, Inc. (CSIM)
Distributor: Charles Schwab & Co., Inc. (Schwab)
Schwab Balanced Fund | Annual Report
The performance data quoted represents past performance. Past performance does not guarantee future results. Investment returns and principal value of an investment will fluctuate so that an investor’s shares may be worth more or less than their original cost. Current performance may be lower or higher than performance data quoted. To obtain performance information current to the most recent month end, please visitwww.schwabfunds.com/schwabfunds_prospectus.
| Total Return for the 12 Months Ended October 31, 2019 |
| Schwab Balanced Fund (Ticker Symbol: SWOBX) | 11.19% |
| Balanced Blended Index | 12.35% |
| Fund Category: Morningstar Allocation—50% to 70% Equity1 | 10.26% |
| Performance Details | pages 7-9 |
All total returns on this page assume dividends and distributions were reinvested. Index figures do not include trading and management costs, which would lower performance. Indices are unmanaged and cannot be invested in directly. Performance results less than one year are not annualized.
The components that make up the composite index may vary over time. For index definition, please see the Glossary.
Fund expenses may have been partially absorbed by CSIM and its affiliates. Without these reductions, the fund’s total return would have been lower. Performance does not reflect the deduction of taxes that a shareholder would pay on fund distributions or on the redemption of fund shares.
| 1 | Source for category information: Morningstar, Inc. The Morningstar Category return represents all active and index mutual funds within the category as of the report date. |
Schwab Balanced Fund | Annual Report
Jonathan de St. Paer
President of Charles Schwab
Investment Management, Inc.
and the fund covered
in this report.
Dear Shareholder,
At the crux of every investment decision, one consideration that may be top of mind is your risk tolerance. It may seem like a straightforward consideration, but it’s often not. Most of us are risk-averse by nature and as investors, the fear of a significant market decline is ever-present in our minds. This can sometimes lead us to make decisions that may get in the way of the performance of our investments. Our feelings about risk are also fluid, impacted by changes in market conditions and our progress toward our financial goals. For example, some investors may have been prompted to rethink their risk appetite as a result of the latest bout of market volatility.
At Charles Schwab Investment Management, we provide a range of foundational products that are designed to suit a variety of risk appetites and help investors remain focused on their long-term investment plans despite market volatility. One way we do that is by providing asset allocation solutions, which take on the job of adjusting the allocation to varying asset classes in response to changing market conditions.
The Schwab Balanced Fund can play an important role in fulfilling this objective. The fund offers an all-in-one portfolio solution that holds a combination of equity funds, bond funds, and cash in one place. The portfolio management team balances the exposures between each asset class. The fund typically invests most of its assets in equity funds while maintaining an allocation to bond funds.
The fund seeks to provide investors access to both growth and income opportunities. When either stocks or bonds are under pressure, this diversification can offer downside protection. And at times like the present, when stocks and bonds are experiencing a simultaneous climb, diversification helps investors stay invested and benefit from both.
When it comes to investing, it’s important to have a long-term investing plan and portfolio based on your individual goals and risk tolerance. It can at times be tough to maintain that discipline in the face of day-to-day uncertainty. We aim to offer products with clear objectives, straightforward pricing, and a consistent approach to investing to help simplify investing decisions, so investors can focus on their long-term goals without unnecessary complexity.
Thank you for investing with Charles Schwab Investment Management, and for trusting us to help you achieve your financial goals. For more information about the Schwab Balanced Fund, please continue reading this report. In addition, you can find further details about this fund by visiting our website at www.schwabfunds.com. We are also happy to hear from you at 1-877-824-5615.
Sincerely,
“The fund offers an all-in-one portfolio solution that holds a combination of equity funds, bond funds, and cash in one place.”
Diversification and asset allocation strategies do not ensure a profit and cannot protect against losses in a declining market.
Management views may have changed since the report date.
Schwab Balanced Fund | Annual Report
The Investment Environment
For the 12-month reporting period ended October 31, 2019, global equity and fixed income markets generated positive returns. The final two months of 2018 were marked by significant market volatility and steep declines across global equity markets, driven by concerns about slowing international growth, a trade war between the U.S. and China, falling oil prices, the waning strength of the U.S. economy, and the pace of future interest rate hikes despite low inflation. By late December, major market indices had fallen to near-bear market territory. However, as the Federal Reserve (Fed) put interest rate hikes on hold, stocks, particularly in the U.S., staged a strong recovery in the first four months of 2019, which generally continued through the end of the reporting period despite several setbacks. Over the period, the U.S. dollar strengthened slightly against a basket of foreign currencies, generally reducing the returns on overseas investments in U.S. dollar terms. For the reporting period, the S&P 500® Index, a bellwether for the overall U.S. stock market, returned 14.33%. Despite headwinds, markets outside the U.S. also rose, particularly toward the end of the reporting period with the MSCI EAFE® Index (Net)*, a broad measure of developed international equity performance, returning 11.04%. Fixed-income markets were particularly strong over the period. The Bloomberg Barclays US Aggregate Bond Index returned 11.51% and the FTSE non-US Dollar World Government Bond Index returned 9.25%.
Economic growth around the globe was uneven over the reporting period, largely as a result of manufacturing weakness in developed international markets. Despite escalating trade tensions with China, the U.S. maintained its steady growth in its tenth year of expansion, although at a declining pace. In the last two months of 2018, economies around the globe showed increasing signs of weakness, but many regained economic momentum in the first six months of 2019, demonstrating resilient growth despite lingering uncertainties on various fronts. As the year progressed, signs of slowing growth increased amid a weakening global economy, waning manufacturing activity, and the ongoing U.S.-China trade war. However, toward the end of the period, prospects of a partial trade resolution relieved some of the pressure. U.S. gross domestic product (GDP) grew at an annual rate of 2.1% in the third quarter of 2019, up slightly from 2.0% in the second quarter, but down from 3.1% in the first quarter of 2019. Unemployment declined in September 2019 to a 50-year low. While consumer confidence edged lower in October to hit a four-month low, it remained a stable source of GDP growth in the U.S. Inflation remained benign.
Asset Class Performance Comparison % returns during the 12 months ended October 31, 2019
Index figures assume dividends and distributions were reinvested. Index figures do not include trading and management costs, which would lower performance. Indices are unmanaged and cannot be invested in directly. Performance results less than one year are not annualized. Past performance is not an indication of future results.
For index definitions, please see the Glossary.
Data source: Index provider websites and CSIM.
Nothing in this report represents a recommendation of a security by the investment adviser.
Management views may have changed since the report date.
| * | The net version of the index reflects reinvested dividends net of withholding taxes, but reflects no deductions for expenses or other taxes. |
Schwab Balanced Fund | Annual Report
The Investment Environment(continued)
Outside the U.S., conditions continued to soften, dampened by trade issues, slowing economic output, and geopolitical concerns. Oil prices, which had fallen steeply in the fourth quarter of 2018, rebounded through the first four months of 2019, as major exporters sought to curb supply and central banks took steps to ease growth-related fears, before dipping in May when trade concerns escalated. Oil prices remained volatile through period end. In the eurozone, growth slowed in the second and third quarters of 2019, down slightly from the first quarter. Growth was subdued by tepid wage growth and constrained consumer spending. The United Kingdom’s economy contracted in the second quarter of 2019 amid growing Brexit-related economic and political uncertainty that dampened industrial output, construction, and services sectors. Japan’s economy, however, experienced growth in recent quarters after contracting sharply in the third quarter of 2018. Several Asian economies, including China and India, exhibited signs of slowing, but still outpaced many developed economies.
In response to the economic environment and flat or inverted yield curves around the world, to bolster growth, and to ensure stability given ongoing trade tensions, a number of central banks reduced their policy rates, including the U.S., while others maintained their generally low—and for some international central banks, negative—interest rates. In the U.S., after raising interest rates four times in 2018, the Fed held rates unchanged through the first half of 2019. But amid growing signs of global economic weakness that threatened to dampen U.S. economic growth, along with continued low inflation and weakness in manufacturing, the Fed enacted three interest rate cuts by the end of the period—in July, September, and October. Following the October interest rate cut, the Fed signaled that subsequent interest rate cuts would be put on hold provided the economy continues to expand moderately and the labor market remains strong. The federal funds rate ended the reporting period in a range of 1.50% to 1.75%. Outside the U.S., the European Central Bank held interest rates steady and launched an asset-purchase program to help stimulate the economy. The Bank of Japan maintained its short-term interest rate target of –0.1% throughout the period. Despite growing Brexit-related division, the Bank of England maintained its key official bank rate at 0.75% throughout the period, where it has remained since August 2018. Central banks in key emerging market economies—including India, Thailand, and China—lowered their policy rates in response to inflation and trade-related pressures.
Bond prices generally rose over the reporting period as yields fell. (Bond yields and bond prices move in opposite directions.) Short-term yields, which typically respond to changes in the federal funds rate, remained flat for the first half of the period before declining as the Fed implemented interest rate cuts, with the three-month Treasury yield falling from 2.34% at the outset of the period to 1.54% at the end of the period. Longer-term yields, which are influenced more by economic growth and inflation expectations, trended downward over most of the period before moderating in the final two months. During the reporting period, the yield curve flattened with portions of the yield curve inverting, which is often an indicator of a potential recession. Over the reporting period, the 10-year Treasury yield fell from 3.15% to 1.69%. Outside the U.S., bond yields generally remained low.
Schwab Balanced Fund | Annual Report
 | Zifan Tang, Ph.D., CFA, Senior Portfolio Manager, is responsible for the co-management of the fund. She has served as portfolio manager of the fund since February 2012. Prior to joining CSIM in 2012, Ms. Tang was a product manager at Thomson Reuters and, from 1997 to 2009, worked as a portfolio manager at Barclays Global Investors, which was subsequently acquired by BlackRock. |
 | Patrick Kwok, CFA, Portfolio Manager, is responsible for the co-management of the fund. He has served as portfolio manager of the fund since February 2019. Prior to joining CSIM in 2008, Mr. Kwok spent two years as an asset operations specialist at Charles Schwab Trust Company. He also previously worked for one year at State Street Bank & Trust as a portfolio accountant and pricing specialist. |
Schwab Balanced Fund | Annual Report
The Schwab Balanced Fund (the fund) seeks capital growth and income. To pursue its goal, the fund generally invests in a diversified group of other affiliated Schwab and/or Laudus Funds, in accordance with its target portfolio allocation. Normally, the fund invests 55% to 65% of its assets in equity securities (including stocks and equity funds) and 35% to 45% in fixed-income securities (including bonds and fixed income funds), and cash and cash equivalents (including money market funds). The fund’s allocation is designed to provide a mix of the growth opportunities of stock investing with the income opportunities of bonds and other fixed-income securities. For more information concerning the fund’s investment objective, strategies, and risks, please see the fund’s prospectus.
Market Highlights. Over the 12-month reporting period, the U.S. economy maintained its steady growth in its tenth year of expansion, although at a declining pace. Unemployment declined while consumer confidence lagged. Inflation remained benign. In response to the economic environment, to bolster growth, and to ensure stability given ongoing trade tensions, the Federal Reserve reduced its policy rates. Bond prices generally rose over the reporting period as yields fell.
Performance. For the 12-month reporting period ended October 31, 2019, the fund returned 11.19%. The fund’s internally calculated comparative index, the Balanced Blended Index (the index), returned 12.35%.
Positioning and Strategies. Over the reporting period, the fund’s asset allocations were broadly in line with those of the index.
The fund’s U.S. large-cap equity exposure contributed positively to total return but dragged on relative performance. The Schwab Core Equity Fund returned approximately 12.0% for the reporting period while its comparative index, the S&P 500® Index returned approximately 14.3%. The Laudus U.S. Large Cap Growth Fund also contributed positively to the fund’s total return, returning approximately 15.8%.
The fund’s fixed income allocation contributed to the fund’s total return. The Schwab U.S. Aggregate Bond Index Fund returned approximately 11.3%, while its comparative benchmark, the Bloomberg Barclays US Aggregate Bond Index, returned approximately 11.5%. The fund’s allocation to the Schwab U.S. Aggregate Bond Index Fund was increased in January 2019 when the allocation to the Schwab Intermediate-Term Bond Fund was replaced with the Schwab U.S. Aggregate Bond Index Fund. While held by the fund, the Schwab Intermediate-Term Bond Fund returned approximately 2.1% while the comparative index, the Bloomberg Barclays US Aggregate Intermediate Index, returned approximately 2.5%.
The U.S. small-cap equity allocation neither contributed nor detracted to the return of the fund and the return for this allocation was nearly flat. The U.S. small-cap equity allocation dragged on relative performance, underperforming the comparative benchmark, the Russell 2000® Index which returned approximately 4.9%. In January 2019, the fund transitioned its U.S. small-cap equity allocation from the Laudus Small-Cap MarketMasters Fund to the Schwab Small-Cap Equity Fund. While held by the fund, the Laudus Small-Cap MarketMasters Fund and the Schwab Small-Cap Equity Fund returned approximately -2.7% and 4.3%, respectively.
Management views and portfolio holdings may have changed since the report date.
Schwab Balanced Fund | Annual Report
Performance and Fund Factsas of October 31, 2019
The performance data quoted represents past performance. Past performance does not guarantee future results. Investment returns and principal value of an investment will fluctuate so that an investor’s shares may be worth more or less than their original cost. Current performance may be lower or higher than performance data quoted. To obtain performance information current to the most recent month end, please visitwww.schwabfunds.com/schwabfunds_prospectus.
Performance of Hypothetical $10,000 Investment (October 31, 2009 – October 31, 2019)1
Average Annual Total Returns1
| Fund and Inception Date | 1 Year | 5 Years | 10 Years |
| Fund: Schwab Balanced Fund (11/18/96) | 11.19% | 6.73% | 8.86% |
| Balanced Blended Index | 12.35% | 7.52% | 9.54% |
| S&P 500® Index | 14.33% | 10.78% | 13.70% |
| Bloomberg Barclays US Aggregate Bond Index | 11.51% | 3.24% | 3.73% |
| Fund Category: Morningstar Allocation—50% to 70% Equity2 | 10.26% | 5.57% | 8.08% |
| Fund Expense Ratios3: Net 0.50%; Gross 0.54% |
All total returns on this page assume dividends and distributions were reinvested. Index figures do not include trading and management costs, which would lower performance. Indices are unmanaged and cannot be invested in directly. Performance results less than one year are not annualized.
The first index listed for the fund is the fund’s primary benchmark, as shown in the prospectus. Additional indices shown are provided for comparative purposes.
For index definitions, please see the Glossary.
| 1 | Fund expenses may have been partially absorbed by CSIM and its affiliates. Without these reductions, the fund’s returns would have been lower. These returns do not reflect the deduction of taxes that a shareholder would pay on fund distributions or the redemption of fund shares. |
| 2 | Source for category information: Morningstar, Inc. The Morningstar Category return represents all active and index mutual funds within the category as of the report date. |
| 3 | As stated in the prospectus. Includes 0.50% of acquired fund fees and expenses (AFFE), which are based on estimated amounts for the current fiscal year and are indirect expenses incurred by the fund through its investments in the underlying funds. Net Expense: Expenses reduced by a contractual fee waiver in effect for so long as CSIM serves as the investment adviser to the fund. Gross Expense: Does not reflect the effect of contractual fee waivers. For actual expense ratios during the period, not including AFFE, refer to the financial highlights section of the financial statements. |
Schwab Balanced Fund | Annual Report
Performance and Fund Factsas of October 31, 2019 (continued)
| Number of Holdings | 6 |
| Portfolio Turnover Rate | 32% |
Asset Class Weightings % of Investments1
Top Holdings % of Net Assets2,3
Portfolio holdings may have changed since the report date.
Small-company stocks are subject to greater volatility than many other asset classes.
| 1 | The percentage may differ from the Portfolio Holdings because the above calculation is based on a percentage of total investments, whereas the calculation in the Portfolio Holdings is based on a percentage of net assets. |
| 2 | This list is not a recommendation of any security by the investment adviser. |
| 3 | The holdings listed exclude any temporary liquidity investments. |
Schwab Balanced Fund | Annual Report
Examples for a $1,000 Investment
As a fund shareholder, you may incur two types of costs: (1) transaction costs; and (2) ongoing costs, including transfer agent fees and other fund expenses.
The expense examples below are intended to help you understand your ongoing cost (in dollars) of investing in the fund and to compare this cost with the ongoing cost of investing in other mutual funds. These examples are based on an investment of $1,000 invested for six months beginning May 1, 2019 and held through October 31, 2019.
Actual Return lines in the table below provide information about actual account values and actual expenses. You may use this information, together with the amount you invested, to estimate the expenses that you paid over the period. To do so, simply divide your account value by $1,000 (for example, an $8,600 account value ÷ $1,000 = 8.6), then multiply the result by the number given for the fund under the heading entitled “Expenses Paid During Period.”
Hypothetical Return lines in the table below provide information about hypothetical account values and hypothetical expenses based on the fund’s actual expense ratio and an assumed return of 5% per year before expenses. Because the return used is not an actual return, it may not be used to estimate the actual ending account value or expenses you paid for the period.
You may use this information to compare the ongoing costs of investing in the fund and other funds. To do so, compare this 5% hypothetical example with the 5% hypothetical examples that appear in the shareholder reports of the other funds.
Please note that the expenses shown in the table are meant to highlight your ongoing costs only, and do not reflect any transactional costs. Therefore, the hypothetical return lines of the table are useful in comparing ongoing costs only, and will not help you determine the relative total costs of owning different funds. In addition, if these transactional costs were included, your costs would have been higher.
| | Expense Ratio
(Annualized)1,2 | Effective
Expense Ratio
(Annualized)3,4 | Beginning
Account Value
at 5/1/19 | Ending
Account Value
(Net of Expenses)
at 10/31/19 | Expenses Paid
During Period
5/1/19-10/31/192,5 | Effective
Expenses Paid
During Period
5/1/19-10/31/194,5 |
| Schwab Balanced Fund | | | | | | |
| Actual Return | 0.00% | 0.50% | $1,000.00 | $1,029.60 | $0.00 | $2.56 |
| Hypothetical 5% Return | 0.00% | 0.50% | $1,000.00 | $1,025.20 | $0.00 | $2.55 |
| 1 | Based on the most recent six-month expense ratio. |
| 2 | Excludes acquired fund fees and expenses, which are indirect expenses incurred by the fund through its investments in underlying funds. |
| 3 | Based on the most recent six-month acquired fund fees and expense ratio; may differ from the acquired fund fees and expense ratio in the prospectus, which are based on estimated amounts for the current fiscal year. |
| 4 | Includes acquired fund fees and expenses, which are indirect expenses incurred by the fund through its investments in underlying funds. |
| 5 | Expenses for each fund are equal to its annualized expense ratio, multiplied by the average account value over the period, multiplied by the 184 days of the period, and divided by the 365 days of the fiscal year. |
Schwab Balanced Fund | Annual Report
Financial Statements
Financial Highlights
| | 11/1/18–
10/31/19 | 11/1/17–
10/31/18 | 11/1/16–
10/31/17 | 11/1/15–
10/31/16 | 11/1/14–
10/31/15 | |
| Per-Share Data |
| Net asset value at beginning of period | $15.41 | $15.60 | $14.51 | $15.40 | $15.56 | |
| Income (loss) from investment operations: | | | | | | |
| Net investment income (loss)1 | 0.24 | 0.23 | 0.21 | 0.19 | 0.18 | |
| Net realized and unrealized gains (losses) | 1.32 | 0.082 | 1.96 | 0.003 | 0.42 | |
| Total from investment operations | 1.56 | 0.31 | 2.17 | 0.19 | 0.60 | |
| Less distributions: | | | | | | |
| Distributions from net investment income | (0.37) | (0.48) | (0.22) | (0.32) | (0.34) | |
| Distributions from net realized gains | (0.61) | (0.02) | (0.86) | (0.76) | (0.42) | |
| Total distributions | (0.98) | (0.50) | (1.08) | (1.08) | (0.76) | |
| Net asset value at end of period | $15.99 | $15.41 | $15.60 | $14.51 | $15.40 | |
| Total return | 11.19% | 1.94% | 15.90% | 1.41% | 3.95% | |
| Ratios/Supplemental Data |
| Ratios to average net assets: | | | | | | |
| Net operating expenses4 | 0.00% | 0.00% | 0.00% | 0.00%5 | 0.00%5 | |
| Gross operating expenses4 | 0.04% | 0.04% | 0.06% | 0.06% | 0.07% | |
| Net investment income (loss) | 1.55% | 1.44% | 1.39% | 1.34% | 1.18% | |
| Portfolio turnover rate | 32% | 6% | 28%6 | 19% | 5% | |
| Net assets, end of period (x 1,000,000) | $526 | $447 | $386 | $282 | $305 | |
| |
1
Calculated based on the average shares outstanding during the period.
2
The per share amount does not accord with the change in aggregate gains and losses in securities during the period because of the timing of sales and repurchases of fund shares in relation to fluctuating market values.
3
Less than $0.005.
4
The expenses incurred by underlying funds in which the fund invests are not included in this ratio.
5
Less than 0.005%; the ratio of net operating expenses would have been 0.00%, if certain non-routine expenses and/or interest expense had not been incurred.
6
The portfolio turnover rate increased due to the in-kind transactions relating to Schwab Total Bond Market Fund and Schwab U.S. Aggregate Bond Index Fund. For comparison purposes, the portfolio turnover rate would have been 7% without including these transactions. There were no transaction costs associated with these transactions.
Schwab Balanced Fund | Annual Report
Portfolio Holdings as of October 31, 2019
This section shows all the securities in the fund’s portfolio and their values as of the report date.
The fund files its complete schedule of portfolio holdings with the U.S. Securities and Exchange Commission (SEC) for the first and third quarters of each fiscal year on Form N-Q. Effective March 31, 2019, Form N-PORT Part F has replaced Form N-Q. The fund’s Form N-Q and Form N-PORT Part F are available on the SEC’s website atwww.sec.gov. The fund also makes available its complete schedule of portfolio holdings 15 to 20 days after the end of the month on the fund’s website atwww.schwabfunds.com/schwabfunds_prospectus.
| Security | Number
of Shares | Value ($) |
| Affiliated Underlying Funds99.3% of net assets |
| |
| Equity Funds 60.2% |
| Large-Cap 50.0% |
| Laudus U.S. Large Cap Growth Fund * | 3,461,758 | 77,612,608 |
| Schwab Core Equity Fund | 8,488,742 | 185,648,795 |
| | | 263,261,403 |
| Small-Cap 10.2% |
| Schwab Small-Cap Equity Fund | 3,196,837 | 53,323,240 |
| | | 316,584,643 |
| |
| Fixed-Income Fund 36.8% |
| Intermediate-Term Bond 36.8% |
| Schwab U.S. Aggregate Bond Index Fund | 18,675,589 | 193,852,620 |
| |
| Money Market Fund 2.3% |
| Schwab Variable Share Price Money Fund, Ultra Shares 1.85%(a) | 12,112,940 | 12,118,997 |
| Total Affiliated Underlying Funds |
| (Cost $475,454,387) | | 522,556,260 |
| Security | Number
of Shares | Value ($) |
| Unaffiliated Underlying Fund0.7% of net assets |
| |
| Money Market Fund 0.7% |
| State Street Institutional U.S. Government Money Market Fund, Premier Class 1.75%(a) | 3,821,366 | 3,821,366 |
| Total Unaffiliated Underlying Fund |
| (Cost $3,821,366) | | 3,821,366 |
| * | Non-income producing security. |
| (a) | The rate shown is the 7-day yield. |
Below is a summary of the fund’s transactions with its affiliated underlying funds during the period ended October 31, 2019:
| Affiliated Underlying Funds | Market
Value at
10/31/18 | Gross
Purchases | Gross
Sales | Realized
Gains (Losses) | Net Change
in Unrealized
Appreciation
(depreciation) | Market
Value at
10/31/19 | Balance
of Shares
Held at
10/31/19 | Distributions
Received* |
| Laudus Small-Cap MarketMasters Fund, Select Shares | $44,913,075 | $2,370,000 | ($41,276,972) | ($362,506) | ($5,643,597) | $— | — | $4,489,301 |
| Laudus U.S. Large Cap Growth Fund | 66,622,785 | 15,268,559 | (10,075,000) | (340,756) | 6,137,020 | 77,612,608 | 3,461,758 | 5,008,159 |
| Schwab Core Equity Fund | 157,179,451 | 46,498,943 | (17,575,000) | (3,276,849) | 2,822,250 | 185,648,795 | 8,488,742 | 20,048,943 |
| Schwab Intermediate-Term Bond Fund | 50,815,631 | 2,675,201 | (54,131,542) | (1,847,142) | 2,487,852 | — | — | 289,075 |
| Schwab Small-Cap Equity Fund | — | 52,798,000 | (833,000) | (16,237) | 1,374,477 | 53,323,240 | 3,196,837 | — |
| Schwab U.S. Aggregate Bond Index Fund | 115,403,823 | 94,523,143 | (28,913,000) | (509,608) | 13,348,262 | 193,852,620 | 18,675,589 | 4,861,893 |
| Schwab Variable Share Price Money Fund, Ultra Shares | 10,364,980 | 1,750,559 | — | — | 3,458 | 12,118,997 | 12,112,940 | 250,654 |
| Total | $445,299,745 | $215,884,405 | ($152,804,514) | ($6,353,098) | $20,529,722 | $522,556,260 | | $34,948,025 |
| * | Distributions received include distributions from net investment income and capital gains, if any, from the underlying funds. |
| | |
At October 31, 2019, all of the fund’s investment securities were classified as Level 1. Fund investments in underlying mutual funds are classified as Level 1, without consideration to the classification level of the investments held by the underlying mutual funds, which could be Level 1, Level 2 or Level 3 (see financial note 2(a) for additional information).
Schwab Balanced Fund | Annual Report
Statement of Assets and Liabilities
As of October 31, 2019
| Assets |
| Investments in affiliated underlying funds, at value (cost $475,454,387) | | $522,556,260 |
| Investments in unaffiliated underlying funds, at value (cost $3,821,366) | | 3,821,366 |
| Receivables: | | |
| Fund shares sold | | 1,255,808 |
| Dividends | | 469,874 |
| Due from investment adviser | | 19,915 |
| Prepaid expenses | + | 21,442 |
| Total assets | | 528,144,665 |
| Liabilities |
| Payables: | | |
| Investments bought | | 1,554,102 |
| Fund shares redeemed | | 361,423 |
| Accrued expenses | + | 55,309 |
| Total liabilities | | 1,970,834 |
| Net Assets |
| Total assets | | 528,144,665 |
| Total liabilities | – | 1,970,834 |
| Net assets | | $526,173,831 |
| Net Assets by Source | | |
| Capital received from investors | | 460,308,724 |
| Total distributable earnings | | 65,865,107 |
| Net Asset Value (NAV) |
| Net Assets | ÷ | Shares
Outstanding | = | NAV |
| $526,173,831 | | 32,907,989 | | $15.99 |
| | | | | |
Schwab Balanced Fund | Annual Report
Statement of Operations
For the period November 1, 2018 through October 31, 2019
| Investment Income |
| Dividends received from affiliated underlying funds | | $7,390,752 |
| Dividends received from unaffiliated underlying funds | + | 70,340 |
| Total investment income | | 7,461,092 |
| Expenses |
| Registration fees | | 51,420 |
| Shareholder reports | | 44,293 |
| Professional fees | | 31,136 |
| Portfolio accounting fees | | 28,555 |
| Transfer agent fees | | 21,861 |
| Independent trustees’ fees | | 10,337 |
| Custodian fees | | 1,790 |
| Other expenses | + | 9,253 |
| Total expenses | | 198,645 |
| Expense reduction by CSIM and its affiliates | – | 198,645 |
| Net expenses | – | — |
| Net investment income | | 7,461,092 |
| Realized and Unrealized Gains (Losses) |
| Realized capital gain distributions received from affiliated underlying funds | | 27,557,273 |
| Net realized losses on sales of affiliated underlying funds | + | (6,353,098) |
| Net realized gains | | 21,204,175 |
| Net change in unrealized appreciation (depreciation) on affiliated underlying funds | + | 20,529,722 |
| Net realized and unrealized gains | | 41,733,897 |
| Increase in net assets resulting from operations | | $49,194,989 |
Schwab Balanced Fund | Annual Report
Statement of Changes in Net Assets
For the current and prior report periods
| Operations | |
| | 11/1/18-10/31/19 | 11/1/17-10/31/18 |
| Net investment income | | $7,461,092 | $6,070,669 |
| Net realized gains | | 21,204,175 | 24,111,718 |
| Net change in unrealized appreciation (depreciation) | + | 20,529,722 | (24,870,807) |
| Increase in net assets from operations | | 49,194,989 | 5,311,580 |
| Distributions to Shareholders | |
| Total distributions | | ($28,049,773) | ($12,185,118) |
| Transactions in Fund Shares | | | |
| | | 11/1/18-10/31/19 | 11/1/17-10/31/18 |
| | | SHARES | VALUE | SHARES | VALUE |
| Shares sold | | 11,096,629 | $169,470,196 | 10,224,123 | $162,133,182 |
| Shares reinvested | | 1,812,747 | 24,889,012 | 690,392 | 10,707,988 |
| Shares redeemed | + | (8,978,575) | (135,957,018) | (6,642,949) | (104,866,438) |
| Net transactions in fund shares | | 3,930,801 | $58,402,190 | 4,271,566 | $67,974,732 |
| Shares Outstanding and Net Assets | | | |
| | | 11/1/18-10/31/19 | 11/1/17-10/31/18 |
| | | SHARES | NET ASSETS | SHARES | NET ASSETS |
| Beginning of period | | 28,977,188 | $446,626,425 | 24,705,622 | $385,525,231 |
| Total increase | + | 3,930,801 | 79,547,406 | 4,271,566 | 61,101,194 |
| End of period | | 32,907,989 | $526,173,831 | 28,977,188 | $446,626,425 |
Schwab Balanced Fund | Annual Report
1. Business Structure of the Fund:
Schwab Balanced Fund is a series of Schwab Capital Trust (the trust), a no-load, open-end management investment company. The trust is organized as a Massachusetts business trust and is registered under the Investment Company Act of 1940, as amended (the 1940 Act). The list below shows all the funds in the trust as of the end of the period, including the fund discussed in this report, which is highlighted:
| SCHWAB CAPITAL TRUST (ORGANIZED MAY 7, 1993) |
| Schwab Balanced Fund | Schwab Target 2040 Fund |
| Schwab S&P 500 Index Fund | Schwab Target 2045 Fund |
| Schwab Small-Cap Index Fund® | Schwab Target 2050 Fund |
| Schwab Total Stock Market Index Fund® | Schwab Target 2055 Fund |
| Schwab U.S. Large-Cap Growth Index Fund | Schwab Target 2060 Fund |
| Schwab U.S. Large-Cap Value Index Fund | Schwab Fundamental US Large Company Index Fund |
| Schwab U.S. Mid-Cap Index Fund | Schwab Fundamental US Small Company Index Fund |
| Schwab International Index Fund® | Schwab Fundamental International Large Company Index Fund |
| Schwab MarketTrack All Equity Portfolio™ | Schwab Fundamental International Small Company Index Fund |
| Schwab MarketTrack Growth Portfolio™ | Schwab Fundamental Emerging Markets Large Company Index Fund |
| Schwab MarketTrack Balanced Portfolio™ | Schwab Fundamental Global Real Estate Index Fund |
| Schwab MarketTrack Conservative Portfolio™ | Schwab Target 2010 Index Fund |
| Laudus International MarketMasters Fund™ | Schwab Target 2015 Index Fund |
| Schwab Core Equity Fund | Schwab Target 2020 Index Fund |
| Schwab Dividend Equity Fund | Schwab Target 2025 Index Fund |
| Schwab Large-Cap Growth Fund | Schwab Target 2030 Index Fund |
| Schwab Small-Cap Equity Fund | Schwab Target 2035 Index Fund |
| Schwab Hedged Equity Fund | Schwab Target 2040 Index Fund |
| Schwab Health Care Fund | Schwab Target 2045 Index Fund |
| Schwab International Core Equity Fund | Schwab Target 2050 Index Fund |
| Schwab Target 2010 Fund | Schwab Target 2055 Index Fund |
| Schwab Target 2015 Fund | Schwab Target 2060 Index Fund |
| Schwab Target 2020 Fund | Schwab Monthly Income Fund - Moderate Payout |
| Schwab Target 2025 Fund | Schwab Monthly Income Fund - Enhanced Payout |
| Schwab Target 2030 Fund | Schwab Monthly Income Fund - Maximum Payout |
| Schwab Target 2035 Fund | |
The Schwab Balanced Fund is a single class “fund of funds” which seeks to achieve its investment objective by investing in a diversified group of other affiliated Schwab and/or Laudus Funds (the underlying funds), but also may invest in other unaffiliated, third party mutual funds, including exchange-traded funds (ETFs). In addition, the fund may invest a portion of its assets directly in equity and fixed-income securities to maintain its allocations.
The fund offers one share class. Shares are bought and sold at closing net asset value per share (NAV), which is the price for all outstanding shares of the fund. Each share has a par value of 1/1,000 of a cent, and the fund’s Board of Trustees (the Board) may authorize the issuance of as many shares as necessary.
The fund maintains its own account for purposes of holding assets and accounting, and is considered a separate entity for tax purposes. Within its account, the fund may also keep certain assets in segregated accounts, as required by securities law.
2. Significant Accounting Policies:
The following is a summary of the significant accounting policies the fund uses in its preparation of financial statements. The fund follows the investment company accounting and reporting guidance of the Financial Accounting Standards Board (FASB) Accounting Standard CodificationTopic 946 Financial Services — Investment Companies. The accounting policies are in conformity with accounting principles generally accepted in the United States of America (GAAP).
The financial statements of the fund should be read in conjunction with the underlying funds’ financial statements. For more information about the underlying funds’ operations and policies, please refer to those funds’ semiannual and annual reports, which are filed and available on the U.S. Securities and Exchange Commission’s (SEC) website at www.sec.gov.
Schwab Balanced Fund | Annual Report
Financial Notes(continued)
2. Significant Accounting Policies (continued):
(a) Security Valuation:
Under procedures approved by the Board, the investment adviser has formed a Pricing Committee to administer the pricing and valuation of portfolio securities and other assets and to ensure that prices used for internal purposes or provided by third parties reasonably reflect fair market value. Among other things, these procedures allow the fund to utilize independent pricing services, quotations from securities and financial instrument dealers and other market sources to determine fair value.
The fund values the securities in its portfolio every business day. The fund uses the following policies to value various types of securities:
• Underlying funds:Mutual funds are valued at their respective NAVs.
• Securities for which no quoted value is available:The Board has adopted procedures to fair value the fund’s securities when market prices are not “readily available” or are unreliable. For example, the fund may fair value a security when it is de-listed or its trading is halted or suspended; when a security’s primary pricing source is unable or unwilling to provide a price; or when a security’s primary trading market is closed during regular market hours. The fund makes fair value determinations in good faith in accordance with the fund’s valuation procedures. The Pricing Committee considers a number of factors, including unobservable market inputs when arriving at fair value. The Pricing Committee may employ techniques such as the review of related or comparable assets or liabilities, related market activities, recent transactions, market multiples, book values, transactional back-testing, disposition analysis and other relevant information. The Pricing Committee regularly reviews these inputs and assumptions to calibrate the valuations. Due to the subjective and variable nature of fair value pricing, there can be no assurance that the fund could obtain the fair value assigned to the security upon the sale of such security. The Board convenes on a regular basis to review fair value determinations made by the fund pursuant to the valuation procedures.
In accordance with the authoritative guidance on fair value measurements and disclosures under GAAP, the fund discloses the fair value of its investments in a hierarchy that prioritizes the significant inputs to valuation techniques used to measure the fair value. The hierarchy gives the highest priority to valuations based upon unadjusted quoted prices in active markets for identical assets or liabilities (Level 1 measurements) and the lowest priority to valuations based upon unobservable inputs that are significant to the valuation (Level 3 measurements). If inputs used to measure the financial instruments fall within different levels of the hierarchy, the categorization is based on the lowest level input that is significant to the valuation. If the fund determines that either the volume and/or level of activity for an asset or liability has significantly decreased (from normal conditions for that asset or liability) or price quotations or observable inputs are not associated with orderly transactions, increased analysis and management judgment will be required to estimate fair value.
The three levels of the fair value hierarchy are as follows:
• Level 1—quoted prices in active markets for identical securities—Investments whose values are based on quoted market prices in active markets, and whose values are therefore classified as Level 1 prices, include active listed equities. Investments in mutual funds are valued daily at their NAVs, which are classified as Level 1 prices, without consideration to the classification level of the specific investments held by an underlying fund.
• Level 2—other significant observable inputs (including quoted prices for similar securities, interest rates, prepayment speeds, credit risk, etc.)—Investments that trade in markets that are not considered to be active, but whose values are based on quoted market prices, dealer quotations or valuations provided by alternative pricing sources supported by observable inputs are classified as Level 2 prices. These generally include U.S. government and sovereign obligations, most government agency securities, investment-grade corporate bonds, certain mortgage products, less liquid listed equities, and state, municipal and provincial obligations.
• Level 3—significant unobservable inputs (including the fund’s own assumptions in determining the fair value of investments)—Investments whose values are classified as Level 3 prices have significant unobservable inputs, as they may trade infrequently or not at all. When observable prices are not available for these securities, the fund uses one or more valuation techniques for which sufficient and reliable data is available. The inputs used by the fund in estimating the value of Level 3 prices may include the original transaction price, quoted prices for similar securities or assets in active markets, completed or pending third-party transactions in the underlying investment or comparable issuers, and changes in financial ratios or cash flows. Level 3 prices may also be adjusted to reflect illiquidity and/or non-transferability, with the amount of such discount estimated by the fund in the absence of market information. Assumptions used by the fund due to the lack of observable inputs may significantly impact the resulting fair value and therefore the fund’s results of operations.
The inputs or methodology used for valuing securities are not necessarily an indication of the risk associated with investing in those securities.
Schwab Balanced Fund | Annual Report
Financial Notes(continued)
2. Significant Accounting Policies (continued):
(b) Security Transactions:
Security transactions are recorded as of the date the order to buy or sell the security is executed. Realized gains and losses from security transactions are based on the identified costs of the securities involved.
(c) Investment Income:
Interest income is recorded as it accrues. Dividends and distributions from portfolio securities and underlying funds are recorded on the date they are effective (the ex-dividend date), although the fund records certain foreign security dividends on the day it learns of the ex-dividend date. Any distributions from underlying funds are recorded in accordance with the character of the distributions as designated by the underlying funds.
(d) Expenses:
Expenses that are specific to the fund are charged directly to the fund. Expenses that are common to more than one fund in the trusts generally are allocated among those funds in proportion to their average daily net assets. The fund bears its share of the acquired fund fees and expenses of the underlying funds, which are indirect expenses incurred by the fund through its investments in the underlying funds. Such expenses are reflected in the net asset values of the underlying funds.
(e) Distributions to Shareholders:
The fund makes distributions from net investment income and net realized capital gains, if any, once a year.
(f) Accounting Estimates:
The accounting policies described in this report conform to GAAP. Notwithstanding this, shareholders should understand that in order to follow these principles, fund management has to make estimates and assumptions that affect the information reported in the financial statements. It’s possible that once the results are known, they may turn out to be different from these estimates and these differences may be material.
(g) Federal Income Taxes:
The fund intends to meet federal income and excise tax requirements for regulated investment companies under subchapter M of the Internal Revenue Code, as amended. Accordingly, the fund distributes substantially all of its net investment income and net realized capital gains, if any, to its respective shareholders each year. As long as the fund meets the tax requirements, it is not required to pay federal income tax.
(h) Indemnification:
Under the fund’s organizational documents, the officers and trustees are indemnified against certain liabilities arising out of the performance of their duties to the fund. In addition, in the normal course of business the fund enters into contracts with its vendors and others that provide general indemnifications. The fund’s maximum exposure under these arrangements is unknown as this would involve future claims that may be made against the fund. However, based on experience, the fund expects the risk of loss attributable to these arrangements to be remote.
(i) Recent Accounting Standards:
In August 2018, the FASB issued Accounting Standards Update “Fair Value Measurement (Topic 820)” (ASU 2018-13) which modifies the disclosure requirements for fair value measurement by removing, modifying, or adding certain disclosures. The amendments are effective for annual periods beginning after December 15, 2019, and interim periods within those annual periods. The fund is permitted to early adopt any removed or modified disclosures upon issuance of this update and delay adoption of the additional disclosures until their effective date. The fund has early adopted certain removed or modified disclosures, including the amount of and reasons for transfers between Level 1 and Level 2 of the fair value hierarchy and the policy for timing of transfers between levels upon issuance of ASU 2018-13, and has delayed adoption of the additional disclosures until their effective date. At this time, management is currently evaluating the impact that the adoption of the additional disclosures will have on the fund’s financial statements.
3. Risk Factors:
Investing in the fund may involve certain risks, as discussed in the fund’s prospectus, including, but not limited to, those described below. Any of these risks could cause an investor to lose money.
Schwab Balanced Fund | Annual Report
Financial Notes(continued)
3. Risk Factors (continued):
Asset Allocation Risk. The fund is subject to the risk that the selection of the underlying funds and the allocation of the fund’s assets among the various asset classes and market segments may cause the fund to underperform other funds with a similar investment objective.
Conflicts of Interest Risk. The investment adviser’s authority to select and substitute underlying funds from a variety of affiliated and unaffiliated mutual funds and ETFs may create a conflict of interest because the fees paid to it and its affiliates by some underlying funds are higher than the fees paid by other underlying funds. The investment adviser also may have an incentive to select an affiliated underlying fund for other reasons, including to increase assets under management or to support new investment strategies. In addition, other conflicts of interest may exist where the best interests of the affiliated underlying fund may not be aligned with those of the fund. However, the investment adviser is a fiduciary to the fund and is legally obligated to act in the fund’s best interests when selecting underlying funds.
Market Risk.Financial markets rise and fall in response to a variety of factors, sometimes rapidly and unpredictably. As with any investment whose performance is tied to these markets, the value of an investment in the fund will fluctuate, which means that an investor could lose money over short or long periods.
Direct Investment Risk.The fund may invest directly in cash, cash equivalents and equity and fixed-income securities, including money market securities, to maintain its allocations. The fund’s direct investment in these securities is subject to the same or similar risks as an underlying fund’s investment in the same securities.
Underlying Fund Investment Risk.Before investing in the fund, investors should assess the risks associated with the underlying funds in which the fund may invest, which include any combination of the risks described below.
• Investment Risk.The fund may experience losses with respect to its investment in an underlying fund. Further, there is no guarantee that an underlying fund will be able to achieve its objective.
• Management Risk.Generally, the underlying funds are actively managed mutual funds. Any actively managed mutual fund is subject to the risk that its investment adviser (or subadviser(s)) will select or allocate assets that could cause the fund to underperform or otherwise not meet its objective. An underlying fund’s adviser applies its own investment techniques and risk analyses in making investment decisions for the underlying fund, but there can be no guarantee that they will produce the desired results.
• Equity Risk.The prices of equity securities rise and fall daily. These price movements may result from factors affecting individual companies, industries or the securities market as a whole. In addition, equity markets tend to move in cycles, which may cause stock prices to fall over short or extended periods of time.
• Market Capitalization Risk.Securities issued by companies of different market capitalizations tend to go in and out of favor based on market and economic conditions. During a period when securities of a particular market capitalization fall behind other types of investments, an underlying fund’s performance could be impacted.
• Growth Investing Risk. An underlying fund’s investments in growth stocks can be volatile. Growth companies usually invest a high portion of earnings in their businesses and may lack the dividends of value stocks that can cushion stock prices in a falling market. The prices of growth stocks are based largely on projections of the issuer’s future earnings and revenues. If a company’s earnings or revenues fall short of expectations, its stock price may fall dramatically. Growth stocks may also be more expensive relative to their earnings or assets compared to value or other stocks.
• Fixed Income Risk.Interest rates rise and fall over time, which will affect an underlying fund’s yield and share price. A change in a central bank’s monetary policy or improving economic conditions, among other things, may result in an increase in interest rates. A rise in interest rates could cause an underlying fund’s share price to fall. The credit quality of a portfolio investment could also cause an underlying fund’s share price to fall. An underlying fund could lose money if the issuer or guarantor of a portfolio investment or the counterparty to a derivatives contract fails to make timely principal or interest payments or otherwise honor its obligations. Fixed income securities may be paid off earlier or later than expected. Either situation could cause an underlying fund to hold securities paying lower-than-market rates of interest, which could hurt the fund’s yield or share price. Below investment-grade bonds (junk bonds) involve greater credit risk, are more volatile, involve greater risk of price declines and may be more susceptible to economic downturns than investment-grade securities.
• ETF Risk. When an underlying fund invests in an ETF, it will bear a proportionate share of the ETF’s expenses. In addition, lack of liquidity in the market for an ETF’s shares can result in its value being more volatile than the underlying portfolio of securities.
Schwab Balanced Fund | Annual Report
Financial Notes(continued)
3. Risk Factors (continued):
• Money Market Fund Risk. The fund may invest in underlying money market funds that either seek to maintain a stable $1 net asset value (“stable share price money market funds”) or that have a share price that fluctuates (“variable share price money market funds”). Although an underlying stable share price money market fund seeks to maintain a stable $1 net asset value, it is possible to lose money by investing in such a money market fund. Because the share price of an underlying variable share price money market fund will fluctuate, when the fund sells the shares it owns they may be worth more or less than what the fund originally paid for them. In addition, neither type of money market fund is designed to offer capital appreciation. Certain underlying money market funds may impose a fee upon the sale of shares or may temporarily suspend the ability to sell shares if such fund’s liquidity falls below required minimums.
• Foreign Investment Risk. An underlying fund’s investments in securities of foreign issuers involve certain risks that may be greater than those associated with investments in securities of U.S. issuers. These include risks of adverse changes in foreign economic, political, regulatory and other conditions; changes in currency exchange rates or exchange control regulations (including limitations on currency movements and exchanges); the imposition of economic sanctions or other government restrictions; differing accounting, auditing, financial reporting and legal standards and practices; differing securities market structures; and higher transaction costs. These risks may negatively impact the value or liquidity of an underlying fund’s investments, and could impair the underlying fund’s ability to meet its investment objective or invest in accordance with its investment strategy. There is a risk that investments in securities denominated in, and/or receiving revenues in, foreign currencies will decline in value relative to the U.S. dollar.
• Emerging Markets Risk.Emerging market countries may be more likely to experience political turmoil or rapid changes in market or economic conditions than more developed countries. Emerging market countries often have less uniformity in accounting and reporting requirements and greater risk associated with the custody of securities. In addition, the financial stability of issuers (including governments) in emerging market countries may be more precarious than in developed countries. As a result, there may be an increased risk of illiquidity and price volatility associated with an underlying fund’s investments in emerging market countries, which may be magnified by currency fluctuations relative to the U.S. dollar, and, at times, it may be difficult to value such investments.
• Derivatives Risk. An underlying fund may use derivatives to enhance returns or hedge against market declines. Examples of derivatives are options, futures, options on futures and swaps. An option is the right to buy or sell an instrument at a specific price before a specific date. A future is an agreement to buy or sell a financial instrument at a specific price on a specific day. A swap is an agreement whereby two parties agree to exchange payment streams calculated in relation to a rate, index, instrument or certain securities and a predetermined amount. A credit default swap is an agreement in which the seller agrees to make a payment to the buyer in the event of a specified credit event in exchange for a fixed payment or series of fixed payments.
An underlying fund’s use of derivative instruments involves risks different from or possibly greater than the risks associated with investing directly in securities and other traditional investments. Certain of these risks, such as credit risk, leverage risk, liquidity risk, market risk and management risk, are discussed elsewhere in this section. An underlying fund’s use of derivatives is also subject to lack of availability risk, valuation risk, correlation risk and tax risk. Lack of availability risk is the risk that suitable derivative transactions may not be available in all circumstances for risk management or other purposes. Valuation risk is the risk that a particular derivative may be valued incorrectly. Correlation risk is the risk that changes in the value of the derivative may not correlate perfectly with the underlying asset, rate or index. Tax risk is the risk that the use of derivatives may cause an underlying fund to realize higher amounts of short-term capital gain. An underlying fund’s use of derivatives could reduce the underlying fund’s performance, increase its volatility, and could cause the fund to lose more than the initial amount invested. The use of derivatives that are subject to regulation by the Commodity Futures Trading Commission (CFTC) by an underlying fund could cause the fund to become a commodity pool, which would require the fund to comply with certain CFTC rules.
• Leverage Risk.Certain underlying fund transactions, such as derivatives transactions, short sales, reverse repurchase agreements, and mortgage dollar rolls, may give rise to a form of leverage and may expose an underlying fund to greater risk. Leverage tends to magnify the effect of any decrease or increase in the value of an underlying fund’s portfolio securities, which means even a small amount of leverage can have a disproportionately large impact on the underlying fund.
• Liquidity Risk.An underlying fund may be unable to sell certain securities, such as illiquid securities, readily at a favorable time or price, or an underlying fund may have to sell them at a loss.
Schwab Balanced Fund | Annual Report
Financial Notes(continued)
3. Risk Factors (continued):
• Portfolio Turnover Risk.Certain of the underlying funds may buy and sell portfolio securities actively. If they do, their portfolio turnover rate and transaction costs will rise, which may lower the underlying fund’s performance and may increase the likelihood of capital gains distributions.
• Securities Lending Risk. An underlying fund may lend its portfolio securities to brokers, dealers, and other financial institutions. Securities lending involves the risk of loss of rights in, or delay in recovery of, the loaned securities if the borrower fails to return the security loaned or becomes insolvent.
• Mortgage-Backed and Mortgage Pass-Through Securities Risk. Certain of the mortgage-backed securities in which an underlying fund may invest are not backed by the full faith and credit of the U.S. government and there can be no assurance that the U.S. government would provide financial support to its agencies or instrumentalities where it was not obligated to do so. Mortgage-backed securities tend to increase in value less than other debt securities when interest rates decline, but are subject to similar or greater risk of decline in market value during periods of rising interest rates. Because of prepayment and extension risk, mortgage-backed securities react differently to changes in interest rates than other bonds. Small movements in interest rates — both increases and decreases — may quickly and significantly affect the value of certain mortgage-backed securities. Transactions in mortgage pass-through securities often occur through to-be-announced (TBA) transactions. Default by or bankruptcy of a counterparty to a TBA transaction would expose an underlying fund to possible losses because of an adverse market action, expenses, or delays in connection with the purchase or sale of the pools of mortgage pass-through securities specified in the TBA transaction.
• Mortgage Dollar Rolls Risk. Mortgage dollar rolls are transactions in which an underlying fund sells mortgage-backed securities to a dealer and simultaneously agrees to repurchase similar securities in the future at a predetermined price. An underlying fund’s mortgage dollar rolls could lose money if the price of the mortgage-backed securities sold falls below the agreed upon repurchase price, or if the counterparty is unable to honor the agreement.
Please refer to the fund’s prospectus for a more complete description of the principal risks of investing in the fund.
4. Affiliates and Affiliated Transactions:
Investment Adviser
Charles Schwab Investment Management, Inc. (CSIM or the investment adviser), a wholly owned subsidiary of The Charles Schwab Corporation, serves as the fund’s investment adviser and administrator pursuant to an Investment Advisory and Administration Agreement between CSIM and the trust.
Shareholder Servicing
The Board has adopted a Shareholder Servicing Plan (the Plan) on behalf of the fund. The Plan enables the fund to bear expenses relating to the provision by financial intermediaries, including Charles Schwab & Co., Inc., a broker-dealer affiliate of CSIM (together, service providers), of certain shareholder services to the current shareholders of the fund. The fund is not subject to any fee under the Plan.
Expense Limitation
CSIM and its affiliates have agreed with the fund, for so long as CSIM serves as the investment adviser to the fund, which may only be amended or terminated with the approval of the Board, to limit the total annual fund operating expenses charged, excluding interest, taxes and certain non-routine expenses to 0.00%.
The agreement to limit the fund’s total expenses charged is limited to the fund’s direct operating expenses and, therefore, does not apply to underlying fund fees and expenses, which are indirect expenses incurred by a fund through its investments in the underlying funds.
Schwab Balanced Fund | Annual Report
Financial Notes(continued)
4. Affiliates and Affiliated Transactions (continued):
Investments in Affiliates
The fund may engage in certain transactions involving related parties. Pursuant to an exemptive order issued by the SEC, the fund may invest in other related funds. As of October 31, 2019, the fund’s ownership percentages of other related funds’ shares are:
| Laudus U.S. Large Cap Growth Fund | 3.5% |
| Schwab Core Equity Fund | 8.5% |
| Schwab Small-Cap Equity Fund | 9.2% |
| Schwab U.S. Aggregate Bond Index Fund | 6.2% |
| Schwab Variable Share Price Money Fund, Ultra Shares | 0.2% |
Interfund Borrowing and Lending
Pursuant to an exemptive order issued by the SEC, the fund may enter into interfund borrowing and lending transactions with other funds in the Fund Complex (for definition refer to Trustees and Officers section). All loans are for temporary or emergency purposes and the interest rate to be charged will be the average of the overnight repurchase agreement rate and the short-term bank loan rate. All loans are subject to numerous conditions designed to ensure fair and equitable treatment of all participating funds. The interfund lending facility is subject to the oversight and periodic review by the Board. The fund had no interfund borrowing or lending activity during the period.
5. Board of Trustees:
The Board may include people who are officers and/or directors of CSIM or its affiliates. Federal securities law limits the percentage of such “interested persons” who may serve on a trust’s board, and the trust was in compliance with these limitations throughout the report period. The trust did not pay any of these interested persons for their services as trustees, but it did pay non-interested persons (independent trustees), as noted on the fund’s Statement of Operations. For information regarding the trustees, please refer to the Trustees and Officers table at the end of this report.
6. Borrowing from Banks:
During the period, the fund was a participant with other U.S. registered investment companies managed by CSIM in a joint, syndicated, committed $750 million line of credit (the Syndicated Credit Facility), which matured on October 3, 2019. On October 3, 2019, the Syndicated Credit Facility was amended to run for a new 364 day period with the line of credit amount remaining unchanged, maturing on October 1, 2020. Under the terms of the Syndicated Credit Facility, in addition to the interest charged on any borrowings by a fund, the fund paid a commitment fee of 0.15% per annum on the fund’s proportionate share of the unused portion of the Syndicated Credit Facility.
During the period, the fund was a participant with other U.S. registered investment companies managed by CSIM in a joint, unsecured, uncommitted $500 million line of credit (the Uncommitted Credit Facility), with State Street Bank and Trust Company, which matured on November 30, 2018. On November 30, 2018, the Uncommitted Credit Facility was amended to run for a new 364 day period with the line of credit amount remaining unchanged, maturing on November 29, 2019. Under the terms of the Uncommitted Credit Facility, the fund pays interest on the amount it borrows. There were no borrowings from either line of credit during the period.
The fund also has access to custodian overdraft facilities. The fund may have utilized the overdraft facility and incurred an interest expense, which is disclosed on the fund’s Statement of Operations, if any. The interest expense is determined based on a negotiated rate above the current Federal Funds Rate.
7. Purchases and Sales of Investment Securities:
For the period ended October 31, 2019, purchases and sales of securities (excluding short-term obligations) were as follows:
Purchases
of Securities | Sales
of Securities |
| $215,884,405 | $152,804,514 |
Schwab Balanced Fund | Annual Report
Financial Notes(continued)
8. Federal Income Taxes:
As of October 31, 2019, the tax basis cost of the fund’s investments and gross unrealized appreciation and depreciation were as follows:
| Tax cost | $484,908,783 |
| Gross unrealized appreciation | $43,932,821 |
| Gross unrealized depreciation | (2,463,978) |
| Net unrealized appreciation (depreciation) | $41,468,843 |
As of October 31, 2019, the components of distributable earnings on a tax basis were as follows:
| Undistributed ordinary income | $4,542,108 |
| Undistributed long-term capital gains | 19,854,156 |
| Net unrealized appreciation (depreciation) on investments | 41,468,843 |
| Total | $65,865,107 |
The primary difference between book basis and tax basis unrealized appreciation or unrealized depreciation of investments is the tax deferral of losses on wash sales. The tax cost of the fund’s investments, disclosed above, has been adjusted from the book amounts to reflect these unrealized appreciation or depreciation differences, as applicable.
Capital loss carryforwards may be used to offset future realized capital gains for federal income tax purposes. As of October 31, 2019, the fund had no capital loss carryforwards available to offset future net capital gains.
The tax basis components of distributions paid during the current and prior fiscal years were as follows:
| Current period distributions | |
| Ordinary income | $10,526,518 |
| Long-term capital gains | 17,523,255 |
| Prior period distributions | |
| Ordinary income | $11,740,011 |
| Long-term capital gains | 445,107 |
Distributions paid to shareholders are based on net investment income and net realized gains determined on a tax basis, which may differ from net investment income and net realized gains for financial reporting purposes. These differences reflect the differing character of certain income items and net realized gains and losses for financial statement and tax purposes, and may result in reclassification among certain capital accounts on the financial statements.
Permanent book and tax basis differences may result in reclassifications between components of net assets as required. The adjustments will have no impact on net assets or the results of operations.
As of October 31, 2019, management has reviewed the tax positions for open periods (for federal purposes, three years from the date of filing and for state purposes, four years from the date of filing) as applicable to the fund, and has determined that no provision for income tax is required in the fund’s financial statements. The fund recognizes interest and penalties, if any, related to unrecognized tax benefits as income tax expense in the Statement of Operations. During the fiscal year ended October 31, 2019, the fund did not incur any interest or penalties.
9. Subsequent Events:
Management has determined there are no subsequent events or transactions through the date the financial statements were issued that would have materially impacted the financial statements as presented.
Schwab Balanced Fund | Annual Report
Report of Independent Registered Public Accounting Firm
To the Board of Trustees of Schwab Capital Trust and Shareholders of Schwab Balanced Fund
Opinion on the Financial Statements
We have audited the accompanying statement of assets and liabilities, including the portfolio holdings, of Schwab Balanced Fund (one of the funds constituting Schwab Capital Trust, referred to hereafter as the “Fund”) as of October 31, 2019, the related statement of operations for the year ended October 31, 2019, the statement of changes in net assets for each of the two years in the period ended October 31, 2019, including the related notes, and the financial highlights for each of the five years in the period ended October 31, 2019 (collectively referred to as the “financial statements”). In our opinion, the financial statements present fairly, in all material respects, the financial position of the Fund as of October 31, 2019, the results of its operations for the year then ended, the changes in its net assets for each of the two years in the period ended October 31, 2019 and the financial highlights for each of the five years in the period ended October 31, 2019 in conformity with accounting principles generally accepted in the United States of America.
Basis for Opinion
These financial statements are the responsibility of the Fund’s management. Our responsibility is to express an opinion on the Fund’s financial statements based on our audits. We are a public accounting firm registered with the Public Company Accounting Oversight Board (United States) (PCAOB) and are required to be independent with respect to the Fund in accordance with the U.S. federal securities laws and the applicable rules and regulations of the Securities and Exchange Commission and the PCAOB.
We conducted our audits of these financial statements in accordance with the standards of the PCAOB. Those standards require that we plan and perform the audit to obtain reasonable assurance about whether the financial statements are free of material misstatement, whether due to error or fraud.
Our audits included performing procedures to assess the risks of material misstatement of the financial statements, whether due to error or fraud, and performing procedures that respond to those risks. Such procedures included examining, on a test basis, evidence regarding the amounts and disclosures in the financial statements. Our audits also included evaluating the accounting principles used and significant estimates made by management, as well as evaluating the overall presentation of the financial statements. Our procedures included confirmation of securities owned as of October 31, 2019 by correspondence with the custodian, transfer agent and broker; when replies were not received from the broker, we performed other auditing procedures. We believe that our audits provide a reasonable basis for our opinion.
/s/ PricewaterhouseCoopers LLP
San Francisco, California
December 16, 2019
We have served as the auditor of one or more investment companies in the Schwab Funds Complex since 1989.
Schwab Balanced Fund | Annual Report
Other Federal Tax Information (unaudited)
For corporate shareholders, 26.05% of the fund’s dividend distributions paid during the fiscal year ended October 31, 2019, qualify for the corporate dividends received deduction.
For the fiscal year ended October 31, 2019, the fund designates $3,086,580 of the dividend distributions as qualified dividends for the purposes of the maximum rate under section 1(h)(11) of the Internal Revenue Code. Shareholders will be notified in January 2020 via IRS Form 1099 of the amounts for use in preparing their 2019 income tax return.
Under section 852(b)(3)(C) of the Internal Revenue Code, the fund hereby designates $17,523,255 as long-term capital gain dividends for the fiscal year ended October 31, 2019.
Schwab Balanced Fund | Annual Report
Investment Advisory Agreement Approval
The Investment Company Act of 1940, as amended, requires that the continuation of a fund’s investment advisory agreement must be specifically approved (1) by the vote of the trustees or by a vote of the shareholders of the fund, and (2) by the vote of a majority of the trustees who are not parties to the investment advisory agreement or “interested persons” of any party (the Independent Trustees), cast in person at a meeting called for the purpose of voting on such approval. In connection with such approvals, the fund’s trustees must request and evaluate, and the investment adviser is required to furnish, such information as may be reasonably necessary to evaluate the terms of the investment advisory agreement.
The Board of Trustees (the Board or the Trustees, as appropriate) calls and holds one or more meetings each year that are dedicated, in whole or in part, to considering whether to renew the investment advisory and administration agreement (the Agreement) between Schwab Capital Trust (the Trust) and Charles Schwab Investment Management, Inc. (CSIM) with respect to the existing funds in the Trust, including Schwab Balanced Fund (the Fund), and to review certain other agreements pursuant to which CSIM provides investment advisory services to certain other registered investment companies. In preparation for the meeting(s), the Board requests and reviews a wide variety of materials provided by CSIM, including information about CSIM’s affiliates, personnel, business goals and priorities, profitability, third-party oversight, corporate structure and operations. As part of the renewal process, the Independent Trustees’ legal counsel sends an information request letter to CSIM seeking certain relevant information. The responses by CSIM are provided to the Trustees for their review prior to their meeting, and the Trustees are provided with the opportunity to request any additional materials. The Board also receives data provided by an independent provider of investment company data. This information is in addition to the detailed information about the Fund that the Board reviews during the course of each year, including information that relates to the Fund’s operations and performance, legal and compliance matters, risk management, portfolio turnover, and sales and marketing activity. The Independent Trustees receive advice from Independent Trustees’ legal counsel, including a memorandum regarding the responsibilities of trustees for the approval of investment advisory agreements. In addition, the Independent Trustees meet in executive session outside the presence of Fund management and participate in question and answer sessions with representatives of CSIM.
The Board, including a majority of the Independent Trustees, considered information specifically relating to the continuance of the Agreement with respect to the Fund at meetings held on May 13, 2019 and June 4, 2019, and approved the renewal of the Agreement with respect to the Fund for an additional
one-year term at the June 4, 2019 in person meeting called for the purpose of voting on such approval.
The Board’s approval of the continuance of the Agreement with respect to the Fund was based on consideration and evaluation of a variety of specific factors discussed at these meetings and at prior meetings, including:
| 1. | the nature, extent and quality of the services provided to the Fund under the Agreement, including the resources of CSIM and its affiliates dedicated to the Fund; |
| 2. | the Fund’s investment performance and how it compared to that of certain other comparable mutual funds and benchmark data; |
| 3. | the Fund’s expenses and how those expenses compared to those of certain other similar mutual funds; |
| 4. | the profitability of CSIM and its affiliates, including Charles Schwab & Co., Inc. (Schwab), with respect to the Fund, including both direct and indirect benefits accruing to CSIM and its affiliates; and |
| 5. | the extent to which economies of scale would be realized as the Fund grows and whether fee levels in the Agreement reflect those economies of scale for the benefit of Fund investors. |
Nature, Extent and Quality of Services. The Board considered the nature, extent and quality of the services provided by CSIM to the Fund and the resources of CSIM and its affiliates dedicated to the Fund. In this regard, the Trustees evaluated, among other things, CSIM’s experience, track record, compliance program, resources dedicated to hiring and retaining skilled personnel and specialized talent, and information security resources. The Trustees also considered information provided by CSIM relating to services and support provided with respect to the Fund’s portfolio management team, portfolio strategy, and internal investment guidelines, as well as trading infrastructure, liquidity management, product design and analysis, shareholder communications, securities valuation, fund accounting and custody, and vendor and risk oversight. The Trustees also considered investments CSIM has made in its infrastructure, including modernizing CSIM’s technology and use of data, increasing expertise in key areas (including portfolio management and trade operations), and improving business continuity, cybersecurity, due diligence, risk management processes, and information security programs, which are designed to provide enhanced services to the Fund and its shareholders. The Trustees also considered that many of the Fund’s shareholders are also brokerage clients of Schwab and considered Schwab’s wide range of products, services, and channel alternatives such as investment research tools and an array of account features that benefit the Fund and shareholders who are brokerage clients of Schwab. Finally,
Schwab Balanced Fund | Annual Report
the Trustees also considered Schwab’s reputation as a full service brokerage firm and the firm’s overall financial condition. Following such evaluation, the Board concluded, within the context of its full deliberations, that the nature, extent and quality of services provided by CSIM to the Fund and the resources of CSIM and its affiliates dedicated to the Fund supported renewal of the Agreement with respect to the Fund.
Fund Performance. The Board considered the Fund’s performance in determining whether to renew the Agreement with respect to the Fund. Specifically, the Trustees considered the Fund’s performance relative to a peer category of other mutual funds and applicable indices/benchmarks, in light of total return, yield, if applicable, and market trends, as well as in consideration of the Fund’s investment style and strategy attributes and disclosures. As part of this review, the Trustees considered the composition of the peer category, selection criteria and the reputation of the independent provider of investment company data who prepared the peer category analysis. The Trustees further considered the level of Fund performance in the context of their review of Fund expenses and adviser profitability discussed below and also noted that performance is reviewed throughout the year by a designated committee of the Board and by the Board. Following such evaluation, the Board concluded, within the context of its full deliberations, that the performance of the Fund supported renewal of the Agreement with respect to the Fund.
Fund Expenses. With respect to the Fund’s expenses, the Trustees considered the rate of compensation called for by the Agreement, and the Fund’s net operating expense ratio, in each case, in comparison to those of other similar mutual funds, such peer groups and comparisons having been selected and calculated by an independent provider of investment company data. CSIM reported to the Board, and the Board took into account, the risk assumed by CSIM in the development of products and provision of services as well as the competitive marketplace for financial products. When applicable, the Trustees considered the effects of CSIM’s and Schwab’s practice of waiving certain fees to prevent total annual Fund operating expenses from exceeding a specified cap. The Trustees also considered CSIM’s contractual commitment to keep the Fund’s expense cap for so long as CSIM serves as the adviser to the Fund. The Trustees also considered fees charged by CSIM to other mutual funds and to other types of accounts, but, with respect to such other types of accounts, accorded less weight to such comparisons due to the different legal, regulatory, compliance and operating features of mutual funds as compared to these other types of accounts, and any differences in the nature and scope of the services CSIM provides to these other accounts, as well as differences in the market for these types of accounts. The Trustees noted that shareholders of the Fund indirectly pay their pro rata share of the fees and expenses of the underlying funds in which the Fund invests. Following such evaluation, the Board concluded, within the context of its full deliberations,
that the expenses of the Fund are reasonable and supported renewal of the Agreement with respect to the Fund.
Profitability. The Trustees considered the compensation flowing to CSIM and its affiliates, directly or indirectly and reviewed profitability on a pre-tax basis, without regard to distribution expenses. In this connection, the Trustees reviewed management’s profitability analyses. The Trustees also reviewed profitability of CSIM relating to the Schwab fund complex as a whole, noting the benefit to Fund shareholders of being part of the Schwab fund complex, including the allocations of certain fixed costs across other funds in the complex. The Trustees considered that CSIM is not charging any management fees at the Fund level; it being understood that there is a management fee at the underlying fund level. The Trustees also considered any other benefits derived by CSIM from its relationship with the Fund, such as whether, by virtue of its management of the Fund, CSIM obtains investment information or other research resources that aid it in providing advisory services to other clients. Also, because the Fund invests a portion of its assets in other funds within the Schwab fund complex, the Trustees considered whether CSIM indirectly benefits from the Fund’s investments in other underlying funds managed by CSIM. The Trustees considered whether the varied levels of compensation and profitability with respect to the Fund under the Agreement and other service agreements were reasonable and justified in light of the quality of all services rendered to the Fund by CSIM and its affiliates. The Trustees noted that CSIM continues to invest substantial sums in its business in order to provide enhanced research capabilities, services, and systems to benefit the Fund. Based on this evaluation, the Board concluded, within the context of its full deliberations, that the profitability of CSIM is reasonable and supported renewal of the Agreement with respect to the Fund.
Economies of Scale. Although the Trustees recognized the difficulty of determining economies of scale with precision, the Trustees considered the potential existence of any economies of scale and whether those are passed along to the Fund’s shareholders through (i) the enhancement of services provided to the Fund in return for fees paid, including through investments by CSIM in CSIM’s infrastructure, including modernizing CSIM’s technology and use of data, increasing expertise and capabilities in key areas (including portfolio and trade operations), and improving business continuity, cybersecurity, due diligence, and information security programs, which are designed to provide enhanced services to the Fund and its shareholders; (ii) graduated investment advisory fee schedule, fee waivers, or expense caps by CSIM and its affiliates for those funds in the Schwab Funds complex with such features; and (iii) pricing the Fund to scale and keeping overall expenses down as the Fund grows. The Trustees acknowledged that, in addition, CSIM has shared any economies of scale with the Fund by investing in CSIM’s infrastructure, as discussed above, over time and that CSIM’s internal costs of providing investment management,
Schwab Balanced Fund | Annual Report
technology, administrative, legal and compliance services to the Fund continues to increase as a result of regulatory or other developments. The Trustees considered that CSIM and its affiliates may employ contractual expense caps to protect shareholders from high fees when fund assets are relatively small, for example, in the case of newer funds or funds with investment strategies that are from time to time out of favor, because, among other reasons, shareholders may benefit from the continued availability of such funds at subsidized expense levels. Based on this evaluation, the Board concluded, within the context of its full deliberations, that the Fund obtains reasonable benefits from economies of scale.
In the course of their deliberations, the Trustees may have accorded different weights to various factors and did not identify any particular information or factor that was all important or controlling. Based on the Trustees’ deliberation and their evaluation of the information described above, the Board, including all of the Independent Trustees, approved the continuation of the Agreement with respect to the Fund and concluded that the compensation under the Agreement with respect to the Fund is fair and reasonable in light of such services and expenses and such other matters as the Trustees have considered to be relevant in the exercise of their reasonable judgment.
Schwab Balanced Fund | Annual Report
Trustees and Officers
The tables below give information about the trustees and officers of Schwab Capital Trust, which includes the fund covered in this report. The “Fund Complex” includes The Charles Schwab Family of Funds, Schwab Capital Trust, Schwab Investments, Schwab Annuity Portfolios, Schwab Strategic Trust and Laudus Trust. The Fund Complex includes 101 funds.
The address for all trustees and officers is 211 Main Street, San Francisco, CA 94105. You can find more information about the trustees and officers in the fund’s Statement of Additional Information, which is available free by calling 1-877-824-5615.
| Independent Trustees |
Name, Year of Birth, and
Position(s) with the trust
(Terms of office, and
length of Time Served1) | Principal Occupations
During the Past Five Years | Number of
Portfolios in
Fund Complex
Overseen by
the Trustee | Other Directorships |
Robert W. Burns
1959
Trustee
(Trustee of Schwab Strategic Trust since 2009; The Charles Schwab Family of Funds, Schwab Investments, Schwab Capital Trust, Schwab Annuity Portfolios and Laudus Trust since 2016) | Retired/Private Investor (Jan. 2009 – present). Formerly, Managing Director, Pacific Investment Management Company, LLC (PIMCO) (investment management firm) and President, PIMCO Funds. | 101 | None |
John F. Cogan
1947
Trustee
(Trustee of The Charles Schwab Family of Funds, Schwab Investments, Schwab Capital Trust and Schwab Annuity Portfolios since 2008; Laudus Trust since 2010; Schwab Strategic Trust since 2016) | Senior Fellow (Oct. 1979 – present), The Hoover Institution at Stanford University (public policy think tank); Senior Fellow (2000 – present), Stanford Institute for Economic Policy Research; Professor of Public Policy (1994 – 2015), Stanford University. | 101 | Director (2005 – present), Gilead Sciences, Inc. |
Nancy F. Heller
1956
Trustee
(Trustee of The Charles Schwab Family of Funds, Schwab Investments, Schwab Capital Trust, Schwab Annuity Portfolios, Schwab Strategic Trust and Laudus Trust since 2018) | President and Chairman (2014 – 2016), TIAA Charitable (financial services); Senior Managing Director (2003 – 2016), TIAA (financial services). | 101 | None |
Stephen Timothy Kochis
1946
Trustee
(Trustee of Schwab Strategic Trust since 2012; The Charles Schwab Family of Funds, Schwab Investments, Schwab Capital Trust, Schwab Annuity Portfolios and Laudus Trust since 2016) | CEO and Owner (May 2012 – present), Kochis Global (wealth management consulting). | 101 | None |
Schwab Balanced Fund | Annual Report
| Independent Trustees (continued) |
Name, Year of Birth, and
Position(s) with the trust
(Terms of office, and
length of Time Served1) | Principal Occupations
During the Past Five Years | Number of
Portfolios in
Fund Complex
Overseen by
the Trustee | Other Directorships |
David L. Mahoney
1954
Trustee
(Trustee of The Charles Schwab Family of Funds, Schwab Investments, Schwab Capital Trust, Schwab Annuity Portfolios and Laudus Trust since 2011; Schwab Strategic Trust since 2016) | Private Investor. | 101 | Director (2003 – present), Symantec Corporation
Director (2004 – present), Corcept Therapeutics Incorporated
Director (2009 – present), Adamas Pharmaceuticals, Inc. |
Jane P. Moncreiff
1961
Trustee
(Trustee of The Charles Schwab Family of Funds, Schwab Investments, Schwab Capital Trust, Schwab Annuity Portfolios, Schwab Strategic Trust and Laudus Trust since 2019) | Chief Investment Officer (2009-2017), CareGroup Healthcare System, Inc. (healthcare). | 101 | None |
Kiran M. Patel
1948
Trustee
(Trustee of The Charles Schwab Family of Funds, Schwab Investments, Schwab Capital Trust, Schwab Annuity Portfolios and Laudus Trust since 2011; Schwab Strategic Trust since 2016) | Retired. Executive Vice President and General Manager of Small Business Group (Dec. 2008 – Sept. 2013), Intuit, Inc. (financial software and services firm for consumers and small businesses). | 101 | Director (2008 – present), KLA-Tencor Corporation |
Kimberly S. Patmore
1956
Trustee
(Trustee of The Charles Schwab Family of Funds, Schwab Investments, Schwab Capital Trust, Schwab Annuity Portfolios, Schwab Strategic Trust and Laudus Trust since 2016) | Consultant (2008 – present), Patmore Management Consulting (management consulting). | 101 | None |
Gerald B. Smith
1950
Trustee
(Trustee of The Charles Schwab Family of Funds, Schwab Investments, Schwab Capital Trust and Schwab Annuity Portfolios since 2000; Laudus Trust since 2010; Schwab Strategic Trust since 2016) | Chairman, Chief Executive Officer and Founder (Mar. 1990 �� present), Smith Graham & Co. (investment advisors). | 101 | Director (2012 – present), Eaton Corporation plc |
Schwab Balanced Fund | Annual Report
| Interested Trustees |
Name, Year of Birth, and
Position(s) with the trust
(Terms of office, and
length of Time Served1) | Principal Occupations
During the Past Five Years | Number of
Portfolios in
Fund Complex
Overseen by
the Trustee | Other Directorships |
Walter W. Bettinger II2
1960
Chairman and Trustee
(Trustee of The Charles Schwab Family of Funds, Schwab Investments, Schwab Capital Trust and Schwab Annuity Portfolios since 2008; Schwab Strategic Trust since 2009; Laudus Trust since 2010) | Director, President and Chief Executive Officer (Oct. 2008 – present), The Charles Schwab Corporation; President and Chief Executive Officer (Oct. 2008 – present) and Director (May 2008 – present), Charles Schwab & Co., Inc.; Director (Apr. 2006 – present), Charles Schwab Bank; Director (Nov. 2017 – present), Charles Schwab Premier Bank; Director (May 2008 – present) and President and Chief Executive Officer (Aug. 2017 – present), Schwab Holdings, Inc.; Director (July 2016 – present), Charles Schwab Investment Management, Inc. | 101 | Director (2008 – present), The Charles Schwab Corporation |
Jonathan de St. Paer2
1973
Trustee
(Trustee of The Charles Schwab Family of Funds, Schwab Investments, Schwab Capital Trust, Schwab Annuity Portfolios, Schwab Strategic Trust and Laudus Trust since 2019) | Director (Apr. 2019 – present), President (Oct. 2018 – present), and Chief Executive Officer (Apr. 2019 – Nov. 2019), Charles Schwab Investment Management, Inc.; Trustee and Chief Executive Officer (Apr. 2019 – present) and President (Nov. 2018 – present), Schwab Funds, Laudus Funds and Schwab ETFs; Director (Apr. 2019 – present), Charles Schwab Worldwide Funds plc and Charles Schwab Asset Management (Ireland) Limited; Senior Vice President (Apr. 2019 – present), Senior Vice President – Strategy and Product Development (CSIM) (Jan. 2014 – Mar. 2019), and Vice President (Jan. 2009 – Dec. 2013), Charles Schwab & Co., Inc. | 101 | None |
Joseph R. Martinetto2
1962
Trustee
(Trustee of The Charles Schwab Family of Funds, Schwab Investments, Schwab Capital Trust, Schwab Annuity Portfolios, Schwab Strategic Trust and Laudus Trust since 2016) | Chief Operating Officer (Feb. 2018 – present) and Senior Executive Vice President (July 2015 – Feb. 2018), The Charles Schwab Corporation; Senior Executive Vice President (July 2015 – present), Charles Schwab & Co., Inc.; Chief Financial Officer (July 2015 – Aug. 2017) and Executive Vice President and Chief Financial Officer (May 2007 – July 2015), The Charles Schwab Corporation and Charles Schwab & Co., Inc.; Director (May 2007 – present), Charles Schwab & Co., Inc.; Director (Apr. 2010 – present) and Chief Executive Officer (July 2013 – Apr. 2015), Charles Schwab Bank; Director (Nov. 2017 – present), Charles Schwab Premier Bank; Director (May 2007 – present), Chief Financial Officer (May 2007 – Aug. 2017), Senior Executive Vice President (Feb. 2016 – present), and Executive Vice President (May 2007 – Feb. 2016), Schwab Holdings, Inc. | 101 | None |
| Officers of the Trust |
Name, Year of Birth, and Position(s) with the trust
(Terms of office, and length of Time Served3) | Principal Occupations During the Past Five Years |
Jonathan de St. Paer
1973
President and Chief Executive Officer
(Officer of The Charles Schwab Family of Funds, Schwab Investments, Schwab Capital Trust, Schwab Annuity Portfolios, Schwab Strategic Trust and Laudus Trust since 2018) | Director (Apr. 2019 – present), President (Oct. 2018 – present), and Chief Executive Officer (Apr. 2019 – Nov. 2019), Charles Schwab Investment Management, Inc.; Trustee and Chief Executive Officer (Apr. 2019 – present) and President (Nov. 2018 – present), Schwab Funds, Laudus Funds and Schwab ETFs; Director (Apr. 2019 – present), Charles Schwab Worldwide Funds plc and Charles Schwab Asset Management (Ireland) Limited; Senior Vice President (Apr. 2019 – present), Senior Vice President – Strategy and Product Development (CSIM) (Jan. 2014 – Mar. 2019), and Vice President (Jan. 2009 – Dec. 2013), Charles Schwab & Co., Inc. |
Schwab Balanced Fund | Annual Report
| Officers of the Trust (continued) |
Name, Year of Birth, and Position(s) with the trust
(Terms of office, and length of Time Served3) | Principal Occupations During the Past Five Years |
Mark Fischer
1970
Treasurer and Chief Financial Officer
(Officer of The Charles Schwab Family of Funds, Schwab Investments, Schwab Capital Trust, Schwab Annuity Portfolios, Schwab Strategic Trust and Laudus Trust since 2013) | Treasurer and Chief Financial Officer (Jan. 2016 – present), Schwab Funds, Laudus Funds and Schwab ETFs; Assistant Treasurer (Dec. 2013 – Dec. 2015), Schwab Funds and Laudus Funds; Assistant Treasurer (Nov. 2013 – Dec. 2015), Schwab ETFs; Vice President (Oct. 2013 – present), Charles Schwab Investment Management, Inc.; Executive Director (Apr. 2011 – Sept. 2013), J.P. Morgan Investor Services; Assistant Treasurer (May 2005 – Mar. 2011), Massachusetts Financial Service Investment Management. |
George Pereira
1964
Senior Vice President and Chief Operating Officer
(Officer of The Charles Schwab Family of Funds, Schwab Investments, Schwab Capital Trust and Schwab Annuity Portfolios since 2004; Laudus Trust since 2006; Schwab Strategic Trust since 2009) | Senior Vice President and Chief Financial Officer (Nov. 2004 – present) and Chief Operating Officer (Jan. 2011 – present), Charles Schwab Investment Management, Inc.; Senior Vice President and Chief Operating Officer (Jan. 2016 – present), Schwab Funds, Laudus Funds and Schwab ETFs; Treasurer and Chief Financial Officer (June 2006 – Dec. 2015), Laudus Funds; Treasurer and Principal Financial Officer (Nov. 2004 – Dec. 2015), Schwab Funds; Treasurer and Principal Financial Officer (Oct. 2009 – Dec. 2015), Schwab ETFs; Director (Apr. 2005 – present), Charles Schwab Worldwide Funds plc and Charles Schwab Asset Management (Ireland) Limited. |
Omar Aguilar
1970
Senior Vice President and Chief Investment Officer – Equities and Multi-Asset Strategies
(Officer of The Charles Schwab Family of Funds, Schwab Investments, Schwab Capital Trust, Schwab Annuity Portfolios, Schwab Strategic Trust and Laudus Trust since 2011) | Senior Vice President and Chief Investment Officer (Apr. 2011 – present), Charles Schwab Investment Management, Inc.; Senior Vice President and Chief Investment Officer – Equities and Multi-Asset Strategies (June 2011 – present), Schwab Funds, Laudus Funds and Schwab ETFs; Head of the Portfolio Management Group and Vice President of Portfolio Management (May 2009 – Apr. 2011), Financial Engines, Inc. (investment management firm); Head of Quantitative Equity (July 2004 – Jan. 2009), ING Investment Management. |
Brett Wander
1961
Senior Vice President and Chief Investment Officer – Fixed Income
(Officer of The Charles Schwab Family of Funds, Schwab Investments, Schwab Capital Trust, Schwab Annuity Portfolios, Schwab Strategic Trust and Laudus Trust since 2011) | Senior Vice President and Chief Investment Officer (Apr. 2011 – present), Charles Schwab Investment Management, Inc.; Senior Vice President and Chief Investment Officer – Fixed Income (June 2011 – present), Schwab Funds, Laudus Funds and Schwab ETFs; Senior Managing Director and Global Head of Active Fixed-Income Strategies (Jan. 2008 – Oct. 2010), State Street Global Advisors; Director of Alpha Strategies (Apr. 2006 – Jan. 2008), Loomis, Sayles & Company (investment management firm). |
David Lekich
1964
Chief Legal Officer and Secretary, Schwab Funds and Schwab ETFs
Vice President and Assistant Clerk, Laudus Funds
(Officer of The Charles Schwab Family of Funds, Schwab Investments, Schwab Capital Trust, Schwab Annuity Portfolios, Schwab Strategic Trust and Laudus Trust since 2011) | Senior Vice President (Sept. 2011 – present) and Vice President (Mar. 2004 – Sept. 2011), Charles Schwab & Co., Inc.; Senior Vice President and Chief Counsel (Sept. 2011 – present) and Vice President (Jan. 2011 – Sept. 2011), Charles Schwab Investment Management, Inc.; Secretary (Apr. 2011 – present) and Chief Legal Officer (Dec. 2011 – present), Schwab Funds; Vice President and Assistant Clerk (Apr. 2011 – present), Laudus Funds; Secretary (May 2011 – present) and Chief Legal Officer (Nov. 2011 – present), Schwab ETFs. |
Catherine MacGregor
1964
Vice President and Assistant Secretary, Schwab Funds and Schwab ETFs
Chief Legal Officer, Vice President and Clerk, Laudus Funds
(Officer of The Charles Schwab Family of Funds, Schwab Investments, Schwab Capital Trust, Schwab Annuity Portfolios and Laudus Trust since 2005; Schwab Strategic Trust since 2009) | Vice President (July 2005 – present), Charles Schwab & Co., Inc.; Vice President (Sept. 2005 – present), Charles Schwab Investment Management, Inc.; Vice President (Dec. 2005 – present) and Chief Legal Officer and Clerk (Mar. 2007 – present), Laudus Funds; Vice President (Nov. 2005 – present) and Assistant Secretary (June 2007 – present), Schwab Funds; Vice President and Assistant Secretary (Oct. 2009 – present), Schwab ETFs. |
| 1 | Each Trustee shall hold office until the election and qualification of his or her successor, or until he or she dies, resigns or is removed. The retirement policy requires that each independent trustee retire by December 31 of the year in which the Trustee turns 74 or the Trustee’s twentieth year of service as an independent trustee on any trust in the Fund Complex, whichever occurs first. |
| 2 | Mr. Bettinger, Mr. de St. Paer and Mr. Martinetto are Interested Trustees. Mr. Bettinger is an Interested Trustee because he owns stock of The Charles Schwab Corporation (CSC), the parent company of Charles Schwab Investment Management, Inc. (CSIM), the investment adviser for the trusts in the Fund Complex, is an employee and director of Charles Schwab & Co., Inc. (CS&Co), the principal underwriter for The Charles Schwab Family of Funds, Schwab Investments, Schwab Capital Trust, Schwab Annuity Portfolios and Laudus Trust, and is a director of CSIM. Mr. de St. Paer is an Interested Trustee because he owns stock of CSC and is an employee and director of CSIM. Mr. Martinetto is an Interested Trustee because he owns stock of CSC and is an employee and director of CS&Co. |
| 3 | The President, Treasurer and Secretary/Clerk hold office until their respective successors are chosen and qualified or until he or she sooner dies, resigns, is removed or becomes disqualified. Each of the other officers serves at the pleasure of the Board. |
Schwab Balanced Fund | Annual Report
asset allocation The practice of dividing a portfolio among different asset classes, with each asset class assigned a particular percentage.
asset class A group of securities with similar structure and basic characteristics. Stocks, bonds and cash are the three main examples of asset classes.
Balanced Blended Index A custom blended index developed by CSIM that, effective January 29, 2019, is composed of 50% S&P 500 Index, 10% Russell 2000 Index, 37% Bloomberg Barclays US Aggregate Bond Index, and 3% Bloomberg Barclays US Treasury Bills 1-3 Month Index. From August 1, 2013 to January 29, 2019, the composite was composed of 50% S&P 500 Index, 10% Russell 2000 Index, 25% Bloomberg Barclays US Aggregate Bond Index, 12% Bloomberg Barclays US Intermediate Aggregate Bond Index and 3% Bloomberg Barclays US Treasury Bills 1-3 Month Index. Prior to August 1, 2013 the Balanced Blended Index was composed of 60% S&P 500 Index and 40% Bloomberg Barclays US Aggregate Bond Index. Percentages listed may not total to 100% due to rounding.
Bloomberg Barclays US Aggregate Bond Index An index that is a broad-based benchmark measuring the performance of the U.S. investment grade, taxable bond market, including U.S. Treasuries, government-related and corporate bonds, mortgage pass-through securities, commercial mortgage-backed securities, and asset-backed securities that are publicly available for sale in the United States. To be eligible for inclusion in the index, securities must be fixed rate, non-convertible, U.S. dollar denominated with at least $300 million or more of outstanding face value and have one or more years remaining to maturity. The index excludes certain types of securities, including tax-exempt state and local government series bonds, structured notes embedded with swaps or other special features, private placements, floating rate securities, inflation-linked bonds and Eurobonds. The index is market capitalization weighted and the securities in the index are updated on the last business day of each month.
Bloomberg Barclays US Intermediate Aggregate Bond Index An index that represents securities that are SEC-registered, taxable, and dollar denominated. The index covers the U.S. investment grade fixed rate bond market, with index components for government and corporate securities, mortgage pass-through securities, and asset-backed securities.
Bloomberg Barclays US Treasury Bills 1–3 Month Index An index that includes all publicly issued zero-coupon U.S. Treasury Bills that have a remaining maturity of less than 3 months but more than 1 month, are rated investment grade and have $300 million or more of outstanding face value. It excludes zero-coupon STRIPS.
bond A security representing a loan from the investor to the issuer. A bond typically pays interest at a fixed rate (the coupon rate) until a specified date (the maturity date), at which time the issuer returns the money borrowed (principal or face value) to the bondholder. Because of their structure, bonds are sometimes called “fixed income securities” or “debt securities.”
An individual bond is subject to the credit risk of the issuer. Changes in interest rates can affect a bond’s market value prior to call or maturity. There is no guarantee that a bond’s yield to call or maturity will provide a positive return over the rate of inflation.
bond fund A bond fund is subject to the same credit, interest rate, and inflation risks as bonds. In addition, a bond fund incurs ongoing fees and expenses. A bond fund’s net asset value will fluctuate with the price of the underlying bonds and the portfolio turnover activity; return of principal is not guaranteed.
cap, capitalization See “market cap.”
capital gain, capital loss the difference between the amount paid for an investment and its value at a later time. If the investment has been sold, the capital gain or loss is considered a realized gain or loss. If the investment is still held, the capital gain or loss is considered unrealized appreciation or depreciation.
expense ratio The amount that is taken from a mutual fund’s assets each year to cover the fund’s operating expenses. An expense ratio of 0.50% means that a fund’s expenses amount to half of one percent of its average net assets a year.
FTSE non-US Dollar World Government Bond Index A market capitalization index that measures the total rate of return performance for the government bonds of 22 countries, excluding the U.S., with a remaining maturity of at least 1 year.
market cap, market capitalization The value of a company as determined by the total value of all shares of its stock outstanding.
MSCI EAFE Index (Net) A free float-adjusted market capitalization index that is designed to measure the equity market performance of developed markets in Europe, Australasia, and the Far East. The Net version of the index reflects reinvested dividends net of withholding taxes, but reflects no deductions for expenses or other taxes; returns are calculated applying dividend withholding rates applicable to non-resident persons who do not benefit from double taxation treaties.
net asset value (NAV) The value of one share of a mutual fund. NAV is calculated by taking the fund’s total assets, subtracting liabilities, and dividing by the number of shares outstanding.
outstanding shares, shares outstanding When speaking of a company or mutual fund, indicates all shares currently held by investors.
price-to-book ratio (P/B) The market price of a company’s stock compared with its “book value.” A mutual fund’s P/B is the weighted average of the P/B of all stocks in the fund’s portfolio.
price-to-earnings ratio (P/E) The market price of a company’s stock compared with earnings over the past year. A mutual fund’s P/E is the weighted average of the P/E of all stocks in the fund’s portfolio.
return on equity (ROE) The average yearly rate of return for each dollar of investors’ money, measured over the past five years.
Russell 2000 Index An index that measures the performance of the 2,000 smallest companies in the Russell 3000 Index. The Russell 3000 Index measures the performance of the largest 3,000 U.S. companies representing approximately 98% of the investable U.S. equity market.
S&P 500 Index An index that is designed to measure the performance of 500 leading publicly traded companies from a broad range of industries.
stock A share of ownership, or equity, in the issuing company.
total return The percentage that an investor would have earned or lost on an investment in the fund assuming dividends and distributions were reinvested.
weighted average For mutual funds, an average that gives the same weight to each security as the security represents in the fund’s portfolio.
yield The income paid out by an investment, expressed as a percentage of the investment’s market value.
Schwab Balanced Fund | Annual Report
PRIVACY NOTICE
THIS IS NOT PART OF THE SHAREHOLDER REPORT
A Commitment to Your Privacy
Your Privacy Is Not for Sale
We do not and will not sell your personal information to anyone, for any reason.
We are committed to protecting the privacy of information we maintain about you. Below are details about our commitment, including the types of information we collect and how we use and share that information. This Privacy Notice applies to you only if you are an individual who invests directly in the funds by placing orders through the funds’ transfer agent. If you place orders through your brokerage account at Charles Schwab & Co., Inc. or an account with another broker-dealer, investment advisor, 401(k) plan, employee benefit plan, administrator, bank or other financial intermediary, you are covered by the privacy policies of that financial institution and should consult those policies.
How We Collect Information About You
We collect personal information about you in a number of ways.
• APPLICATION AND REGISTRATION
INFORMATION.
We collect personal information from you when you open an account or utilize one of our services. We may also collect information about you from third parties such as consumer reporting agencies to verify your identity. The information we collect may include personal information, including your Social Security number, as well as details about your interests, investments and investment experience.
• TRANSACTION AND EXPERIENCE
INFORMATION.
Once your account has been opened, we collect and maintain personal information about your account activity, including your transactions, balances, positions and history. This information allows us to administer your account and provide the services you have requested.
• WEBSITE USAGE.
When you visit our websites, we may use devices known as “cookies,” graphic interchange format files (GIFs), or other similar web tools to enhance your web experience. These tools help us to recognize you, maintain your web session, and
provide a more personalized experience. To learn more, please go to www.schwab.com/privacy.
How We Share and Use Your Information
We provide access to information about you to our affiliated companies, outside companies and other third parties in certain limited circumstances, including:
• to help us process transactions for your account;
• when we use other companies to provide services for us, such as printing and mailing your account statements; and
• when we believe that disclosure is required or permitted under law (for example, to cooperate with regulators or law enforcement, resolve consumer disputes, perform credit/authentication checks, or for risk control).
State Laws
We will comply with state laws that apply to the disclosure or use of information about you.
Safeguarding Your Information — Security Is a Partnership
We take precautions to ensure the information we collect about you is protected and is accessed only by authorized individuals or organizations.
Companies we use to provide support services are not allowed to use information about our shareholders for their own purposes and are contractually obligated to maintain strict confidentiality. We limit their use of information to the performance of the specific services we have requested.
We restrict access to personal information by our employees and agents. Our employees are trained about privacy and are required to safeguard personal information.
We maintain physical, electronic and procedural safeguards that comply with federal standards to guard your nonpublic personal information.
Contact Us
To provide us with updated information, report suspected fraud or identity theft, or for any other questions, please call the number below.
Schwab Funds® direct investors: 1-800-407-0256
© 2019 Schwab Funds. All rights reserved.
Schwab Balanced Fund | Annual Report
Charles Schwab Investment Management
With a straightforward lineup of core products and solutions for building the foundation of a portfolio, Charles Schwab Investment Management advocates for investors of all sizes with a steadfast focus on lowering costs and reducing unnecessary complexity. The list below shows all currently available Schwab Funds®.
Investors should carefully consider information contained in the prospectus, or if available, the summary prospectus, including investment objectives, risks, charges and expenses before investing. Please call 1-877-824-5615 for a prospectus for any Schwab Fund. Please read the prospectus carefully before you invest. This report must be preceded or accompanied by a current prospectus.
Proxy Voting Policies, Procedures and Results
A description of the proxy voting policies and procedures used to determine how to vote proxies on behalf of the funds is available without charge, upon request, by visiting the Schwab Funds’ website atwww.schwabfunds.com/schwabfunds_prospectus, the SEC’s website atwww.sec.gov, or by contacting Schwab Funds at 1-877-824-5615.
Information regarding how a fund voted proxies relating to portfolio securities during the most recent twelve-month period ended June 30 is available, without charge, by visiting the fund’s website atwww.schwabfunds.com/schwabfunds_prospectus or the SEC’s website atwww.sec.gov.
Equity Funds
Schwab Core Equity Fund
Schwab Dividend Equity Fund
Schwab Large-Cap Growth Fund
Schwab Small-Cap Equity Fund
Schwab Hedged Equity Fund
Schwab Health Care Fund
Schwab International Core Equity Fund
Schwab Fundamental US Large Company Index Fund
Schwab Fundamental US Small Company Index Fund
Schwab Fundamental International Large Company Index Fund
Schwab Fundamental International Small Company Index Fund
Schwab Fundamental Emerging Markets Large Company Index Fund
Schwab Fundamental Global Real Estate Index Fund
Schwab Global Real Estate Fund
Schwab S&P 500 Index Fund
Schwab 1000 Index® Fund
Schwab Small-Cap Index Fund®
Schwab Total Stock Market Index Fund®
Schwab U.S. Large-Cap Growth Index Fund
Schwab U.S. Large-Cap Value Index Fund
Schwab U.S. Mid-Cap Index Fund
Schwab International Index Fund®
Asset Allocation Funds
Schwab Balanced Fund
Schwab MarketTrack Portfolios®
Schwab Target Funds
Schwab Target Index Funds
Schwab Monthly Income Funds
Bond Funds
Schwab Treasury Inflation Protected Securities Index Fund
Schwab U.S. Aggregate Bond Index Fund
Schwab Short-Term Bond Index Fund
Schwab Tax-Free Bond Fund1
Schwab California Tax-Free Bond Fund1
Schwab Money Funds2
Schwab provides a broad choice of taxable and tax-exempt money market funds for both retail and institutional client types.
Investment Adviser
Charles Schwab Investment Management, Inc.
211 Main Street, San Francisco, CA 94105
Funds
Schwab Funds
1-877-824-5615
© 2019 Charles Schwab & Co., Inc. All rights reserved.
Member SIPC®
Printed on recycled paper.
| ¹ | State, local, and the Federal Alternative Minimum Tax may apply. Capital gains are not exempt from Federal Taxation. |
| ² | You could lose money by investing in the Schwab Money Funds. All Schwab Money Funds with the exception of Schwab Variable Share Price Money Fund seek to preserve the value of your investment at $1.00 per share, but cannot guarantee they will do so. Because the share price of Schwab Variable Share Price Money Fund will fluctuate, when you sell your shares they may be worth more or less than what you originally paid for them. All Schwab Money Funds with the exception of Schwab Government Money Fund, Schwab Retirement Government Money Fund, Schwab U.S. Treasury Money Fund, Schwab Treasury Obligations Money Fund and Schwab Government Money Market Portfolio may impose a fee upon the sale of your shares or may temporarily suspend your ability to sell shares if the Fund’s liquidity falls below required minimums because of market conditions or other factors. An investment in the Schwab Money Funds is not insured or guaranteed by the Federal Deposit Insurance Corporation or any other government agency. The Schwab Money Funds’ sponsor has no legal obligation to provide financial support to the Funds, and you should not expect that the sponsor will provide financial support to the Funds at any time. |
This page is intentionally left blank.
Annual Report | October 31, 2019
Schwab Equity Index Funds®
Schwab S&P 500 Index Fund
Schwab 1000 Index® Fund
Schwab Small-Cap Index Fund®
Schwab Total Stock Market Index Fund®
Schwab U.S. Large-Cap Growth
Index Fund
Schwab U.S. Large-Cap Value
Index Fund
Schwab U.S. Mid-Cap Index Fund
Schwab International Index Fund®
| New Notice Regarding Shareholder Report Delivery Options |
| Beginning on January 1, 2021, paper copies of a fund’s shareholder reports will no longer be sent by mail, unless you specifically request paper copies of the reports from a fund or from your financial intermediary (such as a bank or broker-dealer). Instead, the reports will be made available on a fund’s websitewww.schwabfunds.com/schwabfunds_prospectus, and you will be notified by mail each time a report is posted and the mailing will provide a website link to access the report. You will continue to receive other fund regulatory documents (such as prospectuses or supplements) in paper unless you have elected to receive all fund documents electronically. |
| If you would like to receive a fund’s future shareholder reports in paper free of charge after January 1, 2021, you can make that request: |
| • If you invest through Charles Schwab & Co, Inc. (broker-dealer), by calling 1-866-345-5954 and using the unique identifier attached to this mailing; |
| • If you invest through another financial intermediary (such as a bank or broker-dealer) by contacting them directly; or |
| • If owned directly through a fund by calling 1-800-407-0256. |
| If you already receive shareholder reports and other fund documents electronically, you will not be affected by this change and you need not take any action. |
This page is intentionally left blank.
Eight cost-efficient ways to tap into the power of the stock market for long-term growth potential.
Fund investment adviser: Charles Schwab Investment Management, Inc. (CSIM)
Distributor: Charles Schwab & Co., Inc. (Schwab)
The Sector/Industry classifications in this report use the Global Industry Classification Standard (GICS), which was developed by, and is the exclusive property of, MSCI Inc. (MSCI) and Standard & Poor’s (S&P). GICS is a service mark of MSCI and S&P and has been licensed for use by Schwab. The Industry classifications used in the schedules of Condensed Portfolio Holdings are sub-categories of Sector classifications.
Schwab Equity Index Funds | Annual Report
Schwab Equity Index Funds
The performance data quoted represents past performance. Past performance does not guarantee future results. Investment returns and principal value of an investment will fluctuate so that an investor’s shares may be worth more or less than their original cost. Current performance may be lower or higher than performance data quoted. To obtain performance information current to the most recent month end, please visitwww.schwabfunds.com/schwabfunds_prospectus.
| Total Return for the 12 Months Ended October 31, 2019 |
Schwab S&P 500 Index Fund
(Ticker Symbol: SWPPX) | 14.30% |
| S&P 500® Index | 14.33% |
| Fund Category: Morningstar Large Blend1 | 12.66% |
| Performance Details | pages 7-9 |
| |
Schwab 1000 Index Fund
(Ticker Symbol: SNXFX) | 14.20% |
| Schwab 1000 Index® | 14.25% |
| Russell 1000® Index | 14.15% |
| Fund Category: Morningstar Large Blend1 | 12.66% |
| Performance Details | pages 10-12 |
| |
Schwab Small-Cap Index Fund
(Ticker Symbol: SWSSX) | 4.95% |
| Russell 2000® Index | 4.90% |
| Fund Category: Morningstar Small Blend1 | 4.42% |
| Performance Details | pages 13-15 |
| |
Schwab Total Stock Market Index Fund
(Ticker Symbol: SWTSX) | 13.37% |
| Dow Jones U.S. Total Stock Market IndexSM | 13.39% |
| Fund Category: Morningstar Large Blend1 | 12.66% |
| Performance Details | pages 16-18 |
| Total Return for the 12 Months Ended October 31, 2019 |
Schwab U.S. Large-Cap Growth Index Fund
(Ticker Symbol: SWLGX) | 17.04% |
| Russell 1000® Growth Index | 17.10% |
| Fund Category: Morningstar Large Growth1 | 14.51% |
| Performance Details | pages 19-21 |
| |
Schwab U.S. Large-Cap Value Index Fund
(Ticker Symbol: SWLVX) | 11.08% |
| Russell 1000® Value Index | 11.21% |
| Fund Category: Morningstar Large Value1 | 9.63% |
| Performance Details | pages 22-24 |
| |
Schwab U.S. Mid-Cap Index Fund
(Ticker Symbol: SWMCX) | 13.61% |
| Russell Midcap® Index | 13.72% |
| Fund Category: Morningstar Mid-Cap Blend1 | 9.59% |
| Performance Details | pages 25-27 |
| |
Schwab International Index Fund2
(Ticker Symbol: SWISX) | 11.27% |
| MSCI EAFE® Index (Net)3 | 11.04% |
| Fund Category: Morningstar Foreign Large Blend1 | 10.26% |
| Performance Details | pages 28-30 |
All total returns on this page assume dividends and distributions were reinvested. Index figures do not include trading and management costs, which would lower performance. Indices are unmanaged and cannot be invested in directly. Performance results less than one year are not annualized.
For index definitions, please see the Glossary.
Performance does not reflect the deduction of taxes that a shareholder would pay on fund distributions or on the redemption of fund shares.
| 1 | Source for category information: Morningstar, Inc. The Morningstar Category return represents all active and index mutual funds within the category as of the report date. |
| 2 | The fund’s performance relative to the index may be affected by fair-value pricing and timing differences in foreign exchange calculations. See financial note 2 for more information. |
| 3 | The net version of the index reflects reinvested dividends net of withholding taxes, but reflects no deductions for expenses or other taxes. |
Schwab Equity Index Funds | Annual Report
Schwab Equity Index Funds
Jonathan de St. Paer
President of Charles Schwab
Investment Management, Inc.
and the funds covered
in this report.
Dear Shareholder,
At the crux of every investment decision, one consideration that may be top of mind is your risk tolerance. It may seem like a straightforward consideration, but it’s often not. Most of us are risk-averse by nature and as investors, the fear of a significant market decline is ever-present in our minds. This can sometimes lead us to make decisions that may get in the way of the performance of our investments. Our feelings about risk are also fluid, impacted by changes in market conditions and our progress toward our financial goals. For example, some investors may have been prompted to rethink their risk appetite as a result of the latest bout of market volatility.
At Charles Schwab Investment Management, we provide a range of foundational products that are designed to suit a variety of risk appetites and help investors remain focused on their long-term investment plans despite market volatility. The Schwab Equity Index Funds play a role in this. The funds provide access to broad segments of the equities markets with different risk and return profiles, including small-cap, mid-cap, and large-cap stocks, those oriented toward value or growth, and equities from both U.S. and international markets.
In addition, the Schwab Equity Index Funds can help investors achieve their financial goals by keeping investing costs down. The funds have among the lowest expenses in the industry, along with no investment minimums. As one of the largest providers of index mutual funds, one of our goals is to keep your investing costs down.
When it comes to investing, it’s important to have a long-term investing plan and a portfolio based on your individual goals and risk tolerance. It can at times be tough to maintain that discipline in the face of day-to-day uncertainty. We aim to offer products with clear objectives, straightforward pricing, and a consistent approach to investing to help simplify investing decisions, so investors can focus on their long-term goals without unnecessary complexity.
Thank you for investing with Charles Schwab Investment Management, and for trusting us to help you achieve your financial goals. For more information about the Schwab Equity Index Funds, please continue reading this report. In addition, you can find further details about these funds by visiting our website at www.schwabfunds.com. We are also happy to hear from you at 1-877-824-5615.
Sincerely,
“The funds have among the lowest expenses in the industry, along with no investment minimums.”
Management views may have changed since the report date.
Schwab Equity Index Funds | Annual Report
Schwab Equity Index Funds
The Investment Environment
For the 12-month reporting period ended October 31, 2019, both U.S. and international equity markets generated positive returns. The final two months of 2018 were marked by significant market volatility and steep declines across global equity markets, driven by concerns about slowing international growth, a trade war between the U.S. and China, falling oil prices, the waning strength of the U.S. economy, and the pace of future interest rate hikes despite low inflation. By late December, major market indices had fallen to near-bear market territory. However, as the Federal Reserve (Fed) put interest rate hikes on hold, stocks, particularly in the U.S., staged a strong recovery in the first four months of 2019, which generally continued through the end of the reporting period despite several setbacks. Over the period, the U.S. dollar strengthened slightly against a basket of foreign currencies, generally reducing the returns on overseas investments in U.S. dollar terms. For the reporting period, the S&P 500® Index, a bellwether for the overall U.S. stock market, returned 14.33% and the Russell 2000® Index, a measure of U.S. small-cap stocks, returned 4.90%. Despite headwinds, markets outside the U.S. also rose, particularly toward the end of the reporting period with the MSCI EAFE® Index (Net)*, a broad measure of developed international equity performance, returning 11.04%.
Economic growth around the globe was uneven over the reporting period, largely as a result of manufacturing weakness in developed international markets. Despite escalating trade tensions with China, the U.S. maintained its steady growth in its tenth year of expansion, although at a declining pace. In the last two months of 2018, economies around the globe showed increasing signs of weakness, but many regained economic momentum in the first six months of 2019, demonstrating resilient growth despite lingering uncertainties on various fronts. As the year progressed, signs of slowing growth increased amid a weakening global economy, waning manufacturing activity, and the ongoing U.S.-China trade war. However, toward the end of the period, prospects of a partial trade resolution relieved some of the pressure. U.S. gross domestic product (GDP) grew at an annual rate of 2.1% in the third quarter of 2019, up slightly from 2.0% in the second quarter, but down from 3.1% in the first quarter of 2019. Unemployment declined in September 2019 to a 50-year low. While consumer confidence edged lower in October to hit a four-month low, it remained a stable source of GDP growth in the U.S. Inflation remained benign.
Asset Class Performance Comparison % returns during the 12 months ended October 31, 2019
Index figures assume dividends and distributions were reinvested. Index figures do not include trading and management costs, which would lower performance. Indices are unmanaged and cannot be invested in directly. Performance results less than one year are not annualized. Past performance is not an indication of future results.
For index definitions, please see the Glossary.
Data source: Index provider websites and CSIM.
Nothing in this report represents a recommendation of a security by the investment adviser.
Management views may have changed since the report date.
| * | The net version of the index reflects reinvested dividends net of withholding taxes, but reflects no deductions for expenses or other taxes. |
Schwab Equity Index Funds | Annual Report
Schwab Equity Index Funds
The Investment Environment(continued)
Outside the U.S., conditions continued to soften, dampened by trade issues, slowing economic output, and geopolitical concerns. Oil prices, which had fallen steeply in the fourth quarter of 2018, recovered through the first four months of 2019, as major exporters sought to curb supply and central banks took steps to ease growth-related fears, before dipping in May when trade concerns escalated. Oil prices remained volatile through period end. In the eurozone, growth slowed in the second and third quarters of 2019, down slightly from the first quarter. Growth was subdued by tepid wage growth and constrained consumer spending. The United Kingdom’s economy contracted in the second quarter of 2019 amid growing Brexit-related economic and political uncertainty that dampened industrial output, construction, and services sectors. Japan’s economy, however, experienced growth in recent quarters after contracting sharply in the third quarter of 2018.
In response to the economic environment and flat or inverted yield curves around the world, to bolster growth, and to ensure stability given ongoing trade tensions, a number of central banks reduced their policy rates, including the U.S., while others maintained their generally low—and for some international central banks, negative—interest rates. In the U.S., after raising interest rates four times in 2018, the Fed held rates unchanged through the first half of 2019. But amid growing signs of global economic weakness that threatened to dampen U.S. economic growth, along with continued low inflation and weakness in manufacturing, the Fed enacted three interest rate cuts by the end of the period—in July, September, and October. Following the October interest rate cut, the Fed signaled that subsequent interest rate cuts would be put on hold provided the economy continues to expand moderately and the labor market remains strong. The federal funds rate ended the reporting period in a range of 1.50% to 1.75%. Outside the U.S., the European Central Bank held interest rates steady and launched an asset-purchase program to help stimulate the economy. The Bank of Japan maintained its short-term interest rate target of –0.1% throughout the period. Despite growing Brexit-related division, the Bank of England maintained its key official bank rate at 0.75% throughout the period, where it has remained since August 2018.
Schwab Equity Index Funds | Annual Report
Schwab Equity Index Funds
 | Christopher Bliss, CFA, Vice President and Head of Passive Equity Strategies, leads the portfolio management team for Schwab’s passive equity mutual funds and ETFs. He also has overall responsibility for all aspects of the management of the funds. Prior to joining CSIM in 2016, Mr. Bliss spent 12 years at BlackRock (formerly Barclays Global Investors) managing and leading institutional index teams, most recently as a managing director and head of the Americas institutional index team. Prior to BlackRock, he worked as an equity analyst and portfolio manager for Harris Bretall and before that, as a research analyst for JP Morgan. |
 | Jeremy Brown, Portfolio Manager, is responsible for the day-to-day co-management of the the funds, except for the Schwab International Index Fund. Prior to joining CSIM in 2017, Mr. Brown spent six years with ALPS Advisors, Inc. in Denver, most recently as a senior analyst on the ETF portfolio management and research team where he performed portfolio management, trading and analytics/research functions for ALPS ETFs and passive funds. Additionally, Mr. Brown led a number of investment research, commentary, industry trend analysis and sales and marketing support initiatives. |
 | Chuck Craig, CFA, Senior Portfolio Manager, is responsible for the day-to-day co-management of the Schwab International Index Fund. Prior to joining CSIM in 2012, Mr. Craig worked at Guggenheim Funds (formerly Claymore Group), where he spent more than five years as a managing director of portfolio management and supervision, and three years as vice president of product research and development. Prior to that, he worked as an equity research analyst at First Trust Portfolios (formerly Niké Securities), and a trader and analyst at PMA Securities, Inc. |
 | Ferian Juwono, CFA, Senior Portfolio Manager, is responsible for the day-to-day co-management of the the funds, except for the Schwab International Index Fund. Prior to joining CSIM in 2010, Mr. Juwono worked at BlackRock (formerly Barclays Global Investors), where he spent more than three years as a portfolio manager, managing equity index funds for institutional clients, and two years as a senior business analyst. Prior to that, Mr. Juwono worked for more than four years as a senior financial analyst with Union Bank of California. |
 | Jane Qin, Portfolio Manager, is responsible for the day-to-day co-management of the Schwab International Index Fund. Prior to joining CSIM in 2012, Ms. Qin spent more than four years at The Bank of New York Mellon Corporation. During that time, Ms. Qin spent more than two years as an associate equity portfolio manager and nearly two years as a performance analyst. She also worked at Wells Fargo Funds Management as a mutual fund analyst and at CIGNA Reinsurance in the risk management group as a risk analyst. |
 | David Rios, Portfolio Manager, is responsible for the day-to-day co-management of the Schwab International Index Fund. He joined CSIM in 2008 and became a Portfolio Manager in 2014. Prior to this role, Mr. Rios served as an Associate Portfolio Manager on the Schwab Equity Index Strategies team for four years. His first role with CSIM was as a trade operations specialist. He also previously worked as a senior fund accountant at Investors Bank & Trust (subsequently acquired by State Street Corporation). |
 | Sabya Sinha, Portfolio Manager, is responsible for the day-to-day co-management of the the funds, except for the Schwab International Index Fund. Prior to joining CSIM in 2015, Mr. Sinha spent a year at F-Squared Investments on the product development and analytics team. Prior to F-Squared, he worked at IndexIQ Advisors as a senior index portfolio manager for three years and for Bank of America’s Columbia Management subsidiary as a portfolio manager for three years. |
Schwab Equity Index Funds | Annual Report
Schwab S&P 500 Index Fundas of October 31, 2019
The Schwab S&P 500 Index Fund’s (the fund) goal is to track the total return of the S&P 500® Index (the index), which includes the stocks of 500 leading U.S. publicly traded companies from a broad range of industries. To pursue its goal, the fund seeks to replicate the performance of the index by giving the same weight to a given stock as does the index. For more information concerning the fund’s investment objective, strategies, and risks, please see the fund’s prospectus.
Market Highlights. Over the 12-month reporting period ended October 31, 2019, U.S. large-cap stocks generated positive returns. The final two months of 2018 were marked by significant market volatility and steep declines, driven by concerns about slowing international growth, a trade war between the U.S. and China, falling oil prices, the waning strength of the U.S. economy, and the pace of future interest rate hikes despite low inflation. However, as the Federal Reserve (Fed) put interest rate hikes on hold, stocks, particularly in the U.S., staged a strong recovery in the first four months of 2019, which generally continued through the end of the reporting period. After raising interest rates four times in 2018, the Fed enacted three interest rate cuts by the end of the period—in July, September, and October. From a sector standpoint within the index, the real estate and utilities sectors outperformed over the 12-month reporting period, while the energy and health care sectors underperformed by comparison.
Performance. The fund returned 14.30% for the 12-month reporting period ended October 31, 2019, compared with the index, which returned 14.33%. Differences between the return of the fund and the return of the index may be attributable to, among other things, the operational and transactional costs incurred by the fund and not the index.
Contributors and Detractors. The energy sector was the only detractor from the return of the fund. The energy sector represented an average weight of approximately 5% of the fund’s investments and returned approximately -11% for the reporting period. One example from this sector is Exxon Mobil Corp. The fund’s holdings of Exxon Mobil Corp. returned approximately -11% for the reporting period.
While there were no additional sectors that detracted from performance over the reporting period, the materials sector was the smallest contributor to the return of the fund. The fund’s holdings in the materials sector represented an average weight of approximately 3% of the fund’s investments and returned approximately 13% for the reporting period.
The fund’s holdings in the information technology sector were the largest contributors to the return of the fund. Information technology stocks represented an average weight of approximately 21% of the fund’s investments and returned approximately 23% for the reporting period. The fund’s holdings of Microsoft Corp. are one example from this sector, returning approximately 36% for the reporting period.
Stocks in the consumer discretionary sector also contributed to overall fund performance. Consumer discretionary stocks represented an average weight of approximately 10% of the fund’s investments and returned approximately 16% for the reporting period.
Management views and portfolio holdings may have changed since the report date.
Schwab Equity Index Funds | Annual Report
Schwab S&P 500 Index Fund
Performance and Fund Factsas of October 31, 2019
The performance data quoted represents past performance. Past performance does not guarantee future results. Investment returns and principal value of an investment will fluctuate so that an investor’s shares may be worth more or less than their original cost. Current performance may be lower or higher than performance data quoted. To obtain performance information current to the most recent month end, please visitwww.schwabfunds.com/schwabfunds_prospectus.
Performance of Hypothetical $10,000 Investment (October 31, 2009 – October 31, 2019)1
Average Annual Total Returns1
| Fund and Inception Date | 1 Year | 5 Years | 10 Years |
| Fund: Schwab S&P 500 Index Fund (5/19/97) | 14.30% | 10.70% | 13.61% |
| S&P 500® Index | 14.33% | 10.78% | 13.70% |
| Fund Category: Morningstar Large Blend2 | 12.66% | 8.94% | 12.22% |
| Fund Expense Ratio3: 0.02% |
All total returns on this page assume dividends and distributions were reinvested. Index figures do not include trading and management costs, which would lower performance. Indices are unmanaged and cannot be invested in directly. Performance results less than one year are not annualized.
For index definitions, please see the Glossary.
Index ownership – “Standard & Poor’s®,” “S&P®,” and “S&P 500®” are registered trademarks of Standard & Poor’s Financial Services LLC (S&P), and “Dow Jones®” is a registered trademark of Dow Jones Trademark Holdings LLC (Dow Jones) and have been licensed for use by S& P Dow Jones Indices LLC and its affiliates and sublicensed for certain purposes by CSIM. The “S&P 500® Index” is a product of S&P Dow Jones Indices LLC or its affiliates, and has been licensed for use by CSIM. The Schwab S&P 500 Index Fund is not sponsored, endorsed, sold or promoted by S&P Dow Jones Indices LLC, Dow Jones, S&P, or their respective affiliates, and neither S&P Dow Jones Indices LLC, Dow Jones, S&P, nor their respective affiliates make any representation regarding the advisability of investing in the fund.
| 1 | Performance does not reflect the deduction of taxes that a shareholder would pay on fund distributions or the redemption of fund shares. |
| 2 | Source for category information: Morningstar, Inc. The Morningstar Category return represents all active and index mutual funds within the category as of the report date. |
| 3 | As stated in the prospectus. |
Schwab Equity Index Funds | Annual Report
Schwab S&P 500 Index Fund
Performance and Fund Factsas of October 31, 2019 (continued)
| Number of Holdings | 507 |
| Weighted Average Market Cap (millions) | $262,960 |
| Price/Earnings Ratio (P/E) | 21.2 |
| Price/Book Ratio (P/B) | 3.3 |
| Portfolio Turnover Rate | 3% |
Sector Weightings % of Investments2
Top Equity Holdings % of Net Assets3
Portfolio holdings may have changed since the report date.
Source of Sector Classification: S& P and MSCI.
| 1 | Excludes derivatives. |
| 2 | The percentage may differ from the Portfolio Holdings because the above calculation is based on a percentage of total investments, excluding derivatives, whereas the calculation in the Portfolio Holdings is based on a percentage of net assets. |
| 3 | This list is not a recommendation of any security by the investment adviser. |
Schwab Equity Index Funds | Annual Report
Schwab 1000 Index Fundas of October 31, 2019
The Schwab 1000 Index Fund’s (the fund) goal is to match the total return of the Schwab 1000 Index® (the index), which includes the stocks of the largest 1,000 publicly traded companies in the U.S., with size being determined by market capitalization (total market value of all shares outstanding). To pursue its goal, the fund seeks to replicate the performance of the index by giving the same weight to a given stock as does the index. For more information concerning the fund’s investment objective, strategies, and risks, please see the fund’s prospectus.
Market Highlights. Over the 12-month reporting period ended October 31, 2019, U.S. large-cap stocks generated positive returns. The final two months of 2018 were marked by significant market volatility and steep declines, driven by concerns about slowing international growth, a trade war between the U.S. and China, falling oil prices, the waning strength of the U.S. economy, and the pace of future interest rate hikes despite low inflation. However, as the Federal Reserve (Fed) put interest rate hikes on hold, stocks, particularly in the U.S., staged a strong recovery in the first four months of 2019, which generally continued through the end of the reporting period. After raising interest rates four times in 2018, the Fed enacted three interest rate cuts by the end of the period—in July, September, and October. From a sector standpoint within the index, the real estate and utilities sectors outperformed over the 12-month reporting period, while the energy and health care sectors underperformed by comparison.
Performance. The fund returned 14.20% for the 12-month reporting period ended October 31, 2019, compared with the index, which returned 14.25%. Differences between the return of the fund and the return of the index may be attributable to, among other things, the operational and transactional costs incurred by the fund and not the index.
Contributors and Detractors. The energy sector was the only detractor from the return of the fund. The energy sector represented an average weight of approximately 5% of the fund’s investments and returned approximately -12% for the reporting period. One example from this sector is Exxon Mobil Corp. The fund’s holdings of Exxon Mobil Corp. returned approximately -11% for the reporting period.
While there were no additional sectors that detracted from performance over the reporting period, the materials sector was the smallest contributor to the return of the fund. The fund’s holdings in the materials sector represented an average weight of approximately 3% of the fund’s investments and returned approximately 12% for the reporting period.
The fund’s holdings in the information technology sector were the largest contributors to the return of the fund. Information technology stocks represented an average weight of approximately 21% of the fund’s investments and returned approximately 23% for the reporting period. The fund’s holdings of Microsoft Corp. are one example from this sector, returning approximately 36% for the reporting period.
Stocks in the financials sector were another contributor to overall fund performance. Financials stocks represented an average weight of approximately 13% of the fund’s investments and returned approximately 12% for the reporting period.
Management views and portfolio holdings may have changed since the report date.
Schwab Equity Index Funds | Annual Report
Performance and Fund Factsas of October 31, 2019
The performance data quoted represents past performance. Past performance does not guarantee future results. Investment returns and principal value of an investment will fluctuate so that an investor’s shares may be worth more or less than their original cost. Current performance may be lower or higher than performance data quoted. To obtain performance information current to the most recent month end, please visitwww.schwabfunds.com/schwabfunds_prospectus.
Performance of Hypothetical $10,000 Investment (October 31, 2009 – October 31, 2019)1
Average Annual Total Returns1
| Fund and Inception Date | 1 Year | 5 Years | 10 Years |
| Fund: Schwab 1000 Index Fund (4/2/91) | 14.20% | 10.38% | 13.43% |
| Schwab 1000 Index® | 14.25% | 10.52% | 13.67% |
| Russell 1000® Index | 14.15% | 10.55% | 13.72% |
| Fund Category: Morningstar Large Blend2 | 12.66% | 8.94% | 12.22% |
| Fund Expense Ratio3: 0.05% |
All total returns on this page assume dividends and distributions were reinvested. Index figures do not include trading and management costs, which would lower performance. Indices are unmanaged and cannot be invested in directly. Performance results less than one year are not annualized.
For index definitions, please see the Glossary.
| 1 | Performance does not reflect the deduction of taxes that a shareholder would pay on fund distributions or the redemption of fund shares. |
| 2 | Source for category information: Morningstar, Inc. The Morningstar Category return represents all active and index mutual funds within the category as of the report date. |
| 3 | As stated in the prospectus. |
Schwab Equity Index Funds | Annual Report
Performance and Fund Factsas of October 31, 2019 (continued)
| Number of Holdings | 9882 |
| Weighted Average Market Cap (millions) | $236,490 |
| Price/Earnings Ratio (P/E) | 21.2 |
| Price/Book Ratio (P/B) | 3.2 |
| Portfolio Turnover Rate | 5% |
Sector Weightings % of Investments3
Top Equity Holdings % of Net Assets4
Portfolio holdings may have changed since the report date.
Source of Sector Classification: S& P and MSCI.
| 1 | Excludes derivatives. |
| 2 | As a result of the Schwab 1000 Index®’s once per year reconstitution and the effects of certain corporate actions, the fund may hold less than 1,000 securities. |
| 3 | The percentage may differ from the Portfolio Holdings because the above calculation is based on a percentage of total investments, excluding derivatives, whereas the calculation in the Portfolio Holdings is based on a percentage of net assets. |
| 4 | This list is not a recommendation of any security by the investment adviser. |
Schwab Equity Index Funds | Annual Report
Schwab Small-Cap Index Fundas of October 31, 2019
The Schwab Small-Cap Index Fund’s (the fund) goal is to track the performance of a benchmark index that measures the total return of small-capitalization U.S. stocks. To pursue its investment objective, the fund generally invests in stocks that are included in the Russell 2000® Index (the index). To pursue its goal, the fund seeks to replicate the performance of the index by giving the same weight to a given stock as does the index. For more information concerning the fund’s investment objective, strategies, and risks, please see the fund’s prospectus.
Market Highlights. Over the 12-month reporting period ended October 31, 2019, U.S. small-cap stocks generated positive returns. The final two months of 2018 were marked by significant market volatility and steep declines, driven by concerns about slowing international growth, a trade war between the U.S. and China, falling oil prices, the waning strength of the U.S. economy, and the pace of future interest rate hikes despite low inflation. However, as the Federal Reserve (Fed) put interest rate hikes on hold, stocks, particularly in the U.S., staged a strong recovery in the first four months of 2019, which generally continued through the end of the reporting period. After raising interest rates four times in 2018, the Fed enacted three interest rate cuts by the end of the period—in July, September, and October. From a sector standpoint within the index, the utilities and information technology sectors outperformed over the 12-month reporting period, while the energy and communications services sectors underperformed by comparison.
Performance. The fund returned 4.95% for the 12-month reporting period ended October 31, 2019, compared with the index, which returned 4.90%.
Contributors and Detractors. The fund’s holdings in the information technology sector were the largest contributors to the returns of the fund. Information technology stocks represented an average weight of approximately 14% of the fund’s investments and returned approximately 23%. The fund’s holdings of Coupa Software, Inc. are one example of this sector, returning approximately 95% for the reporting period.
Stocks in the industrials sector also contributed to overall fund performance. Industrials stocks represented an average weight of approximately 15% of the fund’s investments and returned approximately 12% for the reporting period.
Over the reporting period, the energy sector was the largest detractor from the return of the fund. Energy stocks represented an average weight of approximately 4% of the fund’s investments and returned approximately -43% for the reporting period. One example from this sector is Oasis Petroleum, Inc. The fund’s holdings of Oasis Petroleum, Inc. returned approximately -74% over the reporting period.
The health care sector also detracted from the return of the fund. Health care stocks represented an average weight of approximately 16% of the fund’s investments and returned approximately -4% for the reporting period.
Management views and portfolio holdings may have changed since the report date.
Schwab Equity Index Funds | Annual Report
Schwab Small-Cap Index Fund
Performance and Fund Factsas of October 31, 2019
The performance data quoted represents past performance. Past performance does not guarantee future results. Investment returns and principal value of an investment will fluctuate so that an investor’s shares may be worth more or less than their original cost. Current performance may be lower or higher than performance data quoted. To obtain performance information current to the most recent month end, please visitwww.schwabfunds.com/schwabfunds_prospectus.
Performance of Hypothetical $10,000 Investment (October 31, 2009 – October 31, 2019)1
Average Annual Total Returns1
| Fund and Inception Date | 1 Year | 5 Years | 10 Years |
| Fund: Schwab Small-Cap Index Fund (5/19/97) | 4.95% | 7.41% | 12.56% |
| Russell 2000® Index | 4.90% | 7.37% | 12.27% |
| Small-Cap Spliced Index | 4.90% | 7.37% | 12.55% |
| Fund Category: Morningstar Small Blend2 | 4.42% | 6.20% | 11.55% |
| Fund Expense Ratio3: 0.04% |
All total returns on this page assume dividends and distributions were reinvested. Index figures do not include trading and management costs, which would lower performance. Indices are unmanaged and cannot be invested in directly. Performance results less than one year are not annualized.
The first index listed for the fund is the fund’s primary benchmark, as shown in the prospectus. Additional indices shown are provided for comparative purposes.
For index definitions, please see the Glossary.
Index ownership – “Russell 2000®” is a registered mark of the Frank Russell Company (Russell) and has been licensed for use by the Schwab Small-Cap Index Fund. The Schwab Small-Cap Index Fund is not sponsored, endorsed, sold or promoted by Russell and Russell makes no representation regarding the advisability of investing in the fund.
| 1 | Performance does not reflect the deduction of taxes that a shareholder would pay on fund distributions or the redemption of fund shares. |
| 2 | Source for category information: Morningstar, Inc. The Morningstar Category return represents all active and index mutual funds within the category as of the report date. |
| 3 | As stated in the prospectus. |
Schwab Equity Index Funds | Annual Report
Schwab Small-Cap Index Fund
Performance and Fund Factsas of October 31, 2019 (continued)
| Number of Holdings | 2,000 |
| Weighted Average Market Cap (millions) | $2,321 |
| Price/Earnings Ratio (P/E) | 18.0 |
| Price/Book Ratio (P/B) | 1.9 |
| Portfolio Turnover Rate | 14% |
Sector Weightings % of Investments2
Top Equity Holdings % of Net Assets3
Portfolio holdings may have changed since the report date.
Source of Sector Classification: S& P and MSCI.
Small-company stocks are subject to greater volatility than many other asset classes.
| 1 | Excludes derivatives. |
| 2 | The percentage may differ from the Portfolio Holdings because the above calculation is based on a percentage of total investments, excluding derivatives, whereas the calculation in the Portfolio Holdings is based on a percentage of net assets. |
| 3 | This list is not a recommendation of any security by the investment adviser. |
Schwab Equity Index Funds | Annual Report
Schwab Total Stock Market Index Fundas of October 31, 2019
The Schwab Total Stock Market Index Fund’s (the fund) goal is to track the total return of the entire U.S. stock market, as measured by the Dow Jones U.S. Total Stock Market IndexSM (the index), which includes the stocks of all publicly traded companies headquartered in the U.S. for which pricing information is readily available. To pursue its investment objective, the fund uses a sampling investment approach that involves investing in a representative sample of stocks with similar risk and return characteristics as the index, and maintains a tight allocation across all sectors, market capitalizations, and valuation measures compared with the index. For more information concerning the fund’s investment objective, strategies, and risks, please see the fund’s prospectus.
Market Highlights. Over the 12-month reporting period ended October 31, 2019, the U.S. equity market generated positive returns. The final two months of 2018 were marked by significant market volatility and steep declines, driven by concerns about slowing international growth, a trade war between the U.S. and China, falling oil prices, the waning strength of the U.S. economy, and the pace of future interest rate hikes despite low inflation. However, as the Federal Reserve (Fed) put interest rate hikes on hold, stocks, particularly in the U.S., staged a strong recovery in the first four months of 2019, which generally continued through the end of the reporting period. After raising interest rates four times in 2018, the Fed enacted three interest rate cuts by the end of the period—in July, September, and October. From a sector standpoint within the index, the real estate and utilities sectors outperformed over the 12-month reporting period, while the energy and health care sectors underperformed by comparison.
Performance. The fund returned 13.37% for the 12-month reporting period ended October 31, 2019, compared with the index, which returned 13.39%. Differences between the return of the fund and the return of the index may be attributable to, among other things, the operational and transactional costs incurred by the fund and not the index.
Contributors and Detractors. The energy sector was the only detractor from the return of the fund. The energy sector represented an average weight of approximately 5% of the fund’s investments and returned approximately -15% for the reporting period. One example from this sector is Exxon Mobil Corp. The fund’s holdings of Exxon Mobil Corp. returned approximately -11% for the reporting period.
While there were no additional sectors that detracted from performance over the reporting period, the materials sector was the smallest contributor to the return of the fund. The fund’s holdings in the materials sector represented an average weight of approximately 3% of the fund’s investments and returned approximately 11% for the reporting period.
The fund’s holdings in the information technology sector were the largest contributors to the return of the fund. Information technology stocks represented an average weight of approximately 21% of the fund’s investments and returned approximately 23% for the reporting period. The fund’s holdings of Microsoft Corp. are one example from this sector, returning approximately 36% for the reporting period.
Stocks in the financials sector also contributed to overall fund performance. Financials stocks represented an average weight of approximately 14% of the fund’s investments and returned approximately 11% for the reporting period.
Management views and portfolio holdings may have changed since the report date.
Schwab Equity Index Funds | Annual Report
Schwab Total Stock Market Index Fund
Performance and Fund Factsas of October 31, 2019
The performance data quoted represents past performance. Past performance does not guarantee future results. Investment returns and principal value of an investment will fluctuate so that an investor’s shares may be worth more or less than their original cost. Current performance may be lower or higher than performance data quoted. To obtain performance information current to the most recent month end, please visitwww.schwabfunds.com/schwabfunds_prospectus.
Performance of Hypothetical $10,000 Investment (October 31, 2009 – October 31, 2019)1
Average Annual Total Returns1
| Fund and Inception Date | 1 Year | 5 Years | 10 Years |
| Fund: Schwab Total Stock Market Index Fund (6/1/99) | 13.37% | 10.22% | 13.57% |
| Dow Jones U.S. Total Stock Market IndexSM | 13.39% | 10.26% | 13.62% |
| Fund Category: Morningstar Large Blend2 | 12.66% | 8.94% | 12.22% |
| Fund Expense Ratio3: 0.03% |
All total returns on this page assume dividends and distributions were reinvested. Index figures do not include trading and management costs, which would lower performance. Indices are unmanaged and cannot be invested in directly. Performance results less than one year are not annualized.
For index definitions, please see the Glossary.
Index ownership – “Standard & Poor’s®” and “S&P®” are registered trademarks of Standard & Poor’s Financial Services LLC (S&P), and “Dow Jones®” is a registered trademark of Dow Jones Trademark Holdings LLC (Dow Jones) and have been licensed for use by S& P Dow Jones Indices LLC and its affiliates and sublicensed for certain purposes by CSIM. The “Dow Jones U.S. Total Stock Market IndexSM” is a product of S&P Dow Jones Indices LLC or its affiliates, and has been licensed for use by CSIM. The Schwab Total Stock Market Index Fund is not sponsored, endorsed, sold or promoted by S&P Dow Jones Indices LLC, Dow Jones, S&P, or their respective affiliates, and neither S&P Dow Jones Indices LLC, Dow Jones, S&P, nor their respective affiliates make any representation regarding the advisability of investing in the fund.
| 1 | Performance does not reflect the deduction of taxes that a shareholder would pay on fund distributions or the redemption of fund shares. |
| 2 | Source for category information: Morningstar, Inc. The Morningstar Category return represents all active and index mutual funds within the category as of the report date. |
| 3 | As stated in the prospectus. |
Schwab Equity Index Funds | Annual Report
Schwab Total Stock Market Index Fund
Performance and Fund Factsas of October 31, 2019 (continued)
| Number of Holdings | 3,072 |
| Weighted Average Market Cap (millions) | $221,048 |
| Price/Earnings Ratio (P/E) | 21.0 |
| Price/Book Ratio (P/B) | 3.0 |
| Portfolio Turnover Rate | 3% |
Sector Weightings % of Investments2
Top Equity Holdings % of Net Assets3
Portfolio holdings may have changed since the report date.
Source of Sector Classification: S& P and MSCI.
| 1 | Excludes derivatives. |
| 2 | The percentage may differ from the Portfolio Holdings because the above calculation is based on a percentage of total investments, excluding derivatives, whereas the calculation in the Portfolio Holdings is based on a percentage of net assets. |
| 3 | This list is not a recommendation of any security by the investment adviser. |
Schwab Equity Index Funds | Annual Report
Schwab U.S. Large-Cap Growth Index Fundas of October 31, 2019
The Schwab U.S. Large-Cap Growth Index Fund’s (the fund) goal is to track the performance of a benchmark index that measures the total return of large-capitalization U.S. growth stocks. To pursue its investment objective, the fund generally invests in stocks that are included in the Russell 1000® Growth Index (the index). The fund seeks to replicate the performance of the index by giving the same weight to a given stock as does the index. For more information concerning the fund’s investment objective, strategies, and risks, please see the fund’s prospectus.
Market Highlights. Over the 12-month reporting period ended October 31, 2019, U.S. large-cap stocks generated positive returns. The final two months of 2018 were marked by significant market volatility and steep declines, driven by concerns about slowing international growth, a trade war between the U.S. and China, falling oil prices, the waning strength of the U.S. economy, and the pace of future interest rate hikes despite low inflation. However, as the Federal Reserve (Fed) put interest rate hikes on hold, stocks, particularly in the U.S., staged a strong recovery in the first four months of 2019, which generally continued through the end of the reporting period. After raising interest rates four times in 2018, the Fed enacted three interest rate cuts by the end of the period—in July, September, and October. From a sector standpoint within the index, the real estate and materials sectors outperformed over the 12-month reporting period, while the energy and health care sectors underperformed by comparison.
Performance. The fund returned 17.04% during the 12-month reporting period ended October 31, 2019, compared with the index, which returned 17.10%. Differences between the return of the fund and the return of the index may be attributable to, among other things, the operational and transactional costs incurred by the fund and not the index.
Contributors and Detractors. The energy sector was the only detractor from the return of the fund. The energy sector represented an average weight of less than 1% of the fund’s investments and returned approximately -18% for the reporting period. One example from this sector is Halliburton Co. The fund’s holdings of Halliburton Co. returned approximately -33% for the reporting period.
While there were no additional sectors that detracted from performance over the reporting period, the materials sector was the smallest contributor to the return of the fund. The fund’s holdings in the materials sector represented an average weight of approximately 2% of the fund’s investments and returned approximately 27% for the reporting period.
The fund’s holdings in the information technology sector were the largest contributors to the return of the fund. Information technology stocks represented an average weight of approximately 34% of the fund’s investments and returned approximately 22% for the reporting period. The fund’s holdings of Microsoft Corp. are one example from this sector, returning approximately 36% for the reporting period.
Stocks in the consumer discretionary sector also contributed to overall fund performance. Consumer discretionary stocks represented an average weight of approximately 15% of the fund’s investments and returned approximately 16% for the reporting period.
Management views and portfolio holdings may have changed since the report date.
Schwab Equity Index Funds | Annual Report
Schwab U.S. Large-Cap Growth Index Fund
Performance and Fund Factsas of October 31, 2019
The performance data quoted represents past performance. Past performance does not guarantee future results. Investment returns and principal value of an investment will fluctuate so that an investor’s shares may be worth more or less than their original cost. Current performance may be lower or higher than performance data quoted. To obtain performance information current to the most recent month end, please visitwww.schwabfunds.com/schwabfunds_prospectus.
Performance of Hypothetical $10,000 Investment (December 20, 2017 – October 31, 2019)1
| Fund and Inception Date | 1 Year | Since Inception |
| Fund: Schwab U.S. Large-Cap Growth Index Fund (12/20/17) | 17.04% | 12.21% |
| Russell 1000® Growth Index | 17.10% | 12.28% |
| Fund Category: Morningstar Large Growth2 | 14.51% | N/A |
| Fund Expense Ratio3: 0.035% |
All total returns on this page assume dividends and distributions were reinvested. Index figures do not include trading and management costs, which would lower performance. Indices are unmanaged and cannot be invested in directly. Performance results less than one year are not annualized.
For index definitions, please see the Glossary.
Index ownership – The Russell 1000® Growth Index is a registered mark of the Frank Russell Company (Russell) and has been licensed for use by the Schwab U.S. Large-Cap Growth Index Fund. The Schwab U.S. Large-Cap Growth Index Fund is not sponsored, endorsed, sold or promoted by Russell and Russell makes no representation regarding the advisability of investing in the fund.
| 1 | Performance does not reflect the deduction of taxes that a shareholder would pay on fund distributions or the redemption of fund shares. |
| 2 | Source for category information: Morningstar, Inc. The Morningstar Category return represents all active and index mutual funds within the category as of the report date. |
| 3 | As stated in the prospectus. |
Schwab Equity Index Funds | Annual Report
Schwab U.S. Large-Cap Growth Index Fund
Performance and Fund Factsas of October 31, 2019 (continued)
| Number of Holdings | 532 |
| Weighted Average Market Cap (millions) | $350,689 |
| Price/Earnings Ratio (P/E) | 26.8 |
| Price/Book Ratio (P/B) | 7.8 |
| Portfolio Turnover Rate | 46% |
Sector Weightings % of Investments2
Top Equity Holdings % of Net Assets3
Portfolio holdings may have changed since the report date.
Source of Sector Classification: S& P and MSCI.
| 1 | Excludes derivatives. |
| 2 | The percentage may differ from the Portfolio Holdings because the above calculation is based on a percentage of total investments, excluding derivatives, whereas the calculation in the Portfolio Holdings is based on a percentage of net assets. |
| 3 | This list is not a recommendation of any security by the investment adviser. |
Schwab Equity Index Funds | Annual Report
Schwab U.S. Large-Cap Value Index Fundas of October 31, 2019
The Schwab U.S. Large-Cap Value Index Fund’s (the fund) goal is to track the performance of a benchmark index that measures the total return of large-capitalization U.S. value stocks. To pursue its investment objective, the fund generally invests in stocks that are included in the Russell 1000® Value Index (the index). The fund seeks to replicate the performance of the index by giving the same weight to a given stock as does the index. For more information concerning the fund’s investment objective, strategies, and risks, please see the fund’s prospectus.
Market Highlights. Over the 12-month reporting period ended October 31, 2019, U.S. large-cap stocks generated positive returns. The final two months of 2018 were marked by significant market volatility and steep declines, driven by concerns about slowing international growth, a trade war between the U.S. and China, falling oil prices, the waning strength of the U.S. economy, and the pace of future interest rate hikes despite low inflation. However, as the Federal Reserve (Fed) put interest rate hikes on hold, stocks, particularly in the U.S., staged a strong recovery in the first four months of 2019, which generally continued through the end of the reporting period. After raising interest rates four times in 2018, the Fed enacted three interest rate cuts by the end of the period—in July, September, and October. From a sector standpoint within the index, the real estate and utilities sectors outperformed over the 12-month reporting period, while the energy and materials sectors underperformed by comparison.
Performance. The fund returned 11.08% during the 12-month reporting period ended October 31, 2019, compared with the index, which returned 11.21%. Differences between the return of the fund and the return of the index may be attributable to, among other things, the operational and transactional costs incurred by the fund and not the index.
Contributors and Detractors. Over the reporting period, the energy sector was the only detractor from the return of the fund. The energy sector represented an average weight of approximately 9% of the fund’s investments and returned approximately -13% for the reporting period. One example from this sector is Exxon Mobil Corp. The fund’s holdings of Exxon Mobil Corp. returned approximately -11% for the reporting period.
While there were no additional sectors that detracted from performance over the reporting period, the materials sector was the smallest contributor to the return of the fund. The fund’s holdings in the materials sector represented an average weight of approximately 4% of the fund’s investments and returned approximately 7% for the reporting period.
The fund’s holdings in the financials sector were the largest contributors to the return of the fund. Financials stocks represented an average weight of approximately 23% of the fund’s investments and returned approximately 11% for the reporting period. The fund’s holdings of JPMorgan Chase & Co. are one example from this sector, returning approximately 18% for the reporting period.
Stocks in the information technology sector also contributed to overall fund performance. The fund’s holdings in the information technology sector represented an average weight of approximately 8% of the fund’s investments and returned approximately 23% for the reporting period.
Management views and portfolio holdings may have changed since the report date.
Schwab Equity Index Funds | Annual Report
Schwab U.S. Large-Cap Value Index Fund
Performance and Fund Factsas of October 31, 2019
The performance data quoted represents past performance. Past performance does not guarantee future results. Investment returns and principal value of an investment will fluctuate so that an investor’s shares may be worth more or less than their original cost. Current performance may be lower or higher than performance data quoted. To obtain performance information current to the most recent month end, please visitwww.schwabfunds.com/schwabfunds_prospectus.
Performance of Hypothetical $10,000 Investment (December 20, 2017 – October 31, 2019)1
| Fund and Inception Date | 1 Year | Since Inception |
| Fund: Schwab U.S. Large-Cap Value Index Fund (12/20/17) | 11.08% | 5.10% |
| Russell 1000® Value Index | 11.21% | 5.19% |
| Fund Category: Morningstar Large Value2 | 9.63% | N/A |
| Fund Expense Ratio3: 0.035% |
All total returns on this page assume dividends and distributions were reinvested. Index figures do not include trading and management costs, which would lower performance. Indices are unmanaged and cannot be invested in directly. Performance results less than one year are not annualized.
For index definitions, please see the Glossary.
Index ownership – The Russell 1000® Value Index is a registered mark of the Frank Russell Company (Russell) and has been licensed for use by the Schwab U.S. Large-Cap Value Index Fund. The Schwab U.S. Large-Cap Value Index Fund is not sponsored, endorsed, sold or promoted by Russell and Russell makes no representation regarding the advisability of investing in the fund.
| 1 | Performance does not reflect the deduction of taxes that a shareholder would pay on fund distributions or the redemption of fund shares. |
| 2 | Source for category information: Morningstar, Inc. The Morningstar Category return represents all active and index mutual funds within the category as of the report date. |
| 3 | As stated in the prospectus. |
Schwab Equity Index Funds | Annual Report
Schwab U.S. Large-Cap Value Index Fund
Performance and Fund Factsas of October 31, 2019 (continued)
| Number of Holdings | 768 |
| Weighted Average Market Cap (millions) | $123,474 |
| Price/Earnings Ratio (P/E) | 17.3 |
| Price/Book Ratio (P/B) | 2.0 |
| Portfolio Turnover Rate | 22% |
Sector Weightings % of Investments2
Top Equity Holdings % of Net Assets3
Portfolio holdings may have changed since the report date.
Source of Sector Classification: S& P and MSCI.
| 1 | Excludes derivatives. |
| 2 | The percentage may differ from the Portfolio Holdings because the above calculation is based on a percentage of total investments, excluding derivatives, whereas the calculation in the Portfolio Holdings is based on a percentage of net assets. |
| 3 | This list is not a recommendation of any security by the investment adviser. |
Schwab Equity Index Funds | Annual Report
Schwab U.S. Mid-Cap Index Fundas of October 31, 2019
The Schwab U.S. Mid-Cap Index Fund’s (the fund) goal is to track the performance of a benchmark index that measures the total return of mid-capitalization U.S. stocks. To pursue its investment objective, the fund generally invests in stocks that are included in the Russell Midcap® Index (the index). The fund seeks to replicate the performance of the index by giving the same weight to a given stock as does the index. For more information concerning the fund’s investment objective, strategies, and risks, please see the fund’s prospectus.
Market Highlights. Over the 12-month reporting period ended October 31, 2019, the U.S. equity market generated positive returns. The final two months of 2018 were marked by significant market volatility and steep declines, driven by concerns about slowing international growth, a trade war between the U.S. and China, falling oil prices, the waning strength of the U.S. economy, and the pace of future interest rate hikes despite low inflation. However, as the Federal Reserve (Fed) put interest rate hikes on hold, stocks, particularly in the U.S., staged a strong recovery in the first four months of 2019, which generally continued through the end of the reporting period. After raising interest rates four times in 2018, the Fed enacted three interest rate cuts by the end of the period—in July, September, and October. From a sector standpoint within the index, the real estate and information technology sectors outperformed over the 12-month reporting period, while the energy and communication services sectors underperformed by comparison.
Performance. The fund returned 13.61% during the 12-month reporting period ended October 31, 2019, compared with the index, which returned 13.72%. Differences between the return of the fund and the return of the index may be attributable to, among other things, the operational and transactional costs incurred by the fund and not the index.
Contributors and Detractors. Over the reporting period, the energy sector was the largest detractor from the return of the fund. The energy sector represented an average weight of approximately 4% of the fund’s investments and returned approximately -27% for the reporting period. One example from this sector is Concho Resources, Inc. The fund’s holdings of Concho Resources, Inc. returned approximately -51% for the reporting period.
The communication services sector also detracted from the return of the fund. Communication services stocks represented an average weight of approximately 4% of the fund’s investments and returned approximately -2% for the reporting period.
In contrast, the fund’s holdings in the information technology sector were the largest contributors to the return of the fund. Information technology stocks represented an average weight of approximately 18% of the fund’s investments and returned approximately 24%. The fund’s holdings of Lam Research Corp. are one example from this sector, returning approximately 96% for the reporting period.
Stocks in the industrials sector also contributed to overall fund performance. Industrials stocks represented an average weight of approximately 14% of the fund’s investments and returned approximately 21% for the reporting period.
Management views and portfolio holdings may have changed since the report date.
Schwab Equity Index Funds | Annual Report
Schwab U.S. Mid-Cap Index Fund
Performance and Fund Factsas of October 31, 2019
The performance data quoted represents past performance. Past performance does not guarantee future results. Investment returns and principal value of an investment will fluctuate so that an investor’s shares may be worth more or less than their original cost. Current performance may be lower or higher than performance data quoted. To obtain performance information current to the most recent month end, please visitwww.schwabfunds.com/schwabfunds_prospectus.
Performance of Hypothetical $10,000 Investment (December 20, 2017 – October 31, 2019)1
| Fund and Inception Date | 1 Year | Since Inception |
| Fund: Schwab U.S. Mid-Cap Index Fund (12/20/17) | 13.61% | 6.43% |
| Russell Midcap® Index | 13.72% | 6.52% |
| Fund Category: Morningstar Mid-Cap Blend2 | 9.59% | N/A |
| Fund Expense Ratio3: 0.04% |
All total returns on this page assume dividends and distributions were reinvested. Index figures do not include trading and management costs, which would lower performance. Indices are unmanaged and cannot be invested in directly. Performance results less than one year are not annualized.
For index definitions, please see the Glossary.
Index ownership – The Russell Midcap® Index is a registered mark of the Frank Russell Company (Russell) and has been licensed for use by the Schwab U.S. Mid-Cap Index Fund. The Schwab U.S. Mid-Cap Index Fund is not sponsored, endorsed, sold or promoted by Russell and Russell makes no representation regarding the advisability of investing in the fund.
| 1 | Performance does not reflect the deduction of taxes that a shareholder would pay on fund distributions or the redemption of fund shares. |
| 2 | Source for category information: Morningstar, Inc. The Morningstar Category return represents all active and index mutual funds within the category as of the report date. |
| 3 | As stated in the prospectus. |
Schwab Equity Index Funds | Annual Report
Schwab U.S. Mid-Cap Index Fund
Performance and Fund Factsas of October 31, 2019 (continued)
| Number of Holdings | 807 |
| Weighted Average Market Cap (millions) | $16,715 |
| Price/Earnings Ratio (P/E) | 20.6 |
| Price/Book Ratio (P/B) | 2.5 |
| Portfolio Turnover Rate | 21% |
Sector Weightings % of Investments2
Top Equity Holdings % of Net Assets3
Portfolio holdings may have changed since the report date.
Source of Sector Classification: S& P and MSCI.
| 1 | Excludes derivatives. |
| 2 | The percentage may differ from the Portfolio Holdings because the above calculation is based on a percentage of total investments, excluding derivatives, whereas the calculation in the Portfolio Holdings is based on a percentage of net assets. |
| 3 | This list is not a recommendation of any security by the investment adviser. |
Schwab Equity Index Funds | Annual Report
Schwab International Index Fundas of October 31, 2019
The Schwab International Index Fund’s (the fund) goal is to track the performance of a benchmark index that measures the total return of large, publicly traded non-U.S. companies from countries with developed equity markets outside of the U.S. To pursue its investment objective, the fund generally invests in stocks that are included in the MSCI EAFE® Index (Net) (the index), which includes stocks from developed markets in Europe, Australasia and the Far East. To pursue its goal, the fund seeks to replicate the performance of the index by giving the same weight to a given stock as does the index. For more information concerning the fund’s investment objective, strategies, and risks, please see the fund’s prospectus.
Market Highlights. Over the 12-month reporting period ended October 31, 2019, international equity markets generated positive returns. The final two months of 2018 were marked by significant market volatility and steep declines across global equity markets, driven by concerns about slowing international economic growth, a trade war between the U.S. and China, falling oil prices, the waning strength of the U.S. economy, and the pace of future interest rate hikes in the U.S. However, stocks staged a recovery in the first four months of 2019, which generally continued through the end of the reporting period. A number of central banks reduced their policy rates, including the U.S., while others maintained their generally low—and for some international central banks, negative—interest rates.
Performance. The fund returned 11.27% for the 12-month reporting period ended October 31, 2019, compared with the index, which returned 11.04%. Timing differences in foreign exchange calculations and fair valuation of the fund’s holdings contributed to the fund’s relative performance.1
Contributors and Detractors. From a country perspective, stocks from Japan contributed the most to the return of the fund. Representing an average weight of approximately 24% of the fund’s investments, Japanese stocks returned approximately 10% in U.S. dollar terms for the reporting period. One example from Japan is Toyota Motor Corp., which returned approximately 23% in U.S. dollar terms for the reporting period.
Stocks from Switzerland also contributed to overall fund performance. Representing an average weight of approximately 9% of the fund’s investments, stocks from Switzerland returned approximately 20% in U.S. dollar terms for the reporting period.
By comparison, stocks from Norway detracted the most from the fund’s return. Representing an average weight of less than 1% of the fund’s investments, Norwegian stocks returned approximately -5% in U.S. dollar terms for the reporting period. One example from Norway is Equinor A.S.A., which returned approximately -26% in U.S. dollar terms for the reporting period.
Stocks from Israel also dampened fund returns. Representing an average weight of less than 1% of the fund’s investments, stocks from Israel returned approximately -4% in U.S. dollar terms for the reporting period.
Management views and portfolio holdings may have changed since the report date.
| 1 | Typically, the securities in the index are valued using foreign exchange rates obtained at the close of the London foreign currency exchange (11:00 AM EST). Securities in the fund, however, are valued using foreign exchange rates obtained at the close of the New York foreign currency exchange (4:00 PM EST). This difference in closing times can result in different foreign currency exchange rates between the two exchanges, and thus different foreign currency exchange rates used in the valuation of the index’s and fund’s securities. |
Schwab Equity Index Funds | Annual Report
Schwab International Index Fund
Performance and Fund Factsas of October 31, 2019
The performance data quoted represents past performance. Past performance does not guarantee future results. Investment returns and principal value of an investment will fluctuate so that an investor’s shares may be worth more or less than their original cost. Current performance may be lower or higher than performance data quoted. To obtain performance information current to the most recent month end, please visitwww.schwabfunds.com/schwabfunds_prospectus.
Performance of Hypothetical $10,000 Investment (October 31, 2009 – October 31, 2019)1
Average Annual Total Returns1
| Fund and Inception Date | 1 Year | 5 Years | 10 Years |
| Fund: Schwab International Index Fund (5/19/97) | 11.27% | 4.17% | 5.52% |
| MSCI EAFE® Index (Net)2 | 11.04% | 4.31% | 5.41% |
| International Spliced Index | 11.04% | 4.31% | 5.46% |
| Fund Category: Morningstar Foreign Large Blend3 | 10.26% | 3.74% | 5.13% |
| Fund Expense Ratio4: 0.06% |
All total returns on this page assume dividends and distributions were reinvested. Index figures do not include trading and management costs, which would lower performance. Indices are unmanaged and cannot be invested in directly. Performance results less than one year are not annualized.
The first index listed for the fund is the fund’s primary benchmark, as shown in the prospectus. Additional indices shown are provided for comparative purposes.
For index definitions, please see the Glossary.
The fund’s performance relative to the index may be affected by fair-value pricing, see financial note 2 for more information.
Index ownership – “MSCI EAFE®” is a registered mark of MSCI and has been licensed for use by the Schwab International Index Fund. The Schwab International Index Fund is not sponsored, endorsed, sold or promoted by MSCI and MSCI bears no liability with respect to the fund. The Statement of Additional Information contains a more detailed description of the limited relationship MSCI has with the fund.
| 1 | Performance does not reflect the deduction of taxes that a shareholder would pay on fund distributions or the redemption of fund shares. |
| 2 | The net version of the index reflects reinvested dividends net of withholding taxes, but reflects no deductions for expenses or other taxes. |
| 3 | Source for category information: Morningstar, Inc. The Morningstar Category return represents all active and index mutual funds within the category as of the report date. |
| 4 | As stated in the prospectus. |
Schwab Equity Index Funds | Annual Report
Schwab International Index Fund
Performance and Fund Factsas of October 31, 2019 (continued)
| Number of Holdings | 944 |
| Weighted Average Market Cap (millions) | $64,361 |
| Price/Earnings Ratio (P/E) | 16.1 |
| Price/Book Ratio (P/B) | 1.6 |
| Portfolio Turnover Rate | 5% |
Sector Weightings % of Investments1
Top Equity Holdings % of Net Assets2
Top Country Weightings % of Investments3
Portfolio holdings may have changed since the report date.
Source of Sector Classification: S&P and MSCI.
International investments are subject to additional risks such as currency fluctuation, geopolitical risk and the potential for illiquid markets.
| 1 | Excludes derivatives. |
| 2 | This list is not a recommendation of any security by the investment adviser. |
| 3 | The percentage may differ from the Portfolio Holdings because the above calculation is based on a percentage of total investments, excluding derivatives, whereas the calculation in the Portfolio Holdings is based on a percentage of net assets. |
Schwab Equity Index Funds | Annual Report
Schwab Equity Index Funds
Examples for a $1,000 Investment
As a fund shareholder, you may incur two types of costs: (1) transaction costs; and (2) ongoing costs, including management fees.
The expense examples below are intended to help you understand your ongoing cost (in dollars) of investing in a fund and to compare this cost with the ongoing cost of investing in other mutual funds. These examples are based on an investment of $1,000 invested for six months beginning May 1, 2019 and held through October 31, 2019.
Actual Return lines in the table below provide information about actual account values and actual expenses. You may use this information, together with the amount you invested, to estimate the expenses that you paid over the period. To do so, simply divide your account value by $1,000 (for example, an $8,600 account value ÷ $1,000 = 8.6), then multiply the result by the number given for your fund under the heading entitled “Expenses Paid During Period.”
Hypothetical Return lines in the table below provide information about hypothetical account values and hypothetical expenses based on a fund’s actual expense ratio and an assumed return of 5% per year before expenses. Because the return used is not an actual return, it may not be used to estimate the actual ending account value or expenses you paid for the period.
You may use this information to compare the ongoing costs of investing in a fund and other funds. To do so, compare this 5% hypothetical example with the 5% hypothetical examples that appear in the shareholder reports of the other funds.
Please note that the expenses shown in the table are meant to highlight your ongoing costs only, and do not reflect any transactional costs. Therefore, the hypothetical return lines of the table are useful in comparing ongoing costs only, and will not help you determine the relative total costs of owning different funds. In addition, if these transactional costs were included, your costs would have been higher.
| | Expense Ratio
(Annualized)1 | Beginning
Account Value
at 5/1/19 | Ending
Account Value
(Net of Expenses)
at 10/31/19 | Expenses Paid
During Period
5/1/19-10/31/192 |
| Schwab S&P 500 Index Fund | | | | |
| Actual Return | 0.02% | $1,000.00 | $1,041.30 | $0.10 |
| Hypothetical 5% Return | 0.02% | $1,000.00 | $1,025.10 | $0.10 |
| Schwab 1000 Index Fund | | | | |
| Actual Return | 0.05% | $1,000.00 | $1,038.20 | $0.26 |
| Hypothetical 5% Return | 0.05% | $1,000.00 | $1,024.95 | $0.26 |
| Schwab Small-Cap Index Fund | | | | |
| Actual Return | 0.04% | $1,000.00 | $989.40 | $0.20 |
| Hypothetical 5% Return | 0.04% | $1,000.00 | $1,025.00 | $0.20 |
| Schwab Total Stock Market Index Fund | | | | |
| Actual Return | 0.03% | $1,000.00 | $1,033.90 | $0.15 |
| Hypothetical 5% Return | 0.03% | $1,000.00 | $1,025.05 | $0.15 |
| Schwab U.S. Large-Cap Growth Index Fund | | | | |
| Actual Return | 0.035% | $1,000.00 | $1,044.50 | $0.18 |
| Hypothetical 5% Return | 0.035% | $1,000.00 | $1,025.02 | $0.18 |
| Schwab U.S. Large-Cap Value Index Fund | | | | |
| Actual Return | 0.035% | $1,000.00 | $1,030.40 | $0.18 |
| Hypothetical 5% Return | 0.035% | $1,000.00 | $1,025.02 | $0.18 |
| Schwab U.S. Mid-Cap Index Fund | | | | |
| Actual Return | 0.04% | $1,000.00 | $1,018.20 | $0.20 |
| Hypothetical 5% Return | 0.04% | $1,000.00 | $1,025.00 | $0.20 |
| Schwab International Index Fund | | | | |
| Actual Return | 0.06% | $1,000.00 | $1,030.20 | $0.31 |
| Hypothetical 5% Return | 0.06% | $1,000.00 | $1,024.90 | $0.31 |
| 1 | Based on the most recent six-month expense ratio. |
| 2 | Expenses for each fund are equal to its annualized expense ratio, multiplied by the average account value over the period, multiplied by the 184 days of the period, and divided by the 365 days of the fiscal year. |
Schwab Equity Index Funds | Annual Report
Schwab S&P 500 Index Fund
Financial Statements
Financial Highlights
| | 11/1/18–
10/31/19 | 11/1/17–
10/31/18 | 11/1/16–
10/31/17 | 11/1/15–
10/31/16 | 11/1/14–
10/31/15 | |
| Per-Share Data |
| Net asset value at beginning of period | $42.41 | $40.23 | $33.38 | $33.00 | $31.99 | |
| Income (loss) from investment operations: | | | | | | |
| Net investment income (loss)1 | 0.92 | 0.80 | 0.74 | 0.69 | 0.67 | |
| Net realized and unrealized gains (losses) | 4.86 | 2.12 | 6.99 | 0.69 | 0.92 | |
| Total from investment operations | 5.78 | 2.92 | 7.73 | 1.38 | 1.59 | |
| Less distributions: | | | | | | |
| Distributions from net investment income | (0.84) | (0.72) | (0.69) | (0.68) | (0.58) | |
| Distributions from net realized gains | (0.18) | (0.02) | (0.19) | (0.32) | — | |
| Total distributions | (1.02) | (0.74) | (0.88) | (1.00) | (0.58) | |
| Net asset value at end of period | $47.17 | $42.41 | $40.23 | $33.38 | $33.00 | |
| Total return | 14.30% | 7.29% | 23.57% | 4.40% | 5.10% | |
| Ratios/Supplemental Data |
| Ratios to average net assets: | | | | | | |
| Total expenses | 0.02%2 | 0.03% | 0.05%3 | 0.09% | 0.09% | |
| Net operating expenses | N/A | N/A4 | 0.05%3 | 0.09% | 0.09% | |
| Net investment income (loss) | 2.11% | 1.88% | 2.01% | 2.12% | 2.07% | |
| Portfolio turnover rate | 3% | 2% | 2% | 2% | 2% | |
| Net assets, end of period (x 1,000,000) | $40,232 | $34,410 | $29,999 | $22,675 | $21,587 | |
| |
1
Calculated based on the average shares outstanding during the period.
2
Effective December 20, 2018, the annual operating expense ratio was reduced to 0.02%. The ratio presented for period ended 10/31/19 is a blended ratio. (See financial note 4)
3
Effective March 1, 2017, the annual operating expense ratio was reduced. The ratio presented for period ended 10/31/17 is a blended ratio.
4
Effective March 1, 2017, the fund instituted a new fee structure and the contractual expense limitation was terminated.
Schwab Equity Index Funds | Annual Report
Schwab S&P 500 Index Fund
Condensed Portfolio Holdings as of October 31, 2019
This section shows the fund’s 50 largest portfolio holdings in unaffiliated issuers, any holdings exceeding 1% of the fund’s net assets as of the report date, and any affiliated issuers. The remaining securities held by the fund are grouped as "Other Securities" in each category. You can request a complete schedule of portfolio holdings as of the report date, free of charge, by calling Schwab Funds® at 1-877-824-5615. This complete schedule, filed on the fund’s N-CSR(S), is also available on the U.S. Securities and Exchange Commission (SEC)’s website atwww.sec.gov.
In addition, the fund files its complete schedule of portfolio holdings with the SEC for the first and third quarters of each fiscal year on Form N-Q. The fund’s Form N-Q is available on the SEC’s website. Effective March 31, 2019, Form N-PORT Part F has replaced Form N-Q. The fund also makes available its complete schedule of portfolio holdings 15-20 days after the end of the month on the fund’s website atwww.schwabfunds.com/schwabfunds_prospectus.
| Security | Number
of Shares | % of Net
Assets | Value
($) |
| Common Stock99.7% of net assets | |
| |
| Automobiles & Components 0.5% | |
| Other Securities | | 0.5 | 187,568,957 |
| |
| Banks 5.6% | |
| Bank of America Corp. | 13,318,080 | 1.0 | 416,456,362 |
| Citigroup, Inc. | 3,592,729 | 0.6 | 258,173,506 |
| JPMorgan Chase & Co. | 5,081,477 | 1.6 | 634,778,107 |
| Wells Fargo & Co. | 6,373,412 | 0.8 | 329,059,261 |
| Other Securities | | 1.6 | 603,292,711 |
| | | 5.6 | 2,241,759,947 |
| |
| Capital Goods 6.6% | |
| Honeywell International, Inc. | 1,143,259 | 0.5 | 197,475,127 |
| The Boeing Co. | 849,671 | 0.7 | 288,811,670 |
| Other Securities | | 5.4 | 2,149,898,446 |
| | | 6.6 | 2,636,185,243 |
| |
| Commercial & Professional Services 0.7% | |
| Other Securities | | 0.7 | 299,987,306 |
| |
| Consumer Durables & Apparel 1.1% | |
| Other Securities | | 1.1 | 460,540,986 |
| |
| Consumer Services 1.9% | |
| McDonald's Corp. | 1,206,994 | 0.6 | 237,415,720 |
| Other Securities | | 1.3 | 520,524,393 |
| | | 1.9 | 757,940,113 |
| |
| Diversified Financials 5.0% | |
| Berkshire Hathaway, Inc., Class B * | 3,116,389 | 1.6 | 662,481,974 |
| The Charles Schwab Corp.(a) | 1,841,508 | 0.2 | 74,967,791 |
| Other Securities | | 3.2 | 1,282,942,507 |
| | | 5.0 | 2,020,392,272 |
| |
| Energy 4.3% | |
| Chevron Corp. | 3,017,155 | 0.9 | 350,412,382 |
| Exxon Mobil Corp. | 6,724,390 | 1.1 | 454,367,032 |
| Other Securities | | 2.3 | 929,267,758 |
| | | 4.3 | 1,734,047,172 |
| |
| Security | Number
of Shares | % of Net
Assets | Value
($) |
| Food & Staples Retailing 1.6% | |
| Costco Wholesale Corp. | 699,356 | 0.5 | 207,785,661 |
| Walmart, Inc. | 2,260,217 | 0.7 | 265,033,045 |
| Other Securities | | 0.4 | 162,468,064 |
| | | 1.6 | 635,286,770 |
| |
| Food, Beverage & Tobacco 3.8% | |
| PepsiCo, Inc. | 2,221,813 | 0.8 | 304,766,089 |
| Philip Morris International, Inc. | 2,473,205 | 0.5 | 201,417,815 |
| The Coca-Cola Co. | 6,115,520 | 0.8 | 332,867,754 |
| Other Securities | | 1.7 | 709,433,156 |
| | | 3.8 | 1,548,484,814 |
| |
| Health Care Equipment & Services 6.3% | |
| Abbott Laboratories | 2,809,275 | 0.6 | 234,883,483 |
| Medtronic plc | 2,132,179 | 0.6 | 232,194,293 |
| UnitedHealth Group, Inc. | 1,506,989 | 0.9 | 380,816,120 |
| Other Securities | | 4.2 | 1,700,199,462 |
| | | 6.3 | 2,548,093,358 |
| |
| Household & Personal Products 2.0% | |
| The Procter & Gamble Co. | 3,975,874 | 1.2 | 495,036,072 |
| Other Securities | | 0.8 | 294,437,270 |
| | | 2.0 | 789,473,342 |
| |
| Insurance 2.3% | |
| Other Securities | | 2.3 | 933,470,259 |
| |
| Materials 2.7% | |
| Other Securities | | 2.7 | 1,070,785,772 |
| |
| Media & Entertainment 8.1% | |
| Alphabet, Inc., Class A * | 476,068 | 1.5 | 599,274,398 |
| Alphabet, Inc., Class C * | 480,292 | 1.5 | 605,220,752 |
| Comcast Corp., Class A | 7,209,067 | 0.8 | 323,110,383 |
| Facebook, Inc., Class A * | 3,823,917 | 1.8 | 732,853,693 |
| Netflix, Inc. * | 696,229 | 0.5 | 200,103,177 |
| The Walt Disney Co. | 2,863,364 | 0.9 | 372,008,251 |
| Other Securities | | 1.1 | 441,017,207 |
| | | 8.1 | 3,273,587,861 |
| |
| Pharmaceuticals, Biotechnology & Life Sciences 7.6% | |
| AbbVie, Inc. | 2,350,568 | 0.5 | 186,987,684 |
| Amgen, Inc. | 953,396 | 0.5 | 203,311,697 |
| Johnson & Johnson | 4,194,205 | 1.4 | 553,802,828 |
| Merck & Co., Inc. | 4,069,139 | 0.9 | 352,631,586 |
Schwab Equity Index Funds | Annual Report
Schwab S&P 500 Index Fund
Condensed Portfolio Holdings as of October 31, 2019 (continued)
| Security | Number
of Shares | % of Net
Assets | Value
($) |
| Pfizer, Inc. | 8,791,486 | 0.8 | 337,329,318 |
| Thermo Fisher Scientific, Inc. | 636,837 | 0.5 | 192,312,037 |
| Other Securities | | 3.0 | 1,249,920,291 |
| | | 7.6 | 3,076,295,441 |
| |
| Real Estate 3.1% | |
| Other Securities | | 3.1 | 1,262,794,354 |
| |
| Retailing 6.5% | |
| Amazon.com, Inc. * | 660,440 | 2.9 | 1,173,377,330 |
| The Home Depot, Inc. | 1,740,825 | 1.0 | 408,362,728 |
| Other Securities | | 2.6 | 1,025,110,376 |
| | | 6.5 | 2,606,850,434 |
| |
| Semiconductors & Semiconductor Equipment 4.1% | |
| Broadcom, Inc. | 632,887 | 0.5 | 185,340,958 |
| Intel Corp. | 7,041,581 | 1.0 | 398,060,574 |
| NVIDIA Corp. | 968,373 | 0.5 | 194,662,341 |
| Other Securities | | 2.1 | 856,994,887 |
| | | 4.1 | 1,635,058,760 |
| |
| Software & Services 12.1% | |
| Accenture plc, Class A | 1,012,374 | 0.5 | 187,714,387 |
| Adobe, Inc. * | 771,823 | 0.5 | 214,512,766 |
| International Business Machines Corp. | 1,408,106 | 0.5 | 188,306,015 |
| Mastercard, Inc., Class A | 1,418,805 | 1.0 | 392,739,412 |
| Microsoft Corp. | 12,134,708 | 4.3 | 1,739,753,086 |
| Oracle Corp. | 3,499,063 | 0.5 | 190,663,943 |
| PayPal Holdings, Inc. * | 1,870,718 | 0.5 | 194,741,744 |
| salesforce.com, Inc. * | 1,394,352 | 0.5 | 218,202,144 |
| Visa, Inc., Class A | 2,744,096 | 1.2 | 490,809,011 |
| Other Securities | | 2.6 | 1,032,836,377 |
| | | 12.1 | 4,850,278,885 |
| |
| Technology Hardware & Equipment 6.1% | |
| Apple, Inc. | 6,751,993 | 4.2 | 1,679,625,779 |
| Cisco Systems, Inc. | 6,749,583 | 0.8 | 320,672,688 |
| Other Securities | | 1.1 | 454,716,643 |
| | | 6.1 | 2,455,015,110 |
| |
| Telecommunication Services 2.3% | |
| AT&T, Inc. | 11,615,005 | 1.1 | 447,061,542 |
| Verizon Communications, Inc. | 6,573,990 | 1.0 | 397,529,175 |
| Other Securities | | 0.2 | 61,632,135 |
| | | 2.3 | 906,222,852 |
| |
| Security | Number
of Shares | % of Net
Assets | Value
($) |
| Transportation 1.9% | |
| Union Pacific Corp. | 1,120,085 | 0.5 | 185,329,264 |
| Other Securities | | 1.4 | 584,089,711 |
| | | 1.9 | 769,418,975 |
| |
| Utilities 3.5% | |
| Other Securities | | 3.5 | 1,398,207,875 |
| Total Common Stock | |
| (Cost $19,901,583,892) | | | 40,097,746,858 |
|
| Other Investment Company0.0% of net assets | |
| |
| Securities Lending Collateral 0.0% | |
| Other Securities | | 0.0 | 1,405,885 |
| Total Other Investment Company | |
| (Cost $1,405,885) | | | 1,405,885 |
Security
Rate, Maturity Date | Face
Amount ($) | % of Net
Assets | Value
($) |
| Short-Term Investment0.1% of net assets | |
| |
| Time Deposit 0.1% | |
| Other Securities | | 0.1 | 49,185,198 |
| Total Short-Term Investment | |
| (Cost $49,185,198) | | | 49,185,198 |
| | Number of
Contracts | Notional
Amount
($) | Current Value/
Unrealized
Appreciation
($) |
| Futures Contracts | |
| Long | |
| S&P 500 Index, e-mini, expires 12/20/19 | 805 | 122,190,950 | 2,085,885 |
The following footnotes may not be applicable to the Condensed Portfolio Holdings. Please refer to the complete schedule of portfolio holdings.
| * | Non-income producing security. |
| (a) | Issuer is affiliated with the fund’s investment adviser. |
| (b) | All or a portion of this security is on loan. Securities on loan were valued at $1,383,250. |
| (c) | The rate shown is the 7-day yield. |
| (d) | The rate shown is the current daily overnight rate. |
The fund owns shares of an affiliate, The Charles Schwab Corp., since that company is included in its index. Below is the summary of investment activities involving The Charles Schwab Corp. shares owned by the fund during the period ended October 31, 2019:
| | Market
Value at
10/31/18 | Gross
Purchases | Gross
Sales | Realized
Gains (Losses) | Net Change
in Unrealized
Appreciation
(depreciation) | Market
Value at
10/31/19 | Balance
of Shares
Held at
10/31/19 | Distributions
Received |
| The Charles Schwab Corp. | $82,639,619 | $4,501,979 | ($2,161,453) | ($603,274) | ($9,409,080) | $74,967,791 | 1,841,508 | $1,176,223 |
Schwab Equity Index Funds | Annual Report
Schwab S&P 500 Index Fund
Condensed Portfolio Holdings as of October 31, 2019 (continued)
The following is a summary of the inputs used to value the fund’s investments as of October 31, 2019 and reflects the complete schedule of portfolio holdings (see financial note 2(a) for additional information):
| Description | Quoted Prices in
Active Markets for
Identical Assets
(Level 1) | Other Significant
Observable Inputs
(Level 2) | Significant
Unobservable Inputs
(Level 3) | Total | |
| Assets | | | | | |
| Common Stock1 | $40,097,746,858 | $— | $— | $40,097,746,858 | |
| Other Investment Company1 | 1,405,885 | — | — | 1,405,885 | |
| Short-Term Investment1 | — | 49,185,198 | — | 49,185,198 | |
| Futures Contracts2 | 2,085,885 | — | — | 2,085,885 | |
| Total | $40,101,238,628 | $49,185,198 | $— | $40,150,423,826 | |
| 1 | As categorized in the complete schedule of Portfolio Holdings. |
| 2 | Futures contracts are valued at unrealized appreciation or depreciation. |
Fund investments in underlying mutual funds are classified as Level 1, without consideration to the classification level of the investments held by the underlying mutual funds, which could be Level 1, Level 2 or Level 3.
Schwab Equity Index Funds | Annual Report
Schwab S&P 500 Index Fund
Statement of Assets and Liabilities
As of October 31, 2019
| Assets |
| Investment in affiliated issuer, at value (cost $39,311,841) | | $74,967,791 |
| Investments in unaffiliated issuers, at value (cost $19,911,457,249) including securities on loan of $1,383,250 | | 40,071,964,265 |
| Collateral invested for securities on loan, at value (cost $1,405,885) | | 1,405,885 |
| Deposit with broker for futures contracts | | 7,144,112 |
| Receivables: | | |
| Fund shares sold | | 62,567,598 |
| Dividends | | 36,053,469 |
| Variation margin on futures contracts | | 2,087,439 |
| Interest | | 1,639 |
| Income from securities on loan | + | 439 |
| Total assets | | 40,256,192,637 |
| Liabilities |
| Collateral held for securities on loan | | 1,405,885 |
| Payables: | | |
| Investments bought | | 1,178,793 |
| Investment adviser fees | | 668,369 |
| Fund shares redeemed | + | 21,158,839 |
| Total liabilities | | 24,411,886 |
| Net Assets |
| Total assets | | 40,256,192,637 |
| Total liabilities | – | 24,411,886 |
| Net assets | | $40,231,780,751 |
| Net Assets by Source | | |
| Capital received from investors | | 19,520,422,735 |
| Total distributable earnings | | 20,711,358,016 |
| Net Asset Value (NAV) |
| Net Assets | ÷ | Shares
Outstanding | = | NAV |
| $40,231,780,751 | | 852,849,692 | | $47.17 |
| | | | | |
Schwab Equity Index Funds | Annual Report
Schwab S&P 500 Index Fund
Statement of Operations
For the period November 1, 2018 through October 31, 2019
| Investment Income |
| Dividends received from affiliated issuer | | $1,176,223 |
| Dividends received from unaffiliated issuers | | 782,493,103 |
| Interest | | 1,440,642 |
| Securities on loan, net | + | 630,305 |
| Total investment income | | 785,740,273 |
| Expenses |
| Investment adviser fees | | 7,837,329 |
| Total expenses | – | 7,837,329 |
| Net investment income | | 777,902,944 |
| Realized and Unrealized Gains (Losses) |
| Net realized losses on affiliated issuer | | (603,274) |
| Net realized gains on unaffiliated issuers | | 6,872,772 |
| Net realized gains on futures contracts | + | 10,183,707 |
| Net realized gains | | 16,453,205 |
| Net change in unrealized appreciation (depreciation) on affiliated issuer | | (9,409,080) |
| Net change in unrealized appreciation (depreciation) on unaffiliated issuers | | 4,218,033,081 |
| Net change in unrealized appreciation (depreciation) on futures contracts | + | 5,033,468 |
| Net change in unrealized appreciation (depreciation) | + | 4,213,657,469 |
| Net realized and unrealized gains | | 4,230,110,674 |
| Increase in net assets resulting from operations | | $5,008,013,618 |
Schwab Equity Index Funds | Annual Report
Schwab S&P 500 Index Fund
Statement of Changes in Net Assets
For the current and prior report periods
| Operations | |
| | 11/1/18-10/31/19 | 11/1/17-10/31/18 |
| Net investment income | | $777,902,944 | $629,555,318 |
| Net realized gains | | 16,453,205 | 81,971,730 |
| Net change in unrealized appreciation (depreciation) | + | 4,213,657,469 | 1,493,538,632 |
| Increase in net assets from operations | | 5,008,013,618 | 2,205,065,680 |
| Distributions to Shareholders | |
| Total distributions | | ($835,129,475) | ($554,866,625) |
| Transactions in Fund Shares | | | |
| | | 11/1/18-10/31/19 | 11/1/17-10/31/18 |
| | | SHARES | VALUE | SHARES | VALUE |
| Shares sold | | 185,382,757 | $8,015,175,116 | 185,822,593 | $7,893,283,318 |
| Shares reinvested | | 18,929,002 | 700,551,667 | 11,333,723 | 469,442,817 |
| Shares redeemed | + | (162,770,508) | (7,066,557,661) | (131,541,240) | (5,601,858,204) |
| Net transactions in fund shares | | 41,541,251 | $1,649,169,122 | 65,615,076 | $2,760,867,931 |
| Shares Outstanding and Net Assets | | | |
| | | 11/1/18-10/31/19 | 11/1/17-10/31/18 |
| | | SHARES | NET ASSETS | SHARES | NET ASSETS |
| Beginning of period | | 811,308,441 | $34,409,727,486 | 745,693,365 | $29,998,660,500 |
| Total increase | + | 41,541,251 | 5,822,053,265 | 65,615,076 | 4,411,066,986 |
| End of period | | 852,849,692 | $40,231,780,751 | 811,308,441 | $34,409,727,486 |
Schwab Equity Index Funds | Annual Report
Financial Statements
Financial Highlights
| | 11/1/18–
10/31/19 | 11/1/17–
10/31/18 | 11/1/16–
10/31/17 | 11/1/15–
10/31/16 | 11/1/14–
10/31/15 | |
| Per-Share Data |
| Net asset value at beginning of period | $64.19 | $62.61 | $52.40 | $53.67 | $53.63 | |
| Income (loss) from investment operations: | | | | | | |
| Net investment income (loss)1 | 1.38 | 1.18 | 1.08 | 0.95 | 0.94 | |
| Net realized and unrealized gains (losses) | 6.73 | 3.05 | 10.96 | 0.92 | 1.40 | |
| Total from investment operations | 8.11 | 4.23 | 12.04 | 1.87 | 2.34 | |
| Less distributions: | | | | | | |
| Distributions from net investment income | (1.28) | (1.10) | (0.97) | (0.96) | (0.86) | |
| Distributions from net realized gains | (2.34) | (1.55) | (0.86) | (2.18) | (1.44) | |
| Total distributions | (3.62) | (2.65) | (1.83) | (3.14) | (2.30) | |
| Net asset value at end of period | $68.68 | $64.19 | $62.61 | $52.40 | $53.67 | |
| Total return | 14.20% | 6.84% | 23.52% | 3.87% | 4.66% | |
| Ratios/Supplemental Data |
| Ratios to average net assets: | | | | | | |
| Total expenses | 0.05% | 0.05% | 0.14%2 | 0.33% | 0.33% | |
| Net operating expenses | N/A | N/A3 | 0.12%2 | 0.29% | 0.29% | |
| Net investment income (loss) | 2.15% | 1.82% | 1.87% | 1.86% | 1.77% | |
| Portfolio turnover rate | 5% | 4% | 5% | 3% | 4% | |
| Net assets, end of period (x 1,000,000) | $9,346 | $7,909 | $7,681 | $6,432 | $6,550 | |
| |
1
Calculated based on the average shares outstanding during the period.
2
Effective March 1, 2017, the annual operating expense ratio was reduced. The ratio presented for period ended 10/31/17 is a blended ratio.
3
Effective March 1, 2017, the fund instituted a new fee structure and the contractual expense limitation was terminated.
Schwab Equity Index Funds | Annual Report
Condensed Portfolio Holdings as of October 31, 2019
This section shows the fund’s 50 largest portfolio holdings in unaffiliated issuers, any holdings exceeding 1% of the fund’s net assets as of the report date, and any affiliated issuers. The remaining securities held by the fund are grouped as "Other Securities" in each category. You can request a complete schedule of portfolio holdings as of the report date, free of charge, by calling Schwab Funds® at 1-877-824-5615. This complete schedule, filed on the fund’s N-CSR(S), is also available on the U.S. Securities and Exchange Commission (SEC)’s website atwww.sec.gov.
In addition, the fund files its complete schedule of portfolio holdings with the SEC for the first and third quarters of each fiscal year on Form N-Q. The fund’s Form N-Q is available on the SEC’s website. Effective March 31, 2019, Form N-PORT Part F has replaced Form N-Q. The fund also makes available its complete schedule of portfolio holdings 15-20 days after the end of the month on the fund’s website atwww.schwabfunds.com/schwabfunds_prospectus.
| Security | Number
of Shares | % of Net
Assets | Value
($) |
| Common Stock99.8% of net assets | |
| |
| Automobiles & Components 0.7% | |
| Other Securities | | 0.7 | 62,688,732 |
| |
| Banks 5.5% | |
| Bank of America Corp. | 2,771,201 | 0.9 | 86,655,455 |
| Citigroup, Inc. | 747,223 | 0.6 | 53,695,445 |
| JPMorgan Chase & Co. | 1,057,707 | 1.4 | 132,128,758 |
| Wells Fargo & Co. | 1,326,384 | 0.7 | 68,481,206 |
| Other Securities | | 1.9 | 177,313,391 |
| | | 5.5 | 518,274,255 |
| |
| Capital Goods 6.7% | |
| Honeywell International, Inc. | 238,076 | 0.4 | 41,122,868 |
| The Boeing Co. | 176,838 | 0.6 | 60,109,005 |
| Other Securities | | 5.7 | 528,890,068 |
| | | 6.7 | 630,121,941 |
| |
| Commercial & Professional Services 0.9% | |
| Other Securities | | 0.9 | 85,009,212 |
| |
| Consumer Durables & Apparel 1.2% | |
| Other Securities | | 1.2 | 116,237,532 |
| |
| Consumer Services 2.1% | |
| McDonald's Corp. | 251,327 | 0.5 | 49,436,021 |
| Other Securities | | 1.6 | 147,710,201 |
| | | 2.1 | 197,146,222 |
| |
| Diversified Financials 5.1% | |
| Berkshire Hathaway, Inc., Class B * | 648,730 | 1.5 | 137,907,023 |
| The Charles Schwab Corp.(b) | 383,080 | 0.2 | 15,595,187 |
| Other Securities | | 3.4 | 320,367,180 |
| | | 5.1 | 473,869,390 |
| |
| Energy 4.1% | |
| Chevron Corp. | 628,087 | 0.8 | 72,946,024 |
| Exxon Mobil Corp. | 1,399,877 | 1.0 | 94,589,689 |
| Other Securities | | 2.3 | 210,833,680 |
| | | 4.1 | 378,369,393 |
| |
| Security | Number
of Shares | % of Net
Assets | Value
($) |
| Food & Staples Retailing 1.5% | |
| Costco Wholesale Corp. | 145,469 | 0.5 | 43,220,295 |
| Walmart, Inc. | 470,417 | 0.6 | 55,161,097 |
| Other Securities | | 0.4 | 41,344,495 |
| | | 1.5 | 139,725,887 |
| |
| Food, Beverage & Tobacco 3.6% | |
| PepsiCo, Inc. | 462,374 | 0.7 | 63,423,842 |
| Philip Morris International, Inc. | 514,612 | 0.4 | 41,910,001 |
| The Coca-Cola Co. | 1,272,943 | 0.7 | 69,286,287 |
| Other Securities | | 1.8 | 162,261,337 |
| | | 3.6 | 336,881,467 |
| |
| Health Care Equipment & Services 6.2% | |
| Abbott Laboratories | 584,871 | 0.5 | 48,901,064 |
| Medtronic plc | 443,982 | 0.5 | 48,349,640 |
| UnitedHealth Group, Inc. | 313,577 | 0.8 | 79,240,908 |
| Other Securities | | 4.4 | 403,039,066 |
| | | 6.2 | 579,530,678 |
| |
| Household & Personal Products 1.8% | |
| The Procter & Gamble Co. | 827,790 | 1.1 | 103,068,133 |
| Other Securities | | 0.7 | 63,473,575 |
| | | 1.8 | 166,541,708 |
| |
| Insurance 2.6% | |
| Other Securities | | 2.6 | 246,918,872 |
| |
| Materials 2.8% | |
| Other Securities | | 2.8 | 262,379,204 |
| |
| Media & Entertainment 7.8% | |
| Alphabet, Inc., Class A * | 99,084 | 1.3 | 124,726,939 |
| Alphabet, Inc., Class C * | 99,961 | 1.3 | 125,961,856 |
| Comcast Corp., Class A | 1,500,365 | 0.7 | 67,246,359 |
| Facebook, Inc., Class A * | 795,834 | 1.6 | 152,521,586 |
| Netflix, Inc. * | 144,836 | 0.4 | 41,627,315 |
| The Walt Disney Co. | 595,911 | 0.8 | 77,420,757 |
| Other Securities | | 1.7 | 139,734,623 |
| | | 7.8 | 729,239,435 |
| |
| Pharmaceuticals, Biotechnology & Life Sciences 7.4% | |
| AbbVie, Inc. | 489,162 | 0.4 | 38,912,837 |
| Amgen, Inc. | 198,418 | 0.5 | 42,312,639 |
| Johnson & Johnson | 873,082 | 1.2 | 115,281,747 |
| Merck & Co., Inc. | 847,097 | 0.8 | 73,409,426 |
Schwab Equity Index Funds | Annual Report
Condensed Portfolio Holdings as of October 31, 2019 (continued)
| Security | Number
of Shares | % of Net
Assets | Value
($) |
| Pfizer, Inc. | 1,829,840 | 0.8 | 70,210,961 |
| Thermo Fisher Scientific, Inc. | 132,516 | 0.4 | 40,017,182 |
| Other Securities | | 3.3 | 313,357,904 |
| | | 7.4 | 693,502,696 |
| |
| Real Estate 4.0% | |
| Other Securities | | 4.0 | 373,563,859 |
| |
| Retailing 6.1% | |
| Amazon.com, Inc. * | 137,450 | 2.6 | 244,201,917 |
| The Home Depot, Inc. | 362,267 | 0.9 | 84,980,593 |
| Other Securities | | 2.6 | 235,889,364 |
| | | 6.1 | 565,071,874 |
| |
| Semiconductors & Semiconductor Equipment 4.0% | |
| Broadcom, Inc. | 131,684 | 0.4 | 38,563,659 |
| Intel Corp. | 1,465,462 | 0.9 | 82,842,567 |
| NVIDIA Corp. | 201,449 | 0.4 | 40,495,278 |
| Other Securities | | 2.3 | 207,314,318 |
| | | 4.0 | 369,215,822 |
| |
| Software & Services 12.4% | |
| Accenture plc, Class A | 210,604 | 0.4 | 39,050,194 |
| Adobe, Inc. * | 160,601 | 0.5 | 44,635,836 |
| International Business Machines Corp. | 293,036 | 0.4 | 39,187,704 |
| Mastercard, Inc., Class A | 295,309 | 0.9 | 81,744,484 |
| Microsoft Corp. | 2,525,818 | 3.9 | 362,126,527 |
| Oracle Corp. | 728,349 | 0.4 | 39,687,737 |
| PayPal Holdings, Inc. * | 389,255 | 0.4 | 40,521,445 |
| salesforce.com, Inc. * | 290,128 | 0.5 | 45,402,131 |
| Visa, Inc., Class A | 571,272 | 1.1 | 102,177,710 |
| Other Securities | | 3.9 | 362,779,026 |
| | | 12.4 | 1,157,312,794 |
| |
| Technology Hardware & Equipment 5.8% | |
| Apple, Inc. | 1,405,217 | 3.7 | 349,561,781 |
| Cisco Systems, Inc. | 1,404,467 | 0.7 | 66,726,227 |
| Other Securities | | 1.4 | 128,023,505 |
| | | 5.8 | 544,311,513 |
| |
| Telecommunication Services 2.1% | |
| AT&T, Inc. | 2,416,969 | 1.0 | 93,029,137 |
| Verizon Communications, Inc. | 1,368,112 | 0.9 | 82,729,733 |
| Other Securities | | 0.2 | 20,414,999 |
| | | 2.1 | 196,173,869 |
| |
| Security | Number
of Shares | % of Net
Assets | Value
($) |
| Transportation 1.9% | |
| Union Pacific Corp. | 233,055 | 0.4 | 38,561,280 |
| Other Securities | | 1.5 | 139,323,416 |
| | | 1.9 | 177,884,696 |
| |
| Utilities 3.5% | |
| Other Securities | | 3.5 | 323,980,717 |
| Total Common Stock | |
| (Cost $2,767,059,144) | | | 9,323,951,768 |
|
| Other Investment Companies0.1% of net assets | |
| |
| Money Market Fund 0.1% | |
| Other Securities | | 0.1 | 10,018,827 |
| |
| Securities Lending Collateral 0.0% | |
| Other Securities | | 0.0 | 1,635,700 |
| Total Other Investment Companies | |
| (Cost $11,654,527) | | | 11,654,527 |
| | Number of
Contracts | Notional
Amount
($) | Current Value/
Unrealized
Appreciation
($) |
| Futures Contracts | | | |
| Long | |
| S&P 500 Index, e-mini, expires 12/20/19 | 141 | 21,402,390 | 328,676 |
The following footnotes may not be applicable to the Condensed Portfolio Holdings. Please refer to the complete schedule of portfolio holdings.
| * | Non-income producing security. |
| (a) | All or a portion of this security is on loan. Securities on loan were valued at $1,542,868. |
| (b) | Issuer is affiliated with the fund's investment adviser. |
| (c) | The rate shown is the 7-day yield. |
| | |
| REIT — | Real Estate Investment Trust |
The fund owns shares of an affiliate, The Charles Schwab Corp., since that company is included in its index. Below is the summary of investment activities involving The Charles Schwab Corp. shares owned by the fund during the period ended October 31, 2019:
| | Market
Value at
10/31/18 | Gross
Purchases | Gross
Sales | Realized
Gains (Losses) | Net Change
in Unrealized
Appreciation
(depreciation) | Market
Value at
10/31/19 | Balance
of Shares
Held at
10/31/19 | Distributions
Received |
| The Charles Schwab Corp. | $17,019,325 | $1,317,995 | ($710,041) | ($156,625) | ($1,875,467) | $15,595,187 | 383,080 | $239,514 |
Schwab Equity Index Funds | Annual Report
Condensed Portfolio Holdings as of October 31, 2019 (continued)
The following is a summary of the inputs used to value the fund’s investments as of October 31, 2019 and reflects the complete schedule of portfolio holdings (see financial note 2(a) for additional information):
| Description | Quoted Prices in
Active Markets for
Identical Assets
(Level 1) | Other Significant
Observable Inputs
(Level 2) | Significant
Unobservable Inputs
(Level 3) | Total | |
| Assets | | | | | |
| Common Stock1 | $9,323,951,768 | $— | $— | $9,323,951,768 | |
| Other Investment Companies1 | 11,654,527 | — | — | 11,654,527 | |
| Futures Contracts2 | 328,676 | — | — | 328,676 | |
| Total | $9,335,934,971 | $— | $— | $9,335,934,971 | |
| 1 | As categorized in the complete schedule of Portfolio Holdings. |
| 2 | Futures contracts are valued at unrealized appreciation or depreciation. |
Fund investments in underlying mutual funds are classified as Level 1, without consideration to the classification level of the investments held by the underlying mutual funds, which could be Level 1, Level 2 or Level 3.
Schwab Equity Index Funds | Annual Report
Statement of Assets and Liabilities
As of October 31, 2019
| Assets |
| Investment in affiliated issuer, at value (cost $2,755,386) | | $15,595,187 |
| Investments in unaffiliated issuers, at value (cost $2,774,322,585) including securities on loan of $1,542,868 | | 9,318,375,408 |
| Collateral invested for securities on loan, at value (cost $1,635,700) | | 1,635,700 |
| Deposit with broker for futures contracts | | 1,502,467 |
| Receivables: | | |
| Dividends | | 7,936,083 |
| Fund shares sold | | 5,116,414 |
| Variation margin on futures contracts | | 328,941 |
| Income from securities on loan | + | 2,486 |
| Total assets | | 9,350,492,686 |
| Liabilities |
| Collateral held for securities on loan | | 1,635,700 |
| Payables: | | |
| Investments bought | | 839,190 |
| Investment adviser fees | | 388,801 |
| Fund shares redeemed | + | 1,498,724 |
| Total liabilities | | 4,362,415 |
| Net Assets |
| Total assets | | 9,350,492,686 |
| Total liabilities | – | 4,362,415 |
| Net assets | | $9,346,130,271 |
| Net Assets by Source | | |
| Capital received from investors | | 2,511,851,012 |
| Total distributable earnings | | 6,834,279,259 |
| Net Asset Value (NAV) |
| Net Assets | ÷ | Shares
Outstanding | = | NAV |
| $9,346,130,271 | | 136,077,922 | | $68.68 |
| | | | | |
Schwab Equity Index Funds | Annual Report
Statement of Operations
For the period November 1, 2018 through October 31, 2019
| Investment Income |
| Dividends received from affiliated issuer | | $239,514 |
| Dividends received from unaffiliated issuers (net of foreign withholding tax of $4,640) | | 184,440,852 |
| Securities on loan, net | + | 1,236,293 |
| Total investment income | | 185,916,659 |
| Expenses |
| Investment adviser fees | | 4,224,325 |
| Total expenses | – | 4,224,325 |
| Net investment income | | 181,692,334 |
| Realized and Unrealized Gains (Losses) |
| Net realized losses on affiliated issuer | | (156,625) |
| Net realized gains on unaffiliated issuers | | 109,236,448 |
| Net realized gains on futures contracts | + | 1,990,677 |
| Net realized gains | | 111,070,500 |
| Net change in unrealized appreciation (depreciation) on affiliated issuer | | (1,875,467) |
| Net change in unrealized appreciation (depreciation) on unaffiliated issuers | | 832,732,009 |
| Net change in unrealized appreciation (depreciation) on futures contracts | + | 821,537 |
| Net change in unrealized appreciation (depreciation) | + | 831,678,079 |
| Net realized and unrealized gains | | 942,748,579 |
| Increase in net assets resulting from operations | | $1,124,440,913 |
Schwab Equity Index Funds | Annual Report
Statement of Changes in Net Assets
For the current and prior report periods
| Operations | |
| | 11/1/18-10/31/19 | 11/1/17-10/31/18 |
| Net investment income | | $181,692,334 | $147,028,286 |
| Net realized gains | | 111,070,500 | 288,201,026 |
| Net change in unrealized appreciation (depreciation) | + | 831,678,079 | 90,496,487 |
| Increase in net assets from operations | | 1,124,440,913 | 525,725,799 |
| Distributions to Shareholders | |
| Total distributions | | ($445,433,607) | ($324,267,848) |
| Transactions in Fund Shares | | | |
| | | 11/1/18-10/31/19 | 11/1/17-10/31/18 |
| | | SHARES | VALUE | SHARES | VALUE |
| Shares sold | | 20,231,558 | $1,297,409,694 | 8,381,000 | $542,615,615 |
| Shares reinvested | | 6,798,612 | 365,978,493 | 4,263,951 | 268,287,801 |
| Shares redeemed | + | (14,175,603) | (905,415,456) | (12,091,730) | (783,914,000) |
| Net transactions in fund shares | | 12,854,567 | $757,972,731 | 553,221 | $26,989,416 |
| Shares Outstanding and Net Assets | | | |
| | | 11/1/18-10/31/19 | 11/1/17-10/31/18 |
| | | SHARES | NET ASSETS | SHARES | NET ASSETS |
| Beginning of period | | 123,223,355 | $7,909,150,234 | 122,670,134 | $7,680,702,867 |
| Total increase | + | 12,854,567 | 1,436,980,037 | 553,221 | 228,447,367 |
| End of period | | 136,077,922 | $9,346,130,271 | 123,223,355 | $7,909,150,234 |
Schwab Equity Index Funds | Annual Report
Schwab Small-Cap Index Fund
Financial Statements
Financial Highlights
| | 11/1/18–
10/31/19 | 11/1/17–
10/31/18 | 11/1/16–
10/31/17 | 11/1/15–
10/31/16 | 11/1/14–
10/31/15 | |
| Per-Share Data |
| Net asset value at beginning of period | $30.48 | $31.45 | $25.60 | $26.29 | $28.13 | |
| Income (loss) from investment operations: | | | | | | |
| Net investment income (loss)1 | 0.40 | 0.43 | 0.38 | 0.39 | 0.38 | |
| Net realized and unrealized gains (losses) | 0.54 | 0.20 | 6.62 | 0.59 | (0.34) | |
| Total from investment operations | 0.94 | 0.63 | 7.00 | 0.98 | 0.04 | |
| Less distributions: | | | | | | |
| Distributions from net investment income | (0.40) | (0.39) | (0.39) | (0.36) | (0.34) | |
| Distributions from net realized gains | (2.18) | (1.21) | (0.76) | (1.31) | (1.54) | |
| Total distributions | (2.58) | (1.60) | (1.15) | (1.67) | (1.88) | |
| Net asset value at end of period | $28.84 | $30.48 | $31.45 | $25.60 | $26.29 | |
| Total return | 4.95% | 1.93% | 27.84% | 4.17% | 0.36% | |
| Ratios/Supplemental Data |
| Ratios to average net assets: | | | | | | |
| Total expenses | 0.04%2 | 0.05% | 0.10%3 | 0.20% | 0.20% | |
| Net operating expenses | N/A | N/A4 | 0.09%3 | 0.17% | 0.17% | |
| Net investment income (loss) | 1.43% | 1.33% | 1.31% | 1.60% | 1.37% | |
| Portfolio turnover rate | 14% | 17% | 11% | 17% | 17% | |
| Net assets, end of period (x 1,000,000) | $4,187 | $3,874 | $3,531 | $2,619 | $2,607 | |
| |
1
Calculated based on the average shares outstanding during the period.
2
Effective December 20, 2018, the annual operating expense ratio was reduced to 0.04%. The ratio presented for period ended 10/31/19 is a blended ratio. (See financial note 4)
3
Effective March 1, 2017, the annual operating expense ratio was reduced. The ratio presented for period ended 10/31/17 is a blended ratio.
4
Effective March 1, 2017, the fund instituted a new fee structure and the contractual expense limitation was terminated.
Schwab Equity Index Funds | Annual Report
Schwab Small-Cap Index Fund
Condensed Portfolio Holdings as of October 31, 2019
This section shows the fund’s 50 largest portfolio holdings in unaffiliated issuers, any holdings exceeding 1% of the fund’s net assets as of the report date, and any affiliated issuers. The remaining securities held by the fund are grouped as "Other Securities" in each category. You can request a complete schedule of portfolio holdings as of the report date, free of charge, by calling Schwab Funds® at 1-877-824-5615. This complete schedule, filed on the fund’s N-CSR(S), is also available on the U.S. Securities and Exchange Commission (SEC)’s website atwww.sec.gov.
In addition, the fund files its complete schedule of portfolio holdings with the SEC for the first and third quarters of each fiscal year on Form N-Q. The fund’s Form N-Q is available on the SEC’s website. Effective March 31, 2019, Form N-PORT Part F has replaced Form N-Q. The fund also makes available its complete schedule of portfolio holdings 15-20 days after the end of the month on the fund’s website atwww.schwabfunds.com/schwabfunds_prospectus.
| Security | Number
of Shares | % of Net
Assets | Value
($) |
| Common Stock99.6% of net assets | |
| |
| Automobiles & Components 1.2% | |
| Other Securities | | 1.2 | 48,030,497 |
| |
| Banks 12.1% | |
| Essent Group Ltd. | 204,150 | 0.3 | 10,634,173 |
| First Financial Bankshares, Inc. | 275,945 | 0.2 | 9,183,450 |
| Radian Group, Inc. | 432,805 | 0.3 | 10,863,405 |
| Other Securities | | 11.3 | 476,392,251 |
| | | 12.1 | 507,073,279 |
| |
| Capital Goods 10.3% | |
| EMCOR Group, Inc. | 118,324 | 0.2 | 10,378,198 |
| Generac Holdings, Inc. * | 129,573 | 0.3 | 12,514,160 |
| Mercury Systems, Inc. * | 115,000 | 0.2 | 8,470,900 |
| Trex Co., Inc. * | 124,589 | 0.3 | 10,950,127 |
| Other Securities | | 9.3 | 388,228,589 |
| | | 10.3 | 430,541,974 |
| |
| Commercial & Professional Services 4.4% | |
| FTI Consulting, Inc. * | 78,772 | 0.2 | 8,575,908 |
| Insperity, Inc. | 82,068 | 0.2 | 8,668,843 |
| MSA Safety, Inc. | 74,747 | 0.2 | 8,974,872 |
| Tetra Tech, Inc. | 115,673 | 0.2 | 10,117,917 |
| The Brink's Co. | 105,777 | 0.2 | 8,986,814 |
| Other Securities | | 3.4 | 140,285,591 |
| | | 4.4 | 185,609,945 |
| |
| Consumer Durables & Apparel 3.2% | |
| Deckers Outdoor Corp. * | 61,990 | 0.2 | 9,478,271 |
| Other Securities | | 3.0 | 122,915,037 |
| | | 3.2 | 132,393,308 |
| |
| Consumer Services 3.5% | |
| Churchill Downs, Inc. | 74,487 | 0.2 | 9,682,565 |
| Marriott Vacations Worldwide Corp. | 90,940 | 0.2 | 9,997,034 |
| Other Securities | | 3.1 | 126,389,097 |
| | | 3.5 | 146,068,696 |
| |
| Security | Number
of Shares | % of Net
Assets | Value
($) |
| Diversified Financials 3.6% | |
| Blackstone Mortgage Trust, Inc., Class A | 267,532 | 0.2 | 9,711,412 |
| Other Securities | | 3.4 | 141,608,080 |
| | | 3.6 | 151,319,492 |
| |
| Energy 3.1% | |
| Other Securities | | 3.1 | 128,544,014 |
| |
| Food & Staples Retailing 0.7% | |
| Performance Food Group Co. * | 218,079 | 0.2 | 9,292,346 |
| Other Securities | | 0.5 | 18,563,958 |
| | | 0.7 | 27,856,304 |
| |
| Food, Beverage & Tobacco 1.7% | |
| Other Securities | | 1.7 | 71,812,191 |
| |
| Health Care Equipment & Services 6.8% | |
| Amedisys, Inc. * | 66,493 | 0.2 | 8,545,680 |
| Globus Medical, Inc., Class A * | 161,243 | 0.2 | 8,444,296 |
| Haemonetics Corp. * | 108,619 | 0.3 | 13,113,572 |
| Novocure Ltd. * | 184,229 | 0.3 | 13,198,166 |
| Teladoc Health, Inc. * | 151,597 | 0.3 | 11,612,330 |
| Other Securities | | 5.5 | 231,058,090 |
| | | 6.8 | 285,972,134 |
| |
| Household & Personal Products 0.5% | |
| Other Securities | | 0.5 | 22,586,252 |
| |
| Insurance 2.3% | |
| Selective Insurance Group, Inc. | 124,058 | 0.2 | 8,574,889 |
| Other Securities | | 2.1 | 88,676,922 |
| | | 2.3 | 97,251,811 |
| |
| Materials 3.8% | |
| Other Securities | | 3.8 | 159,752,434 |
| |
| Media & Entertainment 1.7% | |
| Other Securities | | 1.7 | 70,986,728 |
| |
| Pharmaceuticals, Biotechnology & Life Sciences 9.6% | |
| ACADIA Pharmaceuticals, Inc. * | 223,542 | 0.2 | 9,480,416 |
| Reata Pharmaceuticals, Inc., Class A * | 42,638 | 0.2 | 8,786,839 |
Schwab Equity Index Funds | Annual Report
Schwab Small-Cap Index Fund
Condensed Portfolio Holdings as of October 31, 2019 (continued)
| Security | Number
of Shares | % of Net
Assets | Value
($) |
| Repligen Corp. * | 109,489 | 0.2 | 8,703,281 |
| Other Securities | | 9.0 | 375,650,345 |
| | | 9.6 | 402,620,881 |
| |
| Real Estate 8.3% | |
| EastGroup Properties, Inc. | 78,518 | 0.3 | 10,517,486 |
| First Industrial Realty Trust, Inc. | 266,951 | 0.3 | 11,241,307 |
| Healthcare Realty Trust, Inc. | 271,102 | 0.2 | 9,426,217 |
| Rexford Industrial Realty, Inc. | 232,111 | 0.3 | 11,162,218 |
| Sabra Health Care REIT, Inc. | 400,831 | 0.2 | 9,860,443 |
| Other Securities | | 7.0 | 294,496,822 |
| | | 8.3 | 346,704,493 |
| |
| Retailing 3.2% | |
| Aaron's, Inc. | 143,234 | 0.3 | 10,732,524 |
| Other Securities | | 2.9 | 120,846,351 |
| | | 3.2 | 131,578,875 |
| |
| Semiconductors & Semiconductor Equipment 2.7% | |
| Cabot Microelectronics Corp. | 61,422 | 0.2 | 9,282,093 |
| Silicon Laboratories, Inc. * | 91,071 | 0.2 | 9,675,383 |
| Other Securities | | 2.3 | 95,592,569 |
| | | 2.7 | 114,550,045 |
| |
| Software & Services 6.9% | |
| Blackbaud, Inc. | 103,629 | 0.2 | 8,699,655 |
| j2 Global, Inc. | 98,717 | 0.2 | 9,374,166 |
| KBR, Inc. | 300,147 | 0.2 | 8,452,139 |
| MAXIMUS, Inc. | 134,640 | 0.2 | 10,332,274 |
| Science Applications International Corp. | 125,809 | 0.2 | 10,394,340 |
| Other Securities | | 5.9 | 240,939,067 |
| | | 6.9 | 288,191,641 |
| |
| Technology Hardware & Equipment 3.9% | |
| Lumentum Holdings, Inc. * | 162,258 | 0.2 | 10,167,086 |
| Tech Data Corp. * | 77,110 | 0.2 | 9,368,865 |
| Other Securities | | 3.5 | 144,413,902 |
| | | 3.9 | 163,949,853 |
| |
| Telecommunication Services 0.7% | |
| Other Securities | | 0.7 | 30,941,256 |
| |
| Transportation 1.4% | |
| Other Securities | | 1.4 | 60,197,597 |
| |
| Utilities 4.0% | |
| ALLETE, Inc. | 109,766 | 0.2 | 9,446,462 |
| Black Hills Corp. | 129,569 | 0.2 | 10,213,924 |
| ONE Gas, Inc. | 110,743 | 0.2 | 10,281,380 |
| PNM Resources, Inc. | 168,729 | 0.2 | 8,799,217 |
| Portland General Electric Co. | 190,318 | 0.3 | 10,825,288 |
| Southwest Gas Holdings, Inc. | 115,158 | 0.2 | 10,053,293 |
| Security | Number
of Shares | % of Net
Assets | Value
($) |
| Spire, Inc. | 105,325 | 0.2 | 8,853,619 |
| Other Securities | | 2.5 | 98,296,502 |
| | | 4.0 | 166,769,685 |
| Total Common Stock | |
| (Cost $3,320,088,458) | | | 4,171,303,385 |
|
| Rights0.0% of net assets | |
| |
| Materials 0.0% | |
| Other Securities | | 0.0 | 22,031 |
| |
| Media & Entertainment 0.0% | |
| Other Securities | | 0.0 | 14,883 |
| |
| Pharmaceuticals, Biotechnology & Life Sciences 0.0% | |
| Other Securities | | 0.0 | 176,683 |
| Total Rights | |
| (Cost $34,960) | | | 213,597 |
|
| Other Investment Company2.1% of net assets | |
| |
| Securities Lending Collateral 2.1% | |
| Wells Fargo Government Money Market Fund, Select Class 1.75%(c) | 85,855,056 | 2.1 | 85,855,056 |
| Total Other Investment Company | |
| (Cost $85,855,056) | | | 85,855,056 |
Security
Rate, Maturity Date | Face
Amount ($) | % of Net
Assets | Value
($) |
| Short-Term Investment0.4% of net assets | |
| |
| Time Deposit 0.4% | |
JPMorgan Chase Bank
1.18%, 11/01/19(d) | 16,137,531 | 0.4 | 16,137,531 |
| Total Short-Term Investment | |
| (Cost $16,137,531) | | | 16,137,531 |
| | Number of
Contracts | Notional
Amount
($) | Current Value/
Unrealized
Appreciation
($) |
| Futures Contracts | |
| Long | |
| Russell 2000 Index, e-mini, expires 12/20/19 | 187 | 14,617,790 | 288,257 |
Schwab Equity Index Funds | Annual Report
Schwab Small-Cap Index Fund
Condensed Portfolio Holdings as of October 31, 2019 (continued)
The following footnotes may not be applicable to the Condensed Portfolio Holdings. Please refer to the complete schedule of portfolio holdings.
| * | Non-income producing security. |
| (a) | All or a portion of this security is on loan. Securities on loan were valued at $82,322,210. |
| (b) | Fair-valued by management using significant unobservable inputs in accordance with procedures approved by fund’s Board of Trustees. |
| (c) | The rate shown is the 7-day yield. |
| (d) | The rate shown is the current daily overnight rate. |
| | |
| CVR — | Contingent Value Rights |
| REIT — | Real Estate Investment Trust |
The following is a summary of the inputs used to value the fund’s investments as of October 31, 2019 and reflects the complete schedule of portfolio holdings (see financial note 2(a) for additional information):
| Description | Quoted Prices in
Active Markets for
Identical Assets
(Level 1) | Other Significant
Observable Inputs
(Level 2) | Significant
Unobservable Inputs
(Level 3) | Total | |
| Assets | | | | | |
| Common Stock1 | $4,011,550,951 | $— | $— | $4,011,550,951 | |
| Materials | 159,752,434 | — | —* | 159,752,434 | |
| Rights1 | | | | | |
| Materials | — | — | 22,031 | 22,031 | |
| Media & Entertainment | — | — | 14,883 | 14,883 | |
| Pharmaceuticals, Biotechnology & Life Sciences | — | — | 176,683* | 176,683 | |
| Other Investment Company1 | 85,855,056 | — | — | 85,855,056 | |
| Short-Term Investment1 | — | 16,137,531 | — | 16,137,531 | |
| Futures Contracts2 | 288,257 | — | — | 288,257 | |
| Total | $4,257,446,698 | $16,137,531 | $213,597 | $4,273,797,826 | |
| * | Level 3 amount shown includes securities determined to have no value at October 31, 2019. |
| 1 | As categorized in the complete schedule of Portfolio Holdings. |
| 2 | Futures contracts are valued at unrealized appreciation or depreciation. |
Fund investments in underlying mutual funds are classified as Level 1, without consideration to the classification level of the investments held by the underlying mutual funds, which could be Level 1, Level 2 or Level 3.
Schwab Equity Index Funds | Annual Report
Schwab Small-Cap Index Fund
Statement of Assets and Liabilities
As of October 31, 2019
| Assets |
| Investments in unaffiliated issuers, at value (cost $3,336,260,949) including securities on loan of $82,322,210 | | $4,187,654,513 |
| Collateral invested for securities on loan, at value (cost $85,855,056) | | 85,855,056 |
| Deposit with broker for futures contracts | | 1,585,540 |
| Receivables: | | |
| Investments sold | | 5,854,407 |
| Fund shares sold | | 5,014,511 |
| Dividends | | 1,518,951 |
| Income from securities on loan | | 547,933 |
| Variation margin on futures contracts | | 288,618 |
| Foreign tax reclaims | | 888 |
| Interest | + | 538 |
| Total assets | | 4,288,320,955 |
| Liabilities |
| Collateral held for securities on loan | | 85,855,056 |
| Payables: | | |
| Investments bought | | 13,438,962 |
| Investment adviser fees | | 138,390 |
| Fund shares redeemed | + | 2,031,442 |
| Total liabilities | | 101,463,850 |
| Net Assets |
| Total assets | | 4,288,320,955 |
| Total liabilities | – | 101,463,850 |
| Net assets | | $4,186,857,105 |
| Net Assets by Source | | |
| Capital received from investors | | 3,154,364,877 |
| Total distributable earnings | | 1,032,492,228 |
| Net Asset Value (NAV) |
| Net Assets | ÷ | Shares
Outstanding | = | NAV |
| $4,186,857,105 | | 145,150,594 | | $28.84 |
| | | | | |
Schwab Equity Index Funds | Annual Report
Schwab Small-Cap Index Fund
Statement of Operations
For the period November 1, 2018 through October 31, 2019
| Investment Income |
| Dividends (net of foreign withholding tax of $17,418) | | $54,340,843 |
| Interest | | 276,682 |
| Securities on loan, net | + | 4,409,021 |
| Total investment income | | 59,026,546 |
| Expenses |
| Investment adviser fees | | 1,658,868 |
| Total expenses | – | 1,658,868 |
| Net investment income | | 57,367,678 |
| Realized and Unrealized Gains (Losses) |
| Net realized gains on investments | | 165,914,560 |
| Net realized losses on futures contracts | | (1,131,125) |
| Net realized losses on foreign currency transactions | + | (573) |
| Net realized gains | | 164,782,862 |
| Net change in unrealized appreciation (depreciation) on investments | | (24,656,602) |
| Net change in unrealized appreciation (depreciation) on futures contracts | + | 552,683 |
| Net change in unrealized appreciation (depreciation) | + | (24,103,919) |
| Net realized and unrealized gains | | 140,678,943 |
| Increase in net assets resulting from operations | | $198,046,621 |
Schwab Equity Index Funds | Annual Report
Schwab Small-Cap Index Fund
Statement of Changes in Net Assets
For the current and prior report periods
| Operations | |
| | 11/1/18-10/31/19 | 11/1/17-10/31/18 |
| Net investment income | | $57,367,678 | $52,431,528 |
| Net realized gains | | 164,782,862 | 264,151,519 |
| Net change in unrealized appreciation (depreciation) | + | (24,103,919) | (264,082,231) |
| Increase in net assets from operations | | 198,046,621 | 52,500,816 |
| Distributions to Shareholders | |
| Total distributions | | ($331,678,196) | ($181,272,871) |
| Transactions in Fund Shares | | | |
| | | 11/1/18-10/31/19 | 11/1/17-10/31/18 |
| | | SHARES | VALUE | SHARES | VALUE |
| Shares sold | | 34,352,492 | $953,623,893 | 31,415,062 | $1,012,294,913 |
| Shares reinvested | | 12,063,839 | 284,224,067 | 5,063,226 | 156,403,042 |
| Shares redeemed | + | (28,348,900) | (791,168,893) | (21,668,855) | (697,115,758) |
| Net transactions in fund shares | | 18,067,431 | $446,679,067 | 14,809,433 | $471,582,197 |
| Shares Outstanding and Net Assets | | | |
| | | 11/1/18-10/31/19 | 11/1/17-10/31/18 |
| | | SHARES | NET ASSETS | SHARES | NET ASSETS |
| Beginning of period | | 127,083,163 | $3,873,809,613 | 112,273,730 | $3,530,999,471 |
| Total increase | + | 18,067,431 | 313,047,492 | 14,809,433 | 342,810,142 |
| End of period | | 145,150,594 | $4,186,857,105 | 127,083,163 | $3,873,809,613 |
Schwab Equity Index Funds | Annual Report
Schwab Total Stock Market Index Fund
Financial Statements
Financial Highlights
| | 11/1/18–
10/31/19 | 11/1/17–
10/31/18 | 11/1/16–
10/31/17 | 11/1/15–
10/31/16 | 11/1/14–
10/31/15 | |
| Per-Share Data |
| Net asset value at beginning of period | $48.38 | $46.25 | $38.19 | $37.69 | $36.96 | |
| Income (loss) from investment operations: | | | | | | |
| Net investment income (loss)1 | 0.99 | 0.88 | 0.80 | 0.75 | 0.72 | |
| Net realized and unrealized gains (losses) | 5.18 | 2.12 | 8.19 | 0.75 | 0.83 | |
| Total from investment operations | 6.17 | 3.00 | 8.99 | 1.50 | 1.55 | |
| Less distributions: | | | | | | |
| Distributions from net investment income | (0.90) | (0.76) | (0.74) | (0.70) | (0.61) | |
| Distributions from net realized gains | (0.23) | (0.11) | (0.19) | (0.30) | (0.21) | |
| Total distributions | (1.13) | (0.87) | (0.93) | (1.00) | (0.82) | |
| Net asset value at end of period | $53.42 | $48.38 | $46.25 | $38.19 | $37.69 | |
| Total return | 13.37% | 6.51% | 23.89% | 4.19% | 4.36% | |
| Ratios/Supplemental Data |
| Ratios to average net assets: | | | | | | |
| Total expenses | 0.03% | 0.03% | 0.05%2 | 0.10% | 0.11% | |
| Net operating expenses | N/A | N/A3 | 0.05%2 | 0.09% | 0.09% | |
| Net investment income (loss) | 1.99% | 1.80% | 1.89% | 2.03% | 1.92% | |
| Portfolio turnover rate | 3% | 4% | 2% | 1% | 2% | |
| Net assets, end of period (x 1,000,000) | $10,220 | $8,410 | $6,720 | $4,850 | $4,477 | |
| |
1
Calculated based on the average shares outstanding during the period.
2
Effective March 1, 2017, the annual operating expense ratio was reduced. The ratio presented for period ended 10/31/17 is a blended ratio.
3
Effective March 1, 2017, the fund instituted a new fee structure and the contractual expense limitation was terminated.
Schwab Equity Index Funds | Annual Report
Schwab Total Stock Market Index Fund
Condensed Portfolio Holdings as of October 31, 2019
This section shows the fund’s 50 largest portfolio holdings in unaffiliated issuers, any holdings exceeding 1% of the fund’s net assets as of the report date, and any affiliated issuers. The remaining securities held by the fund are grouped as "Other Securities" in each category. You can request a complete schedule of portfolio holdings as of the report date, free of charge, by calling Schwab Funds® at 1-877-824-5615. This complete schedule, filed on the fund’s N-CSR(S), is also available on the U.S. Securities and Exchange Commission (SEC)’s website atwww.sec.gov.
In addition, the fund files its complete schedule of portfolio holdings with the SEC for the first and third quarters of each fiscal year on Form N-Q. The fund’s Form N-Q is available on the SEC’s website. Effective March 31, 2019, Form N-PORT Part F has replaced Form N-Q. The fund also makes available its complete schedule of portfolio holdings 15-20 days after the end of the month on the fund’s website atwww.schwabfunds.com/schwabfunds_prospectus.
| Security | Number
of Shares | % of Net
Assets | Value
($) |
| Common Stock99.7% of net assets | |
| |
| Automobiles & Components 0.7% | |
| Other Securities | | 0.7 | 73,029,985 |
| |
| Banks 5.9% | |
| Bank of America Corp. | 2,826,027 | 0.9 | 88,369,864 |
| Citigroup, Inc. | 761,523 | 0.5 | 54,723,043 |
| JPMorgan Chase & Co. | 1,079,035 | 1.3 | 134,793,052 |
| Wells Fargo & Co. | 1,352,423 | 0.7 | 69,825,600 |
| Other Securities | | 2.5 | 255,078,498 |
| | | 5.9 | 602,790,057 |
| |
| Capital Goods 6.9% | |
| Honeywell International, Inc. | 242,400 | 0.4 | 41,869,752 |
| The Boeing Co. | 180,566 | 0.6 | 61,376,189 |
| Other Securities | | 5.9 | 606,906,236 |
| | | 6.9 | 710,152,177 |
| |
| Commercial & Professional Services 1.1% | |
| Other Securities | | 1.1 | 113,151,570 |
| |
| Consumer Durables & Apparel 1.4% | |
| Other Securities | | 1.4 | 139,538,330 |
| |
| Consumer Services 2.2% | |
| McDonald's Corp. | 255,947 | 0.5 | 50,344,775 |
| Other Securities | | 1.7 | 172,147,362 |
| | | 2.2 | 222,492,137 |
| |
| Diversified Financials 5.1% | |
| Berkshire Hathaway, Inc., Class B * | 661,732 | 1.4 | 140,670,989 |
| The Charles Schwab Corp.(b) | 391,184 | 0.2 | 15,925,101 |
| Other Securities | | 3.5 | 369,511,272 |
| | | 5.1 | 526,107,362 |
| |
| Energy 4.0% | |
| Chevron Corp. | 640,939 | 0.7 | 74,438,655 |
| Exxon Mobil Corp. | 1,428,886 | 0.9 | 96,549,827 |
| Other Securities | | 2.4 | 237,130,524 |
| | | 4.0 | 408,119,006 |
| |
| Security | Number
of Shares | % of Net
Assets | Value
($) |
| Food & Staples Retailing 1.4% | |
| Costco Wholesale Corp. | 148,326 | 0.4 | 44,069,138 |
| Walmart, Inc. | 479,409 | 0.6 | 56,215,499 |
| Other Securities | | 0.4 | 45,487,961 |
| | | 1.4 | 145,772,598 |
| |
| Food, Beverage & Tobacco 3.5% | |
| PepsiCo, Inc. | 471,435 | 0.6 | 64,666,739 |
| Philip Morris International, Inc. | 525,352 | 0.4 | 42,784,667 |
| The Coca-Cola Co. | 1,298,326 | 0.7 | 70,667,884 |
| Other Securities | | 1.8 | 177,317,727 |
| | | 3.5 | 355,437,017 |
| |
| Health Care Equipment & Services 6.1% | |
| Abbott Laboratories | 597,438 | 0.5 | 49,951,791 |
| Medtronic plc | 452,799 | 0.5 | 49,309,811 |
| UnitedHealth Group, Inc. | 320,267 | 0.8 | 80,931,471 |
| Other Securities | | 4.3 | 447,295,711 |
| | | 6.1 | 627,488,784 |
| |
| Household & Personal Products 1.7% | |
| The Procter & Gamble Co. | 845,185 | 1.0 | 105,233,984 |
| Other Securities | | 0.7 | 70,734,217 |
| | | 1.7 | 175,968,201 |
| |
| Insurance 2.6% | |
| Other Securities | | 2.6 | 268,029,722 |
| |
| Materials 2.9% | |
| Other Securities | | 2.9 | 294,748,391 |
| |
| Media & Entertainment 7.5% | |
| Alphabet, Inc., Class A * | 101,172 | 1.2 | 127,355,314 |
| Alphabet, Inc., Class C * | 102,040 | 1.3 | 128,581,624 |
| Comcast Corp., Class A | 1,530,587 | 0.7 | 68,600,909 |
| Facebook, Inc., Class A * | 812,722 | 1.5 | 155,758,171 |
| Netflix, Inc. * | 148,108 | 0.4 | 42,567,720 |
| The Walt Disney Co. | 607,952 | 0.8 | 78,985,124 |
| Other Securities | | 1.6 | 165,125,373 |
| | | 7.5 | 766,974,235 |
| |
| Pharmaceuticals, Biotechnology & Life Sciences 7.6% | |
| AbbVie, Inc. | 499,867 | 0.4 | 39,764,420 |
| Amgen, Inc. | 202,635 | 0.4 | 43,211,914 |
| Johnson & Johnson | 891,019 | 1.2 | 117,650,149 |
| Merck & Co., Inc. | 864,827 | 0.7 | 74,945,908 |
Schwab Equity Index Funds | Annual Report
Schwab Total Stock Market Index Fund
Condensed Portfolio Holdings as of October 31, 2019 (continued)
| Security | Number
of Shares | % of Net
Assets | Value
($) |
| Pfizer, Inc. | 1,867,433 | 0.7 | 71,653,404 |
| Thermo Fisher Scientific, Inc. | 135,411 | 0.4 | 40,891,414 |
| Other Securities | | 3.8 | 387,016,593 |
| | | 7.6 | 775,133,802 |
| |
| Real Estate 4.2% | |
| Other Securities | | 4.2 | 432,072,358 |
| |
| Retailing 5.9% | |
| Amazon.com, Inc. * | 140,295 | 2.4 | 249,256,515 |
| The Home Depot, Inc. | 369,415 | 0.8 | 86,657,371 |
| Other Securities | | 2.7 | 264,917,567 |
| | | 5.9 | 600,831,453 |
| |
| Semiconductors & Semiconductor Equipment 3.9% | |
| Broadcom, Inc. | 134,617 | 0.4 | 39,422,588 |
| Intel Corp. | 1,495,417 | 0.8 | 84,535,923 |
| NVIDIA Corp. | 205,823 | 0.4 | 41,374,540 |
| Other Securities | | 2.3 | 229,453,338 |
| | | 3.9 | 394,786,389 |
| |
| Software & Services 12.1% | |
| Accenture plc, Class A | 214,620 | 0.4 | 39,794,840 |
| Adobe, Inc. * | 164,312 | 0.4 | 45,667,234 |
| International Business Machines Corp. | 298,866 | 0.4 | 39,967,350 |
| Mastercard, Inc., Class A | 301,186 | 0.8 | 83,371,297 |
| Microsoft Corp. | 2,577,886 | 3.6 | 369,591,516 |
| Oracle Corp. | 743,579 | 0.4 | 40,517,620 |
| PayPal Holdings, Inc. * | 397,921 | 0.4 | 41,423,576 |
| salesforce.com, Inc. * | 296,646 | 0.5 | 46,422,133 |
| Visa, Inc., Class A | 582,652 | 1.0 | 104,213,137 |
| Other Securities | | 4.2 | 420,710,000 |
| | | 12.1 | 1,231,678,703 |
| |
| Technology Hardware & Equipment 5.7% | |
| Apple, Inc. | 1,434,285 | 3.5 | 356,792,737 |
| Cisco Systems, Inc. | 1,435,213 | 0.7 | 68,186,970 |
| Other Securities | | 1.5 | 157,348,187 |
| | | 5.7 | 582,327,894 |
| |
| Telecommunication Services 2.0% | |
| AT&T, Inc. | 2,466,696 | 0.9 | 94,943,129 |
| Verizon Communications, Inc. | 1,395,897 | 0.8 | 84,409,892 |
| Other Securities | | 0.3 | 25,080,462 |
| | | 2.0 | 204,433,483 |
| |
| Transportation 1.9% | |
| Other Securities | | 1.9 | 196,218,654 |
| |
| Utilities 3.4% | |
| Other Securities | | 3.4 | 345,348,279 |
| Total Common Stock | |
| (Cost $6,088,103,852) | | | 10,192,630,587 |
|
| Security | Number
of Shares | % of Net
Assets | Value
($) |
| Rights0.0% of net assets | |
| |
| Automobiles & Components 0.0% | |
| Other Securities | | 0.0 | — |
| |
| Materials 0.0% | |
| Other Securities | | 0.0 | 3,541 |
| |
| Media & Entertainment 0.0% | |
| Other Securities | | 0.0 | 1,566 |
| |
| Pharmaceuticals, Biotechnology & Life Sciences 0.0% | |
| Other Securities | | 0.0 | 1,592 |
| Total Rights | |
| (Cost $5,439) | | | 6,699 |
|
| Other Investment Company0.2% of net assets | |
| |
| Securities Lending Collateral 0.2% | |
| Other Securities | | 0.2 | 20,636,112 |
| Total Other Investment Company | |
| (Cost $20,636,112) | | | 20,636,112 |
Security
Rate, Maturity Date | Face
Amount ($) | % of Net
Assets | Value
($) |
| Short-Term Investment0.6% of net assets | |
| |
| Time Deposit 0.6% | |
Sumitomo Mitsui Trust Bank, Limited.
1.18%, 11/01/19(e) | 56,245,967 | 0.6 | 56,245,967 |
| Total Short-Term Investment | |
| (Cost $56,245,967) | | | 56,245,967 |
| | Number of
Contracts | Notional
Amount
($) | Current Value/
Unrealized
Depreciation
($) |
| Futures Contracts | |
| Long | |
| Russell 2000 Index, e-mini, expires 12/20/19 | 51 | 3,986,670 | (15,973) |
| S&P 500 Index, e-mini, expires 12/20/19 | 149 | 22,616,710 | (64) |
| Net Unrealized Depreciation | (16,037) |
Schwab Equity Index Funds | Annual Report
Schwab Total Stock Market Index Fund
Condensed Portfolio Holdings as of October 31, 2019 (continued)
The following footnotes may not be applicable to the Condensed Portfolio Holdings. Please refer to the complete schedule of portfolio holdings.
| * | Non-income producing security. |
| (a) | All or a portion of this security is on loan. Securities on loan were valued at $19,526,339. |
| (b) | Issuer is affiliated with the fund’s investment adviser. |
| (c) | Fair-valued by management using significant unobservable inputs in accordance with procedures approved by fund’s Board of Trustees. |
| (d) | The rate shown is the 7-day yield. |
| (e) | The rate shown is the current daily overnight rate. |
| | |
| CVR — | Contingent Value Rights |
| REIT — | Real Estate Investment Trust |
The fund owns shares of an affiliate, The Charles Schwab Corp., since that company is included in its index. Below is the summary of investment activities involving The Charles Schwab Corp. shares owned by the fund during the period ended October 31, 2019:
| | Market
Value at
10/31/18 | Gross
Purchases | Gross
Sales | Realized
Gains (Losses) | Net Change
in Unrealized
Appreciation
(depreciation) | Market
Value at
10/31/19 | Balance
of Shares
Held at
10/31/19 | Distributions
Received |
| The Charles Schwab Corp. | $16,687,785 | $1,836,887 | ($526,687) | ($158,023) | ($1,914,861) | $15,925,101 | 391,184 | $245,916 |
The following is a summary of the inputs used to value the fund’s investments as of October 31, 2019 and reflects the complete schedule of portfolio holdings (see financial note 2(a) for additional information):
| Description | Quoted Prices in
Active Markets for
Identical Assets
(Level 1) | Other Significant
Observable Inputs
(Level 2) | Significant
Unobservable Inputs
(Level 3) | Total | |
| Assets | | | | | |
| Common Stock1 | $9,760,558,229 | $— | $— | $9,760,558,229 | |
| Real Estate | 432,072,358 | — | —* | 432,072,358 | |
| Rights1 | | | | | |
| Automobiles & Components | — | — | —* | — | |
| Materials | — | — | 3,541 | 3,541 | |
| Media & Entertainment | — | — | 1,566 | 1,566 | |
| Pharmaceuticals, Biotechnology & Life Sciences | — | — | 1,592* | 1,592 | |
| Other Investment Company1 | 20,636,112 | — | — | 20,636,112 | |
| Short-Term Investment1 | — | 56,245,967 | — | 56,245,967 | |
| Liabilities | | | | | |
| Futures Contracts2 | (16,037) | — | — | (16,037) | |
| Total | $10,213,250,662 | $56,245,967 | $6,699 | $10,269,503,328 | |
| * | Level 3 amount shown includes securities determined to have no value at October 31, 2019. |
| 1 | As categorized in the complete schedule of Portfolio Holdings. |
| 2 | Futures contracts are valued at unrealized appreciation or depreciation. |
Fund investments in underlying mutual funds are classified as Level 1, without consideration to the classification level of the investments held by the underlying mutual funds, which could be Level 1, Level 2 or Level 3.
Schwab Equity Index Funds | Annual Report
Schwab Total Stock Market Index Fund
Statement of Assets and Liabilities
As of October 31, 2019
| Assets |
| Investment in affiliated issuer, at value (cost $11,764,861) | | $15,925,101 |
| Investments in unaffiliated issuers, at value (cost $6,132,590,397) including securities on loan of $19,526,339 | | 10,232,958,152 |
| Collateral invested for securities on loan, at value (cost $20,636,112) | | 20,636,112 |
| Deposit with broker for futures contracts | | 2,731,118 |
| Receivables: | | |
| Fund shares sold | | 13,924,457 |
| Dividends | | 8,287,264 |
| Income from securities on loan | | 158,902 |
| Interest | | 1,875 |
| Foreign tax reclaims | + | 159 |
| Total assets | | 10,294,623,140 |
| Liabilities |
| Collateral held for securities on loan | | 20,636,112 |
| Payables: | | |
| Investments bought | | 50,947,292 |
| Investment adviser fees | | 253,845 |
| Fund shares redeemed | | 2,860,114 |
| Variation margin on futures contracts | + | 15,650 |
| Total liabilities | | 74,713,013 |
| Net Assets |
| Total assets | | 10,294,623,140 |
| Total liabilities | – | 74,713,013 |
| Net assets | | $10,219,910,127 |
| Net Assets by Source | | |
| Capital received from investors | | 6,014,887,764 |
| Total distributable earnings | | 4,205,022,363 |
| Net Asset Value (NAV) |
| Net Assets | ÷ | Shares
Outstanding | = | NAV |
| $10,219,910,127 | | 191,301,694 | | $53.42 |
| | | | | |
Schwab Equity Index Funds | Annual Report
Schwab Total Stock Market Index Fund
Statement of Operations
For the period November 1, 2018 through October 31, 2019
| Investment Income |
| Dividends received from affiliated issuer | | $245,916 |
| Dividends received from unaffiliated issuers (net of foreign withholding tax of $10,318) | | 184,867,654 |
| Interest | | 497,887 |
| Securities on loan, net | + | 2,174,426 |
| Total investment income | | 187,785,883 |
| Expenses |
| Investment adviser fees | | 2,787,342 |
| Total expenses | – | 2,787,342 |
| Net investment income | | 184,998,541 |
| Realized and Unrealized Gains (Losses) |
| Net realized losses on affiliated issuer | | (158,023) |
| Net realized gains on unaffiliated issuers | | 1,470,510 |
| Net realized losses on futures contracts | + | (705,610) |
| Net realized gains | | 606,877 |
| Net change in unrealized appreciation (depreciation) on affiliated issuer | | (1,914,861) |
| Net change in unrealized appreciation (depreciation) on unaffiliated issuers | | 1,014,336,682 |
| Net change in unrealized appreciation (depreciation) on futures contracts | + | (397,756) |
| Net change in unrealized appreciation (depreciation) | + | 1,012,024,065 |
| Net realized and unrealized gains | | 1,012,630,942 |
| Increase in net assets resulting from operations | | $1,197,629,483 |
Schwab Equity Index Funds | Annual Report
Schwab Total Stock Market Index Fund
Statement of Changes in Net Assets
For the current and prior report periods
| Operations | |
| | 11/1/18-10/31/19 | 11/1/17-10/31/18 |
| Net investment income | | $184,998,541 | $143,017,289 |
| Net realized gains | | 606,877 | 26,416,131 |
| Net change in unrealized appreciation (depreciation) | + | 1,012,024,065 | 268,899,542 |
| Increase in net assets from operations | | 1,197,629,483 | 438,332,962 |
| Distributions to Shareholders | |
| Total distributions | | ($199,442,079) | ($129,534,008) |
| Transactions in Fund Shares | | | |
| | | 11/1/18-10/31/19 | 11/1/17-10/31/18 |
| | | SHARES | VALUE | SHARES | VALUE |
| Shares sold | | 41,564,151 | $2,031,277,091 | 47,531,781 | $2,314,728,323 |
| Shares reinvested | | 3,549,021 | 149,293,091 | 2,083,482 | 98,965,373 |
| Shares redeemed | + | (27,643,143) | (1,368,397,596) | (21,085,111) | (1,033,026,077) |
| Net transactions in fund shares | | 17,470,029 | $812,172,586 | 28,530,152 | $1,380,667,619 |
| Shares Outstanding and Net Assets | | | |
| | | 11/1/18-10/31/19 | 11/1/17-10/31/18 |
| | | SHARES | NET ASSETS | SHARES | NET ASSETS |
| Beginning of period | | 173,831,665 | $8,409,550,137 | 145,301,513 | $6,720,083,564 |
| Total increase | + | 17,470,029 | 1,810,359,990 | 28,530,152 | 1,689,466,573 |
| End of period | | 191,301,694 | $10,219,910,127 | 173,831,665 | $8,409,550,137 |
Schwab Equity Index Funds | Annual Report
Schwab U.S. Large-Cap Growth Index Fund
Financial Statements
Financial Highlights
| | 11/1/18–
10/31/19 | 12/20/171–
10/31/18 | | | | |
| Per-Share Data |
| Net asset value at beginning of period | $42.37 | $40.00 | | | | |
| Income (loss) from investment operations: | | | | | | |
| Net investment income (loss)2 | 0.57 | 0.46 | | | | |
| Net realized and unrealized gains (losses) | 6.52 | 1.913 | | | | |
| Total from investment operations | 7.09 | 2.37 | | | | |
| Less distributions: | | | | | | |
| Distributions from net investment income | (0.40) | — | | | | |
| Net asset value at end of period | $49.06 | $42.37 | | | | |
| Total return | 17.04% | 5.93%4 | | | | |
| Ratios/Supplemental Data |
| Ratios to average net assets: | | | | | | |
| Total expenses | 0.035%5 | 0.040%6,7 | | | | |
| Net operating expenses | N/A | 0.02%6,7 | | | | |
| Net investment income (loss) | 1.27% | 1.23%6 | | | | |
| Portfolio turnover rate | 46% | 23%4 | | | | |
| Net assets, end of period (x 1,000,000) | $166 | $93 | | | | |
| |
1
Commencement of operations.
2
Calculated based on the average shares outstanding during the period.
3
The per share amount does not accord with the change in aggregate gains and losses in securities during the period because of the timing of sales and repurchases of fund shares in relation to fluctuating market values.
4
Not annualized.
5
Effective December 20, 2018, the annual operating expense ratio was reduced to 0.035%. The ratio presented for period ended 10/31/19 is a blended ratio. (See financial note 4)
6
Annualized.
7
The investment adviser voluntarily agreed to waive the fund’s management fees to 0.00% beginning with the fund’s commencement of operations through June 30, 2018. The ratio presented for period ended 10/31/18 is a blended ratio.
Schwab Equity Index Funds | Annual Report
Schwab U.S. Large-Cap Growth Index Fund
Condensed Portfolio Holdings as of October 31, 2019
This section shows the fund’s 50 largest portfolio holdings in unaffiliated issuers, any holdings exceeding 1% of the fund’s net assets as of the report date, and any affiliated issuers. The remaining securities held by the fund are grouped as "Other Securities" in each category. You can request a complete schedule of portfolio holdings as of the report date, free of charge, by calling Schwab Funds® at 1-877-824-5615. This complete schedule, filed on the fund’s N-CSR(S), is also available on the U.S. Securities and Exchange Commission (SEC)’s website atwww.sec.gov.
In addition, the fund files its complete schedule of portfolio holdings with the SEC for the first and third quarters of each fiscal year on Form N-Q. The fund’s Form N-Q is available on the SEC’s website. Effective March 31, 2019, Form N-PORT Part F has replaced Form N-Q. The fund also makes available its complete schedule of portfolio holdings 15-20 days after the end of the month on the fund’s website atwww.schwabfunds.com/schwabfunds_prospectus.
| Security | Number
of Shares | % of Net
Assets | Value
($) |
| Common Stock99.8% of net assets | |
| |
| Automobiles & Components 0.3% | |
| Other Securities | | 0.3 | 528,263 |
| |
| Banks 0.1% | |
| Other Securities | | 0.1 | 144,341 |
| |
| Capital Goods 6.2% | |
| 3M Co. | 4,943 | 0.5 | 815,546 |
| Lockheed Martin Corp. | 2,852 | 0.6 | 1,074,291 |
| The Boeing Co. | 6,110 | 1.3 | 2,076,850 |
| Other Securities | | 3.8 | 6,383,440 |
| | | 6.2 | 10,350,127 |
| |
| Commercial & Professional Services 1.3% | |
| Other Securities | | 1.3 | 2,162,493 |
| |
| Consumer Durables & Apparel 1.5% | |
| NIKE, Inc., Class B | 14,245 | 0.8 | 1,275,640 |
| Other Securities | | 0.7 | 1,245,697 |
| | | 1.5 | 2,521,337 |
| |
| Consumer Services 2.3% | |
| Starbucks Corp. | 13,813 | 0.7 | 1,168,027 |
| Other Securities | | 1.6 | 2,715,213 |
| | | 2.3 | 3,883,240 |
| |
| Diversified Financials 2.1% | |
| S&P Global, Inc. | 2,839 | 0.4 | 732,434 |
| The Charles Schwab Corp.(a) | 8,073 | 0.2 | 328,652 |
| Other Securities | | 1.5 | 2,405,430 |
| | | 2.1 | 3,466,516 |
| |
| Energy 0.3% | |
| Other Securities | | 0.3 | 421,646 |
| |
| Food & Staples Retailing 1.2% | |
| Costco Wholesale Corp. | 5,072 | 0.9 | 1,506,942 |
| Other Securities | | 0.3 | 471,359 |
| | | 1.2 | 1,978,301 |
| |
| Security | Number
of Shares | % of Net
Assets | Value
($) |
| Food, Beverage & Tobacco 3.0% | |
| PepsiCo, Inc. | 13,582 | 1.1 | 1,863,043 |
| The Coca-Cola Co. | 30,183 | 1.0 | 1,642,861 |
| Other Securities | | 0.9 | 1,435,522 |
| | | 3.0 | 4,941,426 |
| |
| Health Care Equipment & Services 6.4% | |
| Abbott Laboratories | 8,612 | 0.4 | 720,049 |
| Intuitive Surgical, Inc. * | 1,323 | 0.4 | 731,553 |
| Stryker Corp. | 3,959 | 0.5 | 856,213 |
| UnitedHealth Group, Inc. | 10,913 | 1.7 | 2,757,715 |
| Other Securities | | 3.4 | 5,579,961 |
| | | 6.4 | 10,645,491 |
| |
| Household & Personal Products 0.6% | |
| Other Securities | | 0.6 | 1,048,293 |
| |
| Insurance 0.9% | |
| Other Securities | | 0.9 | 1,565,558 |
| |
| Materials 1.4% | |
| Other Securities | | 1.4 | 2,334,081 |
| |
| Media & Entertainment 11.5% | |
| Alphabet, Inc., Class A * | 3,455 | 2.6 | 4,349,154 |
| Alphabet, Inc., Class C * | 3,507 | 2.7 | 4,419,206 |
| Comcast Corp., Class A | 24,458 | 0.7 | 1,096,208 |
| Facebook, Inc., Class A * | 27,580 | 3.2 | 5,285,707 |
| Netflix, Inc. * | 4,857 | 0.8 | 1,395,950 |
| Other Securities | | 1.5 | 2,490,832 |
| | | 11.5 | 19,037,057 |
| |
| Pharmaceuticals, Biotechnology & Life Sciences 8.2% | |
| AbbVie, Inc. | 17,074 | 0.8 | 1,358,237 |
| Amgen, Inc. | 6,369 | 0.8 | 1,358,189 |
| Celgene Corp. * | 8,111 | 0.5 | 876,231 |
| Eli Lilly & Co. | 9,929 | 0.7 | 1,131,410 |
| Merck & Co., Inc. | 28,190 | 1.5 | 2,442,945 |
| Thermo Fisher Scientific, Inc. | 3,136 | 0.6 | 947,009 |
| Zoetis, Inc. | 5,527 | 0.4 | 707,014 |
| Other Securities | | 2.9 | 4,753,022 |
| | | 8.2 | 13,574,057 |
| |
Schwab Equity Index Funds | Annual Report
Schwab U.S. Large-Cap Growth Index Fund
Condensed Portfolio Holdings as of October 31, 2019 (continued)
| Security | Number
of Shares | % of Net
Assets | Value
($) |
| Real Estate 2.5% | |
| American Tower Corp. | 5,070 | 0.7 | 1,105,666 |
| Other Securities | | 1.8 | 2,980,561 |
| | | 2.5 | 4,086,227 |
| |
| Retailing 9.9% | |
| Amazon.com, Inc. * | 4,774 | 5.1 | 8,481,775 |
| Booking Holdings, Inc. * | 490 | 0.6 | 1,003,897 |
| Lowe's Cos., Inc. | 9,047 | 0.6 | 1,009,736 |
| The Home Depot, Inc. | 7,253 | 1.0 | 1,701,409 |
| The TJX Cos., Inc. | 14,018 | 0.5 | 808,138 |
| Other Securities | | 2.1 | 3,418,462 |
| | | 9.9 | 16,423,417 |
| |
| Semiconductors & Semiconductor Equipment 4.4% | |
| Broadcom, Inc. | 4,460 | 0.8 | 1,306,111 |
| NVIDIA Corp. | 6,737 | 0.8 | 1,354,272 |
| QUALCOMM, Inc. | 14,038 | 0.7 | 1,129,217 |
| Texas Instruments, Inc. | 10,824 | 0.8 | 1,277,124 |
| Other Securities | | 1.3 | 2,257,779 |
| | | 4.4 | 7,324,503 |
| |
| Software & Services 23.0% | |
| Accenture plc, Class A | 7,356 | 0.8 | 1,363,950 |
| Adobe, Inc. * | 5,621 | 0.9 | 1,562,245 |
| Automatic Data Processing, Inc. | 5,021 | 0.5 | 814,557 |
| International Business Machines Corp. | 6,194 | 0.5 | 828,324 |
| Intuit, Inc. | 2,871 | 0.4 | 739,282 |
| Mastercard, Inc., Class A | 10,361 | 1.7 | 2,868,028 |
| Microsoft Corp. | 87,305 | 7.5 | 12,516,918 |
| Oracle Corp. | 25,878 | 0.9 | 1,410,092 |
| PayPal Holdings, Inc. * | 13,563 | 0.9 | 1,411,908 |
| salesforce.com, Inc. * | 9,462 | 0.9 | 1,480,708 |
| Visa, Inc., Class A | 20,081 | 2.2 | 3,591,688 |
| Other Securities | | 5.8 | 9,494,580 |
| | | 23.0 | 38,082,280 |
| |
| Technology Hardware & Equipment 10.5% | |
| Apple, Inc. | 52,189 | 7.8 | 12,982,536 |
| Cisco Systems, Inc. | 49,468 | 1.4 | 2,350,225 |
| Other Securities | | 1.3 | 1,992,100 |
| | | 10.5 | 17,324,861 |
| |
| Security | Number
of Shares | % of Net
Assets | Value
($) |
| Telecommunication Services 0.2% | |
| Other Securities | | 0.2 | 244,724 |
| |
| Transportation 2.0% | |
| Union Pacific Corp. | 8,177 | 0.8 | 1,352,966 |
| United Parcel Service, Inc., Class B | 8,064 | 0.6 | 928,731 |
| Other Securities | | 0.6 | 1,074,005 |
| | | 2.0 | 3,355,702 |
| Total Common Stock | |
| (Cost $139,882,179) | | | 165,443,941 |
|
| Other Investment Companies0.3% of net assets | |
| |
| Equity Funds 0.1% | |
| Other Securities | | 0.1 | 98,484 |
| |
| Money Market Fund 0.2% | |
| Other Securities | | 0.2 | 383,584 |
| Total Other Investment Companies | |
| (Cost $481,359) | | | 482,068 |
| | Number of
Contracts | Notional
Amount
($) | Current Value/
Unrealized
Depreciation
($) |
| Futures Contracts | | | |
| Long | |
| Russell 1000 Growth Index, e-mini, expires 12/20/19 | 3 | 247,515 | (571) |
The following footnotes may not be applicable to the Condensed Portfolio Holdings. Please refer to the complete schedule of portfolio holdings.
| * | Non-income producing security. |
| (a) | Issuer is affiliated with the fund's investment adviser. |
| (b) | The rate shown is the 7-day yield. |
| | |
| ETF — | Exchange-traded fund |
| REIT — | Real Estate Investment Trust |
The fund owns shares of an affiliate, The Charles Schwab Corp., since that company is included in its index. Below is the summary of investment activities involving The Charles Schwab Corp. shares owned by the fund during the period ended October 31, 2019:
| | Market
Value at
10/31/18 | Gross
Purchases | Gross
Sales | Realized
Gains (Losses) | Net Change
in Unrealized
Appreciation
(depreciation) | Market
Value at
10/31/19 | Balance
of Shares
Held at
10/31/19 | Distributions
Received |
| The Charles Schwab Corp. | $405,247 | $335,030 | ($352,188) | ($89,475) | $30,038 | $328,652 | 8,073 | $6,379 |
Schwab Equity Index Funds | Annual Report
Schwab U.S. Large-Cap Growth Index Fund
Condensed Portfolio Holdings as of October 31, 2019 (continued)
The following is a summary of the inputs used to value the fund’s investments as of October 31, 2019 and reflects the complete schedule of portfolio holdings (see financial note 2(a) for additional information):
| Description | Quoted Prices in
Active Markets for
Identical Assets
(Level 1) | Other Significant
Observable Inputs
(Level 2) | Significant
Unobservable Inputs
(Level 3) | Total | |
| Assets | | | | | |
| Common Stock1 | $165,443,941 | $— | $— | $165,443,941 | |
| Other Investment Companies1 | 482,068 | — | — | 482,068 | |
| Liabilities | | | | | |
| Futures Contracts2 | (571) | — | — | (571) | |
| Total | $165,925,438 | $— | $— | $165,925,438 | |
| 1 | As categorized in the complete schedule of Portfolio Holdings. |
| 2 | Futures contracts are valued at unrealized appreciation or depreciation. |
Fund investments in underlying mutual funds and ETFs are classified as Level 1, without consideration to the classification level of the investments held by the underlying mutual funds and ETFs, which could be Level 1, Level 2 or Level 3.
Schwab Equity Index Funds | Annual Report
Schwab U.S. Large-Cap Growth Index Fund
Statement of Assets and Liabilities
As of October 31, 2019
| Assets |
| Investment in affiliated issuer, at value (cost $356,778) | | $328,652 |
| Investments in unaffiliated issuers, at value (cost $140,006,760) | | 165,597,357 |
| Deposit with broker for futures contracts | | 44,355 |
| Receivables: | | |
| Fund shares sold | | 818,994 |
| Dividends | | 72,165 |
| Income from securities on loan | + | 70 |
| Total assets | | 166,861,593 |
| Liabilities |
| Payables: | | |
| Investments bought | | 989,253 |
| Investment adviser fees | | 4,790 |
| Fund shares redeemed | | 47,623 |
| Variation margin on futures contracts | + | 565 |
| Total liabilities | | 1,042,231 |
| Net Assets |
| Total assets | | 166,861,593 |
| Total liabilities | – | 1,042,231 |
| Net assets | | $165,819,362 |
| Net Assets by Source | | |
| Capital received from investors | | 143,251,421 |
| Total distributable earnings | | 22,567,941 |
| Net Asset Value (NAV) |
| Net Assets | ÷ | Shares
Outstanding | = | NAV |
| $165,819,362 | | 3,380,074 | | $49.06 |
| | | | | |
Schwab Equity Index Funds | Annual Report
Schwab U.S. Large-Cap Growth Index Fund
Statement of Operations
For the period November 1, 2018 through October 31, 2019
| Investment Income |
| Dividends received from affiliated issuer | | $6,379 |
| Dividends received from unaffiliated issuers (net of foreign withholding tax of $19) | | 1,713,406 |
| Securities on loan, net | + | 278 |
| Total investment income | | 1,720,063 |
| Expenses |
| Investment adviser fees | | 46,735 |
| Total expenses | – | 46,735 |
| Net investment income | | 1,673,328 |
| Realized and Unrealized Gains (Losses) |
| Net realized losses on affiliated issuer | | (89,475) |
| Net realized losses on unaffiliated issuers | | (3,864,811) |
| Net realized gains on futures contracts | + | 101,973 |
| Net realized losses | | (3,852,313) |
| Net change in unrealized appreciation (depreciation) on affiliated issuer | | 30,038 |
| Net change in unrealized appreciation (depreciation) on unaffiliated issuers | | 25,085,487 |
| Net change in unrealized appreciation (depreciation) on futures contracts | + | (7,501) |
| Net change in unrealized appreciation (depreciation) | + | 25,108,024 |
| Net realized and unrealized gains | | 21,255,711 |
| Increase in net assets resulting from operations | | $22,929,039 |
Schwab Equity Index Funds | Annual Report
Schwab U.S. Large-Cap Growth Index Fund
Statement of Changes in Net Assets
For the current and prior report periods
| Operations | |
| | 11/1/18-10/31/19 | 12/20/17*-10/31/18 |
| Net investment income | | $1,673,328 | $654,019 |
| Net realized losses | | (3,852,313) | (519,372) |
| Net change in unrealized appreciation (depreciation) | + | 25,108,024 | 453,876 |
| Increase in net assets from operations | | 22,929,039 | 588,523 |
| Distributions to Shareholders | |
| Total distributions | | ($949,803) | $— |
| Transactions in Fund Shares | | | |
| | | 11/1/18-10/31/19 | 12/20/17*-10/31/18 |
| | | SHARES | VALUE | SHARES | VALUE |
| Shares sold | | 2,776,749 | $120,542,470 | 2,550,923 | $107,925,443 |
| Shares reinvested | | 22,696 | 838,591 | — | — |
| Shares redeemed | + | (1,608,317) | (70,292,844) | (361,977) | (15,762,057) |
| Net transactions in fund shares | | 1,191,128 | $51,088,217 | 2,188,946 | $92,163,386 |
| Shares Outstanding and Net Assets | | | |
| | | 11/1/18-10/31/19 | 12/20/17*-10/31/18 |
| | | SHARES | NET ASSETS | SHARES | NET ASSETS |
| Beginning of period | | 2,188,946 | $92,751,909 | — | $— |
| Total increase | + | 1,191,128 | 73,067,453 | 2,188,946 | 92,751,909 |
| End of period | | 3,380,074 | $165,819,362 | 2,188,946 | $92,751,909 |
| * | Commencement of operations. |
Schwab Equity Index Funds | Annual Report
Schwab U.S. Large-Cap Value Index Fund
Financial Statements
Financial Highlights
| | 11/1/18–
10/31/19 | 12/20/171–
10/31/18 | | | | |
| Per-Share Data |
| Net asset value at beginning of period | $39.51 | $40.00 | | | | |
| Income (loss) from investment operations: | | | | | | |
| Net investment income (loss)2 | 1.13 | 0.82 | | | | |
| Net realized and unrealized gains (losses) | 3.10 | (1.31) | | | | |
| Total from investment operations | 4.23 | (0.49) | | | | |
| Less distributions: | | | | | | |
| Distributions from net investment income | (0.62) | — | | | | |
| Distributions from net realized gains | (0.06) | — | | | | |
| Total distributions | (0.68) | — | | | | |
| Net asset value at end of period | $43.06 | $39.51 | | | | |
| Total return | 11.08% | (1.23%)3 | | | | |
| Ratios/Supplemental Data |
| Ratios to average net assets: | | | | | | |
| Total expenses | 0.035%4 | 0.040%5,6 | | | | |
| Net operating expenses | N/A | 0.02%5,6 | | | | |
| Net investment income (loss) | 2.79% | 2.36%5 | | | | |
| Portfolio turnover rate | 22% | 22%3 | | | | |
| Net assets, end of period (x 1,000,000) | $212 | $70 | | | | |
| |
1
Commencement of operations.
2
Calculated based on the average shares outstanding during the period.
3
Not annualized.
4
Effective December 20, 2018, the annual operating expense ratio was reduced to 0.035%. The ratio presented for period ended 10/31/19 is a blended ratio. (See financial note 4)
5
Annualized.
6
The investment adviser voluntarily agreed to waive the fund’s management fees to 0.00% beginning with the fund’s commencement of operations through June 30, 2018. The ratio presented for period ended 10/31/18 is a blended ratio.
Schwab Equity Index Funds | Annual Report
Schwab U.S. Large-Cap Value Index Fund
Condensed Portfolio Holdings as of October 31, 2019
This section shows the fund’s 50 largest portfolio holdings in unaffiliated issuers, any holdings exceeding 1% of the fund’s net assets as of the report date, and any affiliated issuers. The remaining securities held by the fund are grouped as "Other Securities" in each category. You can request a complete schedule of portfolio holdings as of the report date, free of charge, by calling Schwab Funds® at 1-877-824-5615. This complete schedule, filed on the fund’s N-CSR(S), is also available on the U.S. Securities and Exchange Commission (SEC)’s website atwww.sec.gov.
In addition, the fund files its complete schedule of portfolio holdings with the SEC for the first and third quarters of each fiscal year on Form N-Q. The fund’s Form N-Q is available on the SEC’s website. Effective March 31, 2019, Form N-PORT Part F has replaced Form N-Q. The fund also makes available its complete schedule of portfolio holdings 15-20 days after the end of the month on the fund’s website atwww.schwabfunds.com/schwabfunds_prospectus.
| Security | Number
of Shares | % of Net
Assets | Value
($) |
| Common Stock99.6% of net assets | |
| |
| Automobiles & Components 1.0% | |
| Other Securities | | 1.0 | 2,116,112 |
| |
| Banks 11.1% | |
| Bank of America Corp. | 129,894 | 1.9 | 4,061,785 |
| Citigroup, Inc. | 34,830 | 1.2 | 2,502,884 |
| JPMorgan Chase & Co. | 49,037 | 2.9 | 6,125,702 |
| The PNC Financial Services Group, Inc. | 6,860 | 0.5 | 1,006,362 |
| U.S. Bancorp | 22,068 | 0.6 | 1,258,317 |
| Wells Fargo & Co. | 61,239 | 1.5 | 3,161,770 |
| Other Securities | | 2.5 | 5,350,891 |
| | | 11.1 | 23,467,711 |
| |
| Capital Goods 7.2% | |
| Caterpillar, Inc. | 7,760 | 0.5 | 1,069,328 |
| General Electric Co. | 133,474 | 0.6 | 1,332,071 |
| Honeywell International, Inc. | 5,679 | 0.5 | 980,934 |
| United Technologies Corp. | 12,510 | 0.8 | 1,796,186 |
| Other Securities | | 4.8 | 10,198,146 |
| | | 7.2 | 15,376,665 |
| |
| Commercial & Professional Services 0.5% | |
| Other Securities | | 0.5 | 975,664 |
| |
| Consumer Durables & Apparel 0.9% | |
| Other Securities | | 0.9 | 1,958,503 |
| |
| Consumer Services 2.0% | |
| McDonald's Corp. | 9,930 | 0.9 | 1,953,231 |
| Other Securities | | 1.1 | 2,198,916 |
| | | 2.0 | 4,152,147 |
| |
| Diversified Financials 8.1% | |
| Berkshire Hathaway, Inc., Class B * | 30,170 | 3.0 | 6,413,538 |
| BlackRock, Inc. | 1,826 | 0.4 | 843,064 |
| CME Group, Inc. | 5,460 | 0.5 | 1,123,395 |
| Morgan Stanley | 18,324 | 0.4 | 843,820 |
| The Charles Schwab Corp.(a) | 7,215 | 0.1 | 293,723 |
| The Goldman Sachs Group, Inc. | 4,989 | 0.5 | 1,064,553 |
| Other Securities | | 3.2 | 6,703,270 |
| | | 8.1 | 17,285,363 |
| |
| Security | Number
of Shares | % of Net
Assets | Value
($) |
| Energy 8.0% | |
| Chevron Corp. | 29,405 | 1.6 | 3,415,097 |
| ConocoPhillips | 17,139 | 0.4 | 946,073 |
| Exxon Mobil Corp. | 65,292 | 2.1 | 4,411,780 |
| Phillips 66 | 6,917 | 0.4 | 808,044 |
| Other Securities | | 3.5 | 7,500,223 |
| | | 8.0 | 17,081,217 |
| |
| Food & Staples Retailing 1.8% | |
| Walmart, Inc. | 21,659 | 1.2 | 2,539,735 |
| Other Securities | | 0.6 | 1,182,103 |
| | | 1.8 | 3,721,838 |
| |
| Food, Beverage & Tobacco 4.2% | |
| Mondelez International, Inc., Class A | 21,920 | 0.5 | 1,149,704 |
| Philip Morris International, Inc. | 23,972 | 0.9 | 1,952,280 |
| The Coca-Cola Co. | 18,795 | 0.5 | 1,023,012 |
| Other Securities | | 2.3 | 4,825,282 |
| | | 4.2 | 8,950,278 |
| |
| Health Care Equipment & Services 5.8% | |
| Abbott Laboratories | 15,058 | 0.6 | 1,258,999 |
| Becton, Dickinson & Co. | 3,778 | 0.5 | 967,168 |
| CVS Health Corp. | 20,020 | 0.6 | 1,329,128 |
| Danaher Corp. | 9,296 | 0.6 | 1,281,175 |
| Medtronic plc | 20,697 | 1.1 | 2,253,903 |
| Other Securities | | 2.4 | 5,246,870 |
| | | 5.8 | 12,337,243 |
| |
| Household & Personal Products 3.0% | |
| Colgate-Palmolive Co. | 12,963 | 0.4 | 889,262 |
| The Procter & Gamble Co. | 35,913 | 2.1 | 4,471,528 |
| Other Securities | | 0.5 | 975,767 |
| | | 3.0 | 6,336,557 |
| |
| Insurance 4.4% | |
| Chubb Ltd. | 7,020 | 0.5 | 1,069,988 |
| Other Securities | | 3.9 | 8,353,010 |
| | | 4.4 | 9,422,998 |
| |
| Materials 4.2% | |
| Linde plc | 8,369 | 0.8 | 1,659,991 |
| Other Securities | | 3.4 | 7,334,289 |
| | | 4.2 | 8,994,280 |
| |
Schwab Equity Index Funds | Annual Report
Schwab U.S. Large-Cap Value Index Fund
Condensed Portfolio Holdings as of October 31, 2019 (continued)
| Security | Number
of Shares | % of Net
Assets | Value
($) |
| Media & Entertainment 4.0% | |
| Comcast Corp., Class A | 36,831 | 0.8 | 1,650,765 |
| The Walt Disney Co. | 26,932 | 1.6 | 3,499,005 |
| Other Securities | | 1.6 | 3,355,285 |
| | | 4.0 | 8,505,055 |
| |
| Pharmaceuticals, Biotechnology & Life Sciences 6.8% | |
| Allergan plc | 5,058 | 0.4 | 890,764 |
| Bristol-Myers Squibb Co. | 14,888 | 0.4 | 854,125 |
| Gilead Sciences, Inc. | 16,843 | 0.5 | 1,073,068 |
| Johnson & Johnson | 34,789 | 2.2 | 4,593,540 |
| Pfizer, Inc. | 85,817 | 1.6 | 3,292,798 |
| Other Securities | | 1.7 | 3,680,050 |
| | | 6.8 | 14,384,345 |
| |
| Real Estate 5.5% | |
| Prologis, Inc. | 9,678 | 0.4 | 849,341 |
| Other Securities | | 5.1 | 10,848,176 |
| | | 5.5 | 11,697,517 |
| |
| Retailing 2.1% | |
| The Home Depot, Inc. | 7,312 | 0.8 | 1,715,249 |
| Other Securities | | 1.3 | 2,724,632 |
| | | 2.1 | 4,439,881 |
| |
| Semiconductors & Semiconductor Equipment 3.4% | |
| Intel Corp. | 68,383 | 1.8 | 3,865,691 |
| Micron Technology, Inc. * | 17,055 | 0.4 | 810,965 |
| Other Securities | | 1.2 | 2,465,191 |
| | | 3.4 | 7,141,847 |
| |
| Software & Services 1.5% | |
| Other Securities | | 1.5 | 3,162,298 |
| |
| Technology Hardware & Equipment 1.2% | |
| Other Securities | | 1.2 | 2,634,195 |
| |
| Telecommunication Services 4.2% | |
| AT&T, Inc. | 112,599 | 2.0 | 4,333,935 |
| Verizon Communications, Inc. | 63,830 | 1.8 | 3,859,800 |
| Other Securities | | 0.4 | 618,285 |
| | | 4.2 | 8,812,020 |
| |
| Security | Number
of Shares | % of Net
Assets | Value
($) |
| Transportation 1.9% | |
| Other Securities | | 1.9 | 3,981,247 |
| |
| Utilities 6.8% | |
| Dominion Energy, Inc. | 12,357 | 0.5 | 1,020,070 |
| Duke Energy Corp. | 11,227 | 0.5 | 1,058,257 |
| NextEra Energy, Inc. | 7,379 | 0.8 | 1,758,711 |
| The Southern Co. | 16,041 | 0.5 | 1,005,129 |
| Other Securities | | 4.5 | 9,625,194 |
| | | 6.8 | 14,467,361 |
| Total Common Stock | |
| (Cost $196,691,653) | | | 211,402,342 |
|
| Other Investment Companies0.1% of net assets | |
| |
| Equity Funds 0.1% | |
| Other Securities | | 0.1 | 143,077 |
| |
| Securities Lending Collateral 0.0% | |
| Other Securities | | 0.0 | 99,345 |
| Total Other Investment Companies | |
| (Cost $242,598) | | | 242,422 |
| | Number of
Contracts | Notional
Amount
($) | Current Value/
Unrealized
Depreciation
($) |
| Futures Contracts | | | |
| Long | |
| Russell 1000 Growth Index, e-mini, expires 12/20/19 | 10 | 638,450 | (34) |
The following footnotes may not be applicable to the Condensed Portfolio Holdings. Please refer to the complete schedule of portfolio holdings.
| * | Non-income producing security. |
| (a) | Issuer is affiliated with the fund’s investment adviser. |
| (b) | All or a portion of this security is on loan. Securities on loan were valued at $90,270. |
| (c) | The rate shown is the 7-day yield. |
| | |
| ETF — | Exchange-traded fund |
| REIT — | Real Estate Investment Trust |
The fund owns shares of an affiliate, The Charles Schwab Corp., since that company is included in its index. Below is the summary of investment activities involving The Charles Schwab Corp. shares owned by the fund during the period ended October 31, 2019:
| | Market
Value at
10/31/18 | Gross
Purchases | Gross
Sales | Realized
Gains (Losses) | Net Change
in Unrealized
Appreciation
(depreciation) | Market
Value at
10/31/19 | Balance
of Shares
Held at
10/31/19 | Distributions
Received |
| The Charles Schwab Corp. | $— | $296,544 | ($7,029) | ($177) | $4,385 | $293,723 | 7,215 | $1,138 |
Schwab Equity Index Funds | Annual Report
Schwab U.S. Large-Cap Value Index Fund
Condensed Portfolio Holdings as of October 31, 2019 (continued)
The following is a summary of the inputs used to value the fund’s investments as of October 31, 2019 and reflects the complete schedule of portfolio holdings (see financial note 2(a) for additional information):
| Description | Quoted Prices in
Active Markets for
Identical Assets
(Level 1) | Other Significant
Observable Inputs
(Level 2) | Significant
Unobservable Inputs
(Level 3) | Total | |
| Assets | | | | | |
| Common Stock1 | $211,402,342 | $— | $— | $211,402,342 | |
| Other Investment Companies1 | 242,422 | — | — | 242,422 | |
| Liabilities | | | | | |
| Futures Contracts2 | (34) | — | — | (34) | |
| Total | $211,644,730 | $— | $— | $211,644,730 | |
| 1 | As categorized in the complete schedule of Portfolio Holdings. |
| 2 | Futures contracts are valued at unrealized appreciation or depreciation. |
Fund investments in underlying mutual funds and ETFs are classified as Level 1, without consideration to the classification level of the investments held by the underlying mutual funds and ETFs, which could be Level 1, Level 2 or Level 3.
Schwab Equity Index Funds | Annual Report
Schwab U.S. Large-Cap Value Index Fund
Statement of Assets and Liabilities
As of October 31, 2019
| Assets |
| Investment in affiliated issuer, at value (cost $289,338) | | $293,723 |
| Investments in unaffiliated issuers, at value (cost $196,545,568) including securities on loan of $90,270 | | 211,251,696 |
| Collateral invested for securities on loan, at value (cost $99,345) | | 99,345 |
| Deposit with broker for futures contracts | | 42,514 |
| Receivables: | | |
| Fund shares sold | | 784,911 |
| Dividends | | 268,505 |
| Income from securities on loan | + | 332 |
| Total assets | | 212,741,026 |
| Liabilities |
| Collateral held for securities on loan | | 99,345 |
| Payables: | | |
| Investments bought | | 170,855 |
| Investment adviser fees | | 6,108 |
| Due to custodian | | 157,402 |
| Fund shares redeemed | | 93,985 |
| Variation margin on futures contracts | + | 15 |
| Total liabilities | | 527,710 |
| Net Assets |
| Total assets | | 212,741,026 |
| Total liabilities | – | 527,710 |
| Net assets | | $212,213,316 |
| Net Assets by Source | | |
| Capital received from investors | | 190,565,246 |
| Total distributable earnings | | 21,648,070 |
| Net Asset Value (NAV) |
| Net Assets | ÷ | Shares
Outstanding | = | NAV |
| $212,213,316 | | 4,927,964 | | $43.06 |
| | | | | |
Schwab Equity Index Funds | Annual Report
Schwab U.S. Large-Cap Value Index Fund
Statement of Operations
For the period November 1, 2018 through October 31, 2019
| Investment Income |
| Dividends received from affiliated issuer | | $1,138 |
| Dividends received from unaffiliated issuers (net of foreign withholding tax of $579) | | 4,615,666 |
| Securities on loan, net | + | 1,970 |
| Total investment income | | 4,618,774 |
| Expenses |
| Investment adviser fees | | 57,745 |
| Total expenses | – | 57,745 |
| Net investment income | | 4,561,029 |
| Realized and Unrealized Gains (Losses) |
| Net realized losses on affiliated issuer | | (177) |
| Net realized gains on unaffiliated issuers | | 3,149,626 |
| Net realized gains on futures contracts | + | 105,612 |
| Net realized gains | | 3,255,061 |
| Net change in unrealized appreciation (depreciation) on affiliated issuer | | 4,385 |
| Net change in unrealized appreciation (depreciation) on unaffiliated issuers | | 16,349,993 |
| Net change in unrealized appreciation (depreciation) on futures contracts | + | (914) |
| Net change in unrealized appreciation (depreciation) | + | 16,353,464 |
| Net realized and unrealized gains | | 19,608,525 |
| Increase in net assets resulting from operations | | $24,169,554 |
Schwab Equity Index Funds | Annual Report
Schwab U.S. Large-Cap Value Index Fund
Statement of Changes in Net Assets
For the current and prior report periods
| Operations | |
| | 11/1/18-10/31/19 | 12/20/17*-10/31/18 |
| Net investment income | | $4,561,029 | $1,002,360 |
| Net realized gains (losses) | | 3,255,061 | (344,905) |
| Net change in unrealized appreciation (depreciation) | + | 16,353,464 | (1,642,985) |
| Increase (decrease) in net assets from operations | | 24,169,554 | (985,530) |
| Distributions to Shareholders | |
| Total distributions | | ($1,536,515) | $— |
| Transactions in Fund Shares | | | |
| | | 11/1/18-10/31/19 | 12/20/17*-10/31/18 |
| | | SHARES | VALUE | SHARES | VALUE |
| Shares sold | | 4,104,466 | $157,914,398 | 1,995,233 | $80,009,188 |
| Shares reinvested | | 38,320 | 1,344,745 | — | — |
| Shares redeemed | + | (979,981) | (39,427,758) | (230,074) | (9,274,766) |
| Net transactions in fund shares | | 3,162,805 | $119,831,385 | 1,765,159 | $70,734,422 |
| Shares Outstanding and Net Assets | | | |
| | | 11/1/18-10/31/19 | 12/20/17*-10/31/18 |
| | | SHARES | NET ASSETS | SHARES | NET ASSETS |
| Beginning of period | | 1,765,159 | $69,748,892 | — | $— |
| Total increase | + | 3,162,805 | 142,464,424 | 1,765,159 | 69,748,892 |
| End of period | | 4,927,964 | $212,213,316 | 1,765,159 | $69,748,892 |
| * | Commencement of operations. |
Schwab Equity Index Funds | Annual Report
Schwab U.S. Mid-Cap Index Fund
Financial Statements
Financial Highlights
| | 11/1/18–
10/31/19 | 12/20/171–
10/31/18 | | | | |
| Per-Share Data |
| Net asset value at beginning of period | $39.55 | $40.00 | | | | |
| Income (loss) from investment operations: | | | | | | |
| Net investment income (loss)2 | 0.70 | 0.59 | | | | |
| Net realized and unrealized gains (losses) | 4.54 | (1.04) | | | | |
| Total from investment operations | 5.24 | (0.45) | | | | |
| Less distributions: | | | | | | |
| Distributions from net investment income | (0.42) | — | | | | |
| Distributions from net realized gains | (0.08) | — | | | | |
| Total distributions | (0.50) | — | | | | |
| Net asset value at end of period | $44.29 | $39.55 | | | | |
| Total return | 13.61% | (1.13%)3 | | | | |
| Ratios/Supplemental Data |
| Ratios to average net assets: | | | | | | |
| Total expenses | 0.04%4 | 0.05%5,6 | | | | |
| Net operating expenses | N/A | 0.03%5,6 | | | | |
| Net investment income (loss) | 1.67% | 1.65%5 | | | | |
| Portfolio turnover rate | 21% | 15%3 | | | | |
| Net assets, end of period (x 1,000,000) | $357 | $171 | | | | |
| |
1
Commencement of operations.
2
Calculated based on the average shares outstanding during the period.
3
Not annualized.
4
Effective December 20, 2018, the annual operating expense ratio was reduced to 0.04%. The ratio presented for period ended 10/31/19 is a blended ratio. (See financial note 4)
5
Annualized.
6
The investment adviser voluntarily agreed to waive the fund’s management fees to 0.00% beginning with the fund’s commencement of operations through June 30, 2018. The ratio presented for period ended 10/31/18 is a blended ratio.
Schwab Equity Index Funds | Annual Report
Schwab U.S. Mid-Cap Index Fund
Condensed Portfolio Holdings as of October 31, 2019
This section shows the fund’s 50 largest portfolio holdings in unaffiliated issuers, any holdings exceeding 1% of the fund’s net assets as of the report date, and any affiliated issuers. The remaining securities held by the fund are grouped as "Other Securities" in each category. You can request a complete schedule of portfolio holdings as of the report date, free of charge, by calling Schwab Funds® at 1-877-824-5615. This complete schedule, filed on the fund’s N-CSR(S), is also available on the U.S. Securities and Exchange Commission (SEC)’s website atwww.sec.gov.
In addition, the fund files its complete schedule of portfolio holdings with the SEC for the first and third quarters of each fiscal year on Form N-Q. The fund’s Form N-Q is available on the SEC’s website. Effective March 31, 2019, Form N-PORT Part F has replaced Form N-Q. The fund also makes available its complete schedule of portfolio holdings 15-20 days after the end of the month on the fund’s website atwww.schwabfunds.com/schwabfunds_prospectus.
| Security | Number
of Shares | % of Net
Assets | Value
($) |
| Common Stock99.6% of net assets | |
| |
| Automobiles & Components 0.8% | |
| Other Securities | | 0.8 | 2,751,807 |
| |
| Banks 4.2% | |
| SunTrust Banks, Inc. | 20,634 | 0.4 | 1,410,128 |
| Other Securities | | 3.8 | 13,457,214 |
| | | 4.2 | 14,867,342 |
| |
| Capital Goods 9.2% | |
| Cummins, Inc. | 7,165 | 0.3 | 1,235,819 |
| Ingersoll-Rand plc | 11,216 | 0.4 | 1,423,198 |
| L3Harris Technologies, Inc. | 10,288 | 0.6 | 2,122,517 |
| PACCAR, Inc. | 15,800 | 0.3 | 1,201,748 |
| TransDigm Group, Inc. | 2,291 | 0.3 | 1,205,707 |
| Other Securities | | 7.3 | 25,779,857 |
| | | 9.2 | 32,968,846 |
| |
| Commercial & Professional Services 2.6% | |
| IHS Markit Ltd. * | 18,439 | 0.4 | 1,291,099 |
| Other Securities | | 2.2 | 8,167,501 |
| | | 2.6 | 9,458,600 |
| |
| Consumer Durables & Apparel 2.7% | |
| lululemon Athletica, Inc. * | 5,498 | 0.3 | 1,123,076 |
| Other Securities | | 2.4 | 8,662,554 |
| | | 2.7 | 9,785,630 |
| |
| Consumer Services 3.3% | |
| Hilton Worldwide Holdings, Inc. | 13,188 | 0.4 | 1,278,709 |
| Other Securities | | 2.9 | 10,361,433 |
| | | 3.3 | 11,640,142 |
| |
| Diversified Financials 5.0% | |
| Discover Financial Services | 14,808 | 0.3 | 1,188,490 |
| State Street Corp. | 17,353 | 0.3 | 1,146,513 |
| T. Rowe Price Group, Inc. | 10,741 | 0.3 | 1,243,808 |
| Other Securities | | 4.1 | 14,159,239 |
| | | 5.0 | 17,738,050 |
| |
| Security | Number
of Shares | % of Net
Assets | Value
($) |
| Energy 3.6% | |
| ONEOK, Inc. | 19,145 | 0.4 | 1,336,895 |
| The Williams Cos., Inc. | 56,524 | 0.4 | 1,261,050 |
| Other Securities | | 2.8 | 10,451,011 |
| | | 3.6 | 13,048,956 |
| |
| Food & Staples Retailing 0.5% | |
| Other Securities | | 0.5 | 1,755,889 |
| |
| Food, Beverage & Tobacco 2.8% | |
| Other Securities | | 2.8 | 9,998,709 |
| |
| Health Care Equipment & Services 6.0% | |
| IDEXX Laboratories, Inc. * | 3,956 | 0.3 | 1,127,500 |
| McKesson Corp. | 8,615 | 0.3 | 1,145,795 |
| Zimmer Biomet Holdings, Inc. | 9,553 | 0.4 | 1,320,511 |
| Other Securities | | 5.0 | 17,738,770 |
| | | 6.0 | 21,332,576 |
| |
| Household & Personal Products 0.7% | |
| Other Securities | | 0.7 | 2,374,106 |
| |
| Insurance 4.0% | |
| Willis Towers Watson plc | 6,009 | 0.3 | 1,123,082 |
| Other Securities | | 3.7 | 13,349,709 |
| | | 4.0 | 14,472,791 |
| |
| Materials 5.1% | |
| Newmont Goldcorp Corp. | 38,084 | 0.4 | 1,513,077 |
| Other Securities | | 4.7 | 16,738,406 |
| | | 5.1 | 18,251,483 |
| |
| Media & Entertainment 3.8% | |
| Other Securities | | 3.8 | 13,433,563 |
| |
| Pharmaceuticals, Biotechnology & Life Sciences 3.8% | |
| IQVIA Holdings, Inc. * | 8,361 | 0.3 | 1,207,496 |
| Other Securities | | 3.5 | 12,362,385 |
| | | 3.8 | 13,569,881 |
| |
| Real Estate 10.2% | |
| AvalonBay Communities, Inc. | 6,484 | 0.4 | 1,411,307 |
| Digital Realty Trust, Inc. | 9,675 | 0.3 | 1,229,112 |
| Equity Residential | 17,027 | 0.4 | 1,509,614 |
| Realty Income Corp. | 14,821 | 0.3 | 1,212,210 |
Schwab Equity Index Funds | Annual Report
Schwab U.S. Mid-Cap Index Fund
Condensed Portfolio Holdings as of October 31, 2019 (continued)
| Security | Number
of Shares | % of Net
Assets | Value
($) |
| SBA Communications Corp. | 5,222 | 0.4 | 1,256,674 |
| Ventas, Inc. | 17,339 | 0.3 | 1,128,769 |
| Welltower, Inc. | 18,870 | 0.5 | 1,711,320 |
| Other Securities | | 7.6 | 26,780,924 |
| | | 10.2 | 36,239,930 |
| |
| Retailing 4.6% | |
| AutoZone, Inc. * | 1,137 | 0.4 | 1,301,160 |
| Dollar General Corp. | 12,076 | 0.5 | 1,936,266 |
| Dollar Tree, Inc. * | 10,972 | 0.3 | 1,211,309 |
| O'Reilly Automotive, Inc. * | 3,509 | 0.4 | 1,528,205 |
| Other Securities | | 3.0 | 10,442,274 |
| | | 4.6 | 16,419,214 |
| |
| Semiconductors & Semiconductor Equipment 3.5% | |
| Advanced Micro Devices, Inc. * | 46,674 | 0.4 | 1,583,649 |
| KLA Corp. | 7,424 | 0.4 | 1,254,953 |
| Lam Research Corp. | 6,726 | 0.5 | 1,823,015 |
| Other Securities | | 2.2 | 7,717,647 |
| | | 3.5 | 12,379,264 |
| |
| Software & Services 9.8% | |
| Fiserv, Inc. * | 26,286 | 0.8 | 2,789,996 |
| FleetCor Technologies, Inc. * | 3,968 | 0.3 | 1,167,465 |
| Global Payments, Inc. | 13,884 | 0.7 | 2,348,895 |
| Paychex, Inc. | 14,947 | 0.4 | 1,250,167 |
| Other Securities | | 7.6 | 27,411,785 |
| | | 9.8 | 34,968,308 |
| |
| Technology Hardware & Equipment 4.0% | |
| Amphenol Corp., Class A | 13,589 | 0.4 | 1,363,384 |
| Motorola Solutions, Inc. | 7,669 | 0.4 | 1,275,508 |
| Other Securities | | 3.2 | 11,784,410 |
| | | 4.0 | 14,423,302 |
| |
| Telecommunication Services 0.5% | |
| Other Securities | | 0.5 | 1,649,749 |
| |
| Transportation 1.9% | |
| Other Securities | | 1.9 | 6,888,797 |
| |
| Utilities 7.0% | |
| Consolidated Edison, Inc. | 15,501 | 0.4 | 1,429,502 |
| Entergy Corp. | 9,256 | 0.3 | 1,124,419 |
| Eversource Energy | 15,088 | 0.4 | 1,263,469 |
| Security | Number
of Shares | % of Net
Assets | Value
($) |
| FirstEnergy Corp. | 24,751 | 0.3 | 1,195,968 |
| PPL Corp. | 33,696 | 0.3 | 1,128,479 |
| Public Service Enterprise Group, Inc. | 23,514 | 0.4 | 1,488,671 |
| Sempra Energy | 12,790 | 0.5 | 1,848,283 |
| WEC Energy Group, Inc. | 14,680 | 0.4 | 1,385,792 |
| Xcel Energy, Inc. | 23,982 | 0.4 | 1,523,097 |
| Other Securities | | 3.6 | 12,476,550 |
| | | 7.0 | 24,864,230 |
| Total Common Stock | |
| (Cost $329,134,730) | | | 355,281,165 |
|
| Other Investment Companies0.7% of net assets | |
| |
| Equity Funds 0.1% | |
| Other Securities | | 0.1 | 237,510 |
| |
| Money Market Fund 0.4% | |
| State Street Institutional U.S. Government Money Market Fund, Premier Class 1.75%(b) | 1,576,417 | 0.4 | 1,576,417 |
| |
| Securities Lending Collateral 0.2% | |
| Other Securities | | 0.2 | 543,270 |
| Total Other Investment Companies | |
| (Cost $2,354,574) | | | 2,357,197 |
| | Number of
Contracts | Notional
Amount
($) | Current Value/
Unrealized
Depreciation
($) |
| Futures Contracts | | | |
| Long | |
| S&P 400 Mid-Cap Index, e-mini, expires 12/20/19 | 5 | 977,500 | (3,585) |
The following footnotes may not be applicable to the Condensed Portfolio Holdings. Please refer to the complete schedule of portfolio holdings.
| * | Non-income producing security. |
| (a) | All or a portion of this security is on loan. Securities on loan were valued at $508,482. |
| (b) | The rate shown is the 7-day yield. |
| | |
| ETF — | Exchange-traded fund |
| REIT — | Real Estate Investment Trust |
Schwab Equity Index Funds | Annual Report
Schwab U.S. Mid-Cap Index Fund
Condensed Portfolio Holdings as of October 31, 2019 (continued)
The following is a summary of the inputs used to value the fund’s investments as of October 31, 2019 and reflects the complete schedule of portfolio holdings (see financial note 2(a) for additional information):
| Description | Quoted Prices in
Active Markets for
Identical Assets
(Level 1) | Other Significant
Observable Inputs
(Level 2) | Significant
Unobservable Inputs
(Level 3) | Total | |
| Assets | | | | | |
| Common Stock1 | $355,281,165 | $— | $— | $355,281,165 | |
| Other Investment Companies1 | 2,357,197 | — | — | 2,357,197 | |
| Liabilities | | | | | |
| Futures Contracts2 | (3,585) | — | — | (3,585) | |
| Total | $357,634,777 | $— | $— | $357,634,777 | |
| 1 | As categorized in the complete schedule of Portfolio Holdings. |
| 2 | Futures contracts are valued at unrealized appreciation or depreciation. |
Fund investments in underlying mutual funds and ETFs are classified as Level 1, without consideration to the classification level of the investments held by the underlying mutual funds and ETFs, which could be Level 1, Level 2 or Level 3.
Schwab Equity Index Funds | Annual Report
Schwab U.S. Mid-Cap Index Fund
Statement of Assets and Liabilities
As of October 31, 2019
| Assets |
| Investments in unaffiliated issuers, at value (cost $330,946,034) including securities on loan of $508,482 | | $357,095,092 |
| Collateral invested for securities on loan, at value (cost $543,270) | | 543,270 |
| Deposit with broker for futures contracts | | 116,189 |
| Receivables: | | |
| Investments sold | | 50,887 |
| Fund shares sold | | 1,060,764 |
| Dividends | | 160,496 |
| Income from securities on loan | + | 5,172 |
| Total assets | | 359,031,870 |
| Liabilities |
| Collateral held for securities on loan | | 543,270 |
| Payables: | | |
| Investments bought | | 1,788,254 |
| Investment adviser fees | | 11,842 |
| Fund shares redeemed | | 89,132 |
| Variation margin on futures contracts | + | 3,575 |
| Total liabilities | | 2,436,073 |
| Net Assets |
| Total assets | | 359,031,870 |
| Total liabilities | – | 2,436,073 |
| Net assets | | $356,595,797 |
| Net Assets by Source | | |
| Capital received from investors | | 327,701,948 |
| Total distributable earnings | | 28,893,849 |
| Net Asset Value (NAV) |
| Net Assets | ÷ | Shares
Outstanding | = | NAV |
| $356,595,797 | | 8,051,761 | | $44.29 |
| | | | | |
Schwab Equity Index Funds | Annual Report
Schwab U.S. Mid-Cap Index Fund
Statement of Operations
For the period November 1, 2018 through October 31, 2019
| Investment Income |
| Dividends (net of foreign withholding tax of $552) | | $4,885,941 |
| Securities on loan, net | + | 17,324 |
| Total investment income | | 4,903,265 |
| Expenses |
| Investment adviser fees | | 117,274 |
| Total expenses | – | 117,274 |
| Net investment income | | 4,785,991 |
| Realized and Unrealized Gains (Losses) |
| Net realized losses on investments | | (833,813) |
| Net realized gains on futures contracts | + | 171,215 |
| Net realized losses | | (662,598) |
| Net change in unrealized appreciation (depreciation) on investments | | 35,437,205 |
| Net change in unrealized appreciation (depreciation) on futures contracts | + | (9,939) |
| Net change in unrealized appreciation (depreciation) | + | 35,427,266 |
| Net realized and unrealized gains | | 34,764,668 |
| Increase in net assets resulting from operations | | $39,550,659 |
Schwab Equity Index Funds | Annual Report
Schwab U.S. Mid-Cap Index Fund
Statement of Changes in Net Assets
For the current and prior report periods
| Operations | |
| | 11/1/18-10/31/19 | 12/20/17*-10/31/18 |
| Net investment income | | $4,785,991 | $1,634,470 |
| Net realized losses | | (662,598) | (58,632) |
| Net change in unrealized appreciation (depreciation) | + | 35,427,266 | (9,281,793) |
| Increase (decrease) in net assets from operations | | 39,550,659 | (7,705,955) |
| Distributions to Shareholders | |
| Total distributions | | ($2,951,274) | $— |
| Transactions in Fund Shares | | | |
| | | 11/1/18-10/31/19 | 12/20/17*-10/31/18 |
| | | SHARES | VALUE | SHARES | VALUE |
| Shares sold | | 6,140,825 | $247,965,349 | 4,668,513 | $192,981,527 |
| Shares reinvested | | 76,761 | 2,670,904 | — | — |
| Shares redeemed | + | (2,496,685) | (101,917,905) | (337,653) | (13,997,508) |
| Net transactions in fund shares | | 3,720,901 | $148,718,348 | 4,330,860 | $178,984,019 |
| Shares Outstanding and Net Assets | | | |
| | | 11/1/18-10/31/19 | 12/20/17*-10/31/18 |
| | | SHARES | NET ASSETS | SHARES | NET ASSETS |
| Beginning of period | | 4,330,860 | $171,278,064 | — | $— |
| Total increase | + | 3,720,901 | 185,317,733 | 4,330,860 | 171,278,064 |
| End of period | | 8,051,761 | $356,595,797 | 4,330,860 | $171,278,064 |
| * | Commencement of operations. |
Schwab Equity Index Funds | Annual Report
Schwab International Index Fund
Financial Statements
Financial Highlights
| | 11/1/18–
10/31/19 | 11/1/17–
10/31/18 | 11/1/16–
10/31/17 | 11/1/15–
10/31/16 | 11/1/14–
10/31/15 | |
| Per-Share Data |
| Net asset value at beginning of period | $19.00 | $21.01 | $17.52 | $18.49 | $19.42 | |
| Income (loss) from investment operations: | | | | | | |
| Net investment income (loss)1 | 0.64 | 0.62 | 0.55 | 0.53 | 0.54 | |
| Net realized and unrealized gains (losses) | 1.39 | (2.06) | 3.49 | (1.03) | (0.86) | |
| Total from investment operations | 2.03 | (1.44) | 4.04 | (0.50) | (0.32) | |
| Less distributions: | | | | | | |
| Distributions from net investment income | (0.55) | (0.57) | (0.55) | (0.47) | (0.61) | |
| Net asset value at end of period | $20.48 | $19.00 | $21.01 | $17.52 | $18.49 | |
| Total return | 11.27% | (7.11%) | 23.76% | (2.64%) | (1.53%) | |
| Ratios/Supplemental Data |
| Ratios to average net assets: | | | | | | |
| Total expenses | 0.06% | 0.06% | 0.11%2 | 0.23% | 0.23% | |
| Net operating expenses | N/A | N/A3 | 0.10%2 | 0.19% | 0.19% | |
| Net investment income (loss) | 3.32% | 2.99% | 2.88% | 3.06% | 2.82% | |
| Portfolio turnover rate | 5% | 5% | 3% | 4% | 7% | |
| Net assets, end of period (x 1,000,000) | $5,443 | $4,314 | $4,128 | $2,900 | $2,844 | |
| |
1
Calculated based on the average shares outstanding during the period.
2
Effective March 1, 2017, the annual operating expense ratio was reduced. The ratio presented for period ended 10/31/17 is a blended ratio.
3
Effective March 1, 2017, the fund instituted a new fee structure and the contractual expense limitation was terminated.
Schwab Equity Index Funds | Annual Report
Schwab International Index Fund
Condensed Portfolio Holdings as of October 31, 2019
This section shows the fund’s 50 largest portfolio holdings in unaffiliated issuers, any holdings exceeding 1% of the fund’s net assets as of the report date, and any affiliated issuers. The remaining securities held by the fund are grouped as "Other Securities" in each category. You can request a complete schedule of portfolio holdings as of the report date, free of charge, by calling Schwab Funds® at 1-877-824-5615. This complete schedule, filed on the fund’s N-CSR(S), is also available on the U.S. Securities and Exchange Commission (SEC)’s website atwww.sec.gov.
In addition, the fund files its complete schedule of portfolio holdings with the SEC for the first and third quarters of each fiscal year on Form N-Q. The fund’s Form N-Q is available on the SEC’s website. Effective March 31, 2019, Form N-PORT Part F has replaced Form N-Q. The fund also makes available its complete schedule of portfolio holdings 15-20 days after the end of the month on the fund’s website atwww.schwabfunds.com/schwabfunds_prospectus.
| Security | Number
of Shares | % of Net
Assets | Value
($) |
| Common Stock98.8% of net assets | |
| |
| Australia 6.9% | |
| BHP Group Ltd. | 1,115,697 | 0.5 | 27,348,469 |
| Commonwealth Bank of Australia | 669,438 | 0.7 | 36,296,990 |
| CSL Ltd. | 171,339 | 0.6 | 30,216,704 |
| National Australia Bank Ltd. | 1,067,056 | 0.4 | 20,945,385 |
| Westpac Banking Corp. | 1,301,398 | 0.5 | 25,267,275 |
| Other Securities | | 4.2 | 233,526,561 |
| | | 6.9 | 373,601,384 |
| |
| Austria 0.2% | |
| Other Securities | | 0.2 | 12,524,358 |
| |
| Belgium 0.9% | |
| Anheuser-Busch InBev S.A./N.V. | 288,086 | 0.4 | 23,253,549 |
| Other Securities | | 0.5 | 27,442,467 |
| | | 0.9 | 50,696,016 |
| |
| Denmark 1.8% | |
| Novo Nordisk A/S, Class B | 669,249 | 0.7 | 36,801,129 |
| Other Securities | | 1.1 | 58,680,412 |
| | | 1.8 | 95,481,541 |
| |
| Finland 0.9% | |
| Other Securities | | 0.9 | 51,613,708 |
| |
| France 11.3% | |
| Air Liquide S.A. | 178,786 | 0.4 | 23,771,572 |
| Airbus SE | 220,573 | 0.6 | 31,643,014 |
| BNP Paribas S.A. | 427,117 | 0.4 | 22,320,939 |
| L'Oreal S.A. | 95,425 | 0.5 | 27,869,984 |
| LVMH Moet Hennessy Louis Vuitton SE | 105,026 | 0.8 | 44,851,942 |
| Sanofi | 426,921 | 0.7 | 39,356,593 |
| TOTAL S.A. | 906,552 | 0.9 | 47,927,766 |
| Vinci S.A. | 193,107 | 0.4 | 21,665,877 |
| Other Securities | | 6.6 | 355,911,716 |
| | | 11.3 | 615,319,403 |
| |
| Germany 8.2% | |
| adidas AG | 68,493 | 0.4 | 21,148,633 |
| Allianz SE | 160,325 | 0.7 | 39,154,979 |
| BASF SE | 347,610 | 0.5 | 26,425,035 |
| Bayer AG | 352,192 | 0.5 | 27,321,705 |
| Deutsche Telekom AG | 1,260,647 | 0.4 | 22,181,789 |
| SAP SE | 371,644 | 0.9 | 49,243,367 |
| Security | Number
of Shares | % of Net
Assets | Value
($) |
| Siemens AG | 289,259 | 0.6 | 33,380,486 |
| Other Securities | | 4.2 | 226,165,502 |
| | | 8.2 | 445,021,496 |
| |
| Hong Kong 3.6% | |
| AIA Group Ltd. | 4,577,000 | 0.8 | 45,578,762 |
| Other Securities | | 2.8 | 148,863,250 |
| | | 3.6 | 194,442,012 |
| |
| Ireland 0.6% | |
| Other Securities | | 0.6 | 30,088,367 |
| |
| Israel 0.6% | |
| Other Securities | | 0.6 | 30,802,619 |
| |
| Italy 2.3% | |
| Enel S.p.A. | 3,074,359 | 0.4 | 23,827,383 |
| Other Securities | | 1.9 | 104,167,600 |
| | | 2.3 | 127,994,983 |
| |
| Japan 24.6% | |
| Keyence Corp. | 34,400 | 0.4 | 21,750,997 |
| Mitsubishi UFJ Financial Group, Inc. | 4,655,209 | 0.4 | 24,133,946 |
| SoftBank Group Corp. | 624,400 | 0.4 | 24,018,423 |
| Sony Corp. | 482,300 | 0.5 | 29,357,188 |
| Takeda Pharmaceutical Co., Ltd. | 561,090 | 0.4 | 20,273,895 |
| Toyota Motor Corp. | 863,503 | 1.1 | 59,910,600 |
| Other Securities | | 21.4 | 1,157,218,864 |
| | | 24.6 | 1,336,663,913 |
| |
| Netherlands 3.9% | |
| ASML Holding N.V. | 161,035 | 0.8 | 42,209,576 |
| Unilever N.V. | 551,641 | 0.6 | 32,605,664 |
| Other Securities | | 2.5 | 135,212,408 |
| | | 3.9 | 210,027,648 |
| |
| New Zealand 0.2% | |
| Other Securities | | 0.2 | 12,928,238 |
| |
| Norway 0.6% | |
| Other Securities | | 0.6 | 33,821,357 |
| |
| Portugal 0.2% | |
| Other Securities | | 0.2 | 8,556,971 |
| |
Schwab Equity Index Funds | Annual Report
Schwab International Index Fund
Condensed Portfolio Holdings as of October 31, 2019 (continued)
| Security | Number
of Shares | % of Net
Assets | Value
($) |
| Singapore 1.3% | |
| Other Securities | | 1.3 | 69,656,137 |
| |
| Spain 2.8% | |
| Banco Santander S.A. | 6,359,506 | 0.5 | 25,535,308 |
| Iberdrola S.A. | 2,268,409 | 0.4 | 23,316,961 |
| Other Securities | | 1.9 | 106,057,214 |
| | | 2.8 | 154,909,483 |
| |
| Sweden 2.6% | |
| Other Securities | | 2.6 | 142,642,192 |
| |
| Switzerland 9.2% | |
| Nestle S.A. | 1,160,625 | 2.3 | 124,165,185 |
| Novartis AG | 812,898 | 1.3 | 71,027,123 |
| Roche Holding AG | 265,904 | 1.5 | 80,025,351 |
| Zurich Insurance Group AG | 57,412 | 0.4 | 22,488,283 |
| Other Securities | | 3.7 | 203,823,349 |
| | | 9.2 | 501,529,291 |
| |
| United Kingdom 16.1% | |
| AstraZeneca plc | 495,825 | 0.9 | 48,351,474 |
| BP plc | 7,704,296 | 0.9 | 48,855,723 |
| British American Tobacco plc | 871,028 | 0.6 | 30,464,955 |
| Diageo plc | 899,070 | 0.7 | 36,799,813 |
| GlaxoSmithKline plc | 1,892,006 | 0.8 | 43,336,275 |
| HSBC Holdings plc | 7,660,241 | 1.1 | 57,873,949 |
| Reckitt Benckiser Group plc | 268,592 | 0.4 | 20,784,083 |
| Rio Tinto plc | 428,305 | 0.4 | 22,298,332 |
| Royal Dutch Shell plc, A Shares | 1,647,039 | 0.9 | 47,744,501 |
| Royal Dutch Shell plc, B Shares | 1,418,805 | 0.8 | 40,861,248 |
| Unilever plc | 419,199 | 0.5 | 25,101,192 |
| Vodafone Group plc | 10,087,787 | 0.4 | 20,586,342 |
| Other Securities | | 7.7 | 434,191,992 |
| | | 16.1 | 877,249,879 |
| Total Common Stock | |
| (Cost $4,441,053,703) | | | 5,375,570,996 |
|
| Preferred Stock0.5% of net assets | |
| |
| Germany 0.5% | |
| Other Securities | | 0.5 | 29,942,308 |
| |
| United Kingdom 0.0% | |
| Other Securities | | 0.0 | 38,493 |
| Total Preferred Stock | |
| (Cost $26,636,648) | | | 29,980,801 |
| Security | Number
of Shares | % of Net
Assets | Value
($) |
| Other Investment Company0.1% of net assets | |
| |
| United States 0.1% | |
| Securities Lending Collateral 0.1% | |
| Other Securities | | 0.1 | 3,797,238 |
| Total Other Investment Company | |
| (Cost $3,797,238) | | | 3,797,238 |
Security
Rate, Maturity Date | Face
Amount ($) | % of Net
Assets | Value
($) |
| Short-Term Investments0.1% of net assets | |
| |
| Time Deposits 0.1% | |
| Other Securities | | 0.1 | 6,139,051 |
| Total Short-Term Investments | |
| (Cost $6,139,051) | | | 6,139,051 |
| | Number of
Contracts | Notional
Amount
($) | Current Value/
Unrealized
Appreciation
($) |
| Futures Contracts | |
| Long | |
| MSCI EAFE Index, expires 12/20/19 | 376 | 36,795,360 | 845,450 |
The following footnotes may not be applicable to the Condensed Portfolio Holdings. Please refer to the complete schedule of portfolio holdings.
| * | Non-income producing security. |
| (a) | All or a portion of this security is on loan. Securities on loan were valued at $3,604,867. |
| (b) | Fair-valued by management using significant unobservable inputs in accordance with procedures approved by fund’s Board of Trustees. |
| (c) | Securities are traded on separate exchanges for the same entity. |
| (d) | The rate shown is the 7-day yield. |
| (e) | The rate shown is the current daily overnight rate. |
| | |
| ADR — | American Depositary Receipt |
| CVA — | Dutch Certificate |
| REIT — | Real Estate Investment Trust |
| RSP — | Risparmio (Convertible Savings Shares) |
| SDR — | Swedish Depositary Receipt |
Schwab Equity Index Funds | Annual Report
Schwab International Index Fund
Condensed Portfolio Holdings as of October 31, 2019 (continued)
The following is a summary of the inputs used to value the fund’s investments as of October 31, 2019 and reflects the complete schedule of portfolio holdings (see financial note 2(a) for additional information):
| Description | Quoted Prices in
Active Markets for
Identical Assets
(Level 1) | Other Significant
Observable Inputs
(Level 2) | Significant
Unobservable Inputs
(Level 3) | Total | |
| Assets | | | | | |
| Common Stock1 | $— | $868,650,190 | $— | $868,650,190 | |
| Belgium | 1,161,425 | 49,534,591 | — | 50,696,016 | |
| Finland | 2,912,301 | 48,701,407 | — | 51,613,708 | |
| France | 14,738,601 | 600,580,802 | — | 615,319,403 | |
| Germany | 57,277,823 | 387,743,673 | — | 445,021,496 | |
| Hong Kong | 7,035,336 | 187,406,676 | — | 194,442,012 | |
| Ireland | 14,337,258 | 15,751,109 | — | 30,088,367 | |
| Israel | 12,157,662 | 18,644,957 | — | 30,802,619 | |
| Japan | 3,751,875 | 1,332,912,038 | — | 1,336,663,913 | |
| Netherlands | 32,417,996 | 177,609,652 | — | 210,027,648 | |
| Portugal | — | 8,556,971 | —* | 8,556,971 | |
| Spain | — | 153,994,944 | 914,539 | 154,909,483 | |
| Switzerland | 6,188,738 | 495,340,553 | — | 501,529,291 | |
| United Kingdom | 5,252,843 | 871,997,036 | — | 877,249,879 | |
| Preferred Stock1 | — | 29,942,308 | — | 29,942,308 | |
| United Kingdom | — | — | 38,493 | 38,493 | |
| Other Investment Company1 | 3,797,238 | — | — | 3,797,238 | |
| Short-Term Investments1 | — | 6,139,051 | — | 6,139,051 | |
| Futures Contracts2 | 845,450 | — | — | 845,450 | |
| Total | $161,874,546 | $5,253,505,958 | $953,032 | $5,416,333,536 | |
| * | Level 3 amount shown includes securities determined to have no value at October 31, 2019. |
| 1 | As categorized in the complete schedule of Portfolio Holdings. |
| 2 | Futures contracts are valued at unrealized appreciation or depreciation. |
Fund investments in underlying mutual funds are classified as Level 1, without consideration to the classification level of the investments held by the underlying mutual funds, which could be Level 1, Level 2 or Level 3.
Schwab Equity Index Funds | Annual Report
Schwab International Index Fund
Statement of Assets and Liabilities
As of October 31, 2019
| Assets |
| Investments in unaffiliated issuers, at value (cost $4,473,829,402) including securities on loan of $3,604,867 | | $5,411,690,848 |
| Collateral invested for securities on loan, at value (cost $3,797,238) | | 3,797,238 |
| Foreign currency, at value (cost $72,285) | | 72,327 |
| Deposit with broker for futures contracts | | 2,020,001 |
| Receivables: | | |
| Dividends | | 15,085,513 |
| Fund shares sold | | 10,864,700 |
| Foreign tax reclaims | | 6,985,538 |
| Variation margin on futures contracts | | 846,191 |
| Income from securities on loan | | 22,360 |
| Interest | + | 169 |
| Total assets | | 5,451,384,885 |
| Liabilities |
| Collateral held for securities on loan | | 3,797,238 |
| Payables: | | |
| Investments bought | | 720,471 |
| Investment adviser fees | | 269,169 |
| Fund shares redeemed | + | 3,352,301 |
| Total liabilities | | 8,139,179 |
| Net Assets |
| Total assets | | 5,451,384,885 |
| Total liabilities | – | 8,139,179 |
| Net assets | | $5,443,245,706 |
| Net Assets by Source | | |
| Capital received from investors | | 4,616,138,343 |
| Total distributable earnings | | 827,107,363 |
| Net Asset Value (NAV) |
| Net Assets | ÷ | Shares
Outstanding | = | NAV |
| $5,443,245,706 | | 265,794,580 | | $20.48 |
| | | | | |
Schwab Equity Index Funds | Annual Report
Schwab International Index Fund
Statement of Operations
For the period November 1, 2018 through October 31, 2019
| Investment Income |
| Dividends (net of foreign withholding tax of $16,316,458) | | $163,480,665 |
| Interest | | 224,703 |
| Securities on loan, net | + | 870,380 |
| Total investment income | | 164,575,748 |
| Expenses |
| Investment adviser fees | | 2,922,442 |
| Professional fees | + | 48,181* |
| Total expenses | | 2,970,623 |
| Expense reduction by CSIM | – | 48,181* |
| Net expenses | – | 2,922,442 |
| Net investment income | | 161,653,306 |
| Realized and Unrealized Gains (Losses) |
| Net realized losses on investments | | (83,545,365) |
| Net realized gains on futures contracts | | 2,710,754 |
| Net realized losses on foreign currency transactions | + | (212,722) |
| Net realized losses | | (81,047,333) |
| Net change in unrealized appreciation (depreciation) on investments | | 449,951,951 |
| Net change in unrealized appreciation (depreciation) on futures contracts | | 371,769 |
| Net change in unrealized appreciation (depreciation) on foreign currency translations | + | 255,959 |
| Net change in unrealized appreciation (depreciation) | + | 450,579,679 |
| Net realized and unrealized gains | | 369,532,346 |
| Increase in net assets resulting from operations | | $531,185,652 |
| * | Professional fees associated with the filing of tax claims in the European Union deemed to be non-routine expenses of the fund. See financial notes 2(d) and 4 for additional information. |
Schwab Equity Index Funds | Annual Report
Schwab International Index Fund
Statement of Changes in Net Assets
For the current and prior report periods
| Operations | |
| | 11/1/18-10/31/19 | 11/1/17-10/31/18 |
| Net investment income | | $161,653,306 | $133,025,660 |
| Net realized losses | | (81,047,333) | (29,407,991) |
| Net change in unrealized appreciation (depreciation) | + | 450,579,679 | (439,100,565) |
| Increase (decrease) in net assets from operations | | 531,185,652 | (335,482,896) |
| Distributions to Shareholders | |
| Total distributions | | ($132,253,839) | ($112,933,005) |
| Transactions in Fund Shares | | | |
| | | 11/1/18-10/31/19 | 11/1/17-10/31/18 |
| | | SHARES | VALUE | SHARES | VALUE |
| Shares sold | | 101,475,911 | $1,918,826,792 | 68,078,593 | $1,412,881,267 |
| Shares reinvested | | 5,815,026 | 99,611,394 | 4,270,674 | 88,744,607 |
| Shares redeemed | + | (68,493,022) | (1,288,104,681) | (41,807,131) | (866,997,348) |
| Net transactions in fund shares | | 38,797,915 | $730,333,505 | 30,542,136 | $634,628,526 |
| Shares Outstanding and Net Assets | | | |
| | | 11/1/18-10/31/19 | 11/1/17-10/31/18 |
| | | SHARES | NET ASSETS | SHARES | NET ASSETS |
| Beginning of period | | 226,996,665 | $4,313,980,388 | 196,454,529 | $4,127,767,763 |
| Total increase | + | 38,797,915 | 1,129,265,318 | 30,542,136 | 186,212,625 |
| End of period | | 265,794,580 | $5,443,245,706 | 226,996,665 | $4,313,980,388 |
Schwab Equity Index Funds | Annual Report
Schwab Equity Index Funds
1. Business Structure of the Funds:
Each of the funds in this report is a series of Schwab Capital Trust, except Schwab 1000 Index Fund, which is a series of Schwab Investments. Both Schwab Capital Trust and Schwab Investments (the trusts) are no-load, open-end management investment companies. Each trust is organized as a Massachusetts business trust and is registered under the Investment Company Act of 1940, as amended (the 1940 Act). The list below shows all the funds in the trusts as of the end of the period, including the funds discussed in this report, which are highlighted:
| SCHWAB CAPITAL TRUST (ORGANIZED MAY 7, 1993) |
| Schwab S&P 500 Index Fund | Schwab Target 2040 Fund |
| Schwab Small-Cap Index Fund | Schwab Target 2045 Fund |
| Schwab Total Stock Market Index Fund | Schwab Target 2050 Fund |
| Schwab U.S. Large-Cap Growth Index Fund | Schwab Target 2055 Fund |
| Schwab U.S. Large-Cap Value Index Fund | Schwab Target 2060 Fund |
| Schwab U.S. Mid-Cap Index Fund | Schwab Fundamental US Large Company Index Fund |
| Schwab International Index Fund | Schwab Fundamental US Small Company Index Fund |
| Schwab MarketTrack All Equity Portfolio™ | Schwab Fundamental International Large Company Index Fund |
| Schwab MarketTrack Growth Portfolio™ | Schwab Fundamental International Small Company Index Fund |
| Schwab MarketTrack Balanced Portfolio™ | Schwab Fundamental Emerging Markets Large Company Index Fund |
| Schwab MarketTrack Conservative Portfolio™ | Schwab Fundamental Global Real Estate Index Fund |
| Laudus International MarketMasters Fund™ | Schwab Target 2010 Index Fund |
| Schwab Balanced Fund | Schwab Target 2015 Index Fund |
| Schwab Core Equity Fund | Schwab Target 2020 Index Fund |
| Schwab Dividend Equity Fund | Schwab Target 2025 Index Fund |
| Schwab Large-Cap Growth Fund | Schwab Target 2030 Index Fund |
| Schwab Small-Cap Equity Fund | Schwab Target 2035 Index Fund |
| Schwab Hedged Equity Fund | Schwab Target 2040 Index Fund |
| Schwab Health Care Fund | Schwab Target 2045 Index Fund |
| Schwab International Core Equity Fund | Schwab Target 2050 Index Fund |
| Schwab Target 2010 Fund | Schwab Target 2055 Index Fund |
| Schwab Target 2015 Fund | Schwab Target 2060 Index Fund |
| Schwab Target 2020 Fund | Schwab Monthly Income Fund – Moderate Payout |
| Schwab Target 2025 Fund | Schwab Monthly Income Fund – Enhanced Payout |
| Schwab Target 2030 Fund | Schwab Monthly Income Fund – Maximum Payout |
| Schwab Target 2035 Fund | |
| |
| SCHWAB INVESTMENTS (ORGANIZED OCTOBER 26, 1990) |
| Schwab 1000 Index Fund | Schwab Tax-Free Bond Fund |
| Schwab Treasury Inflation Protected Securities Index Fund | Schwab California Tax-Free Bond Fund |
| Schwab U.S. Aggregate Bond Index Fund | Schwab Global Real Estate Fund |
| Schwab Short-Term Bond Index Fund | |
Each fund in this report offers one share class. Shares are bought and sold at closing net asset value per share (NAV), which is the price for all outstanding shares of a fund. Each share has a par value of 1/1,000 of a cent, and the funds’ Board of Trustees (the Board) may authorize the issuance of as many shares as necessary.
Each fund maintains its own account for purposes of holding assets and accounting, and is considered a separate entity for tax purposes. Within its account, each fund may also keep certain assets in segregated accounts, as required by securities law.
2. Significant Accounting Policies:
The following is a summary of the significant accounting policies the funds use in their preparation of financial statements. The funds follow the investment company accounting and reporting guidance of the Financial Accounting Standards Board (FASB) Accounting Standard CodificationTopic 946 Financial Services — Investment Companies. The accounting policies are in conformity with accounting principles generally accepted in the United States of America (GAAP).
Schwab Equity Index Funds | Annual Report
Schwab Equity Index Funds
Financial Notes(continued)
2. Significant Accounting Policies (continued):
The funds may invest in certain other investment companies (underlying funds). For specific investments in underlying funds, please refer to the complete schedule of portfolio holdings on Form N-CSR(S) for this reporting period, which is filed with the U.S. Securities and Exchange Commission (SEC). For more information about the underlying funds’ operations and policies, please refer to those funds’ semiannual and annual reports, which are filed with the SEC and are available on the SEC’s website at www.sec.gov.
(a) Security Valuation:
Under procedures approved by the Board, the investment adviser has formed a Pricing Committee to administer the pricing and valuation of portfolio securities and other assets and to ensure that prices used for internal purposes or provided by third parties reasonably reflect fair market value. Among other things, these procedures allow the funds to utilize independent pricing services, quotations from securities and financial instrument dealers and other market sources to determine fair value.
The funds value the securities in their portfolios every business day. The funds use the following policies to value various types of securities:
• Securities traded on an exchange or over-the-counter:Traded securities are valued at the closing value for the day, or, on days when no closing value has been reported, at the mean of the most recent bid and ask quotes. Securities that are primarily traded on foreign exchanges are valued at the official closing price or the last sales price on the exchange where the securities are principally traded with these values then translated into U.S. dollars at the current exchange rate, unless these securities are fair valued as discussed below.
• Securities for which no quoted value is available:The Board has adopted procedures to fair value each fund’s securities when market prices are not “readily available” or are unreliable. For example, a fund may fair value a security when it is de-listed or its trading is halted or suspended; when a security’s primary pricing source is unable or unwilling to provide a price; or when a security’s primary trading market is closed during regular market hours. Each fund makes fair value determinations in good faith in accordance with the fund’s valuation procedures. The Pricing Committee considers a number of factors, including unobservable market inputs when arriving at fair value. The Pricing Committee may employ techniques such as the review of related or comparable assets or liabilities, related market activities, recent transactions, market multiples, book values, transactional back-testing, disposition analysis and other relevant information. The Pricing Committee regularly reviews these inputs and assumptions to calibrate the valuations. Due to the subjective and variable nature of fair value pricing, there can be no assurance that a fund could obtain the fair value assigned to the security upon the sale of such security. The Board convenes on a regular basis to review fair value determinations made by the funds pursuant to the valuation procedures.
• Foreign equity security fair valuation:The Board has adopted procedures to fair value foreign equity securities that are traded in markets that close prior to the funds valuing their holdings. By fair valuing securities whose prices may have been affected by events occurring after the close of trading, each fund seeks to establish prices that investors might expect to realize upon the current sales of these securities. This methodology is designed to deter “arbitrage” market timers, who seek to exploit delays between the change in the value of a fund’s portfolio holdings and the NAV of the fund’s shares, and seeks to help ensure that the prices at which the fund’s shares are purchased and redeemed are fair and do not result in dilution of shareholder interest or other harm to shareholders. When fair value pricing is used at the open or close of a reporting period, it may cause a temporary divergence between the return of a fund and that of its comparative index or benchmark. The Board regularly reviews fair value determinations made by the funds pursuant to these procedures.
• Futures contracts:Futures contracts are valued at their settlement prices as of the close of their exchanges.
• Underlying funds:Mutual funds are valued at their respective NAVs. Exchange-traded funds (ETFs) traded on a recognized securities exchange are valued at the last reported sale price that day or the official closing price, if applicable.
• Cash management sweep time deposits: Balances held in cash management sweep time deposits are accounted for on a cost basis, which approximates market value.
In accordance with the authoritative guidance on fair value measurements and disclosures under GAAP, the funds disclose the fair value of their investments in a hierarchy that prioritizes the significant inputs to valuation techniques used to measure the fair value. The hierarchy gives the highest priority to valuations based upon unadjusted quoted prices in active markets for identical assets or liabilities (Level 1 measurements) and the lowest priority to valuations based upon unobservable inputs that are significant to the valuation (Level 3 measurements). If inputs used to measure the financial instruments fall within different levels of the hierarchy, the
Schwab Equity Index Funds | Annual Report
Schwab Equity Index Funds
Financial Notes(continued)
2. Significant Accounting Policies (continued):
categorization is based on the lowest level input that is significant to the valuation. If the funds determine that either the volume and/or level of activity for an asset or liability has significantly decreased (from normal conditions for that asset or liability) or price quotations or observable inputs are not associated with orderly transactions, increased analysis and management judgment will be required to estimate fair value.
The three levels of the fair value hierarchy are as follows:
• Level 1—quoted prices in active markets for identical securities—Investments whose values are based on quoted market prices in active markets, and whose values are therefore classified as Level 1 prices, include active listed equities, ETFs and futures contracts. Investments in mutual funds are valued daily at their NAVs, and investments in ETFs are valued daily at the last reported sale price or the official closing price, which are classified as Level 1 prices, without consideration to the classification level of the specific investments held by an underlying fund.
• Level 2—other significant observable inputs (including quoted prices for similar securities, interest rates, prepayment speeds, credit risk, etc.)—Investments that trade in markets that are not considered to be active, but whose values are based on quoted market prices, dealer quotations or valuations provided by alternative pricing sources supported by observable inputs are classified as Level 2 prices. These generally include U.S. government and sovereign obligations, most government agency securities, investment-grade corporate bonds, certain mortgage products, less liquid listed equities, and state, municipal and provincial obligations. In addition, international securities whose markets close hours before the funds value their holdings may require fair valuations due to significant movement in the U.S. markets occurring after the daily close of the foreign markets. The Board has approved a vendor that calculates fair valuations of international equity securities based on a number of factors that appear to correlate to the movements in the U.S. markets.
• Level 3—significant unobservable inputs (including the funds’ own assumptions in determining the fair value of investments)—Investments whose values are classified as Level 3 prices have significant unobservable inputs, as they may trade infrequently or not at all. When observable prices are not available for these securities, the funds use one or more valuation techniques for which sufficient and reliable data is available. The inputs used by the funds in estimating the value of Level 3 prices may include the original transaction price, quoted prices for similar securities or assets in active markets, completed or pending third-party transactions in the underlying investment or comparable issuers, and changes in financial ratios or cash flows. Level 3 prices may also be adjusted to reflect illiquidity and/or non-transferability, with the amount of such discount estimated by the funds in the absence of market information. Assumptions used by the funds due to the lack of observable inputs may significantly impact the resulting fair value and therefore the funds’ results of operations.
The inputs or methodology used for valuing securities are not necessarily an indication of the risk associated with investing in those securities.
The levels associated with valuing the funds’ investments as of October 31, 2019 are disclosed in the Condensed Portfolio Holdings.
(b) Accounting Policies for certain Portfolio Investments (if held):
Futures Contracts: Futures contracts are instruments that represent an agreement between two parties that obligates one party to buy, and the other party to sell, specific instruments at an agreed upon price on a stipulated future date. A fund must give the broker a deposit of cash and/or securities (initial margin) whenever it enters into a futures contract. The amount of the deposit may vary from one contract to another. Subsequent payments (variation margin) are made or received by a fund depending on the daily fluctuations in the value of the futures contract and are accounted for as unrealized appreciation or depreciation until the contract is closed, at which time the gains or losses are realized. Futures contracts are traded publicly on exchanges, and their market value may change daily.
Securities Lending: Under the trusts’ Securities Lending Program, a fund (lender), may make short-term loans of its securities to another party (borrower) to generate additional revenue for the fund. The borrower pledges collateral in the form of cash, securities issued or fully guaranteed by the U.S. government or foreign governments, or letters of credit issued by a bank. Collateral at the individual loan level is required to be maintained on a daily marked-to-market basis in an amount at least equal to the current value of the securities loaned. The lending agent provides a fund with indemnification against borrower default (the borrower fails to return the security on loan) reducing the risk of loss as a result of default. The cash collateral of securities loaned is currently invested in money market portfolios operating under Rule 2a-7 of the 1940 Act. Each fund bears the risk of loss with respect to the investment of cash collateral. The terms of the securities lending agreement allow the funds or the lending agent to terminate any loan at any given time and the securities must be returned within the earlier of the standard trade settlement period or the specified time period under the relevant securities lending agreement. Securities lending income, as disclosed in each fund’s Statement of Operations, if applicable, represents the income earned from the investment of the cash collateral plus any fees paid by borrowers,
Schwab Equity Index Funds | Annual Report
Schwab Equity Index Funds
Financial Notes(continued)
2. Significant Accounting Policies (continued):
less the fees paid to the lending agent and broker rebates which are subject to adjustments pursuant to the securities lending agreement. On loans not collateralized by cash, a fee is received from the borrower, and is allocated between a fund and the lending agent. The aggregate market value of securities loaned will not at any time exceed one-third of the total assets of a fund, including collateral received from the loan. Securities lending fees paid to the unaffiliated lending agents start at 10% of gross lending revenue, with subsequent breakpoints to a low of 7.5%. In this context, the gross lending revenue equals the income received from the investment of cash collateral and fees paid by borrowers less any rebates paid to the borrowers. Any expenses charged by the cash collateral fund are in addition to these fees. All remaining revenue is retained by the fund, as applicable. No portion of lending revenue is paid to or retained by Charles Schwab Investment Management, Inc. (CSIM or the investment adviser) or any affiliate of CSIM.
As of October 31, 2019, the funds had securities on loan, all of which were classified as common stocks. The value of the securities on loan and the related collateral as of October 31, 2019, if any, are disclosed in each fund’s Condensed Portfolio Holdings. The value of the securities on loan and the investment of cash collateral are also disclosed in each fund’s Statement of Assets and Liabilities.
Cash Management Transactions: The funds, except for Schwab 1000 Index Fund, Schwab U.S. Large-Cap Growth Index Fund, Schwab U.S. Large-Cap Value Index Fund and Schwab U.S. Mid-Cap Index Fund may subscribe to the Brown Brothers Harriman & Co. (BBH) Cash Management Service Sweep (CMS Sweep). The BBH CMS Sweep is an investment product that automatically sweeps the funds’ cash balances into overnight offshore time deposits with either the BBH Grand Cayman branch or a branch of a pre-approved commercial bank. This fully automated program allows the funds to earn interest on cash balances. Excess cash invested with deposit institutions domiciled outside of the U.S., as with any offshore deposit, may be subject to sovereign actions in the jurisdiction of the deposit institution including, but not limited to, freeze, seizure or diminution. The funds bear the risk associated with the repayment of principal and payment of interest on such instruments by the institution with which the deposit is ultimately placed.
(c) Security Transactions:
Security transactions are recorded as of the date the order to buy or sell the security is executed. Realized gains and losses from security transactions are based on the identified costs of the securities involved.
Assets and liabilities denominated in foreign currencies are reported in U.S. dollars. For assets and liabilities held on a given date, the dollar value is based on market exchange rates in effect on that date. Transactions involving foreign currencies, including purchases, sales, income receipts and expense payments, are calculated using exchange rates in effect on the transaction date. Realized foreign exchange gains or losses arise from sales of foreign currencies, currency gains or losses realized between the trade and settlement dates on securities transactions and the differences between the recorded amounts of dividends, interest, and foreign withholding taxes and the U.S. dollar equivalent of the amounts actually received or paid. Net unrealized foreign exchange appreciation or depreciation arises from changes in foreign exchange rates on foreign denominated assets and liabilities other than investments in securities held at the end of the reporting period. These realized and unrealized foreign exchange gains or losses are reported in foreign currency transactions or translations in the Statement of Operations. The funds do not isolate the portion of the fluctuations on investments resulting from changes in foreign currency exchange rates from the fluctuations in market prices of investments held. Such fluctuations are included with the net realized and unrealized gain or loss from investments.
Gains realized by the funds on the sale of securities in certain foreign countries may be subject to non-U.S. taxes. In those instances, the funds record a liability based on unrealized appreciation to provide for potential non-U.S. taxes payable upon the sale of these securities.
When a fund closes out a futures contract position, it calculates the difference between the value of the position at the beginning and at the end of the contract, and records a realized gain or loss accordingly.
(d) Investment Income:
Interest income is recorded as it accrues. Dividends, in the form of cash or non-cash income such as in the form of additional securities, and distributions from portfolio securities and underlying funds are recorded on the date they are effective (the ex-dividend date), although the funds record certain foreign security dividends on the day they learn of the ex-dividend date. Any distributions from underlying funds are recorded in accordance with the character of the distributions as designated by the underlying funds.
Schwab Equity Index Funds | Annual Report
Schwab Equity Index Funds
Financial Notes(continued)
2. Significant Accounting Policies (continued):
Income received from foreign sources may result in withholding tax. Withholding taxes are accrued at the same time as the related income if the tax rate is fixed and known, unless a tax withheld is reclaimable from the local tax authorities in which case it is recorded as receivable. If the tax rate is not known or estimable, such expense or reclaim receivable is recorded when the net proceeds are received.
The Schwab International Index Fund filed claims to recover taxes previously withheld in certain European Union countries on the basis that those countries had purportedly violated certain provisions in the Treaty on the Functioning of the European Union. These filings are subject to various administrative and judicial proceedings within these countries, and all professional fees associated with these filings have been paid by the investment adviser.
(e) Expenses:
Pursuant to an Amended and Restated Investment Advisory and Administration Agreement (Advisory Agreement) between CSIM and each trust, CSIM pays the operating expenses of each fund, excluding acquired fund fees and expenses, taxes, any brokerage expenses, and extraordinary or non-routine expenses. Taxes, any brokerage expenses and extraordinary or non-routine expenses that are specific to a fund are charged directly to the fund.
(f) Distributions to Shareholders:
The funds make distributions from net investment income and net realized capital gains, if any, once a year.
(g) Accounting Estimates:
The accounting policies described in this report conform to GAAP. Notwithstanding this, shareholders should understand that in order to follow these principles, fund management has to make estimates and assumptions that affect the information reported in the financial statements. It’s possible that once the results are known, they may turn out to be different from these estimates and these differences may be material.
(h) Federal Income Taxes:
The funds intend to meet federal income and excise tax requirements for regulated investment companies under subchapter M of the Internal Revenue Code, as amended. Accordingly, the funds distribute substantially all of their net investment income and net realized capital gains, if any, to their respective shareholders each year. As long as a fund meets the tax requirements, it is not required to pay federal income tax.
(i) Foreign Taxes:
The funds may be subject to foreign taxes (a portion of which may be reclaimable) on income, corporate events, foreign currency exchanges and capital gains on investments. All foreign taxes are recorded in accordance with the applicable foreign tax regulations and rates that exist in foreign markets in which the funds invest. These foreign taxes, if any, are paid by the funds and are disclosed in the Statement of Operations. Foreign taxes payable as of October 31, 2019, if any, are reflected in each fund’s Statement of Assets and Liabilities.
(j) Indemnification:
Under the funds’ organizational documents, the officers and trustees are indemnified against certain liabilities arising out of the performance of their duties to the funds. In addition, in the normal course of business the funds enter into contracts with their vendors and others that provide general indemnifications. The funds’ maximum exposure under these arrangements is unknown as this would involve future claims that may be made against the funds. However, based on experience, the funds expect the risk of loss attributable to these arrangements to be remote.
(k) Recent Accounting Standards:
In August 2018, the FASB issued Accounting Standards Update “Fair Value Measurement (Topic 820)” (ASU 2018-13) which modifies the disclosure requirements for fair value measurement by removing, modifying, or adding certain disclosures. The amendments are effective for annual periods beginning after December 15, 2019, and interim periods within those annual periods. The funds are permitted to early adopt any removed or modified disclosures upon issuance of this update and delay adoption of the additional disclosures until their effective date. The funds have early adopted certain removed or modified disclosures, including the
Schwab Equity Index Funds | Annual Report
Schwab Equity Index Funds
Financial Notes(continued)
2. Significant Accounting Policies (continued):
amount of and reasons for transfers between Level 1 and Level 2 of the fair value hierarchy and the policy for timing of transfers between levels upon issuance of ASU 2018-13, and have delayed adoption of the additional disclosures until their effective date. At this time, management is currently evaluating the impact that the adoption of the additional disclosures will have on the funds’ financial statements.
3. Risk Factors:
Investing in the funds may involve certain risks, as discussed in the funds’ prospectuses, including, but not limited to, those described below. Any of these risks could cause an investor to lose money.
Market Risk. Financial markets rise and fall in response to a variety of factors, sometimes rapidly and unpredictably. As with any investment whose performance is tied to these markets, the value of an investment in a fund will fluctuate, which means that an investor could lose money over short or long periods.
Equity Risk. The prices of equity securities rise and fall daily. These price movements may result from factors affecting individual companies, industries or the securities market as a whole. In addition, equity markets tend to move in cycles, which may cause stock prices to fall over short or extended periods of time.
Tracking Error Risk. As an index fund, each fund seeks to track the performance of its respective index, although it may not be successful in doing so. The divergence between the performance of a fund and the index, positive or negative, is called “tracking error.” Tracking error can be caused by many factors and it may be significant.
Investment Style Risk. The funds are index funds. Therefore, each fund follows the securities included in its respective index during upturns as well as downturns. Because of its indexing strategy, a fund does not take steps to reduce market exposure or to lessen the effects of a declining market. In addition, because of a fund’s expenses, a fund’s performance may be below that of the index.
Sampling Index Tracking Risk. To the extent a fund uses sampling techniques, a fund will not fully replicate its index and may hold securities not included in the index. As a result, a fund will be subject to the risk that the investment adviser’s investment strategy, the implementation of which is subject to a number of constraints, may not produce the intended results. If a fund utilizes a sampling approach, it may not track the return of the index as well as it would if the fund purchased all of the securities in the index.
Concentration Risk. To the extent that a fund’s or its respective index’s portfolio is concentrated in the securities of issuers in a particular market, industry, group of industries, sector, country or asset class, the fund may be adversely affected by the performance of those securities, may be subject to increased price volatility and may be more vulnerable to adverse economic, market, political or regulatory occurrences affecting that market, industry, group of industries, sector, country or asset class.
Market Capitalization Risk.Securities issued by companies of different market capitalizations tend to go in and out of favor based on market and economic conditions. During a period when securities of a particular market capitalization fall behind other types of investments, a fund’s performance could be impacted.
Large-Cap Company Risk.Large-cap companies are generally more mature and the securities issued by these companies may not be able to reach the same levels of growth as the securities issued by small- or mid-cap companies.
Mid-Cap Company Risk. Mid-cap companies may be more vulnerable to adverse business or economic events than larger, more established companies and the value of securities issued by these companies may move sharply.
Small-Cap Company Risk. Securities issued by small-cap companies may be riskier than those issued by larger companies, and their prices may move sharply, especially during market upturns and downturns.
Growth Investing Risk. Growth stocks can be volatile. Growth companies usually invest a high portion of earnings in their businesses and may lack the dividends of value stocks that can cushion stock prices in a falling market. The prices of growth stocks are based largely on projections of the issuer’s future earnings and revenues. If a company’s earnings or revenues fall short of expectations, its stock price may fall dramatically. Growth stocks may also be more expensive relative to their earnings or assets compared to value or other stocks.
Value Investing Risk. A fund may emphasize “value” style of investing, which targets undervalued companies with characteristics for improved valuations. This style of investing is subject to the risk that the valuations never improve or that the returns on “value” securities may not move in tandem with the returns on other styles of investing or the stock market in general.
Schwab Equity Index Funds | Annual Report
Schwab Equity Index Funds
Financial Notes(continued)
3. Risk Factors (continued):
Foreign Investment Risk. A fund’s investments in securities of foreign issuers involve certain risks that may be greater than those associated with investments in securities of U.S. issuers. These include risks of adverse changes in foreign economic, political, regulatory and other conditions; changes in currency exchange rates or exchange control regulations (including limitations on currency movements and exchanges); the imposition of economic sanctions or other government restrictions; differing accounting, auditing, financial reporting and legal standards and practices; differing securities market structures; and higher transaction costs. These risks may negatively impact the value or liquidity of a fund’s investments, and could impair the fund’s ability to meet its investment objective or invest in accordance with its investment strategy. There is a risk that investments in securities denominated in, and/or receiving revenues in, foreign currencies will decline in value relative to the U.S. dollar. To the extent a fund’s investments in a single country or a limited number of countries represent a large percentage of the fund’s assets, the fund’s performance may be adversely affected by the economic, political, regulatory and social conditions in those countries, and the fund’s price may be more volatile than the price of a fund that is geographically diversified.
Derivatives Risk. A fund may use derivatives to enhance returns or hedge against market declines. Examples of derivatives are futures and options on futures. An option is the right to buy or sell an instrument at a specific price before a specific date. A future is an agreement to buy or sell a financial instrument at a specific price on a specific day. The use of derivatives that are subject to regulation by the Commodity Futures Trading Commission (CFTC) could cause the fund to become a commodity pool, which would require the fund to comply with certain CFTC rules.
A fund’s use of derivative instruments involves risks different from, or possibly greater than, the risks associated with investing directly in securities and other traditional investments. Certain of these risks, such as liquidity risk and market risk, are discussed elsewhere in this section. A fund’s use of derivatives is also subject to lack of availability risk, credit risk, leverage risk, valuation risk, correlation risk and tax risk. Lack of availability risk is the risk that suitable derivative transactions may not be available in all circumstances for risk management or other purposes. Credit risk is the risk that the counterparty to a derivatives transaction may not fulfill its obligations. Leverage risk is the risk that a small percentage of assets invested in derivatives can have a disproportionately large impact on a fund. Valuation risk is the risk that a particular derivative may be valued incorrectly. Correlation risk is the risk that changes in the value of the derivative may not correlate perfectly with the underlying asset, rate or index. Tax risk is the risk that the use of derivatives may cause a fund to realize higher amounts of short-term capital gains. A fund’s use of derivatives could reduce the fund’s performance, increase its volatility, and could cause the fund to lose more than the initial amount invested.
Liquidity Risk. A fund may be unable to sell certain securities, such as illiquid securities, readily at a favorable time or price, or the fund may have to sell them at a loss.
Securities Lending Risk. Securities lending involves the risk of loss of rights in, or delay in recovery of, the loaned securities if the borrower fails to return the security loaned or becomes insolvent.
Please refer to the funds’ prospectuses for a more complete description of the principal risks of investing in the funds.
4. Affiliates and Affiliated Transactions:
Investment Adviser
CSIM, a wholly owned subsidiary of The Charles Schwab Corporation, serves as each fund’s investment adviser and administrator pursuant to an Advisory Agreement between CSIM and each trust.
For its advisory and administrative services to the funds, CSIM is entitled to receive an annual fee, payable monthly, based on a percentage of each fund’s average daily net assets as follows:
Schwab
S&P 500
Index Fund | Schwab
1000
Index Fund | Schwab
Small-Cap
Index Fund | Schwab
Total Stock
Market
Index Fund | Schwab
U.S. Large-Cap
Growth
Index Fund | Schwab
U.S. Large-Cap
Value
Index Fund | Schwab
U.S. Mid-Cap
Index Fund | Schwab
International
Index Fund |
| 0.02% | 0.05% | 0.04% | 0.03% | 0.035% | 0.035% | 0.04% | 0.06% |
Schwab Equity Index Funds | Annual Report
Schwab Equity Index Funds
Financial Notes(continued)
4. Affiliates and Affiliated Transactions (continued):
Prior to December 20, 2018, the advisory and administrative services fee of each fund were as follows:
Schwab
S&P 500
Index Fund | Schwab
1000
Index Fund | Schwab
Small-Cap
Index Fund | Schwab
Total Stock
Market
Index Fund | Schwab
U.S. Large-Cap
Growth
Index Fund | Schwab
U.S. Large-Cap
Value
Index Fund | Schwab
U.S. Mid-Cap
Index Fund | Schwab
International
Index Fund |
| 0.03% | 0.05% | 0.05% | 0.03% | 0.04% | 0.04% | 0.05% | 0.06% |
Investments from Affiliates
Certain funds in the Fund Complex (for definition refer to Trustees and Officers section) may own shares of other funds in the Fund Complex. The table below reflects the percentages of shares of each fund in this report that are owned by other funds in the Fund Complex as of October 31, 2019, as applicable:
| | Underlying Funds | | | |
| | Schwab
S&P 500
Index Fund | Schwab
Small-Cap
Index Fund | Schwab
U.S. Mid-Cap
Index Fund | Schwab
International
Index Fund |
| Schwab MarketTrack All Equity Portfolio | 0.5% | 2.9% | —% | 1.8% |
| Schwab MarketTrack Balanced Portfolio | 0.3% | 1.4% | —% | 0.7% |
| Schwab MarketTrack Conservative Portfolio | 0.1% | 0.4% | —% | 0.2% |
| Schwab MarketTrack Growth Portfolio | 0.6% | 2.7% | —% | 1.4% |
| Schwab Target 2010 Fund | 0.0%* | —% | 0.1% | —% |
| Schwab Target 2015 Fund | 0.0%* | —% | 0.2% | —% |
| Schwab Target 2020 Fund | 0.2% | —% | 1.4% | —% |
| Schwab Target 2025 Fund | 0.2% | —% | 1.8% | —% |
| Schwab Target 2030 Fund | 0.4% | —% | 3.5% | —% |
| Schwab Target 2035 Fund | 0.2% | —% | 1.9% | —% |
| Schwab Target 2040 Fund | 0.4% | —% | 4.2% | —% |
| Schwab Target 2045 Fund | 0.1% | —% | 0.8% | —% |
| Schwab Target 2050 Fund | 0.1% | —% | 0.8% | —% |
| Schwab Target 2055 Fund | 0.0%* | —% | 0.4% | —% |
| Schwab Target 2060 Fund | 0.0%* | —% | 0.1% | —% |
Other Affiliated Transactions
The professional fees related to foreign withholding tax claims discussed in financial note 2 were non-routine expenses. The investment adviser agreed to pay these professional fees for this reporting period, subject to reimbursement by the Schwab International Index Fund to the extent the fund is able to successfully recover taxes withheld in the future.
As of October 31, 2019, the balance of professional fees related to foreign withholding tax subject to future reimbursement by the fund to the investment adviser was $121,249 for Schwab International Index Fund.
No other amounts for additional tax reclaims are reflected in the financial statements due to the uncertainty surrounding the ultimate resolution of proceedings, the likelihood of receipt of these claims, and the potential timing of payment.
Interfund Borrowing and Lending
Pursuant to an exemptive order issued by the SEC, the funds may enter into interfund borrowing and lending transactions with other funds in the Fund Complex. All loans are for temporary or emergency purposes and the interest rate to be charged will be the average of the overnight repurchase agreement rate and the short-term bank loan rate. All loans are subject to numerous conditions designed to ensure fair and equitable treatment of all participating funds. The interfund lending facility is subject to the oversight and periodic review by the Board. The funds had no interfund borrowing or lending activity during the period.
Schwab Equity Index Funds | Annual Report
Schwab Equity Index Funds
Financial Notes(continued)
4. Affiliates and Affiliated Transactions (continued):
Interfund Transactions
The funds may engage in transactions with certain other funds in the Fund Complex when permitted by applicable law. When one fund is seeking to sell a security that another is seeking to buy, an interfund transaction can allow both funds to benefit by reducing transaction costs. This practice is limited to funds that share the same investment adviser, trustees and/or officers. For the period ended October 31, 2019, each fund’s total aggregate security transactions with other funds in the Fund Complex as well as any realized gains (losses) were as follows:
| | Total Aggregate Transactions | Realized Gains (Losses) |
| Schwab S&P 500 Index Fund | $274,889,332 | ($34,265,003) |
| Schwab 1000 Index Fund | 64,602,722 | 2,680,017 |
| Schwab Small-Cap Index Fund | 67,714,672 | (10,471,359) |
| Schwab Total Stock Market Index Fund | 110,590,734 | (11,789,651) |
| Schwab U.S. Large-Cap Growth Index Fund | 37,582,090 | (302,789) |
| Schwab U.S. Large-Cap Value Index Fund | 37,360,388 | 3,238,372 |
| Schwab U.S. Mid-Cap Index Fund | 13,695,328 | (770,586) |
| Schwab International Index Fund | 6,466,093 | (4,066,591) |
5. Board of Trustees:
The Board may include people who are officers and/or directors of CSIM or its affiliates. Federal securities law limits the percentage of such “interested persons” who may serve on a trust’s board, and the trusts were in compliance with these limitations throughout the report period. The funds do not pay any interested or non-interested (independent trustees) trustees. The independent trustees are paid by CSIM. For information regarding the trustees, please refer to the Trustees and Officers table at the end of this report.
6. Borrowing from Banks:
During the period, the funds were participants with other U.S. registered investment companies managed by CSIM in a joint, syndicated, committed $750 million line of credit (the Syndicated Credit Facility), which matured on October 3, 2019. On October 3, 2019, the Syndicated Credit Facility was amended to run for a new 364 day period with the line of credit amount remaining unchanged, maturing on October 1, 2020. Under the terms of the Syndicated Credit Facility, in addition to CSIM paying the interest charged on any borrowings by a fund, CSIM paid a commitment fee of 0.15% per annum on the funds’ proportionate share of the unused portion of the Syndicated Credit Facility.
During the period, the funds were participants with other U.S. registered investment companies managed by CSIM in a joint, unsecured, uncommitted $500 million line of credit (the Uncommitted Credit Facility), with State Street Bank and Trust Company, which matured on November 30, 2018. On November 30, 2018, the Uncommitted Credit Facility was amended to run for a new 364 day period with the line of credit amount remaining unchanged, maturing on November 29, 2019. Under the terms of the Uncommitted Credit Facility, CSIM pays interest on the amount a fund borrows. There were no borrowings from either line of credit during the period.
The funds also have access to custodian overdraft facilities. A fund may have utilized the overdraft facility and incurred an interest expense, which is paid by CSIM. The interest expense is determined based on a negotiated rate above the current Federal Funds Rate.
7. Derivatives:
Certain funds entered into equity index futures contracts during the report period. The funds invested in futures contracts to equitize available cash. The current value and variation margin for futures contracts held at October 31, 2019 are presented on the Condensed Portfolio Holdings and Statement of Assets and Liabilities, respectively. The net realized and change in unrealized gains (losses) on futures contracts are presented on the Statement of Operations, if any. Refer to financial note 2(b) for the funds’
Schwab Equity Index Funds | Annual Report
Schwab Equity Index Funds
Financial Notes(continued)
7. Derivatives (continued):
accounting policies with respect to futures contracts and financial note 3 for disclosures concerning the risks of investing in futures contracts. During the period ended October 31, 2019, the month-end average notional amounts of futures contracts held by the funds and the month-end average number of contracts held were as follows:
| | Notional Amounts | Number of Contracts |
| Schwab S&P 500 Index Fund | $155,022,024 | 1,112 |
| Schwab 1000 Index Fund | 32,407,003 | 232 |
| Schwab Small-Cap Index Fund | 21,477,898 | 285 |
| Schwab Total Stock Market Index Fund | 44,913,148 | 359 |
| Schwab U.S. Large-Cap Growth Index Fund | 416,972 | 5 |
| Schwab U.S. Large-Cap Value Index Fund | 614,935 | 10 |
| Schwab U.S. Mid-Cap Index Fund | 1,243,243 | 7 |
| Schwab International Index Fund | 31,554,195 | 341 |
8. Purchases and Sales of Investment Securities:
For the period ended October 31, 2019, purchases and sales of securities (excluding short-term obligations) were as follows:
| | Purchases
of Securities | Sales
of Securities |
| Schwab S&P 500 Index Fund | $2,891,320,853 | $1,029,744,231 |
| Schwab 1000 Index Fund | 988,076,766 | 434,289,913 |
| Schwab Small-Cap Index Fund | 930,483,181 | 570,333,819 |
| Schwab Total Stock Market Index Fund | 1,211,591,183 | 313,019,150 |
| Schwab U.S. Large-Cap Growth Index Fund | 113,242,865 | 60,438,497 |
| Schwab U.S. Large-Cap Value Index Fund | 159,200,342 | 35,788,952 |
| Schwab U.S. Mid-Cap Index Fund | 214,163,885 | 59,406,845 |
| Schwab International Index Fund | 1,022,577,372 | 236,787,297 |
9. Federal Income Taxes:
As of October 31, 2019, the tax basis cost of the funds’ investments and gross unrealized appreciation and depreciation were as follows:
| | Schwab
S&P 500
Index Fund | Schwab
1000
Index Fund | | Schwab
Small-Cap
Index Fund | | Schwab
Total Stock
Market
Index Fund | | Schwab
U.S. Large-Cap
Growth
Index Fund | |
| Tax cost | $20,113,179,483 | $2,758,100,305 | | $3,482,611,878 | | $6,232,488,004 | | $144,133,385 | |
| Gross unrealized appreciation | $21,313,500,385 | $6,684,919,766 | | $1,331,156,626 | | $4,443,967,375 | | $23,521,541 | |
| Gross unrealized depreciation | (1,276,256,042) | (107,085,100) | | (539,970,678) | | (406,952,051) | | (1,729,488) | |
| Net unrealized appreciation (depreciation) | $20,037,244,343 | $6,577,834,666 | | $791,185,948 | | $4,037,015,324 | | $21,792,053 | |
| | Schwab
U.S. Large-Cap
Value
Index Fund | | Schwab
U.S. Mid-Cap
Index Fund | | Schwab
International
Index Fund |
| Tax cost | $198,424,901 | | $336,811,864 | | $4,629,773,472 |
| Gross unrealized appreciation | $22,084,097 | | $43,362,876 | | $1,234,145,926 |
| Gross unrealized depreciation | (8,864,268) | | (22,539,963) | | (447,585,862) |
| Net unrealized appreciation (depreciation) | $13,219,829 | | $20,822,913 | | $786,560,064 |
Schwab Equity Index Funds | Annual Report
Schwab Equity Index Funds
Financial Notes(continued)
9. Federal Income Taxes (continued):
As of October 31, 2019, the components of distributable earnings on a tax basis were as follows:
| | Schwab
S&P 500
Index Fund | Schwab
1000
Index Fund | | Schwab
Small-Cap
Index Fund | | Schwab
Total Stock
Market
Index Fund | | Schwab
U.S. Large-Cap
Growth
Index Fund | |
| Undistributed ordinary income | $597,401,945 | $140,771,767 | | $53,798,520 | | $141,729,892 | | $1,376,502 | |
| Undistributed long-term capital gains | 76,711,728 | 115,672,826 | | 187,507,760 | | 26,277,147 | | — | |
| Net unrealized appreciation (depreciation) on investments | 20,037,244,343 | 6,577,834,666 | | 791,185,948 | | 4,037,015,324 | | 21,792,053 | |
| Total | $20,711,358,016 | $6,834,279,259 | | $1,032,492,228 | | $4,205,022,363 | | $23,168,555 | |
| | Schwab
U.S. Large-Cap
Value
Index Fund | | Schwab
U.S. Mid-Cap
Index Fund | | Schwab
International
Index Fund |
| Undistributed ordinary income | $6,409,136 | | $5,910,400 | | $157,581,810 |
| Undistributed long-term capital gains | 2,019,105 | | 2,160,536 | | — |
| Net unrealized appreciation (depreciation) on investments | 13,219,829 | | 20,822,913 | | 786,560,064 |
| Net other unrealized appreciation (depreciation) | — | | — | | 31,304 |
| Total | $21,648,070 | | $28,893,849 | | $944,173,178 |
The primary differences between book basis and tax basis unrealized appreciation or unrealized depreciation of investments are the tax deferral of losses on wash sales, realization for tax purposes of unrealized gains (losses) on futures contracts and the realization for tax purposes of unrealized appreciation on investments in Passive Foreign Investment Companies (PFIC) and partnership investments. The tax cost of the funds’ investments, disclosed above, have been adjusted from their book amounts to reflect these unrealized appreciation or depreciation differences, as applicable.
Capital loss carryforwards may be used to offset future realized capital gains for federal income tax purposes. As of October 31, 2019, the funds had capital loss carryforwards available to offset future net capital gains as follows:
| Expiration Date | Schwab
S&P 500
Index Fund | | Schwab
1000
Index Fund | | Schwab
Small-Cap
Index Fund | | Schwab
Total Stock
Market
Index Fund | | Schwab
U.S. Large-Cap
Growth
Index Fund |
| No expiration | $— | | $— | | $— | | $— | | $600,614 |
| Total | $— | | $— | | $— | | $— | | $600,614 |
| Expiration Date | Schwab
U.S. Large-Cap
Value
Index Fund | | Schwab
U.S. Mid-Cap
Index Fund | | Schwab
International
Index Fund |
| No expiration | $— | | $— | | $117,065,815 |
| Total | $— | | $— | | $117,065,815 |
For the fiscal year ended October 31, 2019, the funds had no capital loss carryforwards utilized and had no capital losses expired.
Schwab Equity Index Funds | Annual Report
Schwab Equity Index Funds
Financial Notes(continued)
9. Federal Income Taxes (continued):
The tax basis components of distributions paid during the current and prior fiscal years were as follows:
| | Schwab
S&P 500
Index Fund | Schwab
1000
Index Fund | Schwab
Small-Cap
Index Fund | Schwab
Total Stock
Market
Index Fund | Schwab
U.S. Large-Cap
Growth
Index Fund |
| Current period distributions | | | | | |
| Ordinary income | $696,643,335 | $157,630,133 | $75,407,201 | $163,508,663 | $949,803 |
| Long-term capital gains | 138,486,140 | 287,803,474 | 256,270,995 | 35,933,416 | — |
| Prior period distributions | | | | | |
| Ordinary income | $554,866,625 | $134,342,862 | $61,629,828 | $118,432,377 | $— |
| Long-term capital gains | — | 189,924,986 | 119,643,043 | 11,101,631 | — |
| | Schwab
U.S. Large-Cap
Value
Index Fund | Schwab
U.S. Mid-Cap
Index Fund | Schwab
International
Index Fund |
| Current period distributions | | | |
| Ordinary income | $1,536,515 | $2,937,860 | $132,253,839 |
| Long-term capital gains | — | 13,414 | — |
| Prior period distributions | | | |
| Ordinary income | $— | $— | $112,933,005 |
| Long-term capital gains | — | — | — |
Distributions paid to shareholders are based on net investment income and net realized gains determined on a tax basis, which may differ from net investment income and net realized gains for financial reporting purposes. These differences reflect the differing character of certain income items and net realized gains and losses for financial statement and tax purposes, and may result in reclassification among certain capital accounts on the financial statements.
Permanent book and tax basis differences may result in reclassifications between components of net assets as required. The adjustments will have no impact on net assets or the results of operations.
As of October 31, 2019, management has reviewed the tax positions for open periods (for federal purposes, three years from the date of filing and for state purposes, four years from the date of filing) as applicable to the funds, and has determined that no provision for income tax is required in the funds’ financial statements. The funds recognize interest and penalties, if any, related to unrecognized tax benefits as income tax expense in the Statement of Operations. During the fiscal year ended October 31, 2019, the funds did not incur any interest or penalties.
10. Subsequent Events:
Management has determined there are no subsequent events or transactions through the date the financial statements were issued that would have materially impacted the financial statements as presented.
Schwab Equity Index Funds | Annual Report
Schwab Equity Index Funds
Report of Independent Registered Public Accounting Firm
To the Board of Trustees of Schwab Investments and Schwab Capital Trust and Shareholders of Schwab 1000 Index Fund, Schwab S&P 500 Index Fund, Schwab Small-Cap Index Fund, Schwab Total Stock Market Index Fund, Schwab U.S. Large-Cap Growth Index Fund, Schwab U.S. Large-Cap Value Index Fund, Schwab U.S. Mid-Cap Index Fund and Schwab International Index Fund
Opinions on the Financial Statements
We have audited the accompanying statements of assets and liabilities, including the condensed portfolio holdings, of Schwab 1000 Index Fund (one of the funds constituting Schwab Investments), Schwab S&P 500 Index Fund, Schwab Small-Cap Index Fund, Schwab Total Stock Market Index Fund, Schwab U.S. Large-Cap Growth Index Fund, Schwab U.S. Large-Cap Value Index Fund, Schwab U.S. Mid-Cap Index Fund and Schwab International Index Fund (seven of the funds constituting Schwab Capital Trust) (hereafter collectively referred to as the “Funds”) as of October 31, 2019, the related statements of operations for the year ended October 31, 2019, the statements of changes in net assets for each of the periods indicated in the table below, including the related notes, and the financial highlights for each of the periods indicated therein (collectively referred to as the “financial statements”). In our opinion, the financial statements present fairly, in all material respects, the financial position of each of the Funds as of October 31, 2019, the results of each of their operations for the year then ended, the changes in each of their net assets for each of the periods indicated in the table below and each of the financial highlights for each of the periods indicated therein in conformity with accounting principles generally accepted in the United States of America.
| Schwab 1000 Index Fund, Schwab S&P 500 Index Fund, Schwab Small-Cap Index Fund, Schwab Total Stock Market Index Fund and Schwab International Index Fund: statements of changes in net assets for each of the two years in the period ended October 31, 2019. |
| Schwab U.S. Large-Cap Growth Index Fund, Schwab U.S. Large-Cap Value Index Fund and Schwab U.S. Mid-Cap Index Fund: statements of changes in net assets for the period December 20, 2017 (commencement of operations) through October 31, 2018 and for the year ended October 31, 2019. |
Basis for Opinions
These financial statements are the responsibility of the Funds’ management. Our responsibility is to express an opinion on the Funds’ financial statements based on our audits. We are a public accounting firm registered with the Public Company Accounting Oversight Board (United States) (PCAOB) and are required to be independent with respect to the Funds in accordance with the U.S. federal securities laws and the applicable rules and regulations of the Securities and Exchange Commission and the PCAOB.
We conducted our audits of these financial statements in accordance with the standards of the PCAOB. Those standards require that we plan and perform the audit to obtain reasonable assurance about whether the financial statements are free of material misstatement, whether due to error or fraud.
Our audits included performing procedures to assess the risks of material misstatement of the financial statements, whether due to error or fraud, and performing procedures that respond to those risks. Such procedures included examining, on a test basis, evidence regarding the amounts and disclosures in the financial statements. Our audits also included evaluating the accounting principles used and significant estimates made by management, as well as evaluating the overall presentation of the financial statements. Our procedures included confirmation of securities owned as of October 31, 2019 by correspondence with the custodian and brokers; when replies were not received from brokers, we performed other auditing procedures. We believe that our audits provide a reasonable basis for our opinions.
/s/ PricewaterhouseCoopers LLP
San Francisco, California
December 16, 2019
We have served as the auditor of one or more investment companies in the Schwab Funds Complex since 1989.
Schwab Equity Index Funds | Annual Report
Schwab Equity Index Funds
Other Federal Tax Information (unaudited)
Schwab International Index Fund may elect to pass on the benefits of the foreign tax credit of $15,477,505 to its shareholders for the fiscal year ended October 31, 2019. The respective foreign source income on the fund is $176,237,238.
For corporate shareholders, the following percentage of the funds’ dividend distributions paid during the fiscal year ended October 31, 2019, qualify for the corporate dividends received deduction:
| | Percentage |
| Schwab S&P 500 Index Fund | 92.39 |
| Schwab 1000 Index Fund | 92.37 |
| Schwab Small-Cap Index Fund | 47.79 |
| Schwab Total Stock Market Index Fund | 87.45 |
| Schwab U.S. Large-Cap Growth Index Fund | 92.98 |
| Schwab U.S. Large-Cap Value Index Fund | 73.00 |
| Schwab U.S. Mid-Cap Index Fund | 58.51 |
| Schwab International Index Fund | — |
For the fiscal year ended October 31, 2019, the funds designate the following amounts of the dividend distributions as qualified dividends for the purpose of the maximum rate under section 1(h)(11) of the Internal Revenue Code. Shareholders will be notified in January 2020 via IRS Form 1099 of the amounts for use in preparing their 2019 income tax return.
| | |
| Schwab S&P 500 Index Fund | $678,919,007 |
| Schwab 1000 Index Fund | 151,721,523 |
| Schwab Small-Cap Index Fund | 37,108,334 |
| Schwab Total Stock Market Index Fund | 149,045,045 |
| Schwab U.S. Large-Cap Growth Index Fund | 905,346 |
| Schwab U.S. Large-Cap Value Index Fund | 1,176,354 |
| Schwab U.S. Mid-Cap Index Fund | 1,791,670 |
| Schwab International Index Fund | 130,102,357 |
Under section 852(b)(3)(C) of the Internal Revenue Code, certain funds hereby designate the following amounts as long-term capital gain dividends for the fiscal year ended October 31, 2019:
| | |
| Schwab S&P 500 Index Fund | $138,486,140 |
| Schwab 1000 Index Fund | 287,803,474 |
| Schwab Small-Cap Index Fund | 256,270,995 |
| Schwab Total Stock Market Index Fund | 35,933,416 |
| Schwab U.S. Large-Cap Growth Index Fund | — |
| Schwab U.S. Large-Cap Value Index Fund | — |
| Schwab U.S. Mid-Cap Index Fund | 13,414 |
| Schwab International Index Fund | — |
Schwab Equity Index Funds | Annual Report
Schwab Equity Index Funds
Investment Advisory Agreement Approval
The Investment Company Act of 1940, as amended, requires that the continuation of a fund’s investment advisory agreement must be specifically approved (1) by the vote of the trustees or by a vote of the shareholders of the fund, and (2) by the vote of a majority of the trustees who are not parties to the investment advisory agreement or “interested persons” of any party (the Independent Trustees), cast in person at a meeting called for the purpose of voting on such approval. In connection with such approvals, the fund’s trustees must request and evaluate, and the investment adviser is required to furnish, such information as may be reasonably necessary to evaluate the terms of the investment advisory agreement.
The Board of Trustees (the Board or the Trustees, as appropriate) calls and holds one or more meetings each year that are dedicated, in whole or in part, to considering whether to renew the amended and restated investment advisory and administration agreements (the Agreements) between Schwab Capital Trust and Schwab Investments (collectively, the Trusts) and Charles Schwab Investment Management, Inc. (CSIM) with respect to the existing funds in the Trusts, including Schwab S&P 500 Index Fund, Schwab 1000 Index Fund, Schwab Small-Cap Index Fund, Schwab Total Stock Market Index Fund, Schwab International Index Fund, Schwab U.S. Large-Cap Growth Index Fund, Schwab U.S. Large-Cap Value Index Fund, and Schwab U.S. Mid-Cap Index Fund (each, a Fund and collectively, the Funds), and to review certain other agreements pursuant to which CSIM provides investment advisory services to certain other registered investment companies. In preparation for the meeting(s), the Board requests and reviews a wide variety of materials provided by CSIM, including information about CSIM’s affiliates, personnel, business goals and priorities, profitability, third-party oversight, corporate structure and operations. As part of the renewal process, the Independent Trustees’ legal counsel sends an information request letter to CSIM seeking certain relevant information. The responses by CSIM are provided to the Trustees for their review prior to their meeting, and the Trustees are provided with the opportunity to request any additional materials. The Board also receives data provided by an independent provider of investment company data. This information is in addition to the detailed information about the Funds that the Board reviews during the course of each year, including information that relates to the Funds’ operations and performance, legal and compliance matters, risk management, portfolio turnover, and sales and marketing activity. The Independent Trustees receive advice from Independent Trustees’ legal counsel, including a memorandum regarding the responsibilities of trustees for the approval of investment advisory agreements. In addition, the Independent Trustees meet in executive session outside the presence of Fund management and participate in question and answer sessions with representatives of CSIM.
The Board, including a majority of the Independent Trustees, considered information specifically relating to the continuance of the Agreements with respect to the Funds at meetings held on May 13, 2019 and June 4, 2019, and approved the renewal of the Agreements with respect to the Funds for an additional one-year term at the June 4, 2019 in person meeting called for the purpose of voting on such approval.
The Board’s approval of the continuance of the Agreements with respect to the Funds was based on consideration and evaluation of a variety of specific factors discussed at these meetings and at prior meetings, including:
| 1. | the nature, extent and quality of the services provided to the Funds under the Agreements, including the resources of CSIM and its affiliates dedicated to the Funds; |
| 2. | each Fund’s investment performance and how it compared to that of certain other comparable mutual funds and benchmark data; |
| 3. | each Fund’s expenses and how those expenses compared to those of certain other similar mutual funds; |
| 4. | the profitability of CSIM and its affiliates, including Charles Schwab & Co., Inc. (Schwab), with respect to each Fund, including both direct and indirect benefits accruing to CSIM and its affiliates; and |
| 5. | the extent to which economies of scale would be realized as the Funds grow and whether fee levels in the Agreements reflect those economies of scale for the benefit of Fund investors. |
Nature, Extent and Quality of Services. The Board considered the nature, extent and quality of the services provided by CSIM to the Funds and the resources of CSIM and its affiliates dedicated to the Funds. In this regard, the Trustees evaluated, among other things, CSIM’s experience, track record, compliance program, resources dedicated to hiring and retaining skilled personnel and specialized talent, and information security resources. The Trustees also considered information provided by CSIM relating to services and support provided with respect to the Funds’ portfolio management team, portfolio strategy, and internal investment guidelines, as well as trading infrastructure, liquidity management, product design and analysis, shareholder communications, securities valuation, fund accounting and custody, and vendor and risk oversight. The Trustees also considered investments CSIM has made in its infrastructure, including modernizing CSIM’s technology and use of data, increasing expertise in key areas (including portfolio management and trade operations), and improving business continuity, cybersecurity, due diligence, risk management processes, and information security programs, which are designed to provide enhanced services to the Funds and their shareholders. The Trustees also considered that
Schwab Equity Index Funds | Annual Report
Schwab Equity Index Funds
many of the Funds’ shareholders are also brokerage clients of Schwab and considered Schwab’s wide range of products, services, and channel alternatives such as investment research tools and an array of account features that benefit the Funds and shareholders who are brokerage clients of Schwab. Finally, the Trustees also considered Schwab’s reputation as a full service brokerage firm and its overall financial condition. Following such evaluation, the Board concluded, within the context of its full deliberations, that the nature, extent and quality of services provided by CSIM to the Funds and the resources of CSIM and its affiliates dedicated to the Funds supported renewal of the Agreements with respect to the Funds.
Fund Performance. The Board considered the Funds’ performance in determining whether to renew the Agreements with respect to the Funds. Specifically, the Trustees considered each Fund’s performance relative to a peer category of other mutual funds and applicable indices/benchmarks, in light of total return, yield, if applicable, and market trends, as well as in consideration of each Fund’s investment style and strategy attributes and disclosures. As part of this review, the Trustees considered the composition of the peer category, selection criteria and the reputation of the independent provider of investment company data who prepared the peer category analysis. In evaluating the performance of each Fund, the Trustees considered the risk profile for such Fund and each Fund’s demonstrated performance in tracking its benchmark index. The Trustees further considered the level of Fund performance in the context of their review of Fund expenses and adviser profitability discussed below and also noted that performance is reviewed throughout the year by a designated committee of the Board and by the Board. Following such evaluation, the Board concluded, within the context of its full deliberations, that the performance of the Funds supported renewal of the Agreements with respect to the Funds.
Fund Expenses. With respect to the Funds’ expenses, the Trustees considered the rate of compensation called for by the Agreements, and each Fund’s net operating expense ratio, in each case, in comparison to those of other similar mutual funds, such peer groups and comparisons having been selected and calculated by an independent provider of investment company data. CSIM reported to the Board, and the Board took into account, the risk assumed by CSIM in the development of products and provision of services as well as the competitive marketplace for financial products. The Trustees also considered fees charged by CSIM to other mutual funds and to other types of accounts, but, with respect to such other types of accounts, accorded less weight to such comparisons due to the different legal, regulatory, compliance and operating features of mutual funds as compared to these other types of accounts, and any differences in the nature and scope of the services CSIM provides to these other accounts, as well as differences in the market for these types of accounts. Following such evaluation, the Board concluded, within the context of its full deliberations, that the expenses of
the Funds are reasonable and supported renewal of the Agreements with respect to the Funds.
Profitability. The Trustees considered the compensation flowing to CSIM and its affiliates, directly or indirectly and reviewed profitability on a pre-tax basis, without regard to distribution expenses. In this connection, the Trustees reviewed management’s profitability analyses. The Trustees also reviewed profitability of CSIM relating to the Schwab fund complex as a whole, noting the benefit to Fund shareholders of being part of the Schwab fund complex, including the allocations of certain fixed costs across other funds in the complex. The Trustees also considered any other benefits derived by CSIM from its relationship with the Funds, such as whether, by virtue of its management of the Funds, CSIM obtains investment information or other research resources that aid it in providing advisory services to other clients. The Trustees considered whether the varied levels of compensation and profitability with respect to the Funds under the Agreements and other service agreements were reasonable and justified in light of the quality of all services rendered to each Fund by CSIM and its affiliates. The Trustees noted that CSIM continues to invest substantial sums in its business in order to provide enhanced research capabilities, services, and systems to benefit the Funds. Based on this evaluation, the Board concluded, within the context of its full deliberations, that the profitability of CSIM is reasonable and supported renewal of the Agreements with respect to the Funds.
Economies of Scale. Although the Trustees recognized the difficulty of determining economies of scale with precision, the Trustees considered the potential existence of any economies of scale and whether those are passed along to a Funds’ shareholders by way of the relatively low advisory fee and unitary fee structure of the Funds through (i) the enhancement of services provided to the Funds in return for fees paid, including through investments by CSIM in CSIM’s infrastructure, including modernizing CSIM’s technology and use of data, increasing expertise and capabilities in key areas (including portfolio and trade operations), and improving business continuity, cybersecurity, due diligence, and information security programs, which are designed to provide enhanced services to the Funds and their shareholders; (ii) graduated investment advisory fee schedules, fee waivers, or expense caps by CSIM and its affiliates for those funds in the Schwab Funds complex with such features; and (iii) pricing a fund to scale and keeping overall expenses down as the fund grows. The Trustees acknowledged that CSIM has shared any economies of scale with the Funds by investing in CSIM’s infrastructure, as discussed above, over time and that CSIM’s internal costs of providing investment management, technology, administrative, legal and compliance services to the Funds continues to increase as a result of regulatory or other developments. The Trustees considered that CSIM and its affiliates may employ contractual expense caps to protect shareholders from high fees when fund assets are relatively small, for example, in the case of newer funds or funds with
Schwab Equity Index Funds | Annual Report
Schwab Equity Index Funds
investment strategies that are from time to time out of favor, because, among other reasons, shareholders may benefit from the continued availability of such funds at subsidized expense levels. Based on this evaluation, the Board concluded, within the context of its full deliberations, that the Funds obtain reasonable benefits from economies of scale.
In the course of their deliberations, the Trustees may have accorded different weights to various factors and did not identify any particular information or factor that was all
important or controlling. Based on the Trustees’ deliberation and their evaluation of the information described above, the Board, including all of the Independent Trustees, approved the continuation of the Agreements with respect to the Funds and concluded that the compensation under the Agreements with respect to the Funds is fair and reasonable in light of such services and expenses and such other matters as the Trustees have considered to be relevant in the exercise of their reasonable judgment.
Schwab Equity Index Funds | Annual Report
Schwab Equity Index Funds
Trustees and Officers
The tables below give information about the trustees and officers of Schwab Capital Trust and Schwab Investments, which includes the funds covered in this report. The “Fund Complex” includes The Charles Schwab Family of Funds, Schwab Capital Trust, Schwab Investments, Schwab Annuity Portfolios, Schwab Strategic Trust and Laudus Trust. The Fund Complex includes 101 funds.
The address for all trustees and officers is 211 Main Street, San Francisco, CA 94105. You can find more information about the trustees and officers in the funds’ Statement of Additional Information, which is available free by calling 1-877-824-5615.
| Independent Trustees |
Name, Year of Birth, and
Position(s) with the trust
(Terms of office, and
length of Time Served1) | Principal Occupations
During the Past Five Years | Number of
Portfolios in
Fund Complex
Overseen by
the Trustee | Other Directorships |
Robert W. Burns
1959
Trustee
(Trustee of Schwab Strategic Trust since 2009; The Charles Schwab Family of Funds, Schwab Investments, Schwab Capital Trust, Schwab Annuity Portfolios and Laudus Trust since 2016) | Retired/Private Investor (Jan. 2009 – present). Formerly, Managing Director, Pacific Investment Management Company, LLC (PIMCO) (investment management firm) and President, PIMCO Funds. | 101 | None |
John F. Cogan
1947
Trustee
(Trustee of The Charles Schwab Family of Funds, Schwab Investments, Schwab Capital Trust and Schwab Annuity Portfolios since 2008; Laudus Trust since 2010; Schwab Strategic Trust since 2016) | Senior Fellow (Oct. 1979 – present), The Hoover Institution at Stanford University (public policy think tank); Senior Fellow (2000 – present), Stanford Institute for Economic Policy Research; Professor of Public Policy (1994 – 2015), Stanford University. | 101 | Director (2005 – present), Gilead Sciences, Inc. |
Nancy F. Heller
1956
Trustee
(Trustee of The Charles Schwab Family of Funds, Schwab Investments, Schwab Capital Trust, Schwab Annuity Portfolios, Schwab Strategic Trust and Laudus Trust since 2018) | President and Chairman (2014 – 2016), TIAA Charitable (financial services); Senior Managing Director (2003 – 2016), TIAA (financial services). | 101 | None |
Stephen Timothy Kochis
1946
Trustee
(Trustee of Schwab Strategic Trust since 2012; The Charles Schwab Family of Funds, Schwab Investments, Schwab Capital Trust, Schwab Annuity Portfolios and Laudus Trust since 2016) | CEO and Owner (May 2012 – present), Kochis Global (wealth management consulting). | 101 | None |
Schwab Equity Index Funds | Annual Report
Schwab Equity Index Funds
| Independent Trustees (continued) |
Name, Year of Birth, and
Position(s) with the trust
(Terms of office, and
length of Time Served1) | Principal Occupations
During the Past Five Years | Number of
Portfolios in
Fund Complex
Overseen by
the Trustee | Other Directorships |
David L. Mahoney
1954
Trustee
(Trustee of The Charles Schwab Family of Funds, Schwab Investments, Schwab Capital Trust, Schwab Annuity Portfolios and Laudus Trust since 2011; Schwab Strategic Trust since 2016) | Private Investor. | 101 | Director (2003 – present), Symantec Corporation
Director (2004 – present), Corcept Therapeutics Incorporated
Director (2009 – present), Adamas Pharmaceuticals, Inc. |
Jane P. Moncreiff
1961
Trustee
(Trustee of The Charles Schwab Family of Funds, Schwab Investments, Schwab Capital Trust, Schwab Annuity Portfolios, Schwab Strategic Trust and Laudus Trust since 2019) | Chief Investment Officer (2009-2017), CareGroup Healthcare System, Inc. (healthcare). | 101 | None |
Kiran M. Patel
1948
Trustee
(Trustee of The Charles Schwab Family of Funds, Schwab Investments, Schwab Capital Trust, Schwab Annuity Portfolios and Laudus Trust since 2011; Schwab Strategic Trust since 2016) | Retired. Executive Vice President and General Manager of Small Business Group (Dec. 2008 – Sept. 2013), Intuit, Inc. (financial software and services firm for consumers and small businesses). | 101 | Director (2008 – present), KLA-Tencor Corporation |
Kimberly S. Patmore
1956
Trustee
(Trustee of The Charles Schwab Family of Funds, Schwab Investments, Schwab Capital Trust, Schwab Annuity Portfolios, Schwab Strategic Trust and Laudus Trust since 2016) | Consultant (2008 – present), Patmore Management Consulting (management consulting). | 101 | None |
Gerald B. Smith
1950
Trustee
(Trustee of The Charles Schwab Family of Funds, Schwab Investments, Schwab Capital Trust and Schwab Annuity Portfolios since 2000; Laudus Trust since 2010; Schwab Strategic Trust since 2016) | Chairman, Chief Executive Officer and Founder (Mar. 1990 – present), Smith Graham & Co. (investment advisors). | 101 | Director (2012 – present), Eaton Corporation plc |
Schwab Equity Index Funds | Annual Report
Schwab Equity Index Funds
| Interested Trustees |
Name, Year of Birth, and
Position(s) with the trust
(Terms of office, and
length of Time Served1) | Principal Occupations
During the Past Five Years | Number of
Portfolios in
Fund Complex
Overseen by
the Trustee | Other Directorships |
Walter W. Bettinger II2
1960
Chairman and Trustee
(Trustee of The Charles Schwab Family of Funds, Schwab Investments, Schwab Capital Trust and Schwab Annuity Portfolios since 2008; Schwab Strategic Trust since 2009; Laudus Trust since 2010) | Director, President and Chief Executive Officer (Oct. 2008 – present), The Charles Schwab Corporation; President and Chief Executive Officer (Oct. 2008 – present) and Director (May 2008 – present), Charles Schwab & Co., Inc.; Director (Apr. 2006 – present), Charles Schwab Bank; Director (Nov. 2017 – present), Charles Schwab Premier Bank; Director (May 2008 – present) and President and Chief Executive Officer (Aug. 2017 – present), Schwab Holdings, Inc.; Director (July 2016 – present), Charles Schwab Investment Management, Inc. | 101 | Director (2008 – present), The Charles Schwab Corporation |
Jonathan de St. Paer2
1973
Trustee
(Trustee of The Charles Schwab Family of Funds, Schwab Investments, Schwab Capital Trust, Schwab Annuity Portfolios, Schwab Strategic Trust and Laudus Trust since 2019) | Director (Apr. 2019 – present), President (Oct. 2018 – present), and Chief Executive Officer (Apr. 2019 – Nov. 2019), Charles Schwab Investment Management, Inc.; Trustee and Chief Executive Officer (Apr. 2019 – present) and President (Nov. 2018 – present), Schwab Funds, Laudus Funds and Schwab ETFs; Director (Apr. 2019 – present), Charles Schwab Worldwide Funds plc and Charles Schwab Asset Management (Ireland) Limited; Senior Vice President (Apr. 2019 – present), Senior Vice President – Strategy and Product Development (CSIM) (Jan. 2014 – Mar. 2019), and Vice President (Jan. 2009 – Dec. 2013), Charles Schwab & Co., Inc. | 101 | None |
Joseph R. Martinetto2
1962
Trustee
(Trustee of The Charles Schwab Family of Funds, Schwab Investments, Schwab Capital Trust, Schwab Annuity Portfolios, Schwab Strategic Trust and Laudus Trust since 2016) | Chief Operating Officer (Feb. 2018 – present) and Senior Executive Vice President (July 2015 – Feb. 2018), The Charles Schwab Corporation; Senior Executive Vice President (July 2015 – present), Charles Schwab & Co., Inc.; Chief Financial Officer (July 2015 – Aug. 2017) and Executive Vice President and Chief Financial Officer (May 2007 – July 2015), The Charles Schwab Corporation and Charles Schwab & Co., Inc.; Director (May 2007 – present), Charles Schwab & Co., Inc.; Director (Apr. 2010 – present) and Chief Executive Officer (July 2013 – Apr. 2015), Charles Schwab Bank; Director (Nov. 2017 – present), Charles Schwab Premier Bank; Director (May 2007 – present), Chief Financial Officer (May 2007 – Aug. 2017), Senior Executive Vice President (Feb. 2016 – present), and Executive Vice President (May 2007 – Feb. 2016), Schwab Holdings, Inc. | 101 | None |
| Officers of the Trust |
Name, Year of Birth, and Position(s) with the trust
(Terms of office, and length of Time Served3) | Principal Occupations During the Past Five Years |
Jonathan de St. Paer
1973
President and Chief Executive Officer
(Officer of The Charles Schwab Family of Funds, Schwab Investments, Schwab Capital Trust, Schwab Annuity Portfolios, Schwab Strategic Trust and Laudus Trust since 2018) | Director (Apr. 2019 – present), President (Oct. 2018 – present), and Chief Executive Officer (Apr. 2019 – Nov. 2019), Charles Schwab Investment Management, Inc.; Trustee and Chief Executive Officer (Apr. 2019 – present) and President (Nov. 2018 – present), Schwab Funds, Laudus Funds and Schwab ETFs; Director (Apr. 2019 – present), Charles Schwab Worldwide Funds plc and Charles Schwab Asset Management (Ireland) Limited; Senior Vice President (Apr. 2019 – present), Senior Vice President – Strategy and Product Development (CSIM) (Jan. 2014 – Mar. 2019), and Vice President (Jan. 2009 – Dec. 2013), Charles Schwab & Co., Inc. |
Schwab Equity Index Funds | Annual Report
Schwab Equity Index Funds
| Officers of the Trust (continued) |
Name, Year of Birth, and Position(s) with the trust
(Terms of office, and length of Time Served3) | Principal Occupations During the Past Five Years |
Mark Fischer
1970
Treasurer and Chief Financial Officer
(Officer of The Charles Schwab Family of Funds, Schwab Investments, Schwab Capital Trust, Schwab Annuity Portfolios, Schwab Strategic Trust and Laudus Trust since 2013) | Treasurer and Chief Financial Officer (Jan. 2016 – present), Schwab Funds, Laudus Funds and Schwab ETFs; Assistant Treasurer (Dec. 2013 – Dec. 2015), Schwab Funds and Laudus Funds; Assistant Treasurer (Nov. 2013 – Dec. 2015), Schwab ETFs; Vice President (Oct. 2013 – present), Charles Schwab Investment Management, Inc.; Executive Director (Apr. 2011 – Sept. 2013), J.P. Morgan Investor Services; Assistant Treasurer (May 2005 – Mar. 2011), Massachusetts Financial Service Investment Management. |
George Pereira
1964
Senior Vice President and Chief Operating Officer
(Officer of The Charles Schwab Family of Funds, Schwab Investments, Schwab Capital Trust and Schwab Annuity Portfolios since 2004; Laudus Trust since 2006; Schwab Strategic Trust since 2009) | Senior Vice President and Chief Financial Officer (Nov. 2004 – present) and Chief Operating Officer (Jan. 2011 – present), Charles Schwab Investment Management, Inc.; Senior Vice President and Chief Operating Officer (Jan. 2016 – present), Schwab Funds, Laudus Funds and Schwab ETFs; Treasurer and Chief Financial Officer (June 2006 – Dec. 2015), Laudus Funds; Treasurer and Principal Financial Officer (Nov. 2004 – Dec. 2015), Schwab Funds; Treasurer and Principal Financial Officer (Oct. 2009 – Dec. 2015), Schwab ETFs; Director (Apr. 2005 – present), Charles Schwab Worldwide Funds plc and Charles Schwab Asset Management (Ireland) Limited. |
Omar Aguilar
1970
Senior Vice President and Chief Investment Officer – Equities and Multi-Asset Strategies
(Officer of The Charles Schwab Family of Funds, Schwab Investments, Schwab Capital Trust, Schwab Annuity Portfolios, Schwab Strategic Trust and Laudus Trust since 2011) | Senior Vice President and Chief Investment Officer (Apr. 2011 – present), Charles Schwab Investment Management, Inc.; Senior Vice President and Chief Investment Officer – Equities and Multi-Asset Strategies (June 2011 – present), Schwab Funds, Laudus Funds and Schwab ETFs; Head of the Portfolio Management Group and Vice President of Portfolio Management (May 2009 – Apr. 2011), Financial Engines, Inc. (investment management firm); Head of Quantitative Equity (July 2004 – Jan. 2009), ING Investment Management. |
Brett Wander
1961
Senior Vice President and Chief Investment Officer – Fixed Income
(Officer of The Charles Schwab Family of Funds, Schwab Investments, Schwab Capital Trust, Schwab Annuity Portfolios, Schwab Strategic Trust and Laudus Trust since 2011) | Senior Vice President and Chief Investment Officer (Apr. 2011 – present), Charles Schwab Investment Management, Inc.; Senior Vice President and Chief Investment Officer – Fixed Income (June 2011 – present), Schwab Funds, Laudus Funds and Schwab ETFs; Senior Managing Director and Global Head of Active Fixed-Income Strategies (Jan. 2008 – Oct. 2010), State Street Global Advisors; Director of Alpha Strategies (Apr. 2006 – Jan. 2008), Loomis, Sayles & Company (investment management firm). |
David Lekich
1964
Chief Legal Officer and Secretary, Schwab Funds and Schwab ETFs
Vice President and Assistant Clerk, Laudus Funds
(Officer of The Charles Schwab Family of Funds, Schwab Investments, Schwab Capital Trust, Schwab Annuity Portfolios, Schwab Strategic Trust and Laudus Trust since 2011) | Senior Vice President (Sept. 2011 – present) and Vice President (Mar. 2004 – Sept. 2011), Charles Schwab & Co., Inc.; Senior Vice President and Chief Counsel (Sept. 2011 – present) and Vice President (Jan. 2011 – Sept. 2011), Charles Schwab Investment Management, Inc.; Secretary (Apr. 2011 – present) and Chief Legal Officer (Dec. 2011 – present), Schwab Funds; Vice President and Assistant Clerk (Apr. 2011 – present), Laudus Funds; Secretary (May 2011 – present) and Chief Legal Officer (Nov. 2011 – present), Schwab ETFs. |
Catherine MacGregor
1964
Vice President and Assistant Secretary, Schwab Funds and Schwab ETFs
Chief Legal Officer, Vice President and Clerk, Laudus Funds
(Officer of The Charles Schwab Family of Funds, Schwab Investments, Schwab Capital Trust, Schwab Annuity Portfolios and Laudus Trust since 2005; Schwab Strategic Trust since 2009) | Vice President (July 2005 – present), Charles Schwab & Co., Inc.; Vice President (Sept. 2005 – present), Charles Schwab Investment Management, Inc.; Vice President (Dec. 2005 – present) and Chief Legal Officer and Clerk (Mar. 2007 – present), Laudus Funds; Vice President (Nov. 2005 – present) and Assistant Secretary (June 2007 – present), Schwab Funds; Vice President and Assistant Secretary (Oct. 2009 – present), Schwab ETFs. |
| 1 | Each Trustee shall hold office until the election and qualification of his or her successor, or until he or she dies, resigns or is removed. The retirement policy requires that each independent trustee retire by December 31 of the year in which the Trustee turns 74 or the Trustee’s twentieth year of service as an independent trustee on any trust in the Fund Complex, whichever occurs first. |
| 2 | Mr. Bettinger, Mr. de St. Paer and Mr. Martinetto are Interested Trustees. Mr. Bettinger is an Interested Trustee because he owns stock of The Charles Schwab Corporation (CSC), the parent company of Charles Schwab Investment Management, Inc. (CSIM), the investment adviser for the trusts in the Fund Complex, is an employee and director of Charles Schwab & Co., Inc. (CS&Co), the principal underwriter for The Charles Schwab Family of Funds, Schwab Investments, Schwab Capital Trust, Schwab Annuity Portfolios and Laudus Trust, and is a director of CSIM. Mr. de St. Paer is an Interested Trustee because he owns stock of CSC and is an employee and director of CSIM. Mr. Martinetto is an Interested Trustee because he owns stock of CSC and is an employee and director of CS&Co. |
| 3 | The President, Treasurer and Secretary/Clerk hold office until their respective successors are chosen and qualified or until he or she sooner dies, resigns, is removed or becomes disqualified. Each of the other officers serves at the pleasure of the Board. |
Schwab Equity Index Funds | Annual Report
Schwab Equity Index Funds
asset allocation The practice of dividing a portfolio among different asset classes, with each asset class assigned a particular percentage.
asset class A group of securities with similar structure and basic characteristics. Stocks, bonds and cash are the three main examples of asset classes.
Bloomberg Barclays US Aggregate Bond Index An index that is a broad-based benchmark measuring the performance of the U.S. investment grade, taxable bond market, including U.S. Treasuries, government-related and corporate bonds, mortgage pass-through securities, commercial mortgage-backed securities, and asset-backed securities that are publicly available for sale in the United States. To be eligible for inclusion in the index, securities must be fixed rate, non-convertible, U.S. dollar denominated with at least $300 million or more of outstanding face value and have one or more years remaining to maturity. The index excludes certain types of securities, including tax-exempt state and local government series bonds, structured notes embedded with swaps or other special features, private placements, floating rate securities, inflation-linked bonds and Eurobonds. The index is market capitalization weighted and the securities in the index are updated on the last business day of each month.
Bloomberg Barclays US Treasury Bills 1–3 Month Index An index that includes all publicly issued zero-coupon U.S. Treasury Bills that have a remaining maturity of less than 3 months but more than 1 month, are rated investment grade and have $300 million or more of outstanding face value. It excludes zero-coupon STRIPS.
bond A security representing a loan from the investor to the issuer. A bond typically pays interest at a fixed rate (the coupon rate) until a specified date (the maturity date), at which time the issuer returns the money borrowed (principal or face value) to the bondholder. Because of their structure, bonds are sometimes called “fixed income securities” or “debt securities.”
An individual bond is subject to the credit risk of the issuer. Changes in interest rates can affect a bond’s market value prior to call or maturity. There is no guarantee that a bond’s yield to call or maturity will provide a positive return over the rate of inflation.
bond fund A bond fund is subject to the same credit, interest rate, and inflation risks as bonds. In addition, a bond fund incurs ongoing fees and expenses. A bond fund’s net asset value will fluctuate with the price of the underlying bonds and the portfolio turnover activity; return of principal is not guaranteed.
cap, capitalization See “market cap.”
capital gain, capital loss the difference between the amount paid for an investment and its value at a later time. If the investment has been sold, the capital gain or loss is considered a realized gain or loss. If the investment is still held, the capital gain or loss is considered unrealized appreciation or depreciation.
Dow Jones U.S. Total Stock Market Index An index which includes all publicly traded stocks of companies headquartered in the United States for which pricing information is readily available. The index is a float-adjusted market capitalization weighted index that reflects the shares of securities actually available to investors in the marketplace.
expense ratio The amount that is taken from a mutual fund’s assets each year to cover the fund’s operating expenses. An expense ratio of 0.50% means that a fund’s expenses amount to half of one percent of its average net assets a year.
International Spliced Index An internally calculated index comprised of the Schwab International Index from inception of the Schwab International Index Fund until the close of business on December 20, 2011, the MSCI EAFE Index from December 21, 2011 until the close of business on February 28, 2013, and the MSCI EAFE Index (Net) from March 1, 2013 forward.
market cap, market capitalization The value of a company as determined by the total value of all shares of its stock outstanding.
MSCI EAFE Index (Net) A free float-adjusted market capitalization index that is designed to measure the equity market performance of developed markets in Europe, Australasia, and the Far East. The Net version of the index reflects reinvested dividends net of withholding taxes, but reflects no deductions for expenses or other taxes; returns are calculated applying dividend withholding rates applicable to non-resident persons who do not benefit from double taxation treaties.
net asset value (NAV) The value of one share of a mutual fund. NAV is calculated by taking the fund’s total assets, subtracting liabilities, and dividing by the number of shares outstanding.
outstanding shares, shares outstanding When speaking of a company or mutual fund, indicates all shares currently held by investors.
price-to-book ratio (P/B) The market price of a company’s stock compared with its “book value.” A mutual fund’s P/B is the weighted average of the P/B of all stocks in the fund’s portfolio.
price-to-earnings ratio (P/E) The market price of a company’s stock compared with earnings over the past year. A mutual fund’s P/E is the weighted average of the P/E of all stocks in the fund’s portfolio.
restricted and illiquid securities Restricted securities are securities that are subject to legal restrictions on their sale. Restricted securities generally can be sold in privately negotiated transactions, pursuant to an exemption from registration under the Securities Act of 1933 (the 1933 Act), or in a registered public offering. Certain restricted securities, such as Section 4(a)(2) commercial paper and Rule 144A securities under the 1933 Act, may be considered to be liquid if they meet the criteria for liquidity established by the Board. Illiquid securities generally are any securities that cannot be disposed of promptly and in the ordinary course of business at approximately the amount at which a fund has valued the instruments. The liquidity of a fund’s investments is monitored under the supervision and direction of the Board. Investments currently not considered liquid include repurchase agreements not maturing within seven days and certain restricted securities.
return on equity (ROE) The average yearly rate of return for each dollar of investors’ money, measured over the past five years.
Russell 1000 Growth Index An index that measures the performance of those Russell 1000 Index companies with higher price-to-book ratios and higher forecasted growth values.
Russell 1000 Index An index that measures the performance of the 1,000 largest companies in the Russell 3000 Index, and represents approximately 92% of the total market capitalization of the Russell 3000 Index. The Russell 3000 Index measures the performance of the largest 3,000 U.S. companies representing approximately 98% of the investable U.S. equity market.
Russell 1000 Value Index An index that measures the performance of the large-cap value segment of the U.S. equity universe. It includes those Russell 1000 Index companies with lower price-to-book ratios and lower expected growth values.
Schwab Equity Index Funds | Annual Report
Schwab Equity Index Funds
Russell 2000 Index An index that measures the performance of the 2,000 smallest companies in the Russell 3000 Index. The Russell 3000 Index measures the performance of the largest 3,000 U.S. companies representing approximately 98% of the investable U.S. equity market.
Russell Midcap Index An index that measures the performance of the mid-cap segment of the U.S. equity universe. The Russell Midcap Index is a subset of the Russell 1000 Index. It includes approximately 800 of the smallest securities based on a combination of their market cap and current index membership.
S&P 500 Index An index that is designed to measure the performance of 500 leading publicly traded companies from a broad range of industries.
Schwab 1000 Index A float-adjusted market capitalization weighted index developed by Charles Schwab & Co., Inc. that represents the performance of the largest 1,000 publicly traded companies in the United States. As a result of corporate actions, the index may be comprised of more or less than 1,000 securities.
Small-Cap Spliced Index An internally calculated index comprised of the Schwab Small-Cap Index from inception of the Schwab Small-Cap Index Fund until the close of business on December 14, 2011, and the Russell 2000 Index from December 15, 2011 forward.
stock A share of ownership, or equity, in the issuing company.
total return The percentage that an investor would have earned or lost on an investment in the fund assuming dividends and distributions were reinvested.
weighted average For mutual funds, an average that gives the same weight to each security as the security represents in the fund’s portfolio.
yield The income paid out by an investment, expressed as a percentage of the investment’s market value.
Schwab Equity Index Funds | Annual Report
Schwab Equity Index Funds
PRIVACY NOTICE
THIS IS NOT PART OF THE SHAREHOLDER REPORT
A Commitment to Your Privacy
Your Privacy Is Not for Sale
We do not and will not sell your personal information to anyone, for any reason.
We are committed to protecting the privacy of information we maintain about you. Below are details about our commitment, including the types of information we collect and how we use and share that information. This Privacy Notice applies to you only if you are an individual who invests directly in the funds by placing orders through the funds’ transfer agent. If you place orders through your brokerage account at Charles Schwab & Co., Inc. or an account with another broker-dealer, investment advisor, 401(k) plan, employee benefit plan, administrator, bank or other financial intermediary, you are covered by the privacy policies of that financial institution and should consult those policies.
How We Collect Information About You
We collect personal information about you in a number of ways.
• APPLICATION AND REGISTRATION
INFORMATION.
We collect personal information from you when you open an account or utilize one of our services. We may also collect information about you from third parties such as consumer reporting agencies to verify your identity. The information we collect may include personal information, including your Social Security number, as well as details about your interests, investments and investment experience.
• TRANSACTION AND EXPERIENCE
INFORMATION.
Once your account has been opened, we collect and maintain personal information about your account activity, including your transactions, balances, positions and history. This information allows us to administer your account and provide the services you have requested.
• WEBSITE USAGE.
When you visit our websites, we may use devices known as “cookies,” graphic interchange format files (GIFs), or other similar web tools to enhance your web experience. These tools help us to recognize you, maintain your web session, and
provide a more personalized experience. To learn more, please go to www.schwab.com/privacy.
How We Share and Use Your Information
We provide access to information about you to our affiliated companies, outside companies and other third parties in certain limited circumstances, including:
• to help us process transactions for your account;
• when we use other companies to provide services for us, such as printing and mailing your account statements; and
• when we believe that disclosure is required or permitted under law (for example, to cooperate with regulators or law enforcement, resolve consumer disputes, perform credit/authentication checks, or for risk control).
State Laws
We will comply with state laws that apply to the disclosure or use of information about you.
Safeguarding Your Information — Security Is a Partnership
We take precautions to ensure the information we collect about you is protected and is accessed only by authorized individuals or organizations.
Companies we use to provide support services are not allowed to use information about our shareholders for their own purposes and are contractually obligated to maintain strict confidentiality. We limit their use of information to the performance of the specific services we have requested.
We restrict access to personal information by our employees and agents. Our employees are trained about privacy and are required to safeguard personal information.
We maintain physical, electronic and procedural safeguards that comply with federal standards to guard your nonpublic personal information.
Contact Us
To provide us with updated information, report suspected fraud or identity theft, or for any other questions, please call the number below.
Schwab Funds® direct investors: 1-800-407-0256
© 2019 Schwab Funds. All rights reserved.
Schwab Equity Index Funds | Annual Report
Schwab Equity Index Funds
Charles Schwab Investment Management
With a straightforward lineup of core products and solutions for building the foundation of a portfolio, Charles Schwab Investment Management advocates for investors of all sizes with a steadfast focus on lowering costs and reducing unnecessary complexity. The list below shows all currently available Schwab Funds®.
Investors should carefully consider information contained in the prospectus, or if available, the summary prospectus, including investment objectives, risks, charges and expenses before investing. Please call 1-877-824-5615 for a prospectus for any Schwab Fund. Please read the prospectus carefully before you invest. This report must be preceded or accompanied by a current prospectus.
Proxy Voting Policies, Procedures and Results
A description of the proxy voting policies and procedures used to determine how to vote proxies on behalf of the funds is available without charge, upon request, by visiting the Schwab Funds’ website atwww.schwabfunds.com/schwabfunds_prospectus, the SEC’s website atwww.sec.gov, or by contacting Schwab Funds at 1-877-824-5615.
Information regarding how a fund voted proxies relating to portfolio securities during the most recent twelve-month period ended June 30 is available, without charge, by visiting the fund’s website atwww.schwabfunds.com/schwabfunds_prospectus or the SEC’s website atwww.sec.gov.
Equity Funds
Schwab Core Equity Fund
Schwab Dividend Equity Fund
Schwab Large-Cap Growth Fund
Schwab Small-Cap Equity Fund
Schwab Hedged Equity Fund
Schwab Health Care Fund
Schwab International Core Equity Fund
Schwab Fundamental US Large Company Index Fund
Schwab Fundamental US Small Company Index Fund
Schwab Fundamental International Large Company Index Fund
Schwab Fundamental International Small Company Index Fund
Schwab Fundamental Emerging Markets Large Company Index Fund
Schwab Fundamental Global Real Estate Index Fund
Schwab Global Real Estate Fund
Schwab S&P 500 Index Fund
Schwab 1000 Index® Fund
Schwab Small-Cap Index Fund®
Schwab Total Stock Market Index Fund®
Schwab U.S. Large-Cap Growth Index Fund
Schwab U.S. Large-Cap Value Index Fund
Schwab U.S. Mid-Cap Index Fund
Schwab International Index Fund®
Asset Allocation Funds
Schwab Balanced Fund
Schwab MarketTrack Portfolios®
Schwab Target Funds
Schwab Target Index Funds
Schwab Monthly Income Funds
Bond Funds
Schwab Treasury Inflation Protected Securities Index Fund
Schwab U.S. Aggregate Bond Index Fund
Schwab Short-Term Bond Index Fund
Schwab Tax-Free Bond Fund1
Schwab California Tax-Free Bond Fund1
Schwab Money Funds2
Schwab provides a broad choice of taxable and tax-exempt money market funds for both retail and institutional client types.
Investment Adviser
Charles Schwab Investment Management, Inc.
211 Main Street, San Francisco, CA 94105
Funds
Schwab Funds
1-877-824-5615
© 2019 Charles Schwab & Co., Inc. All rights reserved.
Member SIPC®
Printed on recycled paper.
| ¹ | State, local, and the Federal Alternative Minimum Tax may apply. Capital gains are not exempt from Federal Taxation. |
| ² | You could lose money by investing in the Schwab Money Funds. All Schwab Money Funds with the exception of Schwab Variable Share Price Money Fund seek to preserve the value of your investment at $1.00 per share, but cannot guarantee they will do so. Because the share price of Schwab Variable Share Price Money Fund will fluctuate, when you sell your shares they may be worth more or less than what you originally paid for them. All Schwab Money Funds with the exception of Schwab Government Money Fund, Schwab Retirement Government Money Fund, Schwab U.S. Treasury Money Fund, Schwab Treasury Obligations Money Fund and Schwab Government Money Market Portfolio may impose a fee upon the sale of your shares or may temporarily suspend your ability to sell shares if the Fund’s liquidity falls below required minimums because of market conditions or other factors. An investment in the Schwab Money Funds is not insured or guaranteed by the Federal Deposit Insurance Corporation or any other government agency. The Schwab Money Funds’ sponsor has no legal obligation to provide financial support to the Funds, and you should not expect that the sponsor will provide financial support to the Funds at any time. |
This page is intentionally left blank.
Annual Report | October 31, 2019
Schwab Fundamental Index* Funds
Schwab Fundamental
US Large Company Index Fund
Schwab Fundamental
US Small Company Index Fund
Schwab Fundamental International
Large Company Index Fund
Schwab Fundamental International
Small Company Index Fund
Schwab Fundamental Emerging Markets
Large Company Index Fund
| New Notice Regarding Shareholder Report Delivery Options |
| Beginning on January 1, 2021, paper copies of a fund’s shareholder reports will no longer be sent by mail, unless you specifically request paper copies of the reports from a fund or from your financial intermediary (such as a bank or broker-dealer). Instead, the reports will be made available on a fund’s websitewww.schwabfunds.com/schwabfunds_prospectus, and you will be notified by mail each time a report is posted and the mailing will provide a website link to access the report. You will continue to receive other fund regulatory documents (such as prospectuses or supplements) in paper unless you have elected to receive all fund documents electronically. |
| If you would like to receive a fund’s future shareholder reports in paper free of charge after January 1, 2021, you can make that request: |
| • If you invest through Charles Schwab & Co, Inc. (broker-dealer), by calling 1-866-345-5954 and using the unique identifier attached to this mailing; |
| • If you invest through another financial intermediary (such as a bank or broker-dealer) by contacting them directly; or |
| • If owned directly through a fund by calling 1-800-407-0256. |
| If you already receive shareholder reports and other fund documents electronically, you will not be affected by this change and you need not take any action. |
| * | SCHWAB is a registered trademark of Charles Schwab & Co., Inc.
FUNDAMENTAL INDEX is a registered trademark of Research Affiliates LLC. |
This page is intentionally left blank.
Schwab Fundamental Index Funds
Fund investment adviser: Charles Schwab Investment Management, Inc. (CSIM)
Distributor: Charles Schwab & Co., Inc. (Schwab)
The Sector/Industry classifications in this report use the Global Industry Classification Standard (GICS), which was developed by, and is the exclusive property of MSCI Inc. (MSCI) and Standard & Poor’s (S&P). GICS is a service mark of MSCI and S&P and has been licensed for use by Schwab. The Industry classifications used in the schedules of Condensed Portfolio Holdings are sub-categories of Sector classifications.
Schwab Fundamental Index Funds | Annual Report
Schwab Fundamental Index Funds
The performance data quoted represents past performance. Past performance does not guarantee future results. Investment returns and principal value of an investment will fluctuate so that an investor’s shares may be worth more or less than their original cost. Current performance may be lower or higher than performance data quoted. To obtain performance information current to the most recent month end, please visitwww.schwabfunds.com/schwabfunds_prospectus.
| Total Return for the 12 Months Ended October 31, 2019 |
Schwab Fundamental US Large Company Index Fund
(Ticker Symbol: SFLNX) | 10.56% |
| Russell RAFITM US Large Company Index | 10.81% |
| Russell 1000® Index | 14.15% |
| Fund Category: Morningstar Large Value1 | 9.63% |
| Performance Details | pages 7-9 |
| |
Schwab Fundamental US Small Company Index Fund
(Ticker Symbol: SFSNX) | 5.61% |
| Russell RAFITM US Small Company Index | 5.85% |
| Russell 2000® Index | 4.90% |
| Fund Category: Morningstar Small Blend1 | 4.42% |
| Performance Details | pages 10-12 |
| |
Schwab Fundamental International Large Company Index Fund2
(Ticker Symbol: SFNNX) | 7.04% |
| Russell RAFITM Developed ex US Large Company Index (Net)3 | 6.94% |
| MSCI EAFE® Index (Net)3 | 11.04% |
| Fund Category: Morningstar Foreign Large Value1 | 6.31% |
| Performance Details | pages 13-15 |
| Total Return for the 12 Months Ended October 31, 2019 |
Schwab Fundamental International Small Company Index Fund2
(Ticker Symbol: SFILX) | 5.13% |
| Russell RAFITM Developed ex US Small Company Index (Net)3 | 5.51% |
| S&P Developed ex-U.S. Small Cap Index (Net)3 | 7.40% |
| Fund Category: Morningstar Foreign Small/Mid Blend1 | 7.02% |
| Performance Details | pages 16-18 |
| |
Schwab Fundamental Emerging Markets Large Company Index Fund2
(Ticker Symbol: SFENX) | 10.73% |
| Russell RAFITM Emerging Markets Large Company Index (Net)3 | 11.54% |
| MSCI Emerging Markets Index (Net)3 | 11.86% |
| Fund Category: Morningstar Diversified Emerging Markets1 | 12.93% |
| Performance Details | pages 19-21 |
All total returns on this page assume dividends and distributions were reinvested. Index figures do not include trading and management costs, which would lower performance. Indices are unmanaged and cannot be invested in directly. Performance results less than one year are not annualized.
The first index listed for each fund is the fund’s primary benchmark, as shown in the prospectus. Additional indices shown are provided for comparative purposes.
For index definitions, please see the Glossary.
Performance does not reflect the deduction of taxes that a shareholder would pay on fund distributions or on the redemption of fund shares.
Index ownership — The funds are not in any way sponsored, endorsed, sold or promoted by Frank Russell Company (Russell), by the London Stock Exchange Group companies (LSEG), or by Research Affiliates LLC (RA) (collectively the Licensor Parties), and none of the Licensor Parties make any warranty or representation whatsoever, expressly or impliedly, either as to the results to be obtained from the use of the Russell RAFITM Index Series (the Indices) or otherwise. The Indices are compiled and calculated by Russell in conjunction with RA. None of the Licensor Parties shall be liable (whether in negligence or otherwise) to any person for any error in the Indices and none of the Licensor Parties shall be under any obligation to advise any person of any error therein. “Russell®” is a trademark of Russell. The trade names “Research Affiliates®”, “Fundamental Index®” and “RAFI®” are registered trademarks of RA. CSIM has obtained full license from Russell to use the Indices. For full disclaimer please see the funds’ statement of additional information.
| 1 | Source for category information: Morningstar, Inc. The Morningstar Category return represents all active and index mutual funds within the category as of the report date. |
| 2 | The fund’s performance relative to the index may be affected by fair-value pricing and timing differences in foreign exchange calculations. See financial note 2 for more information. |
| 3 | The net version of the index reflects reinvested dividends net of withholding taxes, but reflects no deductions for expenses or other taxes. |
Schwab Fundamental Index Funds | Annual Report
Schwab Fundamental Index Funds
Jonathan de St. Paer
President of Charles Schwab
Investment Management, Inc.
and the funds covered
in this report.
Dear Shareholder,
At the crux of every investment decision, one consideration that may be top of mind is your risk tolerance. It may seem like a straightforward consideration, but it’s often not. Most of us are risk-averse by nature and as investors, the fear of a significant market decline is ever-present in our minds. This can sometimes lead us to make decisions that may get in the way of the performance of our investments. Our feelings about risk are also fluid, impacted by changes in market conditions and our progress toward our financial goals. For example, some investors may have been prompted to rethink their risk appetite as a result of the latest bout of market volatility.
At Charles Schwab Investment Management, we provide a range of foundational products that are designed to suit a variety of risk appetites and help investors remain focused on their long-term investment plans despite market volatility. The Schwab Fundamental Index Funds play a role in this. The funds weight their holdings based on objective financial measures of company size—adjusted sales, retained operating cash flow, and dividends plus buybacks. This can result in a different risk profile than market-cap index funds that use market capitalization to weight the same set of stocks. When the two approaches are combined, we believe a portfolio has the potential for better diversification and more attractive risk-adjusted returns.
We believe the Schwab Fundamental Index Funds are an attractive complement to market-cap index and actively managed strategies. The funds rebalance quarterly, bringing sector, country, and company weights back to their fundamentally derived weights. That means when prices are constantly rising and investors are focused on growth, the funds may at times underperform market-cap index funds, but it also means when further appreciation becomes challenged and investor sentiment shifts back to value, the funds may at times outperform.
When it comes to investing, it’s important to have a long-term investing plan and a portfolio based on your individual goals and risk tolerance. It can at times be tough to maintain that discipline in the face of day-to-day uncertainty. We aim to offer products with clear objectives, straightforward pricing, and a consistent approach to investing to help simplify investing decisions, so investors can focus on their long-term goals without unnecessary complexity.
Thank you for investing with Charles Schwab Investment Management, and for trusting us to help you achieve your financial goals. For more information about the Schwab Fundamental Index Funds, please continue reading this report. In addition, you can find further details about these funds by visiting our website at www.schwabfunds.com. We are also happy to hear from you at 1-877-824-5615.
Sincerely,
“We believe the Schwab Fundamental Index Funds are an attractive complement to market-cap index and actively managed strategies.”
Diversification and asset allocation strategies do not ensure a profit and cannot protect against losses in a declining market.
Management views may have changed since the report date.
Schwab Fundamental Index Funds | Annual Report
Schwab Fundamental Index Funds
The Investment Environment
For the 12-month reporting period ended October 31, 2019, both U.S. and international equity markets generated positive returns. The final two months of 2018 were marked by significant market volatility and steep declines across global equity markets, driven by concerns about slowing international growth, a trade war between the U.S. and China, falling oil prices, the waning strength of the U.S. economy, and the pace of future interest rate hikes despite low inflation. By late December, major market indices had fallen to near-bear market territory. However, as the Federal Reserve (Fed) put interest rate hikes on hold, stocks, particularly in the U.S., staged a strong recovery in the first four months of 2019, which generally continued through the end of the reporting period despite several setbacks. Over the period, the U.S. dollar strengthened slightly against a basket of foreign currencies, generally reducing the returns on overseas investments in U.S. dollar terms. For the reporting period, the S&P 500® Index, a bellwether for the overall U.S. stock market, returned 14.33% and the Russell 2000® Index, a measure of U.S. small-cap stocks, returned 4.90%. Growth stocks outperformed value stocks with the Russell 1000® Growth Index and the Russell 1000® Value Index returning 17.10% and 11.21%, respectively. Despite headwinds, markets outside the U.S. also rose, particularly toward the end of the reporting period with the MSCI EAFE® Index (Net)*, a broad measure of developed international equity performance, returning 11.04% and the MSCI Emerging Markets Index (Net)* returning 11.86%.
Economic growth around the globe was uneven over the reporting period, largely as a result of manufacturing weakness in developed international markets. Despite escalating trade tensions with China, the U.S. maintained its steady growth in its tenth year of expansion, although at a declining pace. In the last two months of 2018, economies around the globe showed increasing signs of weakness, but many regained economic momentum in the first six months of 2019, demonstrating resilient growth despite lingering uncertainties on various fronts. As the year progressed, signs of slowing growth increased amid a weakening global economy, waning manufacturing activity, and the ongoing U.S.-China trade war. However, toward the end of the period, prospects of a partial trade resolution relieved some of the pressure. U.S. gross domestic product (GDP) grew at an annual rate of 2.1% in the third quarter of 2019, up slightly from 2.0% in the second quarter, but down from 3.1% in the first quarter of 2019. Unemployment declined in September 2019 to a 50-year low. While consumer confidence edged lower in October to hit a four-month low, it remained a stable source of GDP growth in the U.S. Inflation remained benign.
Asset Class Performance Comparison % returns during the 12 months ended October 31, 2019
Index figures assume dividends and distributions were reinvested. Index figures do not include trading and management costs, which would lower performance. Indices are unmanaged and cannot be invested in directly. Performance results less than one year are not annualized. Past performance is not an indication of future results.
For index definitions, please see the Glossary.
Data source: Index provider websites and CSIM.
Nothing in this report represents a recommendation of a security by the investment adviser.
Management views may have changed since the report date.
| * | The net version of the index reflects reinvested dividends net of withholding taxes, but reflects no deductions for expenses or other taxes. |
Schwab Fundamental Index Funds | Annual Report
Schwab Fundamental Index Funds
The Investment Environment(continued)
Outside the U.S., conditions continued to soften, dampened by trade issues, slowing economic output, and geopolitical concerns. Oil prices, which had fallen steeply in the fourth quarter of 2018, recovered through the first four months of 2019, as major exporters sought to curb supply and central banks took steps to ease growth-related fears, before dipping in May when trade concerns escalated. Oil prices remained volatile through period end. In the eurozone, growth slowed in the second and third quarters of 2019, down slightly from the first quarter. Growth was subdued by tepid wage growth and constrained consumer spending. The United Kingdom’s economy contracted in the second quarter of 2019 amid growing Brexit-related economic and political uncertainty that dampened industrial output, construction, and services sectors. Japan’s economy, however, experienced growth in recent quarters after contracting sharply in the third quarter of 2018. Several Asian economies, including China and India, also exhibited signs of slowing but still outpaced many developed economies.
In response to the economic environment and flat or inverted yield curves around the world, to bolster growth, and to ensure stability given ongoing trade tensions, a number of central banks reduced their policy rates, including the U.S., while others maintained their generally low—and for some international central banks, negative—interest rates. In the U.S., after raising interest rates four times in 2018, the Fed held rates unchanged through the first half of 2019. But amid growing signs of global economic weakness that threatened to dampen U.S. economic growth, along with continued low inflation and weakness in manufacturing, the Fed enacted three interest rate cuts by the end of the period—in July, September, and October. Following the October interest rate cut, the Fed signaled that subsequent interest rate cuts would be put on hold provided the economy continues to expand moderately and the labor market remains strong. The federal funds rate ended the reporting period in a range of 1.50% to 1.75%. Outside the U.S., the European Central Bank held interest rates steady and launched an asset-purchase program to help stimulate the economy. The Bank of Japan maintained its short-term interest rate target of –0.1% throughout the period. Despite growing Brexit-related division, the Bank of England maintained its key official bank rate at 0.75% throughout the period, where it has remained since August 2018. Central banks in several key emerging market economies—including India, Thailand, and China—lowered their policy rates in response to inflation and trade-related pressures.
Schwab Fundamental Index Funds | Annual Report
Schwab Fundamental Index Funds
 | Christopher Bliss, CFA, Vice President and Head of Passive Equity Strategies, leads the portfolio management team for Schwab’s passive equity mutual funds and ETFs. He also has overall responsibility for all aspects of the management of the funds. Prior to joining CSIM in 2016, Mr. Bliss spent 12 years at BlackRock (formerly Barclays Global Investors) managing and leading institutional index teams, most recently as a managing director and head of the Americas institutional index team. Prior to BlackRock, he worked as an equity analyst and portfolio manager for Harris Bretall and before that, as a research analyst for JP Morgan. |
 | Jeremy Brown, Portfolio Manager, is responsible for the day-to-day co-management of the Schwab Fundamental US Large Company Index Fund and Schwab Fundamental US Small Company Index Fund. Prior to joining CSIM in 2017, Mr. Brown spent six years with ALPS Advisors, Inc. in Denver, most recently as a senior analyst on the ETF portfolio management and research team where he performed portfolio management, trading and analytics/research functions for ALPS ETFs and passive funds. Additionally, Mr. Brown led a number of investment research, commentary, industry trend analysis and sales and marketing support initiatives. |
 | Chuck Craig, CFA, Senior Portfolio Manager, is responsible for the day-to-day co-management of the Schwab Fundamental International Large Company Index Fund, Schwab Fundamental International Small Company Index Fund, and Schwab Fundamental Emerging Markets Large Company Index Fund. Prior to joining CSIM in 2012, Mr. Craig worked at Guggenheim Funds (formerly Claymore Group), where he spent more than five years as a managing director of portfolio management and supervision, and three years as vice president of product research and development. Prior to that, he worked as an equity research analyst at First Trust Portfolios (formerly Niké Securities), and a trader and analyst at PMA Securities, Inc. |
 | Ferian Juwono, CFA, Senior Portfolio Manager, is responsible for the day-to-day co-management of the Schwab Fundamental US Large Company Index Fund and Schwab Fundamental US Small Company Index Fund. Prior to joining CSIM in 2010, Mr. Juwono worked at BlackRock (formerly Barclays Global Investors), where he spent more than three years as a portfolio manager, managing equity index funds for institutional clients, and two years as a senior business analyst. Prior to that, Mr. Juwono worked for more than four years as a senior financial analyst with Union Bank of California. |
 | Jane Qin, Portfolio Manager, is responsible for the day-to-day co-management of the Schwab Fundamental International Large Company Index Fund, Schwab Fundamental International Small Company Index Fund, and Schwab Fundamental Emerging Markets Large Company Index Fund. Prior to joining CSIM in 2012, Ms. Qin spent more than four years at The Bank of New York Mellon Corporation. During that time, Ms. Qin spent more than two years as an associate equity portfolio manager and nearly two years as a performance analyst. She also worked at Wells Fargo Funds Management as a mutual fund analyst and at CIGNA Reinsurance in the risk management group as a risk analyst. |
 | David Rios, Portfolio Manager, is responsible for the day-to-day co-management of the Schwab Fundamental International Large Company Index Fund, Schwab Fundamental International Small Company Index Fund, and Schwab Fundamental Emerging Markets Large Company Index Fund. He joined CSIM in 2008 and became a Portfolio Manager in 2014. Prior to this role, Mr. Rios served as an Associate Portfolio Manager on the Schwab Equity Index Strategies team for four years. His first role with CSIM was as a trade operations specialist. He also previously worked as a senior fund accountant at Investors Bank & Trust (subsequently acquired by State Street Corporation). |
 | Sabya Sinha, Portfolio Manager, is responsible for the day-to-day co-management of the Schwab Fundamental US Large Company Index Fund and Schwab Fundamental US Small Company Index Fund. Prior to joining CSIM in 2015, Mr. Sinha spent a year at F-Squared Investments on the product development and analytics team. Prior to F-Squared, he worked at IndexIQ Advisors as a senior index portfolio manager for three years and for Bank of America’s Columbia Management subsidiary as a portfolio manager for three years. |
Schwab Fundamental Index Funds | Annual Report
Schwab Fundamental US Large Company Index Fundas of October 31, 2019
The Schwab Fundamental US Large Company Index Fund (the fund) seeks investment results that correspond generally (before fees and expenses) to the total return of the Russell RAFITMUS Large Company Index (the index), which measures the performance of the large company size segment by fundamental overall company scores, which are created using as the universe the U.S. companies in the FTSE Global Total Cap Index. To pursue its investment objective, the fund uses a replication investment approach and generally gives the same weight to a given stock as the index does. For more information concerning the fund’s investment objective, strategies, and risks, please see the fund’s prospectus.
Market Highlights. Over the reporting period, the U.S. equity market generated positive returns. The final two months of 2018 were marked by significant market volatility and steep declines, driven by concerns about slowing international growth, a trade war between the U.S. and China, falling oil prices, the waning strength of the U.S. economy, and the pace of future interest rate hikes despite low inflation. However, as the Federal Reserve (Fed) put interest rate hikes on hold, stocks, particularly in the U.S., staged a strong recovery in the first four months of 2019, which generally continued through the end of the reporting period. After raising interest rates four times in 2018, the Fed enacted three interest rate cuts by the end of the period—in July, September, and October.
Performance. The fund generally tracked the index for the reporting period. The fund returned 10.56% for the 12-month reporting period ended October 31, 2019, while the index returned 10.81%. Differences between the return of the fund and the return of the index may be attributable to, among other things, the operational and transactional costs incurred by the fund and not the index.
Contributors and Detractors. From a sector standpoint, the energy sector detracted the most from the return of the fund. Representing an average weight of approximately 10% of the fund’s investments, the energy sector returned approximately -9% for the reporting period. One example from this sector is Exxon Mobile Corp. The fund’s holding of Exxon Mobile Corp. returned approximately -11% for the reporting period.
While there were no additional sectors that detracted from overall fund performance over the reporting period, the materials sector was the smallest contributor to the return of the fund. The fund’s holdings in the materials sector represented an average weight of approximately 3% of the fund’s investments and returned approximately 7% for the reporting period.
The information technology sector contributed the most to the return of the fund. The information technology sector represented an average weight of approximately 16% of the fund’s investments and returned approximately 22% for the reporting period. Within this sector, Apple, Inc. was one of the largest contributors, with the fund’s holdings of this company returning approximately 15% for the reporting period.
Over the reporting period, the financials sector was also a contributor to overall fund performance. Financials stocks represented an average weight of approximately 14% of the fund’s investments and returned approximately 13% for the reporting period.
Management views and portfolio holdings may have changed since the report date.
Schwab Fundamental Index Funds | Annual Report
Schwab Fundamental US Large Company Index Fund
Performance and Fund Factsas of October 31, 2019
The performance data quoted represents past performance. Past performance does not guarantee future results. Investment returns and principal value of an investment will fluctuate so that an investor’s shares may be worth more or less than their original cost. Current performance may be lower or higher than performance data quoted. To obtain performance information current to the most recent month end, please visitwww.schwabfunds.com/schwabfunds_prospectus.
Performance of Hypothetical $10,000 Investment (October 31, 2009 – October 31, 2019)1,2
Average Annual Total Returns1
| Fund and Inception Date | 1 Year | 5 Years | 10 Years |
| Fund: Schwab Fundamental US Large Company Index Fund (4/2/07) | 10.56% | 8.66% | 12.87% |
| Russell RAFITM US Large Company Index2 | 10.81% | 8.96% | N/A |
| Fundamental U.S. Large Company Spliced Index | 10.81% | 8.96% | 13.18% |
| Russell 1000® Index | 14.15% | 10.55% | 13.72% |
| Fund Category: Morningstar Large Value3 | 9.63% | 7.22% | 11.07% |
| Fund Expense Ratio4: 0.25% |
All total returns on this page assume dividends and distributions were reinvested. Index figures do not include trading and management costs, which would lower performance. Indices are unmanaged and cannot be invested in directly. Performance results less than one year are not annualized.
The first index listed for the fund is the fund’s primary benchmark, as shown in the prospectus. Additional indices shown are provided for comparative purposes.
For index definitions, please see the Glossary.
Index ownership—The Schwab Fundamental US Large Company Index Fund is not in any way sponsored, endorsed, sold or promoted by Frank Russell Company (Russell), by the London Stock Exchange Group companies (LSEG), or by Research Affiliates LLC (RA) (collectively the Licensor Parties), and none of the Licensor Parties make any warranty or representation whatsoever, expressly or impliedly, either as to the results to be obtained from the use of the Russell RAFITM US Large Company Index (the Index) or otherwise. The Index is compiled and calculated by Russell in conjunction with RA. None of the Licensor Parties shall be liable (whether in negligence or otherwise) to any person for any error in the Index and none of the Licensor Parties shall be under any obligation to advise any person of any error therein. “Russell®” is a trademark of Russell. The trade names “Research Affiliates®”, “Fundamental Index®” and “RAFI®” are registered trademarks of RA. CSIM has obtained full license from Russell to use the Index. For full disclaimer please see the fund’s statement of additional information.
| 1 | Performance does not reflect the deduction of taxes that a shareholder would pay on fund distributions or the redemption of fund shares. |
| 2 | The inception date of the Russell RAFITM US Large Company Index is February 24, 2011. The fund began tracking the index on October 19, 2012. |
| 3 | Source for category information: Morningstar, Inc. The Morningstar Category return represents all active and index mutual funds within the category as of the report date. |
| 4 | As stated in the prospectus. |
Schwab Fundamental Index Funds | Annual Report
Schwab Fundamental US Large Company Index Fund
Performance and Fund Factsas of October 31, 2019 (continued)
| Number of Holdings | 705 |
| Weighted Average Market Cap (millions) | $194,639 |
| Price/Earnings Ratio (P/E) | 17.7 |
| Price/Book Ratio (P/B) | 2.3 |
| Portfolio Turnover Rate | 20% |
Sector Weightings % of Investments2
Top Equity Holdings % of Net Assets3
Portfolio holdings may have changed since the report date.
Source of Sector Classification: S& P and MSCI.
| 1 | Excludes derivatives. |
| 2 | The percentage may differ from the Portfolio Holdings because the above calculation is based on a percentage of total investments, excluding derivatives, whereas the calculation in the Portfolio Holdings is based on a percentage of net assets. |
| 3 | This list is not a recommendation of any security by the investment adviser. |
Schwab Fundamental Index Funds | Annual Report
Schwab Fundamental US Small Company Index Fundas of October 31, 2019
The Schwab Fundamental US Small Company Index Fund (the fund) seeks investment results that correspond generally (before fees and expenses) to the total return of the Russell RAFITM US Small Company Index (the index), which measures the performance of the small company size segment by fundamental overall company scores, which are created using as the universe the U.S. companies in the FTSE Global Total Cap Index. To pursue its investment objective, the fund uses a replication investment approach and generally gives the same weight to a given stock as the index does. For more information concerning the fund’s investment objective, strategies, and risks, please see the fund’s prospectus.
Market Highlights. Over the reporting period, the U.S. equity market generated positive returns. The final two months of 2018 were marked by significant market volatility and steep declines, driven by concerns about slowing international growth, a trade war between the U.S. and China, falling oil prices, the waning strength of the U.S. economy, and the pace of future interest rate hikes despite low inflation. However, as the Federal Reserve (Fed) put interest rate hikes on hold, stocks, particularly in the U.S., staged a strong recovery in the first four months of 2019, which generally continued through the end of the reporting period. After raising interest rates four times in 2018, the Fed enacted three interest rate cuts by the end of the period—in July, September, and October.
Performance. The fund generally tracked the index for the reporting period. The fund returned 5.61% for the 12-month reporting period ended October 31, 2019, while the index returned 5.85%. Differences between the return of the fund and the return of the index may be attributable to, among other things, the operational and transactional costs incurred by the fund and not the index.
Contributors and Detractors. Energy stocks were the largest detractors from the return the fund. The energy sector represented an average weight of approximately 4% of the fund’s investments and returned approximately -46% for the reporting period. One example from this sector is Superior Energy Services, Inc., which returned approximately -97% for the reporting period. (Please note this position was sold prior to the end of the reporting period.)
Over the reporting period, the consumer staples sector also detracted from overall fund performance. Consumer staples stocks represented an average weight of approximately 4% of the fund’s investments and returned approximately -1% for the reporting period.
Holdings in the industrials sector were the largest contributors to the return of the fund. Industrials stocks represented an average weight of approximately 20% of the fund’s investments and returned approximately 14% for the reporting period. One example from this sector is the fund’s holdings of Generac Holdings, Inc., which returned approximately 90% for the reporting period.
The information technology sector was another contributor to overall fund performance. Information technology stocks represented an average weight of approximately 12% of the fund’s investments and returned approximately 25% for the reporting period.
Management views and portfolio holdings may have changed since the report date.
Schwab Fundamental Index Funds | Annual Report
Schwab Fundamental US Small Company Index Fund
Performance and Fund Factsas of October 31, 2019
The performance data quoted represents past performance. Past performance does not guarantee future results. Investment returns and principal value of an investment will fluctuate so that an investor’s shares may be worth more or less than their original cost. Current performance may be lower or higher than performance data quoted. To obtain performance information current to the most recent month end, please visitwww.schwabfunds.com/schwabfunds_prospectus.
Performance of Hypothetical $10,000 Investment (October 31, 2009 – October 31, 2019)1,2
Average Annual Total Returns1
| Fund and Inception Date | 1 Year | 5 Years | 10 Years |
| Fund: Schwab Fundamental US Small Company Index Fund (4/2/07) | 5.61% | 7.19% | 12.61% |
| Russell RAFITM US Small Company Index2 | 5.85% | 7.44% | N/A |
| Fundamental U.S. Small Company Spliced Index | 5.85% | 7.44% | 12.82% |
| Russell 2000® Index | 4.90% | 7.37% | 12.27% |
| Fund Category: Morningstar Small Blend3 | 4.42% | 6.20% | 11.55% |
| Fund Expense Ratio4: 0.25% |
All total returns on this page assume dividends and distributions were reinvested. Index figures do not include trading and management costs, which would lower performance. Indices are unmanaged and cannot be invested in directly. Performance results less than one year are not annualized.
The first index listed for the fund is the fund’s primary benchmark, as shown in the prospectus. Additional indices shown are provided for comparative purposes.
For index definitions, please see the Glossary.
Index ownership—The Schwab Fundamental US Small Company Index Fund is not in any way sponsored, endorsed, sold or promoted by Frank Russell Company (Russell), by the London Stock Exchange Group companies (LSEG), or by Research Affiliates LLC (RA) (collectively the Licensor Parties), and none of the Licensor Parties make any warranty or representation whatsoever, expressly or impliedly, either as to the results to be obtained from the use of the Russell RAFITM US Small Company Index (the Index) or otherwise. The Index is compiled and calculated by Russell in conjunction with RA. None of the Licensor Parties shall be liable (whether in negligence or otherwise) to any person for any error in the Index and none of the Licensor Parties shall be under any obligation to advise any person of any error therein. “Russell®” is a trademark of Russell. The trade names “Research Affiliates®”, “Fundamental Index®” and “RAFI®” are registered trademarks of RA. CSIM has obtained full license from Russell to use the Index. For full disclaimer please see the fund’s statement of additional information.
| 1 | Performance does not reflect the deduction of taxes that a shareholder would pay on fund distributions or the redemption of fund shares. |
| 2 | The inception date of the Russell RAFITM US Small Company Index is February 24, 2011. The fund began tracking the index on October 19, 2012. |
| 3 | Source for category information: Morningstar, Inc. The Morningstar Category return represents all active and index mutual funds within the category as of the report date. |
| 4 | As stated in the prospectus. |
Schwab Fundamental Index Funds | Annual Report
Schwab Fundamental US Small Company Index Fund
Performance and Fund Factsas of October 31, 2019 (continued)
| Number of Holdings | 916 |
| Weighted Average Market Cap (millions) | $4,340 |
| Price/Earnings Ratio (P/E) | 17.6 |
| Price/Book Ratio (P/B) | 1.7 |
| Portfolio Turnover Rate | 34% |
Sector Weightings % of Investments2
Top Equity Holdings % of Net Assets3
Portfolio holdings may have changed since the report date.
Source of Sector Classification: S& P and MSCI.
Small-company stocks are subject to greater volatility than many other asset classes.
| 1 | Excludes derivatives. |
| 2 | The percentage may differ from the Portfolio Holdings because the above calculation is based on a percentage of total investments, excluding derivatives, whereas the calculation in the Portfolio Holdings is based on a percentage of net assets. |
| 3 | This list is not a recommendation of any security by the investment adviser. |
Schwab Fundamental Index Funds | Annual Report
Schwab Fundamental International Large Company Index Fundas of October 31, 2019
The Schwab Fundamental International Large Company Index Fund (the fund) seeks investment results that correspond generally (before fees and expenses) to the total return of the Russell RAFITM Developed ex US Large Company Index (Net) (the index), which measures the performance of the large company size segment by fundamental overall company scores, which are created using as the universe the developed ex U.S. companies in the FTSE Global Total Cap Index. To pursue its investment objective, the fund uses a replication investment approach and generally gives the same weight to a given stock as the index does. For more information concerning the fund’s investment objective, strategies, and risks, please see the fund’s prospectus.
Market Highlights. Over the reporting period, international equity markets generated positive returns. The final two months of 2018 were marked by significant market volatility and steep declines across global equity markets, driven by concerns about slowing international economic growth, a trade war between the U.S. and China, falling oil prices, the waning strength of the U.S. economy, and the pace of future interest rate hikes in the U.S. However, stocks staged a recovery in the first four months of 2019, which generally continued through the end of the reporting period. A number of central banks reduced their policy rates, including the U.S., while others maintained their generally low—and for some international central banks, negative—interest rates.
Performance. The fund generally tracked the index for the reporting period. The fund returned 7.04% for the 12-month reporting period ended October 31, 2019, while the index returned 6.94%. Timing differences in foreign exchange calculations and fair valuation of the fund’s holdings contributed to the fund’s relative performance.1
Contributors and Detractors. From a country standpoint, Japanese stocks were the largest contributors to the return of the fund. Japanese stocks represented an average weight of approximately 25% of the fund’s investments and returned approximately 6% in U.S. dollar terms for the reporting period. One example from this country is Toyota Motor Corp. The fund’s holdings of Toyota Motor Corp. returned approximately 23% in U.S. dollar terms for the reporting period.
The fund’s holdings in Switzerland also contributed to overall fund performance, representing an average weight of approximately 6% of the fund’s investments and returning approximately 20% in U.S. dollar terms for the reporting period.
Stocks from Israel were the largest detractors to the return of the fund. The fund’s holdings in Israel represented an average weight of less than 1% of the fund’s investments and returned approximately -36% in U.S. dollar terms for the reporting period. Teva Pharmaceutical Industries Ltd. is one example of the fund’s holdings from this country. The fund’s holdings of Teva Pharmaceutical Industries Ltd. returned approximately -59% in U.S. dollar terms for the reporting period.
The fund’s holdings in South Korea also detracted from the return of the fund. South Korean stocks represented approximately 3% of the fund’s investments and returned approximately -3% in U.S. dollar terms for the reporting period.
Management views and portfolio holdings may have changed since the report date.
| 1 | Typically, the securities in the index are valued using foreign exchange rates obtained at the close of the London foreign currency exchange (11:00 AM EST). Securities in the fund, however, are valued using foreign exchange rates obtained at the close of the New York foreign currency exchange (4:00 PM EST). This difference in closing times can result in different foreign currency exchange rates between the two exchanges, and thus different foreign currency exchange rates used in the valuation of the index’s and fund’s securities. |
Schwab Fundamental Index Funds | Annual Report
Schwab Fundamental International Large Company Index Fund
Performance and Fund Factsas of October 31, 2019
The performance data quoted represents past performance. Past performance does not guarantee future results. Investment returns and principal value of an investment will fluctuate so that an investor’s shares may be worth more or less than their original cost. Current performance may be lower or higher than performance data quoted. To obtain performance information current to the most recent month end, please visitwww.schwabfunds.com/schwabfunds_prospectus.
Performance of Hypothetical $10,000 Investment (October 31, 2009 – October 31, 2019)1,2,3
Average Annual Total Returns1
| Fund and Inception Date | 1 Year | 5 Years | 10 Years |
| Fund: Schwab Fundamental International Large Company Index Fund (4/2/07) | 7.04% | 3.53% | 4.71% |
| Russell RAFITM Developed ex US Large Company Index (Net)2,3 | 6.94% | 3.82% | N/A |
| Fundamental Developed ex-U.S. Large Company Spliced Index | 6.94% | 3.82% | 4.92% |
| MSCI EAFE® Index (Net)3 | 11.04% | 4.31% | 5.41% |
| Fund Category: Morningstar Foreign Large Value4 | 6.31% | 2.00% | 4.18% |
| Fund Expense Ratio5: 0.25% |
All total returns on this page assume dividends and distributions were reinvested. Index figures do not include trading and management costs, which would lower performance. Indices are unmanaged and cannot be invested in directly. Performance results less than one year are not annualized.
The first index listed for the fund is the fund’s primary benchmark, as shown in the prospectus. Additional indices shown are provided for comparative purposes.
For index definitions, please see the Glossary.
The fund’s performance relative to the index may be affected by fair-value pricing, see financial note 2 for more information.
Index ownership—The Schwab Fundamental International Large Company Index Fund is not in any way sponsored, endorsed, sold or promoted by Frank Russell Company (Russell), by the London Stock Exchange Group companies (LSEG), or by Research Affiliates LLC (RA) (collectively the Licensor Parties), and none of the Licensor Parties make any warranty or representation whatsoever, expressly or impliedly, either as to the results to be obtained from the use of the Russell RAFITM Developed ex US Large Company Index (the Index) or otherwise. The Index is compiled and calculated by Russell in conjunction with RA. None of the Licensor Parties shall be liable (whether in negligence or otherwise) to any person for any error in the Index and none of the Licensor Parties shall be under any obligation to advise any person of any error therein. “Russell®” is a trademark of Russell. The trade names “Research Affiliates®”, “Fundamental Index®” and “RAFI®” are registered trademarks of RA. CSIM has obtained full license from Russell to use the Index. For full disclaimer please see the fund’s statement of additional information.
| 1 | Performance does not reflect the deduction of taxes that a shareholder would pay on fund distributions or the redemption of fund shares. |
| 2 | The inception date of the Russell RAFITM Developed ex US Large Company Index (Net) is February 24, 2011. The fund began tracking the index on October 19, 2012. |
| 3 | The net version of the index reflects reinvested dividends net of withholding taxes, but reflects no deductions for expenses or other taxes. |
| 4 | Source for category information: Morningstar, Inc. The Morningstar Category return represents all active and index mutual funds within the category as of the report date. |
| 5 | As stated in the prospectus. |
Schwab Fundamental Index Funds | Annual Report
Schwab Fundamental International Large Company Index Fund
Performance and Fund Factsas of October 31, 2019 (continued)
| Number of Holdings | 965 |
| Weighted Average Market Cap (millions) | $59,466 |
| Price/Earnings Ratio (P/E) | 13.2 |
| Price/Book Ratio (P/B) | 0.8 |
| Portfolio Turnover Rate | 28% |
Sector Weightings % of Investments1
Top Equity Holdings % of Net Assets2
Top Country Weightings % of Investments3
Portfolio holdings may have changed since the report date.
Source of Sector Classification: S&P and MSCI.
International investments are subject to additional risks such as currency fluctuation, geopolitical risk and the potential for illiquid markets.
| 1 | Excludes derivatives. |
| 2 | This list is not a recommendation of any security by the investment adviser. |
| 3 | The percentage may differ from the Portfolio Holdings because the above calculation is based on a percentage of total investments, excluding derivatives, whereas the calculation in the Portfolio Holdings is based on a percentage of net assets. |
Schwab Fundamental Index Funds | Annual Report
Schwab Fundamental International Small Company Index Fundas of October 31, 2019
The Schwab Fundamental International Small Company Index Fund (the fund) seeks investment results that correspond generally (before fees and expenses) to the total return of the Russell RAFITM Developed ex US Small Company Index (Net) (the index), which measures the performance of the small company size segment by fundamental overall company scores, which are created using as the universe the developed ex U.S. companies in the FTSE Global Total Cap Index. To pursue its investment objective, the fund uses a replication investment approach and generally gives the same weight to a given stock as the index does. For more information concerning the fund’s investment objective, strategies, and risks, please see the fund’s prospectus.
Market Highlights. Over the reporting period, international equity markets generated positive returns. The final two months of 2018 were marked by significant market volatility and steep declines across global equity markets, driven by concerns about slowing international economic growth, a trade war between the U.S. and China, falling oil prices, the waning strength of the U.S. economy, and the pace of future interest rate hikes in the U.S. However, stocks staged a recovery in the first four months of 2019, which generally continued through the end of the reporting period. A number of central banks reduced their policy rates, including the U.S., while others maintained their generally low—and for some international central banks, negative—interest rates.
Performance. The fund generally tracked the index for the reporting period. The fund returned 5.13% for the 12-month reporting period ended October 31, 2019, while the index returned 5.51%. Differences between the return of the fund and the return of the index may be attributable to, among other things, the operational and transactional costs incurred by the fund and not the index. Also, timing differences in foreign exchange calculations contributed to, and fair valuation of the fund’s holdings detracted from, the fund’s relative performance.1
Contributors and Detractors. From a country standpoint, South Korean stocks detracted the most from the return of the fund. Representing an average weight of approximately 3% of the fund’s investments, stocks from South Korea returned approximately -15% in U.S. dollar terms for the reporting period. One example from this country is Hanwha Life Insurance Co., Ltd. The fund’s holdings of Hanwha Life Insurance Co., Ltd. returned approximately -48% in U.S. dollar terms for the reporting period.
Stocks from Norway also detracted from the return of the fund. Norwegian stocks represented an average weight of approximately 2% of the fund’s investments and returned approximately -10% in U.S. dollar terms for the reporting period.
Stocks from Japan were the largest contributors to the return of the fund. Japanese stocks represented an average weight of approximately 35% of the fund’s investments and returned approximately 7% in U.S. dollar terms for the reporting period. Hitachi Chemical Co., Ltd., a chemical manufacturer, is one example of the fund’s holdings from this country. The fund’s holdings of Hitachi Chemical Co., Ltd. generated a triple-digit return of approximately 115% in U.S. dollar terms for the reporting period.
The fund’s holdings in the United Kingdom also contributed to overall fund performance, representing an average weight of approximately 11% of the fund’s investments and returning approximately 6% in U.S. dollar terms for the reporting period.
Management views and portfolio holdings may have changed since the report date.
| 1 | Typically, the securities in the index are valued using foreign exchange rates obtained at the close of the London foreign currency exchange (11:00 AM EST). Securities in the fund, however, are valued using foreign exchange rates obtained at the close of the New York foreign currency exchange (4:00 PM EST). This difference in closing times can result in different foreign currency exchange rates between the two exchanges, and thus different foreign currency exchange rates used in the valuation of the index’s and fund’s securities. |
Schwab Fundamental Index Funds | Annual Report
Schwab Fundamental International Small Company Index Fund
Performance and Fund Factsas of October 31, 2019
The performance data quoted represents past performance. Past performance does not guarantee future results. Investment returns and principal value of an investment will fluctuate so that an investor’s shares may be worth more or less than their original cost. Current performance may be lower or higher than performance data quoted. To obtain performance information current to the most recent month end, please visitwww.schwabfunds.com/schwabfunds_prospectus.
Performance of Hypothetical $10,000 Investment (October 31, 2009 – October 31, 2019)1,2,3
Average Annual Total Returns1
| Fund and Inception Date | 1 Year | 5 Years | 10 Years |
| Fund: Schwab Fundamental International Small Company Index Fund (1/31/08) | 5.13% | 5.80% | 7.13% |
| Russell RAFITM Developed ex US Small Company Index (Net)2,3 | 5.51% | 6.36% | N/A |
| Fundamental Developed ex-U.S. Small Company Spliced Index | 5.51% | 6.36% | 7.55% |
| S&P Developed ex-U.S. Small Cap Index (Net)3 | 7.40% | 6.16% | 7.47% |
| Fund Category: Morningstar Foreign Small/Mid Blend4 | 7.02% | 5.15% | 7.12% |
| Fund Expense Ratio5: 0.39% |
All total returns on this page assume dividends and distributions were reinvested. Index figures do not include trading and management costs, which would lower performance. Indices are unmanaged and cannot be invested in directly. Performance results less than one year are not annualized.
The first index listed for the fund is the fund’s primary benchmark, as shown in the prospectus. Additional indices shown are provided for comparative purposes.
For index definitions, please see the Glossary.
The fund’s performance relative to the index may be affected by fair-value pricing, see financial note 2 for more information.
Index ownership—The Schwab Fundamental International Small Company Index Fund is not in any way sponsored, endorsed, sold or promoted by Frank Russell Company (Russell), by the London Stock Exchange Group companies (LSEG), or by Research Affiliates LLC (RA) (collectively the Licensor Parties), and none of the Licensor Parties make any warranty or representation whatsoever, expressly or impliedly, either as to the results to be obtained from the use of the Russell RAFITM Developed ex US Small Company Index (the Index) or otherwise. The Index is compiled and calculated by Russell in conjunction with RA. None of the Licensor Parties shall be liable (whether in negligence or otherwise) to any person for any error in the Index and none of the Licensor Parties shall be under any obligation to advise any person of any error therein. “Russell®” is a trademark of Russell. The trade names “Research Affiliates®”, “Fundamental Index®” and “RAFI®” are registered trademarks of RA. CSIM has obtained full license from Russell to use the Index. For full disclaimer please see the fund’s statement of additional information.
| 1 | Performance does not reflect the deduction of taxes that a shareholder would pay on fund distributions or the redemption of fund shares. |
| 2 | The inception date of the Russell RAFITM Developed ex US Small Company Index (Net) is February 24, 2011. The fund began tracking the index on October 19, 2012. |
| 3 | The net version of the index reflects reinvested dividends net of withholding taxes, but reflects no deductions for expenses or other taxes. |
| 4 | Source for category information: Morningstar, Inc. The Morningstar Category return represents all active and index mutual funds within the category as of the report date. |
| 5 | As stated in the prospectus. |
Schwab Fundamental Index Funds | Annual Report
Schwab Fundamental International Small Company Index Fund
Performance and Fund Factsas of October 31, 2019 (continued)
| Number of Holdings | 1,679 |
| Weighted Average Market Cap (millions) | $3,379 |
| Price/Earnings Ratio (P/E) | 14.0 |
| Price/Book Ratio (P/B) | 1.1 |
| Portfolio Turnover Rate | 38% |
Sector Weightings % of Investments1
Top Equity Holdings % of Net Assets2
Top Country Weightings % of Investments3
Portfolio holdings may have changed since the report date.
Source of Sector Classification: S&P and MSCI.
Small-company stocks are subject to greater volatility than many other asset classes.
International investments are subject to additional risks such as currency fluctuation, geopolitical risk and the potential for illiquid markets.
| 1 | Excludes derivatives. |
| 2 | This list is not a recommendation of any security by the investment adviser. |
| 3 | The percentage may differ from the Portfolio Holdings because the above calculation is based on a percentage of total investments, excluding derivatives, whereas the calculation in the Portfolio Holdings is based on a percentage of net assets. |
Schwab Fundamental Index Funds | Annual Report
Schwab Fundamental Emerging Markets Large Company Index Fundas of October 31, 2019
The Schwab Fundamental Emerging Markets Large Company Index Fund (the fund) seeks investment results that correspond generally (before fees and expenses) to the total return of the Russell RAFITM Emerging Markets Large Company Index (Net) (the index), which measures the performance of the large company size segment by fundamental overall company scores, which are created using as the universe the emerging markets companies in the FTSE Global Total Cap Index. To pursue its investment objective, the fund invests in a representative sample of the securities included in the index which, when taken together, are expected to perform similarly to the index as a whole. Due to the use of sampling techniques, the fund may not hold all of the securities in the index. For more information concerning the fund’s investment objective, strategies, and risks, please see the fund’s prospectus.
Market Highlights. Over the reporting period, international equity markets generated positive returns. The final two months of 2018 were marked by significant market volatility and steep declines across global equity markets, driven by concerns about slowing international economic growth, a trade war between the U.S. and China, falling oil prices, the waning strength of the U.S. economy, and the pace of future interest rate hikes in the U.S. However, stocks staged a recovery in the first four months of 2019, which generally continued through the end of the reporting period. A number of central banks reduced their policy rates, including the U.S., while others maintained their generally low—and for some international central banks, negative—interest rates.
Performance. The fund generally tracked the index for the reporting period. The fund returned 10.73% for the 12-month reporting period ended October 31, 2019, while the index returned 11.54%. Differences between the return of the fund and the return of the index may be attributable to, among other things, the operational and transactional costs incurred by the fund and not the index. Additionally, timing differences in foreign exchange calculations contributed to, and fair valuation of the fund’s holdings detracted from, the fund’s relative performance.1
Contributors and Detractors. From a country standpoint, Chinese stocks detracted the most from the return of the fund. Representing an average weight of approximately 23% of the fund’s investments, stocks from China returned less than 1% in U.S. dollar terms for the reporting period. One example from this country is China Petroleum & Chemical Corp., an oil and gas enterprise. The fund’s holdings of China Petroleum & Chemical Corp. (H Shares) returned approximately -24% in U.S. dollar terms for the reporting period.
Stocks from Chile also detracted from the return of the fund. Chilean stocks represented less than 1% of the fund’s investments and returned approximately -15% in U.S. dollar terms for the reporting period.
Russian stocks contributed the most to the return of the fund. Representing an average weight of approximately 15% of the fund’s investments, stocks from Russia generated a return of approximately 43% in U.S. dollar terms for the reporting period. One example from this country is Gazprom PJSC, an oil and gas company. The fund’s holdings of Gazprom PJSC returned approximately 85% in U.S. dollar terms for the reporting period.
Stocks from Taiwan also contributed to overall fund performance, representing an average weight of approximately 15% of the fund’s investments and returning approximately 15% in U.S. dollar terms for the reporting period.
Management views and portfolio holdings may have changed since the report date.
| 1 | Typically, the securities in the index are valued using foreign exchange rates obtained at the close of the London foreign currency exchange (11:00 AM EST). Securities in the fund, however, are valued using foreign exchange rates obtained at the close of the New York foreign currency exchange (4:00 PM EST). This difference in closing times can result in different foreign currency exchange rates between the two exchanges, and thus different foreign currency exchange rates used in the valuation of the index’s and fund’s securities. |
Schwab Fundamental Index Funds | Annual Report
Schwab Fundamental Emerging Markets Large Company Index Fund
Performance and Fund Factsas of October 31, 2019
The performance data quoted represents past performance. Past performance does not guarantee future results. Investment returns and principal value of an investment will fluctuate so that an investor’s shares may be worth more or less than their original cost. Current performance may be lower or higher than performance data quoted. To obtain performance information current to the most recent month end, please visitwww.schwabfunds.com/schwabfunds_prospectus.
Performance of Hypothetical $10,000 Investment (October 31, 2009 – October 31, 2019)1,2,3
Average Annual Total Returns1
| Fund and Inception Date | 1 Year | 5 Years | 10 Years |
| Fund: Schwab Fundamental Emerging Markets Large Company Index Fund (1/31/08) | 10.73% | 4.22% | 3.26% |
| Russell RAFITM Emerging Markets Large Company Index (Net)2,3 | 11.54% | 4.91% | N/A |
| Fundamental Emerging Markets Large Company Spliced Index | 11.54% | 4.91% | 4.20% |
| MSCI Emerging Markets Index (Net)3 | 11.86% | 2.93% | 3.78% |
| Fund Category: Morningstar Diversified Emerging Markets4 | 12.93% | 2.23% | 3.93% |
| Fund Expense Ratio5: 0.39% |
All total returns on this page assume dividends and distributions were reinvested. Index figures do not include trading and management costs, which would lower performance. Indices are unmanaged and cannot be invested in directly. Performance results less than one year are not annualized.
The first index listed for the fund is the fund’s primary benchmark, as shown in the prospectus. Additional indices shown are provided for comparative purposes.
For index definitions, please see the Glossary.
The fund’s performance relative to the index may be affected by fair-value pricing, see financial note 2 for more information.
Index ownership—The Schwab Fundamental Emerging Markets Large Company Index Fund is not in any way sponsored, endorsed, sold or promoted by Frank Russell Company (Russell), by the London Stock Exchange Group companies (LSEG), or by Research Affiliates LLC (RA) (collectively the Licensor Parties), and none of the Licensor Parties make any warranty or representation whatsoever, expressly or impliedly, either as to the results to be obtained from the use of the Russell RAFITM Emerging Markets Large Company Index (the Index) or otherwise. The Index is compiled and calculated by Russell in conjunction with RA. None of the Licensor Parties shall be liable (whether in negligence or otherwise) to any person for any error in the Index and none of the Licensor Parties shall be under any obligation to advise any person of any error therein. “Russell®” is a trademark of Russell. The trade names “Research Affiliates®”, “Fundamental Index®” and “RAFI®” are registered trademarks of RA. CSIM has obtained full license from Russell to use the Index. For full disclaimer please see the fund’s statement of additional information.
| 1 | Performance does not reflect the deduction of taxes that a shareholder would pay on fund distributions or the redemption of fund shares. |
| 2 | The inception date of the Russell RAFITM Emerging Markets Large Company Index (Net) is February 24, 2011. The fund began tracking the index on October 19, 2012. |
| 3 | The net version of the index reflects reinvested dividends net of withholding taxes, but reflects no deductions for expenses or other taxes. |
| 4 | Source for category information: Morningstar, Inc. The Morningstar Category return represents all active and index mutual funds within the category as of the report date. |
| 5 | As stated in the prospectus. |
Schwab Fundamental Index Funds | Annual Report
Schwab Fundamental Emerging Markets Large Company Index Fund
Performance and Fund Factsas of October 31, 2019 (continued)
| Number of Holdings | 271 |
| Weighted Average Market Cap (millions) | $67,412 |
| Price/Earnings Ratio (P/E) | 10.7 |
| Price/Book Ratio (P/B) | 1.3 |
| Portfolio Turnover Rate | 38% |
Sector Weightings % of Investments1
Top Equity Holdings % of Net Assets2
Top Country Weightings % of Investments3
Portfolio holdings may have changed since the report date.
Source of Sector Classification: S&P and MSCI.
International investments are subject to additional risks such as currency fluctuation, geopolitical risk and the potential for illiquid markets. Investing in emerging markets may accentuate these risks.
| 1 | Excludes derivatives. |
| 2 | This list is not a recommendation of any security by the investment adviser. |
| 3 | The percentage may differ from the Portfolio Holdings because the above calculation is based on a percentage of total investments, excluding derivatives, whereas the calculation in the Portfolio Holdings is based on a percentage of net assets. |
Schwab Fundamental Index Funds | Annual Report
Schwab Fundamental Index Funds
Examples for a $1,000 Investment
As a fund shareholder, you may incur two types of costs: (1) transaction costs; and (2) ongoing costs, including management fees.
The expense examples below are intended to help you understand your ongoing cost (in dollars) of investing in a fund and to compare this cost with the ongoing cost of investing in other mutual funds. These examples are based on an investment of $1,000 invested for six months beginning May 1, 2019 and held through October 31, 2019.
Actual Return lines in the table below provide information about actual account values and actual expenses. You may use this information, together with the amount you invested, to estimate the expenses that you paid over the period. To do so, simply divide your account value by $1,000 (for example, an $8,600 account value ÷ $1,000 = 8.6), then multiply the result by the number given for your fund under the heading entitled “Expenses Paid During Period.”
Hypothetical Return lines in the table below provide information about hypothetical account values and hypothetical expenses based on a fund’s actual expense ratio and an assumed return of 5% per year before expenses. Because the return used is not an actual return, it may not be used to estimate the actual ending account value or expenses you paid for the period.
You may use this information to compare the ongoing costs of investing in a fund and other funds. To do so, compare this 5% hypothetical example with the 5% hypothetical examples that appear in the shareholder reports of the other funds.
Please note that the expenses shown in the table are meant to highlight your ongoing costs only, and do not reflect any transactional costs. Therefore, the hypothetical return lines of the table are useful in comparing ongoing costs only, and will not help you determine the relative total costs of owning different funds. In addition, if these transactional costs were included, your costs would have been higher.
| | Expense Ratio
(Annualized)1 | Beginning
Account Value
at 5/1/19 | Ending
Account Value
(Net of Expenses)
at 10/31/19 | Expenses Paid
During Period
5/1/19-10/31/192 |
| Schwab Fundamental US Large Company Index Fund | | | | |
| Actual Return | 0.25% | $1,000.00 | $1,036.60 | $1.28 |
| Hypothetical 5% Return | 0.25% | $1,000.00 | $1,023.94 | $1.28 |
| Schwab Fundamental US Small Company Index Fund | | | | |
| Actual Return | 0.25% | $1,000.00 | $1,001.40 | $1.26 |
| Hypothetical 5% Return | 0.25% | $1,000.00 | $1,023.94 | $1.28 |
| Schwab Fundamental International Large Company Index Fund | | | | |
| Actual Return | 0.25% | $1,000.00 | $1,012.40 | $1.27 |
| Hypothetical 5% Return | 0.25% | $1,000.00 | $1,023.94 | $1.28 |
| Schwab Fundamental International Small Company Index Fund | | | | |
| Actual Return | 0.39% | $1,000.00 | $1,009.60 | $1.98 |
| Hypothetical 5% Return | 0.39% | $1,000.00 | $1,023.23 | $1.99 |
| Schwab Fundamental Emerging Markets Large Company Index Fund | | | | |
| Actual Return | 0.39% | $1,000.00 | $1,018.70 | $1.98 |
| Hypothetical 5% Return | 0.39% | $1,000.00 | $1,023.23 | $1.99 |
| 1 | Based on the most recent six-month expense ratio. |
| 2 | Expenses for each fund are equal to its annualized expense ratio, multiplied by the average account value over the period, multiplied by 184 days of the period, and divided by 365 days of the fiscal year. |
Schwab Fundamental Index Funds | Annual Report
Schwab Fundamental US Large Company Index Fund
Financial Statements
Financial Highlights
| | 11/1/18–
10/31/19 | 11/1/17–
10/31/18 | 11/1/16–
10/31/17 | 11/1/15–
10/31/16 | 11/1/14–
10/31/15 | |
| Per-Share Data |
| Net asset value at beginning of period | $17.47 | $16.89 | $15.12 | $15.14 | $15.56 | |
| Income (loss) from investment operations: | | | | | | |
| Net investment income (loss)1 | 0.42 | 0.38 | 0.35 | 0.34 | 0.33 | |
| Net realized and unrealized gains (losses) | 1.08 | 0.76 | 2.52 | 0.44 | (0.10) | |
| Total from investment operations | 1.50 | 1.14 | 2.87 | 0.78 | 0.23 | |
| Less distributions: | | | | | | |
| Distributions from net investment income | (0.42) | (0.36) | (0.34) | (0.34) | (0.26) | |
| Distributions from net realized gains | (0.99) | (0.20) | (0.76) | (0.46) | (0.39) | |
| Total distributions | (1.41) | (0.56) | (1.10) | (0.80) | (0.65) | |
| Net asset value at end of period | $17.56 | $17.47 | $16.89 | $15.12 | $15.14 | |
| Total return | 10.56% | 6.83% | 19.69% | 5.61% | 1.44% | |
| Ratios/Supplemental Data |
| Ratios to average net assets: | | | | | | |
| Total expenses | 0.25% | 0.25% | 0.31%2 | 0.39% | 0.39% | |
| Net operating expenses | N/A | N/A3 | 0.30%2 | 0.35% | 0.35% | |
| Net investment income (loss) | 2.53% | 2.17% | 2.19% | 2.33% | 2.16% | |
| Portfolio turnover rate | 20% | 10% | 15% | 11% | 12% | |
| Net assets, end of period (x 1,000,000) | $5,237 | $4,887 | $5,367 | $4,569 | $4,886 | |
| |
1
Calculated based on the average shares outstanding during the period.
2
Effective May 1, 2017, the annual operating expense ratio was reduced. The ratio presented for period ended 10/31/17 is a blended ratio.
3
Effective May 1, 2017, the fund instituted a new fee structure and the contractual expense limitation was terminated.
Schwab Fundamental Index Funds | Annual Report
Schwab Fundamental US Large Company Index Fund
Condensed Portfolio Holdings as of October 31, 2019
This section shows the fund’s 50 largest portfolio holdings in unaffiliated issuers, any holdings exceeding 1% of the fund’s net assets as of the report date, and any affiliated issuers. The remaining securities held by the fund are grouped as "Other Securities" in each category. You can request a complete schedule of portfolio holdings as of the report date, free of charge, by calling Schwab Funds® at 1-877-824-5615. This complete schedule, filed on the fund’s N-CSR(S), is also available on the U.S. Securities and Exchange Commission (SEC)’s website atwww.sec.gov.
In addition, the fund files its complete schedule of portfolio holdings with the SEC for the first and third quarters of each fiscal year on Form N-Q. The fund’s Form N-Q is available on the SEC’s website. Effective March 31, 2019, Form N-PORT Part F has replaced Form N-Q. The fund also makes available its complete schedule of portfolio holdings 15-20 days after the end of the month on the fund’s website atwww.schwabfunds.com/schwabfunds_prospectus.
| Security | Number
of Shares | % of Net
Assets | Value
($) |
| Common Stock99.7% of net assets | |
| |
| Automobiles & Components 1.8% | |
| Ford Motor Co. | 2,956,900 | 0.5 | 25,399,771 |
| General Motors Co. | 890,219 | 0.6 | 33,080,538 |
| Other Securities | | 0.7 | 36,650,124 |
| | | 1.8 | 95,130,433 |
| |
| Banks 5.9% | |
| Bank of America Corp. | 1,271,972 | 0.8 | 39,774,564 |
| Citigroup, Inc. | 681,431 | 0.9 | 48,967,632 |
| JPMorgan Chase & Co. | 611,093 | 1.5 | 76,337,738 |
| Wells Fargo & Co. | 1,242,348 | 1.2 | 64,142,427 |
| Other Securities | | 1.5 | 76,928,009 |
| | | 5.9 | 306,150,370 |
| |
| Capital Goods 8.5% | |
| General Electric Co. | 6,603,687 | 1.3 | 65,904,796 |
| The Boeing Co. | 66,650 | 0.4 | 22,655,001 |
| United Technologies Corp. | 212,387 | 0.6 | 30,494,525 |
| Other Securities | | 6.2 | 325,766,646 |
| | | 8.5 | 444,820,968 |
| |
| Commercial & Professional Services 0.6% | |
| Other Securities | | 0.6 | 32,738,347 |
| |
| Consumer Durables & Apparel 1.5% | |
| Other Securities | | 1.5 | 78,034,955 |
| |
| Consumer Services 1.7% | |
| McDonald's Corp. | 136,051 | 0.5 | 26,761,232 |
| Other Securities | | 1.2 | 63,804,563 |
| | | 1.7 | 90,565,795 |
| |
| Diversified Financials 5.2% | |
| Berkshire Hathaway, Inc., Class B * | 234,950 | 1.0 | 49,945,671 |
| The Charles Schwab Corp.(a) | 76,794 | 0.1 | 3,126,284 |
| The Goldman Sachs Group, Inc. | 120,902 | 0.5 | 25,798,069 |
| Other Securities | | 3.6 | 191,405,505 |
| | | 5.2 | 270,275,529 |
| |
| Energy 8.7% | |
| Chevron Corp. | 724,019 | 1.6 | 84,087,567 |
| ConocoPhillips | 387,994 | 0.4 | 21,417,269 |
| Exxon Mobil Corp. | 1,913,953 | 2.5 | 129,325,804 |
| Marathon Petroleum Corp. | 346,208 | 0.4 | 22,140,002 |
| Security | Number
of Shares | % of Net
Assets | Value
($) |
| Phillips 66 | 286,052 | 0.6 | 33,416,595 |
| Valero Energy Corp. | 371,850 | 0.7 | 36,062,013 |
| Other Securities | | 2.5 | 130,996,800 |
| | | 8.7 | 457,446,050 |
| |
| Food & Staples Retailing 3.1% | |
| Costco Wholesale Corp. | 103,572 | 0.6 | 30,772,277 |
| Walmart, Inc. | 641,278 | 1.4 | 75,196,258 |
| Other Securities | | 1.1 | 55,446,273 |
| | | 3.1 | 161,414,808 |
| |
| Food, Beverage & Tobacco 4.3% | |
| PepsiCo, Inc. | 243,907 | 0.6 | 33,456,723 |
| Philip Morris International, Inc. | 364,893 | 0.6 | 29,716,886 |
| The Coca-Cola Co. | 591,843 | 0.6 | 32,214,015 |
| Other Securities | | 2.5 | 128,690,318 |
| | | 4.3 | 224,077,942 |
| |
| Health Care Equipment & Services 5.5% | |
| CVS Health Corp. | 781,871 | 1.0 | 51,908,416 |
| Medtronic plc | 207,489 | 0.4 | 22,595,552 |
| UnitedHealth Group, Inc. | 160,954 | 0.8 | 40,673,076 |
| Other Securities | | 3.3 | 175,089,731 |
| | | 5.5 | 290,266,775 |
| |
| Household & Personal Products 1.7% | |
| The Procter & Gamble Co. | 474,865 | 1.1 | 59,125,441 |
| Other Securities | | 0.6 | 27,991,922 |
| | | 1.7 | 87,117,363 |
| |
| Insurance 3.8% | |
| American International Group, Inc. | 696,930 | 0.7 | 36,909,413 |
| Other Securities | | 3.1 | 162,140,270 |
| | | 3.8 | 199,049,683 |
| |
| Materials 3.3% | |
| Other Securities | | 3.3 | 172,932,615 |
| |
| Media & Entertainment 4.3% | |
| Alphabet, Inc., Class A * | 20,659 | 0.5 | 26,005,549 |
| Alphabet, Inc., Class C * | 21,007 | 0.5 | 26,471,131 |
| Comcast Corp., Class A | 990,970 | 0.8 | 44,415,275 |
| The Walt Disney Co. | 358,973 | 0.9 | 46,637,772 |
| Other Securities | | 1.6 | 83,222,201 |
| | | 4.3 | 226,751,928 |
| |
Schwab Fundamental Index Funds | Annual Report
Schwab Fundamental US Large Company Index Fund
Condensed Portfolio Holdings as of October 31, 2019 (continued)
| Security | Number
of Shares | % of Net
Assets | Value
($) |
| Pharmaceuticals, Biotechnology & Life Sciences 5.8% | |
| Amgen, Inc. | 113,534 | 0.5 | 24,211,126 |
| Gilead Sciences, Inc. | 429,775 | 0.5 | 27,380,965 |
| Johnson & Johnson | 431,048 | 1.1 | 56,915,578 |
| Merck & Co., Inc. | 470,401 | 0.8 | 40,764,951 |
| Pfizer, Inc. | 1,356,867 | 1.0 | 52,062,987 |
| Other Securities | | 1.9 | 103,853,975 |
| | | 5.8 | 305,189,582 |
| |
| Real Estate 1.7% | |
| Other Securities | | 1.7 | 91,243,478 |
| |
| Retailing 5.2% | |
| Lowe's Cos., Inc. | 211,645 | 0.5 | 23,621,698 |
| Target Corp. | 276,932 | 0.6 | 29,606,800 |
| The Home Depot, Inc. | 193,369 | 0.9 | 45,360,500 |
| Other Securities | | 3.2 | 173,992,341 |
| | | 5.2 | 272,581,339 |
| |
| Semiconductors & Semiconductor Equipment 3.5% | |
| Intel Corp. | 1,135,116 | 1.2 | 64,168,107 |
| QUALCOMM, Inc. | 441,144 | 0.7 | 35,485,623 |
| Other Securities | | 1.6 | 82,293,274 |
| | | 3.5 | 181,947,004 |
| |
| Software & Services 6.2% | |
| International Business Machines Corp. | 400,677 | 1.0 | 53,582,535 |
| Microsoft Corp. | 720,553 | 2.0 | 103,305,684 |
| Oracle Corp. | 559,568 | 0.6 | 30,490,860 |
| Other Securities | | 2.6 | 135,218,084 |
| | | 6.2 | 322,597,163 |
| |
| Technology Hardware & Equipment 7.8% | |
| Apple, Inc. | 1,036,086 | 4.9 | 257,736,753 |
| Cisco Systems, Inc. | 786,448 | 0.7 | 37,364,144 |
| Other Securities | | 2.2 | 114,327,306 |
| | | 7.8 | 409,428,203 |
| |
| Telecommunication Services 3.9% | |
| AT&T, Inc. | 2,855,003 | 2.1 | 109,889,065 |
| Verizon Communications, Inc. | 1,221,338 | 1.4 | 73,854,309 |
| Other Securities | | 0.4 | 20,852,876 |
| | | 3.9 | 204,596,250 |
| |
| Security | Number
of Shares | % of Net
Assets | Value
($) |
| Transportation 2.1% | |
| Union Pacific Corp. | 144,919 | 0.5 | 23,978,298 |
| Other Securities | | 1.6 | 85,291,332 |
| | | 2.1 | 109,269,630 |
| |
| Utilities 3.6% | |
| Other Securities | | 3.6 | 188,730,343 |
| Total Common Stock | |
| (Cost $3,386,667,826) | | | 5,222,356,553 |
|
| Other Investment Companies0.4% of net assets | |
| |
| Money Market Fund 0.1% | |
| Other Securities | | 0.1 | 4,152,873 |
| |
| Securities Lending Collateral 0.3% | |
| Other Securities | | 0.3 | 14,746,015 |
| Total Other Investment Companies | |
| (Cost $18,898,888) | | | 18,898,888 |
| | Number of
Contracts | Notional
Amount
($) | Current Value/
Unrealized
Appreciation
($) |
| Futures Contracts | |
| Long | |
| S&P 500 Index, e-mini, expires 12/20/19 | 93 | 14,116,470 | 328,686 |
The following footnotes may not be applicable to the Condensed Portfolio Holdings. Please refer to the complete schedule of portfolio holdings.
| * | Non-income producing security. |
| (a) | Issuer is affiliated with the fund’s investment adviser. |
| (b) | All or a portion of this security is on loan. Securities on loan were valued at $13,611,262. |
| (c) | The rate shown is the 7-day yield. |
The fund owns shares of an affiliate, The Charles Schwab Corp., since that company is included in its index. Below is the summary of investment activities involving The Charles Schwab Corp. shares owned by the fund during the period ended October 31, 2019:
| | Market
Value at
10/31/18 | Gross
Purchases | Gross
Sales | Realized
Gains (Losses) | Net Change
in Unrealized
Appreciation
(depreciation) | Market
Value at
10/31/19 | Balance
of Shares
Held at
10/31/19 | Distributions
Received |
| The Charles Schwab Corp. | $2,474,534 | $1,086,670 | ($87,084) | ($799) | ($347,037) | $3,126,284 | 76,794 | $39,041 |
Schwab Fundamental Index Funds | Annual Report
Schwab Fundamental US Large Company Index Fund
Condensed Portfolio Holdings as of October 31, 2019 (continued)
The following is a summary of the inputs used to value the fund’s investments as of October 31, 2019 and reflects the complete schedule of portfolio holdings (see financial note 2(a) for additional information):
| Description | Quoted Prices in
Active Markets for
Identical Assets
(Level 1) | Other Significant
Observable Inputs
(Level 2) | Significant
Unobservable Inputs
(Level 3) | Total | |
| Assets | | | | | |
| Common Stock1 | $5,222,356,553 | $— | $— | $5,222,356,553 | |
| Other Investment Companies1 | 18,898,888 | — | — | 18,898,888 | |
| Futures Contracts2 | 328,686 | — | — | 328,686 | |
| Total | $5,241,584,127 | $— | $— | $5,241,584,127 | |
| 1 | As categorized in the complete schedule of Portfolio Holdings. |
| 2 | Futures contracts are valued at unrealized appreciation or depreciation. |
Fund investments in underlying mutual funds are classified as Level 1, without consideration to the classification level of the investments held by the underlying mutual funds, which could be Level 1, Level 2 or Level 3.
Schwab Fundamental Index Funds | Annual Report
Schwab Fundamental US Large Company Index Fund
Statement of Assets and Liabilities
As of October 31, 2019
| Assets |
| Investment in affiliated issuer, at value (cost $1,913,793) | | $3,126,284 |
| Investments in unaffiliated issuers, at value (cost $3,388,906,906) including securities on loan of $13,611,262 | | 5,223,383,142 |
| Collateral invested for securities on loan, at value (cost $14,746,015) | | 14,746,015 |
| Deposit with broker for futures contracts | | 785,909 |
| Receivables: | | |
| Fund shares sold | | 6,486,269 |
| Dividends | | 6,450,829 |
| Variation margin on futures contracts | | 328,866 |
| Income from securities on loan | + | 113,355 |
| Total assets | | 5,255,420,669 |
| Liabilities |
| Collateral held for securities on loan | | 14,746,015 |
| Payables: | | |
| Investment adviser fees | | 1,092,220 |
| Fund shares redeemed | + | 2,196,276 |
| Total liabilities | | 18,034,511 |
| Net Assets |
| Total assets | | 5,255,420,669 |
| Total liabilities | – | 18,034,511 |
| Net assets | | $5,237,386,158 |
| Net Assets by Source | | |
| Capital received from investors | | 3,208,206,838 |
| Total distributable earnings | | 2,029,179,320 |
| Net Asset Value (NAV) |
| Net Assets | ÷ | Shares
Outstanding | = | NAV |
| $5,237,386,158 | | 298,230,494 | | $17.56 |
| | | | | |
Schwab Fundamental Index Funds | Annual Report
Schwab Fundamental US Large Company Index Fund
Statement of Operations
For the period November 1, 2018 through October 31, 2019
| Investment Income |
| Dividends received from affiliated issuer | | $39,041 |
| Dividends received from unaffiliated issuers (net of foreign withholding tax of $5,929) | | 136,103,315 |
| Securities on loan, net | + | 511,993 |
| Total investment income | | 136,654,349 |
| Expenses |
| Investment adviser fees | | 12,279,701 |
| Total expenses | – | 12,279,701 |
| Net investment income | | 124,374,648 |
| Realized and Unrealized Gains (Losses) |
| Net realized losses on affiliated issuer | | (799) |
| Net realized gains on unaffiliated issuers | | 121,533,494 |
| Net realized gains on futures contracts | + | 4,928,421 |
| Net realized gains | | 126,461,116 |
| Net change in unrealized appreciation (depreciation) on affiliated issuer | | (347,037) |
| Net change in unrealized appreciation (depreciation) on unaffiliated issuers | | 245,480,280 |
| Net change in unrealized appreciation (depreciation) on futures contracts | + | 762,870 |
| Net change in unrealized appreciation (depreciation) | + | 245,896,113 |
| Net realized and unrealized gains | | 372,357,229 |
| Increase in net assets resulting from operations | | $496,731,877 |
Schwab Fundamental Index Funds | Annual Report
Schwab Fundamental US Large Company Index Fund
Statement of Changes in Net Assets
For the current and prior report periods
| Operations | |
| | 11/1/18-10/31/19 | 11/1/17-10/31/18 |
| Net investment income | | $124,374,648 | $115,152,596 |
| Net realized gains | | 126,461,116 | 251,731,202 |
| Net change in unrealized appreciation (depreciation) | + | 245,896,113 | 250,974 |
| Increase in net assets from operations | | 496,731,877 | 367,134,772 |
| Distributions to Shareholders | |
| Total distributions | | ($384,906,616) | ($177,108,409) |
| Transactions in Fund Shares | | | |
| | | 11/1/18-10/31/19 | 11/1/17-10/31/18 |
| | | SHARES | VALUE | SHARES | VALUE |
| Shares sold | | 72,965,468 | $1,170,251,181 | 39,154,381 | $686,476,408 |
| Shares reinvested | | 17,039,769 | 240,260,741 | 6,432,720 | 110,964,408 |
| Shares redeemed | + | (71,475,046) | (1,171,686,052) | (83,654,201) | (1,467,928,658) |
| Net transactions in fund shares | | 18,530,191 | $238,825,870 | (38,067,100) | ($670,487,842) |
| Shares Outstanding and Net Assets | | | |
| | | 11/1/18-10/31/19 | 11/1/17-10/31/18 |
| | | SHARES | NET ASSETS | SHARES | NET ASSETS |
| Beginning of period | | 279,700,303 | $4,886,735,027 | 317,767,403 | $5,367,196,506 |
| Total increase or decrease | + | 18,530,191 | 350,651,131 | (38,067,100) | (480,461,479) |
| End of period | | 298,230,494 | $5,237,386,158 | 279,700,303 | $4,886,735,027 |
Schwab Fundamental Index Funds | Annual Report
Schwab Fundamental US Small Company Index Fund
Financial Statements
Financial Highlights
| | 11/1/18–
10/31/19 | 11/1/17–
10/31/18 | 11/1/16–
10/31/17 | 11/1/15–
10/31/16 | 11/1/14–
10/31/15 | |
| Per-Share Data |
| Net asset value at beginning of period | $14.68 | $15.32 | $12.69 | $12.82 | $13.51 | |
| Income (loss) from investment operations: | | | | | | |
| Net investment income (loss)1 | 0.20 | 0.22 | 0.21 | 0.18 | 0.18 | |
| Net realized and unrealized gains (losses) | 0.32 | 0.17 | 2.68 | 0.43 | (0.03) | |
| Total from investment operations | 0.52 | 0.39 | 2.89 | 0.61 | 0.15 | |
| Less distributions: | | | | | | |
| Distributions from net investment income | (0.22) | (0.21) | (0.17) | (0.18) | (0.16) | |
| Distributions from net realized gains | (1.13) | (0.82) | (0.09) | (0.56) | (0.68) | |
| Total distributions | (1.35) | (1.03) | (0.26) | (0.74) | (0.84) | |
| Net asset value at end of period | $13.85 | $14.68 | $15.32 | $12.69 | $12.82 | |
| Total return | 5.61% | 2.40% | 22.94% | 5.37% | 1.01% | |
| Ratios/Supplemental Data |
| Ratios to average net assets: | | | | | | |
| Total expenses | 0.25% | 0.25% | 0.33%2 | 0.43% | 0.43% | |
| Net operating expenses | N/A | N/A3 | 0.30%2 | 0.35% | 0.35% | |
| Net investment income (loss) | 1.50% | 1.42% | 1.43% | 1.50% | 1.37% | |
| Portfolio turnover rate | 34% | 30% | 27% | 30% | 31% | |
| Net assets, end of period (x 1,000,000) | $1,908 | $1,782 | $1,727 | $1,361 | $1,416 | |
| |
1
Calculated based on the average shares outstanding during the period.
2
Effective May 1, 2017, the annual operating expense ratio was reduced. The ratio presented for period ended 10/31/17 is a blended ratio.
3
Effective May 1, 2017, the fund instituted a new fee structure and the contractual expense limitation was terminated.
Schwab Fundamental Index Funds | Annual Report
Schwab Fundamental US Small Company Index Fund
Condensed Portfolio Holdings as of October 31, 2019
This section shows the fund’s 50 largest portfolio holdings in unaffiliated issuers, any holdings exceeding 1% of the fund’s net assets as of the report date, and any affiliated issuers. The remaining securities held by the fund are grouped as "Other Securities" in each category. You can request a complete schedule of portfolio holdings as of the report date, free of charge, by calling Schwab Funds® at 1-877-824-5615. This complete schedule, filed on the fund’s N-CSR(S), is also available on the U.S. Securities and Exchange Commission (SEC)’s website atwww.sec.gov.
In addition, the fund files its complete schedule of portfolio holdings with the SEC for the first and third quarters of each fiscal year on Form N-Q. The fund’s Form N-Q is available on the SEC’s website. Effective March 31, 2019, Form N-PORT Part F has replaced Form N-Q. The fund also makes available its complete schedule of portfolio holdings 15-20 days after the end of the month on the fund’s website atwww.schwabfunds.com/schwabfunds_prospectus.
| Security | Number
of Shares | % of Net
Assets | Value
($) |
| Common Stock99.7% of net assets | |
| |
| Automobiles & Components 1.5% | |
| Other Securities | | 1.5 | 29,189,780 |
| |
| Banks 7.3% | |
| Zions Bancorp NA | 89,623 | 0.2 | 4,344,027 |
| Other Securities | | 7.1 | 134,732,444 |
| | | 7.3 | 139,076,471 |
| |
| Capital Goods 12.5% | |
| Arcosa, Inc. | 112,177 | 0.2 | 4,308,719 |
| Colfax Corp. * | 149,973 | 0.3 | 5,039,093 |
| Curtiss-Wright Corp. | 35,843 | 0.3 | 4,847,766 |
| Generac Holdings, Inc. * | 53,511 | 0.3 | 5,168,092 |
| ITT, Inc. | 76,846 | 0.2 | 4,568,495 |
| MasTec, Inc. * | 79,132 | 0.3 | 4,980,568 |
| Mueller Industries, Inc. | 144,446 | 0.2 | 4,444,603 |
| Teledyne Technologies, Inc. * | 16,879 | 0.3 | 5,563,318 |
| Universal Forest Products, Inc. | 124,976 | 0.3 | 6,293,791 |
| Other Securities | | 10.1 | 192,849,041 |
| | | 12.5 | 238,063,486 |
| |
| Commercial & Professional Services 5.4% | |
| Clean Harbors, Inc. * | 55,676 | 0.2 | 4,591,043 |
| Copart, Inc. * | 59,752 | 0.3 | 4,937,905 |
| Deluxe Corp. | 92,832 | 0.3 | 4,811,483 |
| Stericycle, Inc. * | 85,768 | 0.3 | 4,940,237 |
| Other Securities | | 4.3 | 83,426,376 |
| | | 5.4 | 102,707,044 |
| |
| Consumer Durables & Apparel 4.0% | |
| Deckers Outdoor Corp. * | 28,760 | 0.2 | 4,397,404 |
| Skechers U.S.A., Inc., Class A * | 136,487 | 0.3 | 5,100,519 |
| Steven Madden Ltd. | 111,610 | 0.2 | 4,596,100 |
| Taylor Morrison Home Corp. * | 193,112 | 0.3 | 4,837,456 |
| Other Securities | | 3.0 | 57,384,501 |
| | | 4.0 | 76,315,980 |
| |
| Consumer Services 5.0% | |
| Brinker International, Inc. | 102,172 | 0.2 | 4,541,545 |
| Other Securities | | 4.8 | 90,158,089 |
| | | 5.0 | 94,699,634 |
| |
| Security | Number
of Shares | % of Net
Assets | Value
($) |
| Diversified Financials 4.2% | |
| Chimera Investment Corp. | 212,744 | 0.2 | 4,310,193 |
| Eaton Vance Corp. | 103,712 | 0.2 | 4,729,267 |
| Other Securities | | 3.8 | 71,101,358 |
| | | 4.2 | 80,140,818 |
| |
| Energy 3.9% | |
| Cosan Ltd., Class A * | 301,816 | 0.3 | 5,076,545 |
| Other Securities | | 3.6 | 69,866,514 |
| | | 3.9 | 74,943,059 |
| |
| Food & Staples Retailing 0.7% | |
| Other Securities | | 0.7 | 13,983,114 |
| |
| Food, Beverage & Tobacco 2.6% | |
| Fresh Del Monte Produce, Inc. | 135,203 | 0.2 | 4,312,976 |
| Other Securities | | 2.4 | 45,306,739 |
| | | 2.6 | 49,619,715 |
| |
| Health Care Equipment & Services 3.7% | |
| Community Health Systems, Inc. * | 1,384,721 | 0.3 | 4,901,912 |
| Teleflex, Inc. | 12,890 | 0.2 | 4,478,115 |
| Other Securities | | 3.2 | 60,071,532 |
| | | 3.7 | 69,451,559 |
| |
| Household & Personal Products 0.9% | |
| Avon Products, Inc. * | 1,100,846 | 0.2 | 4,722,629 |
| Other Securities | | 0.7 | 11,518,844 |
| | | 0.9 | 16,241,473 |
| |
| Insurance 2.6% | |
| Brown & Brown, Inc. | 126,639 | 0.3 | 4,771,758 |
| Primerica, Inc. | 35,968 | 0.2 | 4,538,442 |
| Other Securities | | 2.1 | 40,133,284 |
| | | 2.6 | 49,443,484 |
| |
| Materials 6.8% | |
| Axalta Coating Systems Ltd. * | 147,421 | 0.2 | 4,347,445 |
| Boise Cascade Co. | 125,848 | 0.2 | 4,501,583 |
| Cabot Corp. | 100,760 | 0.2 | 4,392,128 |
| PolyOne Corp. | 141,995 | 0.2 | 4,550,940 |
| Other Securities | | 6.0 | 112,164,922 |
| | | 6.8 | 129,957,018 |
| |
Schwab Fundamental Index Funds | Annual Report
Schwab Fundamental US Small Company Index Fund
Condensed Portfolio Holdings as of October 31, 2019 (continued)
| Security | Number
of Shares | % of Net
Assets | Value
($) |
| Media & Entertainment 3.3% | |
| TEGNA, Inc. | 319,756 | 0.3 | 4,805,933 |
| Other Securities | | 3.0 | 57,604,642 |
| | | 3.3 | 62,410,575 |
| |
| Pharmaceuticals, Biotechnology & Life Sciences 2.1% | |
| Other Securities | | 2.1 | 39,782,167 |
| |
| Real Estate 10.8% | |
| Apartment Investment & Management Co., Class A | 85,552 | 0.2 | 4,695,094 |
| Liberty Property Trust | 86,535 | 0.3 | 5,111,622 |
| Omega Healthcare Investors, Inc. | 99,465 | 0.2 | 4,380,439 |
| Other Securities | | 10.1 | 191,840,230 |
| | | 10.8 | 206,027,385 |
| |
| Retailing 3.6% | |
| Asbury Automotive Group, Inc. * | 54,369 | 0.3 | 5,607,075 |
| GNC Holdings, Inc., Class A *(a) | 1,937,302 | 0.3 | 5,114,477 |
| Other Securities | | 3.0 | 58,199,375 |
| | | 3.6 | 68,920,927 |
| |
| Semiconductors & Semiconductor Equipment 2.7% | |
| Cirrus Logic, Inc. * | 75,255 | 0.3 | 5,114,330 |
| Cypress Semiconductor Corp. | 197,765 | 0.2 | 4,601,991 |
| Teradyne, Inc. | 91,844 | 0.3 | 5,622,690 |
| Other Securities | | 1.9 | 35,985,752 |
| | | 2.7 | 51,324,763 |
| |
| Software & Services 4.6% | |
| Genpact Ltd. | 126,592 | 0.3 | 4,958,609 |
| KBR, Inc. | 178,676 | 0.3 | 5,031,516 |
| Other Securities | | 4.0 | 78,335,537 |
| | | 4.6 | 88,325,662 |
| |
| Technology Hardware & Equipment 4.6% | |
| Benchmark Electronics, Inc. | 150,997 | 0.3 | 5,118,798 |
| Insight Enterprises, Inc. * | 86,493 | 0.3 | 5,308,940 |
| Other Securities | | 4.0 | 76,901,548 |
| | | 4.6 | 87,329,286 |
| |
| Telecommunication Services 0.7% | |
| Other Securities | | 0.7 | 13,973,773 |
| |
| Transportation 2.6% | |
| Alaska Air Group, Inc. | 75,045 | 0.3 | 5,210,374 |
| Genesee & Wyoming, Inc., Class A * | 40,794 | 0.2 | 4,529,358 |
| JetBlue Airways Corp. * | 260,248 | 0.3 | 5,022,786 |
| Other Securities | | 1.8 | 35,311,004 |
| | | 2.6 | 50,073,522 |
| |
| Security | Number
of Shares | % of Net
Assets | Value
($) |
| Utilities 3.6% | |
| Hawaiian Electric Industries, Inc. | 105,504 | 0.2 | 4,763,506 |
| Other Securities | | 3.4 | 64,140,291 |
| | | 3.6 | 68,903,797 |
| Total Common Stock | |
| (Cost $1,533,827,819) | | | 1,900,904,492 |
|
| Rights0.0% of net assets | |
| |
| Materials 0.0% | |
| Other Securities | | 0.0 | 16,685 |
| Total Rights | |
| (Cost $16,685) | | | 16,685 |
|
| Other Investment Companies1.5% of net assets | |
| |
| Money Market Fund 0.2% | |
| Other Securities | | 0.2 | 4,074,391 |
| |
| Securities Lending Collateral 1.3% | |
| Wells Fargo Government Money Market Fund, Select Class 1.75%(c) | 24,789,589 | 1.3 | 24,789,589 |
| Total Other Investment Companies | |
| (Cost $28,863,980) | | | 28,863,980 |
| | Number of
Contracts | Notional
Amount
($) | Current Value/
Unrealized
Appreciation
($) |
| Futures Contracts | |
| Long | |
| Russell 2000 Index, e-mini, expires 12/20/19 | 92 | 7,191,640 | 198,320 |
The following footnotes may not be applicable to the Condensed Portfolio Holdings. Please refer to the complete schedule of portfolio holdings.
| * | Non-income producing security. |
| (a) | All or a portion of this security is on loan. Securities on loan were valued at $22,993,967. |
| (b) | Fair-valued by management using significant unobservable inputs in accordance with procedures approved by the fund’s Board of Trustees. |
| (c) | The rate shown is the 7-day yield. |
| | |
| CVR — | Contingent Value Rights |
| REIT — | Real Estate Investment Trust |
Schwab Fundamental Index Funds | Annual Report
Schwab Fundamental US Small Company Index Fund
Condensed Portfolio Holdings as of October 31, 2019 (continued)
The following is a summary of the inputs used to value the fund’s investments as of October 31, 2019 and reflects the complete schedule of portfolio holdings (see financial note 2(a) for additional information):
| Description | Quoted Prices in
Active Markets for
Identical Assets
(Level 1) | Other Significant
Observable Inputs
(Level 2) | Significant
Unobservable Inputs
(Level 3) | Total | |
| Assets | | | | | |
| Common Stock1 | $1,694,877,107 | $— | $— | $1,694,877,107 | |
| Real Estate | 206,027,385 | — | —* | 206,027,385 | |
| Rights1 | | | | | |
| Materials | — | — | 16,685 | 16,685 | |
| Other Investment Companies1 | 28,863,980 | — | — | 28,863,980 | |
| Futures Contracts2 | 198,320 | — | — | 198,320 | |
| Total | $1,929,966,792 | $— | $16,685 | $1,929,983,477 | |
| * | Level 3 amount shown includes securities determined to have no value at October 31, 2019. |
| 1 | As categorized in the complete schedule of Portfolio Holdings. |
| 2 | Futures contracts are valued at unrealized appreciation or depreciation. |
Fund investments in underlying mutual funds are classified as Level 1, without consideration to the classification level of the investments held by the underlying mutual funds, which could be Level 1, Level 2 or Level 3.
Schwab Fundamental Index Funds | Annual Report
Schwab Fundamental US Small Company Index Fund
Statement of Assets and Liabilities
As of October 31, 2019
| Assets |
| Investments in unaffiliated issuers, at value (cost $1,537,918,895) including securities on loan of $22,993,967 | | $1,904,995,568 |
| Collateral invested for securities on loan, at value (cost $24,789,589) | | 24,789,589 |
| Deposit with broker for futures contracts | | 306,649 |
| Receivables: | | |
| Fund shares sold | | 2,627,181 |
| Dividends | | 870,020 |
| Variation margin on futures contracts | | 198,498 |
| Income from securities on loan | + | 42,557 |
| Total assets | | 1,933,830,062 |
| Liabilities |
| Collateral held for securities on loan | | 24,789,589 |
| Payables: | | |
| Investment adviser fees | | 396,764 |
| Fund shares redeemed | + | 971,819 |
| Total liabilities | | 26,158,172 |
| Net Assets |
| Total assets | | 1,933,830,062 |
| Total liabilities | – | 26,158,172 |
| Net assets | | $1,907,671,890 |
| Net Assets by Source | | |
| Capital received from investors | | 1,505,903,459 |
| Total distributable earnings | | 401,768,431 |
| Net Asset Value (NAV) |
| Net Assets | ÷ | Shares
Outstanding | = | NAV |
| $1,907,671,890 | | 137,733,711 | | $13.85 |
| | | | | |
Schwab Fundamental Index Funds | Annual Report
Schwab Fundamental US Small Company Index Fund
Statement of Operations
For the period November 1, 2018 through October 31, 2019
| Investment Income |
| Dividends (net of foreign withholding tax of $23,827) | | $29,778,435 |
| Securities on loan, net | + | 645,061 |
| Total investment income | | 30,423,496 |
| Expenses |
| Investment adviser fees | | 4,334,599 |
| Total expenses | – | 4,334,599 |
| Net investment income | | 26,088,897 |
| Realized and Unrealized Gains (Losses) |
| Net realized gains on investments | | 26,977,487 |
| Net realized gains on futures contracts | + | 1,614,834 |
| Net realized gains | | 28,592,321 |
| Net change in unrealized appreciation (depreciation) on investments | | 43,331,242 |
| Net change in unrealized appreciation (depreciation) on futures contracts | + | 330,762 |
| Net change in unrealized appreciation (depreciation) | + | 43,662,004 |
| Net realized and unrealized gains | | 72,254,325 |
| Increase in net assets resulting from operations | | $98,343,222 |
Schwab Fundamental Index Funds | Annual Report
Schwab Fundamental US Small Company Index Fund
Statement of Changes in Net Assets
For the current and prior report periods
| Operations | |
| | 11/1/18-10/31/19 | 11/1/17-10/31/18 |
| Net investment income | | $26,088,897 | $26,131,598 |
| Net realized gains | | 28,592,321 | 123,072,248 |
| Net change in unrealized appreciation (depreciation) | + | 43,662,004 | (113,831,426) |
| Increase in net assets from operations | | 98,343,222 | 35,372,420 |
| Distributions to Shareholders | |
| Total distributions | | ($157,177,616) | ($115,282,747) |
| Transactions in Fund Shares | | | |
| | | 11/1/18-10/31/19 | 11/1/17-10/31/18 |
| | | SHARES | VALUE | SHARES | VALUE |
| Shares sold | | 41,667,076 | $538,341,603 | 26,248,657 | $407,763,547 |
| Shares reinvested | | 9,687,290 | 109,950,745 | 5,106,460 | 76,494,776 |
| Shares redeemed | + | (34,964,711) | (463,377,091) | (22,738,643) | (350,131,276) |
| Net transactions in fund shares | | 16,389,655 | $184,915,257 | 8,616,474 | $134,127,047 |
| Shares Outstanding and Net Assets | | | |
| | | 11/1/18-10/31/19 | 11/1/17-10/31/18 |
| | | SHARES | NET ASSETS | SHARES | NET ASSETS |
| Beginning of period | | 121,344,056 | $1,781,591,027 | 112,727,582 | $1,727,374,307 |
| Total increase | + | 16,389,655 | 126,080,863 | 8,616,474 | 54,216,720 |
| End of period | | 137,733,711 | $1,907,671,890 | 121,344,056 | $1,781,591,027 |
Schwab Fundamental Index Funds | Annual Report
Schwab Fundamental International Large Company Index Fund
Financial Statements
Financial Highlights
| | 11/1/18–
10/31/19 | 11/1/17–
10/31/18 | 11/1/16–
10/31/17 | 11/1/15–
10/31/16 | 11/1/14–
10/31/15 | |
| Per-Share Data |
| Net asset value at beginning of period | $8.69 | $9.55 | $7.96 | $8.19 | $8.84 | |
| Income (loss) from investment operations: | | | | | | |
| Net investment income (loss)1 | 0.30 | 0.29 | 0.25 | 0.24 | 0.25 | |
| Net realized and unrealized gains (losses) | 0.27 | (0.89) | 1.59 | (0.25) | (0.60) | |
| Total from investment operations | 0.57 | (0.60) | 1.84 | (0.01) | (0.35) | |
| Less distributions: | | | | | | |
| Distributions from net investment income | (0.28) | (0.26) | (0.25) | (0.22) | (0.30) | |
| Net asset value at end of period | $8.98 | $8.69 | $9.55 | $7.96 | $8.19 | |
| Total return | 7.04% | (6.53%) | 23.83% | 0.07% | (4.07%) | |
| Ratios/Supplemental Data |
| Ratios to average net assets: | | | | | | |
| Total expenses | 0.25% | 0.25% | 0.34%2 | 0.46% | 0.46% | |
| Net operating expenses | N/A | N/A3 | 0.29%2 | 0.35% | 0.35% | |
| Net investment income (loss) | 3.51% | 3.10% | 2.92% | 3.20% | 2.96% | |
| Portfolio turnover rate | 28% | 13% | 11% | 18% | 11% | |
| Net assets, end of period (x 1,000,000) | $1,327 | $1,349 | $1,372 | $971 | $1,173 | |
| |
1
Calculated based on the average shares outstanding during the period.
2
Effective May 1, 2017, the annual operating expense ratio was reduced. The ratio presented for period ended 10/31/17 is a blended ratio.
3
Effective May 1, 2017, the fund instituted a new fee structure and the contractual expense limitation was terminated.
Schwab Fundamental Index Funds | Annual Report
Schwab Fundamental International Large Company Index Fund
Condensed Portfolio Holdings as of October 31, 2019
This section shows the fund’s 50 largest portfolio holdings in unaffiliated issuers, any holdings exceeding 1% of the fund’s net assets as of the report date, and any affiliated issuers. The remaining securities held by the fund are grouped as "Other Securities" in each category. You can request a complete schedule of portfolio holdings as of the report date, free of charge, by calling Schwab Funds® at 1-877-824-5615. This complete schedule, filed on the fund’s N-CSR(S), is also available on the U.S. Securities and Exchange Commission (SEC)’s website atwww.sec.gov.
In addition, the fund files its complete schedule of portfolio holdings with the SEC for the first and third quarters of each fiscal year on Form N-Q. The fund’s Form N-Q is available on the SEC’s website. Effective March 31, 2019, Form N-PORT Part F has replaced Form N-Q. The fund also makes available its complete schedule of portfolio holdings 15-20 days after the end of the month on the fund’s website atwww.schwabfunds.com/schwabfunds_prospectus.
| Security | Number
of Shares | % of Net
Assets | Value
($) |
| Common Stock98.4% of net assets | |
| |
| Australia 5.5% | |
| Australia & New Zealand Banking Group Ltd. | 273,257 | 0.4 | 5,021,673 |
| BHP Group Ltd. | 272,663 | 0.5 | 6,683,639 |
| Commonwealth Bank of Australia | 130,350 | 0.5 | 7,067,589 |
| National Australia Bank Ltd. | 272,381 | 0.4 | 5,346,603 |
| Westpac Banking Corp. | 324,269 | 0.5 | 6,295,840 |
| Other Securities | | 3.2 | 42,881,021 |
| | | 5.5 | 73,296,365 |
| |
| Austria 0.3% | |
| Other Securities | | 0.3 | 3,929,912 |
| |
| Belgium 0.8% | |
| Other Securities | | 0.8 | 10,609,997 |
| |
| Canada 6.4% | |
| Royal Bank of Canada | 76,144 | 0.5 | 6,141,932 |
| The Bank of Nova Scotia | 83,615 | 0.4 | 4,795,594 |
| The Toronto-Dominion Bank | 87,752 | 0.4 | 5,010,878 |
| Other Securities | | 5.1 | 69,335,025 |
| | | 6.4 | 85,283,429 |
| |
| Denmark 0.9% | |
| Other Securities | | 0.9 | 12,319,087 |
| |
| Finland 1.0% | |
| Other Securities | | 1.0 | 12,701,888 |
| |
| France 9.2% | |
| AXA S.A. | 190,183 | 0.4 | 5,034,375 |
| BNP Paribas S.A. | 133,971 | 0.5 | 7,001,263 |
| Orange S.A. | 296,681 | 0.4 | 4,774,929 |
| Sanofi | 83,804 | 0.6 | 7,725,645 |
| Societe Generale S.A. | 175,541 | 0.4 | 4,992,193 |
| TOTAL S.A. | 321,513 | 1.3 | 16,997,811 |
| Other Securities | | 5.6 | 75,023,318 |
| | | 9.2 | 121,549,534 |
| |
| Germany 8.1% | |
| Allianz SE | 33,187 | 0.6 | 8,105,014 |
| BASF SE | 132,474 | 0.8 | 10,070,568 |
| Bayer AG | 90,017 | 0.5 | 6,983,174 |
| Bayerische Motoren Werke AG | 66,937 | 0.4 | 5,125,680 |
| Security | Number
of Shares | % of Net
Assets | Value
($) |
| Daimler AG | 186,459 | 0.8 | 10,899,061 |
| Deutsche Telekom AG | 406,294 | 0.5 | 7,148,970 |
| Siemens AG | 69,389 | 0.6 | 8,007,490 |
| Other Securities | | 3.9 | 51,776,396 |
| | | 8.1 | 108,116,353 |
| |
| Hong Kong 1.6% | |
| Other Securities | | 1.6 | 21,408,341 |
| |
| Ireland 0.1% | |
| Other Securities | | 0.1 | 936,267 |
| |
| Israel 0.2% | |
| Other Securities | | 0.2 | 2,718,831 |
| |
| Italy 3.4% | |
| Enel S.p.A. | 1,041,366 | 0.6 | 8,070,959 |
| Eni S.p.A. | 510,251 | 0.6 | 7,741,010 |
| Other Securities | | 2.2 | 28,878,855 |
| | | 3.4 | 44,690,824 |
| |
| Japan 24.8% | |
| Hitachi Ltd. | 173,300 | 0.5 | 6,467,979 |
| Honda Motor Co., Ltd. | 375,700 | 0.8 | 10,164,179 |
| Idemitsu Kosan Co., Ltd. | 160,069 | 0.4 | 4,705,272 |
| KDDI Corp. | 192,800 | 0.4 | 5,334,996 |
| Mitsubishi UFJ Financial Group, Inc. | 1,305,934 | 0.5 | 6,770,338 |
| Nippon Telegraph & Telephone Corp. | 106,808 | 0.4 | 5,302,259 |
| SoftBank Group Corp. | 127,800 | 0.4 | 4,916,006 |
| Toyota Motor Corp. | 303,318 | 1.6 | 21,044,471 |
| Other Securities | | 19.8 | 264,328,642 |
| | | 24.8 | 329,034,142 |
| |
| Netherlands 2.4% | |
| Other Securities | | 2.4 | 32,385,543 |
| |
| New Zealand 0.1% | |
| Other Securities | | 0.1 | 1,416,101 |
| |
| Norway 0.7% | |
| Other Securities | | 0.7 | 9,117,611 |
| |
| Poland 0.3% | |
| Other Securities | | 0.3 | 4,366,980 |
| |
Schwab Fundamental Index Funds | Annual Report
Schwab Fundamental International Large Company Index Fund
Condensed Portfolio Holdings as of October 31, 2019 (continued)
| Security | Number
of Shares | % of Net
Assets | Value
($) |
| Portugal 0.2% | |
| Other Securities | | 0.2 | 2,862,153 |
| |
| Republic of Korea 5.2% | |
| Samsung Electronics Co., Ltd. | 550,670 | 1.8 | 23,799,873 |
| Other Securities | | 3.4 | 45,861,287 |
| | | 5.2 | 69,661,160 |
| |
| Singapore 0.8% | |
| Other Securities | | 0.8 | 9,988,058 |
| |
| Spain 3.1% | |
| Banco Santander S.A. | 2,639,623 | 0.8 | 10,598,872 |
| Iberdrola S.A. | 485,808 | 0.4 | 4,993,617 |
| Telefonica S.A. | 874,825 | 0.5 | 6,718,025 |
| Other Securities | | 1.4 | 18,767,975 |
| | | 3.1 | 41,078,489 |
| |
| Sweden 2.1% | |
| Other Securities | | 2.1 | 27,979,889 |
| |
| Switzerland 5.4% | |
| Nestle S.A. | 141,908 | 1.1 | 15,181,504 |
| Novartis AG | 101,353 | 0.7 | 8,855,738 |
| Roche Holding AG | 34,016 | 0.8 | 10,237,313 |
| Other Securities | | 2.8 | 36,757,215 |
| | | 5.4 | 71,031,770 |
| |
| United Kingdom 15.8% | |
| AstraZeneca plc | 58,258 | 0.4 | 5,681,158 |
| BP plc | 3,070,750 | 1.5 | 19,472,734 |
| British American Tobacco plc | 163,172 | 0.4 | 5,707,081 |
| GlaxoSmithKline plc | 325,847 | 0.6 | 7,463,505 |
| Glencore plc * | 2,597,907 | 0.6 | 7,841,466 |
| HSBC Holdings plc | 1,493,939 | 0.9 | 11,286,871 |
| National Grid plc | 438,769 | 0.4 | 5,130,211 |
| Rio Tinto plc | 100,460 | 0.4 | 5,230,129 |
| Royal Dutch Shell plc, A Shares | 467,168 | 1.0 | 13,542,304 |
| Royal Dutch Shell plc, B Shares | 525,833 | 1.1 | 15,143,866 |
| Vodafone Group plc | 5,142,911 | 0.8 | 10,495,238 |
| Other Securities | | 7.7 | 102,378,106 |
| | | 15.8 | 209,372,669 |
| Total Common Stock | |
| (Cost $1,207,269,003) | | | 1,305,855,393 |
|
| Preferred Stock1.1% of net assets | |
| |
| Germany 0.7% | |
| Volkswagen AG | 35,808 | 0.5 | 6,807,288 |
| Other Securities | | 0.2 | 2,158,431 |
| | | 0.7 | 8,965,719 |
| |
| Security | Number
of Shares | % of Net
Assets | Value
($) |
| Italy 0.1% | |
| Other Securities | | 0.1 | 1,069,619 |
| |
| Republic of Korea 0.3% | |
| Other Securities | | 0.3 | 4,441,477 |
| |
| United Kingdom 0.0% | |
| Other Securities | | 0.0 | 8,896 |
| Total Preferred Stock | |
| (Cost $13,101,728) | | | 14,485,711 |
|
| Other Investment Company0.1% of net assets | |
| |
| United States 0.1% | |
| Securities Lending Collateral 0.1% | |
| Other Securities | | 0.1 | 2,090,033 |
| Total Other Investment Company | |
| (Cost $2,090,033) | | | 2,090,033 |
Security
Rate, Maturity Date | Face
Amount ($) | % of Net
Assets | Value
($) |
| Short-Term Investments0.0% of net assets | |
| |
| Time Deposits 0.0% | |
| Other Securities | | 0.0 | 153,025 |
| Total Short-Term Investments | |
| (Cost $153,025) | | | 153,025 |
| | Number of
Contracts | Notional
Amount
($) | Current Value/
Unrealized
Appreciation
($) |
| Futures Contracts | |
| Long | |
| MSCI EAFE Index, expires 12/20/19 | 67 | 6,556,620 | 98,243 |
The following footnotes may not be applicable to the Condensed Portfolio Holdings. Please refer to the complete schedule of portfolio holdings.
| * | Non-income producing security. |
| (a) | Fair-valued by management using significant unobservable inputs in accordance with procedures approved by the fund’s Board of Trustees. |
| (b) | All or a portion of this security is on loan. Securities on loan were valued at $1,746,171. |
| (c) | The rate shown is the 7-day yield. |
| (d) | The rate shown is the current daily overnight rate. |
| | |
| CVA — | Dutch Certificate |
| REIT — | Real Estate Investment Trust |
| RSP — | Risparmio (Convertible Savings Shares) |
Schwab Fundamental Index Funds | Annual Report
Schwab Fundamental International Large Company Index Fund
Condensed Portfolio Holdings as of October 31, 2019 (continued)
The following is a summary of the inputs used to value the fund’s investments as of October 31, 2019 and reflects the complete schedule of portfolio holdings (see financial note 2(a) for additional information):
| Description | Quoted Prices in
Active Markets for
Identical Assets
(Level 1) | Other Significant
Observable Inputs
(Level 2) | Significant
Unobservable Inputs
(Level 3) | Total | |
| Assets | | | | | |
| Common Stock1 | $— | $489,502,077 | $— | $489,502,077 | |
| Australia | — | 73,295,739 | 626 | 73,296,365 | |
| Belgium | 332,685 | 10,277,312 | — | 10,609,997 | |
| Canada | 85,283,429 | — | — | 85,283,429 | |
| Finland | 445,723 | 12,256,165 | — | 12,701,888 | |
| France | 2,734,870 | 118,814,664 | — | 121,549,534 | |
| Germany | 16,201,154 | 91,915,199 | — | 108,116,353 | |
| Hong Kong | — | 21,203,067 | 205,274 | 21,408,341 | |
| Ireland | 558,188 | 378,079 | — | 936,267 | |
| Netherlands | 1,011,071 | 31,374,472 | —* | 32,385,543 | |
| Republic of Korea | 303,620 | 69,357,540 | — | 69,661,160 | |
| Switzerland | 468,626 | 70,563,144 | — | 71,031,770 | |
| United Kingdom | 2,151,961 | 207,220,708 | — | 209,372,669 | |
| Preferred Stock1 | — | 14,476,815 | — | 14,476,815 | |
| United Kingdom | — | — | 8,896 | 8,896 | |
| Other Investment Company1 | 2,090,033 | — | — | 2,090,033 | |
| Short-Term Investments1 | — | 153,025 | — | 153,025 | |
| Futures Contracts2 | 98,243 | — | — | 98,243 | |
| Total | $111,679,603 | $1,210,788,006 | $214,796 | $1,322,682,405 | |
| * | Level 3 amount shown includes securities determined to have no value at October 31, 2019. |
| 1 | As categorized in the complete schedule of Portfolio Holdings. |
| 2 | Futures contracts are valued at unrealized appreciation or depreciation. |
Fund investments in underlying mutual funds are classified as Level 1, without consideration to the classification level of the investments held by the underlying mutual funds, which could be Level 1, Level 2 or Level 3.
Schwab Fundamental Index Funds | Annual Report
Schwab Fundamental International Large Company Index Fund
Statement of Assets and Liabilities
As of October 31, 2019
| Assets |
| Investments in unaffiliated issuers, at value (cost $1,220,523,756) including securities on loan of $1,746,171 | | $1,320,494,129 |
| Collateral invested for securities on loan, at value (cost $2,090,033) | | 2,090,033 |
| Foreign currency, at value (cost $26,164) | | 26,254 |
| Deposit with broker for futures contracts | | 191,584 |
| Receivables: | | |
| Investments sold | | 4,110,304 |
| Dividends | | 4,686,263 |
| Foreign tax reclaims | | 1,542,943 |
| Fund shares sold | | 788,844 |
| Variation margin on futures contracts | | 98,375 |
| Income from securities on loan | + | 41,437 |
| Total assets | | 1,334,070,166 |
| Liabilities |
| Collateral held for securities on loan | | 2,090,033 |
| Payables: | | |
| Investments bought | | 8,896 |
| Investment adviser fees | | 276,255 |
| Fund shares redeemed | | 2,582,215 |
| Due to custodian | + | 1,859,950 |
| Total liabilities | | 6,817,349 |
| Net Assets |
| Total assets | | 1,334,070,166 |
| Total liabilities | – | 6,817,349 |
| Net assets | | $1,327,252,817 |
| Net Assets by Source | | |
| Capital received from investors | | 1,283,885,568 |
| Total distributable earnings | | 43,367,249 |
| Net Asset Value (NAV) |
| Net Assets | ÷ | Shares
Outstanding | = | NAV |
| $1,327,252,817 | | 147,735,909 | | $8.98 |
| | | | | |
Schwab Fundamental Index Funds | Annual Report
Schwab Fundamental International Large Company Index Fund
Statement of Operations
For the period November 1, 2018 through October 31, 2019
| Investment Income |
| Dividends (net of foreign withholding tax of $5,387,363) | | $50,255,829 |
| Interest | | 37,876 |
| Securities on loan, net | + | 567,329 |
| Total investment income | | 50,861,034 |
| Expenses |
| Investment adviser fees | | 3,383,513 |
| Professional fees | + | 8,198* |
| Total expenses | | 3,391,711 |
| Expense reduction by CSIM | – | 8,198* |
| Net expenses | – | 3,383,513 |
| Net investment income | | 47,477,521 |
| Realized and Unrealized Gains (Losses) |
| Net realized losses on investments | | (74,662,379) |
| Net realized gains on futures contracts | | 443,327 |
| Net realized gains on foreign currency transactions | + | 38,105 |
| Net realized losses | | (74,180,947) |
| Net change in unrealized appreciation (depreciation) on investments | | 115,338,315 |
| Net change in unrealized appreciation (depreciation) on futures contracts | | 181,028 |
| Net change in unrealized appreciation (depreciation) on foreign currency translations | + | 104,473 |
| Net change in unrealized appreciation (depreciation) | + | 115,623,816 |
| Net realized and unrealized gains | | 41,442,869 |
| Increase in net assets resulting from operations | | $88,920,390 |
| * | Professional fees associated with the filing of tax claims in the European Union deemed to be non-routine expenses of the fund. See financial notes 2(d) and 4 for additional information. |
Schwab Fundamental Index Funds | Annual Report
Schwab Fundamental International Large Company Index Fund
Statement of Changes in Net Assets
For the current and prior report periods
| Operations | |
| | 11/1/18-10/31/19 | 11/1/17-10/31/18 |
| Net investment income | | $47,477,521 | $43,708,820 |
| Net realized losses | | (74,180,947) | (6,612,125) |
| Net change in unrealized appreciation (depreciation) | + | 115,623,816 | (130,320,658) |
| Increase (decrease) in net assets from operations | | 88,920,390 | (93,223,963) |
| Distributions to Shareholders | |
| Total distributions | | ($43,980,238) | ($37,237,239) |
| Transactions in Fund Shares | | | |
| | | 11/1/18-10/31/19 | 11/1/17-10/31/18 |
| | | SHARES | VALUE | SHARES | VALUE |
| Shares sold | | 48,492,601 | $406,679,894 | 38,677,793 | $365,243,827 |
| Shares reinvested | | 3,195,805 | 24,767,484 | 2,286,304 | 21,605,579 |
| Shares redeemed | + | (59,146,394) | (498,217,108) | (29,432,622) | (279,199,335) |
| Net transactions in fund shares | | (7,457,988) | ($66,769,730) | 11,531,475 | $107,650,071 |
| Shares Outstanding and Net Assets | | | |
| | | 11/1/18-10/31/19 | 11/1/17-10/31/18 |
| | | SHARES | NET ASSETS | SHARES | NET ASSETS |
| Beginning of period | | 155,193,897 | $1,349,082,395 | 143,662,422 | $1,371,893,526 |
| Total increase or decrease | + | (7,457,988) | (21,829,578) | 11,531,475 | (22,811,131) |
| End of period | | 147,735,909 | $1,327,252,817 | 155,193,897 | $1,349,082,395 |
Schwab Fundamental Index Funds | Annual Report
Schwab Fundamental International Small Company Index Fund
Financial Statements
Financial Highlights
| | 11/1/18–
10/31/19 | 11/1/17–
10/31/18 | 11/1/16–
10/31/17 | 11/1/15–
10/31/16 | 11/1/14–
10/31/15 | |
| Per-Share Data |
| Net asset value at beginning of period | $12.67 | $14.58 | $11.93 | $11.25 | $11.15 | |
| Income (loss) from investment operations: | | | | | | |
| Net investment income (loss)1 | 0.29 | 0.33 | 0.27 | 0.25 | 0.22 | |
| Net realized and unrealized gains (losses) | 0.25 | (1.70) | 2.67 | 0.66 | 0.12 | |
| Total from investment operations | 0.54 | (1.37) | 2.94 | 0.91 | 0.34 | |
| Less distributions: | | | | | | |
| Distributions from net investment income | (0.30) | (0.34) | (0.29) | (0.23) | (0.19) | |
| Distributions from net realized gains | (0.34) | (0.20) | — | — | (0.05) | |
| Total distributions | (0.64) | (0.54) | (0.29) | (0.23) | (0.24) | |
| Net asset value at end of period | $12.57 | $12.67 | $14.58 | $11.93 | $11.25 | |
| Total return | 5.13% | (9.79%) | 25.23% | 8.29% | 3.09% | |
| Ratios/Supplemental Data |
| Ratios to average net assets: | | | | | | |
| Total expenses | 0.39% | 0.39% | 0.48%2 | 0.68% | 0.71% | |
| Net operating expenses | N/A | N/A3 | 0.43%2 | 0.49% | 0.49% | |
| Net investment income (loss) | 2.44% | 2.30% | 2.04% | 2.24% | 1.98% | |
| Portfolio turnover rate | 38% | 26% | 21% | 40% | 37% | |
| Net assets, end of period (x 1,000,000) | $775 | $763 | $749 | $476 | $427 | |
| |
1
Calculated based on the average shares outstanding during the period.
2
Effective May 1, 2017, the annual operating expense ratio was reduced. The ratio presented for period ended 10/31/17 is a blended ratio.
3
Effective May 1, 2017, the fund instituted a new fee structure and the contractual expense limitation was terminated.
Schwab Fundamental Index Funds | Annual Report
Schwab Fundamental International Small Company Index Fund
Condensed Portfolio Holdings as of October 31, 2019
This section shows the fund’s 50 largest portfolio holdings in unaffiliated issuers, any holdings exceeding 1% of the fund’s net assets as of the report date, and any affiliated issuers. The remaining securities held by the fund are grouped as "Other Securities" in each category. You can request a complete schedule of portfolio holdings as of the report date, free of charge, by calling Schwab Funds® at 1-877-824-5615. This complete schedule, filed on the fund’s N-CSR(S), is also available on the U.S. Securities and Exchange Commission (SEC)’s website atwww.sec.gov.
In addition, the fund files its complete schedule of portfolio holdings with the SEC for the first and third quarters of each fiscal year on Form N-Q. The fund’s Form N-Q is available on the SEC’s website. Effective March 31, 2019, Form N-PORT Part F has replaced Form N-Q. The fund also makes available its complete schedule of portfolio holdings 15-20 days after the end of the month on the fund’s website atwww.schwabfunds.com/schwabfunds_prospectus.
| Security | Number
of Shares | % of Net
Assets | Value
($) |
| Common Stock99.3% of net assets | |
| |
| Australia 5.3% | |
| JB Hi-Fi Ltd. | 47,765 | 0.2 | 1,220,666 |
| Qantas Airways Ltd. | 254,451 | 0.1 | 1,125,471 |
| Santos Ltd. | 221,494 | 0.2 | 1,238,930 |
| Other Securities | | 4.8 | 37,202,204 |
| | | 5.3 | 40,787,271 |
| |
| Austria 0.6% | |
| Other Securities | | 0.6 | 4,848,958 |
| |
| Belgium 1.3% | |
| bpost S.A. | 97,835 | 0.1 | 1,118,083 |
| Other Securities | | 1.2 | 8,834,465 |
| | | 1.3 | 9,952,548 |
| |
| Canada 7.9% | |
| Canadian Utilities Ltd., Class A | 38,600 | 0.1 | 1,125,675 |
| Kinross Gold Corp. * | 251,100 | 0.2 | 1,220,135 |
| Parkland Fuel Corp. | 34,800 | 0.1 | 1,155,949 |
| WestJet Airlines Ltd. | 50,800 | 0.2 | 1,181,386 |
| Wheaton Precious Metals Corp. | 42,216 | 0.2 | 1,183,369 |
| Other Securities | | 7.1 | 55,117,208 |
| | | 7.9 | 60,983,722 |
| |
| Denmark 1.1% | |
| Other Securities | | 1.1 | 8,380,166 |
| |
| Finland 1.3% | |
| Huhtamaki Oyj | 26,451 | 0.2 | 1,224,827 |
| Orion Oyj, Class B | 28,367 | 0.2 | 1,258,491 |
| Other Securities | | 0.9 | 7,412,789 |
| | | 1.3 | 9,896,107 |
| |
| France 4.2% | |
| Edenred | 23,749 | 0.2 | 1,251,756 |
| Getlink SE | 69,877 | 0.2 | 1,170,501 |
| SPIE S.A. | 53,647 | 0.1 | 1,132,244 |
| Other Securities | | 3.7 | 28,776,235 |
| | | 4.2 | 32,330,736 |
| |
| Security | Number
of Shares | % of Net
Assets | Value
($) |
| Germany 3.7% | |
| Bilfinger SE | 33,338 | 0.1 | 1,112,838 |
| Hella GmbH & Co. KGaA | 22,909 | 0.1 | 1,114,381 |
| Other Securities | | 3.5 | 26,323,090 |
| | | 3.7 | 28,550,309 |
| |
| Greece 0.0% | |
| Other Securities | | 0.0 | — |
| |
| Hong Kong 3.8% | |
| AAC Technologies Holdings, Inc. | 166,000 | 0.1 | 1,074,235 |
| Other Securities | | 3.7 | 28,299,972 |
| | | 3.8 | 29,374,207 |
| |
| Ireland 0.3% | |
| Other Securities | | 0.3 | 2,555,273 |
| |
| Israel 1.1% | |
| Israel Discount Bank Ltd., Class A | 240,066 | 0.1 | 1,097,059 |
| Other Securities | | 1.0 | 7,449,544 |
| | | 1.1 | 8,546,603 |
| |
| Italy 2.4% | |
| Other Securities | | 2.4 | 18,719,648 |
| |
| Japan 35.2% | |
| Azbil Corp. | 39,100 | 0.1 | 1,088,042 |
| Credit Saison Co., Ltd. | 84,300 | 0.2 | 1,220,726 |
| Hitachi Chemical Co., Ltd. | 48,700 | 0.2 | 1,603,194 |
| Hitachi High-Technologies Corp. | 24,700 | 0.2 | 1,536,728 |
| Kansai Paint Co., Ltd. | 47,200 | 0.1 | 1,136,804 |
| Keihin Corp. | 48,200 | 0.1 | 1,145,841 |
| Kurita Water Industries Ltd. | 39,900 | 0.1 | 1,148,625 |
| Morinaga Milk Industry Co., Ltd. | 29,000 | 0.1 | 1,127,468 |
| Nabtesco Corp. | 34,700 | 0.1 | 1,104,668 |
| Nomura Research Institute Ltd. | 60,080 | 0.2 | 1,275,541 |
| Rakuten, Inc. | 117,260 | 0.1 | 1,117,889 |
| Taiyo Yuden Co., Ltd. | 47,600 | 0.2 | 1,258,826 |
| Toyo Tire Corp. | 77,000 | 0.1 | 1,074,016 |
| Other Securities | | 33.4 | 256,907,214 |
| | | 35.2 | 272,745,582 |
| |
| Luxembourg 0.0% | |
| Other Securities | | 0.0 | — |
| |
Schwab Fundamental Index Funds | Annual Report
Schwab Fundamental International Small Company Index Fund
Condensed Portfolio Holdings as of October 31, 2019 (continued)
| Security | Number
of Shares | % of Net
Assets | Value
($) |
| Netherlands 1.7% | |
| Altice Europe N.V. * | 231,906 | 0.2 | 1,326,921 |
| Other Securities | | 1.5 | 11,789,052 |
| | | 1.7 | 13,115,973 |
| |
| New Zealand 0.9% | |
| Other Securities | | 0.9 | 7,358,666 |
| |
| Norway 1.4% | |
| Other Securities | | 1.4 | 11,174,805 |
| |
| Poland 1.1% | |
| Grupa Lotos S.A. | 43,761 | 0.1 | 1,092,846 |
| Orange Polska S.A. * | 701,900 | 0.1 | 1,150,074 |
| Other Securities | | 0.9 | 6,038,004 |
| | | 1.1 | 8,280,924 |
| |
| Portugal 0.4% | |
| Other Securities | | 0.4 | 3,222,369 |
| |
| Republic of Korea 5.2% | |
| LG Innotek Co., Ltd. | 10,792 | 0.1 | 1,120,962 |
| Other Securities | | 5.1 | 39,140,819 |
| | | 5.2 | 40,261,781 |
| |
| Singapore 1.5% | |
| Other Securities | | 1.5 | 11,649,244 |
| |
| Spain 1.4% | |
| Acciona S.A. | 10,835 | 0.1 | 1,128,772 |
| Other Securities | | 1.3 | 9,996,058 |
| | | 1.4 | 11,124,830 |
| |
| Sweden 3.2% | |
| Getinge AB, B Shares | 86,186 | 0.2 | 1,473,483 |
| Holmen AB, B Shares | 37,061 | 0.1 | 1,093,695 |
| JM AB | 41,940 | 0.1 | 1,074,365 |
| Svenska Cellulosa AB, S.C.A., B Shares | 124,386 | 0.2 | 1,269,251 |
| Other Securities | | 2.6 | 19,898,690 |
| | | 3.2 | 24,809,484 |
| |
| Switzerland 3.4% | |
| Helvetia Holding AG | 7,611 | 0.1 | 1,069,096 |
| Vifor Pharma AG | 7,322 | 0.1 | 1,153,063 |
| Other Securities | | 3.2 | 23,860,761 |
| | | 3.4 | 26,082,920 |
| |
| United Kingdom 10.9% | |
| BBA Aviation plc | 289,136 | 0.1 | 1,137,500 |
| Cobham plc | 561,159 | 0.1 | 1,147,840 |
| Howden Joinery Group plc | 142,294 | 0.1 | 1,064,968 |
| IG Group Holdings plc | 132,204 | 0.1 | 1,088,126 |
| Intermediate Capital Group plc | 61,755 | 0.2 | 1,188,519 |
| Phoenix Group Holdings plc | 132,246 | 0.2 | 1,207,953 |
| Security | Number
of Shares | % of Net
Assets | Value
($) |
| Polymetal International plc | 66,311 | 0.1 | 1,090,650 |
| Other Securities | | 10.0 | 76,832,785 |
| | | 10.9 | 84,758,341 |
| Total Common Stock | |
| (Cost $703,620,154) | | | 769,510,467 |
|
| Preferred Stock0.3% of net assets | |
| |
| Germany 0.3% | |
| Other Securities | | 0.3 | 2,519,059 |
| Total Preferred Stock | |
| (Cost $2,699,209) | | | 2,519,059 |
|
| Rights0.0% of net assets | |
| |
| Australia 0.0% | |
| Other Securities | | 0.0 | 6,179 |
| |
| Italy 0.0% | |
| Other Securities | | 0.0 | — |
| |
| Norway 0.0% | |
| Other Securities | | 0.0 | 4,923 |
| |
| Singapore 0.0% | |
| Other Securities | | 0.0 | 787 |
| |
| Spain 0.0% | |
| Other Securities | | 0.0 | 245,361 |
| Total Rights | |
| (Cost $553,874) | | | 257,250 |
|
| Other Investment Company1.4% of net assets | |
| |
| United States 1.4% | |
| Securities Lending Collateral 1.4% | |
| Wells Fargo Government Money Market Fund, Select Class 1.75%(c) | 11,114,235 | 1.4 | 11,114,235 |
| Total Other Investment Company | |
| (Cost $11,114,235) | | | 11,114,235 |
Security
Rate, Maturity Date | Face
Amount ($) | % of Net
Assets | Value
($) |
| Short-Term Investments0.1% of net assets | |
| |
| Time Deposits 0.1% | |
| Other Securities | | 0.1 | 269,216 |
| Total Short-Term Investments | |
| (Cost $269,216) | | | 269,216 |
Schwab Fundamental Index Funds | Annual Report
Schwab Fundamental International Small Company Index Fund
Condensed Portfolio Holdings as of October 31, 2019 (continued)
| | Number of
Contracts | Notional
Amount
($) | Current Value/
Unrealized
Appreciation
($) |
| Futures Contracts | |
| Long | |
| MSCI EAFE Index, expires 12/20/19 | 34 | 3,327,240 | 22,255 |
The following footnotes may not be applicable to the Condensed Portfolio Holdings. Please refer to the complete schedule of portfolio holdings.
| * | Non-income producing security. |
| (a) | All or a portion of this security is on loan. Securities on loan were valued at $9,652,938. |
| (b) | Fair-valued by management using significant unobservable inputs in accordance with procedures approved by the fund’s Board of Trustees. |
| (c) | The rate shown is the 7-day yield. |
| (d) | The rate shown is the current daily overnight rate. |
| | |
| CVA — | Dutch Certificate |
| REIT — | Real Estate Investment Trust |
Schwab Fundamental Index Funds | Annual Report
Schwab Fundamental International Small Company Index Fund
Condensed Portfolio Holdings as of October 31, 2019 (continued)
The following is a summary of the inputs used to value the fund’s investments as of October 31, 2019 and reflects the complete schedule of portfolio holdings (see financial note 2(a) for additional information):
| Description | Quoted Prices in
Active Markets for
Identical Assets
(Level 1) | Other Significant
Observable Inputs
(Level 2) | Significant
Unobservable Inputs
(Level 3) | Total | |
| Assets | | | | | |
| Common Stock1 | $— | $291,753,492 | $— | $291,753,492 | |
| Australia | — | 40,787,271 | —* | 40,787,271 | |
| Austria | 940,424 | 3,908,534 | — | 4,848,958 | |
| Belgium | 1,685,906 | 8,266,642 | — | 9,952,548 | |
| Canada | 60,983,722 | — | — | 60,983,722 | |
| Denmark | 1,414,900 | 6,965,266 | — | 8,380,166 | |
| Finland | 2,611,988 | 7,284,119 | — | 9,896,107 | |
| France | 2,183,733 | 30,147,003 | — | 32,330,736 | |
| Germany | 6,053,726 | 22,496,583 | — | 28,550,309 | |
| Greece | — | — | —* | — | |
| Hong Kong | 633,037 | 28,741,170 | —* | 29,374,207 | |
| Ireland | 2,555,273 | — | — | 2,555,273 | |
| Israel | 252,532 | 8,294,071 | — | 8,546,603 | |
| Italy | 3,155,681 | 15,497,039 | 66,928* | 18,719,648 | |
| Luxembourg | — | — | —* | — | |
| Netherlands | 1,251,647 | 11,864,326 | — | 13,115,973 | |
| Norway | 1,154,747 | 10,020,058 | — | 11,174,805 | |
| Poland | 791,973 | 7,488,951 | — | 8,280,924 | |
| Portugal | 707,793 | 2,514,576 | —* | 3,222,369 | |
| Republic of Korea | 1,465,857 | 38,795,924 | — | 40,261,781 | |
| Spain | 1,098,255 | 10,026,575 | —* | 11,124,830 | |
| Sweden | 1,898,764 | 22,910,720 | — | 24,809,484 | |
| Switzerland | 2,954,703 | 23,128,217 | — | 26,082,920 | |
| United Kingdom | 26,967,412 | 57,790,929 | —* | 84,758,341 | |
| Preferred Stock | | | | | |
| Germany | 611,350 | 1,907,709 | — | 2,519,059 | |
| Rights | | | | | |
| Australia | 6,179 | — | — | 6,179 | |
| Italy | — | — | —* | — | |
| Norway | 1,359 | — | 3,564 | 4,923 | |
| Singapore | — | — | 787 | 787 | |
| Spain | 245,361 | — | — | 245,361 | |
| Other Investment Company1 | 11,114,235 | — | — | 11,114,235 | |
| Short-Term Investments1 | — | 269,216 | — | 269,216 | |
| Futures Contracts2 | 22,255 | — | — | 22,255 | |
| Total | $132,762,812 | $650,858,391 | $71,279 | $783,692,482 | |
| * | Level 3 amount shown includes securities determined to have no value at October 31, 2019. |
| 1 | As categorized in the complete schedule of Portfolio Holdings. |
| 2 | Futures contracts are valued at unrealized appreciation or depreciation. |
Fund investments in underlying mutual funds are classified as Level 1, without consideration to the classification level of the investments held by the underlying mutual funds, which could be Level 1, Level 2 or Level 3.
Schwab Fundamental Index Funds | Annual Report
Schwab Fundamental International Small Company Index Fund
Statement of Assets and Liabilities
As of October 31, 2019
| Assets |
| Investments in unaffiliated issuers, at value (cost $707,142,453) including securities on loan of $9,652,938 | | $772,555,992 |
| Collateral invested for securities on loan, at value (cost $11,114,235) | | 11,114,235 |
| Deposit with broker for futures contracts | | 129,202 |
| Receivables: | | |
| Investments sold | | 319,717 |
| Dividends | | 2,252,872 |
| Fund shares sold | | 924,851 |
| Foreign tax reclaims | | 448,892 |
| Income from securities on loan | | 53,539 |
| Variation margin on futures contracts | + | 22,322 |
| Total assets | | 787,821,622 |
| Liabilities |
| Collateral held for securities on loan | | 11,114,235 |
| Payables: | | |
| Investment adviser fees | | 251,032 |
| Fund shares redeemed | | 815,819 |
| Due to custodian | + | 382,550 |
| Total liabilities | | 12,563,636 |
| Net Assets |
| Total assets | | 787,821,622 |
| Total liabilities | – | 12,563,636 |
| Net assets | | $775,257,986 |
| Net Assets by Source | | |
| Capital received from investors | | 719,034,779 |
| Total distributable earnings | | 56,223,207 |
| Net Asset Value (NAV) |
| Net Assets | ÷ | Shares
Outstanding | = | NAV |
| $775,257,986 | | 61,656,238 | | $12.57 |
| | | | | |
Schwab Fundamental Index Funds | Annual Report
Schwab Fundamental International Small Company Index Fund
Statement of Operations
For the period November 1, 2018 through October 31, 2019
| Investment Income |
| Dividends (net of foreign withholding tax of $2,418,027) | | $21,126,453 |
| Interest | | 16,919 |
| Securities on loan, net | + | 882,895 |
| Total investment income | | 22,026,267 |
| Expenses |
| Investment adviser fees | | 3,036,519 |
| Total expenses | – | 3,036,519 |
| Net investment income | | 18,989,748 |
| Realized and Unrealized Gains (Losses) |
| Net realized losses on investments | | (13,359,757) |
| Net realized gains on futures contracts | | 642,164 |
| Net realized gains on foreign currency transactions | + | 53,306 |
| Net realized losses | | (12,664,287) |
| Net change in unrealized appreciation (depreciation) on investments | | 31,179,080 |
| Net change in unrealized appreciation (depreciation) on futures contracts | | 120,756 |
| Net change in unrealized appreciation (depreciation) on foreign currency translations | + | 26,278 |
| Net change in unrealized appreciation (depreciation) | + | 31,326,114 |
| Net realized and unrealized gains | | 18,661,827 |
| Increase in net assets resulting from operations | | $37,651,575 |
Schwab Fundamental Index Funds | Annual Report
Schwab Fundamental International Small Company Index Fund
Statement of Changes in Net Assets
For the current and prior report periods
| Operations | |
| | 11/1/18-10/31/19 | 11/1/17-10/31/18 |
| Net investment income | | $18,989,748 | $19,064,937 |
| Net realized gains (losses) | | (12,664,287) | 20,456,783 |
| Net change in unrealized appreciation (depreciation) | + | 31,326,114 | (125,267,429) |
| Increase (decrease) in net assets from operations | | 37,651,575 | (85,745,709) |
| Distributions to Shareholders | |
| Total distributions | | ($40,145,201) | ($29,102,652) |
| Transactions in Fund Shares | | | |
| | | 11/1/18-10/31/19 | 11/1/17-10/31/18 |
| | | SHARES | VALUE | SHARES | VALUE |
| Shares sold | | 21,189,779 | $254,698,550 | 19,163,379 | $275,152,791 |
| Shares reinvested | | 2,920,765 | 31,485,839 | 1,584,447 | 22,641,756 |
| Shares redeemed | + | (22,650,454) | (271,063,058) | (11,914,220) | (169,038,740) |
| Net transactions in fund shares | | 1,460,090 | $15,121,331 | 8,833,606 | $128,755,807 |
| Shares Outstanding and Net Assets | | | |
| | | 11/1/18-10/31/19 | 11/1/17-10/31/18 |
| | | SHARES | NET ASSETS | SHARES | NET ASSETS |
| Beginning of period | | 60,196,148 | $762,630,281 | 51,362,542 | $748,722,835 |
| Total increase | + | 1,460,090 | 12,627,705 | 8,833,606 | 13,907,446 |
| End of period | | 61,656,238 | $775,257,986 | 60,196,148 | $762,630,281 |
Schwab Fundamental Index Funds | Annual Report
Schwab Fundamental Emerging Markets Large Company Index Fund
Financial Statements
Financial Highlights
| | 11/1/18–
10/31/19 | 11/1/17–
10/31/18 | 11/1/16–
10/31/17 | 11/1/15–
10/31/16 | 11/1/14–
10/31/15 | |
| Per-Share Data |
| Net asset value at beginning of period | $8.60 | $9.38 | $7.86 | $6.67 | $8.60 | |
| Income (loss) from investment operations: | | | | | | |
| Net investment income (loss)1 | 0.35 | 0.27 | 0.22 | 0.16 | 0.20 | |
| Net realized and unrealized gains (losses) | 0.54 | (0.83) | 1.47 | 1.22 | (1.92) | |
| Total from investment operations | 0.89 | (0.56) | 1.69 | 1.38 | (1.72) | |
| Less distributions: | | | | | | |
| Distributions from net investment income | (0.24) | (0.22) | (0.17) | (0.19) | (0.21) | |
| Net asset value at end of period | $9.25 | $8.60 | $9.38 | $7.86 | $6.67 | |
| Total return | 10.73% | (6.09%) | 21.96% | 21.64% | (20.28%) | |
| Ratios/Supplemental Data |
| Ratios to average net assets: | | | | | | |
| Total expenses | 0.39% | 0.39% | 0.57%2 | 0.88% | 0.85% | |
| Net operating expenses | N/A | N/A3 | 0.43%2 | 0.49% | 0.49% | |
| Net investment income (loss) | 3.93% | 2.92% | 2.62% | 2.41% | 2.61% | |
| Portfolio turnover rate | 38% | 19% | 18% | 20% | 27% | |
| Net assets, end of period (x 1,000,000) | $671 | $548 | $554 | $336 | $304 | |
| |
1
Calculated based on the average shares outstanding during the period.
2
Effective May 1, 2017, the annual operating expense ratio was reduced. The ratio presented for period ended 10/31/17 is a blended ratio.
3
Effective May 1, 2017, the fund instituted a new fee structure and the contractual expense limitation was terminated.
Schwab Fundamental Index Funds | Annual Report
Schwab Fundamental Emerging Markets Large Company Index Fund
Condensed Portfolio Holdings as of October 31, 2019
This section shows the fund’s 50 largest portfolio holdings in unaffiliated issuers, any holdings exceeding 1% of the fund’s net assets as of the report date, and any affiliated issuers. The remaining securities held by the fund are grouped as "Other Securities" in each category. You can request a complete schedule of portfolio holdings as of the report date, free of charge, by calling Schwab Funds® at 1-877-824-5615. This complete schedule, filed on the fund’s N-CSR(S), is also available on the U.S. Securities and Exchange Commission (SEC)’s website atwww.sec.gov.
In addition, the fund files its complete schedule of portfolio holdings with the SEC for the first and third quarters of each fiscal year on Form N-Q. The fund’s Form N-Q is available on the SEC’s website. Effective March 31, 2019, Form N-PORT Part F has replaced Form N-Q. The fund also makes available its complete schedule of portfolio holdings 15-20 days after the end of the month on the fund’s website atwww.schwabfunds.com/schwabfunds_prospectus.
| Security | Number
of Shares | % of Net
Assets | Value
($) |
| Common Stock92.9% of net assets | |
| |
| Brazil 6.3% | |
| Ambev S.A. | 757,350 | 0.5 | 3,282,070 |
| Banco do Brasil S.A. | 377,415 | 0.7 | 4,531,239 |
| JBS S.A. | 481,000 | 0.5 | 3,392,966 |
| Petroleo Brasileiro S.A. | 783,658 | 1.0 | 6,389,631 |
| Vale S.A. * | 810,797 | 1.4 | 9,542,356 |
| Other Securities | | 2.2 | 15,006,257 |
| | | 6.3 | 42,144,519 |
| |
| Chile 0.8% | |
| Other Securities | | 0.8 | 5,338,014 |
| |
| China 24.9% | |
| Agricultural Bank of China Ltd., H Shares | 9,032,600 | 0.6 | 3,716,947 |
| Alibaba Group Holding Ltd. ADR * | 20,931 | 0.6 | 3,697,880 |
| Bank of China Ltd., H Shares | 26,364,234 | 1.6 | 10,750,933 |
| China Construction Bank Corp., H Shares | 28,144,960 | 3.4 | 22,551,724 |
| China Merchants Bank Co., Ltd., H Shares | 629,150 | 0.4 | 3,000,561 |
| China Mobile Ltd. | 1,646,055 | 2.0 | 13,376,987 |
| China Petroleum & Chemical Corp., H Shares | 21,030,400 | 1.8 | 11,961,559 |
| China Shenhua Energy Co., Ltd., H Shares | 1,356,500 | 0.4 | 2,754,969 |
| China Telecom Corp., Ltd., H Shares | 6,690,000 | 0.4 | 2,845,983 |
| China Unicom (Hong Kong) Ltd. | 2,979,056 | 0.4 | 2,932,877 |
| CNOOC Ltd. | 4,933,075 | 1.1 | 7,341,648 |
| Industrial & Commercial Bank of China Ltd., H Shares | 21,832,172 | 2.3 | 15,640,419 |
| PetroChina Co., Ltd., H Shares | 10,460,000 | 0.8 | 5,100,938 |
| Ping An Insurance Group Co. of China Ltd., H Shares | 400,000 | 0.7 | 4,616,712 |
| Tencent Holdings Ltd. | 128,700 | 0.8 | 5,220,447 |
| Other Securities | | 7.6 | 51,758,199 |
| | | 24.9 | 167,268,783 |
| |
| Colombia 0.3% | |
| Other Securities | | 0.3 | 2,142,250 |
| |
| Czech Republic 0.2% | |
| Other Securities | | 0.2 | 1,342,303 |
| |
| Security | Number
of Shares | % of Net
Assets | Value
($) |
| Egypt 0.1% | |
| Other Securities | | 0.1 | 623,907 |
| |
| Greece 1.2% | |
| Piraeus Bank S.A. * | 815,465 | 0.4 | 2,844,203 |
| Other Securities | | 0.8 | 5,075,488 |
| | | 1.2 | 7,919,691 |
| |
| Hungary 0.5% | |
| Other Securities | | 0.5 | 3,334,995 |
| |
| India 7.3% | |
| Bharat Petroleum Corp., Ltd. | 465,944 | 0.5 | 3,450,791 |
| Infosys Ltd. | 439,383 | 0.6 | 4,225,046 |
| Oil & Natural Gas Corp., Ltd. | 1,421,110 | 0.4 | 2,836,345 |
| Reliance Industries Ltd. | 326,234 | 1.0 | 6,724,107 |
| Tata Motors Ltd. * | 1,169,492 | 0.4 | 2,891,831 |
| Other Securities | | 4.4 | 28,821,550 |
| | | 7.3 | 48,949,670 |
| |
| Indonesia 1.3% | |
| Other Securities | | 1.3 | 8,758,714 |
| |
| Kuwait 0.4% | |
| Other Securities | | 0.4 | 2,338,663 |
| |
| Malaysia 1.7% | |
| Tenaga Nasional Berhad | 1,047,600 | 0.5 | 3,469,384 |
| Other Securities | | 1.2 | 8,222,646 |
| | | 1.7 | 11,692,030 |
| |
| Mexico 4.3% | |
| America Movil S.A.B. de C.V., Series L | 12,010,619 | 1.4 | 9,515,340 |
| Fomento Economico Mexicano S.A.B. de C.V. | 416,915 | 0.6 | 3,699,602 |
| Wal-Mart de Mexico S.A.B. de C.V. | 1,057,237 | 0.5 | 3,172,838 |
| Other Securities | | 1.8 | 12,401,877 |
| | | 4.3 | 28,789,657 |
| |
| Philippines 0.3% | |
| Other Securities | | 0.3 | 1,968,776 |
| |
Schwab Fundamental Index Funds | Annual Report
Schwab Fundamental Emerging Markets Large Company Index Fund
Condensed Portfolio Holdings as of October 31, 2019 (continued)
| Security | Number
of Shares | % of Net
Assets | Value
($) |
| Qatar 0.4% | |
| Other Securities | | 0.4 | 2,600,424 |
| |
| Russia 14.3% | |
| Gazprom PJSC - USD | 8,687,630 | 5.3 | 35,226,072 |
| Lukoil PJSC | 250,510 | 3.4 | 23,125,953 |
| Mobile TeleSystems PJSC | 621,762 | 0.4 | 2,763,495 |
| Rosneft Oil Co. PJSC | 644,820 | 0.6 | 4,283,884 |
| Sberbank of Russia PJSC | 2,067,000 | 1.1 | 7,571,721 |
| Tatneft PJSC | 321,460 | 0.6 | 3,750,889 |
| Other Securities | | 2.9 | 18,858,111 |
| | | 14.3 | 95,580,125 |
| |
| South Africa 5.7% | |
| MTN Group Ltd. | 1,084,865 | 1.0 | 6,714,860 |
| Sasol Ltd. | 258,184 | 0.7 | 4,680,536 |
| Standard Bank Group Ltd. | 277,590 | 0.5 | 3,186,802 |
| Other Securities | | 3.5 | 23,577,167 |
| | | 5.7 | 38,159,365 |
| |
| Taiwan 17.7% | |
| Asustek Computer, Inc. | 475,041 | 0.5 | 3,222,644 |
| Hon Hai Precision Industry Co., Ltd. | 8,197,572 | 3.2 | 21,650,629 |
| Innolux Corp. | 13,262,357 | 0.4 | 2,939,820 |
| MediaTek, Inc. | 302,338 | 0.6 | 4,037,679 |
| Pegatron Corp. | 2,136,264 | 0.6 | 4,148,138 |
| Taiwan Semiconductor Manufacturing Co., Ltd. | 2,646,803 | 3.9 | 25,938,135 |
| Other Securities | | 8.5 | 56,917,714 |
| | | 17.7 | 118,854,759 |
| |
| Thailand 3.1% | |
| PTT PCL NVDR | 4,818,870 | 1.1 | 7,221,075 |
| Other Securities | | 2.0 | 13,543,981 |
| | | 3.1 | 20,765,056 |
| |
| Turkey 1.6% | |
| Other Securities | | 1.6 | 10,932,463 |
| |
| United Arab Emirates 0.5% | |
| Other Securities | | 0.5 | 3,483,348 |
| Total Common Stock | |
| (Cost $559,587,702) | | | 622,987,512 |
|
| Preferred Stock6.9% of net assets | |
| |
| Brazil 5.1% | |
| Banco Bradesco S.A. | 793,994 | 1.0 | 6,962,915 |
| Itau Unibanco Holding S.A. | 1,128,079 | 1.5 | 10,190,825 |
| Security | Number
of Shares | % of Net
Assets | Value
($) |
| Petroleo Brasileiro S.A. | 1,007,354 | 1.1 | 7,633,334 |
| Other Securities | | 1.5 | 9,253,062 |
| | | 5.1 | 34,040,136 |
| |
| Colombia 0.2% | |
| Other Securities | | 0.2 | 1,289,100 |
| |
| Russia 1.6% | |
| Transneft PJSC | 3,189 | 1.2 | 8,280,533 |
| Other Securities | | 0.4 | 2,616,014 |
| | | 1.6 | 10,896,547 |
| Total Preferred Stock | |
| (Cost $32,389,168) | | | 46,225,783 |
Security
Rate, Maturity Date | Face
Amount ($) | % of Net
Assets | Value
($) |
| Short-Term Investments0.0% of net assets | |
| |
| Time Deposits 0.0% | |
| Other Securities | | 0.0 | 177,314 |
| Total Short-Term Investments | |
| (Cost $177,314) | | | 177,314 |
| | Number of
Contracts | Notional
Amount
($) | Current Value/
Unrealized
Appreciation
($) |
| Futures Contracts | |
| Long | |
| MSCI Emerging Markets Index, expires 12/20/19 | 31 | 1,614,170 | 14,105 |
The following footnotes may not be applicable to the Condensed Portfolio Holdings. Please refer to the complete schedule of portfolio holdings.
| * | Non-income producing security. |
| (a) | Fair-valued by management using significant unobservable inputs in accordance with procedures approved by the fund’s Board of Trustees. |
| (b) | The rate shown is the current daily overnight rate. |
| | |
| ADR — | American Depositary Receipt |
| GDR — | Global Depositary Receipt |
| NVDR — | Non-Voting Depositary Receipt |
| |
| USD — | U.S. dollar |
Schwab Fundamental Index Funds | Annual Report
Schwab Fundamental Emerging Markets Large Company Index Fund
Condensed Portfolio Holdings as of October 31, 2019 (continued)
The following is a summary of the inputs used to value the fund’s investments as of October 31, 2019 and reflects the complete schedule of portfolio holdings (see financial note 2(a) for additional information):
| Description | Quoted Prices in
Active Markets for
Identical Assets
(Level 1) | Other Significant
Observable Inputs
(Level 2) | Significant
Unobservable Inputs
(Level 3) | Total | |
| Assets | | | | | |
| Common Stock1 | $— | $177,236,748 | $— | $177,236,748 | |
| Brazil | 42,144,519 | — | — | 42,144,519 | |
| Chile | — | — | 5,338,014 | 5,338,014 | |
| China | 8,194,565 | 159,074,218 | — | 167,268,783 | |
| Colombia | 2,142,250 | — | — | 2,142,250 | |
| Egypt | 623,907 | — | — | 623,907 | |
| India | 7,604,034 | 41,345,636 | — | 48,949,670 | |
| Kuwait | 734,293 | 1,604,370 | — | 2,338,663 | |
| Mexico | 28,789,657 | — | — | 28,789,657 | |
| Russia | 91,987,383 | 3,592,742 | — | 95,580,125 | |
| South Africa | 1,039,093 | 37,120,272 | — | 38,159,365 | |
| Turkey | 870,420 | 10,062,043 | — | 10,932,463 | |
| United Arab Emirates | 1,354,775 | 2,128,573 | — | 3,483,348 | |
| Preferred Stock | | | | | |
| Brazil | 34,040,136 | — | — | 34,040,136 | |
| Colombia | 1,289,100 | — | — | 1,289,100 | |
| Russia | 10,681,510 | 215,037 | — | 10,896,547 | |
| Short-Term Investments1 | — | 177,314 | — | 177,314 | |
| Futures Contracts2 | 14,105 | — | — | 14,105 | |
| Total | $231,509,747 | $432,556,953 | $5,338,014 | $669,404,714 | |
| 1 | As categorized in the complete schedule of Portfolio Holdings. |
| 2 | Futures contracts are valued at unrealized appreciation or depreciation. |
Fund investments in underlying mutual funds are classified as Level 1, without consideration to the classification level of the investments held by the underlying mutual funds, which could be Level 1, Level 2 or Level 3.
Schwab Fundamental Index Funds | Annual Report
Schwab Fundamental Emerging Markets Large Company Index Fund
Statement of Assets and Liabilities
As of October 31, 2019
| Assets |
| Investments in unaffiliated issuers, at value (cost $592,154,184) | | $669,390,609 |
| Foreign currency, at value (cost $397,577) | | 398,028 |
| Deposit with broker for futures contracts | | 257,422 |
| Receivables: | | |
| Dividends | | 755,918 |
| Fund shares sold | | 738,183 |
| Variation margin on futures contracts | | 14,166 |
| Foreign tax reclaims | + | 2,463 |
| Total assets | | 671,556,789 |
| Liabilities |
| Payables: | | |
| Investment adviser fees | | 215,476 |
| Foreign capital gains tax | | 252,312 |
| Fund shares redeemed | + | 179,053 |
| Total liabilities | | 646,841 |
| Net Assets |
| Total assets | | 671,556,789 |
| Total liabilities | – | 646,841 |
| Net assets | | $670,909,948 |
| Net Assets by Source | | |
| Capital received from investors | | 648,699,912 |
| Total distributable earnings | | 22,210,036 |
| Net Asset Value (NAV) |
| Net Assets | ÷ | Shares
Outstanding | = | NAV |
| $670,909,948 | | 72,562,676 | | $9.25 |
| | | | | |
Schwab Fundamental Index Funds | Annual Report
Schwab Fundamental Emerging Markets Large Company Index Fund
Statement of Operations
For the period November 1, 2018 through October 31, 2019
| Investment Income |
| Dividends (net of foreign withholding tax of $3,924,927) | | $26,782,562 |
| Interest | | 16,787 |
| Securities on loan, net | + | 4,831 |
| Total investment income | | 26,804,180 |
| Expenses |
| Investment adviser fees | | 2,419,692 |
| Total expenses | – | 2,419,692 |
| Net investment income | | 24,384,488 |
| Realized and Unrealized Gains (Losses) |
| Net realized gains on investments (net of foreign capital gain tax paid of $8,599) | | 6,857,228 |
| Net realized losses on futures contracts | | (211,622) |
| Net realized losses on foreign currency transactions | + | (318,490) |
| Net realized gains | | 6,327,116 |
| Net change in unrealized appreciation (depreciation) on investments (net of change in foreign capital gains tax of ($59,575)) | | 31,356,231 |
| Net change in unrealized appreciation (depreciation) on futures contracts | | (6,640) |
| Net change in unrealized appreciation (depreciation) on foreign currency translations | + | 1,046 |
| Net change in unrealized appreciation (depreciation) | + | 31,350,637 |
| Net realized and unrealized gains | | 37,677,753 |
| Increase in net assets resulting from operations | | $62,062,241 |
Schwab Fundamental Index Funds | Annual Report
Schwab Fundamental Emerging Markets Large Company Index Fund
Statement of Changes in Net Assets
For the current and prior report periods
| Operations | |
| | 11/1/18-10/31/19 | 11/1/17-10/31/18 |
| Net investment income | | $24,384,488 | $16,898,028 |
| Net realized gains | | 6,327,116 | 7,794,377 |
| Net change in unrealized appreciation (depreciation) | + | 31,350,637 | (60,950,903) |
| Increase (decrease) in net assets from operations | | 62,062,241 | (36,258,498) |
| Distributions to Shareholders | |
| Total distributions | | ($15,972,543) | ($13,342,949) |
| Transactions in Fund Shares | | | |
| | | 11/1/18-10/31/19 | 11/1/17-10/31/18 |
| | | SHARES | VALUE | SHARES | VALUE |
| Shares sold | | 25,021,407 | $219,417,177 | 19,332,450 | $181,411,913 |
| Shares reinvested | | 1,405,982 | 11,419,761 | 981,934 | 9,059,227 |
| Shares redeemed | + | (17,582,733) | (154,001,819) | (15,602,021) | (146,545,728) |
| Net transactions in fund shares | | 8,844,656 | $76,835,119 | 4,712,363 | $43,925,412 |
| Shares Outstanding and Net Assets | | | |
| | | 11/1/18-10/31/19 | 11/1/17-10/31/18 |
| | | SHARES | NET ASSETS | SHARES | NET ASSETS |
| Beginning of period | | 63,718,020 | $547,985,131 | 59,005,657 | $553,661,166 |
| Total increase or decrease | + | 8,844,656 | 122,924,817 | 4,712,363 | (5,676,035) |
| End of period | | 72,562,676 | $670,909,948 | 63,718,020 | $547,985,131 |
Schwab Fundamental Index Funds | Annual Report
Schwab Fundamental Index Funds
1. Business Structure of the Funds:
Each of the funds in this report is a series of Schwab Capital Trust (the trust), a no-load, open-end management investment company. The trust is organized as a Massachusetts business trust and is registered under the Investment Company Act of 1940, as amended (the 1940 Act). The list below shows all the funds in the trust as of the end of the period, including the funds discussed in this report, which are highlighted:
| SCHWAB CAPITAL TRUST (ORGANIZED MAY 7, 1993) |
| Schwab Fundamental US Large Company Index Fund | Schwab Target 2010 Fund |
| Schwab Fundamental US Small Company Index Fund | Schwab Target 2015 Fund |
| Schwab Fundamental International Large Company Index Fund | Schwab Target 2020 Fund |
| Schwab Fundamental International Small Company Index Fund | Schwab Target 2025 Fund |
| Schwab Fundamental Emerging Markets Large Company Index Fund | Schwab Target 2030 Fund |
| Schwab Fundamental Global Real Estate Index Fund | Schwab Target 2035 Fund |
| Schwab S&P 500 Index Fund | Schwab Target 2040 Fund |
| Schwab Small-Cap Index Fund® | Schwab Target 2045 Fund |
| Schwab U.S. Large-Cap Growth Index Fund | Schwab Target 2050 Fund |
| Schwab U.S. Large-Cap Value Index Fund | Schwab Target 2055 Fund |
| Schwab U.S. Mid-Cap Index Fund | Schwab Target 2060 Fund |
| Schwab Total Stock Market Index Fund® | Schwab Target 2010 Index Fund |
| Schwab International Index Fund® | Schwab Target 2015 Index Fund |
| Schwab MarketTrack All Equity Portfolio™ | Schwab Target 2020 Index Fund |
| Schwab MarketTrack Growth Portfolio™ | Schwab Target 2025 Index Fund |
| Schwab MarketTrack Balanced Portfolio™ | Schwab Target 2030 Index Fund |
| Schwab MarketTrack Conservative Portfolio™ | Schwab Target 2035 Index Fund |
| Laudus International MarketMasters Fund™ | Schwab Target 2040 Index Fund |
| Schwab Balanced Fund | Schwab Target 2045 Index Fund |
| Schwab Core Equity Fund | Schwab Target 2050 Index Fund |
| Schwab Dividend Equity Fund | Schwab Target 2055 Index Fund |
| Schwab Large-Cap Growth Fund | Schwab Target 2060 Index Fund |
| Schwab Small-Cap Equity Fund | Schwab Monthly Income Fund - Moderate Payout |
| Schwab Hedged Equity Fund | Schwab Monthly Income Fund - Enhanced Payout |
| Schwab Health Care Fund | Schwab Monthly Income Fund - Maximum Payout |
| Schwab International Core Equity Fund | |
Each fund in this report offers one share class. Shares are bought and sold at closing net asset value per share (NAV), which is the price for all outstanding shares of a fund. Each share has a par value of 1/1,000 of a cent, and the funds’ Board of Trustees (the Board) may authorize the issuance of as many shares as necessary.
Each fund maintains its own account for purposes of holding assets and accounting, and is considered a separate entity for tax purposes. Within its account, each fund may also keep certain assets in segregated accounts, as required by securities law.
2. Significant Accounting Policies:
The following is a summary of the significant accounting policies the funds use in their preparation of financial statements. The funds follow the investment company accounting and reporting guidance of the Financial Accounting Standards Board (FASB) Accounting Standard CodificationTopic 946 Financial Services — Investment Companies. The accounting policies are in conformity with accounting principles generally accepted in the United States of America (GAAP).
The funds may invest in certain other investment companies (underlying funds). For specific investments in underlying funds, please refer to the complete schedule of portfolio holdings on Form N-CSR(S) for this reporting period, which is filed with the U.S. Securities and Exchange Commission (SEC). For more information about the underlying funds’ operations and policies, please refer to those funds’ semiannual and annual reports, which are filed with the SEC and are available on the SEC’s website at www.sec.gov.
(a) Security Valuation:
Under procedures approved by the Board, the investment adviser has formed a Pricing Committee to administer the pricing and valuation of portfolio securities and other assets and to ensure that prices used for internal purposes or provided by third parties reasonably reflect fair market value. Among other things, these procedures allow the funds to utilize independent pricing services, quotations from securities and financial instrument dealers and other market sources to determine fair value.
Schwab Fundamental Index Funds | Annual Report
Schwab Fundamental Index Funds
Financial Notes(continued)
2. Significant Accounting Policies (continued):
The funds value the securities in their portfolios every business day. The funds use the following policies to value various types of securities:
• Securities traded on an exchange or over-the-counter:Traded securities are valued at the closing value for the day, or, on days when no closing value has been reported, at the mean of the most recent bid and ask quotes. Securities that are primarily traded on foreign exchanges are valued at the official closing price or the last sales price on the exchange where the securities are principally traded with these values then translated into U.S. dollars at the current exchange rate, unless these securities are fair valued as discussed below.
• Securities for which no quoted value is available:The Board has adopted procedures to fair value each fund’s securities when market prices are not “readily available” or are unreliable. For example, a fund may fair value a security when it is de-listed or its trading is halted or suspended; when a security’s primary pricing source is unable or unwilling to provide a price; or when a security’s primary trading market is closed during regular market hours. Each fund makes fair value determinations in good faith in accordance with the fund’s valuation procedures. The Pricing Committee considers a number of factors, including unobservable market inputs when arriving at fair value. The Pricing Committee may employ techniques such as the review of related or comparable assets or liabilities, related market activities, recent transactions, market multiples, book values, transactional back-testing, disposition analysis and other relevant information. The Pricing Committee regularly reviews these inputs and assumptions to calibrate the valuations. Due to the subjective and variable nature of fair value pricing, there can be no assurance that a fund could obtain the fair value assigned to the security upon the sale of such security. The Board convenes on a regular basis to review fair value determinations made by the funds pursuant to the valuation procedures.
• Foreign equity security fair valuation:The Board has adopted procedures to fair value foreign equity securities that are traded in markets that close prior to the funds valuing their holdings. By fair valuing securities whose prices may have been affected by events occurring after the close of trading, each fund seeks to establish prices that investors might expect to realize upon the current sales of these securities. This methodology is designed to deter “arbitrage” market timers, who seek to exploit delays between the change in the value of a fund’s portfolio holdings and the NAV of the fund’s shares, and seeks to help ensure that the prices at which the fund’s shares are purchased and redeemed are fair and do not result in dilution of shareholder interest or other harm to shareholders. When fair value pricing is used at the open or close of a reporting period, it may cause a temporary divergence between the return of a fund and that of its comparative index or benchmark. The Board regularly reviews fair value determinations made by the funds pursuant to these procedures.
• Futures contracts:Futures contracts are valued at their settlement prices as of the close of their exchanges.
• Underlying funds:Mutual funds are valued at their respective NAVs.
• Cash management sweep time deposits: Balances held in cash management sweep time deposits are accounted for on a cost basis, which approximates market value.
In accordance with the authoritative guidance on fair value measurements and disclosures under GAAP, the funds disclose the fair value of their investments in a hierarchy that prioritizes the significant inputs to valuation techniques used to measure the fair value. The hierarchy gives the highest priority to valuations based upon unadjusted quoted prices in active markets for identical assets or liabilities (Level 1 measurements) and the lowest priority to valuations based upon unobservable inputs that are significant to the valuation (Level 3 measurements). If inputs used to measure the financial instruments fall within different levels of the hierarchy, the categorization is based on the lowest level input that is significant to the valuation. If the funds determine that either the volume and/or level of activity for an asset or liability has significantly decreased (from normal conditions for that asset or liability) or price quotations or observable inputs are not associated with orderly transactions, increased analysis and management judgment will be required to estimate fair value.
The three levels of the fair value hierarchy are as follows:
• Level 1—quoted prices in active markets for identical securities—Investments whose values are based on quoted market prices in active markets, and whose values are therefore classified as Level 1 prices, include active listed equities and futures contracts. Investments in mutual funds are valued daily at their NAVs, which are classified as Level 1 prices, without consideration to the classification level of the specific investments held by an underlying fund.
• Level 2—other significant observable inputs (including quoted prices for similar securities, interest rates, prepayment speeds, credit risk, etc.)—Investments that trade in markets that are not considered to be active, but whose values are based on quoted market prices, dealer quotations or valuations provided by alternative pricing sources supported by observable inputs are classified as Level 2 prices. These generally include U.S. government and sovereign obligations, most government agency securities, investment-grade corporate bonds, certain mortgage products, less liquid listed equities, and state, municipal and
Schwab Fundamental Index Funds | Annual Report
Schwab Fundamental Index Funds
Financial Notes(continued)
2. Significant Accounting Policies (continued):
provincial obligations. In addition, international securities whose markets close hours before the funds value their holdings may require fair valuations due to significant movement in the U.S. markets occurring after the daily close of the foreign markets. The Board has approved a vendor that calculates fair valuations of international equity securities based on a number of factors that appear to correlate to the movements in the U.S. markets.
• Level 3—significant unobservable inputs (including the funds’ own assumptions in determining the fair value of investments)—Investments whose values are classified as Level 3 prices have significant unobservable inputs, as they may trade infrequently or not at all. When observable prices are not available for these securities, the funds use one or more valuation techniques for which sufficient and reliable data is available. The inputs used by the funds in estimating the value of Level 3 prices may include the original transaction price, quoted prices for similar securities or assets in active markets, completed or pending third-party transactions in the underlying investment or comparable issuers, and changes in financial ratios or cash flows. Level 3 prices may also be adjusted to reflect illiquidity and/or non-transferability, with the amount of such discount estimated by the funds in the absence of market information. Assumptions used by the funds due to the lack of observable inputs may significantly impact the resulting fair value and therefore the funds’ results of operations.
The inputs or methodology used for valuing securities are not necessarily an indication of the risk associated with investing in those securities.
The levels associated with valuing the funds’ investments as of October 31, 2019 are disclosed in the Condensed Portfolio Holdings.
(b) Accounting Policies for certain Portfolio Investments (if held):
Futures Contracts: Futures contracts are instruments that represent an agreement between two parties that obligates one party to buy, and the other party to sell, specific instruments at an agreed upon price on a stipulated future date. A fund must give the broker a deposit of cash and/or securities (initial margin) whenever it enters into a futures contract. The amount of the deposit may vary from one contract to another. Subsequent payments (variation margin) are made or received by a fund depending on the daily fluctuations in the value of the futures contract and are accounted for as unrealized appreciation or depreciation until the contract is closed, at which time the gains or losses are realized. Futures contracts are traded publicly on exchanges, and their market value may change daily.
Securities Lending: Under the trust’s Securities Lending Program, a fund (lender) may make short-term loans of its securities to another party (borrower) to generate additional revenue for the fund. The borrower pledges collateral in the form of cash, securities issued or fully guaranteed by the U.S. government or foreign governments, or letters of credit issued by a bank. Collateral at the individual loan level is required to be maintained on a daily marked-to-market basis in an amount at least equal to the current value of the securities loaned. The lending agent provides a fund with indemnification against borrower default (the borrower fails to return the security on loan) reducing the risk of loss as a result of default. The cash collateral of securities loaned is currently invested in money market portfolios operating under Rule 2a-7 of the 1940 Act. Each fund bears the risk of loss with respect to the investment of cash collateral. The terms of the securities lending agreement allow the funds or the lending agent to terminate any loan at any given time and the securities must be returned within the earlier of the standard trade settlement period or the specified time period under the relevant securities lending agreement. Securities lending income, as disclosed in each fund’s Statement of Operations, if applicable, represents the income earned from the investment of the cash collateral plus any fees paid by borrowers, less the fees paid to the lending agent and broker rebates which are subject to adjustments pursuant to the securities lending agreement. On loans not collateralized by cash, a fee is received from the borrower, and is allocated between a fund and the lending agent. The aggregate market value of securities loaned will not at any time exceed one-third of the total assets of a fund, including collateral received from the loan. Securities lending fees paid to the unaffiliated lending agents start at 10% of gross lending revenue, with subsequent breakpoints to a low of 7.5%. In this context, the gross lending revenue equals the income received from the investment of cash collateral and fees paid by borrowers less any rebates paid to the borrowers. Any expenses charged by the cash collateral fund are in addition to these fees. All remaining revenue is retained by the fund, as applicable. No portion of lending revenue is paid to or retained by Charles Schwab Investment Management, Inc. (CSIM or the investment adviser) or any affiliate of CSIM.
As of October 31, 2019, the funds had securities on loan, all of which were classified as common stocks. The value of the securities on loan and the related collateral as of October 31, 2019, if any, are disclosed in each fund’s Condensed Portfolio Holdings. The value of the securities on loan and the investment of cash collateral are also disclosed in each fund’s Statement of Assets and Liabilities.
Cash Management Transactions: The funds may subscribe to the Brown Brothers Harriman & Co. (BBH) Cash Management Service Sweep (CMS Sweep). The BBH CMS Sweep is an investment product that automatically sweeps the funds’ cash balances into overnight offshore time deposits with either the BBH Grand Cayman branch or a branch of a pre-approved commercial bank. This fully automated program allows the funds to earn interest on cash balances. Excess cash invested with deposit institutions
Schwab Fundamental Index Funds | Annual Report
Schwab Fundamental Index Funds
Financial Notes(continued)
2. Significant Accounting Policies (continued):
domiciled outside of the U.S., as with any offshore deposit, may be subject to sovereign actions in the jurisdiction of the deposit institution including, but not limited to, freeze, seizure or diminution. The funds bear the risk associated with the repayment of principal and payment of interest on such instruments by the institution with which the deposit is ultimately placed.
(c) Security Transactions:
Security transactions are recorded as of the date the order to buy or sell the security is executed. Realized gains and losses from security transactions are based on the identified costs of the securities involved.
Assets and liabilities denominated in foreign currencies are reported in U.S. dollars. For assets and liabilities held on a given date, the dollar value is based on market exchange rates in effect on that date. Transactions involving foreign currencies, including purchases, sales, income receipts and expense payments, are calculated using exchange rates in effect on the transaction date. Realized foreign exchange gains or losses arise from sales of foreign currencies, currency gains or losses realized between the trade and settlement dates on securities transactions and the differences between the recorded amounts of dividends, interest, and foreign withholding taxes and the U.S. dollar equivalent of the amounts actually received or paid. Net unrealized foreign exchange appreciation or depreciation arises from changes in foreign exchange rates on foreign denominated assets and liabilities other than investments in securities held at the end of the reporting period. These realized and unrealized foreign exchange gains or losses are reported in foreign currency transactions or translations in the Statement of Operations. The funds do not isolate the portion of the fluctuations on investments resulting from changes in foreign currency exchange rates from the fluctuations in market prices of investments held. Such fluctuations are included with the net realized and unrealized gain or loss from investments.
Gains realized by the funds on the sale of securities in certain foreign countries may be subject to non-U.S. taxes. In those instances, the funds record a liability based on unrealized appreciation to provide for potential non-U.S. taxes payable upon the sale of these securities.
When a fund closes out a futures contract position, it calculates the difference between the value of the position at the beginning and at the end of the contract, and records a realized gain or loss accordingly.
(d) Investment Income:
Interest income is recorded as it accrues. Dividends, in the form of cash or non-cash income such as in the form of additional securities, and distributions from portfolio securities and underlying funds are recorded on the date they are effective (the ex-dividend date), although the funds record certain foreign security dividends on the day they learn of the ex-dividend date. Any distributions from underlying funds are recorded in accordance with the character of the distributions as designated by the underlying funds.
Income received from foreign sources may result in withholding tax. Withholding taxes are accrued at the same time as the related income if the tax rate is fixed and known, unless a tax withheld is reclaimable from the local tax authorities in which case it is recorded as receivable. If the tax rate is not known or estimable, such expense or reclaim receivable is recorded when the net proceeds are received.
The Schwab Fundamental International Large Company Index Fund filed claims to recover taxes previously withheld in certain European Union countries on the basis that those countries had purportedly violated certain provisions in the Treaty on the Functioning of the European Union. These filings are subject to various administrative and judicial proceedings within these countries, and all professional fees associated with these filings have been paid by the investment adviser.
(e) Expenses:
Pursuant to an Amended and Restated Investment Advisory and Administration Agreement (Advisory Agreement) between CSIM and the trust, CSIM pays the operating expenses of each fund, excluding acquired fund fees and expenses, taxes, any brokerage expenses, and extraordinary or non-routine expenses. Taxes, any brokerage expenses and extraordinary or non-routine expenses that are specific to a fund are charged directly to the fund.
(f) Distributions to Shareholders:
The funds make distributions from net investment income and net realized capital gains, if any, once a year.
(g) Accounting Estimates:
The accounting policies described in this report conform to GAAP. Notwithstanding this, shareholders should understand that in order to follow these principles, fund management has to make estimates and assumptions that affect the information reported in the financial statements. It’s possible that once the results are known, they may turn out to be different from these estimates and these differences may be material.
Schwab Fundamental Index Funds | Annual Report
Schwab Fundamental Index Funds
Financial Notes(continued)
2. Significant Accounting Policies (continued):
(h) Federal Income Taxes:
The funds intend to meet federal income and excise tax requirements for regulated investment companies under subchapter M of the Internal Revenue Code, as amended. Accordingly, the funds distribute substantially all of their net investment income and net realized capital gains, if any, to their respective shareholders each year. As long as a fund meets the tax requirements, it is not required to pay federal income tax.
(i) Foreign Taxes:
The funds may be subject to foreign taxes (a portion of which may be reclaimable) on income, corporate events, foreign currency exchanges and capital gains on investments. All foreign taxes are recorded in accordance with the applicable foreign tax regulations and rates that exist in foreign markets in which the funds invest. These foreign taxes, if any, are paid by the funds and are disclosed in the Statement of Operations. Foreign taxes payable as of October 31, 2019, if any, are reflected in each fund’s Statement of Assets and Liabilities.
(j) Indemnification:
Under the funds’ organizational documents, the officers and trustees are indemnified against certain liabilities arising out of the performance of their duties to the funds. In addition, in the normal course of business the funds enter into contracts with their vendors and others that provide general indemnifications. The funds’ maximum exposure under these arrangements is unknown as this would involve future claims that may be made against the funds. However, based on experience, the funds expect the risk of loss attributable to these arrangements to be remote.
(k) Recent Accounting Standards:
In August 2018, the FASB issued Accounting Standards Update “Fair Value Measurement (Topic 820)” (ASU 2018-13) which modifies the disclosure requirements for fair value measurement by removing, modifying, or adding certain disclosures. The amendments are effective for annual periods beginning after December 15, 2019, and interim periods within those annual periods. The funds are permitted to early adopt any removed or modified disclosures upon issuance of this update and delay adoption of the additional disclosures until their effective date. The funds have early adopted certain removed or modified disclosures, including the amount of and reasons for transfers between Level 1 and Level 2 of the fair value hierarchy and the policy for timing of transfers between levels upon issuance of ASU 2018-13, and have delayed adoption of the additional disclosures until their effective date. At this time, management is currently evaluating the impact that the adoption of the additional disclosures will have on the funds’ financial statements.
3. Risk Factors:
Investing in the funds may involve certain risks, as discussed in the funds’ prospectus, including, but not limited to, those described below. Any of these risks could cause an investor to lose money.
Market Risk. Financial markets rise and fall in response to a variety of factors, sometimes rapidly and unpredictably. As with any investment whose performance is tied to these markets, the value of an investment in a fund will fluctuate, which means that an investor could lose money over short or long periods.
Equity Risk. The prices of equity securities rise and fall daily. These price movements may result from factors affecting individual companies, industries or the securities market as a whole. In addition, equity markets tend to move in cycles, which may cause stock prices to fall over short or extended periods of time.
Tracking Error Risk. As an index fund, each fund seeks to track the performance of its respective index, although it may not be successful in doing so. The divergence between the performance of a fund and its index, positive or negative, is called “tracking error.” Tracking error can be caused by many factors and it may be significant.
Investment Style Risk. The funds are index funds. Therefore, each fund follows the securities included in its respective index during upturns as well as downturns. Because of its indexing strategy, a fund does not take steps to reduce market exposure or to lessen the effects of a declining market. In addition, because of a fund’s expenses, the fund’s performance may be below that of its respective index.
Sampling Index Tracking Risk. To the extent a fund uses a sampling method, the fund may not fully replicate its respective index and may hold securities not included in the index. As a result, the fund is subject to the risk that the investment adviser’s investment management strategy, the implementation of which is subject to a number of constraints, may not produce the intended results. If a fund utilizes a sampling approach, it may not track the return of the index as well as it would if the fund purchased all of the securities in the index.
Schwab Fundamental Index Funds | Annual Report
Schwab Fundamental Index Funds
Financial Notes(continued)
3. Risk Factors (continued):
Concentration Risk. To the extent that a fund’s or its respective index’s portfolio is concentrated in the securities of issuers in a particular market, industry, group of industries, sector, country or asset class, the fund may be adversely affected by the performance of those securities, may be subject to increased price volatility and may be more vulnerable to adverse economic, market, political or regulatory occurrences affecting that market, industry, group of industries, sector, country or asset class.
Market Capitalization Risk.Securities issued by companies of different market capitalizations tend to go in and out of favor based on market and economic conditions. During a period when securities of a particular market capitalization fall behind other types of investments, a fund’s performance could be impacted.
Large-Cap Company Risk. Large-cap companies are generally more mature and the securities issued by these companies may not be able to reach the same levels of growth as the securities issued by small- or mid-cap companies.
Small-Cap Company Risk. Securities issued by small-cap companies may be riskier than those issued by larger companies, and their prices may move sharply, especially during market upturns and downturns.
Foreign Investment Risk. A fund’s investments in securities of foreign issuers involve certain risks that may be greater than those associated with investments in securities of U.S. issuers. These include risks of adverse changes in foreign economic, political, regulatory and other conditions; changes in currency exchange rates or exchange control regulations (including limitations on currency movements and exchanges); the imposition of economic sanctions or other government restrictions; differing accounting, auditing, financial reporting and legal standards and practices; differing securities market structures; and higher transaction costs. These risks may negatively impact the value or liquidity of a fund’s investments, and could impair the fund’s ability to meet its investment objective or invest in accordance with its investment strategy. There is a risk that investments in securities denominated in, and/or receiving revenues in, foreign currencies will decline in value relative to the U.S. dollar. Foreign securities may also include American Depositary Receipts (ADRs), Global Depositary Receipts (GDRs) and European Depositary Receipts (EDRs), which may be less liquid than the underlying shares in their primary trading market and GDRs, many of which are issued by companies in emerging markets, may be more volatile. To the extent a fund’s investments in a single country or a limited number of countries represent a large percentage of the fund’s assets, the fund’s performance may be adversely affected by the economic, political, regulatory and social conditions in those countries, and the fund’s price may be more volatile than the price of a fund that is geographically diversified.
Emerging Markets Risk. Emerging market countries may be more likely to experience political turmoil or rapid changes in market or economic conditions than more developed countries. Emerging market countries often have less uniformity in accounting and reporting requirements and greater risk associated with the custody of securities. In addition, the financial stability of issuers (including governments) in emerging market countries may be more precarious than in developed countries. As a result, there may be an increased risk of illiquidity and price volatility associated with a fund’s investments in emerging market countries, which may be magnified by currency fluctuations relative to the U.S. dollar, and, at times, it may be difficult to value such investments.
ETF Risk. Certain funds may purchase shares of ETFs to gain exposure to a particular portion of the market while awaiting an opportunity to purchase securities directly. When a fund invests in an ETF, in addition to directly bearing the expenses associated with its own operations, it will bear a proportionate share of the ETF’s expenses. Therefore, it may be more costly to own an ETF than to own the underlying securities directly. In addition, while the risks of owning shares of an ETF generally reflect the risks of owning the underlying securities the ETF holds, lack of liquidity in the market for an ETF’s shares can result in its value being more volatile than the underlying portfolio securities.
Derivatives Risk. Each fund may use derivatives to enhance returns or hedge against market declines. Examples of derivatives are options, futures, options on futures and swaps. An option is the right to buy or sell an instrument at a specific price before a specific date. A future is an agreement to buy or sell a financial instrument at a specific price on a specific day. A swap is an agreement whereby two parties agree to exchange payment streams calculated in relation to a rate, index, instrument or certain securities and a predetermined amount. A fund’s use of derivatives that are subject to regulation by the Commodity Futures Trading Commission (CFTC) could cause the fund to become a commodity pool, which would require the fund to comply with certain CFTC rules.
A fund’s use of derivative instruments involves risks different from, or possibly greater than, the risks associated with investing directly in securities and other traditional investments. Certain of these risks, such as liquidity risk and market risk, are discussed elsewhere. A fund’s use of derivatives is also subject to lack of availability risk, credit risk, leverage risk, valuation risk, correlation risk and tax risk. Lack of availability risk is the risk that suitable derivative transactions may not be available in all circumstances for risk management or other purposes. Credit risk is the risk that the counterparty to a derivatives transaction may not fulfill its obligations. Leverage risk is the risk that a small percentage of assets invested in derivatives can have a disproportionately large impact on the fund. Valuation risk is the risk that a particular derivative may be valued incorrectly. Correlation risk is the risk that changes in the value of the derivative may not correlate perfectly with the underlying asset, rate or index. Tax risk is the risk that the use of derivatives may cause the fund to realize higher amounts of short-term capital gains. A fund’s use of derivatives could reduce the fund’s performance, increase the fund’s volatility, and could cause the fund to lose more than the initial amount invested.
Schwab Fundamental Index Funds | Annual Report
Schwab Fundamental Index Funds
Financial Notes(continued)
3. Risk Factors (continued):
Liquidity Risk. A fund may be unable to sell certain securities, such as illiquid securities, readily at a favorable time or price, or the fund may have to sell them at a loss.
Securities Lending Risk. Securities lending involves the risk of loss of rights in, or delay in recovery of, the loaned securities if the borrower fails to return the security loaned or becomes insolvent.
Please refer to the funds’ prospectus for a more complete description of the principal risks of investing in the funds.
4. Affiliates and Affiliated Transactions:
Investment Adviser
CSIM, a wholly owned subsidiary of The Charles Schwab Corporation, serves as each fund’s investment adviser and administrator pursuant to an Advisory Agreement between CSIM and the trust.
For its advisory and administrative services to the funds, CSIM is entitled to receive an annual fee, payable monthly, based on a percentage of each fund’s average daily net assets as follows:
Schwab
Fundamental
US Large
Company
Index Fund | Schwab
Fundamental
US Small
Company
Index Fund | Schwab
Fundamental
International
Large Company
Index Fund | Schwab
Fundamental
International
Small Company
Index Fund | Schwab
Fundamental
Emerging
Markets
Large Company
Index Fund |
| 0.25% | 0.25% | 0.25% | 0.39% | 0.39% |
CSIM has a licensing agreement with the Frank Russell Company to use certain Russell indices and trademarks in connection with the offering and operation of certain registered investment companies. The funds have entered into a sub-license agreement with CSIM pursuant to which CSIM has agreed to sub-license certain Russell indices and trademarks to the funds. CSIM pays all applicable licensing fees.
Investments from Affiliates
Certain funds in the Fund Complex (for definition refer to Trustees and Officers section) may own shares of other funds in the Fund Complex. The table below reflects the percentages of shares of each fund in this report that are owned by other funds in the Fund Complex as of October 31, 2019, as applicable:
| | Underlying Funds |
| | Schwab
Fundamental
US Large
Company
Index Fund | Schwab
Fundamental
US Small
Company
Index Fund | Schwab
Fundamental
International Large
Company
Index Fund | Schwab
Fundamental
International Small
Company
Index Fund | Schwab
Fundamental
Emerging Markets
Large
Company
Index Fund |
| Schwab MarketTrack All Equity Portfolio | 1.8% | 2.7% | 3.0% | 4.5% | 5.1% |
| Schwab MarketTrack Balanced Portfolio | 1.0% | 1.3% | 1.2% | 1.8% | 2.1% |
| Schwab MarketTrack Conservative Portfolio | 0.3% | 0.4% | 0.4% | 0.5% | 0.7% |
| Schwab MarketTrack Growth Portfolio | 1.9% | 2.6% | 2.5% | 3.5% | 4.2% |
Other Affiliated Transactions
The professional fees related to foreign withholding tax claims discussed in financial note 2 were non-routine expenses. The investment adviser agreed to pay these professional fees for this reporting period, subject to reimbursement by the Schwab Fundamental International Large Company Index Fund to the extent the fund is able to successfully recover taxes withheld in the future.
As of October 31, 2019, the balance of professional fees related to foreign withholding tax subject to future reimbursement by the fund to the investment adviser was $56,005 for Schwab Fundamental International Large Company Index Fund.
No other amounts for additional tax reclaims are reflected in the financial statements due to the uncertainty surrounding the ultimate resolution of proceedings, the likelihood of receipt of these claims, and the potential timing of payment.
Schwab Fundamental Index Funds | Annual Report
Schwab Fundamental Index Funds
Financial Notes(continued)
4. Affiliates and Affiliated Transactions (continued):
Interfund Borrowing and Lending
Pursuant to an exemptive order issued by the SEC, the funds may enter into interfund borrowing and lending transactions with other funds in the Fund Complex. All loans are for temporary or emergency purposes and the interest rate to be charged will be the average of the overnight repurchase agreement rate and the short-term bank loan rate. All loans are subject to numerous conditions designed to ensure fair and equitable treatment of all participating funds. The interfund lending facility is subject to the oversight and periodic review by the Board. The funds had no interfund borrowing or lending activity during the period.
Interfund Transactions
The funds may engage in transactions with certain other funds in the Fund Complex when permitted by applicable law. When one fund is seeking to sell a security that another is seeking to buy, an interfund transaction can allow both funds to benefit by reducing transaction costs. This practice is limited to funds that share the same investment adviser, trustees and/or officers. For the period ended October 31, 2019, each fund’s total aggregate security transactions with other funds in the Fund Complex as well as any realized gains (losses) were as follows:
| | Total Aggregate Transactions | Realized Gains (Losses) |
| Schwab Fundamental US Large Company Index Fund | $505,987,175 | $39,950,222 |
| Schwab Fundamental US Small Company Index Fund | 285,613,994 | 42,042,658 |
| Schwab Fundamental International Large Company Index Fund | 149,724,060 | (2,249,116) |
| Schwab Fundamental International Small Company Index Fund | 117,197,333 | 3,542,538 |
| Schwab Fundamental Emerging Markets Large Company Index Fund | 109,843,225 | 10,661,165 |
5. Board of Trustees:
The Board may include people who are officers and/or directors of CSIM or its affiliates. Federal securities law limits the percentage of such “interested persons” who may serve on a trust’s board, and the trust was in compliance with these limitations throughout the report period. The funds do not pay any interested or non-interested (independent trustees) trustees. The independent trustees are paid by CSIM. For information regarding the trustees, please refer to the Trustees and Officers table at the end of this report.
6. Borrowing from Banks:
During the period, the funds were participants with other U.S. registered investment companies managed by CSIM in a joint, syndicated, committed $750 million line of credit (the Syndicated Credit Facility), which matured on October 3, 2019. On October 3, 2019, the Syndicated Credit Facility was amended to run for a new 364 day period with the line of credit amount remaining unchanged, maturing on October 1, 2020. Under the terms of the Syndicated Credit Facility, in addition to CSIM paying the interest charged on any borrowings by a fund, CSIM paid a commitment fee of 0.15% per annum on the funds’ proportionate share of the unused portion of the Syndicated Credit Facility.
During the period, the funds were participants with other U.S. registered investment companies managed by CSIM in a joint, unsecured, uncommitted $500 million line of credit (the Uncommitted Credit Facility), with State Street Bank and Trust Company, which matured on November 30, 2018. On November 30, 2018, the Uncommitted Credit Facility was amended to run for a new 364 day period with the line of credit amount remaining unchanged, maturing on November 29, 2019. Under the terms of the Uncommitted Credit Facility, CSIM pays interest on the amount a fund borrows. There were no borrowings from either line of credit during the period.
The funds also have access to custodian overdraft facilities. A fund may have utilized the overdraft facility and incurred an interest expense, which is paid by CSIM. The interest expense is determined based on a negotiated rate above the current Federal Funds Rate.
Schwab Fundamental Index Funds | Annual Report
Schwab Fundamental Index Funds
Financial Notes(continued)
7. Derivatives:
Certain funds entered into equity index futures contracts during the report period. The funds invested in futures contracts to equitize available cash. The current value and variation margin for futures contracts held at October 31, 2019 are presented on the Condensed Portfolio Holdings and Statement of Assets and Liabilities, respectively. The net realized and change in unrealized gains (losses) on futures contracts are presented on the Statement of Operations, if any. Refer to financial note 2(b) for the funds’ accounting policies with respect to futures contracts and financial note 3 for disclosures concerning the risks of investing in futures contracts. During the period ended October 31, 2019, the month-end average notional amounts of futures contracts held by the funds and the month-end average number of contracts held were as follows:
| | Notional Amounts | Number of Contracts |
| Schwab Fundamental US Large Company Index Fund | $18,117,625 | 130 |
| Schwab Fundamental US Small Company Index Fund | 7,566,014 | 100 |
| Schwab Fundamental International Large Company Index Fund | 8,601,443 | 93 |
| Schwab Fundamental International Small Company Index Fund | 5,439,285 | 59 |
| Schwab Fundamental Emerging Markets Large Company Index Fund | 3,221,390 | 63 |
8. Purchases and Sales of Investment Securities:
For the period ended October 31, 2019, purchases and sales of securities (excluding short-term obligations) were as follows:
| | Purchases
of Securities | Sales
of Securities |
| Schwab Fundamental US Large Company Index Fund | $983,440,204 | $964,567,515 |
| Schwab Fundamental US Small Company Index Fund | 708,022,518 | 598,996,856 |
| Schwab Fundamental International Large Company Index Fund | 376,263,638 | 432,175,737 |
| Schwab Fundamental International Small Company Index Fund | 297,973,125 | 296,810,105 |
| Schwab Fundamental Emerging Markets Large Company Index Fund | 318,450,141 | 234,770,692 |
9. Federal Income Taxes:
As of October 31, 2019, the tax basis cost of the funds’ investments and gross unrealized appreciation and depreciation were as follows:
| | Schwab
Fundamental
US Large
Company
Index Fund | | Schwab
Fundamental
US Small
Company
Index Fund | | Schwab
Fundamental
International
Large
Company
Index Fund | | Schwab
Fundamental
International
Small
Company
Index Fund | | Schwab
Fundamental
Emerging
Markets Large
Company
Index Fund |
| Tax cost | $3,469,100,528 | | $1,591,299,035 | | $1,285,172,485 | | $741,621,702 | | $617,339,769 |
| Gross unrealized appreciation | $1,989,525,591 | | $485,003,612 | | $157,778,307 | | $132,896,627 | | $106,511,647 |
| Gross unrealized depreciation | (217,041,992) | | (146,319,170) | | (120,268,387) | | (90,825,847) | | (54,446,702) |
| Net unrealized appreciation (depreciation) | $1,772,483,599 | | $338,684,442 | | $37,509,920 | | $42,070,780 | | $52,064,945 |
Schwab Fundamental Index Funds | Annual Report
Schwab Fundamental Index Funds
Financial Notes(continued)
9. Federal Income Taxes (continued):
As of October 31, 2019, the components of distributable earnings on a tax basis were as follows:
| | Schwab
Fundamental
US Large
Company
Index Fund | | Schwab
Fundamental
US Small
Company
Index Fund | | Schwab
Fundamental
International
Large
Company
Index Fund | | Schwab
Fundamental
International
Small
Company
Index Fund | | Schwab
Fundamental
Emerging
Markets Large
Company
Index Fund |
| Undistributed ordinary income | $111,278,141 | | $19,581,478 | | $43,815,977 | | $19,829,119 | | $23,902,742 |
| Undistributed long-term capital gains | 145,417,580 | | 43,502,511 | | — | | — | | — |
| Net unrealized appreciation (depreciation) on investments | 1,772,483,599 | | 338,684,442 | | 37,509,920 | | 42,070,780 | | 52,064,945 |
| Net other unrealized appreciation (depreciation) | — | | — | | 20,188 | | 6,735 | | (258,248) |
| Total | $2,029,179,320 | | $401,768,431 | | $81,346,085 | | $61,906,634 | | $75,709,439 |
The primary differences between book basis and tax basis unrealized appreciation or unrealized depreciation of investments are the tax deferral of losses on wash sales, realization for tax purposes of unrealized gains (losses) on futures contracts and the realization for tax purposes of unrealized appreciation on investments in Passive Foreign Investment Companies (PFIC) and partnership investments. The tax cost of the funds’ investments, disclosed above, have been adjusted from their book amounts to reflect these unrealized appreciation or depreciation differences, as applicable.
Capital loss carryforwards may be used to offset future realized capital gains for federal income tax purposes. As of October 31, 2019, the funds had capital loss carryforwards available to offset future net capital gains as follows:
| Expiration Date | Schwab
Fundamental
US Large
Company
Index Fund | | Schwab
Fundamental
US Small
Company
Index Fund | | Schwab
Fundamental
International
Large
Company
Index Fund | | Schwab
Fundamental
International
Small
Company
Index Fund | | Schwab
Fundamental
Emerging
Markets Large
Company
Index Fund |
| No expiration | $— | | $— | | $37,978,836 | | $5,683,427 | | $53,499,403 |
| Total | $— | | $— | | $37,978,836 | | $5,683,427 | | $53,499,403 |
For the fiscal year ended October 31, 2019, the funds had capital loss carryforwards utilized as follows:
| | Schwab
Fundamental
US Large
Company
Index Fund | Schwab
Fundamental
US Small
Company
Index Fund | Schwab
Fundamental
International
Large
Company
Index Fund | Schwab
Fundamental
International
Small
Company
Index Fund | Schwab
Fundamental
Emerging
Markets Large
Company
Index Fund |
| Capital loss carryforwards utilized | $— | $— | $— | $— | $7,619,781 |
The tax basis components of distributions paid during the current and prior fiscal years were as follows:
| | Schwab
Fundamental
US Large
Company
Index Fund | Schwab
Fundamental
US Small
Company
Index Fund | Schwab
Fundamental
International
Large
Company
Index Fund | Schwab
Fundamental
International
Small
Company
Index Fund | Schwab
Fundamental
Emerging
Markets Large
Company
Index Fund |
| Current period distributions | | | | | |
| Ordinary income | $115,941,650 | $49,180,336 | $43,980,238 | $18,761,883 | $15,972,543 |
| Long-term capital gains | 268,964,966 | 107,997,280 | — | 21,383,318 | — |
| Prior period distributions | | | | | |
| Ordinary income | $121,146,529 | $35,855,525 | $37,237,239 | $22,939,959 | $13,342,949 |
| Long-term capital gains | 55,961,880 | 79,427,222 | — | 6,162,693 | — |
Schwab Fundamental Index Funds | Annual Report
Schwab Fundamental Index Funds
Financial Notes(continued)
9. Federal Income Taxes (continued):
Distributions paid to shareholders are based on net investment income and net realized gains determined on a tax basis, which may differ from net investment income and net realized gains for financial reporting purposes. These differences reflect the differing character of certain income items and net realized gains and losses for financial statement and tax purposes, and may result in reclassification among certain capital accounts on the financial statements.
Permanent book and tax basis differences may result in reclassifications between components of net assets as required. The adjustments will have no impact on net assets or the results of operations.
As of October 31, 2019, management has reviewed the tax positions for open periods (for federal purposes, three years from the date of filing and for state purposes, four years from the date of filing) as applicable to the funds, and has determined that no provision for income tax is required in the funds’ financial statements. The funds recognize interest and penalties, if any, related to unrecognized tax benefits as income tax expense in the Statement of Operations. During the fiscal year ended October 31, 2019, the funds did not incur any interest or penalties.
10. Subsequent Events:
Management has determined there are no subsequent events or transactions through the date the financial statements were issued that would have materially impacted the financial statements as presented.
Schwab Fundamental Index Funds | Annual Report
Schwab Fundamental Index Funds
Report of Independent Registered Public Accounting Firm
To the Board of Trustees of Schwab Capital Trust and Shareholders of Schwab Fundamental US Large Company Index Fund, Schwab Fundamental US Small Company Index Fund, Schwab Fundamental International Large Company Index Fund, Schwab Fundamental International Small Company Index Fund and Schwab Fundamental Emerging Markets Large Company Index Fund
Opinions on the Financial Statements
We have audited the accompanying statements of assets and liabilities, including the condensed portfolio holdings, of Schwab Fundamental US Large Company Index Fund, Schwab Fundamental US Small Company Index Fund, Schwab Fundamental International Large Company Index Fund, Schwab Fundamental International Small Company Index Fund and Schwab Fundamental Emerging Markets Large Company Index Fund (five of the funds constituting Schwab Capital Trust, hereafter collectively referred to as the “Funds”) as of October 31, 2019, the related statements of operations for the year ended October 31, 2019, the statements of changes in net assets for each of the two years in the period ended October 31, 2019, including the related notes, and the financial highlights for each of the five years in the period ended October 31, 2019 (collectively referred to as the “financial statements”). In our opinion, the financial statements present fairly, in all material respects, the financial position of each of the Funds as of October 31, 2019, the results of each of their operations for the year then ended, the changes in each of their net assets for each of the two years in the period ended October 31, 2019 and each of the financial highlights for each of the five years in the period ended October 31, 2019 in conformity with accounting principles generally accepted in the United States of America.
Basis for Opinions
These financial statements are the responsibility of the Funds’ management. Our responsibility is to express an opinion on the Funds’ financial statements based on our audits. We are a public accounting firm registered with the Public Company Accounting Oversight Board (United States) (PCAOB) and are required to be independent with respect to the Funds in accordance with the U.S. federal securities laws and the applicable rules and regulations of the Securities and Exchange Commission and the PCAOB.
We conducted our audits of these financial statements in accordance with the standards of the PCAOB. Those standards require that we plan and perform the audit to obtain reasonable assurance about whether the financial statements are free of material misstatement, whether due to error or fraud.
Our audits included performing procedures to assess the risks of material misstatement of the financial statements, whether due to error or fraud, and performing procedures that respond to those risks. Such procedures included examining, on a test basis, evidence regarding the amounts and disclosures in the financial statements. Our audits also included evaluating the accounting principles used and significant estimates made by management, as well as evaluating the overall presentation of the financial statements. Our procedures included confirmation of securities owned as of October 31, 2019 by correspondence with the custodian and brokers; when replies were not received from brokers, we performed other auditing procedures. We believe that our audits provide a reasonable basis for our opinions.
/s/ PricewaterhouseCoopers LLP
San Francisco, California
December 16, 2019
We have served as the auditor of one or more investment companies in the Schwab Funds Complex since 1989.
Schwab Fundamental Index Funds | Annual Report
Schwab Fundamental Index Funds
Other Federal Tax Information (unaudited)
The funds elect to pass through under section 853 of the Internal Revenue Code foreign tax credit to its shareholders for the fiscal year ended October 31, 2019, and the respective foreign source income on the funds as follows.
| | Foreign Tax Credit | Foreign Source Income |
| Schwab Fundamental US Large Company Index Fund | $— | $— |
| Schwab Fundamental US Small Company Index Fund | — | — |
| Schwab Fundamental International Large Company Index Fund | 5,044,069 | 52,033,773 |
| Schwab Fundamental International Small Company Index Fund | 2,288,667 | 20,782,862 |
| Schwab Fundamental Emerging Markets Large Company Index Fund | 3,892,757 | 30,696,531 |
For corporate shareholders, the following percentage of the funds’ dividend distributions paid during the fiscal year ended October 31, 2019, qualify for the corporate dividends received deduction:
| | Percentage |
| Schwab Fundamental US Large Company Index Fund | 99.12 |
| Schwab Fundamental US Small Company Index Fund | 42.43 |
| Schwab Fundamental International Large Company Index Fund | — |
| Schwab Fundamental International Small Company Index Fund | — |
| Schwab Fundamental Emerging Markets Large Company Index Fund | — |
For the fiscal year ended October 31, 2019, the funds designate the following amounts of the dividend distributions as qualified dividends for the purpose of the maximum rate under section 1(h)(11) of the Internal Revenue Code. Shareholders will be notified in January 2020 via IRS Form 1099 of the amounts for use in preparing their 2019 income tax return.
| | |
| Schwab Fundamental US Large Company Index Fund | $115,427,905 |
| Schwab Fundamental US Small Company Index Fund | 21,811,734 |
| Schwab Fundamental International Large Company Index Fund | 46,452,272 |
| Schwab Fundamental International Small Company Index Fund | 17,722,134 |
| Schwab Fundamental Emerging Markets Large Company Index Fund | 15,151,128 |
Under section 852(b)(3)(C) of the Internal Revenue Code, certain funds hereby designate the following amounts as long-term capital gain dividends for the fiscal year ended October 31, 2019:
| | |
| Schwab Fundamental US Large Company Index Fund | $268,964,966 |
| Schwab Fundamental US Small Company Index Fund | 107,997,280 |
| Schwab Fundamental International Large Company Index Fund | — |
| Schwab Fundamental International Small Company Index Fund | 21,383,318 |
| Schwab Fundamental Emerging Markets Large Company Index Fund | — |
Schwab Fundamental Index Funds | Annual Report
Schwab Fundamental Index Funds
Investment Advisory Agreement Approval
The Investment Company Act of 1940, as amended, requires that the continuation of a fund’s investment advisory agreement must be specifically approved (1) by the vote of the trustees or by a vote of the shareholders of the fund, and (2) by the vote of a majority of the trustees who are not parties to the investment advisory agreement or “interested persons” of any party (the Independent Trustees), cast in person at a meeting called for the purpose of voting on such approval. In connection with such approvals, the fund’s trustees must request and evaluate, and the investment adviser is required to furnish, such information as may be reasonably necessary to evaluate the terms of the investment advisory agreement.
The Board of Trustees (the Board or the Trustees, as appropriate) calls and holds one or more meetings each year that are dedicated, in whole or in part, to considering whether to renew the investment advisory and administration agreement (the Agreement) between Schwab Capital Trust (the Trust) and Charles Schwab Investment Management, Inc. (CSIM) with respect to the existing funds in the Trust, including Schwab Fundamental US Large Company Index Fund, Schwab Fundamental US Small Company Index Fund, Schwab Fundamental International Large Company Index Fund, Schwab Fundamental International Small Company Index Fund and Schwab Fundamental Emerging Markets Large Company Index Fund (each, a Fund and collectively, the Funds), and to review certain other agreements pursuant to which CSIM provides investment advisory services to certain other registered investment companies. In preparation for the meeting(s), the Board requests and reviews a wide variety of materials provided by CSIM, including information about CSIM’s affiliates, personnel, business goals and priorities, profitability, third-party oversight, corporate structure and operations. As part of the renewal process, the Independent Trustees’ legal counsel sends an information request letter to CSIM seeking certain relevant information. The responses by CSIM are provided to the Trustees for their review prior to their meeting, and the Trustees are provided with the opportunity to request any additional materials. The Board also receives data provided by an independent provider of investment company data. This information is in addition to the detailed information about the Funds that the Board reviews during the course of each year, including information that relates to the Funds’ operations and performance, legal and compliance matters, risk management, portfolio turnover, and sales and marketing activity. The Independent Trustees receive advice from Independent Trustees’ legal counsel, including a memorandum regarding the responsibilities of trustees for the approval of investment advisory agreements. In addition, the Independent Trustees meet in executive session outside the presence of Fund management and participate in question and answer sessions with representatives of CSIM.
The Board, including a majority of the Independent Trustees, considered information specifically relating to the continuance of the Agreement with respect to the Funds at meetings held on May 13, 2019 and June 4, 2019, and approved the renewal of the Agreement with respect to the Funds for an additional one-year term at the June 4, 2019 in person meeting called for the purpose of voting on such approval.
The Board’s approval of the continuance of the Agreement with respect to the Funds was based on consideration and evaluation of a variety of specific factors discussed at these meetings and at prior meetings, including:
| 1. | the nature, extent and quality of the services provided to the Funds under the Agreement, including the resources of CSIM and its affiliates dedicated to the Funds; |
| 2. | each Fund’s investment performance and how it compared to that of certain other comparable mutual funds and benchmark data; |
| 3. | each Fund’s expenses and how those expenses compared to those of certain other similar mutual funds; |
| 4. | the profitability of CSIM and its affiliates, including Charles Schwab & Co., Inc. (Schwab), with respect to each Fund, including both direct and indirect benefits accruing to CSIM and its affiliates; and |
| 5. | the extent to which economies of scale would be realized as the Funds grow and whether fee levels in the Agreement reflect those economies of scale for the benefit of Fund investors. |
Nature, Extent and Quality of Services. The Board considered the nature, extent and quality of the services provided by CSIM to the Funds and the resources of CSIM and its affiliates dedicated to the Funds. In this regard, the Trustees evaluated, among other things, CSIM’s experience, track record, compliance program, resources dedicated to hiring and retaining skilled personnel and specialized talent, and information security resources. The Trustees also considered information provided by CSIM relating to services and support provided with respect to the Funds’ portfolio management team, portfolio strategy, and internal investment guidelines, as well as trading infrastructure, liquidity management, product design and analysis, shareholder communications, securities valuation, fund accounting and custody, and vendor and risk oversight. The Trustees also considered investments CSIM has made in its infrastructure, including modernizing CSIM’s technology and use of data, increasing expertise in key areas (including portfolio management and trade operations), and improving business continuity, cybersecurity, due diligence, risk management processes, and information security programs, which are designed to provide enhanced services to the Funds and their shareholders. The Trustees also considered that
Schwab Fundamental Index Funds | Annual Report
Schwab Fundamental Index Funds
many of the Funds’ shareholders are also brokerage clients of Schwab and considered Schwab’s wide range of products, services, and channel alternatives such as investment research tools and an array of account features that benefit the Funds and shareholders who are brokerage clients of Schwab. Finally, the Trustees also considered Schwab’s reputation as a full service brokerage firm and its overall financial condition. Following such evaluation, the Board concluded, within the context of its full deliberations, that the nature, extent and quality of services provided by CSIM to the Funds and the resources of CSIM and its affiliates dedicated to the Funds supported renewal of the Agreement with respect to the Funds.
Fund Performance. The Board considered the Funds’ performance in determining whether to renew the Agreement with respect to the Funds. Specifically, the Trustees considered each Fund’s performance relative to a peer category of other mutual funds and applicable indices/benchmarks, in light of total return, yield, if applicable, and market trends, as well as in consideration of each Fund’s investment style and strategy attributes and disclosures. As part of this review, the Trustees considered the composition of the peer category, selection criteria and the reputation of the independent provider of investment company data who prepared the peer category analysis. In evaluating the performance of each Fund, the Trustees considered the risk profile for such Fund and each Fund’s demonstrated performance in tracking its benchmark index. The Trustees further considered the level of Fund performance in the context of their review of Fund expenses and adviser profitability discussed below and also noted that performance is reviewed throughout the year by a designated committee of the Board and by the Board. Following such evaluation, the Board concluded, within the context of its full deliberations, that the performance of the Funds supported renewal of the Agreement with respect to the Funds.
Fund Expenses. With respect to the Funds’ expenses, the Trustees considered the rate of compensation called for by the Agreement, and each Fund’s net operating expense ratio, in each case, in comparison to those of other similar mutual funds, such peer groups and comparisons having been selected and calculated by an independent provider of investment company data. CSIM reported to the Board, and the Board took into account, the risk assumed by CSIM in the development of products and provision of services as well as the competitive marketplace for financial products. The Trustees also considered fees charged by CSIM to other mutual funds and to other types of accounts, but, with respect to such other types of accounts, accorded less weight to such comparisons due to the different legal, regulatory, compliance and operating features of mutual funds as compared to these other types of accounts, and any differences in the nature and scope of the services CSIM provides to these other accounts, as well as differences in the market for these types of accounts. Following such evaluation, the Board concluded, within the context of its full deliberations, that the expenses of
the Funds are reasonable and supported renewal of the Agreement with respect to the Funds.
Profitability. The Trustees considered the compensation flowing to CSIM and its affiliates, directly or indirectly and reviewed profitability on a pre-tax basis, without regard to distribution expenses. In this connection, the Trustees reviewed management’s profitability analyses. The Trustees also reviewed profitability of CSIM relating to the Schwab fund complex as a whole, noting the benefit to Fund shareholders of being part of the Schwab fund complex, including the allocations of certain fixed costs across other funds in the complex. The Trustees also considered any other benefits derived by CSIM from its relationship with the Funds, such as whether, by virtue of its management of the Funds, CSIM obtains investment information or other research resources that aid it in providing advisory services to other clients. The Trustees considered whether the varied levels of compensation and profitability with respect to the Funds under the Agreement and other service agreements were reasonable and justified in light of the quality of all services rendered to each Fund by CSIM and its affiliates. The Trustees noted that CSIM continues to invest substantial sums in its business in order to provide enhanced research capabilities, services, and systems to benefit the Funds. Based on this evaluation, the Board concluded, within the context of its full deliberations, that the profitability of CSIM is reasonable and supported renewal of the Agreement with respect to the Funds.
Economies of Scale. Although the Trustees recognized the difficulty of determining economies of scale with precision, the Trustees considered the potential existence of any economies of scale and whether those are passed along to a Funds’ shareholders by way of the relatively low advisory fee and unitary fee structure of the Funds through (i) the enhancement of services provided to the Funds in return for fees paid, including through investments by CSIM in CSIM’s infrastructure, including modernizing CSIM’s technology and use of data, increasing expertise and capabilities in key areas (including portfolio and trade operations), and improving business continuity, cybersecurity, due diligence, and information security programs, which are designed to provide enhanced services to the Funds and their shareholders; (ii) graduated investment advisory fee schedules, fee waivers, or expense caps by CSIM and its affiliates for those funds in the Schwab Funds complex with such features; and (iii) pricing a fund to scale and keeping overall expenses down as the fund grows. The Trustees acknowledged that CSIM has shared any economies of scale with the Funds by investing in CSIM’s infrastructure, as discussed above, over time and that CSIM’s internal costs of providing investment management, technology, administrative, legal and compliance services to the Funds continues to increase as a result of regulatory or other developments. The Trustees considered that CSIM and its affiliates may employ contractual expense caps to protect shareholders from high fees when fund assets are relatively small, for example, in the case of newer funds or funds with
Schwab Fundamental Index Funds | Annual Report
Schwab Fundamental Index Funds
investment strategies that are from time to time out of favor, because, among other reasons, shareholders may benefit from the continued availability of such funds at subsidized expense levels. Based on this evaluation, the Board concluded, within the context of its full deliberations, that the Funds obtain reasonable benefits from economies of scale.
In the course of their deliberations, the Trustees may have accorded different weights to various factors and did not identify any particular information or factor that was all
important or controlling. Based on the Trustees’ deliberation and their evaluation of the information described above, the Board, including all of the Independent Trustees, approved the continuation of the Agreement with respect to the Funds and concluded that the compensation under the Agreement with respect to the Funds is fair and reasonable in light of such services and expenses and such other matters as the Trustees have considered to be relevant in the exercise of their reasonable judgment.
Schwab Fundamental Index Funds | Annual Report
Schwab Fundamental Index Funds
Trustees and Officers
The tables below give information about the trustees and officers of Schwab Capital Trust, which includes the funds covered in this report. The “Fund Complex” includes The Charles Schwab Family of Funds, Schwab Capital Trust, Schwab Investments, Schwab Annuity Portfolios, Schwab Strategic Trust and Laudus Trust. The Fund Complex includes 101 funds.
The address for all trustees and officers is 211 Main Street, San Francisco, CA 94105. You can find more information about the trustees and officers in the funds’ Statement of Additional Information, which is available free by calling 1-877-824-5615.
| Independent Trustees |
Name, Year of Birth, and
Position(s) with the trust
(Terms of office, and
length of Time Served1) | Principal Occupations
During the Past Five Years | Number of
Portfolios in
Fund Complex
Overseen by
the Trustee | Other Directorships |
Robert W. Burns
1959
Trustee
(Trustee of Schwab Strategic Trust since 2009; The Charles Schwab Family of Funds, Schwab Investments, Schwab Capital Trust, Schwab Annuity Portfolios and Laudus Trust since 2016) | Retired/Private Investor (Jan. 2009 – present). Formerly, Managing Director, Pacific Investment Management Company, LLC (PIMCO) (investment management firm) and President, PIMCO Funds. | 101 | None |
John F. Cogan
1947
Trustee
(Trustee of The Charles Schwab Family of Funds, Schwab Investments, Schwab Capital Trust and Schwab Annuity Portfolios since 2008; Laudus Trust since 2010; Schwab Strategic Trust since 2016) | Senior Fellow (Oct. 1979 – present), The Hoover Institution at Stanford University (public policy think tank); Senior Fellow (2000 – present), Stanford Institute for Economic Policy Research; Professor of Public Policy (1994 – 2015), Stanford University. | 101 | Director (2005 – present), Gilead Sciences, Inc. |
Nancy F. Heller
1956
Trustee
(Trustee of The Charles Schwab Family of Funds, Schwab Investments, Schwab Capital Trust, Schwab Annuity Portfolios, Schwab Strategic Trust and Laudus Trust since 2018) | President and Chairman (2014 – 2016), TIAA Charitable (financial services); Senior Managing Director (2003 – 2016), TIAA (financial services). | 101 | None |
Stephen Timothy Kochis
1946
Trustee
(Trustee of Schwab Strategic Trust since 2012; The Charles Schwab Family of Funds, Schwab Investments, Schwab Capital Trust, Schwab Annuity Portfolios and Laudus Trust since 2016) | CEO and Owner (May 2012 – present), Kochis Global (wealth management consulting). | 101 | None |
Schwab Fundamental Index Funds | Annual Report
Schwab Fundamental Index Funds
| Independent Trustees (continued) |
Name, Year of Birth, and
Position(s) with the trust
(Terms of office, and
length of Time Served1) | Principal Occupations
During the Past Five Years | Number of
Portfolios in
Fund Complex
Overseen by
the Trustee | Other Directorships |
David L. Mahoney
1954
Trustee
(Trustee of The Charles Schwab Family of Funds, Schwab Investments, Schwab Capital Trust, Schwab Annuity Portfolios and Laudus Trust since 2011; Schwab Strategic Trust since 2016) | Private Investor. | 101 | Director (2003 – present), Symantec Corporation
Director (2004 – present), Corcept Therapeutics Incorporated
Director (2009 – present), Adamas Pharmaceuticals, Inc. |
Jane P. Moncreiff
1961
Trustee
(Trustee of The Charles Schwab Family of Funds, Schwab Investments, Schwab Capital Trust, Schwab Annuity Portfolios, Schwab Strategic Trust and Laudus Trust since 2019) | Chief Investment Officer (2009-2017), CareGroup Healthcare System, Inc. (healthcare). | 101 | None |
Kiran M. Patel
1948
Trustee
(Trustee of The Charles Schwab Family of Funds, Schwab Investments, Schwab Capital Trust, Schwab Annuity Portfolios and Laudus Trust since 2011; Schwab Strategic Trust since 2016) | Retired. Executive Vice President and General Manager of Small Business Group (Dec. 2008 – Sept. 2013), Intuit, Inc. (financial software and services firm for consumers and small businesses). | 101 | Director (2008 – present), KLA-Tencor Corporation |
Kimberly S. Patmore
1956
Trustee
(Trustee of The Charles Schwab Family of Funds, Schwab Investments, Schwab Capital Trust, Schwab Annuity Portfolios, Schwab Strategic Trust and Laudus Trust since 2016) | Consultant (2008 – present), Patmore Management Consulting (management consulting). | 101 | None |
Gerald B. Smith
1950
Trustee
(Trustee of The Charles Schwab Family of Funds, Schwab Investments, Schwab Capital Trust and Schwab Annuity Portfolios since 2000; Laudus Trust since 2010; Schwab Strategic Trust since 2016) | Chairman, Chief Executive Officer and Founder (Mar. 1990 – present), Smith Graham & Co. (investment advisors). | 101 | Director (2012 – present), Eaton Corporation plc |
Schwab Fundamental Index Funds | Annual Report
Schwab Fundamental Index Funds
| Interested Trustees |
Name, Year of Birth, and
Position(s) with the trust
(Terms of office, and
length of Time Served1) | Principal Occupations
During the Past Five Years | Number of
Portfolios in
Fund Complex
Overseen by
the Trustee | Other Directorships |
Walter W. Bettinger II2
1960
Chairman and Trustee
(Trustee of The Charles Schwab Family of Funds, Schwab Investments, Schwab Capital Trust and Schwab Annuity Portfolios since 2008; Schwab Strategic Trust since 2009; Laudus Trust since 2010) | Director, President and Chief Executive Officer (Oct. 2008 – present), The Charles Schwab Corporation; President and Chief Executive Officer (Oct. 2008 – present) and Director (May 2008 – present), Charles Schwab & Co., Inc.; Director (Apr. 2006 – present), Charles Schwab Bank; Director (Nov. 2017 – present), Charles Schwab Premier Bank; Director (May 2008 – present) and President and Chief Executive Officer (Aug. 2017 – present), Schwab Holdings, Inc.; Director (July 2016 – present), Charles Schwab Investment Management, Inc. | 101 | Director (2008 – present), The Charles Schwab Corporation |
Jonathan de St. Paer2
1973
Trustee
(Trustee of The Charles Schwab Family of Funds, Schwab Investments, Schwab Capital Trust, Schwab Annuity Portfolios, Schwab Strategic Trust and Laudus Trust since 2019) | Director (Apr. 2019 – present), President (Oct. 2018 – present), and Chief Executive Officer (Apr. 2019 – Nov. 2019), Charles Schwab Investment Management, Inc.; Trustee and Chief Executive Officer (Apr. 2019 – present) and President (Nov. 2018 – present), Schwab Funds, Laudus Funds and Schwab ETFs; Director (Apr. 2019 – present), Charles Schwab Worldwide Funds plc and Charles Schwab Asset Management (Ireland) Limited; Senior Vice President (Apr. 2019 – present), Senior Vice President – Strategy and Product Development (CSIM) (Jan. 2014 – Mar. 2019), and Vice President (Jan. 2009 – Dec. 2013), Charles Schwab & Co., Inc. | 101 | None |
Joseph R. Martinetto2
1962
Trustee
(Trustee of The Charles Schwab Family of Funds, Schwab Investments, Schwab Capital Trust, Schwab Annuity Portfolios, Schwab Strategic Trust and Laudus Trust since 2016) | Chief Operating Officer (Feb. 2018 – present) and Senior Executive Vice President (July 2015 – Feb. 2018), The Charles Schwab Corporation; Senior Executive Vice President (July 2015 – present), Charles Schwab & Co., Inc.; Chief Financial Officer (July 2015 – Aug. 2017) and Executive Vice President and Chief Financial Officer (May 2007 – July 2015), The Charles Schwab Corporation and Charles Schwab & Co., Inc.; Director (May 2007 – present), Charles Schwab & Co., Inc.; Director (Apr. 2010 – present) and Chief Executive Officer (July 2013 – Apr. 2015), Charles Schwab Bank; Director (Nov. 2017 – present), Charles Schwab Premier Bank; Director (May 2007 – present), Chief Financial Officer (May 2007 – Aug. 2017), Senior Executive Vice President (Feb. 2016 – present), and Executive Vice President (May 2007 – Feb. 2016), Schwab Holdings, Inc. | 101 | None |
| Officers of the Trust |
Name, Year of Birth, and Position(s) with the trust
(Terms of office, and length of Time Served3) | Principal Occupations During the Past Five Years |
Jonathan de St. Paer
1973
President and Chief Executive Officer
(Officer of The Charles Schwab Family of Funds, Schwab Investments, Schwab Capital Trust, Schwab Annuity Portfolios, Schwab Strategic Trust and Laudus Trust since 2018) | Director (Apr. 2019 – present), President (Oct. 2018 – present), and Chief Executive Officer (Apr. 2019 – Nov. 2019), Charles Schwab Investment Management, Inc.; Trustee and Chief Executive Officer (Apr. 2019 – present) and President (Nov. 2018 – present), Schwab Funds, Laudus Funds and Schwab ETFs; Director (Apr. 2019 – present), Charles Schwab Worldwide Funds plc and Charles Schwab Asset Management (Ireland) Limited; Senior Vice President (Apr. 2019 – present), Senior Vice President – Strategy and Product Development (CSIM) (Jan. 2014 – Mar. 2019), and Vice President (Jan. 2009 – Dec. 2013), Charles Schwab & Co., Inc. |
Schwab Fundamental Index Funds | Annual Report
Schwab Fundamental Index Funds
| Officers of the Trust (continued) |
Name, Year of Birth, and Position(s) with the trust
(Terms of office, and length of Time Served3) | Principal Occupations During the Past Five Years |
Mark Fischer
1970
Treasurer and Chief Financial Officer
(Officer of The Charles Schwab Family of Funds, Schwab Investments, Schwab Capital Trust, Schwab Annuity Portfolios, Schwab Strategic Trust and Laudus Trust since 2013) | Treasurer and Chief Financial Officer (Jan. 2016 – present), Schwab Funds, Laudus Funds and Schwab ETFs; Assistant Treasurer (Dec. 2013 – Dec. 2015), Schwab Funds and Laudus Funds; Assistant Treasurer (Nov. 2013 – Dec. 2015), Schwab ETFs; Vice President (Oct. 2013 – present), Charles Schwab Investment Management, Inc.; Executive Director (Apr. 2011 – Sept. 2013), J.P. Morgan Investor Services; Assistant Treasurer (May 2005 – Mar. 2011), Massachusetts Financial Service Investment Management. |
George Pereira
1964
Senior Vice President and Chief Operating Officer
(Officer of The Charles Schwab Family of Funds, Schwab Investments, Schwab Capital Trust and Schwab Annuity Portfolios since 2004; Laudus Trust since 2006; Schwab Strategic Trust since 2009) | Senior Vice President and Chief Financial Officer (Nov. 2004 – present) and Chief Operating Officer (Jan. 2011 – present), Charles Schwab Investment Management, Inc.; Senior Vice President and Chief Operating Officer (Jan. 2016 – present), Schwab Funds, Laudus Funds and Schwab ETFs; Treasurer and Chief Financial Officer (June 2006 – Dec. 2015), Laudus Funds; Treasurer and Principal Financial Officer (Nov. 2004 – Dec. 2015), Schwab Funds; Treasurer and Principal Financial Officer (Oct. 2009 – Dec. 2015), Schwab ETFs; Director (Apr. 2005 – present), Charles Schwab Worldwide Funds plc and Charles Schwab Asset Management (Ireland) Limited. |
Omar Aguilar
1970
Senior Vice President and Chief Investment Officer – Equities and Multi-Asset Strategies
(Officer of The Charles Schwab Family of Funds, Schwab Investments, Schwab Capital Trust, Schwab Annuity Portfolios, Schwab Strategic Trust and Laudus Trust since 2011) | Senior Vice President and Chief Investment Officer (Apr. 2011 – present), Charles Schwab Investment Management, Inc.; Senior Vice President and Chief Investment Officer – Equities and Multi-Asset Strategies (June 2011 – present), Schwab Funds, Laudus Funds and Schwab ETFs; Head of the Portfolio Management Group and Vice President of Portfolio Management (May 2009 – Apr. 2011), Financial Engines, Inc. (investment management firm); Head of Quantitative Equity (July 2004 – Jan. 2009), ING Investment Management. |
Brett Wander
1961
Senior Vice President and Chief Investment Officer – Fixed Income
(Officer of The Charles Schwab Family of Funds, Schwab Investments, Schwab Capital Trust, Schwab Annuity Portfolios, Schwab Strategic Trust and Laudus Trust since 2011) | Senior Vice President and Chief Investment Officer (Apr. 2011 – present), Charles Schwab Investment Management, Inc.; Senior Vice President and Chief Investment Officer – Fixed Income (June 2011 – present), Schwab Funds, Laudus Funds and Schwab ETFs; Senior Managing Director and Global Head of Active Fixed-Income Strategies (Jan. 2008 – Oct. 2010), State Street Global Advisors; Director of Alpha Strategies (Apr. 2006 – Jan. 2008), Loomis, Sayles & Company (investment management firm). |
David Lekich
1964
Chief Legal Officer and Secretary, Schwab Funds and Schwab ETFs
Vice President and Assistant Clerk, Laudus Funds
(Officer of The Charles Schwab Family of Funds, Schwab Investments, Schwab Capital Trust, Schwab Annuity Portfolios, Schwab Strategic Trust and Laudus Trust since 2011) | Senior Vice President (Sept. 2011 – present) and Vice President (Mar. 2004 – Sept. 2011), Charles Schwab & Co., Inc.; Senior Vice President and Chief Counsel (Sept. 2011 – present) and Vice President (Jan. 2011 – Sept. 2011), Charles Schwab Investment Management, Inc.; Secretary (Apr. 2011 – present) and Chief Legal Officer (Dec. 2011 – present), Schwab Funds; Vice President and Assistant Clerk (Apr. 2011 – present), Laudus Funds; Secretary (May 2011 – present) and Chief Legal Officer (Nov. 2011 – present), Schwab ETFs. |
Catherine MacGregor
1964
Vice President and Assistant Secretary, Schwab Funds and Schwab ETFs
Chief Legal Officer, Vice President and Clerk, Laudus Funds
(Officer of The Charles Schwab Family of Funds, Schwab Investments, Schwab Capital Trust, Schwab Annuity Portfolios and Laudus Trust since 2005; Schwab Strategic Trust since 2009) | Vice President (July 2005 – present), Charles Schwab & Co., Inc.; Vice President (Sept. 2005 – present), Charles Schwab Investment Management, Inc.; Vice President (Dec. 2005 – present) and Chief Legal Officer and Clerk (Mar. 2007 – present), Laudus Funds; Vice President (Nov. 2005 – present) and Assistant Secretary (June 2007 – present), Schwab Funds; Vice President and Assistant Secretary (Oct. 2009 – present), Schwab ETFs. |
| 1 | Each Trustee shall hold office until the election and qualification of his or her successor, or until he or she dies, resigns or is removed. The retirement policy requires that each independent trustee retire by December 31 of the year in which the Trustee turns 74 or the Trustee’s twentieth year of service as an independent trustee on any trust in the Fund Complex, whichever occurs first. |
| 2 | Mr. Bettinger, Mr. de St. Paer and Mr. Martinetto are Interested Trustees. Mr. Bettinger is an Interested Trustee because he owns stock of The Charles Schwab Corporation (CSC), the parent company of Charles Schwab Investment Management, Inc. (CSIM), the investment adviser for the trusts in the Fund Complex, is an employee and director of Charles Schwab & Co., Inc. (CS&Co), the principal underwriter for The Charles Schwab Family of Funds, Schwab Investments, Schwab Capital Trust, Schwab Annuity Portfolios and Laudus Trust, and is a director of CSIM. Mr. de St. Paer is an Interested Trustee because he owns stock of CSC and is an employee and director of CSIM. Mr. Martinetto is an Interested Trustee because he owns stock of CSC and is an employee and director of CS&Co. |
| 3 | The President, Treasurer and Secretary/Clerk hold office until their respective successors are chosen and qualified or until he or she sooner dies, resigns, is removed or becomes disqualified. Each of the other officers serves at the pleasure of the Board. |
Schwab Fundamental Index Funds | Annual Report
Schwab Fundamental Index Funds
asset allocation The practice of dividing a portfolio among different asset classes, with each asset class assigned a particular percentage.
asset class A group of securities with similar structure and basic characteristics. Stocks, bonds and cash are the three main examples of asset classes.
Bloomberg Barclays US Aggregate Bond Index An index that is a broad-based benchmark measuring the performance of the U.S. investment grade, taxable bond market, including U.S. Treasuries, government-related and corporate bonds, mortgage pass-through securities, commercial mortgage-backed securities, and asset-backed securities that are publicly available for sale in the United States. To be eligible for inclusion in the index, securities must be fixed rate, non-convertible, U.S. dollar denominated with at least $300 million or more of outstanding face value and have one or more years remaining to maturity. The index excludes certain types of securities, including tax-exempt state and local government series bonds, structured notes embedded with swaps or other special features, private placements, floating rate securities, inflation-linked bonds and Eurobonds. The index is market capitalization weighted and the securities in the index are updated on the last business day of each month.
Bloomberg Barclays US Treasury Bills 1–3 Month Index An index that includes all publicly issued zero-coupon U.S. Treasury Bills that have a remaining maturity of less than 3 months but more than 1 month, are rated investment grade and have $300 million or more of outstanding face value. It excludes zero-coupon STRIPS.
bond A security representing a loan from the investor to the issuer. A bond typically pays interest at a fixed rate (the coupon rate) until a specified date (the maturity date), at which time the issuer returns the money borrowed (principal or face value) to the bondholder. Because of their structure, bonds are sometimes called “fixed income securities” or “debt securities.”
An individual bond is subject to the credit risk of the issuer. Changes in interest rates can affect a bond’s market value prior to call or maturity. There is no guarantee that a bond’s yield to call or maturity will provide a positive return over the rate of inflation.
bond fund A bond fund is subject to the same credit, interest rate, and inflation risks as bonds. In addition, a bond fund incurs ongoing fees and expenses. A bond fund’s net asset value will fluctuate with the price of the underlying bonds and the portfolio turnover activity; return of principal is not guaranteed.
cap, capitalization See “market cap.”
capital gain, capital loss the difference between the amount paid for an investment and its value at a later time. If the investment has been sold, the capital gain or loss is considered a realized gain or loss. If the investment is still held, the capital gain or loss is considered unrealized appreciation or depreciation.
expense ratio The amount that is taken from a mutual fund’s assets each year to cover the fund’s operating expenses. An expense ratio of 0.50% means that a fund’s expenses amount to half of one percent of its average net assets a year.
Fundamental Developed ex-U.S. Large Company Spliced Index An internally calculated index comprised of the FTSE RAFI Developed ex-US 1000 Index from inception of the Schwab Fundamental International Large Company Index Fund until the close of business on October 18, 2012 and the Russell RAFI Developed ex US Large Company Index (Net) from October 19, 2012 forward. The FTSE RAFI
Developed ex-US 1000 Index is composed of the largest 1,000 listed companies incorporated outside the United States, ranked by four fundamental financial measures of size, sales, cash flows, book value and dividends. The index is rebalanced and reconstituted annually.
Fundamental Developed ex-U.S. Small Company Spliced Index An internally calculated index comprised of the FTSE RAFI Developed ex US Mid Small 1500 Index from inception of the Schwab Fundamental International Small Company Index Fund until the close of business on October 18, 2012 and the Russell RAFI Developed ex US Small Company Index (Net) from October 19, 2012 forward. The FTSE RAFI Developed ex US Mid Small 1500 Index is designed to track the performance of small- and mid-capitalization equities of companies domiciled in developed international markets (excluding the U.S.), selected based on the following four fundamental measures of firm size: book value, cash flow, sales and dividends. The equities with the highest fundamental strength are weighted according to their fundamental scores. The fundamentally weighted portfolio is rebalanced and reconstituted annually.
Fundamental Emerging Markets Large Company Spliced Index An internally calculated index comprised of the FTSE RAFI Emerging Index from inception of the Schwab Fundamental Emerging Markets Large Company Index Fund until the close of business on October 18, 2012 and the Russell RAFI Emerging Markets Large Company Index (Net) from October 19, 2012 forward. The FTSE RAFI Emerging Index is designed to track the performance of the largest emerging market equities, selected based on the following four fundamental measures of firm size: book value, cash flow, sales and dividends. The equities with the highest fundamental strength are weighted according to their fundamental scores. The fundamentally weighted portfolio is rebalanced and reconstituted annually.
Fundamental U.S. Large Company Spliced Index An internally calculated index comprised of the FTSE RAFI US 1000 Index from inception of the Schwab Fundamental US Large Company Index Fund until the close of business on October 18, 2012 and the Russell RAFI US Large Company Index from October 19, 2012 forward. The FTSE RAFI US 1000 Index is designed to track the performance of the largest U.S. equities, selected based on the following four fundamental measures of firm size, book value, income, sales and dividends. The 1,000 equities with the highest fundamental strength are weighted by their fundamental scale. The fundamentally weighted portfolio is rebalanced and reconstituted annually.
Fundamental U.S. Small Company Spliced Index An internally calculated index comprised of the FTSE RAFI US Mid Small 1500 Index from inception of the Schwab Fundamental US Small Company Index Fund until the close of business on October 18, 2012 and the Russell RAFI US Small Company Index from October 19, 2012 forward. The FTSE RAFI US Mid Small 1500 Index is composed of approximately 1,500 listed small and medium sized companies incorporated in the United States, ranked by fundamental value. The fundamentally weighted portfolio is rebalanced and reconstituted annually.
market cap, market capitalization The value of a company as determined by the total value of all shares of its stock outstanding.
MSCI EAFE Index (Net) A free float-adjusted market capitalization index that is designed to measure the equity market performance of developed markets in Europe, Australasia, and the Far East. The Net version of the index reflects reinvested dividends net of withholding taxes, but reflects no deductions for expenses or other taxes; returns are calculated applying dividend withholding rates applicable to non-resident persons who do not benefit from double taxation treaties.
Schwab Fundamental Index Funds | Annual Report
Schwab Fundamental Index Funds
MSCI Emerging Markets Index (Net) A free float-adjusted market capitalization weighted index that is designed to measure equity market performance in the global emerging markets. This series approximates the minimum possible dividend reinvestment. The returns are calculated applying dividend withholding rates applicable to non-resident persons who do not benefit from double taxation treaties.
net asset value (NAV) The value of one share of a mutual fund. NAV is calculated by taking the fund’s total assets, subtracting liabilities, and dividing by the number of shares outstanding.
outstanding shares, shares outstanding When speaking of a company or mutual fund, indicates all shares currently held by investors.
price-to-book ratio (P/B) The market price of a company’s stock compared with its “book value.” A mutual fund’s P/B is the weighted average of the P/B of all stocks in the fund’s portfolio.
price-to-earnings ratio (P/E) The market price of a company’s stock compared with earnings over the past year. A mutual fund’s P/E is the weighted average of the P/E of all stocks in the fund’s portfolio.
restricted and illiquid securities Restricted securities are securities that are subject to legal restrictions on their sale. Restricted securities generally can be sold in privately negotiated transactions, pursuant to an exemption from registration under the Securities Act of 1933 (the 1933 Act), or in a registered public offering. Certain restricted securities, such as Section 4(a)(2) commercial paper and Rule 144A securities under the 1933 Act, may be considered to be liquid if they meet the criteria for liquidity established by the Board. Illiquid securities generally are any securities that cannot be disposed of promptly and in the ordinary course of business at approximately the amount at which a fund has valued the instruments. The liquidity of a fund’s investments is monitored under the supervision and direction of the Board. Investments currently not considered liquid include repurchase agreements not maturing within seven days and certain restricted securities.
return on equity (ROE) The average yearly rate of return for each dollar of investors’ money, measured over the past five years.
Russell 1000 Growth Index An index that measures the performance of those Russell 1000 Index companies with higher price-to-book ratios and higher forecasted growth values.
Russell 1000 Index An index that measures the performance of the 1,000 largest companies in the Russell 3000 Index, and represents approximately 92% of the total market capitalization of the Russell 3000 Index. The Russell 3000 Index measures the performance of the largest 3,000 U.S. companies representing approximately 98% of the investable U.S. equity market.
Russell 1000 Value Index An index that measures the performance of the large-cap value segment of the U.S. equity universe. It includes those Russell 1000 Index companies with lower price-to-book ratios and lower expected growth values.
Russell 2000 Index An index that measures the performance of the 2,000 smallest companies in the Russell 3000 Index. The Russell 3000 Index measures the performance of the largest 3,000 U.S. companies representing approximately 98% of the investable U.S. equity market.
Russell RAFI Developed ex US Large Company Index (Net) An index that ranks developed ex-U.S. companies in the FTSE Global Total Cap Index by fundamental measures of size and tracks the performance of those companies whose fundamental scores are in the top 87.5%. The index uses a partial quarterly reconstitution methodology in which the index is split into four equal segments at the annual reconstitution and each segment is then rebalanced on a rolling quarterly basis. The Net series reduces index performance by adjusting for local taxes. Selecting
the developed ex-U.S. companies in the FTSE Global Total Cap Index measures the performance of the largest investable securities in developed countries globally, excluding companies assigned to the United States.
Russell RAFI Developed ex US Small Company Index (Net) An index that ranks developed ex-U.S. companies in the FTSE Global Total Cap Index by fundamental measures of size and tracks the performance of those companies whose fundamental scores rank below the 87.5% threshold. The index uses a partial quarterly reconstitution methodology in which the index is split into four equal segments at the annual reconstitution and each segment is then rebalanced on a rolling quarterly basis. The Net series reduces index performance by adjusting for local taxes. Selecting the developed ex-U.S. companies in the FTSE Global Total Cap Index measures the performance of the smallest investable securities in developed countries globally, excluding companies assigned to the United States.
Russell RAFI Emerging Markets Large Company Index (Net) An index that ranks emerging market companies in the FTSE Global Total Cap Index by measures of fundamental size and tracks the performance of those companies whose fundamental scores are in the top 87.5%. The index uses a partial quarterly reconstitution methodology in which the index is split into four equal segments at the annual reconstitution and each segment is then rebalanced on a rolling quarterly basis. The Net series reduces index performance by adjusting for local taxes. Selecting the emerging companies in the FTSE Global Total Cap Index measures the performance of the investable securities in emerging countries globally.
Russell RAFI US Large Company Index An index that ranks U.S. companies in the FTSE Global Total Cap Index. The Russell RAFI US Large Company Index includes only those securities that are members of the U.S. portion whose fundamental scores are in the top 87.5%. The index uses a partial quarterly reconstitution methodology in which the index is split into four equal segments at the annual reconstitution and each segment is then rebalanced on a rolling quarterly basis.
Russell RAFI US Small Company Index An index that ranks U.S. companies in the FTSE Global Total Cap Index. The Russell RAFI US Small Company Index includes only those securities that are members of the U.S. portion and rank below the 87.5% fundamental score threshold. The index uses a partial quarterly reconstitution methodology in which the index is split into four equal segments at the annual reconstitution and each segment is then rebalanced on a rolling quarterly basis.
S&P 500 Index An index that is designed to measure the performance of 500 leading publicly traded companies from a broad range of industries.
S&P Developed ex-U.S. Small Cap Index (Net) An index composed of the stocks representing the lowest 15% of float-adjusted market cap in each developed market country, excluding the U.S. The returns are calculated applying dividend withholding rates applicable to non-resident persons who do not benefit from double taxation treaties.
stock A share of ownership, or equity, in the issuing company.
total return The percentage that an investor would have earned or lost on an investment in the fund assuming dividends and distributions were reinvested.
weighted average For mutual funds, an average that gives the same weight to each security as the security represents in the fund’s portfolio.
yield The income paid out by an investment, expressed as a percentage of the investment’s market value.
Schwab Fundamental Index Funds | Annual Report
Schwab Fundamental Index Funds
PRIVACY NOTICE
THIS IS NOT PART OF THE SHAREHOLDER REPORT
A Commitment to Your Privacy
Your Privacy Is Not for Sale
We do not and will not sell your personal information to anyone, for any reason.
We are committed to protecting the privacy of information we maintain about you. Below are details about our commitment, including the types of information we collect and how we use and share that information. This Privacy Notice applies to you only if you are an individual who invests directly in the funds by placing orders through the funds’ transfer agent. If you place orders through your brokerage account at Charles Schwab & Co., Inc. or an account with another broker-dealer, investment advisor, 401(k) plan, employee benefit plan, administrator, bank or other financial intermediary, you are covered by the privacy policies of that financial institution and should consult those policies.
How We Collect Information About You
We collect personal information about you in a number of ways.
• APPLICATION AND REGISTRATION
INFORMATION.
We collect personal information from you when you open an account or utilize one of our services. We may also collect information about you from third parties such as consumer reporting agencies to verify your identity. The information we collect may include personal information, including your Social Security number, as well as details about your interests, investments and investment experience.
• TRANSACTION AND EXPERIENCE
INFORMATION.
Once your account has been opened, we collect and maintain personal information about your account activity, including your transactions, balances, positions and history. This information allows us to administer your account and provide the services you have requested.
• WEBSITE USAGE.
When you visit our websites, we may use devices known as “cookies,” graphic interchange format files (GIFs), or other similar web tools to enhance your web experience. These tools help us to recognize you, maintain your web session, and
provide a more personalized experience. To learn more, please go to www.schwab.com/privacy.
How We Share and Use Your Information
We provide access to information about you to our affiliated companies, outside companies and other third parties in certain limited circumstances, including:
• to help us process transactions for your account;
• when we use other companies to provide services for us, such as printing and mailing your account statements; and
• when we believe that disclosure is required or permitted under law (for example, to cooperate with regulators or law enforcement, resolve consumer disputes, perform credit/authentication checks, or for risk control).
State Laws
We will comply with state laws that apply to the disclosure or use of information about you.
Safeguarding Your Information — Security Is a Partnership
We take precautions to ensure the information we collect about you is protected and is accessed only by authorized individuals or organizations.
Companies we use to provide support services are not allowed to use information about our shareholders for their own purposes and are contractually obligated to maintain strict confidentiality. We limit their use of information to the performance of the specific services we have requested.
We restrict access to personal information by our employees and agents. Our employees are trained about privacy and are required to safeguard personal information.
We maintain physical, electronic and procedural safeguards that comply with federal standards to guard your nonpublic personal information.
Contact Us
To provide us with updated information, report suspected fraud or identity theft, or for any other questions, please call the number below.
Schwab Funds® direct investors: 1-800-407-0256
© 2019 Schwab Funds. All rights reserved.
Schwab Fundamental Index Funds | Annual Report
Schwab Fundamental Index Funds
Charles Schwab Investment Management
With a straightforward lineup of core products and solutions for building the foundation of a portfolio, Charles Schwab Investment Management advocates for investors of all sizes with a steadfast focus on lowering costs and reducing unnecessary complexity. The list below shows all currently available Schwab Funds®.
Investors should carefully consider information contained in the prospectus, or if available, the summary prospectus, including investment objectives, risks, charges and expenses before investing. Please call 1-877-824-5615 for a prospectus for any Schwab Fund. Please read the prospectus carefully before you invest. This report must be preceded or accompanied by a current prospectus.
Proxy Voting Policies, Procedures and Results
A description of the proxy voting policies and procedures used to determine how to vote proxies on behalf of the funds is available without charge, upon request, by visiting the Schwab Funds’ website atwww.schwabfunds.com/schwabfunds_prospectus, the SEC’s website atwww.sec.gov, or by contacting Schwab Funds at 1-877-824-5615.
Information regarding how a fund voted proxies relating to portfolio securities during the most recent twelve-month period ended June 30 is available, without charge, by visiting the fund’s website atwww.schwabfunds.com/schwabfunds_prospectus or the SEC’s website atwww.sec.gov.
Equity Funds
Schwab Core Equity Fund
Schwab Dividend Equity Fund
Schwab Large-Cap Growth Fund
Schwab Small-Cap Equity Fund
Schwab Hedged Equity Fund
Schwab Health Care Fund
Schwab International Core Equity Fund
Schwab Fundamental US Large Company Index Fund
Schwab Fundamental US Small Company Index Fund
Schwab Fundamental International Large Company Index Fund
Schwab Fundamental International Small Company Index Fund
Schwab Fundamental Emerging Markets Large Company Index Fund
Schwab Fundamental Global Real Estate Index Fund
Schwab Global Real Estate Fund
Schwab S&P 500 Index Fund
Schwab 1000 Index® Fund
Schwab Small-Cap Index Fund®
Schwab Total Stock Market Index Fund®
Schwab U.S. Large-Cap Growth Index Fund
Schwab U.S. Large-Cap Value Index Fund
Schwab U.S. Mid-Cap Index Fund
Schwab International Index Fund®
Asset Allocation Funds
Schwab Balanced Fund
Schwab MarketTrack Portfolios®
Schwab Target Funds
Schwab Target Index Funds
Schwab Monthly Income Funds
Bond Funds
Schwab Treasury Inflation Protected Securities Index Fund
Schwab U.S. Aggregate Bond Index Fund
Schwab Short-Term Bond Index Fund
Schwab Tax-Free Bond Fund1
Schwab California Tax-Free Bond Fund1
Schwab Money Funds2
Schwab provides a broad choice of taxable and tax-exempt money market funds for both retail and institutional client types.
Investment Adviser
Charles Schwab Investment Management, Inc.
211 Main Street, San Francisco, CA 94105
Funds
Schwab Funds
1-877-824-5615
© 2019 Charles Schwab & Co., Inc. All rights reserved.
Member SIPC®
Printed on recycled paper.
| ¹ | State, local, and the Federal Alternative Minimum Tax may apply. Capital gains are not exempt from Federal Taxation. |
| ² | You could lose money by investing in the Schwab Money Funds. All Schwab Money Funds with the exception of Schwab Variable Share Price Money Fund seek to preserve the value of your investment at $1.00 per share, but cannot guarantee they will do so. Because the share price of Schwab Variable Share Price Money Fund will fluctuate, when you sell your shares they may be worth more or less than what you originally paid for them. All Schwab Money Funds with the exception of Schwab Government Money Fund, Schwab Retirement Government Money Fund, Schwab U.S. Treasury Money Fund, Schwab Treasury Obligations Money Fund and Schwab Government Money Market Portfolio may impose a fee upon the sale of your shares or may temporarily suspend your ability to sell shares if the Fund’s liquidity falls below required minimums because of market conditions or other factors. An investment in the Schwab Money Funds is not insured or guaranteed by the Federal Deposit Insurance Corporation or any other government agency. The Schwab Money Funds’ sponsor has no legal obligation to provide financial support to the Funds, and you should not expect that the sponsor will provide financial support to the Funds at any time. |
This page is intentionally left blank.
Annual Report | October 31, 2019
Schwab MarketTrack Portfolios®
Schwab MarketTrack
All Equity Portfolio™
Schwab MarketTrack
Growth Portfolio™
Schwab MarketTrack
Balanced Portfolio™
Schwab MarketTrack
Conservative Portfolio™
| New Notice Regarding Shareholder Report Delivery Options |
| Beginning on January 1, 2021, paper copies of a fund’s shareholder reports will no longer be sent by mail, unless you specifically request paper copies of the reports from a fund or from your financial intermediary (such as a bank or broker-dealer). Instead, the reports will be made available on a fund’s websitewww.schwabfunds.com/schwabfunds_prospectus, and you will be notified by mail each time a report is posted and the mailing will provide a website link to access the report. You will continue to receive other fund regulatory documents (such as prospectuses or supplements) in paper unless you have elected to receive all fund documents electronically. |
| If you would like to receive a fund’s future shareholder reports in paper free of charge after January 1, 2021, you can make that request: |
| • If you invest through Charles Schwab & Co, Inc. (broker-dealer), by calling 1-866-345-5954 and using the unique identifier attached to this mailing; |
| • If you invest through another financial intermediary (such as a bank or broker-dealer) by contacting them directly; or |
| • If owned directly through a fund by calling 1-800-407-0256. |
| If you already receive shareholder reports and other fund documents electronically, you will not be affected by this change and you need not take any action. |
This page is intentionally left blank.
Schwab MarketTrack Portfolios
Fund investment adviser: Charles Schwab Investment Management, Inc. (CSIM)
Distributor: Charles Schwab & Co., Inc. (Schwab)
Schwab MarketTrack Portfolios | Annual Report
Schwab MarketTrack Portfolios
The performance data quoted represents past performance. Past performance does not guarantee future results. Investment returns and principal value of an investment will fluctuate so that an investor’s shares may be worth more or less than their original cost. Current performance may be lower or higher than performance data quoted. To obtain performance information current to the most recent month end, please visitwww.schwabfunds.com/schwabfunds_prospectus.
| Total Return for the 12 Months Ended October 31, 2019 |
| Schwab MarketTrack All Equity Portfolio (Ticker Symbol: SWEGX) | 9.58% |
| All Equity Composite Index | 10.12% |
| Fund Category: Morningstar Allocation—85%+ Equity1 | 10.47% |
| Performance Details | pages 7-9 |
| |
| Schwab MarketTrack Growth Portfolio (Ticker Symbol: SWHGX) | 9.86% |
| Growth Composite Index | 10.39% |
| Fund Category: Morningstar Allocation—70% to 85% Equity1 | 9.88% |
| Performance Details | pages 10-12 |
| |
| Schwab MarketTrack Balanced Portfolio (Ticker Symbol: SWBGX) | 10.14% |
| Balanced Composite Index | 10.78% |
| Fund Category: Morningstar Allocation—50% to 70% Equity1 | 10.26% |
| Performance Details | pages 13-15 |
| |
| Schwab MarketTrack Conservative Portfolio (Ticker Symbol: SWCGX) | 10.31% |
| Conservative Composite Index | 11.02% |
| Fund Category: Morningstar Allocation—30% to 50% Equity1 | 9.38% |
| Performance Details | pages 16-18 |
All total returns on this page assume dividends and distributions were reinvested. Index figures do not include trading and management costs, which would lower performance. Indices are unmanaged and cannot be invested in directly. Performance results less than one year are not annualized.
The components that make up each of the composite indices may vary over time. For index definitions, please see the Glossary.
Fund expenses may have been partially absorbed by CSIM and its affiliates. Without these reductions, a fund’s total return would have been lower. Performance does not reflect the deduction of taxes that a shareholder would pay on fund distributions or on the redemption of fund shares.
| 1 | Source for category information: Morningstar, Inc. The Morningstar Category return represents all active and index mutual funds within the category as of the report date. |
Schwab MarketTrack Portfolios | Annual Report
Schwab MarketTrack Portfolios
Jonathan de St. Paer
President of Charles Schwab
Investment Management, Inc.
and the funds covered
in this report.
Dear Shareholder,
At the crux of every investment decision, one consideration that may be top of mind is your risk tolerance. It may seem like a straightforward consideration, but it’s often not. Most of us are risk-averse by nature and as investors, the fear of a significant market decline is ever-present in our minds. This can sometimes lead us to make decisions that may get in the way of the performance of our investments. Our feelings about risk are also fluid, impacted by changes in market conditions and our progress toward our financial goals. For example, some investors may have been prompted to rethink their risk appetite as a result of the latest bout of market volatility.
At Charles Schwab Investment Management, we provide a range of foundational products that are designed to suit a variety of risk appetites and help investors remain focused on their long-term investment plans despite market volatility. The Schwab MarketTrack Portfolios are an example of this approach, providing investors with four different options based on their risk appetite. For those with a longer time horizon and a greater tolerance for volatility, the Schwab MarketTrack All Equity Portfolio is a diversified all-stock solution. At the other end of the risk spectrum, investors who are more risk averse or seeking short-term stability of their investment can opt to invest in the Schwab MarketTrack Conservative Portfolio, a solution with a larger allocation to bond holdings. The Schwab MarketTrack Growth Portfolio and Schwab MarketTrack Balanced Portfolio fill out the offerings in between.
No matter which risk profile of the Schwab MarketTrack Portfolio you choose, each fund is constructed with risk management in mind. All four funds invest in passive strategies to keep costs down and each fund helps mitigate market risk through thoughtfully designed diversification across asset classes. The funds combine investments in traditional market-cap index funds, Schwab Fundamental Index Funds, which select and weight stocks based on fundamental measures of company size rather than market capitalization, and bond funds. Market-cap index and Fundamental Index strategies can perform differently over time—a key reason why we believe many investors can benefit from combining the two approaches. Additionally, the funds are rebalanced periodically, keeping them in line with investors’ chosen asset allocation and risk level.
When it comes to investing, it’s important to have a long-term investing plan and a portfolio based on your individual goals and risk tolerance. It can at times be tough to maintain that discipline in the face of day-to-day uncertainty. We aim to offer products with clear objectives, straightforward pricing, and a consistent approach to investing to help simplify investing decisions, so investors can focus on their long-term goals without unnecessary complexity.
Thank you for investing with Charles Schwab Investment Management, and for trusting us to help you achieve your financial goals. For more information about the Schwab MarketTrack Portfolios, please continue reading this report. In addition, you can find further details about these funds by visiting our website at www.schwabfunds.com. We are also happy to hear from you at 1-877-824-5615.
Sincerely,
“No matter which risk profile of the Schwab MarketTrack Portfolio you choose, each fund is constructed with risk management in mind.”
Fundamental Index is a registered trademark of Research Affiliates LLC.
Diversification and asset allocation strategies do not ensure a profit and cannot protect against losses in a declining market.
Management views may have changed since the report date.
Schwab MarketTrack Portfolios | Annual Report
Schwab MarketTrack Portfolios
The Investment Environment
For the 12-month reporting period ended October 31, 2019, global equity and fixed income markets generated positive returns. The final two months of 2018 were marked by significant market volatility and steep declines across global equity markets, driven by concerns about slowing international growth, a trade war between the U.S. and China, falling oil prices, the waning strength of the U.S. economy, and the pace of future interest rate hikes despite low inflation. By late December, major market indices had fallen to near-bear market territory. However, as the Federal Reserve (Fed) put interest rate hikes on hold, stocks, particularly in the U.S., staged a strong recovery in the first four months of 2019, which generally continued through the end of the reporting period despite several setbacks. Over the period, the U.S. dollar strengthened slightly against a basket of foreign currencies, generally reducing the returns on overseas investments in U.S. dollar terms. For the reporting period, the S&P 500® Index, a bellwether for the overall U.S. stock market, returned 14.33%. Despite headwinds, markets outside the U.S. also rose, particularly toward the end of the reporting period with the MSCI EAFE® Index (Net)*, a broad measure of developed international equity performance, returning 11.04%. Fixed-income markets were particularly strong over the period. The Bloomberg Barclays US Aggregate Bond Index returned 11.51% and the FTSE non-US Dollar World Government Bond Index returned 9.25%.
Economic growth around the globe was uneven over the reporting period, largely as a result of manufacturing weakness in developed international markets. Despite escalating trade tensions with China, the U.S. maintained its steady growth in its tenth year of expansion, although at a declining pace. In the last two months of 2018, economies around the globe showed increasing signs of weakness, but many regained economic momentum in the first six months of 2019, demonstrating resilient growth despite lingering uncertainties on various fronts. As the year progressed, signs of slowing growth increased amid a weakening global economy, waning manufacturing activity, and the ongoing U.S.-China trade war. However, toward the end of the period, prospects of a partial trade resolution relieved some of the pressure. U.S. gross domestic product (GDP) grew at an annual rate of 2.1% in the third quarter of 2019, up slightly from 2.0% in the second quarter, but down from 3.1% in the first quarter of 2019. Unemployment declined in September 2019 to a 50-year low. While consumer confidence edged lower in October to hit a four-month low, it remained a stable source of GDP growth in the U.S. Inflation remained benign.
Asset Class Performance Comparison % returns during the 12 months ended October 31, 2019
Index figures assume dividends and distributions were reinvested. Index figures do not include trading and management costs, which would lower performance. Indices are unmanaged and cannot be invested in directly. Performance results less than one year are not annualized. Past performance is not an indication of future results.
For index definitions, please see the Glossary.
Data source: Index provider websites and CSIM.
Nothing in this report represents a recommendation of a security by the investment adviser.
Management views may have changed since the report date.
| * | The net version of the index reflects reinvested dividends net of withholding taxes, but reflects no deductions for expenses or other taxes. |
Schwab MarketTrack Portfolios | Annual Report
Schwab MarketTrack Portfolios
The Investment Environment(continued)
Outside the U.S., conditions continued to soften, dampened by trade issues, slowing economic output, and geopolitical concerns. Oil prices, which had fallen steeply in the fourth quarter of 2018, rebounded through the first four months of 2019, as major exporters sought to curb supply and central banks took steps to ease growth-related fears, before dipping in May when trade concerns escalated. Oil prices remained volatile through period end. In the eurozone, growth slowed in the second and third quarters of 2019, down slightly from the first quarter. Growth was subdued by tepid wage growth and constrained consumer spending. The United Kingdom’s economy contracted in the second quarter of 2019 amid growing Brexit-related economic and political uncertainty that dampened industrial output, construction, and services sectors. Japan’s economy, however, experienced growth in recent quarters after contracting sharply in the third quarter of 2018. Several Asian economies, including China and India, exhibited signs of slowing, but still outpaced many developed economies.
In response to the economic environment and flat or inverted yield curves around the world, to bolster growth, and to ensure stability given ongoing trade tensions, a number of central banks reduced their policy rates, including the U.S., while others maintained their generally low—and for some international central banks, negative—interest rates. In the U.S., after raising interest rates four times in 2018, the Fed held rates unchanged through the first half of 2019. But amid growing signs of global economic weakness that threatened to dampen U.S. economic growth, along with continued low inflation and weakness in manufacturing, the Fed enacted three interest rate cuts by the end of the period—in July, September, and October. Following the October interest rate cut, the Fed signaled that subsequent interest rate cuts would be put on hold provided the economy continues to expand moderately and the labor market remains strong. The federal funds rate ended the reporting period in a range of 1.50% to 1.75%. Outside the U.S., the European Central Bank held interest rates steady and launched an asset-purchase program to help stimulate the economy. The Bank of Japan maintained its short-term interest rate target of –0.1% throughout the period. Despite growing Brexit-related division, the Bank of England maintained its key official bank rate at 0.75% throughout the period, where it has remained since August 2018. Central banks in key emerging market economies—including India, Thailand, and China—lowered their policy rates in response to inflation and trade-related pressures.
Bond prices generally rose over the reporting period as yields fell. (Bond yields and bond prices move in opposite directions.) Short-term yields, which typically respond to changes in the federal funds rate, remained flat for the first half of the period before declining as the Fed implemented interest rate cuts, with the three-month Treasury yield falling from 2.34% at the outset of the period to 1.54% at the end of the period. Longer-term yields, which are influenced more by economic growth and inflation expectations, trended downward over most of the period before moderating in the final two months. During the reporting period, the yield curve flattened with portions of the yield curve inverting, which is often an indicator of a potential recession. Over the reporting period, the 10-year Treasury yield fell from 3.15% to 1.69%. Outside the U.S., bond yields generally remained low.
Schwab MarketTrack Portfolios | Annual Report
Schwab MarketTrack Portfolios
 | Zifan Tang, Ph.D., CFA, Senior Portfolio Manager, is responsible for the co-management of the funds. She has served as portfolio manager of the funds since February 2012. Prior to joining CSIM in 2012, Ms. Tang was a product manager at Thomson Reuters and, from 1997 to 2009, worked as a portfolio manager at Barclays Global Investors, which was subsequently acquired by BlackRock. |
 | Patrick Kwok, CFA, Portfolio Manager, is responsible for the co-management of the funds. He has served as portfolio manager of the funds since February 2019. Prior to joining CSIM in 2008, Mr. Kwok spent two years as an asset operations specialist at Charles Schwab Trust Company. He also previously worked for one year at State Street Bank & Trust as a portfolio accountant and pricing specialist. |
Schwab MarketTrack Portfolios | Annual Report
Schwab MarketTrack All Equity Portfolioas of October 31, 2019
The Schwab MarketTrack All Equity Portfolio(the fund) seeks high capital growth through an all-stock portfolio. To pursue its goal, the fund maintains a defined asset allocation. The fund’s target allocation is 100% in stock investments, with certain percentages for different segments of the stock market. For the 12-month reporting period ended October 31, 2019, the fund remained close to the target allocations of 45% in U.S. large-cap, 30% in international, and 25% in U.S. small-cap stocks. The fund invests mainly in other Schwab Funds, including index funds, which seek to track the total returns of various market indices. For more information concerning the fund’s investment objective, strategies, and risks, please see the fund’s prospectus.
Market Highlights.For the 12-month reporting period, global equity and fixed income markets generated positive returns. The U.S. economy maintained its steady growth in its tenth year of expansion, although at a declining pace. Outside the U.S., conditions softened, dampened by trade issues, slowing economic output, and geopolitical concerns. In response to the economic environment, to bolster growth, and to ensure stability given ongoing trade tensions, a number of central banks reduced their policy rates, including the U.S., while others maintained their generally low interest rates. Bond prices generally rose over the reporting period as yields fell.
Performance. For the 12-month reporting period ended October 31, 2019, the fund returned 9.58%. The fund’s custom blended comparative index, the All Equity Composite Index (the composite index), returned 10.12%.
Positioning and Strategies. Over the reporting period, the fund’s asset allocations were broadly in line with those of the composite index.
The fund’s U.S. equity exposure provided the greatest contribution to total return, particularly among its large-cap positions. The Schwab S&P 500 Index Fund returned approximately 14.3% for the reporting period and was the fund’s top contributor, largely due to the Schwab S&P 500 Index Fund’s large position within the fund. On a relative basis, the Schwab S&P 500 Index Fund slightly underperformed its comparative index, the S& P 500® Index. Another top contributor, the Schwab Fundamental US Large Company Index Fund, which returned approximately 10.6%, generally tracked its comparative index, the Russell RAFITM US Large Company Index, which returned approximately 10.8%.
The fund’s international equity allocations contributed positively to the fund’s total return. The fund’s position in the Schwab Fundamental International Small Company Index Fund contributed positively to total return. The Schwab Fundamental International Large Company Index Fund, which returned approximately 7.0%, contributed to absolute return, and slightly outperformed the Russell RAFITM Developed ex US Large Company Index, its comparative index, which returned approximately 6.9%, contributing to relative performance. The Schwab Fundamental Emerging Markets Large Company Index Fund contributed to total return but slightly detracted from the relative performance of the fund.
Management views and portfolio holdings may have changed since the report date.
Schwab MarketTrack Portfolios | Annual Report
Schwab MarketTrack All Equity Portfolio
Performance and Fund Factsas of October 31, 2019
The performance data quoted represents past performance. Past performance does not guarantee future results. Investment returns and principal value of an investment will fluctuate so that an investor’s shares may be worth more or less than their original cost. Current performance may be lower or higher than performance data quoted. To obtain performance information current to the most recent month end, please visitwww.schwabfunds.com/schwabfunds_prospectus.
Performance of Hypothetical $10,000 Investment (October 31, 2009 – October 31, 2019)1
Average Annual Total Returns1
| Fund and Inception Date | 1 Year | 5 Years | 10 Years |
| Fund: Schwab MarketTrack All Equity Portfolio (5/19/98) | 9.58% | 7.35% | 10.37% |
| All Equity Composite Index | 10.12% | 8.02% | 10.79% |
| S&P 500® Index | 14.33% | 10.78% | 13.70% |
| Fund Category: Morningstar Allocation—85%+ Equity2 | 10.47% | 6.39% | 9.90% |
| Fund Expense Ratio3: 0.52% |
All total returns on this page assume dividends and distributions were reinvested. Index figures do not include trading and management costs, which would lower performance. Indices are unmanaged and cannot be invested in directly. Performance results less than one year are not annualized.
The first index listed for the fund is the fund’s primary benchmark, as shown in the prospectus. Additional indices shown are provided for comparative purposes.
For index definitions, please see the Glossary.
| 1 | Fund expenses may have been partially absorbed by CSIM and its affiliates. Without these reductions, the fund’s returns would have been lower. These returns do not reflect the deduction of taxes that a shareholder would pay on fund distributions or the redemption of fund shares. |
| 2 | Source for category information: Morningstar, Inc. The Morningstar Category return represents all active and index mutual funds within the category as of the report date. |
| 3 | As stated in the prospectus. Includes 0.13% of acquired fund fees and expenses (AFFE), which are indirect expenses incurred by the fund through its investments in the underlying funds. Reflects the total annual fund operating expenses without contractual fee waivers. For actual expense ratios during the period, not including AFFE, refer to the financial highlights section of the financial statements. |
Schwab MarketTrack Portfolios | Annual Report
Schwab MarketTrack All Equity Portfolio
Performance and Fund Factsas of October 31, 2019 (continued)
| Number of Holdings | 9 |
| Portfolio Turnover Rate | 6% |
Asset Class Weightings % of Investments1
Top Holdings % of Net Assets2,3
Portfolio holdings may have changed since the report date.
Small-company stocks are subject to greater volatility than many other asset classes.
International investments are subject to additional risks such as currency fluctuation, geopolitical risk and the potential for illiquid markets.
| 1 | The percentage may differ from the Portfolio Holdings because the above calculation is based on a percentage of total investments, whereas the calculation in the Portfolio Holdings is based on a percentage of net assets. |
| 2 | This list is not a recommendation of any security by the investment adviser. |
| 3 | The holdings listed exclude any temporary liquidity investments. |
Schwab MarketTrack Portfolios | Annual Report
Schwab MarketTrack Growth Portfolioas of October 31, 2019
The Schwab MarketTrack Growth Portfolio(the fund) seeks high capital growth with less volatility than an all-stock portfolio. To pursue its goal, the fund maintains a defined asset allocation. The fund’s target allocation includes stock, bond, and cash investments. For the 12-month reporting period ended October 31, 2019, the fund remained close to the target allocations of 80% equity, 15% fixed income, and 5% cash and cash equivalents (including money market funds). The fund invests mainly in other Schwab Funds, including index funds, which seek to track the total returns of various market indices. For more information concerning the fund’s investment objective, strategies, and risks, please see the fund’s prospectus.
Market Highlights.Over the 12-month reporting period, global equity and fixed income markets generated positive returns. The U.S. economy maintained its steady growth in its tenth year of expansion, although at a declining pace. Outside the U.S., conditions softened, dampened by trade issues, slowing economic output, and geopolitical concerns. In response to the economic environment, to bolster growth, and to ensure stability given ongoing trade tensions, a number of central banks reduced their policy rates, including the U.S., while others maintained their generally low interest rates. Bond prices generally rose over the reporting period as yields fell.
Performance. For the 12-month reporting period ended October 31, 2019, the fund returned 9.86%. The fund’s custom blended comparative index, the Growth Composite Index (the composite index), returned 10.39%.
Positioning and Strategies. Over the reporting period, the fund’s asset allocations were broadly in line with those of the composite index.
The fund’s U.S. equity exposure provided the greatest contribution to total return, particularly among its large-cap positions. The Schwab S&P 500 Index Fund returned approximately 14.3% for the reporting period and was the fund’s top contributor, largely due to the Schwab S&P 500 Index Fund’s large position within the fund. On a relative basis, the Schwab S&P 500 Index Fund underperformed its comparative index, the S&P 500® Index only slightly. Another top contributor, the Schwab Fundamental US Large Company Index Fund, which returned approximately 10.6%, generally tracked its comparative index, the Russell RAFITM US Large Company Index, which returned approximately 10.8%.
The fund’s international equity allocations contributed positively to the fund’s total return. The fund’s position in the Schwab International Index Fund contributed positively to both total return and relative performance, returning approximately 11.3% for the reporting period. The Schwab Fundamental Emerging Markets Large Company Index Fund, which returned approximately 10.7%, contributed to absolute return, but underperformed the Russell RAFITM Emerging Markets Large Company Index, its comparative index, which returned approximately 11.5%, detracting from relative performance. The Schwab Fundamental International Large Company Index Fund contributed to total return and relative performance of the fund.
The fund’s fixed-income allocation also contributed to the fund’s total return with the Schwab U.S. Aggregate Bond Index Fund returning approximately 11.3%. The Schwab U.S. Aggregate Bond Index Fund slightly underperformed the Growth Composite Index’s U.S. fixed-income allocation component, the Bloomberg Barclays US Aggregate Bond Index, which returned approximately 11.5% in the same period.
Management views and portfolio holdings may have changed since the report date.
Schwab MarketTrack Portfolios | Annual Report
Schwab MarketTrack Growth Portfolio
Performance and Fund Factsas of October 31, 2019
The performance data quoted represents past performance. Past performance does not guarantee future results. Investment returns and principal value of an investment will fluctuate so that an investor’s shares may be worth more or less than their original cost. Current performance may be lower or higher than performance data quoted. To obtain performance information current to the most recent month end, please visitwww.schwabfunds.com/schwabfunds_prospectus.
Performance of Hypothetical $10,000 Investment (October 31, 2009 – October 31, 2019)1
Average Annual Total Returns1
| Fund and Inception Date | 1 Year | 5 Years | 10 Years |
| Fund: Schwab MarketTrack Growth Portfolio (11/20/95) | 9.86% | 6.70% | 9.25% |
| Growth Composite Index | 10.39% | 7.30% | 9.67% |
| S&P 500® Index | 14.33% | 10.78% | 13.70% |
| Bloomberg Barclays US Aggregate Bond Index | 11.51% | 3.24% | 3.73% |
| Fund Category: Morningstar Allocation—70% to 85% Equity2 | 9.88% | 5.66% | 8.64% |
| Fund Expense Ratio3: 0.51% |
All total returns on this page assume dividends and distributions were reinvested. Index figures do not include trading and management costs, which would lower performance. Indices are unmanaged and cannot be invested in directly. Performance results less than one year are not annualized.
The first index listed for the fund is the fund’s primary benchmark, as shown in the prospectus. Additional indices shown are provided for comparative purposes.
For index definitions, please see the Glossary.
| 1 | Fund expenses may have been partially absorbed by CSIM and its affiliates. Without these reductions, the fund’s returns would have been lower. These returns do not reflect the deduction of taxes that a shareholder would pay on fund distributions or the redemption of fund shares. |
| 2 | Source for category information: Morningstar, Inc. The Morningstar Category return represents all active and index mutual funds within the category as of the report date. |
| 3 | As stated in the prospectus. Includes 0.12% of acquired fund fees and expenses (AFFE), which are indirect expenses incurred by the fund through its investments in the underlying funds. Reflects the total annual fund operating expenses without contractual fee waivers. For actual expense ratios during the period, not including AFFE, refer to the financial highlights section of the financial statements. |
Schwab MarketTrack Portfolios | Annual Report
Schwab MarketTrack Growth Portfolio
Performance and Fund Factsas of October 31, 2019 (continued)
| Number of Holdings | 11 |
| Portfolio Turnover Rate | 7% |
Asset Class Weightings % of Investments1
Top Holdings % of Net Assets2,3
Portfolio holdings may have changed since the report date.
Small-company stocks are subject to greater volatility than many other asset classes.
International investments are subject to additional risks such as currency fluctuation, geopolitical risk and the potential for illiquid markets.
| 1 | The percentage may differ from the Portfolio Holdings because the above calculation is based on a percentage of total investments, whereas the calculation in the Portfolio Holdings is based on a percentage of net assets. |
| 2 | This list is not a recommendation of any security by the investment adviser. |
| 3 | The holdings listed exclude any temporary liquidity investments. |
Schwab MarketTrack Portfolios | Annual Report
Schwab MarketTrack Balanced Portfolioas of October 31, 2019
The Schwab MarketTrack Balanced Portfolio(the fund) seeks both capital growth and income. To pursue its goal, the fund maintains a defined asset allocation. The fund’s target allocation includes bond, stock, and cash investments. For the 12-month reporting period ended October 31, 2019, the fund remained close to the target allocations of 60% equity, 35% fixed income, and 5% cash and cash equivalents (including money market funds). The fund invests mainly in other Schwab Funds, including index funds, which seek to track the total returns of various market indices. For more information concerning the fund’s investment objective, strategies, and risks, please see the fund’s prospectus.
Market Highlights.Over the 12-month reporting period, global equity and fixed income markets generated positive returns. The U.S. economy maintained its steady growth in its tenth year of expansion, although at a declining pace. Outside the U.S., conditions softened, dampened by trade issues, slowing economic output, and geopolitical concerns. In response to the economic environment, to bolster growth, and to ensure stability given ongoing trade tensions, a number of central banks reduced their policy rates, including the U.S., while others maintained their generally low interest rates. Bond prices generally rose over the reporting period as yields fell.
Performance. For the 12-month reporting period ended October 31, 2019, the fund returned 10.14%. The fund’s custom blended comparative index, the Balanced Composite Index (the composite index), returned 10.78%.
Positioning and Strategies. Over the reporting period, the fund’s asset allocations were broadly in line with those of the composite index.
The fund’s U.S. equity exposure provided the greatest contribution to total return, particularly among its large-cap positions. The Schwab S&P 500 Index Fund returned approximately 14.3% for the reporting period and was the fund’s top contributor, largely due to the Schwab S&P 500 Index Fund’s large position within the fund. On a relative basis, the Schwab S&P 500 Index Fund underperformed its comparative index, the S&P 500® Index only slightly. Another top contributor, the Schwab Fundamental US Large Company Index Fund, which returned approximately 10.6%, generally tracked its comparative index, the Russell RAFITM US Large Company Index, which returned approximately 10.8%.
The fund’s fixed-income allocation was also a contributor to the fund’s total return with the Schwab U.S. Aggregate Bond Index Fund returning approximately 11.3%. The Schwab U.S. Aggregate Bond Index Fund slightly underperformed the Balanced Composite Index’s U.S. fixed-income allocation component, the Bloomberg Barclays US Aggregate Bond Index, which returned approximately 11.5% in the same period.
The fund’s international equity allocations contributed positively to the fund’s total return. The fund’s position in the Schwab Fundamental International Small Company Index Fund contributed positively to total return. The Schwab Fundamental International Large Company Index Fund, which returned approximately 7.0%, contributed to absolute return and outperformed its comparative index, the Russell RAFITM Developed ex US Large Company Index by 0.1%. The Schwab Fundamental Emerging Markets Large Company Index Fund, which returned approximately 10.7%, contributed to absolute return, but underperformed the Russell RAFITM Emerging Markets Large Company Index, its comparative index, which returned approximately 11.5%, detracting from relative performance.
Management views and portfolio holdings may have changed since the report date.
Schwab MarketTrack Portfolios | Annual Report
Schwab MarketTrack Balanced Portfolio
Performance and Fund Factsas of October 31, 2019
The performance data quoted represents past performance. Past performance does not guarantee future results. Investment returns and principal value of an investment will fluctuate so that an investor’s shares may be worth more or less than their original cost. Current performance may be lower or higher than performance data quoted. To obtain performance information current to the most recent month end, please visitwww.schwabfunds.com/schwabfunds_prospectus.
Performance of Hypothetical $10,000 Investment (October 31, 2009 – October 31, 2019)1
Average Annual Total Returns1
| Fund and Inception Date | 1 Year | 5 Years | 10 Years |
| Fund: Schwab MarketTrack Balanced Portfolio (11/20/95) | 10.14% | 5.74% | 7.76% |
| Balanced Composite Index | 10.78% | 6.35% | 8.24% |
| S&P 500® Index | 14.33% | 10.78% | 13.70% |
| Bloomberg Barclays US Aggregate Bond Index | 11.51% | 3.24% | 3.73% |
| Fund Category: Morningstar Allocation—50% to 70% Equity2 | 10.26% | 5.57% | 8.08% |
| Fund Expense Ratio3: 0.50% |
All total returns on this page assume dividends and distributions were reinvested. Index figures do not include trading and management costs, which would lower performance. Indices are unmanaged and cannot be invested in directly. Performance results less than one year are not annualized.
The first index listed for the fund is the fund’s primary benchmark, as shown in the prospectus. Additional indices shown are provided for comparative purposes.
For index definitions, please see the Glossary.
| 1 | Fund expenses may have been partially absorbed by CSIM and its affiliates. Without these reductions, the fund’s returns would have been lower. These returns do not reflect the deduction of taxes that a shareholder would pay on fund distributions or the redemption of fund shares. |
| 2 | Source for category information: Morningstar, Inc. The Morningstar Category return represents all active and index mutual funds within the category as of the report date. |
| 3 | As stated in the prospectus. Includes 0.10% of acquired fund fees and expenses (AFFE), which are indirect expenses incurred by the fund through its investments in the underlying funds. Reflects the total annual fund operating expenses without contractual fee waivers. For actual expense ratios during the period, not including AFFE, refer to the financial highlights section of the financial statements. |
Schwab MarketTrack Portfolios | Annual Report
Schwab MarketTrack Balanced Portfolio
Performance and Fund Factsas of October 31, 2019 (continued)
| Number of Holdings | 11 |
| Portfolio Turnover Rate | 11% |
Asset Class Weightings % of Investments1
Top Holdings % of Net Assets2,3
Portfolio holdings may have changed since the report date.
Small-company stocks are subject to greater volatility than many other asset classes.
International investments are subject to additional risks such as currency fluctuation, geopolitical risk and the potential for illiquid markets.
| 1 | The percentage may differ from the Portfolio Holdings because the above calculation is based on a percentage of total investments, whereas the calculation in the Portfolio Holdings is based on a percentage of net assets. |
| 2 | This list is not a recommendation of any security by the investment adviser. |
| 3 | The holdings listed exclude any temporary liquidity investments. |
Schwab MarketTrack Portfolios | Annual Report
Schwab MarketTrack Conservative Portfolioas of October 31, 2019
The Schwab MarketTrack Conservative Portfolio(the fund) seeks income and more growth potential than an all-bond portfolio. To pursue its goal, the fund maintains a defined asset allocation. The fund’s target allocation includes bond, stock, and cash investments. For the 12-month reporting period ended October 31, 2019, the fund remained close to the target allocations of 55% fixed income, 40% equity, and 5% cash and cash equivalents (including money market funds). The fund invests mainly in other Schwab Funds, including index funds, which seek to track the total returns of various market indices. For more information concerning the fund’s investment objective, strategies, and risks, please see the fund’s prospectus.
Market Highlights.Over the 12-month reporting period, global equity and fixed income markets generated positive returns. The U.S. economy maintained its steady growth in its tenth year of expansion, although at a declining pace. Outside the U.S., conditions softened, dampened by trade issues, slowing economic output, and geopolitical concerns. In response to the economic environment, to bolster growth, and to ensure stability given ongoing trade tensions, a number of central banks reduced their policy rates, including the U.S., while others maintained their generally low interest rates. Bond prices generally rose over the reporting period as yields fell.
Performance. For the 12-month reporting period ended October 31, 2019, the fund returned 10.31%. The fund’s custom blended comparative index, the Conservative Composite Index (the composite index), returned 11.02%.
Positioning and Strategies. Over the reporting period, the fund’s asset allocations were broadly in line with those of the composite index.
The fund’s fixed-income allocation, the Schwab U.S. Aggregate Bond Index Fund, was the largest contributor to the fund’s total return. The Schwab U.S. Aggregate Bond Index Fund returned approximately 11.3%, underperforming the Bloomberg Barclays US Aggregate Bond Index, the composite index’s underlying bond component, for the same period.
The fund’s U.S. equity exposure positively contributed to total return, particularly among its large-cap positions. The Schwab S&P 500 Index Fund returned approximately 14.3% for the reporting period. The Schwab S&P 500 Index Fund generally tracked its comparative index, the S&P 500® Index. Another top contributor, the Schwab Fundamental US Large Company Index Fund, which returned approximately 10.6%, generally tracked its comparative index, the Russell RAFITM US Large Company Index, which returned approximately 10.8%.
The fund’s international equity allocations contributed to the fund’s total return. The fund’s position in the Schwab International Index Fund contributed to total return for the fund. The Schwab International Index Fund returned approximately 11.3%. The Schwab Fundamental Emerging Markets Large Company Index Fund, returning approximately 10.7% contributed to absolute return, but underperformed the Russell RAFITM Emerging Markets Large Company Index, its comparative index, which returned approximately 11.5%, detracting from relative performance. The Schwab Fundamental International Large Company Index Fund contributed to total return and relative performance of the fund.
Management views and portfolio holdings may have changed since the report date.
Schwab MarketTrack Portfolios | Annual Report
Schwab MarketTrack Conservative Portfolio
Performance and Fund Factsas of October 31, 2019
The performance data quoted represents past performance. Past performance does not guarantee future results. Investment returns and principal value of an investment will fluctuate so that an investor’s shares may be worth more or less than their original cost. Current performance may be lower or higher than performance data quoted. To obtain performance information current to the most recent month end, please visitwww.schwabfunds.com/schwabfunds_prospectus.
Performance of Hypothetical $10,000 Investment (October 31, 2009 – October 31, 2019)1
Average Annual Total Returns1
| Fund and Inception Date | 1 Year | 5 Years | 10 Years |
| Fund: Schwab MarketTrack Conservative Portfolio (11/20/95) | 10.31% | 4.68% | 6.16% |
| Conservative Composite Index | 11.02% | 5.34% | 6.74% |
| S&P 500® Index | 14.33% | 10.78% | 13.70% |
| Bloomberg Barclays US Aggregate Bond Index | 11.51% | 3.24% | 3.73% |
| Fund Category: Morningstar Allocation—30% to 50% Equity2 | 9.38% | 4.15% | 6.34% |
| Fund Expense Ratio3: 0.49% |
All total returns on this page assume dividends and distributions were reinvested. Index figures do not include trading and management costs, which would lower performance. Indices are unmanaged and cannot be invested in directly. Performance results less than one year are not annualized.
The first index listed for the fund is the fund’s primary benchmark, as shown in the prospectus. Additional indices shown are provided for comparative purposes.
For index definitions, please see the Glossary.
| 1 | Fund expenses may have been partially absorbed by CSIM and its affiliates. Without these reductions, the fund’s returns would have been lower. These returns do not reflect the deduction of taxes that a shareholder would pay on fund distributions or the redemption of fund shares. |
| 2 | Source for category information: Morningstar, Inc. The Morningstar Category return represents all active and index mutual funds within the category as of the report date. |
| 3 | As stated in the prospectus. Includes 0.08% of acquired fund fees and expenses (AFFE), which are indirect expenses incurred by the fund through its investments in the underlying funds. Reflects the total annual fund operating expenses without contractual fee waivers. For actual expense ratios during the period, not including AFFE, refer to the financial highlights section of the financial statements. |
Schwab MarketTrack Portfolios | Annual Report
Schwab MarketTrack Conservative Portfolio
Performance and Fund Factsas of October 31, 2019 (continued)
| Number of Holdings | 11 |
| Portfolio Turnover Rate | 26% |
Asset Class Weightings % of Investments1
Top Holdings % of Net Assets2,3
Portfolio holdings may have changed since the report date.
Small-company stocks are subject to greater volatility than many other asset classes.
International investments are subject to additional risks such as currency fluctuation, geopolitical risk and the potential for illiquid markets.
| 1 | The percentage may differ from the Portfolio Holdings because the above calculation is based on a percentage of total investments, whereas the calculation in the Portfolio Holdings is based on a percentage of net assets. |
| 2 | This list is not a recommendation of any security by the investment adviser. |
| 3 | The holdings listed exclude any temporary liquidity investments. |
Schwab MarketTrack Portfolios | Annual Report
Schwab MarketTrack Portfolios
Examples for a $1,000 Investment
As a fund shareholder, you may incur two types of costs: (1) transaction costs; and (2) ongoing costs, including management fees, transfer agent and shareholder services fees, and other fund expenses.
The expense examples below are intended to help you understand your ongoing cost (in dollars) of investing in a fund and to compare this cost with the ongoing cost of investing in other mutual funds. These examples are based on an investment of $1,000 invested for six months beginning May 1, 2019 and held through October 31, 2019.
Actual Return lines in the table below provide information about actual account values and actual expenses. You may use this information, together with the amount you invested, to estimate the expenses that you paid over the period. To do so, simply divide your account value by $1,000 (for example, an $8,600 account value ÷ $1,000 = 8.6), then multiply the result by the number given for your fund under the heading entitled “Expenses Paid During Period.”
Hypothetical Return lines in the table below provide information about hypothetical account values and hypothetical expenses based on a fund’s actual expense ratio and an assumed return of 5% per year before expenses. Because the return used is not an actual return, it may not be used to estimate the actual ending account value or expenses you paid for the period.
You may use this information to compare the ongoing costs of investing in a fund and other funds. To do so, compare this 5% hypothetical example with the 5% hypothetical examples that appear in the shareholder reports of the other funds.
Please note that the expenses shown in the table are meant to highlight your ongoing costs only, and do not reflect any transactional costs. Therefore, the hypothetical return lines of the table are useful in comparing ongoing costs only, and will not help you determine the relative total costs of owning different funds. In addition, if these transactional costs were included, your costs would have been higher.
| | Expense Ratio
(Annualized)1,2 | Effective
Expense Ratio
(Annualized)3,4 | Beginning
Account Value
at 5/1/19 | Ending
Account Value
(Net of Expenses)
at 10/31/19 | Expenses Paid
During Period
5/1/19-10/31/192,5 | Effective
Expenses Paid
During Period
5/1/19-10/31/194,5 |
| Schwab MarketTrack All Equity Portfolio | | | | | | |
| Actual Return | 0.40% | 0.53% | $1,000.00 | $1,020.80 | $2.04 | $2.70 |
| Hypothetical 5% Return | 0.40% | 0.53% | $1,000.00 | $1,023.18 | $2.04 | $2.70 |
| Schwab MarketTrack Growth Portfolio | | | | | | |
| Actual Return | 0.40% | 0.51% | $1,000.00 | $1,026.20 | $2.04 | $2.60 |
| Hypothetical 5% Return | 0.40% | 0.51% | $1,000.00 | $1,023.18 | $2.04 | $2.60 |
| Schwab MarketTrack Balanced Portfolio | | | | | | |
| Actual Return | 0.40% | 0.50% | $1,000.00 | $1,033.10 | $2.05 | $2.56 |
| Hypothetical 5% Return | 0.40% | 0.50% | $1,000.00 | $1,023.18 | $2.04 | $2.55 |
| Schwab MarketTrack Conservative Portfolio | | | | | | |
| Actual Return | 0.43% | 0.51% | $1,000.00 | $1,039.90 | $2.21 | $2.62 |
| Hypothetical 5% Return | 0.43% | 0.51% | $1,000.00 | $1,023.03 | $2.19 | $2.60 |
| 1 | Based on the most recent six-month expense ratio; may differ from the expense ratio provided in the Financial Highlights which covers a 12-month period. |
| 2 | Excludes acquired fund fees and expenses, which are indirect expenses incurred by the fund through its investments in underlying funds. |
| 3 | Based on the most recent six-month acquired fund fees and expense ratio; may differ from the acquired fund fees and expenses ratios in the prospectus. |
| 4 | Includes acquired fund fees and expenses, which are indirect expenses incurred by the fund through its investments in underlying funds. |
| 5 | Expenses for each portfolio are equal to its annualized expense ratio, multiplied by the average account value over the period, multiplied by the 184 days of the period, and divided by the 365 days of the fiscal year. |
Schwab MarketTrack Portfolios | Annual Report
Schwab MarketTrack All Equity Portfolio
Financial Statements
Financial Highlights
| | 11/1/18–
10/31/19 | 11/1/17–
10/31/18 | 11/1/16–
10/31/17 | 11/1/15–
10/31/16 | 11/1/14–
10/31/15 | |
| Per-Share Data |
| Net asset value at beginning of period | $18.33 | $18.76 | $15.90 | $17.00 | $17.17 | |
| Income (loss) from investment operations: | | | | | | |
| Net investment income (loss)1 | 0.31 | 0.28 | 0.27 | 0.27 | 0.29 | |
| Net realized and unrealized gains (losses) | 1.30 | (0.05) | 3.33 | 0.31 | (0.23) | |
| Total from investment operations | 1.61 | 0.23 | 3.60 | 0.58 | 0.06 | |
| Less distributions: | | | | | | |
| Distributions from net investment income | (0.36) | (0.33) | (0.30) | (0.53) | (0.23) | |
| Distributions from net realized gains | (0.43) | (0.33) | (0.44) | (1.15) | — | |
| Total distributions | (0.79) | (0.66) | (0.74) | (1.68) | (0.23) | |
| Net asset value at end of period | $19.15 | $18.33 | $18.76 | $15.90 | $17.00 | |
| Total return | 9.58% | 1.10% | 23.33% | 3.99% | 0.36% | |
| Ratios/Supplemental Data |
| Ratios to average net assets: | | | | | | |
| Net operating expenses2 | 0.40% | 0.39% | 0.40% | 0.41% | 0.42%3 | |
| Gross operating expenses2 | 0.40% | 0.39% | 0.40% | 0.42% | 0.43%3 | |
| Net investment income (loss) | 1.72% | 1.46% | 1.56% | 1.73% | 1.67% | |
| Portfolio turnover rate | 6% | 5% | 5% | 6% | 42%4 | |
| Net assets, end of period (x 1,000,000) | $691 | $660 | $662 | $553 | $578 | |
| |
1
Calculated based on the average shares outstanding during the period.
2
The expenses incurred by underlying funds in which the fund invests are not included in this ratio.
3
Effective December 1, 2014, the management fee was reduced. The ratio presented for the period ended 10/31/15 is a blended ratio.
4
The portfolio turnover rate increased due to the addition of Schwab Fundamental Index Funds to the portfolio during the period.
Schwab MarketTrack Portfolios | Annual Report
Schwab MarketTrack All Equity Portfolio
Portfolio Holdings as of October 31, 2019
This section shows all the securities in the fund’s portfolio and their values as of the report date.
The fund files its complete schedule of portfolio holdings with the U.S. Securities and Exchange Commission (SEC) for the first and third quarters of each fiscal year on Form N-Q. Effective March 31, 2019, Form N-PORT Part F has replaced Form N-Q. The fund’s Form N-Q and Form N-PORT Part F are available on the SEC’s website atwww.sec.gov. The fund also makes available its complete schedule of portfolio holdings 15 to 20 days after the end of the month on the fund’s website atwww.schwabfunds.com/schwabfunds_prospectus.
| Security | Number
of Shares | Value ($) |
| Affiliated Underlying Funds99.5% of net assets |
| |
| Equity Funds 99.5% |
| International 29.9% |
| Schwab Fundamental Emerging Markets Large Company Index Fund | 3,734,400 | 34,543,201 |
| Schwab Fundamental International Large Company Index Fund | 4,492,862 | 40,345,903 |
| Schwab Fundamental International Small Company Index Fund | 2,797,329 | 35,162,430 |
| Schwab International Index Fund | 4,710,117 | 96,463,199 |
| | | 206,514,733 |
| Large-Cap 44.9% |
| Schwab Fundamental US Large Company Index Fund | 5,309,192 | 93,229,404 |
| Schwab S&P 500 Index Fund | 4,604,763 | 217,206,651 |
| | | 310,436,055 |
| Small-Cap 24.7% |
| Schwab Fundamental US Small Company Index Fund | 3,670,006 | 50,829,585 |
| Schwab Small-Cap Index Fund | 4,156,831 | 119,883,006 |
| | | 170,712,591 |
| Total Affiliated Underlying Funds |
| (Cost $430,281,981) | | 687,663,379 |
Issuer
Rate, Maturity Date | Face
Amount ($) | Value ($) |
| Short-Term Investment0.2% of net assets |
| |
| Time Deposit 0.2% |
| JPMorgan Chase Bank |
| 1.18%, 11/01/19(a) | 1,384,594 | 1,384,594 |
| Total Short-Term Investment |
| (Cost $1,384,594) | | 1,384,594 |
| (a) | The rate shown is the current daily overnight rate. |
Schwab MarketTrack Portfolios | Annual Report
Schwab MarketTrack All Equity Portfolio
Portfolio Holdings as of October 31, 2019 (continued)
Below is a summary of the fund’s transactions with its affiliated underlying funds during the period ended October 31, 2019:
| Affiliated Underlying Funds | Market
Value at
10/31/18 | Gross
Purchases | Gross
Sales | Realized
Gains (Losses) | Net Change
in Unrealized
Appreciation
(depreciation) | Market
Value at
10/31/19 | Balance
of Shares
Held at
10/31/19 | Distributions
Received* |
| Schwab Fundamental Emerging Markets Large Company Index Fund | $33,572,556 | $896,449 | ($2,360,000) | ($165,234) | $2,599,430 | $34,543,201 | 3,734,400 | $896,449 |
| Schwab Fundamental International Large Company Index Fund | 39,820,414 | 2,093,428 | (3,000,000) | (255,949) | 1,688,010 | 40,345,903 | 4,492,862 | 1,273,428 |
| Schwab Fundamental International Small Company Index Fund | 32,238,329 | 3,925,261 | (950,000) | (243,107) | 191,947 | 35,162,430 | 2,797,329 | 1,695,261 |
| Schwab Fundamental US Large Company Index Fund | 90,200,058 | 7,277,962 | (6,279,000) | 621,431 | 1,408,953 | 93,229,404 | 5,309,192 | 7,277,962 |
| Schwab Fundamental US Small Company Index Fund | 48,867,947 | 4,511,963 | (784,000) | (60,915) | (1,705,410) | 50,829,585 | 3,670,006 | 4,511,963 |
| Schwab International Index Fund | 91,593,031 | 3,180,692 | (5,385,000) | (666,431) | 7,740,907 | 96,463,199 | 4,710,117 | 2,610,692 |
| Schwab S&P 500 Index Fund | 208,352,966 | 4,987,298 | (19,284,000) | 8,481,515 | 14,668,872 | 217,206,651 | 4,604,763 | 4,987,297 |
| Schwab Small-Cap Index Fund | 112,162,092 | 13,913,861 | (2,720,000) | (325,250) | (3,147,697) | 119,883,006 | 4,156,831 | 9,463,861 |
| Total | $656,807,393 | $40,786,914 | ($40,762,000) | $7,386,060 | $23,445,012 | $687,663,379 | | $32,716,913 |
| * | Distributions received include distributions from net investment income and capital gains, if any, from the underlying funds. |
| | |
The following is a summary of the inputs used to value the fund’s investments as of October 31, 2019 (see financial note 2(a) for additional information):
| Description | Quoted Prices in
Active Markets for
Identical Assets
(Level 1) | Other Significant
Observable Inputs
(Level 2) | Significant
Unobservable Inputs
(Level 3) | Total | |
| Assets | | | | | |
| Affiliated Underlying Funds1 | $687,663,379 | $— | $— | $687,663,379 | |
| Short-Term Investment1 | — | 1,384,594 | — | 1,384,594 | |
| Total | $687,663,379 | $1,384,594 | $— | $689,047,973 | |
| 1 | As categorized in Portfolio Holdings. |
Fund investments in underlying mutual funds are classified as Level 1, without consideration to the classification level of the investments held by the underlying mutual funds, which could be Level 1, Level 2 or Level 3.
Schwab MarketTrack Portfolios | Annual Report
Schwab MarketTrack All Equity Portfolio
Statement of Assets and Liabilities
As of October 31, 2019
| Assets |
| Investments in affiliated underlying funds, at value (cost $430,281,981) | | $687,663,379 |
| Investments in unaffiliated issuers, at value (cost $1,384,594) | | 1,384,594 |
| Receivables: | | |
| Investments sold | | 2,825,000 |
| Fund shares sold | | 326,772 |
| Prepaid expenses | + | 14,138 |
| Total assets | | 692,213,883 |
| Liabilities |
| Payables: | | |
| Investments bought | | 1,000,000 |
| Investment adviser and administrator fees | | 74,547 |
| Shareholder service fees | | 136,775 |
| Independent trustees’ fees | | 8 |
| Fund shares redeemed | | 140,950 |
| Accrued expenses | + | 60,780 |
| Total liabilities | | 1,413,060 |
| Net Assets |
| Total assets | | 692,213,883 |
| Total liabilities | – | 1,413,060 |
| Net assets | | $690,800,823 |
| Net Assets by Source | | |
| Capital received from investors | | 416,645,305 |
| Total distributable earnings | | 274,155,518 |
| Net Asset Value (NAV) |
| Net Assets | ÷ | Shares
Outstanding | = | NAV |
| $690,800,823 | | 36,069,760 | | $19.15 |
| | | | | |
Schwab MarketTrack Portfolios | Annual Report
Schwab MarketTrack All Equity Portfolio
Statement of Operations
For the period November 1, 2018 through October 31, 2019
| Investment Income |
| Dividends received from affiliated underlying funds | | $14,041,671 |
| Interest | + | 38,108 |
| Total investment income | | 14,079,779 |
| Expenses |
| Investment adviser and administrator fees | | 864,086 |
| Shareholder service fees | | 1,584,995 |
| Shareholder reports | | 64,017 |
| Registration fees | | 31,489 |
| Portfolio accounting fees | | 30,793 |
| Professional fees | | 30,721 |
| Transfer agent fees | | 21,137 |
| Independent trustees’ fees | | 11,302 |
| Custodian fees | | 3,829 |
| Other expenses | + | 11,995 |
| Total expenses | | 2,654,364 |
| Expense reduction by CSIM and its affiliates | – | 21,137 |
| Net expenses | – | 2,633,227 |
| Net investment income | | 11,446,552 |
| Realized and Unrealized Gains (Losses) |
| Realized capital gain distributions received from affiliated underlying funds | | 18,675,242 |
| Net realized gains on sales of affiliated underlying funds | + | 7,386,060 |
| Net realized gains | | 26,061,302 |
| Net change in unrealized appreciation (depreciation) on affiliated underlying funds | + | 23,445,012 |
| Net realized and unrealized gains | | 49,506,314 |
| Increase in net assets resulting from operations | | $60,952,866 |
Schwab MarketTrack Portfolios | Annual Report
Schwab MarketTrack All Equity Portfolio
Statement of Changes in Net Assets
For the current and prior report periods
| Operations | |
| | 11/1/18-10/31/19 | 11/1/17-10/31/18 |
| Net investment income | | $11,446,552 | $10,107,191 |
| Net realized gains | | 26,061,302 | 16,621,580 |
| Net change in unrealized appreciation (depreciation) | + | 23,445,012 | (18,821,693) |
| Increase in net assets from operations | | 60,952,866 | 7,907,078 |
| Distributions to Shareholders | |
| Total distributions | | ($28,006,553) | ($23,113,418) |
| Transactions in Fund Shares | | | |
| | | 11/1/18-10/31/19 | 11/1/17-10/31/18 |
| | | SHARES | VALUE | SHARES | VALUE |
| Shares sold | | 3,457,644 | $62,047,856 | 3,946,287 | $75,536,801 |
| Shares reinvested | | 1,580,131 | 25,376,894 | 1,116,238 | 21,029,930 |
| Shares redeemed | + | (4,966,158) | (89,453,708) | (4,340,184) | (83,234,422) |
| Net transactions in fund shares | | 71,617 | ($2,028,958) | 722,341 | $13,332,309 |
| Shares Outstanding and Net Assets | | | |
| | | 11/1/18-10/31/19 | 11/1/17-10/31/18 |
| | | SHARES | NET ASSETS | SHARES | NET ASSETS |
| Beginning of period | | 35,998,143 | $659,883,468 | 35,275,802 | $661,757,499 |
| Total increase or decrease | + | 71,617 | 30,917,355 | 722,341 | (1,874,031) |
| End of period | | 36,069,760 | $690,800,823 | 35,998,143 | $659,883,468 |
Schwab MarketTrack Portfolios | Annual Report
Schwab MarketTrack Growth Portfolio
Financial Statements
Financial Highlights
| | 11/1/18–
10/31/19 | 11/1/17–
10/31/18 | 11/1/16–
10/31/17 | 11/1/15–
10/31/16 | 11/1/14–
10/31/15 | |
| Per-Share Data |
| Net asset value at beginning of period | $22.67 | $23.47 | $20.54 | $22.68 | $23.20 | |
| Income (loss) from investment operations: | | | | | | |
| Net investment income (loss)1 | 0.41 | 0.37 | 0.34 | 0.32 | 0.34 | |
| Net realized and unrealized gains (losses) | 1.62 | (0.04) | 3.37 | 0.41 | (0.12) | |
| Total from investment operations | 2.03 | 0.33 | 3.71 | 0.73 | 0.22 | |
| Less distributions: | | | | | | |
| Distributions from net investment income | (0.45) | (0.40) | (0.36) | (0.39) | (0.35) | |
| Distributions from net realized gains | (0.71) | (0.73) | (0.42) | (2.48) | (0.39) | |
| Total distributions | (1.16) | (1.13) | (0.78) | (2.87) | (0.74) | |
| Net asset value at end of period | $23.54 | $22.67 | $23.47 | $20.54 | $22.68 | |
| Total return | 9.86% | 1.28% | 18.52% | 3.88% | 0.95% | |
| Ratios/Supplemental Data |
| Ratios to average net assets: | | | | | | |
| Net operating expenses2 | 0.40% | 0.39% | 0.40% | 0.41% | 0.42%3 | |
| Gross operating expenses2 | 0.40% | 0.39% | 0.40% | 0.41% | 0.42%3 | |
| Net investment income (loss) | 1.82% | 1.59% | 1.57% | 1.61% | 1.50% | |
| Portfolio turnover rate | 7% | 7% | 20%4 | 12% | 36%5 | |
| Net assets, end of period (x 1,000,000) | $817 | $783 | $804 | $707 | $716 | |
| |
1
Calculated based on the average shares outstanding during the period.
2
The expenses incurred by underlying funds in which the fund invests are not included in this ratio.
3
Effective December 1, 2014, the management fee was reduced. The ratio presented for the period ended 10/31/15 is a blended ratio.
4
The portfolio turnover rate increased due to the in-kind transactions relating to Schwab Total Bond Market Fund and Schwab U.S. Aggregate Bond Index Fund. For comparison purposes, the portfolio turnover rate would have been 6% without including these transactions. There were no transaction costs associated with these transactions.
5
The portfolio turnover rate increased due to the addition of Schwab Fundamental Index Funds to the portfolio during the period.
Schwab MarketTrack Portfolios | Annual Report
Schwab MarketTrack Growth Portfolio
Portfolio Holdings as of October 31, 2019
This section shows all the securities in the fund’s portfolio and their values as of the report date.
The fund files its complete schedule of portfolio holdings with the U.S. Securities and Exchange Commission (SEC) for the first and third quarters of each fiscal year on Form N-Q. Effective March 31, 2019, Form N-PORT Part F has replaced Form N-Q. The fund’s Form N-Q and Form N-PORT Part F are available on the SEC’s website atwww.sec.gov. The fund also makes available its complete schedule of portfolio holdings 15 to 20 days after the end of the month on the fund’s website atwww.schwabfunds.com/schwabfunds_prospectus.
| Security | Number
of Shares | Value ($) |
| Affiliated Underlying Funds99.2% of net assets |
| |
| Equity Funds 80.3% |
| International 20.1% |
| Schwab Fundamental Emerging Markets Large Company Index Fund | 3,071,731 | 28,413,513 |
| Schwab Fundamental International Large Company Index Fund | 3,667,966 | 32,938,332 |
| Schwab Fundamental International Small Company Index Fund | 2,144,841 | 26,960,646 |
| Schwab International Index Fund | 3,682,149 | 75,410,421 |
| | | 163,722,912 |
| Large-Cap 40.2% |
| Schwab Fundamental US Large Company Index Fund | 5,626,503 | 98,801,392 |
| Schwab S&P 500 Index Fund | 4,865,714 | 229,515,716 |
| | | 328,317,108 |
| Small-Cap 20.0% |
| Schwab Fundamental US Small Company Index Fund | 3,514,849 | 48,680,656 |
| Schwab Small-Cap Index Fund | 3,976,028 | 114,668,640 |
| | | 163,349,296 |
| | | 655,389,316 |
| |
| Security | Number
of Shares | Value ($) |
| Fixed-Income Funds 14.8% |
| Intermediate-Term Bond 14.8% |
| Schwab U.S. Aggregate Bond Index Fund | 11,634,795 | 120,769,170 |
| |
| Money Market Fund 4.1% |
| Schwab Variable Share Price Money Fund, Ultra Shares 1.85%(a) | 33,634,189 | 33,651,006 |
| Total Affiliated Underlying Funds |
| (Cost $506,245,604) | | 809,809,492 |
Issuer
Rate, Maturity Date | Face
Amount ($) | Value ($) |
| Short-Term Investment0.7% of net assets |
| |
| Time Deposit 0.7% |
| JPMorgan Chase Bank |
| 1.18%, 11/01/19(b) | 5,890,360 | 5,890,360 |
| Total Short-Term Investment |
| (Cost $5,890,360) | | 5,890,360 |
| (a) | The rate shown is the 7-day yield. |
| (b) | The rate shown is the current daily overnight rate. |
Schwab MarketTrack Portfolios | Annual Report
Schwab MarketTrack Growth Portfolio
Portfolio Holdings as of October 31, 2019 (continued)
Below is a summary of the fund’s transactions with its affiliated underlying funds during the period ended October 31, 2019:
| Affiliated Underlying Funds | Market
Value at
10/31/18 | Gross
Purchases | Gross
Sales | Realized
Gains (Losses) | Net Change
in Unrealized
Appreciation
(depreciation) | Market
Value at
10/31/19 | Balance
of Shares
Held at
10/31/19 | Distributions
Received* |
| Schwab Fundamental Emerging Markets Large Company Index Fund | $25,765,192 | $1,427,990 | ($780,000) | ($73,066) | $2,073,397 | $28,413,513 | 3,071,731 | $717,989 |
| Schwab Fundamental International Large Company Index Fund | 30,771,226 | 984,042 | — | — | 1,183,064 | 32,938,332 | 3,667,966 | 984,042 |
| Schwab Fundamental International Small Company Index Fund | 24,877,126 | 2,033,491 | — | — | 50,029 | 26,960,646 | 2,144,841 | 1,263,491 |
| Schwab Fundamental US Large Company Index Fund | 95,587,664 | 8,823,641 | (7,999,000) | 945,166 | 1,443,921 | 98,801,392 | 5,626,503 | 7,603,642 |
| Schwab Fundamental US Small Company Index Fund | 46,890,348 | 5,659,372 | (2,400,000) | 96,838 | (1,565,902) | 48,680,656 | 3,514,849 | 4,329,372 |
| Schwab International Index Fund | 72,574,847 | 2,112,310 | (5,180,000) | (136,306) | 6,039,570 | 75,410,421 | 3,682,149 | 2,112,310 |
| Schwab S&P 500 Index Fund | 220,200,992 | 7,065,981 | (22,925,000) | 12,378,211 | 12,795,532 | 229,515,716 | 4,865,714 | 5,315,981 |
| Schwab Small-Cap Index Fund | 106,358,837 | 18,610,763 | (7,230,000) | 531 | (3,071,491) | 114,668,640 | 3,976,028 | 9,549,763 |
| Schwab U.S. Aggregate Bond Index Fund | 121,579,007 | 11,187,570 | (21,330,000) | (322,393) | 9,654,986 | 120,769,170 | 11,634,795 | 3,497,720 |
| Schwab Variable Share Price Money Fund, Ultra Shares | 36,854,941 | 786,056 | (4,000,000) | (404) | 10,413 | 33,651,006 | 33,634,189 | 778,093 |
| Total | $781,460,180 | $58,691,216 | ($71,844,000) | $12,888,577 | $28,613,519 | $809,809,492 | | $36,152,403 |
| * | Distributions received include distributions from net investment income and capital gains, if any, from the underlying funds. |
| | |
The following is a summary of the inputs used to value the fund’s investments as of October 31, 2019 (see financial note 2(a) for additional information):
| Description | Quoted Prices in
Active Markets for
Identical Assets
(Level 1) | Other Significant
Observable Inputs
(Level 2) | Significant
Unobservable Inputs
(Level 3) | Total | |
| Assets | | | | | |
| Affiliated Underlying Funds1 | $809,809,492 | $— | $— | $809,809,492 | |
| Short-Term Investment1 | — | 5,890,360 | — | 5,890,360 | |
| Total | $809,809,492 | $5,890,360 | $— | $815,699,852 | |
| 1 | As categorized in Portfolio Holdings. |
Fund investments in underlying mutual funds are classified as Level 1, without consideration to the classification level of the investments held by the underlying mutual funds, which could be Level 1, Level 2 or Level 3.
Schwab MarketTrack Portfolios | Annual Report
Schwab MarketTrack Growth Portfolio
Statement of Assets and Liabilities
As of October 31, 2019
| Assets |
| Investments in affiliated underlying funds, at value (cost $506,245,604) | | $809,809,492 |
| Investments in unaffiliated issuers, at value (cost $5,890,360) | | 5,890,360 |
| Receivables: | | |
| Investments sold | | 1,300,000 |
| Dividends | | 315,611 |
| Fund shares sold | | 223,870 |
| Prepaid expenses | + | 20,665 |
| Total assets | | 817,559,998 |
| Liabilities |
| Payables: | | |
| Investments bought | | 285,914 |
| Investment adviser and administrator fees | | 88,708 |
| Shareholder service fees | | 164,409 |
| Independent trustees’ fees | | 9 |
| Fund shares redeemed | | 427,601 |
| Accrued expenses | + | 61,740 |
| Total liabilities | | 1,028,381 |
| Net Assets |
| Total assets | | 817,559,998 |
| Total liabilities | – | 1,028,381 |
| Net assets | | $816,531,617 |
| Net Assets by Source | | |
| Capital received from investors | | 482,122,884 |
| Total distributable earnings | | 334,408,733 |
| Net Asset Value (NAV) |
| Net Assets | ÷ | Shares
Outstanding | = | NAV |
| $816,531,617 | | 34,690,701 | | $23.54 |
| | | | | |
Schwab MarketTrack Portfolios | Annual Report
Schwab MarketTrack Growth Portfolio
Statement of Operations
For the period November 1, 2018 through October 31, 2019
| Investment Income |
| Dividends received from affiliated underlying funds | | $17,500,305 |
| Interest | + | 79,515 |
| Total investment income | | 17,579,820 |
| Expenses |
| Investment adviser and administrator fees | | 1,029,558 |
| Shareholder service fees | | 1,905,579 |
| Shareholder reports | | 74,271 |
| Registration fees | | 34,392 |
| Portfolio accounting fees | | 32,486 |
| Professional fees | | 31,568 |
| Transfer agent fees | | 19,806 |
| Independent trustees’ fees | | 11,948 |
| Custodian fees | | 4,508 |
| Other expenses | + | 13,971 |
| Total expenses | | 3,158,087 |
| Expense reduction by CSIM and its affiliates | – | 19,806 |
| Net expenses | – | 3,138,281 |
| Net investment income | | 14,441,539 |
| Realized and Unrealized Gains (Losses) |
| Realized capital gain distributions received from affiliated underlying funds | | 18,652,098 |
| Net realized gains on sales of affiliated underlying funds | + | 12,888,577 |
| Net realized gains | | 31,540,675 |
| Net change in unrealized appreciation (depreciation) on affiliated underlying funds | + | 28,613,519 |
| Net realized and unrealized gains | | 60,154,194 |
| Increase in net assets resulting from operations | | $74,595,733 |
Schwab MarketTrack Portfolios | Annual Report
Schwab MarketTrack Growth Portfolio
Statement of Changes in Net Assets
For the current and prior report periods
| Operations | |
| | 11/1/18-10/31/19 | 11/1/17-10/31/18 |
| Net investment income | | $14,441,539 | $13,006,391 |
| Net realized gains | | 31,540,675 | 25,553,974 |
| Net change in unrealized appreciation (depreciation) | + | 28,613,519 | (27,570,228) |
| Increase in net assets from operations | | 74,595,733 | 10,990,137 |
| Distributions to Shareholders | |
| Total distributions | | ($39,927,176) | ($38,389,944) |
| Transactions in Fund Shares | | | |
| | | 11/1/18-10/31/19 | 11/1/17-10/31/18 |
| | | SHARES | VALUE | SHARES | VALUE |
| Shares sold | | 2,937,909 | $65,107,948 | 3,428,769 | $80,690,535 |
| Shares reinvested | | 1,829,307 | 36,750,784 | 1,546,820 | 35,762,481 |
| Shares redeemed | + | (4,611,016) | (102,839,073) | (4,688,229) | (110,009,491) |
| Net transactions in fund shares | | 156,200 | ($980,341) | 287,360 | $6,443,525 |
| Shares Outstanding and Net Assets | | | |
| | | 11/1/18-10/31/19 | 11/1/17-10/31/18 |
| | | SHARES | NET ASSETS | SHARES | NET ASSETS |
| Beginning of period | | 34,534,501 | $782,843,401 | 34,247,141 | $803,799,683 |
| Total increase or decrease | + | 156,200 | 33,688,216 | 287,360 | (20,956,282) |
| End of period | | 34,690,701 | $816,531,617 | 34,534,501 | $782,843,401 |
Schwab MarketTrack Portfolios | Annual Report
Schwab MarketTrack Balanced Portfolio
Financial Statements
Financial Highlights
| | 11/1/18–
10/31/19 | 11/1/17–
10/31/18 | 11/1/16–
10/31/17 | 11/1/15–
10/31/16 | 11/1/14–
10/31/15 | |
| Per-Share Data |
| Net asset value at beginning of period | $18.24 | $19.12 | $17.35 | $19.07 | $19.50 | |
| Income (loss) from investment operations: | | | | | | |
| Net investment income (loss)1 | 0.36 | 0.34 | 0.30 | 0.27 | 0.29 | |
| Net realized and unrealized gains (losses) | 1.32 | (0.24) | 2.02 | 0.35 | (0.08) | |
| Total from investment operations | 1.68 | 0.10 | 2.32 | 0.62 | 0.21 | |
| Less distributions: | | | | | | |
| Distributions from net investment income | (0.39) | (0.33) | (0.30) | (0.33) | (0.30) | |
| Distributions from net realized gains | (0.78) | (0.65) | (0.25) | (2.01) | (0.34) | |
| Total distributions | (1.17) | (0.98) | (0.55) | (2.34) | (0.64) | |
| Net asset value at end of period | $18.75 | $18.24 | $19.12 | $17.35 | $19.07 | |
| Total return | 10.14% | 0.44% | 13.71% | 3.92% | 1.10% | |
| Ratios/Supplemental Data |
| Ratios to average net assets: | | | | | | |
| Net operating expenses2 | 0.40% | 0.40% | 0.40% | 0.41% | 0.42%3 | |
| Gross operating expenses2 | 0.40% | 0.40% | 0.40% | 0.41% | 0.42%3 | |
| Net investment income (loss) | 1.99% | 1.79% | 1.67% | 1.60% | 1.51% | |
| Portfolio turnover rate | 11% | 8% | 46%4 | 15% | 36%5 | |
| Net assets, end of period (x 1,000,000) | $545 | $515 | $551 | $516 | $512 | |
| |
1
Calculated based on the average shares outstanding during the period.
2
The expenses incurred by underlying funds in which the fund invests are not included in this ratio.
3
Effective December 1, 2014, the management fee was reduced. The ratio presented for the period ended 10/31/15 is a blended ratio.
4
The portfolio turnover rate increased due to the in-kind transactions relating to Schwab Total Bond Market Fund and Schwab U.S. Aggregate Bond Index Fund. For comparison purposes, the portfolio turnover rate would have been 10% without including these transactions. There were no transaction costs associated with these transactions.
5
The portfolio turnover rate increased due to the addition of Schwab Fundamental Index Funds to the portfolio during the period.
Schwab MarketTrack Portfolios | Annual Report
Schwab MarketTrack Balanced Portfolio
Portfolio Holdings as of October 31, 2019
This section shows all the securities in the fund’s portfolio and their values as of the report date.
The fund files its complete schedule of portfolio holdings with the U.S. Securities and Exchange Commission (SEC) for the first and third quarters of each fiscal year on Form N-Q. Effective March 31, 2019, Form N-PORT Part F has replaced Form N-Q. The fund’s Form N-Q and Form N-PORT Part F are available on the SEC’s website atwww.sec.gov. The fund also makes available its complete schedule of portfolio holdings 15 to 20 days after the end of the month on the fund’s website atwww.schwabfunds.com/schwabfunds_prospectus.
| Security | Number
of Shares | Value ($) |
| Affiliated Underlying Funds99.3% of net assets |
| |
| Equity Funds 60.3% |
| International 15.1% |
| Schwab Fundamental Emerging Markets Large Company Index Fund | 1,511,999 | 13,985,994 |
| Schwab Fundamental International Large Company Index Fund | 1,822,000 | 16,361,563 |
| Schwab Fundamental International Small Company Index Fund | 1,109,190 | 13,942,514 |
| Schwab International Index Fund | 1,856,005 | 38,010,985 |
| | | 82,301,056 |
| Large-Cap 30.2% |
| Schwab Fundamental US Large Company Index Fund | 2,841,188 | 49,891,262 |
| Schwab S&P 500 Index Fund | 2,431,109 | 114,675,422 |
| | | 164,566,684 |
| Small-Cap 15.0% |
| Schwab Fundamental US Small Company Index Fund | 1,772,731 | 24,552,319 |
| Schwab Small-Cap Index Fund | 1,969,077 | 56,788,172 |
| | | 81,340,491 |
| | | 328,208,231 |
| |
| Security | Number
of Shares | Value ($) |
| Fixed-Income Fund 34.8% |
| Intermediate-Term Bond 34.8% |
| Schwab U.S. Aggregate Bond Index Fund | 18,251,685 | 189,452,490 |
| |
| Money Market Fund 4.2% |
| Schwab Variable Share Price Money Fund, Ultra Shares 1.85%(a) | 23,033,946 | 23,045,463 |
| Total Affiliated Underlying Funds |
| (Cost $381,714,221) | | 540,706,184 |
Issuer
Rate, Maturity Date | Face
Amount ($) | Value ($) |
| Short-Term Investment0.5% of net assets |
| |
| Time Deposit 0.5% |
| BNP Paribas |
| 1.18%, 11/01/19(b) | 2,980,325 | 2,980,325 |
| Total Short-Term Investment |
| (Cost $2,980,325) | | 2,980,325 |
| (a) | The rate shown is the 7-day yield. |
| (b) | The rate shown is the current daily overnight rate. |
Schwab MarketTrack Portfolios | Annual Report
Schwab MarketTrack Balanced Portfolio
Portfolio Holdings as of October 31, 2019 (continued)
Below is a summary of the fund’s transactions with its affiliated underlying funds during the period ended October 31, 2019:
| Affiliated Underlying Funds | Market
Value at
10/31/18 | Gross
Purchases | Gross
Sales | Realized
Gains (Losses) | Net Change
in Unrealized
Appreciation
(depreciation) | Market
Value at
10/31/19 | Balance
of Shares
Held at
10/31/19 | Distributions
Received* |
| Schwab Fundamental Emerging Markets Large Company Index Fund | $12,554,961 | $1,049,864 | ($645,000) | $21,857 | $1,004,312 | $13,985,994 | 1,511,999 | $349,864 |
| Schwab Fundamental International Large Company Index Fund | 15,285,089 | 488,807 | — | — | 587,667 | 16,361,563 | 1,822,000 | 488,806 |
| Schwab Fundamental International Small Company Index Fund | 12,581,961 | 1,269,028 | — | — | 91,525 | 13,942,514 | 1,109,190 | 639,028 |
| Schwab Fundamental US Large Company Index Fund | 45,785,310 | 5,575,561 | (2,659,000) | 157,891 | 1,031,500 | 49,891,262 | 2,841,188 | 3,845,561 |
| Schwab Fundamental US Small Company Index Fund | 22,944,882 | 4,116,727 | (1,804,000) | 128,153 | (833,443) | 24,552,319 | 1,772,731 | 2,216,727 |
| Schwab International Index Fund | 35,229,878 | 2,745,375 | (3,060,000) | 110,147 | 2,985,585 | 38,010,985 | 1,856,005 | 1,025,375 |
| Schwab S&P 500 Index Fund | 107,791,367 | 9,359,978 | (15,550,000) | 3,524,308 | 9,549,769 | 114,675,422 | 2,431,109 | 2,679,978 |
| Schwab Small-Cap Index Fund | 53,465,395 | 12,221,302 | (7,432,000) | (143,667) | (1,322,858) | 56,788,172 | 1,969,077 | 4,811,301 |
| Schwab U.S. Aggregate Bond Index Fund | 183,405,301 | 22,814,995 | (31,222,000) | (363,590) | 14,817,784 | 189,452,490 | 18,251,685 | 5,425,226 |
| Schwab Variable Share Price Money Fund, Ultra Shares | 24,009,301 | 529,306 | (1,500,000) | (152) | 7,008 | 23,045,463 | 23,033,946 | 525,108 |
| Total | $513,053,445 | $60,170,943 | ($63,872,000) | $3,434,947 | $27,918,849 | $540,706,184 | | $22,006,974 |
| * | Distributions received include distributions from net investment income and capital gains, if any, from the underlying funds. |
| | |
The following is a summary of the inputs used to value the fund’s investments as of October 31, 2019 (see financial note 2(a) for additional information):
| Description | Quoted Prices in
Active Markets for
Identical Assets
(Level 1) | Other Significant
Observable Inputs
(Level 2) | Significant
Unobservable Inputs
(Level 3) | Total | |
| Assets | | | | | |
| Affiliated Underlying Funds1 | $540,706,184 | $— | $— | $540,706,184 | |
| Short-Term Investment1 | — | 2,980,325 | — | 2,980,325 | |
| Total | $540,706,184 | $2,980,325 | $— | $543,686,509 | |
| 1 | As categorized in Portfolio Holdings. |
Fund investments in underlying mutual funds are classified as Level 1, without consideration to the classification level of the investments held by the underlying mutual funds, which could be Level 1, Level 2 or Level 3.
Schwab MarketTrack Portfolios | Annual Report
Schwab MarketTrack Balanced Portfolio
Statement of Assets and Liabilities
As of October 31, 2019
| Assets |
| Investments in affiliated underlying funds, at value (cost $381,714,221) | | $540,706,184 |
| Investments in unaffiliated issuers, at value (cost $2,980,325) | | 2,980,325 |
| Receivables: | | |
| Investments sold | | 2,300,000 |
| Dividends | | 465,215 |
| Fund shares sold | | 137,926 |
| Prepaid expenses | + | 19,796 |
| Total assets | | 546,609,446 |
| Liabilities |
| Payables: | | |
| Investments bought | | 1,444,776 |
| Investment adviser and administrator fees | | 59,302 |
| Shareholder service fees | | 110,254 |
| Independent trustees’ fees | | 8 |
| Fund shares redeemed | | 393,151 |
| Accrued expenses | + | 48,273 |
| Total liabilities | | 2,055,764 |
| Net Assets |
| Total assets | | 546,609,446 |
| Total liabilities | – | 2,055,764 |
| Net assets | | $544,553,682 |
| Net Assets by Source | | |
| Capital received from investors | | 373,397,694 |
| Total distributable earnings | | 171,155,988 |
| Net Asset Value (NAV) |
| Net Assets | ÷ | Shares
Outstanding | = | NAV |
| $544,553,682 | | 29,044,353 | | $18.75 |
| | | | | |
Schwab MarketTrack Portfolios | Annual Report
Schwab MarketTrack Balanced Portfolio
Statement of Operations
For the period November 1, 2018 through October 31, 2019
| Investment Income |
| Dividends received from affiliated underlying funds | | $12,568,536 |
| Interest | + | 48,680 |
| Total investment income | | 12,617,216 |
| Expenses |
| Investment adviser and administrator fees | | 684,737 |
| Shareholder service fees | | 1,270,391 |
| Shareholder reports | | 37,397 |
| Registration fees | | 33,363 |
| Professional fees | | 29,724 |
| Portfolio accounting fees | | 29,297 |
| Transfer agent fees | | 12,128 |
| Independent trustees’ fees | | 10,598 |
| Custodian fees | | 4,156 |
| Other expenses | + | 10,224 |
| Total expenses | | 2,122,015 |
| Expense reduction by CSIM and its affiliates | – | 12,128 |
| Net expenses | – | 2,109,887 |
| Net investment income | | 10,507,329 |
| Realized and Unrealized Gains (Losses) |
| Realized capital gain distributions received from affiliated underlying funds | | 9,438,438 |
| Net realized gains on sales of affiliated underlying funds | + | 3,434,947 |
| Net realized gains | | 12,873,385 |
| Net change in unrealized appreciation (depreciation) on affiliated underlying funds | + | 27,918,849 |
| Net realized and unrealized gains | | 40,792,234 |
| Increase in net assets resulting from operations | | $51,299,563 |
Schwab MarketTrack Portfolios | Annual Report
Schwab MarketTrack Balanced Portfolio
Statement of Changes in Net Assets
For the current and prior report periods
| Operations | |
| | 11/1/18-10/31/19 | 11/1/17-10/31/18 |
| Net investment income | | $10,507,329 | $9,648,629 |
| Net realized gains | | 12,873,385 | 22,266,767 |
| Net change in unrealized appreciation (depreciation) | + | 27,918,849 | (28,789,389) |
| Increase in net assets from operations | | 51,299,563 | 3,126,007 |
| Distributions to Shareholders | |
| Total distributions | | ($32,704,957) | ($28,242,157) |
| Transactions in Fund Shares | | | |
| | | 11/1/18-10/31/19 | 11/1/17-10/31/18 |
| | | SHARES | VALUE | SHARES | VALUE |
| Shares sold | | 4,645,103 | $82,462,045 | 4,005,169 | $75,494,664 |
| Shares reinvested | | 1,824,301 | 29,754,346 | 1,397,751 | 26,012,148 |
| Shares redeemed | + | (5,649,914) | (100,958,347) | (6,003,515) | (112,809,619) |
| Net transactions in fund shares | | 819,490 | $11,258,044 | (600,595) | ($11,302,807) |
| Shares Outstanding and Net Assets | | | |
| | | 11/1/18-10/31/19 | 11/1/17-10/31/18 |
| | | SHARES | NET ASSETS | SHARES | NET ASSETS |
| Beginning of period | | 28,224,863 | $514,701,032 | 28,825,458 | $551,119,989 |
| Total increase or decrease | + | 819,490 | 29,852,650 | (600,595) | (36,418,957) |
| End of period | | 29,044,353 | $544,553,682 | 28,224,863 | $514,701,032 |
Schwab MarketTrack Portfolios | Annual Report
Schwab MarketTrack Conservative Portfolio
Financial Statements
Financial Highlights
| | 11/1/18–
10/31/19 | 11/1/17–
10/31/18 | 11/1/16–
10/31/17 | 11/1/15–
10/31/16 | 11/1/14–
10/31/15 | |
| Per-Share Data |
| Net asset value at beginning of period | $15.63 | $16.27 | $15.31 | $15.94 | $16.00 | |
| Income (loss) from investment operations: | | | | | | |
| Net investment income (loss)1 | 0.35 | 0.31 | 0.27 | 0.24 | 0.25 | |
| Net realized and unrealized gains (losses) | 1.18 | (0.38) | 1.09 | 0.30 | (0.05) | |
| Total from investment operations | 1.53 | (0.07) | 1.36 | 0.54 | 0.20 | |
| Less distributions: | | | | | | |
| Distributions from net investment income | (0.36) | (0.32) | (0.28) | (0.27) | (0.26) | |
| Distributions from net realized gains | (0.37) | (0.25) | (0.12) | (0.90) | — | |
| Total distributions | (0.73) | (0.57) | (0.40) | (1.17) | (0.26) | |
| Net asset value at end of period | $16.43 | $15.63 | $16.27 | $15.31 | $15.94 | |
| Total return | 10.31% | (0.49%) | 9.07% | 3.68% | 1.23% | |
| Ratios/Supplemental Data |
| Ratios to average net assets: | | | | | | |
| Net operating expenses2 | 0.43% | 0.41% | 0.42% | 0.43% | 0.43%3 | |
| Gross operating expenses2 | 0.43% | 0.41% | 0.42% | 0.44% | 0.44%3 | |
| Net investment income (loss) | 2.19% | 1.93% | 1.71% | 1.61% | 1.54% | |
| Portfolio turnover rate | 26% | 9% | 74%4 | 10% | 24%5 | |
| Net assets, end of period (x 1,000,000) | $263 | $239 | $251 | $238 | $228 | |
| |
1
Calculated based on the average shares outstanding during the period.
2
The expenses incurred by underlying funds in which the fund invests are not included in this ratio.
3
Effective December 1, 2014, the management fee was reduced. The ratio presented for the period ended 10/31/15 is a blended ratio.
4
The portfolio turnover rate increased due to the in-kind transactions relating to Schwab Total Bond Market Fund and Schwab U.S. Aggregate Bond Index Fund. For comparison purposes, the portfolio turnover rate would have been 23% without including these transactions. There were no transaction costs associated with these transactions.
5
The portfolio turnover rate increased due to the addition of Schwab Fundamental Index Funds to the portfolio during the period.
Schwab MarketTrack Portfolios | Annual Report
Schwab MarketTrack Conservative Portfolio
Portfolio Holdings as of October 31, 2019
This section shows all the securities in the fund’s portfolio and their values as of the report date.
The fund files its complete schedule of portfolio holdings with the U.S. Securities and Exchange Commission (SEC) for the first and third quarters of each fiscal year on Form N-Q. Effective March 31, 2019, Form N-PORT Part F has replaced Form N-Q. The fund’s Form N-Q and Form N-PORT Part F are available on the SEC’s website atwww.sec.gov. The fund also makes available its complete schedule of portfolio holdings 15 to 20 days after the end of the month on the fund’s website atwww.schwabfunds.com/schwabfunds_prospectus.
| Security | Number
of Shares | Value ($) |
| Affiliated Underlying Funds99.1% of net assets |
| |
| Equity Funds 40.3% |
| International 10.0% |
| Schwab Fundamental Emerging Markets Large Company Index Fund | 497,675 | 4,603,496 |
| Schwab Fundamental International Large Company Index Fund | 590,215 | 5,300,132 |
| Schwab Fundamental International Small Company Index Fund | 334,489 | 4,204,530 |
| Schwab International Index Fund | 600,495 | 12,298,142 |
| | | 26,406,300 |
| Large-Cap 20.3% |
| Schwab Fundamental US Large Company Index Fund | 915,780 | 16,081,095 |
| Schwab S&P 500 Index Fund | 788,720 | 37,203,924 |
| | | 53,285,019 |
| Small-Cap 10.0% |
| Schwab Fundamental US Small Company Index Fund | 587,760 | 8,140,482 |
| Schwab Small-Cap Index Fund | 632,768 | 18,249,017 |
| | | 26,389,499 |
| | | 106,080,818 |
| |
| Security | Number
of Shares | Value ($) |
| Fixed-Income Fund 54.7% |
| Intermediate-Term Bond 54.7% |
| Schwab U.S. Aggregate Bond Index Fund | 13,897,940 | 144,260,615 |
| |
| Money Market Fund 4.1% |
| Schwab Variable Share Price Money Fund, Ultra Shares 1.85%(a) | 10,775,450 | 10,780,838 |
| Total Affiliated Underlying Funds |
| (Cost $206,346,462) | | 261,122,271 |
Issuer
Rate, Maturity Date | Face
Amount ($) | Value ($) |
| Short-Term Investment0.7% of net assets |
| |
| Time Deposit 0.7% |
| Citibank |
| 1.18%, 11/01/19(b) | 1,781,276 | 1,781,276 |
| Total Short-Term Investment |
| (Cost $1,781,276) | | 1,781,276 |
| (a) | The rate shown is the 7-day yield. |
| (b) | The rate shown is the current daily overnight rate. |
Schwab MarketTrack Portfolios | Annual Report
Schwab MarketTrack Conservative Portfolio
Portfolio Holdings as of October 31, 2019 (continued)
Below is a summary of the fund’s transactions with its affiliated underlying funds during the period ended October 31, 2019:
| Affiliated Underlying Funds | Market
Value at
10/31/18 | Gross
Purchases | Gross
Sales | Realized
Gains (Losses) | Net Change
in Unrealized
Appreciation
(depreciation) | Market
Value at
10/31/19 | Balance
of Shares
Held at
10/31/19 | Distributions
Received* |
| Schwab Fundamental Emerging Markets Large Company Index Fund | $4,105,451 | $804,360 | ($650,000) | $6,367 | $337,318 | $4,603,496 | 497,675 | $114,360 |
| Schwab Fundamental International Large Company Index Fund | 4,536,567 | 1,361,816 | (796,000) | (28,129) | 225,878 | 5,300,132 | 590,215 | 161,816 |
| Schwab Fundamental International Small Company Index Fund | 3,794,384 | 1,136,212 | (720,000) | (59,140) | 53,074 | 4,204,530 | 334,489 | 216,212 |
| Schwab Fundamental US Large Company Index Fund | 14,220,447 | 4,070,828 | (2,524,000) | (93,231) | 407,051 | 16,081,095 | 915,780 | 1,280,828 |
| Schwab Fundamental US Small Company Index Fund | 7,155,427 | 3,042,841 | (1,827,000) | (124,323) | (106,463) | 8,140,482 | 587,760 | 737,840 |
| Schwab International Index Fund | 11,180,413 | 2,971,073 | (2,812,000) | 6,162 | 952,494 | 12,298,142 | 600,495 | 341,072 |
| Schwab S&P 500 Index Fund | 33,794,023 | 12,225,875 | (12,913,000) | 356,265 | 3,740,761 | 37,203,924 | 788,720 | 906,876 |
| Schwab Small-Cap Index Fund | 16,435,724 | 8,289,763 | (5,900,000) | (250,647) | (325,823) | 18,249,017 | 632,768 | 1,625,764 |
| Schwab U.S. Aggregate Bond Index Fund | 131,977,198 | 27,346,403 | (25,893,000) | (698,033) | 11,528,047 | 144,260,615 | 13,897,940 | 4,078,575 |
| Schwab Variable Share Price Money Fund, Ultra Shares | 11,128,550 | 11,149,081 | (11,500,000) | 755 | 2,452 | 10,780,838 | 10,775,450 | 247,222 |
| Total | $238,328,184 | $72,398,252 | ($65,535,000) | ($883,954) | $16,814,789 | $261,122,271 | | $9,710,565 |
| * | Distributions received include distributions from net investment income and capital gains, if any, from the underlying funds. |
| | |
The following is a summary of the inputs used to value the fund’s investments as of October 31, 2019 (see financial note 2(a) for additional information):
| Description | Quoted Prices in
Active Markets for
Identical Assets
(Level 1) | Other Significant
Observable Inputs
(Level 2) | Significant
Unobservable Inputs
(Level 3) | Total | |
| Assets | | | | | |
| Affiliated Underlying Funds1 | $261,122,271 | $— | $— | $261,122,271 | |
| Short-Term Investment1 | — | 1,781,276 | — | 1,781,276 | |
| Total | $261,122,271 | $1,781,276 | $— | $262,903,547 | |
| 1 | As categorized in Portfolio Holdings. |
Fund investments in underlying mutual funds are classified as Level 1, without consideration to the classification level of the investments held by the underlying mutual funds, which could be Level 1, Level 2 or Level 3.
Schwab MarketTrack Portfolios | Annual Report
Schwab MarketTrack Conservative Portfolio
Statement of Assets and Liabilities
As of October 31, 2019
| Assets |
| Investments in affiliated underlying funds, at value (cost $206,346,462) | | $261,122,271 |
| Investments in unaffiliated issuers, at value (cost $1,781,276) | | 1,781,276 |
| Receivables: | | |
| Investments sold | | 1,327,000 |
| Dividends | | 347,967 |
| Fund shares sold | | 281,667 |
| Prepaid expenses | + | 16,578 |
| Total assets | | 264,876,759 |
| Liabilities |
| Payables: | | |
| Investments bought | | 1,238,353 |
| Investment adviser and administrator fees | | 28,735 |
| Shareholder service fees | | 54,304 |
| Independent trustees’ fees | | 7 |
| Fund shares redeemed | | 143,722 |
| Accrued expenses | + | 38,687 |
| Total liabilities | | 1,503,808 |
| Net Assets |
| Total assets | | 264,876,759 |
| Total liabilities | – | 1,503,808 |
| Net assets | | $263,372,951 |
| Net Assets by Source | | |
| Capital received from investors | | 207,924,901 |
| Total distributable earnings | | 55,448,050 |
| Net Asset Value (NAV) |
| Net Assets | ÷ | Shares
Outstanding | = | NAV |
| $263,372,951 | | 16,034,149 | | $16.43 |
| | | | | |
Schwab MarketTrack Portfolios | Annual Report
Schwab MarketTrack Conservative Portfolio
Statement of Operations
For the period November 1, 2018 through October 31, 2019
| Investment Income |
| Dividends received from affiliated underlying funds | | $6,543,426 |
| Interest | + | 25,355 |
| Total investment income | | 6,568,781 |
| Expenses |
| Investment adviser and administrator fees | | 326,727 |
| Shareholder service fees | | 615,129 |
| Professional fees | | 27,824 |
| Registration fees | | 26,718 |
| Portfolio accounting fees | | 26,013 |
| Shareholder reports | | 21,336 |
| Independent trustees’ fees | | 9,193 |
| Transfer agent fees | | 6,037 |
| Custodian fees | | 4,638 |
| Other expenses | + | 7,666 |
| Total expenses | | 1,071,281 |
| Expense reduction by CSIM and its affiliates | – | 6,037 |
| Net expenses | – | 1,065,244 |
| Net investment income | | 5,503,537 |
| Realized and Unrealized Gains (Losses) |
| Realized capital gain distributions received from affiliated underlying funds | | 3,167,139 |
| Net realized losses on sales of affiliated underlying funds | + | (883,954) |
| Net realized gains | | 2,283,185 |
| Net change in unrealized appreciation (depreciation) on affiliated underlying funds | + | 16,814,789 |
| Net realized and unrealized gains | | 19,097,974 |
| Increase in net assets resulting from operations | | $24,601,511 |
Schwab MarketTrack Portfolios | Annual Report
Schwab MarketTrack Conservative Portfolio
Statement of Changes in Net Assets
For the current and prior report periods
| Operations | |
| | 11/1/18-10/31/19 | 11/1/17-10/31/18 |
| Net investment income | | $5,503,537 | $4,805,149 |
| Net realized gains | | 2,283,185 | 6,096,291 |
| Net change in unrealized appreciation (depreciation) | + | 16,814,789 | (11,849,125) |
| Increase (decrease) in net assets from operations | | 24,601,511 | (947,685) |
| Distributions to Shareholders | |
| Total distributions | | ($11,877,962) | ($8,820,697) |
| Transactions in Fund Shares | | | |
| | | 11/1/18-10/31/19 | 11/1/17-10/31/18 |
| | | SHARES | VALUE | SHARES | VALUE |
| Shares sold | | 5,250,695 | $82,352,774 | 2,934,247 | $47,195,181 |
| Shares reinvested | | 706,231 | 10,568,989 | 488,168 | 7,849,293 |
| Shares redeemed | + | (5,219,713) | (81,340,605) | (3,570,193) | (57,467,990) |
| Net transactions in fund shares | | 737,213 | $11,581,158 | (147,778) | ($2,423,516) |
| Shares Outstanding and Net Assets | | | |
| | | 11/1/18-10/31/19 | 11/1/17-10/31/18 |
| | | SHARES | NET ASSETS | SHARES | NET ASSETS |
| Beginning of period | | 15,296,936 | $239,068,244 | 15,444,714 | $251,260,142 |
| Total increase or decrease | + | 737,213 | 24,304,707 | (147,778) | (12,191,898) |
| End of period | | 16,034,149 | $263,372,951 | 15,296,936 | $239,068,244 |
Schwab MarketTrack Portfolios | Annual Report
Schwab MarketTrack Portfolios
1. Business Structure of the Funds:
Schwab MarketTrack All Equity Portfolio, Schwab MarketTrack Growth Portfolio, Schwab MarketTrack Balanced Portfolio, and Schwab MarketTrack Conservative Portfolio (the funds) are each a series of Schwab Capital Trust (the trust), a no-load, open-end management investment company. The trust is organized as a Massachusetts business trust and is registered under the Investment Company Act of 1940, as amended (the 1940 Act). The list below shows all the funds in the trust as of the end of the period, including the funds discussed in this report, which are highlighted:
| SCHWAB CAPITAL TRUST (ORGANIZED MAY 7, 1993) |
| Schwab MarketTrack All Equity Portfolio | Schwab Target 2040 Fund |
| Schwab MarketTrack Growth Portfolio | Schwab Target 2045 Fund |
| Schwab MarketTrack Balanced Portfolio | Schwab Target 2050 Fund |
| Schwab MarketTrack Conservative Portfolio | Schwab Target 2055 Fund |
| Schwab S&P 500 Index Fund | Schwab Target 2060 Fund |
| Schwab Small-Cap Index Fund® | Schwab Fundamental US Large Company Index Fund |
| Schwab Total Stock Market Index Fund® | Schwab Fundamental US Small Company Index Fund |
| Schwab U.S. Large-Cap Growth Index Fund | Schwab Fundamental International Large Company Index Fund |
| Schwab U.S. Large-Cap Value Index Fund | Schwab Fundamental International Small Company Index Fund |
| Schwab U.S. Mid-Cap Index Fund | Schwab Fundamental Emerging Markets Large Company Index Fund |
| Schwab International Index Fund® | Schwab Fundamental Global Real Estate Index Fund |
| Laudus International MarketMasters Fund™ | Schwab Target 2010 Index Fund |
| Schwab Balanced Fund | Schwab Target 2015 Index Fund |
| Schwab Core Equity Fund | Schwab Target 2020 Index Fund |
| Schwab Dividend Equity Fund | Schwab Target 2025 Index Fund |
| Schwab Large-Cap Growth Fund | Schwab Target 2030 Index Fund |
| Schwab Small-Cap Equity Fund | Schwab Target 2035 Index Fund |
| Schwab Hedged Equity Fund | Schwab Target 2040 Index Fund |
| Schwab Health Care Fund | Schwab Target 2045 Index Fund |
| Schwab International Core Equity Fund | Schwab Target 2050 Index Fund |
| Schwab Target 2010 Fund | Schwab Target 2055 Index Fund |
| Schwab Target 2015 Fund | Schwab Target 2060 Index Fund |
| Schwab Target 2020 Fund | Schwab Monthly Income Fund - Moderate Payout |
| Schwab Target 2025 Fund | Schwab Monthly Income Fund - Enhanced Payout |
| Schwab Target 2030 Fund | Schwab Monthly Income Fund - Maximum Payout |
| Schwab Target 2035 Fund | |
The Schwab MarketTrack Portfolios are primarily “funds of funds.” Each of the funds seeks to achieve its investment objective by investing mainly in a combination of other Schwab Funds (underlying funds) in accordance with its target portfolio allocation. The funds may also invest directly in equity or fixed-income securities, other mutual funds, exchange-traded funds (ETFs) and cash equivalents, including money market securities, to achieve their investment objectives.
Each fund in this report offers one share class. Shares are bought and sold at closing net asset value per share (NAV), which is the price for all outstanding shares of a fund. Each share has a par value of 1/1,000 of a cent, and the funds’ Board of Trustees (the Board) may authorize the issuance of as many shares as necessary.
Each fund maintains its own account for purposes of holding assets and accounting, and is considered a separate entity for tax purposes. Within its account, each fund may also keep certain assets in segregated accounts, as required by securities law.
2. Significant Accounting Policies:
The following is a summary of the significant accounting policies the funds use in their preparation of financial statements. The funds follow the investment company accounting and reporting guidance of the Financial Accounting Standards Board (FASB) Accounting Standard CodificationTopic 946 Financial Services — Investment Companies. The accounting policies are in conformity with accounting principles generally accepted in the United States of America (GAAP).
The financial statements of the funds should be read in conjunction with the underlying funds’ financial statements. For more information about the underlying funds’ operations and policies, please refer to those funds’ semiannual and annual reports, which are filed with the U.S. Securities and Exchange Commission (SEC) and are available on the SEC’s website at www.sec.gov.
Schwab MarketTrack Portfolios | Annual Report
Schwab MarketTrack Portfolios
Financial Notes(continued)
2. Significant Accounting Policies (continued):
(a) Security Valuation:
Under procedures approved by the Board, the investment adviser has formed a Pricing Committee to administer the pricing and valuation of portfolio securities and other assets and to ensure that prices used for internal purposes or provided by third parties reasonably reflect fair market value. Among other things, these procedures allow the funds to utilize independent pricing services, quotations from securities and financial instrument dealers and other market sources to determine fair value.
The funds value the securities in their portfolios every business day. The funds use the following policies to value various types of securities:
• Underlying funds:Mutual funds are valued at their respective NAVs.
• Securities for which no quoted value is available:The Board has adopted procedures to fair value each fund’s securities when market prices are not “readily available” or are unreliable. For example, a fund may fair value a security when it is de-listed or its trading is halted or suspended; when a security’s primary pricing source is unable or unwilling to provide a price; or when a security’s primary trading market is closed during regular market hours. Each fund makes fair value determinations in good faith in accordance with the fund’s valuation procedures. The Pricing Committee considers a number of factors, including unobservable market inputs when arriving at fair value. The Pricing Committee may employ techniques such as the review of related or comparable assets or liabilities, related market activities, recent transactions, market multiples, book values, transactional back-testing, disposition analysis and other relevant information. The Pricing Committee regularly reviews these inputs and assumptions to calibrate the valuations. Due to the subjective and variable nature of fair value pricing, there can be no assurance that a fund could obtain the fair value assigned to the security upon the sale of such security. The Board convenes on a regular basis to review fair value determinations made by the funds pursuant to the valuation procedures.
• Cash management sweep time deposits: Balances held in cash management sweep time deposits are accounted for on a cost basis, which approximates market value.
In accordance with the authoritative guidance on fair value measurements and disclosures under GAAP, the funds disclose the fair value of their investments in a hierarchy that prioritizes the significant inputs to valuation techniques used to measure the fair value. The hierarchy gives the highest priority to valuations based upon unadjusted quoted prices in active markets for identical assets or liabilities (Level 1 measurements) and the lowest priority to valuations based upon unobservable inputs that are significant to the valuation (Level 3 measurements). If inputs used to measure the financial instruments fall within different levels of the hierarchy, the categorization is based on the lowest level input that is significant to the valuation. If the funds determine that either the volume and/or level of activity for an asset or liability has significantly decreased (from normal conditions for that asset or liability) or price quotations or observable inputs are not associated with orderly transactions, increased analysis and management judgment will be required to estimate fair value.
The three levels of the fair value hierarchy are as follows:
• Level 1—quoted prices in active markets for identical securities—Investments whose values are based on quoted market prices in active markets, and whose values are therefore classified as Level 1 prices, include active listed equities. Investments in mutual funds are valued daily at their NAVs, which are classified as Level 1 prices, without consideration to the classification level of the specific investments held by an underlying fund.
• Level 2—other significant observable inputs (including quoted prices for similar securities, interest rates, prepayment speeds, credit risk, etc.)—Investments that trade in markets that are not considered to be active, but whose values are based on quoted market prices, dealer quotations or valuations provided by alternative pricing sources supported by observable inputs are classified as Level 2 prices. These generally include U.S. government and sovereign obligations, most government agency securities, investment-grade corporate bonds, certain mortgage products, less liquid listed equities, and state, municipal and provincial obligations.
• Level 3—significant unobservable inputs (including the funds’ own assumptions in determining the fair value of investments)—Investments whose values are classified as Level 3 prices have significant unobservable inputs, as they may trade infrequently or not at all. When observable prices are not available for these securities, the funds use one or more valuation techniques for which sufficient and reliable data is available. The inputs used by the funds in estimating the value of Level 3 prices may include the original transaction price, quoted prices for similar securities or assets in active markets, completed or pending third-party transactions in the underlying investment or comparable issuers, and changes in financial
Schwab MarketTrack Portfolios | Annual Report
Schwab MarketTrack Portfolios
Financial Notes(continued)
2. Significant Accounting Policies (continued):
ratios or cash flows. Level 3 prices may also be adjusted to reflect illiquidity and/or non-transferability, with the amount of such discount estimated by the funds in the absence of market information. Assumptions used by the funds due to the lack of observable inputs may significantly impact the resulting fair value and therefore the funds’ results of operations.
The inputs or methodology used for valuing securities are not necessarily an indication of the risk associated with investing in those securities.
The levels associated with valuing the funds’ investments as of October 31, 2019 are disclosed in the Portfolio Holdings.
(b) Accounting Policies for certain Portfolio Investments (if held):
Cash Management Transactions: The funds may subscribe to the Brown Brothers Harriman & Co. (BBH) Cash Management Service Sweep (CMS Sweep). The BBH CMS Sweep is an investment product that automatically sweeps the funds’ cash balances into overnight offshore time deposits with either the BBH Grand Cayman branch or a branch of a pre-approved commercial bank. This fully automated program allows the funds to earn interest on cash balances. Excess cash invested with deposit institutions domiciled outside of the U.S., as with any offshore deposit, may be subject to sovereign actions in the jurisdiction of the deposit institution including, but not limited to, freeze, seizure or diminution. The funds bear the risk associated with the repayment of principal and payment of interest on such instruments by the institution with which the deposit is ultimately placed.
(c) Security Transactions:
Security transactions are recorded as of the date the order to buy or sell the security is executed. Realized gains and losses from security transactions are based on the identified costs of the securities involved.
(d) Investment Income:
Interest income is recorded as it accrues. Dividends and distributions from portfolio securities and underlying funds are recorded on the date they are effective (the ex-dividend date), although the funds record certain foreign security dividends on the day they learn of the ex-dividend date. Any distributions from underlying funds are recorded in accordance with the character of the distributions as designated by the underlying funds.
(e) Expenses:
Expenses that are specific to a fund are charged directly to the fund. Expenses that are common to more than one fund in the trusts generally are allocated among those funds in proportion to their average daily net assets. Each fund bears its share of the acquired fund fees and expenses of the underlying funds, which are indirect expenses incurred by the fund through its investments in the underlying funds. Such expenses are reflected in the net asset values of the underlying funds.
(f) Distributions to Shareholders:
The funds make distributions from net investment income and net realized capital gains, if any, once a year, except for the Schwab MarketTrack Conservative Portfolio, which makes distributions from net investment income quarterly.
(g) Accounting Estimates:
The accounting policies described in this report conform to GAAP. Notwithstanding this, shareholders should understand that in order to follow these principles, fund management has to make estimates and assumptions that affect the information reported in the financial statements. It’s possible that once the results are known, they may turn out to be different from these estimates and these differences may be material.
(h) Federal Income Taxes:
The funds intend to meet federal income and excise tax requirements for regulated investment companies under subchapter M of the Internal Revenue Code, as amended. Accordingly, the funds distribute substantially all of their net investment income and net realized capital gains, if any, to their respective shareholders each year. As long as a fund meets the tax requirements, it is not required to pay federal income tax.
Schwab MarketTrack Portfolios | Annual Report
Schwab MarketTrack Portfolios
Financial Notes(continued)
2. Significant Accounting Policies (continued):
(i) Indemnification:
Under the funds’ organizational documents, the officers and trustees are indemnified against certain liabilities arising out of the performance of their duties to the funds. In addition, in the normal course of business the funds enter into contracts with their vendors and others that provide general indemnifications. The funds’ maximum exposure under these arrangements is unknown as this would involve future claims that may be made against the funds. However, based on experience, the funds expect the risk of loss attributable to these arrangements to be remote.
(j) Recent Accounting Standards:
In August 2018, the FASB issued Accounting Standards Update “Fair Value Measurement (Topic 820)” (ASU 2018-13) which modifies the disclosure requirements for fair value measurement by removing, modifying, or adding certain disclosures. The amendments are effective for annual periods beginning after December 15, 2019, and interim periods within those annual periods. The funds are permitted to early adopt any removed or modified disclosures upon issuance of this update and delay adoption of the additional disclosures until their effective date. The funds have early adopted certain removed or modified disclosures, including the amount of and reasons for transfers between Level 1 and Level 2 of the fair value hierarchy and the policy for timing of transfers between levels upon issuance of ASU 2018-13, and have delayed adoption of the additional disclosures until their effective date. At this time, management is currently evaluating the impact that the adoption of the additional disclosures will have on the funds’ financial statements.
3. Risk Factors:
Investing in the funds may involve certain risks, as discussed in the funds’ prospectus, including, but not limited to, those described below. Any of these risks could cause an investor to lose money.
Asset Allocation Risk. The funds are subject to the risk that the selection of the underlying funds and the allocation of a fund’s assets among the various asset classes and market segments may cause the fund to underperform other funds with a similar investment objective.
Conflicts of Interest Risk. The investment adviser’s authority to select and substitute underlying funds from a variety of affiliated and unaffiliated mutual funds and ETFs may create a conflict of interest because the fees paid to it and its affiliates by some underlying funds are higher than the fees paid by other underlying funds. The investment adviser also may have an incentive to select an affiliated underlying fund for other reasons, including to increase assets under management or to support new investment strategies. In addition, other conflicts of interest may exist where the best interests of the affiliated underlying fund may not be aligned with those of the fund. However, the investment adviser is a fiduciary to the fund and is legally obligated to act in the fund’s best interests when selecting underlying funds.
Market Risk.Financial markets rise and fall in response to a variety of factors, sometimes rapidly and unpredictably. As with any investment whose performance is tied to these markets, the value of an investment in the fund will fluctuate, which means that an investor could lose money over short or long periods.
Direct Investment Risk.The funds may invest directly in cash, cash equivalents and equity and fixed-income securities, including money market securities, to maintain their allocations. A fund’s direct investment in these securities is subject to the same or similar risks as an underlying fund’s investment in the same securities.
Underlying Fund Investment Risk.The value of an investment in the funds is based primarily on the prices of the underlying funds that the fund purchases. In turn, the price of each underlying fund is based on the value of its securities. The funds are subject to the performance, expenses and risks of the underlying funds in which they invest. Before investing in the funds, investors should assess the risks associated with the underlying funds in which the funds may invest and the types of investments made by those underlying funds. These risks include any combination of the risks described below, although a fund’s exposure to a particular risk will be proportionate to the fund’s overall asset allocation and underlying fund allocation.
• Investment Risk.The funds may experience losses with respect to their investment in an underlying fund. Further, there is no guarantee that an underlying fund will be able to achieve its objective.
• Investment Style Risk.Some underlying funds seek to track the performance of various segments of the stock market, as measured by their respective indices. Each underlying fund follows these stocks during upturns as well as downturns. Because of their indexing strategy, the underlying funds do not take steps to reduce market exposure or to lessen the effects of a
Schwab MarketTrack Portfolios | Annual Report
Schwab MarketTrack Portfolios
Financial Notes(continued)
3. Risk Factors (continued):
declining market. In addition, because of an underlying fund’s expenses, the underlying fund’s performance is normally below that of the index. A significant percentage of the index may be composed of securities in a single industry or sector of the economy. If the underlying fund is focused in an industry or sector, it may present more risks than if it were broadly diversified over numerous industries and sectors of the economy.
• Equity Risk.The prices of equity securities rise and fall daily. These price movements may result from factors affecting individual companies, industries or the securities market as a whole. In addition, equity markets tend to move in cycles, which may cause stock prices to fall over short or extended periods of time.
• Fixed Income Risk.Interest rates rise and fall over time, which will affect an underlying fund’s yield and share price. A change in a central bank’s monetary policy or improving economic conditions, among other things, may result in an increase in interest rates. A rise in interest rates could cause an underlying fund’s share price to fall. The credit quality of a portfolio investment could also cause an underlying fund’s share price to fall. An underlying fund could lose money if the issuer or guarantor of a portfolio investment or the counterparty to a derivatives contract fails to make timely principal or interest payments or otherwise honor its obligations. Fixed income securities may be paid off earlier or later than expected. Either situation could cause an underlying fund to hold securities paying lower-than-market rates of interest, which could hurt the fund’s yield or share price. Below investment-grade bonds (junk bonds) involve greater credit risk, are more volatile, involve greater risk of price declines and may be more susceptible to economic downturns than investment-grade securities.
• Tracking Error Risk.Each underlying index fund seeks to track the performance of its benchmark indices, although it may not be successful in doing so. The divergence between the performance of a fund and its benchmark index, positive or negative, is called “tracking error.” Tracking error can be caused by many factors and it may be significant.
• Market Capitalization Risk.Securities issued by companies of different market capitalizations tend to go in and out of favor based on market and economic conditions. During a period when securities of a particular market capitalization fall behind other types of investments, an underlying fund’s performance could be impacted.
• Fundamental Index Risk.The Fundamental Index methodology selects and weights stocks according to fundamental measures of company size: adjusted sales, retained operating cash flow, and dividends plus buybacks. During a period when securities of companies selected by these measures fall behind other types of investments, an underlying fund’s performance could be impacted.
• Money Market Fund Risk. The funds may invest in underlying money market funds that either seek to maintain a stable $1 net asset value (“stable share price money market funds”) or have a share price that fluctuates (“variable share price money market funds”). Although an underlying stable share price money market fund seeks to maintain a stable $1 net asset value, it is possible to lose money by investing in such a money market fund. Because the share price of an underlying variable share price money market fund will fluctuate, when the fund sells the shares it owns they may be worth more or less than what the fund originally paid for them. In addition, neither type of money market fund is designed to offer capital appreciation. Certain underlying money market funds may impose a fee upon the sale of shares or may temporarily suspend the ability to sell shares if such fund’s liquidity falls below required minimums.
• Concentration Risk.To the extent that an underlying fund’s or the index’s portfolio is concentrated in the securities of issuers in a particular market, industry, group of industries, sector, country or asset class, the underlying fund may be adversely affected by the performance of those securities, may be subject to increased price volatility and may be more vulnerable to adverse economic, market, political, or regulatory occurrences affecting that market, industry, group of industries, sector, country or asset class.
• Foreign Investment Risk. An underlying fund’s investments in securities of foreign issuers involve certain risks that may be greater than those associated with investments in securities of U.S. issuers. These include risks of adverse changes in foreign economic, political, regulatory and other conditions; changes in currency exchange rates or exchange control regulations (including limitations on currency movements and exchanges); the imposition of economic sanctions or other government restrictions; differing accounting, auditing, financial reporting and legal standards and practices; differing securities market structures; and higher transaction costs. These risks may negatively impact the value or liquidity of an underlying fund’s investments, and could impair the underlying fund’s ability to meet its investment objective or invest in accordance with its investment strategy. There is a risk that investments in securities denominated in, and/or receiving revenues in, foreign currencies will decline in value relative to the U.S. dollar.
• Emerging Markets Risk.Emerging market countries may be more likely to experience political turmoil or rapid changes in market or economic conditions than more developed countries. Emerging market countries often have less uniformity in accounting and reporting requirements and greater risk associated with the custody of securities. In addition, the financial
Schwab MarketTrack Portfolios | Annual Report
Schwab MarketTrack Portfolios
Financial Notes(continued)
3. Risk Factors (continued):
stability of issuers (including governments) in emerging market countries may be more precarious than in developed countries. As a result, there may be an increased risk of illiquidity and price volatility associated with an underlying fund’s investments in emerging market countries, which may be magnified by currency fluctuations relative to the U.S. dollar, and, at times, it may be difficult to value such investments.
• ETF Risk. When an underlying fund invests in an ETF, it will bear a proportionate share of the ETF’s expenses. In addition, lack of liquidity in the market for an ETF’s shares can result in its value being more volatile than the underlying portfolio of securities.
• Derivatives Risk. An underlying fund may use derivatives to enhance returns or hedge against market declines. Examples of derivatives are options, futures, options on futures and swaps. An option is the right to buy or sell an instrument at a specific price before a specific date. A future is an agreement to buy or sell a financial instrument at a specific price on a specific day. A swap is an agreement whereby two parties agree to exchange payment streams calculated in relation to a rate, index, instrument or certain securities and a predetermined amount. A credit default swap is an agreement in which the seller agrees to make a payment to the buyer in the event of a specified credit event in exchange for a fixed payment or series of fixed payments.
An underlying fund’s use of derivative instruments involves risks different from or possibly greater than the risks associated with investing directly in securities and other traditional investments. Certain of these risks, such as credit risk, leverage risk, liquidity risk and market risk are discussed elsewhere in this section. An underlying fund’s use of derivatives is also subject to lack of availability risk, valuation risk, correlation risk and tax risk. Lack of availability risk is the risk that suitable derivative transactions may not be available in all circumstances for risk management or other purposes. Valuation risk is the risk that a particular derivative may be valued incorrectly. Correlation risk is the risk that changes in the value of the derivative may not correlate perfectly with the underlying asset, rate or index. Tax risk is the risk that the use of derivatives may cause the underlying fund to realize higher amounts of short-term capital gains. An underlying fund’s use of derivatives could reduce the underlying fund’s performance, increase its volatility, and could cause an underlying fund to lose more than the initial amount invested. The use of derivatives that are subject to regulation by the Commodity Futures Trading Commission (CFTC) by an underlying fund could cause a fund to become a commodity pool, which would require the fund to comply with certain CFTC rules.
• Liquidity Risk.An underlying fund may be unable to sell certain securities, such as illiquid securities, readily at a favorable time or price, or an underlying fund may have to sell them at a loss.
• Sampling Index Tracking Risk. To the extent an underlying fund uses a sampling method, the underlying fund will not fully replicate its comparative index and may hold securities not included in the index. As a result, the underlying fund will be subject to the risk that the investment adviser’s investment management strategy, the implementation of which is subject to a number of constraints, may not produce the intended results. If the underlying fund utilizes a sampling approach, it may not track the return of the index as well as it would if the underlying fund purchased all of the securities in the index.
• Securities Lending Risk. An underlying fund may lend its portfolio securities to brokers, dealers, and other financial institutions. Securities lending involves the risk of loss of rights in, or delay in recovery of, the loaned securities if the borrower fails to return the security loaned or becomes insolvent.
• Portfolio Turnover Risk.Certain of the underlying funds may buy and sell portfolio securities actively. If they do, their portfolio turnover rate and transaction costs will rise, which may lower the underlying fund’s performance and may increase the likelihood of capital gains distributions.
Please refer to the funds’ prospectus for a more complete description of the principal risks of investing in the funds.
4. Affiliates and Affiliated Transactions:
Investment Adviser
Charles Schwab Investment Management, Inc. (CSIM or the investment adviser), a wholly owned subsidiary of The Charles Schwab Corporation, serves as each fund’s investment adviser and administrator pursuant to an Investment Advisory and Administration Agreement between CSIM and the trust.
For its advisory and administrative services to the funds, CSIM is entitled to receive an annual fee of 0.13%, payable monthly, based on a percentage of each fund’s average daily net assets.
Schwab MarketTrack Portfolios | Annual Report
Schwab MarketTrack Portfolios
Financial Notes(continued)
4. Affiliates and Affiliated Transactions (continued):
Shareholder Servicing
The Board has adopted a Shareholder Servicing Plan (the Plan) on behalf of the funds. The Plan enables each fund to bear expenses relating to the provision by financial intermediaries, including Charles Schwab & Co., Inc. (Schwab), a broker-dealer affiliate of CSIM, (together, service providers), of certain shareholder services to the current shareholders of the funds.
Pursuant to the Plan, each fund’s shares are subject to an annual shareholder servicing fee of up to 0.25%. The shareholder servicing fee paid to a particular service provider is made pursuant to its written agreement with Schwab, as distributor of the funds (or, in the case of payments made to Schwab acting as a service provider, pursuant to Schwab’s written agreement with the funds). Payments under the Plan are made as described above without regard to whether the fee is more or less than the service provider’s actual cost of providing the services, and if more, such excess may be retained as profit by the service provider.
Expense Limitation
Although these agreements specify certain fees for these services, CSIM and its affiliates have agreed with the funds, for so long as CSIM serves as the investment adviser to the funds, which may only be amended or terminated with the approval of the Board, to limit the total annual fund operating expenses charged, excluding interest, taxes and certain non-routine expenses as a percentage of average daily net assets is as follows:
Schwab
MarketTrack
All Equity
Portfolio | Schwab
MarketTrack
Growth
Portfolio | Schwab
MarketTrack
Balanced
Portfolio | Schwab
MarketTrack
Conservative
Portfolio |
| 0.50% | 0.50% | 0.50% | 0.50% |
The agreement to limit the funds’ total expenses charged is limited to each fund’s direct operating expenses and, therefore, does not apply to underlying fund fees and expenses, which are indirect expenses incurred by a fund through its investments in the underlying funds.
Investments in Affiliates
The funds may engage in certain transactions involving related parties. Pursuant to an exemptive order issued by the SEC, the funds may invest in other related funds. As of October 31, 2019, each Schwab MarketTrack Portfolio’s ownership percentages of other related funds’ shares are:
| Underlying Funds | Schwab
MarketTrack
All Equity
Portfolio | Schwab
MarketTrack
Growth
Portfolio | Schwab
MarketTrack
Balanced
Portfolio | Schwab
MarketTrack
Conservative
Portfolio |
| Schwab Fundamental Emerging Markets Large Company Index Fund | 5.1% | 4.2% | 2.1% | 0.7% |
| Schwab Fundamental International Large Company Index Fund | 3.0% | 2.5% | 1.2% | 0.4% |
| Schwab Fundamental International Small Company Index Fund | 4.5% | 3.5% | 1.8% | 0.5% |
| Schwab Fundamental US Large Company Index Fund | 1.8% | 1.9% | 1.0% | 0.3% |
| Schwab Fundamental US Small Company Index Fund | 2.7% | 2.6% | 1.3% | 0.4% |
| Schwab International Index Fund | 1.8% | 1.4% | 0.7% | 0.2% |
| Schwab S&P 500 Index Fund | 0.5% | 0.6% | 0.3% | 0.1% |
| Schwab Small-Cap Index Fund | 2.9% | 2.7% | 1.4% | 0.4% |
| Schwab U.S. Aggregate Bond Index Fund | —% | 3.9% | 6.1% | 4.6% |
| Schwab Variable Share Price Money Fund, Ultra Shares | —% | 0.7% | 0.4% | 0.2% |
Interfund Borrowing and Lending
Pursuant to an exemptive order issued by the SEC, the funds may enter into interfund borrowing and lending transactions with other funds in the Fund Complex (for definition refer to Trustees and Officers section). All loans are for temporary or emergency purposes and the interest rate to be charged will be the average of the overnight repurchase agreement rate and the short-term bank loan rate. All loans are subject to numerous conditions designed to ensure fair and equitable treatment of all participating funds. The interfund lending facility is subject to the oversight and periodic review by the Board. The funds had no interfund borrowing or lending activity during the period.
Schwab MarketTrack Portfolios | Annual Report
Schwab MarketTrack Portfolios
Financial Notes(continued)
5. Board of Trustees:
The Board may include people who are officers and/or directors of CSIM or its affiliates. Federal securities law limits the percentage of such “interested persons” who may serve on a trust’s board, and the trust was in compliance with these limitations throughout the report period. The trust did not pay any of these interested persons for their services as trustees, but it did pay non-interested persons (independent trustees), as noted on each fund’s Statement of Operations. For information regarding the trustees, please refer to the Trustees and Officers table at the end of this report.
6. Borrowing from Banks:
During the period, the funds were participants with other U.S. registered investment companies managed by CSIM in a joint, syndicated, committed $750 million line of credit (the Syndicated Credit Facility), which matured on October 3, 2019. On October 3, 2019, the Syndicated Credit Facility was amended to run for a new 364 day period with the line of credit amount remaining unchanged, maturing on October 1, 2020. Under the terms of the Syndicated Credit Facility, in addition to the interest charged on any borrowings by a fund, each fund paid a commitment fee of 0.15% per annum on the funds’ proportionate share of the unused portion of the Syndicated Credit Facility.
During the period, the funds were participants with other U.S. registered investment companies managed by CSIM in a joint, unsecured, uncommitted $500 million line of credit (the Uncommitted Credit Facility), with State Street Bank and Trust Company, which matured on November 30, 2018. On November 30, 2018, the Uncommitted Credit Facility was amended to run for a new 364 day period with the line of credit amount remaining unchanged, maturing November 29, 2019. Under the terms of the Uncommitted Credit Facility, each fund pays interest on the amount a fund borrows. There were no borrowings from either line of credit during the period.
The funds also have access to custodian overdraft facilities. A fund may have utilized the overdraft facility and incurred an interest expense, which is disclosed on the fund’s Statement of Operations, if any. The interest expense is determined based on a negotiated rate above the current Federal Funds Rate.
7. Purchases and Sales of Investment Securities:
For the period ended October 31, 2019, purchases and sales of securities (excluding short-term obligations) were as follows:
| | Purchases
of Securities | Sales
of Securities |
| Schwab MarketTrack All Equity Portfolio | $40,786,914 | $40,762,000 |
| Schwab MarketTrack Growth Portfolio | 58,691,216 | 71,844,000 |
| Schwab MarketTrack Balanced Portfolio | 60,170,943 | 63,872,000 |
| Schwab MarketTrack Conservative Portfolio | 72,398,252 | 65,535,000 |
8. Federal Income Taxes:
As of October 31, 2019, the tax basis cost of the funds’ investments and gross unrealized appreciation and depreciation were as follows:
| | Schwab
MarketTrack
All Equity
Portfolio | | Schwab
MarketTrack
Growth
Portfolio | | Schwab
MarketTrack
Balanced
Portfolio | | Schwab
MarketTrack
Conservative
Portfolio |
| Tax cost | $444,045,153 | | $512,677,990 | | $388,288,633 | | $210,811,743 |
| Gross unrealized appreciation | $245,002,820 | | $303,155,822 | | $155,467,394 | | $52,091,804 |
| Gross unrealized depreciation | — | | (133,960) | | (69,518) | | — |
| Net unrealized appreciation (depreciation) | $245,002,820 | | $303,021,862 | | $155,397,876 | | $52,091,804 |
Schwab MarketTrack Portfolios | Annual Report
Schwab MarketTrack Portfolios
Financial Notes(continued)
8. Federal Income Taxes (continued):
As of October 31, 2019, the components of distributable earnings on a tax basis were as follows:
| | Schwab
MarketTrack
All Equity
Portfolio | | Schwab
MarketTrack
Growth
Portfolio | | Schwab
MarketTrack
Balanced
Portfolio | | Schwab
MarketTrack
Conservative
Portfolio |
| Undistributed ordinary income | $3,971,157 | | $2,127,003 | | $4,894,087 | | $814,137 |
| Undistributed long-term capital gains | 25,181,541 | | 29,259,868 | | 10,864,025 | | 2,542,109 |
| Net unrealized appreciation (depreciation) on investments | 245,002,820 | | 303,021,862 | | 155,397,876 | | 52,091,804 |
| Total | $274,155,518 | | $334,408,733 | | $171,155,988 | | $55,448,050 |
The primary difference between book basis and tax basis unrealized appreciation or unrealized depreciation of investments is the tax deferral of losses on wash sales. The tax cost of the funds’ investments, disclosed above, have been adjusted from their book amounts to reflect these unrealized appreciation or depreciation differences, as applicable.
Capital loss carryforwards may be used to offset future realized capital gains for federal income tax purposes. As of October 31, 2019, the funds had no capital loss carryforwards available to offset future net capital gains.
The tax basis components of distributions paid during the current and prior fiscal years were as follows:
| | Schwab
MarketTrack
All Equity
Portfolio | Schwab
MarketTrack
Growth
Portfolio | Schwab
MarketTrack
Balanced
Portfolio | Schwab
MarketTrack
Conservative
Portfolio |
| Current period distributions | | | | |
| Ordinary income | $13,644,585 | $16,219,023 | $10,931,597 | $5,884,258 |
| Long-term capital gains | 14,361,968 | 23,708,153 | 21,773,360 | 5,993,704 |
| Prior period distributions | | | | |
| Ordinary income | $12,462,529 | $14,646,230 | $10,354,405 | $5,603,095 |
| Long-term capital gains | 10,650,889 | 23,743,714 | 17,887,752 | 3,217,602 |
Distributions paid to shareholders are based on net investment income and net realized gains determined on a tax basis, which may differ from net investment income and net realized gains for financial reporting purposes. These differences reflect the differing character of certain income items and net realized gains and losses for financial statement and tax purposes, and may result in reclassification among certain capital accounts on the financial statements.
Permanent book and tax basis differences may result in reclassifications between components of net assets as required. The adjustments will have no impact on net assets or the results of operations.
As of October 31, 2019, management has reviewed the tax positions for open periods (for federal purposes, three years from the date of filing and for state purposes, four years from the date of filing) as applicable to the funds, and has determined that no provision for income tax is required in the funds’ financial statements. The funds recognize interest and penalties, if any, related to unrecognized tax benefits as income tax expense in the Statement of Operations. During the fiscal year ended October 31, 2019, the funds did not incur any interest or penalties.
9. Subsequent Events:
Management has determined there are no subsequent events or transactions through the date the financial statements were issued that would have materially impacted the financial statements as presented. Following the reporting period at a meeting held on December 12, 2019, the Board of the Trust approved the modification of the funds’ investment strategies to include an allocation to U.S. real estate investments; this change will be effective on or about February 28, 2020.
Schwab MarketTrack Portfolios | Annual Report
Schwab MarketTrack Portfolios
Report of Independent Registered Public Accounting Firm
To the Board of Trustees of Schwab Capital Trust and Shareholders of Schwab MarketTrack All Equity Portfolio, Schwab MarketTrack Growth Portfolio, Schwab MarketTrack Balanced Portfolio and Schwab MarketTrack Conservative Portfolio
Opinions on the Financial Statements
We have audited the accompanying statements of assets and liabilities, including the portfolio holdings, of Schwab MarketTrack All Equity Portfolio, Schwab MarketTrack Growth Portfolio, Schwab MarketTrack Balanced Portfolio and Schwab MarketTrack Conservative Portfolio (four of the funds constituting Schwab Capital Trust, hereafter collectively referred to as the “Funds”) as of October 31, 2019, the related statements of operations for the year ended October 31, 2019, the statements of changes in net assets for each of the two years in the period ended October 31, 2019, including the related notes, and the financial highlights for each of the five years in the period ended October 31, 2019 (collectively referred to as the “financial statements”). In our opinion, the financial statements present fairly, in all material respects, the financial position of each of the Funds as of October 31, 2019, the results of each of their operations for the year then ended, the changes in each of their net assets for each of the two years in the period ended October 31, 2019 and each of the financial highlights for each of the five years in the period ended October 31, 2019 in conformity with accounting principles generally accepted in the United States of America.
Basis for Opinions
These financial statements are the responsibility of the Funds’ management. Our responsibility is to express an opinion on the Funds’ financial statements based on our audits. We are a public accounting firm registered with the Public Company Accounting Oversight Board (United States) (PCAOB) and are required to be independent with respect to the Funds in accordance with the U.S. federal securities laws and the applicable rules and regulations of the Securities and Exchange Commission and the PCAOB.
We conducted our audits of these financial statements in accordance with the standards of the PCAOB. Those standards require that we plan and perform the audit to obtain reasonable assurance about whether the financial statements are free of material misstatement, whether due to error or fraud.
Our audits included performing procedures to assess the risks of material misstatement of the financial statements, whether due to error or fraud, and performing procedures that respond to those risks. Such procedures included examining, on a test basis, evidence regarding the amounts and disclosures in the financial statements. Our audits also included evaluating the accounting principles used and significant estimates made by management, as well as evaluating the overall presentation of the financial statements. Our procedures included confirmation of securities owned as of October 31, 2019 by correspondence with the custodian, transfer agents and brokers; when replies were not received from brokers, we performed other auditing procedures. We believe that our audits provide a reasonable basis for our opinions.
/s/ PricewaterhouseCoopers LLP
San Francisco, California
December 16, 2019
We have served as the auditor of one or more investment companies in the Schwab Funds Complex since 1989.
Schwab MarketTrack Portfolios | Annual Report
Schwab MarketTrack Portfolios
Other Federal Tax Information (unaudited)
The funds may elect to pass on the benefits of the foreign tax credit to their shareholders for the fiscal year ended October 31, 2019. The foreign tax credit and the foreign source income amounts are as follows:
| | Foreign Tax Credit | Foreign Source Income |
| Schwab MarketTrack All Equity Portfolio | $610,566 | $5,486,754 |
| Schwab MarketTrack Growth Portfolio | 482,644 | 4,338,165 |
| Schwab MarketTrack Balanced Portfolio | 236,926 | 2,129,620 |
| Schwab MarketTrack Conservative Portfolio | 78,554 | 707,229 |
For corporate shareholders, the following percentage of the funds’ dividend distributions paid during the fiscal year ended October 31, 2019, qualify for the corporate dividends received deduction:
| | Percentage |
| Schwab MarketTrack All Equity Portfolio | 53.79 |
| Schwab MarketTrack Growth Portfolio | 45.80 |
| Schwab MarketTrack Balanced Portfolio | 31.54 |
| Schwab MarketTrack Conservative Portfolio | 21.02 |
For the fiscal year ended October 31, 2019, the funds designate the following amounts of the dividend distributions as qualified dividends for the purpose of the maximum rate under 1(h)(ii) of the Internal Revenue Code. Shareholders will be notified in January 2020 via IRS form 1099 of the amounts for use in preparing their 2019 income tax return.
| | |
| Schwab MarketTrack All Equity Portfolio | $13,175,919 |
| Schwab MarketTrack Growth Portfolio | 12,021,006 |
| Schwab MarketTrack Balanced Portfolio | 5,454,334 |
| Schwab MarketTrack Conservative Portfolio | 1,948,213 |
Under section 852(b)(3)(C) of the Internal Revenue Code, certain funds hereby designate the following amounts as long-term capital gain dividends for the fiscal year ended October 31, 2019:
| | |
| Schwab MarketTrack All Equity Portfolio | $14,361,968 |
| Schwab MarketTrack Growth Portfolio | 23,708,153 |
| Schwab MarketTrack Balanced Portfolio | 21,773,360 |
| Schwab MarketTrack Conservative Portfolio | 5,993,704 |
Schwab MarketTrack Portfolios | Annual Report
Schwab MarketTrack Portfolios
Investment Advisory Agreement Approval
The Investment Company Act of 1940, as amended, requires that the continuation of a fund’s investment advisory agreement must be specifically approved (1) by the vote of the trustees or by a vote of the shareholders of the fund, and (2) by the vote of a majority of the trustees who are not parties to the investment advisory agreement or “interested persons” of any party (the Independent Trustees), cast in person at a meeting called for the purpose of voting on such approval. In connection with such approvals, the fund’s trustees must request and evaluate, and the investment adviser is required to furnish, such information as may be reasonably necessary to evaluate the terms of the investment advisory agreement.
The Board of Trustees (the Board or the Trustees, as appropriate) calls and holds one or more meetings each year that are dedicated, in whole or in part, to considering whether to renew the investment advisory and administration agreement (the Agreement) between Schwab Capital Trust (the Trust) and Charles Schwab Investment Management, Inc. (CSIM) with respect to the existing funds in the Trust, including Schwab MarketTrack All Equity Portfolio, Schwab MarketTrack Growth Portfolio, Schwab MarketTrack Balanced Portfolio and Schwab MarketTrack Conservative Portfolio (each, a Fund and collectively, the Funds), and to review certain other agreements pursuant to which CSIM provides investment advisory services to certain other registered investment companies. In preparation for the meeting(s), the Board requests and reviews a wide variety of materials provided by CSIM, including information about CSIM’s affiliates, personnel, business goals and priorities, profitability, third-party oversight, corporate structure and operations. As part of the renewal process, the Independent Trustees’ legal counsel sends an information request letter to CSIM seeking certain relevant information. The responses by CSIM are provided to the Trustees for their review prior to their meeting, and the Trustees are provided with the opportunity to request any additional materials. The Board also receives data provided by an independent provider of investment company data. This information is in addition to the detailed information about the Funds that the Board reviews during the course of each year, including information that relates to the Funds’ operations and performance, legal and compliance matters, risk management, portfolio turnover, and sales and marketing activity. The Independent Trustees receive advice from Independent Trustees’ legal counsel, including a memorandum regarding the responsibilities of trustees for the approval of investment advisory agreements. In addition, the Independent Trustees meet in executive session outside the presence of Fund management and participate in question and answer sessions with representatives of CSIM.
The Board, including a majority of the Independent Trustees, considered information specifically relating to the continuance of the Agreement with respect to the Funds at meetings held
on May 13, 2019 and June 4, 2019, and approved the renewal of the Agreement with respect to the Funds for an additional one-year term at the June 4, 2019 in person meeting called for the purpose of voting on such approval.
The Board’s approval of the continuance of the Agreement with respect to the Funds was based on consideration and evaluation of a variety of specific factors discussed at these meetings and at prior meetings, including:
| 1. | the nature, extent and quality of the services provided to the Funds under the Agreement, including the resources of CSIM and its affiliates dedicated to the Funds; |
| 2. | each Fund’s investment performance and how it compared to that of certain other comparable mutual funds and benchmark data; |
| 3. | each Fund’s expenses and how those expenses compared to those of certain other similar mutual funds; |
| 4. | the profitability of CSIM and its affiliates, including Charles Schwab & Co., Inc. (Schwab), with respect to each Fund, including both direct and indirect benefits accruing to CSIM and its affiliates; and |
| 5. | the extent to which economies of scale would be realized as the Funds grow and whether fee levels in the Agreement reflect those economies of scale for the benefit of Fund investors. |
Nature, Extent and Quality of Services. The Board considered the nature, extent and quality of the services provided by CSIM to the Funds and the resources of CSIM and its affiliates dedicated to the Funds. In this regard, the Trustees evaluated, among other things, CSIM’s experience, track record, compliance program, resources dedicated to hiring and retaining skilled personnel and specialized talent, and information security resources. The Trustees also considered information provided by CSIM relating to services and support provided with respect to the Funds’ portfolio management team, portfolio strategy, and internal investment guidelines, as well as trading infrastructure, liquidity management, product design and analysis, shareholder communications, securities valuation, fund accounting and custody, and vendor and risk oversight. The Trustees also considered investments CSIM has made in its infrastructure, including modernizing CSIM’s technology and use of data, increasing expertise in key areas (including portfolio management and trade operations), and improving business continuity, cybersecurity, due diligence, risk management processes, and information security programs, which are designed to provide enhanced services to the Funds and their shareholders. The Trustees also considered that many of the Funds’ shareholders are also brokerage clients of Schwab and considered Schwab’s wide range of products, services, and channel alternatives such as investment research
Schwab MarketTrack Portfolios | Annual Report
Schwab MarketTrack Portfolios
tools and an array of account features that benefit the Funds and shareholders who are brokerage clients of Schwab. Finally, the Trustees also considered Schwab’s reputation as a full service brokerage firm and its overall financial condition. Following such evaluation, the Board concluded, within the context of its full deliberations, that the nature, extent and quality of services provided by CSIM to the Funds and the resources of CSIM and its affiliates dedicated to the Funds supported renewal of the Agreement with respect to the Funds.
Fund Performance. The Board considered the Funds’ performance in determining whether to renew the Agreement with respect to the Funds. Specifically, the Trustees considered each Fund’s performance relative to a peer category of other mutual funds and applicable indices/benchmarks, in light of total return, yield, if applicable, and market trends, as well as in consideration of each Fund’s investment style and strategy attributes and disclosures. As part of this review, the Trustees considered the composition of the peer category, selection criteria and the reputation of the independent provider of investment company data who prepared the peer category analysis. The Trustees further considered the level of Fund performance in the context of their review of Fund expenses and adviser profitability discussed below and also noted that performance is reviewed throughout the year by a designated committee of the Board and by the Board. Following such evaluation, the Board concluded, within the context of its full deliberations, that the performance of the Funds supported renewal of the Agreement with respect to the Funds.
Fund Expenses. With respect to the Funds’ expenses, the Trustees considered the rate of compensation called for by the Agreement, and each Fund’s net operating expense ratio, in each case, in comparison to those of other similar mutual funds, such peer groups and comparisons having been selected and calculated by an independent provider of investment company data. CSIM reported to the Board, and the Board took into account, the risk assumed by CSIM in the development of products and provision of services as well as the competitive marketplace for financial products. The Trustees also considered fees charged by CSIM to other mutual funds and to other types of accounts, but, with respect to such other types of accounts, accorded less weight to such comparisons due to the different legal, regulatory, compliance and operating features of mutual funds as compared to these other types of accounts, and any differences in the nature and scope of the services CSIM provides to these other accounts, as well as differences in the market for these types of accounts. The Trustees noted that shareholders of the Funds indirectly pay their pro rata share of the fees and expenses of the underlying funds in which the Funds invest. Following such evaluation, the Board concluded, within the context of its full deliberations, that the expenses of the Funds are reasonable and supported renewal of the Agreement with respect to the Funds.
Profitability. The Trustees considered the compensation flowing to CSIM and its affiliates, directly or indirectly and reviewed profitability on a pre-tax basis, without regard to distribution expenses. In this connection, the Trustees reviewed management’s profitability analyses. The Trustees also reviewed profitability of CSIM relating to the Schwab fund complex as a whole, noting the benefit to Fund shareholders of being part of the Schwab fund complex, including the allocations of certain fixed costs across other funds in the complex. The Trustees also considered any other benefits derived by CSIM from its relationship with the Funds, such as whether, by virtue of its management of the Funds, CSIM obtains investment information or other research resources that aid it in providing advisory services to other clients. Also, because each Fund invests a portion of its assets in other funds within the Schwab fund complex, the Trustees considered whether CSIM indirectly benefits from the Funds’ investments in other underlying funds managed by CSIM. The Trustees considered whether the varied levels of compensation and profitability with respect to the Funds under the Agreement and other service agreements were reasonable and justified in light of the quality of all services rendered to each Fund by CSIM and its affiliates. The Trustees noted that CSIM continues to invest substantial sums in its business in order to provide enhanced research capabilities, services, and systems to benefit the Funds. Based on this evaluation, the Board concluded, within the context of its full deliberations, that the profitability of CSIM is reasonable and supported renewal of the Agreement with respect to the Funds.
Economies of Scale. Although the Trustees recognized the difficulty of determining economies of scale with precision, the Trustees considered the potential existence of any economies of scale and whether those are passed along to a Fund’s shareholders through (i) the enhancement of services provided to the Funds in return for fees paid, including through investments by CSIM in CSIM’s infrastructure, including modernizing CSIM’s technology and use of data, increasing expertise and capabilities in key areas (including portfolio and trade operations), and improving business continuity, cybersecurity, due diligence, and information security programs, which are designed to provide enhanced services to the Funds and their shareholders; (ii) graduated investment advisory fee schedules, fee waivers, or expense caps by CSIM and its affiliates for those funds in the Schwab Funds complex with such features; and (iii) pricing a fund to scale and keeping overall expenses down as the fund grows. The Trustees acknowledged that CSIM has shared any economies of scale with the Funds by investing in CSIM’s infrastructure, as discussed above, over time and that CSIM’s internal costs of providing investment management, technology, administrative, legal and compliance services to the Funds continues to increase as a result of regulatory or other developments. The Trustees considered that CSIM and its affiliates may employ contractual expense caps to protect shareholders from high fees when fund assets are relatively small, for example, in the case of newer funds or funds with investment strategies that
Schwab MarketTrack Portfolios | Annual Report
Schwab MarketTrack Portfolios
are from time to time out of favor, because, among other reasons, shareholders may benefit from the continued availability of such funds at subsidized expense levels. Based on this evaluation, the Board concluded, within the context of its full deliberations, that the Funds obtain reasonable benefits from economies of scale.
In the course of their deliberations, the Trustees may have accorded different weights to various factors and did not identify any particular information or factor that was all
important or controlling. Based on the Trustees’ deliberation and their evaluation of the information described above, the Board, including all of the Independent Trustees, approved the continuation of the Agreement with respect to the Funds and concluded that the compensation under the Agreement with respect to the Funds is fair and reasonable in light of such services and expenses and such other matters as the Trustees have considered to be relevant in the exercise of their reasonable judgment.
Schwab MarketTrack Portfolios | Annual Report
Schwab MarketTrack Portfolios
Trustees and Officers
The tables below give information about the trustees and officers of Schwab Capital Trust, which includes the funds covered in this report. The “Fund Complex” includes The Charles Schwab Family of Funds, Schwab Capital Trust, Schwab Investments, Schwab Annuity Portfolios, Schwab Strategic Trust and Laudus Trust. The Fund Complex includes 101 funds.
The address for all trustees and officers is 211 Main Street, San Francisco, CA 94105. You can find more information about the trustees and officers in the funds’ Statement of Additional Information, which is available free by calling 1-877-824-5615.
| Independent Trustees |
Name, Year of Birth, and
Position(s) with the trust
(Terms of office, and
length of Time Served1) | Principal Occupations
During the Past Five Years | Number of
Portfolios in
Fund Complex
Overseen by
the Trustee | Other Directorships |
Robert W. Burns
1959
Trustee
(Trustee of Schwab Strategic Trust since 2009; The Charles Schwab Family of Funds, Schwab Investments, Schwab Capital Trust, Schwab Annuity Portfolios and Laudus Trust since 2016) | Retired/Private Investor (Jan. 2009 – present). Formerly, Managing Director, Pacific Investment Management Company, LLC (PIMCO) (investment management firm) and President, PIMCO Funds. | 101 | None |
John F. Cogan
1947
Trustee
(Trustee of The Charles Schwab Family of Funds, Schwab Investments, Schwab Capital Trust and Schwab Annuity Portfolios since 2008; Laudus Trust since 2010; Schwab Strategic Trust since 2016) | Senior Fellow (Oct. 1979 – present), The Hoover Institution at Stanford University (public policy think tank); Senior Fellow (2000 – present), Stanford Institute for Economic Policy Research; Professor of Public Policy (1994 – 2015), Stanford University. | 101 | Director (2005 – present), Gilead Sciences, Inc. |
Nancy F. Heller
1956
Trustee
(Trustee of The Charles Schwab Family of Funds, Schwab Investments, Schwab Capital Trust, Schwab Annuity Portfolios, Schwab Strategic Trust and Laudus Trust since 2018) | President and Chairman (2014 – 2016), TIAA Charitable (financial services); Senior Managing Director (2003 – 2016), TIAA (financial services). | 101 | None |
Stephen Timothy Kochis
1946
Trustee
(Trustee of Schwab Strategic Trust since 2012; The Charles Schwab Family of Funds, Schwab Investments, Schwab Capital Trust, Schwab Annuity Portfolios and Laudus Trust since 2016) | CEO and Owner (May 2012 – present), Kochis Global (wealth management consulting). | 101 | None |
Schwab MarketTrack Portfolios | Annual Report
Schwab MarketTrack Portfolios
| Independent Trustees (continued) |
Name, Year of Birth, and
Position(s) with the trust
(Terms of office, and
length of Time Served1) | Principal Occupations
During the Past Five Years | Number of
Portfolios in
Fund Complex
Overseen by
the Trustee | Other Directorships |
David L. Mahoney
1954
Trustee
(Trustee of The Charles Schwab Family of Funds, Schwab Investments, Schwab Capital Trust, Schwab Annuity Portfolios and Laudus Trust since 2011; Schwab Strategic Trust since 2016) | Private Investor. | 101 | Director (2003 – present), Symantec Corporation
Director (2004 – present), Corcept Therapeutics Incorporated
Director (2009 – present), Adamas Pharmaceuticals, Inc. |
Jane P. Moncreiff
1961
Trustee
(Trustee of The Charles Schwab Family of Funds, Schwab Investments, Schwab Capital Trust, Schwab Annuity Portfolios, Schwab Strategic Trust and Laudus Trust since 2019) | Chief Investment Officer (2009-2017), CareGroup Healthcare System, Inc. (healthcare). | 101 | None |
Kiran M. Patel
1948
Trustee
(Trustee of The Charles Schwab Family of Funds, Schwab Investments, Schwab Capital Trust, Schwab Annuity Portfolios and Laudus Trust since 2011; Schwab Strategic Trust since 2016) | Retired. Executive Vice President and General Manager of Small Business Group (Dec. 2008 – Sept. 2013), Intuit, Inc. (financial software and services firm for consumers and small businesses). | 101 | Director (2008 – present), KLA-Tencor Corporation |
Kimberly S. Patmore
1956
Trustee
(Trustee of The Charles Schwab Family of Funds, Schwab Investments, Schwab Capital Trust, Schwab Annuity Portfolios, Schwab Strategic Trust and Laudus Trust since 2016) | Consultant (2008 – present), Patmore Management Consulting (management consulting). | 101 | None |
Gerald B. Smith
1950
Trustee
(Trustee of The Charles Schwab Family of Funds, Schwab Investments, Schwab Capital Trust and Schwab Annuity Portfolios since 2000; Laudus Trust since 2010; Schwab Strategic Trust since 2016) | Chairman, Chief Executive Officer and Founder (Mar. 1990 – present), Smith Graham & Co. (investment advisors). | 101 | Director (2012 – present), Eaton Corporation plc |
Schwab MarketTrack Portfolios | Annual Report
Schwab MarketTrack Portfolios
| Interested Trustees |
Name, Year of Birth, and
Position(s) with the trust
(Terms of office, and
length of Time Served1) | Principal Occupations
During the Past Five Years | Number of
Portfolios in
Fund Complex
Overseen by
the Trustee | Other Directorships |
Walter W. Bettinger II2
1960
Chairman and Trustee
(Trustee of The Charles Schwab Family of Funds, Schwab Investments, Schwab Capital Trust and Schwab Annuity Portfolios since 2008; Schwab Strategic Trust since 2009; Laudus Trust since 2010) | Director, President and Chief Executive Officer (Oct. 2008 – present), The Charles Schwab Corporation; President and Chief Executive Officer (Oct. 2008 – present) and Director (May 2008 – present), Charles Schwab & Co., Inc.; Director (Apr. 2006 – present), Charles Schwab Bank; Director (Nov. 2017 – present), Charles Schwab Premier Bank; Director (May 2008 – present) and President and Chief Executive Officer (Aug. 2017 – present), Schwab Holdings, Inc.; Director (July 2016 – present), Charles Schwab Investment Management, Inc. | 101 | Director (2008 – present), The Charles Schwab Corporation |
Jonathan de St. Paer2
1973
Trustee
(Trustee of The Charles Schwab Family of Funds, Schwab Investments, Schwab Capital Trust, Schwab Annuity Portfolios, Schwab Strategic Trust and Laudus Trust since 2019) | Director (Apr. 2019 – present), President (Oct. 2018 – present), and Chief Executive Officer (Apr. 2019 – Nov. 2019), Charles Schwab Investment Management, Inc.; Trustee and Chief Executive Officer (Apr. 2019 – present) and President (Nov. 2018 – present), Schwab Funds, Laudus Funds and Schwab ETFs; Director (Apr. 2019 – present), Charles Schwab Worldwide Funds plc and Charles Schwab Asset Management (Ireland) Limited; Senior Vice President (Apr. 2019 – present), Senior Vice President – Strategy and Product Development (CSIM) (Jan. 2014 – Mar. 2019), and Vice President (Jan. 2009 – Dec. 2013), Charles Schwab & Co., Inc. | 101 | None |
Joseph R. Martinetto2
1962
Trustee
(Trustee of The Charles Schwab Family of Funds, Schwab Investments, Schwab Capital Trust, Schwab Annuity Portfolios, Schwab Strategic Trust and Laudus Trust since 2016) | Chief Operating Officer (Feb. 2018 – present) and Senior Executive Vice President (July 2015 – Feb. 2018), The Charles Schwab Corporation; Senior Executive Vice President (July 2015 – present), Charles Schwab & Co., Inc.; Chief Financial Officer (July 2015 – Aug. 2017) and Executive Vice President and Chief Financial Officer (May 2007 – July 2015), The Charles Schwab Corporation and Charles Schwab & Co., Inc.; Director (May 2007 – present), Charles Schwab & Co., Inc.; Director (Apr. 2010 – present) and Chief Executive Officer (July 2013 – Apr. 2015), Charles Schwab Bank; Director (Nov. 2017 – present), Charles Schwab Premier Bank; Director (May 2007 – present), Chief Financial Officer (May 2007 – Aug. 2017), Senior Executive Vice President (Feb. 2016 – present), and Executive Vice President (May 2007 – Feb. 2016), Schwab Holdings, Inc. | 101 | None |
| Officers of the Trust |
Name, Year of Birth, and Position(s) with the trust
(Terms of office, and length of Time Served3) | Principal Occupations During the Past Five Years |
Jonathan de St. Paer
1973
President and Chief Executive Officer
(Officer of The Charles Schwab Family of Funds, Schwab Investments, Schwab Capital Trust, Schwab Annuity Portfolios, Schwab Strategic Trust and Laudus Trust since 2018) | Director (Apr. 2019 – present), President (Oct. 2018 – present), and Chief Executive Officer (Apr. 2019 – Nov. 2019), Charles Schwab Investment Management, Inc.; Trustee and Chief Executive Officer (Apr. 2019 – present) and President (Nov. 2018 – present), Schwab Funds, Laudus Funds and Schwab ETFs; Director (Apr. 2019 – present), Charles Schwab Worldwide Funds plc and Charles Schwab Asset Management (Ireland) Limited; Senior Vice President (Apr. 2019 – present), Senior Vice President – Strategy and Product Development (CSIM) (Jan. 2014 – Mar. 2019), and Vice President (Jan. 2009 – Dec. 2013), Charles Schwab & Co., Inc. |
Schwab MarketTrack Portfolios | Annual Report
Schwab MarketTrack Portfolios
| Officers of the Trust (continued) |
Name, Year of Birth, and Position(s) with the trust
(Terms of office, and length of Time Served3) | Principal Occupations During the Past Five Years |
Mark Fischer
1970
Treasurer and Chief Financial Officer
(Officer of The Charles Schwab Family of Funds, Schwab Investments, Schwab Capital Trust, Schwab Annuity Portfolios, Schwab Strategic Trust and Laudus Trust since 2013) | Treasurer and Chief Financial Officer (Jan. 2016 – present), Schwab Funds, Laudus Funds and Schwab ETFs; Assistant Treasurer (Dec. 2013 – Dec. 2015), Schwab Funds and Laudus Funds; Assistant Treasurer (Nov. 2013 – Dec. 2015), Schwab ETFs; Vice President (Oct. 2013 – present), Charles Schwab Investment Management, Inc.; Executive Director (Apr. 2011 – Sept. 2013), J.P. Morgan Investor Services; Assistant Treasurer (May 2005 – Mar. 2011), Massachusetts Financial Service Investment Management. |
George Pereira
1964
Senior Vice President and Chief Operating Officer
(Officer of The Charles Schwab Family of Funds, Schwab Investments, Schwab Capital Trust and Schwab Annuity Portfolios since 2004; Laudus Trust since 2006; Schwab Strategic Trust since 2009) | Senior Vice President and Chief Financial Officer (Nov. 2004 – present) and Chief Operating Officer (Jan. 2011 – present), Charles Schwab Investment Management, Inc.; Senior Vice President and Chief Operating Officer (Jan. 2016 – present), Schwab Funds, Laudus Funds and Schwab ETFs; Treasurer and Chief Financial Officer (June 2006 – Dec. 2015), Laudus Funds; Treasurer and Principal Financial Officer (Nov. 2004 – Dec. 2015), Schwab Funds; Treasurer and Principal Financial Officer (Oct. 2009 – Dec. 2015), Schwab ETFs; Director (Apr. 2005 – present), Charles Schwab Worldwide Funds plc and Charles Schwab Asset Management (Ireland) Limited. |
Omar Aguilar
1970
Senior Vice President and Chief Investment Officer – Equities and Multi-Asset Strategies
(Officer of The Charles Schwab Family of Funds, Schwab Investments, Schwab Capital Trust, Schwab Annuity Portfolios, Schwab Strategic Trust and Laudus Trust since 2011) | Senior Vice President and Chief Investment Officer (Apr. 2011 – present), Charles Schwab Investment Management, Inc.; Senior Vice President and Chief Investment Officer – Equities and Multi-Asset Strategies (June 2011 – present), Schwab Funds, Laudus Funds and Schwab ETFs; Head of the Portfolio Management Group and Vice President of Portfolio Management (May 2009 – Apr. 2011), Financial Engines, Inc. (investment management firm); Head of Quantitative Equity (July 2004 – Jan. 2009), ING Investment Management. |
Brett Wander
1961
Senior Vice President and Chief Investment Officer – Fixed Income
(Officer of The Charles Schwab Family of Funds, Schwab Investments, Schwab Capital Trust, Schwab Annuity Portfolios, Schwab Strategic Trust and Laudus Trust since 2011) | Senior Vice President and Chief Investment Officer (Apr. 2011 – present), Charles Schwab Investment Management, Inc.; Senior Vice President and Chief Investment Officer – Fixed Income (June 2011 – present), Schwab Funds, Laudus Funds and Schwab ETFs; Senior Managing Director and Global Head of Active Fixed-Income Strategies (Jan. 2008 – Oct. 2010), State Street Global Advisors; Director of Alpha Strategies (Apr. 2006 – Jan. 2008), Loomis, Sayles & Company (investment management firm). |
David Lekich
1964
Chief Legal Officer and Secretary, Schwab Funds and Schwab ETFs
Vice President and Assistant Clerk, Laudus Funds
(Officer of The Charles Schwab Family of Funds, Schwab Investments, Schwab Capital Trust, Schwab Annuity Portfolios, Schwab Strategic Trust and Laudus Trust since 2011) | Senior Vice President (Sept. 2011 – present) and Vice President (Mar. 2004 – Sept. 2011), Charles Schwab & Co., Inc.; Senior Vice President and Chief Counsel (Sept. 2011 – present) and Vice President (Jan. 2011 – Sept. 2011), Charles Schwab Investment Management, Inc.; Secretary (Apr. 2011 – present) and Chief Legal Officer (Dec. 2011 – present), Schwab Funds; Vice President and Assistant Clerk (Apr. 2011 – present), Laudus Funds; Secretary (May 2011 – present) and Chief Legal Officer (Nov. 2011 – present), Schwab ETFs. |
Catherine MacGregor
1964
Vice President and Assistant Secretary, Schwab Funds and Schwab ETFs
Chief Legal Officer, Vice President and Clerk, Laudus Funds
(Officer of The Charles Schwab Family of Funds, Schwab Investments, Schwab Capital Trust, Schwab Annuity Portfolios and Laudus Trust since 2005; Schwab Strategic Trust since 2009) | Vice President (July 2005 – present), Charles Schwab & Co., Inc.; Vice President (Sept. 2005 – present), Charles Schwab Investment Management, Inc.; Vice President (Dec. 2005 – present) and Chief Legal Officer and Clerk (Mar. 2007 – present), Laudus Funds; Vice President (Nov. 2005 – present) and Assistant Secretary (June 2007 – present), Schwab Funds; Vice President and Assistant Secretary (Oct. 2009 – present), Schwab ETFs. |
| 1 | Each Trustee shall hold office until the election and qualification of his or her successor, or until he or she dies, resigns or is removed. The retirement policy requires that each independent trustee retire by December 31 of the year in which the Trustee turns 74 or the Trustee’s twentieth year of service as an independent trustee on any trust in the Fund Complex, whichever occurs first. |
| 2 | Mr. Bettinger, Mr. de St. Paer and Mr. Martinetto are Interested Trustees. Mr. Bettinger is an Interested Trustee because he owns stock of The Charles Schwab Corporation (CSC), the parent company of Charles Schwab Investment Management, Inc. (CSIM), the investment adviser for the trusts in the Fund Complex, is an employee and director of Charles Schwab & Co., Inc. (CS&Co), the principal underwriter for The Charles Schwab Family of Funds, Schwab Investments, Schwab Capital Trust, Schwab Annuity Portfolios and Laudus Trust, and is a director of CSIM. Mr. de St. Paer is an Interested Trustee because he owns stock of CSC and is an employee and director of CSIM. Mr. Martinetto is an Interested Trustee because he owns stock of CSC and is an employee and director of CS&Co. |
| 3 | The President, Treasurer and Secretary/Clerk hold office until their respective successors are chosen and qualified or until he or she sooner dies, resigns, is removed or becomes disqualified. Each of the other officers serves at the pleasure of the Board. |
Schwab MarketTrack Portfolios | Annual Report
Schwab MarketTrack Portfolios
All Equity Composite Index A custom blended index developed by CSIM based on a comparable portfolio asset allocation. Effective December 1, 2014, the index is composed of 31.33% S&P 500 Index, 17.33% Russell 2000 Index, 13.50% Russell RAFI US Large Company Index, 7.50% Russell RAFI US Small Company Index, 13.83% MSCI EAFE Index (Net), 6% Russell RAFI Developed ex US Large Company Index (Net), 5% Russell RAFI Developed ex US Small Company Index (Net), 5% Russell RAFI Emerging Markets Large Company Index (Net), and 0.5% Bloomberg Barclays US Treasury Bills 1-3 Month Index. From March 1, 2014 to December 1, 2014, the index was comprised of 45% S&P 500 Index, 25% Russell 2000 Index and 30% MSCI EAFE Index (Net). On March 1, 2014, the combination of the S&P 500 Index and Russell 2000 Index replaced the Dow Jones U.S. Total Stock Market Index in the custom index. Prior to March 1, 2014, the index was comprised of 70% Dow Jones U.S. Total Stock Market Index and 30% MSCI EAFE Index (Net). The components that make up the composite may vary over time.
asset allocation The practice of dividing a portfolio among different asset classes, with each asset class assigned a particular percentage.
asset class A group of securities with similar structure and basic characteristics. Stocks, bonds and cash are the three main examples of asset classes.
Balanced Composite Index A custom blended index developed by CSIM based on a comparable portfolio asset allocation. Effective December 1, 2014 the Balanced Composite Index is composed of 21% S&P 500 Index, 10.50% Russell 2000 Index, 9% Russell RAFI US Large Company Index, 4.50% Russell RAFI US Small Company Index, 7% MSCI EAFE Index (Net), 3% Russell RAFI Developed ex US Large Company Index (Net), 2.50% Russell RAFI Developed ex US Small Company Index (Net), 2.50% Russell RAFI Emerging Markets Large Company Index (Net), 35% Bloomberg Barclays US Aggregate Bond Index, and 5% Bloomberg Barclays US Treasury Bills 1-3 Month Index. From March 1, 2014 to December 1, 2014, the index was comprised of 30% S&P 500 Index, 15% Russell 2000 Index, 15% MSCI EAFE Index (Net), 35% Bloomberg Barclays US Aggregate Bond Index, and 5% Bloomberg Barclays US Treasury Bills 1 – 3 Month Index. On March 1, 2014, the combination of the S&P 500 Index and Russell 2000 Index replaced the Dow Jones U.S. Total Stock Market Index in the custom index. Prior to March 1, 2014, the index was comprised of 45% Dow Jones U.S. Total Stock Market Index, 15% MSCI EAFE Index (Net), 35% Bloomberg Barclays US Aggregate Bond Index, and 5% Bloomberg Barclays US Treasury Bills 1 – 3 Month Index. The components that make up the composite may vary over time.
Bloomberg Barclays US Aggregate Bond Index An index that is a broad-based benchmark measuring the performance of the U.S. investment grade, taxable bond market, including U.S. Treasuries, government-related and corporate bonds, mortgage pass-through securities, commercial mortgage-backed securities, and asset-backed securities that are publicly available for sale in the United States. To be eligible for inclusion in the index, securities must be fixed rate, non-convertible, U.S. dollar denominated with at least $300 million or more of outstanding face value and have one or more years remaining to maturity. The index excludes certain types of securities, including tax-exempt state and local government series bonds, structured notes embedded with swaps or other special features, private placements, floating rate securities, inflation-linked bonds and Eurobonds. The index is market capitalization weighted and the securities in the index are updated on the last business day of each month.
Bloomberg Barclays US Treasury Bills 1–3 Month Index An index that includes all publicly issued zero-coupon U.S. Treasury Bills that have a remaining maturity of less than 3 months but more than 1 month, are rated investment grade and have $300 million or more of outstanding face value. It excludes zero-coupon STRIPS.
bond A security representing a loan from the investor to the issuer. A bond typically pays interest at a fixed rate (the coupon rate) until a specified date (the maturity date), at which time the issuer returns the money borrowed (principal or face value) to the bondholder. Because of their structure, bonds are sometimes called “fixed income securities” or “debt securities.”
An individual bond is subject to the credit risk of the issuer. Changes in interest rates can affect a bond’s market value prior to call or maturity. There is no guarantee that a bond’s yield to call or maturity will provide a positive return over the rate of inflation.
bond fund A bond fund is subject to the same credit, interest rate, and inflation risks as bonds. In addition, a bond fund incurs ongoing fees and expenses. A bond fund’s net asset value will fluctuate with the price of the underlying bonds and the portfolio turnover activity; return of principal is not guaranteed.
cap, capitalization See “market cap.”
capital gain, capital loss the difference between the amount paid for an investment and its value at a later time. If the investment has been sold, the capital gain or loss is considered a realized gain or loss. If the investment is still held, the capital gain or loss is considered unrealized appreciation or depreciation.
Conservative Composite Index A custom blended index developed by CSIM based on a comparable portfolio asset allocation. Effective December 1, 2014, the index is calculated using the following portion allocations: 14.0% S&P 500 Index, 7.0% Russell 2000 Index, 6.0% Russell RAFI US Large Company Index, 3.0% Russell RAFI US Small Company Index, 4.6% MSCI EAFE Index (Net), 2.0% Russell RAFI Developed ex US Large Company Index (Net), 1.7% Russell RAFI Developed ex US Small Company Index (Net), 1.7% Russell RAFI Emerging Markets Large Company Index (Net), 55.0% Bloomberg Barclays US Aggregate Bond Index, and 5.0% Bloomberg Barclays US Treasury Bills 1 – 3 Month Index. From March 1, 2014 to December 1, 2014, the index was comprised of 20% S&P 500 Index, 10% Russell 2000 Index, 10% MSCI EAFE Index (Net), 55% Bloomberg Barclays US Aggregate Bond Index, and 5% Bloomberg Barclays US Treasury Bills 1 – 3 Month Index. On March 1, 2014, the combination of the S&P 500 Index and Russell 2000 Index replaced the Dow Jones U.S. Total Stock Market Index in the custom index. Prior to March 1, 2014, the index was comprised of 30% Dow Jones U.S. Total Stock Market Index, 10% MSCI EAFE Index (Net), 55% Bloomberg Barclays US Aggregate Bond Index, and 5% Bloomberg Barclays US Treasury Bills 1 – 3 Month Index. The components that make up the composite may vary over time.
Dow Jones U.S. Total Stock Market Index An index which includes all publicly traded stocks of companies headquartered in the United States for which pricing information is readily available. The index is a float-adjusted market capitalization weighted index that reflects the shares of securities actually available to investors in the marketplace.
expense ratio The amount that is taken from a mutual fund’s assets each year to cover the fund’s operating expenses. An expense ratio of 0.50% means that a fund’s expenses amount to half of one percent of its average net assets a year.
Schwab MarketTrack Portfolios | Annual Report
Schwab MarketTrack Portfolios
FTSE non-US Dollar World Government Bond Index A market capitalization index that measures the total rate of return performance for the government bonds of 22 countries, excluding the U.S., with a remaining maturity of at least 1 year.
Growth Composite Index A custom blended index developed by CSIM based on a comparable portfolio asset allocation. Effective December 1, 2014 the Growth Composite Index is composed of 28% S&P 500 Index, 14% Russell 2000 Index, 12% Russell RAFI US Large Company Index, 6% Russell RAFI US Small Company Index, 9.33% MSCI EAFE Index (Net), 4% Russell RAFI Developed ex US Large Company Index (Net), 3.33% Russell RAFI Developed ex US Small Company Index (Net), 3.33% Russell RAFI Emerging Markets Large Company Index (Net), 15% Bloomberg Barclays US Aggregate Bond Index, and 5% Bloomberg Barclays US Treasury Bills 1-3 Month Index. From March 1, 2014 to December 1, 2014, the index was comprised of 40% S&P 500 Index, 20% Russell 2000 Index, 20% MSCI EAFE Index (Net), 15% Bloomberg Barclays US Aggregate Bond Index, and 5% Bloomberg Barclays US Treasury Bills 1 – 3 Month Index. On March 1, 2014, the combination of the S&P 500 Index and Russell 2000 Index replaced the Dow Jones U.S. Total Stock Market Index in the custom index. Prior to March 1, 2014 the index was comprised of 60% Dow Jones U.S. Total Stock Market Index, 20% MSCI EAFE Index (Net), 15% Bloomberg Barclays US Aggregate Bond Index, and 5% Bloomberg Barclays US Treasury Bills 1 – 3 Month Index. The components that make up the composite may vary over time.
market cap, market capitalization The value of a company as determined by the total value of all shares of its stock outstanding.
MSCI EAFE Index (Net) A free float-adjusted market capitalization index that is designed to measure the equity market performance of developed markets in Europe, Australasia, and the Far East. The Net version of the index reflects reinvested dividends net of withholding taxes, but reflects no deductions for expenses or other taxes; returns are calculated applying dividend withholding rates applicable to non-resident persons who do not benefit from double taxation treaties.
net asset value (NAV) The value of one share of a mutual fund. NAV is calculated by taking the fund’s total assets, subtracting liabilities, and dividing by the number of shares outstanding.
outstanding shares, shares outstanding When speaking of a company or mutual fund, indicates all shares currently held by investors.
price-to-book ratio (P/B) The market price of a company’s stock compared with its “book value.” A mutual fund’s P/B is the weighted average of the P/B of all stocks in the fund’s portfolio.
price-to-earnings ratio (P/E) The market price of a company’s stock compared with earnings over the past year. A mutual fund’s P/E is the weighted average of the P/E of all stocks in the fund’s portfolio.
return on equity (ROE) The average yearly rate of return for each dollar of investors’ money, measured over the past five years.
Russell 2000 Index An index that measures the performance of the 2,000 smallest companies in the Russell 3000 Index. The Russell 3000 Index measures the performance of the largest 3,000 U.S. companies representing approximately 98% of the investable U.S. equity market.
Russell RAFI Developed ex US Large Company Index (Net) An index that ranks developed ex-U.S. companies in the FTSE Global Total Cap Index by fundamental measures of size and tracks the performance of those companies whose fundamental scores are in the top 87.5%. The index uses a partial quarterly reconstitution methodology in which the index is split into four equal segments at the annual reconstitution and
each segment is then rebalanced on a rolling quarterly basis. The Net series reduces index performance by adjusting for local taxes. Selecting the developed ex-U.S. companies in the FTSE Global Total Cap Index measures the performance of the largest investable securities in developed countries globally, excluding companies assigned to the United States.
Russell RAFI Developed ex US Small Company Index (Net) An index that ranks developed ex-U.S. companies in the FTSE Global Total Cap Index by fundamental measures of size and tracks the performance of those companies whose fundamental scores rank below the 87.5% threshold. The index uses a partial quarterly reconstitution methodology in which the index is split into four equal segments at the annual reconstitution and each segment is then rebalanced on a rolling quarterly basis. The Net series reduces index performance by adjusting for local taxes. Selecting the developed ex-U.S. companies in the FTSE Global Total Cap Index measures the performance of the smallest investable securities in developed countries globally, excluding companies assigned to the United States.
Russell RAFI Emerging Markets Large Company Index (Net) An index that ranks emerging market companies in the FTSE Global Total Cap Index by measures of fundamental size and tracks the performance of those companies whose fundamental scores are in the top 87.5%. The index uses a partial quarterly reconstitution methodology in which the index is split into four equal segments at the annual reconstitution and each segment is then rebalanced on a rolling quarterly basis. The Net series reduces index performance by adjusting for local taxes. Selecting the emerging companies in the FTSE Global Total Cap Index measures the performance of the investable securities in emerging countries globally.
Russell RAFI US Large Company Index An index that ranks U.S. companies in the FTSE Global Total Cap Index. The Russell RAFI US Large Company Index includes only those securities that are members of the U.S. portion whose fundamental scores are in the top 87.5%. The index uses a partial quarterly reconstitution methodology in which the index is split into four equal segments at the annual reconstitution and each segment is then rebalanced on a rolling quarterly basis.
Russell RAFI US Small Company Index An index that ranks U.S. companies in the FTSE Global Total Cap Index. The Russell RAFI US Small Company Index includes only those securities that are members of the U.S. portion and rank below the 87.5% fundamental score threshold. The index uses a partial quarterly reconstitution methodology in which the index is split into four equal segments at the annual reconstitution and each segment is then rebalanced on a rolling quarterly basis.
S&P 500 Index An index that is designed to measure the performance of 500 leading publicly traded companies from a broad range of industries.
stock A share of ownership, or equity, in the issuing company.
total return The percentage that an investor would have earned or lost on an investment in the fund assuming dividends and distributions were reinvested.
weighted average For mutual funds, an average that gives the same weight to each security as the security represents in the fund’s portfolio.
yield The income paid out by an investment, expressed as a percentage of the investment’s market value.
Schwab MarketTrack Portfolios | Annual Report
Schwab MarketTrack Portfolios
PRIVACY NOTICE
THIS IS NOT PART OF THE SHAREHOLDER REPORT
A Commitment to Your Privacy
Your Privacy Is Not for Sale
We do not and will not sell your personal information to anyone, for any reason.
We are committed to protecting the privacy of information we maintain about you. Below are details about our commitment, including the types of information we collect and how we use and share that information. This Privacy Notice applies to you only if you are an individual who invests directly in the funds by placing orders through the funds’ transfer agent. If you place orders through your brokerage account at Charles Schwab & Co., Inc. or an account with another broker-dealer, investment advisor, 401(k) plan, employee benefit plan, administrator, bank or other financial intermediary, you are covered by the privacy policies of that financial institution and should consult those policies.
How We Collect Information About You
We collect personal information about you in a number of ways.
• APPLICATION AND REGISTRATION
INFORMATION.
We collect personal information from you when you open an account or utilize one of our services. We may also collect information about you from third parties such as consumer reporting agencies to verify your identity. The information we collect may include personal information, including your Social Security number, as well as details about your interests, investments and investment experience.
• TRANSACTION AND EXPERIENCE
INFORMATION.
Once your account has been opened, we collect and maintain personal information about your account activity, including your transactions, balances, positions and history. This information allows us to administer your account and provide the services you have requested.
• WEBSITE USAGE.
When you visit our websites, we may use devices known as “cookies,” graphic interchange format files (GIFs), or other similar web tools to enhance your web experience. These tools help us to recognize you, maintain your web session, and
provide a more personalized experience. To learn more, please go to www.schwab.com/privacy.
How We Share and Use Your Information
We provide access to information about you to our affiliated companies, outside companies and other third parties in certain limited circumstances, including:
• to help us process transactions for your account;
• when we use other companies to provide services for us, such as printing and mailing your account statements; and
• when we believe that disclosure is required or permitted under law (for example, to cooperate with regulators or law enforcement, resolve consumer disputes, perform credit/authentication checks, or for risk control).
State Laws
We will comply with state laws that apply to the disclosure or use of information about you.
Safeguarding Your Information — Security Is a Partnership
We take precautions to ensure the information we collect about you is protected and is accessed only by authorized individuals or organizations.
Companies we use to provide support services are not allowed to use information about our shareholders for their own purposes and are contractually obligated to maintain strict confidentiality. We limit their use of information to the performance of the specific services we have requested.
We restrict access to personal information by our employees and agents. Our employees are trained about privacy and are required to safeguard personal information.
We maintain physical, electronic and procedural safeguards that comply with federal standards to guard your nonpublic personal information.
Contact Us
To provide us with updated information, report suspected fraud or identity theft, or for any other questions, please call the number below.
Schwab Funds® direct investors: 1-800-407-0256
© 2019 Schwab Funds. All rights reserved.
Schwab MarketTrack Portfolios | Annual Report
Schwab MarketTrack Portfolios
Charles Schwab Investment Management
With a straightforward lineup of core products and solutions for building the foundation of a portfolio, Charles Schwab Investment Management advocates for investors of all sizes with a steadfast focus on lowering costs and reducing unnecessary complexity. The list below shows all currently available Schwab Funds®.
Investors should carefully consider information contained in the prospectus, or if available, the summary prospectus, including investment objectives, risks, charges and expenses before investing. Please call 1-877-824-5615 for a prospectus for any Schwab Fund. Please read the prospectus carefully before you invest. This report must be preceded or accompanied by a current prospectus.
Proxy Voting Policies, Procedures and Results
A description of the proxy voting policies and procedures used to determine how to vote proxies on behalf of the funds is available without charge, upon request, by visiting the Schwab Funds’ website atwww.schwabfunds.com/schwabfunds_prospectus, the SEC’s website atwww.sec.gov, or by contacting Schwab Funds at 1-877-824-5615.
Information regarding how a fund voted proxies relating to portfolio securities during the most recent twelve-month period ended June 30 is available, without charge, by visiting the fund’s website atwww.schwabfunds.com/schwabfunds_prospectus or the SEC’s website atwww.sec.gov.
Equity Funds
Schwab Core Equity Fund
Schwab Dividend Equity Fund
Schwab Large-Cap Growth Fund
Schwab Small-Cap Equity Fund
Schwab Hedged Equity Fund
Schwab Health Care Fund
Schwab International Core Equity Fund
Schwab Fundamental US Large Company Index Fund
Schwab Fundamental US Small Company Index Fund
Schwab Fundamental International Large Company Index Fund
Schwab Fundamental International Small Company Index Fund
Schwab Fundamental Emerging Markets Large Company Index Fund
Schwab Fundamental Global Real Estate Index Fund
Schwab Global Real Estate Fund
Schwab S&P 500 Index Fund
Schwab 1000 Index® Fund
Schwab Small-Cap Index Fund®
Schwab Total Stock Market Index Fund®
Schwab U.S. Large-Cap Growth Index Fund
Schwab U.S. Large-Cap Value Index Fund
Schwab U.S. Mid-Cap Index Fund
Schwab International Index Fund®
Asset Allocation Funds
Schwab Balanced Fund
Schwab MarketTrack Portfolios®
Schwab Target Funds
Schwab Target Index Funds
Schwab Monthly Income Funds
Bond Funds
Schwab Treasury Inflation Protected Securities Index Fund
Schwab U.S. Aggregate Bond Index Fund
Schwab Short-Term Bond Index Fund
Schwab Tax-Free Bond Fund1
Schwab California Tax-Free Bond Fund1
Schwab Money Funds2
Schwab provides a broad choice of taxable and tax-exempt money market funds for both retail and institutional client types.
Investment Adviser
Charles Schwab Investment Management, Inc.
211 Main Street, San Francisco, CA 94105
Funds
Schwab Funds
1-877-824-5615
© 2019 Charles Schwab & Co., Inc. All rights reserved.
Member SIPC®
Printed on recycled paper.
| ¹ | State, local, and the Federal Alternative Minimum Tax may apply. Capital gains are not exempt from Federal Taxation. |
| ² | You could lose money by investing in the Schwab Money Funds. All Schwab Money Funds with the exception of Schwab Variable Share Price Money Fund seek to preserve the value of your investment at $1.00 per share, but cannot guarantee they will do so. Because the share price of Schwab Variable Share Price Money Fund will fluctuate, when you sell your shares they may be worth more or less than what you originally paid for them. All Schwab Money Funds with the exception of Schwab Government Money Fund, Schwab Retirement Government Money Fund, Schwab U.S. Treasury Money Fund, Schwab Treasury Obligations Money Fund and Schwab Government Money Market Portfolio may impose a fee upon the sale of your shares or may temporarily suspend your ability to sell shares if the Fund’s liquidity falls below required minimums because of market conditions or other factors. An investment in the Schwab Money Funds is not insured or guaranteed by the Federal Deposit Insurance Corporation or any other government agency. The Schwab Money Funds’ sponsor has no legal obligation to provide financial support to the Funds, and you should not expect that the sponsor will provide financial support to the Funds at any time. |
This page is intentionally left blank.
Annual Report | October 31, 2019
Schwab Target Funds
Schwab Target 2010 Fund
Schwab Target 2015 Fund
Schwab Target 2020 Fund
Schwab Target 2025 Fund
Schwab Target 2030 Fund
Schwab Target 2035 Fund
Schwab Target 2040 Fund
Schwab Target 2045 Fund
Schwab Target 2050 Fund
Schwab Target 2055 Fund
Schwab Target 2060 Fund
| New Notice Regarding Shareholder Report Delivery Options |
| Beginning on January 1, 2021, paper copies of a fund’s shareholder reports will no longer be sent by mail, unless you specifically request paper copies of the reports from a fund or from your financial intermediary (such as a bank or broker-dealer). Instead, the reports will be made available on a fund’s websitewww.schwabfunds.com/schwabfunds_prospectus, and you will be notified by mail each time a report is posted and the mailing will provide a website link to access the report. You will continue to receive other fund regulatory documents (such as prospectuses or supplements) in paper unless you have elected to receive all fund documents electronically. |
| If you would like to receive a fund’s future shareholder reports in paper free of charge after January 1, 2021, you can make that request: |
| • If you invest through Charles Schwab & Co, Inc. (broker-dealer), by calling 1-866-345-5954 and using the unique identifier attached to this mailing; |
| • If you invest through another financial intermediary (such as a bank or broker-dealer) by contacting them directly; or |
| • If owned directly through a fund by calling 1-800-407-0256. |
| If you already receive shareholder reports and other fund documents electronically, you will not be affected by this change and you need not take any action. |
This page is intentionally left blank.
Fund investment adviser: Charles Schwab Investment Management, Inc. (CSIM)
Distributor: Charles Schwab & Co., Inc. (Schwab)
Schwab Target Funds | Annual Report
The performance data quoted represents past performance. Past performance does not guarantee future results. Investment returns and principal value of an investment will fluctuate so that an investor’s shares may be worth more or less than their original cost. Current performance may be lower or higher than performance data quoted. To obtain performance information current to the most recent month end, please visitwww.schwabfunds.com/schwabfunds_prospectus.
| Total Return for the 12 Months Ended October 31, 2019 |
| Schwab Target 2010 Fund (Ticker Symbol: SWBRX) | 10.42% |
| Target 2010 Composite Index | 11.10% |
| Fund Category: Morningstar Target-Date 2000-20101 | 10.05% |
| Performance Details | pages 8-10 |
| |
| Schwab Target 2015 Fund (Ticker Symbol: SWGRX) | 10.48% |
| Target 2015 Composite Index | 11.23% |
| Fund Category: Morningstar Target-Date 20151 | 10.50% |
| Performance Details | pages 11-13 |
| |
| Schwab Target 2020 Fund (Ticker Symbol: SWCRX) | 10.58% |
| Target 2020 Composite Index | 11.43% |
| Fund Category: Morningstar Target-Date 20201 | 10.68% |
| Performance Details | pages 14-16 |
| |
| Schwab Target 2025 Fund (Ticker Symbol: SWHRX) | 10.79% |
| Target 2025 Composite Index | 11.99% |
| Fund Category: Morningstar Target-Date 20251 | 11.25% |
| Performance Details | pages 17-19 |
| |
| Schwab Target 2030 Fund (Ticker Symbol: SWDRX) | 10.94% |
| Target 2030 Composite Index | 12.32% |
| Fund Category: Morningstar Target-Date 20301 | 11.54% |
| Performance Details | pages 20-22 |
All total returns on this page assume dividends and distributions were reinvested. Index figures do not include trading and management costs, which would lower performance. Indices are unmanaged and cannot be invested in directly. Performance results less than one year are not annualized.
The components that make up each of the composite indices may vary over time. For index definitions, please see the Glossary.
Fund expenses may have been partially absorbed by CSIM and its affiliates. Without these reductions, a fund’s total return would have been lower. Performance does not reflect the deduction of taxes that a shareholder would pay on fund distributions or on the redemption of fund shares.
| 1 | Source for category information: Morningstar, Inc. The Morningstar Category return represents all active and index mutual funds within the category as of the report date. |
| | |
Schwab Target Funds | Annual Report
Performance at a Glance(continued)
| Total Return for the 12 Months Ended October 31, 2019 |
| Schwab Target 2035 Fund (Ticker Symbol: SWIRX) | 10.90% |
| Target 2035 Composite Index | 12.49% |
| Fund Category: Morningstar Target-Date 20351 | 11.80% |
| Performance Details | pages 23-25 |
| |
| Schwab Target 2040 Fund (Ticker Symbol: SWERX) | 10.90% |
| Target 2040 Composite Index | 12.61% |
| Fund Category: Morningstar Target-Date 20401 | 11.86% |
| Performance Details | pages 26-28 |
| |
| Schwab Target 2045 Fund (Ticker Symbol: SWMRX) | 10.91% |
| Target 2045 Composite Index | 12.69% |
| Fund Category: Morningstar Target-Date 20451 | 12.01% |
| Performance Details | pages 29-31 |
| |
| Schwab Target 2050 Fund (Ticker Symbol: SWNRX) | 10.87% |
| Target 2050 Composite Index | 12.72% |
| Fund Category: Morningstar Target-Date 20501 | 12.05% |
| Performance Details | pages 32-34 |
| |
| Schwab Target 2055 Fund (Ticker Symbol: SWORX) | 10.73% |
| Target 2055 Composite Index | 12.74% |
| Fund Category: Morningstar Target-Date 20551 | 12.07% |
| Performance Details | pages 35-37 |
| |
| Schwab Target 2060 Fund (Ticker Symbol: SWPRX) | 10.85% |
| Target 2060 Composite Index | 12.75% |
| Fund Category: Morningstar Target-Date 2060+1 | 12.15% |
| Performance Details | pages 38-40 |
All total returns on this page assume dividends and distributions were reinvested. Index figures do not include trading and management costs, which would lower performance. Indices are unmanaged and cannot be invested in directly. Performance results less than one year are not annualized.
The components that make up each of the composite indices may vary over time. For index definitions, please see the Glossary.
Fund expenses may have been partially absorbed by CSIM and its affiliates. Without these reductions, a fund’s total return would have been lower. Performance does not reflect the deduction of taxes that a shareholder would pay on fund distributions or on the redemption of fund shares.
| 1 | Source for category information: Morningstar, Inc. The Morningstar Category return represents all active and index mutual funds within the category as of the report date. |
Schwab Target Funds | Annual Report
Jonathan de St. Paer
President of Charles Schwab
Investment Management, Inc.
and the funds covered
in this report.
Dear Shareholder,
At the crux of every investment decision, one consideration that may be top of mind is your risk tolerance. It may seem like a straightforward consideration, but it’s often not. Most of us are risk-averse by nature and as investors, the fear of a significant market decline is ever-present in our minds. This can sometimes lead us to make decisions that may get in the way of the performance of our investments. Our feelings about risk are also fluid, impacted by changes in market conditions and our progress toward our financial goals. For example, some investors may have been prompted to rethink their risk appetite as a result of the latest bout of market volatility.
At Charles Schwab Investment Management, we provide a range of foundational products that are designed to suit a variety of risk appetites and help investors remain focused on their long-term investment plans despite market volatility. The Schwab Target Funds are an example of this approach. Each fund offers an initial asset allocation that aligns with a target date that is typically when an investor plans to retire. Over time, the portfolio management team manages the asset allocation for each fund, following the fund’s “glide path.”
Each fund’s glide path shows how the portfolio managers shift the asset allocation based on the number of years to the target date—with the allocation shifting from equity funds to fixed income funds as the target date gets closer in order to keep risk at the right level for each of the funds. It also shifts from actively managed strategies to passively managed index strategies. The active strategies offer the potential to outperform the benchmarks and can help manage risk with the ability to be more responsive to short-term market developments and changing market conditions. Meanwhile, the passive strategies can capture market returns with low tracking error and reduced fund turnover, helping to keep investors’ costs down. Additionally, the funds are rebalanced periodically, keeping them in line with established asset allocation ranges.
When it comes to investing, it’s important to have a long-term investing plan and portfolio based on your individual goals and risk tolerance. It can at times be tough to maintain that discipline in the face of day-to-day uncertainty. We aim to offer products with clear objectives, straightforward pricing, and a consistent approach to investing to help simplify investing decisions, so investors can focus on their long-term goals without unnecessary complexity.
Thank you for investing with Charles Schwab Investment Management. For more information about the Schwab Target Funds, please continue reading this report. In addition, you can find further details about these funds by visiting our website at www.schwabfunds.com. We are also happy to hear from you at 1-877-824-5615.
Sincerely,
“Each fund’s glide path shows how the portfolio managers shift the asset allocation based on the number of years to the target date—with the allocation shifting from equity funds to fixed income funds as the target date gets closer in order to keep risk at the right level for each of the funds.”
Management views may have changed since the report date.
Schwab Target Funds | Annual Report
The Investment Environment
For the 12-month reporting period ended October 31, 2019, global equity and fixed income markets generated positive returns. The final two months of 2018 were marked by significant market volatility and steep declines across global equity markets, driven by concerns about slowing international growth, a trade war between the U.S. and China, falling oil prices, the waning strength of the U.S. economy, and the pace of future interest rate hikes despite low inflation. By late December, major market indices had fallen to near-bear market territory. However, as the Federal Reserve (Fed) put interest rate hikes on hold, stocks, particularly in the U.S., staged a strong recovery in the first four months of 2019, which generally continued through the end of the reporting period despite several setbacks. Over the period, the U.S. dollar strengthened slightly against a basket of foreign currencies, generally reducing the returns on overseas investments in U.S. dollar terms. For the reporting period, the S&P 500® Index, a bellwether for the overall U.S. stock market, returned 14.33%. Despite headwinds, markets outside the U.S. also rose, particularly toward the end of the reporting period with the MSCI EAFE® Index (Net)*, a broad measure of developed international equity performance, returning 11.04%. Fixed-income markets were particularly strong over the period. The Bloomberg Barclays US Aggregate Bond Index returned 11.51% and the FTSE non-US Dollar World Government Bond Index returned 9.25%.
Economic growth around the globe was uneven over the reporting period, largely as a result of manufacturing weakness in developed international markets. Despite escalating trade tensions with China, the U.S. maintained its steady growth in its tenth year of expansion, although at a declining pace. In the last two months of 2018, economies around the globe showed increasing signs of weakness, but many regained economic momentum in the first six months of 2019, demonstrating resilient growth despite lingering uncertainties on various fronts. As the year progressed, signs of slowing growth increased amid a weakening global economy, waning manufacturing activity, and the ongoing U.S.-China trade war. However, toward the end of the period, prospects of a partial trade resolution relieved some of the pressure. U.S. gross domestic product (GDP) grew at an annual rate of 2.1% in the third quarter of 2019, up slightly from 2.0% in the second quarter, but down from 3.1% in the first quarter of 2019. Unemployment declined in September 2019 to a 50-year low. While consumer confidence edged lower in October to hit a four-month low, it remained a stable source of GDP growth in the U.S. Inflation remained benign.
Asset Class Performance Comparison % returns during the 12 months ended October 31, 2019
Index figures assume dividends and distributions were reinvested. Index figures do not include trading and management costs, which would lower performance. Indices are unmanaged and cannot be invested in directly. Performance results less than one year are not annualized. Past performance is not an indication of future results.
For index definitions, please see the Glossary.
Data source: Index provider websites and CSIM.
Nothing in this report represents a recommendation of a security by the investment adviser.
Management views may have changed since the report date.
| * | The net version of the index reflects reinvested dividends net of withholding taxes, but reflects no deductions for expenses or other taxes. |
Schwab Target Funds | Annual Report
The Investment Environment(continued)
Outside the U.S., conditions continued to soften, dampened by trade issues, slowing economic output, and geopolitical concerns. Oil prices, which had fallen steeply in the fourth quarter of 2018, rebounded through the first four months of 2019, as major exporters sought to curb supply and central banks took steps to ease growth-related fears, before dipping in May when trade concerns escalated. Oil prices remained volatile through period end. In the eurozone, growth slowed in the second and third quarters of 2019, down slightly from the first quarter. Growth was subdued by tepid wage growth and constrained consumer spending. The United Kingdom’s economy contracted in the second quarter of 2019 amid growing Brexit-related economic and political uncertainty that dampened industrial output, construction, and services sectors. Japan’s economy, however, experienced growth in recent quarters after contracting sharply in the third quarter of 2018. Several Asian economies, including China and India, exhibited signs of slowing, but still outpaced many developed economies.
In response to the economic environment and flat or inverted yield curves around the world, to bolster growth, and to ensure stability given ongoing trade tensions, a number of central banks reduced their policy rates, including the U.S., while others maintained their generally low—and for some international central banks, negative—interest rates. In the U.S., after raising interest rates four times in 2018, the Fed held rates unchanged through the first half of 2019. But amid growing signs of global economic weakness that threatened to dampen U.S. economic growth, along with continued low inflation and weakness in manufacturing, the Fed enacted three interest rate cuts by the end of the period—in July, September, and October. Following the October interest rate cut, the Fed signaled that subsequent interest rate cuts would be put on hold provided the economy continues to expand moderately and the labor market remains strong. The federal funds rate ended the reporting period in a range of 1.50% to 1.75%. Outside the U.S., the European Central Bank held interest rates steady and launched an asset-purchase program to help stimulate the economy. The Bank of Japan maintained its short-term interest rate target of –0.1% throughout the period. Despite growing Brexit-related division, the Bank of England maintained its key official bank rate at 0.75% throughout the period, where it has remained since August 2018. Central banks in key emerging market economies—including India, Thailand, and China—lowered their policy rates in response to inflation and trade-related pressures.
Bond prices generally rose over the reporting period as yields fell. (Bond yields and bond prices move in opposite directions.) Short-term yields, which typically respond to changes in the federal funds rate, remained flat for the first half of the period before declining as the Fed implemented interest rate cuts, with the three-month Treasury yield falling from 2.34% at the outset of the period to 1.54% at the end of the period. Longer-term yields, which are influenced more by economic growth and inflation expectations, trended downward over most of the period before moderating in the final two months. During the reporting period, the yield curve flattened with portions of the yield curve inverting, which is often an indicator of a potential recession. Over the reporting period, the 10-year Treasury yield fell from 3.15% to 1.69%. Outside the U.S., bond yields generally remained low.
Schwab Target Funds | Annual Report
 | Zifan Tang, Ph.D., CFA, Senior Portfolio Manager, is responsible for the co-management of the funds. She has served as portfolio manager of the funds since February 2012, with the exception of the Schwab Target 2045 Fund, Schwab Target 2050 Fund and Schwab Target 2055 Fund, for which she has served as portfolio manager since January 2013, and the Schwab Target 2060 Fund, for which she has served as portfolio manager since August 2016. Prior to joining CSIM in 2012, Ms. Tang was a product manager at Thomson Reuters and, from 1997 to 2009, worked as a portfolio manager at Barclays Global Investors, which was subsequently acquired by BlackRock. |
 | Patrick Kwok, CFA, Portfolio Manager, is responsible for the co-management of the funds. He has served as portfolio manager of the funds since July 2018. Prior to joining CSIM in 2008, Mr. Kwok spent two years as an asset operations specialist at Charles Schwab Trust Company. He also previously worked for one year at State Street Bank & Trust as a portfolio accountant and pricing specialist. |
Schwab Target Funds | Annual Report
Schwab Target 2010 Fundas of October 31, 2019
The Schwab Target 2010 Fund (the 2010 Fund) seeks to provide capital appreciation and income consistent with its current asset allocation and seeks to achieve its investment objective by investing primarily in a combination of other affiliated Schwab Funds and Laudus Funds. The 2010 Fund may also invest in unaffiliated third-party mutual funds. The target asset allocation is adjusted annually by the investment adviser; as of the last annual adjustment at the end of January 2019, the 2010 Fund’s asset allocation was approximately 35.9% equity securities, 56.8% fixed-income securities, and 7.3% cash and cash equivalents (including money market funds). (For portfolio allocations as of the end of this reporting period, please see the 2010 Fund’s Portfolio Holdings included in this report.)
Market Highlights. Over the 12-month reporting period, global equity and fixed income markets generated positive returns. The U.S. economy maintained its steady growth in its tenth year of expansion, although at a declining pace. Outside the U.S., conditions softened, dampened by trade issues, slowing economic output, and geopolitical concerns. In response to the economic environment, to bolster growth, and to ensure stability given ongoing trade tensions, a number of central banks reduced their policy rates, including the U.S., while others maintained their generally low interest rates. Bond prices generally rose over the reporting period as yields fell.
Performance. For the 12-month reporting period ended October 31, 2019, the 2010 Fund returned 10.42%. The 2010 Fund’s internally calculated comparative index, the Target 2010 Composite Index (the composite index), returned 11.10%.
Positioning and Strategies. The 2010 Fund’s asset allocations were broadly in line with those of the composite index over the reporting period.
The 2010 Fund’s fixed income exposures provided the greatest contribution to total return. The Schwab U.S. Aggregate Bond Index Fund was the top contributor to the return of the 2010 Fund, returning approximately 11.3% for the reporting period and generally tracking its comparative index, the Bloomberg Barclays US Aggregate Bond Index.
The 2010 Fund’s U.S. equity exposure also contributed to the 2010 Fund’s total return, particularly among U.S. large-cap equity exposure, but detracted from relative performance. The Schwab S&P 500 Index Fund, which returned approximately 14.3% for the reporting period, generally tracked its comparative index, the S&P 500® Index. The Dodge & Cox Stock Fund also contributed positively to total return, but underperformed its comparative index, the S&P 500® Index, detracting from relative performance. The Laudus Small-Cap MarketMasters Fund was the only detractor from the 2010 Fund’s total return, returning approximately -2.7% while held by the 2010 Fund, underperforming its comparative index, the Russell 2000® Index. The Laudus Small-Cap MarketMasters Fund was removed from the 2010 Fund in January 2019.
The 2010 Fund’s international equity allocation provided the smallest contribution to the total return of the 2010 Fund and detracted from the relative return. The Schwab International Core Equity Fund returned approximately 7.1% and dragged on relative performance, as it underperformed its comparative index, the MSCI EAFE® Index (Net), which returned approximately 11.0%.
Management views and portfolio holdings may have changed since the report date.
Schwab Target Funds | Annual Report
Performance and Fund Factsas of October 31, 2019
The performance data quoted represents past performance. Past performance does not guarantee future results. Investment returns and principal value of an investment will fluctuate so that an investor’s shares may be worth more or less than their original cost. Current performance may be lower or higher than performance data quoted. To obtain performance information current to the most recent month end, please visitwww.schwabfunds.com/schwabfunds_prospectus.
Performance of Hypothetical $10,000 Investment (October 31, 2009 – October 31, 2019)1
Average Annual Total Returns1
| Fund and Inception Date | 1 Year | 5 Years | 10 Years |
| Fund: Schwab Target 2010 Fund (7/1/05) | 10.42% | 4.66% | 6.31% |
| Target 2010 Composite Index | 11.10% | 5.08% | 6.49% |
| Dow Jones U.S. Total Stock Market IndexSM | 13.39% | 10.26% | 13.62% |
| Bloomberg Barclays US Aggregate Bond Index | 11.51% | 3.24% | 3.73% |
| Fund Category: Morningstar Target-Date 2000-20102 | 10.05% | 4.61% | 6.40% |
| Fund Expense Ratios3: Net 0.33%; Gross 0.45% |
All total returns on this page assume dividends and distributions were reinvested. Index figures do not include trading and management costs, which would lower performance. Indices are unmanaged and cannot be invested in directly. Performance results less than one year are not annualized.
The first index listed for the fund is the fund’s primary benchmark, as shown in the prospectus. Additional indices shown are provided for comparative purposes.
For index definitions, please see the Glossary.
| 1 | Fund expenses may have been partially absorbed by CSIM and its affiliates. Without these reductions, the fund’s returns would have been lower. These returns do not reflect the deduction of taxes that a shareholder would pay on fund distributions or the redemption of fund shares. |
| 2 | Source for category information: Morningstar, Inc. The Morningstar Category return represents all active and index mutual funds within the category as of the report date. |
| 3 | As stated in the prospectus. Includes 0.33% of acquired fund fees and expenses (AFFE), which are indirect expenses incurred by the fund through its investments in the underlying funds. Net Expense: Expenses reduced by a contractual fee waiver in effect for so long as CSIM serves as the investment adviser to the fund. Gross Expense: Does not reflect the effect of contractual fee waivers. For actual expense ratios during the period, not including AFFE, refer to the financial highlights section of the financial statements. |
Schwab Target Funds | Annual Report
Performance and Fund Factsas of October 31, 2019 (continued)
| Number of Holdings | 20 |
| Portfolio Turnover Rate | 13% |
Asset Class Weightings % of Investments1,2
Top Holdings % of Net Assets3,4
Portfolio holdings may have changed since the report date.
| 1 | The percentage may differ from the Portfolio Holdings because the above calculation is based on a percentage of total investments, whereas the calculation in the Portfolio Holdings is based on a percentage of net assets. |
| 2 | The fund intends to invest in a combination of the underlying funds; however, the fund may also invest directly in equity and fixed income securities, exchange-traded funds, and cash equivalents, including money market securities. |
| 3 | This list is not a recommendation of any security by the investment adviser. |
| 4 | The holdings listed exclude any temporary liquidity investments. |
Schwab Target Funds | Annual Report
Schwab Target 2015 Fundas of October 31, 2019
The Schwab Target 2015 Fund (the 2015 Fund) seeks to provide capital appreciation and income consistent with its current asset allocation and seeks to achieve its investment objective by investing primarily in a combination of other affiliated Schwab Funds and Laudus Funds. The 2015 Fund may also invest in unaffiliated third-party mutual funds. The target asset allocation is adjusted annually by the investment adviser; as of the last annual adjustment at the end of January 2019, the 2015 Fund’s asset allocation was approximately 38.5% equity securities, 54.7% fixed-income securities and 6.8% cash and cash equivalents (including money market funds). (For portfolio allocations as of the end of this reporting period, please see the 2015 Fund’s Portfolio Holdings included in this report.)
Market Highlights. Over the 12-month reporting period, global equity and fixed income markets generated positive returns. The U.S. economy maintained its steady growth in its tenth year of expansion, although at a declining pace. Outside the U.S., conditions softened, dampened by trade issues, slowing economic output, and geopolitical concerns. In response to the economic environment, to bolster growth, and to ensure stability given ongoing trade tensions, a number of central banks reduced their policy rates, including the U.S., while others maintained their generally low interest rates. Bond prices generally rose over the reporting period as yields fell.
Performance. For the 12-month reporting period ended October 31, 2019, the 2015 Fund returned 10.48%. The 2015 Fund’s internally calculated comparative index, the Target 2015 Composite Index (the composite index), returned 11.23%.
Positioning and Strategies. The 2015 Fund’s asset allocations were broadly in line with those of the composite index over the reporting period.
The 2015 Fund’s fixed income exposures provided the greatest contribution to total return. The Schwab U.S. Aggregate Bond Index Fund was the top contributor to the return of the 2015 Fund, returning approximately 11.3% for the reporting period and generally tracking its comparative index, the Bloomberg Barclays US Aggregate Bond Index.
The 2015 Fund’s U.S. equity exposure also contributed to the 2015 Fund’s total return, particularly among U.S. large-cap equity exposure, but detracted from relative performance. The Schwab S&P 500 Index Fund, which returned approximately 14.3% for the reporting period, generally tracked its comparative index, the S&P 500® Index. The Dodge & Cox Stock Fund also contributed positively to total return, but underperformed its comparative index, the S&P 500® Index, detracting from relative performance. The Laudus Small-Cap MarketMasters Fund was the only detractor from the 2015 Fund’s total return, returning approximately -2.7% while held by the 2015 Fund, underperforming its comparative index, the Russell 2000® Index. The Laudus Small-Cap MarketMasters Fund was removed from the 2015 Fund in January 2019.
The 2015 Fund’s international equity allocation provided the smallest contribution to the total return of the 2015 Fund and detracted from the relative return. The Schwab International Core Equity Fund returned approximately 7.1% and dragged on relative performance, as it underperformed its comparative index, the MSCI EAFE® Index (Net), which returned approximately 11.0%.
Management views and portfolio holdings may have changed since the report date.
Schwab Target Funds | Annual Report
Performance and Fund Factsas of October 31, 2019
The performance data quoted represents past performance. Past performance does not guarantee future results. Investment returns and principal value of an investment will fluctuate so that an investor’s shares may be worth more or less than their original cost. Current performance may be lower or higher than performance data quoted. To obtain performance information current to the most recent month end, please visitwww.schwabfunds.com/schwabfunds_prospectus.
Performance of Hypothetical $10,000 Investment (October 31, 2009 – October 31, 2019)1
Average Annual Total Returns1
| Fund and Inception Date | 1 Year | 5 Years | 10 Years |
| Fund: Schwab Target 2015 Fund (3/12/08) | 10.48% | 4.74% | 6.89% |
| Target 2015 Composite Index | 11.23% | 5.22% | 7.05% |
| Dow Jones U.S. Total Stock Market IndexSM | 13.39% | 10.26% | 13.62% |
| Bloomberg Barclays US Aggregate Bond Index | 11.51% | 3.24% | 3.73% |
| Fund Category: Morningstar Target-Date 20152 | 10.50% | 4.90% | 7.06% |
| Fund Expense Ratios3: Net 0.35%; Gross 0.42% |
All total returns on this page assume dividends and distributions were reinvested. Index figures do not include trading and management costs, which would lower performance. Indices are unmanaged and cannot be invested in directly. Performance results less than one year are not annualized.
The first index listed for the fund is the fund’s primary benchmark, as shown in the prospectus. Additional indices shown are provided for comparative purposes.
For index definitions, please see the Glossary.
| 1 | Fund expenses may have been partially absorbed by CSIM and its affiliates. Without these reductions, the fund’s returns would have been lower. These returns do not reflect the deduction of taxes that a shareholder would pay on fund distributions or the redemption of fund shares. |
| 2 | Source for category information: Morningstar, Inc. The Morningstar Category return represents all active and index mutual funds within the category as of the report date. |
| 3 | As stated in the prospectus. Includes 0.35% of acquired fund fees and expenses (AFFE), which are indirect expenses incurred by the fund through its investments in the underlying funds. Net Expense: Expenses reduced by a contractual fee waiver in effect for so long as CSIM serves as the investment adviser to the fund. Gross Expense: Does not reflect the effect of contractual fee waivers. For actual expense ratios during the period, not including AFFE, refer to the financial highlights section of the financial statements. |
Schwab Target Funds | Annual Report
Performance and Fund Factsas of October 31, 2019 (continued)
| Number of Holdings | 20 |
| Portfolio Turnover Rate | 10% |
Asset Class Weightings % of Investments1,2
Top Holdings % of Net Assets3,4
Portfolio holdings may have changed since the report date.
| 1 | The percentage may differ from the Portfolio Holdings because the above calculation is based on a percentage of total investments, whereas the calculation in the Portfolio Holdings is based on a percentage of net assets. |
| 2 | The fund intends to invest in a combination of the underlying funds; however, the fund may also invest directly in equity and fixed income securities, exchange-traded funds, and cash equivalents, including money market securities. |
| 3 | This list is not a recommendation of any security by the investment adviser. |
| 4 | The holdings listed exclude any temporary liquidity investments. |
Schwab Target Funds | Annual Report
Schwab Target 2020 Fundas of October 31, 2019
The Schwab Target 2020 Fund (the 2020 Fund) seeks to provide capital appreciation and income consistent with its current asset allocation and seeks to achieve its investment objective by investing primarily in a combination of other affiliated Schwab Funds and Laudus Funds. The 2020 Fund may also invest in unaffiliated third-party mutual funds. The target asset allocation is adjusted annually by the investment adviser; as of the last annual adjustment at the end of January 2019, the 2020 Fund’s asset allocation was approximately 43.3% equity securities, 50.6% fixed income securities, and 6.1% cash and cash equivalents (including money market funds). At its target date, the 2020 Fund’s allocation will be approximately 40.0% equity securities, 54.0% fixed-income securities, and 6.0% cash and cash equivalents (including money market funds). (For portfolio allocations as of the end of this reporting period, please see the 2020 Fund’s Portfolio Holdings included in this report.)
Market Highlights. Over the 12-month reporting period, global equity and fixed income markets generated positive returns. The U.S. economy maintained its steady growth in its tenth year of expansion, although at a declining pace. Outside the U.S., conditions softened, dampened by trade issues, slowing economic output, and geopolitical concerns. In response to the economic environment, to bolster growth, and to ensure stability given ongoing trade tensions, a number of central banks reduced their policy rates, including the U.S., while others maintained their generally low interest rates. Bond prices generally rose over the reporting period as yields fell.
Performance. For the 12-month reporting period ended October 31, 2019, the 2020 Fund returned 10.58%. The 2020 Fund’s internally calculated comparative index, the Target 2020 Composite Index (the composite index), returned 11.43%.
Positioning and Strategies. The 2020 Fund’s asset allocations were broadly in line with those of the composite index over the reporting period.
The 2020 Fund’s fixed income exposures provided the greatest contribution to total return. The Schwab U.S. Aggregate Bond Index Fund was the top contributor to the return of the 2020 Fund, returning approximately 11.3% for the reporting period and generally tracking its comparative index, the Bloomberg Barclays US Aggregate Bond Index.
The 2020 Fund’s U.S. equity exposure also contributed to the 2020 Fund’s total return, particularly among U.S. large-cap equity exposure, but detracted from relative performance. The Schwab S&P 500 Index Fund returned approximately 14.3% for the reporting period, generally tracking its comparative index, the S&P 500® Index. The Dodge & Cox Stock Fund also contributed positively to total return, but underperformed its comparative index, the S&P 500® Index, detracting from relative performance. The Laudus Small-Cap MarketMasters Fund was the only detractor from the 2020 Fund’s total return, returning approximately -2.7% while held by the 2020 Fund, underperforming its comparative index, the Russell 2000® Index. The Laudus Small-Cap MarketMasters Fund was removed from the 2020 Fund in January 2019.
The 2020 Fund’s international equity allocation provided the smallest contribution to the total return of the 2020 Fund and detracted from the relative return. The Goldman Sachs Emerging Markets Equity Insights Fund (Institutional Class) returned approximately 6.2% and dragged on relative performance, as it underperformed its comparative index, the MSCI Emerging Markets Index (Net), which returned approximately 11.9%.
Management views and portfolio holdings may have changed since the report date.
Schwab Target Funds | Annual Report
Performance and Fund Factsas of October 31, 2019
The performance data quoted represents past performance. Past performance does not guarantee future results. Investment returns and principal value of an investment will fluctuate so that an investor’s shares may be worth more or less than their original cost. Current performance may be lower or higher than performance data quoted. To obtain performance information current to the most recent month end, please visitwww.schwabfunds.com/schwabfunds_prospectus.
Performance of Hypothetical $10,000 Investment (October 31, 2009 – October 31, 2019)1
Average Annual Total Returns1
| Fund and Inception Date | 1 Year | 5 Years | 10 Years |
| Fund: Schwab Target 2020 Fund (7/1/05) | 10.58% | 5.25% | 7.82% |
| Target 2020 Composite Index | 11.43% | 5.79% | 8.00% |
| Dow Jones U.S. Total Stock Market IndexSM | 13.39% | 10.26% | 13.62% |
| Bloomberg Barclays US Aggregate Bond Index | 11.51% | 3.24% | 3.73% |
| Fund Category: Morningstar Target-Date 20202 | 10.68% | 5.01% | 7.18% |
| Fund Expense Ratios3: Net 0.41%; Gross 0.43% |
All total returns on this page assume dividends and distributions were reinvested. Index figures do not include trading and management costs, which would lower performance. Indices are unmanaged and cannot be invested in directly. Performance results less than one year are not annualized.
The first index listed for the fund is the fund’s primary benchmark, as shown in the prospectus. Additional indices shown are provided for comparative purposes.
For index definitions, please see the Glossary.
| 1 | Fund expenses may have been partially absorbed by CSIM and its affiliates. Without these reductions, the fund’s returns would have been lower. These returns do not reflect the deduction of taxes that a shareholder would pay on fund distributions or the redemption of fund shares. |
| 2 | Source for category information: Morningstar, Inc. The Morningstar Category return represents all active and index mutual funds within the category as of the report date. |
| 3 | As stated in the prospectus. Includes 0.41% of acquired fund fees and expenses (AFFE), which are indirect expenses incurred by the fund through its investments in the underlying funds. Net Expense: Expenses reduced by a contractual fee waiver in effect for so long as CSIM serves as the investment adviser to the fund. Gross Expense: Does not reflect the effect of contractual fee waivers. For actual expense ratios during the period, not including AFFE, refer to the financial highlights section of the financial statements. |
Schwab Target Funds | Annual Report
Performance and Fund Factsas of October 31, 2019 (continued)
| Number of Holdings | 22 |
| Portfolio Turnover Rate | 14% |
Asset Class Weightings % of Investments1,2
Top Holdings % of Net Assets3,4
Portfolio holdings may have changed since the report date.
| 1 | The percentage may differ from the Portfolio Holdings because the above calculation is based on a percentage of total investments, whereas the calculation in the Portfolio Holdings is based on a percentage of net assets. |
| 2 | The fund intends to invest in a combination of the underlying funds; however, the fund may also invest directly in equity and fixed income securities, exchange-traded funds, and cash equivalents, including money market securities. |
| 3 | This list is not a recommendation of any security by the investment adviser. |
| 4 | The holdings listed exclude any temporary liquidity investments. |
Schwab Target Funds | Annual Report
Schwab Target 2025 Fundas of October 31, 2019
The Schwab Target 2025 Fund (the 2025 Fund) seeks to provide capital appreciation and income consistent with its current asset allocation and seeks to achieve its investment objective by investing primarily in a combination of other affiliated Schwab Funds and Laudus Funds. The 2025 Fund may also invest in unaffiliated third-party mutual funds. The target asset allocation is adjusted annually by the investment adviser; as of the last annual adjustment at the end of January 2019, the 2025 Fund’s asset allocation was approximately 56.8% equity securities, 38.7% fixed income securities, and 4.4% cash and cash equivalents (including money market funds). At its target date, the 2025 Fund’s allocation will be approximately 40.0% equity securities, 54.0% fixed-income securities, and 6.0% cash and cash equivalents (including money market funds). (For portfolio allocations as of the end of this reporting period, please see the 2025 Fund’s Portfolio Holdings included in this report.)
Market Highlights. Over the 12-month reporting period, global equity and fixed income markets generated positive returns. The U.S. economy maintained its steady growth in its tenth year of expansion, although at a declining pace. Outside the U.S., conditions softened, dampened by trade issues, slowing economic output, and geopolitical concerns. In response to the economic environment, to bolster growth, and to ensure stability given ongoing trade tensions, a number of central banks reduced their policy rates, including the U.S., while others maintained their generally low interest rates. Bond prices generally rose over the reporting period as yields fell.
Performance. For the 12-month reporting period ended October 31, 2019, the 2025 Fund returned 10.79%. The 2025 Fund’s internally calculated comparative index, the Target 2025 Composite Index (the composite index), returned 11.99%.
Positioning and Strategies. The 2025 Fund’s asset allocations were broadly in line with those of the composite index over the reporting period.
The 2025 Fund’s U.S. equity exposure provided the greatest contribution to total return, particularly among U.S. large-cap equity exposure, but detracted from relative performance. The Schwab S&P 500 Index Fund was the top contributor to the return of the 2025 Fund, returning approximately 14.3% for the reporting period and generally tracking its comparative index, the S&P 500® Index. The Dodge & Cox Stock Fund also contributed positively to total return, but underperformed its comparative index, the S&P 500® Index, detracting from relative performance. The Laudus Small-Cap MarketMasters Fund was the only detractor from the 2025 Fund’s total return, returning approximately -2.7% while held by the 2025 Fund, underperforming its comparative index, the Russell 2000® Index. The Laudus Small-Cap MarketMasters Fund was removed from the 2025 Fund in January 2019.
The 2025 Fund’s fixed income exposures also contributed to total return. The Schwab U.S. Aggregate Bond Index Fund returned approximately 11.3% for the reporting period and generally tracked its comparative index, the Bloomberg Barclays US Aggregate Bond Index.
The 2025 Fund’s international equity allocation provided the smallest contribution to the total return of the 2025 Fund and detracted from the relative return. The Goldman Sachs Emerging Markets Equity Insights Fund (Institutional Class) returned approximately 6.2% and dragged on relative performance, as it underperformed its comparative index, the MSCI Emerging Markets Index (Net), which returned approximately 11.9%.
Management views and portfolio holdings may have changed since the report date.
Schwab Target Funds | Annual Report
Performance and Fund Factsas of October 31, 2019
The performance data quoted represents past performance. Past performance does not guarantee future results. Investment returns and principal value of an investment will fluctuate so that an investor’s shares may be worth more or less than their original cost. Current performance may be lower or higher than performance data quoted. To obtain performance information current to the most recent month end, please visitwww.schwabfunds.com/schwabfunds_prospectus.
Performance of Hypothetical $10,000 Investment (October 31, 2009 – October 31, 2019)1
Average Annual Total Returns1
| Fund and Inception Date | 1 Year | 5 Years | 10 Years |
| Fund: Schwab Target 2025 Fund (3/12/08) | 10.79% | 5.79% | 8.60% |
| Target 2025 Composite Index | 11.99% | 6.46% | 8.78% |
| Dow Jones U.S. Total Stock Market IndexSM | 13.39% | 10.26% | 13.62% |
| Bloomberg Barclays US Aggregate Bond Index | 11.51% | 3.24% | 3.73% |
| Fund Category: Morningstar Target-Date 20252 | 11.25% | 5.53% | 8.00% |
| Fund Expense Ratios3: Net 0.50%; Gross 0.52% |
All total returns on this page assume dividends and distributions were reinvested. Index figures do not include trading and management costs, which would lower performance. Indices are unmanaged and cannot be invested in directly. Performance results less than one year are not annualized.
The first index listed for the fund is the fund’s primary benchmark, as shown in the prospectus. Additional indices shown are provided for comparative purposes.
For index definitions, please see the Glossary.
| 1 | Fund expenses may have been partially absorbed by CSIM and its affiliates. Without these reductions, the fund’s returns would have been lower. These returns do not reflect the deduction of taxes that a shareholder would pay on fund distributions or the redemption of fund shares. |
| 2 | Source for category information: Morningstar, Inc. The Morningstar Category return represents all active and index mutual funds within the category as of the report date. |
| 3 | As stated in the prospectus. Includes 0.50% of acquired fund fees and expenses (AFFE), which are indirect expenses incurred by the fund through its investments in the underlying funds. Net Expense: Expenses reduced by a contractual fee waiver in effect for so long as CSIM serves as the investment adviser to the fund. Gross Expense: Does not reflect the effect of contractual fee waivers. For actual expense ratios during the period, not including AFFE, refer to the financial highlights section of the financial statements. |
Schwab Target Funds | Annual Report
Performance and Fund Factsas of October 31, 2019 (continued)
| Number of Holdings | 22 |
| Portfolio Turnover Rate | 15% |
Asset Class Weightings % of Investments1,2
Top Holdings % of Net Assets3,4
Portfolio holdings may have changed since the report date.
| 1 | The percentage may differ from the Portfolio Holdings because the above calculation is based on a percentage of total investments, whereas the calculation in the Portfolio Holdings is based on a percentage of net assets. |
| 2 | The fund intends to invest in a combination of the underlying funds; however, the fund may also invest directly in equity and fixed income securities, exchange-traded funds, and cash equivalents, including money market securities. |
| 3 | This list is not a recommendation of any security by the investment adviser. |
| 4 | The holdings listed exclude any temporary liquidity investments. |
Schwab Target Funds | Annual Report
Schwab Target 2030 Fundas of October 31, 2019
The Schwab Target 2030 Fund (the 2030 Fund) seeks to provide capital appreciation and income consistent with its current asset allocation and seeks to achieve its investment objective by investing primarily in a combination of other affiliated Schwab Funds and Laudus Funds. The 2030 Fund may also invest in unaffiliated third-party mutual funds. The target asset allocation is adjusted annually by the investment adviser; as of the last annual adjustment at the end of January 2019, the 2030 Fund’s asset allocation was approximately 66.7% equity securities, 29.9% fixed-income securities, and 3.3% cash and cash equivalents (including money market funds). At its target date, the 2030 Fund’s allocation will be approximately 40.0% equity securities, 54.0% fixed-income securities, and 6.0% cash and cash equivalents (including money market funds). (For portfolio allocations as of the end of this reporting period, please see the 2030 Fund’s Portfolio Holdings included in this report.)
Market Highlights. Over the 12-month reporting period, global equity and fixed income markets generated positive returns. The U.S. economy maintained its steady growth in its tenth year of expansion, although at a declining pace. Outside the U.S., conditions softened, dampened by trade issues, slowing economic output, and geopolitical concerns. In response to the economic environment, to bolster growth, and to ensure stability given ongoing trade tensions, a number of central banks reduced their policy rates, including the U.S., while others maintained their generally low interest rates. Bond prices generally rose over the reporting period as yields fell.
Performance. For the 12-month reporting period ended October 31, 2019, the 2030 Fund returned 10.94%. The 2030 Fund’s internally calculated comparative index, the Target 2030 Composite Index (the composite index), returned 12.32%.
Positioning and Strategies. The 2030 Fund’s asset allocations were broadly in line with those of the composite index over the reporting period.
The 2030 Fund’s U.S. equity exposure provided the greatest contribution to total return, particularly among U.S. large-cap equity exposure, but detracted from relative performance. The Schwab S&P 500 Index Fund was the top contributor to the return of the 2030 Fund, returning approximately 14.3% for the reporting period and generally tracking its comparative index, the S&P 500® Index. The Dodge & Cox Stock Fund also contributed positively to total return, but underperformed its comparative index, the S&P 500® Index, detracting from relative performance. The Laudus Small-Cap MarketMasters Fund was the only detractor from the 2030 Fund’s total return, returning approximately -2.7% while held by the 2030 Fund, underperforming its comparative index, the Russell 2000® Index. The Laudus Small-Cap MarketMasters Fund was removed from the 2030 Fund in January 2019.
The 2030 Fund’s fixed income exposures also contributed to total return. The Schwab U.S. Aggregate Bond Index Fund returned approximately 11.3% for the reporting period and generally tracked its comparative index, the Bloomberg Barclays US Aggregate Bond Index.
The 2030 Fund’s international equity allocation provided the smallest contribution to the total return of the 2030 Fund and detracted from the relative return. The Goldman Sachs Emerging Markets Equity Insights Fund (Institutional Class) returned approximately 6.2% and dragged on relative performance, as it underperformed its comparative index, the MSCI Emerging Markets Index (Net), which returned approximately 11.9%.
Management views and portfolio holdings may have changed since the report date.
Schwab Target Funds | Annual Report
Performance and Fund Factsas of October 31, 2019
The performance data quoted represents past performance. Past performance does not guarantee future results. Investment returns and principal value of an investment will fluctuate so that an investor’s shares may be worth more or less than their original cost. Current performance may be lower or higher than performance data quoted. To obtain performance information current to the most recent month end, please visitwww.schwabfunds.com/schwabfunds_prospectus.
Performance of Hypothetical $10,000 Investment (October 31, 2009 – October 31, 2019)1
Average Annual Total Returns1
| Fund and Inception Date | 1 Year | 5 Years | 10 Years |
| Fund: Schwab Target 2030 Fund (7/1/05) | 10.94% | 6.15% | 9.12% |
| Target 2030 Composite Index | 12.32% | 6.91% | 9.33% |
| Dow Jones U.S. Total Stock Market IndexSM | 13.39% | 10.26% | 13.62% |
| Bloomberg Barclays US Aggregate Bond Index | 11.51% | 3.24% | 3.73% |
| Fund Category: Morningstar Target-Date 20302 | 11.54% | 5.99% | 8.38% |
| Fund Expense Ratios3: Net 0.57%; Gross 0.59% |
All total returns on this page assume dividends and distributions were reinvested. Index figures do not include trading and management costs, which would lower performance. Indices are unmanaged and cannot be invested in directly. Performance results less than one year are not annualized.
The first index listed for the fund is the fund’s primary benchmark, as shown in the prospectus. Additional indices shown are provided for comparative purposes.
For index definitions, please see the Glossary.
| 1 | Fund expenses may have been partially absorbed by CSIM and its affiliates. Without these reductions, the fund’s returns would have been lower. These returns do not reflect the deduction of taxes that a shareholder would pay on fund distributions or the redemption of fund shares. |
| 2 | Source for category information: Morningstar, Inc. The Morningstar Category return represents all active and index mutual funds within the category as of the report date. |
| 3 | As stated in the prospectus. Includes 0.57% of acquired fund fees and expenses (AFFE), which are indirect expenses incurred by the fund through its investments in the underlying funds. Net Expense: Expenses reduced by a contractual fee waiver in effect for so long as CSIM serves as the investment adviser to the fund. Gross Expense: Does not reflect the effect of contractual fee waivers. For actual expense ratios during the period, not including AFFE, refer to the financial highlights section of the financial statements. |
Schwab Target Funds | Annual Report
Performance and Fund Factsas of October 31, 2019 (continued)
| Number of Holdings | 21 |
| Portfolio Turnover Rate | 17% |
Asset Class Weightings % of Investments1,2
Top Holdings % of Net Assets3,4
Portfolio holdings may have changed since the report date.
| 1 | The percentage may differ from the Portfolio Holdings because the above calculation is based on a percentage of total investments, whereas the calculation in the Portfolio Holdings is based on a percentage of net assets. |
| 2 | The fund intends to invest in a combination of the underlying funds; however, the fund may also invest directly in equity and fixed income securities, exchange-traded funds, and cash equivalents, including money market securities. |
| 3 | This list is not a recommendation of any security by the investment adviser. |
| 4 | The holdings listed exclude any temporary liquidity investments. |
Schwab Target Funds | Annual Report
Schwab Target 2035 Fundas of October 31, 2019
The Schwab Target 2035 Fund (the 2035 Fund) seeks to provide capital appreciation and income consistent with its current asset allocation and seeks to achieve its investment objective by investing primarily in a combination of other affiliated Schwab Funds and Laudus Funds. The 2035 Fund may also invest in unaffiliated third-party mutual funds. The target asset allocation is adjusted annually by the investment adviser; as of the last annual adjustment at the end of January 2019, the 2035 Fund’s asset allocation was approximately 74.6% equity securities, 22.8% fixed-income securities, and 2.5% cash and cash equivalents (including money market funds). At its target date, the 2035 Fund’s allocation will be approximately 40.0% equity securities, 54.0% fixed-income securities, and 6.0% cash and cash equivalents (including money market funds). (For portfolio allocations as of the end of this reporting period, please see the 2035 Fund’s Portfolio Holdings included in this report.)
Market Highlights. Over the 12-month reporting period, global equity and fixed income markets generated positive returns. The U.S. economy maintained its steady growth in its tenth year of expansion, although at a declining pace. Outside the U.S., conditions softened, dampened by trade issues, slowing economic output, and geopolitical concerns. In response to the economic environment, to bolster growth, and to ensure stability given ongoing trade tensions, a number of central banks reduced their policy rates, including the U.S., while others maintained their generally low interest rates. Bond prices generally rose over the reporting period as yields fell.
Performance. For the 12-month reporting period ended October 31, 2019, the 2035 Fund returned 10.90%. The 2035 Fund’s internally calculated comparative index, the Target 2035 Composite Index (the composite index), returned 12.49%.
Positioning and Strategies. The 2035 Fund’s asset allocations were broadly in line with those of the composite index over the reporting period.
The 2035 Fund’s U.S. equity exposure provided the greatest contribution to total return, particularly among U.S. large-cap equity exposure, but detracted from relative performance. The Schwab S&P 500 Index Fund was the top contributor to the return of the 2035 Fund, returning approximately 14.3% for the reporting period and generally tracking its comparative index, the S&P 500® Index. The Dodge & Cox Stock Fund also contributed positively to total return, but underperformed its comparative index, the S&P 500® Index, detracting from relative performance. The Laudus Small-Cap MarketMasters Fund was the only detractor from the 2035 Fund’s total return, returning approximately -2.7% while held by the 2035 Fund, underperforming its comparative index, the Russell 2000® Index. The Laudus Small-Cap MarketMasters Fund was removed from the 2035 Fund in January 2019.
The 2035 Fund’s international equity allocation also contributed to total return, but detracted from relative return. The Laudus International MarketMasters Fund returned approximately 10.5% for the reporting period, underperforming its comparative index, the MSCI EAFE® Index (Net), which returned approximately 11.0%.
The 2035 Fund’s fixed income exposures provided the smallest contribution to the total return of the 2035 Fund. Of the fixed income exposures, the U.S. intermediate term allocation contributed the least to total return. While held by the 2035 Fund, the Schwab Intermediate-Term Bond Fund returned approximately 2.1%, underperforming its comparative index, the Bloomberg Barclays US Intermediate Aggregate Bond Index, which returned approximately 2.5%.
Management views and portfolio holdings may have changed since the report date.
Schwab Target Funds | Annual Report
Performance and Fund Factsas of October 31, 2019
The performance data quoted represents past performance. Past performance does not guarantee future results. Investment returns and principal value of an investment will fluctuate so that an investor’s shares may be worth more or less than their original cost. Current performance may be lower or higher than performance data quoted. To obtain performance information current to the most recent month end, please visitwww.schwabfunds.com/schwabfunds_prospectus.
Performance of Hypothetical $10,000 Investment (October 31, 2009 – October 31, 2019)1
Average Annual Total Returns1
| Fund and Inception Date | 1 Year | 5 Years | 10 Years |
| Fund: Schwab Target 2035 Fund (3/12/08) | 10.90% | 6.40% | 9.58% |
| Target 2035 Composite Index | 12.49% | 7.25% | 9.83% |
| Dow Jones U.S. Total Stock Market IndexSM | 13.39% | 10.26% | 13.62% |
| Bloomberg Barclays US Aggregate Bond Index | 11.51% | 3.24% | 3.73% |
| Fund Category: Morningstar Target-Date 20352 | 11.80% | 6.39% | 9.02% |
| Fund Expense Ratios3: Net 0.62%; Gross 0.65% |
All total returns on this page assume dividends and distributions were reinvested. Index figures do not include trading and management costs, which would lower performance. Indices are unmanaged and cannot be invested in directly. Performance results less than one year are not annualized.
The first index listed for the fund is the fund’s primary benchmark, as shown in the prospectus. Additional indices shown are provided for comparative purposes.
For index definitions, please see the Glossary.
| 1 | Fund expenses may have been partially absorbed by CSIM and its affiliates. Without these reductions, the fund’s returns would have been lower. These returns do not reflect the deduction of taxes that a shareholder would pay on fund distributions or the redemption of fund shares. |
| 2 | Source for category information: Morningstar, Inc. The Morningstar Category return represents all active and index mutual funds within the category as of the report date. |
| 3 | As stated in the prospectus. Includes 0.62% of acquired fund fees and expenses (AFFE), which are indirect expenses incurred by the fund through its investments in the underlying funds. Net Expense: Expenses reduced by a contractual fee waiver in effect for so long as CSIM serves as the investment adviser to the fund. Gross Expense: Does not reflect the effect of contractual fee waivers. For actual expense ratios during the period, not including AFFE, refer to the financial highlights section of the financial statements. |
Schwab Target Funds | Annual Report
Performance and Fund Factsas of October 31, 2019 (continued)
| Number of Holdings | 21 |
| Portfolio Turnover Rate | 15% |
Asset Class Weightings % of Investments1,2
Top Holdings % of Net Assets3,4
Portfolio holdings may have changed since the report date.
| 1 | The percentage may differ from the Portfolio Holdings because the above calculation is based on a percentage of total investments, whereas the calculation in the Portfolio Holdings is based on a percentage of net assets. |
| 2 | The fund intends to invest in a combination of the underlying funds; however, the fund may also invest directly in equity and fixed income securities, exchange-traded funds, and cash equivalents, including money market securities. |
| 3 | This list is not a recommendation of any security by the investment adviser. |
| 4 | The holdings listed exclude any temporary liquidity investments. |
Schwab Target Funds | Annual Report
Schwab Target 2040 Fundas of October 31, 2019
The Schwab Target 2040 Fund (the 2040 Fund) seeks to provide capital appreciation and income consistent with its current asset allocation and seeks to achieve its investment objective by investing primarily in a combination of other affiliated Schwab Funds and Laudus Funds. The 2040 Fund may also invest in unaffiliated third-party mutual funds. The target asset allocation is adjusted annually by the investment adviser; as of the last annual adjustment at the end of January 2019, the 2040 Fund’s asset allocation was approximately 81.6% equity securities, 16.6% fixed income securities, and 1.8% cash and cash equivalents including money market funds). At its target date, the 2040 Fund’s allocation will be approximately 40.0% equity securities, 54.0% fixed-income securities, and 6.0% cash and cash equivalents (including money market funds). (For portfolio allocations as of the end of this reporting period, please see the 2040 Fund’s Portfolio Holdings included in this report.)
Market Highlights. Over the 12-month reporting period, global equity and fixed income markets generated positive returns. The U.S. economy maintained its steady growth in its tenth year of expansion, although at a declining pace. Outside the U.S., conditions softened, dampened by trade issues, slowing economic output, and geopolitical concerns. In response to the economic environment, to bolster growth, and to ensure stability given ongoing trade tensions, a number of central banks reduced their policy rates, including the U.S., while others maintained their generally low interest rates. Bond prices generally rose over the reporting period as yields fell.
Performance. For the 12-month reporting period ended October 31, 2019, the 2040 Fund returned 10.90%. The 2040 Fund’s internally calculated comparative index, the Target 2040 Composite Index (the composite index), returned 12.61%.
Positioning and Strategies. The 2040 Fund’s asset allocations were broadly in line with those of the composite index over the reporting period.
The 2040 Fund’s U.S. equity exposure provided the greatest contribution to total return, particularly among U.S. large-cap equity exposure, but detracted from relative performance. The Schwab S&P 500 Index Fund was the top contributor to the return of the 2040 Fund, returning approximately 14.3% for the reporting period and generally tracking its comparative index, the S&P 500® Index. The Dodge & Cox Stock Fund also contributed positively to total return, but underperformed its comparative index, the S&P 500® Index, detracting from relative performance. The Laudus Small-Cap MarketMasters Fund was the only detractor from the 2040 Fund’s total return, returning approximately -2.7% while held by the 2040 Fund, underperforming its comparative index, the Russell 2000® Index. The Laudus Small-Cap MarketMasters Fund was removed from the 2040 Fund in January 2019.
The 2040 Fund’s international equity allocation also contributed to total return, but detracted from relative return. The Laudus International MarketMasters Fund returned approximately 10.5% for the reporting period, underperforming its comparative index, the MSCI EAFE® Index (Net), which returned approximately 11.0%.
The 2040 Fund’s fixed income exposures provided the smallest contribution to the total return of the 2040 Fund. Of the fixed income exposures, the U.S. intermediate term allocation contributed the least to total return. While held by the 2040 Fund, the Schwab Intermediate-Term Bond Fund returned approximately 2.1%, underperforming its comparative index, the Bloomberg Barclays US Intermediate Aggregate Bond Index, which returned approximately 2.5%.
Management views and portfolio holdings may have changed since the report date.
Schwab Target Funds | Annual Report
Performance and Fund Factsas of October 31, 2019
The performance data quoted represents past performance. Past performance does not guarantee future results. Investment returns and principal value of an investment will fluctuate so that an investor’s shares may be worth more or less than their original cost. Current performance may be lower or higher than performance data quoted. To obtain performance information current to the most recent month end, please visitwww.schwabfunds.com/schwabfunds_prospectus.
Performance of Hypothetical $10,000 Investment (October 31, 2009 – October 31, 2019)1
Average Annual Total Returns1
| Fund and Inception Date | 1 Year | 5 Years | 10 Years |
| Fund: Schwab Target 2040 Fund (7/1/05) | 10.90% | 6.63% | 9.94% |
| Target 2040 Composite Index | 12.61% | 7.55% | 10.21% |
| Dow Jones U.S. Total Stock Market IndexSM | 13.39% | 10.26% | 13.62% |
| Bloomberg Barclays US Aggregate Bond Index | 11.51% | 3.24% | 3.73% |
| Fund Category: Morningstar Target-Date 20402 | 11.86% | 6.60% | 9.11% |
| Fund Expense Ratios3: Net 0.67%; Gross 0.69% |
All total returns on this page assume dividends and distributions were reinvested. Index figures do not include trading and management costs, which would lower performance. Indices are unmanaged and cannot be invested in directly. Performance results less than one year are not annualized.
The first index listed for the fund is the fund’s primary benchmark, as shown in the prospectus. Additional indices shown are provided for comparative purposes.
For index definitions, please see the Glossary.
| 1 | Fund expenses may have been partially absorbed by CSIM and its affiliates. Without these reductions, the fund’s returns would have been lower. These returns do not reflect the deduction of taxes that a shareholder would pay on fund distributions or the redemption of fund shares. |
| 2 | Source for category information: Morningstar, Inc. The Morningstar Category return represents all active and index mutual funds within the category as of the report date. |
| 3 | As stated in the prospectus. Includes 0.67% of acquired fund fees and expenses (AFFE), which are indirect expenses incurred by the fund through its investments in the underlying funds. Net Expense: Expenses reduced by a contractual fee waiver in effect for so long as CSIM serves as the investment adviser to the fund. Gross Expense: Does not reflect the effect of contractual fee waivers. For actual expense ratios during the period, not including AFFE, refer to the financial highlights section of the financial statements. |
Schwab Target Funds | Annual Report
Performance and Fund Factsas of October 31, 2019 (continued)
| Number of Holdings | 21 |
| Portfolio Turnover Rate | 15% |
Asset Class Weightings % of Investments1,2
Top Holdings % of Net Assets3,4
Portfolio holdings may have changed since the report date.
| 1 | The percentage may differ from the Portfolio Holdings because the above calculation is based on a percentage of total investments, whereas the calculation in the Portfolio Holdings is based on a percentage of net assets. |
| 2 | The fund intends to invest in a combination of the underlying funds; however, the fund may also invest directly in equity and fixed income securities, exchange-traded funds, and cash equivalents, including money market securities. |
| 3 | This list is not a recommendation of any security by the investment adviser. |
| 4 | The holdings listed exclude any temporary liquidity investments. |
Schwab Target Funds | Annual Report
Schwab Target 2045 Fundas of October 31, 2019
The Schwab Target 2045 Fund (the 2045 Fund) seeks to provide capital appreciation and income consistent with its current asset allocation and seeks to achieve its investment objective by investing primarily in a combination of other affiliated Schwab Funds and Laudus Funds. The 2045 Fund may also invest in unaffiliated third-party mutual funds. The target asset allocation is adjusted annually by the investment adviser; as of the last annual adjustment at the end of January 2019, the 2045 Fund’s asset allocation was approximately 87.3% equity securities, 11.4% fixed income securities, and 1.3% cash and cash equivalents (including money market funds). At its target date, the 2045 Fund’s allocation will be approximately 40.0% equity securities, 54.0% fixed-income securities, and 6.0% cash and cash equivalents (including money market funds). (For portfolio allocations as of the end of this reporting period, please see the 2045 Fund’s Portfolio Holdings included in this report.)
Market Highlights. Over the 12-month reporting period, global equity and fixed income markets generated positive returns. The U.S. economy maintained its steady growth in its tenth year of expansion, although at a declining pace. Outside the U.S., conditions softened, dampened by trade issues, slowing economic output, and geopolitical concerns. In response to the economic environment, to bolster growth, and to ensure stability given ongoing trade tensions, a number of central banks reduced their policy rates, including the U.S., while others maintained their generally low interest rates. Bond prices generally rose over the reporting period as yields fell.
Performance. For the 12-month reporting period ended October 31, 2019, the 2045 Fund returned 10.91%. The 2045 Fund’s internally calculated comparative index, the Target 2045 Composite Index (the composite index), returned 12.69%.
Positioning and Strategies. The 2045 Fund’s asset allocations were broadly in line with those of the composite index over the reporting period.
The 2045 Fund’s U.S. equity exposure provided the greatest contribution to total return, particularly among U.S. large-cap equity exposure, but detracted from relative performance. The Schwab S&P 500 Index Fund was the top contributor to the return of the 2045 Fund, returning approximately 14.3% for the reporting period and generally tracking its comparative index, the S&P 500® Index. The Dodge & Cox Stock Fund also contributed positively to total return, but underperformed its comparative index, the S&P 500® Index, detracting from relative performance. The Laudus Small-Cap MarketMasters Fund was the only detractor from the 2045 Fund’s total return, returning approximately -2.7% while held by the 2045 Fund, underperforming its comparative index, the Russell 2000® Index. The Laudus Small-Cap MarketMasters Fund was removed from the 2045 Fund in January 2019.
The 2045 Fund’s international equity allocation also contributed to total return, but detracted from relative return. The Laudus International MarketMasters Fund returned approximately 10.5% for the reporting period, underperforming its comparative index, the MSCI EAFE® Index (Net), which returned approximately 11.0%.
The 2045 Fund’s fixed income exposures provided the smallest contribution to the total return of the 2045 Fund. Of the fixed income exposures, the U.S. intermediate term allocation contributed the least to total return. While held by the 2045 Fund, the Schwab Intermediate-Term Bond Fund returned approximately 2.1%, underperforming its comparative index, the Bloomberg Barclays US Intermediate Aggregate Bond Index, which returned approximately 2.5%.
Management views and portfolio holdings may have changed since the report date.
Schwab Target Funds | Annual Report
Performance and Fund Factsas of October 31, 2019
The performance data quoted represents past performance. Past performance does not guarantee future results. Investment returns and principal value of an investment will fluctuate so that an investor’s shares may be worth more or less than their original cost. Current performance may be lower or higher than performance data quoted. To obtain performance information current to the most recent month end, please visitwww.schwabfunds.com/schwabfunds_prospectus.
Performance of Hypothetical $10,000 Investment (January 23, 2013 – October 31, 2019)1
Average Annual Total Returns1
| Fund and Inception Date | 1 Year | 5 Years | Since Inception |
| Fund: Schwab Target 2045 Fund (1/23/13) | 10.91% | 6.74% | 8.91% |
| Target 2045 Composite Index | 12.69% | 7.74% | 9.68% |
| Dow Jones U.S. Total Stock Market IndexSM | 13.39% | 10.26% | 12.90% |
| Bloomberg Barclays US Aggregate Bond Index | 11.51% | 3.24% | 2.85% |
| Fund Category: Morningstar Target-Date 20452 | 12.01% | 6.78% | N/A |
| Fund Expense Ratios3: Net 0.71%; Gross 0.77% |
All total returns on this page assume dividends and distributions were reinvested. Index figures do not include trading and management costs, which would lower performance. Indices are unmanaged and cannot be invested in directly. Performance results less than one year are not annualized.
The first index listed for the fund is the fund’s primary benchmark, as shown in the prospectus. Additional indices shown are provided for comparative purposes.
For index definitions, please see the Glossary.
| 1 | Fund expenses may have been partially absorbed by CSIM and its affiliates. Without these reductions, the fund’s returns would have been lower. These returns do not reflect the deduction of taxes that a shareholder would pay on fund distributions or the redemption of fund shares. |
| 2 | Source for category information: Morningstar, Inc. The Morningstar Category return represents all active and index mutual funds within the category as of the report date. |
| 3 | As stated in the prospectus. Includes 0.71% of acquired fund fees and expenses (AFFE), which are indirect expenses incurred by the fund through its investments in the underlying funds. Net Expense: Expenses reduced by a contractual fee waiver in effect for so long as CSIM serves as the investment adviser to the fund. Gross Expense: Does not reflect the effect of contractual fee waivers. For actual expense ratios during the period, not including AFFE, refer to the financial highlights section of the financial statements. |
Schwab Target Funds | Annual Report
Performance and Fund Factsas of October 31, 2019 (continued)
| Number of Holdings | 21 |
| Portfolio Turnover Rate | 8% |
Asset Class Weightings % of Investments1,2
Top Holdings % of Net Assets3,4
Portfolio holdings may have changed since the report date.
| 1 | The percentage may differ from the Portfolio Holdings because the above calculation is based on a percentage of total investments, whereas the calculation in the Portfolio Holdings is based on a percentage of net assets. |
| 2 | The fund intends to invest in a combination of the underlying funds; however, the fund may also invest directly in equity and fixed income securities, exchange-traded funds, and cash equivalents, including money market securities. |
| 3 | This list is not a recommendation of any security by the investment adviser. |
| 4 | The holdings listed exclude any temporary liquidity investments. |
Schwab Target Funds | Annual Report
Schwab Target 2050 Fundas of October 31, 2019
The Schwab Target 2050 Fund (the 2050 Fund) seeks to provide capital appreciation and income consistent with its current asset allocation and seeks to achieve its investment objective by investing primarily in a combination of other affiliated Schwab Funds and Laudus Funds. The 2050 Fund may also invest in unaffiliated third-party mutual funds. The target asset allocation is adjusted annually by the investment adviser; as of the last annual adjustment at the end of January 2019, the 2050 Fund’s asset allocation was approximately 90.5% equity securities, 8.6% fixed income securities, and 1.0% cash and cash equivalents (including money market funds). At its target date, the 2050 Fund’s allocation will be approximately 40.0% equity securities, 54.0% fixed-income securities, and 6.0% cash and cash equivalents (including money market funds). (For portfolio allocations as of the end of this reporting period, please see the 2050 Fund’s Portfolio Holdings included in this report.)
Market Highlights. Over the 12-month reporting period, global equity and fixed income markets generated positive returns. The U.S. economy maintained its steady growth in its tenth year of expansion, although at a declining pace. Outside the U.S., conditions softened, dampened by trade issues, slowing economic output, and geopolitical concerns. In response to the economic environment, to bolster growth, and to ensure stability given ongoing trade tensions, a number of central banks reduced their policy rates, including the U.S., while others maintained their generally low interest rates. Bond prices generally rose over the reporting period as yields fell.
Performance. For the 12-month reporting period ended October 31, 2019, the 2050 Fund returned 10.87%. The 2050 Fund’s internally calculated comparative index, the Target 2050 Composite Index (the composite index), returned 12.72%.
Positioning and Strategies. The 2050 Fund’s asset allocations were broadly in line with those of the composite index over the reporting period.
The 2050 Fund’s U.S. equity exposure provided the greatest contribution to total return, particularly among U.S. large-cap equity exposure, but detracted from relative performance. The Schwab S&P 500 Index Fund was the top contributor to the return of the 2050 Fund, returning approximately 14.3% for the reporting period and generally tracking its comparative index, the S&P 500® Index. The Dodge & Cox Stock Fund also contributed positively to total return, but underperformed its comparative index, the S&P 500® Index, detracting from relative performance. The Laudus Small-Cap MarketMasters Fund was the only detractor from the 2050 Fund’s total return, returning approximately -2.7% while held by the 2050 Fund, underperforming its comparative index, the Russell 2000® Index. The Laudus Small-Cap MarketMasters Fund was removed from the 2050 Fund in January 2019.
The 2050 Fund’s international equity allocation also contributed to total return, but detracted from relative return. The Laudus International MarketMasters Fund returned approximately 10.5% for the reporting period, underperforming its comparative index, the MSCI EAFE® Index (Net), which returned approximately 11.0%.
The 2050 Fund’s fixed income exposures provided the smallest contribution to the total return of the 2050 Fund. Of the fixed income exposures, the U.S. intermediate term allocation contributed the least to total return. While held by the 2050 Fund, the Schwab Intermediate-Term Bond Fund returned approximately 2.1%, underperforming its comparative index, the Bloomberg Barclays US Intermediate Aggregate Bond Index, which returned approximately 2.5%.
Management views and portfolio holdings may have changed since the report date.
Schwab Target Funds | Annual Report
Performance and Fund Factsas of October 31, 2019
The performance data quoted represents past performance. Past performance does not guarantee future results. Investment returns and principal value of an investment will fluctuate so that an investor’s shares may be worth more or less than their original cost. Current performance may be lower or higher than performance data quoted. To obtain performance information current to the most recent month end, please visitwww.schwabfunds.com/schwabfunds_prospectus.
Performance of Hypothetical $10,000 Investment (January 23, 2013 – October 31, 2019)1
Average Annual Total Returns1
| Fund and Inception Date | 1 Year | 5 Years | Since Inception |
| Fund: Schwab Target 2050 Fund (1/23/13) | 10.87% | 6.83% | 9.07% |
| Target 2050 Composite Index | 12.72% | 7.84% | 9.86% |
| Dow Jones U.S. Total Stock Market IndexSM | 13.39% | 10.26% | 12.90% |
| Bloomberg Barclays US Aggregate Bond Index | 11.51% | 3.24% | 2.85% |
| Fund Category: Morningstar Target-Date 20502 | 12.05% | 6.83% | N/A |
| Fund Expense Ratios3: Net 0.73%; Gross 0.80% |
All total returns on this page assume dividends and distributions were reinvested. Index figures do not include trading and management costs, which would lower performance. Indices are unmanaged and cannot be invested in directly. Performance results less than one year are not annualized.
The first index listed for the fund is the fund’s primary benchmark, as shown in the prospectus. Additional indices shown are provided for comparative purposes.
For index definitions, please see the Glossary.
| 1 | Fund expenses may have been partially absorbed by CSIM and its affiliates. Without these reductions, the fund’s returns would have been lower. These returns do not reflect the deduction of taxes that a shareholder would pay on fund distributions or the redemption of fund shares. |
| 2 | Source for category information: Morningstar, Inc. The Morningstar Category return represents all active and index mutual funds within the category as of the report date. |
| 3 | As stated in the prospectus. Includes 0.73% of acquired fund fees and expenses (AFFE), which are indirect expenses incurred by the fund through its investments in the underlying funds. Net Expense: Expenses reduced by a contractual fee waiver in effect for so long as CSIM serves as the investment adviser to the fund. Gross Expense: Does not reflect the effect of contractual fee waivers. For actual expense ratios during the period, not including AFFE, refer to the financial highlights section of the financial statements. |
Schwab Target Funds | Annual Report
Performance and Fund Factsas of October 31, 2019 (continued)
| Number of Holdings | 21 |
| Portfolio Turnover Rate | 7% |
Asset Class Weightings % of Investments1,2
Top Holdings % of Net Assets3,4
Portfolio holdings may have changed since the report date.
| 1 | The percentage may differ from the Portfolio Holdings because the above calculation is based on a percentage of total investments, whereas the calculation in the Portfolio Holdings is based on a percentage of net assets. |
| 2 | The fund intends to invest in a combination of the underlying funds; however, the fund may also invest directly in equity and fixed income securities, exchange-traded funds, and cash equivalents, including money market securities. |
| 3 | This list is not a recommendation of any security by the investment adviser. |
| 4 | The holdings listed exclude any temporary liquidity investments. |
Schwab Target Funds | Annual Report
Schwab Target 2055 Fundas of October 31, 2019
The Schwab Target 2055 Fund (the 2055 Fund) seeks to provide capital appreciation and income consistent with its current asset allocation and seeks to achieve its investment objective by investing primarily in a combination of other affiliated Schwab Funds and Laudus Funds. The 2055 Fund may also invest in unaffiliated third-party mutual funds. The target asset allocation is adjusted annually by the investment adviser; as of the last annual adjustment at the end of January 2019, the 2055 Fund’s asset allocation was approximately 93.0% equity securities, 6.3% fixed income securities, and 0.7% cash and cash equivalents (including money market funds). At its target date, the 2055 Fund’s allocation will be approximately 40.0% equity securities, 54.0% fixed-income securities, and 6.0% cash and cash equivalents (including money market funds). (For portfolio allocations as of the end of this reporting period, please see the 2055 Fund’s Portfolio Holdings included in this report.)
Market Highlights. Over the 12-month reporting period, global equity and fixed income markets generated positive returns. The U.S. economy maintained its steady growth in its tenth year of expansion, although at a declining pace. Outside the U.S., conditions softened, dampened by trade issues, slowing economic output, and geopolitical concerns. In response to the economic environment, to bolster growth, and to ensure stability given ongoing trade tensions, a number of central banks reduced their policy rates, including the U.S., while others maintained their generally low interest rates. Bond prices generally rose over the reporting period as yields fell.
Performance. For the 12-month reporting period ended October 31, 2019, the 2055 Fund returned 10.73%. The 2055 Fund’s internally calculated comparative index, the Target 2055 Composite Index (the composite index), returned 12.74%.
Positioning and Strategies. The 2055 Fund’s asset allocations were broadly in line with those of the composite index over the reporting period.
The 2055 Fund’s U.S. equity exposure provided the greatest contribution to total return, particularly among U.S. large-cap equity exposure, but detracted from relative performance. The Schwab S&P 500 Index Fund was the top contributor to the return of the 2055 Fund, returning approximately 14.3% for the reporting period and generally tracking its comparative index, the S&P 500® Index. The Dodge & Cox Stock Fund also contributed positively to total return, but underperformed its comparative index, the S&P 500® Index, detracting from relative performance. The Laudus Small-Cap MarketMasters Fund was the only detractor from the 2055 Fund’s total return, returning approximately -2.7% while held by the 2055 Fund, underperforming its comparative index, the Russell 2000® Index. The Laudus Small-Cap MarketMasters Fund was removed from the 2055 Fund in January 2019.
The 2055 Fund’s international equity allocation also contributed to total return, but detracted from relative return. The Laudus International MarketMasters Fund returned approximately 10.5% for the reporting period, underperforming its comparative index, the MSCI EAFE® Index (Net), which returned approximately 11.0%.
The 2055 Fund’s fixed income exposures provided the smallest contribution to the total return of the 2055 Fund. Of the fixed income exposures, the U.S. intermediate term allocation contributed the least to total return. While held by the 2055 Fund, the Schwab Intermediate-Term Bond Fund returned approximately 2.1%, underperforming its comparative index, the Bloomberg Barclays US Intermediate Aggregate Bond Index, which returned approximately 2.5%.
Management views and portfolio holdings may have changed since the report date.
Schwab Target Funds | Annual Report
Performance and Fund Factsas of October 31, 2019
The performance data quoted represents past performance. Past performance does not guarantee future results. Investment returns and principal value of an investment will fluctuate so that an investor’s shares may be worth more or less than their original cost. Current performance may be lower or higher than performance data quoted. To obtain performance information current to the most recent month end, please visitwww.schwabfunds.com/schwabfunds_prospectus.
Performance of Hypothetical $10,000 Investment (January 23, 2013 – October 31, 2019)1
Average Annual Total Returns1
| Fund and Inception Date | 1 Year | 5 Years | Since Inception |
| Fund: Schwab Target 2055 Fund (1/23/13) | 10.73% | 6.88% | 9.16% |
| Target 2055 Composite Index | 12.74% | 7.93% | 9.98% |
| Dow Jones U.S. Total Stock Market IndexSM | 13.39% | 10.26% | 12.90% |
| Bloomberg Barclays US Aggregate Bond Index | 11.51% | 3.24% | 2.85% |
| Fund Category: Morningstar Target-Date 20552 | 12.07% | 6.91% | N/A |
| Fund Expense Ratios3: Net 0.74%; Gross 0.85% |
All total returns on this page assume dividends and distributions were reinvested. Index figures do not include trading and management costs, which would lower performance. Indices are unmanaged and cannot be invested in directly. Performance results less than one year are not annualized.
The first index listed for the fund is the fund’s primary benchmark, as shown in the prospectus. Additional indices shown are provided for comparative purposes.
For index definitions, please see the Glossary.
| 1 | Fund expenses may have been partially absorbed by CSIM and its affiliates. Without these reductions, the fund’s returns would have been lower. These returns do not reflect the deduction of taxes that a shareholder would pay on fund distributions or the redemption of fund shares. |
| 2 | Source for category information: Morningstar, Inc. The Morningstar Category return represents all active and index mutual funds within the category as of the report date. |
| 3 | As stated in the prospectus. Includes 0.74% of acquired fund fees and expenses (AFFE), which are indirect expenses incurred by the fund through its investments in the underlying funds. Net Expense: Expenses reduced by a contractual fee waiver in effect for so long as CSIM serves as the investment adviser to the fund. Gross Expense: Does not reflect the effect of contractual fee waivers. For actual expense ratios during the period, not including AFFE, refer to the financial highlights section of the financial statements. |
Schwab Target Funds | Annual Report
Performance and Fund Factsas of October 31, 2019 (continued)
| Number of Holdings | 20 |
| Portfolio Turnover Rate | 6% |
Asset Class Weightings % of Investments1,2
Top Holdings % of Net Assets3,4
Portfolio holdings may have changed since the report date.
| 1 | The percentage may differ from the Portfolio Holdings because the above calculation is based on a percentage of total investments, whereas the calculation in the Portfolio Holdings is based on a percentage of net assets. |
| 2 | The fund intends to invest in a combination of the underlying funds; however, the fund may also invest directly in equity and fixed income securities, exchange-traded funds, and cash equivalents, including money market securities. |
| 3 | This list is not a recommendation of any security by the investment adviser. |
| 4 | The holdings listed exclude any temporary liquidity investments. |
Schwab Target Funds | Annual Report
Schwab Target 2060 Fundas of October 31, 2019
The Schwab Target 2060 Fund (the 2060 Fund) seeks to provide capital appreciation and income consistent with its current asset allocation and seeks to achieve its investment objective by investing primarily in a combination of other affiliated Schwab Funds and Laudus Funds. The 2060 Fund may also invest in unaffiliated third-party mutual funds. The target asset allocation is adjusted annually by the investment adviser; as of the last annual adjustment at the end of January 2019, the 2060 Fund’s asset allocation was approximately 95.0% equity securities, 4.5% fixed-income securities, and 0.5% cash and cash equivalents (including money market funds). At its target date, the 2060 Fund’s allocation will be approximately 40.0% equity securities, 54.0% fixed-income securities, and 6.0% cash and cash equivalents (including money market funds). (For portfolio allocations as of the end of this reporting period, please see the 2060 Fund’s Portfolio Holdings included in this report.)
Market Highlights. Over the 12-month reporting period, global equity and fixed income markets generated positive returns. The U.S. economy maintained its steady growth in its tenth year of expansion, although at a declining pace. Outside the U.S., conditions softened, dampened by trade issues, slowing economic output, and geopolitical concerns. In response to the economic environment, to bolster growth, and to ensure stability given ongoing trade tensions, a number of central banks reduced their policy rates, including the U.S., while others maintained their generally low interest rates. Bond prices generally rose over the reporting period as yields fell.
Performance. For the 12-month reporting period ended October 31, 2019, the 2060 Fund returned 10.85%. The 2060 Fund’s internally calculated comparative index, the Target 2060 Composite Index (the composite index), returned 12.75%.
Positioning and Strategies. The 2060 Fund’s asset allocations were broadly in line with those of the composite index over the reporting period.
The 2060 Fund’s U.S. equity exposure provided the greatest contribution to total return, particularly among U.S. large-cap equity exposure, but detracted from relative performance. The Schwab S&P 500 Index Fund was the top contributor to the return of the 2060 Fund, returning approximately 14.3% for the reporting period and generally tracking its comparative index, the S&P 500® Index. The Dodge & Cox Stock Fund also contributed positively to total return, but underperformed its comparative index, the S&P 500® Index, detracting from relative performance. The Laudus Small-Cap MarketMasters Fund was the only detractor from the 2060 Fund’s total return, returning approximately -2.7% while held by the 2060 Fund, underperforming its comparative index, the Russell 2000® Index. The Laudus Small-Cap MarketMasters Fund was removed from the 2060 Fund in January 2019.
The 2060 Fund’s international equity allocation also contributed to total return, but detracted from relative return. The Laudus International MarketMasters Fund returned approximately 10.5% for the reporting period, underperforming its comparative index, the MSCI EAFE® Index (Net), which returned approximately 11.0%.
The 2060 Fund’s fixed income exposures provided the smallest contribution to the total return of the 2060 Fund. Of the fixed income exposures, the U.S. intermediate term allocation contributed the least to total return. While held by the 2060 Fund, the Schwab Intermediate-Term Bond Fund returned approximately 2.1%, underperforming its comparative index, the Bloomberg Barclays US Intermediate Aggregate Bond Index, which returned approximately 2.5%.
Management views and portfolio holdings may have changed since the report date.
Schwab Target Funds | Annual Report
Performance and Fund Factsas of October 31, 2019
The performance data quoted represents past performance. Past performance does not guarantee future results. Investment returns and principal value of an investment will fluctuate so that an investor’s shares may be worth more or less than their original cost. Current performance may be lower or higher than performance data quoted. To obtain performance information current to the most recent month end, please visitwww.schwabfunds.com/schwabfunds_prospectus.
Performance of Hypothetical $10,000 Investment (August 25, 2016 – October 31, 2019)1
Average Annual Total Returns1
| Fund and Inception Date | 1 Year | 3 Years | Since Inception |
| Fund: Schwab Target 2060 Fund (8/25/16) | 10.85% | 10.47% | 9.24% |
| Target 2060 Composite Index | 12.75% | 11.65% | 10.22% |
| Dow Jones U.S. Total Stock Market IndexSM | 13.39% | 14.42% | 12.81% |
| Bloomberg Barclays US Aggregate Bond Index | 11.51% | 3.29% | 2.85% |
| Fund Category: Morningstar Target-Date 2060+2 | 12.15% | 10.73% | N/A |
| Fund Expense Ratios3: Net 0.75%; Gross 1.48% |
All total returns on this page assume dividends and distributions were reinvested. Index figures do not include trading and management costs, which would lower performance. Indices are unmanaged and cannot be invested in directly. Performance results less than one year are not annualized.
The first index listed for the fund is the fund’s primary benchmark, as shown in the prospectus. Additional indices shown are provided for comparative purposes.
For index definitions, please see the Glossary.
| 1 | Fund expenses may have been partially absorbed by CSIM and its affiliates. Without these reductions, the fund’s returns would have been lower. These returns do not reflect the deduction of taxes that a shareholder would pay on fund distributions or the redemption of fund shares. |
| 2 | Source for category information: Morningstar, Inc. The Morningstar Category return represents all active and index mutual funds within the category as of the report date. |
| 3 | As stated in the prospectus. Includes 0.75% of acquired fund fees and expenses (AFFE), which are indirect expenses incurred by the fund through its investments in the underlying funds. Net Expense: Expenses reduced by a contractual fee waiver in effect for so long as CSIM serves as the investment adviser to the fund. Gross Expense: Does not reflect the effect of contractual fee waivers. For actual expense ratios during the period, not including AFFE, refer to the financial highlights section of the financial statements. |
Schwab Target Funds | Annual Report
Performance and Fund Factsas of October 31, 2019 (continued)
| Number of Holdings | 20 |
| Portfolio Turnover Rate | 13% |
Asset Class Weightings % of Investments1,2
Top Holdings % of Net Assets3,4
Portfolio holdings may have changed since the report date.
| 1 | The percentage may differ from the Portfolio Holdings because the above calculation is based on a percentage of total investments, whereas the calculation in the Portfolio Holdings is based on a percentage of net assets. |
| 2 | The fund intends to invest in a combination of the underlying funds; however, the fund may also invest directly in equity and fixed income securities, exchange-traded funds, and cash equivalents, including money market securities. |
| 3 | This list is not a recommendation of any security by the investment adviser. |
| 4 | The holdings listed exclude any temporary liquidity investments. |
Schwab Target Funds | Annual Report
Examples for a $1,000 Investment
As a fund shareholder, you may incur two types of costs: (1) transaction costs; and (2) ongoing costs, including transfer agent fees and other fund expenses.
The expense examples below are intended to help you understand your ongoing cost (in dollars) of investing in a fund and to compare this cost with the ongoing cost of investing in other mutual funds. These examples are based on an investment of $1,000 invested for six months beginning May 1, 2019 and held through October 31, 2019.
Actual Return lines in the table below provide information about actual account values and actual expenses. You may use this information, together with the amount you invested, to estimate the expenses that you paid over the period. To do so, simply divide your account value by $1,000 (for example, an $8,600 account value ÷ $1,000 = 8.6), then multiply the result by the number given for your fund under the heading entitled “Expenses Paid During Period.”
Hypothetical Return lines in the table below provide information about hypothetical account values and hypothetical expenses based on a fund’s actual expense ratio and an assumed return of 5% per year before expenses. Because the return used is not an actual return, it may not be used to estimate the actual ending account value or expenses you paid for the period.
You may use this information to compare the ongoing costs of investing in a fund and other funds. To do so, compare this 5% hypothetical example with the 5% hypothetical examples that appear in the shareholder reports of the other funds.
Please note that the expenses shown in the table are meant to highlight your ongoing costs only, and do not reflect any transactional costs. Therefore, the hypothetical return lines of the table are useful in comparing ongoing costs only, and will not help you determine the relative total costs of owning different funds. In addition, if these transactional costs were included, your costs would have been higher.
| | Expense Ratio
(Annualized)1,2 | Effective
Expense Ratio
(Annualized)3,4 | Beginning
Account Value
at 5/1/19 | Ending
Account Value
(Net of Expenses)
at 10/31/192 | Expenses Paid
During Period
5/1/19-10/31/192,5 | Effective
Expenses Paid
During Period
5/1/19-10/31/194,5 |
| Schwab Target 2010 Fund | | | | | | |
| Actual Return | 0.00% | 0.32% | $1,000.00 | $1,039.10 | $0.00 | $1.64 |
| Hypothetical 5% Return | 0.00% | 0.32% | $1,000.00 | $1,025.20 | $0.00 | $1.63 |
| Schwab Target 2015 Fund | | | | | | |
| Actual Return | 0.00% | 0.34% | $1,000.00 | $1,037.80 | $0.00 | $1.75 |
| Hypothetical 5% Return | 0.00% | 0.34% | $1,000.00 | $1,025.20 | $0.00 | $1.73 |
| Schwab Target 2020 Fund | | | | | | |
| Actual Return | 0.00% | 0.37% | $1,000.00 | $1,037.30 | $0.00 | $1.90 |
| Hypothetical 5% Return | 0.00% | 0.37% | $1,000.00 | $1,025.20 | $0.00 | $1.89 |
| Schwab Target 2025 Fund | | | | | | |
| Actual Return | 0.00% | 0.47% | $1,000.00 | $1,032.90 | $0.00 | $2.41 |
| Hypothetical 5% Return | 0.00% | 0.47% | $1,000.00 | $1,025.20 | $0.00 | $2.40 |
| Schwab Target 2030 Fund | | | | | | |
| Actual Return | 0.00% | 0.54% | $1,000.00 | $1,030.00 | $0.00 | $2.76 |
| Hypothetical 5% Return | 0.00% | 0.54% | $1,000.00 | $1,025.20 | $0.00 | $2.75 |
| Schwab Target 2035 Fund | | | | | | |
| Actual Return | 0.00% | 0.60% | $1,000.00 | $1,026.60 | $0.00 | $3.06 |
| Hypothetical 5% Return | 0.00% | 0.60% | $1,000.00 | $1,025.20 | $0.00 | $3.06 |
| Schwab Target 2040 Fund | | | | | | |
| Actual Return | 0.00% | 0.65% | $1,000.00 | $1,023.40 | $0.00 | $3.32 |
| Hypothetical 5% Return | 0.00% | 0.65% | $1,000.00 | $1,025.20 | $0.00 | $3.31 |
| Schwab Target 2045 Fund | | | | | | |
| Actual Return | 0.00% | 0.68% | $1,000.00 | $1,021.30 | $0.00 | $3.46 |
| Hypothetical 5% Return | 0.00% | 0.68% | $1,000.00 | $1,025.20 | $0.00 | $3.47 |
| Schwab Target 2050 Fund | | | | | | |
| Actual Return | 0.00% | 0.71% | $1,000.00 | $1,019.60 | $0.00 | $3.61 |
| Hypothetical 5% Return | 0.00% | 0.71% | $1,000.00 | $1,025.20 | $0.00 | $3.62 |
| Schwab Target 2055 Fund | | | | | | |
| Actual Return | 0.00% | 0.72% | $1,000.00 | $1,018.00 | $0.00 | $3.66 |
| Hypothetical 5% Return | 0.00% | 0.72% | $1,000.00 | $1,025.20 | $0.00 | $3.67 |
Schwab Target Funds | Annual Report
Fund Expenses(Unaudited) (continued)
| | Expense Ratio
(Annualized)1,2 | Effective
Expense Ratio
(Annualized)3,4 | Beginning
Account Value
at 5/1/19 | Ending
Account Value
(Net of Expenses)
at 10/31/192 | Expenses Paid
During Period
5/1/19-10/31/192,5 | Effective
Expenses Paid
During Period
5/1/19-10/31/194,5 |
| Schwab Target 2060 Fund | | | | | | |
| Actual Return | 0.00% | 0.74% | $1,000.00 | $1,017.60 | $0.00 | $3.76 |
| Hypothetical 5% Return | 0.00% | 0.74% | $1,000.00 | $1,025.20 | $0.00 | $3.77 |
| 1 | Based on the most recent six-month expense ratio. |
| 2 | Excludes acquired fund fees and expenses, which are indirect expenses incurred by the fund through its investments in underlying funds. |
| 3 | Based on the most recent six-month acquired fund fees and expense ratio; may differ from the acquired fund fees and expenses ratios in the prospectus. |
| 4 | Includes acquired fund fees and expenses, which are indirect expenses incurred by the fund through its investments in underlying funds. |
| 5 | Expenses for each fund are equal to its annualized expense ratio, multiplied by the average account value over the period, multiplied by the 184 days of the period, and divided by the 365 days of the fiscal year. |
Schwab Target Funds | Annual Report
Financial Statements
Financial Highlights
| | 11/1/18–
10/31/19 | 11/1/17–
10/31/18 | 11/1/16–
10/31/17 | 11/1/15–
10/31/16 | 11/1/14–
10/31/15 | |
| Per-Share Data |
| Net asset value at beginning of period | $13.06 | $13.42 | $12.52 | $12.42 | $12.42 | |
| Income (loss) from investment operations: | | | | | | |
| Net investment income (loss)1 | 0.30 | 0.29 | 0.22 | 0.20 | 0.17 | |
| Net realized and unrealized gains (losses) | 0.97 | (0.35) | 0.90 | 0.12 | 0.08 | |
| Total from investment operations | 1.27 | (0.06) | 1.12 | 0.32 | 0.25 | |
| Less distributions: | | | | | | |
| Distributions from net investment income | (0.34) | (0.30) | (0.22) | (0.22) | (0.25) | |
| Distributions from net realized gains | (0.42) | — | — | — | — | |
| Total distributions | (0.76) | (0.30) | (0.22) | (0.22) | (0.25) | |
| Net asset value at end of period | $13.57 | $13.06 | $13.42 | $12.52 | $12.42 | |
| Total return | 10.42% | (0.52%) | 9.11% | 2.68% | 2.03% | |
| Ratios/Supplemental Data |
| Ratios to average net assets: | | | | | | |
| Net operating expenses2 | 0.00% | 0.00%3 | 0.00% | 0.00%3 | 0.00%3 | |
| Gross operating expenses2 | 0.17% | 0.12% | 0.14% | 0.14% | 0.14% | |
| Net investment income (loss) | 2.33% | 2.15% | 1.75% | 1.60% | 1.40% | |
| Portfolio turnover rate | 13% | 16% | 51%4 | 14% | 33% | |
| Net assets, end of period (x 1,000,000) | $51 | $52 | $59 | $59 | $65 | |
| |
1
Calculated based on the average shares outstanding during the period.
2
The expenses incurred by underlying funds in which the fund invests are not included in this ratio.
3
Less than 0.005%; the ratio of net operating expenses would have been 0.00%, if certain non-routine expenses had not been incurred.
4
The portfolio turnover rate increased due to the in-kind transactions relating to Schwab Total Bond Market Fund and Schwab U.S. Aggregate Bond Index Fund. For comparison purposes, the portfolio turnover rate would have been 30% without including these transactions. There were no transaction costs associated with these transactions.
Schwab Target Funds | Annual Report
Portfolio Holdings as of October 31, 2019
This section shows all the securities in the fund’s portfolio and their values as of the report date.
The fund files its complete schedule of portfolio holdings with the U.S. Securities and Exchange Commission (SEC) for the first and third quarters of each fiscal year on Form N-Q. Effective March 31, 2019, Form N-PORT Part F has replaced Form N-Q. The fund’s Form N-Q and Form N-PORT Part F are available on the SEC’s website atwww.sec.gov. The fund also makes available its complete schedule of portfolio holdings 15 to 20 days after the end of the month on the fund’s website atwww.schwabfunds.com/schwabfunds_prospectus.
| Security | Number
of Shares | Value ($) |
| Affiliated Underlying Funds75.6% of net assets |
| |
| Equity Funds 29.8% |
| Global Real Estate 1.9% |
| Schwab Global Real Estate Fund | 115,058 | 961,884 |
| International 9.5% |
| Laudus International MarketMasters Fund | 126,488 | 2,895,314 |
| Schwab International Core Equity Fund | 197,573 | 1,983,635 |
| | | 4,878,949 |
| Large-Cap 16.2% |
| Schwab Core Equity Fund | 124,304 | 2,718,520 |
| Schwab Dividend Equity Fund | 5,819 | 87,695 |
| Schwab S&P 500 Index Fund | 115,469 | 5,446,654 |
| | | 8,252,869 |
| Mid-Cap 0.7% |
| Schwab U.S. Mid-Cap Index Fund | 8,477 | 375,464 |
| Small-Cap 1.5% |
| Schwab Small-Cap Equity Fund | 44,558 | 743,230 |
| | | 15,212,396 |
| |
| Fixed-Income Funds 39.3% |
| Inflation-Protected Bond 6.3% |
| Schwab Treasury Inflation Protected Securities Index Fund | 287,829 | 3,255,343 |
| Intermediate-Term Bond 23.1% |
| Schwab U.S. Aggregate Bond Index Fund | 1,136,433 | 11,796,171 |
| Short-Term Bond 9.9% |
| Schwab Short-Term Bond Index Fund | 499,774 | 5,052,710 |
| | | 20,104,224 |
| |
| Money Market Fund 6.5% |
| Schwab Variable Share Price Money Fund, Ultra Shares 1.85%(a) | 3,305,817 | 3,307,470 |
| Total Affiliated Underlying Funds |
| (Cost $33,932,523) | | 38,624,090 |
|
| Unaffiliated Underlying Funds23.6% of net assets |
| |
| Equity Funds 6.4% |
| Large-Cap 5.9% |
| ClearBridge Large Cap Growth Fund, Class IS | 28,979 | 1,555,023 |
| Dodge & Cox Stock Fund | 7,725 | 1,475,616 |
| | | 3,030,639 |
| Security | Number
of Shares | Value ($) |
| Small-Cap 0.5% |
| ClearBridge Small Cap Growth Fund, Class IS * | 7,370 | 280,352 |
| | | 3,310,991 |
| |
| Fixed-Income Funds 17.2% |
| Intermediate-Term Bond 15.0% |
| Baird Aggregate Bond Fund, Institutional Class | 224,671 | 2,532,041 |
| Loomis Sayles Investment Grade Bond Fund, Class Y | 50,515 | 575,870 |
| Metropolitan West Total Return Bond Fund, Class I | 412,706 | 4,572,778 |
| | | 7,680,689 |
| International Bond 2.2% |
| PIMCO International Bond Fund (U.S. Dollar-Hedged), Institutional Class | 98,530 | 1,107,476 |
| | | 8,788,165 |
| Total Unaffiliated Underlying Funds |
| (Cost $11,451,793) | | 12,099,156 |
Issuer
Rate, Maturity Date | Face
Amount ($) | Value ($) |
| Short-Term Investment0.4% of net assets |
| |
| Time Deposit 0.4% |
| BNP Paribas |
| 1.18%, 11/01/19(b) | 197,701 | 197,701 |
| Total Short-Term Investment |
| (Cost $197,701) | | 197,701 |
| * | Non-income producing security. |
| (a) | The rate shown is the 7-day yield. |
| (b) | The rate shown is the current daily overnight rate. |
Schwab Target Funds | Annual Report
Portfolio Holdings as of October 31, 2019 (continued)
Below is a summary of the fund’s transactions with its affiliated underlying funds during the period ended October 31, 2019:
| Affiliated Underlying Funds | Market
Value at
10/31/18 | Gross
Purchases | Gross
Sales | Realized
Gains (Losses) | Net Change
in Unrealized
Appreciation
(depreciation) | Market
Value at
10/31/19 | Balance
of Shares
Held at
10/31/19 | Distributions
Received* |
| Laudus International MarketMasters Fund (formerly Laudus International MarketMasters Fund, Select Shares) | $3,089,589 | $368,862 | ($595,000) | ($74,078) | $105,941 | $2,895,314 | 126,488 | $271,862 |
| Laudus Small-Cap MarketMasters Fund, Select Shares | 401,473 | — | (349,523) | 133,991 | (185,941) | — | — | 38,023 |
| Schwab Core Equity Fund | 2,664,098 | 767,222 | (732,000) | (72,440) | 91,640 | 2,718,520 | 124,304 | 325,222 |
| Schwab Dividend Equity Fund | 80,613 | 8,031 | — | — | (949) | 87,695 | 5,819 | 8,032 |
| Schwab Global Real Estate Fund | 778,890 | 155,852 | (138,000) | 5,574 | 159,568 | 961,884 | 115,058 | 35,852 |
| Schwab International Core Equity Fund | 1,970,369 | 177,611 | (263,000) | (19,344) | 117,999 | 1,983,635 | 197,573 | 51,610 |
| Schwab S&P 500 Index Fund | 5,712,773 | 818,576 | (1,747,000) | 255,215 | 407,090 | 5,446,654 | 115,469 | 130,576 |
| Schwab Short-Term Bond Index Fund | 5,263,621 | 177,938 | (576,000) | (5,395) | 192,546 | 5,052,710 | 499,774 | 124,944 |
| Schwab Small-Cap Equity Fund | 676,932 | 185,159 | — | — | (118,861) | 743,230 | 44,558 | 125,159 |
| Schwab Treasury Inflation Protected Securities Index Fund | 3,321,405 | 240,777 | (516,000) | (48,093) | 257,254 | 3,255,343 | 287,829 | 76,778 |
| Schwab U.S. Aggregate Bond Index Fund | 12,514,454 | 766,873 | (2,426,000) | (31,497) | 972,341 | 11,796,171 | 1,136,433 | 354,887 |
| Schwab U.S. Mid-Cap Index Fund | 417,614 | 5,342 | (99,000) | 5,856 | 45,652 | 375,464 | 8,477 | 5,341 |
| Schwab Variable Share Price Money Fund, Ultra Shares | 3,148,618 | 537,961 | (380,000) | (6) | 897 | 3,307,470 | 3,305,817 | 73,661 |
| Total | $40,040,449 | $4,210,204 | ($7,821,523) | $149,783 | $2,045,177 | $38,624,090 | | $1,621,947 |
| * | Distributions received include distributions from net investment income and capital gains, if any, from the underlying funds. |
| | |
The following is a summary of the inputs used to value the fund’s investments as of October 31, 2019 (see financial note 2(a) for additional information):
| Description | Quoted Prices in
Active Markets for
Identical Assets
(Level 1) | Other Significant
Observable Inputs
(Level 2) | Significant
Unobservable Inputs
(Level 3) | Total | |
| Assets | | | | | |
| Affiliated Underlying Funds1 | $38,624,090 | $— | $— | $38,624,090 | |
| Unaffiliated Underlying Funds1 | 12,099,156 | — | — | 12,099,156 | |
| Short-Term Investment1 | — | 197,701 | — | 197,701 | |
| Total | $50,723,246 | $197,701 | $— | $50,920,947 | |
| 1 | As categorized in Portfolio Holdings. |
Fund investments in underlying mutual funds are classified as Level 1, without consideration to the classification level of the investments held by the underlying mutual funds, which could be Level 1, Level 2 or Level 3.
Schwab Target Funds | Annual Report
Statement of Assets and Liabilities
As of October 31, 2019
| Assets |
| Investments in affiliated underlying funds, at value (cost $33,932,523) | | $38,624,090 |
| Investments in unaffiliated funds and issuers, at value (cost $11,649,494) | | 12,296,857 |
| Receivables: | | |
| Investments sold | | 195,000 |
| Dividends | | 52,159 |
| Due from investment adviser | | 9,886 |
| Fund shares sold | | 968 |
| Interest | | 7 |
| Prepaid expenses | + | 10,733 |
| Total assets | | 51,189,700 |
| Liabilities |
| Payables: | | |
| Investments bought | | 49,386 |
| Fund shares redeemed | | 6,725 |
| Accrued expenses | + | 27,502 |
| Total liabilities | | 83,613 |
| Net Assets |
| Total assets | | 51,189,700 |
| Total liabilities | – | 83,613 |
| Net assets | | $51,106,087 |
| Net Assets by Source | | |
| Capital received from investors | | 44,030,902 |
| Total distributable earnings | | 7,075,185 |
| Net Asset Value (NAV) |
| Net Assets | ÷ | Shares
Outstanding | = | NAV |
| $51,106,087 | | 3,767,025 | | $13.57 |
| | | | | |
Schwab Target Funds | Annual Report
Statement of Operations
For the period November 1, 2018 through October 31, 2019
| Investment Income |
| Dividends received from affiliated underlying funds | | $902,615 |
| Dividends received from unaffiliated underlying funds | | 290,951 |
| Interest | + | 6,649 |
| Total investment income | | 1,200,215 |
| Expenses |
| Professional fees | | 26,433 |
| Registration fees | | 20,686 |
| Portfolio accounting fees | | 15,274 |
| Independent trustees’ fees | | 8,188 |
| Shareholder reports | | 7,170 |
| Custodian fees | | 4,474 |
| Transfer agent fees | | 2,051 |
| Other expenses | + | 5,082 |
| Total expenses | | 89,358 |
| Expense reduction by CSIM and its affiliates | – | 89,358 |
| Net expenses | – | — |
| Net investment income | | 1,200,215 |
| Realized and Unrealized Gains (Losses) |
| Realized capital gain distributions received from affiliated underlying funds | | 719,332 |
| Realized capital gain distributions received from unaffiliated underlying funds | | 196,942 |
| Net realized gains on sales of affiliated underlying funds | | 149,783 |
| Net realized gains on sales of unaffiliated underlying funds | + | 203,238 |
| Net realized gains | | 1,269,295 |
| Net change in unrealized appreciation (depreciation) on affiliated underlying funds | | 2,045,177 |
| Net change in unrealized appreciation (depreciation) on unaffiliated underlying funds | + | 630,333 |
| Net change in unrealized appreciation (depreciation) | + | 2,675,510 |
| Net realized and unrealized gains | | 3,944,805 |
| Increase in net assets resulting from operations | | $5,145,020 |
Schwab Target Funds | Annual Report
Statement of Changes in Net Assets
For the current and prior report periods
| Operations | |
| | 11/1/18-10/31/19 | 11/1/17-10/31/18 |
| Net investment income | | $1,200,215 | $1,207,790 |
| Net realized gains | | 1,269,295 | 1,833,956 |
| Net change in unrealized appreciation (depreciation) | + | 2,675,510 | (3,239,769) |
| Increase (decrease) in net assets from operations | | 5,145,020 | (198,023) |
| Distributions to Shareholders | |
| Total distributions | | ($2,901,734) | ($1,288,370) |
| Transactions in Fund Shares | | | |
| | | 11/1/18-10/31/19 | 11/1/17-10/31/18 |
| | | SHARES | VALUE | SHARES | VALUE |
| Shares sold | | 451,805 | $5,747,022 | 618,399 | $8,258,666 |
| Shares reinvested | | 218,767 | 2,638,341 | 86,123 | 1,148,871 |
| Shares redeemed | + | (886,220) | (11,518,751) | (1,101,598) | (14,684,690) |
| Net transactions in fund shares | | (215,648) | ($3,133,388) | (397,076) | ($5,277,153) |
| Shares Outstanding and Net Assets | | | |
| | | 11/1/18-10/31/19 | 11/1/17-10/31/18 |
| | | SHARES | NET ASSETS | SHARES | NET ASSETS |
| Beginning of period | | 3,982,673 | $51,996,189 | 4,379,749 | $58,759,735 |
| Total decrease | + | (215,648) | (890,102) | (397,076) | (6,763,546) |
| End of period | | 3,767,025 | $51,106,087 | 3,982,673 | $51,996,189 |
Schwab Target Funds | Annual Report
Financial Statements
Financial Highlights
| | 11/1/18–
10/31/19 | 11/1/17–
10/31/18 | 11/1/16–
10/31/17 | 11/1/15–
10/31/16 | 11/1/14–
10/31/15 | |
| Per-Share Data |
| Net asset value at beginning of period | $11.49 | $12.21 | $11.72 | $12.23 | $12.81 | |
| Income (loss) from investment operations: | | | | | | |
| Net investment income (loss)1 | 0.27 | 0.25 | 0.20 | 0.18 | 0.17 | |
| Net realized and unrealized gains (losses) | 0.86 | (0.30) | 0.88 | 0.11 | 0.08 | |
| Total from investment operations | 1.13 | (0.05) | 1.08 | 0.29 | 0.25 | |
| Less distributions: | | | | | | |
| Distributions from net investment income | (0.30) | (0.27) | (0.22) | (0.21) | (0.27) | |
| Distributions from net realized gains | (0.25) | (0.40) | (0.37) | (0.59) | (0.56) | |
| Total distributions | (0.55) | (0.67) | (0.59) | (0.80) | (0.83) | |
| Net asset value at end of period | $12.07 | $11.49 | $12.21 | $11.72 | $12.23 | |
| Total return | 10.48% | (0.57%) | 9.67% | 2.59% | 1.99% | |
| Ratios/Supplemental Data |
| Ratios to average net assets: | | | | | | |
| Net operating expenses2 | 0.00% | 0.00%3 | 0.00% | 0.00%3 | 0.00%3 | |
| Gross operating expenses2 | 0.11% | 0.07% | 0.09% | 0.08% | 0.09% | |
| Net investment income (loss) | 2.35% | 2.12% | 1.74% | 1.59% | 1.42% | |
| Portfolio turnover rate | 10% | 14% | 52%4 | 14% | 33% | |
| Net assets, end of period (x 1,000,000) | $81 | $90 | $103 | $104 | $116 | |
| |
1
Calculated based on the average shares outstanding during the period.
2
The expenses incurred by underlying funds in which the fund invests are not included in this ratio.
3
Less than 0.005%; the ratio of net operating expenses would have been 0.00%, if certain non-routine expenses had not been incurred.
4
The portfolio turnover rate increased due to the in-kind transactions relating to Schwab Total Bond Market Fund and Schwab U.S. Aggregate Bond Index Fund. For comparison purposes, the portfolio turnover rate would have been 33% without including these transactions. There were no transaction costs associated with these transactions.
Schwab Target Funds | Annual Report
Portfolio Holdings as of October 31, 2019
This section shows all the securities in the fund’s portfolio and their values as of the report date.
The fund files its complete schedule of portfolio holdings with the U.S. Securities and Exchange Commission (SEC) for the first and third quarters of each fiscal year on Form N-Q. Effective March 31, 2019, Form N-PORT Part F has replaced Form N-Q. The fund’s Form N-Q and Form N-PORT Part F are available on the SEC’s website atwww.sec.gov. The fund also makes available its complete schedule of portfolio holdings 15 to 20 days after the end of the month on the fund’s website atwww.schwabfunds.com/schwabfunds_prospectus.
| Security | Number
of Shares | Value ($) |
| Affiliated Underlying Funds75.4% of net assets |
| |
| Equity Funds 32.3% |
| Global Real Estate 2.0% |
| Schwab Global Real Estate Fund | 195,547 | 1,634,776 |
| International 10.6% |
| Laudus International MarketMasters Fund | 223,762 | 5,121,917 |
| Schwab International Core Equity Fund | 342,322 | 3,436,913 |
| | | 8,558,830 |
| Large-Cap 17.3% |
| Schwab Core Equity Fund | 210,461 | 4,602,775 |
| Schwab Dividend Equity Fund | 15,792 | 237,989 |
| Schwab S&P 500 Index Fund | 195,184 | 9,206,847 |
| | | 14,047,611 |
| Mid-Cap 0.7% |
| Schwab U.S. Mid-Cap Index Fund | 13,167 | 583,167 |
| Small-Cap 1.7% |
| Schwab Small-Cap Equity Fund | 83,313 | 1,389,668 |
| | | 26,214,052 |
| |
| Fixed-Income Funds 37.2% |
| Inflation-Protected Bond 6.1% |
| Schwab Treasury Inflation Protected Securities Index Fund | 435,782 | 4,928,698 |
| Intermediate-Term Bond 21.8% |
| Schwab U.S. Aggregate Bond Index Fund | 1,704,838 | 17,696,214 |
| Short-Term Bond 9.3% |
| Schwab Short-Term Bond Index Fund | 745,703 | 7,539,057 |
| | | 30,163,969 |
| |
| Money Market Fund 5.9% |
| Schwab Variable Share Price Money Fund, Ultra Shares 1.85%(a) | 4,835,212 | 4,837,629 |
| Total Affiliated Underlying Funds |
| (Cost $51,426,468) | | 61,215,650 |
|
| Unaffiliated Underlying Funds23.8% of net assets |
| |
| Equity Funds 6.6% |
| Large-Cap 6.2% |
| ClearBridge Large Cap Growth Fund, Class IS | 48,508 | 2,602,914 |
| Dodge & Cox Stock Fund | 12,561 | 2,399,589 |
| | | 5,002,503 |
| Security | Number
of Shares | Value ($) |
| Small-Cap 0.4% |
| ClearBridge Small Cap Growth Fund, Class IS * | 9,319 | 354,510 |
| | | 5,357,013 |
| |
| Fixed-Income Funds 17.2% |
| Intermediate-Term Bond 14.9% |
| Baird Aggregate Bond Fund, Institutional Class | 329,416 | 3,712,524 |
| Loomis Sayles Investment Grade Bond Fund, Class Y | 88,740 | 1,011,634 |
| Metropolitan West Total Return Bond Fund, Class I | 664,662 | 7,364,457 |
| | | 12,088,615 |
| International Bond 2.3% |
| PIMCO International Bond Fund (U.S. Dollar-Hedged), Institutional Class | 163,712 | 1,840,128 |
| | | 13,928,743 |
| Total Unaffiliated Underlying Funds |
| (Cost $18,221,280) | | 19,285,756 |
Issuer
Rate, Maturity Date | Face
Amount ($) | Value ($) |
| Short-Term Investment0.7% of net assets |
| |
| Time Deposit 0.7% |
| JPMorgan Chase Bank |
| 1.18%, 11/01/19(b) | 528,191 | 528,191 |
| Total Short-Term Investment |
| (Cost $528,191) | | 528,191 |
| * | Non-income producing security. |
| (a) | The rate shown is the 7-day yield. |
| (b) | The rate shown is the current daily overnight rate. |
Schwab Target Funds | Annual Report
Portfolio Holdings as of October 31, 2019 (continued)
Below is a summary of the fund’s transactions with its affiliated underlying funds during the period ended October 31, 2019:
| Affiliated Underlying Funds | Market
Value at
10/31/18 | Gross
Purchases | Gross
Sales | Realized
Gains (Losses) | Net Change
in Unrealized
Appreciation
(depreciation) | Market
Value at
10/31/19 | Balance
of Shares
Held at
10/31/19 | Distributions
Received* |
| Laudus International MarketMasters Fund (formerly Laudus International MarketMasters Fund, Select Shares) | $5,870,698 | $623,250 | ($1,363,000) | ($244,884) | $235,853 | $5,121,917 | 223,762 | $533,250 |
| Laudus Small-Cap MarketMasters Fund, Select Shares | 682,429 | — | (588,447) | 108,766 | (202,748) | — | — | 64,632 |
| Schwab Core Equity Fund | 4,993,273 | 722,102 | (1,010,000) | 49,286 | (151,886) | 4,602,775 | 210,461 | 622,102 |
| Schwab Dividend Equity Fund | 218,771 | 21,794 | — | — | (2,576) | 237,989 | 15,792 | 21,795 |
| Schwab Global Real Estate Fund | 1,541,766 | 163,981 | (346,000) | 41,630 | 233,399 | 1,634,776 | 195,547 | 62,980 |
| Schwab International Core Equity Fund | 3,902,070 | 102,207 | (706,000) | (86,427) | 225,063 | 3,436,913 | 342,322 | 102,207 |
| Schwab S&P 500 Index Fund | 10,096,954 | 1,343,363 | (3,290,250) | 452,502 | 604,278 | 9,206,847 | 195,184 | 242,363 |
| Schwab Short-Term Bond Index Fund | 8,717,703 | 285,773 | (1,752,000) | (23,624) | 311,205 | 7,539,057 | 745,703 | 191,781 |
| Schwab Small-Cap Equity Fund | 1,205,702 | 432,925 | (61,000) | 2,189 | (190,148) | 1,389,668 | 83,313 | 222,925 |
| Schwab Treasury Inflation Protected Securities Index Fund | 5,506,210 | 209,673 | (1,106,000) | (58,413) | 377,228 | 4,928,698 | 435,782 | 120,673 |
| Schwab U.S. Aggregate Bond Index Fund | 20,697,889 | 1,081,048 | (5,542,786) | (93,551) | 1,553,614 | 17,696,214 | 1,704,838 | 548,071 |
| Schwab U.S. Mid-Cap Index Fund | 740,317 | 9,469 | (248,000) | 5,330 | 76,051 | 583,167 | 13,167 | 9,468 |
| Schwab Variable Share Price Money Fund, Ultra Shares | 5,124,081 | 112,109 | (400,000) | (10) | 1,449 | 4,837,629 | 4,835,212 | 111,142 |
| Total | $69,297,863 | $5,107,694 | ($16,413,483) | $152,794 | $3,070,782 | $61,215,650 | | $2,853,389 |
| * | Distributions received include distributions from net investment income and capital gains, if any, from the underlying funds. |
| | |
The following is a summary of the inputs used to value the fund’s investments as of October 31, 2019 (see financial note 2(a) for additional information):
| Description | Quoted Prices in
Active Markets for
Identical Assets
(Level 1) | Other Significant
Observable Inputs
(Level 2) | Significant
Unobservable Inputs
(Level 3) | Total | |
| Assets | | | | | |
| Affiliated Underlying Funds1 | $61,215,650 | $— | $— | $61,215,650 | |
| Unaffiliated Underlying Funds1 | 19,285,756 | — | — | 19,285,756 | |
| Short-Term Investment1 | — | 528,191 | — | 528,191 | |
| Total | $80,501,406 | $528,191 | $— | $81,029,597 | |
| 1 | As categorized in Portfolio Holdings. |
Fund investments in underlying mutual funds are classified as Level 1, without consideration to the classification level of the investments held by the underlying mutual funds, which could be Level 1, Level 2 or Level 3.
Schwab Target Funds | Annual Report
Statement of Assets and Liabilities
As of October 31, 2019
| Assets |
| Investments in affiliated underlying funds, at value (cost $51,426,468) | | $61,215,650 |
| Investments in unaffiliated funds and issuers, at value (cost $18,749,471) | | 19,813,947 |
| Receivables: | | |
| Investments sold | | 138,000 |
| Dividends | | 79,241 |
| Due from investment adviser | | 9,731 |
| Fund shares sold | | 6,508 |
| Interest | | 18 |
| Prepaid expenses | + | 4,861 |
| Total assets | | 81,267,956 |
| Liabilities |
| Payables: | | |
| Investments bought | | 75,220 |
| Fund shares redeemed | | 25,698 |
| Accrued expenses | + | 28,368 |
| Total liabilities | | 129,286 |
| Net Assets |
| Total assets | | 81,267,956 |
| Total liabilities | – | 129,286 |
| Net assets | | $81,138,670 |
| Net Assets by Source | | |
| Capital received from investors | | 67,405,212 |
| Total distributable earnings | | 13,733,458 |
| Net Asset Value (NAV) |
| Net Assets | ÷ | Shares
Outstanding | = | NAV |
| $81,138,670 | | 6,722,917 | | $12.07 |
| | | | | |
Schwab Target Funds | Annual Report
Statement of Operations
For the period November 1, 2018 through October 31, 2019
| Investment Income |
| Dividends received from affiliated underlying funds | | $1,486,727 |
| Dividends received from unaffiliated underlying funds | | 467,389 |
| Interest | + | 9,653 |
| Total investment income | | 1,963,769 |
| Expenses |
| Professional fees | | 26,618 |
| Registration fees | | 21,119 |
| Portfolio accounting fees | | 15,637 |
| Independent trustees’ fees | | 8,355 |
| Shareholder reports | | 8,102 |
| Custodian fees | | 4,670 |
| Transfer agent fees | | 3,007 |
| Other expenses | + | 5,452 |
| Total expenses | | 92,960 |
| Expense reduction by CSIM and its affiliates | – | 92,960 |
| Net expenses | – | — |
| Net investment income | | 1,963,769 |
| Realized and Unrealized Gains (Losses) |
| Realized capital gain distributions received from affiliated underlying funds | | 1,366,662 |
| Realized capital gain distributions received from unaffiliated underlying funds | | 356,395 |
| Net realized gains on sales of affiliated underlying funds | | 152,794 |
| Net realized gains on sales of unaffiliated underlying funds | + | 392,640 |
| Net realized gains | | 2,268,491 |
| Net change in unrealized appreciation (depreciation) on affiliated underlying funds | | 3,070,782 |
| Net change in unrealized appreciation (depreciation) on unaffiliated underlying funds | + | 913,312 |
| Net change in unrealized appreciation (depreciation) | + | 3,984,094 |
| Net realized and unrealized gains | | 6,252,585 |
| Increase in net assets resulting from operations | | $8,216,354 |
Schwab Target Funds | Annual Report
Statement of Changes in Net Assets
For the current and prior report periods
| Operations | |
| | 11/1/18-10/31/19 | 11/1/17-10/31/18 |
| Net investment income | | $1,963,769 | $2,058,749 |
| Net realized gains | | 2,268,491 | 2,267,583 |
| Net change in unrealized appreciation (depreciation) | + | 3,984,094 | (4,623,608) |
| Increase (decrease) in net assets from operations | | 8,216,354 | (297,276) |
| Distributions to Shareholders | |
| Total distributions | | ($4,192,333) | ($5,446,311) |
| Transactions in Fund Shares | | | |
| | | 11/1/18-10/31/19 | 11/1/17-10/31/18 |
| | | SHARES | VALUE | SHARES | VALUE |
| Shares sold | | 663,357 | $7,656,603 | 1,041,859 | $12,323,515 |
| Shares reinvested | | 364,172 | 3,892,994 | 423,003 | 4,970,289 |
| Shares redeemed | + | (2,164,691) | (24,726,747) | (2,003,385) | (23,776,931) |
| Net transactions in fund shares | | (1,137,162) | ($13,177,150) | (538,523) | ($6,483,127) |
| Shares Outstanding and Net Assets | | | |
| | | 11/1/18-10/31/19 | 11/1/17-10/31/18 |
| | | SHARES | NET ASSETS | SHARES | NET ASSETS |
| Beginning of period | | 7,860,079 | $90,291,799 | 8,398,602 | $102,518,513 |
| Total decrease | + | (1,137,162) | (9,153,129) | (538,523) | (12,226,714) |
| End of period | | 6,722,917 | $81,138,670 | 7,860,079 | $90,291,799 |
Schwab Target Funds | Annual Report
Financial Statements
Financial Highlights
| | 11/1/18–
10/31/19 | 11/1/17–
10/31/18 | 11/1/16–
10/31/17 | 11/1/15–
10/31/16 | 11/1/14–
10/31/15 | |
| Per-Share Data |
| Net asset value at beginning of period | $13.87 | $14.71 | $13.84 | $14.33 | $14.32 | |
| Income (loss) from investment operations: | | | | | | |
| Net investment income (loss)1 | 0.32 | 0.30 | 0.23 | 0.22 | 0.20 | |
| Net realized and unrealized gains (losses) | 1.04 | (0.33) | 1.39 | 0.06 | 0.12 | |
| Total from investment operations | 1.36 | (0.03) | 1.62 | 0.28 | 0.32 | |
| Less distributions: | | | | | | |
| Distributions from net investment income | (0.35) | (0.33) | (0.24) | (0.27) | (0.31) | |
| Distributions from net realized gains | (0.42) | (0.48) | (0.51) | (0.50) | — | |
| Total distributions | (0.77) | (0.81) | (0.75) | (0.77) | (0.31) | |
| Net asset value at end of period | $14.46 | $13.87 | $14.71 | $13.84 | $14.33 | |
| Total return | 10.58% | (0.32%) | 12.28% | 2.05% | 2.25% | |
| Ratios/Supplemental Data |
| Ratios to average net assets: | | | | | | |
| Net operating expenses2 | 0.00% | 0.00% | 0.00% | 0.00%3 | 0.00%3 | |
| Gross operating expenses2 | 0.03% | 0.02% | 0.03% | 0.03% | 0.03% | |
| Net investment income (loss) | 2.28% | 2.07% | 1.67% | 1.59% | 1.42% | |
| Portfolio turnover rate | 14% | 18% | 47%4 | 9% | 25% | |
| Net assets, end of period (x 1,000,000) | $549 | $542 | $579 | $530 | $536 | |
| |
1
Calculated based on the average shares outstanding during the period.
2
The expenses incurred by underlying funds in which the fund invests are not included in this ratio.
3
Less than 0.005%; the ratio of net operating expenses would have been 0.00%, if certain non-routine expenses had not been incurred.
4
The portfolio turnover rate increased due to the in-kind transactions relating to Schwab Total Bond Market Fund and Schwab U.S. Aggregate Bond Index Fund. For comparison purposes, the portfolio turnover rate would have been 31% without including these transactions. There were no transaction costs associated with these transactions.
Schwab Target Funds | Annual Report
Portfolio Holdings as of October 31, 2019
This section shows all the securities in the fund’s portfolio and their values as of the report date.
The fund files its complete schedule of portfolio holdings with the U.S. Securities and Exchange Commission (SEC) for the first and third quarters of each fiscal year on Form N-Q. Effective March 31, 2019, Form N-PORT Part F has replaced Form N-Q. The fund’s Form N-Q and Form N-PORT Part F are available on the SEC’s website atwww.sec.gov. The fund also makes available its complete schedule of portfolio holdings 15 to 20 days after the end of the month on the fund’s website atwww.schwabfunds.com/schwabfunds_prospectus.
| Security | Number
of Shares | Value ($) |
| Affiliated Underlying Funds74.7% of net assets |
| |
| Equity Funds 36.1% |
| Global Real Estate 2.3% |
| Schwab Global Real Estate Fund | 1,490,632 | 12,461,685 |
| International 12.3% |
| Laudus International MarketMasters Fund | 1,762,958 | 40,354,107 |
| Schwab International Core Equity Fund | 2,693,659 | 27,044,335 |
| | | 67,398,442 |
| Large-Cap 18.8% |
| Laudus U.S. Large Cap Growth Fund * | 45,634 | 1,023,113 |
| Schwab Core Equity Fund | 1,589,493 | 34,762,217 |
| Schwab Dividend Equity Fund | 90,362 | 1,361,750 |
| Schwab S&P 500 Index Fund | 1,403,263 | 66,191,930 |
| | | 103,339,010 |
| Mid-Cap 0.9% |
| Schwab U.S. Mid-Cap Index Fund | 116,129 | 5,143,346 |
| Small-Cap 1.8% |
| Schwab Small-Cap Equity Fund | 606,965 | 10,124,182 |
| | | 198,466,665 |
| |
| Fixed-Income Funds 33.2% |
| Inflation-Protected Bond 5.0% |
| Schwab Treasury Inflation Protected Securities Index Fund | 2,435,963 | 27,550,743 |
| Intermediate-Term Bond 19.9% |
| Schwab U.S. Aggregate Bond Index Fund | 10,502,153 | 109,012,348 |
| Short-Term Bond 8.3% |
| Schwab Short-Term Bond Index Fund | 4,501,117 | 45,506,292 |
| | | 182,069,383 |
| |
| Money Market Fund 5.4% |
| Schwab Variable Share Price Money Fund, Ultra Shares 1.85%(a) | 29,496,999 | 29,511,748 |
| Total Affiliated Underlying Funds |
| (Cost $342,423,057) | | 410,047,796 |
|
| Unaffiliated Underlying Funds24.6% of net assets |
| |
| Equity Funds 7.5% |
| International 0.1% |
| Goldman Sachs Emerging Markets Equity Insights Fund, Institutional Class | 56,411 | 526,313 |
| Security | Number
of Shares | Value ($) |
| Large-Cap 6.8% |
| ClearBridge Large Cap Growth Fund, Class IS | 348,491 | 18,700,044 |
| Dodge & Cox Stock Fund | 98,320 | 18,781,955 |
| | | 37,481,999 |
| Small-Cap 0.6% |
| ClearBridge Small Cap Growth Fund, Class IS * | 80,004 | 3,043,355 |
| | | 41,051,667 |
| |
| Fixed-Income Funds 17.1% |
| Intermediate-Term Bond 14.3% |
| Baird Aggregate Bond Fund, Institutional Class | 1,876,538 | 21,148,578 |
| Loomis Sayles Investment Grade Bond Fund, Class Y | 804,733 | 9,173,961 |
| Metropolitan West Total Return Bond Fund, Class I | 4,322,043 | 47,888,232 |
| | | 78,210,771 |
| International Bond 2.8% |
| PIMCO International Bond Fund (U.S. Dollar-Hedged), Institutional Class | 1,370,172 | 15,400,735 |
| | | 93,611,506 |
| Total Unaffiliated Underlying Funds |
| (Cost $127,148,972) | | 134,663,173 |
Issuer
Rate, Maturity Date | Face
Amount ($) | Value ($) |
| Short-Term Investment0.6% of net assets |
| |
| Time Deposit 0.6% |
| Citibank |
| 1.18%, 11/01/19(b) | 3,493,567 | 3,493,567 |
| Total Short-Term Investment |
| (Cost $3,493,567) | | 3,493,567 |
| * | Non-income producing security. |
| (a) | The rate shown is the 7-day yield. |
| (b) | The rate shown is the current daily overnight rate. |
Schwab Target Funds | Annual Report
Portfolio Holdings as of October 31, 2019 (continued)
Below is a summary of the fund’s transactions with its affiliated underlying funds during the period ended October 31, 2019:
| Affiliated Underlying Funds | Market
Value at
10/31/18 | Gross
Purchases | Gross
Sales | Realized
Gains (Losses) | Net Change
in Unrealized
Appreciation
(depreciation) | Market
Value at
10/31/19 | Balance
of Shares
Held at
10/31/19 | Distributions
Received* |
| Laudus International MarketMasters Fund (formerly Laudus International MarketMasters Fund, Select Shares) | $42,297,374 | $5,092,187 | ($7,389,000) | ($920,669) | $1,274,215 | $40,354,107 | 1,762,958 | $3,782,187 |
| Laudus Small-Cap MarketMasters Fund, Select Shares | 4,762,986 | — | (4,146,773) | 1,571,480 | (2,187,693) | — | — | 451,098 |
| Laudus U.S. Large Cap Growth Fund | 2,014,639 | 147,336 | (1,170,000) | 585,362 | (554,224) | 1,023,113 | 45,634 | 147,337 |
| Schwab Core Equity Fund | 37,609,025 | 4,591,155 | (6,809,000) | 14,799 | (643,762) | 34,762,217 | 1,589,493 | 4,591,155 |
| Schwab Dividend Equity Fund | 1,251,781 | 124,708 | — | — | (14,739) | 1,361,750 | 90,362 | 124,707 |
| Schwab Global Real Estate Fund | 11,999,919 | 469,290 | (2,087,000) | 66,408 | 2,013,068 | 12,461,685 | 1,490,632 | 469,290 |
| Schwab Intermediate-Term Bond Fund | 2,172,285 | 4,497 | (2,194,795) | (116,114) | 134,127 | — | — | 6,461 |
| Schwab International Core Equity Fund | 28,604,362 | 1,105,233 | (3,780,000) | (575,200) | 1,689,940 | 27,044,335 | 2,693,659 | 749,233 |
| Schwab S&P 500 Index Fund | 67,874,109 | 7,841,782 | (17,206,000) | 2,572,355 | 5,109,684 | 66,191,930 | 1,403,263 | 1,641,782 |
| Schwab Short-Term Bond Index Fund | 41,793,685 | 4,597,463 | (2,515,000) | 10,189 | 1,619,955 | 45,506,292 | 4,501,117 | 1,097,513 |
| Schwab Small-Cap Equity Fund | 9,244,311 | 2,469,200 | — | — | (1,589,329) | 10,124,182 | 606,965 | 1,709,201 |
| Schwab Treasury Inflation Protected Securities Index Fund | 22,816,392 | 5,416,754 | (2,381,000) | (118,322) | 1,816,919 | 27,550,743 | 2,435,963 | 596,753 |
| Schwab U.S. Aggregate Bond Index Fund | 108,887,806 | 8,512,662 | (16,952,000) | (92,517) | 8,656,397 | 109,012,348 | 10,502,153 | 3,229,880 |
| Schwab U.S. Mid-Cap Index Fund | 5,172,726 | 66,159 | (660,000) | (30,143) | 594,604 | 5,143,346 | 116,129 | 66,158 |
| Schwab Variable Share Price Money Fund, Ultra Shares | 26,047,493 | 6,456,437 | (3,000,000) | (300) | 8,118 | 29,511,748 | 29,496,999 | 647,846 |
| Total | $412,548,893 | $46,894,863 | ($70,290,568) | $2,967,328 | $17,927,280 | $410,047,796 | | $19,310,601 |
| * | Distributions received include distributions from net investment income and capital gains, if any, from the underlying funds. |
| | |
Schwab Target Funds | Annual Report
Portfolio Holdings as of October 31, 2019 (continued)
The following is a summary of the inputs used to value the fund’s investments as of October 31, 2019 (see financial note 2(a) for additional information):
| Description | Quoted Prices in
Active Markets for
Identical Assets
(Level 1) | Other Significant
Observable Inputs
(Level 2) | Significant
Unobservable Inputs
(Level 3) | Total | |
| Assets | | | | | |
| Affiliated Underlying Funds1 | $410,047,796 | $— | $— | $410,047,796 | |
| Unaffiliated Underlying Funds1 | 134,663,173 | — | — | 134,663,173 | |
| Short-Term Investment1 | — | 3,493,567 | — | 3,493,567 | |
| Total | $544,710,969 | $3,493,567 | $— | $548,204,536 | |
| 1 | As categorized in Portfolio Holdings. |
Fund investments in underlying mutual funds are classified as Level 1, without consideration to the classification level of the investments held by the underlying mutual funds, which could be Level 1, Level 2 or Level 3.
Schwab Target Funds | Annual Report
Statement of Assets and Liabilities
As of October 31, 2019
| Assets |
| Investments in affiliated underlying funds, at value (cost $342,423,057) | | $410,047,796 |
| Investments in unaffiliated funds and issuers, at value (cost $130,642,539) | | 138,156,740 |
| Receivables: | | |
| Investments sold | | 548,000 |
| Dividends | | 494,473 |
| Fund shares sold | | 95,675 |
| Due from investment adviser | | 14,795 |
| Interest | | 116 |
| Prepaid expenses | + | 15,047 |
| Total assets | | 549,372,642 |
| Liabilities |
| Payables: | | |
| Investments bought | | 470,187 |
| Fund shares redeemed | | 163,742 |
| Accrued expenses | + | 48,287 |
| Total liabilities | | 682,216 |
| Net Assets |
| Total assets | | 549,372,642 |
| Total liabilities | – | 682,216 |
| Net assets | | $548,690,426 |
| Net Assets by Source | | |
| Capital received from investors | | 451,218,328 |
| Total distributable earnings | | 97,472,098 |
| Net Asset Value (NAV) |
| Net Assets | ÷ | Shares
Outstanding | = | NAV |
| $548,690,426 | | 37,954,052 | | $14.46 |
| | | | | |
Schwab Target Funds | Annual Report
Statement of Operations
For the period November 1, 2018 through October 31, 2019
| Investment Income |
| Dividends received from affiliated underlying funds | | $9,226,790 |
| Dividends received from unaffiliated underlying funds | | 3,153,044 |
| Interest | + | 49,601 |
| Total investment income | | 12,429,435 |
| Expenses |
| Registration fees | | 35,239 |
| Shareholder reports | | 34,445 |
| Portfolio accounting fees | | 30,190 |
| Professional fees | | 29,276 |
| Transfer agent fees | | 11,046 |
| Independent trustees’ fees | | 10,699 |
| Custodian fees | | 4,441 |
| Other expenses | + | 10,613 |
| Total expenses | | 165,949 |
| Expense reduction by CSIM and its affiliates | – | 165,949 |
| Net expenses | – | — |
| Net investment income | | 12,429,435 |
| Realized and Unrealized Gains (Losses) |
| Realized capital gain distributions received from affiliated underlying funds | | 10,083,811 |
| Realized capital gain distributions received from unaffiliated underlying funds | | 2,464,884 |
| Net realized gains on sales of affiliated underlying funds | | 2,967,328 |
| Net realized gains on sales of unaffiliated underlying funds | + | 2,348,037 |
| Net realized gains | | 17,864,060 |
| Net change in unrealized appreciation (depreciation) on affiliated underlying funds | | 17,927,280 |
| Net change in unrealized appreciation (depreciation) on unaffiliated underlying funds | + | 6,459,394 |
| Net change in unrealized appreciation (depreciation) | + | 24,386,674 |
| Net realized and unrealized gains | | 42,250,734 |
| Increase in net assets resulting from operations | | $54,680,169 |
Schwab Target Funds | Annual Report
Statement of Changes in Net Assets
For the current and prior report periods
| Operations | |
| | 11/1/18-10/31/19 | 11/1/17-10/31/18 |
| Net investment income | | $12,429,435 | $11,910,803 |
| Net realized gains | | 17,864,060 | 18,933,415 |
| Net change in unrealized appreciation (depreciation) | + | 24,386,674 | (31,955,210) |
| Increase (decrease) in net assets from operations | | 54,680,169 | (1,110,992) |
| Distributions to Shareholders | |
| Total distributions | | ($29,733,328) | ($31,941,953) |
| Transactions in Fund Shares | | | |
| | | 11/1/18-10/31/19 | 11/1/17-10/31/18 |
| | | SHARES | VALUE | SHARES | VALUE |
| Shares sold | | 5,237,831 | $72,332,026 | 6,171,493 | $88,636,849 |
| Shares reinvested | | 2,194,423 | 27,913,053 | 2,123,917 | 30,180,858 |
| Shares redeemed | + | (8,554,258) | (118,357,642) | (8,590,128) | (123,172,064) |
| Net transactions in fund shares | | (1,122,004) | ($18,112,563) | (294,718) | ($4,354,357) |
| Shares Outstanding and Net Assets | | | |
| | | 11/1/18-10/31/19 | 11/1/17-10/31/18 |
| | | SHARES | NET ASSETS | SHARES | NET ASSETS |
| Beginning of period | | 39,076,056 | $541,856,148 | 39,370,774 | $579,263,450 |
| Total increase or decrease | + | (1,122,004) | 6,834,278 | (294,718) | (37,407,302) |
| End of period | | 37,954,052 | $548,690,426 | 39,076,056 | $541,856,148 |
Schwab Target Funds | Annual Report
Financial Statements
Financial Highlights
| | 11/1/18–
10/31/19 | 11/1/17–
10/31/18 | 11/1/16–
10/31/17 | 11/1/15–
10/31/16 | 11/1/14–
10/31/15 | |
| Per-Share Data |
| Net asset value at beginning of period | $14.10 | $14.71 | $13.45 | $14.11 | $14.54 | |
| Income (loss) from investment operations: | | | | | | |
| Net investment income (loss)1 | 0.30 | 0.28 | 0.22 | 0.20 | 0.19 | |
| Net realized and unrealized gains (losses) | 1.10 | (0.34) | 1.73 | 0.06 | 0.15 | |
| Total from investment operations | 1.40 | (0.06) | 1.95 | 0.26 | 0.34 | |
| Less distributions: | | | | | | |
| Distributions from net investment income | (0.34) | (0.34) | (0.23) | (0.26) | (0.32) | |
| Distributions from net realized gains | (0.42) | (0.21) | (0.46) | (0.66) | (0.45) | |
| Total distributions | (0.76) | (0.55) | (0.69) | (0.92) | (0.77) | |
| Net asset value at end of period | $14.74 | $14.10 | $14.71 | $13.45 | $14.11 | |
| Total return | 10.79% | (0.53%) | 15.17% | 2.01% | 2.36% | |
| Ratios/Supplemental Data |
| Ratios to average net assets: | | | | | | |
| Net operating expenses2 | 0.00% | 0.00% | 0.00% | 0.00%3 | 0.00%3 | |
| Gross operating expenses2 | 0.03% | 0.02% | 0.03% | 0.04% | 0.04% | |
| Net investment income (loss) | 2.10% | 1.88% | 1.59% | 1.53% | 1.37% | |
| Portfolio turnover rate | 15% | 13% | 36%4 | 5% | 21% | |
| Net assets, end of period (x 1,000,000) | $577 | $531 | $521 | $443 | $409 | |
| |
1
Calculated based on the average shares outstanding during the period.
2
The expenses incurred by underlying funds in which the fund invests are not included in this ratio.
3
Less than 0.005%; the ratio of net operating expenses would have been 0.00%, if certain non-routine expenses had not been incurred.
4
The portfolio turnover rate increased due to the in-kind transactions relating to Schwab Total Bond Market Fund and Schwab U.S. Aggregate Bond Index Fund. For comparison purposes, the portfolio turnover rate would have been 26% without including these transactions. There were no transaction costs associated with these transactions.
Schwab Target Funds | Annual Report
Portfolio Holdings as of October 31, 2019
This section shows all the securities in the fund’s portfolio and their values as of the report date.
The fund files its complete schedule of portfolio holdings with the U.S. Securities and Exchange Commission (SEC) for the first and third quarters of each fiscal year on Form N-Q. Effective March 31, 2019, Form N-PORT Part F has replaced Form N-Q. The fund’s Form N-Q and Form N-PORT Part F are available on the SEC’s website atwww.sec.gov. The fund also makes available its complete schedule of portfolio holdings 15 to 20 days after the end of the month on the fund’s website atwww.schwabfunds.com/schwabfunds_prospectus.
| Security | Number
of Shares | Value ($) |
| Affiliated Underlying Funds73.4% of net assets |
| |
| Equity Funds 47.9% |
| Global Real Estate 2.9% |
| Schwab Global Real Estate Fund | 2,028,554 | 16,958,713 |
| International 16.2% |
| Laudus International MarketMasters Fund | 2,470,866 | 56,558,130 |
| Schwab International Core Equity Fund | 3,694,346 | 37,091,229 |
| | | 93,649,359 |
| Large-Cap 24.9% |
| Laudus U.S. Large Cap Growth Fund * | 300,107 | 6,728,398 |
| Schwab Core Equity Fund | 2,447,540 | 53,527,691 |
| Schwab Dividend Equity Fund | 137,137 | 2,066,652 |
| Schwab S&P 500 Index Fund | 1,723,066 | 81,277,045 |
| | | 143,599,786 |
| Mid-Cap 1.1% |
| Schwab U.S. Mid-Cap Index Fund | 143,028 | 6,334,698 |
| Small-Cap 2.8% |
| Schwab Small-Cap Equity Fund | 954,032 | 15,913,251 |
| | | 276,455,807 |
| |
| Fixed-Income Funds 21.8% |
| Inflation-Protected Bond 1.8% |
| Schwab Treasury Inflation Protected Securities Index Fund | 922,138 | 10,429,385 |
| Intermediate-Term Bond 14.2% |
| Schwab U.S. Aggregate Bond Index Fund | 7,906,129 | 82,065,620 |
| Short-Term Bond 5.8% |
| Schwab Short-Term Bond Index Fund | 3,307,852 | 33,442,382 |
| | | 125,937,387 |
| |
| Money Market Fund 3.7% |
| Schwab Variable Share Price Money Fund, Ultra Shares 1.85%(a) | 21,380,817 | 21,391,508 |
| Total Affiliated Underlying Funds |
| (Cost $364,414,953) | | 423,784,702 |
|
| Unaffiliated Underlying Funds25.8% of net assets |
| |
| Equity Funds 9.4% |
| International 0.9% |
| Goldman Sachs Emerging Markets Equity Insights Fund, Institutional Class | 578,339 | 5,395,898 |
| Security | Number
of Shares | Value ($) |
| Large-Cap 7.6% |
| ClearBridge Large Cap Growth Fund, Class IS | 372,445 | 19,985,410 |
| Dodge & Cox Stock Fund | 124,291 | 23,743,229 |
| | | 43,728,639 |
| Small-Cap 0.9% |
| ClearBridge Small Cap Growth Fund, Class IS * | 132,166 | 5,027,597 |
| | | 54,152,134 |
| |
| Fixed-Income Funds 16.4% |
| Intermediate-Term Bond 12.1% |
| Baird Aggregate Bond Fund, Institutional Class | 1,084,266 | 12,219,678 |
| Loomis Sayles Investment Grade Bond Fund, Class Y | 1,232,021 | 14,045,043 |
| Metropolitan West Total Return Bond Fund, Class I | 3,915,978 | 43,389,032 |
| | | 69,653,753 |
| International Bond 4.3% |
| PIMCO International Bond Fund (U.S. Dollar-Hedged), Institutional Class | 2,224,271 | 25,000,805 |
| | | 94,654,558 |
| Total Unaffiliated Underlying Funds |
| (Cost $140,999,140) | | 148,806,692 |
Issuer
Rate, Maturity Date | Face
Amount ($) | Value ($) |
| Short-Term Investment0.7% of net assets |
| |
| Time Deposit 0.7% |
| Sumitomo Mitsui Trust Bank, Limited |
| 1.18%, 11/01/19(b) | 3,884,390 | 3,884,390 |
| Total Short-Term Investment |
| (Cost $3,884,390) | | 3,884,390 |
| * | Non-income producing security. |
| (a) | The rate shown is the 7-day yield. |
| (b) | The rate shown is the current daily overnight rate. |
Schwab Target Funds | Annual Report
Portfolio Holdings as of October 31, 2019 (continued)
Below is a summary of the fund’s transactions with its affiliated underlying funds during the period ended October 31, 2019:
| Affiliated Underlying Funds | Market
Value at
10/31/18 | Gross
Purchases | Gross
Sales | Realized
Gains (Losses) | Net Change
in Unrealized
Appreciation
(depreciation) | Market
Value at
10/31/19 | Balance
of Shares
Held at
10/31/19 | Distributions
Received* |
| Laudus International MarketMasters Fund (formerly Laudus International MarketMasters Fund, Select Shares) | $53,312,231 | $6,275,124 | ($3,700,000) | ($985,460) | $1,656,235 | $56,558,130 | 2,470,866 | $4,767,124 |
| Laudus Small-Cap MarketMasters Fund, Select Shares | 7,069,753 | — | (6,155,418) | 911,224 | (1,825,559) | — | — | 669,570 |
| Laudus U.S. Large Cap Growth Fund | 6,814,896 | 498,394 | (1,040,000) | 267,833 | 187,275 | 6,728,398 | 300,107 | 498,394 |
| Schwab Core Equity Fund | 50,116,280 | 7,447,990 | (3,850,000) | (530,738) | 344,159 | 53,527,691 | 2,447,540 | 6,117,990 |
| Schwab Dividend Equity Fund | 3,057,934 | 290,127 | (1,160,000) | 143,533 | (264,942) | 2,066,652 | 137,137 | 290,127 |
| Schwab Global Real Estate Fund | 14,351,983 | 603,149 | (610,000) | 4,683 | 2,608,898 | 16,958,713 | 2,028,554 | 603,149 |
| Schwab Intermediate-Term Bond Fund | 5,369,067 | 11,115 | (5,451,526) | (308,077) | 379,421 | — | — | 24,425 |
| Schwab International Core Equity Fund | 35,575,439 | 3,191,826 | (3,250,000) | (681,972) | 2,255,936 | 37,091,229 | 3,694,346 | 931,826 |
| Schwab S&P 500 Index Fund | 74,538,000 | 6,333,890 | (8,520,000) | 1,077,834 | 7,847,321 | 81,277,045 | 1,723,066 | 1,803,889 |
| Schwab Short-Term Bond Index Fund | 26,132,096 | 6,654,265 | (452,000) | (930) | 1,108,951 | 33,442,382 | 3,307,852 | 754,300 |
| Schwab Small-Cap Equity Fund | 13,616,896 | 4,608,658 | — | — | (2,312,303) | 15,913,251 | 954,032 | 2,517,658 |
| Schwab Treasury Inflation Protected Securities Index Fund | 7,641,063 | 2,193,717 | — | — | 594,605 | 10,429,385 | 922,138 | 213,717 |
| Schwab U.S. Aggregate Bond Index Fund | 81,405,169 | 9,935,708 | (15,580,000) | (165,684) | 6,470,427 | 82,065,620 | 7,906,129 | 2,373,810 |
| Schwab U.S. Mid-Cap Index Fund | 6,178,798 | 79,026 | (675,000) | 30,323 | 721,551 | 6,334,698 | 143,028 | 79,026 |
| Schwab Variable Share Price Money Fund, Ultra Shares | 17,810,996 | 9,575,371 | (6,000,000) | (275) | 5,416 | 21,391,508 | 21,380,817 | 451,032 |
| Total | $402,990,601 | $57,698,360 | ($56,443,944) | ($237,706) | $19,777,391 | $423,784,702 | | $22,096,037 |
| * | Distributions received include distributions from net investment income and capital gains, if any, from the underlying funds. |
| | |
Schwab Target Funds | Annual Report
Portfolio Holdings as of October 31, 2019 (continued)
The following is a summary of the inputs used to value the fund’s investments as of October 31, 2019 (see financial note 2(a) for additional information):
| Description | Quoted Prices in
Active Markets for
Identical Assets
(Level 1) | Other Significant
Observable Inputs
(Level 2) | Significant
Unobservable Inputs
(Level 3) | Total | |
| Assets | | | | | |
| Affiliated Underlying Funds1 | $423,784,702 | $— | $— | $423,784,702 | |
| Unaffiliated Underlying Funds1 | 148,806,692 | — | — | 148,806,692 | |
| Short-Term Investment1 | — | 3,884,390 | — | 3,884,390 | |
| Total | $572,591,394 | $3,884,390 | $— | $576,475,784 | |
| 1 | As categorized in Portfolio Holdings. |
Fund investments in underlying mutual funds are classified as Level 1, without consideration to the classification level of the investments held by the underlying mutual funds, which could be Level 1, Level 2 or Level 3.
Schwab Target Funds | Annual Report
Statement of Assets and Liabilities
As of October 31, 2019
| Assets |
| Investments in affiliated underlying funds, at value (cost $364,414,953) | | $423,784,702 |
| Investments in unaffiliated funds and issuers, at value (cost $144,883,530) | | 152,691,082 |
| Receivables: | | |
| Investments sold | | 400,000 |
| Dividends | | 402,067 |
| Fund shares sold | | 376,450 |
| Due from investment adviser | | 15,285 |
| Interest | | 129 |
| Prepaid expenses | + | 9,649 |
| Total assets | | 577,679,364 |
| Liabilities |
| Payables: | | |
| Investments bought | | 385,749 |
| Fund shares redeemed | | 149,832 |
| Accrued expenses | + | 48,979 |
| Total liabilities | | 584,560 |
| Net Assets |
| Total assets | | 577,679,364 |
| Total liabilities | – | 584,560 |
| Net assets | | $577,094,804 |
| Net Assets by Source | | |
| Capital received from investors | | 488,566,410 |
| Total distributable earnings | | 88,528,394 |
| Net Asset Value (NAV) |
| Net Assets | ÷ | Shares
Outstanding | = | NAV |
| $577,094,804 | | 39,149,627 | | $14.74 |
| | | | | |
Schwab Target Funds | Annual Report
Statement of Operations
For the period November 1, 2018 through October 31, 2019
| Investment Income |
| Dividends received from affiliated underlying funds | | $8,236,472 |
| Dividends received from unaffiliated underlying funds | | 3,240,381 |
| Interest | + | 52,081 |
| Total investment income | | 11,528,934 |
| Expenses |
| Shareholder reports | | 33,978 |
| Registration fees | | 33,673 |
| Portfolio accounting fees | | 30,268 |
| Professional fees | | 29,369 |
| Transfer agent fees | | 12,003 |
| Independent trustees’ fees | | 10,699 |
| Custodian fees | | 4,567 |
| Other expenses | + | 10,586 |
| Total expenses | | 165,143 |
| Expense reduction by CSIM and its affiliates | – | 165,143 |
| Net expenses | – | — |
| Net investment income | | 11,528,934 |
| Realized and Unrealized Gains (Losses) |
| Realized capital gain distributions received from affiliated underlying funds | | 13,859,565 |
| Realized capital gain distributions received from unaffiliated underlying funds | | 2,927,433 |
| Net realized losses on sales of affiliated underlying funds | | (237,706) |
| Net realized gains on sales of unaffiliated underlying funds | + | 2,449,221 |
| Net realized gains | | 18,998,513 |
| Net change in unrealized appreciation (depreciation) on affiliated underlying funds | | 19,777,391 |
| Net change in unrealized appreciation (depreciation) on unaffiliated underlying funds | + | 6,113,973 |
| Net change in unrealized appreciation (depreciation) | + | 25,891,364 |
| Net realized and unrealized gains | | 44,889,877 |
| Increase in net assets resulting from operations | | $56,418,811 |
Schwab Target Funds | Annual Report
Statement of Changes in Net Assets
For the current and prior report periods
| Operations | |
| | 11/1/18-10/31/19 | 11/1/17-10/31/18 |
| Net investment income | | $11,528,934 | $10,383,036 |
| Net realized gains | | 18,998,513 | 19,017,032 |
| Net change in unrealized appreciation (depreciation) | + | 25,891,364 | (32,849,804) |
| Increase (decrease) in net assets from operations | | 56,418,811 | (3,449,736) |
| Distributions to Shareholders | |
| Total distributions | | ($28,587,026) | ($19,662,842) |
| Transactions in Fund Shares | | | |
| | | 11/1/18-10/31/19 | 11/1/17-10/31/18 |
| | | SHARES | VALUE | SHARES | VALUE |
| Shares sold | | 6,370,762 | $89,570,449 | 7,076,563 | $103,937,522 |
| Shares reinvested | | 2,152,966 | 27,536,429 | 1,306,745 | 18,987,000 |
| Shares redeemed | + | (7,018,067) | (98,439,951) | (6,125,912) | (89,717,661) |
| Net transactions in fund shares | | 1,505,661 | $18,666,927 | 2,257,396 | $33,206,861 |
| Shares Outstanding and Net Assets | | | |
| | | 11/1/18-10/31/19 | 11/1/17-10/31/18 |
| | | SHARES | NET ASSETS | SHARES | NET ASSETS |
| Beginning of period | | 37,643,966 | $530,596,092 | 35,386,570 | $520,501,809 |
| Total increase | + | 1,505,661 | 46,498,712 | 2,257,396 | 10,094,283 |
| End of period | | 39,149,627 | $577,094,804 | 37,643,966 | $530,596,092 |
Schwab Target Funds | Annual Report
Financial Statements
Financial Highlights
| | 11/1/18–
10/31/19 | 11/1/17–
10/31/18 | 11/1/16–
10/31/17 | 11/1/15–
10/31/16 | 11/1/14–
10/31/15 | |
| Per-Share Data |
| Net asset value at beginning of period | $15.24 | $16.10 | $14.51 | $15.59 | $15.77 | |
| Income (loss) from investment operations: | | | | | | |
| Net investment income (loss)1 | 0.30 | 0.29 | 0.23 | 0.22 | 0.21 | |
| Net realized and unrealized gains (losses) | 1.21 | (0.38) | 2.18 | 0.01 | 0.17 | |
| Total from investment operations | 1.51 | (0.09) | 2.41 | 0.23 | 0.38 | |
| Less distributions: | | | | | | |
| Distributions from net investment income | (0.37) | (0.39) | (0.24) | (0.30) | (0.36) | |
| Distributions from net realized gains | (0.59) | (0.38) | (0.58) | (1.01) | (0.20) | |
| Total distributions | (0.96) | (0.77) | (0.82) | (1.31) | (0.56) | |
| Net asset value at end of period | $15.79 | $15.24 | $16.10 | $14.51 | $15.59 | |
| Total return | 10.94% | (0.75%) | 17.47% | 1.72% | 2.44% | |
| Ratios/Supplemental Data |
| Ratios to average net assets: | | | | | | |
| Net operating expenses2 | 0.00% | 0.00% | 0.00% | 0.00%3 | 0.00%3 | |
| Gross operating expenses2 | 0.02% | 0.02% | 0.02% | 0.03% | 0.03% | |
| Net investment income (loss) | 2.00% | 1.79% | 1.53% | 1.51% | 1.36% | |
| Portfolio turnover rate | 17% | 14% | 30% | 5% | 19% | |
| Net assets, end of period (x 1,000,000) | $999 | $958 | $966 | $814 | $789 | |
| |
1
Calculated based on the average shares outstanding during the period.
2
The expenses incurred by underlying funds in which the fund invests are not included in this ratio.
3
Less than 0.005%; the ratio of net operating expenses would have been 0.00%, if certain non-routine expenses had not been incurred.
Schwab Target Funds | Annual Report
Portfolio Holdings as of October 31, 2019
This section shows all the securities in the fund’s portfolio and their values as of the report date.
The fund files its complete schedule of portfolio holdings with the U.S. Securities and Exchange Commission (SEC) for the first and third quarters of each fiscal year on Form N-Q. Effective March 31, 2019, Form N-PORT Part F has replaced Form N-Q. The fund’s Form N-Q and Form N-PORT Part F are available on the SEC’s website atwww.sec.gov. The fund also makes available its complete schedule of portfolio holdings 15 to 20 days after the end of the month on the fund’s website atwww.schwabfunds.com/schwabfunds_prospectus.
| Security | Number
of Shares | Value ($) |
| Affiliated Underlying Funds73.2% of net assets |
| |
| Equity Funds 55.8% |
| Global Real Estate 3.5% |
| Schwab Global Real Estate Fund | 4,153,009 | 34,719,157 |
| International 19.0% |
| Laudus International MarketMasters Fund | 4,982,986 | 114,060,550 |
| Schwab International Core Equity Fund | 7,557,585 | 75,878,157 |
| | | 189,938,707 |
| Large-Cap 28.6% |
| Laudus U.S. Large Cap Growth Fund * | 1,007,071 | 22,578,525 |
| Schwab Core Equity Fund | 4,788,058 | 104,714,833 |
| Schwab Dividend Equity Fund | 755,793 | 11,389,803 |
| Schwab S&P 500 Index Fund | 3,126,405 | 147,472,503 |
| | | 286,155,664 |
| Mid-Cap 1.3% |
| Schwab U.S. Mid-Cap Index Fund | 285,642 | 12,651,067 |
| Small-Cap 3.4% |
| Schwab Small-Cap Equity Fund | 2,039,597 | 34,020,480 |
| | | 557,485,075 |
| |
| Fixed-Income Funds 14.7% |
| Intermediate-Term Bond 10.5% |
| Schwab U.S. Aggregate Bond Index Fund | 10,107,673 | 104,917,645 |
| Short-Term Bond 4.2% |
| Schwab Short-Term Bond Index Fund | 4,139,252 | 41,847,840 |
| | | 146,765,485 |
| |
| Money Market Fund 2.7% |
| Schwab Variable Share Price Money Fund, Ultra Shares 1.85%(a) | 26,478,322 | 26,491,561 |
| Total Affiliated Underlying Funds |
| (Cost $577,528,756) | | 730,742,121 |
|
| Unaffiliated Underlying Funds26.1% of net assets |
| |
| Equity Funds 11.3% |
| International 1.8% |
| Goldman Sachs Emerging Markets Equity Insights Fund, Institutional Class | 1,916,962 | 17,885,253 |
| Security | Number
of Shares | Value ($) |
| Large-Cap 8.4% |
| ClearBridge Large Cap Growth Fund, Class IS | 672,732 | 36,098,791 |
| Dodge & Cox Stock Fund | 248,203 | 47,414,301 |
| | | 83,513,092 |
| Small-Cap 1.1% |
| ClearBridge Small Cap Growth Fund, Class IS * | 301,610 | 11,473,233 |
| | | 112,871,578 |
| |
| Fixed-Income Funds 14.8% |
| Intermediate-Term Bond 10.4% |
| Baird Aggregate Bond Fund, Institutional Class | 1,192,567 | 13,440,232 |
| Loomis Sayles Investment Grade Bond Fund, Class Y | 2,459,033 | 28,032,971 |
| Metropolitan West Total Return Bond Fund, Class I | 5,637,747 | 62,466,240 |
| | | 103,939,443 |
| International Bond 4.4% |
| PIMCO International Bond Fund (U.S. Dollar-Hedged), Institutional Class | 3,950,196 | 44,400,207 |
| | | 148,339,650 |
| Total Unaffiliated Underlying Funds |
| (Cost $248,333,384) | | 261,211,228 |
Issuer
Rate, Maturity Date | Face
Amount ($) | Value ($) |
| Short-Term Investment0.5% of net assets |
| |
| Time Deposit 0.5% |
| Sumitomo Mitsui Trust Bank, Limited |
| 1.18%, 11/01/19(b) | 5,107,666 | 5,107,666 |
| Total Short-Term Investment |
| (Cost $5,107,666) | | 5,107,666 |
| * | Non-income producing security. |
| (a) | The rate shown is the 7-day yield. |
| (b) | The rate shown is the current daily overnight rate. |
Schwab Target Funds | Annual Report
Portfolio Holdings as of October 31, 2019 (continued)
Below is a summary of the fund’s transactions with its affiliated underlying funds during the period ended October 31, 2019:
| Affiliated Underlying Funds | Market
Value at
10/31/18 | Gross
Purchases | Gross
Sales | Realized
Gains (Losses) | Net Change
in Unrealized
Appreciation
(depreciation) | Market
Value at
10/31/19 | Balance
of Shares
Held at
10/31/19 | Distributions
Received* |
| Laudus International MarketMasters Fund (formerly Laudus International MarketMasters Fund, Select Shares) | $110,490,799 | $11,199,972 | ($9,013,000) | ($2,150,222) | $3,533,001 | $114,060,550 | 4,982,986 | $9,879,972 |
| Laudus Small-Cap MarketMasters Fund, Select Shares | 16,455,997 | — | (14,294,256) | 3,969,076 | (6,130,817) | — | — | 1,558,534 |
| Laudus U.S. Large Cap Growth Fund | 23,310,863 | 2,814,795 | (5,290,000) | 1,568,684 | 174,183 | 22,578,525 | 1,007,071 | 1,704,794 |
| Schwab Core Equity Fund | 101,074,859 | 14,858,803 | (10,868,000) | (1,082,139) | 731,310 | 104,714,833 | 4,788,058 | 12,338,804 |
| Schwab Dividend Equity Fund | 11,807,908 | 1,159,581 | (1,340,000) | 74,914 | (312,600) | 11,389,803 | 755,793 | 1,159,580 |
| Schwab Global Real Estate Fund | 29,766,078 | 2,157,291 | (2,744,000) | 36,164 | 5,503,624 | 34,719,157 | 4,153,009 | 1,257,290 |
| Schwab Intermediate-Term Bond Fund | 10,993,288 | 21,288 | (11,141,018) | (616,980) | 743,422 | — | — | 54,076 |
| Schwab International Core Equity Fund | 74,293,443 | 3,629,963 | (5,210,000) | (1,079,361) | 4,244,112 | 75,878,157 | 7,557,585 | 1,945,964 |
| Schwab S&P 500 Index Fund | 143,196,912 | 4,738,193 | (16,466,001) | 3,184,614 | 12,818,785 | 147,472,503 | 3,126,405 | 3,433,192 |
| Schwab Short-Term Bond Index Fund | 29,946,008 | 11,063,872 | (540,000) | (599) | 1,378,559 | 41,847,840 | 4,139,252 | 933,916 |
| Schwab Small-Cap Equity Fund | 30,646,887 | 10,746,389 | (2,380,000) | (353,399) | (4,639,397) | 34,020,480 | 2,039,597 | 5,481,389 |
| Schwab U.S. Aggregate Bond Index Fund | 110,719,822 | 13,735,376 | (27,852,000) | (249,787) | 8,564,234 | 104,917,645 | 10,107,673 | 3,102,548 |
| Schwab U.S. Mid-Cap Index Fund | 13,031,474 | 166,670 | (2,031,000) | 4,081 | 1,479,842 | 12,651,067 | 285,642 | 166,671 |
| Schwab Variable Share Price Money Fund, Ultra Shares | 25,544,851 | 6,339,780 | (5,400,000) | (541) | 7,471 | 26,491,561 | 26,478,322 | 564,046 |
| Total | $731,279,189 | $82,631,973 | ($114,569,275) | $3,304,505 | $28,095,729 | $730,742,121 | | $43,580,776 |
| * | Distributions received include distributions from net investment income and capital gains, if any, from the underlying funds. |
| | |
| | |
Schwab Target Funds | Annual Report
Portfolio Holdings as of October 31, 2019 (continued)
The following is a summary of the inputs used to value the fund’s investments as of October 31, 2019 (see financial note 2(a) for additional information):
| Description | Quoted Prices in
Active Markets for
Identical Assets
(Level 1) | Other Significant
Observable Inputs
(Level 2) | Significant
Unobservable Inputs
(Level 3) | Total | |
| Assets | | | | | |
| Affiliated Underlying Funds1 | $730,742,121 | $— | $— | $730,742,121 | |
| Unaffiliated Underlying Funds1 | 261,211,228 | — | — | 261,211,228 | |
| Short-Term Investment1 | — | 5,107,666 | — | 5,107,666 | |
| Total | $991,953,349 | $5,107,666 | $— | $997,061,015 | |
| 1 | As categorized in Portfolio Holdings. |
Fund investments in underlying mutual funds are classified as Level 1, without consideration to the classification level of the investments held by the underlying mutual funds, which could be Level 1, Level 2 or Level 3.
Schwab Target Funds | Annual Report
Statement of Assets and Liabilities
As of October 31, 2019
| Assets |
| Investments in affiliated underlying funds, at value (cost $577,528,756) | | $730,742,121 |
| Investments in unaffiliated funds and issuers, at value (cost $253,441,050) | | 266,318,894 |
| Receivables: | | |
| Investments sold | | 856,000 |
| Fund shares sold | | 916,379 |
| Dividends | | 543,422 |
| Due from investment adviser | | 18,523 |
| Interest | | 170 |
| Prepaid expenses | + | 17,945 |
| Total assets | | 999,413,454 |
| Liabilities |
| Payables: | | |
| Investments bought | | 524,288 |
| Fund shares redeemed | | 144,389 |
| Accrued expenses | + | 63,860 |
| Total liabilities | | 732,537 |
| Net Assets |
| Total assets | | 999,413,454 |
| Total liabilities | – | 732,537 |
| Net assets | | $998,680,917 |
| Net Assets by Source | | |
| Capital received from investors | | 787,898,356 |
| Total distributable earnings | | 210,782,561 |
| Net Asset Value (NAV) |
| Net Assets | ÷ | Shares
Outstanding | = | NAV |
| $998,680,917 | | 63,252,383 | | $15.79 |
| | | | | |
Schwab Target Funds | Annual Report
Statement of Operations
For the period November 1, 2018 through October 31, 2019
| Investment Income |
| Dividends received from affiliated underlying funds | | $13,657,164 |
| Dividends received from unaffiliated underlying funds | | 5,624,104 |
| Interest | + | 93,915 |
| Total investment income | | 19,375,183 |
| Expenses |
| Shareholder reports | | 59,988 |
| Registration fees | | 38,556 |
| Portfolio accounting fees | | 35,158 |
| Professional fees | | 31,837 |
| Transfer agent fees | | 15,043 |
| Independent trustees’ fees | | 12,846 |
| Custodian fees | | 4,499 |
| Other expenses | + | 15,331 |
| Total expenses | | 213,258 |
| Expense reduction by CSIM and its affiliates | – | 213,258 |
| Net expenses | – | — |
| Net investment income | | 19,375,183 |
| Realized and Unrealized Gains (Losses) |
| Realized capital gain distributions received from affiliated underlying funds | | 29,923,612 |
| Realized capital gain distributions received from unaffiliated underlying funds | | 5,782,934 |
| Net realized gains on sales of affiliated underlying funds | | 3,304,505 |
| Net realized gains on sales of unaffiliated underlying funds | + | 5,505,327 |
| Net realized gains | | 44,516,378 |
| Net change in unrealized appreciation (depreciation) on affiliated underlying funds | | 28,095,729 |
| Net change in unrealized appreciation (depreciation) on unaffiliated underlying funds | + | 8,373,742 |
| Net change in unrealized appreciation (depreciation) | + | 36,469,471 |
| Net realized and unrealized gains | | 80,985,849 |
| Increase in net assets resulting from operations | | $100,361,032 |
Schwab Target Funds | Annual Report
Statement of Changes in Net Assets
For the current and prior report periods
| Operations | |
| | 11/1/18-10/31/19 | 11/1/17-10/31/18 |
| Net investment income | | $19,375,183 | $18,017,017 |
| Net realized gains | | 44,516,378 | 44,147,723 |
| Net change in unrealized appreciation (depreciation) | + | 36,469,471 | (69,355,712) |
| Increase (decrease) in net assets from operations | | 100,361,032 | (7,190,972) |
| Distributions to Shareholders | |
| Total distributions | | ($59,673,092) | ($46,459,999) |
| Transactions in Fund Shares | | | |
| | | 11/1/18-10/31/19 | 11/1/17-10/31/18 |
| | | SHARES | VALUE | SHARES | VALUE |
| Shares sold | | 6,655,676 | $100,210,585 | 9,135,640 | $146,351,661 |
| Shares reinvested | | 4,238,554 | 57,474,786 | 2,837,651 | 44,778,141 |
| Shares redeemed | + | (10,487,734) | (157,448,421) | (9,152,781) | (145,893,558) |
| Net transactions in fund shares | | 406,496 | $236,950 | 2,820,510 | $45,236,244 |
| Shares Outstanding and Net Assets | | | |
| | | 11/1/18-10/31/19 | 11/1/17-10/31/18 |
| | | SHARES | NET ASSETS | SHARES | NET ASSETS |
| Beginning of period | | 62,845,887 | $957,756,027 | 60,025,377 | $966,170,754 |
| Total increase or decrease | + | 406,496 | 40,924,890 | 2,820,510 | (8,414,727) |
| End of period | | 63,252,383 | $998,680,917 | 62,845,887 | $957,756,027 |
Schwab Target Funds | Annual Report
Financial Statements
Financial Highlights
| | 11/1/18–
10/31/19 | 11/1/17–
10/31/18 | 11/1/16–
10/31/17 | 11/1/15–
10/31/16 | 11/1/14–
10/31/15 | |
| Per-Share Data |
| Net asset value at beginning of period | $14.94 | $15.58 | $13.82 | $14.70 | $15.23 | |
| Income (loss) from investment operations: | | | | | | |
| Net investment income (loss)1 | 0.28 | 0.27 | 0.21 | 0.20 | 0.19 | |
| Net realized and unrealized gains (losses) | 1.19 | (0.38) | 2.32 | 0.01 | 0.17 | |
| Total from investment operations | 1.47 | (0.11) | 2.53 | 0.21 | 0.36 | |
| Less distributions: | | | | | | |
| Distributions from net investment income | (0.36) | (0.39) | (0.22) | (0.28) | (0.35) | |
| Distributions from net realized gains | (0.59) | (0.14) | (0.55) | (0.81) | (0.54) | |
| Total distributions | (0.95) | (0.53) | (0.77) | (1.09) | (0.89) | |
| Net asset value at end of period | $15.46 | $14.94 | $15.58 | $13.82 | $14.70 | |
| Total return | 10.90% | (0.88%) | 19.19% | 1.63% | 2.43% | |
| Ratios/Supplemental Data |
| Ratios to average net assets: | | | | | | |
| Net operating expenses2 | 0.00% | 0.00%3 | 0.00% | 0.00%3 | 0.00%3 | |
| Gross operating expenses2 | 0.03% | 0.03% | 0.04% | 0.04% | 0.05% | |
| Net investment income (loss) | 1.87% | 1.70% | 1.48% | 1.46% | 1.28% | |
| Portfolio turnover rate | 15% | 14% | 24% | 3% | 14% | |
| Net assets, end of period (x 1,000,000) | $483 | $447 | $440 | $361 | $337 | |
| |
1
Calculated based on the average shares outstanding during the period.
2
The expenses incurred by underlying funds in which the fund invests are not included in this ratio.
3
Less than 0.005%; the ratio of net operating expenses would have been 0.00%, if certain non-routine expenses had not been incurred.
Schwab Target Funds | Annual Report
Portfolio Holdings as of October 31, 2019
This section shows all the securities in the fund’s portfolio and their values as of the report date.
The fund files its complete schedule of portfolio holdings with the U.S. Securities and Exchange Commission (SEC) for the first and third quarters of each fiscal year on Form N-Q. Effective March 31, 2019, Form N-PORT Part F has replaced Form N-Q. The fund’s Form N-Q and Form N-PORT Part F are available on the SEC’s website atwww.sec.gov. The fund also makes available its complete schedule of portfolio holdings 15 to 20 days after the end of the month on the fund’s website atwww.schwabfunds.com/schwabfunds_prospectus.
| Security | Number
of Shares | Value ($) |
| Affiliated Underlying Funds74.9% of net assets |
| |
| Equity Funds 62.3% |
| Global Real Estate 3.9% |
| Schwab Global Real Estate Fund | 2,229,957 | 18,642,442 |
| International 21.1% |
| Laudus International MarketMasters Fund | 2,660,729 | 60,904,081 |
| Schwab International Core Equity Fund | 4,085,406 | 41,017,479 |
| | | 101,921,560 |
| Large-Cap 31.9% |
| Laudus U.S. Large Cap Growth Fund * | 738,975 | 16,567,813 |
| Schwab Core Equity Fund | 2,544,433 | 55,646,758 |
| Schwab Dividend Equity Fund | 539,130 | 8,124,685 |
| Schwab S&P 500 Index Fund | 1,565,786 | 73,858,143 |
| | | 154,197,399 |
| Mid-Cap 1.4% |
| Schwab U.S. Mid-Cap Index Fund | 154,484 | 6,842,087 |
| Small-Cap 4.0% |
| Schwab Small-Cap Equity Fund | 1,172,619 | 19,559,286 |
| | | 301,162,774 |
| |
| Fixed-Income Funds 10.7% |
| Intermediate-Term Bond 7.7% |
| Schwab U.S. Aggregate Bond Index Fund | 3,551,967 | 36,869,413 |
| Short-Term Bond 3.0% |
| Schwab Short-Term Bond Index Fund | 1,432,821 | 14,485,816 |
| | | 51,355,229 |
| |
| Money Market Fund 1.9% |
| Schwab Variable Share Price Money Fund, Ultra Shares 1.85%(a) | 9,177,831 | 9,182,420 |
| Total Affiliated Underlying Funds |
| (Cost $303,571,547) | | 361,700,423 |
|
| Unaffiliated Underlying Funds24.5% of net assets |
| |
| Equity Funds 12.6% |
| International 2.7% |
| Goldman Sachs Emerging Markets Equity Insights Fund, Institutional Class | 1,393,465 | 13,001,028 |
| Security | Number
of Shares | Value ($) |
| Large-Cap 8.6% |
| ClearBridge Large Cap Growth Fund, Class IS | 306,151 | 16,428,063 |
| Dodge & Cox Stock Fund | 131,687 | 25,156,251 |
| | | 41,584,314 |
| Small-Cap 1.3% |
| ClearBridge Small Cap Growth Fund, Class IS * | 167,749 | 6,381,181 |
| | | 60,966,523 |
| |
| Fixed-Income Funds 11.9% |
| Intermediate-Term Bond 8.4% |
| Baird Aggregate Bond Fund, Institutional Class | 332,553 | 3,747,874 |
| Loomis Sayles Investment Grade Bond Fund, Class Y | 1,175,275 | 13,398,131 |
| Metropolitan West Total Return Bond Fund, Class I | 2,125,180 | 23,546,992 |
| | | 40,692,997 |
| International Bond 3.5% |
| PIMCO International Bond Fund (U.S. Dollar-Hedged), Institutional Class | 1,505,735 | 16,924,467 |
| | | 57,617,464 |
| Total Unaffiliated Underlying Funds |
| (Cost $113,123,294) | | 118,583,987 |
Issuer
Rate, Maturity Date | Face
Amount ($) | Value ($) |
| Short-Term Investment0.6% of net assets |
| |
| Time Deposit 0.6% |
| Barclays Bank, plc |
| 1.18%, 11/01/19(b) | 2,691,003 | 2,691,003 |
| Total Short-Term Investment |
| (Cost $2,691,003) | | 2,691,003 |
| * | Non-income producing security. |
| (a) | The rate shown is the 7-day yield. |
| (b) | The rate shown is the current daily overnight rate. |
Schwab Target Funds | Annual Report
Portfolio Holdings as of October 31, 2019 (continued)
Below is a summary of the fund’s transactions with its affiliated underlying funds during the period ended October 31, 2019:
| Affiliated Underlying Funds | Market
Value at
10/31/18 | Gross
Purchases | Gross
Sales | Realized
Gains (Losses) | Net Change
in Unrealized
Appreciation
(depreciation) | Market
Value at
10/31/19 | Balance
of Shares
Held at
10/31/19 | Distributions
Received* |
| Laudus International MarketMasters Fund (formerly Laudus International MarketMasters Fund, Select Shares) | $56,824,717 | $6,661,207 | ($3,450,000) | ($816,445) | $1,684,602 | $60,904,081 | 2,660,729 | $5,081,207 |
| Laudus Small-Cap MarketMasters Fund, Select Shares | 8,812,243 | — | (7,673,138) | 569,039 | (1,708,144) | — | — | 834,600 |
| Laudus U.S. Large Cap Growth Fund | 16,166,919 | 1,182,336 | (2,035,000) | 422,326 | 831,232 | 16,567,813 | 738,975 | 1,182,336 |
| Schwab Core Equity Fund | 51,407,707 | 7,645,642 | (3,311,000) | (309,802) | 214,211 | 55,646,758 | 2,544,433 | 6,275,642 |
| Schwab Dividend Equity Fund | 8,085,170 | 797,747 | (640,000) | (24,001) | (94,231) | 8,124,685 | 539,130 | 797,747 |
| Schwab Global Real Estate Fund | 15,561,834 | 1,598,957 | (1,433,000) | 21,747 | 2,892,904 | 18,642,442 | 2,229,957 | 668,957 |
| Schwab Intermediate-Term Bond Fund | 4,512,914 | 9,343 | (4,571,504) | (245,433) | 294,680 | — | — | 21,493 |
| Schwab International Core Equity Fund | 38,322,205 | 2,773,771 | (1,790,000) | (346,825) | 2,058,328 | 41,017,479 | 4,085,406 | 1,003,771 |
| Schwab S&P 500 Index Fund | 68,710,085 | 3,398,054 | (6,099,000) | 892,145 | 6,956,859 | 73,858,143 | 1,565,786 | 1,658,054 |
| Schwab Short-Term Bond Index Fund | 9,286,817 | 4,805,431 | (68,000) | (83) | 461,651 | 14,485,816 | 1,432,821 | 315,446 |
| Schwab Small-Cap Equity Fund | 16,786,714 | 6,228,732 | (513,000) | (221,380) | (2,721,780) | 19,559,286 | 1,172,619 | 3,103,732 |
| Schwab U.S. Aggregate Bond Index Fund | 36,642,517 | 5,265,603 | (7,881,000) | (81,302) | 2,923,595 | 36,869,413 | 3,551,967 | 1,067,649 |
| Schwab U.S. Mid-Cap Index Fund | 6,548,956 | 83,760 | (560,000) | (2,972) | 772,343 | 6,842,087 | 154,484 | 83,760 |
| Schwab Variable Share Price Money Fund, Ultra Shares | 9,552,861 | 6,597,408 | (6,970,000) | 92 | 2,059 | 9,182,420 | 9,177,831 | 195,749 |
| Total | $347,221,659 | $47,047,991 | ($46,994,642) | ($142,894) | $14,568,309 | $361,700,423 | | $22,290,143 |
| * | Distributions received include distributions from net investment income and capital gains, if any, from the underlying funds. |
| | |
The following is a summary of the inputs used to value the fund’s investments as of October 31, 2019 (see financial note 2(a) for additional information):
| Description | Quoted Prices in
Active Markets for
Identical Assets
(Level 1) | Other Significant
Observable Inputs
(Level 2) | Significant
Unobservable Inputs
(Level 3) | Total | |
| Assets | | | | | |
| Affiliated Underlying Funds1 | $361,700,423 | $— | $— | $361,700,423 | |
| Unaffiliated Underlying Funds1 | 118,583,987 | — | — | 118,583,987 | |
| Short-Term Investment1 | — | 2,691,003 | — | 2,691,003 | |
| Total | $480,284,410 | $2,691,003 | $— | $482,975,413 | |
| 1 | As categorized in Portfolio Holdings. |
Fund investments in underlying mutual funds are classified as Level 1, without consideration to the classification level of the investments held by the underlying mutual funds, which could be Level 1, Level 2 or Level 3.
Schwab Target Funds | Annual Report
Statement of Assets and Liabilities
As of October 31, 2019
| Assets |
| Investments in affiliated underlying funds, at value (cost $303,571,547) | | $361,700,423 |
| Investments in unaffiliated funds and issuers, at value (cost $115,814,297) | | 121,274,990 |
| Receivables: | | |
| Fund shares sold | | 852,657 |
| Dividends | | 196,215 |
| Due from investment adviser | | 16,803 |
| Prepaid expenses | + | 9,667 |
| Total assets | | 484,050,755 |
| Liabilities |
| Payables: | | |
| Investments bought | | 189,763 |
| Fund shares redeemed | | 620,335 |
| Accrued expenses | + | 49,801 |
| Total liabilities | | 859,899 |
| Net Assets |
| Total assets | | 484,050,755 |
| Total liabilities | – | 859,899 |
| Net assets | | $483,190,856 |
| Net Assets by Source | | |
| Capital received from investors | | 398,891,010 |
| Total distributable earnings | | 84,299,846 |
| Net Asset Value (NAV) |
| Net Assets | ÷ | Shares
Outstanding | = | NAV |
| $483,190,856 | | 31,259,584 | | $15.46 |
| | | | | |
Schwab Target Funds | Annual Report
Statement of Operations
For the period November 1, 2018 through October 31, 2019
| Investment Income |
| Dividends received from affiliated underlying funds | | $6,193,810 |
| Dividends received from unaffiliated underlying funds | | 2,410,670 |
| Interest | + | 43,418 |
| Total investment income | | 8,647,898 |
| Expenses |
| Shareholder reports | | 34,728 |
| Registration fees | | 30,960 |
| Portfolio accounting fees | | 29,167 |
| Professional fees | | 28,860 |
| Transfer agent fees | | 12,640 |
| Independent trustees’ fees | | 10,257 |
| Custodian fees | | 4,500 |
| Other expenses | + | 9,283 |
| Total expenses | | 160,395 |
| Expense reduction by CSIM and its affiliates | – | 160,395 |
| Net expenses | – | — |
| Net investment income | | 8,647,898 |
| Realized and Unrealized Gains (Losses) |
| Realized capital gain distributions received from affiliated underlying funds | | 16,096,333 |
| Realized capital gain distributions received from unaffiliated underlying funds | | 2,835,321 |
| Net realized losses on sales of affiliated underlying funds | | (142,894) |
| Net realized gains on sales of unaffiliated underlying funds | + | 2,183,871 |
| Net realized gains | | 20,972,631 |
| Net change in unrealized appreciation (depreciation) on affiliated underlying funds | | 14,568,309 |
| Net change in unrealized appreciation (depreciation) on unaffiliated underlying funds | + | 3,446,416 |
| Net change in unrealized appreciation (depreciation) | + | 18,014,725 |
| Net realized and unrealized gains | | 38,987,356 |
| Increase in net assets resulting from operations | | $47,635,254 |
Schwab Target Funds | Annual Report
Statement of Changes in Net Assets
For the current and prior report periods
| Operations | |
| | 11/1/18-10/31/19 | 11/1/17-10/31/18 |
| Net investment income | | $8,647,898 | $7,874,452 |
| Net realized gains | | 20,972,631 | 21,247,068 |
| Net change in unrealized appreciation (depreciation) | + | 18,014,725 | (33,709,353) |
| Increase (decrease) in net assets from operations | | 47,635,254 | (4,587,833) |
| Distributions to Shareholders | |
| Total distributions | | ($27,960,017) | ($14,879,119) |
| Transactions in Fund Shares | | | |
| | | 11/1/18-10/31/19 | 11/1/17-10/31/18 |
| | | SHARES | VALUE | SHARES | VALUE |
| Shares sold | | 4,397,034 | $64,804,146 | 4,706,172 | $73,978,844 |
| Shares reinvested | | 2,053,408 | 27,084,446 | 927,015 | 14,405,805 |
| Shares redeemed | + | (5,092,947) | (75,084,216) | (3,969,741) | (62,287,162) |
| Net transactions in fund shares | | 1,357,495 | $16,804,376 | 1,663,446 | $26,097,487 |
| Shares Outstanding and Net Assets | | | |
| | | 11/1/18-10/31/19 | 11/1/17-10/31/18 |
| | | SHARES | NET ASSETS | SHARES | NET ASSETS |
| Beginning of period | | 29,902,089 | $446,711,243 | 28,238,643 | $440,080,708 |
| Total increase | + | 1,357,495 | 36,479,613 | 1,663,446 | 6,630,535 |
| End of period | | 31,259,584 | $483,190,856 | 29,902,089 | $446,711,243 |
Schwab Target Funds | Annual Report
Financial Statements
Financial Highlights
| | 11/1/18–
10/31/19 | 11/1/17–
10/31/18 | 11/1/16–
10/31/17 | 11/1/15–
10/31/16 | 11/1/14–
10/31/15 | |
| Per-Share Data |
| Net asset value at beginning of period | $16.27 | $17.14 | $15.12 | $16.42 | $16.77 | |
| Income (loss) from investment operations: | | | | | | |
| Net investment income (loss)1 | 0.28 | 0.28 | 0.23 | 0.22 | 0.21 | |
| Net realized and unrealized gains (losses) | 1.28 | (0.45) | 2.78 | (0.03)2 | 0.20 | |
| Total from investment operations | 1.56 | (0.17) | 3.01 | 0.19 | 0.41 | |
| Less distributions: | | | | | | |
| Distributions from net investment income | (0.39) | (0.44) | (0.24) | (0.32) | (0.39) | |
| Distributions from net realized gains | (0.83) | (0.26) | (0.75) | (1.17) | (0.37) | |
| Total distributions | (1.22) | (0.70) | (0.99) | (1.49) | (0.76) | |
| Net asset value at end of period | $16.61 | $16.27 | $17.14 | $15.12 | $16.42 | |
| Total return | 10.90% | (1.17%) | 21.02% | 1.38% | 2.48% | |
| Ratios/Supplemental Data |
| Ratios to average net assets: | | | | | | |
| Net operating expenses3 | 0.00% | 0.00%4 | 0.00% | 0.00%4 | 0.00%4 | |
| Gross operating expenses3 | 0.02% | 0.02% | 0.02% | 0.03% | 0.03% | |
| Net investment income (loss) | 1.78% | 1.65% | 1.44% | 1.45% | 1.27% | |
| Portfolio turnover rate | 15% | 17% | 21% | 4% | 13% | |
| Net assets, end of period (x 1,000,000) | $1,012 | $962 | $998 | $841 | $834 | |
| |
1
Calculated based on the average shares outstanding during the period.
2
The per share amount does not accord with the change in aggregate gains and losses in securities during the period because of the timing of sales and repurchases of fund shares in relation to fluctuating market values.
3
The expenses incurred by underlying funds in which the fund invests are not included in this ratio.
4
Less than 0.005%; the ratio of net operating expenses would have been 0.00%, if certain non-routine expenses had not been incurred.
Schwab Target Funds | Annual Report
Portfolio Holdings as of October 31, 2019
This section shows all the securities in the fund’s portfolio and their values as of the report date.
The fund files its complete schedule of portfolio holdings with the U.S. Securities and Exchange Commission (SEC) for the first and third quarters of each fiscal year on Form N-Q. Effective March 31, 2019, Form N-PORT Part F has replaced Form N-Q. The fund’s Form N-Q and Form N-PORT Part F are available on the SEC’s website atwww.sec.gov. The fund also makes available its complete schedule of portfolio holdings 15 to 20 days after the end of the month on the fund’s website atwww.schwabfunds.com/schwabfunds_prospectus.
| Security | Number
of Shares | Value ($) |
| Affiliated Underlying Funds76.5% of net assets |
| |
| Equity Funds 68.0% |
| Global Real Estate 4.2% |
| Schwab Global Real Estate Fund | 5,085,418 | 42,514,092 |
| International 23.1% |
| Laudus International MarketMasters Fund | 6,136,016 | 140,453,404 |
| Schwab International Core Equity Fund | 9,254,020 | 92,910,361 |
| | | 233,363,765 |
| Large-Cap 34.6% |
| Laudus U.S. Large Cap Growth Fund * | 2,168,544 | 48,618,750 |
| Schwab Core Equity Fund | 5,737,267 | 125,474,027 |
| Schwab Dividend Equity Fund | 1,534,339 | 23,122,489 |
| Schwab S&P 500 Index Fund | 3,248,965 | 153,253,679 |
| | | 350,468,945 |
| Mid-Cap 1.5% |
| Schwab U.S. Mid-Cap Index Fund | 334,980 | 14,836,274 |
| Small-Cap 4.6% |
| Schwab Small-Cap Equity Fund | 2,801,267 | 46,725,134 |
| | | 687,908,210 |
| |
| Fixed-Income Funds 7.3% |
| Intermediate-Term Bond 5.2% |
| Schwab U.S. Aggregate Bond Index Fund | 5,052,904 | 52,449,147 |
| Short-Term Bond 2.1% |
| Schwab Short-Term Bond Index Fund | 2,057,967 | 20,806,043 |
| | | 73,255,190 |
| |
| Money Market Fund 1.2% |
| Schwab Variable Share Price Money Fund, Ultra Shares 1.85%(a) | 12,547,436 | 12,553,710 |
| Total Affiliated Underlying Funds |
| (Cost $599,372,822) | | 773,717,110 |
|
| Unaffiliated Underlying Funds23.0% of net assets |
| |
| Equity Funds 13.9% |
| International 3.6% |
| Goldman Sachs Emerging Markets Equity Insights Fund, Institutional Class | 3,906,953 | 36,451,873 |
| Security | Number
of Shares | Value ($) |
| Large-Cap 8.8% |
| ClearBridge Large Cap Growth Fund, Class IS | 596,075 | 31,985,384 |
| Dodge & Cox Stock Fund | 297,536 | 56,838,322 |
| | | 88,823,706 |
| Small-Cap 1.5% |
| ClearBridge Small Cap Growth Fund, Class IS * | 414,290 | 15,759,582 |
| | | 141,035,161 |
| |
| Fixed-Income Funds 9.1% |
| Intermediate-Term Bond 6.6% |
| Baird Aggregate Bond Fund, Institutional Class | 439,838 | 4,956,979 |
| Loomis Sayles Investment Grade Bond Fund, Class Y | 2,221,940 | 25,330,113 |
| Metropolitan West Total Return Bond Fund, Class I | 3,243,712 | 35,940,328 |
| | | 66,227,420 |
| International Bond 2.5% |
| PIMCO International Bond Fund (U.S. Dollar-Hedged), Institutional Class | 2,256,842 | 25,366,904 |
| | | 91,594,324 |
| Total Unaffiliated Underlying Funds |
| (Cost $223,633,949) | | 232,629,485 |
Issuer
Rate, Maturity Date | Face
Amount ($) | Value ($) |
| Short-Term Investment0.5% of net assets |
| |
| Time Deposit 0.5% |
| JPMorgan Chase Bank |
| 1.18%, 11/01/19(b) | 5,052,385 | 5,052,385 |
| Total Short-Term Investment |
| (Cost $5,052,385) | | 5,052,385 |
| * | Non-income producing security. |
| (a) | The rate shown is the 7-day yield. |
| (b) | The rate shown is the current daily overnight rate. |
Schwab Target Funds | Annual Report
Portfolio Holdings as of October 31, 2019 (continued)
Below is a summary of the fund’s transactions with its affiliated underlying funds during the period ended October 31, 2019:
| Affiliated Underlying Funds | Market
Value at
10/31/18 | Gross
Purchases | Gross
Sales | Realized
Gains (Losses) | Net Change
in Unrealized
Appreciation
(depreciation) | Market
Value at
10/31/19 | Balance
of Shares
Held at
10/31/19 | Distributions
Received* |
| Laudus International MarketMasters Fund (formerly Laudus International MarketMasters Fund, Select Shares) | $134,778,808 | $14,341,781 | ($10,559,000) | ($2,390,512) | $4,282,327 | $140,453,404 | 6,136,016 | $12,051,781 |
| Laudus Small-Cap MarketMasters Fund, Select Shares | 22,189,201 | — | (19,463,678) | 4,677,167 | (7,402,690) | — | — | 2,008,118 |
| Laudus U.S. Large Cap Growth Fund | 47,924,048 | 3,504,831 | (6,480,000) | 1,489,235 | 2,180,636 | 48,618,750 | 2,168,544 | 3,504,832 |
| Schwab Core Equity Fund | 120,028,711 | 14,652,612 | (8,666,000) | (578,210) | 36,914 | 125,474,027 | 5,737,267 | 14,652,611 |
| Schwab Dividend Equity Fund | 24,329,779 | 2,268,599 | (3,227,000) | 257,767 | (506,656) | 23,122,489 | 1,534,339 | 2,268,598 |
| Schwab Global Real Estate Fund | 38,335,191 | 2,474,850 | (5,166,000) | 106,196 | 6,763,855 | 42,514,092 | 5,085,418 | 1,584,850 |
| Schwab Intermediate-Term Bond Fund | 9,085,987 | 18,522 | (9,206,769) | (404,379) | 506,639 | — | — | 49,025 |
| Schwab International Core Equity Fund | 88,943,233 | 3,869,685 | (3,800,000) | (673,544) | 4,570,987 | 92,910,361 | 9,254,020 | 2,329,685 |
| Schwab S&P 500 Index Fund | 144,466,135 | 3,486,136 | (11,573,500) | 2,793,506 | 14,081,402 | 153,253,679 | 3,248,965 | 3,486,136 |
| Schwab Short-Term Bond Index Fund | 9,624,727 | 10,551,651 | — | — | 629,665 | 20,806,043 | 2,057,967 | 431,673 |
| Schwab Small-Cap Equity Fund | 40,892,761 | 13,110,752 | — | — | (7,278,379) | 46,725,134 | 2,801,267 | 7,560,752 |
| Schwab U.S. Aggregate Bond Index Fund | 51,342,363 | 5,061,196 | (8,040,000) | (45,407) | 4,130,995 | 52,449,147 | 5,052,904 | 1,542,458 |
| Schwab U.S. Mid-Cap Index Fund | 14,834,037 | 189,725 | (2,013,000) | 115,224 | 1,710,288 | 14,836,274 | 334,980 | 189,725 |
| Schwab Variable Share Price Money Fund, Ultra Shares | 16,764,074 | 2,785,548 | (7,000,000) | (100) | 4,188 | 12,553,710 | 12,547,436 | 279,507 |
| Total | $763,539,055 | $76,315,888 | ($95,194,947) | $5,346,943 | $23,710,171 | $773,717,110 | | $51,939,751 |
| * | Distributions received include distributions from net investment income and capital gains, if any, from the underlying funds. |
| | |
The following is a summary of the inputs used to value the fund’s investments as of October 31, 2019 (see financial note 2(a) for additional information):
| Description | Quoted Prices in
Active Markets for
Identical Assets
(Level 1) | Other Significant
Observable Inputs
(Level 2) | Significant
Unobservable Inputs
(Level 3) | Total | |
| Assets | | | | | |
| Affiliated Underlying Funds1 | $773,717,110 | $— | $— | $773,717,110 | |
| Unaffiliated Underlying Funds1 | 232,629,485 | — | — | 232,629,485 | |
| Short-Term Investment1 | — | 5,052,385 | — | 5,052,385 | |
| Total | $1,006,346,595 | $5,052,385 | $— | $1,011,398,980 | |
| 1 | As categorized in Portfolio Holdings. |
Fund investments in underlying mutual funds are classified as Level 1, without consideration to the classification level of the investments held by the underlying mutual funds, which could be Level 1, Level 2 or Level 3.
Schwab Target Funds | Annual Report
Statement of Assets and Liabilities
As of October 31, 2019
| Assets |
| Investments in affiliated underlying funds, at value (cost $599,372,822) | | $773,717,110 |
| Investments in unaffiliated funds and issuers, at value (cost $228,686,334) | | 237,681,870 |
| Receivables: | | |
| Fund shares sold | | 650,201 |
| Dividends | | 286,957 |
| Due from investment adviser | | 20,180 |
| Interest | | 168 |
| Prepaid expenses | + | 17,487 |
| Total assets | | 1,012,373,973 |
| Liabilities |
| Payables: | | |
| Investments bought | | 278,141 |
| Fund shares redeemed | | 458,860 |
| Accrued expenses | + | 79,020 |
| Total liabilities | | 816,021 |
| Net Assets |
| Total assets | | 1,012,373,973 |
| Total liabilities | – | 816,021 |
| Net assets | | $1,011,557,952 |
| Net Assets by Source | | |
| Capital received from investors | | 773,944,834 |
| Total distributable earnings | | 237,613,118 |
| Net Asset Value (NAV) |
| Net Assets | ÷ | Shares
Outstanding | = | NAV |
| $1,011,557,952 | | 60,913,365 | | $16.61 |
| | | | | |
Schwab Target Funds | Annual Report
Statement of Operations
For the period November 1, 2018 through October 31, 2019
| Investment Income |
| Dividends received from affiliated underlying funds | | $12,819,465 |
| Dividends received from unaffiliated underlying funds | | 4,606,960 |
| Interest | + | 88,876 |
| Total investment income | | 17,515,301 |
| Expenses |
| Shareholder reports | | 86,031 |
| Registration fees | | 35,601 |
| Portfolio accounting fees | | 35,308 |
| Professional fees | | 31,878 |
| Transfer agent fees | | 20,395 |
| Independent trustees’ fees | | 12,924 |
| Custodian fees | | 3,965 |
| Other expenses | + | 15,508 |
| Total expenses | | 241,610 |
| Expense reduction by CSIM and its affiliates | – | 241,610 |
| Net expenses | – | — |
| Net investment income | | 17,515,301 |
| Realized and Unrealized Gains (Losses) |
| Realized capital gain distributions received from affiliated underlying funds | | 39,120,286 |
| Realized capital gain distributions received from unaffiliated underlying funds | | 6,501,815 |
| Net realized gains on sales of affiliated underlying funds | | 5,346,943 |
| Net realized gains on sales of unaffiliated underlying funds | + | 7,641,314 |
| Net realized gains | | 58,610,358 |
| Net change in unrealized appreciation (depreciation) on affiliated underlying funds | | 23,710,171 |
| Net change in unrealized appreciation (depreciation) on unaffiliated underlying funds | + | 2,277,026 |
| Net change in unrealized appreciation (depreciation) | + | 25,987,197 |
| Net realized and unrealized gains | | 84,597,555 |
| Increase in net assets resulting from operations | | $102,112,856 |
Schwab Target Funds | Annual Report
Statement of Changes in Net Assets
For the current and prior report periods
| Operations | |
| | 11/1/18-10/31/19 | 11/1/17-10/31/18 |
| Net investment income | | $17,515,301 | $16,982,141 |
| Net realized gains | | 58,610,358 | 58,476,900 |
| Net change in unrealized appreciation (depreciation) | + | 25,987,197 | (85,759,177) |
| Increase (decrease) in net assets from operations | | 102,112,856 | (10,300,136) |
| Distributions to Shareholders | |
| Total distributions | | ($71,258,344) | ($40,865,355) |
| Transactions in Fund Shares | | | |
| | | 11/1/18-10/31/19 | 11/1/17-10/31/18 |
| | | SHARES | VALUE | SHARES | VALUE |
| Shares sold | | 6,025,941 | $95,176,212 | 6,706,755 | $115,547,716 |
| Shares reinvested | | 4,962,246 | 69,868,426 | 2,349,847 | 39,947,404 |
| Shares redeemed | + | (9,203,118) | (146,239,888) | (8,162,708) | (140,666,145) |
| Net transactions in fund shares | | 1,785,069 | $18,804,750 | 893,894 | $14,828,975 |
| Shares Outstanding and Net Assets | | | |
| | | 11/1/18-10/31/19 | 11/1/17-10/31/18 |
| | | SHARES | NET ASSETS | SHARES | NET ASSETS |
| Beginning of period | | 59,128,296 | $961,898,690 | 58,234,402 | $998,235,206 |
| Total increase or decrease | + | 1,785,069 | 49,659,262 | 893,894 | (36,336,516) |
| End of period | | 60,913,365 | $1,011,557,952 | 59,128,296 | $961,898,690 |
Schwab Target Funds | Annual Report
Financial Statements
Financial Highlights
| | 11/1/18–
10/31/19 | 11/1/17–
10/31/18 | 11/1/16–
10/31/17 | 11/1/15–
10/31/16 | 11/1/14–
10/31/15 | |
| Per-Share Data |
| Net asset value at beginning of period | $13.35 | $13.92 | $12.00 | $12.51 | $12.67 | |
| Income (loss) from investment operations: | | | | | | |
| Net investment income (loss)1 | 0.22 | 0.21 | 0.17 | 0.16 | 0.14 | |
| Net realized and unrealized gains (losses) | 1.09 | (0.39) | 2.37 | 0.002 | 0.15 | |
| Total from investment operations | 1.31 | (0.18) | 2.54 | 0.16 | 0.29 | |
| Less distributions: | | | | | | |
| Distributions from net investment income | (0.31) | (0.36) | (0.18) | (0.23) | (0.29) | |
| Distributions from net realized gains | (0.47) | (0.03) | (0.44) | (0.44) | (0.16) | |
| Total distributions | (0.78) | (0.39) | (0.62) | (0.67) | (0.45) | |
| Net asset value at end of period | $13.88 | $13.35 | $13.92 | $12.00 | $12.51 | |
| Total return | 10.91% | (1.43%) | 22.11% | 1.40% | 2.37% | |
| Ratios/Supplemental Data |
| Ratios to average net assets: | | | | | | |
| Net operating expenses3 | 0.00% | 0.00%4 | 0.00% | 0.00%4 | 0.00%4 | |
| Gross operating expenses3 | 0.08% | 0.06% | 0.10% | 0.13% | 0.20% | |
| Net investment income (loss) | 1.65% | 1.52% | 1.31% | 1.34% | 1.09% | |
| Portfolio turnover rate | 8% | 12% | 11% | 1% | 10% | |
| Net assets, end of period (x 1,000,000) | $162 | $139 | $121 | $82 | $66 | |
| |
1
Calculated based on the average shares outstanding during the period.
2
Per-share amount was less than $0.005.
3
The expenses incurred by underlying funds in which the fund invests are not included in this ratio.
4
Less than 0.005%; the ratio of net operating expenses would have been 0.00%, if certain non-routine expenses had not been incurred.
Schwab Target Funds | Annual Report
Portfolio Holdings as of October 31, 2019
This section shows all the securities in the fund’s portfolio and their values as of the report date.
The fund files its complete schedule of portfolio holdings with the U.S. Securities and Exchange Commission (SEC) for the first and third quarters of each fiscal year on Form N-Q. Effective March 31, 2019, Form N-PORT Part F has replaced Form N-Q. The fund’s Form N-Q and Form N-PORT Part F are available on the SEC’s website atwww.sec.gov. The fund also makes available its complete schedule of portfolio holdings 15 to 20 days after the end of the month on the fund’s website atwww.schwabfunds.com/schwabfunds_prospectus.
| Security | Number
of Shares | Value ($) |
| Affiliated Underlying Funds78.1% of net assets |
| |
| Equity Funds 72.6% |
| Global Real Estate 4.6% |
| Schwab Global Real Estate Fund | 898,084 | 7,507,982 |
| International 24.4% |
| Laudus International MarketMasters Fund | 1,044,566 | 23,910,113 |
| Schwab International Core Equity Fund | 1,561,340 | 15,675,852 |
| | | 39,585,965 |
| Large-Cap 36.8% |
| Laudus U.S. Large Cap Growth Fund * | 435,855 | 9,771,857 |
| Schwab Core Equity Fund | 954,323 | 20,871,037 |
| Schwab Dividend Equity Fund | 305,869 | 4,609,450 |
| Schwab S&P 500 Index Fund | 516,116 | 24,345,193 |
| | | 59,597,537 |
| Mid-Cap 1.6% |
| Schwab U.S. Mid-Cap Index Fund | 60,391 | 2,674,726 |
| Small-Cap 5.2% |
| Schwab Small-Cap Equity Fund | 501,048 | 8,357,484 |
| | | 117,723,694 |
| |
| Fixed-Income Funds 4.8% |
| Intermediate-Term Bond 3.5% |
| Schwab U.S. Aggregate Bond Index Fund | 548,691 | 5,695,409 |
| Short-Term Bond 1.3% |
| Schwab Short-Term Bond Index Fund | 207,349 | 2,096,302 |
| | | 7,791,711 |
| |
| Money Market Fund 0.7% |
| Schwab Variable Share Price Money Fund, Ultra Shares 1.85%(a) | 1,077,809 | 1,078,348 |
| Total Affiliated Underlying Funds |
| (Cost $115,936,470) | | 126,593,753 |
|
| Unaffiliated Underlying Funds21.2% of net assets |
| |
| Equity Funds 14.7% |
| International 4.4% |
| Goldman Sachs Emerging Markets Equity Insights Fund, Institutional Class | 766,355 | 7,150,093 |
| Security | Number
of Shares | Value ($) |
| Large-Cap 8.6% |
| ClearBridge Large Cap Growth Fund, Class IS | 79,502 | 4,266,050 |
| Dodge & Cox Stock Fund | 50,956 | 9,734,185 |
| | | 14,000,235 |
| Small-Cap 1.7% |
| ClearBridge Small Cap Growth Fund, Class IS * | 70,420 | 2,678,796 |
| | | 23,829,124 |
| |
| Fixed-Income Funds 6.5% |
| Intermediate-Term Bond 4.7% |
| Baird Aggregate Bond Fund, Institutional Class | 32,639 | 367,843 |
| Loomis Sayles Investment Grade Bond Fund, Class Y | 282,722 | 3,223,030 |
| Metropolitan West Total Return Bond Fund, Class I | 360,494 | 3,994,270 |
| | | 7,585,143 |
| International Bond 1.8% |
| PIMCO International Bond Fund (U.S. Dollar-Hedged), Institutional Class | 252,985 | 2,843,552 |
| | | 10,428,695 |
| Total Unaffiliated Underlying Funds |
| (Cost $33,316,664) | | 34,257,819 |
Issuer
Rate, Maturity Date | Face
Amount ($) | Value ($) |
| Short-Term Investment0.6% of net assets |
| |
| Time Deposit 0.6% |
| JPMorgan Chase Bank |
| 1.18%, 11/01/19(b) | 934,126 | 934,126 |
| Total Short-Term Investment |
| (Cost $934,126) | | 934,126 |
| * | Non-income producing security. |
| (a) | The rate shown is the 7-day yield. |
| (b) | The rate shown is the current daily overnight rate. |
Schwab Target Funds | Annual Report
Portfolio Holdings as of October 31, 2019 (continued)
Below is a summary of the fund’s transactions with its affiliated underlying funds during the period ended October 31, 2019:
| Affiliated Underlying Funds | Market
Value at
10/31/18 | Gross
Purchases | Gross
Sales | Realized
Gains (Losses) | Net Change
in Unrealized
Appreciation
(depreciation) | Market
Value at
10/31/19 | Balance
of Shares
Held at
10/31/19 | Distributions
Received* |
| Laudus International MarketMasters Fund (formerly Laudus International MarketMasters Fund, Select Shares) | $20,550,044 | $2,979,756 | $— | $— | $380,313 | $23,910,113 | 1,044,566 | $1,865,756 |
| Laudus Small-Cap MarketMasters Fund, Select Shares | 3,335,103 | — | (2,904,226) | (319,552) | (111,325) | — | — | 315,865 |
| Laudus U.S. Large Cap Growth Fund | 8,641,161 | 1,256,982 | (941,000) | 125,900 | 688,814 | 9,771,857 | 435,855 | 654,982 |
| Schwab Core Equity Fund | 17,943,628 | 2,884,387 | — | — | 43,022 | 20,871,037 | 954,323 | 2,234,387 |
| Schwab Dividend Equity Fund | 4,092,578 | 561,718 | — | — | (44,846) | 4,609,450 | 305,869 | 407,718 |
| Schwab Global Real Estate Fund | 5,847,007 | 558,920 | — | — | 1,102,055 | 7,507,982 | 898,084 | 258,921 |
| Schwab Intermediate-Term Bond Fund | 862,227 | 1,785 | (875,097) | (36,901) | 47,986 | — | — | 5,249 |
| Schwab International Core Equity Fund | 13,851,897 | 1,192,822 | — | — | 631,133 | 15,675,852 | 1,561,340 | 362,822 |
| Schwab S&P 500 Index Fund | 21,077,950 | 1,088,635 | (392,000) | 41,870 | 2,528,738 | 24,345,193 | 516,116 | 508,635 |
| Schwab Short-Term Bond Index Fund | 755,748 | 1,281,276 | — | — | 59,278 | 2,096,302 | 207,349 | 41,278 |
| Schwab Small-Cap Equity Fund | 6,320,366 | 3,154,881 | — | — | (1,117,763) | 8,357,484 | 501,048 | 1,207,881 |
| Schwab U.S. Aggregate Bond Index Fund | 5,031,351 | 1,054,790 | (810,000) | 7,080 | 412,188 | 5,695,409 | 548,691 | 156,796 |
| Schwab U.S. Mid-Cap Index Fund | 2,126,038 | 282,192 | — | — | 266,496 | 2,674,726 | 60,391 | 27,192 |
| Schwab Variable Share Price Money Fund, Ultra Shares | 2,269,522 | 428,383 | (1,620,000) | 35 | 408 | 1,078,348 | 1,077,809 | 27,019 |
| Total | $112,704,620 | $16,726,527 | ($7,542,323) | ($181,568) | $4,886,497 | $126,593,753 | | $8,074,501 |
| * | Distributions received include distributions from net investment income and capital gains, if any, from the underlying funds. |
| | |
The following is a summary of the inputs used to value the fund’s investments as of October 31, 2019 (see financial note 2(a) for additional information):
| Description | Quoted Prices in
Active Markets for
Identical Assets
(Level 1) | Other Significant
Observable Inputs
(Level 2) | Significant
Unobservable Inputs
(Level 3) | Total | |
| Assets | | | | | |
| Affiliated Underlying Funds1 | $126,593,753 | $— | $— | $126,593,753 | |
| Unaffiliated Underlying Funds1 | 34,257,819 | — | — | 34,257,819 | |
| Short-Term Investment1 | — | 934,126 | — | 934,126 | |
| Total | $160,851,572 | $934,126 | $— | $161,785,698 | |
| 1 | As categorized in Portfolio Holdings. |
Fund investments in underlying mutual funds are classified as Level 1, without consideration to the classification level of the investments held by the underlying mutual funds, which could be Level 1, Level 2 or Level 3.
Schwab Target Funds | Annual Report
Statement of Assets and Liabilities
As of October 31, 2019
| Assets |
| Investments in affiliated underlying funds, at value (cost $115,936,470) | | $126,593,753 |
| Investments in unaffiliated funds and issuers, at value (cost $34,250,790) | | 35,191,945 |
| Receivables: | | |
| Fund shares sold | | 300,042 |
| Dividends | | 30,690 |
| Due from investment adviser | | 12,209 |
| Prepaid expenses | + | 6,032 |
| Total assets | | 162,134,671 |
| Liabilities |
| Payables: | | |
| Investments bought | | 30,015 |
| Fund shares redeemed | | 52,719 |
| Accrued expenses | + | 35,179 |
| Total liabilities | | 117,913 |
| Net Assets |
| Total assets | | 162,134,671 |
| Total liabilities | – | 117,913 |
| Net assets | | $162,016,758 |
| Net Assets by Source | | |
| Capital received from investors | | 144,392,188 |
| Total distributable earnings | | 17,624,570 |
| Net Asset Value (NAV) |
| Net Assets | ÷ | Shares
Outstanding | = | NAV |
| $162,016,758 | | 11,676,524 | | $13.88 |
| | | | | |
Schwab Target Funds | Annual Report
Statement of Operations
For the period November 1, 2018 through October 31, 2019
| Investment Income |
| Dividends received from affiliated underlying funds | | $1,854,013 |
| Dividends received from unaffiliated underlying funds | | 608,103 |
| Interest | + | 16,312 |
| Total investment income | | 2,478,428 |
| Expenses |
| Professional fees | | 27,060 |
| Registration fees | | 24,787 |
| Shareholder reports | | 20,394 |
| Portfolio accounting fees | | 16,529 |
| Independent trustees’ fees | | 8,676 |
| Transfer agent fees | | 4,562 |
| Custodian fees | | 4,232 |
| Other expenses | + | 6,045 |
| Total expenses | | 112,285 |
| Expense reduction by CSIM and its affiliates | – | 112,285 |
| Net expenses | – | — |
| Net investment income | | 2,478,428 |
| Realized and Unrealized Gains (Losses) |
| Realized capital gain distributions received from affiliated underlying funds | | 6,220,488 |
| Realized capital gain distributions received from unaffiliated underlying funds | | 949,012 |
| Net realized losses on sales of affiliated underlying funds | | (181,568) |
| Net realized losses on sales of unaffiliated underlying funds | + | (360,696) |
| Net realized gains | | 6,627,236 |
| Net change in unrealized appreciation (depreciation) on affiliated underlying funds | | 4,886,497 |
| Net change in unrealized appreciation (depreciation) on unaffiliated underlying funds | + | 1,564,440 |
| Net change in unrealized appreciation (depreciation) | + | 6,450,937 |
| Net realized and unrealized gains | | 13,078,173 |
| Increase in net assets resulting from operations | | $15,556,601 |
Schwab Target Funds | Annual Report
Statement of Changes in Net Assets
For the current and prior report periods
| Operations | |
| | 11/1/18-10/31/19 | 11/1/17-10/31/18 |
| Net investment income | | $2,478,428 | $2,092,475 |
| Net realized gains | | 6,627,236 | 6,261,986 |
| Net change in unrealized appreciation (depreciation) | + | 6,450,937 | (11,064,418) |
| Increase (decrease) in net assets from operations | | 15,556,601 | (2,709,957) |
| Distributions to Shareholders | |
| Total distributions | | ($8,203,160) | ($3,508,200) |
| Transactions in Fund Shares | | | |
| | | 11/1/18-10/31/19 | 11/1/17-10/31/18 |
| | | SHARES | VALUE | SHARES | VALUE |
| Shares sold | | 2,379,015 | $31,439,276 | 2,900,247 | $41,054,579 |
| Shares reinvested | | 685,490 | 8,033,942 | 244,001 | 3,416,012 |
| Shares redeemed | + | (1,786,094) | (23,623,378) | (1,449,612) | (20,558,109) |
| Net transactions in fund shares | | 1,278,411 | $15,849,840 | 1,694,636 | $23,912,482 |
| Shares Outstanding and Net Assets | | | |
| | | 11/1/18-10/31/19 | 11/1/17-10/31/18 |
| | | SHARES | NET ASSETS | SHARES | NET ASSETS |
| Beginning of period | | 10,398,113 | $138,813,477 | 8,703,477 | $121,119,152 |
| Total increase | + | 1,278,411 | 23,203,281 | 1,694,636 | 17,694,325 |
| End of period | | 11,676,524 | $162,016,758 | 10,398,113 | $138,813,477 |
Schwab Target Funds | Annual Report
Financial Statements
Financial Highlights
| | 11/1/18–
10/31/19 | 11/1/17–
10/31/18 | 11/1/16–
10/31/17 | 11/1/15–
10/31/16 | 11/1/14–
10/31/15 | |
| Per-Share Data |
| Net asset value at beginning of period | $13.49 | $14.07 | $12.08 | $12.60 | $12.75 | |
| Income (loss) from investment operations: | | | | | | |
| Net investment income (loss)1 | 0.21 | 0.21 | 0.16 | 0.15 | 0.13 | |
| Net realized and unrealized gains (losses) | 1.11 | (0.41) | 2.47 | 0.01 | 0.18 | |
| Total from investment operations | 1.32 | (0.20) | 2.63 | 0.16 | 0.31 | |
| Less distributions: | | | | | | |
| Distributions from net investment income | (0.31) | (0.36) | (0.18) | (0.23) | (0.30) | |
| Distributions from net realized gains | (0.47) | (0.02) | (0.46) | (0.45) | (0.16) | |
| Total distributions | (0.78) | (0.38) | (0.64) | (0.68) | (0.46) | |
| Net asset value at end of period | $14.03 | $13.49 | $14.07 | $12.08 | $12.60 | |
| Total return | 10.87% | (1.50%) | 22.68% | 1.39% | 2.44% | |
| Ratios/Supplemental Data |
| Ratios to average net assets: | | | | | | |
| Net operating expenses2 | 0.00% | 0.00%3 | 0.00% | 0.01%4 | 0.00%3 | |
| Gross operating expenses2 | 0.08% | 0.07% | 0.11% | 0.16% | 0.25% | |
| Net investment income (loss) | 1.54% | 1.45% | 1.27% | 1.31% | 1.05% | |
| Portfolio turnover rate | 7% | 10% | 10% | 1% | 8% | |
| Net assets, end of period (x 1,000,000) | $161 | $122 | $104 | $68 | $53 | |
| |
1
Calculated based on the average shares outstanding during the period.
2
The expenses incurred by underlying funds in which the fund invests are not included in this ratio.
3
Less than 0.005%; the ratio of net operating expenses would have been 0.00%, if certain non-routine expenses had not been incurred.
4
The ratio of net operating expenses would have been 0.00%, if certain non-routine expenses had not been incurred.
Schwab Target Funds | Annual Report
Portfolio Holdings as of October 31, 2019
This section shows all the securities in the fund’s portfolio and their values as of the report date.
The fund files its complete schedule of portfolio holdings with the U.S. Securities and Exchange Commission (SEC) for the first and third quarters of each fiscal year on Form N-Q. Effective March 31, 2019, Form N-PORT Part F has replaced Form N-Q. The fund’s Form N-Q and Form N-PORT Part F are available on the SEC’s website atwww.sec.gov. The fund also makes available its complete schedule of portfolio holdings 15 to 20 days after the end of the month on the fund’s website atwww.schwabfunds.com/schwabfunds_prospectus.
| Security | Number
of Shares | Value ($) |
| Affiliated Underlying Funds79.4% of net assets |
| |
| Equity Funds 75.4% |
| Global Real Estate 4.7% |
| Schwab Global Real Estate Fund | 903,160 | 7,550,419 |
| International 25.4% |
| Laudus International MarketMasters Fund | 1,074,033 | 24,584,626 |
| Schwab International Core Equity Fund | 1,625,390 | 16,318,911 |
| | | 40,903,537 |
| Large-Cap 38.1% |
| Laudus U.S. Large Cap Growth Fund * | 485,838 | 10,892,497 |
| Schwab Core Equity Fund | 974,597 | 21,314,438 |
| Schwab Dividend Equity Fund | 329,746 | 4,969,277 |
| Schwab S&P 500 Index Fund | 512,833 | 24,190,315 |
| | | 61,366,527 |
| Mid-Cap 1.7% |
| Schwab U.S. Mid-Cap Index Fund | 60,447 | 2,677,178 |
| Small-Cap 5.5% |
| Schwab Small-Cap Equity Fund | 530,711 | 8,852,260 |
| | | 121,349,921 |
| |
| Fixed-Income Funds 3.6% |
| Intermediate-Term Bond 2.6% |
| Schwab U.S. Aggregate Bond Index Fund | 395,962 | 4,110,083 |
| Short-Term Bond 1.0% |
| Schwab Short-Term Bond Index Fund | 166,037 | 1,678,637 |
| | | 5,788,720 |
| |
| Money Market Fund 0.4% |
| Schwab Variable Share Price Money Fund, Ultra Shares 1.85%(a) | 694,032 | 694,379 |
| Total Affiliated Underlying Funds |
| (Cost $117,646,073) | | 127,833,020 |
|
| Unaffiliated Underlying Funds20.1% of net assets |
| |
| Equity Funds 15.3% |
| International 4.9% |
| Goldman Sachs Emerging Markets Equity Insights Fund, Institutional Class | 852,691 | 7,955,607 |
| Security | Number
of Shares | Value ($) |
| Large-Cap 8.6% |
| ClearBridge Large Cap Growth Fund, Class IS | 71,582 | 3,841,115 |
| Dodge & Cox Stock Fund | 52,072 | 9,947,403 |
| | | 13,788,518 |
| Small-Cap 1.8% |
| ClearBridge Small Cap Growth Fund, Class IS * | 74,263 | 2,824,947 |
| | | 24,569,072 |
| |
| Fixed-Income Funds 4.8% |
| Intermediate-Term Bond 3.6% |
| Baird Aggregate Bond Fund, Institutional Class | 21,649 | 243,985 |
| Loomis Sayles Investment Grade Bond Fund, Class Y | 222,677 | 2,538,516 |
| Metropolitan West Total Return Bond Fund, Class I | 274,292 | 3,039,158 |
| | | 5,821,659 |
| International Bond 1.2% |
| PIMCO International Bond Fund (U.S. Dollar-Hedged), Institutional Class | 173,052 | 1,945,102 |
| | | 7,766,761 |
| Total Unaffiliated Underlying Funds |
| (Cost $31,633,944) | | 32,335,833 |
Issuer
Rate, Maturity Date | Face
Amount ($) | Value ($) |
| Short-Term Investment0.2% of net assets |
| |
| Time Deposit 0.2% |
| Citibank |
| 1.18%, 11/01/19(b) | 400,135 | 400,135 |
| Total Short-Term Investment |
| (Cost $400,135) | | 400,135 |
| * | Non-income producing security. |
| (a) | The rate shown is the 7-day yield. |
| (b) | The rate shown is the current daily overnight rate. |
Schwab Target Funds | Annual Report
Portfolio Holdings as of October 31, 2019 (continued)
Below is a summary of the fund’s transactions with its affiliated underlying funds during the period ended October 31, 2019:
| Affiliated Underlying Funds | Market
Value at
10/31/18 | Gross
Purchases | Gross
Sales | Realized
Gains (Losses) | Net Change
in Unrealized
Appreciation
(depreciation) | Market
Value at
10/31/19 | Balance
of Shares
Held at
10/31/19 | Distributions
Received* |
| Laudus International MarketMasters Fund (formerly Laudus International MarketMasters Fund, Select Shares) | $18,879,895 | $5,553,221 | ($416,000) | ($95,612) | $663,122 | $24,584,626 | 1,074,033 | $1,688,221 |
| Laudus Small-Cap MarketMasters Fund, Select Shares | 3,137,924 | — | (2,732,521) | (318,072) | (87,331) | — | — | 297,190 |
| Laudus U.S. Large Cap Growth Fund | 8,247,861 | 1,998,625 | (133,000) | 374 | 778,637 | 10,892,497 | 485,838 | 617,625 |
| Schwab Core Equity Fund | 16,430,186 | 4,723,538 | — | — | 160,714 | 21,314,438 | 974,597 | 2,036,538 |
| Schwab Dividend Equity Fund | 3,906,516 | 1,594,782 | (521,000) | (61,752) | 50,731 | 4,969,277 | 329,746 | 395,782 |
| Schwab Global Real Estate Fund | 5,464,854 | 1,019,803 | — | — | 1,065,762 | 7,550,419 | 903,160 | 253,804 |
| Schwab Intermediate-Term Bond Fund | 467,715 | 968 | (474,697) | (21,080) | 27,094 | — | — | 2,848 |
| Schwab International Core Equity Fund | 12,229,280 | 3,596,742 | (133,000) | (17,914) | 643,803 | 16,318,911 | 1,625,390 | 334,742 |
| Schwab S&P 500 Index Fund | 18,650,781 | 2,998,478 | — | — | 2,541,056 | 24,190,315 | 512,833 | 450,478 |
| Schwab Short-Term Bond Index Fund | 673,246 | 959,576 | — | — | 45,815 | 1,678,637 | 166,037 | 32,075 |
| Schwab Small-Cap Equity Fund | 5,798,217 | 4,231,813 | (159,000) | (60,567) | (958,203) | 8,852,260 | 530,711 | 1,100,813 |
| Schwab U.S. Aggregate Bond Index Fund | 2,907,025 | 1,267,206 | (340,000) | 5,355 | 270,497 | 4,110,083 | 395,962 | 106,227 |
| Schwab U.S. Mid-Cap Index Fund | 1,996,844 | 410,540 | — | — | 269,794 | 2,677,178 | 60,447 | 25,539 |
| Schwab Variable Share Price Money Fund, Ultra Shares | 1,920,364 | 518,683 | (1,745,000) | 103 | 229 | 694,379 | 694,032 | 17,337 |
| Total | $100,710,708 | $28,873,975 | ($6,654,218) | ($569,165) | $5,471,720 | $127,833,020 | | $7,359,219 |
| * | Distributions received include distributions from net investment income and capital gains, if any, from the underlying funds. |
| | |
The following is a summary of the inputs used to value the fund’s investments as of October 31, 2019 (see financial note 2(a) for additional information):
| Description | Quoted Prices in
Active Markets for
Identical Assets
(Level 1) | Other Significant
Observable Inputs
(Level 2) | Significant
Unobservable Inputs
(Level 3) | Total | |
| Assets | | | | | |
| Affiliated Underlying Funds1 | $127,833,020 | $— | $— | $127,833,020 | |
| Unaffiliated Underlying Funds1 | 32,335,833 | — | — | 32,335,833 | |
| Short-Term Investment1 | — | 400,135 | — | 400,135 | |
| Total | $160,168,853 | $400,135 | $— | $160,568,988 | |
| 1 | As categorized in Portfolio Holdings. |
Fund investments in underlying mutual funds are classified as Level 1, without consideration to the classification level of the investments held by the underlying mutual funds, which could be Level 1, Level 2 or Level 3.
Schwab Target Funds | Annual Report
Statement of Assets and Liabilities
As of October 31, 2019
| Assets |
| Investments in affiliated underlying funds, at value (cost $117,646,073) | | $127,833,020 |
| Investments in unaffiliated funds and issuers, at value (cost $32,034,079) | | 32,735,968 |
| Receivables: | | |
| Investments sold | | 416,000 |
| Fund shares sold | | 92,348 |
| Dividends | | 22,586 |
| Due from investment adviser | | 13,292 |
| Prepaid expenses | + | 5,777 |
| Total assets | | 161,118,991 |
| Liabilities |
| Payables: | | |
| Investments bought | | 22,151 |
| Fund shares redeemed | | 54,711 |
| Accrued expenses | + | 39,195 |
| Total liabilities | | 116,057 |
| Net Assets |
| Total assets | | 161,118,991 |
| Total liabilities | – | 116,057 |
| Net assets | | $161,002,934 |
| Net Assets by Source | | |
| Capital received from investors | | 144,939,468 |
| Total distributable earnings | | 16,063,466 |
| Net Asset Value (NAV) |
| Net Assets | ÷ | Shares
Outstanding | = | NAV |
| $161,002,934 | | 11,477,753 | | $14.03 |
| | | | | |
Schwab Target Funds | Annual Report
Statement of Operations
For the period November 1, 2018 through October 31, 2019
| Investment Income |
| Dividends received from affiliated underlying funds | | $1,657,957 |
| Dividends received from unaffiliated underlying funds | | 526,505 |
| Interest | + | 15,438 |
| Total investment income | | 2,199,900 |
| Expenses |
| Registration fees | | 27,380 |
| Professional fees | | 26,986 |
| Shareholder reports | | 23,096 |
| Portfolio accounting fees | | 16,433 |
| Independent trustees’ fees | | 8,627 |
| Transfer agent fees | | 5,735 |
| Custodian fees | | 5,216 |
| Other expenses | + | 5,917 |
| Total expenses | | 119,390 |
| Expense reduction by CSIM and its affiliates | – | 119,390 |
| Net expenses | – | — |
| Net investment income | | 2,199,900 |
| Realized and Unrealized Gains (Losses) |
| Realized capital gain distributions received from affiliated underlying funds | | 5,701,262 |
| Realized capital gain distributions received from unaffiliated underlying funds | | 848,632 |
| Net realized losses on sales of affiliated underlying funds | | (569,165) |
| Net realized losses on sales of unaffiliated underlying funds | + | (293,403) |
| Net realized gains | | 5,687,326 |
| Net change in unrealized appreciation (depreciation) on affiliated underlying funds | | 5,471,720 |
| Net change in unrealized appreciation (depreciation) on unaffiliated underlying funds | + | 1,290,434 |
| Net change in unrealized appreciation (depreciation) | + | 6,762,154 |
| Net realized and unrealized gains | | 12,449,480 |
| Increase in net assets resulting from operations | | $14,649,380 |
Schwab Target Funds | Annual Report
Statement of Changes in Net Assets
For the current and prior report periods
| Operations | |
| | 11/1/18-10/31/19 | 11/1/17-10/31/18 |
| Net investment income | | $2,199,900 | $1,737,353 |
| Net realized gains | | 5,687,326 | 5,498,901 |
| Net change in unrealized appreciation (depreciation) | + | 6,762,154 | (10,041,332) |
| Increase (decrease) in net assets from operations | | 14,649,380 | (2,805,078) |
| Distributions to Shareholders | |
| Total distributions | | ($7,175,224) | ($2,923,022) |
| Transactions in Fund Shares | | | |
| | | 11/1/18-10/31/19 | 11/1/17-10/31/18 |
| | | SHARES | VALUE | SHARES | VALUE |
| Shares sold | | 3,665,701 | $48,849,543 | 2,657,737 | $38,112,073 |
| Shares reinvested | | 591,705 | 6,993,949 | 199,234 | 2,825,139 |
| Shares redeemed | + | (1,854,387) | (24,773,359) | (1,184,406) | (16,913,367) |
| Net transactions in fund shares | | 2,403,019 | $31,070,133 | 1,672,565 | $24,023,845 |
| Shares Outstanding and Net Assets | | | |
| | | 11/1/18-10/31/19 | 11/1/17-10/31/18 |
| | | SHARES | NET ASSETS | SHARES | NET ASSETS |
| Beginning of period | | 9,074,734 | $122,458,645 | 7,402,169 | $104,162,900 |
| Total increase | + | 2,403,019 | 38,544,289 | 1,672,565 | 18,295,745 |
| End of period | | 11,477,753 | $161,002,934 | 9,074,734 | $122,458,645 |
Schwab Target Funds | Annual Report
Financial Statements
Financial Highlights
| | 11/1/18–
10/31/19 | 11/1/17–
10/31/18 | 11/1/16–
10/31/17 | 11/1/15–
10/31/16 | 11/1/14–
10/31/15 | |
| Per-Share Data |
| Net asset value at beginning of period | $13.60 | $14.18 | $12.09 | $12.63 | $12.79 | |
| Income (loss) from investment operations: | | | | | | |
| Net investment income (loss)1 | 0.21 | 0.20 | 0.16 | 0.15 | 0.13 | |
| Net realized and unrealized gains (losses) | 1.10 | (0.39) | 2.55 | 0.002 | 0.17 | |
| Total from investment operations | 1.31 | (0.19) | 2.71 | 0.15 | 0.30 | |
| Less distributions: | | | | | | |
| Distributions from net investment income | (0.31) | (0.37) | (0.17) | (0.23) | (0.30) | |
| Distributions from net realized gains | (0.45) | (0.02) | (0.45) | (0.46) | (0.16) | |
| Total distributions | (0.76) | (0.39) | (0.62) | (0.69) | (0.46) | |
| Net asset value at end of period | $14.15 | $13.60 | $14.18 | $12.09 | $12.63 | |
| Total return | 10.73% | (1.49%) | 23.35% | 1.28% | 2.36% | |
| Ratios/Supplemental Data |
| Ratios to average net assets: | | | | | | |
| Net operating expenses3 | 0.00% | 0.00%4 | 0.00% | 0.01%5 | 0.00%4 | |
| Gross operating expenses3 | 0.13% | 0.11% | 0.19% | 0.27% | 0.44% | |
| Net investment income (loss) | 1.53% | 1.41% | 1.24% | 1.26% | 1.03% | |
| Portfolio turnover rate | 6% | 10% | 9% | 1% | 8% | |
| Net assets, end of period (x 1,000,000) | $94 | $73 | $60 | $38 | $29 | |
| |
1
Calculated based on the average shares outstanding during the period.
2
Per-share amount was less than $0.005.
3
The expenses incurred by underlying funds in which the fund invests are not included in this ratio.
4
Less than 0.005%; the ratio of net operating expenses would have been 0.00%, if certain non-routine expenses had not been incurred.
5
The ratio of net operating expenses would have been 0.00%, if certain non-routine expenses had not been incurred.
Schwab Target Funds | Annual Report
Portfolio Holdings as of October 31, 2019
This section shows all the securities in the fund’s portfolio and their values as of the report date.
The fund files its complete schedule of portfolio holdings with the U.S. Securities and Exchange Commission (SEC) for the first and third quarters of each fiscal year on Form N-Q. Effective March 31, 2019, Form N-PORT Part F has replaced Form N-Q. The fund’s Form N-Q and Form N-PORT Part F are available on the SEC’s website atwww.sec.gov. The fund also makes available its complete schedule of portfolio holdings 15 to 20 days after the end of the month on the fund’s website atwww.schwabfunds.com/schwabfunds_prospectus.
| Security | Number
of Shares | Value ($) |
| Affiliated Underlying Funds79.8% of net assets |
| |
| Equity Funds 77.3% |
| Global Real Estate 4.8% |
| Schwab Global Real Estate Fund | 537,955 | 4,497,300 |
| International 26.2% |
| Laudus International MarketMasters Fund | 645,664 | 14,779,238 |
| Schwab International Core Equity Fund | 971,635 | 9,755,219 |
| | | 24,534,457 |
| Large-Cap 39.0% |
| Laudus U.S. Large Cap Growth Fund * | 308,078 | 6,907,119 |
| Schwab Core Equity Fund | 577,424 | 12,628,257 |
| Schwab Dividend Equity Fund | 207,899 | 3,133,035 |
| Schwab S&P 500 Index Fund | 295,569 | 13,941,998 |
| | | 36,610,409 |
| Mid-Cap 1.7% |
| Schwab U.S. Mid-Cap Index Fund | 35,664 | 1,579,537 |
| Small-Cap 5.6% |
| Schwab Small-Cap Equity Fund | 314,844 | 5,251,592 |
| | | 72,473,295 |
| |
| Fixed-Income Funds 2.5% |
| Intermediate-Term Bond 1.7% |
| Schwab U.S. Aggregate Bond Index Fund | 153,503 | 1,593,363 |
| Short-Term Bond 0.8% |
| Schwab Short-Term Bond Index Fund | 77,030 | 778,773 |
| | | 2,372,136 |
| Total Affiliated Underlying Funds |
| (Cost $69,171,251) | | 74,845,431 |
|
| Unaffiliated Underlying Funds19.5% of net assets |
| |
| Equity Funds 15.8% |
| International 5.4% |
| Goldman Sachs Emerging Markets Equity Insights Fund, Institutional Class | 543,970 | 5,075,245 |
| Security | Number
of Shares | Value ($) |
| Large-Cap 8.5% |
| ClearBridge Large Cap Growth Fund, Class IS | 37,532 | 2,013,994 |
| Dodge & Cox Stock Fund | 31,365 | 5,991,714 |
| | | 8,005,708 |
| Small-Cap 1.9% |
| ClearBridge Small Cap Growth Fund, Class IS * | 45,711 | 1,738,844 |
| | | 14,819,797 |
| |
| Fixed-Income Funds 3.7% |
| Intermediate-Term Bond 2.8% |
| Baird Aggregate Bond Fund, Institutional Class | 21,793 | 245,602 |
| Loomis Sayles Investment Grade Bond Fund, Class Y | 102,065 | 1,163,539 |
| Metropolitan West Total Return Bond Fund, Class I | 106,642 | 1,181,592 |
| | | 2,590,733 |
| International Bond 0.9% |
| PIMCO International Bond Fund (U.S. Dollar-Hedged), Institutional Class | 74,240 | 834,461 |
| | | 3,425,194 |
| Total Unaffiliated Underlying Funds |
| (Cost $17,946,455) | | 18,244,991 |
Issuer
Rate, Maturity Date | Face
Amount ($) | Value ($) |
| Short-Term Investment0.6% of net assets |
| |
| Time Deposit 0.6% |
| JPMorgan Chase Bank |
| 1.18%, 11/01/19(a) | 594,485 | 594,485 |
| Total Short-Term Investment |
| (Cost $594,485) | | 594,485 |
| * | Non-income producing security. |
| (a) | The rate shown is the current daily overnight rate. |
Schwab Target Funds | Annual Report
Portfolio Holdings as of October 31, 2019 (continued)
Below is a summary of the fund’s transactions with its affiliated underlying funds during the period ended October 31, 2019:
| Affiliated Underlying Funds | Market
Value at
10/31/18 | Gross
Purchases | Gross
Sales | Realized
Gains (Losses) | Net Change
in Unrealized
Appreciation
(depreciation) | Market
Value at
10/31/19 | Balance
of Shares
Held at
10/31/19 | Distributions
Received* |
| Laudus International MarketMasters Fund | $11,495,156 | $3,012,437 | $— | $— | $271,645 | $14,779,238 | 645,664 | $1,059,437 |
| Laudus Small-Cap MarketMasters Fund, Select Shares | 1,843,099 | 150,000 | (1,741,800) | (202,585) | (48,714) | — | — | 189,439 |
| Laudus U.S. Large Cap Growth Fund | 5,506,094 | 899,565 | — | — | 501,460 | 6,907,119 | 308,078 | 419,564 |
| Schwab Core Equity Fund | 9,896,131 | 2,669,212 | — | — | 62,914 | 12,628,257 | 577,424 | 1,241,211 |
| Schwab Dividend Equity Fund | 2,537,938 | 620,262 | — | — | (25,165) | 3,133,035 | 207,899 | 255,262 |
| Schwab Global Real Estate Fund | 3,300,147 | 559,720 | — | — | 637,433 | 4,497,300 | 537,955 | 150,720 |
| Schwab Intermediate-Term Bond Fund | 174,949 | 363 | (177,561) | (7,287) | 9,536 | — | — | 1,065 |
| Schwab International Core Equity Fund | 7,725,913 | 1,858,364 | (221,000) | (38,449) | 430,391 | 9,755,219 | 971,635 | 202,364 |
| Schwab S&P 500 Index Fund | 11,037,543 | 1,454,570 | — | — | 1,449,885 | 13,941,998 | 295,569 | 269,569 |
| Schwab Short-Term Bond Index Fund | 378,138 | 380,480 | — | — | 20,155 | 778,773 | 77,030 | 14,481 |
| Schwab Small-Cap Equity Fund | 3,787,284 | 2,112,238 | — | — | (647,930) | 5,251,592 | 314,844 | 700,239 |
| Schwab U.S. Aggregate Bond Index Fund | 1,038,462 | 451,356 | — | — | 103,545 | 1,593,363 | 153,503 | 40,359 |
| Schwab U.S. Mid-Cap Index Fund | 1,229,534 | 186,726 | — | — | 163,277 | 1,579,537 | 35,664 | 15,726 |
| Schwab Variable Share Price Money Fund, Ultra Shares | 1,111,810 | 6,462 | (1,118,384) | 71 | 41 | — | — | 6,312 |
| Total | $61,062,198 | $14,361,755 | ($3,258,745) | ($248,250) | $2,928,473 | $74,845,431 | | $4,565,748 |
| * | Distributions received include distributions from net investment income and capital gains, if any, from the underlying funds. |
| | |
The following is a summary of the inputs used to value the fund’s investments as of October 31, 2019 (see financial note 2(a) for additional information):
| Description | Quoted Prices in
Active Markets for
Identical Assets
(Level 1) | Other Significant
Observable Inputs
(Level 2) | Significant
Unobservable Inputs
(Level 3) | Total | |
| Assets | | | | | |
| Affiliated Underlying Funds1 | $74,845,431 | $— | $— | $74,845,431 | |
| Unaffiliated Underlying Funds1 | 18,244,991 | — | — | 18,244,991 | |
| Short-Term Investment1 | — | 594,485 | — | 594,485 | |
| Total | $93,090,422 | $594,485 | $— | $93,684,907 | |
| 1 | As categorized in Portfolio Holdings. |
Fund investments in underlying mutual funds are classified as Level 1, without consideration to the classification level of the investments held by the underlying mutual funds, which could be Level 1, Level 2 or Level 3.
Schwab Target Funds | Annual Report
Statement of Assets and Liabilities
As of October 31, 2019
| Assets |
| Investments in affiliated underlying funds, at value (cost $69,171,251) | | $74,845,431 |
| Investments in unaffiliated funds and issuers, at value (cost $18,540,940) | | 18,839,476 |
| Receivables: | | |
| Fund shares sold | | 102,611 |
| Due from investment adviser | | 12,403 |
| Dividends | | 8,881 |
| Prepaid expenses | + | 5,239 |
| Total assets | | 93,814,041 |
| Liabilities |
| Payables: | | |
| Investments bought | | 8,961 |
| Fund shares redeemed | | 27,334 |
| Accrued expenses | + | 35,236 |
| Total liabilities | | 71,531 |
| Net Assets |
| Total assets | | 93,814,041 |
| Total liabilities | – | 71,531 |
| Net assets | | $93,742,510 |
| Net Assets by Source | | |
| Capital received from investors | | 84,458,593 |
| Total distributable earnings | | 9,283,917 |
| Net Asset Value (NAV) |
| Net Assets | ÷ | Shares
Outstanding | = | NAV |
| $93,742,510 | | 6,625,591 | | $14.15 |
| | | | | |
Schwab Target Funds | Annual Report
Statement of Operations
For the period November 1, 2018 through October 31, 2019
| Investment Income |
| Dividends received from affiliated underlying funds | | $971,933 |
| Dividends received from unaffiliated underlying funds | | 285,461 |
| Interest | + | 9,854 |
| Total investment income | | 1,267,248 |
| Expenses |
| Professional fees | | 26,652 |
| Registration fees | | 23,364 |
| Shareholder reports | | 22,358 |
| Portfolio accounting fees | | 15,674 |
| Independent trustees’ fees | | 8,336 |
| Transfer agent fees | | 4,606 |
| Custodian fees | | 4,356 |
| Other expenses | + | 5,346 |
| Total expenses | | 110,692 |
| Expense reduction by CSIM and its affiliates | – | 110,692 |
| Net expenses | – | — |
| Net investment income | | 1,267,248 |
| Realized and Unrealized Gains (Losses) |
| Realized capital gain distributions received from affiliated underlying funds | | 3,593,815 |
| Realized capital gain distributions received from unaffiliated underlying funds | | 501,606 |
| Net realized losses on sales of affiliated underlying funds | | (248,250) |
| Net realized losses on sales of unaffiliated underlying funds | + | (158,629) |
| Net realized gains | | 3,688,542 |
| Net change in unrealized appreciation (depreciation) on affiliated underlying funds | | 2,928,473 |
| Net change in unrealized appreciation (depreciation) on unaffiliated underlying funds | + | 685,993 |
| Net change in unrealized appreciation (depreciation) | + | 3,614,466 |
| Net realized and unrealized gains | | 7,303,008 |
| Increase in net assets resulting from operations | | $8,570,256 |
Schwab Target Funds | Annual Report
Statement of Changes in Net Assets
For the current and prior report periods
| Operations | |
| | 11/1/18-10/31/19 | 11/1/17-10/31/18 |
| Net investment income | | $1,267,248 | $1,001,544 |
| Net realized gains | | 3,688,542 | 3,199,905 |
| Net change in unrealized appreciation (depreciation) | + | 3,614,466 | (5,978,156) |
| Increase (decrease) in net assets from operations | | 8,570,256 | (1,776,707) |
| Distributions to Shareholders | |
| Total distributions | | ($4,215,901) | ($1,708,287) |
| Transactions in Fund Shares | | | |
| | | 11/1/18-10/31/19 | 11/1/17-10/31/18 |
| | | SHARES | VALUE | SHARES | VALUE |
| Shares sold | | 1,825,581 | $24,571,388 | 1,756,977 | $25,445,073 |
| Shares reinvested | | 343,303 | 4,088,743 | 115,085 | 1,645,717 |
| Shares redeemed | + | (930,807) | (12,531,078) | (691,784) | (10,025,434) |
| Net transactions in fund shares | | 1,238,077 | $16,129,053 | 1,180,278 | $17,065,356 |
| Shares Outstanding and Net Assets | | | |
| | | 11/1/18-10/31/19 | 11/1/17-10/31/18 |
| | | SHARES | NET ASSETS | SHARES | NET ASSETS |
| Beginning of period | | 5,387,514 | $73,259,102 | 4,207,236 | $59,678,740 |
| Total increase | + | 1,238,077 | 20,483,408 | 1,180,278 | 13,580,362 |
| End of period | | 6,625,591 | $93,742,510 | 5,387,514 | $73,259,102 |
Schwab Target Funds | Annual Report
Financial Statements
Financial Highlights
| | 11/1/18–
10/31/19 | 11/1/17–
10/31/18 | 11/1/16–
10/31/17 | 8/25/161–
10/31/16 | | |
| Per-Share Data |
| Net asset value at beginning of period | $11.53 | $12.02 | $9.83 | $10.00 | | |
| Income (loss) from investment operations: | | | | | | |
| Net investment income (loss)2 | 0.16 | 0.14 | 0.08 | 0.01 | | |
| Net realized and unrealized gains (losses) | 0.99 | (0.32) | 2.22 | (0.18) | | |
| Total from investment operations | 1.15 | (0.18) | 2.30 | (0.17) | | |
| Less distributions: | | | | | | |
| Distributions from net investment income | (0.26) | (0.29) | (0.11) | — | | |
| Distributions from net realized gains | (0.26) | (0.02) | — | — | | |
| Total distributions | (0.52) | (0.31) | (0.11) | — | | |
| Net asset value at end of period | $12.16 | $11.53 | $12.02 | $9.83 | | |
| Total return | 10.85% | (1.64%) | 23.63% | (1.70%)3 | | |
| Ratios/Supplemental Data |
| Ratios to average net assets: | | | | | | |
| Net operating expenses4 | 0.00% | 0.00% | 0.00% | 0.00%5 | | |
| Gross operating expenses4 | 0.67% | 0.73% | 1.89% | 7.87%5 | | |
| Net investment income (loss) | 1.42% | 1.18% | 0.75% | 0.43%5 | | |
| Portfolio turnover rate | 13% | 22% | 7% | 0%3 | | |
| Net assets, end of period (x 1,000,000) | $16 | $10 | $6 | $1 | | |
| |
1
Commencement of operations.
2
Calculated based on the average shares outstanding during the period.
3
Not annualized.
4
The expenses incurred by underlying funds in which the fund invests are not included in this ratio.
5
Annualized (except for non-recurring professional fees and shareholder report fees).
Schwab Target Funds | Annual Report
Portfolio Holdings as of October 31, 2019
This section shows all the securities in the fund’s portfolio and their values as of the report date.
The fund files its complete schedule of portfolio holdings with the U.S. Securities and Exchange Commission (SEC) for the first and third quarters of each fiscal year on Form N-Q. Effective March 31, 2019, Form N-PORT Part F has replaced Form N-Q. The fund’s Form N-Q and Form N-PORT Part F are available on the SEC’s website atwww.sec.gov. The fund also makes available its complete schedule of portfolio holdings 15 to 20 days after the end of the month on the fund’s website atwww.schwabfunds.com/schwabfunds_prospectus.
| Security | Number
of Shares | Value ($) |
| Affiliated Underlying Funds81.1% of net assets |
| |
| Equity Funds 79.3% |
| Global Real Estate 4.9% |
| Schwab Global Real Estate Fund | 92,062 | 769,641 |
| International 26.7% |
| Laudus International MarketMasters Fund | 110,556 | 2,530,622 |
| Schwab International Core Equity Fund | 167,603 | 1,682,737 |
| | | 4,213,359 |
| Large-Cap 40.1% |
| Laudus U.S. Large Cap Growth Fund * | 55,526 | 1,244,898 |
| Schwab Core Equity Fund | 98,858 | 2,162,028 |
| Schwab Dividend Equity Fund | 35,992 | 542,402 |
| Schwab S&P 500 Index Fund | 50,223 | 2,369,029 |
| | | 6,318,357 |
| Mid-Cap 1.7% |
| Schwab U.S. Mid-Cap Index Fund | 6,203 | 274,719 |
| Small-Cap 5.9% |
| Schwab Small-Cap Equity Fund | 55,465 | 925,151 |
| | | 12,501,227 |
| |
| Fixed-Income Funds 1.8% |
| Intermediate-Term Bond 1.3% |
| Schwab U.S. Aggregate Bond Index Fund | 19,354 | 200,897 |
| Short-Term Bond 0.5% |
| Schwab Short-Term Bond Index Fund | 7,420 | 75,020 |
| | | 275,917 |
| Total Affiliated Underlying Funds |
| (Cost $12,320,901) | | 12,777,144 |
|
| Unaffiliated Underlying Funds18.5% of net assets |
| |
| Equity Funds 16.0% |
| International 5.9% |
| Goldman Sachs Emerging Markets Equity Insights Fund, Institutional Class | 100,204 | 934,902 |
| Security | Number
of Shares | Value ($) |
| Large-Cap 8.2% |
| ClearBridge Large Cap Growth Fund, Class IS | 5,817 | 312,160 |
| Dodge & Cox Stock Fund | 5,127 | 979,502 |
| | | 1,291,662 |
| Small-Cap 1.9% |
| ClearBridge Small Cap Growth Fund, Class IS * | 7,954 | 302,554 |
| | | 2,529,118 |
| |
| Fixed-Income Funds 2.5% |
| Intermediate-Term Bond 2.0% |
| Baird Aggregate Bond Fund, Institutional Class | 392 | 4,416 |
| Loomis Sayles Investment Grade Bond Fund, Class Y | 13,400 | 152,762 |
| Metropolitan West Total Return Bond Fund, Class I | 13,845 | 153,404 |
| | | 310,582 |
| International Bond 0.5% |
| PIMCO International Bond Fund (U.S. Dollar-Hedged), Institutional Class | 7,173 | 80,630 |
| | | 391,212 |
| Total Unaffiliated Underlying Funds |
| (Cost $2,881,823) | | 2,920,330 |
Issuer
Rate, Maturity Date | Face
Amount ($) | Value ($) |
| Short-Term Investment0.5% of net assets |
| |
| Time Deposit 0.5% |
| Sumitomo Mitsui Trust Bank, Limited |
| 1.18%, 11/01/19(a) | 78,940 | 78,940 |
| Total Short-Term Investment |
| (Cost $78,940) | | 78,940 |
| * | Non-income producing security. |
| (a) | The rate shown is the current daily overnight rate. |
Schwab Target Funds | Annual Report
Portfolio Holdings as of October 31, 2019 (continued)
Below is a summary of the fund’s transactions with its affiliated underlying funds during the period ended October 31, 2019:
| Affiliated Underlying Funds | Market
Value at
10/31/18 | Gross
Purchases | Gross
Sales | Realized
Gains (Losses) | Net Change
in Unrealized
Appreciation
(depreciation) | Market
Value at
10/31/19 | Balance
of Shares
Held at
10/31/19 | Distributions
Received* |
| Laudus International MarketMasters Fund (formerly Laudus International MarketMasters Fund, Select Shares) | $1,667,986 | $930,013 | ($129,000) | ($25,207) | $86,830 | $2,530,622 | 110,556 | $159,012 |
| Laudus Small-Cap MarketMasters Fund, Select Shares | 282,473 | 25,000 | (268,312) | (62,406) | 23,245 | — | — | 29,181 |
| Laudus U.S. Large Cap Growth Fund | 819,665 | 369,938 | (28,000) | (892) | 84,187 | 1,244,898 | 55,526 | 65,938 |
| Schwab Core Equity Fund | 1,442,577 | 814,192 | (125,000) | (13,877) | 44,136 | 2,162,028 | 98,858 | 186,193 |
| Schwab Dividend Equity Fund | 369,814 | 275,985 | (104,000) | (13,152) | 13,755 | 542,402 | 35,992 | 40,985 |
| Schwab Global Real Estate Fund | 481,230 | 209,241 | (22,000) | 109 | 101,061 | 769,641 | 92,062 | 24,241 |
| Schwab Intermediate-Term Bond Fund | 10,562 | 22 | (10,719) | (303) | 438 | — | — | 64 |
| Schwab International Core Equity Fund | 1,117,371 | 575,152 | (73,000) | (11,502) | 74,716 | 1,682,737 | 167,603 | 31,652 |
| Schwab S&P 500 Index Fund | 1,540,113 | 805,934 | (210,000) | (876) | 233,858 | 2,369,029 | 50,223 | 39,434 |
| Schwab Short-Term Bond Index Fund | 14,975 | 83,228 | (25,000) | 23 | 1,794 | 75,020 | 7,420 | 1,514 |
| Schwab Small-Cap Equity Fund | 543,059 | 539,849 | (59,000) | (16,547) | (82,210) | 925,151 | 55,465 | 106,849 |
| Schwab U.S. Aggregate Bond Index Fund | 121,520 | 66,844 | — | — | 12,533 | 200,897 | 19,354 | 4,844 |
| Schwab U.S. Mid-Cap Index Fund | 175,441 | 73,433 | — | — | 25,845 | 274,719 | 6,203 | 2,433 |
| Schwab Variable Share Price Money Fund, Ultra Shares | 151,628 | 882 | (152,525) | 10 | 5 | — | — | 861 |
| Total | $8,738,414 | $4,769,713 | ($1,206,556) | ($144,620) | $620,193 | $12,777,144 | | $693,201 |
| * | Distributions received include distributions from net investment income and capital gains, if any, from the underlying funds. |
| | |
The following is a summary of the inputs used to value the fund’s investments as of October 31, 2019 (see financial note 2(a) for additional information):
| Description | Quoted Prices in
Active Markets for
Identical Assets
(Level 1) | Other Significant
Observable Inputs
(Level 2) | Significant
Unobservable Inputs
(Level 3) | Total | |
| Assets | | | | | |
| Affiliated Underlying Funds1 | $12,777,144 | $— | $— | $12,777,144 | |
| Unaffiliated Underlying Funds1 | 2,920,330 | — | — | 2,920,330 | |
| Short-Term Investment1 | — | 78,940 | — | 78,940 | |
| Total | $15,697,474 | $78,940 | $— | $15,776,414 | |
| 1 | As categorized in Portfolio Holdings. |
Fund investments in underlying mutual funds are classified as Level 1, without consideration to the classification level of the investments held by the underlying mutual funds, which could be Level 1, Level 2 or Level 3.
Schwab Target Funds | Annual Report
Statement of Assets and Liabilities
As of October 31, 2019
| Assets |
| Investments in affiliated underlying funds, at value (cost $12,320,901) | | $12,777,144 |
| Investments in unaffiliated funds and issuers, at value (cost $2,960,763) | | 2,999,270 |
| Receivables: | | |
| Due from investment adviser | | 10,241 |
| Fund shares sold | | 3,024 |
| Prepaid expenses | + | 12,033 |
| Total assets | | 15,801,712 |
| Liabilities |
| Payables: | | |
| Fund shares redeemed | | 7,906 |
| Accrued expenses | + | 28,638 |
| Total liabilities | | 36,544 |
| Net Assets |
| Total assets | | 15,801,712 |
| Total liabilities | – | 36,544 |
| Net assets | | $15,765,168 |
| Net Assets by Source | | |
| Capital received from investors | | 14,932,467 |
| Total distributable earnings | | 832,701 |
| Net Asset Value (NAV) |
| Net Assets | ÷ | Shares
Outstanding | = | NAV |
| $15,765,168 | | 1,296,906 | | $12.16 |
| | | | | |
Schwab Target Funds | Annual Report
Statement of Operations
For the period November 1, 2018 through October 31, 2019
| Investment Income |
| Dividends received from affiliated underlying funds | | $147,010 |
| Dividends received from unaffiliated underlying funds | | 40,697 |
| Interest | + | 1,065 |
| Total investment income | | 188,772 |
| Expenses |
| Professional fees | | 26,121 |
| Registration fees | | 21,400 |
| Portfolio accounting fees | | 14,829 |
| Shareholder reports | | 8,089 |
| Independent trustees’ fees | | 7,989 |
| Custodian fees | | 4,810 |
| Transfer agent fees | | 1,250 |
| Other expenses | + | 4,667 |
| Total expenses | | 89,155 |
| Expense reduction by CSIM and its affiliates | – | 89,155 |
| Net expenses | – | — |
| Net investment income | | 188,772 |
| Realized and Unrealized Gains (Losses) |
| Realized capital gain distributions received from affiliated underlying funds | | 546,191 |
| Realized capital gain distributions received from unaffiliated underlying funds | | 75,036 |
| Net realized losses on sales of affiliated underlying funds | | (144,620) |
| Net realized losses on sales of unaffiliated underlying funds | + | (64,154) |
| Net realized gains | | 412,453 |
| Net change in unrealized appreciation (depreciation) on affiliated underlying funds | | 620,193 |
| Net change in unrealized appreciation (depreciation) on unaffiliated underlying funds | + | 140,428 |
| Net change in unrealized appreciation (depreciation) | + | 760,621 |
| Net realized and unrealized gains | | 1,173,074 |
| Increase in net assets resulting from operations | | $1,361,846 |
Schwab Target Funds | Annual Report
Statement of Changes in Net Assets
For the current and prior report periods
| Operations | |
| | 11/1/18-10/31/19 | 11/1/17-10/31/18 |
| Net investment income | | $188,772 | $110,764 |
| Net realized gains | | 412,453 | 286,971 |
| Net change in unrealized appreciation (depreciation) | + | 760,621 | (782,577) |
| Increase (decrease) in net assets from operations | | 1,361,846 | (384,842) |
| Distributions to Shareholders | |
| Total distributions | | ($501,444) | ($176,152) |
| Transactions in Fund Shares | | | |
| | | 11/1/18-10/31/19 | 11/1/17-10/31/18 |
| | | SHARES | VALUE | SHARES | VALUE |
| Shares sold | | 663,372 | $7,706,262 | 717,620 | $8,830,977 |
| Shares reinvested | | 46,852 | 478,361 | 13,723 | 166,592 |
| Shares redeemed | + | (321,911) | (3,759,126) | (299,186) | (3,681,826) |
| Net transactions in fund shares | | 388,313 | $4,425,497 | 432,157 | $5,315,743 |
| Shares Outstanding and Net Assets | | | |
| | | 11/1/18-10/31/19 | 11/1/17-10/31/18 |
| | | SHARES | NET ASSETS | SHARES | NET ASSETS |
| Beginning of period | | 908,593 | $10,479,269 | 476,436 | $5,724,520 |
| Total increase | + | 388,313 | 5,285,899 | 432,157 | 4,754,749 |
| End of period | | 1,296,906 | $15,765,168 | 908,593 | $10,479,269 |
Schwab Target Funds | Annual Report
1. Business Structure of the Funds:
Each of the funds in this report is a series of Schwab Capital Trust (the trust), a no-load, open-end management investment company. The trust is organized as a Massachusetts business trust and is registered under the Investment Company Act of 1940, as amended (the 1940 Act). The list below shows all the funds in the trust as of the end of the period, including the funds discussed in this report, which are highlighted:
| SCHWAB CAPITAL TRUST (ORGANIZED MAY 7, 1993) |
| Schwab Target 2010 Fund | Schwab Large-Cap Growth Fund |
| Schwab Target 2015 Fund | Schwab Small-Cap Equity Fund |
| Schwab Target 2020 Fund | Schwab Hedged Equity Fund |
| Schwab Target 2025 Fund | Schwab Health Care Fund |
| Schwab Target 2030 Fund | Schwab International Core Equity Fund |
| Schwab Target 2035 Fund | Schwab Fundamental US Large Company Index Fund |
| Schwab Target 2040 Fund | Schwab Fundamental US Small Company Index Fund |
| Schwab Target 2045 Fund | Schwab Fundamental International Large Company Index Fund |
| Schwab Target 2050 Fund | Schwab Fundamental International Small Company Index Fund |
| Schwab Target 2055 Fund | Schwab Fundamental Emerging Markets Large Company Index Fund |
| Schwab Target 2060 Fund | Schwab Fundamental Global Real Estate Index Fund |
| Schwab S&P 500 Index Fund | Schwab Target 2010 Index Fund |
| Schwab Small-Cap Index Fund® | Schwab Target 2015 Index Fund |
| Schwab Total Stock Market Index Fund® | Schwab Target 2020 Index Fund |
| Schwab U.S. Large-Cap Growth Index Fund | Schwab Target 2025 Index Fund |
| Schwab U.S. Large-Cap Value Index Fund | Schwab Target 2030 Index Fund |
| Schwab U.S. Mid-Cap Index Fund | Schwab Target 2035 Index Fund |
| Schwab International Index Fund® | Schwab Target 2040 Index Fund |
| Schwab MarketTrack All Equity Portfolio™ | Schwab Target 2045 Index Fund |
| Schwab MarketTrack Growth Portfolio™ | Schwab Target 2050 Index Fund |
| Schwab MarketTrack Balanced Portfolio™ | Schwab Target 2055 Index Fund |
| Schwab MarketTrack Conservative Portfolio™ | Schwab Target 2060 Index Fund |
| Laudus International MarketMasters Fund™ | Schwab Monthly Income Fund - Moderate Payout |
| Schwab Balanced Fund | Schwab Monthly Income Fund - Enhanced Payout |
| Schwab Core Equity Fund | Schwab Monthly Income Fund - Maximum Payout |
| Schwab Dividend Equity Fund | |
The Schwab Target Funds are “funds of funds.” Each of the funds seeks to achieve its investment objective by investing in a combination of other affiliated Schwab and/or Laudus Funds and other unaffiliated, third-party mutual funds, in accordance with its target portfolio allocation. Each fund may also invest directly in equity and fixed-income securities, exchange-traded funds (ETFs), and cash and cash equivalents, including money market securities.
Each fund in this report offers one share class. Shares are bought and sold at closing net asset value per share (NAV), which is the price for all outstanding shares of a fund. Each share has a par value of 1/1,000 of a cent, and the funds’ Board of Trustees (the Board) may authorize the issuance of as many shares as necessary.
Each fund maintains its own account for purposes of holding assets and accounting, and is considered a separate entity for tax purposes. Within its account, each fund may also keep certain assets in segregated accounts, as required by securities law.
2. Significant Accounting Policies:
The following is a summary of the significant accounting policies the funds use in their preparation of financial statements. The funds follow the investment company accounting and reporting guidance of the Financial Accounting Standards Board (FASB) Accounting Standard CodificationTopic 946 Financial Services — Investment Companies. The accounting policies are in conformity with accounting principles generally accepted in the United States of America (GAAP).
The financial statements of the funds should be read in conjunction with the underlying funds’ financial statements. For more information about the underlying funds’ operations and policies, please refer to those funds’ semiannual and annual reports, which are filed with the U.S. Securities and Exchange Commission (SEC) and are available on the SEC’s website at www.sec.gov.
Schwab Target Funds | Annual Report
Financial Notes(continued)
2. Significant Accounting Policies (continued):
(a) Security Valuation:
Under procedures approved by the Board, the investment adviser has formed a Pricing Committee to administer the pricing and valuation of portfolio securities and other assets and to ensure that prices used for internal purposes or provided by third parties reasonably reflect fair market value. Among other things, these procedures allow the funds to utilize independent pricing services, quotations from securities and financial instrument dealers and other market sources to determine fair value.
The funds value the securities in their portfolios every business day. The funds use the following policies to value various types of securities:
• Underlying funds:Mutual funds are valued at their respective NAVs.
• Securities for which no quoted value is available:The Board has adopted procedures to fair value each fund’s securities when market prices are not “readily available” or are unreliable. For example, a fund may fair value a security when it is de-listed or its trading is halted or suspended; when a security’s primary pricing source is unable or unwilling to provide a price; or when a security’s primary trading market is closed during regular market hours. Each fund makes fair value determinations in good faith in accordance with the fund’s valuation procedures. The Pricing Committee considers a number of factors, including unobservable market inputs when arriving at fair value. The Pricing Committee may employ techniques such as the review of related or comparable assets or liabilities, related market activities, recent transactions, market multiples, book values, transactional back-testing, disposition analysis and other relevant information. The Pricing Committee regularly reviews these inputs and assumptions to calibrate the valuations. Due to the subjective and variable nature of fair value pricing, there can be no assurance that a fund could obtain the fair value assigned to the security upon the sale of such security. The Board convenes on a regular basis to review fair value determinations made by the funds pursuant to the valuation procedures.
• Cash management sweep time deposits: Balances held in cash management sweep time deposits are accounted for on a cost basis, which approximates market value.
In accordance with the authoritative guidance on fair value measurements and disclosures under GAAP, the funds disclose the fair value of their investments in a hierarchy that prioritizes the significant inputs to valuation techniques used to measure the fair value. The hierarchy gives the highest priority to valuations based upon unadjusted quoted prices in active markets for identical assets or liabilities (Level 1 measurements) and the lowest priority to valuations based upon unobservable inputs that are significant to the valuation (Level 3 measurements). If inputs used to measure the financial instruments fall within different levels of the hierarchy, the categorization is based on the lowest level input that is significant to the valuation. If the funds determine that either the volume and/or level of activity for an asset or liability has significantly decreased (from normal conditions for that asset or liability) or price quotations or observable inputs are not associated with orderly transactions, increased analysis and management judgment will be required to estimate fair value.
The three levels of the fair value hierarchy are as follows:
• Level 1—quoted prices in active markets for identical securities—Investments whose values are based on quoted market prices in active markets, and whose values are therefore classified as Level 1 prices, include active listed equities. Investments in mutual funds are valued daily at their NAVs, which are classified as Level 1 prices, without consideration to the classification level of the specific investments held by an underlying fund.
• Level 2—other significant observable inputs (including quoted prices for similar securities, interest rates, prepayment speeds, credit risk, etc.)—Investments that trade in markets that are not considered to be active, but whose values are based on quoted market prices, dealer quotations or valuations provided by alternative pricing sources supported by observable inputs are classified as Level 2 prices. These generally include U.S. government and sovereign obligations, most government agency securities, investment-grade corporate bonds, certain mortgage products, less liquid listed equities, and state, municipal and provincial obligations.
• Level 3—significant unobservable inputs (including the funds’ own assumptions in determining the fair value of investments)—Investments whose values are classified as Level 3 prices have significant unobservable inputs, as they may trade infrequently or not at all. When observable prices are not available for these securities, the funds use one or more valuation techniques for which sufficient and reliable data is available. The inputs used by the funds in estimating the value of Level 3 prices may include the original transaction price, quoted prices for similar securities or assets in active markets, completed or pending third-party transactions in the underlying investment or comparable issuers, and changes in financial
Schwab Target Funds | Annual Report
Financial Notes(continued)
2. Significant Accounting Policies (continued):
ratios or cash flows. Level 3 prices may also be adjusted to reflect illiquidity and/or non-transferability, with the amount of such discount estimated by the funds in the absence of market information. Assumptions used by the funds due to the lack of observable inputs may significantly impact the resulting fair value and therefore the funds’ results of operations.
The inputs or methodology used for valuing securities are not necessarily an indication of the risk associated with investing in those securities.
The levels associated with valuing the funds’ investments as of October 31, 2019 are disclosed in the Portfolio Holdings.
(b) Accounting Policies for certain Portfolio Investments (if held):
Cash Management Transactions: The funds may subscribe to the Brown Brothers Harriman & Co. (BBH) Cash Management Service Sweep (CMS Sweep). The BBH CMS Sweep is an investment product that automatically sweeps the funds’ cash balances into overnight offshore time deposits with either the BBH Grand Cayman branch or a branch of a pre-approved commercial bank. This fully automated program allows the funds to earn interest on cash balances. Excess cash invested with deposit institutions domiciled outside of the U.S., as with any offshore deposit, may be subject to sovereign actions in the jurisdiction of the deposit institution including, but not limited to, freeze, seizure or diminution. The funds bear the risk associated with the repayment of principal and payment of interest on such instruments by the institution with which the deposit is ultimately placed.
(c) Security Transactions:
Security transactions are recorded as of the date the order to buy or sell the security is executed. Realized gains and losses from security transactions are based on the identified costs of the securities involved.
(d) Investment Income:
Interest income is recorded as it accrues. Dividends and distributions from portfolio securities and underlying funds are recorded on the date they are effective (the ex-dividend date), although the funds record certain foreign security dividends on the day they learn of the ex-dividend date. Any distributions from underlying funds are recorded in accordance with the character of the distributions as designated by the underlying funds.
(e) Expenses:
Expenses that are specific to a fund are charged directly to the fund. Expenses that are common to all funds within the trust generally are allocated among the funds in proportion to their average daily net assets. Each fund bears its share of the acquired fund fees and expenses of the underlying funds, which are indirect expenses incurred by the fund through its investments in the underlying funds. Such expenses are reflected in the net asset values of the underlying funds.
(f) Distributions to Shareholders:
The funds make distributions from net investment income and net realized capital gains, if any, once a year.
(g) Accounting Estimates:
The accounting policies described in this report conform to GAAP. Notwithstanding this, shareholders should understand that in order to follow these principles, fund management has to make estimates and assumptions that affect the information reported in the financial statements. It’s possible that once the results are known, they may turn out to be different from these estimates and these differences may be material.
(h) Federal Income Taxes:
The funds intend to meet federal income and excise tax requirements for regulated investment companies under subchapter M of the Internal Revenue Code, as amended. Accordingly, the funds distribute substantially all of their net investment income and net realized capital gains, if any, to their respective shareholders each year. As long as a fund meets the tax requirements, it is not required to pay federal income tax.
Schwab Target Funds | Annual Report
Financial Notes(continued)
2. Significant Accounting Policies (continued):
(i) Indemnification:
Under the funds’ organizational documents, the officers and trustees are indemnified against certain liabilities arising out of the performance of their duties to the funds. In addition, in the normal course of business the funds enter into contracts with their vendors and others that provide general indemnifications. The funds’ maximum exposure under these arrangements is unknown as this would involve future claims that may be made against the funds. However, based on experience, the funds expect the risk of loss attributable to these arrangements to be remote.
(j) Recent Accounting Standards:
In August 2018, the FASB issued Accounting Standards Update “Fair Value Measurement (Topic 820)” (ASU 2018-13) which modifies the disclosure requirements for fair value measurement by removing, modifying, or adding certain disclosures. The amendments are effective for annual periods beginning after December 15, 2019, and interim periods within those annual periods. The funds are permitted to early adopt any removed or modified disclosures upon issuance of this update and delay adoption of the additional disclosures until their effective date. The funds have early adopted certain removed or modified disclosures, including the amount of and reasons for transfers between Level 1 and Level 2 of the fair value hierarchy and the policy for timing of transfers between levels upon issuance of ASU 2018-13, and have delayed adoption of the additional disclosures until their effective date. At this time, management is currently evaluating the impact that the adoption of the additional disclosures will have on the funds’ financial statements.
3. Risk Factors:
Investing in the funds may involve certain risks, as discussed in the funds’ prospectus, including, but not limited to, those described below. Any of these risks could cause an investor to lose money.
Asset Allocation Risk. The funds are subject to the risk that the selection of the underlying funds and the allocation of a fund’s assets among the various asset classes and market segments may cause the fund to underperform other funds with a similar investment objective.
Conflicts of Interest Risk. The investment adviser’s authority to select and substitute underlying funds from a variety of affiliated and unaffiliated mutual funds and ETFs may create a conflict of interest because the fees paid to it and its affiliates by some underlying funds are higher than the fees paid by other underlying funds. The investment adviser also may have an incentive to select an affiliated underlying fund for other reasons, including to increase assets under management or to support new investment strategies. In addition, other conflicts of interest may exist where the best interests of the affiliated underlying fund may not be aligned with those of the fund. However, the investment adviser is a fiduciary to the fund and is legally obligated to act in the fund’s best interests when selecting underlying funds.
Market Risk. Financial markets rise and fall in response to a variety of factors, sometimes rapidly and unpredictably. As with any investment whose performance is tied to these markets, the value of an investment in a fund will fluctuate, which means that an investor could lose money over short or long periods.
Direct Investment Risk.The funds may invest directly in cash, cash equivalents and equity and fixed-income securities, including money market securities, to maintain their allocations. A fund’s direct investment in these securities is subject to the same or similar risks as an underlying fund’s investment in the same securities.
Underlying Fund Investment Risk.The value of an investment in the funds is based primarily on the prices of the underlying funds that the fund purchases. In turn, the price of each underlying fund is based on the value of its securities. The funds are subject to the performance, expenses and risks of the underlying funds in which they invest. Before investing in the funds, investors should assess the risks associated with the underlying funds in which the funds may invest and the types of investments made by those underlying funds. These risks include any combination of the risks described below, although a fund’s exposure to a particular risk will be proportionate to the fund’s overall asset allocation and underlying fund allocation.
• Investment Risk.The funds may experience losses with respect to their investment in an underlying fund. Further, there is no guarantee that an underlying fund will be able to achieve its objective.
• Management Risk.Generally, the underlying funds are actively managed mutual funds. Any actively managed mutual fund is subject to the risk that its investment adviser (or subadviser(s)) will select or allocate assets that could cause the fund to underperform or otherwise not meet its objective. An underlying fund’s adviser applies its own investment techniques and risk analyses in making investment decisions for the underlying fund, but there can be no guarantee that they will produce the desired results.
Schwab Target Funds | Annual Report
Financial Notes(continued)
3. Risk Factors (continued):
• Fixed Income Risk.Interest rates rise and fall over time, which will affect an underlying fund’s yield and share price. A change in a central bank’s monetary policy or improving economic conditions, among other things, may result in an increase in interest rates. A rise in interest rates could cause an underlying fund’s share price to fall. The credit quality of a portfolio investment could also cause an underlying fund’s share price to fall. An underlying fund could lose money if the issuer or guarantor of a portfolio investment or the counterparty to a derivatives contract fails to make timely principal or interest payments or otherwise honor its obligations. Fixed income securities may be paid off earlier or later than expected. Either situation could cause an underlying fund to hold securities paying lower-than-market rates of interest, which could hurt the fund’s yield or share price. Below investment-grade bonds (junk bonds) involve greater credit risk, are more volatile, involve greater risk of price declines and may be more susceptible to economic downturns than investment-grade securities.
• Equity Risk.The prices of equity securities rise and fall daily. These price movements may result from factors affecting individual companies, industries or the securities market as a whole. In addition, equity markets tend to move in cycles, which may cause stock prices to fall over short or extended periods of time.
• Market Capitalization Risk.Securities issued by companies of different market capitalizations tend to go in and out of favor based on market and economic conditions. During a period when securities of a particular market capitalization fall behind other types of investments, an underlying fund’s performance could be impacted.
• Money Market Fund Risk. The funds may invest in underlying money market funds that either seek to maintain a stable $1 net asset value (“stable share price money market funds”) or have a share price that fluctuates (“variable share price money market funds”). Although an underlying stable share price money market fund seeks to maintain a stable $1 net asset value, it is possible to lose money by investing in such a money market fund. Because the share price of an underlying variable share price money market fund will fluctuate, when the fund sells the shares it owns they may be worth more or less than what the fund originally paid for them. In addition, neither type of money market fund is designed to offer capital appreciation. Certain underlying money market funds may impose a fee upon the sale of shares or may temporarily suspend the ability to sell shares if such fund’s liquidity falls below required minimums.
• ETF Risk. When an underlying fund invests in an ETF, it will bear a proportionate share of the ETF’s expenses. In addition, lack of liquidity in the market for an ETF’s shares can result in its value being more volatile than the underlying portfolio of securities.
• Foreign Investment Risk. An underlying fund’s investments in securities of foreign issuers involve certain risks that may be greater than those associated with investments in securities of U.S. issuers. These include risks of adverse changes in foreign economic, political, regulatory and other conditions; changes in currency exchange rates or exchange control regulations (including limitations on currency movements and exchanges); the imposition of economic sanctions or other government restrictions; differing accounting, auditing, financial reporting and legal standards and practices; differing securities market structures; and higher transaction costs. These risks may negatively impact the value or liquidity of an underlying fund’s investments, and could impair the underlying fund’s ability to meet its investment objective or invest in accordance with its investment strategy. There is a risk that investments in securities denominated in, and/or receiving revenues in, foreign currencies will decline in value relative to the U.S. dollar.
• Emerging Markets Risk.Emerging market countries may be more likely to experience political turmoil or rapid changes in market or economic conditions than more developed countries. Emerging market countries often have less uniformity in accounting and reporting requirements and greater risk associated with the custody of securities. In addition, the financial stability of issuers (including governments) in emerging market countries may be more precarious than in developed countries. As a result, there may be an increased risk of illiquidity and price volatility associated with an underlying fund’s investments in emerging market countries, which may be magnified by currency fluctuations relative to the U.S. dollar, and, at times, it may be difficult to value such investments.
• Derivatives Risk. An underlying fund may use derivatives to enhance returns or hedge against market declines. Examples of derivatives are options, futures, options on futures and swaps. An option is the right to buy or sell an instrument at a specific price before a specific date. A future is an agreement to buy or sell a financial instrument at a specific price on a specific day. A swap is an agreement whereby two parties agree to exchange payment streams calculated in relation to a rate, index, instrument or certain securities and a predetermined amount. A credit default swap is an agreement in which the seller agrees to make a payment to the buyer in the event of a specified credit event in exchange for a fixed payment or series of fixed payments.
Schwab Target Funds | Annual Report
Financial Notes(continued)
3. Risk Factors (continued):
An underlying fund’s use of derivative instruments involves risks different from or possibly greater than the risks associated with investing directly in securities and other traditional investments. Certain of these risks, such as credit risk, leverage risk, liquidity risk, market risk and management risk, are discussed elsewhere in this section. An underlying fund’s use of derivatives is also subject to lack of availability risk, valuation risk, correlation risk and tax risk. Lack of availability risk is the risk that suitable derivative transactions may not be available in all circumstances for risk management or other purposes. Valuation risk is the risk that a particular derivative may be valued incorrectly. Correlation risk is the risk that changes in the value of the derivative may not correlate perfectly with the underlying asset, rate or index. Tax risk is the risk that the use of derivatives may cause an underlying fund to realize higher amounts of short-term capital gain. An underlying fund’s use of derivatives could reduce the underlying fund’s performance, increase its volatility, and could cause the fund to lose more than the initial amount invested. The use of derivatives that are subject to regulation by the Commodity Futures Trading Commission (CFTC) by an underlying fund could cause the fund to become a commodity pool, which would require the fund to comply with certain CFTC rules.
• Leverage Risk.Certain underlying fund transactions, such as derivatives transactions, short sales, reverse repurchase agreements, and mortgage dollar rolls, may give rise to a form of leverage and may expose an underlying fund to greater risk. Leverage tends to magnify the effect of any decrease or increase in the value of an underlying fund’s portfolio securities, which means even a small amount of leverage can have a disproportionately large impact on the underlying fund.
• Liquidity Risk.An underlying fund may be unable to sell certain securities, such as illiquid securities, readily at a favorable time or price, or an underlying fund may have to sell them at a loss.
• Portfolio Turnover Risk.Certain of the underlying funds may buy and sell portfolio securities actively. If they do, their portfolio turnover rate and transaction costs will rise, which may lower the underlying fund’s performance and may increase the likelihood of capital gains distributions.
• Securities Lending Risk.An underlying fund may lend its portfolio securities to brokers, dealers, and other financial institutions. Securities lending involves the risk of loss of rights in, or delay in recovery of, the loaned securities if the borrower fails to return the security loaned or becomes insolvent.
Please refer to the funds’ prospectus for a more complete description of the principal risks of investing in the funds.
4. Affiliates and Affiliated Transactions:
Investment Adviser
Charles Schwab Investment Management, Inc. (CSIM or the investment adviser), a wholly owned subsidiary of The Charles Schwab Corporation, serves as each fund’s investment adviser and administrator pursuant to an Investment Advisory and Administration Agreement between CSIM and the trust.
Shareholder Servicing
The Board has adopted a Shareholder Servicing Plan (the Plan) on behalf of the funds. The Plan enables each fund to bear expenses relating to the provision by financial intermediaries, including Charles Schwab & Co., Inc., a broker-dealer affiliate of CSIM (together, service providers), of certain shareholder services to the current shareholders of the funds. The funds are not subject to any fee under the Plan.
Expense Limitation
CSIM and its affiliates have agreed with the funds, for so long as CSIM serves as the investment adviser to the funds, which may only be amended or terminated with the approval of the Board, to limit the total annual fund operating expense charged, excluding interest, taxes and certain non-routine expenses to 0.00%.
The agreement to limit the funds’ total expenses charged is limited to each fund’s direct operating expenses and, therefore, does not apply to underlying fund fees and expenses, which are indirect expenses incurred by a fund through its investments in the underlying funds.
Schwab Target Funds | Annual Report
Financial Notes(continued)
4. Affiliates and Affiliated Transactions (continued):
Investments in Affiliates
The funds may engage in certain transactions involving related parties. Pursuant to an exemptive order issued by the SEC, the funds may invest in other related funds. As of October 31, 2019, each Schwab Target Fund’s ownership percentages of other related funds’ shares are:
| Underlying Funds | Schwab
Target
2010
Fund | Schwab
Target
2015
Fund | Schwab
Target
2020
Fund | Schwab
Target
2025
Fund | Schwab
Target
2030
Fund | Schwab
Target
2035
Fund | Schwab
Target
2040
Fund | Schwab
Target
2045
Fund | Schwab
Target
2050
Fund | Schwab
Target
2055
Fund | Schwab
Target
2060
Fund |
| Laudus International MarketMasters Fund | 0.2% | 0.4% | 2.9% | 4.0% | 8.1% | 4.3% | 9.9% | 1.7% | 1.7% | 1.0% | 0.2% |
| Laudus U.S. Large Cap Growth Fund | —% | —% | 0.0%* | 0.3% | 1.0% | 0.7% | 2.2% | 0.4% | 0.5% | 0.3% | 0.1% |
| Schwab Core Equity Fund | 0.1% | 0.2% | 1.6% | 2.5% | 4.8% | 2.5% | 5.7% | 1.0% | 1.0% | 0.6% | 0.1% |
| Schwab Dividend Equity Fund | 0.0%* | 0.0%* | 0.2% | 0.2% | 1.3% | 1.0% | 2.7% | 0.5% | 0.6% | 0.4% | 0.1% |
| Schwab Global Real Estate Fund | 0.3% | 0.5% | 3.8% | 5.2% | 10.7% | 5.8% | 13.1% | 2.3% | 2.3% | 1.4% | 0.2% |
| Schwab International Core Equity Fund | 0.2% | 0.4% | 2.8% | 3.8% | 7.8% | 4.2% | 9.5% | 1.6% | 1.7% | 1.0% | 0.2% |
| Schwab S&P 500 Index Fund | 0.0%* | 0.0%* | 0.2% | 0.2% | 0.4% | 0.2% | 0.4% | 0.1% | 0.1% | 0.0%* | 0.0%* |
| Schwab Short-Term Bond Index Fund | 0.5% | 0.8% | 4.9% | 3.6% | 4.5% | 1.6% | 2.2% | 0.2% | 0.2% | 0.1% | 0.0%* |
| Schwab Small-Cap Equity Fund | 0.1% | 0.2% | 1.7% | 2.7% | 5.9% | 3.4% | 8.1% | 1.4% | 1.5% | 0.9% | 0.2% |
| Schwab Treasury Inflation Protected Securities Index Fund | 0.3% | 0.5% | 2.8% | 1.1% | —% | —% | —% | —% | —% | —% | —% |
| Schwab U.S. Aggregate Bond Index Fund | 0.4% | 0.6% | 3.5% | 2.6% | 3.4% | 1.2% | 1.7% | 0.2% | 0.1% | 0.1% | 0.0%* |
| Schwab U.S. Mid Cap Index Fund | 0.1% | 0.2% | 1.4% | 1.8% | 3.5% | 1.9% | 4.2% | 0.8% | 0.8% | 0.4% | 0.1% |
| Schwab Variable Share Price Money Fund, Ultra Shares | 0.1% | 0.1% | 0.6% | 0.4% | 0.5% | 0.2% | 0.2% | 0.0%* | 0.0%* | —% | —% |
Interfund Borrowing and Lending
Pursuant to an exemptive order issued by the SEC, the funds may enter into interfund borrowing and lending transactions with other funds in the Fund Complex (for definition refer to Trustees and Officers section). All loans are for temporary or emergency purposes and the interest rate to be charged will be the average of the overnight repurchase agreement rate and the short-term bank loan rate. All loans are subject to numerous conditions designed to ensure fair and equitable treatment of all participating funds. The interfund lending facility is subject to the oversight and periodic review by the Board. The funds had no interfund borrowing or lending activity during the period.
5. Board of Trustees:
The Board may include people who are officers and/or directors of CSIM or its affiliates. Federal securities law limits the percentage of such “interested persons” who may serve on a trust’s board, and the trusts were in compliance with these limitations throughout the report period. The trusts did not pay any of these interested persons for their services as trustees, but they did pay non-interested persons (independent trustees), as noted on each fund’s Statement of Operations. For information regarding the trustees, please refer to the Trustees and Officers table at the end of this report.
6. Borrowing from Banks:
During the period, the funds were participants with other U.S. registered investment companies managed by CSIM in a joint, syndicated, committed $750 million line of credit (the Syndicated Credit Facility), which matured on October 3, 2019. On October 3, 2019, the Syndicated Credit Facility was amended to run for a new 364 day period with the line of credit amount remaining unchanged, maturing on October 1, 2020. Under the terms of the Syndicated Credit Facility, in addition to the interest charged on any borrowings by a fund, each fund paid a commitment fee of 0.15% per annum on the funds’ proportionate share of the unused portion of the Syndicated Credit Facility.
Schwab Target Funds | Annual Report
Financial Notes(continued)
6. Borrowing from Banks (continued):
During the period, the funds were participants with other U.S. registered investment companies managed by CSIM in a joint, unsecured, uncommitted $500 million line of credit (the Uncommitted Credit Facility), with State Street Bank and Trust Company, which matured on November 30, 2018. On November 30, 2018, the Uncommitted Credit Facility was amended to run for a new 364 day period with the line of credit amount remaining unchanged, maturing November 29, 2019. Under the terms of the Uncommitted Credit Facility, each fund pays interest on the amount a fund borrows. There were no borrowings from either line of credit during the period.
The funds also have access to custodian overdraft facilities. A fund may have utilized the overdraft facility and incurred an interest expense, which is disclosed on the fund’s Statement of Operations, if any. The interest expense is determined based on a negotiated rate above the current Federal Funds Rate.
7. Purchases and Sales of Investment Securities:
For the period ended October 31, 2019, purchases and sales of securities (excluding short-term obligations) were as follows:
| | Purchases
of Securities | Sales
of Securities |
| Schwab Target 2010 Fund | $6,497,493 | $10,449,721 |
| Schwab Target 2015 Fund | 8,328,876 | 21,995,328 |
| Schwab Target 2020 Fund | 73,466,282 | 97,494,859 |
| Schwab Target 2025 Fund | 101,208,574 | 84,631,961 |
| Schwab Target 2030 Fund | 161,315,715 | 169,490,334 |
| Schwab Target 2035 Fund | 86,074,779 | 70,418,355 |
| Schwab Target 2040 Fund | 157,966,400 | 147,605,986 |
| Schwab Target 2045 Fund | 28,617,738 | 11,849,403 |
| Schwab Target 2050 Fund | 42,333,388 | 10,019,732 |
| Schwab Target 2055 Fund | 22,000,203 | 5,078,836 |
| Schwab Target 2060 Fund | 6,432,357 | 1,688,976 |
8. Federal Income Taxes:
As of October 31, 2019, the tax basis cost of the funds’ investments and gross unrealized appreciation and depreciation were as follows:
| | Schwab
Target
2010
Fund | | Schwab
Target
2015
Fund | | Schwab
Target
2020
Fund | | Schwab
Target
2025
Fund | | Schwab
Target
2030
Fund | | Schwab
Target
2035
Fund | | Schwab
Target
2040
Fund |
| Tax cost | $45,813,423 | | $70,616,840 | | $474,287,670 | | $511,220,488 | | $836,149,428 | | $421,517,820 | | $834,068,985 |
| Gross unrealized appreciation | $5,303,841 | | $10,915,545 | | $74,646,799 | | $70,015,924 | | $167,685,300 | | $63,254,350 | | $187,916,325 |
| Gross unrealized depreciation | (196,317) | | (502,788) | | (729,933) | | (4,760,628) | | (6,773,713) | | (1,796,757) | | (10,586,330) |
| Net unrealized appreciation (depreciation) | $5,107,524 | | $10,412,757 | | $73,916,866 | | $65,255,296 | | $160,911,587 | | $61,457,593 | | $177,329,995 |
| | Schwab
Target
2045
Fund | | Schwab
Target
2050
Fund | | Schwab
Target
2055
Fund | | Schwab
Target
2060
Fund |
| Tax cost | $150,623,890 | | $150,126,948 | | $87,888,756 | | $15,406,893 |
| Gross unrealized appreciation | $15,760,756 | | $14,856,942 | | $8,662,804 | | $988,236 |
| Gross unrealized depreciation | (4,598,948) | | (4,414,902) | | (2,866,653) | | (618,715) |
| Net unrealized appreciation (depreciation) | $11,161,808 | | $10,442,040 | | $5,796,151 | | $369,521 |
Schwab Target Funds | Annual Report
Financial Notes(continued)
8. Federal Income Taxes (continued):
As of October 31, 2019, the components of distributable earnings on a tax basis were as follows:
| | Schwab
Target
2010
Fund | | Schwab
Target
2015
Fund | | Schwab
Target
2020
Fund | | Schwab
Target
2025
Fund | | Schwab
Target
2030
Fund | | Schwab
Target
2035
Fund | | Schwab
Target
2040
Fund |
| Undistributed ordinary income | $763,787 | | $1,150,528 | | $7,226,192 | | $5,967,779 | | $8,722,458 | | $3,448,592 | | $5,944,812 |
| Undistributed long-term capital gains | 1,203,874 | | 2,170,173 | | 16,329,040 | | 17,305,319 | | 41,148,516 | | 19,393,661 | | 54,338,311 |
| Net unrealized appreciation (depreciation) on investments | 5,107,524 | | 10,412,757 | | 73,916,866 | | 65,255,296 | | 160,911,587 | | 61,457,593 | | 177,329,995 |
| Total | $7,075,185 | | $13,733,458 | | $97,472,098 | | $88,528,394 | | $210,782,561 | | $84,299,846 | | $237,613,118 |
| | Schwab
Target
2045
Fund | | Schwab
Target
2050
Fund | | Schwab
Target
2055
Fund | | Schwab
Target
2060
Fund |
| Undistributed ordinary income | $765,571 | | $662,969 | | $336,340 | | $50,407 |
| Undistributed long-term capital gains | 5,697,191 | | 4,958,457 | | 3,151,426 | | 412,773 |
| Net unrealized appreciation (depreciation) on investments | 11,161,808 | | 10,442,040 | | 5,796,151 | | 369,521 |
| Total | $17,624,570 | | $16,063,466 | | $9,283,917 | | $832,701 |
The primary difference between book basis and tax basis unrealized appreciation or unrealized depreciation of investments is the tax deferral of losses on wash sales. The tax cost of the funds’ investments, disclosed above, have been adjusted from their book amounts to reflect these unrealized appreciation or depreciation differences, as applicable.
Capital loss carryforwards may be used to offset future realized capital gains for federal income tax purposes. As of October 31, 2019, the funds had no capital loss carryforwards available to offset future net capital gains.
The tax basis components of distributions paid during the current and prior fiscal years were as follows:
| | Schwab
Target
2010
Fund | Schwab
Target
2015
Fund | Schwab
Target
2020
Fund | Schwab
Target
2025
Fund | Schwab
Target
2030
Fund | Schwab
Target
2035
Fund | Schwab
Target
2040
Fund |
| Current period distributions | | | | | | | |
| Ordinary income | $1,495,169 | $2,479,149 | $14,329,454 | $13,118,422 | $23,478,753 | $10,929,045 | $23,580,844 |
| Long-term capital gains | 1,406,565 | 1,713,184 | 15,403,874 | 15,468,604 | 36,194,339 | 17,030,972 | 47,677,500 |
| Prior period distributions | | | | | | | |
| Ordinary income | $1,288,370 | $2,404,301 | $13,437,649 | $12,438,291 | $24,231,554 | $11,010,719 | $26,208,462 |
| Long-term capital gains | — | 3,042,010 | 18,504,304 | 7,224,551 | 22,228,445 | 3,868,400 | 14,656,893 |
| | Schwab
Target
2045
Fund | Schwab
Target
2050
Fund | Schwab
Target
2055
Fund | Schwab
Target
2060
Fund |
| Current period distributions | | | | |
| Ordinary income | $3,334,924 | $2,879,645 | $1,737,352 | $258,171 |
| Long-term capital gains | 4,868,236 | 4,295,579 | 2,478,549 | 243,273 |
| Prior period distributions | | | | |
| Ordinary income | $3,207,884 | $2,753,123 | $1,624,107 | $169,124 |
| Long-term capital gains | 300,316 | 169,899 | 84,180 | 7,028 |
Schwab Target Funds | Annual Report
Financial Notes(continued)
8. Federal Income Taxes (continued):
Distributions paid to shareholders are based on net investment income and net realized gains determined on a tax basis, which may differ from net investment income and net realized gains for financial reporting purposes. These differences reflect the differing character of certain income items and net realized gains and losses for financial statement and tax purposes, and may result in reclassification among certain capital accounts on the financial statements.
Permanent book and tax basis differences may result in reclassifications between components of net assets as required. The adjustments will have no impact on net assets or the results of operations.
As of October 31, 2019, management has reviewed the tax positions for open periods (for federal purposes, three years from the date of filing and for state purposes, four years from the date of filing) as applicable to the funds, and has determined that no provision for income tax is required in the funds’ financial statements. The funds recognize interest and penalties, if any, related to unrecognized tax benefits as income tax expense in the Statement of Operations. During the fiscal year ended October 31, 2019, the funds did not incur any interest or penalties.
9. Subsequent Events:
Management has determined there are no subsequent events or transactions through the date the financial statements were issued that would have materially impacted the financial statements as presented.
Schwab Target Funds | Annual Report
Report of Independent Registered Public Accounting Firm
To the Board of Trustees of Schwab Capital Trust and Shareholders of Schwab Target 2010 Fund, Schwab Target 2015 Fund, Schwab Target 2020 Fund, Schwab Target 2025 Fund, Schwab Target 2030 Fund, Schwab Target 2035 Fund, Schwab Target 2040 Fund, Schwab Target 2045 Fund, Schwab Target 2050 Fund, Schwab Target 2055 Fund and Schwab Target 2060 Fund
Opinions on the Financial Statements
We have audited the accompanying statements of assets and liabilities, including the portfolio holdings, of Schwab Target 2010 Fund, Schwab Target 2015 Fund, Schwab Target 2020 Fund, Schwab Target 2025 Fund, Schwab Target 2030 Fund, Schwab Target 2035 Fund, Schwab Target 2040 Fund, Schwab Target 2045 Fund, Schwab Target 2050 Fund, Schwab Target 2055 Fund and Schwab Target 2060 Fund (eleven of the funds constituting Schwab Capital Trust, hereafter collectively referred to as the “Funds”) as of October 31, 2019, the related statements of operations for the year ended October 31, 2019, the statements of changes in net assets for each of the two years in the period ended October 31, 2019, including the related notes, and the financial highlights for each of the periods indicated therein (collectively referred to as the “financial statements”). In our opinion, the financial statements present fairly, in all material respects, the financial position of each of the Funds as of October 31, 2019, the results of each of their operations for the year then ended, the changes in each of their net assets for each of the two years in the period ended October 31, 2019 and each of the financial highlights for each of the periods indicated therein in conformity with accounting principles generally accepted in the United States of America.
Basis for Opinions
These financial statements are the responsibility of the Funds’ management. Our responsibility is to express an opinion on the Funds’ financial statements based on our audits. We are a public accounting firm registered with the Public Company Accounting Oversight Board (United States) (PCAOB) and are required to be independent with respect to the Funds in accordance with the U.S. federal securities laws and the applicable rules and regulations of the Securities and Exchange Commission and the PCAOB.
We conducted our audits of these financial statements in accordance with the standards of the PCAOB. Those standards require that we plan and perform the audit to obtain reasonable assurance about whether the financial statements are free of material misstatement, whether due to error or fraud.
Our audits included performing procedures to assess the risks of material misstatement of the financial statements, whether due to error or fraud, and performing procedures that respond to those risks. Such procedures included examining, on a test basis, evidence regarding the amounts and disclosures in the financial statements. Our audits also included evaluating the accounting principles used and significant estimates made by management, as well as evaluating the overall presentation of the financial statements. Our procedures included confirmation of securities owned as of October 31, 2019 by correspondence with the custodian, transfer agents and brokers; when replies were not received from brokers, we performed other auditing procedures. We believe that our audits provide a reasonable basis for our opinions.
/s/ PricewaterhouseCoopers LLP
San Francisco, California
December 16, 2019
We have served as the auditor of one or more investment companies in the Schwab Funds Complex since 1989.
Schwab Target Funds | Annual Report
Other Federal Tax Information (unaudited)
The funds may elect to pass on the benefits of the foreign tax credit to their shareholders for the fiscal year ended October 31, 2019. The foreign tax credit and the foreign source income amounts are as follows:
| | Foreign Tax Credit | Foreign Source Income |
| Schwab Target 2010 Fund | $16,700 | $105,005 |
| Schwab Target 2015 Fund | 32,927 | 203,600 |
| Schwab Target 2020 Fund | 244,269 | 1,506,129 |
| Schwab Target 2025 Fund | 320,067 | 1,973,802 |
| Schwab Target 2030 Fund | 695,853 | 4,270,545 |
| Schwab Target 2035 Fund | 370,740 | 2,273,319 |
| Schwab Target 2040 Fund | 896,303 | 5,457,235 |
| Schwab Target 2045 Fund | 142,108 | 870,211 |
| Schwab Target 2050 Fund | 131,620 | 812,088 |
| Schwab Target 2055 Fund | 82,328 | 503,992 |
| Schwab Target 2060 Fund | 12,595 | 78,056 |
For corporate shareholders, the following percentage of the funds’ dividend distributions paid during the fiscal year ended October 31, 2019, qualify for the corporate dividends received deduction:
| | Percentage |
| Schwab Target 2010 Fund | 15.55 |
| Schwab Target 2015 Fund | 17.42 |
| Schwab Target 2020 Fund | 20.76 |
| Schwab Target 2025 Fund | 24.33 |
| Schwab Target 2030 Fund | 27.41 |
| Schwab Target 2035 Fund | 29.15 |
| Schwab Target 2040 Fund | 32.62 |
| Schwab Target 2045 Fund | 28.11 |
| Schwab Target 2050 Fund | 32.08 |
| Schwab Target 2055 Fund | 35.26 |
| Schwab Target 2060 Fund | 35.88 |
For the fiscal year ended October 31, 2019, the funds designate the following amounts of the dividend distributions as qualified dividends for the purpose of the maximum rate under section 1(h)(11) of the Internal Revenue Code. Shareholders will be notified in January 2020 via IRS Form 1099 of the amounts for use in preparing their 2019 income tax return.
| | |
| Schwab Target 2010 Fund | $358,845 |
| Schwab Target 2015 Fund | 673,385 |
| Schwab Target 2020 Fund | 4,725,771 |
| Schwab Target 2025 Fund | 5,322,155 |
| Schwab Target 2030 Fund | 11,098,596 |
| Schwab Target 2035 Fund | 5,674,094 |
| Schwab Target 2040 Fund | 13,938,022 |
| Schwab Target 2045 Fund | 1,859,080 |
| Schwab Target 2050 Fund | 1,795,280 |
| Schwab Target 2055 Fund | 1,184,231 |
| Schwab Target 2060 Fund | 180,201 |
Schwab Target Funds | Annual Report
Other Federal Tax Information (unaudited)(continued)
Under section 852(b)(3)(C) of the Internal Revenue Code, certain funds hereby designate the following amounts as long-term capital gain dividends for the fiscal year ended October 31, 2019:
| | |
| Schwab Target 2010 Fund | $1,406,565 |
| Schwab Target 2015 Fund | 1,713,184 |
| Schwab Target 2020 Fund | 15,403,874 |
| Schwab Target 2025 Fund | 15,468,604 |
| Schwab Target 2030 Fund | 36,194,339 |
| Schwab Target 2035 Fund | 17,030,972 |
| Schwab Target 2040 Fund | 47,677,500 |
| Schwab Target 2045 Fund | 4,868,236 |
| Schwab Target 2050 Fund | 4,295,579 |
| Schwab Target 2055 Fund | 2,478,549 |
| Schwab Target 2060 Fund | 243,273 |
Schwab Target Funds | Annual Report
Investment Advisory Agreement Approval
The Investment Company Act of 1940, as amended, requires that the continuation of a fund’s investment advisory agreement must be specifically approved (1) by the vote of the trustees or by a vote of the shareholders of the fund, and (2) by the vote of a majority of the trustees who are not parties to the investment advisory agreement or “interested persons” of any party (the Independent Trustees), cast in person at a meeting called for the purpose of voting on such approval. In connection with such approvals, the fund’s trustees must request and evaluate, and the investment adviser is required to furnish, such information as may be reasonably necessary to evaluate the terms of the investment advisory agreement.
The Board of Trustees (the Board or the Trustees, as appropriate) calls and holds one or more meetings each year that are dedicated, in whole or in part, to considering whether to renew the investment advisory and administration agreement (the Agreement) between Schwab Capital Trust (the Trust) and Charles Schwab Investment Management, Inc. (CSIM) with respect to the existing funds in the Trust, including Schwab Target 2010 Fund, Schwab Target 2015 Fund, Schwab Target 2020 Fund, Schwab Target 2025 Fund, Schwab Target 2030 Fund, Schwab Target 2035 Fund, Schwab Target 2040 Fund, Schwab Target 2045 Fund, Schwab Target 2050 Fund, Schwab Target 2055 Fund and Schwab Target 2060 Fund (each, a Fund and collectively, the Funds), and to review certain other agreements pursuant to which CSIM provides investment advisory services to certain other registered investment companies. In preparation for the meeting(s), the Board requests and reviews a wide variety of materials provided by CSIM, including information about CSIM’s affiliates, personnel, business goals and priorities, profitability, third-party oversight, corporate structure and operations. As part of the renewal process, the Independent Trustees’ legal counsel sends an information request letter to CSIM seeking certain relevant information. The responses by CSIM are provided to the Trustees for their review prior to their meeting, and the Trustees are provided with the opportunity to request any additional materials. The Board also receives data provided by an independent provider of investment company data. This information is in addition to the detailed information about the Funds that the Board reviews during the course of each year, including information that relates to the Funds’ operations and Fund performance, legal and compliance matters, risk management, portfolio turnover, and sales and marketing activity. The Independent Trustees receive advice from Independent Trustees’ legal counsel, including a memorandum regarding the responsibilities of trustees for the approval of investment advisory agreements. In addition, the Independent Trustees meet in executive session outside the presence of Fund management and participate in question and answer sessions with representatives of CSIM.
The Board, including a majority of the Independent Trustees, considered information specifically relating to the continuance of the Agreement with respect to the Funds at meetings held on May 13, 2019 and June 4, 2019, and approved the renewal of the Agreement with respect to the Funds for an additional one-year term at the June 4, 2019 in person meeting called for the purpose of voting on such approval.
The Board’s approval of the continuance of the Agreement with respect to the Funds was based on consideration and evaluation of a variety of specific factors discussed at these meetings and at prior meetings, including:
| 1. | the nature, extent and quality of the services provided to the Funds under the Agreement, including the resources of CSIM and its affiliates dedicated to the Funds; |
| 2. | each Fund’s investment performance and how it compared to that of certain other comparable mutual funds and benchmark data; |
| 3. | each Fund’s expenses and how those expenses compared to those of certain other similar mutual funds; |
| 4. | the profitability of CSIM and its affiliates, including Charles Schwab & Co., Inc. (Schwab), with respect to each Fund, including both direct and indirect benefits accruing to CSIM and its affiliates; and |
| 5. | the extent to which economies of scale would be realized as the Funds grow and whether fee levels in the Agreement reflect those economies of scale for the benefit of Fund investors. |
Nature, Extent and Quality of Services. The Board considered the nature, extent and quality of the services provided by CSIM to the Funds and the resources of CSIM and its affiliates dedicated to the Funds. In this regard, the Trustees evaluated, among other things, CSIM’s experience, track record, compliance program, resources dedicated to hiring and retaining skilled personnel and specialized talent, and information security resources. The Trustees also considered information provided by CSIM relating to services and support provided with respect to each Fund’s portfolio management team, portfolio strategy, and internal investment guidelines, as well as trading infrastructure, liquidity management, product design and analysis, shareholder communications, securities valuation, fund accounting and custody, and vendor and risk oversight. The Trustees also considered investments CSIM has made in its infrastructure, including modernizing CSIM’s technology and use of data, increasing expertise in key areas (including portfolio management and trade operations), and improving business continuity, cybersecurity, due diligence, risk management processes, and information security programs, which are designed to provide enhanced services to the Funds and their shareholders. The Trustees also considered that
Schwab Target Funds | Annual Report
many of the Funds’ shareholders are also brokerage clients of Schwab and considered Schwab’s wide range of products, services, and channel alternatives such as investment and research tools and an array of account features that benefit the Funds and shareholders who are brokerage clients of Schwab. Finally, the Trustees also considered Schwab’s reputation as a full service brokerage firm and its overall financial condition. Following such evaluation, the Board concluded, within the context of its full deliberations, that the nature, extent and quality of services provided by CSIM to the Funds and the resources of CSIM and its affiliates dedicated to the Funds supported renewal of the Agreement with respect to the Funds.
Fund Performance. The Board considered Fund performance in determining whether to renew the Agreement with respect to the Funds. Specifically, the Trustees considered each Fund’s performance relative to a peer category of other mutual funds and applicable indices/benchmarks, in light of total return, yield, if applicable, and market trends, as well as in consideration of each Fund’s investment style and strategy attributes and disclosures. As part of this review, the Trustees considered the composition of the peer category, selection criteria and the reputation of the independent provider of investment company data who prepared the peer category analysis. In evaluating the performance of each Fund, the Trustees considered the risk profile for such Fund and the appropriateness of the benchmark used to compare the performance of each Fund. The Trustees further considered the level of Fund performance in the context of their review of Fund expenses and adviser profitability discussed below and also noted that performance is reviewed throughout the year by a designated committee of the Board and by the Board. Following such evaluation, the Board concluded, within the context of its full deliberations, that the performance of the Funds supported renewal of the Agreement with respect to the Funds.
Fund Expenses. With respect to the Funds’ expenses, the Trustees considered the rate of compensation called for by the Agreement, and each Fund’s net operating expense ratio, in each case, in comparison to those of other similar mutual funds, such peer groups and comparisons having been selected and calculated by an independent provider of investment company data. CSIM reported to the Board, and the Board took into account, the risk assumed by CSIM in the development of products and provision of services as well as the competitive marketplace for financial products. When applicable, the Trustees considered the effects of CSIM’s and Schwab’s practice of waiving certain fees to prevent total annual Fund operating expenses from exceeding a specified cap. The Trustees also considered CSIM’s contractual commitment to keep each Fund’s expense cap for so long as CSIM serves as the adviser to such Fund. The Trustees also considered fees charged by CSIM to other mutual funds and to other types of accounts, but, with respect to such other types of accounts, accorded less weight to such comparisons due to
the different legal, regulatory, compliance and operating features of mutual funds as compared to these other types of accounts, and any differences in the nature and scope of the services CSIM provides to these other accounts, as well as differences in the market for these types of accounts. The Trustees noted that shareholders of the Funds indirectly pay their pro rata share of the fees and expenses of the underlying funds in which the Funds invest. Following such evaluation, the Board concluded, within the context of its full deliberations, that the expenses of the Funds are reasonable and supported renewal of the Agreement with respect to the Funds.
Profitability. The Trustees considered the compensation flowing to CSIM and its affiliates, directly or indirectly and reviewed profitability on a pre-tax basis, without regard to distribution expenses. In this connection, the Trustees reviewed management’s profitability analyses. The Trustees also reviewed profitability of CSIM relating to the Schwab fund complex as a whole, noting the benefit to Fund shareholders of being part of the Schwab fund complex, including the allocations of certain fixed costs across other funds in the complex. The Trustees also considered any other benefits derived by CSIM from its relationship with the Funds, such as whether, by virtue of its management of the Funds, CSIM obtains investment information or other research resources that aid it in providing advisory services to other clients. Also, because each Fund invests a portion of its assets in other funds within the Schwab fund complex, the Trustees considered whether CSIM indirectly benefits from the Fund’s investments in other underlying funds managed by CSIM. The Trustees considered whether the varied levels of compensation and profitability under the Agreement and other service agreements were reasonable and justified in light of the quality of all services rendered to each Fund by CSIM and its affiliates. The Trustees noted that CSIM continues to invest substantial sums in its business in order to provide enhanced research capabilities, services, and systems to benefit the Funds. Based on this evaluation, the Board concluded, within the context of its full deliberations, that the profitability of CSIM is reasonable and supported renewal of the Agreement with respect to the Funds.
Economies of Scale. Although the Trustees recognized the difficulty of determining economies of scale with precision, the Trustees considered the potential existence of any economies of scale and whether those are passed along to a Fund’s shareholders through (i) the enhancement of services provided to the Funds in return for fees paid, including through investments by CSIM in CSIM’s infrastructure, including modernizing CSIM’s technology and use of data, increasing expertise and capabilities in key areas (including portfolio and trade operations), and improving business continuity, cybersecurity, due diligence, and information security programs, which are designed to provide enhanced services to the Funds and their shareholders; (ii) graduated investment advisory fee schedule waivers, or expense caps by CSIM and its affiliates for those funds in the Schwab Funds complex with
Schwab Target Funds | Annual Report
such features; and (iii) pricing a fund to scale and keeping overall expenses down as the fund grows. The Trustees acknowledged that CSIM has shared any economies of scale with the Funds by investing in CSIM’s infrastructure, as discussed above, over time and that CSIM’s internal costs of providing investment management, technology, administrative, legal and compliance services to the Funds continues to increase as a result of regulatory or other developments. The Trustees considered that CSIM and its affiliates have committed resources to minimize the effects on shareholders of diseconomies of scale during periods when Fund assets were relatively small through their contractual expense waivers. For example, such diseconomies of scale may particularly affect newer funds or funds with investment strategies that are from time to time out of favor, but shareholders may benefit from the continued availability of
such funds at subsidized expense levels. Based on this evaluation, the Board concluded, within the context of its full deliberations, that the Funds obtain reasonable benefits from economies of scale.
In the course of their deliberations, the Trustees may have accorded different weights to various factors and did not identify any particular information or factor that was all important or controlling. Based on the Trustees’ deliberation and their evaluation of the information described above, the Board, including all of the Independent Trustees, approved the continuation of the Agreement with respect to the Funds and concluded that the compensation under the Agreement with respect to the Funds is fair and reasonable in light of such services and expenses and such other matters as the Trustees have considered to be relevant in the exercise of their reasonable judgment.
Schwab Target Funds | Annual Report
Trustees and Officers
The tables below give information about the trustees and officers of Schwab Capital Trust, which includes the funds covered in this report. The “Fund Complex” includes The Charles Schwab Family of Funds, Schwab Capital Trust, Schwab Investments, Schwab Annuity Portfolios, Schwab Strategic Trust and Laudus Trust. The Fund Complex includes 101 funds.
The address for all trustees and officers is 211 Main Street, San Francisco, CA 94105. You can find more information about the trustees and officers in the funds’ Statement of Additional Information, which is available free by calling 1-877-824-5615.
| Independent Trustees |
Name, Year of Birth, and
Position(s) with the trust
(Terms of office, and
length of Time Served1) | Principal Occupations
During the Past Five Years | Number of
Portfolios in
Fund Complex
Overseen by
the Trustee | Other Directorships |
Robert W. Burns
1959
Trustee
(Trustee of Schwab Strategic Trust since 2009; The Charles Schwab Family of Funds, Schwab Investments, Schwab Capital Trust, Schwab Annuity Portfolios and Laudus Trust since 2016) | Retired/Private Investor (Jan. 2009 – present). Formerly, Managing Director, Pacific Investment Management Company, LLC (PIMCO) (investment management firm) and President, PIMCO Funds. | 101 | None |
John F. Cogan
1947
Trustee
(Trustee of The Charles Schwab Family of Funds, Schwab Investments, Schwab Capital Trust and Schwab Annuity Portfolios since 2008; Laudus Trust since 2010; Schwab Strategic Trust since 2016) | Senior Fellow (Oct. 1979 – present), The Hoover Institution at Stanford University (public policy think tank); Senior Fellow (2000 – present), Stanford Institute for Economic Policy Research; Professor of Public Policy (1994 – 2015), Stanford University. | 101 | Director (2005 – present), Gilead Sciences, Inc. |
Nancy F. Heller
1956
Trustee
(Trustee of The Charles Schwab Family of Funds, Schwab Investments, Schwab Capital Trust, Schwab Annuity Portfolios, Schwab Strategic Trust and Laudus Trust since 2018) | President and Chairman (2014 – 2016), TIAA Charitable (financial services); Senior Managing Director (2003 – 2016), TIAA (financial services). | 101 | None |
Stephen Timothy Kochis
1946
Trustee
(Trustee of Schwab Strategic Trust since 2012; The Charles Schwab Family of Funds, Schwab Investments, Schwab Capital Trust, Schwab Annuity Portfolios and Laudus Trust since 2016) | CEO and Owner (May 2012 – present), Kochis Global (wealth management consulting). | 101 | None |
Schwab Target Funds | Annual Report
| Independent Trustees (continued) |
Name, Year of Birth, and
Position(s) with the trust
(Terms of office, and
length of Time Served1) | Principal Occupations
During the Past Five Years | Number of
Portfolios in
Fund Complex
Overseen by
the Trustee | Other Directorships |
David L. Mahoney
1954
Trustee
(Trustee of The Charles Schwab Family of Funds, Schwab Investments, Schwab Capital Trust, Schwab Annuity Portfolios and Laudus Trust since 2011; Schwab Strategic Trust since 2016) | Private Investor. | 101 | Director (2003 – present), Symantec Corporation
Director (2004 – present), Corcept Therapeutics Incorporated
Director (2009 – present), Adamas Pharmaceuticals, Inc. |
Jane P. Moncreiff
1961
Trustee
(Trustee of The Charles Schwab Family of Funds, Schwab Investments, Schwab Capital Trust, Schwab Annuity Portfolios, Schwab Strategic Trust and Laudus Trust since 2019) | Chief Investment Officer (2009-2017), CareGroup Healthcare System, Inc. (healthcare). | 101 | None |
Kiran M. Patel
1948
Trustee
(Trustee of The Charles Schwab Family of Funds, Schwab Investments, Schwab Capital Trust, Schwab Annuity Portfolios and Laudus Trust since 2011; Schwab Strategic Trust since 2016) | Retired. Executive Vice President and General Manager of Small Business Group (Dec. 2008 – Sept. 2013), Intuit, Inc. (financial software and services firm for consumers and small businesses). | 101 | Director (2008 – present), KLA-Tencor Corporation |
Kimberly S. Patmore
1956
Trustee
(Trustee of The Charles Schwab Family of Funds, Schwab Investments, Schwab Capital Trust, Schwab Annuity Portfolios, Schwab Strategic Trust and Laudus Trust since 2016) | Consultant (2008 – present), Patmore Management Consulting (management consulting). | 101 | None |
Gerald B. Smith
1950
Trustee
(Trustee of The Charles Schwab Family of Funds, Schwab Investments, Schwab Capital Trust and Schwab Annuity Portfolios since 2000; Laudus Trust since 2010; Schwab Strategic Trust since 2016) | Chairman, Chief Executive Officer and Founder (Mar. 1990 – present), Smith Graham & Co. (investment advisors). | 101 | Director (2012 – present), Eaton Corporation plc |
Schwab Target Funds | Annual Report
| Interested Trustees |
Name, Year of Birth, and
Position(s) with the trust
(Terms of office, and
length of Time Served1) | Principal Occupations
During the Past Five Years | Number of
Portfolios in
Fund Complex
Overseen by
the Trustee | Other Directorships |
Walter W. Bettinger II2
1960
Chairman and Trustee
(Trustee of The Charles Schwab Family of Funds, Schwab Investments, Schwab Capital Trust and Schwab Annuity Portfolios since 2008; Schwab Strategic Trust since 2009; Laudus Trust since 2010) | Director, President and Chief Executive Officer (Oct. 2008 – present), The Charles Schwab Corporation; President and Chief Executive Officer (Oct. 2008 – present) and Director (May 2008 – present), Charles Schwab & Co., Inc.; Director (Apr. 2006 – present), Charles Schwab Bank; Director (Nov. 2017 – present), Charles Schwab Premier Bank; Director (May 2008 – present) and President and Chief Executive Officer (Aug. 2017 – present), Schwab Holdings, Inc.; Director (July 2016 – present), Charles Schwab Investment Management, Inc. | 101 | Director (2008 – present), The Charles Schwab Corporation |
Jonathan de St. Paer2
1973
Trustee
(Trustee of The Charles Schwab Family of Funds, Schwab Investments, Schwab Capital Trust, Schwab Annuity Portfolios, Schwab Strategic Trust and Laudus Trust since 2019) | Director (Apr. 2019 – present), President (Oct. 2018 – present), and Chief Executive Officer (Apr. 2019 – Nov. 2019), Charles Schwab Investment Management, Inc.; Trustee and Chief Executive Officer (Apr. 2019 – present) and President (Nov. 2018 – present), Schwab Funds, Laudus Funds and Schwab ETFs; Director (Apr. 2019 – present), Charles Schwab Worldwide Funds plc and Charles Schwab Asset Management (Ireland) Limited; Senior Vice President (Apr. 2019 – present), Senior Vice President – Strategy and Product Development (CSIM) (Jan. 2014 – Mar. 2019), and Vice President (Jan. 2009 – Dec. 2013), Charles Schwab & Co., Inc. | 101 | None |
Joseph R. Martinetto2
1962
Trustee
(Trustee of The Charles Schwab Family of Funds, Schwab Investments, Schwab Capital Trust, Schwab Annuity Portfolios, Schwab Strategic Trust and Laudus Trust since 2016) | Chief Operating Officer (Feb. 2018 – present) and Senior Executive Vice President (July 2015 – Feb. 2018), The Charles Schwab Corporation; Senior Executive Vice President (July 2015 – present), Charles Schwab & Co., Inc.; Chief Financial Officer (July 2015 – Aug. 2017) and Executive Vice President and Chief Financial Officer (May 2007 – July 2015), The Charles Schwab Corporation and Charles Schwab & Co., Inc.; Director (May 2007 – present), Charles Schwab & Co., Inc.; Director (Apr. 2010 – present) and Chief Executive Officer (July 2013 – Apr. 2015), Charles Schwab Bank; Director (Nov. 2017 – present), Charles Schwab Premier Bank; Director (May 2007 – present), Chief Financial Officer (May 2007 – Aug. 2017), Senior Executive Vice President (Feb. 2016 – present), and Executive Vice President (May 2007 – Feb. 2016), Schwab Holdings, Inc. | 101 | None |
| Officers of the Trust |
Name, Year of Birth, and Position(s) with the trust
(Terms of office, and length of Time Served3) | Principal Occupations During the Past Five Years |
Jonathan de St. Paer
1973
President and Chief Executive Officer
(Officer of The Charles Schwab Family of Funds, Schwab Investments, Schwab Capital Trust, Schwab Annuity Portfolios, Schwab Strategic Trust and Laudus Trust since 2018) | Director (Apr. 2019 – present), President (Oct. 2018 – present), and Chief Executive Officer (Apr. 2019 – Nov. 2019), Charles Schwab Investment Management, Inc.; Trustee and Chief Executive Officer (Apr. 2019 – present) and President (Nov. 2018 – present), Schwab Funds, Laudus Funds and Schwab ETFs; Director (Apr. 2019 – present), Charles Schwab Worldwide Funds plc and Charles Schwab Asset Management (Ireland) Limited; Senior Vice President (Apr. 2019 – present), Senior Vice President – Strategy and Product Development (CSIM) (Jan. 2014 – Mar. 2019), and Vice President (Jan. 2009 – Dec. 2013), Charles Schwab & Co., Inc. |
Schwab Target Funds | Annual Report
| Officers of the Trust (continued) |
Name, Year of Birth, and Position(s) with the trust
(Terms of office, and length of Time Served3) | Principal Occupations During the Past Five Years |
Mark Fischer
1970
Treasurer and Chief Financial Officer
(Officer of The Charles Schwab Family of Funds, Schwab Investments, Schwab Capital Trust, Schwab Annuity Portfolios, Schwab Strategic Trust and Laudus Trust since 2013) | Treasurer and Chief Financial Officer (Jan. 2016 – present), Schwab Funds, Laudus Funds and Schwab ETFs; Assistant Treasurer (Dec. 2013 – Dec. 2015), Schwab Funds and Laudus Funds; Assistant Treasurer (Nov. 2013 – Dec. 2015), Schwab ETFs; Vice President (Oct. 2013 – present), Charles Schwab Investment Management, Inc.; Executive Director (Apr. 2011 – Sept. 2013), J.P. Morgan Investor Services; Assistant Treasurer (May 2005 – Mar. 2011), Massachusetts Financial Service Investment Management. |
George Pereira
1964
Senior Vice President and Chief Operating Officer
(Officer of The Charles Schwab Family of Funds, Schwab Investments, Schwab Capital Trust and Schwab Annuity Portfolios since 2004; Laudus Trust since 2006; Schwab Strategic Trust since 2009) | Senior Vice President and Chief Financial Officer (Nov. 2004 – present) and Chief Operating Officer (Jan. 2011 – present), Charles Schwab Investment Management, Inc.; Senior Vice President and Chief Operating Officer (Jan. 2016 – present), Schwab Funds, Laudus Funds and Schwab ETFs; Treasurer and Chief Financial Officer (June 2006 – Dec. 2015), Laudus Funds; Treasurer and Principal Financial Officer (Nov. 2004 – Dec. 2015), Schwab Funds; Treasurer and Principal Financial Officer (Oct. 2009 – Dec. 2015), Schwab ETFs; Director (Apr. 2005 – present), Charles Schwab Worldwide Funds plc and Charles Schwab Asset Management (Ireland) Limited. |
Omar Aguilar
1970
Senior Vice President and Chief Investment Officer – Equities and Multi-Asset Strategies
(Officer of The Charles Schwab Family of Funds, Schwab Investments, Schwab Capital Trust, Schwab Annuity Portfolios, Schwab Strategic Trust and Laudus Trust since 2011) | Senior Vice President and Chief Investment Officer (Apr. 2011 – present), Charles Schwab Investment Management, Inc.; Senior Vice President and Chief Investment Officer – Equities and Multi-Asset Strategies (June 2011 – present), Schwab Funds, Laudus Funds and Schwab ETFs; Head of the Portfolio Management Group and Vice President of Portfolio Management (May 2009 – Apr. 2011), Financial Engines, Inc. (investment management firm); Head of Quantitative Equity (July 2004 – Jan. 2009), ING Investment Management. |
Brett Wander
1961
Senior Vice President and Chief Investment Officer – Fixed Income
(Officer of The Charles Schwab Family of Funds, Schwab Investments, Schwab Capital Trust, Schwab Annuity Portfolios, Schwab Strategic Trust and Laudus Trust since 2011) | Senior Vice President and Chief Investment Officer (Apr. 2011 – present), Charles Schwab Investment Management, Inc.; Senior Vice President and Chief Investment Officer – Fixed Income (June 2011 – present), Schwab Funds, Laudus Funds and Schwab ETFs; Senior Managing Director and Global Head of Active Fixed-Income Strategies (Jan. 2008 – Oct. 2010), State Street Global Advisors; Director of Alpha Strategies (Apr. 2006 – Jan. 2008), Loomis, Sayles & Company (investment management firm). |
David Lekich
1964
Chief Legal Officer and Secretary, Schwab Funds and Schwab ETFs
Vice President and Assistant Clerk, Laudus Funds
(Officer of The Charles Schwab Family of Funds, Schwab Investments, Schwab Capital Trust, Schwab Annuity Portfolios, Schwab Strategic Trust and Laudus Trust since 2011) | Senior Vice President (Sept. 2011 – present) and Vice President (Mar. 2004 – Sept. 2011), Charles Schwab & Co., Inc.; Senior Vice President and Chief Counsel (Sept. 2011 – present) and Vice President (Jan. 2011 – Sept. 2011), Charles Schwab Investment Management, Inc.; Secretary (Apr. 2011 – present) and Chief Legal Officer (Dec. 2011 – present), Schwab Funds; Vice President and Assistant Clerk (Apr. 2011 – present), Laudus Funds; Secretary (May 2011 – present) and Chief Legal Officer (Nov. 2011 – present), Schwab ETFs. |
Catherine MacGregor
1964
Vice President and Assistant Secretary, Schwab Funds and Schwab ETFs
Chief Legal Officer, Vice President and Clerk, Laudus Funds
(Officer of The Charles Schwab Family of Funds, Schwab Investments, Schwab Capital Trust, Schwab Annuity Portfolios and Laudus Trust since 2005; Schwab Strategic Trust since 2009) | Vice President (July 2005 – present), Charles Schwab & Co., Inc.; Vice President (Sept. 2005 – present), Charles Schwab Investment Management, Inc.; Vice President (Dec. 2005 – present) and Chief Legal Officer and Clerk (Mar. 2007 – present), Laudus Funds; Vice President (Nov. 2005 – present) and Assistant Secretary (June 2007 – present), Schwab Funds; Vice President and Assistant Secretary (Oct. 2009 – present), Schwab ETFs. |
| 1 | Each Trustee shall hold office until the election and qualification of his or her successor, or until he or she dies, resigns or is removed. The retirement policy requires that each independent trustee retire by December 31 of the year in which the Trustee turns 74 or the Trustee’s twentieth year of service as an independent trustee on any trust in the Fund Complex, whichever occurs first. |
| 2 | Mr. Bettinger, Mr. de St. Paer and Mr. Martinetto are Interested Trustees. Mr. Bettinger is an Interested Trustee because he owns stock of The Charles Schwab Corporation (CSC), the parent company of Charles Schwab Investment Management, Inc. (CSIM), the investment adviser for the trusts in the Fund Complex, is an employee and director of Charles Schwab & Co., Inc. (CS&Co), the principal underwriter for The Charles Schwab Family of Funds, Schwab Investments, Schwab Capital Trust, Schwab Annuity Portfolios and Laudus Trust, and is a director of CSIM. Mr. de St. Paer is an Interested Trustee because he owns stock of CSC and is an employee and director of CSIM. Mr. Martinetto is an Interested Trustee because he owns stock of CSC and is an employee and director of CS&Co. |
| 3 | The President, Treasurer and Secretary/Clerk hold office until their respective successors are chosen and qualified or until he or she sooner dies, resigns, is removed or becomes disqualified. Each of the other officers serves at the pleasure of the Board. |
Schwab Target Funds | Annual Report
asset allocation The practice of dividing a portfolio among different asset classes, with each asset class assigned a particular percentage.
asset class A group of securities with similar structure and basic characteristics. Stocks, bonds and cash are the three main examples of asset classes.
Bloomberg Barclays US Aggregate Bond Index An index that is a broad-based benchmark measuring the performance of the U.S. investment grade, taxable bond market, including U.S. Treasuries, government-related and corporate bonds, mortgage pass-through securities, commercial mortgage-backed securities, and asset-backed securities that are publicly available for sale in the United States. To be eligible for inclusion in the index, securities must be fixed rate, non-convertible, U.S. dollar denominated with at least $300 million or more of outstanding face value and have one or more years remaining to maturity. The index excludes certain types of securities, including tax-exempt state and local government series bonds, structured notes embedded with swaps or other special features, private placements, floating rate securities, inflation-linked bonds and Eurobonds. The index is market capitalization weighted and the securities in the index are updated on the last business day of each month.
Bloomberg Barclays US Government/Credit 1 – 5 Year Index An index that is a broad-based benchmark measuring the performance of U.S. dollar-denominated U.S. Treasury bonds, government related bonds (i.e., U.S. and non-U.S. agencies, sovereign, quasi-sovereign, supranational and local authority debt) and investment grade U.S. corporate bonds that have a remaining maturity of greater than or equal to one year and less than five years. To be eligible for inclusion in the index, securities must be fixed rate, non-convertible, U.S. dollar denominated with at least $300 million or more of outstanding face value and have a remaining maturity greater than or equal to one year and less than five years. The index excludes certain types of securities, including, bonds with equity type features (e.g., warrants, convertibles and preferreds), tax-exempt municipal securities, inflation-linked bonds, floating rate issues, strips, private placements, U.S. dollar denominated 25 and 50 par retail bonds, structured notes and pass-through certificates. The index is market capitalization weighted and the securities in the index are updated on the last business day of each month.
Bloomberg Barclays US Intermediate Aggregate Bond Index An index that represents securities that are SEC-registered, taxable, and dollar denominated. The index covers the U.S. investment grade fixed rate bond market, with index components for government and corporate securities, mortgage pass-through securities, and asset-backed securities.
Bloomberg Barclays US Treasury Bills 1–3 Month Index An index that includes all publicly issued zero-coupon U.S. Treasury Bills that have a remaining maturity of less than 3 months but more than 1 month, are rated investment grade and have $300 million or more of outstanding face value. It excludes zero-coupon STRIPS.
Bloomberg Barclays US Treasury Inflation-Linked Bond Index (Series-L) An index which includes all publicly-issued U.S. Treasury Inflation-Protected Securities (TIPS) that have at least one year remaining to maturity, are rated investment grade and have $500 million or more of outstanding face value. The TIPS in the index must be denominated in U.S. dollars and must be fixed-rate and non-convertible. The index is market capitalization weighted and the TIPS in the index are updated on the last business day of each month. TIPS are publicly issued, dollar denominated U.S. Government
securities issued by the U.S. Treasury that have principal and interest payments linked to an official inflation measure (as measured by the Consumer Price Index, or CPI) and their payments are supported by the full faith and credit of the United States.
bond A security representing a loan from the investor to the issuer. A bond typically pays interest at a fixed rate (the coupon rate) until a specified date (the maturity date), at which time the issuer returns the money borrowed (principal or face value) to the bondholder. Because of their structure, bonds are sometimes called “fixed income securities” or “debt securities.”
An individual bond is subject to the credit risk of the issuer. Changes in interest rates can affect a bond’s market value prior to call or maturity. There is no guarantee that a bond’s yield to call or maturity will provide a positive return over the rate of inflation.
bond fund A bond fund is subject to the same credit, interest rate, and inflation risks as bonds. In addition, a bond fund incurs ongoing fees and expenses. A bond fund’s net asset value will fluctuate with the price of the underlying bonds and the portfolio turnover activity; return of principal is not guaranteed.
cap, capitalization See “market cap.”
capital gain, capital loss the difference between the amount paid for an investment and its value at a later time. If the investment has been sold, the capital gain or loss is considered a realized gain or loss. If the investment is still held, the capital gain or loss is considered unrealized appreciation or depreciation.
Dow Jones U.S. Total Stock Market Index An index which includes all publicly traded stocks of companies headquartered in the United States for which pricing information is readily available. The index is a float-adjusted market capitalization weighted index that reflects the shares of securities actually available to investors in the marketplace.
expense ratio The amount that is taken from a mutual fund’s assets each year to cover the fund’s operating expenses. An expense ratio of 0.50% means that a fund’s expenses amount to half of one percent of its average net assets a year.
FTSE EPRA Nareit Global Index (Net) An index that provides a diverse representation of publicly traded equity real estate investment trusts (REITs) and listed property companies worldwide. The index constituents are free-float adjusted, and screened on liquidity, size and revenue. The index is comprised of countries in developed and emerging markets. The Net of Tax Index is calculated based on the maximum withholding tax rates applicable to dividends received by institutional investors who are not resident in the same country as the remitting company and who do not benefit from double taxation treaties.
FTSE non-US Dollar World Government Bond Index A market capitalization index that measures the total rate of return performance for the government bonds of 22 countries, excluding the U.S., with a remaining maturity of at least 1 year.
market cap, market capitalization The value of a company as determined by the total value of all shares of its stock outstanding.
Schwab Target Funds | Annual Report
MSCI EAFE Index (Net) A free float-adjusted market capitalization index that is designed to measure the equity market performance of developed markets in Europe, Australasia, and the Far East. The Net version of the index reflects reinvested dividends net of withholding taxes, but reflects no deductions for expenses or other taxes; returns are calculated applying dividend withholding rates applicable to non-resident persons who do not benefit from double taxation treaties.
MSCI Emerging Markets Index (Net) A free float-adjusted market capitalization weighted index that is designed to measure equity market performance in the global emerging markets. This series approximates the minimum possible dividend reinvestment. The returns are calculated applying dividend withholding rates applicable to non-resident persons who do not benefit from double taxation treaties.
net asset value (NAV) The value of one share of a mutual fund. NAV is calculated by taking the fund’s total assets, subtracting liabilities, and dividing by the number of shares outstanding.
outstanding shares, shares outstanding When speaking of a company or mutual fund, indicates all shares currently held by investors.
Russell 2000 Index An index that measures the performance of the 2,000 smallest companies in the Russell 3000 Index. The Russell 3000 Index measures the performance of the largest 3,000 U.S. companies representing approximately 98% of the investable U.S. equity market.
Russell Midcap Index An index that measures the performance of the mid-cap segment of the U.S. equity universe. The Russell Midcap Index is a subset of the Russell 1000 Index. It includes approximately 800 of the smallest securities based on a combination of their market cap and current index membership.
S&P 500 Index An index that is designed to measure the performance of 500 leading publicly traded companies from a broad range of industries.
stock A share of ownership, or equity, in the issuing company.
Target 2010 Composite Index A custom blended index developed by CSIM based on the 2010 fund’s asset allocation glide schedule and will become more conservative as time elapses. Effective March 1, 2014, the Dow Jones U.S. Total Stock Market Index was replaced by a combination of the S&P 500 Index and the Russell 2000 Index. Effective August 24, 2018, the FTSE non-US Dollar World Government Bond Index was replaced by the Bloomberg Barclays Global Aggregate ex-US Hedged Index. Effective February 1, 2019, the composite is derived using the following portion allocations: 21.8% S&P 500 Index, 0.7% Russell Midcap Index, 2.0% Russell 2000 Index, 9.6% MSCI EAFE Index (Net), 37.1% Bloomberg Barclays US Aggregate Bond Index, 1.8% FTSE EPRA Nareit Global Index (Net), 6.4% Bloomberg Barclays US Treasury Inflation-Linked Bond Index (Series-L), 2.3% Bloomberg Barclays Global Aggregate ex-US Hedged Index, 1.0% Bloomberg Barclays US Government/Credit Index, 9.9% Bloomberg Barclays US Government/Credit 1-5 Year Index, and 7.3% Bloomberg Barclays US Treasury Bills 1-3 Month Index. The components that make up the composite index may vary over time. The composite index represents target allocations for 2019. Percentages listed may not total to 100% due to rounding.
Target 2015 Composite Index A custom blended index developed by CSIM based on the 2015 fund’s asset allocation glide schedule and will become more conservative as time elapses. Effective March 1, 2014, the Dow Jones U.S. Total Stock Market Index was replaced by a combination of the S&P 500 Index and the Russell 2000 Index. Effective August 24, 2018, the FTSE non-US Dollar World Government Bond Index was replaced by the Bloomberg Barclays Global Aggregate ex-US Hedged Index. Effective February 1, 2019, the composite is derived using the following portion allocations: 23.1% S&P 500 Index, 0.8% Russell Midcap Index, 2.1% Russell 2000 Index, 10.6% MSCI EAFE
Index (Net), 35.6% Bloomberg Barclays US Aggregate Bond Index, 1.9% FTSE EPRA Nareit Global Index (Net), 6.1% Bloomberg Barclays US Treasury Inflation-Linked Bond Index (Series-L), 2.4% Bloomberg Barclays Global Aggregate ex-US Hedged Index, 1.2% Bloomberg Barclays US Government/Credit Index, 9.4% Bloomberg Barclays US Government/Credit 1-5 Year Index, and 6.8% Bloomberg Barclays US Treasury Bills 1-3 Month Index. The components that make up the composite index may vary over time. The composite index represents target allocations for 2019. Percentages listed may not total to 100% due to rounding.
Target 2020 Composite Index A custom blended index developed by CSIM based on the 2020 fund’s asset allocation glide schedule and will become more conservative as time elapses. Effective March 1, 2014, the Dow Jones U.S. Total Stock Market Index was replaced by a combination of the S&P 500 Index and the Russell 2000 Index. Effective August 24, 2018, the FTSE non-US Dollar World Government Bond Index was replaced by the Bloomberg Barclays Global Aggregate ex-US Hedged Index. Effective February 1, 2019, the composite is derived using the following portion allocations: 25.4% S&P 500 Index, 0.9% Russell Midcap Index, 2.4% Russell 2000 Index, 12.3% MSCI EAFE Index (Net), 32.6% Bloomberg Barclays US Aggregate Bond Index, 2.2% FTSE EPRA Nareit Global Index (Net), 0.1% MSCI Emerging Markets Index (Net), 5.0% Bloomberg Barclays US Treasury Inflation-Linked Bond Index (Series-L), 3.0% Bloomberg Barclays Global Aggregate ex-US Hedged Index, 1.6% Bloomberg Barclays US Government/Credit Index, 8.4% Bloomberg Barclays US Government/Credit 1-5 Year Index, and 6.1% Bloomberg Barclays US Treasury Bills 1-3 Month Index. The components that make up the composite index may vary over time. The composite index represents target allocations for 2019. Percentages listed may not total to 100% due to rounding.
Target 2025 Composite Index A custom blended index developed by CSIM based on the 2025 fund’s asset allocation glide schedule and will become more conservative as time elapses. Effective March 1, 2014, the Dow Jones U.S. Total Stock Market Index was replaced by a combination of the S&P 500 Index and the Russell 2000® Index. Effective August 24, 2018, the FTSE non-US Dollar World Government Bond Index was replaced by the Bloomberg Barclays Global Aggregate ex-US Hedged Index. Effective February 1, 2019, the composite is derived using the following portion allocations: 32.3% S&P 500 Index, 1.1% Russell Midcap Index, 3.6% Russell 2000 Index, 16.1% MSCI EAFE Index (Net), 24.1% Bloomberg Barclays US Aggregate Bond Index, 2.8% FTSE EPRA Nareit Global Index (Net), 0.9% MSCI Emerging Markets Index (Net), 1.8% Bloomberg Barclays US Treasury Inflation-Linked Bond Index (Series-L), 4.5% Bloomberg Barclays Global Aggregate ex-US Hedged Index, 2.5% Bloomberg Barclays US Government/Credit Index, 5.9% Bloomberg Barclays US Government/Credit 1-5 Year Index, and 4.4% Bloomberg Barclays US Treasury Bills 1-3 Month Index. The components that make up the composite index may vary over time. The composite index represents target allocations for 2019. Percentages listed may not total to 100% due to rounding.
Target 2030 Composite Index A custom blended index developed by CSIM based on the 2030 fund’s asset allocation glide schedule and will become more conservative as time elapses. Effective March 1, 2014, the Dow Jones U.S. Total Stock Market Index was replaced by a combination of the S&P 500 Index and the Russell 2000 Index. Effective August 24, 2018, the FTSE non-US Dollar World Government Bond Index was replaced by the Bloomberg Barclays Global Aggregate ex-US Hedged Index. Effective February 1, 2019, the composite is derived using the following portion allocations: 36.9% S&P 500 Index, 1.3% Russell Midcap Index, 4.6% Russell 2000 Index, 18.9% MSCI EAFE Index (Net), 18.2% Bloomberg Barclays US Aggregate Bond Index, 3.3% FTSE EPRA Nareit Global Index (Net), 1.8% MSCI Emerging Markets Index (Net), 4.7% Bloomberg Barclays Global Aggregate ex-US
Schwab Target Funds | Annual Report
Hedged Index, 2.9% Bloomberg Barclays US Government/Credit Index, 4.2% Bloomberg Barclays US Government/Credit 1-5 Year Index, and 3.3% Bloomberg Barclays US Treasury Bills 1-3 Month Index. The components that make up the composite index may vary over time. The composite index represents target allocations for 2019. Percentages listed may not total to 100% due to rounding.
Target 2035 Composite Index A custom blended index developed by CSIM based on the 2035 fund’s asset allocation glide schedule and will become more conservative as time elapses. Effective March 1, 2014, the Dow Jones U.S. Total Stock Market Index was replaced by a combination of the S&P 500 Index and the Russell 2000 Index. Effective August 24, 2018, the FTSE non-US Dollar World Government Bond Index was replaced by the Bloomberg Barclays Global Aggregate ex-US Hedged Index. Effective February 1, 2019, the composite is derived using the following portion allocations: 40.3% S&P 500 Index, 1.4% Russell Midcap Index, 5.4% Russell 2000 Index, 21.0% MSCI EAFE Index (Net), 13.3% Bloomberg Barclays US Aggregate Bond Index, 3.7% FTSE EPRA Nareit Global Index (Net), 2.7% MSCI Emerging Markets Index (Net), 3.7% Bloomberg Barclays Global Aggregate ex-US Hedged Index, 2.8% Bloomberg Barclays US Government/Credit Index, 3.0% Bloomberg Barclays US Government/Credit 1-5 Year Index, and 2.5% Bloomberg Barclays US Treasury Bills 1-3 Month Index. The components that make up the composite index may vary over time. The composite index represents target allocations for 2019. Percentages listed may not total to 100% due to rounding.
Target 2040 Composite Index A custom blended index developed by CSIM based on the 2040 fund’s asset allocation glide schedule and will become more conservative as time elapses. Effective March 1, 2014, the Dow Jones U.S. Total Stock Market Index was replaced by a combination of the S&P 500 Index and the Russell 2000 Index. Effective August 24, 2018, the FTSE non-US Dollar World Government Bond Index was replaced by the Bloomberg Barclays Global Aggregate ex-US Hedged Index. Effective February 1, 2019, the composite is derived using the following portion allocations: 43.2% S&P 500 Index, 1.5% Russell Midcap Index, 6.2% Russell 2000 Index, 23.0% MSCI EAFE Index (Net), 9.3% Bloomberg Barclays US Aggregate Bond Index, 4.1% FTSE EPRA Nareit Global Index (Net), 3.6% MSCI Emerging Markets Index (Net), 2.7% Bloomberg Barclays Global Aggregate ex-US Hedged Index, 2.5% Bloomberg Barclays US Government/Credit Index, 2.1% Bloomberg Barclays US Government/Credit 1-5 Year Index, and 1.8% Bloomberg Barclays US Treasury Bills 1-3 Month Index. The components that make up the composite index may vary over time. The composite index represents target allocations for 2019. Percentages listed may not total to 100% due to rounding.
Target 2045 Composite Index A custom blended index developed by CSIM based on the 2045 fund’s asset allocation glide schedule and will become more conservative as time elapses. Effective March 1, 2014, the Dow Jones U.S. Total Stock Market Index was replaced by a combination of the S&P 500 Index and the Russell 2000 Index. Effective August 24, 2018, the FTSE non-US Dollar World Government Bond Index was replaced by the Bloomberg Barclays Global Aggregate ex-US Hedged Index. Effective February 1, 2019, the composite is derived using the following portion allocations: 45.5% S&P 500 Index, 1.6% Russell Midcap Index, 6.9% Russell 2000 Index, 24.5% MSCI EAFE Index (Net), 6.1% Bloomberg Barclays US Aggregate Bond Index, 4.4% FTSE EPRA Nareit Global Index (Net), 4.5% MSCI Emerging Markets Index (Net), 1.9% Bloomberg Barclays Global Aggregate ex-US Hedged Index, 2.0% Bloomberg Barclays US Government/Credit Index, 1.4% Bloomberg Barclays US Government/Credit 1-5 Year Index, and 1.3% Bloomberg Barclays US Treasury Bills 1-3 Month Index. The components that make up the composite index may vary over time. The composite index represents target allocations for 2019. Percentages listed may not total to 100% due to rounding.
Target 2050 Composite Index A custom blended index developed by CSIM based on the 2050 fund’s asset allocation glide schedule and will become more conservative as time elapses. Effective March 1, 2014, the Dow Jones U.S. Total Stock Market Index was replaced by a combination of the S&P 500 Index and the Russell 2000 Index. Effective August 24, 2018, the FTSE non-US Dollar World Government Bond Index was replaced by the Bloomberg Barclays Global Aggregate ex-US Hedged Index. Effective February 1, 2019, the composite is derived using the following portion allocations: 46.6% S&P 500 Index, 1.7% Russell Midcap Index, 7.3% Russell 2000 Index, 25.4% MSCI EAFE Index (Net), 4.5% Bloomberg Barclays US Aggregate Bond Index, 4.5% FTSE EPRA Nareit Global Index (Net), 5.0% MSCI Emerging Markets Index (Net), 1.4% Bloomberg Barclays Global Aggregate ex-US Hedged Index, 1.7% Bloomberg Barclays US Government/Credit Index, 1.0% Bloomberg Barclays US Government/Credit 1-5 Year Index, and 1.0% Bloomberg Barclays US Treasury Bills 1-3 Month Index. The components that make up the composite index may vary over time. The composite index represents target allocations for 2019. Percentages listed may not total to 100% due to rounding.
Target 2055 Composite Index A custom blended index developed by CSIM based on the 2055 fund’s asset allocation glide schedule and will become more conservative as time elapses. Effective March 1, 2014, the Dow Jones U.S. Total Stock Market Index was replaced by a combination of the S&P 500 Index and the Russell 2000 Index. Effective August 24, 2018, the FTSE non-US Dollar World Government Bond Index was replaced by the Bloomberg Barclays Global Aggregate ex-US Hedged Index. Effective February 1, 2019, the composite is derived using the following portion allocations: 47.5% S&P 500 Index, 1.7% Russell Midcap Index, 7.6% Russell 2000 Index, 26.1% MSCI EAFE Index (Net), 3.2% Bloomberg Barclays US Aggregate Bond Index, 4.6% FTSE EPRA Nareit Global Index (Net), 5.5% MSCI Emerging Markets Index (Net), 1.0% Bloomberg Barclays Global Aggregate ex-US Hedged Index, 1.0% Bloomberg Barclays US Government/Credit Index, 0.7% Bloomberg Barclays US Government/Credit 1-5 Year Index, and 0.7% Bloomberg Barclays US Treasury Bills 1-3 Month Index. The components that make up the composite index may vary over time. The composite index represents target allocations for 2019. Percentages listed may not total to 100% due to rounding.
Target 2060 Composite Index: A custom blended index developed by CSIM based on the 2060 fund’s asset allocation glide schedule and will become more conservative as time elapses. Effective August 24, 2018, the FTSE non-US Dollar World Government Bond Index was replaced by the Bloomberg Barclays Global Aggregate ex-US Hedged Index. Effective February 1, 2019, the composite is derived using the following portion allocations: 48.3% S&P 500 Index, 1.7% Russell Midcap Index, 7.8% Russell 2000 Index, 26.6% MSCI EAFE Index (Net), 2.3% Bloomberg Barclays US Aggregate Bond Index, 4.8% FTSE EPRA Nareit Global Index (Net), 5.8% MSCI Emerging Markets Index (Net), 0.8% Bloomberg Barclays Global Aggregate ex-US Hedged Index, 1.0% Bloomberg Barclays US Government/Credit Index, 0.5% Bloomberg Barclays US Government/Credit 1-5 Year Index, and 0.5% Bloomberg Barclays US Treasury Bills 1-3 Month Index. The components that make up the composite index may vary over time. The composite index represents target allocations for 2019. Percentages listed may not total to 100% due to rounding.
total return The percentage that an investor would have earned or lost on an investment in the fund assuming dividends and distributions were reinvested.
weighted average For mutual funds, an average that gives the same weight to each security as the security represents in the fund’s portfolio.
yield The income paid out by an investment, expressed as a percentage of the investment’s market value.
Schwab Target Funds | Annual Report
PRIVACY NOTICE
THIS IS NOT PART OF THE SHAREHOLDER REPORT
A Commitment to Your Privacy
Your Privacy Is Not for Sale
We do not and will not sell your personal information to anyone, for any reason.
We are committed to protecting the privacy of information we maintain about you. Below are details about our commitment, including the types of information we collect and how we use and share that information. This Privacy Notice applies to you only if you are an individual who invests directly in the funds by placing orders through the funds’ transfer agent. If you place orders through your brokerage account at Charles Schwab & Co., Inc. or an account with another broker-dealer, investment advisor, 401(k) plan, employee benefit plan, administrator, bank or other financial intermediary, you are covered by the privacy policies of that financial institution and should consult those policies.
How We Collect Information About You
We collect personal information about you in a number of ways.
• APPLICATION AND REGISTRATION
INFORMATION.
We collect personal information from you when you open an account or utilize one of our services. We may also collect information about you from third parties such as consumer reporting agencies to verify your identity. The information we collect may include personal information, including your Social Security number, as well as details about your interests, investments and investment experience.
• TRANSACTION AND EXPERIENCE
INFORMATION.
Once your account has been opened, we collect and maintain personal information about your account activity, including your transactions, balances, positions and history. This information allows us to administer your account and provide the services you have requested.
• WEBSITE USAGE.
When you visit our websites, we may use devices known as “cookies,” graphic interchange format files (GIFs), or other similar web tools to enhance your web experience. These tools help us to recognize you, maintain your web session, and
provide a more personalized experience. To learn more, please go to www.schwab.com/privacy.
How We Share and Use Your Information
We provide access to information about you to our affiliated companies, outside companies and other third parties in certain limited circumstances, including:
• to help us process transactions for your account;
• when we use other companies to provide services for us, such as printing and mailing your account statements; and
• when we believe that disclosure is required or permitted under law (for example, to cooperate with regulators or law enforcement, resolve consumer disputes, perform credit/authentication checks, or for risk control).
State Laws
We will comply with state laws that apply to the disclosure or use of information about you.
Safeguarding Your Information — Security Is a Partnership
We take precautions to ensure the information we collect about you is protected and is accessed only by authorized individuals or organizations.
Companies we use to provide support services are not allowed to use information about our shareholders for their own purposes and are contractually obligated to maintain strict confidentiality. We limit their use of information to the performance of the specific services we have requested.
We restrict access to personal information by our employees and agents. Our employees are trained about privacy and are required to safeguard personal information.
We maintain physical, electronic and procedural safeguards that comply with federal standards to guard your nonpublic personal information.
Contact Us
To provide us with updated information, report suspected fraud or identity theft, or for any other questions, please call the number below.
Schwab Funds® direct investors: 1-800-407-0256
© 2019 Schwab Funds. All rights reserved.
Schwab Target Funds | Annual Report
Charles Schwab Investment Management
With a straightforward lineup of core products and solutions for building the foundation of a portfolio, Charles Schwab Investment Management advocates for investors of all sizes with a steadfast focus on lowering costs and reducing unnecessary complexity. The list below shows all currently available Schwab Funds®.
Investors should carefully consider information contained in the prospectus, or if available, the summary prospectus, including investment objectives, risks, charges and expenses before investing. Please call 1-877-824-5615 for a prospectus for any Schwab Fund. Please read the prospectus carefully before you invest. This report must be preceded or accompanied by a current prospectus.
Proxy Voting Policies, Procedures and Results
A description of the proxy voting policies and procedures used to determine how to vote proxies on behalf of the funds is available without charge, upon request, by visiting the Schwab Funds’ website atwww.schwabfunds.com/schwabfunds_prospectus, the SEC’s website atwww.sec.gov, or by contacting Schwab Funds at 1-877-824-5615.
Information regarding how a fund voted proxies relating to portfolio securities during the most recent twelve-month period ended June 30 is available, without charge, by visiting the fund’s website atwww.schwabfunds.com/schwabfunds_prospectus or the SEC’s website atwww.sec.gov.
Equity Funds
Schwab Core Equity Fund
Schwab Dividend Equity Fund
Schwab Large-Cap Growth Fund
Schwab Small-Cap Equity Fund
Schwab Hedged Equity Fund
Schwab Health Care Fund
Schwab International Core Equity Fund
Schwab Fundamental US Large Company Index Fund
Schwab Fundamental US Small Company Index Fund
Schwab Fundamental International Large Company Index Fund
Schwab Fundamental International Small Company Index Fund
Schwab Fundamental Emerging Markets Large Company Index Fund
Schwab Fundamental Global Real Estate Index Fund
Schwab Global Real Estate Fund
Schwab S&P 500 Index Fund
Schwab 1000 Index® Fund
Schwab Small-Cap Index Fund®
Schwab Total Stock Market Index Fund®
Schwab U.S. Large-Cap Growth Index Fund
Schwab U.S. Large-Cap Value Index Fund
Schwab U.S. Mid-Cap Index Fund
Schwab International Index Fund®
Asset Allocation Funds
Schwab Balanced Fund
Schwab MarketTrack Portfolios®
Schwab Target Funds
Schwab Target Index Funds
Schwab Monthly Income Funds
Bond Funds
Schwab Treasury Inflation Protected Securities Index Fund
Schwab U.S. Aggregate Bond Index Fund
Schwab Short-Term Bond Index Fund
Schwab Tax-Free Bond Fund1
Schwab California Tax-Free Bond Fund1
Schwab Money Funds2
Schwab provides a broad choice of taxable and tax-exempt money market funds for both retail and institutional client types.
Investment Adviser
Charles Schwab Investment Management, Inc.
211 Main Street, San Francisco, CA 94105
Funds
Schwab Funds
1-877-824-5615
© 2019 Charles Schwab & Co., Inc. All rights reserved.
Member SIPC®
Printed on recycled paper.
| ¹ | State, local, and the Federal Alternative Minimum Tax may apply. Capital gains are not exempt from Federal Taxation. |
| ² | You could lose money by investing in the Schwab Money Funds. All Schwab Money Funds with the exception of Schwab Variable Share Price Money Fund seek to preserve the value of your investment at $1.00 per share, but cannot guarantee they will do so. Because the share price of Schwab Variable Share Price Money Fund will fluctuate, when you sell your shares they may be worth more or less than what you originally paid for them. All Schwab Money Funds with the exception of Schwab Government Money Fund, Schwab Retirement Government Money Fund, Schwab U.S. Treasury Money Fund, Schwab Treasury Obligations Money Fund and Schwab Government Money Market Portfolio may impose a fee upon the sale of your shares or may temporarily suspend your ability to sell shares if the Fund’s liquidity falls below required minimums because of market conditions or other factors. An investment in the Schwab Money Funds is not insured or guaranteed by the Federal Deposit Insurance Corporation or any other government agency. The Schwab Money Funds’ sponsor has no legal obligation to provide financial support to the Funds, and you should not expect that the sponsor will provide financial support to the Funds at any time. |
This page is intentionally left blank.
Item 2: Code of Ethics.
| (a) | Registrant has adopted a code of ethics that applies to its principal executive officer, principal financial officer, and any other persons who perform a similar function, regardless of whether these individuals are employed by Registrant or a third party. |
| (c) | During the period covered by the report, no amendments were made to the provisions of this code of ethics. |
| (d) | During the period covered by the report, Registrant did not grant any waivers, including implicit waivers, from the provisions of this code of ethics. |
| (f)(1) | Registrant has filed this code of ethics as an exhibit pursuant to Item 12(a)(1) of FormN-CSR. |
Item 3: Audit Committee Financial Expert.
Registrant’s Board of Trustees has determined that Kiran M. Patel and Kimberly S. Patmore, each currently serving on its audit, compliance and valuation committee, are each an “audit committee financial expert,” as such term is defined in Item 3 of FormN-CSR. Each member of Registrant’s audit, compliance and valuation committee is “independent” under the standards set forth in Item 3 of FormN-CSR.
The designation of each of Mr. Patel and Ms. Patmore as an “audit committee financial expert” pursuant to Item 3 of FormN-CSR does not (i) impose upon such individual any duties, obligations, or liability that are greater than the duties, obligations and liability imposed upon such individual as a member of Registrant’s audit, compliance and valuation committee or Board of Trustees in the absence of such designation; and (ii) affect the duties, obligations or liability of any other member of Registrant’s audit, compliance and valuation committee or Board of Trustees.
Item 4: Principal Accountant Fees and Services.
Registrant is composed offifty-one operational series.Thirty-six series have a fiscalyear-end of October 31, whose annual financial statements are reported in Item 1, three series have a
fiscalyear-end of December 31, eleven series have a fiscalyear-end of March 31, and one series has a fiscalyear-end of February 28. Principal accountant fees disclosed in Items 4(a)-(d) and 4(g) include fees billed for services rendered to the fifty-one operational series during 2018/2019 and the fifty-two operational series during 2017/2018, based on their respective 2018/2019 and 2017/2018 fiscal years, as applicable.
The following table presents fees billed by the principal accountant in each of the last two fiscal years for the services rendered to the Funds:
| | | | | | | | | | | | | | | | | | | | | | | | | | | | | | |
| (a) Audit Fees | | | (b) Audit-Related Fees1 | | | (c) Tax Fees2 | | | (d) All Other Fees | |
Fiscal Year
2018/2019 | | | Fiscal Year
2017/2018 | | | Fiscal Year
2018/2019 | | | Fiscal Year
2017/2018 | | | Fiscal Year
2018/2019 | | | Fiscal Year
2017/2018 | | | Fiscal Year
2018/2019 | | | Fiscal Year
2017/2018 | |
| $ | 1,517,001 | | | $ | 1,473,405 | | | $ | 87,870 | | | $ | 84,840 | | | $ | 177,307 | | | $ | 184,792 | | | $ | 0 | | | $ | 0 | |
| 1 | The nature of the services includes assurance and related services reasonably related to the performance of the audit of financial statements not included in Audit Fees. |
| 2 | The nature of the services includes tax compliance, tax advice and tax planning. |
| (e) (1) | Registrant’s audit, compliance and valuation committee does not havepre-approval policies and procedures as described in paragraph (c)(7) of Rule2-01 of RegulationS-X. |
| | (2) | There were no services described in each of paragraphs (b) through (d) above (including services required to be approved by Registrant’s audit, compliance and valuation committee pursuant to paragraph (c)(7)(ii) of Rule2-01 of RegulationS-X) that were approved by Registrant’s audit, compliance and valuation committee pursuant to paragraph (c)(7)(i)(C) of Rule2-01 of RegulationS-X. |
(f) Not applicable.
(g) Below are the aggregatenon-audit fees billed in each of the last two fiscal years by Registrant’s principal accountant for services rendered to Registrant, to Registrant’s investment adviser, and to any entity controlling, controlled by, or under common control with Registrant’s investment adviser that provides ongoing services to Registrant.
| | |
2018/2019: $265,177 | | 2017/2018: $269,632 |
| (h) | During the past fiscal year, allnon-audit services provided by Registrant’s principal accountant to either Registrant’s investment adviser or to any entity controlling, controlled by, or under common control with Registrant’s investment adviser that provides ongoing services to Registrant werepre-approved. Included in the audit, compliance and valuation committee’spre-approval was the review and consideration as to whether the provision of thesenon-audit services is compatible with maintaining the principal accountant’s independence. |
Item 5: Audit Committee of Listed Registrants.
Not applicable.
Item 6: Schedule of Investments.
Except as noted below, the condensed schedules of investments are included as part of the report to shareholders filed under Item 1 of this Form. The schedules of investments for the Schwab Fundamental US Large Company Index Fund, Schwab Fundamental US Small Company Index Fund, Schwab Fundamental International Large Company Index Fund, Schwab Fundamental International Small Company Index Fund, Schwab Fundamental Emerging Markets Large Company Index Fund, Schwab S&P 500 Index Fund, SchwabSmall-Cap Index Fund, Schwab Total Stock Market Index Fund, Schwab U.S.Large-Cap Growth Index Fund, Schwab U.S.Large-Cap Value Index Fund, Schwab U.S.Mid-Cap Index Fund and Schwab International Index Fund are filed under this Item.
Schwab S&P 500 Index Fund
Portfolio Holdings as of October 31, 2019
This section shows all the securities in the fund’s portfolio and their values as of the report date.
The fund files its complete schedule of portfolio holdings with the U.S. Securities and Exchange Commission (SEC) for the first and third quarters of each fiscal year on Form N-Q. Effective March 31, 2019, Form N-PORT Part F has replaced Form N-Q. The fund’s Form N-Q and Form N-PORT Part F are available on the SEC’s website atwww.sec.gov. The fund also makes available its complete schedule of portfolio holdings 15 to 20 days after the end of the month on the fund’s website atwww.schwabfunds.com/schwabfunds_prospectus.
| Security | Number
of Shares | Value ($) |
| Common Stock99.7% of net assets |
| |
| Automobiles & Components 0.5% |
| Aptiv plc | 407,343 | 36,477,566 |
| BorgWarner, Inc. | 327,994 | 13,670,790 |
| Ford Motor Co. | 6,216,648 | 53,401,006 |
| General Motors Co. | 2,001,382 | 74,371,355 |
| Harley-Davidson, Inc. | 247,963 | 9,648,240 |
| | | 187,568,957 |
| |
| Banks 5.6% |
| Bank of America Corp. | 13,318,080 | 416,456,362 |
| BB&T Corp. | 1,221,478 | 64,799,408 |
| Citigroup, Inc. | 3,592,729 | 258,173,506 |
| Citizens Financial Group, Inc. | 709,381 | 24,941,836 |
| Comerica, Inc. | 236,900 | 15,497,998 |
| Fifth Third Bancorp | 1,156,470 | 33,630,148 |
| First Republic Bank | 266,781 | 28,374,827 |
| Huntington Bancshares, Inc. | 1,656,000 | 23,399,280 |
| JPMorgan Chase & Co. | 5,081,477 | 634,778,107 |
| KeyCorp | 1,591,778 | 28,604,251 |
| M&T Bank Corp. | 211,990 | 33,182,795 |
| People's United Financial, Inc. | 704,862 | 11,397,618 |
| Regions Financial Corp. | 1,583,556 | 25,495,252 |
| SunTrust Banks, Inc. | 705,008 | 48,180,247 |
| SVB Financial Group * | 82,434 | 18,257,482 |
| The PNC Financial Services Group, Inc. | 708,643 | 103,957,928 |
| U.S. Bancorp | 2,279,340 | 129,967,967 |
| Wells Fargo & Co. | 6,373,412 | 329,059,261 |
| Zions Bancorp NA | 280,703 | 13,605,674 |
| | | 2,241,759,947 |
| |
| Capital Goods 6.6% |
| 3M Co. | 914,771 | 150,928,067 |
| A.O. Smith Corp. | 219,589 | 10,909,181 |
| Allegion plc | 147,685 | 17,137,367 |
| AMETEK, Inc. | 362,398 | 33,213,777 |
| Arconic, Inc. | 614,659 | 16,884,683 |
| Caterpillar, Inc. | 894,752 | 123,296,826 |
| Cummins, Inc. | 250,285 | 43,169,157 |
| Deere & Co. | 500,693 | 87,190,679 |
| Dover Corp. | 229,949 | 23,889,402 |
| Eaton Corp. plc | 669,052 | 58,281,120 |
| Emerson Electric Co. | 976,769 | 68,520,345 |
| Fastenal Co. | 913,181 | 32,819,725 |
| Flowserve Corp. | 209,521 | 10,233,006 |
| Fortive Corp. | 469,565 | 32,399,985 |
| Fortune Brands Home & Security, Inc. | 220,509 | 13,241,565 |
| General Dynamics Corp. | 371,217 | 65,631,166 |
| General Electric Co. | 13,877,198 | 138,494,436 |
| Honeywell International, Inc. | 1,143,259 | 197,475,127 |
| Huntington Ingalls Industries, Inc. | 66,400 | 14,983,824 |
| IDEX Corp. | 121,044 | 18,825,973 |
| Illinois Tool Works, Inc. | 467,026 | 78,731,243 |
| Ingersoll-Rand plc | 383,911 | 48,714,467 |
| Jacobs Engineering Group, Inc. | 215,184 | 20,136,919 |
| Security | Number
of Shares | Value ($) |
| Johnson Controls International plc | 1,264,099 | 54,773,410 |
| L3Harris Technologies, Inc. | 355,508 | 73,344,855 |
| Lockheed Martin Corp. | 394,895 | 148,749,049 |
| Masco Corp. | 461,293 | 21,334,801 |
| Northrop Grumman Corp. | 250,366 | 88,249,008 |
| PACCAR, Inc. | 551,523 | 41,948,839 |
| Parker-Hannifin Corp. | 204,258 | 37,479,300 |
| Pentair plc | 266,811 | 11,064,652 |
| Quanta Services, Inc. | 224,425 | 9,437,071 |
| Raytheon Co. | 442,525 | 93,908,230 |
| Rockwell Automation, Inc. | 185,720 | 31,941,983 |
| Roper Technologies, Inc. | 165,059 | 55,618,281 |
| Snap-on, Inc. | 88,402 | 14,380,353 |
| Stanley Black & Decker, Inc. | 241,804 | 36,592,199 |
| Textron, Inc. | 365,263 | 16,834,972 |
| The Boeing Co. | 849,671 | 288,811,670 |
| TransDigm Group, Inc. | 78,754 | 41,446,655 |
| United Rentals, Inc. * | 121,990 | 16,294,204 |
| United Technologies Corp. | 1,289,050 | 185,081,799 |
| W.W. Grainger, Inc. | 70,612 | 21,807,810 |
| Wabtec Corp. | 287,762 | 19,962,050 |
| Xylem, Inc. | 287,078 | 22,016,012 |
| | | 2,636,185,243 |
| |
| Commercial & Professional Services 0.7% |
| Cintas Corp. | 131,751 | 35,397,541 |
| Copart, Inc. * | 319,764 | 26,425,297 |
| Equifax, Inc. | 193,021 | 26,387,901 |
| IHS Markit Ltd. * | 636,892 | 44,595,178 |
| Nielsen Holdings plc | 559,325 | 11,275,992 |
| Republic Services, Inc. | 335,870 | 29,391,984 |
| Robert Half International, Inc. | 185,042 | 10,597,355 |
| Rollins, Inc. | 221,854 | 8,454,856 |
| Verisk Analytics, Inc. | 260,640 | 37,714,608 |
| Waste Management, Inc. | 621,572 | 69,746,594 |
| | | 299,987,306 |
| |
| Consumer Durables & Apparel 1.1% |
| Capri Holdings Ltd. * | 238,940 | 7,423,866 |
| D.R. Horton, Inc. | 533,690 | 27,949,345 |
| Garmin Ltd. | 229,130 | 21,480,938 |
| Hanesbrands, Inc. | 577,947 | 8,790,574 |
| Hasbro, Inc. | 186,096 | 18,109,002 |
| Leggett & Platt, Inc. | 207,237 | 10,631,258 |
| Lennar Corp., Class A | 452,799 | 26,986,820 |
| Mohawk Industries, Inc. * | 95,032 | 13,625,688 |
| Newell Brands, Inc. | 604,050 | 11,458,829 |
| NIKE, Inc., Class B | 1,990,227 | 178,224,828 |
| NVR, Inc. * | 5,451 | 19,823,052 |
| PulteGroup, Inc. | 409,746 | 16,078,433 |
| PVH Corp. | 118,314 | 10,312,248 |
| Ralph Lauren Corp. | 81,999 | 7,876,824 |
| Tapestry, Inc. | 453,028 | 11,715,304 |
| Under Armour, Inc., Class A * | 294,876 | 6,089,189 |
| Under Armour, Inc., Class C * | 313,942 | 5,807,927 |
Schwab Equity Index Funds | Annual Report
Schwab S&P 500 Index Fund
Portfolio Holdings as of October 31, 2019 (continued)
| Security | Number
of Shares | Value ($) |
| VF Corp. | 520,336 | 42,818,449 |
| Whirlpool Corp. | 100,831 | 15,338,412 |
| | | 460,540,986 |
| |
| Consumer Services 1.9% |
| Carnival Corp. | 637,942 | 27,361,332 |
| Chipotle Mexican Grill, Inc. * | 40,452 | 31,478,128 |
| Darden Restaurants, Inc. | 195,426 | 21,940,477 |
| H&R Block, Inc. | 320,597 | 8,011,719 |
| Hilton Worldwide Holdings, Inc. | 455,084 | 44,124,945 |
| Las Vegas Sands Corp. | 538,300 | 33,288,472 |
| Marriott International, Inc., Class A | 433,692 | 54,883,723 |
| McDonald's Corp. | 1,206,994 | 237,415,720 |
| MGM Resorts International | 827,447 | 23,582,240 |
| Norwegian Cruise Line Holdings Ltd. * | 340,971 | 17,307,688 |
| Royal Caribbean Cruises Ltd. | 272,040 | 29,606,113 |
| Starbucks Corp. | 1,902,983 | 160,916,242 |
| Wynn Resorts Ltd. | 154,206 | 18,711,356 |
| Yum! Brands, Inc. | 484,829 | 49,311,958 |
| | | 757,940,113 |
| |
| Diversified Financials 5.0% |
| Affiliated Managers Group, Inc. | 80,700 | 6,446,316 |
| American Express Co. | 1,083,664 | 127,092,114 |
| Ameriprise Financial, Inc. | 207,731 | 31,344,531 |
| Berkshire Hathaway, Inc., Class B * | 3,116,389 | 662,481,974 |
| BlackRock, Inc. | 187,237 | 86,447,323 |
| Capital One Financial Corp. | 746,356 | 69,597,697 |
| Cboe Global Markets, Inc. | 176,680 | 20,344,702 |
| CME Group, Inc. | 569,409 | 117,155,902 |
| Discover Financial Services | 504,927 | 40,525,441 |
| E*TRADE Financial Corp. | 360,464 | 15,063,790 |
| Franklin Resources, Inc. | 447,730 | 12,334,961 |
| Intercontinental Exchange, Inc. | 891,774 | 84,112,124 |
| Invesco Ltd. | 610,769 | 10,273,135 |
| MarketAxess Holdings, Inc. | 59,780 | 22,034,310 |
| Moody's Corp. | 258,185 | 56,978,848 |
| Morgan Stanley | 1,993,390 | 91,795,609 |
| MSCI, Inc. | 134,900 | 31,642,144 |
| Nasdaq, Inc. | 182,034 | 18,161,532 |
| Northern Trust Corp. | 341,052 | 33,996,063 |
| Raymond James Financial, Inc. | 196,221 | 16,382,491 |
| S&P Global, Inc. | 391,930 | 101,114,021 |
| State Street Corp. | 590,075 | 38,986,255 |
| Synchrony Financial | 968,194 | 34,245,022 |
| T. Rowe Price Group, Inc. | 373,600 | 43,262,880 |
| The Bank of New York Mellon Corp. | 1,361,099 | 63,631,378 |
| The Charles Schwab Corp.(a) | 1,841,508 | 74,967,791 |
| The Goldman Sachs Group, Inc. | 515,390 | 109,973,918 |
| | | 2,020,392,272 |
| |
| Energy 4.3% |
| Apache Corp. | 597,629 | 12,944,644 |
| Baker Hughes Co. | 1,029,696 | 22,035,494 |
| Cabot Oil & Gas Corp. | 665,522 | 12,405,330 |
| Chevron Corp. | 3,017,155 | 350,412,382 |
| Cimarex Energy Co. | 161,415 | 6,814,941 |
| Concho Resources, Inc. | 321,431 | 21,703,021 |
| ConocoPhillips | 1,766,767 | 97,525,538 |
| Devon Energy Corp. | 638,762 | 12,954,093 |
| Diamondback Energy, Inc. | 259,022 | 22,213,727 |
| EOG Resources, Inc. | 921,348 | 63,858,630 |
| Exxon Mobil Corp. | 6,724,390 | 454,367,032 |
| Halliburton Co. | 1,404,062 | 27,028,194 |
| Helmerich & Payne, Inc. | 171,303 | 6,423,863 |
| Security | Number
of Shares | Value ($) |
| Hess Corp. | 411,064 | 27,027,458 |
| HollyFrontier Corp. | 240,558 | 13,216,257 |
| Kinder Morgan, Inc. | 3,090,121 | 61,740,618 |
| Marathon Oil Corp. | 1,278,325 | 14,739,087 |
| Marathon Petroleum Corp. | 1,047,441 | 66,983,852 |
| National Oilwell Varco, Inc. | 606,698 | 13,723,509 |
| Noble Energy, Inc. | 766,473 | 14,762,270 |
| Occidental Petroleum Corp. | 1,421,251 | 57,560,665 |
| ONEOK, Inc. | 656,008 | 45,809,039 |
| Phillips 66 | 711,859 | 83,159,368 |
| Pioneer Natural Resources Co. | 266,832 | 32,825,673 |
| Schlumberger Ltd. | 2,199,273 | 71,894,234 |
| TechnipFMC plc | 666,241 | 13,144,935 |
| The Williams Cos., Inc. | 1,924,333 | 42,931,869 |
| Valero Energy Corp. | 658,295 | 63,841,449 |
| | | 1,734,047,172 |
| |
| Food & Staples Retailing 1.6% |
| Costco Wholesale Corp. | 699,356 | 207,785,661 |
| Sysco Corp. | 817,862 | 65,322,638 |
| The Kroger Co. | 1,266,654 | 31,210,355 |
| Walgreens Boots Alliance, Inc. | 1,203,634 | 65,935,071 |
| Walmart, Inc. | 2,260,217 | 265,033,045 |
| | | 635,286,770 |
| |
| Food, Beverage & Tobacco 3.8% |
| Altria Group, Inc. | 2,970,526 | 133,049,860 |
| Archer-Daniels-Midland Co. | 886,159 | 37,254,124 |
| Brown-Forman Corp., Class B | 288,952 | 18,932,135 |
| Campbell Soup Co. | 267,534 | 12,389,500 |
| ConAgra Brands, Inc. | 778,130 | 21,048,416 |
| Constellation Brands, Inc., Class A | 265,523 | 50,536,993 |
| General Mills, Inc. | 957,262 | 48,686,345 |
| Hormel Foods Corp. | 440,362 | 18,006,402 |
| Kellogg Co. | 396,507 | 25,190,090 |
| Lamb Weston Holdings, Inc. | 229,955 | 17,945,688 |
| McCormick & Co., Inc. - Non Voting Shares | 195,472 | 31,410,396 |
| Molson Coors Brewing Co., Class B | 300,969 | 15,867,086 |
| Mondelez International, Inc., Class A | 2,293,000 | 120,267,850 |
| Monster Beverage Corp. * | 612,859 | 34,399,776 |
| PepsiCo, Inc. | 2,221,813 | 304,766,089 |
| Philip Morris International, Inc. | 2,473,205 | 201,417,815 |
| The Coca-Cola Co. | 6,115,520 | 332,867,754 |
| The Hershey Co. | 236,150 | 34,683,350 |
| The JM Smucker Co. | 180,540 | 19,079,467 |
| The Kraft Heinz Co. | 985,572 | 31,863,543 |
| Tyson Foods, Inc., Class A | 468,923 | 38,822,135 |
| | | 1,548,484,814 |
| |
| Health Care Equipment & Services 6.3% |
| Abbott Laboratories | 2,809,275 | 234,883,483 |
| ABIOMED, Inc. * | 72,071 | 14,960,498 |
| Align Technology, Inc. * | 115,091 | 29,036,308 |
| AmerisourceBergen Corp. | 240,572 | 20,540,037 |
| Anthem, Inc. | 406,415 | 109,358,148 |
| Baxter International, Inc. | 809,828 | 62,113,808 |
| Becton, Dickinson & Co. | 429,402 | 109,926,912 |
| Boston Scientific Corp. * | 2,216,782 | 92,439,809 |
| Cardinal Health, Inc. | 471,861 | 23,333,527 |
| Centene Corp. * | 659,290 | 34,995,113 |
| Cerner Corp. | 505,027 | 33,897,412 |
| Cigna Corp. * | 599,566 | 106,998,548 |
| CVS Health Corp. | 2,068,924 | 137,355,864 |
| Danaher Corp. | 1,014,842 | 139,865,524 |
Schwab Equity Index Funds | Annual Report
Schwab S&P 500 Index Fund
Portfolio Holdings as of October 31, 2019 (continued)
| Security | Number
of Shares | Value ($) |
| DaVita, Inc. * | 153,316 | 8,984,318 |
| DENTSPLY SIRONA, Inc. | 355,521 | 19,475,440 |
| Edwards Lifesciences Corp. * | 330,818 | 78,860,395 |
| HCA Healthcare, Inc. | 424,272 | 56,657,283 |
| Henry Schein, Inc. * | 235,266 | 14,724,123 |
| Hologic, Inc. * | 424,755 | 20,519,914 |
| Humana, Inc. | 214,395 | 63,075,009 |
| IDEXX Laboratories, Inc. * | 136,747 | 38,974,263 |
| Intuitive Surgical, Inc. * | 182,990 | 101,184,321 |
| Laboratory Corp. of America Holdings * | 155,841 | 25,677,922 |
| McKesson Corp. | 293,099 | 38,982,167 |
| Medtronic plc | 2,132,179 | 232,194,293 |
| Quest Diagnostics, Inc. | 212,912 | 21,557,340 |
| ResMed, Inc. | 228,688 | 33,827,529 |
| Stryker Corp. | 510,281 | 110,358,472 |
| Teleflex, Inc. | 73,862 | 25,660,397 |
| The Cooper Cos., Inc. | 79,268 | 23,066,988 |
| UnitedHealth Group, Inc. | 1,506,989 | 380,816,120 |
| Universal Health Services, Inc., Class B | 128,539 | 17,668,971 |
| Varian Medical Systems, Inc. * | 144,571 | 17,465,623 |
| WellCare Health Plans, Inc. * | 79,672 | 23,630,715 |
| Zimmer Biomet Holdings, Inc. | 325,738 | 45,026,764 |
| | | 2,548,093,358 |
| |
| Household & Personal Products 2.0% |
| Church & Dwight Co., Inc. | 393,289 | 27,506,633 |
| Colgate-Palmolive Co. | 1,365,079 | 93,644,419 |
| Coty, Inc., Class A | 469,771 | 5,491,623 |
| Kimberly-Clark Corp. | 547,894 | 72,804,155 |
| The Clorox Co. | 200,595 | 29,625,876 |
| The Estee Lauder Cos., Inc., Class A | 350,913 | 65,364,564 |
| The Procter & Gamble Co. | 3,975,874 | 495,036,072 |
| | | 789,473,342 |
| |
| Insurance 2.3% |
| Aflac, Inc. | 1,179,462 | 62,700,200 |
| American International Group, Inc. | 1,380,303 | 73,100,847 |
| Aon plc | 375,562 | 72,543,556 |
| Arthur J. Gallagher & Co. | 295,635 | 26,967,825 |
| Assurant, Inc. | 96,628 | 12,181,892 |
| Chubb Ltd. | 723,870 | 110,332,265 |
| Cincinnati Financial Corp. | 240,996 | 27,283,157 |
| Everest Re Group Ltd. | 65,104 | 16,737,587 |
| Globe Life, Inc. | 160,729 | 15,643,754 |
| Lincoln National Corp. | 317,935 | 17,956,969 |
| Loews Corp. | 412,908 | 20,232,492 |
| Marsh & McLennan Cos., Inc. | 805,954 | 83,512,953 |
| MetLife, Inc. | 1,262,843 | 59,088,424 |
| Principal Financial Group, Inc. | 414,276 | 22,114,053 |
| Prudential Financial, Inc. | 640,560 | 58,380,638 |
| The Allstate Corp. | 522,123 | 55,564,330 |
| The Hartford Financial Services Group, Inc. | 574,102 | 32,769,742 |
| The Progressive Corp. | 927,451 | 64,643,335 |
| The Travelers Cos., Inc. | 413,701 | 54,219,653 |
| Unum Group | 328,041 | 9,034,249 |
| Willis Towers Watson plc | 205,791 | 38,462,338 |
| | | 933,470,259 |
| |
| Materials 2.7% |
| Air Products & Chemicals, Inc. | 349,632 | 74,562,520 |
| Albemarle Corp. | 169,005 | 10,265,364 |
| Amcor plc * | 2,573,825 | 24,502,814 |
| Avery Dennison Corp. | 133,931 | 17,124,418 |
| Ball Corp. | 527,325 | 36,896,930 |
| Security | Number
of Shares | Value ($) |
| Celanese Corp. | 196,470 | 23,802,340 |
| CF Industries Holdings, Inc. | 346,222 | 15,701,168 |
| Corteva, Inc. * | 1,194,420 | 31,508,800 |
| Dow, Inc. * | 1,183,144 | 59,736,941 |
| DuPont de Nemours, Inc. | 1,185,746 | 78,152,519 |
| Eastman Chemical Co. | 220,550 | 16,770,622 |
| Ecolab, Inc. | 397,236 | 76,297,119 |
| FMC Corp. | 207,111 | 18,950,656 |
| Freeport-McMoRan, Inc. | 2,296,965 | 22,556,196 |
| International Flavors & Fragrances, Inc. | 169,490 | 20,679,475 |
| International Paper Co. | 627,203 | 27,396,227 |
| Linde plc | 859,581 | 170,497,891 |
| LyondellBasell Industries N.V., Class A | 409,693 | 36,749,462 |
| Martin Marietta Materials, Inc. | 99,527 | 26,067,117 |
| Newmont Goldcorp Corp. | 1,303,581 | 51,791,273 |
| Nucor Corp. | 479,023 | 25,795,389 |
| Packaging Corp. of America | 151,608 | 16,595,012 |
| PPG Industries, Inc. | 375,100 | 46,932,512 |
| Sealed Air Corp. | 242,598 | 10,133,318 |
| The Mosaic Co. | 566,967 | 11,271,304 |
| The Sherwin-Williams Co. | 130,289 | 74,567,000 |
| Vulcan Materials Co. | 210,979 | 30,142,570 |
| WestRock Co. | 410,458 | 15,338,815 |
| | | 1,070,785,772 |
| |
| Media & Entertainment 8.1% |
| Activision Blizzard, Inc. | 1,217,052 | 68,191,424 |
| Alphabet, Inc., Class A * | 476,068 | 599,274,398 |
| Alphabet, Inc., Class C * | 480,292 | 605,220,752 |
| CBS Corp., Class B - Non Voting Shares | 518,969 | 18,703,643 |
| Charter Communications, Inc., Class A * | 257,137 | 120,304,117 |
| Comcast Corp., Class A | 7,209,067 | 323,110,383 |
| Discovery, Inc., Class A * | 250,778 | 6,759,721 |
| Discovery, Inc., Class C * | 550,065 | 13,883,641 |
| DISH Network Corp., Class A * | 381,101 | 13,102,252 |
| Electronic Arts, Inc. * | 469,005 | 45,212,082 |
| Facebook, Inc., Class A * | 3,823,917 | 732,853,693 |
| Fox Corp., Class A | 562,292 | 18,015,836 |
| Fox Corp., Class B * | 257,652 | 8,049,048 |
| Netflix, Inc. * | 696,229 | 200,103,177 |
| News Corp., Class A | 607,032 | 8,322,409 |
| News Corp., Class B | 205,200 | 2,897,424 |
| Omnicom Group, Inc. | 344,709 | 26,608,088 |
| Take-Two Interactive Software, Inc. * | 180,938 | 21,775,888 |
| The Interpublic Group of Cos., Inc. | 618,378 | 13,449,721 |
| The Walt Disney Co. | 2,863,364 | 372,008,251 |
| TripAdvisor, Inc. * | 167,462 | 6,765,465 |
| Twitter, Inc. * | 1,226,451 | 36,756,736 |
| Viacom, Inc., Class B | 566,777 | 12,219,712 |
| | | 3,273,587,861 |
| |
| Pharmaceuticals, Biotechnology & Life Sciences 7.6% |
| AbbVie, Inc. | 2,350,568 | 186,987,684 |
| Agilent Technologies, Inc. | 490,664 | 37,167,798 |
| Alexion Pharmaceuticals, Inc. * | 356,425 | 37,567,195 |
| Allergan plc | 522,035 | 91,935,584 |
| Amgen, Inc. | 953,396 | 203,311,697 |
| Biogen, Inc. * | 292,604 | 87,403,741 |
| Bristol-Myers Squibb Co. | 2,600,808 | 149,208,355 |
| Celgene Corp. * | 1,127,072 | 121,757,588 |
| Eli Lilly & Co. | 1,350,589 | 153,899,617 |
| Gilead Sciences, Inc. | 2,014,266 | 128,328,887 |
| Illumina, Inc. * | 233,507 | 69,005,989 |
| Incyte Corp. * | 285,126 | 23,927,774 |
| IQVIA Holdings, Inc. * | 288,876 | 41,719,472 |
| Johnson & Johnson | 4,194,205 | 553,802,828 |
Schwab Equity Index Funds | Annual Report
Schwab S&P 500 Index Fund
Portfolio Holdings as of October 31, 2019 (continued)
| Security | Number
of Shares | Value ($) |
| Merck & Co., Inc. | 4,069,139 | 352,631,586 |
| Mettler-Toledo International, Inc. * | 39,149 | 27,597,696 |
| Mylan N.V. * | 819,793 | 15,699,036 |
| PerkinElmer, Inc. | 176,716 | 15,190,507 |
| Perrigo Co., plc | 215,899 | 11,446,965 |
| Pfizer, Inc. | 8,791,486 | 337,329,318 |
| Regeneron Pharmaceuticals, Inc. * | 126,784 | 38,831,403 |
| Thermo Fisher Scientific, Inc. | 636,837 | 192,312,037 |
| Vertex Pharmaceuticals, Inc. * | 407,788 | 79,714,398 |
| Waters Corp. * | 105,826 | 22,394,898 |
| Zoetis, Inc. | 759,251 | 97,123,388 |
| | | 3,076,295,441 |
| |
| Real Estate 3.1% |
| Alexandria Real Estate Equities, Inc. | 181,504 | 28,813,760 |
| American Tower Corp. | 703,512 | 153,421,897 |
| Apartment Investment & Management Co., Class A | 234,561 | 12,872,708 |
| AvalonBay Communities, Inc. | 221,579 | 48,228,885 |
| Boston Properties, Inc. | 228,256 | 31,316,723 |
| CBRE Group, Inc., Class A * | 533,749 | 28,582,259 |
| Crown Castle International Corp. | 659,898 | 91,587,243 |
| Digital Realty Trust, Inc. | 330,589 | 41,998,026 |
| Duke Realty Corp. | 573,562 | 20,154,969 |
| Equinix, Inc. | 135,044 | 76,540,238 |
| Equity Residential | 553,076 | 49,035,718 |
| Essex Property Trust, Inc. | 104,844 | 34,297,618 |
| Extra Space Storage, Inc. | 204,415 | 22,949,672 |
| Federal Realty Investment Trust | 110,665 | 15,051,547 |
| HCP, Inc. | 779,170 | 29,312,375 |
| Host Hotels & Resorts, Inc. | 1,158,688 | 18,990,896 |
| Iron Mountain, Inc. | 453,512 | 14,875,194 |
| Kimco Realty Corp. | 672,204 | 14,492,718 |
| Mid-America Apartment Communities, Inc. | 181,581 | 25,237,943 |
| Prologis, Inc. | 1,004,746 | 88,176,509 |
| Public Storage | 239,244 | 53,317,918 |
| Realty Income Corp. | 504,906 | 41,296,262 |
| Regency Centers Corp. | 267,561 | 17,990,802 |
| SBA Communications Corp. | 179,418 | 43,176,942 |
| Simon Property Group, Inc. | 490,176 | 73,859,720 |
| SL Green Realty Corp. | 131,590 | 11,000,924 |
| The Macerich Co.(b) | 176,260 | 4,847,150 |
| UDR, Inc. | 464,679 | 23,350,120 |
| Ventas, Inc. | 591,112 | 38,481,391 |
| Vornado Realty Trust | 251,105 | 16,480,021 |
| Welltower, Inc. | 645,869 | 58,573,860 |
| Weyerhaeuser Co. | 1,180,498 | 34,482,346 |
| | | 1,262,794,354 |
| |
| Retailing 6.5% |
| Advance Auto Parts, Inc. | 112,678 | 18,307,921 |
| Amazon.com, Inc. * | 660,440 | 1,173,377,330 |
| AutoZone, Inc. * | 39,004 | 44,635,398 |
| Best Buy Co., Inc. | 370,455 | 26,609,783 |
| Booking Holdings, Inc. * | 67,625 | 138,548,071 |
| CarMax, Inc. * | 261,974 | 24,408,118 |
| Dollar General Corp. | 407,780 | 65,383,445 |
| Dollar Tree, Inc. * | 375,934 | 41,503,114 |
| eBay, Inc. | 1,250,816 | 44,091,264 |
| Expedia Group, Inc. | 221,810 | 30,312,555 |
| Genuine Parts Co. | 231,881 | 23,786,353 |
| Kohl's Corp. | 252,246 | 12,930,130 |
| L Brands, Inc. | 367,808 | 6,267,448 |
| LKQ Corp. * | 488,037 | 16,588,378 |
| Lowe's Cos., Inc. | 1,227,470 | 136,997,927 |
| Security | Number
of Shares | Value ($) |
| Macy's, Inc. | 492,092 | 7,460,115 |
| Nordstrom, Inc. | 167,165 | 6,001,224 |
| O'Reilly Automotive, Inc. * | 121,330 | 52,840,428 |
| Ross Stores, Inc. | 579,757 | 63,581,950 |
| Target Corp. | 813,052 | 86,923,389 |
| The Gap, Inc. | 347,386 | 5,648,496 |
| The Home Depot, Inc. | 1,740,825 | 408,362,728 |
| The TJX Cos., Inc. | 1,925,083 | 110,981,035 |
| Tiffany & Co. | 174,048 | 21,670,716 |
| Tractor Supply Co. | 188,134 | 17,876,493 |
| Ulta Salon, Cosmetics & Fragrance, Inc. * | 93,316 | 21,756,625 |
| | | 2,606,850,434 |
| |
| Semiconductors & Semiconductor Equipment 4.1% |
| Advanced Micro Devices, Inc. * | 1,722,298 | 58,437,571 |
| Analog Devices, Inc. | 588,446 | 62,745,997 |
| Applied Materials, Inc. | 1,465,591 | 79,522,968 |
| Broadcom, Inc. | 632,887 | 185,340,958 |
| Intel Corp. | 7,041,581 | 398,060,574 |
| KLA Corp. | 252,647 | 42,707,449 |
| Lam Research Corp. | 229,303 | 62,150,285 |
| Maxim Integrated Products, Inc. | 436,087 | 25,580,863 |
| Microchip Technology, Inc. | 378,214 | 35,661,798 |
| Micron Technology, Inc. * | 1,752,258 | 83,319,868 |
| NVIDIA Corp. | 968,373 | 194,662,341 |
| Qorvo, Inc. * | 186,824 | 15,106,589 |
| QUALCOMM, Inc. | 1,932,610 | 155,459,148 |
| Skyworks Solutions, Inc. | 272,632 | 24,825,870 |
| Texas Instruments, Inc. | 1,484,467 | 175,152,261 |
| Xilinx, Inc. | 400,311 | 36,324,220 |
| | | 1,635,058,760 |
| |
| Software & Services 12.1% |
| Accenture plc, Class A | 1,012,374 | 187,714,387 |
| Adobe, Inc. * | 771,823 | 214,512,766 |
| Akamai Technologies, Inc. * | 263,194 | 22,766,281 |
| Alliance Data Systems Corp. | 65,077 | 6,507,700 |
| ANSYS, Inc. * | 134,183 | 29,540,387 |
| Autodesk, Inc. * | 348,809 | 51,400,494 |
| Automatic Data Processing, Inc. | 690,064 | 111,949,083 |
| Broadridge Financial Solutions, Inc. | 180,907 | 22,653,175 |
| Cadence Design Systems, Inc. * | 444,991 | 29,080,162 |
| Citrix Systems, Inc. | 195,246 | 21,254,480 |
| Cognizant Technology Solutions Corp., Class A | 876,402 | 53,407,938 |
| DXC Technology Co. | 411,997 | 11,399,957 |
| Fidelity National Information Services, Inc. | 975,525 | 128,535,174 |
| Fiserv, Inc. * | 908,329 | 96,410,040 |
| FleetCor Technologies, Inc. * | 137,922 | 40,579,411 |
| Fortinet, Inc. * | 225,352 | 18,379,709 |
| Gartner, Inc. * | 143,092 | 22,047,615 |
| Global Payments, Inc. | 476,147 | 80,554,549 |
| International Business Machines Corp. | 1,408,106 | 188,306,015 |
| Intuit, Inc. | 413,712 | 106,530,840 |
| Jack Henry & Associates, Inc. | 122,457 | 17,335,013 |
| Leidos Holdings, Inc. | 214,501 | 18,496,421 |
| Mastercard, Inc., Class A | 1,418,805 | 392,739,412 |
| Microsoft Corp. | 12,134,708 | 1,739,753,086 |
| Oracle Corp. | 3,499,063 | 190,663,943 |
| Paychex, Inc. | 509,313 | 42,598,939 |
| PayPal Holdings, Inc. * | 1,870,718 | 194,741,744 |
| salesforce.com, Inc. * | 1,394,352 | 218,202,144 |
| Symantec Corp. | 902,445 | 20,647,942 |
| Synopsys, Inc. * | 238,574 | 32,386,421 |
| The Western Union Co. | 671,770 | 16,834,556 |
Schwab Equity Index Funds | Annual Report
Schwab S&P 500 Index Fund
Portfolio Holdings as of October 31, 2019 (continued)
| Security | Number
of Shares | Value ($) |
| VeriSign, Inc. * | 165,983 | 31,540,090 |
| Visa, Inc., Class A | 2,744,096 | 490,809,011 |
| | | 4,850,278,885 |
| |
| Technology Hardware & Equipment 6.1% |
| Amphenol Corp., Class A | 474,367 | 47,593,241 |
| Apple, Inc. | 6,751,993 | 1,679,625,779 |
| Arista Networks, Inc. * | 86,369 | 21,123,266 |
| CDW Corp. | 229,624 | 29,371,206 |
| Cisco Systems, Inc. | 6,749,583 | 320,672,688 |
| Corning, Inc. | 1,242,453 | 36,813,882 |
| F5 Networks, Inc. * | 95,974 | 13,827,934 |
| FLIR Systems, Inc. | 217,819 | 11,230,748 |
| Hewlett Packard Enterprise Co. | 2,073,062 | 34,018,947 |
| HP, Inc. | 2,351,474 | 40,845,103 |
| IPG Photonics Corp. * | 55,795 | 7,492,153 |
| Juniper Networks, Inc. | 544,995 | 13,526,776 |
| Keysight Technologies, Inc. * | 298,110 | 30,082,280 |
| Motorola Solutions, Inc. | 262,652 | 43,684,280 |
| NetApp, Inc. | 377,645 | 21,102,803 |
| Seagate Technology plc | 375,726 | 21,803,380 |
| TE Connectivity Ltd. | 533,582 | 47,755,589 |
| Western Digital Corp. | 469,737 | 24,261,916 |
| Xerox Holdings Corp. | 300,122 | 10,183,139 |
| | | 2,455,015,110 |
| |
| Telecommunication Services 2.3% |
| AT&T, Inc. | 11,615,005 | 447,061,542 |
| CenturyLink, Inc. | 1,558,736 | 20,170,044 |
| T-Mobile US, Inc. * | 501,598 | 41,462,091 |
| Verizon Communications, Inc. | 6,573,990 | 397,529,175 |
| | | 906,222,852 |
| |
| Transportation 1.9% |
| Alaska Air Group, Inc. | 196,980 | 13,676,321 |
| American Airlines Group, Inc. | 625,978 | 18,816,899 |
| C.H. Robinson Worldwide, Inc. | 216,051 | 16,342,098 |
| CSX Corp. | 1,270,181 | 89,255,619 |
| Delta Air Lines, Inc. | 917,283 | 50,523,948 |
| Expeditors International of Washington, Inc. | 271,811 | 19,825,894 |
| FedEx Corp. | 380,750 | 58,125,295 |
| JB Hunt Transport Services, Inc. | 134,458 | 15,806,882 |
| Kansas City Southern | 160,133 | 22,543,524 |
| Norfolk Southern Corp. | 419,395 | 76,329,890 |
| Southwest Airlines Co. | 767,068 | 43,055,527 |
| Union Pacific Corp. | 1,120,085 | 185,329,264 |
| United Airlines Holdings, Inc. * | 350,744 | 31,861,585 |
| United Parcel Service, Inc., Class B | 1,110,760 | 127,926,229 |
| | | 769,418,975 |
| |
| Utilities 3.5% |
| AES Corp. | 1,057,993 | 18,038,781 |
| Alliant Energy Corp. | 380,335 | 20,287,069 |
| Ameren Corp. | 391,221 | 30,397,872 |
| American Electric Power Co., Inc. | 785,845 | 74,175,909 |
| American Water Works Co., Inc. | 287,602 | 35,452,698 |
| Atmos Energy Corp. | 187,695 | 21,111,934 |
| CenterPoint Energy, Inc. | 795,970 | 23,138,848 |
| CMS Energy Corp. | 450,078 | 28,768,986 |
| Consolidated Edison, Inc. | 529,154 | 48,798,582 |
| Dominion Energy, Inc. | 1,306,955 | 107,889,135 |
| DTE Energy Co. | 291,659 | 37,134,024 |
| Duke Energy Corp. | 1,158,413 | 109,192,009 |
| Security | Number
of Shares | Value ($) |
| Edison International | 568,174 | 35,738,145 |
| Entergy Corp. | 315,084 | 38,276,404 |
| Evergy, Inc. | 373,016 | 23,839,453 |
| Eversource Energy | 512,976 | 42,956,610 |
| Exelon Corp. | 1,546,901 | 70,368,526 |
| FirstEnergy Corp. | 856,660 | 41,393,811 |
| NextEra Energy, Inc. | 776,419 | 185,051,704 |
| NiSource, Inc. | 590,897 | 16,568,752 |
| NRG Energy, Inc. | 400,038 | 16,049,525 |
| Pinnacle West Capital Corp. | 179,552 | 16,899,434 |
| PPL Corp. | 1,148,803 | 38,473,412 |
| Public Service Enterprise Group, Inc. | 801,922 | 50,769,682 |
| Sempra Energy | 435,764 | 62,972,256 |
| The Southern Co. | 1,662,027 | 104,142,612 |
| WEC Energy Group, Inc. | 500,844 | 47,279,674 |
| Xcel Energy, Inc. | 835,176 | 53,042,028 |
| | | 1,398,207,875 |
| Total Common Stock |
| (Cost $19,901,583,892) | | 40,097,746,858 |
|
| Other Investment Company0.0% of net assets |
| |
| Securities Lending Collateral 0.0% |
| Wells Fargo Government Money Market Fund, Select Class 1.75%(c) | 1,405,885 | 1,405,885 |
| Total Other Investment Company |
| (Cost $1,405,885) | | 1,405,885 |
Security
Rate, Maturity Date | Face
Amount ($) | Value ($) |
| Short-Term Investment0.1% of net assets |
| |
| Time Deposit 0.1% |
| Sumitomo Mitsui Trust Bank, Limited. |
| 1.18%, 11/01/19(d) | 49,185,198 | 49,185,198 |
| Total Short-Term Investment |
| (Cost $49,185,198) | | 49,185,198 |
| | Number of
Contracts | Notional
Amount
($) | Current Value/
Unrealized
Appreciation
($) |
| Futures Contracts | |
| Long | |
| S&P 500 Index, e-mini, expires 12/20/19 | 805 | 122,190,950 | 2,085,885 |
| * | Non-income producing security. |
| (a) | Issuer is affiliated with the fund’s investment adviser. |
| (b) | All or a portion of this security is on loan. Securities on loan were valued at $1,383,250. |
| (c) | The rate shown is the 7-day yield. |
| (d) | The rate shown is the current daily overnight rate. |
Schwab Equity Index Funds | Annual Report
Portfolio Holdings as of October 31, 2019
This section shows all the securities in the fund’s portfolio and their values as of the report date.
The fund files its complete schedule of portfolio holdings with the U.S. Securities and Exchange Commission (SEC) for the first and third quarters of each fiscal year on Form N-Q. Effective March 31, 2019, Form N-PORT Part F has replaced Form N-Q. The fund’s Form N-Q and Form N-PORT Part F are available on the SEC’s website atwww.sec.gov. The fund also makes available its complete schedule of portfolio holdings 15 to 20 days after the end of the month on the fund’s website atwww.schwabfunds.com/schwabfunds_prospectus.
| Security | Number
of Shares | Value ($) |
| Common Stock99.8% of net assets |
| |
| Automobiles & Components 0.7% |
| Aptiv plc | 84,410 | 7,558,915 |
| Autoliv, Inc. | 25,928 | 2,018,235 |
| BorgWarner, Inc. | 68,688 | 2,862,916 |
| Ford Motor Co. | 1,293,386 | 11,110,186 |
| General Motors Co. | 415,679 | 15,446,632 |
| Gentex Corp. | 83,942 | 2,354,573 |
| Harley-Davidson, Inc. | 51,547 | 2,005,694 |
| Lear Corp. | 18,352 | 2,161,315 |
| Tesla, Inc. * | 46,816 | 14,743,295 |
| The Goodyear Tire & Rubber Co. | 78,523 | 1,246,160 |
| Thor Industries, Inc. | 18,666 | 1,180,811 |
| | | 62,688,732 |
| |
| Banks 5.5% |
| Associated Banc-Corp. | 52,421 | 1,054,186 |
| Bank of America Corp. | 2,771,201 | 86,655,455 |
| Bank OZK | 40,961 | 1,149,366 |
| BankUnited, Inc. | 31,045 | 1,064,844 |
| BB&T Corp. | 252,999 | 13,421,597 |
| BOK Financial Corp. | 10,599 | 817,713 |
| CIT Group, Inc. | 30,989 | 1,329,118 |
| Citigroup, Inc. | 747,223 | 53,695,445 |
| Citizens Financial Group, Inc. | 147,943 | 5,201,676 |
| Comerica, Inc. | 49,298 | 3,225,075 |
| Commerce Bancshares, Inc. | 32,860 | 2,114,870 |
| Cullen/Frost Bankers, Inc. | 18,693 | 1,683,865 |
| East West Bancorp, Inc. | 48,273 | 2,071,877 |
| Essent Group Ltd. | 32,857 | 1,711,521 |
| F.N.B. Corp. | 108,393 | 1,307,220 |
| Fifth Third Bancorp | 242,147 | 7,041,635 |
| First Citizens BancShares, Inc., Class A | 2,854 | 1,403,940 |
| First Financial Bankshares, Inc. | 45,227 | 1,505,155 |
| First Hawaiian, Inc. | 43,668 | 1,193,446 |
| First Horizon National Corp. | 101,562 | 1,621,945 |
| First Republic Bank | 55,662 | 5,920,210 |
| Glacier Bancorp, Inc. | 28,293 | 1,197,360 |
| Hancock Whitney Corp. | 30,679 | 1,196,481 |
| Huntington Bancshares, Inc. | 343,748 | 4,857,159 |
| IBERIABANK Corp. | 17,273 | 1,267,665 |
| Investors Bancorp, Inc. | 75,440 | 909,052 |
| JPMorgan Chase & Co. | 1,057,707 | 132,128,758 |
| KeyCorp | 332,279 | 5,971,054 |
| LendingTree, Inc. * | 2,535 | 912,220 |
| M&T Bank Corp. | 44,226 | 6,922,696 |
| MGIC Investment Corp. | 118,705 | 1,627,446 |
| New York Community Bancorp, Inc. | 156,892 | 1,827,792 |
| PacWest Bancorp | 39,758 | 1,470,648 |
| People's United Financial, Inc. | 146,704 | 2,372,204 |
| Pinnacle Financial Partners, Inc. | 24,309 | 1,429,855 |
| Popular, Inc. | 32,233 | 1,755,409 |
| Prosperity Bancshares, Inc. | 31,369 | 2,165,088 |
| Radian Group, Inc. | 66,938 | 1,680,144 |
| Regions Financial Corp. | 329,655 | 5,307,445 |
| Signature Bank | 17,868 | 2,114,142 |
| Security | Number
of Shares | Value ($) |
| Sterling Bancorp | 67,030 | 1,317,139 |
| SunTrust Banks, Inc. | 146,570 | 10,016,594 |
| SVB Financial Group * | 17,185 | 3,806,134 |
| Synovus Financial Corp. | 50,957 | 1,725,914 |
| TFS Financial Corp. | 16,400 | 315,864 |
| The PNC Financial Services Group, Inc. | 147,283 | 21,606,416 |
| U.S. Bancorp | 474,347 | 27,047,266 |
| UMB Financial Corp. | 14,027 | 915,402 |
| Umpqua Holdings Corp. | 73,204 | 1,158,087 |
| United Bankshares, Inc. | 33,952 | 1,342,462 |
| Valley National Bancorp | 111,634 | 1,292,722 |
| Webster Financial Corp. | 30,730 | 1,355,193 |
| Wells Fargo & Co. | 1,326,384 | 68,481,206 |
| Western Alliance Bancorp | 32,143 | 1,585,614 |
| Wintrust Financial Corp. | 18,766 | 1,197,646 |
| Zions Bancorp NA | 57,929 | 2,807,819 |
| | | 518,274,255 |
| |
| Capital Goods 6.7% |
| 3M Co. | 190,299 | 31,397,432 |
| A.O. Smith Corp. | 45,777 | 2,274,201 |
| Acuity Brands, Inc. | 13,338 | 1,664,449 |
| AECOM * | 52,049 | 2,082,481 |
| AGCO Corp. | 20,635 | 1,582,498 |
| Air Lease Corp. | 34,403 | 1,513,044 |
| Allegion plc | 30,790 | 3,572,872 |
| Allison Transmission Holdings, Inc. | 40,203 | 1,753,253 |
| AMETEK, Inc. | 75,823 | 6,949,178 |
| Arconic, Inc. | 127,972 | 3,515,391 |
| BWX Technologies, Inc. | 31,743 | 1,844,268 |
| Carlisle Cos., Inc. | 18,649 | 2,839,683 |
| Caterpillar, Inc. | 186,152 | 25,651,746 |
| Crane Co. | 16,966 | 1,298,238 |
| Cummins, Inc. | 52,270 | 9,015,530 |
| Curtiss-Wright Corp. | 14,280 | 1,931,370 |
| Deere & Co. | 104,194 | 18,144,343 |
| Donaldson Co., Inc. | 42,469 | 2,239,815 |
| Dover Corp. | 48,323 | 5,020,276 |
| Eaton Corp. plc | 138,851 | 12,095,311 |
| EMCOR Group, Inc. | 18,661 | 1,636,756 |
| Emerson Electric Co. | 203,754 | 14,293,343 |
| EnerSys | 14,387 | 961,915 |
| Fastenal Co. | 188,951 | 6,790,899 |
| Flowserve Corp. | 43,779 | 2,138,166 |
| Fluor Corp. | 46,510 | 749,276 |
| Fortive Corp. | 97,279 | 6,712,251 |
| Fortune Brands Home & Security, Inc. | 46,737 | 2,806,557 |
| Gardner Denver Holdings, Inc. * | 44,603 | 1,419,714 |
| Gates Industrial Corp. plc * | 14,417 | 144,170 |
| Generac Holdings, Inc. * | 20,749 | 2,003,938 |
| General Dynamics Corp. | 77,382 | 13,681,138 |
| General Electric Co. | 2,887,009 | 28,812,350 |
| Graco, Inc. | 55,281 | 2,498,701 |
| GrafTech International Ltd. | 18,736 | 226,331 |
| HD Supply Holdings, Inc. * | 57,074 | 2,256,706 |
| HEICO Corp. | 13,213 | 1,629,691 |
| HEICO Corp., Class A | 24,022 | 2,288,576 |
| Hexcel Corp. | 28,336 | 2,114,432 |
Schwab Equity Index Funds | Annual Report
Portfolio Holdings as of October 31, 2019 (continued)
| Security | Number
of Shares | Value ($) |
| Honeywell International, Inc. | 238,076 | 41,122,868 |
| Hubbell, Inc. | 18,131 | 2,569,163 |
| Huntington Ingalls Industries, Inc. | 13,580 | 3,064,463 |
| IDEX Corp. | 24,948 | 3,880,162 |
| Illinois Tool Works, Inc. | 97,477 | 16,432,673 |
| Ingersoll-Rand plc | 80,122 | 10,166,681 |
| ITT, Inc. | 29,201 | 1,735,999 |
| Jacobs Engineering Group, Inc. | 44,782 | 4,190,700 |
| Johnson Controls International plc | 262,842 | 11,388,944 |
| L3Harris Technologies, Inc. | 73,872 | 15,240,532 |
| Lennox International, Inc. | 11,548 | 2,856,513 |
| Lincoln Electric Holdings, Inc. | 20,215 | 1,810,658 |
| Lockheed Martin Corp. | 82,195 | 30,961,213 |
| Masco Corp. | 95,146 | 4,400,503 |
| MasTec, Inc. * | 19,962 | 1,256,408 |
| MSC Industrial Direct Co., Inc., Class A | 14,524 | 1,063,302 |
| Nordson Corp. | 16,803 | 2,634,878 |
| Northrop Grumman Corp. | 52,056 | 18,348,699 |
| nVent Electric plc | 50,997 | 1,175,991 |
| Oshkosh Corp. | 22,571 | 1,927,112 |
| Owens Corning | 36,379 | 2,229,305 |
| PACCAR, Inc. | 114,466 | 8,706,284 |
| Parker-Hannifin Corp. | 42,608 | 7,818,142 |
| Pentair plc | 55,620 | 2,306,561 |
| Proto Labs, Inc. * | 8,590 | 832,972 |
| Quanta Services, Inc. | 47,141 | 1,982,279 |
| Raytheon Co. | 91,978 | 19,518,651 |
| RBC Bearings, Inc. * | 8,292 | 1,330,369 |
| Rockwell Automation, Inc. | 38,593 | 6,637,610 |
| Roper Technologies, Inc. | 34,339 | 11,570,869 |
| Sensata Technologies Holding plc * | 53,076 | 2,716,960 |
| Snap-on, Inc. | 18,092 | 2,943,026 |
| Spirit AeroSystems Holdings, Inc., Class A | 34,044 | 2,785,480 |
| Stanley Black & Decker, Inc. | 50,007 | 7,567,559 |
| Teledyne Technologies, Inc. * | 12,111 | 3,991,786 |
| Textron, Inc. | 76,615 | 3,531,185 |
| The Boeing Co. | 176,838 | 60,109,005 |
| The Middleby Corp. * | 18,512 | 2,239,026 |
| The Timken Co. | 22,955 | 1,124,795 |
| The Toro Co. | 35,498 | 2,737,961 |
| TransDigm Group, Inc. | 16,419 | 8,640,991 |
| Trex Co., Inc. * | 19,670 | 1,728,796 |
| United Rentals, Inc. * | 25,389 | 3,391,209 |
| United Technologies Corp. | 268,353 | 38,530,124 |
| W.W. Grainger, Inc. | 14,553 | 4,494,549 |
| WABCO Holdings, Inc. * | 16,677 | 2,245,058 |
| Wabtec Corp. | 59,936 | 4,157,760 |
| Watsco, Inc. | 10,729 | 1,891,523 |
| Woodward, Inc. | 18,687 | 1,993,155 |
| Xylem, Inc. | 59,867 | 4,591,200 |
| | | 630,121,941 |
| |
| Commercial & Professional Services 0.9% |
| ADT, Inc.(a) | 37,530 | 290,482 |
| Cintas Corp. | 27,452 | 7,375,529 |
| Copart, Inc. * | 66,455 | 5,491,841 |
| CoStar Group, Inc. * | 12,061 | 6,627,761 |
| Equifax, Inc. | 40,215 | 5,497,793 |
| IAA, Inc. * | 44,407 | 1,694,127 |
| IHS Markit Ltd. * | 132,527 | 9,279,540 |
| Insperity, Inc. | 13,089 | 1,382,591 |
| KAR Auction Services, Inc. | 44,407 | 1,103,958 |
| ManpowerGroup, Inc. | 20,020 | 1,820,218 |
| MSA Safety, Inc. | 11,702 | 1,405,059 |
| Nielsen Holdings plc | 118,804 | 2,395,089 |
| Republic Services, Inc. | 70,045 | 6,129,638 |
| Robert Half International, Inc. | 38,499 | 2,204,838 |
| Security | Number
of Shares | Value ($) |
| Rollins, Inc. | 46,334 | 1,765,789 |
| Stericycle, Inc. * | 30,083 | 1,732,781 |
| The Brink's Co. | 16,696 | 1,418,492 |
| TransUnion | 61,735 | 5,100,546 |
| Verisk Analytics, Inc. | 54,117 | 7,830,730 |
| Waste Management, Inc. | 128,887 | 14,462,410 |
| | | 85,009,212 |
| |
| Consumer Durables & Apparel 1.2% |
| Brunswick Corp. | 27,826 | 1,620,586 |
| Capri Holdings Ltd. * | 51,002 | 1,584,632 |
| Carter's, Inc. | 14,569 | 1,460,397 |
| Columbia Sportswear Co. | 9,818 | 888,038 |
| D.R. Horton, Inc. | 110,821 | 5,803,696 |
| Deckers Outdoor Corp. * | 9,744 | 1,489,858 |
| Garmin Ltd. | 47,771 | 4,478,531 |
| Hanesbrands, Inc. | 120,823 | 1,837,718 |
| Hasbro, Inc. | 38,828 | 3,778,353 |
| Kontoor Brands, Inc. * | 16,175 | 614,650 |
| Leggett & Platt, Inc. | 43,800 | 2,246,940 |
| Lennar Corp., Class A | 94,199 | 5,614,260 |
| lululemon Athletica, Inc. * | 37,372 | 7,633,978 |
| Mattel, Inc. * | 115,930 | 1,384,204 |
| Mohawk Industries, Inc. * | 19,786 | 2,836,917 |
| Newell Brands, Inc. | 125,922 | 2,388,740 |
| NIKE, Inc., Class B | 413,902 | 37,064,924 |
| NVR, Inc. * | 1,137 | 4,134,803 |
| Polaris, Inc. | 19,133 | 1,887,470 |
| PulteGroup, Inc. | 85,198 | 3,343,170 |
| PVH Corp. | 24,313 | 2,119,121 |
| Ralph Lauren Corp. | 16,833 | 1,616,978 |
| Skechers U.S.A., Inc., Class A * | 44,618 | 1,667,375 |
| Tapestry, Inc. | 94,373 | 2,440,486 |
| Toll Brothers, Inc. | 42,829 | 1,703,309 |
| Under Armour, Inc., Class A * | 63,104 | 1,303,098 |
| Under Armour, Inc., Class C * | 64,030 | 1,184,555 |
| VF Corp. | 107,976 | 8,885,345 |
| Whirlpool Corp. | 21,203 | 3,225,400 |
| | | 116,237,532 |
| |
| Consumer Services 2.1% |
| Aramark | 82,012 | 3,588,845 |
| Bright Horizons Family Solutions, Inc. * | 19,193 | 2,850,544 |
| Caesars Entertainment Corp. * | 183,951 | 2,258,918 |
| Carnival Corp. | 131,941 | 5,658,950 |
| Chegg, Inc. * | 37,671 | 1,154,993 |
| Chipotle Mexican Grill, Inc. * | 8,447 | 6,573,118 |
| Choice Hotels International, Inc. | 10,274 | 909,044 |
| Churchill Downs, Inc. | 11,834 | 1,538,302 |
| Cracker Barrel Old Country Store, Inc. | 8,038 | 1,249,909 |
| Darden Restaurants, Inc. | 40,487 | 4,545,476 |
| Domino's Pizza, Inc. | 13,520 | 3,672,302 |
| Dunkin' Brands Group, Inc. | 27,592 | 2,169,283 |
| Eldorado Resorts, Inc. * | 21,730 | 972,852 |
| Grand Canyon Education, Inc. * | 16,119 | 1,482,303 |
| H&R Block, Inc. | 66,106 | 1,651,989 |
| Hilton Worldwide Holdings, Inc. | 95,008 | 9,211,976 |
| Las Vegas Sands Corp. | 112,179 | 6,937,149 |
| Marriott International, Inc., Class A | 90,541 | 11,457,964 |
| Marriott Vacations Worldwide Corp. | 12,537 | 1,378,192 |
| McDonald's Corp. | 251,327 | 49,436,021 |
| MGM Resorts International | 172,799 | 4,924,772 |
| Norwegian Cruise Line Holdings Ltd. * | 70,837 | 3,595,686 |
| Planet Fitness, Inc., Class A * | 27,952 | 1,779,424 |
| Royal Caribbean Cruises Ltd. | 56,645 | 6,164,675 |
| Service Corp. International | 60,607 | 2,756,406 |
Schwab Equity Index Funds | Annual Report
Portfolio Holdings as of October 31, 2019 (continued)
| Security | Number
of Shares | Value ($) |
| ServiceMaster Global Holdings, Inc. * | 45,364 | 1,831,798 |
| Six Flags Entertainment Corp. | 25,990 | 1,096,518 |
| Starbucks Corp. | 396,199 | 33,502,588 |
| Texas Roadhouse, Inc. | 21,380 | 1,207,970 |
| The Wendy's Co. | 61,568 | 1,304,010 |
| Vail Resorts, Inc. | 13,183 | 3,063,334 |
| Wyndham Destinations, Inc. | 30,227 | 1,402,835 |
| Wyndham Hotels & Resorts, Inc. | 31,459 | 1,697,842 |
| Wynn Resorts Ltd. | 32,230 | 3,910,788 |
| Yum! Brands, Inc. | 100,378 | 10,209,446 |
| | | 197,146,222 |
| |
| Diversified Financials 5.1% |
| Affiliated Managers Group, Inc. | 16,479 | 1,316,343 |
| AGNC Investment Corp. | 180,010 | 3,069,170 |
| Ally Financial, Inc. | 128,717 | 3,942,602 |
| American Express Co. | 225,179 | 26,408,993 |
| Ameriprise Financial, Inc. | 43,343 | 6,540,025 |
| Annaly Capital Management, Inc. | 478,172 | 4,293,985 |
| AXA Equitable Holdings, Inc. | 99,098 | 2,140,517 |
| Berkshire Hathaway, Inc., Class B * | 648,730 | 137,907,023 |
| BlackRock, Inc. | 38,889 | 17,955,051 |
| Blackstone Mortgage Trust, Inc., Class A | 45,023 | 1,634,335 |
| Capital One Financial Corp. | 155,708 | 14,519,771 |
| Cboe Global Markets, Inc. | 36,829 | 4,240,859 |
| Chimera Investment Corp. | 62,683 | 1,269,958 |
| CME Group, Inc. | 118,527 | 24,386,930 |
| Credit Acceptance Corp. * | 4,602 | 2,014,802 |
| Discover Financial Services | 105,374 | 8,457,317 |
| E*TRADE Financial Corp. | 75,025 | 3,135,295 |
| Eaton Vance Corp. | 38,050 | 1,735,080 |
| Evercore, Inc., Class A | 12,967 | 954,890 |
| FactSet Research Systems, Inc. | 12,736 | 3,228,831 |
| FirstCash, Inc. | 13,886 | 1,171,840 |
| Franklin Resources, Inc. | 93,498 | 2,575,870 |
| Green Dot Corp., Class A * | 16,392 | 472,745 |
| Interactive Brokers Group, Inc., Class A | 25,103 | 1,194,150 |
| Intercontinental Exchange, Inc. | 185,556 | 17,501,642 |
| Invesco Ltd. | 127,458 | 2,143,844 |
| Janus Henderson Group plc | 52,158 | 1,206,415 |
| Jefferies Financial Group, Inc. | 81,909 | 1,529,241 |
| Lazard Ltd., Class A | 43,357 | 1,618,517 |
| LPL Financial Holdings, Inc. | 27,466 | 2,220,351 |
| MarketAxess Holdings, Inc. | 12,407 | 4,573,096 |
| Moody's Corp. | 53,833 | 11,880,405 |
| Morgan Stanley | 415,779 | 19,146,623 |
| Morningstar, Inc. | 6,799 | 1,100,350 |
| MSCI, Inc. | 27,910 | 6,546,570 |
| Nasdaq, Inc. | 38,043 | 3,795,550 |
| New Residential Investment Corp. | 138,642 | 2,196,089 |
| Northern Trust Corp. | 71,155 | 7,092,730 |
| OneMain Holdings, Inc. | 25,087 | 1,003,480 |
| Raymond James Financial, Inc. | 40,814 | 3,407,561 |
| S&P Global, Inc. | 81,535 | 21,035,215 |
| Santander Consumer USA Holdings, Inc. | 34,243 | 858,814 |
| SEI Investments Co. | 41,874 | 2,509,090 |
| SLM Corp. | 138,796 | 1,171,438 |
| Starwood Property Trust, Inc. | 93,731 | 2,305,783 |
| State Street Corp. | 123,148 | 8,136,388 |
| Stifel Financial Corp. | 22,626 | 1,266,603 |
| Synchrony Financial | 202,191 | 7,151,496 |
| T. Rowe Price Group, Inc. | 78,127 | 9,047,107 |
| TD Ameritrade Holding Corp. | 89,108 | 3,419,965 |
| The Bank of New York Mellon Corp. | 283,946 | 13,274,475 |
| The Charles Schwab Corp.(b) | 383,080 | 15,595,187 |
| The Goldman Sachs Group, Inc. | 107,079 | 22,848,517 |
| Security | Number
of Shares | Value ($) |
| Two Harbors Investment Corp. | 90,007 | 1,248,397 |
| Voya Financial, Inc. | 45,813 | 2,472,069 |
| | | 473,869,390 |
| |
| Energy 4.1% |
| Antero Resources Corp. * | 66,200 | 165,500 |
| Apache Corp. | 125,516 | 2,718,677 |
| Baker Hughes Co. | 214,698 | 4,594,537 |
| Cabot Oil & Gas Corp. | 138,178 | 2,575,638 |
| Centennial Resource Development, Inc., Class A * | 59,100 | 200,940 |
| Cheniere Energy, Inc. * | 77,403 | 4,764,155 |
| Chevron Corp. | 628,087 | 72,946,024 |
| Cimarex Energy Co. | 33,916 | 1,431,934 |
| Concho Resources, Inc. | 66,081 | 4,461,789 |
| ConocoPhillips | 367,501 | 20,286,055 |
| Continental Resources, Inc. * | 28,913 | 852,066 |
| CVR Energy, Inc. | 8,925 | 423,223 |
| Devon Energy Corp. | 133,046 | 2,698,173 |
| Diamondback Energy, Inc. | 54,023 | 4,633,012 |
| EOG Resources, Inc. | 192,328 | 13,330,254 |
| EQT Corp. | 85,155 | 914,565 |
| Equitrans Midstream Corp. | 68,050 | 947,256 |
| Exxon Mobil Corp. | 1,399,877 | 94,589,689 |
| Halliburton Co. | 290,788 | 5,597,669 |
| Helmerich & Payne, Inc. | 36,540 | 1,370,250 |
| Hess Corp. | 85,684 | 5,633,723 |
| HollyFrontier Corp. | 50,124 | 2,753,813 |
| Kinder Morgan, Inc. | 643,059 | 12,848,319 |
| Marathon Oil Corp. | 267,709 | 3,086,685 |
| Marathon Petroleum Corp. | 217,436 | 13,905,032 |
| Murphy Oil Corp. | 51,132 | 1,054,853 |
| National Oilwell Varco, Inc. | 128,053 | 2,896,559 |
| Noble Energy, Inc. | 157,372 | 3,030,985 |
| Occidental Petroleum Corp. | 295,495 | 11,967,547 |
| ONEOK, Inc. | 136,287 | 9,516,921 |
| Parsley Energy, Inc., Class A | 93,091 | 1,471,769 |
| PBF Energy, Inc., Class A | 33,772 | 1,090,160 |
| Peabody Energy Corp. | 23,624 | 248,761 |
| Phillips 66 | 148,476 | 17,344,966 |
| Pioneer Natural Resources Co. | 55,508 | 6,828,594 |
| Schlumberger Ltd. | 457,318 | 14,949,725 |
| Targa Resources Corp. | 77,514 | 3,013,744 |
| TechnipFMC plc | 138,686 | 2,736,275 |
| The Williams Cos., Inc. | 399,776 | 8,919,003 |
| Transocean Ltd. * | 189,158 | 898,500 |
| Valero Energy Corp. | 136,901 | 13,276,659 |
| WPX Energy, Inc. * | 139,819 | 1,395,394 |
| | | 378,369,393 |
| |
| Food & Staples Retailing 1.5% |
| BJ's Wholesale Club Holdings, Inc. * | 40,795 | 1,089,227 |
| Casey's General Stores, Inc. | 12,222 | 2,087,640 |
| Costco Wholesale Corp. | 145,469 | 43,220,295 |
| Performance Food Group Co. * | 35,113 | 1,496,165 |
| Sysco Corp. | 169,720 | 13,555,536 |
| The Kroger Co. | 263,373 | 6,489,511 |
| U.S. Foods Holding Corp. * | 72,655 | 2,882,224 |
| Walgreens Boots Alliance, Inc. | 250,898 | 13,744,192 |
| Walmart, Inc. | 470,417 | 55,161,097 |
| | | 139,725,887 |
| |
| Food, Beverage & Tobacco 3.6% |
| Altria Group, Inc. | 617,441 | 27,655,182 |
| Archer-Daniels-Midland Co. | 184,707 | 7,765,082 |
Schwab Equity Index Funds | Annual Report
Portfolio Holdings as of October 31, 2019 (continued)
| Security | Number
of Shares | Value ($) |
| Brown-Forman Corp., Class B | 60,157 | 3,941,487 |
| Bunge Ltd. | 47,128 | 2,544,912 |
| Campbell Soup Co. | 55,642 | 2,576,781 |
| ConAgra Brands, Inc. | 161,997 | 4,382,019 |
| Constellation Brands, Inc., Class A | 55,420 | 10,548,089 |
| Darling Ingredients, Inc. * | 55,304 | 1,067,367 |
| Flowers Foods, Inc. | 64,122 | 1,392,730 |
| General Mills, Inc. | 199,478 | 10,145,451 |
| Hormel Foods Corp. | 91,674 | 3,748,550 |
| Ingredion, Inc. | 22,258 | 1,758,382 |
| Kellogg Co. | 81,877 | 5,201,646 |
| Keurig Dr Pepper, Inc. | 88,388 | 2,489,006 |
| Lamb Weston Holdings, Inc. | 47,949 | 3,741,940 |
| Lancaster Colony Corp. | 6,589 | 917,057 |
| McCormick & Co., Inc. - Non Voting Shares | 40,804 | 6,556,795 |
| Molson Coors Brewing Co., Class B | 62,447 | 3,292,206 |
| Mondelez International, Inc., Class A | 476,837 | 25,010,101 |
| Monster Beverage Corp. * | 127,954 | 7,182,058 |
| National Beverage Corp.(a) | 4,100 | 180,236 |
| PepsiCo, Inc. | 462,374 | 63,423,842 |
| Philip Morris International, Inc. | 514,612 | 41,910,001 |
| Pilgrim's Pride Corp. * | 18,242 | 553,827 |
| Post Holdings, Inc. * | 22,899 | 2,356,307 |
| Seaboard Corp. | 90 | 379,718 |
| The Coca-Cola Co. | 1,272,943 | 69,286,287 |
| The Hershey Co. | 49,212 | 7,227,766 |
| The JM Smucker Co. | 37,424 | 3,954,968 |
| The Kraft Heinz Co. | 204,691 | 6,617,660 |
| TreeHouse Foods, Inc. * | 18,832 | 1,017,305 |
| Tyson Foods, Inc., Class A | 97,315 | 8,056,709 |
| | | 336,881,467 |
| |
| Health Care Equipment & Services 6.2% |
| Abbott Laboratories | 584,871 | 48,901,064 |
| ABIOMED, Inc. * | 15,020 | 3,117,852 |
| Align Technology, Inc. * | 23,937 | 6,039,066 |
| Amedisys, Inc. * | 10,618 | 1,364,625 |
| AmerisourceBergen Corp. | 50,302 | 4,294,785 |
| Anthem, Inc. | 84,630 | 22,772,240 |
| Baxter International, Inc. | 169,111 | 12,970,814 |
| Becton, Dickinson & Co. | 89,348 | 22,873,088 |
| Boston Scientific Corp. * | 461,142 | 19,229,621 |
| Cantel Medical Corp. | 12,112 | 882,844 |
| Cardinal Health, Inc. | 98,004 | 4,846,298 |
| Centene Corp. * | 136,232 | 7,231,195 |
| Cerner Corp. | 105,332 | 7,069,884 |
| Chemed Corp. | 5,287 | 2,082,602 |
| Cigna Corp. * | 124,778 | 22,267,882 |
| Covetrus, Inc. * | 32,898 | 326,184 |
| CVS Health Corp. | 430,186 | 28,560,049 |
| Danaher Corp. | 211,315 | 29,123,433 |
| DaVita, Inc. * | 31,988 | 1,874,497 |
| DENTSPLY SIRONA, Inc. | 74,275 | 4,068,784 |
| DexCom, Inc. * | 30,050 | 4,634,912 |
| Edwards Lifesciences Corp. * | 68,858 | 16,414,370 |
| Encompass Health Corp. | 32,963 | 2,110,291 |
| Globus Medical, Inc., Class A * | 25,641 | 1,342,819 |
| Haemonetics Corp. * | 16,531 | 1,995,788 |
| HCA Healthcare, Inc. | 87,998 | 11,751,253 |
| HealthEquity, Inc. * | 23,292 | 1,322,753 |
| Henry Schein, Inc. * | 49,006 | 3,067,040 |
| Hill-Rom Holdings, Inc. | 22,278 | 2,332,284 |
| Hologic, Inc. * | 88,024 | 4,252,439 |
| Humana, Inc. | 44,759 | 13,168,098 |
| ICU Medical, Inc. * | 6,378 | 1,030,749 |
| IDEXX Laboratories, Inc. * | 28,361 | 8,083,169 |
| Security | Number
of Shares | Value ($) |
| Insulet Corp. * | 19,750 | 2,870,070 |
| Integra LifeSciences Holdings Corp. * | 23,608 | 1,370,680 |
| Intuitive Surgical, Inc. * | 38,136 | 21,087,301 |
| Laboratory Corp. of America Holdings * | 32,458 | 5,348,105 |
| LHC Group, Inc. * | 9,771 | 1,084,288 |
| LivaNova plc * | 16,259 | 1,149,999 |
| Masimo Corp. * | 16,355 | 2,384,395 |
| McKesson Corp. | 61,157 | 8,133,881 |
| MEDNAX, Inc. * | 27,268 | 598,805 |
| Medtronic plc | 443,982 | 48,349,640 |
| Molina Healthcare, Inc. * | 20,883 | 2,456,676 |
| Penumbra, Inc. * | 10,379 | 1,618,813 |
| Quest Diagnostics, Inc. | 44,790 | 4,534,987 |
| ResMed, Inc. | 47,313 | 6,998,539 |
| Steris plc | 27,785 | 3,933,522 |
| Stryker Corp. | 106,229 | 22,974,146 |
| Teladoc Health, Inc. * | 23,422 | 1,794,125 |
| Teleflex, Inc. | 15,380 | 5,343,166 |
| The Cooper Cos., Inc. | 16,298 | 4,742,718 |
| UnitedHealth Group, Inc. | 313,577 | 79,240,908 |
| Universal Health Services, Inc., Class B | 26,840 | 3,689,426 |
| Varian Medical Systems, Inc. * | 30,201 | 3,648,583 |
| Veeva Systems, Inc., Class A * | 43,029 | 6,102,803 |
| WellCare Health Plans, Inc. * | 16,580 | 4,917,628 |
| West Pharmaceutical Services, Inc. | 24,202 | 3,481,216 |
| Wright Medical Group N.V. * | 42,065 | 874,952 |
| Zimmer Biomet Holdings, Inc. | 67,992 | 9,398,534 |
| | | 579,530,678 |
| |
| Household & Personal Products 1.8% |
| Church & Dwight Co., Inc. | 82,014 | 5,736,059 |
| Colgate-Palmolive Co. | 284,160 | 19,493,376 |
| Coty, Inc., Class A | 94,332 | 1,102,741 |
| Herbalife Nutrition Ltd. * | 31,416 | 1,403,353 |
| Kimberly-Clark Corp. | 113,864 | 15,130,248 |
| Nu Skin Enterprises, Inc., Class A | 18,980 | 846,128 |
| The Clorox Co. | 41,534 | 6,134,157 |
| The Estee Lauder Cos., Inc., Class A | 73,160 | 13,627,513 |
| The Procter & Gamble Co. | 827,790 | 103,068,133 |
| | | 166,541,708 |
| |
| Insurance 2.6% |
| Aflac, Inc. | 244,955 | 13,021,808 |
| Alleghany Corp. * | 4,737 | 3,686,760 |
| American Financial Group, Inc. | 24,522 | 2,551,269 |
| American International Group, Inc. | 288,038 | 15,254,492 |
| American National Insurance Co. | 3,237 | 388,375 |
| Aon plc | 78,001 | 15,066,673 |
| Arch Capital Group Ltd. * | 134,419 | 5,613,337 |
| Arthur J. Gallagher & Co. | 61,882 | 5,644,876 |
| Assurant, Inc. | 20,009 | 2,522,535 |
| Assured Guaranty Ltd. | 32,468 | 1,523,399 |
| Athene Holding Ltd., Class A * | 39,502 | 1,712,412 |
| Axis Capital Holdings Ltd. | 27,912 | 1,658,810 |
| Brighthouse Financial, Inc. * | 36,771 | 1,388,473 |
| Brown & Brown, Inc. | 77,637 | 2,925,362 |
| Chubb Ltd. | 150,775 | 22,981,126 |
| Cincinnati Financial Corp. | 50,113 | 5,673,293 |
| CNA Financial Corp. | 9,511 | 426,473 |
| Erie Indemnity Co., Class A | 6,101 | 1,124,231 |
| Everest Re Group Ltd. | 13,550 | 3,483,570 |
| Fidelity National Financial, Inc. | 90,454 | 4,146,411 |
| First American Financial Corp. | 37,257 | 2,301,737 |
| Globe Life, Inc. | 33,097 | 3,221,331 |
| Kemper Corp. | 20,964 | 1,506,892 |
| Lincoln National Corp. | 66,563 | 3,759,478 |
Schwab Equity Index Funds | Annual Report
Portfolio Holdings as of October 31, 2019 (continued)
| Security | Number
of Shares | Value ($) |
| Loews Corp. | 85,949 | 4,211,501 |
| Markel Corp. * | 4,544 | 5,321,024 |
| Marsh & McLennan Cos., Inc. | 167,446 | 17,350,755 |
| MetLife, Inc. | 263,266 | 12,318,216 |
| Old Republic International Corp. | 95,114 | 2,124,847 |
| Primerica, Inc. | 13,705 | 1,729,297 |
| Principal Financial Group, Inc. | 85,226 | 4,549,364 |
| Prudential Financial, Inc. | 132,945 | 12,116,607 |
| Reinsurance Group of America, Inc. | 20,901 | 3,395,785 |
| RenaissanceRe Holdings Ltd. | 14,760 | 2,762,777 |
| Selective Insurance Group, Inc. | 19,709 | 1,362,286 |
| The Allstate Corp. | 108,930 | 11,592,331 |
| The Hanover Insurance Group, Inc. | 13,008 | 1,713,284 |
| The Hartford Financial Services Group, Inc. | 119,541 | 6,823,400 |
| The Progressive Corp. | 193,628 | 13,495,872 |
| The Travelers Cos., Inc. | 86,062 | 11,279,286 |
| Unum Group | 68,986 | 1,899,874 |
| W. R. Berkley Corp. | 47,387 | 3,312,351 |
| Willis Towers Watson plc | 42,680 | 7,976,892 |
| | | 246,918,872 |
| |
| Materials 2.8% |
| Air Products & Chemicals, Inc. | 72,946 | 15,556,464 |
| Albemarle Corp. | 35,335 | 2,146,248 |
| Alcoa Corp. * | 62,234 | 1,293,845 |
| Amcor plc * | 535,396 | 5,096,970 |
| AptarGroup, Inc. | 21,051 | 2,487,176 |
| Ashland Global Holdings, Inc. | 19,967 | 1,544,847 |
| Avery Dennison Corp. | 28,074 | 3,589,542 |
| Axalta Coating Systems Ltd. * | 67,564 | 1,992,462 |
| Ball Corp. | 109,573 | 7,666,823 |
| Berry Global Group, Inc. * | 43,554 | 1,807,927 |
| Celanese Corp. | 40,950 | 4,961,092 |
| CF Industries Holdings, Inc. | 72,814 | 3,302,115 |
| Corteva, Inc. * | 247,014 | 6,516,229 |
| Crown Holdings, Inc. * | 45,123 | 3,286,759 |
| Dow, Inc. * | 245,474 | 12,393,982 |
| DuPont de Nemours, Inc. | 246,916 | 16,274,234 |
| Eastman Chemical Co. | 45,376 | 3,450,391 |
| Ecolab, Inc. | 82,841 | 15,911,271 |
| Element Solutions, Inc. * | 74,692 | 811,155 |
| FMC Corp. | 43,298 | 3,961,767 |
| Freeport-McMoRan, Inc. | 482,385 | 4,737,021 |
| Graphic Packaging Holding Co. | 99,149 | 1,552,673 |
| Huntsman Corp. | 67,330 | 1,490,013 |
| Ingevity Corp. * | 13,907 | 1,171,108 |
| International Flavors & Fragrances, Inc. | 35,337 | 4,311,467 |
| International Paper Co. | 129,373 | 5,651,013 |
| Linde plc | 178,787 | 35,462,401 |
| Livent Corp. * | 45,294 | 310,717 |
| Louisiana-Pacific Corp. | 41,200 | 1,204,276 |
| LyondellBasell Industries N.V., Class A | 85,407 | 7,661,008 |
| Martin Marietta Materials, Inc. | 20,568 | 5,386,965 |
| NewMarket Corp. | 2,440 | 1,184,596 |
| Newmont Goldcorp Corp. | 270,908 | 10,763,175 |
| Nucor Corp. | 100,496 | 5,411,710 |
| Olin Corp. | 55,042 | 1,009,470 |
| Packaging Corp. of America | 31,470 | 3,444,706 |
| PPG Industries, Inc. | 78,328 | 9,800,399 |
| Reliance Steel & Aluminum Co. | 21,731 | 2,521,665 |
| Royal Gold, Inc. | 21,913 | 2,529,637 |
| RPM International, Inc. | 42,904 | 3,107,537 |
| Sealed Air Corp. | 50,489 | 2,108,926 |
| Sonoco Products Co. | 33,411 | 1,927,815 |
| Steel Dynamics, Inc. | 72,019 | 2,186,497 |
| The Chemours Co. | 52,344 | 858,965 |
| Security | Number
of Shares | Value ($) |
| The Mosaic Co. | 118,507 | 2,355,919 |
| The Scotts Miracle-Gro Co. | 13,135 | 1,318,623 |
| The Sherwin-Williams Co. | 27,164 | 15,546,500 |
| United States Steel Corp.(a) | 54,372 | 625,822 |
| Valvoline, Inc. | 62,822 | 1,340,621 |
| Vulcan Materials Co. | 43,573 | 6,225,274 |
| W.R. Grace & Co. | 18,495 | 1,228,993 |
| Westlake Chemical Corp. | 11,139 | 703,873 |
| WestRock Co. | 85,323 | 3,188,520 |
| | | 262,379,204 |
| |
| Media & Entertainment 7.8% |
| Activision Blizzard, Inc. | 253,870 | 14,224,336 |
| Alphabet, Inc., Class A * | 99,084 | 124,726,939 |
| Alphabet, Inc., Class C * | 99,961 | 125,961,856 |
| Altice USA, Inc., Class A * | 102,138 | 3,161,171 |
| Cable One, Inc. | 1,659 | 2,198,789 |
| Cargurus, Inc. * | 23,438 | 787,282 |
| CBS Corp., Class B - Non Voting Shares | 108,243 | 3,901,078 |
| Charter Communications, Inc., Class A * | 53,479 | 25,020,685 |
| Cinemark Holdings, Inc. | 35,543 | 1,300,874 |
| Comcast Corp., Class A | 1,500,365 | 67,246,359 |
| Discovery, Inc., Class A * | 52,444 | 1,413,628 |
| Discovery, Inc., Class C * | 114,577 | 2,891,923 |
| DISH Network Corp., Class A * | 79,543 | 2,734,688 |
| Electronic Arts, Inc. * | 97,186 | 9,368,730 |
| Facebook, Inc., Class A * | 795,834 | 152,521,586 |
| Fox Corp., Class A | 116,942 | 3,746,822 |
| Fox Corp., Class B * | 54,188 | 1,692,833 |
| IAC/InterActiveCorp * | 23,906 | 5,432,638 |
| Liberty Broadband Corp., Class C * | 50,306 | 5,939,629 |
| Liberty Global plc, Class A * | 53,391 | 1,342,784 |
| Liberty Global plc, Class C * | 136,649 | 3,261,812 |
| Liberty Media Corp. - Liberty Formula One, Class C * | 67,508 | 2,869,090 |
| Liberty Media Corp. - Liberty SiriusXM, Class A * | 27,946 | 1,255,055 |
| Liberty Media Corp. - Liberty SiriusXM, Class C * | 49,720 | 2,246,847 |
| Live Nation Entertainment, Inc. * | 46,235 | 3,259,567 |
| Netflix, Inc. * | 144,836 | 41,627,315 |
| News Corp., Class A | 128,555 | 1,762,489 |
| Nexstar Media Group, Inc., Class A | 15,282 | 1,486,786 |
| Omnicom Group, Inc. | 71,793 | 5,541,702 |
| Sirius XM Holdings, Inc. | 455,959 | 3,064,044 |
| Snap, Inc., Class A * | 253,254 | 3,814,005 |
| Take-Two Interactive Software, Inc. * | 37,654 | 4,531,659 |
| The Interpublic Group of Cos., Inc. | 128,602 | 2,797,094 |
| The Madison Square Garden Co., Class A * | 5,539 | 1,478,470 |
| The New York Times Co., Class A | 47,452 | 1,466,267 |
| The Walt Disney Co. | 595,911 | 77,420,757 |
| TripAdvisor, Inc. * | 34,337 | 1,387,215 |
| Twitter, Inc. * | 255,755 | 7,664,977 |
| Viacom, Inc., Class B | 117,870 | 2,541,277 |
| World Wrestling Entertainment, Inc., Class A | 15,714 | 880,613 |
| Zillow Group, Inc., Class C * | 41,315 | 1,345,630 |
| Zynga, Inc., Class A * | 311,529 | 1,922,134 |
| | | 729,239,435 |
| |
| Pharmaceuticals, Biotechnology & Life Sciences 7.4% |
| AbbVie, Inc. | 489,162 | 38,912,837 |
| Agilent Technologies, Inc. | 102,477 | 7,762,633 |
| Agios Pharmaceuticals, Inc. * | 17,506 | 526,580 |
Schwab Equity Index Funds | Annual Report
Portfolio Holdings as of October 31, 2019 (continued)
| Security | Number
of Shares | Value ($) |
| Alexion Pharmaceuticals, Inc. * | 73,936 | 7,792,854 |
| Alkermes plc * | 52,026 | 1,016,068 |
| Allergan plc | 108,529 | 19,113,042 |
| Alnylam Pharmaceuticals, Inc. * | 36,806 | 3,192,552 |
| Amgen, Inc. | 198,418 | 42,312,639 |
| Bio-Rad Laboratories, Inc., Class A * | 7,114 | 2,359,145 |
| Bio-Techne Corp. | 12,625 | 2,628,146 |
| Biogen, Inc. * | 61,053 | 18,237,142 |
| BioMarin Pharmaceutical, Inc. * | 58,983 | 4,318,145 |
| Bluebird Bio, Inc. * | 18,348 | 1,486,188 |
| Bristol-Myers Squibb Co. | 541,187 | 31,047,898 |
| Bruker Corp. | 33,500 | 1,490,750 |
| Catalent, Inc. * | 48,616 | 2,365,168 |
| Celgene Corp. * | 234,510 | 25,334,115 |
| Charles River Laboratories International, Inc. * | 16,112 | 2,094,238 |
| Eli Lilly & Co. | 281,122 | 32,033,852 |
| Emergent BioSolutions, Inc. * | 14,214 | 812,472 |
| Exact Sciences Corp. * | 43,136 | 3,752,832 |
| Exelixis, Inc. * | 100,262 | 1,549,048 |
| FibroGen, Inc. * | 25,222 | 987,441 |
| Gilead Sciences, Inc. | 418,672 | 26,673,593 |
| Horizon Therapeutics plc * | 60,769 | 1,756,832 |
| Illumina, Inc. * | 48,521 | 14,338,926 |
| Immunomedics, Inc. * | 54,593 | 873,488 |
| Incyte Corp. * | 59,322 | 4,978,302 |
| Intercept Pharmaceuticals, Inc. * | 7,966 | 579,766 |
| Ionis Pharmaceuticals, Inc. * | 42,331 | 2,358,683 |
| IQVIA Holdings, Inc. * | 60,312 | 8,710,259 |
| Jazz Pharmaceuticals plc * | 18,561 | 2,331,818 |
| Johnson & Johnson | 873,082 | 115,281,747 |
| Merck & Co., Inc. | 847,097 | 73,409,426 |
| Mettler-Toledo International, Inc. * | 8,101 | 5,710,719 |
| Mylan N.V. * | 171,450 | 3,283,268 |
| Nektar Therapeutics * | 58,188 | 996,470 |
| Neurocrine Biosciences, Inc. * | 30,339 | 3,018,427 |
| PerkinElmer, Inc. | 36,877 | 3,169,947 |
| Perrigo Co., plc | 44,989 | 2,385,317 |
| Pfizer, Inc. | 1,829,840 | 70,210,961 |
| PRA Health Sciences, Inc. * | 20,762 | 2,028,655 |
| Regeneron Pharmaceuticals, Inc. * | 26,464 | 8,105,394 |
| Sage Therapeutics, Inc. * | 17,167 | 2,328,704 |
| Sarepta Therapeutics, Inc. * | 23,286 | 1,934,135 |
| Seattle Genetics, Inc. * | 37,456 | 4,022,774 |
| Syneos Health, Inc. * | 20,617 | 1,033,943 |
| Thermo Fisher Scientific, Inc. | 132,516 | 40,017,182 |
| United Therapeutics Corp. * | 14,658 | 1,316,875 |
| Vertex Pharmaceuticals, Inc. * | 85,082 | 16,631,829 |
| Waters Corp. * | 22,108 | 4,678,495 |
| Zoetis, Inc. | 157,997 | 20,210,976 |
| | | 693,502,696 |
| |
| Real Estate 4.0% |
| Alexandria Real Estate Equities, Inc. | 37,615 | 5,971,381 |
| American Campus Communities, Inc. | 45,738 | 2,285,985 |
| American Homes 4 Rent, Class A | 84,749 | 2,243,306 |
| American Tower Corp. | 146,459 | 31,939,779 |
| Americold Realty Trust | 62,843 | 2,519,376 |
| Apartment Investment & Management Co., Class A | 49,009 | 2,689,614 |
| Apple Hospitality REIT, Inc. | 71,106 | 1,171,827 |
| AvalonBay Communities, Inc. | 46,130 | 10,040,656 |
| Boston Properties, Inc. | 47,501 | 6,517,137 |
| Brixmor Property Group, Inc. | 99,647 | 2,194,227 |
| Camden Property Trust | 32,186 | 3,681,113 |
| CBRE Group, Inc., Class A * | 111,394 | 5,965,149 |
| CoreSite Realty Corp. | 12,262 | 1,440,785 |
| Security | Number
of Shares | Value ($) |
| Cousins Properties, Inc. | 48,636 | 1,951,763 |
| Crown Castle International Corp. | 137,764 | 19,120,266 |
| CubeSmart | 63,449 | 2,011,333 |
| CyrusOne, Inc. | 37,184 | 2,650,476 |
| Digital Realty Trust, Inc. | 68,684 | 8,725,615 |
| Douglas Emmett, Inc. | 53,967 | 2,337,850 |
| Duke Realty Corp. | 119,886 | 4,212,794 |
| EastGroup Properties, Inc. | 12,163 | 1,629,234 |
| EPR Properties | 25,871 | 2,012,505 |
| Equinix, Inc. | 28,059 | 15,903,280 |
| Equity Commonwealth | 40,489 | 1,302,936 |
| Equity LifeStyle Properties, Inc. | 60,124 | 4,205,073 |
| Equity Residential | 115,329 | 10,225,069 |
| Essex Property Trust, Inc. | 21,670 | 7,088,907 |
| Extra Space Storage, Inc. | 42,557 | 4,777,874 |
| Federal Realty Investment Trust | 22,920 | 3,117,349 |
| First Industrial Realty Trust, Inc. | 42,574 | 1,792,791 |
| Gaming & Leisure Properties, Inc. | 67,360 | 2,718,650 |
| HCP, Inc. | 162,618 | 6,117,689 |
| Healthcare Realty Trust, Inc. | 42,920 | 1,492,328 |
| Healthcare Trust of America, Inc., Class A | 68,512 | 2,123,872 |
| Highwoods Properties, Inc. | 34,481 | 1,613,711 |
| Host Hotels & Resorts, Inc. | 242,977 | 3,982,393 |
| Hudson Pacific Properties, Inc. | 51,484 | 1,849,305 |
| Invitation Homes, Inc. | 158,288 | 4,873,688 |
| Iron Mountain, Inc. | 95,695 | 3,138,796 |
| JBG SMITH Properties | 38,146 | 1,535,758 |
| Jones Lang LaSalle, Inc. | 16,836 | 2,466,811 |
| Kilroy Realty Corp. | 30,564 | 2,565,237 |
| Kimco Realty Corp. | 140,739 | 3,034,333 |
| Lamar Advertising Co., Class A | 28,462 | 2,277,245 |
| Liberty Property Trust | 51,964 | 3,069,513 |
| Life Storage, Inc. | 15,551 | 1,693,815 |
| Medical Properties Trust, Inc. | 147,361 | 3,054,794 |
| Mid-America Apartment Communities, Inc. | 37,470 | 5,207,955 |
| National Health Investors, Inc. | 14,234 | 1,221,135 |
| National Retail Properties, Inc. | 56,634 | 3,336,309 |
| Omega Healthcare Investors, Inc. | 71,868 | 3,165,067 |
| Paramount Group, Inc. | 66,793 | 899,702 |
| Park Hotels & Resorts, Inc. | 79,118 | 1,839,493 |
| Pebblebrook Hotel Trust | 43,526 | 1,119,053 |
| Prologis, Inc. | 209,012 | 18,342,893 |
| PS Business Parks, Inc. | 6,686 | 1,207,157 |
| Public Storage | 49,659 | 11,067,005 |
| Rayonier, Inc. | 43,188 | 1,165,212 |
| Realty Income Corp. | 105,378 | 8,618,867 |
| Regency Centers Corp. | 55,830 | 3,754,009 |
| Ryman Hospitality Properties, Inc. | 17,140 | 1,442,674 |
| Sabra Health Care REIT, Inc. | 63,542 | 1,563,133 |
| SBA Communications Corp. | 37,396 | 8,999,347 |
| Service Properties Trust | 53,012 | 1,341,204 |
| Simon Property Group, Inc. | 101,967 | 15,364,388 |
| SL Green Realty Corp. | 27,403 | 2,290,891 |
| Spirit Realty Capital, Inc. | 29,685 | 1,479,500 |
| STORE Capital Corp. | 69,269 | 2,805,394 |
| Sun Communities, Inc. | 29,787 | 4,844,856 |
| Sunstone Hotel Investors, Inc. | 72,950 | 985,555 |
| The Howard Hughes Corp. * | 14,258 | 1,594,330 |
| The Macerich Co. | 37,236 | 1,023,990 |
| UDR, Inc. | 96,817 | 4,865,054 |
| Uniti Group, Inc. | 63,369 | 438,513 |
| Ventas, Inc. | 123,341 | 8,029,499 |
| VEREIT, Inc. | 349,108 | 3,435,223 |
| VICI Properties, Inc. | 152,150 | 3,583,132 |
| Vornado Realty Trust | 52,154 | 3,422,867 |
| Weingarten Realty Investors | 40,495 | 1,284,906 |
| Welltower, Inc. | 133,722 | 12,127,248 |
Schwab Equity Index Funds | Annual Report
Portfolio Holdings as of October 31, 2019 (continued)
| Security | Number
of Shares | Value ($) |
| Weyerhaeuser Co. | 245,532 | 7,171,990 |
| WP Carey, Inc. | 56,408 | 5,192,920 |
| | | 373,563,859 |
| |
| Retailing 6.1% |
| Advance Auto Parts, Inc. | 23,445 | 3,809,344 |
| Amazon.com, Inc. * | 137,450 | 244,201,917 |
| American Eagle Outfitters, Inc. | 52,754 | 811,356 |
| AutoNation, Inc. * | 19,588 | 996,050 |
| AutoZone, Inc. * | 8,131 | 9,304,954 |
| Best Buy Co., Inc. | 76,637 | 5,504,836 |
| Booking Holdings, Inc. * | 14,064 | 28,813,901 |
| Burlington Stores, Inc. * | 21,928 | 4,213,904 |
| CarMax, Inc. * | 54,771 | 5,103,014 |
| Dollar General Corp. | 84,879 | 13,609,499 |
| Dollar Tree, Inc. * | 78,370 | 8,652,048 |
| eBay, Inc. | 260,853 | 9,195,068 |
| Etsy, Inc. * | 40,119 | 1,784,894 |
| Expedia Group, Inc. | 46,292 | 6,326,265 |
| Five Below, Inc. * | 18,633 | 2,331,175 |
| Foot Locker, Inc. | 36,091 | 1,570,319 |
| Genuine Parts Co. | 47,966 | 4,920,352 |
| GrubHub, Inc. * | 30,316 | 1,032,563 |
| Kohl's Corp. | 52,138 | 2,672,594 |
| L Brands, Inc. | 76,263 | 1,299,521 |
| LKQ Corp. * | 102,286 | 3,476,701 |
| Lowe's Cos., Inc. | 255,305 | 28,494,591 |
| Macy's, Inc. | 102,675 | 1,556,553 |
| Nordstrom, Inc. | 35,853 | 1,287,123 |
| O'Reilly Automotive, Inc. * | 25,313 | 11,024,065 |
| Ollie's Bargain Outlet Holdings, Inc. * | 18,244 | 1,165,427 |
| Penske Automotive Group, Inc. | 10,978 | 534,848 |
| Pool Corp. | 13,161 | 2,729,591 |
| Qurate Retail, Inc. Class A * | 128,523 | 1,226,109 |
| Ross Stores, Inc. | 120,649 | 13,231,576 |
| Target Corp. | 169,114 | 18,079,978 |
| The Gap, Inc. | 71,646 | 1,164,964 |
| The Home Depot, Inc. | 362,267 | 84,980,593 |
| The TJX Cos., Inc. | 400,352 | 23,080,293 |
| Tiffany & Co. | 35,989 | 4,480,990 |
| Tractor Supply Co. | 39,158 | 3,720,793 |
| Ulta Salon, Cosmetics & Fragrance, Inc. * | 19,475 | 4,540,596 |
| Urban Outfitters, Inc. * | 23,024 | 660,789 |
| Wayfair, Inc., Class A * | 21,440 | 1,763,011 |
| Williams-Sonoma, Inc. | 25,748 | 1,719,709 |
| | | 565,071,874 |
| |
| Semiconductors & Semiconductor Equipment 4.0% |
| Advanced Micro Devices, Inc. * | 359,080 | 12,183,584 |
| Analog Devices, Inc. | 121,955 | 13,004,062 |
| Applied Materials, Inc. | 305,566 | 16,580,011 |
| Broadcom, Inc. | 131,684 | 38,563,659 |
| Cree, Inc. * | 35,308 | 1,685,251 |
| Cypress Semiconductor Corp. | 121,636 | 2,830,470 |
| Entegris, Inc. | 45,093 | 2,164,464 |
| First Solar, Inc. * | 25,238 | 1,307,076 |
| Intel Corp. | 1,465,462 | 82,842,567 |
| KLA Corp. | 52,683 | 8,905,534 |
| Lam Research Corp. | 47,809 | 12,958,151 |
| Marvell Technology Group Ltd. | 218,668 | 5,333,313 |
| Maxim Integrated Products, Inc. | 89,791 | 5,267,140 |
| Microchip Technology, Inc. | 78,424 | 7,394,599 |
| Micron Technology, Inc. * | 365,138 | 17,362,312 |
| MKS Instruments, Inc. | 18,095 | 1,958,241 |
| Monolithic Power Systems, Inc. | 13,189 | 1,977,295 |
| NVIDIA Corp. | 201,449 | 40,495,278 |
| Security | Number
of Shares | Value ($) |
| ON Semiconductor Corp. * | 136,894 | 2,792,638 |
| Qorvo, Inc. * | 38,995 | 3,153,136 |
| QUALCOMM, Inc. | 402,142 | 32,348,302 |
| Semtech Corp. * | 22,287 | 1,124,602 |
| Silicon Laboratories, Inc. * | 14,380 | 1,527,731 |
| Skyworks Solutions, Inc. | 56,880 | 5,179,493 |
| Teradyne, Inc. | 56,442 | 3,455,379 |
| Texas Instruments, Inc. | 308,837 | 36,439,678 |
| Universal Display Corp. | 13,879 | 2,778,298 |
| Xilinx, Inc. | 83,795 | 7,603,558 |
| | | 369,215,822 |
| |
| Software & Services 12.4% |
| Accenture plc, Class A | 210,604 | 39,050,194 |
| ACI Worldwide, Inc. * | 39,115 | 1,227,820 |
| Adobe, Inc. * | 160,601 | 44,635,836 |
| Akamai Technologies, Inc. * | 54,565 | 4,719,872 |
| Alliance Data Systems Corp. | 13,757 | 1,375,700 |
| Amdocs Ltd. | 45,152 | 2,943,910 |
| ANSYS, Inc. * | 27,713 | 6,101,017 |
| Aspen Technology, Inc. * | 22,688 | 2,611,616 |
| Autodesk, Inc. * | 72,806 | 10,728,692 |
| Automatic Data Processing, Inc. | 143,623 | 23,299,959 |
| Black Knight, Inc. * | 49,365 | 3,169,233 |
| Blackbaud, Inc. | 16,222 | 1,361,837 |
| Booz Allen Hamilton Holding Corp. | 46,785 | 3,292,260 |
| Broadridge Financial Solutions, Inc. | 37,561 | 4,703,388 |
| CACI International, Inc., Class A * | 8,308 | 1,858,915 |
| Cadence Design Systems, Inc. * | 92,683 | 6,056,834 |
| CDK Global, Inc. | 39,438 | 1,993,197 |
| Cerence, Inc. * | 11,925 | 184,838 |
| Ceridian HCM Holding, Inc. * | 29,466 | 1,421,735 |
| Citrix Systems, Inc. | 41,039 | 4,467,506 |
| Cognizant Technology Solutions Corp., Class A | 182,709 | 11,134,286 |
| Coupa Software, Inc. * | 20,425 | 2,808,233 |
| DocuSign, Inc. * | 40,819 | 2,701,810 |
| Dropbox, Inc., Class A * | 70,731 | 1,401,888 |
| DXC Technology Co. | 87,569 | 2,423,034 |
| EPAM Systems, Inc. * | 18,109 | 3,186,460 |
| Euronet Worldwide, Inc. * | 17,998 | 2,520,980 |
| Fair Isaac Corp. * | 9,525 | 2,895,981 |
| Fidelity National Information Services, Inc. | 202,946 | 26,740,165 |
| FireEye, Inc. * | 71,497 | 1,132,512 |
| Fiserv, Inc. * | 188,841 | 20,043,584 |
| FleetCor Technologies, Inc. * | 28,640 | 8,426,461 |
| Fortinet, Inc. * | 46,775 | 3,814,969 |
| Gartner, Inc. * | 29,972 | 4,618,086 |
| Genpact Ltd. | 50,665 | 1,984,548 |
| Global Payments, Inc. | 99,253 | 16,791,623 |
| GoDaddy, Inc., Class A * | 58,794 | 3,823,374 |
| Guidewire Software, Inc. * | 27,099 | 3,055,141 |
| HubSpot, Inc. * | 13,231 | 2,052,128 |
| International Business Machines Corp. | 293,036 | 39,187,704 |
| Intuit, Inc. | 86,045 | 22,156,587 |
| j2 Global, Inc. | 15,475 | 1,469,506 |
| Jack Henry & Associates, Inc. | 25,301 | 3,581,610 |
| Leidos Holdings, Inc. | 44,670 | 3,851,894 |
| LogMeIn, Inc. | 15,983 | 1,049,763 |
| Mastercard, Inc., Class A | 295,309 | 81,744,484 |
| MAXIMUS, Inc. | 21,323 | 1,636,327 |
| Microsoft Corp. | 2,525,818 | 362,126,527 |
| New Relic, Inc. * | 16,436 | 1,052,890 |
| Nuance Communications, Inc. * | 95,404 | 1,556,993 |
| Nutanix, Inc., Class A * | 47,363 | 1,383,947 |
| Okta, Inc. * | 35,258 | 3,845,590 |
| Oracle Corp. | 728,349 | 39,687,737 |
Schwab Equity Index Funds | Annual Report
Portfolio Holdings as of October 31, 2019 (continued)
| Security | Number
of Shares | Value ($) |
| Palo Alto Networks, Inc. * | 31,702 | 7,208,718 |
| Paychex, Inc. | 105,513 | 8,825,107 |
| Paycom Software, Inc. * | 16,190 | 3,424,671 |
| Paylocity Holding Corp. * | 11,760 | 1,206,576 |
| PayPal Holdings, Inc. * | 389,255 | 40,521,445 |
| Pegasystems, Inc. | 12,324 | 926,888 |
| Proofpoint, Inc. * | 18,498 | 2,134,114 |
| PTC, Inc. * | 34,630 | 2,317,093 |
| RealPage, Inc. * | 26,267 | 1,590,467 |
| RingCentral, Inc., Class A * | 23,726 | 3,832,224 |
| Sabre Corp. | 89,255 | 2,095,707 |
| salesforce.com, Inc. * | 290,128 | 45,402,131 |
| Science Applications International Corp. | 16,184 | 1,337,122 |
| ServiceNow, Inc. * | 62,021 | 15,335,312 |
| Splunk, Inc. * | 49,483 | 5,935,981 |
| Square, Inc., Class A * | 113,315 | 6,960,940 |
| SS&C Technologies Holdings, Inc. | 73,031 | 3,798,342 |
| Symantec Corp. | 188,118 | 4,304,140 |
| Synopsys, Inc. * | 49,941 | 6,779,491 |
| Teradata Corp. * | 37,196 | 1,113,276 |
| The Trade Desk, Inc., Class A * | 12,916 | 2,593,533 |
| The Western Union Co. | 139,203 | 3,488,427 |
| Twilio, Inc., Class A * | 40,198 | 3,881,519 |
| Tyler Technologies, Inc. * | 12,765 | 3,427,658 |
| VeriSign, Inc. * | 34,543 | 6,563,861 |
| Visa, Inc., Class A | 571,272 | 102,177,710 |
| VMware, Inc., Class A | 26,015 | 4,117,394 |
| WEX, Inc. * | 14,404 | 2,724,949 |
| Workday, Inc., Class A * | 53,456 | 8,668,425 |
| Zendesk, Inc. * | 36,741 | 2,595,752 |
| Zscaler, Inc. * | 21,206 | 932,640 |
| | | 1,157,312,794 |
| |
| Technology Hardware & Equipment 5.8% |
| Amphenol Corp., Class A | 98,421 | 9,874,579 |
| Apple, Inc. | 1,405,217 | 349,561,781 |
| Arista Networks, Inc. * | 18,007 | 4,403,972 |
| Arrow Electronics, Inc. * | 27,332 | 2,166,881 |
| Avnet, Inc. | 34,443 | 1,362,565 |
| CDW Corp. | 48,118 | 6,154,773 |
| Ciena Corp. * | 51,322 | 1,905,073 |
| Cisco Systems, Inc. | 1,404,467 | 66,726,227 |
| Cognex Corp. | 55,794 | 2,872,833 |
| CommScope Holding Co., Inc. * | 65,396 | 732,435 |
| Corning, Inc. | 258,605 | 7,662,466 |
| Dell Technologies, Inc., Class C * | 50,944 | 2,694,428 |
| Dolby Laboratories, Inc., Class A | 21,477 | 1,381,615 |
| F5 Networks, Inc. * | 19,824 | 2,856,242 |
| FLIR Systems, Inc. | 45,228 | 2,331,956 |
| Hewlett Packard Enterprise Co. | 431,421 | 7,079,619 |
| HP, Inc. | 489,866 | 8,508,972 |
| IPG Photonics Corp. * | 11,844 | 1,590,412 |
| Jabil, Inc. | 46,736 | 1,720,820 |
| Juniper Networks, Inc. | 112,954 | 2,803,518 |
| Keysight Technologies, Inc. * | 61,965 | 6,252,888 |
| Littelfuse, Inc. | 8,241 | 1,446,872 |
| Lumentum Holdings, Inc. * | 24,961 | 1,564,056 |
| Motorola Solutions, Inc. | 54,798 | 9,114,003 |
| National Instruments Corp. | 39,038 | 1,615,783 |
| NetApp, Inc. | 78,608 | 4,392,615 |
| Pure Storage, Inc., Class A * | 73,397 | 1,428,306 |
| Seagate Technology plc | 78,211 | 4,538,584 |
| SYNNEX Corp. | 13,178 | 1,551,578 |
| TE Connectivity Ltd. | 111,077 | 9,941,392 |
| Tech Data Corp. * | 11,639 | 1,414,139 |
| Trimble, Inc. * | 83,776 | 3,337,636 |
| Ubiquiti, Inc.(a) | 4,302 | 544,590 |
| Security | Number
of Shares | Value ($) |
| ViaSat, Inc. * | 19,102 | 1,314,982 |
| Western Digital Corp. | 98,202 | 5,072,133 |
| Xerox Holdings Corp. | 62,708 | 2,127,683 |
| Zebra Technologies Corp., Class A * | 17,922 | 4,263,106 |
| | | 544,311,513 |
| |
| Telecommunication Services 2.1% |
| AT&T, Inc. | 2,416,969 | 93,029,137 |
| CenturyLink, Inc. | 324,464 | 4,198,564 |
| GCI Liberty, Inc., Class A * | 31,562 | 2,208,709 |
| Intelsat S.A. * | 23,121 | 587,042 |
| Sprint Corp. * | 202,631 | 1,258,338 |
| T-Mobile US, Inc. * | 104,948 | 8,675,002 |
| Telephone & Data Systems, Inc. | 31,560 | 823,400 |
| Verizon Communications, Inc. | 1,368,112 | 82,729,733 |
| Zayo Group Holdings, Inc. * | 78,030 | 2,663,944 |
| | | 196,173,869 |
| |
| Transportation 1.9% |
| Alaska Air Group, Inc. | 41,154 | 2,857,322 |
| AMERCO | 2,722 | 1,102,519 |
| American Airlines Group, Inc. | 130,298 | 3,916,758 |
| C.H. Robinson Worldwide, Inc. | 44,858 | 3,393,059 |
| CSX Corp. | 264,039 | 18,554,021 |
| Delta Air Lines, Inc. | 191,380 | 10,541,210 |
| Expeditors International of Washington, Inc. | 56,400 | 4,113,816 |
| FedEx Corp. | 79,468 | 12,131,585 |
| Genesee & Wyoming, Inc., Class A * | 18,800 | 2,087,364 |
| JB Hunt Transport Services, Inc. | 28,354 | 3,333,296 |
| JetBlue Airways Corp. * | 98,317 | 1,897,518 |
| Kansas City Southern | 33,137 | 4,665,027 |
| Kirby Corp. * | 19,773 | 1,565,231 |
| Knight-Swift Transportation Holdings, Inc. | 39,957 | 1,456,832 |
| Landstar System, Inc. | 12,814 | 1,449,904 |
| Macquarie Infrastructure Corp. | 25,805 | 1,113,228 |
| Norfolk Southern Corp. | 87,142 | 15,859,844 |
| Old Dominion Freight Line, Inc. | 21,289 | 3,876,301 |
| Southwest Airlines Co. | 159,939 | 8,977,376 |
| Spirit Airlines, Inc. * | 22,837 | 857,758 |
| Union Pacific Corp. | 233,055 | 38,561,280 |
| United Airlines Holdings, Inc. * | 72,876 | 6,620,056 |
| United Parcel Service, Inc., Class B | 230,954 | 26,598,972 |
| XPO Logistics, Inc. * | 30,817 | 2,354,419 |
| | | 177,884,696 |
| |
| Utilities 3.5% |
| AES Corp. | 220,896 | 3,766,277 |
| ALLETE, Inc. | 17,168 | 1,477,478 |
| Alliant Energy Corp. | 78,507 | 4,187,563 |
| Ameren Corp. | 81,106 | 6,301,936 |
| American Electric Power Co., Inc. | 163,653 | 15,447,207 |
| American Water Works Co., Inc. | 59,720 | 7,361,684 |
| Aqua America, Inc. | 70,790 | 3,208,911 |
| Atmos Energy Corp. | 39,260 | 4,415,965 |
| Avangrid, Inc. | 18,860 | 943,943 |
| Black Hills Corp. | 20,082 | 1,583,064 |
| CenterPoint Energy, Inc. | 167,101 | 4,857,626 |
| CMS Energy Corp. | 93,536 | 5,978,821 |
| Consolidated Edison, Inc. | 109,935 | 10,138,206 |
| Dominion Energy, Inc. | 272,012 | 22,454,591 |
| DTE Energy Co. | 60,569 | 7,711,645 |
| Duke Energy Corp. | 241,049 | 22,721,279 |
| Edison International | 118,417 | 7,448,429 |
| Entergy Corp. | 65,655 | 7,975,769 |
Schwab Equity Index Funds | Annual Report
Portfolio Holdings as of October 31, 2019 (continued)
| Security | Number
of Shares | Value ($) |
| Evergy, Inc. | 77,831 | 4,974,179 |
| Eversource Energy | 106,829 | 8,945,860 |
| Exelon Corp. | 321,710 | 14,634,588 |
| FirstEnergy Corp. | 178,363 | 8,618,500 |
| Hawaiian Electric Industries, Inc. | 36,361 | 1,641,699 |
| IDACORP, Inc. | 16,803 | 1,808,339 |
| MDU Resources Group, Inc. | 66,777 | 1,929,188 |
| National Fuel Gas Co. | 28,828 | 1,306,197 |
| New Jersey Resources Corp. | 29,624 | 1,291,606 |
| NextEra Energy, Inc. | 161,622 | 38,520,987 |
| NiSource, Inc. | 124,360 | 3,487,054 |
| NRG Energy, Inc. | 82,825 | 3,322,939 |
| OGE Energy Corp. | 66,695 | 2,871,887 |
| ONE Gas, Inc. | 17,559 | 1,630,178 |
| Pinnacle West Capital Corp. | 37,462 | 3,525,923 |
| PNM Resources, Inc. | 26,572 | 1,385,730 |
| Portland General Electric Co. | 29,771 | 1,693,374 |
| PPL Corp. | 237,920 | 7,967,941 |
| Public Service Enterprise Group, Inc. | 166,921 | 10,567,769 |
| Sempra Energy | 90,662 | 13,101,566 |
| Southwest Gas Holdings, Inc. | 17,725 | 1,547,393 |
| Spire, Inc. | 16,945 | 1,424,397 |
| The Southern Co. | 345,606 | 21,655,672 |
| UGI Corp. | 68,506 | 3,265,681 |
| Vistra Energy Corp. | 149,478 | 4,040,390 |
| WEC Energy Group, Inc. | 104,255 | 9,841,672 |
| Xcel Energy, Inc. | 173,195 | 10,999,614 |
| | | 323,980,717 |
| Total Common Stock |
| (Cost $2,767,059,144) | | 9,323,951,768 |
|
| Other Investment Companies0.1% of net assets |
| |
| Money Market Fund 0.1% |
| State Street Institutional U.S. Government Money Market Fund, Premier Class 1.75%(c) | 10,018,827 | 10,018,827 |
| |
| Securities Lending Collateral 0.0% |
| Wells Fargo Government Money Market Fund, Select Class 1.75%(c) | 1,635,700 | 1,635,700 |
| Total Other Investment Companies |
| (Cost $11,654,527) | | 11,654,527 |
| | Number of
Contracts | Notional
Amount
($) | Current Value/
Unrealized
Appreciation
($) |
| Futures Contracts | |
| Long | |
| S&P 500 Index, e-mini, expires 12/20/19 | 141 | 21,402,390 | 328,676 |
| * | Non-income producing security. |
| (a) | All or a portion of this security is on loan. Securities on loan were valued at $1,542,868. |
| (b) | Issuer is affiliated with the fund's investment adviser. |
| (c) | The rate shown is the 7-day yield. |
| | |
| REIT — | Real Estate Investment Trust |
Schwab Equity Index Funds | Annual Report
Schwab Small-Cap Index Fund
Portfolio Holdings as of October 31, 2019
This section shows all the securities in the fund’s portfolio and their values as of the report date.
The fund files its complete schedule of portfolio holdings with the U.S. Securities and Exchange Commission (SEC) for the first and third quarters of each fiscal year on Form N-Q. Effective March 31, 2019, Form N-PORT Part F has replaced Form N-Q. The fund’s Form N-Q and Form N-PORT Part F are available on the SEC’s website atwww.sec.gov. The fund also makes available its complete schedule of portfolio holdings 15 to 20 days after the end of the month on the fund’s website atwww.schwabfunds.com/schwabfunds_prospectus.
| Security | Number
of Shares | Value ($) |
| Common Stock99.6% of net assets |
| |
| Automobiles & Components 1.2% |
| Adient plc * | 186,138 | 3,944,264 |
| American Axle & Manufacturing Holdings, Inc. * | 238,617 | 1,994,838 |
| Cooper Tire & Rubber Co. | 106,827 | 3,016,795 |
| Cooper-Standard Holding, Inc. * | 35,854 | 1,142,308 |
| Dana, Inc. | 305,639 | 4,960,521 |
| Dorman Products, Inc. * | 56,977 | 4,099,495 |
| Fox Factory Holding Corp. * | 79,836 | 4,865,206 |
| Gentherm, Inc. * | 69,767 | 2,914,168 |
| LCI Industries | 51,834 | 5,034,118 |
| Modine Manufacturing Co. * | 105,687 | 1,208,002 |
| Motorcar Parts of America, Inc. * | 39,984 | 762,095 |
| Standard Motor Products, Inc. | 44,607 | 2,335,623 |
| Stoneridge, Inc. * | 56,192 | 1,735,209 |
| Tenneco, Inc., Class A | 107,826 | 1,357,529 |
| Visteon Corp. * | 59,152 | 5,502,319 |
| Winnebago Industries, Inc. | 65,696 | 3,158,007 |
| | | 48,030,497 |
| |
| Banks 12.1% |
| 1st Constitution Bancorp | 16,177 | 307,201 |
| 1st Source Corp. | 29,955 | 1,533,097 |
| ACNB Corp. | 14,432 | 510,748 |
| Allegiance Bancshares, Inc. * | 41,392 | 1,376,698 |
| Amalgamated Bank, Class A | 28,824 | 524,885 |
| Amerant Bancorp, Inc. *(a) | 41,536 | 816,182 |
| American National Bankshares, Inc. | 23,054 | 834,555 |
| Ameris Bancorp | 129,279 | 5,539,605 |
| Ames National Corp. | 18,414 | 510,068 |
| Arrow Financial Corp. | 27,616 | 969,874 |
| Atlantic Capital Bancshares, Inc. * | 46,972 | 876,028 |
| Atlantic Union Bankshares Corp. | 171,955 | 6,338,261 |
| Axos Financial, Inc. * | 122,984 | 3,572,685 |
| Banc of California, Inc. | 96,167 | 1,324,220 |
| BancFirst Corp. | 39,324 | 2,276,466 |
| BancorpSouth Bank | 202,771 | 6,218,987 |
| Bank First Corp.(a) | 12,389 | 867,230 |
| Bank of Commerce Holdings | 35,924 | 403,067 |
| Bank of Marin Bancorp | 28,360 | 1,244,153 |
| Bank7 Corp. | 8,289 | 150,860 |
| BankFinancial Corp. | 28,923 | 372,528 |
| Bankwell Financial Group, Inc. | 13,790 | 394,670 |
| Banner Corp. | 72,256 | 3,900,379 |
| Bar Harbor Bankshares | 32,890 | 823,894 |
| Baycom Corp. * | 23,139 | 489,158 |
| BCB Bancorp, Inc. | 28,912 | 372,965 |
| Berkshire Hills Bancorp, Inc. | 97,719 | 3,032,221 |
| Boston Private Financial Holdings, Inc. | 175,648 | 1,976,040 |
| Bridge Bancorp, Inc. | 34,201 | 1,108,112 |
| Bridgewater Bancshares, Inc. * | 47,045 | 592,297 |
| Brookline Bancorp, Inc. | 165,417 | 2,597,047 |
| Bryn Mawr Bank Corp. | 42,287 | 1,611,558 |
| Business First Bancshares, Inc. | 26,935 | 658,291 |
| Byline Bancorp, Inc. * | 49,808 | 863,671 |
| Security | Number
of Shares | Value ($) |
| C&F Financial Corp. | 7,144 | 363,344 |
| Cadence BanCorp | 266,772 | 4,102,953 |
| Cambridge Bancorp | 9,245 | 716,580 |
| Camden National Corp. | 32,673 | 1,447,741 |
| Capital Bancorp, Inc. * | 16,489 | 238,926 |
| Capital City Bank Group, Inc. | 28,822 | 819,986 |
| Capitol Federal Financial, Inc. | 279,765 | 3,992,247 |
| Capstar Financial Holdings, Inc. | 30,343 | 513,100 |
| Carolina Financial Corp. | 44,474 | 1,687,788 |
| Carter Bank & Trust * | 48,600 | 954,990 |
| Cathay General Bancorp | 162,620 | 5,784,393 |
| CBTX, Inc. | 37,802 | 1,083,027 |
| CenterState Bank Corp. | 263,997 | 6,694,964 |
| Central Pacific Financial Corp. | 59,235 | 1,713,076 |
| Central Valley Community Bancorp | 23,928 | 498,420 |
| Century Bancorp, Inc., Class A | 5,970 | 519,450 |
| Chemung Financial Corp. | 7,551 | 321,446 |
| Citizens & Northern Corp. | 25,377 | 652,443 |
| City Holding Co. | 33,974 | 2,695,497 |
| Civista Bancshares, Inc. | 33,010 | 742,065 |
| CNB Financial Corp. | 31,299 | 978,720 |
| Coastal Financial Corp. * | 16,651 | 250,598 |
| Codorus Valley Bancorp, Inc. | 20,003 | 433,054 |
| Colony Bankcorp, Inc. | 15,437 | 239,891 |
| Columbia Banking System, Inc. | 156,064 | 6,133,315 |
| Columbia Financial, Inc. * | 112,055 | 1,847,787 |
| Community Bank System, Inc. | 107,874 | 7,311,700 |
| Community Bankers Trust Corp. | 46,562 | 403,227 |
| Community Trust Bancorp, Inc. | 32,889 | 1,440,867 |
| ConnectOne Bancorp, Inc. | 70,513 | 1,712,056 |
| CrossFirst Bankshares, Inc. *(a) | 13,869 | 185,429 |
| Customers Bancorp, Inc. * | 60,407 | 1,424,397 |
| CVB Financial Corp. | 282,956 | 5,879,826 |
| Dime Community Bancshares, Inc. | 67,355 | 1,299,278 |
| DNB Financial Corp. | 7,225 | 328,593 |
| Eagle Bancorp, Inc. | 71,492 | 3,227,149 |
| Entegra Financial Corp. * | 14,115 | 424,861 |
| Enterprise Bancorp, Inc. | 18,823 | 561,114 |
| Enterprise Financial Services Corp. | 52,066 | 2,280,491 |
| Equity Bancshares, Inc., Class A * | 31,417 | 872,136 |
| Esquire Financial Holdings, Inc. * | 13,259 | 322,194 |
| ESSA Bancorp, Inc. | 20,206 | 330,368 |
| Essent Group Ltd. | 204,150 | 10,634,173 |
| Evans Bancorp, Inc. | 10,030 | 381,040 |
| Farmers & Merchants Bancorp, Inc. | 20,959 | 536,550 |
| Farmers National Banc Corp. | 53,448 | 797,444 |
| FB Financial Corp. | 36,263 | 1,366,027 |
| Federal Agricultural Mortgage Corp., Class C | 19,242 | 1,629,605 |
| Fidelity D&D Bancorp, Inc. | 5,770 | 380,531 |
| Financial Institutions, Inc. | 33,069 | 1,039,359 |
| First BanCorp | 453,955 | 4,775,607 |
| First BanCorp (North Carolina) | 61,886 | 2,336,196 |
| First BanCorp, Inc. | 21,254 | 600,851 |
| First Bank/Hamilton NJ | 35,703 | 377,024 |
| First Busey Corp. | 109,534 | 2,888,412 |
| First Business Financial Services, Inc. | 17,671 | 429,759 |
| First Capital, Inc. | 6,734 | 395,286 |
| First Choice Bancorp | 20,928 | 467,950 |
Schwab Equity Index Funds | Annual Report
Schwab Small-Cap Index Fund
Portfolio Holdings as of October 31, 2019 (continued)
| Security | Number
of Shares | Value ($) |
| First Commonwealth Financial Corp. | 206,407 | 2,908,275 |
| First Community Bankshares, Inc. | 32,761 | 1,042,783 |
| First Defiance Financial Corp. | 41,525 | 1,283,953 |
| First Financial Bancorp | 206,186 | 4,833,000 |
| First Financial Bankshares, Inc. | 275,945 | 9,183,450 |
| First Financial Corp. | 27,924 | 1,225,026 |
| First Financial Northwest, Inc. | 17,493 | 247,526 |
| First Foundation, Inc. | 83,326 | 1,334,049 |
| First Guaranty Bancshares, Inc. | 9,650 | 202,650 |
| First Internet Bancorp | 20,089 | 456,824 |
| First Interstate BancSystem, Inc., Class A | 79,998 | 3,356,716 |
| First Merchants Corp. | 116,008 | 4,588,116 |
| First Mid Bancshares, Inc. | 31,133 | 1,086,542 |
| First Midwest Bancorp, Inc. | 225,859 | 4,639,144 |
| First Northwest Bancorp | 18,910 | 332,249 |
| Flagstar Bancorp, Inc. | 60,454 | 2,196,898 |
| Flushing Financial Corp. | 57,530 | 1,244,949 |
| FNCB Bancorp, Inc. | 35,568 | 264,270 |
| Franklin Financial Network, Inc. | 28,101 | 934,920 |
| Franklin Financial Services Corp. | 8,719 | 312,053 |
| FS Bancorp, Inc. | 8,496 | 486,396 |
| Fulton Financial Corp. | 344,476 | 5,876,761 |
| FVCBankcorp, Inc. * | 25,236 | 434,564 |
| German American Bancorp, Inc. | 52,638 | 1,739,686 |
| Glacier Bancorp, Inc. | 184,101 | 7,791,154 |
| Great Southern Bancorp, Inc. | 23,601 | 1,425,972 |
| Great Western Bancorp, Inc. | 121,480 | 4,236,008 |
| Greene County Bancorp, Inc. | 6,562 | 182,555 |
| Guaranty Bancshares, Inc. | 17,108 | 541,639 |
| Hancock Whitney Corp. | 191,296 | 7,460,544 |
| Hanmi Financial Corp. | 64,741 | 1,246,264 |
| HarborOne Bancorp, Inc. * | 56,727 | 579,183 |
| Hawthorn Bancshares, Inc. | 11,763 | 282,312 |
| Heartland Financial USA, Inc. | 73,520 | 3,439,266 |
| Heritage Commerce Corp. | 87,837 | 1,055,801 |
| Heritage Financial Corp. | 77,502 | 2,133,630 |
| Hilltop Holdings, Inc. | 151,767 | 3,545,277 |
| Hingham Institution for Savings | 2,882 | 547,551 |
| Home Bancorp, Inc. | 16,237 | 619,604 |
| Home BancShares, Inc. | 329,391 | 6,087,146 |
| HomeStreet, Inc. * | 47,854 | 1,436,099 |
| HomeTrust Bancshares, Inc. | 33,235 | 887,374 |
| Hope Bancorp, Inc. | 254,598 | 3,633,113 |
| Horizon Bancorp, Inc. | 79,316 | 1,447,914 |
| Howard Bancorp, Inc. * | 26,940 | 452,053 |
| IBERIABANK Corp. | 110,524 | 8,111,356 |
| Independent Bank Corp. | 70,531 | 5,789,184 |
| Independent Bank Corp., Michigan | 45,447 | 1,023,012 |
| Independent Bank Group, Inc. | 75,772 | 4,051,529 |
| International Bancshares Corp. | 117,733 | 4,822,344 |
| Investar Holding Corp. | 19,673 | 488,087 |
| Investors Bancorp, Inc. | 488,805 | 5,890,100 |
| Kearny Financial Corp. | 173,744 | 2,437,628 |
| Lakeland Bancorp, Inc. | 103,522 | 1,713,289 |
| Lakeland Financial Corp. | 52,118 | 2,426,093 |
| LCNB Corp. | 25,937 | 468,941 |
| Level One Bancorp, Inc. | 11,014 | 268,742 |
| Live Oak Bancshares, Inc. | 54,390 | 987,178 |
| Luther Burbank Corp. | 42,018 | 486,148 |
| Macatawa Bank Corp. | 56,031 | 585,804 |
| Mackinac Financial Corp. | 19,127 | 299,146 |
| MainStreet Bancshares, Inc. * | 14,760 | 306,122 |
| Malvern Bancorp, Inc. * | 15,895 | 355,730 |
| Mercantile Bank Corp. | 34,281 | 1,207,034 |
| Merchants Bancorp | 18,153 | 296,438 |
| Meridian Bancorp, Inc. | 101,473 | 1,984,812 |
| Meta Financial Group, Inc. | 74,722 | 2,365,699 |
| Metropolitan Bank Holding Corp. * | 14,584 | 626,237 |
| Security | Number
of Shares | Value ($) |
| Mid Penn Bancorp, Inc. | 14,307 | 364,828 |
| Midland States Bancorp, Inc. | 46,142 | 1,236,606 |
| MidWestOne Financial Group, Inc. | 25,562 | 833,193 |
| MMA Capital Holdings, Inc. * | 10,183 | 324,125 |
| Mr Cooper Group, Inc. * | 161,121 | 2,062,349 |
| MutualFirst Financial, Inc. | 12,456 | 496,870 |
| MVB Financial Corp. | 19,572 | 394,376 |
| National Bank Holdings Corp., Class A | 62,370 | 2,145,528 |
| National Bankshares, Inc. | 13,187 | 554,909 |
| NBT Bancorp, Inc. | 90,605 | 3,601,549 |
| Nicolet Bankshares, Inc. * | 17,562 | 1,211,427 |
| NMI Holdings, Inc., Class A * | 138,452 | 4,049,721 |
| Northeast Bank * | 15,360 | 328,858 |
| Northfield Bancorp, Inc. | 91,587 | 1,557,895 |
| Northrim BanCorp, Inc. | 13,896 | 541,249 |
| Northwest Bancshares, Inc. | 213,004 | 3,593,377 |
| Norwood Financial Corp. | 12,153 | 379,174 |
| Oak Valley Bancorp | 14,367 | 239,929 |
| OceanFirst Financial Corp. | 106,678 | 2,552,805 |
| Ocwen Financial Corp. * | 280,054 | 473,291 |
| OFG Bancorp | 106,899 | 2,171,119 |
| Ohio Valley Banc Corp. | 8,584 | 315,376 |
| Old Line Bancshares, Inc. | 31,930 | 934,910 |
| Old National Bancorp | 362,541 | 6,523,925 |
| Old Second Bancorp, Inc. | 60,747 | 733,216 |
| OP Bancorp | 27,171 | 266,276 |
| Opus Bank | 46,602 | 1,155,264 |
| Origin Bancorp, Inc. | 40,723 | 1,433,042 |
| Oritani Financial Corp. | 83,614 | 1,560,237 |
| Orrstown Financial Services, Inc. | 21,296 | 461,910 |
| Pacific Mercantile Bancorp * | 40,314 | 288,648 |
| Pacific Premier Bancorp, Inc. | 125,687 | 4,242,565 |
| Park National Corp. | 28,043 | 2,839,354 |
| Parke Bancorp, Inc. | 18,716 | 449,933 |
| PCB Bancorp | 26,244 | 439,062 |
| PCSB Financial Corp. | 34,917 | 707,418 |
| Peapack-Gladstone Financial Corp. | 40,410 | 1,179,972 |
| Penns Woods Bancorp, Inc. | 14,238 | 435,256 |
| PennyMac Financial Services, Inc. * | 53,251 | 1,657,704 |
| People's Utah Bancorp | 33,709 | 980,932 |
| Peoples Bancorp of North Carolina, Inc. | 10,021 | 298,025 |
| Peoples Bancorp, Inc. | 38,471 | 1,258,386 |
| Peoples Financial Services Corp. | 14,918 | 733,667 |
| Pioneer Bancorp Inc/NY * | 23,117 | 312,079 |
| Ponce de Leon Federal Bank * | 18,609 | 261,084 |
| Preferred Bank | 29,886 | 1,593,223 |
| Premier Financial Bancorp, Inc. | 27,058 | 480,279 |
| Provident Bancorp, Inc. * | 17,584 | 200,458 |
| Provident Financial Holdings, Inc. | 12,133 | 243,388 |
| Provident Financial Services, Inc. | 131,128 | 3,271,644 |
| Prudential Bancorp, Inc. | 18,550 | 323,697 |
| QCR Holdings, Inc. | 31,582 | 1,281,598 |
| Radian Group, Inc. | 432,805 | 10,863,405 |
| RBB Bancorp | 35,145 | 707,820 |
| Red River Bancshares, Inc. * | 1,443 | 63,492 |
| Reliant Bancorp, Inc. | 21,239 | 483,400 |
| Renasant Corp. | 121,028 | 4,199,672 |
| Republic Bancorp, Inc., Class A | 20,750 | 922,752 |
| Republic First Bancorp, Inc. * | 90,400 | 366,120 |
| Richmond Mutual BanCorp., Inc. * | 28,530 | 397,993 |
| Riverview Bancorp, Inc. | 44,975 | 323,370 |
| S&T Bancorp, Inc. | 71,253 | 2,683,032 |
| Sandy Spring Bancorp, Inc. | 74,188 | 2,559,486 |
| SB One Bancorp | 16,982 | 374,963 |
| Seacoast Banking Corp. of Florida * | 106,862 | 2,992,136 |
| Select Bancorp, Inc. * | 33,934 | 383,454 |
| ServisFirst Bancshares, Inc. | 100,787 | 3,527,545 |
| Shore Bancshares, Inc. | 26,439 | 412,713 |
Schwab Equity Index Funds | Annual Report
Schwab Small-Cap Index Fund
Portfolio Holdings as of October 31, 2019 (continued)
| Security | Number
of Shares | Value ($) |
| Sierra Bancorp | 30,779 | 838,420 |
| Simmons First National Corp., Class A | 192,876 | 4,613,594 |
| SmartFinancial, Inc. * | 26,445 | 556,667 |
| South Plains Financial, Inc. | 7,099 | 118,908 |
| South State Corp. | 71,832 | 5,664,671 |
| Southern First Bancshares, Inc. * | 14,932 | 601,909 |
| Southern Missouri Bancorp, Inc. | 16,338 | 594,867 |
| Southern National Bancorp of Virginia, Inc. | 41,139 | 651,642 |
| Southside Bancshares, Inc. | 67,765 | 2,334,504 |
| Spirit of Texas Bancshares, Inc. * | 28,142 | 588,168 |
| Sterling Bancorp, Inc. | 35,705 | 345,981 |
| Stock Yards Bancorp, Inc. | 43,230 | 1,726,606 |
| Summit Financial Group, Inc. | 22,894 | 582,881 |
| Territorial Bancorp, Inc. | 16,732 | 494,598 |
| The Bancorp, Inc. * | 106,329 | 1,158,986 |
| The Bank of N.T. Butterfield & Son Ltd. | 116,197 | 3,828,691 |
| The Bank of Princeton | 11,896 | 342,129 |
| The Community Financial Corp. | 10,202 | 339,931 |
| The First Bancshares, Inc. | 35,402 | 1,166,850 |
| The First of Long Island Corp. | 51,238 | 1,201,019 |
| Timberland Bancorp, Inc. | 16,741 | 443,636 |
| Tompkins Financial Corp. | 30,731 | 2,689,270 |
| Towne Bank | 141,313 | 3,969,482 |
| TriCo Bancshares | 56,572 | 2,128,804 |
| TriState Capital Holdings, Inc. * | 52,595 | 1,215,996 |
| Triumph Bancorp, Inc. * | 51,400 | 1,667,930 |
| TrustCo Bank Corp. | 201,844 | 1,743,932 |
| Trustmark Corp. | 136,007 | 4,667,760 |
| UMB Financial Corp. | 93,879 | 6,126,544 |
| Union Bankshares, Inc. | 8,199 | 272,535 |
| United Bankshares, Inc. | 206,647 | 8,170,822 |
| United Community Banks, Inc. | 166,892 | 5,041,807 |
| United Community Financial Corp. | 98,796 | 1,125,286 |
| United Security Bancshares | 28,174 | 286,530 |
| Unity Bancorp, Inc. | 16,985 | 370,952 |
| Univest Financial Corp. | 61,057 | 1,572,218 |
| Valley National Bancorp | 688,034 | 7,967,434 |
| Veritex Holdings, Inc. | 109,675 | 2,700,198 |
| Walker & Dunlop, Inc. | 58,748 | 3,700,536 |
| Washington Federal, Inc. | 167,548 | 6,108,800 |
| Washington Trust Bancorp, Inc. | 32,118 | 1,640,909 |
| Waterstone Financial, Inc. | 51,201 | 953,875 |
| WesBanco, Inc. | 111,922 | 4,207,148 |
| West Bancorp, Inc. | 34,487 | 809,755 |
| Westamerica Bancorp | 55,377 | 3,655,990 |
| Western New England Bancorp, Inc. | 49,327 | 471,566 |
| WSFS Financial Corp. | 111,230 | 4,690,569 |
| | | 507,073,279 |
| |
| Capital Goods 10.3% |
| AAON, Inc. | 87,248 | 4,245,488 |
| AAR Corp. | 70,456 | 2,941,538 |
| Actuant Corp., Class A | 118,417 | 2,933,189 |
| Advanced Drainage Systems, Inc. | 76,838 | 2,844,543 |
| Aegion Corp. * | 65,223 | 1,413,382 |
| Aerojet Rocketdyne Holdings, Inc. * | 154,865 | 6,694,814 |
| Aerovironment, Inc. * | 45,013 | 2,609,854 |
| Aircastle Ltd. | 110,696 | 3,013,145 |
| Alamo Group, Inc. | 20,621 | 2,207,684 |
| Albany International Corp., Class A | 64,962 | 5,455,509 |
| Allied Motion Technologies, Inc. | 15,271 | 578,160 |
| Altra Industrial Motion Corp. | 136,638 | 4,208,450 |
| Ameresco, Inc., Class A * | 47,304 | 697,261 |
| American Superconductor Corp. * | 43,755 | 342,602 |
| American Woodmark Corp. * | 35,580 | 3,528,113 |
| Apogee Enterprises, Inc. | 55,409 | 2,080,054 |
| Security | Number
of Shares | Value ($) |
| Applied Industrial Technologies, Inc. | 81,393 | 4,870,557 |
| Arcosa, Inc. | 103,306 | 3,967,983 |
| Argan, Inc. | 31,576 | 1,195,152 |
| Armstrong Flooring, Inc. * | 37,614 | 230,950 |
| Astec Industries, Inc. | 48,082 | 1,687,197 |
| Astronics Corp. * | 52,075 | 1,507,051 |
| Atkore International Group, Inc. * | 98,946 | 3,433,426 |
| Axon Enterprise, Inc. * | 123,756 | 6,327,644 |
| AZZ, Inc. | 54,911 | 2,129,998 |
| Barnes Group, Inc. | 99,673 | 5,825,887 |
| Beacon Roofing Supply, Inc. * | 143,609 | 4,457,623 |
| Bloom Energy Corp., Class A *(a) | 114,756 | 351,153 |
| Blue Bird Corp. * | 31,558 | 616,643 |
| BlueLinx Holdings, Inc. *(a) | 18,787 | 587,282 |
| BMC Stock Holdings, Inc. * | 141,275 | 3,813,012 |
| Briggs & Stratton Corp. | 91,826 | 676,758 |
| Builders FirstSource, Inc. * | 242,010 | 5,471,846 |
| Caesarstone Ltd. | 48,426 | 817,915 |
| CAI International, Inc. * | 34,393 | 817,522 |
| Chart Industries, Inc. * | 76,475 | 4,483,729 |
| CIRCOR International, Inc. * | 41,395 | 1,585,015 |
| Columbus McKinnon Corp. | 48,889 | 1,834,315 |
| Comfort Systems USA, Inc. | 76,835 | 3,873,252 |
| Commercial Vehicle Group, Inc. * | 65,877 | 480,243 |
| Concrete Pumping Holdings, Inc. * | 34,136 | 117,428 |
| Construction Partners, Inc., Class A * | 26,562 | 454,741 |
| Continental Building Products, Inc. * | 73,784 | 2,206,879 |
| Cornerstone Building Brands, Inc. * | 95,548 | 597,175 |
| CSW Industrials, Inc. | 31,404 | 2,173,785 |
| Cubic Corp. | 66,115 | 4,875,320 |
| Douglas Dynamics, Inc. | 47,493 | 2,224,097 |
| Ducommun, Inc. * | 22,951 | 1,137,911 |
| DXP Enterprises, Inc. * | 34,737 | 1,199,121 |
| Dycom Industries, Inc. * | 64,255 | 2,929,385 |
| EMCOR Group, Inc. | 118,324 | 10,378,198 |
| Encore Wire Corp. | 43,034 | 2,418,511 |
| Energous Corp. *(a) | 57,934 | 158,739 |
| Energy Recovery, Inc. * | 80,065 | 745,405 |
| EnerSys | 90,568 | 6,055,376 |
| EnPro Industries, Inc. | 43,403 | 3,018,679 |
| ESCO Technologies, Inc. | 54,081 | 4,569,304 |
| EVI Industries, Inc.(a) | 9,435 | 324,470 |
| Evoqua Water Technologies Corp. * | 158,164 | 2,747,309 |
| Federal Signal Corp. | 126,560 | 4,105,606 |
| Foundation Building Materials, Inc. * | 30,829 | 573,111 |
| Franklin Electric Co., Inc. | 97,801 | 5,266,584 |
| GATX Corp. | 75,346 | 5,993,774 |
| Gencor Industries, Inc. * | 19,194 | 239,925 |
| Generac Holdings, Inc. * | 129,573 | 12,514,160 |
| General Finance Corp. * | 24,570 | 240,295 |
| Gibraltar Industries, Inc. * | 68,472 | 3,644,765 |
| GMS, Inc. * | 67,932 | 2,035,243 |
| Graham Corp. | 20,928 | 474,228 |
| Granite Construction, Inc. | 99,116 | 2,333,191 |
| Great Lakes Dredge & Dock Corp. * | 129,926 | 1,396,705 |
| Griffon Corp. | 77,609 | 1,653,848 |
| H&E Equipment Services, Inc. | 67,974 | 2,307,038 |
| Harsco Corp. * | 169,103 | 3,427,718 |
| Helios Technologies, Inc. | 62,049 | 2,459,002 |
| Herc Holdings, Inc. * | 51,006 | 2,257,526 |
| Hillenbrand, Inc. | 130,921 | 4,031,058 |
| Hurco Cos., Inc. | 13,045 | 453,836 |
| Hyster-Yale Materials Handling, Inc. | 21,551 | 1,093,067 |
| IES Holdings, Inc. * | 17,000 | 329,800 |
| Insteel Industries, Inc. | 39,815 | 759,272 |
| JELD-WEN Holding, Inc. * | 142,823 | 2,440,845 |
| John Bean Technologies Corp. | 66,108 | 6,793,919 |
| Kadant, Inc. | 23,270 | 2,112,916 |
Schwab Equity Index Funds | Annual Report
Schwab Small-Cap Index Fund
Portfolio Holdings as of October 31, 2019 (continued)
| Security | Number
of Shares | Value ($) |
| Kaman Corp. | 58,820 | 3,450,969 |
| Kennametal, Inc. | 173,764 | 5,377,996 |
| Kratos Defense & Security Solutions, Inc. * | 191,310 | 3,611,933 |
| L.B. Foster Co., Class A * | 21,897 | 398,525 |
| Lawson Products, Inc. * | 8,762 | 402,614 |
| Lindsay Corp. | 22,853 | 2,157,552 |
| Luxfer Holdings plc | 54,741 | 922,933 |
| Lydall, Inc. * | 36,787 | 719,922 |
| Masonite International Corp. * | 52,588 | 3,229,429 |
| MasTec, Inc. * | 127,141 | 8,002,255 |
| Maxar Technologies, Inc. *(a) | 127,729 | 1,084,419 |
| Mercury Systems, Inc. * | 115,000 | 8,470,900 |
| Meritor, Inc. * | 167,750 | 3,695,532 |
| Milacron Holdings Corp. * | 144,864 | 2,422,126 |
| Miller Industries, Inc. | 23,722 | 852,806 |
| Moog, Inc., Class A | 68,216 | 5,710,361 |
| MRC Global, Inc. * | 169,438 | 1,924,816 |
| Mueller Industries, Inc. | 117,775 | 3,623,937 |
| Mueller Water Products, Inc., Class A | 332,718 | 3,892,801 |
| MYR Group, Inc. * | 33,805 | 1,163,230 |
| National Presto Industries, Inc. | 10,665 | 918,150 |
| Navistar International Corp. * | 104,787 | 3,277,737 |
| NN, Inc. | 90,411 | 652,767 |
| Northwest Pipe Co. * | 20,115 | 613,508 |
| NOW, Inc. * | 229,123 | 2,414,956 |
| NV5 Global, Inc. * | 21,981 | 1,592,084 |
| Omega Flex, Inc. | 6,050 | 561,743 |
| Park Aerospace Corp. | 39,203 | 666,059 |
| Park-Ohio Holdings Corp. | 18,496 | 568,937 |
| Parsons Corp. * | 40,362 | 1,436,887 |
| Patrick Industries, Inc. * | 47,986 | 2,370,988 |
| PGT Innovations, Inc. * | 120,086 | 2,120,719 |
| Plug Power, Inc. *(a) | 503,391 | 1,333,986 |
| Powell Industries, Inc. | 18,811 | 736,639 |
| Preformed Line Products Co. | 6,934 | 378,596 |
| Primoris Services Corp. | 93,792 | 1,917,108 |
| Proto Labs, Inc. * | 57,253 | 5,551,823 |
| Quanex Building Products Corp. | 70,205 | 1,354,254 |
| Raven Industries, Inc. | 75,936 | 2,648,648 |
| RBC Bearings, Inc. * | 51,378 | 8,243,086 |
| REV Group, Inc. | 56,738 | 705,821 |
| Rexnord Corp. * | 223,014 | 6,309,066 |
| Rush Enterprises, Inc., Class A | 58,340 | 2,548,875 |
| Rush Enterprises, Inc., Class B | 10,325 | 443,149 |
| Simpson Manufacturing Co., Inc. | 94,891 | 7,841,792 |
| SiteOne Landscape Supply, Inc. * | 86,702 | 7,634,978 |
| Spartan Motors, Inc. | 72,917 | 1,273,860 |
| SPX Corp. * | 92,651 | 4,219,327 |
| SPX FLOW, Inc. * | 88,931 | 4,026,796 |
| Standex International Corp. | 26,610 | 2,016,506 |
| Sterling Construction Co., Inc. * | 55,757 | 905,772 |
| Sunrun, Inc. * | 239,845 | 3,727,191 |
| Systemax, Inc. | 25,994 | 562,510 |
| Tennant Co. | 37,985 | 2,941,179 |
| Terex Corp. | 134,072 | 3,693,684 |
| Textainer Group Holdings Ltd. * | 58,950 | 610,133 |
| The Eastern Co. | 11,372 | 313,753 |
| The Gorman-Rupp Co. | 37,375 | 1,380,633 |
| The Greenbrier Cos., Inc. | 68,095 | 1,994,503 |
| The Manitowoc Co., Inc. * | 73,967 | 943,819 |
| Thermon Group Holdings, Inc. * | 69,039 | 1,645,199 |
| Titan International, Inc. | 104,346 | 278,604 |
| Titan Machinery, Inc. * | 39,748 | 659,817 |
| TPI Composites, Inc. * | 61,369 | 1,259,906 |
| Transcat, Inc. * | 15,080 | 472,607 |
| Trex Co., Inc. * | 124,589 | 10,950,127 |
| TriMas Corp. * | 96,547 | 3,120,399 |
| Triton International Ltd. | 117,354 | 4,306,892 |
| Security | Number
of Shares | Value ($) |
| Triumph Group, Inc. | 105,003 | 2,180,912 |
| Tutor Perini Corp. * | 85,813 | 1,327,527 |
| Twin Disc, Inc. * | 20,839 | 224,228 |
| Universal Forest Products, Inc. | 126,393 | 6,365,151 |
| Vectrus, Inc. * | 24,066 | 1,100,057 |
| Veritiv Corp. * | 26,921 | 367,202 |
| Vicor Corp. * | 37,838 | 1,375,411 |
| Vivint Solar, Inc. * | 90,791 | 636,445 |
| Wabash National Corp. | 114,228 | 1,628,891 |
| Watts Water Technologies, Inc., Class A | 58,532 | 5,458,109 |
| Welbilt, Inc. * | 274,697 | 5,208,255 |
| Wesco Aircraft Holdings, Inc. * | 113,324 | 1,248,830 |
| Willis Lease Finance Corp. * | 5,995 | 326,787 |
| WillScot Corp. * | 109,666 | 1,728,336 |
| | | 430,541,974 |
| |
| Commercial & Professional Services 4.4% |
| ABM Industries, Inc. | 141,345 | 5,153,439 |
| Acacia Research Corp. * | 104,359 | 265,072 |
| ACCO Brands Corp. | 204,666 | 1,872,694 |
| Advanced Disposal Services, Inc. * | 154,086 | 5,050,939 |
| ASGN, Inc. * | 108,324 | 6,888,323 |
| Barrett Business Services, Inc. | 15,257 | 1,338,497 |
| BG Staffing, Inc. | 20,677 | 395,551 |
| Brady Corp., Class A | 101,337 | 5,709,327 |
| BrightView Holdings, Inc. * | 66,505 | 1,183,789 |
| Casella Waste Systems, Inc., Class A * | 94,642 | 4,125,445 |
| CBIZ, Inc. * | 108,262 | 2,963,131 |
| CECO Environmental Corp. * | 64,133 | 439,952 |
| Charah Solutions, Inc. * | 19,137 | 36,552 |
| Cimpress N.V. * | 46,068 | 6,086,504 |
| CompX International, Inc. | 2,900 | 42,514 |
| Covanta Holding Corp. | 250,659 | 3,619,516 |
| CRA International, Inc. | 16,204 | 798,047 |
| Deluxe Corp. | 91,256 | 4,729,798 |
| Ennis, Inc. | 54,529 | 1,068,223 |
| Exponent, Inc. | 109,624 | 6,964,413 |
| Forrester Research, Inc. | 22,880 | 788,902 |
| Franklin Covey Co. * | 20,737 | 792,153 |
| FTI Consulting, Inc. * | 78,772 | 8,575,908 |
| GP Strategies Corp. * | 26,313 | 292,074 |
| Healthcare Services Group, Inc. | 158,024 | 3,849,465 |
| Heidrick & Struggles International, Inc. | 40,113 | 1,141,616 |
| Heritage-Crystal Clean, Inc. * | 31,529 | 836,780 |
| Herman Miller, Inc. | 124,952 | 5,810,268 |
| HNI Corp. | 90,626 | 3,443,788 |
| Huron Consulting Group, Inc. * | 47,690 | 3,154,217 |
| ICF International, Inc. | 38,515 | 3,300,350 |
| InnerWorkings, Inc. * | 95,599 | 463,655 |
| Insperity, Inc. | 82,068 | 8,668,843 |
| Interface, Inc. | 123,220 | 2,049,149 |
| Kelly Services, Inc., Class A | 70,146 | 1,684,205 |
| Kforce, Inc. | 45,845 | 1,875,519 |
| Kimball International, Inc., Class B | 75,840 | 1,544,102 |
| Knoll, Inc. | 103,904 | 2,778,393 |
| Korn Ferry | 119,735 | 4,393,077 |
| LSC Communications, Inc. | 67,322 | 65,639 |
| Matthews International Corp., Class A | 65,406 | 2,418,714 |
| McGrath RentCorp | 51,370 | 3,920,045 |
| Mistras Group, Inc. * | 37,756 | 585,218 |
| Mobile Mini, Inc. | 94,459 | 3,553,548 |
| MSA Safety, Inc. | 74,747 | 8,974,872 |
| NL Industries, Inc. * | 14,900 | 61,537 |
| NRC Group Holdings Corp. *(a) | 23,384 | 286,220 |
| PICO Holdings, Inc. * | 37,639 | 405,748 |
| Pitney Bowes, Inc. | 364,650 | 1,604,460 |
| Quad Graphics, Inc. | 67,519 | 305,861 |
Schwab Equity Index Funds | Annual Report
Schwab Small-Cap Index Fund
Portfolio Holdings as of October 31, 2019 (continued)
| Security | Number
of Shares | Value ($) |
| Resources Connection, Inc. | 65,451 | 958,857 |
| RR Donnelley & Sons Co. | 148,636 | 648,053 |
| SP Plus Corp. * | 48,426 | 2,138,976 |
| Steelcase, Inc., Class A | 183,585 | 3,207,230 |
| Team, Inc. * | 62,470 | 1,134,455 |
| Tetra Tech, Inc. | 115,673 | 10,117,917 |
| The Brink's Co. | 105,777 | 8,986,814 |
| TriNet Group, Inc. * | 94,780 | 5,022,392 |
| TrueBlue, Inc. * | 84,421 | 1,933,241 |
| UniFirst Corp. | 32,062 | 6,439,332 |
| Upwork, Inc. * | 120,468 | 1,811,839 |
| US Ecology, Inc. | 46,650 | 2,903,029 |
| Viad Corp. | 42,375 | 2,585,723 |
| VSE Corp. | 18,731 | 719,645 |
| Willdan Group, Inc. * | 21,333 | 646,390 |
| | | 185,609,945 |
| |
| Consumer Durables & Apparel 3.2% |
| Acushnet Holdings Corp. | 74,752 | 2,126,694 |
| American Outdoor Brands Corp. * | 115,584 | 818,335 |
| Bassett Furniture Industries, Inc. | 20,616 | 314,394 |
| Beazer Homes USA, Inc. * | 60,280 | 904,803 |
| Callaway Golf Co. | 197,537 | 3,994,198 |
| Cavco Industries, Inc. * | 18,321 | 3,511,220 |
| Centric Brands, Inc. *(a) | 34,283 | 85,708 |
| Century Communities, Inc. * | 55,805 | 1,683,637 |
| Clarus Corp. | 48,787 | 622,034 |
| Crocs, Inc. * | 131,597 | 4,604,579 |
| Culp, Inc. | 23,369 | 361,518 |
| Deckers Outdoor Corp. * | 61,990 | 9,478,271 |
| Delta Apparel, Inc. * | 12,822 | 319,909 |
| Escalade, Inc. | 22,596 | 258,950 |
| Ethan Allen Interiors, Inc. | 51,252 | 1,010,177 |
| Flexsteel Industries, Inc. | 15,246 | 252,626 |
| Fossil Group, Inc. * | 99,605 | 1,083,702 |
| G-III Apparel Group Ltd. * | 95,688 | 2,402,726 |
| GoPro, Inc., Class A *(a) | 265,854 | 1,105,953 |
| Green Brick Partners, Inc. * | 50,448 | 508,011 |
| Hamilton Beach Brands Holding Co., Class A | 13,375 | 249,444 |
| Helen of Troy Ltd. * | 53,236 | 7,972,623 |
| Hooker Furniture Corp. | 24,626 | 582,897 |
| Installed Building Products, Inc. * | 47,855 | 3,121,103 |
| iRobot Corp. *(a) | 58,353 | 2,804,445 |
| Johnson Outdoors, Inc., Class A | 10,287 | 602,304 |
| KB Home | 181,981 | 6,494,902 |
| Kontoor Brands, Inc. * | 93,962 | 3,570,556 |
| La-Z-Boy, Inc. | 95,403 | 3,387,761 |
| Legacy Housing Corp. * | 12,206 | 193,465 |
| LGI Homes, Inc. * | 42,592 | 3,342,620 |
| Lifetime Brands, Inc. | 25,133 | 200,813 |
| M.D.C. Holdings, Inc. | 104,955 | 4,062,808 |
| M/I Homes, Inc. * | 56,272 | 2,486,097 |
| Malibu Boats, Inc., Class A * | 44,286 | 1,444,609 |
| Marine Products Corp. | 15,402 | 206,695 |
| MasterCraft Boat Holdings, Inc. * | 38,757 | 610,423 |
| Meritage Homes Corp. * | 76,866 | 5,541,270 |
| Movado Group, Inc. | 33,816 | 880,907 |
| Oxford Industries, Inc. | 35,216 | 2,424,974 |
| Purple Innovation, Inc. *(a) | 6,717 | 48,564 |
| Rocky Brands, Inc. | 14,917 | 414,842 |
| Skyline Champion Corp. * | 107,088 | 3,023,094 |
| Sonos, Inc. * | 149,752 | 1,958,756 |
| Steven Madden Ltd. | 177,724 | 7,318,674 |
| Sturm, Ruger & Co., Inc. | 35,884 | 1,642,052 |
| Superior Group of Cos., Inc. | 22,105 | 319,859 |
| Taylor Morrison Home Corp. * | 222,510 | 5,573,876 |
| Security | Number
of Shares | Value ($) |
| The Lovesac Co. * | 18,421 | 300,815 |
| TopBuild Corp. * | 72,034 | 7,486,494 |
| TRI Pointe Group, Inc. * | 299,856 | 4,719,734 |
| Tupperware Brands Corp. | 103,682 | 998,458 |
| Unifi, Inc. * | 30,273 | 826,453 |
| Universal Electronics, Inc. * | 28,612 | 1,491,257 |
| Vera Bradley, Inc. * | 44,209 | 475,689 |
| Vince Holding Corp. * | 6,386 | 134,872 |
| Vista Outdoor, Inc. * | 124,282 | 832,689 |
| William Lyon Homes, Class A * | 67,634 | 1,308,718 |
| Wolverine World Wide, Inc. | 178,018 | 5,283,574 |
| YETI Holdings, Inc. *(a) | 65,342 | 2,176,542 |
| ZAGG, Inc. * | 58,363 | 430,135 |
| | | 132,393,308 |
| |
| Consumer Services 3.5% |
| Adtalem Global Education, Inc. * | 119,517 | 3,559,216 |
| American Public Education, Inc. * | 32,874 | 714,023 |
| BBX Capital Corp. | 138,011 | 616,909 |
| Biglari Holdings, Inc., Class B * | 2,048 | 170,967 |
| BJ's Restaurants, Inc. | 43,562 | 1,724,620 |
| Bloomin' Brands, Inc. | 184,825 | 3,661,383 |
| Bluegreen Vacations Corp. | 15,000 | 144,150 |
| Boyd Gaming Corp. | 171,204 | 4,665,309 |
| Brinker International, Inc. | 79,386 | 3,528,708 |
| Career Education Corp. * | 145,640 | 2,062,262 |
| Carriage Services, Inc. | 34,482 | 888,256 |
| Carrols Restaurant Group, Inc. * | 74,545 | 531,506 |
| Century Casinos, Inc. * | 56,687 | 418,917 |
| Chegg, Inc. * | 246,243 | 7,549,810 |
| Churchill Downs, Inc. | 74,487 | 9,682,565 |
| Chuy's Holdings, Inc. * | 35,210 | 858,068 |
| Collectors Universe, Inc. | 16,652 | 477,246 |
| Cracker Barrel Old Country Store, Inc. | 40,893 | 6,358,862 |
| Dave & Buster's Entertainment, Inc. | 76,917 | 3,059,758 |
| Del Taco Restaurants, Inc. * | 60,359 | 460,841 |
| Denny's Corp. * | 122,235 | 2,459,368 |
| Dine Brands Global, Inc. | 34,542 | 2,526,747 |
| Drive Shack, Inc. * | 126,888 | 506,283 |
| El Pollo Loco Holdings, Inc. * | 43,034 | 500,055 |
| Eldorado Resorts, Inc. * | 139,405 | 6,241,162 |
| Empire Resorts, Inc. * | 8,021 | 77,884 |
| Everi Holdings, Inc. * | 146,112 | 1,469,887 |
| Fiesta Restaurant Group, Inc. * | 49,166 | 422,582 |
| Golden Entertainment, Inc. * | 35,749 | 517,646 |
| Houghton Mifflin Harcourt Co. * | 222,846 | 1,439,585 |
| Inspired Entertainment, Inc. * | 18,366 | 134,990 |
| J Alexander's Holdings, Inc. * | 27,760 | 267,884 |
| Jack in the Box, Inc. | 54,815 | 4,605,556 |
| K12, Inc. * | 81,724 | 1,617,318 |
| Kura Sushi USA, Inc. Class A * | 7,069 | 130,423 |
| Laureate Education, Inc., Class A * | 222,410 | 3,437,347 |
| Lindblad Expeditions Holdings, Inc. * | 49,210 | 774,565 |
| Marriott Vacations Worldwide Corp. | 90,940 | 9,997,034 |
| Monarch Casino & Resort, Inc. * | 24,273 | 1,048,351 |
| Nathan's Famous, Inc. | 6,532 | 497,085 |
| Noodles & Co. * | 59,378 | 316,485 |
| OneSpaWorld Holdings Ltd. * | 96,688 | 1,503,498 |
| Papa John's International, Inc.(a) | 46,741 | 2,736,686 |
| Penn National Gaming, Inc. * | 233,290 | 4,972,576 |
| PlayAGS, Inc. * | 55,369 | 638,958 |
| Potbelly Corp. * | 43,800 | 186,150 |
| RCI Hospitality Holdings, Inc. | 18,724 | 351,075 |
| Red Lion Hotels Corp. * | 49,311 | 295,866 |
| Red Robin Gourmet Burgers, Inc. * | 27,808 | 848,144 |
| Red Rock Resorts, Inc., Class A | 147,614 | 3,215,033 |
| Regis Corp. * | 60,825 | 1,252,995 |
Schwab Equity Index Funds | Annual Report
Schwab Small-Cap Index Fund
Portfolio Holdings as of October 31, 2019 (continued)
| Security | Number
of Shares | Value ($) |
| Ruth's Hospitality Group, Inc. | 60,364 | 1,242,291 |
| Scientific Games Corp., Class A * | 117,927 | 2,829,069 |
| SeaWorld Entertainment, Inc. * | 99,655 | 2,632,885 |
| Select Interior Concepts, Inc., Class A * | 44,804 | 513,454 |
| Shake Shack, Inc., Class A * | 61,516 | 5,061,537 |
| Strategic Education, Inc. | 45,223 | 5,563,786 |
| Target Hospitality Corp. * | 68,698 | 380,587 |
| Texas Roadhouse, Inc. | 140,086 | 7,914,859 |
| The Cheesecake Factory, Inc. | 88,372 | 3,693,066 |
| The Habit Restaurants, Inc., Class A * | 42,369 | 445,298 |
| Twin River Worldwide Holdings, Inc. | 41,179 | 1,033,593 |
| Wingstop, Inc. | 62,026 | 5,174,829 |
| WW International, Inc. * | 99,250 | 3,460,848 |
| | | 146,068,696 |
| |
| Diversified Financials 3.6% |
| AG Mortgage Investment Trust, Inc. | 68,041 | 1,064,161 |
| Anworth Mortgage Asset Corp. | 217,867 | 745,105 |
| Apollo Commercial Real Estate Finance, Inc. | 327,944 | 6,001,375 |
| Ares Commercial Real Estate Corp. | 58,354 | 904,487 |
| Ares Management Corp., Class A | 141,870 | 4,195,096 |
| Arlington Asset Investment Corp., Class A | 74,900 | 432,922 |
| ARMOUR Residential REIT, Inc. | 123,670 | 2,068,999 |
| Artisan Partners Asset Management, Inc., Class A | 105,686 | 2,890,512 |
| Ashford, Inc. * | 612 | 14,624 |
| Assetmark Financial Holdings, Inc. * | 28,785 | 789,860 |
| Associated Capital Group, Inc., Class A | 4,096 | 166,298 |
| B. Riley Financial, Inc. | 43,173 | 1,215,320 |
| Banco Latinoamericano de Comercio Exterior, S.A., Class E | 65,536 | 1,352,008 |
| Blackstone Mortgage Trust, Inc., Class A | 267,532 | 9,711,412 |
| Blucora, Inc. * | 101,659 | 2,198,884 |
| BrightSphere Investment Group, Inc. * | 147,139 | 1,444,905 |
| Cannae Holdings, Inc. * | 143,159 | 4,180,243 |
| Capstead Mortgage Corp. | 201,597 | 1,558,345 |
| Cherry Hill Mortgage Investment Corp. | 32,246 | 435,966 |
| Cohen & Steers, Inc. | 48,413 | 3,168,147 |
| Colony Credit Real Estate, Inc. | 172,281 | 2,468,787 |
| Cowen, Inc. * | 61,515 | 920,880 |
| Curo Group Holdings Corp. * | 36,163 | 505,920 |
| Diamond Hill Investment Group, Inc. | 6,685 | 941,649 |
| Donnelley Financial Solutions, Inc. * | 65,092 | 735,540 |
| Dynex Capital, Inc. | 49,835 | 805,334 |
| Elevate Credit, Inc. * | 49,529 | 202,574 |
| Ellington Financial, Inc. | 66,073 | 1,217,065 |
| Encore Capital Group, Inc. * | 65,331 | 2,168,336 |
| Enova International, Inc. * | 70,008 | 1,644,488 |
| Exantas Capital Corp. | 63,532 | 747,136 |
| EZCORP, Inc., Class A * | 105,689 | 555,924 |
| Federated Investors, Inc., Class B | 204,068 | 6,517,932 |
| FGL Holdings | 310,221 | 2,801,296 |
| FirstCash, Inc. | 89,896 | 7,586,323 |
| Focus Financial Partners, Inc., Class A * | 64,271 | 1,406,249 |
| GAIN Capital Holdings, Inc. | 40,142 | 169,399 |
| GAMCO Investors, Inc., Class A | 11,397 | 179,617 |
| Granite Point Mortgage Trust, Inc. | 114,947 | 2,138,014 |
| Great Ajax Corp. | 35,247 | 551,616 |
| Green Dot Corp., Class A * | 102,616 | 2,959,445 |
| Greenhill & Co., Inc. | 33,885 | 548,937 |
| GWG Holdings, Inc. *(a) | 3,801 | 38,960 |
| Hamilton Lane, Inc., Class A | 46,053 | 2,745,680 |
| Houlihan Lokey, Inc. | 87,381 | 4,129,626 |
| INTL. FCStone, Inc. * | 33,881 | 1,355,240 |
| Invesco Mortgage Capital, Inc. | 305,192 | 4,803,722 |
| KKR Real Estate Finance Trust, Inc. | 53,820 | 1,079,091 |
| Security | Number
of Shares | Value ($) |
| Ladder Capital Corp. | 218,120 | 3,766,932 |
| Ladenburg Thalmann Financial Services, Inc. | 247,169 | 558,602 |
| LendingClub Corp. * | 139,854 | 1,767,755 |
| Marlin Business Services Corp. | 18,213 | 432,377 |
| Medallion Financial Corp. * | 42,846 | 293,067 |
| Moelis & Co., Class A | 100,977 | 3,602,859 |
| Nelnet, Inc., Class A | 38,079 | 2,333,100 |
| New York Mortgage Trust, Inc. | 497,714 | 3,115,690 |
| On Deck Capital, Inc. * | 138,266 | 616,666 |
| Oppenheimer Holdings, Inc., Class A | 19,926 | 541,987 |
| Orchid Island Capital, Inc. | 133,369 | 742,865 |
| PennyMac Mortgage Investment Trust | 183,225 | 4,194,020 |
| Piper Jaffray Cos. | 29,053 | 2,281,823 |
| PJT Partners, Inc., Class A | 48,058 | 1,995,849 |
| PRA Group, Inc. * | 95,245 | 3,231,663 |
| Pzena Investment Management, Inc., Class A | 37,290 | 309,507 |
| Ready Capital Corp. | 66,579 | 1,053,946 |
| Redwood Trust, Inc. | 203,581 | 3,326,513 |
| Regional Management Corp. * | 18,750 | 542,437 |
| Safeguard Scientifics, Inc. * | 40,517 | 458,247 |
| Sculptor Capital Management, Inc. | 35,058 | 629,992 |
| Siebert Financial Corp. *(a) | 16,650 | 149,350 |
| Silvercrest Asset Management Group, Inc., Class A | 17,734 | 213,163 |
| Stifel Financial Corp. | 143,422 | 8,028,764 |
| TPG RE Finance Trust, Inc. | 104,492 | 2,113,873 |
| Value Line, Inc. | 1,900 | 38,437 |
| Virtus Investment Partners, Inc. | 14,155 | 1,535,534 |
| Waddell & Reed Financial, Inc., Class A | 152,689 | 2,528,530 |
| Western Asset Mortgage Capital Corp. | 109,462 | 1,098,998 |
| Westwood Holdings Group, Inc. | 17,318 | 523,523 |
| WisdomTree Investments, Inc. | 283,844 | 1,450,443 |
| World Acceptance Corp. * | 13,289 | 1,379,531 |
| | | 151,319,492 |
| |
| Energy 3.1% |
| Abraxas Petroleum Corp. * | 333,304 | 96,658 |
| Altus Midstream Co., Class A * | 104,732 | 230,410 |
| Amplify Energy Corp. | 27,233 | 197,439 |
| Arch Coal, Inc., Class A | 34,494 | 2,721,232 |
| Archrock, Inc. | 274,211 | 2,643,394 |
| Ardmore Shipping Corp. * | 70,072 | 559,875 |
| Berry Petroleum Corp. | 131,620 | 1,235,912 |
| Bonanza Creek Energy, Inc. * | 40,721 | 725,648 |
| Brigham Minerals, Inc., Class A | 33,461 | 638,770 |
| Cactus, Inc., Class A * | 99,583 | 2,959,607 |
| California Resources Corp. *(a) | 103,459 | 578,336 |
| Callon Petroleum Co. * | 487,221 | 1,851,440 |
| Carrizo Oil & Gas, Inc. * | 188,841 | 1,389,870 |
| Chaparral Energy, Inc., Class A * | 64,581 | 60,532 |
| Clean Energy Fuels Corp. * | 284,851 | 640,915 |
| CNX Resources Corp. * | 394,385 | 3,324,666 |
| Comstock Resources, Inc. *(a) | 31,231 | 213,620 |
| CONSOL Energy, Inc. * | 57,114 | 755,618 |
| Contura Energy, Inc. * | 40,655 | 932,626 |
| Covia Holdings Corp. * | 86,510 | 119,384 |
| CVR Energy, Inc. | 62,434 | 2,960,620 |
| Delek US Holdings, Inc. | 159,357 | 6,366,312 |
| Denbury Resources, Inc. * | 997,613 | 995,718 |
| DHT Holdings, Inc. | 187,337 | 1,448,115 |
| Diamond Offshore Drilling, Inc. * | 135,164 | 715,018 |
| Diamond S Shipping, Inc. * | 48,812 | 712,655 |
| DMC Global, Inc. | 30,132 | 1,348,106 |
| Dorian LPG Ltd. * | 58,072 | 722,996 |
| Dril-Quip, Inc. * | 76,629 | 3,143,322 |
Schwab Equity Index Funds | Annual Report
Schwab Small-Cap Index Fund
Portfolio Holdings as of October 31, 2019 (continued)
| Security | Number
of Shares | Value ($) |
| Earthstone Energy, Inc., Class A * | 41,977 | 162,871 |
| Energy Fuels, Inc. *(a) | 196,779 | 395,526 |
| Era Group, Inc. * | 40,183 | 388,570 |
| Evolution Petroleum Corp. | 56,495 | 317,502 |
| Exterran Corp. * | 64,215 | 813,604 |
| Extraction Oil & Gas, Inc. *(a) | 177,936 | 302,491 |
| Falcon Minerals Corp. | 80,229 | 494,211 |
| Forum Energy Technologies, Inc. * | 172,262 | 199,824 |
| Frank's International N.V. * | 228,678 | 1,120,522 |
| FTS International, Inc. * | 70,517 | 107,186 |
| GasLog Ltd. | 86,529 | 1,186,313 |
| Geospace Technologies Corp. * | 27,555 | 402,027 |
| Golar LNG Ltd. | 200,884 | 2,766,173 |
| Goodrich Petroleum Corp. * | 18,729 | 180,360 |
| Green Plains, Inc. | 79,349 | 978,373 |
| Gulfport Energy Corp. * | 342,824 | 954,765 |
| Hallador Energy Co. | 42,080 | 141,599 |
| Helix Energy Solutions Group, Inc. * | 301,272 | 2,587,926 |
| HighPoint Resources Corp. * | 233,382 | 247,385 |
| Independence Contract Drilling, Inc. * | 96,360 | 85,760 |
| International Seaways, Inc. * | 53,502 | 1,345,040 |
| Jagged Peak Energy, Inc. * | 141,346 | 1,002,143 |
| KLX Energy Services Holdings, Inc. * | 43,335 | 344,080 |
| Laredo Petroleum, Inc. * | 386,265 | 911,585 |
| Liberty Oilfield Services, Inc., Class A | 111,621 | 1,028,029 |
| Magnolia Oil & Gas Corp., Class A * | 215,580 | 2,116,996 |
| Mammoth Energy Services, Inc. | 25,335 | 40,536 |
| Matador Resources Co. * | 235,087 | 3,270,060 |
| Matrix Service Co. * | 56,655 | 1,062,848 |
| McDermott International, Inc. *(a) | 382,393 | 623,301 |
| Montage Resources Corp. * | 44,440 | 200,869 |
| Nabors Industries Ltd. | 750,247 | 1,387,957 |
| NACCO Industries, Inc., Class A | 7,792 | 393,496 |
| National Energy Services Reunited Corp. * | 49,361 | 341,084 |
| Natural Gas Services Group, Inc. * | 26,169 | 311,149 |
| NCS Multistage Holdings, Inc. * | 24,476 | 55,071 |
| Newpark Resources, Inc. * | 191,155 | 1,146,930 |
| NextDecade Corp. *(a) | 23,710 | 140,363 |
| NexTier Oilfield Solutions, Inc. * | 332,611 | 1,436,878 |
| Nine Energy Service, Inc. * | 33,083 | 186,919 |
| Noble Corp. plc * | 524,241 | 644,816 |
| Nordic American Tankers Ltd. | 296,557 | 1,061,674 |
| Northern Oil & Gas, Inc. * | 610,805 | 1,197,178 |
| Oasis Petroleum, Inc. * | 675,700 | 1,763,577 |
| Oceaneering International, Inc. * | 209,746 | 2,970,003 |
| Oil States International, Inc. * | 128,033 | 1,827,031 |
| Overseas Shipholding Group, Inc., Class A * | 134,333 | 218,963 |
| Pacific Drilling S.A. *(a) | 62,142 | 155,355 |
| Panhandle Oil & Gas, Inc., Class A | 32,554 | 461,941 |
| Par Pacific Holdings, Inc. * | 75,401 | 1,707,833 |
| Parker Drilling Co. * | 19,411 | 358,521 |
| PDC Energy, Inc. * | 132,641 | 2,646,188 |
| Peabody Energy Corp. | 145,236 | 1,529,335 |
| Penn Virginia Corp. * | 28,193 | 670,993 |
| PrimeEnergy Resources Corp. *(a) | 1,079 | 170,935 |
| ProPetro Holding Corp. * | 168,197 | 1,303,527 |
| QEP Resources, Inc. | 507,968 | 1,691,533 |
| Renewable Energy Group, Inc. * | 78,270 | 1,278,932 |
| REX American Resources Corp. * | 11,761 | 951,700 |
| RigNet, Inc. * | 31,747 | 166,354 |
| Ring Energy, Inc. * | 128,602 | 213,479 |
| Roan Resources, Inc. * | 74,112 | 111,168 |
| Rosehill Resources, Inc. * | 21,663 | 33,361 |
| RPC, Inc.(a) | 120,998 | 500,932 |
| SandRidge Energy, Inc. * | 63,258 | 277,070 |
| Scorpio Tankers, Inc. | 91,534 | 2,911,697 |
| SEACOR Holdings, Inc. * | 36,919 | 1,584,194 |
| Security | Number
of Shares | Value ($) |
| SEACOR Marine Holdings, Inc. * | 41,879 | 544,846 |
| Seadrill Ltd. *(a) | 122,010 | 214,738 |
| Select Energy Services, Inc., Class A * | 124,463 | 945,919 |
| SemGroup Corp., Class A | 168,792 | 2,717,551 |
| Ship Finance International Ltd. | 171,690 | 2,484,354 |
| SilverBow Resources, Inc. * | 14,100 | 111,390 |
| SM Energy Co. | 237,539 | 1,862,306 |
| Smart Sand, Inc. * | 48,150 | 112,189 |
| Solaris Oilfield Infrastructure, Inc., Class A | 65,862 | 700,772 |
| Southwestern Energy Co. * | 1,152,958 | 2,363,564 |
| SRC Energy, Inc. * | 513,680 | 1,602,682 |
| Talos Energy, Inc. * | 43,032 | 926,479 |
| Teekay Corp.(a) | 147,560 | 754,032 |
| Teekay Tankers Ltd., Class A * | 426,679 | 870,425 |
| Tellurian, Inc. *(a) | 200,653 | 1,599,204 |
| TETRA Technologies, Inc. * | 253,261 | 430,544 |
| Tidewater, Inc. * | 83,272 | 1,351,505 |
| U.S. Well Services, Inc. * | 41,722 | 79,689 |
| Unit Corp. * | 110,436 | 225,289 |
| Uranium Energy Corp. * | 366,940 | 347,529 |
| US Silica Holdings, Inc. | 156,424 | 697,651 |
| W&T Offshore, Inc. * | 202,197 | 814,854 |
| Whiting Petroleum Corp. * | 191,684 | 1,215,277 |
| World Fuel Services Corp. | 136,361 | 5,695,799 |
| | | 128,544,014 |
| |
| Food & Staples Retailing 0.7% |
| BJ's Wholesale Club Holdings, Inc. * | 235,957 | 6,300,052 |
| HF Foods Group, Inc. * | 15,641 | 303,905 |
| Ingles Markets, Inc., Class A | 29,705 | 1,171,268 |
| Natural Grocers by Vitamin Cottage, Inc. * | 19,294 | 169,209 |
| Performance Food Group Co. * | 218,079 | 9,292,346 |
| PriceSmart, Inc. | 47,532 | 3,522,121 |
| Rite Aid Corp. *(a) | 115,380 | 1,061,496 |
| SpartanNash, Co. | 76,786 | 1,005,513 |
| The Andersons, Inc. | 67,291 | 1,239,500 |
| The Chefs' Warehouse, Inc. * | 51,857 | 1,717,763 |
| United Natural Foods, Inc. * | 110,450 | 828,375 |
| Village Super Market, Inc., Class A | 17,018 | 450,977 |
| Weis Markets, Inc. | 20,623 | 793,779 |
| | | 27,856,304 |
| |
| Food, Beverage & Tobacco 1.7% |
| 22nd Century Group, Inc. *(a) | 239,180 | 452,050 |
| Alico, Inc. | 8,375 | 275,119 |
| B&G Foods, Inc.(a) | 137,206 | 2,133,553 |
| Bridgford Foods Corp. * | 3,608 | 89,009 |
| Cal-Maine Foods, Inc. | 67,031 | 2,673,867 |
| Calavo Growers, Inc. | 34,430 | 2,986,114 |
| Celsius Holdings, Inc. *(a) | 55,986 | 197,071 |
| Coca-Cola Consolidated, Inc. | 9,912 | 2,719,456 |
| Craft Brew Alliance, Inc. * | 23,721 | 172,926 |
| Darling Ingredients, Inc. * | 347,593 | 6,708,545 |
| Dean Foods Co.(a) | 164,820 | 161,524 |
| Farmer Brothers Co. * | 22,152 | 284,210 |
| Fresh Del Monte Produce, Inc. | 65,680 | 2,095,192 |
| Freshpet, Inc. * | 73,084 | 3,819,370 |
| Hostess Brands, Inc. * | 253,892 | 3,244,740 |
| J&J Snack Foods Corp. | 32,028 | 6,109,661 |
| John B. Sanfilippo & Son, Inc. | 18,301 | 1,942,102 |
| Lancaster Colony Corp. | 40,079 | 5,578,195 |
| Landec Corp. * | 51,262 | 504,931 |
| Limoneira Co. | 32,556 | 615,960 |
| MGP Ingredients, Inc. | 27,378 | 1,174,242 |
| National Beverage Corp.(a) | 25,170 | 1,106,473 |
| New Age Beverages Corp. *(a) | 158,455 | 426,244 |
Schwab Equity Index Funds | Annual Report
Schwab Small-Cap Index Fund
Portfolio Holdings as of October 31, 2019 (continued)
| Security | Number
of Shares | Value ($) |
| Primo Water Corp. * | 75,144 | 908,867 |
| Pyxus International, Inc. *(a) | 17,377 | 198,445 |
| Sanderson Farms, Inc. | 42,206 | 6,533,911 |
| Seneca Foods Corp., Class A * | 14,603 | 516,654 |
| The Boston Beer Co., Inc., Class A * | 17,678 | 6,619,704 |
| The Simply Good Foods Co. * | 174,667 | 4,286,328 |
| Tootsie Roll Industries, Inc. | 34,957 | 1,198,326 |
| Turning Point Brands, Inc. | 17,237 | 359,736 |
| Universal Corp. | 52,204 | 2,860,779 |
| Vector Group Ltd. | 234,335 | 2,858,887 |
| | | 71,812,191 |
| |
| Health Care Equipment & Services 6.8% |
| Accuray, Inc. * | 182,312 | 474,011 |
| Addus HomeCare Corp. * | 22,387 | 1,885,209 |
| Allscripts Healthcare Solutions, Inc. * | 350,249 | 3,831,724 |
| Alphatec Holdings, Inc. * | 79,985 | 550,297 |
| Amedisys, Inc. * | 66,493 | 8,545,680 |
| American Renal Associates Holdings, Inc. * | 38,180 | 317,658 |
| AMN Healthcare Services, Inc. * | 97,765 | 5,744,671 |
| AngioDynamics, Inc. * | 76,598 | 1,171,949 |
| Antares Pharma, Inc. * | 344,869 | 1,158,760 |
| Apollo Medical Holdings, Inc. *(a) | 13,284 | 198,861 |
| Apyx Medical Corp. * | 69,304 | 457,406 |
| AtriCure, Inc. * | 78,774 | 2,094,601 |
| Atrion Corp. | 3,023 | 2,549,689 |
| Avalon GloboCare Corp. *(a) | 44,971 | 65,658 |
| Avanos Medical, Inc. * | 100,513 | 4,426,593 |
| Avedro, Inc. * | 16,346 | 379,881 |
| AxoGen, Inc. * | 72,550 | 902,159 |
| Axonics Modulation Technologies, Inc. * | 33,220 | 821,198 |
| BioLife Solutions, Inc. * | 14,196 | 241,474 |
| BioSig Technologies, Inc. *(a) | 32,972 | 218,604 |
| BioTelemetry, Inc. * | 69,961 | 2,753,665 |
| Brookdale Senior Living, Inc. * | 392,637 | 2,885,882 |
| Cardiovascular Systems, Inc. * | 72,597 | 3,232,018 |
| Castlight Health, Inc., Class B * | 209,420 | 316,224 |
| Catasys, Inc. *(a) | 14,702 | 229,498 |
| Cerus Corp. * | 294,699 | 1,281,941 |
| Community Health Systems, Inc. * | 181,990 | 644,245 |
| Computer Programs & Systems, Inc. | 26,413 | 609,348 |
| ConforMIS, Inc. * | 132,984 | 253,999 |
| CONMED Corp. | 57,802 | 6,359,376 |
| CorVel Corp. * | 19,160 | 1,515,939 |
| Cross Country Healthcare, Inc. * | 77,572 | 838,553 |
| CryoLife, Inc. * | 77,041 | 1,729,570 |
| CryoPort, Inc. * | 65,955 | 925,349 |
| Cutera, Inc. * | 29,537 | 930,415 |
| CytoSorbents Corp. * | 71,062 | 337,544 |
| Diplomat Pharmacy, Inc. * | 124,243 | 675,882 |
| ElectroCore, Inc. *(a) | 24,895 | 39,334 |
| Enzo Biochem, Inc. * | 92,538 | 292,420 |
| Evolent Health, Inc., Class A * | 158,510 | 1,207,846 |
| Genesis Healthcare, Inc. * | 169,619 | 217,112 |
| GenMark Diagnostics, Inc. * | 113,296 | 635,591 |
| Glaukos Corp. * | 76,583 | 4,888,293 |
| Globus Medical, Inc., Class A * | 161,243 | 8,444,296 |
| Haemonetics Corp. * | 108,619 | 13,113,572 |
| Hanger, Inc. * | 77,141 | 1,744,158 |
| Health Catalyst, Inc. * | 17,018 | 547,299 |
| HealthEquity, Inc. * | 146,953 | 8,345,461 |
| HealthStream, Inc. * | 55,349 | 1,553,093 |
| Heska Corp. * | 14,834 | 1,201,851 |
| HMS Holdings Corp. * | 184,241 | 6,022,838 |
| Inogen, Inc. * | 38,789 | 2,111,479 |
| Inovalon Holdings, Inc., Class A * | 150,146 | 2,346,782 |
| Security | Number
of Shares | Value ($) |
| Inspire Medical Systems, Inc. * | 28,280 | 1,724,514 |
| Integer Holdings Corp. * | 68,783 | 5,326,556 |
| IntriCon Corp. * | 17,104 | 353,711 |
| Invacare Corp. | 70,019 | 540,547 |
| iRadimed Corp. * | 9,166 | 231,442 |
| iRhythm Technologies, Inc. * | 52,221 | 3,489,407 |
| Lantheus Holdings, Inc. * | 80,967 | 1,688,162 |
| LeMaitre Vascular, Inc. | 34,681 | 1,199,963 |
| LHC Group, Inc. * | 63,885 | 7,089,318 |
| LivaNova plc * | 103,088 | 7,291,414 |
| Livongo Health, Inc. *(a) | 30,356 | 655,386 |
| Magellan Health, Inc. * | 46,394 | 3,010,971 |
| Meridian Bioscience, Inc. | 90,045 | 881,541 |
| Merit Medical Systems, Inc. * | 113,853 | 2,351,634 |
| Mesa Laboratories, Inc. | 8,149 | 1,855,935 |
| Misonix, Inc. * | 15,299 | 265,438 |
| National HealthCare Corp. | 25,805 | 2,120,655 |
| National Research Corp., Class A | 25,535 | 1,466,475 |
| Natus Medical, Inc. * | 71,340 | 2,402,731 |
| Neogen Corp. * | 108,827 | 7,080,285 |
| Neuronetics, Inc. * | 28,082 | 250,211 |
| Nevro Corp. * | 63,226 | 5,450,081 |
| NextGen Healthcare, Inc. * | 116,512 | 1,969,635 |
| Novocure Ltd. * | 184,229 | 13,198,166 |
| NuVasive, Inc. * | 110,179 | 7,772,027 |
| Omnicell, Inc. * | 87,689 | 6,172,429 |
| OptimizeRx Corp. * | 28,965 | 376,545 |
| Option Care Health, Inc. * | 263,816 | 933,909 |
| OraSure Technologies, Inc. * | 131,567 | 1,123,582 |
| Orthofix Medical, Inc. * | 38,274 | 1,608,656 |
| OrthoPediatrics Corp. * | 18,930 | 732,212 |
| Owens & Minor, Inc. | 131,780 | 886,879 |
| Patterson Cos., Inc. | 176,655 | 3,026,100 |
| Pennant Group, Inc. * | 52,893 | 951,545 |
| PetIQ, Inc. * | 41,199 | 1,018,439 |
| Phreesia, Inc. * | 21,460 | 635,860 |
| Pulse Biosciences, Inc. *(a) | 23,993 | 337,821 |
| Quidel Corp. * | 75,209 | 4,279,392 |
| R1 RCM, Inc. * | 221,209 | 2,351,452 |
| RadNet, Inc. * | 89,407 | 1,396,537 |
| Rockwell Medical, Inc. *(a) | 129,859 | 286,988 |
| RTI Surgical Holdings, Inc. * | 118,940 | 261,668 |
| SeaSpine Holdings Corp. * | 32,977 | 456,402 |
| Select Medical Holdings Corp. * | 233,639 | 4,256,903 |
| Senseonics Holdings, Inc. *(a) | 257,655 | 301,456 |
| Shockwave Medical, Inc. *(a) | 13,764 | 468,251 |
| SI-BONE, Inc. * | 33,436 | 556,709 |
| Sientra, Inc. * | 80,851 | 519,872 |
| Silk Road Medical, Inc. * | 24,522 | 812,169 |
| Simulations Plus, Inc. | 25,629 | 907,523 |
| Soliton, Inc. *(a) | 11,097 | 123,399 |
| STAAR Surgical Co. * | 93,864 | 3,076,862 |
| Surgery Partners, Inc. * | 50,012 | 397,595 |
| Surmodics, Inc. * | 27,903 | 1,325,672 |
| Tabula Rasa HealthCare, Inc. * | 41,335 | 2,105,605 |
| Tactile Systems Technology, Inc. * | 38,498 | 1,748,579 |
| Tandem Diabetes Care, Inc. * | 118,942 | 7,324,448 |
| Teladoc Health, Inc. * | 151,597 | 11,612,330 |
| Tenet Healthcare Corp. * | 218,293 | 5,531,545 |
| The Ensign Group, Inc. | 107,083 | 4,524,257 |
| The Joint Corp. * | 27,194 | 518,590 |
| The Providence Service Corp. * | 24,750 | 1,580,782 |
| Tivity Health, Inc. * | 100,960 | 1,636,562 |
| TransEnterix, Inc. * | 383,079 | 87,419 |
| TransMedics Group, Inc. *(a) | 13,918 | 249,689 |
| Triple-S Management Corp., Class B * | 48,175 | 728,888 |
| U.S. Physical Therapy, Inc. | 26,676 | 3,773,854 |
| Utah Medical Products, Inc. | 7,347 | 752,847 |
Schwab Equity Index Funds | Annual Report
Schwab Small-Cap Index Fund
Portfolio Holdings as of October 31, 2019 (continued)
| Security | Number
of Shares | Value ($) |
| Vapotherm, Inc. * | 30,839 | 317,642 |
| Varex Imaging Corp. * | 79,855 | 2,396,449 |
| ViewRay, Inc. * | 147,739 | 384,121 |
| Vocera Communications, Inc. * | 66,621 | 1,327,090 |
| Wright Medical Group N.V. * | 267,114 | 5,555,971 |
| Zynex, Inc.(a) | 32,411 | 299,478 |
| | | 285,972,134 |
| |
| Household & Personal Products 0.5% |
| Central Garden & Pet Co. * | 22,370 | 671,547 |
| Central Garden & Pet Co., Class A * | 88,428 | 2,500,744 |
| Edgewell Personal Care Co. * | 114,944 | 4,023,040 |
| elf Beauty, Inc. * | 56,037 | 941,422 |
| Inter Parfums, Inc. | 37,446 | 2,899,444 |
| Lifevantage Corp. * | 29,117 | 394,826 |
| Medifast, Inc. | 23,936 | 2,655,460 |
| Nature's Sunshine Products, Inc. * | 18,214 | 171,940 |
| Oil-Dri Corp. of America | 10,781 | 377,443 |
| Revlon, Inc., Class A *(a) | 14,442 | 379,680 |
| USANA Health Sciences, Inc. * | 27,356 | 2,027,353 |
| WD-40 Co. | 29,152 | 5,463,085 |
| Youngevity International, Inc. *(a) | 17,188 | 80,268 |
| | | 22,586,252 |
| |
| Insurance 2.3% |
| Ambac Financial Group, Inc. * | 95,722 | 1,962,301 |
| American Equity Investment Life Holding Co. | 191,446 | 4,724,887 |
| AMERISAFE, Inc. | 40,695 | 2,585,353 |
| Argo Group International Holdings Ltd. | 69,015 | 4,269,958 |
| Citizens, Inc. * | 107,297 | 714,598 |
| CNO Financial Group, Inc. | 329,642 | 5,158,897 |
| Crawford & Co., Class A | 34,321 | 363,459 |
| Donegal Group, Inc., Class A | 21,314 | 313,742 |
| eHealth, Inc. * | 47,520 | 3,280,781 |
| Employers Holdings, Inc. | 67,143 | 2,842,835 |
| Enstar Group Ltd. * | 24,423 | 4,906,581 |
| FBL Financial Group, Inc., Class A | 20,302 | 1,164,929 |
| FedNat Holding Co. | 24,276 | 348,361 |
| Genworth Financial, Inc., Class A * | 1,070,230 | 4,580,584 |
| Global Indemnity Ltd. | 17,474 | 432,656 |
| Goosehead Insurance, Inc., Class A | 24,414 | 1,249,509 |
| Greenlight Capital Re Ltd., Class A * | 61,932 | 668,866 |
| Hallmark Financial Services, Inc. * | 28,193 | 502,399 |
| HCI Group, Inc. | 13,090 | 550,434 |
| Health Insurance Innovations, Inc., Class A *(a) | 20,354 | 538,974 |
| Heritage Insurance Holdings, Inc. | 57,235 | 762,370 |
| Horace Mann Educators Corp. | 87,641 | 3,817,642 |
| Independence Holding Co. | 10,284 | 402,104 |
| Investors Title Co. | 3,028 | 459,348 |
| James River Group Holdings Ltd. | 63,062 | 2,258,250 |
| Kinsale Capital Group, Inc. | 43,229 | 4,570,170 |
| MBIA, Inc. * | 169,152 | 1,571,422 |
| National General Holdings Corp. | 143,907 | 3,068,097 |
| National Western Life Group, Inc., Class A | 4,876 | 1,329,198 |
| NI Holdings, Inc. * | 20,281 | 354,917 |
| Palomar Holdings, Inc. * | 12,517 | 565,143 |
| ProAssurance Corp. | 112,833 | 4,425,310 |
| ProSight Global, Inc. * | 19,079 | 302,593 |
| Protective Insurance Corp., Class B | 19,116 | 304,136 |
| RLI Corp. | 84,555 | 8,228,893 |
| Safety Insurance Group, Inc. | 31,409 | 3,052,955 |
| Selective Insurance Group, Inc. | 124,058 | 8,574,889 |
| State Auto Financial Corp. | 36,606 | 1,211,293 |
| Stewart Information Services Corp. | 49,590 | 2,029,223 |
| Security | Number
of Shares | Value ($) |
| Third Point Reinsurance Ltd. * | 157,941 | 1,498,860 |
| Tiptree, Inc. | 53,210 | 391,093 |
| Trupanion, Inc. *(a) | 60,386 | 1,431,148 |
| United Fire Group, Inc. | 44,744 | 2,036,747 |
| United Insurance Holdings Corp. | 42,821 | 524,985 |
| Universal Insurance Holdings, Inc. | 64,847 | 1,758,002 |
| Watford Holdings Ltd. * | 43,167 | 1,162,919 |
| | | 97,251,811 |
| |
| Materials 3.8% |
| Advanced Emissions Solutions, Inc. | 34,544 | 477,744 |
| AdvanSix, Inc. * | 59,527 | 1,354,835 |
| AK Steel Holding Corp. * | 669,624 | 1,580,313 |
| Allegheny Technologies, Inc. * | 266,289 | 5,594,732 |
| American Vanguard Corp. | 62,012 | 866,928 |
| Amyris, Inc. *(a) | 77,549 | 257,075 |
| Balchem Corp. | 68,221 | 6,904,647 |
| Boise Cascade Co. | 82,093 | 2,936,467 |
| Carpenter Technology Corp. | 100,056 | 4,904,745 |
| Century Aluminum Co. * | 104,464 | 609,025 |
| Chase Corp. | 15,521 | 1,818,285 |
| Clearwater Paper Corp. * | 33,680 | 624,427 |
| Cleveland-Cliffs, Inc.(a) | 569,777 | 4,119,488 |
| Coeur Mining, Inc. * | 465,707 | 2,570,703 |
| Commercial Metals Co. | 250,425 | 4,840,715 |
| Compass Minerals International, Inc. | 72,136 | 4,074,241 |
| Ferro Corp. * | 173,546 | 1,931,567 |
| Ferroglobe Representation & Warranty Insurance *(b) | 108,500 | — |
| Flotek Industries, Inc. * | 110,660 | 211,361 |
| Forterra, Inc. * | 40,593 | 333,269 |
| FutureFuel Corp. | 55,522 | 684,586 |
| GCP Applied Technologies, Inc. * | 114,465 | 2,364,847 |
| Gold Resource Corp. | 127,527 | 558,568 |
| Greif, Inc., Class A | 54,582 | 2,137,977 |
| Greif, Inc., Class B | 12,762 | 600,197 |
| H.B. Fuller Co. | 107,680 | 5,254,784 |
| Hawkins, Inc. | 20,878 | 892,534 |
| Haynes International, Inc. | 26,521 | 913,914 |
| Hecla Mining Co. | 1,018,443 | 2,342,419 |
| Ingevity Corp. * | 88,966 | 7,491,827 |
| Innophos Holdings, Inc. | 41,804 | 1,363,646 |
| Innospec, Inc. | 51,420 | 4,697,731 |
| Intrepid Potash, Inc. * | 204,632 | 632,313 |
| Kaiser Aluminum Corp. | 34,009 | 3,641,684 |
| Koppers Holdings, Inc. * | 40,129 | 1,288,141 |
| Kraton Corp. * | 66,239 | 1,485,078 |
| Kronos Worldwide, Inc. | 48,778 | 618,505 |
| Livent Corp. * | 310,728 | 2,131,594 |
| Louisiana-Pacific Corp. | 263,286 | 7,695,850 |
| LSB Industries, Inc. * | 49,037 | 207,427 |
| Marrone Bio Innovations, Inc. * | 101,700 | 134,244 |
| Materion Corp. | 42,831 | 2,434,514 |
| Mayville Engineering Co., Inc. * | 13,093 | 111,945 |
| Minerals Technologies, Inc. | 74,752 | 3,696,486 |
| Myers Industries, Inc. | 75,411 | 1,276,708 |
| Neenah, Inc. | 35,437 | 2,285,686 |
| Novagold Resources, Inc. * | 492,195 | 3,583,180 |
| Olympic Steel, Inc. | 19,559 | 292,994 |
| OMNOVA Solutions, Inc. * | 92,449 | 934,659 |
| Orion Engineered Carbons S.A. | 127,700 | 2,114,712 |
| P.H. Glatfelter Co. | 92,671 | 1,668,078 |
| PolyOne Corp. | 162,684 | 5,214,022 |
| PQ Group Holdings, Inc. * | 80,531 | 1,326,346 |
| Quaker Chemical Corp. | 27,823 | 4,253,580 |
| Ramaco Resources, Inc. * | 16,927 | 60,091 |
| Rayonier Advanced Materials, Inc. | 103,218 | 430,419 |
Schwab Equity Index Funds | Annual Report
Schwab Small-Cap Index Fund
Portfolio Holdings as of October 31, 2019 (continued)
| Security | Number
of Shares | Value ($) |
| Ryerson Holding Corp. * | 34,841 | 302,768 |
| Schnitzer Steel Industries, Inc., Class A | 54,785 | 1,169,112 |
| Schweitzer-Mauduit International, Inc. | 65,266 | 2,642,620 |
| Sensient Technologies Corp. | 89,692 | 5,611,132 |
| Stepan Co. | 43,353 | 4,236,455 |
| Summit Materials, Inc., Class A * | 237,993 | 5,457,179 |
| SunCoke Energy, Inc. * | 160,709 | 850,151 |
| Synalloy Corp. | 18,134 | 283,978 |
| TimkenSteel Corp. * | 83,916 | 471,608 |
| Trecora Resources * | 46,660 | 409,208 |
| Tredegar Corp. | 55,676 | 1,106,839 |
| Trinseo S.A. | 85,584 | 3,637,320 |
| Tronox Holdings plc, Class A * | 194,195 | 1,648,716 |
| UFP Technologies, Inc. * | 14,282 | 594,274 |
| United States Lime & Minerals, Inc. | 4,197 | 371,434 |
| US Concrete, Inc. * | 33,957 | 1,774,593 |
| Valhi, Inc. | 60,161 | 113,704 |
| Verso Corp., Class A * | 75,141 | 1,100,064 |
| Warrior Met Coal, Inc. | 109,159 | 2,126,417 |
| Worthington Industries, Inc. | 81,853 | 3,013,009 |
| | | 159,752,434 |
| |
| Media & Entertainment 1.7% |
| AMC Entertainment Holdings, Inc., Class A(a) | 110,314 | 1,033,642 |
| Boston Omaha Corp., Class A * | 22,036 | 494,929 |
| Cardlytics, Inc. * | 29,013 | 1,215,935 |
| Care.com, Inc. * | 44,863 | 524,000 |
| Cargurus, Inc. * | 157,157 | 5,278,904 |
| Cars.com, Inc. * | 141,413 | 1,599,381 |
| Central European Media Enterprises Ltd., Class A * | 185,189 | 830,573 |
| Clear Channel Outdoor Holdings, Inc. * | 102,841 | 239,620 |
| comScore, Inc. * | 101,829 | 235,225 |
| Cumulus Media, Inc., Class A * | 31,328 | 428,880 |
| Daily Journal Corp. *(a) | 2,347 | 659,530 |
| DHI Group, Inc. * | 106,368 | 385,052 |
| Emerald Expositions Events, Inc. | 51,158 | 497,256 |
| Entercom Communications Corp., Class A | 269,157 | 936,666 |
| Entravision Communications Corp., Class A | 133,374 | 378,782 |
| Eros International plc *(a) | 153,042 | 342,814 |
| Eventbrite, Inc., Class A * | 77,711 | 1,397,244 |
| EverQuote, Inc., Class A * | 18,763 | 380,889 |
| Fluent, Inc. * | 88,752 | 206,792 |
| Gaia, Inc. *(a) | 22,400 | 155,232 |
| Gannett Co., Inc. | 223,994 | 2,430,335 |
| Glu Mobile, Inc. * | 245,578 | 1,456,278 |
| Gray Television, Inc. * | 192,564 | 3,159,975 |
| Hemisphere Media Group, Inc. * | 35,700 | 460,887 |
| IMAX Corp. * | 111,022 | 2,370,320 |
| Lee Enterprises, Inc. * | 111,206 | 201,283 |
| Liberty Latin America Ltd., Class A * | 98,685 | 1,844,423 |
| Liberty Latin America Ltd., Class C * | 240,461 | 4,426,887 |
| Liberty Media Corp. - Liberty Braves, Class A * | 20,631 | 609,027 |
| Liberty Media Corp. - Liberty Braves, Class C * | 76,852 | 2,260,217 |
| Liberty TripAdvisor Holdings, Inc., Class A * | 155,657 | 1,502,090 |
| LiveXLive Media, Inc. *(a) | 73,289 | 124,591 |
| Loral Space & Communications, Inc. * | 27,486 | 1,099,165 |
| Marchex, Inc., Class B * | 80,968 | 268,004 |
| MDC Partners, Inc., Class A * | 115,975 | 363,002 |
| Meredith Corp. | 84,255 | 3,176,413 |
| MSG Networks, Inc., Class A * | 123,919 | 2,008,727 |
| Security | Number
of Shares | Value ($) |
| National CineMedia, Inc. | 133,292 | 1,118,986 |
| New Media Investment Group, Inc. | 128,175 | 1,129,222 |
| QuinStreet, Inc. * | 96,494 | 1,238,018 |
| Reading International, Inc., Class A * | 35,745 | 406,421 |
| Rosetta Stone, Inc. * | 44,060 | 844,190 |
| Saga Communications, Inc., Class A | 7,830 | 236,231 |
| Scholastic Corp. | 62,538 | 2,407,713 |
| TechTarget, Inc. * | 48,501 | 1,183,424 |
| TEGNA, Inc. | 461,527 | 6,936,751 |
| The E.W. Scripps Co., Class A | 116,561 | 1,565,997 |
| The Marcus Corp. | 47,625 | 1,719,262 |
| The Meet Group, Inc. * | 153,507 | 653,940 |
| Travelzoo * | 11,052 | 111,846 |
| Tribune Publishing Co. | 35,823 | 320,974 |
| TrueCar, Inc. * | 223,986 | 734,674 |
| WideOpenWest, Inc. * | 51,725 | 328,454 |
| Yelp, Inc. * | 146,846 | 5,067,655 |
| | | 70,986,728 |
| |
| Pharmaceuticals, Biotechnology & Life Sciences 9.6% |
| Abeona Therapeutics, Inc. * | 69,313 | 164,272 |
| ACADIA Pharmaceuticals, Inc. * | 223,542 | 9,480,416 |
| Accelerate Diagnostics, Inc. *(a) | 58,156 | 895,602 |
| Acceleron Pharma, Inc. * | 95,494 | 4,284,816 |
| AcelRx Pharmaceuticals, Inc. *(a) | 163,045 | 326,090 |
| Acer Therapeutics, Inc. *(a) | 10,439 | 32,674 |
| Achillion Pharmaceuticals, Inc. * | 290,363 | 1,861,227 |
| Aclaris Therapeutics, Inc. *(a) | 64,197 | 112,345 |
| Acorda Therapeutics, Inc. * | 93,321 | 153,980 |
| Adamas Pharmaceuticals, Inc. * | 46,928 | 192,874 |
| ADMA Biologics, Inc. * | 105,534 | 516,061 |
| Aduro Biotech, Inc. * | 130,400 | 148,656 |
| Adverum Biotechnologies, Inc. * | 116,013 | 843,415 |
| Aeglea BioTherapeutics, Inc. * | 54,376 | 413,801 |
| Aerie Pharmaceuticals, Inc. * | 89,800 | 1,992,662 |
| Affimed N.V. * | 125,393 | 368,655 |
| Agenus, Inc. * | 226,026 | 585,407 |
| AgeX Therapeutics, Inc. * | 44,218 | 68,980 |
| Aimmune Therapeutics, Inc. * | 94,080 | 2,617,306 |
| Akcea Therapeutics, Inc. *(a) | 26,867 | 492,472 |
| Akebia Therapeutics, Inc. * | 252,019 | 940,031 |
| Akero Therapeutics, Inc. * | 10,101 | 234,444 |
| Akorn, Inc. * | 199,632 | 996,164 |
| Albireo Pharma, Inc. * | 22,884 | 420,379 |
| Aldeyra Therapeutics, Inc. * | 46,894 | 262,137 |
| Alector, Inc. * | 64,978 | 1,094,230 |
| Allakos, Inc. * | 41,392 | 2,839,491 |
| Allogene Therapeutics, Inc. *(a) | 81,986 | 2,361,197 |
| AMAG Pharmaceuticals, Inc. *(a) | 70,329 | 682,543 |
| Amicus Therapeutics, Inc. * | 541,376 | 4,563,800 |
| Amneal Pharmaceuticals, Inc. * | 194,976 | 600,526 |
| Amphastar Pharmaceuticals, Inc. * | 76,441 | 1,476,458 |
| AnaptysBio, Inc. * | 52,159 | 1,967,437 |
| Anavex Life Sciences Corp. *(a) | 90,347 | 245,744 |
| ANI Pharmaceuticals, Inc. * | 19,422 | 1,517,052 |
| Anika Therapeutics, Inc. * | 28,532 | 2,008,367 |
| Apellis Pharmaceuticals, Inc. * | 102,166 | 3,002,659 |
| Applied Therapeutics, Inc. * | 4,216 | 69,606 |
| Arcus Biosciences, Inc. * | 68,138 | 534,883 |
| Ardelyx, Inc. * | 100,424 | 502,120 |
| Arena Pharmaceuticals, Inc. * | 106,146 | 5,170,902 |
| ArQule, Inc. * | 237,796 | 2,404,118 |
| Arrowhead Pharmaceuticals, Inc. * | 198,156 | 7,936,148 |
| Arvinas Holding Co. LLC * | 38,428 | 793,922 |
| Assembly Biosciences, Inc. * | 48,697 | 803,987 |
| Assertio Therapeutics, Inc. * | 134,103 | 105,955 |
| Atara Biotherapeutics, Inc. * | 110,642 | 1,208,211 |
Schwab Equity Index Funds | Annual Report
Schwab Small-Cap Index Fund
Portfolio Holdings as of October 31, 2019 (continued)
| Security | Number
of Shares | Value ($) |
| Athenex, Inc. * | 145,484 | 1,606,143 |
| Athersys, Inc. * | 299,043 | 382,775 |
| Atreca, Inc. Class A * | 13,743 | 154,609 |
| Audentes Therapeutics, Inc. * | 95,285 | 2,563,166 |
| Avid Bioservices, Inc. * | 116,553 | 623,559 |
| Avrobio, Inc. * | 43,112 | 625,986 |
| Axcella Health, Inc. * | 3,346 | 17,700 |
| Axsome Therapeutics, Inc. * | 52,761 | 1,270,485 |
| Beyondspring, Inc. *(a) | 25,149 | 297,513 |
| BioCryst Pharmaceuticals, Inc. * | 229,124 | 458,248 |
| BioDelivery Sciences International, Inc. * | 175,162 | 1,012,436 |
| Biohaven Pharmaceutical Holding Co., Ltd. * | 83,131 | 3,817,376 |
| BioSpecifics Technologies Corp. * | 12,760 | 617,967 |
| Bioxcel Therapeutics, Inc. * | 12,536 | 52,150 |
| Blueprint Medicines Corp. * | 103,380 | 7,116,679 |
| Bridgebio Pharma, Inc. * | 47,295 | 1,069,340 |
| Calithera Biosciences, Inc. * | 99,321 | 286,044 |
| Calyxt, Inc. * | 19,347 | 88,609 |
| Cambrex Corp. * | 71,364 | 4,262,572 |
| Cara Therapeutics, Inc. * | 84,958 | 1,763,728 |
| CareDx, Inc. * | 87,121 | 2,283,441 |
| CASI Pharmaceuticals, Inc. *(a) | 105,221 | 345,125 |
| Castle Biosciences, Inc. * | 7,797 | 183,541 |
| Catalyst Pharmaceuticals, Inc. * | 205,684 | 972,885 |
| cbdMD, Inc. *(a) | 19,647 | 69,157 |
| CEL-SCI Corp. *(a) | 57,982 | 397,757 |
| Celcuity, Inc. * | 12,209 | 192,292 |
| Cellular Biomedicine Group, Inc. * | 25,626 | 468,700 |
| Cerecor, Inc. *(a) | 44,615 | 153,476 |
| Checkpoint Therapeutics, Inc. * | 47,968 | 93,538 |
| ChemoCentryx, Inc. * | 88,249 | 758,941 |
| Chiasma, Inc. * | 71,847 | 376,478 |
| Chimerix, Inc. * | 99,789 | 142,698 |
| ChromaDex Corp. *(a) | 84,574 | 244,419 |
| Clovis Oncology, Inc. *(a) | 106,268 | 336,870 |
| Codexis, Inc. * | 112,114 | 1,515,781 |
| Coherus Biosciences, Inc. * | 130,806 | 2,272,100 |
| Collegium Pharmaceutical, Inc. * | 69,076 | 828,912 |
| Concert Pharmaceuticals, Inc. * | 44,328 | 276,163 |
| Constellation Pharmaceuticals, Inc. * | 32,312 | 446,229 |
| Corbus Pharmaceuticals Holdings, Inc. *(a) | 123,552 | 638,764 |
| Corcept Therapeutics, Inc. * | 202,224 | 2,950,448 |
| CorMedix, Inc. *(a) | 49,061 | 273,760 |
| Cortexyme, Inc. *(a) | 6,003 | 124,682 |
| Crinetics Pharmaceuticals, Inc. * | 22,965 | 404,414 |
| Cue Biopharma, Inc. * | 41,735 | 358,086 |
| Cyclerion Therapeutics, Inc. * | 49,126 | 117,411 |
| Cymabay Therapeutics, Inc. * | 143,397 | 643,853 |
| Cytokinetics, Inc. * | 118,701 | 1,382,867 |
| CytomX Therapeutics, Inc. * | 93,818 | 575,104 |
| Deciphera Pharmaceuticals, Inc. * | 40,379 | 1,790,405 |
| Denali Therapeutics, Inc. * | 101,797 | 1,595,159 |
| Dermira, Inc. * | 99,866 | 668,104 |
| Dicerna Pharmaceuticals, Inc. * | 110,342 | 1,819,540 |
| Dova Pharmaceuticals, Inc. * | 17,923 | 510,985 |
| Dynavax Technologies Corp. *(a) | 174,665 | 889,045 |
| Eagle Pharmaceuticals, Inc. * | 19,501 | 1,222,713 |
| Editas Medicine, Inc. * | 105,325 | 2,194,973 |
| Eidos Therapeutics, Inc. *(a) | 23,595 | 1,144,357 |
| Eiger BioPharmaceuticals, Inc. * | 48,760 | 531,484 |
| Eloxx Pharmaceuticals, Inc. * | 53,030 | 322,953 |
| Emergent BioSolutions, Inc. * | 96,910 | 5,539,376 |
| Enanta Pharmaceuticals, Inc. * | 36,352 | 2,213,110 |
| Endo International plc * | 477,250 | 2,190,577 |
| Enochian Biosciences, Inc. *(a) | 8,080 | 46,056 |
| Epizyme, Inc. * | 164,416 | 1,892,428 |
| Security | Number
of Shares | Value ($) |
| Esperion Therapeutics, Inc. * | 53,106 | 2,112,026 |
| Evelo Biosciences, Inc. * | 29,924 | 195,404 |
| Evofem Biosciences, Inc. * | 29,423 | 149,763 |
| Evolus, Inc. *(a) | 31,665 | 505,057 |
| EyePoint Pharmaceuticals, Inc. * | 128,809 | 291,108 |
| Fate Therapeutics, Inc. * | 111,550 | 1,667,672 |
| FibroGen, Inc. * | 165,062 | 6,462,177 |
| Five Prime Therapeutics, Inc. * | 81,037 | 320,096 |
| Flexion Therapeutics, Inc. * | 72,443 | 1,243,846 |
| Fluidigm Corp. * | 146,403 | 720,303 |
| Forty Seven, Inc. * | 46,680 | 322,559 |
| Fulcrum Therapeutics, Inc. * | 9,718 | 60,932 |
| G1 Therapeutics, Inc. * | 71,908 | 1,525,888 |
| Galectin Therapeutics, Inc. * | 84,431 | 336,035 |
| Genomic Health, Inc. * | 57,326 | 3,822,498 |
| Geron Corp. *(a) | 364,657 | 521,460 |
| Global Blood Therapeutics, Inc. * | 122,659 | 5,881,499 |
| GlycoMimetics, Inc. * | 70,362 | 371,511 |
| Gossamer Bio, Inc. * | 91,267 | 1,877,819 |
| Gritstone Oncology, Inc. * | 51,856 | 420,552 |
| Halozyme Therapeutics, Inc. * | 302,605 | 4,635,909 |
| Harpoon Therapeutics, Inc. * | 15,304 | 203,543 |
| Heron Therapeutics, Inc. * | 156,162 | 3,318,442 |
| Homology Medicines, Inc. * | 51,903 | 681,486 |
| Hookipa Pharma, Inc. * | 4,287 | 35,068 |
| ImmunoGen, Inc. * | 304,232 | 724,072 |
| Immunomedics, Inc. * | 371,902 | 5,950,432 |
| Innoviva, Inc. * | 135,484 | 1,574,324 |
| Inovio Pharmaceuticals, Inc. *(a) | 190,916 | 406,651 |
| Insmed, Inc. * | 188,201 | 3,498,657 |
| Intellia Therapeutics, Inc. * | 81,117 | 1,012,746 |
| Intercept Pharmaceuticals, Inc. * | 53,182 | 3,870,586 |
| Intersect ENT, Inc. * | 65,602 | 1,169,028 |
| Intra-Cellular Therapies, Inc. * | 93,138 | 861,527 |
| Intrexon Corp. *(a) | 151,066 | 767,415 |
| Invitae Corp. * | 182,924 | 2,946,906 |
| Iovance Biotherapeutics, Inc. * | 242,802 | 5,130,406 |
| Ironwood Pharmaceuticals, Inc. * | 324,937 | 3,262,367 |
| Jounce Therapeutics, Inc. * | 31,400 | 113,511 |
| Kadmon Holdings, Inc. * | 280,835 | 811,613 |
| Kala Pharmaceuticals, Inc. *(a) | 45,405 | 164,820 |
| Kaleido Biosciences, Inc. *(a) | 10,461 | 61,301 |
| KalVista Pharmaceuticals, Inc. * | 24,293 | 257,506 |
| Karuna Therapeutics, Inc. * | 9,680 | 134,746 |
| Karyopharm Therapeutics, Inc. * | 125,474 | 1,468,046 |
| Kezar Life Sciences, Inc. * | 32,337 | 105,095 |
| Kindred Biosciences, Inc. * | 80,781 | 659,981 |
| Kiniksa Pharmaceuticals Ltd., Class A * | 29,404 | 207,298 |
| Kodiak Sciences, Inc. * | 50,344 | 1,042,624 |
| Krystal Biotech, Inc. * | 21,955 | 901,692 |
| Kura Oncology, Inc. * | 71,957 | 1,077,916 |
| La Jolla Pharmaceutical Co. * | 44,342 | 311,059 |
| Lannett Co., Inc. * | 67,893 | 807,248 |
| Lexicon Pharmaceuticals, Inc. *(a) | 85,580 | 317,502 |
| Ligand Pharmaceuticals, Inc. * | 39,361 | 4,282,870 |
| Lineage Cell Therapeutics, Inc. * | 233,687 | 182,276 |
| Liquidia Technologies, Inc. * | 27,919 | 122,285 |
| LogicBio Therapeutics, Inc. * | 18,169 | 180,782 |
| Luminex Corp. | 89,071 | 1,825,510 |
| MacroGenics, Inc. * | 99,854 | 848,759 |
| Madrigal Pharmaceuticals, Inc. * | 16,708 | 1,544,320 |
| Magenta Therapeutics, Inc. * | 40,522 | 421,834 |
| Mallinckrodt plc *(a) | 174,898 | 552,678 |
| MannKind Corp. *(a) | 390,146 | 509,141 |
| Marinus Pharmaceuticals, Inc. * | 104,440 | 122,195 |
| Marker Therapeutics, Inc. *(a) | 56,393 | 216,549 |
| MediciNova, Inc. *(a) | 85,672 | 690,516 |
| Medpace Holdings, Inc. * | 58,616 | 4,315,896 |
Schwab Equity Index Funds | Annual Report
Schwab Small-Cap Index Fund
Portfolio Holdings as of October 31, 2019 (continued)
| Security | Number
of Shares | Value ($) |
| MEI Pharma, Inc. * | 141,679 | 256,439 |
| MeiraGTx Holdings plc * | 35,860 | 518,177 |
| Menlo Therapeutics, Inc. * | 32,171 | 163,107 |
| Mersana Therapeutics, Inc. * | 74,695 | 140,427 |
| Millendo Therapeutics, Inc. * | 19,511 | 140,674 |
| Minerva Neurosciences, Inc. * | 61,339 | 290,747 |
| Mirati Therapeutics, Inc. * | 57,651 | 5,429,571 |
| Mirum Pharmaceuticals, Inc. * | 5,831 | 41,867 |
| Molecular Templates, Inc. * | 35,404 | 299,518 |
| Momenta Pharmaceuticals, Inc. * | 208,569 | 3,228,648 |
| Morphic Holding, Inc. * | 10,420 | 145,880 |
| Mustang Bio, Inc. * | 57,935 | 153,528 |
| MyoKardia, Inc. * | 94,463 | 5,415,564 |
| Myriad Genetics, Inc. * | 148,910 | 5,013,800 |
| NanoString Technologies, Inc. * | 71,020 | 1,605,052 |
| Natera, Inc. * | 118,822 | 4,577,023 |
| NeoGenomics, Inc. * | 202,403 | 4,641,101 |
| Neon Therapeutics, Inc. * | 30,308 | 63,950 |
| NextCure, Inc. * | 5,979 | 149,475 |
| NGM Biopharmaceuticals, Inc. *(a) | 13,964 | 181,113 |
| Novavax, Inc. *(a) | 48,825 | 203,600 |
| Ocular Therapeutix, Inc. *(a) | 87,122 | 282,275 |
| Odonate Therapeutics, Inc. * | 24,559 | 779,994 |
| Omeros Corp. *(a) | 99,265 | 1,572,358 |
| Oncocyte Corp. * | 44,686 | 75,966 |
| OPKO Health, Inc. * | 746,726 | 1,060,351 |
| Optinose, Inc. *(a) | 51,825 | 405,272 |
| Organogenesis Holdings, Inc. * | 21,873 | 153,330 |
| Osmotica Pharmaceuticals plc * | 19,680 | 87,182 |
| Pacific Biosciences of California, Inc. * | 302,301 | 1,463,137 |
| Pacira BioSciences, Inc. * | 85,643 | 3,467,685 |
| Palatin Technologies, Inc. * | 414,510 | 334,924 |
| Paratek Pharmaceuticals, Inc. *(a) | 66,998 | 206,689 |
| PDL BioPharma, Inc. * | 237,639 | 670,142 |
| Personalis, Inc. * | 18,697 | 193,701 |
| Pfenex, Inc. * | 62,759 | 578,638 |
| PhaseBio Pharmaceuticals, Inc. * | 28,558 | 117,373 |
| Phibro Animal Health Corp., Class A | 44,198 | 1,058,984 |
| Pieris Pharmaceuticals, Inc. * | 96,581 | 319,683 |
| PolarityTE, Inc. *(a) | 29,159 | 79,021 |
| Portola Pharmaceuticals, Inc. * | 159,062 | 4,598,482 |
| Precision BioSciences, Inc. * | 19,025 | 123,472 |
| Prestige Consumer Healthcare, Inc. * | 106,659 | 3,782,128 |
| Prevail Therapeutics, Inc. * | 15,662 | 172,595 |
| Principia Biopharma, Inc. * | 28,685 | 1,012,867 |
| Progenics Pharmaceuticals, Inc. * | 182,254 | 967,769 |
| Protagonist Therapeutics, Inc. * | 35,694 | 480,084 |
| Prothena Corp. plc * | 83,804 | 762,616 |
| PTC Therapeutics, Inc. * | 121,952 | 4,986,617 |
| Puma Biotechnology, Inc. * | 63,996 | 435,173 |
| Quanterix Corp. * | 27,233 | 567,808 |
| Ra Pharmaceuticals, Inc. * | 73,652 | 3,466,800 |
| Radius Health, Inc. * | 95,430 | 2,714,029 |
| Reata Pharmaceuticals, Inc., Class A * | 42,638 | 8,786,839 |
| Recro Pharma, Inc. * | 42,103 | 663,964 |
| REGENXBIO, Inc. * | 70,620 | 2,520,428 |
| Repligen Corp. * | 109,489 | 8,703,281 |
| Replimune Group, Inc. * | 24,007 | 408,119 |
| resTORbio, Inc. * | 31,120 | 225,620 |
| Retrophin, Inc. * | 90,233 | 1,082,796 |
| Revance Therapeutics, Inc. * | 94,073 | 1,473,183 |
| Rhythm Pharmaceuticals, Inc. * | 49,281 | 1,050,671 |
| Rigel Pharmaceuticals, Inc. * | 355,043 | 727,838 |
| Rocket Pharmaceuticals, Inc. * | 64,405 | 936,449 |
| Rubius Therapeutics, Inc. *(a) | 75,486 | 667,296 |
| Sangamo Therapeutics, Inc. * | 243,158 | 2,200,580 |
| Savara, Inc. * | 69,319 | 61,146 |
| Scholar Rock Holding Corp. * | 36,840 | 340,770 |
| Security | Number
of Shares | Value ($) |
| Seres Therapeutics, Inc. * | 76,688 | 268,408 |
| SIGA Technologies, Inc. * | 114,561 | 635,814 |
| Solid Biosciences, Inc. *(a) | 41,184 | 455,083 |
| Sorrento Therapeutics, Inc. *(a) | 262,135 | 398,445 |
| Spark Therapeutics, Inc. * | 72,955 | 7,964,497 |
| Spectrum Pharmaceuticals, Inc. * | 237,587 | 1,843,675 |
| Spero Therapeutics, Inc. * | 23,403 | 256,731 |
| Stemline Therapeutics, Inc. * | 93,869 | 938,690 |
| Stoke Therapeutics, Inc. *(a) | 19,215 | 544,553 |
| Strongbridge Biopharma plc * | 75,231 | 159,490 |
| Supernus Pharmaceuticals, Inc. * | 104,557 | 2,905,639 |
| Sutro Biopharma, Inc. * | 22,592 | 226,598 |
| Syndax Pharmaceuticals, Inc. * | 41,829 | 281,091 |
| Syneos Health, Inc. * | 132,068 | 6,623,210 |
| Synlogic, Inc. * | 32,508 | 69,567 |
| Synthorx, Inc. *(a) | 20,110 | 276,311 |
| Syros Pharmaceuticals, Inc. * | 72,087 | 373,050 |
| TCR2 Therapeutics, Inc. * | 24,579 | 305,517 |
| TG Therapeutics, Inc. * | 176,213 | 1,203,535 |
| The Medicines Co. * | 160,336 | 8,416,037 |
| TherapeuticsMD, Inc. *(a) | 417,680 | 1,111,029 |
| Theravance Biopharma, Inc. * | 94,185 | 1,518,262 |
| Tocagen, Inc. * | 45,640 | 28,776 |
| Translate Bio, Inc. * | 61,656 | 563,844 |
| Tricida, Inc. * | 46,474 | 1,738,592 |
| Turning Point Therapeutics, Inc. * | 13,811 | 529,790 |
| Twist Bioscience Corp. * | 46,291 | 1,102,652 |
| Tyme Technologies, Inc. *(a) | 123,263 | 163,940 |
| Ultragenyx Pharmaceutical, Inc. * | 115,525 | 4,637,173 |
| UNITY Biotechnology, Inc. * | 55,498 | 346,308 |
| UroGen Pharma Ltd. * | 39,185 | 886,757 |
| Vanda Pharmaceuticals, Inc. * | 110,924 | 1,498,583 |
| VBI Vaccines, Inc. * | 174,576 | 102,127 |
| Veracyte, Inc. * | 99,518 | 2,281,948 |
| Vericel Corp. * | 94,674 | 1,502,476 |
| Verrica Pharmaceuticals, Inc. * | 26,813 | 362,512 |
| Viking Therapeutics, Inc. *(a) | 140,573 | 909,507 |
| Voyager Therapeutics, Inc. * | 51,929 | 799,187 |
| WaVe Life Sciences Ltd. * | 48,149 | 1,217,688 |
| X4 Pharmaceuticals, Inc. * | 24,886 | 304,854 |
| XBiotech, Inc. *(a) | 39,765 | 432,246 |
| Xencor, Inc. * | 99,908 | 3,417,853 |
| Xeris Pharmaceuticals, Inc. * | 55,482 | 453,843 |
| Y-mAbs Therapeutics, Inc. * | 43,400 | 1,351,910 |
| ZIOPHARM Oncology, Inc. *(a) | 340,214 | 1,435,703 |
| Zogenix, Inc. * | 90,128 | 4,024,215 |
| Zynerba Pharmaceuticals, Inc. *(a) | 47,935 | 371,976 |
| | | 402,620,881 |
| |
| Real Estate 8.3% |
| Acadia Realty Trust | 176,310 | 4,933,154 |
| Agree Realty Corp. | 86,820 | 6,838,811 |
| Alexander & Baldwin, Inc. | 145,020 | 3,409,420 |
| Alexander's, Inc. | 4,522 | 1,561,899 |
| Altisource Portfolio Solutions S.A. * | 13,938 | 248,096 |
| American Assets Trust, Inc. | 102,570 | 5,021,827 |
| American Finance Trust, Inc. | 226,373 | 3,350,320 |
| American Realty Investors, Inc. * | 5,220 | 83,259 |
| Armada Hoffler Properties, Inc. | 111,438 | 2,088,348 |
| Ashford Hospitality Trust, Inc. | 189,530 | 517,417 |
| Bluerock Residential Growth REIT, Inc. | 47,376 | 569,460 |
| Braemar Hotels & Resorts, Inc. | 62,472 | 576,617 |
| BRT Apartments Corp. | 20,757 | 346,642 |
| CareTrust REIT, Inc. | 201,895 | 4,893,935 |
| CatchMark Timber Trust, Inc., Class A | 107,133 | 1,228,815 |
| CBL & Associates Properties, Inc.(a) | 362,360 | 521,798 |
| Cedar Realty Trust, Inc. | 182,555 | 609,734 |
Schwab Equity Index Funds | Annual Report
Schwab Small-Cap Index Fund
Portfolio Holdings as of October 31, 2019 (continued)
| Security | Number
of Shares | Value ($) |
| Chatham Lodging Trust | 97,350 | 1,757,167 |
| CIM Commercial Trust Corp. | 2,770 | 40,303 |
| City Office REIT, Inc. | 81,281 | 1,100,545 |
| Clipper Realty, Inc. | 31,412 | 302,812 |
| Community Healthcare Trust, Inc. | 39,215 | 1,898,790 |
| Consolidated-Tomoka Land Co. | 10,258 | 656,204 |
| CoreCivic, Inc. | 251,734 | 3,841,461 |
| CorEnergy Infrastructure Trust, Inc. | 27,380 | 1,318,895 |
| CorePoint Lodging, Inc. | 83,497 | 822,445 |
| Cushman & Wakefield plc * | 217,455 | 4,055,536 |
| DiamondRock Hospitality Co. | 427,992 | 4,271,360 |
| Easterly Government Properties, Inc. | 166,957 | 3,726,480 |
| EastGroup Properties, Inc. | 78,518 | 10,517,486 |
| Essential Properties Realty Trust, Inc. | 161,722 | 4,149,786 |
| eXp World Holdings, Inc. *(a) | 33,315 | 298,836 |
| Farmland Partners, Inc.(a) | 57,625 | 386,087 |
| First Industrial Realty Trust, Inc. | 266,951 | 11,241,307 |
| Forestar Group, Inc. * | 21,619 | 406,005 |
| Four Corners Property Trust, Inc. | 144,977 | 4,153,591 |
| Franklin Street Properties Corp. | 220,767 | 1,898,596 |
| Front Yard Residential Corp. | 105,938 | 1,310,453 |
| FRP Holdings, Inc. * | 15,230 | 788,609 |
| Getty Realty Corp. | 70,640 | 2,369,266 |
| Gladstone Commercial Corp. | 64,950 | 1,530,222 |
| Gladstone Land Corp. | 38,787 | 463,893 |
| Global Medical REIT, Inc. | 66,322 | 802,496 |
| Global Net Lease, Inc. | 179,297 | 3,492,706 |
| Griffin Industrial Realty, Inc. | 2,012 | 79,233 |
| Hannon Armstrong Sustainable Infrastructure Capital, Inc. | 134,620 | 4,019,753 |
| Healthcare Realty Trust, Inc. | 271,102 | 9,426,217 |
| Hersha Hospitality Trust | 73,340 | 1,012,092 |
| Independence Realty Trust, Inc. | 190,062 | 2,926,955 |
| Industrial Logistics Properties Trust | 136,866 | 2,907,034 |
| Innovative Industrial Properties, Inc.(a) | 22,907 | 1,740,932 |
| Investors Real Estate Trust | 24,727 | 1,871,092 |
| iStar, Inc. | 126,125 | 1,640,886 |
| Jernigan Capital, Inc. | 44,761 | 850,011 |
| Kennedy-Wilson Holdings, Inc. | 260,312 | 5,989,779 |
| Kite Realty Group Trust | 176,055 | 3,137,300 |
| Lexington Realty Trust | 486,085 | 5,288,605 |
| LTC Properties, Inc. | 83,275 | 4,317,809 |
| Mack-Cali Realty Corp. | 183,792 | 3,936,825 |
| Marcus & Millichap, Inc. * | 48,825 | 1,744,029 |
| Maui Land & Pineapple Co., Inc. * | 14,430 | 148,485 |
| Monmouth Real Estate Investment Corp. | 196,078 | 2,956,856 |
| National Health Investors, Inc. | 88,646 | 7,604,940 |
| National Storage Affiliates Trust | 125,582 | 4,291,137 |
| New Senior Investment Group, Inc. | 175,575 | 1,236,048 |
| Newmark Group, Inc., Class A | 303,731 | 3,225,623 |
| NexPoint Residential Trust, Inc. | 40,254 | 1,963,188 |
| Office Properties Income Trust | 100,935 | 3,217,808 |
| One Liberty Properties, Inc. | 32,901 | 934,717 |
| Pebblebrook Hotel Trust | 275,254 | 7,076,780 |
| Pennsylvania Real Estate Investment Trust(a) | 149,677 | 826,217 |
| Physicians Realty Trust | 394,057 | 7,357,044 |
| Piedmont Office Realty Trust, Inc., Class A | 265,374 | 5,954,993 |
| PotlatchDeltic Corp. | 140,567 | 5,969,880 |
| Preferred Apartment Communities, Inc., Class A | 95,751 | 1,371,154 |
| PS Business Parks, Inc. | 42,420 | 7,658,931 |
| QTS Realty Trust, Inc., Class A | 116,180 | 6,226,086 |
| Rafael Holdings, Inc., Class B * | 21,967 | 381,567 |
| RE/MAX Holdings, Inc., Class A | 38,191 | 1,277,489 |
| Realogy Holdings Corp.(a) | 241,309 | 1,901,515 |
| Redfin Corp. * | 186,610 | 3,245,148 |
| Retail Opportunity Investments Corp. | 238,830 | 4,457,762 |
| Security | Number
of Shares | Value ($) |
| Retail Value, Inc. | 31,863 | 1,166,504 |
| Rexford Industrial Realty, Inc. | 232,111 | 11,162,218 |
| RLJ Lodging Trust | 365,560 | 5,998,840 |
| RPT Realty | 165,705 | 2,402,722 |
| Ryman Hospitality Properties, Inc. | 97,354 | 8,194,286 |
| Sabra Health Care REIT, Inc. | 400,831 | 9,860,443 |
| Safehold, Inc. | 22,305 | 771,307 |
| Saul Centers, Inc. | 25,380 | 1,358,845 |
| Senior Housing Properties Trust | 503,050 | 4,992,771 |
| Seritage Growth Properties, Class A | 71,476 | 3,108,491 |
| STAG Industrial, Inc. | 271,121 | 8,415,596 |
| Stratus Properties, Inc. * | 12,705 | 350,404 |
| Summit Hotel Properties, Inc. | 218,960 | 2,684,450 |
| Sunstone Hotel Investors, Inc. | 476,022 | 6,431,057 |
| Tanger Factory Outlet Centers, Inc. | 193,430 | 3,118,092 |
| Tejon Ranch Co. * | 44,214 | 710,961 |
| Terreno Realty Corp. | 136,661 | 7,709,047 |
| The GEO Group, Inc. | 251,400 | 3,826,308 |
| The RMR Group, Inc., Class A | 32,292 | 1,562,933 |
| The St. Joe Co. * | 70,880 | 1,314,824 |
| Transcontinental Realty Investors, Inc. * | 2,037 | 64,247 |
| UMH Properties, Inc. | 75,199 | 1,122,721 |
| Uniti Group, Inc. | 390,748 | 2,703,976 |
| Universal Health Realty Income Trust | 27,193 | 3,242,221 |
| Urban Edge Properties | 243,582 | 5,142,016 |
| Urstadt Biddle Properties, Inc., Class A | 62,851 | 1,529,165 |
| Washington Prime Group, Inc.(a) | 398,803 | 1,682,949 |
| Washington Real Estate Investment Trust | 169,583 | 5,260,465 |
| Whitestone REIT | 82,374 | 1,173,006 |
| Xenia Hotels & Resorts, Inc. | 240,894 | 5,070,819 |
| | | 346,704,493 |
| |
| Retailing 3.2% |
| 1-800-Flowers.com, Inc., Class A * | 51,849 | 739,367 |
| Aaron's, Inc. | 143,234 | 10,732,524 |
| Abercrombie & Fitch Co., Class A | 139,075 | 2,251,624 |
| America's Car-Mart, Inc. * | 13,325 | 1,212,442 |
| American Eagle Outfitters, Inc. | 343,534 | 5,283,553 |
| Asbury Automotive Group, Inc. * | 40,981 | 4,226,370 |
| Ascena Retail Group, Inc. * | 306,754 | 108,039 |
| At Home Group, Inc. * | 101,705 | 866,527 |
| Barnes & Noble Education, Inc. * | 86,330 | 354,816 |
| Bed Bath & Beyond, Inc.(a) | 257,968 | 3,534,162 |
| Big Lots, Inc. | 82,670 | 1,791,459 |
| Boot Barn Holdings, Inc. * | 59,286 | 2,077,974 |
| Caleres, Inc. | 87,007 | 1,872,391 |
| Camping World Holdings, Inc., Class A(a) | 69,130 | 653,278 |
| Chico's FAS, Inc. | 250,391 | 861,345 |
| Citi Trends, Inc. | 23,629 | 421,778 |
| Conn's, Inc. * | 42,453 | 1,026,938 |
| Core-Mark Holding Co., Inc. | 95,779 | 2,923,175 |
| Designer Brands, Inc. | 137,840 | 2,274,360 |
| Dillard's, Inc., Class A(a) | 22,025 | 1,519,284 |
| Duluth Holdings, Inc., Class B * | 22,340 | 206,422 |
| Express, Inc. * | 142,357 | 458,389 |
| Funko, Inc., Class A * | 37,403 | 673,254 |
| GameStop Corp., Class A(a) | 188,723 | 1,026,653 |
| Genesco, Inc. * | 34,094 | 1,324,552 |
| GNC Holdings, Inc., Class A *(a) | 175,290 | 462,766 |
| Greenlane Holdings, Inc., Class A *(a) | 12,915 | 50,756 |
| Group 1 Automotive, Inc. | 37,309 | 3,710,007 |
| Groupon, Inc. * | 955,951 | 2,657,544 |
| Guess?, Inc. | 106,608 | 1,785,684 |
| Haverty Furniture Cos., Inc. | 37,165 | 674,173 |
| Hibbett Sports, Inc. * | 37,370 | 891,648 |
| Hudson Ltd., Class A * | 84,905 | 1,054,520 |
| J. Jill, Inc.(a) | 35,071 | 60,673 |
Schwab Equity Index Funds | Annual Report
Schwab Small-Cap Index Fund
Portfolio Holdings as of October 31, 2019 (continued)
| Security | Number
of Shares | Value ($) |
| J.C. Penney Co., Inc. * | 661,882 | 661,882 |
| Lands' End, Inc. * | 21,745 | 262,462 |
| Leaf Group Ltd. * | 35,960 | 106,801 |
| Liquidity Services, Inc. * | 56,879 | 369,145 |
| Lithia Motors, Inc., Class A | 46,926 | 7,389,906 |
| Lumber Liquidators Holdings, Inc. *(a) | 59,669 | 550,745 |
| MarineMax, Inc. * | 44,423 | 686,335 |
| Monro, Inc. | 69,101 | 4,844,671 |
| Murphy USA, Inc. * | 64,646 | 7,623,703 |
| National Vision Holdings, Inc. * | 166,472 | 3,962,034 |
| Office Depot, Inc. | 1,158,863 | 2,387,258 |
| Overstock.com, Inc. * | 56,221 | 592,007 |
| Party City Holdco, Inc. * | 114,128 | 641,399 |
| PetMed Express, Inc. | 41,784 | 978,372 |
| Quotient Technology, Inc. * | 161,027 | 1,386,442 |
| Rent-A-Center, Inc. | 102,786 | 2,659,074 |
| RH * | 35,114 | 6,380,214 |
| RTW RetailWinds, Inc. * | 67,220 | 99,486 |
| Sally Beauty Holdings, Inc. * | 256,329 | 3,973,099 |
| Shoe Carnival, Inc. | 19,689 | 653,478 |
| Shutterstock, Inc. * | 40,645 | 1,649,374 |
| Signet Jewelers Ltd. | 109,898 | 1,762,764 |
| Sleep Number Corp. * | 60,933 | 2,932,096 |
| Sonic Automotive, Inc., Class A | 51,764 | 1,668,354 |
| Sportsman's Warehouse Holdings, Inc. * | 91,630 | 624,000 |
| Stamps.com, Inc. * | 35,418 | 2,990,342 |
| Stitch Fix, Inc., Class A *(a) | 89,045 | 2,035,569 |
| Tailored Brands, Inc.(a) | 103,982 | 482,476 |
| The Buckle, Inc. | 61,536 | 1,287,333 |
| The Cato Corp., Class A | 47,606 | 832,629 |
| The Children's Place, Inc. | 32,615 | 2,671,495 |
| The Container Store Group, Inc. * | 32,932 | 138,973 |
| The Michaels Cos., Inc. * | 179,793 | 1,569,593 |
| The RealReal Inc *(a) | 36,600 | 845,826 |
| The Rubicon Project, Inc. * | 102,618 | 872,253 |
| Tile Shop Holdings, Inc. | 75,340 | 126,571 |
| Tilly's, Inc., Class A | 45,402 | 465,824 |
| Waitr Holdings, Inc. *(a) | 124,017 | 53,923 |
| Weyco Group, Inc. | 12,841 | 316,787 |
| Winmark Corp. | 5,120 | 921,600 |
| Zumiez, Inc. * | 42,436 | 1,354,133 |
| | | 131,578,875 |
| |
| Semiconductors & Semiconductor Equipment 2.7% |
| Adesto Technologies Corp. * | 58,425 | 535,173 |
| Advanced Energy Industries, Inc. * | 80,588 | 4,762,751 |
| Alpha & Omega Semiconductor Ltd. * | 43,106 | 562,964 |
| Ambarella, Inc. * | 67,029 | 3,527,736 |
| Amkor Technology, Inc. * | 208,229 | 2,588,286 |
| Axcelis Technologies, Inc. * | 69,098 | 1,324,609 |
| AXT, Inc. * | 80,595 | 251,456 |
| Brooks Automation, Inc. | 150,525 | 6,392,797 |
| Cabot Microelectronics Corp. | 61,422 | 9,282,093 |
| CEVA, Inc. * | 46,299 | 1,260,259 |
| Cirrus Logic, Inc. * | 123,255 | 8,376,410 |
| Cohu, Inc. | 85,551 | 1,421,858 |
| Diodes, Inc. * | 87,044 | 4,060,603 |
| DSP Group, Inc. * | 45,299 | 675,408 |
| Enphase Energy, Inc. *(a) | 194,485 | 3,778,844 |
| FormFactor, Inc. * | 157,855 | 3,445,975 |
| GSI Technology, Inc. * | 34,625 | 270,767 |
| Ichor Holdings Ltd. * | 46,918 | 1,365,783 |
| Impinj, Inc. * | 31,607 | 1,039,712 |
| Inphi Corp. * | 95,305 | 6,850,523 |
| Lattice Semiconductor Corp. * | 264,004 | 5,171,838 |
| MACOM Technology Solutions Holdings, Inc. * | 97,397 | 2,214,808 |
| Security | Number
of Shares | Value ($) |
| MaxLinear, Inc. * | 138,680 | 2,629,373 |
| NeoPhotonics Corp. * | 82,871 | 545,291 |
| NVE Corp. | 9,925 | 617,831 |
| Onto Innovation, Inc. * | 102,099 | 3,287,588 |
| PDF Solutions, Inc. * | 60,654 | 980,169 |
| Photronics, Inc. * | 138,709 | 1,636,766 |
| Power Integrations, Inc. | 60,051 | 5,471,247 |
| Rambus, Inc. * | 233,195 | 3,228,585 |
| Semtech Corp. * | 139,740 | 7,051,280 |
| Silicon Laboratories, Inc. * | 91,071 | 9,675,383 |
| SMART Global Holdings, Inc. * | 27,351 | 812,325 |
| SunPower Corp. * | 134,065 | 1,174,409 |
| Synaptics, Inc. * | 71,096 | 2,993,853 |
| Ultra Clean Holdings, Inc. * | 83,076 | 1,775,334 |
| Veeco Instruments, Inc. * | 102,464 | 1,397,609 |
| Xperi Corp. | 104,031 | 2,112,349 |
| | | 114,550,045 |
| |
| Software & Services 6.9% |
| 8x8, Inc. * | 199,271 | 3,849,916 |
| A10 Networks, Inc. * | 119,406 | 887,187 |
| ACI Worldwide, Inc. * | 244,197 | 7,665,344 |
| Agilysys, Inc. * | 44,315 | 1,116,295 |
| Alarm.com Holdings, Inc. * | 77,969 | 3,851,669 |
| Altair Engineering, Inc., Class A * | 82,959 | 3,058,698 |
| American Software, Inc., Class A | 61,613 | 998,747 |
| Appfolio, Inc., Class A * | 33,155 | 3,223,661 |
| Appian Corp. * | 66,331 | 2,961,016 |
| Avaya Holdings Corp. * | 234,210 | 2,831,599 |
| Benefitfocus, Inc. * | 63,018 | 1,432,714 |
| Blackbaud, Inc. | 103,629 | 8,699,655 |
| Blackline, Inc. * | 90,874 | 4,247,451 |
| Bottomline Technologies (de), Inc. * | 90,974 | 3,725,385 |
| Box, Inc., Class A * | 304,339 | 5,149,416 |
| Brightcove, Inc. * | 81,074 | 771,014 |
| Carbonite, Inc. * | 70,493 | 1,210,365 |
| Cardtronics plc, Class A * | 79,015 | 2,707,054 |
| Cass Information Systems, Inc. | 30,033 | 1,721,191 |
| ChannelAdvisor Corp. * | 56,127 | 528,155 |
| Cision Ltd. * | 196,392 | 1,977,667 |
| Cloudera, Inc. * | 501,457 | 4,252,355 |
| CommVault Systems, Inc. * | 85,659 | 4,254,683 |
| Conduent, Inc. * | 366,864 | 2,267,220 |
| Cornerstone OnDemand, Inc. * | 120,603 | 7,063,718 |
| CSG Systems International, Inc. | 69,777 | 4,021,946 |
| Digimarc Corp. * | 25,118 | 894,201 |
| Digital Turbine, Inc. * | 164,905 | 1,152,686 |
| Domo, Inc., Class B * | 37,689 | 606,039 |
| Ebix, Inc. | 49,450 | 2,108,053 |
| eGain Corp. * | 42,420 | 319,210 |
| Endurance International Group Holdings, Inc. * | 151,289 | 593,053 |
| Envestnet, Inc. * | 101,345 | 6,333,049 |
| Everbridge, Inc. * | 70,356 | 4,890,446 |
| EVERTEC, Inc. | 128,439 | 3,928,949 |
| Evo Payments, Inc., Class A * | 75,197 | 2,137,851 |
| Exela Technologies, Inc. * | 99,570 | 60,847 |
| ExlService Holdings, Inc. * | 70,919 | 4,938,090 |
| Five9, Inc. * | 126,541 | 7,024,291 |
| ForeScout Technologies, Inc. * | 87,562 | 2,693,407 |
| GTT Communications, Inc. *(a) | 69,318 | 521,965 |
| GTY Technology Holdings, Inc. *(a) | 83,420 | 434,618 |
| I3 Verticals, Inc., Class A * | 30,340 | 620,453 |
| Ideanomics, Inc. *(a) | 106,432 | 122,397 |
| Information Services Group, Inc. * | 71,976 | 155,468 |
| Instructure, Inc. * | 72,315 | 3,379,280 |
| Intelligent Systems Corp. *(a) | 14,196 | 641,233 |
Schwab Equity Index Funds | Annual Report
Schwab Small-Cap Index Fund
Portfolio Holdings as of October 31, 2019 (continued)
| Security | Number
of Shares | Value ($) |
| International Money Express, Inc. * | 28,691 | 439,546 |
| j2 Global, Inc. | 98,717 | 9,374,166 |
| KBR, Inc. | 300,147 | 8,452,139 |
| Limelight Networks, Inc. * | 242,781 | 1,024,536 |
| LivePerson, Inc. * | 130,122 | 5,341,508 |
| LiveRamp Holdings, Inc. * | 141,890 | 5,546,480 |
| Majesco * | 15,678 | 134,988 |
| ManTech International Corp., Class A | 56,765 | 4,494,653 |
| MAXIMUS, Inc. | 134,640 | 10,332,274 |
| MicroStrategy, Inc., Class A * | 17,490 | 2,680,342 |
| Mitek Systems, Inc. * | 79,238 | 763,854 |
| MobileIron, Inc. * | 203,718 | 1,275,275 |
| Model N, Inc. * | 68,863 | 2,051,429 |
| NIC, Inc. | 139,874 | 3,289,836 |
| OneSpan, Inc. * | 69,863 | 1,307,137 |
| Paysign, Inc. *(a) | 61,990 | 668,252 |
| Perficient, Inc. * | 68,100 | 2,669,520 |
| Perspecta, Inc. | 299,798 | 7,956,639 |
| Phunware, Inc. *(a) | 67,278 | 111,009 |
| Presidio, Inc. | 97,872 | 1,624,675 |
| PRGX Global, Inc. * | 42,456 | 212,280 |
| Priority Technology Holdings, Inc. * | 13,581 | 46,990 |
| Progress Software Corp. | 94,424 | 3,765,629 |
| PROS Holdings, Inc. * | 69,644 | 3,568,559 |
| Q2 Holdings, Inc. * | 91,334 | 6,529,468 |
| QAD, Inc., Class A | 23,532 | 1,093,767 |
| Qualys, Inc. * | 71,954 | 6,139,835 |
| Rapid7, Inc. * | 103,528 | 5,185,717 |
| Rimini Street, Inc. * | 40,989 | 160,267 |
| SailPoint Technologies Holding, Inc. * | 182,262 | 3,528,592 |
| Science Applications International Corp. | 125,809 | 10,394,340 |
| SecureWorks Corp., Class A * | 17,646 | 214,575 |
| SharpSpring, Inc. *(a) | 21,553 | 219,625 |
| ShotSpotter, Inc. * | 16,703 | 337,401 |
| SPS Commerce, Inc. * | 74,268 | 3,919,122 |
| StarTek, Inc. * | 33,768 | 219,492 |
| SVMK, Inc. * | 182,299 | 3,354,302 |
| Sykes Enterprises, Inc. * | 80,809 | 2,496,594 |
| Synchronoss Technologies, Inc. * | 79,616 | 477,696 |
| Telaria, Inc. * | 92,961 | 703,715 |
| Telenav, Inc. * | 71,551 | 337,005 |
| Tenable Holdings, Inc. * | 78,524 | 1,978,805 |
| The Hackett Group, Inc. | 51,053 | 863,306 |
| TiVo Corp. | 259,748 | 2,114,349 |
| TTEC Holdings, Inc. | 30,468 | 1,443,269 |
| Tucows, Inc., Class A * | 20,191 | 1,121,408 |
| Unisys Corp. * | 108,667 | 1,114,923 |
| Upland Software, Inc. * | 48,650 | 1,823,402 |
| Varonis Systems, Inc. * | 62,926 | 4,502,355 |
| Verint Systems, Inc. * | 138,814 | 6,300,767 |
| Verra Mobility Corp. * | 246,072 | 3,531,133 |
| VirnetX Holding Corp. *(a) | 130,199 | 761,664 |
| Virtusa Corp. * | 61,718 | 2,300,847 |
| Workiva, Inc. * | 78,101 | 3,254,469 |
| Yext, Inc. * | 196,366 | 3,232,184 |
| Zix Corp. * | 114,804 | 758,854 |
| Zuora, Inc., Class A * | 183,647 | 2,616,970 |
| | | 288,191,641 |
| |
| Technology Hardware & Equipment 3.9% |
| 3D Systems Corp. * | 243,441 | 2,310,255 |
| Acacia Communications, Inc. * | 80,205 | 5,266,260 |
| ADTRAN, Inc. | 102,176 | 900,171 |
| Airgain, Inc. * | 19,261 | 218,998 |
| Akoustis Technologies, Inc. *(a) | 52,252 | 426,899 |
| Anixter International, Inc. * | 64,637 | 5,348,712 |
| Applied Optoelectronics, Inc. *(a) | 39,941 | 373,848 |
| Security | Number
of Shares | Value ($) |
| Arlo Technologies, Inc. * | 154,974 | 528,461 |
| AstroNova, Inc. | 14,219 | 225,513 |
| Avid Technology, Inc. * | 60,378 | 407,853 |
| AVX Corp. | 99,692 | 1,527,281 |
| Badger Meter, Inc. | 60,716 | 3,509,385 |
| Bel Fuse, Inc., Class B | 20,511 | 301,717 |
| Belden, Inc. | 82,818 | 4,246,907 |
| Benchmark Electronics, Inc. | 79,620 | 2,699,118 |
| CalAmp Corp. * | 68,843 | 772,418 |
| Calix, Inc. * | 103,460 | 791,469 |
| Cambium Networks Corp. * | 9,213 | 80,706 |
| Casa Systems, Inc. * | 65,752 | 441,853 |
| Clearfield, Inc. * | 23,802 | 293,479 |
| Coda Octopus Group, Inc. * | 9,641 | 70,765 |
| Comtech Telecommunications Corp. | 49,889 | 1,743,620 |
| CTS Corp. | 68,789 | 1,835,290 |
| Daktronics, Inc. | 78,100 | 535,766 |
| DASAN Zhone Solutions, Inc. * | 16,622 | 125,247 |
| Diebold Nixdorf, Inc. * | 162,852 | 1,139,964 |
| Digi International, Inc. * | 58,265 | 840,181 |
| ePlus, Inc. * | 28,266 | 2,208,423 |
| Extreme Networks, Inc. * | 248,018 | 1,597,236 |
| Fabrinet * | 77,396 | 4,351,977 |
| FARO Technologies, Inc. * | 36,534 | 1,741,941 |
| Fitbit, Inc., Class A * | 475,277 | 2,937,212 |
| Harmonic, Inc. * | 183,418 | 1,426,992 |
| II-VI, Inc. * | 189,094 | 6,268,466 |
| Immersion Corp. * | 64,843 | 533,009 |
| Infinera Corp. * | 372,247 | 2,080,861 |
| Inseego Corp. *(a) | 97,047 | 556,079 |
| Insight Enterprises, Inc. * | 75,099 | 4,609,577 |
| InterDigital, Inc. | 65,985 | 3,538,775 |
| Iteris, Inc. * | 84,271 | 451,693 |
| Itron, Inc. * | 72,839 | 5,554,702 |
| KEMET Corp. | 120,159 | 2,612,257 |
| Kimball Electronics, Inc. * | 51,463 | 764,740 |
| Knowles Corp. * | 172,650 | 3,725,787 |
| KVH Industries, Inc. * | 34,626 | 353,878 |
| Lumentum Holdings, Inc. * | 162,258 | 10,167,086 |
| Methode Electronics, Inc. | 77,265 | 2,657,916 |
| MTS Systems Corp. | 38,005 | 2,146,522 |
| Napco Security Technologies, Inc. * | 24,151 | 733,224 |
| NETGEAR, Inc. * | 65,152 | 1,770,180 |
| NetScout Systems, Inc. * | 153,715 | 3,722,977 |
| nLight, Inc. * | 69,271 | 925,461 |
| Novanta, Inc. * | 71,477 | 6,365,027 |
| OSI Systems, Inc. * | 35,303 | 3,503,470 |
| PAR Technology Corp. *(a) | 24,078 | 603,395 |
| PC Connection, Inc. | 23,675 | 1,156,287 |
| Plantronics, Inc. | 70,840 | 2,792,513 |
| Plexus Corp. * | 61,336 | 4,535,184 |
| Ribbon Communications, Inc. * | 128,516 | 551,334 |
| Rogers Corp. * | 39,147 | 5,303,636 |
| Sanmina Corp. * | 143,438 | 4,407,850 |
| ScanSource, Inc. * | 54,971 | 1,775,563 |
| Sonim Technologies, Inc. * | 7,492 | 17,906 |
| Stratasys Ltd. * | 108,629 | 2,246,448 |
| Tech Data Corp. * | 77,110 | 9,368,865 |
| TESSCO Technologies, Inc. | 15,031 | 199,762 |
| TTM Technologies, Inc. * | 209,591 | 2,454,311 |
| Viavi Solutions, Inc. * | 487,640 | 7,782,734 |
| Vishay Intertechnology, Inc. | 281,445 | 5,671,117 |
| Vishay Precision Group, Inc. * | 22,119 | 753,152 |
| Wrap Technologies, Inc. *(a) | 15,825 | 62,192 |
| | | 163,949,853 |
| |
Schwab Equity Index Funds | Annual Report
Schwab Small-Cap Index Fund
Portfolio Holdings as of October 31, 2019 (continued)
| Security | Number
of Shares | Value ($) |
| Telecommunication Services 0.7% |
| Anterix, Inc. * | 22,494 | 912,357 |
| ATN International, Inc. | 23,714 | 1,404,580 |
| Bandwidth, Inc., Class A * | 33,998 | 1,908,988 |
| Boingo Wireless, Inc. * | 93,176 | 882,377 |
| Cincinnati Bell, Inc. * | 103,307 | 527,899 |
| Cogent Communications Holdings, Inc. | 88,995 | 5,218,667 |
| Consolidated Communications Holdings, Inc. | 150,299 | 601,196 |
| Frontier Communications Corp. *(a) | 214,428 | 195,130 |
| Gogo, Inc. *(a) | 116,789 | 718,252 |
| IDT Corp., Class B * | 34,645 | 235,932 |
| Intelsat S.A. * | 142,554 | 3,619,446 |
| Iridium Communications, Inc. * | 210,390 | 5,148,243 |
| Ooma, Inc. * | 40,371 | 458,211 |
| ORBCOMM, Inc. * | 155,937 | 625,307 |
| Pareteum Corp. * | 223,677 | 82,761 |
| Shenandoah Telecommunications Co. | 101,602 | 3,267,520 |
| Spok Holdings, Inc. | 37,787 | 449,665 |
| Vonage Holdings Corp. * | 479,501 | 4,684,725 |
| | | 30,941,256 |
| |
| Transportation 1.4% |
| Air Transport Services Group, Inc. * | 123,456 | 2,581,465 |
| Allegiant Travel Co. | 27,513 | 4,603,750 |
| ArcBest Corp. | 54,230 | 1,566,705 |
| Atlas Air Worldwide Holdings, Inc. * | 49,008 | 1,074,745 |
| Avis Budget Group, Inc. * | 125,519 | 3,729,169 |
| Costamare, Inc. | 102,998 | 809,564 |
| Covenant Transportation Group, Inc., Class A * | 27,545 | 423,367 |
| Daseke, Inc. * | 95,044 | 255,668 |
| Eagle Bulk Shipping, Inc. * | 92,453 | 401,246 |
| Echo Global Logistics, Inc. * | 57,368 | 1,142,197 |
| Forward Air Corp. | 59,741 | 4,132,285 |
| Genco Shipping & Trading Ltd. * | 31,256 | 308,809 |
| Hawaiian Holdings, Inc. | 99,223 | 2,838,770 |
| Heartland Express, Inc. | 97,319 | 2,033,967 |
| Hertz Global Holdings, Inc. * | 214,262 | 2,894,680 |
| Hub Group, Inc., Class A * | 68,706 | 3,146,735 |
| Marten Transport Ltd. | 83,410 | 1,806,661 |
| Matson, Inc. | 90,360 | 3,449,945 |
| Mesa Air Group, Inc. * | 43,289 | 329,862 |
| P.A.M. Transportation Services, Inc. * | 4,100 | 234,930 |
| Radiant Logistics, Inc. * | 80,976 | 436,461 |
| Roadrunner Transportation Systems, Inc. * | 7,402 | 83,198 |
| Safe Bulkers, Inc. * | 110,082 | 179,434 |
| Saia, Inc. * | 55,104 | 4,915,277 |
| Scorpio Bulkers, Inc. | 116,758 | 758,927 |
| SkyWest, Inc. | 106,238 | 6,326,473 |
| Spirit Airlines, Inc. * | 145,053 | 5,448,191 |
| Universal Logistics Holdings, Inc. | 17,261 | 325,456 |
| US Xpress Enterprises, Inc., Class A * | 46,159 | 239,565 |
| Werner Enterprises, Inc. | 95,675 | 3,492,138 |
| YRC Worldwide, Inc. * | 68,047 | 227,957 |
| | | 60,197,597 |
| |
| Utilities 4.0% |
| ALLETE, Inc. | 109,766 | 9,446,462 |
| American States Water Co. | 77,629 | 7,384,847 |
| AquaVenture Holdings Ltd. * | 29,437 | 577,554 |
| Artesian Resources Corp., Class A | 16,624 | 616,750 |
| Atlantic Power Corp. * | 225,133 | 524,560 |
| Avista Corp. | 139,367 | 6,693,797 |
| Black Hills Corp. | 129,569 | 10,213,924 |
| Security | Number
of Shares | Value ($) |
| Cadiz, Inc. *(a) | 27,127 | 321,184 |
| California Water Service Group | 102,084 | 5,713,641 |
| Chesapeake Utilities Corp. | 33,926 | 3,216,185 |
| Clearway Energy, Inc., Class A | 74,223 | 1,274,409 |
| Clearway Energy, Inc., Class C | 156,169 | 2,831,344 |
| Consolidated Water Co., Ltd. | 30,469 | 534,426 |
| El Paso Electric Co. | 86,027 | 5,738,861 |
| Genie Energy Ltd., Class B | 29,973 | 223,299 |
| Global Water Resources, Inc. | 24,457 | 299,598 |
| MGE Energy, Inc. | 73,922 | 5,694,951 |
| Middlesex Water Co. | 33,989 | 2,285,760 |
| New Jersey Resources Corp. | 188,470 | 8,217,292 |
| Northwest Natural Holding Co. | 64,178 | 4,451,386 |
| NorthWestern Corp. | 107,267 | 7,779,003 |
| ONE Gas, Inc. | 110,743 | 10,281,380 |
| Ormat Technologies, Inc. | 84,014 | 6,432,112 |
| Otter Tail Corp. | 83,496 | 4,732,553 |
| Pattern Energy Group, Inc., Class A | 187,493 | 5,255,429 |
| PNM Resources, Inc. | 168,729 | 8,799,217 |
| Portland General Electric Co. | 190,318 | 10,825,288 |
| Pure Cycle Corp. * | 36,687 | 410,161 |
| RGC Resources, Inc. | 15,613 | 455,431 |
| SJW Group. | 55,762 | 4,034,381 |
| South Jersey Industries, Inc. | 196,016 | 6,303,875 |
| Southwest Gas Holdings, Inc. | 115,158 | 10,053,293 |
| Spark Energy, Inc., Class A | 24,312 | 232,666 |
| Spire, Inc. | 105,325 | 8,853,619 |
| Sunnova Energy International, Inc. * | 28,084 | 298,252 |
| TerraForm Power, Inc., Class A | 154,117 | 2,616,907 |
| The York Water Co. | 27,589 | 1,215,020 |
| Unitil Corp. | 31,008 | 1,930,868 |
| | | 166,769,685 |
| Total Common Stock |
| (Cost $3,320,088,458) | | 4,171,303,385 |
|
| Rights0.0% of net assets |
| |
| Materials 0.0% |
| A. Schulman, Inc. CVR *(b) | 50,881 | 22,031 |
| |
| Media & Entertainment 0.0% |
| Media General, Inc. CVR *(b) | 174,886 | 14,883 |
| |
| Pharmaceuticals, Biotechnology & Life Sciences 0.0% |
| Corium International, Inc. CVR *(b) | 50,000 | 9,000 |
| Omthera Pharmaceuticals, Inc. CVR *(b) | 8,400 | — |
| Oncternal Therapeutics, Inc. *(a)(b) | 1,506 | 3,088 |
| Tobira Therapeutics, Inc. CVR *(b) | 14,029 | 164,595 |
| | | 176,683 |
| Total Rights |
| (Cost $34,960) | | 213,597 |
|
| Other Investment Company2.1% of net assets |
| |
| Securities Lending Collateral 2.1% |
| Wells Fargo Government Money Market Fund, Select Class 1.75%(c) | 85,855,056 | 85,855,056 |
| Total Other Investment Company |
| (Cost $85,855,056) | | 85,855,056 |
Schwab Equity Index Funds | Annual Report
Schwab Small-Cap Index Fund
Portfolio Holdings as of October 31, 2019 (continued)
Security
Rate, Maturity Date | Face
Amount ($) | Value ($) |
| Short-Term Investment0.4% of net assets |
| |
| Time Deposit 0.4% |
| JPMorgan Chase Bank |
| 1.18%, 11/01/19(d) | 16,137,531 | 16,137,531 |
| Total Short-Term Investment |
| (Cost $16,137,531) | | 16,137,531 |
| | Number of
Contracts | Notional
Amount
($) | Current Value/
Unrealized
Appreciation
($) |
| Futures Contracts | |
| Long | |
| Russell 2000 Index, e-mini, expires 12/20/19 | 187 | 14,617,790 | 288,257 |
| * | Non-income producing security. |
| (a) | All or a portion of this security is on loan. Securities on loan were valued at $82,322,210. |
| (b) | Fair-valued by management using significant unobservable inputs in accordance with procedures approved by the fund’s Board of Trustees. |
| (c) | The rate shown is the 7-day yield. |
| (d) | The rate shown is the current daily overnight rate. |
| | |
| CVR — | Contingent Value Rights |
| REIT — | Real Estate Investment Trust |
Schwab Equity Index Funds | Annual Report
Schwab Total Stock Market Index Fund
Portfolio Holdings as of October 31, 2019
This section shows all the securities in the fund’s portfolio and their values as of the report date.
The fund files its complete schedule of portfolio holdings with the U.S. Securities and Exchange Commission (SEC) for the first and third quarters of each fiscal year on Form N-Q. Effective March 31, 2019, Form N-PORT Part F has replaced Form N-Q. The fund’s Form N-Q and Form N-PORT Part F are available on the SEC’s website atwww.sec.gov. The fund also makes available its complete schedule of portfolio holdings 15 to 20 days after the end of the month on the fund’s website atwww.schwabfunds.com/schwabfunds_prospectus.
| Security | Number
of Shares | Value ($) |
| Common Stock99.7% of net assets |
| |
| Automobiles & Components 0.7% |
| Adient plc * | 30,290 | 641,845 |
| American Axle & Manufacturing Holdings, Inc. * | 37,198 | 310,975 |
| Aptiv plc | 85,982 | 7,699,688 |
| Autoliv, Inc. | 26,463 | 2,059,880 |
| BorgWarner, Inc. | 70,415 | 2,934,897 |
| Cooper Tire & Rubber Co. | 16,286 | 459,917 |
| Cooper-Standard Holding, Inc. * | 6,229 | 198,456 |
| Dana, Inc. | 47,950 | 778,229 |
| Delphi Technologies plc | 29,887 | 364,920 |
| Dorman Products, Inc. * | 10,202 | 734,034 |
| Ford Motor Co. | 1,320,487 | 11,342,983 |
| Fox Factory Holding Corp. * | 12,576 | 766,381 |
| Garrett Motion, Inc. * | 26,315 | 249,993 |
| General Motors Co. | 426,448 | 15,846,808 |
| Gentex Corp. | 85,280 | 2,392,104 |
| Gentherm, Inc. * | 11,532 | 481,692 |
| Harley-Davidson, Inc. | 52,399 | 2,038,845 |
| LCI Industries | 8,433 | 819,013 |
| Lear Corp. | 18,431 | 2,170,619 |
| Modine Manufacturing Co. * | 17,500 | 200,025 |
| Motorcar Parts of America, Inc. * | 5,552 | 105,821 |
| Shiloh Industries, Inc. * | 4,387 | 15,881 |
| Standard Motor Products, Inc. | 6,318 | 330,811 |
| Stoneridge, Inc. * | 10,196 | 314,852 |
| Strattec Security Corp. | 1,500 | 33,945 |
| Tenneco, Inc., Class A | 22,341 | 281,273 |
| Tesla, Inc. * | 47,684 | 15,016,645 |
| The Goodyear Tire & Rubber Co. | 76,362 | 1,211,865 |
| Thor Industries, Inc. | 18,074 | 1,143,361 |
| Veoneer, Inc. * | 31,546 | 502,212 |
| Visteon Corp. * | 9,724 | 904,527 |
| Winnebago Industries, Inc. | 11,705 | 562,659 |
| Workhorse Group, Inc. *(a) | 5,690 | 14,396 |
| XPEL, Inc. * | 9,214 | 100,433 |
| | | 73,029,985 |
| |
| Banks 5.9% |
| 1st Constitution Bancorp | 2,000 | 37,980 |
| 1st Source Corp. | 5,295 | 270,998 |
| ACNB Corp. | 2,261 | 80,017 |
| Allegiance Bancshares, Inc. * | 7,867 | 261,656 |
| Amalgamated Bank, Class A | 11,099 | 202,113 |
| Amerant Bancorp, Inc. * | 8,788 | 172,684 |
| American National Bankshares, Inc. | 4,310 | 156,022 |
| American River Bankshares | 3,244 | 46,746 |
| Ameris Bancorp | 22,504 | 964,296 |
| AmeriServ Financial, Inc. | 10,799 | 44,924 |
| Ames National Corp. | 2,389 | 66,175 |
| Arrow Financial Corp. | 4,986 | 175,108 |
| Associated Banc-Corp. | 54,272 | 1,091,410 |
| Atlantic Capital Bancshares, Inc. * | 7,985 | 148,920 |
| Atlantic Union Bankshares Corp. | 29,178 | 1,075,501 |
| Auburn National Bancorp, Inc.(a) | 1,391 | 59,396 |
| Security | Number
of Shares | Value ($) |
| Axos Financial, Inc. * | 19,991 | 580,739 |
| Banc of California, Inc. | 17,916 | 246,703 |
| BancFirst Corp. | 6,788 | 392,957 |
| Bancorp of New Jersey, Inc. * | 3,401 | 61,694 |
| BancorpSouth Bank | 29,709 | 911,175 |
| Bank First Corp.(a) | 2,265 | 158,550 |
| Bank of America Corp. | 2,826,027 | 88,369,864 |
| Bank of Commerce Holdings | 5,000 | 56,100 |
| Bank of Hawaii Corp. | 14,212 | 1,240,850 |
| Bank of Marin Bancorp | 3,742 | 164,162 |
| Bank OZK | 40,810 | 1,145,129 |
| BankFinancial Corp. | 4,321 | 55,655 |
| BankUnited, Inc. | 31,580 | 1,083,194 |
| Bankwell Financial Group, Inc. | 2,000 | 57,240 |
| Banner Corp. | 12,659 | 683,333 |
| Bar Harbor Bankshares | 5,502 | 137,825 |
| Baycom Corp. * | 8,199 | 173,327 |
| BB&T Corp. | 258,365 | 13,706,263 |
| BCB Bancorp, Inc. | 4,200 | 54,180 |
| Berkshire Hills Bancorp, Inc. | 16,351 | 507,372 |
| BOK Financial Corp. | 11,253 | 868,169 |
| Boston Private Financial Holdings, Inc. | 28,203 | 317,284 |
| Bridge Bancorp, Inc. | 5,500 | 178,200 |
| Bridgewater Bancshares, Inc. * | 4,163 | 52,412 |
| Brookline Bancorp, Inc. | 26,142 | 410,429 |
| Bryn Mawr Bank Corp. | 6,152 | 234,453 |
| Business First Bancshares, Inc. | 4,553 | 111,275 |
| Byline Bancorp, Inc. * | 9,933 | 172,238 |
| C&F Financial Corp. | 1,200 | 61,032 |
| Cadence BanCorp | 41,959 | 645,329 |
| Cambridge Bancorp | 1,228 | 95,182 |
| Camden National Corp. | 4,903 | 217,252 |
| Capital City Bank Group, Inc. | 5,225 | 148,651 |
| Capitol Federal Financial, Inc. | 48,563 | 692,994 |
| Capstar Financial Holdings, Inc. | 2,802 | 47,382 |
| Carolina Financial Corp. | 9,797 | 371,796 |
| Carter Bank & Trust * | 8,134 | 159,833 |
| Cathay General Bancorp | 24,528 | 872,461 |
| CB Financial Services, Inc. | 1,482 | 39,718 |
| CBTX, Inc. | 6,037 | 172,960 |
| CenterState Bank Corp. | 44,811 | 1,136,407 |
| Central Pacific Financial Corp. | 8,622 | 249,348 |
| Central Valley Community Bancorp | 3,755 | 78,217 |
| Century Bancorp, Inc., Class A | 1,223 | 106,413 |
| Chemung Financial Corp. | 968 | 41,208 |
| CIT Group, Inc. | 31,516 | 1,351,721 |
| Citigroup, Inc. | 761,523 | 54,723,043 |
| Citizens & Northern Corp. | 4,229 | 108,728 |
| Citizens Community Bancorp, Inc. | 3,744 | 41,633 |
| Citizens Financial Group, Inc. | 149,192 | 5,245,591 |
| City Holding Co. | 5,897 | 467,868 |
| Civista Bancshares, Inc. | 3,796 | 85,334 |
| CNB Financial Corp. | 5,361 | 167,639 |
| Codorus Valley Bancorp, Inc. | 2,829 | 61,241 |
| Colony Bankcorp, Inc. | 2,706 | 42,051 |
| Columbia Banking System, Inc. | 26,491 | 1,041,096 |
| Columbia Financial, Inc. * | 19,578 | 322,841 |
| Comerica, Inc. | 49,260 | 3,222,589 |
| Commerce Bancshares, Inc. | 33,212 | 2,137,524 |
Schwab Equity Index Funds | Annual Report
Schwab Total Stock Market Index Fund
Portfolio Holdings as of October 31, 2019 (continued)
| Security | Number
of Shares | Value ($) |
| Community Bank System, Inc. | 18,906 | 1,281,449 |
| Community Bankers Trust Corp. | 7,000 | 60,620 |
| Community Trust Bancorp, Inc. | 5,256 | 230,265 |
| ConnectOne Bancorp, Inc. | 8,775 | 213,057 |
| County Bancorp, Inc. | 2,567 | 56,448 |
| Cullen/Frost Bankers, Inc. | 19,072 | 1,718,006 |
| Customers Bancorp, Inc. * | 10,510 | 247,826 |
| CVB Financial Corp. | 49,745 | 1,033,701 |
| Dime Community Bancshares, Inc. | 9,580 | 184,798 |
| DNB Financial Corp. | 1,193 | 54,258 |
| Eagle Bancorp Montana, Inc. | 2,558 | 48,653 |
| Eagle Bancorp, Inc. | 12,070 | 544,840 |
| East West Bancorp, Inc. | 48,737 | 2,091,792 |
| Entegra Financial Corp. * | 2,050 | 61,705 |
| Enterprise Bancorp, Inc. | 2,816 | 83,945 |
| Enterprise Financial Services Corp. | 9,438 | 413,384 |
| Equity Bancshares, Inc., Class A * | 5,288 | 146,795 |
| Esquire Financial Holdings, Inc. * | 1,750 | 42,525 |
| ESSA Bancorp, Inc. | 2,841 | 46,450 |
| Essent Group Ltd. | 33,599 | 1,750,172 |
| Evans Bancorp, Inc. | 1,382 | 52,502 |
| F.N.B. Corp. | 112,278 | 1,354,073 |
| Farmers & Merchants Bancorp, Inc. | 2,641 | 67,610 |
| Farmers National Banc Corp. | 7,093 | 105,828 |
| Fauquier Bankshares, Inc. | 2,085 | 41,075 |
| FB Financial Corp. | 5,492 | 206,884 |
| Federal Agricultural Mortgage Corp., Class A | 643 | 48,161 |
| Federal Agricultural Mortgage Corp., Class C | 2,925 | 247,718 |
| Fidelity D&D Bancorp, Inc. | 800 | 52,760 |
| Fifth Third Bancorp | 249,194 | 7,246,562 |
| Financial Institutions, Inc. | 4,637 | 145,741 |
| First BanCorp | 75,196 | 791,062 |
| First BanCorp (North Carolina) | 10,445 | 394,299 |
| First BanCorp, Inc. | 3,885 | 109,829 |
| First Bank/Hamilton NJ | 6,451 | 68,123 |
| First Busey Corp. | 16,944 | 446,813 |
| First Business Financial Services, Inc. | 2,369 | 57,614 |
| First Capital, Inc. | 1,074 | 63,044 |
| First Choice Bancorp | 2,370 | 52,993 |
| First Citizens BancShares, Inc., Class A | 2,793 | 1,373,933 |
| First Commonwealth Financial Corp. | 32,758 | 461,560 |
| First Community Bankshares, Inc. | 4,583 | 145,877 |
| First Community Corp. | 2,104 | 40,292 |
| First Defiance Financial Corp. | 7,044 | 217,801 |
| First Financial Bancorp | 32,014 | 750,408 |
| First Financial Bankshares, Inc. | 44,912 | 1,494,671 |
| First Financial Corp. | 3,997 | 175,348 |
| First Financial Northwest, Inc. | 2,467 | 34,908 |
| First Foundation, Inc. | 11,843 | 189,606 |
| First Guaranty Bancshares, Inc. | 2,136 | 44,856 |
| First Hawaiian, Inc. | 44,256 | 1,209,517 |
| First Horizon National Corp. | 107,270 | 1,713,102 |
| First Internet Bancorp | 4,592 | 104,422 |
| First Interstate BancSystem, Inc., Class A | 14,267 | 598,643 |
| First Merchants Corp. | 17,712 | 700,510 |
| First Mid Bancshares, Inc. | 6,521 | 227,583 |
| First Midwest Bancorp, Inc. | 39,319 | 807,612 |
| First Northwest Bancorp | 3,416 | 60,019 |
| First Republic Bank | 57,413 | 6,106,447 |
| First Savings Financial Group, Inc. | 860 | 53,268 |
| First United Corp. | 2,475 | 57,915 |
| Flagstar Bancorp, Inc. | 11,375 | 413,368 |
| Flushing Financial Corp. | 8,253 | 178,595 |
| FNCB Bancorp, Inc. | 4,152 | 30,849 |
| Franklin Financial Network, Inc. | 3,791 | 126,127 |
| Franklin Financial Services Corp. | 1,600 | 57,264 |
| Security | Number
of Shares | Value ($) |
| FS Bancorp, Inc. | 938 | 53,701 |
| Fulton Financial Corp. | 53,140 | 906,568 |
| FVCBankcorp, Inc. * | 5,555 | 95,657 |
| German American Bancorp, Inc. | 9,856 | 325,741 |
| Glacier Bancorp, Inc. | 29,832 | 1,262,490 |
| Great Southern Bancorp, Inc. | 3,639 | 219,868 |
| Great Western Bancorp, Inc. | 18,522 | 645,862 |
| Greene County Bancorp, Inc. | 1,473 | 40,979 |
| Guaranty Bancshares, Inc. | 2,780 | 88,015 |
| Guaranty Federal Bancshares, Inc. | 1,961 | 47,594 |
| Hancock Whitney Corp. | 28,840 | 1,124,760 |
| Hanmi Financial Corp. | 10,693 | 205,840 |
| HarborOne Bancorp, Inc. * | 19,941 | 203,598 |
| Hawthorn Bancshares, Inc. | 1,665 | 39,960 |
| Heartland Financial USA, Inc. | 11,104 | 519,445 |
| Heritage Commerce Corp. | 11,571 | 139,083 |
| Heritage Financial Corp. | 14,397 | 396,349 |
| Hilltop Holdings, Inc. | 25,847 | 603,786 |
| Hingham Institution for Savings | 534 | 101,455 |
| Home Bancorp, Inc. | 1,946 | 74,259 |
| Home BancShares, Inc. | 51,875 | 958,650 |
| HomeStreet, Inc. * | 9,269 | 278,163 |
| HomeTrust Bancshares, Inc. | 6,004 | 160,307 |
| Hope Bancorp, Inc. | 47,307 | 675,071 |
| Horizon Bancorp, Inc. | 12,027 | 219,553 |
| Howard Bancorp, Inc. * | 4,800 | 80,544 |
| Huntington Bancshares, Inc. | 348,093 | 4,918,554 |
| IBERIABANK Corp. | 17,944 | 1,316,910 |
| Independent Bank Corp. | 11,089 | 910,185 |
| Independent Bank Corp., Michigan | 7,335 | 165,111 |
| Independent Bank Group, Inc. | 12,943 | 692,062 |
| International Bancshares Corp. | 19,695 | 806,707 |
| Investar Holding Corp. | 2,523 | 62,596 |
| Investors Bancorp, Inc. | 74,260 | 894,833 |
| JPMorgan Chase & Co. | 1,079,035 | 134,793,052 |
| Kearny Financial Corp. | 30,708 | 430,833 |
| KeyCorp | 334,853 | 6,017,308 |
| Lakeland Bancorp, Inc. | 15,000 | 248,250 |
| Lakeland Financial Corp. | 10,005 | 465,733 |
| LCNB Corp. | 4,536 | 82,011 |
| LegacyTexas Financial Group, Inc. | 15,859 | 674,642 |
| LendingTree, Inc. * | 2,539 | 913,659 |
| Live Oak Bancshares, Inc. | 7,662 | 139,065 |
| Luther Burbank Corp. | 6,821 | 78,919 |
| M&T Bank Corp. | 45,457 | 7,115,384 |
| Macatawa Bank Corp. | 7,248 | 75,778 |
| Mackinac Financial Corp. | 2,963 | 46,341 |
| MainStreet Bancshares, Inc. * | 3,000 | 62,220 |
| Malvern Bancorp, Inc. * | 1,956 | 43,775 |
| Mercantile Bank Corp. | 5,614 | 197,669 |
| Merchants Bancorp | 5,609 | 91,595 |
| Meridian Bancorp, Inc. | 18,271 | 357,381 |
| Meridian Corp. * | 2,531 | 44,925 |
| Meta Financial Group, Inc. | 11,373 | 360,069 |
| Metropolitan Bank Holding Corp. * | 2,381 | 102,240 |
| MGIC Investment Corp. | 117,944 | 1,617,012 |
| Mid Penn Bancorp, Inc. | 1,996 | 50,898 |
| Middlefield Banc Corp. | 904 | 41,584 |
| Midland States Bancorp, Inc. | 7,038 | 188,618 |
| MidWestOne Financial Group, Inc. | 3,261 | 106,292 |
| MMA Capital Holdings, Inc. * | 1,499 | 47,713 |
| Mr Cooper Group, Inc. * | 25,993 | 332,710 |
| MSB Financial Corp. | 2,482 | 38,967 |
| MutualFirst Financial, Inc. | 1,990 | 79,381 |
| MVB Financial Corp. | 3,423 | 68,973 |
| National Bank Holdings Corp., Class A | 9,231 | 317,546 |
| National Bankshares, Inc. | 2,688 | 113,111 |
| NBT Bancorp, Inc. | 16,748 | 665,733 |
Schwab Equity Index Funds | Annual Report
Schwab Total Stock Market Index Fund
Portfolio Holdings as of October 31, 2019 (continued)
| Security | Number
of Shares | Value ($) |
| New York Community Bancorp, Inc. | 158,433 | 1,845,744 |
| Nicolet Bankshares, Inc. * | 2,665 | 183,832 |
| NMI Holdings, Inc., Class A * | 21,585 | 631,361 |
| Northeast Bank * | 1,965 | 42,071 |
| Northfield Bancorp, Inc. | 20,650 | 351,257 |
| Northrim BanCorp, Inc. | 2,596 | 101,114 |
| Northwest Bancshares, Inc. | 33,446 | 564,234 |
| Norwood Financial Corp. | 1,600 | 49,920 |
| Oak Valley Bancorp | 2,528 | 42,218 |
| OceanFirst Financial Corp. | 15,478 | 370,389 |
| Ocwen Financial Corp. * | 33,720 | 56,987 |
| OFG Bancorp | 16,312 | 331,297 |
| Ohio Valley Banc Corp. | 1,139 | 41,847 |
| Old Line Bancshares, Inc. | 4,758 | 139,314 |
| Old National Bancorp | 63,751 | 1,147,199 |
| Old Second Bancorp, Inc. | 10,602 | 127,966 |
| Opus Bank | 7,454 | 184,785 |
| Origin Bancorp, Inc. | 7,700 | 270,963 |
| Oritani Financial Corp. | 10,694 | 199,550 |
| Orrstown Financial Services, Inc. | 2,174 | 47,154 |
| Pacific Mercantile Bancorp * | 4,589 | 32,857 |
| Pacific Premier Bancorp, Inc. | 21,337 | 720,230 |
| PacWest Bancorp | 38,677 | 1,430,662 |
| Park National Corp. | 4,958 | 501,998 |
| Parke Bancorp, Inc. | 2,239 | 53,826 |
| PB Bancorp, Inc. | 4,076 | 61,466 |
| PCB Bancorp | 6,102 | 102,086 |
| PCSB Financial Corp. | 6,385 | 129,360 |
| Peapack-Gladstone Financial Corp. | 5,216 | 152,307 |
| Penns Woods Bancorp, Inc. | 2,250 | 68,783 |
| PennyMac Financial Services, Inc. * | 14,649 | 456,023 |
| People's United Financial, Inc. | 130,139 | 2,104,348 |
| People's Utah Bancorp | 5,381 | 156,587 |
| Peoples Bancorp of North Carolina, Inc. | 1,427 | 42,439 |
| Peoples Bancorp, Inc. | 6,847 | 223,965 |
| Peoples Financial Services Corp. | 2,448 | 120,393 |
| Pinnacle Financial Partners, Inc. | 25,044 | 1,473,088 |
| Plumas Bancorp | 1,860 | 40,920 |
| Ponce de Leon Federal Bank * | 3,464 | 48,600 |
| Popular, Inc. | 32,043 | 1,745,062 |
| Preferred Bank | 5,001 | 266,603 |
| Premier Financial Bancorp, Inc. | 2,848 | 50,552 |
| Prosperity Bancshares, Inc. | 22,843 | 1,576,624 |
| Provident Bancorp, Inc. * | 1,515 | 17,271 |
| Provident Financial Holdings, Inc. | 2,246 | 45,055 |
| Provident Financial Services, Inc. | 21,746 | 542,563 |
| Prudential Bancorp, Inc. | 2,109 | 36,802 |
| QCR Holdings, Inc. | 6,599 | 267,787 |
| Radian Group, Inc. | 66,430 | 1,667,393 |
| RBB Bancorp | 4,010 | 80,761 |
| Regions Financial Corp. | 343,156 | 5,524,812 |
| Reliant Bancorp, Inc. | 2,700 | 61,452 |
| Renasant Corp. | 21,291 | 738,798 |
| Republic Bancorp, Inc., Class A | 2,950 | 131,187 |
| Republic First Bancorp, Inc. * | 17,184 | 69,595 |
| Richmond Mutual BanCorp., Inc. * | 7,448 | 103,900 |
| Riverview Bancorp, Inc. | 5,400 | 38,826 |
| S&T Bancorp, Inc. | 12,483 | 470,047 |
| Salisbury Bancorp, Inc. | 1,041 | 39,620 |
| Sandy Spring Bancorp, Inc. | 12,945 | 446,603 |
| SB Financial Group, Inc. | 2,430 | 41,116 |
| SB One Bancorp | 1,887 | 41,665 |
| Seacoast Banking Corp. of Florida * | 17,503 | 490,084 |
| Select Bancorp, Inc. * | 5,100 | 57,630 |
| ServisFirst Bancshares, Inc. | 16,569 | 579,915 |
| Severn Bancorp, Inc. | 5,134 | 42,612 |
| Shore Bancshares, Inc. | 4,629 | 72,259 |
| Sierra Bancorp | 4,155 | 113,182 |
| Security | Number
of Shares | Value ($) |
| Signature Bank | 18,380 | 2,174,722 |
| Simmons First National Corp., Class A | 31,070 | 743,194 |
| SmartFinancial, Inc. * | 7,276 | 153,160 |
| Sound Financial Bancorp, Inc. | 1,293 | 47,582 |
| South State Corp. | 11,139 | 878,422 |
| Southern First Bancshares, Inc. * | 1,875 | 75,581 |
| Southern Missouri Bancorp, Inc. | 3,020 | 109,958 |
| Southern National Bancorp of Virginia, Inc. | 6,730 | 106,603 |
| Southside Bancshares, Inc. | 10,547 | 363,344 |
| Spirit of Texas Bancshares, Inc. * | 3,720 | 77,748 |
| Standard AVB Financial Corp. | 1,872 | 52,004 |
| Sterling Bancorp | 67,222 | 1,320,912 |
| Sterling Bancorp, Inc. | 7,691 | 74,526 |
| Stock Yards Bancorp, Inc. | 7,278 | 290,683 |
| Summit Financial Group, Inc. | 3,433 | 87,404 |
| SunTrust Banks, Inc. | 149,881 | 10,242,868 |
| SVB Financial Group * | 17,851 | 3,953,640 |
| Synovus Financial Corp. | 51,358 | 1,739,496 |
| TCF Financial Corp. | 51,099 | 2,023,009 |
| Territorial Bancorp, Inc. | 2,571 | 75,999 |
| Texas Capital Bancshares, Inc. * | 16,425 | 887,936 |
| TFS Financial Corp. | 19,782 | 381,001 |
| The Bancorp, Inc. * | 15,734 | 171,501 |
| The Bank of Princeton | 1,521 | 43,744 |
| The Community Financial Corp. | 1,476 | 49,180 |
| The First Bancshares, Inc. | 6,742 | 222,216 |
| The First of Long Island Corp. | 12,169 | 285,241 |
| The PNC Financial Services Group, Inc. | 150,073 | 22,015,709 |
| Timberland Bancorp, Inc. | 2,502 | 66,303 |
| Tompkins Financial Corp. | 4,024 | 352,140 |
| Towne Bank | 22,138 | 621,856 |
| TriCo Bancshares | 11,657 | 438,653 |
| TriState Capital Holdings, Inc. * | 7,935 | 183,457 |
| Triumph Bancorp, Inc. * | 9,993 | 324,273 |
| TrustCo Bank Corp. | 28,716 | 248,106 |
| Trustmark Corp. | 22,989 | 788,983 |
| Two River Bancorp | 2,741 | 57,479 |
| U.S. Bancorp | 482,615 | 27,518,707 |
| UMB Financial Corp. | 15,587 | 1,017,208 |
| Umpqua Holdings Corp. | 80,096 | 1,267,119 |
| Union Bankshares, Inc. | 1,200 | 39,888 |
| United Bankshares, Inc. | 35,319 | 1,396,513 |
| United Community Banks, Inc. | 27,233 | 822,709 |
| United Community Financial Corp. | 18,657 | 212,503 |
| United Financial Bancorp, Inc. | 15,207 | 214,723 |
| United Security Bancshares | 4,123 | 41,931 |
| Unity Bancorp, Inc. | 2,299 | 50,210 |
| Univest Financial Corp. | 10,769 | 277,302 |
| Valley National Bancorp | 107,799 | 1,248,312 |
| Veritex Holdings, Inc. | 15,506 | 381,758 |
| Walker & Dunlop, Inc. | 8,850 | 557,462 |
| Washington Federal, Inc. | 26,742 | 975,013 |
| Washington Trust Bancorp, Inc. | 4,849 | 247,735 |
| Waterstone Financial, Inc. | 9,659 | 179,947 |
| Webster Financial Corp. | 30,645 | 1,351,445 |
| Wells Fargo & Co. | 1,352,423 | 69,825,600 |
| WesBanco, Inc. | 17,140 | 644,293 |
| West Bancorp, Inc. | 4,641 | 108,971 |
| Westamerica Bancorp | 9,699 | 640,328 |
| Western Alliance Bancorp | 31,301 | 1,544,078 |
| Western New England Bancorp, Inc. | 10,349 | 98,936 |
| Wintrust Financial Corp. | 18,783 | 1,198,731 |
| WSFS Financial Corp. | 17,604 | 742,361 |
| Zions Bancorp NA | 58,333 | 2,827,401 |
| | | 602,790,057 |
| |
Schwab Equity Index Funds | Annual Report
Schwab Total Stock Market Index Fund
Portfolio Holdings as of October 31, 2019 (continued)
| Security | Number
of Shares | Value ($) |
| Capital Goods 6.9% |
| 3M Co. | 194,221 | 32,044,523 |
| A.O. Smith Corp. | 48,113 | 2,390,254 |
| AAON, Inc. | 13,579 | 660,754 |
| AAR Corp. | 12,256 | 511,688 |
| Actuant Corp., Class A | 19,179 | 475,064 |
| Acuity Brands, Inc. | 13,528 | 1,688,159 |
| Advanced Drainage Systems, Inc. | 18,364 | 679,835 |
| AECOM * | 52,814 | 2,113,088 |
| Aegion Corp. * | 12,259 | 265,653 |
| Aerojet Rocketdyne Holdings, Inc. * | 24,833 | 1,073,531 |
| Aerovironment, Inc. * | 6,673 | 386,901 |
| AGCO Corp. | 21,204 | 1,626,135 |
| Air Lease Corp. | 33,619 | 1,478,564 |
| Aircastle Ltd. | 16,101 | 438,269 |
| Alamo Group, Inc. | 3,373 | 361,113 |
| Albany International Corp., Class A | 10,638 | 893,379 |
| Allegion plc | 31,359 | 3,638,898 |
| Allied Motion Technologies, Inc. | 1,959 | 74,168 |
| Allison Transmission Holdings, Inc. | 41,393 | 1,805,149 |
| Altra Industrial Motion Corp. | 21,554 | 663,863 |
| Ameresco, Inc., Class A * | 5,440 | 80,186 |
| American Superconductor Corp. * | 5,600 | 43,848 |
| American Woodmark Corp. * | 4,841 | 480,034 |
| AMETEK, Inc. | 76,185 | 6,982,355 |
| Apogee Enterprises, Inc. | 9,481 | 355,917 |
| Applied Industrial Technologies, Inc. | 13,758 | 823,279 |
| Arconic, Inc. | 132,012 | 3,626,370 |
| Arcosa, Inc. | 17,207 | 660,921 |
| Argan, Inc. | 4,405 | 166,729 |
| Armstrong Flooring, Inc. * | 7,547 | 46,339 |
| Armstrong World Industries, Inc. | 16,287 | 1,523,323 |
| Arotech Corp. * | 11,503 | 34,164 |
| Astec Industries, Inc. | 6,955 | 244,051 |
| Astronics Corp. * | 9,681 | 280,168 |
| Atkore International Group, Inc. * | 15,845 | 549,821 |
| Axon Enterprise, Inc. * | 19,650 | 1,004,704 |
| AZZ, Inc. | 9,021 | 349,925 |
| Babcock & Wilcox Enterprises, Inc. * | 12,254 | 56,246 |
| Barnes Group, Inc. | 16,937 | 989,968 |
| Beacon Roofing Supply, Inc. * | 23,005 | 714,075 |
| Bloom Energy Corp., Class A *(a) | 6,100 | 18,666 |
| Blue Bird Corp. * | 6,024 | 117,709 |
| BlueLinx Holdings, Inc. *(a) | 2,241 | 70,054 |
| BMC Stock Holdings, Inc. * | 24,109 | 650,702 |
| Briggs & Stratton Corp. | 12,415 | 91,499 |
| Builders FirstSource, Inc. * | 38,094 | 861,305 |
| BWX Technologies, Inc. | 32,683 | 1,898,882 |
| CAI International, Inc. * | 4,600 | 109,342 |
| Carlisle Cos., Inc. | 19,079 | 2,905,159 |
| Caterpillar, Inc. | 189,588 | 26,125,226 |
| Chart Industries, Inc. * | 11,869 | 695,879 |
| CIRCOR International, Inc. * | 5,887 | 225,413 |
| Colfax Corp. * | 28,587 | 960,523 |
| Columbus McKinnon Corp. | 8,311 | 311,829 |
| Comfort Systems USA, Inc. | 14,426 | 727,215 |
| Commercial Vehicle Group, Inc. * | 7,300 | 53,217 |
| Construction Partners, Inc., Class A * | 12,670 | 216,910 |
| Continental Building Products, Inc. * | 10,633 | 318,033 |
| Cornerstone Building Brands, Inc. * | 14,252 | 89,075 |
| CPI Aerostructures, Inc. * | 6,418 | 49,996 |
| Crane Co. | 17,455 | 1,335,657 |
| CSW Industrials, Inc. | 4,946 | 342,362 |
| Cubic Corp. | 10,678 | 787,396 |
| Cummins, Inc. | 53,030 | 9,146,614 |
| Curtiss-Wright Corp. | 14,611 | 1,976,138 |
| Deere & Co. | 106,505 | 18,546,781 |
| Security | Number
of Shares | Value ($) |
| Donaldson Co., Inc. | 41,916 | 2,210,650 |
| Douglas Dynamics, Inc. | 6,985 | 327,108 |
| Dover Corp. | 48,739 | 5,063,495 |
| Ducommun, Inc. * | 3,200 | 158,656 |
| DXP Enterprises, Inc. * | 4,731 | 163,314 |
| Dycom Industries, Inc. * | 11,476 | 523,191 |
| Eaton Corp. plc | 141,339 | 12,312,040 |
| EMCOR Group, Inc. | 18,306 | 1,605,619 |
| Emerson Electric Co. | 206,692 | 14,499,444 |
| Encore Wire Corp. | 7,393 | 415,487 |
| Energous Corp. *(a) | 5,300 | 14,522 |
| Energy Recovery, Inc. * | 9,780 | 91,052 |
| EnerSys | 14,027 | 937,845 |
| EnPro Industries, Inc. | 7,727 | 537,413 |
| ESCO Technologies, Inc. | 8,457 | 714,532 |
| EVI Industries, Inc.(a) | 1,400 | 48,146 |
| Evoqua Water Technologies Corp. * | 25,169 | 437,186 |
| Fastenal Co. | 192,861 | 6,931,424 |
| Federal Signal Corp. | 21,858 | 709,074 |
| Flowserve Corp. | 44,328 | 2,164,980 |
| Fluor Corp. | 46,688 | 752,144 |
| Fortive Corp. | 100,355 | 6,924,495 |
| Fortune Brands Home & Security, Inc. | 47,275 | 2,838,864 |
| Foundation Building Materials, Inc. * | 5,200 | 96,668 |
| Franklin Electric Co., Inc. | 14,084 | 758,423 |
| FreightCar America, Inc. * | 3,100 | 10,354 |
| Gardner Denver Holdings, Inc. * | 46,337 | 1,474,907 |
| Gates Industrial Corp. plc * | 17,841 | 178,410 |
| GATX Corp. | 12,164 | 967,646 |
| Gencor Industries, Inc. * | 3,540 | 44,250 |
| Generac Holdings, Inc. * | 21,680 | 2,093,854 |
| General Dynamics Corp. | 78,743 | 13,921,762 |
| General Electric Co. | 2,956,906 | 29,509,922 |
| General Finance Corp. * | 3,300 | 32,274 |
| Gibraltar Industries, Inc. * | 10,558 | 562,002 |
| GMS, Inc. * | 14,254 | 427,050 |
| Graco, Inc. | 57,002 | 2,576,490 |
| GrafTech International Ltd. | 17,928 | 216,570 |
| Graham Corp. | 2,809 | 63,652 |
| Granite Construction, Inc. | 17,068 | 401,781 |
| Great Lakes Dredge & Dock Corp. * | 19,016 | 204,422 |
| Griffon Corp. | 14,664 | 312,490 |
| H&E Equipment Services, Inc. | 9,632 | 326,910 |
| Harsco Corp. * | 28,455 | 576,783 |
| HD Supply Holdings, Inc. * | 56,799 | 2,245,832 |
| HEICO Corp. | 13,718 | 1,691,978 |
| HEICO Corp., Class A | 24,189 | 2,304,486 |
| Helios Technologies, Inc. | 9,064 | 359,206 |
| Herc Holdings, Inc. * | 8,885 | 393,250 |
| Hexcel Corp. | 28,147 | 2,100,329 |
| Hillenbrand, Inc. | 22,065 | 679,381 |
| Honeywell International, Inc. | 242,400 | 41,869,752 |
| Houston Wire & Cable Co. * | 8,228 | 34,969 |
| Hubbell, Inc. | 17,977 | 2,547,341 |
| Huntington Ingalls Industries, Inc. | 13,735 | 3,099,440 |
| Hurco Cos., Inc. | 2,000 | 69,580 |
| Hyster-Yale Materials Handling, Inc. | 3,600 | 182,592 |
| IDEX Corp. | 25,255 | 3,927,910 |
| IES Holdings, Inc. * | 4,126 | 80,044 |
| Illinois Tool Works, Inc. | 99,238 | 16,729,542 |
| Ingersoll-Rand plc | 81,133 | 10,294,966 |
| Insteel Industries, Inc. | 5,095 | 97,162 |
| ITT, Inc. | 29,658 | 1,763,168 |
| Jacobs Engineering Group, Inc. | 45,203 | 4,230,097 |
| JELD-WEN Holding, Inc. * | 24,661 | 421,456 |
| John Bean Technologies Corp. | 10,923 | 1,122,557 |
| Johnson Controls International plc | 268,875 | 11,650,354 |
| Kadant, Inc. | 3,843 | 348,944 |
Schwab Equity Index Funds | Annual Report
Schwab Total Stock Market Index Fund
Portfolio Holdings as of October 31, 2019 (continued)
| Security | Number
of Shares | Value ($) |
| Kaman Corp. | 10,367 | 608,232 |
| Kennametal, Inc. | 26,199 | 810,859 |
| Kratos Defense & Security Solutions, Inc. * | 30,097 | 568,231 |
| L.B. Foster Co., Class A * | 3,200 | 58,240 |
| L3Harris Technologies, Inc. | 75,249 | 15,524,621 |
| Lawson Products, Inc. * | 4,509 | 207,189 |
| Lennox International, Inc. | 12,011 | 2,971,041 |
| Lincoln Electric Holdings, Inc. | 20,282 | 1,816,659 |
| Lindsay Corp. | 4,281 | 404,169 |
| LiqTech International, Inc. * | 5,399 | 39,089 |
| Lockheed Martin Corp. | 83,651 | 31,509,659 |
| LSI Industries, Inc. | 14,777 | 76,693 |
| Lydall, Inc. * | 5,500 | 107,635 |
| Manitex International, Inc. * | 4,549 | 25,292 |
| Masco Corp. | 98,992 | 4,578,380 |
| Masonite International Corp. * | 8,180 | 502,334 |
| MasTec, Inc. * | 19,794 | 1,245,834 |
| Maxar Technologies, Inc. * | 21,013 | 178,400 |
| Mercury Systems, Inc. * | 19,567 | 1,441,305 |
| Meritor, Inc. * | 27,700 | 610,231 |
| Milacron Holdings Corp. * | 21,974 | 367,405 |
| Miller Industries, Inc. | 3,410 | 122,590 |
| Moog, Inc., Class A | 11,470 | 960,154 |
| MRC Global, Inc. * | 31,160 | 353,978 |
| MSC Industrial Direct Co., Inc., Class A | 14,699 | 1,076,114 |
| Mueller Industries, Inc. | 19,369 | 595,984 |
| Mueller Water Products, Inc., Class A | 49,694 | 581,420 |
| MYR Group, Inc. * | 4,624 | 159,112 |
| National Presto Industries, Inc. | 1,664 | 143,254 |
| Navistar International Corp. * | 22,953 | 717,970 |
| NN, Inc. | 15,065 | 108,769 |
| Nordson Corp. | 17,611 | 2,761,581 |
| Northrop Grumman Corp. | 53,228 | 18,761,805 |
| Northwest Pipe Co. * | 2,896 | 88,328 |
| NOW, Inc. * | 33,879 | 357,085 |
| NV5 Global, Inc. * | 3,797 | 275,017 |
| nVent Electric plc | 54,394 | 1,254,326 |
| Omega Flex, Inc. | 832 | 77,251 |
| Orion Group Holdings, Inc. * | 8,139 | 39,881 |
| Oshkosh Corp. | 23,664 | 2,020,432 |
| Owens Corning | 36,549 | 2,239,723 |
| PACCAR, Inc. | 117,115 | 8,907,767 |
| Park Aerospace Corp. | 6,594 | 112,032 |
| Park-Ohio Holdings Corp. | 3,600 | 110,736 |
| Parker-Hannifin Corp. | 42,916 | 7,874,657 |
| Parsons Corp. * | 6,853 | 243,967 |
| Patrick Industries, Inc. * | 8,643 | 427,051 |
| Pentair plc | 56,707 | 2,351,639 |
| PGT Innovations, Inc. * | 19,928 | 351,928 |
| Plug Power, Inc. *(a) | 79,297 | 210,137 |
| Powell Industries, Inc. | 2,862 | 112,076 |
| Preformed Line Products Co. | 1,000 | 54,600 |
| Primoris Services Corp. | 17,353 | 354,695 |
| Proto Labs, Inc. * | 8,737 | 847,227 |
| Quanex Building Products Corp. | 10,061 | 194,077 |
| Quanta Services, Inc. | 46,954 | 1,974,416 |
| Raven Industries, Inc. | 11,752 | 409,910 |
| Raytheon Co. | 94,073 | 19,963,231 |
| RBC Bearings, Inc. * | 8,636 | 1,385,560 |
| Regal Beloit Corp. | 13,569 | 1,004,784 |
| Resideo Technologies, Inc. * | 41,983 | 400,098 |
| REV Group, Inc. | 7,500 | 93,300 |
| Rexnord Corp. * | 33,311 | 942,368 |
| Rockwell Automation, Inc. | 40,098 | 6,896,455 |
| Roper Technologies, Inc. | 35,144 | 11,842,122 |
| Rush Enterprises, Inc., Class A | 11,326 | 494,833 |
| Rush Enterprises, Inc., Class B | 750 | 32,190 |
| Security | Number
of Shares | Value ($) |
| Sensata Technologies Holding plc * | 55,015 | 2,816,218 |
| Simpson Manufacturing Co., Inc. | 14,564 | 1,203,569 |
| SiteOne Landscape Supply, Inc. * | 13,439 | 1,183,438 |
| Snap-on, Inc. | 18,778 | 3,054,617 |
| Spartan Motors, Inc. | 9,445 | 165,004 |
| Spirit AeroSystems Holdings, Inc., Class A | 34,727 | 2,841,363 |
| SPX Corp. * | 16,323 | 743,349 |
| SPX FLOW, Inc. * | 13,487 | 610,691 |
| Standex International Corp. | 4,408 | 334,038 |
| Stanley Black & Decker, Inc. | 50,997 | 7,717,376 |
| Sterling Construction Co., Inc. * | 7,334 | 119,141 |
| Sunrun, Inc. * | 26,305 | 408,780 |
| Systemax, Inc. | 3,800 | 82,232 |
| Tecogen, Inc. * | 11,344 | 28,473 |
| Teledyne Technologies, Inc. * | 12,206 | 4,023,098 |
| Tennant Co. | 5,863 | 453,972 |
| Terex Corp. | 21,913 | 603,703 |
| Textron, Inc. | 77,543 | 3,573,957 |
| The Boeing Co. | 180,566 | 61,376,189 |
| The Eastern Co. | 1,864 | 51,428 |
| The ExOne Co. *(a) | 4,754 | 31,947 |
| The Gorman-Rupp Co. | 5,933 | 219,165 |
| The Greenbrier Cos., Inc. | 11,186 | 327,638 |
| The Manitowoc Co., Inc. * | 12,331 | 157,344 |
| The Middleby Corp. * | 19,066 | 2,306,033 |
| The Timken Co. | 22,054 | 1,080,646 |
| The Toro Co. | 35,882 | 2,767,579 |
| Thermon Group Holdings, Inc. * | 13,548 | 322,849 |
| Titan International, Inc. | 13,787 | 36,811 |
| Titan Machinery, Inc. * | 5,599 | 92,943 |
| TPI Composites, Inc. * | 13,097 | 268,881 |
| Transcat, Inc. * | 2,013 | 63,087 |
| TransDigm Group, Inc. | 16,916 | 8,902,552 |
| Trex Co., Inc. * | 19,919 | 1,750,681 |
| TriMas Corp. * | 15,539 | 502,220 |
| Trinity Industries, Inc. | 35,969 | 711,467 |
| Triton International Ltd. | 17,182 | 630,579 |
| Triumph Group, Inc. | 16,938 | 351,802 |
| Tutor Perini Corp. * | 11,769 | 182,066 |
| Twin Disc, Inc. * | 3,405 | 36,638 |
| Ultralife Corp. * | 4,422 | 38,206 |
| United Rentals, Inc. * | 26,664 | 3,561,510 |
| United Technologies Corp. | 274,053 | 39,348,530 |
| Univar Solutions, Inc. * | 51,058 | 1,095,705 |
| Universal Forest Products, Inc. | 19,898 | 1,002,063 |
| Valmont Industries, Inc. | 7,730 | 1,060,479 |
| Vectrus, Inc. * | 3,418 | 156,237 |
| Veritiv Corp. * | 3,278 | 44,712 |
| Vicor Corp. * | 7,778 | 282,730 |
| Vivint Solar, Inc. * | 17,131 | 120,088 |
| W.W. Grainger, Inc. | 14,933 | 4,611,908 |
| Wabash National Corp. | 19,725 | 281,279 |
| WABCO Holdings, Inc. * | 17,440 | 2,347,773 |
| Wabtec Corp. | 60,952 | 4,228,240 |
| Watsco, Inc. | 11,181 | 1,971,210 |
| Watts Water Technologies, Inc., Class A | 9,037 | 842,700 |
| Welbilt, Inc. * | 46,762 | 886,608 |
| Wesco Aircraft Holdings, Inc. * | 20,800 | 229,216 |
| WESCO International, Inc. * | 13,771 | 690,616 |
| Willis Lease Finance Corp. * | 1,177 | 64,158 |
| WillScot Corp. * | 16,161 | 254,697 |
| Woodward, Inc. | 18,544 | 1,977,903 |
| Xylem, Inc. | 61,146 | 4,689,287 |
| | | 710,152,177 |
| |
Schwab Equity Index Funds | Annual Report
Schwab Total Stock Market Index Fund
Portfolio Holdings as of October 31, 2019 (continued)
| Security | Number
of Shares | Value ($) |
| Commercial & Professional Services 1.1% |
| ABM Industries, Inc. | 23,031 | 839,710 |
| Acacia Research Corp. * | 15,357 | 39,007 |
| ACCO Brands Corp. | 34,735 | 317,825 |
| ADT, Inc.(a) | 42,276 | 327,216 |
| Advanced Disposal Services, Inc. * | 23,888 | 783,049 |
| Aqua Metals, Inc. * | 12,685 | 20,296 |
| ASGN, Inc. * | 18,496 | 1,176,161 |
| Barrett Business Services, Inc. | 3,084 | 270,559 |
| BG Staffing, Inc. | 2,500 | 47,825 |
| Brady Corp., Class A | 17,257 | 972,259 |
| BrightView Holdings, Inc. * | 11,485 | 204,433 |
| Casella Waste Systems, Inc., Class A * | 15,213 | 663,135 |
| CBIZ, Inc. * | 21,447 | 587,004 |
| CECO Environmental Corp. * | 9,324 | 63,963 |
| Cintas Corp. | 28,099 | 7,549,358 |
| Clean Harbors, Inc. * | 17,394 | 1,434,309 |
| Copart, Inc. * | 67,693 | 5,594,150 |
| CoStar Group, Inc. * | 12,257 | 6,735,467 |
| Covanta Holding Corp. | 37,612 | 543,117 |
| CRA International, Inc. | 2,542 | 125,194 |
| Deluxe Corp. | 14,100 | 730,803 |
| Ennis, Inc. | 11,953 | 234,159 |
| Equifax, Inc. | 40,316 | 5,511,600 |
| Exponent, Inc. | 17,886 | 1,136,298 |
| Forrester Research, Inc. | 3,376 | 116,404 |
| Franklin Covey Co. * | 2,861 | 109,290 |
| FTI Consulting, Inc. * | 12,563 | 1,367,734 |
| GP Strategies Corp. * | 5,086 | 56,455 |
| Healthcare Services Group, Inc. | 23,875 | 581,595 |
| Heidrick & Struggles International, Inc. | 5,759 | 163,901 |
| Heritage-Crystal Clean, Inc. * | 3,533 | 93,766 |
| Herman Miller, Inc. | 20,697 | 962,410 |
| Hill International, Inc. * | 13,292 | 37,882 |
| HNI Corp. | 16,018 | 608,684 |
| Hudson Technologies, Inc. * | 14,328 | 9,022 |
| Huron Consulting Group, Inc. * | 8,402 | 555,708 |
| IAA, Inc. * | 44,400 | 1,693,860 |
| ICF International, Inc. | 6,209 | 532,049 |
| IHS Markit Ltd. * | 134,369 | 9,408,517 |
| InnerWorkings, Inc. * | 23,299 | 113,000 |
| Insperity, Inc. | 13,333 | 1,408,365 |
| Interface, Inc. | 19,952 | 331,802 |
| KAR Auction Services, Inc. | 44,400 | 1,103,784 |
| Kelly Services, Inc., Class A | 13,781 | 330,882 |
| Kforce, Inc. | 6,775 | 277,165 |
| Kimball International, Inc., Class B | 11,882 | 241,918 |
| Knoll, Inc. | 15,973 | 427,118 |
| Korn Ferry | 18,537 | 680,123 |
| LSC Communications, Inc. | 9,950 | 9,701 |
| ManpowerGroup, Inc. | 20,515 | 1,865,224 |
| Matthews International Corp., Class A | 10,170 | 376,087 |
| McGrath RentCorp | 8,505 | 649,017 |
| Mistras Group, Inc. * | 5,000 | 77,500 |
| Mobile Mini, Inc. | 15,499 | 583,072 |
| MSA Safety, Inc. | 11,975 | 1,437,838 |
| Nielsen Holdings plc | 119,697 | 2,413,092 |
| NRC Group Holdings Corp. *(a) | 5,211 | 63,783 |
| PICO Holdings, Inc. * | 7,559 | 81,486 |
| Pitney Bowes, Inc. | 56,836 | 250,078 |
| Quad Graphics, Inc. | 9,800 | 44,394 |
| Republic Services, Inc. | 71,646 | 6,269,741 |
| Resources Connection, Inc. | 11,300 | 165,545 |
| Robert Half International, Inc. | 39,218 | 2,246,015 |
| Rollins, Inc. | 46,359 | 1,766,741 |
| RR Donnelley & Sons Co. | 19,875 | 86,655 |
| SP Plus Corp. * | 10,305 | 455,172 |
| Security | Number
of Shares | Value ($) |
| Steelcase, Inc., Class A | 29,265 | 511,260 |
| Stericycle, Inc. * | 31,055 | 1,788,768 |
| Team, Inc. * | 8,225 | 149,366 |
| Tetra Tech, Inc. | 19,290 | 1,687,296 |
| The Brink's Co. | 17,192 | 1,460,632 |
| TransUnion | 63,659 | 5,259,507 |
| TriNet Group, Inc. * | 14,460 | 766,235 |
| TrueBlue, Inc. * | 14,540 | 332,966 |
| UniFirst Corp. | 4,981 | 1,000,384 |
| Upwork, Inc. * | 21,190 | 318,698 |
| US Ecology, Inc. | 7,422 | 461,871 |
| Verisk Analytics, Inc. | 55,156 | 7,981,073 |
| Viad Corp. | 7,132 | 435,195 |
| VSE Corp. | 2,601 | 99,930 |
| Waste Management, Inc. | 131,970 | 14,808,354 |
| Willdan Group, Inc. * | 4,309 | 130,563 |
| | | 113,151,570 |
| |
| Consumer Durables & Apparel 1.4% |
| Acushnet Holdings Corp. | 11,316 | 321,940 |
| American Outdoor Brands Corp. * | 22,871 | 161,927 |
| Bassett Furniture Industries, Inc. | 388 | 5,917 |
| Beazer Homes USA, Inc. * | 7,323 | 109,918 |
| Brunswick Corp. | 28,630 | 1,667,411 |
| Callaway Golf Co. | 33,432 | 675,995 |
| Capri Holdings Ltd. * | 50,412 | 1,566,301 |
| Carter's, Inc. | 14,934 | 1,496,984 |
| Cavco Industries, Inc. * | 2,736 | 524,354 |
| Century Communities, Inc. * | 11,045 | 333,228 |
| Clarus Corp. | 6,000 | 76,500 |
| Columbia Sportswear Co. | 10,217 | 924,128 |
| Crocs, Inc. * | 20,701 | 724,328 |
| CSS Industries, Inc. | 2,830 | 12,735 |
| Culp, Inc. | 5,320 | 82,300 |
| D.R. Horton, Inc. | 113,022 | 5,918,962 |
| Deckers Outdoor Corp. * | 9,598 | 1,467,534 |
| Delta Apparel, Inc. * | 1,907 | 47,580 |
| Escalade, Inc. | 3,955 | 45,324 |
| Ethan Allen Interiors, Inc. | 7,327 | 144,415 |
| Flexsteel Industries, Inc. | 1,900 | 31,483 |
| Fossil Group, Inc. * | 12,996 | 141,396 |
| G-III Apparel Group Ltd. * | 12,985 | 326,053 |
| Garmin Ltd. | 48,665 | 4,562,344 |
| GoPro, Inc., Class A *(a) | 41,540 | 172,806 |
| Green Brick Partners, Inc. * | 7,100 | 71,497 |
| Hamilton Beach Brands Holding Co., Class A | 1,750 | 32,637 |
| Hanesbrands, Inc. | 119,302 | 1,814,583 |
| Hasbro, Inc. | 39,499 | 3,843,648 |
| Helen of Troy Ltd. * | 8,312 | 1,244,805 |
| Hooker Furniture Corp. | 5,161 | 122,161 |
| Hovnanian Enterprises, Inc., Class A * | 2,020 | 50,662 |
| Installed Building Products, Inc. * | 6,876 | 448,453 |
| iRobot Corp. *(a) | 9,024 | 433,693 |
| Johnson Outdoors, Inc., Class A | 1,700 | 99,535 |
| KB Home | 29,731 | 1,061,099 |
| Kontoor Brands, Inc. * | 15,411 | 585,618 |
| La-Z-Boy, Inc. | 16,047 | 569,829 |
| Lakeland Industries, Inc. * | 4,088 | 45,172 |
| Leggett & Platt, Inc. | 43,690 | 2,241,297 |
| Lennar Corp., B Shares | 5,605 | 263,547 |
| Lennar Corp., Class A | 96,915 | 5,776,134 |
| Levi Strauss & Co., Class A | 15,208 | 271,007 |
| LGI Homes, Inc. * | 7,240 | 568,195 |
| Libbey, Inc. * | 7,232 | 13,018 |
| Lifetime Brands, Inc. | 5,000 | 39,950 |
| lululemon Athletica, Inc. * | 38,405 | 7,844,989 |
Schwab Equity Index Funds | Annual Report
Schwab Total Stock Market Index Fund
Portfolio Holdings as of October 31, 2019 (continued)
| Security | Number
of Shares | Value ($) |
| M.D.C. Holdings, Inc. | 18,241 | 706,109 |
| M/I Homes, Inc. * | 9,900 | 437,382 |
| Malibu Boats, Inc., Class A * | 6,152 | 200,678 |
| Marine Products Corp. | 3,933 | 52,781 |
| MasterCraft Boat Holdings, Inc. * | 4,993 | 78,640 |
| Mattel, Inc. * | 117,802 | 1,406,556 |
| Meritage Homes Corp. * | 12,324 | 888,437 |
| Mohawk Industries, Inc. * | 20,577 | 2,950,330 |
| Movado Group, Inc. | 5,167 | 134,600 |
| Newell Brands, Inc. | 126,923 | 2,407,729 |
| NIKE, Inc., Class B | 422,916 | 37,872,128 |
| NVR, Inc. * | 1,165 | 4,236,627 |
| Oxford Industries, Inc. | 5,331 | 367,093 |
| Polaris, Inc. | 19,417 | 1,915,487 |
| PulteGroup, Inc. | 88,003 | 3,453,238 |
| PVH Corp. | 24,887 | 2,169,151 |
| Ralph Lauren Corp. | 17,193 | 1,651,560 |
| Rocky Brands, Inc. | 1,800 | 50,058 |
| Skechers U.S.A., Inc., Class A * | 46,669 | 1,744,021 |
| Skyline Champion Corp. * | 16,024 | 452,358 |
| Sonos, Inc. * | 22,107 | 289,160 |
| Steven Madden Ltd. | 27,804 | 1,144,969 |
| Sturm, Ruger & Co., Inc. | 5,258 | 240,606 |
| Superior Group of Cos., Inc. | 3,200 | 46,304 |
| Tapestry, Inc. | 97,658 | 2,525,436 |
| Taylor Morrison Home Corp. * | 36,816 | 922,241 |
| Tempur Sealy International, Inc. * | 15,525 | 1,411,999 |
| The Lovesac Co. * | 1,800 | 29,394 |
| Toll Brothers, Inc. | 44,285 | 1,761,214 |
| TopBuild Corp. * | 11,848 | 1,231,363 |
| TRI Pointe Group, Inc. * | 51,826 | 815,741 |
| Tupperware Brands Corp. | 14,971 | 144,171 |
| Turtle Beach Corp. *(a) | 2,910 | 31,661 |
| Under Armour, Inc., Class A * | 62,761 | 1,296,015 |
| Under Armour, Inc., Class C * | 64,286 | 1,189,291 |
| Unifi, Inc. * | 4,248 | 115,970 |
| Universal Electronics, Inc. * | 4,081 | 212,702 |
| Vera Bradley, Inc. * | 5,909 | 63,581 |
| VF Corp. | 111,244 | 9,154,269 |
| Vista Outdoor, Inc. * | 17,574 | 117,746 |
| Vuzix Corp. *(a) | 7,800 | 18,720 |
| Whirlpool Corp. | 21,400 | 3,255,368 |
| William Lyon Homes, Class A * | 9,666 | 187,037 |
| Wolverine World Wide, Inc. | 30,060 | 892,181 |
| YETI Holdings, Inc. *(a) | 6,721 | 223,876 |
| ZAGG, Inc. * | 8,000 | 58,960 |
| | | 139,538,330 |
| |
| Consumer Services 2.2% |
| Adtalem Global Education, Inc. * | 18,133 | 540,001 |
| American Public Education, Inc. * | 5,600 | 121,632 |
| Aramark | 82,509 | 3,610,594 |
| Aspen Group, Inc. * | 4,985 | 31,156 |
| BBX Capital Corp. | 20,416 | 91,260 |
| BJ's Restaurants, Inc. | 6,241 | 247,081 |
| Bloomin' Brands, Inc. | 28,402 | 562,644 |
| Bluegreen Vacations Corp. | 2,223 | 21,363 |
| Boyd Gaming Corp. | 25,952 | 707,192 |
| Bright Horizons Family Solutions, Inc. * | 19,474 | 2,892,278 |
| Brinker International, Inc. | 12,650 | 562,293 |
| Caesars Entertainment Corp. * | 185,580 | 2,278,922 |
| Career Education Corp. * | 25,565 | 362,000 |
| Carnival Corp. | 136,025 | 5,834,112 |
| Carriage Services, Inc. | 6,911 | 178,027 |
| Carrols Restaurant Group, Inc. * | 10,038 | 71,571 |
| Century Casinos, Inc. * | 7,935 | 58,640 |
| Chegg, Inc. * | 38,678 | 1,185,867 |
| Security | Number
of Shares | Value ($) |
| Chipotle Mexican Grill, Inc. * | 8,659 | 6,738,087 |
| Choice Hotels International, Inc. | 10,703 | 947,001 |
| Churchill Downs, Inc. | 11,732 | 1,525,043 |
| Chuy's Holdings, Inc. * | 5,160 | 125,749 |
| Collectors Universe, Inc. | 2,500 | 71,650 |
| Cracker Barrel Old Country Store, Inc. | 8,065 | 1,254,108 |
| Darden Restaurants, Inc. | 41,397 | 4,647,641 |
| Dave & Buster's Entertainment, Inc. | 11,742 | 467,097 |
| Del Taco Restaurants, Inc. * | 10,395 | 79,366 |
| Denny's Corp. * | 21,100 | 424,532 |
| Dine Brands Global, Inc. | 5,538 | 405,105 |
| Domino's Pizza, Inc. | 13,845 | 3,760,579 |
| Drive Shack, Inc. * | 17,215 | 68,688 |
| Dunkin' Brands Group, Inc. | 27,664 | 2,174,944 |
| El Pollo Loco Holdings, Inc. * | 6,221 | 72,288 |
| Eldorado Resorts, Inc. * | 21,543 | 964,480 |
| Everi Holdings, Inc. * | 27,873 | 280,402 |
| Extended Stay America, Inc. | 60,722 | 862,860 |
| Fiesta Restaurant Group, Inc. * | 7,980 | 68,588 |
| frontdoor, Inc. * | 29,034 | 1,400,310 |
| Golden Entertainment, Inc. * | 6,136 | 88,849 |
| Graham Holdings Co., Class B | 1,451 | 913,637 |
| Grand Canyon Education, Inc. * | 16,295 | 1,498,488 |
| H&R Block, Inc. | 67,923 | 1,697,396 |
| Hilton Grand Vacations, Inc. * | 28,105 | 976,087 |
| Hilton Worldwide Holdings, Inc. | 97,291 | 9,433,335 |
| Houghton Mifflin Harcourt Co. * | 37,061 | 239,414 |
| Hyatt Hotels Corp., Class A | 13,340 | 997,032 |
| Inspired Entertainment, Inc. * | 6,626 | 48,701 |
| J Alexander's Holdings, Inc. * | 6,429 | 62,040 |
| Jack in the Box, Inc. | 8,383 | 704,340 |
| K12, Inc. * | 12,100 | 239,459 |
| Las Vegas Sands Corp. | 113,641 | 7,027,559 |
| Laureate Education, Inc., Class A * | 35,961 | 555,777 |
| Lindblad Expeditions Holdings, Inc. * | 7,500 | 118,050 |
| Marriott International, Inc., Class A | 92,909 | 11,757,634 |
| Marriott Vacations Worldwide Corp. | 13,189 | 1,449,867 |
| McDonald's Corp. | 255,947 | 50,344,775 |
| MGM Resorts International | 178,781 | 5,095,259 |
| Monarch Casino & Resort, Inc. * | 5,782 | 249,725 |
| Nathan's Famous, Inc. | 842 | 64,076 |
| Noodles & Co. * | 12,000 | 63,960 |
| Norwegian Cruise Line Holdings Ltd. * | 73,850 | 3,748,626 |
| OneSpaWorld Holdings Ltd. * | 12,005 | 186,678 |
| Papa John's International, Inc.(a) | 7,000 | 409,850 |
| Penn National Gaming, Inc. * | 35,224 | 750,800 |
| Planet Fitness, Inc., Class A * | 28,383 | 1,806,862 |
| Playa Hotels & Resorts N.V. * | 16,595 | 138,402 |
| PlayAGS, Inc. * | 10,460 | 120,708 |
| Potbelly Corp. * | 7,813 | 33,205 |
| RCI Hospitality Holdings, Inc. | 2,500 | 46,875 |
| Red Lion Hotels Corp. * | 7,000 | 42,000 |
| Red Robin Gourmet Burgers, Inc. * | 3,624 | 110,532 |
| Red Rock Resorts, Inc., Class A | 25,517 | 555,760 |
| Regis Corp. * | 10,203 | 210,182 |
| Royal Caribbean Cruises Ltd. | 57,905 | 6,301,801 |
| Ruth's Hospitality Group, Inc. | 8,878 | 182,709 |
| Scientific Games Corp., Class A * | 17,505 | 419,945 |
| SeaWorld Entertainment, Inc. * | 13,437 | 355,006 |
| Select Interior Concepts, Inc., Class A * | 7,504 | 85,996 |
| Service Corp. International | 62,071 | 2,822,989 |
| ServiceMaster Global Holdings, Inc. * | 45,568 | 1,840,036 |
| Shake Shack, Inc., Class A * | 10,298 | 847,319 |
| Six Flags Entertainment Corp. | 26,328 | 1,110,778 |
| Starbucks Corp. | 403,790 | 34,144,482 |
| Strategic Education, Inc. | 7,306 | 898,857 |
| Target Hospitality Corp. * | 12,493 | 69,211 |
| Texas Roadhouse, Inc. | 22,890 | 1,293,285 |
Schwab Equity Index Funds | Annual Report
Schwab Total Stock Market Index Fund
Portfolio Holdings as of October 31, 2019 (continued)
| Security | Number
of Shares | Value ($) |
| The Cheesecake Factory, Inc. | 14,852 | 620,665 |
| The Habit Restaurants, Inc., Class A * | 6,100 | 64,111 |
| The Wendy's Co. | 61,459 | 1,301,702 |
| Twin River Worldwide Holdings, Inc. | 8,823 | 221,457 |
| Universal Technical Institute, Inc. * | 13,059 | 77,309 |
| Vail Resorts, Inc. | 13,820 | 3,211,353 |
| Wingstop, Inc. | 9,652 | 805,266 |
| WW International, Inc. * | 16,524 | 576,192 |
| Wyndham Destinations, Inc. | 33,136 | 1,537,842 |
| Wyndham Hotels & Resorts, Inc. | 33,142 | 1,788,674 |
| Wynn Resorts Ltd. | 32,673 | 3,964,542 |
| Yum! Brands, Inc. | 102,935 | 10,469,519 |
| | | 222,492,137 |
| |
| Diversified Financials 5.1% |
| Affiliated Managers Group, Inc. | 17,171 | 1,371,619 |
| AG Mortgage Investment Trust, Inc. | 14,385 | 224,981 |
| AGNC Investment Corp. | 182,081 | 3,104,481 |
| Ally Financial, Inc. | 130,183 | 3,987,505 |
| American Express Co. | 229,474 | 26,912,711 |
| Ameriprise Financial, Inc. | 43,752 | 6,601,739 |
| Annaly Capital Management, Inc. | 494,222 | 4,438,114 |
| Anworth Mortgage Asset Corp. | 30,522 | 104,385 |
| Apollo Commercial Real Estate Finance, Inc. | 44,990 | 823,317 |
| Arbor Realty Trust, Inc. | 31,801 | 434,402 |
| Ares Commercial Real Estate Corp. | 10,752 | 166,656 |
| Ares Management Corp., Class A | 24,343 | 719,822 |
| Arlington Asset Investment Corp., Class A | 11,092 | 64,112 |
| ARMOUR Residential REIT, Inc. | 21,030 | 351,832 |
| Artisan Partners Asset Management, Inc., Class A | 18,701 | 511,472 |
| Ashford, Inc. * | 869 | 20,786 |
| Assetmark Financial Holdings, Inc. * | 4,688 | 128,639 |
| Associated Capital Group, Inc., Class A | 1,241 | 50,385 |
| AXA Equitable Holdings, Inc. | 99,784 | 2,155,334 |
| B. Riley Financial, Inc. | 6,039 | 169,998 |
| Berkshire Hathaway, Inc., Class B * | 661,732 | 140,670,989 |
| BGC Partners, Inc., Class A | 93,111 | 484,177 |
| BlackRock, Inc. | 39,538 | 18,254,695 |
| Blackstone Mortgage Trust, Inc., Class A | 44,745 | 1,624,243 |
| Blucora, Inc. * | 15,753 | 340,737 |
| BrightSphere Investment Group, Inc. * | 24,528 | 240,865 |
| Cannae Holdings, Inc. * | 23,093 | 674,316 |
| Capital One Financial Corp. | 159,919 | 14,912,447 |
| Capstead Mortgage Corp. | 28,021 | 216,602 |
| Cboe Global Markets, Inc. | 37,818 | 4,354,743 |
| Cherry Hill Mortgage Investment Corp. | 12,753 | 172,421 |
| Chimera Investment Corp. | 62,935 | 1,275,063 |
| CME Group, Inc. | 120,988 | 24,893,281 |
| Cohen & Steers, Inc. | 8,356 | 546,817 |
| Colony Credit Real Estate, Inc. | 30,690 | 439,788 |
| Cowen, Inc. * | 8,211 | 122,919 |
| Credit Acceptance Corp. * | 4,736 | 2,073,468 |
| Curo Group Holdings Corp. * | 6,544 | 91,551 |
| Diamond Hill Investment Group, Inc. | 1,017 | 143,255 |
| Discover Financial Services | 108,626 | 8,718,323 |
| Donnelley Financial Solutions, Inc. * | 9,665 | 109,214 |
| Dynex Capital, Inc. | 12,368 | 199,867 |
| E*TRADE Financial Corp. | 76,210 | 3,184,816 |
| Eaton Vance Corp. | 38,920 | 1,774,752 |
| Elevate Credit, Inc. * | 5,396 | 22,070 |
| Ellington Financial, Inc. | 11,129 | 204,996 |
| Ellington Residential Mortgage REIT | 2,688 | 29,219 |
| Encore Capital Group, Inc. * | 8,553 | 283,874 |
| Enova International, Inc. * | 10,313 | 242,252 |
| Security | Number
of Shares | Value ($) |
| Evercore, Inc., Class A | 13,443 | 989,942 |
| Exantas Capital Corp. | 9,433 | 110,932 |
| EZCORP, Inc., Class A * | 14,614 | 76,870 |
| FactSet Research Systems, Inc. | 13,026 | 3,302,351 |
| Federated Investors, Inc., Class B | 31,576 | 1,008,537 |
| FGL Holdings | 44,500 | 401,835 |
| FirstCash, Inc. | 14,065 | 1,186,945 |
| Focus Financial Partners, Inc., Class A * | 12,247 | 267,964 |
| Franklin Resources, Inc. | 94,503 | 2,603,558 |
| GAIN Capital Holdings, Inc. | 6,506 | 27,455 |
| GAMCO Investors, Inc., Class A | 2,351 | 37,052 |
| Granite Point Mortgage Trust, Inc. | 19,886 | 369,880 |
| Great Ajax Corp. | 5,000 | 78,250 |
| Great Elm Capital Group, Inc. * | 11,791 | 38,792 |
| Green Dot Corp., Class A * | 15,760 | 454,518 |
| Greenhill & Co., Inc. | 6,539 | 105,932 |
| Hamilton Lane, Inc., Class A | 8,909 | 531,155 |
| Houlihan Lokey, Inc. | 15,921 | 752,426 |
| Hunt Cos. Finance Trust, Inc. | 13,059 | 43,486 |
| Interactive Brokers Group, Inc., Class A | 25,219 | 1,199,668 |
| Intercontinental Exchange, Inc. | 188,919 | 17,818,840 |
| INTL. FCStone, Inc. * | 6,044 | 241,760 |
| Invesco Ltd. | 134,423 | 2,260,995 |
| Invesco Mortgage Capital, Inc. | 45,888 | 722,277 |
| Janus Henderson Group plc | 55,258 | 1,278,118 |
| Jefferies Financial Group, Inc. | 82,157 | 1,533,871 |
| KKR & Co., Inc., Class A | 187,210 | 5,397,264 |
| KKR Real Estate Finance Trust, Inc. | 8,629 | 173,011 |
| Ladder Capital Corp. | 36,027 | 622,186 |
| Ladenburg Thalmann Financial Services, Inc. | 36,436 | 82,345 |
| Lazard Ltd., Class A | 43,222 | 1,613,477 |
| Legg Mason, Inc. | 27,907 | 1,039,815 |
| LendingClub Corp. * | 30,093 | 380,376 |
| LPL Financial Holdings, Inc. | 27,937 | 2,258,427 |
| MarketAxess Holdings, Inc. | 12,776 | 4,709,106 |
| Marlin Business Services Corp. | 4,000 | 94,960 |
| MFA Financial, Inc. | 152,167 | 1,154,948 |
| Moelis & Co., Class A | 17,869 | 637,566 |
| Moody's Corp. | 54,760 | 12,084,984 |
| Morgan Stanley | 422,752 | 19,467,730 |
| Morningstar, Inc. | 6,910 | 1,118,314 |
| MSCI, Inc. | 28,413 | 6,664,553 |
| Nasdaq, Inc. | 39,059 | 3,896,916 |
| Navient Corp. | 69,259 | 953,696 |
| Nelnet, Inc., Class A | 6,877 | 421,354 |
| New Residential Investment Corp. | 139,113 | 2,203,550 |
| New York Mortgage Trust, Inc. | 76,002 | 475,773 |
| Northern Trust Corp. | 73,248 | 7,301,361 |
| On Deck Capital, Inc. * | 20,000 | 89,200 |
| OneMain Holdings, Inc. | 26,737 | 1,069,480 |
| Oppenheimer Holdings, Inc., Class A | 3,500 | 95,200 |
| Orchid Island Capital, Inc. | 30,714 | 171,077 |
| PennyMac Mortgage Investment Trust | 29,083 | 665,710 |
| Piper Jaffray Cos. | 4,986 | 391,600 |
| PJT Partners, Inc., Class A | 6,501 | 269,987 |
| PRA Group, Inc. * | 14,609 | 495,683 |
| Pzena Investment Management, Inc., Class A | 8,430 | 69,969 |
| Raymond James Financial, Inc. | 41,383 | 3,455,067 |
| Ready Capital Corp. | 8,683 | 137,452 |
| Redwood Trust, Inc. | 35,407 | 578,550 |
| Regional Management Corp. * | 3,000 | 86,790 |
| S&P Global, Inc. | 82,877 | 21,381,437 |
| Safeguard Scientifics, Inc. * | 7,000 | 79,170 |
| Santander Consumer USA Holdings, Inc. | 36,681 | 919,959 |
| Sculptor Capital Management, Inc. | 5,600 | 100,632 |
| SEI Investments Co. | 43,216 | 2,589,503 |
Schwab Equity Index Funds | Annual Report
Schwab Total Stock Market Index Fund
Portfolio Holdings as of October 31, 2019 (continued)
| Security | Number
of Shares | Value ($) |
| Siebert Financial Corp. *(a) | 3,682 | 33,028 |
| Silvercrest Asset Management Group, Inc., Class A | 3,213 | 38,620 |
| SLM Corp. | 142,528 | 1,202,936 |
| Starwood Property Trust, Inc. | 93,888 | 2,309,645 |
| State Street Corp. | 126,199 | 8,337,968 |
| Stifel Financial Corp. | 22,562 | 1,263,021 |
| Synchrony Financial | 207,866 | 7,352,220 |
| T. Rowe Price Group, Inc. | 79,857 | 9,247,441 |
| TD Ameritrade Holding Corp. | 90,362 | 3,468,094 |
| The Bank of New York Mellon Corp. | 289,093 | 13,515,098 |
| The Blackstone Group Inc | 224,134 | 11,914,963 |
| The Charles Schwab Corp.(b) | 391,184 | 15,925,101 |
| The Goldman Sachs Group, Inc. | 109,116 | 23,283,172 |
| TPG RE Finance Trust, Inc. | 16,170 | 327,119 |
| Tradeweb Markets, Inc. | 15,506 | 647,375 |
| Two Harbors Investment Corp. | 99,517 | 1,380,301 |
| Victory Capital Holdings, Inc., Class A | 3,900 | 60,684 |
| Virtu Financial, Inc., Class A | 26,912 | 456,428 |
| Virtus Investment Partners, Inc. | 2,646 | 287,038 |
| Voya Financial, Inc. | 46,304 | 2,498,564 |
| Waddell & Reed Financial, Inc., Class A | 25,984 | 430,295 |
| Western Asset Mortgage Capital Corp. | 15,107 | 151,674 |
| Westwood Holdings Group, Inc. | 2,653 | 80,200 |
| WisdomTree Investments, Inc. | 38,043 | 194,400 |
| World Acceptance Corp. * | 2,084 | 216,340 |
| | | 526,107,362 |
| |
| Energy 4.0% |
| Abraxas Petroleum Corp. * | 81,152 | 23,534 |
| Adams Resources & Energy, Inc. | 1,166 | 34,980 |
| Altus Midstream Co., Class A * | 17,889 | 39,356 |
| Antero Midstream Corp.(a) | 91,995 | 592,448 |
| Antero Resources Corp. * | 74,733 | 186,833 |
| Apache Corp. | 127,078 | 2,752,509 |
| Apergy Corp. * | 26,919 | 677,551 |
| Arch Coal, Inc., Class A | 5,290 | 417,328 |
| Archrock, Inc. | 39,936 | 384,983 |
| Aspen Aerogels, Inc. * | 6,261 | 36,502 |
| Baker Hughes Co. | 217,079 | 4,645,491 |
| Basic Energy Services, Inc. * | 6,128 | 3,493 |
| Berry Petroleum Corp. | 15,620 | 146,672 |
| Bonanza Creek Energy, Inc. * | 5,626 | 100,255 |
| Brigham Minerals, Inc., Class A | 5,000 | 95,450 |
| Cabot Oil & Gas Corp. | 140,252 | 2,614,297 |
| Cactus, Inc., Class A * | 15,987 | 475,134 |
| California Resources Corp. *(a) | 16,680 | 93,241 |
| Callon Petroleum Co. * | 83,244 | 316,327 |
| CARBO Ceramics, Inc. * | 6,353 | 9,212 |
| Carrizo Oil & Gas, Inc. * | 27,793 | 204,556 |
| Centennial Resource Development, Inc., Class A * | 64,330 | 218,722 |
| Cheniere Energy, Inc. * | 80,547 | 4,957,668 |
| Chesapeake Energy Corp. *(a) | 394,199 | 528,227 |
| Chevron Corp. | 640,939 | 74,438,655 |
| Cimarex Energy Co. | 33,379 | 1,409,261 |
| Clean Energy Fuels Corp. * | 36,000 | 81,000 |
| CNX Resources Corp. * | 70,542 | 594,669 |
| Comstock Resources, Inc. *(a) | 6,806 | 46,553 |
| Concho Resources, Inc. | 67,676 | 4,569,484 |
| ConocoPhillips | 374,871 | 20,692,879 |
| CONSOL Energy, Inc. * | 8,270 | 109,412 |
| Contango Oil & Gas Co. * | 14,038 | 34,955 |
| Continental Resources, Inc. * | 28,202 | 831,113 |
| Contura Energy, Inc. * | 6,988 | 160,305 |
| Core Laboratories N.V. | 13,970 | 615,239 |
| CVR Energy, Inc. | 10,411 | 493,690 |
| Security | Number
of Shares | Value ($) |
| Dawson Geophysical Co. * | 14,633 | 35,119 |
| Delek US Holdings, Inc. | 26,175 | 1,045,691 |
| Denbury Resources, Inc. * | 137,039 | 136,779 |
| Devon Energy Corp. | 135,553 | 2,749,015 |
| Diamond Offshore Drilling, Inc. * | 27,749 | 146,792 |
| Diamond S Shipping, Inc. * | 8,382 | 122,377 |
| Diamondback Energy, Inc. | 54,798 | 4,699,476 |
| DMC Global, Inc. | 4,394 | 196,588 |
| Dorian LPG Ltd. * | 11,000 | 136,950 |
| Dril-Quip, Inc. * | 13,403 | 549,791 |
| Earthstone Energy, Inc., Class A * | 5,613 | 21,778 |
| EOG Resources, Inc. | 196,406 | 13,612,900 |
| EQT Corp. | 84,261 | 904,963 |
| Equitrans Midstream Corp. | 66,172 | 921,114 |
| Era Group, Inc. * | 6,921 | 66,926 |
| Evolution Petroleum Corp. | 8,679 | 48,776 |
| Exterran Corp. * | 9,906 | 125,509 |
| Extraction Oil & Gas, Inc. *(a) | 30,147 | 51,250 |
| Exxon Mobil Corp. | 1,428,886 | 96,549,827 |
| Falcon Minerals Corp. | 13,000 | 80,080 |
| Forum Energy Technologies, Inc. * | 33,550 | 38,918 |
| Frank's International N.V. * | 42,473 | 208,118 |
| FTS International, Inc. * | 9,805 | 14,904 |
| Geospace Technologies Corp. * | 7,458 | 108,812 |
| Goodrich Petroleum Corp. * | 3,169 | 30,517 |
| Green Plains, Inc. | 13,339 | 164,470 |
| Gulf Island Fabrication, Inc. * | 4,500 | 23,580 |
| Gulfport Energy Corp. * | 53,493 | 148,978 |
| Hallador Energy Co. | 8,706 | 29,296 |
| Halliburton Co. | 300,824 | 5,790,862 |
| Helix Energy Solutions Group, Inc. * | 52,600 | 451,834 |
| Helmerich & Payne, Inc. | 36,341 | 1,362,787 |
| Hess Corp. | 86,741 | 5,703,221 |
| Hi-Crush, Inc. * | 48,197 | 57,354 |
| HighPoint Resources Corp. * | 33,805 | 35,833 |
| HollyFrontier Corp. | 50,627 | 2,781,447 |
| Independence Contract Drilling, Inc. * | 11,500 | 10,235 |
| International Seaways, Inc. * | 8,633 | 217,034 |
| ION Geophysical Corp. * | 3,676 | 34,665 |
| Jagged Peak Energy, Inc. * | 18,587 | 131,782 |
| Kinder Morgan, Inc. | 656,262 | 13,112,115 |
| KLX Energy Services Holdings, Inc. * | 8,644 | 68,633 |
| Kosmos Energy Ltd. | 123,816 | 767,659 |
| Laredo Petroleum, Inc. * | 45,079 | 106,386 |
| Liberty Oilfield Services, Inc., Class A | 16,890 | 155,557 |
| Lilis Energy, Inc. * | 28,432 | 6,255 |
| Lonestar Resources US, Inc., Class A * | 6,800 | 16,320 |
| Magnolia Oil & Gas Corp., Class A * | 34,040 | 334,273 |
| Mammoth Energy Services, Inc. | 4,000 | 6,400 |
| Marathon Oil Corp. | 269,099 | 3,102,711 |
| Marathon Petroleum Corp. | 223,452 | 14,289,755 |
| Matador Resources Co. * | 33,967 | 472,481 |
| Matrix Service Co. * | 8,000 | 150,080 |
| McDermott International, Inc. *(a) | 64,061 | 104,419 |
| Montage Resources Corp. * | 2,898 | 13,099 |
| Murphy Oil Corp. | 50,267 | 1,037,008 |
| Nabors Industries Ltd. | 129,406 | 239,401 |
| NACCO Industries, Inc., Class A | 1,900 | 95,950 |
| National Oilwell Varco, Inc. | 129,302 | 2,924,811 |
| Natural Gas Services Group, Inc. * | 4,213 | 50,093 |
| NCS Multistage Holdings, Inc. * | 4,000 | 9,000 |
| Newpark Resources, Inc. * | 27,584 | 165,504 |
| NexTier Oilfield Solutions, Inc. * | 55,547 | 239,961 |
| Nine Energy Service, Inc. * | 4,359 | 24,628 |
| Noble Corp. plc * | 107,107 | 131,742 |
| Noble Energy, Inc. | 159,510 | 3,072,163 |
| Northern Oil & Gas, Inc. * | 84,525 | 165,669 |
| Oasis Petroleum, Inc. * | 98,252 | 256,438 |
Schwab Equity Index Funds | Annual Report
Schwab Total Stock Market Index Fund
Portfolio Holdings as of October 31, 2019 (continued)
| Security | Number
of Shares | Value ($) |
| Occidental Petroleum Corp. | 302,306 | 12,243,393 |
| Oceaneering International, Inc. * | 31,277 | 442,882 |
| Oil States International, Inc. * | 18,469 | 263,553 |
| ONEOK, Inc. | 140,891 | 9,838,419 |
| Overseas Shipholding Group, Inc., Class A * | 18,500 | 30,155 |
| Pacific Ethanol, Inc. * | 22,969 | 12,702 |
| Panhandle Oil & Gas, Inc., Class A | 6,200 | 87,978 |
| Par Pacific Holdings, Inc. * | 12,907 | 292,344 |
| Parsley Energy, Inc., Class A | 100,332 | 1,586,249 |
| Patterson-UTI Energy, Inc. | 74,009 | 615,755 |
| PBF Energy, Inc., Class A | 34,678 | 1,119,406 |
| PDC Energy, Inc. * | 20,165 | 402,292 |
| Peabody Energy Corp. | 27,434 | 288,880 |
| Penn Virginia Corp. * | 3,770 | 89,726 |
| Phillips 66 | 151,219 | 17,665,404 |
| Pioneer Natural Resources Co. | 56,057 | 6,896,132 |
| ProPetro Holding Corp. * | 24,021 | 186,163 |
| QEP Resources, Inc. | 77,176 | 256,996 |
| Range Resources Corp. | 66,553 | 268,209 |
| Renewable Energy Group, Inc. * | 11,517 | 188,188 |
| REX American Resources Corp. * | 1,646 | 133,194 |
| Ring Energy, Inc. * | 20,681 | 34,330 |
| Roan Resources, Inc. * | 11,000 | 16,500 |
| RPC, Inc. | 17,418 | 72,111 |
| SandRidge Energy, Inc. * | 8,633 | 37,813 |
| Schlumberger Ltd. | 466,686 | 15,255,965 |
| SEACOR Holdings, Inc. * | 7,085 | 304,017 |
| SEACOR Marine Holdings, Inc. * | 4,876 | 63,437 |
| Select Energy Services, Inc., Class A * | 17,554 | 133,410 |
| SemGroup Corp., Class A | 26,100 | 420,210 |
| SilverBow Resources, Inc. * | 1,839 | 14,528 |
| SM Energy Co. | 35,926 | 281,660 |
| Solaris Oilfield Infrastructure, Inc., Class A | 14,882 | 158,344 |
| Southwestern Energy Co. * | 193,835 | 397,362 |
| SRC Energy, Inc. * | 85,339 | 266,258 |
| Talos Energy, Inc. * | 7,627 | 164,209 |
| Targa Resources Corp. | 78,567 | 3,054,685 |
| TechnipFMC plc | 141,297 | 2,787,790 |
| Tellurian, Inc. *(a) | 28,096 | 223,925 |
| TETRA Technologies, Inc. * | 33,023 | 56,139 |
| The Williams Cos., Inc. | 413,713 | 9,229,937 |
| Tidewater, Inc. * | 12,517 | 203,151 |
| Torchlight Energy Resources, Inc. * | 33,032 | 28,408 |
| Transocean Ltd. * | 195,370 | 928,008 |
| U.S. Well Services, Inc. * | 10,920 | 20,857 |
| Unit Corp. * | 17,972 | 36,663 |
| Uranium Energy Corp. * | 39,550 | 37,458 |
| US Silica Holdings, Inc. | 23,982 | 106,960 |
| VAALCO Energy, Inc. * | 20,055 | 39,909 |
| Valaris plc * | 68,457 | 281,358 |
| Valero Energy Corp. | 140,175 | 13,594,171 |
| W&T Offshore, Inc. * | 25,000 | 100,750 |
| Whiting Petroleum Corp. * | 32,291 | 204,725 |
| World Fuel Services Corp. | 22,400 | 935,648 |
| WPX Energy, Inc. * | 142,630 | 1,423,447 |
| | | 408,119,006 |
| |
| Food & Staples Retailing 1.4% |
| BJ's Wholesale Club Holdings, Inc. * | 40,545 | 1,082,551 |
| Casey's General Stores, Inc. | 12,422 | 2,121,802 |
| Costco Wholesale Corp. | 148,326 | 44,069,138 |
| Grocery Outlet Holding Corp. * | 10,391 | 331,473 |
| Ingles Markets, Inc., Class A | 4,200 | 165,606 |
| Natural Grocers by Vitamin Cottage, Inc. * | 2,400 | 21,048 |
| Security | Number
of Shares | Value ($) |
| Performance Food Group Co. * | 35,573 | 1,515,766 |
| PriceSmart, Inc. | 7,280 | 539,448 |
| Rite Aid Corp. *(a) | 19,024 | 175,021 |
| SpartanNash, Co. | 10,256 | 134,302 |
| Sprouts Farmers Market, Inc. * | 40,062 | 777,603 |
| Sysco Corp. | 172,902 | 13,809,683 |
| The Andersons, Inc. | 12,706 | 234,045 |
| The Chefs' Warehouse, Inc. * | 9,323 | 308,824 |
| The Kroger Co. | 270,968 | 6,676,652 |
| U.S. Foods Holding Corp. * | 75,322 | 2,988,024 |
| United Natural Foods, Inc. * | 18,511 | 138,832 |
| Village Super Market, Inc., Class A | 3,931 | 104,171 |
| Walgreens Boots Alliance, Inc. | 257,294 | 14,094,565 |
| Walmart, Inc. | 479,409 | 56,215,499 |
| Weis Markets, Inc. | 6,977 | 268,545 |
| | | 145,772,598 |
| |
| Food, Beverage & Tobacco 3.5% |
| 22nd Century Group, Inc. *(a) | 28,273 | 53,436 |
| Alico, Inc. | 475 | 15,604 |
| Altria Group, Inc. | 630,334 | 28,232,660 |
| Archer-Daniels-Midland Co. | 188,650 | 7,930,846 |
| B&G Foods, Inc.(a) | 20,423 | 317,578 |
| Beyond Meat, Inc. *(a) | 3,416 | 288,481 |
| Brown-Forman Corp., Class A | 18,730 | 1,164,069 |
| Brown-Forman Corp., Class B | 60,831 | 3,985,647 |
| Bunge Ltd. | 48,069 | 2,595,726 |
| Cal-Maine Foods, Inc. | 10,307 | 411,146 |
| Calavo Growers, Inc. | 5,260 | 456,200 |
| Campbell Soup Co. | 56,521 | 2,617,488 |
| Celsius Holdings, Inc. *(a) | 12,799 | 45,052 |
| Coca-Cola Consolidated, Inc. | 1,426 | 391,237 |
| ConAgra Brands, Inc. | 163,617 | 4,425,840 |
| Constellation Brands, Inc., Class A | 56,943 | 10,837,961 |
| Craft Brew Alliance, Inc. * | 3,000 | 21,870 |
| Darling Ingredients, Inc. * | 54,643 | 1,054,610 |
| Dean Foods Co. | 52,659 | 51,606 |
| Farmer Brothers Co. * | 4,500 | 57,735 |
| Flowers Foods, Inc. | 64,495 | 1,400,831 |
| Fresh Del Monte Produce, Inc. | 11,734 | 374,315 |
| Freshpet, Inc. * | 10,053 | 525,370 |
| General Mills, Inc. | 204,149 | 10,383,018 |
| Hormel Foods Corp. | 94,052 | 3,845,786 |
| Hostess Brands, Inc. * | 38,002 | 485,666 |
| Ingredion, Inc. | 22,212 | 1,754,748 |
| J&J Snack Foods Corp. | 4,866 | 928,238 |
| John B. Sanfilippo & Son, Inc. | 3,617 | 383,836 |
| Kellogg Co. | 84,934 | 5,395,857 |
| Keurig Dr Pepper, Inc. | 90,653 | 2,552,788 |
| Lamb Weston Holdings, Inc. | 49,833 | 3,888,967 |
| Lancaster Colony Corp. | 6,637 | 923,738 |
| Landec Corp. * | 9,100 | 89,635 |
| Limoneira Co. | 4,500 | 85,140 |
| McCormick & Co., Inc. - Non Voting Shares | 41,555 | 6,677,473 |
| MGP Ingredients, Inc. | 4,637 | 198,881 |
| Molson Coors Brewing Co., Class B | 64,826 | 3,417,627 |
| Mondelez International, Inc., Class A | 485,106 | 25,443,810 |
| Monster Beverage Corp. * | 129,705 | 7,280,342 |
| National Beverage Corp.(a) | 4,003 | 175,972 |
| New Age Beverages Corp. *(a) | 25,010 | 67,277 |
| PepsiCo, Inc. | 471,435 | 64,666,739 |
| Philip Morris International, Inc. | 525,352 | 42,784,667 |
| Pilgrim's Pride Corp. * | 17,681 | 536,795 |
| Post Holdings, Inc. * | 22,968 | 2,363,407 |
| Primo Water Corp. * | 10,121 | 122,413 |
| Pyxus International, Inc. * | 5,438 | 62,102 |
Schwab Equity Index Funds | Annual Report
Schwab Total Stock Market Index Fund
Portfolio Holdings as of October 31, 2019 (continued)
| Security | Number
of Shares | Value ($) |
| RiceBran Technologies * | 12,444 | 36,088 |
| Sanderson Farms, Inc. | 6,501 | 1,006,420 |
| Seaboard Corp. | 95 | 400,814 |
| Seneca Foods Corp., Class A * | 2,000 | 70,760 |
| The Alkaline Water Co., Inc. *(a) | 16,336 | 21,237 |
| The Boston Beer Co., Inc., Class A * | 3,128 | 1,171,311 |
| The Coca-Cola Co. | 1,298,326 | 70,667,884 |
| The Hain Celestial Group, Inc. * | 29,151 | 689,130 |
| The Hershey Co. | 50,058 | 7,352,018 |
| The JM Smucker Co. | 38,909 | 4,111,903 |
| The Kraft Heinz Co. | 212,718 | 6,877,173 |
| The Simply Good Foods Co. * | 31,186 | 765,304 |
| Tootsie Roll Industries, Inc. | 5,933 | 203,383 |
| TreeHouse Foods, Inc. * | 18,275 | 987,215 |
| Turning Point Brands, Inc. | 2,757 | 57,539 |
| Tyson Foods, Inc., Class A | 99,647 | 8,249,775 |
| Universal Corp. | 9,019 | 494,241 |
| Vector Group Ltd. | 41,360 | 504,592 |
| | | 355,437,017 |
| |
| Health Care Equipment & Services 6.1% |
| Abbott Laboratories | 597,438 | 49,951,791 |
| ABIOMED, Inc. * | 15,238 | 3,163,104 |
| Acadia Healthcare Co., Inc. * | 29,166 | 874,688 |
| Accuray, Inc. * | 28,423 | 73,900 |
| Addus HomeCare Corp. * | 4,546 | 382,819 |
| Align Technology, Inc. * | 24,475 | 6,174,798 |
| Allscripts Healthcare Solutions, Inc. * | 53,720 | 587,697 |
| Alphatec Holdings, Inc. * | 17,902 | 123,166 |
| Amedisys, Inc. * | 10,726 | 1,378,506 |
| American Renal Associates Holdings, Inc. * | 4,023 | 33,471 |
| AmerisourceBergen Corp. | 50,978 | 4,352,502 |
| AMN Healthcare Services, Inc. * | 15,960 | 937,810 |
| AngioDynamics, Inc. * | 11,450 | 175,185 |
| Antares Pharma, Inc. * | 62,307 | 209,352 |
| Anthem, Inc. | 86,667 | 23,320,356 |
| Apollo Medical Holdings, Inc. *(a) | 6,700 | 100,299 |
| Apyx Medical Corp. * | 8,600 | 56,760 |
| AtriCure, Inc. * | 12,275 | 326,392 |
| Atrion Corp. | 475 | 400,629 |
| Avanos Medical, Inc. * | 17,115 | 753,745 |
| AxoGen, Inc. * | 11,943 | 148,511 |
| Axonics Modulation Technologies, Inc. * | 2,812 | 69,513 |
| Baxter International, Inc. | 172,937 | 13,264,268 |
| Becton, Dickinson & Co. | 91,491 | 23,421,696 |
| BioLife Solutions, Inc. * | 2,800 | 47,628 |
| BioSig Technologies, Inc. *(a) | 8,008 | 53,093 |
| BioTelemetry, Inc. * | 10,678 | 420,286 |
| Boston Scientific Corp. * | 470,477 | 19,618,891 |
| Brookdale Senior Living, Inc. * | 69,175 | 508,436 |
| Cantel Medical Corp. | 12,347 | 899,973 |
| Capital Senior Living Corp. * | 22,888 | 94,070 |
| Cardinal Health, Inc. | 100,592 | 4,974,274 |
| Cardiovascular Systems, Inc. * | 13,266 | 590,602 |
| Castlight Health, Inc., Class B * | 20,805 | 31,416 |
| Catasys, Inc. *(a) | 2,607 | 40,695 |
| Centene Corp. * | 138,598 | 7,356,782 |
| Cerner Corp. | 107,463 | 7,212,917 |
| Cerus Corp. * | 45,797 | 199,217 |
| Change Healthcare, Inc. * | 16,492 | 218,024 |
| Chembio Diagnostics, Inc. * | 7,487 | 40,055 |
| Chemed Corp. | 5,525 | 2,176,353 |
| Cigna Corp. * | 127,511 | 22,755,613 |
| Community Health Systems, Inc. * | 34,809 | 123,224 |
| Computer Programs & Systems, Inc. | 3,700 | 85,359 |
| ConforMIS, Inc. * | 21,969 | 41,961 |
| Security | Number
of Shares | Value ($) |
| CONMED Corp. | 9,398 | 1,033,968 |
| CorVel Corp. * | 3,002 | 237,518 |
| Covetrus, Inc. * | 30,651 | 303,905 |
| Cross Country Healthcare, Inc. * | 14,856 | 160,593 |
| CryoLife, Inc. * | 12,053 | 270,590 |
| CryoPort, Inc. * | 14,093 | 197,725 |
| Cutera, Inc. * | 4,219 | 132,899 |
| CVS Health Corp. | 439,923 | 29,206,488 |
| CytoSorbents Corp. * | 15,802 | 75,060 |
| Danaher Corp. | 215,937 | 29,760,437 |
| DaVita, Inc. * | 32,387 | 1,897,878 |
| DENTSPLY SIRONA, Inc. | 74,929 | 4,104,611 |
| DexCom, Inc. * | 30,636 | 4,725,297 |
| Diplomat Pharmacy, Inc. * | 16,723 | 90,973 |
| Edwards Lifesciences Corp. * | 70,561 | 16,820,331 |
| Ekso Bionics Holdings, Inc. * | 21,090 | 13,709 |
| Encompass Health Corp. | 32,917 | 2,107,346 |
| Endologix, Inc. * | 7,640 | 18,718 |
| Enzo Biochem, Inc. * | 13,471 | 42,568 |
| Evolent Health, Inc., Class A * | 21,273 | 162,100 |
| FONAR Corp. * | 1,870 | 38,017 |
| Genesis Healthcare, Inc. * | 32,553 | 41,668 |
| GenMark Diagnostics, Inc. * | 16,600 | 93,126 |
| Glaukos Corp. * | 11,751 | 750,066 |
| Globus Medical, Inc., Class A * | 25,743 | 1,348,161 |
| Guardant Health, Inc. * | 13,977 | 971,402 |
| Haemonetics Corp. * | 17,151 | 2,070,640 |
| Hanger, Inc. * | 13,820 | 312,470 |
| HCA Healthcare, Inc. | 90,356 | 12,066,140 |
| Health Catalyst, Inc. * | 3,066 | 98,603 |
| HealthEquity, Inc. * | 23,151 | 1,314,745 |
| HealthStream, Inc. * | 7,648 | 214,603 |
| Helius Medical Technologies, Inc. *(a) | 4,659 | 6,895 |
| Henry Schein, Inc. * | 49,791 | 3,116,170 |
| Heska Corp. * | 2,364 | 191,531 |
| Hill-Rom Holdings, Inc. | 22,070 | 2,310,508 |
| HMS Holdings Corp. * | 29,159 | 953,208 |
| Hologic, Inc. * | 88,790 | 4,289,445 |
| HTG Molecular Diagnostics, Inc. * | 18,640 | 17,730 |
| Humana, Inc. | 45,694 | 13,443,175 |
| ICU Medical, Inc. * | 6,547 | 1,058,061 |
| IDEXX Laboratories, Inc. * | 28,923 | 8,243,344 |
| Inogen, Inc. * | 5,839 | 317,846 |
| Inovalon Holdings, Inc., Class A * | 22,744 | 355,489 |
| Inspire Medical Systems, Inc. * | 4,371 | 266,544 |
| Insulet Corp. * | 20,610 | 2,995,045 |
| Integer Holdings Corp. * | 10,644 | 824,271 |
| Integra LifeSciences Holdings Corp. * | 23,714 | 1,376,835 |
| IntriCon Corp. * | 4,256 | 88,014 |
| Intuitive Surgical, Inc. * | 38,885 | 21,501,461 |
| Invacare Corp. | 9,218 | 71,163 |
| iRadimed Corp. * | 1,334 | 33,684 |
| iRhythm Technologies, Inc. * | 9,107 | 608,530 |
| Laboratory Corp. of America Holdings * | 33,172 | 5,465,750 |
| Lantheus Holdings, Inc. * | 15,270 | 318,380 |
| LeMaitre Vascular, Inc. | 7,388 | 255,625 |
| LHC Group, Inc. * | 9,623 | 1,067,864 |
| LivaNova plc * | 16,277 | 1,151,272 |
| Livongo Health, Inc. *(a) | 5,021 | 108,403 |
| Magellan Health, Inc. * | 6,957 | 451,509 |
| Masimo Corp. * | 16,585 | 2,417,927 |
| McKesson Corp. | 62,370 | 8,295,210 |
| MEDNAX, Inc. * | 29,765 | 653,639 |
| Medtronic plc | 452,799 | 49,309,811 |
| Meridian Bioscience, Inc. | 17,657 | 172,862 |
| Merit Medical Systems, Inc. * | 17,753 | 366,688 |
| Mesa Laboratories, Inc. | 1,318 | 300,175 |
| Misonix, Inc. * | 2,200 | 38,170 |
Schwab Equity Index Funds | Annual Report
Schwab Total Stock Market Index Fund
Portfolio Holdings as of October 31, 2019 (continued)
| Security | Number
of Shares | Value ($) |
| Molina Healthcare, Inc. * | 20,928 | 2,461,970 |
| National HealthCare Corp. | 3,965 | 325,844 |
| National Research Corp., Class A | 3,945 | 226,561 |
| Natus Medical, Inc. * | 13,282 | 447,338 |
| Neogen Corp. * | 18,220 | 1,185,393 |
| Neuronetics, Inc. * | 8,872 | 79,050 |
| Nevro Corp. * | 10,264 | 884,757 |
| NextGen Healthcare, Inc. * | 16,383 | 276,955 |
| NuVasive, Inc. * | 17,797 | 1,255,400 |
| Nuvectra Corp. * | 2,913 | 3,845 |
| Omnicell, Inc. * | 13,621 | 958,782 |
| OptimizeRx Corp. * | 3,035 | 39,455 |
| Option Care Health, Inc. * | 36,021 | 127,514 |
| OraSure Technologies, Inc. * | 17,275 | 147,529 |
| Orthofix Medical, Inc. * | 6,531 | 274,498 |
| OrthoPediatrics Corp. * | 4,422 | 171,043 |
| Owens & Minor, Inc. | 18,500 | 124,505 |
| Patterson Cos., Inc. | 31,422 | 538,259 |
| Pennant Group, Inc. * | 8,273 | 148,831 |
| Penumbra, Inc. * | 10,621 | 1,656,557 |
| PetIQ, Inc. * | 6,200 | 153,264 |
| Phreesia, Inc. * | 3,932 | 116,505 |
| Premier, Inc., Class A * | 21,426 | 698,059 |
| Psychemedics Corp. | 2,969 | 28,591 |
| Pulse Biosciences, Inc. *(a) | 3,000 | 42,240 |
| Quest Diagnostics, Inc. | 46,197 | 4,677,446 |
| Quidel Corp. * | 12,426 | 707,039 |
| Quorum Health Corp. * | 11,722 | 13,011 |
| R1 RCM, Inc. * | 30,270 | 321,770 |
| RadNet, Inc. * | 11,938 | 186,472 |
| ResMed, Inc. | 48,340 | 7,150,453 |
| Rockwell Medical, Inc. *(a) | 13,042 | 28,823 |
| RTI Surgical Holdings, Inc. * | 18,100 | 39,820 |
| SeaSpine Holdings Corp. * | 3,910 | 54,114 |
| Select Medical Holdings Corp. * | 39,462 | 718,998 |
| Senseonics Holdings, Inc. *(a) | 26,000 | 30,420 |
| Sensus Healthcare, Inc. * | 5,903 | 33,647 |
| Shockwave Medical, Inc. * | 2,225 | 75,695 |
| SI-BONE, Inc. * | 4,040 | 67,266 |
| Sientra, Inc. * | 21,100 | 135,673 |
| Silk Road Medical, Inc. * | 2,557 | 84,688 |
| Simulations Plus, Inc. | 3,188 | 112,887 |
| STAAR Surgical Co. * | 10,272 | 336,716 |
| Steris plc | 29,034 | 4,110,343 |
| Stryker Corp. | 108,487 | 23,462,484 |
| Surgery Partners, Inc. * | 5,591 | 44,448 |
| Surmodics, Inc. * | 4,200 | 199,542 |
| Tabula Rasa HealthCare, Inc. * | 5,870 | 299,018 |
| Tactile Systems Technology, Inc. * | 7,432 | 337,561 |
| Tandem Diabetes Care, Inc. * | 19,235 | 1,184,491 |
| Teladoc Health, Inc. * | 24,362 | 1,866,129 |
| Teleflex, Inc. | 15,645 | 5,435,229 |
| Tenet Healthcare Corp. * | 34,964 | 885,988 |
| The Cooper Cos., Inc. | 16,737 | 4,870,467 |
| The Ensign Group, Inc. | 16,546 | 699,069 |
| The Joint Corp. * | 3,340 | 63,694 |
| The Providence Service Corp. * | 3,302 | 210,899 |
| Tivity Health, Inc. * | 16,969 | 275,068 |
| TransEnterix, Inc. * | 54,700 | 12,483 |
| TransMedics Group, Inc. * | 3,680 | 66,019 |
| Triple-S Management Corp., Class B * | 6,987 | 105,713 |
| U.S. Physical Therapy, Inc. | 4,069 | 575,641 |
| UnitedHealth Group, Inc. | 320,267 | 80,931,471 |
| Universal Health Services, Inc., Class B | 27,780 | 3,818,639 |
| Utah Medical Products, Inc. | 1,365 | 139,872 |
| Vapotherm, Inc. * | 2,247 | 23,144 |
| Varex Imaging Corp. * | 11,819 | 354,688 |
| Varian Medical Systems, Inc. * | 30,601 | 3,696,907 |
| Security | Number
of Shares | Value ($) |
| Veeva Systems, Inc., Class A * | 43,764 | 6,207,048 |
| ViewRay, Inc. * | 19,429 | 50,515 |
| Vocera Communications, Inc. * | 10,583 | 210,813 |
| VolitionRX Ltd. *(a) | 15,384 | 85,843 |
| WellCare Health Plans, Inc. * | 16,854 | 4,998,896 |
| West Pharmaceutical Services, Inc. | 24,652 | 3,545,944 |
| Wright Medical Group N.V. * | 47,693 | 992,014 |
| Zimmer Biomet Holdings, Inc. | 70,076 | 9,686,605 |
| | | 627,488,784 |
| |
| Household & Personal Products 1.7% |
| Avon Products, Inc. * | 148,757 | 638,167 |
| Central Garden & Pet Co. * | 4,210 | 126,384 |
| Central Garden & Pet Co., Class A * | 13,239 | 374,399 |
| Church & Dwight Co., Inc. | 82,918 | 5,799,285 |
| Colgate-Palmolive Co. | 290,873 | 19,953,888 |
| Coty, Inc., Class A | 100,228 | 1,171,665 |
| Edgewell Personal Care Co. * | 18,438 | 645,330 |
| elf Beauty, Inc. * | 7,500 | 126,000 |
| Energizer Holdings, Inc. | 20,781 | 882,985 |
| Herbalife Nutrition Ltd. * | 31,964 | 1,427,832 |
| Inter Parfums, Inc. | 5,613 | 434,615 |
| Kimberly-Clark Corp. | 115,964 | 15,409,296 |
| Lifevantage Corp. * | 5,280 | 71,597 |
| Medifast, Inc. | 3,897 | 432,333 |
| Natural Health Trends Corp. | 2,166 | 14,664 |
| Nature's Sunshine Products, Inc. * | 5,329 | 50,306 |
| Nu Skin Enterprises, Inc., Class A | 18,865 | 841,002 |
| Oil-Dri Corp. of America | 1,600 | 56,016 |
| Revlon, Inc., Class A *(a) | 3,255 | 85,574 |
| Spectrum Brands Holdings, Inc. | 15,073 | 756,815 |
| The Clorox Co. | 42,517 | 6,279,336 |
| The Estee Lauder Cos., Inc., Class A | 74,886 | 13,949,015 |
| The Procter & Gamble Co. | 845,185 | 105,233,984 |
| USANA Health Sciences, Inc. * | 4,945 | 366,474 |
| WD-40 Co. | 4,489 | 841,239 |
| | | 175,968,201 |
| |
| Insurance 2.6% |
| Aflac, Inc. | 249,894 | 13,284,365 |
| Alleghany Corp. * | 4,909 | 3,820,626 |
| Ambac Financial Group, Inc. * | 18,544 | 380,152 |
| American Equity Investment Life Holding Co. | 29,147 | 719,348 |
| American Financial Group, Inc. | 25,423 | 2,645,009 |
| American International Group, Inc. | 292,888 | 15,511,348 |
| American National Insurance Co. | 3,761 | 451,245 |
| AMERISAFE, Inc. | 7,229 | 459,258 |
| Aon plc | 79,498 | 15,355,834 |
| Arch Capital Group Ltd. * | 135,456 | 5,656,643 |
| Argo Group International Holdings Ltd. | 11,607 | 718,125 |
| Arthur J. Gallagher & Co. | 62,283 | 5,681,455 |
| Assurant, Inc. | 20,716 | 2,611,666 |
| Assured Guaranty Ltd. | 32,878 | 1,542,636 |
| Athene Holding Ltd., Class A * | 41,312 | 1,790,875 |
| Axis Capital Holdings Ltd. | 28,405 | 1,688,109 |
| Brighthouse Financial, Inc. * | 37,570 | 1,418,643 |
| Brown & Brown, Inc. | 77,562 | 2,922,536 |
| Chubb Ltd. | 153,227 | 23,354,859 |
| Cincinnati Financial Corp. | 51,457 | 5,825,447 |
| Citizens, Inc. * | 22,044 | 146,813 |
| CNA Financial Corp. | 9,550 | 428,222 |
| CNO Financial Group, Inc. | 57,112 | 893,803 |
| Crawford & Co., Class A | 4,938 | 52,293 |
| Crawford & Co., Class B | 5,800 | 53,940 |
| Donegal Group, Inc., Class A | 5,782 | 85,111 |
Schwab Equity Index Funds | Annual Report
Schwab Total Stock Market Index Fund
Portfolio Holdings as of October 31, 2019 (continued)
| Security | Number
of Shares | Value ($) |
| eHealth, Inc. * | 6,602 | 455,802 |
| Employers Holdings, Inc. | 11,759 | 497,876 |
| Enstar Group Ltd. * | 4,837 | 971,753 |
| Erie Indemnity Co., Class A | 6,044 | 1,113,728 |
| Everest Re Group Ltd. | 13,635 | 3,505,422 |
| FBL Financial Group, Inc., Class A | 3,305 | 189,641 |
| FedNat Holding Co. | 4,085 | 58,620 |
| Fidelity National Financial, Inc. | 92,446 | 4,237,725 |
| First American Financial Corp. | 37,060 | 2,289,567 |
| Genworth Financial, Inc., Class A * | 174,782 | 748,067 |
| Global Indemnity Ltd. | 2,000 | 49,520 |
| Globe Life, Inc. | 33,417 | 3,252,477 |
| Goosehead Insurance, Inc., Class A | 4,956 | 253,648 |
| Greenlight Capital Re Ltd., Class A * | 12,115 | 130,842 |
| Hallmark Financial Services, Inc. * | 3,228 | 57,523 |
| HCI Group, Inc. | 2,926 | 123,038 |
| Health Insurance Innovations, Inc., Class A *(a) | 3,371 | 89,264 |
| Heritage Insurance Holdings, Inc. | 9,756 | 129,950 |
| Horace Mann Educators Corp. | 13,092 | 570,288 |
| Independence Holding Co. | 2,346 | 91,729 |
| Investors Title Co. | 416 | 63,107 |
| James River Group Holdings Ltd. | 9,426 | 337,545 |
| Kemper Corp. | 20,537 | 1,476,200 |
| Kingstone Cos., Inc. | 2,696 | 21,757 |
| Kinsale Capital Group, Inc. | 7,030 | 743,212 |
| Lincoln National Corp. | 68,460 | 3,866,621 |
| Loews Corp. | 87,784 | 4,301,416 |
| Maiden Holdings Ltd. * | 18,900 | 10,868 |
| Markel Corp. * | 4,673 | 5,472,083 |
| Marsh & McLennan Cos., Inc. | 171,035 | 17,722,647 |
| MBIA, Inc. * | 23,883 | 221,873 |
| Mercury General Corp. | 9,807 | 471,324 |
| MetLife, Inc. | 267,372 | 12,510,336 |
| National General Holdings Corp. | 21,670 | 462,004 |
| National Western Life Group, Inc., Class A | 964 | 262,786 |
| NI Holdings, Inc. * | 2,860 | 50,050 |
| Old Republic International Corp. | 96,450 | 2,154,693 |
| Palomar Holdings, Inc. * | 4,260 | 192,339 |
| Primerica, Inc. | 14,322 | 1,807,150 |
| Principal Financial Group, Inc. | 88,805 | 4,740,411 |
| ProAssurance Corp. | 18,940 | 742,827 |
| Protective Insurance Corp., Class B | 4,607 | 73,297 |
| Prudential Financial, Inc. | 135,402 | 12,340,538 |
| Reinsurance Group of America, Inc. | 21,112 | 3,430,067 |
| RenaissanceRe Holdings Ltd. | 14,847 | 2,779,061 |
| RLI Corp. | 13,764 | 1,339,512 |
| Safety Insurance Group, Inc. | 5,451 | 529,837 |
| Selective Insurance Group, Inc. | 20,690 | 1,430,093 |
| State Auto Financial Corp. | 5,500 | 181,995 |
| Stewart Information Services Corp. | 9,355 | 382,807 |
| The Allstate Corp. | 110,729 | 11,783,780 |
| The Hanover Insurance Group, Inc. | 13,250 | 1,745,157 |
| The Hartford Financial Services Group, Inc. | 122,198 | 6,975,062 |
| The Progressive Corp. | 197,779 | 13,785,196 |
| The Travelers Cos., Inc. | 87,538 | 11,472,730 |
| Third Point Reinsurance Ltd. * | 32,236 | 305,920 |
| Tiptree, Inc. | 7,504 | 55,154 |
| Trupanion, Inc. *(a) | 9,088 | 215,386 |
| United Fire Group, Inc. | 8,730 | 397,390 |
| United Insurance Holdings Corp. | 6,439 | 78,942 |
| Universal Insurance Holdings, Inc. | 9,563 | 259,253 |
| Unum Group | 71,355 | 1,965,117 |
| W. R. Berkley Corp. | 48,136 | 3,364,706 |
| Security | Number
of Shares | Value ($) |
| White Mountains Insurance Group Ltd. | 991 | 1,061,361 |
| Willis Towers Watson plc | 43,506 | 8,131,271 |
| | | 268,029,722 |
| |
| Materials 2.9% |
| Advanced Emissions Solutions, Inc. | 5,901 | 81,611 |
| AdvanSix, Inc. * | 8,959 | 203,907 |
| AgroFresh Solutions, Inc. * | 10,000 | 23,000 |
| Air Products & Chemicals, Inc. | 74,411 | 15,868,890 |
| AK Steel Holding Corp. * | 92,567 | 218,458 |
| Albemarle Corp. | 36,521 | 2,218,286 |
| Alcoa Corp. * | 64,376 | 1,338,377 |
| Allegheny Technologies, Inc. * | 40,422 | 849,266 |
| Amcor plc * | 549,011 | 5,226,585 |
| American Vanguard Corp. | 7,917 | 110,680 |
| Amyris, Inc. *(a) | 15,000 | 49,725 |
| AptarGroup, Inc. | 21,486 | 2,538,571 |
| Ashland Global Holdings, Inc. | 20,666 | 1,598,928 |
| Avery Dennison Corp. | 28,424 | 3,634,293 |
| Axalta Coating Systems Ltd. * | 70,138 | 2,068,370 |
| Balchem Corp. | 10,584 | 1,071,207 |
| Ball Corp. | 111,458 | 7,798,716 |
| Berry Global Group, Inc. * | 44,386 | 1,842,463 |
| Boise Cascade Co. | 14,993 | 536,300 |
| Cabot Corp. | 18,903 | 823,982 |
| Carpenter Technology Corp. | 15,701 | 769,663 |
| Celanese Corp. | 41,432 | 5,019,487 |
| Century Aluminum Co. * | 14,114 | 82,285 |
| CF Industries Holdings, Inc. | 73,475 | 3,332,091 |
| Chase Corp. | 2,182 | 255,621 |
| Clearwater Paper Corp. * | 7,956 | 147,504 |
| Cleveland-Cliffs, Inc.(a) | 85,860 | 620,768 |
| Coeur Mining, Inc. * | 75,926 | 419,112 |
| Commercial Metals Co. | 37,272 | 720,468 |
| Compass Minerals International, Inc. | 11,822 | 667,707 |
| Corteva, Inc. * | 254,884 | 6,723,840 |
| Crown Holdings, Inc. * | 45,457 | 3,311,088 |
| Domtar Corp. | 20,887 | 760,078 |
| Dow, Inc. * | 251,386 | 12,692,479 |
| DuPont de Nemours, Inc. | 252,480 | 16,640,957 |
| Eagle Materials, Inc. | 14,491 | 1,323,608 |
| Eastman Chemical Co. | 45,852 | 3,486,586 |
| Ecolab, Inc. | 84,304 | 16,192,269 |
| Element Solutions, Inc. * | 76,011 | 825,479 |
| Ferro Corp. * | 25,700 | 286,041 |
| Flotek Industries, Inc. * | 16,539 | 31,589 |
| FMC Corp. | 44,207 | 4,044,940 |
| Forterra, Inc. * | 5,539 | 45,475 |
| Freeport-McMoRan, Inc. | 488,786 | 4,799,878 |
| FutureFuel Corp. | 8,300 | 102,339 |
| GCP Applied Technologies, Inc. * | 19,258 | 397,870 |
| Gold Resource Corp. | 19,195 | 84,074 |
| Graphic Packaging Holding Co. | 101,329 | 1,586,812 |
| Greif, Inc., Class A | 9,091 | 356,094 |
| Greif, Inc., Class B | 2,000 | 94,060 |
| H.B. Fuller Co. | 17,701 | 863,809 |
| Hawkins, Inc. | 3,679 | 157,277 |
| Haynes International, Inc. | 3,574 | 123,160 |
| Hecla Mining Co. | 160,671 | 369,543 |
| Huntsman Corp. | 67,829 | 1,501,056 |
| Ingevity Corp. * | 13,947 | 1,174,477 |
| Innophos Holdings, Inc. | 6,990 | 228,014 |
| Innospec, Inc. | 7,808 | 713,339 |
| International Flavors & Fragrances, Inc. | 35,787 | 4,366,372 |
| International Paper Co. | 132,389 | 5,782,751 |
| Intrepid Potash, Inc. * | 27,197 | 84,039 |
| Kaiser Aluminum Corp. | 6,075 | 650,511 |
Schwab Equity Index Funds | Annual Report
Schwab Total Stock Market Index Fund
Portfolio Holdings as of October 31, 2019 (continued)
| Security | Number
of Shares | Value ($) |
| Koppers Holdings, Inc. * | 8,533 | 273,909 |
| Kraton Corp. * | 9,654 | 216,443 |
| Kronos Worldwide, Inc. | 6,230 | 78,996 |
| Linde plc | 182,361 | 36,171,304 |
| Livent Corp. * | 47,698 | 327,208 |
| Loop Industries, Inc. *(a) | 4,729 | 47,054 |
| Louisiana-Pacific Corp. | 40,157 | 1,173,789 |
| LSB Industries, Inc. * | 5,600 | 23,688 |
| LyondellBasell Industries N.V., Class A | 87,268 | 7,827,940 |
| Marrone Bio Innovations, Inc. * | 27,730 | 36,604 |
| Martin Marietta Materials, Inc. | 21,039 | 5,510,324 |
| Materion Corp. | 7,145 | 406,122 |
| McEwen Mining, Inc. * | 126,062 | 210,524 |
| Mercer International, Inc. | 14,607 | 178,205 |
| Minerals Technologies, Inc. | 12,903 | 638,053 |
| Myers Industries, Inc. | 14,310 | 242,268 |
| Neenah, Inc. | 6,513 | 420,088 |
| NewMarket Corp. | 2,461 | 1,194,791 |
| Newmont Goldcorp Corp. | 277,398 | 11,021,023 |
| Northern Technologies International Corp. | 3,248 | 40,535 |
| Nucor Corp. | 103,702 | 5,584,353 |
| Olin Corp. | 56,546 | 1,037,054 |
| Olympic Steel, Inc. | 2,550 | 38,199 |
| OMNOVA Solutions, Inc. * | 14,068 | 142,227 |
| Owens-Illinois, Inc. | 50,995 | 433,457 |
| P.H. Glatfelter Co. | 17,901 | 322,218 |
| Packaging Corp. of America | 32,043 | 3,507,427 |
| PolyOne Corp. | 25,918 | 830,672 |
| PPG Industries, Inc. | 79,558 | 9,954,297 |
| PQ Group Holdings, Inc. * | 17,505 | 288,307 |
| Quaker Chemical Corp. | 4,376 | 669,003 |
| Rayonier Advanced Materials, Inc. | 17,736 | 73,959 |
| Reliance Steel & Aluminum Co. | 22,340 | 2,592,334 |
| Resolute Forest Products, Inc. | 28,000 | 101,360 |
| Royal Gold, Inc. | 22,694 | 2,619,795 |
| RPM International, Inc. | 43,835 | 3,174,969 |
| Ryerson Holding Corp. * | 4,659 | 40,487 |
| Schnitzer Steel Industries, Inc., Class A | 9,050 | 193,127 |
| Schweitzer-Mauduit International, Inc. | 10,032 | 406,196 |
| Sealed Air Corp. | 51,349 | 2,144,848 |
| Sensient Technologies Corp. | 14,680 | 918,381 |
| Silgan Holdings, Inc. | 26,115 | 803,559 |
| Sonoco Products Co. | 33,867 | 1,954,126 |
| Steel Dynamics, Inc. | 74,842 | 2,272,203 |
| Stepan Co. | 6,704 | 655,115 |
| Summit Materials, Inc., Class A * | 39,293 | 900,988 |
| SunCoke Energy, Inc. * | 29,816 | 157,727 |
| Synalloy Corp. | 2,200 | 34,452 |
| Tecnoglass, Inc. | 4,997 | 42,225 |
| The Chemours Co. | 54,183 | 889,143 |
| The Mosaic Co. | 123,021 | 2,445,657 |
| The Scotts Miracle-Gro Co. | 12,913 | 1,296,336 |
| The Sherwin-Williams Co. | 27,721 | 15,865,283 |
| TimkenSteel Corp. * | 10,796 | 60,674 |
| Trecora Resources * | 10,224 | 89,664 |
| Tredegar Corp. | 8,263 | 164,268 |
| Trinseo S.A. | 12,840 | 545,700 |
| Tronox Holdings plc, Class A * | 28,746 | 244,054 |
| UFP Technologies, Inc. * | 3,202 | 133,235 |
| United States Lime & Minerals, Inc. | 1,011 | 89,473 |
| United States Steel Corp.(a) | 59,379 | 683,452 |
| Universal Stainless & Alloy Products, Inc. * | 1,800 | 24,156 |
| US Concrete, Inc. * | 6,497 | 339,533 |
| Valvoline, Inc. | 63,880 | 1,363,199 |
| Venator Materials plc * | 13,280 | 32,802 |
| Verso Corp., Class A * | 11,750 | 172,020 |
| Security | Number
of Shares | Value ($) |
| Vulcan Materials Co. | 44,465 | 6,352,715 |
| W.R. Grace & Co. | 18,620 | 1,237,299 |
| Warrior Met Coal, Inc. | 18,646 | 363,224 |
| Westlake Chemical Corp. | 11,447 | 723,336 |
| WestRock Co. | 87,441 | 3,267,670 |
| Worthington Industries, Inc. | 13,511 | 497,340 |
| | | 294,748,391 |
| |
| Media & Entertainment 7.5% |
| Activision Blizzard, Inc. | 258,554 | 14,486,781 |
| Alphabet, Inc., Class A * | 101,172 | 127,355,314 |
| Alphabet, Inc., Class C * | 102,040 | 128,581,624 |
| Altice USA, Inc., Class A * | 103,123 | 3,191,657 |
| AMC Entertainment Holdings, Inc., Class A(a) | 22,090 | 206,983 |
| AMC Networks, Inc., Class A * | 14,615 | 636,483 |
| ANGI Homeservices, Inc., Class A *(a) | 22,425 | 153,611 |
| Boston Omaha Corp., Class A * | 2,600 | 58,396 |
| Cable One, Inc. | 1,674 | 2,218,669 |
| Cardlytics, Inc. * | 5,907 | 247,562 |
| Care.com, Inc. * | 12,196 | 142,449 |
| Cargurus, Inc. * | 24,433 | 820,705 |
| Cars.com, Inc. * | 19,198 | 217,129 |
| CBS Corp., Class A | 2,103 | 84,015 |
| CBS Corp., Class B - Non Voting Shares | 108,750 | 3,919,350 |
| Central European Media Enterprises Ltd., Class A * | 43,184 | 193,680 |
| Charter Communications, Inc., Class A * | 54,602 | 25,546,092 |
| Cinemark Holdings, Inc. | 37,192 | 1,361,227 |
| Clear Channel Outdoor Holdings, Inc. * | 120,149 | 279,947 |
| Comcast Corp., Class A | 1,530,587 | 68,600,909 |
| comScore, Inc. * | 18,690 | 43,174 |
| Cumulus Media, Inc., Class A * | 6,971 | 95,433 |
| Daily Journal Corp. *(a) | 427 | 119,991 |
| DHI Group, Inc. * | 17,016 | 61,598 |
| Discovery, Inc., Class A * | 53,351 | 1,438,076 |
| Discovery, Inc., Class C * | 115,914 | 2,925,669 |
| DISH Network Corp., Class A * | 81,910 | 2,816,066 |
| Electronic Arts, Inc. * | 99,438 | 9,585,823 |
| Emerald Expositions Events, Inc. | 7,527 | 73,162 |
| Entercom Communications Corp., Class A | 36,599 | 127,365 |
| Entravision Communications Corp., Class A | 23,831 | 67,680 |
| Eventbrite, Inc., Class A * | 12,976 | 233,309 |
| EverQuote, Inc., Class A * | 4,483 | 91,005 |
| Facebook, Inc., Class A * | 812,722 | 155,758,171 |
| Fluent, Inc. * | 13,431 | 31,294 |
| Fox Corp., Class A | 119,464 | 3,827,627 |
| Fox Corp., Class B * | 53,914 | 1,684,273 |
| Gaia, Inc. * | 3,400 | 23,562 |
| Gannett Co., Inc. | 39,315 | 426,568 |
| Global Eagle Entertainment, Inc. * | 17,279 | 10,903 |
| Glu Mobile, Inc. * | 32,800 | 194,504 |
| Gray Television, Inc. * | 32,171 | 527,926 |
| Hemisphere Media Group, Inc. * | 4,890 | 63,130 |
| IAC/InterActiveCorp * | 24,332 | 5,529,447 |
| IHeartMedia, Inc. *(a) | 20,035 | 287,302 |
| John Wiley & Sons, Inc., Class A | 15,690 | 722,838 |
| Lee Enterprises, Inc. * | 15,450 | 27,965 |
| Liberty Broadband Corp., Class A * | 8,502 | 1,003,151 |
| Liberty Broadband Corp., Class C * | 51,737 | 6,108,588 |
| Liberty Global plc, Class A * | 54,654 | 1,374,548 |
| Liberty Global plc, Class C * | 143,281 | 3,420,118 |
| Liberty Latin America Ltd., Class A * | 14,389 | 268,930 |
| Liberty Latin America Ltd., Class C * | 38,968 | 717,401 |
Schwab Equity Index Funds | Annual Report
Schwab Total Stock Market Index Fund
Portfolio Holdings as of October 31, 2019 (continued)
| Security | Number
of Shares | Value ($) |
| Liberty Media Corp. - Liberty Braves, Class A * | 2,953 | 87,173 |
| Liberty Media Corp. - Liberty Braves, Class C * | 10,998 | 323,451 |
| Liberty Media Corp. - Liberty Formula One, Class A * | 8,605 | 347,900 |
| Liberty Media Corp. - Liberty Formula One, Class C * | 70,986 | 3,016,905 |
| Liberty Media Corp. - Liberty SiriusXM, Class A * | 28,055 | 1,259,950 |
| Liberty Media Corp. - Liberty SiriusXM, Class C * | 51,810 | 2,341,294 |
| Liberty TripAdvisor Holdings, Inc., Class A * | 24,773 | 239,059 |
| Lions Gate Entertainment Corp., Class A * | 19,000 | 151,810 |
| Lions Gate Entertainment Corp., Class B * | 34,368 | 257,416 |
| Live Nation Entertainment, Inc. * | 46,640 | 3,288,120 |
| LiveXLive Media, Inc. *(a) | 8,492 | 14,436 |
| Loral Space & Communications, Inc. * | 3,815 | 152,562 |
| Marchex, Inc., Class B * | 10,570 | 34,987 |
| Match Group, Inc.(a) | 17,962 | 1,311,046 |
| MDC Partners, Inc., Class A * | 38,263 | 119,763 |
| Meredith Corp. | 14,298 | 539,035 |
| MSG Networks, Inc., Class A * | 21,079 | 341,691 |
| National CineMedia, Inc. | 18,547 | 155,702 |
| Netflix, Inc. * | 148,108 | 42,567,720 |
| New Media Investment Group, Inc.(a) | 19,939 | 175,663 |
| News Corp., Class A | 127,807 | 1,752,234 |
| News Corp., Class B | 41,136 | 580,840 |
| Nexstar Media Group, Inc., Class A | 15,258 | 1,484,451 |
| Omnicom Group, Inc. | 72,884 | 5,625,916 |
| Pinterest, Inc. * | 29,303 | 736,677 |
| QuinStreet, Inc. * | 14,714 | 188,781 |
| Reading International, Inc., Class A * | 4,446 | 50,551 |
| Roku, Inc. * | 28,982 | 4,266,150 |
| Rosetta Stone, Inc. * | 8,648 | 165,696 |
| Saga Communications, Inc., Class A | 1,496 | 45,134 |
| Scholastic Corp. | 10,758 | 414,183 |
| Sciplay Corp. * | 8,602 | 83,181 |
| Sinclair Broadcast Group, Inc., Class A | 22,351 | 890,464 |
| Sirius XM Holdings, Inc. | 460,706 | 3,095,944 |
| Snap, Inc., Class A * | 259,917 | 3,914,350 |
| Take-Two Interactive Software, Inc. * | 38,567 | 4,641,539 |
| TechTarget, Inc. * | 9,109 | 222,260 |
| TEGNA, Inc. | 73,530 | 1,105,156 |
| The E.W. Scripps Co., Class A | 18,724 | 251,557 |
| The Interpublic Group of Cos., Inc. | 128,534 | 2,795,615 |
| The Madison Square Garden Co., Class A * | 5,804 | 1,549,204 |
| The Marcus Corp. | 7,772 | 280,569 |
| The Meet Group, Inc. * | 20,844 | 88,795 |
| The New York Times Co., Class A | 48,572 | 1,500,875 |
| The Walt Disney Co. | 607,952 | 78,985,124 |
| Travelzoo * | 3,496 | 35,380 |
| Tribune Publishing Co. | 7,731 | 69,270 |
| TripAdvisor, Inc. * | 35,109 | 1,418,404 |
| TrueCar, Inc. * | 24,896 | 81,659 |
| Twitter, Inc. * | 262,762 | 7,874,977 |
| Viacom, Inc., Class A | 2,300 | 54,947 |
| Viacom, Inc., Class B | 121,894 | 2,628,035 |
| WideOpenWest, Inc. * | 13,374 | 84,925 |
| World Wrestling Entertainment, Inc., Class A | 15,955 | 894,118 |
| Yelp, Inc. * | 21,122 | 728,920 |
| Zillow Group, Inc., Class A * | 13,429 | 434,965 |
| Security | Number
of Shares | Value ($) |
| Zillow Group, Inc., Class C * | 39,415 | 1,283,747 |
| Zynga, Inc., Class A * | 316,820 | 1,954,779 |
| | | 766,974,235 |
| |
| Pharmaceuticals, Biotechnology & Life Sciences 7.6% |
| AbbVie, Inc. | 499,867 | 39,764,420 |
| Abeona Therapeutics, Inc. * | 8,452 | 20,031 |
| ACADIA Pharmaceuticals, Inc. * | 35,771 | 1,517,048 |
| Accelerate Diagnostics, Inc. *(a) | 10,300 | 158,620 |
| Acceleron Pharma, Inc. * | 16,020 | 718,817 |
| AcelRx Pharmaceuticals, Inc. *(a) | 28,438 | 56,876 |
| Acer Therapeutics, Inc. *(a) | 1,495 | 4,679 |
| Achillion Pharmaceuticals, Inc. * | 42,273 | 270,970 |
| Aclaris Therapeutics, Inc. * | 20,505 | 35,884 |
| Acorda Therapeutics, Inc. * | 15,538 | 25,638 |
| Actinium Pharmaceuticals, Inc. * | 80,219 | 20,015 |
| Adamis Pharmaceuticals Corp. * | 16,516 | 13,378 |
| Adaptive Biotechnologies Corp. * | 5,299 | 138,118 |
| ADMA Biologics, Inc. * | 8,300 | 40,587 |
| Adverum Biotechnologies, Inc. * | 19,753 | 143,604 |
| Aeglea BioTherapeutics, Inc. * | 5,245 | 39,914 |
| Aerie Pharmaceuticals, Inc. * | 12,866 | 285,497 |
| Aerpio Pharmaceuticals, Inc. * | 12,835 | 6,803 |
| Agenus, Inc. * | 38,795 | 100,479 |
| AgeX Therapeutics, Inc. * | 10,645 | 16,606 |
| Agilent Technologies, Inc. | 103,763 | 7,860,047 |
| Agios Pharmaceuticals, Inc. * | 17,426 | 524,174 |
| Aimmune Therapeutics, Inc. * | 15,127 | 420,833 |
| Akcea Therapeutics, Inc. *(a) | 4,993 | 91,522 |
| Akebia Therapeutics, Inc. * | 35,152 | 131,117 |
| Akorn, Inc. * | 41,431 | 206,741 |
| Albireo Pharma, Inc. * | 2,099 | 38,559 |
| Aldeyra Therapeutics, Inc. * | 6,642 | 37,129 |
| Alector, Inc. * | 11,206 | 188,709 |
| Alexion Pharmaceuticals, Inc. * | 76,208 | 8,032,323 |
| Alimera Sciences, Inc. * | 39,406 | 11,822 |
| Alkermes plc * | 51,588 | 1,007,514 |
| Allakos, Inc. * | 7,990 | 548,114 |
| Allena Pharmaceuticals, Inc. * | 6,539 | 34,461 |
| Allergan plc | 110,560 | 19,470,722 |
| Allogene Therapeutics, Inc. * | 18,038 | 519,494 |
| Alnylam Pharmaceuticals, Inc. * | 37,663 | 3,266,889 |
| AMAG Pharmaceuticals, Inc. *(a) | 9,201 | 89,296 |
| Amgen, Inc. | 202,635 | 43,211,914 |
| Amicus Therapeutics, Inc. * | 82,209 | 693,022 |
| Amneal Pharmaceuticals, Inc. * | 27,858 | 85,803 |
| Amphastar Pharmaceuticals, Inc. * | 14,831 | 286,461 |
| Ampio Pharmaceuticals, Inc. * | 73,284 | 27,034 |
| AnaptysBio, Inc. * | 7,720 | 291,198 |
| Anavex Life Sciences Corp. *(a) | 15,874 | 43,177 |
| ANI Pharmaceuticals, Inc. * | 3,733 | 291,585 |
| Anika Therapeutics, Inc. * | 4,606 | 324,216 |
| Anixa Biosciences, Inc. *(a) | 9,149 | 35,407 |
| Apellis Pharmaceuticals, Inc. * | 13,300 | 390,887 |
| Aptinyx, Inc. * | 1,900 | 6,308 |
| Arcus Biosciences, Inc. * | 14,488 | 113,731 |
| Ardelyx, Inc. * | 12,366 | 61,830 |
| Arena Pharmaceuticals, Inc. * | 17,164 | 836,144 |
| ArQule, Inc. * | 34,889 | 352,728 |
| Arrowhead Pharmaceuticals, Inc. * | 31,590 | 1,265,179 |
| Arvinas Holding Co. LLC * | 2,500 | 51,650 |
| Assembly Biosciences, Inc. * | 7,557 | 124,766 |
| Assertio Therapeutics, Inc. * | 18,832 | 14,879 |
| Atara Biotherapeutics, Inc. * | 21,018 | 229,517 |
| Athenex, Inc. * | 13,114 | 144,779 |
| Athersys, Inc. * | 44,000 | 56,320 |
| Audentes Therapeutics, Inc. * | 16,406 | 441,321 |
Schwab Equity Index Funds | Annual Report
Schwab Total Stock Market Index Fund
Portfolio Holdings as of October 31, 2019 (continued)
| Security | Number
of Shares | Value ($) |
| Avantor, Inc. * | 74,275 | 1,055,448 |
| AVEO Pharmaceuticals, Inc. * | 28,629 | 25,852 |
| Avid Bioservices, Inc. * | 24,181 | 129,368 |
| Avrobio, Inc. * | 7,131 | 103,542 |
| Axsome Therapeutics, Inc. * | 9,735 | 234,419 |
| Bio-Rad Laboratories, Inc., Class A * | 7,219 | 2,393,965 |
| Bio-Techne Corp. | 12,695 | 2,642,718 |
| BioCryst Pharmaceuticals, Inc. * | 38,239 | 76,478 |
| BioDelivery Sciences International, Inc. * | 37,494 | 216,715 |
| Biogen, Inc. * | 62,396 | 18,638,309 |
| Biohaven Pharmaceutical Holding Co., Ltd. * | 14,436 | 662,901 |
| BioMarin Pharmaceutical, Inc. * | 60,923 | 4,460,173 |
| BioSpecifics Technologies Corp. * | 1,514 | 73,323 |
| Bluebird Bio, Inc. * | 19,068 | 1,544,508 |
| Blueprint Medicines Corp. * | 16,608 | 1,143,295 |
| BrainStorm Cell Therapeutics, Inc. *(a) | 11,287 | 40,972 |
| Bridgebio Pharma, Inc. * | 7,785 | 176,019 |
| Bristol-Myers Squibb Co. | 552,987 | 31,724,864 |
| Bruker Corp. | 34,962 | 1,555,809 |
| Calithera Biosciences, Inc. * | 9,145 | 26,338 |
| Calyxt, Inc. * | 2,501 | 11,455 |
| Cambrex Corp. * | 11,666 | 696,810 |
| Cara Therapeutics, Inc. * | 15,339 | 318,438 |
| CareDx, Inc. * | 12,115 | 317,534 |
| CASI Pharmaceuticals, Inc. * | 1,522 | 4,992 |
| Catalent, Inc. * | 49,866 | 2,425,981 |
| Catalyst Biosciences, Inc. * | 5,715 | 31,090 |
| Catalyst Pharmaceuticals, Inc. * | 28,204 | 133,405 |
| CEL-SCI Corp. *(a) | 15,653 | 107,380 |
| Celcuity, Inc. * | 2,500 | 39,375 |
| Celgene Corp. * | 238,886 | 25,806,855 |
| Celldex Therapeutics, Inc. * | 8,808 | 19,730 |
| Cellular Biomedicine Group, Inc. * | 2,900 | 53,041 |
| Cerecor, Inc. * | 5,381 | 18,511 |
| Charles River Laboratories International, Inc. * | 17,042 | 2,215,119 |
| ChemoCentryx, Inc. * | 11,922 | 102,529 |
| Chiasma, Inc. * | 7,614 | 39,897 |
| Chimerix, Inc. * | 15,000 | 21,450 |
| ChromaDex Corp. *(a) | 12,690 | 36,674 |
| Clovis Oncology, Inc. *(a) | 17,986 | 57,016 |
| Codexis, Inc. * | 17,581 | 237,695 |
| Cohbar, Inc. * | 14,681 | 29,509 |
| Coherus Biosciences, Inc. * | 19,857 | 344,916 |
| Collegium Pharmaceutical, Inc. * | 8,383 | 100,596 |
| Concert Pharmaceuticals, Inc. * | 4,499 | 28,029 |
| ContraFect Corp. * | 39,150 | 12,724 |
| Corbus Pharmaceuticals Holdings, Inc. *(a) | 13,863 | 71,672 |
| Corcept Therapeutics, Inc. * | 35,050 | 511,379 |
| CorMedix, Inc. *(a) | 5,920 | 33,034 |
| Cortexyme, Inc. *(a) | 1,589 | 33,004 |
| Crinetics Pharmaceuticals, Inc. * | 1,700 | 29,937 |
| Cue Biopharma, Inc. * | 6,911 | 59,296 |
| Cyclerion Therapeutics, Inc. * | 5,131 | 12,263 |
| Cymabay Therapeutics, Inc. * | 20,365 | 91,439 |
| Cytokinetics, Inc. * | 22,346 | 260,331 |
| CytomX Therapeutics, Inc. * | 15,748 | 96,535 |
| Deciphera Pharmaceuticals, Inc. * | 5,487 | 243,294 |
| Denali Therapeutics, Inc. * | 23,955 | 375,375 |
| Dermira, Inc. * | 16,451 | 110,057 |
| Dicerna Pharmaceuticals, Inc. * | 18,700 | 308,363 |
| Dova Pharmaceuticals, Inc. * | 3,704 | 105,601 |
| Durect Corp. * | 84,487 | 155,456 |
| Dynavax Technologies Corp. *(a) | 27,027 | 137,567 |
| Eagle Pharmaceuticals, Inc. * | 4,489 | 281,460 |
| Editas Medicine, Inc. * | 16,810 | 350,320 |
| Security | Number
of Shares | Value ($) |
| Eidos Therapeutics, Inc. *(a) | 2,511 | 121,783 |
| Eiger BioPharmaceuticals, Inc. * | 4,600 | 50,140 |
| Elanco Animal Health, Inc. * | 124,449 | 3,362,612 |
| Eli Lilly & Co. | 287,344 | 32,742,849 |
| Eloxx Pharmaceuticals, Inc. * | 6,055 | 36,875 |
| Emergent BioSolutions, Inc. * | 14,639 | 836,765 |
| Enanta Pharmaceuticals, Inc. * | 5,853 | 356,331 |
| Endo International plc * | 64,200 | 294,678 |
| Enochian Biosciences, Inc. *(a) | 7,176 | 40,903 |
| Epizyme, Inc. * | 24,693 | 284,216 |
| Esperion Therapeutics, Inc. * | 8,439 | 335,619 |
| Evolus, Inc. *(a) | 3,116 | 49,700 |
| Exact Sciences Corp. * | 44,612 | 3,881,244 |
| Exelixis, Inc. * | 102,669 | 1,586,236 |
| Exicure, Inc. *(a) | 38,626 | 100,814 |
| EyePoint Pharmaceuticals, Inc. * | 14,600 | 32,996 |
| Fate Therapeutics, Inc. * | 25,733 | 384,708 |
| FibroGen, Inc. * | 26,724 | 1,046,245 |
| Five Prime Therapeutics, Inc. * | 14,036 | 55,442 |
| Flexion Therapeutics, Inc. * | 11,400 | 195,738 |
| Fluidigm Corp. * | 20,340 | 100,073 |
| Forty Seven, Inc. * | 11,566 | 79,921 |
| G1 Therapeutics, Inc. * | 10,022 | 212,667 |
| Galectin Therapeutics, Inc. * | 8,013 | 31,892 |
| Genomic Health, Inc. * | 7,854 | 523,705 |
| Geron Corp. *(a) | 62,177 | 88,913 |
| Gilead Sciences, Inc. | 426,558 | 27,176,010 |
| Global Blood Therapeutics, Inc. * | 19,895 | 953,965 |
| GlycoMimetics, Inc. * | 11,422 | 60,308 |
| Gossamer Bio, Inc. * | 14,096 | 290,025 |
| Gritstone Oncology, Inc. * | 3,670 | 29,764 |
| Halozyme Therapeutics, Inc. * | 41,819 | 640,667 |
| Harpoon Therapeutics, Inc. * | 3,414 | 45,406 |
| Harrow Health, Inc. * | 6,848 | 34,240 |
| Harvard Bioscience, Inc. * | 7,316 | 20,485 |
| Heron Therapeutics, Inc. * | 24,691 | 524,684 |
| Homology Medicines, Inc. * | 10,003 | 131,339 |
| Horizon Therapeutics plc * | 65,177 | 1,884,267 |
| Idera Pharmaceuticals, Inc. * | 6,495 | 17,147 |
| Illumina, Inc. * | 49,520 | 14,634,150 |
| ImmunoGen, Inc. * | 46,115 | 109,754 |
| Immunomedics, Inc. * | 55,414 | 886,624 |
| Incyte Corp. * | 60,368 | 5,066,083 |
| Infinity Pharmaceuticals, Inc. * | 29,948 | 31,146 |
| Innoviva, Inc. * | 25,683 | 298,436 |
| Inovio Pharmaceuticals, Inc. *(a) | 24,594 | 52,385 |
| Insmed, Inc. * | 30,518 | 567,330 |
| Intellia Therapeutics, Inc. * | 16,250 | 202,881 |
| Intercept Pharmaceuticals, Inc. * | 8,482 | 617,320 |
| Intersect ENT, Inc. * | 10,273 | 183,065 |
| Intra-Cellular Therapies, Inc. * | 15,000 | 138,750 |
| Intrexon Corp. *(a) | 19,807 | 100,620 |
| Invitae Corp. * | 27,863 | 448,873 |
| Ionis Pharmaceuticals, Inc. * | 43,150 | 2,404,318 |
| Iovance Biotherapeutics, Inc. * | 36,756 | 776,654 |
| IQVIA Holdings, Inc. * | 62,003 | 8,954,473 |
| Ironwood Pharmaceuticals, Inc. * | 51,313 | 515,182 |
| IVERIC bio, Inc. *(a) | 9,361 | 30,704 |
| Jazz Pharmaceuticals plc * | 19,247 | 2,418,001 |
| Johnson & Johnson | 891,019 | 117,650,149 |
| Jounce Therapeutics, Inc. * | 8,460 | 30,583 |
| Kadmon Holdings, Inc. * | 44,130 | 127,536 |
| Kala Pharmaceuticals, Inc. * | 6,000 | 21,780 |
| KalVista Pharmaceuticals, Inc. * | 3,000 | 31,800 |
| Karyopharm Therapeutics, Inc. * | 23,352 | 273,218 |
| Kezar Life Sciences, Inc. * | 2,720 | 8,840 |
| Kindred Biosciences, Inc. * | 9,941 | 81,218 |
| Kiniksa Pharmaceuticals Ltd., Class A * | 7,000 | 49,350 |
Schwab Equity Index Funds | Annual Report
Schwab Total Stock Market Index Fund
Portfolio Holdings as of October 31, 2019 (continued)
| Security | Number
of Shares | Value ($) |
| Kodiak Sciences, Inc. * | 5,428 | 112,414 |
| Krystal Biotech, Inc. * | 4,398 | 180,626 |
| Kura Oncology, Inc. * | 15,348 | 229,913 |
| La Jolla Pharmaceutical Co. * | 9,862 | 69,182 |
| Lannett Co., Inc. * | 8,800 | 104,632 |
| Lexicon Pharmaceuticals, Inc. *(a) | 18,214 | 67,574 |
| Ligand Pharmaceuticals, Inc. * | 6,860 | 746,437 |
| Liquidia Technologies, Inc. * | 2,763 | 12,102 |
| Luminex Corp. | 12,900 | 264,385 |
| MacroGenics, Inc. * | 21,007 | 178,559 |
| Madrigal Pharmaceuticals, Inc. * | 2,520 | 232,924 |
| Magenta Therapeutics, Inc. * | 7,928 | 82,530 |
| Mallinckrodt plc *(a) | 25,602 | 80,902 |
| MannKind Corp. *(a) | 76,925 | 100,387 |
| Marinus Pharmaceuticals, Inc. * | 22,321 | 26,116 |
| Marker Therapeutics, Inc. *(a) | 8,200 | 31,488 |
| Matinas BioPharma Holdings, Inc. * | 35,096 | 31,586 |
| MediciNova, Inc. *(a) | 10,435 | 84,106 |
| Medpace Holdings, Inc. * | 9,670 | 712,002 |
| MEI Pharma, Inc. * | 15,228 | 27,563 |
| Merck & Co., Inc. | 864,827 | 74,945,908 |
| Merrimack Pharmaceuticals, Inc. | 7,188 | 28,393 |
| Mersana Therapeutics, Inc. * | 10,350 | 19,458 |
| Mettler-Toledo International, Inc. * | 8,340 | 5,879,200 |
| Minerva Neurosciences, Inc. * | 8,467 | 40,134 |
| Mirati Therapeutics, Inc. * | 11,949 | 1,125,357 |
| Moderna, Inc. * | 70,203 | 1,175,900 |
| Molecular Templates, Inc. * | 8,381 | 70,903 |
| Momenta Pharmaceuticals, Inc. * | 32,005 | 495,437 |
| Mustang Bio, Inc. * | 12,479 | 33,069 |
| Mylan N.V. * | 178,037 | 3,409,409 |
| MyoKardia, Inc. * | 16,139 | 925,249 |
| Myriad Genetics, Inc. * | 24,574 | 827,407 |
| NanoString Technologies, Inc. * | 11,523 | 260,420 |
| Natera, Inc. * | 20,558 | 791,894 |
| Nektar Therapeutics * | 58,495 | 1,001,727 |
| NeoGenomics, Inc. * | 35,075 | 804,270 |
| Neoleukin Therapeutics, Inc. * | 6,825 | 20,338 |
| Neos Therapeutics, Inc. * | 21,090 | 31,213 |
| Neurocrine Biosciences, Inc. * | 30,951 | 3,079,315 |
| NextCure, Inc. * | 2,706 | 67,650 |
| Ocular Therapeutix, Inc. *(a) | 21,913 | 70,998 |
| Odonate Therapeutics, Inc. * | 4,197 | 133,297 |
| Omeros Corp. *(a) | 14,156 | 224,231 |
| Oncocyte Corp. * | 9,386 | 15,956 |
| OPKO Health, Inc. * | 126,764 | 180,005 |
| Optinose, Inc. *(a) | 13,962 | 109,183 |
| Organogenesis Holdings, Inc. *(a) | 6,071 | 42,558 |
| Organovo Holdings, Inc. * | 33,744 | 10,228 |
| Otonomy, Inc. * | 8,686 | 19,804 |
| Pacific Biosciences of California, Inc. * | 47,700 | 230,868 |
| Pacira BioSciences, Inc. * | 13,130 | 531,634 |
| Palatin Technologies, Inc. * | 56,900 | 45,975 |
| Paratek Pharmaceuticals, Inc. *(a) | 17,405 | 53,694 |
| PDL BioPharma, Inc. * | 83,810 | 236,344 |
| PerkinElmer, Inc. | 36,957 | 3,176,824 |
| Perrigo Co., plc | 45,945 | 2,436,004 |
| Pfenex, Inc. * | 8,600 | 79,292 |
| Pfizer, Inc. | 1,867,433 | 71,653,404 |
| PhaseBio Pharmaceuticals, Inc. * | 8,241 | 33,870 |
| Phibro Animal Health Corp., Class A | 6,184 | 148,169 |
| Pieris Pharmaceuticals, Inc. * | 19,437 | 64,336 |
| PolarityTE, Inc. *(a) | 4,800 | 13,008 |
| Portola Pharmaceuticals, Inc. * | 22,854 | 660,709 |
| PRA Health Sciences, Inc. * | 21,009 | 2,052,789 |
| Prestige Consumer Healthcare, Inc. * | 16,079 | 570,161 |
| Principia Biopharma, Inc. * | 7,815 | 275,948 |
| Progenics Pharmaceuticals, Inc. * | 22,368 | 118,774 |
| Security | Number
of Shares | Value ($) |
| Protagonist Therapeutics, Inc. * | 4,920 | 66,174 |
| Proteostasis Therapeutics, Inc. * | 7,700 | 6,391 |
| Prothena Corp. plc * | 14,018 | 127,564 |
| Provention Bio, Inc. *(a) | 8,170 | 53,023 |
| PTC Therapeutics, Inc. * | 20,805 | 850,716 |
| Puma Biotechnology, Inc. * | 12,061 | 82,015 |
| Quanterix Corp. * | 4,871 | 101,560 |
| Ra Pharmaceuticals, Inc. * | 12,677 | 596,706 |
| Radius Health, Inc. * | 14,153 | 402,511 |
| Reata Pharmaceuticals, Inc., Class A * | 8,042 | 1,657,295 |
| Recro Pharma, Inc. * | 5,876 | 92,664 |
| Regeneron Pharmaceuticals, Inc. * | 26,937 | 8,250,264 |
| REGENXBIO, Inc. * | 10,013 | 357,364 |
| Repligen Corp. * | 15,368 | 1,221,602 |
| Replimune Group, Inc. * | 3,655 | 62,135 |
| resTORbio, Inc. * | 5,465 | 39,621 |
| Retrophin, Inc. * | 17,035 | 204,420 |
| Revance Therapeutics, Inc. * | 17,210 | 269,509 |
| Rhythm Pharmaceuticals, Inc. * | 14,084 | 300,271 |
| Rigel Pharmaceuticals, Inc. * | 48,200 | 98,810 |
| Rocket Pharmaceuticals, Inc. * | 10,739 | 156,145 |
| Rubius Therapeutics, Inc. *(a) | 14,159 | 125,166 |
| Sage Therapeutics, Inc. * | 17,507 | 2,374,825 |
| Sangamo Therapeutics, Inc. * | 39,121 | 354,045 |
| Sarepta Therapeutics, Inc. * | 24,245 | 2,013,790 |
| Savara, Inc. * | 8,700 | 7,674 |
| Scholar Rock Holding Corp. * | 7,746 | 71,650 |
| Seattle Genetics, Inc. * | 38,346 | 4,118,360 |
| Selecta Biosciences, Inc. * | 14,661 | 21,552 |
| Seres Therapeutics, Inc. * | 26,451 | 92,578 |
| Sesen Bio, Inc. * | 11,000 | 13,420 |
| SIGA Technologies, Inc. * | 12,274 | 68,121 |
| Sorrento Therapeutics, Inc. *(a) | 31,000 | 47,120 |
| Spark Therapeutics, Inc. * | 12,162 | 1,327,726 |
| Spectrum Pharmaceuticals, Inc. * | 35,369 | 274,463 |
| Spero Therapeutics, Inc. * | 3,823 | 41,938 |
| Spring Bank Pharmaceuticals, Inc. * | 3,900 | 11,583 |
| Stemline Therapeutics, Inc. * | 19,996 | 199,960 |
| Stoke Therapeutics, Inc. * | 3,770 | 106,842 |
| Supernus Pharmaceuticals, Inc. * | 16,821 | 467,456 |
| Syndax Pharmaceuticals, Inc. * | 8,335 | 56,011 |
| Syneos Health, Inc. * | 21,529 | 1,079,679 |
| Synlogic, Inc. * | 4,700 | 10,058 |
| Synthorx, Inc. * | 3,342 | 45,919 |
| Syros Pharmaceuticals, Inc. * | 8,677 | 44,903 |
| T2 Biosystems, Inc. *(a) | 9,688 | 23,736 |
| TCR2 Therapeutics, Inc. * | 5,730 | 71,224 |
| Teligent, Inc. * | 12,899 | 8,113 |
| TG Therapeutics, Inc. * | 20,100 | 137,283 |
| The Medicines Co. * | 25,258 | 1,325,792 |
| TherapeuticsMD, Inc. *(a) | 66,164 | 175,996 |
| Theravance Biopharma, Inc. * | 13,214 | 213,010 |
| Thermo Fisher Scientific, Inc. | 135,411 | 40,891,414 |
| Tocagen, Inc. * | 5,300 | 3,342 |
| Translate Bio, Inc. * | 12,674 | 115,904 |
| Trevena, Inc. * | 31,860 | 30,586 |
| Tricida, Inc. * | 9,420 | 352,402 |
| Turning Point Therapeutics, Inc. * | 6,021 | 230,966 |
| Twist Bioscience Corp. * | 7,295 | 173,767 |
| Tyme Technologies, Inc. *(a) | 21,100 | 28,063 |
| Ultragenyx Pharmaceutical, Inc. * | 18,883 | 757,964 |
| United Therapeutics Corp. * | 14,277 | 1,282,646 |
| UNITY Biotechnology, Inc. * | 12,594 | 78,587 |
| Urovant Sciences Ltd. *(a) | 3,443 | 32,846 |
| Vanda Pharmaceuticals, Inc. * | 15,429 | 208,446 |
| VBI Vaccines, Inc. * | 26,272 | 15,369 |
| Veracyte, Inc. * | 16,005 | 366,995 |
| Vericel Corp. * | 16,052 | 254,745 |
Schwab Equity Index Funds | Annual Report
Schwab Total Stock Market Index Fund
Portfolio Holdings as of October 31, 2019 (continued)
| Security | Number
of Shares | Value ($) |
| Verrica Pharmaceuticals, Inc. * | 7,095 | 95,924 |
| Vertex Pharmaceuticals, Inc. * | 87,320 | 17,069,314 |
| Viking Therapeutics, Inc. *(a) | 27,321 | 176,767 |
| Voyager Therapeutics, Inc. * | 7,809 | 120,180 |
| Waters Corp. * | 22,391 | 4,738,383 |
| WaVe Life Sciences Ltd. * | 6,065 | 153,384 |
| X4 Pharmaceuticals, Inc. * | 6,559 | 80,348 |
| XBiotech, Inc. *(a) | 6,000 | 65,220 |
| Xencor, Inc. * | 16,064 | 549,549 |
| Xeris Pharmaceuticals, Inc. * | 12,101 | 98,986 |
| XOMA Corp. *(a) | 3,029 | 58,429 |
| Y-mAbs Therapeutics, Inc. * | 3,055 | 95,163 |
| ZIOPHARM Oncology, Inc. *(a) | 53,154 | 224,310 |
| Zoetis, Inc. | 161,141 | 20,613,157 |
| Zogenix, Inc. * | 13,052 | 582,772 |
| Zynerba Pharmaceuticals, Inc. *(a) | 9,398 | 72,928 |
| | | 775,133,802 |
| |
| Real Estate 4.2% |
| Acadia Realty Trust | 30,302 | 847,850 |
| Agree Realty Corp. | 13,966 | 1,100,102 |
| Alexander & Baldwin, Inc. | 25,298 | 594,756 |
| Alexander's, Inc. | 799 | 275,975 |
| Alexandria Real Estate Equities, Inc. | 37,887 | 6,014,561 |
| Altisource Portfolio Solutions S.A. * | 3,227 | 57,441 |
| American Assets Trust, Inc. | 15,636 | 765,539 |
| American Campus Communities, Inc. | 46,902 | 2,344,162 |
| American Finance Trust, Inc. | 38,891 | 575,587 |
| American Homes 4 Rent, Class A | 84,262 | 2,230,415 |
| American Tower Corp. | 149,522 | 32,607,758 |
| Americold Realty Trust | 63,966 | 2,564,397 |
| Apartment Investment & Management Co., Class A | 49,579 | 2,720,896 |
| Apple Hospitality REIT, Inc. | 68,202 | 1,123,969 |
| Armada Hoffler Properties, Inc. | 16,153 | 302,707 |
| Ashford Hospitality Trust, Inc. | 26,337 | 71,900 |
| AvalonBay Communities, Inc. | 47,022 | 10,234,809 |
| Bluerock Residential Growth REIT, Inc. | 7,000 | 84,140 |
| Boston Properties, Inc. | 48,291 | 6,625,525 |
| Braemar Hotels & Resorts, Inc. | 9,906 | 91,432 |
| Brandywine Realty Trust | 56,616 | 865,092 |
| Brixmor Property Group, Inc. | 99,589 | 2,192,950 |
| BRT Apartments Corp. | 3,343 | 55,828 |
| Camden Property Trust | 32,638 | 3,732,808 |
| CareTrust REIT, Inc. | 33,592 | 814,270 |
| CatchMark Timber Trust, Inc., Class A | 18,210 | 208,869 |
| CBL & Associates Properties, Inc. | 72,502 | 104,403 |
| CBRE Group, Inc., Class A * | 112,839 | 6,042,528 |
| Cedar Realty Trust, Inc. | 24,073 | 80,404 |
| Chatham Lodging Trust | 15,396 | 277,898 |
| City Office REIT, Inc. | 14,341 | 194,177 |
| Clipper Realty, Inc. | 4,400 | 42,416 |
| Colony Capital, Inc. | 172,207 | 964,359 |
| Columbia Property Trust, Inc. | 41,944 | 860,691 |
| Community Healthcare Trust, Inc. | 5,328 | 257,982 |
| Consolidated-Tomoka Land Co. | 2,000 | 127,940 |
| CoreCivic, Inc. | 39,234 | 598,711 |
| CorEnergy Infrastructure Trust, Inc. | 3,676 | 177,073 |
| CorePoint Lodging, Inc. | 11,164 | 109,965 |
| CoreSite Realty Corp. | 12,735 | 1,496,363 |
| Corporate Office Properties Trust | 36,405 | 1,079,044 |
| Cousins Properties, Inc. | 49,980 | 2,005,697 |
| Crown Castle International Corp. | 140,585 | 19,511,792 |
| CubeSmart | 63,765 | 2,021,351 |
| CyrusOne, Inc. | 38,670 | 2,756,398 |
| DiamondRock Hospitality Co. | 64,994 | 648,640 |
| Digital Realty Trust, Inc. | 70,680 | 8,979,187 |
| Security | Number
of Shares | Value ($) |
| Douglas Emmett, Inc. | 54,925 | 2,379,351 |
| Duke Realty Corp. | 122,583 | 4,307,567 |
| Easterly Government Properties, Inc. | 26,264 | 586,212 |
| EastGroup Properties, Inc. | 12,483 | 1,672,098 |
| Empire State Realty Trust, Inc., Class A | 51,702 | 748,128 |
| EPR Properties | 25,895 | 2,014,372 |
| Equinix, Inc. | 28,697 | 16,264,886 |
| Equity Commonwealth | 40,393 | 1,299,847 |
| Equity LifeStyle Properties, Inc. | 61,318 | 4,288,581 |
| Equity Residential | 117,002 | 10,373,397 |
| Essential Properties Realty Trust, Inc. | 27,249 | 699,209 |
| Essex Property Trust, Inc. | 22,209 | 7,265,230 |
| eXp World Holdings, Inc. *(a) | 10,600 | 95,082 |
| Extra Space Storage, Inc. | 43,087 | 4,837,377 |
| Farmland Partners, Inc.(a) | 14,823 | 99,314 |
| Federal Realty Investment Trust | 23,552 | 3,203,308 |
| First Industrial Realty Trust, Inc. | 41,020 | 1,727,352 |
| Forestar Group, Inc. * | 8,763 | 164,569 |
| Four Corners Property Trust, Inc. | 23,222 | 665,310 |
| Franklin Street Properties Corp. | 34,230 | 294,378 |
| Front Yard Residential Corp. | 16,297 | 201,594 |
| FRP Holdings, Inc. * | 2,400 | 124,272 |
| Gaming & Leisure Properties, Inc. | 69,537 | 2,806,513 |
| Getty Realty Corp. | 10,767 | 361,125 |
| Gladstone Commercial Corp. | 10,000 | 235,600 |
| Gladstone Land Corp. | 4,200 | 50,232 |
| Global Medical REIT, Inc. | 15,239 | 184,392 |
| Global Net Lease, Inc. | 25,740 | 501,415 |
| Griffin Industrial Realty, Inc. | 1,332 | 52,454 |
| Hannon Armstrong Sustainable Infrastructure Capital, Inc. | 22,350 | 667,371 |
| HCP, Inc. | 165,464 | 6,224,756 |
| Healthcare Realty Trust, Inc. | 44,672 | 1,553,245 |
| Healthcare Trust of America, Inc., Class A | 70,224 | 2,176,944 |
| Hersha Hospitality Trust | 12,806 | 176,723 |
| Highwoods Properties, Inc. | 34,596 | 1,619,093 |
| Host Hotels & Resorts, Inc. | 243,318 | 3,987,982 |
| Hudson Pacific Properties, Inc. | 54,728 | 1,965,830 |
| Independence Realty Trust, Inc. | 29,685 | 457,149 |
| Industrial Logistics Properties Trust | 24,598 | 522,462 |
| Innovative Industrial Properties, Inc.(a) | 3,735 | 283,860 |
| Investors Real Estate Trust | 3,746 | 283,460 |
| Invitation Homes, Inc. | 160,026 | 4,927,201 |
| Iron Mountain, Inc. | 99,106 | 3,250,677 |
| iStar, Inc. | 19,869 | 258,496 |
| JBG SMITH Properties | 39,120 | 1,574,971 |
| Jernigan Capital, Inc. | 8,486 | 161,149 |
| Jones Lang LaSalle, Inc. | 16,913 | 2,478,093 |
| Kennedy-Wilson Holdings, Inc. | 41,765 | 961,013 |
| Kilroy Realty Corp. | 30,793 | 2,584,456 |
| Kimco Realty Corp. | 143,218 | 3,087,780 |
| Kite Realty Group Trust | 25,983 | 463,017 |
| Lamar Advertising Co., Class A | 28,722 | 2,298,047 |
| Lexington Realty Trust | 84,044 | 914,399 |
| Liberty Property Trust | 52,143 | 3,080,087 |
| Life Storage, Inc. | 15,690 | 1,708,955 |
| LTC Properties, Inc. | 12,155 | 630,237 |
| Mack-Cali Realty Corp. | 32,057 | 686,661 |
| Marcus & Millichap, Inc. * | 8,253 | 294,797 |
| Maui Land & Pineapple Co., Inc. * | 3,129 | 32,197 |
| Medical Properties Trust, Inc. | 152,835 | 3,168,270 |
| Mid-America Apartment Communities, Inc. | 38,619 | 5,367,655 |
| Monmouth Real Estate Investment Corp. | 32,076 | 483,706 |
| National Health Investors, Inc. | 15,304 | 1,312,930 |
| National Retail Properties, Inc. | 58,608 | 3,452,597 |
| National Storage Affiliates Trust | 19,731 | 674,208 |
Schwab Equity Index Funds | Annual Report
Schwab Total Stock Market Index Fund
Portfolio Holdings as of October 31, 2019 (continued)
| Security | Number
of Shares | Value ($) |
| New Century Financial Corp. *(c) | 3,600 | — |
| New Senior Investment Group, Inc. | 31,775 | 223,696 |
| Newmark Group, Inc., Class A | 51,828 | 550,413 |
| NexPoint Residential Trust, Inc. | 8,829 | 430,590 |
| Office Properties Income Trust | 15,045 | 479,635 |
| Omega Healthcare Investors, Inc. | 73,328 | 3,229,365 |
| One Liberty Properties, Inc. | 6,071 | 172,477 |
| Outfront Media, Inc. | 49,316 | 1,297,504 |
| Paramount Group, Inc. | 68,880 | 927,814 |
| Park Hotels & Resorts, Inc. | 80,018 | 1,860,419 |
| Pebblebrook Hotel Trust | 43,324 | 1,113,860 |
| Pennsylvania Real Estate Investment Trust(a) | 18,917 | 104,422 |
| Physicians Realty Trust | 61,530 | 1,148,765 |
| Piedmont Office Realty Trust, Inc., Class A | 45,430 | 1,019,449 |
| Plymouth Industrial REIT, Inc. | 2,889 | 54,487 |
| PotlatchDeltic Corp. | 24,056 | 1,021,658 |
| Preferred Apartment Communities, Inc., Class A | 15,145 | 216,876 |
| Prologis, Inc. | 213,332 | 18,722,016 |
| PS Business Parks, Inc. | 6,633 | 1,197,588 |
| Public Storage | 50,831 | 11,328,197 |
| QTS Realty Trust, Inc., Class A | 20,188 | 1,081,875 |
| Rafael Holdings, Inc., Class B * | 3,200 | 55,584 |
| Rayonier, Inc. | 44,038 | 1,188,145 |
| RE/MAX Holdings, Inc., Class A | 6,136 | 205,249 |
| Realogy Holdings Corp.(a) | 39,454 | 310,898 |
| Realty Income Corp. | 106,881 | 8,741,797 |
| Redfin Corp. * | 29,547 | 513,822 |
| Regency Centers Corp. | 56,115 | 3,773,173 |
| Retail Opportunity Investments Corp. | 40,733 | 760,281 |
| Retail Properties of America, Inc., Class A | 70,408 | 968,814 |
| Retail Value, Inc. | 4,749 | 173,861 |
| Rexford Industrial Realty, Inc. | 37,111 | 1,784,668 |
| RLJ Lodging Trust | 59,027 | 968,633 |
| RPT Realty | 25,122 | 364,269 |
| Ryman Hospitality Properties, Inc. | 17,318 | 1,457,656 |
| Sabra Health Care REIT, Inc. | 62,473 | 1,536,836 |
| Safehold, Inc. | 2,548 | 88,110 |
| Saul Centers, Inc. | 4,700 | 251,638 |
| SBA Communications Corp. | 38,457 | 9,254,677 |
| Senior Housing Properties Trust | 84,248 | 836,161 |
| Seritage Growth Properties, Class A | 12,504 | 543,799 |
| Service Properties Trust | 55,854 | 1,413,106 |
| Simon Property Group, Inc. | 103,918 | 15,658,364 |
| SITE Centers Corp. | 46,256 | 718,356 |
| SL Green Realty Corp. | 28,083 | 2,347,739 |
| Sotherly Hotels, Inc. | 6,858 | 44,166 |
| Spirit Realty Capital, Inc. | 30,793 | 1,534,723 |
| STAG Industrial, Inc. | 40,540 | 1,258,362 |
| STORE Capital Corp. | 72,256 | 2,926,368 |
| Stratus Properties, Inc. * | 3,398 | 93,717 |
| Summit Hotel Properties, Inc. | 33,342 | 408,773 |
| Sun Communities, Inc. | 30,410 | 4,946,186 |
| Sunstone Hotel Investors, Inc. | 72,757 | 982,947 |
| Tanger Factory Outlet Centers, Inc.(a) | 34,601 | 557,768 |
| Taubman Centers, Inc. | 21,237 | 759,860 |
| Tejon Ranch Co. * | 8,332 | 133,979 |
| Terreno Realty Corp. | 22,206 | 1,252,640 |
| The GEO Group, Inc. | 39,008 | 593,702 |
| The Howard Hughes Corp. * | 14,321 | 1,601,374 |
| The Macerich Co. | 38,110 | 1,048,025 |
| The RMR Group, Inc., Class A | 5,078 | 245,775 |
| The St. Joe Co. * | 12,244 | 227,126 |
| Transcontinental Realty Investors, Inc. * | 1,319 | 41,601 |
| Trinity Place Holdings, Inc. * | 12,207 | 48,584 |
| Security | Number
of Shares | Value ($) |
| UDR, Inc. | 97,862 | 4,917,565 |
| UMH Properties, Inc. | 10,800 | 161,244 |
| Uniti Group, Inc. | 70,885 | 490,524 |
| Universal Health Realty Income Trust | 4,004 | 477,397 |
| Urban Edge Properties | 39,017 | 823,649 |
| Urstadt Biddle Properties, Inc., Class A | 9,781 | 237,972 |
| Ventas, Inc. | 125,224 | 8,152,082 |
| VEREIT, Inc. | 354,631 | 3,489,569 |
| VICI Properties, Inc. | 155,390 | 3,659,434 |
| Vornado Realty Trust | 52,977 | 3,476,881 |
| Washington Prime Group, Inc.(a) | 74,197 | 313,111 |
| Washington Real Estate Investment Trust | 29,116 | 903,178 |
| Weingarten Realty Investors | 39,698 | 1,259,618 |
| Welltower, Inc. | 137,323 | 12,453,823 |
| Weyerhaeuser Co. | 253,160 | 7,394,804 |
| Whitestone REIT | 10,368 | 147,640 |
| WP Carey, Inc. | 58,254 | 5,362,863 |
| Xenia Hotels & Resorts, Inc. | 39,629 | 834,190 |
| | | 432,072,358 |
| |
| Retailing 5.9% |
| 1-800-Flowers.com, Inc., Class A * | 7,004 | 99,877 |
| Aaron's, Inc. | 22,333 | 1,673,412 |
| Abercrombie & Fitch Co., Class A | 21,254 | 344,102 |
| Advance Auto Parts, Inc. | 24,287 | 3,946,152 |
| Amazon.com, Inc. * | 140,295 | 249,256,515 |
| America's Car-Mart, Inc. * | 2,683 | 244,126 |
| American Eagle Outfitters, Inc. | 53,009 | 815,278 |
| Asbury Automotive Group, Inc. * | 6,190 | 638,375 |
| Ascena Retail Group, Inc. * | 50,000 | 17,610 |
| At Home Group, Inc. * | 19,985 | 170,272 |
| AutoNation, Inc. * | 20,397 | 1,037,187 |
| AutoZone, Inc. * | 8,290 | 9,486,910 |
| Barnes & Noble Education, Inc. * | 22,732 | 93,429 |
| Bed Bath & Beyond, Inc.(a) | 44,734 | 612,856 |
| Best Buy Co., Inc. | 78,908 | 5,667,962 |
| Big 5 Sporting Goods Corp.(a) | 12,274 | 39,277 |
| Big Lots, Inc. | 12,897 | 279,478 |
| Blue Apron Holdings, Inc. *(a) | 3,119 | 22,332 |
| Booking Holdings, Inc. * | 14,371 | 29,442,874 |
| Boot Barn Holdings, Inc. * | 8,400 | 294,420 |
| Build-A-Bear Workshop, Inc. * | 6,224 | 21,660 |
| Burlington Stores, Inc. * | 22,357 | 4,296,345 |
| Caleres, Inc. | 13,090 | 281,697 |
| Camping World Holdings, Inc., Class A(a) | 12,348 | 116,689 |
| CarMax, Inc. * | 55,280 | 5,150,438 |
| Carvana Co. * | 16,728 | 1,356,306 |
| Chewy, Inc. *(a) | 19,040 | 469,717 |
| Chico's FAS, Inc. | 43,544 | 149,791 |
| Citi Trends, Inc. | 3,906 | 69,722 |
| Conn's, Inc. * | 7,143 | 172,789 |
| Core-Mark Holding Co., Inc. | 15,301 | 466,987 |
| Designer Brands, Inc. | 21,162 | 349,173 |
| Destination XL Group, Inc. * | 18,114 | 26,265 |
| Dick's Sporting Goods, Inc. | 21,411 | 833,530 |
| Dillard's, Inc., Class A(a) | 3,769 | 259,986 |
| Dollar General Corp. | 86,627 | 13,889,773 |
| Dollar Tree, Inc. * | 80,164 | 8,850,106 |
| Duluth Holdings, Inc., Class B * | 2,900 | 26,796 |
| eBay, Inc. | 267,527 | 9,430,327 |
| Etsy, Inc. * | 41,712 | 1,855,767 |
| Expedia Group, Inc. | 47,483 | 6,489,027 |
| Express, Inc. * | 20,816 | 67,028 |
| Five Below, Inc. * | 18,549 | 2,320,665 |
| Floor & Decor Holdings, Inc., Class A * | 23,257 | 1,065,868 |
| Foot Locker, Inc. | 37,189 | 1,618,093 |
Schwab Equity Index Funds | Annual Report
Schwab Total Stock Market Index Fund
Portfolio Holdings as of October 31, 2019 (continued)
| Security | Number
of Shares | Value ($) |
| Funko, Inc., Class A * | 7,067 | 127,206 |
| GameStop Corp., Class A(a) | 31,567 | 171,724 |
| Genesco, Inc. * | 5,704 | 221,600 |
| Genuine Parts Co. | 49,303 | 5,057,502 |
| GNC Holdings, Inc., Class A *(a) | 36,061 | 95,201 |
| Group 1 Automotive, Inc. | 5,612 | 558,057 |
| Groupon, Inc. * | 143,303 | 398,382 |
| GrubHub, Inc. * | 30,435 | 1,036,616 |
| Guess?, Inc. | 15,095 | 252,841 |
| Haverty Furniture Cos., Inc. | 5,712 | 103,616 |
| Hibbett Sports, Inc. * | 5,715 | 136,360 |
| J. Jill, Inc.(a) | 6,408 | 11,086 |
| J.C. Penney Co., Inc. * | 104,289 | 104,289 |
| Kirkland's, Inc. * | 5,229 | 8,262 |
| Kohl's Corp. | 52,824 | 2,707,758 |
| L Brands, Inc. | 78,262 | 1,333,584 |
| Lands' End, Inc. * | 5,100 | 61,557 |
| Liquidity Services, Inc. * | 10,485 | 68,048 |
| Lithia Motors, Inc., Class A | 7,756 | 1,221,415 |
| LKQ Corp. * | 105,959 | 3,601,546 |
| Lowe's Cos., Inc. | 260,702 | 29,096,950 |
| Lumber Liquidators Holdings, Inc. * | 7,615 | 70,286 |
| Macy's, Inc. | 103,028 | 1,561,904 |
| MarineMax, Inc. * | 6,661 | 102,912 |
| Monro, Inc. | 11,231 | 787,405 |
| Murphy USA, Inc. * | 10,535 | 1,242,393 |
| National Vision Holdings, Inc. * | 26,191 | 623,346 |
| Nordstrom, Inc. | 37,424 | 1,343,522 |
| O'Reilly Automotive, Inc. * | 25,826 | 11,247,481 |
| Office Depot, Inc. | 201,581 | 415,257 |
| Ollie's Bargain Outlet Holdings, Inc. * | 17,761 | 1,134,573 |
| Overstock.com, Inc. * | 11,102 | 116,904 |
| Party City Holdco, Inc. * | 16,146 | 90,741 |
| Penske Automotive Group, Inc. | 12,486 | 608,318 |
| PetMed Express, Inc.(a) | 5,544 | 129,813 |
| Pier 1 Imports, Inc. * | 1,811 | 10,196 |
| Pool Corp. | 13,486 | 2,796,996 |
| Quotient Technology, Inc. * | 23,785 | 204,789 |
| Qurate Retail, Inc. Class A * | 133,197 | 1,270,699 |
| Remark Holdings, Inc. * | 14,578 | 10,496 |
| Rent-A-Center, Inc. | 18,166 | 469,954 |
| Revolve Group, Inc. *(a) | 5,247 | 108,928 |
| RH * | 5,262 | 956,105 |
| Ross Stores, Inc. | 123,378 | 13,530,865 |
| RTW RetailWinds, Inc. * | 15,491 | 22,927 |
| Sally Beauty Holdings, Inc. * | 38,688 | 599,664 |
| Shoe Carnival, Inc. | 4,036 | 133,955 |
| Shutterstock, Inc. * | 6,548 | 265,718 |
| Signet Jewelers Ltd. | 17,080 | 273,963 |
| Sleep Number Corp. * | 10,441 | 502,421 |
| Sonic Automotive, Inc., Class A | 7,037 | 226,802 |
| Sportsman's Warehouse Holdings, Inc. * | 10,300 | 70,143 |
| Stamps.com, Inc. * | 5,751 | 485,557 |
| Stitch Fix, Inc., Class A * | 7,900 | 180,594 |
| Tailored Brands, Inc.(a) | 15,557 | 72,184 |
| Target Corp. | 172,686 | 18,461,860 |
| The Buckle, Inc. | 7,969 | 166,711 |
| The Cato Corp., Class A | 7,100 | 124,179 |
| The Children's Place, Inc. | 5,680 | 465,249 |
| The Container Store Group, Inc. * | 6,755 | 28,506 |
| The Gap, Inc. | 70,685 | 1,149,338 |
| The Home Depot, Inc. | 369,415 | 86,657,371 |
| The Michaels Cos., Inc. * | 23,490 | 205,068 |
| The RealReal Inc *(a) | 6,281 | 145,154 |
| The Rubicon Project, Inc. * | 13,000 | 110,500 |
| The TJX Cos., Inc. | 408,209 | 23,533,249 |
| Tiffany & Co. | 37,129 | 4,622,932 |
| Tile Shop Holdings, Inc. | 13,900 | 23,352 |
| Security | Number
of Shares | Value ($) |
| Tilly's, Inc., Class A | 8,425 | 86,440 |
| Tractor Supply Co. | 40,833 | 3,879,952 |
| Tuesday Morning Corp. * | 19,035 | 25,888 |
| Ulta Salon, Cosmetics & Fragrance, Inc. * | 19,700 | 4,593,055 |
| Urban Outfitters, Inc. * | 22,644 | 649,883 |
| Waitr Holdings, Inc. *(a) | 19,879 | 8,643 |
| Wayfair, Inc., Class A * | 21,468 | 1,765,314 |
| Weyco Group, Inc. | 3,066 | 75,638 |
| Williams-Sonoma, Inc. | 26,805 | 1,790,306 |
| Winmark Corp. | 768 | 138,240 |
| Zumiez, Inc. * | 8,343 | 266,225 |
| | | 600,831,453 |
| |
| Semiconductors & Semiconductor Equipment 3.9% |
| ACM Research, Inc., Class A * | 3,856 | 48,547 |
| Adesto Technologies Corp. * | 7,400 | 67,784 |
| Advanced Energy Industries, Inc. * | 12,244 | 723,620 |
| Advanced Micro Devices, Inc. * | 365,571 | 12,403,824 |
| Alpha & Omega Semiconductor Ltd. * | 6,543 | 85,452 |
| Ambarella, Inc. * | 10,609 | 558,352 |
| Amkor Technology, Inc. * | 33,795 | 420,072 |
| Analog Devices, Inc. | 125,698 | 13,403,178 |
| Applied Materials, Inc. | 312,984 | 16,982,512 |
| Axcelis Technologies, Inc. * | 11,082 | 212,442 |
| AXT, Inc. * | 23,470 | 73,226 |
| Broadcom, Inc. | 134,617 | 39,422,588 |
| Brooks Automation, Inc. | 23,744 | 1,008,408 |
| Cabot Microelectronics Corp. | 9,760 | 1,474,931 |
| CEVA, Inc. * | 9,239 | 251,486 |
| Cirrus Logic, Inc. * | 18,917 | 1,285,599 |
| Cohu, Inc. | 12,667 | 210,526 |
| Cree, Inc. * | 35,436 | 1,691,360 |
| CyberOptics Corp. * | 2,095 | 38,506 |
| Cypress Semiconductor Corp. | 124,915 | 2,906,772 |
| Diodes, Inc. * | 15,037 | 701,476 |
| DSP Group, Inc. * | 6,300 | 93,933 |
| Enphase Energy, Inc. *(a) | 25,967 | 504,539 |
| Entegris, Inc. | 47,011 | 2,256,528 |
| Everspin Technologies, Inc. * | 5,399 | 31,584 |
| First Solar, Inc. * | 25,270 | 1,308,733 |
| FormFactor, Inc. * | 27,482 | 599,932 |
| GSI Technology, Inc. * | 8,500 | 66,470 |
| Ichor Holdings Ltd. * | 8,793 | 255,964 |
| Impinj, Inc. * | 5,438 | 178,883 |
| Inphi Corp. * | 15,346 | 1,103,071 |
| Intel Corp. | 1,495,417 | 84,535,923 |
| inTEST Corp. * | 4,258 | 20,438 |
| KLA Corp. | 53,706 | 9,078,462 |
| Kopin Corp. * | 19,600 | 10,917 |
| Kulicke & Soffa Industries, Inc. | 20,470 | 486,060 |
| Lam Research Corp. | 48,649 | 13,185,825 |
| Lattice Semiconductor Corp. * | 43,433 | 850,853 |
| MACOM Technology Solutions Holdings, Inc. * | 16,799 | 382,009 |
| Marvell Technology Group Ltd. | 221,370 | 5,399,214 |
| Maxim Integrated Products, Inc. | 90,591 | 5,314,068 |
| MaxLinear, Inc. * | 20,732 | 393,079 |
| Microchip Technology, Inc. | 80,647 | 7,604,208 |
| Micron Technology, Inc. * | 373,603 | 17,764,823 |
| MKS Instruments, Inc. | 18,138 | 1,962,894 |
| Monolithic Power Systems, Inc. | 13,712 | 2,055,703 |
| NeoPhotonics Corp. * | 20,928 | 137,706 |
| NVE Corp. | 1,664 | 103,584 |
| NVIDIA Corp. | 205,823 | 41,374,540 |
| ON Semiconductor Corp. * | 136,526 | 2,785,130 |
| Onto Innovation, Inc. * | 15,214 | 489,891 |
| PDF Solutions, Inc. * | 9,699 | 156,736 |
Schwab Equity Index Funds | Annual Report
Schwab Total Stock Market Index Fund
Portfolio Holdings as of October 31, 2019 (continued)
| Security | Number
of Shares | Value ($) |
| Photronics, Inc. * | 20,293 | 239,457 |
| Pixelworks, Inc. * | 8,973 | 34,905 |
| Power Integrations, Inc. | 9,512 | 866,638 |
| Qorvo, Inc. * | 40,035 | 3,237,230 |
| QUALCOMM, Inc. | 410,780 | 33,043,143 |
| QuickLogic Corp. * | 61,286 | 22,167 |
| Rambus, Inc. * | 42,063 | 582,362 |
| Semtech Corp. * | 22,349 | 1,127,731 |
| Silicon Laboratories, Inc. * | 14,888 | 1,581,701 |
| Skyworks Solutions, Inc. | 57,501 | 5,236,041 |
| SMART Global Holdings, Inc. * | 3,678 | 109,237 |
| SolarEdge Technologies, Inc. * | 16,645 | 1,414,159 |
| SunPower Corp. * | 22,805 | 199,772 |
| Synaptics, Inc. * | 10,518 | 442,913 |
| Teradyne, Inc. | 56,736 | 3,473,378 |
| Texas Instruments, Inc. | 314,988 | 37,165,434 |
| Ultra Clean Holdings, Inc. * | 13,767 | 294,201 |
| Universal Display Corp. | 14,270 | 2,856,569 |
| Veeco Instruments, Inc. * | 22,345 | 304,786 |
| Xilinx, Inc. | 84,877 | 7,701,739 |
| Xperi Corp. | 19,230 | 390,465 |
| | | 394,786,389 |
| |
| Software & Services 12.1% |
| 2U, Inc. * | 20,000 | 358,500 |
| 8x8, Inc. * | 35,704 | 689,801 |
| A10 Networks, Inc. * | 15,072 | 111,985 |
| Accenture plc, Class A | 214,620 | 39,794,840 |
| ACI Worldwide, Inc. * | 40,243 | 1,263,228 |
| Adobe, Inc. * | 164,312 | 45,667,234 |
| Agilysys, Inc. * | 8,873 | 223,511 |
| Akamai Technologies, Inc. * | 56,257 | 4,866,231 |
| Alarm.com Holdings, Inc. * | 11,765 | 581,191 |
| Alliance Data Systems Corp. | 14,005 | 1,400,500 |
| Altair Engineering, Inc., Class A * | 13,212 | 487,126 |
| Alteryx, Inc., Class A * | 15,488 | 1,417,152 |
| American Software, Inc., Class A | 9,461 | 153,363 |
| Anaplan, Inc. * | 28,220 | 1,331,984 |
| ANSYS, Inc. * | 28,388 | 6,249,618 |
| Appfolio, Inc., Class A * | 4,467 | 434,326 |
| Appian Corp. * | 11,341 | 506,262 |
| Aspen Technology, Inc. * | 22,986 | 2,645,918 |
| Asure Software, Inc. * | 7,413 | 66,976 |
| Autodesk, Inc. * | 74,466 | 10,973,310 |
| Automatic Data Processing, Inc. | 146,522 | 23,770,264 |
| Avalara, Inc. * | 22,098 | 1,568,958 |
| Avaya Holdings Corp. * | 34,372 | 415,557 |
| Benefitfocus, Inc. * | 12,031 | 273,525 |
| Black Knight, Inc. * | 50,057 | 3,213,659 |
| Blackbaud, Inc. | 17,002 | 1,427,318 |
| Blackline, Inc. * | 13,693 | 640,011 |
| Booz Allen Hamilton Holding Corp. | 47,050 | 3,310,909 |
| Bottomline Technologies (de), Inc. * | 13,177 | 539,598 |
| Box, Inc., Class A * | 46,681 | 789,843 |
| Brightcove, Inc. * | 15,409 | 146,540 |
| Broadridge Financial Solutions, Inc. | 38,342 | 4,801,185 |
| CACI International, Inc., Class A * | 8,354 | 1,869,208 |
| Cadence Design Systems, Inc. * | 93,754 | 6,126,824 |
| Carbonite, Inc. * | 9,694 | 166,446 |
| Cardtronics plc, Class A * | 12,687 | 434,657 |
| Cass Information Systems, Inc. | 3,769 | 216,001 |
| CDK Global, Inc. | 42,540 | 2,149,972 |
| Cerence, Inc. * | 11,892 | 184,326 |
| Ceridian HCM Holding, Inc. * | 30,122 | 1,453,387 |
| ChannelAdvisor Corp. * | 6,900 | 64,929 |
| Cision Ltd. * | 37,691 | 379,548 |
| Citrix Systems, Inc. | 41,202 | 4,485,250 |
| Security | Number
of Shares | Value ($) |
| Cloudera, Inc. * | 84,232 | 714,287 |
| Cognizant Technology Solutions Corp., Class A | 186,730 | 11,379,326 |
| CommVault Systems, Inc. * | 13,742 | 682,565 |
| Conduent, Inc. * | 60,525 | 374,045 |
| CoreLogic, Inc. * | 27,679 | 1,120,723 |
| Cornerstone OnDemand, Inc. * | 18,618 | 1,090,456 |
| Coupa Software, Inc. * | 20,649 | 2,839,031 |
| Crowdstrike Holdings, Inc. *(a) | 7,185 | 358,603 |
| CSG Systems International, Inc. | 10,871 | 626,604 |
| Digimarc Corp. * | 4,511 | 160,592 |
| Digital Turbine, Inc. * | 18,000 | 125,820 |
| DocuSign, Inc. * | 41,517 | 2,748,010 |
| Domo, Inc., Class B * | 8,618 | 138,577 |
| Dropbox, Inc., Class A * | 72,513 | 1,437,208 |
| DXC Technology Co. | 90,081 | 2,492,541 |
| Dynatrace, Inc. * | 12,759 | 258,115 |
| Ebix, Inc. | 6,724 | 286,644 |
| eGain Corp. * | 7,634 | 57,446 |
| Elastic N.V. * | 10,561 | 760,498 |
| Endurance International Group Holdings, Inc. * | 22,190 | 86,985 |
| Envestnet, Inc. * | 18,797 | 1,174,625 |
| EPAM Systems, Inc. * | 18,312 | 3,222,180 |
| Euronet Worldwide, Inc. * | 18,246 | 2,555,717 |
| Everbridge, Inc. * | 11,385 | 791,371 |
| EVERTEC, Inc. | 19,361 | 592,253 |
| Evo Payments, Inc., Class A * | 11,170 | 317,563 |
| ExlService Holdings, Inc. * | 11,709 | 815,298 |
| Fair Isaac Corp. * | 9,776 | 2,972,295 |
| Fastly, Inc. *(a) | 4,824 | 96,576 |
| Fidelity National Information Services, Inc. | 207,566 | 27,348,896 |
| Finjan Holdings, Inc. * | 6,437 | 12,359 |
| FireEye, Inc. * | 74,806 | 1,184,927 |
| Fiserv, Inc. * | 192,389 | 20,420,168 |
| Five9, Inc. * | 20,826 | 1,156,051 |
| FleetCor Technologies, Inc. * | 29,519 | 8,685,080 |
| ForeScout Technologies, Inc. * | 13,060 | 401,726 |
| Fortinet, Inc. * | 47,785 | 3,897,345 |
| Gartner, Inc. * | 30,835 | 4,751,057 |
| Genpact Ltd. | 51,414 | 2,013,886 |
| Global Payments, Inc. | 101,953 | 17,248,409 |
| GlobalSCAPE, Inc. | 3,901 | 37,840 |
| GoDaddy, Inc., Class A * | 60,534 | 3,936,526 |
| GreenSky, Inc., Class A *(a) | 12,400 | 94,860 |
| GTT Communications, Inc. *(a) | 11,441 | 86,151 |
| GTY Technology Holdings, Inc. * | 16,630 | 86,642 |
| Guidewire Software, Inc. * | 27,443 | 3,093,924 |
| HubSpot, Inc. * | 13,589 | 2,107,654 |
| I3 Verticals, Inc., Class A * | 5,840 | 119,428 |
| Information Services Group, Inc. * | 16,112 | 34,802 |
| Instructure, Inc. * | 12,310 | 575,246 |
| Intelligent Systems Corp. *(a) | 2,218 | 100,187 |
| Internap Corp. *(a) | 9,578 | 22,796 |
| International Business Machines Corp. | 298,866 | 39,967,350 |
| International Money Express, Inc. * | 6,533 | 100,086 |
| Intuit, Inc. | 87,647 | 22,569,102 |
| j2 Global, Inc. | 15,865 | 1,506,540 |
| Jack Henry & Associates, Inc. | 26,018 | 3,683,108 |
| KBR, Inc. | 46,622 | 1,312,876 |
| Leidos Holdings, Inc. | 45,067 | 3,886,127 |
| Limelight Networks, Inc. * | 37,860 | 159,769 |
| LivePerson, Inc. * | 20,467 | 840,170 |
| LiveRamp Holdings, Inc. * | 23,402 | 914,784 |
| LogMeIn, Inc. | 16,384 | 1,076,101 |
| Manhattan Associates, Inc. * | 21,857 | 1,638,182 |
| ManTech International Corp., Class A | 8,531 | 675,485 |
Schwab Equity Index Funds | Annual Report
Schwab Total Stock Market Index Fund
Portfolio Holdings as of October 31, 2019 (continued)
| Security | Number
of Shares | Value ($) |
| Mastercard, Inc., Class A | 301,186 | 83,371,297 |
| MAXIMUS, Inc. | 21,433 | 1,644,768 |
| Medallia, Inc. * | 5,812 | 169,013 |
| Microsoft Corp. | 2,577,886 | 369,591,516 |
| MicroStrategy, Inc., Class A * | 2,864 | 438,908 |
| Mitek Systems, Inc. * | 10,165 | 97,991 |
| MobileIron, Inc. * | 31,619 | 197,935 |
| Model N, Inc. * | 7,661 | 228,221 |
| MoneyGram International, Inc. *(a) | 19,116 | 75,699 |
| MongoDB, Inc. * | 11,655 | 1,489,159 |
| NetSol Technologies, Inc. * | 5,701 | 29,702 |
| New Relic, Inc. * | 18,228 | 1,167,686 |
| NIC, Inc. | 21,419 | 503,775 |
| Nuance Communications, Inc. * | 95,139 | 1,552,668 |
| Nutanix, Inc., Class A * | 49,603 | 1,449,400 |
| Okta, Inc. * | 35,704 | 3,894,235 |
| OneSpan, Inc. * | 9,000 | 168,390 |
| Oracle Corp. | 743,579 | 40,517,620 |
| Pagerduty, Inc. * | 3,384 | 77,798 |
| Palo Alto Networks, Inc. * | 32,579 | 7,408,139 |
| Park City Group, Inc. *(a) | 5,812 | 31,675 |
| Paychex, Inc. | 108,293 | 9,057,627 |
| Paycom Software, Inc. * | 16,442 | 3,477,976 |
| Paylocity Holding Corp. * | 12,076 | 1,238,998 |
| PayPal Holdings, Inc. * | 397,921 | 41,423,576 |
| Paysign, Inc. *(a) | 12,225 | 131,786 |
| Pegasystems, Inc. | 13,316 | 1,001,496 |
| Perficient, Inc. * | 10,300 | 403,760 |
| Perspecta, Inc. | 47,635 | 1,264,233 |
| PFSweb, Inc. * | 7,732 | 24,124 |
| Pivotal Software, Inc., Class A * | 25,842 | 386,855 |
| Pluralsight, Inc., Class A * | 28,161 | 509,151 |
| Presidio, Inc. | 14,732 | 244,551 |
| PRGX Global, Inc. * | 6,500 | 32,500 |
| Progress Software Corp. | 15,976 | 637,123 |
| Proofpoint, Inc. * | 18,969 | 2,188,454 |
| PROS Holdings, Inc. * | 12,461 | 638,502 |
| PTC, Inc. * | 36,344 | 2,431,777 |
| Q2 Holdings, Inc. * | 14,102 | 1,008,152 |
| QAD, Inc., Class A | 3,753 | 174,439 |
| Qualys, Inc. * | 11,618 | 991,364 |
| Rapid7, Inc. * | 14,555 | 729,060 |
| RealNetworks, Inc. * | 13,613 | 22,053 |
| RealPage, Inc. * | 27,075 | 1,639,391 |
| Repay Holdings Corp. * | 11,120 | 149,342 |
| RingCentral, Inc., Class A * | 24,909 | 4,023,302 |
| Sabre Corp. | 94,261 | 2,213,248 |
| SailPoint Technologies Holding, Inc. * | 29,216 | 565,622 |
| salesforce.com, Inc. * | 296,646 | 46,422,133 |
| Science Applications International Corp. | 17,418 | 1,439,075 |
| SecureWorks Corp., Class A * | 2,900 | 35,264 |
| ServiceNow, Inc. * | 63,386 | 15,672,822 |
| ServiceSource International, Inc. * | 26,733 | 33,416 |
| SharpSpring, Inc. * | 3,003 | 30,601 |
| ShotSpotter, Inc. * | 2,300 | 46,460 |
| Slack Technologies, Inc. Class A *(a) | 14,367 | 316,074 |
| Smartsheet, Inc., Class A * | 28,529 | 1,124,043 |
| SolarWinds Corp. * | 23,132 | 438,351 |
| Splunk, Inc. * | 51,567 | 6,185,977 |
| SPS Commerce, Inc. * | 11,316 | 597,145 |
| Square, Inc., Class A * | 116,702 | 7,169,004 |
| SS&C Technologies Holdings, Inc. | 73,755 | 3,835,998 |
| StarTek, Inc. * | 5,834 | 37,921 |
| Steel Connect, Inc. * | 18,290 | 28,532 |
| SVMK, Inc. * | 30,524 | 561,642 |
| Switch, Inc., Class A | 16,791 | 248,003 |
| Sykes Enterprises, Inc. * | 12,854 | 397,124 |
| Symantec Corp. | 190,564 | 4,360,104 |
| Security | Number
of Shares | Value ($) |
| Synchronoss Technologies, Inc. * | 15,860 | 95,160 |
| Synopsys, Inc. * | 50,430 | 6,845,872 |
| Telaria, Inc. * | 8,914 | 67,479 |
| Telenav, Inc. * | 9,800 | 46,158 |
| Tenable Holdings, Inc. * | 14,600 | 367,920 |
| Teradata Corp. * | 39,683 | 1,187,712 |
| The Hackett Group, Inc. | 8,738 | 147,760 |
| The Trade Desk, Inc., Class A * | 13,042 | 2,618,834 |
| The Western Union Co. | 143,151 | 3,587,364 |
| TiVo Corp. | 38,279 | 311,591 |
| TTEC Holdings, Inc. | 4,849 | 229,697 |
| Twilio, Inc., Class A * | 40,639 | 3,924,102 |
| Tyler Technologies, Inc. * | 13,031 | 3,499,084 |
| Unisys Corp. * | 15,300 | 156,978 |
| Upland Software, Inc. * | 6,900 | 258,612 |
| Varonis Systems, Inc. * | 9,890 | 707,630 |
| Verint Systems, Inc. * | 22,552 | 1,023,635 |
| VeriSign, Inc. * | 34,798 | 6,612,316 |
| Verra Mobility Corp. * | 41,043 | 588,967 |
| VirnetX Holding Corp. *(a) | 14,945 | 87,428 |
| Virtusa Corp. * | 9,272 | 345,660 |
| Visa, Inc., Class A | 582,652 | 104,213,137 |
| VMware, Inc., Class A | 26,336 | 4,168,199 |
| WEX, Inc. * | 14,750 | 2,790,405 |
| Workday, Inc., Class A * | 54,434 | 8,827,017 |
| Workiva, Inc. * | 11,965 | 498,582 |
| Yext, Inc. * | 32,885 | 541,287 |
| Zendesk, Inc. * | 36,756 | 2,596,811 |
| Zix Corp. * | 17,000 | 112,370 |
| Zoom Video Communications, Inc. * | 7,996 | 558,840 |
| Zscaler, Inc. * | 21,610 | 950,408 |
| Zuora, Inc., Class A * | 24,237 | 345,377 |
| | | 1,231,678,703 |
| |
| Technology Hardware & Equipment 5.7% |
| 3D Systems Corp. * | 36,503 | 346,413 |
| Acacia Communications, Inc. * | 12,609 | 827,907 |
| ADTRAN, Inc. | 15,268 | 134,511 |
| Airgain, Inc. * | 3,401 | 38,669 |
| Akoustis Technologies, Inc. *(a) | 7,703 | 62,934 |
| Amphenol Corp., Class A | 100,402 | 10,073,333 |
| Anixter International, Inc. * | 10,581 | 875,578 |
| Apple, Inc. | 1,434,285 | 356,792,737 |
| Applied Optoelectronics, Inc. *(a) | 6,000 | 56,160 |
| Arista Networks, Inc. * | 18,220 | 4,456,065 |
| Arlo Technologies, Inc. * | 21,716 | 74,052 |
| Arrow Electronics, Inc. * | 28,196 | 2,235,379 |
| AstroNova, Inc. | 1,900 | 30,134 |
| Avid Technology, Inc. * | 9,400 | 63,497 |
| Avnet, Inc. | 34,085 | 1,348,403 |
| AVX Corp. | 14,751 | 225,985 |
| Badger Meter, Inc. | 10,799 | 624,182 |
| Bel Fuse, Inc., Class B | 3,500 | 51,485 |
| Belden, Inc. | 12,455 | 638,692 |
| Benchmark Electronics, Inc. | 13,708 | 464,701 |
| CalAmp Corp. * | 9,892 | 110,988 |
| Calix, Inc. * | 12,108 | 92,626 |
| Casa Systems, Inc. * | 8,800 | 59,136 |
| CDW Corp. | 48,610 | 6,217,705 |
| Ciena Corp. * | 51,896 | 1,926,380 |
| Cisco Systems, Inc. | 1,435,213 | 68,186,970 |
| Clearfield, Inc. * | 3,291 | 40,578 |
| Cognex Corp. | 58,857 | 3,030,547 |
| Coherent, Inc. * | 8,069 | 1,201,635 |
| CommScope Holding Co., Inc. * | 65,675 | 735,560 |
| Comtech Telecommunications Corp. | 8,949 | 312,768 |
| Corning, Inc. | 263,434 | 7,805,549 |
Schwab Equity Index Funds | Annual Report
Schwab Total Stock Market Index Fund
Portfolio Holdings as of October 31, 2019 (continued)
| Security | Number
of Shares | Value ($) |
| CTS Corp. | 10,207 | 272,323 |
| Daktronics, Inc. | 14,170 | 97,206 |
| DASAN Zhone Solutions, Inc. * | 4,470 | 33,681 |
| Dell Technologies, Inc., Class C * | 51,591 | 2,728,648 |
| Diebold Nixdorf, Inc. * | 28,307 | 198,149 |
| Digi International, Inc. * | 9,100 | 131,222 |
| Dolby Laboratories, Inc., Class A | 21,771 | 1,400,528 |
| Eastman Kodak Co. * | 13,330 | 35,591 |
| EchoStar Corp., Class A * | 15,098 | 588,822 |
| EMCORE Corp. * | 11,147 | 33,107 |
| ePlus, Inc. * | 5,276 | 412,214 |
| Extreme Networks, Inc. * | 36,200 | 233,128 |
| F5 Networks, Inc. * | 20,959 | 3,019,773 |
| Fabrinet * | 12,888 | 724,692 |
| FARO Technologies, Inc. * | 6,085 | 290,133 |
| Fitbit, Inc., Class A * | 84,474 | 522,049 |
| FLIR Systems, Inc. | 45,312 | 2,336,287 |
| Genasys, Inc. * | 16,638 | 56,569 |
| Harmonic, Inc. * | 28,370 | 220,719 |
| Hewlett Packard Enterprise Co. | 438,261 | 7,191,863 |
| HP, Inc. | 500,259 | 8,689,499 |
| Identiv, Inc. * | 8,288 | 40,445 |
| II-VI, Inc. * | 29,479 | 977,229 |
| Immersion Corp. * | 10,166 | 83,565 |
| Infinera Corp. * | 49,462 | 276,493 |
| Inseego Corp. *(a) | 13,900 | 79,647 |
| Insight Enterprises, Inc. * | 11,782 | 723,179 |
| InterDigital, Inc. | 11,287 | 605,322 |
| Intevac, Inc. * | 6,954 | 40,194 |
| IPG Photonics Corp. * | 11,818 | 1,586,921 |
| Iteris, Inc. * | 7,250 | 38,860 |
| Itron, Inc. * | 12,104 | 923,051 |
| Jabil, Inc. | 46,334 | 1,706,018 |
| Juniper Networks, Inc. | 115,864 | 2,875,744 |
| KEMET Corp. | 20,294 | 441,192 |
| Keysight Technologies, Inc. * | 64,225 | 6,480,945 |
| Kimball Electronics, Inc. * | 11,150 | 165,689 |
| Knowles Corp. * | 30,607 | 660,499 |
| KVH Industries, Inc. * | 5,000 | 51,100 |
| Littelfuse, Inc. | 8,379 | 1,471,101 |
| Lumentum Holdings, Inc. * | 25,685 | 1,609,422 |
| Luna Innovations, Inc. * | 11,699 | 70,545 |
| Methode Electronics, Inc. | 11,479 | 394,878 |
| MicroVision, Inc. * | 37,436 | 27,856 |
| Motorola Solutions, Inc. | 56,385 | 9,377,953 |
| MTS Systems Corp. | 5,904 | 333,458 |
| Napco Security Technologies, Inc. * | 3,300 | 100,188 |
| National Instruments Corp. | 40,292 | 1,667,686 |
| NCR Corp. * | 45,182 | 1,319,766 |
| NetApp, Inc. | 79,582 | 4,447,042 |
| NETGEAR, Inc. * | 11,902 | 323,377 |
| NetScout Systems, Inc. * | 21,875 | 529,812 |
| nLight, Inc. * | 12,303 | 164,368 |
| Novanta, Inc. * | 12,175 | 1,084,184 |
| OSI Systems, Inc. * | 5,852 | 580,752 |
| PAR Technology Corp. *(a) | 3,100 | 77,686 |
| PC Connection, Inc. | 4,382 | 214,017 |
| PC-Tel, Inc. * | 9,339 | 66,774 |
| Plantronics, Inc. | 11,458 | 451,674 |
| Plexus Corp. * | 10,389 | 768,163 |
| Powerfleet, Inc. * | 7,153 | 42,346 |
| Pure Storage, Inc., Class A * | 75,085 | 1,461,154 |
| Ribbon Communications, Inc. * | 15,542 | 66,675 |
| Richardson Electronics Ltd. | 6,205 | 35,803 |
| Rogers Corp. * | 6,188 | 838,350 |
| Sanmina Corp. * | 22,139 | 680,331 |
| ScanSource, Inc. * | 9,015 | 291,185 |
| Seagate Technology plc | 80,526 | 4,672,924 |
| Security | Number
of Shares | Value ($) |
| SYNNEX Corp. | 13,580 | 1,598,909 |
| TE Connectivity Ltd. | 113,329 | 10,142,945 |
| Tech Data Corp. * | 12,810 | 1,556,415 |
| TESSCO Technologies, Inc. | 1,269 | 16,865 |
| TransAct Technologies, Inc. | 5,070 | 62,665 |
| Trimble, Inc. * | 84,819 | 3,379,189 |
| TTM Technologies, Inc. * | 37,069 | 434,078 |
| Ubiquiti, Inc.(a) | 4,398 | 556,743 |
| ViaSat, Inc. * | 19,196 | 1,321,453 |
| Viavi Solutions, Inc. * | 80,514 | 1,285,003 |
| Vishay Intertechnology, Inc. | 42,924 | 864,919 |
| Vishay Precision Group, Inc. * | 4,093 | 139,367 |
| Western Digital Corp. | 99,689 | 5,148,937 |
| Xerox Holdings Corp. | 65,416 | 2,219,565 |
| Zebra Technologies Corp., Class A * | 18,152 | 4,317,816 |
| | | 582,327,894 |
| |
| Telecommunication Services 2.0% |
| Alaska Communications Systems Group, Inc. * | 26,271 | 43,084 |
| Anterix, Inc. * | 5,831 | 236,505 |
| AT&T, Inc. | 2,466,696 | 94,943,129 |
| ATN International, Inc. | 3,277 | 194,097 |
| Bandwidth, Inc., Class A * | 5,234 | 293,889 |
| Boingo Wireless, Inc. * | 12,610 | 119,417 |
| CenturyLink, Inc. | 331,707 | 4,292,289 |
| Cincinnati Bell, Inc. * | 14,894 | 76,108 |
| Cogent Communications Holdings, Inc. | 14,646 | 858,841 |
| Consolidated Communications Holdings, Inc. | 30,887 | 123,548 |
| Frontier Communications Corp. *(a) | 31,111 | 28,311 |
| GCI Liberty, Inc., Class A * | 32,047 | 2,242,649 |
| Globalstar, Inc. * | 173,777 | 66,383 |
| Gogo, Inc. *(a) | 16,000 | 98,400 |
| IDT Corp., Class B * | 6,600 | 44,946 |
| Iridium Communications, Inc. * | 33,235 | 813,260 |
| NII Holdings, Inc. * | 28,127 | 53,160 |
| Ooma, Inc. * | 5,385 | 61,120 |
| ORBCOMM, Inc. * | 28,696 | 115,071 |
| Pareteum Corp. * | 56,410 | 20,872 |
| Shenandoah Telecommunications Co. | 17,629 | 566,949 |
| Spok Holdings, Inc. | 5,240 | 62,356 |
| Sprint Corp. * | 212,955 | 1,322,450 |
| T-Mobile US, Inc. * | 107,374 | 8,875,535 |
| Telephone & Data Systems, Inc. | 31,867 | 831,410 |
| United States Cellular Corp. * | 5,400 | 200,988 |
| Verizon Communications, Inc. | 1,395,897 | 84,409,892 |
| Vonage Holdings Corp. * | 76,936 | 751,665 |
| Zayo Group Holdings, Inc. * | 78,710 | 2,687,159 |
| | | 204,433,483 |
| |
| Transportation 1.9% |
| Air Transport Services Group, Inc. * | 21,611 | 451,886 |
| Alaska Air Group, Inc. | 41,780 | 2,900,785 |
| Allegiant Travel Co. | 4,527 | 757,503 |
| AMERCO | 2,676 | 1,083,887 |
| American Airlines Group, Inc. | 134,829 | 4,052,960 |
| ArcBest Corp. | 9,560 | 276,188 |
| Atlas Air Worldwide Holdings, Inc. * | 7,665 | 168,093 |
| Avis Budget Group, Inc. * | 20,631 | 612,947 |
| C.H. Robinson Worldwide, Inc. | 45,379 | 3,432,468 |
| Covenant Transportation Group, Inc., Class A * | 3,000 | 46,110 |
| CSX Corp. | 269,532 | 18,940,014 |
| Daseke, Inc. * | 20,197 | 54,330 |
| Delta Air Lines, Inc. | 196,124 | 10,802,510 |
Schwab Equity Index Funds | Annual Report
Schwab Total Stock Market Index Fund
Portfolio Holdings as of October 31, 2019 (continued)
| Security | Number
of Shares | Value ($) |
| Eagle Bulk Shipping, Inc. * | 21,200 | 92,008 |
| Echo Global Logistics, Inc. * | 10,195 | 202,982 |
| Expeditors International of Washington, Inc. | 56,932 | 4,152,620 |
| FedEx Corp. | 81,272 | 12,406,984 |
| Forward Air Corp. | 9,608 | 664,585 |
| Genco Shipping & Trading Ltd. * | 3,574 | 35,311 |
| Genesee & Wyoming, Inc., Class A * | 19,285 | 2,141,214 |
| Hawaiian Holdings, Inc. | 15,015 | 429,579 |
| Heartland Express, Inc. | 14,643 | 306,039 |
| Hertz Global Holdings, Inc. * | 33,097 | 447,141 |
| Hub Group, Inc., Class A * | 10,614 | 486,121 |
| JB Hunt Transport Services, Inc. | 28,578 | 3,359,630 |
| JetBlue Airways Corp. * | 99,628 | 1,922,820 |
| Kansas City Southern | 33,878 | 4,769,345 |
| Kirby Corp. * | 20,313 | 1,607,977 |
| Knight-Swift Transportation Holdings, Inc. | 41,398 | 1,509,371 |
| Landstar System, Inc. | 13,558 | 1,534,088 |
| Lyft, Inc., Class A * | 67,366 | 2,791,647 |
| Macquarie Infrastructure Corp. | 25,201 | 1,087,171 |
| Marten Transport Ltd. | 12,211 | 264,490 |
| Matson, Inc. | 14,354 | 548,036 |
| Mesa Air Group, Inc. * | 13,374 | 101,910 |
| Norfolk Southern Corp. | 88,734 | 16,149,588 |
| Old Dominion Freight Line, Inc. | 21,502 | 3,915,084 |
| P.A.M. Transportation Services, Inc. * | 907 | 51,971 |
| Radiant Logistics, Inc. * | 10,193 | 54,940 |
| Ryder System, Inc. | 18,502 | 899,752 |
| Saia, Inc. * | 9,047 | 806,992 |
| Schneider National, Inc., Class B | 15,816 | 361,712 |
| SkyWest, Inc. | 17,068 | 1,016,399 |
| Southwest Airlines Co. | 163,083 | 9,153,849 |
| Spirit Airlines, Inc. * | 23,183 | 870,754 |
| Uber Technologies, Inc. *(a) | 70,037 | 2,206,166 |
| Union Pacific Corp. | 237,733 | 39,335,302 |
| United Airlines Holdings, Inc. * | 74,854 | 6,799,737 |
| United Parcel Service, Inc., Class B | 235,424 | 27,113,782 |
| Universal Logistics Holdings, Inc. | 3,300 | 62,222 |
| Werner Enterprises, Inc. | 16,196 | 591,154 |
| XPO Logistics, Inc. * | 30,886 | 2,359,690 |
| YRC Worldwide, Inc. * | 8,600 | 28,810 |
| | | 196,218,654 |
| |
| Utilities 3.4% |
| AES Corp. | 223,312 | 3,807,470 |
| ALLETE, Inc. | 17,202 | 1,480,404 |
| Alliant Energy Corp. | 79,498 | 4,240,423 |
| Ameren Corp. | 82,508 | 6,410,872 |
| American Electric Power Co., Inc. | 166,461 | 15,712,254 |
| American States Water Co. | 11,892 | 1,131,286 |
| American Water Works Co., Inc. | 61,028 | 7,522,922 |
| Aqua America, Inc. | 73,640 | 3,338,101 |
| AquaVenture Holdings Ltd. * | 6,516 | 127,844 |
| Artesian Resources Corp., Class A | 3,837 | 142,353 |
| Atmos Energy Corp. | 39,480 | 4,440,710 |
| Avangrid, Inc. | 19,861 | 994,043 |
| Avista Corp. | 21,423 | 1,028,947 |
| Black Hills Corp. | 20,739 | 1,634,855 |
| Cadiz, Inc. *(a) | 6,356 | 75,255 |
| California Water Service Group | 17,255 | 965,762 |
| CenterPoint Energy, Inc. | 172,971 | 5,028,267 |
| Chesapeake Utilities Corp. | 5,602 | 531,070 |
| Clearway Energy, Inc., Class A | 11,000 | 188,870 |
| Clearway Energy, Inc., Class C | 26,372 | 478,124 |
| CMS Energy Corp. | 96,018 | 6,137,471 |
| Consolidated Edison, Inc. | 112,227 | 10,349,574 |
| Security | Number
of Shares | Value ($) |
| Dominion Energy, Inc. | 277,403 | 22,899,618 |
| DTE Energy Co. | 61,802 | 7,868,631 |
| Duke Energy Corp. | 244,969 | 23,090,778 |
| Edison International | 121,377 | 7,634,613 |
| El Paso Electric Co. | 13,777 | 919,064 |
| Entergy Corp. | 67,644 | 8,217,393 |
| Evergy, Inc. | 78,327 | 5,005,879 |
| Eversource Energy | 109,187 | 9,143,319 |
| Exelon Corp. | 327,648 | 14,904,708 |
| FirstEnergy Corp. | 180,234 | 8,708,907 |
| Genie Energy Ltd., Class B | 5,585 | 41,608 |
| Global Water Resources, Inc. | 4,694 | 57,501 |
| Hawaiian Electric Industries, Inc. | 35,748 | 1,614,022 |
| IDACORP, Inc. | 17,160 | 1,846,759 |
| MDU Resources Group, Inc. | 66,666 | 1,925,981 |
| MGE Energy, Inc. | 11,963 | 921,630 |
| Middlesex Water Co. | 5,342 | 359,249 |
| National Fuel Gas Co. | 31,306 | 1,418,475 |
| New Jersey Resources Corp. | 30,820 | 1,343,752 |
| NextEra Energy, Inc. | 164,620 | 39,235,531 |
| NiSource, Inc. | 125,685 | 3,524,207 |
| Northwest Natural Holding Co. | 9,868 | 684,444 |
| NorthWestern Corp. | 17,760 | 1,287,955 |
| NRG Energy, Inc. | 84,710 | 3,398,565 |
| OGE Energy Corp. | 69,429 | 2,989,613 |
| ONE Gas, Inc. | 17,642 | 1,637,883 |
| Ormat Technologies, Inc. | 17,239 | 1,319,818 |
| Otter Tail Corp. | 15,277 | 865,900 |
| Pattern Energy Group, Inc., Class A | 32,644 | 915,011 |
| Pinnacle West Capital Corp. | 38,076 | 3,583,713 |
| PNM Resources, Inc. | 27,818 | 1,450,709 |
| Portland General Electric Co. | 30,909 | 1,758,104 |
| PPL Corp. | 244,724 | 8,195,807 |
| Public Service Enterprise Group, Inc. | 170,852 | 10,816,640 |
| Pure Cycle Corp. * | 8,000 | 89,440 |
| RGC Resources, Inc. | 2,000 | 58,340 |
| Sempra Energy | 92,424 | 13,356,192 |
| SJW Group. | 8,905 | 644,277 |
| South Jersey Industries, Inc. | 29,866 | 960,491 |
| Southwest Gas Holdings, Inc. | 18,141 | 1,583,709 |
| Spark Energy, Inc., Class A | 5,059 | 48,415 |
| Spire, Inc. | 17,363 | 1,459,534 |
| TerraForm Power, Inc., Class A | 27,688 | 470,142 |
| The Southern Co. | 351,492 | 22,024,489 |
| The York Water Co. | 4,611 | 203,068 |
| UGI Corp. | 69,914 | 3,332,800 |
| Unitil Corp. | 4,900 | 305,123 |
| Vistra Energy Corp. | 153,568 | 4,150,943 |
| WEC Energy Group, Inc. | 107,197 | 10,119,397 |
| Xcel Energy, Inc. | 176,181 | 11,189,255 |
| | | 345,348,279 |
| Total Common Stock |
| (Cost $6,088,103,852) | | 10,192,630,587 |
|
| Rights0.0% of net assets |
| |
| Automobiles & Components 0.0% |
| Thestreet.Com, Inc. CVR *(c) | 2,023 | — |
| |
| Materials 0.0% |
| A. Schulman, Inc. CVR *(c) | 8,178 | 3,541 |
| |
| Media & Entertainment 0.0% |
| Media General, Inc. CVR *(c) | 18,400 | 1,566 |
| |
Schwab Equity Index Funds | Annual Report
Schwab Total Stock Market Index Fund
Portfolio Holdings as of October 31, 2019 (continued)
| Security | Number
of Shares | Value ($) |
| Pharmaceuticals, Biotechnology & Life Sciences 0.0% |
| Corium International, Inc. CVR *(c) | 8,309 | 1,495 |
| Elanco Animal Health, Inc. CVR *(c) | 16,000 | 97 |
| FRD Acquisition Co. CVR *(c) | 8,700 | — |
| | | 1,592 |
| Total Rights |
| (Cost $5,439) | | 6,699 |
|
| Other Investment Company0.2% of net assets |
| |
| Securities Lending Collateral 0.2% |
| Wells Fargo Government Money Market Fund, Select Class 1.75%(d) | 20,636,112 | 20,636,112 |
| Total Other Investment Company |
| (Cost $20,636,112) | | 20,636,112 |
Security
Rate, Maturity Date | Face
Amount ($) | Value ($) |
| Short-Term Investment0.6% of net assets |
| |
| Time Deposit 0.6% |
| Sumitomo Mitsui Trust Bank, Limited. |
| U.S. Dollar | | |
| 1.18%, 11/01/19(e) | 56,245,967 | 56,245,967 |
| Total Short-Term Investment |
| (Cost $56,245,967) | | 56,245,967 |
| | Number of
Contracts | Notional
Amount
($) | Current Value/
Unrealized
Depreciation
($) |
| Futures Contracts | |
| Long | |
| Russell 2000 Index, e-mini, expires 12/20/19 | 51 | 3,986,670 | (15,973) |
| S&P 500 Index, e-mini, expires 12/20/19 | 149 | 22,616,710 | (64) |
| Net Unrealized Depreciation | (16,037) |
| * | Non-income producing security. |
| (a) | All or a portion of this security is on loan. Securities on loan were valued at $19,526,339. |
| (b) | Issuer is affiliated with the fund’s investment adviser. |
| (c) | Fair-valued by management using significant unobservable inputs in accordance with procedures approved by the fund’s Board of Trustees. |
| (d) | The rate shown is the 7-day yield. |
| (e) | The rate shown is the current daily overnight rate. |
| | |
| CVR — | Contingent Value Rights |
| REIT — | Real Estate Investment Trust |
Schwab Equity Index Funds | Annual Report
Schwab U.S. Large-Cap Growth Index Fund
Portfolio Holdings as of October 31, 2019
This section shows all the securities in the fund’s portfolio and their values as of the report date.
The fund files its complete schedule of portfolio holdings with the U.S. Securities and Exchange Commission (SEC) for the first and third quarters of each fiscal year on Form N-Q. Effective March 31, 2019, Form N-PORT Part F has replaced Form N-Q. The fund’s Form N-Q and Form N-PORT Part F are available on the SEC’s website atwww.sec.gov. The fund also makes available its complete schedule of portfolio holdings 15 to 20 days after the end of the month on the fund’s website atwww.schwabfunds.com/schwabfunds_prospectus.
| Security | Number
of Shares | Value ($) |
| Common Stock99.8% of net assets |
| |
| Automobiles & Components 0.3% |
| Aptiv plc | 195 | 17,463 |
| Tesla, Inc. * | 1,622 | 510,800 |
| | | 528,263 |
| |
| Banks 0.1% |
| CIT Group, Inc. | 83 | 3,560 |
| Comerica, Inc. | 100 | 6,542 |
| First Republic Bank | 351 | 37,332 |
| LendingTree, Inc. * | 87 | 31,307 |
| Prosperity Bancshares, Inc. | 115 | 7,937 |
| Signature Bank | 312 | 36,916 |
| SVB Financial Group * | 44 | 9,745 |
| Synovus Financial Corp. | 118 | 3,997 |
| Western Alliance Bancorp | 142 | 7,005 |
| | | 144,341 |
| |
| Capital Goods 6.2% |
| 3M Co. | 4,943 | 815,546 |
| A.O. Smith Corp. | 240 | 11,923 |
| Acuity Brands, Inc. | 115 | 14,351 |
| Air Lease Corp. | 78 | 3,430 |
| Allegion plc | 815 | 94,573 |
| Allison Transmission Holdings, Inc. | 1,279 | 55,777 |
| AMETEK, Inc. | 2,088 | 191,365 |
| Armstrong World Industries, Inc. | 566 | 52,938 |
| BWX Technologies, Inc. | 823 | 47,816 |
| Carlisle Cos., Inc. | 560 | 85,271 |
| Caterpillar, Inc. | 493 | 67,935 |
| Deere & Co. | 407 | 70,875 |
| Donaldson Co., Inc. | 1,476 | 77,844 |
| Dover Corp. | 732 | 76,047 |
| Emerson Electric Co. | 605 | 42,441 |
| Fastenal Co. | 5,951 | 213,879 |
| Flowserve Corp. | 328 | 16,020 |
| Fortive Corp. | 772 | 53,268 |
| Fortune Brands Home & Security, Inc. | 526 | 31,586 |
| General Dynamics Corp. | 194 | 34,299 |
| Graco, Inc. | 1,899 | 85,835 |
| HEICO Corp. | 448 | 55,256 |
| HEICO Corp., Class A | 874 | 83,266 |
| Hexcel Corp. | 908 | 67,755 |
| Honeywell International, Inc. | 4,051 | 699,729 |
| Hubbell, Inc. | 340 | 48,178 |
| Huntington Ingalls Industries, Inc. | 372 | 83,946 |
| IDEX Corp. | 436 | 67,811 |
| Illinois Tool Works, Inc. | 3,745 | 631,332 |
| Ingersoll-Rand plc | 2,612 | 331,437 |
| L3Harris Technologies, Inc. | 1,285 | 265,108 |
| Lennox International, Inc. | 368 | 91,029 |
| Lincoln Electric Holdings, Inc. | 647 | 57,952 |
| Lockheed Martin Corp. | 2,852 | 1,074,291 |
| Nordson Corp. | 598 | 93,772 |
| Northrop Grumman Corp. | 1,826 | 643,629 |
| Security | Number
of Shares | Value ($) |
| Quanta Services, Inc. | 375 | 15,769 |
| Raytheon Co. | 2,001 | 424,632 |
| Rockwell Automation, Inc. | 1,347 | 231,671 |
| Roper Technologies, Inc. | 180 | 60,653 |
| Sensata Technologies Holding plc * | 784 | 40,133 |
| Spirit AeroSystems Holdings, Inc., Class A | 1,064 | 87,056 |
| The Boeing Co. | 6,110 | 2,076,850 |
| The Middleby Corp. * | 641 | 77,529 |
| The Toro Co. | 1,217 | 93,867 |
| TransDigm Group, Inc. | 462 | 243,141 |
| United Rentals, Inc. * | 633 | 84,550 |
| W.W. Grainger, Inc. | 506 | 156,273 |
| WABCO Holdings, Inc. * | 498 | 67,041 |
| Wabtec Corp. | 567 | 39,333 |
| Woodward, Inc. | 522 | 55,677 |
| Xylem, Inc. | 2,066 | 158,442 |
| | | 10,350,127 |
| |
| Commercial & Professional Services 1.3% |
| Cintas Corp. | 965 | 259,267 |
| Copart, Inc. * | 2,273 | 187,841 |
| CoStar Group, Inc. * | 415 | 228,051 |
| Equifax, Inc. | 1,176 | 160,771 |
| IAA, Inc. * | 1,416 | 54,020 |
| IHS Markit Ltd. * | 2,867 | 200,747 |
| KAR Auction Services, Inc. | 1,384 | 34,406 |
| Nielsen Holdings plc | 504 | 10,161 |
| Republic Services, Inc. | 147 | 12,864 |
| Robert Half International, Inc. | 1,343 | 76,914 |
| Rollins, Inc. | 1,635 | 62,310 |
| TransUnion | 2,158 | 178,294 |
| Verisk Analytics, Inc. | 1,845 | 266,971 |
| Waste Management, Inc. | 3,831 | 429,876 |
| | | 2,162,493 |
| |
| Consumer Durables & Apparel 1.5% |
| Capri Holdings Ltd. * | 669 | 20,786 |
| Carter's, Inc. | 227 | 22,754 |
| Columbia Sportswear Co. | 221 | 19,989 |
| Hanesbrands, Inc. | 3,241 | 49,296 |
| Hasbro, Inc. | 1,337 | 130,103 |
| Lennar Corp., B Shares | 80 | 3,762 |
| Lennar Corp., Class A | 1,325 | 78,970 |
| lululemon Athletica, Inc. * | 1,362 | 278,216 |
| Mattel, Inc. * | 2,765 | 33,014 |
| NIKE, Inc., Class B | 14,245 | 1,275,640 |
| NVR, Inc. * | 37 | 134,554 |
| Polaris, Inc. | 597 | 58,894 |
| Skechers U.S.A., Inc., Class A * | 548 | 20,479 |
| Tempur Sealy International, Inc. * | 522 | 47,476 |
| Under Armour, Inc., Class A * | 1,411 | 29,137 |
| Under Armour, Inc., Class C * | 1,444 | 26,714 |
| VF Corp. | 3,543 | 291,553 |
| | | 2,521,337 |
| |
Schwab Equity Index Funds | Annual Report
Schwab U.S. Large-Cap Growth Index Fund
Portfolio Holdings as of October 31, 2019 (continued)
| Security | Number
of Shares | Value ($) |
| Consumer Services 2.3% |
| Bright Horizons Family Solutions, Inc. * | 659 | 97,875 |
| Chipotle Mexican Grill, Inc. * | 295 | 229,557 |
| Choice Hotels International, Inc. | 171 | 15,130 |
| Darden Restaurants, Inc. | 1,420 | 159,423 |
| Domino's Pizza, Inc. | 469 | 127,390 |
| Dunkin' Brands Group, Inc. | 885 | 69,579 |
| Grand Canyon Education, Inc. * | 47 | 4,322 |
| H&R Block, Inc. | 393 | 9,821 |
| Hilton Grand Vacations, Inc. * | 126 | 4,376 |
| Hilton Worldwide Holdings, Inc. | 3,266 | 316,671 |
| Las Vegas Sands Corp. | 1,893 | 117,063 |
| Marriott International, Inc., Class A | 3,170 | 401,164 |
| McDonald's Corp. | 1,426 | 280,494 |
| MGM Resorts International | 500 | 14,250 |
| Norwegian Cruise Line Holdings Ltd. * | 525 | 26,649 |
| Planet Fitness, Inc., Class A * | 963 | 61,305 |
| Service Corp. International | 724 | 32,928 |
| ServiceMaster Global Holdings, Inc. * | 244 | 9,853 |
| Six Flags Entertainment Corp. | 77 | 3,249 |
| Starbucks Corp. | 13,813 | 1,168,027 |
| The Wendy's Co. | 2,095 | 44,372 |
| Vail Resorts, Inc. | 411 | 95,504 |
| Wyndham Hotels & Resorts, Inc. | 329 | 17,756 |
| Wynn Resorts Ltd. | 939 | 113,938 |
| Yum China Holdings, Inc. | 3,376 | 143,480 |
| Yum! Brands, Inc. | 3,137 | 319,064 |
| | | 3,883,240 |
| |
| Diversified Financials 2.1% |
| American Express Co. | 4,406 | 516,736 |
| Ameriprise Financial, Inc. | 216 | 32,592 |
| Cboe Global Markets, Inc. | 310 | 35,696 |
| Credit Acceptance Corp. * | 108 | 47,283 |
| Discover Financial Services | 1,287 | 103,295 |
| E*TRADE Financial Corp. | 511 | 21,355 |
| Evercore, Inc., Class A | 160 | 11,782 |
| FactSet Research Systems, Inc. | 431 | 109,267 |
| Interactive Brokers Group, Inc., Class A | 228 | 10,846 |
| Intercontinental Exchange, Inc. | 2,547 | 240,233 |
| Lazard Ltd., Class A | 438 | 16,351 |
| LPL Financial Holdings, Inc. | 952 | 76,960 |
| MarketAxess Holdings, Inc. | 426 | 157,019 |
| Moody's Corp. | 1,896 | 418,428 |
| Morningstar, Inc. | 223 | 36,090 |
| MSCI, Inc. | 952 | 223,301 |
| Raymond James Financial, Inc. | 333 | 27,802 |
| S&P Global, Inc. | 2,839 | 732,434 |
| SEI Investments Co. | 718 | 43,023 |
| Synchrony Financial | 2,075 | 73,393 |
| T. Rowe Price Group, Inc. | 769 | 89,050 |
| TD Ameritrade Holding Corp. | 2,734 | 104,931 |
| The Charles Schwab Corp.(a) | 8,073 | 328,652 |
| Virtu Financial, Inc., Class A | 249 | 4,223 |
| Voya Financial, Inc. | 107 | 5,774 |
| | | 3,466,516 |
| |
| Energy 0.3% |
| Cabot Oil & Gas Corp. | 3,018 | 56,255 |
| Cheniere Energy, Inc. * | 1,538 | 94,664 |
| Diamondback Energy, Inc. | 392 | 33,618 |
| Equitrans Midstream Corp. | 206 | 2,867 |
| ONEOK, Inc. | 1,500 | 104,745 |
| Security | Number
of Shares | Value ($) |
| Parsley Energy, Inc., Class A | 1,748 | 27,636 |
| Pioneer Natural Resources Co. | 828 | 101,861 |
| | | 421,646 |
| |
| Food & Staples Retailing 1.2% |
| Casey's General Stores, Inc. | 102 | 17,423 |
| Costco Wholesale Corp. | 5,072 | 1,506,942 |
| Grocery Outlet Holding Corp. * | 84 | 2,680 |
| Sprouts Farmers Market, Inc. * | 625 | 12,131 |
| Sysco Corp. | 5,498 | 439,125 |
| | | 1,978,301 |
| |
| Food, Beverage & Tobacco 3.0% |
| Altria Group, Inc. | 10,541 | 472,131 |
| Brown-Forman Corp., Class A | 491 | 30,516 |
| Brown-Forman Corp., Class B | 1,842 | 120,688 |
| Campbell Soup Co. | 1,078 | 49,922 |
| Kellogg Co. | 1,084 | 68,867 |
| Lamb Weston Holdings, Inc. | 446 | 34,806 |
| McCormick & Co., Inc. - Non Voting Shares | 918 | 147,513 |
| Monster Beverage Corp. * | 4,461 | 250,396 |
| PepsiCo, Inc. | 13,582 | 1,863,043 |
| Pilgrim's Pride Corp. * | 248 | 7,529 |
| Post Holdings, Inc. * | 330 | 33,957 |
| The Coca-Cola Co. | 30,183 | 1,642,861 |
| The Hershey Co. | 1,452 | 213,255 |
| TreeHouse Foods, Inc. * | 110 | 5,942 |
| | | 4,941,426 |
| |
| Health Care Equipment & Services 6.4% |
| Abbott Laboratories | 8,612 | 720,049 |
| ABIOMED, Inc. * | 509 | 105,658 |
| Align Technology, Inc. * | 911 | 229,836 |
| AmerisourceBergen Corp. | 1,753 | 149,671 |
| Anthem, Inc. | 865 | 232,754 |
| Baxter International, Inc. | 2,626 | 201,414 |
| Becton, Dickinson & Co. | 266 | 68,096 |
| Boston Scientific Corp. * | 16,030 | 668,451 |
| Cantel Medical Corp. | 231 | 16,838 |
| Centene Corp. * | 3,934 | 208,817 |
| Cerner Corp. | 3,659 | 245,592 |
| Change Healthcare, Inc. * | 282 | 3,728 |
| Chemed Corp. | 180 | 70,904 |
| Cigna Corp. * | 1,312 | 234,140 |
| Danaher Corp. | 390 | 53,750 |
| DexCom, Inc. * | 1,045 | 161,181 |
| Edwards Lifesciences Corp. * | 2,395 | 570,920 |
| Encompass Health Corp. | 561 | 35,915 |
| Guardant Health, Inc. * | 413 | 28,703 |
| HCA Healthcare, Inc. | 1,864 | 248,919 |
| Henry Schein, Inc. * | 211 | 13,205 |
| Hill-Rom Holdings, Inc. | 404 | 42,295 |
| Hologic, Inc. * | 2,451 | 118,408 |
| Humana, Inc. | 666 | 195,937 |
| ICU Medical, Inc. * | 68 | 10,989 |
| IDEXX Laboratories, Inc. * | 980 | 279,310 |
| Insulet Corp. * | 683 | 99,254 |
| Intuitive Surgical, Inc. * | 1,323 | 731,553 |
| Laboratory Corp. of America Holdings * | 67 | 11,040 |
| Masimo Corp. * | 543 | 79,164 |
| McKesson Corp. | 239 | 31,787 |
| Molina Healthcare, Inc. * | 558 | 65,643 |
| Penumbra, Inc. * | 363 | 56,617 |
| ResMed, Inc. | 1,640 | 242,589 |
| Steris plc | 55 | 7,786 |
Schwab Equity Index Funds | Annual Report
Schwab U.S. Large-Cap Growth Index Fund
Portfolio Holdings as of October 31, 2019 (continued)
| Security | Number
of Shares | Value ($) |
| Stryker Corp. | 3,959 | 856,213 |
| Teleflex, Inc. | 533 | 185,170 |
| The Cooper Cos., Inc. | 74 | 21,534 |
| UnitedHealth Group, Inc. | 10,913 | 2,757,715 |
| Varian Medical Systems, Inc. * | 1,043 | 126,005 |
| Veeva Systems, Inc., Class A * | 1,489 | 211,185 |
| WellCare Health Plans, Inc. * | 524 | 155,418 |
| West Pharmaceutical Services, Inc. | 635 | 91,338 |
| | | 10,645,491 |
| |
| Household & Personal Products 0.6% |
| Church & Dwight Co., Inc. | 2,839 | 198,560 |
| Herbalife Nutrition Ltd. * | 182 | 8,130 |
| The Clorox Co. | 1,180 | 174,274 |
| The Estee Lauder Cos., Inc., Class A | 2,479 | 461,763 |
| The Procter & Gamble Co. | 1,651 | 205,566 |
| | | 1,048,293 |
| |
| Insurance 0.9% |
| Alleghany Corp. * | 17 | 13,231 |
| Aon plc | 2,700 | 521,532 |
| Arch Capital Group Ltd. * | 579 | 24,179 |
| Arthur J. Gallagher & Co. | 457 | 41,688 |
| Athene Holding Ltd., Class A * | 694 | 30,085 |
| Axis Capital Holdings Ltd. | 88 | 5,230 |
| Brown & Brown, Inc. | 174 | 6,556 |
| Erie Indemnity Co., Class A | 192 | 35,380 |
| Everest Re Group Ltd. | 138 | 35,478 |
| Kemper Corp. | 132 | 9,488 |
| Markel Corp. * | 13 | 15,223 |
| Marsh & McLennan Cos., Inc. | 5,137 | 532,296 |
| Primerica, Inc. | 339 | 42,775 |
| RenaissanceRe Holdings Ltd. | 188 | 35,190 |
| The Progressive Corp. | 2,199 | 153,270 |
| The Travelers Cos., Inc. | 488 | 63,957 |
| | | 1,565,558 |
| |
| Materials 1.4% |
| Air Products & Chemicals, Inc. | 361 | 76,987 |
| AptarGroup, Inc. | 291 | 34,382 |
| Avery Dennison Corp. | 906 | 115,841 |
| Axalta Coating Systems Ltd. * | 725 | 21,380 |
| Ball Corp. | 3,799 | 265,816 |
| Berry Global Group, Inc. * | 604 | 25,072 |
| CF Industries Holdings, Inc. | 248 | 11,247 |
| Crown Holdings, Inc. * | 869 | 63,298 |
| Eagle Materials, Inc. | 392 | 35,805 |
| Ecolab, Inc. | 2,911 | 559,116 |
| Element Solutions, Inc. * | 989 | 10,740 |
| Martin Marietta Materials, Inc. | 222 | 58,144 |
| NewMarket Corp. | 72 | 34,955 |
| PPG Industries, Inc. | 879 | 109,980 |
| Royal Gold, Inc. | 245 | 28,283 |
| RPM International, Inc. | 243 | 17,600 |
| Sealed Air Corp. | 119 | 4,971 |
| Southern Copper Corp. | 676 | 24,052 |
| The Scotts Miracle-Gro Co. | 463 | 46,481 |
| The Sherwin-Williams Co. | 957 | 547,710 |
| Vulcan Materials Co. | 1,394 | 199,161 |
| W.R. Grace & Co. | 648 | 43,060 |
| | | 2,334,081 |
| |
| Security | Number
of Shares | Value ($) |
| Media & Entertainment 11.5% |
| Activision Blizzard, Inc. | 465 | 26,054 |
| Alphabet, Inc., Class A * | 3,455 | 4,349,154 |
| Alphabet, Inc., Class C * | 3,507 | 4,419,206 |
| Altice USA, Inc., Class A * | 3,596 | 111,296 |
| AMC Networks, Inc., Class A * | 509 | 22,167 |
| Cable One, Inc. | 50 | 66,269 |
| CBS Corp., Class B - Non Voting Shares | 3,455 | 124,518 |
| Charter Communications, Inc., Class A * | 1,084 | 507,160 |
| Comcast Corp., Class A | 24,458 | 1,096,208 |
| Electronic Arts, Inc. * | 3,025 | 291,610 |
| Facebook, Inc., Class A * | 27,580 | 5,285,707 |
| Fox Corp., Class A | 379 | 12,143 |
| Fox Corp., Class B * | 190 | 5,936 |
| IAC/InterActiveCorp * | 497 | 112,943 |
| Live Nation Entertainment, Inc. * | 1,481 | 104,411 |
| Match Group, Inc. | 644 | 47,006 |
| Netflix, Inc. * | 4,857 | 1,395,950 |
| Nexstar Media Group, Inc., Class A | 405 | 39,402 |
| Omnicom Group, Inc. | 1,317 | 101,659 |
| Roku, Inc. * | 979 | 144,109 |
| Sinclair Broadcast Group, Inc., Class A | 649 | 25,856 |
| Sirius XM Holdings, Inc. | 15,728 | 105,692 |
| Spotify Technology S.A. * | 1,364 | 196,825 |
| Take-Two Interactive Software, Inc. * | 603 | 72,571 |
| The Interpublic Group of Cos., Inc. | 403 | 8,765 |
| The Madison Square Garden Co., Class A * | 24 | 6,406 |
| The New York Times Co., Class A | 348 | 10,753 |
| TripAdvisor, Inc. * | 1,115 | 45,046 |
| Twitter, Inc. * | 8,705 | 260,889 |
| World Wrestling Entertainment, Inc., Class A | 498 | 27,908 |
| Zynga, Inc., Class A * | 2,178 | 13,438 |
| | | 19,037,057 |
| |
| Pharmaceuticals, Biotechnology & Life Sciences 8.2% |
| AbbVie, Inc. | 17,074 | 1,358,237 |
| Adaptive Biotechnologies Corp. * | 132 | 3,441 |
| Agilent Technologies, Inc. | 344 | 26,058 |
| Agios Pharmaceuticals, Inc. * | 58 | 1,745 |
| Alexion Pharmaceuticals, Inc. * | 1,880 | 198,152 |
| Alnylam Pharmaceuticals, Inc. * | 1,022 | 88,648 |
| Amgen, Inc. | 6,369 | 1,358,189 |
| Avantor, Inc. * | 1,874 | 26,630 |
| Bio-Techne Corp. | 431 | 89,721 |
| Biogen, Inc. * | 728 | 217,461 |
| BioMarin Pharmaceutical, Inc. * | 2,051 | 150,154 |
| Bristol-Myers Squibb Co. | 7,744 | 444,273 |
| Bruker Corp. | 1,196 | 53,222 |
| Celgene Corp. * | 8,111 | 876,231 |
| Charles River Laboratories International, Inc. * | 555 | 72,139 |
| Eli Lilly & Co. | 9,929 | 1,131,410 |
| Exact Sciences Corp. * | 1,478 | 128,586 |
| Exelixis, Inc. * | 1,366 | 21,105 |
| Gilead Sciences, Inc. | 2,130 | 135,702 |
| Horizon Therapeutics plc * | 223 | 6,447 |
| Illumina, Inc. * | 1,694 | 500,611 |
| Incyte Corp. * | 2,051 | 172,120 |
| Ionis Pharmaceuticals, Inc. * | 1,470 | 81,908 |
| IQVIA Holdings, Inc. * | 888 | 128,245 |
| Jazz Pharmaceuticals plc * | 569 | 71,483 |
| Johnson & Johnson | 4,631 | 611,477 |
| Merck & Co., Inc. | 28,190 | 2,442,945 |
| Mettler-Toledo International, Inc. * | 281 | 198,088 |
| Moderna, Inc. * | 2,080 | 34,840 |
| Nektar Therapeutics * | 261 | 4,470 |
| Neurocrine Biosciences, Inc. * | 1,037 | 103,171 |
Schwab Equity Index Funds | Annual Report
Schwab U.S. Large-Cap Growth Index Fund
Portfolio Holdings as of October 31, 2019 (continued)
| Security | Number
of Shares | Value ($) |
| PerkinElmer, Inc. | 275 | 23,639 |
| PRA Health Sciences, Inc. * | 716 | 69,960 |
| Regeneron Pharmaceuticals, Inc. * | 195 | 59,725 |
| Sage Therapeutics, Inc. * | 580 | 78,677 |
| Sarepta Therapeutics, Inc. * | 821 | 68,192 |
| Seattle Genetics, Inc. * | 1,332 | 143,057 |
| Thermo Fisher Scientific, Inc. | 3,136 | 947,009 |
| Vertex Pharmaceuticals, Inc. * | 2,960 | 578,621 |
| Waters Corp. * | 762 | 161,254 |
| Zoetis, Inc. | 5,527 | 707,014 |
| | | 13,574,057 |
| |
| Real Estate 2.5% |
| American Homes 4 Rent, Class A | 1,307 | 34,596 |
| American Tower Corp. | 5,070 | 1,105,666 |
| Americold Realty Trust | 2,194 | 87,957 |
| Brookfield Property REIT, Inc., Class A | 828 | 15,649 |
| CBRE Group, Inc., Class A * | 1,426 | 76,362 |
| Colony Capital, Inc. | 220 | 1,232 |
| CoreSite Realty Corp. | 323 | 37,953 |
| Crown Castle International Corp. | 4,786 | 664,249 |
| Equinix, Inc. | 967 | 548,076 |
| Equity LifeStyle Properties, Inc. | 2,006 | 140,300 |
| Extra Space Storage, Inc. | 1,159 | 130,121 |
| Iron Mountain, Inc. | 364 | 11,939 |
| Jones Lang LaSalle, Inc. | 66 | 9,670 |
| Lamar Advertising Co., Class A | 975 | 78,010 |
| Outfront Media, Inc. | 257 | 6,762 |
| Public Storage | 1,295 | 288,604 |
| SBA Communications Corp. | 1,293 | 311,160 |
| Simon Property Group, Inc. | 3,145 | 473,889 |
| Sun Communities, Inc. | 240 | 39,036 |
| The Howard Hughes Corp. * | 144 | 16,102 |
| UDR, Inc. | 177 | 8,894 |
| | | 4,086,227 |
| |
| Retailing 9.9% |
| Advance Auto Parts, Inc. | 184 | 29,896 |
| Amazon.com, Inc. * | 4,774 | 8,481,775 |
| AutoZone, Inc. * | 282 | 322,715 |
| Best Buy Co., Inc. | 538 | 38,645 |
| Booking Holdings, Inc. * | 490 | 1,003,897 |
| Burlington Stores, Inc. * | 755 | 145,088 |
| CarMax, Inc. * | 908 | 84,598 |
| Carvana Co. * | 524 | 42,486 |
| Dollar General Corp. | 2,812 | 450,876 |
| Dollar Tree, Inc. * | 1,471 | 162,399 |
| eBay, Inc. | 9,176 | 323,454 |
| Etsy, Inc. * | 1,382 | 61,485 |
| Expedia Group, Inc. | 1,386 | 189,411 |
| Five Below, Inc. * | 632 | 79,070 |
| Floor & Decor Holdings, Inc., Class A * | 763 | 34,968 |
| GrubHub, Inc. * | 1,036 | 35,286 |
| L Brands, Inc. | 408 | 6,952 |
| LKQ Corp. * | 503 | 17,097 |
| Lowe's Cos., Inc. | 9,047 | 1,009,736 |
| Nordstrom, Inc. | 1,234 | 44,301 |
| O'Reilly Automotive, Inc. * | 869 | 378,458 |
| Ollie's Bargain Outlet Holdings, Inc. * | 617 | 39,414 |
| Pool Corp. | 442 | 91,671 |
| Ross Stores, Inc. | 4,151 | 455,240 |
| Target Corp. | 312 | 33,356 |
| The Home Depot, Inc. | 7,253 | 1,701,409 |
| The TJX Cos., Inc. | 14,018 | 808,138 |
| Tractor Supply Co. | 1,368 | 129,987 |
| Ulta Salon, Cosmetics & Fragrance, Inc. * | 650 | 151,548 |
| Security | Number
of Shares | Value ($) |
| Wayfair, Inc., Class A * | 718 | 59,041 |
| Williams-Sonoma, Inc. | 165 | 11,020 |
| | | 16,423,417 |
| |
| Semiconductors & Semiconductor Equipment 4.4% |
| Advanced Micro Devices, Inc. * | 11,558 | 392,163 |
| Analog Devices, Inc. | 565 | 60,246 |
| Applied Materials, Inc. | 5,787 | 314,003 |
| Broadcom, Inc. | 4,460 | 1,306,111 |
| Cree, Inc. * | 91 | 4,343 |
| Entegris, Inc. | 1,558 | 74,784 |
| KLA Corp. | 1,838 | 310,696 |
| Lam Research Corp. | 1,462 | 396,260 |
| Maxim Integrated Products, Inc. | 1,171 | 68,691 |
| Microchip Technology, Inc. | 750 | 70,718 |
| Monolithic Power Systems, Inc. | 484 | 72,561 |
| NVIDIA Corp. | 6,737 | 1,354,272 |
| QUALCOMM, Inc. | 14,038 | 1,129,217 |
| Skyworks Solutions, Inc. | 91 | 8,286 |
| Teradyne, Inc. | 1,975 | 120,909 |
| Texas Instruments, Inc. | 10,824 | 1,277,124 |
| Universal Display Corp. | 489 | 97,888 |
| Xilinx, Inc. | 2,934 | 266,231 |
| | | 7,324,503 |
| |
| Software & Services 23.0% |
| 2U, Inc. * | 217 | 3,890 |
| Accenture plc, Class A | 7,356 | 1,363,950 |
| Adobe, Inc. * | 5,621 | 1,562,245 |
| Akamai Technologies, Inc. * | 1,693 | 146,444 |
| Alliance Data Systems Corp. | 49 | 4,900 |
| Alteryx, Inc., Class A * | 516 | 47,214 |
| Anaplan, Inc. * | 979 | 46,209 |
| ANSYS, Inc. * | 960 | 211,344 |
| Aspen Technology, Inc. * | 800 | 92,088 |
| Atlassian Corp. plc, Class A * | 1,215 | 146,760 |
| Autodesk, Inc. * | 1,963 | 289,268 |
| Automatic Data Processing, Inc. | 5,021 | 814,557 |
| Avalara, Inc. * | 541 | 38,411 |
| Black Knight, Inc. * | 1,647 | 105,737 |
| Booz Allen Hamilton Holding Corp. | 1,577 | 110,973 |
| Broadridge Financial Solutions, Inc. | 1,310 | 164,038 |
| Cadence Design Systems, Inc. * | 3,195 | 208,793 |
| CDK Global, Inc. | 1,396 | 70,554 |
| Ceridian HCM Holding, Inc. * | 770 | 37,152 |
| Citrix Systems, Inc. | 1,294 | 140,865 |
| Cognizant Technology Solutions Corp., Class A | 492 | 29,982 |
| CoreLogic, Inc. * | 45 | 1,822 |
| Coupa Software, Inc. * | 702 | 96,518 |
| DocuSign, Inc. * | 1,756 | 116,230 |
| Dropbox, Inc., Class A * | 2,452 | 48,599 |
| Dynatrace, Inc. * | 337 | 6,817 |
| Elastic N.V. * | 501 | 36,077 |
| EPAM Systems, Inc. * | 595 | 104,696 |
| Euronet Worldwide, Inc. * | 576 | 80,680 |
| Fair Isaac Corp. * | 325 | 98,813 |
| Fidelity National Information Services, Inc. | 4,308 | 567,622 |
| FireEye, Inc. * | 2,266 | 35,893 |
| Fiserv, Inc. * | 6,508 | 690,759 |
| FleetCor Technologies, Inc. * | 984 | 289,512 |
| Fortinet, Inc. * | 1,661 | 135,471 |
| Gartner, Inc. * | 1,009 | 155,467 |
| Genpact Ltd. | 2,002 | 78,418 |
| Global Payments, Inc. | 3,439 | 581,810 |
| GoDaddy, Inc., Class A * | 2,038 | 132,531 |
Schwab Equity Index Funds | Annual Report
Schwab U.S. Large-Cap Growth Index Fund
Portfolio Holdings as of October 31, 2019 (continued)
| Security | Number
of Shares | Value ($) |
| Guidewire Software, Inc. * | 934 | 105,299 |
| HubSpot, Inc. * | 460 | 71,346 |
| International Business Machines Corp. | 6,194 | 828,324 |
| Intuit, Inc. | 2,871 | 739,282 |
| Jack Henry & Associates, Inc. | 785 | 111,125 |
| Manhattan Associates, Inc. * | 741 | 55,538 |
| Mastercard, Inc., Class A | 10,361 | 2,868,028 |
| Medallia, Inc. * | 144 | 4,188 |
| Microsoft Corp. | 87,305 | 12,516,918 |
| MongoDB, Inc. * | 484 | 61,841 |
| New Relic, Inc. * | 585 | 37,475 |
| Nutanix, Inc., Class A * | 1,632 | 47,687 |
| Okta, Inc. * | 1,172 | 127,830 |
| Oracle Corp. | 25,878 | 1,410,092 |
| Pagerduty, Inc. * | 104 | 2,391 |
| Palo Alto Networks, Inc. * | 1,084 | 246,491 |
| Paychex, Inc. | 3,698 | 309,301 |
| Paycom Software, Inc. * | 571 | 120,784 |
| Paylocity Holding Corp. * | 382 | 39,193 |
| PayPal Holdings, Inc. * | 13,563 | 1,411,908 |
| Pegasystems, Inc. | 435 | 32,716 |
| Pluralsight, Inc., Class A * | 710 | 12,837 |
| Proofpoint, Inc. * | 634 | 73,145 |
| PTC, Inc. * | 1,197 | 80,091 |
| RealPage, Inc. * | 917 | 55,524 |
| RingCentral, Inc., Class A * | 819 | 132,285 |
| Sabre Corp. | 546 | 12,820 |
| salesforce.com, Inc. * | 9,462 | 1,480,708 |
| ServiceNow, Inc. * | 2,150 | 531,609 |
| Smartsheet, Inc., Class A * | 1,027 | 40,464 |
| SolarWinds Corp. * | 129 | 2,445 |
| Splunk, Inc. * | 1,728 | 207,291 |
| Square, Inc., Class A * | 3,919 | 240,744 |
| SS&C Technologies Holdings, Inc. | 2,315 | 120,403 |
| Switch, Inc., Class A | 670 | 9,896 |
| Synopsys, Inc. * | 1,712 | 232,404 |
| Teradata Corp. * | 1,336 | 39,986 |
| The Trade Desk, Inc., Class A * | 442 | 88,754 |
| The Western Union Co. | 1,105 | 27,691 |
| Twilio, Inc., Class A * | 1,380 | 133,253 |
| Tyler Technologies, Inc. * | 436 | 117,075 |
| VeriSign, Inc. * | 833 | 158,287 |
| Visa, Inc., Class A | 20,081 | 3,591,688 |
| VMware, Inc., Class A | 889 | 140,702 |
| WEX, Inc. * | 492 | 93,077 |
| Workday, Inc., Class A * | 1,841 | 298,537 |
| Zendesk, Inc. * | 1,256 | 88,736 |
| Zscaler, Inc. * | 704 | 30,962 |
| | | 38,082,280 |
| |
| Technology Hardware & Equipment 10.5% |
| Amphenol Corp., Class A | 3,370 | 338,112 |
| Apple, Inc. | 52,189 | 12,982,536 |
| Arista Networks, Inc. * | 684 | 167,286 |
| CDW Corp. | 1,665 | 212,970 |
| Cisco Systems, Inc. | 49,468 | 2,350,225 |
| Cognex Corp. | 1,882 | 96,904 |
| Corning, Inc. | 2,808 | 83,201 |
| Dell Technologies, Inc., Class C * | 1,278 | 67,593 |
| Dolby Laboratories, Inc., Class A | 87 | 5,597 |
| F5 Networks, Inc. * | 636 | 91,635 |
| FLIR Systems, Inc. | 137 | 7,064 |
| HP, Inc. | 903 | 15,685 |
| IPG Photonics Corp. * | 27 | 3,626 |
| Jabil, Inc. | 352 | 12,961 |
| Keysight Technologies, Inc. * | 2,156 | 217,562 |
| Motorola Solutions, Inc. | 1,407 | 234,012 |
| Security | Number
of Shares | Value ($) |
| National Instruments Corp. | 76 | 3,146 |
| NCR Corp. * | 1,366 | 39,901 |
| NetApp, Inc. | 2,766 | 154,564 |
| Pure Storage, Inc., Class A * | 2,668 | 51,919 |
| Trimble, Inc. * | 492 | 19,601 |
| Ubiquiti, Inc. | 170 | 21,520 |
| Zebra Technologies Corp., Class A * | 619 | 147,241 |
| | | 17,324,861 |
| |
| Telecommunication Services 0.2% |
| T-Mobile US, Inc. * | 1,888 | 156,062 |
| Zayo Group Holdings, Inc. * | 2,597 | 88,662 |
| | | 244,724 |
| |
| Transportation 2.0% |
| Alaska Air Group, Inc. | 627 | 43,533 |
| American Airlines Group, Inc. | 470 | 14,128 |
| C.H. Robinson Worldwide, Inc. | 1,177 | 89,028 |
| CSX Corp. | 3,170 | 222,756 |
| Delta Air Lines, Inc. | 1,357 | 74,744 |
| Expeditors International of Washington, Inc. | 1,396 | 101,824 |
| Genesee & Wyoming, Inc., Class A * | 110 | 12,213 |
| JB Hunt Transport Services, Inc. | 296 | 34,798 |
| JetBlue Airways Corp. * | 284 | 5,481 |
| Landstar System, Inc. | 416 | 47,070 |
| Lyft, Inc., Class A * | 34 | 1,409 |
| Norfolk Southern Corp. | 410 | 74,620 |
| Old Dominion Freight Line, Inc. | 312 | 56,809 |
| Southwest Airlines Co. | 3,319 | 186,296 |
| Uber Technologies, Inc. * | 229 | 7,214 |
| Union Pacific Corp. | 8,177 | 1,352,966 |
| United Airlines Holdings, Inc. * | 604 | 54,867 |
| United Parcel Service, Inc., Class B | 8,064 | 928,731 |
| XPO Logistics, Inc. * | 618 | 47,215 |
| | | 3,355,702 |
| Total Common Stock |
| (Cost $139,882,179) | | 165,443,941 |
|
| Other Investment Companies0.3% of net assets |
| |
| Equity Funds 0.1% |
| iShares Russell 1000 Growth ETF | 600 | 98,484 |
| |
| Money Market Fund 0.2% |
| State Street Institutional U.S. Government Money Market Fund, Premier Class 1.75%(b) | 383,584 | 383,584 |
| Total Other Investment Companies |
| (Cost $481,359) | | 482,068 |
Schwab Equity Index Funds | Annual Report
Schwab U.S. Large-Cap Growth Index Fund
Portfolio Holdings as of October 31, 2019 (continued)
| | Number of
Contracts | Notional
Amount
($) | Current Value/
Unrealized
Depreciation
($) |
| Futures Contracts | |
| Long | |
| Russell 1000 Growth Index, e-mini, expires 12/20/19 | 3 | 247,515 | (571) |
| * | Non-income producing security. |
| (a) | Issuer is affiliated with the fund's investment adviser. |
| (b) | The rate shown is the 7-day yield. |
| | |
| ETF — | Exchange-traded fund |
| REIT — | Real Estate Investment Trust |
Schwab Equity Index Funds | Annual Report
Schwab U.S. Large-Cap Value Index Fund
Portfolio Holdings as of October 31, 2019
This section shows all the securities in the fund’s portfolio and their values as of the report date.
The fund files its complete schedule of portfolio holdings with the U.S. Securities and Exchange Commission (SEC) for the first and third quarters of each fiscal year on Form N-Q. Effective March 31, 2019, Form N-PORT Part F has replaced Form N-Q. The fund’s Form N-Q and Form N-PORT Part F are available on the SEC’s website atwww.sec.gov. The fund also makes available its complete schedule of portfolio holdings 15 to 20 days after the end of the month on the fund’s website atwww.schwabfunds.com/schwabfunds_prospectus.
| Security | Number
of Shares | Value ($) |
| Common Stock99.6% of net assets |
| |
| Automobiles & Components 1.0% |
| Aptiv plc | 3,699 | 331,246 |
| BorgWarner, Inc. | 3,179 | 132,501 |
| Ford Motor Co. | 60,258 | 517,616 |
| General Motors Co. | 19,118 | 710,425 |
| Gentex Corp. | 3,936 | 110,405 |
| Harley-Davidson, Inc. | 2,416 | 94,007 |
| Lear Corp. | 942 | 110,939 |
| The Goodyear Tire & Rubber Co. | 3,598 | 57,100 |
| Thor Industries, Inc. | 820 | 51,873 |
| | | 2,116,112 |
| |
| Banks 11.1% |
| Associated Banc-Corp. | 2,456 | 49,390 |
| Bank of America Corp. | 129,894 | 4,061,785 |
| Bank of Hawaii Corp. | 623 | 54,394 |
| Bank OZK | 1,870 | 52,472 |
| BankUnited, Inc. | 1,418 | 48,637 |
| BB&T Corp. | 11,799 | 625,937 |
| BOK Financial Corp. | 502 | 38,729 |
| CIT Group, Inc. | 1,350 | 57,902 |
| Citigroup, Inc. | 34,830 | 2,502,884 |
| Citizens Financial Group, Inc. | 6,898 | 242,534 |
| Comerica, Inc. | 2,151 | 140,719 |
| Commerce Bancshares, Inc. | 1,520 | 97,827 |
| Cullen/Frost Bankers, Inc. | 866 | 78,009 |
| East West Bancorp, Inc. | 2,250 | 96,570 |
| F.N.B. Corp. | 5,001 | 60,312 |
| Fifth Third Bancorp | 11,316 | 329,069 |
| First Citizens BancShares, Inc., Class A | 111 | 54,603 |
| First Hawaiian, Inc. | 2,024 | 55,316 |
| First Horizon National Corp. | 4,759 | 76,001 |
| First Republic Bank | 2,101 | 223,462 |
| Huntington Bancshares, Inc. | 16,100 | 227,493 |
| JPMorgan Chase & Co. | 49,037 | 6,125,702 |
| KeyCorp | 15,491 | 278,373 |
| M&T Bank Corp. | 2,057 | 321,982 |
| MGIC Investment Corp. | 5,434 | 74,500 |
| New York Community Bancorp, Inc. | 7,010 | 81,667 |
| PacWest Bancorp | 1,799 | 66,545 |
| People's United Financial, Inc. | 6,783 | 109,681 |
| Pinnacle Financial Partners, Inc. | 1,147 | 67,467 |
| Popular, Inc. | 1,459 | 79,457 |
| Prosperity Bancshares, Inc. | 1,249 | 86,206 |
| Regions Financial Corp. | 15,414 | 248,165 |
| Signature Bank | 420 | 49,694 |
| Sterling Bancorp | 3,086 | 60,640 |
| SunTrust Banks, Inc. | 6,839 | 467,377 |
| SVB Financial Group * | 743 | 164,560 |
| Synovus Financial Corp. | 2,102 | 71,195 |
| TCF Financial Corp. | 2,333 | 92,364 |
| Texas Capital Bancshares, Inc. * | 757 | 40,924 |
| TFS Financial Corp. | 732 | 14,098 |
| The PNC Financial Services Group, Inc. | 6,860 | 1,006,362 |
| U.S. Bancorp | 22,068 | 1,258,317 |
| Security | Number
of Shares | Value ($) |
| Umpqua Holdings Corp. | 3,397 | 53,741 |
| Webster Financial Corp. | 1,396 | 61,564 |
| Wells Fargo & Co. | 61,239 | 3,161,770 |
| Western Alliance Bancorp | 1,318 | 65,017 |
| Wintrust Financial Corp. | 867 | 55,332 |
| Zions Bancorp NA | 2,702 | 130,966 |
| | | 23,467,711 |
| |
| Capital Goods 7.2% |
| 3M Co. | 2,029 | 334,765 |
| A.O. Smith Corp. | 1,738 | 86,344 |
| Acuity Brands, Inc. | 448 | 55,906 |
| AECOM * | 2,379 | 95,184 |
| AGCO Corp. | 973 | 74,619 |
| Air Lease Corp. | 1,487 | 65,398 |
| Allegion plc | 360 | 41,774 |
| AMETEK, Inc. | 714 | 65,438 |
| Arconic, Inc. | 6,005 | 164,957 |
| BWX Technologies, Inc. | 365 | 21,206 |
| Carlisle Cos., Inc. | 114 | 17,359 |
| Caterpillar, Inc. | 7,760 | 1,069,328 |
| Colfax Corp. * | 1,438 | 48,317 |
| Crane Co. | 765 | 58,538 |
| Cummins, Inc. | 2,371 | 408,950 |
| Curtiss-Wright Corp. | 660 | 89,265 |
| Deere & Co. | 4,367 | 760,469 |
| Dover Corp. | 1,250 | 129,862 |
| Eaton Corp. plc | 6,515 | 567,522 |
| Emerson Electric Co. | 8,625 | 605,044 |
| Fastenal Co. | 845 | 30,369 |
| Flowserve Corp. | 1,578 | 77,070 |
| Fluor Corp. | 2,165 | 34,878 |
| Fortive Corp. | 3,535 | 243,915 |
| Fortune Brands Home & Security, Inc. | 1,455 | 87,373 |
| Gardner Denver Holdings, Inc. * | 2,030 | 64,615 |
| Gates Industrial Corp. plc * | 800 | 8,000 |
| General Dynamics Corp. | 3,667 | 648,326 |
| General Electric Co. | 133,474 | 1,332,071 |
| GrafTech International Ltd. | 947 | 11,440 |
| HD Supply Holdings, Inc. * | 2,640 | 104,386 |
| Hexcel Corp. | 96 | 7,164 |
| Honeywell International, Inc. | 5,679 | 980,934 |
| Hubbell, Inc. | 374 | 52,996 |
| Huntington Ingalls Industries, Inc. | 129 | 29,110 |
| IDEX Corp. | 577 | 89,741 |
| Ingersoll-Rand plc | 219 | 27,789 |
| ITT, Inc. | 1,336 | 79,425 |
| Jacobs Engineering Group, Inc. | 2,040 | 190,903 |
| Johnson Controls International plc | 12,275 | 531,876 |
| L3Harris Technologies, Inc. | 1,692 | 349,077 |
| Lennox International, Inc. | 49 | 12,121 |
| Lincoln Electric Holdings, Inc. | 54 | 4,837 |
| Masco Corp. | 4,424 | 204,610 |
| MSC Industrial Direct Co., Inc., Class A | 674 | 49,344 |
| Nordson Corp. | 79 | 12,388 |
| nVent Electric plc | 2,358 | 54,375 |
| Oshkosh Corp. | 1,043 | 89,051 |
| Owens Corning | 1,655 | 101,418 |
Schwab Equity Index Funds | Annual Report
Schwab U.S. Large-Cap Value Index Fund
Portfolio Holdings as of October 31, 2019 (continued)
| Security | Number
of Shares | Value ($) |
| PACCAR, Inc. | 5,229 | 397,718 |
| Parker-Hannifin Corp. | 1,976 | 362,576 |
| Pentair plc | 2,559 | 106,122 |
| Quanta Services, Inc. | 1,670 | 70,223 |
| Raytheon Co. | 1,639 | 347,812 |
| Regal Beloit Corp. | 650 | 48,132 |
| Resideo Technologies, Inc. * | 1,926 | 18,355 |
| Roper Technologies, Inc. | 1,335 | 449,842 |
| Sensata Technologies Holding plc * | 1,408 | 72,076 |
| Snap-on, Inc. | 841 | 136,805 |
| Spirit AeroSystems Holdings, Inc., Class A | 161 | 13,173 |
| Stanley Black & Decker, Inc. | 2,336 | 353,507 |
| Teledyne Technologies, Inc. * | 552 | 181,939 |
| Textron, Inc. | 3,535 | 162,928 |
| The Timken Co. | 1,041 | 51,009 |
| TransDigm Group, Inc. | 141 | 74,205 |
| Trinity Industries, Inc. | 1,603 | 31,707 |
| United Rentals, Inc. * | 350 | 46,749 |
| United Technologies Corp. | 12,510 | 1,796,186 |
| Univar Solutions, Inc. * | 2,434 | 52,234 |
| Valmont Industries, Inc. | 321 | 44,038 |
| WABCO Holdings, Inc. * | 125 | 16,828 |
| Wabtec Corp. | 1,985 | 137,699 |
| Watsco, Inc. | 495 | 87,268 |
| WESCO International, Inc. * | 634 | 31,795 |
| Woodward, Inc. | 149 | 15,892 |
| | | 15,376,665 |
| |
| Commercial & Professional Services 0.5% |
| ADT, Inc. | 1,746 | 13,514 |
| Clean Harbors, Inc. * | 785 | 64,731 |
| Equifax, Inc. | 284 | 38,826 |
| IAA, Inc. * | 170 | 6,485 |
| IHS Markit Ltd. * | 2,267 | 158,735 |
| KAR Auction Services, Inc. | 188 | 4,674 |
| ManpowerGroup, Inc. | 911 | 82,828 |
| Nielsen Holdings plc | 4,806 | 96,889 |
| Republic Services, Inc. | 3,080 | 269,531 |
| Stericycle, Inc. * | 1,385 | 79,776 |
| Waste Management, Inc. | 1,423 | 159,675 |
| | | 975,664 |
| |
| Consumer Durables & Apparel 0.9% |
| Brunswick Corp. | 1,307 | 76,120 |
| Capri Holdings Ltd. * | 1,293 | 40,173 |
| Carter's, Inc. | 368 | 36,888 |
| Columbia Sportswear Co. | 157 | 14,201 |
| D.R. Horton, Inc. | 5,245 | 274,681 |
| Garmin Ltd. | 2,240 | 210,000 |
| Hanesbrands, Inc. | 1,189 | 18,085 |
| Leggett & Platt, Inc. | 2,027 | 103,985 |
| Lennar Corp., B Shares | 134 | 6,301 |
| Lennar Corp., Class A | 2,546 | 151,741 |
| Mattel, Inc. * | 1,575 | 18,805 |
| Mohawk Industries, Inc. * | 921 | 132,053 |
| Newell Brands, Inc. | 5,812 | 110,254 |
| Polaris, Inc. | 93 | 9,174 |
| PulteGroup, Inc. | 3,911 | 153,468 |
| PVH Corp. | 1,155 | 100,670 |
| Ralph Lauren Corp. | 790 | 75,887 |
| Skechers U.S.A., Inc., Class A * | 1,284 | 47,983 |
| Tapestry, Inc. | 4,400 | 113,784 |
| Toll Brothers, Inc. | 2,030 | 80,733 |
| Under Armour, Inc., Class A * | 966 | 19,948 |
| Security | Number
of Shares | Value ($) |
| Under Armour, Inc., Class C * | 1,030 | 19,055 |
| Whirlpool Corp. | 950 | 144,514 |
| | | 1,958,503 |
| |
| Consumer Services 2.0% |
| Aramark | 3,755 | 164,319 |
| Caesars Entertainment Corp. * | 8,795 | 108,003 |
| Carnival Corp. | 6,135 | 263,130 |
| Choice Hotels International, Inc. | 294 | 26,013 |
| Dunkin' Brands Group, Inc. | 90 | 7,076 |
| Extended Stay America, Inc. | 2,879 | 40,911 |
| frontdoor, Inc. * | 1,294 | 62,410 |
| Graham Holdings Co., Class B | 65 | 40,928 |
| Grand Canyon Education, Inc. * | 661 | 60,785 |
| H&R Block, Inc. | 2,655 | 66,348 |
| Hilton Grand Vacations, Inc. * | 1,155 | 40,113 |
| Hyatt Hotels Corp., Class A | 574 | 42,901 |
| International Game Technology plc | 1,501 | 19,873 |
| Las Vegas Sands Corp. | 2,724 | 168,452 |
| McDonald's Corp. | 9,930 | 1,953,231 |
| MGM Resorts International | 7,129 | 203,176 |
| Norwegian Cruise Line Holdings Ltd. * | 2,628 | 133,397 |
| Royal Caribbean Cruises Ltd. | 2,643 | 287,638 |
| Service Corp. International | 1,745 | 79,363 |
| ServiceMaster Global Holdings, Inc. * | 1,752 | 70,746 |
| Six Flags Entertainment Corp. | 1,108 | 46,746 |
| Vail Resorts, Inc. | 66 | 15,336 |
| Wyndham Destinations, Inc. | 1,393 | 64,649 |
| Wyndham Hotels & Resorts, Inc. | 1,044 | 56,345 |
| Wynn Resorts Ltd. | 255 | 30,942 |
| Yum China Holdings, Inc. | 1,090 | 46,325 |
| Yum! Brands, Inc. | 521 | 52,991 |
| | | 4,152,147 |
| |
| Diversified Financials 8.1% |
| Affiliated Managers Group, Inc. | 777 | 62,067 |
| AGNC Investment Corp. | 8,471 | 144,430 |
| Ally Financial, Inc. | 6,030 | 184,699 |
| American Express Co. | 4,665 | 547,111 |
| Ameriprise Financial, Inc. | 1,738 | 262,247 |
| Annaly Capital Management, Inc. | 22,359 | 200,784 |
| AXA Equitable Holdings, Inc. | 4,542 | 98,107 |
| Berkshire Hathaway, Inc., Class B * | 30,170 | 6,413,538 |
| BGC Partners, Inc., Class A | 4,539 | 23,603 |
| BlackRock, Inc. | 1,826 | 843,064 |
| Capital One Financial Corp. | 7,206 | 671,959 |
| Cboe Global Markets, Inc. | 1,279 | 147,277 |
| Chimera Investment Corp. | 2,855 | 57,842 |
| CME Group, Inc. | 5,460 | 1,123,395 |
| Credit Acceptance Corp. * | 19 | 8,318 |
| Discover Financial Services | 3,182 | 255,387 |
| E*TRADE Financial Corp. | 3,010 | 125,788 |
| Eaton Vance Corp. | 1,716 | 78,250 |
| Evercore, Inc., Class A | 381 | 28,057 |
| Franklin Resources, Inc. | 4,327 | 119,209 |
| Interactive Brokers Group, Inc., Class A | 852 | 40,530 |
| Intercontinental Exchange, Inc. | 5,164 | 487,068 |
| Invesco Ltd. | 6,091 | 102,451 |
| Janus Henderson Group plc | 2,477 | 57,293 |
| Jefferies Financial Group, Inc. | 4,041 | 75,445 |
| Lazard Ltd., Class A | 1,014 | 37,853 |
| Legg Mason, Inc. | 1,330 | 49,556 |
| MFA Financial, Inc. | 6,917 | 52,500 |
| Morgan Stanley | 18,324 | 843,820 |
| Nasdaq, Inc. | 1,778 | 177,391 |
| Navient Corp. | 3,105 | 42,756 |
Schwab Equity Index Funds | Annual Report
Schwab U.S. Large-Cap Value Index Fund
Portfolio Holdings as of October 31, 2019 (continued)
| Security | Number
of Shares | Value ($) |
| New Residential Investment Corp. | 6,412 | 101,566 |
| Northern Trust Corp. | 3,046 | 303,625 |
| OneMain Holdings, Inc. | 1,011 | 40,440 |
| Raymond James Financial, Inc. | 1,476 | 123,231 |
| Santander Consumer USA Holdings, Inc. | 1,573 | 39,451 |
| SEI Investments Co. | 1,041 | 62,377 |
| SLM Corp. | 6,556 | 55,333 |
| Starwood Property Trust, Inc. | 4,208 | 103,517 |
| State Street Corp. | 5,741 | 379,308 |
| Synchrony Financial | 7,449 | 263,471 |
| T. Rowe Price Group, Inc. | 2,532 | 293,206 |
| TD Ameritrade Holding Corp. | 556 | 21,339 |
| The Bank of New York Mellon Corp. | 12,929 | 604,431 |
| The Charles Schwab Corp.(a) | 7,215 | 293,723 |
| The Goldman Sachs Group, Inc. | 4,989 | 1,064,553 |
| Two Harbors Investment Corp. | 4,176 | 57,921 |
| Virtu Financial, Inc., Class A | 465 | 7,886 |
| Voya Financial, Inc. | 2,005 | 108,190 |
| | | 17,285,363 |
| |
| Energy 8.0% |
| Antero Midstream Corp. | 3,535 | 22,765 |
| Antero Resources Corp. * | 4,046 | 10,115 |
| Apache Corp. | 5,776 | 125,108 |
| Apergy Corp. * | 1,209 | 30,431 |
| Baker Hughes Co. | 9,724 | 208,094 |
| Cabot Oil & Gas Corp. | 2,373 | 44,233 |
| Centennial Resource Development, Inc., Class A * | 2,829 | 9,619 |
| Cheniere Energy, Inc. * | 1,513 | 93,125 |
| Chesapeake Energy Corp. *(b) | 19,764 | 26,484 |
| Chevron Corp. | 29,405 | 3,415,097 |
| Cimarex Energy Co. | 1,531 | 64,639 |
| Concho Resources, Inc. | 3,052 | 206,071 |
| ConocoPhillips | 17,139 | 946,073 |
| Continental Resources, Inc. * | 1,314 | 38,724 |
| Devon Energy Corp. | 6,225 | 126,243 |
| Diamondback Energy, Inc. | 2,007 | 172,120 |
| EOG Resources, Inc. | 8,949 | 620,255 |
| EQT Corp. | 3,926 | 42,165 |
| Equitrans Midstream Corp. | 2,833 | 39,435 |
| Exxon Mobil Corp. | 65,292 | 4,411,780 |
| Halliburton Co. | 13,422 | 258,373 |
| Helmerich & Payne, Inc. | 1,621 | 60,788 |
| Hess Corp. | 4,142 | 272,336 |
| HollyFrontier Corp. | 2,357 | 129,494 |
| Kinder Morgan, Inc. | 30,078 | 600,958 |
| Kosmos Energy Ltd. | 5,436 | 33,703 |
| Marathon Oil Corp. | 12,328 | 142,142 |
| Marathon Petroleum Corp. | 10,124 | 647,430 |
| Murphy Oil Corp. | 2,388 | 49,264 |
| National Oilwell Varco, Inc. | 5,928 | 134,091 |
| Noble Energy, Inc. | 7,309 | 140,771 |
| Occidental Petroleum Corp. | 13,806 | 559,143 |
| ONEOK, Inc. | 4,317 | 301,456 |
| Parsley Energy, Inc., Class A | 1,812 | 28,648 |
| Patterson-UTI Energy, Inc. | 3,088 | 25,692 |
| PBF Energy, Inc., Class A | 1,832 | 59,137 |
| Phillips 66 | 6,917 | 808,044 |
| Pioneer Natural Resources Co. | 1,476 | 181,578 |
| Range Resources Corp. | 3,346 | 13,484 |
| Schlumberger Ltd. | 21,362 | 698,324 |
| Targa Resources Corp. | 3,513 | 136,585 |
| The Williams Cos., Inc. | 18,704 | 417,286 |
| Transocean Ltd. * | 8,941 | 42,470 |
| Security | Number
of Shares | Value ($) |
| Valero Energy Corp. | 6,423 | 622,903 |
| WPX Energy, Inc. * | 6,467 | 64,541 |
| | | 17,081,217 |
| |
| Food & Staples Retailing 1.8% |
| Casey's General Stores, Inc. | 420 | 71,740 |
| Grocery Outlet Holding Corp. * | 409 | 13,047 |
| Sprouts Farmers Market, Inc. * | 952 | 18,478 |
| The Kroger Co. | 12,251 | 301,865 |
| U.S. Foods Holding Corp. * | 3,348 | 132,815 |
| Walgreens Boots Alliance, Inc. | 11,759 | 644,158 |
| Walmart, Inc. | 21,659 | 2,539,735 |
| | | 3,721,838 |
| |
| Food, Beverage & Tobacco 4.2% |
| Altria Group, Inc. | 14,772 | 661,638 |
| Archer-Daniels-Midland Co. | 8,584 | 360,871 |
| Beyond Meat, Inc. * | 197 | 16,637 |
| Brown-Forman Corp., Class A | 45 | 2,797 |
| Brown-Forman Corp., Class B | 178 | 11,663 |
| Bunge Ltd. | 2,123 | 114,642 |
| Campbell Soup Co. | 1,114 | 51,589 |
| ConAgra Brands, Inc. | 7,453 | 201,604 |
| Constellation Brands, Inc., Class A | 2,443 | 464,976 |
| Flowers Foods, Inc. | 2,983 | 64,791 |
| General Mills, Inc. | 9,239 | 469,895 |
| Hormel Foods Corp. | 4,292 | 175,500 |
| Ingredion, Inc. | 1,023 | 80,817 |
| Kellogg Co. | 2,328 | 147,898 |
| Keurig Dr Pepper, Inc. | 3,161 | 89,014 |
| Lamb Weston Holdings, Inc. | 1,665 | 129,937 |
| McCormick & Co., Inc. - Non Voting Shares | 669 | 107,502 |
| Molson Coors Brewing Co., Class B | 2,684 | 141,500 |
| Mondelez International, Inc., Class A | 21,920 | 1,149,704 |
| PepsiCo, Inc. | 3,453 | 473,648 |
| Philip Morris International, Inc. | 23,972 | 1,952,280 |
| Pilgrim's Pride Corp. * | 531 | 16,121 |
| Post Holdings, Inc. * | 545 | 56,080 |
| Seaboard Corp. | 4 | 16,876 |
| The Coca-Cola Co. | 18,795 | 1,023,012 |
| The Hain Celestial Group, Inc. * | 1,407 | 33,261 |
| The Hershey Co. | 282 | 41,417 |
| The JM Smucker Co. | 1,684 | 177,965 |
| The Kraft Heinz Co. | 9,624 | 311,144 |
| TreeHouse Foods, Inc. * | 711 | 38,408 |
| Tyson Foods, Inc., Class A | 4,434 | 367,091 |
| | | 8,950,278 |
| |
| Health Care Equipment & Services 5.8% |
| Abbott Laboratories | 15,058 | 1,258,999 |
| Acadia Healthcare Co., Inc. * | 1,341 | 40,217 |
| Anthem, Inc. | 2,810 | 756,115 |
| Baxter International, Inc. | 3,941 | 302,275 |
| Becton, Dickinson & Co. | 3,778 | 967,168 |
| Cantel Medical Corp. | 253 | 18,441 |
| Cardinal Health, Inc. | 4,603 | 227,618 |
| Centene Corp. * | 1,027 | 54,513 |
| Change Healthcare, Inc. * | 356 | 4,706 |
| Cigna Corp. * | 3,985 | 711,163 |
| Covetrus, Inc. * | 1,471 | 14,585 |
| CVS Health Corp. | 20,020 | 1,329,128 |
| Danaher Corp. | 9,296 | 1,281,175 |
| DaVita, Inc. * | 1,884 | 110,402 |
| DENTSPLY SIRONA, Inc. | 3,421 | 187,402 |
| Encompass Health Corp. | 750 | 48,015 |
Schwab Equity Index Funds | Annual Report
Schwab U.S. Large-Cap Value Index Fund
Portfolio Holdings as of October 31, 2019 (continued)
| Security | Number
of Shares | Value ($) |
| HCA Healthcare, Inc. | 1,673 | 223,412 |
| Henry Schein, Inc. * | 1,994 | 124,795 |
| Hill-Rom Holdings, Inc. | 498 | 52,136 |
| Hologic, Inc. * | 805 | 38,890 |
| Humana, Inc. | 1,188 | 349,510 |
| ICU Medical, Inc. * | 209 | 33,777 |
| Integra LifeSciences Holdings Corp. * | 1,086 | 63,053 |
| Laboratory Corp. of America Holdings * | 1,421 | 234,138 |
| McKesson Corp. | 2,536 | 337,288 |
| MEDNAX, Inc. * | 1,269 | 27,867 |
| Medtronic plc | 20,697 | 2,253,903 |
| Molina Healthcare, Inc. * | 209 | 24,587 |
| Premier, Inc., Class A * | 786 | 25,608 |
| Quest Diagnostics, Inc. | 2,073 | 209,891 |
| Steris plc | 1,217 | 172,291 |
| The Cooper Cos., Inc. | 648 | 188,568 |
| Universal Health Services, Inc., Class B | 1,215 | 167,014 |
| WellCare Health Plans, Inc. * | 74 | 21,948 |
| West Pharmaceutical Services, Inc. | 276 | 39,700 |
| Zimmer Biomet Holdings, Inc. | 3,161 | 436,945 |
| | | 12,337,243 |
| |
| Household & Personal Products 3.0% |
| Colgate-Palmolive Co. | 12,963 | 889,262 |
| Coty, Inc., Class A | 4,470 | 52,254 |
| Energizer Holdings, Inc. | 951 | 40,408 |
| Herbalife Nutrition Ltd. * | 1,338 | 59,769 |
| Kimberly-Clark Corp. | 5,264 | 699,480 |
| Nu Skin Enterprises, Inc., Class A | 857 | 38,205 |
| Spectrum Brands Holdings, Inc. | 644 | 32,335 |
| The Clorox Co. | 361 | 53,316 |
| The Procter & Gamble Co. | 35,913 | 4,471,528 |
| | | 6,336,557 |
| |
| Insurance 4.4% |
| Aflac, Inc. | 11,372 | 604,536 |
| Alleghany Corp. * | 192 | 149,432 |
| American Financial Group, Inc. | 1,142 | 118,814 |
| American International Group, Inc. | 13,419 | 710,670 |
| American National Insurance Co. | 110 | 13,198 |
| Arch Capital Group Ltd. * | 5,081 | 212,183 |
| Arthur J. Gallagher & Co. | 2,223 | 202,782 |
| Assurant, Inc. | 944 | 119,010 |
| Assured Guaranty Ltd. | 1,471 | 69,019 |
| Athene Holding Ltd., Class A * | 1,357 | 58,826 |
| Axis Capital Holdings Ltd. | 1,151 | 68,404 |
| Brighthouse Financial, Inc. * | 1,709 | 64,532 |
| Brown & Brown, Inc. | 3,417 | 128,753 |
| Chubb Ltd. | 7,020 | 1,069,988 |
| Cincinnati Financial Corp. | 2,348 | 265,817 |
| CNA Financial Corp. | 416 | 18,654 |
| Erie Indemnity Co., Class A | 131 | 24,139 |
| Everest Re Group Ltd. | 432 | 111,063 |
| Fidelity National Financial, Inc. | 4,075 | 186,798 |
| First American Financial Corp. | 1,689 | 104,346 |
| Globe Life, Inc. | 1,664 | 161,957 |
| Kemper Corp. | 789 | 56,713 |
| Lincoln National Corp. | 3,080 | 173,958 |
| Loews Corp. | 4,024 | 197,176 |
| Markel Corp. * | 192 | 224,832 |
| Marsh & McLennan Cos., Inc. | 959 | 99,372 |
| Mercury General Corp. | 419 | 20,137 |
| MetLife, Inc. | 12,206 | 571,119 |
| Old Republic International Corp. | 4,359 | 97,380 |
| Primerica, Inc. | 176 | 22,208 |
| Principal Financial Group, Inc. | 4,260 | 227,399 |
| Security | Number
of Shares | Value ($) |
| Prudential Financial, Inc. | 6,253 | 569,898 |
| Reinsurance Group of America, Inc. | 960 | 155,971 |
| RenaissanceRe Holdings Ltd. | 411 | 76,931 |
| The Allstate Corp. | 5,067 | 539,230 |
| The Hanover Insurance Group, Inc. | 613 | 80,738 |
| The Hartford Financial Services Group, Inc. | 5,554 | 317,022 |
| The Progressive Corp. | 6,050 | 421,685 |
| The Travelers Cos., Inc. | 3,381 | 443,114 |
| Unum Group | 3,226 | 88,844 |
| W. R. Berkley Corp. | 2,207 | 154,269 |
| White Mountains Insurance Group Ltd. | 47 | 50,337 |
| Willis Towers Watson plc | 1,989 | 371,744 |
| | | 9,422,998 |
| |
| Materials 4.2% |
| Air Products & Chemicals, Inc. | 2,911 | 620,800 |
| Albemarle Corp. | 1,623 | 98,581 |
| Alcoa Corp. * | 2,833 | 58,898 |
| AptarGroup, Inc. | 590 | 69,708 |
| Ardagh Group S.A. | 313 | 5,844 |
| Ashland Global Holdings, Inc. | 920 | 71,180 |
| Avery Dennison Corp. | 87 | 11,124 |
| Axalta Coating Systems Ltd. * | 2,195 | 64,731 |
| Berry Global Group, Inc. * | 1,253 | 52,012 |
| Cabot Corp. | 860 | 37,487 |
| Celanese Corp. | 1,901 | 230,306 |
| CF Industries Holdings, Inc. | 3,013 | 136,640 |
| Corteva, Inc. * | 11,562 | 305,006 |
| Crown Holdings, Inc. * | 855 | 62,278 |
| Domtar Corp. | 962 | 35,007 |
| Dow, Inc. * | 11,549 | 583,109 |
| DuPont de Nemours, Inc. | 11,560 | 761,920 |
| Eagle Materials, Inc. | 115 | 10,504 |
| Eastman Chemical Co. | 2,098 | 159,532 |
| Element Solutions, Inc. * | 2,185 | 23,729 |
| FMC Corp. | 2,027 | 185,470 |
| Freeport-McMoRan, Inc. | 22,241 | 218,407 |
| Graphic Packaging Holding Co. | 4,516 | 70,721 |
| Huntsman Corp. | 3,363 | 74,423 |
| International Flavors & Fragrances, Inc. | 1,637 | 199,730 |
| International Paper Co. | 6,036 | 263,652 |
| Linde plc | 8,369 | 1,659,991 |
| LyondellBasell Industries N.V., Class A | 4,099 | 367,680 |
| Martin Marietta Materials, Inc. | 669 | 175,218 |
| NewMarket Corp. | 10 | 4,855 |
| Newmont Goldcorp Corp. | 12,600 | 500,598 |
| Nucor Corp. | 4,700 | 253,095 |
| Olin Corp. | 2,535 | 46,492 |
| Owens-Illinois, Inc. | 2,438 | 20,723 |
| Packaging Corp. of America | 1,436 | 157,185 |
| PPG Industries, Inc. | 2,455 | 307,170 |
| Reliance Steel & Aluminum Co. | 1,007 | 116,852 |
| Royal Gold, Inc. | 691 | 79,769 |
| RPM International, Inc. | 1,642 | 118,930 |
| Sealed Air Corp. | 2,230 | 93,147 |
| Silgan Holdings, Inc. | 1,213 | 37,324 |
| Sonoco Products Co. | 1,536 | 88,627 |
| Southern Copper Corp. | 353 | 12,560 |
| Steel Dynamics, Inc. | 3,231 | 98,093 |
| The Chemours Co. | 2,547 | 41,796 |
| The Mosaic Co. | 5,427 | 107,889 |
| United States Steel Corp. | 2,580 | 29,696 |
| Valvoline, Inc. | 2,886 | 61,587 |
| Vulcan Materials Co. | 164 | 23,431 |
Schwab Equity Index Funds | Annual Report
Schwab U.S. Large-Cap Value Index Fund
Portfolio Holdings as of October 31, 2019 (continued)
| Security | Number
of Shares | Value ($) |
| Westlake Chemical Corp. | 552 | 34,881 |
| WestRock Co. | 3,904 | 145,892 |
| | | 8,994,280 |
| |
| Media & Entertainment 4.0% |
| Activision Blizzard, Inc. | 11,049 | 619,075 |
| CBS Corp., Class B - Non Voting Shares | 514 | 18,525 |
| Charter Communications, Inc., Class A * | 1,015 | 474,878 |
| Cinemark Holdings, Inc. | 1,638 | 59,951 |
| Comcast Corp., Class A | 36,831 | 1,650,765 |
| Discovery, Inc., Class A * | 2,381 | 64,180 |
| Discovery, Inc., Class C * | 5,402 | 136,346 |
| DISH Network Corp., Class A * | 3,597 | 123,665 |
| Electronic Arts, Inc. * | 439 | 42,320 |
| Fox Corp., Class A | 4,874 | 156,163 |
| Fox Corp., Class B * | 2,273 | 71,009 |
| IAC/InterActiveCorp * | 476 | 108,171 |
| John Wiley & Sons, Inc., Class A | 659 | 30,360 |
| Liberty Broadband Corp., Class A * | 378 | 44,600 |
| Liberty Broadband Corp., Class C * | 1,625 | 191,864 |
| Liberty Media Corp. - Liberty Formula One, Class A * | 362 | 14,636 |
| Liberty Media Corp. - Liberty Formula One, Class C * | 3,059 | 130,007 |
| Liberty Media Corp. - Liberty SiriusXM, Class A * | 1,298 | 58,293 |
| Liberty Media Corp. - Liberty SiriusXM, Class C * | 2,366 | 106,920 |
| Lions Gate Entertainment Corp., Class A * | 765 | 6,112 |
| Lions Gate Entertainment Corp., Class B * | 1,689 | 12,651 |
| News Corp., Class A | 5,918 | 81,136 |
| News Corp., Class B | 1,866 | 26,348 |
| Nexstar Media Group, Inc., Class A | 153 | 14,885 |
| Omnicom Group, Inc. | 1,545 | 119,259 |
| Sinclair Broadcast Group, Inc., Class A | 65 | 2,590 |
| Take-Two Interactive Software, Inc. * | 930 | 111,925 |
| The Interpublic Group of Cos., Inc. | 5,369 | 116,776 |
| The Madison Square Garden Co., Class A * | 258 | 68,865 |
| The New York Times Co., Class A | 2,025 | 62,572 |
| The Walt Disney Co. | 26,932 | 3,499,005 |
| TripAdvisor, Inc. * | 177 | 7,151 |
| Viacom, Inc., Class A | 158 | 3,775 |
| Viacom, Inc., Class B | 5,432 | 117,114 |
| Zillow Group, Inc., Class A * | 896 | 29,021 |
| Zillow Group, Inc., Class C * | 1,888 | 61,492 |
| Zynga, Inc., Class A * | 10,154 | 62,650 |
| | | 8,505,055 |
| |
| Pharmaceuticals, Biotechnology & Life Sciences 6.8% |
| Adaptive Biotechnologies Corp. * | 74 | 1,929 |
| Agilent Technologies, Inc. | 4,322 | 327,391 |
| Agios Pharmaceuticals, Inc. * | 700 | 21,056 |
| Alexion Pharmaceuticals, Inc. * | 814 | 85,796 |
| Alkermes plc * | 2,380 | 46,481 |
| Allergan plc | 5,058 | 890,764 |
| Alnylam Pharmaceuticals, Inc. * | 258 | 22,379 |
| Amgen, Inc. | 737 | 157,165 |
| Avantor, Inc. * | 1,018 | 14,466 |
| Bio-Rad Laboratories, Inc., Class A * | 328 | 108,771 |
| Biogen, Inc. * | 1,865 | 557,094 |
| Bluebird Bio, Inc. * | 841 | 68,121 |
| Bristol-Myers Squibb Co. | 14,888 | 854,125 |
| Catalent, Inc. * | 2,227 | 108,344 |
| Elanco Animal Health, Inc. * | 5,734 | 154,933 |
| Exelixis, Inc. * | 2,738 | 42,302 |
| Gilead Sciences, Inc. | 16,843 | 1,073,068 |
| Security | Number
of Shares | Value ($) |
| Horizon Therapeutics plc * | 2,482 | 71,755 |
| IQVIA Holdings, Inc. * | 1,587 | 229,195 |
| Jazz Pharmaceuticals plc * | 94 | 11,809 |
| Johnson & Johnson | 34,789 | 4,593,540 |
| Merck & Co., Inc. | 2,068 | 179,213 |
| Moderna, Inc. * | 310 | 5,192 |
| Mylan N.V. * | 7,895 | 151,189 |
| Nektar Therapeutics * | 2,211 | 37,863 |
| PerkinElmer, Inc. | 1,330 | 114,327 |
| Perrigo Co., plc | 1,947 | 103,230 |
| Pfizer, Inc. | 85,817 | 3,292,798 |
| QIAGEN N.V. * | 3,393 | 101,145 |
| Regeneron Pharmaceuticals, Inc. * | 1,001 | 306,586 |
| Thermo Fisher Scientific, Inc. | 1,962 | 592,485 |
| United Therapeutics Corp. * | 666 | 59,833 |
| | | 14,384,345 |
| |
| Real Estate 5.5% |
| Alexandria Real Estate Equities, Inc. | 1,720 | 273,050 |
| American Campus Communities, Inc. | 2,113 | 105,608 |
| American Homes 4 Rent, Class A | 2,254 | 59,663 |
| Apartment Investment & Management Co., Class A | 2,286 | 125,456 |
| Apple Hospitality REIT, Inc. | 3,229 | 53,214 |
| AvalonBay Communities, Inc. | 2,144 | 466,663 |
| Boston Properties, Inc. | 2,383 | 326,948 |
| Brandywine Realty Trust | 2,706 | 41,348 |
| Brixmor Property Group, Inc. | 4,589 | 101,050 |
| Camden Property Trust | 1,443 | 165,036 |
| CBRE Group, Inc., Class A * | 3,258 | 174,466 |
| Colony Capital, Inc. | 7,022 | 39,323 |
| Columbia Property Trust, Inc. | 1,814 | 37,223 |
| CoreSite Realty Corp. | 122 | 14,335 |
| Corporate Office Properties Trust | 1,726 | 51,159 |
| Cousins Properties, Inc. | 2,229 | 89,450 |
| CubeSmart | 2,970 | 94,149 |
| CyrusOne, Inc. | 1,717 | 122,388 |
| Digital Realty Trust, Inc. | 3,201 | 406,655 |
| Douglas Emmett, Inc. | 2,538 | 109,946 |
| Duke Realty Corp. | 5,554 | 195,168 |
| Empire State Realty Trust, Inc., Class A | 2,219 | 32,109 |
| EPR Properties | 1,176 | 91,481 |
| Equity Commonwealth | 1,868 | 60,112 |
| Equity Residential | 5,631 | 499,244 |
| Essex Property Trust, Inc. | 1,008 | 329,747 |
| Extra Space Storage, Inc. | 366 | 41,091 |
| Federal Realty Investment Trust | 1,154 | 156,955 |
| Gaming & Leisure Properties, Inc. | 3,110 | 125,520 |
| HCP, Inc. | 7,577 | 285,047 |
| Healthcare Trust of America, Inc., Class A | 3,153 | 97,743 |
| Highwoods Properties, Inc. | 1,560 | 73,008 |
| Host Hotels & Resorts, Inc. | 11,156 | 182,847 |
| Hudson Pacific Properties, Inc. | 2,327 | 83,586 |
| Invitation Homes, Inc. | 7,347 | 226,214 |
| Iron Mountain, Inc. | 3,887 | 127,494 |
| JBG SMITH Properties | 1,872 | 75,367 |
| Jones Lang LaSalle, Inc. | 705 | 103,297 |
| Kilroy Realty Corp. | 1,524 | 127,909 |
| Kimco Realty Corp. | 6,228 | 134,276 |
| Liberty Property Trust | 2,396 | 141,532 |
| Life Storage, Inc. | 709 | 77,224 |
| Medical Properties Trust, Inc. | 6,807 | 141,109 |
| Mid-America Apartment Communities, Inc. | 1,749 | 243,093 |
| National Retail Properties, Inc. | 2,492 | 146,804 |
| Omega Healthcare Investors, Inc. | 3,280 | 144,451 |
| Outfront Media, Inc. | 1,834 | 48,253 |
| Paramount Group, Inc. | 3,094 | 41,676 |
Schwab Equity Index Funds | Annual Report
Schwab U.S. Large-Cap Value Index Fund
Portfolio Holdings as of October 31, 2019 (continued)
| Security | Number
of Shares | Value ($) |
| Park Hotels & Resorts, Inc. | 3,694 | 85,885 |
| Prologis, Inc. | 9,678 | 849,341 |
| Public Storage | 552 | 123,019 |
| Rayonier, Inc. | 1,967 | 53,070 |
| Realty Income Corp. | 4,905 | 401,180 |
| Regency Centers Corp. | 2,566 | 172,538 |
| Retail Properties of America, Inc., Class A | 3,300 | 45,408 |
| Service Properties Trust | 2,490 | 62,997 |
| Simon Property Group, Inc. | 536 | 80,764 |
| SITE Centers Corp. | 2,097 | 32,566 |
| SL Green Realty Corp. | 1,257 | 105,085 |
| Spirit Realty Capital, Inc. | 1,374 | 68,480 |
| STORE Capital Corp. | 3,223 | 130,531 |
| Sun Communities, Inc. | 1,038 | 168,831 |
| Taubman Centers, Inc. | 876 | 31,343 |
| The Howard Hughes Corp. * | 421 | 47,076 |
| The Macerich Co. | 2,187 | 60,142 |
| UDR, Inc. | 4,238 | 212,959 |
| Ventas, Inc. | 5,737 | 373,479 |
| VEREIT, Inc. | 16,302 | 160,412 |
| VICI Properties, Inc. | 7,117 | 167,605 |
| Vornado Realty Trust | 2,664 | 174,838 |
| Weingarten Realty Investors | 1,872 | 59,399 |
| Welltower, Inc. | 6,243 | 566,178 |
| Weyerhaeuser Co. | 11,478 | 335,272 |
| WP Carey, Inc. | 2,603 | 239,632 |
| | | 11,697,517 |
| |
| Retailing 2.1% |
| Advance Auto Parts, Inc. | 807 | 131,121 |
| AutoNation, Inc. * | 822 | 41,799 |
| Best Buy Co., Inc. | 2,795 | 200,765 |
| CarMax, Inc. * | 1,347 | 125,500 |
| Dick's Sporting Goods, Inc. | 1,020 | 39,709 |
| Dollar General Corp. | 239 | 38,321 |
| Dollar Tree, Inc. * | 1,658 | 183,043 |
| Expedia Group, Inc. | 275 | 37,581 |
| Foot Locker, Inc. | 1,685 | 73,314 |
| Genuine Parts Co. | 2,172 | 222,804 |
| Kohl's Corp. | 2,503 | 128,304 |
| L Brands, Inc. | 2,922 | 49,791 |
| LKQ Corp. * | 4,052 | 137,727 |
| Macy's, Inc. | 4,785 | 72,541 |
| Penske Automotive Group, Inc. | 516 | 25,140 |
| Qurate Retail, Inc. Class A * | 5,916 | 56,439 |
| Target Corp. | 7,281 | 778,412 |
| The Gap, Inc. | 3,343 | 54,357 |
| The Home Depot, Inc. | 7,312 | 1,715,249 |
| Tiffany & Co. | 1,865 | 232,211 |
| Urban Outfitters, Inc. * | 1,072 | 30,766 |
| Williams-Sonoma, Inc. | 973 | 64,987 |
| | | 4,439,881 |
| |
| Semiconductors & Semiconductor Equipment 3.4% |
| Analog Devices, Inc. | 4,903 | 522,807 |
| Applied Materials, Inc. | 6,686 | 362,782 |
| Cree, Inc. * | 1,508 | 71,977 |
| Cypress Semiconductor Corp. | 5,655 | 131,592 |
| First Solar, Inc. * | 1,258 | 65,152 |
| Intel Corp. | 68,383 | 3,865,691 |
| Lam Research Corp. | 273 | 73,994 |
| Marvell Technology Group Ltd. | 10,121 | 246,851 |
| Maxim Integrated Products, Inc. | 2,615 | 153,396 |
| Microchip Technology, Inc. | 2,566 | 241,948 |
| Micron Technology, Inc. * | 17,055 | 810,965 |
| MKS Instruments, Inc. | 830 | 89,823 |
| Security | Number
of Shares | Value ($) |
| ON Semiconductor Corp. * | 6,276 | 128,030 |
| Qorvo, Inc. * | 1,818 | 147,004 |
| Skyworks Solutions, Inc. | 2,524 | 229,835 |
| | | 7,141,847 |
| |
| Software & Services 1.5% |
| 2U, Inc. * | 543 | 9,733 |
| Akamai Technologies, Inc. * | 219 | 18,943 |
| Alliance Data Systems Corp. | 551 | 55,100 |
| Amdocs Ltd. | 2,075 | 135,290 |
| Autodesk, Inc. * | 774 | 114,057 |
| CACI International, Inc., Class A * | 381 | 85,249 |
| Cerence, Inc. * | 540 | 8,370 |
| Ceridian HCM Holding, Inc. * | 236 | 11,387 |
| Citrix Systems, Inc. | 218 | 23,731 |
| Cognizant Technology Solutions Corp., Class A | 7,821 | 476,612 |
| CoreLogic, Inc. * | 1,167 | 47,252 |
| DXC Technology Co. | 4,017 | 111,150 |
| Dynatrace, Inc. * | 104 | 2,104 |
| Fidelity National Information Services, Inc. | 3,649 | 480,792 |
| International Business Machines Corp. | 5,403 | 722,543 |
| Jack Henry & Associates, Inc. | 142 | 20,102 |
| Leidos Holdings, Inc. | 2,099 | 180,997 |
| LogMeIn, Inc. | 757 | 49,720 |
| Medallia, Inc. * | 65 | 1,890 |
| Nuance Communications, Inc. * | 4,412 | 72,004 |
| Sabre Corp. | 3,487 | 81,875 |
| SolarWinds Corp. * | 504 | 9,551 |
| SS&C Technologies Holdings, Inc. | 327 | 17,007 |
| Symantec Corp. | 8,916 | 203,998 |
| The Western Union Co. | 5,101 | 127,831 |
| VeriSign, Inc. * | 500 | 95,010 |
| | | 3,162,298 |
| |
| Technology Hardware & Equipment 1.2% |
| Arrow Electronics, Inc. * | 1,268 | 100,527 |
| Avnet, Inc. | 1,562 | 61,793 |
| Ciena Corp. * | 2,397 | 88,977 |
| Coherent, Inc. * | 370 | 55,100 |
| CommScope Holding Co., Inc. * | 2,875 | 32,200 |
| Corning, Inc. | 8,158 | 241,722 |
| Dell Technologies, Inc., Class C * | 656 | 34,696 |
| Dolby Laboratories, Inc., Class A | 839 | 53,973 |
| EchoStar Corp., Class A * | 715 | 27,885 |
| F5 Networks, Inc. * | 70 | 10,086 |
| FLIR Systems, Inc. | 1,898 | 97,861 |
| Hewlett Packard Enterprise Co. | 20,659 | 339,014 |
| HP, Inc. | 22,035 | 382,748 |
| IPG Photonics Corp. * | 504 | 67,677 |
| Jabil, Inc. | 1,793 | 66,018 |
| Juniper Networks, Inc. | 5,250 | 130,305 |
| Littelfuse, Inc. | 364 | 63,907 |
| Motorola Solutions, Inc. | 662 | 110,104 |
| National Instruments Corp. | 1,872 | 77,482 |
| SYNNEX Corp. | 638 | 75,118 |
| Trimble, Inc. * | 3,196 | 127,329 |
| ViaSat, Inc. * | 866 | 59,615 |
| Western Digital Corp. | 4,522 | 233,561 |
| Xerox Holdings Corp. | 2,844 | 96,497 |
| | | 2,634,195 |
| |
| Telecommunication Services 4.2% |
| AT&T, Inc. | 112,599 | 4,333,935 |
| CenturyLink, Inc. | 16,787 | 217,224 |
Schwab Equity Index Funds | Annual Report
Schwab U.S. Large-Cap Value Index Fund
Portfolio Holdings as of October 31, 2019 (continued)
| Security | Number
of Shares | Value ($) |
| GCI Liberty, Inc., Class A * | 1,520 | 106,370 |
| Sprint Corp. * | 8,799 | 54,642 |
| T-Mobile US, Inc. * | 2,300 | 190,118 |
| Telephone & Data Systems, Inc. | 1,560 | 40,700 |
| United States Cellular Corp. * | 248 | 9,231 |
| Verizon Communications, Inc. | 63,830 | 3,859,800 |
| | | 8,812,020 |
| |
| Transportation 1.9% |
| Alaska Air Group, Inc. | 997 | 69,222 |
| AMERCO | 136 | 55,085 |
| American Airlines Group, Inc. | 5,498 | 165,270 |
| C.H. Robinson Worldwide, Inc. | 493 | 37,291 |
| Copa Holdings S.A., Class A | 483 | 49,140 |
| CSX Corp. | 7,512 | 527,868 |
| Delta Air Lines, Inc. | 7,185 | 395,750 |
| Expeditors International of Washington, Inc. | 763 | 55,653 |
| FedEx Corp. | 3,720 | 567,895 |
| Genesee & Wyoming, Inc., Class A * | 714 | 79,275 |
| JB Hunt Transport Services, Inc. | 908 | 106,745 |
| JetBlue Airways Corp. * | 4,138 | 79,863 |
| Kansas City Southern | 1,546 | 217,646 |
| Kirby Corp. * | 909 | 71,956 |
| Knight-Swift Transportation Holdings, Inc. | 1,908 | 69,566 |
| Landstar System, Inc. | 50 | 5,658 |
| Lyft, Inc., Class A * | 474 | 19,643 |
| Macquarie Infrastructure Corp. | 1,130 | 48,748 |
| Norfolk Southern Corp. | 3,553 | 646,646 |
| Old Dominion Freight Line, Inc. | 572 | 104,150 |
| Ryder System, Inc. | 802 | 39,001 |
| Schneider National, Inc., Class B | 831 | 19,005 |
| Southwest Airlines Co. | 3,010 | 168,951 |
| Uber Technologies, Inc. *(b) | 2,497 | 78,656 |
| United Airlines Holdings, Inc. * | 2,832 | 257,259 |
| XPO Logistics, Inc. * | 593 | 45,305 |
| | | 3,981,247 |
| |
| Utilities 6.8% |
| AES Corp. | 10,241 | 174,609 |
| Alliant Energy Corp. | 3,678 | 196,185 |
| Ameren Corp. | 3,778 | 293,551 |
| American Electric Power Co., Inc. | 7,620 | 719,252 |
| American Water Works Co., Inc. | 2,784 | 343,184 |
| Aqua America, Inc. | 3,312 | 150,133 |
| Atmos Energy Corp. | 1,805 | 203,026 |
| Avangrid, Inc. | 868 | 43,443 |
| CenterPoint Energy, Inc. | 7,746 | 225,176 |
| CMS Energy Corp. | 4,342 | 277,541 |
| Consolidated Edison, Inc. | 5,129 | 472,996 |
| Dominion Energy, Inc. | 12,357 | 1,020,070 |
| DTE Energy Co. | 2,818 | 358,788 |
| Duke Energy Corp. | 11,227 | 1,058,257 |
| Edison International | 5,396 | 339,408 |
| Entergy Corp. | 3,066 | 372,458 |
| Evergy, Inc. | 3,626 | 231,738 |
| Eversource Energy | 4,996 | 418,365 |
| Exelon Corp. | 14,954 | 680,257 |
| FirstEnergy Corp. | 8,193 | 395,886 |
| Hawaiian Electric Industries, Inc. | 1,646 | 74,317 |
| IDACORP, Inc. | 766 | 82,437 |
| MDU Resources Group, Inc. | 2,994 | 86,497 |
| National Fuel Gas Co. | 1,249 | 56,592 |
| NextEra Energy, Inc. | 7,379 | 1,758,711 |
| NiSource, Inc. | 5,723 | 160,473 |
| NRG Energy, Inc. | 3,873 | 155,385 |
| OGE Energy Corp. | 3,072 | 132,280 |
| Security | Number
of Shares | Value ($) |
| PG&E Corp. * | 8,077 | 49,835 |
| Pinnacle West Capital Corp. | 1,723 | 162,169 |
| PPL Corp. | 11,145 | 373,246 |
| Public Service Enterprise Group, Inc. | 7,779 | 492,489 |
| Sempra Energy | 4,232 | 611,566 |
| The Southern Co. | 16,041 | 1,005,129 |
| UGI Corp. | 3,200 | 152,544 |
| Vistra Energy Corp. | 6,502 | 175,749 |
| WEC Energy Group, Inc. | 4,866 | 459,350 |
| Xcel Energy, Inc. | 7,940 | 504,269 |
| | | 14,467,361 |
| Total Common Stock |
| (Cost $196,691,653) | | 211,402,342 |
|
| Other Investment Companies0.1% of net assets |
| |
| Equity Funds 0.1% |
| iShares Russell 1000 Value ETF | 1,100 | 143,077 |
| |
| Securities Lending Collateral 0.0% |
| Wells Fargo Government Money Market Fund, Select Class 1.75%(c) | 99,345 | 99,345 |
| Total Other Investment Companies |
| (Cost $242,598) | | 242,422 |
| | Number of
Contracts | Notional
Amount
($) | Current Value/
Unrealized
Depreciation
($) |
| Futures Contracts | |
| Long | |
| Russell 1000 Growth Index, e-mini, expires 12/20/19 | 10 | 638,450 | (34) |
| * | Non-income producing security. |
| (a) | Issuer is affiliated with the fund’s investment adviser. |
| (b) | All or a portion of this security is on loan. Securities on loan were valued at $90,270. |
| (c) | The rate shown is the 7-day yield. |
| | |
| ETF — | Exchange-traded fund |
| REIT — | Real Estate Investment Trust |
Schwab Equity Index Funds | Annual Report
Schwab U.S. Mid-Cap Index Fund
Portfolio Holdings as of October 31, 2019
This section shows all the securities in the fund’s portfolio and their values as of the report date.
The fund files its complete schedule of portfolio holdings with the U.S. Securities and Exchange Commission (SEC) for the first and third quarters of each fiscal year on Form N-Q. Effective March 31, 2019, Form N-PORT Part F has replaced Form N-Q. The fund’s Form N-Q and Form N-PORT Part F are available on the SEC’s website atwww.sec.gov. The fund also makes available its complete schedule of portfolio holdings 15 to 20 days after the end of the month on the fund’s website atwww.schwabfunds.com/schwabfunds_prospectus.
| Security | Number
of Shares | Value ($) |
| Common Stock99.6% of net assets |
| |
| Automobiles & Components 0.8% |
| Aptiv plc | 11,993 | 1,073,973 |
| BorgWarner, Inc. | 9,636 | 401,629 |
| Gentex Corp. | 11,858 | 332,617 |
| Harley-Davidson, Inc. | 7,265 | 282,681 |
| Lear Corp. | 2,834 | 333,760 |
| The Goodyear Tire & Rubber Co. | 10,888 | 172,793 |
| Thor Industries, Inc. | 2,440 | 154,354 |
| | | 2,751,807 |
| |
| Banks 4.2% |
| Associated Banc-Corp. | 7,509 | 151,006 |
| Bank of Hawaii Corp. | 1,891 | 165,103 |
| Bank OZK | 5,665 | 158,960 |
| BankUnited, Inc. | 4,383 | 150,337 |
| BOK Financial Corp. | 1,486 | 114,645 |
| CIT Group, Inc. | 4,411 | 189,188 |
| Citizens Financial Group, Inc. | 20,780 | 730,625 |
| Comerica, Inc. | 6,939 | 453,949 |
| Commerce Bancshares, Inc. | 4,627 | 297,794 |
| Cullen/Frost Bankers, Inc. | 2,632 | 237,091 |
| East West Bancorp, Inc. | 6,739 | 289,238 |
| F.N.B. Corp. | 15,095 | 182,046 |
| Fifth Third Bancorp | 34,158 | 993,315 |
| First Citizens BancShares, Inc., Class A | 340 | 167,253 |
| First Hawaiian, Inc. | 6,201 | 169,473 |
| First Horizon National Corp. | 14,527 | 231,996 |
| First Republic Bank | 7,748 | 824,077 |
| Huntington Bancshares, Inc. | 48,441 | 684,471 |
| KeyCorp | 46,785 | 840,726 |
| LendingTree, Inc. * | 354 | 127,387 |
| M&T Bank Corp. | 6,207 | 971,582 |
| MGIC Investment Corp. | 16,508 | 226,325 |
| New York Community Bancorp, Inc. | 21,038 | 245,093 |
| PacWest Bancorp | 5,495 | 203,260 |
| People's United Financial, Inc. | 20,499 | 331,469 |
| Pinnacle Financial Partners, Inc. | 3,492 | 205,399 |
| Popular, Inc. | 4,431 | 241,312 |
| Prosperity Bancshares, Inc. | 4,241 | 292,714 |
| Regions Financial Corp. | 46,523 | 749,020 |
| Signature Bank | 2,505 | 296,392 |
| Sterling Bancorp | 9,425 | 185,201 |
| SunTrust Banks, Inc. | 20,634 | 1,410,128 |
| SVB Financial Group * | 2,417 | 535,317 |
| Synovus Financial Corp. | 6,842 | 231,738 |
| TCF Financial Corp. | 7,090 | 280,693 |
| Texas Capital Bancshares, Inc. * | 2,304 | 124,554 |
| TFS Financial Corp. | 2,354 | 45,338 |
| Umpqua Holdings Corp. | 10,340 | 163,579 |
| Webster Financial Corp. | 4,264 | 188,042 |
| Western Alliance Bancorp | 4,511 | 222,528 |
| Wintrust Financial Corp. | 2,616 | 166,953 |
| Zions Bancorp NA | 8,088 | 392,025 |
| | | 14,867,342 |
| |
| Security | Number
of Shares | Value ($) |
| Capital Goods 9.2% |
| A.O. Smith Corp. | 6,284 | 312,189 |
| Acuity Brands, Inc. | 1,843 | 229,988 |
| AECOM * | 7,228 | 289,192 |
| AGCO Corp. | 2,961 | 227,079 |
| Air Lease Corp. | 4,858 | 213,655 |
| Allegion plc | 4,374 | 507,559 |
| Allison Transmission Holdings, Inc. | 5,153 | 224,722 |
| AMETEK, Inc. | 10,587 | 970,299 |
| Arconic, Inc. | 18,177 | 499,322 |
| Armstrong World Industries, Inc. | 2,280 | 213,248 |
| BWX Technologies, Inc. | 4,410 | 256,221 |
| Carlisle Cos., Inc. | 2,623 | 399,404 |
| Colfax Corp. * | 4,367 | 146,731 |
| Crane Co. | 2,342 | 179,210 |
| Cummins, Inc. | 7,165 | 1,235,819 |
| Curtiss-Wright Corp. | 1,976 | 267,254 |
| Donaldson Co., Inc. | 5,927 | 312,590 |
| Dover Corp. | 6,730 | 699,180 |
| Fastenal Co. | 26,623 | 956,831 |
| Flowserve Corp. | 6,075 | 296,703 |
| Fluor Corp. | 6,419 | 103,410 |
| Fortive Corp. | 13,760 | 949,440 |
| Fortune Brands Home & Security, Inc. | 6,458 | 387,803 |
| Gardner Denver Holdings, Inc. * | 6,168 | 196,327 |
| Gates Industrial Corp. plc * | 2,005 | 20,050 |
| Graco, Inc. | 7,641 | 345,373 |
| GrafTech International Ltd. | 2,866 | 34,621 |
| HD Supply Holdings, Inc. * | 7,918 | 313,078 |
| HEICO Corp. | 1,809 | 223,122 |
| HEICO Corp., Class A | 3,559 | 339,066 |
| Hexcel Corp. | 3,930 | 293,257 |
| Hubbell, Inc. | 2,514 | 356,234 |
| Huntington Ingalls Industries, Inc. | 1,886 | 425,595 |
| IDEX Corp. | 3,522 | 547,777 |
| Ingersoll-Rand plc | 11,216 | 1,423,198 |
| ITT, Inc. | 4,082 | 242,675 |
| Jacobs Engineering Group, Inc. | 6,146 | 575,143 |
| L3Harris Technologies, Inc. | 10,288 | 2,122,517 |
| Lennox International, Inc. | 1,634 | 404,186 |
| Lincoln Electric Holdings, Inc. | 2,739 | 245,332 |
| Masco Corp. | 13,439 | 621,554 |
| MSC Industrial Direct Co., Inc., Class A | 2,045 | 149,714 |
| Nordson Corp. | 2,672 | 418,996 |
| nVent Electric plc | 7,084 | 163,357 |
| Oshkosh Corp. | 3,162 | 269,972 |
| Owens Corning | 5,003 | 306,584 |
| PACCAR, Inc. | 15,800 | 1,201,748 |
| Parker-Hannifin Corp. | 5,965 | 1,094,518 |
| Pentair plc | 7,762 | 321,890 |
| Quanta Services, Inc. | 6,573 | 276,395 |
| Regal Beloit Corp. | 1,956 | 144,842 |
| Resideo Technologies, Inc. * | 5,633 | 53,683 |
| Rockwell Automation, Inc. | 5,431 | 934,078 |
| Sensata Technologies Holding plc * | 7,362 | 376,861 |
| Snap-on, Inc. | 2,558 | 416,110 |
| Spirit AeroSystems Holdings, Inc., Class A | 4,807 | 393,309 |
| Stanley Black & Decker, Inc. | 7,057 | 1,067,936 |
Schwab Equity Index Funds | Annual Report
Schwab U.S. Mid-Cap Index Fund
Portfolio Holdings as of October 31, 2019 (continued)
| Security | Number
of Shares | Value ($) |
| Teledyne Technologies, Inc. * | 1,668 | 549,773 |
| Textron, Inc. | 10,751 | 495,514 |
| The Middleby Corp. * | 2,571 | 310,962 |
| The Timken Co. | 3,142 | 153,958 |
| The Toro Co. | 4,942 | 381,176 |
| TransDigm Group, Inc. | 2,291 | 1,205,707 |
| Trinity Industries, Inc. | 4,962 | 98,148 |
| United Rentals, Inc. * | 3,584 | 478,715 |
| Univar Solutions, Inc. * | 7,364 | 158,031 |
| Valmont Industries, Inc. | 985 | 135,132 |
| W.W. Grainger, Inc. | 2,039 | 629,725 |
| WABCO Holdings, Inc. * | 2,371 | 319,184 |
| Wabtec Corp. | 8,363 | 580,141 |
| Watsco, Inc. | 1,509 | 266,037 |
| WESCO International, Inc. * | 1,995 | 100,049 |
| Woodward, Inc. | 2,547 | 271,663 |
| Xylem, Inc. | 8,319 | 637,984 |
| | | 32,968,846 |
| |
| Commercial & Professional Services 2.6% |
| ADT, Inc.(a) | 5,316 | 41,146 |
| Cintas Corp. | 3,896 | 1,046,738 |
| Clean Harbors, Inc. * | 2,406 | 198,399 |
| Copart, Inc. * | 9,199 | 760,205 |
| CoStar Group, Inc. * | 1,675 | 920,446 |
| Equifax, Inc. | 5,604 | 766,123 |
| IAA, Inc. * | 6,188 | 236,072 |
| IHS Markit Ltd. * | 18,439 | 1,291,099 |
| KAR Auction Services, Inc. | 6,110 | 151,895 |
| ManpowerGroup, Inc. | 2,773 | 252,121 |
| Nielsen Holdings plc | 16,459 | 331,813 |
| Republic Services, Inc. | 9,926 | 868,624 |
| Robert Half International, Inc. | 5,374 | 307,769 |
| Rollins, Inc. | 6,587 | 251,031 |
| Stericycle, Inc. * | 4,156 | 239,386 |
| TransUnion | 8,715 | 720,033 |
| Verisk Analytics, Inc. | 7,434 | 1,075,700 |
| | | 9,458,600 |
| |
| Consumer Durables & Apparel 2.7% |
| Brunswick Corp. | 3,940 | 229,466 |
| Capri Holdings Ltd. * | 6,636 | 206,181 |
| Carter's, Inc. | 2,057 | 206,194 |
| Columbia Sportswear Co. | 1,370 | 123,917 |
| D.R. Horton, Inc. | 15,843 | 829,698 |
| Garmin Ltd. | 6,735 | 631,406 |
| Hanesbrands, Inc. | 16,692 | 253,885 |
| Hasbro, Inc. | 5,405 | 525,961 |
| Leggett & Platt, Inc. | 6,090 | 312,417 |
| Lennar Corp., B Shares | 771 | 36,252 |
| Lennar Corp., Class A | 13,049 | 777,720 |
| lululemon Athletica, Inc. * | 5,498 | 1,123,076 |
| Mattel, Inc. * | 16,024 | 191,327 |
| Mohawk Industries, Inc. * | 2,758 | 395,442 |
| Newell Brands, Inc. | 17,599 | 333,853 |
| NVR, Inc. * | 151 | 549,125 |
| Polaris, Inc. | 2,679 | 264,283 |
| PulteGroup, Inc. | 11,876 | 466,014 |
| PVH Corp. | 3,450 | 300,702 |
| Ralph Lauren Corp. | 2,395 | 230,064 |
| Skechers U.S.A., Inc., Class A * | 6,115 | 228,518 |
| Tapestry, Inc. | 13,301 | 343,964 |
| Tempur Sealy International, Inc. * | 2,153 | 195,815 |
| Toll Brothers, Inc. | 6,208 | 246,892 |
| Under Armour, Inc., Class A * | 8,716 | 179,985 |
| Security | Number
of Shares | Value ($) |
| Under Armour, Inc., Class C * | 8,947 | 165,520 |
| Whirlpool Corp. | 2,879 | 437,953 |
| | | 9,785,630 |
| |
| Consumer Services 3.3% |
| Aramark | 11,389 | 498,383 |
| Bright Horizons Family Solutions, Inc. * | 2,681 | 398,182 |
| Caesars Entertainment Corp. * | 26,383 | 323,983 |
| Chipotle Mexican Grill, Inc. * | 1,190 | 926,010 |
| Choice Hotels International, Inc. | 1,567 | 138,648 |
| Darden Restaurants, Inc. | 5,714 | 641,511 |
| Domino's Pizza, Inc. | 1,912 | 519,338 |
| Dunkin' Brands Group, Inc. | 3,831 | 301,193 |
| Extended Stay America, Inc. | 8,616 | 122,433 |
| frontdoor, Inc. * | 3,958 | 190,894 |
| Graham Holdings Co., Class B | 193 | 121,524 |
| Grand Canyon Education, Inc. * | 2,216 | 203,783 |
| H&R Block, Inc. | 9,478 | 236,855 |
| Hilton Grand Vacations, Inc. * | 4,016 | 139,476 |
| Hilton Worldwide Holdings, Inc. | 13,188 | 1,278,709 |
| Hyatt Hotels Corp., Class A | 1,741 | 130,122 |
| International Game Technology plc | 4,484 | 59,368 |
| MGM Resorts International | 23,426 | 667,641 |
| Norwegian Cruise Line Holdings Ltd. * | 9,993 | 507,245 |
| Planet Fitness, Inc., Class A * | 3,964 | 252,348 |
| Royal Caribbean Cruises Ltd. | 7,988 | 869,334 |
| Service Corp. International | 8,262 | 375,756 |
| ServiceMaster Global Holdings, Inc. * | 6,311 | 254,838 |
| Six Flags Entertainment Corp. | 3,713 | 156,652 |
| The Wendy's Co. | 8,647 | 183,144 |
| Vail Resorts, Inc. | 1,872 | 434,997 |
| Wyndham Destinations, Inc. | 4,258 | 197,614 |
| Wyndham Hotels & Resorts, Inc. | 4,459 | 240,652 |
| Wynn Resorts Ltd. | 4,548 | 551,854 |
| Yum China Holdings, Inc. | 16,886 | 717,655 |
| | | 11,640,142 |
| |
| Diversified Financials 5.0% |
| Affiliated Managers Group, Inc. | 2,349 | 187,638 |
| AGNC Investment Corp. | 25,550 | 435,628 |
| Ally Financial, Inc. | 18,210 | 557,772 |
| Ameriprise Financial, Inc. | 6,090 | 918,920 |
| Annaly Capital Management, Inc. | 67,737 | 608,278 |
| AXA Equitable Holdings, Inc. | 13,620 | 294,192 |
| BGC Partners, Inc., Class A | 13,335 | 69,342 |
| Cboe Global Markets, Inc. | 5,142 | 592,101 |
| Chimera Investment Corp. | 8,743 | 177,133 |
| Credit Acceptance Corp. * | 487 | 213,213 |
| Discover Financial Services | 14,808 | 1,188,490 |
| E*TRADE Financial Corp. | 11,184 | 467,379 |
| Eaton Vance Corp. | 5,209 | 237,530 |
| Evercore, Inc., Class A | 1,860 | 136,970 |
| FactSet Research Systems, Inc. | 1,747 | 442,899 |
| Franklin Resources, Inc. | 13,036 | 359,142 |
| Interactive Brokers Group, Inc., Class A | 3,488 | 165,924 |
| Invesco Ltd. | 18,302 | 307,840 |
| Janus Henderson Group plc | 7,521 | 173,961 |
| Jefferies Financial Group, Inc. | 12,344 | 230,463 |
| Lazard Ltd., Class A | 4,836 | 180,528 |
| Legg Mason, Inc. | 4,026 | 150,009 |
| LPL Financial Holdings, Inc. | 3,801 | 307,273 |
| MarketAxess Holdings, Inc. | 1,710 | 630,289 |
| MFA Financial, Inc. | 20,900 | 158,631 |
| Morningstar, Inc. | 922 | 149,217 |
| MSCI, Inc. | 3,831 | 898,599 |
| Nasdaq, Inc. | 5,385 | 537,261 |
Schwab Equity Index Funds | Annual Report
Schwab U.S. Mid-Cap Index Fund
Portfolio Holdings as of October 31, 2019 (continued)
| Security | Number
of Shares | Value ($) |
| Navient Corp. | 9,324 | 128,392 |
| New Residential Investment Corp. | 19,206 | 304,223 |
| Northern Trust Corp. | 9,203 | 917,355 |
| OneMain Holdings, Inc. | 2,984 | 119,360 |
| Raymond James Financial, Inc. | 5,776 | 482,238 |
| Santander Consumer USA Holdings, Inc. | 4,822 | 120,936 |
| SEI Investments Co. | 5,980 | 358,322 |
| SLM Corp. | 19,993 | 168,741 |
| Starwood Property Trust, Inc. | 12,618 | 310,403 |
| State Street Corp. | 17,353 | 1,146,513 |
| Synchrony Financial | 30,878 | 1,092,155 |
| T. Rowe Price Group, Inc. | 10,741 | 1,243,808 |
| Two Harbors Investment Corp. | 12,725 | 176,496 |
| Virtu Financial, Inc., Class A | 2,366 | 40,127 |
| Voya Financial, Inc. | 6,530 | 352,359 |
| | | 17,738,050 |
| |
| Energy 3.6% |
| Antero Midstream Corp.(a) | 10,353 | 66,673 |
| Antero Resources Corp. * | 12,263 | 30,658 |
| Apache Corp. | 17,495 | 378,942 |
| Apergy Corp. * | 3,561 | 89,630 |
| Baker Hughes Co. | 29,370 | 628,518 |
| Cabot Oil & Gas Corp. | 19,135 | 356,676 |
| Centennial Resource Development, Inc., Class A * | 8,318 | 28,281 |
| Cheniere Energy, Inc. * | 10,816 | 665,725 |
| Chesapeake Energy Corp. *(a) | 60,125 | 80,568 |
| Cimarex Energy Co. | 4,661 | 196,787 |
| Concho Resources, Inc. | 9,261 | 625,303 |
| Continental Resources, Inc. * | 3,977 | 117,202 |
| Devon Energy Corp. | 18,830 | 381,872 |
| Diamondback Energy, Inc. | 7,646 | 655,721 |
| EQT Corp. | 11,957 | 128,418 |
| Equitrans Midstream Corp. | 9,575 | 133,284 |
| Halliburton Co. | 40,503 | 779,683 |
| Helmerich & Payne, Inc. | 4,986 | 186,975 |
| Hess Corp. | 12,530 | 823,848 |
| HollyFrontier Corp. | 7,105 | 390,349 |
| Kosmos Energy Ltd. | 16,705 | 103,571 |
| Marathon Oil Corp. | 37,439 | 431,672 |
| Murphy Oil Corp. | 7,069 | 145,833 |
| National Oilwell Varco, Inc. | 18,009 | 407,364 |
| Noble Energy, Inc. | 22,087 | 425,396 |
| ONEOK, Inc. | 19,145 | 1,336,895 |
| Parsley Energy, Inc., Class A | 12,530 | 198,099 |
| Patterson-UTI Energy, Inc. | 9,157 | 76,186 |
| PBF Energy, Inc., Class A | 5,570 | 179,800 |
| Pioneer Natural Resources Co. | 7,805 | 960,171 |
| Range Resources Corp. | 9,523 | 38,378 |
| Targa Resources Corp. | 10,673 | 414,966 |
| The Williams Cos., Inc. | 56,524 | 1,261,050 |
| Transocean Ltd. * | 27,228 | 129,333 |
| WPX Energy, Inc. * | 19,552 | 195,129 |
| | | 13,048,956 |
| |
| Food & Staples Retailing 0.5% |
| Casey's General Stores, Inc. | 1,699 | 290,206 |
| Grocery Outlet Holding Corp. * | 1,477 | 47,116 |
| Sprouts Farmers Market, Inc. * | 5,397 | 104,756 |
| The Kroger Co. | 37,024 | 912,271 |
| U.S. Foods Holding Corp. * | 10,122 | 401,540 |
| | | 1,755,889 |
| |
| Security | Number
of Shares | Value ($) |
| Food, Beverage & Tobacco 2.8% |
| Archer-Daniels-Midland Co. | 25,954 | 1,091,106 |
| Beyond Meat, Inc. * | 604 | 51,008 |
| Brown-Forman Corp., Class A | 2,095 | 130,204 |
| Brown-Forman Corp., Class B | 8,008 | 524,684 |
| Bunge Ltd. | 6,435 | 347,490 |
| Campbell Soup Co. | 7,818 | 362,052 |
| ConAgra Brands, Inc. | 22,400 | 605,920 |
| Flowers Foods, Inc. | 9,143 | 198,586 |
| Hormel Foods Corp. | 12,906 | 527,726 |
| Ingredion, Inc. | 3,103 | 245,137 |
| Kellogg Co. | 11,434 | 726,402 |
| Lamb Weston Holdings, Inc. | 6,807 | 531,218 |
| McCormick & Co., Inc. - Non Voting Shares | 5,716 | 918,504 |
| Molson Coors Brewing Co., Class B | 8,107 | 427,401 |
| Pilgrim's Pride Corp. * | 2,437 | 73,987 |
| Post Holdings, Inc. * | 3,008 | 309,523 |
| Seaboard Corp. | 12 | 50,629 |
| The Hain Celestial Group, Inc. * | 4,226 | 99,903 |
| The Hershey Co. | 6,725 | 987,701 |
| The JM Smucker Co. | 5,104 | 539,391 |
| TreeHouse Foods, Inc. * | 2,604 | 140,668 |
| Tyson Foods, Inc., Class A | 13,401 | 1,109,469 |
| | | 9,998,709 |
| |
| Health Care Equipment & Services 6.0% |
| ABIOMED, Inc. * | 2,056 | 426,784 |
| Acadia Healthcare Co., Inc. * | 3,982 | 119,420 |
| Align Technology, Inc. * | 3,691 | 931,202 |
| AmerisourceBergen Corp. | 7,046 | 601,587 |
| Cantel Medical Corp. | 1,746 | 127,266 |
| Cardinal Health, Inc. | 13,903 | 687,503 |
| Centene Corp. * | 19,068 | 1,012,129 |
| Cerner Corp. | 14,756 | 990,423 |
| Change Healthcare, Inc. * | 2,152 | 28,449 |
| Chemed Corp. | 722 | 284,403 |
| Covetrus, Inc. * | 4,460 | 44,221 |
| DaVita, Inc. * | 5,679 | 332,789 |
| DENTSPLY SIRONA, Inc. | 10,354 | 567,192 |
| DexCom, Inc. * | 4,225 | 651,664 |
| Encompass Health Corp. | 4,535 | 290,331 |
| Guardant Health, Inc. * | 1,719 | 119,471 |
| Henry Schein, Inc. * | 6,935 | 434,027 |
| Hill-Rom Holdings, Inc. | 3,100 | 324,539 |
| Hologic, Inc. * | 12,430 | 600,493 |
| ICU Medical, Inc. * | 903 | 145,934 |
| IDEXX Laboratories, Inc. * | 3,956 | 1,127,500 |
| Insulet Corp. * | 2,769 | 402,391 |
| Integra LifeSciences Holdings Corp. * | 3,304 | 191,830 |
| Laboratory Corp. of America Holdings * | 4,557 | 750,857 |
| Masimo Corp. * | 2,183 | 318,260 |
| McKesson Corp. | 8,615 | 1,145,795 |
| MEDNAX, Inc. * | 3,811 | 83,690 |
| Molina Healthcare, Inc. * | 2,912 | 342,568 |
| Penumbra, Inc. * | 1,465 | 228,496 |
| Premier, Inc., Class A * | 2,387 | 77,768 |
| Quest Diagnostics, Inc. | 6,262 | 634,028 |
| ResMed, Inc. | 6,609 | 977,603 |
| Steris plc | 3,892 | 550,990 |
| Teleflex, Inc. | 2,148 | 746,237 |
| The Cooper Cos., Inc. | 2,266 | 659,406 |
| Universal Health Services, Inc., Class B | 3,676 | 505,303 |
| Varian Medical Systems, Inc. * | 4,234 | 511,510 |
| Veeva Systems, Inc., Class A * | 6,033 | 855,660 |
| WellCare Health Plans, Inc. * | 2,336 | 692,858 |
Schwab Equity Index Funds | Annual Report
Schwab U.S. Mid-Cap Index Fund
Portfolio Holdings as of October 31, 2019 (continued)
| Security | Number
of Shares | Value ($) |
| West Pharmaceutical Services, Inc. | 3,403 | 489,488 |
| Zimmer Biomet Holdings, Inc. | 9,553 | 1,320,511 |
| | | 21,332,576 |
| |
| Household & Personal Products 0.7% |
| Church & Dwight Co., Inc. | 11,465 | 801,862 |
| Coty, Inc., Class A | 13,286 | 155,313 |
| Energizer Holdings, Inc. | 2,948 | 125,260 |
| Herbalife Nutrition Ltd. * | 4,771 | 213,121 |
| Nu Skin Enterprises, Inc., Class A | 2,540 | 113,233 |
| Spectrum Brands Holdings, Inc. | 1,974 | 99,115 |
| The Clorox Co. | 5,865 | 866,202 |
| | | 2,374,106 |
| |
| Insurance 4.0% |
| Alleghany Corp. * | 651 | 506,667 |
| American Financial Group, Inc. | 3,411 | 354,880 |
| American National Insurance Co. | 348 | 41,753 |
| Arch Capital Group Ltd. * | 17,864 | 746,001 |
| Arthur J. Gallagher & Co. | 8,570 | 781,755 |
| Assurant, Inc. | 2,841 | 358,165 |
| Assured Guaranty Ltd. | 4,496 | 210,952 |
| Athene Holding Ltd., Class A * | 6,786 | 294,173 |
| Axis Capital Holdings Ltd. | 3,838 | 228,092 |
| Brighthouse Financial, Inc. * | 5,215 | 196,918 |
| Brown & Brown, Inc. | 10,946 | 412,445 |
| Cincinnati Financial Corp. | 7,088 | 802,433 |
| CNA Financial Corp. | 1,307 | 58,606 |
| Erie Indemnity Co., Class A | 1,146 | 211,173 |
| Everest Re Group Ltd. | 1,877 | 482,558 |
| Fidelity National Financial, Inc. | 12,295 | 563,603 |
| First American Financial Corp. | 5,063 | 312,792 |
| Globe Life, Inc. | 5,027 | 489,278 |
| Kemper Corp. | 2,919 | 209,818 |
| Lincoln National Corp. | 9,303 | 525,434 |
| Loews Corp. | 12,242 | 599,858 |
| Markel Corp. * | 632 | 740,072 |
| Mercury General Corp. | 1,252 | 60,171 |
| Old Republic International Corp. | 13,081 | 292,230 |
| Primerica, Inc. | 1,927 | 243,149 |
| Principal Financial Group, Inc. | 12,829 | 684,812 |
| Reinsurance Group of America, Inc. | 2,915 | 473,600 |
| RenaissanceRe Holdings Ltd. | 2,033 | 380,537 |
| The Hanover Insurance Group, Inc. | 1,836 | 241,820 |
| The Hartford Financial Services Group, Inc. | 16,780 | 957,802 |
| Unum Group | 9,647 | 265,678 |
| W. R. Berkley Corp. | 6,699 | 468,260 |
| White Mountains Insurance Group Ltd. | 144 | 154,224 |
| Willis Towers Watson plc | 6,009 | 1,123,082 |
| | | 14,472,791 |
| |
| Materials 5.1% |
| Albemarle Corp. | 4,875 | 296,107 |
| Alcoa Corp. * | 8,707 | 181,019 |
| AptarGroup, Inc. | 2,965 | 350,315 |
| Ardagh Group S.A. | 799 | 14,917 |
| Ashland Global Holdings, Inc. | 2,801 | 216,713 |
| Avery Dennison Corp. | 3,925 | 501,850 |
| Axalta Coating Systems Ltd. * | 9,645 | 284,431 |
| Ball Corp. | 15,389 | 1,076,768 |
| Berry Global Group, Inc. * | 6,125 | 254,249 |
| Cabot Corp. | 2,678 | 116,734 |
| Celanese Corp. | 5,728 | 693,947 |
| CF Industries Holdings, Inc. | 10,153 | 460,439 |
| Corteva, Inc. * | 34,949 | 921,955 |
| Security | Number
of Shares | Value ($) |
| Crown Holdings, Inc. * | 6,050 | 440,682 |
| Domtar Corp. | 2,962 | 107,787 |
| Eagle Materials, Inc. | 1,950 | 178,113 |
| Eastman Chemical Co. | 6,375 | 484,755 |
| Element Solutions, Inc. * | 10,651 | 115,670 |
| FMC Corp. | 6,119 | 559,888 |
| Freeport-McMoRan, Inc. | 67,298 | 660,866 |
| Graphic Packaging Holding Co. | 13,712 | 214,730 |
| Huntsman Corp. | 10,147 | 224,553 |
| International Flavors & Fragrances, Inc. | 4,961 | 605,292 |
| International Paper Co. | 18,327 | 800,523 |
| Martin Marietta Materials, Inc. | 2,909 | 761,896 |
| NewMarket Corp. | 316 | 153,415 |
| Newmont Goldcorp Corp. | 38,084 | 1,513,077 |
| Nucor Corp. | 14,208 | 765,101 |
| Olin Corp. | 7,629 | 139,916 |
| Owens-Illinois, Inc. | 7,356 | 62,526 |
| Packaging Corp. of America | 4,342 | 475,275 |
| Reliance Steel & Aluminum Co. | 3,020 | 350,441 |
| Royal Gold, Inc. | 3,046 | 351,630 |
| RPM International, Inc. | 5,952 | 431,103 |
| Sealed Air Corp. | 7,215 | 301,371 |
| Silgan Holdings, Inc. | 3,566 | 109,726 |
| Sonoco Products Co. | 4,604 | 265,651 |
| Steel Dynamics, Inc. | 9,733 | 295,494 |
| The Chemours Co. | 7,697 | 126,308 |
| The Mosaic Co. | 16,304 | 324,124 |
| The Scotts Miracle-Gro Co. | 1,843 | 185,019 |
| United States Steel Corp.(a) | 7,918 | 91,136 |
| Valvoline, Inc. | 8,792 | 187,621 |
| Vulcan Materials Co. | 6,117 | 873,936 |
| W.R. Grace & Co. | 2,677 | 177,887 |
| Westlake Chemical Corp. | 1,625 | 102,684 |
| WestRock Co. | 11,877 | 443,843 |
| | | 18,251,483 |
| |
| Media & Entertainment 3.8% |
| Altice USA, Inc., Class A * | 14,596 | 451,746 |
| AMC Networks, Inc., Class A * | 1,935 | 84,269 |
| Cable One, Inc. | 203 | 269,050 |
| CBS Corp., Class B - Non Voting Shares | 15,411 | 555,412 |
| Cinemark Holdings, Inc. | 4,995 | 182,817 |
| Discovery, Inc., Class A * | 7,255 | 195,559 |
| Discovery, Inc., Class C * | 16,255 | 410,276 |
| DISH Network Corp., Class A * | 10,847 | 372,920 |
| Fox Corp., Class A | 16,377 | 524,719 |
| Fox Corp., Class B * | 7,541 | 235,581 |
| IAC/InterActiveCorp * | 3,464 | 787,194 |
| John Wiley & Sons, Inc., Class A | 2,008 | 92,509 |
| Liberty Broadband Corp., Class A * | 1,132 | 133,565 |
| Liberty Broadband Corp., Class C * | 4,923 | 581,259 |
| Liberty Media Corp. - Liberty Formula One, Class A * | 1,187 | 47,990 |
| Liberty Media Corp. - Liberty Formula One, Class C * | 9,163 | 389,428 |
| Liberty Media Corp. - Liberty SiriusXM, Class A * | 3,959 | 177,799 |
| Liberty Media Corp. - Liberty SiriusXM, Class C * | 7,144 | 322,837 |
| Lions Gate Entertainment Corp., Class A * | 2,252 | 17,994 |
| Lions Gate Entertainment Corp., Class B * | 5,149 | 38,566 |
| Live Nation Entertainment, Inc. * | 6,022 | 424,551 |
| Match Group, Inc.(a) | 2,560 | 186,854 |
| News Corp., Class A | 17,942 | 245,985 |
| News Corp., Class B | 5,587 | 78,888 |
| Nexstar Media Group, Inc., Class A | 2,086 | 202,947 |
| Omnicom Group, Inc. | 10,053 | 775,991 |
Schwab Equity Index Funds | Annual Report
Schwab U.S. Mid-Cap Index Fund
Portfolio Holdings as of October 31, 2019 (continued)
| Security | Number
of Shares | Value ($) |
| Roku, Inc. * | 3,972 | 584,678 |
| Sinclair Broadcast Group, Inc., Class A | 2,807 | 111,831 |
| Sirius XM Holdings, Inc. | 63,874 | 429,233 |
| Spotify Technology S.A. * | 5,494 | 792,784 |
| Take-Two Interactive Software, Inc. * | 5,224 | 628,708 |
| The Interpublic Group of Cos., Inc. | 17,936 | 390,108 |
| The Madison Square Garden Co., Class A * | 864 | 230,619 |
| The New York Times Co., Class A | 7,555 | 233,450 |
| TripAdvisor, Inc. * | 4,918 | 198,687 |
| Twitter, Inc. * | 35,066 | 1,050,928 |
| Viacom, Inc., Class A | 423 | 10,106 |
| Viacom, Inc., Class B | 16,481 | 355,330 |
| World Wrestling Entertainment, Inc., Class A | 2,071 | 116,059 |
| Zillow Group, Inc., Class A * | 2,584 | 83,696 |
| Zillow Group, Inc., Class C * | 5,753 | 187,375 |
| Zynga, Inc., Class A * | 39,427 | 243,265 |
| | | 13,433,563 |
| |
| Pharmaceuticals, Biotechnology & Life Sciences 3.8% |
| Adaptive Biotechnologies Corp. * | 733 | 19,106 |
| Agilent Technologies, Inc. | 14,438 | 1,093,678 |
| Agios Pharmaceuticals, Inc. * | 2,411 | 72,523 |
| Alkermes plc * | 7,316 | 142,881 |
| Alnylam Pharmaceuticals, Inc. * | 4,936 | 428,149 |
| Avantor, Inc. * | 10,970 | 155,884 |
| Bio-Rad Laboratories, Inc., Class A * | 984 | 326,314 |
| Bio-Techne Corp. | 1,753 | 364,922 |
| BioMarin Pharmaceutical, Inc. * | 8,341 | 610,645 |
| Bluebird Bio, Inc. * | 2,565 | 207,765 |
| Bruker Corp. | 4,772 | 212,354 |
| Catalent, Inc. * | 6,718 | 326,831 |
| Charles River Laboratories International, Inc. * | 2,237 | 290,765 |
| Elanco Animal Health, Inc. * | 17,399 | 470,121 |
| Exact Sciences Corp. * | 5,940 | 516,780 |
| Exelixis, Inc. * | 13,913 | 214,956 |
| Horizon Therapeutics plc * | 8,549 | 247,152 |
| Incyte Corp. * | 8,257 | 692,927 |
| Ionis Pharmaceuticals, Inc. * | 5,952 | 331,645 |
| IQVIA Holdings, Inc. * | 8,361 | 1,207,496 |
| Jazz Pharmaceuticals plc * | 2,565 | 322,241 |
| Mettler-Toledo International, Inc. * | 1,140 | 803,632 |
| Moderna, Inc. * | 9,578 | 160,431 |
| Mylan N.V. * | 23,868 | 457,072 |
| Nektar Therapeutics * | 7,895 | 135,202 |
| Neurocrine Biosciences, Inc. * | 4,211 | 418,952 |
| PerkinElmer, Inc. | 5,134 | 441,319 |
| Perrigo Co., plc | 5,850 | 310,167 |
| PRA Health Sciences, Inc. * | 2,883 | 281,698 |
| QIAGEN N.V. * | 10,248 | 305,493 |
| Sage Therapeutics, Inc. * | 2,358 | 319,863 |
| Sarepta Therapeutics, Inc. * | 3,272 | 271,772 |
| Seattle Genetics, Inc. * | 5,346 | 574,160 |
| United Therapeutics Corp. * | 2,025 | 181,926 |
| Waters Corp. * | 3,086 | 653,059 |
| | | 13,569,881 |
| |
| Real Estate 10.2% |
| Alexandria Real Estate Equities, Inc. | 5,201 | 825,659 |
| American Campus Communities, Inc. | 6,354 | 317,573 |
| American Homes 4 Rent, Class A | 11,935 | 315,919 |
| Americold Realty Trust | 8,870 | 355,598 |
| Apartment Investment & Management Co., Class A | 6,841 | 375,434 |
| Apple Hospitality REIT, Inc. | 9,768 | 160,977 |
| AvalonBay Communities, Inc. | 6,484 | 1,411,307 |
| Security | Number
of Shares | Value ($) |
| Boston Properties, Inc. | 7,206 | 988,663 |
| Brandywine Realty Trust | 8,070 | 123,310 |
| Brixmor Property Group, Inc. | 13,795 | 303,766 |
| Brookfield Property REIT, Inc., Class A | 3,445 | 65,111 |
| Camden Property Trust | 4,330 | 495,222 |
| CBRE Group, Inc., Class A * | 15,605 | 835,648 |
| Colony Capital, Inc. | 22,025 | 123,340 |
| Columbia Property Trust, Inc. | 5,339 | 109,556 |
| CoreSite Realty Corp. | 1,709 | 200,808 |
| Corporate Office Properties Trust | 5,250 | 155,610 |
| Cousins Properties, Inc. | 6,774 | 271,841 |
| CubeSmart | 8,908 | 282,384 |
| CyrusOne, Inc. | 5,221 | 372,153 |
| Digital Realty Trust, Inc. | 9,675 | 1,229,112 |
| Douglas Emmett, Inc. | 7,681 | 332,741 |
| Duke Realty Corp. | 16,779 | 589,614 |
| Empire State Realty Trust, Inc., Class A | 6,779 | 98,092 |
| EPR Properties | 3,580 | 278,488 |
| Equity Commonwealth | 5,630 | 181,173 |
| Equity LifeStyle Properties, Inc. | 8,088 | 565,675 |
| Equity Residential | 17,027 | 1,509,614 |
| Essex Property Trust, Inc. | 3,045 | 996,111 |
| Extra Space Storage, Inc. | 5,769 | 647,686 |
| Federal Realty Investment Trust | 3,463 | 471,003 |
| Gaming & Leisure Properties, Inc. | 9,451 | 381,442 |
| HCP, Inc. | 22,922 | 862,326 |
| Healthcare Trust of America, Inc., Class A | 9,478 | 293,818 |
| Highwoods Properties, Inc. | 4,728 | 221,270 |
| Host Hotels & Resorts, Inc. | 33,711 | 552,523 |
| Hudson Pacific Properties, Inc. | 7,072 | 254,026 |
| Invitation Homes, Inc. | 22,239 | 684,739 |
| Iron Mountain, Inc. | 13,281 | 435,617 |
| JBG SMITH Properties | 5,700 | 229,482 |
| Jones Lang LaSalle, Inc. | 2,399 | 351,501 |
| Kilroy Realty Corp. | 4,625 | 388,176 |
| Kimco Realty Corp. | 18,836 | 406,104 |
| Lamar Advertising Co., Class A | 3,940 | 315,239 |
| Liberty Property Trust | 7,249 | 428,198 |
| Life Storage, Inc. | 2,151 | 234,287 |
| Medical Properties Trust, Inc. | 20,637 | 427,805 |
| Mid-America Apartment Communities, Inc. | 5,274 | 733,033 |
| National Retail Properties, Inc. | 7,525 | 443,298 |
| Omega Healthcare Investors, Inc. | 9,943 | 437,890 |
| Outfront Media, Inc. | 6,694 | 176,119 |
| Paramount Group, Inc. | 9,326 | 125,621 |
| Park Hotels & Resorts, Inc. | 11,076 | 257,517 |
| Rayonier, Inc. | 6,073 | 163,850 |
| Realty Income Corp. | 14,821 | 1,212,210 |
| Regency Centers Corp. | 7,718 | 518,958 |
| Retail Properties of America, Inc., Class A | 9,976 | 137,270 |
| SBA Communications Corp. | 5,222 | 1,256,674 |
| Service Properties Trust | 7,517 | 190,180 |
| SITE Centers Corp. | 6,372 | 98,957 |
| SL Green Realty Corp. | 3,806 | 318,182 |
| Spirit Realty Capital, Inc. | 4,175 | 208,082 |
| STORE Capital Corp. | 9,843 | 398,642 |
| Sun Communities, Inc. | 4,116 | 669,467 |
| Taubman Centers, Inc. | 2,691 | 96,284 |
| The Howard Hughes Corp. * | 1,864 | 208,432 |
| The Macerich Co. | 6,586 | 181,115 |
| UDR, Inc. | 13,507 | 678,727 |
| Ventas, Inc. | 17,339 | 1,128,769 |
| VEREIT, Inc. | 49,167 | 483,803 |
| VICI Properties, Inc. | 21,502 | 506,372 |
| Vornado Realty Trust | 8,059 | 528,912 |
| Weingarten Realty Investors | 5,630 | 178,640 |
| Welltower, Inc. | 18,870 | 1,711,320 |
Schwab Equity Index Funds | Annual Report
Schwab U.S. Mid-Cap Index Fund
Portfolio Holdings as of October 31, 2019 (continued)
| Security | Number
of Shares | Value ($) |
| Weyerhaeuser Co. | 34,696 | 1,013,470 |
| WP Carey, Inc. | 7,847 | 722,395 |
| | | 36,239,930 |
| |
| Retailing 4.6% |
| Advance Auto Parts, Inc. | 3,200 | 519,936 |
| AutoNation, Inc. * | 2,535 | 128,905 |
| AutoZone, Inc. * | 1,137 | 1,301,160 |
| Best Buy Co., Inc. | 10,681 | 767,216 |
| Burlington Stores, Inc. * | 3,041 | 584,389 |
| CarMax, Inc. * | 7,709 | 718,247 |
| Carvana Co. * | 2,057 | 166,782 |
| Dick's Sporting Goods, Inc. | 3,067 | 119,398 |
| Dollar General Corp. | 12,076 | 1,936,266 |
| Dollar Tree, Inc. * | 10,972 | 1,211,309 |
| Etsy, Inc. * | 5,532 | 246,119 |
| Expedia Group, Inc. | 6,443 | 880,500 |
| Five Below, Inc. * | 2,538 | 317,529 |
| Floor & Decor Holdings, Inc., Class A * | 3,176 | 145,556 |
| Foot Locker, Inc. | 5,105 | 222,119 |
| Genuine Parts Co. | 6,540 | 670,873 |
| GrubHub, Inc. * | 4,256 | 144,959 |
| Kohl's Corp. | 7,596 | 389,371 |
| L Brands, Inc. | 10,639 | 181,289 |
| LKQ Corp. * | 14,260 | 484,697 |
| Macy's, Inc. | 14,382 | 218,031 |
| Nordstrom, Inc. | 5,047 | 181,187 |
| O'Reilly Automotive, Inc. * | 3,509 | 1,528,205 |
| Ollie's Bargain Outlet Holdings, Inc. * | 2,469 | 157,720 |
| Penske Automotive Group, Inc. | 1,580 | 76,978 |
| Pool Corp. | 1,800 | 373,320 |
| Qurate Retail, Inc. Class A * | 17,838 | 170,174 |
| The Gap, Inc. | 10,164 | 165,267 |
| Tiffany & Co. | 5,631 | 701,116 |
| Tractor Supply Co. | 5,543 | 526,696 |
| Ulta Salon, Cosmetics & Fragrance, Inc. * | 2,619 | 610,620 |
| Urban Outfitters, Inc. * | 3,245 | 93,131 |
| Wayfair, Inc., Class A * | 2,885 | 237,234 |
| Williams-Sonoma, Inc. | 3,637 | 242,915 |
| | | 16,419,214 |
| |
| Semiconductors & Semiconductor Equipment 3.5% |
| Advanced Micro Devices, Inc. * | 46,674 | 1,583,649 |
| Cree, Inc. * | 4,906 | 234,163 |
| Cypress Semiconductor Corp. | 17,203 | 400,314 |
| Entegris, Inc. | 6,226 | 298,848 |
| First Solar, Inc. * | 3,835 | 198,615 |
| KLA Corp. | 7,424 | 1,254,953 |
| Lam Research Corp. | 6,726 | 1,823,015 |
| Marvell Technology Group Ltd. | 30,441 | 742,456 |
| Maxim Integrated Products, Inc. | 12,662 | 742,753 |
| Microchip Technology, Inc. | 10,834 | 1,021,538 |
| MKS Instruments, Inc. | 2,512 | 271,849 |
| Monolithic Power Systems, Inc. | 1,943 | 291,294 |
| ON Semiconductor Corp. * | 18,887 | 385,295 |
| Qorvo, Inc. * | 5,483 | 443,355 |
| Skyworks Solutions, Inc. | 8,010 | 729,391 |
| Teradyne, Inc. | 7,955 | 487,005 |
| Universal Display Corp. | 1,978 | 395,956 |
| Xilinx, Inc. | 11,845 | 1,074,815 |
| | | 12,379,264 |
| |
| Software & Services 9.8% |
| 2U, Inc. * | 2,609 | 46,766 |
| Akamai Technologies, Inc. * | 7,480 | 647,020 |
| Security | Number
of Shares | Value ($) |
| Alliance Data Systems Corp. | 1,870 | 187,000 |
| Alteryx, Inc., Class A * | 2,095 | 191,693 |
| Amdocs Ltd. | 6,319 | 411,999 |
| Anaplan, Inc. * | 3,891 | 183,655 |
| ANSYS, Inc. * | 3,895 | 857,484 |
| Aspen Technology, Inc. * | 3,220 | 370,654 |
| Atlassian Corp. plc, Class A * | 4,912 | 593,320 |
| Avalara, Inc. * | 2,148 | 152,508 |
| Black Knight, Inc. * | 6,701 | 430,204 |
| Booz Allen Hamilton Holding Corp. | 6,352 | 446,990 |
| Broadridge Financial Solutions, Inc. | 5,300 | 663,666 |
| CACI International, Inc., Class A * | 1,140 | 255,075 |
| Cadence Design Systems, Inc. * | 12,957 | 846,740 |
| CDK Global, Inc. | 5,630 | 284,540 |
| Cerence, Inc. * | 1,642 | 25,451 |
| Ceridian HCM Holding, Inc. * | 3,780 | 182,385 |
| Citrix Systems, Inc. | 5,840 | 635,742 |
| CoreLogic, Inc. * | 3,763 | 152,364 |
| Coupa Software, Inc. * | 2,840 | 390,472 |
| DocuSign, Inc. * | 7,110 | 470,611 |
| Dropbox, Inc., Class A * | 9,879 | 195,802 |
| DXC Technology Co. | 12,140 | 335,914 |
| Dynatrace, Inc. * | 1,638 | 33,137 |
| Elastic N.V. * | 2,086 | 150,213 |
| EPAM Systems, Inc. * | 2,416 | 425,119 |
| Euronet Worldwide, Inc. * | 2,315 | 324,262 |
| Fair Isaac Corp. * | 1,323 | 402,245 |
| FireEye, Inc. * | 9,248 | 146,488 |
| Fiserv, Inc. * | 26,286 | 2,789,996 |
| FleetCor Technologies, Inc. * | 3,968 | 1,167,465 |
| Fortinet, Inc. * | 6,654 | 542,700 |
| Gartner, Inc. * | 4,054 | 624,640 |
| Genpact Ltd. | 8,136 | 318,687 |
| Global Payments, Inc. | 13,884 | 2,348,895 |
| GoDaddy, Inc., Class A * | 8,206 | 533,636 |
| Guidewire Software, Inc. * | 3,805 | 428,976 |
| HubSpot, Inc. * | 1,845 | 286,159 |
| Jack Henry & Associates, Inc. | 3,571 | 505,511 |
| Leidos Holdings, Inc. | 6,352 | 547,733 |
| LogMeIn, Inc. | 2,307 | 151,524 |
| Manhattan Associates, Inc. * | 2,984 | 223,651 |
| Medallia, Inc. * | 700 | 20,356 |
| MongoDB, Inc. * | 1,946 | 248,640 |
| New Relic, Inc. * | 2,330 | 149,260 |
| Nuance Communications, Inc. * | 13,358 | 218,003 |
| Nutanix, Inc., Class A * | 6,548 | 191,333 |
| Okta, Inc. * | 4,742 | 517,210 |
| Pagerduty, Inc. * | 476 | 10,943 |
| Palo Alto Networks, Inc. * | 4,366 | 992,785 |
| Paychex, Inc. | 14,947 | 1,250,167 |
| Paycom Software, Inc. * | 2,291 | 484,615 |
| Paylocity Holding Corp. * | 1,511 | 155,029 |
| Pegasystems, Inc. | 1,760 | 132,370 |
| Pluralsight, Inc., Class A * | 2,807 | 50,751 |
| Proofpoint, Inc. * | 2,543 | 293,386 |
| PTC, Inc. * | 4,819 | 322,439 |
| RealPage, Inc. * | 3,692 | 223,551 |
| RingCentral, Inc., Class A * | 3,313 | 535,116 |
| Sabre Corp. | 12,760 | 299,605 |
| Smartsheet, Inc., Class A * | 4,066 | 160,200 |
| SolarWinds Corp. * | 2,048 | 38,810 |
| Splunk, Inc. * | 6,991 | 838,640 |
| Square, Inc., Class A * | 15,798 | 970,471 |
| SS&C Technologies Holdings, Inc. | 10,288 | 535,079 |
| Switch, Inc., Class A | 2,683 | 39,628 |
| Symantec Corp. | 27,017 | 618,149 |
| Synopsys, Inc. * | 6,935 | 941,426 |
| Teradata Corp. * | 5,319 | 159,198 |
Schwab Equity Index Funds | Annual Report
Schwab U.S. Mid-Cap Index Fund
Portfolio Holdings as of October 31, 2019 (continued)
| Security | Number
of Shares | Value ($) |
| The Trade Desk, Inc., Class A * | 1,797 | 360,838 |
| The Western Union Co. | 19,717 | 494,108 |
| Twilio, Inc., Class A * | 5,583 | 539,094 |
| Tyler Technologies, Inc. * | 1,756 | 471,521 |
| VeriSign, Inc. * | 4,893 | 929,768 |
| WEX, Inc. * | 2,007 | 379,684 |
| Zendesk, Inc. * | 5,114 | 361,304 |
| Zscaler, Inc. * | 2,859 | 125,739 |
| | | 34,968,308 |
| |
| Technology Hardware & Equipment 4.0% |
| Amphenol Corp., Class A | 13,589 | 1,363,384 |
| Arista Networks, Inc. * | 2,768 | 676,970 |
| Arrow Electronics, Inc. * | 3,834 | 303,959 |
| Avnet, Inc. | 4,733 | 187,237 |
| CDW Corp. | 6,746 | 862,881 |
| Ciena Corp. * | 7,189 | 266,856 |
| Cognex Corp. | 7,653 | 394,053 |
| Coherent, Inc. * | 1,128 | 167,982 |
| CommScope Holding Co., Inc. * | 8,743 | 97,922 |
| Corning, Inc. | 35,993 | 1,066,473 |
| Dolby Laboratories, Inc., Class A | 2,936 | 188,873 |
| EchoStar Corp., Class A * | 2,200 | 85,800 |
| F5 Networks, Inc. * | 2,786 | 401,407 |
| FLIR Systems, Inc. | 6,249 | 322,198 |
| Hewlett Packard Enterprise Co. | 62,491 | 1,025,477 |
| IPG Photonics Corp. * | 1,651 | 221,696 |
| Jabil, Inc. | 6,917 | 254,684 |
| Juniper Networks, Inc. | 15,890 | 394,390 |
| Keysight Technologies, Inc. * | 8,732 | 881,146 |
| Littelfuse, Inc. | 1,116 | 195,936 |
| Motorola Solutions, Inc. | 7,669 | 1,275,508 |
| National Instruments Corp. | 6,033 | 249,706 |
| NCR Corp. * | 5,623 | 164,248 |
| NetApp, Inc. | 11,109 | 620,771 |
| Pure Storage, Inc., Class A * | 10,567 | 205,634 |
| SYNNEX Corp. | 1,928 | 227,003 |
| Trimble, Inc. * | 11,716 | 466,765 |
| Ubiquiti, Inc.(a) | 694 | 87,853 |
| ViaSat, Inc. * | 2,632 | 181,187 |
| Western Digital Corp. | 13,655 | 705,281 |
| Xerox Holdings Corp. | 8,501 | 288,439 |
| Zebra Technologies Corp., Class A * | 2,487 | 591,583 |
| | | 14,423,302 |
| |
| Telecommunication Services 0.5% |
| CenturyLink, Inc. | 50,695 | 655,993 |
| GCI Liberty, Inc., Class A * | 4,563 | 319,319 |
| Sprint Corp. * | 26,511 | 164,633 |
| Telephone & Data Systems, Inc. | 4,715 | 123,014 |
| United States Cellular Corp. * | 704 | 26,203 |
| Zayo Group Holdings, Inc. * | 10,562 | 360,587 |
| | | 1,649,749 |
| |
| Transportation 1.9% |
| Alaska Air Group, Inc. | 5,639 | 391,516 |
| AMERCO | 412 | 166,877 |
| American Airlines Group, Inc. | 18,575 | 558,365 |
| C.H. Robinson Worldwide, Inc. | 6,259 | 473,431 |
| Copa Holdings S.A., Class A | 1,470 | 149,558 |
| Expeditors International of Washington, Inc. | 7,965 | 580,967 |
| Genesee & Wyoming, Inc., Class A * | 2,594 | 288,012 |
| JB Hunt Transport Services, Inc. | 3,968 | 466,478 |
| JetBlue Airways Corp. * | 13,672 | 263,870 |
| Kansas City Southern | 4,672 | 657,724 |
| Security | Number
of Shares | Value ($) |
| Kirby Corp. * | 2,763 | 218,719 |
| Knight-Swift Transportation Holdings, Inc. | 5,692 | 207,530 |
| Landstar System, Inc. | 1,839 | 208,083 |
| Lyft, Inc., Class A * | 1,514 | 62,740 |
| Macquarie Infrastructure Corp. | 3,445 | 148,617 |
| Old Dominion Freight Line, Inc. | 3,023 | 550,428 |
| Ryder System, Inc. | 2,388 | 116,128 |
| Schneider National, Inc., Class B | 2,604 | 59,553 |
| United Airlines Holdings, Inc. * | 10,958 | 995,425 |
| XPO Logistics, Inc. * | 4,251 | 324,776 |
| | | 6,888,797 |
| |
| Utilities 7.0% |
| AES Corp. | 30,912 | 527,050 |
| Alliant Energy Corp. | 11,017 | 587,647 |
| Ameren Corp. | 11,407 | 886,324 |
| American Water Works Co., Inc. | 8,406 | 1,036,208 |
| Aqua America, Inc. | 10,055 | 455,793 |
| Atmos Energy Corp. | 5,443 | 612,229 |
| Avangrid, Inc. | 2,641 | 132,182 |
| CenterPoint Energy, Inc. | 23,329 | 678,174 |
| CMS Energy Corp. | 13,191 | 843,169 |
| Consolidated Edison, Inc. | 15,501 | 1,429,502 |
| DTE Energy Co. | 8,510 | 1,083,493 |
| Edison International | 16,308 | 1,025,773 |
| Entergy Corp. | 9,256 | 1,124,419 |
| Evergy, Inc. | 10,919 | 697,833 |
| Eversource Energy | 15,088 | 1,263,469 |
| FirstEnergy Corp. | 24,751 | 1,195,968 |
| Hawaiian Electric Industries, Inc. | 5,011 | 226,247 |
| IDACORP, Inc. | 2,335 | 251,293 |
| MDU Resources Group, Inc. | 9,137 | 263,968 |
| National Fuel Gas Co. | 3,825 | 173,311 |
| NiSource, Inc. | 17,366 | 486,943 |
| NRG Energy, Inc. | 11,754 | 471,570 |
| OGE Energy Corp. | 9,316 | 401,147 |
| PG&E Corp. * | 24,604 | 151,807 |
| Pinnacle West Capital Corp. | 5,229 | 492,153 |
| PPL Corp. | 33,696 | 1,128,479 |
| Public Service Enterprise Group, Inc. | 23,514 | 1,488,671 |
| Sempra Energy | 12,790 | 1,848,283 |
| UGI Corp. | 9,671 | 461,016 |
| Vistra Energy Corp. | 19,653 | 531,220 |
| WEC Energy Group, Inc. | 14,680 | 1,385,792 |
| Xcel Energy, Inc. | 23,982 | 1,523,097 |
| | | 24,864,230 |
| Total Common Stock |
| (Cost $329,134,730) | | 355,281,165 |
|
| Other Investment Companies0.7% of net assets |
| |
| Equity Funds 0.1% |
| iShares Russell Mid-Cap ETF | 4,200 | 237,510 |
| |
| Money Market Fund 0.4% |
| State Street Institutional U.S. Government Money Market Fund, Premier Class 1.75%(b) | 1,576,417 | 1,576,417 |
| |
Schwab Equity Index Funds | Annual Report
Schwab U.S. Mid-Cap Index Fund
Portfolio Holdings as of October 31, 2019 (continued)
| Security | Number
of Shares | Value ($) |
| Securities Lending Collateral 0.2% |
| Wells Fargo Government Money Market Fund, Select Class 1.75%(b) | 543,270 | 543,270 |
| Total Other Investment Companies |
| (Cost $2,354,574) | | 2,357,197 |
| | Number of
Contracts | Notional
Amount
($) | Current Value/
Unrealized
Depreciation
($) |
| Futures Contracts | |
| Long | |
| S&P 400 Mid-Cap Index, e-mini, expires 12/20/19 | 5 | 977,500 | (3,585) |
| * | Non-income producing security. |
| (a) | All or a portion of this security is on loan. Securities on loan were valued at $508,482. |
| (b) | The rate shown is the 7-day yield. |
| | |
| ETF — | Exchange-traded fund |
| REIT — | Real Estate Investment Trust |
Schwab Equity Index Funds | Annual Report
Schwab International Index Fund
Portfolio Holdings as of October 31, 2019
This section shows all the securities in the fund’s portfolio and their values as of the report date.
The fund files its complete schedule of portfolio holdings with the U.S. Securities and Exchange Commission (SEC) for the first and third quarters of each fiscal year on Form N-Q. Effective March 31, 2019, Form N-PORT Part F has replaced Form N-Q. The fund’s Form N-Q and Form N-PORT Part F are available on the SEC’s website atwww.sec.gov. The fund also makes available its complete schedule of portfolio holdings 15 to 20 days after the end of the month on the fund’s website atwww.schwabfunds.com/schwabfunds_prospectus.
| Security | Number
of Shares | Value ($) |
| Common Stock98.8% of net assets |
| |
| Australia 6.9% |
| AGL Energy Ltd. | 249,147 | 3,401,009 |
| Alumina Ltd. | 912,535 | 1,424,568 |
| AMP Ltd. | 1,264,683 | 1,597,977 |
| APA Group | 452,316 | 3,633,116 |
| Aristocrat Leisure Ltd. | 216,483 | 4,720,418 |
| ASX Ltd. | 73,663 | 4,181,246 |
| Aurizon Holdings Ltd. | 743,126 | 3,023,213 |
| AusNet Services | 712,405 | 910,004 |
| Australia & New Zealand Banking Group Ltd. | 1,070,667 | 19,675,762 |
| Bank of Queensland Ltd.(a) | 155,105 | 968,019 |
| Bendigo & Adelaide Bank Ltd. | 181,580 | 1,332,634 |
| BHP Group Ltd. | 1,115,697 | 27,348,469 |
| BlueScope Steel Ltd. | 200,203 | 1,832,694 |
| Boral Ltd. | 444,663 | 1,543,833 |
| Brambles Ltd. | 613,001 | 5,067,709 |
| Caltex Australia Ltd. | 92,735 | 1,743,289 |
| Challenger Ltd. | 212,229 | 1,164,015 |
| CIMIC Group Ltd. | 36,940 | 841,822 |
| Coca-Cola Amatil Ltd. | 184,982 | 1,298,138 |
| Cochlear Ltd. | 22,040 | 3,215,415 |
| Coles Group Ltd. | 427,764 | 4,426,872 |
| Commonwealth Bank of Australia | 669,438 | 36,296,990 |
| Computershare Ltd. | 192,759 | 2,104,053 |
| Crown Resorts Ltd. | 141,542 | 1,215,931 |
| CSL Ltd. | 171,339 | 30,216,704 |
| Dexus | 416,183 | 3,432,040 |
| Flight Centre Travel Group Ltd. | 22,400 | 658,038 |
| Fortescue Metals Group Ltd. | 530,529 | 3,247,168 |
| Goodman Group | 618,231 | 6,138,576 |
| Harvey Norman Holdings Ltd. | 213,558 | 602,557 |
| Incitec Pivot Ltd. | 614,922 | 1,463,169 |
| Insurance Australia Group Ltd. | 863,601 | 4,731,731 |
| James Hardie Industries plc | 165,442 | 2,841,334 |
| LendLease Group | 208,939 | 2,700,684 |
| Macquarie Group Ltd. | 121,567 | 11,225,182 |
| Magellan Financial Group Ltd. | 49,837 | 1,652,990 |
| Medibank Pvt Ltd. | 1,060,373 | 2,471,435 |
| Mirvac Group | 1,492,030 | 3,306,156 |
| National Australia Bank Ltd. | 1,067,056 | 20,945,385 |
| Newcrest Mining Ltd. | 290,053 | 6,331,371 |
| Oil Search Ltd. | 518,821 | 2,560,530 |
| Orica Ltd. | 142,948 | 2,259,107 |
| Origin Energy Ltd. | 663,761 | 3,598,550 |
| QBE Insurance Group Ltd. | 499,561 | 4,346,372 |
| Ramsay Health Care Ltd. | 60,539 | 2,860,507 |
| REA Group Ltd. | 21,389 | 1,605,230 |
| Rio Tinto Ltd. | 142,302 | 8,898,568 |
| Santos Ltd. | 674,765 | 3,774,307 |
| Scentre Group | 2,008,296 | 5,306,210 |
| SEEK Ltd. | 122,454 | 1,916,409 |
| Sonic Healthcare Ltd. | 169,336 | 3,335,069 |
| South32 Ltd. | 1,883,677 | 3,296,303 |
| Stockland | 886,757 | 2,993,666 |
| Suncorp Group Ltd. | 486,548 | 4,517,353 |
| Security | Number
of Shares | Value ($) |
| Sydney Airport | 412,686 | 2,499,410 |
| Tabcorp Holdings Ltd. | 752,613 | 2,493,892 |
| Telstra Corp., Ltd. | 1,579,952 | 3,805,226 |
| The GPT Group | 721,903 | 2,963,216 |
| TPG Telecom Ltd. | 149,223 | 672,574 |
| Transurban Group | 1,006,105 | 10,304,470 |
| Treasury Wine Estates Ltd. | 275,041 | 3,334,361 |
| Vicinity Centres | 1,203,306 | 2,214,952 |
| Washington H Soul Pattinson & Co., Ltd. | 46,995 | 702,492 |
| Wesfarmers Ltd. | 430,236 | 11,820,695 |
| Westpac Banking Corp. | 1,301,398 | 25,267,275 |
| Woodside Petroleum Ltd. | 354,351 | 7,853,645 |
| Woolworths Group Ltd. | 477,309 | 12,307,949 |
| Worley Ltd. | 123,727 | 1,161,330 |
| | | 373,601,384 |
| |
| Austria 0.2% |
| ANDRITZ AG | 28,400 | 1,277,041 |
| Erste Group Bank AG * | 113,695 | 4,021,147 |
| OMV AG | 56,357 | 3,294,720 |
| Raiffeisen Bank International AG | 56,738 | 1,397,984 |
| Verbund AG | 26,003 | 1,408,713 |
| voestalpine AG | 44,824 | 1,124,753 |
| | | 12,524,358 |
| |
| Belgium 0.9% |
| Ageas | 68,017 | 3,922,586 |
| Anheuser-Busch InBev S.A./N.V. | 288,086 | 23,253,549 |
| Colruyt S.A. | 20,894 | 1,161,425 |
| Groupe Bruxelles Lambert S.A. | 29,917 | 3,005,337 |
| KBC Group N.V. | 94,255 | 6,627,472 |
| Proximus | 57,207 | 1,758,015 |
| Solvay S.A. | 27,660 | 3,007,360 |
| Telenet Group Holding N.V. * | 18,167 | 892,563 |
| UCB S.A. | 48,372 | 3,898,726 |
| Umicore S.A. | 76,768 | 3,168,983 |
| | | 50,696,016 |
| |
| Denmark 1.8% |
| AP Moeller - Maersk A/S, Series A | 1,471 | 1,767,033 |
| AP Moeller - Maersk A/S, Series B | 2,420 | 3,086,956 |
| Carlsberg A/S, Class B | 40,284 | 5,672,960 |
| Chr. Hansen Holding A/S | 39,439 | 3,027,956 |
| Coloplast A/S, Class B | 44,811 | 5,395,062 |
| Danske Bank A/S | 250,345 | 3,577,562 |
| Demant A/S * | 41,624 | 1,099,506 |
| DSV PANALPINA A/S | 82,581 | 8,025,974 |
| Genmab A/S * | 24,385 | 5,327,990 |
| H. Lundbeck A/S | 25,941 | 886,419 |
| ISS A/S | 58,405 | 1,529,114 |
| Novo Nordisk A/S, Class B | 669,249 | 36,801,129 |
| Novozymes A/S, B Shares | 82,942 | 3,909,849 |
| Orsted A/S | 71,046 | 6,235,827 |
| Pandora A/S | 40,264 | 1,981,232 |
Schwab Equity Index Funds | Annual Report
Schwab International Index Fund
Portfolio Holdings as of October 31, 2019 (continued)
| Security | Number
of Shares | Value ($) |
| Tryg A/S | 49,078 | 1,371,781 |
| Vestas Wind Systems A/S | 71,012 | 5,785,191 |
| | | 95,481,541 |
| |
| Finland 0.9% |
| Elisa Oyj | 53,323 | 2,912,301 |
| Fortum Oyj | 169,993 | 4,154,224 |
| Kone Oyj, Class B | 127,870 | 8,142,224 |
| Metso Oyj | 39,488 | 1,494,889 |
| Neste Oyj | 160,728 | 5,807,498 |
| Nokia Oyj | 2,135,285 | 7,838,650 |
| Nokian Renkaat Oyj | 48,245 | 1,378,800 |
| Orion Oyj, Class B | 39,607 | 1,757,149 |
| Sampo Oyj, A Shares | 166,979 | 6,842,772 |
| Stora Enso Oyj, R Shares | 216,376 | 2,811,096 |
| UPM-Kymmene Oyj | 205,288 | 6,686,116 |
| Wartsila Oyj Abp | 169,241 | 1,787,989 |
| | | 51,613,708 |
| |
| France 11.3% |
| Accor S.A. | 68,539 | 2,948,108 |
| Aeroports de Paris | 11,188 | 2,127,837 |
| Air Liquide S.A. | 178,786 | 23,771,572 |
| Airbus SE | 220,573 | 31,643,014 |
| Alstom S.A. | 70,985 | 3,071,038 |
| Amundi S.A. | 23,050 | 1,647,320 |
| ArcelorMittal | 258,086 | 3,837,474 |
| Arkema S.A. | 25,992 | 2,659,967 |
| Atos SE | 37,062 | 2,876,256 |
| AXA S.A. | 732,293 | 19,384,685 |
| BioMerieux | 16,157 | 1,323,016 |
| BNP Paribas S.A. | 427,117 | 22,320,939 |
| Bollore S.A. | 355,615 | 1,540,656 |
| Bollore S.A. New * | 1,920 | 8,180 |
| Bouygues S.A. | 85,233 | 3,615,418 |
| Bureau Veritas S.A. | 110,282 | 2,819,531 |
| Capgemini SE | 59,709 | 6,731,003 |
| Carrefour S.A. | 224,313 | 3,819,052 |
| Casino Guichard Perrachon S.A.(a) | 19,672 | 1,061,246 |
| CNP Assurances | 67,687 | 1,343,536 |
| Compagnie de Saint-Gobain | 185,268 | 7,545,583 |
| Compagnie Generale des Etablissements Michelin | 64,653 | 7,871,968 |
| Covivio | 16,880 | 1,911,647 |
| Credit Agricole S.A. | 440,771 | 5,751,332 |
| Danone S.A. | 232,947 | 19,297,612 |
| Dassault Aviation S.A. | 935 | 1,298,856 |
| Dassault Systemes SE | 49,405 | 7,503,470 |
| Edenred | 90,786 | 4,785,125 |
| Eiffage S.A. | 30,552 | 3,281,472 |
| Electricite de France S.A. | 223,737 | 2,311,386 |
| Engie S.A. | 691,989 | 11,587,198 |
| EssilorLuxottica S.A. | 107,136 | 16,359,056 |
| Eurazeo SE | 14,796 | 1,032,442 |
| Eurofins Scientific SE | 4,390 | 2,225,704 |
| Eutelsat Communications S.A. | 66,475 | 1,261,025 |
| Faurecia SE | 28,566 | 1,333,122 |
| Gecina S.A. | 17,813 | 3,057,939 |
| Getlink SE | 168,128 | 2,816,291 |
| Hermes International | 11,888 | 8,563,549 |
| ICADE | 11,528 | 1,128,860 |
| Iliad S.A. | 9,951 | 1,031,276 |
| Imerys S.A. | 15,287 | 590,516 |
| Ingenico Group S.A. | 22,340 | 2,388,840 |
| Ipsen S.A. | 15,158 | 1,615,655 |
| JCDecaux S.A. | 26,452 | 723,079 |
| Security | Number
of Shares | Value ($) |
| Kering S.A. | 28,666 | 16,310,848 |
| Klepierre S.A. | 75,290 | 2,806,452 |
| L'Oreal S.A. | 95,425 | 27,869,984 |
| Legrand S.A. | 101,246 | 7,909,741 |
| LVMH Moet Hennessy Louis Vuitton SE | 105,026 | 44,851,942 |
| Natixis S.A. | 351,840 | 1,616,466 |
| Orange S.A. | 756,384 | 12,173,615 |
| Pernod-Ricard S.A. | 80,263 | 14,827,232 |
| Peugeot S.A. | 223,600 | 5,662,919 |
| Publicis Groupe S.A. | 79,819 | 3,435,292 |
| Remy Cointreau S.A. | 8,794 | 1,176,837 |
| Renault S.A. | 72,081 | 3,680,378 |
| Safran S.A. | 123,494 | 19,560,200 |
| Sanofi | 426,921 | 39,356,593 |
| Sartorius Stedim Biotech | 10,428 | 1,562,233 |
| Schneider Electric SE | 207,665 | 19,300,460 |
| SCOR SE | 60,979 | 2,572,041 |
| SEB S.A. | 8,571 | 1,302,389 |
| SES S.A. | 140,810 | 2,729,588 |
| Societe BIC S.A. | 9,957 | 691,289 |
| Societe Generale S.A. | 293,216 | 8,338,741 |
| Sodexo S.A. | 33,736 | 3,709,899 |
| STMicroelectronics N.V. | 259,382 | 5,887,014 |
| Suez | 130,676 | 2,038,224 |
| Teleperformance | 21,888 | 4,966,024 |
| Thales S.A. | 40,343 | 3,943,916 |
| TOTAL S.A. | 906,552 | 47,927,766 |
| UbiSoft Entertainment S.A. * | 31,273 | 1,848,210 |
| Unibail-Rodamco-Westfield | 52,634 | 8,139,127 |
| Valeo S.A. | 91,522 | 3,408,342 |
| Veolia Environnement S.A. | 201,946 | 5,315,978 |
| Vinci S.A. | 193,107 | 21,665,877 |
| Vivendi S.A. | 344,499 | 9,593,469 |
| Wendel S.A. | 9,974 | 1,414,285 |
| Worldline S.A. * | 31,278 | 1,903,181 |
| | | 615,319,403 |
| |
| Germany 8.2% |
| 1&1 Drillisch AG | 19,078 | 510,962 |
| adidas AG | 68,493 | 21,148,633 |
| Allianz SE | 160,325 | 39,154,979 |
| Aroundtown S.A. | 344,262 | 2,909,904 |
| Axel Springer SE * | 18,420 | 1,283,989 |
| BASF SE | 347,610 | 26,425,035 |
| Bayer AG | 352,192 | 27,321,705 |
| Bayerische Motoren Werke AG | 125,234 | 9,589,755 |
| Beiersdorf AG | 38,750 | 4,587,576 |
| Brenntag AG | 57,192 | 2,866,476 |
| Carl Zeiss Meditec AG, Class B | 15,110 | 1,647,052 |
| Commerzbank AG | 370,143 | 2,214,841 |
| Continental AG | 42,216 | 5,654,444 |
| Covestro AG | 65,704 | 3,155,232 |
| Daimler AG | 342,705 | 20,032,086 |
| Delivery Hero SE * | 42,696 | 2,003,411 |
| Deutsche Bank AG | 739,904 | 5,365,584 |
| Deutsche Boerse AG | 72,007 | 11,150,977 |
| Deutsche Lufthansa AG | 90,361 | 1,565,340 |
| Deutsche Post AG | 375,097 | 13,287,824 |
| Deutsche Telekom AG | 1,260,647 | 22,181,789 |
| Deutsche Wohnen SE | 136,269 | 5,137,670 |
| E.ON SE | 831,417 | 8,384,397 |
| Evonik Industries AG | 68,809 | 1,813,388 |
| Fraport AG Frankfurt Airport Services Worldwide | 15,675 | 1,310,158 |
| Fresenius Medical Care AG & Co. KGaA | 81,792 | 5,903,714 |
Schwab Equity Index Funds | Annual Report
Schwab International Index Fund
Portfolio Holdings as of October 31, 2019 (continued)
| Security | Number
of Shares | Value ($) |
| Fresenius SE & Co. KGaA | 156,850 | 8,258,977 |
| GEA Group AG | 58,433 | 1,786,318 |
| Hannover Rueck SE | 22,370 | 3,964,049 |
| HeidelbergCement AG | 57,086 | 4,232,243 |
| Henkel AG & Co. KGaA | 40,070 | 3,855,452 |
| HOCHTIEF AG | 9,822 | 1,227,189 |
| Hugo Boss AG | 23,589 | 994,571 |
| Infineon Technologies AG | 469,742 | 9,098,324 |
| Innogy SE | 52,976 | 2,639,818 |
| KION Group AG | 24,718 | 1,644,680 |
| Knorr-Bremse AG | 19,045 | 1,922,087 |
| LANXESS AG | 32,172 | 2,090,510 |
| Merck KGaA | 48,826 | 5,823,303 |
| METRO AG | 65,086 | 1,062,815 |
| MTU Aero Engines AG | 20,073 | 5,368,143 |
| Muenchener Rueckversicherungs-Gesellschaft AG | 54,582 | 15,165,040 |
| Puma SE | 31,659 | 2,381,610 |
| QIAGEN N.V. * | 85,692 | 2,577,533 |
| RTL Group S.A. | 13,511 | 686,535 |
| RWE AG | 207,921 | 6,336,281 |
| SAP SE | 371,644 | 49,243,367 |
| Siemens AG | 289,259 | 33,380,486 |
| Siemens Healthineers AG | 56,236 | 2,389,318 |
| Symrise AG | 48,383 | 4,649,936 |
| Telefonica Deutschland Holding AG | 333,962 | 1,059,671 |
| ThyssenKrupp AG | 148,752 | 2,121,290 |
| Uniper SE | 76,117 | 2,372,304 |
| United Internet AG | 46,746 | 1,411,185 |
| Volkswagen AG | 12,698 | 2,400,432 |
| Vonovia SE | 193,148 | 10,286,067 |
| Wirecard AG | 45,202 | 5,718,771 |
| Zalando SE * | 52,270 | 2,266,270 |
| | | 445,021,496 |
| |
| Hong Kong 3.6% |
| AIA Group Ltd. | 4,577,000 | 45,578,762 |
| ASM Pacific Technology Ltd. | 117,700 | 1,643,425 |
| BeiGene Ltd. ADR * | 13,642 | 1,887,234 |
| BOC Hong Kong (Holdings) Ltd. | 1,417,500 | 4,869,997 |
| Budweiser Brewing Co. APAC Ltd. * | 450,000 | 1,645,302 |
| CK Asset Holdings Ltd. | 973,525 | 6,773,503 |
| CK Hutchison Holdings Ltd. | 1,015,525 | 9,376,420 |
| CK Infrastructure Holdings Ltd. | 254,500 | 1,831,568 |
| CLP Holdings Ltd. | 621,080 | 6,450,175 |
| Dairy Farm International Holdings Ltd. | 131,200 | 791,136 |
| Galaxy Entertainment Group Ltd. | 819,000 | 5,639,335 |
| Hang Lung Properties Ltd. | 781,000 | 1,716,795 |
| Hang Seng Bank Ltd. | 288,036 | 6,009,897 |
| Henderson Land Development Co., Ltd. | 540,735 | 2,700,744 |
| HK Electric Investments & HK Electric Investments Ltd. | 972,500 | 970,521 |
| HKT Trust & HKT Ltd. | 1,450,000 | 2,255,706 |
| Hong Kong & China Gas Co., Ltd. | 3,852,260 | 7,476,853 |
| Hong Kong Exchanges & Clearing Ltd. | 460,765 | 14,354,687 |
| Hongkong Land Holdings Ltd. | 443,000 | 2,433,574 |
| Hysan Development Co., Ltd. | 236,000 | 930,134 |
| Jardine Matheson Holdings Ltd. | 85,000 | 4,845,936 |
| Jardine Strategic Holdings Ltd. | 82,341 | 2,658,941 |
| Kerry Properties Ltd. | 248,500 | 803,565 |
| Link REIT | 791,500 | 8,620,543 |
| Security | Number
of Shares | Value ($) |
| Melco Resorts & Entertainment Ltd. ADR | 80,833 | 1,741,143 |
| MGM China Holdings Ltd. | 331,600 | 525,083 |
| MTR Corp., Ltd. | 593,091 | 3,400,654 |
| New World Development Co., Ltd. | 2,312,113 | 3,307,328 |
| NWS Holdings Ltd. | 603,000 | 897,432 |
| PCCW Ltd. | 1,551,000 | 921,162 |
| Power Assets Holdings Ltd. | 525,500 | 3,750,038 |
| Sands China Ltd. | 922,800 | 4,545,361 |
| Shangri-La Asia Ltd. | 474,000 | 486,519 |
| Sino Land Co., Ltd. | 1,123,765 | 1,679,879 |
| SJM Holdings Ltd. | 706,000 | 754,178 |
| Sun Hung Kai Properties Ltd. | 598,604 | 9,070,830 |
| Swire Pacific Ltd., Class A | 183,090 | 1,745,265 |
| Swire Properties Ltd. | 471,400 | 1,482,576 |
| Techtronic Industries Co., Ltd. | 519,000 | 4,055,989 |
| The Bank of East Asia Ltd. | 519,569 | 1,251,589 |
| The Wharf Holdings Ltd. | 459,100 | 1,041,814 |
| Vitasoy International Holdings Ltd. | 270,000 | 1,097,903 |
| WH Group Ltd. | 3,590,500 | 3,789,925 |
| Wharf Real Estate Investment Co., Ltd. | 455,100 | 2,676,772 |
| Wheelock & Co., Ltd. | 303,000 | 1,873,934 |
| Wynn Macau Ltd. | 580,800 | 1,260,383 |
| Yue Yuen Industrial Holdings Ltd. | 291,500 | 821,502 |
| | | 194,442,012 |
| |
| Ireland 0.6% |
| AIB Group plc | 300,432 | 962,326 |
| Bank of Ireland Group plc | 367,098 | 1,769,425 |
| CRH plc | 305,137 | 11,109,965 |
| Flutter Entertainment plc | 29,820 | 3,080,378 |
| Kerry Group plc, Class A | 60,089 | 7,264,669 |
| Kingspan Group plc | 58,473 | 3,029,885 |
| Smurfit Kappa Group plc | 85,986 | 2,871,719 |
| | | 30,088,367 |
| |
| Israel 0.6% |
| Azrieli Group Ltd. | 17,134 | 1,320,658 |
| Bank Hapoalim B.M. | 431,585 | 3,454,259 |
| Bank Leumi Le-Israel B.M. | 564,550 | 4,112,321 |
| Check Point Software Technologies Ltd. * | 45,983 | 5,168,949 |
| CyberArk Software Ltd. * | 14,356 | 1,458,282 |
| Elbit Systems Ltd. | 9,450 | 1,549,392 |
| Israel Chemicals Ltd. | 255,462 | 1,135,543 |
| Israel Discount Bank Ltd., Class A | 438,449 | 2,003,635 |
| Mizrahi Tefahot Bank Ltd. | 53,075 | 1,316,822 |
| Nice Ltd. * | 23,788 | 3,752,327 |
| Teva Pharmaceutical Industries Ltd. ADR * | 410,970 | 3,349,406 |
| Wix.com Ltd. * | 17,867 | 2,181,025 |
| | | 30,802,619 |
| |
| Italy 2.3% |
| Assicurazioni Generali S.p.A. | 416,749 | 8,450,621 |
| Atlantia S.p.A. | 189,592 | 4,684,045 |
| CNH Industrial N.V. | 392,807 | 4,276,745 |
| Davide Campari-Milano S.p.A. | 229,272 | 2,102,952 |
| Enel S.p.A. | 3,074,359 | 23,827,383 |
| Eni S.p.A. | 958,144 | 14,535,988 |
| EXOR N.V. | 41,832 | 3,207,009 |
| Ferrari N.V. | 46,019 | 7,370,262 |
| Fiat Chrysler Automobiles N.V. | 409,024 | 6,347,547 |
| FinecoBank Banca Fineco S.p.A. | 234,069 | 2,638,738 |
Schwab Equity Index Funds | Annual Report
Schwab International Index Fund
Portfolio Holdings as of October 31, 2019 (continued)
| Security | Number
of Shares | Value ($) |
| Intesa Sanpaolo S.p.A. | 5,603,757 | 14,042,029 |
| Leonardo S.p.A. | 150,576 | 1,749,333 |
| Mediobanca Banca di Credito Finanziario S.p.A. | 233,687 | 2,778,849 |
| Moncler S.p.A. | 68,505 | 2,643,522 |
| Pirelli & C S.p.A. | 144,810 | 837,130 |
| Poste Italiane S.p.A | 201,047 | 2,442,000 |
| Prysmian S.p.A. | 91,103 | 2,107,421 |
| Recordati S.p.A. | 39,491 | 1,659,573 |
| Snam S.p.A. | 777,714 | 3,992,708 |
| Telecom Italia S.p.A. * | 3,491,434 | 2,043,514 |
| Telecom Italia S.p.A. - RSP | 2,225,747 | 1,288,271 |
| Tenaris S.A. | 186,480 | 1,891,819 |
| Terna - Rete Elettrica Nationale S.p.A. | 522,154 | 3,451,125 |
| UniCredit S.p.A. | 758,759 | 9,626,399 |
| | | 127,994,983 |
| |
| Japan 24.6% |
| ABC-Mart, Inc. | 11,880 | 814,557 |
| Acom Co., Ltd. | 157,000 | 630,770 |
| Advantest Corp. | 75,000 | 3,413,135 |
| Aeon Co., Ltd. | 247,900 | 4,987,835 |
| AEON Financial Service Co., Ltd. | 42,400 | 646,193 |
| Aeon Mall Co., Ltd. | 39,800 | 636,761 |
| AGC, Inc. | 68,400 | 2,404,949 |
| Air Water, Inc. | 55,500 | 1,039,014 |
| Aisin Seiki Co., Ltd. | 60,400 | 2,410,552 |
| Ajinomoto Co., Inc. | 164,000 | 3,117,998 |
| Alfresa Holdings Corp. | 73,200 | 1,634,471 |
| Alps Alpine Co., Ltd. | 77,500 | 1,661,492 |
| Amada Holdings Co., Ltd. | 125,700 | 1,431,485 |
| ANA Holdings, Inc. | 43,300 | 1,486,855 |
| Aozora Bank Ltd. | 46,400 | 1,190,548 |
| Asahi Group Holdings Ltd. | 136,900 | 6,855,600 |
| Asahi Intecc Co., Ltd. | 73,600 | 2,025,133 |
| Asahi Kasei Corp. | 485,100 | 5,385,260 |
| Astellas Pharma, Inc. | 716,950 | 12,304,787 |
| Bandai Namco Holdings, Inc. | 75,800 | 4,660,878 |
| Benesse Holdings, Inc. | 25,800 | 690,660 |
| Bridgestone Corp. | 214,957 | 8,931,443 |
| Brother Industries Ltd. | 84,600 | 1,589,975 |
| Calbee, Inc. | 31,800 | 1,062,938 |
| Canon, Inc. | 376,095 | 10,319,938 |
| Casio Computer Co., Ltd. | 72,400 | 1,175,311 |
| Central Japan Railway Co. | 54,700 | 11,220,831 |
| Chubu Electric Power Co., Inc. | 242,400 | 3,636,543 |
| Chugai Pharmaceutical Co., Ltd. | 85,700 | 7,212,149 |
| Coca-Cola Bottlers Japan Holdings, Inc. | 47,200 | 1,071,631 |
| Concordia Financial Group Ltd. | 399,300 | 1,628,318 |
| Credit Saison Co., Ltd. | 56,400 | 816,713 |
| CyberAgent, Inc. | 38,100 | 1,238,310 |
| Dai Nippon Printing Co., Ltd. | 91,400 | 2,441,156 |
| Dai-ichi Life Holdings, Inc. | 406,700 | 6,628,968 |
| Daicel Corp. | 89,200 | 797,397 |
| Daifuku Co., Ltd. | 38,000 | 2,016,346 |
| Daiichi Sankyo Co., Ltd. | 214,500 | 14,104,187 |
| Daikin Industries Ltd. | 94,400 | 13,212,186 |
| Daito Trust Construction Co., Ltd. | 27,300 | 3,617,808 |
| Daiwa House Industry Co., Ltd. | 214,400 | 7,380,738 |
| Daiwa House REIT Investment Corp. | 715 | 2,081,939 |
| Daiwa Securities Group, Inc. | 579,400 | 2,604,288 |
| Denso Corp. | 165,600 | 7,688,794 |
| Dentsu, Inc. | 80,400 | 2,874,279 |
| Disco Corp. | 10,200 | 2,226,022 |
| East Japan Railway Co. | 114,860 | 10,427,104 |
| Security | Number
of Shares | Value ($) |
| Eisai Co., Ltd. | 95,800 | 6,934,865 |
| Electric Power Development Co., Ltd. | 55,600 | 1,349,991 |
| FamilyMart Co., Ltd. | 97,100 | 2,408,682 |
| Fanuc Corp. | 73,600 | 14,517,546 |
| Fast Retailing Co., Ltd. | 22,100 | 13,628,887 |
| Fuji Electric Co., Ltd. | 49,000 | 1,557,299 |
| FUJIFILM Holdings Corp. | 138,511 | 6,080,939 |
| Fujitsu Ltd. | 74,200 | 6,576,273 |
| Fukuoka Financial Group, Inc. | 64,900 | 1,251,099 |
| GMO Payment Gateway, Inc. | 15,400 | 1,134,966 |
| Hakuhodo DY Holdings, Inc. | 87,600 | 1,307,229 |
| Hamamatsu Photonics K.K. | 52,300 | 2,030,769 |
| Hankyu Hanshin Holdings, Inc. | 84,900 | 3,397,442 |
| Hikari Tsushin, Inc. | 7,800 | 1,709,734 |
| Hino Motors Ltd. | 109,600 | 1,036,192 |
| Hirose Electric Co., Ltd. | 11,964 | 1,507,106 |
| Hisamitsu Pharmaceutical Co., Inc. | 20,200 | 940,093 |
| Hitachi Chemical Co., Ltd. | 40,000 | 1,316,792 |
| Hitachi Construction Machinery Co., Ltd. | 39,100 | 1,009,256 |
| Hitachi High-Technologies Corp. | 26,100 | 1,623,830 |
| Hitachi Ltd. | 366,215 | 13,668,037 |
| Hitachi Metals Ltd. | 82,000 | 1,029,125 |
| Honda Motor Co., Ltd. | 613,239 | 16,590,554 |
| Hoshizaki Corp. | 20,400 | 1,734,046 |
| Hoya Corp. | 144,407 | 12,762,288 |
| Hulic Co., Ltd. | 118,100 | 1,282,182 |
| Idemitsu Kosan Co., Ltd. | 72,603 | 2,134,185 |
| IHI Corp. | 56,500 | 1,392,337 |
| Iida Group Holdings Co., Ltd. | 57,000 | 949,455 |
| Inpex Corp. | 381,200 | 3,523,995 |
| Isetan Mitsukoshi Holdings Ltd. | 129,500 | 1,032,784 |
| Isuzu Motors Ltd. | 215,600 | 2,505,252 |
| ITOCHU Corp. | 506,900 | 10,598,204 |
| Itochu Techno-Solutions Corp. | 35,000 | 942,578 |
| J. Front Retailing Co., Ltd. | 91,900 | 1,168,590 |
| Japan Airlines Co., Ltd. | 43,400 | 1,352,435 |
| Japan Airport Terminal Co., Ltd. | 19,700 | 973,112 |
| Japan Exchange Group, Inc. | 198,000 | 3,268,684 |
| Japan Post Bank Co., Ltd. | 149,700 | 1,489,143 |
| Japan Post Holdings Co., Ltd. | 592,200 | 5,435,940 |
| Japan Prime Realty Investment Corp. | 299 | 1,436,994 |
| Japan Real Estate Investment Corp. | 503 | 3,433,380 |
| Japan Retail Fund Investment Corp. | 992 | 2,314,881 |
| Japan Tobacco, Inc. | 456,800 | 10,324,916 |
| JFE Holdings, Inc. | 186,600 | 2,333,925 |
| JGC Holdings Corp. | 85,800 | 1,240,963 |
| JSR Corp. | 73,000 | 1,370,482 |
| JTEKT Corp. | 79,900 | 1,019,075 |
| JXTG Holdings, Inc. | 1,228,200 | 5,740,900 |
| Kajima Corp. | 169,400 | 2,327,992 |
| Kakaku.com, Inc. | 51,300 | 1,191,179 |
| Kamigumi Co., Ltd. | 40,300 | 911,229 |
| Kaneka Corp. | 17,600 | 585,879 |
| Kansai Paint Co., Ltd. | 67,500 | 1,625,726 |
| Kao Corp. | 185,219 | 14,891,357 |
| Kawasaki Heavy Industries Ltd. | 53,500 | 1,283,910 |
| KDDI Corp. | 667,300 | 18,464,953 |
| Keihan Holdings Co., Ltd. | 36,800 | 1,737,581 |
| Keikyu Corp. | 86,500 | 1,721,836 |
| Keio Corp. | 39,400 | 2,437,419 |
| Keisei Electric Railway Co., Ltd. | 48,100 | 1,966,590 |
| Keyence Corp. | 34,400 | 21,750,997 |
| Kikkoman Corp. | 54,800 | 2,636,024 |
| Kintetsu Group Holdings Co., Ltd. | 65,400 | 3,564,687 |
| Kirin Holdings Co., Ltd. | 310,500 | 6,587,054 |
| Kobayashi Pharmaceutical Co., Ltd. | 18,700 | 1,495,252 |
| Kobe Steel Ltd. | 108,500 | 583,353 |
Schwab Equity Index Funds | Annual Report
Schwab International Index Fund
Portfolio Holdings as of October 31, 2019 (continued)
| Security | Number
of Shares | Value ($) |
| Koito Manufacturing Co., Ltd. | 39,000 | 2,040,214 |
| Komatsu Ltd. | 347,209 | 8,129,867 |
| Konami Holdings Corp. | 36,200 | 1,589,136 |
| Konica Minolta, Inc. | 181,500 | 1,332,173 |
| Kose Corp. | 12,700 | 2,251,632 |
| Kubota Corp. | 396,800 | 6,302,475 |
| Kuraray Co., Ltd. | 121,500 | 1,445,523 |
| Kurita Water Industries Ltd. | 37,700 | 1,085,292 |
| Kyocera Corp. | 122,500 | 8,036,841 |
| Kyowa Kirin Co., Ltd. | 93,900 | 1,727,762 |
| Kyushu Electric Power Co., Inc. | 142,000 | 1,419,072 |
| Kyushu Railway Co. | 60,400 | 1,995,468 |
| Lawson, Inc. | 19,900 | 1,097,811 |
| LINE Corp. * | 23,900 | 879,207 |
| Lion Corp. | 86,700 | 1,814,410 |
| LIXIL Group Corp. | 105,800 | 1,967,659 |
| M3, Inc. | 165,800 | 3,973,125 |
| Makita Corp. | 83,000 | 2,791,361 |
| Marubeni Corp. | 604,300 | 4,253,110 |
| Marui Group Co., Ltd. | 70,900 | 1,576,132 |
| Maruichi Steel Tube Ltd. | 20,600 | 562,551 |
| Mazda Motor Corp. | 217,900 | 2,000,391 |
| McDonald's Holdings Co., Ltd. | 25,900 | 1,299,988 |
| Mebuki Financial Group, Inc. | 343,780 | 873,412 |
| Medipal Holdings Corp. | 67,100 | 1,533,069 |
| MEIJI Holdings Co., Ltd. | 43,900 | 3,164,216 |
| Mercari, Inc. * | 26,725 | 602,556 |
| Minebea Mitsumi, Inc. | 138,800 | 2,636,026 |
| MISUMI Group, Inc. | 105,700 | 2,657,165 |
| Mitsubishi Chemical Holdings Corp. | 494,500 | 3,768,694 |
| Mitsubishi Corp. | 507,900 | 12,918,134 |
| Mitsubishi Electric Corp. | 691,800 | 9,884,052 |
| Mitsubishi Estate Co., Ltd. | 450,902 | 8,754,427 |
| Mitsubishi Gas Chemical Co., Inc. | 66,000 | 931,056 |
| Mitsubishi Heavy Industries Ltd. | 119,700 | 4,844,180 |
| Mitsubishi Materials Corp. | 41,600 | 1,196,209 |
| Mitsubishi Motors Corp. | 249,600 | 1,139,624 |
| Mitsubishi Tanabe Pharma Corp. | 80,500 | 963,447 |
| Mitsubishi UFJ Financial Group, Inc. | 4,655,209 | 24,133,946 |
| Mitsubishi UFJ Lease & Finance Co., Ltd. | 144,700 | 888,311 |
| Mitsui & Co., Ltd. | 629,800 | 10,816,161 |
| Mitsui Chemicals, Inc. | 69,900 | 1,662,322 |
| Mitsui Fudosan Co., Ltd. | 340,677 | 8,715,482 |
| Mitsui O.S.K. Lines Ltd. | 43,500 | 1,184,875 |
| Mizuho Financial Group, Inc. | 9,128,434 | 14,171,670 |
| MonotaRO Co., Ltd. | 47,900 | 1,447,087 |
| MS&AD Insurance Group Holdings, Inc. | 178,362 | 5,759,526 |
| Murata Manufacturing Co., Ltd. | 217,800 | 11,858,808 |
| Nabtesco Corp. | 43,900 | 1,397,548 |
| Nagoya Railroad Co., Ltd. | 70,900 | 2,253,759 |
| NEC Corp. | 94,200 | 3,733,202 |
| Nexon Co., Ltd. * | 189,300 | 2,193,655 |
| NGK Insulators Ltd. | 99,300 | 1,525,522 |
| NGK Spark Plug Co., Ltd. | 60,500 | 1,226,565 |
| NH Foods Ltd. | 31,400 | 1,319,298 |
| Nidec Corp. | 84,800 | 12,484,747 |
| Nikon Corp. | 119,900 | 1,528,761 |
| Nintendo Co., Ltd. | 42,239 | 15,492,731 |
| Nippon Building Fund, Inc. | 505 | 3,831,236 |
| Nippon Electric Glass Co., Ltd. | 29,800 | 671,291 |
| Nippon Express Co., Ltd. | 29,600 | 1,688,845 |
| Nippon Paint Holdings Co., Ltd. | 56,100 | 3,055,233 |
| Nippon Prologis REIT, Inc. | 770 | 2,150,828 |
| Nippon Steel Corp. | 305,541 | 4,459,531 |
| Nippon Telegraph & Telephone Corp. | 243,856 | 12,105,718 |
| Nippon Yusen K.K. | 58,300 | 1,047,364 |
| Security | Number
of Shares | Value ($) |
| Nissan Chemical Corp. | 48,600 | 1,995,412 |
| Nissan Motor Co., Ltd. | 878,196 | 5,541,926 |
| Nisshin Seifun Group, Inc. | 72,700 | 1,441,219 |
| Nissin Foods Holdings Co., Ltd. | 23,800 | 1,797,765 |
| Nitori Holdings Co., Ltd. | 30,300 | 4,611,995 |
| Nitto Denko Corp. | 59,900 | 3,314,010 |
| Nomura Holdings, Inc. | 1,246,900 | 5,667,138 |
| Nomura Real Estate Holdings, Inc. | 47,800 | 1,132,830 |
| Nomura Real Estate Master Fund, Inc. | 1,601 | 3,060,405 |
| Nomura Research Institute Ltd. | 127,400 | 2,704,792 |
| NSK Ltd. | 135,100 | 1,256,215 |
| NTT Data Corp. | 245,600 | 3,224,934 |
| NTT DOCOMO, Inc. | 503,200 | 13,795,277 |
| Obayashi Corp. | 239,400 | 2,463,758 |
| Obic Co., Ltd. | 24,900 | 3,117,610 |
| Odakyu Electric Railway Co., Ltd. | 111,200 | 2,706,850 |
| Oji Holdings Corp. | 330,200 | 1,707,213 |
| Olympus Corp. | 437,300 | 5,950,070 |
| Omron Corp. | 73,300 | 4,288,180 |
| Ono Pharmaceutical Co., Ltd. | 148,200 | 2,791,622 |
| Oracle Corp., Japan | 14,800 | 1,300,863 |
| Oriental Land Co., Ltd. | 75,800 | 11,112,351 |
| ORIX Corp. | 503,200 | 7,907,733 |
| Osaka Gas Co., Ltd. | 138,700 | 2,712,234 |
| Otsuka Corp. | 39,500 | 1,592,559 |
| Otsuka Holdings Co., Ltd. | 146,900 | 6,124,294 |
| Pan Pacific International Holdings Corp. | 168,400 | 2,650,842 |
| Panasonic Corp. | 831,712 | 6,990,023 |
| Park24 Co., Ltd. | 44,500 | 1,050,932 |
| PeptiDream, Inc. * | 35,400 | 1,776,856 |
| Persol Holdings Co., Ltd. | 67,500 | 1,296,541 |
| Pigeon Corp. | 43,500 | 2,123,597 |
| Pola Orbis Holdings, Inc. | 34,100 | 769,494 |
| Rakuten, Inc. | 329,920 | 3,145,267 |
| Recruit Holdings Co., Ltd. | 512,800 | 17,042,416 |
| Renesas Electronics Corp. * | 303,000 | 2,051,211 |
| Resona Holdings, Inc. | 790,600 | 3,437,973 |
| Ricoh Co., Ltd. | 250,100 | 2,227,294 |
| Rinnai Corp. | 12,200 | 896,741 |
| Rohm Co., Ltd. | 35,200 | 2,788,853 |
| Ryohin Keikaku Co., Ltd. | 94,100 | 2,094,879 |
| Sankyo Co., Ltd. | 16,700 | 584,461 |
| Santen Pharmaceutical Co., Ltd. | 139,200 | 2,465,696 |
| SBI Holdings, Inc. | 90,490 | 1,968,006 |
| Secom Co., Ltd. | 79,300 | 7,348,210 |
| Sega Sammy Holdings, Inc. | 67,800 | 954,156 |
| Seibu Holdings, Inc. | 76,700 | 1,353,755 |
| Seiko Epson Corp. | 104,500 | 1,477,739 |
| Sekisui Chemical Co., Ltd. | 136,200 | 2,374,747 |
| Sekisui House Ltd. | 235,900 | 5,087,037 |
| Seven & i Holdings Co., Ltd. | 286,103 | 10,809,055 |
| Seven Bank Ltd. | 211,400 | 612,883 |
| SG Holdings Co., Ltd. | 53,200 | 1,317,437 |
| Sharp Corp. | 83,400 | 956,695 |
| Shimadzu Corp. | 82,700 | 2,208,594 |
| Shimamura Co., Ltd. | 9,000 | 762,328 |
| Shimano, Inc. | 27,900 | 4,643,972 |
| Shimizu Corp. | 227,600 | 2,121,688 |
| Shin-Etsu Chemical Co., Ltd. | 137,460 | 15,326,955 |
| Shinsei Bank Ltd. | 73,700 | 1,148,964 |
| Shionogi & Co., Ltd. | 102,200 | 6,134,338 |
| Shiseido Co., Ltd. | 151,500 | 12,490,854 |
| Showa Denko K.K. | 50,000 | 1,402,847 |
| SMC Corp. | 21,500 | 9,288,878 |
| Softbank Corp. | 631,200 | 8,658,365 |
| SoftBank Group Corp. | 624,400 | 24,018,423 |
Schwab Equity Index Funds | Annual Report
Schwab International Index Fund
Portfolio Holdings as of October 31, 2019 (continued)
| Security | Number
of Shares | Value ($) |
| Sohgo Security Services Co., Ltd. | 27,300 | 1,482,876 |
| Sompo Holdings, Inc. | 129,600 | 5,094,068 |
| Sony Corp. | 482,300 | 29,357,188 |
| Sony Financial Holdings, Inc. | 59,500 | 1,280,049 |
| Stanley Electric Co., Ltd. | 52,400 | 1,450,078 |
| Subaru Corp. | 236,200 | 6,768,904 |
| Sumco Corp. | 91,200 | 1,514,911 |
| Sumitomo Chemical Co., Ltd. | 563,500 | 2,577,662 |
| Sumitomo Corp. | 447,500 | 7,268,470 |
| Sumitomo Dainippon Pharma Co., Ltd. | 59,800 | 1,043,699 |
| Sumitomo Electric Industries Ltd. | 284,700 | 3,904,306 |
| Sumitomo Heavy Industries Ltd. | 42,000 | 1,304,605 |
| Sumitomo Metal Mining Co., Ltd. | 88,400 | 2,956,951 |
| Sumitomo Mitsui Financial Group, Inc. | 502,946 | 17,856,176 |
| Sumitomo Mitsui Trust Holdings, Inc. | 125,300 | 4,566,609 |
| Sumitomo Realty & Development Co., Ltd. | 125,800 | 4,566,318 |
| Sumitomo Rubber Industries Ltd. | 68,100 | 902,581 |
| Sundrug Co., Ltd. | 28,400 | 939,776 |
| Suntory Beverage & Food Ltd. | 53,900 | 2,304,269 |
| Suzuken Co., Ltd. | 27,300 | 1,457,653 |
| Suzuki Motor Corp. | 138,900 | 6,558,041 |
| Sysmex Corp. | 64,800 | 4,228,073 |
| T&D Holdings, Inc. | 205,000 | 2,283,235 |
| Taiheiyo Cement Corp. | 46,900 | 1,326,753 |
| Taisei Corp. | 76,000 | 2,996,940 |
| Taisho Pharmaceutical Holdings Co., Ltd. | 13,900 | 989,325 |
| Taiyo Nippon Sanso Corp. | 49,800 | 1,165,803 |
| Takeda Pharmaceutical Co., Ltd. | 561,090 | 20,273,895 |
| TDK Corp. | 49,000 | 4,835,014 |
| Teijin Ltd. | 65,600 | 1,314,515 |
| Terumo Corp. | 246,900 | 8,058,008 |
| The Bank of Kyoto Ltd. | 18,800 | 744,114 |
| The Chiba Bank Ltd. | 209,100 | 1,136,531 |
| The Chugoku Electric Power Co., Inc. | 107,000 | 1,425,428 |
| The Kansai Electric Power Co., Inc. | 267,200 | 3,117,189 |
| The Shizuoka Bank Ltd. | 169,800 | 1,290,272 |
| The Yokohama Rubber Co., Ltd. | 43,000 | 960,415 |
| THK Co., Ltd. | 44,300 | 1,273,859 |
| Tobu Railway Co., Ltd. | 72,500 | 2,419,318 |
| Toho Co., Ltd. | 42,300 | 1,708,305 |
| Toho Gas Co., Ltd. | 30,300 | 1,180,141 |
| Tohoku Electric Power Co., Inc. | 165,700 | 1,703,028 |
| Tokio Marine Holdings, Inc. | 241,799 | 13,073,005 |
| Tokyo Century Corp. | 15,400 | 711,107 |
| Tokyo Electric Power Co. Holdings, Inc. * | 580,290 | 2,687,405 |
| Tokyo Electron Ltd. | 59,400 | 12,034,356 |
| Tokyo Gas Co., Ltd. | 146,440 | 3,574,750 |
| Tokyu Corp. | 188,600 | 3,567,106 |
| Tokyu Fudosan Holdings Corp. | 230,200 | 1,526,893 |
| Toppan Printing Co., Ltd. | 106,600 | 1,971,601 |
| Toray Industries, Inc. | 521,200 | 3,683,393 |
| Toshiba Corp. | 197,417 | 6,750,904 |
| Tosoh Corp. | 98,500 | 1,348,711 |
| TOTO Ltd. | 52,700 | 2,151,520 |
| Toyo Seikan Group Holdings Ltd. | 51,900 | 820,195 |
| Toyo Suisan Kaisha Ltd. | 33,600 | 1,414,726 |
| Toyoda Gosei Co., Ltd. | 23,300 | 545,097 |
| Toyota Industries Corp. | 55,400 | 3,324,137 |
| Toyota Motor Corp. | 863,503 | 59,910,600 |
| Toyota Tsusho Corp. | 80,000 | 2,759,882 |
| Trend Micro, Inc. | 48,200 | 2,432,859 |
| Tsuruha Holdings, Inc. | 14,100 | 1,586,088 |
| Security | Number
of Shares | Value ($) |
| Unicharm Corp. | 152,800 | 5,178,525 |
| United Urban Investment Corp. | 1,092 | 2,203,033 |
| USS Co., Ltd. | 82,300 | 1,594,001 |
| Welcia Holdings Co., Ltd. | 17,800 | 1,022,792 |
| West Japan Railway Co. | 61,400 | 5,335,066 |
| Yakult Honsha Co., Ltd. | 44,900 | 2,573,206 |
| Yamada Denki Co., Ltd. | 237,600 | 1,148,435 |
| Yamaha Corp. | 54,800 | 2,551,995 |
| Yamaha Motor Co., Ltd. | 105,300 | 2,061,029 |
| Yamato Holdings Co., Ltd. | 116,800 | 1,959,041 |
| Yamazaki Baking Co., Ltd. | 46,700 | 796,174 |
| Yaskawa Electric Corp. | 89,200 | 3,392,965 |
| Yokogawa Electric Corp. | 84,100 | 1,540,957 |
| Z Holdings Corp. | 1,002,900 | 3,087,645 |
| ZOZO, Inc.(a) | 76,200 | 1,774,922 |
| | | 1,336,663,913 |
| |
| Netherlands 3.9% |
| ABN AMRO Group N.V. CVA | 162,301 | 3,025,300 |
| Adyen N.V. * | 3,966 | 2,792,124 |
| Aegon N.V. | 686,899 | 2,979,997 |
| AerCap Holdings N.V. * | 46,704 | 2,703,228 |
| Akzo Nobel N.V. | 86,088 | 7,936,744 |
| ASML Holding N.V. | 161,035 | 42,209,576 |
| Coca-Cola European Partners plc | 88,182 | 4,718,619 |
| Heineken Holding N.V. | 44,454 | 4,241,599 |
| Heineken N.V. | 97,477 | 9,954,298 |
| ING Groep N.V. | 1,480,604 | 16,765,599 |
| Koninklijke Ahold Delhaize N.V. | 449,413 | 11,199,396 |
| Koninklijke DSM N.V. | 68,894 | 8,176,887 |
| Koninklijke KPN N.V. | 1,378,876 | 4,280,538 |
| Koninklijke Philips N.V. | 349,861 | 15,349,826 |
| Koninklijke Vopak N.V. | 26,427 | 1,451,785 |
| NN Group N.V. | 116,171 | 4,432,724 |
| NXP Semiconductors N.V. | 108,049 | 12,283,010 |
| Prosus N.V. * | 184,358 | 12,713,139 |
| Randstad N.V. | 44,005 | 2,442,139 |
| Unilever N.V. | 551,641 | 32,605,664 |
| Wolters Kluwer N.V. | 105,433 | 7,765,456 |
| | | 210,027,648 |
| |
| New Zealand 0.2% |
| a2 Milk Co., Ltd. * | 283,997 | 2,357,844 |
| Auckland International Airport Ltd. | 373,767 | 2,227,585 |
| Fisher & Paykel Healthcare Corp., Ltd. | 213,767 | 2,621,894 |
| Fletcher Building Ltd. | 330,886 | 972,188 |
| Meridian Energy Ltd. | 473,317 | 1,395,191 |
| Ryman Healthcare Ltd. | 154,764 | 1,279,116 |
| Spark New Zealand Ltd. | 723,131 | 2,074,420 |
| | | 12,928,238 |
| |
| Norway 0.6% |
| Aker BP A.S.A. | 41,407 | 1,148,521 |
| DNB A.S.A. | 369,552 | 6,728,536 |
| Equinor A.S.A. | 383,682 | 7,123,317 |
| Gjensidige Forsikring A.S.A. | 75,317 | 1,408,061 |
| Mowi A.S.A. | 163,847 | 3,999,825 |
| Norsk Hydro A.S.A. | 516,771 | 1,826,041 |
| Orkla A.S.A. | 284,975 | 2,739,132 |
| Schibsted A.S.A., B Shares | 37,970 | 1,059,399 |
| Telenor A.S.A. | 279,400 | 5,229,180 |
| Yara International A.S.A. | 65,698 | 2,559,345 |
| | | 33,821,357 |
| |
Schwab Equity Index Funds | Annual Report
Schwab International Index Fund
Portfolio Holdings as of October 31, 2019 (continued)
| Security | Number
of Shares | Value ($) |
| Portugal 0.2% |
| Banco Espirito Santo S.A. *(b) | 470,491 | — |
| EDP - Energias de Portugal S.A. | 963,483 | 3,968,807 |
| Galp Energia, SGPS, S.A. | 186,453 | 2,982,273 |
| Jeronimo Martins, SGPS, S.A. | 95,568 | 1,605,891 |
| | | 8,556,971 |
| |
| Singapore 1.3% |
| Ascendas Real Estate Investment Trust | 953,900 | 2,221,681 |
| CapitaLand Commercial Trust | 981,200 | 1,477,671 |
| CapitaLand Ltd. | 951,100 | 2,513,968 |
| CapitaLand Mall Trust | 949,300 | 1,771,245 |
| City Developments Ltd. | 168,300 | 1,332,800 |
| ComfortDelGro Corp., Ltd. | 815,800 | 1,377,626 |
| DBS Group Holdings Ltd. | 675,346 | 12,872,682 |
| Genting Singapore Ltd. | 2,308,100 | 1,592,388 |
| Golden Agri-Resources Ltd. | 2,252,500 | 338,103 |
| Jardine Cycle & Carriage Ltd. | 35,600 | 855,900 |
| Keppel Corp., Ltd. | 554,000 | 2,789,603 |
| Oversea-Chinese Banking Corp., Ltd. | 1,232,487 | 9,908,219 |
| SATS Ltd. | 251,300 | 931,938 |
| Sembcorp Industries Ltd. | 439,900 | 738,544 |
| Singapore Airlines Ltd. | 199,700 | 1,380,279 |
| Singapore Exchange Ltd. | 310,100 | 2,035,974 |
| Singapore Press Holdings Ltd. | 617,400 | 1,004,753 |
| Singapore Technologies Engineering Ltd. | 587,200 | 1,720,111 |
| Singapore Telecommunications Ltd. | 3,066,537 | 7,425,785 |
| Suntec Real Estate Investment Trust | 759,700 | 1,037,832 |
| United Overseas Bank Ltd. | 480,633 | 9,462,431 |
| UOL Group Ltd. | 186,667 | 1,068,833 |
| Venture Corp., Ltd. | 105,200 | 1,220,280 |
| Wilmar International Ltd. | 722,900 | 1,987,597 |
| Yangzijiang Shipbuilding Holdings Ltd. | 842,600 | 589,894 |
| | | 69,656,137 |
| |
| Spain 2.8% |
| ACS Actividades de Construccion y Servicios S.A. | 99,634 | 4,042,961 |
| Aena SME S.A. | 25,463 | 4,674,040 |
| Amadeus IT Group S.A. | 165,764 | 12,262,931 |
| Banco Bilbao Vizcaya Argentaria S.A. | 2,509,168 | 13,215,355 |
| Banco De Sabadell S.A. | 2,111,732 | 2,321,278 |
| Banco Santander S.A. | 6,359,506 | 25,535,308 |
| Bankia S.A. | 479,606 | 915,002 |
| Bankinter S.A. | 258,237 | 1,788,522 |
| CaixaBank S.A. | 1,359,406 | 3,898,229 |
| Cellnex Telecom S.A. * | 73,030 | 3,151,159 |
| Cellnex Telecom S.A., Interim Shares *(b) | 21,195 | 914,539 |
| Enagas S.A. | 89,296 | 2,209,593 |
| Endesa S.A. | 121,436 | 3,307,290 |
| Ferrovial S.A. | 180,853 | 5,335,740 |
| Grifols S.A. | 116,504 | 3,758,483 |
| Iberdrola S.A. | 2,268,409 | 23,316,961 |
| Industria de Diseno Textil S.A. | 413,185 | 12,875,180 |
| Mapfre S.A. | 412,392 | 1,150,984 |
| Naturgy Energy Group S.A. | 113,127 | 3,082,153 |
| Red Electrica Corp. S.A. | 163,853 | 3,293,039 |
| Repsol S.A. | 547,079 | 9,015,697 |
| Security | Number
of Shares | Value ($) |
| Siemens Gamesa Renewable Energy S.A. | 90,348 | 1,243,808 |
| Telefonica S.A. | 1,771,160 | 13,601,231 |
| | | 154,909,483 |
| |
| Sweden 2.6% |
| Alfa Laval AB | 117,311 | 2,715,194 |
| Assa Abloy AB, Class B | 381,369 | 9,056,890 |
| Atlas Copco AB, A Shares | 253,418 | 8,944,770 |
| Atlas Copco AB, B Shares | 146,046 | 4,531,561 |
| Boliden AB | 102,447 | 2,762,736 |
| Electrolux AB, B Shares | 85,983 | 2,260,608 |
| Epiroc AB, Class A | 259,199 | 2,920,460 |
| Epiroc AB, Class B | 144,732 | 1,576,335 |
| Essity AB, Class B | 227,723 | 7,114,230 |
| Hennes & Mauritz AB, B Shares | 302,542 | 6,341,129 |
| Hexagon AB, B Shares | 97,964 | 5,015,551 |
| Husqvarna AB, B Shares | 154,895 | 1,186,636 |
| ICA Gruppen AB | 34,351 | 1,520,091 |
| Industrivarden AB, C Shares | 63,794 | 1,382,202 |
| Investor AB, B Shares | 171,468 | 8,797,069 |
| Kinnevik AB, Class B | 91,959 | 2,516,697 |
| LE Lundbergfortagen AB, B Shares | 28,402 | 1,070,466 |
| Lundin Petroleum AB | 70,819 | 2,345,388 |
| Millicom International Cellular S.A. SDR | 25,286 | 1,152,741 |
| Nordea Bank Abp(c) | 16,453 | 120,417 |
| Nordea Bank Abp(c) | 1,205,640 | 8,824,482 |
| Sandvik AB | 427,121 | 7,546,084 |
| Securitas AB, B Shares | 124,443 | 1,992,597 |
| Skandinaviska Enskilda Banken AB, A Shares | 623,515 | 5,980,340 |
| Skanska AB, B Shares | 129,748 | 2,764,519 |
| SKF AB, B Shares | 148,084 | 2,681,231 |
| Svenska Handelsbanken AB, A Shares | 576,698 | 5,787,628 |
| Swedbank AB, A Shares | 339,543 | 4,758,113 |
| Swedish Match AB | 63,050 | 2,961,985 |
| Tele2 AB, B Shares | 192,610 | 2,757,242 |
| Telefonaktiebolaget LM Ericsson, B Shares | 1,167,355 | 10,201,262 |
| Telia Co. AB | 1,056,619 | 4,647,970 |
| Volvo AB, B Shares | 561,037 | 8,407,568 |
| | | 142,642,192 |
| |
| Switzerland 9.2% |
| ABB Ltd. | 701,934 | 14,740,602 |
| Adecco Group AG | 60,342 | 3,587,100 |
| Alcon, Inc. * | 157,690 | 9,325,490 |
| Baloise Holding AG | 18,611 | 3,442,168 |
| Barry Callebaut AG | 830 | 1,754,038 |
| Chocoladefabriken Lindt & Spruengli AG | 39 | 3,194,323 |
| Chocoladefabriken Lindt & Spruengli AG - Participation Certificates | 403 | 2,994,415 |
| Cie Financiere Richemont S.A. | 197,923 | 15,553,017 |
| Clariant AG * | 76,271 | 1,564,512 |
| Credit Suisse Group AG * | 960,853 | 11,893,307 |
| Dufry AG * | 16,489 | 1,434,142 |
| EMS-Chemie Holding AG | 3,217 | 2,015,446 |
| Geberit AG | 14,149 | 7,188,965 |
| Givaudan S.A. | 3,502 | 10,288,645 |
| Julius Baer Group Ltd. * | 83,555 | 3,700,116 |
| Kuehne & Nagel International AG | 20,383 | 3,293,019 |
| LafargeHolcim Ltd. * | 184,401 | 9,518,497 |
Schwab Equity Index Funds | Annual Report
Schwab International Index Fund
Portfolio Holdings as of October 31, 2019 (continued)
| Security | Number
of Shares | Value ($) |
| Lonza Group AG * | 28,007 | 10,094,631 |
| Nestle S.A. | 1,160,625 | 124,165,185 |
| Novartis AG | 812,898 | 71,027,123 |
| Pargesa Holding S.A. | 14,867 | 1,175,216 |
| Partners Group Holding AG | 7,048 | 5,507,739 |
| Roche Holding AG | 265,904 | 80,025,351 |
| Schindler Holding AG | 7,502 | 1,776,576 |
| Schindler Holding AG - Participation Certificates | 15,573 | 3,815,328 |
| SGS S.A. | 2,012 | 5,247,505 |
| Sika AG | 48,068 | 8,263,202 |
| Sonova Holding AG | 20,967 | 4,811,472 |
| Straumann Holding AG | 3,958 | 3,536,401 |
| Swiss Life Holding AG | 12,833 | 6,426,981 |
| Swiss Prime Site AG * | 28,440 | 2,931,363 |
| Swiss Re AG | 115,266 | 12,090,103 |
| Swisscom AG | 9,755 | 4,989,627 |
| Temenos AG * | 24,488 | 3,503,521 |
| The Swatch Group AG | 20,575 | 1,104,597 |
| The Swatch Group AG - Bearer Shares | 11,005 | 3,051,445 |
| UBS Group AG * | 1,464,961 | 17,338,047 |
| Vifor Pharma AG | 16,966 | 2,671,793 |
| Zurich Insurance Group AG | 57,412 | 22,488,283 |
| | | 501,529,291 |
| |
| United Kingdom 16.1% |
| 3i Group plc | 373,611 | 5,459,532 |
| Admiral Group plc | 72,995 | 1,910,408 |
| Anglo American plc | 398,471 | 10,255,485 |
| Antofagasta plc | 147,159 | 1,657,409 |
| Ashtead Group plc | 175,313 | 5,337,547 |
| Associated British Foods plc | 138,046 | 3,984,666 |
| AstraZeneca plc | 495,825 | 48,351,474 |
| Auto Trader Group plc | 346,045 | 2,521,384 |
| Aviva plc | 1,476,249 | 7,957,049 |
| BAE Systems plc | 1,206,050 | 9,008,845 |
| Barclays plc | 6,486,790 | 14,070,313 |
| Barratt Developments plc | 376,420 | 3,078,289 |
| BHP Group plc | 797,866 | 16,923,171 |
| BP plc | 7,704,296 | 48,855,723 |
| British American Tobacco plc | 871,028 | 30,464,955 |
| BT Group plc | 3,224,037 | 8,556,132 |
| Bunzl plc | 128,907 | 3,353,482 |
| Burberry Group plc | 156,290 | 4,144,336 |
| Carnival plc | 62,407 | 2,497,327 |
| Centrica plc | 2,166,866 | 2,039,166 |
| Coca-Cola HBC AG * | 75,063 | 2,285,569 |
| Compass Group plc | 600,212 | 15,980,099 |
| Croda International plc | 48,103 | 3,001,227 |
| DCC plc | 37,981 | 3,561,837 |
| Diageo plc | 899,070 | 36,799,813 |
| Direct Line Insurance Group plc | 543,098 | 1,914,828 |
| easyJet plc | 62,548 | 1,003,395 |
| Evraz plc | 184,834 | 882,019 |
| Experian plc | 345,184 | 10,880,649 |
| Ferguson plc | 88,467 | 7,554,491 |
| Fresnillo plc | 85,522 | 790,119 |
| G4S plc | 588,643 | 1,578,705 |
| GlaxoSmithKline plc | 1,892,006 | 43,336,275 |
| Glencore plc * | 4,132,925 | 12,474,732 |
| GVC Holdings plc | 219,459 | 2,531,842 |
| Halma plc | 147,560 | 3,580,606 |
| Hargreaves Lansdown plc | 105,092 | 2,413,256 |
| HSBC Holdings plc | 7,660,241 | 57,873,949 |
| Imperial Brands plc | 363,067 | 7,964,043 |
| Informa plc | 481,955 | 4,844,251 |
| Security | Number
of Shares | Value ($) |
| InterContinental Hotels Group plc | 66,951 | 4,051,520 |
| Intertek Group plc | 61,684 | 4,276,910 |
| Investec plc | 260,850 | 1,478,877 |
| ITV plc | 1,343,280 | 2,330,274 |
| J. Sainsbury plc | 664,952 | 1,752,331 |
| John Wood Group plc | 258,202 | 1,133,666 |
| Johnson Matthey plc | 73,080 | 2,903,241 |
| Kingfisher plc | 773,561 | 2,075,160 |
| Land Securities Group plc | 265,560 | 3,234,658 |
| Legal & General Group plc | 2,257,519 | 7,716,964 |
| Lloyds Banking Group plc | 26,964,485 | 19,835,239 |
| London Stock Exchange Group plc | 119,230 | 10,744,868 |
| M&G plc * | 964,602 | 2,671,425 |
| Marks & Spencer Group plc | 732,484 | 1,725,578 |
| Meggitt plc | 293,141 | 2,371,900 |
| Melrose Industries plc | 1,849,088 | 5,110,300 |
| Merlin Entertainments plc | 273,561 | 1,611,673 |
| Micro Focus International plc | 126,459 | 1,735,676 |
| Mondi plc | 183,566 | 3,806,039 |
| National Grid plc | 1,299,930 | 15,199,148 |
| Next plc | 52,398 | 4,468,836 |
| NMC Health plc | 38,499 | 1,091,318 |
| Ocado Group plc * | 170,503 | 2,938,836 |
| Pearson plc | 295,248 | 2,607,510 |
| Persimmon plc | 120,443 | 3,552,620 |
| Prudential plc | 964,602 | 16,848,545 |
| Reckitt Benckiser Group plc | 268,592 | 20,784,083 |
| RELX plc | 737,172 | 17,747,678 |
| Rentokil Initial plc | 698,302 | 4,109,642 |
| Rio Tinto plc | 428,305 | 22,298,332 |
| Rolls-Royce Holdings plc * | 646,003 | 5,944,357 |
| Royal Bank of Scotland Group plc | 1,854,094 | 5,125,158 |
| Royal Dutch Shell plc, A Shares | 1,647,039 | 47,744,501 |
| Royal Dutch Shell plc, B Shares | 1,418,805 | 40,861,248 |
| RSA Insurance Group plc | 380,881 | 2,576,771 |
| Schroders plc | 45,614 | 1,828,638 |
| Segro plc | 411,238 | 4,498,658 |
| Severn Trent plc | 88,374 | 2,581,418 |
| Smith & Nephew plc | 328,615 | 7,054,184 |
| Smiths Group plc | 150,224 | 3,140,227 |
| Spirax-Sarco Engineering plc | 28,199 | 2,893,887 |
| SSE plc | 387,064 | 6,439,214 |
| St. James's Place plc | 202,239 | 2,727,812 |
| Standard Chartered plc | 1,049,698 | 9,524,886 |
| Standard Life Aberdeen plc | 926,946 | 3,644,439 |
| Taylor Wimpey plc | 1,255,288 | 2,692,219 |
| Tesco plc | 3,684,543 | 11,247,260 |
| The Berkeley Group Holdings plc | 46,172 | 2,631,777 |
| The British Land Co., plc | 338,078 | 2,718,192 |
| The Sage Group plc | 411,522 | 3,835,425 |
| The Weir Group plc | 101,001 | 1,764,187 |
| TUI AG | 165,147 | 2,160,497 |
| Unilever plc | 419,199 | 25,101,192 |
| United Utilities Group plc | 262,699 | 2,966,296 |
| Vodafone Group plc | 10,087,787 | 20,586,342 |
| Whitbread plc | 51,891 | 2,731,367 |
| WM Morrison Supermarkets plc | 933,410 | 2,411,328 |
| WPP plc | 474,949 | 5,927,154 |
| | | 877,249,879 |
| Total Common Stock |
| (Cost $4,441,053,703) | | 5,375,570,996 |
|
Schwab Equity Index Funds | Annual Report
Schwab International Index Fund
Portfolio Holdings as of October 31, 2019 (continued)
| Security | Number
of Shares | Value ($) |
| Preferred Stock0.5% of net assets |
| |
| Germany 0.5% |
| Bayerische Motoren Werke AG | 22,418 | 1,379,898 |
| Fuchs Petrolub SE | 26,831 | 1,143,113 |
| Henkel AG & Co. KGaA | 67,322 | 6,992,918 |
| Porsche Automobil Holding SE | 59,355 | 4,370,345 |
| Sartorius AG | 13,916 | 2,704,184 |
| Volkswagen AG | 70,234 | 13,351,850 |
| | | 29,942,308 |
| |
| United Kingdom 0.0% |
| Rolls-Royce Holdings plc *(b) | 29,716,138 | 38,493 |
| Total Preferred Stock |
| (Cost $26,636,648) | | 29,980,801 |
|
| Other Investment Company0.1% of net assets |
| |
| United States 0.1% |
| Securities Lending Collateral 0.1% |
| Wells Fargo Government Money Market Fund, Select Class 1.75%(d) | 3,797,238 | 3,797,238 |
| Total Other Investment Company |
| (Cost $3,797,238) | | 3,797,238 |
Security
Rate, Maturity Date | Face Amount
Local Currency | Value ($) |
| Short-Term Investments0.1% of net assets |
| |
| Time Deposits 0.1% |
| Brown Brothers Harriman |
| Australian Dollar | | |
| 0.35%, 11/01/19(e) | 374,293 | 258,019 |
| Danish Krone | | |
| (0.95%), 11/01/19(e) | 44,569 | 6,653 |
| Hong Kong Dollar | | |
| 2.30%, 11/01/19(e) | 898,050 | 114,606 |
| New Zealand Dollar | | |
| 0.50%, 11/01/19(e) | 31,502 | 20,198 |
| Norwegian Krone | | |
| 0.60%, 11/01/19(e) | 838,201 | 91,147 |
| Singapore Dollar | | |
| 0.55%, 11/01/19(e) | 24,389 | 17,927 |
| Swedish Krona | | |
| (0.37%), 11/01/19(e) | 2,257,748 | 233,825 |
| Swiss Franc | | |
| (1.57%), 11/01/19(e) | 13,359 | 13,542 |
| Citibank |
| Euro | | |
| (0.67%), 11/01/19(e) | 133,553 | 148,952 |
| Pound Sterling | | |
| 0.38%, 11/01/19(e) | 85,436 | 110,670 |
| U.S. Dollar | | |
| 1.18%, 11/01/19(e) | 5,060,196 | 5,060,196 |
| Sumitomo Mitsui Banking Corp. |
| Japanese Yen | | |
| (0.27%), 11/01/19(e) | 6,837,469 | 63,316 |
| Total Short-Term Investments |
| (Cost $6,139,051) | | 6,139,051 |
| | Number of
Contracts | Notional
Amount
($) | Current Value/
Unrealized
Appreciation
($) |
| Futures Contracts | |
| Long | |
| MSCI EAFE Index, expires 12/20/19 | 376 | 36,795,360 | 845,450 |
| * | Non-income producing security. |
| (a) | All or a portion of this security is on loan. Securities on loan were valued at $3,604,867. |
| (b) | Fair-valued by management using significant unobservable inputs in accordance with procedures approved by fund’s Board of Trustees. |
| (c) | Securities are traded on separate exchanges for the same entity. |
| (d) | The rate shown is the 7-day yield. |
| (e) | The rate shown is the current daily overnight rate. |
| | |
| ADR — | American Depositary Receipt |
| CVA — | Dutch Certificate |
| REIT — | Real Estate Investment Trust |
| RSP — | Risparmio (Convertible Savings Shares) |
| SDR — | Swedish Depositary Receipt |
Schwab Equity Index Funds | Annual Report
Schwab Fundamental US Large Company Index Fund
Portfolio Holdings as of October 31, 2019
This section shows all the securities in the fund’s portfolio and their values as of the report date.
The fund files its complete schedule of portfolio holdings with the U.S. Securities and Exchange Commission (SEC) for the first and third quarters of each fiscal year on Form N-Q. Effective March 31, 2019, Form N-PORT Part F has replaced Form N-Q. The fund’s Form N-Q and Form N-PORT Part F are available on the SEC’s website atwww.sec.gov. The fund also makes available its complete schedule of portfolio holdings 15 to 20 days after the end of the month on the fund’s website atwww.schwabfunds.com/schwabfunds_prospectus.
| Security | Number
of Shares | Value ($) |
| Common Stock99.7% of net assets |
| |
| Automobiles & Components 1.8% |
| Adient plc | 175,571 | 3,720,350 |
| Aptiv plc | 65,785 | 5,891,047 |
| Autoliv, Inc. | 34,867 | 2,714,047 |
| BorgWarner, Inc. | 82,835 | 3,452,563 |
| Cooper Tire & Rubber Co. | 42,326 | 1,195,286 |
| Dana, Inc. | 88,448 | 1,435,511 |
| Ford Motor Co. | 2,956,900 | 25,399,771 |
| General Motors Co. | 890,219 | 33,080,538 |
| Gentex Corp. | 59,139 | 1,658,849 |
| Harley-Davidson, Inc. | 66,914 | 2,603,624 |
| Lear Corp. | 32,733 | 3,854,965 |
| The Goodyear Tire & Rubber Co. | 294,588 | 4,675,112 |
| Thor Industries, Inc. | 26,936 | 1,703,971 |
| Visteon Corp. * | 40,258 | 3,744,799 |
| | | 95,130,433 |
| |
| Banks 5.9% |
| Bank of America Corp. | 1,271,972 | 39,774,564 |
| BB&T Corp. | 141,887 | 7,527,105 |
| CIT Group, Inc. | 56,294 | 2,414,450 |
| Citigroup, Inc. | 681,431 | 48,967,632 |
| Citizens Financial Group, Inc. | 100,612 | 3,537,518 |
| Comerica, Inc. | 26,562 | 1,737,686 |
| Fifth Third Bancorp | 224,324 | 6,523,342 |
| First Republic Bank | 11,679 | 1,242,178 |
| Huntington Bancshares, Inc. | 157,482 | 2,225,221 |
| JPMorgan Chase & Co. | 611,093 | 76,337,738 |
| KeyCorp | 159,772 | 2,871,103 |
| M&T Bank Corp. | 22,860 | 3,578,276 |
| New York Community Bancorp, Inc. | 141,928 | 1,653,461 |
| People's United Financial, Inc. | 65,142 | 1,053,346 |
| Regions Financial Corp. | 225,693 | 3,633,657 |
| SunTrust Banks, Inc. | 90,464 | 6,182,310 |
| The PNC Financial Services Group, Inc. | 95,595 | 14,023,786 |
| U.S. Bancorp | 328,386 | 18,724,570 |
| Wells Fargo & Co. | 1,242,348 | 64,142,427 |
| | | 306,150,370 |
| |
| Capital Goods 8.5% |
| 3M Co. | 125,310 | 20,674,897 |
| A.O. Smith Corp. | 23,989 | 1,191,774 |
| Acuity Brands, Inc. | 9,265 | 1,156,179 |
| AECOM * | 69,426 | 2,777,734 |
| AerCap Holdings N.V. * | 45,924 | 2,658,081 |
| AGCO Corp. | 35,507 | 2,723,032 |
| Allison Transmission Holdings, Inc. | 32,149 | 1,402,018 |
| AMETEK, Inc. | 29,020 | 2,659,683 |
| Arconic, Inc. | 98,278 | 2,699,697 |
| Carlisle Cos., Inc. | 12,720 | 1,936,874 |
| Caterpillar, Inc. | 132,632 | 18,276,690 |
| Cummins, Inc. | 52,316 | 9,023,464 |
| Deere & Co. | 81,419 | 14,178,305 |
| Donaldson Co., Inc. | 25,180 | 1,327,993 |
| Security | Number
of Shares | Value ($) |
| Dover Corp. | 33,108 | 3,439,590 |
| Eaton Corp. plc | 134,943 | 11,754,885 |
| EMCOR Group, Inc. | 20,640 | 1,810,334 |
| Emerson Electric Co. | 183,924 | 12,902,269 |
| EnerSys | 15,208 | 1,016,807 |
| Fastenal Co. | 93,570 | 3,362,906 |
| Flowserve Corp. | 42,354 | 2,068,569 |
| Fluor Corp. | 183,686 | 2,959,181 |
| Fortive Corp. | 29,780 | 2,054,820 |
| Fortune Brands Home & Security, Inc. | 40,740 | 2,446,437 |
| GATX Corp. | 14,249 | 1,133,508 |
| General Dynamics Corp. | 70,225 | 12,415,780 |
| General Electric Co. | 6,603,687 | 65,904,796 |
| HD Supply Holdings, Inc. * | 32,347 | 1,279,000 |
| Hexcel Corp. | 15,091 | 1,126,090 |
| Honeywell International, Inc. | 116,161 | 20,064,490 |
| Hubbell, Inc. | 14,492 | 2,053,516 |
| Huntington Ingalls Industries, Inc. | 10,222 | 2,306,697 |
| IDEX Corp. | 9,396 | 1,461,360 |
| Illinois Tool Works, Inc. | 80,135 | 13,509,158 |
| Ingersoll-Rand plc | 45,693 | 5,797,985 |
| Jacobs Engineering Group, Inc. | 45,876 | 4,293,076 |
| Johnson Controls International plc | 169,651 | 7,350,978 |
| L3Harris Technologies, Inc. | 41,401 | 8,541,440 |
| Lincoln Electric Holdings, Inc. | 17,322 | 1,551,532 |
| Lockheed Martin Corp. | 38,346 | 14,444,171 |
| Masco Corp. | 49,211 | 2,276,009 |
| MSC Industrial Direct Co., Inc., Class A | 15,012 | 1,099,029 |
| Nordson Corp. | 8,142 | 1,276,747 |
| Northrop Grumman Corp. | 34,699 | 12,230,704 |
| Oshkosh Corp. | 30,355 | 2,591,710 |
| Owens Corning | 43,209 | 2,647,848 |
| PACCAR, Inc. | 103,276 | 7,855,173 |
| Parker-Hannifin Corp. | 31,679 | 5,812,780 |
| Pentair plc | 43,834 | 1,817,796 |
| Quanta Services, Inc. | 70,418 | 2,961,077 |
| Raytheon Co. | 61,070 | 12,959,665 |
| Regal Beloit Corp. | 15,239 | 1,128,448 |
| Resideo Technologies, Inc. * | 61,967 | 590,545 |
| Rockwell Automation, Inc. | 21,877 | 3,762,625 |
| Roper Technologies, Inc. | 6,587 | 2,219,556 |
| Sensata Technologies Holding plc * | 19,591 | 1,002,863 |
| Snap-on, Inc. | 13,209 | 2,148,708 |
| Spirit AeroSystems Holdings, Inc., Class A | 25,936 | 2,122,084 |
| Stanley Black & Decker, Inc. | 33,383 | 5,051,849 |
| Terex Corp. | 51,049 | 1,406,400 |
| Textron, Inc. | 78,835 | 3,633,505 |
| The Boeing Co. | 66,650 | 22,655,001 |
| The Timken Co. | 27,813 | 1,362,837 |
| The Toro Co. | 15,227 | 1,174,458 |
| TransDigm Group, Inc. | 6,029 | 3,172,942 |
| Trinity Industries, Inc. | 79,547 | 1,573,440 |
| United Rentals, Inc. * | 33,381 | 4,458,700 |
| United Technologies Corp. | 212,387 | 30,494,525 |
| Valmont Industries, Inc. | 9,182 | 1,259,679 |
| W.W. Grainger, Inc. | 13,447 | 4,152,971 |
| WABCO Holdings, Inc. * | 10,062 | 1,354,546 |
| Wabtec Corp. | 27,462 | 1,905,039 |
| Watsco, Inc. | 8,296 | 1,462,585 |
Schwab Fundamental Index Funds | Annual Report
Schwab Fundamental US Large Company Index Fund
Portfolio Holdings as of October 31, 2019 (continued)
| Security | Number
of Shares | Value ($) |
| WESCO International, Inc. * | 36,923 | 1,851,688 |
| Xylem, Inc. | 21,015 | 1,611,640 |
| | | 444,820,968 |
| |
| Commercial & Professional Services 0.6% |
| ABM Industries, Inc. | 30,591 | 1,115,348 |
| Cintas Corp. | 10,471 | 2,813,244 |
| Equifax, Inc. | 15,528 | 2,122,833 |
| IAA, Inc. * | 22,685 | 865,433 |
| IHS Markit Ltd. * | 27,415 | 1,919,598 |
| KAR Auction Services, Inc. | 22,685 | 563,949 |
| ManpowerGroup, Inc. | 48,631 | 4,421,530 |
| Nielsen Holdings plc | 152,484 | 3,074,077 |
| Pitney Bowes, Inc. | 243,747 | 1,072,487 |
| Republic Services, Inc. | 38,992 | 3,412,190 |
| Robert Half International, Inc. | 38,324 | 2,194,815 |
| Verisk Analytics, Inc. | 9,577 | 1,385,792 |
| Waste Management, Inc. | 69,308 | 7,777,051 |
| | | 32,738,347 |
| |
| Consumer Durables & Apparel 1.5% |
| Brunswick Corp. | 27,914 | 1,625,711 |
| Capri Holdings Ltd. * | 84,253 | 2,617,741 |
| Carter's, Inc. | 16,362 | 1,640,127 |
| D.R. Horton, Inc. | 77,783 | 4,073,496 |
| Fossil Group, Inc. * | 98,019 | 1,066,447 |
| Garmin Ltd. | 20,756 | 1,945,875 |
| Hanesbrands, Inc. | 111,554 | 1,696,736 |
| Hasbro, Inc. | 21,707 | 2,112,308 |
| Kontoor Brands, Inc. * | 9,421 | 357,998 |
| Leggett & Platt, Inc. | 42,305 | 2,170,247 |
| Lennar Corp., Class A | 49,750 | 2,965,100 |
| lululemon Athletica, Inc. * | 6,487 | 1,325,099 |
| Mattel, Inc. * | 225,324 | 2,690,369 |
| Mohawk Industries, Inc. * | 20,309 | 2,911,904 |
| Newell Brands, Inc. | 160,524 | 3,045,140 |
| NIKE, Inc., Class B | 182,482 | 16,341,263 |
| NVR, Inc. * | 737 | 2,680,167 |
| Polaris, Inc. | 21,717 | 2,142,382 |
| PulteGroup, Inc. | 95,746 | 3,757,073 |
| PVH Corp. | 27,831 | 2,425,750 |
| Ralph Lauren Corp. | 24,034 | 2,308,706 |
| Tapestry, Inc. | 111,304 | 2,878,321 |
| Toll Brothers, Inc. | 35,250 | 1,401,893 |
| Under Armour, Inc., Class A * | 23,860 | 492,709 |
| Under Armour, Inc., Class C * | 26,160 | 483,960 |
| VF Corp. | 63,758 | 5,246,646 |
| Whirlpool Corp. | 37,022 | 5,631,787 |
| | | 78,034,955 |
| |
| Consumer Services 1.7% |
| Aramark | 71,832 | 3,143,368 |
| Carnival Corp. | 121,293 | 5,202,257 |
| Chipotle Mexican Grill, Inc. * | 3,372 | 2,623,956 |
| Darden Restaurants, Inc. | 21,415 | 2,404,262 |
| Domino's Pizza, Inc. | 5,376 | 1,460,229 |
| H&R Block, Inc. | 54,067 | 1,351,134 |
| Hilton Worldwide Holdings, Inc. | 23,439 | 2,272,645 |
| Las Vegas Sands Corp. | 88,472 | 5,471,109 |
| Marriott International, Inc., Class A | 25,808 | 3,266,002 |
| McDonald's Corp. | 136,051 | 26,761,232 |
| MGM Resorts International | 106,238 | 3,027,783 |
| Norwegian Cruise Line Holdings Ltd. * | 33,302 | 1,690,410 |
| Royal Caribbean Cruises Ltd. | 30,834 | 3,355,664 |
| Service Corp. International | 23,284 | 1,058,956 |
| Security | Number
of Shares | Value ($) |
| Six Flags Entertainment Corp. | 18,741 | 790,683 |
| Starbucks Corp. | 141,620 | 11,975,387 |
| The Wendy's Co. | 57,638 | 1,220,773 |
| Wyndham Destinations, Inc. | 31,287 | 1,452,030 |
| Wynn Resorts Ltd. | 20,501 | 2,487,591 |
| Yum China Holdings, Inc. | 60,824 | 2,585,020 |
| Yum! Brands, Inc. | 68,482 | 6,965,304 |
| | | 90,565,795 |
| |
| Diversified Financials 5.2% |
| Affiliated Managers Group, Inc. | 14,500 | 1,158,260 |
| AGNC Investment Corp. | 76,778 | 1,309,065 |
| Ally Financial, Inc. | 264,427 | 8,099,399 |
| American Express Co. | 157,471 | 18,468,199 |
| Ameriprise Financial, Inc. | 50,931 | 7,684,979 |
| Annaly Capital Management, Inc. | 266,108 | 2,389,650 |
| Berkshire Hathaway, Inc., Class A * | 53 | 16,903,767 |
| Berkshire Hathaway, Inc., Class B * | 234,950 | 49,945,671 |
| BlackRock, Inc. | 18,164 | 8,386,319 |
| Capital One Financial Corp. | 208,469 | 19,439,734 |
| CME Group, Inc. | 22,609 | 4,651,802 |
| Discover Financial Services | 137,002 | 10,995,781 |
| FactSet Research Systems, Inc. | 4,059 | 1,029,038 |
| Franklin Resources, Inc. | 154,688 | 4,261,654 |
| Intercontinental Exchange, Inc. | 31,750 | 2,994,660 |
| Invesco Ltd. | 187,838 | 3,159,435 |
| Janus Henderson Group plc | 46,215 | 1,068,953 |
| Jefferies Financial Group, Inc. | 89,581 | 1,672,477 |
| Lazard Ltd., Class A | 32,244 | 1,203,669 |
| Legg Mason, Inc. | 57,295 | 2,134,812 |
| LPL Financial Holdings, Inc. | 18,308 | 1,480,019 |
| Moody's Corp. | 16,625 | 3,668,971 |
| Morgan Stanley | 237,174 | 10,921,863 |
| MSCI, Inc. | 6,470 | 1,517,603 |
| Nasdaq, Inc. | 12,294 | 1,226,572 |
| Navient Corp. | 269,427 | 3,710,010 |
| New Residential Investment Corp. | 71,647 | 1,134,888 |
| Northern Trust Corp. | 28,135 | 2,804,497 |
| Raymond James Financial, Inc. | 16,336 | 1,363,893 |
| S&P Global, Inc. | 20,694 | 5,338,845 |
| Santander Consumer USA Holdings, Inc. | 53,812 | 1,349,605 |
| SEI Investments Co. | 20,985 | 1,257,421 |
| Starwood Property Trust, Inc. | 45,979 | 1,131,083 |
| State Street Corp. | 108,006 | 7,135,956 |
| Synchrony Financial | 269,151 | 9,519,871 |
| T. Rowe Price Group, Inc. | 51,873 | 6,006,893 |
| TD Ameritrade Holding Corp. | 27,989 | 1,074,218 |
| The Bank of New York Mellon Corp. | 201,810 | 9,434,617 |
| The Charles Schwab Corp.(a) | 76,794 | 3,126,284 |
| The Goldman Sachs Group, Inc. | 120,902 | 25,798,069 |
| Voya Financial, Inc. | 61,044 | 3,293,934 |
| Waddell & Reed Financial, Inc., Class A | 61,781 | 1,023,093 |
| | | 270,275,529 |
| |
| Energy 8.7% |
| Antero Resources Corp. * | 195,384 | 488,460 |
| Apache Corp. | 164,156 | 3,555,619 |
| Baker Hughes Co. | 267,166 | 5,717,352 |
| Cabot Oil & Gas Corp. | 46,586 | 868,363 |
| Chevron Corp. | 724,019 | 84,087,567 |
| Concho Resources, Inc. | 18,837 | 1,271,874 |
| ConocoPhillips | 387,994 | 21,417,269 |
| Devon Energy Corp. | 94,113 | 1,908,612 |
| EOG Resources, Inc. | 80,956 | 5,611,060 |
| Exxon Mobil Corp. | 1,913,953 | 129,325,804 |
| Halliburton Co. | 337,977 | 6,506,057 |
Schwab Fundamental Index Funds | Annual Report
Schwab Fundamental US Large Company Index Fund
Portfolio Holdings as of October 31, 2019 (continued)
| Security | Number
of Shares | Value ($) |
| Helmerich & Payne, Inc. | 45,920 | 1,722,000 |
| Hess Corp. | 102,176 | 6,718,072 |
| HollyFrontier Corp. | 108,731 | 5,973,681 |
| Kinder Morgan, Inc. | 556,663 | 11,122,127 |
| Marathon Oil Corp. | 366,304 | 4,223,485 |
| Marathon Petroleum Corp. | 346,208 | 22,140,002 |
| Murphy Oil Corp. | 118,472 | 2,444,077 |
| Nabors Industries Ltd. | 700,835 | 1,296,545 |
| National Oilwell Varco, Inc. | 303,314 | 6,860,963 |
| Noble Corp. plc * | 890,668 | 1,095,522 |
| Noble Energy, Inc. | 131,553 | 2,533,711 |
| Occidental Petroleum Corp. | 306,369 | 12,407,945 |
| Oceaneering International, Inc. * | 107,705 | 1,525,103 |
| ONEOK, Inc. | 46,321 | 3,234,595 |
| Patterson-UTI Energy, Inc. | 118,896 | 989,215 |
| PBF Energy, Inc., Class A | 94,028 | 3,035,224 |
| Phillips 66 | 286,052 | 33,416,595 |
| Pioneer Natural Resources Co. | 18,753 | 2,306,994 |
| QEP Resources, Inc. | 177,680 | 591,674 |
| Range Resources Corp. | 145,972 | 588,267 |
| Schlumberger Ltd. | 539,525 | 17,637,072 |
| SM Energy Co. | 76,241 | 597,729 |
| Targa Resources Corp. | 59,313 | 2,306,089 |
| The Williams Cos., Inc. | 217,664 | 4,856,084 |
| Transocean Ltd. * | 491,035 | 2,332,416 |
| Valaris plc * | 258,971 | 1,064,371 |
| Valero Energy Corp. | 371,850 | 36,062,013 |
| World Fuel Services Corp. | 182,103 | 7,606,442 |
| | | 457,446,050 |
| |
| Food & Staples Retailing 3.1% |
| Casey's General Stores, Inc. | 13,003 | 2,221,043 |
| Costco Wholesale Corp. | 103,572 | 30,772,277 |
| Performance Food Group Co. * | 41,876 | 1,784,336 |
| Rite Aid Corp. *(b) | 202,090 | 1,859,228 |
| SpartanNash, Co. | 81,580 | 1,068,290 |
| Sysco Corp. | 112,220 | 8,963,012 |
| The Kroger Co. | 618,445 | 15,238,485 |
| U.S. Foods Holding Corp. * | 91,881 | 3,644,919 |
| Walgreens Boots Alliance, Inc. | 377,272 | 20,666,960 |
| Walmart, Inc. | 641,278 | 75,196,258 |
| | | 161,414,808 |
| |
| Food, Beverage & Tobacco 4.3% |
| Altria Group, Inc. | 437,412 | 19,591,683 |
| Archer-Daniels-Midland Co. | 470,447 | 19,777,592 |
| Brown-Forman Corp., Class B | 34,427 | 2,255,657 |
| Bunge Ltd. | 168,272 | 9,086,688 |
| Campbell Soup Co. | 46,422 | 2,149,803 |
| Coca-Cola European Partners plc | 32,126 | 1,719,062 |
| ConAgra Brands, Inc. | 137,181 | 3,710,746 |
| Constellation Brands, Inc., Class A | 17,814 | 3,390,539 |
| Flowers Foods, Inc. | 53,502 | 1,162,063 |
| General Mills, Inc. | 184,005 | 9,358,494 |
| Hormel Foods Corp. | 52,453 | 2,144,803 |
| Ingredion, Inc. | 28,224 | 2,229,696 |
| Kellogg Co. | 59,422 | 3,775,080 |
| McCormick & Co., Inc. - Non Voting Shares | 11,489 | 1,846,167 |
| Molson Coors Brewing Co., Class B | 46,275 | 2,439,618 |
| Mondelez International, Inc., Class A | 348,008 | 18,253,020 |
| Monster Beverage Corp. * | 31,175 | 1,749,853 |
| PepsiCo, Inc. | 243,907 | 33,456,723 |
| Philip Morris International, Inc. | 364,893 | 29,716,886 |
| Sanderson Farms, Inc. | 10,121 | 1,566,832 |
| The Coca-Cola Co. | 591,843 | 32,214,015 |
| Security | Number
of Shares | Value ($) |
| The Hershey Co. | 19,893 | 2,921,685 |
| The JM Smucker Co. | 34,151 | 3,609,078 |
| The Kraft Heinz Co. | 203,457 | 6,577,765 |
| Tyson Foods, Inc., Class A | 113,231 | 9,374,394 |
| | | 224,077,942 |
| |
| Health Care Equipment & Services 5.5% |
| Abbott Laboratories | 163,120 | 13,638,463 |
| AmerisourceBergen Corp. | 47,075 | 4,019,264 |
| Anthem, Inc. | 78,015 | 20,992,276 |
| Baxter International, Inc. | 53,030 | 4,067,401 |
| Becton, Dickinson & Co. | 18,972 | 4,856,832 |
| Boston Scientific Corp. * | 54,797 | 2,285,035 |
| Cardinal Health, Inc. | 235,298 | 11,635,486 |
| Centene Corp. * | 70,836 | 3,759,975 |
| Cerner Corp. | 43,349 | 2,909,585 |
| Cigna Corp. * | 57,040 | 10,179,358 |
| Covetrus, Inc. * | 21,714 | 215,294 |
| CVS Health Corp. | 781,871 | 51,908,416 |
| Danaher Corp. | 49,419 | 6,810,927 |
| DaVita, Inc. * | 60,808 | 3,563,349 |
| DENTSPLY SIRONA, Inc. | 37,748 | 2,067,835 |
| Edwards Lifesciences Corp. * | 9,052 | 2,157,816 |
| Encompass Health Corp. | 16,674 | 1,067,469 |
| HCA Healthcare, Inc. | 70,906 | 9,468,787 |
| Henry Schein, Inc. * | 41,358 | 2,588,390 |
| Hologic, Inc. * | 23,778 | 1,148,715 |
| Humana, Inc. | 44,155 | 12,990,401 |
| Intuitive Surgical, Inc. * | 5,313 | 2,937,823 |
| Laboratory Corp. of America Holdings * | 17,640 | 2,906,543 |
| Magellan Health, Inc. * | 18,158 | 1,178,454 |
| McKesson Corp. | 127,856 | 17,004,848 |
| MEDNAX, Inc. * | 48,931 | 1,074,525 |
| Medtronic plc | 207,489 | 22,595,552 |
| Molina Healthcare, Inc. * | 9,697 | 1,140,755 |
| Patterson Cos., Inc. | 63,733 | 1,091,746 |
| Quest Diagnostics, Inc. | 44,278 | 4,483,148 |
| ResMed, Inc. | 11,952 | 1,767,940 |
| Steris plc | 8,292 | 1,173,898 |
| Stryker Corp. | 27,930 | 6,040,421 |
| Tenet Healthcare Corp. * | 71,882 | 1,821,490 |
| The Cooper Cos., Inc. | 3,753 | 1,092,123 |
| UnitedHealth Group, Inc. | 160,954 | 40,673,076 |
| Universal Health Services, Inc., Class B | 24,549 | 3,374,506 |
| Varian Medical Systems, Inc. * | 13,386 | 1,617,163 |
| WellCare Health Plans, Inc. * | 7,912 | 2,346,699 |
| Zimmer Biomet Holdings, Inc. | 26,152 | 3,614,991 |
| | | 290,266,775 |
| |
| Household & Personal Products 1.7% |
| Church & Dwight Co., Inc. | 32,044 | 2,241,157 |
| Colgate-Palmolive Co. | 130,863 | 8,977,202 |
| Coty, Inc., Class A | 88,187 | 1,030,906 |
| Herbalife Nutrition Ltd. * | 24,455 | 1,092,405 |
| Kimberly-Clark Corp. | 55,809 | 7,415,900 |
| Nu Skin Enterprises, Inc., Class A | 23,749 | 1,058,730 |
| The Clorox Co. | 15,517 | 2,291,706 |
| The Estee Lauder Cos., Inc., Class A | 20,851 | 3,883,916 |
| The Procter & Gamble Co. | 474,865 | 59,125,441 |
| | | 87,117,363 |
| |
| Insurance 3.8% |
| Aflac, Inc. | 201,960 | 10,736,194 |
| Alleghany Corp. * | 2,827 | 2,200,226 |
| American Financial Group, Inc. | 15,346 | 1,596,598 |
Schwab Fundamental Index Funds | Annual Report
Schwab Fundamental US Large Company Index Fund
Portfolio Holdings as of October 31, 2019 (continued)
| Security | Number
of Shares | Value ($) |
| American International Group, Inc. | 696,930 | 36,909,413 |
| Aon plc | 41,206 | 7,959,351 |
| Arch Capital Group Ltd. * | 44,314 | 1,850,553 |
| Arthur J. Gallagher & Co. | 22,215 | 2,026,452 |
| Assurant, Inc. | 20,790 | 2,620,995 |
| Assured Guaranty Ltd. | 53,859 | 2,527,064 |
| Athene Holding Ltd., Class A * | 24,919 | 1,080,239 |
| Axis Capital Holdings Ltd. | 30,370 | 1,804,889 |
| Chubb Ltd. | 69,587 | 10,606,450 |
| Cincinnati Financial Corp. | 23,729 | 2,686,360 |
| CNO Financial Group, Inc. | 100,195 | 1,568,052 |
| Everest Re Group Ltd. | 13,473 | 3,463,774 |
| Fidelity National Financial, Inc. | 58,746 | 2,692,917 |
| First American Financial Corp. | 27,519 | 1,700,124 |
| Genworth Financial, Inc., Class A * | 405,995 | 1,737,659 |
| Globe Life, Inc. | 20,977 | 2,041,691 |
| Lincoln National Corp. | 67,407 | 3,807,147 |
| Loews Corp. | 97,467 | 4,775,883 |
| Markel Corp. * | 1,381 | 1,617,151 |
| Marsh & McLennan Cos., Inc. | 76,281 | 7,904,237 |
| MetLife, Inc. | 236,517 | 11,066,630 |
| Old Republic International Corp. | 74,215 | 1,657,963 |
| Principal Financial Group, Inc. | 69,910 | 3,731,796 |
| Prudential Financial, Inc. | 120,122 | 10,947,919 |
| Reinsurance Group of America, Inc. | 15,444 | 2,509,187 |
| RenaissanceRe Holdings Ltd. | 9,983 | 1,868,618 |
| The Allstate Corp. | 115,457 | 12,286,934 |
| The Hanover Insurance Group, Inc. | 8,881 | 1,169,716 |
| The Hartford Financial Services Group, Inc. | 107,866 | 6,156,991 |
| The Progressive Corp. | 80,093 | 5,582,482 |
| The Travelers Cos., Inc. | 137,849 | 18,066,490 |
| Unum Group | 76,533 | 2,107,719 |
| W. R. Berkley Corp. | 30,495 | 2,131,600 |
| White Mountains Insurance Group Ltd. | 1,494 | 1,600,074 |
| Willis Towers Watson plc | 12,050 | 2,252,145 |
| | | 199,049,683 |
| |
| Materials 3.3% |
| Air Products & Chemicals, Inc. | 26,916 | 5,740,106 |
| Albemarle Corp. | 24,096 | 1,463,591 |
| Alcoa Corp. * | 136,134 | 2,830,226 |
| AptarGroup, Inc. | 9,737 | 1,150,427 |
| Ashland Global Holdings, Inc. | 16,588 | 1,283,414 |
| Avery Dennison Corp. | 18,106 | 2,315,033 |
| Ball Corp. | 33,972 | 2,377,021 |
| Berry Global Group, Inc. * | 22,855 | 948,711 |
| Celanese Corp. | 26,713 | 3,236,280 |
| CF Industries Holdings, Inc. | 70,172 | 3,182,300 |
| Commercial Metals Co. | 90,610 | 1,751,491 |
| Corteva, Inc. * | 174,725 | 4,609,246 |
| Crown Holdings, Inc. * | 23,311 | 1,697,973 |
| Domtar Corp. | 45,898 | 1,670,228 |
| Dow, Inc. * | 186,775 | 9,430,270 |
| DuPont de Nemours, Inc. | 176,739 | 11,648,867 |
| Eastman Chemical Co. | 57,394 | 4,364,240 |
| Ecolab, Inc. | 32,077 | 6,161,029 |
| FMC Corp. | 14,192 | 1,298,568 |
| Freeport-McMoRan, Inc. | 463,403 | 4,550,617 |
| Graphic Packaging Holding Co. | 114,157 | 1,787,699 |
| Huntsman Corp. | 94,081 | 2,082,013 |
| International Flavors & Fragrances, Inc. | 12,906 | 1,574,661 |
| International Paper Co. | 150,281 | 6,564,274 |
| Linde plc | 74,044 | 14,686,627 |
| LyondellBasell Industries N.V., Class A | 211,282 | 18,951,995 |
| Martin Marietta Materials, Inc. | 9,198 | 2,409,048 |
| Newmont Goldcorp Corp. | 121,747 | 4,837,008 |
| Security | Number
of Shares | Value ($) |
| Nucor Corp. | 128,106 | 6,898,508 |
| Olin Corp. | 57,279 | 1,050,497 |
| Owens-Illinois, Inc. | 88,774 | 754,579 |
| Packaging Corp. of America | 23,202 | 2,539,691 |
| PPG Industries, Inc. | 61,632 | 7,711,396 |
| Reliance Steel & Aluminum Co. | 37,675 | 4,371,807 |
| RPM International, Inc. | 24,583 | 1,780,547 |
| Sealed Air Corp. | 51,171 | 2,137,413 |
| Sonoco Products Co. | 27,612 | 1,593,212 |
| Steel Dynamics, Inc. | 78,878 | 2,394,736 |
| The Mosaic Co. | 218,269 | 4,339,188 |
| The Sherwin-Williams Co. | 8,925 | 5,107,956 |
| United States Steel Corp.(b) | 113,214 | 1,303,093 |
| Vulcan Materials Co. | 13,965 | 1,995,180 |
| WestRock Co. | 116,453 | 4,351,849 |
| | | 172,932,615 |
| |
| Media & Entertainment 4.3% |
| Activision Blizzard, Inc. | 123,565 | 6,923,347 |
| Alphabet, Inc., Class A * | 20,659 | 26,005,549 |
| Alphabet, Inc., Class C * | 21,007 | 26,471,131 |
| Altice USA, Inc., Class A * | 59,737 | 1,848,860 |
| CBS Corp., Class B - Non Voting Shares | 168,044 | 6,056,306 |
| Charter Communications, Inc., Class A * | 20,448 | 9,566,801 |
| Cinemark Holdings, Inc. | 28,314 | 1,036,292 |
| Comcast Corp., Class A | 990,970 | 44,415,275 |
| Discovery, Inc., Class A * | 40,771 | 1,098,982 |
| Discovery, Inc., Class C * | 90,650 | 2,288,006 |
| DISH Network Corp., Class A * | 60,477 | 2,079,199 |
| Electronic Arts, Inc. * | 29,250 | 2,819,700 |
| Facebook, Inc., Class A * | 85,513 | 16,388,567 |
| Fox Corp., Class A | 74,111 | 2,374,517 |
| Fox Corp., Class B * | 35,424 | 1,106,646 |
| IAC/InterActiveCorp * | 5,352 | 1,216,242 |
| Liberty Global plc, Class A * | 87,184 | 2,192,678 |
| Liberty Global plc, Class C * | 221,801 | 5,294,390 |
| Liberty Media Corp. - Liberty SiriusXM, Class A * | 37,989 | 1,706,086 |
| Liberty Media Corp. - Liberty SiriusXM, Class C * | 73,958 | 3,342,162 |
| Netflix, Inc. * | 3,096 | 889,821 |
| News Corp., Class A | 145,623 | 1,996,491 |
| News Corp., Class B | 46,402 | 655,196 |
| Omnicom Group, Inc. | 50,655 | 3,910,060 |
| The Interpublic Group of Cos., Inc. | 87,460 | 1,902,255 |
| The Walt Disney Co. | 358,973 | 46,637,772 |
| Viacom, Inc., Class B | 302,857 | 6,529,597 |
| | | 226,751,928 |
| |
| Pharmaceuticals, Biotechnology & Life Sciences 5.8% |
| AbbVie, Inc. | 258,765 | 20,584,756 |
| Agilent Technologies, Inc. | 33,754 | 2,556,866 |
| Alexion Pharmaceuticals, Inc. * | 14,546 | 1,533,148 |
| Allergan plc | 46,765 | 8,235,784 |
| Amgen, Inc. | 113,534 | 24,211,126 |
| Biogen, Inc. * | 27,635 | 8,254,851 |
| Bristol-Myers Squibb Co. | 243,060 | 13,944,352 |
| Celgene Corp. * | 102,947 | 11,121,364 |
| Eli Lilly & Co. | 93,851 | 10,694,322 |
| Gilead Sciences, Inc. | 429,775 | 27,380,965 |
| Illumina, Inc. * | 3,945 | 1,165,826 |
| IQVIA Holdings, Inc. * | 17,584 | 2,539,481 |
| Johnson & Johnson | 431,048 | 56,915,578 |
| Mallinckrodt plc *(b) | 195,546 | 617,925 |
| Merck & Co., Inc. | 470,401 | 40,764,951 |
| Mettler-Toledo International, Inc. * | 2,365 | 1,667,183 |
Schwab Fundamental Index Funds | Annual Report
Schwab Fundamental US Large Company Index Fund
Portfolio Holdings as of October 31, 2019 (continued)
| Security | Number
of Shares | Value ($) |
| Mylan N.V. * | 152,836 | 2,926,809 |
| Perrigo Co., plc | 26,138 | 1,385,837 |
| Pfizer, Inc. | 1,356,867 | 52,062,987 |
| Regeneron Pharmaceuticals, Inc. * | 5,118 | 1,567,541 |
| Thermo Fisher Scientific, Inc. | 29,613 | 8,942,534 |
| United Therapeutics Corp. * | 17,457 | 1,568,337 |
| Waters Corp. * | 7,628 | 1,614,237 |
| Zoetis, Inc. | 22,927 | 2,932,822 |
| | | 305,189,582 |
| |
| Real Estate 1.7% |
| Alexandria Real Estate Equities, Inc. | 7,258 | 1,152,207 |
| American Tower Corp. | 22,155 | 4,831,562 |
| AvalonBay Communities, Inc. | 12,270 | 2,670,688 |
| Boston Properties, Inc. | 22,897 | 3,141,468 |
| Brixmor Property Group, Inc. | 71,102 | 1,565,666 |
| Camden Property Trust | 10,768 | 1,231,536 |
| CBRE Group, Inc., Class A * | 47,440 | 2,540,412 |
| CoreCivic, Inc. | 73,462 | 1,121,030 |
| Crown Castle International Corp. | 32,043 | 4,447,248 |
| Digital Realty Trust, Inc. | 18,519 | 2,352,654 |
| Duke Realty Corp. | 38,115 | 1,339,361 |
| Equinix, Inc. | 5,168 | 2,929,119 |
| Equity Residential | 42,827 | 3,797,042 |
| Essex Property Trust, Inc. | 4,879 | 1,596,067 |
| HCP, Inc. | 75,108 | 2,825,563 |
| Host Hotels & Resorts, Inc. | 212,463 | 3,482,269 |
| Iron Mountain, Inc. | 72,890 | 2,390,792 |
| Jones Lang LaSalle, Inc. | 12,547 | 1,838,386 |
| Kimco Realty Corp. | 70,723 | 1,524,788 |
| Lamar Advertising Co., Class A | 13,164 | 1,053,252 |
| Mid-America Apartment Communities, Inc. | 10,636 | 1,478,298 |
| Outfront Media, Inc. | 46,289 | 1,217,864 |
| Park Hotels & Resorts, Inc. | 56,387 | 1,310,998 |
| Prologis, Inc. | 40,158 | 3,524,266 |
| Public Storage | 11,434 | 2,548,181 |
| Realogy Holdings Corp. | 169,742 | 1,337,567 |
| Realty Income Corp. | 18,792 | 1,536,998 |
| Senior Housing Properties Trust | 118,644 | 1,177,542 |
| Service Properties Trust | 61,819 | 1,564,021 |
| Simon Property Group, Inc. | 34,860 | 5,252,705 |
| SL Green Realty Corp. | 17,427 | 1,456,897 |
| The Macerich Co. | 35,170 | 967,175 |
| UDR, Inc. | 24,977 | 1,255,094 |
| Ventas, Inc. | 57,286 | 3,729,319 |
| VEREIT, Inc. | 178,398 | 1,755,436 |
| Vornado Realty Trust | 27,015 | 1,772,994 |
| Welltower, Inc. | 58,826 | 5,334,930 |
| Weyerhaeuser Co. | 170,755 | 4,987,754 |
| WP Carey, Inc. | 13,082 | 1,204,329 |
| | | 91,243,478 |
| |
| Retailing 5.2% |
| Aaron's, Inc. | 19,828 | 1,485,712 |
| Abercrombie & Fitch Co., Class A | 69,064 | 1,118,146 |
| Advance Auto Parts, Inc. | 14,500 | 2,355,960 |
| Amazon.com, Inc. * | 9,078 | 16,128,520 |
| American Eagle Outfitters, Inc. | 82,687 | 1,271,726 |
| AutoNation, Inc. * | 43,623 | 2,218,230 |
| AutoZone, Inc. * | 2,340 | 2,677,849 |
| Bed Bath & Beyond, Inc.(b) | 463,554 | 6,350,690 |
| Best Buy Co., Inc. | 123,019 | 8,836,455 |
| Big Lots, Inc. | 57,766 | 1,251,789 |
| Booking Holdings, Inc. * | 4,370 | 8,953,125 |
| CarMax, Inc. * | 49,754 | 4,635,580 |
| Security | Number
of Shares | Value ($) |
| Chico's FAS, Inc. | 273,989 | 942,522 |
| Core-Mark Holding Co., Inc. | 57,642 | 1,759,234 |
| Designer Brands, Inc. | 51,945 | 857,093 |
| Dick's Sporting Goods, Inc. | 55,187 | 2,148,430 |
| Dillard's, Inc., Class A(b) | 18,769 | 1,294,686 |
| Dollar General Corp. | 68,571 | 10,994,674 |
| Dollar Tree, Inc. * | 45,341 | 5,005,646 |
| eBay, Inc. | 187,732 | 6,617,553 |
| Expedia Group, Inc. | 16,037 | 2,191,616 |
| Foot Locker, Inc. | 67,890 | 2,953,894 |
| GameStop Corp., Class A(b) | 395,975 | 2,154,104 |
| Genuine Parts Co. | 42,700 | 4,380,166 |
| Group 1 Automotive, Inc. | 19,690 | 1,957,974 |
| Kohl's Corp. | 136,022 | 6,972,488 |
| L Brands, Inc. | 151,241 | 2,577,147 |
| Lithia Motors, Inc., Class A | 10,801 | 1,700,941 |
| LKQ Corp. * | 80,086 | 2,722,123 |
| Lowe's Cos., Inc. | 211,645 | 23,621,698 |
| Macy's, Inc. | 321,541 | 4,874,562 |
| Murphy USA, Inc. * | 28,025 | 3,304,988 |
| Nordstrom, Inc. | 79,769 | 2,863,707 |
| O'Reilly Automotive, Inc. * | 12,673 | 5,519,218 |
| Office Depot, Inc. | 896,215 | 1,846,203 |
| Penske Automotive Group, Inc. | 23,821 | 1,160,559 |
| Qurate Retail, Inc. Class A * | 288,161 | 2,749,056 |
| Ross Stores, Inc. | 51,929 | 5,695,053 |
| Sally Beauty Holdings, Inc. * | 73,644 | 1,141,482 |
| Signet Jewelers Ltd. | 111,082 | 1,781,755 |
| Target Corp. | 276,932 | 29,606,800 |
| The Gap, Inc. | 175,212 | 2,848,947 |
| The Home Depot, Inc. | 193,369 | 45,360,500 |
| The TJX Cos., Inc. | 259,355 | 14,951,816 |
| Tiffany & Co. | 27,321 | 3,401,738 |
| Tractor Supply Co. | 28,066 | 2,666,831 |
| Ulta Salon, Cosmetics & Fragrance, Inc. * | 5,188 | 1,209,582 |
| Urban Outfitters, Inc. * | 44,553 | 1,278,671 |
| Williams-Sonoma, Inc. | 32,701 | 2,184,100 |
| | | 272,581,339 |
| |
| Semiconductors & Semiconductor Equipment 3.5% |
| Analog Devices, Inc. | 29,959 | 3,194,528 |
| Applied Materials, Inc. | 173,957 | 9,438,907 |
| Broadcom, Inc. | 19,191 | 5,620,084 |
| First Solar, Inc. * | 22,014 | 1,140,105 |
| Intel Corp. | 1,135,116 | 64,168,107 |
| KLA Corp. | 25,176 | 4,255,751 |
| Lam Research Corp. | 19,669 | 5,331,086 |
| Marvell Technology Group Ltd. | 82,976 | 2,023,785 |
| Maxim Integrated Products, Inc. | 39,941 | 2,342,939 |
| Microchip Technology, Inc. | 22,781 | 2,148,020 |
| Micron Technology, Inc. * | 201,950 | 9,602,722 |
| NVIDIA Corp. | 29,929 | 6,016,328 |
| NXP Semiconductors N.V. | 41,389 | 4,705,102 |
| ON Semiconductor Corp. * | 66,651 | 1,359,680 |
| Qorvo, Inc. * | 27,459 | 2,220,335 |
| QUALCOMM, Inc. | 441,144 | 35,485,623 |
| Skyworks Solutions, Inc. | 37,043 | 3,373,136 |
| Texas Instruments, Inc. | 145,702 | 17,191,379 |
| Xilinx, Inc. | 25,671 | 2,329,387 |
| | | 181,947,004 |
| |
| Software & Services 6.2% |
| Accenture plc, Class A | 74,722 | 13,854,953 |
| Adobe, Inc. * | 13,509 | 3,754,556 |
| Akamai Technologies, Inc. * | 22,484 | 1,944,866 |
| Alliance Data Systems Corp. | 17,051 | 1,705,100 |
Schwab Fundamental Index Funds | Annual Report
Schwab Fundamental US Large Company Index Fund
Portfolio Holdings as of October 31, 2019 (continued)
| Security | Number
of Shares | Value ($) |
| Amdocs Ltd. | 39,378 | 2,567,446 |
| ANSYS, Inc. * | 6,002 | 1,321,340 |
| Autodesk, Inc. * | 7,598 | 1,119,641 |
| Automatic Data Processing, Inc. | 40,086 | 6,503,152 |
| Booz Allen Hamilton Holding Corp. | 24,075 | 1,694,158 |
| Broadridge Financial Solutions, Inc. | 13,171 | 1,649,273 |
| CACI International, Inc., Class A * | 5,648 | 1,263,740 |
| Cadence Design Systems, Inc. * | 18,522 | 1,210,413 |
| CDK Global, Inc. | 21,006 | 1,061,643 |
| Check Point Software Technologies Ltd. * | 15,072 | 1,694,244 |
| Citrix Systems, Inc. | 21,520 | 2,342,667 |
| Cognizant Technology Solutions Corp., Class A | 103,029 | 6,278,587 |
| Conduent, Inc. * | 157,971 | 976,261 |
| DXC Technology Co. | 81,512 | 2,255,437 |
| Fidelity National Information Services, Inc. | 45,078 | 5,939,477 |
| Fiserv, Inc. * | 72,140 | 7,656,940 |
| FleetCor Technologies, Inc. * | 4,556 | 1,340,466 |
| Global Payments, Inc. | 23,409 | 3,960,335 |
| International Business Machines Corp. | 400,677 | 53,582,535 |
| Intuit, Inc. | 18,493 | 4,761,947 |
| Jack Henry & Associates, Inc. | 8,263 | 1,169,710 |
| Leidos Holdings, Inc. | 33,166 | 2,859,904 |
| Mastercard, Inc., Class A | 47,323 | 13,099,480 |
| Microsoft Corp. | 720,553 | 103,305,684 |
| Oracle Corp. | 559,568 | 30,490,860 |
| Paychex, Inc. | 35,681 | 2,984,359 |
| PayPal Holdings, Inc. * | 42,815 | 4,457,041 |
| Perspecta, Inc. | 34,765 | 922,663 |
| Sabre Corp. | 45,137 | 1,059,817 |
| salesforce.com, Inc. * | 10,627 | 1,663,019 |
| Symantec Corp. | 197,379 | 4,516,032 |
| Synopsys, Inc. * | 10,259 | 1,392,659 |
| Teradata Corp. * | 43,407 | 1,299,171 |
| The Western Union Co. | 150,792 | 3,778,848 |
| VeriSign, Inc. * | 5,735 | 1,089,765 |
| Visa, Inc., Class A | 101,023 | 18,068,974 |
| | | 322,597,163 |
| |
| Technology Hardware & Equipment 7.8% |
| Amphenol Corp., Class A | 34,782 | 3,489,678 |
| Anixter International, Inc. * | 19,581 | 1,620,328 |
| Apple, Inc. | 1,036,086 | 257,736,753 |
| Arrow Electronics, Inc. * | 60,112 | 4,765,679 |
| Avnet, Inc. | 128,482 | 5,082,748 |
| CDW Corp. | 19,879 | 2,542,723 |
| Cisco Systems, Inc. | 786,448 | 37,364,144 |
| CommScope Holding Co., Inc. * | 86,848 | 972,698 |
| Corning, Inc. | 336,397 | 9,967,443 |
| Dell Technologies, Inc., Class C * | 17,034 | 900,928 |
| F5 Networks, Inc. * | 13,377 | 1,927,358 |
| Flex Ltd. * | 349,743 | 4,109,480 |
| FLIR Systems, Inc. | 21,737 | 1,120,760 |
| Hewlett Packard Enterprise Co. | 815,971 | 13,390,084 |
| HP, Inc. | 381,871 | 6,633,099 |
| Jabil, Inc. | 116,975 | 4,307,019 |
| Juniper Networks, Inc. | 154,519 | 3,835,162 |
| Keysight Technologies, Inc. * | 13,980 | 1,410,722 |
| Motorola Solutions, Inc. | 39,403 | 6,553,507 |
| NCR Corp. * | 44,099 | 1,288,132 |
| NetApp, Inc. | 69,143 | 3,863,711 |
| Sanmina Corp. * | 53,071 | 1,630,872 |
| Seagate Technology plc | 166,192 | 9,644,122 |
| SYNNEX Corp. | 24,516 | 2,886,514 |
| TE Connectivity Ltd. | 69,344 | 6,206,288 |
| Tech Data Corp. * | 36,205 | 4,398,907 |
| Trimble, Inc. * | 29,921 | 1,192,053 |
| Security | Number
of Shares | Value ($) |
| Western Digital Corp. | 139,487 | 7,204,504 |
| Xerox Holdings Corp. | 99,699 | 3,382,787 |
| | | 409,428,203 |
| |
| Telecommunication Services 3.9% |
| AT&T, Inc. | 2,855,003 | 109,889,065 |
| CenturyLink, Inc. | 882,037 | 11,413,559 |
| Frontier Communications Corp. *(b) | 1,860,042 | 1,692,638 |
| Sprint Corp. * | 269,156 | 1,671,459 |
| T-Mobile US, Inc. * | 55,064 | 4,551,590 |
| Telephone & Data Systems, Inc. | 58,399 | 1,523,630 |
| Verizon Communications, Inc. | 1,221,338 | 73,854,309 |
| | | 204,596,250 |
| |
| Transportation 2.1% |
| American Airlines Group, Inc. | 148,487 | 4,463,519 |
| Avis Budget Group, Inc. * | 93,152 | 2,767,546 |
| C.H. Robinson Worldwide, Inc. | 43,102 | 3,260,235 |
| CSX Corp. | 133,272 | 9,365,024 |
| Delta Air Lines, Inc. | 54,441 | 2,998,610 |
| Expeditors International of Washington, Inc. | 46,047 | 3,358,668 |
| FedEx Corp. | 96,586 | 14,744,819 |
| Hertz Global Holdings, Inc. * | 186,186 | 2,515,373 |
| JB Hunt Transport Services, Inc. | 19,503 | 2,292,773 |
| Kansas City Southern | 19,008 | 2,675,946 |
| Kirby Corp. * | 14,640 | 1,158,902 |
| Knight-Swift Transportation Holdings, Inc. | 31,369 | 1,143,714 |
| Landstar System, Inc. | 10,314 | 1,167,029 |
| Macquarie Infrastructure Corp. | 28,200 | 1,216,548 |
| Norfolk Southern Corp. | 50,241 | 9,143,862 |
| Old Dominion Freight Line, Inc. | 8,765 | 1,595,931 |
| Ryder System, Inc. | 45,007 | 2,188,691 |
| Southwest Airlines Co. | 45,763 | 2,568,677 |
| Union Pacific Corp. | 144,919 | 23,978,298 |
| United Airlines Holdings, Inc. * | 25,648 | 2,329,864 |
| United Parcel Service, Inc., Class B | 110,345 | 12,708,434 |
| XPO Logistics, Inc. * | 21,298 | 1,627,167 |
| | | 109,269,630 |
| |
| Utilities 3.6% |
| AES Corp. | 335,076 | 5,713,046 |
| Alliant Energy Corp. | 39,919 | 2,129,279 |
| Ameren Corp. | 51,361 | 3,990,750 |
| American Electric Power Co., Inc. | 106,914 | 10,091,613 |
| American Water Works Co., Inc. | 22,544 | 2,778,999 |
| Atmos Energy Corp. | 16,420 | 1,846,922 |
| CenterPoint Energy, Inc. | 122,767 | 3,568,837 |
| CMS Energy Corp. | 56,423 | 3,606,558 |
| Consolidated Edison, Inc. | 80,701 | 7,442,246 |
| Dominion Energy, Inc. | 128,841 | 10,635,825 |
| DTE Energy Co. | 38,970 | 4,961,660 |
| Duke Energy Corp. | 188,689 | 17,785,825 |
| Edison International | 98,346 | 6,185,963 |
| Entergy Corp. | 51,067 | 6,203,619 |
| Eversource Energy | 62,917 | 5,268,670 |
| Exelon Corp. | 287,639 | 13,084,698 |
| FirstEnergy Corp. | 81,698 | 3,947,647 |
| NextEra Energy, Inc. | 62,107 | 14,802,582 |
| NiSource, Inc. | 63,775 | 1,788,251 |
| NRG Energy, Inc. | 43,461 | 1,743,655 |
| OGE Energy Corp. | 39,272 | 1,691,052 |
| PG&E Corp. * | 511,111 | 3,153,555 |
| Pinnacle West Capital Corp. | 26,261 | 2,471,685 |
| Portland General Electric Co. | 20,528 | 1,167,633 |
Schwab Fundamental Index Funds | Annual Report
Schwab Fundamental US Large Company Index Fund
Portfolio Holdings as of October 31, 2019 (continued)
| Security | Number
of Shares | Value ($) |
| PPL Corp. | 218,737 | 7,325,502 |
| Public Service Enterprise Group, Inc. | 118,299 | 7,489,510 |
| Sempra Energy | 45,710 | 6,605,552 |
| The Southern Co. | 240,885 | 15,093,854 |
| UGI Corp. | 43,846 | 2,090,139 |
| Vistra Energy Corp. | 107,382 | 2,902,536 |
| WEC Energy Group, Inc. | 47,830 | 4,515,152 |
| Xcel Energy, Inc. | 104,669 | 6,647,528 |
| | | 188,730,343 |
| Total Common Stock |
| (Cost $3,386,667,826) | | 5,222,356,553 |
|
| Other Investment Companies0.4% of net assets |
| |
| Money Market Fund 0.1% |
| State Street Institutional U.S. Government Money Market Fund, Premier Class 1.75%(c) | 4,152,873 | 4,152,873 |
| |
| Securities Lending Collateral 0.3% |
| Wells Fargo Government Money Market Fund, Select Class 1.75%(c) | 14,746,015 | 14,746,015 |
| Total Other Investment Companies |
| (Cost $18,898,888) | | 18,898,888 |
| | Number of
Contracts | Notional
Amount
($) | Current Value/
Unrealized
Appreciation
($) |
| Futures Contracts | |
| Long | |
| S&P 500 Index, e-mini, expires 12/20/19 | 93 | 14,116,470 | 328,686 |
| * | Non-income producing security. |
| (a) | Issuer is affiliated with the fund’s investment adviser. |
| (b) | All or a portion of this security is on loan. Securities on loan were valued at $13,611,262. |
| (c) | The rate shown is the 7-day yield. |
Schwab Fundamental Index Funds | Annual Report
Schwab Fundamental US Small Company Index Fund
Portfolio Holdings as of October 31, 2019
This section shows all the securities in the fund’s portfolio and their values as of the report date.
The fund files its complete schedule of portfolio holdings with the U.S. Securities and Exchange Commission (SEC) for the first and third quarters of each fiscal year on Form N-Q. Effective March 31, 2019, Form N-PORT Part F has replaced Form N-Q. The fund’s Form N-Q and Form N-PORT Part F are available on the SEC’s website atwww.sec.gov. The fund also makes available its complete schedule of portfolio holdings 15 to 20 days after the end of the month on the fund’s website atwww.schwabfunds.com/schwabfunds_prospectus.
| Security | Number
of Shares | Value ($) |
| Common Stock99.7% of net assets |
| |
| Automobiles & Components 1.5% |
| American Axle & Manufacturing Holdings, Inc. * | 375,634 | 3,140,300 |
| Cooper-Standard Holding, Inc. * | 74,983 | 2,388,958 |
| Delphi Technologies plc | 273,687 | 3,341,718 |
| Dorman Products, Inc. * | 21,782 | 1,567,215 |
| Garrett Motion, Inc. * | 109,651 | 1,041,685 |
| Gentherm, Inc. * | 35,172 | 1,469,135 |
| LCI Industries | 34,345 | 3,335,587 |
| Modine Manufacturing Co. * | 98,824 | 1,129,558 |
| Standard Motor Products, Inc. | 32,953 | 1,725,419 |
| Stoneridge, Inc. * | 20,476 | 632,299 |
| Superior Industries International, Inc. | 259,937 | 675,836 |
| Tenneco, Inc., Class A | 279,301 | 3,516,400 |
| Tesla, Inc. * | 5,208 | 1,640,103 |
| Veoneer, Inc. * | 85,036 | 1,353,773 |
| Winnebago Industries, Inc. | 46,428 | 2,231,794 |
| | | 29,189,780 |
| |
| Banks 7.3% |
| Associated Banc-Corp. | 121,117 | 2,435,663 |
| Atlantic Union Bankshares Corp. | 28,045 | 1,033,739 |
| BancorpSouth Bank | 51,881 | 1,591,190 |
| Bank of Hawaii Corp. | 29,072 | 2,538,276 |
| Bank OZK | 62,693 | 1,759,166 |
| BankUnited, Inc. | 83,383 | 2,860,037 |
| Banner Corp. | 16,080 | 867,998 |
| BOK Financial Corp. | 21,916 | 1,690,819 |
| Boston Private Financial Holdings, Inc. | 56,719 | 638,089 |
| Capitol Federal Financial, Inc. | 108,259 | 1,544,856 |
| Cathay General Bancorp | 42,858 | 1,524,459 |
| Central Pacific Financial Corp. | 30,280 | 875,698 |
| Columbia Banking System, Inc. | 38,402 | 1,509,199 |
| Commerce Bancshares, Inc. | 47,348 | 3,047,317 |
| Community Bank System, Inc. | 20,365 | 1,380,340 |
| Cullen/Frost Bankers, Inc. | 30,812 | 2,775,545 |
| CVB Financial Corp. | 44,250 | 919,515 |
| East West Bancorp, Inc. | 91,456 | 3,925,291 |
| Essent Group Ltd. | 25,270 | 1,316,314 |
| F.N.B. Corp. | 215,561 | 2,599,666 |
| First BanCorp | 110,145 | 1,158,725 |
| First Citizens BancShares, Inc., Class A | 3,720 | 1,829,942 |
| First Commonwealth Financial Corp. | 67,936 | 957,218 |
| First Financial Bancorp | 39,801 | 932,935 |
| First Financial Bankshares, Inc. | 33,091 | 1,101,268 |
| First Hawaiian, Inc. | 62,060 | 1,696,100 |
| First Horizon National Corp. | 146,514 | 2,339,829 |
| First Midwest Bancorp, Inc. | 51,692 | 1,061,754 |
| Fulton Financial Corp. | 147,179 | 2,510,874 |
| Glacier Bancorp, Inc. | 37,784 | 1,599,019 |
| Great Western Bancorp, Inc. | 40,021 | 1,395,532 |
| Hancock Whitney Corp. | 62,074 | 2,420,886 |
| Hilltop Holdings, Inc. | 38,563 | 900,832 |
| Home BancShares, Inc. | 70,501 | 1,302,858 |
| Hope Bancorp, Inc. | 84,985 | 1,212,736 |
| Security | Number
of Shares | Value ($) |
| IBERIABANK Corp. | 22,622 | 1,660,229 |
| Independent Bank Corp. | 8,266 | 678,473 |
| International Bancshares Corp. | 39,980 | 1,637,581 |
| Investors Bancorp, Inc. | 151,273 | 1,822,840 |
| LegacyTexas Financial Group, Inc. | 15,244 | 648,480 |
| MGIC Investment Corp. | 222,370 | 3,048,693 |
| National Bank Holdings Corp., Class A | 23,071 | 793,642 |
| NBT Bancorp, Inc. | 29,376 | 1,167,696 |
| Northwest Bancshares, Inc. | 70,882 | 1,195,779 |
| Ocwen Financial Corp. * | 895,729 | 1,513,782 |
| OFG Bancorp | 34,664 | 704,026 |
| Old National Bancorp | 92,174 | 1,658,671 |
| PacWest Bancorp | 98,573 | 3,646,215 |
| Park National Corp. | 10,653 | 1,078,616 |
| Pinnacle Financial Partners, Inc. | 14,420 | 848,184 |
| Popular, Inc. | 67,962 | 3,701,211 |
| Prosperity Bancshares, Inc. | 37,354 | 2,578,173 |
| Provident Financial Services, Inc. | 39,367 | 982,207 |
| Radian Group, Inc. | 134,907 | 3,386,166 |
| Signature Bank | 22,015 | 2,604,815 |
| Simmons First National Corp., Class A | 26,583 | 635,865 |
| South State Corp. | 16,154 | 1,273,904 |
| Sterling Bancorp | 38,259 | 751,789 |
| SVB Financial Group * | 17,576 | 3,892,732 |
| Synovus Financial Corp. | 104,661 | 3,544,868 |
| TCF Financial Corp. | 102,957 | 4,076,068 |
| Texas Capital Bancshares, Inc. * | 24,565 | 1,327,984 |
| The Bank of N.T. Butterfield & Son Ltd. | 31,428 | 1,035,553 |
| Trustmark Corp. | 47,465 | 1,628,999 |
| UMB Financial Corp. | 23,949 | 1,562,912 |
| Umpqua Holdings Corp. | 177,468 | 2,807,544 |
| United Bankshares, Inc. | 52,837 | 2,089,175 |
| United Community Banks, Inc. | 37,023 | 1,118,465 |
| Valley National Bancorp | 202,685 | 2,347,092 |
| Walker & Dunlop, Inc. | 24,314 | 1,531,539 |
| Washington Federal, Inc. | 83,936 | 3,060,307 |
| Webster Financial Corp. | 51,481 | 2,270,312 |
| WesBanco, Inc. | 23,850 | 896,521 |
| Westamerica Bancorp | 14,844 | 980,001 |
| Western Alliance Bancorp | 30,553 | 1,507,179 |
| Wintrust Financial Corp. | 27,961 | 1,784,471 |
| Zions Bancorp NA | 89,623 | 4,344,027 |
| | | 139,076,471 |
| |
| Capital Goods 12.5% |
| AAON, Inc. | 21,294 | 1,036,166 |
| AAR Corp. | 69,265 | 2,891,814 |
| Actuant Corp., Class A | 96,567 | 2,391,965 |
| Aegion Corp. * | 86,851 | 1,882,061 |
| Air Lease Corp. | 78,464 | 3,450,847 |
| Aircastle Ltd. | 94,497 | 2,572,208 |
| Alamo Group, Inc. | 12,151 | 1,300,886 |
| Albany International Corp., Class A | 15,807 | 1,327,472 |
| Allegion plc | 30,075 | 3,489,903 |
| Altra Industrial Motion Corp. | 36,862 | 1,135,350 |
| American Woodmark Corp. * | 14,779 | 1,465,486 |
| Apogee Enterprises, Inc. | 46,645 | 1,751,053 |
| Applied Industrial Technologies, Inc. | 66,519 | 3,980,497 |
Schwab Fundamental Index Funds | Annual Report
Schwab Fundamental US Small Company Index Fund
Portfolio Holdings as of October 31, 2019 (continued)
| Security | Number
of Shares | Value ($) |
| Arcosa, Inc. | 112,177 | 4,308,719 |
| Argan, Inc. | 15,164 | 573,957 |
| Armstrong World Industries, Inc. | 28,525 | 2,667,943 |
| Astec Industries, Inc. | 57,840 | 2,029,606 |
| Atkore International Group, Inc. * | 58,972 | 2,046,328 |
| AZZ, Inc. | 35,812 | 1,389,147 |
| Barnes Group, Inc. | 48,322 | 2,824,421 |
| Beacon Roofing Supply, Inc. * | 99,170 | 3,078,237 |
| BMC Stock Holdings, Inc. * | 102,586 | 2,768,796 |
| Briggs & Stratton Corp. | 230,760 | 1,700,701 |
| Builders FirstSource, Inc. * | 99,373 | 2,246,824 |
| BWX Technologies, Inc. | 61,940 | 3,598,714 |
| Caesarstone Ltd. | 39,290 | 663,608 |
| Chart Industries, Inc. * | 18,599 | 1,090,459 |
| Colfax Corp. * | 149,973 | 5,039,093 |
| Comfort Systems USA, Inc. | 40,829 | 2,058,190 |
| Continental Building Products, Inc. * | 26,291 | 786,364 |
| Crane Co. | 43,207 | 3,306,200 |
| Cubic Corp. | 22,713 | 1,674,857 |
| Curtiss-Wright Corp. | 35,843 | 4,847,766 |
| DXP Enterprises, Inc. * | 29,050 | 1,002,806 |
| Dycom Industries, Inc. * | 54,754 | 2,496,235 |
| Encore Wire Corp. | 38,416 | 2,158,979 |
| EnPro Industries, Inc. | 19,766 | 1,374,725 |
| ESCO Technologies, Inc. | 15,584 | 1,316,692 |
| Federal Signal Corp. | 55,881 | 1,812,780 |
| Franklin Electric Co., Inc. | 41,573 | 2,238,706 |
| Gardner Denver Holdings, Inc. * | 24,388 | 776,270 |
| Generac Holdings, Inc. * | 53,511 | 5,168,092 |
| Gibraltar Industries, Inc. * | 28,602 | 1,522,484 |
| GMS, Inc. * | 65,743 | 1,969,660 |
| Graco, Inc. | 85,595 | 3,868,894 |
| Granite Construction, Inc. | 73,405 | 1,727,954 |
| Griffon Corp. | 92,198 | 1,964,739 |
| H&E Equipment Services, Inc. | 70,956 | 2,408,247 |
| Harsco Corp. * | 76,071 | 1,541,959 |
| HEICO Corp. | 7,220 | 890,515 |
| HEICO Corp., Class A | 14,452 | 1,376,842 |
| Herc Holdings, Inc. * | 39,636 | 1,754,289 |
| Hillenbrand, Inc. | 68,418 | 2,106,590 |
| Hyster-Yale Materials Handling, Inc. | 27,370 | 1,388,206 |
| Insteel Industries, Inc. | 30,126 | 574,503 |
| ITT, Inc. | 76,846 | 4,568,495 |
| JELD-WEN Holding, Inc. * | 56,981 | 973,805 |
| John Bean Technologies Corp. | 11,542 | 1,186,171 |
| Kaman Corp. | 29,017 | 1,702,427 |
| Kennametal, Inc. | 95,708 | 2,962,163 |
| Lennox International, Inc. | 16,641 | 4,116,318 |
| Lindsay Corp. | 14,634 | 1,381,596 |
| Lydall, Inc. * | 29,220 | 571,835 |
| Masonite International Corp. * | 45,110 | 2,770,205 |
| MasTec, Inc. * | 79,132 | 4,980,568 |
| Meritor, Inc. * | 66,388 | 1,462,528 |
| Milacron Holdings Corp. * | 86,466 | 1,445,712 |
| Moog, Inc., Class A | 44,269 | 3,705,758 |
| MRC Global, Inc. * | 216,030 | 2,454,101 |
| Mueller Industries, Inc. | 144,446 | 4,444,603 |
| Mueller Water Products, Inc., Class A | 146,687 | 1,716,238 |
| MYR Group, Inc. * | 47,417 | 1,631,619 |
| National Presto Industries, Inc. | 7,614 | 655,489 |
| NOW, Inc. * | 301,178 | 3,174,416 |
| nVent Electric plc | 130,918 | 3,018,969 |
| Patrick Industries, Inc. * | 19,295 | 953,366 |
| Primoris Services Corp. | 91,386 | 1,867,930 |
| Proto Labs, Inc. * | 5,539 | 537,117 |
| Quanex Building Products Corp. | 64,678 | 1,247,639 |
| Raven Industries, Inc. | 28,965 | 1,010,299 |
| RBC Bearings, Inc. * | 8,412 | 1,349,621 |
| Security | Number
of Shares | Value ($) |
| Rexnord Corp. * | 93,059 | 2,632,639 |
| Rush Enterprises, Inc., Class A | 78,253 | 3,418,874 |
| Simpson Manufacturing Co., Inc. | 33,721 | 2,786,703 |
| SiteOne Landscape Supply, Inc. * | 11,942 | 1,051,613 |
| SPX FLOW, Inc. * | 59,024 | 2,672,607 |
| Standex International Corp. | 15,811 | 1,198,158 |
| Teledyne Technologies, Inc. * | 16,879 | 5,563,318 |
| Tennant Co. | 20,259 | 1,568,654 |
| Textainer Group Holdings Ltd. * | 99,033 | 1,024,992 |
| The Greenbrier Cos., Inc. | 108,335 | 3,173,132 |
| The Manitowoc Co., Inc. * | 37,988 | 484,727 |
| The Middleby Corp. * | 28,149 | 3,404,622 |
| Titan International, Inc. | 204,268 | 545,396 |
| Titan Machinery, Inc. * | 65,495 | 1,087,217 |
| Trex Co., Inc. * | 16,560 | 1,455,458 |
| TriMas Corp. * | 37,832 | 1,222,730 |
| Triton International Ltd. | 55,665 | 2,042,905 |
| Triumph Group, Inc. | 98,748 | 2,050,996 |
| Tutor Perini Corp. * | 218,006 | 3,372,553 |
| Univar Solutions, Inc. * | 183,808 | 3,944,520 |
| Universal Forest Products, Inc. | 124,976 | 6,293,791 |
| Vectrus, Inc. * | 18,015 | 823,466 |
| Veritiv Corp. * | 99,913 | 1,362,813 |
| Wabash National Corp. | 181,346 | 2,585,994 |
| Watts Water Technologies, Inc., Class A | 21,463 | 2,001,425 |
| Welbilt, Inc. * | 85,867 | 1,628,038 |
| Woodward, Inc. | 37,140 | 3,961,352 |
| | | 238,063,486 |
| |
| Commercial & Professional Services 5.4% |
| ACCO Brands Corp. | 229,877 | 2,103,375 |
| Advanced Disposal Services, Inc. * | 57,635 | 1,889,275 |
| ASGN, Inc. * | 46,970 | 2,986,822 |
| Brady Corp., Class A | 39,877 | 2,246,670 |
| CBIZ, Inc. * | 46,330 | 1,268,052 |
| Cimpress N.V. * | 10,256 | 1,355,023 |
| Clean Harbors, Inc. * | 55,676 | 4,591,043 |
| Copart, Inc. * | 59,752 | 4,937,905 |
| CoStar Group, Inc. * | 3,479 | 1,911,780 |
| Covanta Holding Corp. | 162,904 | 2,352,334 |
| Deluxe Corp. | 92,832 | 4,811,483 |
| Exponent, Inc. | 16,966 | 1,077,850 |
| FTI Consulting, Inc. * | 34,579 | 3,764,616 |
| Healthcare Services Group, Inc. | 74,883 | 1,824,150 |
| Herman Miller, Inc. | 77,841 | 3,619,606 |
| HNI Corp. | 81,936 | 3,113,568 |
| Huron Consulting Group, Inc. * | 23,505 | 1,554,621 |
| ICF International, Inc. | 18,803 | 1,611,229 |
| InnerWorkings, Inc. * | 132,093 | 640,651 |
| Insperity, Inc. | 11,446 | 1,209,041 |
| Interface, Inc. | 105,336 | 1,751,738 |
| Kelly Services, Inc., Class A | 168,428 | 4,043,956 |
| Kforce, Inc. | 40,147 | 1,642,414 |
| Knoll, Inc. | 68,434 | 1,829,925 |
| Korn Ferry | 46,835 | 1,718,376 |
| Matthews International Corp., Class A | 42,789 | 1,582,337 |
| McGrath RentCorp | 23,149 | 1,766,500 |
| Mobile Mini, Inc. | 39,033 | 1,468,421 |
| MSA Safety, Inc. | 17,412 | 2,090,659 |
| Quad Graphics, Inc. | 166,978 | 756,410 |
| Resources Connection, Inc. | 54,014 | 791,305 |
| Rollins, Inc. | 46,273 | 1,763,464 |
| RR Donnelley & Sons Co. | 801,477 | 3,494,440 |
| SP Plus Corp. * | 39,827 | 1,759,159 |
| Steelcase, Inc., Class A | 184,182 | 3,217,660 |
| Stericycle, Inc. * | 85,768 | 4,940,237 |
| Team, Inc. * | 61,303 | 1,113,262 |
Schwab Fundamental Index Funds | Annual Report
Schwab Fundamental US Small Company Index Fund
Portfolio Holdings as of October 31, 2019 (continued)
| Security | Number
of Shares | Value ($) |
| Tetra Tech, Inc. | 46,487 | 4,066,218 |
| The Brink's Co. | 30,233 | 2,568,596 |
| TransUnion | 44,365 | 3,665,436 |
| TrueBlue, Inc. * | 105,719 | 2,420,965 |
| UniFirst Corp. | 15,858 | 3,184,921 |
| US Ecology, Inc. | 10,549 | 656,464 |
| Viad Corp. | 25,321 | 1,545,087 |
| | | 102,707,044 |
| |
| Consumer Durables & Apparel 4.0% |
| Acushnet Holdings Corp. | 29,123 | 828,549 |
| American Outdoor Brands Corp. * | 162,372 | 1,149,594 |
| Beazer Homes USA, Inc. * | 68,010 | 1,020,830 |
| Callaway Golf Co. | 79,524 | 1,607,975 |
| Cavco Industries, Inc. * | 5,966 | 1,143,384 |
| Columbia Sportswear Co. | 20,107 | 1,818,678 |
| Crocs, Inc. * | 40,574 | 1,419,684 |
| Deckers Outdoor Corp. * | 28,760 | 4,397,404 |
| Ethan Allen Interiors, Inc. | 68,790 | 1,355,851 |
| G-III Apparel Group Ltd. * | 93,053 | 2,336,561 |
| Helen of Troy Ltd. * | 22,845 | 3,421,267 |
| iRobot Corp. *(a) | 13,895 | 667,794 |
| KB Home | 96,460 | 3,442,657 |
| La-Z-Boy, Inc. | 90,899 | 3,227,823 |
| M.D.C. Holdings, Inc. | 69,274 | 2,681,597 |
| M/I Homes, Inc. * | 48,114 | 2,125,677 |
| Meritage Homes Corp. * | 59,742 | 4,306,801 |
| Movado Group, Inc. | 29,172 | 759,931 |
| Oxford Industries, Inc. | 22,335 | 1,537,988 |
| Skechers U.S.A., Inc., Class A * | 136,487 | 5,100,519 |
| Steven Madden Ltd. | 111,610 | 4,596,100 |
| Sturm, Ruger & Co., Inc. | 36,040 | 1,649,190 |
| Taylor Morrison Home Corp. * | 193,112 | 4,837,456 |
| Tempur Sealy International, Inc. * | 39,481 | 3,590,797 |
| TopBuild Corp. * | 36,194 | 3,761,642 |
| TRI Pointe Group, Inc. * | 203,036 | 3,195,787 |
| Tupperware Brands Corp. | 176,542 | 1,700,099 |
| Unifi, Inc. * | 42,369 | 1,156,674 |
| Universal Electronics, Inc. * | 25,965 | 1,353,296 |
| Vista Outdoor, Inc. * | 353,663 | 2,369,542 |
| William Lyon Homes, Class A * | 42,806 | 828,296 |
| Wolverine World Wide, Inc. | 98,603 | 2,926,537 |
| | | 76,315,980 |
| |
| Consumer Services 5.0% |
| Adtalem Global Education, Inc. * | 77,624 | 2,311,643 |
| American Public Education, Inc. * | 31,203 | 677,729 |
| Arcos Dorados Holdings, Inc., Class A | 182,732 | 1,365,008 |
| BJ's Restaurants, Inc. | 34,420 | 1,362,688 |
| Bloomin' Brands, Inc. | 159,389 | 3,157,496 |
| Boyd Gaming Corp. | 85,348 | 2,325,733 |
| Bright Horizons Family Solutions, Inc. * | 19,914 | 2,957,627 |
| Brinker International, Inc. | 102,172 | 4,541,545 |
| Caesars Entertainment Corp. * | 128,939 | 1,583,371 |
| Career Education Corp. * | 56,206 | 795,877 |
| Choice Hotels International, Inc. | 15,104 | 1,336,402 |
| Churchill Downs, Inc. | 20,025 | 2,603,050 |
| Cracker Barrel Old Country Store, Inc. | 20,567 | 3,198,168 |
| Dave & Buster's Entertainment, Inc. | 29,518 | 1,174,226 |
| Denny's Corp. * | 31,078 | 625,289 |
| Dine Brands Global, Inc. | 17,307 | 1,266,007 |
| Dunkin' Brands Group, Inc. | 41,423 | 3,256,676 |
| Eldorado Resorts, Inc. * | 13,975 | 625,661 |
| Extended Stay America, Inc. | 242,284 | 3,442,856 |
| frontdoor, Inc. * | 32,642 | 1,574,324 |
| Graham Holdings Co., Class B | 5,263 | 3,313,901 |
| Security | Number
of Shares | Value ($) |
| Grand Canyon Education, Inc. * | 17,676 | 1,625,485 |
| Hilton Grand Vacations, Inc. * | 61,095 | 2,121,829 |
| Houghton Mifflin Harcourt Co. * | 262,648 | 1,696,706 |
| Hyatt Hotels Corp., Class A | 50,152 | 3,748,360 |
| International Game Technology plc | 268,287 | 3,552,120 |
| Jack in the Box, Inc. | 42,178 | 3,543,796 |
| K12, Inc. * | 55,602 | 1,100,364 |
| Laureate Education, Inc., Class A * | 90,152 | 1,393,299 |
| Marriott Vacations Worldwide Corp. | 36,860 | 4,052,020 |
| Papa John's International, Inc.(a) | 13,779 | 806,760 |
| Penn National Gaming, Inc. * | 143,757 | 3,064,180 |
| Red Rock Resorts, Inc., Class A | 64,095 | 1,395,989 |
| Regis Corp. * | 98,868 | 2,036,681 |
| Scientific Games Corp., Class A * | 48,283 | 1,158,309 |
| SeaWorld Entertainment, Inc. * | 52,617 | 1,390,141 |
| ServiceMaster Global Holdings, Inc. * | 41,673 | 1,682,756 |
| Strategic Education, Inc. | 9,188 | 1,130,400 |
| Texas Roadhouse, Inc. | 55,210 | 3,119,365 |
| The Cheesecake Factory, Inc. | 85,645 | 3,579,105 |
| Vail Resorts, Inc. | 14,738 | 3,424,669 |
| WW International, Inc. * | 40,878 | 1,425,416 |
| Wyndham Hotels & Resorts, Inc. | 77,017 | 4,156,607 |
| | | 94,699,634 |
| |
| Diversified Financials 4.2% |
| Apollo Commercial Real Estate Finance, Inc. | 39,170 | 716,811 |
| Artisan Partners Asset Management, Inc., Class A | 41,580 | 1,137,213 |
| AXA Equitable Holdings, Inc. | 123,563 | 2,668,961 |
| BGC Partners, Inc., Class A | 237,780 | 1,236,456 |
| Blackstone Mortgage Trust, Inc., Class A | 39,445 | 1,431,854 |
| Cannae Holdings, Inc. * | 117,653 | 3,435,468 |
| Capstead Mortgage Corp. | 141,771 | 1,095,890 |
| Cboe Global Markets, Inc. | 34,978 | 4,027,717 |
| Chimera Investment Corp. | 212,744 | 4,310,193 |
| Cohen & Steers, Inc. | 18,753 | 1,227,196 |
| Credit Acceptance Corp. * | 4,974 | 2,177,667 |
| Donnelley Financial Solutions, Inc. * | 80,789 | 912,916 |
| E*TRADE Financial Corp. | 88,671 | 3,705,561 |
| Eaton Vance Corp. | 103,712 | 4,729,267 |
| Encore Capital Group, Inc. * | 26,450 | 877,876 |
| Enova International, Inc. * | 45,506 | 1,068,936 |
| Evercore, Inc., Class A | 40,658 | 2,994,055 |
| Federated Investors, Inc., Class B | 116,112 | 3,708,617 |
| FGL Holdings | 77,811 | 702,633 |
| FirstCash, Inc. | 20,442 | 1,725,100 |
| Green Dot Corp., Class A * | 19,568 | 564,341 |
| Greenhill & Co., Inc. | 63,142 | 1,022,900 |
| Houlihan Lokey, Inc. | 14,094 | 666,082 |
| Invesco Mortgage Capital, Inc. | 120,041 | 1,889,445 |
| Ladder Capital Corp. | 65,740 | 1,135,330 |
| MarketAxess Holdings, Inc. | 5,774 | 2,128,239 |
| MFA Financial, Inc. | 345,167 | 2,619,818 |
| Moelis & Co., Class A | 21,438 | 764,908 |
| Morningstar, Inc. | 9,194 | 1,487,957 |
| Nelnet, Inc., Class A | 25,141 | 1,540,389 |
| New York Mortgage Trust, Inc. | 193,121 | 1,208,938 |
| OneMain Holdings, Inc. | 106,614 | 4,264,560 |
| PennyMac Mortgage Investment Trust | 88,843 | 2,033,616 |
| Piper Jaffray Cos. | 13,283 | 1,043,247 |
| PRA Group, Inc. * | 66,596 | 2,259,602 |
| Redwood Trust, Inc. | 84,247 | 1,376,596 |
| SLM Corp. | 429,289 | 3,623,199 |
| Stifel Financial Corp. | 33,122 | 1,854,170 |
| Two Harbors Investment Corp. | 207,467 | 2,877,567 |
Schwab Fundamental Index Funds | Annual Report
Schwab Fundamental US Small Company Index Fund
Portfolio Holdings as of October 31, 2019 (continued)
| Security | Number
of Shares | Value ($) |
| WisdomTree Investments, Inc. | 115,629 | 590,864 |
| World Acceptance Corp. * | 12,510 | 1,298,663 |
| | | 80,140,818 |
| |
| Energy 3.9% |
| Apergy Corp. * | 54,654 | 1,375,641 |
| Arch Coal, Inc., Class A | 20,454 | 1,613,616 |
| Archrock, Inc. | 194,106 | 1,871,182 |
| Basic Energy Services, Inc. * | 323,350 | 184,309 |
| Cheniere Energy, Inc. * | 10,164 | 625,594 |
| Chesapeake Energy Corp. *(a) | 693,288 | 929,006 |
| Cimarex Energy Co. | 50,927 | 2,150,138 |
| CNX Resources Corp. * | 351,451 | 2,962,732 |
| CONSOL Energy, Inc. * | 55,001 | 727,663 |
| Continental Resources, Inc. * | 54,902 | 1,617,962 |
| Core Laboratories N.V. | 40,536 | 1,785,205 |
| Cosan Ltd., Class A * | 301,816 | 5,076,545 |
| CVR Energy, Inc. | 40,510 | 1,920,984 |
| Delek US Holdings, Inc. | 102,032 | 4,076,178 |
| Denbury Resources, Inc. * | 515,998 | 515,018 |
| Diamond Offshore Drilling, Inc. *(a) | 407,354 | 2,154,903 |
| Diamondback Energy, Inc. | 12,952 | 1,110,763 |
| Dril-Quip, Inc. * | 65,237 | 2,676,022 |
| EQT Corp. | 236,255 | 2,537,379 |
| Equitrans Midstream Corp. | 140,345 | 1,953,602 |
| Exterran Corp. * | 98,214 | 1,244,371 |
| Frank's International N.V. * | 154,024 | 754,718 |
| Green Plains, Inc. | 232,012 | 2,860,708 |
| Helix Energy Solutions Group, Inc. * | 175,567 | 1,508,121 |
| International Seaways, Inc. * | 47,012 | 1,181,882 |
| Kosmos Energy Ltd. | 154,175 | 955,885 |
| Matrix Service Co. * | 67,963 | 1,274,986 |
| McDermott International, Inc. *(a) | 471,758 | 768,966 |
| Newpark Resources, Inc. * | 170,225 | 1,021,350 |
| Oasis Petroleum, Inc. * | 637,468 | 1,663,791 |
| Oil States International, Inc. * | 188,888 | 2,695,432 |
| Par Pacific Holdings, Inc. * | 34,448 | 780,247 |
| Parsley Energy, Inc., Class A | 60,544 | 957,201 |
| PDC Energy, Inc. * | 51,578 | 1,028,981 |
| Peabody Energy Corp. | 92,362 | 972,572 |
| Renewable Energy Group, Inc. * | 102,571 | 1,676,010 |
| REX American Resources Corp. * | 14,443 | 1,168,728 |
| RPC, Inc.(a) | 139,719 | 578,437 |
| SandRidge Energy, Inc. * | 112,920 | 494,590 |
| Scorpio Tankers, Inc. | 56,325 | 1,791,698 |
| SEACOR Holdings, Inc. * | 25,571 | 1,097,252 |
| SemGroup Corp., Class A | 181,005 | 2,914,180 |
| Ship Finance International Ltd. | 108,256 | 1,566,464 |
| Tidewater, Inc. * | 64,118 | 1,040,635 |
| Unit Corp. * | 173,247 | 353,424 |
| US Silica Holdings, Inc. | 128,755 | 574,247 |
| Whiting Petroleum Corp. * | 195,741 | 1,240,998 |
| WPX Energy, Inc. * | 291,858 | 2,912,743 |
| | | 74,943,059 |
| |
| Food & Staples Retailing 0.7% |
| BJ's Wholesale Club Holdings, Inc. * | 44,301 | 1,182,837 |
| Ingles Markets, Inc., Class A | 69,558 | 2,742,672 |
| PriceSmart, Inc. | 45,152 | 3,345,763 |
| Sprouts Farmers Market, Inc. * | 180,263 | 3,498,905 |
| The Andersons, Inc. | 99,346 | 1,829,953 |
| Weis Markets, Inc. | 35,931 | 1,382,984 |
| | | 13,983,114 |
| |
| Security | Number
of Shares | Value ($) |
| Food, Beverage & Tobacco 2.6% |
| Adecoagro S.A. * | 187,283 | 1,110,588 |
| B&G Foods, Inc.(a) | 93,441 | 1,453,008 |
| Cal-Maine Foods, Inc. | 52,136 | 2,079,705 |
| Calavo Growers, Inc. | 12,439 | 1,078,834 |
| Coca-Cola Consolidated, Inc. | 1,974 | 541,587 |
| Darling Ingredients, Inc. * | 202,770 | 3,913,461 |
| Fresh Del Monte Produce, Inc. | 135,203 | 4,312,976 |
| J&J Snack Foods Corp. | 10,907 | 2,080,619 |
| John B. Sanfilippo & Son, Inc. | 13,808 | 1,465,305 |
| Keurig Dr Pepper, Inc. | 61,415 | 1,729,446 |
| Lamb Weston Holdings, Inc. | 42,482 | 3,315,295 |
| Lancaster Colony Corp. | 14,343 | 1,996,259 |
| Nomad Foods Ltd. * | 137,566 | 2,683,913 |
| Pilgrim's Pride Corp. * | 109,818 | 3,334,074 |
| Post Holdings, Inc. * | 32,639 | 3,358,553 |
| Pyxus International, Inc. * | 41,444 | 473,290 |
| The Boston Beer Co., Inc., Class A * | 5,260 | 1,969,660 |
| The Hain Celestial Group, Inc. * | 125,941 | 2,977,245 |
| TreeHouse Foods, Inc. * | 68,083 | 3,677,844 |
| Universal Corp. | 72,727 | 3,985,440 |
| Vector Group Ltd. | 170,706 | 2,082,613 |
| | | 49,619,715 |
| |
| Health Care Equipment & Services 3.7% |
| ABIOMED, Inc. * | 2,397 | 497,569 |
| Acadia Healthcare Co., Inc. * | 81,492 | 2,443,945 |
| Align Technology, Inc. * | 11,464 | 2,892,253 |
| Allscripts Healthcare Solutions, Inc. * | 155,140 | 1,697,232 |
| Amedisys, Inc. * | 10,046 | 1,291,112 |
| AMN Healthcare Services, Inc. * | 30,168 | 1,772,672 |
| Avanos Medical, Inc. * | 34,558 | 1,521,934 |
| Brookdale Senior Living, Inc. * | 478,786 | 3,519,077 |
| Cantel Medical Corp. | 12,904 | 940,573 |
| Chemed Corp. | 9,334 | 3,676,756 |
| Community Health Systems, Inc. * | 1,384,721 | 4,901,912 |
| CONMED Corp. | 14,775 | 1,625,545 |
| Diplomat Pharmacy, Inc. * | 260,911 | 1,419,356 |
| Globus Medical, Inc., Class A * | 24,956 | 1,306,946 |
| Haemonetics Corp. * | 14,455 | 1,745,152 |
| Hill-Rom Holdings, Inc. | 31,030 | 3,248,531 |
| HMS Holdings Corp. * | 33,764 | 1,103,745 |
| ICU Medical, Inc. * | 3,039 | 491,133 |
| IDEXX Laboratories, Inc. * | 8,986 | 2,561,100 |
| Integer Holdings Corp. * | 13,482 | 1,044,046 |
| Integra LifeSciences Holdings Corp. * | 17,944 | 1,041,829 |
| Invacare Corp. | 152,761 | 1,179,315 |
| LHC Group, Inc. * | 9,888 | 1,097,271 |
| LivaNova plc * | 13,576 | 960,230 |
| Masimo Corp. * | 14,654 | 2,136,407 |
| Merit Medical Systems, Inc. * | 14,108 | 291,401 |
| Neogen Corp. * | 9,440 | 614,166 |
| NextGen Healthcare, Inc. * | 51,078 | 863,474 |
| NuVasive, Inc. * | 23,376 | 1,648,943 |
| Orthofix Medical, Inc. * | 10,138 | 426,100 |
| Pennant Group, Inc. * | 13,651 | 245,581 |
| Premier, Inc., Class A * | 29,057 | 946,677 |
| Select Medical Holdings Corp. * | 173,100 | 3,153,882 |
| Teleflex, Inc. | 12,890 | 4,478,115 |
| The Ensign Group, Inc. | 27,302 | 1,153,509 |
| The Providence Service Corp. * | 17,288 | 1,104,185 |
| Tivity Health, Inc. * | 65,729 | 1,065,467 |
| Triple-S Management Corp., Class B * | 101,091 | 1,529,507 |
| Varex Imaging Corp. * | 43,608 | 1,308,676 |
Schwab Fundamental Index Funds | Annual Report
Schwab Fundamental US Small Company Index Fund
Portfolio Holdings as of October 31, 2019 (continued)
| Security | Number
of Shares | Value ($) |
| Veeva Systems, Inc., Class A * | 4,429 | 628,165 |
| West Pharmaceutical Services, Inc. | 26,961 | 3,878,070 |
| | | 69,451,559 |
| |
| Household & Personal Products 0.9% |
| Avon Products, Inc. * | 1,100,846 | 4,722,629 |
| Central Garden & Pet Co., Class A * | 51,414 | 1,453,988 |
| Edgewell Personal Care Co. * | 92,918 | 3,252,130 |
| Energizer Holdings, Inc. | 34,663 | 1,472,831 |
| Spectrum Brands Holdings, Inc. | 64,613 | 3,244,219 |
| USANA Health Sciences, Inc. * | 13,293 | 985,144 |
| WD-40 Co. | 5,926 | 1,110,532 |
| | | 16,241,473 |
| |
| Insurance 2.6% |
| Ambac Financial Group, Inc. * | 92,046 | 1,886,943 |
| American Equity Investment Life Holding Co. | 140,941 | 3,478,424 |
| American National Insurance Co. | 7,531 | 903,569 |
| AMERISAFE, Inc. | 15,733 | 999,518 |
| Argo Group International Holdings Ltd. | 29,845 | 1,846,510 |
| Brighthouse Financial, Inc. * | 84,236 | 3,180,751 |
| Brown & Brown, Inc. | 126,639 | 4,771,758 |
| CNA Financial Corp. | 34,384 | 1,541,779 |
| Employers Holdings, Inc. | 22,169 | 938,636 |
| Enstar Group Ltd. * | 5,634 | 1,131,871 |
| Horace Mann Educators Corp. | 32,389 | 1,410,865 |
| James River Group Holdings Ltd. | 36,446 | 1,305,131 |
| Kemper Corp. | 38,210 | 2,746,535 |
| MBIA, Inc. * | 341,383 | 3,171,448 |
| Mercury General Corp. | 35,036 | 1,683,830 |
| National General Holdings Corp. | 44,904 | 957,353 |
| Primerica, Inc. | 35,968 | 4,538,442 |
| ProAssurance Corp. | 95,701 | 3,753,393 |
| RLI Corp. | 17,917 | 1,743,683 |
| Safety Insurance Group, Inc. | 13,372 | 1,299,758 |
| Selective Insurance Group, Inc. | 32,598 | 2,253,174 |
| Stewart Information Services Corp. | 52,885 | 2,164,054 |
| United Fire Group, Inc. | 16,772 | 763,461 |
| Universal Insurance Holdings, Inc. | 35,876 | 972,598 |
| | | 49,443,484 |
| |
| Materials 6.8% |
| AdvanSix, Inc. * | 61,230 | 1,393,595 |
| AK Steel Holding Corp. * | 706,506 | 1,667,354 |
| Allegheny Technologies, Inc. * | 116,975 | 2,457,645 |
| Axalta Coating Systems Ltd. * | 147,421 | 4,347,445 |
| Balchem Corp. | 12,777 | 1,293,160 |
| Boise Cascade Co. | 125,848 | 4,501,583 |
| Cabot Corp. | 100,760 | 4,392,128 |
| Carpenter Technology Corp. | 74,255 | 3,639,980 |
| Century Aluminum Co. * | 145,314 | 847,181 |
| Clearwater Paper Corp. * | 110,747 | 2,053,249 |
| Cleveland-Cliffs, Inc.(a) | 343,769 | 2,485,450 |
| Compass Minerals International, Inc. | 52,874 | 2,986,323 |
| Constellium SE * | 105,009 | 1,399,770 |
| Eagle Materials, Inc. | 34,852 | 3,183,382 |
| Element Solutions, Inc. * | 225,859 | 2,452,829 |
| Ferro Corp. * | 54,275 | 604,081 |
| GCP Applied Technologies, Inc. * | 53,838 | 1,112,293 |
| Greif, Inc., Class A | 64,792 | 2,537,903 |
| H.B. Fuller Co. | 58,518 | 2,855,678 |
| Hecla Mining Co. | 589,097 | 1,354,923 |
| Ingevity Corp. * | 15,912 | 1,339,950 |
| Innophos Holdings, Inc. | 65,083 | 2,123,007 |
| Security | Number
of Shares | Value ($) |
| Innospec, Inc. | 23,271 | 2,126,039 |
| Kaiser Aluminum Corp. | 25,382 | 2,717,905 |
| Kraton Corp. * | 46,259 | 1,037,127 |
| Louisiana-Pacific Corp. | 139,998 | 4,092,142 |
| Materion Corp. | 30,100 | 1,710,884 |
| Mercer International, Inc. | 44,873 | 547,451 |
| Minerals Technologies, Inc. | 44,198 | 2,185,591 |
| Myers Industries, Inc. | 35,400 | 599,322 |
| Neenah, Inc. | 22,033 | 1,421,128 |
| NewMarket Corp. | 7,769 | 3,771,772 |
| Nexa Resources S.A. | 102,611 | 1,096,912 |
| PolyOne Corp. | 141,995 | 4,550,940 |
| Quaker Chemical Corp. | 7,020 | 1,073,218 |
| Rayonier Advanced Materials, Inc. | 199,448 | 831,698 |
| Resolute Forest Products, Inc. | 280,691 | 1,016,101 |
| Royal Gold, Inc. | 17,104 | 1,974,486 |
| Schnitzer Steel Industries, Inc., Class A | 95,147 | 2,030,437 |
| Schweitzer-Mauduit International, Inc. | 55,274 | 2,238,044 |
| Sensient Technologies Corp. | 52,422 | 3,279,520 |
| Silgan Holdings, Inc. | 123,476 | 3,799,356 |
| Southern Copper Corp. | 81,883 | 2,913,397 |
| Stepan Co. | 26,071 | 2,547,658 |
| Summit Materials, Inc., Class A * | 108,529 | 2,488,570 |
| SunCoke Energy, Inc. * | 160,532 | 849,214 |
| The Chemours Co. | 188,741 | 3,097,240 |
| The Scotts Miracle-Gro Co. | 40,262 | 4,041,902 |
| Trinseo S.A. | 95,949 | 4,077,832 |
| Tronox Holdings plc, Class A * | 232,579 | 1,974,596 |
| US Concrete, Inc. * | 14,335 | 749,147 |
| Valvoline, Inc. | 95,144 | 2,030,373 |
| Verso Corp., Class A * | 91,843 | 1,344,582 |
| W.R. Grace & Co. | 49,918 | 3,317,051 |
| Warrior Met Coal, Inc. | 86,437 | 1,683,793 |
| Westlake Chemical Corp. | 41,586 | 2,627,819 |
| Worthington Industries, Inc. | 83,805 | 3,084,862 |
| | | 129,957,018 |
| |
| Media & Entertainment 3.3% |
| AMC Entertainment Holdings, Inc., Class A(a) | 148,458 | 1,391,051 |
| AMC Networks, Inc., Class A * | 58,916 | 2,565,792 |
| Cable One, Inc. | 1,568 | 2,078,180 |
| Cars.com, Inc. * | 115,288 | 1,303,907 |
| Gannett Co., Inc. | 380,450 | 4,127,882 |
| Gray Television, Inc. * | 59,352 | 973,966 |
| John Wiley & Sons, Inc., Class A | 57,962 | 2,670,309 |
| Liberty Latin America Ltd., Class A * | 39,624 | 740,573 |
| Liberty Latin America Ltd., Class C * | 104,963 | 1,932,369 |
| Liberty Media Corp. - Liberty Formula One, Class A * | 5,101 | 206,233 |
| Liberty Media Corp. - Liberty Formula One, Class C * | 40,693 | 1,729,453 |
| Liberty TripAdvisor Holdings, Inc., Class A * | 82,840 | 799,406 |
| Lions Gate Entertainment Corp., Class A * | 30,384 | 242,768 |
| Lions Gate Entertainment Corp., Class B * | 60,844 | 455,722 |
| Live Nation Entertainment, Inc. * | 48,619 | 3,427,639 |
| Meredith Corp. | 49,099 | 1,851,032 |
| MSG Networks, Inc., Class A * | 34,143 | 553,458 |
| National CineMedia, Inc. | 194,513 | 1,632,937 |
| New Media Investment Group, Inc.(a) | 152,707 | 1,345,349 |
| Nexstar Media Group, Inc., Class A | 22,128 | 2,152,833 |
| Scholastic Corp. | 58,811 | 2,264,224 |
| Sinclair Broadcast Group, Inc., Class A | 79,492 | 3,166,961 |
| Sirius XM Holdings, Inc. | 517,624 | 3,478,433 |
| Take-Two Interactive Software, Inc. * | 27,451 | 3,303,728 |
| TEGNA, Inc. | 319,756 | 4,805,933 |
Schwab Fundamental Index Funds | Annual Report
Schwab Fundamental US Small Company Index Fund
Portfolio Holdings as of October 31, 2019 (continued)
| Security | Number
of Shares | Value ($) |
| The Madison Square Garden Co., Class A * | 6,817 | 1,819,594 |
| The New York Times Co., Class A | 57,065 | 1,763,309 |
| TripAdvisor, Inc. * | 54,315 | 2,194,326 |
| Twitter, Inc. * | 53,804 | 1,612,506 |
| Yandex N.V., Class A * | 88,434 | 2,952,811 |
| Yelp, Inc. * | 23,367 | 806,395 |
| Zynga, Inc., Class A * | 334,116 | 2,061,496 |
| | | 62,410,575 |
| |
| Pharmaceuticals, Biotechnology & Life Sciences 2.1% |
| Alkermes plc * | 25,012 | 488,484 |
| Bio-Rad Laboratories, Inc., Class A * | 9,332 | 3,094,678 |
| Bio-Techne Corp. | 9,532 | 1,984,276 |
| BioMarin Pharmaceutical, Inc. * | 11,261 | 824,418 |
| Bruker Corp. | 46,810 | 2,083,045 |
| Cambrex Corp. * | 22,322 | 1,333,293 |
| Catalent, Inc. * | 53,748 | 2,614,840 |
| Charles River Laboratories International, Inc. * | 20,251 | 2,632,225 |
| Emergent BioSolutions, Inc. * | 15,703 | 897,584 |
| ICON plc * | 27,466 | 4,034,755 |
| Incyte Corp. * | 6,740 | 565,621 |
| Jazz Pharmaceuticals plc * | 30,506 | 3,832,469 |
| Myriad Genetics, Inc. * | 98,519 | 3,317,135 |
| PDL BioPharma, Inc. * | 704,077 | 1,985,497 |
| PerkinElmer, Inc. | 48,180 | 4,141,553 |
| PRA Health Sciences, Inc. * | 14,133 | 1,380,935 |
| Prestige Consumer Healthcare, Inc. * | 45,574 | 1,616,054 |
| Syneos Health, Inc. * | 18,677 | 936,652 |
| Taro Pharmaceutical Industries Ltd. | 13,011 | 1,051,809 |
| Vertex Pharmaceuticals, Inc. * | 4,946 | 966,844 |
| | | 39,782,167 |
| |
| Real Estate 10.8% |
| Acadia Realty Trust | 37,502 | 1,049,306 |
| Alexander & Baldwin, Inc. | 73,950 | 1,738,564 |
| Altisource Portfolio Solutions S.A. * | 46,626 | 829,943 |
| American Assets Trust, Inc. | 16,832 | 824,095 |
| American Campus Communities, Inc. | 84,667 | 4,231,657 |
| American Homes 4 Rent, Class A | 71,197 | 1,884,585 |
| Apartment Investment & Management Co., Class A | 85,552 | 4,695,094 |
| Apple Hospitality REIT, Inc. | 249,784 | 4,116,440 |
| Brandywine Realty Trust | 175,427 | 2,680,525 |
| Brookfield Property REIT, Inc., Class A | 80,507 | 1,521,582 |
| Chatham Lodging Trust | 36,549 | 659,709 |
| Colony Capital, Inc. | 597,081 | 3,343,654 |
| Columbia Property Trust, Inc. | 132,279 | 2,714,365 |
| CorePoint Lodging, Inc. | 114,412 | 1,126,958 |
| CoreSite Realty Corp. | 7,028 | 825,790 |
| Corporate Office Properties Trust | 85,810 | 2,543,408 |
| Cousins Properties, Inc. | 65,605 | 2,632,729 |
| CubeSmart | 71,079 | 2,253,204 |
| CyrusOne, Inc. | 28,118 | 2,004,251 |
| DiamondRock Hospitality Co. | 263,798 | 2,632,704 |
| Douglas Emmett, Inc. | 70,248 | 3,043,143 |
| EastGroup Properties, Inc. | 11,426 | 1,530,513 |
| Empire State Realty Trust, Inc., Class A | 81,190 | 1,174,819 |
| EPR Properties | 31,782 | 2,472,322 |
| Equity Commonwealth | 62,399 | 2,008,000 |
| Equity LifeStyle Properties, Inc. | 52,252 | 3,654,505 |
| Extra Space Storage, Inc. | 37,481 | 4,207,992 |
| Federal Realty Investment Trust | 30,506 | 4,149,121 |
| First Industrial Realty Trust, Inc. | 46,308 | 1,950,030 |
| Franklin Street Properties Corp. | 179,556 | 1,544,182 |
| Security | Number
of Shares | Value ($) |
| Front Yard Residential Corp. | 73,027 | 903,344 |
| Gaming & Leisure Properties, Inc. | 85,466 | 3,449,408 |
| Global Net Lease, Inc. | 32,730 | 637,580 |
| Healthcare Realty Trust, Inc. | 67,808 | 2,357,684 |
| Healthcare Trust of America, Inc., Class A | 84,384 | 2,615,904 |
| Hersha Hospitality Trust | 67,064 | 925,483 |
| Highwoods Properties, Inc. | 75,825 | 3,548,610 |
| HomeBanc Corp. *(b) | 6,875 | — |
| Hudson Pacific Properties, Inc. | 57,092 | 2,050,745 |
| Investors Real Estate Trust | 15,821 | 1,197,175 |
| Invitation Homes, Inc. | 61,193 | 1,884,132 |
| iStar, Inc. | 86,968 | 1,131,454 |
| JBG SMITH Properties | 22,753 | 916,036 |
| Kennedy-Wilson Holdings, Inc. | 62,895 | 1,447,214 |
| Kilroy Realty Corp. | 38,695 | 3,247,671 |
| Kite Realty Group Trust | 90,746 | 1,617,094 |
| Lexington Realty Trust | 213,064 | 2,318,136 |
| Liberty Property Trust | 86,535 | 5,111,622 |
| Life Storage, Inc. | 21,537 | 2,345,810 |
| LTC Properties, Inc. | 12,441 | 645,066 |
| Mack-Cali Realty Corp. | 99,180 | 2,124,436 |
| Medical Properties Trust, Inc. | 133,301 | 2,763,330 |
| National Health Investors, Inc. | 13,744 | 1,179,098 |
| National Retail Properties, Inc. | 51,386 | 3,027,149 |
| Newmark Group, Inc., Class A | 66,112 | 702,109 |
| Office Properties Income Trust | 53,122 | 1,693,529 |
| Omega Healthcare Investors, Inc. | 99,465 | 4,380,439 |
| Paramount Group, Inc. | 148,552 | 2,000,995 |
| Pebblebrook Hotel Trust | 95,610 | 2,458,133 |
| Physicians Realty Trust | 37,848 | 706,622 |
| Piedmont Office Realty Trust, Inc., Class A | 163,296 | 3,664,362 |
| PotlatchDeltic Corp. | 33,200 | 1,410,004 |
| PS Business Parks, Inc. | 8,240 | 1,487,732 |
| QTS Realty Trust, Inc., Class A | 24,801 | 1,329,086 |
| Rayonier, Inc. | 117,903 | 3,181,023 |
| Regency Centers Corp. | 49,545 | 3,331,406 |
| Retail Opportunity Investments Corp. | 57,902 | 1,080,741 |
| Retail Properties of America, Inc., Class A | 264,882 | 3,644,776 |
| RLJ Lodging Trust | 209,454 | 3,437,140 |
| RPT Realty | 89,744 | 1,301,288 |
| Ryman Hospitality Properties, Inc. | 30,034 | 2,527,962 |
| Sabra Health Care REIT, Inc. | 64,800 | 1,594,080 |
| SBA Communications Corp. | 17,181 | 4,134,608 |
| Seritage Growth Properties, Class A | 21,744 | 945,647 |
| SITE Centers Corp. | 239,497 | 3,719,388 |
| Spirit Realty Capital, Inc. | 72,102 | 3,593,564 |
| STAG Industrial, Inc. | 36,907 | 1,145,593 |
| STORE Capital Corp. | 40,621 | 1,645,151 |
| Summit Hotel Properties, Inc. | 109,971 | 1,348,244 |
| Sun Communities, Inc. | 23,631 | 3,843,582 |
| Sunstone Hotel Investors, Inc. | 268,057 | 3,621,450 |
| Tanger Factory Outlet Centers, Inc.(a) | 114,135 | 1,839,856 |
| Taubman Centers, Inc. | 67,363 | 2,410,248 |
| The GEO Group, Inc. | 187,131 | 2,848,134 |
| The Howard Hughes Corp. * | 12,077 | 1,350,450 |
| The St. Joe Co. * | 34,837 | 646,226 |
| Uniti Group, Inc. | 310,304 | 2,147,304 |
| Urban Edge Properties | 74,303 | 1,568,536 |
| Washington Prime Group, Inc.(a) | 795,748 | 3,358,057 |
| Washington Real Estate Investment Trust | 61,741 | 1,915,206 |
| Weingarten Realty Investors | 95,414 | 3,027,486 |
| Xenia Hotels & Resorts, Inc. | 166,264 | 3,499,857 |
| | | 206,027,385 |
| |
| Retailing 3.6% |
| Asbury Automotive Group, Inc. * | 54,369 | 5,607,075 |
| Ascena Retail Group, Inc. * | 3,705,205 | 1,304,973 |
Schwab Fundamental Index Funds | Annual Report
Schwab Fundamental US Small Company Index Fund
Portfolio Holdings as of October 31, 2019 (continued)
| Security | Number
of Shares | Value ($) |
| Barnes & Noble Education, Inc. * | 364,857 | 1,499,562 |
| Big 5 Sporting Goods Corp.(a) | 378,962 | 1,212,678 |
| Burlington Stores, Inc. * | 16,988 | 3,264,584 |
| Caleres, Inc. | 129,438 | 2,785,506 |
| Citi Trends, Inc. | 50,189 | 895,874 |
| Conn's, Inc. * | 42,745 | 1,034,002 |
| Five Below, Inc. * | 12,348 | 1,544,858 |
| Genesco, Inc. * | 94,602 | 3,675,288 |
| GNC Holdings, Inc., Class A *(a) | 1,937,302 | 5,114,477 |
| Groupon, Inc. * | 715,395 | 1,988,798 |
| GrubHub, Inc. * | 10,059 | 342,610 |
| Guess?, Inc. | 167,959 | 2,813,313 |
| Haverty Furniture Cos., Inc. | 62,268 | 1,129,541 |
| Hibbett Sports, Inc. * | 116,481 | 2,779,237 |
| Kirkland's, Inc. *(a) | 184,729 | 291,872 |
| MercadoLibre, Inc. * | 1,915 | 998,711 |
| Monro, Inc. | 20,543 | 1,440,270 |
| National Vision Holdings, Inc. * | 24,721 | 588,360 |
| Ollie's Bargain Outlet Holdings, Inc. * | 12,446 | 795,050 |
| Overstock.com, Inc. * | 41,553 | 437,553 |
| Party City Holdco, Inc. *(a) | 182,694 | 1,026,740 |
| Pier 1 Imports, Inc. * | 144,273 | 812,257 |
| Pool Corp. | 18,779 | 3,894,765 |
| Rent-A-Center, Inc. | 87,964 | 2,275,629 |
| RH * | 19,887 | 3,613,468 |
| Shoe Carnival, Inc. | 35,489 | 1,177,880 |
| Sleep Number Corp. * | 49,585 | 2,386,030 |
| Stamps.com, Inc. * | 9,790 | 826,570 |
| The Buckle, Inc. | 118,486 | 2,478,727 |
| The Cato Corp., Class A | 116,856 | 2,043,811 |
| The Children's Place, Inc. | 26,062 | 2,134,738 |
| The Michaels Cos., Inc. * | 241,257 | 2,106,174 |
| Vitamin Shoppe, Inc. * | 132,009 | 852,778 |
| Zumiez, Inc. * | 54,753 | 1,747,168 |
| | | 68,920,927 |
| |
| Semiconductors & Semiconductor Equipment 2.7% |
| Advanced Energy Industries, Inc. * | 24,856 | 1,468,990 |
| Advanced Micro Devices, Inc. * | 37,425 | 1,269,830 |
| Amkor Technology, Inc. * | 306,046 | 3,804,152 |
| Brooks Automation, Inc. | 33,028 | 1,402,699 |
| Cabot Microelectronics Corp. | 11,482 | 1,735,160 |
| Cirrus Logic, Inc. * | 75,255 | 5,114,330 |
| Cree, Inc. * | 84,692 | 4,042,349 |
| Cypress Semiconductor Corp. | 197,765 | 4,601,991 |
| Diodes, Inc. * | 32,193 | 1,501,803 |
| Entegris, Inc. | 54,731 | 2,627,088 |
| Kulicke & Soffa Industries, Inc. | 71,078 | 1,687,747 |
| Mellanox Technologies Ltd. * | 9,576 | 1,079,215 |
| MKS Instruments, Inc. | 31,893 | 3,451,460 |
| Monolithic Power Systems, Inc. | 7,016 | 1,051,839 |
| Photronics, Inc. * | 120,455 | 1,421,369 |
| Power Integrations, Inc. | 15,519 | 1,413,936 |
| Rambus, Inc. * | 54,883 | 759,855 |
| Semtech Corp. * | 21,565 | 1,088,170 |
| Silicon Laboratories, Inc. * | 16,432 | 1,745,736 |
| Synaptics, Inc. * | 72,587 | 3,056,639 |
| Teradyne, Inc. | 91,844 | 5,622,690 |
| Xperi Corp. | 67,851 | 1,377,715 |
| | | 51,324,763 |
| |
| Software & Services 4.6% |
| ACI Worldwide, Inc. * | 64,083 | 2,011,565 |
| Aspen Technology, Inc. * | 16,940 | 1,949,963 |
| Black Knight, Inc. * | 49,369 | 3,169,490 |
| Blackbaud, Inc. | 8,006 | 672,104 |
| Security | Number
of Shares | Value ($) |
| Cardtronics plc, Class A * | 42,828 | 1,467,287 |
| Cerence, Inc. * | 18,110 | 280,705 |
| CommVault Systems, Inc. * | 22,269 | 1,106,101 |
| CoreLogic, Inc. * | 87,504 | 3,543,037 |
| CSG Systems International, Inc. | 34,841 | 2,008,235 |
| Ebix, Inc. | 13,511 | 575,974 |
| EPAM Systems, Inc. * | 11,277 | 1,984,301 |
| Euronet Worldwide, Inc. * | 17,644 | 2,471,395 |
| EVERTEC, Inc. | 38,700 | 1,183,833 |
| ExlService Holdings, Inc. * | 19,687 | 1,370,806 |
| Fair Isaac Corp. * | 9,393 | 2,855,848 |
| Fortinet, Inc. * | 13,396 | 1,092,578 |
| Gartner, Inc. * | 25,728 | 3,964,170 |
| Genpact Ltd. | 126,592 | 4,958,609 |
| GoDaddy, Inc., Class A * | 9,790 | 636,644 |
| InterXion Holding N.V. * | 16,559 | 1,460,835 |
| j2 Global, Inc. | 29,375 | 2,789,450 |
| KBR, Inc. | 178,676 | 5,031,516 |
| LiveRamp Holdings, Inc. * | 32,174 | 1,257,682 |
| LogMeIn, Inc. | 10,873 | 714,139 |
| Manhattan Associates, Inc. * | 35,292 | 2,645,135 |
| ManTech International Corp., Class A | 35,946 | 2,846,204 |
| MAXIMUS, Inc. | 52,763 | 4,049,033 |
| MicroStrategy, Inc., Class A * | 6,825 | 1,045,931 |
| Net 1 UEPS Technologies, Inc. * | 178,880 | 524,118 |
| NIC, Inc. | 33,857 | 796,317 |
| Nuance Communications, Inc. * | 145,615 | 2,376,437 |
| Perficient, Inc. * | 30,379 | 1,190,857 |
| Presidio, Inc. | 45,446 | 754,404 |
| Progress Software Corp. | 47,123 | 1,879,265 |
| PTC, Inc. * | 26,937 | 1,802,355 |
| Science Applications International Corp. | 43,305 | 3,577,859 |
| SS&C Technologies Holdings, Inc. | 45,463 | 2,364,531 |
| Sykes Enterprises, Inc. * | 69,882 | 2,159,004 |
| TiVo Corp. | 171,351 | 1,394,797 |
| Tyler Technologies, Inc. * | 6,054 | 1,625,620 |
| Unisys Corp. * | 117,057 | 1,201,005 |
| Verint Systems, Inc. * | 29,361 | 1,332,696 |
| Virtusa Corp. * | 13,148 | 490,157 |
| VMware, Inc., Class A | 22,619 | 3,579,909 |
| WEX, Inc. * | 11,279 | 2,133,761 |
| | | 88,325,662 |
| |
| Technology Hardware & Equipment 4.6% |
| ADTRAN, Inc. | 140,204 | 1,235,197 |
| Arista Networks, Inc. * | 5,893 | 1,441,251 |
| AVX Corp. | 63,196 | 968,163 |
| Badger Meter, Inc. | 11,688 | 675,567 |
| Belden, Inc. | 57,382 | 2,942,549 |
| Benchmark Electronics, Inc. | 150,997 | 5,118,798 |
| Ciena Corp. * | 64,413 | 2,391,011 |
| Cognex Corp. | 42,027 | 2,163,970 |
| Coherent, Inc. * | 15,084 | 2,246,309 |
| Comtech Telecommunications Corp. | 38,958 | 1,361,582 |
| CTS Corp. | 19,754 | 527,037 |
| Dolby Laboratories, Inc., Class A | 34,028 | 2,189,021 |
| EchoStar Corp., Class A * | 69,050 | 2,692,950 |
| ePlus, Inc. * | 19,439 | 1,518,769 |
| Fabrinet * | 26,704 | 1,501,566 |
| Fitbit, Inc., Class A * | 283,842 | 1,754,144 |
| II-VI, Inc. * | 60,393 | 2,002,028 |
| Insight Enterprises, Inc. * | 86,493 | 5,308,940 |
| InterDigital, Inc. | 36,962 | 1,982,272 |
| IPG Photonics Corp. * | 15,882 | 2,132,635 |
| Itron, Inc. * | 29,482 | 2,248,297 |
| KEMET Corp. | 34,787 | 756,269 |
| Knowles Corp. * | 110,981 | 2,394,970 |
Schwab Fundamental Index Funds | Annual Report
Schwab Fundamental US Small Company Index Fund
Portfolio Holdings as of October 31, 2019 (continued)
| Security | Number
of Shares | Value ($) |
| Littelfuse, Inc. | 10,998 | 1,930,919 |
| Lumentum Holdings, Inc. * | 25,261 | 1,582,854 |
| Methode Electronics, Inc. | 62,535 | 2,151,204 |
| MTS Systems Corp. | 17,571 | 992,410 |
| National Instruments Corp. | 62,788 | 2,598,795 |
| NETGEAR, Inc. * | 37,835 | 1,027,977 |
| NetScout Systems, Inc. * | 116,294 | 2,816,641 |
| OSI Systems, Inc. * | 16,230 | 1,610,665 |
| PC Connection, Inc. | 28,949 | 1,413,869 |
| Plantronics, Inc. | 51,026 | 2,011,445 |
| Plexus Corp. * | 54,311 | 4,015,755 |
| Rogers Corp. * | 9,324 | 1,263,216 |
| ScanSource, Inc. * | 102,065 | 3,296,700 |
| Stratasys Ltd. * | 26,814 | 554,514 |
| TTM Technologies, Inc. * | 191,725 | 2,245,100 |
| ViaSat, Inc. * | 29,963 | 2,062,653 |
| Viavi Solutions, Inc. * | 80,196 | 1,279,928 |
| Vishay Intertechnology, Inc. | 200,958 | 4,049,304 |
| Zebra Technologies Corp., Class A * | 12,074 | 2,872,042 |
| | | 87,329,286 |
| |
| Telecommunication Services 0.7% |
| ATN International, Inc. | 8,904 | 527,384 |
| Cogent Communications Holdings, Inc. | 21,399 | 1,254,837 |
| Consolidated Communications Holdings, Inc. | 321,158 | 1,284,632 |
| GCI Liberty, Inc., Class A * | 22,590 | 1,580,848 |
| Intelsat S.A. * | 81,492 | 2,069,082 |
| Iridium Communications, Inc. * | 43,083 | 1,054,241 |
| Shenandoah Telecommunications Co. | 21,765 | 699,962 |
| United States Cellular Corp. * | 24,994 | 930,277 |
| Vonage Holdings Corp. * | 125,256 | 1,223,751 |
| Zayo Group Holdings, Inc. * | 98,089 | 3,348,759 |
| | | 13,973,773 |
| |
| Transportation 2.6% |
| Air Transport Services Group, Inc. * | 59,406 | 1,242,180 |
| Alaska Air Group, Inc. | 75,045 | 5,210,374 |
| Allegiant Travel Co. | 9,465 | 1,583,778 |
| AMERCO | 7,082 | 2,868,493 |
| ArcBest Corp. | 88,622 | 2,560,290 |
| Copa Holdings S.A., Class A | 22,140 | 2,252,524 |
| Costamare, Inc. | 171,169 | 1,345,388 |
| Daseke, Inc. * | 547,505 | 1,472,788 |
| Echo Global Logistics, Inc. * | 57,530 | 1,145,422 |
| Forward Air Corp. | 29,468 | 2,038,302 |
| Genesee & Wyoming, Inc., Class A * | 40,794 | 4,529,358 |
| Hawaiian Holdings, Inc. | 45,181 | 1,292,628 |
| Heartland Express, Inc. | 55,107 | 1,151,736 |
| Hub Group, Inc., Class A * | 87,220 | 3,994,676 |
| JetBlue Airways Corp. * | 260,248 | 5,022,786 |
| Marten Transport Ltd. | 56,328 | 1,220,065 |
| Saia, Inc. * | 29,362 | 2,619,090 |
| Schneider National, Inc., Class B | 73,704 | 1,685,611 |
| Seaspan Corp.(a) | 162,093 | 1,757,088 |
| Spirit Airlines, Inc. * | 30,978 | 1,163,534 |
| Werner Enterprises, Inc. | 82,973 | 3,028,515 |
| YRC Worldwide, Inc. * | 265,342 | 888,896 |
| | | 50,073,522 |
| |
| Utilities 3.6% |
| ALLETE, Inc. | 39,774 | 3,422,950 |
| American States Water Co. | 19,098 | 1,816,793 |
| Aqua America, Inc. | 85,844 | 3,891,308 |
| Atlantica Yield plc | 53,893 | 1,293,971 |
| Security | Number
of Shares | Value ($) |
| Avangrid, Inc. | 38,669 | 1,935,383 |
| Avista Corp. | 76,820 | 3,689,665 |
| Black Hills Corp. | 39,726 | 3,131,601 |
| California Water Service Group | 25,953 | 1,452,589 |
| Chesapeake Utilities Corp. | 9,909 | 939,373 |
| Clearway Energy, Inc., Class A | 17,021 | 292,251 |
| Clearway Energy, Inc., Class C | 34,932 | 633,317 |
| El Paso Electric Co. | 38,802 | 2,588,481 |
| Hawaiian Electric Industries, Inc. | 105,504 | 4,763,506 |
| IDACORP, Inc. | 34,318 | 3,693,303 |
| MGE Energy, Inc. | 22,461 | 1,730,395 |
| National Fuel Gas Co. | 69,458 | 3,147,142 |
| New Jersey Resources Corp. | 69,175 | 3,016,030 |
| Northwest Natural Holding Co. | 24,165 | 1,676,084 |
| NorthWestern Corp. | 43,853 | 3,180,220 |
| ONE Gas, Inc. | 37,194 | 3,453,091 |
| Ormat Technologies, Inc. | 22,178 | 1,697,948 |
| Otter Tail Corp. | 32,849 | 1,861,881 |
| Pattern Energy Group, Inc., Class A | 62,860 | 1,761,966 |
| PNM Resources, Inc. | 75,556 | 3,940,245 |
| South Jersey Industries, Inc. | 66,536 | 2,139,798 |
| Southwest Gas Holdings, Inc. | 47,363 | 4,134,790 |
| Spire, Inc. | 35,094 | 2,950,002 |
| Unitil Corp. | 10,755 | 669,714 |
| | | 68,903,797 |
| Total Common Stock |
| (Cost $1,533,827,819) | | 1,900,904,492 |
|
| Rights0.0% of net assets |
| |
| Materials 0.0% |
| A. Schulman, Inc. CVR *(b) | 38,533 | 16,685 |
| Total Rights |
| (Cost $16,685) | | 16,685 |
|
| Other Investment Companies1.5% of net assets |
| |
| Money Market Fund 0.2% |
| State Street Institutional U.S. Government Money Market Fund, Premier Class 1.75%(c) | 4,074,391 | 4,074,391 |
| |
| Securities Lending Collateral 1.3% |
| Wells Fargo Government Money Market Fund, Select Class 1.75%(c) | 24,789,589 | 24,789,589 |
| Total Other Investment Companies |
| (Cost $28,863,980) | | 28,863,980 |
Schwab Fundamental Index Funds | Annual Report
Schwab Fundamental US Small Company Index Fund
Portfolio Holdings as of October 31, 2019 (continued)
| | Number of
Contracts | Notional
Amount
($) | Current Value/
Unrealized
Appreciation
($) |
| Futures Contracts | |
| Long | |
| Russell 2000 Index, e-mini, expires 12/20/19 | 92 | 7,191,640 | 198,320 |
| * | Non-income producing security. |
| (a) | All or a portion of this security is on loan. Securities on loan were valued at $22,993,967. |
| (b) | Fair-valued by management using significant unobservable inputs in accordance with procedures approved by the fund’s Board of Trustees. |
| (c) | The rate shown is the 7-day yield. |
| | |
| CVR — | Contingent Value Rights |
| REIT — | Real Estate Investment Trust |
Schwab Fundamental Index Funds | Annual Report
Schwab Fundamental International Large Company Index Fund
Portfolio Holdings as of October 31, 2019
This section shows all the securities in the fund’s portfolio and their values as of the report date.
The fund files its complete schedule of portfolio holdings with the U.S. Securities and Exchange Commission (SEC) for the first and third quarters of each fiscal year on Form N-Q. Effective March 31, 2019, Form N-PORT Part F has replaced Form N-Q. The fund’s Form N-Q and Form N-PORT Part F are available on the SEC’s website atwww.sec.gov. The fund also makes available its complete schedule of portfolio holdings 15 to 20 days after the end of the month on the fund’s website atwww.schwabfunds.com/schwabfunds_prospectus.
| Security | Number
of Shares | Value ($) |
| Common Stock98.4% of net assets |
| |
| Australia 5.5% |
| AGL Energy Ltd. | 65,872 | 899,193 |
| Amcor plc | 95,769 | 917,025 |
| AMP Ltd. | 951,128 | 1,201,788 |
| APA Group | 59,524 | 478,112 |
| Aurizon Holdings Ltd. | 218,473 | 888,800 |
| Australia & New Zealand Banking Group Ltd. | 273,257 | 5,021,673 |
| Bendigo & Adelaide Bank Ltd. | 43,826 | 321,643 |
| BGP Holdings plc *(a) | 453,854 | 626 |
| BHP Group Ltd. | 272,663 | 6,683,639 |
| BlueScope Steel Ltd. | 67,792 | 620,580 |
| Boral Ltd. | 119,550 | 415,068 |
| Brambles Ltd. | 101,338 | 837,766 |
| Caltex Australia Ltd. | 69,531 | 1,307,086 |
| CIMIC Group Ltd. | 9,810 | 223,559 |
| Coca-Cola Amatil Ltd. | 53,845 | 377,865 |
| Coles Group Ltd. | 78,609 | 813,514 |
| Commonwealth Bank of Australia | 130,350 | 7,067,589 |
| Crown Resorts Ltd. | 40,616 | 348,916 |
| CSL Ltd. | 10,158 | 1,791,427 |
| Downer EDI Ltd. | 94,683 | 526,632 |
| Fortescue Metals Group Ltd. | 208,365 | 1,275,323 |
| Goodman Group | 35,241 | 349,917 |
| GrainCorp Ltd., Class A | 49,252 | 245,440 |
| Incitec Pivot Ltd. | 159,714 | 380,030 |
| Insurance Australia Group Ltd. | 181,319 | 993,460 |
| LendLease Group | 75,433 | 975,025 |
| Macquarie Group Ltd. | 15,400 | 1,421,996 |
| Medibank Pvt Ltd. | 247,349 | 576,502 |
| Metcash Ltd. | 315,563 | 613,425 |
| Mirvac Group | 230,727 | 511,263 |
| National Australia Bank Ltd. | 272,381 | 5,346,603 |
| Newcrest Mining Ltd. | 19,171 | 418,471 |
| Oil Search Ltd. | 42,412 | 209,315 |
| Orica Ltd. | 39,531 | 624,736 |
| Origin Energy Ltd. | 198,842 | 1,078,013 |
| QBE Insurance Group Ltd. | 119,481 | 1,039,531 |
| Ramsay Health Care Ltd. | 6,580 | 310,909 |
| Rio Tinto Ltd. | 34,283 | 2,143,818 |
| Scentre Group | 236,630 | 625,211 |
| Sims Metal Management Ltd. | 37,890 | 243,858 |
| Sonic Healthcare Ltd. | 28,325 | 557,860 |
| South32 Ltd. | 226,378 | 396,146 |
| Stockland | 184,285 | 622,141 |
| Suncorp Group Ltd. | 153,011 | 1,420,630 |
| Tabcorp Holdings Ltd. | 93,788 | 310,780 |
| Telstra Corp., Ltd. | 785,973 | 1,892,972 |
| Transurban Group | 52,530 | 538,009 |
| Viva Energy Group Ltd. | 218,490 | 300,934 |
| Wesfarmers Ltd. | 159,019 | 4,369,033 |
| Westpac Banking Corp. | 324,269 | 6,295,840 |
| Woodside Petroleum Ltd. | 78,311 | 1,735,643 |
| Security | Number
of Shares | Value ($) |
| Woolworths Group Ltd. | 170,014 | 4,384,002 |
| Worley Ltd. | 36,972 | 347,028 |
| | | 73,296,365 |
| |
| Austria 0.3% |
| ANDRITZ AG | 6,346 | 285,356 |
| Erste Group Bank AG * | 25,661 | 907,574 |
| OMV AG | 22,629 | 1,322,928 |
| Raiffeisen Bank International AG | 16,369 | 403,320 |
| voestalpine AG | 27,599 | 692,532 |
| Wienerberger AG | 11,748 | 318,202 |
| | | 3,929,912 |
| |
| Belgium 0.8% |
| Ageas | 20,977 | 1,209,758 |
| Anheuser-Busch InBev S.A./N.V. | 49,255 | 3,975,735 |
| Colruyt S.A. | 5,985 | 332,685 |
| Groupe Bruxelles Lambert S.A. | 7,862 | 789,784 |
| KBC Group N.V. | 23,118 | 1,625,525 |
| Proximus | 19,523 | 599,957 |
| Solvay S.A. | 8,407 | 914,059 |
| UCB S.A. | 5,111 | 411,941 |
| Umicore S.A. | 18,182 | 750,553 |
| | | 10,609,997 |
| |
| Canada 6.4% |
| Agnico-Eagle Mines Ltd. | 8,995 | 552,840 |
| Air Canada * | 9,900 | 352,524 |
| Alimentation Couche-Tard, Inc., Class B | 58,180 | 1,744,826 |
| AltaGas Ltd. | 22,200 | 322,946 |
| ARC Resources Ltd. | 71,472 | 302,797 |
| Atco Ltd., Class I | 10,789 | 379,266 |
| Bank of Montreal | 41,461 | 3,069,203 |
| Barrick Gold Corp. | 46,670 | 810,728 |
| Bausch Health Cos., Inc. * | 37,609 | 934,871 |
| BCE, Inc. | 29,022 | 1,376,733 |
| Brookfield Asset Management, Inc., Class A | 42,232 | 2,335,249 |
| Cameco Corp. | 29,167 | 260,424 |
| Canadian Imperial Bank of Commerce | 29,638 | 2,527,252 |
| Canadian National Railway Co. | 35,417 | 3,167,658 |
| Canadian Natural Resources Ltd. | 102,745 | 2,590,662 |
| Canadian Pacific Railway Ltd. | 7,050 | 1,603,178 |
| Canadian Tire Corp., Ltd., Class A | 8,076 | 870,633 |
| Celestica, Inc. * | 37,366 | 270,649 |
| Cenovus Energy, Inc. | 172,695 | 1,471,140 |
| CGI, Inc. * | 13,192 | 1,025,432 |
| CI Financial Corp. | 33,315 | 484,890 |
| Crescent Point Energy Corp. | 279,471 | 1,020,618 |
| Dollarama, Inc. | 12,900 | 433,983 |
| Empire Co., Ltd., Class A | 27,300 | 724,836 |
| Enbridge, Inc. | 73,086 | 2,661,860 |
| Encana Corp. | 97,568 | 382,242 |
| Fairfax Financial Holdings Ltd. | 1,250 | 529,573 |
Schwab Fundamental Index Funds | Annual Report
Schwab Fundamental International Large Company Index Fund
Portfolio Holdings as of October 31, 2019 (continued)
| Security | Number
of Shares | Value ($) |
| Finning International, Inc. | 22,417 | 381,758 |
| First Quantum Minerals Ltd. | 61,070 | 516,065 |
| Fortis, Inc. | 22,336 | 927,967 |
| George Weston Ltd. | 10,194 | 816,155 |
| Gibson Energy, Inc. | 19,553 | 340,853 |
| Gildan Activewear, Inc. | 11,700 | 298,918 |
| Great-West Lifeco, Inc. | 19,454 | 473,094 |
| H&R Real Estate Investment Trust | 20,800 | 351,852 |
| Husky Energy, Inc. | 70,221 | 490,497 |
| Hydro One Ltd. | 26,900 | 500,175 |
| Imperial Oil Ltd. | 31,041 | 773,020 |
| Intact Financial Corp. | 6,106 | 630,025 |
| Inter Pipeline Ltd. | 27,974 | 469,596 |
| Keyera Corp. | 14,600 | 338,424 |
| Linamar Corp. | 8,600 | 280,442 |
| Loblaw Cos., Ltd. | 18,543 | 988,885 |
| Magna International, Inc. | 66,427 | 3,571,756 |
| Manulife Financial Corp. | 118,100 | 2,199,524 |
| Methanex Corp. | 8,300 | 314,519 |
| Metro, Inc. | 20,294 | 858,231 |
| National Bank of Canada | 19,533 | 1,008,758 |
| Nutrien Ltd. | 17,200 | 822,847 |
| Onex Corp. | 9,665 | 568,188 |
| Open Text Corp. | 6,700 | 270,727 |
| Pembina Pipeline Corp. | 20,778 | 731,513 |
| Power Corp. of Canada | 57,644 | 1,333,983 |
| Power Financial Corp. | 26,714 | 624,699 |
| RioCan Real Estate Investment Trust | 17,500 | 351,169 |
| Rogers Communications, Inc., Class B | 22,741 | 1,070,662 |
| Royal Bank of Canada | 76,144 | 6,141,932 |
| Saputo, Inc. | 16,875 | 489,427 |
| Shaw Communications, Inc., Class B | 40,944 | 835,604 |
| SNC-Lavalin Group, Inc. | 29,840 | 539,435 |
| Sun Life Financial, Inc. | 35,075 | 1,573,595 |
| Suncor Energy, Inc. | 153,937 | 4,576,853 |
| TC Energy Corp. | 42,994 | 2,167,164 |
| Teck Resources Ltd., Class B | 54,068 | 854,677 |
| TELUS Corp. | 20,771 | 738,836 |
| TFI International, Inc. | 8,500 | 270,856 |
| The Bank of Nova Scotia | 83,615 | 4,795,594 |
| The Toronto-Dominion Bank | 87,752 | 5,010,878 |
| Thomson Reuters Corp. | 18,517 | 1,244,355 |
| TransAlta Corp. | 56,921 | 336,228 |
| Waste Connections, Inc. | 4,700 | 434,137 |
| West Fraser Timber Co., Ltd. | 8,800 | 406,894 |
| WSP Global, Inc. | 5,700 | 355,649 |
| | | 85,283,429 |
| |
| Denmark 0.9% |
| AP Moeller - Maersk A/S, Series A | 843 | 1,012,650 |
| AP Moeller - Maersk A/S, Series B | 1,187 | 1,514,139 |
| Carlsberg A/S, Class B | 6,252 | 880,433 |
| Coloplast A/S, Class B | 3,182 | 383,100 |
| Danske Bank A/S | 70,764 | 1,011,255 |
| DSV PANALPINA A/S | 8,488 | 824,941 |
| ISS A/S | 24,321 | 636,754 |
| Maersk Drilling A/S * | 4,231 | 238,833 |
| Novo Nordisk A/S, Class B | 63,743 | 3,505,144 |
| Novozymes A/S, B Shares | 9,167 | 432,128 |
| Orsted A/S | 5,471 | 480,199 |
| Pandora A/S | 10,993 | 540,922 |
| Vestas Wind Systems A/S | 10,539 | 858,589 |
| | | 12,319,087 |
| |
| Security | Number
of Shares | Value ($) |
| Finland 1.0% |
| Elisa Oyj | 8,161 | 445,723 |
| Fortum Oyj | 33,147 | 810,034 |
| Kesko Oyj, B Shares | 10,730 | 714,919 |
| Kone Oyj, Class B | 18,348 | 1,168,323 |
| Metso Oyj | 9,256 | 350,402 |
| Neste Oyj | 24,378 | 880,837 |
| Nokia Oyj | 373,003 | 1,369,297 |
| Nokian Renkaat Oyj | 13,091 | 374,129 |
| Nordea Bank Abp | 268,055 | 1,961,851 |
| Outokumpu Oyj | 98,068 | 278,651 |
| Sampo Oyj, A Shares | 28,043 | 1,149,198 |
| Stora Enso Oyj, R Shares | 73,892 | 959,984 |
| UPM-Kymmene Oyj | 57,769 | 1,881,504 |
| Wartsila Oyj Abp | 33,795 | 357,036 |
| | | 12,701,888 |
| |
| France 9.2% |
| Accor S.A. | 9,573 | 411,769 |
| Air France-KLM * | 46,687 | 556,531 |
| Air Liquide S.A. | 24,557 | 3,265,124 |
| Airbus SE | 16,011 | 2,296,910 |
| Alstom S.A. | 13,286 | 574,795 |
| Arkema S.A. | 8,873 | 908,044 |
| Atos SE | 9,376 | 727,639 |
| AXA S.A. | 190,183 | 5,034,375 |
| BNP Paribas S.A. | 133,971 | 7,001,263 |
| Bollore S.A. | 70,119 | 303,781 |
| Bollore S.A. New * | 444 | 1,892 |
| Bouygues S.A. | 34,981 | 1,483,826 |
| Bureau Veritas S.A. | 15,509 | 396,512 |
| Capgemini SE | 9,567 | 1,078,489 |
| Carrefour S.A. | 145,001 | 2,468,722 |
| Casino Guichard Perrachon S.A.(b) | 23,180 | 1,250,493 |
| CGG S.A. * | 179,843 | 419,244 |
| CNP Assurances | 15,031 | 298,354 |
| Compagnie de Saint-Gobain | 97,380 | 3,966,087 |
| Compagnie Generale des Etablissements Michelin | 18,215 | 2,217,807 |
| Credit Agricole S.A. | 105,179 | 1,372,412 |
| Danone S.A. | 30,628 | 2,537,261 |
| Dassault Systemes SE | 1,950 | 296,160 |
| Eiffage S.A. | 8,489 | 911,770 |
| Electricite de France S.A. | 99,627 | 1,029,228 |
| Engie S.A. | 279,050 | 4,672,629 |
| EssilorLuxottica S.A. | 7,238 | 1,105,201 |
| Eurazeo SE | 6,079 | 424,183 |
| Eutelsat Communications S.A. | 17,270 | 327,610 |
| Faurecia SE | 15,489 | 722,843 |
| Hermes International | 477 | 343,608 |
| Iliad S.A. | 2,441 | 252,974 |
| Ingenico Group S.A. | 3,469 | 370,944 |
| Kering S.A. | 1,909 | 1,086,214 |
| Klepierre S.A. | 9,860 | 367,534 |
| L'Oreal S.A. | 8,169 | 2,385,852 |
| Lagardere S.C.A. | 20,870 | 466,352 |
| Legrand S.A. | 13,086 | 1,022,331 |
| LVMH Moet Hennessy Louis Vuitton SE | 8,356 | 3,568,477 |
| Natixis S.A. | 88,708 | 407,553 |
| Orange S.A. | 296,681 | 4,774,929 |
| Pernod-Ricard S.A. | 7,254 | 1,340,054 |
| Peugeot S.A. | 79,804 | 2,021,125 |
| Publicis Groupe S.A. | 17,008 | 731,999 |
| Rallye S.A. | 75,916 | 706,987 |
| Renault S.A. | 39,566 | 2,020,197 |
Schwab Fundamental Index Funds | Annual Report
Schwab Fundamental International Large Company Index Fund
Portfolio Holdings as of October 31, 2019 (continued)
| Security | Number
of Shares | Value ($) |
| Rexel S.A. | 93,855 | 1,163,568 |
| Rubis SCA | 4,228 | 245,172 |
| Safran S.A. | 10,539 | 1,669,271 |
| Sanofi | 83,804 | 7,725,645 |
| Schneider Electric SE | 43,042 | 4,000,339 |
| SCOR SE | 14,160 | 597,256 |
| SES S.A. | 33,322 | 645,944 |
| Societe Generale S.A. | 175,541 | 4,992,193 |
| Sodexo S.A. | 7,052 | 775,498 |
| STMicroelectronics N.V. | 28,848 | 654,743 |
| Suez | 53,804 | 839,210 |
| TechnipFMC plc | 32,592 | 648,849 |
| Teleperformance | 1,854 | 420,642 |
| Thales S.A. | 4,293 | 419,682 |
| TOTAL S.A. | 321,513 | 16,997,811 |
| Valeo S.A. | 43,482 | 1,619,299 |
| Veolia Environnement S.A. | 68,576 | 1,805,178 |
| Vinci S.A. | 34,286 | 3,846,760 |
| Vivendi S.A. | 77,073 | 2,146,298 |
| Wendel S.A. | 2,878 | 408,092 |
| | | 121,549,534 |
| |
| Germany 8.1% |
| adidas AG | 7,140 | 2,204,623 |
| Allianz SE | 33,187 | 8,105,014 |
| Aurubis AG | 14,220 | 699,148 |
| BASF SE | 132,474 | 10,070,568 |
| Bayer AG | 90,017 | 6,983,174 |
| Bayerische Motoren Werke AG | 66,937 | 5,125,680 |
| Beiersdorf AG | 3,601 | 426,319 |
| Brenntag AG | 18,773 | 940,907 |
| Commerzbank AG | 203,899 | 1,220,080 |
| Continental AG | 17,004 | 2,277,529 |
| Covestro AG | 25,072 | 1,204,005 |
| Daimler AG | 186,459 | 10,899,061 |
| Deutsche Bank AG | 288,369 | 2,091,174 |
| Deutsche Boerse AG | 4,859 | 752,463 |
| Deutsche Lufthansa AG | 56,223 | 973,962 |
| Deutsche Pfandbriefbank AG | 23,029 | 314,722 |
| Deutsche Post AG | 119,814 | 4,244,415 |
| Deutsche Telekom AG | 406,294 | 7,148,970 |
| Deutsche Wohnen SE | 6,128 | 231,040 |
| E.ON SE | 310,266 | 3,128,867 |
| Evonik Industries AG | 22,349 | 588,984 |
| Freenet AG | 20,255 | 449,818 |
| Fresenius Medical Care AG & Co. KGaA | 16,990 | 1,226,331 |
| Fresenius SE & Co. KGaA | 38,812 | 2,043,656 |
| GEA Group AG | 19,951 | 609,909 |
| Hannover Rueck SE | 3,861 | 684,184 |
| HeidelbergCement AG | 18,992 | 1,408,029 |
| Henkel AG & Co. KGaA | 7,136 | 686,611 |
| Hugo Boss AG | 7,165 | 302,094 |
| Infineon Technologies AG | 48,679 | 942,852 |
| K&S AG | 34,488 | 489,729 |
| KION Group AG | 5,383 | 358,173 |
| Kloeckner & Co. SE | 42,921 | 247,965 |
| LANXESS AG | 10,927 | 710,028 |
| Leoni AG * | 17,153 | 203,189 |
| Merck KGaA | 5,657 | 674,690 |
| METRO AG | 44,424 | 725,417 |
| MTU Aero Engines AG | 1,720 | 459,981 |
| Muenchener Rueckversicherungs-Gesellschaft AG | 12,810 | 3,559,125 |
| OSRAM Licht AG | 13,684 | 610,470 |
| ProSiebenSat.1 Media SE | 40,396 | 596,510 |
| Security | Number
of Shares | Value ($) |
| Rheinmetall AG | 3,307 | 398,846 |
| RTL Group S.A. | 5,231 | 265,803 |
| RWE AG | 102,759 | 3,131,525 |
| Salzgitter AG | 14,641 | 265,486 |
| SAP SE | 30,852 | 4,087,935 |
| Siemens AG | 69,389 | 8,007,490 |
| Symrise AG | 3,611 | 347,042 |
| Telefonica Deutschland Holding AG | 107,309 | 340,494 |
| ThyssenKrupp AG | 57,711 | 822,993 |
| Uniper SE | 56,525 | 1,761,689 |
| United Internet AG | 8,807 | 265,869 |
| Volkswagen AG | 5,921 | 1,119,307 |
| Vonovia SE | 12,814 | 682,408 |
| | | 108,116,353 |
| |
| Hong Kong 1.6% |
| AIA Group Ltd. | 280,800 | 2,796,268 |
| BOC Hong Kong (Holdings) Ltd. | 204,000 | 700,867 |
| China Mengniu Dairy Co., Ltd. * | 103,000 | 410,635 |
| CK Asset Holdings Ltd. | 133,500 | 928,854 |
| CK Hutchison Holdings Ltd. | 175,500 | 1,620,405 |
| CLP Holdings Ltd. | 110,000 | 1,142,396 |
| Galaxy Entertainment Group Ltd. | 85,000 | 585,279 |
| Hang Seng Bank Ltd. | 28,100 | 586,309 |
| Henderson Land Development Co., Ltd. | 53,300 | 266,211 |
| Hong Kong & China Gas Co., Ltd. | 224,208 | 435,166 |
| Hong Kong Exchanges & Clearing Ltd. | 13,121 | 408,772 |
| Hongkong Land Holdings Ltd. | 50,300 | 276,318 |
| Jardine Matheson Holdings Ltd. | 15,000 | 855,165 |
| Jardine Strategic Holdings Ltd. | 12,790 | 413,012 |
| Lenovo Group Ltd. | 978,000 | 681,806 |
| Li & Fung Ltd. | 4,036,000 | 441,380 |
| Link REIT | 36,500 | 397,536 |
| MTR Corp., Ltd. | 76,364 | 437,855 |
| New World Development Co., Ltd. | 516,689 | 739,090 |
| Noble Group Ltd. *(a) | 18,617,693 | 205,274 |
| PCCW Ltd. | 595,000 | 353,379 |
| Sands China Ltd. | 144,000 | 709,289 |
| Sino Land Co., Ltd. | 174,000 | 260,107 |
| SJM Holdings Ltd. | 300,000 | 320,472 |
| Sun Hung Kai Properties Ltd. | 88,000 | 1,333,491 |
| Swire Pacific Ltd., Class A | 63,300 | 603,393 |
| Swire Pacific Ltd., Class B | 101,251 | 149,520 |
| Techtronic Industries Co., Ltd. | 51,000 | 398,566 |
| The Wharf Holdings Ltd. | 213,000 | 483,351 |
| Want Want China Holdings Ltd. | 375,000 | 315,903 |
| WH Group Ltd. | 1,024,500 | 1,081,403 |
| Wharf Real Estate Investment Co., Ltd. | 39,000 | 229,387 |
| Wheelock & Co., Ltd. | 75,000 | 463,845 |
| Yue Yuen Industrial Holdings Ltd. | 134,000 | 377,637 |
| | | 21,408,341 |
| |
| Ireland 0.1% |
| Bank of Ireland Group plc | 78,439 | 378,079 |
| Kerry Group plc, Class A | 4,617 | 558,188 |
| | | 936,267 |
| |
| Israel 0.2% |
| Bank Hapoalim B.M. | 63,568 | 508,776 |
| Bank Leumi Le-Israel B.M. | 62,643 | 456,307 |
| Bezeq The Israeli Telecommunication Corp., Ltd. * | 651,735 | 430,024 |
Schwab Fundamental Index Funds | Annual Report
Schwab Fundamental International Large Company Index Fund
Portfolio Holdings as of October 31, 2019 (continued)
| Security | Number
of Shares | Value ($) |
| Israel Chemicals Ltd. | 78,499 | 348,933 |
| Teva Pharmaceutical Industries Ltd. * | 119,001 | 974,791 |
| | | 2,718,831 |
| |
| Italy 3.4% |
| A2A S.p.A. | 155,007 | 311,173 |
| Assicurazioni Generali S.p.A. | 124,816 | 2,530,954 |
| Atlantia S.p.A. | 40,206 | 993,326 |
| Banco BPM S.p.A. * | 190,681 | 434,059 |
| BPER Banca | 73,443 | 328,568 |
| CNH Industrial N.V. | 108,416 | 1,180,396 |
| Enel S.p.A. | 1,041,366 | 8,070,959 |
| Eni S.p.A. | 510,251 | 7,741,010 |
| EXOR N.V. | 37,411 | 2,868,077 |
| Fiat Chrysler Automobiles N.V. | 224,877 | 3,489,813 |
| Hera S.p.A. | 81,111 | 347,456 |
| Intesa Sanpaolo S.p.A. | 1,705,811 | 4,274,462 |
| Leonardo S.p.A. | 42,667 | 495,688 |
| Mediobanca Banca di Credito Finanziario S.p.A. | 34,258 | 407,373 |
| Pirelli & C S.p.A. | 43,605 | 252,076 |
| Poste Italiane S.p.A | 38,558 | 468,341 |
| Prysmian S.p.A. | 24,252 | 561,004 |
| Saipem S.p.A. * | 78,888 | 358,076 |
| Saras S.p.A. | 171,161 | 328,700 |
| Snam S.p.A. | 154,925 | 795,370 |
| Telecom Italia S.p.A. * | 3,379,766 | 1,978,156 |
| Tenaris S.A. | 45,316 | 459,726 |
| Terna - Rete Elettrica Nationale S.p.A. | 76,198 | 503,623 |
| UniCredit S.p.A. | 353,659 | 4,486,883 |
| Unione di Banche Italiane S.p.A. | 191,951 | 584,735 |
| Unipol Gruppo S.p.A. | 78,985 | 440,820 |
| | | 44,690,824 |
| |
| Japan 24.8% |
| Aeon Co., Ltd. | 82,900 | 1,667,977 |
| AGC, Inc. | 36,500 | 1,283,342 |
| Air Water, Inc. | 23,100 | 432,455 |
| Aisin Seiki Co., Ltd. | 41,300 | 1,648,275 |
| Ajinomoto Co., Inc. | 47,700 | 906,881 |
| Alfresa Holdings Corp. | 27,900 | 622,975 |
| Alps Alpine Co., Ltd. | 29,700 | 636,727 |
| Amada Holdings Co., Ltd. | 32,000 | 364,419 |
| ANA Holdings, Inc. | 15,400 | 528,812 |
| Asahi Group Holdings Ltd. | 24,500 | 1,226,897 |
| Asahi Kasei Corp. | 160,900 | 1,786,206 |
| Asics Corp. | 21,000 | 360,535 |
| Astellas Pharma, Inc. | 137,300 | 2,356,437 |
| Bandai Namco Holdings, Inc. | 12,700 | 780,912 |
| Bic Camera, Inc. | 22,300 | 243,473 |
| Bridgestone Corp. | 92,300 | 3,835,056 |
| Brother Industries Ltd. | 33,100 | 622,082 |
| Canon, Inc. | 132,300 | 3,630,274 |
| Casio Computer Co., Ltd. | 23,100 | 374,995 |
| Central Japan Railway Co. | 12,300 | 2,523,149 |
| Chubu Electric Power Co., Inc. | 118,400 | 1,776,265 |
| Chugai Pharmaceutical Co., Ltd. | 4,500 | 378,701 |
| Citizen Watch Co., Ltd. | 53,400 | 283,904 |
| Coca-Cola Bottlers Japan Holdings, Inc. | 13,900 | 315,586 |
| COMSYS Holdings Corp. | 11,400 | 336,313 |
| Concordia Financial Group Ltd. | 98,600 | 402,084 |
| Cosmo Energy Holdings Co., Ltd. | 19,200 | 410,580 |
| Dai Nippon Printing Co., Ltd. | 52,100 | 1,391,513 |
| Dai-ichi Life Holdings, Inc. | 104,400 | 1,701,658 |
| Security | Number
of Shares | Value ($) |
| Daicel Corp. | 49,400 | 441,608 |
| Daido Steel Co., Ltd. | 7,300 | 318,558 |
| Daiichi Sankyo Co., Ltd. | 27,900 | 1,834,531 |
| Daikin Industries Ltd. | 14,100 | 1,973,430 |
| Daito Trust Construction Co., Ltd. | 6,600 | 874,635 |
| Daiwa House Industry Co., Ltd. | 67,200 | 2,313,366 |
| Daiwa Securities Group, Inc. | 161,200 | 724,562 |
| Denka Co., Ltd. | 12,000 | 346,304 |
| Denso Corp. | 65,300 | 3,031,874 |
| Dentsu, Inc. | 17,101 | 611,356 |
| DIC Corp. | 16,500 | 472,644 |
| Dowa Holdings Co., Ltd. | 9,000 | 310,718 |
| East Japan Railway Co. | 33,618 | 3,051,875 |
| Ebara Corp. | 13,800 | 408,291 |
| EDION Corp. | 31,600 | 314,045 |
| Eisai Co., Ltd. | 11,000 | 796,279 |
| Electric Power Development Co., Ltd. | 26,600 | 645,859 |
| Fanuc Corp. | 8,900 | 1,755,518 |
| Fast Retailing Co., Ltd. | 1,300 | 801,699 |
| Fuji Electric Co., Ltd. | 13,800 | 438,586 |
| FUJIFILM Holdings Corp. | 43,100 | 1,892,185 |
| Fujikura Ltd. | 101,300 | 470,039 |
| Fujitsu Ltd. | 31,200 | 2,765,225 |
| Furukawa Electric Co., Ltd. | 13,900 | 388,523 |
| H2O Retailing Corp. | 25,600 | 290,343 |
| Hakuhodo DY Holdings, Inc. | 27,500 | 410,375 |
| Hankyu Hanshin Holdings, Inc. | 17,300 | 692,294 |
| Hanwa Co., Ltd. | 15,300 | 445,743 |
| Haseko Corp. | 41,000 | 529,079 |
| Hino Motors Ltd. | 59,600 | 563,477 |
| Hitachi Construction Machinery Co., Ltd. | 12,700 | 327,815 |
| Hitachi Ltd. | 173,300 | 6,467,979 |
| Hitachi Metals Ltd. | 34,800 | 436,751 |
| Hokuriku Electric Power Co. * | 39,900 | 284,377 |
| Honda Motor Co., Ltd. | 375,700 | 10,164,179 |
| Hoya Corp. | 13,150 | 1,162,160 |
| Ibiden Co., Ltd. | 18,200 | 420,251 |
| Idemitsu Kosan Co., Ltd. | 160,069 | 4,705,272 |
| IHI Corp. | 20,100 | 495,327 |
| Iida Group Holdings Co., Ltd. | 26,600 | 443,079 |
| Inpex Corp. | 154,800 | 1,431,045 |
| Isetan Mitsukoshi Holdings Ltd. | 76,100 | 606,910 |
| Isuzu Motors Ltd. | 78,900 | 916,811 |
| ITOCHU Corp. | 142,400 | 2,977,282 |
| J. Front Retailing Co., Ltd. | 43,700 | 555,684 |
| Japan Airlines Co., Ltd. | 13,000 | 405,107 |
| Japan Display, Inc. *(b) | 578,000 | 337,707 |
| Japan Post Bank Co., Ltd. | 30,200 | 300,415 |
| Japan Post Holdings Co., Ltd. | 144,900 | 1,330,070 |
| Japan Tobacco, Inc. | 115,800 | 2,617,393 |
| JFE Holdings, Inc. | 144,400 | 1,806,103 |
| JGC Holdings Corp. | 37,700 | 545,272 |
| JSR Corp. | 24,400 | 458,079 |
| JTEKT Corp. | 53,700 | 684,910 |
| JXTG Holdings, Inc. | 685,650 | 3,204,892 |
| K's Holdings Corp. | 37,100 | 423,879 |
| Kajima Corp. | 52,900 | 726,982 |
| Kaneka Corp. | 10,800 | 359,517 |
| Kao Corp. | 19,900 | 1,599,933 |
| Kawasaki Heavy Industries Ltd. | 29,200 | 700,751 |
| Kawasaki Kisen Kaisha Ltd. * | 30,800 | 458,302 |
| KDDI Corp. | 192,800 | 5,334,996 |
| Keio Corp. | 5,500 | 340,249 |
| Kewpie Corp. | 14,600 | 331,379 |
| Keyence Corp. | 1,146 | 724,612 |
| Kikkoman Corp. | 8,100 | 389,631 |
| Kinden Corp. | 18,000 | 270,771 |
Schwab Fundamental Index Funds | Annual Report
Schwab Fundamental International Large Company Index Fund
Portfolio Holdings as of October 31, 2019 (continued)
| Security | Number
of Shares | Value ($) |
| Kintetsu Group Holdings Co., Ltd. | 11,400 | 621,367 |
| Kirin Holdings Co., Ltd. | 67,600 | 1,434,090 |
| Kobe Steel Ltd. | 129,100 | 694,109 |
| Koito Manufacturing Co., Ltd. | 9,900 | 517,901 |
| Komatsu Ltd. | 93,900 | 2,198,660 |
| Konica Minolta, Inc. | 85,700 | 629,021 |
| Kubota Corp. | 90,000 | 1,429,493 |
| Kuraray Co., Ltd. | 53,000 | 630,557 |
| Kyocera Corp. | 25,600 | 1,679,536 |
| Kyushu Electric Power Co., Inc. | 71,100 | 710,535 |
| Kyushu Railway Co. | 11,700 | 386,539 |
| Leopalace21 Corp. *(b) | 109,900 | 299,859 |
| LIXIL Group Corp. | 52,500 | 976,390 |
| Makita Corp. | 16,300 | 548,183 |
| Marubeni Corp. | 284,200 | 2,000,222 |
| Matsumotokiyoshi Holdings Co., Ltd. | 8,900 | 313,496 |
| Mazda Motor Corp. | 174,000 | 1,597,375 |
| Medipal Holdings Corp. | 29,800 | 680,856 |
| MEIJI Holdings Co., Ltd. | 11,500 | 828,895 |
| Minebea Mitsumi, Inc. | 34,700 | 659,007 |
| MISUMI Group, Inc. | 11,500 | 289,096 |
| Mitsubishi Chemical Holdings Corp. | 244,300 | 1,861,865 |
| Mitsubishi Corp. | 116,900 | 2,973,282 |
| Mitsubishi Electric Corp. | 258,300 | 3,690,446 |
| Mitsubishi Estate Co., Ltd. | 52,500 | 1,019,307 |
| Mitsubishi Gas Chemical Co., Inc. | 31,200 | 440,136 |
| Mitsubishi Heavy Industries Ltd. | 52,600 | 2,128,687 |
| Mitsubishi Materials Corp. | 31,000 | 891,406 |
| Mitsubishi Motors Corp. | 125,300 | 572,095 |
| Mitsubishi Tanabe Pharma Corp. | 21,400 | 256,121 |
| Mitsubishi UFJ Financial Group, Inc. | 1,305,934 | 6,770,338 |
| Mitsui & Co., Ltd. | 209,500 | 3,597,945 |
| Mitsui Chemicals, Inc. | 30,900 | 734,846 |
| Mitsui Fudosan Co., Ltd. | 55,500 | 1,419,847 |
| Mitsui Mining & Smelting Co., Ltd. | 14,100 | 394,062 |
| Mitsui O.S.K. Lines Ltd. | 28,100 | 765,402 |
| Mizuho Financial Group, Inc. | 2,383,116 | 3,699,729 |
| MS&AD Insurance Group Holdings, Inc. | 48,790 | 1,575,488 |
| Murata Manufacturing Co., Ltd. | 33,800 | 1,840,348 |
| Nagase & Co., Ltd. | 29,400 | 444,559 |
| Nagoya Railroad Co., Ltd. | 14,900 | 473,639 |
| NEC Corp. | 38,100 | 1,509,926 |
| NGK Insulators Ltd. | 27,700 | 425,548 |
| NGK Spark Plug Co., Ltd. | 24,000 | 486,571 |
| NH Foods Ltd. | 21,900 | 920,147 |
| NHK Spring Co., Ltd. | 40,800 | 333,303 |
| Nichirei Corp. | 11,400 | 261,799 |
| Nidec Corp. | 6,900 | 1,015,858 |
| Nikon Corp. | 42,200 | 538,063 |
| Nintendo Co., Ltd. | 2,080 | 762,918 |
| Nippon Electric Glass Co., Ltd. | 14,300 | 322,130 |
| Nippon Express Co., Ltd. | 13,500 | 770,250 |
| Nippon Paper Industries Co., Ltd. | 26,400 | 455,073 |
| Nippon Shokubai Co., Ltd. | 4,300 | 265,150 |
| Nippon Steel Corp. | 204,500 | 2,984,785 |
| Nippon Steel Trading Corp. | 6,300 | 263,767 |
| Nippon Telegraph & Telephone Corp. | 106,808 | 5,302,259 |
| Nippon Yusen K.K. | 58,300 | 1,047,364 |
| Nissan Motor Co., Ltd. | 476,900 | 3,009,515 |
| Nisshin Seifun Group, Inc. | 20,730 | 410,956 |
| Nisshinbo Holdings, Inc. | 34,000 | 283,076 |
| Nissin Foods Holdings Co., Ltd. | 4,700 | 355,021 |
| Nitori Holdings Co., Ltd. | 3,200 | 487,075 |
| Nitto Denko Corp. | 20,400 | 1,128,644 |
| NOK Corp. | 28,000 | 438,565 |
| Nomura Holdings, Inc. | 395,000 | 1,795,268 |
| Nomura Real Estate Holdings, Inc. | 14,200 | 336,531 |
| Security | Number
of Shares | Value ($) |
| NSK Ltd. | 76,200 | 708,539 |
| NTN Corp. | 116,400 | 360,904 |
| NTT Data Corp. | 50,000 | 656,542 |
| NTT DOCOMO, Inc. | 121,900 | 3,341,900 |
| Obayashi Corp. | 85,000 | 874,768 |
| Odakyu Electric Railway Co., Ltd. | 16,600 | 404,080 |
| Oji Holdings Corp. | 146,000 | 754,855 |
| Olympus Corp. | 57,800 | 786,449 |
| Omron Corp. | 18,100 | 1,058,882 |
| Ono Pharmaceutical Co., Ltd. | 15,000 | 282,553 |
| Oriental Land Co., Ltd. | 3,800 | 557,084 |
| ORIX Corp. | 98,300 | 1,544,774 |
| Osaka Gas Co., Ltd. | 67,000 | 1,310,164 |
| Otsuka Corp. | 7,600 | 306,416 |
| Otsuka Holdings Co., Ltd. | 33,400 | 1,392,453 |
| Pan Pacific International Holdings Corp. | 20,000 | 314,827 |
| Panasonic Corp. | 385,750 | 3,241,989 |
| Recruit Holdings Co., Ltd. | 36,400 | 1,209,719 |
| Renesas Electronics Corp. * | 55,600 | 376,394 |
| Resona Holdings, Inc. | 194,758 | 846,917 |
| Ricoh Co., Ltd. | 130,800 | 1,164,854 |
| Rohm Co., Ltd. | 6,700 | 530,833 |
| Ryohin Keikaku Co., Ltd. | 13,800 | 307,219 |
| San-Ai Oil Co., Ltd. | 30,900 | 323,500 |
| Santen Pharmaceutical Co., Ltd. | 18,200 | 322,383 |
| Secom Co., Ltd. | 10,900 | 1,010,031 |
| Sega Sammy Holdings, Inc. | 21,900 | 308,201 |
| Seiko Epson Corp. | 45,800 | 647,660 |
| Seino Holdings Co., Ltd. | 25,900 | 333,022 |
| Sekisui Chemical Co., Ltd. | 51,900 | 904,915 |
| Sekisui House Ltd. | 87,300 | 1,882,570 |
| Seven & i Holdings Co., Ltd. | 86,300 | 3,260,439 |
| SG Holdings Co., Ltd. | 13,000 | 321,930 |
| Shikoku Electric Power Co., Inc. | 24,400 | 241,887 |
| Shimadzu Corp. | 12,900 | 344,509 |
| Shimamura Co., Ltd. | 4,700 | 398,105 |
| Shimano, Inc. | 3,000 | 499,352 |
| Shimizu Corp. | 72,500 | 675,845 |
| Shin-Etsu Chemical Co., Ltd. | 22,400 | 2,497,627 |
| Shionogi & Co., Ltd. | 9,300 | 558,213 |
| Shiseido Co., Ltd. | 9,100 | 750,276 |
| Showa Denko K.K. | 16,500 | 462,939 |
| Skylark Holdings Co., Ltd. | 15,900 | 288,587 |
| SMC Corp. | 2,100 | 907,286 |
| Softbank Corp. | 84,100 | 1,153,626 |
| SoftBank Group Corp. | 127,800 | 4,916,006 |
| Sojitz Corp. | 199,800 | 628,879 |
| Sompo Holdings, Inc. | 33,700 | 1,324,615 |
| Sony Corp. | 56,900 | 3,463,454 |
| Stanley Electric Co., Ltd. | 14,600 | 404,029 |
| Subaru Corp. | 104,300 | 2,988,978 |
| Sumitomo Chemical Co., Ltd. | 262,100 | 1,198,944 |
| Sumitomo Corp. | 127,700 | 2,074,153 |
| Sumitomo Electric Industries Ltd. | 168,100 | 2,305,282 |
| Sumitomo Forestry Co., Ltd. | 30,100 | 436,887 |
| Sumitomo Heavy Industries Ltd. | 15,700 | 487,674 |
| Sumitomo Metal Mining Co., Ltd. | 27,900 | 933,246 |
| Sumitomo Mitsui Financial Group, Inc. | 131,010 | 4,651,270 |
| Sumitomo Mitsui Trust Holdings, Inc. | 28,300 | 1,031,405 |
| Sumitomo Realty & Development Co., Ltd. | 18,900 | 686,037 |
| Sumitomo Rubber Industries Ltd. | 44,700 | 592,443 |
| Suntory Beverage & Food Ltd. | 9,800 | 418,958 |
| Suzuken Co., Ltd. | 11,730 | 626,310 |
| Suzuki Motor Corp. | 45,600 | 2,152,964 |
| Sysmex Corp. | 5,300 | 345,815 |
Schwab Fundamental Index Funds | Annual Report
Schwab Fundamental International Large Company Index Fund
Portfolio Holdings as of October 31, 2019 (continued)
| Security | Number
of Shares | Value ($) |
| T&D Holdings, Inc. | 54,550 | 607,563 |
| Taiheiyo Cement Corp. | 20,000 | 565,779 |
| Taisei Corp. | 20,900 | 824,158 |
| Takashimaya Co., Ltd. | 34,200 | 396,994 |
| Takeda Pharmaceutical Co., Ltd. | 69,521 | 2,512,006 |
| TDK Corp. | 13,300 | 1,312,361 |
| Teijin Ltd. | 31,900 | 639,223 |
| Terumo Corp. | 21,700 | 708,217 |
| The Chugoku Electric Power Co., Inc. | 44,500 | 592,818 |
| The Kansai Electric Power Co., Inc. | 109,400 | 1,276,274 |
| The Yokohama Rubber Co., Ltd. | 16,200 | 361,831 |
| TIS, Inc. | 6,200 | 375,928 |
| Tobu Railway Co., Ltd. | 16,200 | 540,592 |
| Toho Gas Co., Ltd. | 9,800 | 381,696 |
| Toho Holdings Co., Ltd. | 11,800 | 299,276 |
| Tohoku Electric Power Co., Inc. | 111,000 | 1,140,833 |
| Tokio Marine Holdings, Inc. | 44,300 | 2,395,105 |
| Tokyo Electric Power Co. Holdings, Inc. * | 523,900 | 2,426,255 |
| Tokyo Electron Ltd. | 6,900 | 1,397,930 |
| Tokyo Gas Co., Ltd. | 67,700 | 1,652,626 |
| Tokyu Corp. | 36,000 | 680,890 |
| Tokyu Fudosan Holdings Corp. | 63,700 | 422,516 |
| Toppan Printing Co., Ltd. | 53,700 | 993,198 |
| Toray Industries, Inc. | 206,000 | 1,455,831 |
| Toshiba Corp. | 22,100 | 755,735 |
| Tosoh Corp. | 48,600 | 665,456 |
| TOTO Ltd. | 11,600 | 473,579 |
| Toyo Seikan Group Holdings Ltd. | 27,000 | 426,691 |
| Toyo Suisan Kaisha Ltd. | 8,800 | 370,524 |
| Toyoda Gosei Co., Ltd. | 17,700 | 414,086 |
| Toyota Industries Corp. | 17,600 | 1,056,043 |
| Toyota Motor Corp. | 303,318 | 21,044,471 |
| Toyota Tsusho Corp. | 50,800 | 1,752,525 |
| TS Tech Co., Ltd. | 12,300 | 393,938 |
| Tsuruha Holdings, Inc. | 3,200 | 359,963 |
| Ube Industries Ltd. | 22,000 | 471,046 |
| Unicharm Corp. | 13,700 | 464,305 |
| West Japan Railway Co. | 17,563 | 1,526,055 |
| Yakult Honsha Co., Ltd. | 4,700 | 269,356 |
| Yamada Denki Co., Ltd. | 173,900 | 840,542 |
| Yamaha Corp. | 8,900 | 414,466 |
| Yamaha Motor Co., Ltd. | 47,200 | 923,842 |
| Yamato Holdings Co., Ltd. | 41,100 | 689,354 |
| Yamazaki Baking Co., Ltd. | 19,800 | 337,564 |
| Yaskawa Electric Corp. | 10,800 | 410,807 |
| Yokogawa Electric Corp. | 18,200 | 333,477 |
| Z Holdings Corp. | 167,400 | 515,377 |
| | | 329,034,142 |
| |
| Netherlands 2.4% |
| Aalberts N.V. | 7,422 | 299,090 |
| ABN AMRO Group N.V. CVA | 33,259 | 619,950 |
| Aegon N.V. | 268,541 | 1,165,021 |
| Akzo Nobel N.V. | 16,440 | 1,515,659 |
| APERAM S.A. | 10,208 | 261,549 |
| ArcelorMittal | 156,925 | 2,333,314 |
| ASML Holding N.V. | 7,002 | 1,835,324 |
| ASR Nederland N.V. | 12,460 | 456,766 |
| Boskalis Westminster N.V. | 14,305 | 314,868 |
| Heineken Holding N.V. | 8,518 | 812,749 |
| Heineken N.V. | 11,644 | 1,189,079 |
| ING Groep N.V. | 341,540 | 3,867,423 |
| Koninklijke Ahold Delhaize N.V. | 164,736 | 4,105,230 |
| Koninklijke DSM N.V. | 10,403 | 1,234,711 |
| Koninklijke KPN N.V. | 374,904 | 1,163,840 |
| Koninklijke Philips N.V. | 58,501 | 2,566,677 |
| Security | Number
of Shares | Value ($) |
| NN Group N.V. | 22,786 | 869,443 |
| Prosus N.V. * | 2,999 | 206,808 |
| Randstad N.V. | 18,376 | 1,019,810 |
| Signify N.V. | 26,859 | 786,970 |
| SNS Reaal N.V. *(a)(b) | 124,822 | — |
| Unibail-Rodamco-Westfield | 5,201 | 804,263 |
| Unilever N.V. | 71,008 | 4,197,047 |
| Wolters Kluwer N.V. | 10,318 | 759,952 |
| | | 32,385,543 |
| |
| New Zealand 0.1% |
| Contact Energy Ltd. | 71,699 | 339,108 |
| Fletcher Building Ltd. | 177,921 | 522,756 |
| Spark New Zealand Ltd. | 193,204 | 554,237 |
| | | 1,416,101 |
| |
| Norway 0.7% |
| DNB A.S.A. | 69,033 | 1,256,903 |
| Equinor A.S.A. | 162,568 | 3,018,185 |
| Mowi A.S.A. | 25,760 | 628,852 |
| Norsk Hydro A.S.A. | 226,492 | 800,323 |
| Orkla A.S.A. | 60,722 | 583,650 |
| Seadrill Ltd. *(b) | 57,514 | 103,777 |
| Subsea 7 S.A. | 47,212 | 443,543 |
| Telenor A.S.A. | 66,491 | 1,244,429 |
| Yara International A.S.A. | 26,644 | 1,037,949 |
| | | 9,117,611 |
| |
| Poland 0.3% |
| Bank Polska Kasa Opieki S.A. | 16,020 | 452,416 |
| Kghm Polska Miedz S.A. * | 22,898 | 502,007 |
| PGE Polska Grupa Energetyczna S.A. * | 181,867 | 389,952 |
| Polski Koncern Naftowy Orlen S.A. | 57,584 | 1,574,525 |
| Polskie Gornictwo Naftowe i Gazownictwo S.A. | 259,182 | 319,317 |
| Powszechna Kasa Oszczednosci Bank Polski S.A. | 38,855 | 387,963 |
| Powszechny Zaklad Ubezpieczen S.A. | 46,776 | 452,656 |
| Tauron Polska Energia S.A. * | 665,762 | 288,144 |
| | | 4,366,980 |
| |
| Portugal 0.2% |
| EDP - Energias de Portugal S.A. | 370,217 | 1,525,009 |
| Galp Energia, SGPS, S.A. | 57,614 | 921,523 |
| Jeronimo Martins, SGPS, S.A. | 24,734 | 415,621 |
| | | 2,862,153 |
| |
| Republic of Korea 5.2% |
| Amorepacific Corp. | 2,204 | 362,587 |
| CJ CheilJedang Corp. | 1,298 | 255,120 |
| CJ Corp. | 4,203 | 297,080 |
| Daelim Industrial Co., Ltd. | 3,786 | 294,284 |
| DB Insurance Co., Ltd. | 7,672 | 332,624 |
| Doosan Heavy Industries & Construction Co., Ltd. * | 54,818 | 289,064 |
| E-Mart, Inc. | 5,325 | 509,356 |
| GS Holdings Corp. | 10,913 | 465,081 |
| Hana Financial Group, Inc. | 30,552 | 884,558 |
| Hankook Tire & Technology Co., Ltd. | 15,564 | 415,016 |
| Hanwha Chemical Corp. | 16,811 | 235,224 |
Schwab Fundamental Index Funds | Annual Report
Schwab Fundamental International Large Company Index Fund
Portfolio Holdings as of October 31, 2019 (continued)
| Security | Number
of Shares | Value ($) |
| Hanwha Corp. | 15,868 | 323,493 |
| Hyundai Engineering & Construction Co., Ltd. | 12,686 | 467,391 |
| Hyundai Glovis Co., Ltd. | 3,502 | 453,621 |
| Hyundai Marine & Fire Insurance Co., Ltd. | 13,020 | 282,752 |
| Hyundai Mobis Co., Ltd. | 12,784 | 2,607,086 |
| Hyundai Motor Co. | 33,448 | 3,503,489 |
| Hyundai Steel Co. | 22,691 | 617,987 |
| Hyundai Wia Corp. | 8,226 | 361,494 |
| Industrial Bank of Korea | 36,896 | 373,659 |
| KB Financial Group, Inc. | 34,518 | 1,242,627 |
| Kia Motors Corp. | 72,811 | 2,661,050 |
| Korea Electric Power Corp. * | 104,619 | 2,287,036 |
| Korea Gas Corp. | 9,139 | 308,765 |
| Korea Shipbuilding & Offshore Engineering Co., Ltd. * | 6,006 | 627,702 |
| Korea Zinc Co., Ltd. | 1,019 | 379,713 |
| Korean Air Lines Co., Ltd. | 14,877 | 318,421 |
| KT&G Corp. | 8,045 | 690,596 |
| LG Chem Ltd. | 4,904 | 1,293,896 |
| LG Corp. | 7,621 | 454,338 |
| LG Display Co., Ltd. * | 120,884 | 1,417,006 |
| LG Electronics, Inc. | 29,737 | 1,704,204 |
| LG Household & Health Care Ltd. | 308 | 333,286 |
| LG Uplus Corp. | 37,611 | 434,507 |
| Lotte Chemical Corp. | 2,639 | 513,428 |
| Lotte Shopping Co., Ltd. | 3,666 | 391,830 |
| NAVER Corp. | 3,445 | 485,733 |
| POSCO | 19,603 | 3,556,877 |
| Posco International Corp. | 17,303 | 270,425 |
| S-Oil Corp. | 6,199 | 529,587 |
| Samsung C&T Corp. | 4,359 | 373,266 |
| Samsung Electro-Mechanics Co., Ltd. | 5,392 | 522,023 |
| Samsung Electronics Co., Ltd. | 550,670 | 23,799,873 |
| Samsung Fire & Marine Insurance Co., Ltd. | 3,498 | 650,711 |
| Samsung Heavy Industries Co., Ltd. * | 52,252 | 324,443 |
| Samsung Life Insurance Co., Ltd. | 6,976 | 423,634 |
| Samsung SDI Co., Ltd. | 2,077 | 405,318 |
| Samsung SDS Co., Ltd. | 1,857 | 320,734 |
| Shinhan Financial Group Co., Ltd. | 45,115 | 1,643,769 |
| SK Holdings Co., Ltd. | 3,591 | 796,679 |
| SK Hynix, Inc. | 45,301 | 3,185,383 |
| SK Innovation Co., Ltd. | 15,632 | 2,139,013 |
| SK Networks Co., Ltd. | 92,316 | 460,465 |
| SK Telecom Co., Ltd. | 2,378 | 486,054 |
| Woongjin Coway Co., Ltd. | 3,848 | 303,620 |
| Woori Financial Group, Inc. | 58,936 | 594,182 |
| | | 69,661,160 |
| |
| Singapore 0.8% |
| CapitaLand Ltd. | 161,000 | 425,559 |
| ComfortDelGro Corp., Ltd. | 236,600 | 399,542 |
| DBS Group Holdings Ltd. | 83,656 | 1,594,556 |
| Golden Agri-Resources Ltd. | 1,561,300 | 234,353 |
| Hutchison Port Holdings Trust, Class U | 1,264,264 | 195,836 |
| Jardine Cycle & Carriage Ltd. | 13,900 | 334,186 |
| Keppel Corp., Ltd. | 179,300 | 902,844 |
| Oversea-Chinese Banking Corp., Ltd. | 164,041 | 1,318,760 |
| Sembcorp Industries Ltd. | 162,800 | 273,323 |
| Singapore Airlines Ltd. | 83,470 | 576,925 |
| Singapore Telecommunications Ltd. | 636,686 | 1,541,769 |
| Security | Number
of Shares | Value ($) |
| United Overseas Bank Ltd. | 65,652 | 1,292,519 |
| Wilmar International Ltd. | 326,566 | 897,886 |
| | | 9,988,058 |
| |
| Spain 3.1% |
| Acerinox S.A. | 27,884 | 261,422 |
| ACS Actividades de Construccion y Servicios S.A. | 29,956 | 1,215,558 |
| Aena SME S.A. | 2,613 | 479,648 |
| Amadeus IT Group S.A. | 11,135 | 823,748 |
| Banco Bilbao Vizcaya Argentaria S.A. | 699,207 | 3,682,603 |
| Banco De Sabadell S.A. | 1,060,589 | 1,165,831 |
| Banco Santander S.A. | 2,639,623 | 10,598,872 |
| Bankia S.A. | 124,224 | 236,997 |
| Bankinter S.A. | 41,807 | 289,551 |
| CaixaBank S.A. | 189,210 | 542,578 |
| Enagas S.A. | 15,440 | 382,056 |
| Endesa S.A. | 46,710 | 1,272,139 |
| Ferrovial S.A. | 28,027 | 826,886 |
| Grifols S.A. | 11,627 | 375,093 |
| Iberdrola S.A. | 485,808 | 4,993,617 |
| Industria de Diseno Textil S.A. | 49,506 | 1,542,647 |
| Mapfre S.A. | 147,875 | 412,718 |
| Naturgy Energy Group S.A. | 36,793 | 1,002,428 |
| Red Electrica Corp. S.A. | 24,386 | 490,098 |
| Repsol S.A. | 228,522 | 3,765,974 |
| Telefonica S.A. | 874,825 | 6,718,025 |
| | | 41,078,489 |
| |
| Sweden 2.1% |
| Alfa Laval AB | 18,599 | 430,479 |
| Assa Abloy AB, Class B | 43,444 | 1,031,724 |
| Atlas Copco AB, A Shares | 35,507 | 1,253,273 |
| Atlas Copco AB, B Shares | 20,255 | 628,479 |
| BillerudKorsnas AB | 22,510 | 270,729 |
| Boliden AB | 29,720 | 801,473 |
| Electrolux AB, B Shares | 26,165 | 687,913 |
| Epiroc AB, Class A | 21,691 | 244,398 |
| Epiroc AB, Class B | 15,190 | 165,440 |
| Essity AB, Class B | 33,633 | 1,050,719 |
| Hennes & Mauritz AB, B Shares | 123,082 | 2,579,737 |
| Hexagon AB, B Shares | 8,146 | 417,058 |
| Husqvarna AB, B Shares | 40,524 | 310,450 |
| ICA Gruppen AB | 8,101 | 358,483 |
| Industrivarden AB, A Shares | 7,098 | 157,120 |
| Industrivarden AB, C Shares | 8,507 | 184,318 |
| Investor AB, A Shares | 7,475 | 376,802 |
| Investor AB, B Shares | 23,587 | 1,210,118 |
| Kinnevik AB, Class B | 9,957 | 272,499 |
| Sandvik AB | 77,186 | 1,363,670 |
| Securitas AB, B Shares | 33,351 | 534,020 |
| Skandinaviska Enskilda Banken AB, A Shares | 114,111 | 1,094,477 |
| Skanska AB, B Shares | 51,181 | 1,090,505 |
| SKF AB, B Shares | 47,712 | 863,881 |
| SSAB AB, A Shares | 54,465 | 152,445 |
| SSAB AB, B Shares | 100,831 | 254,015 |
| Svenska Handelsbanken AB, A Shares | 124,315 | 1,247,601 |
| Swedbank AB, A Shares | 92,958 | 1,302,647 |
| Swedish Match AB | 9,579 | 450,006 |
| Tele2 AB, B Shares | 45,264 | 647,961 |
| Telefonaktiebolaget LM Ericsson, B Shares | 281,457 | 2,459,592 |
| Telia Co. AB | 340,392 | 1,497,353 |
Schwab Fundamental Index Funds | Annual Report
Schwab Fundamental International Large Company Index Fund
Portfolio Holdings as of October 31, 2019 (continued)
| Security | Number
of Shares | Value ($) |
| Trelleborg AB, B Shares | 24,768 | 400,514 |
| Volvo AB, B Shares | 146,138 | 2,189,990 |
| | | 27,979,889 |
| |
| Switzerland 5.4% |
| ABB Ltd. | 166,871 | 3,504,288 |
| Adecco Group AG | 28,556 | 1,697,544 |
| Alcon, Inc. * | 21,503 | 1,271,647 |
| Baloise Holding AG | 2,772 | 512,691 |
| Chocoladefabriken Lindt & Spruengli AG | 3 | 245,717 |
| Chocoladefabriken Lindt & Spruengli AG Participation Certificates | 30 | 222,909 |
| Cie Financiere Richemont S.A. | 30,200 | 2,373,151 |
| Clariant AG * | 15,078 | 309,288 |
| Credit Suisse Group AG * | 126,296 | 1,563,275 |
| Geberit AG | 1,233 | 626,475 |
| Georg Fischer AG | 390 | 372,470 |
| Givaudan S.A. | 329 | 966,580 |
| Julius Baer Group Ltd. * | 8,695 | 385,046 |
| Kuehne & Nagel International AG | 4,121 | 665,777 |
| LafargeHolcim Ltd. * | 45,716 | 2,359,790 |
| Lonza Group AG * | 1,542 | 555,787 |
| Nestle S.A. | 141,908 | 15,181,504 |
| Novartis AG | 101,353 | 8,855,738 |
| Pargesa Holding S.A. | 2,692 | 212,799 |
| Roche Holding AG | 34,016 | 10,237,313 |
| Roche Holding AG - Bearer Shares | 1,338 | 398,894 |
| Schindler Holding AG | 838 | 198,450 |
| Schindler Holding AG - Participation Certificates | 1,533 | 375,579 |
| Schweizerische Nationalbank | 310 | 1,787,588 |
| SGS S.A. | 244 | 636,377 |
| Sika AG | 5,147 | 884,803 |
| Sonova Holding AG | 1,364 | 313,008 |
| Swiss Life Holding AG | 1,695 | 848,884 |
| Swiss Prime Site AG * | 3,587 | 369,719 |
| Swiss Re AG | 33,911 | 3,556,881 |
| Swisscom AG | 2,306 | 1,179,506 |
| The Swatch Group AG | 4,755 | 255,279 |
| The Swatch Group AG - Bearer Shares | 3,163 | 877,031 |
| UBS Group AG * | 217,342 | 2,572,277 |
| Zurich Insurance Group AG | 11,891 | 4,657,705 |
| | | 71,031,770 |
| |
| United Kingdom 15.8% |
| 3i Group plc | 46,209 | 675,247 |
| Admiral Group plc | 11,552 | 302,336 |
| Aggreko plc | 40,157 | 411,691 |
| Anglo American plc | 72,919 | 1,876,723 |
| Antofagasta plc | 32,880 | 370,318 |
| Ashtead Group plc | 27,392 | 833,972 |
| Associated British Foods plc | 33,486 | 966,566 |
| AstraZeneca plc | 58,258 | 5,681,158 |
| Aviva plc | 347,453 | 1,872,788 |
| Babcock International Group plc | 47,658 | 342,289 |
| BAE Systems plc | 300,628 | 2,245,604 |
| Barclays plc | 1,857,826 | 4,029,758 |
| Barratt Developments plc | 103,953 | 850,107 |
| Bellway plc | 11,531 | 471,957 |
| BHP Group plc | 176,852 | 3,751,127 |
| BP plc | 3,070,750 | 19,472,734 |
| British American Tobacco plc | 163,172 | 5,707,081 |
| BT Group plc | 1,405,839 | 3,730,895 |
| Bunzl plc | 21,940 | 570,763 |
| Security | Number
of Shares | Value ($) |
| Burberry Group plc | 28,483 | 755,283 |
| Capita plc * | 231,213 | 467,704 |
| Carnival plc | 12,812 | 512,695 |
| Centrica plc | 1,669,208 | 1,570,836 |
| Coca-Cola HBC AG * | 11,951 | 363,892 |
| Compass Group plc | 79,701 | 2,121,967 |
| CRH plc | 53,414 | 1,947,113 |
| Croda International plc | 4,994 | 311,584 |
| DCC plc | 8,482 | 795,437 |
| Diageo plc | 79,161 | 3,240,137 |
| Direct Line Insurance Group plc | 200,572 | 707,167 |
| Dixons Carphone plc | 403,841 | 686,758 |
| Drax Group plc | 88,331 | 339,580 |
| DS Smith plc | 113,620 | 526,767 |
| easyJet plc | 36,248 | 581,490 |
| Experian plc | 32,828 | 1,034,781 |
| Ferguson plc | 22,783 | 1,945,516 |
| FirstGroup plc * | 432,836 | 723,830 |
| Flutter Entertainment plc | 2,720 | 280,526 |
| G4S plc | 185,330 | 497,044 |
| GlaxoSmithKline plc | 325,847 | 7,463,505 |
| Glencore plc * | 2,597,907 | 7,841,466 |
| Hays plc | 178,193 | 362,635 |
| Hiscox Ltd. | 14,064 | 271,588 |
| HSBC Holdings plc | 1,493,939 | 11,286,871 |
| IMI plc | 27,414 | 356,496 |
| Imperial Brands plc | 105,965 | 2,324,391 |
| Inchcape plc | 84,704 | 708,172 |
| Informa plc | 42,300 | 425,168 |
| Inmarsat plc | 56,745 | 404,814 |
| InterContinental Hotels Group plc | 9,099 | 550,623 |
| International Consolidated Airlines Group S.A. | 90,220 | 621,039 |
| Intertek Group plc | 4,921 | 341,202 |
| Investec plc | 55,663 | 315,579 |
| ITV plc | 454,889 | 789,125 |
| J. Sainsbury plc | 492,767 | 1,298,576 |
| John Wood Group plc | 72,625 | 318,869 |
| Johnson Matthey plc | 34,576 | 1,373,597 |
| Kingfisher plc | 645,623 | 1,731,953 |
| Land Securities Group plc | 42,783 | 521,119 |
| Legal & General Group plc | 434,903 | 1,486,646 |
| Lloyds Banking Group plc | 5,337,399 | 3,926,223 |
| London Stock Exchange Group plc | 5,013 | 451,766 |
| M&G plc * | 123,823 | 342,923 |
| Marks & Spencer Group plc | 455,387 | 1,072,796 |
| Meggitt plc | 65,668 | 531,341 |
| Micro Focus International plc | 10,428 | 143,126 |
| Mondi plc | 47,523 | 985,337 |
| National Grid plc | 438,769 | 5,130,211 |
| Next plc | 12,730 | 1,085,696 |
| Pearson plc | 73,566 | 649,705 |
| Pennon Group plc | 37,058 | 431,164 |
| Persimmon plc | 29,101 | 858,371 |
| Prudential plc | 122,333 | 2,136,771 |
| Reckitt Benckiser Group plc | 30,888 | 2,390,163 |
| RELX plc | 64,894 | 1,562,346 |
| Rentokil Initial plc | 58,688 | 345,390 |
| Rio Tinto plc | 100,460 | 5,230,129 |
| Rolls-Royce Holdings plc * | 146,429 | 1,347,403 |
| Royal Dutch Shell plc, A Shares | 467,168 | 13,542,304 |
| Royal Dutch Shell plc, B Shares | 525,833 | 15,143,866 |
| Royal Mail plc | 423,155 | 1,157,942 |
| RSA Insurance Group plc | 64,865 | 438,831 |
| Severn Trent plc | 22,391 | 654,044 |
| Smith & Nephew plc | 37,471 | 804,368 |
| Smiths Group plc | 32,400 | 677,278 |
| Smurfit Kappa Group plc | 19,711 | 655,732 |
Schwab Fundamental Index Funds | Annual Report
Schwab Fundamental International Large Company Index Fund
Portfolio Holdings as of October 31, 2019 (continued)
| Security | Number
of Shares | Value ($) |
| SSE plc | 164,110 | 2,730,141 |
| St. James's Place plc | 21,987 | 296,562 |
| Standard Chartered plc | 281,238 | 2,551,934 |
| Standard Life Aberdeen plc | 239,659 | 942,258 |
| Tate & Lyle plc | 50,379 | 439,420 |
| Taylor Wimpey plc | 369,876 | 793,274 |
| Tesco plc | 949,756 | 2,899,180 |
| The Berkeley Group Holdings plc | 11,925 | 679,718 |
| The British Land Co., plc | 43,287 | 348,033 |
| The Sage Group plc | 54,978 | 512,400 |
| The Weir Group plc | 19,086 | 333,376 |
| Travis Perkins plc | 47,410 | 880,600 |
| TUI AG | 57,482 | 751,995 |
| Unilever plc | 50,440 | 3,020,294 |
| United Utilities Group plc | 63,304 | 714,804 |
| Virgin Money UK plc | 157,384 | 280,044 |
| Vodafone Group plc | 5,142,911 | 10,495,238 |
| Whitbread plc | 11,280 | 593,741 |
| William Hill plc | 168,837 | 432,253 |
| WM Morrison Supermarkets plc | 560,859 | 1,448,897 |
| WPP plc | 173,614 | 2,166,626 |
| | | 209,372,669 |
| Total Common Stock |
| (Cost $1,207,269,003) | | 1,305,855,393 |
|
| Preferred Stock1.1% of net assets |
| |
| Germany 0.7% |
| Bayerische Motoren Werke AG | 11,509 | 708,415 |
| Fuchs Petrolub SE | 7,201 | 306,793 |
| Henkel AG & Co. KGaA | 11,006 | 1,143,223 |
| Volkswagen AG | 35,808 | 6,807,288 |
| | | 8,965,719 |
| |
| Italy 0.1% |
| Telecom Italia S.p.A. - RSP | 1,847,982 | 1,069,619 |
| |
| Republic of Korea 0.3% |
| Hyundai Motor Co., Ltd. | 5,864 | 367,746 |
| Hyundai Motor Co., Ltd. 2nd | 8,388 | 570,581 |
| LG Chem Ltd. | 863 | 127,286 |
| Samsung Electronics Co., Ltd. | 95,903 | 3,375,864 |
| | | 4,441,477 |
| |
| United Kingdom 0.0% |
| Rolls-Royce Holdings plc *(a) | 6,867,938 | 8,896 |
| Total Preferred Stock |
| (Cost $13,101,728) | | 14,485,711 |
|
| Other Investment Company0.1% of net assets |
| |
| United States 0.1% |
| Securities Lending Collateral 0.1% |
| Wells Fargo Government Money Market Fund, Select Class 1.75%(c) | 2,090,033 | 2,090,033 |
| Total Other Investment Company |
| (Cost $2,090,033) | | 2,090,033 |
Security
Rate, Maturity Date | Face Amount
Local Currency | Value ($) |
| Short-Term Investments0.0% of net assets |
| |
| Time Deposits 0.0% |
| Brown Brothers Harriman |
| Australian Dollar | | |
| 0.35%, 11/01/19(d) | 598 | 412 |
| Canadian Dollar | | |
| 0.87%, 11/01/19(d) | 61,756 | 46,888 |
| Danish Krone | | |
| (0.95%), 11/01/19(d) | 5,146 | 768 |
| Euro | | |
| (0.67%), 11/01/19(d) | 34 | 38 |
| Hong Kong Dollar | | |
| 2.30%, 11/01/19(d) | 156,042 | 19,914 |
| New Zealand Dollar | | |
| 0.50%, 11/01/19(d) | 2 | 1 |
| Norwegian Krone | | |
| 0.60%, 11/01/19(d) | 199,474 | 21,691 |
| Pound Sterling | | |
| 0.38%, 11/01/19(d) | 14,157 | 18,339 |
| Singapore Dollar | | |
| 0.55%, 11/01/19(d) | 1,348 | 991 |
| Swedish Krona | | |
| (0.37%), 11/01/19(d) | 150,077 | 15,543 |
| Swiss Franc | | |
| (1.57%), 11/01/19(d) | 3,164 | 3,207 |
| Sumitomo Mitsui Banking Corp. |
| Japanese Yen | | |
| (0.27%), 11/01/19(d) | 2,724,913 | 25,233 |
| Total Short-Term Investments |
| (Cost $153,025) | | 153,025 |
| | Number of
Contracts | Notional
Amount
($) | Current Value/
Unrealized
Appreciation
($) |
| Futures Contracts | |
| Long | |
| MSCI EAFE Index, expires 12/20/19 | 67 | 6,556,620 | 98,243 |
| * | Non-income producing security. |
| (a) | Fair-valued by management using significant unobservable inputs in accordance with procedures approved by the fund’s Board of Trustees. |
| (b) | All or a portion of this security is on loan. Securities on loan were valued at $1,746,171. |
| (c) | The rate shown is the 7-day yield. |
| (d) | The rate shown is the current daily overnight rate. |
| | |
| CVA — | Dutch Certificate |
| REIT — | Real Estate Investment Trust |
| RSP — | Risparmio (Convertible Savings Shares) |
Schwab Fundamental Index Funds | Annual Report
Schwab Fundamental International Small Company Index Fund
Portfolio Holdings as of October 31, 2019
This section shows all the securities in the fund’s portfolio and their values as of the report date.
The fund files its complete schedule of portfolio holdings with the U.S. Securities and Exchange Commission (SEC) for the first and third quarters of each fiscal year on Form N-Q. Effective March 31, 2019, Form N-PORT Part F has replaced Form N-Q. The fund’s Form N-Q and Form N-PORT Part F are available on the SEC’s website atwww.sec.gov. The fund also makes available its complete schedule of portfolio holdings 15 to 20 days after the end of the month on the fund’s website atwww.schwabfunds.com/schwabfunds_prospectus.
| Security | Number
of Shares | Value ($) |
| Common Stock99.3% of net assets |
| |
| Australia 5.3% |
| Adelaide Brighton Ltd. | 208,631 | 443,119 |
| ALS Ltd. | 108,930 | 605,823 |
| Ansell Ltd. | 36,883 | 701,396 |
| Aristocrat Leisure Ltd. | 45,751 | 997,602 |
| ASX Ltd. | 15,939 | 904,727 |
| AusNet Services | 575,895 | 735,630 |
| Australian Pharmaceutical Industries Ltd. | 463,191 | 423,222 |
| Bank of Queensland Ltd.(a) | 146,692 | 915,513 |
| Bapcor Ltd. | 35,036 | 172,710 |
| Beach Energy Ltd. | 193,855 | 304,930 |
| Bega Cheese Ltd.(a) | 94,283 | 232,493 |
| Breville Group Ltd. | 26,723 | 283,012 |
| carsales.com Ltd. | 30,810 | 330,175 |
| Challenger Ltd. | 134,295 | 736,569 |
| Charter Hall Retail REIT | 60,409 | 183,539 |
| Cleanaway Waste Management Ltd. | 241,182 | 306,541 |
| Cochlear Ltd. | 4,463 | 651,107 |
| Computershare Ltd. | 86,267 | 941,644 |
| Costa Group Holdings Ltd. | 53,510 | 105,238 |
| Cromwell Property Group | 305,506 | 279,154 |
| CSR Ltd. | 338,615 | 967,906 |
| Dexus | 111,848 | 922,351 |
| Domino's Pizza Enterprises Ltd. | 4,952 | 174,220 |
| Eclipx Group Ltd. | 172,550 | 186,641 |
| Evolution Mining Ltd. | 106,669 | 304,261 |
| FlexiGroup Ltd. | 145,816 | 195,900 |
| Flight Centre Travel Group Ltd. | 17,954 | 527,429 |
| G.U.D. Holdings Ltd. | 26,983 | 201,224 |
| G8 Education Ltd. | 163,357 | 289,958 |
| Genworth Mortgage Insurance Australia Ltd. | 162,576 | 437,152 |
| GWA Group Ltd. | 111,999 | 224,650 |
| Harvey Norman Holdings Ltd.(a) | 214,501 | 605,218 |
| Healius Ltd. | 333,895 | 709,776 |
| Iluka Resources Ltd. | 70,796 | 458,252 |
| Independence Group NL | 42,216 | 184,888 |
| Inghams Group Ltd. | 74,900 | 160,354 |
| InvoCare Ltd. | 22,199 | 200,641 |
| IOOF Holdings Ltd. | 164,124 | 834,623 |
| IRESS Ltd. | 22,436 | 197,032 |
| James Hardie Industries plc | 58,503 | 1,004,742 |
| JB Hi-Fi Ltd. | 47,765 | 1,220,666 |
| Link Administration Holdings Ltd. | 58,420 | 225,279 |
| MACA Ltd. | 341,450 | 223,957 |
| Magellan Financial Group Ltd. | 6,000 | 199,008 |
| McMillan Shakespeare Ltd. | 20,099 | 222,335 |
| Mineral Resources Ltd. | 53,737 | 528,553 |
| Monadelphous Group Ltd. | 60,235 | 637,537 |
| Myer Holdings Ltd. * | 2,687,273 | 1,007,052 |
| nib Holdings Ltd. | 110,333 | 533,355 |
| Nine Entertainment Co. Holdings Ltd. | 380,650 | 482,982 |
| Northern Star Resources Ltd. | 52,147 | 353,469 |
| NRW Holdings Ltd. | 98,796 | 153,636 |
| Nufarm Ltd. * | 145,111 | 592,170 |
| Security | Number
of Shares | Value ($) |
| Orora Ltd. | 386,030 | 822,807 |
| OZ Minerals Ltd. | 101,349 | 707,155 |
| Pact Group Holdings Ltd. * | 119,582 | 199,640 |
| Pendal Group Ltd. | 71,193 | 351,524 |
| Perenti Global Ltd. | 192,609 | 303,417 |
| Perpetual Ltd. | 14,214 | 352,378 |
| Premier Investments Ltd. | 24,218 | 320,966 |
| Qantas Airways Ltd. | 254,451 | 1,125,471 |
| Qube Holdings Ltd. | 224,827 | 504,085 |
| REA Group Ltd. | 2,142 | 160,756 |
| Regis Resources Ltd. | 91,561 | 310,306 |
| Resolute Mining Ltd. * | 290,824 | 243,625 |
| Sandfire Resources NL | 74,706 | 298,369 |
| Santos Ltd. | 221,494 | 1,238,930 |
| SEEK Ltd. | 49,011 | 767,024 |
| Seven Group Holdings Ltd. | 30,133 | 389,477 |
| Seven West Media Ltd. * | 981,869 | 269,637 |
| Sigma Healthcare Ltd. | 1,784,247 | 714,891 |
| Southern Cross Media Group Ltd. | 308,813 | 174,423 |
| St. Barbara Ltd. | 57,016 | 109,996 |
| Super Retail Group Ltd. | 88,635 | 582,290 |
| Sydney Airport | 118,655 | 718,627 |
| Tassal Group Ltd. | 42,773 | 122,128 |
| The GPT Group | 201,143 | 825,637 |
| The Star Entertainment Grp Ltd. | 302,700 | 981,501 |
| TPG Telecom Ltd. | 73,994 | 333,504 |
| Treasury Wine Estates Ltd. | 79,455 | 963,244 |
| Vicinity Centres | 512,357 | 943,107 |
| Virgin Australia International Holdings *(b) | 176,214 | — |
| Vocus Group Ltd. * | 51,808 | 118,778 |
| Washington H Soul Pattinson & Co., Ltd. | 11,120 | 166,224 |
| Whitehaven Coal Ltd. | 108,158 | 245,993 |
| | | 40,787,271 |
| |
| Austria 0.6% |
| Austria Technologie & Systemtechnik AG | 13,534 | 251,851 |
| BAWAG Group AG * | 9,216 | 380,901 |
| CA Immobilien Anlagen AG | 7,633 | 294,122 |
| DO & Co. AG | 1,496 | 139,152 |
| EVN AG | 9,511 | 173,753 |
| IMMOFINANZ AG * | 15,371 | 441,926 |
| Lenzing AG | 5,777 | 608,507 |
| Oesterreichische Post AG | 16,433 | 605,633 |
| POLYTEC Holding AG(a) | 15,442 | 140,578 |
| S IMMO AG | 9,779 | 247,669 |
| UNIQA Insurance Group AG | 42,691 | 410,549 |
| Verbund AG | 9,724 | 526,798 |
| Vienna Insurance Group AG Wiener Versicherung Gruppe | 15,498 | 420,023 |
| Zumtobel Group AG * | 26,130 | 207,496 |
| | | 4,848,958 |
| |
Schwab Fundamental Index Funds | Annual Report
Schwab Fundamental International Small Company Index Fund
Portfolio Holdings as of October 31, 2019 (continued)
| Security | Number
of Shares | Value ($) |
| Belgium 1.3% |
| Ackermans & van Haaren N.V. | 5,049 | 773,991 |
| AGFA-Gevaert N.V. * | 108,819 | 496,550 |
| Barco N.V. | 2,163 | 471,068 |
| Befimmo S.A. | 3,795 | 245,322 |
| Bekaert S.A. | 29,356 | 819,259 |
| bpost S.A. | 97,835 | 1,118,083 |
| Cie d'Entreprises CFE | 3,094 | 298,249 |
| Cofinimmo S.A. | 3,445 | 509,477 |
| D'ieteren S.A./N.V. | 16,345 | 1,032,325 |
| Econocom Group S.A. | 42,029 | 109,595 |
| Elia System Operator S.A./N.V. | 5,988 | 516,241 |
| Euronav N.V. | 51,030 | 575,492 |
| Gimv N.V. | 2,805 | 168,444 |
| Greenyard N.V.(a) | 42,211 | 204,318 |
| Melexis N.V. | 2,305 | 161,742 |
| Nyrstar N.V. * | 501,161 | 108,435 |
| Ontex Group N.V. | 34,063 | 617,923 |
| Orange Belgium S.A. | 15,797 | 347,435 |
| Sofina S.A. | 1,174 | 259,797 |
| Telenet Group Holding N.V. * | 15,669 | 769,833 |
| Tessenderlo Group S.A. * | 10,548 | 348,969 |
| | | 9,952,548 |
| |
| Canada 7.9% |
| Aecon Group, Inc. | 38,972 | 538,524 |
| Aimia, Inc. * | 133,299 | 369,404 |
| Alacer Gold Corp. * | 49,100 | 243,058 |
| Algonquin Power & Utilities Corp. | 52,949 | 727,240 |
| Allied Properties Real Estate Investment Trust | 11,800 | 480,027 |
| Altus Group Ltd. | 5,900 | 163,503 |
| Artis Real Estate Investment Trust | 63,673 | 599,457 |
| ATS Automation Tooling Systems, Inc. * | 10,800 | 146,613 |
| AutoCanada, Inc.(a) | 35,500 | 223,442 |
| Badger Daylighting Ltd.(a) | 4,900 | 145,166 |
| Baytex Energy Corp. * | 471,100 | 525,789 |
| Birchcliff Energy Ltd. | 95,900 | 146,351 |
| BlackBerry Ltd. * | 67,000 | 352,016 |
| Boardwalk Real Estate Investment Trust(a) | 12,377 | 410,468 |
| Bombardier, Inc., Class B * | 138,000 | 173,928 |
| Bonavista Energy Corp. | 945,400 | 351,717 |
| Bonterra Energy Corp. | 46,522 | 114,442 |
| Boyd Group Income Fund | 1,600 | 223,121 |
| BRP, Inc. | 5,600 | 251,237 |
| CAE, Inc. | 41,919 | 1,051,237 |
| Calfrac Well Services Ltd. *(a) | 120,300 | 102,297 |
| Canadian Apartment Properties REIT | 16,199 | 674,477 |
| Canadian Utilities Ltd., Class A | 38,600 | 1,125,675 |
| Canadian Western Bank | 20,739 | 525,128 |
| Canfor Corp. * | 57,695 | 697,369 |
| Canfor Pulp Products, Inc. | 17,800 | 117,036 |
| CanWel Building Materials Group Ltd. | 41,000 | 141,014 |
| Capital Power Corp. | 34,799 | 834,109 |
| Cascades, Inc. | 63,719 | 603,277 |
| CCL Industries, Inc., Class B | 18,390 | 756,907 |
| Centerra Gold, Inc. * | 88,177 | 751,824 |
| CES Energy Solutions Corp. | 154,542 | 206,510 |
| Chartwell Retirement Residences | 39,400 | 440,935 |
| Chemtrade Logistics Income Fund(a) | 56,881 | 451,299 |
| Choice Properties Real Estate Investment Trust | 24,500 | 258,560 |
| Chorus Aviation, Inc.(a) | 46,300 | 274,545 |
| Cineplex, Inc. | 30,060 | 512,373 |
| Security | Number
of Shares | Value ($) |
| Cogeco Communications, Inc. | 3,831 | 331,151 |
| Cogeco, Inc. | 8,300 | 642,335 |
| Colliers International Group, Inc. | 4,434 | 297,093 |
| Cominar Real Estate Investment Trust | 93,913 | 957,597 |
| Constellation Software, Inc. | 943 | 931,351 |
| Corus Entertainment, Inc., Class B | 91,743 | 352,456 |
| Cott Corp. | 35,400 | 454,763 |
| Crombie Real Estate Investment Trust | 25,800 | 309,890 |
| Detour Gold Corp. * | 28,300 | 469,912 |
| Dream Global Real Estate Investment Trust | 23,080 | 292,289 |
| Dream Office Real Estate Investment Trust | 36,517 | 812,351 |
| Eldorado Gold Corp. * | 75,561 | 636,225 |
| Element Fleet Management Corp. | 31,200 | 265,310 |
| Emera, Inc. | 11,600 | 480,258 |
| Enerflex Ltd. | 42,849 | 335,739 |
| Enerplus Corp. | 117,500 | 709,229 |
| Ensign Energy Services, Inc. | 198,489 | 403,880 |
| Exchange Income Corp.(a) | 12,130 | 359,268 |
| Extendicare, Inc.(a) | 41,700 | 282,095 |
| First Capital Realty, Inc. | 28,678 | 474,664 |
| FirstService Corp. | 3,200 | 279,305 |
| Franco-Nevada Corp. | 9,415 | 913,550 |
| Frontera Energy Corp. | 53,200 | 426,537 |
| Genworth MI Canada, Inc. | 11,905 | 480,864 |
| Granite Real Estate Investment Trust | 5,704 | 282,450 |
| Great Canadian Gaming Corp. * | 8,727 | 276,036 |
| Home Capital Group, Inc. *(a) | 31,870 | 655,983 |
| Horizon North Logistics, Inc. | 131,000 | 96,477 |
| Hudbay Minerals, Inc. | 78,056 | 283,280 |
| Hudson's Bay Co. | 106,600 | 807,735 |
| IAMGOLD Corp. * | 126,668 | 476,051 |
| IGM Financial, Inc. | 33,000 | 931,296 |
| Innergex Renewable Energy, Inc. | 20,700 | 258,377 |
| Interfor Corp. * | 43,095 | 513,698 |
| Intertape Polymer Group, Inc. | 21,085 | 271,507 |
| Just Energy Group, Inc. | 95,914 | 222,107 |
| Kinross Gold Corp. * | 251,100 | 1,220,135 |
| Kirkland Lake Gold Ltd. | 7,000 | 328,715 |
| Laurentian Bank of Canada | 12,311 | 423,421 |
| Lundin Mining Corp. | 151,825 | 766,560 |
| Maple Leaf Foods, Inc. | 31,563 | 550,453 |
| Martinrea International, Inc. | 88,571 | 722,233 |
| Medical Facilities Corp. | 25,586 | 151,911 |
| MEG Energy Corp. * | 146,162 | 561,521 |
| Morneau Shepell, Inc.(a) | 10,912 | 262,713 |
| Mullen Group Ltd. | 73,992 | 460,659 |
| NFI Group, Inc. | 18,492 | 406,737 |
| Norbord, Inc. | 21,000 | 606,195 |
| Northland Power, Inc. | 24,846 | 496,128 |
| Northview Apartment Real Estate Investment Trust | 9,700 | 212,544 |
| OceanaGold Corp. | 174,072 | 417,635 |
| Pan American Silver Corp. | 52,405 | 890,061 |
| Parex Resources, Inc. * | 25,600 | 346,944 |
| Parkland Fuel Corp. | 34,800 | 1,155,949 |
| Pason Systems, Inc. | 19,996 | 214,671 |
| Peyto Exploration & Development Corp.(a) | 178,802 | 357,034 |
| PrairieSky Royalty Ltd. | 22,500 | 219,687 |
| Precision Drilling Corp. * | 426,300 | 453,132 |
| Premium Brands Holdings Corp. | 4,800 | 316,659 |
| Quebecor, Inc., Class B | 32,900 | 764,861 |
| Restaurant Brands International, Inc. | 12,500 | 817,800 |
| Richelieu Hardware Ltd.(a) | 17,714 | 363,668 |
| Ritchie Bros. Auctioneers, Inc. | 11,855 | 487,755 |
| Rogers Sugar, Inc. | 44,770 | 184,573 |
Schwab Fundamental Index Funds | Annual Report
Schwab Fundamental International Small Company Index Fund
Portfolio Holdings as of October 31, 2019 (continued)
| Security | Number
of Shares | Value ($) |
| Russel Metals, Inc. | 54,117 | 888,323 |
| Secure Energy Services, Inc. | 96,531 | 310,752 |
| SEMAFO, Inc. * | 86,600 | 279,440 |
| Seven Generations Energy Ltd., Class A * | 66,800 | 374,295 |
| ShawCor Ltd. | 52,896 | 532,534 |
| Sherritt International Corp. * | 214,500 | 39,086 |
| SmartCentres Real Estate Investment Trust | 23,025 | 556,614 |
| Stantec, Inc. | 31,248 | 666,668 |
| Stella-Jones, Inc. | 12,500 | 346,595 |
| Superior Plus Corp. | 82,543 | 745,149 |
| The North West Co., Inc. | 20,315 | 434,649 |
| The Stars Group, Inc. * | 15,000 | 326,399 |
| TMX Group Ltd. | 7,200 | 629,091 |
| Toromont Industries Ltd. | 13,881 | 716,762 |
| Tourmaline Oil Corp. | 62,377 | 535,161 |
| Transcontinental, Inc., Class A | 52,620 | 600,869 |
| Trican Well Service Ltd. * | 449,566 | 293,544 |
| Turquoise Hill Resources Ltd. * | 312,300 | 128,040 |
| Uni-Select, Inc. | 30,920 | 250,017 |
| Vermilion Energy, Inc.(a) | 50,500 | 667,148 |
| Western Forest Products, Inc. | 387,495 | 382,464 |
| WestJet Airlines Ltd. | 50,800 | 1,181,386 |
| Westshore Terminals Investment Corp. | 15,856 | 274,961 |
| Wheaton Precious Metals Corp. | 42,216 | 1,183,369 |
| Whitecap Resources, Inc. | 189,300 | 527,470 |
| Winpak Ltd. | 7,600 | 269,125 |
| Yamana Gold, Inc. | 273,900 | 1,000,273 |
| | | 60,983,722 |
| |
| Denmark 1.1% |
| Chr. Hansen Holding A/S | 5,788 | 444,378 |
| D/S Norden A/S | 23,295 | 340,752 |
| Demant A/S * | 12,862 | 339,752 |
| Dfds A/S | 11,631 | 458,147 |
| FLSmidth & Co. A/S | 19,625 | 703,427 |
| Genmab A/S * | 762 | 166,493 |
| GN Store Nord A/S | 13,441 | 591,309 |
| H. Lundbeck A/S | 7,119 | 243,260 |
| Jyske Bank A/S * | 21,872 | 727,575 |
| Matas A/S | 24,940 | 191,168 |
| Nilfisk Holding A/S * | 11,138 | 188,216 |
| NKT A/S * | 21,205 | 372,022 |
| Rockwool International A/S, B Shares | 2,086 | 409,979 |
| Royal Unibrew A/S | 6,078 | 498,634 |
| Scandinavian Tobacco Group A/S | 32,891 | 388,625 |
| Schouw & Co. A/S | 5,470 | 392,515 |
| SimCorp A/S | 3,034 | 271,476 |
| Spar Nord Bank A/S | 19,760 | 193,027 |
| Sydbank A/S | 30,697 | 602,136 |
| Topdanmark A/S | 5,268 | 235,923 |
| Tryg A/S | 22,230 | 621,352 |
| | | 8,380,166 |
| |
| Finland 1.3% |
| Aktia Bank Oyj | 14,723 | 143,352 |
| Cargotec Oyj, B Shares | 24,496 | 859,385 |
| Caverion Oyj | 44,759 | 334,462 |
| Cramo Oyj | 23,869 | 252,900 |
| Finnair Oyj | 33,079 | 216,026 |
| Huhtamaki Oyj | 26,451 | 1,224,827 |
| Kemira Oyj | 43,682 | 709,601 |
| Konecranes Oyj | 21,145 | 653,008 |
| Metsa Board Oyj | 75,619 | 501,106 |
| Orion Oyj, Class B | 28,367 | 1,258,491 |
| Security | Number
of Shares | Value ($) |
| Outotec Oyj * | 73,642 | 474,637 |
| Ramirent Oyj(a) | 45,995 | 448,346 |
| Sanoma Oyj | 39,629 | 414,137 |
| Tieto Oyj | 29,014 | 825,162 |
| Tokmanni Group Corp. | 15,123 | 193,629 |
| Uponor Oyj | 26,643 | 348,519 |
| Valmet Oyj | 30,984 | 693,438 |
| Yit Oyj | 57,454 | 345,081 |
| | | 9,896,107 |
| |
| France 4.2% |
| Aeroports de Paris | 4,261 | 810,396 |
| Albioma S.A. | 10,435 | 270,847 |
| ALD S.A. | 67,639 | 959,320 |
| Altarea S.C.A. | 910 | 200,086 |
| Alten S.A. | 5,912 | 650,332 |
| Altran Technologies S.A. | 56,120 | 892,251 |
| Amundi S.A. | 10,691 | 764,056 |
| Beneteau S.A. | 12,502 | 116,762 |
| BioMerieux | 4,809 | 393,785 |
| Bonduelle S.C.A. | 6,457 | 167,795 |
| Cie Plastic Omnium S.A. | 27,182 | 742,517 |
| Coface S.A. | 31,314 | 342,260 |
| Covivio | 8,163 | 924,453 |
| Dassault Aviation S.A. | 266 | 369,514 |
| Derichebourg S.A. | 88,813 | 320,179 |
| Edenred | 23,749 | 1,251,756 |
| Elior Group S.A. | 68,826 | 891,341 |
| Elis S.A. | 46,305 | 885,283 |
| Eramet | 3,624 | 181,585 |
| Eurofins Scientific SE | 981 | 497,361 |
| Euronext N.V. | 9,651 | 778,566 |
| Europcar Mobility Group | 42,845 | 157,349 |
| Fnac Darty S.A. * | 6,737 | 389,971 |
| Gaztransport Et Technigaz S.A. | 2,548 | 232,476 |
| Gecina S.A. | 5,261 | 903,150 |
| Getlink SE | 69,877 | 1,170,501 |
| ICADE | 8,722 | 854,087 |
| Imerys S.A. | 19,229 | 742,791 |
| Ipsen S.A. | 3,352 | 357,282 |
| IPSOS | 22,590 | 680,748 |
| JCDecaux S.A. | 19,278 | 526,974 |
| Kaufman & Broad S.A. | 7,121 | 271,661 |
| Korian S.A. | 12,686 | 537,974 |
| Latecoere SACA * | 55,274 | 236,954 |
| LISI | 7,377 | 259,302 |
| Maisons du Monde S.A. | 14,682 | 203,176 |
| Mercialys S.A. | 25,802 | 359,843 |
| Mersen S.A. | 4,708 | 153,277 |
| Metropole Television S.A. | 30,458 | 535,831 |
| Nexans S.A. | 25,582 | 1,040,986 |
| Nexity S.A. | 16,234 | 840,243 |
| Orpea | 6,010 | 723,863 |
| Quadient | 35,466 | 759,549 |
| Remy Cointreau S.A. | 2,788 | 373,098 |
| Rothschild & Co. | 5,994 | 168,576 |
| SEB S.A. | 5,463 | 830,119 |
| Societe BIC S.A. | 11,805 | 819,591 |
| Solocal Group *(a) | 361,870 | 283,227 |
| Sopra Steria Group | 4,875 | 669,197 |
| SPIE S.A. | 53,647 | 1,132,244 |
| Tarkett S.A. | 24,619 | 400,904 |
| Technicolor S.A. * | 665,144 | 556,519 |
| Television Francaise | 66,691 | 559,656 |
| Trigano S.A. | 1,621 | 146,195 |
| UbiSoft Entertainment S.A. * | 11,054 | 653,283 |
| Vallourec S.A. *(a) | 337,664 | 820,185 |
Schwab Fundamental Index Funds | Annual Report
Schwab Fundamental International Small Company Index Fund
Portfolio Holdings as of October 31, 2019 (continued)
| Security | Number
of Shares | Value ($) |
| Vicat S.A. | 9,128 | 387,068 |
| Vilmorin & Cie S.A. | 3,336 | 182,441 |
| | | 32,330,736 |
| |
| Germany 3.7% |
| 1&1 Drillisch AG | 5,733 | 153,546 |
| Aareal Bank AG | 24,454 | 820,962 |
| Alstria Office REIT AG | 10,190 | 190,930 |
| Aroundtown S.A. | 23,601 | 199,490 |
| Axel Springer SE * | 13,262 | 924,444 |
| Bauer AG | 11,360 | 180,925 |
| BayWa AG | 21,662 | 633,703 |
| Bechtle AG | 7,066 | 765,210 |
| Bertrandt AG | 2,819 | 140,695 |
| Bilfinger SE | 33,338 | 1,112,838 |
| CANCOM SE | 6,819 | 364,693 |
| Carl Zeiss Meditec AG, Class B | 2,033 | 221,605 |
| CECONOMY AG * | 120,253 | 605,139 |
| Cewe Stiftung & Co. KGaA | 1,585 | 152,443 |
| CTS Eventim AG & Co. KGaA | 5,741 | 347,709 |
| Deutsche Euroshop AG | 9,265 | 277,298 |
| Deutz AG | 76,764 | 427,089 |
| Dialog Semiconductor plc * | 22,152 | 996,403 |
| Duerr AG | 20,168 | 595,028 |
| DWS Group GmbH & Co. KGaA | 6,000 | 194,062 |
| ElringKlinger AG * | 46,075 | 340,610 |
| Fielmann AG | 5,043 | 388,925 |
| Fraport AG Frankfurt Airport Services Worldwide | 9,253 | 773,390 |
| Gerresheimer AG | 8,634 | 696,290 |
| Grand City Properties S.A. | 8,188 | 191,692 |
| GRENKE AG | 1,550 | 146,681 |
| Hamburger Hafen und Logistik AG | 6,998 | 181,297 |
| Hapag-Lloyd AG | 12,043 | 875,737 |
| Heidelberger Druckmaschinen AG * | 211,795 | 274,852 |
| Hella GmbH & Co. KGaA | 22,909 | 1,114,381 |
| HOCHTIEF AG | 6,924 | 865,105 |
| Hornbach Holding AG & Co. KGaA | 11,632 | 703,146 |
| Indus Holding AG | 10,059 | 383,358 |
| Jenoptik AG | 9,954 | 295,983 |
| Knorr-Bremse AG | 4,320 | 435,989 |
| Koenig & Bauer AG | 4,004 | 132,319 |
| Krones AG | 7,388 | 482,674 |
| LEG Immobilien AG | 6,426 | 738,115 |
| Nordex SE * | 31,291 | 408,528 |
| Norma Group SE | 10,022 | 367,909 |
| Pfeiffer Vacuum Technology AG | 1,490 | 233,150 |
| Puma SE | 12,294 | 924,840 |
| QIAGEN N.V. * | 13,032 | 391,990 |
| Rational AG | 209 | 159,018 |
| Rhoen-Klinikum AG | 11,592 | 238,920 |
| SAF-Holland S.A. | 26,550 | 187,451 |
| Scout24 AG | 12,868 | 797,640 |
| Siemens Healthineers AG | 10,136 | 430,652 |
| Siltronic AG | 5,254 | 500,388 |
| Sixt SE | 3,800 | 371,607 |
| Software AG | 14,695 | 467,463 |
| Stabilus S.A. | 3,734 | 209,633 |
| Stroeer SE & Co. KGaA | 2,428 | 195,620 |
| Suedzucker AG | 64,390 | 926,624 |
| TAG Immobilien AG * | 17,727 | 430,797 |
| Takkt AG | 18,328 | 217,903 |
| Talanx AG * | 16,418 | 756,680 |
| TLG Immobilien AG | 7,366 | 215,652 |
| Wacker Chemie AG | 8,218 | 643,809 |
| Wacker Neuson SE | 13,356 | 228,028 |
| Security | Number
of Shares | Value ($) |
| Wirecard AG | 3,012 | 381,066 |
| Zalando SE * | 12,459 | 540,185 |
| | | 28,550,309 |
| |
| Greece 0.0% |
| TT Hellenic Postbank S.A. *(b) | 24,275 | — |
| |
| Hong Kong 3.8% |
| AAC Technologies Holdings, Inc. | 166,000 | 1,074,235 |
| ASM Pacific Technology Ltd. | 66,000 | 921,547 |
| BOC Aviation Ltd. | 31,000 | 291,242 |
| Brightoil Petroleum Holdings Ltd. *(b) | 1,150,000 | — |
| Cafe De Coral Holdings Ltd. | 126,000 | 343,803 |
| Cathay Pacific Airways Ltd. | 378,000 | 482,914 |
| China Harmony New Energy Auto Holding Ltd. | 785,000 | 270,133 |
| China Travel International Investment Hong Kong Ltd. | 1,126,000 | 177,756 |
| Chow Tai Fook Jewellery Group Ltd. | 532,400 | 478,687 |
| CITIC Telecom International Holdings Ltd. | 586,000 | 222,434 |
| CK Infrastructure Holdings Ltd. | 30,000 | 215,902 |
| Dah Sing Financial Holdings Ltd. | 54,000 | 200,938 |
| Dairy Farm International Holdings Ltd. | 75,523 | 455,404 |
| Esprit Holdings Ltd. * | 4,088,076 | 781,558 |
| First Pacific Co., Ltd. | 2,528,000 | 967,119 |
| Fortune REIT | 140,000 | 164,235 |
| Giordano International Ltd. | 746,000 | 236,811 |
| Global Brands Group Holding Ltd. | 5,348,823 | 368,191 |
| Haitong International Securities Group Ltd. | 568,500 | 164,836 |
| Hang Lung Group Ltd. | 338,000 | 846,566 |
| Hang Lung Properties Ltd. | 450,000 | 989,191 |
| Huabao International Holdings Ltd. | 322,000 | 117,711 |
| Hutchison Telecommunications Hong Kong Holdings Ltd. | 896,000 | 162,081 |
| Hysan Development Co., Ltd. | 74,000 | 291,652 |
| IGG, Inc. | 135,000 | 88,221 |
| Johnson Electric Holdings Ltd. | 216,500 | 395,349 |
| K Wah International Holdings Ltd. | 555,000 | 303,290 |
| Kerry Logistics Network Ltd. | 225,500 | 359,795 |
| Kerry Properties Ltd. | 261,000 | 843,986 |
| L'Occitane International S.A. | 145,250 | 327,000 |
| Lifestyle International Holdings Ltd. | 143,000 | 150,524 |
| Luk Fook Holdings International Ltd. | 222,000 | 589,657 |
| Man Wah Holdings Ltd. | 670,400 | 456,607 |
| Melco International Development Ltd. | 187,000 | 495,615 |
| MGM China Holdings Ltd. | 202,000 | 319,863 |
| Minth Group Ltd. | 159,500 | 564,180 |
| MMG Ltd. * | 1,108,000 | 230,665 |
| NagaCorp Ltd. | 140,000 | 254,392 |
| NewOcean Energy Holdings Ltd. * | 1,096,000 | 177,633 |
| Nexteer Automotive Group Ltd. | 262,000 | 244,189 |
| NWS Holdings Ltd. | 394,000 | 586,382 |
| Pacific Basin Shipping Ltd. | 1,660,000 | 384,352 |
| Pacific Textile Holdings Ltd. | 278,000 | 202,215 |
| Pou Sheng International Holdings Ltd. | 1,176,000 | 443,971 |
| Power Assets Holdings Ltd. | 71,643 | 511,254 |
| Prada S.p.A. | 185,700 | 638,412 |
| Road King Infrastructure Ltd. | 122,000 | 223,188 |
| Sa Sa International Holdings Ltd.(a) | 722,518 | 172,958 |
| Samsonite International S.A. | 354,100 | 721,005 |
| Semiconductor Manufacturing International Corp. * | 757,900 | 962,721 |
| Shangri-La Asia Ltd. | 256,000 | 262,762 |
Schwab Fundamental Index Funds | Annual Report
Schwab Fundamental International Small Company Index Fund
Portfolio Holdings as of October 31, 2019 (continued)
| Security | Number
of Shares | Value ($) |
| Shougang Fushan Resources Group Ltd. | 1,418,000 | 292,601 |
| Shui On Land Ltd. | 1,764,000 | 354,993 |
| SITC International Holdings Co., Ltd. | 326,000 | 358,958 |
| SmarTone Telecommunications Holdings Ltd. | 275,000 | 238,677 |
| Sun Art Retail Group Ltd. | 896,000 | 914,271 |
| Swire Properties Ltd. | 136,400 | 428,985 |
| Television Broadcasts Ltd. | 224,200 | 369,813 |
| The Bank of East Asia Ltd. | 283,867 | 683,807 |
| Tingyi (Cayman Islands) Holding Corp. | 646,000 | 859,371 |
| Towngas China Co., Ltd. * | 187,000 | 144,154 |
| Truly International Holdings Ltd. * | 2,366,000 | 306,546 |
| Uni-President China Holdings Ltd. | 352,000 | 363,592 |
| Value Partners Group Ltd. | 229,000 | 120,550 |
| Vitasoy International Holdings Ltd. | 60,000 | 243,978 |
| VSTECS Holdings Ltd. | 622,000 | 316,977 |
| VTech Holdings Ltd. | 81,200 | 711,947 |
| Wynn Macau Ltd. | 320,400 | 695,294 |
| Xinyi Glass Holdings Ltd. | 576,000 | 647,619 |
| Xinyi Solar Holdings Ltd. | 330,850 | 186,942 |
| | | 29,374,207 |
| |
| Ireland 0.3% |
| AIB Group plc | 125,890 | 403,243 |
| Glanbia plc | 46,231 | 515,099 |
| Irish Continental Group plc | 43,489 | 207,594 |
| Kingspan Group plc | 19,418 | 1,006,179 |
| Total Produce plc | 259,871 | 423,158 |
| | | 2,555,273 |
| |
| Israel 1.1% |
| Azrieli Group Ltd. | 5,025 | 387,318 |
| Cellcom Israel Ltd. * | 42,475 | 108,480 |
| Clal Insurance Enterprise Holdings Ltd. * | 11,382 | 175,573 |
| Delek Group Ltd. | 2,371 | 296,248 |
| El Al Israel Airlines * | 655,403 | 252,532 |
| Elbit Systems Ltd. | 4,096 | 671,567 |
| First International Bank of Israel Ltd. * | 10,669 | 292,901 |
| Gazit-Globe Ltd. | 46,966 | 473,302 |
| Harel Insurance Investments & Finances Service Ltd. | 28,391 | 227,054 |
| Israel Discount Bank Ltd., Class A | 240,066 | 1,097,059 |
| Mehadrin Ltd. * | — | 3 |
| Mizrahi Tefahot Bank Ltd. | 22,454 | 557,097 |
| Nice Ltd. * | 4,858 | 766,303 |
| Oil Refineries Ltd. | 941,897 | 483,593 |
| Partner Communications Co., Ltd. * | 45,445 | 204,851 |
| Paz Oil Co., Ltd. | 4,998 | 766,380 |
| Shikun & Binui Ltd. | 68,877 | 273,328 |
| Shufersal Ltd. | 27,039 | 182,839 |
| The Israel Corp., Ltd. * | 2,734 | 521,895 |
| The Phoenix Holdings Ltd. | 28,285 | 172,533 |
| Tower Semiconductor Ltd. * | 28,764 | 635,747 |
| | | 8,546,603 |
| |
| Italy 2.4% |
| ACEA S.p.A. | 18,030 | 358,831 |
| Alitalia - Linee Aeree Italiane S.p.A. *(b) | 14,782 | — |
| Amplifon S.p.A. | 11,455 | 288,074 |
| Anima Holding S.p.A. | 110,862 | 481,259 |
| Astaldi S.p.A. * | 385,104 | 284,333 |
| Security | Number
of Shares | Value ($) |
| ASTM S.p.A. | 15,831 | 498,967 |
| Autogrill S.p.A. | 58,167 | 575,084 |
| Azimut Holding S.p.A. | 36,407 | 748,660 |
| Banca Carige S.p.A. *(b) | 60,009,170 | 66,928 |
| Banca Generali S.p.A. | 12,304 | 401,682 |
| Banca IFIS S.p.A. | 9,239 | 156,743 |
| Banca Mediolanum S.p.A. | 67,450 | 578,371 |
| Banca Monte dei Paschi di Siena S.p.A. * | 195,430 | 314,945 |
| Banca Popolare Di Sondrio Scarl | 362,003 | 723,972 |
| Buzzi Unicem S.p.A. | 31,950 | 770,909 |
| Cerved Group S.p.A. | 46,091 | 448,580 |
| Danieli & C Officine Meccaniche S.p.A. | 24,156 | 417,050 |
| Davide Campari-Milano S.p.A. | 48,308 | 443,096 |
| De'Longhi S.p.A. | 19,554 | 360,181 |
| DiaSorin S.p.A. | 2,189 | 246,812 |
| Enav S.p.A. | 69,553 | 404,928 |
| ERG S.p.A. | 22,371 | 473,520 |
| Esprinet S.p.A. | 58,871 | 244,579 |
| Ferrari N.V. | 6,378 | 1,021,481 |
| Fincantieri S.p.A. * | 124,659 | 131,545 |
| FinecoBank Banca Fineco S.p.A. | 37,551 | 423,325 |
| Freni Brembo S.p.A. | 43,357 | 461,293 |
| Industria Macchine Automatiche S.p.A. | 2,032 | 138,356 |
| Infrastrutture Wireless Italiane S.p.A. | 17,437 | 178,917 |
| Interpump Group S.p.A. | 11,452 | 313,937 |
| Iren S.p.A. | 270,312 | 838,714 |
| Italgas S.p.A. | 132,169 | 850,864 |
| MARR S.p.A. | 10,082 | 211,879 |
| Mediaset S.p.A. * | 207,632 | 620,978 |
| Moncler S.p.A. | 12,574 | 485,215 |
| OVS S.p.A. * | 262,466 | 523,739 |
| Piaggio & C. S.p.A. | 51,320 | 161,507 |
| Recordati S.p.A. | 12,162 | 511,097 |
| Salini Impregilo S.p.A. *(a) | 141,450 | 287,991 |
| Salvatore Ferragamo S.p.A. | 16,092 | 300,968 |
| Societa Cattolica di Assicurazioni SC | 69,152 | 603,228 |
| Societa Iniziative Autostradali e Servizi S.p.A. | 20,864 | 360,798 |
| Tod's S.p.A. | 6,080 | 288,193 |
| UnipolSai Assicurazioni S.p.A. | 257,302 | 718,119 |
| | | 18,719,648 |
| |
| Japan 35.2% |
| ABC-Mart, Inc. | 7,000 | 479,958 |
| Acom Co., Ltd. | 45,900 | 184,410 |
| Adastria Co., Ltd. | 19,180 | 471,731 |
| ADEKA Corp. | 58,200 | 832,903 |
| Advantest Corp. | 18,100 | 823,703 |
| Aeon Delight Co., Ltd. | 9,800 | 341,288 |
| AEON Financial Service Co., Ltd. | 34,700 | 528,842 |
| Aeon Mall Co., Ltd. | 37,330 | 597,244 |
| Ahresty Corp. | 46,600 | 236,651 |
| Aica Kogyo Co., Ltd. | 16,200 | 514,473 |
| Aichi Steel Corp. | 13,600 | 442,620 |
| Aida Engineering Ltd. | 34,900 | 297,070 |
| Ain Holdings, Inc. | 7,000 | 400,534 |
| Aisan Industry Co., Ltd. | 44,000 | 363,782 |
| Alconix Corp. | 16,800 | 212,283 |
| Alpen Co., Ltd. | 15,100 | 240,046 |
| Amano Corp. | 20,100 | 594,290 |
| Anritsu Corp.(a) | 24,100 | 459,593 |
| AOKI Holdings, Inc. | 30,300 | 308,269 |
| Aoyama Trading Co., Ltd. | 40,700 | 716,100 |
| Aozora Bank Ltd. | 35,600 | 913,438 |
| Arata Corp. | 16,200 | 607,327 |
| Arcland Sakamoto Co., Ltd. | 21,400 | 252,439 |
Schwab Fundamental Index Funds | Annual Report
Schwab Fundamental International Small Company Index Fund
Portfolio Holdings as of October 31, 2019 (continued)
| Security | Number
of Shares | Value ($) |
| Arcs Co., Ltd. | 39,600 | 794,648 |
| Asahi Diamond Industrial Co., Ltd. | 35,600 | 221,474 |
| Asahi Holdings, Inc. | 16,400 | 381,798 |
| ASKUL Corp. | 8,300 | 227,994 |
| Autobacs Seven Co., Ltd. | 37,000 | 610,800 |
| Avex, Inc. | 23,200 | 282,248 |
| Axial Retailing, Inc. | 9,300 | 359,534 |
| Azbil Corp. | 39,100 | 1,088,042 |
| Belc Co., Ltd. | 4,400 | 211,625 |
| Belluna Co., Ltd. | 21,100 | 137,942 |
| Benesse Holdings, Inc. | 32,000 | 856,632 |
| BML, Inc. | 7,500 | 220,005 |
| Bunka Shutter Co., Ltd. | 38,900 | 337,653 |
| Calbee, Inc. | 19,000 | 635,089 |
| Canon Electronics, Inc. | 12,400 | 232,150 |
| Canon Marketing Japan, Inc. | 31,100 | 658,005 |
| Capcom Co., Ltd. | 14,800 | 349,333 |
| Cawachi Ltd. | 16,300 | 332,519 |
| Central Glass Co., Ltd. | 29,500 | 711,053 |
| Chiyoda Co., Ltd. | 18,100 | 268,221 |
| Chiyoda Corp. * | 208,200 | 538,341 |
| Chubu Shiryo Co., Ltd. | 28,800 | 336,118 |
| Chudenko Corp. | 13,300 | 306,608 |
| Chugoku Marine Paints Ltd. | 29,700 | 287,151 |
| CKD Corp. | 30,800 | 432,402 |
| Cocokara fine, Inc. | 14,800 | 816,052 |
| Colowide Co., Ltd. | 7,200 | 139,612 |
| CONEXIO Corp. | 11,300 | 156,268 |
| Cosmos Pharmaceutical Corp. | 2,300 | 474,975 |
| Create SD Holdings Co., Ltd. | 8,700 | 215,554 |
| Credit Saison Co., Ltd. | 84,300 | 1,220,726 |
| CyberAgent, Inc. | 16,800 | 546,026 |
| Daido Metal Co., Ltd. | 35,700 | 226,464 |
| Daifuku Co., Ltd. | 13,700 | 726,946 |
| Daihen Corp. | 10,900 | 341,606 |
| Daiho Corp. | 10,100 | 285,352 |
| Daiichikosho Co., Ltd. | 12,400 | 589,463 |
| Daikyonishikawa Corp. | 44,100 | 338,802 |
| Dainichiseika Color & Chemicals Manufacturing Co., Ltd. | 11,800 | 355,106 |
| Daio Paper Corp. | 42,400 | 565,180 |
| Daiseki Co., Ltd. | 10,000 | 290,492 |
| Daiwabo Holdings Co., Ltd. | 15,100 | 659,811 |
| DCM Holdings Co., Ltd. | 70,300 | 695,913 |
| Dena Co., Ltd. | 40,786 | 695,230 |
| Descente Ltd. | 14,600 | 187,141 |
| Dexerials Corp. | 31,700 | 279,829 |
| Disco Corp. | 4,700 | 1,025,716 |
| DMG Mori Co., Ltd. | 26,700 | 432,278 |
| Doshisha Co., Ltd. | 16,000 | 253,556 |
| Doutor Nichires Holdings Co., Ltd. | 14,900 | 298,364 |
| DTS Corp. | 13,200 | 279,555 |
| Duskin Co., Ltd. | 22,100 | 587,237 |
| DyDo Group Holdings, Inc. | 6,000 | 250,126 |
| Eagle Industry Co., Ltd. | 24,500 | 246,044 |
| Earth Corp. | 5,100 | 269,188 |
| Eizo Corp. | 7,450 | 277,076 |
| Exedy Corp. | 29,300 | 690,151 |
| Ezaki Glico Co., Ltd. | 17,200 | 798,139 |
| F-Tech, Inc. | 19,100 | 135,429 |
| F.C.C. Co., Ltd. | 21,800 | 451,049 |
| FamilyMart Co., Ltd. | 27,300 | 677,209 |
| Fancl Corp. | 9,800 | 276,938 |
| Feed One Co., Ltd. | 119,700 | 187,428 |
| Foster Electric Co., Ltd. | 30,600 | 547,076 |
| FP Corp. | 5,000 | 310,439 |
| Fuji Co., Ltd. | 19,700 | 354,456 |
| Fuji Corp. | 33,338 | 553,586 |
| Security | Number
of Shares | Value ($) |
| Fuji Media Holdings, Inc. | 21,700 | 293,223 |
| Fuji Oil Co., Ltd. | 124,100 | 294,035 |
| Fuji Oil Holdings, Inc. | 15,700 | 472,185 |
| Fuji Seal International, Inc. | 10,400 | 258,333 |
| Fuji Soft, Inc. | 7,700 | 335,419 |
| Fujimori Kogyo Co., Ltd. | 10,200 | 360,632 |
| Fujitec Co., Ltd. | 44,300 | 644,447 |
| Fujitsu General Ltd. | 30,900 | 557,769 |
| Fukuoka Financial Group, Inc. | 44,300 | 853,986 |
| Fukuyama Transporting Co., Ltd. | 13,500 | 484,239 |
| Funai Electric Co., Ltd. * | 31,900 | 175,845 |
| Furukawa Co., Ltd. | 24,500 | 350,967 |
| Futaba Corp. | 18,200 | 234,094 |
| Futaba Industrial Co., Ltd. | 74,900 | 529,563 |
| Fuyo General Lease Co., Ltd. | 4,300 | 280,268 |
| G-Tekt Corp. | 24,200 | 417,215 |
| Geo Holdings Corp. | 38,300 | 477,296 |
| Glory Ltd. | 30,200 | 889,165 |
| Gree, Inc. | 78,800 | 374,143 |
| GS Yuasa Corp. | 51,700 | 942,505 |
| GungHo Online Entertainment, Inc. | 24,750 | 536,045 |
| Gunze Ltd. | 9,900 | 430,764 |
| H-One Co., Ltd. | 21,100 | 142,527 |
| H.I.S. Co., Ltd. | 12,200 | 316,599 |
| Hakuto Co., Ltd. | 12,900 | 154,132 |
| Hamakyorex Co., Ltd. | 6,400 | 218,372 |
| Hamamatsu Photonics K.K. | 17,400 | 675,629 |
| Happinet Corp. | 15,600 | 196,820 |
| Hazama Ando Corp. | 114,200 | 884,833 |
| Heiwa Corp. | 24,200 | 498,101 |
| Heiwa Real Estate Co., Ltd. | 6,800 | 164,009 |
| Heiwado Co., Ltd. | 25,900 | 479,828 |
| Hikari Tsushin, Inc. | 3,100 | 679,510 |
| Hirose Electric Co., Ltd. | 8,339 | 1,050,464 |
| Hisamitsu Pharmaceutical Co., Inc. | 15,400 | 716,705 |
| Hitachi Capital Corp. | 13,300 | 298,029 |
| Hitachi Chemical Co., Ltd. | 48,700 | 1,603,194 |
| Hitachi High-Technologies Corp. | 24,700 | 1,536,728 |
| Hitachi Transport System Ltd. | 19,000 | 540,792 |
| Hitachi Zosen Corp. | 192,100 | 649,123 |
| Hokkaido Electric Power Co., Inc. | 153,400 | 805,134 |
| Hokuetsu Corp. | 105,500 | 537,290 |
| Hokuhoku Financial Group, Inc. | 56,600 | 553,652 |
| Horiba Ltd. | 12,300 | 830,014 |
| Hoshizaki Corp. | 10,500 | 892,524 |
| Hosiden Corp. | 53,400 | 560,974 |
| House Foods Group, Inc. | 16,900 | 640,549 |
| Hulic Co., Ltd. | 53,400 | 579,750 |
| IDOM, Inc. | 56,700 | 239,751 |
| Iino Kaiun Kaisha Ltd. | 67,300 | 225,991 |
| Inaba Denki Sangyo Co., Ltd. | 17,400 | 799,334 |
| Inabata & Co., Ltd. | 59,900 | 784,206 |
| Internet Initiative Japan, Inc. | 11,900 | 282,172 |
| Iriso Electronics Co., Ltd. | 3,200 | 158,216 |
| Iseki & Co., Ltd. | 15,800 | 240,301 |
| Ishihara Sangyo Kaisha Ltd. | 27,300 | 281,843 |
| Ito En Ltd. | 14,600 | 711,631 |
| Itochu Enex Co., Ltd. | 62,600 | 523,084 |
| Itochu Techno-Solutions Corp. | 24,600 | 662,498 |
| Itoham Yonekyu Holdings, Inc. | 160,400 | 1,033,863 |
| Iwatani Corp. | 29,600 | 1,026,435 |
| Izumi Co., Ltd. | 17,000 | 639,512 |
| Jaccs Co., Ltd. | 14,300 | 322,765 |
| Jafco Co., Ltd. | 9,100 | 341,813 |
| Japan Airport Terminal Co., Ltd. | 9,800 | 484,086 |
| Japan Aviation Electronics Industry Ltd. | 33,000 | 614,751 |
| Japan Exchange Group, Inc. | 59,500 | 982,256 |
Schwab Fundamental Index Funds | Annual Report
Schwab Fundamental International Small Company Index Fund
Portfolio Holdings as of October 31, 2019 (continued)
| Security | Number
of Shares | Value ($) |
| Japan Petroleum Exploration Co., Ltd. | 23,100 | 590,612 |
| Japan Post Insurance Co., Ltd. | 23,700 | 373,887 |
| Japan Pulp & Paper Co., Ltd. | 13,100 | 504,228 |
| Joshin Denki Co., Ltd. | 23,300 | 467,196 |
| Joyful Honda Co., Ltd. | 36,700 | 466,377 |
| Juki Corp. | 18,200 | 164,164 |
| JVCKenwood Corp. | 166,800 | 486,174 |
| Kadokawa Dwango * | 25,800 | 368,787 |
| Kaga Electronics Co., Ltd. | 23,100 | 447,764 |
| Kagome Co., Ltd. | 21,700 | 546,945 |
| Kakaku.com, Inc. | 12,000 | 278,638 |
| Kaken Pharmaceutical Co., Ltd. | 10,300 | 504,996 |
| Kameda Seika Co., Ltd. | 4,200 | 188,920 |
| Kamigumi Co., Ltd. | 42,400 | 958,712 |
| Kanamoto Co., Ltd. | 14,900 | 398,338 |
| Kandenko Co., Ltd. | 62,400 | 590,015 |
| Kanematsu Corp. | 80,300 | 978,281 |
| Kansai Paint Co., Ltd. | 47,200 | 1,136,804 |
| Kasai Kogyo Co., Ltd. | 49,600 | 401,441 |
| Kato Sangyo Co., Ltd. | 23,400 | 742,785 |
| Kato Works Co., Ltd. | 7,600 | 143,752 |
| Keihan Holdings Co., Ltd. | 19,900 | 939,616 |
| Keihin Corp. | 48,200 | 1,145,841 |
| Keikyu Corp. | 51,800 | 1,031,111 |
| Keisei Electric Railway Co., Ltd. | 21,900 | 895,391 |
| KH Neochem Co., Ltd. | 10,400 | 253,260 |
| Kintetsu World Express, Inc. | 24,200 | 391,370 |
| Kissei Pharmaceutical Co., Ltd. | 8,900 | 229,285 |
| Kitz Corp. | 48,700 | 331,888 |
| Kobayashi Pharmaceutical Co., Ltd. | 7,700 | 615,692 |
| Kohnan Shoji Co., Ltd. | 20,900 | 485,348 |
| Kokusai Pulp & Paper Co., Ltd. | 70,300 | 214,185 |
| Kokuyo Co., Ltd. | 45,800 | 672,088 |
| Komeri Co., Ltd. | 22,400 | 480,039 |
| Komori Corp. | 26,600 | 283,242 |
| Konami Holdings Corp. | 18,000 | 790,178 |
| Konishi Co., Ltd. | 16,200 | 228,672 |
| Konoike Transport Co., Ltd. | 21,400 | 326,184 |
| Kose Corp. | 3,100 | 549,611 |
| Kumagai Gumi Co., Ltd. | 17,300 | 533,361 |
| Kura Sushi, Inc. | 3,200 | 134,623 |
| Kurabo Industries Ltd. | 19,000 | 435,032 |
| Kureha Corp. | 8,000 | 511,310 |
| Kurita Water Industries Ltd. | 39,900 | 1,148,625 |
| Kusuri no Aoki Holdings Co., Ltd. | 2,000 | 149,155 |
| KYB Corp. * | 28,200 | 900,591 |
| Kyoei Steel Ltd. | 16,500 | 300,475 |
| Kyokuto Kaihatsu Kogyo Co., Ltd. | 20,900 | 280,100 |
| Kyokuyo Co., Ltd. | 9,000 | 240,966 |
| KYORIN Holdings, Inc. | 18,500 | 324,046 |
| Kyoritsu Maintenance Co., Ltd. | 4,300 | 190,214 |
| Kyowa Exeo Corp. | 39,200 | 997,324 |
| Kyowa Kirin Co., Ltd. | 51,400 | 945,761 |
| Kyudenko Corp. | 15,200 | 496,685 |
| Kyushu Financial Group, Inc. | 96,300 | 388,703 |
| Lawson, Inc. | 15,600 | 860,596 |
| Life Corp. | 16,300 | 374,129 |
| Lintec Corp. | 28,100 | 590,179 |
| Lion Corp. | 47,300 | 989,869 |
| LIXIL VIVA Corp. | 11,400 | 197,108 |
| M3, Inc. | 14,700 | 352,261 |
| Mabuchi Motor Co., Ltd. | 18,300 | 741,462 |
| Macnica Fuji Electronics Holdings, Inc. | 40,900 | 693,287 |
| Maeda Corp. | 61,600 | 571,698 |
| Maeda Road Construction Co., Ltd. | 32,100 | 690,578 |
| Makino Milling Machine Co., Ltd. | 10,900 | 541,939 |
| Mandom Corp. | 10,900 | 302,059 |
| Marudai Food Co., Ltd. | 28,800 | 620,390 |
| Security | Number
of Shares | Value ($) |
| Maruha Nichiro Corp. | 19,000 | 493,474 |
| Marui Group Co., Ltd. | 43,000 | 955,905 |
| Maruichi Steel Tube Ltd. | 20,600 | 562,551 |
| Maruzen Showa Unyu Co., Ltd. | 6,600 | 185,496 |
| Max Co., Ltd. | 17,100 | 313,719 |
| Maxell Holdings Ltd. | 31,300 | 431,996 |
| MCJ Co., Ltd. | 21,400 | 141,231 |
| Mebuki Financial Group, Inc. | 277,900 | 706,036 |
| Megmilk Snow Brand Co., Ltd. | 32,400 | 779,266 |
| Meidensha Corp. | 27,900 | 535,279 |
| Meitec Corp. | 6,500 | 338,847 |
| Ministop Co., Ltd. | 9,000 | 121,070 |
| Miraca Holdings, Inc. | 39,300 | 927,567 |
| Mirait Holdings Corp. | 36,500 | 586,081 |
| Mitsuba Corp. | 85,900 | 542,072 |
| Mitsubishi Logistics Corp. | 24,500 | 621,925 |
| Mitsubishi Pencil Co., Ltd. | 12,400 | 195,797 |
| Mitsubishi Steel Manufacturing Co., Ltd. | 13,400 | 142,757 |
| Mitsubishi UFJ Lease & Finance Co., Ltd. | 96,400 | 591,798 |
| Mitsuboshi Belting Ltd. | 11,200 | 210,739 |
| Mitsui E&S Holdings Co., Ltd. * | 101,000 | 1,022,289 |
| Mitsui Matsushima Holdings Co., Ltd. | 11,400 | 135,935 |
| Mitsui Sugar Co., Ltd. | 8,200 | 178,301 |
| Mitsui-Soko Holdings Co., Ltd. | 15,600 | 252,949 |
| Miura Co., Ltd. | 13,800 | 415,836 |
| Mizuno Corp. | 15,000 | 392,332 |
| Mochida Pharmaceutical Co., Ltd. | 6,900 | 275,364 |
| Modec, Inc. | 6,200 | 170,068 |
| Morinaga & Co., Ltd. | 9,600 | 474,235 |
| Morinaga Milk Industry Co., Ltd. | 29,000 | 1,127,468 |
| Morita Holdings Corp. | 14,200 | 237,922 |
| MOS Food Services, Inc. | 8,200 | 207,405 |
| Musashi Seimitsu Industry Co., Ltd. | 26,100 | 362,567 |
| Nabtesco Corp. | 34,700 | 1,104,668 |
| Nachi-Fujikoshi Corp. | 11,400 | 545,531 |
| Namura Shipbuilding Co., Ltd. | 89,100 | 248,758 |
| Nankai Electric Railway Co., Ltd. | 29,000 | 753,621 |
| NEC Networks & System Integration Corp. | 13,500 | 426,114 |
| NET One Systems Co., Ltd. | 18,300 | 493,378 |
| Nexon Co., Ltd. * | 49,422 | 572,714 |
| Nichi-iko Pharmaceutical Co., Ltd. | 19,100 | 223,795 |
| Nichias Corp. | 28,600 | 603,349 |
| Nichicon Corp. | 38,500 | 378,862 |
| Nichiha Corp. | 12,300 | 353,677 |
| NichiiGakkan Co., Ltd. | 17,100 | 289,921 |
| Nifco, Inc. | 30,000 | 791,877 |
| Nihon Kohden Corp. | 20,500 | 613,312 |
| Nihon Parkerizing Co., Ltd. | 31,200 | 365,819 |
| Nihon Unisys Ltd. | 16,500 | 544,656 |
| Nikkiso Co., Ltd. | 26,900 | 290,621 |
| Nikkon Holdings Co., Ltd. | 23,900 | 580,956 |
| Nippo Corp. | 33,400 | 686,284 |
| Nippon Chemi-Con Corp. | 15,000 | 247,940 |
| Nippon Denko Co., Ltd. | 89,400 | 154,950 |
| Nippon Densetsu Kogyo Co., Ltd. | 16,400 | 355,006 |
| Nippon Flour Mills Co., Ltd. | 31,800 | 510,689 |
| Nippon Gas Co., Ltd. | 13,400 | 379,294 |
| Nippon Kayaku Co., Ltd. | 71,600 | 870,175 |
| Nippon Koei Co., Ltd. | 9,700 | 300,084 |
| Nippon Light Metal Holdings Co., Ltd. | 495,400 | 963,572 |
| Nippon Paint Holdings Co., Ltd. | 19,400 | 1,056,533 |
| Nippon Seiki Co., Ltd. | 34,000 | 525,688 |
| Nippon Sheet Glass Co., Ltd. | 107,700 | 674,775 |
| Nippon Shinyaku Co., Ltd. | 4,700 | 424,018 |
| Nippon Signal Co., Ltd. | 31,500 | 362,993 |
Schwab Fundamental Index Funds | Annual Report
Schwab Fundamental International Small Company Index Fund
Portfolio Holdings as of October 31, 2019 (continued)
| Security | Number
of Shares | Value ($) |
| Nippon Soda Co., Ltd. | 18,100 | 482,102 |
| Nippon Suisan Kaisha Ltd. | 142,400 | 815,532 |
| Nippon Television Holdings, Inc. | 19,300 | 252,420 |
| Nippon Yakin Kogyo Co., Ltd. | 7,010 | 153,879 |
| Nipro Corp. | 55,100 | 646,079 |
| Nishi-Nippon Financial Holdings, Inc. | 62,000 | 459,434 |
| Nishi-Nippon Railroad Co., Ltd. | 36,300 | 842,247 |
| Nishimatsu Construction Co., Ltd. | 35,700 | 743,306 |
| Nishimatsuya Chain Co., Ltd. | 31,400 | 279,430 |
| Nishio Rent All Co., Ltd. | 10,400 | 279,398 |
| Nissan Chemical Corp. | 19,400 | 796,522 |
| Nissan Shatai Co., Ltd. | 72,500 | 668,120 |
| Nissha Co., Ltd. | 23,400 | 243,704 |
| Nissin Electric Co., Ltd. | 14,900 | 174,431 |
| Nissin Kogyo Co., Ltd. | 32,600 | 667,614 |
| Nittetsu Mining Co., Ltd. | 7,600 | 318,792 |
| Nitto Boseki Co., Ltd. | 12,900 | 393,261 |
| Nitto Kogyo Corp. | 17,300 | 363,476 |
| NOF Corp. | 18,600 | 628,290 |
| Nojima Corp. | 18,600 | 329,950 |
| Nomura Co., Ltd. | 14,800 | 182,659 |
| Nomura Research Institute Ltd. | 60,080 | 1,275,541 |
| Noritake Co., Ltd. | 6,900 | 316,997 |
| Noritz Corp. | 33,300 | 411,651 |
| North Pacific Bank Ltd. | 297,700 | 640,123 |
| NS Solutions Corp. | 9,300 | 316,182 |
| NS United Kaiun Kaisha Ltd. | 6,400 | 144,927 |
| NSD Co., Ltd. | 8,600 | 265,092 |
| Obic Co., Ltd. | 4,100 | 513,341 |
| Oiles Corp. | 15,080 | 229,316 |
| Okabe Co., Ltd. | 22,300 | 188,807 |
| Okamoto Industries, Inc. | 4,800 | 185,374 |
| Okamura Corp. | 43,500 | 436,240 |
| Okasan Securities Group, Inc. | 91,600 | 323,457 |
| Oki Electric Industry Co., Ltd. | 66,100 | 887,092 |
| OKUMA Corp. | 12,200 | 728,952 |
| Okumura Corp. | 16,100 | 456,042 |
| Onoken Co., Ltd. | 17,000 | 222,923 |
| Onward Holdings Co., Ltd. | 111,300 | 643,443 |
| Open House Co., Ltd. | 12,200 | 311,766 |
| Oracle Corp., Japan | 4,600 | 404,322 |
| Orient Corp. | 221,700 | 323,887 |
| Osaka Soda Co., Ltd. | 9,700 | 274,592 |
| Osaki Electric Co., Ltd. | 23,600 | 163,403 |
| OSG Corp. | 24,100 | 515,487 |
| Pacific Industrial Co., Ltd. | 21,800 | 297,466 |
| PALTAC Corp. | 17,500 | 843,946 |
| Paramount Bed Holdings Co., Ltd. | 6,900 | 263,835 |
| Park24 Co., Ltd. | 26,200 | 618,751 |
| Penta-Ocean Construction Co., Ltd. | 141,000 | 864,955 |
| Persol Holdings Co., Ltd. | 46,100 | 885,489 |
| Pigeon Corp. | 11,000 | 537,002 |
| Pilot Corp. | 6,900 | 279,848 |
| Piolax, Inc. | 10,703 | 209,319 |
| Plenus Co., Ltd. | 18,500 | 321,248 |
| Pola Orbis Holdings, Inc. | 13,900 | 313,665 |
| Press Kogyo Co., Ltd. | 95,300 | 404,213 |
| Prima Meat Packers Ltd. | 22,200 | 548,600 |
| Raito Kogyo Co., Ltd. | 20,200 | 321,037 |
| Raiznext Corp. | 21,800 | 221,477 |
| Rakuten, Inc. | 117,260 | 1,117,889 |
| Relia, Inc. | 21,200 | 276,793 |
| Relo Group, Inc. | 10,600 | 259,418 |
| Rengo Co., Ltd. | 119,000 | 862,873 |
| Resorttrust, Inc. | 18,700 | 298,417 |
| Restar Holdings Corp. | 22,500 | 382,349 |
| Riken Corp. | 6,100 | 226,329 |
| Rinnai Corp. | 14,100 | 1,036,397 |
| Security | Number
of Shares | Value ($) |
| Riso Kagaku Corp. | 14,300 | 234,952 |
| Rohto Pharmaceutical Co., Ltd. | 20,300 | 609,863 |
| Round One Corp. | 21,800 | 281,102 |
| Royal Holdings Co., Ltd. | 9,500 | 239,916 |
| Ryobi Ltd. | 26,400 | 491,361 |
| Ryosan Co., Ltd. | 27,800 | 721,760 |
| Ryoyo Electro Corp. | 18,200 | 323,000 |
| S Foods, Inc. | 9,000 | 242,482 |
| Saizeriya Co., Ltd. | 13,400 | 304,235 |
| Sakai Chemical Industry Co., Ltd. | 10,600 | 264,473 |
| Sakata INX Corp. | 31,300 | 353,786 |
| Sakata Seed Corp. | 5,600 | 185,514 |
| Sala Corp. | 26,400 | 158,375 |
| San-A Co., Ltd. | 9,000 | 426,169 |
| Sanden Holdings Corp. * | 54,700 | 356,218 |
| Sangetsu Corp. | 25,300 | 478,342 |
| Sanken Electric Co., Ltd. | 17,700 | 415,484 |
| Sanki Engineering Co., Ltd. | 26,000 | 316,672 |
| Sankyo Co., Ltd. | 14,100 | 493,467 |
| Sankyo Tateyama, Inc. | 40,600 | 442,316 |
| Sankyu, Inc. | 19,100 | 971,067 |
| Sanoh Industrial Co., Ltd.(a) | 32,100 | 401,557 |
| Sanrio Co., Ltd. | 14,900 | 298,734 |
| Sanshin Electronics Co., Ltd. | 14,400 | 205,467 |
| Sanwa Holdings Corp. | 79,700 | 932,141 |
| Sanyo Chemical Industries Ltd. | 6,150 | 293,424 |
| Sanyo Denki Co., Ltd. | 5,600 | 261,442 |
| Sanyo Shokai Ltd. | 17,100 | 227,296 |
| Sanyo Special Steel Co., Ltd. | 24,700 | 312,820 |
| Sapporo Holdings Ltd. | 37,300 | 938,024 |
| Sato Holdings Corp. | 9,100 | 267,872 |
| Sawai Pharmaceutical Co., Ltd. | 10,500 | 592,482 |
| SBI Holdings, Inc. | 42,500 | 924,304 |
| SCREEN Holdings Co., Ltd. | 14,100 | 978,880 |
| SCSK Corp. | 9,976 | 507,822 |
| Seibu Holdings, Inc. | 58,400 | 1,030,760 |
| Seiko Holdings Corp. | 19,000 | 466,564 |
| Seiren Co., Ltd. | 21,800 | 268,755 |
| Sekisui Jushi Corp. | 11,000 | 225,248 |
| Senko Group Holdings Co., Ltd. | 72,900 | 586,377 |
| Senshu Ikeda Holdings, Inc. | 114,500 | 205,353 |
| Seven Bank Ltd. | 159,200 | 461,547 |
| Sharp Corp. | 43,100 | 494,407 |
| Shibuya Corp. | 5,000 | 136,394 |
| Shima Seiki Manufacturing Ltd. | 8,200 | 196,059 |
| Shimachu Co., Ltd. | 26,800 | 726,985 |
| Shindengen Electric Manufacturing Co., Ltd. | 6,400 | 217,507 |
| Shinko Electric Industries Co., Ltd. | 45,100 | 440,149 |
| Shinko Shoji Co., Ltd. | 24,200 | 207,454 |
| Shinmaywa Industries Ltd. | 45,800 | 564,213 |
| Shinsei Bank Ltd. | 33,900 | 528,492 |
| Shinsho Corp. | 10,300 | 243,882 |
| Ship Healthcare Holdings, Inc. | 13,400 | 571,131 |
| Shizuoka Gas Co., Ltd. | 52,100 | 450,422 |
| SHO-BOND Holdings Co., Ltd. | 6,700 | 260,030 |
| Shochiku Co., Ltd. | 1,900 | 278,788 |
| Shoei Foods Corp.(a) | 5,400 | 158,610 |
| Showa Corp. | 33,500 | 699,970 |
| Siix Corp. | 27,500 | 416,946 |
| Sintokogio Ltd. | 32,700 | 315,440 |
| SKY Perfect JSAT Holdings, Inc. | 86,500 | 357,245 |
| Sohgo Security Services Co., Ltd. | 17,100 | 928,835 |
| Sony Financial Holdings, Inc. | 30,999 | 666,895 |
| Sotetsu Holdings, Inc. | 20,200 | 536,721 |
| Square Enix Holdings Co., Ltd. | 19,500 | 927,971 |
| St. Marc Holdings Co., Ltd. | 8,800 | 196,303 |
| Starts Corp., Inc. | 12,000 | 309,482 |
Schwab Fundamental Index Funds | Annual Report
Schwab Fundamental International Small Company Index Fund
Portfolio Holdings as of October 31, 2019 (continued)
| Security | Number
of Shares | Value ($) |
| Starzen Co., Ltd. | 10,800 | 455,235 |
| Sugi Holdings Co., Ltd. | 16,000 | 888,117 |
| Sumco Corp. | 63,300 | 1,051,468 |
| Sumitomo Bakelite Co., Ltd. | 14,200 | 588,808 |
| Sumitomo Dainippon Pharma Co., Ltd. | 30,200 | 527,085 |
| Sumitomo Mitsui Construction Co., Ltd. | 89,780 | 509,515 |
| Sumitomo Osaka Cement Co., Ltd. | 20,400 | 890,500 |
| Sumitomo Riko Co., Ltd. | 44,100 | 383,725 |
| Sumitomo Seika Chemicals Co., Ltd. | 7,000 | 222,821 |
| Sundrug Co., Ltd. | 32,000 | 1,058,903 |
| Suruga Bank Ltd. * | 128,900 | 560,225 |
| Sushiro Global Holdings Ltd. | 4,400 | 302,513 |
| T-Gaia Corp. | 16,400 | 394,411 |
| Tachi-S Co., Ltd. | 38,300 | 508,683 |
| Tachibana Eletech Co., Ltd. | 19,000 | 318,001 |
| Tadano Ltd. | 68,800 | 623,620 |
| Taihei Dengyo Kaisha Ltd. | 9,500 | 224,144 |
| Taikisha Ltd. | 15,500 | 501,397 |
| Taisho Pharmaceutical Holdings Co., Ltd. | 8,500 | 604,983 |
| Taiyo Holdings Co., Ltd. | 4,300 | 155,834 |
| Taiyo Nippon Sanso Corp. | 34,600 | 809,976 |
| Taiyo Yuden Co., Ltd. | 47,600 | 1,258,826 |
| Takamatsu Construction Group Co., Ltd. | 9,100 | 218,976 |
| Takara Holdings, Inc. | 50,600 | 502,283 |
| Takara Standard Co., Ltd. | 28,100 | 492,824 |
| Takasago International Corp. | 9,900 | 248,453 |
| Takasago Thermal Engineering Co., Ltd. | 29,400 | 531,885 |
| Takeuchi Manufacturing Co., Ltd. | 15,000 | 234,395 |
| Takuma Co., Ltd. | 22,300 | 265,368 |
| Tamron Co., Ltd. | 10,000 | 218,370 |
| Tamura Corp. | 32,600 | 186,705 |
| TechnoPro Holdings, Inc. | 4,400 | 270,626 |
| The 77 Bank Ltd. | 20,300 | 319,810 |
| The Awa Bank Ltd. | 9,300 | 221,475 |
| The Bank of Kyoto Ltd. | 10,600 | 419,554 |
| The Chiba Bank Ltd. | 181,500 | 986,516 |
| The Chugoku Bank Ltd. | 47,900 | 468,073 |
| The Gunma Bank Ltd. | 158,300 | 532,702 |
| The Hachijuni Bank Ltd. | 135,700 | 583,735 |
| The Hiroshima Bank Ltd. | 115,500 | 588,744 |
| The Hokkoku Bank Ltd. | 8,600 | 241,699 |
| The Hyakugo Bank Ltd. | 60,000 | 193,129 |
| The Hyakujushi Bank Ltd. | 10,600 | 220,287 |
| The Iyo Bank Ltd. | 87,200 | 460,743 |
| The Japan Steel Works Ltd. | 28,900 | 608,993 |
| The Japan Wool Textile Co., Ltd. | 35,900 | 352,915 |
| The Juroku Bank Ltd. | 13,700 | 313,516 |
| The Keiyo Bank Ltd. | 49,700 | 311,688 |
| The Kiyo Bank Ltd. | 20,300 | 313,212 |
| The Musashino Bank Ltd. | 12,300 | 214,441 |
| The Nanto Bank Ltd. | 11,900 | 301,754 |
| The Nippon Road Co., Ltd. | 4,700 | 287,178 |
| The Nisshin Oillio Group Ltd. | 18,400 | 644,307 |
| The Ogaki Kyoritsu Bank Ltd. | 12,400 | 299,088 |
| The Oita Bank Ltd. | 4,500 | 124,380 |
| The Okinawa Electric Power Co., Inc. | 31,931 | 529,088 |
| The San-in Godo Bank Ltd. | 43,100 | 252,809 |
| The Shiga Bank Ltd. | 10,900 | 262,679 |
| The Shizuoka Bank Ltd. | 128,000 | 972,643 |
| The Sumitomo Warehouse Co., Ltd. | 28,900 | 391,668 |
| THK Co., Ltd. | 36,800 | 1,058,195 |
| Toa Corp. | 19,800 | 266,376 |
| Toagosei Co., Ltd. | 64,800 | 718,228 |
| Toda Corp. | 115,400 | 720,851 |
| Security | Number
of Shares | Value ($) |
| Toei Co., Ltd. | 1,700 | 235,406 |
| Toho Co., Ltd. | 19,900 | 803,670 |
| Toho Zinc Co., Ltd. | 15,100 | 306,417 |
| Tokai Carbon Co., Ltd.(a) | 33,900 | 342,352 |
| TOKAI Holdings Corp. | 53,700 | 526,660 |
| Tokai Rika Co., Ltd. | 49,800 | 961,154 |
| Tokai Tokyo Financial Holdings, Inc. | 113,700 | 296,478 |
| Token Corp. | 5,950 | 381,578 |
| Tokuyama Corp. | 32,200 | 860,190 |
| Tokyo Broadcasting System Holdings, Inc. | 16,000 | 255,127 |
| Tokyo Century Corp. | 9,800 | 452,522 |
| Tokyo Dome Corp. | 33,200 | 292,814 |
| Tokyo Ohka Kogyo Co., Ltd. | 13,700 | 542,566 |
| Tokyo Seimitsu Co., Ltd. | 13,700 | 440,031 |
| Tokyo Steel Manufacturing Co., Ltd. | 43,000 | 346,181 |
| Tokyo Tatemono Co., Ltd. | 64,100 | 911,981 |
| Tokyu Construction Co., Ltd. | 39,800 | 315,231 |
| TOMONY Holdings, Inc. | 40,700 | 141,710 |
| Tomy Co., Ltd. | 31,700 | 343,764 |
| Tonami Holdings Co., Ltd. | 3,500 | 161,519 |
| Topcon Corp. | 30,800 | 424,687 |
| Toppan Forms Co., Ltd. | 41,500 | 414,827 |
| Topre Corp. | 28,400 | 492,816 |
| Topy Industries Ltd. | 22,200 | 453,823 |
| Toshiba Machine Co., Ltd. | 16,000 | 358,037 |
| Toshiba Plant Systems & Services Corp. | 14,100 | 275,497 |
| Toshiba TEC Corp. | 14,100 | 508,524 |
| Totetsu Kogyo Co., Ltd. | 11,700 | 364,758 |
| Towa Pharmaceutical Co., Ltd. | 5,500 | 141,035 |
| Toyo Construction Co., Ltd. | 54,200 | 254,675 |
| Toyo Ink SC Holdings Co., Ltd. | 30,600 | 745,786 |
| Toyo Tire Corp. | 77,000 | 1,074,016 |
| Toyobo Co., Ltd. | 69,200 | 935,379 |
| Toyota Boshoku Corp. | 61,500 | 903,607 |
| TPR Co., Ltd. | 24,900 | 445,761 |
| Trancom Co., Ltd. | 3,800 | 250,782 |
| Transcosmos, Inc. | 15,400 | 387,408 |
| Trend Micro, Inc. | 17,400 | 878,252 |
| Trusco Nakayama Corp. | 16,900 | 408,624 |
| TSI Holdings Co., Ltd. | 79,300 | 414,182 |
| Tsubaki Nakashima Co., Ltd. | 12,800 | 217,884 |
| Tsubakimoto Chain Co. | 21,300 | 727,733 |
| Tsukishima Kikai Co., Ltd. | 15,200 | 234,132 |
| Tsumura & Co. | 18,600 | 512,234 |
| TV Asahi Holdings Corp. | 13,200 | 206,170 |
| UACJ Corp. | 34,230 | 627,027 |
| Ulvac, Inc. | 15,000 | 656,241 |
| Unipres Corp. | 50,600 | 827,598 |
| United Arrows Ltd. | 12,300 | 376,001 |
| United Super Markets Holdings, Inc. | 68,800 | 618,838 |
| Unizo Holdings Co., Ltd. | 6,400 | 295,184 |
| Ushio, Inc. | 49,600 | 741,264 |
| USS Co., Ltd. | 30,800 | 596,540 |
| Valor Holdings Co., Ltd. | 34,000 | 580,118 |
| Vital KSK Holdings, Inc. | 30,800 | 314,483 |
| VT Holdings Co., Ltd. | 60,700 | 271,255 |
| Wacoal Holdings Corp. | 28,500 | 749,305 |
| Wacom Co., Ltd. | 59,700 | 222,206 |
| Wakita & Co., Ltd. | 24,600 | 248,657 |
| Warabeya Nichiyo Holdings Co., Ltd. | 22,100 | 389,062 |
| Welcia Holdings Co., Ltd. | 13,500 | 775,713 |
| World Co., Ltd. | 7,800 | 179,581 |
| Xebio Holdings Co., Ltd. | 27,900 | 312,659 |
| Yamabiko Corp. | 25,100 | 284,938 |
| Yamaguchi Financial Group, Inc. | 74,700 | 524,118 |
| Yamato Kogyo Co., Ltd. | 15,000 | 389,125 |
Schwab Fundamental Index Funds | Annual Report
Schwab Fundamental International Small Company Index Fund
Portfolio Holdings as of October 31, 2019 (continued)
| Security | Number
of Shares | Value ($) |
| Yamazen Corp. | 54,700 | 505,035 |
| Yaoko Co., Ltd. | 7,600 | 354,474 |
| Yellow Hat Ltd. | 20,800 | 338,633 |
| Yodogawa Steel Works Ltd. | 25,200 | 475,826 |
| Yokogawa Bridge Holdings Corp. | 14,700 | 269,113 |
| Yokohama Reito Co., Ltd. | 27,600 | 273,787 |
| Yorozu Corp. | 28,400 | 362,948 |
| Yoshinoya Holdings Co., Ltd. | 25,200 | 585,983 |
| Yuasa Trading Co., Ltd. | 16,200 | 502,570 |
| Yurtec Corp. | 43,300 | 267,738 |
| Zenkoku Hosho Co., Ltd. | 4,300 | 179,521 |
| Zensho Holdings Co., Ltd. | 21,900 | 463,199 |
| Zeon Corp. | 77,300 | 880,578 |
| ZERIA Pharmaceutical Co., Ltd. | 10,500 | 197,882 |
| Zojirushi Corp. | 18,400 | 282,356 |
| ZOZO, Inc.(a) | 14,600 | 340,077 |
| | | 272,745,582 |
| |
| Luxembourg 0.0% |
| Espirito Santo Financial Group S.A. *(b) | 69,773 | — |
| |
| Netherlands 1.7% |
| Accell Group N.V. | 12,434 | 308,863 |
| Altice Europe N.V. * | 231,906 | 1,326,921 |
| Altice Europe N.V., Class B * | 20,854 | 119,851 |
| AMG Advanced Metallurgical Group N.V.(a) | 5,758 | 141,668 |
| Arcadis N.V. | 45,491 | 899,359 |
| ASM International N.V. | 8,662 | 873,318 |
| BE Semiconductor Industries N.V. | 15,256 | 565,583 |
| Brunel International N.V. | 17,677 | 163,697 |
| Corbion N.V. | 22,822 | 659,242 |
| Eurocommercial Properties N.V. CVA | 11,728 | 374,095 |
| ForFarmers N.V. | 35,437 | 214,999 |
| Fugro N.V. CVA *(a) | 86,241 | 781,751 |
| GrandVision N.V. | 9,972 | 304,845 |
| IMCD N.V. | 5,550 | 433,367 |
| Intertrust N.V. | 11,273 | 214,597 |
| Koninklijke BAM Groep N.V | 196,094 | 497,852 |
| Koninklijke Volkerwessels N.V. | 21,975 | 510,954 |
| Koninklijke Vopak N.V. | 16,924 | 929,731 |
| NSI N.V. | 4,780 | 218,310 |
| OCI N.V. * | 13,973 | 314,174 |
| PostNL N.V. | 286,615 | 658,533 |
| SBM Offshore N.V. | 53,760 | 927,118 |
| Sligro Food Group N.V. | 20,248 | 515,368 |
| TKH Group N.V. | 12,632 | 647,548 |
| TomTom N.V. * | 17,595 | 199,255 |
| Wereldhave N.V.(a) | 13,306 | 314,974 |
| | | 13,115,973 |
| |
| New Zealand 0.9% |
| Air New Zealand Ltd. | 374,432 | 677,855 |
| Auckland International Airport Ltd. | 80,041 | 477,030 |
| Chorus Ltd. | 164,744 | 560,152 |
| EBOS Group Ltd. | 30,881 | 487,747 |
| Fisher & Paykel Healthcare Corp., Ltd. | 51,251 | 628,603 |
| Freightways Ltd. | 25,971 | 128,130 |
| Genesis Energy Ltd. | 215,287 | 452,266 |
| Infratil Ltd. | 186,307 | 588,678 |
| Mainfreight Ltd. | 18,602 | 479,207 |
| Mercury NZ Ltd. | 183,670 | 584,068 |
| Meridian Energy Ltd. | 272,320 | 802,715 |
| SKY Network Television Ltd. | 679,683 | 392,800 |
| Security | Number
of Shares | Value ($) |
| SKYCITY Entertainment Group Ltd. | 222,823 | 558,246 |
| Z Energy Ltd. | 157,593 | 541,169 |
| | | 7,358,666 |
| |
| Norway 1.4% |
| Adevinta A.S.A., Class B * | 21,878 | 249,799 |
| Aker A.S.A., A Shares | 8,987 | 477,540 |
| Aker BP A.S.A. | 6,820 | 189,169 |
| Aker Solutions A.S.A. * | 122,964 | 283,907 |
| Atea A.S.A. * | 39,516 | 499,301 |
| Austevoll Seafood A.S.A. | 32,078 | 323,926 |
| Bakkafrost P/F | 6,286 | 393,635 |
| Borregaard A.S.A. | 31,220 | 300,803 |
| BW LPG Ltd. | 70,281 | 492,205 |
| BW Offshore Ltd. * | 33,020 | 252,193 |
| DOF A.S.A. * | 399,760 | 60,209 |
| Elkem A.S.A. | 67,329 | 160,023 |
| Entra A.S.A. | 16,494 | 247,001 |
| Europris A.S.A. | 84,265 | 228,685 |
| Gjensidige Forsikring A.S.A. | 46,594 | 871,081 |
| Kongsberg Automotive A.S.A. * | 302,729 | 157,683 |
| Kongsberg Gruppen A.S.A. | 25,794 | 380,901 |
| Kvaerner A.S.A. | 97,628 | 123,906 |
| Leroy Seafood Group A.S.A. | 58,083 | 390,173 |
| PGS A.S.A. * | 406,293 | 687,642 |
| Salmar A.S.A. | 8,263 | 385,615 |
| Schibsted A.S.A., B Shares | 9,283 | 259,004 |
| Schibsted A.S.A., Class A | 8,797 | 258,354 |
| Sparebank 1 Nord Norge | 42,524 | 329,888 |
| SpareBank 1 SMN | 37,738 | 406,612 |
| SpareBank 1 SR Bank A.S.A. | 34,379 | 366,364 |
| Storebrand A.S.A. | 87,491 | 618,517 |
| TGS NOPEC Geophysical Co., A.S.A. | 30,436 | 790,463 |
| Tomra Systems A.S.A. | 11,281 | 304,060 |
| Veidekke A.S.A. | 48,834 | 529,546 |
| XXL A.S.A. * | 76,397 | 156,600 |
| | | 11,174,805 |
| |
| Poland 1.1% |
| Alior Bank S.A. * | 22,884 | 161,675 |
| Asseco Poland S.A. | 51,378 | 690,850 |
| Bank Handlowy w Warszawie S.A. | 10,466 | 139,706 |
| Bank Millennium S.A. * | 95,708 | 154,070 |
| CCC S.A. | 3,612 | 105,524 |
| Ciech S.A. * | 14,578 | 123,778 |
| Cyfrowy Polsat S.A. | 75,603 | 548,383 |
| Enea S.A. * | 248,520 | 549,181 |
| Energa S.A. * | 375,506 | 604,787 |
| Eurocash S.A. | 71,138 | 408,136 |
| Grupa Azoty S.A. * | 50,671 | 465,645 |
| Grupa Lotos S.A. | 43,761 | 1,092,846 |
| Jastrzebska Spolka Weglowa S.A. | 23,157 | 117,663 |
| Kernel Holding S.A. | 36,976 | 411,042 |
| LPP S.A. | 172 | 367,420 |
| mBank S.A. * | 2,443 | 244,131 |
| Orange Polska S.A. * | 701,900 | 1,150,074 |
| PLAY Communications S.A. | 71,582 | 567,920 |
| Santander Bank Polska S.A. | 4,609 | 378,093 |
| | | 8,280,924 |
| |
| Portugal 0.4% |
| Banco Espirito Santo S.A. *(b) | 320,558 | — |
| CTT-Correios de Portugal S.A. | 138,020 | 440,866 |
| EDP Renovaveis S.A. | 23,418 | 266,927 |
| Mota-Engil SGPS, S.A. | 110,264 | 244,253 |
Schwab Fundamental Index Funds | Annual Report
Schwab Fundamental International Small Company Index Fund
Portfolio Holdings as of October 31, 2019 (continued)
| Security | Number
of Shares | Value ($) |
| NOS SGPS, S.A. | 73,642 | 437,820 |
| Redes Energeticas Nacionais SGPS, S.A. | 135,661 | 402,670 |
| Semapa-Sociedade de Investimento e Gestao | 17,464 | 240,517 |
| Sonae SGPS, S.A. | 691,871 | 698,055 |
| The Navigator Co., S.A. | 136,132 | 491,261 |
| | | 3,222,369 |
| |
| Republic of Korea 5.2% |
| AK Holdings, Inc. | 3,800 | 102,010 |
| AMOREPACIFIC Group | 12,350 | 895,038 |
| Asiana Airlines, Inc. * | 81,930 | 374,722 |
| BNK Financial Group, Inc. | 164,433 | 982,056 |
| Celltrion, Inc. * | 1,645 | 281,542 |
| Cheil Worldwide, Inc. | 18,997 | 403,791 |
| CJ ENM Co., Ltd. | 2,871 | 406,328 |
| CJ Hello Co., Ltd. | 23,408 | 122,649 |
| CJ Logistics Corp. * | 2,772 | 375,151 |
| Com2uSCorp | 1,827 | 154,032 |
| Daeduck Electronics Co. | 22,965 | 210,693 |
| Daesang Corp. | 15,570 | 286,736 |
| Daewoo Engineering & Construction Co., Ltd. * | 113,855 | 424,568 |
| Daewoo Shipbuilding & Marine Engineering Co., Ltd. * | 12,930 | 311,831 |
| DB HiTek Co., Ltd. | 13,596 | 198,341 |
| DGB Financial Group, Inc. | 97,684 | 589,726 |
| Dongkuk Steel Mill Co., Ltd. * | 119,487 | 602,152 |
| Dongwon Industries Co., Ltd. | 677 | 124,382 |
| Doosan Bobcat, Inc. | 10,220 | 275,558 |
| Doosan Co., Ltd. | 7,029 | 469,129 |
| Doosan Fuel Cell Co., Ltd. * | 23,507 | 155,979 |
| Doosan Infracore Co., Ltd. * | 115,999 | 562,527 |
| Doosan Solus Co., Ltd. * | 12,957 | 198,233 |
| Fila Korea Ltd. | 3,038 | 149,903 |
| Green Cross Corp. | 1,316 | 144,865 |
| Green Cross Holdings Corp. | 7,409 | 132,083 |
| GS Engineering & Construction Corp. | 19,813 | 524,564 |
| GS Home Shopping, Inc. | 1,530 | 195,591 |
| GS Retail Co., Ltd. | 15,080 | 495,610 |
| Halla Holdings Corp. | 6,047 | 216,995 |
| Hanjin Transportation Co., Ltd. | 7,821 | 207,091 |
| Hanon Systems | 52,681 | 524,304 |
| Hansol Paper Co., Ltd. | 17,610 | 221,602 |
| Hanssem Co., Ltd. | 3,709 | 201,650 |
| Hanwha Aerospace Co., Ltd. * | 15,272 | 496,083 |
| Hanwha General Insurance Co., Ltd. | 114,928 | 275,643 |
| Hanwha Life Insurance Co., Ltd. | 326,491 | 624,809 |
| Harim Holdings Co., Ltd. | 35,505 | 274,271 |
| HDC Holdings Co., Ltd. | 18,796 | 190,997 |
| Hite Jinro Co., Ltd. | 16,470 | 402,468 |
| Hotel Shilla Co., Ltd. | 6,820 | 453,372 |
| Huchems Fine Chemical Corp. | 7,326 | 139,345 |
| Hyosung Corp. | 4,793 | 340,465 |
| Hyundai Corp. | 15,631 | 236,709 |
| Hyundai Department Store Co., Ltd. | 8,258 | 524,306 |
| Hyundai Elevator Co., Ltd. | 2,185 | 137,833 |
| Hyundai Greenfood Co., Ltd. | 29,919 | 287,997 |
| Hyundai Home Shopping Network Corp. | 2,580 | 187,396 |
| Hyundai Merchant Marine Co., Ltd. * | 107,478 | 303,772 |
| Hyundai Mipo Dockyard Co., Ltd. | 3,272 | 122,018 |
| Hyundai Rotem Co., Ltd. * | 14,046 | 193,663 |
| iMarketKorea, Inc. | 34,513 | 322,232 |
| Interpark Holdings Corp. | 80,402 | 165,748 |
| Security | Number
of Shares | Value ($) |
| IS Dongseo Co., Ltd. | 5,558 | 152,570 |
| JB Financial Group Co., Ltd. | 72,543 | 332,865 |
| Kakao Corp. | 2,545 | 308,842 |
| Kangwon Land, Inc. | 26,288 | 707,781 |
| KCC Corp. | 3,350 | 650,229 |
| KEPCO Plant Service & Engineering Co., Ltd. | 10,687 | 299,040 |
| Kolon Corp. | 11,166 | 166,064 |
| Kolon Industries, Inc. | 18,140 | 734,367 |
| Korea Aerospace Industries Ltd. | 15,514 | 506,399 |
| Korea Investment Holdings Co., Ltd. | 6,630 | 385,166 |
| Korea Petrochemical Ind Co., Ltd. | 2,788 | 284,634 |
| Korean Reinsurance Co. | 70,361 | 479,384 |
| Kumho Petrochemical Co., Ltd. | 8,774 | 525,336 |
| Kumho Tire Co., Inc. * | 99,493 | 361,401 |
| LF Corp. | 17,019 | 287,125 |
| LG Hausys Ltd. | 9,088 | 464,581 |
| LG Innotek Co., Ltd. | 10,792 | 1,120,962 |
| LG International Corp. | 56,885 | 758,304 |
| Lotte Chilsung Beverage Co., Ltd. | 1,631 | 192,117 |
| Lotte Corp. | 5,350 | 167,472 |
| LOTTE Fine Chemical Co., Ltd. | 7,577 | 287,291 |
| LOTTE Himart Co., Ltd. | 16,041 | 417,161 |
| LS Corp. | 22,353 | 930,745 |
| LS Industrial Systems Co., Ltd. | 8,744 | 373,658 |
| Mando Corp. | 30,984 | 949,716 |
| Meritz Financial Group, Inc. | 13,894 | 148,498 |
| Meritz Fire & Marine Insurance Co., Ltd. | 33,299 | 528,471 |
| Meritz Securities Co., Ltd. | 43,264 | 167,257 |
| Mirae Asset Daewoo Co., Ltd. | 52,392 | 321,212 |
| Mirae Asset Life Insurance Co., Ltd. | 62,985 | 216,682 |
| NCSoft Corp. | 1,429 | 634,184 |
| Nexen Tire Corp. | 26,918 | 216,326 |
| NH Investment & Securities Co., Ltd. | 20,013 | 207,528 |
| NongShim Co., Ltd. | 1,921 | 399,880 |
| OCI Co., Ltd. | 9,843 | 530,384 |
| Orange Life Insurance Ltd. | 13,654 | 328,277 |
| Ottogi Corp. | 411 | 199,681 |
| Pan Ocean Co., Ltd. * | 71,389 | 269,089 |
| Partron Co., Ltd. | 25,793 | 261,554 |
| Poongsan Corp. | 23,567 | 406,450 |
| S-1 Corp. | 5,009 | 403,407 |
| Samsung Card Co., Ltd. | 15,457 | 445,868 |
| Samsung Engineering Co., Ltd. * | 26,985 | 411,956 |
| Samsung Securities Co., Ltd. | 11,208 | 322,897 |
| Samyang Holding Corp. | 5,655 | 307,808 |
| Seah Besteel Corp. | 16,933 | 232,988 |
| Seoul Semiconductor Co., Ltd. | 15,434 | 177,353 |
| Shinsegae, Inc. | 2,579 | 522,665 |
| SK Gas Ltd. | 5,791 | 417,682 |
| SKC Co., Ltd. | 11,351 | 432,942 |
| SL Corp. | 7,444 | 134,198 |
| Sungwoo Hitech Co., Ltd. | 121,238 | 360,431 |
| Taekwang Industrial Co., Ltd. | 521 | 491,243 |
| Taeyoung Engineering & Construction Co., Ltd. | 11,984 | 133,588 |
| Tongyang, Inc. | 132,243 | 162,956 |
| Winiadimchae Co., Ltd. * | 104,746 | 283,056 |
| WONIK IPS Co., Ltd. | 9,183 | 260,784 |
| Young Poong Corp. | 456 | 238,828 |
| Youngone Corp. | 11,379 | 339,440 |
| Yuhan Corp. | 1,569 | 302,449 |
| | | 40,261,781 |
| |
Schwab Fundamental Index Funds | Annual Report
Schwab Fundamental International Small Company Index Fund
Portfolio Holdings as of October 31, 2019 (continued)
| Security | Number
of Shares | Value ($) |
| Singapore 1.5% |
| Ascendas Real Estate Investment Trust | 308,900 | 719,444 |
| Ascott Residence Trust | 170,000 | 172,296 |
| Asian Pay Television Trust | 2,719,500 | 333,424 |
| CapitaLand Commercial Trust | 148,502 | 223,642 |
| CapitaLand Mall Trust | 268,800 | 501,539 |
| City Developments Ltd. | 134,200 | 1,062,755 |
| First Resources Ltd. | 115,700 | 129,920 |
| Genting Singapore Ltd. | 1,231,200 | 849,421 |
| Mapletree Commercial Trust | 158,500 | 271,302 |
| Mapletree Industrial Trust | 165,944 | 310,841 |
| Mapletree Logistics Trust | 233,316 | 287,983 |
| Mapletree North Asia Commercial Trust | 250,900 | 235,862 |
| Olam International Ltd. | 400,300 | 537,583 |
| SATS Ltd. | 140,649 | 521,592 |
| Sembcorp Marine Ltd. * | 383,996 | 385,863 |
| Singapore Exchange Ltd. | 108,500 | 712,361 |
| Singapore Post Ltd. | 498,000 | 351,119 |
| Singapore Press Holdings Ltd. | 602,700 | 980,830 |
| Singapore Technologies Engineering Ltd. | 340,700 | 998,028 |
| StarHub Ltd. | 347,300 | 331,863 |
| Suntec Real Estate Investment Trust | 170,100 | 232,375 |
| UOL Group Ltd. | 94,901 | 543,392 |
| Venture Corp., Ltd. | 82,400 | 955,809 |
| | | 11,649,244 |
| |
| Spain 1.4% |
| Abengoa S.A., B Shares * | 64,026,477 | 695,092 |
| Acciona S.A. | 10,835 | 1,128,772 |
| Applus Services S.A. | 36,575 | 441,987 |
| Bolsas y Mercados Espanoles, SHMSF, S.A. | 15,347 | 425,714 |
| Caja de Ahorros del Mediterraneo *(b) | 5,382 | — |
| Cellnex Telecom S.A. * | 8,532 | 368,146 |
| Cia de Distribucion Integral Logista Holdings S.A. | 16,749 | 351,176 |
| Cie Automotive S.A. | 10,391 | 258,812 |
| Construcciones y Auxiliar de Ferrocarriles S.A. | 5,083 | 228,180 |
| Distribuidora Internacional de Alimentacion S.A. *(a) | 1,222,199 | 238,409 |
| Ebro Foods S.A. | 29,117 | 639,202 |
| Ence Energia y Celulosa S.A. | 30,395 | 120,026 |
| Euskaltel S.A. | 18,130 | 168,638 |
| FAES FARMA S.A. | 48,386 | 278,054 |
| Gestamp Automocion S.A. | 86,428 | 370,343 |
| Indra Sistemas S.A. * | 14,859 | 143,540 |
| Inmobiliaria Colonial Socimi S.A. | 12,275 | 158,622 |
| Liberbank S.A. | 506,324 | 162,206 |
| Mediaset Espana Comunicacion S.A. | 92,454 | 565,713 |
| Melia Hotels International S.A. | 40,271 | 328,377 |
| Merlin Properties Socimi S.A. | 14,756 | 217,220 |
| Obrascon Huarte Lain S.A. *(a) | 610,001 | 703,278 |
| Prosegur Cash S.A. | 73,536 | 114,986 |
| Prosegur Cia de Seguridad S.A. | 119,299 | 463,028 |
| Sacyr S.A. | 151,714 | 431,652 |
| Siemens Gamesa Renewable Energy S.A. | 27,765 | 382,237 |
| Tecnicas Reunidas S.A. * | 13,513 | 340,147 |
| Unicaja Banco S.A. | 592,044 | 536,146 |
| Security | Number
of Shares | Value ($) |
| Viscofan S.A. | 10,612 | 575,523 |
| Zardoya Otis S.A. | 38,196 | 289,604 |
| | | 11,124,830 |
| |
| Sweden 3.2% |
| AAK AB | 33,669 | 597,256 |
| Adapteo Oyj * | 23,088 | 253,125 |
| AF POYRY AB | 22,971 | 489,008 |
| Arjo AB, B Shares | 59,251 | 244,370 |
| Attendo AB | 46,024 | 234,798 |
| Axfood AB | 39,571 | 852,313 |
| Betsson AB * | 55,325 | 272,508 |
| Bilia AB, A Shares | 45,916 | 460,783 |
| Bonava AB, B Shares | 28,178 | 271,765 |
| Bravida Holding AB | 54,789 | 504,858 |
| Castellum AB | 31,728 | 648,382 |
| Clas Ohlson AB, B Shares | 30,561 | 293,877 |
| Cloetta AB, B Shares | 57,317 | 194,622 |
| Coor Service Management Holding AB | 30,383 | 259,705 |
| Dometic Group AB | 79,010 | 733,547 |
| Elekta AB, B Shares | 43,521 | 606,283 |
| Fabege AB | 21,062 | 314,549 |
| Getinge AB, B Shares | 86,186 | 1,473,483 |
| Granges AB | 28,865 | 280,981 |
| Hemfosa Fastigheter AB | 22,880 | 235,655 |
| Hexpol AB | 79,205 | 706,681 |
| Holmen AB, B Shares | 37,061 | 1,093,695 |
| Indutrade AB | 15,235 | 469,737 |
| Intrum AB | 13,875 | 374,057 |
| Inwido AB | 33,326 | 222,062 |
| JM AB | 41,940 | 1,074,365 |
| Kungsleden AB | 29,608 | 269,056 |
| LE Lundbergfortagen AB, B Shares | 21,699 | 817,831 |
| Lifco AB, B Shares | 4,643 | 231,581 |
| Lindab International AB | 30,214 | 337,954 |
| Loomis AB, Class B | 24,603 | 952,614 |
| Lundin Petroleum AB | 4,859 | 160,921 |
| Mekonomen AB * | 26,603 | 226,474 |
| Modern Times Group MTG AB, B Shares * | 18,647 | 172,880 |
| NCC AB, B Shares | 59,817 | 961,375 |
| Nibe Industrier AB, B Shares | 38,818 | 531,513 |
| Nobia AB | 75,730 | 483,536 |
| Nolato AB, B Shares | 4,193 | 234,933 |
| Nordic Entertainment Group AB, B Shares | 16,984 | 481,955 |
| Pandox AB | 14,273 | 285,621 |
| Peab AB | 112,614 | 949,612 |
| Ratos AB, B Shares | 284,440 | 734,075 |
| Saab AB, Class B | 20,076 | 619,986 |
| SAS AB * | 227,578 | 355,833 |
| Scandic Hotels Group AB | 38,342 | 368,926 |
| Svenska Cellulosa AB, S.C.A., B Shares | 124,386 | 1,269,251 |
| Sweco AB, B Shares | 12,726 | 447,760 |
| Thule Group AB | 15,923 | 324,255 |
| Wallenstam AB, B Shares | 14,041 | 153,782 |
| Wihlborgs Fastigheter AB | 18,195 | 275,295 |
| | | 24,809,484 |
| |
| Switzerland 3.4% |
| Allreal Holding AG * | 3,181 | 619,755 |
| Alpiq Holding AG * | 2,183 | 157,999 |
| ALSO Holding AG * | 2,158 | 321,247 |
| ams AG * | 10,738 | 482,487 |
| Arbonia AG * | 14,952 | 187,765 |
Schwab Fundamental Index Funds | Annual Report
Schwab Fundamental International Small Company Index Fund
Portfolio Holdings as of October 31, 2019 (continued)
| Security | Number
of Shares | Value ($) |
| Aryzta AG * | 1,024,207 | 809,051 |
| Autoneum Holding AG | 2,461 | 276,079 |
| Banque Cantonale Vaudoise | 452 | 354,423 |
| Barry Callebaut AG | 326 | 688,935 |
| Belimo Holding AG | 64 | 401,441 |
| Bell Food Group AG * | 860 | 236,249 |
| Berner Kantonalbank AG | 587 | 129,420 |
| BKW AG | 4,935 | 364,247 |
| Bobst Group S.A. | 2,265 | 118,818 |
| Bucher Industries AG | 2,268 | 701,996 |
| Burckhardt Compression Holding AG | 838 | 199,625 |
| Cembra Money Bank AG | 5,564 | 590,037 |
| Conzzeta AG | 393 | 342,631 |
| Daetwyler Holding AG | 2,308 | 397,762 |
| DKSH Holding AG | 14,867 | 706,941 |
| dormakaba Holding AG, Series B * | 535 | 342,706 |
| Dufry AG * | 9,295 | 808,439 |
| Emmi AG | 502 | 424,906 |
| EMS-Chemie Holding AG | 997 | 624,619 |
| Flughafen Zuerich AG | 3,514 | 633,195 |
| Forbo Holding AG | 248 | 395,186 |
| Galenica AG * | 13,678 | 818,864 |
| GAM Holding AG * | 193,993 | 647,588 |
| Helvetia Holding AG | 7,611 | 1,069,096 |
| Huber & Suhner AG | 4,176 | 278,217 |
| Implenia AG | 13,318 | 507,551 |
| Inficon Holding AG | 256 | 183,469 |
| Komax Holding AG(a) | 650 | 138,318 |
| Kudelski S.A. - BR * | 31,291 | 181,751 |
| Landis+Gyr Group AG * | 7,617 | 707,263 |
| Logitech International S.A. | 21,078 | 865,190 |
| Mobimo Holding AG * | 1,279 | 360,428 |
| OC Oerlikon Corp. AG | 57,955 | 594,743 |
| Partners Group Holding AG | 1,143 | 893,210 |
| PSP Swiss Property AG | 3,954 | 523,371 |
| Rieter Holding AG | 1,720 | 234,455 |
| Schweiter Technologies AG | 333 | 342,283 |
| SFS Group AG | 4,880 | 432,312 |
| Siegfried Holding AG * | 490 | 199,739 |
| SIG Combibloc Group AG * | 19,110 | 264,954 |
| Straumann Holding AG | 524 | 468,184 |
| Sulzer AG | 7,193 | 727,445 |
| Sunrise Communications Group AG * | 11,121 | 865,274 |
| Tecan Group AG | 1,168 | 276,325 |
| Temenos AG * | 2,134 | 305,313 |
| u-blox Holding AG * | 1,870 | 151,577 |
| Valiant Holding AG | 2,745 | 278,810 |
| Valora Holding AG * | 2,118 | 606,590 |
| VAT Group AG * | 2,688 | 395,221 |
| Vifor Pharma AG | 7,322 | 1,153,063 |
| Vontobel Holding AG | 5,083 | 296,357 |
| | | 26,082,920 |
| |
| United Kingdom 10.9% |
| 888 Holdings plc | 99,351 | 231,135 |
| AA plc | 776,227 | 443,419 |
| Ascential plc | 31,891 | 144,499 |
| Ashmore Group plc | 65,480 | 394,954 |
| Auto Trader Group plc | 44,825 | 326,608 |
| B&M European Value Retail S.A. | 184,883 | 886,955 |
| Balfour Beatty plc | 342,458 | 997,930 |
| Bank of Georgia Group plc | 8,605 | 145,237 |
| BBA Aviation plc | 289,136 | 1,137,500 |
| BCA Marketplace plc | 239,409 | 731,880 |
| Beazley plc | 111,484 | 847,314 |
| Biffa plc | 68,312 | 225,644 |
| Big Yellow Group plc | 11,157 | 165,121 |
| Security | Number
of Shares | Value ($) |
| Bodycote plc | 70,576 | 654,375 |
| Bovis Homes Group plc | 55,250 | 837,347 |
| Brewin Dolphin Holdings plc | 62,280 | 268,481 |
| Britvic plc | 58,558 | 748,359 |
| C&C Group plc | 86,578 | 426,166 |
| Card Factory plc | 184,830 | 405,577 |
| Centamin plc | 429,199 | 649,229 |
| Chemring Group plc | 125,852 | 327,675 |
| Cineworld Group plc | 120,454 | 347,096 |
| Clarkson plc | 4,517 | 165,001 |
| Close Brothers Group plc | 42,158 | 755,945 |
| Coats Group plc | 273,859 | 252,932 |
| Cobham plc | 561,159 | 1,147,840 |
| Computacenter plc | 39,146 | 692,740 |
| ConvaTec Group plc | 336,164 | 858,806 |
| Costain Group plc | 73,746 | 159,530 |
| Countryside Properties plc | 68,672 | 314,307 |
| Cranswick plc | 20,027 | 805,239 |
| Crest Nicholson Holdings plc | 134,179 | 676,125 |
| Daily Mail & General Trust plc | 58,738 | 668,869 |
| De La Rue plc | 58,656 | 119,289 |
| Dechra Pharmaceuticals plc | 3,936 | 134,263 |
| Derwent London plc | 8,897 | 409,128 |
| Dignity plc | 19,566 | 140,537 |
| Diploma plc | 17,731 | 367,256 |
| Domino's Pizza Group plc | 88,783 | 328,999 |
| Dunelm Group plc | 30,406 | 310,956 |
| EI Group plc * | 227,957 | 831,520 |
| Electrocomponents plc | 98,133 | 865,839 |
| Elementis plc | 233,222 | 448,810 |
| Entertainment One Ltd. | 113,825 | 822,043 |
| Equiniti Group plc | 55,014 | 153,692 |
| Essentra plc | 118,145 | 583,691 |
| Evraz plc | 122,578 | 584,937 |
| Ferrexpo plc | 125,426 | 205,528 |
| Fresnillo plc | 43,140 | 398,561 |
| Galliford Try plc | 85,302 | 809,625 |
| Games Workshop Group plc | 2,715 | 157,209 |
| Genus plc | 8,003 | 300,683 |
| Grafton Group plc | 99,996 | 1,012,584 |
| Grainger plc | 91,801 | 305,372 |
| Great Portland Estates plc | 34,663 | 353,638 |
| Greencore Group plc | 194,730 | 585,458 |
| Greggs plc | 27,583 | 634,442 |
| GVC Holdings plc | 32,493 | 374,863 |
| Halfords Group plc | 215,574 | 442,322 |
| Halma plc | 36,093 | 875,812 |
| Hammerson plc | 173,828 | 653,008 |
| Hargreaves Lansdown plc | 16,108 | 369,892 |
| Headlam Group plc | 55,555 | 346,863 |
| Hikma Pharmaceuticals plc | 18,535 | 482,703 |
| Hill & Smith Holdings plc | 20,223 | 343,166 |
| HomeServe plc | 33,797 | 507,398 |
| Howden Joinery Group plc | 142,294 | 1,064,968 |
| Hunting plc | 59,564 | 304,389 |
| Ibstock plc | 121,058 | 378,286 |
| IG Group Holdings plc | 132,204 | 1,088,126 |
| Indivior plc * | 656,102 | 332,304 |
| Intermediate Capital Group plc | 61,755 | 1,188,519 |
| International Personal Finance plc | 293,035 | 504,845 |
| Intu Properties plc *(a) | 854,503 | 498,096 |
| IWG plc | 192,349 | 958,141 |
| J.D. Wetherspoon plc | 23,113 | 438,014 |
| JD Sports Fashion plc | 53,576 | 532,948 |
| John Laing Group plc | 70,845 | 335,470 |
| Jupiter Fund Management plc | 170,899 | 758,760 |
| Just Group plc * | 680,685 | 536,846 |
| KAZ Minerals plc | 40,104 | 245,088 |
Schwab Fundamental Index Funds | Annual Report
Schwab Fundamental International Small Company Index Fund
Portfolio Holdings as of October 31, 2019 (continued)
| Security | Number
of Shares | Value ($) |
| Keller Group plc | 76,527 | 514,171 |
| Kier Group plc(a) | 214,459 | 315,302 |
| Lancashire Holdings Ltd. | 84,026 | 775,915 |
| Lookers plc | 538,864 | 346,217 |
| Man Group plc | 474,536 | 883,194 |
| Mapeley Ltd. *(b) | 2,199 | — |
| Marshalls plc | 35,873 | 330,621 |
| Marston's plc | 391,809 | 625,784 |
| McCarthy & Stone plc | 218,788 | 415,191 |
| Mediclinic International plc | 88,083 | 417,705 |
| Melrose Industries plc | 346,195 | 956,774 |
| Merlin Entertainments plc | 170,657 | 1,005,418 |
| Mitchells & Butlers plc * | 142,945 | 788,798 |
| Mitie Group plc | 194,190 | 398,446 |
| Moneysupermarket.com Group plc | 107,191 | 476,963 |
| Morgan Advanced Materials plc | 125,544 | 383,141 |
| Morgan Sindall Group plc | 25,870 | 428,937 |
| N Brown Group plc | 198,907 | 322,583 |
| National Express Group plc | 169,961 | 982,790 |
| Northgate plc | 143,041 | 638,318 |
| Ocado Group plc * | 18,686 | 322,077 |
| OneSavings Bank plc | 36,661 | 171,014 |
| Pagegroup plc | 114,258 | 658,325 |
| Paragon Banking Group plc | 64,069 | 417,645 |
| PayPoint plc | 17,320 | 205,060 |
| Pendragon plc | 3,329,331 | 617,571 |
| Petra Diamonds Ltd. * | 1,043,550 | 114,900 |
| Petrofac Ltd. | 178,742 | 892,077 |
| Pets at Home Group plc | 271,358 | 724,801 |
| Phoenix Group Holdings plc | 132,246 | 1,207,953 |
| Playtech plc | 168,499 | 857,636 |
| Plus500 Ltd. | 36,092 | 374,014 |
| Polymetal International plc | 66,311 | 1,090,650 |
| Polypipe Group plc | 48,621 | 285,147 |
| Premier Oil plc * | 815,346 | 876,107 |
| Provident Financial plc | 177,648 | 1,014,372 |
| PZ Cussons plc | 88,647 | 231,380 |
| QinetiQ Group plc | 179,313 | 730,995 |
| Quilter plc | 274,537 | 487,113 |
| Rathbone Brothers plc | 7,062 | 189,816 |
| Redrow plc | 66,660 | 519,670 |
| Renewi plc | 363,024 | 139,081 |
| Renishaw plc | 4,492 | 220,816 |
| Rhi Magnesita N.V. | 4,028 | 181,537 |
| Rightmove plc | 44,997 | 349,275 |
| Rotork plc | 161,746 | 631,646 |
| Royal Bank of Scotland Group plc | 170,229 | 470,554 |
| RPS Group plc | 188,201 | 345,201 |
| Safestore Holdings plc | 16,844 | 152,841 |
| Saga plc | 943,791 | 573,616 |
| Savills plc | 49,039 | 582,580 |
| Schroders plc | 22,476 | 901,049 |
| Segro plc | 76,532 | 837,207 |
| Senior plc | 199,753 | 477,911 |
| Serco Group plc * | 362,343 | 732,203 |
| SIG plc | 505,741 | 737,656 |
| Spectris plc | 32,249 | 999,772 |
| Spirax-Sarco Engineering plc | 8,450 | 867,171 |
| Spire Healthcare Group plc | 273,725 | 414,137 |
| Sports Direct International plc * | 155,713 | 623,262 |
| SSP Group plc | 72,152 | 594,975 |
| St. Modwen Properties plc | 44,462 | 259,530 |
| Stagecoach Group plc | 313,038 | 556,743 |
| Stock Spirits Group plc | 66,062 | 175,171 |
| Superdry plc | 56,610 | 300,599 |
| Synthomer plc | 93,421 | 337,283 |
| TalkTalk Telecom Group plc | 329,719 | 478,191 |
| Ted Baker plc | 9,161 | 48,253 |
| Security | Number
of Shares | Value ($) |
| Telecom Plus plc | 18,320 | 285,806 |
| The Go-Ahead Group plc | 26,575 | 703,392 |
| The Restaurant Group plc | 253,502 | 446,394 |
| The Unite Group plc | 21,717 | 316,301 |
| Thomas Cook Group plc *(a)(b) | 4,104,924 | — |
| TP ICAP plc | 102,962 | 457,819 |
| TT Electronics plc | 70,979 | 213,307 |
| Tullow Oil plc | 120,015 | 320,719 |
| Tyman plc | 85,084 | 234,204 |
| UDG Healthcare plc | 64,670 | 648,269 |
| Ultra Electronics Holdings plc | 23,390 | 590,781 |
| Vesuvius plc | 104,104 | 538,595 |
| Victrex plc | 19,100 | 542,602 |
| WH Smith plc | 29,637 | 839,838 |
| Wizz Air Holdings plc * | 7,527 | 372,741 |
| | | 84,758,341 |
| Total Common Stock |
| (Cost $703,620,154) | | 769,510,467 |
|
| Preferred Stock0.3% of net assets |
| |
| Germany 0.3% |
| Draegerwerk AG & Co. KGaA | 10,431 | 611,350 |
| Jungheinrich AG | 23,081 | 585,569 |
| Sartorius AG | 2,175 | 422,650 |
| Schaeffler AG | 66,751 | 563,096 |
| Sixt SE | 4,972 | 336,394 |
| Total Preferred Stock |
| (Cost $2,699,209) | | 2,519,059 |
|
| Rights0.0% of net assets |
| |
| Australia 0.0% |
Costa Group Holdings Ltd.
expires 11/18/19 * | 13,378 | 6,179 |
| |
| Italy 0.0% |
Mediaset S.p.A.
expires 11/06/19 *(b) | 207,632 | — |
| |
| Norway 0.0% |
Adevinta A.S.A.
expires 11/12/19 * | 8,893 | 1,359 |
| XXL A.S.A. *(b) | 8,404 | 3,564 |
| | | 4,923 |
| |
| Singapore 0.0% |
Mapletree Commercial Trust
expires 11/07/19 *(b) | 11,892 | 787 |
| |
| Spain 0.0% |
Distribuidora Internacional de Alimentacion S.A.
expires 11/13/19 * | 12,221,990 | 245,361 |
| Total Rights |
| (Cost $553,874) | | 257,250 |
|
Schwab Fundamental Index Funds | Annual Report
Schwab Fundamental International Small Company Index Fund
Portfolio Holdings as of October 31, 2019 (continued)
| Security | Number
of Shares | Value ($) |
| Other Investment Company1.4% of net assets |
| |
| United States 1.4% |
| Securities Lending Collateral 1.4% |
| Wells Fargo Government Money Market Fund, Select Class 1.75%(c) | 11,114,235 | 11,114,235 |
| Total Other Investment Company |
| (Cost $11,114,235) | | 11,114,235 |
Security
Rate, Maturity Date | Face Amount
Local Currency | Value ($) |
| Short-Term Investments0.1% of net assets |
| |
| Time Deposits 0.1% |
| Brown Brothers Harriman |
| Australian Dollar | | |
| 0.35%, 11/01/19(d) | 22,914 | 15,796 |
| Canadian Dollar | | |
| 0.87%, 11/01/19(d) | 47,216 | 35,848 |
| Danish Krone | | |
| (0.95%), 11/01/19(d) | 14,751 | 2,202 |
| Hong Kong Dollar | | |
| 2.30%, 11/01/19(d) | 145,052 | 18,511 |
| New Zealand Dollar | | |
| 0.50%, 11/01/19(d) | 322 | 206 |
| Norwegian Krone | | |
| 0.60%, 11/01/19(d) | 11,427 | 1,243 |
| Singapore Dollar | | |
| 0.55%, 11/01/19(d) | 4,066 | 2,989 |
| Swedish Krona | | |
| (0.37%), 11/01/19(d) | 68,373 | 7,081 |
| Swiss Franc | | |
| (1.57%), 11/01/19(d) | 11,194 | 11,347 |
| Citibank |
| Euro | | |
| (0.67%), 11/01/19(d) | 18,925 | 21,107 |
| Pound Sterling | | |
| 0.38%, 11/01/19(d) | 82,654 | 107,065 |
| Sumitomo Mitsui Banking Corp. |
| Japanese Yen | | |
| (0.27%), 11/01/19(d) | 4,948,221 | 45,821 |
| Total Short-Term Investments |
| (Cost $269,216) | | 269,216 |
| | Number of
Contracts | Notional
Amount
($) | Current Value/
Unrealized
Appreciation
($) |
| Futures Contracts | |
| Long | |
| MSCI EAFE Index, expires 12/20/19 | 34 | 3,327,240 | 22,255 |
| * | Non-income producing security. |
| (a) | All or a portion of this security is on loan. Securities on loan were valued at $9,652,938. |
| (b) | Fair-valued by management using significant unobservable inputs in accordance with procedures approved by fund’s Board of Trustees. |
| (c) | The rate shown is the 7-day yield. |
| (d) | The rate shown is the current daily overnight rate. |
| | |
| CVA — | Dutch Certificate |
| REIT — | Real Estate Investment Trust |
Schwab Fundamental Index Funds | Annual Report
Schwab Fundamental Emerging Markets Large Company Index Fund
Portfolio Holdings as of October 31, 2019
This section shows all the securities in the fund’s portfolio and their values as of the report date.
The fund files its complete schedule of portfolio holdings with the U.S. Securities and Exchange Commission (SEC) for the first and third quarters of each fiscal year on Form N-Q. Effective March 31, 2019, Form N-PORT Part F has replaced Form N-Q. The fund’s Form N-Q and Form N-PORT Part F are available on the SEC’s website atwww.sec.gov. The fund also makes available its complete schedule of portfolio holdings 15 to 20 days after the end of the month on the fund’s website atwww.schwabfunds.com/schwabfunds_prospectus.
| Security | Number
of Shares | Value ($) |
| Common Stock92.9% of net assets |
| |
| Brazil 6.3% |
| Ambev S.A. | 757,350 | 3,282,070 |
| B3 S.A. - Brasil Bolsa Balcao | 93,733 | 1,130,732 |
| Banco Bradesco S.A. | 211,571 | 1,732,978 |
| Banco do Brasil S.A. | 377,415 | 4,531,239 |
| BRF S.A. * | 228,018 | 2,018,930 |
| CCR S.A. | 269,100 | 1,103,105 |
| Centrais Eletricas Brasileiras S.A. | 48,616 | 479,553 |
| Cia Energetica de Minas Gerais | 37,300 | 139,044 |
| Cielo S.A. | 433,734 | 817,611 |
| Cogna Educacao | 317,700 | 766,029 |
| Companhia de Saneamento Basico do Estado de Sao Paulo | 92,410 | 1,258,555 |
| Embraer S.A. | 248,451 | 1,085,986 |
| JBS S.A. | 481,000 | 3,392,966 |
| Petrobras Distribuidora S.A. | 141,300 | 996,376 |
| Petroleo Brasileiro S.A. | 783,658 | 6,389,631 |
| Tim Participacoes S.A. | 303,747 | 864,927 |
| Ultrapar Participacoes S.A. | 555,228 | 2,612,431 |
| Vale S.A. * | 810,797 | 9,542,356 |
| | | 42,144,519 |
| |
| Chile 0.8% |
| Cencosud S.A.(a) | 828,541 | 1,124,048 |
| Empresas Copec S.A.(a) | 149,224 | 1,335,656 |
| Enel Americas S.A.(a) | 7,177,409 | 1,344,653 |
| Latam Airlines Group S.A.(a) | 91,063 | 1,007,033 |
| S.A.C.I. Falabella(a) | 103,541 | 526,624 |
| | | 5,338,014 |
| |
| China 24.9% |
| Agile Group Holdings Ltd. | 572,000 | 770,980 |
| Agricultural Bank of China Ltd., H Shares | 9,032,600 | 3,716,947 |
| Alibaba Group Holding Ltd. ADR * | 20,931 | 3,697,880 |
| Anhui Conch Cement Co., Ltd., H Shares | 202,500 | 1,210,287 |
| Baidu, Inc. ADR * | 18,983 | 1,933,419 |
| Bank of China Ltd., H Shares | 26,364,234 | 10,750,933 |
| Bank of Communications Co., Ltd., H Shares | 2,424,000 | 1,655,464 |
| China Cinda Asset Management Co., Ltd., H Shares | 3,691,000 | 765,686 |
| China CITIC Bank Corp., Ltd., H Shares | 3,030,000 | 1,756,372 |
| China Communications Construction Co., Ltd., H Shares | 1,664,322 | 1,266,952 |
| China Communications Services Corp., Ltd., H Shares | 965,000 | 595,914 |
| China Construction Bank Corp., H Shares | 28,144,960 | 22,551,724 |
| China Evergrande Group * | 423,000 | 1,029,690 |
| China Huarong Asset Management Co., Ltd., H Shares | 6,680,000 | 986,199 |
| Security | Number
of Shares | Value ($) |
| China Life Insurance Co., Ltd., H Shares | 804,000 | 2,067,638 |
| China Merchants Bank Co., Ltd., H Shares | 629,150 | 3,000,561 |
| China Minsheng Banking Corp., Ltd., H Shares | 2,260,800 | 1,581,363 |
| China Mobile Ltd. | 1,646,055 | 13,376,987 |
| China National Building Material Co., Ltd., H Shares | 1,940,000 | 1,635,078 |
| China Overseas Land & Investment Ltd. | 768,000 | 2,423,417 |
| China Pacific Insurance Group Co., Ltd., H Shares | 328,600 | 1,192,256 |
| China Petroleum & Chemical Corp., H Shares | 21,030,400 | 11,961,559 |
| China Railway Construction Corp., Ltd., H Shares | 882,500 | 965,267 |
| China Railway Group Ltd., H Shares | 1,530,000 | 922,154 |
| China Resources Beer Holdings Co., Ltd. | 219,000 | 1,122,818 |
| China Resources Land Ltd. | 461,000 | 1,960,576 |
| China Resources Power Holdings Co., Ltd. | 992,000 | 1,246,680 |
| China Shenhua Energy Co., Ltd., H Shares | 1,356,500 | 2,754,969 |
| China Telecom Corp., Ltd., H Shares | 6,690,000 | 2,845,983 |
| China Unicom (Hong Kong) Ltd. | 2,979,056 | 2,932,877 |
| China Vanke Co., Ltd., H Shares | 223,900 | 816,462 |
| CITIC Ltd. | 1,680,000 | 2,210,012 |
| CNOOC Ltd. | 4,933,075 | 7,341,648 |
| Country Garden Holdings Co., Ltd. | 974,000 | 1,352,135 |
| Dongfeng Motor Group Co., Ltd., H Shares | 989,000 | 992,078 |
| ENN Energy Holdings Ltd. | 78,400 | 894,430 |
| Fosun International Ltd. | 552,500 | 722,436 |
| GCL-Poly Energy Holdings Ltd. * | 12,677,000 | 507,476 |
| Geely Automobile Holdings Ltd. | 497,000 | 940,429 |
| Great Wall Motor Co., Ltd., H Shares | 1,302,800 | 1,055,595 |
| Guangzhou R&F Properties Co., Ltd., H Shares | 517,200 | 801,377 |
| Haier Electronics Group Co., Ltd. | 321,000 | 916,483 |
| Hengan International Group Co., Ltd. | 112,500 | 785,474 |
| Huaneng Power International, Inc., H Shares | 2,192,000 | 1,041,145 |
| Industrial & Commercial Bank of China Ltd., H Shares | 21,832,172 | 15,640,419 |
| JD.com, Inc. ADR * | 39,652 | 1,235,160 |
| Jiangxi Copper Co., Ltd., H Shares | 1,020,000 | 1,194,143 |
| Kingboard Holdings Ltd. | 338,500 | 902,069 |
| Kunlun Energy Co., Ltd. | 886,000 | 824,632 |
| Longfor Group Holdings Ltd. | 229,500 | 952,459 |
| NetEase, Inc. ADR | 4,646 | 1,328,106 |
| PetroChina Co., Ltd., H Shares | 10,460,000 | 5,100,938 |
| PICC Property & Casualty Co., Ltd., H Shares | 1,866,000 | 2,361,457 |
| Ping An Insurance Group Co. of China Ltd., H Shares | 400,000 | 4,616,712 |
| Shimao Property Holdings Ltd. | 372,000 | 1,246,231 |
Schwab Fundamental Index Funds | Annual Report
Schwab Fundamental Emerging Markets Large Company Index Fund
Portfolio Holdings as of October 31, 2019 (continued)
| Security | Number
of Shares | Value ($) |
| Sinopec Shanghai Petrochemical Co., Ltd., H Shares | 2,044,000 | 564,531 |
| Sinopharm Group Co., Ltd., H Shares | 286,400 | 1,025,669 |
| Tencent Holdings Ltd. | 128,700 | 5,220,447 |
| | | 167,268,783 |
| |
| Colombia 0.3% |
| Bancolombia S.A. | 60,002 | 729,610 |
| Ecopetrol S.A. | 1,570,633 | 1,412,640 |
| | | 2,142,250 |
| |
| Czech Republic 0.2% |
| CEZ A/S | 58,846 | 1,342,303 |
| |
| Egypt 0.1% |
| Commercial International Bank Egypt S.A.E. GDR | 126,297 | 623,907 |
| |
| Greece 1.2% |
| Alpha Bank AE * | 1,061,604 | 2,265,238 |
| Hellenic Telecommunications Organization S.A. | 64,078 | 971,832 |
| National Bank of Greece S.A. * | 542,083 | 1,838,418 |
| Piraeus Bank S.A. * | 815,465 | 2,844,203 |
| | | 7,919,691 |
| |
| Hungary 0.5% |
| MOL Hungarian Oil & Gas plc | 189,523 | 1,874,241 |
| OTP Bank plc | 31,675 | 1,460,754 |
| | | 3,334,995 |
| |
| India 7.3% |
| Axis Bank Ltd. | 111,818 | 1,158,563 |
| Bharat Petroleum Corp., Ltd. | 465,944 | 3,450,791 |
| Bharti Airtel Ltd. | 356,472 | 1,880,897 |
| Coal India Ltd. | 431,381 | 1,260,196 |
| HCL Technologies Ltd. | 77,384 | 1,268,572 |
| Hero MotoCorp Ltd. | 20,416 | 777,486 |
| Hindalco Industries Ltd. | 387,192 | 1,023,534 |
| Hindustan Petroleum Corp., Ltd. | 420,247 | 1,921,090 |
| Housing Development Finance Corp., Ltd. | 80,681 | 2,421,402 |
| Indian Oil Corp., Ltd. | 1,326,169 | 2,739,248 |
| Infosys Ltd. | 439,383 | 4,225,046 |
| ITC Ltd. | 273,808 | 993,702 |
| JSW Steel Ltd. | 248,651 | 797,845 |
| Mahindra & Mahindra Ltd. | 86,380 | 737,729 |
| Maruti Suzuki India Ltd. | 9,795 | 1,043,645 |
| NTPC Ltd. | 630,361 | 1,087,798 |
| Oil & Natural Gas Corp., Ltd. | 1,421,110 | 2,836,345 |
| Rajesh Exports Ltd. | 86,697 | 829,277 |
| Reliance Industries Ltd. | 326,234 | 6,724,107 |
| State Bank of India * | 407,418 | 1,791,775 |
| Sun Pharmaceutical Industries Ltd. | 138,022 | 843,137 |
| Tata Consultancy Services Ltd. | 79,299 | 2,537,490 |
| Tata Motors Ltd. * | 1,169,492 | 2,891,831 |
| Tata Motors Ltd., Class A * | 473,814 | 545,249 |
| Tata Steel Ltd. | 127,810 | 684,341 |
| Vedanta Ltd. | 805,830 | 1,681,871 |
| Wipro Ltd. | 217,561 | 796,703 |
| | | 48,949,670 |
| |
| Security | Number
of Shares | Value ($) |
| Indonesia 1.3% |
| PT Astra International Tbk | 4,229,800 | 2,092,062 |
| PT Bank Central Asia Tbk | 459,200 | 1,027,840 |
| PT Bank Mandiri (Persero) Tbk | 2,453,100 | 1,226,229 |
| PT Bank Rakyat Indonesia (Persero) Tbk | 5,701,200 | 1,708,280 |
| PT Telekomunikasi Indonesia (Persero) Tbk | 9,267,000 | 2,704,303 |
| | | 8,758,714 |
| |
| Kuwait 0.4% |
| Kuwait Finance House KSCP | 267,081 | 602,603 |
| Mobile Telecommunications Co. KSC | 537,544 | 1,001,767 |
| National Bank of Kuwait SAKP | 236,753 | 734,293 |
| | | 2,338,663 |
| |
| Malaysia 1.7% |
| Axiata Group Berhad | 1,293,473 | 1,329,512 |
| CIMB Group Holdings Berhad | 1,203,680 | 1,510,643 |
| Genting Berhad | 777,100 | 1,079,478 |
| Malayan Banking Berhad | 938,261 | 1,929,470 |
| Petronas Chemicals Group Berhad | 461,500 | 824,522 |
| Public Bank Berhad | 319,165 | 1,549,021 |
| Tenaga Nasional Berhad | 1,047,600 | 3,469,384 |
| | | 11,692,030 |
| |
| Mexico 4.3% |
| Alfa S.A.B. de C.V., Class A | 1,625,500 | 1,409,473 |
| America Movil S.A.B. de C.V., Series L | 12,010,619 | 9,515,340 |
| Banco Santander Mexico S.A. Institucion de Banca Multiple Grupo Financiero Santand, Class B | 136,200 | 182,884 |
| Cemex S.A.B. de C.V., Series CPO | 7,017,856 | 2,637,647 |
| Coca-Cola Femsa S.A.B. de C.V. | 128,000 | 703,396 |
| Fomento Economico Mexicano S.A.B. de C.V. | 416,915 | 3,699,602 |
| Grupo Bimbo S.A.B. de C.V., Series A | 586,400 | 1,089,488 |
| Grupo Financiero Banorte S.A.B. de C.V., Class O | 418,000 | 2,281,600 |
| Grupo Mexico S.A.B. de C.V., Series B | 990,136 | 2,608,073 |
| Grupo Televisa S.A.B., Series CPO | 674,417 | 1,489,316 |
| Wal-Mart de Mexico S.A.B. de C.V. | 1,057,237 | 3,172,838 |
| | | 28,789,657 |
| |
| Philippines 0.3% |
| PLDT, Inc. | 54,230 | 1,167,002 |
| SM Investments Corp. | 39,550 | 801,774 |
| | | 1,968,776 |
| |
| Qatar 0.4% |
| Ooredoo QPSC | 406,555 | 815,925 |
| Qatar National Bank QPSC | 338,497 | 1,784,499 |
| | | 2,600,424 |
| |
| Russia 14.3% |
| Alrosa PJSC | 734,550 | 853,890 |
| Gazprom PJSC - USD | 8,687,630 | 35,226,072 |
| Gazprom PJSC | 282,200 | 1,144,789 |
| Inter RAO UES PJSC | 23,651,001 | 1,594,063 |
| Lukoil PJSC | 250,510 | 23,125,953 |
| Magnit PJSC | 52,672 | 2,654,854 |
Schwab Fundamental Index Funds | Annual Report
Schwab Fundamental Emerging Markets Large Company Index Fund
Portfolio Holdings as of October 31, 2019 (continued)
| Security | Number
of Shares | Value ($) |
| MMC Norilsk Nickel PJSC | 9,440 | 2,633,439 |
| Mobile TeleSystems PJSC | 621,762 | 2,763,495 |
| NovaTek PJSC | 100,150 | 2,124,122 |
| Rosneft Oil Co. PJSC | 644,820 | 4,283,884 |
| Rostelecom PJSC | 829,890 | 1,015,967 |
| Sberbank of Russia PJSC | 2,067,000 | 7,571,721 |
| Severstal PJSC | 65,310 | 898,538 |
| Sistema PJSC FC | 8,084,700 | 1,836,763 |
| Surgutneftegas PJSC | 3,970,505 | 2,662,585 |
| Tatneft PJSC | 321,460 | 3,750,889 |
| VTB Bank PJSC | 2,141,520,000 | 1,439,101 |
| | | 95,580,125 |
| |
| South Africa 5.7% |
| Absa Group Ltd. | 234,458 | 2,404,620 |
| AngloGold Ashanti Ltd. | 74,699 | 1,652,215 |
| Aspen Pharmacare Holdings Ltd. * | 106,466 | 743,228 |
| Barloworld Ltd. | 134,905 | 1,074,515 |
| Bid Corp., Ltd. | 73,200 | 1,707,698 |
| FirstRand Ltd. | 490,437 | 2,120,150 |
| Gold Fields Ltd. | 340,624 | 2,115,405 |
| MTN Group Ltd. | 1,084,865 | 6,714,860 |
| MultiChoice Group * | 6,860 | 57,133 |
| Naspers Ltd., N Shares | 7,585 | 1,073,342 |
| Nedbank Group Ltd. | 83,598 | 1,268,206 |
| Remgro Ltd. | 61,707 | 707,530 |
| Sanlam Ltd. | 246,077 | 1,295,064 |
| Sappi Ltd. | 244,943 | 628,999 |
| Sasol Ltd. | 258,184 | 4,680,536 |
| Shoprite Holdings Ltd. | 156,487 | 1,402,199 |
| Standard Bank Group Ltd. | 277,590 | 3,186,802 |
| Steinhoff International Holdings N.V. * | 16,021,650 | 1,039,093 |
| The Bidvest Group Ltd. | 66,933 | 913,692 |
| Tiger Brands Ltd. | 48,312 | 686,021 |
| Vodacom Group Ltd. | 171,727 | 1,500,262 |
| Woolworths Holdings Ltd. | 312,419 | 1,187,795 |
| | | 38,159,365 |
| |
| Taiwan 17.7% |
| Acer, Inc. | 1,593,496 | 929,794 |
| Asustek Computer, Inc. | 475,041 | 3,222,644 |
| AU Optronics Corp. | 9,763,800 | 2,489,381 |
| Catcher Technology Co., Ltd. | 195,000 | 1,652,841 |
| Cathay Financial Holding Co., Ltd. | 1,252,599 | 1,658,013 |
| Cheng Shin Rubber Industry Co., Ltd. | 697,000 | 1,095,422 |
| China Steel Corp. | 3,245,198 | 2,498,753 |
| Chunghwa Telecom Co., Ltd. | 730,906 | 2,691,536 |
| Compal Electronics, Inc. | 4,404,305 | 2,629,227 |
| CTBC Financial Holding Co., Ltd. | 2,550,201 | 1,772,932 |
| Delta Electronics, Inc. | 413,590 | 1,815,860 |
| Far Eastern New Century Corp. | 1,374,817 | 1,337,073 |
| Far EasTone Telecommunications Co., Ltd. | 334,622 | 802,902 |
| First Financial Holding Co., Ltd. | 1,199,346 | 879,418 |
| Formosa Chemicals & Fibre Corp. | 724,442 | 2,105,718 |
| Formosa Petrochemical Corp. | 325,330 | 1,036,210 |
| Formosa Plastics Corp. | 645,732 | 2,072,732 |
| Foxconn Technology Co., Ltd. | 432,317 | 924,504 |
| Fubon Financial Holding Co., Ltd. | 1,750,674 | 2,561,298 |
| Hon Hai Precision Industry Co., Ltd. | 8,197,572 | 21,650,629 |
| Innolux Corp. | 13,262,357 | 2,939,820 |
| Inventec Corp. | 1,949,639 | 1,412,662 |
| Largan Precision Co., Ltd. | 8,050 | 1,181,211 |
| Lite-On Technology Corp. | 848,167 | 1,397,629 |
| MediaTek, Inc. | 302,338 | 4,037,679 |
| Mega Financial Holding Co., Ltd. | 1,519,340 | 1,491,196 |
| Security | Number
of Shares | Value ($) |
| Nan Ya Plastics Corp. | 1,124,622 | 2,657,563 |
| Pegatron Corp. | 2,136,264 | 4,148,138 |
| Pou Chen Corp. | 1,021,267 | 1,365,367 |
| President Chain Store Corp. | 79,000 | 788,113 |
| Quanta Computer, Inc. | 1,245,500 | 2,389,218 |
| Synnex Technology International Corp. | 860,850 | 1,026,765 |
| Taiwan Cement Corp. | 935,467 | 1,241,966 |
| Taiwan Mobile Co., Ltd. | 245,334 | 914,748 |
| Taiwan Semiconductor Manufacturing Co., Ltd. | 2,646,803 | 25,938,135 |
| Uni-President Enterprises Corp. | 872,678 | 2,155,847 |
| United Microelectronics Corp. | 5,438,965 | 2,504,753 |
| Walsin Lihwa Corp. | 1,731,000 | 846,526 |
| Wistron Corp. | 2,499,682 | 2,291,709 |
| WPG Holdings Ltd. | 1,142,880 | 1,448,868 |
| Yuanta Financial Holding Co., Ltd. | 1,360,000 | 849,959 |
| | | 118,854,759 |
| |
| Thailand 3.1% |
| Advanced Info Service PCL NVDR | 195,575 | 1,483,638 |
| Charoen Pokphand Foods PCL NVDR | 1,031,700 | 863,065 |
| CP ALL PCL NVDR | 358,700 | 927,147 |
| Kasikornbank PCL NVDR | 268,600 | 1,235,952 |
| Krung Thai Bnk Ltd. NVDR | 1,488,900 | 818,537 |
| PTT Exploration & Production Public Co., Ltd. NVDR | 335,100 | 1,336,881 |
| PTT Global Chemical PCL NVDR | 905,200 | 1,529,037 |
| PTT PCL NVDR | 4,818,870 | 7,221,075 |
| Thai Oil PCL NVDR | 531,200 | 1,204,946 |
| The Siam Cement PCL NVDR | 198,200 | 2,410,226 |
| The Siam Commercial Bank PCL NVDR | 468,000 | 1,734,552 |
| | | 20,765,056 |
| |
| Turkey 1.6% |
| Akbank T.A.S. * | 1,235,147 | 1,492,261 |
| BIM Birlesik Magazalar A/S | 105,165 | 870,420 |
| Eregli Demir ve Celik Fabrikalari TAS | 681,358 | 778,902 |
| Haci Omer Sabanci Holding A/S | 661,301 | 956,627 |
| KOC Holding A/S | 468,499 | 1,535,643 |
| Tupras-Turkiye Petrol Rafinerileri A/S | 52,029 | 1,132,480 |
| Turk Hava Yollari AO * | 321,958 | 655,213 |
| Turkcell Iletisim Hizmetleri A/S | 578,977 | 1,273,060 |
| Turkiye Garanti Bankasi A/S * | 933,836 | 1,501,015 |
| Turkiye Halk Bankasi A/S * | 804,528 | 736,842 |
| | | 10,932,463 |
| |
| United Arab Emirates 0.5% |
| Abu Dhabi Commercial Bank PJSC | 332,464 | 705,257 |
| Emaar Properties PJSC | 654,563 | 760,739 |
| Emirates Telecommunications Group Co. PJSC | 300,468 | 1,354,775 |
| First Abu Dhabi Bank PJSC | 160,090 | 662,577 |
| | | 3,483,348 |
| Total Common Stock |
| (Cost $559,587,702) | | 622,987,512 |
|
Schwab Fundamental Index Funds | Annual Report
Schwab Fundamental Emerging Markets Large Company Index Fund
Portfolio Holdings as of October 31, 2019 (continued)
| Security | Number
of Shares | Value ($) |
| Preferred Stock6.9% of net assets |
| |
| Brazil 5.1% |
| Banco Bradesco S.A. | 793,994 | 6,962,915 |
| Centrais Eletricas Brasileiras S.A., Class B | 35,620 | 364,060 |
| Companhia Energetica de Minas Gerais | 469,408 | 1,597,661 |
| Compania Brasileira de Distribuicao Grupo Pao de Acucar | 65,515 | 1,355,714 |
| Gerdau S.A. | 503,806 | 1,687,100 |
| Itau Unibanco Holding S.A. | 1,128,079 | 10,190,825 |
| Itausa - Investimentos Itau S.A. | 310,307 | 1,060,793 |
| Metalurgica Gerdau S.A. | 641,177 | 1,005,611 |
| Petroleo Brasileiro S.A. | 1,007,354 | 7,633,334 |
| Telefonica Brasil S.A. | 164,872 | 2,182,123 |
| | | 34,040,136 |
| |
| Colombia 0.2% |
| Bancolombia S.A. | 98,757 | 1,289,100 |
| |
| Russia 1.6% |
| Surgutneftegas PJSC | 4,085,900 | 2,400,977 |
| Tatneft PJSC * | 20,890 | 215,037 |
| Transneft PJSC | 3,189 | 8,280,533 |
| | | 10,896,547 |
| Total Preferred Stock |
| (Cost $32,389,168) | | 46,225,783 |
Security
Rate, Maturity Date | Face Amount
Local Currency | Value ($) |
| Short-Term Investments0.0% of net assets |
| |
| Time Deposits 0.0% |
| BNP Paribas |
| U.S. Dollar | | |
| 1.18%, 11/01/19(b) | 84,039 | 84,039 |
| Brown Brothers Harriman |
| Euro | | |
| (0.67%), 11/01/19(b) | 10,413 | 11,614 |
| Hong Kong Dollar | | |
| 2.30%, 11/01/19(b) | 108,130 | 13,799 |
| South African Rand | | |
| 5.04%, 11/01/19(b) | 1,025,426 | 67,862 |
| Total Short-Term Investments |
| (Cost $177,314) | | 177,314 |
| | Number of
Contracts | Notional
Amount
($) | Current Value/
Unrealized
Appreciation
($) |
| Futures Contracts | |
| Long | |
| MSCI Emerging Markets Index, expires 12/20/19 | 31 | 1,614,170 | 14,105 |
| * | Non-income producing security. |
| (a) | Fair-valued by management using significant unobservable inputs in accordance with procedures approved by the fund’s Board of Trustees. |
| (b) | The rate shown is the current daily overnight rate. |
| | |
| ADR — | American Depositary Receipt |
| GDR — | Global Depositary Receipt |
| NVDR — | Non-Voting Depositary Receipt |
| |
| USD — | U.S. dollar |
Schwab Fundamental Index Funds | Annual Report

Report of Independent Registered Public Accounting Firm
TotheBoard of Trustees of Schwab Capital Trust and Shareholders of Schwab S&P 500 Index Fund, SchwabSmall-Cap Index Fund, Schwab Total Stock Market Index Fund, Schwab U.S.Large-Cap Growth Index Fund, Schwab U.S.Large-Cap Value Index Fund, Schwab U.S.Mid-Cap Index Fund, Schwab International Index Fund, Schwab Fundamental US Large Company Index Fund, Schwab Fundamental US Small Company Index Fund, Schwab Fundamental International Large Company Index Fund, Schwab Fundamental International Small Company Index Fund and Schwab Fundamental Emerging Markets Large Company Index Fund.
Opinions on the Financial Statements
We have audited the accompanying statements of assets and liabilities, including the condensed portfolio holdings, of Schwab S&P 500 Index Fund, SchwabSmall-Cap Index Fund, Schwab Total Stock Market Index Fund, Schwab U.S.Large-Cap Growth Index Fund, Schwab U.S.Large-Cap Value Index Fund, Schwab U.S.Mid-Cap Index Fund, Schwab International Index Fund, Schwab Fundamental US Large Company Index Fund, Schwab Fundamental US Small Company Index Fund, Schwab Fundamental International Large Company Index Fund, Schwab Fundamental International Small Company Index Fund and Schwab Fundamental Emerging Markets Large Company Index Fund (twelve of the funds constituting Schwab Capital Trust, hereafter referred to as the “Funds”) as of October 31, 2019, the related statements of operationsfor the year ended October 31, 2019, the statements of changes in net assetsfor each of the periods indicated in the table below, including the related notes, and the financial highlights for each of the periods indicated therein (included in Item 1 of this FormN-CSR) and the portfolio holdings (included in Item 6 of this FormN-CSR) as of October 31, 2019 (collectively referred to as the “financial statements”). In our opinion, the financial statements present fairly, in all material respects, the financial position of each of the Funds as of October 31, 2019, the results of each of their operations for the year then ended, the changes in each of their net assets for each of the periods indicated in the table below and the financial highlights for each of the periods indicated therein in conformity with accounting principles generally accepted in the United States of America.
|
| Schwab S&P 500 Index Fund, SchwabSmall-Cap Index Fund, Schwab Total Stock Market Index Fund, Schwab International Index Fund, Schwab Fundamental US Large Company Index Fund, Schwab Fundamental US Small Company Index Fund, Schwab Fundamental International Large Company Index Fund, Schwab Fundamental International Small Company Index Fund and Schwab Fundamental Emerging Markets Large Company Index Fund: statements of operations for the year ended October 31, 2019 and statements of changes in net assets for each of the two years in the period ended October 31, 2019. |
Schwab U.S.Large-Cap Growth Index Fund, Schwab U.S.Large-Cap Value Index Fund and Schwab U.S.Mid-Cap Index Fund: statements of changes in net assets for the period December 20, 2017 (commencement of operations) through October 31, 2018 and for the year ended October 31, 2019. |
|
PricewaterhouseCoopers LLP, Three Embarcadero Center, San Francisco, CA 94111-4004 |
| T: (415) 498 5000, F: (415) 498 7100,www.pwc.com/us |
Basis for Opinions
These financial statements are the responsibility of the Funds’ management. Our responsibility is to express an opinion on the Fund’s financial statements based on our audits. We are a public accounting firm registered with the Public Company Accounting Oversight Board (United States) (PCAOB) and are required to be independent with respect to the Funds in accordance with the U.S. federal securities laws and the applicable rules and regulations of the Securities and Exchange Commission and the PCAOB.
We conducted our audits of these financial statements in accordance with the standards of the PCAOB. Those standards require that we plan and perform the audit to obtain reasonable assurance about whether the financial statements are free of material misstatement, whether due to error or fraud.
Our audits included performing procedures to assess the risks of material misstatement of the financial statements, whether due to error or fraud, and performing procedures that respond to those risks. Such procedures included examining, on a test basis, evidence regarding the amounts and disclosures in the financial statements. Our audits also included evaluating the accounting principles used and significant estimates made by management, as well as evaluating the overall presentation of the financial statements. Our procedures included confirmation of securities owned as of October 31, 2019 by correspondence with the custodian and brokers; when replies were not received from brokers, we performed other auditing procedures. We believe that our audits provide a reasonable basis for our opinion.
|
 |
| December 16, 2019 |
We have served as the auditor of one or more investment companies in the Schwab Funds Complex since 1989.
2 of 2
Item 7: Disclosure of Proxy Voting Policies and Procedures forClosed-End Management Investment Companies.
Not applicable.
Item 8: Portfolio Managers ofClosed-End Management Investment Companies.
Not applicable.
Item 9: Purchases of Equity Securities byClosed-End Management Investment Company and Affiliated Purchasers.
Not applicable.
Item 10: Submission of Matters to a Vote of Security Holders.
Not applicable.
Item 11: Controls and Procedures.
| (a) | Based on their evaluation of Registrant’s disclosure controls and procedures, as of a date within 90 days of the filing date, Registrant’s Chief Executive Officer, Jonathan de St. Paer and Registrant’s Chief Financial Officer, Mark Fischer, have concluded that Registrant’s disclosure controls and procedures are: (i) reasonably designed to ensure that information required to be disclosed in this report is appropriately communicated to Registrant’s officers to allow timely decisions regarding disclosures required in this report; (ii) reasonably designed to ensure that information required to be disclosed in this report is recorded, processed, summarized and reported in a timely manner; and (iii) are effective in achieving the goals described in (i) and (ii) above. |
| (b) | During the period covered by this report, there have been no changes in Registrant’s internal control over financial reporting that the above officers believe to have materially affected, or to be reasonably likely to materially affect, Registrant’s internal control over financial reporting. |
Item 12: Disclosure of Securities Lending Activities forClosed-End Management Investment Companies.
Not applicable.
Item 13: Exhibits.
| (a) (1) | Registrant’s code of ethics (that is the subject of the disclosure required by Item 2(a)) is attached. |
| | (2) | Separate certifications for Registrant’s principal executive officer and principal financial officer, as required by Rule30a-2(a) under the 1940 Act, are attached. |
| (b) | A certification for Registrant’s principal executive officer and principal financial officer, as required by Rule30a-2(b) under the 1940 Act, is attached. This certification is being furnished to the Securities and Exchange Commission solely pursuant to 18 U.S.C. section 1350 and is not being filed as part of the FormN-CSR with the Commission. |
Pursuant to the requirements of the Securities Exchange Act of 1934 and the Investment Company Act of 1940, the registrant has duly caused this report to be signed on its behalf by the undersigned, thereunto duly authorized.
(Registrant) Schwab Capital Trust
| | |
| By: | | /s/ Jonathan de St. Paer |
| | Jonathan de St. Paer Chief Executive Officer |
| |
| Date: | | December 16, 2019 |
Pursuant to the requirements of the Securities Exchange Act of 1934 and the Investment Company Act of 1940, this report has been signed below by the following persons on behalf of the registrant and in the capacities and on the dates indicated.
| | |
| By: | | /s/ Jonathan de St. Paer |
| | Jonathan de St. Paer Chief Executive Officer |
| |
| Date: | | December 16, 2019 |
| | |
| By: | | /s/ Mark Fischer |
| | Mark Fischer Chief Financial Officer |
| |
| Date: | | December 16, 2019 |