UNITED STATES
SECURITIES AND EXCHANGE COMMISSION
Washington, D.C. 20549
FORM N-CSR
CERTIFIED SHAREHOLDER REPORT OF REGISTERED
MANAGEMENT INVESTMENT COMPANIES
Investment Company Act File Number 811-07760
KEELEY Small Cap Value Fund, Inc.
(Exact name of registrant as specified in charter)
| | |
401 South LaSalle Street Suite 1201 Chicago, Illinois | | 60605 |
|
| (Address of principal executive offices) | | (Zip code) |
| | |
| John L. Keeley, Jr. | | Copy to: |
| Keeley Asset Management Corp. | | Stephen E. Goodman |
| 401 South LaSalle Street | | Meltzer Purtill & Stelle LLC |
| Suite 1201 | | 1515 E. Woodfield Road |
| Chicago, Illinois 60605 | | Schaumburg, Illinois 60173 |
(Name and address of agents for service)
Registrant’s telephone number, including area code: (312)786-5000
Date of fiscal year end: September 30
Date of reporting period: September 30, 2005
Item 1. Reports to Stockholders.
The following is a copy of the report transmitted to shareholders pursuant to Rule 30e-1 under the Investment Company Act of 1940 (the “Act”) (17 CFR 270.30e-1)
LETTER TO SHAREHOLDERS
Dear Shareholder,
During the past six months from April 1, 2005 through September 30, 2005, the Fund’s net assets grew to $850,183,943 and the number of shareholders grew to 49,292. For the six month period ending September 30, 2005, the portfolio turnover was 10.69% and the expense ratio remained at 1.52%. The Fund’s portfolio is widely diversified with investments in 162 companies. The Fund is registered for sale in all 50 states and the District of Columbia. Our broker dealer network totals over 200 broker dealers and trust entities.
We are pleased to announce that in September the Fund was named to the Forbes Honor Roll 2005 for the second year in a row. The criteria for inclusion on the 10-member honor roll are stringent. Funds selected must perform well over four market cycles beginning 1/31/95; must demonstrate superior capital preservation in down markets; must practice wide portfolio diversification and must demonstrate long-term continuity of management.
As of this date, the Fund was rated five of five stars by Morningstar among 77 Small Blend funds for the 10-year period. The KEELEY Small Cap Value Fund, Inc. received four of five stars for the three year period (among 366 funds) and five of five stars (among 258 funds) for the five year period Morningstar ratings reflect historial risk adjusted performance as of 9/30/05 and are subject to change every month. Morningstar ratings are based on a risk adjusted return measure that accounts for variation in a Fund’s monthly performance (including the effects of sales charges and redemption fees), placing more emphasis on downward variations and rewarding consistent performance. The overall rating is a weighted average of the three-, five-, and 10-year returns. The top 10% are labeled five stars, the next 22.5% are labeled four stars, the next 35% are labeled three stars, the next 22.5% are labeled two stars and the bottom 10% one star. ©2005 Morningstar, Inc. All Rights Reserved. The information contained herein: (1) is proprietary to Morningstar and/or its content providers; (2) may not be copied or distributed; and (3) is not warranted to be accurate, complete or timely. Neither Morningstar nor its content providers are responsible for any damages or losses arising from any use of this information. Past performance is no guarantee of future results.
There are risks associated with an investment in small-cap mutual funds, such as smaller product lines and market shares, and limited available information. You should consider the investment objectives, risks and charges and expenses of the investment company carefully before investing. For further details regarding such risks, including information on fees and expenses please refer to the Fund’s prospectus. Read the Prospectus carefully before investing.
Performance Data Excluding 4.5% Maximum Up-Front Sales Charge
For the quarter ended September 30, 2005, the Fund’s total return was 13.41% versus a return of 4.69% for the Russell 2000 Index. For the one year ending September 30, 2004, the Fund’s average annual return was 32.37% versus 17.95% for the Russell 2000 Index. For the five year period the Fund’s average annual return was 18.65% versus 6.45% for the Russell 2000 Index. Since inception, October 1, 1993, the Fund’s average annual return was 16.06% versus 9.90% for the Russell 2000 Index. Performance Data does not reflect the deduction of the sales load or fee, and that, if reflected, the load or fee would reduce the performance quoted.
Performance data quoted represents past performance and does not guarantee future results. The investment return and principal value of an investment will fluctuate so that an investor’s shares, when redeemed, may be worth more
or less than their original cost and the current performance my be lower or higher than the performance data quoted. You may call toll-free at 888-933-5391, or visit our website at www.keeleyfunds.com to obtain performance data current to the most recent month end.
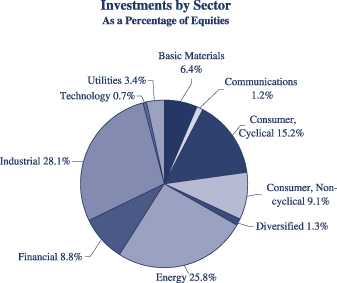
During the six months ended September 30, 2005, the portfolio advanced with particular strength in the energy sector. Two years ago it was deemed that financial stocks acted poorly in an increasing interest rate environment and were deemphasized. Since June 2004, the Federal Reserve System has raised interest rates 11 times in 1/4-point increments. At the same time we believed that energy commodities (coal, natural gas, and light sweet crude) and industrial companies would advance in strengthening U.S., India and Chinese economies. In addition we believed that the shares of energy companies did not reflect the increasing strength of the underlying commodity. This was borne out with particular force with hurricane Katrina which sent the energy complex substantially higher. We continue to expect the energy and industrial sectors to be a top performer for the Fund. During the six month period Spinnaker Exploration Co. received a takeover bid at a premium to the market.
Looking ahead, there are a number of concerns for investors, namely:
| | • | | A slowdown in the U.S. economy with weak consumer outlook |
| | • | | Uncertainty with change in the Federal Reserve chairman |
| | • | | Declining investor confidence in the Bush administration |
As we begin the Fund’s 13th year of operation, the equity markets have taken a number of these risks into account. In addition, GDP growth is still forecast to average over 3% for the second half of the year. Stock market breadth has been strong and broad-based as a result. Within this environment, we remain committed to our value driven strategy which buys stocks of relatively unknown (spin-offs) and out-of-favor (below actual or perceived book-value) companies. This lack of Wall Street coverage and sponsorship allows us to buy stock at a discount to our assessment of fair market value.
Thank you for your continued commitment to the Fund.
Sincerely,

John L. Keeley, Jr.
President
Performance Data Including 4.5% Maximum Up-Front Sales Charge
For the quarter ended September 30, 2005, the Fund’s total return was 8.30% versus a return of 4.69% for the Russell 2000 Index. For the one year ending September 30, 2004, the Fund’s average annual return was 26.41% versus 17.95% for the Russell 2000 Index. For the five year period the Fund’s average annual return was 17.56% versus 6.45% for the Russell 2000 Index. Since inception, October 1, 1993, the Fund’s average annual return was 15.62% versus 9.90% for the Russell 2000 Index.
A description of the Fund’s proxy voting policies and procedures is available (i) without charge, upon request, by calling toll free 1-888-933-5391; (ii) on the Fund’s website at http://www.keeleyfunds.com; and (iii) on the Securities and Exchange Commission’s (SEC) at http://www.sec.gov. The Fund plans to file its proxy voting record with the SEC for the year ended June 30, 2005. A copy of the information can be obtained by on the same methods listed above.
The Fund will file its complete schedule of portfolio holdings with the SEC for the first and third quarters of each fiscal year on Form N-Q. The Fund’s Form N-Q will be available on the EDGAR database on the SEC’s website at http://www.sec.gov. These Forms may also be reviewed and copied at the SEC’s Public Reference Room in Washington, D.C. Information about the operation of the Public Reference Room may be obtained by calling 1-800-SEC-0330. The information may also be obtained by calling 1-888-933-5391.
Index Comparison
Comparison of a Hypothetical $10,000 Investment
In the KSCVX* and Russell 2000**
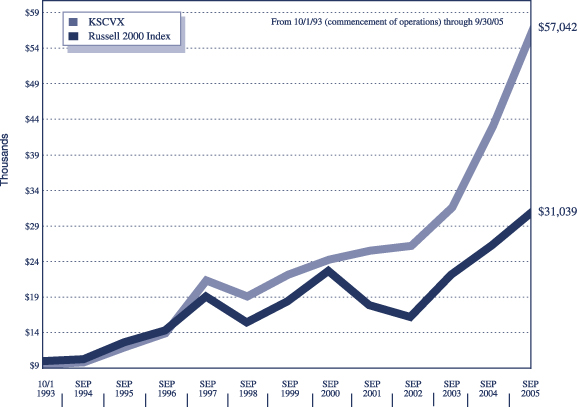
Average annual total returns***
For the periods ended September 30, 2005
| | | | | | | | |
| | | 12 mos ended
9/30/05
| | 5 yrs ended
9/30/05
| | 10 yrs ended
9/30/05
| | Since Commencement
of Operations (12 yrs)
10/1/93 to 9/30/05
|
KSCVX | | +32.37% | | +18.65% | | +16.91% | | +16.06% |
KSCVX (includes max 4 1/2% front-end load) | | +26.41% | | +17.56% | | +16.37% | | +15.62% |
Russell 2000 Index | | +17.95% | | +6.45% | | +9.37% | | +9.90% |
| * | Performance graph includes deduction of 4 1/2% front end load. |
| ** | The Russell 2000 Index is comprised of the smallest 2,000 companies in the Russell 3000 Index. The Russell 3000 Index is comprised of the 3,000 largest U.S. companies based on market capitalization. The Index is unmanaged and returns include reinvested dividends. |
| *** | PERFORMANCE DATA quoted represents past performance which is not predictive of future performance. The investment return and principal value of shares will fluctuate and when redeemed, may be worth more or less than their original cost. |
KEELEY Small Cap Value Fund, Inc.
Expense Example
For the Six Months Ended September 30, 2005
(Unaudited)
As a shareholder of the KEELEY Small Cap Value Fund (the “Fund”), you incur two types of costs: (1) transaction costs, including sales charges (loads) on purchase payments; and (2) ongoing costs, including management fees; distribution (12b-1) fees; and other Fund expenses. This Example is intended to help you understand your ongoing costs (in dollars) of investing in the Fund and to compare these costs with the ongoing costs of investing in other mutual funds.
The Example is based on an investment of $1,000 invested at the beginning of the period and held for the entire period from April 1, 2005 to September 30, 2005 (the “period”).
Actual Expenses
The first line of the table below provides information about actual account values and actual expenses. You may use the information in this line, together with the amount you invested, to estimate the expenses you paid over the period. Simply divide your account value by $1,000 (for example, an $8,600 account value divided by $1,000 equals 8.6), then multiply the result by the number in the first line under the heading entitled “Expenses Paid During Period” to estimate the expenses you paid on your account during the period.
Hypothetical Example for Comparison Purposes
The second line of the table below provides information about hypothetical account values and hypothetical expenses based on the Fund’s actual expense ratio and an assumed rate of return of 5% per year before expenses, which is not the Fund’s actual return. The hypothetical account values and expenses may not be used to estimate the actual ending account balance or expenses you paid for the period. You may use this information to compare the ongoing costs of investing in the Fund and other funds. To do so, compare this 5% hypothetical example with the 5% hypothetical examples that appear in the shareholder reports of other funds.
Please note that the expenses shown in the table are meant to highlight your ongoing costs only and do not reflect any transactional costs, such as sales charges (loads). Therefore, the second line of the table is useful in comparing the ongoing costs only, and will not help you determine the relative total costs of owning different funds. In addition, if these transactional costs were included, your costs could have been higher.
Expenses Paid During the Period
| | | | | | | | | |
| | | Beginning account value
April 1, 2005
| | Ending account value
September 30, 2005
| | Expenses paid during
the period ended
September 30, 2005*
|
Actual | | $ | 1,000.00 | | $ | 1,143.10 | | $ | 8.22 |
Hypothetical (5% return before expenses) | | | 1,000.00 | | | 1,017.33 | | | 7.73 |
| * | Expenses are equal to the Fund’s annualized expense ratio of 1.52% for the period, multiplied by the average account value over the period, multiplied by 183/365 (to reflect the one-half year period). |
KEELEY Small Cap Value Fund, Inc.
STATEMENT OF ASSETS AND LIABILITIES
September 30, 2005
| | | |
ASSETS: | | | |
| |
Investments at value (cost $683,599,972) | | $ | 859,025,562 |
| |
Cash | | | 3,425,692 |
| |
Receivable for investments sold | | | 61,267 |
| |
Receivable for shares issued | | | 9,718,510 |
| |
Dividends and interest receivable | | | 312,776 |
| |
Prepaid expenses and other assets | | | 62,265 |
| | |
|
|
| |
Total Assets | | | 872,606,072 |
| | |
|
|
| |
LIABILITIES: | | | |
| |
Payable for investments purchased | | | 21,274,418 |
| |
Payable for shares redeemed | | | 73,411 |
| |
Payable to Adviser | | | 650,300 |
| |
Accrued 12b-1 fees | | | 163,352 |
| |
Other accrued expenses | | | 260,648 |
| | |
|
|
| |
Total Liabilities | | | 22,422,129 |
| | |
|
|
| |
NET ASSETS | | $ | 850,183,943 |
| | |
|
|
| |
NET ASSETS CONSIST OF: | | | |
| |
Capital stock | | $ | 666,990,082 |
| |
Undistributed net realized gain on investments | | | 7,768,271 |
| |
Net unrealized appreciation on investments | | | 175,425,590 |
| | |
|
|
| |
NET ASSETS | | $ | 850,183,943 |
| | |
|
|
| |
CAPITAL STOCK, $0.01 par value | | | |
| |
Authorized | | | 100,000,000 |
| |
Issued and outstanding | | | 19,561,085 |
| |
NET ASSET VALUE AND REDEMPTION PRICE PER SHARE | | $ | 43.46 |
| | |
|
|
| |
MAXIMUM OFFERING PRICE PER SHARE ($43.46 / 0.955) | | $ | 45.51 |
| | |
|
|
KEELEY Small Cap Value Fund, Inc.
STATEMENT OF OPERATIONS
For The Year Ended September 30, 2005
| | | | |
INVESTMENT INCOME: | | | | |
| |
Dividend income (net of $3,106 of foreign withholding taxes) | | $ | 4,198,475 | |
| |
Interest income | | | 527,393 | |
| | |
|
|
|
| |
Total Investment Income | | | 4,725,868 | |
| | |
|
|
|
| |
EXPENSES: | | | | |
| |
Investment advisory fees | | | 4,633,456 | |
| |
12b-1 fees | | | 1,158,364 | |
| |
Transfer agent fees and expenses | | | 367,317 | |
| |
Administration fees | | | 281,673 | |
| |
Professional fees | | | 167,757 | |
| |
Custody fees | | | 147,904 | |
| |
Federal and state registration fees | | | 113,831 | |
| |
Fund accounting fees | | | 78,937 | |
| |
Reports to shareholders | | | 62,391 | |
| |
Directors’ fees | | | 31,361 | |
| |
Other | | | 16,061 | |
| | |
|
|
|
| |
Total Expenses | | | 7,059,052 | |
| | |
|
|
|
| |
NET INVESTMENT LOSS | | | (2,333,184 | ) |
| | |
|
|
|
| |
REALIZED AND UNREALIZED GAIN ON INVESTMENTS: | | | | |
| |
Net realized gain on investments | | | 7,778,432 | |
| |
Change in net unrealized appreciation on investments | | | 124,250,455 | |
| | |
|
|
|
| |
Net Gain on Investments | | | 132,028,887 | |
| | |
|
|
|
| |
NET INCREASE IN NET ASSETS RESULTING FROM OPERATIONS | | $ | 129,695,703 | |
| | |
|
|
|
See notes to the financial statements.
KEELEY Small Cap Value Fund, Inc.
SCHEDULE OF INVESTMENTS
September 30, 2005
| | | | | | | | |
Number
of Shares
| | | | | | | Value
|
| | | COMMON STOCKS | | 97.74 | % | | | |
| | | |
| | | Aerospace / Defense | | 1.64 | % | | | |
| 326,500 | | GenCorp, Inc.* | | | | | $ | 6,089,225 |
| 70,500 | | Moog, Inc., Class B* | | | | | | 2,082,570 |
| 167,000 | | Teledyne Technologies, Inc.* | | | | | | 5,756,490 |
| | | | | | | |
|
|
| | | | | | | | | 13,928,285 |
| | | | | | | |
|
|
| | | |
| | | Auto Parts and Equipment | | 0.99 | % | | | |
| 265,000 | | Tenneco Automotive, Inc.* | | | | | | 4,640,150 |
| 275,000 | | Titan International, Inc. | | | | | | 3,775,750 |
| | | | | | | |
|
|
| | | | | | | | | 8,415,900 |
| | | | | | | |
|
|
| | | |
| | | Banks | | 1.11 | % | | | |
| 225,000 | | BankFinancial Corp.* | | | | | | 3,195,000 |
| 90,000 | | PrivateBancorp, Inc. | | | | | | 3,085,200 |
| 62,000 | | Wintrust Financial Corp. | | | | | | 3,116,120 |
| | | | | | | |
|
|
| | | | | | | | | 9,396,320 |
| | | | | | | |
|
|
| | | |
| | | Building Materials | | 1.86 | % | | | |
| 200,000 | | Ready Mix, Inc.* | | | | | | 2,764,000 |
| 162,000 | | Texas Industries, Inc. | | | | | | 8,812,800 |
| 550,105 | | U.S. Concrete, Inc.* | | | | | | 4,241,309 |
| | | | | | | |
|
|
| | | | | | | | | 15,818,109 |
| | | | | | | |
|
|
| | | |
| | | Coal | | 3.21 | % | | | |
| 226,000 | | Alpha Natural Resources, Inc.* | | | | | | 6,789,040 |
| 216,500 | | Foundation Coal Holdings, Inc. | | | | | | 8,324,425 |
| 114,000 | | James River Coal Co.* | | | | | | 5,753,580 |
| 125,000 | | Massey Energy Co. | | | | | | 6,383,750 |
| | | | | | | |
|
|
| | | | | | | | | 27,250,795 |
| | | | | | | |
|
|
| | | |
| | | Commercial Services | | 4.61 | % | | | |
| 252,000 | | Adesa, Inc. | | | | | | 5,569,200 |
| 595,000 | | Cenveo, Inc.* | | | | | | 6,170,150 |
| 112,000 | | Interactive Data Corp. | | | | | | 2,536,800 |
| 204,700 | | Mac-Gray Corp.* | | | | | | 2,650,865 |
| 277,500 | | Midas, Inc.* | | | | | | 5,516,700 |
| 222,500 | | PHH Corp.* | | | | | | 6,109,850 |
| 240,500 | | Standard Parking Corp.* | | | | | | 4,576,715 |
| 282,500 | | Wright Express Corp.* | | | | | | 6,099,175 |
| | | | | | | |
|
|
| | | | | | | | | 39,229,455 |
| | | | | | | |
|
|
| | | |
| | | Distribution / Wholesale | | 0.58 | % | | | |
| 146,000 | | WESCO International, Inc.* | | | | | | 4,945,020 |
| | | | | | | |
|
|
| | | |
| | | Diversified Financial Services | | 2.86 | % | | | |
| 52,000 | | CIT Group, Inc. | | | | | | 2,349,360 |
| 602,300 | | Epoch Holding Corp.* | | | | | | 3,011,500 |
| 46,500 | | Jefferies Group, Inc. | | | | | | 2,025,075 |
| 595,000 | | LaBranche & Co., Inc.* | | | | | | 5,170,550 |
| 226,127 | | MarketAxess Holdings, Inc.* | | | | | | 3,075,327 |
| 317,500 | | SWS Group, Inc. | | | | | | 5,207,000 |
| 645,000 | | Van der Moolen Holding N.V. ADR | | | | | | 3,495,900 |
| | | | | | | |
|
|
| | | | | | | | | 24,334,712 |
| | | | | | | |
|
|
| | | | | | | | |
Number
of Shares
| | | | | | | Value
|
| | | |
| | | Electric | | 3.32 | % | | | |
| 185,000 | | Allegheny Energy, Inc.* | | | | | $ | 5,683,200 |
| 925,000 | | Aquila, Inc.* | | | | | | 3,663,000 |
| 210,000 | | Centerpoint Energy, Inc. | | | | | | 3,122,700 |
| 270,000 | | CMS Energy Corp.* | | | | | | 4,441,500 |
| 160,000 | | Duquesne Light Holdings, Inc. | | | | | | 2,753,600 |
| 152,000 | | Florida Public Utilities Co. | | | | | | 2,413,760 |
| 195,000 | | Reliant Energy, Inc.* | | | | | | 3,010,800 |
| 130,000 | | Westar Energy, Inc. | | | | | | 3,136,900 |
| | | | | | | |
|
|
| | | | | | | | | 28,225,460 |
| | | | | | | |
|
|
| | | |
| | | Electrical Components & Equipment | | 2.21 | % | | | |
| 55,000 | | Ametek, Inc. | | | | | | 2,363,350 |
| 375,000 | | General Cable Corp.* | | | | | | 6,300,000 |
| 295,000 | | The Lamson & Sessions Co.* | | | | | | 5,404,400 |
| 262,500 | | Superior Essex, Inc.* | | | | | | 4,727,625 |
| | | | | | | |
|
|
| | | | | | | | | 18,795,375 |
| | | | | | | |
|
|
| | | |
| | | Electronics | | 2.27 | % | | | |
| 225,000 | | Brady Corp., Class A | | | | | | 6,961,500 |
| 225,000 | | Methode Electronics, Inc., Class A | | | | | | 2,592,000 |
| 145,500 | | Thomas & Betts Corp.* | | | | | | 5,006,655 |
| 165,500 | | Watts Water Technologies, Inc. | | | | | | 4,774,675 |
| | | | | | | |
|
|
| | | | | | | | | 19,334,830 |
| | | | | | | |
|
|
| | | |
| | | Energy—Alternate Sources | | 2.61 | % | | | |
| 666,520 | | Covanta Holding Corp.* | | | | | | 8,951,364 |
| 210,000 | | Headwaters, Inc.* | | | | | | 7,854,000 |
| 312,500 | | KFX, Inc.* | | | | | | 5,350,000 |
| | | | | | | |
|
|
| | | | | | | | | 22,155,364 |
| | | | | | | |
|
|
| | | |
| | | Engineering and Construction | | 2.87 | % | | | |
| 186,500 | | Chicago Bridge & Iron Co. N.V. | | | | | | 5,798,285 |
| 319,000 | | Foster Wheeler, Ltd.* | | | | | | 9,853,910 |
| 240,000 | | McDermott International, Inc.* | | | | | | 8,786,400 |
| | | | | | | |
|
|
| | | | | | | | | 24,438,595 |
| | | | | | | |
|
|
| | | |
| | | Entertainment | | 1.29 | % | | | |
| 320,000 | | Bluegreen Corp.* | | | | | | 5,648,000 |
| 184,000 | | Vail Resorts, Inc.* | | | | | | 5,290,000 |
| | | | | | | |
|
|
| | | | | | | | | 10,938,000 |
| | | | | | | |
|
|
| | | |
| | | Food | | 1.94 | % | | | |
| 205,000 | | Chiquita Brands International, Inc. | | | | | | 5,729,750 |
| 196,500 | | Flowers Foods, Inc. | | | | | | 5,360,520 |
| 128,000 | | Ralcorp Holdings, Inc. | | | | | | 5,365,760 |
| | | | | | | |
|
|
| | | | | | | | | 16,456,030 |
| | | | | | | |
|
|
| | | |
| | | Forest Products and Paper | | 1.65 | % | | | |
| 101,500 | | Deltic Timber Corp. | | | | | | 4,674,075 |
| 220,000 | | Longview Fibre Co. | | | | | | 4,287,800 |
| 174,000 | | Neenah Paper, Inc. | | | | | | 5,098,200 |
| | | | | | | |
|
|
| | | | | | | | | 14,060,075 |
| | | | | | | |
|
|
See notes to the financial statements.
KEELEY Small Cap Value Fund, Inc.
SCHEDULE OF INVESTMENTS
September 30, 2005
| | | | | | | | |
Number
of Shares
| | | | | | | Value
|
| | | Hand / Machine Tools | | 1.31 | % | | | |
| 132,000 | | Lincoln Electric Holdings, Inc. | | | | | $ | 5,200,800 |
| 182,500 | | Regal-Beloit Corp. | | | | | | 5,920,300 |
| | | | | | | |
|
|
| | | | | | | | | 11,121,100 |
| | | | | | | |
|
|
| | | |
| | | Healthcare—Products | | 0.66 | % | | | |
| 134,500 | | Sybron Dental Specialties, Inc.* | | | | | | 5,592,510 |
| | | | | | | |
|
|
| | | |
| | | Healthcare—Services | | 0.42 | % | | | |
| 210,000 | | Emeritus Corp.* | | | | | | 3,601,500 |
| | | | | | | |
|
|
| | | |
| | | Holding Companies—Diversified | | 1.22 | % | | | |
| 90,000 | | Leucadia National Corp. | | | | | | 3,879,000 |
| 168,500 | | National Patent Development Corp.* | | | | | | 438,100 |
| 124,000 | | Walter Industries, Inc. | | | | | | 6,066,080 |
| | | | | | | |
|
|
| | | | | | | | | 10,383,180 |
| | | | | | | |
|
|
| | | |
| | | Home Builders | | 3.30 | % | | | |
| 679,500 | | Cavalier Homes, Inc.* | | | | | | 4,491,495 |
| 505,000 | | Champion Enterprises, Inc.* | | | | | | 7,463,900 |
| 535,000 | | Fleetwood Enterprises, Inc.* | | | | | | 6,580,500 |
| 190,000 | | Levitt Corp. | | | | | | 4,358,600 |
| 182,000 | | WCI Communities, Inc.* | | | | | | 5,163,340 |
| | | | | | | |
|
|
| | | | | | | | | 28,057,835 |
| | | | | | | |
|
|
| | | |
| | | Household Products | | 1.30 | % | | | |
| 270,000 | | ACCO Brands Corp.* | | | | | | 7,619,400 |
| 170,000 | | Water Pik Technologies, Inc.* | | | | | | 3,451,000 |
| | | | | | | |
|
|
| | | | | | | | | 11,070,400 |
| | | | | | | |
|
|
| | | |
| | | Insurance | | 2.38 | % | | | |
| 327,500 | | Conseco, Inc.* | | | | | | 6,913,525 |
| 442,500 | | Crawford & Co. | | | | | | 3,464,775 |
| 54,000 | | Fidelity National Financial, Inc. | | | | | | 2,404,080 |
| 415,000 | | Meadowbrook Insurance Group, Inc.* | | | | | | 2,324,000 |
| 417,500 | | The Phoenix Companies, Inc. | | | | | | 5,093,500 |
| | | | | | | |
|
|
| | | | | | | | | 20,199,880 |
| | | | | | | |
|
|
| | | |
| | | Iron / Steel | | 3.27 | % | | | |
| 221,500 | | Allegheny Technologies, Inc. | | | | | | 6,862,070 |
| 272,500 | | Chaparral Steel Co.* | | | | | | 6,872,450 |
| 277,500 | | Oregon Steel Mills, Inc.* | | | | | | 7,742,250 |
| 295,000 | | Ryerson Tull, Inc. | | | | | | 6,283,500 |
| | | | | | | |
|
|
| | | | | | | | | 27,760,270 |
| | | | | | | |
|
|
| | | |
| | | Lodging | | 3.46 | % | | | |
| 191,000 | | Aztar Corp.* | | | | | | 5,884,710 |
| 2,500 | | Choice Hotels International, Inc. | | | | | | 161,600 |
| 145,000 | | Gaylord Entertainment Co.* | | | | | | 6,909,250 |
| 670,000 | | La Quinta Corp.* | | | | | | 5,822,300 |
| 235,000 | | Marcus Corp. | | | | | | 4,709,400 |
| 207,500 | | Orient-Express Hotels, Ltd. | | | | | | 5,897,150 |
| | | | | | | |
|
|
| | | | | | | | | 29,384,410 |
| | | | | | | |
|
|
| | | | | | | | |
Number
of Shares
| | | | | | | Value
|
| | | Machinery—Construction and Mining | | 1.84 | % | | | |
| 142,000 | | Bucyrus International, Inc. | | | | | $ | 6,976,460 |
| 80,000 | | Joy Global, Inc. | | | | | | 4,036,800 |
| 94,000 | | Terex Corp.* | | | | | | 4,646,420 |
| | | | | | | |
|
|
| | | | | | | | | 15,659,680 |
| | | | | | | |
|
|
| | | |
| | | Machinery—Diversified | | 4.11 | % | | | |
| 293,550 | | Flow International Corp.* | | | | | | 2,266,206 |
| 167,500 | | Flowserve Corp.* | | | | | | 6,088,625 |
| 160,000 | | Gardner Denver, Inc.* | | | | | | 7,136,000 |
| 665,000 | | Global Power Equipment Group, Inc.* | | | | | | 4,741,450 |
| 118,000 | | Manitowoc Company, Inc. | | | | | | 5,929,500 |
| 113,000 | | Sauer-Danfoss, Inc. | | | | | | 2,260,000 |
| 237,500 | | Wabtec Corp. | | | | | | 6,479,000 |
| | | | | | | |
|
|
| | | | | | | | | 34,900,781 |
| | | | | | | |
|
|
| | | |
| | | Media | | 1.15 | % | | | |
| 545,000 | | Gray Television, Inc. | | | | | | 5,771,550 |
| 245,000 | | Journal Register Co. | | | | | | 3,964,100 |
| | | | | | | |
|
|
| | | | | | | | | 9,735,650 |
| | | | | | | |
|
|
| | | |
| | | Metal Fabricate / Hardware | | 3.18 | % | | | |
| 352,500 | | AM Castle & Co.* | | | | | | 6,168,750 |
| 215,000 | | CIRCOR International, Inc. | | | | | | 5,901,750 |
| 194,500 | | Commercial Metals Co. | | | | | | 6,562,430 |
| 190,000 | | RBC Bearings, Inc.* | | | | | | 3,030,500 |
| 181,500 | | Timken Co. | | | | | | 5,377,845 |
| | | | | | | |
|
|
| | | | | | | | | 27,041,275 |
| | | | | | | |
|
|
| | | |
| | | Mining | | 1.37 | % | | | |
| 357,500 | | Brush Engineered Materials, Inc.* | | | | | | 5,677,100 |
| 187,500 | | Compass Minerals International, Inc. | | | | | | 4,312,500 |
| 135,000 | | Oglebay Norton Co.* | | | | | | 1,687,500 |
| | | | | | | |
|
|
| | | | | | | | | 11,677,100 |
| | | | | | | |
|
|
| | | |
| | | Miscellaneous Manufacturing | | 3.50 | % | | | |
| 102,000 | | The Brink’s Co. | | | | | | 4,188,120 |
| 150,000 | | EnPro Industries, Inc.* | | | | | | 5,053,500 |
| 190,000 | | Freightcar America, Inc. | | | | | | 7,748,200 |
| 297,500 | | GP Strategies Corp.* | | | | | | 2,680,475 |
| 312,500 | | Hexcel Corp.* | | | | | | 5,715,625 |
| 545,000 | | Jacuzzi Brands, Inc.* | | | | | | 4,392,700 |
| | | | | | | |
|
|
| | | | | | | | | 29,778,620 |
| | | | | | | |
|
|
| | | |
| | | Oil and Gas | | 12.08 | % | | | |
| 381,200 | | Bois d’ Arc Energy, Inc.* | | | | | | 6,560,452 |
| 302,500 | | Carrizo Oil & Gas, Inc.* | | | | | | 8,863,250 |
| 156,000 | | Cimarex Energy Co.* | | | | | | 7,071,480 |
| 235,000 | | Comstock Resources, Inc.* | | | | | | 7,710,350 |
| 160,000 | | Encore Acquisition Co.* | | | | | | 6,216,000 |
| 638,100 | | Gasco Energy, Inc.* | | | | | | 4,243,365 |
| 264,500 | | Goodrich Petroleum Corp.* | | | | | | 6,207,815 |
See notes to the financial statements.
KEELEY Small Cap Value Fund, Inc.
SCHEDULE OF INVESTMENTS
September 30, 2005
| | | | | | | | |
Number
of Shares
| | | | | | | Value
|
| | | Oil and Gas (continued) | | | | | | |
| 290,000 | | KCS Energy, Inc.* | | | | | $ | 7,983,700 |
| 780,000 | | Parker Drilling Co.* | | | | | | 7,230,600 |
| 332,500 | | Pioneer Drilling Co.* | | | | | | 6,490,400 |
| 130,000 | | Plains Exploration & Production Co.* | | | | | | 5,566,600 |
| 152,500 | | Quicksilver Resources, Inc.* | | | | | | 7,287,975 |
| 210,000 | | Range Resources Corp. | | | | | | 8,108,100 |
| 160,000 | | Remington Oil & Gas Corp.* | | | | | | 6,640,000 |
| 149,000 | | Whiting Petroleum Corp.* | | | | | | 6,532,160 |
| | | | | | | |
|
|
| | | | | | | | | 102,712,247 |
| | | | | | | |
|
|
| | | |
| | | Oil and Gas Services | | 6.43 | % | | | |
| 10,000 | | Allis-Chalmers Energy, Inc.* | | | | | | 118,400 |
| 305,000 | | Dresser-Rand Group, Inc.* | | | | | | 7,512,150 |
| 174,000 | | FMC Technologies, Inc.* | | | | | | 7,327,140 |
| 215,500 | | Hornbeck Offshore Services, Inc.* | | | | | | 7,893,765 |
| 137,000 | | Lufkin Industries, Inc. | | | | | | 5,966,350 |
| 197,500 | | Natural Gas Services Group, Inc.* | | | | | | 6,957,925 |
| 48,400 | | RPC, Inc. | | | | | | 1,246,784 |
| 152,500 | | Universal Compression Holdings, Inc.* | | | | | | 6,064,925 |
| 182,500 | | Veritas DGC, Inc.* | | | | | | 6,683,150 |
| 310,000 | | Willbros Group, Inc.* | | | | | | 4,913,500 |
| | | | | | | |
|
|
| | | | | | | | | 54,684,089 |
| | | | | | | |
|
|
| | | |
| | | Packaging and Containers | | 0.68 | % | | | |
| 365,000 | | Crown Holdings, Inc.* | | | | | | 5,818,100 |
| | | | | | | |
|
|
| | | |
| | | Pipelines | | 0.88 | % | | | |
| 146,000 | | Western Gas Resources, Inc. | | | | | | 7,479,580 |
| | | | | | | |
|
|
| | | |
| | | Real Estate | | 0.42 | % | | | |
| 57,000 | | The St. Joe Co. | | | | | | 3,559,650 |
| | | | | | | |
|
|
| | | |
| | | Retail | | 5.21 | % | | | |
| 400,000 | | AFC Enterprises, Inc. | | | | | | 4,616,000 |
| 208,000 | | Dillard’s, Inc. | | | | | | 4,343,040 |
| 220,000 | | Eddie Bauer Holdings, Inc.* | | | | | | 5,445,000 |
| 98,000 | | IHOP Corp. | | | | | | 3,992,520 |
| 285,000 | | Movado Group, Inc. | | | | | | 5,335,200 |
| 495,000 | | Retail Ventures, Inc.* | | | | | | 5,435,100 |
| 190,000 | | Stage Stores, Inc. | | | | | | 5,105,300 |
| 212,500 | | The Steak N Shake Co.* | | | | | | 3,856,875 |
| 320,000 | | Triarc Companies, Inc. | | | | | | 5,376,000 |
| 54,000 | | Triarc Companies, Inc., Class B | | | | | | 824,580 |
| | | | | | | |
|
|
| | | | | | | | | 44,329,615 |
| | | | | | | |
|
|
| | | | | | | | | | |
Number
of Shares
| | | | | | | Value
| |
| | | | Savings and Loans | | 1.80 | % | | | | |
| | 300,000 | | BankAtlantic Bancorp, Inc. | | | | | $ | 5,097,000 | |
| | 140,000 | | Citizens First Bancorp, Inc. | | | | | | 2,987,600 | |
| | 170,000 | | Home Federal Bancorp, Inc. | | | | | | 2,159,425 | |
| | 185,000 | | NewAlliance Bancshares, Inc. | | | | | | 2,708,400 | |
| | 90,000 | | TierOne Corp. | | | | | | 2,367,900 | |
| | | | | | | | |
|
|
|
| | | | | | | | | | 15,320,325 | |
| | | | | | | | |
|
|
|
| | | |
| | | | Software | | 0.73 | % | | | | |
| | 284,000 | | MoneyGram International, Inc. | | | | | | 6,165,640 | |
| | | | | | | | |
|
|
|
| | | |
| | | | Transportation | | 1.27 | % | | | | |
| | 87,500 | | Atlas Air Worldwide Holdings, Inc.* | | | | | | 2,861,250 | |
| | 275,000 | | Kansas City Southern* | | | | | | 6,410,250 | |
| | 110,000 | | Providence and Worcester Railroad Co. | | | | | | 1,538,900 | |
| | | | | | | | |
|
|
|
| | | | | | | | | | 10,810,400 | |
| | | | | | | | |
|
|
|
| | | |
| | | | Trucking and Leasing | | 0.75 | % | | | | |
| | 110,000 | | Amerco, Inc.* | | | | | | 6,400,900 | |
| | | | | | | | |
|
|
|
| | | | Total Common Stocks | | | | | | | |
| | | | (cost $655,541,472) | | | | | | 830,967,062 | |
| | | | | | | | |
|
|
|
Principal
Amount
| | | | | | | | |
| | | | SHORT-TERM INVESTMENTS | | 3.30 | % | | | | |
| $ | 14,508,700 | | American Family Demand Note, 3.44% | | | | | | 14,508,700 | |
| | 13,549,800 | | US Bank Demand Note, 3.59% | | | | | | 13,549,800 | |
| | | | | | | | |
|
|
|
| | | | Total Short-Term Investments | | | | | | | |
| | | | (cost $28,058,500) | | | | | | 28,058,500 | |
| | | | | | | | |
|
|
|
| | | | Total Investments | | 101.04 | % | | | | |
| | | | (cost $683,599,972) | | | | | | 859,025,562 | |
| | | | Liabilities less Other Assets | | (1.04 | )% | | | (8,841,619 | ) |
| | | | | | | | |
|
|
|
| | | |
| | | | NET ASSETS | | 100.00 | % | | $ | 850,183,943 | |
| | | | | | | | |
|
|
|
* Non-income producing.
Percentages are based on net assets.
See notes to the financial statements.
KEELEY Small Cap Value Fund, Inc.
STATEMENTS OF CHANGES IN NET ASSETS
| | | | | | | | |
| | | Year Ended
September 30, 2005
| | | Year Ended
September 30, 2004
| |
OPERATIONS: | | | | | | | | |
| | |
Net investment loss | | $ | (2,333,184 | ) | | $ | (740,094 | ) |
| | |
Net realized gain on investments | | | 7,778,432 | | | | 8,580,664 | |
| | |
Change in net unrealized appreciation on investments | | | 124,250,455 | | | | 29,818,413 | |
| | |
|
|
| |
|
|
|
Net increase in net assets resulting from operations | | | 129,695,703 | | | | 37,658,983 | |
| | |
|
|
| |
|
|
|
| | |
DISTRIBUTIONS: | | | | | | | | |
| | |
Net realized gains | | | (8,145,394 | ) | | | — | |
| | |
|
|
| |
|
|
|
| | |
CAPITAL STOCK TRANSACTIONS: | | | | | | | | |
| | |
Proceeds from 16,844,450 and 3,106,257 shares issued, respectively | | | 647,864,920 | | | | 98,624,637 | |
| | |
Proceeds from 186,919 and 0 shares of distributions reinvested, respectively | | | 6,588,903 | | | | — | |
| | |
Cost of 3,566,673 and 646,573 shares redeemed, respectively | | | (132,796,640 | ) | | | (19,777,694 | ) |
| | |
|
|
| |
|
|
|
| | |
Net increase from capital stock transactions | | | 521,657,183 | | | | 78,846,943 | |
| | |
|
|
| |
|
|
|
| | |
TOTAL INCREASE IN NET ASSETS | | | 643,207,492 | | | | 116,505,926 | |
| | |
NET ASSETS: | | | | | | | | |
| | |
Beginning of year | | | 206,976,451 | | | | 90,470,525 | |
| | |
|
|
| |
|
|
|
| | |
End of year (includes accumulated net investment loss of $0 for 2005 and 2004) | | $ | 850,183,943 | | | $ | 206,976,451 | |
| | |
|
|
| |
|
|
|
See notes to the financial statements.
KEELEY Small Cap Value Fund, Inc.
FINANCIAL HIGHLIGHTS
| | | | | | | | | | | | | | | | | | | | |
| | | Year Ended
September 30,
2005
| | | Year Ended
September 30,
2004
| | | Year Ended
September 30,
2003
| | | Year Ended
September 30,
2002
| | | Year Ended
September 30,
2001
| |
PER SHARE DATA (1) | | | | | | | | | | | | | | | | | | | | |
Net asset value, beginning of year | | $ | 33.95 | | | $ | 24.88 | | | $ | 21.91 | | | $ | 22.43 | | | $ | 21.82 | |
Income from investment operations: | | | | | | | | | | | | | | | | | | | | |
Net investment loss | | | (0.12 | ) | | | (0.12 | ) | | | (0.15 | ) | | | (0.21 | ) | | | (0.20 | ) |
Net realized and unrealized gains on investments | | | 10.83 | | | | 9.19 | | | | 4.43 | | | | 0.85 | | | | 1.32 | |
| | |
|
|
| |
|
|
| |
|
|
| |
|
|
| |
|
|
|
Total from investment operations | | | 10.71 | | | | 9.07 | | | | 4.28 | | | | 0.64 | | | | 1.12 | |
| | |
|
|
| |
|
|
| |
|
|
| |
|
|
| |
|
|
|
Less distributions: | | | | | | | | | | | | | | | | | | | | |
Net realized gains | | | (1.20 | ) | | | — | | | | (1.31 | ) | | | (1.16 | ) | | | (0.51 | ) |
| | |
|
|
| |
|
|
| |
|
|
| |
|
|
| |
|
|
|
Net asset value, end of year | | $ | 43.46 | | | $ | 33.95 | | | $ | 24.88 | | | $ | 21.91 | | | $ | 22.43 | |
| | |
|
|
| |
|
|
| |
|
|
| |
|
|
| |
|
|
|
Total return (2) | | | 32.37 | % | | | 36.45 | % | | | 20.61 | % | | | 2.57 | % | | | 5.25 | % |
Supplemental data and ratios: | | | | | | | | | | | | | | | | | | | | |
Net assets, end of year (in 000’s) | | $ | 850,184 | | | $ | 206,976 | | | $ | 90,471 | | | $ | 63,894 | | | $ | 57,784 | |
Ratio of expenses to average net assets | | | 1.52 | % | | | 1.64 | % | | | 1.75 | % | | | 1.72 | % | | | 1.80 | % |
Ratio of net investment loss to average net assets | | | (0.50 | )% | | | (0.57 | )% | | | (0.68 | )% | | | (0.90 | )% | | | (0.90 | )% |
Portfolio turnover rate | | | 22.93 | % | | | 29.63 | % | | | 38.83 | % | | | 45.31 | % | | | 43.61 | % |
| (1) | Per share data is for a share outstanding throughout the period. |
| (2) | The total return calculation does not reflect the sales load imposed on the purchase of shares (see Note 7). |
See notes to the financial statements.
KEELEY Small Cap Value Fund, Inc.
NOTES TO THE FINANCIAL STATEMENTS
September 30, 2005
The KEELEY Small Cap Value Fund, Inc. (the “Fund”) was incorporated on May 17, 1993 as a Maryland corporation and is registered as a diversified open-end investment company under the Investment Company Act of 1940 (the “1940 Act”).
| 2. | SIGNIFICANT ACCOUNTING POLICIES |
The following is a summary of significant accounting policies consistently followed by the Fund in the preparation of its financial statements. These policies are in conformity with accounting principles generally accepted in the United States of America (“GAAP”). The presentation of financial statements in conformity with GAAP requires management to make estimates and assumptions that affect the reported amounts of assets and liabilities at the date of the financial statements and the reported amounts of revenues and expenses during the reporting period. Actual results could differ from those estimates and assumptions.
a) Investment Valuation—Securities which are traded on a recognized stock exchange are valued at the last sale price on the securities exchange on which such securities are primarily traded or at the last sale price on a national securities exchange. Exchange-traded securities for which there were no transactions are valued at the current bid prices. Securities listed on the NASDAQ National Market are valued at the NASDAQ Official Closing Price (“NOCP”). Securities traded on only over-the-counter markets are valued on the basis of last sale price, or closing over-the-counter bid prices when there is no last sale price available. Securities for which quotations are not readily available are valued at fair value as determined in good faith by the Board of Directors. For each investment that is fair valued, the Board of Directors considers, to the extent applicable, various factors including, but not limited to, the financial condition of the company, comparable companies in the public market, the nature and duration of the cause for a quotation not being readily available and other relevant factors.
b) Federal Income and Excise Taxes—It is the Fund’s policy to meet the requirements of the Internal Revenue Code applicable to regulated investment companies and to distribute substantially all investment company net taxable income and net capital gains to shareholders in a manner which results in no tax cost to the Fund. Therefore, no federal income or excise tax provision is recorded.
c) Distributions to Shareholders—Dividends from net investment income, if any, are declared and paid annually. Distributions of net realized gains, if any, are declared and paid annually. Distributions to shareholders are recorded on the ex-dividend date. The Fund may periodically make reclassifications among certain of its capital accounts as a result of the characterization of certain income and realized gains determined annually in accordance with federal tax regulations that may differ from generally accepted accounting principles. Where appropriate, reclassifications between net asset accounts are made for such differences that are permanent in nature. On November 11, 2005, the Fund distributed $7,926,302 from net long term capital gains ($0.41 per share). The distribution was paid on November 11, 2005 to shareholders of record on November 10, 2005.
KEELEY Small Cap Value Fund, Inc.
NOTES TO THE FINANCIAL STATEMENTS (continued)
September 30, 2005
d) Other—Investment transactions are recorded on the trade date. The Fund determines the gain or loss realized from investment transactions by comparing the identified original cost of the security lot sold with the net sale proceeds. Dividend income is recognized on the ex-dividend date and interest income is recognized on an accrual basis.
e) Guarantees and Indemnifications—In the normal course of business, the Fund enters into contracts with service providers that contain general indemnification clauses. The Fund’s maximum exposure under these arrangements is unknown as this would involve future claims against the Fund that have not yet occurred. Based on experience, the Fund expects the risk of loss to be remote.
| 3. | INVESTMENT ADVISORY AGREEMENT |
The Fund has an agreement with Keeley Asset Management Corp. (the “Adviser”), with whom certain officers and directors of the Fund are affiliated, to furnish investment advisory services to the Fund. Under the terms of this agreement, the Fund pays the Adviser a monthly fee at the annual rate of 1.00% of the Fund’s average daily net assets. Under the investment advisory agreement, if the aggregate annual operating expenses (excluding interest, taxes, brokerage commissions and other costs incurred in connection with the purchase or sale of portfolio securities, and extraordinary items) exceed 2.50% of the Fund’s average daily net assets, the Adviser will reimburse the Fund for the amount of such excess.
The Fund has adopted a Distribution Plan (the “Plan”) pursuant to Rule 12b-1 under the 1940 Act. The Plan is designed to reimburse Keeley Investment Corp. (the “Distributor”), with whom certain officers and directors of the Fund are affiliated, for certain promotional and other sales related costs and to permit the Fund to compensate other dealers of its shares. Unreimbursed amounts may be carried forward and paid in a subsequent year, to the extent that total expenses under the plan do not exceed 0.25% of the average daily net assets of the Fund. The Fund paid to the Distributor and each dealer a monthly fee at the annual rate of 0.25% of the average daily net assets of Fund shares beneficially owned by the Distributor’s and each dealer’s existing brokerage clients. For the year ended September 30, 2005, the Fund paid $168,728 of distribution fees to the Distributor.
| 5. | INVESTMENT TRANSACTIONS |
The aggregate purchases and sales of securities, excluding short-term investments, for the Fund for the year ended September 30, 2005, were $599,686,302 and $103,464,694, respectively. For the year ended September 30, 2005, the Fund paid $1,789,965 of brokerage commissions on trades of securities to the Distributor.
KEELEY Small Cap Value Fund, Inc.
NOTES TO THE FINANCIAL STATEMENTS (continued)
September 30, 2005
| 6. | FEDERAL INCOME TAX INFORMATION |
At September 30, 2005, gross unrealized appreciation and depreciation of investments, based on cost for federal income tax purposes were as follows:
| | | | |
Cost of Investments | | $ | 683,758,003 | |
| | |
|
|
|
Gross Unrealized Appreciation | | $ | 191,514,851 | |
Gross Unrealized Depreciation | | | (16,247,292 | ) |
| | |
|
|
|
Net Unrealized Appreciation on Investments | | $ | 175,267,559 | |
| | |
|
|
|
The difference between cost amounts for financial statement and federal income tax purposes is due primarily to timing differences in recognizing certain gains and losses in security transactions.
The tax character of distributions paid during the fiscal years ended September 30, 2005 and 2004 were as follows:
| | | | | | |
| | | 2005
| | 2004
|
Long-Term Capital Gains | | $ | 8,145,394 | | $ | — |
As of September 30, 2005 the components of accumulated earnings on a tax basis were as follows:
| | | |
Undistributed Long-Term Capital Gain | | $ | 7,926,302 |
Net Unrealized Appreciation on Investments | | | 175,267,559 |
| | |
|
|
Total Accumulated Earnings | | $ | 183,193,861 |
| | |
|
|
| 7. | OFFERING PRICE PER SHARE |
The public offering price is the net asset value plus a sales charge, which varies in accordance with the amount of the purchase as follows:
| | | | | | | | | |
Amount of Single Transaction
| | Sales Charge
as a Percentage of
Offering Price
| | | Sales Charge
as a Percentage of
Net Amount Invested
| | | Dealer Reallowance
as a Percentage of
Offering Price
| |
Less than $50,000 | | 4.50 | % | | 4.71 | % | | 4.00 | % |
$50,000 but less than $100,000 | | 4.00 | % | | 4.17 | % | | 3.50 | % |
$100,000 but less than $250,000 | | 3.00 | % | | 3.09 | % | | 2.50 | % |
$250,000 but less than $500,000 | | 2.50 | % | | 2.56 | % | | 2.00 | % |
$500,000 and over | | 2.00 | % | | 2.04 | % | | 1.50 | % |
KEELEY Small Cap Value Fund, Inc.
NOTES TO THE FINANCIAL STATEMENTS (continued)
September 30, 2005
The Distributor retains the entire sales charge when it makes sales directly to the public. Otherwise, when sales are made through dealers, the Distributor receives a portion of the related sales charge. For the year ended September 30, 2005, the Fund was advised that the Distributor received $787,641 of sales charges. Sales charges are not an expense of the Fund and are not reflected in the financial statements of the Fund.
As specified in the Fund’s Prospectus, reduced sales charges are available through a right of accumulation and certain sales of Fund shares can be made at net asset value per share.
| 8. | RELATED PARTY TRANSACTION |
As of September 30, 2005, one director of the Fund beneficially owned 464,609 shares of the Fund, which represents 2.4% of the Fund’s outstanding shares.
Report of Independent Registered Public Accounting Firm
To the Board of Directors and Shareholders of
KEELEY Small Cap Value Fund, Inc.:
In our opinion, the accompanying statement of assets and liabilities, including the schedule of investments, and the related statements of operations and of changes in net assets and the financial highlights present fairly, in all material respects, the financial position of KEELEY Small Cap Value Fund, Inc. (the “Fund”) at September 30, 2005, and the results of its operations for the year then ended, the changes in its net assets for each of the two years in the period then ended and financial highlights for each of the five years in the period then ended, in conformity with accounting principles generally accepted in the United States of America. These financial statements and financial highlights (hereafter referred to as “financial statements”) are the responsibility of the Fund’s management; our responsibility is to express an opinion on these financial statements based on our audits. We conducted our audits of these financial statements in accordance with the standards of the Public Company Accounting Oversight Board (United States). Those standards require that we plan and perform the audits to obtain reasonable assurance about whether the financial statements are free of material misstatement. An audit includes examining, on a test basis, evidence supporting the amounts and disclosures in the financial statements, assessing the accounting principles used and significant estimates made by management, and evaluating the overall financial statement presentation. We believe that our audits, which included confirmation of securities at September 30, 2005 by correspondence with the custodian, provide a reasonable basis for our opinion.

Milwaukee, WI
November 18, 2005
KEELEY Small Cap Value Fund, Inc.
Directors and Officers
Independent Directors
| | | | | | | | | | |
Name, Age and Address
| | Position(s)
Held with
Fund
| | Term of
Office* and
Length of
Time Served
| | Principal Occupation(s)
During the Past Five Years
| | Number of
Portfolios Overseen
Within the Fund
Complex
| | Other
Directorships
Held Outside the
Fund Complex
|
Jerome J. Klingenberger Age: 50 561 Hillgrove Ave. LaGrange, IL 60525 | | Director | | Served as Director since 1999 | | Executive Vice President and Chief Financial Officer for Grayhill, Inc. (electronic components and control systems) | | 2 | | None |
John G. Kyle Age: 64 10 Skokie Hwy Highland Park, IL 60035 | | Director | | Served as Director since 1993 | | Owner and operator of Shell Oil Services Stations and Gasoline Distributor | | 2 | | None |
John F. Lesch Age: 65 200 W Adams Street Suite 2500 Chicago, IL 60606 | | Director | | Served as Director since 1993 | | Attorney with Nisen & Elliott, LLC | | 2 | | None |
Sean Lowry Age: 51 401 South LaSalle Street Suite 605 Chicago, IL 60605 | | Director | | Served as Director since 1999 | | Executive Vice President of Pacor Mortgage Corp. | | 2 | | None |
Elwood P. Walmsley Age: 64 100 Cobblestone Court Twin Lakes, WI 53181 | | Director | | Served as Director since 1999 | | Owner of J. FitzWoody’s Lakeshore Grill, since 2002 and Director of Sales for H.B. Taylor Company (food services), since 2003; Prior thereto, National Account Executive for Haarmann & Reimer, Division of Bayer International, since 1999. | | 2 | | None |
|
Interested Director and Officers |
Name, Age and Address
| | Position(s)
Held with
Fund
| | Term of
Office* and
Length of
Time Served
| | Principal Occupation(s)
During the Past Five Years
| | Number of
Portfolios Overseen
Within the Fund
Complex
| | Other
Directorships
Held Outside the
Fund Complex
|
John L. Keeley, Jr. Age: 65 401 South LaSalle Street Suite 1201 Chicago, IL 60605 | | Director and President | | Served as Director and President since 1993 | | President and Treasurer of Keeley Investment Corp., President of Keeley Asset Management Corp. and KEELEY Small Cap Value Fund, Inc. | | 2 | | None |
Mark Zahorik Age: 43 401 South LaSalle Street Suite 1201 Chicago, IL 60605 | | Vice President | | Served as Vice President since 1997 | | Vice President of Keeley Asset Management Corp., Keeley Investment Corp., and KEELEY Small Cap Value Fund, Inc. | | N/A | | N/A |
John L. Keeley, III Age: 44 401 South LaSalle Street Suite 1201 Chicago, IL 60605 | | Vice President | | Served as Vice President since 2005 | | Vice President of Keeley Asset Management Corp. and Keeley Investment Corp. (2002 – Present); Trader for Mid-American and Chicago Board of Trade (1983 – 2001) | | N/A | | N/A |
Emily Viehweg Age: 39 401 South LaSalle Street Suite 1201 Chicago, IL 60605 | | Treasurer | | Served as Treasurer since 1997 | | Treasurer of Keeley Asset Management Corp. and KEELEY Small Cap Value Fund, Inc. since 2001 (formerly Assistant Treasurer of Keeley Asset Management Corp.), Assistant Treasurer of Keeley Investment Corp. | | N/A | | N/A |
KEELEY Small Cap Value Fund, Inc.
Directors and Officers (continued)
| | | | | | | | | | |
|
Interested Director and Officers (continued) |
Name, Age and Address
| | Position(s)
Held with
Fund
| | Term of
Office* and
Length of
Time Served
| | Principal Occupation(s)
During the Past Five Years
| | Number of
Portfolios Overseen
Within the Fund
Complex
| | Other
Directorships
Held Outside the
Fund Complex
|
Mary A. Ferrari Age: 46 401 South LaSalle Street Suite 1201 Chicago, IL 60605 | | Secretary | | Served as Secretary since 1996 | | Corporate Secretary of Keeley Asset Management Corp. and Keeley Investment Corp. | | N/A | | N/A |
Guy Talarico Age: 50 41 Madison Ave New York, NY 10010 | | Chief Compliance Officer | | Served as Chief Compliance Officer since 2004 | | Co-Chief Executive Officer of EOS Compliance Services, LLC since 2004; Senior Director of Investors Bank & Trust Institutional Custody Division 2001 to 2004; Vice President of Chase Investment Services Group 1997 to 2001 | | N/A | | N/A |
* Each Director serves an indefinite term until the election of a successor. Each Officer serves an indefinite term, renewed annually, until the election of a successor.
The Statement of Additional Information includes additional information about the Directors and is available upon request, without charge, by calling 1-888-933-5391.
Investment Adviser
KEELEY ASSET MANAGEMENT CORP.
Chicago, Illinois
Distributor
KEELEY INVESTMENT CORP.
Chicago, Illinois
Custodian
U.S. BANK, N.A.
Milwaukee, Wisconsin
888-933-5391
Transfer Agent and Dividend Disbursing Agent
U.S. BANCORP FUND SERVICES, LLC
Milwaukee, Wisconsin
888-933-5391
Independent Registered Public Accounting Firm
PRICEWATERHOUSECOOPERS LLP
Milwaukee, Wisconsin
Counsel
MELTZER, PURTILL & STELLE LLC
Schaumburg, Illinois
Performance information is historical and is no guarantee of future results. The investment return and principal value of shares will fluctuate and when redeemed, may be worth more or less than the investor’s original cost. This material may only be used when preceded or accompanied by the Fund’s prospectus.
401 South LaSalle Street Ÿ Suite 1201 Ÿ Chicago Ÿ Illinois Ÿ 60605
(312) 786-5050 Ÿ (800) 533-5344 Ÿ (312) 786-5003
KEELEY SMALL CAP VALUE FUND, INC.
ANNUAL REPORT
SEPTEMBER 30, 2005
Item 2. Code of Ethics.
(a) The registrant has not adopted a code of ethics, as of the end of the period covered by this report, that applies to the registrant’s principal executive officer and principal financial officer, or persons performing similar functions which conforms to all of the definitions of a “code of ethics” for purposes of this item. However, the registrant does have in place a code of ethics which goes beyond the requirement of rule 17(j)-1, which addresses, among other things, conflicts of interest which may result from personal securities transactions and dealings with third parties, and certain outside activities In the judgment of management of the registrant, that code of ethics, as adopted, is reasonably designed to deter wrongdoing and promote ethical conduct, internal reporting and accountability for adherence to that code. The registrant’s existing code of ethics, as so adopted, does not directly address issues of disclosure in reports that the registrant files with the Commission and other public communication or compliance with applicable governmental laws, rules and regulations. There are two people in the registrant’s organization who would be required to be covered under any code of ethics adopted by the registrant which would meet the definition of a code of ethics in this item. Those persons are John Keeley, the president of the registrant, and Emily Viehweg, the treasurer of the registrant. Both John Keeley and Emily Viehweg are subject to the registrant’s existing code. In the judgment of the registrant, the small size of the registrant’s and adviser’s staff who are involved in matters which would be covered by any such code of ethics as defined in this item, and the use and involvement of a third party service provider (administrator), independent auditors and outside counsel in those activities makes an additional code of ethics unnecessary. A copy of the registrant’s existing code of ethics (which, however, does not meet all of the definitions of a “code of ethics” as defined in this item) is attached hereto as Exhibit (a).
(b) Not Applicable
(c) Not Applicable
Item 3. Audit Committee Financial Expert.
The registrant’s board of directors has determined that the registrant has at least one audit committee financial expert serving on its audit committee. That audit committee financial expert is Mr. Jerome Klingenberger. Mr. Klingenberger is one of the members of the board of directors and is “independent” for purposes of this Item. Since the registrant does not have a separate audit committee, the entire board of directors constitutes the audit committee, and as a member of the board of directors, Mr. Klingenberger is a member of the audit committee for purposes of this Item.
Item 4. Principal Accountant Fees and Services
The aggregate fees for each of the last two fiscal years for professional services rendered by the principal accountant for the audit of the registrant’s annual financial statements or services that are normally provided by the accountant in connection with statutory and regulatory filings or engagements are listed below.
(a) Audit fees.
Fiscal year ended September 30, 2005 $21,200
Fiscal year ended September 30, 2004 $20,000
(b) Audit-related fees.
None.
(c) Tax fees.
Fiscal year ended September 30, 2005 $3,800
Fiscal year ended September 30, 2004 $3,600
(d) All other fees.
None.
(e)
(1) It is the policy of the registrant’s Board of Directors to pre-approve all audit and non-audit services at a regularly scheduled meeting of the Board of Directors.
(2) During 2005, all of the audit and non-audit services provided by the registrant’s principal accountant were pre-approved by the registrant’s Board of Directors.
(f) None.
(g) None.
(h) Not applicable.
Item 5. Audit Committee of Listed Registrants
Not applicable.
Item 6. Schedule of Investments
The schedule of investments in securities of unaffiliated issuers is included as part of the report to shareholders filed under Item 1.
Item 7. Disclosure of Proxy Voting Policies and Procedures for Closed-End Management Investment Companies
Not applicable.
Item 8. Portfolio Managers of Closed-End Management Investment Companies
Not applicable.
Item 9. Purchases of Equity Securities by Closed-End Management Investment Company and Affiliated Purchasers
Not applicable.
Item 10. Submission of Matters to a Vote of Security Holders
As of the end of the period covered by this report, the registrant had not adopted any procedures by which shareholders may recommend nominees to the registrant’s Board of Directors.
Item 11. Controls and Procedures.
(a) The registrant’s certifying officers have reasonably designed disclosure controls and procedures to ensure material information relating to the registrant is made known to them by others, particularly during the period in which this report is being prepared. The registrant’s certifying officers have determined that the registrant’s disclosure controls and procedures are effective based on their evaluation of these controls and procedures as of a date within 90 days prior to the filing date of this report.
(b) There were no significant changes in the registrant’s internal controls over financial reporting or in other factors during the second fiscal quarter of the period covered by this report that could materially affect, or are reasonably likely to materially affect these controls.
Item 12. Exhibits.
(a)(1) Not applicable.
(a)(2) Certification for each principal executive and principal financial officer of the registrant as required by Rule 30a-2 under the Act (17 CFR 270.30a-2(a)) – Filed as an attachment to this filing.
(a)(3) Not applicable.
(b) Certifications required by Rule 30a-2(b) under the Act (17 CFR 270.30a-2(b)), Rule 13a-14(b) or Rule 15d-14(b) under the Exchange Act (17 CFR 240.13a-14(b) or 240.15d-14(b)), and Section 1350 of Chapter 63 of Title 18 of the United States Code (18 U.S.C. 1350) – Filed as an attachment to this filing.
SIGNATURES
Pursuant to the requirements of the Securities Exchange Act of 1934 and the Investment Company Act of 1940, the registrant has duly caused this report to be signed on its behalf by the undersigned, thereunto duly authorized.
| | |
| KEELEY Small Cap Value Fund, Inc. |
| |
| By: | | /s/ John L. Keeley, Jr.
|
| | | John L. Keeley, Jr. |
| | | President |
| |
Date: | | December 5, 2005 |
Pursuant to the requirements of the Securities Exchange Act of 1934 and the Investment Company Act of 1940, this report has been signed below by the following persons on behalf of the registrant and in the capacities and on the dates indicated.
| | |
| By: | | /s/ John L. Keeley, Jr.
|
| | | John L. Keeley, Jr. |
| | | President |
| |
| Date: | | December 5, 2005 |
| |
| By: | | /s/ Emily Viehweg
|
| | | Emily Viehweg |
| | | Treasurer |
| |
| Date: | | December 5, 2005 |