In November 2006, the Board of Directors of the Fund considered renewal of the Fund’s Investment Advisory Agreement, and, after a detailed analysis, approved such renewal. In considering renewal, the Board reviewed and discussed in detail the following factors: (i) the nature, extent and quality of service of the Adviser, (ii) the investment performance of the Fund and the Adviser; (iii) the cost of the services to be performed and the profits realized by the Adviser and its affiliates from the relationship with the Fund; (iv) the extent to which economies of scale would be realized as the Fund grows and (v) whether the fee levels reflect economies of scale for the benefit of Fund Investors.
With respect to the first factor, the Board reviewed the Investment Advisory Agreement and noted that under that agreement, the Adviser provided only investment advice, and that most of the other services were paid for by the Fund and provided by other service providers, such as the transfer agent, custodian, pricing service and administrator. The Board noted, however, that the distributor, an affiliate of the Adviser, paid for certain expenses of the Fund, such as the cost of certain brokerage platforms, which reduced the Fund’s transfer agent expense. The Board noted that the distributor received 12b-1 fees as reimbursement for those expenses, but to date the expenditures by the distributor exceed the reimbursements. The Board discussed the possibility of the Adviser expanding the services to the Fund, but felt that having outside service providers was a benefit to the Fund and its shareholders, and did not feel that the fact that the Adviser was not providing such services was a negative or should adversely impact its decision about renewal of the Investment Advisory Agreement. The Board then directly addressed the quality of the Advisory services, which the Board felt were reflected by the performance of the Adviser and the Fund (which factor is discussed in detail below). Based on the performance, the Board concluded that the quality of the services provided by the Adviser was a significant factor and a basis to renew the Agreement.
The next factor the Board considered was the cost of the services and the profits to the Adviser. In terms of cost, the Board recognized that the Advisory fee was higher than the fee charged by many advisers. In making that analysis, the Board reviewed peer group information of 15 other small cap value funds that ranged in size from $67.7 million to $2.5 billion. In that analysis, the Board noted that the average adviser expense for the group was 0.67%. However, the Board also noted that the three year performance of the Fund was better than any of the funds in the peer group, and such performance was calculated after all expenses, including the adviser expenses. The Board also was reminded that the Adviser had modified its Adviser expense by
adding a breakpoint in its fee. The Board reviewed the Fund-related revenue collected by the Adviser and its affiliates over the past year, which included the investment advisory fee, 12b-1 fees, brokerage commissions to the affiliated broker and sales load on retail sales made by the distributor. In evaluating those items, the Board compared the 12b-1 fees received versus the expenses incurred. With respect to brokerage, the Board noted that all of the transactions were at a price which the Adviser had represented was the lowest price charged by the affiliated broker to any brokerage customer. In looking at the costs to the Fund, the Board paid particular attention to the total expenses of the Fund. The Board noted that although the advisory fee was in excess of the median, the total expenses of the Fund, at 1.39%, were close to the average, of 1.23%. The Board concluded that the total expenses of the Fund are in line with industry standards and averages, and on the basis of the factor of cost to the Fund and benefit to the Adviser, the agreement should be renewed.
The next factor the Board considered was the extent to which economies of scale would be realized as the Fund grows. In that analysis, the Board reviewed with the Adviser the services to be performed and how those would change as the Fund grew. The Board noted that there were now over 160 names in the portfolio and that small cap stocks by nature, do not receive the same level of coverage as larger stocks. The Board noted that there would be some benefits, but they were not likely to be as substantial as in the case of a fund which invested in larger capitalization companies. The Adviser also reviewed with the Board personnel changes it had made to deal with the increased workload, and also reviewed with the Board anticipated additional hirings. The Board concluded that economies of scale could be recognized by the Fund with respect to a number of the service providers, as their fee schedules include break points with increased asset size, but was not certain that a significant economy would result to the Adviser. The Adviser also reminded the Board that it had increased its office space, hired interns, improved benefits and added two disaster recovery areas. The Adviser had also changed fund administrators and is working with a concentrated, efficient team that helps keep costs low.
On the several factors described above, the Board concluded that the Investment Advisory Agreement should be renewed.
Other Matters
The Fund invests in small capitalization stocks (i.e., those securities that the Fund previously defined in 2002 as having a market capitalization of $1 billion or less, and, effective as of January 31, 2007, that it defines as $2.5 billion or less). Since July 31, 2002, the rules to which the Fund is subject have required the Fund to adopt a policy that requires the Fund to invest eighty percent (80%) of its net assests in such securities. However, due to our inadvertent misinterpretation of those rules, and also because of the market appreciation of certain of the Fund’s holdings, the Fund’s adopted policy has not been met since the end of July 2002. As a result, the Fund’s quarter-end holdings in small capitalization stocks ranged from 51% to 78% of its total net assets during this period. The Fund’s performance throughout this period generally has exceeded the Fund’s benchmark, the Russell 2000 Index, and as of the date of the mailing of this report, the Fund has been operating in compliance with its adopted policy and those rules.
19
| LETTER TO SHAREHOLDERS — |
| KEELEY MID CAP VALUE FUND (KMCVX) |
Dear Shareholder,
During the past six months from October 1st, 2006 through March 31st, 2007, the Fund’s net assets grew to $64,672,738 and the number of shareholders grew to 2,655. For the six month period ending March 31st, 2007, the portfolio turnover was 43.78% and the expense ratio was capped by Keeley Asset Management Corp. at 1.49%, which will stay in place for the next 18 months. The Fund’s portfolio is diversified with investments in 49 equities. The Fund is registered for sale in all 50 states and the District of Columbia. Our broker dealer network totals over 50 broker dealers and trust entities. As of March 31st, 2007, the Keeley family beneficially owns 17.8% of the Fund’s outstanding shares.
For the quarter ended March 31st, 2007, the Fund’s total return was 6.00% versus a return of 4.86% for the Russell Mid Cap Value Index. For the six month period ended March 31st, 2007, the Fund’s return was 16.70% versus 13.77% for the Russell Mid Cap Value Index. For the one year period ended March 31, 2007, the Fund’s return was 7.94% versus 17.13% for the Russell Mid Cap Value Index. Since inception, August 15th, 2005, the Fund’s average annual return was 13.99% versus 17.12% for the Russell Mid Cap Value Index. Performance Data does not reflect the deduction of the sales load or fee, and, reflected, the load or fee would reduce the performance quoted.
Performance Data Including 4.5% Maximum Up-Front Sales Charge
For the quarter ended March 31st, 2007, the Fund’s total return was 1.23% versus a return of 4.86% for the Russell Mid Cap Value Index. For the six month period ended March 31st, 2007, the Fund’s return was 11.45% versus 13.77% for the Russell Mid Cap Value Index. For the one year period ended March 31, 2007, the Fund’s return was 3.08% versus 17.13% for the Russell Mid Cap Value Index. Since inception, August 15th, 2005, the Fund’s average annual return was 10.78% versus 17.12% for the Russell Mid Cap Value Index.
Performance data quoted represents past performance and does not guarantee future results. The investment return and principal value of an investment will fluctuate so that an investor’s shares, when redeemed, may be worth more or less than their original cost and the current performance my be lower or higher than the performance data quoted. You may call toll-free at 888-933-5391, or visit our website at www.keeleyfunds.com to obtain performance data current to the most recent month end.
During the first quarter of 2007, the sectors that made a positive contribution to the Fund’s performance included consumer discretionary, utilities, and materials. All economic sectors that we invested in had a positive return during the quarter.
Within the materials sector, Martin Marietta Materials was the best performing stock in the portfolio, climbing over 30% and contributing 76 basis points of performance to the Fund. The construction aggregates maker posted strong fourth quarter results citing positive pricing and improved cost controls at the company. Temple Inland was another
20
strong performer, rising almost 30% and contributing 57 basis points of return to the portfolio. The news that the company will be broken up into three divisions was well received by the market after the announcement was made in late February.
Within the consumer discretionary sector, our third largest holding, Idearc Inc., which was spun off from Verizon Communications in November of 2006, rose over 22% during the quarter. The company reported strong cash flow in its first quarter as a stand alone company, and also announced that it will fund a quarterly dividend to shareholders. Hanesbrands Inc. also performed well, contributing 47 basis points of return to the Fund. Despite weaker profits during its first quarter as a stand alone business, the underwear and hosiery maker climbed over 24% during the quarter.
Thank you for your continued commitment to the Fund.
Sincerely,

John L. Keeley, Jr.
President
There are risks associated with investing in small-cap mutual funds, such as lines and market shares, including limited available information. You should consider objectives, risks and charges and expenses of a fund carefully before investing. Additional information regarding such risks, including information on fees is located in the Fund’s prospectus. Please read the Fund’s prospectus carefully before investing.
21
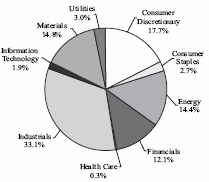
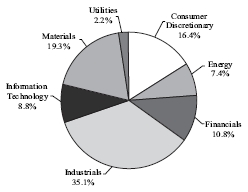
Investments by Sector
As a Percentage of Equities
(Unaudited)
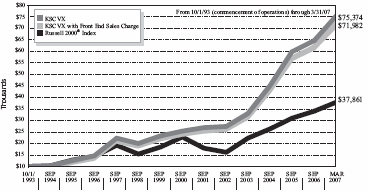
Index Comparison
Comparison of a Hypothetical $10,000 Investment
In KMCVX and Russell Midcap® Value Index*
(Unaudited)
Average annual total returns **
For the periods ended March 31, 2007
| | | | Since Commencement |
| | | | of Operations |
| | 1-Year | | (8/12/2005) |
| KMCVX | +7.94% | | +13.99% |
| KMCVX (includes max | | | |
| 4 1/2% front-end load) | +3.08% | | +10.78% |
| Russell Midcap® Value | | | |
| Index | +17.13% | | +17.12% |
| * | | The Russell Midcap® Value Index of common is an unmananged index of common stock prices that measures the performance of those Russell Midcap® companies with lower price-to-book ratios and lower forecasted growth values. These Index figures do not reflect any deduction for fees, expenses or taxes, and are not available for investment. |
| ** | | PERFORMANCE DATA quoted represents past performance which is not predictive of future performance. The investment return and principal value of shares will fluctuate and when redeemed, may be worth more or less than their original cost. Returns shown include the reinvestment of all dividends. The graph and table do not reflect the deduction of taxes that a shareholder would pay on Fund distributions or the redemption of shares. |
| |
22
KEELEY Mid Cap Value Fund
Expense Example
For the Six Month Period Ended March 31, 2007
(Unaudited)
As a shareholder of the KEELEY Mid Cap Value Fund (the “Fund”), you incur two types of costs: (1) transaction costs, including sales charges (loads) on purchase payments; and (2) ongoing costs, including management fees; distribution (12b-1) fees; and other Fund expenses. This Example is intended to help you understand your ongoing costs (in dollars) of investing in the Fund and to compare these costs with the ongoing costs of investing in other mutual funds.
The Example is based on an investment of $1,000 invested at the beginning of the period and held for the entire period from October 1, 2006 to March 31, 2007 (the “period”).
Actual Expenses
The first line of the table below provides information about actual account values and actual expenses. You may use the information in this line, together with the amount you invested, to estimate the expenses you paid over the period. Simply divide your account value by $1,000 (for example, an $8,600 account value divided by $1,000 equals 8.6), then multiply the result by the number in the first line under the heading entitled “Expenses Paid During Period” to estimate the expenses you paid on your account during the period.
Hypothetical Example for Comparison Purposes
The second line of the table below provides information about hypothetical account values and hypothetical expenses based on the Fund’s actual expense ratio and an assumed rate of return of 5% per year before expenses, which is not the Fund’s actual return. The hypothetical account values and expenses may not be used to estimate the actual ending account balance or expenses you paid for the period. You may use this information to compare the ongoing costs of investing in the Fund and other funds. To do so, compare this 5% hypothetical example with the 5% hypothetical examples that appear in the shareholder reports of other funds.
Please note that the expenses shown in the table are meant to highlight your ongoing costs only and do not reflect any transactional costs, such as sales charges (loads). Therefore, the second line of the table is useful in comparing the ongoing costs only, and will not help you determine the relative total costs of owning different funds. In addition, if these transactional costs were included, your costs could have been higher.
Expenses Paid During the Period
| | | Beginning | | Ending | | Expenses paid during |
| | | account value | | account value | | the period ended |
| | | October 1, 2006 | | March 31, 2007 | | March 31, 2007* |
| Actual | | $1,000.00 | | | $1,167.00 | | | $8.05 | |
| Hypothetical (5% return | | | | | | |
| before expenses) | | 1,000.00 | | | 1,017.50 | | | 7.49 | |
| * | | Expenses are equal to the Fund’s expense ratio of 1.49% for the period, multiplied by the average account value over the period, multiplied by 182/365 (to reflect the number of days the Fund operated during the period). |
| |
23
KEELEY Mid Cap Value Fund
SCHEDULE OF INVESTMENTS
March 31, 2007
(Unaudited)
| Number | | | | | |
| of Shares | | | | Value |
| | | COMMON STOCKS – 100.01% | | | |
| | | Aerospace & Defense – 1.88% | | | |
| 60,000 | | KBR, Inc. (a) | | $ | 1,221,000 |
| | | Capital Markets – 5.85% | | | |
| 21,000 | | Ameriprise Financial Inc. | | | 1,199,940 |
| 60,000 | | Janus Capital Group, Inc. | | | 1,254,600 |
| 46,000 | | Jefferies Group, Inc. | | | 1,331,700 |
| | | | | | 3,786,240 |
| | | Chemicals – 4.02% | | | |
| 19,000 | | Ashland Inc. | | | 1,246,400 |
| 18,000 | | FMC Corp. | | | 1,357,740 |
| | | | | | 2,604,140 |
| | | Commercial Services & Supplies – 3.79% | | | |
| 44,500 | | Avis Budget Group Inc. (a) | | | 1,215,740 |
| 19,500 | | The Brink’s Co. | | | 1,237,275 |
| | | | | | 2,453,015 |
| | | Computers & Peripherals – 1.90% | | | |
| 25,700 | | NCR Corp. (a) | | | 1,227,689 |
| | | Construction & Engineering – 8.33% | | | |
| 44,500 | | Chicago Bridge & Iron Co. NV - ADR | | | 1,368,375 |
| 25,500 | | Foster Wheeler Ltd. (a) | | | 1,488,945 |
| 26,000 | | McDermott International, Inc. (a) | | | 1,273,480 |
| 50,000 | | Quanta Services, Inc. (a) | | | 1,261,000 |
| | | | | | 5,391,800 |
| | | Construction Materials – 5.66% | | | |
| 14,000 | | Martin Marietta Materials, Inc. | | | 1,892,800 |
| 23,500 | | Texas Industries, Inc. | | | 1,774,955 |
| | | | | | 3,667,755 |
| | | Containers & Packaging – 3.05% | | | |
| 17,400 | | Crown Holdings, Inc. (a) | | | 425,604 |
| 26,000 | | Temple-Inland, Inc. | | | 1,553,240 |
| | | | | | 1,978,844 |
| | | Diversified Financial Services – 3.99% | | | |
| 44,000 | | Leucadia National Corp. | | | 1,294,480 |
| 9,500 | | Nymex Holdings, Inc. (a) | | | 1,289,720 |
| | | | | | 2,584,200 |
| | | Electric Utilities – 1.97% | | | |
| 26,000 | | Allegheny Energy, Inc. (a) | | | 1,277,640 |
| | | Electrical Equipment – 3.92% | | | |
| 36,000 | | Ametek, Inc. | | | 1,243,440 |
| 26,500 | | Thomas & Betts Corp. (a) | | | 1,293,730 |
| | | | | | 2,537,170 |
| | | Energy Equipment & Services – 4.29% | | | |
| 20,000 | | FMC Technologies, Inc. (a) | | | 1,395,200 |
| 52,000 | | Tesco Corp. (a) | | | 1,380,600 |
| | | | | | 2,775,800 |
| | | Hotels, Restaurants & Leisure – 3.97% | | | |
| 23,500 | | Gaylord Entertainment Co. (a) | | | 1,242,445 |
| 39,000 | | Wyndham Worldwide Corp. (a) | | | 1,331,850 |
| | | | | | 2,574,295 |
| | | Household Durables – 1.92% | | | |
| 40,000 | | Newell Rubbermaid, Inc. | | | 1,243,600 |
| | | Independent Power Producers & Energy Traders – 2.50% | | | |
| 40,000 | | Mirant Corp. (a) | | | 1,618,400 |
| | | Insurance – 3.65% | | | |
| 70,000 | | Conseco, Inc. (a) | | | 1,211,000 |
| 52,000 | | Covanta Holding Corp. (a) | | | 1,153,360 |
| | | | | | 2,364,360 |
| | | IT Services – 4.11% | | | |
| 38,000 | | Ceridian Corp. (a) | | | 1,323,920 |
| 29,500 | | Fidelity National Information Services Inc. | | | 1,341,070 |
| | | | | | 2,664,990 |
The accompanying notes are an integral part of these financial statements.
24
KEELEY Mid Cap Value Fund
SCHEDULE OF INVESTMENTS (Continued)
March 31, 2007
(Unaudited)
| Number | | | | | |
| of Shares | | | | Value |
| | | Machinery – 14.52% | | | |
| 25,000 | | Dover Corp. | | $ | 1,220,250 |
| 29,500 | | Ingersoll-Rand Co. | | | 1,279,415 |
| 21,500 | | ITT Industries, Inc. | | | 1,296,880 |
| 32,000 | | Joy Global, Inc. | | | 1,372,800 |
| 25,000 | | Oshkosh Truck Corp. | | | 1,325,000 |
| 23,000 | | Terex Corp. (a) | | | 1,650,480 |
| 41,500 | | Timken Co. | | | 1,257,865 |
| | | | | | 9,402,690 |
| | | Media – 2.66% | | | |
| 49,000 | | Idearc, Inc. | | | 1,719,900 |
| | | Metals & Mining – 2.18% | | | |
| 45,000 | | Commercial Metals Co. | | | 1,410,750 |
| | | Oil, Gas & Consumable Fuels – 7.94% | | | |
| 48,000 | | CNX Gas Corp. (a) | | | 1,359,840 |
| 31,000 | | Pioneer Natural Resources Co. | | | 1,336,410 |
| 26,000 | | Plains Exploration & Production Co. (a) | | | 1,173,640 |
| 32,000 | | Quicksilver Resources, Inc. (a) | | | 1,272,640 |
| | | | | | 5,142,530 |
| | | Real Estate Management & Development – 1.74% | | | |
| 21,500 | | The St Joe Co. | | | 1,124,665 |
| | | Road & Rail – 2.20% | | | |
| 40,000 | | Kansas City Southern (a) | | | 1,423,200 |
| | | Textiles, Apparel & Luxury Goods – 2.22% | | | |
| 49,000 | | Hanesbrands, Inc. (a) | | | 1,440,110 |
| | | Thrifts & Mortgage Finance – 1.75% | | | |
| 83,000 | | Hudson City Bancorp, Inc. | | | 1,135,440 |
| | | Total Common Stocks | | | |
| | | (Cost $54,931,456) | | | 64,770,223 |
| Principal | | | | | | |
| Amount | | | | Value |
| | | SHORT-TERM INVESTMENTS – 0.03% | | | | |
| $17,400 | | U.S. Bank, N.A. Demand Note, 4.50% | | $ | 17,400 | |
| | | Total Short-Term | | | | |
| | | Investments (Cost $17,400) | | | 17,400 | |
| | | Total Investments | | | | |
| | | (Cost $54,948,856) – 100.04% | | | 64,787,623 | |
| | | Liabilities in Excess of Other Assets – (0.04)% | | | (26,202 | ) |
| | | NET ASSETS – 100.00% | | $ | 64,761,421 | |
| |
| |
| | | (a) Non-Income Producing | | | | |
| |
| | | Percentages are based on net assets. | |
The accompanying notes are an integral part of these financial statements.
25
| KEELEY Mid Cap Value Fund |
| STATEMENT OF ASSETS AND |
| LIABILITIES |
| March 31, 2007 |
| (Unaudited) |
| |
| ASSETS: | | | |
| Investments, at value | | | |
| (cost $54,948,856) | $ | 64,787,623 | |
| Cash | | 151,012 | |
| Receivable for shares issued | | 190,484 | |
| Dividends and interest receivable | | 10,473 | |
| Prepaid expenses and other assets | | 13,299 | |
| Total Assets | | 65,152,891 | |
| |
| LIABILITIES: | | | |
| Payable for investments purchased | | 110,306 | |
| Payable for shares redeemed | | 13,247 | |
| Payable to Adviser | | 52,113 | |
| Accrued 12b-1 fees | | 12,615 | |
| Payable for outstanding loan | | 151,000 | |
| Other accrued expenses | | 52,189 | |
| Total Liabilities | | 391,470 | |
| NET ASSETS | $ | 64,761,421 | |
| |
| NET ASSETS CONSIST OF: | | | |
| Capital stock | $ | 56,274,587 | |
| Accumulated undistributed net | | | |
| investment loss | | (35,874 | ) |
| Accumulated undistributed net | | | |
| realized loss on investments | | (1,316,059 | ) |
| Net unrealized appreciation on | | | |
| investments | | 9,838,767 | |
| NET ASSETS | $ | 64,761,421 | |
| CAPITAL STOCK, $0.0001 | | | |
| par value | | | |
| Authorized | | 100,000,000 | |
| Issued and outstanding | | 5,236,251 | |
| NET ASSET VALUE AND | | | |
| REDEMPTION PRICE PER | | | |
| SHARE | $ | 12.37 | |
| MAXIMUM OFFERING PRICE | | | |
| PER SHARE ($12.37 / 0.955) | $ | 12.95 | |
| KEELEY Mid Cap Value Fund |
| STATEMENT OF OPERATIONS | |
| For the Six Months Ended |
| March 31, 2007 |
| (Unaudited) |
| |
| INVESTMENT INCOME: | | | |
| Dividend income (net of $639 of | | | |
| foreign witholding taxes) | $ | 400,449 | |
| Interest income | | 5,594 | |
| Total Investment Income | | 406,043 | |
| |
| EXPENSES: | | | |
| Investment advisory fees | | 294,357 | |
| 12b-1 fees | | 73,589 | |
| Transfer agent fees and expenses | | 8,933 | |
| Administration fees | | 5,400 | |
| Federal and state registration fees | | 15,812 | |
| Custody fees | | 1,112 | |
| Fund accounting fees | | 354 | |
| Professional fees | | 14,692 | |
| Reports to shareholders | | 8,330 | |
| Directors’ fees | | 7,468 | |
| Other | | 12,913 | |
| Total expenses before | | | |
| reimbursement | | 442,960 | |
| Reimbursement of expenses by | | | |
| Adviser | | (1,043 | ) |
| NET EXPENSES | | 441,917 | |
| NET INVESTMENT LOSS | | (35,874 | ) |
| REALIZED AND UNREALIZED | | | |
| GAIN ON INVESTMENTS: | | | |
| Net realized gain on investments | | 61,814 | |
| Change in net unrealized | | | |
| appreciation on investments | | 8,924,329 | |
| Net Gain on Investments | | 8,986,143 | |
| NET INCREASE IN NET | | | |
| ASSETS RESULTING FROM | | | |
| OPERATIONS | $ | 8,950,269 | |
The accompanying notes are an integral part of these financial statements.
26
KEELEY Mid Cap Value Fund
STATEMENTS OF CHANGES IN NET ASSETS
| | Six Months | | |
| | Ended | | Year Ended |
| | March 31, 2007 | | September 30, |
| | (Unaudited) | | 2006 |
| OPERATIONS: | | | | | | | |
| Net investment loss | $ | (35,874 | ) | | $ | (420,025 | ) |
| Net realized gain (loss) on investments | | 61,814 | | | | (1,377,873 | ) |
| Change in net unrealized appreciation on investments | | 8,924,329 | | | | 541,368 | |
| Net increase/(decrease) in net assets resulting from | | | | | | | |
| operations | | 8,950,269 | | | | (1,256,530 | ) |
| CAPITAL STOCK TRANSACTIONS: | | | | | | | |
| Proceeds from 841,054 and 4,761,960 shares issued, | | | | | | | |
| respectively | | 9,897,807 | | | | 52,244,763 | |
| Cost of 748,402 and 718,448 shares redeemed, respectively | | (8,599,171 | ) | | | (7,944,725 | ) |
| Net increase from capital stock transactions | | 1,298,636 | | | | 44,300,038 | |
| TOTAL INCREASE IN NET ASSETS | | 10,248,905 | | | | 43,043,508 | |
| |
| NET ASSETS: | | | | | | | |
| Beginning of period | | 54,512,516 | | | | 11,469,008 | |
| End of period | $ | 64,761,421 | | | $ | 54,512,516 | |
| Accumulated undistributed net investment loss | $ | (35,874 | ) | | $ | — | |
The accompanying notes are an integral part of these financial statements.
27
KEELEY Mid Cap Value Fund
FINANCIAL HIGHLIGHTS
| | | | | | | | | | | Period from |
| | | Six Months | | | | | | August 15, 2005 |
| | | Ended | | | | | | (Commencement |
| | | March 31, 2007 | | Year Ended | | of Operations) to |
| | | (Unaudited) | | September 30, 2006 | | September 30, 2005 |
| PER SHARE DATA (1) | | | | | | | | | | | | |
| Net asset value, beginning of | | | | | | | | | | | | |
| period | | $ | 10.60 | | | $ | 10.43 | | | $ | 10.00 | |
| Income from investment | | | | | | | | | | | | |
| operations: | | | | | | | | | | | | |
| Net investment loss | | | (0.01 | ) | | | (0.08 | ) | | | (0.01 | ) |
| Net realized and unrealized gains | | | | | | | | | | | | |
| on investments | | | 1.78 | | | | 0.25 | | | | 0.44 | |
| |
| Total from investment operations | | | 1.77 | | | | 0.17 | | | | 0.43 | |
| |
| Net asset value, end of period | | $ | 12.37 | | | $ | 10.60 | | | $ | 10.43 | |
| |
| Total return (2) (3) | | | 16.70 | % | | | 1.63 | % | | | 4.30 | % |
| |
| Supplemental data and ratios: | | | | | | | | | | | | |
| Net assets, end of period (in 000’s) | | $ | 64,761 | | | $ | 54,513 | | | $ | 11,469 | |
| Ratio of expenses to average net | | | | | | | | | | | | |
| assets: | | | | | | | | | | | | |
| Before expense reimbursement (4) | | | 1.50 | % (5) | | | 2.27 | % | | | 9.87 | % |
| After expense reimbursement (4) | | | 1.50 | % (5) | | | 1.94 | % | | | 2.00 | % |
| Ratio of net investment income | | | | | | | | | | | | |
| (loss) to average net assets: | | | | | | | | | | | | |
| Before expense reimbursement (4) | | | (0.13 | %) | | | (1.42 | %) | | | (9.19 | %) |
| After expense reimbursement (4) | | | (0.12 | %) | | | (1.10 | %) | | | (1.32 | %) |
| Portfolio turnover rate (3) | | | 43.78 | % | | | 63.76 | % | | | 0.00 | % |
| (1) | | Per share data is for a share outstanding throughout the period. |
| (2) | | The total return calculation does not reflect the sales load imposed on the purchase of shares (see Note 7). |
| (3) | | Not annualized for periods less than one year. |
| (4) | | Annualized for periods less than one year. |
| (5) | | The ratio of expenses to average net assets includes interest expense, which is excluded for purposes of calculating the expense reimbursement (see Note 3). The before expense reimbursement and after expense reimbursement ratios excluding interest expense were 1.49% and 1.49%, respectively, for the six months ended March 31, 2007. |
The accompanying notes are an integral part of these financial statements.
28
| LETTER TO SHAREHOLDERS — |
| KEELEY ALL CAP VALUE FUND (KACVX) |
Dear Shareholder,
The KEELEY All Cap Value commenced operations on June 14th, 2006. During the past six months from October 1st, 2006 through March 31st, 2007, the Fund’s net assets grew to $34,022,550 and the number of shareholders grew to 1,181. For the six month period ending March 31st, 2007, the portfolio turnover was 26.77% and the expense ratio was capped by Keeley Asset Management Corp. at 1.49% which will stay in place for the next 18 months. The Fund’s portfolio is widely diversified with investments in 84 equities. The Fund is registered for sale in all 50 states and the District of Columbia. Our broker dealer network totals over 50 broker dealers and trust entities. As of March 31st, 2007, the Keeley family beneficially owns 27.86% of the outstanding shares.
For the quarter ended March 31st, 2007, the Fund’s total return was 5.77% versus a return of 1.26% for the Russell 3000 Value Index. For the six month period ended March 31st, 2007, the Fund’s return was 20.07% versus 9.46% for the Russell 3000 Value Index. Since inception, June 14th, 2006, the Fund’s return was 19.23% versus 21.30% for the Russell 3000 Value Index. Performance Data does not reflect the deduction of the sales load or fee, and that, if reflected, the load or fee would reduce the performance quoted.
Performance Data Including 4.5% Maximum Up-Front Sales Charge
For the quarter ended March 31st, 2007, the Fund’s total return was 1.01% versus a return of 1.26% for the Russell 3000 Value Index. For the six month period ended March 31st, 2007, the Fund’s return was 14.67% versus 9.46% for the Russell 3000 Value Index. Since inception, June 14th, 2006, the Fund’s average annual return was 13.87% versus 21.30% for the Russell 3000 Value Index.
Performance data quoted represents past performance and does not guarantee future results. The investment return and principal value of an investment will fluctuate so that an investor’s shares, when redeemed, may be worth more or less than their original cost and the current performance my be lower or higher than the performance data quoted. You may call toll-free at 888-933-5391, or visit our website at www.keeleyfunds.com to obtain performance data current to the most recent month end.
During the first quarter of 2007, the sectors that made a positive contribution to the Fund’s performance included consumer discretionary, energy, and materials. All economic sectors that we invested in had a positive return other than a slight negative contribution from the financials sector.
Within the materials sector, United States Steel Corp. was the strongest contributor, rising over 35% during the quarter. The stock surged to an all time high after a favorable reaction to the announcement that the company will acquire steel pipe manufacturer Lone Star Technologies Inc. Martin Marietta Materials was another strong performer within the sector, climbing over 30%. The construction aggregates maker posted strong fourth quarter results citing positive pricing and improved cost controls at the company.
29
Within the consumer discretionary sector, Houston Wire & Cable Co. was the top performer, rising over 34% during the quarter. The distributor of specialty wire and cables had fourth quarter profit rise 87% with significant margin expansion due to greater than expected demand. Top ten holding Idearc Inc., which was spun off from Verizon Communications in November of 2006, rose over 22% during the quarter. The company reported strong cash flow in its first quarter as a stand alone company, and also announced that it will fund a quarterly dividend to shareholders. Within the energy sector, Tesco Corp. was our second best performing stock during the quarter, climbing over 50% and contributing 65 basis points of performance to the portfolio. The energy services company produced 91% year on year revenue growth as well as record earnings in the fourth quarter of 2006. After a difficult fourth quarter, Helix Energy Solutions rebounded in 2007, rising over 18% in the first quarter. The energy services company expects to benefit from the initial public offering of a minority stake in its Cal Dive International Inc. unit. As mentioned previously, the only material negative impact to performance from a sector perspective came from financials. However, the total return in the sector was 0.29% and only detracted 0.01% of return from the Fund. Pressure from the housing market and the negative press of the sub prime mortgage crisis had an impact on a handful of financial stocks in the portfolio. Going forward, we continue to look for ideas within our five investment themes that focus on companies undergoing corporate restructuring. We are excited about a number of opportunities that are upcoming in 2007. With the anticipated break up of Tyco International, American Standard, and Temple Inland, our research staff will diligently continue the pursuit of adding shareholder value.
Thank you for your continued commitment to the Fund.
Sincerely,

John L. Keeley, Jr.
President
There are risks associated with investing in small-cap mutual funds, such as lines and market shares, including limited available information. You should consider objectives, risks and charges and expenses of a fund carefully before investing. Additional information regarding such risks, including information on fees is located in Fund’s prospectus. Please read the Fund’s prospectus carefully before investing.
30
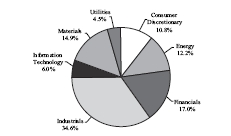
Investments by Sector
As a Percentage of Equities
(Unaudited)
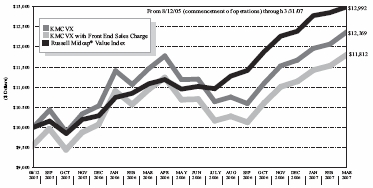
Index Comparison
Comparison of a Hypothetical $10,000 Investment
In KACVX and Russell 3000® Value Index*
(Unaudited)

| | | | | | | | | | Since Commencement |
| | | 1 month ended | | 3 months ended | | 6 months ended | | of Operations(1) |
| | | 3/31/2007(1) | | 3/31/2007(1) | | 3/31/2007(1) | | (6/14/2006) |
| KACVX | | +2.85% | | +5.77% | | +20.07% | | | +19.23% |
| KACVX (includes max | | | | | | | | | |
| 4 1/2% front-end load) | | –1.78% | | +1.01% | | +14.67% | | | +13.87% |
| Russell 3000® Value Index | | +1.52% | | +1.26% | | +9.46% | | | +21.00% |
| * | | The Russell 3000® Value Index measures the performance of those Russell 3000® Index companies with lower price-to-book ratios and lower forecasted growth values. The stocks in this index are also members of either the Russell 1000® Value or the Russell 2000® Value indexes. |
| ** | | PERFORMANCE DATA quoted represents past performance which is not predictive of future performance. The investment return and principal value of shares will not fluctuate and when redeemed, may be worth more or less than their original cost. Returns shown include the reinvestment of all dividends. The graph and table do not reflect the deduction of taxes that a shareholder would pay on Fund distributions or the redemption of shares. |
| (1) | | Not annualized |
31
KEELEY All Cap Value Fund
Expense Example
For the Six Month Period Ended March 31, 2007
(Unaudited)
As a shareholder of the KEELEY All Cap Value Fund (the “Fund”), you incur two types of costs: (1) transaction costs, including sales charges (loads) on purchase payments; and (2) ongoing costs, including management fees; distribution (12b-1) fees; and other Fund expenses. This Example is intended to help you understand your ongoing costs (in dollars) of investing in the Fund and to compare these costs with the ongoing costs of investing in other mutual funds.
The Example is based on an investment of $1,000 invested at the beginning of the period and held for the entire period from October 1, 2006 to March 31, 2007 (the “period”).
Actual Expenses
The first line of the table below provides information about actual account values and actual expenses. You may use the information in this line, together with the amount you invested, to estimate the expenses you paid over the period. Simply divide your account value by $1,000 (for example, an $8,600 account value divided by $1,000 equals 8.6), then multiply the result by the number in the first line under the heading entitled “Expenses Paid During Period” to estimate the expenses you paid on your account during the period.
Hypothetical Example for Comparison Purposes
The second line of the table below provides information about hypothetical account values and hypothetical expenses based on the Fund’s actual expense ratio and an assumed rate of return of 5% per year before expenses, which is not the Fund’s actual return. The hypothetical account values and expenses may not be used to estimate the actual ending account balance or expenses you paid for the period. You may use this information to compare the ongoing costs of investing in the Fund and other funds. To do so, compare this 5% hypothetical example with the 5% hypothetical examples that appear in the shareholder reports of other funds.
Please note that the expenses shown in the table are meant to highlight your ongoing costs only and do not reflect any transactional costs, such as sales charges (loads). Therefore, the second line of the table is useful in comparing the ongoing costs only, and will not help you determine the relative total costs of owning different funds. In addition, if these transactional costs were included, your costs could have been higher.
| Expenses Paid During the Period | | | | | | | |
| | | Beginning | | Ending | | Expenses paid during |
| | | account value | | account value | | the period ended |
| | | October 1, 2006 | | March 31, 2007 | | March 31, 2007* |
| Actual | | $1,000.00 | | | $1,200.70 | | | $8.18 | |
| Hypothetical (5% return | | | | | | | | | |
| before expenses) | | 1,000.00 | | | 1,017.50 | | | 7.49 | |
| * | | Expenses are equal to the Fund’s annualized expense ratio of 1.49% for the period, multiplied by the average account value over the period, multiplied by 182/365 (to reflect the number of day that the fund operated during the period). |
32
KEELEY All Cap Value Fund
SCHEDULE OF INVESTMENTS
March 31, 2007
(Unaudited)
| Number | | | | | |
| of Shares | | | | Value |
| | COMMON STOCKS – 99.05% | | | |
| | Aerospace & Defense – 3.31% | | | |
| 20,000 | | Hexcel Corp. (a) | | $ | 397,000 |
| 8,000 | | Honeywell International, Inc. | 368,480 |
| 17,900 | | KBR, Inc. (a) | | | 364,265 |
| | | | | | 1,129,745 |
| | | Auto Components – 0.68% | |
| 7,500 | | The Goodyear Tire & Rubber Co. (a) | | | 233,925 |
| | | Building Products – 2.61% | |
| 7,500 | | American Standard Companies, Inc. | | | 397,650 |
| 15,500 | | Owens Corning Inc. (a) | | | 493,830 |
| | | | | | 891,480 |
| | | Capital Markets – 4.59% | |
| 6,000 | | Ameriprise Financial Inc. | | | 342,840 |
| 21,000 | | Cowen Group, Inc. (a) | | | 349,440 |
| 5,500 | | Morgan Stanley | | | 433,180 |
| 10,000 | | Stifel Financial Corp. (a) | | | 443,000 |
| | | | | | 1,568,460 |
| | | Chemicals – 3.18% | | | |
| 5,500 | | Ashland Inc. | | | 360,800 |
| 4,700 | | FMC Corp. | | | 354,521 |
| 14,500 | | Koppers Holdings, Inc. | | | 372,070 |
| | | | | | 1,087,391 |
| | | Commercial Services & Supplies – 2.40% | | | |
| 100,000 | | APAC Customer Services, Inc. (a) | | | 469,000 |
| 5,500 | | The Brink’s Co. | | | 348,975 |
| | | | | | 817,975 |
| | | Computers & Peripherals – 1.68% | | | |
| 12,000 | | NCR Corp. (a) | | | 573,240 |
| | | Construction & Engineering – 6.08% | | | |
| 20,000 | | ABB Ltd. - ADR | | | 343,600 |
| 12,000 | | Chicago Bridge & Iron Co. NV - ADR | | | 369,000 |
| 6,500 | | Foster Wheeler Ltd. (a) | | | 379,535 |
| 22,000 | | Integrated Electrical Services Inc. (a) | | | 544,060 |
| 9,000 | | McDermott International, Inc. (a) | | | 440,820 |
| | | | | | 2,077,015 |
| | | Construction Materials – 2.49% | | | |
| 3,500 | | Martin Marietta Materials, Inc. | | | 473,200 |
| 5,000 | | Texas Industries, Inc. | | | 377,650 |
| | | | | | 850,850 |
| | | Containers & Packaging – 1.49% | | | |
| 8,500 | | Temple-Inland, Inc. | | | 507,790 |
| | | Diversified Financial Services – 4.04% | | | |
| 8,000 | | J.P. Morgan Chase & Co. | | | 387,040 |
| 4,000 | | Nymex Holdings, Inc. (a) | | | 543,040 |
| 4,800 | | NYSE Group, Inc. (a) | | | 450,000 |
| | | | | | 1,380,080 |
| | | Electric Utilities – 1.02% | | | |
| 7,500 | | Allete, Inc. | | | 349,650 |
| | | Electrical Equipment – 1.02% | | | |
| 7,500 | | Regal-Beloit Corp. | | | 347,850 |
| | | Electronic Equipment & Instruments – 2.31% | | | |
| 40,000 | | NU Horizons Electronics Corp. (a) | | | 421,200 |
| 39,500 | | Richardson Electronics Ltd | | | 368,930 |
| | | | | | 790,130 |
| | | Energy Equipment & Services – 4.06% | | | |
| 13,000 | | Halliburton Co. | | | 412,620 |
| 11,500 | | Helix Energy Solutions Group, Inc. (a) | | | 428,835 |
| 20,500 | | Tesco Corp. (a) | | | 544,275 |
| | | | | | 1,385,730 |
| | | Hotels, Restaurants & Leisure – 4.88% | | | |
| 4,500 | | Las Vegas Sands Corp. (a) | | | 389,745 |
| 6,500 | | MGM Mirage (a) | | | 451,880 |
The accompanying notes are an integral part of these financial statements.
33
KEELEY All Cap Value Fund
SCHEDULE OF INVESTMENTS (Continued)
March 31, 2007
(Unaudited)
| Number | | | | | |
| of Shares | | | | Value |
| | | Hotels, Restaurants & Leisure (continued) | | | |
| 7,500 | | Orient-Express Hotels Ltd. | | $ | 448,650 |
| 11,000 | | Wyndham Worldwide Corp. (a) | | | 375,650 |
| | | | | | 1,665,925 |
| | | Household Durables – 2.18% | | | |
| 4,500 | | Fortune Brands, Inc. | | | 354,690 |
| 12,500 | | Newell Rubbermaid, Inc. | | | 388,625 |
| | | | | | 743,315 |
| | | Industrial Conglomerates – 3.42% | | | |
| 4,000 | | Textron, Inc. | | | 359,200 |
| 13,500 | | Tyco International Ltd. | | | 425,925 |
| 15,500 | | Walter Industries, Inc. | | | 383,625 |
| | | | | | 1,168,750 |
| | | Insurance – 1.10% | | | |
| 8,000 | | Unitrin, Inc. | | | 376,560 |
| | | IT Services – 4.70% | | | |
| 11,500 | | Ceridian Corp. (a) | | | 400,660 |
| 7,800 | | Fidelity National Information Services Inc. | | | 354,588 |
| 4,500 | | Mastercard, Inc. | | | 478,080 |
| 17,000 | | Western Un Co. | | | 373,150 |
| | | | | | 1,606,478 |
| | | Machinery – 12.33% | | | |
| 32,000 | | Altra Holdings, Inc. (a) | | | 438,720 |
| 12,500 | | American Railcar Industries, Inc. | | | 372,625 |
| 9,500 | | Crane Co. | | | 383,990 |
| 7,000 | | Dover Corp. | | | 341,670 |
| 15,500 | | Foster L B Co. (a) | | | 319,455 |
| 8,500 | | Ingersoll-Rand Co. | | | 368,645 |
| 6,000 | | ITT Industries, Inc. | | | 361,920 |
| 8,500 | | Joy Global, Inc. | | | 364,650 |
| 12,000 | | Mueller Water Products, Inc. Class B | | | 160,680 |
| 22,000 | | Mueller Water Products, Inc. Class A | | | 303,820 |
| 6,000 | | Terex Corp. (a) | | | 430,560 |
| 12,000 | | Timken Co. | | | 363,720 |
| | | | | | 4,210,455 |
| | | Media – 2.64% | | | |
| 14,000 | | Idearc, Inc. | | | 491,400 |
| 6,500 | | The McGraw-Hill Companies, Inc. | | | 408,720 |
| | | | | | 900,120 |
| | | Metals & Mining – 9.48% | | | |
| 3,600 | | Allegheny Technologies, Inc. | | | 384,084 |
| 13,000 | | AMCOL International Corp. | | | 385,450 |
| 8,000 | | Chaparral Steel Co. | | | 465,360 |
| 13,000 | | Commercial Metals Co. | | | 407,550 |
| 6,000 | | Haynes International, Inc. (a) | | | 437,580 |
| 9,000 | | Kaiser Aluminum Corp. (a) | | | 702,000 |
| 4,600 | | United States Steel Corp. | | | 456,182 |
| | | | | | 3,238,206 |
| | | Multiline Retail – 2.01% | | | |
| 10,000 | | Dillard’s Inc. | | | 327,300 |
| 8,000 | | Federated Department Stores Inc. | | | 360,400 |
| | | | | | 687,700 |
| | | Multi-Utilities – 1.16% | | | |
| 5,500 | | NRG Energy, Inc. (a) | | | 396,220 |
| |
| | | Oil And Gas Field Services, Not Elsewhere Classified – 1.26% | | | |
| 70,000 | | Ico Inc New (a) | | | 429,800 |
| | | Oil, Gas & Consumable Fuels – 3.31% | | | |
| 13,000 | | Comstock Resources, Inc. (a) | | | 355,940 |
| 22,000 | | EXCO Resources, Inc. (a) | | | 364,760 |
| 31,000 | | PetroHawk Energy Corp. (a) | | | 408,270 |
| | | | | | 1,128,970 |
| | | Paper & Forest Products – 1.23% | | | |
| 45,000 | | Domtar Corp. (a) | | | 418,950 |
| | | Road & Rail – 2.28% | | | |
| 14,000 | | Genesee & Wyoming, Inc. (a) | | | 372,540 |
| 4,000 | | Union Pacific Corp. | | | 406,200 |
| | | | | | 778,740 |
| | | Specialty Retail – 2.59% | | | |
| 22,000 | | PEP Boys-Manny, Moe & Jack | | | 419,980 |
| 4,500 | | Rex Stores Corp. (a) | | | 73,620 |
| 42,500 | | Sally Beauty Holdings, Inc. | | | 390,575 |
| | | | | | 884,175 |
The accompanying notes are an integral part of these financial statements.
34
KEELEY All Cap Value Fund
SCHEDULE OF INVESTMENTS (Continued)
March 31, 2007
(Unaudited)
| Number | | | | |
| of Shares | | | | Value |
| | | Textiles, Apparel & Luxury Goods – 1.25% | | | |
| 14,500 | | Hanesbrands, Inc. (a) | | $ | 426,155 |
| | | Thrifts & Mortgage Finance – 1.00% | | | |
| 25,000 | | Hudson City Bancorp, Inc. | | | 342,000 |
| | | Trading Companies & Distributors – 1.27% | | | |
| 15,500 | | Houston Wire & Cable Co. (a) | | | 434,310 |
| | | Total Common Stocks | | | |
| | | (Cost $30,131,873) | | | 33,828,140 |
| |
| Principal | | | | | |
| Amount | | | | Value |
| | | SHORT-TERM INVESTMENTS – 0.12% | | | |
| $42,500 | | U.S. Bank, N.A. Demand Note, 4.50% | | | 42,500 |
| | | Total Short-Term Investments | | | |
| | | (Cost $42,500) | | | 42,500 |
| | | Total Investments | | | |
| | | (Cost $30,174,373) – 99.17% | | | 33,870,640 |
| | | Other Assets in Excess of Liabilities – 0.83% | | | 282,882 |
| | | NET ASSETS – 100.00% | | $ | 34,153,522 |
| | | | | |
| | (a) Non-Income Producing | | | |
| |
| | | Percentages are based on net assets. |
The accompanying notes are an integral part of these financial statements.
35
KEELEY All Cap Value Fund
STATEMENT OF ASSETS AND
LIABILITIES
March 31, 2007
(Unaudited)
| ASSETS: |
| Investments, at value | | | | |
| (cost $30,174,373) | | $ | 33,870,640 | |
| Cash | | | 451 | |
| Receivable for shares issued | | | 562,095 | |
| Dividends and interest receivable | | | 11,516 | |
| Prepaid expenses and other assets | | | 6,593 | |
| Total Assets | | | 34,451,295 | |
| | | | | |
| LIABILITIES: | | | | |
| Payable for investments purchased | | | 231,195 | |
| Payable to Adviser | | | 20,629 | |
| Accrued 12b-1 fees | | | 6,518 | |
| Other accrued expenses | | | 39,431 | |
| Total Liabilities | | | 297,773 | |
| NET ASSETS | | $ | 34,153,522 | |
| | | | | |
| NET ASSETS CONSIST OF: | | | | |
| Capital stock | | $ | 30,559,664 | |
| Accumulated undistributed net | | | | |
| investment loss | | | (35,668 | ) |
| Accumulated undistributed net | | | | |
| realized loss on investments | | | (66,741 | ) |
| Net unrealized appreciation on | | | | |
| investments | | | 3,696,267 | |
| NET ASSETS | | $ | 34,153,522 | |
| CAPITAL STOCK, $0.0001 | | | | |
| par value | | | | |
| Authorized | | | 100,000,000 | |
| Issued and outstanding | | | 2,865,517 | |
| NET ASSET VALUE AND | | | | |
| REDEMPTION PRICE PER | | | | |
| SHARE | | $ | 11.92 | |
| MAXIMUM OFFERING PRICE | | | | |
| PER SHARE ($11.92 / 0.955) | | $ | 12.48 | |
KEELEY All Cap Value Fund
STATEMENT OF OPERATIONS
For the Six Months Ended
March 31, 2007
(Unaudited)
| INVESTMENT INCOME: | | | | |
| Dividend income (net of $182 of | | | | |
| foreign witholding taxes) | | $ | 146,892 | |
| Interest income | | | 4,260 | |
| Total Investment Income | | | 151,152 | |
| EXPENSES: | | | | |
| Investment advisory fees | | | 119,528 | |
| 12b-1 fees | | | 29,882 | |
| Professional fees | | | 19,672 | |
| Transfer agent fees and expenses | | | 17,499 | |
| Reports to shareholders | | | 10,864 | |
| Custody fees | | | 6,339 | |
| Directors’ fees | | | 5,090 | |
| Federal and state registration fees | | | 4,244 | |
| Fund accounting fees | | | 3,356 | |
| Administration fees | | | 3,337 | |
| Other | | | 6,170 | |
| Total expenses before reimbursement | | | 225,981 | |
| Reimbursement of expenses by | | | | |
| Adviser | | | (45,800 | ) |
| NET EXPENSES | | | 180,181 | |
| NET INVESTMENT LOSS | | | (29,029 | ) |
| REALIZED AND UNREALIZED | | | | |
| GAIN ON INVESTMENTS: | | | | |
| Net realized gain on investments | | | 123,579 | |
| Change in net unrealized appreciation | | | | |
| on investments | | | 3,800,901 | |
| Net Gain on Investments | | | 3,924,480 | |
| NET INCREASE IN NET | | | | |
| ASSETS RESULTING FROM | | | | |
| OPERATIONS | | $ | 3,895,451 | |
The accompanying notes are an integral part of these financial statements.
36
KEELEY All Cap Value Fund
STATEMENTS OF CHANGES IN NET ASSETS
| | | | | Period from | |
| | | | | June 14, 2006 | |
| | Six Months Ended | | | (Commencement | |
| | March 31, 2007 | | | of Operations) to | |
| | (Unaudited) | | | September 30, 2006 | |
| OPERATIONS: | | | | | | | |
| Net investment loss | $ | (29,029 | ) | | $ | (16,442 | ) |
| Net realized gain (loss) on investments | | 123,579 | | | | (190,222 | ) |
| Change in net unrealized appreciation | | | | | | | |
| (depreciation) on investments | | 3,800,901 | | | | (104,634 | ) |
| Net increase/(decrease) in net assets resulting | | | | | | | |
| from operations | | 3,895,451 | | | | (311,298 | ) |
| | | | | | | | |
| DISTRIBUTIONS: | | | | | | | |
| Net investment income | | (6,639 | ) | | | — | |
| | | | | | | | |
| CAPITAL STOCK TRANSACTIONS: | | | | | | | |
| Proceeds from 1,444,920 and 1,505,318 | | | | | | | |
| shares issued, respectively | | 16,235,722 | | | | 15,255,185 | |
| Proceeds from 524 and 0 shares of | | | | | | | |
| distributions reinvested, respectively | | 5,943 | | | | — | |
| Cost of 83,698 and 1,547 shares redeemed, | | | | | | | |
| respectively | | (905,385 | ) | | | (15,457 | ) |
| Net increase from capital stock transactions | | 15,336,280 | | | | 15,239,728 | |
| TOTAL INCREASE IN NET ASSETS | | 19,225,092 | | | | 14,928,430 | |
| NET ASSETS: | | | | | | | |
| Beginning of period | | 14,928,430 | | | | — | |
| End of period | $ | 34,153,522 | | | $ | 14,928,430 | |
| Accumulated undistributed net investment | | | | | | | |
| loss | $ | (29,029 | ) | | $ | — | |
The accompanying notes are an integral part of these financial statements.
37
KEELEY All Cap Value Fund
FINANCIAL HIGHLIGHTS
| | | | Period from |
| | | | June 14, 2006 |
| | Six Months Ended | | (Commencement |
| | March 31, 2007 | | of Operations) to |
| (Unaudited) | | September 30, 2006 |
| PER SHARE DATA (1) | | | | | | | | | |
| Net asset value, beginning of period | | $ | 9.93 | | | | $ | 10.00 | |
| Income from investment operations: | | | | | | | | | |
| Net investment loss | | | (0.01 | ) | | | | (0.01 | ) |
| Net realized and unrealized gains (losses) on | | | | | | | | | |
| investments | | | 2.00 | | | | | (0.06 | ) |
| | | | | | | | | | |
| Total from investment operations | | | 1.99 | | | | | (0.07 | ) |
| | | | | | | | | | |
| Less distributions: | | | | | | | | | |
| Net investment income | | | — | (2) | | | | — | |
| Net asset value, end of period | | $ | 11.92 | | | | $ | 9.93 | |
| |
| Total return (3)(4) | | | 20.07 | % | | | | (0.70 | )% |
| | | | | | | | | | |
| Supplemental data and ratios: | | | | | | | | | |
| Net assets, end of period (in 000’s) | | $ | 34,154 | | | | $ | 14,928 | |
| Ratio of expenses to average net assets: | | | | | | | | | |
| Before expenses reimbursement (5) | | | 1.89 | % (6) | | | | 3.97 | % |
| After expense reimbursement (5) | | | 1.51 | % (6) | | | | 1.72 | % |
| Ratio of net investment income (loss) to average | | | | | | | | | |
| net assets | | | | | | | | | |
| Before expense reimbursement (5) | | | (0.63 | %) | | | | (2.82 | %) |
| After expense reimbursement (5) | | | (0.24 | %) | | | | (0.57 | %) |
| Portfolio turnover rate (4) | | | 26.74 | % | | | | 25.66 | % |
| (1) | | Per share data is for a share outstanding throughout the period. |
| (2) | | Amount calculated is less than $0.005 per share. |
| (3) | | The total return calculation does not reflect the sales load imposed on the purchase of shares (see Note 7). |
| (4) | | Not annualized for periods less than one year. |
| (5) | | Annualized for periods less than one year. |
| (6) | | The ratio of expenses to average net assets includes interest expense, which is excluded for purposes of calculating the expense reimbursement (see Note 3). The before expense reimbursement and after expense reimbursement ratios excluding interest expense were 1.87% and 1.49%, respectively, for the six months ended March 31, 2007. |
The accompanying notes are an integral part of these financial statements.
38
KEELEY Funds, Inc.
NOTES TO THE FINANCIAL STATEMENTS
March 31, 2007
(Unaudited)
| 1. | | ORGANIZATION |
| |
| | | KEELEY Funds, Inc. (the “Company”) was organized on April 7, 2005 as a Maryland corporation and is registered under the Investment Company Act of 1940, as amended (the “1940 Act”) as a diversified, open-end investment company. The Company consists of the KEELEY Mid Cap Value Fund (“KMCVX”) and the KEELEY All Cap Value Fund (“KACVX”), each a series. KMCVX and KACVX commenced operations on August 15, 2005, and June 14, 2006, respectively (each a “commencement date”, collectively the “commencement dates”). KMCVX and KACVX will be collectively referred to herein as the “Funds”. |
| |
| 2. | | SIGNIFICANT ACCOUNTING POLICIES |
| |
| | | The following is a summary of significant accounting policies consistently followed by the Company in the preparation of its financial statements. These policies are in conformity with accounting principles generally accepted in the United States of America (“GAAP”). The presentation of financial statements in conformity with GAAP requires management to make estimates and assumptions that affect the reported amounts of assets and liabilities at the date of the financial statements and the reported amounts of revenues and expenses during the reporting period. Actual results could differ from those estimates and assumptions. |
| |
| | | a) Investment Valuation – Securities which are traded on a recognized stock exchange are valued at the last sale price each day on the securities exchange on which such securities are primarily traded or at the last sale price on a national securities exchange. Exchange-traded securities for which there were no transactions are valued at the current bid prices. Securities traded on only over-the-counter markets are valued on the basis of last sale price, or closing over-the-counter bid prices when there is no last sale price available. Debt securities (other than short-term obligations) are valued by a service that used electronic data processing methods, avoiding exclusive reliance on exchange or over-the-counter prices. Debt securities purchased within 60 days of their stated maturity date are valued at amortized cost, which approximates fair value. Securities for which quotations are not readily available are valued at fair value as determined in good faith by the Board of Directors. For each investment that is fair valued, the Board of Directors considers, to the extent applicable, various factors including, but not limited to, the financial condition of the company, comparable companies in the public market, the nature and duration of the cause for a quotation not being readily available and other relevant factors. |
| |
| | | In September 2006, the Financial Accounting Standards Board issued its new Standard No. 157, “Fair Value Measurements” (“FAS 157”). FAS 157 is designed to unify guidance for the measurement of fair value of all types of assets, including financial instruments, and certain liabilities, throughout a number of accounting standards. FAS 157 also establishes a hierarchy for measuring fair value in generally accepted accounting principles and expands financial statement disclosures about fair value measurements that are relevant to mutual funds. FAS 157 is effective for financial statements issued for fiscal years beginning after November 15, 2007, and earlier adoption is permitted. At this time, management believes the adoption of FAS 157 will have no material impact on the financial statements of the Company. |
39
KEELEY Funds, Inc.
NOTES TO THE FINANCIAL STATEMENTS (Continued)
March 31, 2007
(Unaudited)
| | | b) Federal Income and Excise Taxes – It is the Company’s policy to meet the requirements of the Internal Revenue Code applicable to regulated investment companies and to distribute substantially all investment company net taxable income and net capital gains to shareholders in a manner which results in no tax cost to the Company. Therefore, no federal income or excise tax provision is required. |
| |
| | | On July 13, 2006, the Financial Accounting Standards Board (“FASB”) released FASB Interpretation No. 48 “Accounting for Uncertainty in Income Taxes” (“FIN 48”). FIN 48 provides guidance for how uncertain tax positions should be recognized, measured, presented and disclosed in the financial statements. FIN 48 requires the evaluation of tax positions taken or expected to be taken in the course of preparing the Company’s tax returns to determine whether the tax positions are “more-likely-than-not” of being sustained by the applicable tax authority. Tax positions not deemed to meet the more-likely-than-not threshold would be recorded as a tax benefit or expense in the current year. Adoption of FIN 48 is required as of the date of the last net asset value calculation in the first required financial statement reporting period for fiscal years beginning after December 15, 2006 and is to be applied to all open tax years as of the effective date. At this time, management is evaluating the implications of FIN 48 and its impact in the financial statements has not yet been determined. |
| | |
| | c) Distributions to Shareholders – Dividends from net investment income, if any, will be declared and paid annually. Distributions of net realized gains, if any, will be declared and paid annually. Distributions to shareholders are recorded on the ex-dividend date. The Company may periodically make reclassifications among certain of its capital accounts as a result of the characterization of certain income and realized gains determined annually in accordance with federal tax regulations that may differ from generally accepted accounting principles. Where appropriate, reclassifications between capital accounts are made for only those differences that are permanent in nature. |
| | |
| | d) Other – Investment transactions are recorded on the trade date. The Company determines the gain or loss realized from investment transactions by comparing the identified original cost of the security lot sold with the net sale proceeds. Dividend income is recognized on the ex-dividend date and interest income is recognized on an accrual basis. |
| | |
| | e) Guarantees and Indemnifications – In the normal course of business, the Company enters into contracts with service providers that contain general indemnification clauses. The Company’s maximum exposure under these arrangements is unknown as this would involve future claims against the Company that have not yet occurred. Based on experience, the Company expects the risk of loss to be remote. |
| |
| 3. | | INVESTMENT ADVISORY AGREEMENT |
| |
| | | The Company has an agreement with Keeley Asset Management Corp. (the “Adviser”), with whom certain officers and directors of the Company are affiliated, to furnish investment advisory services to the Company (the “Investment Advisory Agreement”). Under the terms of this agreement, the Funds each pay the Adviser a monthly fee at the annual rate of 1.00% of each fund’s first $350 million, 0.90% of the next $350 million, and 0.80% in excess of $700 million of each fund’s average daily net assets. |
40
KEELEY Funds, Inc.
NOTES TO THE FINANCIAL STATEMENTS (Continued)
March 31, 2007
(Unaudited)
| | | Under the Investment Advisory Agreement for the two-year period ended September 30, 2008, if the aggregate annual operating expenses (excluding interest, taxes, brokerage commissions and other costs incurred in connection with the purchase or sale of portfolio securities, and extraordinary items) exceed 1.49% of KMCVX’s average daily net assets, and 1.49% of KACVX’s average daily net assets, the Adviser will reimburse KMCVX and KACVX for the amount of such excess expenses. |
| |
| 4. | | DISTRIBUTION PLAN |
| |
| | | The Company has adopted a Distribution Plan (the “Plan”) pursuant to Rule 12b-1 under the 1940 Act. The Plan is designed to reimburse Keeley Investment Corp. (the “Distributor”), with whom certain officers and directors of the Company are affiliated, for certain promotional and other sales related costs and to permit the Company to compensate other dealers of its shares. Unreimbursed amounts may be carried forward and paid in a subsequent year, to the extent that total expenses under the plan do not exceed 0.25% of the average daily net assets of the Funds. The Funds paid to the Distributor and each dealer a monthly fee at the annual rate of 0.25% of the average daily net assets of Fund shares beneficially owned by the Distributor’s and each dealer’s existing brokerage clients. For the period from October 1, 2006 to March 31, 2007, KMCVX paid $73,589 in distribution fees, of which $23,248 was paid to the Distributor. KACVX paid $29,882 in distribution fees, of which $14,080 was paid to the Distributor. |
| |
| 5. | | INVESTMENT TRANSACTIONS |
| |
| | | The aggregate purchases and sales of securities, excluding short-term investments, for KMCVX for the period from October 1, 2006 to March 31, 2007, were $27,180,861 and $25,957,390, respectively. For the period from October 1, 2006 to March 31, 2007, KMCVX paid $87,176 in brokerage commissions on trades of securities to the Distributor. |
| |
| | | The aggregate purchases and sales of securities, excluding short-term investments, for KACVX for the period from October 1, 2006 to March 31, 2007, were $21,422,511 and $6,444,158, respectively. For the period from October 1, 2006 to March 31, 2007, KACVX paid $40,032 in brokerage commissions on trades of securities to the Distributor. |
| |
| 6. | | FEDERAL INCOME TAX INFORMATION |
| | | | |
| | | At September 30, 2006, gross unrealized appreciation and depreciation of investments, based on cost for federal income tax purposes were as follows: |
| |
| | KMCVX | | KACVX |
| Cost of Investments | $ | 53,715,406 | | | $ | 15,104,741 | |
| Gross Unrealized Appreciation | $ | 3,697,754 | | | $ | 436,520 | |
| Gross Unrealized Depreciation | | (2,792,651 | ) | | | (541,154 | ) |
| Net Unrealized Appreciation | | | | | | | |
| (Depreciation) on investments | $ | 905,103 | | | $ | (104,634 | ) |
41
KEELEY Funds, Inc.
NOTES TO THE FINANCIAL STATEMENTS (Continued)
March 31, 2007
(Unaudited)
The difference between cost amounts for financial statement and federal income tax purposes is due primarily to timing differences resulting from wash sale transactions during the year.
At September 30, 2006, KMCVX and KACVX had net Post-October realized capital losses of $1,297,709, and 190,320, respectively, from transactions between November 1, 2005, and September 30, 2006.
At September 30, 2006, KMCVX had accumulated capital loss carryforwards for federal income tax purposes of $70,829 expiring in 2014. To the extent that KMCVX may realize future net capital gains, those gains will be offset by any of its unused capital loss carryforward.
As of September 30, 2006 the components of accumulated (deficit) on a tax basis were as follows:
| | KMCVX | | KACVX |
| Accumulated Capital and Other Losses | $ | (1,368,538 | ) | | $ | (190,320 | ) |
| Unrealized Appreciation (Depreciation) on Investments | | 905,103 | | | | (104,634 | ) |
| Total Accumulated (Deficit) | $ | (463,435 | ) | | $ | (294,954 | ) |
| 7. | | OFFERING PRICE PER SHARE |
| |
| | | The public offering price is the net asset value plus a sales charge, which varies in accordance with the amount of the purchase up to a maximum of 4.5%. |
| |
| | | The Distributor retains the entire sales charge when it makes sales directly to the public. Otherwise, when sales are made through dealers, the Distributor receives a portion of the related sales charge. For the period from October 1, 2006 to March 31, 2007, the Distributor received $20,958 of sales charges on behalf of KMCVX. For the period from October 1, 2006 to March 31, 2007, the Distributor received $28,097 of sales charges on behalf of KACVX. Sales charges are not an expense of the Funds and are not reflected in the financial statements of the Funds. |
| |
| | | As specified in the Funds’ Prospectuses, reduced sales charges are available through a right of accumulation and certain sales of shares of the Funds can be made at net asset value per share. |
| |
| 8. | | LINE OF CREDIT ARRANGEMENTS |
| |
| | | The Funds are parties to uncommitted line of credit agreements with U.S. Bank, N.A., expiring March 1st, 2008, under which KMCVX may borrow up to the lesser of (a) $2.75 million or (b) 10% of the market value of the assets of KMCVX. Under a separate agreement, KACVX may borrow up to the lesser of (a) $530,000 or (b) 10% of the market value of the assets of KACVX. Interest is charged on borrowings at the prevailing Prime Rate. The Funds have borrowed under these agreements from time to time to increase the efficiency of cash flow management. For the six months ended March 31, 2007, KMCVX and KACVX made interest payments of $3,633 and $2,085, respectively. |
| |
| 9. | | RELATED PARTY TRANSACTIONS |
| |
| | | As of March 31, 2007, one director of KMCVX beneficially owned 934,254 shares of KMCVX, which represents 17.84% of the fund’s outstanding shares. |
| |
| | | As of March 31, 2007, one director of KACVX beneficially owned 798,289 shares of the KACVX, which represents 27.86% of the fund’s outstanding shares. |
42
RENEWAL OF INVESTMENT ADVISORY CONTACT
In November 2006, the Board of Directors of the Fund considered renewal of the Fund’s Investment Advisory Agreement and after a detailed analysis, approved such renewal. In considering renewal, the Board reviewed and discussed in detail the following factors: (i) the nature, extent and quality of service of the Adviser, (ii) the investment performance of the Funds and the Adviser; (iii) the cost of the services to be performed and the profits to be realized by the Adviser and its affiliates from the relationship with the Funds; (iv) the extent to which economies of scale would be realized as the Funds grew and (v) whether the fee levels reflect economies of scale for the benefit of the Funds’ investors.
With respect to the first factor, the Board reviewed the Investment Advisory Agreement and noted that under that agreement, the Adviser provided only investment advice, and that most of the other services were paid for by the Funds and provided by other service providers, such as the transfer agent, custodian, pricing service and administrator. The Board noted, however, that the distributor, an affiliate of the Adviser, paid for certain expenses of the Funds, such as the cost of certain brokerage platforms, which reduced the Funds’ transfer agent expense. The Board noted that the distributor received 12b-1 fees as reimbursement for those expenses, but to date the expenditures by the distributor exceed the reimbursements. The Board discussed the possibility of the Adviser expanding the services to the Funds, but felt that having outside service providers was a benefit to the Funds and its shareholders, and did not feel that the fact that the Adviser was not providing such services was a negative or should adversely impact its decision about renewal of the Investment Advisory Agreement. The Board then directly addressed the quality of the Advisory services, which the Board felt were reflected by the performance of the Adviser and the Funds (which factor is discussed in detail below). Based on the performance, the Board concluded that the quality of the services provided by the Adviser was a significant factor and a basis to renew the Agreement.
The Board reviewed the performance of the Funds based on the information in the draft annual report and in other material furnished to the Board for the purpose of evaluating the performance of the Funds and the Adviser, comparing the Funds’ performance, with and without load, against the S&P Mid Cap 400 Index and the Russell Mid Cap Value Index (Mid Cap Fund) and the Russell 3000 Value Index (All Cap Fund) for the prior 3 month and 1 year (except All Cap) periods and since commencement of operations. The Board also reviewed Morningstar data and S&P data. Using this data, the Funds were consistently in the bottom 5% of its categories for all periods reviewed. The Board considered the fact that the Funds have not been in existence very long and the performance factors were a result of the initial start up of the Funds.
The next factor considered was the cost of the services and the profits to the Adviser. In terms of cost, the Board recognized that the Advisory fee was higher than the fee charged by many Advisers. In making that analysis, the Board reviewed peer group information of 15 other funds. The group of 12 funds were all mid cap value funds and ranged in size from $16.6 million to $2.7 billion. In that analysis, the Board noted that the average Adviser expense for the group was 0.76%. The Board reviewed the Fund-related revenue collected by the Adviser and its affiliates over the past year, which included the investment Advisory fee, 12b-1 fees, brokerage commissions to the affiliated broker and sales load on retail sales made by the distributor. In evaluating those items, the Board compared the 12b-1 fees received versus the expenses incurred. With respect to brokerage, the Board noted that all of the transactions were at a price which the Adviser had represented was the lowest price charged by the affiliated broker to any brokerage customer. In looking at the costs to the Funds, the Board paid particular attention to the total expenses of the Funds, which the Board felt were a reflection of the overall services of the Adviser. The Board
43
noted that although the Advisory fee was in excess of the median and the total expenses of the Fund were 1.95%, the Adviser had just put in place an expense cap at 1.49%, which is close to the average of 1.42%. The Board concluded that although the cost of the Adviser was in excess of the median, the total expenses of the Funds are in line with industry standards and averages, and on the basis of the factor of cost to the Funds and benefit to the Adviser, the agreement should be renewed.
The next factor the Board considered was the extent to which economies of scale would be realized as the Funds grow. In that analysis, the Board reviewed with the Adviser the services to be performed and how those would change as the Funds grew. The Adviser also reviewed with the Board personnel changes it had made to deal with the increased workload, and also reviewed with the Board anticipated additional hirings. The Board concluded that economies of scale could be recognized by the Funds with respect to a number of the service providers, as their fee schedules include break points with increased asset size, but was not certain that a significant economy would result to the Adviser. The Adviser also reminded the Board that it had increased its office space, hired interns, improved benefits and added two disaster recovery areas. The Adviser had also changed fund administrators and is working with a concentrated, efficient team that helps keep costs low.
On the several factors described above, the Board concluded that the Investment Advisory Agreement should be renewed.
44
Proxy Voting Policies and Procedure
You may obtain a description of KEELEY Funds’ proxy voting policies and procedures, without charge, upon request by calling 800.933.5391. That information also is included in KEELEY funds’ statements of additional information, which is available on the Funds’ website at www.keeleyfunds.com and the Securities and Exchange Commission’s website at www.sec.gov.
Information relating to how each KEELEY fund voted proxies relating to portfolio securities held during the twelve month period ended June 30, 2006 is available on the Funds’ website at www.keeleyfunds.com and the Securities and Exchange Commission’s website at www.sec.gov.
Information About Portfolio Securities
KEELEY Funds files a complete schedule of portfolio holding with the Securities and Exchange Commission for the quarters ending June 30, 2006 and December 31, 2006 (the first and third quarters of the funds’ fiscal year) on Form N-Q. The funds’ Forms N-Q are available on the Securities and Exchanges Commission’s website at www.sec. gov. You may also review and copy those documents by visiting the Securities and Exchange Commission’s Public Reference Room in Washington, D.C. Information on the operation of the Public Reference Room may be obtained by calling the Securities and Exchange Commission at 800.SEC.0330.
45

Investment Adviser

KEELEY ASSET MANAGEMENT CORP.
Chicago, Illinois
Distributor

KEELEY INVESTMENT CORP.
Chicago, Illinois
Custodian
U.S. BANK, N.A.
Milwaukee, Wisconsin
888-933-5391
Transfer Agent and Dividend Disbursing Agent
U.S. BANCORP FUND SERVICES, LLC
Milwaukee, Wisconsin
888-933-5391
Independent Registered Public Accounting Firm
PRICEWATERHOUSECOOPERS LLP
Milwaukee, Wisconsin
Counsel
MELTZER, PURTILL, STELLE LLC
Schaumburg, Illinois
Performance information is historical and is not a guarantee of future results. The investment return and principal value of shares will fluctuate and when redeemed, may be worth more or less than the investor’s original cost. This material may only be used when preceded or accompanied by each Fund’s Prospectus.
401 South LaSalle Street • Suite 1201 • Chicago • Illinois • 60605
(312) 786-5050 • (800) 533-5344 • FAX (312) 786-5003
46
Item 2. Code of Ethics.
Not applicable for semi-annual reports.
Item 3. Audit Committee Financial Expert.
Not applicable for semi-annual reports.
Item 4. Principal Accountant Fees and Services.
Not applicable for semi-annual reports.
Item 5. Audit Committee of Listed Registrants.
Not applicable to registrants who are not listed issuers (as defined in Rule 10A-3 under the Securities Exchange Act of 1934).
Item 6. Schedule of Investments.
Schedule of Investments is included as part of the report to shareholders filed under Item 1 of this Form.
Item 7. Disclosure of Proxy Voting Policies and Procedures for Closed-End Management Investment Companies.
Not applicable to open-end investment companies.
Item 8. Portfolio Managers of Closed-End Management Investment Companies.
Not applicable to open-end investment companies.
Item 9. Purchases of Equity Securities by Closed-End Management Investment Company and Affiliated Purchasers.
Not applicable to open-end investment companies.
Item 10. Submission of Matters to a Vote of Security Holders.
There have been no material changes to the procedures by which shareholders may recommend nominees to the registrant’s board of directors/trustees.
Item 11. Controls and Procedures.
| (a) | | The Registrant’s President and Treasurer have reviewed the Registrant's disclosure controls and procedures (as defined in Rule 30a-3(c) under the Investment Company Act of 1940 (the “Act”)) as of a date within 90 days of the filing of this report, as required by Rule 30a-3(b) under the Act and Rules 13a-15(b) or 15d-15(b) under the Securities Exchange Act of 1934. Based on their review, such officers have concluded that the disclosure controls and procedures are effective in ensuring that information required to be disclosed in this report is appropriately recorded, processed, summarized and reported and made known to them by others within the Registrant and by the Registrant’s service provider. |
| |
| (b) | | There were no changes in the Registrant's internal control over financial reporting (as defined in Rule 30a-3(d) under the Act) that occurred during the second fiscal quarter of the period covered by this report that has materially affected, or is reasonably likely to materially affect, the Registrant's internal control over financial reporting. |
Item 12. Exhibits.
| (a) | | (1) Any code of ethics or amendment thereto, that is subject of the disclosure required by Item 2, to the extent that the registrant intends to satisfy Item 2 requirements through filing an exhibit. Not Applicable |
| | |
| | (2) Certifications pursuant to Section 302 of the Sarbanes-Oxley Act of 2002. Filed herewith. |
| | |
| | (3) Any written solicitation to purchase securities under Rule 23c-1 under the Act sent or given during the period covered by the report by or on behalf of the registrant to 10 or more persons. Not applicable to open-end investment companies. |
| | |
| (b) | | Certification pursuant to Section 906 of the Sarbanes-Oxley Act of 2002. Furnished herewith. |
SIGNATURES
Pursuant to the requirements of the Securities Exchange Act of 1934 and the Investment Company Act of 1940, the registrant has duly caused this report to be signed on its behalf by the undersigned, thereunto duly authorized.
| | (Registrant) | Keeley Small Cap Value Fund, Inc. | |
| | By (Signature and Title)* | /s/ John Keeley, Jr. | |
| | John L. Keeley Jr., President | |
| Date | May 24, 2007 | |
Pursuant to the requirements of the Securities Exchange Act of 1934 and the Investment Company Act of 1940, this report has been signed below by the following persons on behalf of the registrant and in the capacities and on the dates indicated.
| | By (Signature and Title)* | /s/ John Keeley Jr. | |
| | | John L. Keeley Jr., President | |
| | Date | May 24, 2007 | |
| By (Signature and Title)* | /s/ Emily Viehweg | |
| | Emily Viehweg, Treasurer | |
| Date | May 24, 2007 | |
* Print the name and title of each signing officer under his or her signature.