LETTER TO SHAREHOLDERS —
KEELEY SMALL CAP VALUE FUND (KSCVX) |
Dear Shareholder,
During the past six months from March 31, 2007 through September 30, 2007, the Fund’s net assets grew from $4,188,378,061 to $5,591,784,929 and the number of shareholders grew from 185,280 to 252,414. For the six month period ending September 30, 2007, the portfolio turnover was 7.51% and the expense ratio was 1.33%. The Fund’s portfolio is widely diversified with investments in 174 equities. As of September 30, 2007, the Keeley family beneficially owned 0.30% of the Fund’s outstanding shares.
As of this date, the KEELEY Small Cap Value Fund was rated five stars («««««) by Morningstar among 157 Small Blend funds for the 10-year period. The Fund also received five stars («««««) for the five year period among 397 funds and five stars («««««) for the three year period among 507 funds. Morningstar ratings reflect historical risk adjusted performance as of September 30, 2007 and are subject to change every month*. As of this date, the Fund rated as a Lipper Leader in the Overall Total Return, Overall Consistent Return, and Overall Tax Efficiency among 574, 571, and 574 funds, respectively. Lipper ratings for Overall Total Return and Overall Consistent Return reflect the Fund’s historical total return performance relative to peers. The Overall rating is calculated monthly, based upon an equal-weighted average of percentile ranks for each measure over three, five, and ten-year periods (if applicable).
For the quarter ended September 30, 2007, the Fund’s total return was -1.90% versus a return of -3.09% for the Russell 2000 Index. For the six month period ended September 30, 2007, the Fund’s return was 6.63% versus 1.19% for the Russell 2000 Index. For the one year period the Fund’s return was 24.30% versus 12.34% for the Russell 2000 Index. For the five-year period, the Fund’s average annual return was 24.00% versus 18.75% for the Russell 2000 Index. For the ten year period, the Fund’s average annual return was 13.66% versus 7.22% for the Russell 2000 Index. Since its inception, October 1, 1993, the Fund’s average annual return was 16.04% versus 10.07% for the Russell 2000 Index. Performance Data does not reflect the deduction of the sales load or fee, and, if reflected, the load or fee would reduce the performance quoted.
Performance Data Including 4.5% Maximum Up-Front Sales Charge
For the quarter ended September 30, 2007, the Fund’s return was -6.31% versus a return of -3.09% for the Russell 2000 Index. For the six month period ended September 30, 2007, the Fund’s return was 1.83% versus 1.19% for the Russell 2000 Index. For the one year period, the Fund’s return was 18.71% versus 12.34% for the Russell 2000 Index. For the five year period, the Fund’s average annual return was 22.86% versus 18.75% for the Russell 2000 Index. For the ten year period, the Fund’s average annual return was 13.14% versus 7.22% for the Russell 2000 Index. Since inception, October 1, 1993, the Fund’s average annual return was 15.66% versus 10.07% for the Russell 2000 Index.
1
Performance data quoted represents past performance and does not guarantee future results. The investment return and principal value of an investment will fluctuate so that an investor’s shares, when redeemed, may be worth more or less than their original cost and the current performance may be lower or higher than the performance data quoted. You may call toll-free at 888-933-5391, or visit our website at www.keeleyfunds.com to obtain performance data current to the most recent month end.
For the third quarter ended September 30, 2007, the KEELEY Small Cap Value Fund (KSCVX) fell -1.90%, outperforming its benchmark, the Russell 2000 Index, which fell -3.09% during the third quarter. The Fund also outperformed the Russell 2000 Value Index, which fell -6.26% in the third quarter. Year-to-date, the portfolio rose 11.00% compared to a 3.16% rise for the Russell 2000 Index, and a -2.70% drop for the Russell 2000 Value Index. For the past several years, we have favored and overweighted the industrial and energy sectors while underweighting financial services. These sector weightings have made a positive contribution to investment results and have been a key factor in the excess return that we have generated for the portfolio over this period of time. During the most recent quarter, the portfolio continued to benefit from exposure in the industrial sector, as the Fund’s holdings in this area contributed 58 basis points of performance to the Fund. Other sectors that contributed positively to results were the materials and utilities sectors. Returns in the financials, energy, and consumer discretionary sectors were the largest detractors during the third quarter. The top two performing names in the Fund came from the industrials sector during the third quarter. Layne Christensen (LAYN) was the top performer, rising over 35% and contributing 35 basis points of return to the Fund. The drilling and construction services company grew second quarter earnings by 33%, driven by strong revenue growth in their energy, mineral exploration, and water infrastructure divisions. McDermott International (MDR) continued its impressive performance in 2007, rising over 30% and contributing 33 basis points of return to the portfolio in the third quarter. The energy services provider has now risen over 110% for the year, and with strong order backlogs and upward earnings revisions, the outlook remains positive. The materials sector also contributed positively to results in the third quarter. AMCOL International (ACO) was the best performer, rising over 21% and contributing 19 basis points of return to the Fund. The maker of specialty minerals is experiencing stronger sales and expanding margins in their environmental and oilfield services divisions.
While it is not our intention to have companies within the portfolio acquired, takeovers are a natural by-product of our investment philosophy. Since many opportunities within the corporate restructuring process are “pure-plays” on a single industry, our companies are inherently takeover prone. In 2006, we had 17 companies acquired at a premium price, and so far in 2007, 11 companies have been acquired or agreed to an acquisition. Recently, announced buyouts of savings bank TierOne (TONE) and laundry equipment maker Coinmach Service (DRA) helped boost returns in 2007. From a macroeconomic standpoint, volatility plagued the markets throughout the third quarter as tightening credit sent stocks sharply lower in July and August. In times of higher volatility, thoughtful stock selection becomes a critical aspect of producing strong returns and fortunately, there is a wealth of activity within our primary investment themes. Our research team continues to
2
be presented with an abundance of restructuring opportunities for our portfolios. We will continue to employ our unique investment process to identify compelling opportunities that we believe will unlock shareholder value.
Thank you for your continued commitment to the Fund.
| Sincerely, |
| |
 |
| John L. Keeley, Jr. |
| President |
There are risks associated with investing in small-cap mutual funds, such as smaller product lines and market shares, including limited available information. You should consider objectives, risks and charges and expenses of a fund carefully before investing. Additional information regarding such risks, including information on fees is located in the Fund’s prospectus. Please read the Fund’s prospectus carefully before investing.
____________________
| * | | Morningstar ratings are based on a risk adjusted return measure that accounts for variation in a Fund’s monthly performance (including the effects of sales charges and redemption fees), placing more emphasis on downward variations and rewarding consistent performance. The overall rating is a weighted average of the three-, five-, and ten-year returns. The top 10% of funds are labeled five stars; the next 22.5% are labeled four stars, the next 35% are labeled three stars; the next 22.5% are labeled two stars and the bottom 10% one star. ©2005 Morningstar, Inc. All Rights Reserved. The information contained herein: (1) is proprietary to Morningstar and/or its content providers; (2) may not be copied or distributed; and (3) is not warranted to be accurate, complete or timely. Neither Morningstar nor its content providers are responsible for any damages or losses arising from any use of this information. Past performance is no guarantee of future results. |
3
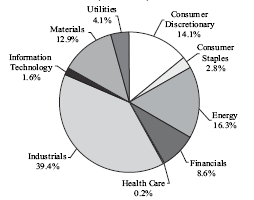
Investments by Sector
As a Percentage of Investments
As of 9/30/2007
(Unaudited)
Index Comparison
Comparison of a Hypothetical $10,000 Investment
In KSCVX and Russell 2000® Index*
(Unaudited)
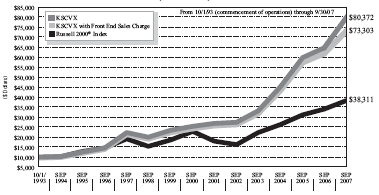
Average annual total returns **
For the periods ended September 30, 2007
| | | | | | | | | Since Commencement |
| | | | | | | | | of Operations |
| | | 1-Year | | 5-Years | | 10-Years | | (10/1/1993) |
| KSCVX | | +24.30% | | +24.00% | | +13.66% | | +16.04% |
| KSCVX (includes max | | | | | | | | |
| 4.50% front-end load) | | +18.71% | | +22.86% | | +13.14% | | +15.66% |
| Russell 2000® Index | | +12.34% | | +18.75% | | +7.22% | | +10.07% |
| * | | The Russell 2000® Index is comprised of the smallest 2,000 companies in the Russell 3000® Index.
The Russell 3000® Index is comprised of the 3,000 largest U.S. companies based on market capitalization. The Russell 2000® Index is unmanaged and returns include reinvested dividends. |
| ** | | PERFORMANCE DATA quoted represents past performance, which is not predictive of future performance. The investment return and principal value of shares will fluctuate and when redeemed, may be worth more or less than their original cost. Returns shown include the reinvestment of all dividends. The graph and table do not reflect the deduction of taxes that a shareholder would pay on Fund distributions or the redemption of shares. |
4
KEELEY Small Cap Value Fund, Inc.
Expense Example
For the Six Month Period Ended September 30, 2007
(Unaudited)
As a shareholder of the KEELEY Small Cap Value Fund (the “Fund”), you incur two types of costs: (1) transaction costs, including sales charges (loads) on purchase payments; and (2) ongoing costs, including management fees; distribution (12b-1) fees; and other Fund expenses. This Example is intended to help you understand your ongoing costs (in dollars) of investing in the Fund and to compare these costs with the ongoing costs of investing in other mutual funds.
The Example is based on an investment of $1,000 invested at the beginning of the period and held for the entire period from April 1, 2007 to September 30, 2007 (the “period”).
Actual Expenses
The first line of the table below provides information about actual account values and actual expenses. You may use the information in this line, together with the amount you invested, to estimate the expenses you paid over the period. Simply divide your account value by $1,000 (for example, an $8,600 account value divided by $1,000 equals 8.6), then multiply the result by the number in the first line under the heading entitled “Expenses Paid During Period” to estimate the expenses you paid on your account during the period.
Hypothetical Example for Comparison Purposes
The second line of the table below provides information about hypothetical account values and hypothetical expenses based on the Fund’s actual expense ratio and an assumed rate of return of 5% per year before expenses, which is not the Fund’s actual return. The hypothetical account values and expenses may not be used to estimate the actual ending account balance or expenses you paid for the period. You may use this information to compare the ongoing costs of investing in the Fund and other funds. To do so, compare this 5% hypothetical example with the 5% hypothetical examples that appear in the shareholder reports of other funds.
Please note that the expenses shown in the table are meant to highlight your ongoing costs only and do not reflect any transactional costs, such as sales charges (loads). Therefore, the second line of the table is useful in comparing the ongoing costs only, and will not help you determine the relative total costs of owning different funds. In addition, if these transactional costs were included, your costs could have been higher.
Expenses Paid During the Period
| | | Beginning | | Ending | | Expenses paid during |
| | | account value | | account value | | the period ended |
| | | April 1, 2007 | | September 30, 2007 | | September 30, 2007* |
| Actual | | $1,000.00 | | $1,066.30 | | $6.89 |
| Hypothetical (5% return | | | | | | |
| before expenses) | | 1,000.00 | | 1,018.40 | | 6.73 |
| * | | Expenses are equal to the Fund’s expense ratio of 1.33% for the six month period, multiplied by the average account value over the period, multiplied by 183/365 (to reflect one-half year period). |
5
KEELEY Small Cap Value Fund
SCHEDULE OF INVESTMENTS
September 30, 2007
| Shares | | | Value |
| | COMMON STOCKS – 100.15% | | |
| | Aerospace & Defense – 3.28% | | |
| 1,195,000 | | GenCorp, Inc. (a) | $ | 14,292,200 |
| 2,170,000 | | Hexcel Corp. (a) | | 49,280,700 |
| 340,000 | | Kaman Corp. | | 11,750,400 |
| 880,000 | | Ladish, Inc. (a) (b) | | 48,822,400 |
| 1,110,000 | | Teledyne Technologies, Inc. (a) | | 59,262,900 |
| | | | | 183,408,600 |
| | | Air Freight & Logistics – 0.48% | | |
| 515,000 | | Atlas Air Worldwide Holdings, Inc. (a) | | 26,589,450 |
| | | Auto Components – 1.53% | | |
| 1,500,000 | | LKQ Corp. (a) | | 52,215,000 |
| 1,270,000 | | Midas, Inc. (a) (b) | | 23,964,900 |
| 361,000 | | Sauer-Danfoss, Inc. | | 9,631,480 |
| | | | | 85,811,380 |
| | | Capital Markets – 3.42% | | |
| 745,000 | | Cowen Group, Inc. (a) (b) | | 10,295,900 |
| 998,000 | | Epoch Holding Corp. (a) (b) | | 14,051,840 |
| 765,000 | | Greenhill & Co., Inc. | | 46,703,250 |
| 1,190,000 | | Investment Technology Group, Inc. (a) | | 51,146,200 |
| 490,000 | | Piper Jaffray Companies (a) | | 26,264,000 |
| 1,350,000 | | SWS Group, Inc. | | 23,881,500 |
| 1,285,000 | | Thomas Weisel Partners Group, Inc. (a) (b) | | 18,645,350 |
| | | | | 190,988,040 |
| | | Chemicals – 2.53% | | |
| 715,000 | | Arch Chemicals, Inc. | | 33,519,200 |
| 1,405,000 | | Koppers Holdings, Inc. (b) | | 54,247,050 |
| 455,000 | | Sensient Technologies Corp. | | 13,135,850 |
| 1,515,000 | | W.R. Grace & Co. (a) | | 40,692,900 |
| | | | | 141,595,000 |
| | | Commercial Banks – 2.35% | | |
| 610,000 | | BankFinancial Corp. | | 9,650,200 |
| 1,625,000 | | Boston Private Financial Holdings, Inc. | | 45,240,000 |
| 435,000 | | MB Financial Corp. | | 15,029,250 |
| 1,097,500 | | PrivateBancorp, Inc. | | 38,236,900 |
| 550,000 | | Wintrust Financial Corp. | | 23,479,500 |
| | | | | 131,635,850 |
| | | Commercial Services & Supplies – 3.58% | | |
| 1,205,000 | | ACCO Brands Corp. (a) | 27,040,200 |
| 1,470,000 | | Cenveo, Inc. (a) | | 31,796,100 |
| 765,000 | | GP Strategies Corp. (a) | | 8,491,500 |
| 1,255,000 | | Layne Christensen Co. (a) (b) | | 69,627,400 |
| 600,000 | | Mac-Gray Corp. (a) | | 7,728,000 |
| 1,660,000 | | PHH Corp. (a) | | 43,624,800 |
| 305,000 | | Standard Parking Corp. (a) | | 12,135,950 |
| | | | | 200,443,950 |
| | | Construction & Engineering – 7.06% | | |
| 1,345,000 | | AECOM Technology Corp. (a) | 46,980,850 |
| 1,020,000 | | Chicago Bridge & Iron Co. | 43,921,200 |
| 632,000 | | Foster Wheeler Ltd. (a) | | 82,968,960 |
| 790,000 | | Granite Construction, Inc. | | 41,885,800 |
| 657,500 | | Integrated Electrical Services, Inc. (a) | | 16,838,575 |
| 1,412,500 | | McDermott International, Inc. (a) | | 76,388,000 |
| 1,335,000 | | Quanta Services, Inc. (a) | | 35,310,750 |
| 867,500 | | The Shaw Group, Inc. (a) | | 50,401,750 |
| | | | | 394,695,885 |
| | | Construction Materials – 0.93% | | |
| 660,000 | | Texas Industries, Inc. | | 51,810,000 |
The accompanying notes are an integral part of these financial statements.
6
KEELEY Small Cap Value Fund
SCHEDULE OF INVESTMENTS (Continued)
September 30, 2007
| Shares | | | | Value |
| | | Consumer Finance – 0.74% | | | |
| 1,830,000 | | Moneygram International, Inc. | | $ | 41,339,700 |
| | | Diversified Financial Services – 1.02% | | | |
| 847,500 | | GATX Corp. | | | 36,230,625 |
| 1,395,000 | | MarketAxess Holdings, Inc. (a) | | | 20,925,000 |
| | | | | | 57,155,625 |
| | | Electric Utilities – 3.08% | | | |
| 762,500 | | Black Hills Corp. | | | 31,277,750 |
| 1,220,000 | | Cleco Corp. | | | 30,829,400 |
| 870,000 | | ITC Holdings Corp. | | | 43,108,500 |
| 1,725,000 | | Portland General Electric Co. | | | 47,955,000 |
| 785,000 | | Westar Energy, Inc. | | | 19,279,600 |
| | | | | | 172,450,250 |
| | | Electrical Equipment – 2.81% | | | |
| 535,000 | | AZZ, Inc. (a) | | | 18,703,600 |
| 797,500 | | General Cable Corp. (a) | | | 53,528,200 |
| 835,000 | | Regal-Beloit Corp. | | | 39,988,150 |
| 1,197,500 | | Superior Essex, Inc. (a) (b) | | | 44,642,800 |
| | | | | | 156,862,750 |
| | | Energy Equipment & Services – 6.49% | | | |
| 1,585,000 | | Allis-Chalmers Energy, Inc. (a) | | | 30,019,900 |
| 995,000 | | Basic Energy Services, Inc. (a) | | | 20,914,900 |
| 1,215,000 | | Bronco Drilling Co., Inc. (a) | | | 17,982,000 |
| 1,105,000 | | Dresser-Rand Group, Inc. (a) | | | 47,194,550 |
| 325,000 | | Key Energy Services, Inc. (a) | | | 5,525,000 |
| 549,000 | | Lufkin Industries, Inc. | | | 30,205,980 |
| 1,457,500 | | Natural Gas Services Group, Inc. (a) (b) | | | 25,083,575 |
| 2,325,000 | | Parker Drilling Co. (a) | | | 18,879,000 |
| 2,550,000 | | Pioneer Drilling Co. (a) (b) | | | 31,059,000 |
| 2,045,000 | | RPC, Inc. | | | 29,059,450 |
| 1,187,500 | | Superior Well Services, Inc. (a) (b) | | | 26,991,875 |
| 1,302,500 | | Tesco Corp. (a) | | | 35,362,875 |
| 1,312,500 | | Willbros Group, Inc. (a) | | | 44,625,000 |
| | | | | | 362,903,105 |
| | | Food Products – 2.51% | | | |
| 1,545,000 | | Flowers Foods, Inc. | | | 33,681,000 |
| 1,475,000 | | Lance, Inc. | | | 33,954,500 |
| 658,000 | | Ralcorp Holdings, Inc. (a) | | | 36,729,560 |
| 1,325,000 | | TreeHouse Foods, Inc. (a) | | | 35,841,250 |
| | | | | | 140,206,310 |
| | | Gas Utilities – 0.69% | | | |
| 1,110,000 | | South Jersey Industries, Inc. | | | 38,628,000 |
| | | Health Care Providers & Services – 0.17% | | | |
| 342,000 | | Emeritus Corp. (a) | | | 9,268,200 |
| | | Hotels Restaurants & Leisure – 0.68% | | | |
| 1,185,000 | | AFC Enterprises, Inc (a) | | | 17,834,250 |
| 5,030,000 | | Denny’s Corp. (a) (b) | | | 20,120,000 |
| | | | | | 37,954,250 |
| | | Hotels, Restaurants & Leisure – 6.38% | | | |
| 2,055,000 | | CKE Restaurants, Inc. | | | 33,311,550 |
| 940,000 | | Gaylord Entertainment Co. (a) | | | 50,026,800 |
| 707,000 | | IHOP Corp. | | | 44,774,310 |
| 2,015,000 | | Interstate Hotels & Resorts, Inc. (a) (b) | | | 9,168,250 |
| 1,530,000 | | Marcus Corp. (b) | | | 29,376,000 |
| 950,000 | | Orient-Express Hotels Ltd. | | | 48,706,500 |
The accompanying notes are an integral part of these financial statements.
7
KEELEY Small Cap Value Fund
SCHEDULE OF INVESTMENTS (Continued)
September 30, 2007
| Shares | | | Value |
| | | Hotels, Restaurants & Leisure (continued) | | |
| 1,440,000 | | Red Lion Hotels Corp. (a) (b) | $ | 14,832,000 |
| 1,275,000 | | The Steak N Shake Co. (a) | | 19,137,750 |
| 54,000 | | Triarc Companies, Inc. - Class A | | 675,540 |
| 1,357,500 | | Triarc Companies, Inc. - Class B | | 16,683,675 |
| 907,500 | | Vail Resorts, Inc. (a) | | 56,528,175 |
| 1,030,000 | | Wyndham Worldwide Corp. | | 33,742,800 |
| | | | | 356,963,350 |
| | | Industrial Conglomerates – 0.86% | | |
| 1,785,000 | | Walter Industries, Inc. | | 48,016,500 |
| | | Insurance – 1.33% | | |
| 700,000 | | Conseco, Inc. (a) | | 11,200,000 |
| 1,077,500 | | Covanta Holding Corp. (a) | | 26,409,525 |
| 1,355,000 | | Meadowbrook Insurance Group, Inc. (a) | | 12,208,550 |
| 1,747,500 | | Phoenix Companies, Inc. | | 24,657,225 |
| | | | | 74,475,300 |
| | | IT Services – 0.82% | | |
| 1,252,500 | | Wright Express Corp. (a) | | 45,703,725 |
| | | Machinery – 18.30% | | |
| 845,000 | | Actuant Corp. - Class A | | 54,899,650 |
| 990,000 | | Albany International Corp. | | 37,115,100 |
| 1,550,000 | | Altra Holdings, Inc. (a) (b) | | 25,838,500 |
| 830,000 | | American Railcar Industries, Inc. | | 18,276,600 |
| 780,000 | | Ampco-Pittsburgh Corp. (b) | | 30,716,400 |
| 584,000 | | Bucyrus International, Inc. - Class A | | 42,591,120 |
| 945,000 | | CIRCOR International, Inc. (b) | | 42,912,450 |
| 730,000 | | EnPro Industries, Inc. (a) | | 29,638,000 |
| 2,265,000 | | Federal Signal Corp. | | 34,790,400 |
| 535,000 | | Flowserve Corp. | | 40,756,300 |
| 1,100,000 | | Gardner Denver, Inc. (a) | | 42,900,000 |
| 1,622,500 | | Greenbrier Companies, Inc. (b) | | 43,336,975 |
| 582,500 | | Joy Global, Inc. | | 29,625,950 |
| 975,000 | | Kaydon Corp. | | 50,690,250 |
| 1,085,000 | | L B Foster Co. (a) (b) | | 47,154,100 |
| 910,000 | | Lindsay Manufacturing Co. (b) | | 39,839,800 |
| 1,075,000 | | Manitowoc Co. | | 47,601,000 |
| 1,360,000 | | Mueller Water Products, Inc. - Class A | | 16,850,400 |
| 1,547,500 | | Mueller Water Products, Inc. - Class B | | 17,022,500 |
| 900,000 | | RBC Bearings, Inc. (a) | | 34,515,000 |
| 615,000 | | Sun Hydraulics, Inc. | | 19,557,000 |
| 580,000 | | Tennant Co. | | 28,246,000 |
| 667,000 | | Terex Corp. (a) | | 59,376,340 |
| 555,000 | | Titan International, Inc. | | 17,715,600 |
| 917,500 | | Trinity Industries, Inc. | | 34,442,950 |
| 715,000 | | Valmont Industries, Inc. | | 60,667,750 |
| 950,000 | | Watts Water Technologies, Inc. - Class A | | 29,165,000 |
| 1,255,000 | | Westinghouse Air Brake Technologies Corp. | | 47,012,300 |
| | | | | 1,023,253,435 |
| | | Media – 1.29% | | |
| 1,112,500 | | Carmike Cinemas, Inc. (b) | | 20,436,625 |
| 2,940,000 | | Gray Television, Inc. (b) | | 24,960,600 |
| 857,500 | | Idearc, Inc. | | 26,985,525 |
| | | | | 72,382,750 |
| | | Metals & Mining – 9.73% | | |
| 235,000 | | Allegheny Technologies, Inc. | | 25,838,250 |
| 1,742,500 | | Alpha Natural Resources, Inc. (a) | | 40,478,275 |
The accompanying notes are an integral part of these financial statements.
8
KEELEY Small Cap Value Fund
SCHEDULE OF INVESTMENTS (Continued)
September 30, 2007
| Shares | | | Value |
| Metals & Mining (continued) | | |
| 1,210,000 | | AM Castle & Co. (b) | $ | 39,446,000 |
| 1,705,000 | | AMCOL International Corp. (b) | | 56,418,450 |
| 960,000 | | Brush Engineered Materials, Inc. (a) | | 49,814,400 |
| 945,000 | | Century Aluminum Co. (a) | | 49,754,250 |
| 1,050,000 | | Commercial Metals Co. | | 33,232,500 |
| 1,085,000 | | Compass Minerals International, Inc. | | 36,933,400 |
| 1,297,500 | | Foundation Coal Holdings, Inc. | | 50,862,000 |
| 570,000 | | Haynes International, Inc. (a) | | 48,660,900 |
| 705,000 | | Kaiser Aluminum Corp. | | 49,751,850 |
| 1,015,000 | | Ryerson, Inc. | | 34,246,100 |
| 720,000 | | Universal Stainless & Alloy (a) (b) | | 28,648,800 |
| | | | | 544,085,175 |
| | | Multiline Retail – 0.83% | | |
| 2,030,000 | | Retail Ventures, Inc. (a) | | 21,132,300 |
| 1,490,000 | | Saks, Inc. | | 25,553,500 |
| | | | | 46,685,800 |
| | | Multi-Utilities – 0.30% | | |
| 3,620,000 | | Aquila, Inc. (a) | | 14,516,200 |
| 173,000 | | Florida Public Utilities Co. | | 2,041,400 |
| | | | | 16,557,600 |
| | | Oil, Gas & Consumable Fuels – 8.17% | | |
| 1,560,000 | | Bois d’Arc Energy, Inc. (a) | | 29,905,200 |
| 992,500 | | Carrizo Oil & Gas, Inc. (a) | | 44,523,550 |
| 1,125,000 | | Comstock Resources, Inc. (a) | | 34,695,000 |
| 997,500 | | Encore Acquisition Co. (a) | | 31,570,875 |
| 2,382,500 | | EXCO Resources, Inc. (a) | | 39,406,550 |
| 1,425,000 | | Goodrich Petroleum Corp. (a) (b) | | 45,172,500 |
| 1,290,000 | | Penn Virginia Corp. (b) | | 56,734,200 |
| 2,250,000 | | PetroHawk Energy Corp. (a) | 36,945,000 |
| 670,000 | | Quicksilver Resources, Inc. (a) | | 31,523,500 |
| 807,500 | | Range Resources Corp. | | 32,832,950 |
| 830,000 | | Western Refining, Inc. | | 33,681,400 |
| 895,000 | | Whiting Petroleum Corp. (a) | | 39,782,750 |
| | | | | 456,773,475 |
| | | Paper & Forest Products – 1.37% | | |
| 402,000 | | Deltic Timber Corp. | | 22,881,840 |
| 1,107,500 | | Neenah Paper, Inc. (b) | | 36,647,175 |
| 1,520,000 | | Wausau Paper Corp. | | 16,948,000 |
| | | | | 76,477,015 |
| | | Road & Rail – 2.03% | | |
| 392,000 | | Amerco, Inc. (a) | | 24,876,320 |
| 1,765,000 | | Genesee & Wyoming, Inc. (a) | | 50,902,600 |
| 1,072,500 | | Kansas City Southern (a) | 34,502,325 |
| 190,000 | | Providence & Worcester Railroad Co. | | 3,439,000 |
| | | | | 113,720,245 |
| | | Specialty Retail – 2.45% | |
| 2,117,500 | | Maidenform Brands, Inc. (a) (b) | | 33,625,900 |
| 2,340,000 | | PEP Boys-Manny, Moe & Jack | | 32,830,200 |
| 1,675,300 | | Prestige Brands Holdings, Inc. (a) | | 18,394,794 |
| 3,025,000 | | Sally Beauty Holdings, Inc. (a) | | 25,561,250 |
| 1,457,500 | | Stage Stores, Inc. | | 26,570,225 |
| | | | | 136,982,369 |
The accompanying notes are an integral part of these financial statements.
9
KEELEY Small Cap Value Fund
SCHEDULE OF INVESTMENTS (Continued)
September 30, 2007
| Shares | | | Value |
| | | Textiles, Apparel & Luxury Goods – 1.31% | | |
| 1,082,500 | | Hanesbrands, Inc. (a) | $ | 30,374,950 |
| 1,345,000 | | Movado Group, Inc. (b) | | 42,932,400 |
| | | | | 73,307,350 |
| | | Thrifts & Mortgage Finance – 1.63% | | |
| 1,870,000 | | BankAtlantic Bancorp, Inc. | | 16,212,900 |
| 310,000 | | Citizens First Bancorp, Inc. | | 5,564,500 |
| 475,000 | | First Niagara Financial Group, Inc. | | 6,721,250 |
| 540,000 | | Home Federal Bancorp, Inc. | | 7,187,400 |
| 1,785,000 | | NewAlliance Bancshares, Inc. | | 26,203,800 |
| 735,000 | | Provident Financial Services, Inc. | | 12,031,950 |
| 1,770,000 | | Westfield Financial, Inc. (b) | | 17,186,700 |
| | | | | 91,108,500 |
| |
| | | Total Common Stocks | | |
| | | (Cost $4,696,122,599) | $ | 5,600,238,934 |
| Principal | | | | | |
| Amount | | | Value | |
| | | SHORT TERM INVESTMENTS – 0.05% | | | |
| | | Investment Companies – 0.05% | | | |
| 2,885,700 | | Fidelity Institutional Money Market Portfolio | $ | 2,885,700 | |
| | | Total Short Term Investments | | | |
| | | (Cost $2,885,700) | $ | 2,885,700 | |
| | | Total Investments – 100.20% | | | |
| | | (Cost $4,699,008,299) | $ | 5,603,124,634 | |
| | | Liabilities in Excess of Other Assets – (0.20)% | | (11,339,705 | ) |
| | | TOTAL NET ASSETS – 100.00% | $ | 5,591,784,929 | |
| | | | | |
| | Percentages are stated as a percent of net assets. | | | |
| | (a) | | Non Income Producing. |
| |
| (b) | | Affliated issuer. See Note 10 in Notes to the Financial Statements |
The accompanying notes are an integral part of these financial statements.
10
KEELEY Small Cap Value Fund, Inc.
STATEMENT OF ASSETS AND LIABILITIES
September 30, 2007
| ASSETS: | | |
| Investments, at value | | |
| Unaffiliated issuers (cost $3,734,929,237) | $ | 4,530,188,719 |
| Affiliated issuers (cost $964,079,062) | | 1,072,935,915 |
| Total Investments | | 5,603,124,634 |
| Cash | | 33,788 |
| Receivable for investments sold | | 2,252,235 |
| Receivable for shares issued | | 37,108,324 |
| Dividends and interest receivable | | 2,581,568 |
| Prepaid expenses and other assets | | 153,598 |
| Total Assets | | 5,645,254,147 |
| | | |
| LIABILITIES: | | |
| Payable for investments purchased | | 33,232,504 |
| Payable for shares redeemed | | 13,620,952 |
| Payable to Adviser | | 4,051,703 |
| Payable to Directors | | 33,999 |
| Accrued 12b-1 fees | | 944,882 |
| Other accrued expenses | | 1,585,178 |
| Total Liabilities | | 53,469,218 |
| NET ASSETS | $ | 5,591,784,929 |
| | | |
| NET ASSETS CONSIST OF: | | |
| Capital stock | $ | 4,568,070,178 |
| Accumulated undistributed net realized gain on investments | | 119,598,416 |
| Net unrealized appreciation on investments | | 904,116,335 |
| NET ASSETS | $ | 5,591,784,929 |
| | | |
| CAPITAL STOCK, $0.01 par value | | |
| Authorized | | 500,000,000 |
| Issued and outstanding | | 193,147,278 |
| | | |
| NET ASSET VALUE AND REDEMPTION PRICE PER SHARE | $ | 28.95 |
| | | |
| MAXIMUM OFFERING PRICE | $ | 30.32 |
KEELEY Small Cap Value Fund, Inc.
STATEMENT OF OPERATIONS
For the Year Ended
September 30, 2007
| INVESTMENT INCOME: | | | |
| Dividend income | | | |
| Affiliated issuers | $ | 3,798,497 | |
| Unaffiliated issuers (Net of $27,823 of foreign witholding taxes) | | 26,003,548 | |
| Interest income | | 2,067,370 | |
| Total Investment Income | | 31,869,415 | |
| | | | |
| EXPENSES: | | | |
| Investment advisory fees | | 39,483,939 | |
| 12b-1 fees | | 10,689,983 | |
| Transfer agent fees and expenses | | 3,639,624 | |
| Administration and accounting fees | | 957,573 | |
| Federal and state registration fees | | 316,832 | |
| Custody fees | | 392,624 | |
| Audit Fees | | 70,034 | |
| Reports to shareholders | | 492,299 | |
| Directors’ fees | | 149,955 | |
| Other | | 407,049 | |
| Total Expenses | | 56,599,912 | |
| NET INVESTMENT LOSS | | (24,730,497 | ) |
| | | | |
| REALIZED AND UNREALIZED GAIN ON INVESTMENTS: | | | |
| Net realized gain/(loss) on investments | | | |
| Unaffiliated issuers | | 153,751,407 | |
| Affiliated issuers | | (3,840,991 | ) |
| Change in net unrealized | | | |
| appreciation on investments | | 658,857,690 | |
| Net Gain on Investments | | 808,768,106 | |
| NET INCREASE IN NET ASSETS RESULTING FROM OPERATIONS | $ | 784,037,609 | |
The accompanying notes are an integral part of these financial statements.
11
KEELEY Small Cap Value Fund, Inc.
STATEMENTS OF CHANGES IN NET ASSETS
| | Year Ended | | Year Ended |
| | September 30, 2007 | | September 30, 2006 |
| OPERATIONS: | | | | | | | |
| Net investment loss | $ | (24,730,497 | ) | | $ | (8,265,612 | ) |
| Net realized gain (loss) on investments | | 149,910,416 | | | | (28,875,466 | ) |
| Change in net unrealized appreciation | | | | | | | |
| on investments | | 658,857,690 | | | | 69,833,055 | |
| Net increase in net assets resulting | | | | | | | |
| from operations | | 784,037,609 | | | | 32,691,977 | |
| | | | | | | | |
| DISTRIBUTIONS: | | | | | | | |
| Net realized gains | | (34,902 | ) | | | (9,190,330 | ) |
| | | | | | | | |
| CAPITAL STOCK TRANSACTIONS: | | | | | | | |
| Proceeds from 106,925,545 and 114,139,817(1) | | | | | | | |
| shares issued, respectively | | 2,920,915,219 | | | | 2,245,147,049 | |
| Proceeds from 1,216 and 399,186(1) shares of | | | | | | | |
| distributions reinvested, respectively | | 32,024 | | | | 8,263,222 | |
| Cost of 32,004,504 and 15,875,067(1) shares | | | | | | | |
| redeemed, respectively | | (867,004,922 | ) | | | (373,255,960 | ) |
| Net increase from capital stock transactions | | 2,053,942,321 | | | | 1,880,154,311 | |
| TOTAL INCREASE IN NET ASSETS | | 2,837,945,028 | | | | 1,903,655,958 | |
| | | | | | | | |
| NET ASSETS: | | | | | | | |
| Beginning of period | | 2,753,839,901 | | | | 850,183,943 | |
| End of period | $ | 5,591,784,929 | | | $ | 2,753,839,901 | |
| Accumulated undistributed net investment loss | $ | — | | | $ | — | |
| (1) | | On July 10, 2006, the Board of Directors declared a 2 for 1 stock split. As a result of the split, each share was converted into two shares on that date. The number of shares in capital stock transactions for the period October 1, 2005 through July 10, 2006 reflect the impact of the split. |
The accompanying notes are an integral part of these financial statements.
12
KEELEY Small Cap Value Fund, Inc.
FINANCIAL HIGHLIGHTS
| | Year Ended September 30, |
| | 2007 | | 2006 | | 2005 | | 2004 | | 2003 |
| PER SHARE DATA (1) | | | | | | | | | | | | | | | | | | | |
| Net asset value, beginning of period | $ | 23.29 | | | $ | 21.73 | | | $ | 16.98 | | | $ | 12.44 | | | $ | 10.95 | |
| Income from investment operations: | | | | | | | | | | | | | | | | | | | |
| Net investment loss | | (0.13 | ) | | | (0.07 | ) | | | (0.06 | ) | | | (0.06 | ) | | | (0.08 | ) |
| Net realized and unrealized gains on | | | | | | | | | | | | | | | | | | | |
| investments | | 5.79 | | | | 2.04 | | | | 5.41 | | | | 4.60 | | | | 2.23 | |
| Total from investment operations | | 5.66 | | | | 1.97 | | | | 5.35 | | | | 4.54 | | | | 2.15 | |
| | | | | | | | | | | | | | | | | | | | |
| Less distributions: | | | | | | | | | | | | | | | | | | | |
| Net realized gains | | — | (2) | | | (0.41 | ) | | | (0.60 | ) | | | — | | | | (0.66 | ) |
| Net asset value, end of period | $ | 28.95 | | | $ | 23.29 | | | $ | 21.73 | | | $ | 16.98 | | | $ | 12.44 | |
| |
| Total return (3) | | 24.30 | % | | | 8.25 | % | | | 32.37 | % | | | 36.45 | % | | | 20.61 | % |
| | | | | | | | | | | | | | | | | | | | |
| Supplemental data and ratios: | | | | | | | | | | | | | | | | | | | |
| Net assets, end of period (in 000’s) | $ | 5,591,785 | | | $ | 2,753,840 | | | $ | 850,184 | | | $ | 206,976 | | | $ | 90,471 | |
| Ratio of expenses to average net assets | | 1.33 | % | | | 1.39 | % | | | 1.52 | % | | | 1.64 | % | | | 1.75 | % |
| Ratio of net investment loss to average | | | | | | | | | | | | | | | | | | | |
| net assets | | (0.58 | )% | | | (0.47 | )% | | | (0.50 | )% | | | (0.57 | )% | | | (0.68 | )% |
| Portfolio turnover rate | | 29.60 | % | | | 17.58 | % | | | 22.93 | % | | | 29.63 | % | | | 38.83 | % |
| (1) | | Per share data is for a share outstanding during the period. On July 10, 2006, the Board of Directors declared a 2 for 1 stock split. As a result of the split, each share was converted into two shares on that date. Per share data for all five years is for a share outstanding throughout the period reflecting the impact of the stock split. |
| (2) | | Amount calculated is less than $0.005 per share. |
| (3) | | The total return calculation does not reflect the sales load imposed on the purchase of shares (see Note 7). |
The accompanying notes are an integral part of these financial statements.
13
KEELEY Small Cap Value Fund, Inc.
NOTES TO THE FINANCIAL STATEMENTS
September 30, 2007
| 1. | | ORGANIZATION |
| | |
| | The KEELEY Small Cap Value Fund, Inc. ( the “Fund”) was incorporated on May 17, 1993 as a Maryland corporation and is registered as a diversified open-end investment company under the Investment Company Act of 1940 (the “1940 Act”). |
| | | |
| 2. | | SIGNIFICANT ACCOUNTING POLICIES |
| | |
| | The following is a summary of significant accounting policies consistently followed by the Fund in the preparation of its financial statements. These policies are in conformity with accounting principles generally accepted in the United States of America (“GAAP”) The presentation of financial statements in conformity with GAAP requires management to make estimates and assumptions that affect the reported amounts of assets and liabilities at the date of the financial statements and the reported amounts of revenues and expenses during the reporting period. Actual results could differ from those estimates and assumptions. |
| | |
| | a) Investment Valuation – Securities which are traded on a recognized stock exchange are valued at the last sale price each day on the securities exchange on which such securities are primarily traded or at the last sale price on a national securities exchange. Exchange-traded securities for which there were no transactions are valued at the current bid prices. Securities traded on only over-the-counter markets are valued on the basis of last sale price, or closing over-the-counter bid prices when there is no last sale price available. Debt securities (other than short-term obligations) are valued by a service that uses electronic data processing methods, avoiding exclusive reliance on exchange or over-the-counter prices. Debt securities purchased within 60 days of their stated maturity date are valued at amortized cost, which approximates fair value. Securities for which quotations are not readily available are valued at fair value as determined in good faith by the Board of Directors. For each investment that is fair valued, if any, the Board of Directors considers, to the extent applicable, various factors including, but not limited to, the financial condition of the company, comparable companies in the public market, the nature and duration of the cause for a quotation not being readily available and other relevant factors. |
| | |
| | In September 2006, the Financial Accounting Standards Board issued its new Standard No. 157, “Fair Value Measurements” (“FAS 157”). FAS 157 is designed to unify guidance for the measurement of fair value of all types of assets, including financial instruments, and certain liabilities, throughout a number of accounting standards. FAS 157 also establishes a hierarchy for measuring fair value in generally accepted accounting principles and expands financial statement disclosures about fair value measurements that are relevant to mutual funds. FAS 157 is effective for financial statements issued for fiscal years beginning after November 15, 2007, and earlier adoption is permitted. At this time, management believes the adoption of FAS 157 will have no material impact on the financial statements of the Fund. |
14
KEELEY Small Cap Value Fund, Inc.
NOTES TO THE FINANCIAL STATEMENTS (Continued)
September 30, 2007
| | | b) Federal Income and Excise Taxes – It is the Fund’s policy to meet the requirements of Subtitle A, Chapter 1, Subchapter M of the Internal Revenue Code, as amended, applicable to regulated investment companies and to distribute substantially all investment company net taxable income and net capital gains to shareholders in a manner which results in no tax cost to the Fund. Therefore, no federal income or excise tax provision is required. On July 13, 2006, the Financial Accounting Standards Board (“FASB”) released FASB Interpretation No. 48 “Accounting for Uncertainty in Income Taxes” (“FIN 48”). FIN 48 provides guidance for how uncertain tax positions should be recognized, measured, presented and disclosed in the financial statements. FIN 48 requires the evaluation of tax positions taken or expected to be taken in the course of preparing the Fund’s tax returns to determine whether the tax positions are “more-likely-than-not” of being sustained by the applicable tax authority. Tax positions not deemed to meet the more-likely-than-not threshold would be recorded as a tax benefit or expense in the current year. Adoption of FIN 48 is required as of the date of the last net asset value calculation in the first required financial statement reporting period for fiscal years beginning after December 15, 2006 and is to be applied to all open tax years as of the effective date. At this time, management is evaluating the implications of FIN 48 to the Fund and its impact in the financial statements has not yet been determined. c) Distributions to Shareholders – Dividends from net investment income, if any, will be declared and paid annually. Distributions of net realized gains, if any, will be declared and paid annually. Distributions to shareholders are recorded on the ex-dividend date. The Fund may periodically make reclassifications among certain of its capital accounts as a result of the characterization of certain income and realized gains determined annually in accordance with federal tax regulations that may differ from generally accepted accounting principles. For the year ended September 30, 2007, the Fund increased undistributed net investment income by $24,730,497, increased accumulated net realized gain by $27,846 and decreased paid in capital by $24,758,343. These reclassifications between capital accounts were made for only those differences that are permanent in nature. d) Other – Investment transactions are recorded on the trade date. The Fund determines the gain or loss realized from investment transactions by comparing the identified original cost of the security lot sold with the net sale proceeds. Dividend income is recognized on the ex-dividend date and interest income is recognized on an accrual basis, including amortization/accretion of premiums or discounts using the effective interest method. e) Guarantees and Indemnifications – In the normal course of business, the Fund enters into contracts with service providers that contain general indemnification clauses. The Fund’s maximum exposure under these arrangements is unknown as this would involve future claims against the Fund that have not yet occurred. Based on experience, the Fund expects the risk of loss to be remote. |
15
KEELEY Small Cap Value Fund, Inc.
NOTES TO THE FINANCIAL STATEMENTS (Continued)
September 30, 2007
| 3. | | INVESTMENT ADVISORY AGREEMENT |
| |
| | | The Fund has an agreement with Keeley Asset Management Corp. (the “Adviser”), with whom certain officers and directors of the Fund are affiliated, to furnish investment advisory services to the Fund (the “Investment Advisory Agreement”). Under the terms of this agreement, the Fund pays the Adviser a monthly fee at the annual rate of 1.00% of the Fund’s first $1 billion and 0.90% in excess of $1 billion of the Fund’s average daily net assets. Under the Investment Advisory Agreement, if the aggregate annual operating expenses (excluding interest, taxes, brokerage commissions and other costs incurred in connection with the purchase or sale of portfolio securities, and extraordinary items) exceed 2.50% of the Fund’s average daily net assets, the Adviser will reimburse the Fund for the amount of such excess expenses. Because the aggregate annual operating expenses did not exceed 2.50% of the Fund’s average daily net assets, the Adviser has not reimbursed the Fund in the current fiscal year, nor the prior three fiscal years. |
| |
| 4. | | DISTRIBUTION PLAN |
| |
| | | The Fund has adopted a Distribution Plan (the “Plan”) pursuant to Rule 12b-1 under the 1940 Act. The Plan is designed to reimburse Keeley Investment Corp. (the “Distributor”), with whom certain officers and directors of the Fund are affiliated, for certain promotional and other sales related costs and to permit the Fund to compensate other dealers of its shares. Unreimbursed amounts may be carried forward and paid in a subsequent year, to the extent that total expenses under the plan do not exceed 0.25% of the average daily net assets of the Fund. The Fund paid to the Distributor and each dealer a monthly fee at the annual rate of 0.25% of the average daily net assets of Fund shares beneficially owned by the Distributor’s and each dealer’s existing brokerage clients. For the period from October 1, 2006 to September 30, 2007, the Fund paid $10,689,983 in distribution fees, of which $624,757 was paid to the Distributor. |
| |
| 5. | | INVESTMENT TRANSACTIONS |
| |
| | | The aggregate purchases and sales of securities, excluding short-term investments, for the Fund for the period from October 1, 2006 to September 30, 2007, were $3,361,229,474 and $1,251,267,376, respectively. For the period from October 1, 2006 to September 30, 2007, the Fund paid $8,151,376 in brokerage commissions on trades of securities to the Distributor. |
| |
| 6. | | FEDERAL INCOME TAX INFORMATION |
| |
| | | At September 30, 2007, gross unrealized appreciation and depreciation of investments, based on cost for federal income tax purposes were as follows: |
| | Cost of Investments | | $ | 4,700,606,522 | |
| Gross Unrealized Appreciation | | $ | 1,142,875,163 | |
| Gross Unrealized Depreciation | | | (240,357,051 | ) |
| Net Unrealized Appreciation | | | | |
| on Investments | | $ | 902,518,112 | |
16
KEELEY Small Cap Value Fund, Inc.
NOTES TO THE FINANCIAL STATEMENTS (Continued)
September 30, 2007
| | The difference between cost amounts for financial statement and federal income tax purposes is due primarily to timing differences resulting from wash sale transactions during the year. |
| |
| At September 30, 2007, the Fund had no realized Post-October capital losses for federal income tax purposes from transactions between November 1, 2006 and September 30, 2007. |
| |
| | The tax character of distributions paid during the fiscal years ended September 30, 2007 and 2006 were as follows: |
| | | 2007 | | | 2006 |
| | Long-Term Capital Gains | $ | 34,902 | | $ | 9,190,330 |
| | As of September 30, 2007 the components of accumulated earnings on a tax basis were as follows: | | |
| | | |
| | Undistributed Long-term Capital Gains | $ | 121,196,639 |
| | Unrealized Appreciation on Investments | | 902,518,112 |
| | Total Accumulated Earnings | $ | 1,023,714,751 |
| 7. | | OFFERING PRICE PER SHARE |
| |
| | | The public offering price is the net asset value plus a sales charge, which varies in accordance with the amount of the purchase up to a maximum of 4.5%. |
| |
| | | The Distributor retains the entire sales charge when it makes sales directly to the public. Otherwise, when sales are made through dealers, the Distributor receives a portion of the related sales charge. For the period from October 1, 2006 to September 30, 2007, the Distributor received $1,700,092 of sales charges. Sales charges are not an expense of the Fund and are not reflected in the financial statements of the Fund. |
| |
| | | As specified in the Fund’s Prospectus, reduced sales charges are available through a right of accumulation and certain sales of Fund shares can be made at net asset value per share. |
| |
| 8. | | LINE OF CREDIT ARRANGEMENT |
| |
| | | The Fund is party to an uncommitted line of credit with U.S. Bank, N.A., expiring March 1st, 2008, under which the Fund may borrow up to the lesser of (a) $300 million or (b) 10% of the market value of the assets of the Fund. Interest is charged on borrowings at the prevailing Prime Rate. The Fund has borrowed under these agreements from time to time to increase the efficiency of cash flow management. For the year ended September 30, 2007, the Fund made interest payments of $28,287 in connection with the use of this line of credit, and had average daily borrowings of $327,784. |
| |
| 9. | | RELATED PARTY TRANSACTION |
| |
| | | As of September 30, 2007, one affiliated director beneficially owned 583,505 shares of the Fund, which represents 0.30% of the Fund’s outstanding shares. |
| |
17
KEELEY Small Cap Value Fund, Inc.
NOTES TO THE FINANCIAL STATEMENTS (Continued)
September 30, 2007
| 10. | | TRANSACTIONS WITH AFFILIATES |
| |
| | | The following issuers are affiliated with the Fund; that is, the Fund held 5% or more of the outstanding voting securities during the period from October 1, 2006 through September 30, 2007. As defined in Section (2)(a)(3) of the 1940 Act, such issuers are: |
| |
| | | Share Balance | | | | | | Share Balance | | | | Value At |
| | | At October 1, | | | | | | At September 30, | | Dividend | | September 30, |
| Issuer Name | | 2006 | | Additions | | Reductions | | 2007 | | Income | | 2007 |
| Altra Holdings, Inc. | | — | | 1,550,000 | | | — | | | 1,550,000 | | $ | — | | $ | 25,838,500 |
| AM Castle & Co. | | 597,500 | | 612,500 | | | — | | | 1,210,000 | | | 199,200 | | | 39,446,000 |
| AMCOL International Corp. | | — | | 1,705,000 | | | — | | | 1,705,000 | | | 449,800 | | | 56,418,450 |
| Ampco-Pittsburgh Corp. | | — | | 780,000 | | | — | | | 780,000 | | | 140,985 | | | 30,716,400 |
| Carmike Cinemas, Inc. | | — | | 1,112,500 | | | — | | | 1,112,500 | | | 286,738 | | | 20,436,625 |
| CIRCOR International, Inc. | | 600,000 | | 345,000 | | | — | | | 945,000 | | | 118,406 | | | 42,912,450 |
| Cowen Group, Inc. | | 150,000 | | 595,000 | | | — | | | 745,000 | | | — | | | 10,295,900 |
| Denny’s Corp. | | 3,874,500 | | 1,155,500 | | | — | | | 5,030,000 | | | — | | | 20,120,000 |
| Epoch Holding Corp. | | 945,714 | | 52,286 | | | — | | | 998,000 | | | — | | | 14,051,840 |
| Goodrich Petroleum Corp. | | 647,500 | | 777,500 | | | — | | | 1,425,000 | | | — | | | 45,172,500 |
| Gray Television, Inc. | | — | | 2,940,000 | | | — | | | 2,940,000 | | | 219,600 | | | 24,960,600 |
| Greenbrier Companies, Inc. | | 760,000 | | 862,500 | | | — | | | 1,622,500 | | | 378,400 | | | 43,336,975 |
| Interstate Hotels & Resorts, Inc. | | 1,310,000 | | 725,000 | | | (20,000 | ) | | 2,015,000 | | | — | | | 9,168,250 |
| Koppers Holdings, Inc. | | — | | 1,405,000 | | | — | | | 1,405,000 | | | 482,256 | | | 54,247,050 |
| L B Foster Co. | | 830,000 | | 255,000 | | | — | | | 1,085,000 | | | — | | | 47,154,100 |
| Ladish, Inc. | | 632,500 | | 247,500 | | | — | | | 880,000 | | | — | | | 48,822,400 |
| Layne Christensen Co. | | — | | 1,255,000 | | | — | | | 1,255,000 | | | — | | | 69,627,400 |
| Lindsay Manufacturing Co. | | 415,000 | | 495,000 | | | — | | | 910,000 | | | 174,000 | | | 39,839,800 |
| Maidenform Brands, Inc. | | — | | 2,117,500 | | | — | | | 2,117,500 | | | — | | | 33,625,900 |
| Marcus Corp. | | 867,500 | | 662,500 | | | — | | | 1,530,000 | | | 369,500 | | | 29,376,000 |
| Midas, Inc. | | 780,000 | | 490,000 | | | — | | | 1,270,000 | | | — | | | 23,964,900 |
| Movado Group, Inc. | | 775,000 | | 570,000 | | | — | | | 1,345,000 | | | 283,800 | | | 42,932,400 |
| Natural Gas Services | | | | | | | | | | | | | | | | |
| Group, Inc. | | 655,000 | | 802,500 | | | — | | | 1,457,500 | | | — | | | 25,083,575 |
| Neenah Paper, Inc. | | 500,000 | | 607,500 | | | — | | | 1,107,500 | | | 335,250 | | | 36,647,175 |
| NU Horizons Electronics Corp. | | 617,000 | | 768,000 | | | (1,385,000 | ) | | — | | | — | | | — |
| Penn Virginia Corp. | | — | | 675,000 | * | | — | | | 1,290,000 | | | 146,812 | | | 56,734,200 |
| Pioneer Drilling Co. | | 950,000 | | 1,600,000 | | | — | | | 2,550,000 | | | — | | | 31,059,000 |
| Ready Mix, Inc. | | 297,500 | | — | | | (297,500 | ) | | — | | | — | | | — |
| Red Lion Hotels Corp. | | 1,380,000 | | 60,000 | | | — | | | 1,440,000 | | | — | | | 14,832,000 |
| Superior Essex, Inc. | | 625,000 | | 572,500 | | | — | | | 1,197,500 | | | — | | | 44,642,800 |
| Superior Well Services, Inc. | | 595,000 | | 592,500 | | | — | | | 1,187,500 | | | — | | | 26,991,875 |
| Thomas Weisel Partners | | | | | | | | | | | | | | | | |
| Group, Inc. | | 55,000 | | 1,295,000 | | | (65,000 | ) | | 1,285,000 | | | — | | | 18,645,350 |
| Universal Stainless & Alloy | | — | | 720,000 | | | — | | | 720,000 | | | — | | | 28,648,800 |
| Westfeild Financial, Inc. | | — | | 1,770,000 | | | — | | | 1,770,000 | | | 213,750 | | | 17,186,700 |
| | | | | | | | | | | | | $ | 3,798,497 | | $ | 1,072,935,915 |
| * | The Fund purchased 615,000 shares prior to a 2 for 1 stock split in the company on June 20, 2007. 60,000 shares were purchased post-split. The total share balance as of September 30, 2007 represents the split-adjusted amount. |
18
KEELEY Small Cap Value Fund, Inc.
NOTES TO THE FINANCIAL STATEMENTS (Continued)
September 30, 2007
| 11. | SUBSEQUENT EVENTS |
| |
| | On August 14, 2007, the Board of Directors of KEELEY Funds, Inc. unanimously approved a plan of reorganization of KEELEY Small Cap Value Fund, Inc. into a newly created series of KEELEY Funds, Inc., designated “KEELEY Small Cap Value Fund,” effective as of December 31, 2007. |
| |
19
| LETTER TO SHAREHOLDERS — |
| KEELEY MID CAP VALUE FUND (KMCVX) |
Dear Shareholder,
During the past six months from March 31, 2007 through September 30, 2007, the Fund’s net assets grew from $64,761,421 to $108,571,966 and the number of shareholders grew from 2,632 to 4,278. For the six month period ending September 30, 2007, the portfolio turnover was 18.96% and the expense ratio was 1.47%. On August 15, 2007 Keeley Asset Management Corp. (the “Adviser”) contractually agreed, effective October 1, 2007 to waive a portion of its fee or reimburse the Fund to the extent that the total ordinary operating expenses exceed 1.39%. This waiver will be in effect until September 30, 2008. The Fund’s portfolio is diversified with investments in 53 equities. As of September 30, 2007, the Keeley family beneficially owned 11.76% of the Fund’s outstanding shares.
For the quarter ended September 30, 2007, the Fund’s return was 1.22% versus a return of -3.55% for the Russell Mid Cap Value Index. For the six month period ended September 30, 2007, the Fund’s return was 14.31% versus -0.03% for the Russell Mid Cap Value Index. For the one year period ended September 30, 2007, the Fund’s return was 33.40% versus 13.75% for the Russell Mid Cap Value Index. Since inception, August 15, 2005, the Fund’s average annual return was 17.70% versus 12.82% for the Russell Mid Cap Value Index. Performance data does not reflect the deduction of the sales load or fee, and, if reflected, the load or fee would reduce the performance quoted.
Performance Data Including 4.5% Maximum Up-Front Sales Charge
For the quarter ended September 30, 2007, the Fund’s return was -3.34% versus a return of -3.55% for the Russell Mid Cap Value Index. For the six month period ended September 30, 2007, the Fund’s return was 9.16% versus -0.03% for the Russell Mid Cap Value Index. For the one year period ended September 30, 2007, the Fund’s return was 27.39% versus 13.75% for the Russell Mid Cap Value Index. Since inception, August 15, 2005, the Fund’s average annual return was 15.15% versus 12.82% for the Russell Mid Cap Value Index.
Performance data quoted represents past performance and does not guarantee future results. The investment return and principal value of an investment will fluctuate so that an investor’s shares, when redeemed, may be worth more or less than their original cost and the current performance my be lower or higher than the performance data quoted. You may call toll-free at 888-933-5391, or visit our website at www.keeleyfunds.com to obtain performance data current to the most recent month end.
The KEELEY Mid Cap Value Fund (KMCVX) outperformed its benchmark, the Russell Mid Cap Value Index, for the quarter ended September 30, 2007. The portfolio rose 1.22% compared to a -3.55% decline for the benchmark. Year-to-date, the Fund has substantially outperformed its benchmark, rising 21.17% compared to a 4.83% increase for the Russell Mid Cap Value Index. The portfolio continued to benefit from exposure in the industrial sector, as the Fund’s holdings in this area were very strong, contributing 282 basis points of performance. Other sectors that contributed positively to results were the financials
20
and energy sectors. Returns in the materials and consumer discretionary sectors were the largest detractors during the third quarter. A number of the portfolio’s best stocks in the third quarter came from the industrial sector. The top performing position in the Fund was KBR Inc. (KBR), which rose 47% and contributed 86 basis points of return to the fund. The engineering and construction services company, which was spun-off from Halliburton in April, benefited from the sale of its stake in a British dockyard, and second quarter earnings rose 52%. McDermott International (MDR) was the second best performing industrial name as it continued its impressive performance in 2007, rising over 30% and contributing 74 basis points of return to the portfolio in the third quarter. The energy services provider has now risen over 110% for the year, and with strong order backlogs and upward earnings revisions, the outlook remains positive.
From a macroeconomic standpoint, volatility plagued the markets throughout the third quarter as tightening credit sent stocks sharply lower in July and August. In times of higher volatility, thoughtful stock selection becomes a critical aspect of producing strong returns and fortunately, there is a wealth of activity within our primary investment themes. Our research team continues to be presented with an abundance of restructuring opportunities for our portfolios. We will continue to employ our unique investment process to identify compelling opportunities that we believe will unlock shareholder value.
Thank you for your continued commitment to the Fund.
| Sincerely, |
 |
| John L. Keeley, Jr. |
| President |
There are risks associated with investing in small-cap mutual funds, such as smaller product lines and market shares, including limited available information. You should consider objectives, risks and charges and expenses of a fund carefully before investing. Additional information regarding such risks, including information on fees is located in the Fund’s prospectus. Please read the Fund’s prospectus carefully before investing.
21
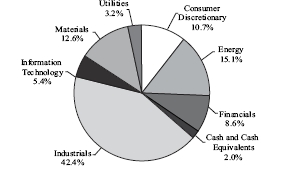
Investments by Sector
As a Percentage of Investments
As of 9/30/07
(Unaudited)
Index Comparison
Comparison of a Hypothetical $10,000 Investment
In KMCVX and Russell Midcap® Value Index*
(Unaudited)

Average annual total returns **
For the periods ended September 30, 2007
| | | | Since Commencement |
| | | | of Operations |
| | 1-Year | | (8/12/2005)(1) |
| KMCVX | +33.40% | | +17.70% |
| KMCVX (includes max | | | |
| 4.50% front-end load) | +27.39% | | +15.15% |
| Russell Midcap® Value Index | +13.75% | | +12.82% |
| * | | The Russell Midcap® Value Index of common is an unmananged index of common stock prices that measures the performance of those Russell Midcap® companies with lower price-to-book ratios and lower forecasted growth values. These Index figures do not reflect any deduction for fees, expenses or taxes, and are not available for investment. |
| ** | | PERFORMANCE DATA quoted represents past performance which is not predictive of future performance. The investment return and principal value of shares will fluctuate and when redeemed, may be worth more or less than their original cost. Returns shown include the reinvestment of all dividends. The graph and table do not reflect the deduction of taxes that a shareholder would pay on Fund distributions or the redemption of shares. |
| (1) | | Not annualized. |
22
LETTER TO SHAREHOLDERS —
KEELEY ALL CAP VALUE FUND (KACVX) |
Dear Shareholder,
The KEELEY All Cap Value Fund commenced operations on June 14, 2006. During the past six months from March 31, 2007 through September 30, 2007, the Fund’s net assets grew from $34,153,522 to $76,989,943 and the number of shareholders grew from 1,151 to 2,785. For the six month period ending September 30, 2007, the portfolio turnover was 21.64% and the expense ratio was capped by Keeley Asset Management Corp. (the “Adviser”) at 1.49%. On August 15, 2007 the Adviser contractually agreed, effective October 1, 2007 to waive a portion of its fee or reimburse the Fund to the extent that the total ordinary operating expenses exceed 1.39%. This waiver will be in effect until September 30, 2008. The Fund’s portfolio is widely diversified with investments in 97 equities. As of September 30th, 2007, the Keeley family beneficially owned 15.38% of the Fund’s outstanding shares.
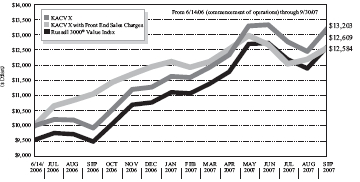
For the quarter ended September 30, 2007, the Fund’s return was -0.90% versus a return of -0.75% for the Russell 3000 Value Index. For the six month period ended September 30, 2007, the Fund’s return was 10.74% versus 3.90% for the Russell 3000 Value Index. For the one year period ended September 30, 2007, the Fund’s return was 32.97% versus 13.73% for the Russell 3000 Value Index. Since inception, June 14, 2006, the Fund’s return was 23.92% versus 19.32% for the Russell 3000 Value Index. Performance Data does not reflect the deduction of the sales load or fee, and, if reflected, the load or fee would reduce the performance quoted.
Performance Data Including 4.5% Maximum Up-Front Sales Charge
For the quarter ended September 30, 2007, the Fund’s total return was -5.36% versus a return of -0.75% for the Russell 3000 Value Index. For the six month period ended September 30, 2007, the Fund’s return was 5.76% versus 3.90% for the Russell 3000 Value Index. For the one year period ended September 30th, 2007, the Fund’s return was 26.98% versus 13.73% for the Russell 3000 Value Index. Since inception, June 14, 2006, the Fund’s average annual return was 19.55% versus 19.32% for the Russell 3000 Value Index.
Performance data quoted represents past performance and does not guarantee future results. The investment return and principal value of an investment will fluctuate so that an investor’s shares, when redeemed, may be worth more or less than their original cost and the current performance my be lower or higher than the performance data quoted. You may call toll-free at 888-933-5391, or visit our website at www.keeleyfunds.com to obtain performance data current to the most recent month end.
The KEELEY All Cap Value Fund (KACVX) slightly underperformed its benchmark, the Russell 3000 Value Index, for the quarter ended September 30, 2007. The portfolio declined -0.90% versus a -0.75% drop for the benchmark. Year-to-date, the Fund has substantially outperformed its benchmark, rising 17.13% compared to a 5.21% increase for the Russell 3000 Value Index. The portfolio continued to benefit from exposure in the industrial
23
sector, as the Fund’s holdings in this area contributed 140 basis points of performance to the portfolio. While stock selection was strong in the consumer discretionary sector, returns in that area were the largest detractor from the Fund’s performance in the third quarter. Returns from the industrial sector had the greatest positive impact on performance during the third quarter. L.B. Foster (FSTR) was the top performer, rising over 51% and adding 57 basis points of return to the Fund. Shares of the maker of rail and construction products rose sharply after second-quarter profit more than doubled. The firm also benefited from the announcement that the Canadian Pacific Railway reached an agreement to acquire the Dakota Minnesota and Eastern Railroad (“DM&E”) in which L.B. Foster holds a minority equity interest. KBR Inc. (KBR) was the second best performing industrial name, rising over 47% and contributing 46 basis points to the Fund. The engineering and construction services company, which was spun-off from Halliburton in April, benefited from the sale of its stake in a British dockyard, and second quarter earnings rose 52%. As mentioned previously, the largest detractor from performance during the third quarter was the consumer discretionary sector. However, stock selection in the sector was strong, and the single largest contributor to performance, Las Vegas Sands (LVS), came from this area. Dillard’s (DDS) was the weakest performing stock in the sector, falling 39% and detracting 48 basis points of performance from the Fund. The retailer saw same-store sales drop 5% in August and 7% in September. Houston Wire & Cable (HWCC) was the second largest detractor in the sector, dropping 31% and detracting 40 basis points of return from the portfolio. Although second quarter profits and sales rose, results for the cable and wire distributor were below Wall Street analysts’ expectations.
From a macroeconomic standpoint, volatility plagued the markets throughout the third quarter as tightening credit sent stocks sharply lower in July and August. In times of higher volatility, thoughtful stock selection becomes a critical aspect of producing strong returns and fortunately, there is a wealth of activity within our primary investment themes. Our research team continues to be presented with an abundance of restructuring opportunities for our portfolios. We will continue to employ our unique investment process to identify compelling opportunities that we believe will unlock shareholder value.
| Sincerely, | |
 | |
| John L. Keeley, Jr. | |
| President | |
There are risks associated with investing in small-cap mutual funds, such as smaller product lines and market shares, including limited available information. You should consider objectives, risks and charges and expenses of a fund carefully before investing. Additional information regarding such risks, including information on fees is located in Fund’s prospectus. Please read the Fund’s prospectus carefully before investing.
24
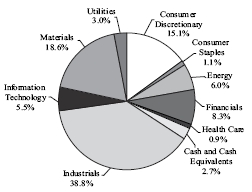
Investments by Sector
As a Percentage of Investments
As of 9/30/07
(Unaudited)
Index Comparison
Comparison of a Hypothetical $10,000 Investment
In KACVX and Russell 3000® Value Index*
(Unaudited)
Total returns **
For the periods ended September 30, 2007
| | | | Since Commencement |
| | | | of Operations(1) |
| | 1 year | | (6/14/2006) |
| KACVX | +32.97% | | +23.92% |
| KACVX (includes max | | | |
| 4.50% front-end load) | +26.98% | | +19.55% |
| Russell 3000® Value Index | +13.73% | | +19.32% |
| * | | The Russell 3000® Value Index measures the performance of those Russell 3000® Index companies with lower price-to-book ratios and lower forecasted growth values. The stocks in this index are also members of either the Russell 1000® Value or the Russell 2000® Value indexes. |
| ** | | PERFORMANCE DATA quoted represents past performance which is not predictive of future performance. The investment return and principal value of shares will not fluctuate and when redeemed, may be worth more or less than their original cost. Returns shown include the reinvestment of all dividends. The graph and table do not reflect the deduction of taxes that a shareholder would pay on Fund distributions or the redemption of shares. |
| (1) | | Not annualized. |
25
| LETTER TO SHAREHOLDERS — |
| KEELEY SMALL-MID CAP VALUE FUND (KSMVX AND KSMIX) |
Dear Shareholder,
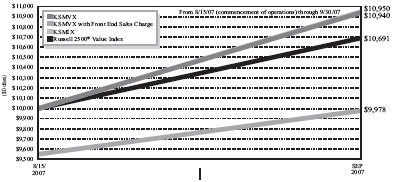
The KEELEY Small-Mid Cap Value Fund commenced operations on August 15, 2007. As of September 30, 2007, the Fund’s net assets were $4,780,416 and the fund had 93 shareholders. For the period ending September 30, 2007, the portfolio turnover was 0.91%. On August 15, 2007 Keeley Asset Management Corp. (the “Adviser”) contractually agreed to waive a portion of its fee or reimburse the Fund to the extent that the total ordinary operating expenses exceed 1.39% for the Class A shares and 1.14% for the Class I shares. This waiver will be in effect until September 30, 2009. The Fund’s portfolio is widely diversified with investments in 77 equities. As of September 30, 2007, the Keeley family beneficially owned 55.81% of the Fund’s Class A outstanding shares and 100% of the Fund’s Class I outstanding shares. In the first full month of its history, the Class A shares rose 6.42% and the Class I shares rose 6.31%, outperforming its benchmark, the Russell 2500 Value Index, which climbed 1.04% in September. Performance Data does not reflect the deduction of the sales load or fee, and that, if reflected, the load or fee would reduce the performance quoted.
Performance Data Including 4.5% Maximum Up-Front Sales Charge
In the first full month of its history, the Class A shares rose 1.63%, outperforming its benchmark, the Russell 2500 Value Index, which climbed 1.04% in September. The Fund does not charge up-front sales charges for investments in Class I shares.
Performance data quoted represents past performance and does not guarantee future results. The investment return and principal value of an investment will fluctuate so that an investor’s shares, when redeemed, may be worth more or less than their original cost and the current performance my be lower or higher than the performance data quoted. You may call toll-free at 888-933-5391, or visit our website at www.keeleyfunds.com to obtain performance data current to the most recent month end.
The Small-Mid Cap Value Fund is the natural evolution of our highly successful KEELEY Small Cap Value Fund. With our patient, long-term approach to stock selection, we believe the added flexibility in market capitalization will be a strong complement to our other product offerings, specifically the Small Cap Value Fund. The Fund will be managed using the same corporate restructuring investment discipline as the firm’s highly-rated flagship product, the KEELEY Small Cap Value Fund (KSCVX), as well as the KEELEY Mid
26
Cap Value Fund (KMCVX) and KEELEY All Cap Value Fund (KACVX). The Fund will not concentrate on any specific sector or industry and primarily invest in small and mid-cap stocks with market capitalizations of $7.5 billion or less at the time of investment.
| Sincerely, | |
 | |
| John L. Keeley, Jr. | |
| President | |
There are risks associated with investing in small-cap mutual funds, such as smaller product lines and market shares, including limited available information. You should consider objectives, risks and charges and expenses of a fund carefully before investing. Additional information regarding such risks, including information on fees is located in Fund’s prospectus. Please read the Fund’s prospectus carefully before investing.
27
Investments by Sector
As a Percentage of Investments
As of 9/30/07
(Unaudited)

Index Comparison
Comparison of a Hypothetical $10,000 Investment
In KSMVX and KSMIX and Russell 2500® Value Index*
(Unaudited)
Total returns **
For the periods ended September 30, 2007
| | | | Since Commencement |
| | 1 month ended | | of Operations(1) |
| | 9/30/2007(1) | | (8/15/2007) |
| KSMVX | +6.42% | | +9.40% |
| KSMVX (includes max 4.50% front-end load) | +1.63% | | +4.48% |
| KSMIX | +6.31% | | +9.50% |
| Russell 2500® Value Index | +1.04% | | +6.91% |
| * | | The Russell 2500® Value Index measures the performance of those Russell 2500® Index companies with lower price-to-book ratios and lower forecasted growth values. The stocks in this index are also members of either the Russell 1000® Value or the Russell 2000® Value indexes. |
| ** | | PERFORMANCE DATA quoted represents past performance which is not predictive of future performance. The investment return and principal value of shares will not fluctuate and when redeemed, may be worth more or less than their original cost. Returns shown include the reinvestment of all dividends. The graph and table do not reflect the deduction of taxes that a shareholder would pay on Fund distributions or the redemption of shares. |
| (1) | | Not annualized. |
28
KEELEY Funds, Inc.
Expense Example
For the Six Month Period Ended September 30, 2007
(Unaudited)
As a shareholder of the Funds, you incur two types of costs: (1) transaction costs, including sales charges (loads) on purchase payments; and (2) ongoing costs, including management fees; distribution (12b-1) fees; and other Fund expenses. This Example is intended to help you understand your ongoing costs (in dollars) of investing in the Funds and to compare these costs with the ongoing costs of investing in other mutual funds.
The Example is based on an investment of $1,000 invested at the beginning of the period and held for the entire period from April 1, 2007 to September 30, 2007 (the “period”) for the Mid Cap Value Fund and the All Cap Value Fund, and from August 15, 2007 (commencement of operations) to September 30, 2007 for the Small-Mid Cap Value Fund.
Actual Expenses
The table below provides information about actual account values and actual expenses. You may use the information in this line, together with the amount you invested, to estimate the expenses you paid over the period. Simply divide your account value by $1,000 (for example, an $8,600 account value divided by $1,000 equals 8.6), then multiply the result by the number in the first line under the heading entitled “Expenses Paid During Period” to estimate the expenses you paid on your account during the period.
| | | | | | CLASS A(1) | | | CLASS I |
| | | | | | | | | | Expenses | | | | | | | Expenses |
| | | Beginning | | | Ending | | Six-Month | | paid | | | Ending | | Six-Month | | paid |
| | | account | | | account | | Expense | | during | | | account | | Expense | | during |
| | | value | | | value | | Ratio | | period* | | | value | | Ratio | | period* |
| Mid Cap Value Fund | | $1,000.00 | | | $1,143.10 | | 1.42% | | $7.63 | | | N/A | | N/A | | N/A |
| All Cap Value Fund | | 1,000.00 | | | 1,107.40 | | 1.48% | | 7.82 | | | N/A | | N/A | | N/A |
| Small-Mid Cap Value Fund | | 1,000.00 | | | 1,094.00 | | 1.39% | | 1.87 | | | $1,095.00 | | 1.14% | | $1.54 |
| * | | Expenses are equal to the Funds’ expense ratio for the six-month period, multiplied by the average account value over the period, multiplied by 183/365 for the Mid Cap Value and All Cap Value Funds (to reflect the one-half year period) and multiplied by 47/365 for the Small-Mid Cap Value Fund (to reflect the period since commencement). |
| (1) | | The Small-Mid Cap Value Fund is the only series of Keeley Funds, Inc. that has two distinct share classes: Class A and Class I. The Mid Cap Value Fund and All Cap Value Fund have a single common share class which has the same characteristics of the Small-Mid Cap Value Fund – Class A shares. |
29
KEELEY Funds, Inc.
Expense Example (Continued)
For the Six Month Period Ended September 30, 2007
(Unaudited)
Hypothetical Example for Comparison Purposes
The table below provides information about hypothetical account values and hypothetical expenses based on the Funds’ actual expense ratio and an assumed rate of return of 5% per year before expenses, which is not the Fund s’ actual return. The hypothetical account values and expenses may not be used to estimate the actual ending account balance or expenses you paid for the period. You may use this information to compare the ongoing costs of investing in the Funds and other funds. To do so, compare this 5% hypothetical example with the 5% hypothetical examples that appear in the shareholder reports of other funds.
Please note that the expenses shown in the table are meant to highlight your ongoing costs only and do not reflect any transactional costs, such as sales charges (loads). Therefore, the table below is useful in comparing the ongoing costs only, and will not help you determine the relative total costs of owning different funds. In addition, if these transactional costs were included, your costs could have been higher.
| | | | | | CLASS A(1) | | | CLASS I |
| | | | | | | | | | Expenses | | | | | | | Expenses |
| | | Beginning | | | Ending | | Six-Month | | paid | | | Ending | | Six-Month | | paid |
| | | account | | | account | | Expense | | during | | | account | | Expense | | during |
| | | value | | | value | | Ratio | | period* | | | value | | Ratio | | period* |
| Mid Cap Value Fund | | $1,000.00 | | | $1,017.75 | | 1.42% | | $7.18 | | | N/A | | N/A | | N/A |
| All Cap Value Fund | | 1,000.00 | | | 1,017.60 | | 1.48% | | 7.49 | | | N/A | | N/A | | N/A |
| Small-Mid Cap Value Fund | | 1,000.00 | | | 1,004.65 | | 1.39% | | 1.79 | | | $1,004.97 | | 1.14% | | $1.47 |
| * | | Expenses are equal to the Funds’ expense ratio for the six-month period, multiplied by the average account value over the period, multiplied by 183/365 for the Mid Cap Value and All Cap Value Funds (to reflect the one-half year period and multiplied by 47/365 for the Small-Mid Cap Value Fund (to reflect the period since commencement). |
| (1) | | The Small-Mid Cap Value Fund is the only series of Keeley Funds, Inc. that has two distinct share classes: Class A and Class I. The Mid Cap Value Fund and All Cap Value Fund have a single common share class which has the same characteristics of the Small-Mid Cap Value Fund – Class A shares. |
30
KEELEY Mid Cap Value Fund
SCHEDULE OF INVESTMENTS
September 30, 2007
| Shares | | | | Value |
| COMMON STOCKS – 97.85% |
| Aerospace & Defense – 4.27% |
| 66,400 | | KBR, Inc. (a) | | $ 2,574,328 |
| 53,000 | | Spirit Aerosystems Holdings, Inc. (a) | | 2,063,820 |
| | | | | 4,638,148 |
| | | Auto Components – 1.79% | | |
| 41,500 | | Wabco Holdings, Inc. (a) | | 1,940,125 |
| | | Capital Markets – 3.75% | | |
| 72,000 | | Janus Capital Group, Inc. | | 2,036,160 |
| 73,000 | | Jefferies Group, Inc. | | 2,031,590 |
| | | | | 4,067,750 |
| | | Chemicals – 3.74% | | |
| 30,500 | | Ashland, Inc. | | 1,836,405 |
| 42,800 | | FMC Corp. | | 2,226,456 |
| | | | | 4,062,861 |
| | | Commercial Services & Supplies – 1.65% | | |
| 32,000 | | The Brink’s Co. | | 1,788,160 |
| | | Computers & Peripherals – 1.70% | | |
| 37,000 | | NCR Corp. (a) | | 1,842,600 |
| | | Construction & Engineering – 14.13% | | |
| 72,000 | | AECOM Technology Corp. (a) | | 2,514,960 |
| 50,000 | | Chicago Bridge & Iron Co. | | 2,153,000 |
| 25,500 | | Foster Wheeler Ltd. (a) | | 3,347,640 |
| 56,000 | | McDermott International, Inc. (a) | | 3,028,480 |
| 68,000 | | Quanta Services, Inc. (a) | | 1,798,600 |
| 43,000 | | The Shaw Group, Inc. (a) | | 2,498,300 |
| | | | | 15,340,980 |
| | | Construction Materials – 3.60% | | |
| 14,900 | | Martin Marietta Materials, Inc. | | 1,989,895 |
| 24,500 | | Texas Industries, Inc. | | 1,923,250 |
| | | | | 3,913,145 |
| | | Containers & Packaging – 3.34% | | |
| 77,000 | | Crown Holdings, Inc. (a) | | 1,752,520 |
| 35,500 | | Temple-Inland, Inc. | | 1,868,365 |
| | | | | 3,620,885 |
| | | Diversified Financial Services – 2.32% | | |
| 52,300 | | Leucadia National Corp. | | 2,521,906 |
| | | Electric Utilities – 1.54% | | |
| 32,000 | | Allegheny Energy, Inc. (a) | | 1,672,320 |
| | | Electrical Equipment – 3.78% | | |
| 46,100 | | Ametek, Inc. | | 1,992,442 |
| 36,000 | | Thomas & Betts Corp. (a) | | 2,111,040 |
| | | | | 4,103,482 |
| | | Energy Equipment & Services – 5.84% | | |
| 46,800 | | FMC Technologies, Inc. (a) | | 2,698,488 |
| 58,700 | | Helmerich & Payne, Inc. | | 1,927,121 |
| 63,000 | | Tesco Corp. (a) | | 1,710,450 |
| | | | | 6,336,059 |
| | | Hotels, Restaurants & Leisure – 3.58% | | |
| 36,000 | | Gaylord Entertainment Co. (a) | | 1,915,920 |
| 60,000 | | Wyndham Worldwide Corp. | | 1,965,600 |
| | | | | 3,881,520 |
| | | Household Durables – 1.91% | | |
| 72,000 | | Newell Rubbermaid, Inc. | | 2,075,040 |
| | | Independent Power Producers & Energy Traders – 1.63% | | |
| 43,500 | | Mirant Corp. (a) | | 1,769,580 |
| | | Insurance – 4.73% | | |
| 85,000 | | Conseco, Inc. (a) | | 1,360,000 |
| 79,000 | | Covanta Holding Corp. (a) | | 1,936,290 |
| 99,000 | | Old Republic International Corp. | | 1,855,260 |
| | | | | 5,151,550 |
The accompanying notes are an integral part of these financial statements.
31
KEELEY Mid Cap Value Fund
SCHEDULE OF INVESTMENTS (Continued)
September 30, 2007
| Shares | | | | Value |
| | IT Services – 1.71% | | | |
| 98,000 | | Broadridge Financial Solutions, Inc. | | $ | 1,857,100 |
| | | | | |
| | | Machinery – 14.74% | | | |
| 36,000 | | Dover Corp. | | | 1,834,200 |
| 35,500 | | Harsco Corp. | | | 2,104,085 |
| 32,500 | | Ingersoll-Rand Co. | | | 1,770,275 |
| 27,500 | | ITT Industries, Inc. | | | 1,868,075 |
| 41,500 | | Joy Global, Inc. | | | 2,110,690 |
| 33,000 | | Oshkosh Truck Corp. | | | 2,045,010 |
| 25,000 | | Terex Corp. (a) | | | 2,225,500 |
| 55,000 | | Timken Co. | | | 2,043,250 |
| | | | | 16,001,085 |
| | Media – 1.61% | | | |
| 55,400 | | Idearc, Inc. | | | 1,743,438 |
| | Metals & Mining – 1.84% | | | |
| 63,000 | | Commercial Metals Co. | | | 1,993,950 |
| | Oil, Gas & Consumable Fuels – 9.15% | | | |
| 63,000 | | CNX Gas Corp. (a) | | | 1,812,510 |
| 44,000 | | Consol Energy, Inc. | | | 2,050,400 |
| 42,000 | | Pioneer Natural Resources Co. | | | 1,889,160 |
| 47,500 | | Plains Exploration & Production Co. (a) | | | 2,100,450 |
| 44,500 | | Quicksilver Resources, Inc. (a) | | | 2,093,725 |
| | | | | 9,946,245 |
| | Road & Rail – 1.69% | | | |
| 57,000 | | Kansas City Southern (a) | | | 1,833,690 |
| | Semiconductor & Semiconductor Equipment – 1.98% | | | |
| 73,500 | | Cypress Semiconductor Corp. (a) | | | 2,146,935 |
| | Textiles, Apparel & Luxury Goods – 1.83% | | | |
| 70,800 | | Hanesbrands, Inc. (a) | | | 1,986,648 |
| | Total Common Stocks | | | |
| | (Cost $84,631,654) | | | 106,235,202 |
| Principal | | | | | |
| Amount | | | | Value |
| | SHORT TERM INVESTMENTS – 1.96% | | | |
| | Variable Rate Demand Notes – 1.96% | | | |
| $2,129,900 | | U.S. Bank, N.A., 4.879% (b) | | $ | 2,129,900 |
| | Total Short Term Investments | | | |
| | (Cost $2,129,900) | | | 2,129,900 |
| | Total Investments – 99.81% | | | |
| | (Cost $86,761,554) | | | 108,365,102 |
| | Other Assets in Excess of Liabilities – 0.19% | | | 206,864 |
| | TOTAL NET ASSETS – 100.00% | | $ | 108,571,966 |
| | | | | |
| | Percentages are stated as a percent of net assets. | | | |
| | | | | |
| | (a) | Non Income Producing. | | | |
| | | | | | |
| | (b) | Variable rate demand notes are considered short-term obligations and are payable on demand. Interest rates change periodically on specified dates. The rate shown is as of September 30, 2007. |
The accompanying notes are an integral part of these financial statements.
32
KEELEY All Cap Value Fund
SCHEDULE OF INVESTMENTS
September 30, 2007
| Shares | | | | Value |
| | COMMON STOCKS – 97.48% | | | |
| | | Aerospace & Defense – 4.32% | | | |
| 35,000 | | Hexcel Corp. (a) | | $ | 794,850 |
| 12,500 | | Honeywell International, Inc. | | | 743,375 |
| 24,500 | | KBR, Inc. (a) | | | 949,865 |
| 21,500 | | Spirit Aerosystems Holdings, Inc. (a) | | | 837,210 |
| | | | | | 3,325,300 |
| | | Auto Components – 2.04% | | | |
| 27,000 | | The Goodyear Tire & Rubber Co. (a) | | | 821,070 |
| 16,000 | | Wabco Holdings, Inc. (a) | | | 748,000 |
| | | | | | 1,569,070 |
| | | Building Products – 0.95% | | | |
| 20,500 | | American Standard Companies, Inc. | | | 730,210 |
| | | Capital Markets – 3.17% | | | |
| 12,000 | | Ameriprise Financial, Inc. | | | 757,320 |
| 58,000 | | Epoch Holding Corp. (a) | | | 816,640 |
| 15,000 | | Stifel Financial Corp. (a) | | | 867,600 |
| | | | | | 2,441,560 |
| | | Chemicals – 5.96% | | | |
| 11,500 | | Ashland, Inc. | | | 692,415 |
| 14,500 | | CF Industries Holdings, Inc. | | | 1,100,695 |
| 16,000 | | FMC Corp. | | | 832,320 |
| 25,000 | | Koppers Holdings, Inc. | | | 965,250 |
| 32,000 | | Terra Industries, Inc. (a) | | | 1,000,320 |
| | | | | | 4,591,000 |
| | | Commercial Services – 1.56% | | | |
| 28,000 | | Avis Budget Group, Inc. (a) | | | 640,920 |
| 10,000 | | The Brink’s Co. | | | 558,800 |
| | | | | | 1,199,720 |
| | | Computers & Peripherals – 1.78% | | | |
| 30,000 | | EMC Corp. (a) | | | 624,000 |
| 15,000 | | NCR Corp. (a) | | | 747,000 |
| | | | | | 1,371,000 |
| | | Construction & Engineering – 11.09% | | | |
| 33,000 | | ABB Ltd. - ADR | | | 865,590 |
| 26,000 | | AECOM Technology Corp. (a) | | | 908,180 |
| 21,000 | | Chicago Bridge & Iron Co. | | | 904,260 |
| 7,500 | | Foster Wheeler Ltd. (a) | | | 984,600 |
| 98,000 | | Furmanite Corporation (a) | | | 891,800 |
| 87,000 | | Great Lakes Dredge & Dock Corp. (a) | | | 762,120 |
| 50,000 | | Hill International, Inc. (a) | | | 450,000 |
| 27,500 | | Integrated Electrical Services, Inc. (a) | | | 704,275 |
| 20,000 | | McDermott International, Inc. (a) | | | 1,081,600 |
| 17,000 | | The Shaw Group, Inc. (a) | | | 987,700 |
| | | | | | 8,540,125 |
| | | Construction Materials – 1.94% | | | |
| 5,600 | | Martin Marietta Materials, Inc. | | | 747,880 |
| 9,500 | | Texas Industries, Inc. | | | 745,750 |
| | | | | | 1,493,630 |
| | | Containers & Packaging – 0.89% | | | |
| 13,000 | | Temple-Inland, Inc. | | | 684,190 |
| | | Diversified Financial Services – 2.93% | | | |
| 35,000 | | Discover Financial Services (a) | | | 728,000 |
| 16,000 | | J.P. Morgan Chase & Co. | | | 733,120 |
| 10,000 | | NYSE Euronext, Inc. | | | 791,700 |
| | | | | | 2,252,820 |
| | | Electric Utilities – 0.90% | | | |
| 15,500 | | Allete, Inc. | | | 693,780 |
| | Electrical Equipment – 1.84% | | | |
| 160,000 | | Magnetek, Inc. (a) | | | 768,000 |
| 13,500 | | Regal–Beloit Corp. | | | 646,515 |
| | | | | | 1,414,515 |
The accompanying notes are an integral part of these financial statements.
33
KEELEY All Cap Value Fund
SCHEDULE OF INVESTMENTS (Continued)
September 30, 2007
| Shares | | | | Value |
| | | Energy Equipment & Services – 3.00% | | | |
| 21,000 | | Halliburton Co. | | $ | 806,400 |
| 18,500 | | Helix Energy Solutions Group, Inc. (a) | | | 785,510 |
| 26,500 | | Tesco Corp. (a) | | | 719,475 |
| | | | | | 2,311,385 |
| | | Food & Staples Retailing – 1.08% | | | |
| 21,000 | | CVS Corp. | | | 832,230 |
| | | Health Care Equipment & Supplies – 0.94% | | | |
| 17,500 | | Covidien Ltd. (a) | | | 726,250 |
| | | Hotels, Restaurants & Leisure – 4.79% | | | |
| 9,500 | | Las Vegas Sands Corp. (a) | | | 1,267,490 |
| 10,000 | | MGM Mirage (a) | | | 894,400 |
| 14,500 | | Orient–Express Hotels Ltd. | | | 743,415 |
| 24,000 | | Wyndham Worldwide Corp. | | | 786,240 |
| | | | | | 3,691,545 |
| | Household Durables – 0.85% | | | |
| 8,000 | | Fortune Brands, Inc. | | | 651,920 |
| | | Independent Power Producers & Energy Traders – 1.00% | | | |
| 83,000 | | Dynegy, Inc. (a) | | | 766,920 |
| | | Industrial Conglomerates – 2.96% | | | |
| 12,400 | | Textron, Inc. | | | 771,404 |
| 17,000 | | Tyco International Ltd. | | | 753,780 |
| 28,000 | | Walter Industries, Inc. | | | 753,200 |
| | | | | | 2,278,384 |
| | | Insurance – 1.48% | | | |
| 23,000 | | Conseco, Inc. (a) | | | 368,000 |
| 15,500 | | Unitrin, Inc. | | | 768,645 |
| | | | | | 1,136,645 |
| | | IT Services – 2.29% | | | |
| 52,000 | | Broadridge Financial Solutions, Inc. | | | 985,400 |
| 37,000 | | Western Union Co. | | | 775,890 |
| | | | | | 1,761,290 |
| | | Machinery – 14.51% | | | |
| 41,000 | | Altra Holdings, Inc. (a) | | | 683,470 |
| 23,000 | | American Railcar Industries, Inc. | | | 506,460 |
| 16,000 | | Crane Co. | | | 767,520 |
| 14,200 | | Dover Corp. | | | 723,490 |
| 18,000 | | Harsco Corp. | | | 1,066,860 |
| 14,500 | | Ingersoll–Rand Co. | | | 789,815 |
| 11,500 | | ITT Industries, Inc. | | | 781,195 |
| 16,000 | | Joy Global, Inc. | | | 813,760 |
| 25,000 | | L B Foster Co. (a) | | | 1,086,500 |
| 19,000 | | Manitowoc Co. | | | 841,320 |
| 22,000 | | Mueller Water Products, Inc. – Class A | | | 272,580 |
| 33,000 | | Mueller Water Products, Inc. – Class B | | | 363,000 |
| 43,000 | | Tecumseh Products Co. (a) | 827,750 |
| 9,500 | | Terex Corp. (a) | | | 845,690 |
| 21,500 | | Timken Co. | | | 798,725 |
| | | | | | 11,168,135 |
| | | Media – 1.78% | | | |
| 21,000 | | Idearc, Inc. | | | 660,870 |
| 14,000 | | The McGraw–Hill Companies, Inc. | | | 712,740 |
| | | | | | 1,373,610 |
| | | Metals & Mining – 7.43% | |
| 7,000 | | Allegheny Technologies, Inc. | 769,650 |
| 27,500 | | AMCOL International Corp. | 909,975 |
| 25,000 | | Commercial Metals Co. | | | 791,250 |
| 10,000 | | Haynes International, Inc. (a) | 853,700 |
| 11,000 | | Kaiser Aluminum Corp. | | | 776,270 |
| 23,000 | | Titanium Metals Corp. (a) | 771,880 |
| 8,000 | | United States Steel Corp. | | 847,520 |
| | | | | | 5,720,245 |
| | | Multiline Retail – 1.87% | |
| 33,000 | | Dillard’s, Inc. | | | 720,390 |
| 42,000 | | Saks, Inc. | | | 720,300 |
| | | | | | 1,440,690 |
The accompanying notes are an integral part of these financial statements.
34
KEELEY All Cap Value Fund
SCHEDULE OF INVESTMENTS (Continued)
September 30, 2007
| Shares | | | | Value |
| | | Multi-Utilities – 1.04% | | | |
| 19,000 | | NRG Energy, Inc. (a) | | $ | 803,510 |
| | | Oil, Gas & Consumable Fuels – 4.37% | | | |
| 25,000 | | Comstock Resources, Inc. (a) | | | 771,000 |
| 41,500 | | EXCO Resources, Inc. (a) | | | 686,410 |
| 75,000 | | ICO, Inc. (a) | | | 1,056,000 |
| 47,000 | | PetroHawk Energy Corp. (a) | | | 771,740 |
| 10,000 | | Rex Energy Corporation (a) | | | 80,500 |
| | | | | | 3,365,650 |
| | | Paper & Forest Products – 0.91% | | | |
| 85,000 | | Domtar Corp. (a) | | | 697,000 |
| | | Road & Rail – 1.95% | | | |
| 26,500 | | Genesee & Wyoming, Inc. (a) | | | 764,260 |
| 6,500 | | Union Pacific Corp. | | | 734,890 |
| | | | | | 1,499,150 |
| | | Semiconductor & Semiconductor Equipment – 1.40% | | | |
| 37,000 | | Cypress Semiconductor Corp. (a) | | | 1,080,770 |
| | | Specialty Retail – 2.71% | | | |
| 46,500 | | PEP Boys–Manny, Moe & Jack | | | 652,395 |
| 37,000 | | Rex Stores Corp. (a) | | | 715,950 |
| 85,000 | | Sally Beauty Holdings, Inc. (a) | | | 718,250 |
| | | | | | 2,086,595 |
| | | Textiles, Apparel & Luxury Goods – 0.98% | | | |
| 27,000 | | Hanesbrands, Inc. (a) | | | 757,620 |
| | | Thrifts & Mortgage Finance – 0.77% | | | |
| 42,000 | | First Niagara Financial Group, Inc. | | | 594,300 |
| | Total Common Stocks | | | |
| | | (Cost $65,809,151) | | $ | 75,050,764 |
| Principal | | | | | | |
| Amount | | | | Value |
| | | SHORT TERM INVESTMENTS – 2.72% | | | | |
| | | Variable Rate Demand Notes – 2.72% | | | | |
| $2,093,000 | | U.S. Bank, N.A., 4.876% (b) | | $ | 2,093,000 | |
| | Total Short Term Investments | | | | |
| | | (Cost $2,093,000) | | $ | 2,093,000 | |
| | | Total Investments – 100.20% | | | | |
| | | (Cost $67,902,151) | | $ | 77,143,764 | |
| | | Liabilities in Excess of Other Assets – (0.20)% | | | (153,821 | ) |
| | | TOTAL NET ASSETS – 100.00% | | $ | 76,989,943 | |
| | | | | | |
| | Percentages are stated as a percent of net assets. | | | | |
| | | | | | |
| | ADR American Depository Receipt. | | | | |
| | | | | | |
| | (a) | | Non Income Producing. | | | | |
| | | | | | | | |
| | (b) | | Variable rate demand notes are considered short-term obligations and are payable on demand. Interest rates change periodically on specified dates. The rate shown is as of September 30, 2007. |
The accompanying notes are an integral part of these financial statements.
35
KEELEY Small-Mid Cap Value Fund
SCHEDULE OF INVESTMENTS
September 30, 2007
| Shares | | | | Value |
| | COMMON STOCKS – 99.25% | | | |
| | Aerospace & Defense – 3.62% | | | |
| 3,000 | | Hexcel Corp. (a) | | $ | 68,130 |
| 1,100 | | KBR, Inc. (a) | | | 42,647 |
| 1,600 | | Spirit Aerosystems Holdings, Inc. (a) | | | 62,304 |
| | | | | | 173,081 |
| | | Auto Components – 1.96% | |
| 2,000 | | Wabco Holdings, Inc. (a) | | | 93,500 |
| | | Capital Markets – 5.42% | |
| 6,000 | | Epoch Holding Corp. (a) | | | 84,480 |
| 2,500 | | Janus Capital Group, Inc. | | | 70,700 |
| 1,800 | | Stifel Financial Corp. (a) | | | 104,112 |
| | | | | | 259,292 |
| | | Chemicals – 3.30% | | | |
| 600 | | Ashland, Inc. | | | 36,126 |
| 1,600 | | FMC Corp. | | | 83,232 |
| 1,000 | | Koppers Holdings, Inc. | | | 38,610 |
| | | | | | 157,968 |
| | | Commercial Services & Supplies – 2.47% | | | |
| 800 | | The Brink’s Co. | | | 44,704 |
| 2,800 | | PHH Corp. (a) | | | 73,584 |
| | | | | | 118,288 |
| | | Construction & Engineering – 12.80% | | | |
| 1,500 | | ABB Ltd. - ADR | | | 39,345 |
| 1,400 | | AECOM Technology Corp. (a) | | | 48,902 |
| 1,000 | | Chicago Bridge & Iron Co. | 43,060 |
| 800 | | Foster Wheeler Ltd. (a) | | | 105,024 |
| 2,200 | | Granite Construction, Inc. | | | 116,644 |
| 9,000 | | Great Lakes Dredge & Dock Corp. (a) | | | 78,840 |
| 1,200 | | McDermott International, Inc. (a) | | | 64,896 |
| 1,500 | | Quanta Services, Inc. (a) | | | 39,675 |
| 1,300 | | The Shaw Group, Inc. (a) | | | 75,530 |
| | | | | | 611,916 |
| | | Construction Materials – 3.30% | | | |
| 300 | | Martin Marietta Materials, Inc. | | | 40,065 |
| 1,500 | | Texas Industries, Inc. | | | 117,750 |
| | | | | | 157,815 |
| | | Consumer Finance – 1.65% | | | |
| 3,500 | | MoneyGram International, Inc. | | | 79,065 |
| | | Containers & Packaging – 1.32% | | | |
| 1,200 | | Temple-Inland, Inc. | | | 63,156 |
| | | Diversified Financial Services – 1.72% | | | |
| 2,100 | | Discover Financial Services (a) | | | 43,680 |
| 800 | | Leucadia National Corp. | | | 38,576 |
| | | | | | 82,256 |
| | | Electric Utilities – 2.05% | | | |
| 800 | | ITC Holdings Corp. | | | 39,640 |
| 2,100 | | Portland General Electric Co. | | | 58,380 |
| | | | | | 98,020 |
| | Electrical Equipment – 2.41% | | | |
| 900 | | Ametek, Inc. | | | 38,898 |
| 1,300 | | Thomas & Betts Corp. (a) | | | 76,232 |
| | | | | | 115,130 |
| | | Energy Equipment & Services – 5.92% | | | |
| 1,000 | | Halliburton Co. | | | 38,400 |
| 1,600 | | Helix Energy Solutions Group, Inc. (a) | | | 67,936 |
| 1,200 | | Helmerich & Payne, Inc. | | | 39,396 |
| 3,300 | | Tesco Corp. (a) | | | 89,595 |
| 1,400 | | Willbros Group, Inc. (a) | | | 47,600 |
| | | | | | 282,927 |
| | | Food & Staples Retailing – 0.95% |
| 1,150 | | CVS Corp. | | | 45,575 |
| | | Health Care Equipment & Supplies – 1.04% | | | |
| 1,200 | | Covidien Ltd. (a) | | | 49,800 |
The accompanying notes are an integral part of these financial statements.
36
KEELEY Small-Mid Cap Value Fund
SCHEDULE OF INVESTMENTS (Continued)
September 30, 2007
| Shares | | | | Value |
| | | Hotels, Restaurants & Leisure – 3.59% | | | |
| 700 | | Gaylord Entertainment Co. (a) | | $ | 37,254 |
| 800 | | Orient-Express Hotels Ltd. | | | 41,016 |
| 700 | | Vail Resorts, Inc. (a) | | | 43,603 |
| 1,500 | | Wyndham Worldwide Corp. | | | 49,140 |
| | | | | | 171,013 |
| | | Industrial Conglomerates – 0.90% | | | |
| 1,600 | | Walter Industries, Inc. | | | 43,040 |
| | | Insurance – 1.18% | | | |
| 2,300 | | Covanta Holding Corp. (a) | | | 56,373 |
| | | IT Services – 1.78% | | | |
| 4,500 | | Broadridge Financial Solutions, Inc. | | | 85,275 |
| | | Machinery – 21.12% | | | |
| 1,900 | | Bucyrus International, Inc. - Class A | | | 138,567 |
| 900 | | Dover Corp. | | | 45,855 |
| 500 | | Flowserve Corp. | | | 38,090 |
| 2,700 | | Greenbrier Companies, Inc. | | | 72,117 |
| 900 | | Harsco Corp. | | | 53,343 |
| 700 | | Ingersoll-Rand Co. | | | 38,129 |
| 600 | | ITT Industries, Inc. | | | 40,758 |
| 1,700 | | Joy Global, Inc. | | | 86,462 |
| 900 | | L. B. Foster Co. (a) | | | 39,114 |
| 1,400 | | Manitowoc Co. | | | 61,992 |
| 7,000 | | Mueller Water Products, Inc. - Class B | | | 77,000 |
| 800 | | Oshkosh Truck Corp. | | | 49,576 |
| 1,800 | | Tennant Co. | | | 87,660 |
| 900 | | Terex Corp. (a) | | | 80,118 |
| 1,100 | | Timken Co. | | | 40,865 |
| 1,600 | | Trinity Industries, Inc. | | | 60,064 |
| | | | | | 1,009,710 |
| | | Media – 0.92% | | | |
| 1,400 | | Idearc, Inc. | | | 44,058 |
| | | Metals & Mining – 4.00% | | | |
| 1,600 | | Commercial Metals Co. | | | 50,640 |
| 900 | | Haynes International, Inc. (a) | | | 76,833 |
| 900 | | Kaiser Aluminum Corp. | | | 63,513 |
| | | | | | 190,986 |
| | | Multiline Retail – 2.62% | | | |
| 7,300 | | Saks, Inc. | | | 125,195 |
| | | Oil, Gas & Consumable Fuels – 7.76% | | | |
| 1,200 | | Consol Energy, Inc. | | | 55,920 |
| 2,800 | | EXCO Resources, Inc. (a) | | | 46,312 |
| 900 | | Penn Virginia Corp. | | | 39,582 |
| 3,600 | | PetroHawk Energy Corp. (a) | | | 59,112 |
| 1,700 | | Pioneer Natural Resources Co. | | | 76,466 |
| 2,100 | | Plains Exploration & Production Co. (a) | | | 92,862 |
| | | | | | 370,254 |
| | | Road & Rail – 2.53% | | | |
| 1,400 | | Genesee & Wyoming, Inc. (a) | | | 40,376 |
| 2,500 | | Kansas City Southern (a) | | | 80,425 |
| | | | | | 120,801 |
| | | Textiles, Apparel & Luxury Goods – 0.76% | | | |
| 1,300 | | Hanesbrands, Inc. (a) | | | 36,478 |
| | | Thrifts & Mortgage Finance – 2.16% | | | |
| 7,300 | | First Niagara Financial Group, Inc. | | | 103,295 |
| | | Total Common Stocks | | | |
| | | (Cost $4,330,692) | | $ | 4,744,267 |
The accompanying notes are an integral part of these financial statements.
37
KEELEY Small-Mid Cap Value Fund
SCHEDULE OF INVESTMENTS (Continued)
September 30, 2007
| Principal | | | | | |
| Amount | | | | | Value |
| | | SHORT TERM INVESTMENTS – 0.10% | | | |
| | | Variable Rate Demand Notes – 0.10% | | | |
| $4,900 | | U.S. Bank, N.A., 4.876% (b) | | $ | 4,900 |
| | Total Short Term Investments | | | |
| | | (Cost $4,900) | | $ | 4,900 |
| | Total Investments – 99.35% | | | |
| | | (Cost $4,335,592) | | $ | 4,749,167 |
| | | Other Assets in Excess of Liabilities – 0.65% | | | 31,249 |
| | | TOTAL NET ASSETS – 100.00% | | $ | 4,780,416 |
| | | | | |
| | Percentages are stated as a percent of net assets. | | | |
| | | | | |
| | ADR American Depository Receipt. | | | |
| | | | | |
| | (a) | | Non Income Producing. | | | |
| | | | | | | |
| | (b) | | Variable rate demand notes are considered short-term obligations and are payable on demand. Interest rates change periodically on specified dates. The rate shown is as of September 30, 2007. |
The accompanying notes are an integral part of these financial statements.
38
KEELEY Funds, Inc.
STATEMENT OF ASSETS AND LIABILITIES
September 30, 2007
| | Mid Cap | | All Cap | | Small-Mid Cap |
| | Value Fund | | Value Fund | | Value Fund |
| ASSETS: | | | | | | | | | | | |
| Investments, at value(1) | $ | 108,365,102 | | | $ | 77,143,764 | | | | $ 4,749,167 | |
| Cash | | 1,420 | | | | 689 | | | | 86 | |
| Receivable for shares issued | | 1,503,813 | | | | 738,047 | | | | 62,537 | |
| Dividends and interest receivable | | 28,819 | | | | 28,975 | | | | 2,305 | |
| Prepaid expenses and other assets | | 19,206 | | | | 15,976 | | | | — | |
| Due from Adviser | | — | | | | — | | | | 47,450 | |
| Total Assets | | 109,918,360 | | | | 77,927,451 | | | | 4,861,545 | |
| LIABILITIES: | | | | | | | | | | | |
| Payable for investments purchased | | 957,391 | | | | 541,446 | | | | 53,165 | |
| Payable for shares redeemed | | 220,749 | | | | 269,126 | | | | — | |
| Payable to Adviser | | 84,239 | | | | 59,345 | | | | — | |
| Payable to Directors | | 2,463 | | | | 2,360 | | | | 2,095 | |
| Accrued 12b-1 fees | | 20,295 | | | | 13,234 | | | | 651 | |
| Other accrued expenses | | 61,257 | | | | 51,997 | | | | 25,218 | |
| Total Liabilities | | 1,346,394 | | | | 937,508 | | | | 81,129 | |
| NET ASSETS | $ | 108,571,966 | | | $ | 76,989,943 | | | | $ 4,780,416 | |
| NET ASSETS CONSIST OF: | | | | | | | | | | | |
| Capital stock | $ | 89,259,625 | | | $ | 68,918,646 | | | | $ 4,369,382 | |
| Accumulated undistributed net realized loss on investments | | (2,291,207 | ) | | | (1,170,316 | ) | | | (2,541 | ) |
| Net unrealized appreciation on investments | | 21,603,548 | | | | 9,241,613 | | | | 413,575 | |
| NET ASSETS | $ | 108,571,966 | | | $ | 76,989,943 | | | | $ 4,780,416 | |
| CAPITAL STOCK, $0.0001 par value | | | | | | | | | | | |
| Class A Shares | | | | | | | | | | | |
| Authorized | | 100,000,000 | | | | 100,000,000 | | | | 100,000,000 | |
| Issued and outstanding | | 7,679,700 | | | | 5,832,355 | | | | 336,925 | |
| NET ASSETS | $ | 108,571,966 | | | $ | 76,989,943 | | | | 3,685,851 | |
| NET ASSET VALUE AND REDEMPTION PRICE PER SHARE | $ | 14.14 | | | $ | 13.20 | | | | $ 10.94 | |
| MAXIMUM OFFERING PRICE PER SHARE(2) | $ | 14.81 | | | $ | 13.82 | | | | $ 11.46 | |
| Class I Shares | | | | | | | | | | | |
| Authorized | | N/A | | | | N/A | | | | 100,000,000 | |
| Issued and outstanding | | N/A | | | | N/A | | | | 100,000 | |
| NET ASSETS | | N/A | | | | N/A | | | | 1,094,565 | |
| NET ASSET VALUE, REDEMPTION | | | | | | | | | | | |
| AND OFFERING PRICE PER SHARE | $ | — | | | $ | — | | | | $ 10.95 | |
| $ | 86,761,554 | | | $ | 67,902,151 | | | | $ 4,335,592 | |
(1) Cost of Investments
(2) Includes a sales load of 4.50% (see Note 7).The accompanying notes are an integral part of these financial statements.
39
KEELEY Funds, Inc.
STATEMENT OF OPERATIONS
September 30, 2007
| | Mid Cap | | All Cap | | Small-Mid Cap |
| | Value Fund | | Value Fund | | Value Fund |
| | | | | | From |
| | | | | | August 15, 2007 |
| | Year Ended | | Year Ended | | (Commencement Date) |
| | September 30, 2007 | | September 30, 2007 | | to September 30, 2007 |
| INVESTMENT INCOME: | | | | | | | | | | | |
| Dividend income | | $ 669,012 | | | | $ 344,683 | | | | $ 3,670 | |
| Less: Foreign withholding tax | | (1,237 | ) | | | (1,247 | ) | | | (10 | ) |
| Interest income | | 41,649 | | | | 31,181 | | | | 1,051 | |
| Total Investment Income | | 709,424 | | | | 374,617 | | | | 4,711 | |
| EXPENSES: | | | | | | | | | | | |
| Investment advisory fees | | 726,845 | | | | 411,494 | | | | 5,129 | |
| 12b-1 fees – Class A | | 181,711 | | | | 102,874 | | | | 957 | |
| Transfer agent fees and expenses | | 40,333 | | | | 35,208 | | | | 1,210 | |
| Federal and state registration fees | | 29,324 | | | | 16,960 | | | | 1,661 | |
| Audit Expense | | 26,662 | | | | 35,718 | | | | 19,740 | |
| Fund Administration and Accounting fees | | 15,551 | | | | 14,342 | | | | 336 | |
| Directors’ fees | | 13,464 | | | | 10,955 | | | | 2,095 | |
| Custody fees | | 6,170 | | | | 13,255 | | | | 1,230 | |
| Reports to shareholders | | 3,530 | | | | 7,710 | | | | 146 | |
| Other | | 23,435 | | | | 13,604 | | | | 823 | |
| Organizational Costs | | — | | | | — | | | | 26,056 | |
| Total expenses before reimbursement | | 1,067,025 | | | | 662,120 | | | | 59,383 | |
| Reimbursement of expenses by Adivser | | (9,126 | ) | | | (49,240 | ) | | | (52,579 | ) |
| NET EXPENSES | | 1,057,899 | | | | 612,880 | | | | 6,804 | |
| NET INVESTMENT LOSS | | (348,475 | ) | | | (238,263 | ) | | | (2,093 | ) |
| REALIZED AND UNREALIZED | | | | | | | | | | | |
| GAIN ON INVESTMENTS: | | | | | | | | | | | |
| Net realized loss on investments | | (913,334 | ) | | | (979,339 | ) | | | (2,541 | ) |
| Change in net unrealized appreciation on investments | | 20,689,110 | | | | 9,346,247 | | | | 413,575 | |
| Net Gain on Investments | | 19,775,776 | | | | 8,366,908 | | | | 411,034 | |
| NET INCREASE IN NET ASSETS | | | | | | | | | | | |
| RESULTING FROM OPERATIONS | | $19,427,301 | | | | $8,128,645 | | | | $408,941 | |
The accompanying notes are an integral part of these financial statements.
40
KEELEY Funds, Inc.
STATEMENTS OF CHANGES IN NET ASSETS
September 30, 2007
| | Mid Cap Value Fund |
| |
| | Year Ended | | Year Ended |
| | September 30, | | September 30, |
| | 2007 | | 2006 |
| OPERATIONS: | | | | | | | |
| Net investment loss | $ | (348,475 | ) | | $ | (420,025 | ) |
| Net realized loss on investments | | (913,334 | ) | | | (1,377,873 | ) |
| Change in net unrealized appreciation/(depreciation) on investments | | 20,689,110 | | | | 541,368 | |
| Net increase/(decrease) in net assets resulting from operations | | 19,427,301 | | | | (1,256,530 | ) |
| DISTRIBUTIONS: | | | | | | | |
| Tax return of capital | | — | | | | — | |
| |
| CAPITAL STOCK TRANSACTIONS: | | | | | | | |
| Class A Shares | | | | | | | |
| Proceeds from shares issued | | 56,612,303 | | | | 52,244,763 | |
| Proceeds from distributions reinvested | | — | | | | — | |
| Cost of shares redeemed | | (21,980,154 | ) | | | (7,944,725 | ) |
| Net increase from capital stock transactions | | 34,632,149 | | | | 44,300,038 | |
| Class I Shares | | | | | | | |
| Proceeds from shares issued | | N/A | | | | N/A | |
| Proceeds from distributions reinvested | | N/A | | | | N/A | |
| Cost of shares redeemed | | N/A | | | | N/A | |
| Net increase from capital stock transactions | | — | | | | — | |
| TOTAL INCREASE IN NET ASSETS | | 54,059,450 | | | | 43,043,508 | |
| |
| NET ASSETS: | | | | | | | |
| Beginning of period | | 54,512,516 | | | | 11,469,008 | |
| End of period | $ | 108,571,966 | | | $ | 54,512,516 | |
| Accumulated undistributed net investment loss | $ | — | | | $ | — | |
| |
| CAPITAL SHARE TRANSACTIONS: | | | | | | | |
| Class A Shares | | | | | | | |
| Shares Sold | | 4,277,414 | | | | 4,761,960 | |
| Issued to shareholder in reinvestment of dividends | | — | | | | — | |
| Shares redeemed | | (1,741,312 | ) | | | (718,448 | ) |
| Net increase decrease from capital stock transactions | | 2,536,102 | | | | 4,043,512 | |
| |
| Class I Shares | | | | | | | |
| Shares Sold | | N/A | | | | N/A | |
| Issued to shareholder in reinvestment of dividends | | N/A | | | | N/A | |
| Shares redeemed | | N/A | | | | N/A | |
| Net increase decrease from capital stock transactions | | — | | | | — | |
The accompanying notes are an integral part of these financial statements.
42
KEELEY Funds, Inc.
STATEMENTS OF CHANGES IN NET ASSETS (Continued)
September 30, 2007
| All Cap Value Fund | | Small-Mid Cap Value Fund |
| | | Period from | | Period from |
| | | June 14, 2006 | | August 15, 2007 |
| Year Ended | | (Commencement | | (Commencement |
| September 30, | | of Operations) to | | of Operations to |
| 2007 | | September 30, 2006 | | September 30, 2007 |
| | $ | (238,263 | ) | | | $ | (16,442 | ) | | | $ | (2,093 | ) |
| | (979,339 | ) | | | (190,222 | ) | | | (2,541 | ) |
| | 9,346,247 | | | | | (104,634 | ) | | | | 413,575 | |
| | 8,128,645 | | | | | (311,298 | ) | | | | 408,941 | |
| |
| | (6,639 | ) | | | | — | | | | | — | |
| |
| |
| |
| | 58,739,310 | | | | 15,255,185 | | | | 3,371,475 | |
| 5,943 | | | | — | | | | — | |
| | (4,805,746 | ) | | | | (15,457 | ) | | | | — | |
| | 53,939,507 | | | | | 15,239,728 | | | | | 3,371,475 | |
| |
| N/A | | | | N/A | | | | 1,000,000 | |
| N/A | | | | N/A | | | | — | |
| | N/A | | | | | N/A | | | | | — | |
| | — | | | | | — | | | | | 1,000,000 | |
| | 62,061,513 | | | | | 14,928,430 | | | | | 4,780,416 | |
| |
| |
| | 14,928,430 | | | | | — | | | | | — | |
| | $ | 76,989,943 | | | | $ | 14,928,430 | | | | $ | 4,780,416 | |
| $ | — | | | | $ | — | | | | $ | — | |
| |
| 4,721,352 | | | | 1,505,318 | | | | 336,925 | |
| 524 | | | | — | | | | — | |
| | (393,292 | ) | | | | 15,457 | | | | | — | |
| | 4,328,584 | | | | | 1,520,775 | | | | | 336,925 | |
| |
| N/A | | | | N/A | | | | 100,000 | |
| N/A | | | | N/A | | | | — | |
| | N/A | | | | | N/A | | | | | — | |
| | — | | | | | — | | | | | 100,000 | |
The accompanying notes are an integral part of these financial statements.
43
FINANCIAL HIGHLIGHTS
KEELEY Mid Cap Value Fund
| | | | | | Period from |
| | | | | | August 15, 2005 |
| | | | | | (Commencement |
| | Year Ended | | Year Ended | | of Operations) |
| | September 30, | | September 30, | | to September 30, |
| | 2007 | | 2006 | | 2005 |
| PER SHARE DATA (1) | | | | | | | | | | | |
| Net asset value, beginning of period | $ | 10.60 | | | $ | 10.43 | | | $ | 10.00 | |
| Income from investment | | | | | | | | | | | |
| operations: | | | | | | | | | | | |
| Net investment loss | | (0.05 | ) | | | (0.08 | ) | | | (0.01 | ) |
| Net realized and unrealized gains on | | | | | | | | | | | |
| investments | | 3.59 | | | | 0.25 | | | | 0.44 | |
| Total from investment operations | | 3.54 | | | | 0.17 | | | | 0.43 | |
| Net asset value, end of period | $ | 14.14 | | | $ | 10.60 | | | $ | 10.43 | |
| Total return (2) | | 33.40 | % | | | 1.63 | % | | | 4.30 | % (3) |
| Supplemental data and ratios: | | | | | | | | | | | |
| Net assets, end of period (in 000’s) | $ | 108,572 | | | $ | 54,513 | | | $ | 11,469 | |
| Ratio of expenses to average net | | | | | | | | | | | |
| assets | | | | | | | | | | | |
| Before reimbursement of expenses | | | | | | | | | | | |
| by Adviser | | 1.47 | % (5) | | | 2.27 | % | | | 9.87 | % (4) |
| After reimbursement of expenses by | | | | | | | | | | | |
| Adviser | | 1.46 | % (5) | | | 1.94 | % | | | 2.00 | % (4) |
| Ratio of net investment loss to | | | | | | | | | | | |
| average net assets | | | | | | | | | | | |
| Before reimbursement of expenses | | | | | | | | | | | |
| by Adviser | | (0.49 | )% | | | (1.42 | )% | | | (9.19 | )% (4) |
| After reimbursement of expenses by | | | | | | | | | | | |
| Adviser | | (0.48 | )% | | | (1.10 | )% | | | (1.32 | )% (4) |
| Portfolio turnover rate | | 57.71 | % | | | 63.76 | % | | | 0.00 | % (3) |
| (1) | | Per share data is for a share outstanding throughout the period. |
| (2) | | The total return calculation does not reflect the sales load imposed on the purchase of shares (see Note 7). |
| (3) | | Not annualized. |
| (4) | | Annualized. |
| (5) | | The ratio of expenses to average net assets includes interest expense, which is excluded for purposes of calculating the expense reimbursement (see Note 3). The before expense reimbursement and after expense reimbursement ratios excluding interest expense were 1.46% and 1.45%, respectively, for the year ended September 30, 2007. |
The accompanying notes are an integral part of these financial statements.
44
FINANCIAL HIGHLIGHTS
KEELEY All Cap Value Fund
| | | | Period from |
| | | | June 14, 2006 |
| | | | (Commencement |
| | Year Ended | | of Operations) |
| | September 30, | | to September 30, |
| | 2007 | | 2006 |
| PER SHARE DATA (1) | | | | | | | |
| Net asset value, beginning of period | $ | 9.93 | | | $ | 10.00 | |
| Income from investment operations: | | | | | | | |
| Net investment loss | | (0.04 | ) | | | (0.01 | ) |
| Net realized and unrealized gains (losses) | | | | | | | |
| on investments | | 3.31 | | | | (0.06 | ) |
| Total from investment operations | | 3.27 | | | | (0.07 | ) |
| Less distributions: | | | | | | | |
| Tax return of capital | | — | (6) | | | — | |
| Net asset value, end of period | $ | 13.20 | | | $ | 9.93 | |
| Total return (2) | | 32.97 | % | | | (0.70 | )% (3) |
| Supplemental data and ratios: | | | | | | | |
| Net assets, end of period (in 000’s) | $ | 76,990 | | | $ | 14,928 | |
| Ratio of expenses to average net assets | | | | | | | |
| Before reimbursement of expenses by Adviser | | 1.61 | %(5) | | | 3.97 | % (4) |
| After reimbursement of expenses by Adviser | | 1.49 | %(5) | | | 1.72 | % (4) |
| Ratio of net investment loss to average net assets | | | | | | | |
| Before reimbursement of expenses by Adviser | | (0.70 | )% | | | (2.82 | )% (4) |
| After reimbursement of expenses by Adviser | | (0.58 | )% | | | (0.57 | )% (4) |
| Portfolio turnover rate | | 45.71 | % | | | 25.66 | % (3) |
| (1) | | Per share data is for a share outstanding throughout the period. |
| (2) | | The total return calculation does not reflect the sales load imposed on the purchase of shares (see Note 7). |
| (3) | | Not annualized. |
| (4) | | Annualized. |
| (5) | | The ratio of expenses to average net assets includes interest expense, which is excluded for purposes of calculating the expense reimbursement (see Note 3). The before expense reimbursement and after expense reimbursement ratios excluding interest expense were 1.60% and 1.48%, respectively, for the year ended September 30, 2007. |
| (6) | | Amount calculated is less than $0.005 per share. |
The accompanying notes are an integral part of these financial statements.
45
FINANCIAL HIGHLIGHTS
KEELEY Small-Mid Cap Value Fund
| | Period from |
| | August 15, 2007 |
| | (Commencement |
| | of Operations) |
| | to September 30, |
| | 2007 |
| CLASS A | | | |
| PER SHARE DATA (1) | | | |
| Net asset value, beginning of period | $ | 10.00 | |
| Income from investment operations: | | | |
| Net investment loss | | (0.01 | ) |
| Net realized and unrealized gains on investments | | 0.95 | |
| Total from investment operations | | 0.94 | |
| Net asset value, end of period | $ | 10.94 | |
| Total return (2) | | 9.40 | % (3) |
| Supplemental data and ratios: | | | |
| Net assets, end of period (in 000’s) | $ | 3,685 | |
| Ratio of expenses to average net assets | | | |
| Before reimbursement of expenses by Adviser | | 11.79 | % (4) |
| After reimbursement of expenses by Adviser | | 1.39 | % (4) |
| Ratio of net investment loss to average net assets | | | |
| Before reimbursement of expenses by Adviser | | (10.88 | )% (4) |
| After reimbursement of expenses by Adviser | | (0.49 | )% (4) |
| Portfolio turnover rate | | 0.91 | % (3) |
| |
| CLASS I | | | |
| PER SHARE DATA (1) | | | |
| Net asset value, beginning of period | $ | 10.00 | |
| Income from investment operations: | | | |
| Net investment loss | | 0.00 | (5) |
| Net realized and unrealized gains on investments | | 0.95 | |
| Total from investment operations | | 0.95 | |
| Net asset value, end of period | $ | 10.95 | |
| Total return (2) | | 9.50 | % (3) |
| Supplemental data and ratios: | | | |
| Net assets, end of period (in 000’s) | $ | 1,095 | |
| Ratio of expenses to average net assets | | | |
| Before reimbursement of expenses by Adviser | | 10.97 | % (4) |
| After reimbursement of expenses by Adviser | | 1.14 | % (4) |
| Ratio of net investment loss to average net assets | | | |
| Before reimbursement of expenses by Adviser | | (10.01 | )% (4) |
| After reimbursement of expenses by Adviser | | (0.18 | )% (4) |
| Portfolio turnover rate | | 0.91 | % (3) |
| (1) | | Per share data is for a share outstanding throughout the period. |
| (2) | | The total return calculation does not reflect the sales load imposed on the purchase of shares (see Note 7). |
| (3) | | Not annualized. |
| (4) | | Annualized. |
| (5) | | Amount calculated is less than $0.005 per share. |
The accompanying notes are an integral part of these financial statements.
46
KEELEY Funds, Inc.
NOTES TO THE FINANCIAL STATEMENTS
September 30, 2007
| 1. | | ORGANIZATION |
| |
| | | KEELEY Funds, Inc. (the “Company”) was organized on April 7, 2005 as a Maryland corporation and is registered under the Investment Company Act of 1940, as amended (the “1940 Act”) as a diversified, open-end investment company. The Company consists of the KEELEY Mid Cap Value Fund (“KMCVX”), the KEELEY All Cap Value Fund (“KACVX”) and the KEELEY Small-Mid Cap Value Fund, a multi-class fund consisting of Class A (“KSMVX”) shares and Class I (“KSMIX”) institutional shares. KMCVX and KACVX have a single common share class which has the same characteristics of KSMVX. Since the characteristics of KMCVX and KACVX are identical to KSMVX, the common shares of KMCVX and KACVX are referred to as Class A shares in these financial statements. KSMVX and KSMIX are collectively referred to herein as “KSMVF”. KMCVX, KACVX, and KSMVF commenced operations on August 15, 2005, June 14, 2006, and August 15, 2007, respectively (each a “commencement date”, collectively the “commencement dates”). KMCVX, KACVX and KSMVF are collectively referred to herein as the “Funds.” |
| |
| 2. | | SIGNIFICANT ACCOUNTING POLICIES |
| |
| | | The following is a summary of significant accounting policies consistently followed by the Company in the preparation of its financial statements. These policies are in conformity with accounting principles generally accepted in the United States of America (“GAAP”). The presentation of financial statements in conformity with GAAP requires management to make estimates and assumptions that affect the reported amounts of assets and liabilities at the date of the financial statements and the reported amounts of revenues and expenses during the reporting period. Actual results could differ from those estimates and assumptions. |
| |
| | | a) Investment Valuation – Securities which are traded on a recognized stock exchange are valued at the last sale price each day on the securities exchange on which such securities are primarily traded or at the last sale price on a national securities exchange. Exchange-traded securities for which there were no transactions are valued at the current bid prices. Securities traded on only over-the-counter markets are valued on the basis of last sale price, or closing over-the-counter bid prices when there is no last sale price available. Debt securities (other than short-term obligations) are valued by a service that uses electronic data processing methods, avoiding exclusive reliance on exchange or over-the-counter prices. Debt securities purchased within 60 days of their stated maturity date are valued at amortized cost, which approximates fair value. Securities for which quotations are not readily available are valued at fair value as determined in good faith by the Board of Directors. For each investment that is fair valued, if any, the Board of Directors considers, to the extent applicable, various factors including, but not limited to, the financial condition of the company, comparable companies in the public market, the nature and duration of the cause for a quotation not being readily available and other relevant factors. |
| |
| | | In September 2006, the Financial Accounting Standards Board issued its new Standard No. 157, “Fair Value Measurements” (“FAS 157”). FAS 157 is designed to unify guidance for the measurement of fair value of all types of assets, including financial instruments, and certain liabilities, throughout a number of accounting standards. FAS 157 also establishes a hierarchy for measuring fair value in generally accepted accounting principles and expands financial statement disclosures about fair value measurements that are relevant to mutual |
47
KEELEY Funds, Inc.
NOTES TO THE FINANCIAL STATEMENTS (Continued)
September 30, 2007
| | | funds. FAS 157 is effective for financial statements issued for fiscal years beginning after November 15, 2007, and earlier adoption is permitted. At this time, management believes the adoption of FAS 157 will have no material impact on the financial statements of the Company. b) Federal Income and Excise Taxes – It is the Company’s policy to meet the requirements of Subtitle A, Chapter 1, Subchapter M of the Internal Revenue Code, as amended, applicable to regulated investment companies and to distribute substantially all investment company net taxable income and net capital gains to shareholders in a manner which results in no tax cost to the Company. Therefore, no federal income or excise tax provision is required. On July 13, 2006, the Financial Accounting Standards Board (“FASB”) released FASB Interpretation No. 48 “Accounting for Uncertainty in Income Taxes” (“FIN 48”). FIN 48 provides guidance for how uncertain tax positions should be recognized, measured, presented and disclosed in the financial statements. FIN 48 requires the evaluation of tax positions taken or expected to be taken in the course of preparing the Company’s tax returns to determine whether the tax positions are “more-likely-than-not” of being sustained by the applicable tax authority. Tax positions not deemed to meet the more-likely-than-not threshold would be recorded as a tax benefit or expense in the current year. Adoption of FIN 48 is required as of the date of the last net asset value calculation in the first required financial statement reporting period for fiscal years beginning after December 15, 2006 and is to be applied to all open tax years as of the effective date. At this time, management is evaluating the implications of FIN 48 to the Funds and its impact in the financial statements has not yet been determined. c) Distributions to Shareholders – Dividends from net investment income, if any, will be declared and paid annually. Distributions of net realized gains, if any, will be declared and paid annually. Distributions to shareholders are recorded on the ex-dividend date. The Company may periodically make reclassifications among certain of its capital accounts as a result of the characterization of certain income and realized gains determined annually in accordance with federal tax regulations that may differ from generally accepted accounting principles. For the year ended September 30, 2007, KMCVX, KACVX and KSMVF increased undistributed net investment income by $348,475, $244,902 and $2,093, respectively and decreased paid in capital by $348,475, $244,245 and $2,093, respectively. Additionally, KACVX increased accumulated undistributed net realized loss on investments by $657. These reclassifications between capital accounts were made for only those differences that are permanent in nature. d) Other – Investment transactions are recorded on the trade date. The Company determines the gain or loss realized from investment transactions by comparing the identified original cost of the security lot sold with the net sale proceeds. Dividend income is recognized on the ex-dividend date and interest income is recognized on an accrual basis, including amortization/accretion of premiums or discounts using the effective interest method. Net investment income, other than class specific expenses, and realized and unrealized gains and losses are allocated daily to each class of shares based upon the relative net asset value of outstanding shares of each class of shares at the beginning of the day (after adjusting for the current capital shares activity of the respective class). Expenses common to all portfolios are allocated among the Funds based upon their relative net asset values or other appropriate allocation methods. |
48
KEELEY Funds, Inc.
NOTES TO THE FINANCIAL STATEMENTS (Continued)
September 30, 2007
| | e) Guarantees and Indemnifications – In the normal course of business, the Company enters into contracts with service providers that contain general indemnification clauses. The Company’s maximum exposure under these arrangements is unknown as this would involve future claims against the Company that have not yet occurred. Based on experience, the Company expects the risk of loss to be remote. |
| | |
| 3. | | INVESTMENT ADVISORY AGREEMENT |
| |
| | | The Company has an agreement with Keeley Asset Management Corp. (the “Adviser”), with whom certain officers and directors of the Company are affiliated, to furnish investment advisory services to the Company (the “Investment Advisory Agreement”). Under the terms of this agreement, the Funds each pay the Adviser a monthly fee at the annual rate of 1.00% of each Fund’s first $350 million, 0.90% of the next $350 million, and 0.80% in excess of $700 million of each Fund’s average daily net assets. |
| |
| | | The Adviser has contractually agreed to waive fees and/or reimburse expenses with respect to KMCVX and KACVX until September 30, 2008, and until September 30, 2009 for KSMVF (“Expense Cap Agreement”), such that total expenses, exclusive of interest, taxes, litigation, brokerage commissions, charges from buying and selling Fund securities and other extraordinary expenses will not exceed the following amounts of average daily net assets of the respective Fund: |
| Fund | | Class A | | Class I |
| KMCVX | 1.49% | | — |
| KACVX | 1.49% | | — |
| KSMVF | 1.39% | | 1.14% |
Beginning October 1, 2007, the Adviser contractually agreed to increase its waiver with respect to KMCVX and KACVX until September 30, 2008, such that total expenses, exclusive of interest, taxes, litigation, brokerage commissions, charges from buying and selling Fund securities and other extraordinary expenses will not exceed 1.39% of the respective Funds’ average daily net assets.
Any reimbursements or fee waivers made by the Adviser to a Fund are subject to repayment by the Fund, to the extent that the Fund is able to make the repayment within its Expense Cap Agreement. Under the Expense Cap Agreement, such recoupments must be made within three years following the fiscal year in which the Adviser reduced its compensation and/or assumed expenses for the applicable Fund. The Adviser did not recoup any fees previously waived or reimbursed under the Expense Cap Agreement during the fiscal period ended September 30, 2007.
| | Recovery Expiring on |
| Fund | | 9/30/08 | | 9/30/09 | | 9/30/10 |
| KMCVX | $ | 80,430 | | $ | 123,634 | | $ | 9,126 |
| KACVX | | — | | | 65,150 | | | 49,240 |
| KSMVX | | — | | | — | | | 39,797 |
| KSMIX | | — | | | — | | | 12,782 |
49
KEELEY Funds, Inc.
NOTES TO THE FINANCIAL STATEMENTS (Continued)
September 30, 2007
| 4. | | DISTRIBUTION PLAN |
| |
| | | The Company has adopted a Distribution Plan (the “Plan”) pursuant to Rule 12b-1 under the 1940 Act for all Class A shares. The Plan is designed to reimburse Keeley Investment Corp. (the “Distributor”), with whom certain officers and directors of the Company are affiliated, for certain promotional and other sales related costs and to permit the Company to compensate other dealers of its shares. Unreimbursed amounts may be carried forward and paid in a subsequent year, to the extent that total expenses under the plan do not exceed 0.25% of the average daily net assets of the Funds. The Funds paid to the Distributor and each dealer a monthly fee at the annual rate of 0.25% of the average daily net assets of Fund shares beneficially owned by the Distributor’s and each dealer’s existing brokerage clients. For the period from October 1, 2006 to September 30, 2007, KMCVX paid $181,711 in distribution fees, of which $55,139 was paid to the Distributor. KACVX paid $102,874 in distribution fees, of which $39,289 was paid to the Distributor. For the period from August 15, 2007 to September 30, 2007, KSMVX paid $957 in distribution fees, of which $802 was paid to the Distributor. |
| |
| 5. | | INVESTMENT TRANSACTIONS |
| |
| | | The aggregate cost of purchases and proceeds from sales of securities, excluding short-term investments, for the period from October 1, 2006 to September 30, 2007, were as follows: |
| |
| | U.S. Government | | Other Investment |
| | Securities | | Securities |
| Fund | | Purchases | | Sales | | Purchases | | Sales |
| KMCVX | $ — | | $ — | | $74,139,885 | | $42,241,068 |
| KACVX | — | | — | | 70,624,246 | | 18,865,697 |
| KSMVF | — | | — | | 4,364,481 | | 31,248 |
| | | For the period from October 1, 2006 to September 30, 2007, KMCVX, KACVX and KSMVF paid $216,951, $181,806 and $7,228, respectively, in brokerage commissions on trades of securities to the Distributor. |
| |
| 6. | | FEDERAL INCOME TAX INFORMATION |
| |
| | | At September 30, 2007, gross unrealized appreciation and depreciation of investments, based on cost for federal income tax purposes were as follows: |
| |
| | KMCVX | | KACVX | | KSMVF |
| Cost of Investments | $ | 86,927,327 | | | $ | 67,902,154 | | | $ | 4,335,592 | |
| Gross Unrealized Appreciation | $ | 22,610,014 | | | $ | 11,648,091 | | | $ | 436,290 | |
| Gross Unrealized Depreciation | | (1,172,239 | ) | | | (2,406,481 | ) | | | (22,715 | ) |
| Net Unrealized Appreciation | | | | | | | | | | | |
| on investments | $ | 21,437,775 | | | $ | 9,241,610 | | | $ | 413,575 | |
| | | The difference between cost amounts for financial statement and federal income tax purposes is due primarily to timing differences resulting from wash sale transactions during the year. |
50
KEELEY Funds, Inc.
NOTES TO THE FINANCIAL STATEMENTS (Continued)
September 30, 2007
| | | At September 30, 2007, KMCVX, KACVX and KSMVF had net Post-October realized capital losses of $824,730, $922,291 and $2,541 respectively, from transactions between November 1, 2006, and September 30, 2007. |
| | |
| | At September 30, 2007, KMCVX had accumulated capital loss carryforwards for federal income tax purposes of $70,829 and $1,229,875 expiring on September 30, 2014 and September 30, 2015, respectively and KACVX had accumulated capital loss carryforwards for federal income tax purposes of $248,022 expiring on September 30, 2015. To the extent that KMCVX or KACVX may realize future net capital gains, those gains will be offset by any of their unused respective capital loss carryforwards. |
| | |
| | The tax character of distributions paid during the fiscal year ended September 30, 2007 and 2006 were as follows: |
| | |
| | | Ordinary | | Long-Term | | |
| | | Income | | Capital Gains | | Return of Capital |
| Fund | | 2007 | | 2006 | | 2007 | | 2006 | | 2007 | | 2006 |
| KMCVX | | — | | — | | — | | — | | — | | — |
| KACVX | | — | | — | | — | | — | | $6,639 | | — |
| KSMVF | | — | | — | | — | | — | | — | | — |
| | | As of September 30, 2007 the components of accumulated earnings on a tax basis were as follows: |
| | |
| | KMCVX | | KACVX | | KSMVF |
| Accumulated Capital and Other Losses | $ | (2,125,434 | ) | | $ | (1,170,313 | ) | | $ | (2,541 | ) |
| Unrealized Appreciation on Investments | | 21,437,775 | | | | 9,241,610 | | | | 413,575 | |
| Total Accumulated Earnings | $ | 19,312,341 | | | $ | 8,071,297 | | | $ | 411,034 | |
| 7. | | OFFERING PRICE PER SHARE |
| |
| | | The public offering price for Class A shares is the net asset value plus a sales charge, which varies in accordance with the amount of the purchase up to a maximum of 4.50%. The public offering price for Class I shares is the net asset value. |
| |
| | | The Distributor retains the entire sales charge when it makes sales directly to the public. Otherwise, when sales are made through dealers, the Distributor receives a portion of the related sales charge. For the period from October 1, 2006 to September 30, 2007, the Distributor received $80,581 and $103,994 of sales charges on behalf of KMCVX and KACVX, respectively. For the period of August 15, 2007 to September 30, 2007, the Distributor received $3,481 of sales charges on behalf of KSMVX and did not receive any on behalf of KSMIX. Sales charges are not an expense of the Funds and are not reflected in the financial statements of the Funds. |
| |
| | | As specified in the Funds’ Prospectuses, reduced sales charges are available through a right of accumulation and certain sales of shares of the Funds can be made at net asset value per share. |
| |
| 8. | | LINE OF CREDIT ARRANGEMENTS |
| |
| | | KMCVX and KACVX are parties to uncommitted line of credit agreements with U.S. Bank, N.A., expiring March 1st, 2008, under which KMCVX may borrow up to the lesser of (a) $5.75 million or (b) 10% of the market value of the assets of KMCVX. Under a separate |
51
KEELEY Funds, Inc.
NOTES TO THE FINANCIAL STATEMENTS (Continued)
September 30, 2007
| | | agreement, KACVX may borrow up to the lesser of (a) $2.50 million or (b) 10% of the market value of the assets of KACVX. There is no line of credit for SMID. Interest is charged on borrowings at the prevailing Prime Rate. The Funds have borrowed under these agreements from time to time to increase the efficiency of cash flow management. For the year ended September 30, 2007, KMCVX and KACVX made interest payments of $6,892 and $3,708 in connection with this line of credit, and had average daily borrowings of $71,358 and $26,395, respectively. |
| |
| 9. | | RELATED PARTY TRANSACTIONS |
| |
| | | As of September 30, 2007 one affiliated director of the Funds beneficially owned 902,761 shares of KMCVX, 896,748 shares of KACVX, 188,043 shares of KSMVX and 100,000 shares of KSMIX, which 11.76%, 15.38%, 55.81% and 100% of the respective fund’s outstanding shares. |
| |
| 10. | | SUBSEQUENT EVENTS |
| |
| | | On August 14, 2007, the Board of Directors of KEELEY Funds, Inc. unanimously approved a plan of reorganization of KEELEY Small Cap Value Fund, Inc. into a newly created series of KEELEY Funds, Inc., designated “KEELEY Small Cap Value Fund,” effective as of December 31, 2007. |
52
Report of Independent Registered Public Accounting Firm
To the Board of Directors and Shareholders of
KEELEY Small Cap Value Fund, Inc. and KEELEY Funds, Inc.:
In our opinion, the accompanying statements of assets and liabilities, including the schedules of investments, and the related statements of operations and of changes in net assets and the financial highlights present fairly, in all material respects, the financial position of KEELEY Small Cap Value Fund, Inc. and KEELEY Funds, Inc. (constituting KEELEY Small-Mid Cap Value Fund, KEELEY Mid Cap Value Fund and KEELEY All Cap Value Fund, hereafter referred to as the “Funds”) at September 30, 2007, the results of each of their operations for the year or period then ended, and the changes in each of their net assets and the financial highlights for the periods presented, in conformity with accounting principles generally accepted in the United States of America. These financial statements and financial highlights (hereafter referred to as “ financial statements”) are the responsibility of the Funds’ management; our responsibility is to express an opinion on these financial statements based on our audits. We conducted our audits of these financial statements in accordance with the standards of the Public Company Accounting Oversight Board (United States). Those standards require that we plan and perform the audit to obtain reasonable assurance about whether the financial statements are free of material misstatement. An audit includes examining, on a test basis, evidence supporting the amounts and disclosures in the financial statements, assessing the accounting principles used and significant estimates made by management, and evaluating the overall financial statement presentation. We believe that our audits, which included confirmation of securities at September 30, 2007 by correspondence with the custodian and brokers, provide a reasonable basis for our opinion.

PricewaterhouseCoopers LLP
Milwaukee, WI
DATE
53
Approval of Investment Management Agreement for Keeley Small-Mid Cap Value Fund (Unaudited)
At a Meeting of the Board of Directors of Keeley Funds, Inc. (the “Company”) held on August 14, 2007, the Directors, including all of the Directors who are not “interested persons” as defined in Section 2(a)(19) of the 1940 Act, unanimously approved an amendment to the advisory agreement between the Company and Keeley Asset Management Corp. (respectively, the “Agreement” and the “Adviser”) to make the Adviser the investment adviser to the Company’s newly formed series, Keeley Small-Mid Cap Value Fund (the “Fund”).
The Board’s Independent Directors were assisted in their review by independent legal counsel, and met with such counsel separately from representatives of the Adviser. Independent legal counsel provided the Board with a memorandum that discussed the various factors that the Board should consider as part of its review of the Agreement, including, among other things, the nature and the quality of the services proposed to be provided by the Adviser, projected profitability (including any fall-out benefits) from the proposed relationship with the Fund, economies of scale and the role played by the Independent Directors. The Board also received materials on projected performance and expenses. The Directors discussed this material extensively among themselves and with their independent legal counsel. In their deliberations, the Directors did not identify any single factor which alone was responsible for the Board’s decision to approve the amendment to the Agreement.
Nature, Extent and Quality of Services
The Board examined the services proposed to be provided by the Adviser. In that regard, the Board considered the general reputation, financial resources and business activities of the Adviser and its current services to the Company. After considering all of this information, the Board concluded that the Adviser has more than sufficient resources and expertise to be able to provide acceptable services to the Fund.
Benefits from the Relationship with the Funds
The Board considered whether the Adviser would derive any other direct or indirect benefits from serving as investment adviser to the Fund. The Board noted the Adviser’s assertion that it was not aware of any ancillary or other benefits (other than advisory fees) that the Adviser would receive for serving as investment adviser to the Fund. The Board concluded that the lack of any ancillary, or so-called “fallout” benefits would enable the Adviser to manage the assets of the Fund in a manner that appeared to be free of conflicts of interest.
Economies of Scale
The Board considered the extent to which economies of scale would be realized as the Fund grows and whether the Fund’s fee levels reflect economies of scale for the benefit of its shareholder. The Board determined that because the Fund had not yet commenced operations, this factor was not a determinative factor.
54
Performance of the Funds and Costs of Services Provided
The Board considered information about the projected performance of the Fund and the costs of the services to be provided under the terms of the Agreement. The Board noted that because the Fund had not commenced operations, there was no actual performance or actual expenses to examine. The Board considered the Adviser’s assertion that the Fund would be managed in similar manner as to the other series of the Company, and reviewed with the Adviser the performance of each of those funds. The Board then reviewed the proposed expense information for the Fund, including against the expense structure of the other Funds and considered the projected costs and expenses of the Fund. The Board also considered the proposed advisory fees, noting that the Adviser was proposing to reimburse expenses. The Board concluded that the proposed expenses and fees were acceptable in light of the services proposed to be provided.
55
KEELEY funds Directors and Officers
Independent Directors
| | | | | | | | | Number of | | Other |
| | | | | Term of | | | | Portfolios | | Directorships |
| | | Position(s) | | Office* and | | | | Overseen | | Held Outside |
| | | Held with | | Length of | | Principal Occupation(s) During | | Within the | | the Fund |
| Name, Age and Address | | Fund | | Time Served | | the Past Five Years | | Fund Complex | | Complex |
| Jerome J. Klingenberger | | Director | | Served as | | Executive Vice President and Chief | | 4 | | None |
| Age: 52 | | | | Director since | | Financial Officer for Grayhill, Inc. | | | | |
| 561 Hillgrove Ave. | | | | 1999 | | (electronic components and control | | | | |
| LaGrange, IL 60525 | | | | | | systems) | | | | |
| John G. Kyle | | Director | | Served as | | Owner and operator of Shell Oil | | 4 | | None |
| Age: 66 | | | | Director since | | Services Stations and Gasoline | | | | |
| 10 Skokie Hwy | | | | 1993 | | Distributor | | | | |
| Highland Park, IL 60035 | | | | | | | | | | |
| John F. Lesch | | Director | | Served as | | Attorney with Nisen & Elliott, LLC | | 4 | | None |
| Age: 67 | | | | Director since | | | | | | |
| 200 W Adams Street | | | | 1993 | | | | | | |
| Suite 2500 | | | | | | | | | | |
| Chicago, IL 60606 | | | | | | | | | | |
| Sean P. Lowry | | Director | | Served as | | Executive Vice President of Pacor | | 4 | | None |
| Age: 53 | | | | Director since | | Mortgage Corp. | | | | |
| 401 South LaSalle Street | | | | 1999 | | | | | | |
| Suite 201 | | | | | | | | | | |
| Chicago, IL 60605 | | | | | | | | | | |
| Elwood P. Walmsley | | Director | | Served as | | Owner of J. FitzWoody’s Lakeshore | | 4 | | None |
| Age: 66 | | | | Director since | | Grill, since 2002 and Director of | | | | |
| 100 Cobblestone Court | | | | 1999 | | Sales for H.B. Taylor Company | | | | |
| Twin Lakes, WI 53181 | | | | | | (food services), since 2003; Prior | | | | |
| | | | | | | thereto, National Account Executive | | | | |
| | | | | | | for Haarmann & Reimer, Division of | | | | |
| | | | | | | Bayer International, since 1999. | | | | |
| Walter D. Fitzgerald | | Director | | Served as | | Vice President, RBC Dain Rauscher | | 4 | | None |
| Age: 66 | | | | Director since | | until retirement June 1, 2005 | | | | |
| P.O. Box 170 | | | | 2006 | | | | | | |
| Winnetka, IL 60093 | | | | | | | | | | |
| |
| Interested Director and Officers | | | | | | |
| | | | | | | | | Number of | | Other |
| | | | | Term of | | | | Portfolios | | Directorships |
| | | Position(s) | | Office* and | | | | Overseen | | Held Outside |
| | | Held with | | Length of | | Principal Occupation(s) During | | Within the | | the Fund |
| Name, Age and Address | | Fund | | Time Served | | the Past Five Years | | Fund Complex | | Complex |
| John L. Keeley, Jr. | | Director | | Served as | | President and Treasurer of Keeley | | 4 | | Marquette |
| Age: 67 | | and | | Director and | | Investment Corp., President of | | | | National Corp. |
| 401 South LaSalle Street | | President | | President | | Keeley Asset Management Corp., | | | | |
| Suite 1201 | | | | since 1993 | | KEELEY Small Cap Value Fund, | | | | |
| Chicago, IL 60605 | | | | | | Inc. and Keeley Funds, Inc. | | | | |
| Robert H. Becker | | Vice | | Served | | Senior Vice President of Keeley | | N/A | | N/A |
| Age: 65 | | President | | as Vice | | Asset Management Corp. | | | | |
| 401 South LaSalle Street | | | | President | | | | | | |
| Suite 1201 | | | | since 2007 | | | | | | |
| Chicago, IL 60605 | | | | | | | | | | |
| Mark E. Zahorik | | Vice | | Served | | Vice President of Keeley Asset | | N/A | | N/A |
| Age: 45 | | President | | as Vice | | Management Corp., Keeley | | | | |
| 401 South LaSalle Street | | | | President | | Investment Corp., KEELEY Small | | | | |
| Suite 1201 | | | | since 1997 | | Cap Value Fund, Inc. and Keeley | | | | |
| Chicago, IL 60605 | | | | | | Funds, Inc. | | | | |
| John L. Keeley, III | | Vice | | Served | | Vice President of Keeley Asset | | N/A | | N/A |
| Age: 46 | | President | | as Vice | | Management Corp., Keeley | | | | |
| 401 South LaSalle Street | | | | President | | Investment Corp., Keeley Small | | | | |
| Suite 1201 | | | | since 2005 | | Cap Value Fund, Inc. (2002 | | | | |
| Chicago, IL 60605 | | | | | | – Present) and Keeley Funds, Inc. | | | | |
| | | | | | | (2005 – Present); Trader for Mid- | | | | |
| | | | | | | American and Chicago Board of | | | | |
| | | | | | | Trade (1983 – 2001) | | | | |
56
KEELEY funds Directors and Officers (continued)
| | | | | | | | | Number of | | Other |
| | | | | Term of | | | | Portfolios | | Directorships |
| | | Position(s) | | Office* and | | | | Overseen | | Held Outside |
| | | Held with | | Length of | | Principal Occupation(s) | | Within the | | the Fund |
| Name, Age and Address | | Fund | | Time Served | | During the Past Five Years | | Fund Complex | | Complex |
| Robert Kurinsky | | Secretary and | | Served as | | Corporate Secretary and | | N/A | | N/A |
| Age: 35 | | Treasurer | | Corporate | | General Counsel of KEELEY | | | | |
| 401 South LaSalle Street | | | | Secretary | | Asset Management Corp., and | | | | |
| Suite 1201 | | | | since 2006 | | KEELEY Investment Corp., | | | | |
| Chicago, IL 60605 | | | | and Treasurer | | Corporate Secretary of KEELEY | | | | |
| | | | | since 2007 | | Small Cap Value Fund, Inc. | | | | |
| | | | | | | and KEELEY Funds, Inc. since | | | | |
| | | | | | | 2006, Chief Financial Officer of | | | | |
| | | | | | | KEELEY Investment Corp. and | | | | |
| | | | | | | KEELEY Asset Management | | | | |
| | | | | | | Corp. and Treasurer of the | | | | |
| | | | | | | KEELEY Small Cap Value | | | | |
| | | | | | | Fund, Inc. and KEELEY Funds, | | | | |
| | | | | | | Inc. since 2007, Various legal, | | | | |
| | | | | | | accounting and risk management | | | | |
| | | | | | | positions for Driehaus Capital | | | | |
| | | | | | | Management, Inc. | | | | |
| | | | | | | (2001 – 2006). | | | | |
| Guy Talarico | | Chief | | Served | | Co-Chief Executive Officer of | | N/A | | N/A |
| Age: 52 | | Compliance | | as Chief | | Alaric Compliance Services, | | | | |
| 41 Madison Ave | | Officer | | Compliance | | LLC since 2004; Senior | | | | |
| New York, NY 10010 | | | | Officer since | | Director of Investors Bank & | | | | |
| | | | | 2004 | | Trust Institutional Custody | | | | |
| | | | | | | Division 2001 to 2004. | | | | |
* Each Director serves an indefinite term until the election of a successor. Each Officer serves an indefinite term, renewed annually, until the election of a successor.
The Statement of Additional Information includes additional information about the Directors and is available upon request, without charge, by calling 1-888-933-5391.
Proxy Voting Policies and Procedure
You may obtain a description of KEELEY Funds’ proxy voting policies and procedures that the Funds use to determine how to vote proxies related to portfolio securities, without charge, upon request by calling 800.933.5391. This information also is included in KEELEY Funds’ statements of additional information, which is available on the Funds’ website at www.keeleyfunds.com and the Securities and Exchange Commission’s website at www.sec.gov.
Information relating to how each KEELEY Fund voted proxies relating to portfolio securities held during the twelve month period ended June 30, 200 7 is available on the Funds’ website at www.keeleyfunds.com and the Securities and Exchange Commission’s website at www.sec.gov.
Information About Portfolio Securities
KEELEY Funds files a complete schedule of portfolio holdings with the Securities and Exchange Commission for the quarters ending December 31, 2006 and June 30, 2007 (the first and third quarters of the Funds’ fiscal year) on Form N-Q. The Funds’ Forms N-Q are available on the Securities and Exchanges Commission’s website at www.sec.gov. You may also review and copy those documents by visiting the Securities and Exchange Commission’s Public Reference Room in Washington, D.C. Information on the operation of the Public Reference Room may be obtained by calling the Securities and Exchange Commission at 800.SEC.0330.
TAX NOTICE
Corporate Dividends Received Deduction and Qualified Dividend Income: None of the dividends paid by the Small Cap Value Fund or the All Cap Value Fund qualify for the corporate dividends received deduction or are considered qualified dividend income.
Short-Term Capital Gains: There were no short-term capital gain distributions that are considered taxable ordinary income distributions under Internal Revenue Section 871(k)(2)(c) for the Funds.
57

Investment Adviser

KEELEY ASSET MANAGEMENT CORP.
Chicago, Illinois
Distributor

KEELEY INVESTMENT CORP.
Chicago, Illinois
Custodian
U.S. BANK, N.A.
Milwaukee, Wisconsin
888-933-5391
Transfer Agent and Dividend Disbursing Agent
U.S. BANCORP FUND SERVICES, LLC
Milwaukee, Wisconsin
888-933-5391
Independent Registered Public Accounting Firm
PRICEWATERHOUSECOOPERS LLP
Milwaukee, Wisconsin
Counsel
BELL, BOYD & LLOYD LLP
Chicago, Illinois
Performance information quoted represents past performance and does not guarantee future results. The investment return and principal value of shares will fluctuate so that an investor’s shares, when redeemed, may be worth more or less than its original cost. This material may only be used when preceded or accompanied by each Fund’s Prospectus.
401 South LaSalle Street • Suite 1201 • Chicago • Illinois • 60605
(312) 786-5050 • (800) 533-5344 • FAX (312) 786-5003
Item 2. Code of Ethics.
At the date of this filing, the registrant has not adopted a formal code of ethics that conforms to the standards listed in the General Instructions to this Form N-CSR (the “N-CSR Code”). However, the registrant has adopted a code of ethics in accordance with Rule 17j-1 under the Investment Company Act of 1940 (the “Code”), that addresses, among other things, conflicts of interest that may result from personal securities transactions and dealings with third parties, and certain outside activities. The Code is reasonably designed to deter wrongdoing and promote ethical conduct, internal reporting and accountability for adherence to the Code. In the judgment of the registrant, the adoption of a separate N-CSR Code is not necessary at the current time because of the small size of the registrant's and adviser's staff.
Item 3. Audit Committee Financial Expert.
Registrant's board of directors has determined that Jerome Klingenberger, member and chairman of the registrant's Committee of Independent Directors (which performs all audit committee functions on behalf of registrant), has all the attributes of an "audit committee financial expert," as such term is defined in Instruction 2(b) to Item 3 of Form N-CSR. Mr. Klingenberger is "independent" as such term is defined in paragraph (a)(2) of Item 3 of Form N-CSR.
Under applicable securities laws, a person who is determined to be an audit committee financial expert will not be deemed an "expert" for any purpose, including without limitation for the purposes of Section 11 of the Securities Act of 1933, as a result of being designated or identified as an audit committee financial expert. The designation or identification of a person as an audit committee financial expert does not impose on such person any duties, obligations, or liabilities that are greater than the duties, obligations, and liabilities imposed on such person as a member of the audit committee and board of directors in the absence of such designation or identification.
Item 4. Principal Accountant Fees and Services.
Aggregate fees billed to the registrant for professional services rendered by the registrant’s accountant are summarized in the tables below. The tables summarize fees billed (or to be billed) by the registrant’s principal accountant for work performed relating to each applicable period identified below.
| | | FYE 9/30/2007 | | FYE 9/30/2006 |
| Audit Fees | | $24,300 | | $23,000 |
| Audit-Related Fees | | 0 | | 0 |
| Tax Fees | | $4,425 | | $4,085 |
| All Other Fees | | 0 | | 0 |
1
(a) “Audit Fees” include amounts for professional services rendered by the principal accountant for the audit of the registrant’s annual financial statements and services that are normally provided by the accountant in connection with statutory and regulatory filings or engagements, including fees billed for review of the registrant’s post-effective amendments to the registrant’s registration statements filed for each of the last two fiscal years.
(b) “Audit-Related Fees” include amounts for assurance and related services by the principal accountant that are reasonably related to the performance of the audit of the registrant’s financial statements. Audit-related fees have not been reported under the item “audit fees” in the chart above.
(c) “Tax Fees” include amounts for professional services rendered by the principal accountant for tax compliance, tax advice and tax planning.
(d) None.
(e)(1) During its regularly scheduled periodic meetings, the registrant's Committee of Independent Directors considers any requests to pre-approve any audit, audit-related, tax and other services to be provided by the principal accountants of the registrant. Under paragraph (c)(7)(i)(C) of Rule 2-01 of Regulation S-X, pre-approval of non-audit services may be waived provided that: 1) the aggregate fees for all such services provided constitutes no more than five percent of the total amount of fees paid by the registrant to its principal accountant during the fiscal year in which services are provided, 2) such services were not recognized by the registrant at the time of engagement as non-audit services and 3) such services are promptly brought to the attention of the Committee of Independent Directors of the registrant and approved prior to the completion of the audit.
(e)(2) No services included in Items 4(b) - - (d) above were approved pursuant to paragraph (c)(7)(i)(C) of Rule 2-01 of Regulation S-X.
(f) Less than 50 percent of the hours expended on the principal accountant’s engagement to audit the registrant’s financial statements for the most recent fiscal year were attributed to work performed by persons other than the principal accountant’s full-time, permanent employees.
(g) The aggregate fees billed for the fiscal years ended September 30, 2006 and September 30, 2007 by the registrant’s principal accountant for non-audit services rendered to the registrant are shown in the tables. For the registrant’s fiscal years ended September 30, 2006 and September 30, 2007, PricewaterhouseCoopers LLP served as the registrant’s principal accountant and provided no services and billed no fees, for non-audit services rendered to the registrant, the registrant’s adviser or entities controlling, controlled by or under common control with the adviser.
(h) The Committee of Independent Directors of the registrant has considered whether the provision of non-audit services that were rendered to the registrant's investment adviser, and any entity controlling, controlled by or under common control with the investment adviser that provides ongoing services to the registrant that were not pre-approved pursuant to paragraph (c)(7)(ii) of Rule 2-01 of Regulation S-X is compatible with maintaining the principal accountant's independence. No such services were rendered during the two most recent fiscal years.
2
Item 5. Audit Committee of Listed Registrants.
Not applicable to registrants who are not listed issuers (as defined in Rule 10A-3 under the Securities Exchange Act of 1934).
Item 6. Schedule of Investments.
Schedule of Investments is included as part of the report to shareholders filed under Item 1 of this Form.
Item 7. Disclosure of Proxy Voting Policies and Procedures for Closed-End Management Investment Companies.
Not applicable to open-end investment companies.
Item 8. Portfolio Managers of Closed-End Management Investment Companies.
Not applicable to open-end investment companies.
Item 9. Purchases of Equity Securities by Closed-End Management Investment Company and Affiliated Purchasers.
Not applicable to open-end investment companies.
Item 10. Submission of Matters to a Vote of Security Holders.
The registrant has not adopted any procedure by which shareholders may recommend nominees to the registrant’s board of directors.
Item 11. Controls and Procedures.
(a) The registrant's principal executive officer and principal financial officer have concluded, based on an evaluation of the registrant's disclosure controls and procedures (as defined in Rule 30a-3(c) under the Investment Company Act of 1940, as amended) as of a date within 90 days prior to the filing date of this Form N-CSR, that the disclosure controls are effectively designed to ensure that information required to be disclosed by the registrant in this Form N-CSR is recorded, processed, summarized and reported by the filing date, including ensuring that information required to be disclosed in this Form N-CSR is accumulated and communicated to the registrant's management, including the registrant's principal executive officer and principal financial officer, as appropriate to allow timely decisions regarding required disclosure.
(b) There were no significant changes in the registrant's internal control over financial reporting (as defined in Rule 30a-3(d) under the Investment Company Act of 1940, as amended) that occurred during the second fiscal half-year covered by this report that has materially affected, or is reasonably likely to materially affect, the registrant's internal control over financial reporting.
3
Item 12. Exhibits.
(a)(1) Not applicable.
(a)(2) A separate certification for each principal executive officer and principal financial officer of the registrant as required by Rule 30a-2(a) under the Act (17 CFR 270.30a-2(a)): attached hereto as EX-99.CERT.
(a)(3) Not applicable.
(b) Certification of principal executive officer and principal financial officer as required by Rule 30a-2(b) under the Act (17 CFR 270.30a-2(b)), Rule 13a-14(b) or Rule 15d-14(b) under the Securities Exchange Act of 1934 (17 CFR 240.13a-14(b) or 240.15d-14(b) (as applicable), and Section 1350 of Chapter 63 of Title 18 of the United States Code (18 U.S.C. 1350): attached hereto as EX-99.906CERT.
4
SIGNATURES
Pursuant to the requirements of the Securities Exchange Act of 1934 and the Investment Company Act of 1940, the registrant has duly caused this report to be signed on its behalf by the undersigned, thereunto duly authorized.
| | KEELEY Small Cap Value Fund, Inc. |
| |
| By | /s/ John L. Keeley Jr. |
| John L. Keeley Jr., President |
| |
| Date | 12/3/07 |
Pursuant to the requirements of the Securities Exchange Act of 1934 and the Investment Company Act of 1940, this report has been signed below by the following persons on behalf of the registrant and in the capacities and on the dates indicated.
| | By | /s/ John L. Keeley Jr. |
| John L. Keeley Jr., President |
| |
| Date | 12/3/07 |
| | By | /s/ Robert Kurinsky |
| Robert Kurinsky, Treasurer |
| |
| Date | 12/3/07 |
5