UNITED STATES
SECURITIES AND EXCHANGE COMMISSION
Washington, D.C. 20549
FORM N-CSR
CERTIFIED SHAREHOLDER REPORT OF REGISTERED
MANAGEMENT INVESTMENT COMPANIES
Investment Company Act file number | 811-7762 |
|
First Eagle Funds |
(Exact name of registrant as specified in charter) |
|
1345 Avenue of the Americas New York, NY | | 10105-4300 |
(Address of principal executive offices) | | (Zip code) |
|
Robert Bruno First Eagle Funds 1345 Avenue of the Americas New York, NY 10105-4300 |
(Name and address of agent for service) |
|
Registrant’s telephone number, including area code: | 1-212-632-2700 | |
|
Date of fiscal year end: | October 31, 2007 | |
|
Date of reporting period: | October 31, 2007 | |
| | | | | | | | |
Form N-CSR is to be used by management investment companies to file reports with the Commission not later than 10 days after the transmission to stockholders of any report that is required to be transmitted to stockholders under Rule 30e-1 under the Investment Company Act of 1940 (17 CFR 270.30e-1). The Commission may use the information provided on Form N-CSR in its regulatory, disclosure review, inspection, and policymaking roles.
A registrant is required to disclose the information specified by Form N-CSR, and the Commission will make this information public. A registrant is not required to respond to the collection of information contained in Form N-CSR unless the Form displays a currently valid Office of Management and Budget (“OMB”) control number. Please direct comments concerning the accuracy of the information collection burden estimate and any suggestions for reducing the burden to Secretary, Securities and Exchange Commission, 450 Fifth Street, NW, Washington, DC 20549-0609. The OMB has reviewed this collection of information under the clearance requirements of 44 U.S.C. § 3507.
Item 1. Reports to Stockholders.
First Eagle Funds
Annual Report
October 31, 2007
First Eagle Global Fund
First Eagle Overseas Fund
First Eagle U.S. Value Fund
First Eagle Gold Fund
First Eagle Fund of America

Advised by Arnhold and S. Bleichroeder Advisers, LLC

FIRST EAGLE FUNDS
Table of Contents
| Letter from the President | | | 1 | | |
|
| Performance Chart | | | 2 | | |
|
| Letter from the Portfolio Manager | | | 4 | | |
|
Management's Discussion of Fund Performance: First Eagle Global Fund,
First Eagle Overseas Fund, First Eagle U.S. Value Fund and First Eagle Gold Fund | | | 5 | | |
|
| First Eagle Global Fund: | |
|
| Fund Overview | | | 8 | | |
|
| Schedule of Investments | | | 9 | | |
|
| First Eagle Overseas Fund: | |
|
| Fund Overview | | | 24 | | |
|
| Schedule of Investments | | | 25 | | |
|
| First Eagle U.S. Value Fund: | |
|
| Fund Overview | | | 36 | | |
|
| Schedule of Investments | | | 37 | | |
|
| First Eagle Gold Fund: | |
|
| Fund Overview | | | 42 | | |
|
| Schedule of Investments | | | 43 | | |
|
| First Eagle Fund of America: | |
|
| Management's Discussion of Fund Performance | | | 45 | | |
|
| Fund Overview | | | 46 | | |
|
| Schedule of Investments | | | 47 | | |
|
| Statements of Assets and Liabilities | | | 52 | | |
|
| Statements of Operations | | | 53 | | |
|
| Statements of Changes in Net Assets | | | 54 | | |
|
| Notes to Financial Statements | | | 57 | | |
|
| Financial Highlights | | | 70 | | |
|
| Report of Independent Registered Public Accounting Firm | | | 82 | | |
|
| Fund Expenses | | | 83 | | |
|
| Tax Information | | | 85 | | |
|
| Additional Information | | | 86 | | |
|
The First Eagle Funds file their complete schedule of portfolio holdings with the Securities and Exchange Commission for the first and third quarters of each fiscal year on Form N-Q. The Funds' Forms N-Q are available on the Commission's website at www.sec.gov. The Funds' Forms N-Q may be reviewed and copied at the Commission's Public Reference Room in Washington D.C., and information on the operation of the Public Reference Room may be obtained by calling 1-800-SEC-0330. To obtain information on the Form N-Q from the Funds, shareholders can call 1-800-334-2143.
A copy of the Trust's policies and procedures with respect to the voting of proxies relating to the Trust's portfolio investments and information regarding the proxy-voting record of the Trust for the most recent twelve-month period ended June 30 is available by calling the Trust at 1-800-334-2143. This information also is available on the SEC's website at http://www.sec.gov.
FORWARD-LOOKING STATEMENT DISCLOSURE
One of our most important responsibilities as mutual fund managers is to communicate with shareholders in an open and direct manner. Some of our comments in our letters to shareholders are based on current management expectations and are considered "forward-looking statements.'' Actual future results, however, may prove to be different from our expectations. You can identify forward-looking statements by words such as "may'', "will'', "believe'', "attempt'', "seem'', "think'', "ought'', "try'' and other similar terms. We cannot promise future returns. Our opinions are a reflection of our best judgment at the time this report is compiled, and we disclaim any obligation to update or alter forward-looking statements as a result of new information, future events, or otherwise.

John P. Arnhold
FIRST EAGLE FUNDS
LETTER FROM THE PRESIDENT
Dear Fellow Shareholder,
Since my last communication in April of this year, we have witnessed more market volatility, particularly on the downside, than we have seen in the past five years. It is in these uncertain times that I am reminded why our investment team has been so successful over the long term by adhering to its investment philosophy. The credit crisis and the resulting slowdown due to the sub-prime problems, which has caused much angst for so many financial institutions, is on the minds of our team and we continue to be concerned. Although we are not macro-economic forecasters, we worry a lot about what can go wrong and try to properly prepare the portfolios in any way we can to avoid losses for our shareholders. For decades we have believed that focusing first and foremost on attempting to avoid losers and preserving capital is the best way to help our clients achieve their long-term investment goals.
During a raging bull market as we have experienced in most markets these past five years, where every sector and asset class has risen sharply, we have sometimes been criticized for not "keeping up with the Joneses"—(underperforming benchmarks or peers in the short term). It is at times like these when our team shows its true discipline, as it is un-willing to follow the herd and invest in what it believes are overpriced securities. As a shareholder you should understand that while the funds may give up some relative performance on the upside, our conservative posturing and focus on avoiding downside risk should serve you well on an absolute basis which to us (and we believe to you) is what matters most.
I am pleased to announce that we have broadened our global value team with the additions of Bruce Greenwald and Abhay Deshpande. Bruce Greenwald has joined the First Eagle team as our Director of Research. Professor Greenwald is a respected expert on value investing and is the Director of the Helibrunn Center for Graham and Dodd Investing at Columbia Business School. We are delighted to have Bruce on board and believe he will assist our analyst team to continue to apply and refine our value investing techniques. I am also happy to announce that Abhay Deshpande has been named Associate Portfolio Manager of the Global, Overseas, and U.S. Value Funds. Abhay has re-joined the global value team, where he had been a senior analyst from 2000-2004. Although he left the group in 2005, he remained with the firm and managed a number of private client accounts. His investment style and philosophy which was crafted under the tutelage of Jean - -Marie Eveillard, is very much the same, thus making his return to the team a natural fit. I am confident with Abhay and Bruce joining the already talented team of analysts, that the investment style established by Jean-Marie will continue to serve our shareholders well for decades into the future, as it has for decades past.
In closing, as a shareholder of the funds, you should be assured that your investments continue to be managed in the same manner they have for years. Although we have some new additions to our team, you should remain confident that Jean-Marie has instilled his investment wisdom and discipline very deeply within each member of our team. Also, as the year comes to a close, I would be remiss by not mentioning again how proud we are of our First Eagle Fund of America in its 20th anniversary year. A 20th anniversary is quite an accomplishment in itself, but coupled with the impressive long-term track record this fund has makes it truly extraordinary.
Sincerely,
John P. Arnhold
November 2007
Past performance is no guarantee of future result. Portfolio actively managed. Portfolio and opinions expressed herein are subject to change.
PERFORMANCE
FIRST EAGLE FUNDS Average Annual Returns1 as of October 31, 2007 (unaudited)
| | | ONE-YEAR | | THREE-YEARS | | FIVE-YEARS | | TEN-YEARS | | SINCE
INCEPTION | | INCEPTION
DATE | |
| FIRST EAGLE GLOBAL FUND | |
| First Eagle Global Fund - Class A (SGENX) | |
| without sales load | | | 16.91 | % | | | 18.59 | % | | | 22.11 | % | | | 14.79 | % | | | 15.84 | % | | 1/01/792 | |
| with sales load | | | 11.06 | % | | | 16.58 | % | | | 20.86 | % | | | 14.35 | % | | | 15.69 | % | | 1/01/792 | |
| First Eagle Global Fund - Class I (SGIIX) | | | 17.19 | % | | | 18.88 | % | | | 22.42 | % | | | — | | | | 15.90 | % | | 7/31/98 | |
| First Eagle Global Fund - Class C (FESGX) | | | 14.90 | % | | | 17.69 | % | | | 21.20 | % | | | — | | | | 16.73 | % | | 6/05/00 | |
| MSCI World Index3 | | | 20.39 | % | | | 18.27 | % | | | 18.31 | % | | | 7.90 | % | | | 11.72 | % | | 1/01/79 | |
| FIRST EAGLE OVERSEAS FUND | |
| First Eagle Overseas Fund - Class A (SGOVX) | |
| without sales load | | | 18.20 | % | | | 20.52 | % | | | 24.55 | % | | | 16.52 | % | | | 15.10 | % | | 8/31/93 | |
| with sales load | | | 12.29 | % | | | 18.48 | % | | | 23.28 | % | | | 16.07 | % | | | 14.79 | % | | 8/31/93 | |
| First Eagle Overseas Fund - Class I (SGOIX) | | | 18.52 | % | | | 20.83 | % | | | 24.86 | % | | | — | | | | 17.24 | % | | 7/31/98 | |
| First Eagle Overseas Fund - Class C (FESOX) | | | 16.16 | % | | | 19.63 | % | | | 23.63 | % | | | — | | | | 17.35 | % | | 6/05/00 | |
| MSCI EAFE Index4 | | | 24.91 | % | | | 23.44 | % | | | 23.21 | % | | | 9.26 | % | | | 8.30 | % | | 8/31/93 | |
| FIRST EAGLE U.S. VALUE FUND | |
| First Eagle U.S. Value Fund - Class A (FEVAX) | |
| without sales load | | | 11.47 | % | | | 11.62 | % | | | 15.14 | % | | | — | | | | 13.15 | % | | 9/04/01 | |
| with sales load | | | 5.89 | % | | | 9.73 | % | | | 13.96 | % | | | — | | | | 12.21 | % | | 9/04/01 | |
| First Eagle U.S. Value Fund - Class I (FEVIX) | | | 11.78 | % | | | 11.93 | % | | | 15.41 | % | | | — | | | | 13.42 | % | | 9/04/01 | |
| First Eagle U.S. Value Fund - Class C (FEVCX) | | | 9.57 | % | | | 10.83 | % | | | 14.26 | % | | | — | | | | 12.31 | % | | 9/04/01 | |
| Standard &Poor's 500 Index7 | | | 14.56 | % | | | 13.16 | % | | | 13.88 | % | | | — | | | | 7.06 | % | | 9/04/01 | |
| Russell 2000 Index5 | | | 9.27 | % | | | 13.69 | % | | | 18.67 | % | | | — | | | | 11.03 | % | | 9/04/01 | |
| FIRST EAGLE GOLD FUND | |
| First Eagle Gold Fund - Class A (SGGDX) | |
| without sales load | | | 37.57 | % | | | 25.34 | % | | | 27.02 | % | | | 16.87 | % | | | 11.08 | % | | 8/31/93 | |
| with sales load | | | 30.69 | % | | | 23.22 | % | | | 25.73 | % | | | 16.42 | % | | | 10.78 | % | | 8/31/93 | |
| First Eagle Gold Fund - Class I (FEGIX) | | | 37.93 | % | | | 25.64 | % | | | — | | | | — | | | | 25.81 | % | | 5/15/03 | |
| First Eagle Gold Fund - Class C (FEGOX) | | | 35.32 | % | | | 24.39 | % | | | — | | | | — | | | | 24.58 | % | | 5/15/03 | |
| MSCI World Index3 | | | 20.39 | % | | | 18.27 | % | | | 18.31 | % | | | 7.90 | % | | | 9.14 | % | | 8/31/93 | |
| FTSE Gold Mines Index6 | | | 35.14 | % | | | 21.05 | % | | | 24.05 | % | | | 9.75 | % | | | 3.70 | % | | 8/31/93 | |
| FIRST EAGLE FUND OF AMERICA | |
| First Eagle Fund of America - Class A (FEFAX) | |
| without sales load | | | 21.28 | % | | | 15.64 | % | | | 15.87 | % | | | — | | | | 10.26 | % | | 11/20/98 | |
| with sales load | | | 15.35 | % | | | 13.75 | % | | | 14.73 | % | | | — | | | | 9.62 | % | | 11/20/98 | |
| First Eagle Fund of America - Class C (FEAMX) | | | 19.17 | % | | | 14.79 | % | | | 15.04 | % | | | — | | | | 9.34 | % | | 3/02/98 | |
| First Eagle Fund of America - Class Y (FEAFX) | | | 21.25 | % | | | 15.65 | % | | | 15.90 | % | | | 11.52 | % | | | 13.86 | % | | 4/10/87 | |
| Standard &Poor's 500 Index7 | | | 14.56 | % | | | 13.16 | % | | | 13.88 | % | | | 7.10 | % | | | 10.96 | % | | 4/10/87 | |
Please see the following page for important notes to this table.
2
FIRST EAGLE FUNDS PERFORMANCE—(Continued)
(1) The performance data quoted herein represents past performance and does not guarantee future results. Market volatility can dramatically impact the funds' short term performance. Current performance may be lower or higher than figures shown. The investment return and principal value will fluctuate so that an investor's shares, when redeemed, may be worth more or less than their original cost. Past performance data through the most recent month end is available at www.firsteaglefunds.com or by calling (800) 334-2143. The average annual returns shown on the prior page are historical and reflect changes in share price, reinvested dividends and are net of expenses. The average annual returns for Class A Shares "with sales load" of Firs t Eagle Global Fund, First Eagle Overseas Fund and First Eagle Gold Fund give effect to the deduction of the maximum sales load of 3.75% for periods prior to March 1, 2000 and of 5.00% thereafter. The average annual returns for Class A Shares "with sales load" of First Eagle U.S. Value Fund and First Eagle Fund of America give effect to the deduction of the maximum sales load of 5.00%.
The average annual returns for Class C Shares reflect the CDSC (Contingent Deferred Sales Charge) of 1.00% which pertains to the first year or less of investment only.
Class I Shares of First Eagle Global Fund, First Eagle Overseas Fund, First Eagle U.S. Value Fund, and First Eagle Gold Fund require $1mm minimum investment and are offered without load.
Class Y Shares of First Eagle Fund of America are offered without load.
(2) Commencement of management by Mr. Jean-Marie Eveillard since January 1, 1979.
(3) The MSCI World Index is a widely followed, unmanaged group of stocks from 23 international markets and is not available for purchase. This index is a trademark of Morgan Stanley Capital International SA in Geneva, Switzerland.
(4) The MSCI EAFE Index is a total return index, reported in U.S. dollars, based on share prices and reinvested net dividends of approximately 1,100 companies from 21 countries and is not available for purchase.
(5) The Russell 2000 Index is an unmanaged index that measures the performance of the 2,000 smallest companies in the Russell 3000 Index and is not available for purchase.
(6) The FTSE Gold Mines Index is an unmanaged index composed of approximately 19 mining companies and is only available without dividends reinvested and is not available for purchase.
(7) The Standard & Poor's 500 Index is a widely recognized unmanaged index including a representative sample of 500 leading companies in leading sectors of the U.S. economy and is not available for purchase. Although the Standard & Poor's 500 Index focuses on the large-cap segment of the market, with approximately 75% coverage of U.S. equities, it is also considered a proxy for the total market.
| | | Expense Ratios As Stated In The Most Recent Prospectus
Total Annual Gross Operating Expense Ratios8 | |
| | | Class A | | Class I | | Class C | | Class Y | |
| First Eagle Global Fund | | | 1.15 | % | | | 0.90 | % | | | 1.90 | % | | | — | | |
| First Eagle Overseas Fund | | | 1.14 | % | | | 0.89 | % | | | 1.89 | % | | | — | | |
| First Eagle U.S. Value Fund | | | 1.25 | % | | | 1.00 | % | | | 2.00 | % | | | — | | |
| First Eagle Gold Fund | | | 1.22 | % | | | 0.97 | % | | | 1.97 | % | | | — | | |
| First Eagle Fund of America | | | 1.41 | % | | | — | | | | 2.16 | % | | | 1.41 | % | |
(8) These expense ratios are presented as of October 31, 2006 and may differ from corresponding ratios shown elsewhere in this report because of differing time periods (and/or, if applicable, because these expense ratios do not include expense credits or waivers).
3

Jean-Marie Eveillard
FIRST EAGLE FUNDS
First Eagle Global Fund • First Eagle Overseas Fund
First Eagle U.S. Value Fund • First Eagle Gold Fund
LETTER FROM THE PORTFOLIO MANAGER
Dear Fellow Shareholder,
We are "value" investors, so we are "bottom up" (as opposed to "top down") investors. In other words, we analyze individual securities in an attempt to establish—through quantitative and qualitative means—their "intrinsic" value. We do not pay too much attention to the "top down", i.e. the "big picture" of the economy, interest rates, etc ...or even themes (they turn too easily into fads ...). We only worry about economic and financial circumstances turning so negative—for an extended period of time—that our "intrinsic" values would prove temporarily too high.
In that respect, we have been faced since August with the so-called sub-prime housing problem, which is financial crisis no. 6 in only twenty years. No. 1 was the October 1987 crash, no. 2 the real estate debacle of 1990, no. 3 the Mexican devaluation of late 1994, no. 4, the Asian and then Russian crises of 1997-1998 culminating in the Long Term Capital Management hedge fund collapse, no. 5 the bursting of the technology-media-telecom bubble in the spring of 2000.
In all five cases, the Federal Reserve flooded the system with liquidity, and the crisis came and went in a few months, without price inflation accelerating, thanks to a large extent to improvements in productivity associated with the technological revolution and to the low-cost Chinese economy becoming the manufacturing center of the world.
The odds may be good that crisis no. 6 too shall pass in the next few months. However, speculators have been bolder (the Fed will bail us out, so why worry?), the housing bubble was big, the leverage in the system (some of it hidden) has increased. Sometimes, what matters is not so much how low the odds are that circumstances would turn quite negative, what matters possibly more is what the consequences would be if that happened.
Therefore, we are on the side of caution, as indicated by the stakes in gold (as potential insurance against "extreme outcomes"), in cash (so far in dollars, since we have a large exposure to foreign securities on an unhedged-yen or 30% hedged-euro-basis). As well, "value" stocks may be less vulnerable than other securities in difficult markets.
At the same time, we remain alert to investment opportunities, as circumstances and prices change.
In 2006 and so far in 2007, your funds have continued to deliver positive absolute returns but they have lagged their peers and the benchmarks. That is not a surprise: as bull markets age, investors get bolder (a paradox, of course ...) and, as I have said, we have been on the side of caution: too much in cash and too little in emerging markets for instance. However, the long-term record (see page 2) remains good. Of course, we cannot promise future returns.
As I wrote at the end of my letter back in June, we are patient long-term investors and we hope that the Funds' shareholders will be as well.

Jean-Marie Eveillard
Portfolio Manager
November 2007
Past performance is no guarantee of future result. Portfolio actively managed. Portfolio and opinions expressed herein are subject to change.
4

Jean-Marie Eveillard

Abhay Deshpande
FIRST EAGLE FUNDS
First Eagle Global Fund • First Eagle Overseas Fund
First Eagle U.S. Value Fund • First Eagle Gold Fund
MANAGEMENT'S DISCUSSION OF FUND PERFORMANCE
Despite a downturn in worldwide markets in February and August related to problems in the U.S. sub-prime housing market, equity markets finished the year higher on October 31, 2007. Corporate profits were strong while interest rates remained low. European stocks benefited from increased M&A activity in a variety of industries. The German DAX Index rose 27.9% and the French CAC 40 Index rose 9.3% during the twelve month period. In South Korea, the Kospi Large Cap Index rose 45.6% during the year as a result of improved corporate earnings and attractively valued Korean equities relative to equities in other markets like China. Japan's Nikkei 225 Index rose only a modest 2.1% for the year. Returns were further boosted by the dollar weakening against several currencies. The U.S. dollar fell 1.3% against the Japanese yen and 11.9% against the euro during the year. The MSCI World Index increased 20.4% while in the U.S, the S&P 500 Index rose 14.6%. Crude oil rose 61% during the twelve month period to a year high of $95 on October 31st fueling concerns about inflation. Gold also reached a peak of $797 an ounce on October 31st, an increase of 31% over last year, mostly on the back of higher energy prices.
First Eagle Global Fund
The net asset value ("NAV") of the Fund's Class 'A' shares rose 16.91% for the year ended October 31, 2007, while the MSCI World Index was up 20.39%. The Fund's cash position remained in the 13.8% to 19.7% range throughout the period and was 18.2% on October 31, 2007.
The five largest contributors to the performance of the First Eagle Global Fund over the period were gold bullion, Sodexho Alliance SA (corporate services, France), Industrias Peñoles, SAB de C.V. (mining, Mexico), Nestlé SA (food company, Switzerland) and Berkshire Hathaway Inc., Class 'A' (holding company, U.S.) collectively accounting for 4.29% of the year's performance.
The five largest detractors were Comcast Corporation-Special Class 'A' (cable, U.S.), Getty Images, Inc. (media, U.S.), International Speedway Corporation Class 'A' (racetracks, U.S.), Aioi Insurance Company, Limited (insurance, Japan) and Wal-Mart Stores, Inc. (retail, U.S.). Their combined negative performance over the twelve month period subtracted 0.72% points from the Fund's performance.
As of October 31, 2007, the Fund was approximately 30% hedged against the euro, which is up from 0% last year, as we believe the euro may be overvalued against the U.S. dollar. We also initiated a 10% hedge on the Swiss Franc and a 70% hedge on the British Pound. The Fund remained 0% hedged against the Japanese yen as we believe Asian currencies should ultimately be revalued against the U.S. dollar. The Fund is also somewhat protected against a sharp rise of the U.S. dollar by having all of its cash in U.S. dollar denominated commercial paper and by having in the portfolio the stock of quite a few European and Japanese companies that have major operations in the U.S. or export significantly to U.S. dollar-based countries, thus having a natural built-in hedge.
5
First Eagle Overseas Fund
The NAV of the Fund's Class 'A' shares rose 18.20% for the fiscal year ended October 31, 2007, while the MSCI EAFE Index increased 24.91% over the same period. The Fund's cash position was between 12.4% and 24.7% throughout the period and was at 12.4% on October 31, 2007.
The five largest contributors to the performance of the First Eagle Overseas Fund over the period were gold bullion, Nestlé SA (food company, Switzerland), Sodexho Alliance SA (corporate services, France), Industrias Peñoles, SAB de C.V. (mining, Mexico) and Wendel (holding company, France) collectively accounting for 5.02% of the year's performance.
The five largest detractors were Aioi Insurance Company, Limited (insurance, Japan), Takefuji Corporation (consumer loan company, Japan), Kose Corporation (cosmetics, Japan), Fuji Seal International, Inc. (packaging materials company, Japan) and Télévision Française 1 SA (media, France). Their combined negative performance over the twelve month period subtracted 0.57% from the Fund's performance.
Again, we believe in most cases that the negative performance is nothing more than a temporary (rather than permanent) impairment of capital. In some cases, the Fund seized the opportunity to add to the positions at prices we deemed attractive. In particular, four of the five detractors were Japanese securities. We believe that the Japanese market currently offers attractive investment opportunities.
As of October 31, 2007, the Fund was approximately 30% hedged against the euro, which is up from 0% last year, as we believe the euro may be overvalued against the U.S. dollar. We also initiated a 10% hedge on the Swiss Franc and a 70% hedge on the British Pound. The Fund remained 0% hedged against the Japanese yen as we believe Asian currencies should ultimately be revalued against the U.S. dollar. The Fund is also somewhat protected against a sharp rise of the U.S. dollar by having all of its cash in U.S. dollar denominated commercial paper and by having in the portfolio the stock of quite a few European and Japanese companies that have major operations in the U.S. or export significantly to U.S. dollar-based countries, thus having a natural built-in hedge.
First Eagle U.S. Value Fund
The NAV of the First Eagle U.S. Value Fund's Class 'A' shares rose 11.47% for the year ended October 31, 2007, while the S&P 500 Index and the Russell 2000 Index rose 14.56% and 9.27%, respectively. The Fund held cash positions between 15.9% and 36.5% of net assets during the twelve month period and was at 15.9% on October 31, 2007. The high cash positions reflect our inability to find securities in the U.S. that we feel provide enough of a margin of safety, and our refusal to buy what we believe are fully priced—not to mention overpriced—securities.
The five largest contributors to the performance of the First Eagle U.S. Value Fund over the period were Apache Corporation (energy), gold bullion, Berkshire Hathaway Inc., Class 'A' (holding company), McDonald's Corporation (restaurant) and Costco Wholesale Corporation (retail), collectively accounting for 4.43% of the year's performance.
The five largest detractors were Getty Images, Inc. (media), International Speedway Corporation, Class 'A' (racetracks), Comcast Corporation—Special Class 'A' (cable), Cintas Corporation (uniform rental) and New York Times Company, Class 'A' (publishing). Their combined negative performance over the twelve month period subtracted 1.55% from the Fund's performance.
6
First Eagle Gold Fund
The NAV of the First Eagle Gold Fund's Class 'A' shares rose 37.57% for the year ended October 31, 2007, while the FTSE Gold Mines Index rose 35.14%. The Fund held cash positions between 0.9% and 4.3% of net assets during the twelve month period and was at 2.5% on October 31, 2007.
The three largest contributors to the performance of the First Eagle Gold Fund over the period were gold bullion, Industrias Peñoles, SAB de C.V. (Mexico) and Lihir Gold Limited (Australia), collectively accounting for 15.81% of the year's performance.
The three largest detractors were Harmony Gold Mining Limited ADR (South Africa), Dundee Precious Metals, Inc., Class 'A' (Canada) and IAMGOLD Corporation (Canada). Their combined negative performance over the twelve month period subtracted 2.06% from the Fund's performance.
General Commentary
Our focus has always been, and remains, on preservation of capital. To the First Eagle team, downside matters more than the upside. Together with our group of analysts, we continue to search the globe for mispriced securities. The discounts to intrinsic values (intrinsic value defined as the amount that a knowledgeable buyer would pay in cash for the whole business) remain narrower than we would like, especially in the U.S. and in Europe. We are, however, finding what we believe are decent investment opportunities in Asia, most notably in Japan and South Korea.
As always, we appreciate your confidence and thank you for your support.
 | |  | |
|
Jean-Marie Eveillard
Portfolio Manager | | Abhay Deshpande
Associate Portfolio Manager,
First Eagle Global, Overseas and U.S. Value Funds | |
|
November 2007
Past performance is no guarantee of future results. Portfolio is actively managed. Portfolio and opinions expressed herein are subject to change.
7
FUND OVERVIEW
FIRST EAGLE GLOBAL FUND Data as of October 31, 2007 (Unaudited)
THE INVESTMENT STYLE
The First Eagle Global Fund seeks long-term growth of capital by investing in a wide range of asset classes from markets in the United States and around the world. This truly global fund is managed with a highly disciplined, bottom-up, value oriented style that helps minimize risk.
ASSET ALLOCATION

COUNTRIES
| United States | | | 32.77 | % | |
| Japan | | | 15.24 | % | |
| France | | | 10.60 | % | |
| Switzerland | | | 5.36 | % | |
| South Korea | | | 5.27 | % | |
| Italy | | | 1.54 | % | |
| Netherlands | | | 1.51 | % | |
| Germany | | | 1.34 | % | |
| South Africa | | | 1.19 | % | |
| Mexico | | | 1.14 | % | |
| Hong Kong | | | 1.11 | % | |
| Singapore | | | 1.06 | % | |
| United Kingdom | | | 0.67 | % | |
| Thailand | | | 0.48 | % | |
| Brazil | | | 0.46 | % | |
| India | | | 0.38 | % | |
| Malaysia | | | 0.28 | % | |
| Spain | | | 0.25 | % | |
| Belgium | | | 0.21 | % | |
| Taiwan | | | 0.21 | % | |
| Canada | | | 0.19 | % | |
| Sweden | | | 0.11 | % | |
| Other | | | 0.42 | % | |
The Fund's portfolio composition (represented as a percentage of net assets) is subject to change at any time.
AVERAGE ANNUAL RETURNS
| | | ONE-YEAR | | FIVE-YEARS | | TEN-YEARS | |
| First Eagle Global Fund (A Shares) | |
| without sales load | | | 16.91 | % | | | 22.11 | % | | | 14.79 | % | |
| with sales load | | | 11.06 | % | | | 20.86 | % | | | 14.35 | % | |
| MSCI World Index | | | 20.39 | % | | | 18.31 | % | | | 7.90 | % | |
| Consumer Price Index | | | 3.54 | % | | | 2.88 | % | | | 2.60 | % | |
GROWTH OF A $10,000 INITIAL INVESTMENT
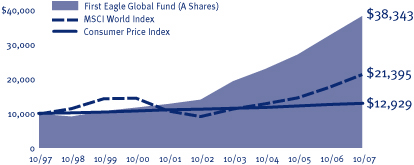
Performance data quoted herein represents past performance and should not be considered indicative of future results. Performance data quoted herein does not reflect the deduction of taxes that a shareholder would pay on Fund distributions or the sale of Fund shares. The average annual returns shown above are historical and reflect changes in share price, reinvested dividends and are net of expenses. The average annual returns for Class A Shares give effect to the deduction of the maximum sales load of 3.75% for periods prior to March 1, 2000 and of 5.00% thereafter. The MSCI World Index is a widely followed, unmanaged group of stocks from 23 international markets and is not available for purchase. This index is a trademark of Morgan Stanley Capital International SA in Geneva, Switzerland. The Consumer Price Index (CPI) represents the change in price of all goods and services purchased for consumption by urban households.
TOP 10 HOLDINGS
| Gold bullion (precious metal) | | | 4.46 | % | |
| Berkshire Hathaway Inc., Class 'A' (U.S. holding company) | | | 2.93 | % | |
| Nestlé SA (Swiss food manufacturer) | | | 2.11 | % | |
| Sanofi-Aventis (French health care company) | | | 2.11 | % | |
| Johnson & Johnson (U.S. health care products manufacturer) | | | 2.04 | % | |
| Pargesa Holding SA (Swiss diversified financials company) | | | 1.95 | % | |
SK Telecom Company, Limited ADR
(South Korean wireless telecommunications company) | | | 1.85 | % | |
| Microsoft Corporation (U.S. software developer) | | | 1.76 | % | |
| McDonald's Corporation (U.S. restaurant) | | | 1.70 | % | |
| Sodexho Alliance SA (French food management services provider) | | | 1.56 | % | |
8
FIRST EAGLE GLOBAL FUND
SCHEDULE OF INVESTMENTS
October 31, 2007
Number
of Shares | |
| | Cost
(Note 1) | | Value
(Note 1) | |
| | | Common and Preferred Stocks—U.S. (25.88%) | |
| | | Consumer Discretionary (2.49%) | |
| | 6,346,169 | | | McDonald's Corporation | | $ | 174,009,852 | | | $ | 378,866,289 | | |
| | 3,528,030 | | | International Speedway Corporation, Class 'A' (c) | | | 178,296,774 | | | | 156,750,373 | | |
| | 390,000 | | | Weyco Group, Inc. | | | 1,285,375 | | | | 12,464,400 | | |
| | 185,000 | | | St. John Knits International Inc. (a) | | | 3,180,703 | | | | 5,850,625 | | |
| | | | 356,772,704 | | | | 553,931,687 | | |
| | | Consumer Staples (0.52%) | |
| | 2,235,148 | | | Anheuser-Busch Companies, Inc. | | | 97,185,155 | | | | 114,618,389 | | |
| | 5,025 | | | Seneca Foods Corporation, Class 'A' (a) | | | 75,626 | | | | 136,178 | | |
| | | | 97,260,781 | | | | 114,754,567 | | |
| | | Energy (3.97%) | |
| | 3,154,041 | | | Apache Corporation | | | 210,743,103 | | | | 327,420,996 | | |
| | 3,850,673 | | | ConocoPhillips Company | | | 191,679,756 | | | | 327,153,178 | | |
| | 1,107,340 | | | Murphy Oil Corporation | | | 45,709,775 | | | | 81,533,444 | | |
| | 1,787,638 | | | San Juan Basin Royalty Trust | | | 60,872,821 | | | | 66,231,988 | | |
| | 1,883,846 | | | BJ Services Company | | | 51,505,506 | | | | 47,454,081 | | |
| | 1,042,780 | | | Helmerich & Payne, Inc. | | | 30,576,616 | | | | 32,972,704 | | |
| | | | 591,087,577 | | | | 882,766,391 | | |
| | | Financials (0.01%) | |
| | 114,750 | | | East Texas Financial Services, Inc. (c) | | | 862,688 | | | | 1,893,375 | | |
| | | Health Care (2.29%) | |
| | 6,964,100 | | | Johnson & Johnson | | | 427,078,919 | | | | 453,850,397 | | |
| | 706,840 | | | Wellpoint Inc. (a) | | | 52,614,057 | | | | 56,002,933 | | |
| | | | 479,692,976 | | | | 509,853,330 | | |
| | | Holding Companies (2.94%) | |
| | 4,915 | | | Berkshire Hathaway Inc., Class 'A' (a) | | | 414,943,985 | | | | 651,237,500 | | |
| | 2,485 | | | J.G. Boswell Company | | | 573,840 | | | | 2,516,063 | | |
| | | | 415,517,825 | | | | 653,753,563 | | |
| | | Industrials (2.09%) | |
| | 7,350,531 | | | Cintas Corporation | | | 275,662,666 | | | | 269,029,435 | | |
| | 8,811,151 | | | Blount International, Inc. (a)(c) | | | 116,304,729 | | | | 107,760,377 | | |
| | 1,576,258 | | | UniFirst Corporation | | | 37,181,601 | | | | 59,314,588 | | |
| | 304,940 | | | 3M Company | | | 26,195,578 | | | | 26,334,618 | | |
See Notes to Financial Statements.
9
FIRST EAGLE GLOBAL FUND
SCHEDULE OF INVESTMENTS—(Continued)
October 31, 2007
Number
of Shares | |
| | Cost
(Note 1) | | Value
(Note 1) | |
| | | Common and Preferred Stocks—U.S.—(continued) | |
| | | Industrials—(continued) | |
| | 4,805 | | | Conbraco Industries, Inc. (a)(c) | | $ | 1,568,050 | | | $ | 1,518,380 | | |
| | 365,000 | | | Kaiser Ventures LLC (a)(c)(d)(e)(f) | | | — | | | | 1,047,550 | | |
| | | | 456,912,624 | | | | 465,004,948 | | |
| | | Media (2.14%) | |
| | 10,287,835 | | | Comcast Corporation-Special Class 'A' (a) | | | 226,820,210 | | | | 214,707,116 | | |
| | 3,400,450 | | | Getty Images, Inc. (a)(c) | | | 133,280,462 | | | | 96,062,713 | | |
| | 2,901,070 | | | News Corporation, Class 'A' | | | 43,437,715 | | | | 62,866,187 | | |
| | 3,135,120 | | | New York Times Company, Class 'A' | | | 76,647,143 | | | | 61,322,947 | | |
| | 1,886,124 | | | Liberty Interactive (a) | | | 28,860,750 | | | | 40,042,413 | | |
| | 34,924 | | | Mills Music Trust (c) | | | 1,055,337 | | | | 1,510,463 | | |
| | | | 510,101,617 | | | | 476,511,839 | | |
| | | Paper and Forest Products (2.36%) | |
| | 5,905,362 | | | Rayonier Inc. (c) | | | 132,354,108 | | | | 285,169,931 | | |
| | 4,869,138 | | | Plum Creek Timber Company, Inc. | | | 164,045,755 | | | | 217,504,394 | | |
| | 389,630 | | | Deltic Timber Corporation | | | 19,003,408 | | | | 21,788,110 | | |
| | | | 315,403,271 | | | | 524,462,435 | | |
| | | Precious Metals (0.89%) | |
| | 7,231,612 | | | Newmont Mining Corporation Holding Company | | | 141,938,366 | | | | 198,202,847 | | |
| | | Real Estate (0.02%) | |
| | 258,133 | | | Price Legacy Corporation Pfd., Series 'A' | | | 2,935,244 | | | | 3,678,395 | | |
| | 192,250 | | | LandCo LLC (a)(d)(e)(f) | | | 669,030 | | | | 669,030 | | |
| | 21,124 | | | Security Capital European Realty (a)(d)(f) | | | — | | | | — | | |
| | | | 3,604,274 | | | | 4,347,425 | | |
| | | Retail (2.83%) | |
| | 4,716,640 | | | Costco Wholesale Corporation | | | 186,369,556 | | | | 317,241,206 | | |
| | 2,775,690 | | | Wal-Mart Stores, Inc. | | | 124,330,190 | | | | 125,488,945 | | |
| | 1,528,010 | | | Tiffany & Company | | | 42,153,738 | | | | 82,787,582 | | |
| | 2,267,707 | | | Dillard's Inc., Class 'A' | | | 44,501,141 | | | | 52,225,292 | | |
| | 1,347,150 | | | Barnes & Noble, Inc. | | | 30,166,364 | | | | 52,053,876 | | |
| | | | 427,520,989 | | | | 629,796,901 | | |
| | | Technology and Telecommunications (2.85%) | |
| | 10,615,417 | | | Microsoft Corporation | | | 251,005,195 | | | | 390,753,500 | | |
| | 3,757,950 | | | Intel Corporation | | | 70,587,311 | | | | 101,088,855 | | |
See Notes to Financial Statements.
10
FIRST EAGLE GLOBAL FUND
SCHEDULE OF INVESTMENTS—(Continued)
October 31, 2007
Number
of Shares | |
| | Cost
(Note 1) | | Value
(Note 1) | |
| | | Common and Preferred Stocks—U.S.—(continued) | |
| | | Technology and Telecommunications—(continued) | |
| | 2,534,490 | | | Linear Technology Corporation | | $ | 82,493,960 | | | $ | 83,688,860 | | |
| | 2,141,250 | | | Maxim Integrated Products, Inc. | | | 67,784,801 | | | | 58,027,875 | | |
| | | | 471,871,267 | | | | 633,559,090 | | |
| | | Utilities (0.48%) | |
| | 2,575,280 | | | IDACORP, Inc. (c) | | | 83,983,597 | | | | 89,851,519 | | |
| | 325,000 | | | CalEnergy Capital Trust 61/2% Conv. Pfd. | | | 14,327,813 | | | | 15,518,750 | | |
| | | | 98,311,410 | | | | 105,370,269 | | |
| | | | | Total Common and Preferred Stocks—U.S. | | | 4,366,858,369 | | | | 5,754,208,667 | | |
| | | Common and Preferred Stocks—Non-U.S. (46.07%) | |
| | | Australia (0.06%) | |
| | 3,184,178 | | | Spotless Group Limited (8) | | | 8,887,624 | | | | 13,183,573 | | |
| | | Belgium (0.21%) | |
| | 1,934,375 | | | Deceuninck (c)(1) | | | 48,605,944 | | | | 47,708,801 | | |
| | | Brazil (0.46%) | |
| | 1,242,090 | | | Petroleo Brasileiro SA ADR (3) | | | 35,187,758 | | | | 103,329,467 | | |
| | | Canada (0.19%) | |
| | 3,516,160 | | | IAMGOLD Corporation (12) | | | 27,681,714 | | | | 30,642,885 | | |
| | 267,580 | | | Aber Diamond Corporation (9) | | | 7,505,475 | | | | 11,699,056 | | |
| | | | 35,187,189 | | | | 42,341,941 | | |
| | | Chile (0.07%) | |
| | 7,277,480 | | | Quinenco SA (8) | | | 4,986,964 | | | | 16,380,047 | | |
| | | France (9.77%) | |
| | 5,352,800 | | | Sanofi-Aventis (6) | | | 455,918,570 | | | | 468,766,834 | | |
| | 4,830,342 | | | Sodexho Alliance SA (1) | | | 132,562,556 | | | | 347,759,470 | | |
| | 1,465,199 | | | Wendel (7) | | | 33,051,195 | | | | 251,264,779 | | |
| | 1,488,880 | | | Air Liquide (9) | | | 186,400,677 | | | | 204,583,699 | | |
| | 2,395,660 | | | Rémy Cointreau SA (2) | | | 79,021,917 | | | | 183,841,694 | | |
| | 1,878,813 | | | Carrefour SA (2) | | | 123,201,648 | | | | 135,047,328 | | |
| | 1,391,933 | | | Essilor International SA (6) | | | 28,046,415 | | | | 88,573,894 | | |
| | 1,094,410 | | | Société BIC SA (8) | | | 57,679,683 | | | | 84,934,322 | | |
| | 698,452 | | | Neopost SA (8) | | | 52,974,211 | | | | 80,999,417 | | |
| | 481,017 | | | L'Oréal SA (2) | | | 35,409,835 | | | | 63,068,683 | | |
| | 657,810 | | | Total SA (3) | | | 44,053,939 | | | | 52,954,038 | | |
| | 1,034,165 | | | Vivendi SA (10) | | | 26,670,799 | | | | 46,494,790 | | |
See Notes to Financial Statements.
11
FIRST EAGLE GLOBAL FUND
SCHEDULE OF INVESTMENTS—(Continued)
October 31, 2007
Number
of Shares | |
| | Cost
(Note 1) | | Value
(Note 1) | |
| | | Common and Preferred Stocks—Non-U.S.—(continued) | |
| | | France—(continued) | |
| | 52,143 | | | Société Sucrière de Pithiviers-le-Vieil (c)(2) | | $ | 27,198,161 | | | $ | 46,011,502 | | |
| | 185,056 | | | Guyenne et Gascogne SA (2) | | | 22,064,685 | | | | 34,502,919 | | |
| | 133,493 | | | Robertet SA (2) | | | 17,101,230 | | | | 24,717,350 | | |
| | 42,252 | | | Robertet SA C.I. (2) | | | 800,508 | | | | 5,256,288 | | |
| | 443,640 | | | Trigano SA (1) | | | 20,272,620 | | | | 23,212,005 | | |
| | 70,000 | | | NSC Groupe (c)(8) | | | 12,400,388 | | | | 8,251,555 | | |
| | 92,987 | | | Gaumont SA (10) | | | 5,094,361 | | | | 8,097,523 | | |
| | 385,000 | | | Sabeton SA (c)(7) | | | 4,841,233 | | | | 7,239,983 | | |
| | 35,690 | | | Société Foncière Financière et de Participations (7) | | | 3,933,965 | | | | 5,903,590 | | |
| | | | 1,368,698,596 | | | | 2,171,481,663 | | |
| | | Germany (1.34%) | |
| | 1,795,985 | | | Fraport AG (16) | | | 63,995,065 | | | | 139,927,314 | | |
| | 763,089 | | | Hornbach Holding AG Pfd. (14) | | | 50,442,554 | | | | 96,034,635 | | |
| | 1,337,532 | | | Bertelsmann AG D.R.C. (10) | | | 33,414,943 | | | | 43,823,376 | | |
| | 168,299 | | | Hornbach Baumarkt AG (14) | | | 8,109,997 | | | | 10,967,554 | | |
| | 89,094 | | | Pfeiffer Vacuum Technology AG (8) | | | 5,649,179 | | | | 7,584,525 | | |
| | | | 161,611,738 | | | | 298,337,404 | | |
| | | Hong Kong (0.75%) | |
| | 7,424,650 | | | Guoco Group Limited (7) | | | 67,965,963 | | | | 113,995,478 | | |
| | 23,438,970 | | | Shaw Brothers (Hong Kong) Limited (c)(10) | | | 22,914,297 | | | | 48,386,385 | | |
| | 20,738,780 | | | City e-Solutions Limited (c)(1) | | | 936,898 | | | | 3,478,494 | | |
| | | | 91,817,158 | | | | 165,860,357 | | |
| | | India (0.38%) | |
| | 2,325,000 | | | Tata Motors Limited (1) | | | 23,275,395 | | | | 44,807,844 | | |
| | 1,001,999 | | | Nestlé India Limited (2) | | | 12,190,035 | | | | 39,820,309 | | |
| | | | 35,465,430 | | | | 84,628,153 | | |
| | | Italy (1.54%) | |
| | 12,300,128 | | | Italcementi S.p.A. RNC (9) | | | 169,864,626 | | | | 204,616,624 | | |
| | 1,028,651 | | | Italmobiliare S.p.A. RNC (9) | | | 78,786,482 | | | | 86,154,915 | | |
| | 307,283 | | | Italmobiliare S.p.A. (9) | | | 43,113,981 | | | | 37,653,613 | | |
| | 2,041,133 | | | Gewiss S.p.A. (8) | | | 12,508,882 | | | | 14,940,161 | | |
| | | | 304,273,971 | | | | 343,365,313 | | |
| | | Japan (15.24%) | |
| | 4,923,300 | | | Secom Company, Limited (8) | | | 204,435,787 | | | | 252,586,510 | | |
| | 1,879,700 | | | SMC Corporation (8) | | | 245,870,240 | | | | 250,963,896 | | |
See Notes to Financial Statements.
12
FIRST EAGLE GLOBAL FUND
SCHEDULE OF INVESTMENTS—(Continued)
October 31, 2007
Number
of Shares | |
| | Cost
(Note 1) | | Value
(Note 1) | |
| | | Common and Preferred Stocks—Non-U.S.—(continued) | |
| | | Japan—(continued) | |
| | 1,018,000 | | | Keyence Corporation (15) | | $ | 221,689,014 | | | $ | 233,920,396 | | |
| | 19,206,950 | | | Sompo Japan Insurance Inc. (4) | | | 218,327,190 | | | | 224,090,809 | | |
| | 141,975 | | | NTT DoCoMo Inc. (15) | | | 219,205,019 | | | | 204,590,911 | | |
| | 4,951,570 | | | Shimano Inc. (c)(1) | | | 83,955,810 | | | | 179,674,140 | | |
| | 3,179,400 | | | Ono Pharmaceutical Company, Limited (6) | | | 135,077,099 | | | | 163,944,928 | | |
| | 8,037,080 | | | Toho Company, Limited (10) | | | 139,480,068 | | | | 159,771,806 | | |
| | 3,521,900 | | | Astellas Pharma Inc. (6) | | | 149,737,802 | | | | 155,618,482 | | |
| | 3,050,060 | | | Canon Inc. (15) | | | 152,377,061 | | | | 152,244,846 | | |
| | 10,184,000 | | | Kirin Brewery Company, Limited (2) | | | 134,098,071 | | | | 141,892,617 | | |
| | 1,013,500 | | | Hirose Electric Company, Limited (15) | | | 121,853,743 | | | | 120,710,274 | | |
| | 11,428,800 | | | PARK24 Company, Limited (c)(8) | | | 116,657,624 | | | | 113,102,409 | | |
| | 3,663,695 | | | Meitec Corporation (c)(8) | | | 109,855,533 | | | | 107,816,538 | | |
| | 18,411,400 | | | Aioi Insurance Company, Limited (4) | | | 62,469,076 | | | | 106,445,526 | | |
| | 4,190,500 | | | Aiful Corporation (4) | | | 71,636,438 | | | | 98,400,994 | | |
| | 1,655,420 | | | Toyota Motor Corporation (1) | | | 59,710,902 | | | | 94,414,770 | | |
| | 3,236,000 | | | Kose Corporation (c)(2) | | | 97,344,390 | | | | 82,869,916 | | |
| | 8,453,000 | | | NIPPONKOA Insurance Company, Limited (4) | | | 41,599,718 | | | | 77,048,917 | | |
| | 3,831,700 | | | T. Hasegawa Company, Limited (c)(2) | | | 59,135,379 | | | | 67,523,339 | | |
| | 2,641,800 | | | THK Company, Limited (8) | | | 54,078,554 | | | | 57,906,550 | | |
| | 3,390,700 | | | MISUMI Group Inc. (8) | | | 58,167,196 | | | | 57,073,374 | | |
| | 3,113,500 | | | Circle K Sunkus Company, Limited (2) | | | 54,512,401 | | | | 47,542,398 | | |
| | 1,379,100 | | | Shimachu Company, Limited (14) | | | 32,950,108 | | | | 39,507,183 | | |
| | 2,668,292 | | | Nissin Healthcare Food Service Company, Limited (2) | | | 38,972,304 | | | | 32,706,526 | | |
| | 1,852,400 | | | Chofu Seisakusho Company, Limited (c)(1) | | | 34,983,211 | | | | 30,311,854 | | |
| | 407,830 | | | Mabuchi Motor Company, Limited (15) | | | 24,369,065 | | | | 27,473,074 | | |
| | 1,213,200 | | | Ariake Japan Company, Limited (2) | | | 22,437,298 | | | | 25,065,463 | | |
| | 2,060,700 | | | Seikagaku Corporation (6) | | | 21,875,804 | | | | 24,489,763 | | |
| | 1,680,500 | | | Mitsui Sumitomo Insurance Company, Limited (4) | | | 13,640,866 | | | | 19,139,859 | | |
| | 1,323,650 | | | Cosel Company, Limited (8) | | | 22,653,585 | | | | 18,844,446 | | |
| | 1,051,300 | | | Aderans Company, Limited (2) | | | 24,356,774 | | | | 16,892,715 | | |
| | 188,760 | | | Shoei Company, Limited (7) | | | 491,308 | | | | 3,391,928 | | |
| | | | 3,048,004,438 | | | | 3,387,977,157 | | |
| | | Mexico (1.14%) | |
| | 10,693,250 | | | Industrias Peñoles, SAB de C.V. (12) | | | 22,816,662 | | | | 252,770,452 | | |
| | | Netherlands (0.87%) | |
| | 2,945,303 | | | Heineken Holding NV (2) | | | 80,551,195 | | | | 173,957,358 | | |
| | 473,438 | | | Koninklijke Grolsch NV (2) | | | 12,444,932 | | | | 18,634,816 | | |
| | | | 92,996,127 | | | | 192,592,174 | | |
See Notes to Financial Statements.
13
FIRST EAGLE GLOBAL FUND
SCHEDULE OF INVESTMENTS—(Continued)
October 31, 2007
Number
of Shares | |
| | Cost
(Note 1) | | Value
(Note 1) | |
| | | Common and Preferred Stocks—Non-U.S.—(continued) | |
| | | Singapore (0.53%) | |
| | 12,704,120 | | | Fraser & Neave Limited (2) | | $ | 12,799,700 | | | $ | 52,617,761 | | |
| | 3,238,180 | | | United Overseas Bank Limited (4) | | | 41,783,813 | | | | 48,059,138 | | |
| | 13,467,250 | | | ComfortDelgro Corporation Limited (16) | | | 3,279,184 | | | | 17,942,079 | | |
| | | | 57,862,697 | | | | 118,618,978 | | |
| | | South Africa (1.19%) | |
| | 11,490,840 | | | Gold Fields Limited ADR (12) | | | 185,736,111 | | | | 207,639,479 | | |
| | 749,210 | | | Gold Fields Limited (12) | | | 2,173,736 | | | | 13,395,184 | | |
| | 2,876,557 | | | Harmony Gold Mining Company, Limited ADR (a)(12) | | | 35,612,421 | | | | 32,217,438 | | |
| | 1,000,000 | | | Harmony Gold Mining Company, Limited (a)(12) | | | 4,591,642 | | | | 11,250,908 | | |
| | | | 228,113,910 | | | | 264,503,009 | | |
| | | South Korea (5.27%) | |
| | 13,328,201 | | | SK Telecom Company, Limited ADR (15) | | | 307,511,342 | | | | 410,641,873 | | |
| | 679,300 | | | Samsung Electronics Company, Limited Pfd. (15) | | | 149,636,480 | | | | 320,531,253 | | |
| | 1,862,671 | | | KT&G Corporation (2) | | | 87,524,545 | | | | 149,725,081 | | |
| | 3,490,053 | | | Kangwon Land Inc. (1) | | | 67,186,812 | | | | 92,995,750 | | |
| | 51,900 | | | Lotte Confectionery Company, Limited (2) | | | 21,157,499 | | | | 85,222,716 | | |
| | 47,392 | | | Nam Yang Dairy Products Company, Limited (2) | | | 9,133,102 | | | | 47,881,337 | | |
| | 124,183 | | | SK Holdings Company Limited (3) | | | 15,948,637 | | | | 36,950,199 | | |
| | 1,869,420 | | | Daeduck Electronics Company, Limited (15) | | | 13,292,480 | | | | 14,217,305 | | |
| | 1,589,160 | | | Daeduck GDS Company, Limited (c)(15) | | | 14,042,994 | | | | 14,132,532 | | |
| | | | 685,433,891 | | | | 1,172,298,046 | | |
| | | Spain (0.25%) | |
| | 727,652 | | | Corporacion Financiera Alba SA (7) | | | 13,645,609 | | | | 54,418,644 | | |
| | | Switzerland (5.36%) | |
| | 1,019,173 | | | Nestlé SA (2) | | | 285,931,385 | | | | 469,934,410 | | |
| | 3,820,052 | | | Pargesa Holding SA (7) | | | 241,364,420 | | | | 434,666,027 | | |
| | 1,709,736 | | | Kuehne & Nagel International AG (16) | | | 14,749,723 | | | | 183,186,000 | | |
| | 21,200 | | | Lindt & Spruengli AG PC (2) | | | 8,190,224 | | | | 73,153,899 | | |
| | 310 | | | Lindt & Spruengli AG (2) | | | 2,394,516 | | | | 11,793,478 | | |
| | 39,740 | | | Edipresse SA (10) | | | 10,811,874 | | | | 19,009,515 | | |
| | | | 563,442,142 | | | | 1,191,743,329 | | |
| | | Taiwan (0.21%) | |
| | 45,464,474 | | | Phoenixtec Power Company, Limited (c)(8) | | | 46,785,849 | | | | 47,218,505 | | |
See Notes to Financial Statements.
14
FIRST EAGLE GLOBAL FUND
SCHEDULE OF INVESTMENTS—(Continued)
October 31, 2007
Number
of Shares | |
| | Cost
(Note 1) | | Value
(Note 1) | |
| | | Common and Preferred Stocks—Non-U.S.—(continued) | |
| | | Thailand (0.48%) | |
| | 26,375,300 | | | Bangkok Bank Public Company Limited NVDR (4) | | $ | 84,757,791 | | | $ | 97,010,814 | | |
| | 448,850 | | | Bangkok Bank Public Company Limited (4) | | | 1,459,292 | | | | 1,677,327 | | |
| | 577,000 | | | The Oriental Hotel Public Company, Limited (1) | | | 2,636,472 | | | | 8,760,688 | | |
| | | | 88,853,555 | | | | 107,448,829 | | |
| | | United Kingdom (0.64%) | |
| | 1,609,143 | | | Anglo American Plc (12) | | | 35,465,322 | | | | 110,848,275 | | |
| | 3,434,002 | | | Mondi Plc (11) | | | 31,636,962 | | | | 31,818,060 | | |
| | | | 67,102,284 | | | | 142,666,335 | | |
| | | Miscellaneous (0.12%) | |
| | 1,375,000 | | | Banco Latinoamericano de Exportaciones SA ADR (4) | | | 22,535,552 | | | | 26,771,250 | | |
| | | | | Total Common and Preferred Stocks—Non U.S. | | | 7,032,315,088 | | | | 10,245,643,427 | | |
| Ounces | | | | | | | |
| | | Commodity (4.46%) | |
| | 1,249,002 | | | Gold bullion (a) | | | 693,749,790 | | | | 992,494,359 | | |
Principal
Amount | |
| |
| |
| |
| | | Notes, Bonds and Convertible Bonds (5.38%) | |
| | | U.S. Treasury Notes (1.65%) | |
| $ | 10,000,000 | | | U.S. Treasury Zero Coupon Strip due 11/15/2007 (a)(5) | | | 9,976,069 | | | | 9,984,820 | | |
| | 64,872,052 | | | U.S. Treasury Inflation Index Note 41/4% due 1/15/2010 (g)(5) | | | 66,969,595 | | | | 68,434,955 | | |
| | 11,117,860 | | | U.S. Treasury Inflation Index Note 23/8% due 4/15/2011 (g)(5) | | | 11,285,413 | | | | 11,294,190 | | |
| | 266,593,000 | | | U.S. Treasury Note 51/8% due 6/30/2011 (5) | | | 266,916,223 | | | | 276,569,443 | | |
| | | | 355,147,300 | | | | 366,283,408 | | |
| | | U.S. Dollar Notes and Bonds (0.87%) | |
| | 3,500,000 | | | Computer Associates International Inc. 61/2% due 4/15/2008 (15) | | | 3,430,854 | | | | 3,539,973 | | |
| | 13,500,000 | | | GATX Corporation 87/8% due 6/01/2009 (4) | | | 13,243,066 | | | | 14,321,313 | | |
| | 4,910,000 | | | American Standard Companies Inc. 81/4% due 6/01/2009 (8) | | | 4,994,267 | | | | 5,125,210 | | |
| | 6,900,000 | | | Briggs & Stratton Corporation 87/8% due 3/15/2011 (1) | | | 7,107,143 | | | | 7,383,000 | | |
| | 3,500,000 | | | Toys 'R' Us, Inc. 75/8% due 8/01/2011 (14) | | | 3,444,976 | | | | 3,150,000 | | |
| | 28,930,000 | | | Blount International Inc. 87/8% due 8/01/2012 (c)(8) | | | 28,964,209 | | | | 29,508,600 | | |
| | 21,147,000 | | | Tronox Worldwide LLC 91/2% due 12/01/2012 (9) | | | 21,667,317 | | | | 20,512,590 | | |
| | 12,522,000 | | | Sirius Satellite Radio Inc. 95/8% due 8/01/2013 (10) | | | 12,246,308 | | | | 12,506,347 | | |
| | 2,810,655 | | | Avis Budget Car Rental LLC 75/8% due 5/15/2014 (8) | | | 2,752,778 | | | | 2,796,602 | | |
| | 14,500,000 | | | Level 3 Financing, Inc. 91/4% due 11/01/2014 (15) | | | 14,000,375 | | | | 13,738,750 | | |
See Notes to Financial Statements.
15
FIRST EAGLE GLOBAL FUND
SCHEDULE OF INVESTMENTS—(Continued)
October 31, 2007
Principal
Amount | |
| | Cost
(Note 1) | | Value
(Note 1) | |
| | | Notes, Bonds and Convertible Bonds—(continued) | |
| | | U.S. Dollar Notes and Bonds—(continued) | |
| $ | 12,554,000 | | | Yankee Acquisition Corporation 81/2% due 2/15/2015 (1) | | $ | 12,445,663 | | | $ | 11,831,635 | | |
| | 22,554,000 | | | Yankee Acquisition Corporation 93/4% due 2/15/2017 (1) | | | 21,710,408 | | | | 20,975,220 | | |
| | 28,622,000 | | | Valassis Communications, Inc 81/4 due 3/01/2015 (10) | | | 26,039,359 | | | | 24,257,145 | | |
| | 2,000,000 | | | Legrand SA 81/2% due 2/15/2025 (8) | | | 1,956,808 | | | | 2,350,000 | | |
| | 4,200,000 | | | Bausch & Lomb Inc. 71/8% due 8/01/2028 (6) | | | 3,556,000 | | | | 3,864,000 | | |
| | 10,000,000 | | | Christiania Bank Floating Rate Perpetual Notes
(5.5625% @ 10/31/2007) (4) | | | 6,903,005 | | | | 7,997,480 | | |
| | 3,500,000 | | | Den Norske Bank Floating Rate Perpetual Notes
(5.65% @ 10/31/2007) (4) | | | 2,651,444 | | | | 2,836,750 | | |
| | 3,170,000 | | | Den Norske Bank Floating Rate Perpetual Notes
(5.8125% @ 10/31/2007) (4) | | | 2,177,816 | | | | 2,585,357 | | |
| | 5,500,000 | | | Bergen Bank Floating Rate Perpetual Notes
(5.5625% @ 10/31/2007) (4) | | | 3,970,882 | | | | 4,400,000 | | |
| | | | 193,262,678 | | | | 193,679,972 | | |
| | | Non U.S. Dollar Notes and Bonds (2.86%) | |
| HKD | 205,000,000 | | | Hong Kong Government 3.57% due 12/17/2007 (5) | | | 26,350,531 | | | | 26,503,046 | | |
| HKD | 199,650,000 | | | Hong Kong Government 3.34% due 12/19/2008 (5) | | | 25,523,746 | | | | 25,886,186 | | |
| HKD | 217,650,000 | | | Hong Kong Government 2.52% due 3/24/2009 (5) | | | 27,756,943 | | | | 27,931,516 | | |
| EUR | 2,959,000 | | | Koninklijke Ahold NV 57/8% due 5/09/2008 (14) | | | 3,197,605 | | | | 4,299,603 | | |
| SEK | 125,000,000 | | | Sweden Government I/L 4.6745% due 12/01/2008 (g)(5) | | | 17,644,048 | | | | 23,924,065 | | |
| MYR | 165,000,000 | | | Malaysian Government 4.305% due 2/27/2009 (5) | | | 43,623,401 | | | | 49,995,346 | | |
| MYR | 37,014,000 | | | Malaysian Government 3.756% due 4/28/2011 (5) | | | 9,917,721 | | | | 11,180,703 | | |
| EUR | 2,500,000 | | | Independent News & Media Plc 53/4% due 5/17/2009 (10) | | | 2,816,098 | | | | 3,625,416 | | |
| SGD | 52,947,000 | | | Singapore Government 23/8% due 10/01/2009 (5) | | | 32,118,393 | | | | 36,787,831 | | |
| SGD | 109,583,000 | | | Singapore Government 45/8% due 7/01/2010 (5) | | | 78,981,506 | | | | 80,484,445 | | |
| EUR | 13,650,000 | | | Waterford Wedgwood Plc 97/8% due 12/01/2010 (b)(1) | | | 15,815,759 | | | | 17,672,139 | | |
| GBP | 3,000,000 | | | Marks & Spencer Group Plc 63/8% due 11/07/2011 (14) | | | 5,149,742 | | | | 6,262,696 | | |
| EUR | 107,178,066 | | | Republic of France O.A.T. I/L 3% due 7/25/2012 (g)(5) | | | 144,228,979 | | | | 162,874,382 | | |
| EUR | 37,300,000 | | | UPC Holding BV 85/8% due 1/15/2014 (b)(10) | | | 44,099,174 | | | | 55,844,785 | | |
| EUR | 57,200,000 | | | UPC Holding BV 73/4% due 1/15/2014 (b)(10) | | | 66,673,273 | | | | 82,949,516 | | |
| EUR | 12,000,000 | | | FINEL 91/2% due 6/30/2017 (b)(d)(e)(f)(11) | | | 14,474,400 | | | | 8,679,300 | | |
| EUR | 15,000,000 | | | FINEL 91/2% due 10/15/2017 (b)(d)(e)(f)(11) | | | 18,067,500 | | | | 10,849,125 | | |
| | | | 576,438,819 | | | | 635,750,100 | | |
| | | | | Total Notes, Bonds and Convertible Bonds | | | 1,124,848,797 | | | | 1,195,713,480 | | |
| | | Short-Term Investments (18.77%) | |
| $ | 25,000,000 | | | 3M Company 4.68% due 11/27/2007 | | | 24,915,500 | | | | 24,915,500 | | |
| | 12,193,000 | | | 7-Eleven Inc. 4.72% due 11/01/2007 | | | 12,193,000 | | | | 12,193,000 | | |
| | 20,000,000 | | | 7-Eleven Inc. 4.7% due 11/06/2007 | | | 19,986,944 | | | | 19,986,944 | | |
See Notes to Financial Statements.
16
FIRST EAGLE GLOBAL FUND
SCHEDULE OF INVESTMENTS—(Continued)
October 31, 2007
Principal
Amount | |
| | Cost
(Note 1) | | Value
(Note 1) | |
| | | Short-Term Investments—(continued) | |
| $ | 15,000,000 | | | 7-Eleven Inc. 4.69% due 11/07/2007 | | $ | 14,988,275 | | | $ | 14,988,275 | | |
| | 10,000,000 | | | 7-Eleven Inc. 4.71% due 11/20/2007 | | | 9,975,142 | | | | 9,975,142 | | |
| | 13,000,000 | | | 7-Eleven Inc. 4.65% due 11/21/2007 | | | 12,966,417 | | | | 12,966,417 | | |
| | 10,010,000 | | | Air Liquide 4.71% due 11/02/2007 | | | 10,008,690 | | | | 10,008,690 | | |
| | 20,085,000 | | | Air Liquide 4.78% due 11/05/2007 | | | 20,074,333 | | | | 20,074,333 | | |
| | 25,120,000 | | | Air Liquide 4.76% due 11/13/2007 | | | 25,080,143 | | | | 25,080,143 | | |
| | 15,067,000 | | | Air Liquide 4.75% due 11/19/2007 | | | 15,031,216 | | | | 15,031,216 | | |
| | 50,000,000 | | | Air Liquide 4.68% due 11/29/2007 | | | 49,818,000 | | | | 49,818,000 | | |
| | 25,559,000 | | | Air Liquide 4.65% due 11/29/2007 | | | 25,466,562 | | | | 25,466,562 | | |
| | 25,113,000 | | | Air Liquide 4.6% due 11/29/2007 | | | 25,023,151 | | | | 25,023,151 | | |
| | 20,000,000 | | | AstraZeneca 4.88% due 11/02/2007 | | | 19,997,289 | | | | 19,997,289 | | |
| | 10,384,000 | | | AstraZeneca 5.45% due 11/05/2007 | | | 10,377,712 | | | | 10,377,712 | | |
| | 26,753,000 | | | AstraZeneca 4.85% due 11/06/2007 | | | 26,734,979 | | | | 26,734,979 | | |
| | 15,650,000 | | | AstraZeneca 4.86% due 11/09/2007 | | | 15,633,098 | | | | 15,633,098 | | |
| | 13,300,000 | | | AstraZeneca 4.88% due 11/13/2007 | | | 13,278,365 | | | | 13,278,365 | | |
| | 25,000,000 | | | AstraZeneca 4.87% due 12/10/2007 | | | 24,868,104 | | | | 24,868,104 | | |
| | 25,841,000 | | | BASF Corporation 5.3% due 11/05/2007 | | | 25,825,783 | | | | 25,825,783 | | |
| | 55,000,000 | | | BASF Corporation 4.75% due 12/14/2007 | | | 54,687,951 | | | | 54,687,951 | | |
| | 35,792,000 | | | BMW US Capital LLC 4.73% due 11/09/2007 | | | 35,754,379 | | | | 35,754,379 | | |
| | 30,112,000 | | | BMW US Capital LLC 4.73% due 12/10/2007 | | | 29,957,701 | | | | 29,957,701 | | |
| | 20,000,000 | | | BP Capital Markets PLC 4.96% due 11/15/2007 | | | 19,961,422 | | | | 19,961,422 | | |
| | 25,000,000 | | | Caterpillar Financial Services Corporation 4.72% due 11/05/2007 | | | 24,986,889 | | | | 24,986,889 | | |
| | 28,273,000 | | | Cintas Corporation 4.78% due 11/01/2007 | | | 28,273,000 | | | | 28,273,000 | | |
| | 49,000,000 | | | Cintas Corporation 4.77% due 11/02/2007 | | | 48,993,507 | | | | 48,993,507 | | |
| | 25,000,000 | | | Cintas Corporation 4.72% due 11/02/2007 | | | 24,996,722 | | | | 24,996,722 | | |
| | 30,000,000 | | | Cintas Corporation 4.78% due 11/05/2007 | | | 29,984,067 | | | | 29,984,067 | | |
| | 20,000,000 | | | Cintas Corporation 4.68% due 11/05/2007 | | | 19,989,600 | | | | 19,989,600 | | |
| | 14,500,000 | | | Cintas Corporation 4.77% due 11/05/2007 | | | 14,492,315 | | | | 14,492,315 | | |
| | 11,000,000 | | | Cintas Corporation 4.76% due 11/06/2007 | | | 10,992,728 | | | | 10,992,728 | | |
| | 18,000,000 | | | Cintas Corporation 4.74% due 11/07/2007 | | | 17,985,780 | | | | 17,985,780 | | |
| | 15,000,000 | | | Cintas Corporation 4.77% due 11/14/2007 | | | 14,974,163 | | | | 14,974,163 | | |
| | 11,000,000 | | | Cintas Corporation 4.77% due 11/15/2007 | | | 10,979,595 | | | | 10,979,595 | | |
| | 52,085,000 | | | Cintas Corporation 4.77% due 11/16/2007 | | | 51,981,482 | | | | 51,981,482 | | |
| | 19,000,000 | | | The Coca-Cola Company 4.54% due 11/19/2007 | | | 18,956,870 | | | | 18,956,870 | | |
| | 20,000,000 | | | The Clorox Company 5.05% due 11/05/2007 | | | 19,988,778 | | | | 19,988,778 | | |
| | 15,200,000 | | | Colgate-Palmolive Company 4.67% due 11/20/2007 | | | 15,162,536 | | | | 15,162,536 | | |
| | 29,250,000 | | | ConocoPhillips Company 4.87% due 11/27/2007 | | | 29,147,121 | | | | 29,147,121 | | |
| | 24,165,000 | | | Diageo Capital Plc 5.23% due 11/01/2007 | | | 24,165,000 | | | | 24,165,000 | | |
| | 6,077,000 | | | Diageo Capital Plc 5.2% due 11/01/2007 | | | 6,077,000 | | | | 6,077,000 | | |
| | 26,323,000 | | | Diageo Capital Plc 5.25% due 11/02/2007 | | | 26,319,161 | | | | 26,319,161 | | |
| | 25,000,000 | | | Diageo Capital Plc 5.3% due 11/02/2007 | | | 24,996,319 | | | | 24,996,319 | | |
| | 15,000,000 | | | Diageo Capital Plc 5.2% due 11/02/2007 | | | 14,997,833 | | | | 14,997,833 | | |
See Notes to Financial Statements.
17
FIRST EAGLE GLOBAL FUND
SCHEDULE OF INVESTMENTS—(Continued)
October 31, 2007
Principal
Amount | |
| | Cost
(Note 1) | | Value
(Note 1) | |
| | | Short-Term Investments—(continued) | |
| $ | 25,000,000 | | | Diageo Capital Plc 5.27% due 11/05/2007 | | $ | 24,985,361 | | | $ | 24,985,361 | | |
| | 15,000,000 | | | Diageo Capital Plc 5.27% due 11/06/2007 | | | 14,989,021 | | | | 14,989,021 | | |
| | 15,780,000 | | | Diageo Capital Plc 5.15% due 11/08/2007 | | | 15,764,198 | | | | 15,764,198 | | |
| | 36,494,000 | | | Diageo Capital Plc 5.28% due 11/09/2007 | | | 36,451,180 | | | | 36,451,180 | | |
| | 15,000,000 | | | Diageo Capital Plc 5.27% due 11/13/2007 | | | 14,973,650 | | | | 14,973,650 | | |
| | 11,172,000 | | | Diageo Capital Plc 5.29% due 11/13/2007 | | | 11,152,300 | | | | 11,152,300 | | |
| | 25,972,000 | | | Diageo Capital Plc 5.28% due 11/14/2007 | | | 25,922,480 | | | | 25,922,480 | | |
| | 1,956,000 | | | Diageo Capital Plc 5.22% due 11/14/2007 | | | 1,952,313 | | | | 1,952,313 | | |
| | 32,547,000 | | | Diageo Capital Plc 5.2% due 11/15/2007 | | | 32,481,183 | | | | 32,481,183 | | |
| | 11,813,000 | | | Diageo Capital Plc 5.28% due 11/15/2007 | | | 11,788,744 | | | | 11,788,744 | | |
| | 12,214,000 | | | Diageo Capital Plc 5.28% due 11/16/2007 | | | 12,187,129 | | | | 12,187,129 | | |
| | 24,000,000 | | | Diageo Capital Plc 4.75% due 12/04/2007 | | | 23,895,500 | | | | 23,895,500 | | |
| | 13,426,000 | | | Diageo Capital Plc 5.3% due 12/10/2007 | | | 13,348,912 | | | | 13,348,912 | | |
| | 12,000,000 | | | Diageo Capital Plc 5.31% due 12/14/2007 | | | 11,923,890 | | | | 11,923,890 | | |
| | 25,000,000 | | | Dover Corporation 4.8% due 11/06/2007 | | | 24,983,333 | | | | 24,983,333 | | |
| | 33,049,000 | | | Dover Corporation 4.68% due 11/20/2007 | | | 32,967,369 | | | | 32,967,369 | | |
| | 23,380,000 | | | The Dow Chemical Company 5.2% due 11/08/2007 | | | 23,356,360 | | | | 23,356,360 | | |
| | 2,300,000 | | | Emerson Electric Company 4.7% due 11/02/2007 | | | 2,299,700 | | | | 2,299,700 | | |
| | 20,000,000 | | | Emerson Electric Company 4.6% due 11/05/2007 | | | 19,989,778 | | | | 19,989,778 | | |
| | 10,145,000 | | | Estèe Lauder Inc. 4.75% due 11/06/2007 | | | 10,138,307 | | | | 10,138,307 | | |
| | 10,000,000 | | | Estèe Lauder Inc. 4.75% due 11/19/2007 | | | 9,976,250 | | | | 9,976,250 | | |
| | 5,075,000 | | | Estèe Lauder Inc. 4.71% due 12/07/2007 | | | 5,051,097 | | | | 5,051,097 | | |
| | 9,000,000 | | | Estèe Lauder Inc. 4.72% due 12/11/2007 | | | 8,952,800 | | | | 8,952,800 | | |
| | 4,000,000 | | | Estèe Lauder Inc. 4.72% due 12/12/2007 | | | 3,978,498 | | | | 3,978,498 | | |
| | 15,915,000 | | | Genentech Inc. 4.67% due 11/09/2007 | | | 15,898,484 | | | | 15,898,484 | | |
| | 25,000,000 | | | Hitachi Limited 5% due 11/01/2007 | | | 25,000,000 | | | | 25,000,000 | | |
| | 11,500,000 | | | Hitachi Limited 5.15% due 11/01/2007 | | | 11,500,000 | | | | 11,500,000 | | |
| | 20,000,000 | | | Hitachi Limited 4.9% due 11/02/2007 | | | 19,997,278 | | | | 19,997,278 | | |
| | 20,000,000 | | | Hitachi Limited 4.75% due 11/27/2007 | | | 19,931,389 | | | | 19,931,389 | | |
| | 15,000,000 | | | Hitachi Limited 4.85% due 11/27/2007 | | | 14,947,458 | | | | 14,947,458 | | |
| | 23,141,000 | | | The Home Depot U.S.A. Inc. 5.065% due 11/01/2007 | | | 23,141,000 | | | | 23,141,000 | | |
| | 30,000,000 | | | Honeywell International Inc. 4.71% due 12/04/2007 | | | 29,870,475 | | | | 29,870,475 | | |
| | 20,000,000 | | | ITT Corporation 5.3% due 11/05/2007 | | | 19,988,222 | | | | 19,988,222 | | |
| | 20,000,000 | | | ITT Corporation 5% due 11/06/2007 | | | 19,986,111 | | | | 19,986,111 | | |
| | 15,600,000 | | | ITT Corporation 5.25% due 11/14/2007 | | | 15,570,425 | | | | 15,570,425 | | |
| | 30,000,000 | | | ITT Corporation 5.2% due 11/19/2007 | | | 29,922,000 | | | | 29,922,000 | | |
| | 25,000,000 | | | ITT Corporation 4.95% due 11/19/2007 | | | 24,938,125 | | | | 24,938,125 | | |
| | 24,487,000 | | | ITT Corporation 5% due 11/19/2007 | | | 24,425,783 | | | | 24,425,783 | | |
| | 18,456,000 | | | ITT Corporation 4.85% due 12/06/2007 | | | 18,368,975 | | | | 18,368,975 | | |
| | 18,000,000 | | | Johnson & Johnson 4.65% due 11/13/2007 | | | 17,972,100 | | | | 17,972,100 | | |
| | 6,686,000 | | �� | Johnson & Johnson 4.6% due 12/10/2007 | | | 6,652,681 | | | | 6,652,681 | | |
| | 25,000,000 | | | Kraft Foods Inc. 4.86% due 11/01/2007 | | | 25,000,000 | | | | 25,000,000 | | |
See Notes to Financial Statements.
18
FIRST EAGLE GLOBAL FUND
SCHEDULE OF INVESTMENTS—(Continued)
October 31, 2007
Principal
Amount | |
| | Cost
(Note 1) | | Value
(Note 1) | |
| | | Short-Term Investments—(continued) | |
| $ | 25,000,000 | | | Kraft Foods Inc. 4.87% due 11/01/2007 | | $ | 25,000,000 | | | $ | 25,000,000 | | |
| | 5,000,000 | | | Kraft Foods Inc. 4.84% due 11/01/2007 | | | 5,000,000 | | | | 5,000,000 | | |
| | 23,000,000 | | | Kraft Foods Inc. 5.35% due 11/02/2007 | | | 22,996,582 | | | | 22,996,582 | | |
| | 23,486,000 | | | Kraft Foods Inc. 4.75% due 11/08/2007 | | | 23,464,308 | | | | 23,464,308 | | |
| | 10,000,000 | | | Kraft Foods Inc. 4.78% due 11/08/2007 | | | 9,990,706 | | | | 9,990,706 | | |
| | 13,050,000 | | | Kraft Foods Inc. 4.8% due 11/09/2007 | | | 13,036,080 | | | | 13,036,080 | | |
| | 25,000,000 | | | Kraft Foods Inc. 4.86% due 11/19/2007 | | | 24,939,250 | | | | 24,939,250 | | |
| | 25,000,000 | | | Kraft Foods Inc. 4.63% due 12/07/2007 | | | 24,884,250 | | | | 24,884,250 | | |
| | 20,000,000 | | | L'Orèal SA 4.75% due 11/02/2007 | | | 19,997,361 | | | | 19,997,361 | | |
| | 22,845,000 | | | L'Orèal SA 4.73% due 11/05/2007 | | | 22,832,994 | | | | 22,832,994 | | |
| | 17,500,000 | | | L'Orèal SA 4.73% due 11/16/2007 | | | 17,465,510 | | | | 17,465,510 | | |
| | 21,250,000 | | | L'Orèal SA 4.72% due 11/19/2007 | | | 21,199,850 | | | | 21,199,850 | | |
| | 20,000,000 | | | L'Orèal SA 4.72% due 11/20/2007 | | | 19,950,178 | | | | 19,950,178 | | |
| | 30,000,000 | | | L'Orèal SA 4.72% due 11/21/2007 | | | 29,921,333 | | | | 29,921,333 | | |
| | 20,000,000 | | | L'Orèal SA 4.7% due 11/26/2007 | | | 19,934,722 | | | | 19,934,722 | | |
| | 25,000,000 | | | Monsanto Company 5.25% due 11/26/2007 | | | 24,908,854 | | | | 24,908,854 | | |
| | 9,697,000 | | | Monsanto Company 5.27% due 11/26/2007 | | | 9,661,512 | | | | 9,661,512 | | |
| | 20,000,000 | | | Monsanto Company 4.9% due 11/29/2007 | | | 19,923,778 | | | | 19,923,778 | | |
| | 20,000,000 | | | Monsanto Company 5% due 11/29/2007 | | | 19,922,222 | | | | 19,922,222 | | |
| | 26,860,000 | | | Monsanto Company 5.05% due 11/30/2007 | | | 26,750,732 | | | | 26,750,732 | | |
| | 18,563,000 | | | Monsanto Company 5.25% due 11/30/2007 | | | 18,484,494 | | | | 18,484,494 | | |
| | 16,202,000 | | | Nestlè Capital Corporation 5.25% due 11/13/2007 | | | 16,173,647 | | | | 16,173,647 | | |
| | 10,108,000 | | | Nestlè Capital Corporation 4.54% due 11/26/2007 | | | 10,076,132 | | | | 10,076,132 | | |
| | 25,000,000 | | | Nestlè Capital Corporation 4.29% due 12/04/2007 | | | 24,901,687 | | | | 24,901,687 | | |
| | 7,400,000 | | | NetJets Inc. 4.55% due 12/20/2007 | | | 7,354,171 | | | | 7,354,171 | | |
| | 15,700,000 | | | Pitney Bowes Inc. 4.7% due 11/08/2007 | | | 15,685,652 | | | | 15,685,652 | | |
| | 18,850,000 | | | Praxair Inc. 4.72% due 11/01/2007 | | | 18,850,000 | | | | 18,850,000 | | |
| | 20,000,000 | | | Praxair Inc. 4.72% due 11/08/2007 | | | 19,981,644 | | | | 19,981,644 | | |
| | 13,560,000 | | | Praxair Inc. 4.71% due 11/08/2007 | | | 13,547,581 | | | | 13,547,581 | | |
| | 20,000,000 | | | Praxair Inc. 4.7% due 11/09/2007 | | | 19,979,111 | | | | 19,979,111 | | |
| | 25,000,000 | | | Praxair Inc. 4.67% due 11/13/2007 | | | 24,961,083 | | | | 24,961,083 | | |
| | 19,073,000 | | | Praxair Inc. 4.67% due 11/13/2007 | | | 19,043,310 | | | | 19,043,310 | | |
| | 25,000,000 | | | Praxair Inc. 4.67% due 11/14/2007 | | | 24,957,840 | | | | 24,957,840 | | |
| | 26,910,000 | | | Praxair Inc. 4.65% due 11/15/2007 | | | 26,861,338 | | | | 26,861,338 | | |
| | 25,000,000 | | | Praxair Inc. 4.65% due 11/16/2007 | | | 24,951,563 | | | | 24,951,563 | | |
| | 24,650,000 | | | Praxair Inc. 4.58% due 11/19/2007 | | | 24,593,552 | | | | 24,593,552 | | |
| | 20,786,000 | | | Praxair Inc. 4.6% due 11/19/2007 | | | 20,738,192 | | | | 20,738,192 | | |
| | 28,028,000 | | | Praxair Inc. 4.55% due 11/26/2007 | | | 27,939,439 | | | | 27,939,439 | | |
| | 25,000,000 | | | Procter & Gamble Company 4.78% due 11/05/2007 | | | 24,986,722 | | | | 24,986,722 | | |
| | 25,000,000 | | | Procter & Gamble Company 4.79% due 11/05/2007 | | | 24,986,694 | | | | 24,986,694 | | |
| | 25,000,000 | | | Procter & Gamble Company 4.73% due 11/09/2007 | | | 24,973,722 | | | | 24,973,722 | | |
| | 19,865,000 | | | Procter & Gamble Company 4.73% due 11/14/2007 | | | 19,831,069 | | | | 19,831,069 | | |
See Notes to Financial Statements.
19
FIRST EAGLE GLOBAL FUND
SCHEDULE OF INVESTMENTS—(Continued)
October 31, 2007
Principal
Amount | |
| | Cost
(Note 1) | | Value
(Note 1) | |
| | | Short-Term Investments—(continued) | |
| $ | 13,203,000 | | | Procter & Gamble Company 4.77% due 11/14/2007 | | $ | 13,180,258 | | | $ | 13,180,258 | | |
| | 28,239,000 | | | Procter & Gamble Company 4.98% due 11/16/2007 | | | 28,180,404 | | | | 28,180,404 | | |
| | 30,000,000 | | | Procter & Gamble Company 4.73% due 11/19/2007 | | | 29,929,050 | | | | 29,929,050 | | |
| | 25,000,000 | | | Procter & Gamble Company 4.75% due 11/19/2007 | | | 24,940,625 | | | | 24,940,625 | | |
| | 25,000,000 | | | Procter & Gamble Company 4.74% due 12/03/2007 | | | 24,894,667 | | | | 24,894,667 | | |
| | 30,000,000 | | | Procter & Gamble Company 4.74% due 12/10/2007 | | | 29,845,950 | | | | 29,845,950 | | |
| | 25,000,000 | | | Siemens AG 4.79% due 11/07/2007 | | | 24,980,042 | | | | 24,980,042 | | |
| | 25,000,000 | | | Siemens AG 4.78% due 11/09/2007 | | | 24,973,444 | | | | 24,973,444 | | |
| | 14,849,000 | | | Siemens AG 4.79% due 11/14/2007 | | | 14,823,315 | | | | 14,823,315 | | |
| | 25,000,000 | | | Siemens AG 4.75% due 11/15/2007 | | | 24,953,819 | | | | 24,953,819 | | |
| | 28,525,000 | | | Siemens AG 4.81% due 11/20/2007 | | | 28,452,586 | | | | 28,452,586 | | |
| | 25,000,000 | | | Siemens AG 4.81% due 11/21/2007 | | | 24,933,194 | | | | 24,933,194 | | |
| | 11,300,000 | | | Siemens AG 4.8% due 12/06/2007 | | | 11,247,267 | | | | 11,247,267 | | |
| | 24,708,000 | | | Siemens AG 4.7% due 12/17/2007 | | | 24,559,615 | | | | 24,559,615 | | |
| | 10,992,000 | | | Siemens AG 4.68% due 12/17/2007 | | | 10,926,268 | | | | 10,926,268 | | |
| | 20,000,000 | | | Siemens AG 4.65% due 12/21/2007 | | | 19,870,833 | | | | 19,870,833 | | |
| | 25,000,000 | | | Starbucks Corporation 5.3% due 11/01/2007 | | | 25,000,000 | | | | 25,000,000 | | |
| | 21,931,000 | | | Starbucks Corporation 5.3% due 11/01/2007 | | | 21,931,000 | | | | 21,931,000 | | |
| | 24,000,000 | | | Starbucks Corporation 5.25% due 11/02/2007 | | | 23,996,500 | | | | 23,996,500 | | |
| | 28,041,000 | | | Starbucks Corporation 5.25% due 11/05/2007 | | | 28,024,643 | | | | 28,024,643 | | |
| | 25,000,000 | | | Starbucks Corporation 5.25% due 11/05/2007 | | | 24,985,417 | | | | 24,985,417 | | |
| | 21,421,000 | | | Starbucks Corporation 5.2% due 11/05/2007 | | | 21,408,623 | | | | 21,408,623 | | |
| | 23,950,000 | | | Starbucks Corporation 4.85% due 11/06/2007 | | | 23,933,867 | | | | 23,933,867 | | |
| | 19,143,000 | | | Starbucks Corporation 4.85% due 11/15/2007 | | | 19,106,894 | | | | 19,106,894 | | |
| | 15,644,000 | | | Starbucks Corporation 5.25% due 11/15/2007 | | | 15,612,060 | | | | 15,612,060 | | |
| | 25,000,000 | | | Telstra Corporation Limited 5% due 11/02/2007 | | | 24,996,528 | | | | 24,996,528 | | |
| | 30,000,000 | | | Telstra Corporation Limited 5.5% due 11/05/2007 | | | 29,981,667 | | | | 29,981,667 | | |
| | 25,000,000 | | | Telstra Corporation Limited 5.2% due 11/05/2007 | | | 24,985,556 | | | | 24,985,556 | | |
| | 15,000,000 | | | Telstra Corporation Limited 5.45% due 11/05/2007 | | | 14,990,917 | | | | 14,990,917 | | |
| | 50,000,000 | | | Telstra Corporation Limited 5.43% due 11/07/2007 | | | 49,954,750 | | | | 49,954,750 | | |
| | 18,944,000 | | | Telstra Corporation Limited 5.55% due 11/07/2007 | | | 18,926,477 | | | | 18,926,477 | | |
| | 90,012,000 | | | Telstra Corporation Limited 5.55% due 11/09/2007 | | | 89,900,985 | | | | 89,900,985 | | |
| | 30,000,000 | | | Telstra Corporation Limited 5.5% due 11/09/2007 | | | 29,963,333 | | | | 29,963,333 | | |
| | 29,988,000 | | | Telstra Corporation Limited 5% due 11/09/2007 | | | 29,954,680 | | | | 29,954,680 | | |
| | 25,000,000 | | | Telstra Corporation Limited 5% due 11/13/2007 | | | 24,958,333 | | | | 24,958,333 | | |
| | 25,000,000 | | | Telstra Corporation Limited 4.9% due 11/15/2007 | | | 24,952,361 | | | | 24,952,361 | | |
| | 35,000,000 | | | Telstra Corporation Limited 4.81% due 11/16/2007 | | | 34,929,854 | | | | 34,929,854 | | |
| | 44,000,000 | | | Telstra Corporation Limited 5.15% due 11/21/2007 | | | 43,874,111 | | | | 43,874,111 | | |
| | 30,000,000 | | | Telstra Corporation Limited 5.5% due 11/21/2007 | | | 29,908,333 | | | | 29,908,333 | | |
| | 25,000,000 | | | Telstra Corporation Limited 5.45% due 11/21/2007 | | | 24,924,306 | | | | 24,924,306 | | |
| | 50,000,000 | | | Telstra Corporation Limited 4.94% due 12/06/2007 | | | 49,759,861 | | | | 49,759,861 | | |
| | 30,000,000 | | | Telstra Corporation Limited 4.95% due 12/12/2007 | | | 29,830,875 | | | | 29,830,875 | | |
See Notes to Financial Statements.
20
FIRST EAGLE GLOBAL FUND
SCHEDULE OF INVESTMENTS—(Continued)
October 31, 2007
Principal
Amount | |
| | Cost
(Note 1) | | Value
(Note 1) | |
| | | Short-Term Investments—(continued) | |
| $ | 25,000,000 | | | Telstra Corporation Limited 4.55% due 12/14/2007 | | $ | 24,864,132 | | | $ | 24,864,132 | | |
| | 25,000,000 | | | Time Warner Inc. 5.06% due 11/19/2007 | | | 24,936,750 | | | | 24,936,750 | | |
| | 21,446,000 | | | Time Warner Inc. 5.08% due 11/19/2007 | | | 21,391,527 | | | | 21,391,527 | | |
| | 25,000,000 | | | Time Warner Inc. 5.01% due 11/26/2007 | | | 24,913,021 | | | | 24,913,021 | | |
| | 25,000,000 | | | Time Warner Inc. 4.94% due 11/27/2007 | | | 24,910,806 | | | | 24,910,806 | | |
| | 25,000,000 | | | Time Warner Inc. 5.06% due 11/27/2007 | | | 24,908,639 | | | | 24,908,639 | | |
| | 16,380,000 | | | Time Warner Inc. 4.98% due 11/27/2007 | | | 16,321,087 | | | | 16,321,087 | | |
| | 25,000,000 | | | Time Warner Inc. 5.33% due 11/30/2007 | | | 24,892,660 | | | | 24,892,660 | | |
| | 23,000,000 | | | Time Warner Inc. 5.32% due 12/03/2007 | | | 22,891,236 | | | | 22,891,236 | | |
| | 30,000,000 | | | Time Warner Inc. 5.2% due 12/06/2007 | | | 29,848,333 | | | | 29,848,333 | | |
| | 28,893,000 | | | Time Warner Inc. 4.97% due 12/26/2007 | | | 28,673,614 | | | | 28,673,614 | | |
| | 25,000,000 | | | The Walt Disney Company 5.06% due 11/09/2007 | | | 24,971,889 | | | | 24,971,889 | | |
| | 25,000,000 | | | The Walt Disney Company 5.08% due 11/13/2007 | | | 24,957,667 | | | | 24,957,667 | | |
| | 12,500,000 | | | The Walt Disney Company 4.78% due 11/13/2007 | | | 12,480,083 | | | | 12,480,083 | | |
| | 25,000,000 | | | The Walt Disney Company 5.1% due 11/15/2007 | | | 24,950,417 | | | | 24,950,417 | | |
| | 13,411,000 | | | The Walt Disney Company 4.75% due 11/16/2007 | | | 13,384,457 | | | | 13,384,457 | | |
| | 25,000,000 | | | Unilever N.V. 5.31% due 11/05/2007 | | | 24,985,250 | | | | 24,985,250 | | |
| | 4,031,000 | | | United Technologies Corporation 4.7% due 11/02/2007 | | | 4,030,474 | | | | 4,030,474 | | |
| | | | | Total Short-Term Investments | | | 4,173,098,656 | | | | 4,173,098,656 | | |
| | | | | Total Investments (100.56%) | | $ | 17,390,870,700 | * | | | 22,361,158,589 | ** | |
| | | | | Liabilities in excess of other assets (–0.56%) | | | | | | | (123,866,196 | ) | |
| | | | | Net Assets (100.00%) | | | | | | $ | 22,237,292,393 | | |
* At October 31, 2007 cost of investments for federal income tax purposes was $17,710,281,903.
** Gross unrealized appreciation and depreciation of securities at October 31, 2007 for federal income tax purposes were $4,860,040,288 and $209,163,602 respectively (net appreciation was $4,650,876,686).
See Notes to Financial Statements.
21
FIRST EAGLE GLOBAL FUND
SCHEDULE OF INVESTMENTS—(Continued)
October 31, 2007
| Foreign Currency Exchange Contracts | |
| Purchases | |
Settlement
Dates
Through | |
Foreign Currency To
Be Received | | U.S. $ Value at
October 31,
2007 | | U.S. $
To Be
Delivered | | Unrealized
Appreciation at
October 31, 2007 | | Unrealized
Depreciation at
October 31, 2007 | |
| 12/12/07 | | | 8,179,000 | | | euro | | $ | 11,834,719 | | | $ | 11,565,924 | | | $ | 268,795 | | | $ | — | | |
| Sales | |
Settlement
Dates
Through | |
Foreign Currency To
Be Delivered | | U.S. $
To Be
Received | | U.S. $ Value at
October 31,
2007 | | Unrealized
Appreciation at
October 31, 2007 | | Unrealized
Depreciation at
October 31, 2007 | |
| 12/12/07 | | | 713,035,000 | | | euro | | $ | 965,000,964 | | | $ | 1,031,735,976 | | | $ | — | | | $ | (66,735,012 | ) | |
| 1/09/08 | | | 38,427,000 | | | pound sterling | | | 77,512,552 | | | | 79,664,935 | | | | — | | | | (2,152,383 | ) | |
| 1/09/08 | | | 11,630,000 | | | pound sterling | | | 23,775,209 | | | | 24,110,734 | | | | — | | | | (335,525 | ) | |
| 4/09/08 | | | 140,899,000 | | | Swiss franc | | | 120,870,721 | | | | 122,536,107 | | | | — | | | | (1,665,386 | ) | |
| | | | | | | | | | 1,187,159,446 | | | | 1,258,047,752 | | | | — | | | | (70,888,306 | ) | |
| | | | | | | | | $ | 1,198,994,165 | | | $ | 1,269,613,676 | | | $ | 268,795 | | | $ | (70,888,306 | ) | |
| Foreign Currencies | | Sector/Industry Classifications | | Percent of Net Assets | |
| EUR— euro | | | (1 | ) | | Consumer Discretionary | | | 6.68 | % | |
| GBP— pound sterling | | | (2 | ) | | Consumer Staples | | | 9.65 | % | |
| HKD— Hong Kong dollar | | | (3 | ) | | Energy | | | 4.84 | % | |
| MYR— Malaysian ringgit | | | (4 | ) | | Financials | | | 3.29 | % | |
| SEK— Swedish krona | | | (5 | ) | | Government Issues | | | 3.65 | % | |
| SGD— Singapore dollar | | | (6 | ) | | Health Care | | | 6.36 | % | |
| | | | | | (7 | ) | | Holding Companies | | | 6.86 | % | |
| | | | | | (8 | ) | | Industrials | | | 7.36 | % | |
| | | | | | (9 | ) | | Materials | | | 2.54 | % | |
| | | | | | (10 | ) | | Media | | | 4.41 | % | |
| | | | | | (11 | ) | | Paper and Forest Products | | | 2.59 | % | |
| | | | | | (12 | ) | | Precious Metals | | | 8.31 | % | |
| | | | | | (13 | ) | | Real Estate | | | 0.02 | % | |
| | | | | | (14 | ) | | Retail | | | 3.55 | % | |
| | | | | | (15 | ) | | Technology and Telecommunications | | | 9.67 | % | |
| | | | | | (16 | ) | | Transportation | | | 1.53 | % | |
| | | | | | (17 | ) | | Utilities | | | 0.48 | % | |
(a) Non-income producing security/commodity.
(b) All or a portion of the security is exempt from registration under the Securities Act of 1933. Rule 144A securities may only be sold to qualified institutional buyers, pursuant to Rule 144A under the Securities Act of 1933.
See Notes to Financial Statements.
22
FIRST EAGLE GLOBAL FUND
SCHEDULE OF INVESTMENTS—(Continued)
October 31, 2007
(c) Affiliate as defined by the Investment Company Act of 1940. An affiliate is defined as a company in which the Fund directly or indirectly owns, controls, or holds power to vote 5% or more of the outstanding voting securities. Following is a summary of transactions with each such affiliate for the year ended October 31, 2007.
| | | Purchases | | Sales | | Realized | | Dividend | |
| Affiliate | | Shares | | Cost | | Shares | | Cost | | Gain (Loss) | | Income | |
| Blount International, Inc. | | | 505,180 | | | $ | 5,831,104 | | | | — | | | | — | | | | — | | | | — | | |
| Chofu Seisakusho Company, Limited | | | 422,800 | | | | 7,457,540 | | | | — | | | | — | | | | — | | | $ | 306,925 | | |
| City e-Solutions Limited | | | — | | | | — | | | | 761,220 | | | $ | 34,389 | | | $ | 131,504 | | | | 165,100 | | |
| Conbraco Industries, Inc. | | | — | | | | — | | | | — | | | | — | | | | — | | | | — | | |
| Daeduck GDS Company, Limited | | | — | | | | — | | | | — | | | | — | | | | — | | | | 428,117 | | |
| Deceuninck | | | — | | | | — | | | | — | | | | — | | | | — | | | | 478,637 | | |
| East Texas Financial Services, Inc. | | | — | | | | — | | | | — | | | | — | | | | — | | | | 17,213 | | |
| Getty Images, Inc. | | | 3,400,450 | | | | 133,280,462 | | | | — | | | | — | | | | — | | | | — | | |
| IDACORP, Inc. | | | 1,847,350 | | | | 61,722,388 | | | | 10,150 | | | | 322,590 | | | | 74,032 | | | | 873,516 | | |
| International Speedway Corporation, Class 'A' | | | 3,038,000 | | | | 156,219,744 | | | | 244,570 | | | | 13,026,189 | | | | (1,759,069 | ) | | | 257,494 | | |
| Kaiser Ventures LLC | | | — | | | | — | | | | — | | | | — | | | | — | | | | — | | |
| Kose Corporation | | | 1,162,100 | | | | 31,613,678 | | | | 278,800 | | | | 8,185,277 | | | | (859,121 | ) | | | 976,854 | | |
| Meitec Corporation | | | 2,859,105 | | | | 83,992,185 | | | | — | | | | — | | | | — | | | | 1,364,556 | | |
| Mills Music Trust | | | — | | | | — | | | | — | | | | — | | | | — | | | | 126,732 | | |
| Nam Yang Dairy Products Company, Limited | | | — | | | | — | | | | 18,108 | | | | 5,671,900 | | | | 11,825,372 | | | | 55,878 | | |
| NSC Groupe | | | — | | | | — | | | | — | | | | — | | | | — | | | | 175,619 | | |
| PARK 24 Company, Limited | | | 11,428,800 | | | | 116,657,624 | | | | — | | | | — | | | | — | | | | 2,800,857 | | |
| Phoenixtec Power Company, Limited | | | 13,801,970 | | | | 14,028,896 | | | | — | | | | — | | | | — | | | | 1,690,434 | | |
| Rayonier Inc. | | | 242,880 | | | | 11,054,555 | | | | 251,850 | | | | 6,433,928 | | | | 3,400,514 | | | | 10,815,341 | | |
| Sabeton SA | | | — | | | | — | | | | — | | | | — | | | | — | | | | 69,618 | | |
| Shaw Brothers (Hong Kong) Limited | | | — | | | | — | | | | 864,400 | | | | 1,247,052 | | | | 320,125 | | | | 1,352,295 | | |
| Shimano Inc. | | | 495,100 | | | | 15,479,890 | | | | 1,792,630 | | | | 41,020,217 | | | | 13,096,621 | | | | 1,610,364 | | |
| Société Sucrière de Pithiviers-le-Vieil | | | — | | | | — | | | | — | | | | — | | | | — | | | | 1,564,778 | | |
| T. Hasegawa Company, Limited | | | 471,200 | | | | 7,958,020 | | | | — | | | | — | | | | — | | | | 717,638 | | |
| Total | | | | | | | | | | | | | | | | | | $ | 26,229,978 | | | $ | 25,847,966 | | |
(d) Security for which there is less than three market makers.
(e) Represents interest in a restricted security which has not been registered with the Securities and Exchange Commission under the Securities Act of 1933. Information concerning each restricted security holding on October 31, 2007 is shown below.
| Security | | Acquisition
Date | | Cost | | Carrying Value
Per Share/Principal | |
| Kaiser Ventures LLC | | 6/24/1993 | | | — | | | $ | 2.87 | | |
| FINEL 91/2% due 6/30/2017 | | 6/22/2005 | | $ | 14,474,400 | | | | 0.72 | | |
| FINEL 91/2% due 10/15/2017 | | 10/11/2005 | | | 18,067,500 | | | | 0.72 | | |
| LandCo LLC | | 9/06/2006 | | | 669,030 | | | | 3.48 | | |
(f) Securities valued in accordance with fair value procedures under the supervision of the Board of Trustees, representing 0.10% of net assets.
(g) Inflation protected security.
See Notes to Financial Statements.
23
FUND OVERVIEW
FIRST EAGLE OVERSEAS FUND Data as of October 31, 2007 (Unaudited)
THE INVESTMENT STYLE
The First Eagle Overseas Fund seeks long-term growth of capital by investing primarily in equities issued by non-U.S. corporations. Management's research-driven process seeks to minimize risk by focusing on undervalued securities.
ASSET ALLOCATION
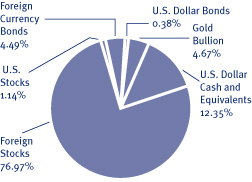
COUNTRIES
| Japan | | | 24.11 | % | |
| France | | | 17.37 | % | |
| South Korea | | | 7.34 | % | |
| Switzerland | | | 7.08 | % | |
| United States | | | 5.81 | % | |
| Singapore | | | 2.94 | % | |
| Germany | | | 2.84 | % | |
| Netherlands | | | 2.57 | % | |
| Italy | | | 2.37 | % | |
| Hong Kong | | | 2.13 | % | |
| Mexico | | | 1.83 | % | |
| Canada | | | 1.72 | % | |
| Thailand | | | 1.50 | % | |
| United Kingdom | | | 1.42 | % | |
| South Africa | | | 1.19 | % | |
| Brazil | | | 1.07 | % | |
| Taiwan | | | 0.82 | % | |
| Malaysia | | | 0.69 | % | |
| Chile | | | 0.48 | % | |
| Belgium | | | 0.45 | % | |
| Australia | | | 0.44 | % | |
| Spain | | | 0.42 | % | |
| India | | | 0.37 | % | |
| Ireland | | | 0.33 | % | |
| Other | | | 0.36 | % | |
The Fund's portfolio composition (represented as a percentage of net assets) is subject to change at any time.
AVERAGE ANNUAL RETURNS
| | | ONE-YEAR | | FIVE-YEARS | | TEN-YEARS | |
| First Eagle Overseas Fund (A Shares) | |
| without sales load | | | 18.20 | % | | | 24.55 | % | | | 16.52 | % | |
| with sales load | | | 12.29 | % | | | 23.28 | % | | | 16.07 | % | |
| MSCI EAFE Index | | | 24.91 | % | | | 23.21 | % | | | 9.26 | % | |
| Consumer Price Index | | | 3.54 | % | | | 2.88 | % | | | 2.60 | % | |
GROWTH OF A $10,000 INITIAL INVESTMENT
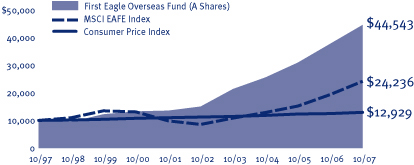
Performance data quoted herein represents past performance and should not be considered indicative of future results. Performance data quoted herein does not reflect the deduction of taxes that a shareholder would pay on Fund distributions or the sale of Fund shares. The average annual returns shown above are historical and reflect changes in share price, reinvested dividends and are net of expenses. The average annual returns for Class A Shares give effect to the deduction of the maximum sales load of 3.75% for periods prior to March 1, 2000 and of 5.00% thereafter. The MSCI EAFE Index is a total return index, reported in U.S. Dollars, based on share prices and reinvested net dividends of approximately 1,100 companies from 21 countries and is not available for purchase. The Consumer Price Index (CPI) represents the change in price of all goods and services purchased for consumption by urban households.
TOP 10 HOLDINGS
| Gold bullion (precious metal) | | | 4.67 | % | |
| Nestlé SA (Swiss food manufacturer) | | | 3.16 | % | |
| Sanofi-Aventis (French health care company) | | | 2.53 | % | |
| Sodexho Alliance SA (French food management services provider) | | | 2.37 | % | |
| Pargesa Holding SA (Swiss diversified financials company) | | | 2.35 | % | |
SK Telecom Company, Limited ADR
(South Korean wireless telecommunications company) | | | 2.05 | % | |
| Shimano Inc. (Japanese bicycle parts manufacturer) | | | 1.76 | % | |
Samsung Electronics Company, Limited Pfd.
(South Korean electronics company) | | | 1.76 | % | |
| Sompo Japan Insurance Inc. (Japanese insurance company) | | | 1.68 | % | |
Republic of France O.A.T. I/L 3% due 7/25/2012
(French government bond) | | | 1.51 | % | |
24
FIRST EAGLE OVERSEAS FUND
SCHEDULE OF INVESTMENTS
October 31, 2007
Number
of Shares | |
| | Cost
(Note 1) | | Value
(Note 1) | |
| | | Common and Preferred Stocks (78.11%) | |
| | | Australia and New Zealand (0.49%) | |
| | 11,881,161 | | | Spotless Group Limited (c)(8) | | $ | 36,382,798 | | | $ | 49,192,022 | | |
| | 5,750,000 | | | Tasman Farms (a)(c)(2) | | | 1,054,354 | | | | 4,862,026 | | |
| | | | 37,437,152 | | | | 54,054,048 | | |
| | | Belgium (0.45%) | |
| | 2,027,619 | | | Deceuninck (c)(1) | | | 47,275,994 | | | | 50,008,540 | | |
| | | Brazil (1.07%) | |
| | 1,436,872 | | | Petroleo Brasiliero SA ADR (3) | | | 33,865,845 | | | | 119,533,382 | | |
| | | Canada (1.38%) | |
| | 905,890 | | | EnCana Corporation (3) | | | 18,012,558 | | | | 63,140,533 | | |
| | 2,960,580 | | | IAMGOLD Corporation (12) | | | 18,361,679 | | | | 25,801,076 | | |
| | 659,400 | | | Goldcorp Inc. (12) | | | 16,153,559 | | | | 23,164,722 | | |
| | 525,720 | | | Aber Diamond Corporation (9) | | | 10,955,057 | | | | 22,985,379 | | |
| | 583,062 | | | Calfrac Well Services Limited (3) | | | 9,961,243 | | | | 12,371,887 | | |
| | 3,638,271 | | | Catalyst Paper Corporation (a)(11) | | | 10,981,521 | | | | 5,437,685 | | |
| | | | 84,425,617 | | | | 152,901,282 | | |
| | | Chile (0.48%) | |
| | 23,895,802 | | | Quinenco SA (8) | | | 15,827,311 | | | | 53,784,327 | | |
| | | Commonwealth of Independent States (0.00%) | |
| | 100,000 | | | First NIS Regional Fund SICAV (b)(f)(7) | | | 1,000,000 | | | | 50,000 | | |
| | 9,000 | | | Baltic Republic Fund (d)(7) | | | 185,750 | | | | 6,750 | | |
| | | | 1,185,750 | | | | 56,750 | | |
| | | France (15.37%) | |
| | 3,218,890 | | | Sanofi-Aventis (6) | | | 273,471,188 | | | | 281,891,510 | | |
| | 3,657,394 | | | Sodexho Alliance SA (1) | | | 105,532,249 | | | | 263,313,322 | | |
| | 834,577 | | | Wendel (7) | | | 18,222,426 | | | | 143,120,358 | | |
| | 1,477,554 | | | Rémy Cointreau SA (2) | | | 43,919,771 | | | | 113,386,720 | | |
| | 760,240 | | | Air Liquide SA (9) | | | 95,168,038 | | | | 104,462,893 | | |
| | 541,618 | | | Laurent-Perrier (c)(2) | | | 17,871,120 | | | | 100,904,068 | | |
| | 728,170 | | | Neopost SA (8) | | | 36,266,681 | | | | 84,445,811 | | |
| | 1,078,850 | | | Société BIC SA (8) | | | 55,417,087 | | | | 83,726,750 | | |
| | 1,084,568 | | | Carrefour SA (2) | | | 61,330,991 | | | | 77,957,738 | | |
| | 344,440 | | | Société Foncière Financière et de Participations (7) | | | 22,591,007 | | | | 56,974,850 | | |
| | 613,300 | | | Total SA (3) | | | 41,767,710 | | | | 49,370,961 | | |
| | 735,683 | | | Essilor International SA (6) | | | 14,575,627 | | | | 46,814,256 | | |
| | 227,140 | | | Robertet SA (c)(2) | | | 19,306,879 | | | | 42,056,878 | | |
See Notes to Financial Statements.
25
FIRST EAGLE OVERSEAS FUND
SCHEDULE OF INVESTMENTS—(Continued)
October 31, 2007
Number
of Shares | |
| | Cost
(Note 1) | | Value
(Note 1) | |
| | | Common and Preferred Stocks—(continued) | |
| | | France—(continued) | |
| | 51,500 | | | Robertet SA C.I. (2) | | $ | 2,151,628 | | | $ | 6,406,770 | | |
| | 540,680 | | | Zodiac SA (8) | | | 29,937,796 | | | | 37,385,367 | | |
| | 38,750 | | | Société Sucrière de Pithiviers-le Vieil (c)(2) | | | 15,309,438 | | | | 34,193,386 | | |
| | 250,182 | | | L' Oréal SA (2) | | | 18,415,523 | | | | 32,802,685 | | |
| | 619,193 | | | Trigano SA (1) | | | 29,362,325 | | | | 32,397,238 | | |
| | 1,007,646 | | | Télévision Française 1 SA (10) | | | 26,502,643 | | | | 27,825,781 | | |
| | 279,361 | | | Gaumont SA (10) | | | 14,354,980 | | | | 24,327,401 | | |
| | 533,620 | | | Vivendi SA (10) | | | 17,346,777 | | | | 23,990,901 | | |
| | 102,796 | | | Guyenne et Gascogne SA (2) | | | 17,226,064 | | | | 19,165,885 | | |
| | 300,000 | | | Frégate SAS 2% Conv. Pfd due 3/31/2013 (a)(d)(e)(f)(7) | | | 3,620,400 | | | | 8,101,172 | | |
| | 3,593,581 | | | FINEL (b)(c)(d)(e)(f)(h)(11) | | | 9,152,131 | | | | 5,146,311 | | |
| | 26,499 | | | NSC Groupe (8) | | | 4,385,060 | | | | 3,123,685 | | |
| | 20,000 | | | Didot-Bottin SA (a)(7) | | | 1,934,129 | | | | 2,004,629 | | |
| | 1,000 | | | Société Vermandoise de Sucreries (2) | | | 854,846 | | | | 1,938,377 | | |
| | 100,000 | | | Sabeton SA (7) | | | 1,463,142 | | | | 1,880,515 | | |
| | | | 997,457,656 | | | | 1,709,116,218 | | |
| | | Germany (2.84%) | |
| | 915,140 | | | Pfeiffer Vacuum Technology AG (c)(8) | | | 39,449,539 | | | | 77,905,380 | | |
| | 917,125 | | | Fraport AG (16) | | | 35,695,044 | | | | 71,454,293 | | |
| | 553,222 | | | Hornbach Holding AG Pfd. (14) | | | 35,962,361 | | | | 69,622,905 | | |
| | 1,358,769 | | | Bertelsmann AG D.R.C. (10) | | | 30,601,684 | | | | 44,519,193 | | |
| | 195,535 | | | Axel Springer AG (10) | | | 9,333,359 | | | | 30,200,017 | | |
| | 1,644,040 | | | Singulus Technologies (a)(8) | | | 20,586,775 | | | | 20,048,108 | | |
| | 39,239 | | | Grenkeleasing AG (4) | | | 1,523,059 | | | | 1,690,915 | | |
| | | | 173,151,821 | | | | 315,440,811 | | |
| | | Hong Kong (1.71%) | |
| | 6,776,030 | | | Guoco Group Limited (7) | | | 49,652,331 | | | | 104,036,793 | | |
| | 17,482,440 | | | Shaw Brothers (Hong Kong) Limited (10) | | | 15,754,118 | | | | 36,089,985 | | |
| | 7,000,000 | | | Hopewell Holdings Limited (13) | | | 7,763,618 | | | | 36,035,920 | | |
| | 10,000,000 | | | SmarTone Telecommunications Holdings Limited (15) | | | 11,260,665 | | | | 12,205,507 | | |
| | 10,851,720 | | | City e-Solutions Limited (1) | | | 323,358 | | | | 1,820,148 | | |
| | | | 84,754,090 | | | | 190,188,353 | | |
| | | India (0.37%) | |
| | 1,150,000 | | | Tata Motors Limited (1) | | | 11,635,888 | | | | 22,163,020 | | |
| | 482,001 | | | Nestlé India Limited (2) | | | 6,511,864 | | | | 19,155,138 | | |
| | | | 18,147,752 | | | | 41,318,158 | | |
See Notes to Financial Statements.
26
FIRST EAGLE OVERSEAS FUND
SCHEDULE OF INVESTMENTS—(Continued)
October 31, 2007
Number
of Shares | |
| | Cost
(Note 1) | | Value
(Note 1) | |
| | | Common and Preferred Stocks—(continued) | |
| | | Indonesia (0.02%) | |
| | 4,500,000 | | | PT Bat Indonesia Tbk (a)(c)(2) | | $ | 4,735,462 | | | $ | 2,324,942 | | |
| | | Italy (2.37%) | |
| | 6,971,566 | | | Italcementi S.p.A. RNC (9) | | | 81,896,049 | | | | 115,974,265 | | |
| | 1,126,696 | | | Italmobiliare S.p.A. RNC (9) | | | 45,280,095 | | | | 94,366,698 | | |
| | 85,325 | | | Italmobiliare S.p.A. (9) | | | 11,927,829 | | | | 10,455,491 | | |
| | 5,828,718 | | | Gewiss S.p.A. (8) | | | 21,929,171 | | | | 42,663,551 | | |
| | | | 161,033,144 | | | | 263,460,005 | | |
| | | Japan (24.11%) | |
| | 5,398,500 | | | Shimano Inc. (c)(1) | | | 95,184,798 | | | | 195,891,575 | | |
| | 16,004,250 | | | Sompo Japan Insurance Inc. (4) | | | 181,680,296 | | | | 186,724,354 | | |
| | 100,097 | | | NTT DoCoMo Inc. (15) | | | 156,505,175 | | | | 144,243,257 | | |
| | 1,052,900 | | | SMC Corporation (8) | | | 137,686,217 | | | | 140,575,563 | | |
| | 2,717,900 | | | Secom Company, Limited (8) | | | 114,814,839 | | | | 139,439,984 | | |
| | 564,600 | | | Keyence Corporation (15) | | | 122,592,037 | | | | 129,736,204 | | |
| | 996,680 | | | Hirose Electric Company, Limited (15) | | | 119,146,885 | | | | 118,706,972 | | |
| | 2,240,100 | | | Ono Pharmaceutical Company, Limited (6) | | | 90,296,952 | | | | 115,510,170 | | |
| | 2,273,020 | | | Astellas Pharma Inc. (6) | | | 96,480,690 | | | | 100,435,538 | | |
| | 1,724,870 | | | Toyota Motor Corporation (1) | | | 62,362,453 | | | | 98,375,762 | | |
| | 1,712,270 | | | Canon Inc. (15) | | | 83,350,232 | | | | 85,468,575 | | |
| | 4,155,310 | | | Toho Company, Limited (10) | | | 62,538,089 | | | | 82,604,800 | | |
| | 13,699,900 | | | Aioi Insurance Company, Limited (4) | | | 43,912,843 | | | | 79,205,985 | | |
| | 2,936,700 | | | Kose Corporation (2) | | | 85,642,014 | | | | 75,205,217 | | |
| | 2,387,767 | | | Meitec Corporation (c)(8) | | | 73,219,254 | | | | 70,268,068 | | |
| | 7,500,930 | | | NIPPONKOA Insurance Company, Limited (4) | | | 33,069,082 | | | | 68,370,819 | | |
| | 3,147,491 | | | T. Hasegawa Company, Limited (c)(2) | | | 42,160,090 | | | | 55,466,007 | | |
| | 10,460,000 | | | Okumura Corporation (8) | | | 54,694,686 | | | | 55,207,952 | | |
| | 2,152,900 | | | AIFUL Corporation (4) | | | 36,805,548 | | | | 50,554,230 | | |
| | 2,271,850 | | | Nitto Kohki Company, Limited (c)(8) | | | 38,484,456 | | | | 49,501,658 | | |
| | 2,805,900 | | | MISUMI Group Inc. (8) | | | 48,180,532 | | | | 47,229,829 | | |
| | 5,453,000 | | | Kansai Paint Company, Limited (9) | | | 41,956,987 | | | | 40,851,938 | | |
| | 1,760,700 | | | Ariake Japan Company, Limited (c)(2) | | | 38,204,234 | | | | 36,377,152 | | |
| | 3,189,600 | | | Mitsui Sumitomo Insurance Company, Limited (4) | | | 15,084,508 | | | | 36,327,577 | | |
| | 296,400 | | | FANUC Limited (8) | | | 28,488,769 | | | | 32,265,775 | | |
| | 2,079,020 | | | Cosel Company, Limited (c)(8) | | | 34,721,250 | | | | 29,598,444 | | |
| | 1,546,300 | | | Fuji Seal International, Inc. (c)(9) | | | 37,966,813 | | | | 28,927,267 | | |
| | 2,030,330 | | | Maezawa Kasei Industries Company, Limited (c)(8) | | | 31,422,463 | | | | 27,741,998 | | |
| | 1,716,770 | | | Circle K Sunkus Company, Limited (2) | | | 30,450,607 | | | | 26,214,666 | | |
| | 2,181,200 | | | Seikagaku Corporation (6) | | | 17,605,118 | | | | 25,921,809 | | |
| | 1,578,100 | | | Chofu Seisakusho Company, Limited (1) | | | 25,267,903 | | | | 25,823,330 | | |
See Notes to Financial Statements.
27
FIRST EAGLE OVERSEAS FUND
SCHEDULE OF INVESTMENTS—(Continued)
October 31, 2007
Number
of Shares | |
| | Cost
(Note 1) | | Value
(Note 1) | |
| | | Common and Preferred Stocks—(continued) | |
| | | Japan—(continued) | |
| | 1,897,056 | | | Nissin Healthcare Food Service Company, Limited (2) | | $ | 32,039,654 | | | $ | 23,253,119 | | |
| | 936,347 | | | Mandom Corporation (2) | | | 15,567,941 | | | | 23,247,124 | | |
| | 807,000 | | | Shimachu Company, Limited (14) | | | 16,965,249 | | | | 23,118,191 | | |
| | 853,360 | | | Icom Inc. (c)(15) | | | 22,353,412 | | | | 22,297,961 | | |
| | 303,200 | | | Mabuchi Motor Company, Limited (15) | | | 18,025,224 | | | | 20,424,775 | | |
| | 2,681,675 | | | The Tokushima Bank, Limited (4) | | | 18,101,280 | | | | 18,157,963 | | |
| | 798,380 | | | Chudenko Corporation (8) | | | 12,166,734 | | | | 16,252,451 | | |
| | 100,000 | | | ASAHI Broadcasting Corporation (10) | | | 6,141,481 | | | | 15,452,060 | | |
| | 1,547,100 | | | PARK24 Company, Limited (8) | | | 13,768,972 | | | | 15,310,508 | | |
| | 608,246 | | | Matsumoto Yushi-Seiyaku Company, Limited (c)(9) | | | 14,767,376 | | | | 15,259,611 | | |
| | 427,500 | | | SK Kaken Company, Limited (8) | | | 7,390,751 | | | | 14,102,175 | | |
| | 894,400 | | | Daiichikosho Company, Limited (10) | | | 9,256,567 | | | | 10,559,347 | | |
| | 985,500 | | | Yomeishu Seizo Company, Limited (2) | | | 8,201,966 | | | | 9,838,318 | | |
| | 594,300 | | | Aderans Company, Limited (2) | | | 11,805,545 | | | | 9,549,453 | | |
| | 1,026,000 | | | Shingakukai Company, Limited (c)(1) | | | 7,935,087 | | | | 6,466,218 | | |
| | 1,035,290 | | | Sansei Yusoki Company, Limited (c)(8) | | | 9,147,298 | | | | 6,111,352 | | |
| | 456,000 | | | OSG Corporation (8) | | | 5,581,793 | | | | 5,739,832 | | |
| | 312,785 | | | Shoei Company, Limited (7) | | | 1,376,325 | | | | 5,620,599 | | |
| | 175,600 | | | As One Corporation (6) | | | 4,732,542 | | | | 4,070,072 | | |
| | 211,364 | | | Nagaileben Company, Limited (6) | | | 4,361,527 | | | | 3,899,028 | | |
| | 423,700 | | | Tachi-S Company, Limited (1) | | | 3,263,755 | | | | 3,210,991 | | |
| | 122,100 | | | Milbon Company, Limited (2) | | | 3,584,409 | | | | 3,201,024 | | |
| | 325,000 | | | Sonton Food Industry Company, Limited (2) | | | 3,298,777 | | | | 2,736,664 | | |
| | 37,100 | | | Tachihi Enterprise Company, Limited (13) | | | 1,374,762 | | | | 2,045,097 | | |
| | 120,600 | | | Doshisha Corporation, Limited (1) | | | 2,390,102 | | | | 2,040,448 | | |
| | | | 2,333,574,349 | | | | 2,680,736,856 | | |
| | | Malaysia (0.39%) | |
| | 17,724,610 | | | Genting Berhad (1) | | | 39,307,907 | | | | 43,846,486 | | |
| | | Mexico (1.83%) | |
| | 6,510,750 | | | Industrias Peñoles SAB de C.V. (12) | | | 6,770,859 | | | | 153,903,184 | | |
| | 10,734,970 | | | Grupo Modelo SA de C.V. (2) | | | 39,834,954 | | | | 49,938,263 | | |
| | | | 46,605,813 | | | | 203,841,447 | | |
| | | Netherlands (1.72%) | |
| | 1,589,959 | | | Heineken Holding NV (2) | | | 38,301,461 | | | | 93,907,169 | | |
| | 496,018 | | | Hal Trust NV (7) | | | 13,919,475 | | | | 58,090,000 | | |
| | 1,000,000 | | | Koninklijke Grolsch NV (c)(2) | | | 23,826,083 | | | | 39,360,625 | | |
| | | | 76,047,019 | | | | 191,357,794 | | |
See Notes to Financial Statements.
28
FIRST EAGLE OVERSEAS FUND
SCHEDULE OF INVESTMENTS—(Continued)
October 31, 2007
Number
of Shares | |
| | Cost
(Note 1) | | Value
(Note 1) | |
| | | Common and Preferred Stocks—(continued) | |
| | | Singapore (2.43%) | |
| | 16,074,650 | | | Haw Par Corporation Limited (c)(8) | | $ | 42,645,819 | | | $ | 87,660,743 | | |
| | 3,132,020 | | | United Overseas Bank Limited (4) | | | 40,462,665 | | | | 46,483,574 | | |
| | 9,974,000 | | | Fraser & Neave Limited (2) | | | 10,285,189 | | | | 41,310,185 | | |
| | 10,000,000 | | | United Overseas Land Limited (7) | | | 12,162,423 | | | | 36,240,638 | | |
| | 16,750,000 | | | Singapore Airport Terminal Services Limited (16) | | | 20,204,311 | | | | 34,687,468 | | |
| | 17,549,625 | | | ComfortDelgro Corporation Limited (16) | | | 6,946,456 | | | | 23,380,924 | | |
| | | | 132,706,863 | | | | 269,763,532 | | |
| | | South Africa (1.19%) | |
| | 5,947,430 | | | Gold Fields Limited ADR (12) | | | 88,910,618 | | | | 107,470,060 | | |
| | 1,591,010 | | | Harmony Gold Mining Company, Limited ADR (a)(12) | | | 17,567,971 | | | | 17,819,312 | | |
| | 669,619 | | | Mondi Limited (11) | | | 5,448,700 | | | | 6,750,223 | | |
| | | | 111,927,289 | | | | 132,039,595 | | |
| | | South Korea (7.34%) | |
| | 7,400,144 | | | SK Telecom Company, Limited ADR (15) | | | 167,547,629 | | | | 227,998,437 | | |
| | 414,774 | | | Samsung Electronics Company, Limited Pfd. (15) | | | 72,531,622 | | | | 195,713,279 | | |
| | 1,077,369 | | | KT&G Corporation (2) | | | 47,344,293 | | | | 86,600,994 | | |
| | 36,226 | | | Lotte Confectionery Company, Limited (2) | | | 11,571,325 | | | | 59,485,127 | | |
| | 2,110,930 | | | Kangwon Land Inc. (1) | | | 40,812,240 | | | | 56,247,718 | | |
| | 117,880 | | | Pacific Corporation (2) | | | 18,010,606 | | | | 26,698,701 | | |
| | 120,620 | | | Nong Shim Company, Limited (2) | | | 31,736,226 | | | | 26,649,695 | | |
| | 39,708 | | | Nong Shim Holding Company, Limited (2) | | | 3,625,272 | | | | 3,725,243 | | |
| | 939,030 | | | Fursys Inc. (c)(8) | | | 11,308,973 | | | | 23,613,889 | | |
| | 22,950 | | | Nam Yang Dairy Products Company, Limited (2) | | | 4,912,653 | | | | 23,186,966 | | |
| | 28,850 | | | Nam Yang Dairy Products Company, Limited Pfd. (2) | | | 479,094 | | | | 12,139,614 | | |
| | 71,177 | | | SK Holdings Company, Limited (3) | | | 9,160,124 | | | | 21,178,457 | | |
| | 494,900 | | | Hankuk Paper Manufacturing Company, Limited (c)(11) | | | 17,020,271 | | | | 19,725,669 | | |
| | 1,182,040 | | | Dong Ah Tire & Rubber Company, Limited (1) | | | 5,161,359 | | | | 11,417,506 | | |
| | 1,042,250 | | | Daeduck GDS Company, Limited (c)(15) | | | 8,149,986 | | | | 9,268,816 | | |
| | 1,087,440 | | | Daeduck Electronics Company, Limited (15) | | | 7,707,302 | | | | 8,270,194 | | |
| | 290,204 | | | Sam-A Pharmaceutical Company, Limited (6) | | | 2,323,904 | | | | 2,519,591 | | |
| | 23,136 | | | Daekyo Company, Limited Pfd. (1) | | | 905,979 | | | | 1,258,648 | | |
| | | | 460,308,858 | | | | 815,698,544 | | |
| | | Spain (0.42%) | |
| | 621,910 | | | Corporacion Financiera Alba SA (7) | | | 11,881,966 | | | | 46,510,556 | | |
| | | Switzerland (7.08%) | |
| | 762,865 | | | Nestlé SA (2) | | | 207,054,279 | | | | 351,752,366 | | |
| | 2,300,398 | | | Pargesa Holding SA (7) | | | 128,181,891 | | | | 261,751,636 | | |
See Notes to Financial Statements.
29
FIRST EAGLE OVERSEAS FUND
SCHEDULE OF INVESTMENTS—(Continued)
October 31, 2007
Number
of Shares | |
| | Cost
(Note 1) | | Value
(Note 1) | |
| | | Common and Preferred Stocks—(continued) | |
| | | Switzerland—(continued) | |
| | 1,065,286 | | | Kuehne & Nagel International AG (16) | | $ | 7,762,368 | | | $ | 114,137,786 | | |
| | 992 | | | Lindt & Spruengli AG (2) | | | 6,439,975 | | | | 37,739,130 | | |
| | 35,000 | | | Edipresse SA (10) | | | 11,616,314 | | | | 16,742,150 | | |
| | 7,000 | | | Hilti AG (d)(e)(f)(8) | | | 4,485,845 | | | | 5,434,783 | | |
| | | | 365,540,672 | | | | 787,557,851 | | |
| | | Taiwan (0.82%) | |
| | 28,936,495 | | | Compal Electronics Inc. (15) | | | 31,238,207 | | | | 36,661,825 | | |
| | 24,970,522 | | | Phoenixtec Power Company, Limited (c)(8) | | | 25,716,769 | | | | 25,933,891 | | |
| | 15,207,560 | | | Taiwan Secom Company, Limited (8) | | | 24,546,981 | | | | 23,280,709 | | |
| | 5,318,607 | | | Taiwan-Sogo Shinkong Security Company, Limited (8) | | | 5,029,979 | | | | 5,408,892 | | |
| | | | 86,531,936 | | | | 91,285,317 | | |
| | | Thailand (1.50%) | |
| | 592,872,785 | | | Thai Beverage Public Company Limited (2) | | | 102,744,140 | | | | 106,407,293 | | |
| | 14,789,489 | | | Bangkok Bank Public Company Limited NVDR (4) | | | 47,460,044 | | | | 54,397,120 | | |
| | 496,220 | | | Bangkok Bank Public Company Limited (4) | | | 1,613,300 | | | | 1,854,346 | | |
| | 250,000 | | | The Oriental Hotel Public Company, Limited (1) | | | 1,152,072 | | | | 3,795,792 | | |
| | | | 152,969,556 | | | | 166,454,551 | | |
| | | United Kingdom (1.40%) | |
| | 2,986,700 | | | Spirax-Sarco Engineering Plc (8) | | | 20,282,387 | | | | 66,987,665 | | |
| | 892,218 | | | Anglo American Plc (12) | | | 18,748,394 | | | | 61,461,801 | | |
| | 1,831,655 | | | Mondi Plc (11) | | | 16,770,956 | | | | 16,971,367 | | |
| | 2,282,289 | | | JZ Equity Partners, Plc (4) | | | 4,089,888 | | | | 6,831,482 | | |
| | 1,640,549 | | | Chrysalis Group Plc (10) | | | 3,646,837 | | | | 3,785,245 | | |
| | | | 63,538,462 | | | | 156,037,560 | | |
| | | United States (1.14%) | |
| | 1,597,613 | | | Newmont Mining Corporation Holding Company (12) | | | 51,732,028 | | | | 81,254,597 | | |
| | 1,754,615 | | | News Corporation, Class 'A' (10) | | | 25,499,954 | | | | 38,022,507 | | |
| | 34,500 | | | Third Avenue Global Value Fund L.P. (a)(b)(d) (7) | | | 3,450,000 | | | | 7,550,761 | | |
| | 14,083 | | | Security Capital European Realty (a)(d)(f)(13) | | | — | | | | — | | |
| | | | 80,681,982 | | | | 126,827,865 | | |
| | | Miscellaneous (0.19%) | |
| | 1,094,523 | | | Banco Latinoamericano de Exportaciones SA ADR (4) | | | 13,960,676 | | | | 21,310,363 | | |
| | | | | Total Common and Preferred Stocks | | | 5,634,880,942 | | | | 8,685,455,133 | | |
See Notes to Financial Statements.
30
FIRST EAGLE OVERSEAS FUND
SCHEDULE OF INVESTMENTS—(Continued)
October 31, 2007
| Ounces | |
| | Cost
(Note 1) | | Value
(Note 1) | |
| | | Commodity (4.67%) | |
| | 652,751 | | | Gold bullion (a) | | $ | 343,206,873 | | | $ | 518,695,182 | | |
Principal
Amount | |
| |
| |
| |
| | | Notes, Bonds and Convertible Bonds (4.87%) | |
| | | U.S. Dollar Notes and Bonds (0.38%) | |
| $ | 1,000,000 | | | YPF Sociedad Anonima SA 91/8% due 2/24/2009 (3) | | | 918,943 | | | | 1,043,000 | | |
| | 5,000,000 | | | Catalyst Paper Corporation 85/8% due 6/15/2011 (11) | | | 4,368,228 | | | | 3,975,000 | | |
| | 47,142,000 | | | Catalyst Paper Corporation 73/8% due 3/01/2014 (11) | | | 38,124,386 | | | | 34,767,225 | | |
| | 2,000,000 | | | Legrand SA 81/2% due 2/15/2025 (8) | | | 2,062,600 | | | | 2,350,000 | | |
| | | | 45,474,157 | | | | 42,135,225 | | |
| | | Non U.S. Dollar Notes and Bonds (4.45%) | |
| HKD | 67,500,000 | | | Hong Kong Government 3.57% due 12/17/2007 (5) | | | 8,684,874 | | | | 8,726,613 | | |
| HKD | 164,250,000 | | | Hong Kong Government 3.34% due 12/19/2008 (5) | | | 20,998,129 | | | | 21,296,299 | | |
| HKD | 125,300,000 | | | Hong Kong Government 2.52% due 3/24/2009 (5) | | | 15,965,858 | | | | 16,080,032 | | |
| EUR | 9,766,000 | | | Koninklijke Ahold NV 57/8% due 5/09/2008 (14) | | | 10,564,222 | | | | 14,190,579 | | |
| SEK | 55,000,000 | | | Sweden Government I/L 4.6745% due 12/01/2008 (g)(5) | | | 7,620,833 | | | | 10,526,588 | | |
| MYR | 50,260,000 | | | Malaysian Government 4.305% due 2/27/2009 (5) | | | 13,283,208 | | | | 15,228,885 | | |
| MYR | 56,664,000 | | | Malaysian Government 3.756% due 4/28/2011 (5) | | | 15,182,839 | | | | 17,116,317 | | |
| EUR | 5,500,000 | | | Independent News & Media Plc 53/4% due 5/17/2009 (10) | | | 6,140,141 | | | | 7,975,915 | | |
| EUR | 24,443,454 | | | Republic of France O.A.T. I/L 3% due 7/25/2009 (g)(5) | | | 26,181,026 | | | | 35,864,448 | | |
| EUR | 110,252,718 | | | Republic of France O.A.T. I/L 3% due 7/25/2012 (g)(5) | | | 146,670,407 | | | | 167,546,812 | | |
| SGD | 56,842,000 | | | Singapore Government 23/8% due 10/01/2009 (5) | | | 34,465,057 | | | | 39,494,096 | | |
| SGD | 23,270,000 | | | Singapore Government 45/8% due 7/01/2010 (5) | | | 16,884,767 | | | | 17,090,909 | | |
| EUR | 22,300,000 | | | Waterford Wedgwood Plc 97/8% due 12/01/2010 (b)(1) | | | 27,485,625 | | | | 28,870,968 | | |
| GBP | 1,000,000 | | | Marks & Spencer 63/8% due 11/07/2011 (1) | | | 1,711,618 | | | | 2,087,565 | | |
| EUR | 33,100,000 | | | UPC Holding BV 73/4% due 1/15/2014 (b)(10) | | | 38,567,975 | | | | 48,000,506 | | |
| EUR | 21,600,000 | | | UPC Holding BV 85/8% due 1/15/2014 (b)(10) | | | 25,560,898 | | | | 32,339,071 | | |
| EUR | 10,000,000 | | | FINEL 91/2% due 10/15/2017 (b)(d)(e)(f)(11) | | | 12,045,000 | | | | 7,232,750 | | |
| EUR | 8,000,000 | | | FINEL 91/2% due 6/30/2017 (b)(d)(e)(f)(11) | | | 9,649,600 | | | | 5,786,200 | | |
| | | | 437,662,077 | | | | 495,454,553 | | |
| | | Non U.S. Dollar Convertible Bonds (0.04%) | |
| EUR | 243,500 | | | Havas SA 4% due 1/01/2009 (10) | | | 1,986,854 | | | | 3,861,833 | | |
| | | | | Total Notes, Bonds and Convertible Bonds | | | 485,123,088 | | | | 541,451,611 | | |
| | | Short-Term Investments (12.99%) | |
| $ | 50,000,000 | | | Air Liquide SA 4.68% due 11/29/2007 | | | 49,818,000 | | | | 49,818,000 | | |
| | 15,541,000 | | | Air Liquide SA 4.65% due 11/29/2007 | | | 15,484,793 | | | | 15,484,793 | | |
| | 26,000,000 | | | AstraZeneca 4.88% due 11/02/2007 | | | 25,996,476 | | | | 25,996,476 | | |
See Notes to Financial Statements.
31
FIRST EAGLE OVERSEAS FUND
SCHEDULE OF INVESTMENTS—(Continued)
October 31, 2007
Principal
Amount | |
| | Cost
(Note 1) | | Value
(Note 1) | |
| | | Short-Term Investments—(continued) | |
| $ | 24,159,000 | | | BASF Corporation 5.3% due 11/05/2007 | | $ | 24,144,773 | | | $ | 24,144,773 | | |
| | 20,000,000 | | | BP Capital Markets Plc 4.9% due 11/15/2007 | | | 19,961,422 | | | | 19,961,422 | | |
| | 25,000,000 | | | Caterpillar Financial Services Corporation 4.72% due 11/05/2007 | | | 24,986,889 | | | | 24,986,889 | | |
| | 15,000,000 | | | Caterpillar Financial Services Corporation 4.57% due 11/19/2007 | | | 14,965,725 | | | | 14,965,725 | | |
| | 23,236,000 | | | Cintas Corporation 4.7% due 11/02/2007 | | | 23,232,966 | | | | 23,232,966 | | |
| | 15,000,000 | | | Cintas Corporation 4.77% due 11/14/2007 | | | 14,974,163 | | | | 14,974,163 | | |
| | 36,915,000 | | | Cintas Corporation 4.77% due 11/16/2007 | | | 36,841,631 | | | | 36,841,631 | | |
| | 19,000,000 | | | The Coca-Cola Company 4.54% due 11/19/2007 | | | 18,956,870 | | | | 18,956,870 | | |
| | 7,776,000 | | | Colgate-Palmolive Company 4.65% due 11/26/2007 | | | 7,750,890 | | | | 7,750,890 | | |
| | 29,250,000 | | | ConocoPhillips Company 4.87% due 11/27/2007 | | | 29,147,121 | | | | 29,147,121 | | |
| | 23,677,000 | | | Diageo Capital Plc 5.25% due 11/02/2007 | | | 23,673,547 | | | | 23,673,547 | | |
| | 21,156,000 | | | Diageo Capital Plc 5.25% due 11/09/2007 | | | 21,131,177 | | | | 21,131,177 | | |
| | 15,000,000 | | | Diageo Capital Plc 5.27% due 11/13/2007 | | | 14,973,650 | | | | 14,973,650 | | |
| | 32,044,000 | | | Diageo Capital Plc 5.22% due 11/14/2007 | | | 31,983,597 | | | | 31,983,597 | | |
| | 11,184,000 | | | Diageo Capital Plc 5.28% due 11/15/2007 | | | 11,161,036 | | | | 11,161,036 | | |
| | 24,000,000 | | | Diageo Capital Plc 4.75% due 12/04/2007 | | | 23,895,500 | | | | 23,895,500 | | |
| | 12,000,000 | | | Diageo Capital Plc 5.31% due 5/08/2007 | | | 11,923,890 | | | | 11,923,890 | | |
| | 25,000,000 | | | The Walt Disney Company 5.08% due 11/13/2007 | | | 24,957,667 | | | | 24,957,667 | | |
| | 12,500,000 | | | The Walt Disney Company 4.78% due 11/13/2007 | | | 12,480,083 | | | | 12,480,083 | | |
| | 26,589,000 | | | The Walt Disney Company 4.75% due 11/16/2007 | | | 26,536,376 | | | | 26,536,376 | | |
| | 25,000,000 | | | Dover Corporation 4.8% due 11/06/2007 | | | 24,983,333 | | | | 24,983,333 | | |
| | 23,380,000 | | | The Dow Chemical Company 5.2% due 11/08/2007 | | | 23,356,360 | | | | 23,356,360 | | |
| | 20,000,000 | | | Emerson Electric Company 4.6% due 11/05/2007 | | | 19,989,778 | | | | 19,989,778 | | |
| | 25,000,000 | | | Hitachi Limited 5% due 11/01/2007 | | | 25,000,000 | | | | 25,000,000 | | |
| | 30,000,000 | | | Honeywell International Inc. 4.71% due 12/04/2007 | | | 29,870,475 | | | | 29,870,475 | | |
| | 20,000,000 | | | ITT Corporation 5.3% due 11/05/2007 | | | 19,988,222 | | | | 19,988,222 | | |
| | 15,600,000 | | | ITT Corporation 5.25% due 11/14/2007 | | | 15,570,425 | | | | 15,570,425 | | |
| | 20,614,000 | | | Johnson & Johnson 4.6% due 12/10/2007 | | | 20,511,274 | | | | 20,511,274 | | |
| | 19,799,000 | | | Kraft Foods Inc. 4.87% due 11/01/2007 | | | 19,799,000 | | | | 19,799,000 | | |
| | 17,500,000 | | | L'Oréal SA 4.73% due 11/16/2007 | | | 17,465,510 | | | | 17,465,510 | | |
| | 21,250,000 | | | L'Oréal SA 4.72% due 11/19/2007 | | | 21,199,850 | | | | 21,199,850 | | |
| | 8,460,000 | | | Monsanto Company 5.25% due 11/26/2007 | | | 8,429,156 | | | | 8,429,156 | | |
| | 21,220,000 | | | Monsanto Company 5.02% due 11/29/2007 | | | 21,137,148 | | | | 21,137,148 | | |
| | 25,000,000 | | | Nestlé Capital Corporation 4.29% due 12/04/2007 | | | 24,901,688 | | | | 24,901,688 | | |
| | 18,850,000 | | | Praxair Inc. 4.72% due 11/01/2007 | | | 18,850,000 | | | | 18,850,000 | | |
| | 20,000,000 | | | Praxair Inc. 4.72% due 11/08/2007 | | | 19,981,644 | | | | 19,981,644 | | |
| | 21,208,000 | | | Praxair Inc. 4.72% due 11/09/2007 | | | 21,185,849 | | | | 21,185,849 | | |
| | 25,000,000 | | | Praxair Inc. 4.72% due 11/16/2007 | | | 24,951,563 | | | | 24,951,563 | | |
| | 25,000,000 | | | Procter and Gamble Company 4.79% due 11/05/2007 | | | 24,986,694 | | | | 24,986,694 | | |
| | 34,797,000 | | | Procter and Gamble Company 4.77% due 11/14/2007 | | | 34,737,062 | | | | 34,737,062 | | |
| | 11,761,000 | | | Procter and Gamble Company 4.98% due 11/16/2007 | | | 11,736,596 | | | | 11,736,596 | | |
| | 25,000,000 | | | Procter and Gamble Company 4.74% due 12/03/2007 | | | 24,894,667 | | | | 24,894,667 | | |
See Notes to Financial Statements.
32
FIRST EAGLE OVERSEAS FUND
SCHEDULE OF INVESTMENTS—(Continued)
October 31, 2007
Principal
Amount | |
| | Cost
(Note 1) | | Value
(Note 1) | |
| | | Short-Term Investments—(continued) | |
| $ | 25,000,000 | | | Siemens AG 4.79% due 11/07/2007 | | $ | 24,980,042 | | | $ | 24,980,042 | | |
| | 25,000,000 | | | Siemens AG 4.78% due 11/09/2007 | | | 24,973,444 | | | | 24,973,444 | | |
| | 8,717,000 | | | Siemens AG 4.79% due 11/14/2007 | | | 8,701,922 | | | | 8,701,922 | | |
| | 20,000,000 | | | Siemens AG 4.65% due 12/21/2007 | | | 19,870,833 | | | | 19,870,833 | | |
| | 25,000,000 | | | Starbucks Corporation 5.3% due 11/02/2007 | | | 24,996,319 | | | | 24,996,319 | | |
| | 11,959,000 | | | Starbucks Corporation 5.25% due 11/05/2007 | | | 11,952,024 | | | | 11,952,024 | | |
| | 26,050,000 | | | Starbucks Corporation 4.85% due 11/06/2007 | | | 26,032,452 | | | | 26,032,452 | | |
| | 25,000,000 | | | Telstra Corporation 5% due 11/02/2007 | | | 24,996,528 | | | | 24,996,528 | | |
| | 25,000,000 | | | Telstra Corporation 5.2% due 11/05/2007 | | | 24,985,556 | | | | 24,985,556 | | |
| | 50,000,000 | | | Telstra Corporation 5.43% due 11/07/2007 | | | 49,954,750 | | | | 49,954,750 | | |
| | 25,000,000 | | | Telstra Corporation 5% due 11/13/2007 | | | 24,958,333 | | | | 24,958,333 | | |
| | 25,000,000 | | | Telstra Corporation 4.9% due 11/15/2007 | | | 24,952,361 | | | | 24,952,361 | | |
| | 30,000,000 | | | Telstra Corporation 4.95% due 12/12/2007 | | | 29,830,875 | | | | 29,830,875 | | |
| | 12,743,000 | | | Telstra Corporation 4.93% due 12/12/2007 | | | 12,671,452 | | | | 12,671,452 | | |
| | 25,000,000 | | | Time Warner Inc. 5.06% due 11/19/2007 | | | 24,936,750 | | | | 24,936,750 | | |
| | 18,554,000 | | | Time Warner Inc. 5.08% due 11/19/2007 | | | 18,506,873 | | | | 18,506,873 | | |
| | 25,000,000 | | | Time Warner Inc. 4.94% due 11/27/2007 | | | 24,910,806 | | | | 24,910,806 | | |
| | 20,000,000 | | | Time Warner Inc. 5.33% due 11/30/2007 | | | 19,914,128 | | | | 19,914,128 | | |
| | 20,000,000 | | | Time Warner Inc. 4.97% due 12/26/2007 | | | 19,848,139 | | | | 19,848,139 | | |
| | 20,000,000 | | | Vulcan Materials Company 4.9% due 11/06/2007 | | | 19,986,389 | | | | 19,986,389 | | |
| | | | | Total Short-Term Investments | | | 1,444,464,512 | | | | 1,444,464,512 | | |
| | | | | Total Investments (100.64%) | | $ | 7,907,675,415 | * | | | 11,190,066,438 | ** | |
| | | | | Liabilities in excess of other assets (–0.64%) | | | | | | | (70,961,234 | ) | |
| | | | | Net Assets (100.00%) | | | | | | $ | 11,119,105,204 | | |
* At October 31, 2007 cost of investments for federal income tax purposes was $8,268,898,804.
** Gross unrealized appreciation and depreciation of investments at October 31, 2007 for federal income tax purposes were $3,026,435,216 and $105,267,582, respectively (net appreciation was $2,921,167,634).
See Notes to Financial Statements.
33
FIRST EAGLE OVERSEAS FUND
SCHEDULE OF INVESTMENTS—(Continued)
October 31, 2007
| Foreign Currency Exchange Contracts | |
| Purchases | |
Settlement
Dates
Through | |
Foreign Currency To
Be Received | | U.S. $ Value at
October 31,
2007 | | U.S. $
To Be
Delivered | | Unrealized
Appreciation at
October 31, 2007 | | Unrealized
Depreciation at
October 31, 2007 | |
| 12/12/07 | | | 53,253,000 | | | euro | | $ | 77,055,174 | | | $ | 75,305,067 | | | $ | 1,750,107 | | | $ | — | | |
| Sales | |
Settlement
Dates
Through | |
Foreign Currency To
Be Delivered | | U.S. $
To Be
Received | | U.S. $ Value at
October 31,
2007 | | Unrealized
Appreciation at
October 31, 2007 | | Unrealized
Depreciation at
October 31, 2007 | |
| 12/12/07 | | | 662,275,000 | | | euro | | $ | 896,370,592 | | | $ | 958,288,083 | | | $ | — | | | $ | (61,917,491 | ) | |
| 1/09/08 | | | 38,707,000 | | | pound sterling | | | 77,921,575 | | | | 80,245,417 | | | | — | | | | (2,323,842 | ) | |
| 1/09/08 | | | 14,000,000 | | | pound sterling | | | 28,620,200 | | | | 29,024,100 | | | | — | | | | (403,900 | ) | |
| 4/09/08 | | | 92,023,000 | | | Swiss franc | | | 78,942,266 | | | | 80,029,952 | | | | — | | | | (1,087,686 | ) | |
| | | | | | | | | | 1,081,854,633 | | | | 1,147,587,552 | | | | — | | | | (65,732,919 | ) | |
| | | | | | | | | $ | 1,158,909,807 | | | $ | 1,222,892,619 | | | $ | 1,750,107 | | | $ | (65,732,919 | ) | |
| Foreign Currencies | | Sector/Industry Classifications | | Percent of Net Assets | |
| EUR— euro | | | (1 | ) | | Consumer Discretionary | | | 7.64 | % | |
| GBP— pound sterling | | | (2 | ) | | Consumer Staples | | | 15.10 | % | |
| HKD— Hong Kong dollar | | | (3 | ) | | Energy | | | 2.40 | % | |
| MYR— Malaysian ringgit | | | (4 | ) | | Financials | | | 5.15 | % | |
| SEK— Swedish krona | | | (5 | ) | | Government Issues | | | 3.14 | % | |
| SGD— Singapore dollar | | | (6 | ) | | Health Care | | | 5.23 | % | |
| | | | | | (7 | ) | | Holding Companies | | | 6.58 | % | |
| | | | | | (8 | ) | | Industrials | | | 12.07 | % | |
| | | | | | (9 | ) | | Materials | | | 3.90 | % | |
| | | | | | (10 | ) | | Media | | | 4.01 | % | |
| | | | | | (11 | ) | | Paper and Forest Products | | | 0.95 | % | |
| | | | | | (12 | ) | | Precious Metals | | | 8.90 | % | |
| | | | | | (13 | ) | | Real Estate | | | 0.34 | % | |
| | | | | | (14 | ) | | Retail | | | 0.96 | % | |
| | | | | | (15 | ) | | Technology and Telecommunications | | | 9.09 | % | |
| | | | | | (16 | ) | | Transportation | | | 2.19 | % | |
(a) Non-income producing security/commodity.
(b) All or a portion of this security is exempt from registration under the Securities Act of 1933. Rule 144A securities may only be sold to qualified institutional buyers under the Securities Act of 1933.
See Notes to Financial Statements.
34
FIRST EAGLE OVERSEAS FUND
SCHEDULE OF INVESTMENTS—(Continued)
October 31, 2007
(c) Affiliate as defined by the Investment Company Act of 1940. An affiliate is defined as a company in which the Fund directly or indirectly owns, controls, or holds power to vote 5% or more of the outstanding voting securities. Following is a summary of transactions with each such affiliate for the year ended October 31, 2007.
| | | Purchases | | Sales | | Realized | | Dividend | |
| Affiliate | | Shares | | Cost | | Shares | | Cost | | Gain | | Income | |
| Ariake Japan Company, Limited | | | 1,032,900 | | | $ | 22,045,905 | | | | — | | | | — | | | | — | | | $ | 422,229 | | |
| Cosel Company Limited | | | 1,814,900 | | | | 30,080,304 | | | | 25,500 | | | $ | 440,672 | | | $ | 84,362 | | | | 286,858 | | |
| Daeduck GDS Company, Limited | | | — | | | | — | | | | — | | | | — | | | | — | | | | 280,780 | | |
| Deceuninck | | | 82,310 | | | | 2,482,623 | | | | — | | | | — | | | | — | | | | 501,710 | | |
| FINEL | | | — | | | | — | | | | — | | | | — | | | | — | | | | — | | |
| Fuji Seal International, Inc. | | | 785,300 | | | | 17,814,004 | | | | — | | | | — | | | | — | | | | 168,363 | | |
| Fursys Inc. | | | 197,530 | | | | 5,671,168 | | | | — | | | | — | | | | — | | | | 332,931 | | |
| Hankuk Paper Manufacturing Company, Limited | | | 267,710 | | | | 8,547,478 | | | | — | | | | — | | | | — | | | | 135,166 | | |
| Haw Par Corporation Limited | | | 969,800 | | | | 4,577,096 | | | | — | | | | — | | | | — | | | | 2,116,092 | | |
| Icom Incorporated | | | 528,400 | | | | 14,517,598 | | | | — | | | | — | | | | — | | | | 203,064 | | |
| Koninklijke Grolsch NV | | | — | | | | — | | | | — | | | | — | | | | — | | | | 1,020,038 | | |
| Laurent-Perrier | | | — | | | | — | | | | 74,299 | | | | 3,874,725 | | | | 4,092,896 | | | | 734,689 | | |
| Maezawa Kasei Industries Company, Limited | | | 1,169,730 | | | | 16,196,994 | | | | — | | | | — | | | | — | | | | 275,285 | | |
| Matsumoto Yushi-Seiyaku Company, Limited | | | 133,246 | | | | 3,249,011 | | | | — | | | | — | | | | — | | | | 205,979 | | |
| Meitec Corporation | | | 1,446,367 | | | | 42,958,359 | | | | — | | | | — | | | | — | | | | 1,090,102 | | |
| Nitto Kohki Company, Limited | | | — | | | | — | | | | — | | | | — | | | | — | | | | 726,409 | | |
| Pfeiffer Vacuum Technology AG | | | 118,530 | | | | 11,435,945 | | | | — | | | | — | | | | — | | | | 2,267,414 | | |
| Phoenixtec Power Company, Limited | | | 6,457,732 | | | | 6,557,952 | | | | — | | | | — | | | | — | | | | 924,469 | | |
| PT Bat Indonesia Tbk | | | — | | | | — | | | | — | | | | — | | | | — | | | | — | | |
| Robertet SA | | | 7,140 | | | | 1,124,981 | | | | — | | | | — | | | | — | | | | 438,077 | | |
| Sansei Yusoki Company, Limited | | | 24,400 | | | | 178,348 | | | | — | | | | — | | | | — | | | | 162,654 | | |
| Shimano Inc. | | | 232,300 | | | | 6,545,671 | | | | — | | | | — | | | | — | | | | 1,570,420 | | |
| Shingakukai Company, Limited | | | 296,000 | | | | 1,806,807 | | | | — | | | | — | | | | — | | | | 92,089 | | |
| Société Sucrière de Pithiviers-le Vieil | | | — | | | | — | | | | — | | | | — | | | | — | | | | 1,162,862 | | |
| Spotless Group Limited | | | 2,501,980 | | | | 9,922,287 | | | | — | | | | — | | | | — | | | | 1,826,242 | | |
| T. Hasegawa Company, Limited | | | 222,500 | | | | 3,757,847 | | | | — | | | | — | | | | — | | | | 607,032 | | |
| Tasman Farms | | | — | | | | — | | | | — | | | | — | | | | — | | | | — | | |
| Total | | | | | | | | | | | | | | | | | | $ | 4,177,258 | | | $ | 17,550,954 | | |
(d) Security for which there is less than three market makers.
(e) Represents interest in a restricted security which has not been registered with the Securities and Exchange Commission under the Securities Act of 1933. Information concerning each restricted security holding on October 31, 2007 is shown below.
| Security | | Acquisition Date | | Cost | | Carrying Value
Per Share/Principal | |
| FINEL | | 7/14/1999 | | $ | 9,152,131 | | | $ | 1.43 | | |
| FINEL 91/2% due 6/30/2017 | | 6/22/2005 | | | 9,649,600 | | | | 0.72 | | |
| FINEL 91/2% due 10/15/2017 | | 10/11/2005 | | | 12,045,000 | | | | 0.72 | | |
| Fregaté SAS 2% Conv. Pfd. due 3/31/2013 | | 4/30/2004 | | | 3,620,400 | | | | 27.00 | | |
| Hilti AG | | 11/30/2001 | | | 4,485,845 | | | | 776.40 | | |
(f) Securities valued in accordance with fair value procedures under the supervision of the Board of Trustees, representing 0.29% of net assets.
(g) Inflation protected security.
(h) Held through Financiere Bleue, LLC.
See Notes to Financial Statements.
35
FUND OVERVIEW
FIRST EAGLE U.S. VALUE FUND Data as of October 31, 2007 (Unaudited)
THE INVESTMENT STYLE
The First Eagle U.S. Value Fund seeks long-term growth of capital by investing primarily in equities issued by U.S. corporations. Management utilizes a highly disciplined, bottom-up, value-oriented approach in achieving its investment objective.
ASSET ALLOCATION
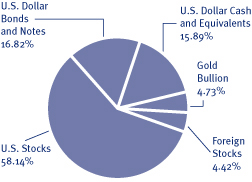
SECTOR/INDUSTRY
| Industrials | | | 11.11 | % | |
| Consumer Discretionary | | | 10.57 | % | |
| Media | | | 9.28 | % | |
| Health Care | | | 9.04 | % | |
| Technology | | | 8.74 | % | |
| Energy | | | 8.62 | % | |
| Retail | | | 6.64 | % | |
| Precious Metals | | | 5.62 | % | |
| Holding Companies | | | 4.83 | % | |
| Paper & Forest Products | | | 3.14 | % | |
| Materials | | | 2.24 | % | |
| Consumer Staples | | | 1.84 | % | |
| Utilities | | | 1.65 | % | |
| Financials | | | 0.72 | % | |
| Government Bonds | | | 0.05 | % | |
| Real Estate | | | 0.02 | % | |
The Fund's portfolio composition (represented as a percentage of net assets) is subject to change at any time.
AVERAGE ANNUAL RETURNS
| | | ONE-YEAR | | FIVE-YEARS | | SINCE INCEPTION | |
| | | | | | | (9-04-01) | |
| First Eagle U.S. Value Fund (A Shares) | |
| without sales load | | | 11.47 | % | | | 15.14 | % | | | 13.15 | % | |
| with sales load | | | 5.89 | % | | | 13.96 | % | | | 12.21 | % | |
| Standard & Poor's 500 Index | | | 14.56 | % | | | 13.88 | % | | | 7.06 | % | |
| Russell 2000 Index | | | 9.27 | % | | | 18.67 | % | | | 11.03 | % | |
| Consumer Price Index | | | 3.54 | % | | | 2.88 | % | | | 2.68 | % | |
GROWTH OF A $10,000 INITIAL INVESTMENT
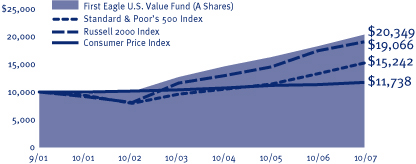
Performance data quoted herein represents past performance and should not be considered indicative of future results. Performance data quoted herein does not reflect the deduction of taxes that a shareholder would pay on Fund distributions or the sale of Fund shares. The average annual returns shown above are historical and reflect changes in share price, reinvested dividends and are net of expenses. The average annual returns for Class A Shares with a sales load gives effect to the deduction of the maximum sales load of 5.00%. The Russell 2000 Index is an unmanaged index that measures the performance of the 2,000 smallest companies in the Russell 3000 Index and is not available for purchase. The Standard & Poor's 500 Index is a widely recognized unmanaged index including a representative sample of 500 leading companies in leading sectors of the U.S. economy and is not available for purchase. Although the Standard & Poor's 500 Index focuses on the large-cap segment of the market, with approximately 75% coverage of U.S. equities, it is also considered a proxy for the total market. The Consumer Price Index (CPI) represents the change in price of all goods and services purchased for consumption by urban households.
TOP 10 HOLDINGS
| Berkshire Hathaway Inc., Class 'A' (holding company) | | | 4.83 | % | |
| Gold bullion (precious metal) | | | 4.73 | % | |
| Sanofi-Aventis ADR (French health care company) | | | 3.89 | % | |
| Yankee Acquisition Corporation (Notes) (consumer retail) | | | 3.68 | % | |
| Johnson & Johnson (health care products manufacturer) | | | 3.64 | % | |
| Apache Corporation (energy company) | | | 3.08 | % | |
| Cintas Corporation (uniform designer and manufacturer) | | | 2.83 | % | |
Blount International Inc. 87/8% due 8/01/2012
(outdoor industrial equipment manufacturer) | | | 2.82 | % | |
| Costco Wholesale Corporation (multiline retail) | | | 2.47 | % | |
| Blount International Inc. (outdoor industrial equipment manufacturer) | | | 2.29 | % | |
36
FIRST EAGLE U.S. VALUE FUND
SCHEDULE OF INVESTMENTS
October 31, 2007
Number
of Shares | |
| | Cost
(Note 1) | | Value
(Note 1) | |
| | | Common and Preferred Stocks—U.S. (58.14%) | |
| | | Consumer Discretionary (5.02%) | |
| | 330,260 | | | International Speedway Corporation, Class 'A' | | $ | 16,387,537 | | | $ | 14,673,452 | | |
| | 226,400 | | | McDonald's Corporation | | | 6,443,554 | | | | 13,516,080 | | |
| | 129,710 | | | Weyco Group, Inc. | | | 2,262,417 | | | | 4,145,532 | | |
| | 70,000 | | | Hampshire Group, Limited (a) | | | 1,171,963 | | | | 857,500 | | |
| | 600 | | | St. John Knits International Inc. (a) | | | 18,600 | | | | 18,975 | | |
| | | | 26,284,071 | | | | 33,211,539 | | |
| | | Consumer Staples (1.80%) | |
| | 116,664 | | | Anheuser-Busch Companies Inc. | | | 5,143,798 | | | | 5,982,530 | | |
| | 168,915 | | | Seneca Foods Corporation 0% Conv. Pfd. due 12/31/2049 (a)(c) | | | 2,542,171 | | | | 4,577,596 | | |
| | 50,000 | | | Seneca Foods Corporation, Class 'A' (a) | | | 752,500 | | | | 1,355,000 | | |
| | | | 8,438,469 | | | | 11,915,126 | | |
| | | Energy (8.62%) | |
| | 196,340 | | | Apache Corporation | | | 13,222,585 | | | | 20,382,055 | | |
| | 119,928 | | | ConocoPhillips Company | | | 4,247,616 | | | | 10,189,083 | | |
| | 126,970 | | | Murphy Oil Corporation | | | 6,509,946 | | | | 9,348,801 | | |
| | 161,760 | | | Helmerich & Payne, Inc. | | | 4,793,133 | | | | 5,114,851 | | |
| | 199,362 | | | BJ Services Company | | | 5,443,336 | | | | 5,021,929 | | |
| | 121,870 | | | San Juan Basin Royalty Trust | | | 4,494,880 | | | | 4,515,284 | | |
| | 27,131 | | | SEACOR Holdings Inc. (a) | | | 2,047,306 | | | | 2,486,556 | | |
| | | | 40,758,802 | | | | 57,058,559 | | |
| | | Financials (0.49%) | |
| | 49,620 | | | Mercury General Corporation | | | 2,712,236 | | | | 2,546,002 | | |
| | 48,900 | | | First Internet Bancorp (a) | | | 802,923 | | | | 667,485 | | |
| | | | 3,515,159 | | | | 3,213,487 | | |
| | | Health Care (5.06%) | |
| | 369,400 | | | Johnson & Johnson | | | 22,850,944 | | | | 24,073,798 | | |
| | 111,522 | | | Covidien Limited | | | 3,829,380 | | | | 4,639,315 | | |
| | 39,590 | | | Wellpoint Inc. (a) | | | 2,979,244 | | | | 3,136,716 | | |
| | 40,000 | | | Dentsply International Inc. | | | 580,150 | | | | 1,659,200 | | |
| | | | 30,239,718 | | | | 33,509,029 | | |
| | | Holding Companies (4.83%) | |
| | 241 | | | Berkshire Hathaway Inc., Class 'A' (a) | | | 21,817,785 | | | | 31,932,500 | | |
| | | Industrials (8.09%) | |
| | 512,310 | | | Cintas Corporation | | | 19,131,528 | | | | 18,750,546 | | |
| | 1,239,695 | | | Blount International, Inc. (a) | | | 13,695,961 | | | | 15,161,470 | | |
See Notes to Financial Statements.
37
FIRST EAGLE U.S. VALUE FUND
SCHEDULE OF INVESTMENTS—(Continued)
October 31, 2007
Number
of Shares | |
| | Cost
(Note 1) | | Value
(Note 1) | |
| | | Common and Preferred Stocks—U.S.—(continued) | |
| | | Industrials—(continued) | |
| | 290,862 | | | UniFirst Corporation | | $ | 8,235,507 | | | $ | 10,945,137 | | |
| | 165,270 | | | Copart, Inc (a) | | | 4,842,500 | | | | 6,343,063 | | |
| | 60,940 | | | UTI Worldwide, Inc. | | | 1,349,681 | | | | 1,554,579 | | |
| | 9,120 | | | 3M Company | | | 783,447 | | | | 787,603 | | |
| | | | 48,038,624 | | | | 53,542,398 | | |
| | | Materials (0.67%) | |
| | 484,470 | | | Tronox Inc. Class 'A' | | | 5,166,266 | | | | 4,122,840 | | |
| | 426 | | | Central Steel & Wire Company | | | 167,885 | | | | 282,225 | | |
| | | | 5,334,151 | | | | 4,405,065 | | |
| | | Media (6.22%) | |
| | 319,120 | | | Getty Images, Inc. (a) | | | 12,954,807 | | | | 9,015,140 | | |
| | 416,523 | | | Liberty Interactive (a) | | | 7,182,492 | | | | 8,842,783 | | |
| | 367,595 | | | Comcast Corporation-Special Class 'A' (a) | | | 8,361,047 | | | | 7,671,708 | | |
| | 197,385 | | | News Corporation, Class 'A' | | | 3,343,154 | | | | 4,277,333 | | |
| | 190,848 | | | New York Times Company, Class 'A' | | | 4,611,454 | | | | 3,732,987 | | |
| | 102,830 | | | CBS Corporation, Class 'B' | | | 2,969,115 | | | | 2,951,221 | | |
| | 14,554 | | | Liberty Capital (a) | | | 795,902 | | | | 1,818,959 | | |
| | 37,988 | | | Clear Channel Communications, Inc. | | | 1,147,587 | | | | 1,434,807 | | |
| | 33,410 | | | Viacom Inc. (a) | | | 1,141,884 | | | | 1,379,499 | | |
| | | | 42,507,442 | | | | 41,124,437 | | |
| | | Paper and Forest Products (3.14%) | |
| | 222,045 | | | Plum Creek Timber Company, Inc. | | | 7,295,639 | | | | 9,918,750 | | |
| | 168,900 | | | Rayonier Inc. | | | 5,603,666 | | | | 8,156,181 | | |
| | 48,020 | | | Deltic Timber Corporation | | | 2,307,309 | | | | 2,685,278 | | |
| | | | 15,206,614 | | | | 20,760,209 | | |
| | | Precious Metals (0.89%) | |
| | 116,468 | | | Newmont Mining Corporation Holding Company | | | 5,194,147 | | | | 5,923,562 | | |
| | | Real Estate (0.02%) | |
| | 1,595 | | | Prologis Trust 8.54% Pfd. Series 'C' | | | 82,039 | | | | 96,597 | | |
| | 8,000 | | | LandCo LLC (a)(b)(c)(d) | | | 27,840 | | | | 27,840 | | |
| | | | 109,879 | | | | 124,437 | | |
| | | Retail (6.64%) | |
| | 242,790 | | | Costco Wholesale Corporation | | | 10,584,824 | | | | 16,330,056 | | |
| | 298,410 | | | Wal-Mart Stores, Inc. | | | 13,546,499 | | | | 13,491,116 | | |
| | 118,290 | | | Tiffany & Company | | | 3,962,174 | | | | 6,408,952 | | |
See Notes to Financial Statements.
38
FIRST EAGLE U.S. VALUE FUND
SCHEDULE OF INVESTMENTS—(Continued)
October 31, 2007
Number
of Shares | |
| | Cost
(Note 1) | | Value
(Note 1) | |
| | | Common and Preferred Stocks—U.S.—(continued) | |
| | | Retail—(continued) | |
| | 113,560 | | | Barnes & Noble, Inc. | | $ | 4,002,218 | | | $ | 4,387,958 | | |
| | 142,320 | | | Dillard's Inc., Class 'A' | | | 2,819,918 | | | | 3,277,630 | | |
| | | | 34,915,633 | | | | 43,895,712 | | |
| | | Technology and Telecommunications (5.00%) | |
| | 400,135 | | | Microsoft Corporation | | | 9,293,123 | | | | 14,728,969 | | |
| | 290,680 | | | Intel Corporation | | | 5,482,727 | | | | 7,819,292 | | |
| | 149,870 | | | Linear Technology Corporation | | | 4,906,570 | | | | 4,948,707 | | |
| | 108,980 | | | Maxim Integrated Products | | | 3,491,903 | | | | 2,953,358 | | |
| | 73,955 | | | Dell Inc. (a) | | | 1,662,205 | | | | 2,263,023 | | |
| | 150,000 | | | Sanmina-SCI Corporation (a) | | | 306,315 | | | | 331,500 | | |
| | | | 25,142,843 | | | | 33,044,849 | | |
| | | Utilities (1.65%) | |
| | 166,350 | | | IDACORP, Inc. | | | 5,284,998 | | | | 5,803,952 | | |
| | 88,100 | | | CalEnergy Capital Trust 61/2% Conv. Pfd. | | | 3,778,987 | | | | 4,206,775 | | |
| | 40,000 | | | Hawaiian Electric Industries, Inc. | | | 845,477 | | | | 928,000 | | |
| | | | 9,909,462 | | | | 10,938,727 | | |
| | | | | Total Common and Preferred Stocks—U.S. | | | 317,412,799 | | | | 384,599,636 | | |
| | | Common Stocks—Non U.S. (4.42%) | |
| | | France (3.89%) | |
| | 585,440 | | | Sanofi-Aventis ADR (5) | | | 23,933,180 | | | | 25,765,214 | | |
| | | United Kingdom (0.53%) | |
| | 90,110 | | | Amdocs Limited (a)(10) | | | 3,134,747 | | | | 3,099,784 | | |
| | 135,619 | | | JZ Equity Partners, Plc (3) | | | 270,370 | | | | 405,943 | | |
| | | | 3,405,117 | | | | 3,505,727 | | |
| | | | | Total Common Stocks—Non U.S. | | | 27,338,297 | | | | 29,270,941 | | |
| Ounces | | | | | | | |
| | | Commodity (4.73%) | |
| | 39,366 | | | Gold bullion (a) | | | 22,847,023 | | | | 31,281,386 | | |
See Notes to Financial Statements.
39
FIRST EAGLE U.S. VALUE FUND
SCHEDULE OF INVESTMENTS—(Continued)
October 31, 2007
Principal
Amount | |
| | Cost
(Note 1) | | Value
(Note 1) | |
| | | Notes, Bonds and Convertible Bonds (16.82%) | |
| | | U.S. Treasury Note (0.05%) | |
| $ | 335,222 | | | U.S. Treasury Inflation Index Note 23/8% due 4/15/2011 (e)(4) | | $ | 340,274 | | | $ | 340,539 | | |
| | | U.S. Dollar Notes and Bonds (16.77%) | |
| | 1,075,000 | | | GATX Corporation 87/8% due 6/01/2009 (3) | | | 1,052,695 | | | | 1,140,401 | | |
| | 500,000 | | | American Standard Companies Inc. 81/4% due 6/01/2009 (6) | | | 507,814 | | | | 521,916 | | |
| | 1,000,000 | | | Briggs & Stratton Corporation 87/8% due 3/15/2011 (1) | | | 1,028,194 | | | | 1,070,000 | | |
| | 7,505,000 | | | Beazer Homes USA, Inc. 85/8 due 5/15/2011 (1) | | | 6,102,397 | | | | 6,191,625 | | |
| | 6,814,000 | | | Celestica Inc. 77/8% 7/01/2011 (10) | | | 6,532,584 | | | | 6,694,755 | | |
| | 3,520,000 | | | Celestica Inc. 75/8% 7/01/2013 (10) | | | 3,276,184 | | | | 3,396,800 | | |
| | 18,300,000 | | | Blount International Inc. 87/8% due 8/01/2012 (6) | | | 18,582,577 | | | | 18,666,000 | | |
| | 9,681,000 | | | Tronox Worldwide LLC 91/2% due 12/01/2012 (7) | | | 9,925,514 | | | | 9,390,570 | | |
| | 3,800,000 | | | Sanmina-SCI Corporation 63/4% due 3/01/2013 (10) | | | 3,262,530 | | | | 3,334,500 | | |
| | 2,000,000 | | | Sanmina-SCI Corporation 81/8% due 3/01/2016 (10) | | | 1,730,228 | | | | 1,765,000 | | |
| | 1,000,000 | | | Texas Industries, Inc. 71/4% due 7/15/2013 (7) | | | 1,000,000 | | | | 1,005,000 | | |
| | 12,786,000 | | | Sirius Satellite Radio Inc. 95/8% due 8/01/2013 (8) | | | 12,288,391 | | | | 12,770,018 | | |
| | 250,000 | | | Jostens, Inc. 101/4% due 12/01/2013 (a)(1) | | | 184,460 | | | | 235,000 | | |
| | 250,000 | | | Elizabeth Arden Inc. 73/4% due 1/15/2014 (2) | | | 250,000 | | | | 250,625 | | |
| | 814,345 | | | Avis Budget Car Rental LLC 75/8% due 5/15/2014 (6) | | | 797,576 | | | | 810,273 | | |
| | 6,862,000 | | | Level 3 Financing, Inc. 91/4% due 11/01/2014 (10) | | | 6,617,710 | | | | 6,501,745 | | |
| | 6,424,000 | | | Yankee Acquisition Corporation 81/2% due 2/15/2015 (1) | | | 6,551,569 | | | | 6,054,620 | | |
| | 19,697,000 | | | Yankee Acquisition Corporation 93/4% due 2/15/2017 (1) | | | 19,742,572 | | | | 18,318,210 | | |
| | 8,808,000 | | | Valassis Communications, Inc 81/4 due 3/01/2015 (8) | | | 7,998,396 | | | | 7,464,780 | | |
| | 5,000,000 | | | Lear Corporation 83/4% due 12/01/2016 (1) | | | 4,716,494 | | | | 4,825,000 | | |
| | 600,000 | | | Bausch & Lomb Inc. 71/8% due 8/01/2028 (5) | | | 510,115 | | | | 552,000 | | |
| | | | 112,658,000 | | | | 110,958,838 | | |
| | | | | Total Notes, Bonds and Convertible Bonds | | | 112,998,274 | | | | 111,299,377 | | |
| | | Short-Term Investments (17.66%) | |
| | 11,865,000 | | | Air Liquide 4.79% due 11/05/2007 | | | 11,858,685 | | | | 11,858,685 | | |
| | 20,000,000 | | | BMW US Capital LLC 4.73% due 11/09/2007 | | | 19,978,978 | | | | 19,978,978 | | |
| | 26,100,000 | | | Cintas Corporation 4.8% due 11/01/2007 | | | 26,100,000 | | | | 26,100,000 | | |
| | 9,028,000 | | | Diageo Capital Plc 5.28% due 11/14/2007 | | | 9,010,787 | | | | 9,010,787 | | |
| | 2,855,000 | | | Estèe Lauder Inc. 4.75% due 11/06/2007 | | | 2,853,117 | | | | 2,853,117 | | |
| | 5,000,000 | | | Genentech Inc. 4.73% due 11/05/2007 | | | 4,997,372 | | | | 4,997,372 | | |
| | 5,000,000 | | | Hitachi Limited 4.9% due 11/02/2007 | | | 4,999,319 | | | | 4,999,319 | | |
| | 7,000,000 | | | Hitachi Limited 4.75% due 11/27/2007 | | | 6,975,986 | | | | 6,975,986 | | |
| | 8,648,000 | | | Kraft Foods Inc. 4.78% due 11/08/2007 | | | 8,639,962 | | | | 8,639,962 | | |
See Notes to Financial Statements.
40
FIRST EAGLE U.S. VALUE FUND
SCHEDULE OF INVESTMENTS—(Continued)
October 31, 2007
Principal
Amount | |
| | Cost
(Note 1) | | Value
(Note 1) | |
| | | Short-Term Investments—(continued) | |
| $ | 13,050,000 | | | PPG Industries 4.75% due 11/02/2007 | | $ | 13,048,278 | | | $ | 13,048,278 | | |
| | 8,357,000 | | | Starbucks Corporation 4.85% due 11/15/2007 | | | 8,341,238 | | | | 8,341,238 | | |
| | | Total Short-Term Investments | | | 116,803,722 | | | | 116,803,722 | | |
| | | Total Investments (101.77%) | | $ | 597,400,115 | * | | | 673,255,062 | ** | |
| | | Liabilities in excess of other assets (–1.77%) | | | | | | | (11,715,958 | ) | |
| | | Net assets (100.00%) | | | | | | $ | 661,539,104 | | |
* At October 31, 2007 cost of investments for federal income tax purposes was $597,218,620.
** Gross unrealized appreciation and depreciation of securities at October 31, 2007 for federal income tax purposes were $88,475,453 and $12,439,011 respectively (net appreciation was $76,036,442).
| Sector/Industry Classifications | |
| | (1 | ) | | Consumer Discretionary | |
| | (2 | ) | | Consumer Staples | |
| | (3 | ) | | Financials | |
| | (4 | ) | | Government Issues | |
| | (5 | ) | | Health Care | |
| | (6 | ) | | Industrials | |
| | (7 | ) | | Materials | |
| | (8 | ) | | Media | |
| | (9 | ) | | Real Estate | |
| | (10 | ) | | Technology and Telecommunications | |
(a) Non-income producing security.
(b) Represents interest in a restricted security which has not been registered with the Securities and Exchange Commission under the Securities Act of 1933. Information concerning each restricted security holding on October 31, 2007 is shown below.
| Security | | Acquisition Date | | Cost | | Carrying Value
Per Share/Principal | |
| LandCo LLC | | | 9/6/06 | | | $ | 27,840 | | | $ | 3.48 | | |
(c) Securities valued in accordance with fair value procedures under the supervision of the Board of Trustees, representing 0.70% of net assets.
(d) Security for which there is less than three market makers.
(e) Inflation protected security.
See Notes to Financial Statements.
41
FUND OVERVIEW
FIRST EAGLE GOLD FUND Data as of October 31, 2007 (Unaudited)
THE INVESTMENT STYLE
The First Eagle Gold Fund is a non-diversified fund whose investment objective is to provide exposure to the investment characteristics of gold and, to a limited extent, other precious metals. In seeking to achieve its objective, the Fund invests primarily in securities of companies engaged in mining, processing, dealing in or holding gold or other precious metals such as silver, platinum and palladium, both in the United States and in foreign countries.
ASSET ALLOCATION
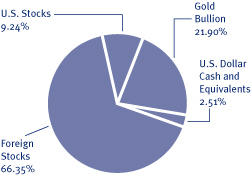
COUNTRIES
| Canada | | | 33.54 | % | |
| United States | | | 31.14 | % | |
| South Africa | | | 15.66 | % | |
| Australia | | | 12.97 | % | |
| Mexico | | | 4.18 | % | |
The Fund's portfolio composition (represented as a percentage of net assets) is subject to change at any time.
AVERAGE ANNUAL RETURNS
| | | ONE-YEAR | | FIVE-YEARS | | TEN-YEARS | |
| First Eagle Gold Fund (A Shares) | |
| without sales load | | | 37.57 | % | | | 27.02 | % | | | 16.87 | % | |
| with sales load | | | 30.69 | % | | | 25.73 | % | | | 16.42 | % | |
| FTSE Gold Mines Index | | | 35.14 | % | | | 24.05 | % | | | 9.75 | % | |
| MSCI World Index | | | 20.39 | % | | | 18.31 | % | | | 7.90 | % | |
| Consumer Price Index | | | 3.54 | % | | | 2.88 | % | | | 2.60 | % | |
GROWTH OF A $10,000 INITIAL INVESTMENT
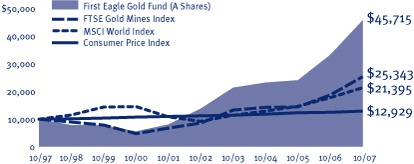
Performance data quoted herein represents past performance and should not be considered indicative of future results. Performance data quoted herein does not reflect the deduction of taxes that a shareholder would pay on Fund distributions or the sale of Fund shares. The average annual returns shown above are historical and reflect changes in share price, reinvested dividends and are net of expenses. The average annual returns for Class A Shares with a sales load give effect to the deduction of the maximum sales load of 3.75%for periods prior to March 1, 2000 and of 5.00% thereafter. The MSCI World Index is a widely followed, unmanaged group of stocks from 23 international markets and is not available for purchase. This index is a trademark of Morgan Stanley Capital International SA in Geneva, Switzerland. The FTSE Gold Mines Index is an unmanaged index composed of approximately 19 mining companies and is only available without dividends rei nvested and is not available for purchase. The Consumer Price Index (CPI) represents the change in price of all goods and services purchased for consumption by urban households.
TOP 10 HOLDINGS
| Gold bullion (United States) | | | 21.90 | % | |
| Barrick Gold Corporation (Canada) | | | 7.30 | % | |
| Newmont Mining Corporation Holding Company (United States) | | | 5.65 | % | |
| Lihir Gold Limited (Australia) | | | 5.48 | % | |
| Newcrest Mining Limited (Australia) | | | 5.42 | % | |
| Kinross Gold Corporation (Canada) | | | 4.78 | % | |
| Gold Fields Limited ADR (South Africa) | | | 4.53 | % | |
| Randgold Resources Limited ADR (South Africa) | | | 4.51 | % | |
| IAMGOLD Corporation (Canada) | | | 4.49 | % | |
| Industrias Peñoles, SAB de C.V. (Mexico) | | | 4.18 | % | |
42
FIRST EAGLE GOLD FUND
SCHEDULE OF INVESTMENTS
October 31, 2007
Number
of Shares | |
| | Cost
(Note 1) | | Value
(Note 1) | |
| | | Common Stocks and Warrants (75.59%) | |
| | | Australia (12.97%) | |
| | 17,928,675 | | | Lihir Gold Limited (a) | | $ | 21,334,280 | | | $ | 68,584,586 | | |
| | 2,260,300 | | | Newcrest Mining Limited | | | 30,349,876 | | | | 67,832,741 | | |
| | 2,690,234 | | | Kingsgate Consolidated Limited (a) | | | 9,860,009 | | | | 13,256,533 | | |
| | 1,850,800 | | | Independence Group NL | | | 8,497,001 | | | | 12,668,704 | | |
| | | | 70,041,166 | | | | 162,342,564 | | |
| | | Canada (33.54%) | |
| | 2,070,814 | | | Barrick Gold Corporation | | | 59,335,747 | | | | 91,385,022 | | |
| | 3,038,690 | | | Kinross Gold Corporation (a) | | | 27,388,391 | | | | 59,801,419 | | |
| | 6,449,712 | | | IAMGOLD Corporation | | | 36,772,119 | | | | 56,208,415 | | |
| | 1,069,030 | | | Goldcorp Inc. | | | 30,230,983 | | | | 37,555,024 | | |
| | 915,530 | | | Meridian Gold Inc. (a) | | | 22,306,076 | | | | 36,569,165 | | |
| | 2,029,350 | | | Minefinders Corporation (a) | | | 16,778,990 | | | | 26,058,383 | | |
| | 4,621,350 | | | Aurizon Mines Limited (a) | | | 6,761,828 | | | | 19,650,831 | | |
| | 2,850,940 | | | Miramar Mining Corporation (a) | | | 2,526,866 | | | | 19,324,338 | | |
| | 2,819,290 | | | Metallica Resources Inc. (a) | | | 3,861,514 | | | | 16,320,487 | | |
| | 1,559,950 | | | Dundee Precious Metals, Inc., Class 'A' (a) | | | 11,250,260 | | | | 15,827,721 | | |
| | 1,326,000 | | | Aurelian Resources Inc. (a) | | | 8,591,431 | | | | 13,677,297 | | |
| | 1,275,580 | | | Gammon Gold Inc. (a) | | | 10,530,848 | | | | 13,157,230 | | |
| | 127,173 | | | Agnico-Eagle Mines Limited | | | 1,104,231 | | | | 7,226,682 | | |
| | 1,798,480 | | | Richmont Mines, Inc. (a)(b) | | | 5,783,406 | | | | 7,079,587 | | |
| | | | 243,222,690 | | | | 419,841,601 | | |
| | | Mexico (4.18%) | |
| | 2,213,750 | | | Industrias Peñoles, SAB de C.V. | | | 6,297,860 | | | | 52,329,328 | | |
| | | South Africa (15.66%) | |
| | 3,139,250 | | | Gold Fields Limited ADR | | | 46,599,630 | | | | 56,726,248 | | |
| | 1,569,710 | | | Randgold Resources Limited ADR | | | 28,215,528 | | | | 56,415,377 | | |
| | 1,004,630 | | | AngloGold Ashanti Limited ADR | | | 38,755,378 | | | | 46,665,064 | | |
| | 3,243,370 | | | Harmony Gold Mining Company Limited ADR (a) | | | 35,590,644 | | | | 36,325,744 | | |
| | | | 149,161,180 | | | | 196,132,433 | | |
| | | United States (9.24%) | |
| | 1,391,207 | | | Newmont Mining Corporation Holding Company | | | 58,218,989 | | | | 70,756,788 | | |
| | 1,270,320 | | | Royal Gold, Inc. | | | 26,933,843 | | | | 44,893,109 | | |
| | 400,000 | | | Canyon Resources Corporation warrants exp 12/01/2008 (a)(c)(d) | | | — | | | | — | | |
| | | | 85,152,832 | | | | 115,649,897 | | |
| | | | | Total Common Stocks and Warrants | | | 553,875,728 | | | | 946,295,823 | | |
See Notes to Financial Statements.
43
FIRST EAGLE GOLD FUND
SCHEDULE OF INVESTMENTS—(Continued)
October 31, 2007
| Ounces | |
| | Cost
(Note 1) | | Value
(Note 1) | |
| | | Commodity (21.90%) | |
| | 344,969 | | | Gold bullion (a) | | $ | 151,703,605 | | | $ | 274,122,360 | | |
Principal
Amount | |
| |
| |
| |
| | | Short-Term Investment (2.52%) | |
| $ | 31,626,000 | | | Hitachi Limited 5% due 11/01/2007 | | | 31,626,000 | | | | 31,626,000 | | |
| | | Total Investments (100.01%) | | $ | 737,205,333 | * | | | 1,252,044,183 | ** | |
| | | Liabilities in excess of other assets (–0.01%) | | | | | | | (139,830 | ) | |
| | | Net Assets (100.00%) | | | | | | $ | 1,251,904,353 | | |
* At October 31, 2007 cost of investments for federal income tax purposes was $774,653,815.
** Gross unrealized appreciation and depreciation of investments at October 31, 2007 for federal income tax purposes were $477,390,368 and $0 respectively (net appreciation was $477,390,368).
(a) Non-income producing security/commodity.
(b) Affiliate as defined by the Investment Company Act of 1940. An affiliate is defined as a company in which the Fund directly or indirectly owns, controls, or holds power to vote 5% or more of the outstanding voting securities. Following is a summary of transactions with each such affiliate for the year ended October 31, 2007.
| | | Purchases | |
| Affiliate | | Shares | | Cost | |
| Richmont Mines, Inc. | | | 544,920 | | | $ | 1,514,101 | | |
(c) Security for which there is less than three market makers.
(d) Securities valued in accordance with fair value procedures under the supervision of the Board of Trustees, representing 0.00% of net assets.
See Notes to Financial Statements.
44


Harold Levy
FIRST EAGLE FUND OF AMERICA
MANAGEMENT'S DISCUSSION OF FUND PERFORMANCE
The deal frenzy so apparent in the first half of calendar 2007 has given way to a much more subdued equity environment. Lenders are pulling in their horns to compensate for excessive risk taking and the somewhat surprising extent of mortgage borrowers being unable to maintain their payments, and the implications of large scale defaults are working their way through the financial system. We have not participated in this debacle since we tend to avoid financials and in fact have not owned any now for several years. Nevertheless, a much less credit friendly environment is not positive for the real economy and may add significant nervousness to equity valuations.
We have no particular view on when this crisis will end but continue to believe that it is likely the system will reliquidify, lenders will take their well deserved losses and companies that create value for customers and owners will still be prized assets. We continue to own equities and find more on a regular basis. Some environments are good for realizing value and some for finding value. Ultimately we will switch to an environment where realization is king, but today we are clearly in the latter environment.
In terms of performance of the Fund during the period, top contributors were Teekay Corporation (marine transportation), Precision Castparts Corporation (industrial technology), and Rural Cellular Corporation (wireless telecommunications). Those that detracted did so very minimally and included names such as LSI Corporation (electronic technology), HealthSouth Corporation (health care services), and Wesco International Inc. (electrical supplies and equipment distribution).
We are doing nothing different from what we have done in the past; we are not panicked nor surprised by significant volatility both in individual stocks and the market overall and believe that investments at today's prices may be well rewarded several years hence.
Sincerely,

Harold Levy
Portfolio Manager
November 2007
First Eagle Fund of America Class Y will only accept additional investments from existing shareholders. However, Class A and Class C remain open to all investors.
Past performance is no guarantee of future result. Portfolio actively managed. Portfolio and opinions expressed herein are subject to change.
45
FUND OVERVIEW
FIRST EAGLE FUND OF AMERICA Data as of October 31, 2007 (Unaudited)
THE INVESTMENT STYLE
The First Eagle Fund of America is a non-diversified U.S. equity fund that seeks long-term capital appreciation. The Fund has a unique event-driven bias that focuses on identifying companies poised to benefit from change that the market has not yet recognized.
ASSET ALLOCATION
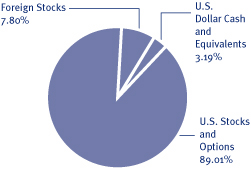
SECTOR/INDUSTRY*
| Energy | | | 22.66 | % | |
| Industrials | | | 14.46 | % | |
| Materials | | | 13.87 | % | |
| Consumer Discretionary | | | 10.76 | % | |
| Information Technology | | | 9.44 | % | |
| Health Care Services | | | 8.99 | % | |
| Telecommunication Services | | | 7.99 | % | |
| Pharmaceuticals | | | 5.48 | % | |
| Biotechnology | | | 3.20 | % | |
| Consumer Staples | | | 1.91 | % | |
| *percentages exclude option positions | |
The Fund's portfolio composition (represented as a percentage of net assets) is subject to change at any time.
AVERAGE ANNUAL RETURNS
| | | ONE-YEAR | | FIVE-YEARS | | TEN-YEARS | |
First Eagle Fund of America
(Y Shares) | | | 21.25 | % | | | 15.90 | % | | | 11.52 | % | |
| Standard & Poor's 500 Index | | | 14.56 | % | | | 13.88 | % | | | 7.10 | % | |
GROWTH OF A $10,000 INITIAL INVESTMENT
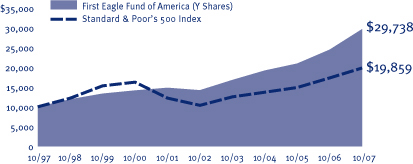
Performance data quoted herein represents past performance and should not be considered indicative of future results. Performance data quoted herein does not reflect the deduction of taxes that a shareholder would pay on Fund distributions or the sale of Fund shares. The Fund's average annual returns shown above are historical and reflect changes in share price, reinvested dividends and is net of expenses. The Standard & Poor's 500 Index is a widely recognized unmanaged index including a representative sample of 500 leading companies in leading sectors of the U.S. economy and is not available for purchase. Although the Standard & Poor's 500 Index focuses on the large-cap segment of the market, with approximately 75% coverage of U.S. equities, it is also considered a proxy for the total market.
TOP 10 HOLDINGS
| Teekay Corporation (marine transportation) | | | 4.37 | % | |
| Baxter International Inc. (diversified medical products and services) | | | 4.25 | % | |
| Devon Energy Corporation (energy company) | | | 3.90 | % | |
| DST Systems Inc. (data processing services provider) | | | 3.89 | % | |
| Agilent Technologies Inc. (electronic equipment provider) | | | 3.71 | % | |
| General Dynamics Corporation (aerospace and defense manufacturer) | | | 3.66 | % | |
| American Standard Companies Inc. (building products manufacturer) | | | 3.43 | % | |
| Autoliv Inc. (automobile components supplier) | | | 2.82 | % | |
| The DIRECTV Group, Inc. (cable/satellite television services provider) | | | 2.63 | % | |
| UTS Energy Corporation (energy company) | | | 2.59 | % | |
46
FIRST EAGLE FUND OF AMERICA
SCHEDULE OF INVESTMENTS
October 31, 2007
Number
of Shares | |
| | Cost
(Note 1) | | Value
(Note 1) | |
| | | Common and Preferred Stocks - U.S. (90.96%) | |
| | | Biotechnology (3.20%) | |
| | 390,510 | | | Amgen Inc. (a)(c) | | $ | 21,443,309 | | | $ | 22,692,536 | | |
| | 1,135,996 | | | Isolagen Inc. (a) | | | 3,335,919 | | | | 3,532,948 | | |
| | 135,521 | | | InterMune Inc. (a) | | | 2,007,756 | | | | 2,699,578 | | |
| | | | 26,786,984 | | | | 28,925,062 | | |
| | | Consumer Discretionary (10.76%) | |
| | 402,600 | | | Autoliv Inc. (c) | | | 17,456,288 | | | | 25,436,268 | | |
| | 897,920 | | | The DIRECTV Group, Inc. (a) | | | 21,402,142 | | | | 23,776,922 | | |
| | 251,040 | | | The Stanley Works (c) | | | 11,837,403 | | | | 14,447,352 | | |
| | 449,720 | | | Virgin Media Inc. | | | 12,102,279 | | | | 9,943,309 | | |
| | 173,553 | | | WABCO Holdings Inc. | | | 6,349,269 | | | | 8,819,963 | | |
| | 97,900 | | | Whirlpool Corporation (c) | | | 8,763,798 | | | | 7,751,722 | | |
| | 28,700 | | | The Black & Decker Corporation (c) | | | 2,160,249 | | | | 2,580,417 | | |
| | 43,710 | | | Harley-Davidson, Inc. | | | 2,253,889 | | | | 2,251,065 | | |
| | 140,130 | | | Domino's Pizza Inc. (c) | | | 2,491,310 | | | | 2,163,607 | | |
| | | | 84,816,627 | | | | 97,170,625 | | |
| | | Consumer Staples (1.91%) | |
| | 517,390 | | | Dean Foods Company | | | 7,525,646 | | | | 14,367,920 | | |
| | 102,740 | | | Treehouse Foods Inc. (a) | | | 2,077,487 | | | | 2,866,446 | | |
| | | | 9,603,133 | | | | 17,234,366 | | |
| | | Energy (20.06%) | |
| | 705,600 | | | Teekay Corporation (c) | | | 29,944,634 | | | | 39,478,320 | | |
| | 377,550 | | | Devon Energy Corporation (c) | | | 24,196,543 | | | | 35,263,170 | | |
| | 443,590 | | | Grant Prideco Inc. (a)(c) | | | 19,412,901 | | | | 21,806,884 | | |
| | 483,800 | | | Halliburton Company (c) | | | 15,670,528 | | | | 19,071,396 | | |
| | 296,480 | | | Denbury Resources Inc. (a)(c) | | | 10,246,637 | | | | 16,780,768 | | |
| | 350,620 | | | Dresser-Rand Group Inc. (a)(c) | | | 12,069,179 | | | | 13,568,994 | | |
| | 270,455 | | | Atlas Pipeline Partners, L.P. (e)(f) | | | 11,900,020 | | | | 12,706,144 | | |
| | 77,777 | | | Atlas Pipeline Holdings, L.P. (e)(f) | | | 2,099,979 | | | | 2,706,536 | | |
| | 208,110 | | | Atlas America Inc. | | | 7,716,956 | | | | 12,007,947 | | |
| | 87,800 | | | GlobalSantaFe Corporation (c) | | | 5,413,286 | | | | 7,114,434 | | |
| | 22,300 | | | Teekay Offshore Partners LP | | | 468,300 | | | | 647,369 | | |
| | | | 139,138,963 | | | | 181,151,962 | | |
See Notes to Financial Statements.
47
FIRST EAGLE FUND OF AMERICA
SCHEDULE OF INVESTMENTS—(Continued)
October 31, 2007
Number
of Shares | |
| | Cost
(Note 1) | | Value
(Note 1) | |
| | | Common and Preferred Stocks—U.S.—(continued) | |
| | | Health Care Services (8.46%) | |
| | 639,110 | | | Baxter International Inc. (c) | | $ | 25,011,293 | | | $ | 38,352,991 | | |
| | 395,400 | | | Edwards Lifesciences Corporation (a) | | | 16,363,221 | | | | 19,856,988 | | |
| | 791,640 | | | HealthSouth Corporation (a) | | | 19,523,294 | | | | 15,872,382 | | |
| | 40,000 | | | Chemed Corporation (c) | | | 2,214,972 | | | | 2,292,800 | | |
| | 67,777 | | | Assistive Technology Inc. Ser. E-1 (a)(b)(d)(e) | | | 883,921 | | | | — | | |
| | 51,966 | | | Assistive Technology Inc. Ser. E-2 (a)(b)(d)(e) | | | 500,000 | | | | — | | |
| | 26,057 | | | Assistive Technology Inc. Ser. F Pfd. (a)(b)(d)(e) | | | 342,000 | | | | — | | |
| | | | 64,838,701 | | | | 76,375,161 | | |
| | | Industrials (14.46%) | |
| | 363,700 | | | General Dynamics Corporation (c) | | | 20,579,243 | | | | 33,082,152 | | |
| | 831,410 | | | American Standard Companies Inc. (c) | | | 23,011,919 | | | | 30,986,651 | | |
| | 792,900 | | | DynCorp International Inc. (a)(c) | | | 10,024,728 | | | | 17,951,256 | | |
| | 119,800 | | | Precision Castparts Corporation (c) | | | 5,486,008 | | | | 17,947,238 | | |
| | 290,610 | | | WESCO International Inc. (a) | | | 16,315,056 | | | | 13,556,957 | | |
| | 449,370 | | | J.B. Hunt Transport Services, Inc. (c) | | | 12,271,718 | | | | 12,456,536 | | |
| | 110,590 | | | Tyco International Limited | | | 3,029,564 | | | | 4,552,990 | | |
| | | | 90,718,236 | | | | 130,533,780 | | |
| | | Information Technology (8.81%) | |
| | 415,200 | | | DST Systems Inc. (a)(c) | | | 21,491,416 | | | | 35,171,592 | | |
| | 908,700 | | | Agilent Technologies Inc. (a)(c) | | | 27,120,420 | | | | 33,485,595 | | |
| | 1,646,898 | | | LSI Corporation (a) | | | 15,548,151 | | | | 10,869,527 | | |
| | | | 64,159,987 | | | | 79,526,714 | | |
| | | Materials (12.07%) | |
| | 265,030 | | | Praxair, Inc. (c) | | | 18,641,271 | | | | 22,654,764 | | |
| | 874,520 | | | Crown Holdings Inc. (a) | | | 15,848,464 | | | | 21,688,096 | | |
| | 359,810 | | | Ball Corporation (c) | | | 10,899,915 | | | | 17,839,380 | | |
| | 392,550 | | | Celanese Corporation, Series 'A' (c) | | | 15,294,751 | | | | 16,471,398 | | |
| | 201,100 | | | Eastman Chemical Company (c) | | | 12,207,242 | | | | 13,391,249 | | |
| | 306,300 | | | Eagle Materials Inc. | | | 13,726,166 | | | | 12,101,913 | | |
| | 40,700 | | | Freeport-McMoRan Copper & Gold Inc., Class 'B' | | | 2,928,609 | | | | 4,789,576 | | |
| | | | 89,546,418 | | | | 108,936,376 | | |
| | | Pharmaceuticals (3.24%) | |
| | 1,305,340 | | | Millennium Pharmaceuticals Inc. (a)(c) | | | 13,284,403 | | | | 15,429,119 | | |
| | 375,863 | | | Theravance Inc. (a) | | | 8,078,013 | | | | 9,404,092 | | |
| | 465,800 | | | Enzon Pharmaceuticals, Inc. (a) | | | 4,032,747 | | | | 4,439,074 | | |
| | | | 25,395,163 | | | | 29,272,285 | | |
See Notes to Financial Statements.
48
FIRST EAGLE FUND OF AMERICA
SCHEDULE OF INVESTMENTS—(Continued)
October 31, 2007
Number
of Shares | |
| | Cost
(Note 1) | | Value
(Note 1) | |
| | | Common and Preferred Stocks—U.S.—(continued) | |
| | | Telecommunication Services (7.99%) | |
| | 301,730 | | | Leap Wireless International Inc. (a)(c) | | $ | 13,030,326 | | | $ | 21,516,366 | | |
| | 1,168,462 | | | Dobson Communications Corporation (a) | | | 5,702,182 | | | | 15,119,898 | | |
| | 188,940 | | | Alltel Corporation | | | 10,644,680 | | | | 13,443,081 | | |
| | 302,439 | | | Rural Cellular Corporation, Class 'A' (a) | | | 3,658,416 | | | | 13,419,218 | | |
| | 410,870 | | | Global Crossing Limited (a)(c) | | | 9,227,934 | | | | 8,665,248 | | |
| | | | 42,263,538 | | | | 72,163,811 | | |
| | | | | Total Common and Preferred Stocks—U.S. | | | 637,267,750 | | | | 821,290,142 | | |
| | | Common Stocks—Non U.S. (7.80%) | |
| | | Canada (4.93%) | |
| | 3,641,070 | | | UTS Energy Corporation (1)(a) | | | 19,671,648 | | | | 23,415,366 | | |
| | 324,200 | | | Teck Cominco Limited, Class 'B' (4)(c) | | | 11,788,739 | | | | 16,210,000 | | |
| | 214,900 | | | MDS Inc. (2)(a) | | | 3,896,934 | | | | 4,833,102 | | |
| | | | 35,357,321 | | | | 44,458,468 | | |
| | | Singapore (0.63%) | |
| | 248,700 | | | Verigy Limited (3)(a) | | | 4,437,322 | | | | 5,717,613 | | |
| | | United Kingdom (2.24%) | |
| | 268,830 | | | Shire Plc ADR (5)(c) | | | 6,985,359 | | | | 20,202,575 | | |
| | | | | Total Common Stock—Non U.S. | | | 46,780,002 | | | | 70,378,656 | | |
| | | Warrants—U.S. (0.00%) | |
| | 9,873 | | | Assistive Technology Inc. (a)(b)(d)(e)(2) | | | 382 | | | | — | | |
| | 37,234 | | | Assistive Technology Inc. Ser. E-1 (a)(b)(d)(e)(2) | | | — | | | | — | | |
| | 1,470,588 | | | Regen Biologics Inc. (a)(d)(e)(f)(2) | | | — | | | | — | | |
| | | | | Total Warrants—U.S. | | | 382 | | | | — | | |
| | | Repurchase Agreement (3.77%) | |
| | 34,076,839 | | | State Steet Bank and Trust 33/4%, dated 10/31/2007,
due 11/01/2007, repurchase value $34,080,389
(collateralized by U.S. Treasury Bonds) | | | 34,076,839 | | | | 34,076,839 | | |
| | | | | Total Investment Portfolio Excluding Options Written | | $ | 718,124,973 | * | | | 925,745,637 | ** | |
| Contracts | | | | | | | |
| | | Covered Call Options Written (–1.95%) | |
| | 137 | | | Agilent Technologies Inc. @ $35 exp. Nov 2007 | | | | | | | (34,318 | ) | |
| | 641 | | | American Standard Companies Inc. @ $35 exp. Jan 2008 | | | | | | | (249,990 | ) | |
| | 795 | | | Amgen Inc. @ $55 exp. Nov 2007 | | | | | | | (142,230 | ) | |
See Notes to Financial Statements.
49
FIRST EAGLE FUND OF AMERICA
SCHEDULE OF INVESTMENTS—(Continued)
October 31, 2007
| Contracts | | | | Value
(Note 1) | |
| | | Covered Call Options Written—(continued) | |
| | 431 | | | Amgen Inc. @ $60 exp. Jan 2008 | | $ | (147,870 | ) | |
| | 403 | | | Autoliv Inc. @ $65 exp. Dec 2007 | | | (44,330 | ) | |
| | 360 | | | Ball Corporation @ $55 exp. Nov 2007 | | | (5,400 | ) | |
| | 310 | | | Baxter International Inc. @ $55 exp. Nov 2007 | | | (162,750 | ) | |
| | 287 | | | The Black & Decker Corporation @ $85 exp. Nov 2007 | | | (157,850 | ) | |
| | 1,787 | | | Celanese Corporation, Series 'A' @ $40 exp. Nov 2007 | | | (442,282 | ) | |
| | 1,914 | | | Celanese Corporation, Series 'A' @ $40 exp. Dec 2007 | | | (641,190 | ) | |
| | 400 | | | Chemed Corporation @ $60 exp. Dec 2007 | | | (56,000 | ) | |
| | 448 | | | Denbury Resources Inc. @ $50 exp. Dec 20007 | | | (331,520 | ) | |
| | 144 | | | Devon Energy Corporation @ $85 exp. Nov 2007 | | | (128,160 | ) | |
| | 763 | | | Devon Energy Corporation @ $80 exp. Nov 2007 | | | (1,030,050 | ) | |
| | 746 | | | Devon Energy Corporation @ $90 exp. Jan 2008 | | | (559,500 | ) | |
| | 395 | | | Domino's Pizza Inc. @ $16.50 exp. Dec 2007 | | | (13,825 | ) | |
| | 2,568 | | | Dresser-Rand Group Inc. @ 35 exp. Dec 2007 | | | (1,194,120 | ) | |
| | 116 | | | DST Systems Inc. @ $80 exp. Jan 2008 | | | (79,460 | ) | |
| | 1,233 | | | DynCorp International Inc. @ $22.50 exp. Dec 2007 | | | (206,527 | ) | |
| | 248 | | | DynCorp International Inc. @ $20 exp. Dec 2007 | | | (80,600 | ) | |
| | 1,422 | | | Eastman Chemical Company @ $65 exp. Dec 2007 | | | (412,380 | ) | |
| | 736 | | | General Dynamics Corporation @ $80 exp. Nov 2007 | | | (809,600 | ) | |
| | 781 | | | Global Crossing Limited @ $22.5 exp. Dec 2007 | | | (113,245 | ) | |
| | 1,084 | | | Global Crossing Limited @ $20 exp. Dec 2007 | | | (298,100 | ) | |
| | 379 | | | GlobalSantaFe Corporation @ $67.50 exp. Nov 2007 | | | (509,755 | ) | |
| | 383 | | | GlobalSantaFe Corporation @ $65 exp. Nov 2007 | | | (610,885 | ) | |
| | 422 | | | Grant Prideco Inc. @ $55 exp. Nov 2007 | | | (12,660 | ) | |
| | 222 | | | Grant Prideco Inc. @ $50 exp. Jul 2007 | | | (29,970 | ) | |
| | 217 | | | Grant Prideco Inc. @ $50 exp. Dec 2007 | | | (67,270 | ) | |
| | 283 | | | Halliburton Company @ $37.50 exp. Nov 2007 | | | (69,335 | ) | |
| | 699 | | | Halliburton Company @ $35 exp. Nov 2007 | | | (318,045 | ) | |
| | 612 | | | Halliburton Company @ $32.50 exp. Nov 2007 | | | (428,400 | ) | |
| | 321 | | | J.B. Hunt Transport Services, Inc. @ $30 exp. Dec 2007 | | | (23,272 | ) | |
| | 91 | | | Leap Wireless International Inc. @ $70 exp. Nov 2007 | | | (39,130 | ) | |
| | 337 | | | Leap Wireless International Inc. @ $65 exp. Nov 2007 | | | (249,380 | ) | |
| | 1,149 | | | Millennium Pharmaceuticals Inc. @ $10 exp. Nov 2007 | | | (195,330 | ) | |
| | 299 | | | Praxair, Inc. @ $85 exp. Nov 2007 | | | (46,345 | ) | |
| | 759 | | | Praxair, Inc. @ $75 exp. Nov 2007 | | | (815,925 | ) | |
| | 239 | | | Praxair, Inc. @ $85 exp. Jan 2008 | | | (102,770 | ) | |
| | 536 | | | Praxair, Inc. @ $75 exp. Jan 2008 | | | (589,600 | ) | |
| | 1,109 | | | Precision Castparts Corporation @ $105 exp. Dec 2007 | | | (5,023,770 | ) | |
| | 1,106 | | | Shire Plc ADR @ $70 exp. Nov 2007 | | | (702,310 | ) | |
| | 352 | | | The Stanley Works @ $60 exp. Nov 2007 | | | (12,320 | ) | |
| | 9 | | | Teck Cominco Limited, Class 'B' @ $55 exp. Nov 2007 | | | (157 | ) | |
| | 324 | | | Teck Cominco Limited, Class 'B' @ $50 exp. Nov 2007 | | | (48,600 | ) | |
See Notes to Financial Statements.
50
FIRST EAGLE FUND OF AMERICA
SCHEDULE OF INVESTMENTS—(Continued)
October 31, 2007
| Contracts | |
| | Value
(Note 1) | |
| | | Covered Call Options Written—(continued) | |
| | 246 | | | Teck Cominco Limited, Class 'B' @ $45 exp. Nov 2007 | | $ | (115,620 | ) | |
| | 259 | | | Teck Cominco Limited, Class 'B' @ $50 exp. Dec 2007 | | | (78,995 | ) | |
| | 563 | | | Teekay Shipping Corporation @ $55 exp. Nov 2007 | | | (143,565 | ) | |
| | 979 | | | Whirlpool Corporation @ $90 exp. Nov 2007 | | | (19,580 | ) | |
| | | | | Total Covered Call Options Written (premiums received $15,679,875) | | | (17,594,286 | ) | |
| | | | | Total Investment Portfolio (100.58%) | | | 908,151,351 | | |
| | | | | Liabilities in excess of other assets (–0.58%) | | | (5,236,583 | ) | |
| | | | | Net Assets (100.00%) | | $ | 902,914,768 | | |
* At October 31, 2007 cost of investments for federal income tax purposes was $718,286,795.
** Gross unrealized appreciation and depreciation of investments at October 31, 2007 for federal income tax purposes were $225,961,292 and $18,502,450 respectively (net appreciation was $207,458,842).
| Sector/Industry Classification | |
| | (1 | ) | | Energy | |
| | (2 | ) | | Health Care Services | |
| | (3 | ) | | Information Technology | |
| | (4 | ) | | Materials | |
| | (5 | ) | | Pharmaceuticals | |
(a) Non-income producing security.
(b) Restricted security priced at fair value by the Valuation Committee of the Board of Trustees. Represents ownership interest in a security which has not been registered with the Securities and Exchange Commission under the Securities Act of 1933. Information concerning each restricted security holding on October 31, 2007 is shown below:
| Security | | Acquisition Date | | Cost | | Carrying Value
Per Share/Principal | |
| Assistive Technology Inc. Ser. E-1 | | 10/31/1995 | | $ | 883,921 | | | | — | | |
| Assistive Technology Inc. Ser. E-2 | | 12/19/1996 | | | 500,000 | | | | — | | |
| Assistive Technology Inc. Ser. F Pfd. | | 12/07/2001 | | | 342,000 | | | | — | | |
| Assistive Technology Inc. Warrants | | 10/21/1998 | | | 382 | | | | — | | |
| Assistive Technology Inc. Ser. E-1 Warrants | | 10/21/1998 | | | — | | | | — | | |
(c) At October 31, 2007, all or a portion of this security was segregated to cover collateral requirement for options.
(d) Security for which there is less than three market makers.
(e) Securities valued in accordance with the fair value procedures under the supervision of the Board of Trustees, representing 1.71% of net assets.
(f) All or a portion of the security is exempt from registration under the Securities Act of 1933.
See Notes to Financial Statements.
51
FIRST EAGLE FUNDS
STATEMENTS OF ASSETS AND LIABILITIES
October 31, 2007
| | | First Eagle
Global Fund | | First Eagle
Overseas Fund | | First Eagle
U.S. Value Fund | | First Eagle
Gold Fund | | First Eagle
Fund of America | |
| Assets: | |
| Investments in: (Note 1) | |
Unaffiliated issuers, at value (cost: $16,054,374,142,
$7,142,903,268, $597,400,115, $731,421,927
and $718,124,973, respectively ) | | $ | 20,767,986,618 | | | $ | 10,074,001,941 | | | $ | 673,255,062 | | | $ | 1,244,964,596 | | | $ | 925,745,637 | | |
Non-controlled affiliates, at value (cost: $1,336,496,558,
$764,772,147, $0, $5,783,406 and $0, respectively) | | | 1,593,171,971 | | | | 1,116,064,497 | | | | — | | | | 7,079,587 | | | | — | | |
| Cash | | | 1,077,909 | | | | 237,963 | | | | 256 | | | | 796 | | | | — | | |
Foreign cash (cost: $3,041,944 and $1,806,290,
respectively) | | | 3,097,115 | | | | 1,802,292 | | | | — | | | | — | | | | — | | |
Receivable for forward currency contracts held,
at value (Note 1) | | | 268,795 | | | | 1,750,107 | | | | — | | | | — | | | | — | | |
| Receivable for investment securities sold | | | 4,296,107 | | | | 5,968,979 | | | | 98,077 | | | | 14,927,022 | | | | 1,624,204 | | |
| Receivable for Fund shares sold | | | 27,544,357 | | | | 9,992,003 | | | | 826,782 | | | | 2,956,666 | | | | 440,505 | | |
| Accrued interest and dividends receivable | | | 47,755,135 | | | | 26,871,467 | | | | 3,776,987 | | | | — | | | | 213,545 | | |
Investment for trustee deferred compensation plan
(Note 2) | | | 240,424 | | | | 274,091 | | | | 65,455 | | | | 24,077 | | | | 164,600 | | |
| Other assets | | | 157,484 | | | | 88,056 | | | | 4,529 | | | | 8,446 | | | | 19,280 | | |
| Total Assets | | | 22,445,595,915 | | | | 11,237,051,396 | | | | 678,027,148 | | | | 1,269,961,190 | | | | 928,207,771 | | |
| Liabilities: | |
Options written, at value (premiums received
$15,679,875) (Note 3) | | | — | | | | — | | | | — | | | | — | | | | 17,594,286 | | |
| Payable for Fund shares redeemed | | | 39,143,304 | | | | 19,946,079 | | | | 2,062,056 | | | | 1,563,890 | | | | 567,177 | | |
| Payable for investment securities purchased | | | 67,835,277 | | | | 18,274,928 | | | | 13,397,865 | | | | 14,877,529 | | | | 5,675,823 | | |
Payable for forward currency contracts held, at
value (Note 1) | | | 70,888,306 | | | | 65,732,919 | | | | — | | | | — | | | | — | | |
| Investment advisory fees payable (Note 2) | | | 13,933,071 | | | | 7,113,745 | | | | 428,317 | | | | 747,516 | | | | 755,726 | | |
| Administrative costs payable (Note 2) | | | 330,786 | | | | 168,918 | | | | 10,172 | | | | 17,739 | | | | 13,457 | | |
| Distribution fees payable (Note 4) | | | 6,318,506 | | | | 2,023,772 | | | | 218,823 | | | | 291,597 | | | | 216,002 | | |
| Services fees payable (Note 4) | | | 1,170,423 | | | | 253,530 | | | | 49,029 | | | | 38,582 | | | | 13,535 | | |
| Trustee deferred compensation plan (Note 2) | | | 240,424 | | | | 274,091 | | | | 65,455 | | | | 24,077 | | | | 164,600 | | |
| Accrued expenses and other liabilities | | | 8,443,425 | | | | 4,158,210 | | | | 256,327 | | | | 495,907 | | | | 292,397 | | |
| Total Liabilities | | | 208,303,522 | | | | 117,946,192 | | | | 16,488,044 | | | | 18,056,837 | | | | 25,293,003 | | |
| Net Assets: | |
| Capital stock (par value, $0.001 per share) | | | 436,332 | | | | 395,042 | | | | 38,938 | | | | 45,961 | | | | 30,142 | | |
| Capital surplus | | | 15,308,646,000 | | | | 6,696,577,859 | | | | 552,324,226 | | | | 698,167,512 | | | | 612,522,520 | | |
| Net unrealized appreciation (depreciation) on: | |
| Investments | | | 4,970,287,889 | | | | 3,282,391,023 | | | | 75,854,947 | | | | 514,838,850 | | | | 207,620,664 | | |
| Foreign currency related transactions | | | (72,390,757 | ) | | | (64,769,372 | ) | | | — | | | | — | | | | — | | |
| Written Options | | | — | | | | — | | | | — | | | | — | | | | (1,914,411 | ) | |
| Undistributed net realized gains on investments | | | 1,973,950,898 | | | | 1,254,798,916 | | | | 25,219,103 | | | | 40,989,173 | | | | 83,094,203 | | |
| Undistributed net investment income (loss) | | | 56,362,031 | | | | (50,288,264 | ) | | | 8,101,890 | | | | (2,137,143 | ) | | | 1,561,650 | | |
| Net Assets | | $ | 22,237,292,393 | | | $ | 11,119,105,204 | | | $ | 661,539,104 | | | $ | 1,251,904,353 | | | $ | 902,914,768 | | |
| Class A share capital | | $ | 13,450,956,087 | | | $ | 5,974,242,569 | | | $ | 323,714,918 | | | $ | 890,021,438 | | | $ | 82,085,686 | | |
Shares of beneficial interest outstanding (Class A)
(Note 6) | | | 263,273,028 | | | | 212,651,482 | | | | 19,026,666 | | | | 32,627,262 | | | | 2,755,354 | | |
| Net asset value per share | | $ | 51.09 | | | $ | 28.09 | | | $ | 17.01 | | | $ | 27.28 | | | $ | 29.79 | | |
| Maximum offering price per share | | $ | 53.78 | | | $ | 29.57 | | | $ | 17.91 | | | $ | 28.72 | | | $ | 31.36 | | |
| Class I share capital | | $ | 3,192,749,307 | | | $ | 3,942,323,899 | | | $ | 104,423,328 | | | $ | 166,079,947 | | | | — | | |
Shares of beneficial interest outstanding (Class I)
(Note 6) | | | 62,207,792 | | | | 138,917,580 | | | | 6,075,347 | | | | 6,044,183 | | | | — | | |
| Net asset value per share | | $ | 51.32 | | | $ | 28.38 | | | $ | 17.19 | | | $ | 27.48 | | | | — | | |
| Class C share capital | | $ | 5,593,586,999 | | | $ | 1,202,538,736 | | | $ | 233,400,858 | | | $ | 195,802,968 | | | $ | 65,219,010 | | |
Shares of beneficial interest outstanding (Class C)
(Note 6) | | | 110,851,443 | | | | 43,472,598 | | | | 13,835,995 | | | | 7,289,674 | | | | 2,380,881 | | |
| Net asset value per share | | $ | 50.46 | | | $ | 27.66 | | | $ | 16.87 | | | $ | 26.86 | | | $ | 27.39 | | |
| Class Y share capital | | | — | | | | — | | | | — | | | | — | | | $ | 755,610,072 | | |
Shares of beneficial interest outstanding (Class Y)
(Note 6) | | | — | | | | — | | | | — | | | | — | | | | 25,006,094 | | |
| Net asset value per share | | | — | | | | — | | | | — | | | | — | | | $ | 30.22 | | |
See Notes to Financial Statements.
52
FIRST EAGLE FUNDS
STATEMENTS OF OPERATIONS
For the Year Ended October 31, 2007
| | | First Eagle
Global Fund | | First Eagle
Overseas Fund | | First Eagle
U.S. Value Fund | | First Eagle
Gold Fund | | First Eagle
Fund of America | |
| Investment Income: | |
| Income: | |
| Interest | | $ | 258,717,213 | | | $ | 140,407,261 | | | $ | 15,141,865 | | | $ | 1,951,595 | | | $ | 2,614,303 | | |
Dividends from: (net of $22,274,839, $18,712,135, $0,
$185,117 and $43,971, foreign taxes withheld,
respectively)
Unaffiliated issuers | | | 246,686,431 | | | | 147,116,445 | | | | 5,652,606 | | | | 4,963,797 | | | | 10,892,833 | | |
| Non-controlled affiliates | | | 25,847,966 | | | | 17,550,954 | | | | — | | | | — | | | | — | | |
| Other Income | | | 459,963 | | | | 417,897 | | | | 37,158 | | | | — | | | | — | | |
| Total income | | | 531,711,573 | | | | 305,492,557 | | | | 20,831,629 | | | | 6,915,392 | | | | 13,507,136 | | |
| Expenses: | |
| Investment advisory fees (Note 2) | | | 158,615,873 | | | | 86,136,880 | | | | 4,812,126 | | | | 8,025,824 | | | | 8,160,464 | | |
| Administrative costs (Note 2) | | | 4,030,447 | | | | 2,201,445 | | | | 119,891 | | | | 208,769 | | | | 157,172 | | |
| Distribution fees (Note 4) | |
| Class A | | | 32,013,581 | | | | 15,122,600 | | | | 801,960 | | | | 1,893,275 | | | | 149,210 | | |
| Class C | | | 40,090,262 | | | | 8,996,191 | | | | 1,547,631 | | | | 1,215,840 | | | | 422,840 | | |
| Class Y | | | — | | | | — | | | | — | | | | — | | | | 1,746,293 | | |
| Service fees - Class C (Note 4) | | | 13,363,421 | | | | 2,998,730 | | | | 515,877 | | | | 405,280 | | | | 140,947 | | |
| Shareholder servicing agent fees | | | 14,313,562 | | | | 6,527,689 | | | | 845,373 | | | | 1,184,110 | | | | 803,406 | | |
| Custodian fees | | | 2,901,907 | | | | 2,627,588 | | | | 34,856 | | | | 349,193 | | | | 35,590 | | |
| Trustees' fees | | | 532,753 | | | | 294,669 | | | | 15,854 | | | | 27,476 | | | | 21,103 | | |
| Other fees | | | 4,662,195 | | | | 2,231,184 | | | | 300,850 | | | | 422,155 | | | | 315,471 | | |
| Total expenses | | | 270,524,001 | | | | 127,136,976 | | | | 8,994,418 | | | | 13,731,922 | | | | 11,952,496 | | |
| Expense reductions due to earnings credits (Note 1) | | | (1,362,624 | ) | | | (568,875 | ) | | | (48,526 | ) | | | (80,827 | ) | | | (78,170 | ) | |
| Net expenses | | | 269,161,377 | | | | 126,568,101 | | | | 8,945,892 | | | | 13,651,095 | | | | 11,874,326 | | |
| Net investment income (loss) (Note 1) | | | 262,550,196 | | | | 178,924,456 | | | | 11,885,737 | | | | (6,735,703 | ) | | | 1,632,810 | | |
Realized and Unrealized Gains (Losses) on Investments,
Foreign Currency Related Transactions and Written
Options (Note 1 ): | |
| Net realized gains (losses) from: | |
| Unaffiliated issuers | | | 2,167,052,091 | | | | 1,451,609,859 | | | | 27,345,487 | | | | 72,934,602 | | | | 110,912,014 | | |
| Non-controlled affiliates | | | 26,229,978 | | | | 4,177,258 | | | | — | | | | — | | | | — | | |
| Commodity related transactions | | | — | | | | — | | | | — | | | | 7,904,208 | | | | — | | |
| Foreign currency related transactions | | | 35,869,261 | | | | 27,261,810 | | | | (168 | ) | | | 235,869 | | | | — | | |
| Written Options | | | — | | | | — | | | | — | | | | — | | | | (23,238,012 | ) | |
| | | | 2,229,151,330 | | | | 1,483,048,927 | | | | 27,345,319 | | | | 81,074,679 | | | | 87,674,002 | | |
| Change in unrealized appreciation (depreciation) of: | |
| Investments | | | 828,202,985 | | | | 313,601,026 | | | | 28,496,843 | | | | 277,311,717 | | | | 67,939,938 | | |
| Foreign currency translation | | | (74,964,884 | ) | | | (65,030,385 | ) | | | — | | | | — | | | | — | | |
| Written Options | | | — | | | | — | | | | — | | | | — | | | | (1,827,713 | ) | |
| | | | 753,238,101 | | | | 248,570,641 | | | | 28,496,843 | | | | 277,311,717 | | | | 66,112,225 | | |
Net gains on investments, foreign currency related
transactions and written options | | | 2,982,389,431 | | | | 1,731,619,568 | | | | 55,842,162 | | | | 358,386,396 | | | | 153,786,227 | | |
| Net Increase in Net Assets Resulting from Operations | | $ | 3,244,939,627 | | | $ | 1,910,544,024 | | | $ | 67,727,899 | | | $ | 351,650,693 | | | $ | 155,419,037 | | |
See Notes to Financial Statements.
53
FIRST EAGLE FUNDS
STATEMENTS OF CHANGES IN NET ASSETS
| | | First Eagle
Global Fund | | First Eagle
Overseas Fund | | First Eagle
U.S. Value Fund | |
| | | Year Ended October 31, | | Year Ended October 31, | | Year Ended October 31, | |
| | | 2007 | | 2006 | | 2007 | | 2006 | | 2007 | | 2006 | |
| Operations: | |
| Net investment income (loss) | | $ | 262,550,196 | | | $ | 202,086,191 | | | $ | 178,924,456 | | | $ | 160,352,124 | | | $ | 11,885,737 | | | $ | 7,140,779 | | |
Net realized gain from investments, foreign currency related
transactions and written options | | | 2,229,151,330 | | | | 1,729,022,968 | | | | 1,483,048,927 | | | | 1,110,693,744 | | | | 27,345,319 | | | | 25,876,243 | | |
Increase in unrealized appreciation
(depreciation) of investments, foreign currency
translation and written options | | | 753,238,101 | | | | 1,269,653,522 | | | | 248,570,641 | | | | 711,018,507 | | | | 28,496,843 | | | | 15,113,970 | | |
| Net increase in net assets resulting from operations | | | 3,244,939,627 | | | | 3,200,762,681 | | | | 1,910,544,024 | | | | 1,982,064,375 | | | | 67,727,899 | | | | 48,130,992 | | |
| Distributions to Shareholders: | |
| Dividends paid from net investment income | | | (466,827,023 | ) | | | (283,481,518 | ) | | | (357,741,423 | ) | | | (301,669,892 | ) | | | (9,311,493 | ) | | | (5,204,225 | ) | |
Distributions paid from net realized gains from
investment transactions | |
| Class A | | | (890,383,733 | ) | | | (380,311,467 | ) | | | (474,701,910 | ) | | | (320,085,336 | ) | | | (10,814,242 | ) | | | (2,885,328 | ) | |
| Class I | | | (199,381,200 | ) | | | (70,203,372 | ) | | | (329,439,371 | ) | | | (199,381,304 | ) | | | (4,725,972 | ) | | | (1,280,821 | ) | |
| Class C | | | (374,703,576 | ) | | | (155,099,118 | ) | | | (95,188,701 | ) | | | (65,934,209 | ) | | | (6,912,351 | ) | | | (1,879,885 | ) | |
| Class Y | | | — | | | | — | | | | — | | | | — | | | | — | | | | — | | |
| Decrease in net assets resulting from distributions | | | (1,931,295,532 | ) | | | (889,095,475 | ) | | | (1,257,071,405 | ) | | | (887,070,741 | ) | | | (31,764,058 | ) | | | (11,250,259 | ) | |
| Fund Share Transactions (Note 6): | |
| Net proceeds from shares sold | | | 2,599,172,960 | | | | 3,058,013,044 | | | | 1,215,645,963 | | | | 1,611,386,621 | | | | 246,698,098 | | | | 243,977,278 | | |
Net asset value of shares issued for reinvested dividends
and distributions | | | 1,592,691,429 | | | | 737,750,171 | | | | 1,061,174,198 | | | | 741,975,762 | | | | 22,893,687 | | | | 8,022,368 | | |
| Cost of shares redeemed | | | (2,691,012,778 | ) | | | (1,790,535,142 | ) | | | (2,771,757,783 | ) | | | (1,376,427,484 | ) | | | (173,473,004 | ) | | | (74,814,310 | ) | |
| Increase in net assets from Fund share transactions | | | 1,500,851,611 | | | | 2,005,228,073 | | | | (494,937,622 | ) | | | 976,934,899 | | | | 96,118,781 | | | | 177,185,336 | | |
| Net increase in net assets | | | 2,814,495,706 | | | | 4,316,895,279 | | | | 158,534,997 | | | | 2,071,928,533 | | | | 132,082,622 | | | | 214,066,069 | | |
| Net Assets (Note 1): | |
| Beginning of year | | | 19,422,796,687 | | | | 15,105,901,408 | | | | 10,960,570,207 | | | | 8,888,641,674 | | | | 529,456,482 | | | | 315,390,413 | | |
End of year (including undistributed net investment (loss)
income of $56,362,031, $101,080,362,$(50,288,264),
$20,593,575, $8,101,890, $6,110,042, $(2,137,143),
$969,257, $1,561,650 and $100,216, respectively) | | $ | 22,237,292,393 | | | $ | 19,422,796,687 | | | $ | 11,119,105,204 | | | $ | 10,960,570,207 | | | $ | 661,539,104 | | | $ | 529,456,482 | | |
See Notes to Financial Statements.
54
| | | First Eagle
Gold Fund | | First Eagle
Fund of America | |
| | | Year Ended October 31, | | Year Ended October 31, | |
| | | 2007 | | 2006 | | 2007 | | 2006 | |
| Operations: | |
| Net investment income (loss) | | $ | (6,735,703 | ) | | $ | (7,303,097 | ) | | $ | 1,632,810 | | | $ | (2,638,843 | ) | |
Net realized gain from investments, foreign currency related
transactions and written options | | | 81,074,679 | | | | 197,637,626 | | | | 87,674,002 | | | | 106,682,335 | | |
Increase in unrealized appreciation
(depreciation) of investments, foreign currency
translation and written options | | | 277,311,717 | | | | 104,692,554 | | | | 66,112,225 | | | | 14,367,100 | | |
| Net increase in net assets resulting from operations | | | 351,650,693 | | | | 295,027,083 | | | | 155,419,037 | | | | 118,410,592 | | |
| Distributions to Shareholders: | |
| Dividends paid from net investment income | | | (33,158,082 | ) | | | (21,502,525 | ) | | | — | | | | — | | |
Distributions paid from net realized gains from
investment transactions | |
| Class A | | | (100,864,904 | ) | | | — | | | | (5,917,839 | ) | | | (2,779,103 | ) | |
| Class I | | | (19,372,844 | ) | | | — | | | | — | | | | — | | |
| Class C | | | (21,208,209 | ) | | | — | | | | (6,484,100 | ) | | | (3,556,274 | ) | |
| Class Y | | | — | | | | — | | | | (81,196,044 | ) | | | (59,542,911 | ) | |
| Decrease in net assets resulting from distributions | | | (174,604,039 | ) | | | (21,502,525 | ) | | | (93,597,983 | ) | | | (65,878,288 | ) | |
| Fund Share Transactions (Note 6): | |
| Net proceeds from shares sold | | | 130,832,536 | | | | 339,700,156 | | | | 134,432,746 | | | | 67,272,045 | | |
Net asset value of shares issued for reinvested dividends
and distributions | | | 141,010,689 | | | | 17,043,395 | | | | 78,266,917 | | | | 58,571,211 | | |
| Cost of shares redeemed | | | (275,883,221 | ) | | | (320,345,919 | ) | | | (137,169,995 | ) | | | (161,334,938 | ) | |
| Increase in net assets from Fund share transactions | | | (4,039,996 | ) | | | 36,397,632 | | | | 75,529,668 | | | | (35,491,682 | ) | |
| Net increase in net assets | | | 173,006,658 | | | | 309,922,190 | | | | 137,350,722 | | | | 17,040,622 | | |
| Net Assets (Note 1): | |
| Beginning of year | | | 1,078,897,695 | | | | 768,975,505 | | | | 765,564,046 | | | | 748,523,424 | | |
End of year (including undistributed net investment (loss)
income of $56,362,031, $101,080,362,$(50,288,264),
$20,593,575, $8,101,890, $6,110,042, $(2,137,143),
$969,257, $1,561,650 and $100,216, respectively) | | $ | 1,251,904,353 | | | $ | 1,078,897,695 | | | $ | 902,914,768 | | | $ | 765,564,046 | | |
55

FIRST EAGLE FUNDS
NOTES TO FINANCIAL STATEMENTS
Note 1—Significant Accounting Policies
First Eagle Funds (the "Trust"), is an open-end management investment company registered under the Investment Company Act of 1940, as amended ("1940 Act"). The Trust consists of five separate portfolios, First Eagle Global Fund, First Eagle Overseas Fund, First Eagle U.S. Value Fund, First Eagle Gold Fund and First Eagle Fund of America (each individually a "Fund" or collectively the "Funds"). All the Funds are diversified mutual funds except for First Eagle Gold Fund and First Eagle Fund of America, which are non-diversified. The Trust is a Delaware statutory trust and was, until April 23, 2004, a Maryland corporation operating under the name First Eagle Funds, Inc. (First Eagle SoGen Funds, Inc. prior to December 31, 2002). First Eagle Fund of America, previously a portfolio of a separate Delaware statutory trust, was reorganized as a portfolio of the Trust effective December 31, 2002. The First Eagle Global Fund seeks long-te rm growth of capital by investing in a wide range of asset classes from markets in the United States and around the world. The First Eagle Overseas Fund seeks long-term growth of capital by investing primarily in equities issued by non-U.S. corporations. The First Eagle U.S. Value Fund seeks long-term growth of capital by investing primarily in equities issued by U.S. corporations. The First Eagle Gold Fund's investment objective is to provide exposure to the investment characteristics of gold and, to a limited extent, other precious metals. The First Eagle Fund of America is a U.S. equity fund with a unique event-driven bias that seeks capital appreciation.
The following is a summary of significant accounting policies adhered to by the Funds and are in conformity with U.S. generally accepted accounting principles ("GAAP").
a) Investment valuation—Each Fund computes its net asset value once daily as of the close of trading on each day the New York Stock Exchange ("NYSE") is open for trading. The net asset value per share is computed by dividing the total current value of the assets of a Fund, less its liabilities, by the total number of shares outstanding at the time of such computation.
A portfolio security (including an option), other than a bond, which is traded on a U.S. national securities exchange or a securities exchange abroad is normally valued at the price of the last sale on the exchange as of the close of business on the date on which assets are valued. If there are no sales on such date, such portfolio investment will be valued at the mean between the closing bid and asked prices (and if there is only a bid or only an asked price on such date, valuation will be at such bid or asked price for long or short positions, respectively). Securities, other than bonds, traded in the over-the-counter market are valued at the mean between the last bid and asked prices prior to the time of valuation (and if there is only a bid or only an asked price on such date, valuation will be at such bid or asked price for long or short positions, respectively), except if such unlisted security traded on the NASDAQ in whic h case it is valued at its last sale price (or, if available in the case of NASDAQ securities, the NASDAQ Official Closing Price ('NOCP')).
Commodities (such as physical metals) are valued at the spot price at the time trading on the New York Stock Exchange closes (normally 4:00 p.m. E.S.T.). Forward currency contracts are valued at the current cost of covering or offsetting such contracts.
57
FIRST EAGLE FUNDS
NOTES TO FINANCIAL STATEMENTS—(Continued)
All bonds, whether listed on an exchange or traded in the over-the-counter market (and except for short-term investments as described in the next sentence), for which market quotations are readily available are valued at the mean between the last bid and asked prices received from dealers in the over-the-counter market in the United States or abroad, except that when no asked price is available, bonds are valued at the last bid price alone. Short-term investments maturing in sixty days or less are valued at cost plus interest earned (or discount amortized, as the case may be), which is deemed to approximate value.
London closing exchange rates typically are used to convert foreign security prices into U.S. dollars. Any security that is listed or traded on more than one exchange (or traded in multiple markets) is valued at the relevant quotation on the exchange or market deemed to be the primary trading venue for that security. In the absence of such a quotation, a quotation from the exchange or market deemed by Arnhold and S. Bleichroeder Advisers, LLC (the "Adviser") Adviser to be the secondary trading venue for the particular security shall be used. The Funds use pricing services to identify the market prices of publicly traded securities in their portfolios. When market prices are determined to be "stale" as a result of limited market activity for a particular holding, or in other circumstances when market prices are unavailable, such as for private placements, or determined to be unreliable for a particular holding, such holdings may be "fair valued" in accordance with procedures approved by the Board of Trustees ("Board"). Additionally, with respect to foreign holdings, specifically in circumstances leading the Adviser to believe that significant events occurring after the close of a foreign market have materially affected the value of a Fund's holdings in that market, such holdings may be fair valued to reflect the events in accordance with procedures approved by the Board. The determination of whether a particular foreign investment should be fair valued will be based on review of a number of factors, including developments in foreign markets, the performance of U.S. securities markets, and security-specific events. The values assigned to a Fund's holdings therefore may differ on occasion from reported market values.
b) Investment transactions and income—Investment transactions are accounted for on a trade date basis. The specific identification method is used in determining realized gains and losses from investment transactions. Dividend income is recorded on the ex-dividend date. Interest income is recorded daily on the accrual basis. In computing investment income, each Fund accretes discounts and amortizes premiums on debt obligations using the interest method. Investment income is allocated to each Fund's share class in proportion to its relative net assets. Payments received from certain investments held by the Funds may be comprised of dividends, capital gains and return of capital. The Funds originally estimate the expected classification of such payments. The amounts m ay subsequently be reclassified upon receipt of information from the issuer.
c) Expenses—Expenses arising in connection with a Fund are charged directly to that Fund. Expenses common to all Funds are allocated to each Fund in proportion to its relative net assets. Certain expenses are shared with the First Eagle Variable Funds, an affiliated fund group. Such costs are generally allocated using the ratio of the Fund's average daily net assets relative to the total average daily net assets of the First Eagle Variable Funds. Earnings credits reduce custody fees, shareholder servicing agent fees and accounting fees by the amount of interest earned on balances with such service provider.
d) Foreign currency translation—The market values of securities which are not traded in U.S. currency are recorded in the financial statements after translation to U.S. dollars based on the applicable exchange rates at the end of the period. The costs of such securities are translated at exchange rates prevailing when acquired. Related dividends,
58
FIRST EAGLE FUNDS
NOTES TO FINANCIAL STATEMENTS—(Continued)
interest and withholding taxes are accrued at the rates of exchange prevailing on the respective dates of such transactions.
The net assets of each of the Funds are presented at the foreign exchange rates and market values at the close of the period. The Funds do not isolate that portion of gains and losses on investments which is due to changes in foreign exchange rates from that which is due to changes in market prices of the equity securities. However, for federal income tax purposes each Fund does isolate the effect of changes in foreign exchange rates from the changes in market prices for realized gains and losses on debt obligations.
e) Forward currency contracts—In connection with portfolio purchases and sales of securities denominated in foreign currencies, the Funds may enter into forward currency contracts. Additionally, each Fund may enter into such contracts to hedge certain other foreign currency denominated investments. These contracts are valued at the current cost of covering or offsetting such contracts, and the related realized and unrealized foreign exchange gains and losses are included in the statement of operations. In the event that counterparties fail to settle these currency contracts or the related foreign security trades, a Fund could be exposed to foreign currency fluctuations.
f) Repurchase agreements—The First Eagle Fund of America may enter into repurchase agreement transactions with institutions that meet the advisor's credit guidelines. Each repurchase agreement is valued at amortized cost. The Fund requires that the collateral received in a repurchase agreement transaction be transferred to a custodian in a manner sufficient to enable the Fund to obtain collateral in the event of a counterparty default. If the counterparty defaults and the fair value of the collateral declines, realization of the collateral by the Fund may be delayed or limited.
g) Options—In order to produce incremental earnings or protect against changes in the value of portfolio securities, the First Eagle Fund of America may buy and sell put and call options, write covered call options on portfolio securities and write cash-secured put options.
First Eagle Fund of America generally purchases put options or writes covered call options to hedge against adverse movements in the value of portfolio holdings. First Eagle Fund of America may also use options for speculative purposes, although it does not employ options for this purpose at the present time. First Eagle Fund of America will segregate assets to cover its obligations under option contracts.
Options contracts are valued daily based upon the last sale price on the principal exchange on which the option is traded and unrealized appreciation/depreciation is recorded. If there is no sale on such day, the mean between the last bid and asked prices is used. First Eagle Fund of America will realize a gain or loss upon the expiration or closing of the option transaction. When an option is exercised, the proceeds on the sale of a written call option, the purchase cost of a written put option, or the cost of the security for a purchased put or call option is adjusted by the amount of premium received or paid. When a written option expires, First Eagle Fund of America will realize a gain equal to the amount of the premium received. When First Eagle Fund of America enters into a closing purchase transaction, First Eagle Fund of America will realize a gain (or loss, if the cost of the closing purchase transaction exceeds the pre mium received when the option was written) without regard to any unrealized gain or loss on the underlying security and the liability related to such option is eliminated.
59
FIRST EAGLE FUNDS
NOTES TO FINANCIAL STATEMENTS—(Continued)
The risk in writing a call option is that the Fund gives up the opportunity for profit if the market price of the security increases and the option is exercised. The risk in writing a put option is that First Eagle Fund of America may incur a loss if the market price of the security decreases and the option is exercised. First Eagle Fund of America also has the additional risk of not being able to enter into a closing transaction if a liquid secondary market does not exist. The Fund may also write over-the-counter options where the completion of the obligation is dependent upon the credit standing of the counterparty.
h) Treasury Inflation-Protected Securities—The Funds may invest in Treasury Inflation-Protected Securities ("TIPS") which are specially structured bonds in which the principal amount is adjusted to keep pace with inflation, as measured by the U.S. Consumer Price Index ("CPI"). The inflation (deflation) adjustment is applied to the principal of each bond on a monthly basis and is accounted for as interest income on the Statements of Operations. TIPS are subject to interest rate risk.
i) Structured notes—In order to qualify as a regulated investment company ("RIC") under the Internal Revenue Code of 1986, as amended (the "Code") , the Fund must meet certain requirements regarding the source of its income, the diversification of its assets and the distribution of its income. One of these requirements is that the Fund derive at least 90% of its gross income for each taxable year from dividends, interest, payments with respect to certain securities loans, gains from the sale or other disposition of stock, securities or foreign currencies, other income derived with respect to its business of investing in such stock, securities or currencies or net income derived from interests in certain publicly traded partnerships ("Qualifying Income"). There curr ently is some uncertainty as to the status of income from commodity-linked structured notes in which certain of the First Eagle Funds have invested, and these Funds have treated such income as Qualifying Income. If any Fund fails to qualify as a RIC, the Fund will be subject to federal, state and local income tax on its net income and capital gains at regular corporate rates (without reduction for distributions to shareholders). When distributed, that income would also be taxable to shareholders as an ordinary dividend to the extent attributable to each Fund's earnings and profits. None of the Funds held structured notes as of October 31, 2007.
j) Short Sales—The First Eagle Fund of America may seek to realize additional gains through short sale transactions in securities listed on one or more national security exchanges, or in unlisted securities. At the time a short sale is effected, the Fund incurs an obligation to replace the security borrowed at whatever its price may be at the time the Fund purchases it for delivery to the lender. The price at such time may be more or less than the price at which the security was sold by the Fund. Until the security is replaced, the Fund is required to pay the lender amounts equal to any dividend or interest that accrues during the period of the loan. To borrow the security, the Fund may also be required to pay a premium. The proceeds of the short sale will be retai ned by the broker, to the extent necessary to meet margin requirements, until the short position is closed. There were no open short sales as of October 31, 2007.
k) United States income taxes—No provision has been made for U.S. federal income taxes since it is the intention of each Fund to distribute to shareholders all taxable net investment income and net realized gains on investments, if any, within the allowable time limit, and to comply with the provisions of the Internal Revenue Code for a regulated investment company. First Eagle Global Fund, First Eagle Overseas Fund, First Eagle U.S. Value Fund, First Eagle Gold Fund and First Eagle Fund of America declare and pay such income, dividends and capital gains distributions on an annual basis.
60
FIRST EAGLE FUNDS
NOTES TO FINANCIAL STATEMENTS—(Continued)
At October 31, 2007, the components of distributable earnings on a tax basis were as follows:
| | | Undistributed Net
Investment Income | | Undistributed Net
Realized Gains (Losses) | | Net Unrealized
Appreciation (Depreciation) | |
| First Eagle Global Fund | | $ | 453,145,760 | | | $ | 1,826,343,484 | | | $ | 4,649,105,439 | | |
| First Eagle Overseas Fund | | | 341,421,051 | | | | 1,160,564,781 | | | | 2,920,381,072 | | |
| First Eagle U.S. Value Fund | | | 12,537,867 | | | | 20,622,265 | | | | 76,036,442 | | |
| First Eagle Gold Fund | | | 38,975,435 | | | | 37,345,615 | | | | 477,390,368 | | |
| First Eagle Fund of America | | | 5,420,568 | | | | 82,678,134 | | | | 202,304,056 | | |
The differences between the components of distributable earnings on a tax basis and the amounts reflected in the statements of net assets are primarily due to wash sales, investments in partnerships and the treatment of passive foreign investment companies.
l) Reclassification of capital accounts—On the statements of assets and liabilities, as a result of certain differences in the computation of net investment income and net realized capital gains under federal income tax rules and regulations versus generally accepted accounting principles, a reclassification has been made to increase (decrease) undistributed net investment income, undistributed net realized gains on investments and capital surplus for First Eagle Global Fund, First Eagle Overseas Fund, First Eagle U.S. Value Fund, First Eagle Gold Fund and First Eagle Fund of America as follows:
| | | Undistributed Net
Investment Income | | Undistributed Net
Realized Gains (Losses) | | Capital Surplus | |
| First Eagle Global Fund | | $ | 159,558,496 | | | $ | (245,229,471 | ) | | $ | 85,670,975 | | |
| First Eagle Overseas Fund | | | 107,935,128 | | | | (223,015,749 | ) | | | 115,080,621 | | |
| First Eagle U.S. Value Fund | | | (582,396 | ) | | | (2,204,277 | ) | | | 2,786,673 | | |
| First Eagle Gold Fund | | | 36,787,385 | | | | (39,738,413 | ) | | | 2,951,028 | | |
| First Eagle Fund of America | | | (171,376 | ) | | | (2,417,683 | ) | | | 2,589,059 | | |
The primary permanent differences causing such reclassification include the tax treatment of currency gains and losses, dividend redesignations, distributions paid in connection with the redemption of Fund shares, investments in passive foreign investment companies, distributions from real estate investment trusts, investments in partnerships, gold-linked notes and the disallowance of net operating losses.
m) Distributions to shareholders—Distributions to shareholders, which are determined in accordance with income tax regulations, are recorded on the ex-dividend date.
61
FIRST EAGLE FUNDS
NOTES TO FINANCIAL STATEMENTS—(Continued)
For the year ended October 31, 2007 and 2006, the tax character of distributions paid by the Funds was as follows:
| | | Ordinary Income | | Long Term Capital Gains | |
| | | 2007 | | 2006 | | 2007 | | 2006 | |
| First Eagle Global Fund | | $ | 547,199,121 | | | $ | 387,362,891 | | | $ | 1,384,096,410 | | | $ | 501,732,584 | | |
| First Eagle Overseas Fund | | | 395,332,681 | | | | 335,828,826 | | | | 861,738,724 | | | | 551,241,915 | | |
| First Eagle U.S. Value Fund | | | 11,464,478 | | | | 6,321,321 | | | | 20,299,580 | | | | 4,928,938 | | |
| First Eagle Gold Fund | | | 43,450,846 | | | | 21,502,525 | | | | 131,153,193 | | | | — | | |
| First Eagle Fund of America | | | 24,638,156 | | | | 3,941,436 | | | | 68,959,827 | | | | 61,936,852 | | |
n) Class Accounting—Investment income, common expenses and realized/unrealized gain (loss) on investments are allocated to the various classes of the Fund on the basis of daily net assets of each class. Fees relating to a specific class are charged directly to that class.
o) Use of estimates—The preparation of financial statements in conformity with generally accepted accounting principles requires management to make estimates and assumptions that affect the reported amounts of assets and liabilities at the date of the financial statements and the reported amounts of revenues and expenses during the reporting period. Actual results could differ from those estimates.
p) Recently issued accounting pronouncements—In June 2006, the Financial Accounting Standards Board (FASB) issued FASB Interpretation No. 48—Accounting for Uncertainty in Income Taxes that require the tax effects of certain tax positions to be recognized. These tax positions must meet a "more likely than not" standard that based on their technical merits, have a more than 50 percent likelihood of being sustained upon examination. FASB Interpretation No. 48 is effective for fiscal periods beginning after December 15, 2006. At adoption, the financial statements must be adjusted to reflect only those tax positions that are more likely than not of being sustained. Management of the Trust has evaluated its tax positions and determined that FASB Interpretation No. 4 8 has no impact on the Trust's financial statements.
In September 2006, the FASB issued SFAS No. 157, "Fair Value Measurements ("SFAS 157")." SFAS 157 defines fair value, establishes a framework for measuring fair value, and expands disclosures about fair value measurements. SFAS 157 applies to reporting periods beginning after November 15, 2007. Management of the Trust is currently evaluating the impact the adoptio n of SFAS 157 will have on the Funds' financial statements disclosures.
Note 2—Investment Advisory Agreements and Transactions with Related Persons
Arnhold and S. Bleichroeder Advisers, LLC (the "Adviser"), a wholly owned subsidiary of Arnhold and S. Bleichroeder Holdings, Inc. ("ASB Holdings"), manages the Funds. For its services, the Adviser receives, pursuant to an Investment Advisory Agreement between the Funds and the Adviser (the "Advisory Agreement") an annual advisory fee as follows: First Eagle Global Fund, First Eagle Overseas Fund, First Eagle U.S. Value Fund and First Eagle Gold Fund at 0.75% of each Fund's average daily net assets and First Eagle Fund of America at 1% of the Fund's average daily net assets. Prior to March 1, 2004, First Eagle Global Fund's annual advisory fee was at a rate of 1% of the first $25,000,000 and 0.75% in excess of $25,000,000.
62
FIRST EAGLE FUNDS
NOTES TO FINANCIAL STATEMENTS—(Continued)
The Adviser also performs certain administrative, accounting, operations, compliance and other services on behalf of the Funds, and in accordance with its agreement with them, the Funds reimburse the Adviser for costs (including personnel, related overhead and other costs) related to those services. For the year ended October 31, 2007, the Funds reimbursed the Adviser amounts as disclosed in the Statements of Operations.
Prior to December 31, 2002, the Adviser had agreed to reimburse the First Eagle U.S. Value Fund to the extent that the aggregate annualized expenses exceeded 1.50% for Class A, 1.25% for Class I and 2.25% for Class C of average daily net assets. If necessary, the Adviser agreed to reimburse the First Eagle Gold Fund to the extent that the aggregate annualized expenses exceeded 2% for Class I and 3% for Class C of average daily net assets until February 29, 2004. For the period from November 1, 2003 to February 29, 2004, the Adviser did not need to reimburse or waive any of First Eagle Gold Fund's fees.
Pursuant to a subadvisory agreement, dated December 10, 2002 ("Subadvisory Agreement") with the Adviser/Iridian Asset Management LLC ("Iridian" or the "Subadviser") manages the investments of the First Eagle Fund of America. Iridian, a registered investment adviser whose primary office is at 276 Post Road West, Westport, CT 06880, is a majority-owned subsidiary of BIAM (US), Inc., a U.S. subsidiary of The Governor and Company of The Bank of Ireland. The fees paid to Iridian by the Adviser under the Subadvisory Agreement are based on a reference amount equal to 50% of the combined (i) fees received by the Adviser for advisory services on behalf of the Fund and (ii) the fees received by the Fund's distributor for its shareholder liaison services on behalf of the Fund. These amounts are reduced by certain direct marketing costs borne by the Adviser in connection with the Fund and are further reduced by the amount paid by the Advise r for certain administrative expenses incurred in providing services to the Fund.
On December 6, 2002, First Eagle Funds Distributors, a division of ASB Securities LLC, a wholly owned subsidiary of ASB Holdings, assumed the duties of the Funds' principal underwriter. Previously, Arnhold and S. Bleichroeder, Inc. ("ASB") acted as the Funds' principal underwriter. For the year ended October 31, 2007, First Eagle Funds Distributors realized $901,189, $118,524, $115,157, $56,236 and $24,762, pertaining to the sales of shares of First Eagle Global Fund, First Eagle Overseas Fund, First Eagle U.S. Value Fund, First Eagle Gold Fund and First Eagle Fund of America, respectively.
Included in the accrued expenses, on the accompanying statements of assets and liabilities of First Eagle Global Fund, First Eagle Overseas Fund, First Eagle U.S. Value Fund, First Eagle Gold Fund and First Eagle Fund of America are fees that are payable to trustees in the amounts of $61,525, $33,599, $1,865, $3,094 and $2,362, respectively. The Trust adopted a Trustee Deferred Compensation Plan which allows the independent Trustees to defer the receipt of all or a portion of compensation related to performance of their duties as a Trustee. The deferred fees are invested in various First Eagle Funds until distribution in accordance with the Trustee Deferred Compensation Plan.
63
FIRST EAGLE FUNDS
NOTES TO FINANCIAL STATEMENTS—(Continued)
Note 3—Options
For the year ended October 31, 2007, First Eagle Fund of America had the following written options transactions:
| | | Number of Contracts | | Premium Received | |
| Options outstanding at October 31, 2006 | | | 54,352 | | | $ | 13,742,018 | | |
| Options written | | | 233,751 | | | | 90,377,773 | | |
| Options assigned | | | (21,938 | ) | | | (8,566,870 | ) | |
| Options expired/closed | | | (236,121 | ) | | | (79,873,046 | ) | |
| Options outstanding at October 31, 2007 | | | 30,044 | | | $ | 15,679,875 | | |
As of October 31, 2007, portfolio securities valued at approximately $168,000,000 were segregated to cover collateral requirements for written options.
Additionally, First Eagle Fund of America had the following long options transactions:
| | | Number of Contracts | | Premium Paid | |
| Options outstanding at October 31, 2006 | | | 839 | | | $ | 390,727 | | |
| Options expired/closed | | | (839 | ) | | | (390,727 | ) | |
| Options outstanding at October 31, 2007 | | | — | | | $ | — | | |
Note 4—Plans of Distribution
Under the terms of the Distribution Plans and Agreements ("the Plans") with First Eagle Funds Distributors, a division of ASB Securities LLC ("the Distributor"), pursuant to the provisions of Rule 12b-1 under the 1940 Act, the First Eagle Global Fund, First Eagle Overseas Fund, First Eagle U.S. Value Fund and First Eagle Gold Fund pay the Distributor quarterly, a distribution fee with respect to Class A and Class C shares at an annual rate of up to 0.25% and 0.75%, respectively, of each Fund's average daily net assets. In the case of First Eagle Fund of America, it pays the Distributor quarterly, a distribution fee with respect to Class Y, Class C and Class A shares at an annual rate of up to 0.25%, 0.75% and 0.25%, respectively of the average daily net assets. Prior to March 1, 2005, First Eagle Fund of America's distribution fee for its Class A shares was at an annual rate of 0.50% of average daily net assets. The Distributor is obligated to use the amounts received under the Plans for payments to qualifying dealers for their assistance in the distribution of a Fund's shares and the provision of shareholder services and for other expenses such as advertising costs and the payment for the printing and distribution of prospectuses to prospective investors.
The Distributor bears distribution costs of a Fund to the extent they exceed payments received under the Plan. For the year ended October 31, 2007, the distribution fees incurred by the Funds were as disclosed in the Statements of Operations.
The Distributor receives an annual service fee with respect to Class C at the annual rate of 0.25% of each Fund's average daily net assets, payable quarterly to cover expenses incurred by the Distributor for providing shareholder liaison services, including assistance with subscriptions, redemptions and other shareholder questions. For the year ended October 31, 2007, the services fees incurred by the Funds were as disclosed in the Statement of Operations.
64
FIRST EAGLE FUNDS
NOTES TO FINANCIAL STATEMENTS—(Continued)
Note 5—Purchases and Sales of Securities
During the year ended October 31, 2007, the aggregate cost of purchases of investments, excluding short-term securities, totaled $6,596,324,038, $3,237,381,945, $307,455,374, $169,331,874 and $426,438,811 for First Eagle Global Fund, First Eagle Overseas Fund, First Eagle U.S. Value Fund, First Eagle Gold Fund and First Eagle Fund of America, respectively. Proceeds from sales of investments, excluding short-term securities, totaled $7,166,027,096, $3,354,054,516, $145,490,181, $289,104,876 and $388,723,360 for First Eagle Global Fund, First Eagle Overseas Fund, First Eagle U.S. Value Fund, First Eagle Gold Fund and First Eagle Fund of America, respectively.
65
FIRST EAGLE FUNDS
NOTES TO FINANCIAL STATEMENTS—(Continued)
Note 6—Capital Stock
At October 31, 2007, the Funds have an unlimited number of shares authorized for issuance. The Funds have the ability to issue multiple classes of shares.
Transactions in shares of capital stock were as follows:
| | | Year ended October 31, 2007 | |
| | | First Eagle Global Fund | | First Eagle Overseas Fund | | First Eagle U.S. Value Fund | |
| | | Class A | | Class I | | Class C | | Class A | | Class I | | Class C | | Class A | | Class I | | Class C | |
| Shares sold | | | 29,423,126 | | | | 13,408,641 | | | | 11,833,957 | | | | 25,527,944 | | | | 17,695,896 | | | | 2,943,615 | | | | 8,319,730 | | | | 1,806,798 | | | | 5,219,216 | | |
Shares issued for reinvested
dividends and distributions | | | 23,202,772 | | | | 4,328,546 | | | | 7,497,567 | | | | 24,146,635 | | | | 14,846,977 | | | | 3,553,059 | | | | 870,048 | | | | 157,706 | | | | 435,662 | | |
| Shares redeemed | | | (34,474,198 | ) | | | (9,914,371 | ) | | | (11,511,953 | ) | | | (53,710,207 | ) | | | (43,244,940 | ) | | | (6,500,188 | ) | | | (5,829,160 | ) | | | (2,921,414 | ) | | | (1,827,587 | ) | |
| Net increase (decrease) | | | 18,151,700 | | | | 7,822,816 | | | | 7,819,571 | | | | (4,035,628 | ) | | | (10,702,067 | ) | | | (3,514 | ) | | | 3,360,618 | | | | (956,910 | ) | | | 3,827,291 | | |
| | | Year ended October 31, 2006 | |
| | | First Eagle Global Fund | | First Eagle Overseas Fund | | First Eagle U.S. Value Fund | |
| | | Class A | | Class I | | Class C | | Class A | | Class I | | Class C | | Class A | | Class I | | Class C | |
| Shares sold | | | 35,583,874 | | | | 16,936,625 | | | | 15,968,391 | | | | 31,491,864 | | | | 28,485,440 | | | | 4,335,354 | | | | 7,931,207 | | | | 3,378,844 | | | | 4,664,020 | | |
Shares issued for reinvested
dividends and distributions | | | 12,214,236 | | | | 1,781,748 | | | | 3,641,882 | | | | 19,245,274 | | | | 10,302,236 | | | | 2,877,882 | | | | 324,121 | | | | 50,463 | | | | 166,361 | | |
| Shares redeemed | | | (26,998,818 | ) | | | (5,439,910 | ) | | | (7,574,088 | ) | | | (35,686,105 | ) | | | (13,619,021 | ) | | | (5,445,943 | ) | | | (2,654,731 | ) | | | (889,439 | ) | | | (1,348,459 | ) | |
| Net increase (decrease) | | | 20,799,292 | | | | 13,278,463 | | | | 12,036,185 | | | | 15,051,033 | | | | 25,168,655 | | | | 1,767,293 | | | | 5,600,597 | | | | 2,539,868 | | | | 3,481,922 | | |
66
| | | Year ended October 31, 2007 | |
| | | First Eagle Gold Fund | | First Eagle Fund of America | |
| | | Class A | | Class I | | Class C | | Class Y | | Class A | | Class C | |
| Shares sold | | | 3,911,647 | | | | 915,411 | | | | 1,085,929 | | | | 2,845,188 | | | | 1,320,584 | | | | 666,151 | | |
Shares issued for reinvested
dividends and distributions | | | 4,971,320 | | | | 934,960 | | | | 928,749 | | | | 2,621,034 | | | | 219,398 | | | | 213,865 | | |
| Shares redeemed | | | (9,216,431 | ) | | | (2,043,469 | ) | | | (1,532,639 | ) | | | (4,201,617 | ) | | | (433,618 | ) | | | (338,596 | ) | |
| Net increase (decrease) | | | (333,464 | ) | | | (193,098 | ) | | | 482,039 | | | | 1,264,605 | | | | 1,106,364 | | | | 541,420 | | |
| | | Year ended October 31, 2006 | |
| | | First Eagle Gold Fund | | First Eagle Fund of America | |
| | | Class A | | Class I | | Class C | | Class Y | | Class A | | Class C | |
| Shares sold | | | 10,404,322 | | | | 1,884,960 | | | | 2,710,203 | | | | 1,258,857 | | | | 690,423 | | | | 623,809 | | |
Shares issued for reinvested
dividends and distributions | | | 676,086 | | | | 106,997 | | | | 94,725 | | | | 2,071,253 | | | | 101,510 | | | | 118,604 | | |
| Shares redeemed | | | (10,768,465 | ) | | | (541,824 | ) | | | (2,679,916 | ) | | | (5,465,037 | ) | | | (267,431 | ) | | | (339,524 | ) | |
| Net increase (decrease) | | | 311,943 | | | | 1,450,133 | | | | 125,012 | | | | (2,134,927 | ) | | | 524,502 | | | | 402,889 | | |
67
FIRST EAGLE FUNDS
NOTES TO FINANCIAL STATEMENTS—(Continued)
Transactions in dollars of capital stock were as follows:
| | | Year ended October 31, 2007 | |
| | | First Eagle Global Fund | | First Eagle Overseas Fund | | First Eagle U.S. Value Fund | |
| | | Class A | | Class I | | Class C | | Class A | | Class I | | Class C | | Class A | | Class I | | Class C | |
| Shares sold | | $ | 1,405,054,425 | | | $ | 639,851,362 | | | $ | 554,267,173 | | | $ | 673,109,394 | | | $ | 467,501,394 | | | $ | 75,035,175 | | | $ | 133,936,401 | | | $ | 29,137,821 | | | $ | 83,623,876 | | |
Shares issued
for reinvested
dividends and
distributions | | | 1,055,958,184 | | | | 197,468,312 | | | | 339,264,933 | | | | 601,009,577 | | | | 372,510,660 | | | | 87,653,961 | | | | 13,607,553 | | | | 2,485,438 | | | | 6,800,696 | | |
| Shares redeemed | | | (1,660,695,277 | ) | | | (480,504,284 | ) | | | (549,813,217 | ) | | | (1,429,894,742 | ) | | | (1,170,779,059 | ) | | | (171,083,982 | ) | | | (96,094,297 | ) | | | (47,792,894 | ) | | | (29,585,813 | ) | |
Net increase
(decrease) | | $ | 800,317,332 | | | $ | 356,815,390 | | | $ | 343,718,889 | | | $ | (155,775,771 | ) | | $ | (330,767,005 | ) | | $ | (8,394,846 | ) | | $ | 51,449,657 | | | $ | (16,169,635 | ) | | $ | 60,838,759 | | |
| | | Year ended October 31, 2006 | |
| | | First Eagle Global Fund | | First Eagle Overseas Fund | | First Eagle U.S. Value Fund | |
| | | Class A | | Class I | | Class C | | Class A | | Class I | | Class C | | Class A | | Class I | | Class C | |
| Shares sold | | $ | 1,596,531,159 | | | $ | 754,220,639 | | | $ | 707,261,246 | | | $ | 787,524,279 | | | $ | 719,043,046 | | | $ | 104,819,296 | | | $ | 121,442,539 | | | $ | 51,563,403 | | | $ | 70,971,336 | | |
Shares issued
for reinvested
dividends and
distributions | | | 511,287,885 | | | | 74,705,038 | | | | 151,757,248 | | | | 439,754,509 | | | | 236,950,899 | | | | 65,270,354 | | | | 4,803,478 | | | | 753,419 | | | | 2,465,472 | | |
| Shares redeemed | | | (1,207,582,500 | ) | | | (243,958,680 | ) | | | (338,993,962 | ) | | | (897,093,982 | ) | | | (344,196,140 | ) | | | (135,137,362 | ) | | | (40,509,067 | ) | | | (13,759,193 | ) | | | (20,546,051 | ) | |
Net increase
(decrease) | | $ | 900,236,544 | | | $ | 584,966,997 | | | $ | 520,024,532 | | | $ | 330,184,806 | | | $ | 611,797,805 | | | $ | 34,952,288 | | | $ | 85,736,950 | | | $ | 38,557,629 | | | $ | 52,890,757 | | |
Note 7—Indemnification and Foreign Investment Risk
In the normal course of business the Funds enter into contracts that contain a variety of representations which provide general indemnifications. Each Fund's maximum exposure under these arrangements is unknown, as this would involve future claims that may be made against each Fund that have not yet occurred. However, based on experience, the Funds expect the risk of loss to be remote. The Funds may have elements of risk not typically associated with investments in the United States of America due to their investments in foreign countries or regions. Such foreign investments may subject the Funds to additional risks resulting from political or economic conditions in such countries or regions and the possible imposition of adverse governmental laws or currency exchange restrictions could cause the securities and their markets to be less liquid and their prices to be more volatile than those of comparable U.S. securities.
68
| | | Year ended October 31, 2007 | |
| | | First Eagle Gold Fund | | First Eagle Fund of America | |
| | | Class A | | Class I | | Class C | | Class Y | | Class A | | Class C | |
| Shares sold | | $ | 86,695,475 | | | $ | 19,969,661 | | | $ | 24,167,400 | | | $ | 79,945,230 | | | $ | 37,384,703 | | | $ | 17,102,813 | | |
Shares issued
for reinvested
dividends and
distributions | | | 102,608,042 | | | | 19,400,427 | | | | 19,002,220 | | | | 67,648,890 | | | | 5,581,501 | | | | 5,036,526 | | |
| Shares redeemed | | | (197,397,958 | ) | | | (46,005,974 | ) | | | (32,479,289 | ) | | | (116,426,130 | ) | | | (12,092,526 | ) | | | (8,651,339 | ) | |
Net increase
(decrease) | | $ | (8,094,441 | ) | | $ | (6,635,886 | ) | | $ | 10,690,331 | | | $ | 31,167,990 | | | $ | 30,873,678 | | | $ | 13,488,000 | | |
| | | Year ended October 31, 2006 | |
| | | First Eagle Gold Fund | | First Eagle Fund of America | |
| | | Class A | | Class I | | Class C | | Class Y | | Class A | | Class C | |
| Shares sold | | $ | 236,601,779 | | | $ | 42,023,295 | | | $ | 61,075,082 | | | $ | 33,619,327 | | | $ | 18,235,645 | | | $ | 15,417,073 | | |
Shares issued
for reinvested
dividends and
distributions | | | 13,129,705 | | | | 2,086,441 | | | | 1,827,249 | | | | 53,169,070 | | | | 2,572,259 | | | | 2,829,882 | | |
| Shares redeemed | | | (247,252,691 | ) | | | (13,257,098 | ) | | | (59,836,130 | ) | | | (145,954,594 | ) | | | (7,020,402 | ) | | | (8,359,942 | ) | |
Net increase
(decrease) | | $ | 2,478,793 | | | $ | 30,852,638 | | | $ | 3,066,201 | | | $ | (59,166,197 | ) | | $ | 13,787,502 | | | $ | 9,887,013 | | |
69
FIRST EAGLE FUNDS
FINANCIAL HIGHLIGHTS
| | | Year ended October 31, | |
| | | 2007 | | 2006 | |
| | | Class A | | Class I | | Class C | | Class A | | Class I | | Class C | |
| First Eagle Global Fund | |
| Selected Per Share Data* | |
| Net asset value, beginning of year | | $ | 48.36 | | | $ | 48.56 | | | $ | 47.83 | | | $ | 42.47 | | | $ | 42.62 | | | $ | 42.06 | | |
| Income from investment operations: | |
| Net investment income | | | 0.67 | | | | 0.79 | | | | 0.31 | | | | 0.59 | | | | 0.71 | | | | 0.25 | | |
| Net realized and unrealized gains on investments | | | 6.91 | | | | 6.94 | | | | 6.84 | | | | 7.82 | | | | 7.85 | | | | 7.77 | | |
| Total from investment operations | | | 7.58 | | | | 7.73 | | | | 7.15 | | | | 8.41 | | | | 8.56 | | | | 8.02 | | |
| Less distributions: | |
| Dividends from net investment income | | | (1.22 | ) | | | (1.34 | ) | | | (0.89 | ) | | | (0.84 | ) | | | (0.94 | ) | | | (0.57 | ) | |
| Distributions from capital gains | | | (3.63 | ) | | | (3.63 | ) | | | (3.63 | ) | | | (1.68 | ) | | | (1.68 | ) | | | (1.68 | ) | |
| Total distributions | | | (4.85 | ) | | | (4.97 | ) | | | (4.52 | ) | | | (2.52 | ) | | | (2.62 | ) | | | (2.25 | ) | |
| Net asset value, end of year | | $ | 51.09 | | | $ | 51.32 | | | $ | 50.46 | | | $ | 48.36 | | | $ | 48.56 | | | $ | 47.83 | | |
| Total Returnc | | | 16.91 | % | | | 17.19 | % | | | 16.03 | % | | | 20.73 | % | | | 21.06 | % | | | 19.86 | % | |
| Ratios and Supplemental Data | |
| Net assets, end of period (millions) | | $ | 13,451 | | | $ | 3,193 | | | $ | 5,593 | | | $ | 11,854 | | | $ | 2,641 | | | $ | 4,928 | | |
| Ratio of operating expenses to average net assetse | | | 1.12 | % | | | 0.87 | % | | | 1.87 | % | | | 1.13 | % | | | 0.88 | % | | | 1.88 | % | |
| Ratio of net investment income to average net assetsf | | | 1.40 | % | | | 1.64 | % | | | 0.65 | % | | | 1.31 | % | | | 1.57 | % | | | 0.56 | % | |
| Portfolio turnover rate | | | 37.58 | % | | | 37.58 | % | | | 37.58 | % | | | 28.59 | % | | | 28.59 | % | | | 28.59 | % | |
* Per share amounts have been calculated using the average shares method.
See Notes to Financial Highlights.
See Notes to Financial Statements.
70
| | | Year ended October 31, | |
| | | 2005 | | 2004 | | 2003 | |
| | | Class A | | Class I | | Class C | | Class A | | Class I | | Class C | | Class A | | Class I | | Class C | |
| First Eagle Global Fund | |
| Selected Per Share Data* | |
| Net asset value, beginning of year | | $ | 36.53 | | | $ | 36.64 | | | $ | 36.30 | | | $ | 32.37 | | | $ | 32.41 | | | $ | 32.15 | | | $ | 24.34 | | | $ | 24.36 | | | $ | 24.15 | | |
| Income from investment operations: | |
| Net investment income | | | 0.48 | | | | 0.60 | | | | 0.19 | | | | 0.50 | | | | 0.56 | | | | 0.23 | | | | 0.53 | | | | 0.59 | | | | 0.30 | | |
| Net realized and unrealized gains on investments | | | 6.07 | | | | 6.06 | | | | 6.01 | | | | 5.18 | | | | 5.22 | | | | 5.18 | | | | 8.39 | | | | 8.41 | | | | 8.38 | | |
| Total from investment operations | | | 6.55 | | | | 6.66 | | | | 6.20 | | | | 5.68 | | | | 5.78 | | | | 5.41 | | | | 8.92 | | | | 9.00 | | | | 8.68 | | |
| Less distributions: | |
| Dividends from net investment income | | | (0.43 | ) | | | (0.50 | ) | | | (0.26 | ) | | | (0.67 | ) | | | (0.70 | ) | | | (0.41 | ) | | | (0.49 | ) | | | (0.55 | ) | | | (0.28 | ) | |
| Distributions from capital gains | | | (0.18 | ) | | | (0.18 | ) | | | (0.18 | ) | | | (0.85 | ) | | | (0.85 | ) | | | (0.85 | ) | | | (0.40 | ) | | | (0.40 | ) | | | (0.40 | ) | |
| Total distributions | | | (0.61 | ) | | | (0.68 | ) | | | (0.44 | ) | | | (1.52 | ) | | | (1.55 | ) | | | (1.26 | ) | | | (0.89 | ) | | | (0.95 | ) | | | (0.68 | ) | |
| Net asset value, end of year | | $ | 42.47 | | | $ | 42.62 | | | $ | 42.06 | | | $ | 36.53 | | | $ | 36.64 | | | $ | 36.30 | | | $ | 32.37 | | | $ | 32.41 | | | $ | 32.15 | | |
| Total Returnc | | | 18.15 | % | | | 18.42 | % | | | 17.23 | % | | | 18.18 | % | | | 18.47 | % | | | 17.31 | % | | | 37.75 | % | | | 38.14 | % | | | 36.77 | % | |
| Ratios and Supplemental Data | |
| Net assets, end of period (millions) | | $ | 9,526 | | | $ | 1,752 | | | $ | 3,828 | | | $ | 5,972 | | | $ | 641 | | | $ | 1,986 | | | $ | 3,255 | | | $ | 242 | | | $ | 617 | | |
| Ratio of operating expenses to average net assetse | | | 1.20 | % | | | 0.95 | % | | | 1.95 | % | | | 1.24 | % | | | 0.99 | % | | | 1.99 | % | | | 1.32 | % | | | 1.06 | % | | | 2.07 | % | |
| Ratio of net investment income to average net assetsf | | | 1.21 | % | | | 1.48 | % | | | 0.47 | % | | | 1.46 | % | | | 1.67 | % | | | 0.66 | % | | | 1.91 | % | | | 2.11 | % | | | 1.07 | % | |
| Portfolio turnover rate | | | 12.29 | % | | | 12.29 | % | | | 12.29 | % | | | 4.94 | % | | | 4.94 | % | | | 4.94 | % | | | 7.20 | % | | | 7.20 | % | | | 7.20 | % | |
71
FIRST EAGLE FUNDS
FINANCIAL HIGHLIGHTS — (Continued)
| | | Year ended October 31, 2007 | |
| | | 2007 | | 2006 | |
| | | Class A | | Class I | | Class C | | Class A | | Class I | | Class C | |
| First Eagle Overseas Fund | |
| Selected Per Share Data* | |
| Net asset value, beginning of year | | $ | 26.70 | | | $ | 26.94 | | | $ | 26.33 | | | $ | 24.13 | | | $ | 24.33 | | | $ | 23.83 | | |
| Income from investment operations: | |
| Net investment income (losses) | | | 0.41 | | | | 0.48 | | | | 0.21 | | | | 0.39 | | | | 0.46 | | | | 0.20 | | |
| Net realized and unrealized gains on investments | | | 4.05 | | | | 4.10 | | | | 4.00 | | | | 4.57 | | | | 4.60 | | | | 4.53 | | |
| Total from investment operations | | | 4.46 | | | | 4.58 | | | | 4.21 | | | | 4.96 | | | | 5.06 | | | | 4.73 | | |
| Less distributions: | |
| Dividends from net investment income | | | (0.87 | ) | | | (0.94 | ) | | | (0.68 | ) | | | (0.81 | ) | | | (0.87 | ) | | | (0.65 | ) | |
| Distributions from capital gains | | | (2.20 | ) | | | (2.20 | ) | | | (2.20 | ) | | | (1.58 | ) | | | (1.58 | ) | | | (1.58 | ) | |
| Total distributions | | | (3.07 | ) | | | (3.14 | ) | | | (2.88 | ) | | | (2.39 | ) | | | (2.45 | ) | | | (2.23 | ) | |
| Net asset value, end of year | | $ | 28.09 | | | $ | 28.38 | | | $ | 27.66 | | | $ | 26.70 | | | $ | 26.94 | | | $ | 26.33 | | |
| Total Returnc | | | 18.20 | % | | | 18.52 | % | | | 17.31 | % | | | 22.24 | % | | | 22.53 | % | | | 21.33 | % | |
| Ratios and Supplemental Data | |
| Net assets, end of period (millions) | | $ | 5,974 | | | $ | 3,942 | | | $ | 1,203 | | | $ | 5,785 | | | $ | 4,031 | | | $ | 1,145 | | |
| Ratio of operating expenses to average net assetse | | | 1.12 | % | | | 0.87 | % | | | 1.87 | % | | | 1.12 | % | | | 0.87 | % | | | 1.87 | % | |
| Ratio of net investment income to average net assetsf | | | 1.54 | % | | | 1.80 | % | | | 0.79 | % | | | 1.57 | % | | | 1.82 | % | | | 0.81 | % | |
| Portfolio turnover rate | | | 34.29 | % | | | 34.29 | % | | | 34.29 | % | | | 27.98 | % | | | 27.98 | % | | | 27.98 | % | |
* Per share amounts have been calculated using the average shares method.
See Notes to Financial Highlights.
See Notes to Financial Statements.
72
| | | Year ended October 31, 2007 | |
| | | 2005 | | 2004 | | 2003 | |
| | | Class A | | Class I | | Class C | | Class A | | Class I | | Class C | | Class A | | Class I | | Class C | |
| First Eagle Overseas Fund | |
| Selected Per Share Data* | |
| Net asset value, beginning of year | | $ | 20.25 | | | $ | 20.37 | | | $ | 19.97 | | | $ | 17.50 | | | $ | 17.57 | | | $ | 17.28 | | | $ | 12.45 | | | $ | 12.48 | | | $ | 12.30 | | |
| Income from investment operations: | |
| Net investment income (losses) | | | 0.27 | | | | 0.33 | | | | 0.10 | | | | 0.17 | | | | 0.22 | | | | 0.03 | | | | 0.18 | | | | 0.22 | | | | 0.07 | | |
| Net realized and unrealized gains on investments | | | 3.96 | | | | 3.99 | | | | 3.93 | | | | 3.20 | | | | 3.22 | | | | 3.17 | | | | 5.09 | | | | 5.10 | | | | 5.04 | | |
| Total from investment operations | | | 4.23 | | | | 4.32 | | | | 4.03 | | | | 3.37 | | | | 3.44 | | | | 3.20 | | | | 5.27 | | | | 5.32 | | | | 5.11 | | |
| Less distributions: | |
| Dividends from net investment income | | | (0.24 | ) | | | (0.25 | ) | | | (0.06 | ) | | | (0.47 | ) | | | (0.49 | ) | | | (0.36 | ) | | | (0.21 | ) | | | (0.22 | ) | | | (0.12 | ) | |
| Distributions from capital gains | | | (0.11 | ) | | | (0.11 | ) | | | (0.11 | ) | | | (0.15 | ) | | | (0.15 | ) | | | (0.15 | ) | | | (0.01 | ) | | | (0.01 | ) | | | (0.01 | ) | |
| Total distributions | | | (0.35 | ) | | | (0.36 | ) | | | (0.17 | ) | | | (0.62 | ) | | | (0.64 | ) | | | (0.51 | ) | | | (0.22 | ) | | | (0.23 | ) | | | (0.13 | ) | |
| Net asset value, end of year | | $ | 24.13 | | | $ | 24.33 | | | $ | 23.83 | | | $ | 20.25 | | | $ | 20.37 | | | $ | 19.97 | | | $ | 17.50 | | | $ | 17.57 | | | $ | 17.28 | | |
| Total Returnc | | | 21.16 | % | | | 21.47 | % | | | 20.28 | % | | | 19.77 | % | | | 20.09 | % | | | 18.89 | % | | | 42.96 | % | | | 43.29 | % | | | 41.91 | % | |
| Ratios and Supplemental Data | |
| Net assets, end of period (millions) | | $ | 4,866 | | | $ | 3,028 | | | $ | 994 | | | $ | 3,846 | | | $ | 2,152 | | | $ | 804 | | | $ | 2,345 | | | $ | 1,084 | | | $ | 390 | | |
| Ratio of operating expenses to average net assetse | | | 1.18 | % | | | 0.93 | % | | | 1.93 | % | | | 1.25 | % | | | 1.00 | % | | | 2.00 | % | | | 1.31 | % | | | 1.05 | % | | | 2.05 | % | |
| Ratio of net investment income to average net assetsf | | | 1.21 | % | | | 1.46 | % | | | 0.46 | % | | | 0.90 | % | | | 1.17 | % | | | 0.17 | % | | | 1.23 | % | | | 1.48 | % | | | 0.45 | % | |
| Portfolio turnover rate | | | 19.40 | % | | | 19.40 | % | | | 19.40 | % | | | 5.88 | % | | | 5.88 | % | | | 5.88 | % | | | 3.46 | % | | | 3.46 | % | | | 3.46 | % | |
73
FIRST EAGLE FUNDS
FINANCIAL HIGHLIGHTS — (Continued)
| | | Year ended October 31, | |
| | | 2007 | | 2006 | |
| | | Class A | | Class I | | Class C | | Class A | | Class I | | Class C | |
| First Eagle U.S. Value Fund | |
| Selected Per Share Data* | |
| Net asset value, beginning of year | | $ | 16.19 | | | $ | 16.34 | | | $ | 16.08 | | | $ | 14.95 | | | $ | 15.07 | | | $ | 14.90 | | |
| Income from investment operations: | |
| Net investment income | | | 0.33 | | | | 0.38 | | | | 0.21 | | | | 0.29 | | | | 0.33 | | | | 0.17 | | |
| Net realized and unrealized gains on investments | | | 1.45 | | | | 1.46 | | | | 1.44 | | | | 1.46 | | | | 1.48 | | | | 1.47 | | |
| Total from investment operations | | | 1.78 | | | | 1.84 | | | | 1.65 | | | | 1.75 | | | | 1.81 | | | | 1.64 | | |
| Less distributions: | |
| Dividends from net investment income | | | (0.30 | ) | | | (0.33 | ) | | | (0.20 | ) | | | (0.24 | ) | | | (0.27 | ) | | | (0.19 | ) | |
| Distributions from capital gains | | | (0.66 | ) | | | (0.66 | ) | | | (0.66 | ) | | | (0.27 | ) | | | (0.27 | ) | | | (0.27 | ) | |
| Total distributions | | | (0.96 | ) | | | (0.99 | ) | | | (0.86 | ) | | | (0.51 | ) | | | (0.54 | ) | | | (0.46 | ) | |
| Net asset value, end of year | | $ | 17.01 | | | $ | 17.19 | | | $ | 16.87 | | | $ | 16.19 | | | $ | 16.34 | | | $ | 16.08 | | |
| Total Returnc | | | 11.47 | % | | | 11.78 | % | | | 10.65 | % | | | 12.05 | % | | | 12.35 | % | | | 11.26 | % | |
| Ratios and Supplemental Data | |
| Net assets, end of period (millions) | | $ | 324 | | | $ | 104 | | | $ | 233 | | | $ | 254 | | | $ | 115 | | | $ | 161 | | |
| Ratio of operating expenses to average net assetse | | | 1.20 | % | | | 0.95 | % | | | 1.95 | % | | | 1.25 | % | | | 0.99 | % | | | 1.99 | % | |
| Ratio of net investment income to average net assetsf | | | 2.04 | % | | | 2.32 | % | | | 1.29 | % | | | 1.87 | % | | | 2.13 | % | | | 1.13 | % | |
| Portfolio turnover rate | | | 32.54 | % | | | 32.54 | % | | | 32.54 | % | | | 31.76 | % | | | 31.76 | % | | | 31.76 | % | |
* Per share amounts have been calculated using the average shares method.
See Notes to Financial Highlights.
See Notes to Financial Statements.
74
| | | Year ended October 31, | |
| | | 2005 | | 2004 | | 2003 | |
| | | Class A | | Class I | | Class C | | Class A | | Class I | | Class C | | Class A | | Class I | | Class C | |
| First Eagle U.S. Value Fund | |
| Selected Per Share Data* | |
| Net asset value, beginning of year | | $ | 13.95 | | | $ | 14.05 | | | $ | 13.92 | | | $ | 12.71 | | | $ | 12.76 | | | $ | 12.61 | | | $ | 10.56 | | | $ | 10.59 | | | $ | 10.48 | | |
| Income from investment operations: | |
| Net investment income | | | 0.20 | | | | 0.24 | | | | 0.10 | | | | 0.22 | | | | 0.27 | | | | 0.13 | | | | 0.19 | | | | 0.23 | | | | 0.11 | | |
| Net realized and unrealized gains on investments | | | 1.35 | | | | 1.36 | | | | 1.35 | | | | 1.66 | | | | 1.65 | | | | 1.64 | | | | 2.46 | | | | 2.45 | | | | 2.43 | | |
| Total from investment operations | | | 1.55 | | | | 1.60 | | | | 1.45 | | | | 1.88 | | | | 1.92 | | | | 1.77 | | | | 2.65 | | | | 2.68 | | | | 2.54 | | |
| Less distributions: | |
| Dividends from net investment income | | | (0.20 | ) | | | (0.23 | ) | | | (0.12 | ) | | | (0.32 | ) | | | (0.31 | ) | | | (0.14 | ) | | | (0.16 | ) | | | (0.17 | ) | | | (0.07 | ) | |
| Distributions from capital gains | | | (0.35 | ) | | | (0.35 | ) | | | (0.35 | ) | | | (0.32 | ) | | | (0.32 | ) | | | (0.32 | ) | | | (0.34 | ) | | | (0.34 | ) | | | (0.34 | ) | |
| Total distributions | | | (0.55 | ) | | | (0.58 | ) | | | (0.47 | ) | | | (0.64 | ) | | | (0.63 | ) | | | (0.46 | ) | | | (0.50 | ) | | | (0.51 | ) | | | (0.41 | ) | |
| Net asset value, end of year | | $ | 14.95 | | | $ | 15.07 | | | $ | 14.90 | | | $ | 13.95 | | | $ | 14.05 | | | $ | 13.92 | | | $ | 12.71 | | | $ | 12.76 | | | $ | 12.61 | | |
| Total Returnc | | | 11.35 | % | | | 11.65 | % | | | 10.56 | % | | | 15.38 | % | | | 15.58 | % | | | 14.43 | % | | | 26.10 | % | | | 26.34 | % | | | 25.03 | % | |
| Ratios and Supplemental Data | |
| Net assets, end of period (millions) | | $ | 150 | | | $ | 68 | | | $ | 97 | | | $ | 62 | | | $ | 54 | | | $ | 29 | | | $ | 41 | | | $ | 49 | | | $ | 20 | | |
| Ratio of operating expenses to average net assetse | | | 1.28 | % | | | 1.04 | % | | | 2.02 | % | | | 1.38 | % | | | 1.13 | % | | | 2.13 | % | | | 1.51 | % | | | 1.26 | % | | | 2.26 | % | |
| Ratio of net investment income to average net assetsf | | | 1.40 | % | | | 1.63 | % | | | 0.67 | % | | | 1.66 | % | | | 2.00 | % | | | 0.95 | % | | | 1.72 | % | | | 1.99 | % | | | 0.97 | % | |
| Portfolio turnover rate | | | 17.22 | % | | | 17.22 | % | | | 17.22 | % | | | 23.47 | % | | | 23.47 | % | | | 23.47 | % | | | 33.45 | % | | | 33.45 | % | | | 33.45 | % | |
75
FIRST EAGLE FUNDS
FINANCIAL HIGHLIGHTS — (Continued)
| | | Year Ended October 31, | |
| | | 2007 | | 2006 | |
| | | Class A | | Class I | | Class C | | Class A | | Class I | | Class C | |
| First Eagle Gold Fund | |
| Selected Per Share Data* | |
| Net asset value, beginning of year | | $ | 23.48 | | | $ | 23.62 | | | $ | 23.17 | | | $ | 17.45 | | | $ | 17.55 | | | $ | 17.25 | | |
| Income from investment operations: | |
| Net investment (loss) income | | | (0.12 | ) | | | (0.07 | ) | | | (0.28 | ) | | | (0.13 | ) | | | (0.08 | ) | | | (0.30 | ) | |
| Net realized and unrealized gains on investments | | | 7.72 | | | | 7.78 | | | | 7.61 | | | | 6.65 | | | | 6.69 | | | | 6.60 | | |
| Total from investment operations | | | 7.60 | | | | 7.71 | | | | 7.33 | | | | 6.52 | | | | 6.61 | | | | 6.30 | | |
| Less distributions: | |
| Dividends from net investment income | | | (0.74 | ) | | | (0.79 | ) | | | (0.58 | ) | | | (0.49 | ) | | | (0.54 | ) | | | (0.38 | ) | |
| Distributions from capital gains | | | (3.06 | ) | | | (3.06 | ) | | | (3.06 | ) | | | — | | | | — | | | | — | | |
| Total distributions | | | (3.80 | ) | | | (3.85 | ) | | | (3.64 | ) | | | (0.49 | ) | | | (0.54 | ) | | | (0.38 | ) | |
| Net asset value, end of year | | $ | 27.28 | | | $ | 27.48 | | | $ | 26.86 | | | $ | 23.48 | | | $ | 23.62 | | | $ | 23.17 | | |
| Total Returnc | | | 37.57 | % | | | 37.93 | % | | | 36.55 | % | | | 37.97 | % | | | 38.29 | % | | | 36.95 | % | |
| Ratios and Supplemental Data | |
| Net assets, end of period (millions) | | $ | 890 | | | $ | 166 | | | $ | 196 | | | $ | 774 | | | $ | 147 | | | $ | 158 | | |
| Ratio of operating expenses to average net assetse | | | 1.20 | % | | | 0.95 | % | | | 1.95 | % | | | 1.21 | % | | | 0.96 | % | | | 1.96 | % | |
| Ratio of net investment (loss) income to average net assetsf | | | (0.55 | %) | | | (0.30 | %) | | | (1.30 | %) | | | (0.59 | %) | | | (0.34 | %) | | | (1.33 | %) | |
| Portfolio turnover rate | | | 16.37 | % | | | 16.37 | % | | | 16.37 | % | | | 32.26 | % | | | 32.26 | % | | | 32.26 | % | |
* Per share amounts have been calculated using the average shares method.
** Amount represents less than $0.01 per share.
See Notes to Financial Highlights.
See Notes to Financial Statements.
76
| | | Year Ended October 31, | |
| | | 2005 | | 2004 | | 2003 | |
| | | Class A | | Class I | | Class C | | Class A | | Class I | | Class C | | Class A | | Class Id | | Class Cd | |
| First Eagle Gold Fund | |
| Selected Per Share Data* | |
| Net asset value, beginning of year | | $ | 16.82 | | | $ | 16.88 | | | $ | 16.76 | | | $ | 15.99 | | | $ | 16.03 | | | $ | 15.96 | | | $ | 10.41 | | | $ | 12.41 | | | $ | 12.41 | | |
| Income from investment operations: | |
| Net investment (loss) income | | | (0.04 | ) | | | 0.00 | ** | | | (0.16 | ) | | | (0.10 | ) | | | (0.05 | ) | | | (0.21 | ) | | | (0.06 | ) | | | (0.02 | ) | | | (0.09 | ) | |
| Net realized and unrealized gains on investments | | | 0.67 | | | | 0.67 | | | | 0.65 | | | | 1.49 | | | | 1.48 | | | | 1.47 | | | | 5.72 | | | | 3.64 | | | | 3.64 | | |
| Total from investment operations | | | 0.63 | | | | 0.67 | | | | 0.49 | | | | 1.39 | | | | 1.43 | | | | 1.26 | | | | 5.66 | | | | 3.62 | | | | 3.55 | | |
| Less distributions: | |
| Dividends from net investment income | | | — | | | | — | | | | — | | | | (0.56 | ) | | | (0.58 | ) | | | (0.46 | ) | | | (0.08 | ) | | | — | | | | — | | |
| Distributions from capital gains | | | — | | | | — | | | | — | | | | — | | | | — | | | | — | | | | — | | | | — | | | | — | | |
| Total distributions | | | — | | | | — | | | | — | | | | (0.56 | ) | | | (0.58 | ) | | | (0.46 | ) | | | (0.08 | ) | | | — | | | | — | | |
| Net asset value, end of year | | $ | 17.45 | | | $ | 17.55 | | | $ | 17.25 | | | $ | 16.82 | | | $ | 16.88 | | | $ | 16.76 | | | $ | 15.99 | | | $ | 16.03 | | | $ | 15.96 | | |
| Total Returnc | | | 3.75 | % | | | 3.97 | % | | | 2.92 | % | | | 8.59 | % | | | 8.82 | % | | | 7.79 | % | | | 54.64 | % | | | 29.17 | %b | | | 28.61 | %b | |
| Ratios and Supplemental Data | |
| Net assets, end of period (millions) | | $ | 570 | | | $ | 84 | | | $ | 115 | | | $ | 516 | | | $ | 75 | | | $ | 92 | | | $ | 374 | | | $ | 30 | | | $ | 32 | | |
| Ratio of operating expenses to average net assetse | | | 1.29 | % | | | 1.04 | % | | | 2.04 | % | | | 1.39 | % | | | 1.14 | % | | | 2.14 | % | | | 1.49 | % | | | 1.23 | %a | | | 2.19 | %a | |
| Ratio of net investment (loss) income to average net assetsf | | | (0.24 | %) | | | 0.02 | % | | | (0.98 | %) | | | (0.62 | %) | | | (0.35 | %) | | | (1.34 | %) | | | (0.43 | %) | | | (0.24 | %)a | | | (1.26 | %)a | |
| Portfolio turnover rate | | | 21.73 | % | | | 21.73 | % | | | 21.73 | % | | | 3.61 | % | | | 3.61 | % | | | 3.61 | % | | | 0.98 | % | | | 0.98 | %b | | | 0.98 | %b | |
77
FIRST EAGLE FUNDS
FINANCIAL HIGHLIGHTS — (Continued)
| | | Year ended October 31, | |
| | | 2007 | | 2006 | |
| | | Class Y | | Class C | | Class A | | Class Y | | Class C | | Class A | |
| First Eagle Fund of America | |
| Selected Per Share Data* | |
| Net asset value, beginning of year | | $ | 28.28 | | | $ | 26.12 | | | $ | 27.92 | | | $ | 26.42 | | | $ | 24.74 | | | $ | 26.11 | | |
| Income from investment operations: | |
| Net investment income (loss) | | | 0.07 | g | | | (0.13 | )g | | | 0.05 | g | | | (0.08 | ) | | | (0.26 | ) | | | (0.08 | ) | |
| Net realized and unrealized gains on investments | | | 5.35 | | | | 4.88 | | | | 5.30 | | | | 4.28 | | | | 3.98 | | | | 4.23 | | |
| Total from investment operations | | | 5.42 | | | | 4.75 | | | | 5.35 | | | | 4.20 | | | | 3.72 | | | | 4.15 | | |
| Less distributions: | |
| Distributions from capital gains | | | (3.48 | ) | | | (3.48 | ) | | | (3.48 | ) | | | (2.34 | ) | | | (2.34 | ) | | | (2.34 | ) | |
| Total distributions | | | (3.48 | ) | | | (3.48 | ) | | | (3.48 | ) | | | (2.34 | ) | | | (2.34 | ) | | | (2.34 | ) | |
| Net asset value, end of year | | $ | 30.22 | | | $ | 27.39 | | | $ | 29.79 | | | $ | 28.28 | | | $ | 26.12 | | | $ | 27.92 | | |
| Total Returnc | | | 21.25 | % | | | 20.34 | % | | | 21.28 | % | | | 16.80 | % | | | 15.93 | % | | | 16.81 | % | |
| Ratios and Supplemental Data | |
| Net assets, end of period (millions) | | $ | 756 | | | $ | 65 | | | $ | 82 | | | $ | 671 | | | $ | 48 | | | $ | 46 | | |
| Ratio of operating expenses to average net assetse | | | 1.40 | % | | | 2.15 | % | | | 1.40 | % | | | 1.41 | % | | | 2.16 | % | | | 1.41 | % | |
| Ratio of net investment income (loss) to average net assetsf | | | 0.26 | %g | | | (0.51 | %)g | | | 0.18 | %g | | | (0.30 | %) | | | (1.05 | %) | | | (0.30 | %) | |
| Portfolio turnover rate | | | 50.26 | % | | | 50.26 | % | | | 50.26 | % | | | 40.38 | % | | | 40.38 | % | | | 40.38 | % | |
* Per share amounts have been calculated using the average shares method.
See Notes to Financial Highlights.
See Notes to Financial Statements.
78
| | | Year ended October 31, | |
| | | 2005 | | 2004 | | 2003 | |
| | | Class Y | | Class C | | Class A | | Class Y | | Class C | | Class A | | Class Y | | Class C | | Class A | |
| First Eagle Fund of America | |
| Selected Per Share Data* | |
| Net asset value, beginning of year | | $ | 25.81 | | | $ | 24.44 | | | $ | 25.54 | | | $ | 23.03 | | | $ | 21.99 | | | $ | 22.80 | | | $ | 19.47 | | | $ | 18.73 | | | $ | 19.29 | | |
| Income from investment operations: | |
| Net investment income (loss) | | | (0.07 | ) | | | (0.26 | ) | | | (0.09 | ) | | | (0.16 | ) | | | (0.33 | ) | | | (0.22 | ) | | | (0.17 | ) | | | (0.31 | ) | | | (0.22 | ) | |
| Net realized and unrealized gains on investments | | | 2.38 | | | | 2.26 | | | | 2.36 | | | | 3.41 | | | | 3.25 | | | | 3.43 | | | | 3.73 | | | | 3.57 | | | | 3.73 | | |
| Total from investment operations | | | 2.31 | | | | 2.00 | | | | 2.27 | | | | 3.25 | | | | 2.92 | | | | 3.21 | | | | 3.56 | | | | 3.26 | | | | 3.51 | | |
| Less distributions: | |
| Distributions from capital gains | | | (1.70 | ) | | | (1.70 | ) | | | (1.70 | ) | | | (0.47 | ) | | | (0.47 | ) | | | (0.47 | ) | | | — | | | | — | | | | — | | |
| Total distributions | | | (1.70 | ) | | | (1.70 | ) | | | (1.70 | ) | | | (0.47 | ) | | | (0.47 | ) | | | (0.47 | ) | | | — | | | | — | | | | — | | |
| Net asset value, end of year | | $ | 26.42 | | | $ | 24.74 | | | $ | 26.11 | | | $ | 25.81 | | | $ | 24.44 | | | $ | 25.54 | | | $ | 23.03 | | | $ | 21.99 | | | $ | 22.80 | | |
| Total Returnc | | | 9.23 | % | | | 8.43 | % | | | 9.16 | % | | | 14.30 | % | | | 13.46 | % | | | 14.27 | % | | | 18.28 | % | | | 17.41 | % | | | 18.20 | % | |
| Ratios and Supplemental Data | |
| Net assets, end of period (millions) | | $ | 684 | | | $ | 36 | | | $ | 29 | | | $ | 601 | | | $ | 14 | | | $ | 17 | | | $ | 554 | | | $ | 11 | | | $ | 6 | | |
| Ratio of operating expenses to average net assetse | | | 1.43 | % | | | 2.17 | % | | | 1.49 | % | | | 1.46 | % | | | 2.21 | % | | | 1.72 | % | | | 1.50 | % | | | 2.25 | % | | | 1.75 | % | |
| Ratio of net investment income (loss) to average net assetsf | | | (0.27 | %) | | | (1.03 | %) | | | (0.34 | %) | | | (0.63 | %) | | | (1.39 | %) | | | (0.91 | %) | | | (0.79 | %) | | | (1.55 | %) | | | (1.07 | %) | |
| Portfolio turnover rate | | | 54.54 | % | | | 54.54 | % | | | 54.54 | % | | | 44.68 | % | | | 44.68 | % | | | 44.68 | % | | | 47.88 | % | | | 47.88 | % | | | 47.88 | % | |
79
FIRST EAGLE FUNDS
NOTES TO FINANCIAL HIGHLIGHTS
a Annualized.
b Not annualized.
c Does not give effect to the deduction of the CDSC (Contingent Deferred Sales Charge) of 1.00%.
d May 15, 2003 inception date.
e The ratio of operating expenses to average net assets without the effect of earnings credits and in the case of the First Eagle U.S. Value Fund,without the effect of earnings credits and expense reimbursements are as follows:
| | | Year ended October 31, | |
| | | 2007 | | 2006 | | 2005 | |
| | | Class A | | Class I | | Class C | | Class A | | Class I | | Class C | | Class A | | Class I | | Class C | |
| First Eagle Global Fund | | | 1.12 | % | | | 0.87 | % | | | 1.87 | % | | | 1.14 | % | | | 0.89 | % | | | 1.89 | % | | | 1.20 | % | | | 0.95 | % | | | 1.95 | % | |
| First Eagle Overseas Fund | | | 1.12 | % | | | 0.87 | % | | | 1.87 | % | | | 1.12 | % | | | 0.87 | % | | | 1.87 | % | | | 1.18 | % | | | 0.93 | % | | | 1.93 | % | |
| First Eagle U.S. Value Fund | | | 1.20 | % | | | 0.96 | % | | | 1.95 | % | | | 1.25 | % | | | 1.00 | % | | | 2.00 | % | | | 1.28 | % | | | 1.04 | % | | | 2.02 | % | |
| First Eagle Gold Fund | | | 1.20 | % | | | 0.95 | % | | | 1.95 | % | | | 1.22 | % | | | 0.97 | % | | | 1.97 | % | | | 1.30 | % | | | 1.05 | % | | | 2.05 | % | |
| | | Year ended October 31, | |
| | | 2007 | | 2006 | | 2005 | |
| | | Class Y | | Class C | | Class A | | Class Y | | Class C | | Class A | | Class Y | | Class C | | Class A | |
| First Eagle Fund of America | | | 1.41 | % | | | 2.16 | % | | | 1.41 | % | | | 1.41 | % | | | 2.16 | % | | | 1.41 | % | | | 1.43 | % | | | 2.17 | % | | | 1.49 | % | |
f The ratio of net investment income (loss) to average net assets without the effect of earnings credits and in the case of the First Eagle U.S. Value Fund, without the effect of earnings credits and expense reimbursements are as follows:
| | | Year ended October 31, | |
| | | 2007 | | 2006 | | 2005 | |
| | | Class A | | Class I | | Class C | | Class A | | Class I | | Class C | | Class A | | Class I | | Class C | |
| First Eagle Global Fund | | | 1.39 | % | | | 1.64 | % | | | 0.64 | % | | | 1.30 | % | | | 1.57 | % | | | 0.56 | % | | | 1.20 | % | | | 1.48 | % | | | 0.47 | % | |
| First Eagle Overseas Fund | | | 1.54 | % | | | 1.79 | % | | | 0.78 | % | | | 1.56 | % | | | 1.82 | % | | | 0.81 | % | | | 1.21 | % | | | 1.46 | % | | | 0.46 | % | |
| First Eagle U.S. Value Fund | | | 2.04 | % | | | 2.32 | % | | | 1.28 | % | | | 1.87 | % | | | 2.12 | % | | | 1.12 | % | | | 1.40 | % | | | 1.63 | % | | | 0.66 | % | |
| First Eagle Gold Fund | | | (0.56 | %) | | | (0.31 | %) | | | (1.31 | %) | | | (0.59 | %) | | | (0.34 | %) | | | (1.34 | %) | | | (0.24 | %) | | | (0.01 | %) | | | (0.98 | %) | |
| | | Year ended October 31, | |
| | | 2007 | | 2006 | | 2005 | |
| | | Class Y | | Class C | | Class A | | Class Y | | Class C | | Class A | | Class Y | | Class C | | Class A | |
| First Eagle Fund of America | | | 0.25 | %g | | | (0.52 | %)g | | | 0.17 | %g | | | (0.30 | %) | | | (1.05 | %) | | | (0.30 | %) | | | (0.27 | %) | | | (1.04 | %) | | | (0.34 | %) | |
g Investment income (loss) per share reflects special dividends received in the First Eagle Fund of America (Class Y, C and A) which amounted to $0.13, $0.12, and $0.13 per share. Excluding the special dividends, the ratio of net investment income (loss) to average net assets both with and without the effect of earnings credits in First Eagle Fund of America (Class Y, C, and A) would have been (0.22%), (1.00%), and (0.31%).
80
| | | Year ended October 31, | |
| | | 2004 | | 2003 | |
| | | Class A | | Class I | | Class C | | Class A | | Class I | | Class C | |
| First Eagle Global Fund | | | 1.24 | % | | | 0.99 | % | | | 1.99 | % | | | 1.32 | % | | | 1.07 | % | | | 2.07 | % | |
| First Eagle Overseas Fund | | | 1.25 | % | | | 1.00 | % | | | 2.00 | % | | | 1.31 | % | | | 1.06 | % | | | 2.05 | % | |
| First Eagle U.S. Value Fund | | | 1.38 | % | | | 1.13 | % | | | 2.13 | % | | | 1.51 | % | | | 1.26 | % | | | 2.26 | % | |
| First Eagle Gold Fund | | | 1.39 | % | | | 1.14 | % | | | 2.14 | % | | | 1.50 | % | | | 1.23 | %ad | | | 2.19 | %ad | |
| | | Year ended October 31, | |
| | | 2004 | | 2003 | |
| | | Class Y | | Class C | | Class A | | Class Y | | Class C | | Class A | |
| First Eagle Fund of America | | | 1.46 | % | | | 2.21 | % | | | 1.72 | % | | | 1.50 | % | | | 2.25 | % | | | 1.75 | % | |
| | | Year ended October 31, | |
| | | 2004 | | 2003 | |
| | | Class A | | Class I | | Class C | | Class A | | Class I | | Class C | |
| First Eagle Global Fund | | | 1.46 | % | | | 1.67 | % | | | 0.66 | % | | | 1.91 | % | | | 2.10 | % | | | 1.07 | % | |
| First Eagle Overseas Fund | | | 0.90 | % | | | 1.17 | % | | | 0.17 | % | | | 1.23 | % | | | 1.48 | % | | | 0.45 | % | |
| First Eagle U.S. Value Fund | | | 1.66 | % | | | 2.00 | % | | | 0.95 | % | | | 1.72 | % | | | 1.99 | % | | | 0.97 | % | |
| First Eagle Gold Fund | | | (0.62 | %) | | | (0.35 | %) | | | (1.34 | %) | | | (0.43 | %) | | | (0.25 | %)ad | | | (1.26 | %)ad | |
| | | Year ended October 31, | |
| | | 2004 | | 2003 | |
| | | Class Y | | Class C | | Class A | | Class Y | | Class C | | Class A | |
| First Eagle Fund of America | | | (0.57 | %) | | | (1.32 | %) | | | (0.84 | %) | | | (0.79 | %) | | | (1.55 | %) | | | (1.07 | %) | |
81
REPORT OF INDEPENDENT REGISTERED PUBLIC ACCOUNTING FIRM
To the Board of Trustees and Shareholders of
First Eagle Funds:
In our opinion, the accompanying statements of assets and liabilities, including the schedules of investments, and the related statements of operations, of changes in net assets and the financial highlights present fairly, in all material respects, the financial position of First Eagle Global Fund, First Eagle Overseas Fund, First Eagle U.S. Value Fund, First Eagle Gold Fund and First Eagle Fund of America (collectively hereafter referred to as the "Funds") at October 31, 2007, the results of each of their operations for the year then ended, and the changes in each of their net assets and the financial highlights for the two years then ended, in conformity with accounting principles generally accepted in the United States of America. These financial statements and financial highlights (hereafter referred to as "financial statements") are the responsibility of the Funds' management. Our responsibility is to express an opinion on these financial statements based on our audits. We conducted our audits of these financial statements in accordance with the standards of the Public Company Accounting Oversight Board (United States). Those standards require that we plan and perform the audits to obtain reasonable assurance about whether the financial statements are free of material misstatement. An audit includes examining, on a test basis, evidence supporting the amounts and disclosures in the financial statements, assessing the accounting principles used and significant estimates made by management, and evaluating the overall financial statement presentation. We believe that our audits, which included confirmation of securities at October 31, 2007 by correspondence with the custodian and brokers, provide a reasonable basis for our opinion. The financial highlights for each of the three years ended October 31, 2005 were audited by another independent registered public accounting firm, whose report dated December 22, 2005 was unqualified.

PricewaterhouseCoopers LLP
New York, New York
December 21, 2007
82
FIRST EAGLE FUNDS
Fund Expenses
(Unaudited)
Example
As a shareholder of the First Eagle Funds, you may incur two types of costs: (1) transaction costs, including front-end and contingent deferred sales charges (loads), and (2) ongoing costs, including advisory fees, distribution (12b-1) and/or service fees and other fund expenses. This Example is intended to help you understand your ongoing costs (in dollars) of investing in each of the First Eagle Funds and to compare these costs with the ongoing costs of investing in other mutual funds.
This Example is based on an investment of $1,000 invested on May 1, 2007 and held for the six months ended October 31, 2007.
Actual Expenses
The table below titled "Based on Actual Total Return" provides information about actual account values and actual expenses. You may use the information provided in this table, together with the amount you invested, to estimate the expenses that you paid over the period. To estimate the expenses you paid on your account, divide your ending account value by $1,000 (for example, an $8,600 ending account value divided by $1,000 = 8.6), then multiply the result by the number under the heading entitled "Expenses Paid During the Period".
Based on Actual Total Return (1)
| | | Actual Total
Return
Without
Sales Charges(2) | | Beginning
Account
Value | | Ending
Account
Value | | Expenses
Paid
During the
Period(3) | |
| First Eagle Global Fund Class A | | | 5.86 | % | | $ | 1,000.00 | | | $ | 1,058.60 | | | $ | 5.81 | | |
| First Eagle Global Fund Class I | | | 5.99 | % | | | 1,000.00 | | | | 1,059.90 | | | | 4.52 | | |
| First Eagle Global Fund Class C | | | 5.48 | % | | | 1,000.00 | | | | 1,054.80 | | | | 9.69 | | |
| First Eagle Overseas Fund Class A | | | 4.35 | % | | | 1,000.00 | | | | 1,043.50 | | | | 5.77 | | |
| First Eagle Overseas Fund Class I | | | 4.49 | % | | | 1,000.00 | | | | 1,044.90 | | | | 4.48 | | |
| First Eagle Overseas Fund Class C | | | 3.95 | % | | | 1,000.00 | | | | 1,039.50 | | | | 9.61 | | |
| First Eagle U.S. Value Fund Class A | | | 5.06 | % | | | 1,000.00 | | | | 1,050.60 | | | | 6.15 | | |
| First Eagle U.S. Value Fund Class I | | | 5.20 | % | | | 1,000.00 | | | | 1,052.00 | | | | 4.86 | | |
| First Eagle U.S. Value Fund Class C | | | 4.65 | % | | | 1,000.00 | | | | 1,046.50 | | | | 10.01 | | |
| First Eagle Gold Fund Class A | | | 27.66 | % | | | 1,000.00 | | | | 1,276.60 | | | | 6.89 | | |
| First Eagle Gold Fund Class I | | | 27.81 | % | | | 1,000.00 | | | | 1,278.10 | | | | 5.45 | | |
| First Eagle Gold Fund Class C | | | 27.18 | % | | | 1,000.00 | | | | 1,271.80 | | | | 11.17 | | |
| First Eagle Fund of America Class A | | | 6.55 | % | | | 1,000.00 | | | | 1,065.50 | | | | 7.29 | | |
| First Eagle Fund of America Class C | | | 6.12 | % | | | 1,000.00 | | | | 1,061.20 | | | | 11.17 | | |
| First Eagle Fund of America Class Y | | | 6.56 | % | | | 1,000.00 | | | | 1,065.60 | | | | 7.29 | | |
(1) For the six months ended October 31, 2007.
(2) Assumes reinvestment of all dividends and capital gain distributions, if any, at net asset value and does not reflect the deduction of the applicable sales charge. Had the effect of sales charges been reflected, expenses would have been higher and returns lower. Total return is not annualized, as it may not be representative of the total return for the year.
(3) Expenses are equal to the annualized expense ratio of 1.12%, 0.87%, 1.87%, 1.12%, 0.87%, 1.87%, 1.19%, 0.94%, 1.94%, 1.20%, 0.95%, 1.95%, 1.40%, 2.15%, and 1.40% for the First Eagle Global Fund Class A, I and C; First Eagle Overseas Fund Class A, I, and C; First Eagle U.S. Value Fund Class A, I, and C; First Eagle Gold Fund Class A, I and C ; and First Eagle Fund of America Class A, C, and Y, respectively, multiplied by the average account value over the period, multiplied by 184/365 (to reflect the one-half year period).
83
FIRST EAGLE FUNDS
Fund Expenses—(Continued)
(Unaudited)
Hypothetical Example for Comparison Purposes
The table below titled "Based on Hypothetical Total Return" provides information about hypothetical account values and hypothetical expenses based on the actual expense ratios and an assumed rate of return of 5.00% per year before expenses, which is not the First Eagle Fund's actual return. The hypothetical account values and expenses may not be used to estimate the actual ending account balance or expenses you paid for the period. You may use the information provided in this table to compare the ongoing costs of investing in the First Eagle Funds and other funds. To do so, compare the 5.00% hypothetical example relating to the First Eagle Funds with the 5.00% hypothetical examples that appear in the shareholder reports of other funds.
Please note that the expenses shown in the table below are meant to highlight your ongoing costs only and do not reflect any transactional costs, such as front-end or contingent deferred sales charges (loads). Therefore, the table is useful in comparing ongoing costs only, and will not help you determine the relative total costs of owning different funds. In addition, if these transaction costs were included, your costs would have been higher.
Based on Hypothetical Total Return (1)
| | | Hypothetical
Annualized
Total
Return | | Beginning
Account
Value | | Ending
Account
Value | | Expenses
Paid
During the
Period(2) | |
| First Eagle Global Fund Class A | | | 5.00 | % | | $ | 1,000.00 | | | $ | 1,019.56 | | | $ | 5.70 | | |
| First Eagle Global Fund Class I | | | 5.00 | % | | | 1,000.00 | | | | 1,020.82 | | | | 4.43 | | |
| First Eagle Global Fund Class C | | | 5.00 | % | | | 1,000.00 | | | | 1,015.78 | | | | 9.50 | | |
| First Eagle Overseas Fund Class A | | | 5.00 | % | | | 1,000.00 | | | | 1,019.56 | | | | 5.70 | | |
| First Eagle Overseas Fund Class I | | | 5.00 | % | | | 1,000.00 | | | | 1,020.82 | | | | 4.43 | | |
| First Eagle Overseas Fund Class C | | | 5.00 | % | | | 1,000.00 | | | | 1,015.78 | | | | 9.50 | | |
| First Eagle U.S. Value Fund Class A | | | 5.00 | % | | | 1,000.00 | | | | 1,019.21 | | | | 6.06 | | |
| First Eagle U.S. Value Fund Class I | | | 5.00 | % | | | 1,000.00 | | | | 1,020.47 | | | | 4.79 | | |
| First Eagle U.S. Value Fund Class C | | | 5.00 | % | | | 1,000.00 | | | | 1,015.43 | | | | 9.86 | | |
| First Eagle Gold Fund Class A | | | 5.00 | % | | | 1,000.00 | | | | 1,019.16 | | | | 6.11 | | |
| First Eagle Gold Fund Class I | | | 5.00 | % | | | 1,000.00 | | | | 1,020.42 | | | | 4.84 | | |
| First Eagle Gold Fund Class C | | | 5.00 | % | | | 1,000.00 | | | | 1,015.38 | | | | 9.91 | | |
| First Eagle Fund of America Class A | | | 5.00 | % | | | 1,000.00 | | | | 1,018.15 | | | | 7.12 | | |
| First Eagle Fund of America Class C | | | 5.00 | % | | | 1,000.00 | | | | 1,014.37 | | | | 10.92 | | |
| First Eagle Fund of America Class Y | | | 5.00 | % | | | 1,000.00 | | | | 1,018.15 | | | | 7.12 | | |
(1) For the six months ended October 31, 2007.
(2) Expenses are equal to the annualized expense ratio of 1.12%, 0.87%, 1.87%, 1.12%, 0.87%, 1.87%, 1.19%, 0.94%, 1.94%, 1.20%, 0.95%, 1.95%, 1.40%, 2.15%, and 1.40% for the First Eagle Global Fund Class A, I and C; First Eagle Overseas Fund Class A, I, and C; First Eagle U.S. Value Fund Class A, I, and C; First Eagle Gold Fund Class A, I and C ; and First Eagle Fund of America Class A, C, and Y, respectively, multiplied by the average account value over the period, multiplied by 184/365 (to reflect the one-half year period).
84
FIRST EAGLE FUNDS
TAX INFORMATION
Fiscal Year Ended October 31, 2007
(Unaudited)
Each portfolio designates the following amounts (or the maximum amount allowable) distributed during the fiscal year ended October 31, 2007, if any, as capital gain dividends, dividends eligible for the corporate dividends received deduction and/or qualified dividend income:
| | | % of Qualifying | | % of Dividends
Eligible for the
Dividends Received | | Long-Term
Capital
Gains** | |
| | | Dividend Income | | Deduction | | 2007 | |
| First Eagle Global Fund | | | 37.87 | % | | | 12.12 | % | | $ | 1,450,916,799 | | |
| First Eagle Overseas Fund* | | | 27.05 | % | | | 1.00 | % | | | 943,616,712 | | |
| First Eagle U.S. Value | | | 24.10 | % | | | 24.10 | % | | | 21,935,538 | | |
| First Eagle Gold Fund | | | 7.01 | % | | | 2.32 | % | | | 132,595,518 | | |
| First Eagle Fund of America | | | 11.27 | % | | | 11.27 | % | | | 71,270,795 | | |
* First Eagle Overseas Fund paid foreign taxes of $18,583,314 and recognized foreign source income of $213,764,034. Pursuant to Section 853 of the Internal Revenue Code, the Fund designates such amounts as having been paid in connection with dividends distributed from investment taxable income during the fiscal year ended October 31, 2007.
** First Eagle Global Fund, First Eagle Overseas Fund, First Eagle U.S. Value Fund First Eagle Gold Fund and First Eagle Fund of America distributed long-term gains at rates of 15% and 28% as follows: $1,415,976,385 and $34,940,414, $923,547,622 and $20,069,090, $21,296,432 and $639,106, $115,435,275 and $17,160,243 and $71,270,795 and $0, respectively.
85
FIRST EAGLE FUNDS
ADDITIONAL INFORMATION
(Unaudited)
MANAGEMENT OF THE TRUST
The business of the Trust is managed by its Board of Trustees, which elects officers responsible for the day to day operations of the Funds and for the execution of the policies formulated by the Board of Trustees.
Pertinent information regarding the members of the Board of Trustees and principal officers of the Trust is set forth below. Some of the Trustees and officers are employees of the Adviser and its affiliates. At least a majority of the Trust's Board of Trustees are not "interested persons" as that term is defined in the Investment Company Act.
INDEPENDENT TRUSTEES(1)
| Name, Age and Address | | Position(s)
Held with
the Trust | | Term of
Office(2)
and Length
of Time
Served | | Principal
Occupation(s)
During Past 5 Years | | Number of
Portfolios
in the Fund
Complex
Overseen by
Trustee | | Other
Directorships/
Trusteeships
Held by Trustee | |
Lisa Anderson
1345 Avenue of the Americas
New York, New York 10105
(born October 1950) | | Trustee | | December 2005 to present | | James T. Shotwell Professor of International Relations and Dean, School of International and Public Affairs, Columbia University; President, Middle East Studies Association | | | 6 | | | Chair, Social Science Research Council; Member, Carnegie Council on Ethics and International Affairs; Member Emerita, Human Rights Watch; Trustee, First Eagle Variable Funds (1 portfolio) | |
|
Candace K. Beinecke
One Battery Park Plaza
New York, New York 10004
(born December 1946) | | Trustee
(Chair) | | December 1999 to present(3) | | Chair, Hughes Hubbard & Reed LLP | | | 6 | | | Director, ALSTOM; Director, Partnership for New York City; Director, Merce Cunningham Dance Foundation, Inc.; Director, Rockefeller Financial Services, Inc.; Director, Rockefeller & Company, Inc.; Board of Advisors, Yale Law School Center for the Study of Corporate Law; Trustee, First Eagle Variable Funds (Chair) (1 portfolio) | |
|
(1) Trustees who are not "interested persons' of the Trust as defined in the Investment Company Act.
(2) The term of office of each Trustee expires on his/her 70th birthday.
(3) Ms. Beinecke also served as a trustee of a predecessor fund to First Eagle Fund of America since 1996.
86
| Name, Age and Address | | Position(s)
Held with
the Trust | | Term of
Office(1)
and Length
of Time
Served | | Principal
Occupation(s)
During Past 5 Years | | Number of
Portfolios
in the Fund
Complex
Overseen by
Trustee | | Other
Directorships/
Trusteeships
Held by Trustee | |
Jean D. Hamilton
1345 Avenue of the Americas
New York, New York 10105
(born January 1947) | | Trustee | | March 2003 to present | | Private Investor/
Independent Consultant; Member, Brock Capital Group LLC; prior to November 2002, Chief Executive Officer, Prudential Institutional; Executive Vice President, Prudential Financial, Inc. | | | 6 | | | Director, RenaissanceRe Holdings Ltd.; Director, Four Nations; Trustee, First Eagle Variable Funds (1 portfolio) | |
|
James E. Jordan
1345 Avenue of the Americas
New York, New York 10105
(born April 1944) | | Trustee | | December 1999 to present | | Private Investor and Independent Consultant; prior to July 2005, Managing Director, Arnhold and S. Bleichroeder Advisers, LLC and Director, ASB Securities LLC and ASB Advisers UK, Limited; prior to July 2002, private investor and consultant to The Jordan Company (private investment banking firm) since June 1997 | | | 6 | | | Director, Leucadia National Corporation; Director, Consolidated-Tomoka Land Company; Director, JZ Equity Partners, Plc. (U.K. investment trust company); Director, Columbia University School of International and Public Affairs; Chairman's Council, Conservation International; Trustee, First Eagle Variable Funds (1 portfolio) | |
|
William M. Kelly
500 Fifth Avenue,
50th Floor
New York, New York 10110
(born February 1944) | | Trustee | | December 1999 to present(2) | | President, Lingold Associates | | | 6 | | | Treasurer and Trustee, Black Rock Forest Preservation and Consortium; Trustee, St. Anselm College; Trustee, First Eagle Variable Funds (1 portfolio) | |
|
(1) The term of office of each Trustee expires on his/her 70th birthday.
(2) Mr. Kelly also served as a trustee of a predecessor fund to First Eagle Fund of America since 1998.
87
| Name, Age and Address | | Position(s)
Held with
the Trust | | Term of
Office(1)
and Length
of Time
Served | | Principal
Occupation(s)
During Past 5 Years | | Number of
Portfolios
in the Fund
Complex
Overseen by
Trustee | | Other
Directorships/
Trusteeships
Held by Trustee | |
Paul J. Lawler
One Michigan Avenue
East Battle Creek,
Michigan 49017
(born May 1948) | | Trustee | | March 2002 to present | | Vice President Investments and Chief Investment Officer, W.K. Kellogg Foundation | | | 6 | | | Finance and Investment Committee Member, Battle Creek Community Foundation; Custody Advisory Committee Member, The Bank of New York; Advisory Committee, Common Fund Capital; Advisory Committee, TA Realty Advisors; Trustee, First Eagle Variable Funds (1 portfolio) | |
|
Dominique M. Raillard
15 Boulevard Delessert
75016 Paris France
(born June 1938) | | Trustee | | April 1987 to present | | Private Investor and Independent Consultant | | | 6 | | | Trustee, First Eagle Variable Funds (1 portfolio) | |
|
(1) The term of office of each Trustee expires on his/her 70th birthday.
88
INTERESTED TRUSTEE
| Name, Age and Address | | Position(s)
Held with
the Trust | | Term of
Office(1)
and Length
of Time
Served | | Principal
Occupation(s)
During Past 5 Years | | Number of
Portfolios
in the Fund
Complex
Overseen by
Trustee | | Other
Directorships/
Trusteeships
Held by Trustee | |
John P. Arnhold(2)
1345 Avenue of the Americas
New York, New York 10105
(born December 1953) | | President and Trustee | | December 1999 to present | | Co-President, Co-CEO and Director, Arnhold and S. Bleichroeder Holdings, Inc.; Chairman, CEO and Director, Arnhold and S. Bleichroeder Advisers, LLC and ASB Securities LLC; prior to March 2005, President and Director, Natexis Bleichroeder, Inc. and Natexis Bleichroeder, UK | | | 6 | | | Director, Arnhold Ceramics; Director, The Arnhold Foundation; Director, The Mulago Foundation; Director, Hanseatic Asset Management LBG; Director, Quantum Endowment Fund; Director, Educational Broadcasting Corporation; Trustee, Trinity Episcopal Schools Corp.; Trustee, Vassar College; Trustee, Sports and Arts in Schools Foundation; Trustee, Jazz at Lincoln Center; President and Trustee, First Eagle Variable Funds (1 portfolio) | |
|
(1) The term of office of each Trustee expires on his/her 70th birthday.
(2) Mr. Arnhold is an Interested Trustee (i.e., an "interested persons" of the Trust as defined in the Investment Company Act) because he is an officer and director of the Trust's investment adviser and principal underwriter.
89
OFFICERS
| Name, Age and Address | | Position(s)
Held with
the Trust | | Term of Office
and Length of
Time Served(1) | | Principal Occupation(s)
During Past Five (5) Years | |
John P. Arnhold
1345 Avenue of the Americas
New York, New York 10105
(born December 1953) | | President and Trustee | | December
1999 to present | | See table on preceding page related to Interested Trustees | |
|
Robert Bruno
1345 Avenue of the Americas
New York, New York 10105
(born June 1964) | | Chief Operations and Financial Officer | | December
1999 to present | | Senior Vice President, Arnhold and S. Bleichroeder Advisers, LLC; Chief Compliance Officer and Senior Vice President, ASB Securities LLC; Chief Operations and Financial Officer, First Eagle Variable Funds | |
|
Mark D. Goldstein
1345 Avenue of the Americas
New York, New York 10105
(born October 1964) | | Chief Compliance Officer | | February 2005 to present | | General Counsel, Chief Compliance Officer and Senior Vice President, Arnhold and S. Bleichroeder Advisers, LLC; General Counsel and Secretary of Arnhold and S. Bleichroeder Holdings, Inc., and Chief Compliance Officer, First Eagle Variable Funds from February 2005; Chief Compliance Officer, Good Hope Advisers, LLC from January 2006; Senior Counsel and Chief Compliance Officer, MacKay Shields LLC from April 2004; Senior Associate General Counsel, UBS Financial Services, Inc. from May 1998 | |
|
Suzan J. Afifi
1345 Avenue of the Americas
New York, New York 10105
(born October 1952) | | Vice President and Secretary | | December
1999 to present | | Vice President, Arnhold and S. Bleichroeder Advisers, LLC; Vice President, ASB Securities LLC; Vice President and Secretary, First Eagle Variable Funds | |
|
Stefanie Hempstead
1345 Avenue of the Americas
New York, New York 10105
(born July 1973) | | Vice President and Treasurer | | May 2000 to present | | Senior Vice President, Arnhold and S. Bleichroeder Advisers, LLC; Vice President, ASB Securities LLC; Vice President and Treasurer, First Eagle Variable Funds | |
|
Michael Luzzatto
1345 Avenue of the Americas
New York, New York 10105
(born April 1977) | | Assistant Vice President | | December
2004 to present | | Vice President, Arnhold and S. Bleichroeder Advisers, LLC; Vice President, ASB Securities LLC; Assistant Vice President, First Eagle Variable Funds from December 2004 | |
|
Winnie Chin
1345 Avenue of the Americas
New York, New York 10105
(born July 1974) | | Assistant Treasurer | | March 2001 to present | | Vice President, Arnhold and S. Bleichroeder Advisers, LLC; Assistant Treasurer, First Eagle Variable Funds | |
|
Philip Santopadre
1345 Avenue of the Americas
New York, New York 10105
(born August 1977) | | Assistant Treasurer | | September
2005 to present | | Vice President, Arnhold and S. Bleichroeder Advisers, LLC; Assistant Treasurer, First Eagle Variable Funds | |
|
(1) The term of office of each officer is indefinite. Length of time served represents time served as an officer of the Trust (or its predecessor entities), although various positions may have been held during the period.
90
First Eagle Funds
1345 Avenue of the Americas
New York, NY 10105
www.firsteaglefunds.com
Trustees
Lisa Anderson
John P. Arnhold
Candace K. Beinecke (Chair)
Jean D. Hamilton
James E. Jordan
William M. Kelly
Paul J. Lawler
Dominique Raillard
Officers
John P. Arnhold
President
Robert Bruno
Chief Operations & Financial Officer
Mark D. Goldstein
Chief Compliance Officer
Suzan J. Afifi
Vice President & Secretary
Stefanie Hempstead
Vice President & Treasurer
Michael Luzzatto
Assistant Vice President
Winnie Chin
Assistant Treasurer
Philip Santopadre
Assistant Treasurer
Investment Adviser
Arnhold and S. Bleichroeder
Advisers, LLC
1345 Avenue of the Americas
New York, NY 10105
Legal Counsel
Shearman & Sterling LLP
599 Lexington Avenue
New York, NY 10022
Custodian
State Street Bank and Trust Company
801 Pennsylvania
Kansas City, MO 64105
Shareholder Servicing Agent
DST Systems, Inc.
330 West 9th Street
Kansas City, MO 64105
(800) 334-2143
Underwriter
First Eagle Funds Distributors,
a division of ASB Securities LLC
1345 Avenue of the Americas
New York, NY 10105
Independent Registered
Public Accounting Firm
PricewaterhouseCoopers LLP
300 Madison Avenue
New York, NY 10017
This report is not authorized for distribution to prospective investors unless preceded or accompanied by a currently effective prospectus of First Eagle Funds.

Item 2. Code of Ethics.
The Registrant has adopted a code of ethics that applies to its principal executive officer and principal financial officer. Copies of the code of ethics may be requested free of charge by calling 1-800-334-2143 (toll free).
Item 3. Audit Committee Financial Expert.
The Board of Trustees of the registrant has designated Paul J. Lawler and William M. Kelly as Audit Committee Financial Experts. Mr. Lawler and Mr. Kelly are both considered by the Board to be independent trustees.
Item 4. Principal Accountant Fees and Services
(a) – (d) Aggregate fees billed to the registrant for the last two fiscal years for professional services rendered by the registrant’s principal accountant were as follows:
| | 2007 | | 2006 | |
| | | | | |
Audit Fees | | $ | 318,981 | | $ | 206,818 | |
| | | | | |
Audit-Related Fees | | | | | |
| | | | | |
Tax Fees | | 183,690 | | $ | 123,228 | |
| | �� | | | |
All Other Fees | | | | | |
| | | | | | | |
Audit fees include amounts related to the audit of the registrant’s annual financial statements and services normally provided by the accountant in connection with statutory and regulatory filings. Audit-related fees include amounts reasonably related to the performance of the audit of the registrant’s financial statements, in particular the issuance of a report on internal controls. Tax fees include amounts related to tax compliance, tax planning, and tax advice. Other fees include the registrant’s pro-rata share of amounts for agreed-upon procedures in conjunction with service contract approvals by the registrant’s Board of Trustees.
(e)(1) The registrant’s audit committee has adopted a policy whereby audit and non-audit services performed by the registrant’s principal accountant for the registrant, its investment adviser, and any entity controlling, controlled by, or under common control with the investment adviser that provides ongoing services to the registrant require pre-approval by the committee or a designated member thereof. If such a service is required between regularly scheduled audit committee meetings, pre-approval may be authorized by one audit committee member with ratification at the next scheduled audit committee meeting. Waiver of pre-approval for audit and non-audit services requiring fees of a de minimis amount is not permitted.
(e)(2) No services included in (b) – (d) above were approved pursuant to paragraph (c)(7)(i)(C) of Rule 2-01 of Regulation S-X.
(f) Not applicable.
(g) Other than as described in the table above, the aggregate fees billed for the most recent fiscal year and the preceding fiscal year by the registrant’s principal accountant for non-audit services rendered to the registrant, its investment adviser, and any entity controlling, controlled by, or under common control with the investment adviser that provides ongoing services to the registrant was $0 in both 2007 and 2006.
(h) Not applicable.
Item 5. Audit Committee of Listed Registrants
Not applicable at this time.
Item 6. Schedule of Investments
Included as part of the Report to Stockholders filed pursuant to Item 1.
Item 7. Disclosure of Proxy Voting Policies and Procedures for Closed-End Management Investment Companies.
Not applicable at this time.
Item 8. Portfolio Managers of Closed-End Investment Companies.
Not applicable at this time.
Item 9. Purchases of Equity Securities by Closed-End Management Investment Company and Affiliated Purchasers.
Not applicable at this time.
Item 10. Submission of Matters to a Vote of Security Holders.
No material change to report at this time.
Item 11. Controls and Procedures.
(a) In the opinion of the principal executive officer and principal financial officer, based on their evaluation, the registrant’s disclosure controls and procedures are adequately designed and are operating effectively to ensure (i) that material information relating to the registrant, including its consolidated subsidiaries, is made known to them by others within those entities, particularly during the period in which this report is being prepared; and (ii) that information required to be disclosed by the registrant on Form N-CSR is recorded, processed, summarized and reported within the time periods specified in the Securities and Exchange Commission’s rules and forms.
(b) There were no changes in the registrant’s internal control over financial reporting that occurred during the registrant’s most recent fiscal half-year (the registrant’s second fiscal half-year in the case of an annual report) that have materially affected or are reasonably likely to materially affect, the registrant’s internal control over financial reporting.
Item 12. Exhibits.
(a)(1) Code of ethics required to be disclosed under Item 2 of Form N-CSR.
(a)(2) Certifications pursuant to Rule 30a-2(a) under the Investment Company Act of 1940 (17 CFR 270.30a-2(a)): Attached hereto.
(a)(3) Not applicable.
(b) Certification pursuant to Rule 30a-2(b) under the Investment Company Act of 1940 (17 CFR 270.30a-2(b)): Attached hereto.
SIGNATURES
Pursuant to the requirements of the Securities Exchange Act of 1934 and the Investment Company Act of 1940, the registrant has duly caused this report to be signed on its behalf by the undersigned, thereunto duly authorized.
(Registrant) | | First Eagle Funds |
| | |
By (Signature and Title)* | | /s/ John P. Arnhold |
| | |
| | John P. Arnhold, President |
Date 1/7/2008
Pursuant to the requirements of the Securities Exchange Act of 1934 and the Investment Company Act of 1940, this report has been signed below by the following persons on behalf of the registrant and in the capacities and on the dates indicated.
By (Signature and Title)* | | /s/ John P. Arnhold |
| | |
| | John P. Arnhold, Principal Executive Officer |
Date 1/7/2008
By (Signature and Title)* | | /s/ Robert Bruno |
| | |
| | Robert Bruno, Principal Financial Officer |
Date 1/7/2008
* Print the name and title of each signing officer under his or her signature.