UNITED STATES
SECURITIES AND EXCHANGE COMMISSION
Washington, D.C. 20549
FORM N-CSR
CERTIFIED SHAREHOLDER REPORT OF REGISTERED
MANAGEMENT INVESTMENT COMPANIES
Investment Company Act file number | 811-7762 |
|
First Eagle Funds |
(Exact name of registrant as specified in charter) |
|
1345 Avenue of the Americas
New York, NY | | 10105-4300 |
(Address of principal executive offices) | | (Zip code) |
|
Robert Bruno First Eagle Funds 1345 Avenue of the Americas New York, NY 10105-4300 |
(Name and address of agent for service) |
|
Registrant’s telephone number, including area code: | 1-212-632-2700 | |
|
Date of fiscal year end: | October 31, 2008 | |
|
Date of reporting period: | October 31, 2008 | |
| | | | | | | | | |
Form N-CSR is to be used by management investment companies to file reports with the Commission not later than 10 days after the transmission to stockholders of any report that is required to be transmitted to stockholders under Rule 30e-1 under the Investment Company Act of 1940 (17 CFR 270.30e-1). The Commission may use the information provided on Form N-CSR in its regulatory, disclosure review, inspection, and policymaking roles.
A registrant is required to disclose the information specified by Form N-CSR, and the Commission will make this information public. A registrant is not required to respond to the collection of information contained in Form N-CSR unless the Form displays a currently valid Office of Management and Budget (“OMB”) control number. Please direct comments concerning the accuracy of the information collection burden estimate and any suggestions for reducing the burden to Secretary, Securities and Exchange Commission, 450 Fifth Street, NW, Washington, DC 20549-0609. The OMB has reviewed this collection of information under the clearance requirements of 44 U.S.C. § 3507.
Item 1. Reports to Stockholders.
First Eagle Funds
Annual Report
October 31, 2008
First Eagle Global Fund
First Eagle Overseas Fund
First Eagle U.S. Value Fund
First Eagle Gold Fund
First Eagle Fund of America

Advised by Arnhold and S. Bleichroeder Advisers, LLC

FIRST EAGLE FUNDS
Table of Contents
| Letter from the President | | | 3 | | |
|
| Letter from the Portfolio Managers | | | 4 | | |
|
Management's Discussion of Fund Performance: First Eagle Global Fund,
First Eagle Overseas Fund, First Eagle U.S. Value Fund and First Eagle Gold Fund | | | 5 | | |
|
| Performance Chart | | | 8 | | |
|
| First Eagle Global Fund: | |
|
| Fund Overview | | | 10 | | |
|
| Schedule of Investments | | | 11 | | |
|
| First Eagle Overseas Fund: | |
|
| Fund Overview | | | 24 | | |
|
| Schedule of Investments | | | 25 | | |
|
| First Eagle U.S. Value Fund: | |
|
| Fund Overview | | | 35 | | |
|
| Schedule of Investments | | | 36 | | |
|
| First Eagle Gold Fund: | |
|
| Fund Overview | | | 42 | | |
|
| Schedule of Investments | | | 43 | | |
|
| First Eagle Fund of America: | |
|
| Management's Discussion of Fund Performance | | | 46 | | |
|
| Fund Overview | | | 47 | | |
|
| Schedule of Investments | | | 48 | | |
|
| Statements of Assets and Liabilities | | | 53 | | |
|
| Statements of Operations | | | 55 | | |
|
| Statements of Changes in Net Assets | | | 56 | | |
|
| Notes to Financial Statements | | | 58 | | |
|
| Financial Highlights | | | 72 | | |
|
| Report of Independent Registered Public Accounting Firm | | | 84 | | |
|
| Fund Expenses | | | 85 | | |
|
| Tax Information | | | 87 | | |
|
| Additional Information | | | 88 | | |
|
The First Eagle Funds file their complete schedule of portfolio holdings with the Securities and Exchange Commission for the first and third quarters of each fiscal year on Form N-Q. The Funds' Forms N-Q is available on the Commission's website at www.sec.gov. The Funds' Forms N-Q may be reviewed and copied at the Commission's Public Reference Room in Washington D.C., and information on the operation of the Public Reference Room may be obtained by calling 1-800-SEC-0330. To obtain information on the Form N-Q from the Funds, shareholders can call 1-800-334-2143.
A copy of the Trust's policies and procedures with respect to the voting of proxies relating to the Trust's portfolio investments and information regarding the proxy-voting record of the Trust for the most recent twelve-month period ended June 30 is available by calling the Trust at 1-800-334-2143. This information also is available on the SEC's website at http://www.sec.gov.
FORWARD-LOOKING STATEMENT DISCLOSURE
One of our most important responsibilities as mutual fund managers is to communicate with shareholders in an open and direct manner. Some of our comments in our letters to shareholders are based on current management expectations and are considered "forward-looking statements." Actual future results, however, may prove to be different from our expectations. You can identify forward-looking statements by words such as "may", "will", "believe", "attempt", "seem", "think", "ought", "try" and other similar terms. We cannot promise future returns. Our opinions are a reflection of our best judgment at the time this report is compiled, and we disclaim any obligation to update or alter forward-looking statements as a result of new information, future events, or otherwise.

John P. Arnhold
FIRST EAGLE FUNDS
LETTER FROM THE PRESIDENT
Dear Fellow Shareholder,
Since I wrote to you in May, global equity markets have declined significantly and the depth and magnitude of the credit crisis has brought with it volatility, fears of serious recession and deflation. Venerable financial institutions have collapsed or been rescued by government support across the globe. The headline economic news could hardly be bleaker.
While the macroeconomic backdrop will have a dramatic effect on corporate profitability and, in some cases, sustainability, a concerted effort by government bodies in all major areas will likely provide much-needed stimulus. Therefore, as we tend to do at First Eagle, we will persevere with our portfolio, which we believe represents high quality businesses with strong balance sheets.
As you know, we have never focused on benchmark returns or relative performance. We have always sought to preserve capital and to provide satisfactory absolute returns over time. We are not pleased with our performance for the year but, as we look back, we believe that we have not suffered from permanent impairment of value in our holdings. The Global Value team of Portfolio Managers, Jean-Marie Eveillard, Matthew McLennan and Abhay Deshpande and our team of ten analysts continue to find new investment opportunities and are adding to existing positions. Our consistent approach of seeking to uncover good businesses at attractive prices through fundamental bottom-up research is our hallmark. With this disciplined style and even temperament we believe that our methodology is timeless. Through patience and a long-term time horizon we believe that we can help our clients achieve their investment goals.
We are also proud of First Eagle Fund of America's record over the last twenty-plus years as the investment team seeks to benefit from corporate change, which is generally misunderstood or underappreciated by the markets. There are very few peers available for investment today that offer comparable long-term performance records with a similar modest risk profile.
Please be assured that your investments in our funds will continue to be managed in the same manner as they have been over the years. All of our portfolio managers and other senior executives have substantial investments alongside of yours and we are grateful for the confidence that you continue to place in our firm.
Sincerely,
John P. Arnhold
December 2008
Past performance is no guarantee of future results. The portfolio actively is managed. The portfolio and opinions expressed herein are subject to change.

Jean-Marie Eveillard

Matthew McLennan

Abhay Deshpande
FIRST EAGLE FUNDS
LETTER FROM THE PORTFOLIO MANAGERS
Dear Shareholder,
The fiscal year ended October 31, 2008, was our worst ever in absolute terms. Even though the funds proved resilient during the first half of the fiscal year, they were unable to withstand the relentless selling which gathered pace in the second half. As we suggested in March, the de-leveraging of the global economy would likely have serious repercussions. Even as we avoided the permanent impairments among the "financials," our general exposure to equities meant that we were exposed to those repercussions, whether caused by forced hedge fund selling or selling associated with fears of potential weakness in the economy. In hindsight, we should have been less eager to part with our cash. Unfortunately, we found too much value too early.
Oddly enough, our worst year in absolute terms was one of our best in relative terms. Not that it is at all comforting (we eat our own cooking...) but there is a difference between temporary mark-to-market losses and those caused by permanent declines in value. In our case, it is possible—even likely—that the losses can be erased over time. Had our losses been caused by exposure to "financials" (AIG, Fannie Mae...) we might never be able to recover the lost capital. This is the position in which many funds find themselves today and why we find at least some solace in our performance this year.
That said, and though opportunities are more abundant today, we remain wary over the longer term consequences of the massive global reflation effort currently underway. We can't divine the future but we do wonder if one potential outcome is that authorities are too successful over time. Our gold position could provide some ballast in a world where currency reserve standards may be subject to change.
In the meantime, we continue to be attracted to the Japanese market but with the steep declines in almost all global assets our research staff is busy looking for opportunities in other markets as well. Our team of ten analysts, the heart of our operations, deserves praise for helping us navigate through these difficult times and for recently discovering new and interesting opportunities in equities, high-yield bonds, and even bank debt. Thankfully we have some excess capital and our shareholders, so far, have been patient and redemptions have been modest allowing us to accumulate or add to such positions at what looks like very attractive prices.
Thank you for your continued support.
 | |  | |
|
| Jean-Marie Eveillard | | Matthew McLennan | |
|
 | |
|
| Abhay Deshpande | |
|
December 2008
Past performance is no guarantee of future results. The portfolio is actively managed. The portfolio and opinions expressed herein are subject to change.
4

Jean-Marie Eveillard

Matthew McLennan

Abhay Deshpande
FIRST EAGLE FUNDS
First Eagle Global Fund • First Eagle Overseas Fund
First Eagle U.S. Value Fund • First Eagle Gold Fund
MANAGEMENT'S DISCUSSION OF FUND PERFORMANCE
Markets around the world were pummeled beginning in September as the effects of the U.S. credit crisis spread globally, causing fear and panic about the duration of the economic downturn. Every major market was affected. In Europe, the French CAC 40 Index fell 40% and the German DAX Index declined 38% during the twelve month period. In Japan, the Nikkei 225 Index fell 49% for the year. In the U.S, the S&P 500 Index fell 36%. The U.S. dollar fell 15% against the Japanese yen, but it rose 14% against the euro. The dollar strengthened against the euro with the expectation that the European Central Bank will likely have to lower interest rates because of the financial slowdown. Crude oil fell 28% during the twelve month period to $68 from a high of $145 in July as consumer demand for oil fell. Gold fell 9% to $725 an ounce from a high of $1,003 in March.
First Eagle Global Fund
The net asset value ("NAV") of the Fund's Class 'A' shares declined 24.41% for the year ended October 31, 2008, while the MSCI World Index was down 41.85%. The Fund's cash position was 6.22% as of October 31, 2008.
The five largest contributors to the performance of the First Eagle Global Fund over the period were Chofu Seisakusho Company, Limited (building products, Japan), Phoenixtec Power Company, Limited (power supply equipment, Taiwan), NTT DoCoMo Inc. (telecommunications, Japan), Getty Images, Inc. (visual images, U.S.) and Koninklijke Grolsch NV (beer manufacturer, Netherlands) collectively accounting for 0.38% of the year's performance.
The five largest detractors were Wendel (holding company, France), Gold bullion (gold, U.S.), Gold Fields Limited (gold mining, South Africa), Newmont Mining Corporation Holding Company (gold mining, U.S.) and Italcementi S.p.A. (building products, Italy). Their combined negative performance over the twelve month period subtracted 3.84% from the Fund's performance.
Corporate activity during the year included the takeovers of Phoenixtec Power Company, Limited (Taiwan), Getty Images, Inc. (U.S.) and Koninklijke Grolsch NV (Netherlands).
As of October 31, 2008, the Fund was approximately 60% hedged against the euro, which is up from 30% last year, as we believe the euro may be modestly overvalued against the U.S. dollar. We also kept a 10% hedge on the Swiss franc, and increased our hedge on the British pound from 70% last year to 100% by the end of October. We initiated a 10% hedge on the Japanese yen though we continue to believe that Asian currencies should ultimately be revalued against the U.S. dollar.
5
First Eagle Overseas Fund
The NAV of the Fund's Class 'A' shares fell 28.15% for the fiscal year ended October 31, 2008, while the MSCI EAFE Index decreased 46.62% over the same period. The Fund's cash position was 7.07% on October 31, 2008.
The five largest contributors to the performance of the First Eagle Overseas Fund over the period were Koninklijke Grolsch NV (beer manufacturer, Netherlands), Chofu Seisakusho Company, Limited (building products, Japan), NTT DoCoMo Inc. (telecommunications, Japan), Phoenixtec Power Company, Limited (power supply equipment, Taiwan) and Daekyo Company, Limited Pfd. (publishing, South Korea) collectively accounting for 0.64% of the year's performance.
The five largest detractors were Wendel (holding company, France), Gold bullion (gold, U.S.), Sodexo SA (catering services, France), Pargesa Holding SA (holding company, Switzerland) and Haw Par Corporation Limited (holding company, Singapore). Their combined negative performance over the twelve month period subtracted 4.51% from the Fund's performance.
Corporate activity during the year included the takeovers of Koninklijke Grolsch NV (Netherlands), Phoenixtec Power Company, Limited (Taiwan) and Hilti AG (Switzerland).
As of October 31, 2008, the Fund was approximately 60% hedged against the euro, which is up from 30% last year, as we believe the euro may be modestly overvalued against the U.S. dollar. We also kept a 10% hedge on the Swiss franc, and increased our hedge on the British pound from 70% last year to 100% at the end of October. We initiated a 10% hedge on the Japanese yen though we continue to believe that Asian currencies should ultimately be revalued against the U.S. dollar.
First Eagle U.S. Value Fund
The NAV of the First Eagle U.S. Value Fund's Class 'A' shares fell 20.56% for the year ended October 31, 2008, while the S&P 500 Index declined 36.10%. The Fund held 20.82% of its portfolio in cash on October 31, 2008.
The five largest contributors to the performance of the First Eagle U.S. Value Fund over the period were Wal-Mart Stores, Inc. (retail), Getty Images, Inc. (visual images), BJ Services Company (energy), Copart, Inc. (auto supplier) and Covidien Limited (medical products) collectively accounting for 1.15% of the year's performance.
The five largest detractors were Newmont Mining Corporation Holding Company (mining), Cintas Corporation (uniform supplier), Gold bullion (gold), Sanofi-Aventis ADR (pharmaceuticals) and Berkshire Hathaway Inc., Class 'A' (holding company). Their combined negative performance over the twelve month period subtracted 4.29% from the Fund's performance.
Getty Images, Inc. was the target of a take-over during the year.
First Eagle Gold Fund
The NAV of the First Eagle Gold Fund's Class 'A' shares fell 41.56% for the year ended October 31, 2008, while the FTSE Gold Mines Index declined 52.65%. The Fund was at 4.50% in cash on October 31, 2008.
There were no significant contributors to the performance of the Fund over the twelve month period. The five largest detractors to the Fund were Gold bullion (U.S.), Newcrest Mining Limited (Australia), Lihir Gold Limited (Australia), Gold Fields Limited (South Africa) and Industrias Peñoles, SAB de C.V. (Mexico). Their combined negative performance over the twelve month period subtracted 16.21% from the Fund's performance.
6
Corporate activity during the year included the takeovers of Metallica Resources Inc. (Canada), Miramar Mining Corporation (Canada), Aurelian Resources Inc. (Canada) and the IPO of Fresnillo Plc (U.K.), a spin-off of Industrias Penoles.
In most of these instances, prices declined in the absence of changes in our estimates of business value. In some cases, the Fund seized these opportunities to add to the positions at prices we deemed attractive.
We look at gold as insurance against "extreme outcomes." In the U.S., the current financial crisis is the worst since the Great Depression. The status of the U.S. dollar as the world's reserve currency is suspect, and the other major currencies (the euro, the yen) are not particularly appealing. From a long-term standpoint, gold as insurance still makes sense, we believe.
As always, we appreciate your confidence and thank you for your support.
 | |  | |  | |
|
| Jean-Marie Eveillard | | Matthew McLennan | | Abhay Deshpande | |
|
December 2008
Past performance is no guarantee of future results. The portfolio is actively managed. The portfolio and opinions expressed herein are subject to change.
7
PERFORMANCE
FIRST EAGLE FUNDS Average Annual Returns1 as of October 31, 2008 (unaudited)
| | | ONE-YEAR | | THREE-YEARS | | FIVE-YEARS | | TEN-YEARS | | SINCE
INCEPTION | | INCEPTION
DATE | |
| FIRST EAGLE GLOBAL FUND | |
| First Eagle Global Fund - Class A (SGENX) | |
| without sales load | | | (24.41 | %) | | | 2.18 | % | | | 8.30 | % | | | 12.12 | % | | | 14.20 | % | | 1/1/792 | |
| with sales load | | | (28.19 | %) | | | 0.45 | % | | | 7.19 | % | | | 11.69 | % | | | 14.05 | % | | 1/1/792 | |
| First Eagle Global Fund - Class I (SGIIX) | | | (24.21 | %) | | | 2.45 | % | | | 8.57 | % | | | 12.37 | % | | | 11.19 | % | | 7/31/98 | |
| First Eagle Global Fund - Class C (FESGX) | | | (25.74 | %) | | | 1.42 | % | | | 7.48 | % | | | — | | | | 10.75 | % | | 6/5/00 | |
| MSCI World Index3 | | | (41.85 | %) | | | (5.30 | %) | | | 1.73 | % | | | 0.77 | % | | | 9.30 | % | | 1/1/79 | |
| FIRST EAGLE OVERSEAS FUND | |
| First Eagle Overseas Fund - Class A (SGOVX) | |
| without sales load | | | (28.15 | %) | | | 1.25 | % | | | 8.54 | % | | | 13.16 | % | | | 11.57 | % | | 8/31/93 | |
| with sales load | | | (31.74 | %) | | | (0.46 | %) | | | 7.43 | % | | | 12.73 | % | | | 11.29 | % | | 8/31/93 | |
| First Eagle Overseas Fund - Class I (SGOIX) | | | (27.97 | %) | | | 1.51 | % | | | 8.82 | % | | | 13.41 | % | | | 11.80 | % | | 7/31/98 | |
| First Eagle Overseas Fund - Class C (FESOX) | | | (29.39 | %) | | | 0.50 | % | | | 7.74 | % | | | — | | | | 10.60 | % | | 6/5/00 | |
| MSCI EAFE Index4 | | | (46.62 | %) | | | (5.26 | %) | | | 3.60 | % | | | 1.67 | % | | | 3.37 | % | | 8/31/93 | |
| FIRST EAGLE U.S. VALUE FUND | |
| First Eagle U.S. Value Fund - Class A (FEVAX) | |
| without sales load | | | (20.56 | %) | | | (0.26 | %) | | | 4.98 | % | | | — | | | | 7.70 | % | | 9/4/01 | |
| with sales load | | | (24.53 | %) | | | (1.95 | %) | | | 3.90 | % | | | — | | | | 6.93 | % | | 9/4/01 | |
| First Eagle U.S. Value Fund - Class I (FEVIX) | | | (20.36 | %) | | | 0.01 | % | | | 5.24 | % | | | — | | | | 7.95 | % | | 9/4/01 | |
| First Eagle U.S. Value Fund - Class C (FEVCX) | | | (21.95 | %) | | | (0.99 | %) | | | 4.19 | % | | | — | | | | 6.89 | % | | 9/4/01 | |
| Standard & Poor's 500 Index5 | | | (36.10 | %) | | | (5.21 | %) | | | 0.26 | % | | | — | | | | (0.38 | %) | | 9/4/01 | |
| FIRST EAGLE GOLD FUND | |
| First Eagle Gold Fund - Class A (SGGDX) | |
| without sales load | | | (41.56 | %) | | | 3.52 | % | | | 4.56 | % | | | 13.06 | % | | | 6.48 | % | | 8/31/93 | |
| with sales load | | | (44.48 | %) | | | 1.76 | % | | | 3.49 | % | | | 12.63 | % | | | 6.21 | % | | 8/31/93 | |
| First Eagle Gold Fund - Class I (FEGIX) | | | (41.36 | %) | | | 3.80 | % | | | 4.82 | % | | | — | | | | 9.40 | % | | 5/15/03 | |
| First Eagle Gold Fund - Class C (FEGOX) | | | (42.57 | %) | | | 2.75 | % | | | 3.78 | % | | | — | | | | 8.32 | % | | 5/15/03 | |
| MSCI World Index3 | | | (41.85 | %) | | | (5.30 | %) | | | 1.73 | % | | | 0.77 | % | | | 4.70 | % | | 8/31/93 | |
| FTSE Gold Mines Index6 | | | (52.65 | %) | | | (6.02 | %) | | | (2.02 | %) | | | 2.96 | % | | | (1.52 | %) | | 8/31/93 | |
| FIRST EAGLE FUND OF AMERICA | |
| First Eagle Fund of America - Class A (FEFAX) | |
| without sales load | | | (29.20 | %) | | | 0.10 | % | | | 4.58 | % | | | — | | | | 5.46 | % | | 11/20/98 | |
| with sales load | | | (32.91 | %) | | | (1.53 | %) | | | 3.54 | % | | | — | | | | 4.91 | % | | 11/20/98 | |
| First Eagle Fund of America - Class C (FEAMX) | | | (30.45 | %) | | | (0.67 | %) | | | 3.81 | % | | | 5.06 | % | | | 4.90 | % | | 3/2/98 | |
| First Eagle Fund of America - Class Y (FEAFX) | | | (29.23 | %) | | | 0.08 | % | | | 4.59 | % | | | 5.85 | % | | | 11.38 | % | | 4/10/87 | |
| Standard & Poor's 500 Index5 | | | (36.10 | %) | | | (5.21 | %) | | | 0.26 | % | | | 0.40 | % | | | 8.16 | % | | 4/10/87 | |
Please see the following page for important notes to this table.
8
FIRST EAGLE FUNDS PERFORMANCE—(Continued) (unaudited)
(1) The performance data quoted herein represents past performance and does not guarantee future results. Market volatility can dramatically impact the funds' short term performance. Current performance may be lower or higher than figures shown. The investment return and principal value will fluctuate so that an investor's shares, when redeemed, may be worth more or less than their original cost. Past performance data through the most recent month end is available at www.firsteaglefunds.com or by calling (800) 334-2143. The average annual returns shown on the prior page are historical and reflect changes in share price, reinvested dividends and are net of expenses. The average annual returns for Class A Shares "with sales load" of Firs t Eagle Global Fund, First Eagle Overseas Fund and First Eagle Gold Fund give effect to the deduction of the maximum sales load of 3.75% for periods prior to March 1, 2000 and of 5.00% thereafter. The average annual returns for Class A Shares "with sales load" of First Eagle U.S. Value Fund and First Eagle Fund of America give effect to the deduction of the maximum sales load of 5.00%.
The average annual returns for Class C Shares reflect the CDSC (Contingent Deferred Sales Charge) of 1.00% which pertains to the first year or less of investment only.
Class I Shares of First Eagle Global Fund, First Eagle Overseas Fund, First Eagle U.S. Value Fund, and First Eagle Gold Fund require $1mm minimum investment and are offered without load.
Class Y Shares of First Eagle Fund of America are offered without load.
(2) Commencement of management by Mr. Jean-Marie Eveillard since January 1, 1979.
(3) The MSCI World Index is a widely followed, unmanaged group of stocks from 23 international markets and is not available for purchase.
(4) The MSCI EAFE Index is a total return index, reported in U.S. dollars, based on share prices and reinvested net dividends of approximately 1,100 companies from 21 countries and is not available for purchase.
(5) The Standard & Poor's 500 Index is a widely recognized unmanaged index including a representative sample of 500 leading companies in leading sectors of the U.S. economy and is not available for purchase. Although the Standard & Poor's 500 Index focuses on the large-cap segment of the market, with approximately 75% coverage of U.S. equities, it is also considered a proxy for the total market.
(6) The FTSE Gold Mines Index is an unmanaged index composed of approximately 19 mining companies and is only available without dividends reinvested and is not available for purchase.
| | | Expense Ratios As Stated In The Most Recent Prospectus
Total Annual Gross Operating Expense Ratios7 | |
| | | Class A | | Class I | | Class C | | Class Y | |
| First Eagle Global Fund | | | 1.13 | % | | | 0.88 | % | | | 1.88 | % | | | — | | |
| First Eagle Overseas Fund | | | 1.13 | % | | | 0.88 | % | | | 1.88 | % | | | — | | |
| First Eagle U.S. Value Fund | | | 1.20 | % | | | 0.96 | % | | | 1.95 | % | | | — | | |
| First Eagle Gold Fund | | | 1.20 | % | | | 0.95 | % | | | 1.95 | % | | | — | | |
| First Eagle Fund of America | | | 1.41 | % | | | — | | | | 2.16 | % | | | 1.41 | % | |
(7) These expense ratios are presented as of October 31, 2007 and may differ from corresponding ratios shown elsewhere in this report because of differing time periods (and/or, if applicable, because these expense ratios do not include expense credits or waivers).
9
FUND OVERVIEW
FIRST EAGLE GLOBAL FUND Data as of October 31, 2008 (unaudited)
THE INVESTMENT STYLE
The First Eagle Global Fund seeks long-term growth of capital by investing in a wide range of asset classes from markets in the United States and around the world. This truly global fund is managed with a highly disciplined, bottom-up, value oriented style that helps minimize risk.
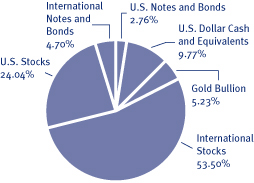
ASSET ALLOCATION
COUNTRIES
| United States | | | 32.03 | % | |
| Japan | | | 23.00 | % | |
| France | | | 14.37 | % | |
| Switzerland | | | 4.68 | % | |
| South Korea | | | 2.81 | % | |
| Hong Kong | | | 1.96 | % | |
| Italy | | | 1.70 | % | |
| South Africa | | | 1.49 | % | |
| Singapore | | | 1.46 | % | |
| Germany | | | 1.44 | % | |
| Malaysia | | | 0.99 | % | |
| United Kingdom | | | 0.96 | % | |
| Netherlands | | | 0.77 | % | |
| Taiwan | | | 0.63 | % | |
| Mexico | | | 0.51 | % | |
| Thailand | | | 0.35 | % | |
| Canada | | | 0.27 | % | |
| Brazil | | | 0.19 | % | |
| India | | | 0.14 | % | |
| Panama | | | 0.13 | % | |
| Belgium | | | 0.10 | % | |
| Other | | | 0.25 | % | |
The Fund's portfolio composition (represented as a percentage of net assets) is subject to change at any time.
AVERAGE ANNUAL RETURNS
| | | ONE-YEAR | | FIVE-YEARS | | TEN-YEARS | |
| First Eagle Global Fund (A Shares) | |
| without sales load | | | (24.41 | %) | | | 8.30 | % | | | 12.12 | % | |
| with sales load | | | (28.19 | %) | | | 7.19 | % | | | 11.69 | % | |
| MSCI World Index | | | (41.85 | %) | | | 1.73 | % | | | 0.77 | % | |
| Consumer Price Index | | | 3.66 | % | | | 3.20 | % | | | 2.82 | % | |
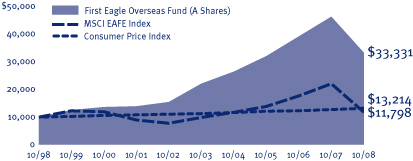
GROWTH OF A $10,000 INITIAL INVESTMENT
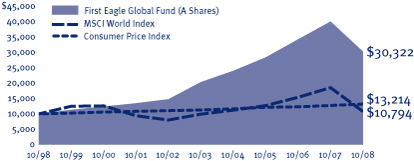
Performance data quoted herein represents past performance and should not be considered indicative of future results. Performance data quoted herein does not reflect the deduction of taxes that a shareholder would pay on Fund distributions or the sale of Fund shares. The average annual returns shown above are historical and reflect changes in share price, reinvested dividends and are net of expenses. The average annual returns for Class A Shares give effect to the deduction of the maximum sales load of 3.75% for periods prior to March 1, 2000 and of 5.00% thereafter. The MSCI World Index is a widely followed, unmanaged group of stocks from 23 international markets and is not available for purchase. The Consumer Price Index (CPI) represents the change in price of all goods and services purchased for consumption by urban households.
TOP 10 HOLDINGS
| Gold bullion (precious metal) | | | 5.23 | % | |
| Berkshire Hathaway Inc., Class 'A' (U.S. holding company) | | | 3.07 | % | |
| Sanofi-Aventis (French health care company) | | | 2.18 | % | |
| SMC Corporation (Japanese automated control devices manufacturer) | | | 2.17 | % | |
| Secom Company, Limited (Japanese security services provider) | | | 2.10 | % | |
| Fanuc Limited (Japanese industrial manufacturing company) | | | 2.02 | % | |
| Sodexo SA (French food management services provider) | | | 1.95 | % | |
| Pargesa Holding SA (Swiss diversified financials company) | | | 1.73 | % | |
| 3M Company (U.S. industrial conglomerate) | | | 1.70 | % | |
| Astellas Pharma Inc. (Japanese pharmaceuticals company) | | | 1.66 | % | |
10
FIRST EAGLE GLOBAL FUND
SCHEDULE OF INVESTMENTS
October 31, 2008
Number
of Shares | |
| | Value
(Note 1) | |
| | | U.S. Common and Preferred Stocks—24.04% | |
| | | Consumer Discretionary—0.23% | |
| | 476,071 | | | McDonald's Corporation | | $ | 27,578,793 | | |
| | 259,605 | | | Weyco Group, Inc. | | | 7,217,019 | | |
| | 185,000 | | | St. John Knits International Inc. (a) | | | 4,555,625 | | |
| | | | 39,351,437 | | |
| | | Energy—2.71% | |
| | 4,218,754 | | | San Juan Basin Royalty Trust (c) | | | 156,304,836 | | |
| | 1,749,931 | | | Apache Corporation | | | 144,071,819 | | |
| | 1,886,053 | | | ConocoPhillips Company | | | 98,112,477 | | |
| | 827,570 | | | Murphy Oil Corporation | | | 41,908,145 | | |
| | 830,490 | | | Helmerich & Payne, Inc. | | | 28,494,112 | | |
| | | | 468,891,389 | | |
| | | Financials—2.18% | |
| | 9,253,133 | | | American Express | | | 254,461,158 | | |
| | 2,559,630 | | | Willis Group Holdings Limited | | | 67,164,691 | | |
| | 2,544,770 | | | Legg Mason, Inc. | | | 56,468,446 | | |
| | | | 378,094,295 | | |
| | | Health Care—0.84% | |
| | 2,499,370 | | | Wellpoint Inc. (a) | | | 97,150,512 | | |
| | 783,920 | | | Johnson & Johnson | | | 48,085,653 | | |
| | | | 145,236,165 | | |
| | | Holding Companies—3.07% | |
| | 4,599 | | | Berkshire Hathaway Inc., Class 'A' (a) | | | 531,138,510 | | |
| | 2,485 | | | J.G. Boswell Company | | | 1,279,775 | | |
| | | | 532,418,285 | | |
| | | Industrials—4.45% | |
| | 4,564,980 | | | 3M Company | | | 293,528,214 | | |
| | 10,059,141 | | | Cintas Corporation (c) | | | 238,401,642 | | |
| | 1,278,640 | | | Alliant Techsystems Inc. (a) | | | 105,538,946 | | |
| | 9,778,961 | | | Blount International, Inc. (a)(c) | | | 84,979,171 | | |
| | 1,381,358 | | | UniFirst Corporation | | | 45,073,712 | | |
| | 4,169 | | | Conbraco Industries, Inc. (a)(c) | | | 1,298,644 | | |
| | 365,000 | | | Kaiser Ventures LLC (a)(c)(d)(e)(f) | | | 1,007,400 | | |
| | | | 769,827,729 | | |
| | | Materials—0.53% | |
| | 1,699,990 | | | Vulcan Materials Company | | | 92,275,457 | | |
See Notes to Financial Statements
11
FIRST EAGLE GLOBAL FUND
SCHEDULE OF INVESTMENTS—(Continued)
October 31, 2008
Number
of Shares | |
| | Value
(Note 1) | |
| | | U.S. Common and Preferred Stocks—(continued) | |
| | | Media—0.65% | |
| | 7,185,595 | | | Comcast Corporation-Special Class 'A' | | $ | 110,801,875 | | |
| | 34,924 | | | Mills Music Trust (c) | | | 1,292,188 | | |
| | | | 112,094,063 | | |
| | | Paper and Forest Products—2.74% | |
| | 5,905,362 | | | Rayonier Inc. (c) | | | 195,349,375 | | |
| | 3,987,548 | | | Plum Creek Timber Company, Inc. | | | 148,655,790 | | |
| | 1,896,440 | | | Weyerhaeuser Company | | | 72,481,937 | | |
| | 1,258,500 | | | Deltic Timber Corporation (c) | | | 57,324,675 | | |
| | | | 473,811,777 | | |
| | | Precious Metals—1.05% | |
| | 10,187,842 | | | Newmont Mining Corporation Holding Company | | | 181,444,495 | | |
| | | Real Estate—0.01% | |
| | 137,410 | | | Price Legacy Corporation Pfd., Series 'A' | | | 1,236,690 | | |
| | 192,250 | | | LandCo LLC (a)(d)(e)(f) | | | 669,030 | | |
| | 21,124 | | | Security Capital European Realty (a)(d)(f) | | | — | | |
| | | | 1,905,720 | | |
| | | Retail—2.73% | |
| | 2,236,590 | | | Costco Wholesale Corporation | | | 127,507,996 | | |
| | 6,483,956 | | | Barnes & Noble, Inc. (c) | | | 122,417,089 | | |
| | 4,463,150 | | | The Home Depot Inc. | | | 105,285,709 | | |
| | 2,408,250 | | | Tiffany & Company | | | 66,106,463 | | |
| | 797,725 | | | Wal-Mart Stores, Inc. | | | 44,521,032 | | |
| | 1,286,607 | | | Dillard's Inc., Class 'A' | | | 6,857,615 | | |
| | | | 472,695,904 | | |
| | | Technology and Telecommunications—2.08% | |
| | 10,931,897 | | | Microsoft Corporation | | | 244,109,260 | | |
| | 5,082,910 | | | Linear Technology Corporation | | | 115,280,399 | | |
| | | | 359,389,659 | | |
| | | Utilities—0.77% | |
| | 4,440,260 | | | IDACORP, Inc. (c) | | | 118,377,332 | | |
| | 335,000 | | | CalEnergy Capital Trust 6.5% Conv. Pfd. | | | 15,075,000 | | |
| | | | 133,452,332 | | |
| | | | | Total U.S. Common and Preferred Stocks (Cost: $4,681,144,985) | | | 4,160,888,707 | | |
See Notes to Financial Statements
12
FIRST EAGLE GLOBAL FUND
SCHEDULE OF INVESTMENTS—(Continued)
October 31, 2008
Number
of Shares | |
| | Value
(Note 1) | |
| | | International Common and Preferred Stocks—53.50% | |
| | | Belgium—0.10% | |
| | 2,210,071 | | | Deceuninck (c) | | $ | 16,592,653 | | |
| | | Brazil—0.19% | |
| | 1,506,230 | | | Petroleo Brasileiro SA ADR | | | 33,242,496 | | |
| | | Canada—0.15% | |
| | 2,628,490 | | | Harry Winston Diamond Corporation | | | 25,737,298 | | |
| | | Chile—0.06% | |
| | 7,600,803 | | | Quinenco SA | | | 9,688,687 | | |
| | | France—13.58% | |
| | 5,985,467 | | | Sanofi-Aventis | | | 376,483,746 | | |
| | 7,082,902 | | | Sodexo | | | 338,077,195 | | |
| | 3,039,356 | | | Neopost SA (c) | | | 252,939,642 | | |
| | 5,821,523 | | | Carrefour SA | | | 243,867,555 | | |
| | 5,200,289 | | | Essilor International SA | | | 232,004,800 | | |
| | 5,361,738 | | | Rémy Cointreau SA (c) | | | 221,741,269 | | |
| | 2,041,357 | | | Air Liquide | | | 174,833,185 | | |
| | 2,464,113 | | | Société BIC SA | | | 129,374,124 | | |
| | 2,554,751 | | | Wendel (c) | | | 120,414,042 | | |
| | 4,278,860 | | | Vivendi SA | | | 111,102,097 | | |
| | 541,213 | | | Guyenne et Gascogne SA (c) | | | 40,632,899 | | |
| | 63,019 | | | Société Sucrière de Pithiviers-le-Vieil (c) | | | 37,288,310 | | |
| | 657,810 | | | Total SA | | | 35,838,845 | | |
| | 165,085 | | | Robertet SA | | | 17,645,927 | | |
| | 42,252 | | | Robertet SA C.I. (f) | | | 3,451,754 | | |
| | 104,457 | | | Gaumont SA | | | 5,981,466 | | |
| | 385,000 | | | Sabeton SA (c) | | | 5,389,035 | | |
| | 70,650 | | | NSC Groupe (c) | | | 2,890,352 | | |
| | | | 2,349,956,243 | | |
| | | Germany—1.44% | |
| | 2,460,306 | | | Fraport AG | | | 79,270,283 | | |
| | 1,172,304 | | | Pfeiffer Vacuum Technology AG (c) | | | 70,560,064 | | |
| | 877,242 | | | Hornbach Holding AG Pfd. | | | 57,488,930 | | |
| | 1,337,532 | | | Bertelsmann AG D.R.C. | | | 27,232,138 | | |
| | 386,842 | | | Hornbach Baumarkt AG | | | 14,521,558 | | |
| | | | 249,072,973 | | |
| | | Hong Kong—0.98% | |
| | 37,399,150 | | | The Wharf (Holdings) Limited | | | 72,384,051 | | |
| | 12,148,900 | | | Guoco Group Limited | | | 70,540,635 | | |
See Notes to Financial Statements
13
FIRST EAGLE GLOBAL FUND
SCHEDULE OF INVESTMENTS—(Continued)
October 31, 2008
Number
of Shares | |
| | Value
(Note 1) | |
| | | International Common and Preferred Stocks—(continued) | |
| | | Hong Kong—(continued) | |
| | 23,404,770 | | | Shaw Brothers (Hong Kong) Limited (c) | | $ | 25,004,870 | | |
| | 20,738,780 | | | City e-Solutions Limited (c) | | | 1,364,719 | | |
| | | | 169,294,275 | | |
| | | India—0.14% | |
| | 4,107,526 | | | Tata Motors Limited | | | 14,083,540 | | |
| | 370,182 | | | Nestlé India Limited | | | 10,854,680 | | |
| | | | 24,938,220 | | |
| | | Italy—1.70% | |
| | 18,139,395 | | | Italcementi S.p.A. RNC | | | 125,568,087 | | |
| | 4,682,069 | | | Italcementi S.p.A. | | | 53,978,845 | | |
| | 1,734,972 | | | Italmobiliare S.p.A. RNC | | | 59,167,721 | | |
| | 1,021,137 | | | Italmobiliare S.p.A. | | | 41,528,703 | | |
| | 3,224,470 | | | Gewiss S.p.A. | | | 12,965,910 | | |
| | | | 293,209,266 | | |
| | | Japan—22.89% | |
| | 4,053,720 | | | SMC Corporation (c) | | | 375,420,843 | | |
| | 9,712,830 | | | Secom Company, Limited | | | 363,761,596 | | |
| | 5,405,880 | | | FANUC Limited | | | 349,902,268 | | |
| | 7,234,220 | | | Astellas Pharma Inc. | | | 286,394,421 | | |
| | 1,470,690 | | | Keyence Corporation | | | 277,045,307 | | |
| | 64,994,300 | | | Aioi Insurance Company, Limited (c) | | | 261,273,646 | | |
| | 13,084,120 | | | Toho Company, Limited (c) | | | 245,144,158 | | |
| | 5,211,900 | | | Ono Pharmaceutical Company, Limited | | | 229,671,555 | | |
| | 14,646,430 | | | MISUMI Group Inc. (c) | | | 222,394,398 | | |
| | 7,086,170 | | | Shimano Inc. (c) | | | 201,205,112 | | |
| | 14,581,600 | | | THK Company, Limited (c) | | | 196,627,519 | | |
| | 4,567,060 | | | Canon Inc. | | | 155,240,997 | | |
| | 1,579,510 | | | Hirose Electric Company, Limited | | | 135,028,333 | | |
| | 10,972,000 | | | Kirin Holdings Company, Limited | | | 119,144,352 | | |
| | 14,391,850 | | | Sompo Japan Insurance Inc. | | | 97,547,040 | | |
| | 3,501,380 | | | Chofu Seisakusho Company, Limited (c) | | | 75,187,378 | | |
| | 5,147,000 | | | T. Hasegawa Company, Limited (c) | | | 73,281,630 | | |
| | 3,663,695 | | | Meitec Corporation (c) | | | 71,961,443 | | |
| | 3,045,610 | | | Shimachu Company, Limited (c) | | | 68,189,925 | | |
| | 2,365,070 | | | Circle K Sunkus Company, Limited | | | 39,979,455 | | |
| | 3,461,892 | | | Nissin Healthcare Food Service Company, Limited | | | 32,554,327 | | |
| | 1,725,100 | | | Ariake Japan Company, Limited (c) | | | 27,897,251 | | |
| | 2,002,100 | | | Seikagaku Corporation | | | 17,706,339 | | |
See Notes to Financial Statements
14
FIRST EAGLE GLOBAL FUND
SCHEDULE OF INVESTMENTS—(Continued)
October 31, 2008
Number
of Shares | |
| | Value
(Note 1) | |
| | | International Common and Preferred Stocks—(continued) | |
| | | Japan—(continued) | |
| | 2,567,150 | | | NIPPONKOA Insurance Company, Limited | | $ | 15,127,008 | | |
| | 1,051,300 | | | Aderans Company, Limited | | | 10,110,711 | | |
| | 175,240 | | | Mabuchi Motor Company, Limited | | | 6,812,709 | | |
| | 1,059,860 | | | PARK24 Company, Limited | | | 4,228,222 | | |
| | 188,760 | | | Shoei Company, Limited | | | 1,746,213 | | |
| | | | 3,960,584,156 | | |
| | | Malaysia—0.72% | |
| | 98,012,905 | | | Genting Berhad | | | 124,758,753 | | |
| | | Mexico—0.51% | |
| | 9,745,693 | | | Industrias Peñoles, SAB de C.V. | | | 87,995,421 | | |
| | | Netherlands—0.38% | |
| | 2,199,913 | | | Heineken Holding NV | | | 66,345,494 | | |
| | | Panama—0.13% | |
| | 2,036,652 | | | Banco Latinoamericano de Exportaciones SA ADR | | | 21,649,611 | | |
| | | Singapore—0.36% | |
| | 3,238,180 | | | United Overseas Bank Limited | | | 28,434,398 | | |
| | 12,704,120 | | | Fraser & Neave Limited | | | 23,390,489 | | |
| | 13,467,250 | | | ComfortDelgro Corporation Limited | | | 10,808,314 | | |
| | | | 62,633,201 | | |
| | | South Africa—1.49% | |
| | 28,654,070 | | | Gold Fields Limited ADR | | | 190,549,566 | | |
| | 749,210 | | | Gold Fields Limited | | | 5,296,669 | | |
| | 7,540,927 | | | Harmony Gold Mining Company, Limited ADR (a) | | | 55,124,176 | | |
| | 1,000,000 | | | Harmony Gold Mining Company, Limited (a) | | | 7,551,230 | | |
| | | | 258,521,641 | | |
| | | South Korea—2.72% | |
| | 10,255,631 | | | SK Telecom Company, Limited ADR | | | 176,499,410 | | |
| | 465,610 | | | Samsung Electronics Company, Limited Pfd. | | | 120,644,909 | | |
| | 1,753,891 | | | KT&G Corporation | | | 111,677,323 | | |
| | 51,900 | | | Lotte Confectionery Company, Limited | | | 43,781,014 | | |
| | 39,989 | | | Nam Yang Dairy Products Company, Limited (c) | | | 12,359,589 | | |
| | 1,392,790 | | | Daeduck GDS Company, Limited (c) | | | 3,830,051 | | |
| | 888,780 | | | Daeduck Electronics Company, Limited | | | 2,024,101 | | |
| | | | 470,816,397 | | |
See Notes to Financial Statements
15
FIRST EAGLE GLOBAL FUND
SCHEDULE OF INVESTMENTS—(Continued)
October 31, 2008
Number
of Shares | |
| | Value
(Note 1) | |
| | | International Common and Preferred Stocks—(continued) | |
| | | Switzerland—4.68% | |
| | 3,929,462 | | | Pargesa Holding SA | | $ | 299,468,148 | | |
| | 4,963,030 | | | Nestlé SA | | | 192,324,090 | | |
| | 1,979,836 | | | Kuehne & Nagel International AG | | | 119,088,521 | | |
| | 4,280 | | | Lindt & Spruengli AG | | | 103,199,139 | | |
| | 40,274 | | | Lindt & Spruengli AG PC | | | 86,426,530 | | |
| | 39,740 | | | Edipresse SA | | | 10,095,414 | | |
| | | | 810,601,842 | | |
| | | Thailand—0.35% | |
| | 26,375,300 | | | Bangkok Bank Public Company Limited NVDR | | | 52,299,097 | | |
| | 448,850 | | | Bangkok Bank Public Company Limited | | | 890,016 | | |
| | 577,000 | | | The Oriental Hotel Public Company, Limited | | | 8,099,401 | | |
| | | | 61,288,514 | | |
| | | United Kingdom—0.93% | |
| | 24,728,070 | | | Home Retail Group plc | | | 78,571,347 | | |
| | 1,867,903 | | | Anglo American Plc | | | 46,213,868 | | |
| | 18,196,000 | | | Fresnillo Plc | | | 35,879,867 | | |
| | | | 160,665,082 | | |
| | | | | Total International Common and Preferred Stocks (Cost: $11,188,266,857) | | | 9,257,592,223 | | |
| Ounces | | | | | |
| | | Commodity—5.23% | |
| | 1,249,002 | | | Gold bullion (a) (Cost: $693,749,790) | | | 904,714,507 | | |
Principal
Amount | |
| |
| |
| | | U.S. Notes and Bonds—2.76% | |
| | | U.S. Government Obligations—1.88% | |
| $ | 121,488,980 | | | U.S. Treasury Inflation Index Note 1.875% due 7/15/2013 (g) | | | 113,687,201 | | |
| | 137,277,972 | | | U.S. Treasury Inflation Index Note 2.375% due 4/15/2011 (g) | | | 130,188,937 | | |
| | 82,002,468 | | | U.S. Treasury Inflation Index Note 4.25% due 1/15/2010 (g) | | | 81,252,965 | | |
| | | | 325,129,103 | | |
| | | U.S. Corporate Bonds—0.88% | |
| | 4,910,000 | | | American Standard Companies Inc. 8.25% due 6/1/2009 | | | 4,976,260 | | |
| | 2,810,655 | | | Avis Budget Car Rental LLC 7.625% due 5/15/2014 | | | 1,025,889 | | |
| | 5,467,000 | | | Bausch & Lomb Inc. 7.125% due 8/1/2028 (d) | | | 1,366,750 | | |
| | 28,930,000 | | | Blount International, Inc. 8.875% due 8/1/2012 | | | 24,879,800 | | |
| | 6,900,000 | | | Briggs & Stratton Corporation 8.875% due 3/15/2011 | | | 6,555,000 | | |
| | 13,500,000 | | | GATX Corporation 8.875% due 6/1/2009 | | | 13,146,476 | | |
See Notes to Financial Statements
16
FIRST EAGLE GLOBAL FUND
SCHEDULE OF INVESTMENTS—(Continued)
October 31, 2008
Principal
Amount | |
| | Value
(Note 1) | |
| | | U.S. Notes and Bonds—(continued) | |
| | | U.S. Corporate Bonds—(continued) | |
| $ | 11,000,000 | | | Level 3 Financing, Inc. 9.25% due 11/1/2014 | | $ | 6,325,000 | | |
| | 5,000,000 | | | Pulte Homes, Inc. 5.20% due 2/15/2015 | | | 3,125,000 | | |
| | 30,962,000 | | | Pulte Homes, Inc. 7.875% due 8/1/2011 | | | 26,395,105 | | |
| | 12,721,000 | | | Pulte Homes, Inc. 8.125% due 3/1/2011 | | | 11,130,875 | | |
| | 12,522,000 | | | Sirius Satellite Radio Inc. 9.625% due 8/1/2013 | | | 3,944,430 | | |
| | 3,500,000 | | | Toys 'R' Us, Inc. 7.625% due 8/1/2011 | | | 2,292,500 | | |
| | 57,142,000 | | | Tronox Worldwide LLC 9.50% due 12/1/2012 | | | 12,856,950 | | |
| | 28,622,000 | | | Valassis Communications, Inc 8.25 due 3/1/2015 | | | 15,598,990 | | |
| | 12,554,000 | | | Yankee Acquisition Corporation 8.50% due 2/15/2015 | | | 7,155,780 | | |
| | 22,554,000 | | | Yankee Acquisition Corporation 9.75% due 2/15/2017 | | | 11,305,193 | | |
| | | | | | | | 152,079,998 | | |
| | | | | Total U.S. Notes and Bonds (Cost: $588,904,627) | | | 477,209,101 | | |
| | | International Notes and Bonds—4.70% | |
| | | International Government Bonds—3.80% | |
| | | France—0.54% | |
| EUR | 73,045,828 | | | Republic of France O.A.T. I/L 3% due 7/25/2012 (g) | | | 94,401,174 | | |
| | | Hong Kong—0.98% | |
| HKD | 612,900,000 | | | Hong Kong Government 2.52% due 3/24/2009 | | | 79,763,951 | | |
| HKD | 199,650,000 | | | Hong Kong Government 3.34% due 12/19/2008 | | | 25,867,544 | | |
| HKD | 461,050,000 | | | Hong Kong Government 3.63% due 12/19/2011 | | | 63,545,797 | | |
| | | | 169,177,292 | | |
| | | Japan—0.11% | |
| JPY | 2,242,790,100 | | | Japan Government 1.40% due 6/10/2018 (g) | | | 19,485,203 | | |
| | | Malaysia—0.27% | |
| MYR | 17,714,000 | | | Malaysian Government 3.756% due 4/28/2011 | | | 4,968,994 | | |
| MYR | 146,000,000 | | | Malaysian Government 4.305% due 2/27/2009 | | | 41,193,133 | | |
| | | | 46,162,127 | | |
| | | Singapore—1.10% | |
| SGD | 52,947,000 | | | Singapore Government 2.375% due 10/1/2009 | | | 36,111,979 | | |
| SGD | 60,827,000 | | | Singapore Government 3.625% due 7/1/2011 | | | 43,311,244 | | |
| SGD | 154,630,000 | | | Singapore Government 4.625% due 7/1/2010 | | | 110,065,379 | | |
| | | | 189,488,602 | | |
| | | South Korea—0.09% | |
| KRW | 22,707,720,000 | | | Korean Treasury ILB 2.75% due 3/10/2017 (g) | | | 15,286,071 | | |
| | | Sweden—0.08% | |
| SEK | 84,000,000 | | | Sweden Government I/L 4.00% due 12/1/2008 (g) | | | 13,415,669 | | |
See Notes to Financial Statements
17
FIRST EAGLE GLOBAL FUND
SCHEDULE OF INVESTMENTS—(Continued)
October 31, 2008
Principal
Amount | |
| | Value
(Note 1) | |
| | | International Notes and Bonds—(continued) | |
| | | International Government Bonds—(continued) | |
| | | Taiwan—0.63% | |
| TWD | 1,767,500,000 | | | Taiwan Government 2.00% due 7/20/2012 | | $ | 53,652,099 | | |
| TWD | 1,826,000,000 | | | Taiwan Government 2.375% due 1/16/2013 | | | 56,260,177 | | |
| | | | 109,912,276 | | |
| | | International Corporate Bonds—0.90% | |
| | | Canada—0.12% | |
| USD | 33,260,000 | | | Canwest Mediaworks LP 9.25% due 8/1/2015 (b) | | | 20,454,900 | | |
| | | France—0.25% | |
| EUR | 12,000,000 | | | FINEL 9.50% due 6/30/2017 (d)(e)(f)(h) | | | 7,634,996 | | |
| EUR | 15,000,000 | | | FINEL 9.50% due 10/15/2017 (d)(e)(f)(h) | | | 9,543,745 | | |
| USD | 2,000,000 | | | Legrand SA 8.50% due 2/15/2025 | | | 1,869,502 | | |
| EUR | 12,050,000 | | | Wendel 4.375% due 8/9/2017 | | | 6,555,029 | | |
| EUR | 3,500,000 | | | Wendel 4.875% due 5/26/2016 | | | 2,254,385 | | |
| EUR | 10,000,000 | | | Wendel 4.875% due 9/21/2015 | | | 6,235,247 | | |
| EUR | 9,951,000 | | | Wendel 5.00% due 2/6/2011 | | | 9,154,836 | | |
| | | | 43,247,740 | | |
| | | Ireland—0.02% | |
| EUR | 13,650,000 | | | Waterford Wedgwood Plc 9.875% due 12/1/2010 (b) | | | 3,473,923 | | |
| | | Jersey Channel Islands—0.02% | |
| EUR | 2,500,000 | | | Independent News & Media Plc 5.75% due 5/17/2009 | | | 3,101,717 | | |
| | | Netherlands—0.39% | |
| EUR | 47,050,000 | | | UPC Holding BV 7.75% due 1/15/2014 (b) | | | 41,909,767 | | |
| EUR | 29,150,000 | | | UPC Holding BV 8.625% due 1/15/2014 (b) | | | 26,892,684 | | |
| | | | 68,802,451 | | |
| | | Norway—0.07% | |
| USD | 5,500,000 | | | Bergen Bank Floating Rate Perpetual Notes 3.25% @ 10/31/2008 | | | 3,212,550 | | |
| USD | 10,000,000 | | | Christiania Bank Floating Rate Perpetual Notes 3.1875% @ 10/31/2008 | | | 5,754,290 | | |
| USD | 3,500,000 | | | Den Norske Bank Floating Rate Perpetual Notes 3.275% @ 10/31/2008 | | | 2,006,235 | | |
| USD | 3,170,000 | | | Den Norske Bank Floating Rate Perpetual Notes 3.0625% @ 10/31/2008 | | | 1,871,251 | | |
| | | | 12,844,326 | | |
| | | United Kingdom—0.03% | |
| GBP | 3,000,000 | | | Marks & Spencer Group Plc 6.375% due 11/7/2011 | | | 4,460,204 | | |
| | | | | Total International Notes and Bonds (Cost: $882,161,111) | | | 813,713,675 | | |
| | | | | Total Notes and Bonds (Cost: $1,471,065,738) | | | 1,290,922,776 | | |
See Notes to Financial Statements
18
FIRST EAGLE GLOBAL FUND
SCHEDULE OF INVESTMENTS—(Continued)
October 31, 2008
Principal
Amount | |
| | Value
(Note 1) | |
| | | Commercial Paper—6.22% | |
| | | U.S. Commercial Paper—4.73% | |
| $ | 37,995,000 | | | AT&T 1.55% due 11/12/2008 | | $ | 37,977,005 | | |
| | 25,000,000 | | | Cintas Corporation 2.12% due 11/4/2008 | | | 24,995,583 | | |
| | 25,000,000 | | | The Clorox Company 5.50% due 11/3/2008 | | | 24,992,361 | | |
| | 28,148,000 | | | The Clorox Company 5.50% due 11/6/2008 | | | 28,126,498 | | |
| | 30,000,000 | | | The Clorox Company 5.50% due 11/12/2008 | | | 29,949,583 | | |
| | 22,197,000 | | | The Clorox Company 5.50% due 11/17/2008 | | | 22,142,741 | | |
| | 37,322,000 | | | CME Group Inc. 2.25% due 11/4/2008 | | | 37,315,002 | | |
| | 21,329,000 | | | H.J. Heinz Company 3.75% due 11/17/2008 | | | 21,293,452 | | |
| | 16,865,000 | | | H.J. Heinz Company 4.15% due 11/5/2008 | | | 16,857,223 | | |
| | 25,000,000 | | | H.J. Heinz Company 4.25% due 11/13/2008 | | | 24,964,583 | | |
| | 20,763,000 | | | H.J. Heinz Company 4.25% due 11/17/2008 | | | 20,723,781 | | |
| | 22,269,000 | | | H.J. Heinz Company 4.30% due 11/10/2008 | | | 22,245,061 | | |
| | 25,000,000 | | | H.J. Heinz Company 4.35% due 11/12/2008 | | | 24,966,771 | | |
| | 22,500,000 | | | H.J. Heinz Company 4.35% due 11/13/2008 | | | 22,467,375 | | |
| | 25,000,000 | | | H.J. Heinz Company 4.50% due 11/4/2008 | | | 24,990,625 | | |
| | 9,150,000 | | | H.J. Heinz Company 4.55% due 11/5/2008 | | | 9,145,374 | | |
| | 25,000,000 | | | H.J. Heinz Company 5.00% due 11/7/2008 | | | 24,979,167 | | |
| | 31,000,000 | | | ITT Corporation 2.90% due 11/3/2008 | | | 30,995,006 | | |
| | 18,871,000 | | | ITT Corporation 6.10% due 11/5/2008 | | | 18,858,210 | | |
| | 16,185,000 | | | Kraft Foods Inc. 4.25% due 11/3/2008 | | | 16,181,179 | | |
| | 15,000,000 | | | Kraft Foods Inc. 4.25% due 11/3/2008 | | | 14,996,458 | | |
| | 23,550,000 | | | Kraft Foods Inc. 4.25% due 11/4/2008 | | | 23,541,659 | | |
| | 38,696,000 | | | Philip Morris USA 1.90% due 11/14/2008 | | | 38,669,450 | | |
| | 11,261,000 | | | Procter & Gamble 1.70% due 12/2/2008 | | | 11,244,515 | | |
| | 27,442,000 | | | Sara Lee Corporation 3.50% due 11/19/2008 | | | 27,393,976 | | |
| | 18,500,000 | | | Sara Lee Corporation 3.75% due 11/6/2008 | | | 18,490,365 | | |
| | 19,347,000 | | | Sara Lee Corporation 3.80% due 12/8/2008 | | | 19,271,439 | | |
| | 68,541,000 | | | Starbucks Corporation 3.00% due 11/3/2008 | | | 68,529,576 | | |
| | 22,763,000 | | | The Dow Chemical Company 3.05% due 11/3/2008 | | | 22,759,143 | | |
| | 40,333,000 | | | The Dow Chemical Company 5.45% due 11/3/2008 | | | 40,320,788 | | |
| | 20,000,000 | | | Time Warner Inc. 4.21% due 11/3/2008 | | | 19,995,322 | | |
| | 30,000,000 | | | Whirlpool Corporation 6.25% due 11/3/2008 | | | 29,989,583 | | |
| | | | | Total U.S. Commercial Paper (Cost: $819,368,854) | | | 819,368,854 | | |
| | | International Commercial Paper—1.49% | |
| | | Finland—0.66% | |
| USD | 30,104,000 | | | Nokia Corporation 1.80% due 11/18/2008 | | | 30,078,412 | | |
| USD | 30,000,000 | | | Nokia Corporation 2.30% due 12/1/2008 | | | 29,942,500 | | |
| USD | 30,000,000 | | | Nokia Corporation 2.30% due 12/2/2008 | | | 29,940,583 | | |
| USD | 23,558,000 | | | Nokia Corporation 2.35% due 11/5/2008 | | | 23,551,849 | | |
| | | | 113,513,344 | | |
See Notes to Financial Statements
19
FIRST EAGLE GLOBAL FUND
SCHEDULE OF INVESTMENTS—(Continued)
October 31, 2008
Principal
Amount | |
| | Value
(Note 1) | |
| | | International Commercial Paper—(continued) | |
| | | Netherlands—0.08% | |
| USD | 13,935,000 | | | Royal Dutch Shell plc 2.15% due 9/18/2008 | | $ | 13,933,800 | | |
| | | United Kingdom—0.75% | |
| USD | 9,750,000 | | | Diageo Capital Plc 2.92% due 11/4/2008 | | | 9,747,627 | | |
| USD | 20,115,000 | | | Diageo Capital Plc 2.97% due 11/3/2008 | | | 20,111,681 | | |
| USD | 23,599,000 | | | Diageo Capital Plc 3.00% due 11/14/2008 | | | 23,573,434 | | |
| USD | 15,000,000 | | | Diageo Capital Plc 5.75% due 11/10/2008 | | | 14,978,437 | | |
| USD | 43,760,000 | | | Diageo Capital Plc 6.00% due 11/6/2008 | | | 43,723,533 | | |
| USD | 18,102,000 | | | Diageo Capital Plc 6.25% due 11/12/2008 | | | 18,067,430 | | |
| | | | 130,202,142 | | |
| | | | | Total International Commercial Paper (Cost: $257,649,286) | | | 257,649,286 | | |
| | | | | Total Commercial Paper (Cost: $1,077,018,140) | | | 1,077,018,140 | | |
| | | | | Total Investments—96.45% (Cost: $19,111,245,510) | | | 16,691,136,353 | | |
| | | | | Other assets in excess of liabilities—3.55% | | | 613,691,209 | | |
| | | | | Net Assets—100.00% | | $ | 17,304,827,562 | | |
Aggregate cost for federal income tax purposes was $19,207,442,683; and net unrealized depreciation consisted of:
| Gross unrealized appreciation | | $ | 1,021,954,459 | | |
| Gross unrealized depreciation | | | (3,538,260,789 | ) | |
| Net unrealized depreciation | | ($ | 2,516,306,330 | ) | |
(a) Non-income producing security/commodity.
(b) All or a portion of the security is exempt from registration under the Securities Act of 1933. Rule 144A securities may only be sold to qualified institutional buyers, pursuant to Rule 144A under the Securities Act of 1933.
(c) Affiliate as defined by the Investment Company Act of 1940. An affiliate is defined as a company in which the Fund directly or indirectly owns, controls, or holds power to vote 5% or more of the outstanding voting securities.
(d) Security is deemed illiquid. At October 31, 2008, the value of these securities amounted to $20,221,921 or 0.12% of net assets.
(e) Represents interest in a restricted security which has not been registered with the Securities and Exchange Commission under the Securities Act of 1933. At October 31, 2008, the value of these securities amounted to $18,855,171 or 0.11% of net assets.
(f) Securities valued in accordance with fair value procedures under the supervision of the Board of Trustees, representing $22,306,925 or 0.13% of net assets.
(g) Inflation protected security.
(h) Defaulted security.
ADR— American Depositary Receipt
RNC— Represents non-voting shares
See Notes to Financial Statements
20
FIRST EAGLE GLOBAL FUND
SCHEDULE OF INVESTMENTS—(Continued)
October 31, 2008
Foreign Currencies
EUR — Euro
GBP — Pound sterling
HKD — Hong Kong dollar
JPY — Japanese Yen
KRW — Korean Won
MYR — Malaysian ringgit
SEK — Swedish krona
SGD — Singapore dollar
TWD — Taiwan dollar
USD — United States dollar
Affiliated Securities
| | | Purchases | | Sales | | Realized | | Dividend | |
| Affiliate | | Shares | | Cost | | Shares | | Cost | | Gain/(Loss) | | Income | |
| Aioi Insurance Company, Limited | | | 48,009,000 | | | $ | 256,756,630 | | | | 1,426,100 | | | $ | 6,231,023 | | | $ | 1,162,726 | | | $ | 2,556,744 | | |
| Ariake Japan Company, Limited | | | 511,900 | | | | 7,316,821 | | | | — | | | | — | | | | — | | | | 540,620 | | |
| Barnes & Noble, Inc. | | | 5,507,306 | | | | 154,967,298 | | | | 370,500 | | | | 13,366,161 | | | | (4,628,480 | ) | | | 3,730,678 | | |
| Blount International, Inc. | | | 967,810 | | | | 11,606,321 | | | | — | | | | — | | | | — | | | | — | | |
| Chofu Seisakusho Company, Limited | | | 1,648,980 | | | | 28,738,106 | | | | — | | | | — | | | | — | | | | 622,031 | | |
| Cintas Corporation | | | 2,708,610 | | | | 87,798,931 | | | | — | | | | — | | | | — | | | | 4,492,683 | | |
| City e-Solutions Limited | | | — | | | | — | | | | — | | | | — | | | | — | | | | 79,886 | | |
| Conbraco Industries, Inc. | | | — | | | | — | | | | 636 | | | | 309,552 | | | | (109,668 | ) | | | — | | |
| Daeduck GDS Company, Limited | | | — | | | | — | | | | 196,370 | | | | 2,269,834 | | | | (1,624,191 | ) | | | 423,968 | | |
| Deceuninck | | | 275,696 | | | | 6,662,060 | | | | — | | | | — | | | | — | | | | 640,888 | | |
| Deltic Timber Corporation | | | 868,870 | | | | 43,899,835 | | | | — | | | | — | | | | — | | | | 274,670 | | |
| Guyenne et Gascogne SA | | | 356,157 | | | | 50,238,696 | | | | — | | | | — | | | | — | | | | 6,325,480 | | |
| IDACORP, Inc. | | | 1,864,980 | | | | 64,351,045 | | | | — | | | | — | | | | — | | | | 4,768,818 | | |
| Kaiser Ventures LLC | | | — | | | | — | | | | — | | | | — | | | | — | | | | — | | |
| Meitec Corporation | | | — | | | | — | | | | — | | | | — | | | | — | | | | 2,743,633 | | |
| Mills Music Trust | | | — | | | | — | | | | — | | | | — | | | | — | | | | 98,011 | | |
| MISUMI Group Inc. | | | 11,255,730 | | | | 198,631,452 | | | | — | | | | — | | | | — | | | | 2,349,989 | | |
| Nam Yang Dairy Products Company, Limited | | | — | | | | — | | | | 7,403 | | | | 1,807,636 | | | | 5,335,655 | | | | 34,308 | | |
| Neopost SA | | | 2,384,174 | | | | 246,949,785 | | | | 43,270 | | | | 5,055,440 | | | | (1,122,234 | ) | | | 12,718,341 | | |
| NSC Groupe | | | 1,000 | | | | 102,788 | | | | 350 | | | | 35,976 | | | | (20,163 | ) | | | 185,976 | | |
| Pfeiffer Vacuum Technology AG | | | 1,083,210 | | | | 100,118,094 | | | | — | | | | — | | | | — | | | | 2,878,070 | | |
| Rayonier Inc. | | | — | | | | — | | | | — | | | | — | | | | — | | | | 11,810,724 | | |
| Rémy Cointreau SA | | | 2,966,078 | | | | 171,298,118 | | | | — | | | | — | | | | — | | | | 7,947,147 | | |
| Sabeton SA | | | — | | | | — | | | | — | | | | — | | | | — | | | | 85,100 | | |
| San Juan Basin Royalty Trust | | | 2,691,923 | | | | 102,414,394 | | | | 260,807 | | | | 11,470,196 | | | | (1,563,603 | ) | | | 11,572,802 | | |
| Shaw Brothers (Hong Kong) Limited | | | 4,766,220 | | | | 10,644,234 | | | | 4,800,420 | | | | 5,987,824 | | | | 7,487,601 | | | | 1,342,595 | | |
| Shimachu Company, Limited | | | 1,666,510 | | | | 43,979,005 | | | | — | | | | — | | | | — | | | | 661,214 | | |
| Shimano Inc. | | | 2,134,600 | | | | 80,358,781 | | | | — | | | | — | | | | — | | | | 2,884,597 | | |
| SMC Corporation | | | 2,174,020 | | | | 229,071,410 | | | | — | | | | — | | | | — | | | | 3,960,952 | | |
| Société Sucrière de Pithiviers-le-Vieil | | | 10,876 | | | | 8,749,466 | | | | — | | | | — | | | | — | | | | 1,943,753 | | |
| T. Hasegawa Company, Limited | | | 1,315,300 | | | | 20,714,279 | | | | — | | | | — | | | | — | | | | 1,528,113 | | |
| THK Company, Limited | | | 11,939,800 | | | | 219,494,815 | | | | — | | | | — | | | | — | | | | 3,534,050 | | |
| Toho Company, Limited | | | 5,546,220 | | | | 121,797,283 | | | | 499,180 | | | | 12,005,057 | | | | (2,971,198 | ) | | | 2,343,536 | | |
| Wendel | | | 1,501,779 | | | | 193,260,893 | | | | 412,227 | | | | 62,927,337 | | | | (12,634,488 | ) | | | 6,152,438 | | |
| Total | | | | | | | | | | | | | | | | | | ( | $10,688,043 | ) | | $ | 101,231,815 | | |
See Notes to Financial Statements
21
FIRST EAGLE GLOBAL FUND
SCHEDULE OF INVESTMENTS—(Continued)
October 31, 2008
Restricted Securities
| Security | | Acquisition
Date | | Cost | | Carrying Value
Per Share/Principal | |
| Kaiser Ventures LLC | | 6/24/1993 | | | — | | | $ | 2.76 | | |
| FINEL 9 1/2% due 6/30/2017 | | 6/22/2005 | | $ | 14,474,400 | | | | 0.64 | | |
| FINEL 9 1/2% due 10/15/2017 | | 10/11/2005 | | | 18,067,500 | | | | 0.64 | | |
| LandCo LLC | | 9/6/2006 | | | 669,030 | | | | 3.48 | | |
Foreign Currency Exchange Contracts
Sales
| | | Settlement
Dates
Through | | Foreign Currency To
Be Delivered | | U.S. $
To Be
Received | | U.S. $ Value at
October 31,
2008 | | Unrealized
Appreciation at
October 31, 2008 | | Unrealized
Depreciation at
October 31, 2008 | |
| | 1/14/09 | | | 1,240,498,000 | | | Euro | | $ | 2,079,396,065 | | | $ | 1,577,837,786 | | | $ | 501,558,279 | | | $ | — | | |
| | 3/4/09 | | | 35,162,592,000 | | | Japanese yen | | | 379,266,891 | | | | 358,119,705 | | | | 21,147,186 | | | | — | | |
| | 4/8/09 | | | 238,801,000 | | | Euro | | | 335,934,107 | | | | 303,636,084 | | | | 32,298,023 | | | | — | | |
| | 4/8/09 | | | 101,049,000 | | | Pound sterling | | | 192,016,717 | | | | 162,263,281 | | | | 29,753,436 | | | | — | | |
| | 4/8/09 | | | 69,404,000 | | | Swiss franc | | | 61,231,971 | | | | 60,144,253 | | | | 1,087,718 | | | | — | | |
| | | | | | | | | | | $ | 3,047,845,751 | | | $ | 2,462,001,109 | | | $ | 585,844,642 | | | $ | — | | |
| Industry Diversification for Portfolio Holdings | | Percent of Net Assets | |
| U.S. Equities | |
| Consumer Discretionary | | | 0.23 | % | |
| Energy | | | 2.71 | | |
| Financials | | | 2.18 | | |
| Health Care | | | 0.84 | | |
| Holding Companies | | | 3.07 | | |
| Industrials | | | 4.45 | | |
| Materials | | | 0.53 | | |
| Media | | | 0.65 | | |
| Paper and Forest Products | | | 2.74 | | |
| Precious Metals | | | 1.05 | | |
| Real Estate | | | 0.01 | | |
| Retail | | | 2.73 | | |
| Technology and Telecommunications | | | 2.08 | | |
| Utilities | | | 0.77 | | |
| | | | 24.04 | % | |
See Notes to Financial Statements
22
FIRST EAGLE GLOBAL FUND
SCHEDULE OF INVESTMENTS—(Continued)
October 31, 2008
| Industry Diversification for Portfolio Holdings | | Percent of Net Assets | |
| International Equities | |
| Consumer Discretionary | | | 4.50 | % | |
| Consumer Staples | | | 8.35 | | |
| Energy | | | 0.40 | | |
| Financials | | | 2.76 | | |
| Health Care | | | 6.60 | | |
| Holding Companies | | | 3.29 | | |
| Industrials | | | 11.92 | | |
| Materials | | | 3.20 | | |
| Media | | | 2.45 | | |
| Precious Metals | | | 2.48 | | |
| Retail | | | 1.27 | | |
| Technology and Telecommunications | | | 5.07 | | |
| Transportation | | | 1.21 | | |
| | | | 53.50 | | |
| Commodity | | | 5.23 | | |
| U.S. Bonds | |
| Consumer Discretionary | | | 0.38 | | |
| Financials | | | 0.08 | | |
| Government Issues | | | 1.88 | | |
| Health Care | | | 0.01 | | |
| Industrials | | | 0.18 | | |
| Materials | | | 0.07 | | |
| Media | | | 0.11 | | |
| Retail | | | 0.01 | | |
| Technology and Telecommunications | | | 0.04 | | |
| | | | 2.76 | | |
| International Bonds | |
| Consumer Discretionary | | | 0.02 | | |
| Financials | | | 0.07 | | |
| Government Issues | | | 3.80 | | |
| Holding Companies | | | 0.14 | | |
| Media | | | 0.53 | | |
| Paper and Forest Products | | | 0.10 | | |
| Retail | | | 0.03 | | |
| Technology and Telecommunications | | | 0.01 | | |
| | | | 4.70 | | |
| Commercial Paper | |
| U.S. Commercial Paper | | | 4.73 | | |
| International Commercial Paper | | | 1.49 | | |
| Total Commercial Paper | | | 6.22 | | |
| Total Investments | | | 96.45 | % | |
See Notes to Financial Statements
23
FUND OVERVIEW
FIRST EAGLE OVERSEAS FUND Data as of October 31, 2008 (unaudited)
THE INVESTMENT STYLE
The First Eagle Overseas Fund seeks long-term growth of capital by investing primarily in equities issued by non-U.S. corporations. Management's research-driven process seeks to minimize risk by focusing on undervalued securities.
ASSET ALLOCATION

COUNTRIES
| Japan | | | 31.93 | % | |
| France | | | 15.90 | % | |
| United States | | | 7.50 | % | |
| Switzerland | | | 5.48 | % | |
| South Korea | | | 4.40 | % | |
| Singapore | | | 3.52 | % | |
| Germany | | | 3.11 | % | |
| Italy | | | 1.99 | % | |
| Hong Kong | | | 1.84 | % | |
| Thailand | | | 1.77 | % | |
| Netherlands | | | 1.58 | % | |
| United Kingdom | | | 1.48 | % | |
| Taiwan | | | 1.45 | % | |
| Canada | | | 1.42 | % | |
| South Africa | | | 1.12 | % | |
| Brazil | | | 0.77 | % | |
| Malaysia | | | 0.73 | % | |
| Mexico | | | 0.52 | % | |
| Chile | | | 0.49 | % | |
| Panama | | | 0.25 | % | |
| Australia | | | 0.25 | % | |
| Belgium | | | 0.24 | % | |
| India | | | 0.15 | % | |
| Other | | | 0.27 | % | |
The Fund's portfolio composition (represented as a percentage of net assets) is subject to change at any time.
AVERAGE ANNUAL RETURNS
| | | ONE-YEAR | | FIVE-YEARS | | TEN-YEARS | |
| First Eagle Overseas Fund (A Shares) | |
| without sales load | | | (28.15 | %) | | | 8.54 | % | | | 13.16 | % | |
| with sales load | | | (31.74 | %) | | | 7.43 | % | | | 12.73 | % | |
| MSCI EAFE Index | | | (46.62 | %) | | | 3.60 | % | | | 1.67 | % | |
| Consumer Price Index | | | 3.66 | % | | | 3.20 | % | | | 2.82 | % | |
GROWTH OF A $10,000 INITIAL INVESTMENT
Performance data quoted herein represents past performance and should not be considered indicative of future results. Performance data quoted herein does not reflect the deduction of taxes that a shareholder would pay on Fund distributions or the sale of Fund shares. The average annual returns shown above are historical and reflect changes in share price, reinvested dividends and are net of expenses. The average annual returns for Class A Shares give effect to the deduction of the maximum sales load of 3.75% for periods prior to March 1, 2000 and of 5.00% thereafter. The MSCI EAFE Index is a total return index, reported in U.S. Dollars, based on share prices and reinvested net dividends of approximately 1,100 companies from 21 countries and is not available for purchase. The Consumer Price Index (CPI) represents the change in price of all goods and services purchased for consumption by urban households.
TOP 10 HOLDINGS
| Gold bullion (precious metal) | | | 6.73 | % | |
| Pargesa Holding SA (Swiss diversified financials company) | | | 2.82 | % | |
| Sodexo SA (French food management services provider) | | | 2.65 | % | |
| Shimano Inc. (Japanese bicycle parts manufacturer) | | | 2.58 | % | |
| Sanofi-Aventis (French health care company) | | | 1.91 | % | |
| SMC Corporation (Japanese automated control devices manufacturer) | | | 1.83 | % | |
Ono Pharmaceutical Company Limited
(Japanese pharmaceutical company) | | | 1.79 | % | |
| Secom Company, Limited (Japanese security services provider) | | | 1.75 | % | |
| Keyence Corporation (Japanese sensors manufacturer) | | | 1.71 | % | |
| Astellas Pharma Inc. (Japanese pharmaceuticals company) | | | 1.61 | % | |
24
FIRST EAGLE OVERSEAS FUND
SCHEDULE OF INVESTMENTS
October 31, 2008
Number
of Shares | |
| | Value
(Note 1) | |
| | | Common and Preferred Stocks—77.50% | |
| | | Australia—0.25% | |
| | 9,330,074 | | | Spotless Group Limited | | $ | 15,497,257 | | |
| | | Belgium—0.24% | |
| | 2,027,619 | | | Deceuninck (c) | | | 15,222,849 | | |
| | | Brazil—0.77% | |
| | 2,178,264 | | | Petroleo Brasiliero SA ADR | | | 48,074,286 | | |
| | | Canada—0.88% | |
| | 905,890 | | | EnCana Corporation | | | 46,118,860 | | |
| | 864,070 | | | Harry Winston Diamond Corporation | | | 8,460,685 | | |
| | | | 54,579,545 | | |
| | | Chile—0.49% | |
| | 24,062,197 | | | Quinenco SA | | | 30,671,902 | | |
| | | Commonwealth of Independent States—0.00% | |
| | 100,000 | | | First NIS Regional Fund SICAV (a)(e)(f) | | | 50,000 | | |
| | | France—14.62% | |
| | 3,452,024 | | | Sodexo | | | 164,770,117 | | |
| | 1,894,153 | | | Sanofi-Aventis | | | 119,141,550 | | |
| | 1,107,930 | | | Neopost SA | | | 92,203,552 | | |
| | 1,492,745 | | | Rémy Cointreau SA | | | 61,734,305 | | |
| | 719,649 | | | Air Liquide SA | | | 61,634,749 | | |
| | 1,098,583 | | | Société BIC SA | | | 57,679,260 | | |
| | 563,378 | | | Laurent-Perrier (c) | | | 45,515,864 | | |
| | 999,278 | | | Carrefour SA | | | 41,860,435 | | |
| | 870,478 | | | Wendel | | | 41,028,568 | | |
| | 842,903 | | | Essilor International SA | | | 37,605,130 | | |
| | 613,300 | | | Total SA | | | 33,413,848 | | |
| | 236,140 | | | Robertet SA (c) | | | 25,240,992 | | |
| | 51,500 | | | Robertet SA C.I. (f) | | | 4,207,265 | | |
| | 39,143 | | | Société Sucrière de Pithiviers-le Vieil (c) | | | 23,160,893 | | |
| | 821,290 | | | Vivendi SA | | | 21,325,082 | | |
| | 540,680 | | | Zodiac SA | | | 20,977,576 | | |
| | 364,373 | | | Gaumont SA (c) | | | 20,864,899 | | |
| | 438,430 | | | Société Foncière Financière et de Participations | | | 18,645,082 | | |
| | 120,246 | | | Guyenne et Gascogne SA | | | 9,027,765 | | |
| | 300,000 | | | Frégate (a)(d)(e)(f) | | | 7,291,421 | | |
| | 100,000 | | | Sabeton SA | | | 1,399,749 | | |
| | 1,000 | | | Société Vermandoise de Sucreries | | | 1,208,874 | | |
| | 3,593,581 | | | FINEL (a)(c)(d)(e)(f)(h) | | | — | | |
| | | | 909,936,976 | | |
See Notes to Financial Statements
25
FIRST EAGLE OVERSEAS FUND
SCHEDULE OF INVESTMENTS—(Continued)
October 31, 2008
Number
of Shares | |
| | Value
(Note 1) | |
| | | Common and Preferred Stocks—(continued) | |
| | | Germany—3.11% | |
| | 915,140 | | | Pfeiffer Vacuum Technology AG (c) | | $ | 55,081,563 | | |
| | 581,442 | | | Hornbach Holding AG Pfd. | | | 38,104,056 | | |
| | 876,905 | | | Fraport AG | | | 28,253,602 | | |
| | 1,358,769 | | | Bertelsmann AG D.R.C. | | | 27,664,523 | | |
| | 1,844,060 | | | Tognum AG | | | 20,227,392 | | |
| | 2,047,306 | | | Deutsche Wohnen AG (a)(c) | | | 18,757,408 | | |
| | 95,809 | | | Axel Springer AG | | | 5,459,438 | | |
| | | | 193,547,982 | | |
| | | Hong Kong—1.84% | |
| | 7,767,710 | | | Guoco Group Limited | | | 45,101,959 | | |
| | 12,545,300 | | | Wharf Holdings Limited | | | 24,280,756 | | |
| | 7,000,000 | | | Hopewell Holdings Limited | | | 21,225,396 | | |
| | 15,571,620 | | | Shaw Brothers (Hong Kong) Limited | | | 16,636,196 | | |
| | 8,254,000 | | | SmarTone Telecommunications Holdings Limited | | | 6,358,119 | | |
| | 10,851,720 | | | City e-Solutions Limited | | | 714,099 | | |
| | | | 114,316,525 | | |
| | | India—0.15% | |
| | 178,058 | | | Nestlé India Limited | | | 5,221,114 | | |
| | 1,178,610 | | | Tata Motors Limited | | | 4,041,119 | | |
| | | | 9,262,233 | | |
| | | Italy—1.99% | |
| | 7,315,306 | | | Italcementi S.p.A. RNC | | | 50,639,450 | | |
| | 1,197,736 | | | Italmobiliare S.p.A. RNC | | | 40,846,371 | | |
| | 165,635 | | | Italmobiliare S.p.A. | | | 6,736,223 | | |
| | 6,421,411 | | | Gewiss S.p.A. (c) | | | 25,821,123 | | |
| | | | 124,043,167 | | |
| | | Japan—31.93% | |
| | 5,654,500 | | | Shimano Inc. (c) | | | 160,554,193 | | |
| | 1,231,500 | | | SMC Corporation | | | 114,050,987 | | |
| | 2,528,100 | | | Ono Pharmaceutical Company, Limited | | | 111,405,180 | | |
| | 2,915,900 | | | Secom Company, Limited | | | 109,205,292 | | |
| | 564,600 | | | Keyence Corporation | | | 106,358,091 | | |
| | 2,523,420 | | | Astellas Pharma Inc. | | | 99,899,286 | | |
| | 20,785,230 | | | Nissay Dowa General Insurance Company (c) | | | 90,747,646 | | |
| | 1,360,500 | | | FANUC Limited | | | 88,060,045 | | |
| | 11,702,810 | | | Sompo Japan Insurance Inc. | | | 79,320,898 | | |
| | 769,380 | | | Hirose Electric Company, Limited | | | 65,772,359 | | |
See Notes to Financial Statements
26
FIRST EAGLE OVERSEAS FUND
SCHEDULE OF INVESTMENTS—(Continued)
October 31, 2008
Number
of Shares | |
| | Value
(Note 1) | |
| | | Common and Preferred Stocks—(continued) | |
| | | Japan—(continued) | |
| | 4,305,870 | | | MISUMI Group Inc. | | $ | 65,381,214 | | |
| | 1,838,970 | | | Canon Inc. | | | 62,509,259 | | |
| | 3,334,990 | | | Toho Company, Limited | | | 62,484,394 | | |
| | 15,519,800 | | | Aioi Insurance Company, Limited | | | 62,388,775 | | |
| | 2,832,150 | | | Nitto Kohki Company, Limited (c) | | | 51,016,746 | | |
| | 3,452,591 | | | T. Hasegawa Company, Limited (c) | | | 49,157,081 | | |
| | 2,387,767 | | | Meitec Corporation (c) | | | 46,899,962 | | |
| | 2,022,800 | | | Chofu Seisakusho Company, Limited (c) | | | 43,436,882 | | |
| | 5,693,500 | | | Japan Wool Textile Company, Limited (c) | | | 42,240,601 | | |
| | 9,513,700 | | | Okumura Corporation | | | 36,889,067 | | |
| | 2,538,900 | | | THK Company, Limited | | | 34,236,134 | | |
| | 5,453,000 | | | Kansai Paint Company, Limited | | | 29,745,654 | | |
| | 1,760,700 | | | Ariake Japan Company, Limited (c) | | | 28,472,952 | | |
| | 936,347 | | | Mandom Corporation | | | 25,062,005 | | |
| | 4,226,650 | | | NIPPONKOA Insurance Company, Limited | | | 24,905,662 | | |
| | 1,954,500 | | | Fuji Seal International, Inc. (c) | | | 21,800,651 | | |
| | 2,535,900 | | | Yomeishu Seizo Company, Limited (c) | | | 21,601,346 | | |
| | 3,005,000 | | | OSG Corporation | | | 21,438,072 | | |
| | 2,068,330 | | | Maezawa Kasei Industries Company, Limited (c) | | | 20,460,175 | | |
| | 2,376,980 | | | Daiichikosho Company, Limited | | | 20,392,776 | | |
| | 2,181,200 | | | Seikagaku Corporation | | | 19,290,279 | | |
| | 807,000 | | | Shimachu Company, Limited | | | 18,068,390 | | |
| | 1,897,056 | | | Nissin Healthcare Food Service Company, Limited | | | 17,839,199 | | |
| | 853,360 | | | Icom Inc. (c) | | | 16,405,425 | | |
| | 1,058,246 | | | Matsumoto Yushi-Seiyaku Company, Limited (c) | | | 15,077,798 | | |
| | 2,572,675 | | | The Tokushima Bank Limited | | | 12,462,785 | | |
| | 629,002 | | | Nagaileben Company, Limited | | | 12,418,725 | | |
| | 798,380 | | | Chudenko Corporation | | | 11,862,760 | | |
| | 303,200 | | | Mabuchi Motor Company, Limited | | | 11,787,340 | | |
| | 507,106 | | | SK Kaken Company, Limited | | | 10,682,978 | | |
| | 100,000 | | | ASAHI Broadcasting Corporation | | | 10,533,279 | | |
| | 528,130 | | | As One Corporation | | | 10,507,777 | | |
| | 1,223,670 | | | Sansei Yusoki Company, Limited (c) | | | 9,389,855 | | |
| | 1,444,600 | | | Shingakukai Company, Limited (c) | | | 4,733,983 | | |
| | 300,800 | | | Doshisha Corporation, Limited | | | 3,349,025 | | |
| | 312,785 | | | Shoei Company, Limited | | | 2,893,564 | | |
| | 312,000 | | | Sonton Food Industry Company, Limited | | | 1,949,603 | | |
| | 33,800 | | | Tachihi Enterprise Company, Limited | | | 1,702,727 | | |
| | | | 1,986,848,877 | | |
See Notes to Financial Statements
27
FIRST EAGLE OVERSEAS FUND
SCHEDULE OF INVESTMENTS—(Continued)
October 31, 2008
Number
of Shares | |
| | Value
(Note 1) | |
| | | Common and Preferred Stocks—(continued) | |
| | | Malaysia—0.73% | |
| | 35,612,520 | | | Genting Berhad | | $ | 45,330,496 | | |
| | | Mexico—0.52% | |
| | 3,552,612 | | | Industrias Peñoles SAB de C.V. | | | 32,077,102 | | |
| | | Netherlands—0.95% | |
| | 496,018 | | | Hal Trust NV | | | 38,281,225 | | |
| | 698,529 | | | Heineken Holding NV | | | 21,066,402 | | |
| | | | 59,347,627 | | |
| | | New Zealand—0.06% | |
| | 5,750,000 | | | Tasman Farms (a)(c) | | | 3,760,316 | | |
| | | Panama—0.25% | |
| | 1,461,723 | | | Banco Latinoamericano de Exportaciones SA ADR | | | 15,538,115 | | |
| | | Singapore—2.50% | |
| | 23,149,730 | | | Haw Par Corporation Limited (c) | | | 53,395,432 | | |
| | 27,917,700 | | | Singapore Airport Terminal Services Limited | | | 27,677,639 | | |
| | 3,132,020 | | | United Overseas Bank Limited | | | 27,502,209 | | |
| | 9,974,000 | | | Fraser & Neave Limited | | | 18,363,864 | | |
| | 11,657,433 | | | UOL Group Limited | | | 14,780,627 | | |
| | 17,549,625 | | | ComfortDelgro Corporation Limited | | | 14,084,676 | | |
| | | | 155,804,447 | | |
| | | South Africa—1.12% | |
| | 8,156,160 | | | Gold Fields Limited ADR | | | 54,238,464 | | |
| | 2,073,780 | | | Harmony Gold Mining Company, Limited ADR (a) | | | 15,159,332 | | |
| | | | 69,397,796 | | |
| | | South Korea—4.40% | |
| | 263,014 | | | Samsung Electronics Company, Limited Pfd. | | | 68,149,954 | | |
| | 3,045,524 | | | SK Telecom Company, Limited ADR | | | 52,413,468 | | |
| | 796,799 | | | KT&G Corporation | | | 50,735,410 | | |
| | 33,070 | | | Lotte Confectionery Company, Limited | | | 27,896,688 | | |
| | 120,620 | | | Nong Shim Holding Company, Limited | | | 19,434,494 | | |
| | 39,708 | | | Nong Shim Holdings Company, Limited | | | 1,968,560 | | |
| | 939,030 | | | Fursys Inc. (c) | | | 16,075,420 | | |
| | 494,900 | | | Hankuk Paper Manufacturing Company, Limited (c) | | | 8,433,944 | | |
| | 22,950 | | | Nam Yang Dairy Products Company, Limited | | | 7,093,265 | | |
| | 28,850 | | | Nam Yang Dairy Products Company, Limited Pfd. | | | 4,089,663 | | |
| | 117,880 | | | Pacific Corporation | | | 6,866,707 | | |
| | 1,182,040 | | | Dong Ah Tire & Rubber Company, Limited | | | 5,448,033 | | |
| | 912,730 | | | Daeduck GDS Company, Limited | | | 2,509,930 | | |
See Notes to Financial Statements
28
FIRST EAGLE OVERSEAS FUND
SCHEDULE OF INVESTMENTS—(Continued)
October 31, 2008
Number
of Shares | |
| | Value
(Note 1) | |
| | | Common and Preferred Stocks—(continued) | |
| | | South Korea—(continued) | |
| | 542,700 | | | Daeduck Electronics Company, Limited | | $ | 1,235,941 | | |
| | 290,204 | | | Sam-A Pharmaceutical Company, Limited | | | 973,379 | | |
| | 231,360 | | | Daekyo Company, Limited Pfd. | | | 546,611 | | |
| | | | 273,871,467 | | |
| | | Switzerland—5.48% | |
| | 2,300,398 | | | Pargesa Holding SA | | | 175,315,585 | | |
| | 2,260,150 | | | Nestlé SA | | | 87,583,854 | | |
| | 719,956 | | | Kuehne & Nagel International AG | | | 43,305,857 | | |
| | 1,072 | | | Lindt & Spruengli AG | | | 25,848,009 | | |
| | 35,000 | | | Edipresse SA | | | 8,891,281 | | |
| | | | 340,944,586 | | |
| | | Taiwan—1.23% | |
| | 65,598,907 | | | Compal Electronics Inc. | | | 47,136,939 | | |
| | 18,842,980 | | | Taiwan Secom Company, Limited | | | 23,252,006 | | |
| | 12,966,228 | | | Taiwan-Sogo Shinkong Security Company, Limited | | | 5,955,836 | | |
| | | | 76,344,781 | | |
| | | Thailand—1.77% | |
| | 552,092,549 | | | Thai Beverage Public Company Limited | | | 76,330,449 | | |
| | 14,789,489 | | | Bangkok Bank Public Company Limited NVDR | | | 29,325,806 | | |
| | 250,000 | | | The Oriental Hotel Public Company, Limited | | | 3,509,272 | | |
| | 496,220 | | | Bangkok Bank Public Company Limited | | | 983,946 | | |
| | | | 110,149,473 | | |
| | | United Kingdom—1.45% | |
| | 2,986,700 | | | Spirax-Sarco Engineering Plc | | | 38,562,866 | | |
| | 9,117,080 | | | Home Retail Group | | | 28,968,749 | | |
| | 892,218 | | | Anglo American Plc | | | 22,074,404 | | |
| | 656,219 | | | Chrysalis Group Plc (a) | | | 794,821 | | |
| | | | 90,400,840 | | |
| | | United States—0.77% | |
| | 1,597,613 | | | Newmont Mining Corporation Holding Company | | | 42,081,126 | | |
| | 34,500 | | | Third Avenue Global Value Fund L.P. (a)(d)(e) | | | 5,504,057 | | |
| | 14,083 | | | Security Capital European Realty (a)(d)(f) | | | — | | |
| | | | 47,585,183 | | |
| | | | | Total Common and Preferred Stocks (Cost: $5,147,933,813) | | | 4,822,603,828 | | |
See Notes to Financial Statements
29
FIRST EAGLE OVERSEAS FUND
SCHEDULE OF INVESTMENTS—(Continued)
October 31, 2008
| Ounces | |
| | Value
(Note 1) | |
| | | Commodity—6.73% | |
| | 577,779 | | | Gold bullion (a) (Cost: $293,104,679) | | $ | 418,513,962 | | |
Principal
Amount | |
| |
| |
| | | International Bonds—3.93% | |
| | | International Government Bonds—2.13% | |
| | | France—0.89% | |
| EUR | 42,834,844 | | | Republic of France O.A.T. I/L 3.00% due 7/25/2012 (g) | | | 55,357,845 | | |
| | | Singapore—1.01% | |
| SGD | 42,342,000 | | | Singapore Government 2.375% due 10/1/2009 | | | 28,878,943 | | |
| SGD | 8,682,000 | | | Singapore Government 3.625% due 7/1/2011 | | | 6,181,929 | | |
| SGD | 39,282,000 | | | Singapore Government 4.625% due 7/1/2010 | | | 27,960,863 | | |
| | | | 63,021,735 | | |
| | | Taiwan—0.23% | |
| TWD | 462,700,000 | | | Taiwan Government 2.00% due 7/20/2012 | | | 14,045,163 | | |
| | | International Corporate Bonds—1.80% | |
| | | Argentina—0.02% | |
| USD | 1,000,000 | | | YPF Sociedad Anonima SA 9.125% due 2/24/2009 | | | 955,000 | | |
| | | Canada—0.54% | |
| USD | 10,000,000 | | | Canwest Mediaworks LP 9.250% due 8/1/2015 (b) | | | 6,150,000 | | |
| USD | 47,142,000 | | | Catalyst Paper Corporation 7.375% due 3/1/2014 | | | 24,749,550 | | |
| USD | 5,000,000 | | | Catalyst Paper Corporation 8.625% due 6/15/2011 | | | 2,975,000 | | |
| | | | 33,874,550 | | |
| | | France—0.27% | |
| EUR | 8,000,000 | | | FINEL 9.50% due 6/30/2017 (d)(e)(f)(i) | | | 5,089,998 | | |
| EUR | 10,000,000 | | | FINEL 9.50% due 10/15/2017 (d)(e)(f)(i) | | | 6,362,497 | | |
| EUR | 243,500 | | | Havas SA 4.00% due 1/1/2009 | | | 3,384,779 | | |
| USD | 2,000,000 | | | Legrand SA 8.50% due 2/15/2025 | | | 1,869,502 | | |
| | | | 16,706,776 | | |
| | | Ireland—0.09% | |
| EUR | 22,300,000 | | | Waterford Wedgwood Plc 9.875% due 12/1/2010 (b) | | | 5,675,347 | | |
| | | Jersey Channel Islands—0.11% | |
| EUR | 5,500,000 | | | Independent News & Media Plc 5.750% due 5/17/2009 | | | 6,823,778 | | |
| | | Luxembourg—0.12% | |
| EUR | 6,256,000 | | | Wendel 4.875% due 11/4/2014 | | | 4,397,641 | | |
| EUR | 3,577,000 | | | Wendel 5.00% due 2/16/2011 | | | 3,290,810 | | |
| | | | 7,688,451 | | |
See Notes to Financial Statements
30
FIRST EAGLE OVERSEAS FUND
SCHEDULE OF INVESTMENTS—(Continued)
October 31, 2008
Principal
Amount | |
| | Value
(Note 1) | |
| | | International Corporate Bonds—(continued) | |
| | | Netherlands—0.63% | |
| EUR | 26,750,000 | | | UPC Holding BV 7.75% due 1/15/2014 (b) | | $ | 23,827,551 | | |
| EUR | 16,550,000 | | | UPC Holding BV 8.625% due 1/15/2014 (b) | | | 15,268,402 | | |
| | | | 39,095,953 | | |
| | | United Kingdom—0.02% | |
| GBP | 1,000,000 | | | Marks & Spencer 6.38% due 11/7/2011 | | | 1,486,735 | | |
| | | | | Total International Bonds (Cost: $304,187,228) | | | 244,731,333 | | |
| | | Commercial Paper—7.07% | |
| | | U.S. Commercial Paper—6.05% | |
| $ | 12,005,000 | | | AT&T 1.55% due 11/12/2008 | | | 11,999,314 | | |
| | 11,400,000 | | | The Clorox Company 5.50% due 11/4/2008 | | | 11,394,775 | | |
| | 28,147,000 | | | The Clorox Company 5.50% due 11/6/2008 | | | 28,125,499 | | |
| | 13,903,000 | | | The Clorox Company 5.50% due 11/17/2008 | | | 13,869,015 | | |
| | 10,454,000 | | | ConocoPhillips Company 1.10% due 11/7/2008 | | | 10,452,083 | | |
| | 26,731,000 | | | H.J. Heinz Company 4.30% due 11/10/2008 | | | 26,702,264 | | |
| | 22,500,000 | | | H.J. Heinz Company 4.35% due 11/13/2008 | | | 22,467,375 | | |
| | 18,985,000 | | | H.J. Heinz Company 4.55% due 11/5/2008 | | | 18,975,402 | | |
| | 25,000,000 | | | H.J. Heinz Company 5.00% due 11/7/2008 | | | 24,979,167 | | |
| | 15,000,000 | | | Kraft Foods Inc. 4.25% due 11/3/2008 | | | 14,996,458 | | |
| | 26,450,000 | | | Kraft Foods Inc. 4.25% due 11/4/2008 | | | 26,440,632 | | |
| | 25,000,000 | | | Philip Morris USA 1.40% due 12/2/2008 | | | 24,969,861 | | |
| | 15,000,000 | | | Sara Lee 3.75% due 11/5/2008 | | | 14,993,750 | | |
| | 18,500,000 | | | Sara Lee 3.75% due 11/6/2008 | | | 18,490,365 | | |
| | 24,488,000 | | | Sara Lee 3.80% due 12/8/2008 | | | 24,392,361 | | |
| | 53,029,000 | | | Starbucks Corporation 3.00% due 11/3/2008 | | | 53,020,162 | | |
| | 30,000,000 | | | Whirlpool Corporation 6.25% due 11/2/2008 | | | 29,989,583 | | |
| | | | | Total U.S. Commercial Paper (Cost: $376,258,066) | | | 376,258,066 | | |
| | | International Commercial Paper—1.02% | |
| | | Finland—0.76% | |
| USD | 20,996,000 | | | Nokia Corporation 2.20% due 11/18/2008 | | | 20,974,187 | | |
| USD | 26,442,000 | | | Nokia Corporation 2.35% due 11/5/2008 | | | 26,435,096 | | |
| | | | 47,409,283 | | |
| | | United Kingdom—0.26% | |
| USD | 16,240,000 | | | Diageo Capital Plc 6.00% due 11/6/2008 | | | 16,226,467 | | |
| | | | | Total International Commercial Paper (Cost: $63,635,750) | | $ | 63,635,750 | | |
| | | | | Total Commercial Paper (Cost: $439,893,816) | | | 439,893,816 | | |
See Notes to Financial Statements
31
FIRST EAGLE OVERSEAS FUND
SCHEDULE OF INVESTMENTS—(Continued)
October 31, 2008
| | Value
(Note 1) | |
| Total Investments—95.23% (Cost: $6,185,119,536) | | $ | 5,925,742,939 | | |
| Other assets in excess of liabilities—4.77% | | | 296,997,931 | | |
| Net Assets—100.00% | | $ | 6,222,740,870 | | |
Aggregate cost for federal income tax purposes was $6,301,124,016; and net unrealized depreciation consisted of:
| Gross unrealized appreciation | | $ | 742,304,030 | | |
| Gross unrealized depreciation | | | (1,117,685,107 | ) | |
| Net unrealized depreciation | | $ | (375,381,077 | ) | |
(a) Non-income producing security/commodity.
(b) All or a portion of the security is exempt from registration under the Securities Act of 1933. Rule 144A securities may only be sold to qualified institutional buyers, pursuant to Rule 144A under the Securities Act of 1933.
(c) Affiliate as defined by the Investment Company Act of 1940. An affiliate is defined as a company in which the Fund directly or indirectly owns, controls, or holds power to vote 5% or more of the outstanding voting securities.
(d) Security is deemed illiquid. At October 31, 2008, the value of these securities amounted to $24,247,973 or 0.39% of net assets.
(e) Represents interest in a restricted security which has not been registered with the Securities and Exchange Commission under the Securities Act of 1933. At October 31, 2008, the value of these securities amounted to $24,297,973 or 0.39% of net assets.
(f) Securities valued in accordance with fair value procedures under the supervision of the Board of Trustees, representing $23,001,181 or 0.37% of net assets.
(g) Inflation protected security.
(h) Held through Financiere Bleue, LLC.
(i) Defaulted security.
ADR— American Depositary Receipt
RNC— Represents non-voting shares
Currencies
EUR — Euro
GBP — Pound sterling
SGD — Singapore dollar
TWD — Taiwan dollar
USD — United States dollar
See Notes to Financial Statements
32
FIRST EAGLE OVERSEAS FUND
SCHEDULE OF INVESTMENTS—(Continued)
October 31, 2008
Affiliated Securities
| | | Purchases | | Sales | | Realized | | Dividend | |
| Affiliate | | Shares | | Cost | | Shares | | Cost | | Gain/(Loss) | | Income | |
| Ariake Japan Company, Limited | | | — | | | | — | | | | — | | | | — | | | | — | | | $ | 554,147 | | |
| Chofu Seisakusho Company, Limited | | | 444,700 | | | $ | 7,828,182 | | | | — | | | | — | | | | — | | | | 445,792 | | |
| Deceuninck | | | — | | | | — | | | | — | | | | — | | | | — | | | | 587,980 | | |
| Deutsche Wohnen AG | | | 2,047,306 | | | | 39,841,345 | | | | — | | | | — | | | | — | | | | — | | |
| FINEL | | | — | | | | — | | | | — | | | | — | | | | — | | | | 211,156 | | |
| Fuji Seal International, Inc. | | | 553,500 | | | | 8,770,034 | | | | 145,300 | | | $ | 2,721,569 | | | | ($1,171,236 | ) | | | 735,739 | | |
| Fursys Inc. | | | — | | | | — | | | | — | | | | — | | | | — | | | | 501,043 | | |
| Gaumont SA | | | 85,012 | | | | 7,343,774 | | | | — | | | | — | | | | — | | | | 125,256 | | |
| Gewiss S.p.A. | | | 657,477 | | | | 4,346,349 | | | | 64,784 | | | | 471,962 | | | | (207,501 | ) | | | 738,198 | | |
| Hankuk Paper Manufacturing Company, Limited | | | — | | | | — | | | | — | | | | — | | | | — | | | | 132,033 | | |
| Haw Par Corporation Limited | | | 7,075,080 | | | | 34,061,669 | | | | — | | | | — | | | | — | | | | 3,656,780 | | |
| Icom Inc. | | | — | | | | — | | | | — | | | | — | | | | — | | | | 308,138 | | |
| Japan Wool Textile Company, Limited | | | 5,693,500 | | | | 44,154,843 | | | | — | | | | — | | | | — | | | | 354,021 | | |
| Laurent-Perrier | | | 36,330 | | | | 3,028,573 | | | | 14,570 | | | | 663,000 | | | | 2,012,667 | | | | 876,531 | | |
| Maezawa Kasei Industries Company, Limited | | | 38,000 | | | | 517,168 | | | | — | | | | — | | | | — | | | | 616,150 | | |
| Matsumoto Yushi-Seiyaku Company, Limited | | | 450,000 | | | | 11,183,186 | | | | — | | | | — | | | | — | | | | 588,676 | | |
| Meitec Corporation | | | — | | | | — | | | | — | | | | — | | | | — | | | | 1,788,128 | | |
| Nissay Dowa General Insurance Company | | | 20,785,230 | | | | 109,655,110 | | | | — | | | | — | | | | — | | | | 772,429 | | |
| Nitto Kohki Company, Limited | | | 570,300 | | | | 11,863,524 | | | | 10,000 | | | | 226,271 | | | | (13,610 | ) | | | 1,205,849 | | |
| Pfeiffer Vacuum Technology AG | | | — | | | | — | | | | — | | | | — | | | | — | | | | 3,555,184 | | |
| Robertet SA | | | 9,000 | | | | 1,332,624 | | | | — | | | | — | | | | — | | | | 672,517 | | |
| Sansei Yusoki Company, Limited | | | 188,380 | | | | 1,117,861 | | | | — | | | | — | | | | — | | | | 221,115 | | |
| Shimano Inc. | | | 256,000 | | | | 9,144,700 | | | | — | | | | — | | | | — | | | | 2,411,027 | | |
| Shingakukai Company, Limited | | | 434,000 | | | | 2,565,382 | | | | 15,400 | | | | 100,841 | | | | (49,074 | ) | | | 135,360 | | |
| Société Sucrière de Pithiviers-le Vieil | | | 393 | | | | 288,868 | | | | — | | | | — | | | | — | | | | 1,379,864 | | |
| T. Hasegawa Company, Limited | | | 305,100 | | | | 5,184,041 | | | | — | | | | — | | | | — | | | | 1,036,114 | | |
| Tasman Farms | | | — | | | | — | | | | — | | | | — | | | | — | | | | — | | |
| Yomeishu Seizo Company, Limited | | | 1,550,400 | | | | 14,645,657 | | | | — | | | | — | | | | — | | | | 239,627 | | |
| Total | | | | | | | | | | | | | | | | | | $ | 571,246 | | | $ | 23,848,854 | | |
Restricted Securities
| Security | | Acquisition
Date | | Cost | | Carrying Value Per
Share/Principal | |
| FINEL | | 7/14/99 | | $ | 9,152,131 | | | | — | | |
| FINEL 9 1/2% due 6/30/2017 | | 6/22/05 | | | 9,649,600 | | | $ | 0.64 | | |
| FINEL 9 1/2% due 10/15/2017 | | 10/11/05 | | | 12,045,000 | | | | 0.64 | | |
| First NIS Regional Fund SICAV | | 11/22/94 | �� | | 1,000,000 | | | | 0.50 | | |
| Fregaté | | 4/30/04 | | | 3,620,400 | | | | 24.30 | | |
| Third Avenue Global Value Fund L.P. | | 6/30/97 | | | 3,450,000 | | | | 159.54 | | |
See Notes to Financial Statements
33
FIRST EAGLE OVERSEAS FUND
SCHEDULE OF INVESTMENTS—(Continued)
October 31, 2008
Foreign Currency Exchange Contracts
Sales
| | | Settlement
Dates
Through | | Foreign Currency To
Be Delivered | | U.S. $
To Be
Received | | U.S. $ Value at
October 31,
2008 | | Unrealized
Appreciation at
October 31, 2008 | | Unrealized
Depreciation at
October 31, 2008 | |
| | 1/14/2009 | | | 638,835,000 | | | Euro | | $ | 1,117,423,481 | | | $ | 812,559,151 | | | $ | 304,864,330 | | | | — | | |
| | 1/14/2009 | | | 55,208,000 | | | Pound sterling | | | 111,299,975 | | | | 88,688,505 | | | | 22,611,470 | | | | — | | |
| | 3/4/2009 | | | 17,823,768,000 | | | Japanese yen | | | 192,248,770 | | | | 181,529,352 | | | | 10,719,418 | | | | — | | |
| | 4/8/2009 | | | 13,465,000 | | | Euro | | | 10,388,437 | | | | 17,096,142 | | | | — | | | ( | $6,707,705 | ) | |
| | 4/8/2009 | | | 28,590,000 | | | Swiss franc | | | 25,222,506 | | | | 24,775,930 | | | | 446,576 | | | | | | |
| | | | | | | | | | | $ | 1,456,583,169 | | | $ | 1,124,649,080 | | | $ | 338,641,794 | | | ( | $6,707,705 | ) | |
| Industry Diversification for Portfolio Holdings | | Percent of Net Assets | |
| U.S. Equities | |
| Holding Companies | | | 0.09 | % | |
| Precious Metals | | | 0.68 | | |
| | | | 0.77 | | |
| International Equities | |
| Consumer Discretionary | | | 9.31 | | |
| Consumer Staples | | | 10.66 | | |
| Energy | | | 2.05 | | |
| Financials | | | 5.51 | | |
| Health Care | | | 6.61 | | |
| Holding Companies | | | 5.54 | | |
| Industrials | | | 17.27 | | |
| Materials | | | 4.57 | | |
| Media | | | 3.13 | | |
| Paper and Forest Products | | | 0.14 | | |
| Precious Metals | | | 1.98 | | |
| Real Estate | | | 1.06 | | |
| Technology and Telecommunications | | | 7.08 | | |
| Transportation | | | 1.82 | | |
| | | | 76.73 | | |
| Commodity | | | 6.73 | | |
| International Bonds | |
| Consumer Discretionary | | | 0.11 | | |
| Energy | | | 0.02 | | |
| Government Issues | | | 2.13 | | |
| Holding Companies | | | 0.12 | | |
| Industrials | | | 0.03 | | |
| Media | | | 0.89 | | |
| Paper and Forest Products | | | 0.63 | | |
| | | | 3.93 | | |
| Commercial Paper | |
| U.S. Commercial Paper | | | 6.05 | | |
| International Commercial Paper | | | 1.02 | | |
| Total Commercial Paper | | | 7.07 | | |
| Total Investments | | | 95.23 | % | |
See Notes to Financial Statements
34
FUND OVERVIEW
FIRST EAGLE U.S. VALUE FUND Data as of October 31, 2008 (unaudited)
THE INVESTMENT STYLE
The First Eagle U.S. Value Fund seeks long-term growth of capital by investing primarily in equities issued by U.S. corporations. Management utilizes a highly disciplined, bottom-up, value-oriented approach in achieving its investment objective.
ASSET ALLOCATION
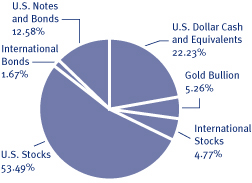
SECTOR/INDUSTRY
| Industrials | | | 13.86 | % | |
| Technology and Telecommunications | | | 7.80 | % | |
| Retail | | | 7.08 | % | |
| Energy | | | 6.84 | % | |
| Consumer Discretionary | | | 6.83 | % | |
| Precious Metals | | | 6.72 | % | |
| Health Care | | | 6.51 | % | |
| Media | | | 4.97 | % | |
| Holding Companies | | | 4.90 | % | |
| Financials | | | 3.61 | % | |
| Paper & Forest Products | | | 3.25 | % | |
| Materials | | | 2.25 | % | |
| Utilities | | | 1.89 | % | |
| Government Bonds | | | 0.72 | % | |
| Consumer Staples | | | 0.54 | % | |
The Fund's portfolio composition (represented as a percentage of net assets) is subject to change at any time.
AVERAGE ANNUAL RETURNS
| | | ONE-YEAR | | FIVE-YEARS | | SINCE
INCEPTION
(9-04-01) | |
| First Eagle U.S. Value Fund (A Shares) | |
| without sales load | | | (20.56 | %) | | | 4.98 | % | | | 7.70 | % | |
| with sales load | | | (24.53 | %) | | | 3.90 | % | | | 6.93 | % | |
| Standard & Poor's 500 Index | | | (36.10 | %) | | | 0.26 | % | | | (0.38 | %) | |
| Consumer Price Index | | | 3.66 | % | | | 3.20 | % | | | 2.81 | % | |
GROWTH OF A $10,000 INITIAL INVESTMENT
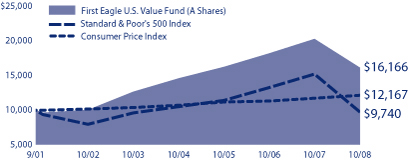
Performance data quoted herein represents past performance and should not be considered indicative of future results. Performance data quoted herein does not reflect the deduction of taxes that a shareholder would pay on Fund distributions or the sale of Fund shares. The average annual returns shown above are historical and reflect changes in share price, reinvested dividends and are net of expenses. The average annual returns for Class A Shares with a sales load gives effect to the deduction of the maximum sales load of 5.00%. The Standard & Poor's 500 Index is a widely recognized unmanaged index including a representative sample of 500 leading companies in leading sectors of the U.S. economy and is not available for purchase. Although the Standard & Poor's 500 Index focuses on the large-cap segment of the market, with approximately 75% coverage of U.S. equities, it is also considered a proxy for the total market. The Consumer Price Index (CPI) represents the change in price of all goods and services purchased for consumption by urban households.
TOP 10 HOLDINGS
| Gold bullion (precious metal) | | | 5.26 | % | |
| Berkshire Hathaway Inc., Class 'A' (holding company) | | | 4.90 | % | |
| Sanofi-Aventis ADR (French health care company) | | | 3.41 | % | |
Blount International Inc. 8.875% due 8/1/2012 2.90%
(outdoor industrial equipment manufacturer) | | | | | |
| Cintas Corporation (uniform designer and manufacturer) | | | 2.57 | % | |
| Wal-Mart Stores Inc. (retail) | | | 2.44 | % | |
| 3M Company (industrial conglomerate) | | | 2.20 | % | |
| Johnson & Johnson (health care products manufacturer) | | | 2.19 | % | |
| Apache Corporation (energy company) | | | 2.10 | % | |
| Blount International Inc. (outdoor industrial equipment manufacturer) | | | 1.99 | % | |
35
FIRST EAGLE U.S. VALUE FUND
SCHEDULE OF INVESTMENTS
October 31, 2008
Number
of Shares | |
| | Value
(Note 1) | |
| | | U.S. Common and Preferred Stocks—53.49% | |
| | | Consumer Discretionary—2.62% | |
| | 200,640 | | | International Speedway Corporation, Class 'A' | | $ | 6,298,090 | | |
| | 83,960 | | | McDonald's Corporation | | | 4,863,803 | | |
| | 96,632 | | | Weyco Group, Inc. | | | 2,686,370 | | |
| | 70,000 | | | Hampshire Group, Limited (a) | | | 339,500 | | |
| | 600 | | | St. John Knits International Inc. (a) | | | 14,775 | | |
| | | | 14,202,538 | | |
| | | Consumer Staples—0.51% | |
| | 168,915 | | | Seneca Foods Corporation 0% Conv. Pfd. due 12/31/2049 (a)(c)(d) | | | 2,748,247 | | |
| | | Energy—6.84% | |
| | 138,150 | | | Apache Corporation | | | 11,373,889 | | |
| | 197,289 | | | San Juan Basin Royalty Trust | | | 7,309,557 | | |
| | 179,560 | | | Helmerich & Payne, Inc. | | | 6,160,704 | | |
| | 119,380 | | | Murphy Oil Corporation | | | 6,045,403 | | |
| | 84,088 | | | ConocoPhillips Company | | | 4,374,258 | | |
| | 27,131 | | | SEACOR Holdings Inc. (a) | | | 1,822,389 | | |
| | | | 37,086,200 | | |
| | | Financials—3.41% | |
| | 316,490 | | | American Express Company | | | 8,703,475 | | |
| | 210,535 | | | Willis Group Holdings Limited | | | 5,524,438 | | |
| | 49,620 | | | Mercury General Corporation | | | 2,548,979 | | |
| | 78,360 | | | Legg Mason, Inc. | | | 1,738,808 | | |
| | | | 18,515,700 | | |
| | | Health Care—3.07% | |
| | 193,660 | | | Johnson & Johnson | | | 11,879,104 | | |
| | 90,840 | | | Wellpoint Inc. (a) | | | 3,530,951 | | |
| | 40,000 | | | Dentsply International Inc. | | | 1,215,200 | | |
| | | | 16,625,255 | | |
| | | Holding Companies—4.90% | |
| | 230 | | | Berkshire Hathaway Inc., Class 'A' (a) | | | 26,562,700 | | |
| | | Industrials—10.30% | |
| | 587,750 | | | Cintas Corporation | | | 13,929,675 | | |
| | 185,260 | | | 3M Company | | | 11,912,218 | | |
| | 1,239,695 | | | Blount International, Inc. (a) | | | 10,772,950 | | |
| | 290,862 | | | UniFirst Corporation | | | 9,490,827 | | |
See Notes to Financial Statements
36
FIRST EAGLE U.S. VALUE FUND
SCHEDULE OF INVESTMENTS—(Continued)
October 31, 2008
Number
of Shares | |
| | Value
(Note 1) | |
| | | U.S. Common and Preferred Stocks—(continued) | |
| | | Industrials—(continued) | |
| | 71,270 | | | Alliant Techsystems (a) | | $ | 5,882,626 | | |
| | 330,220 | | | UTI Worldwide, Inc. | | | 3,883,387 | | |
| | | | 55,871,683 | | |
| | | Materials—0.68% | |
| | 67,770 | | | Vulcan Materials Company | | | 3,678,556 | | |
| | | Media—3.34% | |
| | 440,165 | | | Comcast Corporation-Special Class 'A' | | | 6,787,344 | | |
| | 245,760 | | | Ascent Media Group, LLC (a) | | | 6,215,270 | | |
| | 336,742 | | | Liberty Interactive (a) | | | 1,643,301 | | |
| | 102,830 | | | CBS Corporation, Class 'B' | | | 998,479 | | |
| | 58,216 | | | Liberty Entertainment (a) | | | 937,278 | | |
| | 72,795 | | | News Corporation, Class 'A' | | | 774,539 | | |
| | 33,410 | | | Viacom Inc. (a) | | | 675,550 | | |
| | 14,554 | | | Liberty Capital (a) | | | 99,113 | | |
| | | | 18,130,874 | | |
| | | Paper and Forest Products—3.25% | |
| | 168,900 | | | Rayonier Inc. | | | 5,587,212 | | |
| | 126,157 | | | Plum Creek Timber Company, Inc. | | | 4,703,133 | | |
| | 101,090 | | | WeyerHaeuser Company | | | 3,863,660 | | |
| | 76,500 | | | Deltic Timber Corporation | | | 3,484,575 | | |
| | | | 17,638,580 | | |
| | | Precious Metals—1.46% | |
| | 300,642 | | | Newmont Mining Corporation Holding Company | | | 7,918,910 | | |
| | | Real Estate— 0.01% | |
| | 8,000 | | | LandCo LLC (a)(b)(c)(d) | | | 27,840 | | |
| | | Retail—7.08% | |
| | 237,034 | | | Wal-Mart Stores, Inc. | | | 13,228,868 | | |
| | 172,800 | | | Costco Wholesale Corporation | | | 9,851,328 | | |
| | 264,430 | | | The Home Depot Inc. | | | 6,237,904 | | |
| | 274,366 | | | Barnes & Noble, Inc. | | | 5,180,030 | | |
| | 143,090 | | | Tiffany & Company | | | 3,927,821 | | |
| | | | 38,425,951 | | |
See Notes to Financial Statements
37
FIRST EAGLE U.S. VALUE FUND
SCHEDULE OF INVESTMENTS—(Continued)
October 31, 2008
Number
of Shares | |
| | Value
(Note 1) | |
| | | Technology and Telecommunications—4.13% | |
| | 425,745 | | | Microsoft Corporation | | $ | 9,506,886 | | |
| | 248,460 | | | Linear Technology Corporation | | | 5,635,073 | | |
| | 291,304 | | | Intel Corporation | | | 4,660,864 | | |
| | 203,745 | | | Dell Inc. (a) | | | 2,475,502 | | |
| | 150,000 | | | Sanmina-SCI Corporation (a) | | | 112,500 | | |
| | | | 22,390,825 | | |
| | | Utilities—1.89% | |
| | 194,840 | | | IDACORP, Inc. | | | 5,194,434 | | |
| | 88,100 | | | CalEnergy Capital Trust 6.5% Conv. Pfd. | | | 3,964,500 | | |
| | 40,000 | | | Hawaiian Electric Industries, Inc. | | | 1,064,800 | | |
| | | | 10,223,734 | | |
| | | | | Total U.S. Common and Preferred Stocks (Cost: $320,756,886) | | | 290,047,593 | | |
| | | International Common Stocks— 4.77% | |
| | | Canada—0.80% | |
| | 299,997 | | | Franco-Nevada | | | 4,317,457 | | |
| | | France—3.41% | |
| | 585,440 | | | Sanofi-Aventis ADR | | | 18,511,613 | | |
| | | United Kingdom—0.56% | |
| | 134,630 | | | Amdocs Limited (a) | | | 3,037,253 | | |
| | | | | Total International Common Stocks (Cost: $33,046,157) | | | 25,866,323 | | |
| | | | | Total Common and Preferred Stocks (Cost: $353,803,043) | | | 315,913,916 | | |
| Ounces | | | | | |
| | | Commodity—5.26% | |
| | 39,366 | | | Gold bullion (a) (Cost: $22,847,023) | | | 28,514,745 | | |
Principal
Amount | |
| |
| |
| | | U.S. Notes and Bonds—12.58% | |
| | | U.S. Treasury Note—0.72% | |
| $ | 4,128,661 | | | U.S. Treasury Inflation Index Note 2.375% due 4/15/2011 (e) | | | 3,915,457 | | |
| | | U.S. Notes and Bonds—11.86% | |
| | 500,000 | | | American Standard Companies Inc. 8.25% due 6/1/2009 | | | 506,747 | | |
| | 814,345 | | | Avis Budget Car Rental LLC 7.625% due 5/15/2014 | | | 297,236 | | |
| | 600,000 | | | Bausch & Lomb Inc. 7.125% due 8/1/2028 (d) | | | 150,000 | | |
| | 8,000,000 | | | Beazer Homes USA, Inc. 8.625% due 5/15/2011 | | | 5,240,000 | | |
See Notes to Financial Statements
38
FIRST EAGLE U.S. VALUE FUND
SCHEDULE OF INVESTMENTS—(Continued)
October 31, 2008
Principal
Amount | |
| | Value
(Note 1) | |
| | | Notes and Bonds—(continued) | |
| | | U.S. Notes and Bonds —(continued) | |
| $ | 18,300,000 | | | Blount International Inc. 8.875% due 8/1/2012 | | $ | 15,738,000 | | |
| | 1,000,000 | | | Briggs & Stratton Corporation 8.875% due 3/15/2011 | | | 950,000 | | |
| | 250,000 | | | Elizabeth Arden Inc. 7.75% due 1/15/2014 | | | 181,250 | | |
| | 1,075,000 | | | GATX Corporation 8.875% due 6/1/2009 | | | 1,046,849 | | |
| | 250,000 | | | Jostens, Inc. 10.25% due 12/1/2013 (a) | | | 173,750 | | |
| | 5,000,000 | | | Lear Corporation 8.75% due 12/1/2016 | | | 1,875,000 | | |
| | 6,862,000 | | | Level 3 Financing, Inc. 9.25% due 11/1/2014 | | | 3,945,650 | | |
| | 4,250,000 | | | Mueller Water Products 7.375% due 6/1/2017 | | | 2,805,000 | | |
| | 2,000,000 | | | Pulte Homes, Inc. 6.25% due 2/15/2013 | | | 1,510,000 | | |
| | 3,800,000 | | | Sanmina-SCI Corporation 6.75% due 3/1/2013 | | | 2,603,000 | | |
| | 2,000,000 | | | Sanmina-SCI Corporation 8.125% due 3/1/2016 | | | 1,270,000 | | |
| | 6,319,000 | | | Sealy Mattress Company 8.25% due 6/15/2014 | | | 3,601,830 | | |
| | 12,786,000 | | | Sirius Satellite Radio Inc. 9.625% due 8/1/2013 | | | 4,027,590 | | |
| | 1,000,000 | | | Texas Industries, Inc. 7.25% due 7/15/2013 | | | 790,000 | | |
| | 14,966,000 | | | Tronox Worldwide LLC 9.50% due 12/1/2012 | | | 3,367,350 | | |
| | 8,808,000 | | | Valassis Communications, Inc 8.25% due 3/1/2015 | | | 4,800,360 | | |
| | 5,424,000 | | | Yankee Acquisition Corporation 8.50% due 2/15/2015 | | | 3,091,680 | | |
| | 12,697,000 | | | Yankee Acquisition Corporation 9.75% due 2/15/2017 | | | 6,364,371 | | |
| | | | 64,335,663 | | |
| | | | | Total U.S. Notes and Bonds (Cost: $113,415,591) | | | 68,251,120 | | |
| | | International Corporate Bonds—1.67% | |
| | | Canada—1.67% | |
| | 3,520,000 | | | Celestica Inc. 7.625% 7/1/2013 | | | 2,868,800 | | |
| | 6,814,000 | | | Celestica Inc. 7.875% 7/1/2011 | | | 6,166,670 | | |
| | | | | Total International Corporate Bonds (Cost: $9,910,897) | | | 9,035,470 | | |
| | | | | Total Notes and Bonds (Cost: $123,326,488) | | | 77,286,590 | | |
| | | Commercial Paper—20.82% | |
| | | U.S. Commercial Paper—19.11% | |
| | 9,705,000 | | | The Clorox Company 5.50% due 11/6/2008 | | | 9,697,586 | | |
| | 9,682,000 | | | CME Group Inc. 2.25% due 11/7/2008 | | | 9,677,966 | | |
| | 13,546,000 | | | ConocoPhillips Company 1.10% due 11/7/2008 | | | 13,543,517 | | |
| | 8,886,000 | | | Kraft Foods Inc. 4.25% due 11/3/2008 | | | 8,883,902 | | |
| | 3,216,000 | | | Kraft Foods Inc. 3.80% due 11/18/2008 | | | 3,210,229 | | |
| | 8,000,000 | | | Sara Lee Corporation 3.75% due 11/6/2008 | | | 7,995,833 | | |
| | 9,001,000 | | | Sara Lee Corporation 3.50% due 11/19/2008 | | | 8,985,248 | | |
| | 25,000,000 | | | Starbucks Corporation 3.00% due 11/3/2008 | | | 24,995,833 | | |
| | 16,667,000 | | | The Dow Chemical Company 5.45% due 11/3/2008 | | | 16,661,954 | | |
| | | | | Total U.S. Commercial Paper (Cost: $103,652,068) | | | 103,652,068 | | |
See Notes to Financial Statements
39
FIRST EAGLE U.S. VALUE FUND
SCHEDULE OF INVESTMENTS—(Continued)
October 31, 2008
Principal
Amount | |
| | Value
(Note 1) | |
| | | Commercial Paper—(continued) | |
| | | International Commercial Paper—1.71% | |
| | | Switzerland—1.71% | |
| USD | 9,264,000 | | | Novartis 1.74% due 11/12/2008 (Cost: $9,259,075) | | $ | 9,259,075 | | |
| | | Total Commercial Paper (Cost: $112,911,143) | | | 112,911,143 | | |
| | | Total Investments—98.59% (Cost: $612,887,697) | | | 534,626,394 | | |
| | | Other assets in excess of liabilities—1.41% | | | 7,660,778 | | |
| | | Net assets—100.00% | | $ | 542,287,172 | | |
Aggregate cost for federal income tax purposes was $612,036,454; and net unrealized depreciation consisted of:
| Gross unrealized appreciation | | $ | 30,059,882 | | |
| Gross unrealized depreciation | | | (107,469,942 | ) | |
| Net unrealized depreciation | | ($ | 77,410,060 | ) | |
(a) Non-income producing security.
(b) Represents interest in a restricted security which has not been registered with the Securities and Exchange Commission under the Securities Act of 1933. At October 31, 2008, the value of these securities amounted to $27,840 or less than 0.01% of net assets.
(c) Securities valued in accordance with fair value procedures under the supervision of the Board of Trustees, representing $2,776,087 or 0.51% of net assets.
(d) Security is deemed illiquid. At October 31, 2008, the value of these securities amounted to $2,926,087 or 0.54% of net assets.
(e) Inflation protected security.
ADR— American Depositary Receipt
Restricted Security
| Security | | Acquisition
Date | | Cost | | Carrying Value
Per Share/Principal | |
| LandCo LLC | | | 9/6/2006 | | | $ | 27,840 | | | $ | 3.48 | | |
| Industry Diversification for Portfolio Holdings | | Percent of Net Assets | |
| U.S. Equities | |
| Consumer Discretionary | | | 2.62 | % | |
| Consumer Staples | | | 0.51 | | |
| Energy | | | 6.84 | | |
| Financials | | | 3.41 | | |
| Health Care Services | | | 3.07 | | |
| Holding Companies | | | 4.90 | | |
| Industrials | | | 10.30 | | |
| Materials | | | 0.68 | | |
| Media | | | 3.34 | | |
| Paper and Forest Products | | | 3.25 | | |
| Precious Metals | | | 1.46 | | |
| Real Estate | | | 0.01 | | |
| Retail | | | 7.08 | | |
| Technology and Telecommunications | | | 4.13 | | |
| Utilities | | | 1.89 | | |
| Total U.S. Equities | | | 53.49 | % | |
See Notes to Financial Statements
40
FIRST EAGLE U.S. VALUE FUND
SCHEDULE OF INVESTMENTS—(Continued)
October 31, 2008
| Industry Diversification for Portfolio Holdings | | Percent of Net Assets | |
| International Equities | |
| Health Care Services | | | 3.41 | % | |
| Technology and Telecommunications | | | 0.56 | | |
| Materials | | | 0.80 | | |
| Total International Equities | | | 4.77 | | |
| Commodity | | | 5.26 | | |
| Notes and Bonds | |
| Government Issues | | | 0.72 | | |
| Consumer Discretionary | | | 4.21 | | |
| Consumer Staples | | | 0.03 | | |
| Financials | | | 0.19 | | |
| Health Care Services | | | 0.03 | | |
| Industrials | | | 3.56 | | |
| Materials | | | 0.77 | | |
| Media | | | 1.63 | | |
| Technology and Telecommunications | | | 3.11 | | |
| Total Notes and Bonds | | | 14.25 | | |
| Commercial Paper | |
| U.S. Commercial Paper | | | 19.11 | | |
| International Commercial Paper | | | 1.71 | | |
| Total Commercial Paper | | | 20.82 | | |
| Total Investments | | | 98.59 | % | |
See Notes to Financial Statements
41
FUND OVERVIEW
FIRST EAGLE GOLD FUND Data as of October 31, 2008 (unaudited)
THE INVESTMENT STYLE
The First Eagle Gold Fund is a non-diversified fund whose investment objective is to provide exposure to the investment characteristics of gold and, to a limited extent, other precious metals. In seeking to achieve its objective, the Fund invests primarily in securities of companies engaged in mining, processing, dealing in or holding gold or other precious metals such as silver, platinum and palladium, both in the United States and in foreign countries.
ASSET ALLOCATION
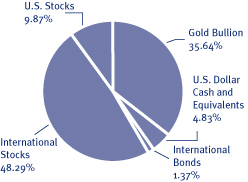
COUNTRIES
| United States | | | 45.51 | % | |
| Canada | | | 21.15 | % | |
| South Africa | | | 17.24 | % | |
| Australia | | | 7.56 | % | |
| Mexico | | | 2.75 | % | |
| United Kingdom | | | 0.96 | % | |
The Fund's portfolio composition (represented as a percentage of net assets) is subject to change at any time.
AVERAGE ANNUAL RETURNS
| | | ONE-YEAR | | FIVE-YEARS | | TEN-YEARS | |
| First Eagle Gold Fund (A Shares) | |
| without sales load | | | (41.56 | %) | | | 4.56 | % | | | 13.06 | % | |
| with sales load | | | (44.48 | %) | | | 3.49 | % | | | 12.63 | % | |
| FTSE Gold Mines Index | | | (52.65 | %) | | | (2.02 | %) | | | 2.96 | % | |
| MSCI World Index | | | (41.85 | %) | | | 1.73 | % | | | 0.77 | % | |
| Consumer Price Index | | | 3.66 | % | | | 3.20 | % | | | 2.82 | % | |
GROWTH OF A $10,000 INITIAL INVESTMENT
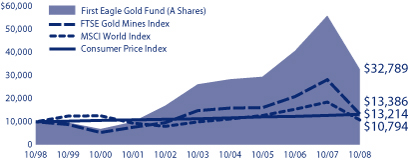
Performance data quoted herein represents past performance and should not be considered indicative of future results. Performance data quoted herein does not reflect the deduction of taxes that a shareholder would pay on Fund distributions or the sale of Fund shares. The average annual returns shown above are historical and reflect changes in share price, reinvested dividends and are net of expenses. The average annual returns for Class A Shares with a sales load give effect to the deduction of the maximum sales load of 3.75%for periods prior to March 1, 2000 and of 5.00% thereafter. The MSCI World Index is a widely followed, unmanaged group of stocks from 23 international markets and is not available for purchase. The FTSE Gold Mines Index is an unmanaged index composed of approximately 19 mining companies and is only available without dividends reinvested and is not available for purchase. The Consumer Price Index (CPI) represents the chan ge in price of all goods and services purchased for consumption by urban households.
TOP 10 HOLDINGS
| Gold bullion (United States) | | | 35.64 | % | |
| Randgold Resources Limited ADR (South Africa) | | | 6.19 | % | |
| Royal Gold Inc. (United States) | | | 5.33 | % | |
| Gold Fields Limited ADR (South Africa) | | | 4.56 | % | |
| Newmont Mining Corporation Holding Company (United States) | | | 4.54 | % | |
| Kinross Gold Corporation (Canada) | | | 3.99 | % | |
| Newcrest Mining Limited (Australia) | | | 3.93 | % | |
| Harmony Gold Mining Company Limited ADR (South Africa) | | | 3.63 | % | |
| Barrick Gold Corporation (Canada) | | | 3.24 | % | |
| IAMGOLD Corporation (Canada) | | | 2.96 | % | |
42
FIRST EAGLE GOLD FUND
SCHEDULE OF INVESTMENTS
October 31, 2008
Number
of Shares | |
| | Value
(Note 1) | |
| | | Common Stocks—58.16% | |
| | | International Common Stocks—48.29% | |
| | | Australia—7.56% | |
| | 1,875,270 | | | Newcrest Mining Limited | | $ | 25,915,338 | | |
| | 13,608,205 | | | Lihir Gold Limited (a) | | | 17,630,523 | | |
| | 2,881,247 | | | Kingsgate Consolidated Limited (a) | | | 4,977,183 | | |
| | 1,485,330 | | | Independence Group NL | | | 1,391,463 | | |
| | | | 49,914,507 | | |
| | | Canada—21.15% | |
| | 2,526,482 | | | Kinross Gold Corporation | | | 26,351,207 | | |
| | 941,104 | | | Barrick Gold Corporation | | | 21,381,883 | | |
| | 5,871,622 | | | IAMGOLD Corporation | | | 19,572,073 | | |
| | 1,027,800 | | | Goldcorp Inc. | | | 19,178,748 | | |
| | 2,136,414 | | | Minefinders Corporation (a) | | | 10,521,839 | | |
| | 475,753 | | | Franco-Nevada Corporation | | | 6,846,879 | | |
| | 1,416,209 | | | Yamana Gold Inc. | | | 6,786,001 | | |
| | 4,474,350 | | | Aurizon Mines Limited (a) | | | 6,525,094 | | |
| | 1,664,518 | | | NovaGold Resources Inc. (a) | | | 4,743,876 | | |
| | 2,307,906 | | | Dundee Precious Metals, Inc., Class 'A' (a) | | | 4,615,812 | | |
| | 1,787,980 | | | Richmont Mines, Inc. (a)(b) | | | 2,979,967 | | |
| | 881,650 | | | Gammon Gold Inc. (a) | | | 2,968,222 | | |
| | 2,537,361 | | | New Gold Inc. (a) | | | 2,960,254 | | |
| | 98,763 | | | Agnico-Eagle Mines Limited | | | 2,737,381 | | |
| | 747,390 | | | European Goldfields Limited (a) | | | 940,466 | | |
| | 1,090,750 | | | Etruscan Resources Inc. (a) | | | 518,106 | | |
| | | | 139,627,808 | | |
| | | Mexico—2.75% | |
| | 2,009,860 | | | Industrias Peñoles, SAB de C.V. | | | 18,147,347 | | |
| | | South Africa—15.87% | |
| | 1,316,860 | | | Randgold Resources Limited ADR | | | 40,835,829 | | |
| | 4,522,444 | | | Gold Fields Limited ADR | | | 30,074,253 | | |
| | 3,279,103 | | | Harmony Gold Mining Company Limited ADR (a) | | | 23,970,243 | | |
| | 543,669 | | | AngloGold Ashanti Limited ADR | | | 9,921,959 | | |
| | | | 104,802,284 | | |
| | | United Kingdom—0.96% | |
| | 192,464 | | | Anglo American Plc | | | 4,761,760 | | |
| | 814,630 | | | Fresnillo Plc | | | 1,606,332 | | |
| | | | 6,368,092 | | |
| | | | | Total International Common Stocks (Cost: $422,899,452) | | | 318,860,038 | | |
See Notes to Financial Statements
43
FIRST EAGLE GOLD FUND
SCHEDULE OF INVESTMENTS—(Continued)
October 31, 2008
Number
of Shares | |
| | Value
(Note 1) | |
| | | Common Stocks—(continued) | |
| | | U.S. Common Stocks—9.87% | |
| | | United States—9.87% | |
| | 1,221,101 | | | Royal Gold, Inc. | | $ | 35,204,342 | | |
| | 1,136,987 | | | Newmont Mining Corporation Holding Company | | | 29,948,238 | | |
| | | | | Total U.S. Common Stocks (Cost: $71,572,692) | | | 65,152,580 | | |
| | | | | Total Common Stocks (Cost: $494,472,144) | | | 384,012,618 | | |
| | | Warrants—0.00% | |
| | 400,000 | | | Canyon Resources Corporation warrants exp 12/01/2008 (a)(c)(d)(e) (Cost: $0) | | | — | | |
Principal
Amount | |
| |
| |
| | | International Bond—1.37% | |
| | | South Africa—1.37% | |
| USD | 10,000,000 | | | AngloGold Ashanti Limited 2.375% due 2/27/2009 (f) (Cost: $9,023,259) | | | 9,020,000 | | |
| Ounces | | | | | |
| | | Commodity—35.64% | |
| | 324,877 | | | Gold bullion (a) (Cost: $140,331,567) | | | 235,324,997 | | |
Principal
Amount | |
| |
| |
| | | U.S. Commercial Paper—4.50% | |
| $ | 14,929,000 | | | Kraft Foods Inc. 4.25% due 11/3/2008 | | | 14,925,475 | | |
| | 14,821,000 | | | Starbucks Corporation 3.00% due 11/3/2008 | | | 14,818,530 | | |
| | | | | Total U.S. Commercial Paper (Cost: $29,744,005) | | | 29,744,005 | | |
| | | | | Total Investments—99.67% (Cost: $673,570,975) | | | 658,101,620 | | |
| | | | | Other assets in excess of liabilities—0.33% | | | 2,181,396 | | |
| | | | | Net Assets—100.00% | | $ | 660,283,016 | | |
Aggregate cost for federal income tax purposes was $683,450,359; and net unrealized depreciation consisted of:
| Gross unrealized appreciation | | $ | 136,632,107 | | |
| Gross unrealized depreciation | | | (161,980,846 | ) | |
| Net unrealized depreciation | | ($ | 25,348,739 | ) | |
(a) Non-income producing security/commodity.
(b) Affiliate as defined by the Investment Company Act of 1940. An affiliate is defined as a company in which the Fund directly or indirectly owns, controls, or holds power to vote 5% or more of the outstanding voting securities.
(c) Security is deemed illiquid. At October 31, 2008, the value of these securities amounted to $0 or 0.00% of net assets.
(d) Securities valued in accordance with fair value procedures under the supervision of the Board of Trustees, representing $0 or 0.00% of net assets.
See Notes to Financial Statements
44
FIRST EAGLE GOLD FUND
SCHEDULE OF INVESTMENTS—(Continued)
October 31, 2008
(e) Represents interest in a restricted security which has not been registered with the Securities and Exchange Commission under the Securities Act of 1933. At October 31, 2008, the value of these securities amounted to $0 or 0.00% of net assets.
(f) Represents a security registered under Regulation S. Bonds sold under Regulation S may not be offered, sold or delivered within the U.S. or to, or for the account or benefit of, U.S. persons, except pursuant to an exemption from, or in a transaction not subject to, the registration requirements of the Securities Act of 1933.
ADR—American Depositary Receipt
Affiliated Security
| | | Sale | | Realized | |
| Affiliate | | Share | | Cost | | (Loss) | |
| Richmont Mines, Inc. | | | 10,500 | | | $ | 55,288 | | | ($ | 14,185 | ) | |
Restricted Security
| Security | | Acquisition
Date | | Cost | | Carrying Value
Per Security | |
| Canyon Resources Corporation warrants exp 12/1/2008 | | | 12/16/2005 | | | | — | | | | — | | |
| Industry Diversification for Portfolio Holdings | | Percent of Net Assets | |
| International Equities | |
| Precious Metals | | | 48.29 | % | |
| U.S. Equities | |
| Precious Metals | | | 9.87 | | |
| Commodity | | | 35.64 | | |
| International Bonds | |
| Precious Metals | | | 1.37 | | |
| Commercial Paper | |
| U.S. Commercial Paper | | | 4.50 | | |
| Total Investments | | | 99.67 | % | |
See Notes to Financial Statements
45

Harold Levy
FIRST EAGLE FUND OF AMERICA
MANAGEMENT'S DISCUSSION OF FUND PERFORMANCE
In our last few letters we noted that we expected the financial sector to be in deep stress and that the consumer sector would also suffer, but hoped that the fallout could be confined there. We believed the other sectors of the economy wouldn't be immune, but would not suffer nearly the same fate. That logic held until Lehman Brothers was allowed to fail and the cataclysmic seizing up of credit and capital markets throughout the world. We understand all the issues involved in propping up a practitioner of mindless leveraging, but felt that implications of not doing it were too severe. We must now deal with the consequences.
It is not an exaggeration to say that no one in at least the last 35 years has seen a financial environment like this. Furthermore, we see no easy fixes to a loss of confidence and the need to deleverage.
So what are we doing? We know that eventually economic conditions will improve and that confidence in financial markets will not be far behind, but we don't know when. Therefore, while we always stress balance sheets and free cash flow our emphasis today is even stronger. Investments today have to pass these tests even in the face of severely stressed financial markets and economic activity. We want to be confident that our companies will be there to enjoy the fruits of the investment and not the creditors.
The conditions we face today are extraordinarily difficult yet we find the opportunities given current valuations as compelling as we have ever seen. We have significant cash and are prepared for a rocky, though we hope eventually very rewarding, couple of years.
Sincerely,

Harold Levy
Portfolio Manager
December 2008
First Eagle Fund of America Class Y will only accept additional investments from existing shareholders. However, Class A and Class C remain open to all investors.
Past performance is no guarantee of future results. Portfolio is actively managed. Portfolio and opinions expressed herein are subject to change.
46
FUND OVERVIEW
FIRST EAGLE FUND OF AMERICA Data as of October 31, 2008 (unaudited)
THE INVESTMENT STYLE
The First Eagle Fund of America is a non-diversified U.S. equity fund that seeks long-term capital appreciation. The Fund has a unique event-driven bias that focuses on identifying companies poised to benefit from change that the market has not yet recognized.
ASSET ALLOCATION

SECTOR/INDUSTRY*
| Materials | | | 15.30 | % | |
| Energy | | | 14.54 | % | |
| Technology and Telecommunications | | | 14.63 | % | |
| Industrials | | | 9.06 | % | |
| Pharmaceuticals | | | 6.44 | % | |
| Health Care Services | | | 6.11 | % | |
| Biotechnology | | | 2.78 | % | |
| Consumer Discretionary | | | 1.69 | % | |
| Consumer Staples | | | 1.49 | % | |
*percentages exclude option positions.
The Fund's portfolio composition (represented as a percentage of net assets) is subject to change at any time.
AVERAGE ANNUAL RETURNS
| | | ONE-YEAR | | FIVE-YEARS | | TEN-YEARS | |
| First Eagle Fund of America | |
| (Y Shares) | | | (29.23 | %) | | | 4.59 | % | | | 5.85 | % | |
| Standard & Poor's 500 Index | | | (36.10 | %) | | | 0.26 | % | | | 0.40 | % | |
GROWTH OF A $10,000 INITIAL INVESTMENT
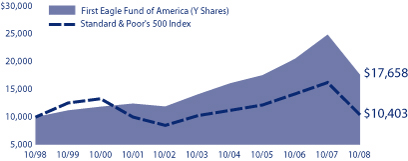
Performance data quoted herein represents past performance and should not be considered indicative of future results. Performance data quoted herein does not reflect the deduction of taxes that a shareholder would pay on Fund distributions or the sale of Fund shares. The Fund's average annual returns shown above are historical and reflect changes in share price, reinvested dividends and is net of expenses. The Standard & Poor's 500 Index is a widely recognized unmanaged index including a representative sample of 500 leading companies in leading sectors of the U.S. economy and is not available for purchase. Although the Standard & Poor's 500 Index focuses on the large-cap segment of the market, with approximately 75% coverage of U.S. equities, it is also considered a proxy for the total market.
TOP 10 HOLDINGS
| General Dynamics Corporation (aerospace and defense manufacturer) | | | 3.86 | % | |
| Devon Energy Corporation (energy company) | | | 3.72 | % | |
| Valeant Pharmaceuticals International (pharmaceuticals company) | | | 3.60 | % | |
| Dresser-Rand Group Inc. (oilfield services and equipment) | | | 3.34 | % | |
| Praxair Inc. (specialty chemicals) | | | 3.26 | % | |
| Crown Holdings Inc. (containers and packaging manufacturer) | | | 3.03 | % | |
| DST Systems Inc. (data processing services provider) | | | 2.92 | % | |
| Precision Castparts Corporation (metal components manufacturer) | | | 2.87 | % | |
| Amgen Inc. (biotechnology company) | | | 2.78 | % | |
| Ball Corporation (containers and packaging manufacturer) | | | 2.62 | % | |
47
FIRST EAGLE FUND OF AMERICA
SCHEDULE OF INVESTMENTS
October 31, 2008
Number
of Shares | |
| | Value
(Note 1) | |
| | | U.S. Common and Preferred Stocks—68.62% | |
| | | Biotechnology—2.78% | |
| | 319,820 | | | Amgen Inc. (a)(b) | | $ | 19,154,020 | | |
| | | Consumer Discretionary—1.69% | |
| | 228,290 | | | The Stanley Works | | | 7,474,215 | | |
| | 190,090 | | | The DIRECTV Group, Inc. (a)(b) | | | 4,161,070 | | |
| | | | 11,635,285 | | |
| | | Consumer Staples—1.49% | |
| | 470,990 | | | Dean Foods Company (a) | | | 10,295,841 | | |
| | | Energy—14.19% | |
| | 316,980 | | | Devon Energy Corporation (b) | | | 25,631,002 | | |
| | 1,026,330 | | | Dresser-Rand Group Inc. (a)(b) | | | 22,989,792 | | |
| | 816,470 | | | Teekay Corporation | | | 17,431,634 | | |
| | 707,165 | | | Atlas America Inc. | | | 16,201,150 | | |
| | 487,750 | | | Denbury Resources Inc. (a) | | | 6,199,302 | | |
| | 373,150 | | | McMoRan Exploration Company (a) | | | 5,294,999 | | |
| | 190,830 | | | Teekay Tankers Limited | | | 2,318,585 | | |
| | 135,200 | | | Teekay Offshore Partners LP | | | 1,710,280 | | |
| | | | 97,776,744 | | |
| | | Health Care Services—3.94% | |
| | 295,190 | | | Edwards Lifesciences Corporation (a)(b) | | | 15,597,840 | | |
| | 264,400 | | | Chemed Corporation | | | 11,578,076 | | |
| | | | 27,175,916 | | |
| | | Industrials—9.06% | |
| | 440,490 | | | General Dynamics Corporation (b) | | | 26,570,357 | | |
| | 304,800 | | | Precision Castparts Corporation (b) | | | 19,754,088 | | |
| | 966,790 | | | DynCorp International Inc. (a) | | | 12,780,964 | | |
| | 88,800 | | | Rockwell Collins, Inc. | | | 3,306,024 | | |
| | | | 62,411,433 | | |
| | | Technology and Telecommunications—13.73% | |
| | 496,418 | | | DST Systems Inc. (a) | | | 20,144,642 | | |
| | 1,874,377 | | | L-1 Identity Solutions, Inc. (a) | | | 15,369,891 | | |
| | 3,388,946 | | | LSI Corporation (a) | | | 13,047,442 | | |
| | 496,800 | | | Agilent Technologies Inc. (a) | | | 11,023,992 | | |
| | 1,142,462 | | | General Communication Inc. (a) | | | 8,774,108 | | |
| | 988,550 | | | Nvidia Corporation (a) | | | 8,659,698 | | |
| | 1,844,580 | | | Atmel Corporation (a) | | | 7,655,007 | | |
| | 230,770 | | | Leap Wireless International Inc. (a) | | | 6,470,791 | | |
See Notes to Financial Statements
48
FIRST EAGLE FUND OF AMERICA
SCHEDULE OF INVESTMENTS—(Continued)
October 31, 2008
Number
of Shares | |
| | Value
(Note 1) | |
| | | U.S. Common and Preferred Stocks (continued) | |
| | | Technology and Telecommunications—(continued) | |
| | 244,100 | | | Savvis Communications (a) | | $ | 2,099,260 | | |
| | 208,400 | | | Global Crossing Limited (a) | | | 1,387,944 | | |
| | | | 94,632,775 | | |
| | | Materials—15.30% | |
| | 344,530 | | | Praxair, Inc. (b) | | | 22,446,129 | | |
| | 1,033,250 | | | Crown Holdings Inc. (a)(b) | | | 20,850,985 | | |
| | 526,930 | | | Ball Corporation (b) | | | 18,021,006 | | |
| | 348,770 | | | Eastman Chemical Company (b) | | | 14,086,820 | | |
| | 536,720 | | | Celanese Corporation, Series 'A' | | | 7,438,939 | | |
| | 343,560 | | | Eagle Materials Inc. | | | 6,084,448 | | |
| | 336,270 | | | Valspar Corpoartion (b) | | | 6,876,722 | | |
| | 318,700 | | | Packaging Corporation of America (b) | | | 5,363,721 | | |
| | 112,380 | | | Owens-Illinois, Inc. (a) | | | 2,571,254 | | |
| | 135,200 | | | Rockwood Holdings, Inc. (a) | | | 1,669,720 | | |
| | | | 105,409,744 | | |
| | | Pharmaceuticals—6.44% | |
| | 1,321,650 | | | Valeant Pharmaceuticals International (a)(b) | | | 24,807,371 | | |
| | 1,434,150 | | | PDL BioPhama, Inc. | | | 13,982,963 | | |
| | 1,119,443 | | | Enzon Pharmaceuticals, Inc. (a) | | | 5,563,632 | | |
| | | | 44,353,966 | | |
| | | | | U.S. Total Common and Preferred Stocks (Cost: $588,949,054) | | | 472,845,724 | | |
| | | International Common Stocks—3.42% | |
| | | Canada—1.48% | |
| | 728,362 | | | MDS Inc.(a) | | | 7,749,772 | | |
| | 3,151,510 | | | UTS Energy Corporation (a) | | | 2,416,158 | | |
| | | | 10,165,930 | | |
| | | Singapore—0.90% | |
| | 429,200 | | | Verigy Limited (a)(b) | | | 6,223,400 | | |
| | | United Kingdom—1.04% | |
| | 181,274 | | | Shire Plc ADR | | | 7,151,259 | | |
| | | | | Total International Common Stocks (Cost: $41,051,978) | | | 23,540,589 | | |
| | | Warrants—0.00% | |
| | 1,470,588 | | | Regen Biologics Inc. (a)(c)(d)(e) (Cost: $0) | | | — | | |
See Notes to Financial Statements
49
FIRST EAGLE FUND OF AMERICA
SCHEDULE OF INVESTMENTS—(Continued)
October 31, 2008
Number
of Shares | |
| | Value
(Note 1) | |
| | | U.S. Government Obligations—26.83% | |
| | 100,000,000 | | | United States Treasury Bill 0.62% due 12/11/2008 | | $ | 99,950,000 | | |
| | 85,000,000 | | | United States Treasury Bill 0.43% due 1/2/2009 | | | 84,956,083 | | |
| | | Total U.S. Government Obligations (Cost: $184,906,083) | | | 184,906,083 | | |
| | | Total Investment Portfolio Excluding Options Written (Cost: $814,907,115) | | | 681,292,396 | | |
| Contracts | |
| | Expiration
Date | | Value | |
| | | Covered Call Options Written—(0.94%) | |
| | 330 | | | Amgen Inc. @ $52.5 | | Nov 2008 | | | (297,000 | ) | |
| | 656 | | | Amgen Inc. @ $55 | | Dec 2008 | | | (455,920 | ) | |
| | 154 | | | Amgen Inc. @ $60 | | Nov 2008 | | | (39,886 | ) | |
| | 577 | | | Amgen Inc. @ $60 | | Dec 2008 | | | (250,995 | ) | |
| | 827 | | | Ball Corporation @ $35 | | Nov 2008 | | | (132,320 | ) | |
| | 196 | | | Ball Corporation @ $35 | | Dec 2008 | | | (52,430 | ) | |
| | 354 | | | Crown Holdings Inc. @ $17.5 | | Nov 2008 | | | (111,510 | ) | |
| | 160 | | | Crown Holdings Inc. @ $22.5 | | Dec 2008 | | | (16,800 | ) | |
| | 354 | | | Crown Holdings Inc. @ $20 | | Nov 2008 | | | (47,790 | ) | |
| | 743 | | | Devon Energy Corporation @ $70 | | Nov 2008 | | | (1,025,340 | ) | |
| | 127 | | | Devon Energy Corporation @ $105 | | Nov 2008 | | | (3,493 | ) | |
| | 235 | | | Devon Energy Corporation @ $100 | | Nov 2008 | | | (19,975 | ) | |
| | 65 | | | Devon Energy Corporation @ $95 | | Nov 2008 | | | (10,075 | ) | |
| | 1,047 | | | Devon Energy Corporation @ $90 | | Nov 2008 | | | (308,865 | ) | |
| | 329 | | | Devon Energy Corporation @ $80 | | Nov 2008 | | | (200,690 | ) | |
| | 623 | | | Devon Energy Corporation @ $75 | | Nov 2008 | | | (632,345 | ) | |
| | 1,728 | | | The DIRECTV Group, Inc. @ $22.5 | | Nov 2008 | | | (226,368 | ) | |
| | 644 | | | Dresser-Rand Group Inc @ $20 | | Nov 2008 | | | (215,740 | ) | |
| | 322 | | | Dresser-Rand Group Inc @ $22.5 | | Dec 2008 | | | (84,525 | ) | |
| | 211 | | | Dresser-Rand Group Inc @ $40 | | Nov 2008 | | | (3,165 | ) | |
| | 119 | | | Dresser-Rand Group Inc @ $35 | | Nov 2008 | | | (1,190 | ) | |
| | 959 | | | Dresser-Rand Group Inc @ $22.5 | | Nov 2008 | | | (134,260 | ) | |
| | 157 | | | Eastman Chemical Company @ $45 | | Nov 2008 | | | (11,775 | ) | |
| | 170 | | | Eastman Chemical Company @ $40 | | Dec 2008 | | | (61,200 | ) | |
| | 590 | | | Edwards Lifesciences Corporation @ $60 | | Nov 2008 | | | (22,125 | ) | |
| | 741 | | | General Dynamics Corporation @ $55 | | Nov 2008 | | | (503,880 | ) | |
| | 112 | | | General Dynamics Corporation @ $60 | | Dec 2008 | | | (61,600 | ) | |
| | 103 | | | General Dynamics Corporation @ $90 | | Nov 2008 | | | (515 | ) | |
| | 196 | | | General Dynamics Corporation @ $85 | | Nov 2008 | | | (1,960 | ) | |
| | 235 | | | General Dynamics Corporation @ $80 | | Nov 2008 | | | (2,350 | ) | |
| | 228 | | | General Dynamics Corporation @ $65 | | Nov 2008 | | | (36,024 | ) | |
| | 572 | | | General Dynamics Corporation @ $60 | | Nov 2008 | | | (228,800 | ) | |
See Notes to Financial Statements
50
FIRST EAGLE FUND OF AMERICA
SCHEDULE OF INVESTMENTS—(Continued)
October 31, 2008
| Contracts | |
| | Expiration
Date | | Value | |
| | | Covered Call Options Written—(continued) | |
| | 975 | | | Packaging Corporation of America @ $17.5 | | Nov 2008 | | $ | (58,500 | ) | |
| | 2,212 | | | Packaging Corporation of America @ $17.5 | | Dec 2008 | | | (210,140 | ) | |
| | 259 | | | Praxair, Inc. @ $65 | | Nov 2008 | | | (102,305 | ) | |
| | 106 | | | Praxair, Inc. @ $65 | | Dec 2008 | | | (55,120 | ) | |
| | 106 | | | Praxair, Inc. @ $60 | | Dec 2008 | | | (89,570 | ) | |
| | 178 | | | Praxair, Inc. @ $85 | | Nov 2008 | | | (2,670 | ) | |
| | 113 | | | Praxair, Inc. @ $80 | | Nov 2008 | | | (2,260 | ) | |
| | 211 | | | Praxair, Inc. @ $70 | | Nov 2008 | | | (37,453 | ) | |
| | 107 | | | Precision Castparts Corporation @ $60 | | Dec 2008 | | | (100,580 | ) | |
| | 208 | | | Precision Castparts Corporation @ $65 | | Dec 2008 | | | (145,600 | ) | |
| | 2,260 | | | Valeant Pharmaceuticals International @ $17.5 | | Nov 2008 | | | (339,000 | ) | |
| | 397 | | | Valeant Pharmaceuticals International @ $17.5 | | Dec 2008 | | | (71,460 | ) | |
| | 346 | | | Valspar Corporation @ $20 | | Dec 2008 | | | (64,010 | ) | |
| | 1,000 | | | Verigy Limited @ $20 | | Nov 2008 | | | (10,000 | ) | |
| | | | | Total Covered Call Options Written (Cost: $7,422,821) | | | | | (6,489,579 | ) | |
| | | | | Total Investment Portfolio—97.93% (Cost: $807,484,294) | | | | | 674,802,817 | | |
| | | | | Other assets in excess of liabilities—2.07% | | | | | 14,241,280 | | |
| | | | | Net Assets—(100.00%) | | | | $ | 689,044,097 | | |
Aggregate cost for federal income tax purposes, excluding options written, was $816,263,527; and net unrealized depreciation consisted of:
| Gross unrealized appreciation | | $ | 19,040,342 | | |
| Gross unrealized depreciation | | | (154,011,473 | ) | |
| Net unrealized depreciation | | ($ | 134,971,131 | ) | |
(a) Non-income producing security.
(b) At October 31, 2008 all or a portion of this security was segregated to cover collateral requirement for options.
(c) Security is deemed illiquid. At October 31, 2008, the value of these securities amounted to $0 or 0% of net assets.
(d) Securities valued in accordance with fair value procedures under the supervision of the Board of Trustees, representing $0 or 0% of net assets.
(e) Represents interest in a restricted security which has not been registered with the Securities and Exchange Commission under the Securities Act of 1933. At October 31, 2008, the value of these securities amounted to $0 or 0.00% of net assets.
ADR—American Depositary Receipt
See Notes to Financial Statements
51
FIRST EAGLE FUND OF AMERICA
SCHEDULE OF INVESTMENTS—(Continued)
October 31, 2008
Restricted Security
| Security | | Acquisition
Date | | Cost | | Carrying Value
Per Security | |
| Regen Biologics Inc. - Warrants | | | 7/14/2005 | | | | — | | | | — | | |
| Industry Diversification for Portfolio Holdings | | Percent of Net Assets | |
| U.S. Equities | |
| Biotechnology | | | 2.78 | % | |
| Consumer Discretionary | | | 1.69 | | |
| Consumer Staples | | | 1.49 | | |
| Energy | | | 14.19 | | |
| Health Care Services | | | 3.94 | | |
| Industrials | | | 9.06 | | |
| Technology and Telecommunications | | | 13.73 | | |
| Materials | | | 15.30 | | |
| Pharmaceuticals | | | 6.44 | | |
| Total U.S. Equities | | | 68.62 | | |
| International Equities | |
| Energy | | | 0.35 | | |
| Health Care Services | | | 2.17 | | |
| Technology and Telecommunications | | | 0.90 | | |
| Total International Equities | | | 3.42 | | |
| U.S. Government Obligations | |
| U.S. Treasury Bills | | | 26.83 | | |
| Total U.S. Government Obligations | | | 26.83 | | |
| Covered Call Options Written | | | (0.94 | ) | |
| Total Investments | | | 97.93 | % | |
See Notes to Financial Statements
52
FIRST EAGLE FUNDS
STATEMENTS OF ASSETS AND LIABILITIES
October 31, 2008
| | | First Eagle
Global Fund | | First Eagle
Overseas Fund | | First Eagle
U.S. Value Fund | | First Eagle
Gold Fund | | First Eagle
Fund of America | |
| Assets: | |
| Investments in: (Note 1) | |
Unaffiliated issuers, at value
(cost: $14,815,603,251, $5,171,436,474,
$612,887,697, $667,842,858 and
$814,907,115, respectively ) | | $ | 13,084,793,204 | | | $ | 4,992,416,940 | | | $ | 534,626,394 | | | $ | 655,121,653 | | | $ | 681,292,396 | | |
Affiliated issuers, at value
(cost: $4,295,642,259, $1,013,683,062,
$0, $5,728,117 and $0, respectively) | | | 3,606,343,149 | | | | 933,325,999 | | | | — | | | | 2,979,967 | | | | — | | |
| | | | 16,691,136,353 | | | | 5,925,742,939 | | | | 534,626,394 | | | | 658,101,620 | | | | 681,292,396 | | |
| Cash | | | 1,399,851 | | | | 282,828 | | | | 576 | | | | 938 | | | | 12,609,820 | | |
Foreign cash (cost: $1,749,518 and $680,711,
respectively) | | | 1,739,889 | | | | 675,307 | | | | — | | | | — | | | | — | | |
Receivable for forward currency contracts held,
at value (Note 1) | | | 585,844,642 | | | | 338,641,794 | | | | — | | | | — | | | | — | | |
| Receivable for investment securities sold | | | 8,109,288 | | | | 7,763,576 | | | | 233,646 | | | | 2,302,110 | | | | 13,860,864 | | |
| Receivable for premiums for written options | | | — | | | | — | | | | — | | | | — | | | | 1,370,888 | | |
| Receivable for Fund shares sold | | | 38,345,072 | | | | 14,646,142 | | | | 6,264,384 | | | | 4,980,281 | | | | 2,241,611 | | |
| Accrued interest and dividends receivable | | | 54,999,621 | | | | 21,120,272 | | | | 3,606,229 | | | | 53,600 | | | | 231,010 | | |
Investment for trustee deferred compensation plan
(Note 2) | | | 363,090 | | | | 397,308 | | | | 102,896 | | | | 28,776 | | | | 225,952 | | |
| Other assets | | | 175,525 | | | | 75,153 | | | | 5,250 | | | | 10,850 | | | | 75,294 | | |
| Total Assets | | | 17,382,113,331 | | | | 6,309,345,319 | | | | 544,839,375 | | | | 665,478,175 | | | | 711,907,835 | | |
| Liabilities: | |
Options written, at value (premiums received
$7,422,821) (Note 3) | | | — | | | | — | | | | — | | | | — | | | | 6,489,579 | | |
| Payable for Fund shares redeemed | | | 38,388,902 | | | | 65,031,945 | | | | 1,657,638 | | | | 1,701,050 | | | | 561,913 | | |
| Payable for investment securities purchased | | | 12,624,926 | | | | 5,155,272 | | | | — | | | | 2,254,413 | | | | 14,542,357 | | |
Payable for forward currency contracts held, at
value (Note 1) | | | — | | | | 6,707,705 | | | | — | | | | — | | | | — | | |
| Investment advisory fees payable (Note 2) | | | 11,373,173 | | | | 4,137,106 | | | | 340,396 | | | | 470,000 | | | | 586,209 | | |
| Administrative costs payable (Note 2) | | | 303,285 | | | | 110,323 | | | | 9,077 | | | | 12,533 | | | | 11,724 | | |
| Distribution fees payable (Note 4) | | | 5,159,272 | | | | 1,267,497 | | | | 162,893 | | | | 190,732 | | | | 172,131 | | |
| Services fees payable (Note 4) | | | 1,008,103 | | | | 162,361 | | | | 35,578 | | | | 25,543 | | | | 12,789 | | |
| Trustee deferred compensation plan (Note 2) | | | 363,090 | | | | 397,308 | | | | 102,896 | | | | 28,776 | | | | 225,952 | | |
| Accrued expenses and other liabilities | | | 8,065,018 | | | | 3,634,932 | | | | 243,725 | | | | 512,112 | | | | 261,084 | | |
| Total Liabilities | | | 77,285,769 | | | | 86,604,449 | | | | 2,552,203 | | | | 5,195,159 | | | | 22,863,738 | | |
| Net Assets: | |
| Capital stock (par value, $0.001 per share) | | | 503,742 | | | | 360,924 | | | | 42,570 | | | | 44,548 | | | | 36,335 | | |
| Capital surplus | | | 18,663,752,698 | | | | 6,037,392,533 | | | | 605,896,120 | | | | 638,773,506 | | | | 783,252,689 | | |
| Net unrealized appreciation (depreciation) on: | |
| Investments | | | (2,420,109,157 | ) | | | (259,376,597 | ) | | | (78,261,303 | ) | | | (15,469,355 | ) | | | (133,614,719 | ) | |
| Foreign currency related translation | | | 586,383,899 | | | | 332,055,636 | | | | — | | | | — | | | | — | | |
| Written Options | | | — | | | | — | | | | — | | | | — | | | | 933,242 | | |
| Undistributed net realized gains on investments | | | 523,258,648 | | | | 224,741,501 | | | | 5,656,937 | | | | 45,650,936 | | | | 38,470,568 | | |
| Undistributed net investment income (loss) | | | (48,962,268 | ) | | | (112,433,127 | ) | | | 8,952,848 | | | | (8,716,619 | ) | | | (34,018 | ) | |
| Net Assets | | $ | 17,304,827,562 | | | $ | 6,222,740,870 | | | $ | 542,287,172 | | | $ | 660,283,016 | | | $ | 689,044,097 | | |
See Notes to Financial Statements
53
FIRST EAGLE FUNDS
STATEMENTS OF ASSETS AND LIABILITIES
October 31, 2008
| | | First Eagle
Global Fund | | First Eagle
Overseas Fund | | First Eagle
U.S. Value Fund | | First Eagle
Gold Fund | | First Eagle
Fund of America | |
| Class A: | |
| Net assets | | $ | 9,784,279,104 | | | $ | 3,517,947,825 | | | $ | 271,020,805 | | | $ | 480,297,625 | | | $ | 126,971,255 | | |
| Shares outstanding | | | 284,037,426 | | | | 204,358,225 | | | | 21,252,796 | | | | 32,342,731 | | | | 6,710,466 | | |
Net asset value per share and redemption
proceeds per share | | $ | 34.45 | | | $ | 17.21 | | | $ | 12.75 | | | $ | 14.85 | | | $ | 18.92 | | |
Offering price per share (NAV) per share plus
maximum sales charge) | | $ | 36.26 | | | $ | 18.12 | | | $ | 13.42 | | | $ | 15.63 | | | $ | 19.92 | | |
| Class I: | |
| Net assets | | $ | 2,897,510,254 | | | $ | 1,968,282,417 | | | $ | 103,643,784 | | | $ | 70,499,798 | | | | — | | |
| Shares outstanding | | | 83,700,318 | | | | 113,057,598 | | | | 8,043,620 | | | | 4,707,046 | | | | — | | |
Net asset value per share and redemption
proceeds per share | | $ | 34.62 | | | $ | 17.41 | | | $ | 12.89 | | | $ | 14.98 | | | | — | | |
| Class C: | |
| Net assets | | $ | 4,623,038,204 | | | $ | 736,510,628 | | | $ | 167,622,583 | | | $ | 109,485,593 | | | $ | 61,293,510 | | |
| Shares outstanding | | | 136,004,142 | | | | 43,507,684 | | | | 13,273,566 | | | | 7,498,611 | | | | 3,576,662 | | |
Net asset value per share and redemption
proceeds per share | | $ | 33.99 | | | $ | 16.93 | | | $ | 12.63 | | | $ | 14.60 | | | $ | 17.14 | | |
| Class Y: | |
| Net assets | | | — | | | | — | | | | — | | | | — | | | $ | 500,779,332 | | |
| Shares outstanding | | | — | | | | — | | | | — | | | | — | | | | 26,047,958 | | |
Net asset value per share and redemption
proceeds per share | | | — | | | | — | | | | — | | | | — | | | $ | 19.23 | | |
See Notes to Financial Statements
54
FIRST EAGLE FUNDS
STATEMENTS OF OPERATIONS
For the Year Ended October 31, 2008
| | | First Eagle
Global Fund | | First Eagle
Overseas Fund | | First Eagle
U.S. Value Fund | | First Eagle
Gold Fund | | First Eagle
Fund of America | |
| Investment Income: | |
| Income: | |
| Interest | | $ | 184,767,311 | | | $ | 56,364,242 | | | $ | 14,104,418 | | | $ | 630,347 | | | $ | 1,041,241 | | |
Dividends from: (net of $33,319,697, $21,374,904
$145,119, $254,859, $7,860, foreign taxes withheld,
respectively) | |
| Unaffiliated issuers | | | 280,902,745 | | | | 161,060,974 | | | | 6,882,596 | | | | 8,340,783 | | | | 10,047,171 | | |
| Affiliated issuers | | | 101,231,815 | | | | 23,848,854 | | | | — | | | | — | | | | — | | |
| Other Income | | | 66,558 | | | | 44,434 | | | | 92,482 | | | | 18,081 | | | | 66,872 | | |
| Total income | | | 566,968,429 | | | | 241,318,504 | | | | 21,079,496 | | | | 8,989,211 | | | | 11,155,284 | | |
| Expenses: | |
| Investment advisory fees (Note 2) | | | 162,361,713 | | | | 67,137,015 | | | | 4,541,725 | | | | 8,278,266 | | | | 8,436,675 | | |
| Administrative costs (Note 2) | | | 4,399,603 | | | | 1,860,199 | | | | 124,282 | | | | 222,837 | | | | 171,742 | | |
| Distribution fees (Note 4) | |
| Class A | | | 31,595,423 | | | | 12,651,404 | | | | 748,133 | | | | 2,022,950 | | | | 262,042 | | |
| Class C | | | 41,967,121 | | | | 7,770,840 | | | | 1,541,628 | | | | 1,351,923 | | | | 485,101 | | |
| Class Y | | | — | | | | — | | | | — | | | | — | | | | 1,685,426 | | |
| Service fees - Class C (Note 4) | | | 13,989,041 | | | | 2,590,280 | | | | 513,876 | | | | 450,641 | | | | 161,700 | | |
| Shareholder servicing agent fees | | | 17,559,798 | | | | 6,903,946 | | | | 798,198 | | | | 1,304,794 | | | | 856,247 | | |
| Custodian fees | | | 3,515,731 | | | | 2,515,071 | | | | 39,085 | | | | 315,536 | | | | 33,770 | | |
| Shareholder reporting fees | | | 1,668,931 | | | | 684,077 | | | | 73,937 | | | | 117,049 | | | | 65,829 | | |
| Accounting fees | | | 1,031,458 | | | | 476,238 | | | | 31,277 | | | | 58,182 | | | | 42,382 | | |
| Trustees' fees | | | 686,352 | | | | 299,360 | | | | 19,403 | | | | 39,323 | | | | 26,597 | | |
| Insurance fees | | | 349,475 | | | | 168,069 | | | | 9,855 | | | | 20,090 | | | | 12,963 | | |
| Registration and filing fees | | | 466,146 | | | | 191,895 | | | | 91,451 | | | | 104,225 | | | | 103,374 | | |
| Professional fees | | | 637,773 | | | | 324,926 | | | | 58,586 | | | | 98,656 | | | | 77,273 | | |
| Miscellaneous fees | | | 96,171 | | | | 49,743 | | | | 2,865 | | | | 4,998 | | | | 15,348 | | |
| Total expenses | | | 280,324,736 | | | | 103,623,063 | | | | 8,594,301 | | | | 14,389,470 | | | | 12,436,469 | | |
| Expense reductions due to earnings credits (Note 1) | | | (533,096 | ) | | | (255,934 | ) | | | (15,915 | ) | | | (25,914 | ) | | | (87,329 | ) | |
| Net expenses | | | 279,791,640 | | | | 103,367,129 | | | | 8,578,386 | | | | 14,363,556 | | | | 12,349,140 | | |
| Net investment income (loss) (Note 1) | | | 287,176,789 | | | | 137,951,375 | | | | 12,501,110 | | | | (5,374,345 | ) | | | (1,193,856 | ) | |
Realized and Unrealized Gains (Losses) on Investments,
Foreign Currency, Commodity, Related Transactions
and Written Options (Note 1 ): | |
| Net realized gains (losses) from: | |
| Investment transactions of unaffiliated issuers | | | 729,054,265 | | | | 403,914,475 | | | | 6,454,122 | | | | 46,663,522 | | | | 29,829,394 | | |
| Investment transactions of affiliated issuers | | | (10,688,043 | ) | | | 571,246 | | | | — | | | | (14,185 | ) | | | — | | |
| Commodity related transactions | | | — | | | | 17,678,751 | | | | — | | | | 5,398,505 | | | | — | | |
| Foreign currency related transactions | | | (146,558,499 | ) | | | (108,490,159 | ) | | | (387 | ) | | | (171,031 | ) | | | — | | |
| Written Options | | | — | | | | — | | | | — | | | | — | | | | 18,132,934 | | |
| | | | 571,807,723 | | | | 313,674,313 | | | | 6,453,735 | | | | 51,876,811 | | | | 47,962,328 | | |
| Change in unrealized appreciation (depreciation) of: | |
| Investments | | | (7,390,397,046 | ) | | | (3,541,767,620 | ) | | | (154,116,250 | ) | | | (530,308,205 | ) | | | (341,235,383 | ) | |
| Foreign currency related translation | | | 658,774,656 | | | | 396,825,008 | | | | — | | | | — | | | | — | | |
| Written Options | | | — | | | | — | | | | — | | | | — | | | | 2,847,653 | | |
| | | | (6,731,622,390 | ) | | | (3,144,942,612 | ) | | | (154,116,250 | ) | | | (530,308,205 | ) | | | (338,387,730 | ) | |
Net realized and unrealized losses on
investments, foreign currency, commodity,
related transactions and written options | | | (6,159,814,667 | ) | | | (2,831,268,299 | ) | | | (147,662,515 | ) | | | (478,431,394 | ) | | | (290,425,402 | ) | |
| Net Decrease in Net Assets Resulting from Operations | | ( | $5,872,637,878 | ) | | ( | $2,693,316,924 | ) | | ( | $135,161,405 | ) | | ( | $483,805,739 | ) | | ( | $291,619,258 | ) | |
See Notes to Financial Statements
55
FIRST EAGLE FUNDS
STATEMENTS OF CHANGES IN NET ASSETS
| | | First Eagle
Global Fund | | First Eagle
Overseas Fund | | First Eagle
U.S. Value Fund | |
| | | Year Ended
October 31, | | Year Ended
October 31, | | Year Ended
October 31, | |
| | | 2008 | | 2007 | | 2008 | | 2007 | | 2008 | | 2007 | |
| Operations: | |
| Net investment income (loss) | | $ | 287,176,789 | | | $ | 262,550,196 | | | $ | 137,951,375 | | | $ | 178,924,456 | | | $ | 12,501,110 | | | $ | 11,885,737 | | |
Net realized gain from investments, foreign currency,
commodity, related transactions and written options | | | 571,807,723 | | | | 2,229,151,330 | | | | 313,674,313 | | | | 1,483,048,927 | | | | 6,453,735 | | | | 27,345,319 | | |
Change in unrealized appreciation (depreciation) of
investments, foreign currency translation and
written options | | | (6,731,622,390 | ) | | | 753,238,101 | | | | (3,144,942,612 | ) | | | 248,570,641 | | | | (154,116,250 | ) | | | 28,496,843 | | |
Net increase (decrease) in net assets resulting
from operations | | | (5,872,637,878 | ) | | | 3,244,939,627 | | | | (2,693,316,924 | ) | | | 1,910,544,024 | | | | (135,161,405 | ) | | | 67,727,899 | | |
| Distributions to Shareholders: | |
| Dividends paid from net investment income | |
| Class A | | | (279,366,208 | ) | | | (301,070,902 | ) | | | (180,189,537 | ) | | | (188,065,434 | ) | | | (5,722,863 | ) | | | (4,872,278 | ) | |
| Class I | | | (74,255,465 | ) | | | (73,681,966 | ) | | | (121,691,715 | ) | | | (140,397,151 | ) | | | (2,101,375 | ) | | | (2,366,582 | ) | |
| Class C | | | (76,410,477 | ) | | | (92,074,155 | ) | | | (28,086,827 | ) | | | (29,278,838 | ) | | | (2,651,972 | ) | | | (2,072,633 | ) | |
| Class Y | | | — | | | | — | | | | — | | | | — | | | | — | | | | — | | |
Distributions paid from net realized gains from
investment transactions | |
| Class A | | | (1,149,497,548 | ) | | | (890,383,733 | ) | | | (652,293,124 | ) | | | (474,701,910 | ) | | | (12,287,319 | ) | | | (10,814,242 | ) | |
| Class I | | | (273,763,609 | ) | | | (199,381,200 | ) | | | (406,827,856 | ) | | | (329,439,371 | ) | | | (3,944,580 | ) | | | (4,725,972 | ) | |
| Class C | | | (481,349,457 | ) | | | (374,703,576 | ) | | | (133,975,356 | ) | | | (95,188,701 | ) | | | (9,027,699 | ) | | | (6,912,351 | ) | |
| Class Y | | | — | | | | — | | | | — | | | | — | | | | — | | | | — | | |
| Decrease in net assets resulting from distributions | | | (2,334,642,764 | ) | | | (1,931,295,532 | ) | | | (1,523,064,415 | ) | | | (1,257,071,405 | ) | | | (35,735,808 | ) | | | (31,764,058 | ) | |
| Fund Share Transactions (Note 7): | |
| Net proceeds from shares sold | | | 7,080,403,346 | | | | 2,599,172,960 | | | | 2,177,489,462 | | | | 1,215,645,963 | | | | 250,653,753 | | | | 246,698,098 | | |
Net asset value of shares issued for reinvested dividends
and distributions | | | 1,934,139,194 | | | | 1,592,691,429 | | | | 1,295,750,389 | | | | 1,061,174,198 | | | | 29,227,280 | | | | 22,893,687 | | |
| Cost of shares redeemed | | | (5,741,382,568 | ) | | | (2,691,380,823 | ) | | | (4,153,912,271 | ) | | | (2,772,043,850 | ) | | | (228,317,642 | ) | | | (173,518,105 | ) | |
| Redemption fees | | | 1,655,839 | | | | 368,045 | | | | 689,425 | | | | 286,067 | | | | 81,890 | | | | 45,101 | | |
Increase (decrease) in net assets from Fund
share transactions | | | 3,274,815,811 | | | | 1,500,851,611 | | | | (679,982,995 | ) | | | (494,937,622 | ) | | | 51,645,281 | | | | 96,118,781 | | |
| Net increase (decrease) in net assets | | | (4,932,464,831 | ) | | | 2,814,495,706 | | | | (4,896,364,334 | ) | | | 158,534,997 | | | | (119,251,932 | ) | | | 132,082,622 | | |
| Net Assets (Note 1): | |
| Beginning of year | | | 22,237,292,393 | | | | 19,422,796,687 | | | | 11,119,105,204 | | | | 10,960,570,207 | | | | 661,539,104 | | | | 529,456,482 | | |
End of year (including undistributed net investment (loss)
income of ($48,962,268), $56,362,031 ,($112,433,127),
($50,288,264), $8,952,848, $8,101,890, ($8,716,619),
($2,137,143), ($34,018) and $1,561,650, respectively) | | $ | 17,304,827,562 | | | $ | 22,237,292,393 | | | $ | 6,222,740,870 | | | $ | 11,119,105,204 | | | $ | 542,287,172 | | | $ | 661,539,104 | | |
See Notes to Financial Statements
56
| | | First Eagle
Gold Fund | | First Eagle
Fund of America | |
| | | Year Ended
October 31, | | Year Ended
October 31, | |
| | | 2008 | | 2007 | | 2008 | | 2007 | |
| Operations: | |
| Net investment income (loss) | | $ | (5,374,345 | ) | | $ | (6,735,703 | ) | | $ | (1,193,856 | ) | | $ | 1,632,810 | | |
Net realized gain from investments, foreign currency,
commodity, related transactions and written options | | | 51,876,811 | | | | 81,074,679 | | | | 47,962,328 | | | | 87,674,002 | | |
Change in unrealized appreciation (depreciation) of
investments, foreign currency translation and
written options | | | (530,308,205 | ) | | | 277,311,717 | | | | (338,387,730 | ) | | | 66,112,225 | | |
Net increase (decrease) in net assets resulting
from operations | | | (483,805,739 | ) | | | 351,650,693 | | | | (291,619,258 | ) | | | 155,419,037 | | |
| Distributions to Shareholders: | |
| Dividends paid from net investment income | |
| Class A | | | (25,074,580 | ) | | | (24,195,172 | ) | | | (204,496 | ) | | | — | | |
| Class I | | | (4,201,766 | ) | | | (4,975,988 | ) | | | — | | | | — | | |
| Class C | | | (4,460,113 | ) | | | (3,986,922 | ) | | | — | | | | — | | |
| Class Y | | | — | | | | — | | | | (1,385,075 | ) | | | — | | |
Distributions paid from net realized gains from
investment transactions | |
| Class A | | | (30,818,251 | ) | | | (100,864,904 | ) | | | (8,095,784 | ) | | | (5,917,839 | ) | |
| Class I | | | (4,799,864 | ) | | | (19,372,844 | ) | | | — | | | | — | | |
| Class C | | | (6,948,463 | ) | | | (21,208,209 | ) | | | (6,936,699 | ) | | | (6,484,100 | ) | |
| Class Y | | | — | | | | — | | | | (71,479,766 | ) | | | (81,196,044 | ) | |
| Decrease in net assets resulting from distributions | | | (76,303,037 | ) | | | (174,604,039 | ) | | | (88,101,820 | ) | | | (93,597,983 | ) | |
| Fund Share Transactions (Note 7): | |
| Net proceeds from shares sold | | | 293,412,807 | | | | 130,832,536 | | | | 275,946,279 | | | | 134,432,746 | | |
Net asset value of shares issued for reinvested dividends
and distributions | | | 62,146,503 | | | | 141,010,689 | | | | 77,214,426 | | | | 78,266,917 | | |
| Cost of shares redeemed | | | (387,225,293 | ) | | | (275,922,098 | ) | | | (187,350,534 | ) | | | (137,194,245 | ) | |
| Redemption fees | | | 153,422 | | | | 38,877 | | | | 40,236 | | | | 24,250 | | |
Increase (decrease) in net assets from Fund
share transactions | | | (31,512,561 | ) | | | (4,039,996 | ) | | | 165,850,407 | | | | 75,529,668 | | |
| Net increase (decrease) in net assets | | | (591,621,337 | ) | | | 173,006,658 | | | | (213,870,671 | ) | | | 137,350,722 | | |
| Net Assets (Note 1): | |
| Beginning of year | | | 1,251,904,353 | | | | 1,078,897,695 | | | | 902,914,768 | | | | 765,564,046 | | |
End of year (including undistributed net investment (loss)
income of ($48,962,268), $56,362,031 ,($112,433,127),
($50,288,264), $8,952,848, $8,101,890, ($8,716,619),
($2,137,143), ($34,018) and $1,561,650, respectively) | | $ | 660,283,016 | | | $ | 1,251,904,353 | | | $ | 689,044,097 | | | $ | 902,914,768 | | |
57
FIRST EAGLE FUNDS
NOTES TO FINANCIAL STATEMENTS
Note 1—Significant Accounting Policies
First Eagle Funds (the "Trust"), is an open-end management investment company registered under the Investment Company Act of 1940, as amended ("1940 Act"). The Trust consists of five separate portfolios, First Eagle Global Fund, First Eagle Overseas Fund, First Eagle U.S. Value Fund, First Eagle Gold Fund and First Eagle Fund of America (each individually a "Fund" or collectively the "Funds"). All the Funds are diversified mutual funds except for First Eagle Gold Fund and First Eagle Fund of America, which are non-diversified. The Trust is a Delaware statutory trust and was, until April 23, 2004, a Maryland corporation operating under the name First Eagle Funds, Inc. First Eagle Fund of America, previously a portfolio of a separate Delaware statutory trust, was reorganized as a portfolio of the Trust effective December 31, 2002. The First Eagle Global Fund seeks long-term growth of capital by investing in a wide range of asset c lasses from markets in the United States and around the world. The First Eagle Overseas Fund seeks long-term growth of capital by investing primarily in equities issued by non-U.S. corporations. The First Eagle U.S. Value Fund seeks long-term growth of capital by investing primarily in equities issued by U.S. corporations. The First Eagle Gold Fund's investment objective is to provide exposure to the investment characteristics of gold and, to a limited extent, other precious metals. The First Eagle Fund of America is a U.S. equity fund with a unique event-driven bias that seeks capital appreciation.
The following is a summary of significant accounting policies adhered to by the Funds and are in conformity with U.S. generally accepted accounting principles ("GAAP").
a) Investment valuation—Each Fund computes its net asset value once daily as of the close of trading on each day the New York Stock Exchange ("NYSE") is open for trading. The net asset value per share is computed by dividing the total current value of the assets of a Fund, less its liabilities, by the total number of shares outstanding at the time of such computation.
A portfolio security (including an option), other than a bond, which is traded on a U.S. national securities exchange or a securities exchange abroad is normally valued at the price of the last sale on the exchange as of the close of business on the date on which assets are valued. If there are no sales on such date, such portfolio investment will be valued at the mean between the closing bid and asked prices (and if there is only a bid or only an asked price on such date, valuation will be at such bid or asked price for long or short positions, respectively). Securities, other than bonds, traded in the over-the-counter market are valued at the mean between the last bid and asked prices prior to the time of valuation (and if there is only a bid or only an asked price on such date, valuation will be at such bid or asked price for long or short positions, respectively), except if such unlisted security traded on the NASDAQ in whic h case it is valued at its last sale price (or, if available in the case of NASDAQ securities, the NASDAQ Official Closing Price ('NOCP')).
Commodities (such as physical metals) are valued at the spot price at the time trading on the New York Stock Exchange closes (normally 4:00 p.m. E.S.T.).
Forward currency contracts are valued at the current cost of covering or offsetting such contracts.
All bonds, whether listed on an exchange or traded in the over-the-counter market (and except for short-term investments as described in the next sentence), for which market quotations are readily available are valued at the mean between the last bid and asked prices received from dealers in the over-the-counter market in the United States
58
FIRST EAGLE FUNDS
NOTES TO FINANCIAL STATEMENTS—(Continued)
or abroad, except that when no asked price is available, bonds are valued at the last bid price alone. Short-term investments maturing in sixty days or less are valued at cost plus interest earned (or discount amortized, as the case may be), which is deemed to approximate value.
The 2 pm E.S.T. exchange rates typically are used to convert foreign security prices into U.S. dollars. Any security that is listed or traded on more than one exchange (or traded in multiple markets) is valued at the relevant quotation on the exchange or market deemed to be the primary trading venue for that security. In the absence of such a quotation, a quotation from the exchange or market deemed by Arnhold and S. Bleichroeder Advisers, LLC (the "Adviser") to be the secondary trading venue for the particular security shall be used. The Funds use pricing services to identify the market prices of publicly traded securities in their portfolios. When market prices are determined to be "stale" as a result of limited market activity for a particular holding, or in other circumstances when market prices are unavailable, such as for private placements, or determined to be unreliable for a particular holding, such holdings may be "fai r valued" in accordance with procedures approved by the Board of Trustees ("Board"). Additionally, with respect to foreign holdings, specifically in circumstances leading the Adviser to believe that significant events occurring after the close of a foreign market have materially affected the value of a Fund's holdings in that market, such holdings may be fair valued to reflect the events in accordance with procedures approved by the Board. The determination of whether a particular foreign investment should be fair valued will be based on review of a number of factors, including developments in foreign markets, the performance of U.S. securities markets, and security-specific events. The values assigned to a Fund's holdings therefore may differ on occasion from reported market values.
The Funds have adopted procedures under which movements in the prices for U.S. securities (beyond specified thresholds) occurring after the close of a foreign market may require fair valuation of securities traded on that foreign market. The values assigned to a Fund's holdings therefore may differ on occasion from reported market values. The Trust and the Adviser believe relying on the procedures described above will result in prices that are more reflective of the actual market value of portfolio securities held by the Funds.
b) Investment transactions and income—Investment transactions are accounted for on a trade date basis. The specific identification method is used in determining realized gains and losses from investment transactions. Dividend income is recorded on the ex-dividend date. Interest income is recorded daily on the accrual basis. In computing investment income, each Fund accretes discounts and amortizes premiums on debt obligations using the interest method. Investment income is allocated to each Fund's share class in proportion to its relative net assets. Payments received from certain investments held by the Funds may be comprised of dividends, capital gains and return of capital. The Funds originally estimate the expected classification of such payments. The amounts m ay subsequently be reclassified upon receipt of information from the issuer.
c) Expenses—Expenses arising in connection with a Fund are charged directly to that Fund. Expenses common to all Funds are allocated to each Fund in proportion to its relative net assets. Certain expenses are shared with the First Eagle Variable Funds, an affiliated fund group. Such costs are generally allocated using the ratio of the Fund's average daily net assets relative to the total average daily net assets of the First Eagle Variable Funds. Earnings credits reduce custody fees, shareholder servicing agent fees and accounting fees by the amount of interest earned on balances with such service provider.
59
FIRST EAGLE FUNDS
NOTES TO FINANCIAL STATEMENTS—(Continued)
d) Foreign currency translation—The books and records of the Funds are maintained in U.S. dollars. The market values of securities which are not traded in U.S. currency are recorded in the financial statements after translation to U.S. dollars based on the applicable exchange rates at the end of the period. The costs of such securities are translated at exchange rates prevailing when acquired. Related dividends, interest and withholding taxes are accrued at the rates of exchange prevailing on the respective dates of such transactions.
The net assets of each of the Funds are presented at the foreign exchange rates and market values at the close of the period. The Funds do not isolate that portion of gains and losses on investments which is due to changes in foreign exchange rates from that which is due to changes in market prices of the equity securities. However, for federal income tax purposes each Fund does isolate the effect of changes in foreign exchange rates from the changes in market prices for realized gains and losses on debt obligations.
e) Forward currency contracts—In connection with portfolio purchases and sales of securities denominated in foreign currencies, the Funds may enter into forward currency contracts. Additionally, each Fund may enter into such contracts to hedge certain other foreign currency denominated investments. These contracts are valued at the current cost of covering or offsetting such contracts, and the related realized and unrealized foreign exchange gains and losses are included in the statement of operations. In the event that counterparties fail to settle these currency contracts or the related foreign security trades, a Fund could be exposed to foreign currency fluctuations.
f) Repurchase agreements—The Funds may enter into repurchase agreement transactions with institutions that meet the advisor's credit guidelines. Each repurchase agreement is valued at amortized cost. The Funds require that the collateral received in a repurchase agreement transaction be transferred to a custodian in a manner sufficient to enable the Funds to obtain collateral in the event of a counterparty default. If the counterparty defaults and the fair value of the collateral declines, realization of the collateral by the Funds may be delayed or limited. There were no repurchase agreements as of October 31, 2008.
g) Options—In order to produce incremental earnings or protect against changes in the value of portfolio securities, the First Eagle Fund of America may buy and sell put and call options, write covered call options on portfolio securities and write cash-secured put options.
First Eagle Fund of America generally purchases put options or writes covered call options to hedge against adverse movements in the value of portfolio holdings. First Eagle Fund of America may also use options for speculative purposes, although it does not employ options for this purpose at the present time. First Eagle Fund of America will segregate assets to cover its obligations under option contracts.
Options contracts are valued daily based upon the last sale price on the principal exchange on which the option is traded and unrealized appreciation/depreciation is recorded. If there is no sale on such day, the mean between the last bid and asked prices is used. First Eagle Fund of America will realize a gain or loss upon the expiration or closing of the option transaction. When an option is exercised, the proceeds on the sale of a written call option, the purchase cost of a written put option, or the cost of the security for a purchased put or call option is adjusted by the amount of premium received or paid. When a written option expires, First Eagle Fund of America will realize a gain equal to the amount of the premium received. When First Eagle Fund of America enters into a closing purchase transaction,
60
FIRST EAGLE FUNDS
NOTES TO FINANCIAL STATEMENTS—(Continued)
First Eagle Fund of America will realize a gain (or loss, if the cost of the closing purchase transaction exceeds the premium received when the option was written) without regard to any unrealized gain or loss on the underlying security and the liability related to such option is eliminated.
The risk in writing a call option is that the Fund gives up the opportunity for profit if the market price of the security increases and the option is exercised. The risk in writing a put option is that First Eagle Fund of America may incur a loss if the market price of the security decreases and the option is exercised. First Eagle Fund of America also has the additional risk of not being able to enter into a closing transaction if a liquid secondary market does not exist. The Fund may also write over-the-counter options where the completion of the obligation is dependent upon the credit standing of the counterparty.
h) Treasury Inflation-Protected Securities—The Funds may invest in Treasury Inflation-Protected Securities ("TIPS") which are specially structured bonds in which the principal amount is adjusted to keep pace with inflation, as measured by the U.S. Consumer Price Index ("CPI"). The inflation (deflation) adjustment is applied to the principal of each bond on a monthly basis and is accounted for as interest income on the Statements of Operations. TIPS are subject to interest rate risk.
i) Structured notes—In order to qualify as a regulated investment company ("RIC") under the Internal Revenue Code of 1986, as amended (the "Code") , the Fund must meet certain requirements regarding the source of its income, the diversification of its assets and the distribution of its income. One of these requirements is that the Fund derive at least 90% of its gross income for each taxable year from dividends, interest, payments with respect to certain securities loans, gains from the sale or other disposition of stock, securities or foreign currencies, other income derived with respect to its business of investing in such stock, securities or currencies or net income derived from interests in certain publicly traded partnerships ("Qualifying Income"). There curr ently is some uncertainty as to the status of income from commodity-linked structured notes in which certain of the First Eagle Funds have invested, and these Funds have treated such income as Qualifying Income. If any Fund fails to qualify as a RIC, the Fund will be subject to federal, state and local income tax on its net income and capital gains at regular corporate rates (without reduction for distributions to shareholders). When distributed, that income would also be taxable to shareholders as an ordinary dividend to the extent attributable to each Fund's earnings and profits. None of the Funds held structured notes as of October 31, 2008.
j) Short Sales—The First Eagle Fund of America may seek to realize additional gains through short sale transactions in securities listed on one or more national security exchanges, or in unlisted securities. At the time a short sale is effected, the Fund incurs an obligation to replace the security borrowed at whatever its price may be at the time the Fund purchases it for delivery to the lender. The price at such time may be more or less than the price at which the security was sold by the Fund. Until the security is replaced, the Fund is required to pay the lender amounts equal to any dividend or interest that accrues during the period of the loan. To borrow the security, the Fund may also be required to pay a premium. The proceeds of the short sale will be retai ned by the broker, to the extent necessary to meet margin requirements, until the short position is closed. There were no open short sales as of October 31, 2008.
k) Restricted Securities—The Funds may invest in securities that are subject to legal or contractual restrictions on resale. These securities generally may be resold in transactions exempt from registration or to the public if the
61
FIRST EAGLE FUNDS
NOTES TO FINANCIAL STATEMENTS—(Continued)
securities are registered. Disposal of these securities may involve time-consuming negotiations and expense, and prompt sale at an acceptable price may be difficult. Information regarding restricted securities, if any, is included at the end of each Fund's Portfolio of Investments.
l) United States income taxes—No provision has been made for U.S. federal income taxes since it is the intention of each Fund to distribute to shareholders all taxable net investment income and net realized gains on investments, if any, within the allowable time limit, and to comply with the provisions of the Internal Revenue Code for a regulated investment company. First Eagle Global Fund, First Eagle Overseas Fund, First Eagle U.S. Value Fund, First Eagle Gold Fund and First Eagle Fund of America declare and pay such income, dividends and capital gains distributions on an annual basis.
In June 2006, the Financial Accounting Standards Board (FASB) issued FASB Interpretation No. 48 – Accounting for Uncertainty in Income Taxes that require the tax effects of certain tax positions to be recognized. These tax positions must meet a "more likely than not" standard that based on their technical merits, have a more than 50 percent likelihood of being sustained upon examination. FASB Interpretation No. 48 is effective for fiscal periods beginning after December 15, 2006. At adoption, the financial statements must be adjusted to reflect only those tax positions that are more likely than not of being sustained. In accordance with FASB Interpretation No. 48, management of the Trust has analyzed the Funds' tax positions taken on federal and state income tax returns for all open tax years (the current and the prior three tax years) and has concluded that no provision for income tax is required in the Funds' financial st atements.
At October 31, 2008, the components of accumulated earnings on a tax basis were as follows:
| | | Undistributed Net
Investment Income | | Undistributed Net
Realized Gains | | Net Unrealized
(Depreciation) | |
| First Eagle Global Fund | | $ | 44,373,589 | | | $ | 1,112,806,093 | | | ($ | 2,515,767,072 | ) | |
| First Eagle Overseas Fund | | | — | | | | 560,685,127 | | | | (375,259,530 | ) | |
| First Eagle U.S. Value Fund | | | 7,950,805 | | | | 5,841,361 | | | | (77,410,060 | ) | |
| First Eagle Gold Fund | | | — | | | | 46,859,852 | | | | (25,348,739 | ) | |
| First Eagle Fund of America | | | — | | | | 41,195,280 | | | | (134,037,889 | ) | |
The differences between the components of distributable earnings on a tax basis and the amounts reflected in the Statements of Net Assets are primarily due to the treatment of passive foreign investment companies, distributions from real estate investment trusts, investments in partnerships and trusts, the treatment of foreign currencies and wash sales.
m) Reclassification of capital accounts—On the Statements of Assets and Liabilities, as a result of certain differences in the computation of net investment income and net realized capital gains under federal income tax rules and regulations versus generally accepted accounting principles, a reclassification has been made to increase (decrease) undistributed net investment income, undistributed net realized gains on investments and capital surplus for
62
FIRST EAGLE FUNDS
NOTES TO FINANCIAL STATEMENTS—(Continued)
First Eagle Global Fund, First Eagle Overseas Fund, First Eagle U.S. Value Fund, First Eagle Gold Fund and First Eagle Fund of America as follows:
| | | Undistributed Net
Investment Income (Loss) | | Undistributed Net
Realized Gains (Losses) | | Capital Surplus | |
| First Eagle Global Fund | | $ | 37,531,062 | | | $ | (117,889,359 | ) | | $ | 80,358,297 | | |
| First Eagle Overseas Fund | | | 129,871,841 | | | | (150,635,392 | ) | | | 20,763,551 | | |
| First Eagle U.S. Value Fund | | | (1,173,942 | ) | | | (756,303 | ) | | | 1,930,245 | | |
| First Eagle Gold Fund | | | 32,531,328 | | | | (4,648,470 | ) | | | (27,882,858 | ) | |
| First Eagle Fund of America | | | 1,187,759 | | | | (6,073,714 | ) | | | 4,885,955 | | |
The primary permanent differences causing such reclassification include the tax treatment of currency gains and losses, dividend redesignations, distributions paid in connection with the redemption of Fund shares, investments in passive foreign investment companies, distributions from real estate investment trusts, investments in partnerships and the disallowance of net operating losses.
n) Distributions to shareholders—Distributions to shareholders, which are determined in accordance with income tax regulations, are recorded on the ex-dividend date.
| | | Ordinary Income | | Long Term Capital Gains | |
| | | 2008 | | 2007 | | 2008 | | 2007 | |
| First Eagle Global Fund | | $ | 508,107,740 | | | $ | 547,199,121 | | | $ | 1,826,535,025 | | | $ | 1,384,096,410 | | |
| First Eagle Overseas Fund | | | 353,628,152 | | | | 395,332,681 | | | | 1,169,436,263 | | | | 861,738,724 | | |
| First Eagle U.S. Value Fund | | | 15,113,545 | | | | 11,464,478 | | | | 20,622,265 | | | | 20,299,580 | | |
| First Eagle Gold Fund | | | 38,957,421 | | | | 43,450,846 | | | | 37,345,615 | | | | 131,153,193 | | |
| First Eagle Fund of America | | | 5,420,568 | | | | 24,638,156 | | | | 82,681,252 | | | | 68,959,827 | | |
o) Class Accounting—Investment income, common expenses and realized/unrealized gain (loss) on investments are allocated to the various classes of the Fund on the basis of daily net assets of each class. Fees relating to a specific class are charged directly to that class.
p) Use of estimates—The preparation of financial statements in conformity with generally accepted accounting principles requires management to make estimates and assumptions that affect the reported amounts of assets and liabilities at the date of the financial statements and the reported amounts of revenues and expenses during the reporting period. Actual results could differ from those estimates.
q) Redemption Fee—Effective May 1, 2008, the redemption fee period was shortened for the First Eagle Global Fund, First Eagle Overseas Fund and First Eagle Gold Fund. The sale or exchange of shares of these Funds will be subject to a redemption fee if sold or exchanged within 60 days of the purchase of such shares, rather than if sold or exchanged within 90 days of the purchase of such shares. The redemption fee of 2% remains the same.
Also on May 1, 2008, the redemption fee was removed for the First Eagle U.S. Value Fund and the First Eagle Fund of America. The sale or exchange of shares of these Funds will no longer be subject to a redemption fee.
63
FIRST EAGLE FUNDS
NOTES TO FINANCIAL STATEMENTS—(Continued)
r) Recently issued accounting pronouncements—In September 2006, the FASB issued SFAS No. 157, "Fair Value Measurements ("SFAS 157")." SFAS 157 defines fair value, establishes a framework for measuring fair value, and expands disclosures about fair value measurements. SFAS 157 applies to reporting periods beginning after November 15, 2007. Management of the Trust is currently evaluating the impact the adoption of SFAS 157 will have on the Funds' financial statements disclosures.
In March 2008, FASB issued Statement of Financial Accounting Standards, No. 161 ("FAS 161") "Disclosures about Derivative Instruments and Hedging Activities," an amendment of FASB Statement No. 133. FAS 161 requires enhanced disclosure about an entity's derivative and hedging activities. FAS 161 is effective for fiscal years beginning after November 15, 2008 and interim periods within these fiscal years. Management of the Trust is currently evaluating the impact the adoption of FAS 161 will have on the Funds' financial statement disclosures.
Note 2—Investment Advisory and Custody Agreements and Transactions with Related Persons
Arnhold and S. Bleichroeder Advisers, LLC (the "Adviser"), a wholly owned subsidiary of Arnhold and S. Bleichroeder Holdings, Inc. ("ASB Holdings"), manages the Funds. For its services, the Adviser receives, pursuant to an Investment Advisory Agreement between the Funds and the Adviser (the "Advisory Agreement") an annual advisory fee as follows: First Eagle Global Fund, First Eagle Overseas Fund, First Eagle U.S. Value Fund and First Eagle Gold Fund at 0.75% of each Fund's average daily net assets and First Eagle Fund of America at 1% of the Fund's average daily net assets.
The Adviser also performs certain administrative, accounting, operations, compliance and other services on behalf of the Funds, and in accordance with its agreement with them, the Funds reimburse the Adviser for costs (including personnel, related overhead and other costs) related to those services. For the year ended October 31, 2008, the Funds reimbursed the Adviser amounts as disclosed in the Statements of Operations.
The Adviser agreed to reimburse the First Eagle Gold Fund to the extent that the aggregate annualized expenses exceeded 2% for Class I and 3% for Class C of average daily net assets until February 29, 2004. For the period from November 1, 2003 to February 29, 2004, the Adviser did not need to reimburse or waive any of First Eagle Gold Fund's fees.
Pursuant to a subadvisory agreement, dated December 10, 2002 ("Subadvisory Agreement") with the Iridian Asset Management LLC ("Iridian" or the "Subadviser") who manages the investments of the First Eagle Fund of America. Iridian, a registered investment adviser, is a majority-owned subsidiary of BIAM (US), Inc., a U.S. subsidiary of The Governor and Company of The Bank of Ireland. The fees paid to Iridian by the Adviser under the Subadvisory Agreement are based on a reference amount equal to 50% of the combined (i) fees received by the Adviser for advisory services on behalf of the Fund and (ii) the fees received by the Fund's distributor for its shareholder liaison services on behalf of the Fund. These amounts are reduced by certain direct marketing costs borne by the Adviser in connection with the Fund and are further reduced by the amount paid by the Adviser for certain administrative expenses incurred in providing services t o the Fund.
64
FIRST EAGLE FUNDS
NOTES TO FINANCIAL STATEMENTS—(Continued)
The Funds have entered into Custody Agreements with State Street Bank and Trust Co. ("SSB"). The Custody Agreements provide for an annual fee based on the amount of assets under custody plus transaction charges. SSB serves as custodian of the Funds' portfolio securities and other assets, with the exception of gold bullion, which is maintained by HSBC Bank, USA, N.A ("HSBC"). SSB has directly entered into a sub-custodial agreement with HSBC to maintain the custody of gold bullion. Under the terms of the Custody Agreement between the Funds and SSB, SSB maintains and deposits in separate accounts, cash, securities and other assets of the Funds. SSB is also required, upon the order of the Funds, to deliver securities held by SSB and HSBC, and to make payments for securities purchased by the Funds. SSB has also entered into sub-custodian agreements with a number of foreign banks and clearing agencies, pursuant to which portfolio secu rities purchased outside the United States are maintained in the custody of these entities. SSB serves as the custodian for the Funds.
First Eagle Funds Distributors, a division of ASB Securities LLC, a wholly owned subsidiary of ASB Holdings, serves as the Funds' principal underwriter. For the year ended October 31, 2008, First Eagle Funds Distributors realized $1,953,252, $353,878, $57,688, $155,450 and $50,500, pertaining to the sales of shares of First Eagle Global Fund, First Eagle Overseas Fund, First Eagle U.S. Value Fund, First Eagle Gold Fund and First Eagle Fund of America, respectively.
Included in the accrued expenses, on the accompanying statements of assets and liabilities of First Eagle Global Fund, First Eagle Overseas Fund, First Eagle U.S. Value Fund, First Eagle Gold Fund and First Eagle Fund of America are fees that are payable to trustees in the amounts of $73,898, $33,235, $2,115, $4,673 and $3,200, respectively. The Trust adopted a Trustee Deferred Compensation Plan, which allows the independent Trustees to defer the receipt of all or a portion of compensation related to performance of their duties as a Trustee. The deferred fees are invested in various First Eagle Funds until distribution in accordance with the Trustee Deferred Compensation Plan.
Note 3—Options
For the year ended October 31, 2008, First Eagle Fund of America had the following written options transactions:
| | | Number of Contracts | | Premiums Received | |
| Options outstanding at October 31, 2007 | | | 30,492 | | | $ | 15,679,877 | | |
| Options written | | | 121,420 | | | | 45,632,946 | | |
| Options assigned | | | (5,761 | ) | | | (2,489,347 | ) | |
| Options expired/closed | | | (123,809 | ) | | | (51,400,655 | ) | |
| Options outstanding at October 31, 2008 | | | 22,342 | | | $ | 7,422,821 | | |
As of October 31, 2008, portfolio securities valued at $88,511,109 were segregated to cover collateral requirements for written options.
Note 4—Plans of Distribution
Under the terms of the Distribution Plans and Agreements ("the Plans") with First Eagle Funds Distributors, a division of ASB Securities LLC ("the Distributor"), pursuant to the provisions of Rule 12b-1 under the 1940 Act, the First Eagle Global Fund, First Eagle Overseas Fund, First Eagle U.S. Value Fund and First Eagle Gold Fund pay the
65
FIRST EAGLE FUNDS
NOTES TO FINANCIAL STATEMENTS—(Continued)
Distributor quarterly, a distribution fee with respect to Class A and Class C shares at an annual rate of up to 0.25% and 0.75%, respectively, of each Fund's average daily net assets. In the case of First Eagle Fund of America, it pays the Distributor quarterly, a distribution fee with respect to Class Y, Class C and Class A shares at an annual rate of up to 0.25%, 0.75% and 0.25%, respectively of the average daily net assets. Under the Plan, the Distributor is obligated to use the amounts received under the Plans for payments to qualifying dealers for their assistance in the distribution of a Fund's shares and the provision of shareholder services and for other expenses such as advertising costs and the payment for the printing and distribution of prospectuses to prospective investors.
The Distributor bears distribution costs of a Fund to the extent they exceed payments received under the Plan. For the year ended October 31, 2008, the distribution fees incurred by the Funds were as disclosed in the Statements of Operations.
The Distributor receives an annual service fee with respect to Class C at the annual rate of 0.25% of each Fund's average daily net assets, payable quarterly to cover expenses incurred by the Distributor for providing shareholder liaison services, including assistance with subscriptions, redemptions and other shareholder questions. For the year ended October 31, 2008, the services fees incurred by the Funds were as disclosed in the Statement of Operations.
Note 5—Purchases and Sales of Securities
During the year ended October 31, 2008, the cost of purchases of investments, excluding U.S. Government and short-term securities, totaled $9,463,884,200, $1,297,662,765, $150,921,019, $94,810,679 and $485,586,842 for First Eagle Global Fund, First Eagle Overseas Fund, First Eagle U.S. Value Fund, First Eagle Gold Fund and First Eagle Fund of America, respectively. Proceeds from sales of investments, excluding U.S. government securities and short-term securities, totaled $5,097,529,774, $2,315,884,097, $112,951,601, $185,312,174 and $521,009,744 for First Eagle Global Fund, First Eagle Overseas Fund, First Eagle U.S. Value Fund, First Eagle Gold Fund and First Eagle Fund of America, respectively.
The cost of purchases of U.S. Government securities totaled $445,358,251, $0, $6,794,568, $0 and $0 for First Eagle Global Fund, First Eagle Overseas Fund, First Eagle U.S. Value Fund, First Eagle Gold Fund and First Eagle Fund of America, respectively. Proceeds from sales of U.S. government securities, totaled $481,801,830, $0, $3,057,499, $0 and $0 for First Eagle Global Fund, First Eagle Overseas Fund, First Eagle U.S. Value Fund, First Eagle Gold Fund and First Eagle Fund of America, respectively.
Note 6—Line of Credit
As of September 10, 2008, the Board of Trustees approved a $200 million committed, unsecured line of credit ("Credit Facility") with State Street Bank and Trust Company for the Funds, to be utilized for temporary financing the purchase or sale of securities for prompt delivery in the ordinary course of business or temporarily finance the redemption of shares of each Fund at the request of shareholders and other temporary or emergency purposes. Interest on amounts borrowed is calculated based on federal funds rate plus 0.50%. Under the Credit Facility arrangement, each Fund has agreed to pay commitment fees pro rata, based on the relative asset size of the Funds. Commitment fees related to the line of credit are paid by the Funds and are included in miscellaneous expenses in the Statements of Operations. As of October 31, 2008, there were no borrowings from the credit facility.
66

FIRST EAGLE FUNDS
NOTES TO FINANCIAL STATEMENTS—(Continued)
Note 7—Capital Stock
At October 31, 2008, the Funds have an unlimited number of shares authorized for issuance. The Funds have the ability to issue multiple classes of shares.
Transactions in shares of capital stock were as follows:
| | | Year ended October 31, 2008 | |
| | | First Eagle Global Fund | | First Eagle Overseas Fund | | First Eagle U.S. Value Fund | |
| | | Class A | | Class I | | Class C | | Class A | | Class I | | Class C | | Class A | | Class I | | Class C | |
| Shares sold | | | 75,198,015 | | | | 46,137,156 | | | | 42,650,283 | | | | 53,918,059 | | | | 36,339,153 | | | | 8,976,374 | | | | 8,871,653 | | | | 4,173,274 | | | | 3,757,921 | | |
Shares issued for reinvested
dividends and distributions | | | 28,071,819 | | | | 5,754,096 | | | | 9,114,495 | | | | 32,392,050 | | | | 18,060,451 | | | | 5,046,138 | | | | 985,724 | | | | 284,778 | | | | 545,993 | | |
| Shares redeemed | | | (82,505,436 | ) | | | (30,398,726 | ) | | | (26,612,079 | ) | | | (94,603,366 | ) | | | (80,259,586 | ) | | | (13,987,426 | ) | | | (7,631,247 | ) | | | (2,489,779 | ) | | | (4,866,343 | ) | |
| Net increase (decrease) | | | 20,764,398 | | | | 21,492,526 | | | | 25,152,699 | | | | (8,293,257 | ) | | | (25,859,982 | ) | | | 35,086 | | | | 2,226,130 | | | | 1,968,273 | | | | (562,429 | ) | |
| | | Year ended October 31, 2007 | |
| | | First Eagle Global Fund | | First Eagle Overseas Fund | | First Eagle U.S. Value Fund | |
| | | Class A | | Class I | | Class C | | Class A | | Class I | | Class C | | Class A | | Class I | | Class C | |
| Shares sold | | | 29,423,126 | | | | 13,408,641 | | | | 11,833,957 | | | | 25,527,944 | | | | 17,695,896 | | | | 2,943,615 | | | | 8,319,730 | | | | 1,806,798 | | | | 5,219,216 | | |
Shares issued for reinvested
dividends and distributions | | | 23,202,772 | | | | 4,328,546 | | | | 7,497,567 | | | | 24,146,635 | | | | 14,846,977 | | | | 3,553,059 | | | | 870,048 | | | | 157,706 | | | | 435,662 | | |
| Shares redeemed | | | (34,474,198 | ) | | | (9,914,371 | ) | | | (11,511,953 | ) | | | (53,710,207 | ) | | | (43,244,940 | ) | | | (6,500,188 | ) | | | (5,829,160 | ) | | | (2,921,414 | ) | | | (1,827,587 | ) | |
| Net increase (decrease) | | | 18,151,700 | | | | 7,822,816 | | | | 7,819,571 | | | | (4,035,628 | ) | | | (10,702,067 | ) | | | (3,514 | ) | | | 3,360,618 | | | | (956,910 | ) | | | 3,827,291 | | |
68
| | | Year ended October 31, 2008 | |
| | | First Eagle Gold Fund | | First Eagle Fund of America | |
| | | Class A | | Class I | | Class C | | Class Y | | Class A | | Class C | |
| Shares sold | | | 9,428,364 | | | | 1,314,468 | | | | 2,219,049 | | | | 4,012,896 | | | | 5,447,853 | | | | 1,689,034 | | |
Shares issued for reinvested
dividends and distributions | | | 1,974,866 | | | | 307,964 | | | | 358,191 | | | | 2,452,363 | | | | 292,451 | | | | 224,578 | | |
| Shares redeemed | | | (11,687,761 | ) | | | (2,959,569 | ) | | | (2,368,303 | ) | | | (5,423,395 | ) | | | (1,785,192 | ) | | | (717,831 | ) | |
| Net increase (decrease) | | | (284,531 | ) | | | (1,337,137 | ) | | | 208,937 | | | | 1,041,864 | | | | 3,955,112 | | | | 1,195,781 | | |
| | | Year ended October 31, 2007 | |
| | | First Eagle Gold Fund | | First Eagle Fund of America | |
| | | Class A | | Class I | | Class C | | Class Y | | Class A | | Class C | |
| Shares sold | | | 3,911,647 | | | | 915,411 | | | | 1,085,929 | | | | 2,845,188 | | | | 1,320,584 | | | | 666,151 | | |
Shares issued for reinvested
dividends and distributions | | | 4,971,320 | | | | 934,960 | | | | 928,749 | | | | 2,621,034 | | | | 219,398 | | | | 213,865 | | |
| Shares redeemed | | | (9,216,431 | ) | | | (2,043,469 | ) | | | (1,532,639 | ) | | | (4,201,617 | ) | | | (433,618 | ) | | | (338,596 | ) | |
| Net increase (decrease) | | | (333,464 | ) | | | (193,098 | ) | | | 482,039 | | | | 1,264,605 | | | | 1,106,364 | | | | 541,420 | | |
69
FIRST EAGLE FUNDS
NOTES TO FINANCIAL STATEMENTS—(Continued)
Transactions in dollars of capital stock were as follows:
| | | Year ended October 31, 2008 | |
| | | First Eagle Global Fund | | First Eagle Overseas Fund | |
| | | Class A | | Class I | | Class C | | Class A | | Class I | | Class C | |
| Shares sold | | $ | 3,253,372,393 | | | $ | 1,988,837,367 | | | $ | 1,838,193,586 | | | $ | 1,186,545,157 | | | $ | 793,760,846 | | | $ | 197,183,459 | | |
Shares issued for reinvested dividends
and distributions | | | 1,265,758,306 | | | | 260,142,643 | | | | 408,238,245 | | | | 754,734,774 | | | | 424,601,202 | | | | 116,414,413 | | |
| Shares redeemed | | | (3,421,928,092 | ) | | | (1,239,421,544 | ) | | | (1,078,377,093 | ) | | | (2,041,179,422 | ) | | | (1,816,450,609 | ) | | | (295,592,815 | ) | |
| Net increase | | $ | 1,097,202,607 | | | $ | 1,009,558,466 | | | $ | 1,168,054,738 | | | $ | (99,899,491 | ) | | $ | (598,088,561 | ) | | $ | 18,005,057 | | |
| | | Year ended October 31, 2007 | |
| | | First Eagle Global Fund | | First Eagle Overseas Fund | |
| | | Class A | | Class I | | Class C | | Class A | | Class I | | Class C | |
| Shares sold | | $ | 1,405,054,425 | | | $ | 639,851,362 | | | $ | 554,267,173 | | | $ | 673,109,394 | | | $ | 467,501,394 | | | $ | 75,035,175 | | |
Shares issued for reinvested dividends
and distributions | | | 1,055,958,184 | | | | 197,468,312 | | | | 339,264,933 | | | | 601,009,577 | | | | 372,510,660 | | | | 87,653,961 | | |
| Shares redeemed | | | (1,660,695,277 | ) | | | (480,504,284 | ) | | | (549,813,217 | ) | | | (1,429,894,742 | ) | | | (1,170,779,059 | ) | | | (171,083,982 | ) | |
| Net increase (decrease) | | $ | 800,317,332 | | | $ | 356,815,390 | | | $ | 343,718,889 | | | $ | (155,775,771 | ) | | $ | (330,767,005 | ) | | $ | (8,394,846 | ) | |
Note 8—Indemnification and Foreign Investment Risk
In the normal course of business, the Funds enter into contracts that contain a variety of representations which provide general indemnifications. Each Fund's maximum exposure under these arrangements is unknown, as this would involve future claims that may be made against each Fund that have not yet occurred. However, based on experience, the Funds expect the risk of loss to be remote. The Funds may have elements of risk not typically associated with investments in the United States of America due to their investments in foreign countries or regions. Such foreign investments may subject the Funds to additional risks resulting from political or economic conditions in such countries or regions and the possible imposition of adverse governmental laws or currency exchange restrictions could cause the securities and their markets to be less liquid and their prices to be more volatile than those of comparable U.S. securities. The se curities markets in many emerging-market countries are substantially smaller, less developed, less liquid and more volatile than the securities markets of developed countries.
70
| | | Year ended October 31, 2008 | |
| | | First Eagle U.S. Value Fund | | First Eagle Gold Fund | | First Eagle Fund of America | |
| | | Class A | | Class I | | Class C | | Class A | | Class I | | Class C | | Class Y | | Class A | | Class C | |
| Shares sold | | $ | 131,925,450 | | | $ | 63,391,324 | | | $ | 55,336,979 | | | $ | 218,484,735 | | | $ | 25,386,715 | | | $ | 49,541,357 | | | $ | 103,149,091 | | | $ | 134,887,588 | | | $ | 37,909,600 | | |
Shares issued for reinvested dividends
and distributions | | | 15,850,445 | | | | 4,619,106 | | | | 8,757,729 | | | | 46,508,074 | | | | 7,292,576 | | | | 8,345,853 | | | | 64,374,523 | | | | 7,551,098 | | | | 5,288,805 | | |
| Shares redeemed | | | (116,253,611 | ) | | | (38,125,997 | ) | | | (73,856,144 | ) | | | (262,984,501 | ) | | | (72,465,944 | ) | | | (51,621,426 | ) | | | (130,526,933 | ) | | | (41,259,286 | ) | | | (15,524,079 | ) | |
| Net increase | | $ | 31,522,284 | | | $ | 29,884,433 | | | ( | $9,761,436 | ) | | $ | 2,008,308 | | | ( | $39,786,653 | ) | | $ | 6,265,784 | | | $ | 36,996,681 | | | $ | 101,179,400 | | | $ | 27,674,326 | | |
| | | Year ended October 31, 2007 | |
| | | First Eagle U.S. Value Fund | | First Eagle Gold Fund | | First Eagle Fund of America | |
| | | Class A | | Class I | | Class C | | Class A | | Class I | | Class C | | Class Y | | Class A | | Class C | |
| Shares sold | | $ | 133,936,401 | | | $ | 29,137,821 | | | $ | 83,623,876 | | | $ | 86,695,475 | | | $ | 19,969,661 | | | $ | 24,167,400 | | | $ | 79,945,230 | | | $ | 37,384,703 | | | $ | 17,102,813 | | |
Shares issued for reinvested dividends
and distributions | | | 13,607,553 | | | | 2,485,438 | | | | 6,800,696 | | | | 102,608,042 | | | | 19,400,427 | | | | 19,002,220 | | | | 67,648,890 | | | | 5,581,501 | | | | 5,036,526 | | |
| Shares redeemed | | | (96,094,297 | ) | | | (47,792,894 | ) | | | (29,585,813 | ) | | | (197,397,958 | ) | | | (46,005,974 | ) | | | (32,479,289 | ) | | | (116,426,130 | ) | | | (12,092,526 | ) | | | (8,651,339 | ) | |
| Net increase (decrease) | | $ | 51,449,657 | | | ( | $16,169,635 | ) | | $ | 60,838,759 | | | | ($8,094,441 | ) | | ( | $6,635,886 | ) | | $ | 10,690,331 | | | $ | 31,167,990 | | | $ | 30,873,678 | | | $ | 13,488,000 | | |
71
FIRST EAGLE FUNDS
FINANCIAL HIGHLIGHTS
Selected data for a share of beneficial interest outstanding throughout each year is presented below:
| | | Year ended October 31, | |
| | | 2008 | | 2007 | | 2006 | |
| | | Class A | | Class I | | Class C | | Class A | | Class I | | Class C | | Class A | | Class I | | Class C | |
| First Eagle Global Fund | |
| Selected Per Share Data* | |
| Net asset value, beginning of year | | $ | 51.09 | | | $ | 51.32 | | | $ | 50.46 | | | $ | 48.36 | | | $ | 48.56 | | | $ | 47.83 | | | $ | 42.47 | | | $ | 42.62 | | | $ | 42.06 | | |
| Income from investment operations: | |
| Net investment income | | | 0.64 | | | | 0.76 | | | | 0.31 | | | | 0.67 | | | | 0.79 | | | | 0.31 | | | | 0.59 | | | | 0.71 | | | | 0.25 | | |
Net realized and unrealized gains
(losses) on investments | | | (11.82 | ) | | | (11.88 | ) | | | (11.69 | ) | | | 6.91 | | | | 6.94 | | | | 6.84 | | | | 7.82 | | | | 7.85 | | | | 7.77 | | |
| Total from investment operations | | | (11.18 | ) | | | (11.12 | ) | | | (11.38 | ) | | | 7.58 | | | | 7.73 | | | | 7.15 | | | | 8.41 | | | | 8.56 | | | | 8.02 | | |
| Less distributions: | |
Dividends from net investment
income | | | (1.07 | ) | | | (1.19 | ) | | | (0.70 | ) | | | (1.22 | ) | | | (1.34 | ) | | | (0.89 | ) | | | (0.84 | ) | | | (0.94 | ) | | | (0.57 | ) | |
| Distributions from capital gains | | | (4.39 | ) | | | (4.39 | ) | | | (4.39 | ) | | | (3.63 | ) | | | (3.63 | ) | | | (3.63 | ) | | | (1.68 | ) | | | (1.68 | ) | | | (1.68 | ) | |
| Total distributions | | | (5.46 | ) | | | (5.58 | ) | | | (5.09 | ) | | | (4.85 | ) | | | (4.97 | ) | | | (4.52 | ) | | | (2.52 | ) | | | (2.62 | ) | | | (2.25 | ) | |
| Net asset value, end of year | | $ | 34.45 | | | $ | 34.62 | | | $ | 33.99 | | | $ | 51.09 | | | $ | 51.32 | | | $ | 50.46 | | | $ | 48.36 | | | $ | 48.56 | | | $ | 47.83 | | |
| Total Return | | | (24.41 | %) | | | (24.21 | %) | | | (24.99 | %)(a) | | | 16.91 | % | | | 17.19 | % | | | 16.03 | %(a) | | | 20.73 | % | | | 21.06 | % | | | 19.86 | %(a) | |
| Ratios and Supplemental Data | |
| Net assets, end of year (millions) | | $ | 9,784 | | | $ | 2,898 | | | $ | 4,623 | | | $ | 13,451 | | | $ | 3,193 | | | $ | 5,593 | | | $ | 11,854 | | | $ | 2,641 | | | $ | 4,928 | | |
Ratio of operating expenses to
average net assets(b) | | | 1.14 | % | | | 0.89 | % | | | 1.89 | % | | | 1.12 | % | | | 0.87 | % | | | 1.87 | % | | | 1.13 | % | | | 0.88 | % | | | 1.88 | % | |
Ratio of net investment income to
average net assets(c) | | | 1.48 | % | | | 1.74 | % | | | 0.73 | % | | | 1.40 | % | | | 1.64 | % | | | 0.65 | % | | | 1.31 | % | | | 1.57 | % | | | 0.56 | % | |
| Portfolio turnover rate | | | 29.69 | % | | | 29.69 | % | | | 29.69 | % | | | 37.58 | % | | | 37.58 | % | | | 37.58 | % | | | 28.59 | % | | | 28.59 | % | | | 28.59 | % | |
* Per share amounts have been calculated using the average shares method.
See Notes to Financial Highlights.
See Notes to Financial Statements.
72
| | | Year ended October 31, | |
| | | 2005 | | 2004 | |
| | | Class A | | Class I | | Class C | | Class A | | Class I | | Class C | |
| First Eagle Global Fund | |
| Selected Per Share Data* | |
| Net asset value, beginning of year | | $ | 36.53 | | | $ | 36.64 | | | $ | 36.30 | | | $ | 32.37 | | | $ | 32.41 | | | $ | 32.15 | | |
| Income from investment operations: | |
| Net investment income | | | 0.48 | | | | 0.60 | | | | 0.19 | | | | 0.50 | | | | 0.56 | | | | 0.23 | | |
Net realized and unrealized gains
(losses) on investments | | | 6.07 | | | | 6.06 | | | | 6.01 | | | | 5.18 | | | | 5.22 | | | | 5.18 | | |
| Total from investment operations | | | 6.55 | | | | 6.66 | | | | 6.20 | | | | 5.68 | | | | 5.78 | | | | 5.41 | | |
| Less distributions: | |
Dividends from net investment
income | | | (0.43 | ) | | | (0.50 | ) | | | (0.26 | ) | | | (0.67 | ) | | | (0.70 | ) | | | (0.41 | ) | |
| Distributions from capital gains | | | (0.18 | ) | | | (0.18 | ) | | | (0.18 | ) | | | (0.85 | ) | | | (0.85 | ) | | | (0.85 | ) | |
| Total distributions | | | (0.61 | ) | | | (0.68 | ) | | | (0.44 | ) | | | (1.52 | ) | | | (1.55 | ) | | | (1.26 | ) | |
| Net asset value, end of year | | $ | 42.47 | | | $ | 42.62 | | | $ | 42.06 | | | $ | 36.53 | | | $ | 36.64 | | | $ | 36.30 | | |
| Total Return | | | 18.15 | % | | | 18.42 | % | | | 17.23 | %(a) | | | 18.18 | % | | | 18.47 | % | | | 17.31 | %(a) | |
| Ratios and Supplemental Data | |
| Net assets, end of year (millions) | | $ | 9,526 | | | $ | 1,752 | | | $ | 3,828 | | | $ | 5,972 | | | $ | 641 | | | $ | 1,986 | | |
Ratio of operating expenses to
average net assets(b) | | | 1.20 | % | | | 0.95 | % | | | 1.95 | % | | | 1.24 | % | | | 0.99 | % | | | 1.99 | % | |
Ratio of net investment income to
average net assets(c) | | | 1.21 | % | | | 1.48 | % | | | 0.47 | % | | | 1.46 | % | | | 1.67 | % | | | 0.66 | % | |
| Portfolio turnover rate | | | 12.29 | % | | | 12.29 | % | | | 12.29 | % | | | 4.94 | % | | | 4.94 | % | | | 4.94 | % | |
73
FIRST EAGLE FUNDS
FINANCIAL HIGHLIGHTS
Selected data for a share of beneficial interest outstanding throughout each year is presented below:
| | | Year ended October 31, | |
| | | 2008 | | 2007 | |
| | | Class A | | Class I | | Class C | | Class A | | Class I | | Class C | |
| First Eagle Overseas Fund | |
| Selected Per Share Data* | |
| Net asset value, beginning of year | | $ | 28.09 | | | $ | 28.38 | | | $ | 27.66 | | | $ | 26.70 | | | $ | 26.94 | | | $ | 26.33 | | |
| Income from investment operations: | |
| Net investment income | | | 0.35 | | | | 0.40 | | | | 0.18 | | | | 0.41 | | | | 0.48 | | | | 0.21 | | |
| Net realized and unrealized gains (losses) on investments | | | (7.21 | ) | | | (7.28 | ) | | | (7.10 | ) | | | 4.05 | | | | 4.10 | | | | 4.00 | | |
| Total from investment operations | | | (6.86 | ) | | | (6.88 | ) | | | (6.92 | ) | | | 4.46 | | | | 4.58 | | | | 4.21 | | |
| Less distributions: | |
| Dividends from net investment income | | | (0.87 | ) | | | (0.94 | ) | | | (0.66 | ) | | | (0.87 | ) | | | (0.94 | ) | | | (0.68 | ) | |
| Distributions from capital gains | | | (3.15 | ) | | | (3.15 | ) | | | (3.15 | ) | | | (2.20 | ) | | | (2.20 | ) | | | (2.20 | ) | |
| Total distributions | | | (4.02 | ) | | | (4.09 | ) | | | (3.81 | ) | | | (3.07 | ) | | | (3.14 | ) | | | (2.88 | ) | |
| Net asset value, end of year | | $ | 17.21 | | | $ | 17.41 | | | $ | 16.93 | | | $ | 28.09 | | | $ | 28.38 | | | $ | 27.66 | | |
| Total Return | | | (28.15 | %) | | | (27.97 | %) | | | (28.67 | %)(a) | | | 18.20 | % | | | 18.52 | % | | | 17.31 | %(a) | |
| Ratios and Supplemental Data | |
| Net assets, end of year (millions) | | $ | 3,518 | | | $ | 1,968 | | | $ | 737 | | | $ | 5,974 | | | $ | 3,942 | | | $ | 1,203 | | |
| Ratio of operating expenses to average net assets(b) | | | 1.15 | % | | | 0.90 | % | | | 1.90 | % | | | 1.12 | % | | | 0.87 | % | | | 1.87 | % | |
| Ratio of net investment income to average net assets(c) | | | 1.57 | % | | | 1.76 | % | | | 0.82 | % | | | 1.54 | % | | | 1.80 | % | | | 0.79 | % | |
| Portfolio turnover rate | | | 15.72 | % | | | 15.72 | % | | | 15.72 | % | | | 34.29 | % | | | 34.29 | % | | | 34.29 | % | |
* Per share amounts have been calculated using the average shares method.
See Notes to Financial Highlights.
See Notes to Financial Statements.
74
| | | Year ended October 31, | |
| | | 2006 | | 2005 | | 2004 | |
| | | Class A | | Class I | | Class C | | Class A | | Class I | | Class C | | Class A | | Class I | | Class C | |
| First Eagle Overseas Fund | |
| Selected Per Share Data* | |
| Net asset value, beginning of year | | $ | 24.13 | | | $ | 24.33 | | | $ | 23.83 | | | $ | 20.25 | | | $ | 20.37 | | | $ | 19.97 | | | $ | 17.50 | | | $ | 17.57 | | | $ | 17.28 | | |
| Income from investment operations: | |
| Net investment income | | | 0.39 | | | | 0.46 | | | | 0.20 | | | | 0.27 | | | | 0.33 | | | | 0.10 | | | | 0.17 | | | | 0.22 | | | | 0.03 | | |
| Net realized and unrealized gains (losses) on investments | | | 4.57 | | | | 4.60 | | | | 4.53 | | | | 3.96 | | | | 3.99 | | | | 3.93 | | | | 3.20 | | | | 3.22 | | | | 3.17 | | |
| Total from investment operations | | | 4.96 | | | | 5.06 | | | | 4.73 | | | | 4.23 | | | | 4.32 | | | | 4.03 | | | | 3.37 | | | | 3.44 | | | | 3.20 | | |
| Less distributions: | |
| Dividends from net investment income | | | (0.81 | ) | | | (0.87 | ) | | | (0.65 | ) | | | (0.24 | ) | | | (0.25 | ) | | | (0.06 | ) | | | (0.47 | ) | | | (0.49 | ) | | | (0.36 | ) | |
| Distributions from capital gains | | | (1.58 | ) | | | (1.58 | ) | | | (1.58 | ) | | | (0.11 | ) | | | (0.11 | ) | | | (0.11 | ) | | | (0.15 | ) | | | (0.15 | ) | | | (0.15 | ) | |
| Total distributions | | | (2.39 | ) | | | (2.45 | ) | | | (2.23 | ) | | | (0.35 | ) | | | (0.36 | ) | | | (0.17 | ) | | | (0.62 | ) | | | (0.64 | ) | | | (0.51 | ) | |
| Net asset value, end of year | | $ | 26.70 | | | $ | 26.94 | | | $ | 26.33 | | | $ | 24.13 | | | $ | 24.33 | | | $ | 23.83 | | | $ | 20.25 | | | $ | 20.37 | | | $ | 19.97 | | |
| Total Return | | | 22.24 | % | | | 22.53 | % | | | 21.33 | %(a) | | | 21.16 | % | | | 21.47 | % | | | 20.28 | %(a) | | | 19.77 | % | | | 20.09 | % | | | 18.89 | %(a) | |
| Ratios and Supplemental Data | |
| Net assets, end of year (millions) | | $ | 5,785 | | | $ | 4,031 | | | $ | 1,145 | | | $ | 4,866 | | | $ | 3,028 | | | $ | 994 | | | $ | 3,846 | | | $ | 2,152 | | | $ | 804 | | |
| Ratio of operating expenses to average net assets(b) | | | 1.12 | % | | | 0.87 | % | | | 1.87 | % | | | 1.18 | % | | | 0.93 | % | | | 1.93 | % | | | 1.25 | % | | | 1.00 | % | | | 2.00 | % | |
| Ratio of net investment income to average net assets(c) | | | 1.57 | % | | | 1.82 | % | | | 0.81 | % | | | 1.21 | % | | | 1.46 | % | | | 0.46 | % | | | 0.90 | % | | | 1.17 | % | | | 0.17 | % | |
| Portfolio turnover rate | | | 27.98 | % | | | 27.98 | % | | | 27.98 | % | | | 19.40 | % | | | 19.40 | % | | | 19.40 | % | | | 5.88 | % | | | 5.88 | % | | | 5.88 | % | |
75
FIRST EAGLE FUNDS
FINANCIAL HIGHLIGHTS
Selected data for a share of beneficial interest outstanding throughout each year is presented below:
| | | Year ended October 31, | |
| | | 2008 | | 2007 | | 2006 | |
| | | Class A | | Class I | | Class C | | Class A | | Class I | | Class C | | Class A | | Class I | | Class C | |
| First Eagle U.S. Value Fund | |
| Selected Per Share Data* | |
Net asset value,
beginning of year | | $ | 17.01 | | | $ | 17.19 | | | $ | 16.87 | | | $ | 16.19 | | | $ | 16.34 | | | $ | 16.08 | | | $ | 14.95 | | | $ | 15.07 | | | $ | 14.90 | | |
| Income from investment operations: | |
| Net investment income | | | 0.36 | | | | 0.40 | | | | 0.24 | | | | 0.33 | | | | 0.38 | | | | 0.21 | | | | 0.29 | | | | 0.33 | | | | 0.17 | | |
Net realized and unrealized gains
(losses) on investments | | | (3.65 | ) | | | (3.69 | ) | | | (3.63 | ) | | | 1.45 | | | | 1.46 | | | | 1.44 | | | | 1.46 | | | | 1.48 | | | | 1.47 | | |
Total from investment
operations | | | (3.29 | ) | | | (3.29 | ) | | | (3.39 | ) | | | 1.78 | | | | 1.84 | | | | 1.65 | | | | 1.75 | | | | 1.81 | | | | 1.64 | | |
| Less distributions: | |
Dividends from net investment
income | | | (0.31 | ) | | | (0.35 | ) | | | (0.19 | ) | | | (0.30 | ) | | | (0.33 | ) | | | (0.20 | ) | | | (0.24 | ) | | | (0.27 | ) | | | (0.19 | ) | |
| Distributions from capital gains | | | (0.66 | ) | | | (0.66 | ) | | | (0.66 | ) | | | (0.66 | ) | | | (0.66 | ) | | | (0.66 | ) | | | (0.27 | ) | | | (0.27 | ) | | | (0.27 | ) | |
| Total distributions | | | (0.97 | ) | | | (1.01 | ) | | | (0.85 | ) | | | (0.96 | ) | | | (0.99 | ) | | | (0.86 | ) | | | (0.51 | ) | | | (0.54 | ) | | | (0.46 | ) | |
| Net asset value, end of year | | $ | 12.75 | | | $ | 12.89 | | | $ | 12.63 | | | $ | 17.01 | | | $ | 17.19 | | | $ | 16.87 | | | $ | 16.19 | | | $ | 16.34 | | | $ | 16.08 | | |
| Total Return | | | (20.56 | %) | | | (20.36 | %) | | | (21.17 | %)(a) | | | 11.47 | % | | | 11.78 | % | | | 10.65 | %(a) | | | 12.05 | % | | | 12.35 | % | | | 11.26 | %(a) | |
| Ratios and Supplemental Data | |
| Net assets, end of year (millions) | | $ | 271 | | | $ | 104 | | | $ | 167 | | | $ | 324 | | | $ | 104 | | | $ | 233 | | | $ | 254 | | | $ | 115 | | | $ | 161 | | |
Ratio of operating expenses to
average net assets(b) | | | 1.20 | % | | | 0.95 | % | | | 1.96 | % | | | 1.20 | % | | | 0.95 | % | | | 1.95 | % | | | 1.25 | % | | | 0.99 | % | | | 1.99 | % | |
Ratio of net investment income to
average net assets(c) | | | 2.28 | % | | | 2.53 | % | | | 1.53 | % | | | 2.04 | % | | | 2.32 | % | | | 1.29 | % | | | 1.87 | % | | | 2.13 | % | | | 1.13 | % | |
| Portfolio turnover rate | | | 21.75 | % | | | 21.75 | % | | | 21.75 | % | | | 32.54 | % | | | 32.54 | % | | | 32.54 | % | | | 31.76 | % | | | 31.76 | % | | | 31.76 | % | |
* Per share amounts have been calculated using the average shares method.
See Notes to Financial Highlights.
See Notes to Financial Statements.
76
| | | Year ended October 31, | |
| | | 2005 | | 2004 | |
| | | Class A | | Class I | | Class C | | Class A | | Class I | | Class C | |
| First Eagle U.S. Value Fund | |
| Selected Per Share Data* | |
Net asset value,
beginning of year | | $ | 13.95 | | | $ | 14.05 | | | $ | 13.92 | | | $ | 12.71 | | | $ | 12.76 | | | $ | 12.61 | | |
| Income from investment operations: | |
| Net investment income | | | 0.20 | | | | 0.24 | | | | 0.10 | | | | 0.22 | | | | 0.27 | | | | 0.13 | | |
Net realized and unrealized gains
(losses) on investments | | | 1.35 | | | | 1.36 | | | | 1.35 | | | | 1.66 | | | | 1.65 | | | | 1.64 | | |
Total from investment
operations | | | 1.55 | | | | 1.60 | | | | 1.45 | | | | 1.88 | | | | 1.92 | | | | 1.77 | | |
| Less distributions: | |
Dividends from net investment
income | | | (0.20 | ) | | | (0.23 | ) | | | (0.12 | ) | | | (0.32 | ) | | | (0.31 | ) | | | (0.14 | ) | |
| Distributions from capital gains | | | (0.35 | ) | | | (0.35 | ) | | | (0.35 | ) | | | (0.32 | ) | | | (0.32 | ) | | | (0.32 | ) | |
| Total distributions | | | (0.55 | ) | | | (0.58 | ) | | | (0.47 | ) | | | (0.64 | ) | | | (0.63 | ) | | | (0.46 | ) | |
| Net asset value, end of year | | $ | 14.95 | | | $ | 15.07 | | | $ | 14.90 | | | $ | 13.95 | | | $ | 14.05 | | | $ | 13.92 | | |
| Total Return | | | 11.35 | % | | | 11.65 | % | | | 10.56 | %(a) | | | 15.38 | % | | | 15.58 | % | | | 14.43 | %(a) | |
| Ratios and Supplemental Data | |
| Net assets, end of year (millions) | | $ | 150 | | | $ | 68 | | | $ | 97 | | | $ | 62 | | | $ | 54 | | | $ | 29 | | |
Ratio of operating expenses to
average net assets(b) | | | 1.28 | % | | | 1.04 | % | | | 2.02 | % | | | 1.38 | % | | | 1.13 | % | | | 2.13 | % | |
Ratio of net investment income to
average net assets(c) | | | 1.40 | % | | | 1.63 | % | | | 0.67 | % | | | 1.66 | % | | | 2.00 | % | | | 0.95 | % | |
| Portfolio turnover rate | | | 17.22 | % | | | 17.22 | % | | | 17.22 | % | | | 23.47 | % | | | 23.47 | % | | | 23.47 | % | |
77
FIRST EAGLE FUNDS
FINANCIAL HIGHLIGHTS
Selected data for a share of beneficial interest outstanding throughout each year is presented below:
| | | Year ended October 31, | |
| | | 2008 | | 2007 | | 2006 | |
| | | Class A | | Class I | | Class C | | Class A | | Class I | | Class C | | Class A | | Class I | | Class C | |
| First Eagle Gold Fund | |
| Selected Per Share Data* | |
Net asset value,
beginning of year | | $ | 27.28 | | | $ | 27.48 | | | $ | 26.86 | | | $ | 23.48 | | | $ | 23.62 | | | $ | 23.17 | | | $ | 17.45 | | | $ | 17.55 | | | $ | 17.25 | | |
| Income from investment operations: | |
| Net investment income (loss) | | | (0.09 | ) | | | (0.05 | ) | | | (0.27 | ) | | | (0.12 | ) | | | (0.07 | ) | | | (0.28 | ) | | | (0.13 | ) | | | (0.08 | ) | | | (0.30 | ) | |
Net realized and unrealized gains
(losses) on investments | | | (10.61 | ) | | | (10.66 | ) | | | (10.43 | ) | | | 7.72 | | | | 7.78 | | | | 7.61 | | | | 6.65 | | | | 6.69 | | | | 6.60 | | |
| Total from investment operations | | | (10.70 | ) | | | (10.71 | ) | | | (10.70 | ) | | | 7.60 | | | | 7.71 | | | | 7.33 | | | | 6.52 | | | | 6.61 | | | | 6.30 | | |
| Less distributions: | |
Dividends from net investment
income | | | (0.78 | ) | | | (0.84 | ) | | | (0.61 | ) | | | (0.74 | ) | | | (0.79 | ) | | | (0.58 | ) | | | (0.49 | ) | | | (0.54 | ) | | | (0.38 | ) | |
| Distributions from capital gains | | | (0.95 | ) | | | (0.95 | ) | | | (0.95 | ) | | | (3.06 | ) | | | (3.06 | ) | | | (3.06 | ) | | | — | | | | — | | | | — | | |
| Total distributions | | | (1.73 | ) | | | (1.79 | ) | | | (1.56 | ) | | | (3.80 | ) | | | (3.85 | ) | | | (3.64 | ) | | | (0.49 | ) | | | (0.54 | ) | | | (0.38 | ) | |
| Net asset value, end of year | | $ | 14.85 | | | $ | 14.98 | | | $ | 14.60 | | | $ | 27.28 | | | $ | 27.48 | | | $ | 26.86 | | | $ | 23.48 | | | $ | 23.62 | | | $ | 23.17 | | |
| Total Return | | | (41.56 | %) | | | (41.36 | %) | | | (41.99 | %)(a) | | | 37.57 | % | | | 37.93 | % | | | 36.55 | %(a) | | | 37.97 | % | | | 38.29 | % | | | 36.95 | %(a) | |
| Ratios and Supplemental Data | |
| Net assets, end of year (millions) | | $ | 480 | | | $ | 71 | | | $ | 109 | | | $ | 890 | | | $ | 166 | | | $ | 196 | | | $ | 774 | | | $ | 147 | | | $ | 158 | | |
Ratio of operating expenses to
average net assets(b) | | | 1.21 | % | | | 0.95 | % | | | 1.96 | % | | | 1.20 | % | | | 0.95 | % | | | 1.95 | % | | | 1.21 | % | | | 0.96 | % | | | 1.96 | % | |
Ratio of net investment (loss)
income to average net assets(c) | | | (0.38 | %) | | | (0.20 | %) | | | (1.13 | %) | | | (0.55 | %) | | | (0.30 | %) | | | (1.30 | %) | | | (0.59 | %) | | | (0.34 | %) | | | (1.33 | %) | |
| Portfolio turnover rate | | | 8.74 | % | | | 8.74 | % | | | 8.74 | % | | | 16.37 | % | | | 16.37 | % | | | 16.37 | % | | | 32.26 | % | | | 32.26 | % | | | 32.26 | % | |
* Per share amounts have been calculated using the average shares method.
** Amount represents less than $0.01 per share.
See Notes to Financial Highlights.
See Notes to Financial Statements.
78
| | | Year ended October 31, | |
| | | 2005 | | 2004 | |
| | | Class A | | Class I | | Class C | | Class A | | Class I | | Class C | |
| First Eagle Gold Fund | |
| Selected Per Share Data* | |
Net asset value,
beginning of year | | $ | 16.82 | | | $ | 16.88 | | | $ | 16.76 | | | $ | 15.99 | | | $ | 16.03 | | | $ | 15.96 | | |
| Income from investment operations: | |
| Net investment income (loss) | | | (0.04 | ) | | | 0.00 | ** | | | (0.16 | ) | | | (0.10 | ) | | | (0.05 | ) | | | (0.21 | ) | |
Net realized and unrealized gains
(losses) on investments | | | 0.67 | | | | 0.67 | | | | 0.65 | | | | 1.49 | | | | 1.48 | | | | 1.47 | | |
| Total from investment operations | | | 0.63 | | | | 0.67 | | | | 0.49 | | | | 1.39 | | | | 1.43 | | | | 1.26 | | |
| Less distributions: | |
Dividends from net investment
income | | | — | | | | — | | | | — | | | | (0.56 | ) | | | (0.58 | ) | | | (0.46 | ) | |
| Distributions from capital gains | | | — | | | | — | | | | — | | | | — | | | | — | | | | — | | |
| Total distributions | | | — | | | | — | | | | — | | | | (0.56 | ) | | | (0.58 | ) | | | (0.46 | ) | |
| Net asset value, end of year | | $ | 17.45 | | | $ | 17.55 | | | $ | 17.25 | | | $ | 16.82 | | | $ | 16.88 | | | $ | 16.76 | | |
| Total Return | | | 3.75 | % | | | 3.97 | % | | | 2.92 | %(a) | | | 8.59 | % | | | 8.82 | % | | | 7.79 | %(a) | |
| Ratios and Supplemental Data | |
| Net assets, end of year (millions) | | $ | 570 | | | $ | 84 | | | $ | 115 | | | $ | 516 | | | $ | 75 | | | $ | 92 | | |
Ratio of operating expenses to
average net assets(b) | | | 1.29 | % | | | 1.04 | % | | | 2.04 | % | | | 1.39 | % | | | 1.14 | % | | | 2.14 | % | |
Ratio of net investment (loss)
income to average net assets(c) | | | (0.24 | %) | | | 0.02 | % | | | (0.98 | %) | | | (0.62 | %) | | | (0.35 | %) | | | (1.34 | %) | |
| Portfolio turnover rate | | | 21.73 | % | | | 21.73 | % | | | 21.73 | % | | | 3.61 | % | | | 3.61 | % | | | 3.61 | % | |
79
FIRST EAGLE FUNDS
FINANCIAL HIGHLIGHTS
Selected data for a share of beneficial interest outstanding throughout each year is presented below:
| | | Year ended October 31, | |
| | | 2008 | | 2007 | | 2006 | |
| | | Class Y | | Class C | | Class A | | Class Y | | Class C | | Class A | | Class Y | | Class C | | Class A | |
| First Eagle Fund of America | |
| Selected Per Share Data* | |
Net asset value,
beginning of year | | $ | 30.22 | | | $ | 27.39 | | | $ | 29.79 | | | $ | 28.28 | | | $ | 26.12 | | | $ | 27.92 | | | $ | 26.42 | | | $ | 24.74 | | | $ | 26.11 | | |
| Income from investment operations: | |
| Net investment income (loss) | | | (0.01 | ) | | | (0.20 | ) | | | (0.06 | ) | | | 0.07 | (d) | | | (0.13 | )(d) | | | 0.05 | (d) | | | (0.08 | ) | | | (0.26 | ) | | | (0.08 | ) | |
Net realized and unrealized gains
(losses) on investments | | | (8.03 | ) | | | (7.16 | ) | | | (7.85 | ) | | | 5.35 | | | | 4.88 | | | | 5.30 | | | | 4.28 | | | | 3.98 | | | | 4.23 | | |
Total from investment
operations | | | (8.04 | ) | | | (7.36 | ) | | | (7.91 | ) | | | 5.42 | | | | 4.75 | | | | 5.35 | | | | 4.20 | | | | 3.72 | | | | 4.15 | | |
| Less distributions: | |
Dividends from net investment
income | | | (0.06 | ) | | | — | | | | (0.07 | ) | | | — | | | | — | | | | — | | | | — | | | | — | | | | — | | |
| Distributions from capital gains | | | (2.89 | ) | | | (2.89 | ) | | | (2.89 | ) | | | (3.48 | ) | | | (3.48 | ) | | | (3.48 | ) | | | (2.34 | ) | | | (2.34 | ) | | | (2.34 | ) | |
| Total distributions | | | (2.95 | ) | | | (2.89 | ) | | | (2.96 | ) | | | (3.48 | ) | | | (3.48 | ) | | | (3.48 | ) | | | (2.34 | ) | | | (2.34 | ) | | | (2.34 | ) | |
| Net asset value, end of year | | $ | 19.23 | | | $ | 17.14 | | | $ | 18.92 | | | $ | 30.22 | | | $ | 27.39 | | | $ | 29.79 | | | $ | 28.28 | | | $ | 26.12 | | | $ | 27.92 | | |
| Total Return | | | (29.23 | %) | | | (29.74 | %)(a) | | | (29.20 | %) | | | 21.25 | % | | | 20.34 | %(a) | | | 21.28 | % | | | 16.80 | % | | | 15.93 | %(a) | | | 16.81 | % | |
| Ratios and Supplemental Data | |
Net assets, end of year
(millions) | | $ | 501 | | | $ | 61 | | | $ | 127 | | | $ | 756 | | | $ | 65 | | | $ | 82 | | | $ | 671 | | | $ | 48 | | | $ | 46 | | |
Ratio of operating expenses to
average net assets(b) | | | 1.41 | % | | | 2.16 | % | | | 1.41 | % | | | 1.40 | % | | | 2.15 | % | | | 1.40 | % | | | 1.41 | % | | | 2.16 | % | | | 1.41 | % | |
Ratio of net investment income (loss)
to average net assets(c) | | | (0.06 | %) | | | (0.87 | %) | | | (0.23 | %) | | | 0.26 | %(d) | | | (0.51 | %)(d) | | | 0.18 | %(d) | | | (0.30 | %) | | | (1.05 | %) | | | (0.30 | %) | |
| Portfolio turnover rate | | | 63.97 | % | | | 63.97 | % | | | 63.97 | % | | | 50.26 | % | | | 50.26 | % | | | 50.26 | % | | | 40.38 | % | | | 40.38 | % | | | 40.38 | % | |
* Per share amounts have been calculated using the average shares method.
See Notes to Financial Highlights.
See Notes to Financial Statements.
80
| | | Year ended October 31, | |
| | | 2005 | | 2004 | |
| | | Class Y | | Class C | | Class A | | Class Y | | Class C | | Class A | |
| First Eagle Fund of America | |
| Selected Per Share Data* | |
Net asset value,
beginning of year | | $ | 25.81 | | | $ | 24.44 | | | $ | 25.54 | | | $ | 23.03 | | | $ | 21.99 | | | $ | 22.80 | | |
| Income from investment operations: | |
| Net investment income (loss) | | | (0.07 | ) | | | (0.26 | ) | | | (0.09 | ) | | | (0.16 | ) | | | (0.33 | ) | | | (0.22 | ) | |
Net realized and unrealized gains
(losses) on investments | | | 2.38 | | | | 2.26 | | | | 2.36 | | | | 3.41 | | | | 3.25 | | | | 3.43 | | |
Total from investment
operations | | | 2.31 | | | | 2.00 | | | | 2.27 | | | | 3.25 | | | | 2.92 | | | | 3.21 | | |
| Less distributions: | |
Dividends from net investment
income | | | — | | | | — | | | | — | | | | — | | | | — | | | | — | | |
| Distributions from capital gains | | | (1.70 | ) | | | (1.70 | ) | | | (1.70 | ) | | | (0.47 | ) | | | (0.47 | ) | | | (0.47 | ) | |
| Total distributions | | | (1.70 | ) | | | (1.70 | ) | | | (1.70 | ) | | | (0.47 | ) | | | (0.47 | ) | | | (0.47 | ) | |
| Net asset value, end of year | | $ | 26.42 | | | $ | 24.74 | | | $ | 26.11 | | | $ | 25.81 | | | $ | 24.44 | | | $ | 25.54 | | |
| Total Return | | | 9.23 | % | | | 8.43 | %(a) | | | 9.16 | % | | | 14.30 | % | | | 13.46 | %(a) | | | 14.27 | % | |
| Ratios and Supplemental Data | |
Net assets, end of year
(millions) | | $ | 684 | | | $ | 36 | | | $ | 29 | | | $ | 601 | | | $ | 17 | | | $ | 14 | | |
Ratio of operating expenses to
average net assets(b) | | | 1.43 | % | | | 2.17 | % | | | 1.49 | % | | | 1.46 | % | | | 2.21 | % | | | 1.72 | % | |
Ratio of net investment income (loss)
to average net assets(c) | | | (0.27 | %) | | | (1.03 | %) | | | (0.34 | %) | | | (0.63 | %) | | | (1.39 | %) | | | (0.91 | %) | |
| Portfolio turnover rate | | | 54.54 | % | | | 54.54 | % | | | 54.54 | % | | | 44.68 | % | | | 44.68 | % | | | 44.68 | % | |
81
FIRST EAGLE FUNDS
NOTES TO FINANCIAL HIGHLIGHTS
(a) Does not give effect to the deduction of the CDSC (Contingent Deferred Sales Charge) of 1.00%.
(b) The ratio of operating expenses to average net assets without the effect of earnings credits and in the case of the First Eagle U.S. Value Fund, without the effect of earnings credits and expense reimbursements are as follows:
| | | Year ended October 31, | |
| | | 2008 | | 2007 | | 2006 | |
| | | Class A | | Class I | | Class C | | Class A | | Class I | | Class C | | Class A | | Class I | | Class C | |
| First Eagle Global Fund | | | 1.14 | % | | | 0.89 | % | | | 1.89 | % | | | 1.12 | % | | | 0.87 | % | | | 1.87 | % | | | 1.14 | % | | | 0.89 | % | | | 1.89 | % | |
| First Eagle Overseas Fund | | | 1.15 | % | | | 0.90 | % | | | 1.90 | % | | | 1.12 | % | | | 0.87 | % | | | 1.87 | % | | | 1.12 | % | | | 0.87 | % | | | 1.87 | % | |
| First Eagle U.S. Value Fund | | | 1.21 | % | | | 0.96 | % | | | 1.96 | % | | | 1.20 | % | | | 0.96 | % | | | 1.95 | % | | | 1.25 | % | | | 1.00 | % | | | 2.00 | % | |
| First Eagle Gold Fund | | | 1.21 | % | | | 0.96 | % | | | 1.96 | % | | | 1.20 | % | | | 0.95 | % | | | 1.95 | % | | | 1.22 | % | | | 0.97 | % | | | 1.97 | % | |
| | | Year ended October 31, | |
| | | 2008 | | 2007 | | 2006 | |
| | | Class Y | | Class C | | Class A | | Class Y | | Class C | | Class A | | Class Y | | Class C | | Class A | |
| First Eagle Fund of America | | | 1.42 | % | | | 2.17 | % | | | 1.42 | % | | | 1.41 | % | | | 2.16 | % | | | 1.41 | % | | | 1.41 | % | | | 2.16 | % | | | 1.41 | % | |
(c) The ratio of net investment income (loss) to average net assets without the effect of earnings credits and in the case of the First Eagle U.S. Value Fund, without the effect of earnings credits and expense reimbursements are as follows:
| | | Year ended October 31, | |
| | | 2008 | | 2007 | | 2006 | |
| | | Class A | | Class I | | Class C | | Class A | | Class I | | Class C | | Class A | | Class I | | Class C | |
| First Eagle Global Fund | | | 1.48 | % | | | 1.74 | % | | | 0.73 | % | | | 1.39 | % | | | 1.64 | % | | | 0.64 | % | | | 1.30 | % | | | 1.57 | % | | | 0.56 | % | |
| First Eagle Overseas Fund | | | 1.57 | % | | | 1.76 | % | | | 0.82 | % | | | 1.54 | % | | | 1.79 | % | | | 0.78 | % | | | 1.56 | % | | | 1.82 | % | | | 0.81 | % | |
| First Eagle U.S. Value Fund | | | 2.28 | % | | | 2.53 | % | | | 1.52 | % | | | 2.04 | % | | | 2.32 | % | | | 1.28 | % | | | 1.87 | % | | | 2.12 | % | | | 1.12 | % | |
| First Eagle Gold Fund | | | (0.38 | %) | | | (0.20 | %) | | | (1.14 | %) | | | (0.56 | %) | | | (0.31 | %) | | | (1.31 | %) | | | (0.59 | %) | | | (0.34 | %) | | | (1.34 | %) | |
| | | Year ended October 31, | |
| | | 2008 | | 2007 | | 2006 | |
| | | Class Y | | Class C | | Class A | | Class Y | | Class C | | Class A | | Class Y | | Class C | | Class A | |
| First Eagle Fund of America | | | (0.07 | %) | | | (0.88 | %) | | | (0.24 | %) | | | 0.25 | %(d) | | | (0.52 | %)(d) | | | 0.17 | %(d) | | | (0.30 | %) | | | (1.05 | %) | | | (0.30 | %) | |
(d) Investment income (loss) per share reflects special divideneds recieved in the First Eagle Fund of America (Class Y, C and A) which amounted to $0.13, $0.12, and $0.13 per share. Excluding the special dividend, the ratio of net investment income (loss) to average net assets both with and without the effect of earnings credits in First Eagle Fund of America (Class Y, C and A) would have been (0.22%), (1.00%), and (0.31%).
82
| | | Year ended October 31, | |
| | | 2005 | | 2004 | |
| | | Class A | | Class I | | Class C | | Class A | | Class I | | Class C | |
| First Eagle Global Fund | | | 1.20 | % | | | 0.95 | % | | | 1.95 | % | | | 1.24 | % | | | 0.99 | % | | | 1.99 | % | |
| First Eagle Overseas Fund | | | 1.18 | % | | | 0.93 | % | | | 1.93 | % | | | 1.25 | % | | | 1.00 | % | | | 2.00 | % | |
| First Eagle U.S. Value Fund | | | 1.28 | % | | | 1.04 | % | | | 2.02 | % | | | 1.38 | % | | | 1.13 | % | | | 2.13 | % | |
| First Eagle Gold Fund | | | 1.30 | % | | | 1.05 | % | | | 2.05 | % | | | 1.39 | % | | | 1.14 | % | | | 2.14 | % | |
| | | Year ended October 31, | |
| | | 2005 | | 2004 | |
| | | Class Y | | Class C | | Class A | | Class Y | | Class C | | Class A | |
| First Eagle Fund of America | | | 1.43 | % | | | 2.17 | % | | | 1.49 | % | | | 1.46 | % | | | 2.21 | % | | | 1.72 | % | |
| | | Year ended October 31, | |
| | | 2005 | | 2004 | |
| | | Class A | | Class I | | Class C | | Class A | | Class I | | Class C | |
| First Eagle Global Fund | | | 1.20 | % | | | 1.48 | % | | | 0.47 | % | | | 1.46 | % | | | 1.67 | % | | | 0.66 | % | |
| First Eagle Overseas Fund | | | 1.21 | % | | | 1.46 | % | | | 0.46 | % | | | 0.90 | % | | | 1.17 | % | | | 0.17 | % | |
| First Eagle U.S. Value Fund | | | 1.40 | % | | | 1.63 | % | | | 0.66 | % | | | 1.66 | % | | | 2.00 | % | | | 0.95 | % | |
| First Eagle Gold Fund | | | (0.24 | %) | | | (0.01 | %) | | | (0.98 | %) | | | (0.62 | %) | | | (0.35 | %) | | | (1.34 | %) | |
| | | Year ended October 31, | |
| | | 2005 | | 2004 | |
| | | Class Y | | Class C | | Class A | | Class Y | | Class C | | Class A | |
| First Eagle Fund of America | | | (0.27 | %) | | | (1.04 | %) | | | (0.34 | %) | | | (0.57 | %) | | | (1.32 | %) | | | (0.84 | %) | |
83
REPORT OF INDEPENDENT REGISTERED PUBLIC ACCOUNTING FIRM
To the Board of Trustees and Shareholders of
First Eagle Funds:
In our opinion, the accompanying statements of assets and liabilities, including the schedules of investments, and the related statements of operations, of changes in net assets and the financial highlights present fairly, in all material respects, the financial position of First Eagle Global Fund, First Eagle Overseas Fund, First Eagle U.S. Value Fund, First Eagle Gold Fund and First Eagle Fund of America (collectively hereafter referred to as the "Funds") at October 31, 2008, the results of each of their operations for the year then ended, and the changes in each of their net assets for the two years then ended and the financial highlights for the three years then ended, in conformity with accounting principles generally accepted in the United States of America. These financial statements and financial highlights (hereafter referred to as "financial statements") are the responsibility of the Funds' management. Our responsibili ty is to express an opinion on these financial statements based on our audits. We conducted our audits of these financial statements in accordance with the standards of the Public Company Accounting Oversight Board (United States). Those standards require that we plan and perform the audits to obtain reasonable assurance about whether the financial statements are free of material misstatement. An audit includes examining, on a test basis, evidence supporting the amounts and disclosures in the financial statements, assessing the accounting principles used and significant estimates made by management, and evaluating the overall financial statement presentation. We believe that our audits, which included confirmation of securities at October 31, 2008 by correspondence with the custodian and brokers, provide a reasonable basis for our opinion. The financial highlights for each of the two years ended October 31, 2005 were audited by another independent registered public accounting firm, whose report dated Decembe r 22, 2005 was unqualified.
PricewaterhouseCoopers LLP
New York, New York
December 24, 2008
84
FIRST EAGLE FUNDS
Fund Expenses (Unaudited)
Example
As a shareholder of the First Eagle Funds, you may incur two types of costs: (1) transaction costs, including front-end and contingent deferred sales charges (loads), and (2) ongoing costs, including advisory fees; distribution (12b-1) and/or service fees; and other fund expenses. This Example is intended to help you understand your ongoing costs (in dollars) of investing in each of the First Eagle Funds and to compare these costs with the ongoing costs of investing in other mutual funds.
This Example is based on an investment of $1,000 invested on May 1, 2008 and held for the six months ended October 31, 2008.
Actual Expenses
The table below titled "Based on Actual Total Return" provides information about actual account values and actual expenses. You may use the information provided in this table, together with the amount you invested, to estimate the expenses that you paid over the period. To estimate the expenses you paid on your account, divide your ending account value by $1,000 (for example, an $8,600 ending account value divided by $1,000 = 8.6), then multiply the result by the number under the heading entitled "Expenses Paid During the Period".
Based on Actual Total Return (1)
| | | Actual Total
Return
Without
Sales Charges(2) | | Beginning
account
Value | | Ending
Account
Value | | Expenses
Paid
During the
Period(3) | |
| First Eagle Global Fund Class A | | | (24.29 | %) | | $ | 1,000.00 | | | $ | 757.10 | | | $ | 5.04 | | |
| First Eagle Global Fund Class I | | | (24.20 | %) | | | 1,000.00 | | | | 758.00 | | | | 3.93 | | |
| First Eagle Global Fund Class C | | | (24.58 | %) | | | 1,000.00 | | | | 754.20 | | | | 8.33 | | |
| First Eagle Overseas Fund Class A | | | (26.62 | %) | | | 1,000.00 | | | | 733.80 | | | | 5.01 | | |
| First Eagle Overseas Fund Class I | | | (26.54 | %) | | | 1,000.00 | | | | 734.60 | | | | 3.92 | | |
| First Eagle Overseas Fund Class C | | | (26.91 | %) | | | 1,000.00 | | | | 730.90 | | | | 8.31 | | |
| First Eagle U.S. Value Fund Class A | | | (20.65 | %) | | | 1,000.00 | | | | 793.50 | | | | 5.41 | | |
| First Eagle U.S. Value Fund Class I | | | (20.56 | %) | | | 1,000.00 | | | | 794.40 | | | | 4.28 | | |
| First Eagle U.S. Value Fund Class C | | | (20.92 | %) | | | 1,000.00 | | | | 790.80 | | | | 8.78 | | |
| First Eagle Gold Fund Class A | | | (38.20 | %) | | | 1,000.00 | | | | 618.00 | | | | 5.00 | | |
| First Eagle Gold Fund Class I | | | (38.08 | %) | | | 1,000.00 | | | | 619.20 | | | | 3.99 | | |
| First Eagle Gold Fund Class C | | | (38.42 | %) | | | 1,000.00 | | | | 615.80 | | | | 8.08 | | |
| First Eagle Fund of America Class A | | | (28.24 | %) | | | 1,000.00 | | | | 717.60 | | | | 6.04 | | |
| First Eagle Fund of America Class C | | | (28.51 | %) | | | 1,000.00 | | | | 714.90 | | | | 9.27 | | |
| First Eagle Fund of America Class Y | | | (28.22 | %) | | | 1,000.00 | | | | 717.80 | | | | 6.05 | | |
(1) For the six months ended October 31, 2008.
(2) Assumes reinvestment of all dividends and capital gain distributions, if any, at net asset value and does not reflect the deduction of the applicable sales charge, exchange fees or redemption fees. Had the effect of sales charges been reflected, expenses would have been higher and returns lower. Total return is not annualized, as it may not be representative of the total return for the year.
(3) Expenses are equal to the annualized expense ratio of 1.14%, 0.89%, 1.89%, 1.15%, 0.90%, 1.91%, 1.20%, 0.95%, 1.95%, 1.23%, 0.98%, 1.99%, 1.40%, 2.15% and 1.40% for the First Eagle Global Fund Class A, I and C; First Eagle Overseas Fund Class A, I and C; First Eagle U.S. Value Fund Class A, I and C; First Eagle Gold Fund Class A, I and C ; and First Eagle Fund of America Class A, C and Y, respectively, multiplied by the average account value over the period, multiplied by 184/366 (to reflect the one-half year period).
85
FIRST EAGLE FUNDS
Fund Expenses—(Continued) (Unaudited)
Hypothetical Example for Comparison Purposes
The table below titled "Based on Hypothetical Total Return" provides information about hypothetical account values and hypothetical expenses based on the actual expense ratios and an assumed rate of return of 5.00% per year before expenses, which is not the First Eagle Fund's actual return. The hypothetical account values and expenses may not be used to estimate the actual ending account balance or expenses you paid for the period. You may use the information provided in this table to compare the ongoing costs of investing in the First Eagle Funds and other funds. To do so, compare the 5.00% hypothetical example relating to the First Eagle Funds with the 5.00% hypothetical examples that appear in the shareholder reports of other funds.
This Example is based on an investment of $1,000 invested on May 1, 2008 and held for the six months ended October 31, 2008.
Please note that the expenses shown in the table below are meant to highlight your ongoing costs only and do not reflect any transactional costs, such as front-end or back-end sales charges (loads). Therefore, the table is useful in comparing ongoing costs only, and will not help you determine the relative total costs of owning different funds. In addition, if these transaction costs were included, your costs would have been higher.
Based on Hypothetical Total Return (1)
| | | Hypothetical
Annualized
Total
Return | | Beginning
Account
Value | | Ending
Account
Value | | Expenses
Paid
During the
Period(2) | |
| First Eagle Global Fund Class A | | | 5.00 | % | | $ | 1,000.00 | | | $ | 1,019.41 | | | $ | 5.79 | | |
| First Eagle Global Fund Class I | | | 5.00 | % | | | 1,000.00 | | | | 1,020.66 | | | | 4.52 | | |
| First Eagle Global Fund Class C | | | 5.00 | % | | | 1,000.00 | | | | 1,015.63 | | | | 9.58 | | |
| First Eagle Overseas Fund Class A | | | 5.00 | % | | | 1,000.00 | | | | 1,019.36 | | | | 5.84 | | |
| First Eagle Overseas Fund Class I | | | 5.00 | % | | | 1,000.00 | | | | 1,020.61 | | | | 4.57 | | |
| First Eagle Overseas Fund Class C | | | 5.00 | % | | | 1,000.00 | | | | 1,015.53 | | | | 9.68 | | |
| First Eagle U.S. Value Fund Class A | | | 5.00 | % | | | 1,000.00 | | | | 1,019.10 | | | | 6.09 | | |
| First Eagle U.S. Value Fund Class I | | | 5.00 | % | | | 1,000.00 | | | | 1,020.36 | | | | 4.82 | | |
| First Eagle U.S. Value Fund Class C | | | 5.00 | % | | | 1,000.00 | | | | 1,015.33 | | | | 9.88 | | |
| First Eagle Gold Fund Class A | | | 5.00 | % | | | 1,000.00 | | | | 1,018.95 | | | | 6.24 | | |
| First Eagle Gold Fund Class I | | | 5.00 | % | | | 1,000.00 | | | | 1,020.21 | | | | 4.98 | | |
| First Eagle Gold Fund Class C | | | 5.00 | % | | | 1,000.00 | | | | 1,015.13 | | | | 10.08 | | |
| First Eagle Fund of America Class A | | | 5.00 | % | | | 1,000.00 | | | | 1,018.10 | | | | 7.10 | | |
| First Eagle Fund of America Class C | | | 5.00 | % | | | 1,000.00 | | | | 1,014.33 | | | | 10.89 | | |
| First Eagle Fund of America Class Y | | | 5.00 | % | | | 1,000.00 | | | | 1,018.10 | | | | 7.10 | | |
(1) For the six months ended October 31, 2008.
(2) Expenses are equal to the annualized expense ratio of 1.14%, 0.89%, 1.89%, 1.15%, 0.90%, 1.91%, 1.20%, 0.95%, 1.95%, 1.23%, 0.98%, 1.99%, 1.40%, 2.15% and 1.40% for the First Eagle Global fund Class A, I and C; First Eagle Overseas Fund Class A, I and C; First Eagle U.S. Value Fund Class A, I and C; First Eagle Gold Fund Class A, I and C; and First Eagle Fund of America Class A, C and Y, respectively, multiplied by the average account value over the period, multiplied by 184/366 (to reflect the one-half year period).
86
FIRST EAGLE FUNDS
TAX INFORMATION
Fiscal Year Ended October 31, 2008
(Unaudited)
Each portfolio designates the following amounts (or the maximum amount allowable) distributed during the fiscal year ended October 31, 2008, if any, as capital gain dividends, dividends eligible for the corporate dividends received deduction and/or qualified dividend income:
| | | % of Qualifying | | % of Dividends
Eligible for the
Dividends Received | | Long-Term Capital Gains | |
| | | Dividend Income | | Deduction | | 15% | | 28% | |
| First Eagle Global Fund* | | | 51.34 | % | | | 20.00 | % | | $ | 1,898,692,462 | | | | — | | |
| First Eagle Overseas Fund* | | | 34.96 | % | | | 0.89 | % | | | 1,205,385,118 | | | $ | 1,079,172 | | |
| First Eagle U.S. Value | | | 31.49 | % | | | 31.49 | % | | | 21,573,216 | | | | — | | |
| First Eagle Gold Fund | | | 12.71 | % | | | 4.78 | % | | | 31,428,147 | | | | 7,821,031 | | |
| First Eagle Fund of America | | | 100.00 | % | | | 100.00 | % | | | 88,998,140 | | | | — | | |
* First Eagle Global Fund and First Eagle Overseas Fund paid foreign taxes of $32,726,272 and $21,298,888, respectively, and recognized foreign source income of $335,876,933 and $224,556,491, respectively. Pursuant to Section 853 of the Internal Revenue Code, each Fund designates such amounts as having been paid in connection with dividends distributed from investment taxable income during the fiscal year ended October 31, 2008.
87
FIRST EAGLE FUNDS
ADDITIONAL INFORMATION
(Unaudited)
MANAGEMENT OF THE TRUST
The business of the Trust is managed by its Board of Trustees, which elects officers responsible for the day to day operations of the Funds and for the execution of the policies formulated by the Board of Trustees.
Pertinent information regarding the members of the Board of Trustees and principal officers of the Trust is set forth below. Some of the Trustees and officers are employees of the Adviser and its affiliates. At least a majority of the Trust's Board of Trustees are not "interested persons" as that term is defined in the Investment Company Act.
INDEPENDENT TRUSTEES(1)
| Name, Age and Address | | Position(s)
Held with
the Trust | | Term of
Office(2)
and Length
of Time
Served | | Principal
Occupation(s)
During Past 5 Years | | Number of
Portfolios
in the Fund
Complex
Overseen by
Trustee | | Other
Directorships/
Trusteeships
Held by Trustee | |
Lisa Anderson
1345 Avenue of the Americas
New York, New York 10105
(born October 1950) | | Trustee | | December 2005 to present | | Provost, American University in Cairo; James T. Shotwell Professor of International Relations and Dean, School of International and Public Affairs, Columbia University | | | 6 | | | Chair, Social Science Research Council; Member, Carnegie Council on Ethics and International Affairs; Member Emerita, Human Rights Watch; Trustee, First Eagle Variable Funds (1 portfolio) | |
|
Candace K. Beinecke
One Battery Park Plaza
New York, New York 10004
(born December 1946) | | Trustee
(Chair) | | December 1999 to present(3) | | Chair, Hughes Hubbard & Reed LLP | | | 6 | | | Director, ALSTOM; Trustee, Vornado Realty Trust; Director, Rockefeller Financial Services, Inc.; Director, Rockefeller & Company, Inc.; Trustee, The Wallace Foundation; Director, Vice Chair and Member of the Executive Committee, Partnership for New York City; Board of Advisors, Yale Law School Center for the Study of Corporate Law; Trustee, First Eagle Variable Funds (Chair) (1 portfolio) | |
|
(1) Trustees who are not "interested persons" of the Trust as defined in the Investment Company Act.
(2) The term of office of each Independent Trustee expires on his/her 70th birthday.
(3) Ms. Beinecke also served as a trustee of a predecessor fund to First Eagle Fund of America since 1996.
88
| Name, Age and Address | | Position(s)
Held with
the Trust | | Term of
Office(1)
and Length
of Time
Served | | Principal
Occupation(s)
During Past 5 Years | | Number of
Portfolios
in the Fund
Complex
Overseen by
Trustee | | Other
Directorships/
Trusteeships
Held by Trustee | |
Jean D. Hamilton
1345 Avenue of the Americas
New York, New York 10105
(born January 1947) | | Trustee | | March 2003 to present | | Private Investor/ Independent Consultant/Member, Brock Capital Group LLC; prior to November 2002, Chief Executive Officer, Prudential Institutional; Executive Vice President, Prudential Financial, Inc. | | | 6 | | | Director, RenaissanceRe Holdings Ltd; Director, Four Nations; Trustee, First Eagle Variable Funds (1 portfolio) | |
|
James E. Jordan
1345 Avenue of the Americas
New York, New York 10105
(born April 1944) | | Trustee | | December 1999 to present | | Private Investor and Independent Consultant; prior to July 2005, Managing Director, Arnhold and S. Bleichroeder Advisers, LLC and Director, ASB Securities LLC and ASB Advisers UK, Limited; prior to July 2002, private investor and consultant to The Jordan Company (private investment banking firm) since June 1997 | | | 6 | | | Director, Leucadia National Corporation; Director, JZ Capital Partners, Plc. (Guernsey investment trust company); Dean's Advisory Council, Columbia University School of International and Public Affairs; Chairman's Council, Conservation International; Trustee, First Eagle Variable Funds (1 portfolio) | |
|
William M. Kelly
500 Fifth Avenue,
50th Floor
New York, New York 10110
(born February 1944) | | Trustee | | December 1999 to present(2) | | President, Lingold Associates | | | 6 | | | Treasurer and Trustee, Black Rock Forest Preservation and Consortium; Trustee, St. Anselm College; Trustee, First Eagle Variable Funds (1 portfolio) | |
|
(1) The term of office of each Independent Trustee expires on his/her 70th birthday.
(2) Mr. Kelly also served as a trustee of a predecessor fund to First Eagle Fund of America since 1998.
89
| Name, Age and Address | | Position(s)
Held with
the Trust | | Term of
Office(1)
and Length
of Time
Served | | Principal
Occupation(s)
During Past 5 Years | | Number of
Portfolios
in the Fund
Complex
Overseen by
Trustee | | Other
Directorships/
Trusteeships
Held by Trustee | |
Paul J. Lawler
One Michigan Avenue
East Battle Creek,
Michigan 49017
(born May 1948) | | Trustee | | March 2002 to present | | Vice President Investments and Chief Investment Officer, W.K. Kellogg Foundation | | | 6 | | | Finance and Investment Committee Member, Battle Creek Community Foundation; Custody Advisory Committee Member, The Bank of New York; Advisory Committee, Common Fund Capital; Advisory Committee, TA Realty Advisors; Trustee, First Eagle Variable Funds (1 portfolio) | |
|
(1) The term of office of each Independent Trustee expires on his/her 70th birthday.
90
INTERESTED TRUSTEES
| Name, Age and Address | | Position(s)
Held with
the Trust | | Term of
Office(1)
and Length
of Time
Served | | Principal
Occupation(s)
During Past 5 Years | | Number of
Portfolios
in the Fund
Complex
Overseen by
Trustee | | Other
Directorships/
Trusteeships
Held by Trustee | |
John P. Arnhold
1345 Avenue of the Americas
New York, New York 10105
(born December 1953) | | President and Trustee | | December 1999 to present | | Co-President, Co-CEO and Director, Arnhold and S. Bleichroeder Holdings, Inc.; Chairman, CEO and Director, Arnhold and S. Bleichroeder Advisers, LLC and ASB Securities LLC; prior to March 2005, President and Director, Natexis Bleichroeder, Inc. and Natexis Bleichroeder, UK | | | 6 | | | Director, Arnhold Ceramics; Director, The Arnhold Foundation; Director, The Mulago Foundation; Director, Hanseatic Asset Management LBG; Director, Quantum Endowment Fund; Director, Educational Broadcasting Corporation;Trustee, Trinity Episcopal Schools Corp.; Trustee, Vassar College; Trustee, Sports and Arts in Schools Foundation; Trustee, Jazz at Lincoln Center; President and Trustee, First Eagle Variable Funds (1 portfolio) | |
|
Jean-Marie Eveillard
1345 Avenue of the Americas
New York, New York 10105
(born January 1940) | | Portfolio Manager and Trustee | | June 2008 to present (with portfolio management tenure described in next column | | Portfolio Manager of First Eagle Global Fund, First Eagle Overseas Fund, First Eagle U.S. Value Fund, First Eagle Gold Fund, and First Eagle Variable Funds since March 2007 and prior to December 2004 (portfolio management responsibilities commenced 1979); Senior Advisor to Arnhold and S. Bleichroeder Advisers, LLC since January 2005 | | | 6 | | | Portfolio Manager and Trustee, First Eagle Variable Funds (1 portfolio) | |
|
(1) The term of office of each Interested Trustee is indefinite.
91
OFFICERS
| Name, Age and Address | | Position(s)
Held with
the Trust | | Term of Office
and Length of
Time Served(1) | | Principal Occupation(s)
During Past Five (5) Years | |
John P. Arnhold
1345 Avenue of the Americas
New York, New York 10105
(born December 1953) | | President and Trustee | | December
1999 to present | | See table on preceding page related to Interested Trustees | |
|
Robert Bruno
1345 Avenue of the Americas
New York, New York 10105
(born June 1964) | | Chief Operations Officer | | December
1999 to present | | Senior Vice President, Arnhold and S. Bleichroeder Advisers, LLC; President, ASB Securities LLC; Chief Operations Officer, First Eagle Variable Funds | |
|
Joseph T. Malone
1345 Avenue of the Americas
New York, New York 10105
(born September 1967) | | Chief Financial Officer | | September 2008 to present | | Senior Vice President, Arnhold and S. Bleichroeder Advisers, LLC; Chief Financial Officer, First Eagle Variable Funds; from September 2008; Chief Financial Officer and Treasurer, Aberdeen Funds from November 2007; Director, UBS Global Asset Management from October 2001; Global Fund Treasurer, UBS Global Asset Management from September 2006; Treasurer and Co-Head Mutual Fund Administration Group, UBS Global Asset Management from October 2001 | |
|
Mark D. Goldstein
1345 Avenue of the Americas
New York, New York 10105
(born October 1964) | | Chief Compliance Officer | | February 2005 to present | | General Counsel, Chief Compliance Officer and Senior Vice President, Arnhold and S. Bleichroeder Advisers, LLC; General Counsel and Secretary of Arnhold and S. Bleichroeder Holdings, Inc., and Chief Compliance Officer, First Eagle Variable Funds from February 2005; Chief Compliance Officer, Good Hope Advisers, LLC from January 2006; Senior Counsel and Chief Compliance Officer, MacKay Shields LLC from April 2004; Senior Associate General Counsel, UBS Financial Services, Inc. from May 1998 | |
|
Suzan J. Afifi
1345 Avenue of the Americas
New York, New York 10105
(born October 1952) | | Vice President and Secretary | | December
1999 to present | | Senior Vice President, Arnhold and S. Bleichroeder Advisers, LLC; Vice President, ASB Securities LLC; Vice President and Secretary, First Eagle Variable Funds | |
|
Philip Santopadre
1345 Avenue of the Americas
New York, New York 10105
(born August 1977) | | Treasurer | | September
2005 to present | | Vice President, Arnhold and S. Bleichroeder Advisers, LLC; Treasurer, First Eagle Variable Funds | |
|
Michael Luzzatto
1345 Avenue of the Americas
New York, New York 10105
(born April 1977) | | Vice President | | December
2004 to present | | Senior Vice President, Arnhold and S. Bleichroeder Advisers, LLC; Vice President, ASB Securities LLC; Assistant Vice President, First Eagle Variable Funds | |
|
Winnie Chin
1345 Avenue of the Americas
New York, New York 10105
(born July 1974) | | Assistant Treasurer | | March 2001 to present | | Vice President, Arnhold and S. Bleichroeder Advisers, LLC; Assistant Treasurer, First Eagle Variable Funds | |
|
(1) The term of office of each officer is indefinite. Length of time served represents time served as an officer of the Trust (or its predecessor entities), although various positions may have been held during the period.
92
This report is printed on recycled paper which is 30%
post-industrial recycled fiber and manufactured using biogas energy.


First Eagle Funds
1345 Avenue of the Americas
New York, NY 10105
www.firsteaglefunds.com
Trustees
Lisa Anderson
John P. Arnhold
Candace K. Beinecke (Chair)
Jean-Marie Eveillard
Jean D. Hamilton
James E. Jordan
William M. Kelly
Paul J. Lawler
Officers
John P. Arnhold
President
Robert Bruno
Chief Operations Officer
Joseph T. Malone
Chief Financial Officer
Mark D. Goldstein
Chief Compliance Officer
Suzan J. Afifi
Vice President & Secretary
Philip Santopadre
Treasurer
Michael Luzzatto
Vice President
Winnie Chin
Assistant Treasurer
Investment Adviser
Arnhold and S. Bleichroeder
Advisers, LLC
1345 Avenue of the Americas
New York, NY 10105
Legal Counsel
Shearman & Sterling LLP
599 Lexington Avenue
New York, NY 10022
Custodian
State Street Bank and Trust Company
801 Pennsylvania
Kansas City, MO 64105
Shareholder Servicing Agent
DST Systems, Inc.
330 West 9th Street
Kansas City, MO 64105
(800) 334-2143
Underwriter
First Eagle Funds Distributors,
a division of ASB Securities LLC
1345 Avenue of the Americas
New York, NY 10105
Independent Registered
Public Accounting Firm
PricewaterhouseCoopers LLP
300 Madison Avenue
New York, NY 10017
This report is not authorized for distribution to prospective investors unless preceded or accompanied by a currently effective prospectus of First Eagle Funds.

Item 2. Code of Ethics.
The Registrant has adopted a code of ethics that applies to its principal executive officer and principal financial officer. Copies of the code of ethics may be requested free of charge by calling 1-800-334-2143 (toll free).
Item 3. Audit Committee Financial Expert.
The Board of Trustees of the registrant has designated Paul J. Lawler and William M. Kelly as Audit Committee Financial Experts. Mr. Lawler and Mr. Kelly are both considered by the Board to be independent trustees.
Item 4. Principal Accountant Fees and Services
(a) Audit Fees:
For the fiscal years ended October 31, 2008 and October 31, 2007, the aggregate PricewaterhouseCoopers LLP (PwC) audit fees for professional services rendered to the registrant were approximately $363,177 and $302,381, respectively. Fees included in the audit fees category are those associated with the annual audits of financial statements and services that are normally provided in connection with statutory and regulatory filings.
(b) Audit-Related Fees:
For the fiscal years ended October 31, 2008 and October 31, 2007, the aggregate PwC fees for assurance and related services rendered to the registrant were approximately $16,800 and $16,600, respectively.
(c) Tax Fees:
In each of the fiscal years ended October 31, 2008 and October 31, 2007, the aggregate tax fees billed by PwC for professional services rendered to the registrant were approximately $168,478 and $183,690, respectively.
Fees included in the tax fees category comprise all services performed by professional staff in the independent accountant’s tax division except those services related to the audits. This category comprises fees for tax compliance and preparation of tax returns.
(d) All Other Fees:
In each of the fiscal years ended October 31, 2008 and October 31, 2007, there were no fees billed by PwC for products and services, other than 4(a)-(c) above, rendered to the registrant.
(e) (1) The registrant’s audit committee has adopted a policy whereby audit and non-audit services performed by the registrant’s principal accountant for the registrant, its investment adviser, and any entity controlling, controlled by, or under common control with the investment adviser that provides ongoing services to the registrant require pre-approval by the committee or a designated member thereof. If such a service is required between regularly scheduled audit committee meetings, pre-approval may be authorized by one audit committee member with ratification at the next scheduled audit committee meeting. Waiver of pre-approval for audit and non-audit services requiring fees of a de minimis amount is not permitted.
(2) No services included in (b) – (d) above were approved pursuant to paragraph (c)(7)(i)(C) of Rule 2-01 of Regulation S-X.
(f) According to PwC, for the fiscal year ended October 31, 2008, the percentage of hours spent on the audit of the registrant’s financial statements for the most recent fiscal year that were attributable to work performed by persons who are not full-time, permanent employees of PwC was 0%.
(g) Other than as described above, the aggregate fees billed for the most recent fiscal year and the preceding fiscal year by the registrant’s principal accountant for non-audit services rendered to the registrant, its investment adviser, and any entity controlling, controlled by, or under common control with the investment adviser that provides ongoing services to the registrant was $0 in 2008 and 2007.
(h) Not applicable.
Item 5. Audit Committee of Listed Registrants
Not applicable at this time.
Item 6. Schedule of Investments
Please see schedule of investments contained in the Report to Stockholders included under Item 1 of this Form N-CSR.
Item 7. Disclosure of Proxy Voting Policies and Procedures for Closed-End Management Investment Companies.
Not applicable at this time.
Item 8. Portfolio Managers of Closed-End Investment companies.
Not applicable at this time.
Item 9. Purchases of Equity Securities by Closed-End Management Investment Company and Affiliated Purchasers.
Not applicable at this time.
Item 10. Submission of Matters to a Vote of Security Holders.
No material change to report at this time.
Item 11. Controls and Procedures.
(a) In the opinion of the principal executive officer and principal financial officer, based on their evaluation, the registrant’s disclosure controls and procedures are adequately designed and are operating effectively to ensure (i) that material information relating to the registrant, including its consolidated subsidiaries, is made known to them by others within those entities, particularly during the period in which this report is being prepared; and (ii) that information required to be disclosed by the registrant on Form N-CSR is recorded, processed, summarized and reported within the time periods specified in the Securities and Exchange Commission’s rules and forms.
(b) There were no changes in the registrant’s internal control over financial reporting that occurred during the registrant’s most recent fiscal half-year (the registrant’s second fiscal half-year in the case of an annual report) that have materially affected or are reasonably likely to materially affect, the registrant’s internal control over financial reporting.
Item 12. Exhibits.
(a)(1) Code of ethics required to be disclosed under Item 2 of Form N-CSR.
(a)(2) Certifications pursuant to Rule 30a-2(a) under the Investment Company Act of 1940 (17 CFR 270.30a-2(a)): Attached hereto.
(a)(3) Not applicable.
(b) Certification pursuant to Rule 30a-2(b) under the Investment Company Act of 1940 (17 CFR 270.30a-2(b)): Attached hereto.
SIGNATURES
Pursuant to the requirements of the Securities Exchange Act of 1934 and the Investment Company Act of 1940, the registrant has duly caused this report to be signed on its behalf by the undersigned, thereunto duly authorized.
(Registrant) | First Eagle Funds |
| |
| |
By (Signature and Title)* | /s/ John P. Arnhold |
| John P. Arnhold, President |
Date: January 8, 2009
Pursuant to the requirements of the Securities Exchange Act of 1934 and the Investment Company Act of 1940, this report has been signed below by the following persons on behalf of the registrant and in the capacities and on the dates indicated.
By (Signature and Title)* | /s/ John P. Arnhold |
| John P. Arnhold, Principal Executive Officer |
Date: January 8, 2009
By (Signature and Title)* | /s/ Joseph T. Malone |
| Joseph T. Malone, Principal Financial Officer |
Date: January 8, 2009
* Print the name and title of each signing officer under his or her signature.