UNITED STATES
SECURITIES AND EXCHANGE COMMISSION
Washington, D.C. 20549
FORM N-CSR
CERTIFIED SHAREHOLDER REPORT OF REGISTERED
MANAGEMENT INVESTMENT COMPANIES
Investment Company Act file number | 811-7762 |
|
First Eagle Funds |
(Exact name of registrant as specified in charter) |
|
1345 Avenue of the Americas
New York, NY | | 10105-4300 |
(Address of principal executive offices) | | (Zip code) |
|
Robert Bruno
First Eagle Funds
1345 Avenue of the Americas
New York, NY 10105-4300 |
(Name and address of agent for service) |
|
Registrant’s telephone number, including area code: | 1-212-632-2700 | |
|
Date of fiscal year end: | October 31 | |
|
Date of reporting period: | October 31, 2009 | |
| | | | | | | | |
Form N-CSR is to be used by management investment companies to file reports with the Commission not later than 10 days after the transmission to stockholders of any report that is required to be transmitted to stockholders under Rule 30e-1 under the Investment Company Act of 1940 (17 CFR 270.30e-1). The Commission may use the information provided on Form N-CSR in its regulatory, disclosure review, inspection, and policymaking roles.
A registrant is required to disclose the information specified by Form N-CSR, and the Commission will make this information public. A registrant is not required to respond to the collection of information contained in Form N-CSR unless the Form displays a currently valid Office of Management and Budget (“OMB”) control number. Please direct comments concerning the accuracy of the information collection burden estimate and any suggestions for reducing the burden to Secretary, Securities and Exchange Commission, 450 Fifth Street, NW, Washington, DC 20549-0609. The OMB has reviewed this collection of information under the clearance requirements of 44 U.S.C. § 3507.
Item 1. Reports to Stockholders.

Annual Report
OCTOBER 31, 2009
Global Fund
Overseas Fund
U.S. Value Fund
Gold Fund
Fund of America
ADVISED BY FIRST EAGLE INVESTMENT MANAGEMENT, LLC
Forward-Looking Statement Disclosure
One of our most important responsibilities as mutual fund managers is to communicate with shareholders in an open and direct manner. Some of our comments in our letters to shareholders are based on current management expectations and are considered "forward-looking statements". Actual future results, however, may prove to be different from our expectations. You can identify forward-looking statements by words such as "may", "will", "believe", "attempt", "seem", "think", "ought", "try" and other similar terms. We cannot promise future returns. Our opinions are a reflection of our best judgment at the time this report is compiled, and we disclaim any obligation to update or alter forward-looking statements as a result of new information, future events, or otherwise.
Table of Contents
| Letter from the President | | | 4 | | |
|
| Letter from the Global Value Team Portfolio Managers | | | 6 | | |
|
Management's Discussion of Fund Performance: First Eagle Global,
Overseas, U.S. Value and Gold Funds | | | 9 | | |
|
| Performance Chart | | | 13 | | |
|
| First Eagle Global Fund: | |
|
| Fund Overview | | | 16 | | |
|
| Schedule of Investments | | | 18 | | |
|
| First Eagle Overseas Fund: | |
|
| Fund Overview | | | 36 | | |
|
| Schedule of Investments | | | 38 | | |
|
| First Eagle U.S. Value Fund: | |
|
| Fund Overview | | | 52 | | |
|
| Schedule of Investments | | | 54 | | |
|
| First Eagle Gold Fund: | |
|
| Fund Overview | | | 62 | | |
|
| Schedule of Investments | | | 64 | | |
|
| First Eagle Fund of America: | |
|
| Management's Discussion of Fund Performance | | | 68 | | |
|
| Fund Overview | | | 70 | | |
|
| Schedule of Investments | | | 72 | | |
|
| Statements of Assets and Liabilities | | | 78 | | |
|
| Statements of Operations | | | 82 | | |
|
| Statements of Changes in Net Assets | | | 84 | | |
|
| Financial Highlights | | | 88 | | |
|
| Notes to Financial Statements | | | 98 | | |
|
| Report of Independent Registered Public Accounting Firm | | | 127 | | |
|
| Fund Expenses | | | 128 | | |
|
| Tax Information | | | 131 | | |
|
| General Information | | | 132 | | |
|
| Privacy Notice | | | 133 | | |
|
| Additional Information | | | 135 | | |
|
Letter from the President
Dear Fellow Shareholders,
Since my last letter in May, financial markets around the world have experienced a strong rally from their depths in March. With a backdrop of gloomy economic data, rising unemployment and weakness in the U.S. dollar, the S&P 500 Index is up over 17% and the MSCI World Index is up over 22% for the year to date. Whether this rally is sustainable remains to be seen. We do not speculate on future market movements or on potential economic developments, but we do continue to approach every investment decision with the first question of, "What can go wrong?"
As I stated in my last letter, we believed that a significant portion of our 2008 losses might be temporary in nature as opposed to permanent impairments of capital. And we have, over this past year, made a steady recovery. We have navigated our way through the crisis, not by trying to anticipate market movements, but by continuing to practice prudence and patience, as is our custom. The market's volatility enabled our portfolio management teams to deploy capital and to select what we believed to be under-priced securities; essentially sowing the seeds that we hope will provide value for our shareholders in the years to come. In fact, many of those securities which impacted the performance of the Funds negatively in 2008 have been our top performing companies in 2009.
Whether it is a market bubble, the recent crisis or an event that has yet to arise, we have and will continue to invest with an eye on achieving our primary goal of preserving capital over time for our shareholders. We attain this by managing your assets in adherence to the value investing principles that were founded by Benjamin Graham so many years ago.
Our global search for high-quality businesses whose securities trade at a substantial discount to our estimates of intrinsic value is ongoing. To execute this continuous exploration, we have built a Global Value Team comprised of not only outstanding talent, but one that manifests the temperament required to be successful value investors. The analyst team is currently 11 strong, with the recent additions of Giorgio Caputo and Manish Gupta. The team is led by

John P. Arnhold
FIRST EAGLE FUNDS | ANNUAL REPORT | OCTOBER 31, 2009
4
Portfolio Manager Matt McLennan alongside Portfolio Managers Abhay Deshpande, Rachel Benepe and Director of Research Bruce Greenwald. Jean-Marie Eveillard continues in his role as Senior Adviser and Trustee of the First Eagle Funds and was recently nominated by Morningstar for the title of Foreign Manager of the Decade. We are honored that he continues to play an active and important role in our investment team and the First Eagle family as a whole.
Harold Levy and David Cohen of Iridian Asset Management, continue to produce solid returns for the First Eagle Fund of America. The First Eagle Fund of America is one of the few funds in the industry with an admirable long-term record, historical low volatility and the same management team since inception.
Please be assured that your investments in our funds will continue to be managed in the same diligent manner as they have been for over 30 years. Many of our portfolio managers and other senior executives have substantial investments alongside of yours and we are grateful for the confidence that you continue to place in our firm.
Sincerely,

John P. Arnhold
President
November 2009
Past performance is no guarantee of future results. The portfolio is actively managed. The portfolio and opinions expressed herein are subject to change. Current and future portfolio holdings are subject to risk.
FIRST EAGLE FUNDS | ANNUAL REPORT | OCTOBER 31, 2009
5
Letter from the Global Value Team Portfolio Managers
Benjamin Graham wrote of the parable of Mr. Market in his investment classic The Intelligent Investor. The lesson he delivered was that owning stocks is akin to being in business with a partner called Mr. Market who is sometimes wildly optimistic about the future and at other times wildly pessimistic and willing to trade with you on the basis of that emotion. What a huge advantage and ultimately wealth creation opportunity one has if one is able to keep one's equanimity with such a volatile partner. Benjamin Graham further highlighted that no one forces an unlevered investor to recognize a price loss and no one prevents an investor with deferred purchasing power from taking advantage of lower prices. It is the role of the investor to analytically assess if there has been permanent or temporary impairment of capital rather than emotionally responding to price trends. The past year has been one of market extremes with no shortage of matching extreme prognostications from market "experts". Would it have paid to listen to the experts? If so, which experts? Or would it have been better and simpler to buy more when prices appeared low and be a little reserved when prices appeared high?
Rather than betting on market direction, it is more prudent to accept that the future is uncertain in its specifics and to focus on things that can be deduced. What we can say is that price matters—if you buy investments cheaply enough you don't have to be right about the future especially if you've avoided undue balance sheet risk and aggressive management behavior. What we can also say is that the scope for productive increases around the world has arguably never been better with more rapid diffusion of technology than ever before and a growing acceptance of markets and property rights (despite marked imperfections of the last year). So we believe there should be a long term positive drift to the ownership of enterprise bought at a discount. However, it is also likely that along the way there will be policy errors and periods of punctured equilibrium where confidence cycles produce material market volatility around that t rend. Looking at this holistically means that instead of trying to precisely time market movements, one should be willing to try to take advantage of them after the fact, one should keep an eye on the biggest macro imbalances that could cause permanent impairment of capital and one should keep an eye on the micro security by security bargains that exist for the enquiring investor. If one avoids the biggest pockets of market vulnerability, if one locates cheap securities one at a time and if one calibrates the overall investment level in enterprise to the
FIRST EAGLE FUNDS | ANNUAL REPORT | OCTOBER 31, 2009
6

Pictured: (from left to right) Abhay Deshpande, Matthew McLennan and Jean-Marie Eveillard
valuation backdrop, one should tend to muddle through market surprises surprisingly well. Winning by not losing—this in a nutshell is what we attempt to do.
Over the past twelve-months the portfolio has evolved as we have deployed some of our deferred purchasing power and we have recycled capital from ideas that were approaching our estimate of intrinsic value to those appearing to offer greater value. We like what we own today—what we believe to be some good businesses at good prices, some mundane businesses at compelling prices, some gold as insurance and a little cash in reserve for a rainy day. On the business front, many of the companies we own have no debt at all, support worldwide leadership positions in their markets, are run by prudent entrepreneurs and most importantly trade at single digit multiples of their pre-tax operating profit potential. We believe that these investments offer potential cash yields well in excess of bonds and scope for long term participation in a growing pool of nominal world wealth. The gold insurance is not as cheap as it was, but with the e picenter of world monetary creation moving from the Western advanced economies to the Asian emerging economies, there are new buyers competing for this scarce monetary insurance and reluctant sellers given the architectural challenges recently experienced in the advanced world financial system. Our cash level has varied being drawn down at the depths of the crisis as our allocation to equities went up and subsequently drifting up a bit as some ideas approached intrinsic value but the cash level is still well below historical peak levels where value appeared harder to come by.
Our team has also evolved over the past year. Never before have we fielded so experienced a team and most importantly never has the temperament of the team been more aligned with our core investment values of avoiding hubris, making sure we are open-minded and having patience that endures well beyond that of the typical investor. Our analysts have worked very hard through the past year to surface new ideas, to challenge existing thinking and to share insights in a collaborative manner. Our seasoned traders have thoughtfully implemented
FIRST EAGLE FUNDS | ANNUAL REPORT | OCTOBER 31, 2009
7
Letter from the Global Value Team Portfolio Managers (continued)
our ideas. If you don't have a crystal ball, you had better make sure you've got balanced temperament. Benjamin Graham's parable of Mr. Market resonates as deeply today as ever before. As a team, we feel a duty to carry forward this sound, time tested approach to capital allocation.
| Matthew McLennan | |
|
Head of the Global Value Team
Portfolio Manager | |
|

| Abhay Deshpande | |
|
| Portfolio Manager | |
|
November 2009
Past performance is no guarantee of future results. The portfolio is actively managed. The portfolio and opinions expressed herein are subject to change. Current and future portfolio holdings are subject to risk.
FIRST EAGLE FUNDS | ANNUAL REPORT | OCTOBER 31, 2009
8
Management's Discussion of Fund Performance
A global market recovery seemed to be in full swing by late 2009 as markets around the world showed enough strength to overcome weakness in the early part of the year. In Japan, the Nikkei 225 Index rose 17% for the year ended October 31, 2009. In Europe, the German DAX Index rose 8.6% and the French CAC 40 Index rose 3.5% during the twelve-month period. In the U.S., the S&P 500 Index increased 9.8%. The U.S. dollar fell 8.5% against the Japanese yen and 13.5% against the euro. Crude oil rose 13.6% during the twelve-month period to $77. Gold surged 44% to a twelve-month high of $1,046 an ounce as demand from investors looking for alternatives to financial assets.
First Eagle Global Fund
The net asset value ("NAV") of the Fund's Class 'A' Shares rose 20.81% for the year ended October 31, 2009, while the MSCI World Index increased 18.42%. The Fund's cash position was 8.78% as of October 31, 2009.
The five largest contributors to the performance of the First Eagle Global Fund over the period were Gold bullion (gold, U.S.), Gold Fields Limited, ADR (gold mining, South Africa), Fresnillo PLC (gold & silver mining, Mexico), Wharf Holdings Limited (real estate investment company, Hong Kong) and Newmont Mining Corporation (gold mining, U.S.) collectively accounting for 7.77% of the year's performance.
The five largest detractors were San Juan Basin Royalty Trust (energy trust, U.S.), Berkshire Hathaway, Inc., Class 'A' (holding company, U.S.), Toho Company Limited (motion picture distributor, Japan), Astellas Pharma, Inc. (pharmaceuticals, Japan) and Legg Mason, Inc. (investment management, U.S.). Their combined negative performance over the twelve-month period subtracted 1.85% from the Fund's performance.
As of October 31, 2009, the Fund was approximately 30% hedged versus the Japanese yen and approximately 60% hedged versus the euro. We also initiated a 100% hedge on the Mexican peso on our non-mining holdings.
First Eagle Overseas Fund
The NAV of the Fund's Class 'A' Shares rose 24.95% for the fiscal year ended October 31, 2009, while the MSCI EAFE Index increased 27.71% over the same period. The Fund's cash position was 9.58% on October 31, 2009.
FIRST EAGLE FUNDS | ANNUAL REPORT | OCTOBER 31, 2009
9
Management's Discussion of Fund Performance (continued)
The five largest contributors to the performance of the First Eagle Overseas Fund over the period were Gold bullion (gold, U.S.), Gold Fields Limited, ADR (gold mining, South Africa), Shimano, Inc. (bicycle parts, Japan), Wharf Holdings Limited (real estate investment company, Hong Kong) and Petroleo Brasileiro SA, ADR (energy, Brazil) collectively accounting for 8.48% of the year's performance.
The five largest detractors were Toho Company Limited (motion picture distributor, Japan), Deceuninck NV (building products, Belgium), KT&G Corporation (tobacco, South Korea), Sompo Japan Insurance, Inc. (insurance, Japan) and Meitec Corporation (engineering outsourcing, Japan). Their combined negative performance over the twelve-month period subtracted 0.85% from the Fund's performance.
As of October 31, 2009, the Fund was approximately 30% hedged versus the Japanese yen and approximately 60% hedged versus the euro. We also initiated a 100% hedge on the Mexican peso on our non-mining holdings.
First Eagle U.S. Value Fund
The NAV of the First Eagle U.S. Value Fund's Class 'A' shares increased 14.52% for the year ended October 31, 2009, while the S&P 500 Index rose 9.80%. The Fund's cash position was 19.41% on October 31, 2009.
The five largest contributors to the performance of the First Eagle U.S. Value Fund over the period were Gold bullion (gold), Newmont Mining Corporation (gold mining), Cintas Corporation (uniform supplier), American Express Company (credit cards) and Helmerich & Payne, Inc. (oil drilling) collectively accounting for 6.03% of the year's performance.
The five largest detractors were San Juan Basin Royalty Trust (energy trust), Berkshire Hathaway, Inc., Class 'A' (holding company), Blount International, Inc. (industrial manufacturer), International Speedway Corporation, Class 'A' (racetracks) and Mercury General Corporation (property & casualty insurance). Their combined negative performance over the twelve-month period subtracted 2.64% from the Fund's performance.
FIRST EAGLE FUNDS | ANNUAL REPORT | OCTOBER 31, 2009
10
First Eagle Global, Overseas, U.S. Value and Gold Funds
First Eagle Gold Fund
The NAV of the First Eagle Gold Fund's Class 'A' Shares rose 78.93% for the year ended October 31, 2009, while the FTSE Gold Mines Index increased 92.08%. The Fund's cash position was 5.61% on October 31, 2009.
The five largest contributors to the performance of the First Eagle Gold Fund over the period were Gold bullion (U.S.), IAMGOLD Corporation (Canada), Randgold Resources Limited, ADR (Africa), Gold Fields Limited, ADR (South Africa) and Kinross Gold Corporation (Canada) collectively accounting for 39.74% of the year's performance.
The five largest detractors to the fund were NovaGold Resources (Canada), Gammon Gold (Canada), Anglo American PLC (U.K.), Etruscan Resources, Inc. (Canada) and Eldorado Gold Corporation (Canada). Their combined negative performance over the twelve-month period subtracted 1.30% from the Fund's performance.
We look at gold as insurance against "extreme outcomes," which might include such things as inflation, deflation or outright currency debasement. While we may view any of these outcomes as low probability, we believe gold acts as effective insurance to at least partially protect against the potential negative consequences these developments could have on a portfolio.
FIRST EAGLE FUNDS | ANNUAL REPORT | OCTOBER 31, 2009
11
Management's Discussion of Fund Performance (continued)
As always, we appreciate your confidence and thank you for your support.

Matthew McLennan
Head of the Global Value Team
Portfolio Manager
Global, Overseas
and U.S. Value Funds
 | |  | |
|
| Abhay Deshpande | | Rachel Benepe | |
|
| Portfolio Manager | | Portfolio Manager | |
|
Global, Overseas,
U.S. Value and Gold Funds | | Gold Fund | |
|
November 2009
Past performance is no guarantee of future results. The portfolio is actively managed. The portfolio and opinions expressed herein are subject to change. Current and future portfolio holdings are subject to risk.
FIRST EAGLE FUNDS | ANNUAL REPORT | OCTOBER 31, 2009
12
Performance Chart1
| | | ONE-YEAR | | THREE-YEARS | | FIVE-YEARS | | TEN-YEARS | | SINCE
INCEPTION | | INCEPTION
DATE | |
| First Eagle Global Fund | |
| Class A (SGENX) | |
| without sales charge | | | 20.81 | % | | | 2.21 | % | | | 8.78 | % | | | 12.46 | % | | | 14.40 | % | | 01/01/792 | |
| with sales charge | | | 14.77 | | | | 0.47 | | | | 7.67 | | | | 12.03 | | | | 14.26 | | | 01/01/792 | |
| Class C (FESGX) | | | 18.93 | | | | 1.44 | | | | 7.96 | | | | — | | | | 11.69 | | | 06/05/00 | |
| Class I (SGIIX) | | | 21.13 | | | | 2.47 | | | | 9.05 | | | | 12.72 | | | | 12.04 | | | 07/31/98 | |
| MSCI World Index3 | | | 18.42 | | | | -6.06 | | | | 2.64 | | | | 0.23 | | | | 9.59 | | | 01/01/79 | |
| First Eagle Overseas Fund | |
| Class A (SGOVX) | |
| without sales charge | | | 24.95 | % | | | 2.00 | % | | | 9.46 | % | | | 12.75 | % | | | 12.36 | % | | 08/31/93 | |
| with sales charge | | | 18.70 | | | | 0.27 | | | | 8.35 | | | | 12.32 | | | | 12.09 | | | 08/31/93 | |
| Class C (FESOX) | | | 22.96 | | | | 1.22 | | | | 8.64 | | | | — | | | | 11.95 | | | 06/05/00 | |
| Class I (SGOIX) | | | 25.26 | | | | 2.26 | | | | 9.74 | | | | 12.99 | | | | 12.94 | | | 07/31/98 | |
| MSCI EAFE Index4 | | | 27.71 | | | | -5.22 | | | | 5.10 | | | | 2.05 | | | | 4.73 | | | 08/31/93 | |
| First Eagle U.S. Value Fund | |
| Class A (FEVAX) | |
| without sales charge | | | 14.52 | % | | | 0.47 | % | | | 4.82 | % | | | — | | | | 8.51 | % | | 09/04/01 | |
| with sales charge | | | 8.80 | | | | -1.23 | | | | 3.75 | | | | — | | | | 7.83 | | | 09/04/01 | |
| Class C (FEVCX) | | | 12.63 | | | | -0.29 | | | | 4.05 | | | | — | | | | 7.70 | | | 09/04/01 | |
| Class I (FEVIX) | | | 14.78 | | | | 0.72 | | | | 5.09 | | | | — | | | | 8.77 | | | 09/04/01 | |
Standard & Poor's
500 Index5 | | | 9.80 | | | | -7.02 | | | | 0.33 | | | | — | | | | 0.82 | | | 09/04/01 | |
| First Eagle Gold Fund | |
| Class A (SGGDX) | |
| without sales charge | | | 78.93 | % | | | 12.89 | % | | | 15.54 | % | | | 19.86 | % | | | 9.95 | % | | 08/31/93 | |
| with sales charge | | | 69.99 | | | | 10.97 | | | | 14.36 | | | | 19.40 | | | | 9.69 | | | 08/31/93 | |
| Class C (FEGOX) | | | 76.62 | | | | 12.06 | | | | 14.68 | | | | — | | | | 16.92 | | | 05/15/03 | |
| Class I (FEGIX) | | | 79.27 | | | | 13.18 | | | | 15.83 | | | | — | | | | 18.08 | | | 05/15/03 | |
| FTSE Gold Mines Index6 | | | 92.08 | | | | 7.12 | | | | 10.04 | | | | 11.32 | | | | 2.63 | | | 08/31/93 | |
| MSCI World Index3 | | | 18.42 | | | | -6.06 | | | | 2.64 | | | | 0.23 | | | | 5.50 | | | 08/31/93 | |
Please see the following pages for important notes to this table.
FIRST EAGLE FUNDS | ANNUAL REPORT | OCTOBER 31, 2009
13
Average Annual Returns as of October 31, 2009 (unaudited)
| | | ONE-YEAR | | THREE-YEARS | | FIVE-YEARS | | TEN-YEARS | | SINCE
INCEPTION | | INCEPTION
DATE | |
| First Eagle Fund of America | |
| Class A (FEFAX) | |
| without sales charge | | | 9.13 | % | | | -2.14 | % | | | 3.62 | % | | | 5.48 | % | | | 5.79 | % | | 11/20/98 | |
| with sales charge | | | 3.67 | | | | -3.80 | | | | 2.57 | | | | 4.94 | | | | 5.29 | | | 11/20/98 | |
| Class C (FEAMX) | | | 7.34 | | | | -2.88 | | | | 2.86 | | | | 4.79 | | | | 5.19 | | | 03/02/98 | |
| Class Y (FEAFX)7 | | | 9.14 | | | | -2.16 | | | | 3.62 | | | | 5.57 | | | | 11.28 | | | 04/10/87 | |
Standard & Poor's
500 Index5 | | | 9.80 | | | | -7.02 | | | | 0.33 | | | | -0.95 | | | | 8.23 | | | 04/10/87 | |
1The performance data quoted herein represents past performance and does not guarantee future results. Market volatility can dramatically impact the Funds' short term performance. Current performance may be lower or higher than figures shown. The investment return and principal value will fluctuate so that an investor's shares, when redeemed, may be worth more or less than their original cost. Past performance data through the most recent month end is available at www.firsteaglefunds.com or by calling (800) 334-2143. The average annual returns shown on the prior page are historical and reflect changes in share price, reinvested dividends and are net of expenses. The average annual returns for Class A Shares "with sales charge" of First Eagle Global Fund, First Eagle Overseas Fund and First Eagle Gold Fund give effect to the deduction of the maximum sales charge of 3.75% for periods prior to March 1, 2000 and of 5.00% the reafter. The average annual returns for Class A Shares "with sales charge" of First Eagle U.S. Value Fund and First Eagle Fund of America give effect to the deduction of the maximum sales charge of 5.00%.
The average annual returns for Class C Shares reflect the CDSC (Contingent Deferred Sales Charge) of 1.00% which pertains to the first year or less of investment only.
Class I Shares of First Eagle Global Fund, First Eagle Overseas Fund, First Eagle U.S. Value Fund, and First Eagle Gold Fund require $1mm minimum investment and are offered without a sales charge.
Class Y Shares of First Eagle Fund of America are offered without a sales charge.
2Commencement of management by Jean-Marie Eveillard. Mr. Eveillard transitioned to senior adviser on March 26, 2009, a position he also held from January 2005 to March 2007, and continues to be a member of First Eagle Fund's Board of Trustees and a Senior Vice President of First Eagle Investment Management, LLC. The Fund commenced operation April 28, 1970.
3The MSCI World Index is a widely followed, unmanaged group of stocks from 23 international markets and is not available for purchase. The index provides total returns in U.S. dollars with net dividends reinvested.
4The MSCI EAFE Index is a total return index, reported in U.S. dollars, based on share prices and reinvested net dividends of approximately 1,100 companies from 21 countries and is not available for purchase.
Please see the following page for important notes to this table.
FIRST EAGLE FUNDS | ANNUAL REPORT | OCTOBER 31, 2009
14
Performance Chart (continued) (unaudited)
5The Standard & Poor's 500 Index is a widely recognized unmanaged index including a representative sample of 500 leading companies in leading sectors of the U.S. economy and is not available for purchase. Although the Standard & Poor's 500 Index focuses on the large-cap segment of the market, with approximately 75% coverage of U.S. equities, it is also considered a proxy for the total market.
6The FTSE Gold Mines Index is an unmanaged index composed of approximately 19 mining companies and is only available without dividends reinvested and is not available for purchase.
7As of September 1, 2005 First Eagle Fund of America Class Y is closed to new accounts.
Expense Ratios As Stated In The Most Recent Prospectus
Total Annual Gross Operating Expense Ratios
| | | CLASS A | | CLASS C | | CLASS I | | CLASS Y | |
| First Eagle Global Fund | | | 1.14 | % | | | 1.89 | % | | | 0.89 | % | | | — | | |
| First Eagle Overseas Fund | | | 1.15 | | | | 1.90 | | | | 0.90 | | | | — | | |
| First Eagle U.S. Value Fund | | | 1.21 | | | | 1.96 | | | | 0.96 | | | | — | | |
| First Eagle Gold Fund | | | 1.21 | | | | 1.96 | | | | 0.96 | | | | — | | |
| First Eagle Fund of America | | | 1.42 | | | | 2.17 | | | | — | | | | 1.42 | % | |
These expense ratios are presented as of October 31, 2008 and may differ from corresponding ratios shown elsewhere in this report because of differing time periods (and/or, if applicable, because these expense ratios do not include expense credits or waivers).
FIRST EAGLE FUNDS | ANNUAL REPORT | OCTOBER 31, 2009
15
Statements of Assets and Liabilities
| | | FIRST EAGLE
GLOBAL FUND | | FIRST EAGLE
OVERSEAS FUND | | FIRST EAGLE
U.S. VALUE FUND | |
| Assets | |
| Investments, at Cost (Note 1) | |
| Unaffiliated issuers | | $ | 12,948,634,877 | | | $ | 4,755,844,601 | | | $ | 908,536,680 | | |
| Affiliated issuers | | | 3,882,137,271 | | | | 784,358,085 | | | | — | | |
| Gold Bullion | | | 693,749,790 | | | | 272,864,040 | | | | 33,486,747 | | |
| Total Investments, at Cost | | | 17,524,521,938 | | | | 5,813,066,726 | | | | 942,023,427 | | |
| Investments, at Value (Note 1) | |
| Unaffiliated issuers | | | 13,918,621,450 | | | | 5,618,143,084 | | | | 951,646,389 | | |
| Affiliated issuers | | | 3,902,348,782 | | | | 870,028,809 | | | | — | | |
| Gold Bullion | | | 1,306,455,960 | | | | 570,582,616 | | | | 54,304,356 | | |
| Total Investments, at Value | | | 19,127,426,192 | | | | 7,058,754,509 | | | | 1,005,950,745 | | |
| Cash | | | 31,503 | | | | 1,110 | | | | 1,833 | | |
| Receivable for forward currency contracts held, at value (Note 1) | | | 1,492,564 | | | | 731,636 | | | | — | | |
| Receivable for investment securities sold | | | 24,170,714 | | | | 7,643,760 | | | | 271,811 | | |
| Receivable for premiums for written options | | | — | | | | — | | | | — | | |
| Receivable for Fund shares sold | | | 53,279,147 | | | | 22,430,354 | | | | 4,446,954 | | |
| Accrued interest and dividends receivable | | | 52,136,691 | | | | 23,718,423 | | | | 3,092,958 | | |
| Investment for trustee deferred compensation plan (Note 2) | | | 704,232 | | | | 825,875 | | | | 200,756 | | |
| Other assets | | | 922,674 | | | | 71,663 | | | | 34,888 | | |
| Total Assets | | | 19,260,163,717 | | | | 7,114,177,330 | | | | 1,013,999,945 | | |
| Liabilities | |
| Option contracts written, at value (premiums received $17,273,666) (Note 1) | | | — | | | | — | | | | — | | |
| Payable for Fund shares redeemed | | | 37,749,592 | | | | 15,143,942 | | | | 2,535,226 | | |
| Payable for investment securities purchased | | | 14,775,554 | | | | 3,049,795 | | | | 413,612 | | |
| Payable for forward currency contracts held, at value (Note 1) | | | 121,208,005 | | | | 58,441,992 | | | | — | | |
| Investment advisory fees payable (Note 2) | | | 12,390,756 | | | | 4,547,904 | | | | 650,734 | | |
| Distribution fees payable (Note 3) | | | 5,645,778 | | | | 1,385,475 | | | | 289,473 | | |
| Services fees payable (Note 3) | | | 1,117,388 | | | | 171,777 | | | | 57,364 | | |
| Trustee deferred compensation plan (Note 2) | | | 704,232 | | | | 825,875 | | | | 200,756 | | |
| Administrative fees payable (Note 2) | | | 341,000 | | | | 130,258 | | | | 11,450 | | |
| Trustee fees payable | | | 162,368 | | | | 73,691 | | | | 9,833 | | |
| Accrued expenses and other liabilities | | | 7,844,792 | | | | 3,509,385 | | | | 467,689 | | |
| Total Liabilities | | | 201,939,465 | | | | 87,280,094 | | | | 4,636,137 | | |
| Net Assets | | $ | 19,058,224,252 | | | $ | 7,026,897,236 | | | $ | 1,009,363,808 | | |
See Notes to Financial Statements.
FIRST EAGLE FUNDS | ANNUAL REPORT | OCTOBER 31, 2009
78
October 31, 2009
| | | FIRST EAGLE
GOLD FUND | | FIRST EAGLE
FUND OF AMERICA | |
| Assets | |
| Investments, at Cost (Note 1) | |
| Unaffiliated issuers | | $ | 1,065,581,860 | | | $ | 886,693,272 | | |
| Affiliated issuers | | | 34,953,754 | | | | — | | |
| Gold Bullion | | | 139,679,146 | | | | — | | |
| Total Investments, at Cost | | | 1,240,214,760 | | | | 886,693,272 | | |
| Investments, at Value (Note 1) | |
| Unaffiliated issuers | | | 1,484,991,716 | | | | 886,312,491 | | |
| Affiliated issuers | | | 42,271,453 | | | | — | | |
| Gold Bullion | | | 337,725,045 | | | | — | | |
| Total Investments, at Value | | | 1,864,988,214 | | | | 886,312,491 | | |
| Cash | | | 1,788 | | | | — | | |
| Receivable for forward currency contracts held, at value (Note 1) | | | — | | | | — | | |
| Receivable for investment securities sold | | | 6,673 | | | | — | | |
| Receivable for premiums for written options | | | — | | | | 154,727 | | |
| Receivable for Fund shares sold | | | 13,532,085 | | | | 4,845,508 | | |
| Accrued interest and dividends receivable | | | 338,650 | | | | 457,964 | | |
| Investment for trustee deferred compensation plan (Note 2) | | | 88,875 | | | | 425,852 | | |
| Other assets | | | 10,817 | | | | 7,716 | | |
| Total Assets | | | 1,878,967,102 | | | | 892,204,258 | | |
| Liabilities | |
| Option contracts written, at value (premiums received $17,273,666) (Note 1) | | | — | | | | 11,291,800 | | |
| Payable for Fund shares redeemed | | | 9,540,160 | | | | 4,031,397 | | |
| Payable for investment securities purchased | | | 14,174,333 | | | | 5,773,764 | | |
| Payable for forward currency contracts held, at value (Note 1) | | | — | | | | — | | |
| Investment advisory fees payable (Note 2) | | | 1,232,701 | | | | 765,784 | | |
| Distribution fees payable (Note 3) | | | 531,825 | | | | 231,089 | | |
| Services fees payable (Note 3) | | | 78,968 | | | | 19,821 | | |
| Trustee deferred compensation plan (Note 2) | | | 88,875 | | | | 425,852 | | |
| Administrative fees payable (Note 2) | | | 19,455 | | | | 15,500 | | |
| Trustee fees payable | | | 11,243 | | | | 4,690 | | |
| Accrued expenses and other liabilities | | | 958,445 | | | | 436,142 | | |
| Total Liabilities | | | 26,636,005 | | | | 22,995,839 | | |
| Net Assets | | $ | 1,852,331,097 | | | $ | 869,208,419 | | |
FIRST EAGLE FUNDS | ANNUAL REPORT | OCTOBER 31, 2009
79
Statements of Assets and Liabilities (continued)
| | | FIRST EAGLE
GLOBAL FUND | | FIRST EAGLE
OVERSEAS FUND | | FIRST EAGLE
U.S. VALUE FUND | |
| Net Assets Consist of | |
| Capital stock (par value, $0.001 per share) | | $ | 493,875 | | | $ | 359,518 | | | $ | 71,062 | | |
| Capital surplus | | | 18,469,940,473 | | | | 6,048,871,138 | | | | 961,902,932 | | |
| Net unrealized appreciation (depreciation) on: | |
| Investments | | | 1,602,904,254 | | | | 1,245,687,783 | | | | 63,927,318 | | |
| Foreign currency and forward contract related translation | | | (118,662,700 | ) | | | (57,095,703 | ) | | | — | | |
| Written options | | | — | | | | — | | | | — | | |
| Undistributed net realized losses on investments | | | (966,036,871 | ) | | | (209,791,972 | ) | | | (26,577,617 | ) | |
| Undistributed net investment income (loss) | | | 69,585,221 | | | | (1,133,528 | ) | | | 10,040,113 | | |
| Net Assets | | $ | 19,058,224,252 | | | $ | 7,026,897,236 | | | $ | 1,009,363,808 | | |
| Class A | |
| Net assets | | $ | 10,562,172,813 | | | $ | 4,023,864,769 | | | $ | 547,034,715 | | |
| Shares outstanding | | | 272,619,335 | | | | 206,214,861 | | | | 38,488,027 | | |
| Net asset value per share and redemption proceeds per share | | $ | 38.74 | | | $ | 19.51 | | | $ | 14.21 | | |
| Offering price per share (NAV per share plus maximum sales charge)1 | | $ | 40.78 | | | $ | 20.54 | | | $ | 14.96 | | |
| Class C | |
| Net assets | | $ | 5,158,102,848 | | | $ | 791,752,510 | | | $ | 263,644,438 | | |
| Shares outstanding | | | 135,490,441 | | | | 41,601,606 | | | | 18,746,958 | | |
| Net asset value per share | | $ | 38.07 | | | $ | 19.03 | | | $ | 14.06 | | |
Redemption proceeds per share (NAV per share less maximum contingent
deferred sale charge)2 | | $ | 37.69 | | | $ | 18.84 | | | $ | 13.92 | | |
| Class I | |
| Net assets | | $ | 3,337,948,591 | | | $ | 2,211,279,957 | | | $ | 198,684,655 | | |
| Shares outstanding | | | 85,765,294 | | | | 111,701,858 | | | | 13,827,124 | | |
| Net asset value per share and redemption proceeds per share | | $ | 38.92 | | | $ | 19.80 | | | $ | 14.37 | | |
| Class Y | |
| Net assets | | | — | | | | — | | | | — | | |
| Shares outstanding | | | — | | | | — | | | | — | | |
| Net asset value per share and redemption proceeds per share | | | — | | | | — | | | | — | | |
1The maximum sales charge is 5.00% for Class A shares. Classes C, I and Y have no front-end sales charges.
2The maximum CSDC (Contingent Deferred Sales Charge) is 1.00% for Class C shares, which is charged on the lesser of the offering price or the net asset value at the time of sale by shareholder. This pertains to investments of one year or less.
See Notes to Financial Statements.
FIRST EAGLE FUNDS | ANNUAL REPORT | OCTOBER 31, 2009
80
October 31, 2009
| | | FIRST EAGLE
GOLD FUND | | FIRST EAGLE
FUND OF AMERICA | |
| Net Assets Consist of | |
| Capital stock (par value, $0.001 per share) | | $ | 73,939 | | | $ | 45,100 | | |
| Capital surplus | | | 1,259,072,815 | | | | 929,456,643 | | |
| Net unrealized appreciation (depreciation) on: | |
| Investments | | | 624,773,454 | | | | (380,781 | ) | |
| Foreign currency and forward contract related translation | | | 65,267 | | | | — | | |
| Written options | | | — | | | | 5,981,866 | | |
| Undistributed net realized losses on investments | | | (13,596,045 | ) | | | (65,224,152 | ) | |
| Undistributed net investment income (loss) | | | (18,058,333 | ) | | | (670,257 | ) | |
| Net Assets | | $ | 1,852,331,097 | | | $ | 869,208,419 | | |
| Class A | |
| Net assets | | $ | 1,325,226,505 | | | $ | 275,511,947 | | |
| Shares outstanding | | | 52,684,683 | | | | 14,256,841 | | |
| Net asset value per share and redemption proceeds per share | | $ | 25.15 | | | $ | 19.32 | | |
| Offering price per share (NAV per share plus maximum sales charge)1 | | $ | 26.47 | | | $ | 20.35 | | |
| Class C | |
| Net assets | | $ | 361,735,852 | | | $ | 90,345,053 | | |
| Shares outstanding | | | 14,751,858 | | | | 5,237,741 | | |
| Net asset value per share | | $ | 24.52 | | | $ | 17.25 | | |
Redemption proceeds per share (NAV per share less maximum contingent
deferred sale charge)2 | | $ | 24.27 | | | $ | 17.08 | | |
| Class I | |
| Net assets | | $ | 165,368,740 | | | | — | | |
| Shares outstanding | | | 6,502,353 | | | | — | | |
| Net asset value per share and redemption proceeds per share | | $ | 25.43 | | | | — | | |
| Class Y | |
| Net assets | | | — | | | $ | 503,351,419 | | |
| Shares outstanding | | | — | | | | 25,605,616 | | |
| Net asset value per share and redemption proceeds per share | | | — | | | $ | 19.66 | | |
FIRST EAGLE FUNDS | ANNUAL REPORT | OCTOBER 31, 2009
81
Statements of Operations
| | | FIRST EAGLE
GLOBAL FUND | | FIRST EAGLE
OVERSEAS FUND | | FIRST EAGLE
U.S. VALUE FUND | |
| Investment Income | |
| Interest | | $ | 56,110,374 | | | $ | 19,803,707 | | | $ | 12,077,688 | | |
Dividends from: (net of $27,825,230, $16,044,244, $136,486,
$361,324 and $0, foreign taxes withheld, respectively) | |
| Unaffiliated issuers | | | 237,655,762 | | | | 118,004,836 | | | | 10,355,529 | | |
| Affiliated issuers | | | 96,384,123 | | | | 27,598,580 | | | | — | | |
| Other Income | | | 1,168,782 | | | | 72,341 | | | | 39,378 | | |
| Total Income | | | 391,319,041 | | | | 165,479,464 | | | | 22,472,595 | | |
| Expenses | |
| Investment advisory fees (Note 2) | | | 126,386,014 | | | | 45,846,935 | | | | 5,784,712 | | |
| Administrative costs (Note 2) | | | 4,667,076 | | | | 1,696,575 | | | | 195,218 | | |
| Distribution fees (Note 3) | |
| Class A | | | 23,754,101 | | | | 8,763,156 | | | | 994,453 | | |
| Class C | | | 34,209,972 | | | | 5,408,505 | | | | 1,669,984 | | |
| Class Y | | | — | | | | — | | | | — | | |
| Service fees - Class C (Note 3) | | | 11,403,324 | | | | 1,802,835 | | | | 556,661 | | |
| Shareholder servicing agent fees | | | 18,867,579 | | | | 6,393,869 | | | | 1,286,292 | | |
| Custodian and accounting fees | | | 3,382,272 | | | | 1,712,117 | | | | 123,742 | | |
| Shareholder reporting fees | | | 2,267,222 | | | | 784,533 | | | | 109,460 | | |
| Trustees' fees | | | 723,869 | | | | 271,001 | | | | 32,213 | | |
| Registration and filing fees | | | 331,979 | | | | 191,089 | | | | 145,305 | | |
| Professional fees | | | 998,733 | | | | 719,124 | | | | 91,884 | | |
| Other Expenses | | | 669,430 | | | | 255,409 | | | | 25,279 | | |
| Total Expenses | | | 227,661,571 | | | | 73,845,148 | | | | 11,015,203 | | |
| Expense reductions due to earnings credits (Note 1) | | | (8,040 | ) | | | (4,301 | ) | | | (833 | ) | |
| Net expenses | | | 227,653,531 | | | | 73,840,847 | | | | 11,014,370 | | |
| Net investment income (loss) (Note 1) | | | 163,665,510 | | | | 91,638,617 | | | | 11,458,225 | | |
Realized and Unrealized Gains (Losses) on Investments, Foreign
Currency Related Transactions and Written Options (Note 1) | |
| Net realized gains (losses) from: | |
| Investment transactions of unaffiliated issuers | | | (636,874,136 | ) | | | (116,626,219 | ) | | | (26,526,976 | ) | |
| Investment transactions of affiliated issuers | | | (144,779,415 | ) | | | (2,720,151 | ) | | | — | | |
| Commodity related transactions | | | — | | | | 9,787,733 | | | | — | | |
| Foreign currency and forward contract related transactions | | | 426,283,407 | | | | 262,253,623 | | | | 665 | | |
| Written options | | | — | | | | — | | | | — | | |
| Net increase from payments by affiliate | | | 1,837 | | | | — | | | | — | | |
| | | | (355,368,307 | ) | | | 152,694,986 | | | | (26,526,311 | ) | |
| Changes in unrealized appreciation (depreciation) of: | |
| Investment transactions | | | 4,023,013,411 | | | | 1,505,064,380 | | | | 142,188,621 | | |
| Foreign currency and forward contract related translation | | | (705,046,599 | ) | | | (389,151,339 | ) | | | — | | |
| Written options | | | — | | | | — | | | | — | | |
| | | | 3,317,966,812 | | | | 1,115,913,041 | | | | 142,188,621 | | |
Net realized and unrealized gains on investments, foreign currency
and forward contract related transactions and written options | | | 2,962,598,505 | | | | 1,268,608,027 | | | | 115,662,310 | | |
| Net Increase in Net Assets Resulting from Operations | | $ | 3,126,264,015 | | | $ | 1,360,246,644 | | | $ | 127,120,535 | | |
See Notes to Financial Statements.
FIRST EAGLE FUNDS | ANNUAL REPORT | OCTOBER 31, 2009
82
For the Year Ended October 31, 2009
| | | FIRST EAGLE
GOLD FUND | | FIRST EAGLE
FUND OF AMERICA | |
| Investment Income | |
| Interest | | $ | 1,527,457 | | | $ | 267,808 | | |
Dividends from: (net of $27,825,230, $16,044,244, $136,486,
$361,324 and $0, foreign taxes withheld, respectively) | |
| Unaffiliated issuers | | | 6,658,158 | | | | 8,055,891 | | |
| Affiliated issuers | | | — | | | | — | | |
| Other Income | | | 18,730 | | | | — | | |
| Total Income | | | 8,204,345 | | | | 8,323,699 | | |
| Expenses | |
| Investment advisory fees (Note 2) | | | 9,940,205 | | | | 7,312,144 | | |
| Administrative costs (Note 2) | | | 321,919 | | | | 195,481 | | |
| Distribution fees (Note 3) | |
| Class A | | | 2,419,940 | | | | 489,059 | | |
| Class C | | | 1,761,449 | | | | 544,393 | | |
| Class Y | | | — | | | | 1,157,513 | | |
| Service fees - Class C (Note 3) | | | 587,150 | | | | 181,464 | | |
| Shareholder servicing agent fees | | | 2,049,771 | | | | 1,061,599 | | |
| Custodian and accounting fees | | | 420,498 | | | | 159,777 | | |
| Shareholder reporting fees | | | 181,404 | | | | 92,504 | | |
| Trustees' fees | | | 43,801 | | | | 26,999 | | |
| Registration and filing fees | | | 131,782 | | | | 114,363 | | |
| Professional fees | | | 351,080 | | | | 143,418 | | |
| Other Expenses | | | 38,720 | | | | 27,727 | | |
| Total Expenses | | | 18,247,719 | | | | 11,506,441 | | |
| Expense reductions due to earnings credits (Note 1) | | | (610 | ) | | | (14,217 | ) | |
| Net expenses | | | 18,247,109 | | | | 11,492,224 | | |
| Net investment income (loss) (Note 1) | | | (10,042,764 | ) | | | (3,168,525 | ) | |
Realized and Unrealized Gains (Losses) on Investments, Foreign
Currency Related Transactions and Written Options (Note 1) | |
| Net realized gains (losses) from: | |
| Investment transactions of unaffiliated issuers | | | (13,162,852 | ) | | | (70,479,223 | ) | |
| Investment transactions of affiliated issuers | | | — | | | | — | | |
| Commodity related transactions | | | 1,438,357 | | | | — | | |
| Foreign currency and forward contract related transactions | | | 55,526 | | | | — | | |
| Written options | | | — | | | | 7,979,783 | | |
| Net increase from payments by affiliate | | | — | | | | — | | |
| | | | (11,668,969 | ) | | | (62,499,440 | ) | |
| Changes in unrealized appreciation (depreciation) of: | |
| Investment transactions | | | 640,242,809 | | | | 133,233,938 | | |
| Foreign currency and forward contract related translation | | | 65,267 | | | | — | | |
| Written options | | | — | | | | 5,048,624 | | |
| | | | 640,308,076 | | | | 138,282,562 | | |
Net realized and unrealized gains on investments, foreign currency
and forward contract related transactions and written options | | | 628,639,107 | | | | 75,783,122 | | |
| Net Increase in Net Assets Resulting from Operations | | $ | 618,596,343 | | | $ | 72,614,597 | | |
FIRST EAGLE FUNDS | ANNUAL REPORT | OCTOBER 31, 2009
83
Statements of Changes in Net Assets
| | | FIRST EAGLE
GLOBAL FUND | | FIRST EAGLE
OVERSEAS FUND | |
| | | YEAR ENDED OCTOBER 31, | | YEAR ENDED OCTOBER 31, | |
| | | 2009 | | 2008 | | 2009 | | 2008 | |
| Operations | |
| Net investment income (loss) | | $ | 163,665,510 | | | $ | 287,176,789 | | | $ | 91,638,617 | | | $ | 137,951,375 | | |
Net realized gain (loss) from investments, foreign currency and
forward contract related transactions and written options | | | (355,368,307 | ) | | | 571,807,723 | | | | 152,694,986 | | | | 313,674,313 | | |
Change in unrealized appreciation (depreciation) of investments,
foreign currency and forward contract related translation and
written options | | | 3,317,966,812 | | | | (6,731,622,390 | ) | | | 1,115,913,041 | | | | (3,144,942,612 | ) | |
| Net increase (decrease) in net assets resulting from operations | | | 3,126,264,015 | | | | (5,872,637,878 | ) | | | 1,360,246,644 | | | | (2,693,316,924 | ) | |
| Distribution to Shareholders | |
| Dividends paid from net investment income | |
| Class A | | | (39,081,783 | ) | | | (279,366,208 | ) | | | (3,998,540 | ) | | | (180,189,537 | ) | |
| Class C | | | (7,250 | ) | | | (76,410,477 | ) | | | (7,588 | ) | | | (28,086,827 | ) | |
| Class I | | | (19,540,281 | ) | | | (74,255,465 | ) | | | (2,929,304 | ) | | | (121,691,715 | ) | |
Distributions paid from net realized gains from
investment transactions | |
| Class A | | | (631,563,973 | ) | | | (1,149,497,548 | ) | | | (317,087,294 | ) | | | (652,293,124 | ) | |
| Class C | | | (302,779,457 | ) | | | (481,349,457 | ) | | | (69,460,426 | ) | | | (133,975,356 | ) | |
| Class I | | | (178,533,975 | ) | | | (273,763,609 | ) | | | (174,084,325 | ) | | | (406,827,856 | ) | |
| Decrease in net assets resulting from distributions | | | (1,171,506,719 | ) | | | (2,334,642,764 | ) | | | (567,567,477 | ) | | | (1,523,064,415 | ) | |
| Fund Share Transactions (Note 6) | |
| Net proceeds from shares sold | | | 4,078,185,668 | | | | 7,080,403,346 | | | | 1,995,432,080 | | | | 2,177,489,462 | | |
Net asset value of shares issued for reinvested dividends
and distributions | | | 964,568,563 | | | | 1,934,139,194 | | | | 487,753,631 | | | | 1,295,750,389 | | |
| Cost of shares redeemed | | | (5,245,297,583 | ) | | | (5,741,382,568 | ) | | | (2,472,285,641 | ) | | | (4,153,912,271 | ) | |
| Redemption fees | | | 1,182,746 | | | | 1,655,839 | | | | 577,129 | | | | 689,425 | | |
| Increase (decrease) in net assets from Fund share transactions | | | (201,360,606 | ) | | | 3,274,815,811 | | | | 11,477,199 | | | | (679,982,995 | ) | |
| Net increase (decrease) in net assets | | | 1,753,396,690 | | | | (4,932,464,831 | ) | | | 804,156,366 | | | | (4,896,364,334 | ) | |
| Net Assets (Note 1) | |
| Beginning of year | | | 17,304,827,562 | | | | 22,237,292,393 | | | | 6,222,740,870 | | | | 11,119,105,204 | | |
| End of year | | $ | 19,058,224,252 | | | $ | 17,304,827,562 | | | $ | 7,026,897,236 | | | $ | 6,222,740,870 | | |
| Undistributed net investment income (loss) | | $ | 69,585,221 | | | $ | (48,962,268 | ) | | $ | (1,133,528 | ) | | $ | (112,433,127 | ) | |
See Notes to Financial Statements.
FIRST EAGLE FUNDS | ANNUAL REPORT | OCTOBER 31, 2009
84
| | | FIRST EAGLE
U.S. VALUE FUND | | FIRST EAGLE
GOLD FUND | |
| | | YEAR ENDED OCTOBER 31, | | YEAR ENDED OCTOBER 31, | |
| | | 2009 | | 2008 | | 2009 | | 2008 | |
| Operations | |
| Net investment income (loss) | | $ | 11,458,225 | | | $ | 12,501,110 | | | $ | (10,042,764 | ) | | $ | (5,374,345 | ) | |
Net realized gain (loss) from investments, foreign currency and
forward contract related transactions and written options | | | (26,526,311 | ) | | | 6,453,735 | | | | (11,668,969 | ) | | | 51,876,811 | | |
Change in unrealized appreciation (depreciation) of investments,
foreign currency and forward contract related translation and
written options | | | 142,188,621 | | | | (154,116,250 | ) | | | 640,308,076 | | | | (530,308,205 | ) | |
| Net increase (decrease) in net assets resulting from operations | | | 127,120,535 | | | | (135,161,405 | ) | | | 618,596,343 | | | | (483,805,739 | ) | |
| Distribution to Shareholders | |
| Dividends paid from net investment income | |
| Class A | | | (5,591,065 | ) | | | (5,722,863 | ) | | | — | | | | (25,074,580 | ) | |
| Class C | | | (2,430,964 | ) | | | (2,651,972 | ) | | | — | | | | (4,460,113 | ) | |
| Class I | | | (2,247,106 | ) | | | (2,101,375 | ) | | | — | | | | (4,201,766 | ) | |
Distributions paid from net realized gains from
investment transactions | |
| Class A | | | (2,846,360 | ) | | | (12,287,319 | ) | | | (34,328,380 | ) | | | (30,818,251 | ) | |
| Class C | | | (1,987,359 | ) | | | (9,027,699 | ) | | | (7,932,453 | ) | | | (6,948,463 | ) | |
| Class I | | | (1,015,200 | ) | | | (3,944,580 | ) | | | (4,616,129 | ) | | | (4,799,864 | ) | |
| Decrease in net assets resulting from distributions | | | (16,118,054 | ) | | | (35,735,808 | ) | | | (46,876,962 | ) | | | (76,303,037 | ) | |
| Fund Share Transactions (Note 6) | |
| Net proceeds from shares sold | | | 647,979,182 | | | | 250,653,753 | | | | 945,966,437 | | | | 293,412,807 | | |
Net asset value of shares issued for reinvested dividends
and distributions | | | 12,783,370 | | | | 29,227,280 | | | | 40,225,122 | | | | 62,146,503 | | |
| Cost of shares redeemed | | | (304,688,397 | ) | | | (228,317,642 | ) | | | (366,291,764 | ) | | | (387,225,293 | ) | |
| Redemption fees | | | — | | | | 81,890 | | | | 428,905 | | | | 153,422 | | |
| Increase (decrease) in net assets from Fund share transactions | | | 356,074,155 | | | | 51,645,281 | | | | 620,328,700 | | | | (31,512,561 | ) | |
| Net increase (decrease) in net assets | | | 467,076,636 | | | | (119,251,932 | ) | | | 1,192,048,081 | | | | (591,621,337 | ) | |
| Net Assets (Note 1) | |
| Beginning of year | | | 542,287,172 | | | | 661,539,104 | | | | 660,283,016 | | | | 1,251,904,353 | | |
| End of year | | $ | 1,009,363,808 | | | $ | 542,287,172 | | | $ | 1,852,331,097 | | | $ | 660,283,016 | | |
| Undistributed net investment income (loss) | | $ | 10,040,113 | | | $ | 8,952,848 | | | $ | (18,058,333 | ) | | $ | (8,716,619 | ) | |
FIRST EAGLE FUNDS | ANNUAL REPORT | OCTOBER 31, 2009
85
Statements of Changes in Net Assets (continued)
| | | FIRST EAGLE
FUND OF AMERICA | |
| | | YEAR ENDED OCTOBER 31, | |
| | | 2009 | | 2008 | |
| Operations | |
| Net investment loss | | $ | (3,168,525 | ) | | $ | (1,193,856 | ) | |
Net realized gain (loss) from investments, foreign currency and
forward contract related transactions and written options | | | (62,499,440 | ) | | | 47,962,328 | | |
Change in unrealized appreciation (depreciation) of investments,
foreign currency and forward contract related translation and
written options | | | 138,282,562 | | | | (338,387,730 | ) | |
| Net increase (decrease) in net assets resulting from operations | | | 72,614,597 | | | | (291,619,258 | ) | |
| Distribution to Shareholders | |
| Dividends paid from net investment income | |
| Class A | | | — | | | | (204,496 | ) | |
| Class C | | | — | | | | — | | |
| Class Y | | | — | | | | (1,385,075 | ) | |
Distributions paid from net realized gains from
investment transactions | |
| Class A | | | (8,260,417 | ) | | | (8,095,784 | ) | |
| Class C | | | (4,348,195 | ) | | | (6,936,699 | ) | |
| Class Y | | | (28,605,629 | ) | | | (71,479,766 | ) | |
| Decrease in net assets resulting from distributions | | | (41,214,241 | ) | | | (88,101,820 | ) | |
| Fund Share Transactions (Note 6) | |
| Net proceeds from shares sold | | | 312,006,550 | | | | 275,946,279 | | |
Net asset value of shares issued for reinvested dividends
and distributions | | | 34,915,645 | | | | 77,214,426 | | |
| Cost of shares redeemed | | | (198,158,229 | ) | | | (187,350,534 | ) | |
| Redemption fees | | | — | | | | 40,236 | | |
| Increase (decrease) in net assets from Fund share transactions | | | 148,763,966 | | | | 165,850,407 | | |
| Net increase (decrease) in net assets | | | 180,164,322 | | | | (213,870,671 | ) | |
| Net Assets (Note 1) | |
| Beginning of year | | | 689,044,097 | | | | 902,914,768 | | |
| End of year | | $ | 869,208,419 | | | $ | 689,044,097 | | |
| Undistributed net investment income (loss) | | $ | (670,257 | ) | | $ | (34,018 | ) | |
See Notes to Financial Statements.
FIRST EAGLE FUNDS | ANNUAL REPORT | OCTOBER 31, 2009
86
This page was intentionally left blank.

Financial Highlights
| | | YEAR ENDED OCTOBER 31, | |
| | | 2009 | | 2008 | |
| | | CLASS A | | CLASS C | | CLASS I | | CLASS A | | CLASS C | | CLASS I | |
| Selected data for a share of beneficial interest outstanding throughout each year is presented below:* | |
| Net asset value, beginning of year | | $ | 34.45 | | | $ | 33.99 | | | $ | 34.62 | | | $ | 51.09 | | | $ | 50.46 | | | $ | 51.32 | | |
| Income from investment operations: | |
| Net investment income | | | 0.39 | | | | 0.13 | | | | 0.47 | | | | 0.64 | | | | 0.31 | | | | 0.76 | | |
Net realized and unrealized
gains (losses) on investments | | | 6.35 | | | | 6.26 | | | | 6.39 | | | | -11.82 | | | | -11.69 | | | | -11.88 | | |
Total income (loss) from
investment operations | | | 6.74 | | | | 6.39 | | | | 6.86 | | | | -11.18 | | | | -11.38 | | | | -11.12 | | |
| Less distributions: | |
| Dividends from net investment income | | | -0.14 | | | | -0.00 | ** | | | -0.25 | | | | -1.07 | | | | -0.70 | | | | -1.19 | | |
| Distributions from capital gains | | | -2.31 | | | | -2.31 | | | | -2.31 | | | | -4.39 | | | | -4.39 | | | | -4.39 | | |
| Total distributions | | | -2.45 | | | | -2.31 | | | | -2.56 | | | | -5.46 | | | | -5.09 | | | | -5.58 | | |
| Net asset value, end of year | | $ | 38.74 | | | $ | 38.07 | | | $ | 38.92 | | | $ | 34.45 | | | $ | 33.99 | | | $ | 34.62 | | |
| Total return(a) | | | 20.81 | % | | | 19.93 | % | | | 21.13 | % | | | -24.41 | % | | | -24.99 | % | | | -24.21 | % | |
| Ratios and supplemental data | |
| Net assets, end of year (millions) | | $ | 10,562 | | | $ | 5,158 | | | $ | 3,338 | | | $ | 9,784 | | | $ | 4,623 | | | $ | 2,898 | | |
Ratio of operating expenses to
average net assets including
earnings credits | | | 1.19 | % | | | 1.94 | % | | | 0.94 | % | | | 1.14 | % | | | 1.89 | % | | | 0.89 | % | |
Ratio of operating expenses to average
net assets excluding earnings credits | | | 1.19 | % | | | 1.94 | % | | | 0.94 | % | | | 1.14 | % | | | 1.89 | % | | | 0.89 | % | |
Ratio of net investment income to
average net assets including
earnings credits | | | 1.14 | % | | | 0.38 | % | | | 1.37 | % | | | 1.48 | % | | | 0.73 | % | | | 1.74 | % | |
Ratio of net investment income
to average net assets excluding
earnings credits | | | 1.14 | % | | | 0.38 | % | | | 1.37 | % | | | 1.48 | % | | | 0.73 | % | | | 1.74 | % | |
| Portfolio turnover rate | | | 12.52 | % | | | 12.52 | % | | | 12.52 | % | | | 29.69 | % | | | 29.69 | % | | | 29.69 | % | |
*Per share amounts have been calculated using the average shares method.
**Amount represents less than $0.01 per share.
(a) Does not take into account the deduction of the CDSC (Contingent Deferred Sales Charge) of 1.00% for Class C shares.
See Notes to Financial Statements.
FIRST EAGLE FUNDS | ANNUAL REPORT | OCTOBER 31, 2009
88
Global Fund
| | | YEAR ENDED OCTOBER 31, | |
| | | 2007 | | 2006 | | 2005 | |
| | | CLASS A | | CLASS C | | CLASS I | | CLASS A | | CLASS C | | CLASS I | | CLASS A | | CLASS C | | CLASS I | |
| Selected data for a share of beneficial interest outstanding throughout each year is presented below:* | |
| Net asset value, beginning of year | | $ | 48.36 | | | $ | 47.83 | | | $ | 48.56 | | | $ | 42.47 | | | $ | 42.06 | | | $ | 42.62 | | | $ | 36.53 | | | $ | 36.30 | | | $ | 36.64 | | |
| Income from investment operations: | |
| Net investment income | | | 0.67 | | | | 0.31 | | | | 0.79 | | | | 0.59 | | | | 0.25 | | | | 0.71 | | | | 0.48 | | | | 0.19 | | | | 0.60 | | |
Net realized and unrealized
gains (losses) on investments | | | 6.91 | | | | 6.84 | | | | 6.94 | | | | 7.82 | | | | 7.77 | | | | 7.85 | | | | 6.07 | | | | 6.01 | | | | 6.06 | | |
Total income (loss) from
investment operations | | | 7.58 | | | | 7.15 | | | | 7.73 | | | | 8.41 | | | | 8.02 | | | | 8.56 | | | | 6.55 | | | | 6.20 | | | | 6.66 | | |
| Less distributions: | |
| Dividends from net investment income | | | -1.22 | | | | -0.89 | | | | -1.34 | | | | -0.84 | | | | -0.57 | | | | -0.94 | | | | -0.43 | | | | -0.26 | | | | -0.50 | | |
| Distributions from capital gains | | | -3.63 | | | | -3.63 | | | | -3.63 | | | | -1.68 | | | | -1.68 | | | | -1.68 | | | | -0.18 | | | | -0.18 | | | | -0.18 | | |
| Total distributions | | | -4.85 | | | | -4.52 | | | | -4.97 | | | | -2.52 | | | | -2.25 | | | | -2.62 | | | | -0.61 | | | | -0.44 | | | | -0.68 | | |
| Net asset value, end of year | | $ | 51.09 | | | $ | 50.46 | | | $ | 51.32 | | | $ | 48.36 | | | $ | 47.83 | | | $ | 48.56 | | | $ | 42.47 | | | $ | 42.06 | | | $ | 42.62 | | |
| Total return(a) | | | 16.91 | % | | | 16.03 | % | | | 17.19 | % | | | 20.73 | % | | | 19.86 | % | | | 21.06 | % | | | 18.15 | % | | | 17.23 | % | | | 18.42 | % | |
| Ratios and supplemental data | |
| Net assets, end of year (millions) | | $ | 13,451 | | | $ | 5,593 | | | $ | 3,193 | | | $ | 11,854 | | | $ | 4,928 | | | $ | 2,641 | | | $ | 9,526 | | | $ | 3,828 | | | $ | 1,752 | | |
Ratio of operating expenses to
average net assets including
earnings credits | | | 1.12 | % | | | 1.87 | % | | | 0.87 | % | | | 1.13 | % | | | 1.88 | % | | | 0.88 | % | | | 1.20 | % | | | 1.95 | % | | | 0.95 | % | |
Ratio of operating expenses to average
net assets excluding earnings credits | | | 1.12 | % | | | 1.87 | % | | | 0.87 | % | | | 1.14 | % | | | 1.89 | % | | | 0.89 | % | | | 1.20 | % | | | 1.95 | % | | | 0.95 | % | |
Ratio of net investment income to
average net assets including
earnings credits | | | 1.40 | % | | | 0.65 | % | | | 1.64 | % | | | 1.31 | % | | | 0.56 | % | | | 1.57 | % | | | 1.21 | % | | | 0.47 | % | | | 1.48 | % | |
Ratio of net investment income
to average net assets excluding
earnings credits | | | 1.39 | % | | | 0.64 | % | | | 1.64 | % | | | 1.30 | % | | | 0.56 | % | | | 1.57 | % | | | 1.20 | % | | | 0.47 | % | | | 1.48 | % | |
| Portfolio turnover rate | | | 37.58 | % | | | 37.58 | % | | | 37.58 | % | | | 28.59 | % | | | 28.59 | % | | | 28.59 | % | | | 12.29 | % | | | 12.29 | % | | | 12.29 | % | |
FIRST EAGLE FUNDS | ANNUAL REPORT | OCTOBER 31, 2009
89

Financial Highlights
| | | YEAR ENDED OCTOBER 31, | |
| | | 2009 | | 2008 | |
| | | CLASS A | | CLASS C | | CLASS I | | CLASS A | | CLASS C | | CLASS I | |
| Selected data for a share of beneficial interest outstanding throughout each year is presented below:* | |
| Net asset value, beginning of year | | $ | 17.21 | | | $ | 16.93 | | | $ | 17.41 | | | $ | 28.09 | | | $ | 27.66 | | | $ | 28.38 | | |
| Income from investment operations: | |
| Net investment income | | | 0.26 | | | | 0.13 | | | | 0.30 | | | | 0.35 | | | | 0.18 | | | | 0.40 | | |
Net realized and unrealized
gains (losses) on investments | | | 3.72 | | | | 3.63 | | | | 3.78 | | | | -7.21 | | | | -7.10 | | | | -7.28 | | |
Total income (loss) from
investment operations | | | 3.98 | | | | 3.76 | | | | 4.08 | | | | -6.86 | | | | -6.92 | | | | -6.88 | | |
| Less distributions: | |
| Dividends from net investment income | | | -0.02 | | | | -0.00 | ** | | | -0.03 | | | | -0.87 | | | | -0.66 | | | | -0.94 | | |
| Distributions from capital gains | | | -1.66 | | | | -1.66 | | | | -1.66 | | | | -3.15 | | | | -3.15 | | | | -3.15 | | |
| Total distributions | | | -1.68 | | | | -1.66 | | | | -1.69 | | | | -4.02 | | | | -3.81 | | | | -4.09 | | |
| Net asset value, end of year | | $ | 19.51 | | | $ | 19.03 | | | $ | 19.80 | | | $ | 17.21 | | | $ | 16.93 | | | $ | 17.41 | | |
| Total return(a) | | | 24.95 | % | | | 23.96 | % | | | 25.26 | % | | | -28.15 | % | | | -28.67 | % | | | -27.97 | % | |
| Ratios and supplemental data | |
| Net assets, end of year (millions) | | $ | 4,024 | | | $ | 792 | | | $ | 2,211 | | | $ | 3,518 | | | $ | 737 | | | $ | 1,968 | | |
Ratio of operating expenses to
average net assets including
earnings credits | | | 1.20 | % | | | 1.95 | % | | | 0.95 | % | | | 1.15 | % | | | 1.90 | % | | | 0.90 | % | |
Ratio of operating expenses to average
net assets excluding earnings credits | | | 1.20 | % | | | 1.95 | % | | | 0.95 | % | | | 1.15 | % | | | 1.90 | % | | | 0.90 | % | |
Ratio of net investment income to
average net assets including
earnings credits | | | 1.51 | % | | | 0.76 | % | | | 1.75 | % | | | 1.57 | % | | | 0.82 | % | | | 1.76 | % | |
Ratio of net investment income
to average net assets excluding
earnings credits | | | 1.51 | % | | | 0.76 | % | | | 1.75 | % | | | 1.57 | % | | | 0.82 | % | | | 1.76 | % | |
| Portfolio turnover rate | | | 8.65 | % | | | 8.65 | % | | | 8.65 | % | | | 15.72 | % | | | 15.72 | % | | | 15.72 | % | |
*Per share amounts have been calculated using the average shares method.
**Amount represents less than $0.01 per share.
(a) Does not take into account the deduction of the CDSC (Contingent Deferred Sales Charge) of 1.00% for Class C shares.
See Notes to Financial Statements.
FIRST EAGLE FUNDS | ANNUAL REPORT | OCTOBER 31, 2009
90
Overseas Fund
| | | YEAR ENDED OCTOBER 31, | |
| | | 2007 | | 2006 | | 2005 | |
| | | CLASS A | | CLASS C | | CLASS I | | CLASS A | | CLASS C | | CLASS I | | CLASS A | | CLASS C | | CLASS I | |
| Selected data for a share of beneficial interest outstanding throughout each year is presented below:* | |
| Net asset value, beginning of year | | $ | 26.70 | | | $ | 26.33 | | | $ | 26.94 | | | $ | 24.13 | | | $ | 23.83 | | | $ | 24.33 | | | $ | 20.25 | | | $ | 19.97 | | | $ | 20.37 | | |
| Income from investment operations: | |
| Net investment income | | | 0.41 | | | | 0.21 | | | | 0.48 | | | | 0.39 | | | | 0.20 | | | | 0.46 | | | | 0.27 | | | | 0.10 | | | | 0.33 | | |
Net realized and unrealized
gains (losses) on investments | | | 4.05 | | | | 4.00 | | | | 4.10 | | | | 4.57 | | | | 4.53 | | | | 4.60 | | | | 3.96 | | | | 3.93 | | | | 3.99 | | |
Total income (loss) from
investment operations | | | 4.46 | | | | 4.21 | | | | 4.58 | | | | 4.96 | | | | 4.73 | | | | 5.06 | | | | 4.23 | | | | 4.03 | | | | 4.32 | | |
| Less distributions: | |
| Dividends from net investment income | | | -0.87 | | | | -0.68 | | | | -0.94 | | | | -0.81 | | | | -0.65 | | | | -0.87 | | | | -0.24 | | | | -0.06 | | | | -0.25 | | |
| Distributions from capital gains | | | -2.20 | | | | -2.20 | | | | -2.20 | | | | -1.58 | | | | -1.58 | | | | -1.58 | | | | -0.11 | | | | -0.11 | | | | -0.11 | | |
| Total distributions | | | -3.07 | | | | -2.88 | | | | -3.14 | | | | -2.39 | | | | -2.23 | | | | -2.45 | | | | -0.35 | | | | -0.17 | | | | -0.36 | | |
| Net asset value, end of year | | $ | 28.09 | | | $ | 27.66 | | | $ | 28.38 | | | $ | 26.70 | | | $ | 26.33 | | | $ | 26.94 | | | $ | 24.13 | | | $ | 23.83 | | | $ | 24.33 | | |
| Total return(a) | | | 18.20 | % | | | 17.31 | % | | | 18.52 | % | | | 22.24 | % | | | 21.33 | % | | | 22.53 | % | | | 21.16 | % | | | 20.28 | % | | | 21.47 | % | |
| Ratios and supplemental data | |
| Net assets, end of year (millions) | | $ | 5,974 | | | $ | 1,203 | | | $ | 3,942 | | | $ | 5,785 | | | $ | 1,145 | | | $ | 4,031 | | | $ | 4,866 | | | $ | 994 | | | $ | 3,028 | | |
Ratio of operating expenses to
average net assets including
earnings credits | | | 1.12 | % | | | 1.87 | % | | | 0.87 | % | | | 1.12 | % | | | 1.87 | % | | | 0.87 | % | | | 1.18 | % | | | 1.93 | % | | | 0.93 | % | |
Ratio of operating expenses to average
net assets excluding earnings credits | | | 1.12 | % | | | 1.87 | % | | | 0.87 | % | | | 1.12 | % | | | 1.87 | % | | | 0.87 | % | | | 1.18 | % | | | 1.93 | % | | | 0.93 | % | |
Ratio of net investment income to
average net assets including
earnings credits | | | 1.54 | % | | | 0.79 | % | | | 1.80 | % | | | 1.57 | % | | | 0.81 | % | | | 1.82 | % | | | 1.21 | % | | | 0.46 | % | | | 1.46 | % | |
Ratio of net investment income
to average net assets excluding
earnings credits | | | 1.54 | % | | | 0.78 | % | | | 1.79 | % | | | 1.56 | % | | | 0.81 | % | | | 1.82 | % | | | 1.21 | % | | | 0.46 | % | | | 1.46 | % | |
| Portfolio turnover rate | | | 34.29 | % | | | 34.29 | % | | | 34.29 | % | | | 27.98 | % | | | 27.98 | % | | | 27.98 | % | | | 19.40 | % | | | 19.40 | % | | | 19.40 | % | |
FIRST EAGLE FUNDS | ANNUAL REPORT | OCTOBER 31, 2009
91

Financial Highlights
| | | YEAR ENDED OCTOBER 31, | |
| | | 2009 | | 2008 | |
| | | CLASS A | | CLASS C | | CLASS I | | CLASS A | | CLASS C | | CLASS I | |
| Selected data for a share of beneficial interest outstanding throughout each year is presented below:* | |
| Net asset value, beginning of year | | $ | 12.75 | | | $ | 12.63 | | | $ | 12.89 | | | $ | 17.01 | | | $ | 16.87 | | | $ | 17.19 | | |
| Income from investment operations: | |
| Net investment income | | | 0.21 | | | | 0.12 | | | | 0.24 | | | | 0.36 | | | | 0.24 | | | | 0.40 | | |
Net realized and unrealized
gains (losses) on investments | | | 1.58 | | | | 1.56 | | | | 1.60 | | | | -3.65 | | | | -3.63 | | | | -3.69 | | |
Total income (loss) from
investment operations | | | 1.79 | | | | 1.68 | | | | 1.84 | | | | -3.29 | | | | -3.39 | | | | -3.29 | | |
| Less distributions: | |
| Dividends from net investment income | | | -0.22 | | | | -0.14 | | | | -0.25 | | | | -0.31 | | | | -0.19 | | | | -0.35 | | |
| Distributions from capital gains | | | -0.11 | | | | -0.11 | | | | -0.11 | | | | -0.66 | | | | -0.66 | | | | -0.66 | | |
| Total distributions | | | -0.33 | | | | -0.25 | | | | -0.36 | | | | -0.97 | | | | -0.85 | | | | -1.01 | | |
| Net asset value, end of year | | $ | 14.21 | | | $ | 14.06 | | | $ | 14.37 | | | $ | 12.75 | | | $ | 12.63 | | | $ | 12.89 | | |
| Total return(a) | | | 14.52 | % | | | 13.63 | % | | | 14.78 | % | | | -20.56 | % | | | -21.17 | % | | | -20.36 | % | |
| Ratios and supplemental data | |
| Net assets, end of year (millions) | | $ | 547 | | | $ | 263 | | | $ | 199 | | | $ | 271 | | | $ | 167 | | | $ | 104 | | |
Ratio of operating expenses to
average net assets including
earnings credits | | | 1.26 | % | | | 2.00 | % | | | 1.01 | % | | | 1.20 | % | | | 1.96 | % | | | 0.95 | % | |
Ratio of operating expenses to average
net assets excluding earnings credits | | | 1.26 | % | | | 2.00 | % | | | 1.01 | % | | | 1.21 | % | | | 1.96 | % | | | 0.96 | % | |
Ratio of net investment income to
average net assets including
earnings credits | | | 1.63 | % | | | 0.93 | % | | | 1.90 | % | | | 2.28 | % | | | 1.53 | % | | | 2.53 | % | |
Ratio of net investment income
to average net assets excluding
earnings credits | | | 1.63 | % | | | 0.93 | % | | | 1.90 | % | | | 2.28 | % | | | 1.52 | % | | | 2.53 | % | |
| Portfolio turnover rate | | | 14.88 | % | | | 14.88 | % | | | 14.88 | % | | | 21.75 | % | | | 21.75 | % | | | 21.75 | % | |
*Per share amounts have been calculated using the average shares method.
(a) Does not take into account the deduction of the CDSC (Contingent Deferred Sales Charge) of 1.00% for Class C shares.
See Notes to Financial Statements.
FIRST EAGLE FUNDS | ANNUAL REPORT | OCTOBER 31, 2009
92
U.S. Value Fund
| | | YEAR ENDED OCTOBER 31, | |
| | | 2007 | | 2006 | | 2005 | |
| | | CLASS A | | CLASS C | | CLASS I | | CLASS A | | CLASS C | | CLASS I | | CLASS A | | CLASS C | | CLASS I | |
| Selected data for a share of beneficial interest outstanding throughout each year is presented below:* | |
| Net asset value, beginning of year | | $ | 16.19 | | | $ | 16.08 | | | $ | 16.34 | | | $ | 14.95 | | | $ | 14.90 | | | $ | 15.07 | | | $ | 13.95 | | | $ | 13.92 | | | $ | 14.05 | | |
| Income from investment operations: | |
| Net investment income | | | 0.33 | | | | 0.21 | | | | 0.38 | | | | 0.29 | | | | 0.17 | | | | 0.33 | | | | 0.20 | | | | 0.10 | | | | 0.24 | | |
Net realized and unrealized
gains (losses) on investments | | | 1.45 | | | | 1.44 | | | | 1.46 | | | | 1.46 | | | | 1.47 | | | | 1.48 | | | | 1.35 | | | | 1.35 | | | | 1.36 | | |
Total income (loss) from
investment operations | | | 1.78 | | | | 1.65 | | | | 1.84 | | | | 1.75 | | | | 1.64 | | | | 1.81 | | | | 1.55 | | | | 1.45 | | | | 1.60 | | |
| Less distributions: | |
| Dividends from net investment income | | | -0.30 | | | | -0.20 | | | | -0.33 | | | | -0.24 | | | | -0.19 | | | | -0.27 | | | | -0.20 | | | | -0.12 | | | | -0.23 | | |
| Distributions from capital gains | | | -0.66 | | | | -0.66 | | | | -0.66 | | | | -0.27 | | | | -0.27 | | | | -0.27 | | | | -0.35 | | | | -0.35 | | | | -0.35 | | |
| Total distributions | | | -0.96 | | | | -0.86 | | | | -0.99 | | | | -0.51 | | | | -0.46 | | | | -0.54 | | | | -0.55 | | | | -0.47 | | | | -0.58 | | |
| Net asset value, end of year | | $ | 17.01 | | | $ | 16.87 | | | $ | 17.19 | | | $ | 16.19 | | | $ | 16.08 | | | $ | 16.34 | | | $ | 14.95 | | | $ | 14.90 | | | $ | 15.07 | | |
| Total return(a) | | | 11.47 | % | | | 10.65 | % | | | 11.78 | % | | | 12.05 | % | | | 11.26 | % | | | 12.35 | % | | | 11.35 | % | | | 10.56 | % | | | 11.65 | % | |
| Ratios and supplemental data | |
| Net assets, end of year (millions) | | $ | 324 | | | $ | 233 | | | $ | 104 | | | $ | 254 | | | $ | 161 | | | $ | 115 | | | $ | 150 | | | $ | 97 | | | $ | 68 | | |
Ratio of operating expenses to
average net assets including
earnings credits | | | 1.20 | % | | | 1.95 | % | | | 0.95 | % | | | 1.25 | % | | | 1.99 | % | | | 0.99 | % | | | 1.28 | % | | | 2.02 | % | | | 1.04 | % | |
Ratio of operating expenses to average
net assets excluding earnings credits | | | 1.20 | % | | | 1.95 | % | | | 0.96 | % | | | 1.25 | % | | | 2.00 | % | | | 1.00 | % | | | 1.28 | % | | | 2.02 | % | | | 1.04 | % | |
Ratio of net investment income to
average net assets including
earnings credits | | | 2.04 | % | | | 1.29 | % | | | 2.32 | % | | | 1.87 | % | | | 1.13 | % | | | 2.13 | % | | | 1.40 | % | | | 0.67 | % | | | 1.63 | % | |
Ratio of net investment income
to average net assets excluding
earnings credits | | | 2.04 | % | | | 1.28 | % | | | 2.32 | % | | | 1.87 | % | | | 1.12 | % | | | 2.12 | % | | | 1.40 | % | | | 0.66 | % | | | 1.63 | % | |
| Portfolio turnover rate | | | 32.54 | % | | | 32.54 | % | | | 32.54 | % | | | 31.76 | % | | | 31.76 | % | | | 31.76 | % | | | 17.22 | % | | | 17.22 | % | | | 17.22 | % | |
FIRST EAGLE FUNDS | ANNUAL REPORT | OCTOBER 31, 2009
93

Financial Highlights
| | | YEAR ENDED OCTOBER 31, | |
| | | 2009 | | 2008 | |
| | | CLASS A | | CLASS C | | CLASS I | | CLASS A | | CLASS C | | CLASS I | |
| Selected data for a share of beneficial interest outstanding throughout each year is presented below:* | |
| Net asset value, beginning of year | | $ | 14.85 | | | $ | 14.60 | | | $ | 14.98 | | | $ | 27.28 | | | $ | 26.86 | | | $ | 27.48 | | |
| Income from investment operations: | |
| Net investment income | | | -0.14 | | | | -0.30 | | | | -0.09 | | | | -0.09 | | | | -0.27 | | | | -0.05 | | |
Net realized and unrealized
gains (losses) on investments | | | 11.50 | | | | 11.28 | | | | 11.60 | | | | -10.61 | | | | -10.43 | | | | -10.66 | | |
Total income (loss) from
investment operations | | | 11.36 | | | | 10.98 | | | | 11.51 | | | | -10.70 | | | | -10.70 | | | | -10.71 | | |
| Less distributions: | |
| Dividends from net investment income | | | — | | | | — | | | | — | | | | -0.78 | | | | -0.61 | | | | -0.84 | | |
| Distributions from capital gains | | | -1.06 | | | | -1.06 | | | | -1.06 | | | | -0.95 | | | | -0.95 | | | | -0.95 | | |
| Total distributions | | | -1.06 | | | | -1.06 | | | | -1.06 | | | | -1.73 | | | | -1.56 | | | | -1.79 | | |
| Net asset value, end of year | | $ | 25.15 | | | $ | 24.52 | | | $ | 25.43 | | | $ | 14.85 | | | $ | 14.60 | | | $ | 14.98 | | |
| Total return(a) | | | 78.93 | % | | | 77.62 | % | | | 79.27 | % | | | -41.56 | % | | | -41.99 | % | | | -41.36 | % | |
| Ratios and supplemental data | |
| Net assets, end of year (millions) | | $ | 1,325 | | | $ | 362 | | | $ | 165 | | | $ | 480 | | | $ | 109 | | | $ | 71 | | |
Ratio of operating expenses to
average net assets including
earnings credits | | | 1.26 | % | | | 2.01 | % | | | 1.01 | % | | | 1.21 | % | | | 1.96 | % | | | 0.95 | % | |
Ratio of operating expenses to average
net assets excluding earnings credits | | | 1.26 | % | | | 2.01 | % | | | 1.01 | % | | | 1.21 | % | | | 1.96 | % | | | 0.96 | % | |
Ratio of net investment income to
average net assets including
earnings credits | | | -0.65 | % | | | -1.40 | % | | | -0.40 | % | | | -0.38 | % | | | -1.13 | % | | | -0.20 | % | |
Ratio of net investment income
to average net assets excluding
earnings credits | | | -0.65 | % | | | -1.40 | % | | | -0.40 | % | | | -0.38 | % | | | -1.14 | % | | | -0.20 | % | |
| Portfolio turnover rate | | | 3.00 | % | | | 3.00 | % | | | 3.00 | % | | | 8.74 | % | | | 8.74 | % | | | 8.74 | % | |
*Per share amounts have been calculated using the average shares method.
**Amount represents less than $0.01 per share.
(a) Does not take into account the deduction of the CDSC (Contingent Deferred Sales Charge) of 1.00% for Class C shares.
See Notes to Financial Statements.
FIRST EAGLE FUNDS | ANNUAL REPORT | OCTOBER 31, 2009
94
Gold Fund
| | | YEAR ENDED OCTOBER 31, | |
| | | 2007 | | 2006 | | 2005 | |
| | | CLASS A | | CLASS C | | CLASS I | | CLASS A | | CLASS C | | CLASS I | | CLASS A | | CLASS C | | CLASS I | |
| Selected data for a share of beneficial interest outstanding throughout each year is presented below:* | |
| Net asset value, beginning of year | | $ | 23.48 | | | $ | 23.17 | | | $ | 23.62 | | | $ | 17.45 | | | $ | 17.25 | | | $ | 17.55 | | | $ | 16.82 | | | $ | 16.76 | | | $ | 16.88 | | |
| Income from investment operations: | |
| Net investment income | | | -0.12 | | | | -0.28 | | | | -0.07 | | | | -0.13 | | | | -0.30 | | | | -0.08 | | | | -0.04 | | | | -0.16 | | | | 0.00 | ** | |
Net realized and unrealized
gains (losses) on investments | | | 7.72 | | | | 7.61 | | | | 7.78 | | | | 6.65 | | | | 6.60 | | | | 6.69 | | | | 0.67 | | | | 0.65 | | | | 0.67 | | |
Total income (loss) from
investment operations | | | 7.60 | | | | 7.33 | | | | 7.71 | | | | 6.52 | | | | 6.30 | | | | 6.61 | | | | 0.63 | | | | 0.49 | | | | 0.67 | | |
| Less distributions: | |
| Dividends from net investment income | | | -0.74 | | | | -0.58 | | | | -0.79 | | | | -0.49 | | | | -0.38 | | | | -0.54 | | | | — | | | | — | | | | — | | |
| Distributions from capital gains | | | -3.06 | | | | -3.06 | | | | -3.06 | | | | — | | | | — | | | | — | | | | — | | | | — | | | | — | | |
| Total distributions | | | -3.80 | | | | -3.64 | | | | -3.85 | | | | -0.49 | | | | -0.38 | | | | -0.54 | | | | — | | | | — | | | | — | | |
| Net asset value, end of year | | $ | 27.28 | | | $ | 26.86 | | | $ | 27.48 | | | $ | 23.48 | | | $ | 23.17 | | | $ | 23.62 | | | $ | 17.45 | | | $ | 17.25 | | | $ | 17.55 | | |
| Total return(a) | | | 37.57 | % | | | 36.55 | % | | | 37.93 | % | | | 37.97 | % | | | 36.95 | % | | | 38.29 | % | | | 3.75 | % | | | 2.92 | % | | | 3.97 | % | |
| Ratios and supplemental data | |
| Net assets, end of year (millions) | | $ | 890 | | | $ | 196 | | | $ | 166 | | | $ | 774 | | | $ | 158 | | | $ | 147 | | | $ | 570 | | | $ | 115 | | | $ | 84 | | |
Ratio of operating expenses to
average net assets including
earnings credits | | | 1.20 | % | | | 1.95 | % | | | 0.95 | % | | | 1.21 | % | | | 1.96 | % | | | 0.96 | % | | | 1.29 | % | | | 2.04 | % | | | 1.04 | % | |
Ratio of operating expenses to average
net assets excluding earnings credits | | | 1.20 | % | | | 1.95 | % | | | 0.95 | % | | | 1.22 | % | | | 1.97 | % | | | 0.97 | % | | | 1.30 | % | | | 2.05 | % | | | 1.05 | % | |
Ratio of net investment income to
average net assets including
earnings credits | | | -0.55 | % | | | -1.30 | % | | | -0.30 | % | | | -0.59 | % | | | -1.33 | % | | | -0.34 | % | | | -0.24 | % | | | -0.98 | % | | | 0.02 | % | |
Ratio of net investment income
to average net assets excluding
earnings credits | | | -0.56 | % | | | -1.31 | % | | | -0.31 | % | | | -0.59 | % | | | -1.34 | % | | | -0.34 | % | | | -0.24 | % | | | -0.98 | % | | | -0.01 | % | |
| Portfolio turnover rate | | | 16.37 | % | | | 16.37 | % | | | 16.37 | % | | | 32.26 | % | | | 32.26 | % | | | 32.26 | % | | | 21.73 | % | | | 21.73 | % | | | 21.73 | % | |
FIRST EAGLE FUNDS | ANNUAL REPORT | OCTOBER 31, 2009
95

Financial Highlights
| | | YEAR ENDED OCTOBER 31, | |
| | | 2009 | | 2008 | |
| | | CLASS A | | CLASS C | | CLASS Y | | CLASS A | | CLASS C | | CLASS Y | |
| Selected data for a share of beneficial interest outstanding throughout each year is presented below:* | |
| Net asset value, beginning of year | | $ | 18.92 | | | $ | 17.14 | | | $ | 19.23 | | | $ | 29.79 | | | $ | 27.39 | | | $ | 30.22 | | |
| Income from investment operations: | |
| Net investment income | | | -0.06 | | | | -0.18 | | | | -0.07 | | | | -0.06 | | | | -0.20 | | | | -0.01 | | |
Net realized and unrealized
gains (losses) on investments | | | 1.61 | | | | 1.44 | | | | 1.65 | | | | -7.85 | | | | -7.16 | | | | -8.03 | | |
Total income (loss) from
investment operations | | | 1.55 | | | | 1.26 | | | | 1.58 | | | | -7.91 | | | | -7.36 | | | | -8.04 | | |
| Less distributions: | |
| Dividends from net investment income | | | — | | | | — | | | | — | | | | -0.07 | | | | — | | | | -0.06 | | |
| Distributions from capital gains | | | -1.15 | | | | -1.15 | | | | -1.15 | | | | -2.89 | | | | -2.89 | | | | -2.89 | | |
| Total distributions | | | -1.15 | | | | -1.15 | | | | -1.15 | | | | -2.96 | | | | -2.89 | | | | -2.95 | | |
| Net asset value, end of year | | $ | 19.32 | | | $ | 17.25 | | | $ | 19.66 | | | $ | 18.92 | | | $ | 17.14 | | | $ | 19.23 | | |
| Total return(a) | | | 9.13 | % | | | 8.34 | % | | | 9.14 | % | | | -29.20 | % | | | -29.74 | % | | | -29.23 | % | |
| Ratios and supplemental data | |
| Net assets, end of year (millions) | | $ | 276 | | | $ | 90 | | | $ | 503 | | | $ | 127 | | | $ | 61 | | | $ | 501 | | |
Ratio of operating expenses to
average net assets including
earnings credits | | | 1.50 | % | | | 2.25 | % | | | 1.50 | % | | | 1.41 | % | | | 2.16 | % | | | 1.41 | % | |
Ratio of operating expenses to average
net assets excluding earnings credits | | | 1.50 | % | | | 2.25 | % | | | 1.50 | % | | | 1.42 | % | | | 2.17 | % | | | 1.42 | % | |
Ratio of net investment income to
average net assets including
earnings credits | | | -0.34 | % | | | -1.10 | % | | | -0.37 | % | | | -0.23 | % | | | -0.87 | % | | | -0.06 | % | |
Ratio of net investment income
to average net assets excluding
earnings credits | | | -0.34 | % | | | -1.10 | % | | | -0.37 | % | | | -0.24 | % | | | -0.88 | % | | | -0.07 | % | |
| Portfolio turnover rate | | | 40.41 | % | | | 40.41 | % | | | 40.41 | % | | | 63.97 | % | | | 63.97 | % | | | 63.97 | % | |
*Per share amounts have been calculated using the average shares method.
(a) Does not take into account the deduction of the CDSC (Contingent Deferred Sales Charge) of 1.00% for Class C shares.
(b) Investment income (loss) per share reflects special dividends received in Class A, C and Y which amounts to $0.13, $0.12 and $0.13 per share. Excluding the special dividend, the ratio of net investment income (loss) to average new assets both with and without the effect of earnings credits in Class A, C and Y would have been –0.31%, –1.00% and –0.22%.
See Notes to Financial Statements.
FIRST EAGLE FUNDS | ANNUAL REPORT | OCTOBER 31, 2009
96
Fund of America
| | | YEAR ENDED OCTOBER 31, | |
| | | 2007 | | 2006 | | 2005 | |
| | | CLASS A | | CLASS C | | CLASS Y | | CLASS A | | CLASS C | | CLASS Y | | CLASS A | | CLASS C | | CLASS Y | |
| Selected data for a share of beneficial interest outstanding throughout each year is presented below:* | |
| Net asset value, beginning of year | | $ | 27.92 | | | $ | 26.12 | | | $ | 28.28 | | | $ | 26.11 | | | $ | 24.74 | | | $ | 26.42 | | | $ | 25.54 | | | $ | 24.44 | | | $ | 25.81 | | |
| Income from investment operations: | |
| Net investment income | | | 0.05 | (b) | | | -0.13 | (b) | | | 0.07 | (b) | | | -0.08 | | | | -0.26 | | | | -0.08 | | | | -0.09 | | | | -0.26 | | | | -0.07 | | |
Net realized and unrealized
gains (losses) on investments | | | 5.30 | | | | 4.88 | | | | 5.35 | | | | 4.23 | | | | 3.98 | | | | 4.28 | | | | 2.36 | | | | 2.26 | | | | 2.38 | | |
Total income (loss) from
investment operations | | | 5.35 | | | | 4.75 | | | | 5.42 | | | | 4.15 | | | | 3.72 | | | | 4.20 | | | | 2.27 | | | | 2.00 | | | | 2.31 | | |
| Less distributions: | |
| Dividends from net investment income | | | — | | | | — | | | | — | | | | — | | | | — | | | | — | | | | — | | | | — | | | | — | | |
| Distributions from capital gains | | | -3.48 | | | | -3.48 | | | | -3.48 | | | | -2.34 | | | | -2.34 | | | | -2.34 | | | | -1.70 | | | | -1.70 | | | | -1.70 | | |
| Total distributions | | | -3.48 | | | | -3.48 | | | | -3.48 | | | | -2.34 | | | | -2.34 | | | | -2.34 | | | | -1.70 | | | | -1.70 | | | | -1.70 | | |
| Net asset value, end of year | | $ | 29.79 | | | $ | 27.39 | | | $ | 30.22 | | | $ | 27.92 | | | $ | 26.12 | | | $ | 28.28 | | | $ | 26.11 | | | $ | 24.74 | | | $ | 26.42 | | |
| Total return(a) | | | 21.28 | % | | | 20.34 | % | | | 21.25 | % | | | 16.81 | % | | | 15.93 | % | | | 16.80 | % | | | 9.16 | % | | | 8.43 | % | | | 9.23 | % | |
| Ratios and supplemental data | |
| Net assets, end of year (millions) | | $ | 82 | | | $ | 65 | | | $ | 756 | | | $ | 46 | | | $ | 48 | | | $ | 671 | | | $ | 29 | | | $ | 36 | | | $ | 684 | | |
Ratio of operating expenses to
average net assets including
earnings credits | | | 1.40 | % | | | 2.15 | % | | | 1.40 | % | | | 1.41 | % | | | 2.16 | % | | | 1.41 | % | | | 1.49 | % | | | 2.17 | % | | | 1.43 | % | |
Ratio of operating expenses to average
net assets excluding earnings credits | | | 1.41 | % | | | 2.16 | % | | | 1.41 | % | | | 1.41 | % | | | 2.16 | % | | | 1.41 | % | | | 1.49 | % | | | 2.17 | % | | | 1.43 | % | |
Ratio of net investment income to
average net assets including
earnings credits | | | 0.18 | %(b) | | | -0.51 | %(b) | | | 0.26 | %(b) | | | -0.30 | % | | | -1.05 | % | | | -0.30 | % | | | -0.34 | % | | | -1.03 | % | | | -0.27 | % | |
Ratio of net investment income
to average net assets excluding
earnings credits | | | 0.17 | %(b) | | | -0.52 | %(b) | | | 0.25 | %(b) | | | -0.30 | % | | | -1.05 | % | | | -0.30 | % | | | -0.34 | % | | | -1.04 | % | | | -0.27 | % | |
| Portfolio turnover rate | | | 50.26 | % | | | 50.26 | % | | | 50.26 | % | | | 40.38 | % | | | 40.38 | % | | | 40.38 | % | | | 54.54 | % | | | 54.54 | % | | | 54.54 | % | |
FIRST EAGLE FUNDS | ANNUAL REPORT | OCTOBER 31, 2009
97
Notes to Financial Statements
Note 1—Significant Accounting Policies
First Eagle Funds (the "Trust"), is an open-end management investment company registered under the Investment Company Act of 1940, as amended ("1940 Act"). The Trust consists of five separate portfolios, First Eagle Global Fund, First Eagle Overseas Fund, First Eagle U.S. Value Fund, First Eagle Gold Fund and First Eagle Fund of America (each individually a "Fund" or collectively the "Funds"). All the Funds are diversified mutual funds except for First Eagle Gold Fund and First Eagle Fund of America, which are non-diversified. The Trust is a Delaware statutory trust and was, until April 23, 2004, a Maryland corporation operating under the name Fi rst Eagle Funds, Inc. First Eagle Fund of America, previously a portfolio of a separate Delaware statutory trust, was reorganized as a portfolio of the Trust effective December 31, 2002. The First Eagle Global Fund seeks long-term growth of capital by investing in a range of asset classes from markets in the United States and around the world. The First Eagle Overseas Fund seeks long-term growth of capital by investing primarily in equities issued by non-U.S. corporations. The First Eagle U.S. Value Fund seeks long-term growth of capital by investing, under normal market conditions, primarily in equity and debt issued by U.S. corporations. The First Eagle Gold Fund's investment objective is to provide exposure to the investment characteristics of gold and, to a limited extent, other precious metals. The First Eagle Fund of America is primarily a U.S. equity fund that seeks capital appreciation by investing primarily in U.S. stocks and to a lesser extent in debt and foreign equity securities.
The following is a summary of significant accounting policies adhered to by the Funds and are in conformity with U.S. generally accepted accounting principles ("GAAP").
Effective December 7, 2009, Arnhold and S. Bleichroeder Advisers, LLC, has changed its corporate name to First Eagle Investment Management, LLC (the "Adviser").
a) Investment valuation—Each Fund computes its net asset value once daily as of the close of trading on each day the New York Stock Exchange ("NYSE") is open for trading. The net asset value per share is computed by dividing the total current value of the assets of a Fund, less its liabilities, by the total number of shares outstanding at the time of such computation.
A portfolio security (including an option), other than a bond, which is traded on a U.S. national securities exchange or a securities exchange abroad is normally valued at the price of the last sale on the exchange as of the close of
FIRST EAGLE FUNDS | ANNUAL REPORT | OCTOBER 31, 2009
98
(continued)
business on the date on which assets are valued. If there are no sales on such date, such portfolio investment will be valued at the mean between the closing bid and asked prices (and if there is only a bid or only an asked price on such date, valuation will be at such bid or asked price for long or short positions, respectively). Securities, other than bonds, traded in the over-the-counter market are valued at the mean between the last bid and asked prices prior to the time of valuation (and if there is only a bid or only an asked price on such date, valuation will be at such bid or asked price for long or short positions, respectively), except if such unlisted security traded on the NASDAQ in which case it is valued at its last sale price (or, if available in the case of NASDAQ securities, the NASDAQ Official Closing Price ('NOCP').
Commodities (such as physical metals) are valued at the spot price at the time trading on the New York Stock Exchange closes (normally 4:00 p.m. E.S.T.).
Forward currency contracts are valued at the current cost of covering or offsetting such contracts.
All bonds, whether listed on an exchange or traded in the over-the-counter market (and except for short-term investments as described in the next sentence), for which market quotations are readily available are valued at the mean between the last bid and asked prices received from dealers in the over-the-counter market in the United States or abroad, except that when no asked price is available, bonds are valued at the last bid price alone. Short-term investments maturing in sixty days or less are valued at cost plus interest earned (or discount amortized, as the case may be), which is deemed to approximate value.
The 2:00 pm E.S.T. exchange rates typically are used to convert foreign security prices into U.S. dollars. Any security that is listed or traded on more than one exchange (or traded in multiple markets) is valued at the relevant quotation on the exchange or market deemed to be the primary trading venue for that security. In the absence of such a quotation, a quotation from the exchange or market deemed by the Adviser to be the secondary trading venue for the particular security shall be used. The Funds use pricing services to identify the market prices of publicly traded securities in their portfolios. When market prices are determined to be "stale" as a result of limited market activity for a particular holding, or in other circumstances when market prices are unavailable, such as for private placements, or determined to be unreliable for a particular holding, such holdings may be "fair valued" in
FIRST EAGLE FUNDS | ANNUAL REPORT | OCTOBER 31, 2009
99
Notes to Financial Statements
accordance with procedures approved by the Board of Trustees ("Board"). Additionally, with respect to foreign holdings, specifically in circumstances leading the Adviser to believe that significant events occurring after the close of a foreign market have materially affected the value of a Fund's holdings in that market, such holdings may be fair valued to reflect the events in accordance with procedures approved by the Board. The determination of whether a particular foreign investment should be fair valued will be based on a review of a number of factors, including developments in foreign markets, the performance of U.S. securities markets and security-specific events. The values assigned to a Fund's holdings therefore may differ on occasion from reported market values.
The Funds with significant non-U.S. holdings have adopted procedures under which movements in the prices for U.S. securities (beyond specified thresholds) occurring after the close of a foreign market may require fair valuation of securities traded on that foreign market. The values assigned to a Fund's holdings therefore may differ on occasion from reported market values. The Trust and the Adviser believe relying on the procedures described above will result in prices that are more reflective of the actual market value of portfolio securities held by the Funds.
The Funds adopted provisions surrounding fair value measurements and disclosures that define fair value, establishes a framework for measuring fair value in generally accepted accounting principles and expands disclosures about fair value measurements. This applies to fair value measurements that are already required or permitted by other accounting standards and is intended to increase consistency of those measurements and applies broadly to securities and other types of assets and liabilities.
The Funds disclose the fair value of their investments in a hierarchy that prioritizes the inputs or assumptions to valuation techniques used to measure fair value. These inputs are used in determining the value of the Fund's investments and are summarized in the following fair value hierarchy:
Level 1—Quoted prices in active markets for identical securities.
Level 2—Other significant observable inputs (including quoted prices for similar securities, interest rates, prepayment speeds, credit risk, etc.).
Level 3—Other significant unobservable inputs (including fund's own assumption in determining the fair value of investments).
FIRST EAGLE FUNDS | ANNUAL REPORT | OCTOBER 31, 2009
100
(continued)
The following is a summary of the inputs used to value the Fund's investments as of October 31, 2009:
| First Eagle Global Fund | |
| DESCRIPTION | | LEVEL 1 | | LEVEL 2 | | LEVEL 3(a) | | TOTAL | |
| Assets:† | |
| U.S. Common Stocks | | $ | 4,909,936,547 | | | $ | 2,744,838 | | | $ | 246,080 | | | $ | 4,912,927,465 | | |
International
Common Stocks | | | 9,899,078,496 | | | | 32,931,018 | | | | 884,250 | | | | 9,932,893,764 | | |
| U.S. Preferred Stocks | | | — | | | | 16,206,024 | | | | — | | | | 16,206,024 | | |
International
Preferred Stocks | | | 242,235,738 | | | | — | | | | — | | | | 242,235,738 | | |
| Commodity* | | | 1,306,455,960 | | | | — | | | | — | | | | 1,306,455,960 | | |
| U.S. Bonds | | | — | | | | 440,343,236 | | | | — | | | | 440,343,236 | | |
International
Corporate Notes
and Bonds | | | — | | | | 144,692,543 | | | | 30,948,757 | | | | 175,641,300 | | |
International
Government Bonds | | | — | | | | 358,134,148 | | | | — | | | | 358,134,148 | | |
International
Commercial Paper | | | — | | | | 565,781,087 | | | | — | | | | 565,781,087 | | |
| U.S. Commercial Paper | | | — | | | | 1,176,807,470 | | | | — | | | | 1,176,807,470 | | |
Foreign Currency
Contracts** | | | 1,492,564 | | | | — | | | | — | | | | 1,492,564 | | |
| Total | | $ | 16,359,199,305 | | | $ | 2,737,640,364 | | | $ | 32,079,087 | | | $ | 19,128,918,756 | | |
| Liabilities: | |
Foreign Currency
Contracts** | | $ | (121,208,005 | ) | | $ | — | | | $ | — | | | $ | (121,208,005 | ) | |
| Total | | $ | (121,208,005 | ) | | $ | — | | | $ | — | | | $ | (121,208,005 | ) | |
(a) Level 3 securities are identified in the Schedule of Investments with footnote (d).
† See Schedule of Investments for additional detailed categorizations.
* Gold Bullion.
** Foreign currency contracts are valued at net unrealized appreciation (depreciation) on the investment.
FIRST EAGLE FUNDS | ANNUAL REPORT | OCTOBER 31, 2009
101
Notes to Financial Statements
| First Eagle Global Fund—(continued) | |
Fair Value Level 3 activity for the year ended October 31, 2009 was as follows:
| | | U.S. COMMON
STOCKS | | INTERNATIONAL
COMMON STOCKS | | INTERNATIONAL
CORPORATE BONDS | | TOTAL VALUE | |
Beginning Balance—
market value | | $ | 1,676,430 | | | $ | — | | | $ | 17,178,741 | | | $ | 18,855,171 | | |
| Purchases (Sales) | | | (328,500 | ) | | | — | | | | 21,410,094 | | | | 21,081,594 | | |
Transfer In (Out)—
Level 3^ | | | — | | | | — | | | | 3,473,923 | | | | 3,473,923 | | |
| Accrued Amortization | | | — | | | | — | | | | 78,746 | | | | 78,746 | | |
| Realized Gains (Losses) | | | 328,500 | | | | — | | | | (18,067,500 | ) | | | (17,739,000 | ) | |
Change in Unrealized
Appreciation (Depreciation) | | | (1,430,350 | ) | | | 884,250 | | | | 6,874,753 | | | | 6,328,653 | | |
Ending Balance—
market value | | $ | 246,080 | | | $ | 884,250 | | | $ | 30,948,757 | | | $ | 32,079,087 | | |
Change in unrealized
gains or losses relating
to assets still held at
reporting date | | $ | (422,950 | ) | | $ | 884,250 | | | $ | (1,649,002 | ) | | $ | (1,187,702 | ) | |
^ Transfers into/out of Level 3 represent values as of the beginning of the period.
FIRST EAGLE FUNDS | ANNUAL REPORT | OCTOBER 31, 2009
102
(continued)
| First Eagle Overseas Fund | |
| DESCRIPTION | | LEVEL 1 | | LEVEL 2 | | LEVEL 3(a) | | TOTAL | |
| Assets:† | |
International
Common Stocks | | $ | 5,301,304,865 | | | $ | 56,517,854 | | | $ | 27,525,719 | | | $ | 5,385,348,438 | | |
| U.S. Common Stock | | | 54,615,443 | | | | — | | | | — | | | | 54,615,443 | | |
| Investment Companies | | | — | | | | 6,296,796 | | | | 50,000 | | | | 6,346,796 | | |
International
Preferred Stocks | | | 149,473,868 | | | | — | | | | — | | | | 149,473,868 | | |
| Commodity* | | | 570,582,616 | | | | — | | | | — | | | | 570,582,616 | | |
International
Corporate Bonds | | | — | | | | 95,320,587 | | | | 20,632,504 | | | | 115,953,091 | | |
International
Government Bonds | | | — | | | | 71,458,741 | | | | — | | | | 71,458,741 | | |
International
Commercial Paper | | | — | | | | 222,983,709 | | | | — | | | | 222,983,709 | | |
| U.S. Commercial Paper | | | — | | | | 481,991,807 | | | | — | | | | 481,991,807 | | |
Foreign Currency
Contracts** | | | 731,636 | | | | — | | | | — | | | | 731,636 | | |
| Total | | $ | 6,076,708,428 | | | $ | 934,569,494 | | | $ | 48,208,223 | | | $ | 7,059,486,145 | | |
| Liabilities: | |
Foreign Currency
Contracts** | | $ | (58,441,992 | ) | | $ | — | | | $ | — | | | $ | (58,441,992 | ) | |
| Total | | $ | (58,441,992 | ) | | $ | — | | | $ | — | | | $ | (58,441,992 | ) | |
(a) Level 3 securities are identified in the Schedule of Investments with footnote (d).
† See Schedule of Investments for additional detailed categorizations.
* Gold Bullion.
** Foreign currency contracts are valued at net unrealized appreciation (depreciation) on the investment.
FIRST EAGLE FUNDS | ANNUAL REPORT | OCTOBER 31, 2009
103
Notes to Financial Statements
| First Eagle Overseas Fund—(continued) | |
Fair Value Level 3 activity for the year ended October 31, 2009 was as follows:
| | | INTERNATIONAL
COMMON STOCKS | | INVESTMENT
COMPANIES | | INTERNATIONAL
CORPORATE BONDS | | TOTAL VALUE | |
Beginning Balance—
market value | | $ | 7,291,421 | | | $ | 50,000 | | | $ | 11,452,495 | | | $ | 18,793,916 | | |
| Purchases (Sales) | | | 19,615,500 | | | | — | | | | 14,273,396 | | | | 33,888,896 | | |
Transfer In (Out)—
Level 3^ | | | 3,760,316 | | | | — | | | | 5,675,347 | | | | 9,435,663 | | |
| Accrued Amortization | | | — | | | | — | | | | 29,376 | | | | 29,376 | | |
| Realized Losses | | | — | | | | — | | | | (12,045,000 | ) | | | (12,045,000 | ) | |
Change in Unrealized
Appreciation
(Depreciation) | | | (3,141,518 | ) | | | — | | | | 1,246,890 | | | | (1,894,628 | ) | |
Ending Balance—
market value | | $ | 27,525,719 | | | $ | 50,000 | | | $ | 20,632,504 | | | $ | 48,208,223 | | |
Change in unrealized
gains or losses relating
to assets still held at
reporting date | | $ | (3,141,518 | ) | | $ | — | | | $ | (4,435,613 | ) | | $ | (7,577,131 | ) | |
^ Transfers into/out of Level 3 represent values as of the beginning of the period.
| First Eagle U.S. Value Fund | |
| DESCRIPTION | | LEVEL 1 | | LEVEL 2 | | LEVEL 3(a) | | TOTAL | |
| Assets:† | |
| U.S. Common Stocks | | $ | 553,878,489 | | | $ | 1,890 | | | $ | 10,240 | | | $ | 553,890,619 | | |
International
Common Stocks | | | 70,154,824 | | | | — | | | | — | | | | 70,154,824 | | |
| U.S. Preferred Stocks | | | — | | | | 3,920,450 | | | | 4,677,256 | | | | 8,597,706 | | |
| Investment Company | | | 7,069,082 | | | | — | | | | — | | | | 7,069,082 | | |
| Commodity* | | | 54,304,356 | | | | — | | | | — | | | | 54,304,356 | | |
| U.S. Bonds | | | — | | | | 115,854,039 | | | | — | | | | 115,854,039 | | |
International
Corporate Bond | | | — | | | | 3,625,600 | | | | — | | | | 3,625,600 | | |
International
Commercial Paper | | | — | | | | 68,009,954 | | | | — | | | | 68,009,954 | | |
| U.S. Commercial Paper | | | — | | | | 124,444,565 | | | | — | | | | 124,444,565 | | |
| Total | | $ | 685,406,751 | | | $ | 315,856,498 | | | $ | 4,687,496 | | | $ | 1,005,950,745 | | |
(a) Level 3 securities are identified in the Schedule of Investments with footnote (c).
† See Schedule of Investments for additional detailed categorizations.
* Gold Bullion.
FIRST EAGLE FUNDS | ANNUAL REPORT | OCTOBER 31, 2009
104
(continued)
| First Eagle U.S. Value Fund—(continued) | |
Fair Value Level 3 activity for the year ended October 31, 2009 was as follows:
| | | U.S. COMMON STOCKS | | U.S. PREFERRED
STOCKS | | TOTAL VALUE | |
| Beginning Balance—market value | | $ | 27,840 | | | $ | — | | | $ | 27,840 | | |
| Purchases (Sales) | | | — | | | | — | | | | — | | |
| Transfer In (Out)—Level 3^ | | | — | | | | 2,748,247 | | | | 2,748,247 | | |
| Accrued Amortization | | | — | | | | — | | | | — | | |
| Realized Gains (Losses) | | | — | | | | — | | | | — | | |
Change in Unrealized Appreciation
(Depreciation) | | | (17,600 | ) | | | 1,929,009 | | | | 1,911,409 | | |
| Ending Balance—market value | | $ | 10,240 | | | $ | 4,677,256 | | | $ | 4,687,496 | | |
Change in unrealized gains or losses
relating to assets still held at reporting date | | $ | (17,600 | ) | | $ | 1,929,009 | | | $ | 1,911,409 | | |
^ Transfers into/out of Level 3 represent values as of the beginning of the period.
| First Eagle Gold Fund | |
| DESCRIPTION | | LEVEL 1 | | LEVEL 2 | | LEVEL 3 | | TOTAL | |
| Assets:† | |
International
Common Stocks | | $ | 1,255,573,061 | | | $ | — | | | $ | — | | | $ | 1,255,573,061 | | |
| U.S. Common Stocks | | | 153,785,183 | | | | — | | | | — | | | | 153,785,183 | | |
| Warrants | | | 1,373,474 | | | | — | | | | — | | | | 1,373,474 | | |
| Commodity* | | | 337,725,045 | | | | — | | | | — | | | | 337,725,045 | | |
International
Commercial Paper | | | — | | | | 32,376,834 | | | | — | | | | 32,376,834 | | |
| U.S. Commercial Paper | | | — | | | | 84,154,617 | | | | — | | | | 84,154,617 | | |
| Total | | $ | 1,748,456,763 | | | $ | 116,531,451 | | | $ | — | | | $ | 1,864,988,214 | | |
† See Schedule of Investments for additional detailed categorizations.
* Gold Bullion.
FIRST EAGLE FUNDS | ANNUAL REPORT | OCTOBER 31, 2009
105
Notes to Financial Statements
| First Eagle Fund of America | |
| DESCRIPTION | | LEVEL 1 | | LEVEL 2 | | LEVEL 3 | | TOTAL | |
| Assets:† | |
| U.S. Common Stocks | | $ | 754,203,280 | | | $ | — | | | $ | — | | | $ | 754,203,280 | | |
International
Common Stocks | | | 58,613,022 | | | | — | | | | — | | | | 58,613,022 | | |
| Limited Partnership | | | 2,199,704 | | | | — | | | | — | | | | 2,199,704 | | |
| Investment Company | | | 36,582,704 | | | | — | | | | — | | | | 36,582,704 | | |
| U.S. Bond | | | — | | | | 1,624,500 | | | | — | | | | 1,624,500 | | |
| Repurchase Agreement | | | — | | | | 33,089,281 | | | | — | | | | 33,089,281 | | |
| Total | | $ | 851,598,710 | | | $ | 34,713,781 | | | $ | — | | | $ | 886,312,491 | | |
| Liabilities: | |
Covered Call
Options Written | | $ | — | | | $ | (11,291,800 | ) | | $ | — | | | $ | (11,291,800 | ) | |
| Total | | $ | — | | | $ | (11,291,800 | ) | | $ | — | | | $ | (11,291,800 | ) | |
† See Schedule of Investments for additional detailed categorizations.
b) Investment transactions and income—Investment transactions are accounted for on a trade date basis. The specific identification method is used in determining realized gains and losses from investment transactions. Dividend income is recorded on the ex-dividend date. Interest income is recorded daily on an accrual basis. In computing investment income, each Fund accretes discounts and amortizes premiums on debt obligations using the interest method. Investment income is allocated to each Fund's share class in proportion to its relative net assets. Payments received from certain investments held by the Funds may be comprised of dividends, capital gains and return of capital. The Funds originally estimate the expected classification of such payments. The amounts may subsequently be reclassified upon receipt of information from the issu er.
c) Expenses—Expenses arising in connection with a Fund are charged directly to that Fund. Expenses common to all Funds are allocated to each Fund in proportion to its relative net assets. Certain expenses are shared with the First Eagle Variable Funds, an affiliated fund group. Such costs are generally allocated using the ratio of the Fund's average daily net assets relative to the total average daily net assets of the First Eagle Variable Funds. Earnings credits may reduce custody fees, shareholder servicing agent fees and/or accounting fees by the amount of interest earned on balances with such service provider.
FIRST EAGLE FUNDS | ANNUAL REPORT | OCTOBER 31, 2009
106
(continued)
d) Foreign currency translation—The books and records of the Funds are maintained in U.S. dollars. The market values of securities which are not traded in U.S. currency are recorded in the financial statements after translation to U.S. dollars based on the applicable exchange rates at the end of the period. The costs of such securities are translated at exchange rates prevailing when acquired. Related dividends, interest and withholding taxes are accrued at the rates of exchange prevailing on the respective dates of such transactions.
The net assets of each of the Funds are presented at the foreign exchange rates and market values at the close of the period. The Funds do not isolate that portion of gains and losses on investments which is due to changes in foreign exchange rates from that which is due to changes in market prices of the equity securities. However, for federal income tax purposes each Fund does isolate the effect of changes in foreign exchange rates from the changes in market prices for realized gains and losses on debt obligations.
e) Forward currency contracts—In connection with portfolio purchases and sales of securities denominated in foreign currencies, each Fund may enter into forward currency contracts. The Funds' currency transactions may include transaction hedging and portfolio hedging involving either specific transactions or portfolio positions. Transaction hedging is the purchase or sale of a forward contract (or other cash management position) with respect to specific payables or receivables of each Fund in connection with the purchase or sale of portfolio securities. Portfolio hedging is the use of a forward contract (or other cash management position) with respect to one or more portfolio security positions denominated or quoted in a particular currency. Each Fund may engage in portfolio hedging with respect to the currency of a particular country in amounts approximating actual or anticipated positions in securities denominated in that currency. These contracts are valued at the current cost of covering or offsetting such contracts, and the related realized and unrealized foreign exchange gains and losses are included in the Statements of Operations.
Each Fund could be exposed to risk if the value of the currency changes unfavorably, if the counterparties to the contracts are unable to meet the terms of their contracts or if the Fund is unable to enter into a closing position. Risks may exceed amounts recognized on the Statements of Assets and Liabilities. Forward currency contracts outstanding at period end, if any, are listed after the Fund's portfolio. Outstanding contracts at period-end are indicative of the volume of activity during the period.
FIRST EAGLE FUNDS | ANNUAL REPORT | OCTOBER 31, 2009
107
Notes to Financial Statements
The Funds adopted provisions surrounding disclosures and derivative instruments and hedging activities which require qualitative disclosures about objectives and strategies for using derivatives, quantitative disclosures about fair value amounts of gains and losses on derivative instruments, and disclosures about credit-risk-related contingent features in derivative agreements.
At October 31, 2009, the Funds had the following foreign forward currency contracts grouped into appropriate risk categories illustrated below:
| First Eagle Global Fund | |
| Asset Derivatives1 | |
| | | INTEREST
RATE
CONTRACTS
RISK | | FOREIGN
EXCHANGE
CONTRACTS
RISK | | CREDIT
CONTRACTS
RISK | | EQUITY
CONTRACTS
RISK | | COMMODITY
CONTRACTS
RISK | | OTHER
CONTRACTS
RISK | | TOTAL | |
Foreign
Currency
Contracts | | $ | — | | | $ | 1,492,564 | | | $ | — | | | $ | — | | | $ | — | | | $ | — | | | $ | 1,492,564 | | |
| Liability Derivatives2 | |
| | | INTEREST
RATE
CONTRACTS
RISK | | FOREIGN
EXCHANGE
CONTRACTS
RISK | | CREDIT
CONTRACTS
RISK | | EQUITY
CONTRACTS
RISK | | COMMODITY
CONTRACTS
RISK | | OTHER
CONTRACTS
RISK | | TOTAL | |
Foreign
Currency
Contracts | | $ | — | | | $ | (121,208,005 | ) | | $ | — | | | $ | — | | | $ | — | | | $ | — | | | $ | (121,208,005 | ) | |
Transactions in derivative instruments during the year ended October 31, 2009, were as follows:
| Realized Gain3 | |
| | | INTEREST
RATE
CONTRACTS
RISK | | FOREIGN
EXCHANGE
CONTRACTS
RISK | | CREDIT
CONTRACTS
RISK | | EQUITY
CONTRACTS
RISK | | COMMODITY
CONTRACTS
RISK | | OTHER
CONTRACTS
RISK | | TOTAL | |
Foreign
Currency
Contracts | | $ | — | | | $ | 409,469,297 | | | $ | — | | | $ | — | | | $ | — | | | $ | — | | | $ | 409,469,297 | | |
| Change in Depreciation4 | |
| | | INTEREST
RATE
CONTRACTS
RISK | | FOREIGN
EXCHANGE
CONTRACTS
RISK | | CREDIT
CONTRACTS
RISK | | EQUITY
CONTRACTS
RISK | | COMMODITY
CONTRACTS
RISK | | OTHER
CONTRACTS
RISK | | TOTAL | |
Foreign
Currency
Contracts | | $ | — | | | $ | (705,560,083 | ) | | $ | — | | | $ | — | | | $ | — | | | $ | — | | | $ | (705,560,083 | ) | |
FIRST EAGLE FUNDS | ANNUAL REPORT | OCTOBER 31, 2009
108
(continued)
| First Eagle Overseas Fund | |
| Asset Derivatives1 | |
| | | INTEREST
RATE
CONTRACTS
RISK | | FOREIGN
EXCHANGE
CONTRACTS
RISK | | CREDIT
CONTRACTS
RISK | | EQUITY
CONTRACTS
RISK | | COMMODITY
CONTRACTS
RISK | | OTHER
CONTRACTS
RISK | | TOTAL | |
Foreign
Currency
Contracts | | $ | — | | | $ | 731,636 | | | $ | — | | | $ | — | | | $ | — | | | $ | — | | | $ | 731,636 | | |
| Liability Derivatives2 | |
| | | INTEREST
RATE
CONTRACTS
RISK | | FOREIGN
EXCHANGE
CONTRACTS
RISK | | CREDIT
CONTRACTS
RISK | | EQUITY
CONTRACTS
RISK | | COMMODITY
CONTRACTS
RISK | | OTHER
CONTRACTS
RISK | | TOTAL | |
Foreign
Currency
Contracts | | $ | — | | | $ | (58,441,992 | ) | | $ | — | | | $ | — | | | $ | — | | | $ | — | | | $ | (58,441,992 | ) | |
Transactions in derivative instruments during the year ended October 31, 2009, were as follows:
| Realized Gain3 | |
| | | INTEREST
RATE
CONTRACTS
RISK | | FOREIGN
EXCHANGE
CONTRACTS
RISK | | CREDIT
CONTRACTS
RISK | | EQUITY
CONTRACTS
RISK | | COMMODITY
CONTRACTS
RISK | | OTHER
CONTRACTS
RISK | | TOTAL | |
Foreign
Currency
Contracts | | $ | — | | | $ | 255,206,031 | | | $ | — | | | $ | — | | | $ | — | | | $ | — | | | $ | 255,206,031 | | |
| Change in Depreciation4 | |
| | | INTEREST
RATE
CONTRACTS
RISK | | FOREIGN
EXCHANGE
CONTRACTS
RISK | | CREDIT
CONTRACTS
RISK | | EQUITY
CONTRACTS
RISK | | COMMODITY
CONTRACTS
RISK | | OTHER
CONTRACTS
RISK | | TOTAL | |
Foreign
Currency
Contracts | | $ | — | | | $ | (389,644,445 | ) | | $ | — | | | $ | — | | | $ | — | | | $ | — | | | $ | (389,644,445 | ) | |
1Statements of Assets and Liabilities location: Receivable for forward currency contracts held, at value.
2Statements of Assets and Liabilities location: Payable for forward currency contracts held, at value.
3Statements of Operations location: Net realized gains (losses) from: foreign currency and forward contract related transactions.
4Statements of Operations location: Changes in unrealized appreciation (depreciation) of: foreign currency and forward contract related translation.
FIRST EAGLE FUNDS | ANNUAL REPORT | OCTOBER 31, 2009
109
Notes to Financial Statements
f) Repurchase agreements—The Funds may enter into repurchase agreement transactions with institutions that meet the Adviser's credit guidelines. Each repurchase agreement is valued at amortized cost. The Funds require that the collateral received in a repurchase agreement transaction be transferred to a custodian in a manner sufficient to enable the Funds to obtain collateral in the event of a counterparty default. If the counterparty defaults and the fair value of the collateral declines, realization of the collateral by the Funds may be delayed or limited.
g) Options—In order to produce incremental earnings or protect against changes in the value of portfolio securities, the Funds may buy and sell put and call options, write covered call options on portfolio securities and write cash-secured put options.
The Funds generally write covered call options or purchase put options to hedge against adverse movements in the value of portfolio holdings. The Funds may also use options for speculative purposes, although it does not employ options for this purpose at the present time. The Funds will segregate assets to cover its obligations under option contracts.
Options contracts are valued daily based upon the last sale price on the principal exchange on which the option is traded and unrealized appreciation/depreciation is recorded. If there is no sale on such day, the mean between the last bid and asked prices is used. The Funds will realize a gain or loss upon the expiration or closing of the option transaction. When an option is exercised, the proceeds on the sale of a written call option, the purchase cost of a written put option, or the cost of the security for a purchased put or call option is adjusted by the amount of premium received or paid. When a written option expires, the Funds will realize a gain equal to the amount of the premium received. When the Funds enter into a closing purchase transaction, the Funds will realize a gain (or loss, if the cost of the closing purchase transaction exceeds the premium received when the option was written) without regard to any unrealiz ed gain or loss on the underlying security and the liability related to such option is eliminated.
Each Fund may write "covered" call options on equity or debt securities and on stock indices in seeking to enhance investment return or to hedge against declines in the prices of portfolio securities or may write put options to hedge against increases in the prices of securities which it intends to purchase. A call option is covered if a Fund holds, on a share-for-share basis, either the
FIRST EAGLE FUNDS | ANNUAL REPORT | OCTOBER 31, 2009
110
(continued)
underlying shares or a call on the same security as the call written where the exercise price of the call held is equal to or less than the exercise price of the call written (or greater than the exercise price of the call written if the difference is maintained by the Fund in cash, Treasury bills or other high grade short-term obligations in a segregated account with its custodian). A put option is "covered" if a Fund maintains cash, Treasury bills or other high grade short-term obligations with a value equal to the exercise price in a segregated account with its custodian, or holds on a share-for-share basis a put on the same equity or debt security as the put written where the exercise price of the put held is equal to or greater than the exercise price of the put written, or lower than the exercise price of the put written if the difference is maintained in a segregated account with its custodian. One reason for writing opti ons is to attempt to realize, through the receipt of premiums, a greater return than would be realized on the securities alone.
Another reason for writing options is to hedge against a moderate decline in the value of securities owned by a Fund in the case of a call option, or a moderate increase in the value of securities a Fund intends to purchase in the case of a put option. If a covered option written by a Fund expires unexercised, it will realize income equal to the amount of the premium it received for the option. If an increase occurs in the underlying security or stock index sufficient to result in the exercise of a call written by a Fund, it may be required to deliver securities or cash and may thereby forego some or all of the gain that otherwise may have been realized on the securities underlying the call option. This "opportunity cost" may be partially or wholly offset by the premium received for the covered call written by the Fund.
The risk in writing a call option is that the Funds give up the opportunity for profit if the market price of the security increases and the option is exercised. The risk in writing a put option is that the Funds may incur a loss if the market price of the security decreases and the option is exercised. The Funds also have the additional risk of not being able to enter into a closing transaction if a liquid secondary market does not exist. The Fund may also write over-the-counter options where the completion of the obligation is dependent upon the credit standing of the counterparty. Outstanding contracts at period-end are indicative of the volume of activity during the period.
The Funds adopted provisions surrounding disclosures of derivative instruments and hedging activities which require qualitative disclosures about
FIRST EAGLE FUNDS | ANNUAL REPORT | OCTOBER 31, 2009
111
Notes to Financial Statements
objectives and strategies for using derivatives, quantitative disclosures about fair value amounts of gains and losses on derivative instruments, and disclosures about credit-risk-related contingent features in derivative agreements.
At October 31, 2009, the Funds' had the following written covered call options grouped into appropriate risk categories illustrated below:
| First Eagle Fund of America | |
| Liability Derivatives1 | |
| | | INTEREST
RATE
CONTRACTS
RISK | | FOREIGN
EXCHANGE
CONTRACTS
RISK | | CREDIT
CONTRACTS
RISK | | EQUITY
CONTRACTS
RISK | | COMMODITY
CONTRACTS
RISK | | OTHER
CONTRACTS
RISK | | TOTAL | |
Covered
Call
Options
Written | | $ | — | | | $ | — | | | $ | — | | | $ | (11,291,800 | ) | | $ | — | | | $ | — | | | $ | (11,291,800 | ) | |
Transactions in derivative instruments during the year ended October 31, 2009, were as follows:
| Realized Gain2 | |
| | | INTEREST
RATE
CONTRACTS
RISK | | FOREIGN
EXCHANGE
CONTRACTS
RISK | | CREDIT
CONTRACTS
RISK | | EQUITY
CONTRACTS
RISK | | COMMODITY
CONTRACTS
RISK | | OTHER
CONTRACTS
RISK | | TOTAL | |
Covered
Call
Options
Written | | $ | — | | | $ | — | | | $ | — | | | $ | 7,979,783 | | | $ | — | | | $ | — | | | $ | 7,979,783 | | |
| Change in Appreciation3 | |
| | | INTEREST
RATE
CONTRACTS
RISK | | FOREIGN
EXCHANGE
CONTRACTS
RISK | | CREDIT
CONTRACTS
RISK | | EQUITY
CONTRACTS
RISK | | COMMODITY
CONTRACTS
RISK | | OTHER
CONTRACTS
RISK | | TOTAL | |
Covered
Call
Options
Written | | $ | — | | | $ | — | | | $ | — | | | $ | 5,048,624 | | | $ | — | | | $ | — | | | $ | 5,048,624 | | |
1Statements of Assets and Liabilities location: Option contracts written, at value.
2Statements of Operations location: Net realized gains (losses) from: Written options.
3Statements of Operations location: Changes in unrealized appreciation (depreciation) of: Written options.
h) Treasury Inflation-Protected Securities—The Funds may invest in Treasury Inflation-Protected Securities ("TIPS") which are specially structured bonds in which the principal amount is adjusted to keep pace with
FIRST EAGLE FUNDS | ANNUAL REPORT | OCTOBER 31, 2009
112
(continued)
inflation. The inflation (deflation) adjustment is applied to the principal of each bond on a monthly basis and is accounted for as interest income on the Statements of Operations. TIPS are subject to interest rate risk.
i) Structured notes—The Funds may invest in structured notes, the value of which is linked to currencies, interest rates, other commodities, indices or other financial indicators. In order to qualify as a regulated investment company ("RIC") under the Internal Revenue Code of 1986, as amended (the "Code") , the Fund must meet certain requirements regarding the source of its income, the diversification of its assets and the distribution of its income. One of these requirements is that the Fund derive at least 90% of its gross income for each taxable year from dividends, interest, payments with respect to certain securities loans, gains from the sale or other disposition of stock, securities or foreign currencies, other income derived with respect to its business of investing in such stock, securities or currencies or net income derived from interests in certain publicly traded partnerships ("Qualifying Income"). If any Fund fails to qualify as a RIC, the Fund will be subject to federal, state and local income tax on its net income and capital gains at regular corporate rates (without reduction for distributions to shareholders). When distributed, that income would also be taxable to shareholders as an ordinary dividend to the extent attributable to each Fund's earnings and profits. None of the Funds held structured notes as of October 31, 2009.
j) Short Sales—The First Eagle Fund of America may seek to realize additional gains through short sale transactions in securities listed on one or more national security exchanges or in unlisted securities. At the time a short sale is effected, the Fund incurs an obligation to replace the security borrowed at whatever its price may be at the time the Fund purchases it for delivery to the lender. The price at such time may be more or less than the price at which the security was sold by the Fund. Until the security is replaced, the Fund is required to pay the lender amounts equal to any dividend or interest that accrues during the period of the loan. To borrow the security, the Fund may also be required to pay a premium. The proceeds of the short sale will be retained by the broker, to the extent necessary to meet margin requirements, u ntil the short position is closed. There were no open short sales as of October 31, 2009.
k) Restricted Securities—The Funds may invest in securities that are subject to legal or contractual restrictions on resale. These securities generally may be resold in transactions exempt from registration or to the public if the
FIRST EAGLE FUNDS | ANNUAL REPORT | OCTOBER 31, 2009
113
Notes to Financial Statements
securities are registered. Disposal of these securities may involve time-consuming negotiations and expense, and prompt sale at an acceptable price may be difficult. Information regarding restricted securities, if any, is included at the end of each Fund's Schedule of Investments.
l) United States income taxes—No provision has been made for U.S. federal income taxes since it is the intention of each Fund to distribute to shareholders all taxable net investment income and net realized gains on investments, if any, within the allowable time limit, and to comply with the provisions of the Code for a RIC. The Funds declare and pay such income, dividends and capital gains distributions on an annual basis.
The Funds adopted provisions surrounding Income Taxes, which require the tax effects of certain tax positions to be recognized. These tax positions must meet a "more likely than not" standard that based on their technical merits, have a more than 50 percent likelihood of being sustained upon examination. Management of the Trust has analyzed the Funds' tax positions taken on federal and state income tax returns for all open tax years (the current and the prior three tax years) and has concluded that no provision for income tax is required in the Funds' financial statements.
At October 31, 2009, the components of accumulated earnings on a tax basis were as follows:
| | | UNDISTRIBUTED
NET INVESTMENT
INCOME | | UNDISTRIBUTED
NET REALIZED
GAINS | | NET
UNREALIZED
APPRECIATION
(DEPRECIATION) | | CAPITAL LOSS
CARRYFORWARD | |
| First Eagle Global Fund | | $ | 263,702,972 | | | $ | — | | | $ | | 1,391,824,010 | | $ | ( | 1,065,866,428) | |
| First Eagle Overseas Fund | | | 216,831,256 | | | | — | | | | 1,013,981,264 | | | | (252,365,556 | ) | |
| First Eagle U.S. Value Fund | | | 11,051,112 | | | | — | | | | 62,559,972 | | | | (26,167,848 | ) | |
| First Eagle Gold Fund | | | 27,562,737 | | | | — | | | | 577,450,175 | | | | (11,752,123 | ) | |
| First Eagle Fund of America | | | — | | | | — | | | | (9,645,828 | ) | | | (49,383,580 | ) | |
The differences between the components of distributable earnings on a tax basis and the amounts reflected in the Statements of Changes in Net Assets are primarily due to the treatment of passive foreign investment companies, distributions from real estate investment trusts, investments in partnerships and trusts, the treatment of foreign currencies and wash sales.
As of October 31, 2009, the First Eagle Funds had estimated capital loss carryforwards for federal income tax purposes. These amounts, stated in the table above, may be applied to offset future capital gains. These capital loss carryforwards will expire, if not used, on October 31, 2017.
FIRST EAGLE FUNDS | ANNUAL REPORT | OCTOBER 31, 2009
114
(continued)
m) Reclassification of capital accounts—As a result of certain differences in the computation of net investment income and net realized capital gains under federal income tax rules and regulations versus generally accepted accounting principles, a reclassification has been made on the Statements of Assets and Liabilities to increase (decrease) undistributed net investment income, undistributed net realized gains on investments and capital surplus for the Funds as follows:
| | | UNDISTRIBUTED NET
INVESTMENT INCOME
(LOSS) | | UNDISTRIBUTED NET
REALIZED GAINS
(LOSSES) | |
CAPITAL SURPLUS | |
| First Eagle Global Fund | | $ | 13,511,293 | | | $ | (21,049,807 | ) | | $ | 7,538,514 | | |
| First Eagle Overseas Fund | | | 26,596,414 | | | | (26,596,414 | ) | | | — | | |
| First Eagle U.S. Value Fund | | | (101,825 | ) | | | 140,676 | | | | (38,851 | ) | |
| First Eagle Gold Fund | | | 701,050 | | | | (701,050 | ) | | | — | | |
| First Eagle Fund of America | | | 2,532,286 | | | | 18,961 | | | | (2,551,247 | ) | |
The primary permanent differences causing such reclassification include the tax treatment of currency gains and losses, dividend redesignations, investments in passive foreign investment companies, distributions from real estate investment trusts, investments in partnerships and the disallowance of net operating losses.
n) Distributions to shareholders—Distributions made to shareholders during the fiscal year ended October 31, 2009, which are determined in accordance with income tax regulations, are recorded on ex-dividend date.
| | | ORDINARY INCOME | | LONG TERM CAPITAL GAINS | |
| | | 2009 | | 2008 | | 2009 | | 2008 | |
| First Eagle Global Fund | | $ | 58,953,789 | | | $ | 508,107,740 | | | $ | 1,112,552,930 | | | $ | 1,826,535,025 | | |
| First Eagle Overseas Fund | | | 6,882,350 | | | | 353,628,152 | | | | 560,685,127 | | | | 1,169,436,263 | | |
| First Eagle U.S. Value Fund | | | 10,276,693 | | | | 15,113,545 | | | | 5,841,361 | | | | 20,622,265 | | |
| First Eagle Gold Fund | | | 17,110 | | | | 38,957,421 | | | | 46,859,852 | | | | 37,345,615 | | |
| First Eagle Fund of America | | | — | | | | 5,420,568 | | | | 41,214,241 | | | | 82,681,252 | | |
o) Class Accounting—Investment income, common expenses and realized/unrealized gain or loss on investments are allocated to the various classes of the Fund on the basis of daily net assets of each class. Fees relating to a specific class are charged directly to that class.
p) Use of estimates—The preparation of financial statements in conformity with generally accepted accounting principles requires management to make estimates and assumptions that affect the reported amounts of assets and
FIRST EAGLE FUNDS | ANNUAL REPORT | OCTOBER 31, 2009
115
Notes to Financial Statements
liabilities at the date of the financial statements and the reported amounts of revenues and expenses during the reporting period. Actual results could differ from those estimates.
q) Redemption Fee—Effective May 1, 2008, the redemption fee period was shortened for the First Eagle Global Fund, First Eagle Overseas Fund and First Eagle Gold Fund. The sale or exchange of shares of these Funds will be subject to a redemption fee if sold or exchanged within 60 days of the purchase of such shares, rather than if sold or exchanged within 90 days of the purchase of such shares. The redemption fee of 2% remains the same.
Also on May 1, 2008, the redemption fee was removed for the First Eagle U.S. Value Fund and the First Eagle Fund of America. The sale or exchange of shares of these Funds will no longer be subject to a redemption fee.
r) Recently issued accounting pronouncements—In June 2009, an accounting standards codification ("Codification") was established as the source of authoritative accounting principles recognized by the FASB to be applied by nongovernmental entities in the preparation of financial statements in conformity with GAAP. Rules and interpretive releases of the Securities and Exchange Commission ("SEC") under federal securities laws are also sources of authoritative GAAP for SEC registrants. All guidance contained in the Codification carries an equal level of authority. As of the effective date, the Codification has superseded all then-existing non-SEC accounting and reporting standards. Concurrently, all non-grandfathered, non-SEC accounting literature not included in the Codification has been deemed nonauthoritative. This Codification is effec tive for financial statements issued for interim and annual periods ending after September 15, 2009.
Note 2—Investment Advisory, Custody and Administration Agreements; Transactions with Related Persons
The Adviser, a subsidiary of Arnhold and S. Bleichroeder Holdings, Inc. ("ASB Holdings"), manages the Funds. For its services, the Adviser receives, pursuant to an Investment Advisory Agreement between the Funds and the Adviser (the "Advisory Agreement") an annual advisory fee as follows: First Eagle Global Fund, First Eagle Overseas Fund, First Eagle U.S. Value Fund and First Eagle Gold Fund at 0.75% of each Fund's average daily net assets and First Eagle Fund of America at 1% of the Fund's average daily net assets.
FIRST EAGLE FUNDS | ANNUAL REPORT | OCTOBER 31, 2009
116
(continued)
The Adviser also performs certain administrative, accounting, operations, compliance and other services on behalf of the Funds, and in accordance with its agreement with them, the Funds reimburse the Adviser for costs (including personnel, related overhead and other costs) related to those services. For the year ended October 31, 2009, the Funds reimbursed and had payable to the Adviser amounts shown below:
| FUND | | PAID TO ADVISER | | PAYABLE TO ADVISER | |
| First Eagle Global Fund | | $ | 4,629,361 | | | $ | 341,000 | | |
| First Eagle Overseas Fund | | | 1,676,640 | | | | 130,258 | | |
| First Eagle U.S. Value Fund | | | 192,845 | | | | 11,450 | | |
| First Eagle Gold Fund | | | 314,997 | | | | 19,455 | | |
| First Eagle Fund of America | | | 191,705 | | | | 15,500 | | |
The Adviser voluntarily paid the First Eagle Global Fund a total of $1,837 for losses on transaction related activity.
A special meeting of shareholders of First Eagle Fund of America was held on September 18, 2009 to seek approval of a new subadvisory agreement between First Eagle Fund of America and its longtime subadviser, Iridian Asset Management LLC. The required vote to approve the new subadvisory agreement was met. The inspector of election tallied and certified the votes as follows:
| | | SHARES VOTED | |
| For | | | 353,249,413 | | |
| Withhold | | | 67,746,245 | | |
| Representing in Favor (as % of votes present) | | | 83.91 | % | |
Pursuant to a subadvisory agreement, dated December 10, 2002 (agreement was amended and restated most recently in September 2009) ("Subadvisory Agreement") Iridian Asset Management LLC ("Iridian") manages the investments of the First Eagle Fund of America. The fees paid to Iridian by the Adviser under the Subadvisory Agreement are based on a reference amount equal to 50% of the combined (i) fees received by the Adviser for advisory services on behalf of the Fund and (ii) the fees received by the Fund's distributor for its shareholder liaison services on behalf of the Fund. These amounts are reduced by certain direct marketing costs borne by the Adviser in connection with the Fund and are further reduced by the amount paid by the Adviser for certain administrative expenses incurred in providing services to the Fund.
FIRST EAGLE FUNDS | ANNUAL REPORT | OCTOBER 31, 2009
117
Notes to Financial Statements
The Funds have entered into Custody Agreements with State Street Bank and Trust Co. ("SSB"). The Custody Agreements provide for an annual fee based on the amount of assets under custody plus transaction charges. SSB serves as custodian of the Funds' portfolio securities and other assets. SSB has directly entered into a sub-custodial agreement to maintain the custody of gold bullion. Under the terms of the Custody Agreement between the Funds and SSB, SSB maintains and deposits in separate accounts, cash, securities and other assets of the Funds. SSB is also required, upon the order of the Funds, to deliver securities held by SSB and/or its sub-custodians, and to make payments for securities purchased by the Funds. SSB has also entered into sub-custodian agreements with a number of foreign banks and clearing agencies, pursuant to which portfolio securities purchased outside the United States are maintained in the custody of these entities.
The Funds have also entered into an Administration Agreement with SSB, pursuant to which SSB provides certain tax-related and other administrative services. SSB as the Funds' administrator, receives annual fees separate from and in addition to the fees it receives for its services as the Funds' custodian.
First Eagle Funds Distributors, a division of ASB Securities LLC, a wholly owned subsidiary of ASB Holdings, serves as the Funds' principal underwriter. For the year ended October 31, 2009, First Eagle Funds Distributors realized $1,073,607, $190,874, $375,176, $150,029 and $57,592, pertaining to the sales of shares of First Eagle Global Fund, First Eagle Overseas Fund, First Eagle U.S. Value Fund, First Eagle Gold Fund and First Eagle Fund of America, respectively.
The Trust adopted a Trustee Deferred Compensation Plan, which allows the independent Trustees to defer the receipt of all or a portion of compensation related to performance of their duties as a Trustee. The deferred fees are invested in various First Eagle Funds until distribution in accordance with the Trustee Deferred Compensation Plan. As of October 31, 2009, balances to the Plan can be seen on the Statements of Assets and Liabilities.
Note 3—Plans of Distribution
Under the terms of the Distribution Plans and Agreements ("the Plans") with First Eagle Funds Distributors, a division of ASB Securities LLC ("the Distributor"), pursuant to the provisions of Rule 12b-1 under the 1940 Act, the First Eagle Global Fund, First Eagle Overseas Fund, First Eagle U.S. Value Fund and First Eagle Gold Fund pay the Distributor quarterly, a distribution fee with respect to Class A and Class C shares at an annual rate of up to 0.25% and
FIRST EAGLE FUNDS | ANNUAL REPORT | OCTOBER 31, 2009
118
(continued)
0.75%, respectively, of each Fund's average daily net assets. In the case of First Eagle Fund of America, it pays the Distributor quarterly, a distribution fee with respect to Class A, Class C and Class Y shares at an annual rate of up to 0.25%, 0.75% and 0.25%, respectively of the average daily net assets. Under the Plans, the Distributor is obligated to use the amounts received under the Plans for payments to qualifying dealers for their assistance in the distribution of a Fund's shares and the provision of shareholder services and for other expenses such as advertising costs and the payment for the printing and distribution of prospectuses to prospective investors.
The Distributor bears distribution costs of a Fund to the extent they exceed payments received under the Plan. For the year ended October 31, 2009, the distribution fees incurred by the Funds are disclosed in the Statements of Operations.
The Distributor receives an annual service fee with respect to Class C at the annual rate of 0.25% of each Fund's average daily net assets, payable quarterly to cover expenses incurred by the Distributor for providing shareholder liaison services, including assistance with subscriptions, redemptions and other shareholder questions. For the year ended October 31, 2009, the services fees incurred by the Funds are disclosed in the Statement of Operations.
Note 4—Purchases and Sales of Securities
During the year ended October 31, 2009, the cost of purchases of investments, excluding U.S. Government and short-term securities, totaled $1,982,785,853, $483,642,389, $338,440,237, $527,195,704 and $561,034,225 for First Eagle Global Fund, First Eagle Overseas Fund, First Eagle U.S. Value Fund, First Eagle Gold Fund and First Eagle Fund of America, respectively. Proceeds from sales of investments, excluding U.S. government securities and short-term securities, totaled $3,378,568,079, $993,081,643, $94,552,885, $36,591,682 and $247,673,183 for First Eagle Global Fund, First Eagle Overseas Fund, First Eagle U.S. Value Fund, First Eagle Gold Fund and First Eagle Fund of America, respectively.
The cost of purchases of U.S. Government securities, excluding short-term securities, totaled $0, $0, $30,904,234, $0 and $0 for First Eagle Global Fund, First Eagle Overseas Fund, First Eagle U.S. Value Fund, First Eagle Gold Fund and First Eagle Fund of America, respectively. Proceeds from sales of U.S. government
FIRST EAGLE FUNDS | ANNUAL REPORT | OCTOBER 31, 2009
119
Notes to Financial Statements
securities, totaled $39,840,882, $0, $0, $0 and $0 for First Eagle Global Fund, First Eagle Overseas Fund, First Eagle U.S. Value Fund, First Eagle Gold Fund and First Eagle Fund of America, respectively.
For the year ended October 31, 2009, First Eagle Fund of America had the following written option transactions:
| | | NUMBER
OF CONTRACTS | | PREMIUMS
RECEIVED | |
| Options outstanding at October 31, 2008 | | | 22,342 | | | $ | 7,422,821 | | |
| Options written | | | 390,786 | | | | 105,360,488 | | |
| Options assigned (exercised) | | | (56,244 | ) | | | (18,291,863 | ) | |
| Options expired/closed | | | (292,230 | ) | | | (77,217,780 | ) | |
| Options outstanding at October 31, 2009 | | | 64,654 | | | $ | 17,273,666 | | |
As of October 31, 2009, portfolio securities valued at $222,155,489 were segregated to cover collateral requirements for written options.
Note 5—Line of Credit
As of September 8, 2009, the Board of Trustees approved continuing a $200 million committed, unsecured line of credit ("Credit Facility") with State Street Bank and Trust Company for the Funds, to be utilized for temporarily financing the purchase or sale of securities for prompt delivery in the ordinary course of business or for temporarily financing the redemption of shares of each Fund at the request of shareholders and other temporary or emergency purposes. Interest on amounts borrowed is calculated based on the higher of overnight Federal Funds rate plus 1.25% per annum or overnight LIBOR plus 1.25% per annum. Under the Credit Facility arrangement, each Fund has agreed to pay an annual commitment fee on the unused balance, allocated pro rata, based on the
FIRST EAGLE FUNDS | ANNUAL REPORT | OCTOBER 31, 2009
120
(continued)
relative asset size of the Funds. Commitment fees related to the line of credit are paid by the Funds and are included in miscellaneous expenses in the Statements of Operations. During the year ended October 31, 2009, the Funds had borrowings under the agreement as follows:
| FUND | | AVERAGE
DAILY LOAN
BALANCE | | NUMBER OF DAYS
OUTSTANDING | | INTEREST
EXPENSE | | WEIGHTED
AVERAGE
ANNUALIZED
INTEREST RATE | |
| First Eagle Global Fund | | $ | 6,635,000 | | | | 1 | | | $ | 127.17 | | | | 0.69 | % | |
| First Eagle Overseas Fund | | | 3,802,000 | | | | 1 | | | | 79.21 | | | | 0.75 | % | |
| First Eagle U.S. Value Fund | | | 5,175,000 | | | | 4 | | | | 401.86 | | | | 0.70 | % | |
| First Eagle Gold Fund | | | — | | | | — | | | | — | | | | — | | |
| First Eagle Fund of America | | | — | | | | — | | | | — | | | | — | | |
As of October 31, 2009, there were no outstanding borrowings from the credit facility.
Note 6—Capital Stock
At October 31, 2009, the Funds have an unlimited number of shares authorized for issuance. The Funds have the ability to issue multiple classes of shares.
FIRST EAGLE FUNDS | ANNUAL REPORT | OCTOBER 31, 2009
121
Notes to Financial Statements
Transactions in shares of capital stock were as follows:
| | | YEAR ENDED OCTOBER 31, 2009 | | YEAR ENDED OCTOBER 31, 2009 | |
| | | FIRST EAGLE GLOBAL FUND | | FIRST EAGLE OVERSEAS FUND | | FIRST EAGLE U.S. VALUE FUND | |
| | | CLASS A | | CLASS C | | CLASS I | | CLASS A | | CLASS C | | CLASS I | | CLASS A | | CLASS C | | CLASS I | |
| Shares sold | | | 55,110,698 | | | | 29,641,180 | | | | 34,998,883 | | | | 66,485,198 | | | | 10,278,070 | | | | 39,988,853 | | | | 28,759,687 | | | | 12,843,208 | | | | 10,537,802 | | |
Shares issued for reinvested
dividends and distributions | | | 18,109,693 | | | | 6,631,410 | | | | 4,549,282 | | | | 17,644,515 | | | | 3,153,125 | | | | 8,732,564 | | | | 609,076 | | | | 273,853 | | | | 178,097 | | |
| Shares redeemed | | | (84,638,482 | ) | | | (36,786,291 | ) | | | (37,483,189 | ) | | | (82,273,077 | ) | | | (15,337,273 | ) | | | (50,077,157 | ) | | | (12,133,532 | ) | | | (7,643,669 | ) | | | (4,932,395 | ) | |
| Net increase (decrease) | | | (11,418,091 | ) | | | (513,701 | ) | | | 2,064,976 | | | | 1,856,636 | | | | (1,906,078 | ) | | | (1,355,740 | ) | | | 17,235,231 | | | | 5,473,392 | | | | 5,783,504 | | |
| | | YEAR ENDED OCTOBER 31, 2009 | | YEAR ENDED OCTOBER 31, 2009 | |
| | | FIRST EAGLE GOLD FUND | | FIRST EAGLE FUND OF AMERICA | |
| | | CLASS A | | CLASS C | | CLASS I | | CLASS A | | CLASS C | | CLASS Y | |
| Shares sold | | | 32,675,633 | | | | 8,950,595 | | | | 2,724,349 | | | | 11,199,021 | | | | 2,706,863 | | | | 4,093,325 | | |
Shares issued for reinvested
dividends and distributions | | | 1,576,368 | | | | 342,567 | | | | 236,404 | | | | 438,430 | | | | 213,945 | | | | 1,425,578 | | |
| Shares redeemed | | | (13,910,049 | ) | | | (2,039,915 | ) | | | (1,165,446 | ) | | | (4,091,076 | ) | | | (1,259,729 | ) | | | (5,961,245 | ) | |
| Net increase (decrease) | | | 20,341,952 | | | | 7,253,247 | | | | 1,795,307 | | | | 7,546,375 | | | | 1,661,079 | | | | (442,342 | ) | |
| | | YEAR ENDED OCTOBER 31, 2008 | | YEAR ENDED OCTOBER 31, 2008 | |
| | | FIRST EAGLE GLOBAL FUND | | FIRST EAGLE OVERSEAS FUND | | FIRST EAGLE U.S. VALUE FUND | |
| | | CLASS A | | CLASS C | | CLASS I | | CLASS A | | CLASS C | | CLASS I | | CLASS A | | CLASS C | | CLASS I | |
| Shares sold | | | 75,198,015 | | | | 42,650,283 | | | | 46,137,156 | | | | 53,918,059 | | | | 8,976,374 | | | | 36,339,153 | | | | 8,871,653 | | | | 3,757,921 | | | | 4,173,274 | | |
Shares issued for reinvested
dividends and distributions | | | 28,071,819 | | | | 9,114,495 | | | | 5,754,096 | | | | 32,392,050 | | | | 5,046,138 | | | | 18,060,451 | | | | 985,724 | | | | 545,993 | | | | 284,778 | | |
| Shares redeemed | | | (82,505,436 | ) | | | (26,612,079 | ) | | | (30,398,726 | ) | | | (94,603,366 | ) | | | (13,987,426 | ) | | | (80,259,586 | ) | | | (7,631,247 | ) | | | (4,866,343 | ) | | | (2,489,779 | ) | |
| Net increase (decrease) | | | 20,764,398 | | | | 25,152,699 | | | | 21,492,526 | | | | (8,293,257 | ) | | | 35,086 | | | | (25,859,982 | ) | | | 2,226,130 | | | | (562,429 | ) | | | 1,968,273 | | |
| | | YEAR ENDED OCTOBER 31, 2008 | | YEAR ENDED OCTOBER 31, 2008 | |
| | | FIRST EAGLE GOLD FUND | | FIRST EAGLE FUND OF AMERICA | |
| | | CLASS A | | CLASS C | | CLASS I | | CLASS A | | CLASS C | | CLASS Y | |
| Shares sold | | | 9,428,364 | | | | 2,219,049 | | | | 1,314,468 | | | | 5,447,853 | | | | 1,689,034 | | | | 4,012,896 | | |
Shares issued for reinvested
dividends and distributions | | | 1,974,866 | | | | 358,191 | | | | 307,964 | | | | 292,451 | | | | 224,578 | | | | 2,452,363 | | |
| Shares redeemed | | | (11,687,761 | ) | | | (2,368,303 | ) | | | (2,959,569 | ) | | | (1,785,192 | ) | | | (717,831 | ) | | | (5,423,395 | ) | |
| Net increase (decrease) | | | (284,531 | ) | | | 208,937 | | | | (1,337,137 | ) | | | 3,955,112 | | | | 1,195,781 | | | | 1,041,864 | | |
FIRST EAGLE FUNDS | ANNUAL REPORT | OCTOBER 31, 2009
122
(continued)
FIRST EAGLE FUNDS | ANNUAL REPORT | OCTOBER 31, 2009
123
Notes to Financial Statements
Transactions in dollars of capital stock were as follows:
| | | YEAR ENDED OCTOBER 31, 2009 | | YEAR ENDED OCTOBER 31, 2009 | |
| | | FIRST EAGLE GLOBAL FUND | | FIRST EAGLE OVERSEAS FUND | | FIRST EAGLE U.S. VALUE FUND | |
| | | CLASS A | | CLASS C | | CLASS I | | CLASS A | | CLASS C | | CLASS I | | CLASS A | | CLASS C | | CLASS I | |
| Shares sold | | $ | 1,877,816,801 | | | $ | 1,001,226,224 | | | $ | 1,199,142,643 | | | $ | 1,130,619,297 | | | $ | 171,958,689 | | | $ | 692,854,094 | | | $ | 359,149,389 | | | $ | 155,855,041 | | | $ | 132,974,752 | | |
Shares issued for reinvested
dividends and distributions | | | 597,629,082 | | | | 216,449,222 | | | | 150,490,259 | | | | 290,958,051 | | | | 51,049,093 | | | | 145,746,487 | | | | 7,333,267 | | | | 3,286,223 | | | | 2,163,880 | | |
| Shares redeemed | | | (2,795,198,241 | ) | | | (1,205,982,145 | ) | | | (1,242,934,451 | ) | | | (1,373,073,363 | ) | | | (250,700,205 | ) | | | (847,934,944 | ) | | | (149,306,331 | ) | | | (93,069,544 | ) | | | (62,312,522 | ) | |
| Net increase (decrease) | | $ | (319,752,358 | ) | | $ | 11,693,301 | | | $ | 106,698,451 | | | $ | 48,503,985 | | | $ | (27,692,423 | ) | | $ | (9,334,363 | ) | | $ | 217,176,325 | | | $ | 66,071,720 | | | $ | 72,826,110 | | |
| | | YEAR ENDED OCTOBER 31, 2009 | | YEAR ENDED OCTOBER 31, 2009 | |
| | | FIRST EAGLE GOLD FUND | | FIRST EAGLE FUND OF AMERICA | |
| | | CLASS A | | CLASS C | | CLASS I | | CLASS A | | CLASS C | | CLASS Y | |
| Shares sold | | $ | 695,070,658 | | | $ | 191,674,461 | | | $ | 59,221,318 | | | $ | 195,825,006 | | | $ | 42,370,149 | | | $ | 73,811,395 | | |
Shares issued for reinvested
dividends and distributions | | | 29,478,076 | | | | 6,286,099 | | | | 4,460,947 | | | | 7,356,862 | | | | 3,224,158 | | | | 24,334,625 | | |
| Shares redeemed | | | (299,916,979 | ) | | | (42,132,110 | ) | | | (23,813,770 | ) | | | (73,124,361 | ) | | | (19,744,007 | ) | | | (105,289,861 | ) | |
| Net increase (decrease) | | $ | 424,631,755 | | | $ | 155,828,450 | | | $ | 39,868,495 | | | $ | 130,057,507 | | | $ | 25,850,300 | | | $ | (7,143,841 | ) | |
| | | YEAR ENDED OCTOBER 31, 2008 | | YEAR ENDED OCTOBER 31, 2008 | |
| | | FIRST EAGLE GLOBAL FUND | | FIRST EAGLE OVERSEAS FUND | | FIRST EAGLE U.S. VALUE FUND | |
| | | CLASS A | | CLASS C | | CLASS I | | CLASS A | | CLASS C | | CLASS I | | CLASS A | | CLASS C | | CLASS I | |
| Shares sold | | $ | 3,253,372,393 | | | $ | 1,838,193,586 | | | $ | 1,988,837,367 | | | $ | 1,186,545,157 | | | $ | 197,183,459 | | | $ | 793,760,846 | | | $ | 131,925,450 | | | $ | 55,336,979 | | | $ | 63,391,324 | | |
Shares issued for reinvested
dividends and distributions | | | 1,265,758,306 | | | | 408,238,245 | | | | 260,142,643 | | | | 754,734,774 | | | | 116,414,413 | | | | 424,601,202 | | | | 15,850,445 | | | | 8,757,729 | | | | 4,619,106 | | |
| Shares redeemed | | | (3,421,928,092 | ) | | | (1,078,377,093 | ) | | | (1,239,421,544 | ) | | | (2,041,179,422 | ) | | | (295,592,815 | ) | | | (1,816,450,609 | ) | | | (116,253,611 | ) | | | (73,856,144 | ) | | | (38,125,997 | ) | |
| Net increase (decrease) | | $ | 1,097,202,607 | | | $ | 1,168,054,738 | | | $ | 1,009,558,466 | | | $ | (99,899,491 | ) | | $ | 18,005,057 | | | $ | (598,088,561 | ) | | $ | 31,522,284 | | | $ | (9,761,436 | ) | | $ | 29,884,433 | | |
| | | YEAR ENDED OCTOBER 31, 2008 | | YEAR ENDED OCTOBER 31, 2008 | |
| | | FIRST EAGLE GOLD FUND | | FIRST EAGLE FUND OF AMERICA | |
| | | CLASS A | | CLASS C | | CLASS I | | CLASS A | | CLASS C | | CLASS Y | |
| Shares sold | | $ | 218,484,735 | | | $ | 49,541,357 | | | $ | 25,386,715 | | | $ | 134,887,588 | | | $ | 37,909,600 | | | $ | 103,149,091 | | |
Shares issued for reinvested
dividends and distributions | | | 46,508,074 | | | | 8,345,853 | | | | 7,292,576 | | | | 7,551,098 | | | | 5,288,805 | | | | 64,374,523 | | |
| Shares redeemed | | | (262,984,501 | ) | | | (51,621,426 | ) | | | (72,465,944 | ) | | | (41,259,286 | ) | | | (15,524,079 | ) | | | (130,526,933 | ) | |
| Net increase (decrease) | | $ | 2,008,308 | | | $ | 6,265,784 | | | $ | (39,786,653 | ) | | $ | 101,179,400 | | | $ | 27,674,326 | | | $ | 36,996,681 | | |
FIRST EAGLE FUNDS | ANNUAL REPORT | OCTOBER 31, 2009
124
(continued)
FIRST EAGLE FUNDS | ANNUAL REPORT | OCTOBER 31, 2009
125
Notes to Financial Statements (continued)
Note 7—Indemnification and Foreign Investment Risk
In the normal course of business, the Funds enter into contracts that contain a variety of representations which provide general indemnifications. Each Fund's maximum exposure under these arrangements is unknown, as this would involve future claims that may be made against each Fund that have not yet occurred. However, based on experience, the Funds expect the risk of loss to be remote. The Funds may have elements of risk not typically associated with investments in the United States of America due to their investments in foreign countries or regions. Such foreign investments may subject the Funds to additional risks resulting from political or economic conditions in such countries or regions and the possible imposition of adverse governmental laws or currency exchange restrictions could cause the securities and their markets to be less liquid and their prices to be more volatile than those of comparable U.S. securities. The sec urities markets in many emerging-market countries are substantially smaller, less developed, less liquid and more volatile than the securities markets of developed countries.
Note 8—Redemption In-Kind Transactions
A redemption in-kind policy has been approved for the First Eagle Global Fund, First Eagle Overseas Fund, First Eagle U.S. Value Fund and the First Eagle Gold Fund, with arrangements for that policy not presently anticipated to go into effect for redemptions prior to March 1, 2010. The First Eagle Fund of America currently has a redemption in-kind policy in place. The redemption in-kind policy for all of the Funds will reserve the right of the Funds to pay redemptions in-kind (i.e., payments in the form of marketable securities or, as needed, other traded assets, rather than cash) if the redemption request is large enough to affect a Fund's operations (for example, if it represents more than $250,000 or 1% of the Fund's assets). When receiving assets distributed in-kind, the recipient will bear applicable commissions or other costs on their sale. There were no redemptions in-kind as of October 31, 2009.
Note 9—Subsequent Events
In accordance with the provision surrounding Subsequent Events adopted by the Funds, management has evaluated the possibility of subsequent events existing in the Funds' financial statements issued on December 28, 2009. Management has determined that there are no material events that would require disclosures in the Funds' financial statements through this date.
FIRST EAGLE FUNDS | ANNUAL REPORT | OCTOBER 31, 2009
126
Report of Independent Registered Public Accounting Firm
To the Board of Trustees and Shareholders of
First Eagle Funds:
In our opinion, the accompanying statements of assets and liabilities, including the schedules of investments, and the related statements of operations, of changes in net assets and the financial highlights present fairly, in all material respects, the financial position of First Eagle Global Fund, First Eagle Overseas Fund, First Eagle U.S. Value Fund, First Eagle Gold Fund and First Eagle Fund of America (collectively hereafter referred to as the "Funds") at October 31, 2009, the results of each of their operations for the year then ended, the changes in each of their net assets for each of the two years in the period then ended and the financial highlights for the four years then ended, in conformity with accounting principles generally accepted in the United States of America. These financial statements and financial highlights (hereafter referred to as "financial statements") are the responsibility of the Funds' management. Our responsibility is to express an opinion on these financial statements based on our audits. We conducted our audits of these financial statements in accordance with the standards of the Public Company Accounting Oversight Board (United States). Those standards require that we plan and perform the audits to obtain reasonable assurance about whether the financial statements are free of material misstatement. An audit includes examining, on a test basis, evidence supporting the amounts and disclosures in the financial statements, assessing the accounting principles used and significant estimates made by management, and evaluating the overall financial statement presentation. We believe that our audits, which included confirmation of securities at October 31, 2009 by correspondence with the custodian and brokers, provide a reasonable basis for our opinion. The financ ial highlights for the year ended October 31, 2005 were audited by another independent registered public accounting firm, whose report dated December 22, 2005 was unqualified.

PricewaterhouseCoopers LLP
New York, New York
December 28, 2009
FIRST EAGLE FUNDS | ANNUAL REPORT | OCTOBER 31, 2009
127
Fund Expenses (unaudited)
Example
As a shareholder of the First Eagle Funds, you may incur two types of costs: (1) transaction costs, including front-end and contingent deferred sales charges (loads), and (2) ongoing costs, including advisory fees; distribution (12b-1) and/or service fees; and other Fund expenses. This Example is intended to help you understand your ongoing costs (in dollars) of investing in each of the First Eagle Funds and to compare these costs with the ongoing costs of investing in other mutual funds.
This Example is based on an investment of $1,000 invested on May 1, 2009 and held for the six-months ended October 31, 2009.
Actual Expenses
The table titled "Based on Actual Total Return" provides information about actual account values and actual expenses. You may use the information provided in this table, together with the amount you invested, to estimate the expenses that you paid over the period. To estimate the expenses you paid on your account, divide your ending account value by $1,000 (for example, an $8,600 ending account value divided by $1,000 = 8.6), then multiply the result by the number under the column heading entitled "Expenses Paid During the Period".
FIRST EAGLE FUNDS | ANNUAL REPORT | OCTOBER 31, 2009
128
(continued)
Based on Actual Total Return1
| | | ACTUAL TOTAL
RETURN
WITHOUT
SALES CHARGE2 | | BEGINNING
ACCOUNT
VALUE | | ENDING
ACCOUNT
VALUE | | ANNUALIZED
EXPENSE
RATIO | | EXPENSES
PAID
DURING THE
PERIOD3 | |
| First Eagle Global Fund Class A | | | 18.43 | % | | $ | 1,000.00 | | | $ | 1,184.30 | | | | 1.19 | % | | $ | 6.55 | | |
| First Eagle Global Fund Class C | | | 18.01 | | | | 1,000.00 | | | | 1,180.10 | | | | 1.94 | | | | 10.66 | | |
| First Eagle Global Fund Class I | | | 18.59 | | | | 1,000.00 | | | | 1,185.90 | | | | 0.94 | | | | 5.18 | | |
| First Eagle Overseas Fund Class A | | | 22.55 | | | | 1,000.00 | | | | 1,225.50 | | | | 1.17 | | | | 6.56 | | |
| First Eagle Overseas Fund Class C | | | 22.14 | | | | 1,000.00 | | | | 1,221.40 | | | | 1.92 | | | | 10.75 | | |
| First Eagle Overseas Fund Class I | | | 22.75 | | | | 1,000.00 | | | | 1,227.50 | | | | 0.92 | | | | 5.17 | | |
| First Eagle U.S. Value Fund Class A | | | 13.14 | | | | 1,000.00 | | | | 1,131.40 | | | | 1.28 | | | | 6.88 | | |
| First Eagle U.S. Value Fund Class C | | | 12.75 | | | | 1,000.00 | | | | 1,127.50 | | | | 2.03 | | | | 10.89 | | |
| First Eagle U.S. Value Fund Class I | | | 13.33 | | | | 1,000.00 | | | | 1,133.30 | | | | 1.03 | | | | 5.54 | | |
| First Eagle Gold Fund Class A | | | 27.02 | | | | 1,000.00 | | | | 1,270.20 | | | | 1.28 | | | | 7.32 | | |
| First Eagle Gold Fund Class C | | | 26.52 | | | | 1,000.00 | | | | 1,265.20 | | | | 2.03 | | | | 11.59 | | |
| First Eagle Gold Fund Class I | | | 27.15 | | | | 1,000.00 | | | | 1,271.50 | | | | 1.03 | | | | 5.90 | | |
| First Eagle Fund of America Class A | | | 14.12 | | | | 1,000.00 | | | | 1,141.20 | | | | 1.50 | | | | 8.10 | | |
| First Eagle Fund of America Class C | | | 13.71 | | | | 1,000.00 | | | | 1,137.10 | | | | 2.25 | | | | 12.12 | | |
| First Eagle Fund of America Class Y | | | 14.17 | | | | 1,000.00 | | | | 1,141.70 | | | | 1.50 | | | | 8.10 | | |
1For the six-months ended October 31, 2009.
2Assumes reinvestment of all dividends and capital gain distributions, if any, at net asset value and does not reflect the deduction of the applicable sales charge, exchange fees or redemption fees. Had the effect of sales charges been reflected, expenses would have been higher and returns lower. Total return is not annualized, as it may not be representative of the total return for the year.
3Expenses are equal to the annualized expense ratio multiplied by the average account value over the period, multiplied by 184/365 (to reflect the one-half year period).
Hypothetical Example for Comparison Purposes
The table below titled "Based on Hypothetical Total Return" provides information about hypothetical account values and hypothetical expenses based on the actual expense ratios and an assumed rate of return of 5% per year before expenses, which is not the First Eagle Fund's actual return. The hypothetical account values and expenses may not be used to estimate the actual ending account balance or expenses you paid for the period. You may use the information provided in this table to compare the ongoing costs of investing in the First Eagle Funds and other funds. To do so, compare the 5% hypothetical example relating to the First Eagle Funds with the 5% hypothetical examples that appear in the shareholder reports of other funds.
FIRST EAGLE FUNDS | ANNUAL REPORT | OCTOBER 31, 2009
129
Fund Expenses (unaudited) (continued)
This Example is based on an investment of $1,000 invested on May 1, 2009 and held for the six-months ended October 31, 2009.
Please note that the expenses shown in the table below are meant to highlight your ongoing costs only and do not reflect any transactional costs, such as front-end or back-end sales charges (loads). Therefore, the table is useful in comparing ongoing costs only, and will not help you determine the relative total costs of owning different funds. In addition, if these transaction costs were included, your costs would have been higher.
Based on Hypothetical Total Return1
| | | HYPOTHETICAL
ANNUALIZED
TOTAL
RETURN | | BEGINNING
ACCOUNT
VALUE | | ENDING
ACCOUNT
VALUE | | ANNUALIZED
EXPENSE
RATIO | | EXPENSES
PAID
DURING THE
PERIOD2 | |
| First Eagle Global Fund Class A | | | 5.00 | % | | $ | 1,000.00 | | | $ | 1,019.21 | | | | 1.19 | % | | $ | 6.06 | | |
| First Eagle Global Fund Class C | | | 5.00 | | | | 1,000.00 | | | | 1,015.43 | | | | 1.94 | | | | 9.86 | | |
| First Eagle Global Fund Class I | | | 5.00 | | | | 1,000.00 | | | | 1,020.47 | | | | 0.94 | | | | 4.79 | | |
| First Eagle Overseas Fund Class A | | | 5.00 | | | | 1,000.00 | | | | 1,019.31 | | | | 1.17 | | | | 5.96 | | |
| First Eagle Overseas Fund Class C | | | 5.00 | | | | 1,000.00 | | | | 1,015.53 | | | | 1.92 | | | | 9.75 | | |
| First Eagle Overseas Fund Class I | | | 5.00 | | | | 1,000.00 | | | | 1,020.57 | | | | 0.92 | | | | 4.69 | | |
| First Eagle U.S. Value Fund Class A | | | 5.00 | | | | 1,000.00 | | | | 1,018.75 | | | | 1.28 | | | | 6.51 | | |
| First Eagle U.S. Value Fund Class C | | | 5.00 | | | | 1,000.00 | | | | 1,014.97 | | | | 2.03 | | | | 10.31 | | |
| First Eagle U.S. Value Fund Class I | | | 5.00 | | | | 1,000.00 | | | | 1,020.01 | | | | 1.03 | | | | 5.24 | | |
| First Eagle Gold Fund Class A | | | 5.00 | | | | 1,000.00 | | | | 1,018.75 | | | | 1.28 | | | | 6.51 | | |
| First Eagle Gold Fund Class C | | | 5.00 | | | | 1,000.00 | | | | 1,014.97 | | | | 2.03 | | | | 10.31 | | |
| First Eagle Gold Fund Class I | | | 5.00 | | | | 1,000.00 | | | | 1,020.01 | | | | 1.03 | | | | 5.24 | | |
| First Eagle Fund of America Class A | | | 5.00 | | | | 1,000.00 | | | | 1,017.64 | | | | 1.50 | | | | 7.63 | | |
| First Eagle Fund of America Class C | | | 5.00 | | | | 1,000.00 | | | | 1,013.86 | | | | 2.25 | | | | 11.42 | | |
| First Eagle Fund of America Class Y | | | 5.00 | | | | 1,000.00 | | | | 1,017.64 | | | | 1.50 | | | | 7.63 | | |
1For the six-months ended October 31, 2009.
2Expenses are equal to the annualized expense ratio multiplied by the average account value over the period, multiplied by 184/365 (to reflect the one-half year period).
FIRST EAGLE FUNDS | ANNUAL REPORT | OCTOBER 31, 2009
130
Tax Information Fiscal Year Ended October 31, 2009 (unaudited)
Each portfolio designates the following amounts (or the maximum amount allowable) distributed during the fiscal year ended October 31, 2009, if any, as capital gain dividends, dividends eligible for the corporate dividends received deduction and/or qualified dividend income:
| | | % OF QUALIFYING | | % OF DIVIDENDS
ELIGIBLE FOR
THE DIVIDENDS
RECEIVED | | LONG-TERM CAPITAL GAINS | |
| | | DIVIDEND INCOME | | DEDUCTION | | 15% | | 28% | |
| First Eagle Global Fund * | | | 99.27 | % | | | 43.31 | % | | $ | 1,112,552,930 | | | $ | — | | |
| First Eagle Overseas Fund * | | | 51.77 | | | | 0.25 | | | | 544,085,548 | | | | 16,599,579 | | |
| First Eagle U.S. Value | | | 52.69 | | | | 50.11 | | | | 5,841,361 | | | | — | | |
| First Eagle Gold Fund * | | | — | | | | — | | | | 41,672,087 | | | | 5,187,765 | | |
| First Eagle Fund of America | | | — | | | | — | | | | 41,214,241 | | | | — | | |
* First Eagle Global Fund, First Eagle Overseas Fund and First Eagle Gold Fund paid foreign taxes of $27,295,632, $15,169,147, and $296,738, respectively, and recognized foreign source income of $291,048,264, $177,650,783, and $7,081,907, respectively. Pursuant to Section 853 of the Internal Revenue Code, each Fund designates such amounts as having been paid in connection with dividends distributed from investment company taxable income during the fiscal year ended October 31, 2009.
FIRST EAGLE FUNDS | ANNUAL REPORT | OCTOBER 31, 2009
131
General Information
Quarterly Form N-Q portfolio schedule
The First Eagle Funds file their complete schedule of portfolio holdings with the Securities and Exchange Commission ("SEC") for the first and third quarters of each fiscal year on Form N-Q. The Funds' Forms N-Q are available on the SEC's Web site at www.sec.gov. The Funds' Forms N-Q may be reviewed and copied at the SEC's Public Reference Room in Washington, D.C. Information on the operation of the SEC's Public Reference Room may be obtained by calling 1-800-SEC-0330. Additionally, you may obtain copies of Forms N-Q from the Funds upon request by calling 1-800-334-2143.
Proxy voting policies, procedures and record
You may obtain a description of the Funds' (1) proxy voting policies, (2) proxy voting procedures and (3) information regarding how the Funds voted any proxies related to portfolio securities during the most recent twelve-month period ended June 30 for which an SEC filing has been made, without charge, upon request by contacting the Funds directly at 1-800-334-2143 or on the EDGAR Database on the SEC's Web site at www.sec.gov.
FIRST EAGLE FUNDS | ANNUAL REPORT | OCTOBER 31, 2009
132
Privacy Notice
The Trust is committed to protecting your privacy. We are providing you with this privacy notice to inform you of how we handle your personal information that we collect and may disclose to our affiliates. If the Trust changes its information practices, we will provide you with notice of any material changes. This privacy policy supersedes any of our previous policies relating to the information you disclose to us.
Why this Privacy Policy Applies to You
You obtained a financial product or service from or through us for personal, family or household purposes when you opened a shareholder account with the Trust, and are therefore covered by this privacy policy.
What We do to Protect Your Personal Information
We protect personal information provided to us by our individual shareholders according to strict standards of security and confidentiality. These standards apply to both our physical facilities and any online services we may provide. We maintain physical, electronic and procedural safeguards that comply with federal standards to guard consumer information. We permit only authorized individuals, who are trained in the proper handling of individual shareholder information and need to access this information to do their job, to have access to this information.
Personal Information that We Collect and May Disclose
As part of providing you with the Trust's products and services, we may obtain nonpublic personal information about you from the following sources:
• Information we receive from you on subscription applications or other forms, such as your name, address, telephone number, Social Security number, occupation, assets and income;
• Information about your transactions with us, our affiliates, or unaffiliated third parties, such as your account balances, payment history and account activity; and
• Information from public records we may access in the ordinary course of business.
FIRST EAGLE FUNDS | ANNUAL REPORT | OCTOBER 31, 2009
133
Privacy Notice (continued)
Categories of Affiliates to Whom We May Disclose Personal Information
We may share personal information about you with affiliates. Our affiliates do business under names that include Arnhold and S. Bleichroeder Holdings, Inc., First Eagle Investment Management, LLC, ASB Securities LLC and Good Hope Advisers, LLC.
When We May Disclose Your Personal Information to Unaffiliated Third Parties
We will only share your personal information collected, as described above, with unaffiliated third parties:
• At your request;
• When you authorize us to process or service a transaction or product (unaffiliated third parties in this instance may include service providers such as the Trust's distributors, registrar and transfer agent for shareholder transactions, and other parties providing individual shareholder servicing, accounting and recordkeeping services);
• With companies that perform sales and marketing services on our behalf with whom we have agreements to protect the confidentiality of your information and to use the information only for the purposes for which we disclose the information to them; or
• When required by law to disclose such information to appropriate authorities.
We do not otherwise provide information about you to outside firms, organizations or individuals except to our attorneys, accountants and auditors and as permitted by law.
What We do with Personal Information about Our Former Customers
If you decide to discontinue doing business with us, the Trust will continue to adhere to this privacy policy with respect to the information we have in our possession about you and your account following the termination of our shareholder relationship.
FIRST EAGLE FUNDS | ANNUAL REPORT | OCTOBER 31, 2009
134
Additional Information (unaudited)
Management of the Trust
The business of the Trust is managed by its Board of Trustees, which elects officers responsible for the day to day operations of the Funds and for the execution of the policies formulated by the Board of Trustees.
Pertinent information regarding the members of the Board of Trustees and principal officers of the Trust is set forth below. Some of the Trustees and officers are employees of the Adviser and its affiliates. At least a majority of the Trust's Board of Trustees are not "interested persons" as that term is defined in the Investment Company Act.
Independent Trustees(1)(2)
Lisa Anderson | Trustee | December 2005 to present
1345 Avenue of the Americas | New York, New York | 10105
(born October 1950)
Principal Occupation(s) During Past 5 Years: Provost, American University in Cairo; James T. Shotwell Professor of International Relations and Dean, School of International and Public Affairs, Columbia University
Number of Portfolios in the Fund Complex Overseen by Trustee: 6
Other Directorships/Trusteeships Held by Trustee: Chair, Social Science Research Council; Member, Carnegie Council on Ethics and International Affairs; Member Emerita, Human Rights Watch; Trustee, First Eagle Variable Funds (1 portfolio)
Candace K. Beinecke(3) | Trustee (Chair) | December 1999 to present
One Battery Park Plaza | New York, New York | 10004
(born December 1946)
Principal Occupation(s) During Past 5 Years: Chair, Hughes Hubbard & Reed LLP
Number of Portfolios in the Fund Complex Overseen by Trustee: 6
Other Directorships/Trusteeships Held by Trustee: Director, ALSTOM; Trustee, Vornado Realty Trust; Director, Rockefeller Financial Services, Inc.; Director, Rockefeller & Company, Inc.; Trustee, The Wallace Foundation; Director, Vice Chair and Member of the Executive Committee, Partnership for New York City; Board of Advisors, Yale Law School Center for the Study of Corporate Law; Trustee, First Eagle Variable Funds (Chair) (1 portfolio)
(1)Trustees who are not "interested persons" of the Trust as defined in the Investment Company Act.
(2)The term of office of each Independent Trustee expires on his/her 70th birthday.
(3)Ms. Beinecke also served as a trustee of a predecessor fund to First Eagle Fund of America since 1996.
FIRST EAGLE FUNDS | ANNUAL REPORT | OCTOBER 31, 2009
135
Additional Information (unaudited)
Independent Trustees(1)(2)
Jean D. Hamilton | Trustee | March 2003 to present
1345 Avenue of the Americas | New York, New York | 10105
(born January 1947)
Principal Occupation(s) During Past 5 Years: Private Investor/Independent Consultant/Member, Brock Capital Group LLC; prior to November 2002, Chief Executive Officer, Prudential Institutional; Executive Vice President, Prudential Financial, Inc.
Number of Portfolios in the Fund Complex Overseen by Trustee: 6
Other Directorships/Trusteeships Held by Trustee: Director, RenaissanceRe Holdings Ltd; Director, Four Nations; Trustee, First Eagle Variable Funds (1 portfolio)
James E. Jordan | Trustee | December 1999 to present
1345 Avenue of the Americas | New York, New York | 10105
(born April 1944)
Principal Occupation(s) During Past 5 Years: Private Investor and Independent Consultant; prior to July 2005, Managing Director, First Eagle Investment Management, LLC and Director, ASB Securities LLC and ASB Advisers UK, Limited; prior to July 2002, private investor and consultant to The Jordan Company (private investment banking firm) since June 1997
Number of Portfolios in the Fund Complex Overseen by Trustee: 6
Other Directorships/Trusteeships Held by Trustee: Director, Leucadia National Corporation; Director, JZ Capital Partners, Plc. (Guernsey investment trust company); Dean's Advisory Council, Columbia University School of International and Public Affairs; Chairman's Council, Conservation International; Trustee, First Eagle Variable Funds (1 portfolio)
William M. Kelly(4) | Trustee | December 1999 to present
1345 Avenue of the Americas | New York, New York | 10105
(born February 1944)
Principal Occupation(s) During Past 5 Years: President, Lingold Associates
Number of Portfolios in the Fund Complex Overseen by Trustee: 6
Other Directorships/Trusteeships Held by Trustee: Treasurer and Trustee, Black Rock Forest Preservation and Consortium; Trustee, St. Anselm College; Trustee, First Eagle Variable Funds (1 portfolio)
(1)Trustees who are not "interested persons" of the Trust as defined in the Investment Company Act.
(2)The term of office of each Independent Trustee expires on his/her 70th birthday.
(4)Mr. Kelly also served as a trustee of a predecessor fund to First Eagle Fund of America since 1998.
FIRST EAGLE FUNDS | ANNUAL REPORT | OCTOBER 31, 2009
136
(continued)
Independent Trustees(1)(2)
Paul J. Lawler | Trustee | March 2002 to present
1345 Avenue of the Americas | New York, New York | 10105
(born May 1948)
Principal Occupation(s) During Past 5 Years: Vice President Investments and Chief Investment Officer, W.K. Kellogg Foundation
Number of Portfolios in the Fund Complex Overseen by Trustee: 6
Other Directorships/Trusteeships Held by Trustee: Finance and Investment Committee Member, Battle Creek Community Foundation; Custody Advisory Committee Member, The Bank of New York; Advisory Committee, Common Fund Capital; Advisory Committee, TA Realty Advisors; Trustee, First Eagle Variable Funds (1 portfolio)
Interested Trustees(5)
John P. Arnhold(6) | President and Trustee | December 1999 to present
1345 Avenue of the Americas | New York, New York | 10105
(born December 1953)
Principal Occupation(s) During Past 5 Years: Co-President, Co-CEO and Director, Arnhold and S. Bleichroeder Holdings, Inc.; Chairman, CEO and Director, First Eagle Investment Management, LLC and ASB Securities LLC; prior to March 2005, President and Director, Natexis Bleichroeder, Inc. and Natexis Bleichroeder UK
Number of Portfolios in the Fund Complex Overseen by Trustee: 6
(1)Trustees who are not "interested persons" of the Trust as defined in the Investment Company Act.
(2)The term of office of each Independent Trustee expires on his/her 70th birthday.
(5)The term of office of each Interested Trustee is indefinite.
(6)Mr. Arnhold and Mr. Eveillard are Interested Trustees (i.e., each is an "interested person" of the Trust as defined in the Investment Company Act). Mr. Arnhold is an officer and director of the Trust's investment adviser and principal underwriter, and Mr. Eveillard is an employee of the Trust's investment adviser.
FIRST EAGLE FUNDS | ANNUAL REPORT | OCTOBER 31, 2009
137
Additional Information (unaudited)
Interested Trustees(5)—(continued)
Other Directorships/Trusteeships Held by Trustee: Director, Arnhold Ceramics; Director, The Arnhold Foundation; Director, The Mulago Foundation; Director, Quantum Endowment Fund; Director, Educational Broadcasting Corporation; Trustee, Trinity Episcopal Schools Corp.; Trustee, Vassar College; Trustee, Jazz at Lincoln Center; Managing Member, New Eagle Management Company, LLC; President and Trustee, First Eagle Variable Funds (1 portfolio)
Jean-Marie Eveillard(6) | Trustee | June 2008 to present
1345 Avenue of the Americas | New York, New York | 10105
(born January 1940)
Principal Occupation(s) During Past 5 Years: Senior Adviser to First Eagle Investment Management, LLC since March 2009; Senior Vice President, First Eagle Investment Management, LLC since January 2000; previously portfolio Manager of First Eagle Global Fund, First Eagle Overseas Fund, First Eagle U.S. Value Fund, First Eagle Gold Fund, and First Eagle Variable Funds (portfolio management tenure: 1979-2004 March 2007-March 2009)
Number of Portfolios in the Fund Complex Overseen by Trustee: 6
Other Directorships/Trusteeships Held by Trustee: Director, SocGen International SICAV (Luxembourg); Trustee, The Frick Collection; Trustee, First Eagle Variable Funds (1 portfolio)
Officers(7)
John P. Arnhold | President and Trustee | December 1999 to present
1345 Avenue of the Americas | New York, New York | 10105
(born December 1953)
Principal Occupation(s) During Past Five (5) Years: See table on preceding page related to Interested Trustees
(5)The term of office of each Interested Trustee is indefinite.
(6)Mr. Arnhold and Mr. Eveillard are Interested Trustees (i.e., each is an "interested person" of the Trust as defined in the Investment Company Act). Mr. Arnhold is an officer and director of the Trust's investment adviser and principal underwriter, and Mr. Eveillard is an employee of the Trust's investment adviser.
(7)The term of office of each officer is indefinite. Length of time served represents time served as an officer of the Trust (or its predecessor entities), although various positions may have been held during the period.
FIRST EAGLE FUNDS | ANNUAL REPORT | OCTOBER 31, 2009
138
(continued)
Officers(7)—(continued)
Robert Bruno | Chief Operations Officer | December 1999 to present
1345 Avenue of the Americas | New York, New York | 10105
(born June 1964)
Principal Occupation(s) During Past Five (5) Years: Senior Vice President, First Eagle Investment Management, LLC; President, ASB Securities LLC; Chief Operations Officer, First Eagle Variable Funds
Joseph T. Malone | Chief Financial Officer | September 2008 to present
1345 Avenue of the Americas | New York, New York | 10105
(born September 1967)
Principal Occupation(s) During Past Five (5) Years: Senior Vice President, First Eagle Investment Management, LLC; Chief Financial Officer, First Eagle Variable Funds; from September 2008; Chief Financial Officer and Treasurer, Aberdeen Funds from November 2007; Director, UBS Global Asset Management from October 2001; Global Fund Treasurer, UBS Global Asset Management from September 2006; Treasurer and Co-Head Mutual Fund Administration Group, UBS Global Asset Management from July 2005
Mark D. Goldstein | Chief Compliance Officer | February 2005 to present
1345 Avenue of the Americas | New York, New York | 10105
(born October 1964)
Principal Occupation(s) During Past Five (5) Years: General Counsel, Chief Compliance Officer and Senior Vice President, First Eagle Investment Management, LLC; General Counsel and Secretary of Arnhold and S. Bleichroeder Holdings, Inc., and Chief Compliance Officer, First Eagle Variable Funds from February 2005; Chief Compliance Officer, Good Hope Advisers, LLC from January 2006; Senior Counsel and Chief Compliance Officer, MacKay Shields LLC from April 2004
Suzan J. Afifi | Secretary and Vice President | December 1999 to present
1345 Avenue of the Americas | New York, New York | 10105
(born October 1952)
Principal Occupation(s) During Past Five (5) Years: Senior Vice President, First Eagle Investment Management, LLC; Vice President, ASB Securities LLC; Secretary and Vice President, First Eagle Variable Funds
(7)The term of office of each officer is indefinite. Length of time served represents time served as an officer of the Trust (or its predecessor entities), although various positions may have been held during the period.
FIRST EAGLE FUNDS | ANNUAL REPORT | OCTOBER 31, 2009
139
Additional Information (unaudited) (continued)
Officers(7)—(continued)
Philip Santopadre | Treasurer | September 2005 to present
1345 Avenue of the Americas | New York, New York | 10105
(born August 1977)
Principal Occupation(s) During Past Five (5) Years: Vice President, First Eagle Investment Management, LLC; Treasurer, First Eagle Variable Funds
Michael Luzzatto | Vice President | December 2004 to present
1345 Avenue of the Americas | New York, New York | 10105
(born April 1977)
Principal Occupation(s) During Past Five (5) Years: Senior Vice President, First Eagle Investment Management, LLC; Vice President, ASB Securities LLC; Vice President, First Eagle Variable Funds
Winnie Chin | Assistant Treasurer | March 2001 to present
1345 Avenue of the Americas | New York, New York | 10105
(born July 1974)
Principal Occupation(s) During Past Five (5) Years: Vice President, First Eagle Investment Management, LLC; Assistant Treasurer, First Eagle Variable Funds
(7)The term of office of each officer is indefinite. Length of time served represents time served as an officer of the Trust (or its predecessor entities), although various positions may have been held during the period.
FIRST EAGLE FUNDS | ANNUAL REPORT | OCTOBER 31, 2009
140
First Eagle Funds
Trustees
Lisa Anderson
John P. Arnhold
Candace K. Beinecke (Chair)
Jean-Marie Eveillard
Jean D. Hamilton
James E. Jordan
William M. Kelly
Paul J. Lawler
Officers
John P. Arnhold
President
Robert Bruno
Chief Operations Officer
Joseph T. Malone
Chief Financial Officer
Mark D. Goldstein
Chief Compliance Officer
Suzan J. Afifi
Secretary & Vice President
Philip Santopadre
Treasurer
Michael Luzzatto
Vice President
Winnie Chin
Assistant Treasurer
Investment Adviser
First Eagle Investment Management, LLC
1345 Avenue of the Americas
New York, NY 10105
Legal Counsel
Shearman & Sterling LLP
599 Lexington Avenue
New York, NY 10022
Custodian
State Street Bank and Trust Company
801 Pennsylvania
Kansas City, MO 64105
Shareholder Servicing Agent
DST Systems, Inc.
330 West 9th Street
Kansas City, MO 64105
(800) 334-2143
Underwriter
First Eagle Funds Distributors, a division of
ASB Securities LLC
1345 Avenue of the Americas
New York, NY 10105
Independent Registered
Public Accounting Firm
PricewaterhouseCoopers LLP
300 Madison Avenue
New York, NY 10017
This report is not authorized for distribution to prospective investors unless preceded or accompanied by a currently effective prospectus of First Eagle Funds.
FIRST EAGLE FUNDS | ANNUAL REPORT | OCTOBER 31, 2009
141
This page was intentionally left blank.
This page was intentionally left blank.
This page was intentionally left blank.
This page was intentionally left blank.
This page was intentionally left blank.

1345 Avenue of the Americas | New York, NY | 10105-4300 | 800.334.2143 | www.firsteaglefunds.com

Fund Overview | Data as of October 31, 2009 (unaudited)
INVESTMENT OBJECTIVE
First Eagle Global Fund seeks long-term growth of capital by investing in a range of asset classes from markets in the United States and around the world. This truly global fund is managed with a highly disciplined, bottom-up, value oriented style that may help to minimize risk.
Average Annual Returns
| | | ONE-YEAR | | FIVE-YEARS | | TEN-YEARS | |
First Eagle Global
Fund (A Shares) | |
| without sales charge | | | 20.81 | % | | | 8.78 | % | | | 12.46 | % | |
| with sales charge | | | 14.77 | | | | 7.67 | | | | 12.03 | | |
| MSCI World Index | | | 18.42 | | | | 2.64 | | | | 0.23 | | |
| Consumer Price Index | | | -0.18 | | | | 2.52 | | | | 2.54 | | |
Asset Allocation
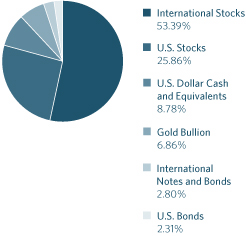
Countries
| United States | | | 35.03 | % | |
| Japan | | | 21.29 | | |
| France | | | 11.78 | | |
| Switzerland | | | 5.05 | | |
| Mexico | | | 2.35 | | |
| South Korea | | | 1.95 | | |
| South Africa | | | 1.84 | | |
| Germany | | | 1.80 | | |
| Italy | | | 1.71 | | |
| Hong Kong | | | 1.49 | | |
| United Kingdom | | | 1.33 | | |
| Singapore | | | 1.31 | | |
| Netherlands | | | 0.94 | | |
| Malaysia | | | 0.70 | | |
| Brazil | | | 0.64 | | |
| Taiwan | | | 0.61 | | |
| Papua New Guinea | | | 0.59 | | |
| Thailand | | | 0.51 | | |
| Other | | | 0.30 | | |
The Fund's portfolio composition (represented as a percentage of net assets) is subject to change at any time.
FIRST EAGLE FUNDS | ANNUAL REPORT | OCTOBER 31, 2009
16
Global Fund
Growth of a $10,000 Initial Investment
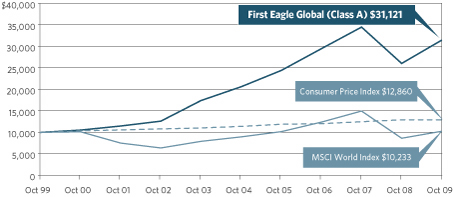
Performance data quoted herein represents past performance and should not be considered indicative of future results. Performance data quoted herein does not reflect the deduction of taxes that a shareholder would pay on Fund distributions or the sale of Fund shares. The average annual returns shown above are historical and reflect changes in share price, reinvested dividends and are net of expenses.
The average annual returns for Class A Shares give effect to the deduction of the maximum sales charge of 3.75% for periods prior to March 1, 2000 and of 5.00% thereafter.
The MSCI World Index is a widely followed, unmanaged group of stocks from 23 international markets and is not available for purchase. The index provides total returns in U.S. dollars with net dividends reinvested. The Consumer Price Index (CPI) represents the change in price of all goods and services purchased for consumption by urban households.
Top 10 Holdings
| Gold Bullion (precious metal) | | | 6.86 | % | |
| Fanuc Limited (Japanese industrial manufacturing company) | | | 2.48 | | |
| Secom Company Limited (Japanese security services provider) | | | 2.41 | | |
| Berkshire Hathaway, Inc., Class 'A' (U.S. holding company) | | | 2.39 | | |
| SMC Corporation (Japanese automated control devices manufacturer) | | | 2.37 | | |
| Sanofi-Aventis SA (French health care company) | | | 2.02 | | |
| Sodexo (French food management services provider) | | | 1.82 | | |
| Astellas Pharma, Inc. (Japanese pharmaceuticals company) | | | 1.76 | | |
| Keyence Corporation (Japanese sensors manufacturer) | | | 1.72 | | |
| Microsoft Corporation (U.S. software developer) | | | 1.71 | | |
FIRST EAGLE FUNDS | ANNUAL REPORT | OCTOBER 31, 2009
17
First Eagle Global Fund
| NUMBER OF SHARES | | DESCRIPTION | | COST (NOTE 1) | | VALUE (NOTE 1) | |
| Common Stocks—77.90% | | | |
| U.S. Common Stocks—25.78% | | | |
| Consumer Discretionary 5.86% | | | |
| | 11,138,751 | | | Cintas Corporation (b) | | $ | 389,081,098 | | | $ | 308,432,015 | | |
| | 4,954,570 | | | Omnicom Group, Inc. | | | 140,489,978 | | | | 169,842,660 | | |
| | 11,783,002 | | | Comcast Corporation, Class 'A' | | | 201,524,713 | | | | 165,197,688 | | |
| | 2,572,580 | | | Costco Wholesale Corporation | | | 98,858,810 | | | | 146,251,173 | | |
| | 5,300,650 | | | Home Depot, Inc. | | | 131,119,191 | | | | 132,993,308 | | |
| | 3,654,083 | | | Barnes & Noble, Inc. (b) | | | 88,371,265 | | | | 60,694,319 | | |
| | 1,381,358 | | | Unifirst Corporation | | | 30,865,195 | | | | 58,113,731 | | |
| | 1,111,175 | | | Wal-Mart Stores, Inc. | | | 51,029,419 | | | | 55,203,174 | | |
| | 772,408 | | | WABCO Holdings, Inc. | | | 16,032,313 | | | | 18,321,518 | | |
| | 2,485 | | | JG Boswell Company (c) | | | 573,840 | | | | 1,180,375 | | |
| | 185,000 | | | St. John Knits
International, Inc. (a)(c) | | | 3,180,703 | | | | 582,750 | | |
| | | | | | | | 1,151,126,525 | | | | 1,116,812,711 | | |
| Energy 3.01% | | | |
| | 2,407,091 | | | Apache Corporation | | | 164,692,743 | | | | 226,555,405 | | |
| | 2,536,293 | | | ConocoPhillips | | | 116,539,901 | | | | 127,271,183 | | |
| | 2,327,880 | | | Helmerich & Payne, Inc. | | | 57,215,205 | | | | 88,505,997 | | |
| | 3,975,644 | | | San Juan Basin Royalty Trust (b) | | | 141,567,358 | | | | 70,806,220 | | |
| | 1,008,530 | | | Murphy Oil Corporation | | | 39,438,919 | | | | 61,661,524 | | |
| | | | | | | | 519,454,126 | | | | 574,800,329 | | |
| Financials 4.80% | | | |
| | 4,599 | | | Berkshire Hathaway, Inc. ,
Class 'A' (a) | | | 392,199,945
| | | | 455,301,000
| | |
| | 9,253,133 | | | American Express Company | | | 397,945,907 | | | | 322,379,154 | | |
| | 5,357,025 | | | Cincinnati Financial Corporation | | | 133,262,949 | | | | 135,854,154 | | |
| | 34,924 | | | Mills Music Trust (b)(c) | | | 1,055,337 | | | | 981,713 | | |
| | 192,250 | | | LandCo Real Estate
LLC (a)(c)(d)(e) | | | 669,030
| | | | 246,080
| | |
| | | | | | | | 925,133,168 | | | | 914,762,101 | | |
| Health Care 0.94% | | | |
| | 2,499,370 | | | WellPoint, Inc. (a) | | | 118,103,478 | | | | 116,870,541 | | |
| | 1,059,980 | | | Johnson & Johnson | | | 59,610,842 | | | | 62,591,819 | | |
| | | | | | | | 177,714,320 | | | | 179,462,360 | | |
| Industrials 3.24% | | | |
| | 3,896,660 | | | 3M Company | | | 307,392,891 | | | | 286,677,276 | | |
| | 1,898,339 | | | Alliant Techsystems, Inc. (a)(b) | | | 190,877,435 | | | | 147,652,807 | | |
| | 2,365,411 | | | Automatic Data Processing, Inc. | | | 85,148,200 | | | | 94,143,358 | | |
See Notes to Financial Statements.
18
Schedule of Investments | Year Ended October 31, 2009
| NUMBER OF SHARES | | DESCRIPTION | | COST (NOTE 1) | | VALUE (NOTE 1) | |
| U.S. Common Stocks—25.78%—(continued) | |
| Industrials 3.24%—(continued) | |
| | 9,778,961 | | | Blount International, Inc. (a)(b) | | $ | 127,911,050 | | | $ | 88,401,808 | | |
| | 4,169 | | | Conbraco Industries,
Inc. (a)(b)(c)(d) | | | 1,258,498
| | | | —
| | |
| | | | | | 712,588,074 | | | | 616,875,249 | | |
| Information Technology 3.13% | |
| | 11,770,017 | | | Microsoft Corporation | | | 289,344,087 | | | | 326,382,571 | | |
| | 5,483,320 | | | Linear Technology Corporation | | | 154,211,819 | | | | 141,908,322 | | |
| | 6,694,310 | | | Intel Corporation | | | 91,240,768 | | | | 127,928,264 | | |
| | | | | | 534,796,674 | | | | 596,219,157 | | |
| Materials 3.54% | |
| | 5,275,011 | | | Rayonier, Inc. , REIT (b) | | | 102,375,275 | | | | 203,509,924 | | |
| | 3,987,548 | | | Plum Creek Timber
Company, Inc. , REIT | | | 147,118,846
| | | | 124,770,377
| | |
| | 2,784,350 | | | Weyerhaeuser Company | | | 124,714,724 | | | | 101,183,279 | | |
| | 2,307,462 | | | Newmont Mining Corporation | | | 79,025,915 | | | | 100,282,298 | | |
| | 3,676,750 | | | Newmont Mining Corporation, CDI | | | 3,394,060 | | | | 15,702,393 | | |
| | 1,655,620 | | | Vulcan Materials Company | | | 110,867,266 | | | | 76,208,189 | | |
| | 1,258,500 | | | Deltic Timber Corporation (b) | | | 62,903,243 | | | | 53,486,250 | | |
| | | | | | 630,399,329 | | | | 675,142,710 | | |
| Telecommunication Services 0.65% | |
| | 5,391,150 | | | Cisco Systems, Inc. (a) | | | 86,351,072 | | | | 123,187,778 | | |
| Utilities 0.61% | |
| | 4,117,660 | | | IDACorporation, Inc. (b) | | | 136,695,395 | | | | 115,665,070 | | |
| Total U.S. Common Stocks | | | | | 4,874,258,683 | | | | 4,912,927,465 | | |
| International Common Stocks—52.12% | |
| Brazil 0.64% | |
| | 3,031,450 | | | Petroleo Brasileiro SA , ADR | | | 50,673,221 | | | | 121,621,774 | | |
| Canada 0.04% | |
| | 998,660 | | | Harry Winston Diamond
Corporation | | | 25,562,601
| | | | 8,192,854
| | |
| Chile 0.08% | |
| | 7,600,803 | | | Quinenco SA (c) | | | 5,676,192 | | | | 15,031,252 | | |
| France 11.45% | |
| | 5,259,547 | | | Sanofi-Aventis SA | | | 415,745,822 | | | | 385,586,377 | | |
| | 6,059,452 | | | Sodexo (b) | | | 204,703,427 | | | | 347,470,938 | | |
| | 2,807,336 | | | Neopost SA (b) | | | 268,923,572 | | | | 246,666,558 | | |
See Notes to Financial Statements.
19
Global Fund
| NUMBER OF SHARES | | DESCRIPTION | | COST (NOTE 1) | | VALUE (NOTE 1) | |
| International Common Stocks—52.12%—(continued) | | | |
| France 11.45%—(continued) | | | |
| | 3,976,126 | | | Rémy Cointreau SA (b) | | $ | 167,006,400 | | | $ | 192,905,172 | | |
| | 2,884,676 | | | Cie Generale d'Optique Essilor
International SA | | | 102,363,148
| | | | 162,186,794
| | |
| | 3,733,423 | | | Carrefour SA | | | 230,370,943 | | | | 161,047,441 | | |
| | 2,271,220 | | | Société BIC SA | | | 123,022,832 | | | | 158,289,616 | | |
| | 2,359,340 | | | Total SA | | | 130,161,165 | | | | 141,291,066 | | |
| | 2,147,945 | | | Wendel (b) | | | 111,924,050 | | | | 119,973,761 | | |
| | 912,153 | | | Guyenne et Gascogne SA (b) | | | 104,249,439 | | | | 91,478,646 | | |
| | 695,211 | | | Air Liquide SA | | | 75,973,435 | | | | 75,203,249 | | |
| | 63,019 | | | Sucrière de Pithiviers-Le-Vieil (b) | | | 35,947,627 | | | | 58,510,790 | | |
| | 165,085 | | | Robertet SA | | | 21,842,347 | | | | 19,950,114 | | |
| | 42,252 | | | Robertet SA CI (c) | | | 800,508 | | | | 3,487,058 | | |
| | 104,457 | | | Gaumont SA | | | 6,087,824 | | | | 6,334,776 | | |
| | 385,000 | | | Sabeton SA (b) | | | 4,841,233 | | | | 6,212,963 | | |
| | 69,500 | | | NSC Groupe (b)(c) | | | 12,298,421 | | | | 3,994,600 | | |
| | 12,000,000 | | | FINEL (a)(b)(c)(d)(e)(f) | | | — | | | | 884,250 | | |
| | | | | | | | 2,016,262,193 | | | | 2,181,474,169 | | |
| Germany 1.35% | | | |
| | 1,172,304 | | | Pfeiffer Vacuum Technology AG (b) | | | 105,767,273 | | | | 88,319,174 | | |
| | 1,815,438 | | | Fraport AG | | | 61,560,708 | | | | 85,616,074 | | |
| | 2,464,510 | | | Tognum AG | | | 26,236,180 | | | | 37,809,873 | | |
| | 1,337,532 | | | Bertelsmann AG , Series 'A' (a)(g) | | | 33,414,943 | | | | 26,295,650 | | |
| | 386,842 | | | Hornbach Baumarkt AG | | | 21,504,161 | | | | 19,549,021 | | |
| | | | | | | | 248,483,265 | | | | 257,589,792 | | |
| Hong Kong 1.49% | | | |
| | 12,693,580 | | | Guoco Group Limited | | | 115,086,260 | | | | 142,903,299 | | |
| | 25,304,450 | | | Wharf Holdings Limited | | | 54,505,038 | | | | 139,580,810 | | |
| | 20,738,780 | | | City e-Solutions Limited (a)(b)(c) | | | 936,898 | | | | 1,873,156 | | |
| | | | | | | | 170,528,196 | | | | 284,357,265 | | |
| Italy 1.71% | | | |
| | 18,139,395 | | | Italcementi S.p.A. RSP | | | 249,186,230 | | | | 137,540,970 | | |
| | 4,682,069 | | | Italcementi S.p.A. | | | 86,201,872 | | | | 67,725,469 | | |
| | 1,734,972 | | | Italmobiliare S.p.A. RSP (a) | | | 121,356,934 | | | | 57,428,322 | | |
| | 1,021,137 | | | Italmobiliare S.p.A. (a) | | | 107,360,738 | | | | 49,240,359 | | |
| | 2,897,743 | | | Gewiss S.p.A. | | | 17,398,762 | | | | 12,897,060 | | |
| | | | | | | | 581,504,536 | | | | 324,832,180 | | |
See Notes to Financial Statements.
20
Schedule of Investments | Year Ended October 31, 2009
| NUMBER OF SHARES | | DESCRIPTION | | COST (NOTE 1) | | VALUE (NOTE 1) | |
| International Common Stocks—52.12%—(continued) | | | |
| Japan 21.17% | | | |
| | 5,515,480 | | | Fanuc Limited | | $ | 471,281,924 | | | $ | 472,519,038 | | |
| | 9,712,830 | | | Secom Company Limited | | | 441,193,277 | | | | 458,686,899 | | |
| | 3,853,720 | | | SMC Corporation (b) | | | 448,114,998 | | | | 451,338,505 | | |
| | 8,977,860 | | | Astellas Pharma, Inc. | | | 362,418,345 | | | | 336,189,657 | | |
| | 1,617,690 | | | Keyence Corporation | | | 323,870,015 | | | | 327,510,548 | | |
| | 64,994,300 | | | Aioi Insurance Company Limited (b) | | | 312,994,683 | | | | 293,934,998 | | |
| | 7,086,170 | | | Shimano, Inc. (b) | | | 164,314,591 | | | | 277,950,776 | | |
| | 14,640,730 | | | MISUMI Group, Inc. (b) | | | 256,686,326 | | | | 255,413,591 | | |
| | 5,211,900 | | | Ono Pharmaceutical
Company Limited | | | 237,044,527
| | | | 250,185,099
| | |
| | 4,567,060 | | | Canon, Inc. | | | 218,295,606 | | | | 179,140,194 | | |
| | 9,730,350 | | | THK Company Limited (b) | | | 181,477,914 | | | | 172,993,611 | | |
| | 1,504,110 | | | Hirose Electric Company Limited | | | 165,653,805 | | | | 158,274,590 | | |
| | 5,147,000 | | | T. Hasegawa Company Limited (b) | | | 79,849,658 | | | | 80,297,661 | | |
| | 3,501,380 | | | Chofu Seisakusho Company
Limited (b) | | | 63,721,317
| | | | 70,303,835
| | |
| | 10,229,750 | | | Nipponkoa Insurance
Company Limited | | | 55,567,429
| | | | 57,289,783
| | |
| | 2,719,100 | | | Meitec Corporation (b) | | | 79,203,905 | | | | 46,710,691 | | |
| | 6,991,450 | | | Sompo Japan Insurance, Inc. | | | 69,408,370 | | | | 42,417,153 | | |
| | 3,461,892 | | | Nissin Healthcare Food Service
Company Limited | | | 47,886,384
| | | | 41,506,544
| | |
| | 1,725,100 | | | Ariake Japan Company Limited (b) | | | 29,754,119 | | | | 27,219,757 | | |
| | 2,002,100 | | | Seikagaku Corporation | | | 21,143,745 | | | | 25,583,810 | | |
| | 331,790 | | | Mitsubishi Estate Company Limited | | | 4,870,410 | | | | 5,176,212 | | |
| | 257,500 | | | Aderans Holdings Company Limited | | | 5,849,064 | | | | 3,241,819 | | |
| | | | | | | | 4,040,600,412 | | | | 4,033,884,771 | | |
| Malaysia 0.70% | | | |
| | 63,109,225 | | | Genting Berhad | | | 128,178,067 | | | | 133,893,271 | | |
| Mexico 2.35% | | | |
| | 9,745,693 | | | Industrias Peñoles S.A.B. de C.V. | | | 17,199,241 | | | | 177,760,095 | | |
| | 11,277,097 | | | Fresnillo PLC | | | 80,042,906 | | | | 137,483,290 | | |
| | 5,853,171 | | | Grupo Televisa SA , ADR | | | 102,919,381 | | | | 113,317,391 | | |
| | 5,207,150 | | | Grupo Televisa S.A.B. CPO | | | 17,371,195 | | | | 20,129,237 | | |
| | | | | | | | 217,532,723 | | | | 448,690,013 | | |
| Netherlands 0.45% | | | |
| | 2,169,186 | | | Heineken Holding NV | | | 62,830,694 | | | | 84,732,205 | | |
See Notes to Financial Statements.
21
Global Fund
| NUMBER OF SHARES | | DESCRIPTION | | COST (NOTE 1) | | VALUE (NOTE 1) | |
| International Common Stocks—52.12%—(continued) | |
| Panama 0.08% | |
| | 1,047,582 | | | Banco Latinoamericano de
Exportaciones SA | | $ | 16,618,795 | | | $ | 14,781,382 | | |
| Papua New Guinea 0.59% | |
| | 40,907,990 | | | Lihir Gold Limited (a) | | | 94,970,915 | | | | 112,180,174 | | |
| Singapore 0.26% | |
| | 12,704,120 | | | Fraser and Neave Limited | | | 12,799,700 | | | | 35,109,040 | | |
| | 13,467,250 | | | ComfortDelgro Corporation Limited | | | 3,279,184 | | | | 14,810,273 | | |
| | | | | | 16,078,884 | | | | 49,919,313 | | |
| South Africa 1.84% | |
| | 22,336,790 | | | Gold Fields Limited , ADR | | | 257,176,799 | | | | 284,794,073 | | |
| | 6,676,147 | | | Harmony Gold Mining Company
Limited , ADR | | | 60,120,073 | | | | 66,494,424 | | |
| | | | | | 317,296,872 | | | | 351,288,497 | �� | |
| South Korea 1.03% | |
| | 2,164,286 | | | KT&G Corporation | | | 123,837,593 | | | | 126,497,917 | | |
| | 51,900 | | | Lotte Confectionery
Company Limited | | | 21,157,499
| | | | 52,240,220
| | |
| | 39,989 | | | Namyang Dairy Products
Company Limited (b) | | | 7,325,466 | | | | 18,265,223 | | |
| | | | | | 152,320,558 | | | | 197,003,360 | | |
| Switzerland 5.05% | |
| | 3,783,070 | | | Pargesa Holding SA | | | 237,781,696 | | | | 303,915,917 | | |
| | 5,417,450 | | | Nestlé SA | | | 135,598,090 | | | | 252,879,554 | | |
| | 2,434,424 | | | Kuehne & Nagel International AG | | | 100,308,967 | | | | 221,473,295 | | |
| | 3,517 | | | Lindt & Spruengli AG | | | 102,938,455 | | | | 89,551,413 | | |
| | 40,274 | | | Lindt & Spruengli AG PC | | | 67,067,587 | | | | 85,072,903 | | |
| | 39,740 | | | Edipresse SA | | | 10,811,874 | | | | 10,085,802 | | |
| | | | | | 654,506,669 | | | | 962,978,884 | | |
| Thailand 0.51% | |
| | 26,134,990 | | | Bangkok Bank PCL NVDR | | | 83,968,951 | | | | 87,572,741 | | |
| | 448,850 | | | Bangkok Bank PCL | | | 1,459,292 | | | | 1,524,143 | | |
| | 577,000 | | | OHTL PCL (c) | | | 3,542,292 | | | | 8,544,952 | | |
| | | | | | 88,970,535 | | | | 97,641,836 | | |
| United Kingdom 1.33% | |
| | 5,700,990 | | | Willis Group Holdings Limited | | | 161,680,002 | | | | 153,926,730 | | |
| | 2,714,983 | | | Anglo American PLC (a) | | | 62,810,159 | | | | 98,874,042 | | |
| | | | | | 224,490,161 | | | | 252,800,772 | | |
| Total International Common Stocks | | | | | 9,113,085,489 | | | | 9,932,893,764 | | |
| Total Common Stocks | | | | | 13,987,344,172 | | | | 14,845,821,229 | | |
See Notes to Financial Statements.
22
Schedule of Investments | Year Ended October 31, 2009
| NUMBER OF SHARES | | DESCRIPTION | | COST (NOTE 1) | | VALUE (NOTE 1) | |
| Preferred Stocks—1.35% | | | |
| U.S. Preferred Stocks—0.08% | | | |
| Financials 0.01% | | | |
| | 137,410 | | | Price Legacy Corporation,
Series '1' REIT, 6.82% (c)(m) | | $ | 1,339,514 | | | $ | 1,298,524 | | |
| Utilities 0.07% | | | |
| | 335,000 | | | Calenergy Capital
Trust III, 6.50% (c)(n) | | | 14,782,812 | | | | 14,907,500 | | |
| | Total U.S. Preferred Stocks | | | | | | 16,122,326 | | | | 16,206,024 | | |
| International Preferred Stocks—1.27% | | | |
| Germany 0.45% | | | |
| | 877,242 | | | Hornbach Holding AG | | | 63,837,360 | | | | 85,805,503 | | |
| South Korea 0.82% | | | |
| | 384,890 | | | Samsung Electronics
Company Limited | | | 58,999,279
| | | | 156,430,235
| | |
| | Total International Preferred Stocks | | | | | | 122,836,639 | | | | 242,235,738 | | |
| | Total Preferred Stocks | | | | | | 138,958,965 | | | | 258,441,762 | | |
| OUNCES | | | | | | | |
| Commodity—6.86% | | | |
| | 1,249,002 | | | Gold bullion (a) | | | 693,749,790 | | | | 1,306,455,960 | | |
| PRINCIPAL AMOUNT | | | | | | | |
| Bonds—5.11% | | | |
| U.S. Bonds—2.31% | | | |
| Corporate Bonds 0.54% | | | |
| $ | 5,467,000 | | | Bausch & Lomb, Inc.
7.125% due 8/1/2028 (c) | | | 4,714,766 | | | | 3,292,173 | | |
| | 28,930,000 | | | Blount International, Inc.
8.875% due 8/1/2012 | | | 28,940,171 | | | | 29,580,925 | | |
| | 6,900,000 | | | Briggs & Stratton Corporation
8.875% due 3/15/2011 | | | 6,990,824 | | | | 7,296,750 | | |
| | 5,000,000 | | | Pulte Homes, Inc.
5.20% due 2/15/2015 | | | 4,281,235 | | | | 4,675,000 | | |
| | 10,867,000 | | | Texas Industries, Inc.
7.25% due 7/15/2013 | | | 8,229,216 | | | | 10,703,995 | | |
| | 15,154,144 | | | The Yankee Candle Company, Inc.
2.25% due 2/6/2014 (l) | | | 10,242,154 | | | | 14,207,009 | | |
| | 12,554,000 | | | Yankee Acquisition Corporation,
Series 'B' 8.50% due 2/15/2015 | | | 12,469,055 | | | | 12,051,840 | | |
See Notes to Financial Statements.
23
Global Fund
| PRINCIPAL AMOUNT | | DESCRIPTION | | COST (NOTE 1) | | VALUE (NOTE 1) | |
| U.S. Bonds—2.31%—(continued) | | | |
| Corporate Bonds 0.54%—(continued) | | | |
| $ | 22,554,000 | | | Yankee Acquisition Corporation,
Series 'B' 9.75% due 2/15/2017 | | | $21,826,871
| | | | $21,369,915
| | |
| | | | | | | | 97,694,292 | | | | 103,177,607 | | |
| Government Obligations 1.59% | | | |
| | 78,528,613 | | | United States Treasury
Inflation Indexed Bond
1.875% due 7/15/2013 (k) | | | 81,050,158
| | | | 82,307,803
| | |
| | 135,203,730 | | | United States Treasury
Inflation Indexed Bond
2.375% due 4/15/2011 (k) | | | 137,358,438 | | | | 139,988,725 | | |
| | 80,763,317 | | | United States Treasury
Inflation Indexed Bond
4.25% due 1/15/2010 (k) | | | 81,036,466 | | | | 81,463,696 | | |
| | | | | | | | 299,445,062 | | | | 303,760,224 | | |
| | | Convertible Bond 0.18% | |
| | 34,617,000 | | | Boston Properties LP
3.625% due 2/15/2014 (h)(o) | | | 25,046,824 | | | | 33,405,405 | | |
| | Total U.S. Bonds | | | | | | 422,186,178 | | | | 440,343,236 | | |
| International Notes and Bonds—2.80% | | | |
| International Corporate Notes and Bonds—0.92% | | | |
| Canada 0.04% | | | |
| | 33,260,000
USD | | | CanWest LP
9.25% due 8/1/2015 (a)(c)(h)(i) | | | 29,121,477
| | | | 6,818,300
| | |
| France 0.33% | | | |
| | 15,000,000
EUR | | | Emin Leydier SA
5.00% due 7/31/2016 (c)(d)(e) | | | 21,410,094
| | | | 22,106,255
| | |
| | 12,000,000
EUR | | | FINEL
9.50% due 6/30/2017 (a)(c)(d)(e) | | | 14,474,400
| | | | 8,842,502
| | |
| | 2,000,000
USD | | | Legrand SA
8.50% due 2/15/2025 | | | 1,958,843
| | | | 2,121,300
| | |
| | 12,050,000
EUR | | | Wendel
4.375% due 8/9/2017 | | | 10,380,827
| | | | 13,851,779
| | |
| | 330,000
EUR | | | Wendel
4.875% due 11/4/2014 | | | 261,794
| | | | 423,114
| | |
| | 10,000,000
EUR | | | Wendel
4.875% due 9/21/2015 (j) | | | 9,765,644
| | | | 12,305,962
| | |
| | 3,500,000
EUR | | | Wendel
4.875% due 5/26/2016 | | | 2,364,393
| | | | 4,307,035
| | |
| | | | | | | | 60,615,995 | | | | 63,957,947 | | |
See Notes to Financial Statements.
24
Schedule of Investments | Year Ended October 31, 2009
| PRINCIPAL AMOUNT | | DESCRIPTION | | COST (NOTE 1) | | VALUE (NOTE 1) | |
| International Corporate Notes and Bonds—0.92%—(continued) | | | |
| Ireland 0.00% | | | |
| | 13,650,000
EUR
| | | Waterford Wedgwood PLC
9.875% due 12/1/2010
(a)(c)(d)(h)(i) | | | $16,339,337
| | | | $—
| | |
| Netherlands 0.49% | | | |
| | 39,700,000
EUR | | | UPC Holding BV
7.75% due 1/15/2014 (j) | | | 46,499,186
| | | | 59,092,966
| | |
| | 22,660,000
EUR | | | UPC Holding BV
8.625% due 1/15/2014 (j) | | | 26,705,791
| | | | 34,397,037
| | |
| | | | | | | | 73,204,977 | | | | 93,490,003 | | |
| Norway 0.06% | | | |
| | 5,500,000
USD | | | Den Norske Bank ASA FRN
0.938% due 2/26/2010 (c) | | | 3,888,750
| | | | 3,052,500
| | |
| | 3,170,000
USD | | | Den Norske Creditbank FRN
0.625% due 11/30/2009 (c) | | | 2,059,625
| | | | 1,632,550
| | |
| | 3,500,000
USD | | | Den Norske Creditbank FRN
0.963% due 2/28/2010 (c) | | | 2,610,000
| | | | 1,540,000
| | |
| | 10,000,000
USD | | | Nordea Bank Norge ASA FRN
1.625% due 5/19/2010 (c) | | | 6,826,750
| | | | 5,150,000
| | |
| | | | | | | | 15,385,125 | | | | 11,375,050 | | |
| | Total International Corporate Notes and Bonds | | | | | | 194,666,911 | | | | 175,641,300 | | |
| International Government Bonds—1.88% | | | |
| Japan 0.12% | | | |
| | 2,189,862,900
JPY | | | Japanese Government CPI Linked
Bond 1.40% due 6/10/2018 (k) | | | 20,103,008
| | | | 22,626,750
| | |
| Singapore 1.05% | | | |
| | 60,827,000
SGD | | | Singapore Government Bond
3.625% due 7/1/2011 | | | 44,552,820
| | | | 45,611,280
| | |
| | 211,030,000
SGD | | | Singapore Government Bond
4.625% due 7/1/2010 | | | 145,150,532
| | | | 154,807,877
| | |
| | | | | | | | 189,703,352 | | | | 200,419,157 | | |
| South Korea 0.10% | | | |
| | 23,194,710,000
KRW
| | | Inflation Linked Korea
Treasury Bond
2.75% due 3/10/2017 (k) | | | 22,110,315
| | | | 19,529,406
| | |
| Taiwan 0.61% | | | |
| | 1,767,500,000
TWD | | | Taiwan Government Bond
2.00% due 7/20/2012 | | | 53,958,517
| | | | 56,392,179
| | |
See Notes to Financial Statements.
25
Global Fund
| PRINCIPAL AMOUNT | | DESCRIPTION | | COST (NOTE 1) | | VALUE (NOTE 1) | |
| International Government Bonds—1.88%—(continued) | | | |
| Taiwan 0.61%—(continued) | | | |
| | 1,826,000,000
TWD | | | Taiwan Government Bond
2.375% due 1/16/2013 | | | $59,152,173
| | | | $59,166,656
| | |
| | | | | | | | 113,110,690 | | | | 115,558,835 | | |
| | Total International Government Bonds | | | | | | 345,027,365 | | | | 358,134,148 | | |
| | Total International Notes and Bonds | | | | | | 539,694,276 | | | | 533,775,448 | | |
| | Total Notes and Bonds | | | | | | 961,880,454 | | | | 974,118,684 | | |
| Commercial Paper—9.14% | | | |
| International Commercial Paper—2.97% | | | |
| Finland 0.05% | | | |
| | 8,500,000
USD | | | Nokia Corporation
0.19% due 11/24/2009 | | | 8,498,968
| | | | 8,498,968
| | |
| France 0.17% | | | |
| | 27,290,000
USD | | | Électricité de France
0.19% due 1/6/2010 | | | 27,280,494
| | | | 27,280,494
| | |
| | 4,378,000
USD | | | L'Air Liquide SA
0.13% due 11/17/2009 | | | 4,377,747
| | | | 4,377,747
| | |
| Germany 0.32% | | | |
| | 28,500,000
USD | | | BMW
0.20% due 11/4/2009 | | | 28,499,525
| | | | 28,499,525
| | |
| | 33,127,000
USD | | | BMW
0.21% due 11/17/2009 | | | 33,123,908
| | | | 33,123,908
| | |
| Japan 0.94% | | | |
| | 25,000,000
USD | | | Hitachi, Limited
0.28% due 11/12/2009 | | | 24,997,861
| | | | 24,997,861
| | |
| | 16,500,000
USD | | | Panasonic Finance
0.18% due 12/7/2009 | | | 16,497,030
| | | | 16,497,030
| | |
| | 26,848,000
USD | | | Panasonic Finance
0.18% due 12/21/2009 | | | 26,841,288
| | | | 26,841,288
| | |
| | 43,154,000
USD | | | Panasonic Finance
0.19% due 12/7/2009 | | | 43,145,801
| | | | 43,145,801
| | |
| | 27,000,000
USD | | | Panasonic Finance
0.19% due 12/14/2009 | | | 26,993,873
| | | | 26,993,873
| | |
| | 41,500,000
USD | | | Panasonic Finance
0.21% due 12/2/2009 | | | 41,492,495
| | | | 41,492,495
| | |
| Netherlands 0.08% | | | |
| | 15,021,000
USD | | | Royal Dutch Shell PLC
0.12% due 11/9/2009 | | | 15,020,600
| | | | 15,020,600
| | |
See Notes to Financial Statements.
26
Schedule of Investments | Year Ended October 31, 2009
| PRINCIPAL AMOUNT | | DESCRIPTION | | COST (NOTE 1) | | VALUE (NOTE 1) | |
| International Commercial Paper—2.97%—(continued) | | | |
| Switzerland 0.49% | | | |
| | 17,826,000
USD | | | Nestlé Capital Corporation
0.10% due 11/24/2009 | | | $17,824,861
| | | | $17,824,861
| | |
| | 20,540,000
USD | | | Nestlé Capital Corporation
0.11% due 11/23/2009 | | | 20,538,619
| | | | 20,538,619
| | |
| | 40,184,000
USD | | | Nestlé Capital Corporation
0.11% due 11/24/2009 | | | 40,181,176
| | | | 40,181,176
| | |
| | 15,000,000
USD | | | Nestlé Capital Corporation
0.21% due 11/4/2009 | | | 14,999,738
| | | | 14,999,738
| | |
| United Kingdom 0.92% | | | |
| | 54,350,000
USD | | | Diageo Capital PLC
0.26% due 11/23/2009 | | | 54,341,364
| | | | 54,341,364
| | |
| | 27,409,000
USD | | | Diageo Capital PLC
0.27% due 11/5/2009 | | | 27,408,178
| | | | 27,408,178
| | |
| | 26,400,000
USD | | | Diageo Capital PLC
0.27% due 11/9/2009 | | | 26,398,416
| | | | 26,398,416
| | |
| | 10,000,000
USD | | | Diageo Capital PLC
0.28% due 11/13/2009 | | | 9,999,067
| | | | 9,999,067
| | |
| | 18,778,000
USD | | | Diageo Capital PLC
0.30% due 11/5/2009 | | | 18,777,374
| | | | 18,777,374
| | |
| | 20,748,000
USD | | | Diageo Capital PLC
0.33% due 11/30/2009 | | | 20,742,484
| | | | 20,742,484
| | |
| | 17,802,000
USD | | | Reed Elsevier PLC
0.20% due 11/19/2009 | | | 17,800,220
| | | | 17,800,220
| | |
| | Total International Commercial Paper | | | | | | 565,781,087 | | | | 565,781,087 | | |
| U.S. Commercial Paper—6.17% | | | |
| $ | 15,750,000 | | | Bemis Company, Inc. | | | 15,749,300 | | | | 15,749,300 | | |
| | | | | 0.20% due 11/9/2009 | | | | | | | | | |
| | 6,800,000 | | | Bemis Company, Inc.
0.20% due 11/10/2009 | | | 6,799,660
| | | | 6,799,660
| | |
| | 3,008,000 | | | The Clorox Company
0.25% due 11/4/2009 | | | 3,007,937
| | | | 3,007,937
| | |
| | 16,964,000 | | | The Coca-Cola Company
0.12% due 12/11/2009 | | | 16,961,738
| | | | 16,961,738
| | |
| | 25,000,000 | | | The Coca-Cola Company
0.13% due 12/18/2009 | | | 24,995,757
| | | | 24,995,757
| | |
| | 30,000,000 | | | The Coca-Cola Company
0.14% due 11/9/2009 | | | 29,999,067
| | | | 29,999,067
| | |
| | 10,000,000 | | | The Coca-Cola Company
0.14% due 1/20/2010 | | | 9,996,889
| | | | 9,996,889
| | |
| | 30,350,000 | | | The Coca-Cola Company
0.15% due 11/25/2009 | | | 30,346,965
| | | | 30,346,965
| | |
See Notes to Financial Statements.
27
Global Fund
| PRINCIPAL AMOUNT | | DESCRIPTION | | COST (NOTE 1) | | VALUE (NOTE 1) | |
| U.S. Commercial Paper—6.17%—(continued) | | | |
| $ | 10,000,000 | | | The Coca-Cola Company
0.16% due 11/17/2009 | | | $9,999,289
| | | | $9,999,289
| | |
| | 23,100,000 | | | Colgate-Palmolive Company
0.08% due 11/5/2009 | | | 23,099,795
| | | | 23,099,795
| | |
| | 10,000,000 | | | Dell, Inc.
0.16% due 12/1/2009 | | | 9,998,667
| | | | 9,998,667
| | |
| | 6,249,000 | | | Dell, Inc.
0.19% due 12/14/2009 | | | 6,247,582 | | | | 6,247,582 | | |
| | 15,000,000 | | | E.I. du Pont de Nemours
and Company
0.12% due 11/3/2009 | | | 14,999,900 | | | | 14,999,900 | | |
| | 28,651,000 | | | E.I. du Pont de Nemours
and Company
0.12% due 11/18/2009 | | | 28,649,376 | | | | 28,649,376 | | |
| | 24,400,000 | | | E.I. du Pont de Nemours
and Company
0.13% due 11/9/2009 | | | 24,399,295 | | | | 24,399,295 | | |
| | 31,456,000 | | | H.J. Heinz Company
0.20% due 12/1/2009 | | | 31,450,757 | | | | 31,450,757 | | |
| | 18,348,000 | | | H.J. Heinz Company
0.28% due 11/2/2009 | | | 18,347,857 | | | | 18,347,857 | | |
| | 5,416,000 | | | Kraft Foods, Inc.
0.33% due 11/6/2009 | | | 5,415,752 | | | | 5,415,752 | | |
| | 8,942,000 | | | Kraft Foods, Inc.
0.38% due 12/15/2009 | | | 8,937,847 | | | | 8,937,847 | | |
| | 24,772,000 | | | Kraft Foods, Inc.
0.40% due 12/15/2009 | | | 24,759,889 | | | | 24,759,889 | | |
| | 3,719,000 | | | Kraft Foods, Inc.
0.44% due 12/15/2009 | | | 3,717,000 | | | | 3,717,000 | | |
| | 9,812,000 | | | Microsoft Corporation
0.08% due 12/14/2009 | | | 9,811,062 | | | | 9,811,062 | | |
| | 50,000,000 | | | Microsoft Corporation
0.11% due 12/9/2009 | | | 49,994,194 | | | | 49,994,194 | | |
| | 58,003,000 | | | Microsoft Corporation
0.13% due 11/10/2009 | | | 58,001,115 | | | | 58,001,115 | | |
| | 25,621,000 | | | Moody's Corporation
0.28% due 11/10/2009 | | | 25,619,207 | | | | 25,619,207 | | |
| | 50,000,000 | | | Moody's Corporation
0.28% due 11/12/2009 | | | 49,995,722 | | | | 49,995,722 | | |
| | 65,930,000 | | | Moody's Corporation
0.32% due 12/21/2009 | | | 65,900,698 | | | | 65,900,698 | | |
| | 48,300,000 | | | Northern Illinois Gas Company
0.10% due 11/2/2009 | | | 48,299,866
| | | | 48,299,866
| | |
| | 11,000,000 | | | NYSE Euronext
0.13% due 11/20/2009 | | | 10,999,245 | | | | 10,999,245 | | |
See Notes to Financial Statements.
28
Schedule of Investments | Year Ended October 31, 2009
| PRINCIPAL AMOUNT | | DESCRIPTION | | COST (NOTE 1) | | VALUE (NOTE 1) | |
| U.S. Commercial Paper—6.17%—(continued) | | | |
| $ | 16,000,000 | | | NYSE Euronext
0.14% due 11/6/2009 | | $15,999,689
| | $15,999,689
| |
| | 20,000,000 | | | NYSE Euronext
0.15% due 11/4/2009 | | 19,999,750
| | 19,999,750
| |
| | 6,164,000 | | | NYSE Euronext
0.15% due 11/9/2009 | | 6,163,795
| | 6,163,795
| |
| | 7,000,000 | | | Philip Morris International, Inc.
0.07% due 11/5/2009 | | 6,999,946
| | 6,999,946
| |
| | 1,500,000 | | | Philip Morris International, Inc.
0.08% due 11/9/2009 | | 1,499,973
| | 1,499,973
| |
| | 67,096,000 | | | Philip Morris International, Inc.
0.10% due 11/9/2009 | | 67,094,509
| | 67,094,509
| |
| | 50,000,000 | | | Philip Morris International, Inc.
0.10% due 12/1/2009 | | 49,995,833
| | 49,995,833
| |
| | 15,000,000 | | | The Procter & Gamble Company
0.10% due 11/2/2009 | | 14,999,958
| | 14,999,958
| |
| | 12,915,000 | | | The Procter & Gamble Company
0.21% due 11/5/2009 | | 12,914,699
| | 12,914,699
| |
| | 21,000,000 | | | Time Warner, Inc.
0.30% due 11/4/2009 | | 20,999,475
| | 20,999,475
| |
| | 22,489,000 | | | Time Warner, Inc.
0.35% due 11/9/2009 | | 22,487,251
| | 22,487,251
| |
| | 8,707,000 | | | Time Warner, Inc.
0.35% due 11/19/2009 | | 8,705,476
| | 8,705,476
| |
| | 9,786,000 | | | Time Warner, Inc.
0.35% due 11/20/2009 | | 9,784,192
| | 9,784,192
| |
| | 10,774,000 | | | Time Warner, Inc.
0.42% due 11/16/2009 | | 10,772,115
| | 10,772,115
| |
| | 25,000,000 | | | Time Warner, Inc.
0.45% due 1/11/2010 | | 24,977,813
| | 24,977,813
| |
| | 50,000,000 | | | Transocean, Inc.
0.27% due 11/3/2009 | | 49,999,250
| | 49,999,250
| |
| | 38,845,000 | | | Transocean, Inc.
0.30% due 11/2/2009 | | 38,844,676
| | 38,844,676
| |
| | 23,169,000 | | | Wal-Mart Stores, Inc.
0.12% due 11/17/2009 | | 23,167,764
| | 23,167,764
| |
| | 10,000,000 | | | WellPoint, Inc.
0.18% due 11/2/2009 | | 9,999,950
| | 9,999,950
| |
| | 16,900,000 | | | Wisconsin Electronic Power
0.12% due 11/2/2009 | | 16,899,944
| | 16,899,944
| |
| | 13,000,000 | | | Wisconsin Energy Corporation
0.15% due 11/2/2009 | | 12,999,946
| | 12,999,946
| |
| | 26,507,000 | | | Wisconsin Energy Corporation
0.20% due 11/6/2009 | | 26,506,264
| | 26,506,264
| |
See Notes to Financial Statements.
29
Global Fund
| PRINCIPAL AMOUNT | | DESCRIPTION | | COST (NOTE 1) | | VALUE (NOTE 1) | |
| U.S. Commercial Paper—6.17%—(continued) | |
| $ | 10,700,000 | | | Wisconsin Energy Corporation | | $ | 10,698,871 | | | $ | 10,698,871 | | |
| | | 0.20% due 11/20/2009 | | | | | | | | | |
| | 27,800,000 | | | Wisconsin Energy Corporation
0.20% due 12/4/2009 | | | 27,794,903 | | | | 27,794,903 | | |
| | | Total U.S. Commercial Paper | | | 1,176,807,470 | | | | 1,176,807,470 | | |
| | | Total Commercial Paper | | | 1,742,588,557 | | | | 1,742,588,557 | | |
| | | Total Investments—100.36% | | $ | 17,524,521,938 | | | | 19,127,426,192 | | |
| | | Liabilities in Excess of Other Assets—(0.36)% | | | | | | | (69,201,940 | ) | |
| | | Net Assets—100.00% | | | | | | $ | 19,058,224,252 | | |
(a) Non-income producing security/commodity.
(b) An affiliate of the Fund as defined by the Investment Company Act of 1940. An affiliate is defined as a company in which the Fund directly or indirectly owns, controls, or holds power to vote 5% or more of the outstanding voting securities.
(c) Security is deemed illiquid. At October 31, 2009, the value of these securities amounted to $105,446,490 or 0.55% of net assets.
(d) Securities valued in accordance with fair value procedures under the supervision of the Board of Trustees, representing $32,079,087 or 0.17% of net assets.
(e) Represents interest in a restricted security which has not been registered with the Securities and Exchange Commission under the Securities Act of 1933. At October 31, 2009, the value of these securities amounted to $32,079,087 or 0.17% of net assets.
(f) Held through Financiere Rouge, LLC.
(g) Participation certificate security—A type of investment with a combination of share and bond-like features. This security does not come with voting rights.
(h) All or a portion of the security is exempt from registration under the Securities Act of 1933. Rule 144A securities may only be sold to qualified institutional buyers, pursuant to Rule 144A under the Securities Act of 1933.
(i) Issuer is in default.
(j) Represents a security registered under Regulation S. Bonds sold under Regulation S may not be offered, sold or delivered within the U.S., or to, or for the account or benefit of, U.S. persons, except pursuant to an exemption from, or in a transaction not subject to, the registration requirements of the Securities Act of 1933.
(k) Inflation protected security.
(l) A term loan security.
(m) This security is subject to a call feature and may be called in full or partially on or anytime after January 6, 2010.
(n) This security is subject to a call feature and may be called in full or partially on or anytime after December 28, 2009.
(o) This security is convertible until February 15, 2014.
At October 31, 2009, aggregate cost for federal income tax purposes was $17,736,654,924; and net unrealized appreciation consisted of:
| Gross unrealized appreciation | | $ | 2,609,611,961 | | |
| Gross unrealized depreciation | | | (1,218,840,693 | ) | |
| Net unrealized appreciation | | $ | 1,390,771,268 | | |
See Notes to Financial Statements.
30
Schedule of Investments | Year Ended October 31, 2009
Abbreviations Used in this Schedule Include:
ADR — American Depository Receipt
CDI — Chess Depository Interest
CPI — Consumer Price Index
CPO — Ordinary Participation Certificate
FRN — Floating Rate Note
NVDR — Non-Voting Depository Receipt
NYSE — New York Stock Exchange
PC — Participation Certificate
PCL — Public Company Limited
PLC — Public Limited Company
REIT — Real Estate Investment Trust
RSP — Represents Non-Voting Shares
Currencies
EUR — Euro
JPY — Japanese Yen
KRW — South Korean Won
SGD — Singapore Dollar
TWD — Taiwan Dollar
USD — United States Dollar
Restricted Securities
| SECURITY | | ACQUISITION
DATE | | COST | | CARRYING VALUE PER
SHARE/PRINCIPAL | |
| Emin Leydier SA 5.00% due 7/31/2016 | | 7/30/2009 | | $ | 21,410,094 | | | $ | 1.47 | | |
| FINEL 9.50% due 6/30/2017 | | 6/22/2005 | | | 14,474,400 | | | | 0.74 | | |
| FINEL | | 7/30/2009 | | | — | | | | 0.07 | | |
| LandCo Real Estate LLC | | 9/6/2006 | | | 669,030 | | | | 1.28 | | |
Foreign Currency Exchange Contracts — Sales
SETTLEMENT
DATES
THROUGH | | FOREIGN CURRENCY
TO BE DELIVERED | | U.S. $
TO BE
RECEIVED | | U.S. $ VALUE
AT OCTOBER 31,
2009 | | UNREALIZED
APPRECIATION
AT OCTOBER 31,
2009 | | UNREALIZED
DEPRECIATION
AT OCTOBER 31,
2009 | |
| 1/20/10 | | | 511,663,500 | | | Euro | | $ | 715,644,969 | | | $ | 753,318,482 | | | $ | — | | | $ | (37,673,513 | ) | |
| 1/20/10 | | | 50,698,236,000 | | | Japanese Yen | | | 525,205,666 | | | | 563,613,193 | | | | — | | | | (38,407,527 | ) | |
| 1/20/10 | | | 588,974,818 | | | Mexican Peso | | | 43,533,158 | | | | 44,243,157 | | | | — | | | | (709,999 | ) | |
| 2/17/10 | | | 547,737,500 | | | Euro | | | 781,920,437 | | | | 806,406,836 | | | | — | | | | (24,486,399 | ) | |
| 2/17/10 | | | 43,489,537,000 | | | Japanese Yen | | | 464,412,532 | | | | 483,544,728 | | | | — | | | | (19,132,196 | ) | |
| 2/17/10 | | | 729,199,561 | | | Mexican Peso | | | 53,936,198 | | | | 54,616,743 | | | | — | | | | (680,545 | ) | |
| 3/17/10 | | | 270,000,000 | | | Euro | | | 398,236,500 | | | | 397,376,550 | | | | 859,950 | | | | — | | |
| 3/17/10 | | | 17,481,365,000 | | | Japanese Yen | | | 195,093,633 | | | | 194,461,019 | | | | 632,614 | | | | — | | |
| 3/17/10 | | | 358,000,000 | | | Mexican Peso | | | 26,474,395 | | | | 26,592,221 | | | | — | | | | (117,826 | ) | |
| | | | | | | | | $ | 3,204,457,488 | | | $ | 3,324,172,929 | | | $ | 1,492,564 | | | $ | (121,208,005 | ) | |
See Notes to Financial Statements.
31
Global Fund
Affiliated Securities
SECURITY | | SHARES
OCTOBER 31,
2008 | | GROSS
ADDITIONS | | GROSS
REDUCTIONS | | SHARES
OCTOBER 31,
2009 | | VALUE
OCTOBER 31,
2009 | | REALIZED
GAIN/(LOSS) | | DIVIDEND
INCOME | |
Aioi
Insurance
Company
Limited | | | 64,994,300 | | | | — | | | | — | | | | 64,994,300 | | | $ | 293,934,998 | | | $ | — | | | $ | 6,193,422 | | |
Alliant
Techsystems,
Inc. | | | 1,278,640 | | | | 619,699 | | | | — | | | | 1,898,339 | | | | 147,652,807 | | | | — | | | | — | | |
Ariake
Japan
Company
Limited | | | 1,725,100 | | | | — | | | | — | | | | 1,725,100 | | | | 27,219,757 | | | | — | | | | 679,375 | | |
Barnes &
Noble, Inc. | | | 6,483,956 | | | | — | | | | 2,829,873 | | | | 3,654,083 | | | | 60,694,319 | | | | (20,088,926 | ) | | | 5,481,568 | | |
Blount
International,
Inc. | | | 9,778,961 | | | | — | | | | — | | | | 9,778,961 | | | | 88,401,808 | | | | — | | | | — | | |
Chofu
Seisakusho
Company
Limited | | | 3,501,380 | | | | — | | | | — | | | | 3,501,380 | | | | 70,303,835 | | | | — | | | | 980,973 | | |
Cintas
Corporation | | | 10,059,141 | | | | 1,079,610 | | | | — | | | | 11,138,751 | | | | 308,432,015 | | | | — | | | | 5,061,233 | | |
City
e-Solutions
Limited | | | 20,738,780 | | | | — | | | | — | | | | 20,738,780 | | | | 1,873,156 | | | | — | | | | — | | |
Conbraco
Industries,
Inc. | | | 4,169 | | | | — | | | | — | | | | 4,169 | | | | — | | | | — | | | | — | | |
Deltic
Timber
Corporation | | | 1,258,500 | | | | — | | | | — | | | | 1,258,500 | | | | 53,486,250 | | | | — | | | | 377,550 | | |
| FINEL | | | — | | | | 12,000,000 | | | | — | | | | 1 | 2,000,000 | | | 884,250 | | | | — | | | | — | | |
Guyenne et
Gascogne SA | | | 541,213 | | | | 370,940 | | | | — | | | | 912,153 | | | | 91,478,646 | | | | — | | | | 2,454,357 | | |
IDA
Corporation,
Inc. | | | 4,440,260 | | | | — | | | | 322,600 | | | | 4,117,660 | | | | 115,665,070 | | | | (2,561,114 | ) | | | 5,328,312 | | |
Meitec
Corporation | | | 3,663,695 | | | | 110,400 | | | | 1,054,995 | | | | 2,719,100 | | | | 46,710,691 | | | | (14,964,639 | ) | | | 1,402,454 | | |
Mills Music
Trust | | | 34,924 | | | | — | | | | — | | | | 34,924 | | | | 981,713 | | | | — | | | | 105,781 | | |
MISUMI
Group, Inc. | | | 14,646,430 | | | | — | | | | 5,700 | | | | 14,640,730 | | | | 255,413,591 | | | | (18,627 | ) | | | 459,088 | | |
Namyang
Dairy
Products
Company
Limited | | | 39,989 | | | | — | | | | — | | | | 39,989 | | | | 18,265,223 | | | | — | | | | 24,409 | | |
| Neopost SA | | | 3,039,356 | | | | — | | | | 232,020 | | | | 2,807,336 | | | | 246,666,558 | | | | (6,149,449 | ) | | | 13,288,040 | | |
| NSC Groupe | | | 70,650 | | | | — | | | | 1,150 | | | | 69,500 | | | | 3,994,600 | | | | (121,438 | ) | | | 183,076 | | |
See Notes to Financial Statements.
32
Schedule of Investments | Year Ended October 31, 2009
Affiliated Securities—(continued)
SECURITY | | SHARES
OCTOBER 31,
2008 | | GROSS
ADDITIONS | | GROSS
REDUCTIONS | | SHARES
OCTOBER 31,
2009 | | VALUE
OCTOBER 31,
2009 | | REALIZED
GAIN/(LOSS) | | DIVIDEND
INCOME | |
Pfeiffer
Vacuum
Technology
AG | | | 1,172,304 | | | | — | | | | — | | | | 1,172,304 | | | $ | 88,319,174 | | | $ | — | | | $ | 4,670,217 | | |
Rayonier,
Inc. | | | 5,905,362 | | | | 588,260 | | | | 1,218,611 | | | | 5,275,011 | | | | 203,509,924 | | | | 2,713,613 | | | | 12,361,694 | | |
Rémy
Cointreau
SA | | | 5,361,738 | | | | — | | | | 1,385,612 | | | | 3,976,126 | | | | 192,905,172 | | | | (24,358,460 | ) | | | 8,010,873 | | |
| Sabeton SA | | | 385,000 | | | | — | | | | — | | | | 385,000 | | | | 6,212,963 | | | | — | | | | 96,040 | | |
San Juan
Basin
Royalty
Trust | | | 4,218,754 | | | | — | | | | 243,110 | | | | 3,975,644 | | | | 70,806,220 | | | | (2,444,034 | ) | | | 3,376,280 | | |
Shimano,
Inc. | | | 7,086,170 | | | | — | | | | — | | | | 7,086,170 | | | | 277,950,776 | | | | — | | | | 4,325,149 | | |
SMC
Corporation | | | 4,053,720 | | | | — | | | | 200,000 | | | | 3,853,720 | | | | 451,338,505 | | | | (4,541,230 | ) | | | 4,275,737 | | |
| Sodexo | | | 7,082,902 | | | | — | | | | 1,023,450 | | | | 6,059,452 | | | | 347,470,938 | | | | (18,784,420 | ) | | | 10,439,643 | | |
Sucrière de
Pithiviers-
Le-Vieil | | | 63,019 | | | | — | | | | — | | | | 63,019 | | | | 58,510,790 | | | | — | | | | 2,122,104 | | |
T. Hasegawa
Company
Limited | | | 5,147,000 | | | | — | | | | — | | | | 5,147,000 | | | | 80,297,661 | | | | — | | | | 1,013,490 | | |
THK
Company
Limited | | | 14,581,600 | | | | — | | | | 4,851,250 | | | | 9,730,350 | | | | 172,993,611 | | | | (15,868,175 | ) | | | 1,134,365 | | |
| Wendel | | | 2,554,751 | | | | — | | | | 406,806 | | | | 2,147,945 | | | | 119,973,761 | | | | (37,592,516 | ) | | | 2,538,893 | | |
| Total | | $ | 3,902,348,782 | | | $ | (144,779,415 | ) | | $ | 96,384,123 | | |
See Notes to Financial Statements.
33
Global Fund
| INDUSTRY DIVERSIFICATION FOR PORTFOLIO HOLDINGS | | PERCENT OF
NET ASSETS | |
| U.S. Common Stocks | |
| Consumer Discretionary | | | 5.86 | % | |
| Energy | | | 3.01 | | |
| Financials | | | 4.80 | | |
| Health Care | | | 0.94 | | |
| Industrials | | | 3.24 | | |
| Information Technology | | | 3.13 | | |
| Materials | | | 3.54 | | |
| Telecommunication Services | | | 0.65 | | |
| Utilities | | | 0.61 | | |
| Total U.S. Common Stocks | | | 25.78 | | |
| International Common Stocks | |
| Consumer Discretionary | | | 5.50 | | |
| Consumer Staples | | | 6.57 | | |
| Energy | | | 1.38 | | |
| Financials | | | 6.53 | | |
| Health Care | | | 6.07 | | |
| Industrials | | | 13.92 | | |
| Information Technology | | | 4.78 | | |
| Materials | | | 7.23 | | |
| Telecommunication Services | | | 0.14 | | |
| Total International Common Stocks | | | 52.12 | | |
| U.S. Preferred Stocks | |
| Financials | | | 0.01 | | |
| Utilities | | | 0.07 | | |
| Total U.S. Preferred Stocks | | | 0.08 | | |
| International Preferred Stocks | |
| Consumer Discretionary | | | 0.45 | | |
| Information Technology | | | 0.82 | | |
| Total International Preferred Stocks | | | 1.27 | | |
| Commodity | | | 6.86 | | |
See Notes to Financial Statements.
34
Schedule of Investments | Year Ended October 31, 2009
| INDUSTRY DIVERSIFICATION FOR PORTFOLIO HOLDINGS—(CONTINUED) | | PERCENT OF
NET ASSETS | |
| U.S. Bonds | |
| Consumer Discretionary | | | 0.29 | % | |
| Energy | | | 0.16 | | |
| Financials | | | 0.18 | | |
| Government Issues | | | 1.59 | | |
| Industrials | | | 0.04 | | |
| Materials | | | 0.05 | | |
| Total U.S. Bonds | | | 2.31 | | |
| International Notes and Bonds | |
| Financials | | | 0.26 | | |
| Government Issues | | | 1.88 | | |
| Industrials | | | 0.01 | | |
| Information Technology | | | 0.49 | | |
| Materials | | | 0.12 | | |
| Telecommunication Services | | | 0.04 | | |
| Total International Notes and Bonds | | | 2.80 | | |
| Commercial Paper | |
| International Commercial Paper | | | 2.97 | | |
| U.S. Commercial Paper | | | 6.17 | | |
| Total Commercial Paper | | | 9.14 | | |
| Total Investments | | | 100.36 | % | |
See Notes to Financial Statements.
35

Fund Overview | Data as of October 31, 2009 (unaudited)
INVESTMENT OBJECTIVE
First Eagle Overseas Fund seeks long-term growth of capital by investing primarily in equities issued by non-U.S. corporations. Management's research-driven process seeks to minimize risk by focusing on undervalued securities.
Average Annual Returns
| | | ONE-YEAR | | FIVE-YEARS | | TEN-YEARS | |
First Eagle Overseas
Fund (A Shares) | |
| without sales charge | | | 24.95 | % | | | 9.46 | % | | | 12.75 | % | |
| with sales charge | | | 18.70 | | | | 8.35 | | | | 12.32 | | |
| MSCI EAFE Index | | | 27.71 | | | | 5.10 | | | | 2.05 | | |
| Consumer Price Index | | | -0.18 | | | | 2.52 | | | | 2.54 | | |
Asset Allocation
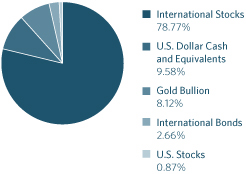
Countries
| Japan | | | 30.95 | % | |
| France | | | 13.66 | | |
| United States | | | 8.99 | | |
| Switzerland | | | 6.09 | | |
| Germany | | | 4.24 | | |
| South Korea | | | 3.59 | | |
| Singapore | | | 3.15 | | |
| Hong Kong | | | 2.35 | | |
| Taiwan | | | 1.98 | | |
| Netherlands | | | 1.87 | | |
| Italy | | | 1.85 | | |
| Thailand | | | 1.85 | | |
| South Africa | | | 1.79 | | |
| Mexico | | | 1.78 | | |
| Brazil | | | 1.33 | | |
| Canada | | | 1.26 | | |
| United Kingdom | | | 1.23 | | |
| Chile | | | 0.68 | | |
| Malaysia | | | 0.68 | | |
| Papua New Guinea | | | 0.59 | | |
| Australia | | | 0.30 | | |
| Panama | | | 0.15 | | |
| Other | | | 0.06 | | |
The Fund's portfolio composition (represented as a percentage of net assets) is subject to change at any time.
FIRST EAGLE FUNDS | ANNUAL REPORT | OCTOBER 31, 2009
36
Overseas Fund
Growth of a $10,000 Initial Investment
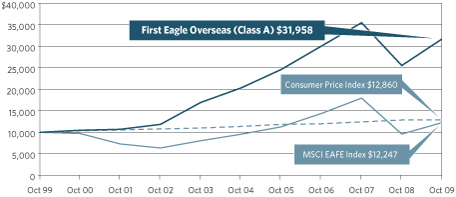
Performance data quoted herein represents past performance and should not be considered indicative of future results. Performance data quoted herein does not reflect the deduction of taxes that a shareholder would pay on Fund distributions or the sale of Fund shares. The average annual returns shown above are historical and reflect changes in share price, reinvested dividends and are net of expenses.
The average annual returns for Class A Shares give effect to the deduction of the maximum sales charge of 3.75% for periods prior to March 1, 2000 and of 5.00% thereafter.
The MSCI EAFE Index is a total return index, reported in U.S. Dollars, based on share prices and reinvested net dividends of approximately 1,100 companies from 21 countries and is not available for purchase. The Consumer Price Index (CPI) represents the change in price of all goods and services purchased for consumption by urban households.
Top 10 Holdings
| Gold Bullion (precious metal) | | | 8.12 | % | |
| Shimano, Inc. (Japanese bicycle parts manufacturer) | | | 2.82 | | |
| Pargesa Holding SA (Swiss diversified financials company) | | | 2.41 | | |
| SMC Corporation (Japanese automated control devices manufacturer) | | | 2.02 | | |
| Secom Company Limited (Japanese security services provider) | | | 2.00 | | |
| Sanofi-Aventis SA (French health care company) | | | 1.89 | | |
| Sodexo (French food management services provider) | | | 1.88 | | |
| Keyence Corporation (Japanese sensors manufacturer) | | | 1.81 | | |
| Ono Pharmaceutical Company Limited (Japanese pharmaceutical company) | | | 1.74 | | |
| Astellas Pharma, Inc. (Japanese pharmaceuticals company) | | | 1.74 | | |
FIRST EAGLE FUNDS | ANNUAL REPORT | OCTOBER 31, 2009
37
First Eagle Overseas Fund
| NUMBER OF SHARES | | DESCRIPTION | | COST (NOTE 1) | | VALUE (NOTE 1) | |
| Common Stocks—77.42% | | | |
| International Common Stocks—76.64% | | | |
| Australia 0.30% | | | |
| | 9,217,342 | | | Spotless Group Limited | | $ | 25,816,120 | | | $ | 21,049,779 | | |
| Brazil 1.33% | | | |
| | 2,334,704 | | | Petroleo Brasileiro SA, ADR | | | 25,923,912 | | | | 93,668,324 | | |
| Canada 0.85% | | | |
| | 1,025,450 | | | EnCana Corporation | | | 23,293,294 | | | | 56,799,676 | | |
| | 318,660 | | | Harry Winston Diamond Corporation | | | 6,540,757 | | | | 2,614,238 | | |
| | | | | | | | 29,834,051 | | | | 59,413,914 | | |
| Chile 0.68% | | | |
| | 24,062,197 | | | Quinenco SA (c) | | | 16,182,017 | | | | 47,585,096 | | |
| France 12.84% | | | |
| | 1,813,233 | | | Sanofi-Aventis SA | | | 149,414,237 | | | | 132,931,209 | | |
| | 2,302,164 | | | Sodexo | | | 65,879,532 | | | | 132,014,427 | | |
| | 973,150 | | | Neopost SA | | | 60,229,865 | | | | 85,505,818 | | |
| | 1,464,954 | | | Rémy Cointreau SA | | | 43,084,759 | | | | 71,073,503 | | |
| | 888,121 | | | Total SA | | | 55,749,821 | | | | 53,185,875 | | |
| | 728,753 | | | Société BIC SA | | | 29,345,942 | | | | 50,789,458 | | |
| | 563,378 | | | Laurent-Perrier (b) | | | 20,236,693 | | | | 45,067,517 | | |
| | 791,228 | | | Wendel | | | 17,493,408 | | | | 44,194,148 | | |
| | 376,329 | | | Air Liquide SA | | | 41,188,855 | | | | 40,708,739 | | |
| | 39,143 | | | Sucrière de Pithiviers-Le-Vieil (b) | | | 15,598,306 | | | | 36,342,815 | | |
| | 599,453 | | | Cie Generale d'Optique Essilor
International SA | | | 14,782,044 | | | | 33,703,390 | | |
| | 326,036 | | | Guyenne et Gascogne SA | | | 38,246,184 | | | | 32,697,729 | | |
| | 236,140 | | | Robertet SA (b) | | | 20,639,502 | | | | 28,536,934 | | |
| | 51,500 | | | Robertet SA CI (c) | | | 2,151,628 | | | | 4,250,296 | | |
| | 442,830 | | | Société Foncière Financière et
de Participations | | | 29,139,582 | | | | 26,463,775 | | |
| | 900,000 | | | Frégate (b)(c)(d)(e) | | | 23,235,900 | | | | 22,548,380 | | |
| | 364,373 | | | Gaumont SA (b) | | | 21,698,753 | | | | 22,097,337 | | |
| | 540,680 | | | Zodiac Aerospace | | | 29,615,032 | | | | 18,327,028 | | |
| | 397,878 | | | Carrefour SA | | | 18,361,975 | | | | 17,163,133 | | |
| | 1,000 | | | Société Vermandoise de Sucreries | | | 854,846 | | | | 1,989,563 | | |
| | 100,000 | | | Sabeton SA | | | 1,463,143 | | | | 1,613,757 | | |
| | 11,593,581 | | | FINEL (a)(b)(c)(d)(e)(f) | | | 9,152,131 | | | | 854,302 | | |
| | | | | | | | 707,562,138 | | | | 902,059,133 | | |
See Notes to Financial Statements.
38
Schedule of Investments | Year Ended October 31, 2009
| NUMBER OF SHARES | | DESCRIPTION | | COST (NOTE 1) | | VALUE (NOTE 1) | |
| International Common Stocks—76.64%—(continued) | | | |
| Germany 3.43% | | | |
| | 6,418,531 | | | Deutsche Wohnen AG (a)(b) | | $ | 67,969,040 | | | $ | 72,931,295 | | |
| | 915,140 | | | Pfeiffer Vacuum Technology AG (b) | | | 39,449,539 | | | | 68,944,923 | | |
| | 2,707,670 | | | Tognum AG | | | 54,386,147 | | | | 41,540,371 | | |
| | 652,927 | | | Fraport AG | | | 21,196,148 | | | | 30,792,044 | | |
| | 1,358,769 | | | Bertelsmann AG , Series 'A' (a)(g) | | | 30,601,684 | | | | 26,713,166 | | |
| | | | | | | | 213,602,558 | | | | 240,921,799 | | |
| Hong Kong 2.35% | | | |
| | 8,045,340 | | | Guoco Group Limited | | | 60,006,340 | | | | 90,573,788 | | |
| | 9,307,800 | | | Wharf Holdings Limited | | | 19,540,519 | | | | 51,342,363 | | |
| | 7,069,700 | | | Hopewell Holdings Limited | | | 7,819,937 | | | | 22,622,748 | | |
| | 10,851,720 | | | City e-Solutions Limited (a)(c) | | | 323,358 | | | | 980,143 | | |
| | | | | | | | 87,690,154 | | | | 165,519,042 | | |
| Italy 1.85% | | | |
| | 7,315,306 | | | Italcementi S.p.A. RSP | | | 87,341,485 | | | | 55,467,907 | | |
| | 1,197,736 | | | Italmobiliare S.p.A. RSP (a) | | | 50,324,929 | | | | 39,645,579 | | |
| | 165,635 | | | Italmobiliare S.p.A. (a) | | | 19,155,452 | | | | 7,987,103 | | |
| | 6,004,580 | | | Gewiss S.p.A. (b) | | | 22,944,785 | | | | 26,724,740 | | |
| | | | | | | | 179,766,651 | | | | 129,825,329 | | |
| Japan 30.95% | | | |
| | 5,055,070 | | | Shimano, Inc. | | | 85,685,947 | | | | 198,282,095 | | |
| | 1,212,590 | | | SMC Corporation | | | 154,196,973 | | | | 142,015,652 | | |
| | 2,972,300 | | | Secom Company Limited | | | 125,814,360 | | | | 140,366,409 | | |
| | 626,900 | | | Keyence Corporation | | | 123,789,502 | | | | 126,919,473 | | |
| | 2,552,600 | | | Ono Pharmaceutical
Company Limited | | | 105,639,342 | | | | 122,531,607 | | |
| | 3,260,440 | | | Astellas Pharma, Inc. | | | 133,084,592 | | | | 122,092,147 | | |
| | 1,419,300 | | | Fanuc Limited | | | 122,137,639 | | | | 121,593,455 | | |
| | 20,991,930 | | | Nissay Dowa General Insurance
Company Limited (b) | | | 110,706,355 | | | | 95,168,703 | | |
| | 4,304,770 | | | MISUMI Group, Inc. | | | 74,354,397 | | | | 75,098,493 | | |
| | 1,856,870 | | | Canon, Inc. | | | 89,360,001 | | | | 72,834,614 | | |
| | 15,519,800 | | | Aioi Insurance Company Limited | | | 54,260,013 | | | | 70,187,884 | | |
| | 598,170 | | | Hirose Electric Company Limited | | | 70,175,701 | | | | 62,944,274 | | |
| | 11,009,150 | | | Nipponkoa Insurance
Company Limited | | | 56,297,714 | | | | 61,654,665 | | |
| | 2,832,150 | | | Nitto Kohki Company Limited (b) | | | 50,121,709 | | | | 59,698,745 | | |
See Notes to Financial Statements.
39
Overseas Fund
| NUMBER OF SHARES | | DESCRIPTION | | COST (NOTE 1) | | VALUE (NOTE 1) | |
| International Common Stocks—76.64%—(continued) | | | |
| Japan 30.95%—(continued) | | | |
| | 3,452,591 | | | T. Hasegawa Company Limited (b) | | $ | 47,344,131 | | | $ | 53,863,412 | | |
| | 5,507,100 | | | Kansai Paint Company Limited | | | 42,397,659 | | | | 47,608,465 | | |
| | 2,502,710 | | | THK Company Limited | | | 40,580,122 | | | | 44,495,094 | | |
| | 6,577,300 | | | Japan Wool Textile
Company Limited (b) | | | 49,871,284 | | | | 44,362,699 | | |
| | 2,022,800 | | | Chofu Seisakusho
Company Limited (b) | | | 33,096,084 | | | | 40,615,585 | | |
| | 5,685,730 | | | Sompo Japan Insurance, Inc. | | | 62,242,692 | | | | 34,495,345 | | |
| | 1,687,000 | | | Fuji Seal International, Inc. (b) | | | 39,025,982 | | | | 34,454,203 | | |
| | 9,608,600 | | | Okumura Corporation | | | 49,462,587 | | | | 34,059,041 | | |
| | 3,034,800 | | | OSG Corporation | | | 35,992,231 | | | | 30,383,408 | | |
| | 2,400,480 | | | Daiichikosho Company Limited | | | 26,050,473 | | | | 28,007,156 | | |
| | 2,184,600 | | | Seikagaku Corporation | | | 17,648,500 | | | | 27,915,884 | | |
| | 1,472,300 | | | Meitec Corporation | | | 43,510,663 | | | | 25,292,247 | | |
| | 945,747 | | | Mandom Corporation | | | 15,836,563 | | | | 24,853,510 | | |
| | 2,535,900 | | | Yomeishu Seizo Company Limited (b) | | | 22,847,623 | | | | 24,599,597 | | |
| | 1,443,600 | | | Ariake Japan Company Limited | | | 30,991,137 | | | | 22,778,066 | | |
| | 2,068,330 | | | Maezawa Kasei Industries
Company Limited (b) | | | 31,939,631 | | | | 22,775,877 | | |
| | 861,660 | | | Icom, Inc. (b) | | | 22,557,750 | | | | 21,063,970 | | |
| | 1,058,246 | | | Matsumoto Yushi-Seiyaku
Company Limited (b) | | | 25,950,562 | | | | 20,460,559 | | |
| | 1,532,856 | | | Nissin Healthcare Food Service
Company Limited | | | 24,558,922 | | | | 18,378,261 | | |
| | 775,202 | | | Nagaileben Company Limited | | | 14,585,552 | | | | 17,167,372 | | |
| | 906,660 | | | AS One Corporation | | | 19,463,092 | | | | 16,925,260 | | |
| | 306,100 | | | Mabuchi Motor Company Limited | | | 18,167,961 | | | | 14,897,694 | | |
| | 508,106 | | | SK Kaken Company Limited | | | 9,470,131 | | | | 12,985,653 | | |
| | 806,280 | | | Chudenko Corporation | | | 12,295,496 | | | | 12,103,831 | | |
| | 2,572,675 | | | The Tokushima Bank Limited | | | 17,372,743 | | | | 9,519,426 | | |
| | 100,000 | | | Asahi Broadcasting Corporation | | | 6,141,481 | | | | 6,811,490 | | |
| | 1,223,670 | | | Sansei Yusoki Company Limited (b) | | | 10,265,159 | | | | 6,186,676 | | |
| | 1,424,100 | | | Shingakukai Company Limited (b) | | | 10,266,277 | | | | 4,763,088 | | |
| | 121,690 | | | Mitsubishi Estate Company Limited | | | 1,786,311 | | | | 1,898,470 | | |
| | | | | | | | 2,137,343,044 | | | | 2,175,109,555 | | |
| Malaysia 0.68% | | | |
| | 22,442,200 | | | Genting Berhad | | | 47,187,263 | | | | 47,613,635 | | |
See Notes to Financial Statements.
40
Schedule of Investments | Year Ended October 31, 2009
| NUMBER OF SHARES | | DESCRIPTION | | COST (NOTE 1) | | VALUE (NOTE 1) | |
| International Common Stocks—76.64%—(continued) | | | |
| Mexico 1.78% | | | |
| | 3,552,612 | | | Industrias Peñoles S.A.B. de C.V. | | $ | 3,110,554 | | | $ | 64,799,153 | | |
| | 2,739,787 | | | Grupo Televisa SA , ADR | | | 48,629,691 | | | | 53,042,276 | | |
| | 1,866,300 | | | Grupo Televisa S.A.B. CPO | | | 6,226,292 | | | | 7,214,541 | | |
| | | | | | | | 57,966,537 | | | | 125,055,970 | | |
| Netherlands 1.10% | | | |
| | 496,018 | | | HAL Trust | | | 13,919,475 | | | | 50,073,957 | | |
| | 697,441 | | | Heineken Holding NV | | | 16,336,512 | | | | 27,243,267 | | |
| | | | | | | | 30,255,987 | | | | 77,317,224 | | |
| New Zealand 0.06% | | | |
| | 5,750,000 | | | Tasman Farms Limited (a)(b)(c)(d) | | | 1,054,354 | | | | 4,123,037 | | |
| Panama 0.15% | | | |
| | 748,613 | | | Banco Latinoamericano de
Exportaciones SA | | | 8,360,468 | | | | 10,562,929 | | |
| Papua New Guinea 0.59% | | | |
| | 15,041,160 | | | Lihir Gold Limited (a) | | | 34,953,239 | | | | 41,246,709 | | |
| Singapore 2.70% | | | |
| | 23,192,830 | | | Haw Par Corporation Limited (b) | | | 76,875,316 | | | | 92,748,133 | | |
| | 28,195,900 | | | Singapore Airport Terminal
Services Limited | | | 32,580,982 | | | | 49,733,190 | | |
| | 10,073,300 | | | Fraser and Neave Limited | | | 10,564,974 | | | | 27,838,520 | | |
| | 17,725,525 | | | ComfortDelgro Corporation Limited | | | 7,149,142 | | | | 19,493,204 | | |
| | | | | | | | 127,170,414 | | | | 189,813,047 | | |
| South Africa 1.79% | | | |
| | 8,237,460 | | | Gold Fields Limited , ADR | | | 112,026,214 | | | | 105,027,615 | | |
| | 2,094,480 | | | Harmony Gold Mining Company
Limited , ADR | | | 21,850,173 | | | | 20,861,021 | | |
| | | | | | | | 133,876,387 | | | | 125,888,636 | | |
| South Korea 2.27% | | | |
| | 794,836 | | | KT&G Corporation | | | 45,504,346 | | | | 46,456,475 | | |
| | 33,225 | | | Lotte Confectionery
Company Limited | | | 10,303,934 | | | | 33,442,800 | | |
| | 120,620 | | | Nong Shim Company Limited | | | 31,736,226 | | | | 24,486,192 | | |
| | 948,330 | | | Fursys, Inc. (b) | | | 11,511,219 | | | | 21,096,282 | | |
| | 119,080 | | | Pacific Corporation | | | 18,151,496 | | | | 14,655,225 | | |
| | 22,950 | | | Namyang Dairy Products
Company Limited | | | 4,912,653 | | | | 10,482,554 | | |
See Notes to Financial Statements.
41
Overseas Fund
| NUMBER OF SHARES | | DESCRIPTION | | COST (NOTE 1) | | VALUE (NOTE 1) | |
| International Common Stocks—76.64%—(continued) | | | |
| South Korea 2.27%—(continued) | | | |
| | 1,182,040 | | | Dong Ah Tire & Rubber | | $ | 5,161,358 | | | $ | 8,248,534 | | |
| | | | | Company Limited | | | | | | | | | |
| | 96,352 | | | Sam-A Pharm Company Limited | | | 664,545 | | | | 450,689 | | |
| | | | | | | | 127,945,777 | | | | 159,318,751 | | |
| Switzerland 6.09% | | | |
| | 2,111,661 | | | Pargesa Holding SA | | | 109,671,397 | | | | 169,641,955 | | |
| | 2,307,150 | | | Nestlé SA | | | 50,656,060 | | | | 107,694,776 | | |
| | 879,040 | | | Kuehne & Nagel International AG | | | 31,330,410 | | | | 79,971,231 | | |
| | 154,216 | | | Rieter Holding AG (a) | | | 26,194,009 | | | | 34,638,198 | | |
| | 1,072 | | | Lindt & Spruengli AG | | | 9,210,852 | | | | 27,295,739 | | |
| | 35,000 | | | Edipresse SA | | | 11,616,314 | | | | 8,882,815 | | |
| | | | | | | | 238,679,042 | | | | 428,124,714 | | |
| Taiwan 1.77% | | | |
| | 66,583,602 | | | Compal Electronics, Inc. | | | 70,220,370 | | | | 85,064,374 | | |
| | 20,184,980 | | | Taiwan Secom Company Limited | | | 32,105,415 | | | | 31,093,918 | | |
| | 13,102,028 | | | Taiwan Sogo Shin Kong Security
Company Limited | | | 11,831,241 | | | | 8,520,367 | | |
| | | | | | | | 114,157,026 | | | | 124,678,659 | | |
| Thailand 1.85% | | | |
| | 459,100,435 | | | Thai Beverage PCL | | | 78,800,369 | | | | 83,600,965 | | |
| | 12,301,859 | | | Bangkok Bank PCL NVDR | | | 39,320,705 | | | | 41,220,889 | | |
| | 496,220 | | | Bangkok Bank PCL | | | 1,613,300 | | | | 1,684,995 | | |
| | 250,000 | | | OHTL PCL (c) | | | 1,554,061 | | | | 3,702,319 | | |
| | | | | | | | 121,288,435 | | | | 130,209,168 | | |
| United Kingdom 1.23% | | | |
| | 2,986,700 | | | Spirax-Sarco Engineering PLC | | | 20,282,387 | | | | 53,427,142 | | |
| | 901,118 | | | Anglo American PLC (a) | | | 19,057,951 | | | | 32,816,846 | | |
| | | | | | | | 39,340,338 | | | | 86,243,988 | | |
| Total International Common Stocks | | | 4,505,955,912 | | | | 5,385,348,438 | | |
| U.S. Common Stock—0.78% | | | |
| Materials 0.78% | | | |
| | 1,256,683 | | | Newmont Mining Corporation | | | 35,948,526 | | | | 54,615,443 | | |
| | | | | Total Common Stocks | | | 4,541,904,438 | | | | 5,439,963,881 | | |
| Investment Companies—0.09% | | | |
| | 100,000 | | | First NIS Regional Fund
SICAV (a)(c)(d)(e) | | | 1,000,000 | | | | 50,000 | | |
See Notes to Financial Statements.
42
Schedule of Investments | Year Ended October 31, 2009
| NUMBER OF SHARES | | DESCRIPTION | | COST (NOTE 1) | | VALUE (NOTE 1) | |
| Investment Companies—0.09%—(continued) | | | |
| | 34,500 | | | Third Avenue Global | | $ | 3,450,000 | | | $ | 6,296,796 | | |
| | | | | Value Fund L.P. (a)(c)(e) | | | | | | | | | |
| | Total Investment Companies | | | | | | 4,450,000 | | | | 6,346,796 | | |
| International Preferred Stocks—2.13% | | | |
| Germany 0.81% | | | |
| | 581,442 | | | Hornbach Holding AG | | | 39,598,446 | | | | 56,872,474 | | |
| South Korea 1.32% | | | |
| | 210,514 | | | Samsung Electronics
Company Limited | | | 27,045,452 | | | | 85,558,873 | | |
| | 28,661 | | | Namyang Dairy Products
Company Limited | | | 449,428 | | | | 7,042,521 | | |
| | | | | | | | 27,494,880 | | | | 92,601,394 | | |
| | Total Preferred Stocks | | | | | | 67,093,326 | | | | 149,473,868 | | |
| OUNCES | | | | | | | |
| Commodity—8.12% | | | |
| | 545,490 | | | Gold bullion (a) | | | 272,864,040 | | | | 570,582,616 | | |
| PRINCIPAL AMOUNT | | | | | | | |
| International Bonds—2.66% | | | |
| International Corporate Bonds—1.65% | | | |
| Canada 0.41% | | | |
| | 10,000,000
USD | | | CanWest LP
9.25% due 8/1/2015 (a)(c)(h)(i) | | | 8,690,560
| | | | 2,050,000
| | |
| | 47,142,000
USD | | | Catalyst Paper Corporation
7.375% due 3/1/2014 (c) | | | 40,303,931
| | | | 23,335,290
| | |
| | 5,000,000
USD | | | Catalyst Paper Corporation, Series 'D'
8.625% due 6/15/2011 (c) | | | 4,680,902
| | | | 3,175,000
| | |
| | | | | | | | 53,675,393 | | | | 28,560,290 | | |
| France 0.47% | | | |
| | 10,000,000
EUR | | | Emin Leydier SA
5.00% due 7/31/2016 (c)(d)(e) | | | 14,273,396
| | | | 14,737,503
| | |
| | 8,000,000
EUR | | | FINEL
9.50% due 6/30/2017 (a)(c)(d)(e) | | | 9,649,600
| | | | 5,895,001
| | |
| | 2,000,000
USD | | | Legrand SA
8.50% due 2/15/2025 | | | 2,058,941
| | | | 2,121,300
| | |
| | 6,352,000
EUR | | | Wendel
4.875% due 11/4/2014 | | | 6,901,686
| | | | 8,144,298
| | |
See Notes to Financial Statements.
43
Overseas Fund
| PRINCIPAL AMOUNT | | DESCRIPTION | | COST (NOTE 1) | | VALUE (NOTE 1) | |
| International Corporate Bonds—1.65%—(continued) | | | |
| France 0.47%—(continued) | | | |
| | 1,950,000
EUR | | | Wendel
4.875% due 9/21/2015 (j) | | | $1,414,027
| | | | $2,399,663
| | |
| | | | | | | | 34,297,650 | | | | 33,297,765 | | |
| Ireland 0.00% | | | |
| | 22,300,000
EUR | | | Waterford Wedgwood PLC
9.875% due 12/1/2010 (a)(c)(d)(h)(i) | | | 27,682,258
| | | | —
| | |
| Netherlands 0.77% | | | |
| | 23,350,000
EUR | | | UPC Holding BV
7.75% due 1/15/2014 (j) | | | 27,360,385
| | | | 34,756,190
| | |
| | 12,740,000
EUR | | | UPC Holding BV
8.625% due 1/15/2014 (j) | | | 15,014,982
| | | | 19,338,846
| | |
| | | | | | | | 42,375,367 | | | | 54,095,036 | | |
| | Total International Corporate Bonds | | | | | | 158,030,668 | | | | 115,953,091 | | |
| International Government Bonds—1.01% | | | |
| France 0.35% | | | |
| | 15,382,293
EUR | | | France Government Bond OAT
3.00% due 7/25/2012 (k) | | | 19,250,460
| | | | 24,490,191
| | |
| Singapore 0.45% | | | |
| | 11,564,000
SGD | | | Singapore Government Bond
3.625% due 7/1/2011 | | | 8,110,501
| | | | 8,671,295
| | |
| | 32,082,000
SGD | | | Singapore Government Bond
4.625% due 7/1/2010 | | | 22,241,571
| | | | 23,534,788
| | |
| | | | | | | | 30,352,072 | | | | 32,206,083 | | |
| Taiwan 0.21% | | | |
| | 462,700,000
TWD | | | Taiwan Government Bond
2.00% due 7/20/2012 | | | 14,146,206
| | | | 14,762,467
| | |
| | Total International Government Bonds | | | | | | 63,748,738 | | | | 71,458,741 | | |
| | Total International Bonds | | | | | | 221,779,406 | | | | 187,411,832 | | |
| Commercial Paper—10.03% | | | |
| International Commercial Paper—3.17% | | | |
| Finland 0.08% | | | |
| | 5,700,000
USD | | | Nokia Corporation
0.19% due 11/24/2009 | | | 5,699,308
| | | | 5,699,308
| | |
| France 0.14% | | | |
| | 10,000,000
USD | | | Électricité de France
0.19% due 1/6/2010 | | | 9,996,517
| | | | 9,996,517
| | |
See Notes to Financial Statements.
44
Schedule of Investments | Year Ended October 31, 2009
| PRINCIPAL AMOUNT | | DESCRIPTION | | COST (NOTE 1) | | VALUE (NOTE 1) | |
| International Commercial Paper—3.17%—(continued) | | | |
| Japan 1.31% | | | |
| | 16,652,000
USD | | | Hitachi, Limited
0.28% due 11/12/2009 | | | $16,650,575
| | | | $16,650,575
| | |
| | 8,500,000
USD | | | Panasonic Finance
0.18% due 12/7/2009 | | | 8,498,470
| | | | 8,498,470
| | |
| | 12,678,000
USD | | | Panasonic Finance
0.18% due 12/21/2009 | | | 12,674,830
| | | | 12,674,830
| | |
| | 14,000,000
USD | | | Panasonic Finance
0.19% due 12/14/2009 | | | 13,996,823
| | | | 13,996,823
| | |
| | 40,000,000
USD | | | Panasonic Finance
0.21% due 12/2/2009 | | | 39,992,767
| | | | 39,992,767
| | |
| Switzerland 0.64% | | | |
| | 10,000,000
USD | | | Nestlé Capital Corporation
0.11% due 11/23/2009 | | | 9,999,328
| | | | 9,999,328
| | |
| | 21,417,000
USD | | | Nestlé Capital Corporation
0.11% due 11/24/2009 | | | 21,415,495
| | | | 21,415,495
| | |
| | 13,496,000
USD | | | Nestlé Capital Corporation
0.21% due 11/4/2009 | | | 13,495,764
| | | | 13,495,764
| | |
| United Kingdom 1.00% | | | |
| | 17,591,000
USD | | | Diageo Capital PLC
0.27% due 11/5/2009 | | | 17,590,472
| | | | 17,590,472
| | |
| | 17,600,000
USD | | | Diageo Capital PLC
0.27% due 11/9/2009 | | | 17,598,944
| | | | 17,598,944
| | |
| | 9,000,000
USD | | | Diageo Capital PLC
0.28% due 11/13/2009 | | | 8,999,160
| | | | 8,999,160
| | |
| | 12,080,000
USD | | | Diageo Capital PLC
0.30% due 11/5/2009 | | | 12,079,597
| | | | 12,079,597
| | |
| | 5,497,000
USD | | | Diageo Capital PLC
0.33% due 11/30/2009 | | | 5,495,539
| | | | 5,495,539
| | |
| | 8,801,000
USD | | | Reed Elsevier PLC
0.20% due 11/19/2009 | | | 8,800,120
| | | | 8,800,120
| | |
| | Total International Commercial Paper | | | | | | 222,983,709 | | | | 222,983,709 | | |
| U.S. Commercial Paper—6.86% | | | |
| $ | 3,508,000 | | | Bemis Company, Inc. | | | 3,507,825 | | | | 3,507,825 | | |
| | | | | 0.20% due 11/10/2009 | | | | | | | | | |
| | 25,318,000 | | | The Coca-Cola Company
0.12% due 12/11/2009 | | | 25,314,624
| | | | 25,314,624
| | |
| | 20,000,000 | | | The Coca-Cola Company
0.14% due 11/9/2009 | | | 19,999,378
| | | | 19,999,378
| | |
| | 7,000,000 | | | The Coca-Cola Company
0.14% due 1/20/2010 | | | 6,997,822
| | | | 6,997,822
| | |
| | 6,700,000 | | | The Coca-Cola Company
0.16% due 11/17/2009 | | | 6,699,524
| | | | 6,699,524
| | |
See Notes to Financial Statements.
45
Overseas Fund
| PRINCIPAL AMOUNT | | DESCRIPTION | | COST (NOTE 1) | | VALUE (NOTE 1) | |
| U.S. Commercial Paper—6.86%—(continued) | | | |
| $ | 11,900,000 | | | Colgate-Palmolive Company | | $ | 11,899,894 | | | $ | 11,899,894 | | |
| | | | | 0.08% due 11/5/2009 | | | | | | | | | |
| | 10,000,000 | | | Dell, Inc.
0.16% due 12/1/2009 | | | 9,998,667
| | | | 9,998,667 | | |
| | 10,000,000 | | | E.I. du Pont de Nemours and Company | | | 9,999,933 | | | | 9,999,933 | | |
| | | | | 0.12% due 11/3/2009 | | | | | | | | | |
| | 20,211,000 | | | E.I. du Pont de Nemours and Company
0.12% due 11/18/2009 | | | 20,209,855
| | | | 20,209,855 | | |
| | 15,600,000 | | | E.I. du Pont de Nemours and Company
0.13% due 11/9/2009 | | | 15,599,549 | | | | 15,599,549 | | |
| | 13,044,000 | | | H.J. Heinz Company
0.20% due 12/1/2009 | | | 13,041,826 | | | | 13,041,826 | | |
| | 7,002,000 | | | H.J. Heinz Company
0.28% due 11/2/2009 | | | 7,001,946 | | | | 7,001,946 | | |
| | 4,000,000 | | | Kraft Foods, Inc.
0.33% due 11/6/2009 | | | 3,999,817 | | | | 3,999,817 | | |
| | 2,514,000 | | | Kraft Foods, Inc.
0.38% due 12/15/2009 | | | 2,512,832 | | | | 2,512,832 | | |
| | 7,700,000 | | | Kraft Foods, Inc.
0.40% due 12/15/2009 | | | 7,696,236 | | | | 7,696,236 | | |
| | 12,188,000 | | | Microsoft Corporation
0.08% due 12/14/2009 | | | 12,186,835 | | | | 12,186,835 | | |
| | 12,718,000 | | | Microsoft Corporation
0.13% due 11/10/2009 | | | 12,717,587 | | | | 12,717,587 | | |
| | 11,864,000 | | | Moody's Corporation
0.28% due 11/10/2009 | | | 11,863,170 | | | | 11,863,170 | | |
| | 29,384,000 | | | Moody's Corporation
0.32% due 12/21/2009 | | | 29,370,940 | | | | 29,370,940 | | |
| | 32,200,000 | | | Northern Illinois Gas Company
0.10% due 11/2/2009 | | | 32,199,911 | | | | 32,199,911 | | |
| | 10,000,000 | | | NYSE Euronext
0.13% due 11/20/2009 | | | 9,999,314 | | | | 9,999,314 | | |
| | 15,000,000 | | | NYSE Euronext
0.14% due 11/6/2009 | | | 14,999,708 | | | | 14,999,708 | | |
| | 15,161,000 | | | Philip Morris International, Inc.
0.10% due 11/9/2009 | | | 15,160,663 | | | | 15,160,663 | | |
| | 10,000,000 | | | The Procter & Gamble Company
0.10% due 11/2/2009 | | | 9,999,972 | | | | 9,999,972 | | |
| | 10,658,000 | | | Time Warner, Inc.
0.30% due 11/4/2009 | | | 10,657,734 | | | | 10,657,734 | | |
| | 11,400,000 | | | Time Warner, Inc.
0.33% due 11/16/2009 | | | 11,398,433 | | | | 11,398,433 | | |
| | 20,000,000 | | | Time Warner, Inc.
0.35% due 11/9/2009 | | | 19,998,444 | | | | 19,998,444 | | |
See Notes to Financial Statements.
46
Schedule of Investments | Year Ended October 31, 2009
| PRINCIPAL AMOUNT | | DESCRIPTION | | COST (NOTE 1) | | VALUE (NOTE 1) | |
| U.S. Commercial Paper—6.86%—(continued) | | | |
| $ | 10,000,000 | | | Time Warner, Inc. | | $ | 9,998,153 | | | $ | 9,998,153 | | |
| | | | | 0.35% due 11/20/2009 | | | | | | | | | |
| | 6,362,000 | | | Time Warner, Inc.
0.42% due 11/16/2009 | | | 6,360,887
| | | | 6,360,887 | | |
| | 20,000,000 | | | Time Warner, Inc. | | | 19,982,250 | | | | 19,982,250 | | |
| | | | | 0.45% due 1/11/2010 | | | | | | | | | |
| | 8,000,000 | | | Transocean, Inc.
0.30% due 11/2/2009 | | | 7,999,933
| | | | 7,999,933
| | |
| | 20,000,000 | | | Wal-Mart Stores, Inc.
0.12% due 11/17/2009 | | | 19,998,933
| | | | 19,998,933
| | |
| | 6,900,000 | | | WellPoint, Inc.
0.18% due 11/2/2009 | | | 6,899,966
| | | | 6,899,966
| | |
| | 11,308,000 | | | Wisconsin Electronic Power
0.12% due 11/2/2009 | | | 11,307,962
| | | | 11,307,962
| | |
| | 8,800,000 | | | Wisconsin Energy Corporation
0.15% due 11/2/2009 | | | 8,799,963
| | | | 8,799,963
| | |
| | 14,849,000 | | | Wisconsin Energy Corporation
0.20% due 11/6/2009 | | | 14,848,588
| | | | 14,848,588
| | |
| | 6,944,000 | | | Wisconsin Energy Corporation
0.20% due 11/20/2009 | | | 6,943,267
| | | | 6,943,267
| | |
| | 13,822,000 | | | Wisconsin Energy Corporation
0.20% due 12/4/2009 | | | 13,819,466
| | | | 13,819,466
| | |
| | | | | Total U.S. Commercial Paper | | | 481,991,807 | | | | 481,991,807 | | |
| | | | | Total Commercial Paper | | | 704,975,516 | | | | 704,975,516 | | |
| | | | | Total Investments—100.45% | | $ | 5,813,066,726 | | | | 7,058,754,509 | | |
| | | | | Liabilities in Excess of Other Assets—(0.45)% | | | | | | | (31,857,273 | ) | |
| | | | | Net Assets—100.00% | | | | | | $ | 7,026,897,236 | | |
(a) Non-income producing security/commodity.
(b) An affiliate of the Fund as defined by the Investment Company Act of 1940. An affiliate is defined as a company in which the Fund directly or indirectly owns, controls, or holds power to vote 5% or more of the outstanding voting securities.
(c) Security is deemed illiquid. At October 31, 2009, the value of these securities amounted to $139,583,163 or 1.99% of net assets.
(d) Securities valued in accordance with fair value procedures under the supervision of the Board of Trustees, representing $48,208,223 or 0.69% of net assets.
(e) Represents interest in a restricted security which has not been registered with the Securities and Exchange Commission under the Securities Act of 1933. At October 31, 2009, the value of these securities amounted to $50,381,982 or 0.72% of net assets.
(f) Held through Financiere Bleue, LLC.
(g) Participation certificate security—A type of investment with a combination of share and bond-like features. This security does not come with voting rights.
See Notes to Financial Statements.
47
Overseas Fund
(h) All or a portion of the security is exempt from registration under the Securities Act of 1933. Rule 144A securities may only be sold to qualified institutional buyers, pursuant to Rule 144A under the Securities Act of 1933.
(i) Issuer is in default.
(j) Represents a security registered under Regulation S. Bonds sold under Regulation S may not be offered, sold or delivered within the U.S., or to, or for the account or benefit of, U.S. persons, except pursuant to an exemption from, or in a transaction not subject to, the registration requirements of the Securities Act of 1933.
(k) Inflation protected security.
At October 31, 2009, aggregate cost for federal income tax purposes was $6,045,387,898; and net unrealized appreciation consisted of:
| Gross unrealized appreciation | | $ | 1,418,603,742 | | |
| Gross unrealized depreciation | | | (405,237,131 | ) | |
| Net unrealized appreciation | | $ | 1,013,366,611 | | |
Abbreviations Used in this Schedule Include:
ADR — American Depository Receipt
CPO — Ordinary Participation Certificate
NVDR — Non-Voting Depository Receipt
NYSE — New York Stock Exchange
OAT — French Treasury Obligation
PCL — Public Company Limited
PLC — Public Limited Company
RSP — Represents Non-Voting Shares
Currencies
EUR — Euro
SGD — Singapore Dollar
TWD — Taiwan Dollar
USD — United States Dollar
Restricted Securities
| SECURITY | | ACQUISITION
DATE | | COST | | CARRYING VALUE PER
SHARE/PRINCIPAL | |
| Emin Leydier SA 5.00% due 7/31/2016 | | 7/30/2009 | | $ | 14,273,396 | | | $ | 1.47 | | |
| FINEL 9.50% due 6/30/2017 | | 6/22/2005 | | | 9,649,600 | | | | 0.74 | | |
| FINEL | | 7/14/1999 | | | 9,152,131 | | | | 0.07 | | |
| First NIS Regional Fund SICAV | | 11/22/1994 | | | 1,000,000 | | | | 0.50 | | |
| Frégate | | 4/30/2004 | | | 23,235,900 | | | | 25.05 | | |
| Third Avenue Global Value Fund L.P. | | 6/30/1997 | | | 3,450,000 | | | | 182.52 | | |
See Notes to Financial Statements.
48
Schedule of Investments | Year Ended October 31, 2009
Foreign Currency Exchange Contracts — Sales
SETTLEMENT
DATES
THROUGH | | FOREIGN CURRENCY
TO BE DELIVERED | | U.S. $
TO BE
RECEIVED | | U.S. $ VALUE
AT OCTOBER 31,
2009 | | UNREALIZED
APPRECIATION
AT OCTOBER 31,
2009 | | UNREALIZED
DEPRECIATION
AT OCTOBER 31,
2009 | |
| 1/20/10 | | | 238,494,000 | | | Euro | | $ | 334,478,018 | | | $ | 351,133,519 | | | $ | — | | | $ | (16,655,501 | ) | |
| 1/20/10 | | | 26,712,117,000 | | | Japanese Yen | | | 277,519,955 | | | | 296,955,941 | | | | — | | | | (19,435,986 | ) | |
| 1/20/10 | | | 251,517,329 | | | Mexican Peso | | | 18,614,297 | | | | 18,883,538 | | | | — | | | | (269,241 | ) | |
| 2/17/10 | | | 24,147,718,000 | | | Japanese Yen | | | 258,018,231 | | | | 268,491,125 | | | | — | | | | (10,472,894 | ) | |
| 2/17/10 | | | 324,298,610 | | | Mexican Peso | | | 24,022,073 | | | | 24,291,137 | | | | — | | | | (269,064 | ) | |
| 2/17/10 | | | 273,357,000 | | | Euro | | | 391,161,043 | | | | 402,442,094 | | | | — | | | | (11,281,051 | ) | |
| 3/17/10 | | | 132,000,000 | | | Euro | | | 194,693,400 | | | | 194,272,980 | | | | 420,420 | | | | — | | |
| 3/17/10 | | | 8,600,000,000 | | | Japanese Yen | | | 95,976,787 | | | | 95,665,571 | | | | 311,216 | | | | — | | |
| 3/17/10 | | | 177,000,000 | | | Mexican Peso | | | 13,089,295 | | | | 13,147,550 | | | | — | | | | (58,255 | ) | |
| | | | | | | | | $ | 1,607,573,099 | | | $ | 1,665,283,455 | | | $ | 731,636 | | | $ | (58,441,992 | ) | |
Affiliated Securities
| SECURITY | | SHARES
OCTOBER 31,
2008 | | GROSS
ADDITIONS | | GROSS
REDUCTIONS | | SHARES
OCTOBER 31,
2009 | | VALUE
OCTOBER 31,
2009 | | REALIZED
LOSS | | DIVIDEND
INCOME | |
Chofu
Seisakusho
Company
Limited | | | 2,022,800 | | | | — | | | | — | | | | 2,022,800 | | | $ | 40,615,585 | | | $ | — | | | $ | 566,723 | | |
Deutsche
Wohnen AG | | | 2,047,306 | | | | 4,371,225 | | | | — | | | | 6,418,531 | | | | 72,931,295 | | | | — | | | | — | | |
| FINEL | | | 3,593,581 | | | | 8,000,000 | | | | — | | | | 11,593,581 | | | | 854,302 | | | | — | | | | — | | |
| Frégate | | | 300,000 | | | | 600,000 | | | | — | | | | 900,000 | | | | 22,548,380 | | | | — | | | | 9,656,366 | | |
Fuji Seal
International,
Inc. | | | 1,954,500 | | | | 16,600 | | | | 284,100 | | | | 1,687,000 | | | | 34,454,203 | | | | (1,541,383 | ) | | | 495,905 | | |
| Fursys, Inc. | | | 939,030 | | | | 9,300 | | | | — | | | | 948,330 | | | | 21,096,282 | | | | — | | | | 362,013 | | |
| Gaumont SA | | | 364,373 | | | | — | | | | — | | | | 364,373 | | | | 22,097,337 | | | | — | | | | 124,190 | | |
| Gewiss S.p.A. | | | 6,421,411 | | | | — | | | | 416,831 | | | | 6,004,580 | | | | 26,724,740 | | | | (1,112,415 | ) | | | 719,441 | | |
Haw Par
Corporation
Limited | | | 23,149,730 | | | | 43,100 | | | | — | | | | 23,192,830 | | | | 92,748,133 | | | | — | | | | 3,176,632 | | |
| Icom, Inc. | | | 853,360 | | | | 8,300 | | | | — | | | | 861,660 | | | | 21,063,970 | | | | — | | | | 250,196 | | |
Japan Wool
Textile
Company
Limited | | | 5,693,500 | | | | 883,800 | | | | — | | | | 6,577,300 | | | | 44,362,699 | | | | — | | | | 1,058,943 | | |
Laurent-
Perrier | | | 563,378 | | | | — | | | | — | | | | 563,378 | | | | 45,067,517 | | | | — | | | | 561,854 | | |
Maezawa
Kasei
Industries
Company
Limited | | | 2,068,330 | | | | — | | | | — | | | | 2,068,330 | | | | 22,775,877 | | | | — | | | | 587,929 | | |
See Notes to Financial Statements.
49
Overseas Fund
Affiliated Securities—(continued)
| SECURITY | | SHARES
OCTOBER 31,
2008 | | GROSS
ADDITIONS | | GROSS
REDUCTIONS | | SHARES
OCTOBER 31,
2009 | | VALUE
OCTOBER 31,
2009 | | REALIZED
LOSS | | DIVIDEND
INCOME | |
Matsumoto
Yushi-Seiyaku
Company
Limited | | | 1,058,246 | | | | — | | | | — | | | | 1,058,246 | | | $ | 20,460,559 | | | $ | — | | | $ | 504,211 | | |
Nissay Dowa
General
Insurance
Company
Limited | | | 20,785,230 | | | | 206,700 | | | | — | | | | 20,991,930 | | | | 95,168,703 | | | | — | | | | 1,584,529 | | |
Nitto Kohki
Company
Limited | | | 2,832,150 | | | | — | | | | — | | | | 2,832,150 | | | | 59,698,745 | | | | — | | | | 1,115,351 | | |
Pfeiffer
Vacuum
Technology
AG | | | 915,140 | | | | — | | | | — | | | | 915,140 | | | | 68,944,923 | | | | — | | | | 3,645,729 | | |
| Robertet SA | | | 236,140 | | | | — | | | | — | | | | 236,140 | | | | 28,536,934 | | | | — | | | | 505,559 | | |
Sansei Yusoki
Company
Limited | | | 1,223,670 | | | | — | | | | — | | | | 1,223,670 | | | | 6,186,676 | | | | — | | | | 168,666 | | |
Shingakukai
Company
Limited | | | 1,444,600 | | | | — | | | | 20,500 | | | | 1,424,100 | | | | 4,763,088 | | | | (66,353 | ) | | | 81,423 | | |
Sucrière de
Pithiviers-
Le-Vieil | | | 39,143 | | | | — | | | | — | | | | 39,143 | | | | 36,342,815 | | | | — | | | | 1,318,103 | | |
T. Hasegawa
Company
Limited | | | 3,452,591 | | | | — | | | | — | | | | 3,452,591 | | | | 53,863,412 | | | | — | | | | 679,846 | | |
Tasman
Farms
Limited | | | 5,750,000 | | | | — | | | | — | | | | 5,750,000 | | | | 4,123,037 | | | | — | | | | — | | |
Yomeishu
Seizo
Company
Limited | | | 2,535,900 | | | | — | | | | — | | | | 2,535,900 | | | | 24,599,597 | | | | — | | | | 434,971 | | |
| Total | | $ | 870,028,809 | | | $ | (2,720,151 | ) | | $ | 27,598,580 | | |
See Notes to Financial Statements.
50
Schedule of Investments | Year Ended October 31, 2009
| INDUSTRY DIVERSIFICATION FOR PORTFOLIO HOLDINGS | | PERCENT OF
NET ASSETS | |
| U.S. Common Stock | |
| Materials | | | 0.78 | % | |
| Total U.S. Common Stocks | | | 0.78 | | |
| International Common Stocks | |
| Consumer Discretionary | | | 9.77 | % | |
| Consumer Staples | | | 9.30 | | |
| Energy | | | 2.90 | | |
| Financials | | | 11.48 | | |
| Health Care | | | 6.74 | | |
| Industrials | | | 20.66 | | |
| Information Technology | | | 6.68 | | |
| Materials | | | 8.73 | | |
| Telecommunication Services | | | 0.38 | | |
| Total International Common Stocks | | | 76.64 | | |
| International Preferred Stocks | |
| Consumer Discretionary | | | 0.81 | | |
| Consumer Staples | | | 0.10 | | |
| Information Technology | | | 1.22 | | |
| Total International Preferred Stocks | | | 2.13 | | |
| Commodity | | | 8.12 | | |
| International Bonds | |
| Financials | | | 0.23 | | |
| Government Issues | | | 1.01 | | |
| Industrials | | | 0.03 | | |
| Information Technology | | | 0.77 | | |
| Materials | | | 0.59 | | |
| Telecommunication Services | | | 0.03 | | |
| Total International Bonds | | | 2.66 | | |
| Investment Companies | | | 0.09 | | |
| Commercial Paper | |
| International Commercial Paper | | | 3.17 | | |
| U.S. Commercial Paper | | | 6.86 | | |
| Total Commercial Paper | | | 10.03 | | |
| Total Investments | | | 100.45 | % | |
See Notes to Financial Statements.
51

Fund Overview | Data as of October 31, 2009 (unaudited)
INVESTMENT OBJECTIVE
First Eagle U.S. Value Fund seeks long-term growth of capital by investing, under normal market conditions, primarily in equity and debt securities issued by U.S. corporations. Management utilizes a highly disciplined, bottom-up, value-oriented approach in achieving its investment objective.
Average Annual Returns
| | | ONE-YEAR | | FIVE-YEARS | | SINCE
INCEPTION
(09-04-01) | |
First Eagle U.S. Value
Fund (A Shares) | |
| without sales charge | | | 14.52 | % | | | 4.82 | % | | | 8.51 | % | |
| with sales charge | | | 8.80 | | | | 3.75 | | | | 7.83 | | |
Standard & Poor's
500 Index | | | 9.80 | | | | 0.33 | | | | 0.82 | | |
| Consumer Price Index | | | -0.18 | | | | 2.52 | | | | 2.44 | | |
Asset Allocation

Sector/Industry
| Consumer Discretionary | | | 19.60 | % | |
| Energy | | | 10.34 | | |
| Financials | | | 9.39 | | |
| Information Technology | | | 9.26 | | |
| Materials | | | 7.17 | | |
| Industrials | | | 6.55 | | |
| Health Care | | | 6.13 | | |
| Commodity (Gold Bullion) | | | 5.38 | | |
| Government Issues | | | 3.75 | | |
| Utilities | | | 1.01 | | |
Telecommunication
Services | | | 0.83 | | |
| Investment Company | | | 0.70 | | |
| Consumer Staples | | | 0.48 | | |
The Fund's portfolio composition (represented as a percentage of net assets) is subject to change at any time.
FIRST EAGLE FUNDS | ANNUAL REPORT | OCTOBER 31, 2009
52
U.S. Value Fund
Growth of a $10,000 Initial Investment
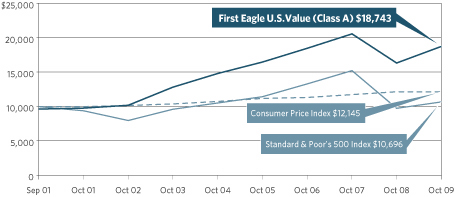
Performance data quoted herein represents past performance and should not be considered indicative of future results. Performance data quoted herein does not reflect the deduction of taxes that a shareholder would pay on Fund distributions or the sale of Fund shares. The average annual returns shown above are historical and reflect changes in share price, reinvested dividends and are net of expenses.
The average annual returns for Class A Shares with a sales charge gives effect to the deduction of the maximum sales charge of 5.00%.
The Standard & Poor's 500 Index is a widely recognized unmanaged index including a representative sample of 500 leading companies in leading sectors of the U.S. economy and is not available for purchase. Although the Standard & Poor's 500 Index focuses on the large-cap segment of the market, with approximately 75% coverage of U.S. equities, it is also considered a proxy for the total market. The Consumer Price Index (CPI) represents the change in price of all goods and services purchased for consumption by urban households.
Top 10 Holdings
| Gold Bullion (precious metal) | | | 5.38 | % | |
United States Treasury Inflation Indexed Bond 1.875% due 7/15/2013
(U.S. Treasury Bond) | | | 3.33 | | |
| Cintas Corporation (U.S. uniform designer and manufacturer) | | | 3.09 | | |
| Sanofi-Aventis SA, ADR (French health care company) | | | 2.96 | | |
| Microsoft Corporation (U.S. software developer) | | | 2.69 | | |
| American Express Company (U.S. credit card and travel services company) | | | 2.67 | | |
| Berkshire Hathaway, Inc., Class 'A' (U.S. holding company) | | | 2.26 | | |
| Home Depot, Inc. (U.S. home improvement retailer) | | | 2.25 | | |
| 3M Company (U.S. industrial conglomerate) | | | 2.17 | | |
| Apache Corporation (U.S. energy company) | | | 2.15 | | |
FIRST EAGLE FUNDS | ANNUAL REPORT | OCTOBER 31, 2009
53
First Eagle U.S. Value Fund
| NUMBER OF SHARES | | DESCRIPTION | | COST (NOTE 1) | | VALUE (NOTE 1) | |
| Common Stocks—61.82% | | | |
| U.S. Common Stocks—54.87% | | | |
| Consumer Discretionary 16.64% | | | |
| | 1,124,570 | | | Cintas Corporation | | $ | 34,034,015 | | | $ | 31,139,343 | | |
| | 904,950 | | | Home Depot, Inc. | | | 21,334,784 | | | | 22,705,195 | | |
| | 1,271,296 | | | Comcast Corporation , Class 'A' | | | 20,520,863 | | | | 17,823,570 | | |
| | 513,250 | | | Omnicom Group, Inc. | | | 15,202,566 | | | | 17,594,210 | | |
| | 283,434 | | | Wal-Mart Stores, Inc. | | | 13,018,272 | | | | 14,081,001 | | |
| | 243,400 | | | Costco Wholesale Corporation | | | 10,485,089 | | | | 13,837,290 | | |
| | 290,862 | | | Unifirst Corporation | | | 8,235,507 | | | | 12,236,564 | | |
| | 320,540 |
| | International Speedway
Corporation , Class 'A' | | | 12,833,406 | | | | 8,176,975 | | |
| | 342,770 | | | Ascent Media Corporation (a) | | | 7,999,427 | | | | 7,948,836 | | |
| | 92,760 | | | McDonald's Corporation | | | 2,230,743 | | | | 5,436,664 | | |
| | 144,110 | | | Copart, Inc. (a) | | | 4,002,001 | | | | 4,636,019 | | |
| | 250,480 | | | Barnes & Noble, Inc. | | | 5,738,398 | | | | 4,160,473 | | |
| | 289,405 | | | News Corporation , Class 'A' | | | 3,490,619 | | | | 3,333,946 | | |
| | 105,610 | | | Viacom, Inc. , Class 'B' (a) | | | 2,891,487 | | | | 2,913,780 | | |
| | 80,412 | | | WABCO Holdings, Inc. | | | 1,669,054 | | | | 1,907,373 | | |
| | 600 | | | St. John Knits International, Inc. (a)(b) | | | 18,600 | | | | 1,890 | | |
| | | | 163,704,831 | | | | 167,933,129 | | |
| Energy 8.57% | |
| | 230,050 | | | Apache Corporation | | | 15,906,114 | | | | 21,652,306 | | |
| | 525,360 | | | Helmerich & Payne, Inc. | | | 13,540,310 | | | | 19,974,187 | | |
| | 380,318 | | | ConocoPhillips | | | 16,819,748 | | | | 19,084,357 | | |
| | 222,980 | | | Murphy Oil Corporation | | | 11,605,604 | | | | 13,632,997 | | |
| | 352,139 | | | San Juan Basin Royalty Trust | | | 10,234,184 | | | | 6,271,596 | | |
| | 71,971 | | | SEACOR Holdings, Inc. (a) | | | 5,296,308 | | | | 5,849,083 | | |
| | | | 73,402,268 | | | | 86,464,526 | | |
| Financials 6.62% | |
| | 773,580 | | | American Express Company | | | 24,599,768 | | | | 26,951,527 | | |
| | 230 | | | Berkshire Hathaway, Inc. , Class 'A' (a) | | | 20,859,068 | | | | 22,770,000 | | |
| | 464,821 | | | Cincinnati Financial Corporation | | | 11,491,850 | | | | 11,787,861 | | |
| | 146,920 | | | Mercury General Corporation | | | 6,867,843 | | | | 5,356,703 | | |
| | 8,000 | | | LandCo Real Estate LLC (a)(b)(c)(d) | | | 27,840 | | | | 10,240 | | |
| | | | 63,846,369 | | | | 66,876,331 | | |
See Notes to Financial Statements.
54
Schedule of Investments | Year Ended October 31, 2009
| NUMBER OF SHARES | | DESCRIPTION | | COST (NOTE 1) | | VALUE (NOTE 1) | |
| U.S. Common Stocks—54.87%—(continued) | | | |
| Health Care 3.17% | | | |
| | 271,870 | | | Johnson & Johnson | | $ | 16,286,137 | | | $ | 16,053,923 | | |
| | 284,280 | | | WellPoint, Inc. (a) | | | 12,976,265 | | | | 13,292,933 | | |
| | 79,310 | | | DENTSPLY International, Inc. | | | 1,696,097 | | | | 2,614,058 | | |
| | | | 30,958,499 | | | | 31,960,914 | | |
| Industrials 5.94% | |
| | 297,860 | | | 3M Company | | | 19,775,534 | | | | 21,913,560 | | |
| | 199,990 | | | Alliant Techsystems, Inc. (a) | | | 17,506,596 | | | | 15,555,222 | | |
| | 284,971 | | | Automatic Data Processing, Inc. | | | 10,321,740 | | | | 11,341,846 | | |
| | 1,239,695 | | | Blount International, Inc. (a) | | | 13,695,961 | | | | 11,206,843 | | |
| | | | 61,299,831 | | | | 60,017,471 | | |
| Information Technology 7.23% | |
| | 978,625 | | | Microsoft Corporation | | | 22,767,240 | | | | 27,137,271 | | |
| | 961,604 | | | Intel Corporation | | | 16,403,973 | | | | 18,376,253 | | |
| | 673,460 | | | Linear Technology Corporation | | | 17,101,345 | | | | 17,429,145 | | |
| | 691,635 | | | Dell, Inc. (a) | | | 9,690,808 | | | | 10,021,791 | | |
| | | | 65,963,366 | | | | 72,964,460 | | |
| Materials 5.25% | |
| | 352,700 | | | Rayonier, Inc. , REIT | | | 11,296,822 | | | | 13,607,166 | | |
| | 309,212 | | | Newmont Mining Corporation | | | 13,055,065 | | | | 13,438,354 | | |
| | 315,810 | | | Weyerhaeuser Company | | | 12,074,848 | | | | 11,476,535 | | |
| | 230,337 | | | Plum Creek Timber Company, Inc. , REIT | | | 7,409,731 | | | | 7,207,245 | | |
| | 95,350 | | | Deltic Timber Corporation | | | 4,565,760 | | | | 4,052,375 | | |
| | 70,650 | | | Vulcan Materials Company | | | 4,616,316 | | | | 3,252,019 | | |
| | | | 53,018,542 | | | | 53,033,694 | | |
| Telecommunication Services 0.83% | |
| | 366,750 | | | Cisco Systems, Inc. (a) | | | 6,324,929 | | | | 8,380,237 | | |
| Utilities 0.62% | |
| | 222,850 | | | IDACorporation, Inc. | | | 7,066,291 | | | | 6,259,857 | | |
| | Total U.S. Common Stocks | | | | | | 525,584,926 | | | | 553,890,61 | 9 | |
| International Common Stocks—6.95% | | | |
| Canada 0.89% | | | |
| | 360,097 | | | Franco-Nevada Corporation | | | 6,543,445 | | | | 8,959,128 | | |
| France 2.96% | | | |
| | 810,262 | | | Sanofi-Aventis SA , ADR | | | 31,195,576 | | | | 29,914,873 | | |
See Notes to Financial Statements.
55
U.S. Value Fund
| NUMBER OF SHARES | | DESCRIPTION | | COST (NOTE 1) | | VALUE (NOTE 1) | |
| International Common Stocks—6.95%—(continued) | | | |
| United Kingdom 3.10% | | | |
| | 739,305 | | | Willis Group Holdings Limited | | $ | 19,697,842 | | | $ | 19,961,235 | | |
| | 449,190 | | | Amdocs Limited (a) | | | 10,521,990 | | | | 11,319,588 | | |
| | | | | | | | 30,219,832 | | | | 31,280,823 | | |
| Total International Common Stocks | | | 67,958,853 | | | | 70,154,824 | | |
| Total Common Stocks | | | 593,543,779 | | | | 624,045,443 | | |
| U.S. Preferred Stocks—0.85% | | | |
| Consumer Staples 0.46% | |
| | 168,915 |
| | Seneca Foods Corporation,
Series '2003' (a)(b)(c)(g) | | | 2,542,171 | | | | 4,677,256 | | |
| Utilities 0.39% | | | |
| | 88,100 |
| | Calenergy Capital Trust III
6.50% (b)(h) | | | 3,778,987
| | | | 3,920,450
| | |
| Total U.S. Preferred Stocks | | | 6,321,158 | | | | 8,597,706 | | |
| Investment Company—0.70% | |
| | 276,460 | | | PowerShares DB Agriculture Fund, ETF (a) | | | 6,753,724 | | | | 7,069,082 | | |
| OUNCES | | | | | | | |
| Commodity—5.38% | |
| | 51,916 | | | Gold bullion (a) | | | 33,486,747 | | | | 54,304,356 | | |
| PRINCIPAL AMOUNT | | | | | | | |
| Bonds—11.84% | |
| U.S. Bonds—11.48% | | | |
| Corporate Bonds 6.94% | |
| $ | 600,000 | | | Bausch & Lomb, Inc. | | | 513,589 | | | | 361,314 | | |
| | | | | 7.125% due 8/1/2028 (b) | | | | | | | | | |
| | 17,429,000 |
| | Blount International, Inc.
8.875% due 8/1/2012 | | | 17,575,227
| | | | 17,821,152
| | |
| | 1,000,000 |
| | Briggs & Stratton Corporation
8.875% due 3/15/2011 | | | 1,012,368
| | | | 1,057,500
| | |
| | 250,000 |
| | Elizabeth Arden, Inc.
7.75% due 1/15/2014 | | | 250,000
| | | | 241,250
| | |
| | 5,975,000 |
| | Mueller Water Products, Inc.
7.375% due 6/1/2017 | | | 4,607,498
| | | | 5,198,250
| | |
| | 2,000,000 | | | Pulte Homes, Inc.
6.25% due 2/15/2013 | | | 1,842,246
| | | | 2,025,000
| | |
See Notes to Financial Statements.
56
Schedule of Investments | Year Ended October 31, 2009
| PRINCIPAL AMOUNT | | DESCRIPTION | | COST (NOTE 1) | | VALUE (NOTE 1) | |
| U.S. Bonds—11.48%—(continued) | | | |
| Corporate Bonds 6.94%—(continued) | |
| $ | 3,800,000 | | | Sanmina-SCI Corporation | | $ | 3,431,399 | | | $ | 3,629,000 | | |
| | | | | 6.75% due 3/1/2013 | | | | | | | | | |
| | 2,000,000 |
| | Sanmina-SCI Corporation
8.125% due 3/1/2016 | | | 1,775,586
| | | | 1,920,000
| | |
| | 10,169,000 |
| | Sealy Mattress Company
8.25% due 6/15/2014 | | | 7,200,317
| | | | 9,914,775
| | |
| | 10,500,000 |
| | Texas Industries, Inc.
7.25% due 7/15/2013 | | | 8,468,558
| | | | 10,342,500
| | |
| | 250,000 |
| | Visant Holding Corporation
10.25% due 12/1/2013 (b) | | | 193,166
| | | | 258,750
| | |
| | 5,424,000 | | | Yankee Acquisition Corporation, | | | 5,506,290 | | | | 5,207,040 | | |
| | | | | Series 'B' 8.50% due 2/15/2015 | | | | | | | | | |
| | 12,697,000 | | | Yankee Acquisition Corporation,
Series 'B' 9.75% due 2/15/2017 | | | 12,692,205
| | | | 12,030,408
| | |
| | | | 65,068,449 | | | | 70,006,939 | | |
| Government Obligations 3.75% | |
| | 32,076,954 | | | United States Treasury
Inflation Indexed Bond
1.875% due 7/15/2013 (e) | | | 30,755,533
| | | | 33,620,658
| | |
| | 4,066,278 | | | United States Treasury
Inflation Indexed Bond
2.375% due 4/15/2011 (e) | | | 4,131,203
| | | | 4,210,187
| | |
| | | | 34,886,736 | | | | 37,830,845 | | |
| Convertible Bond 0.79% | |
| | 8,307,000 | | | Boston Properties LP
3. 625% due 2/15/2014 (f)(i) | | | 6,159,931
| | | | 8,016,255
| | |
| | Total U.S. Bonds | | | | | | 106,115,116 | | | | 115,854,039 | | |
| International Corporate Bond—0.36% | | | |
| Canada 0.36% | |
| | 3,520,000
USD | | | Celestica, Inc.
7.625% due 7/1/2013 | | | 3,348,384
| | | | 3,625,600
| | |
| Total Bonds | | | 109,463,500 | | | | 119,479,639 | | |
| Commercial Paper—19.07% | | | |
| International Commercial Paper—6.74% | | | |
| France 0.60% | |
| | 6,000,000
USD | | | Électricité de France
0.19% due 1/6/2010 | | | 5,997,910
| | | | 5,997,910
| | |
See Notes to Financial Statements.
57
U.S. Value Fund
| PRINCIPAL AMOUNT | | DESCRIPTION | | COST (NOTE 1) | | VALUE (NOTE 1) | |
| International Commercial Paper—6.74%—(continued) | | | |
| Japan 2.44% | |
| | 6,648,000
USD | | | Hitachi, Limited
0.28% due 11/12/2009 | | | $6,647,431
| | | | $6,647,431
| | |
| | 9,000,000
USD | | | Panasonic Finance
0.19% due 12/14/2009 | | | 8,997,958
| | | | 8,997,958
| | |
| | 9,000,000
USD | | | Panasonic Finance
0.21% due 12/2/2009 | | | 8,998,372
| | | | 8,998,372
| | |
| Netherlands 0.49% | |
| | 4,979,000
USD | | | Royal Dutch Shell PLC
0.12% due 11/9/2009 | | | 4,978,867
| | | | 4,978,867
| | |
| Switzerland 1.12% | |
| | 6,310,000
USD | | | Nestlé Capital Corporation
0.11% due 11/23/2009 | | | 6,309,576
| | | | 6,309,576
| | |
| | 5,000,000
USD | | | Nestlé Capital Corporation
0.21% due 11/4/2009 | | | 4,999,913
| | | | 4,999,913
| | |
| United Kingdom 2.09% | |
| | 5,000,000
USD | | | Diageo Capital PLC
0.27% due 11/5/2009 | | | 4,999,850
| | | | 4,999,850
| | |
| | 6,000,000
USD | | | Diageo Capital PLC
0.27% due 11/9/2009 | | | 5,999,640
| | | | 5,999,640
| | |
| | 6,681,000
USD | | | Diageo Capital PLC
0.30% due 11/5/2009 | | | 6,680,777
| | | | 6,680,777
| | |
| | 3,400,000
USD | | | Reed Elsevier PLC
0.20% due 11/19/2009 | | | 3,399,660
| | | | 3,399,660
| | |
| Total International Commercial Paper | | | 68,009,954 | | | | 68,009,954 | | |
| U.S. Commercial Paper—12.33% | | | |
| $ | 3,303,000 | | | Bemis Company, Inc. | | | 3,302,835 | | | | 3,302,835 | | |
| | | | | 0.20% due 11/10/2009 | | | | | | | | | |
| | 3,957,000 | | | The Coca-Cola Company
0.12% due 12/11/2009 | | | 3,956,472
| | | | 3,956,472
| | |
| | 1,348,000 | | | Dell, Inc.
0.19% due 12/14/2009 | | | 1,347,694
| | | | 1,347,694
| | |
| | 7,599,000 | | | E.I. du Pont de Nemours and Company
0.11% due 11/16/2009 | | | 7,598,652
| | | | 7,598,652
| | |
| | 5,000,000 | | | E.I. du Pont de Nemours and Company
0.13% due 11/9/2009 | | | 4,999,856
| | | | 4,999,856
| | |
| | 4,584,000 | | | Kraft Foods, Inc.
0.33% due 11/6/2009 | | | 4,583,790
| | | | 4,583,790
| | |
| | 3,554,000 | | | Microsoft Corporation
0.13% due 11/10/2009 | | | 3,553,885
| | | | 3,553,885
| | |
| | 10,925,000 | | | Moody's Corporation
0.28% due 11/10/2009 | | | 10,924,235
| | | | 10,924,235
| | |
See Notes to Financial Statements.
58
Schedule of Investments | Year Ended October 31, 2009
| PRINCIPAL AMOUNT | | DESCRIPTION | | COST (NOTE 1) | | VALUE (NOTE 1) | |
| U.S. Commercial Paper—12.33%—(continued) | | | |
| $ | 9,654,000 | | | Moody's Corporation | | $ | 9,649,709 | | | $ | 9,649,709 | | |
| | | | | 0.32% due 12/21/2009 | | | | | | | | | |
| | 10,000,000 | | | Northern Illinois Gas Company
0.10% due 11/2/2009 | | | 9,999,972
| | | | 9,999,972
| | |
| | 5,000,000 | | | NYSE Euronext
0.13% due 11/20/2009 | | | 4,999,657
| | | | 4,999,657
| | |
| | 9,844,000 | | | Philip Morris International, Inc.
0.10% due 11/9/2009 | | | 9,843,781
| | | | 9,843,781
| | |
| | 8,400,000 | | | Time Warner, Inc.
0.30% due 11/4/2009 | | | 8,399,790
| | | | 8,399,790
| | |
| | 5,214,000 | | | Time Warner, Inc. | | | 5,213,037 | | | | 5,213,037 | | |
| | | | | 0.35% due 11/20/2009 | | | | | | | | | |
| | 5,000,000 | | | Time Warner, Inc.
0.45% due 1/11/2010 | | | 4,995,563
| | | | 4,995,563
| | |
| | 1,470,000 | | | Transocean, Inc.
0.28% due 11/13/2009 | | | 1,469,863
| | | | 1,469,863
| | |
| | 5,500,000 | | | Transocean, Inc.
0.30% due 11/2/2009 | | | 5,499,954
| | | | 5,499,954
| | |
| | 2,000,000 | | | WellPoint, Inc.
0.18% due 11/2/2009 | | | 1,999,990
| | | | 1,999,990
| | |
| | 5,000,000 | | | Wisconsin Electronic Power
0.12% due 11/2/2009 | | | 4,999,983
| | | | 4,999,983
| | |
| | 3,000,000 | | | Wisconsin Energy Corporation
0.15% due 11/2/2009 | | | 2,999,988
| | | | 2,999,988
| | |
| | 5,730,000 | | | Wisconsin Energy Corporation
0.20% due 11/20/2009 | | | 5,729,395
| | | | 5,729,395
| | |
| | 8,378,000 | | | Wisconsin Energy Corporation
0.20% due 12/4/2009 | | | 8,376,464
| | | | 8,376,464
| | |
| | | | | Total U.S. Commercial Paper | | | 124,444,565 | | | | 124,444,565 | | |
| | | | | Total Commercial Paper | | | 192,454,519 | | | | 192,454,519 | | |
| | | | | Total Investments—99.66% | | $ | 942,023,427 | | | | 1,005,950,745 | | |
| | | | | Other Assets in Excess of Liabilities—0.34% | | | | | | | 3,413,063 | | |
| | | | | Net Assets—100.00% | | | | | | $ | 1,009,363,808 | | |
(a) Non-income producing security/commodity.
(b) Security is deemed illiquid. At October 31, 2009, the value of these securities amounted to $9,229,900 or 0.91% of net assets.
(c) Securities valued in accordance with fair value procedures under the supervision of the Board of Trustees, representing $4,687,496 or 0.46% of net assets.
(d) Represents interest in a restricted security which has not been registered with the Securities and Exchange Commission under the Securities Act of 1933. At October 31, 2009, the value of these securities amounted to $10,240 or 0.00% of net assets.
(e) Inflation protected security.
See Notes to Financial Statements.
59
U.S. Value Fund
(f) All or a portion of the security is exempt from registration under the Securities Act of 1933. Rule 144A securities may only be sold to qualified institutional buyers, pursuant to Rule 144A under the Securities Act of 1933.
(g) This security is convertible until December 31, 2049.
(h) This security is subject to a call feature and may be called in full or partially on or anytime after December 28, 2009.
(i) This security is convertible until February 15, 2014.
At October 31, 2009, aggregate cost for federal income tax purposes was $943,390,773; and net unrealized appreciation consisted of:
| Gross unrealized appreciation | | $ | 90,676,992 | | |
| Gross unrealized depreciation | | | (28,117,020 | ) | |
| Net unrealized appreciation | | $ | 62,559,972 | | |
Abbreviations Used in this Schedule Include:
ADR — American Depository Receipt
ETF — Exchange Traded Fund
NYSE — New York Stock Exchange
PLC — Public Limited Company
REIT — Real Estate Investment Trust
Currency
USD — United States Dollar
Restricted Security
| SECURITY | | ACQUISITION
DATE | | COST | | CARRYING VALUE
PER SHARE | |
| LandCo Real Estate LLC | | | 9/6/2006 | | | $ | 27,840 | | | $ | 1.28 | | |
| INDUSTRY DIVERSIFICATION FOR PORTFOLIO HOLDINGS | | PERCENT OF
NET ASSETS | |
| U.S. Common Stocks | |
| Consumer Discretionary | | | 16.64 | % | |
| Energy | | | 8.57 | | |
| Financials | | | 6.62 | | |
| Health Care | | | 3.17 | | |
| Industrials | | | 5.94 | | |
| Information Technology | | | 7.23 | | |
| Materials | | | 5.25 | | |
| Telecommunication Services | | | 0.83 | | |
| Utilities | | | 0.62 | | |
| Total U.S. Common Stocks | | | 54.87 | | |
See Notes to Financial Statements.
60
Schedule of Investments | Year Ended October 31, 2009
| INDUSTRY DIVERSIFICATION FOR PORTFOLIO HOLDINGS—(CONTINUED) | | PERCENT OF
NET ASSETS | |
| International Common Stocks | |
| Financials | | | 1.98 | % | |
| Health Care | | | 2.96 | | |
| Information Technology | | | 1.12 | | |
| Materials | | | 0.89 | | |
| Total International Common Stocks | | | 6.95 | | |
| U.S. Preferred Stocks | |
| Consumer Staples | | | 0.46 | | |
| Utilities | | | 0.39 | | |
| Total U.S. Preferred Stocks | | | 0.85 | | |
| Investment Company | | | 0.70 | | |
| Commodity | | | 5.38 | | |
| U.S. Bonds | |
| Consumer Discretionary | | | 2.96 | | |
| Consumer Staples | | | 0.02 | | |
| Energy | | | 1.77 | | |
| Financials | | | 0.79 | | |
| Government Issues | | | 3.75 | | |
| Industrials | | | 0.61 | | |
| Information Technology | | | 0.55 | | |
| Materials | | | 1.03 | | |
| Total U.S. Bonds | | | 11.48 | | |
| International Corporate Bond | |
| Information Technology | | | 0.36 | | |
| Total International Corporate Bond | | | 0.36 | | |
| Commercial Paper | | | | | |
| International Commercial Paper | | | 6.74 | | |
| U.S. Commercial Paper | | | 12.33 | | |
| Total Commercial Paper | | | 19.07 | | |
| Total Investments | | | 99.66 | % | |
See Notes to Financial Statements.
61

Fund Overview | Data as of October 31, 2009 (unaudited)
INVESTMENT OBJECTIVE
First Eagle Gold Fund is a non-diversified fund whose investment objective is to provide exposure to the investment characteristics of gold and, to a limited extent, other precious metals. In seeking to achieve its objective, the Fund invests primarily in gold, gold related securities and issuers principally engaged in the gold industry.
Average Annual Returns
| | | ONE-YEAR | | FIVE-YEARS | | TEN-YEARS | |
First Eagle Gold
Fund (A Shares) | |
| without sales charge | | | 78.93 | % | | | 15.54 | % | | | 19.86 | % | |
| with sales charge | | | 69.99 | | | | 14.36 | | | | 19.40 | | |
| FTSE Gold Mines Index | | | 92.08 | | | | 10.04 | | | | 11.32 | | |
| MSCI World Index | | | 18.42 | | | | 2.64 | | | | 0.23 | | |
| Consumer Price Index | | | -0.18 | | | | 2.52 | | | | 2.54 | | |
Asset Allocation

Countries
| Canada | | | 31.92 | % | |
| United States | | | 26.08 | | |
| South Africa | | | 12.68 | | |
| Australia | | | 6.39 | | |
| Africa | | | 6.10 | | |
| Papua New Guinea | | | 5.37 | | |
| Mexico | | | 4.67 | | |
| United Kingdom | | | 0.82 | | |
| Peru | | | 0.36 | | |
The Fund's portfolio composition (represented as a percentage of net assets) is subject to change at any time.
FIRST EAGLE FUNDS | ANNUAL REPORT | OCTOBER 31, 2009
62
Gold Fund
Growth of a $10,000 Initial Investment
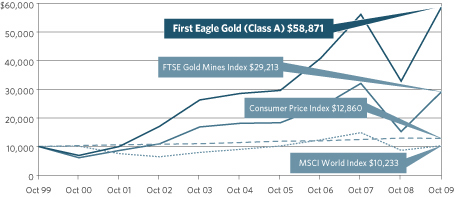
Performance data quoted herein represents past performance and should not be considered indicative of future results. Performance data quoted herein does not reflect the deduction of taxes that a shareholder would pay on Fund distributions or the sale of Fund shares. The average annual returns shown above are historical and reflect changes in share price, reinvested dividends and are net of expenses.
The average annual returns for Class A Shares with a sales charge give effect to the deduction of the maximum sales charge of 3.75% for periods prior to March 1, 2000 and of 5.00% thereafter.
The MSCI World Index is a widely followed, unmanaged group of stocks from 23 international markets and is not available for purchase. The index provides total returns in U.S. dollars with net dividends reinvested. The FTSE Gold Mines Index is an unmanaged index composed of approximately 19 mining companies and is only available without dividends reinvested and is not available for purchase. The Consumer Price Index (CPI) represents the change in price of all goods and services purchased for consumption by urban households.
Top 10 Holdings
| Gold Bullion (United States) | | | 18.23 | % | |
| Lihir Gold Limited (Papua New Guinea) | | | 5.37 | | |
| IAMGOLD Corporation (Canada) | | | 5.10 | | |
| Randgold Resources Limited, ADR (Africa) | | | 4.89 | | |
| Newcrest Mining Limited (Australia) | | | 4.84 | | |
| Goldcorp, Inc. (Canada) | | | 4.72 | | |
| Kinross Gold Corporation (Canada) | | | 4.33 | | |
| Newmont Mining Corporation (United States) | | | 4.30 | | |
| Gold Fields Limited, ADR (South Africa) | | | 4.27 | | |
| Harmony Gold Mining Company Limited, ADR (South Africa) | | | 4.20 | | |
FIRST EAGLE FUNDS | ANNUAL REPORT | OCTOBER 31, 2009
63
First Eagle Gold Fund
| NUMBER OF SHARES | | DESCRIPTION | | COST (NOTE 1) | | VALUE (NOTE 1) | |
| Common Stocks—76.08% | | | |
| International Common Stocks—68.23% | | | |
| Africa 6.10% | | | |
| | 1,358,386 | | | Randgold Resources Limited, ADR | | $ | 28,417,371 | | | $ | 90,617,935 | | |
| | 11,181,200 | | | Centamin Egypt Limited (a) | | | 13,252,882 | | | | 22,337,581 | | |
| | | | | | | | 41,670,253 | | | | 112,955,516 | | |
| Australia 6.39% | | | |
| | 3,087,879 | | | Newcrest Mining Limited | | | 51,383,466 | | | | 89,674,905 | | |
| | 3,021,681 | | | Kingsgate Consolidated Limited | | | 10,180,165 | | | | 20,647,636 | | |
| | 2,093,857 | | | Independence Group NL | | | 7,607,115 | | | | 8,113,951 | | |
| | | | | | | | 69,170,746 | | | | 118,436,492 | | |
| Canada 31.87% | | | |
| | 7,114,972 | | | IAMGOLD Corporation | | | 42,949,740 | | | | 94,431,972 | | |
| | 2,380,100 | | | GoldCorp, Inc. | | | 70,070,391 | | | | 87,516,277 | | |
| | 4,316,532 | | | Kinross Gold Corporation | | | 53,127,693 | | | | 80,201,165 | | |
| | 1,670,424 | | | Barrick Gold Corporation | | | 51,724,185 | | | | 60,018,334 | | |
| | 5,570,749 | | | Yamana Gold, Inc. | | | 53,416,056 | | | | 59,149,277 | | |
| | 1,554,813 | | | Franco-Nevada Corporation | | | 31,874,314 | | | | 38,683,379 | | |
| | 3,955,534 | | | Minefinders Corporation (a)(c) | | | 29,225,637 | | | | 37,426,113 | | |
| | 9,935,971 | | | New Gold, Inc. (a)(b) | | | 20,202,990 | | | | 36,023,868 | | |
| | 4,474,350 | | | Aurizon Mines Limited (a) | | | 6,394,385 | | | | 19,243,181 | | |
| | 3,004,730 | | | European Goldfields Limited (a) | | | 6,640,037 | | | | 16,952,324 | | |
| | 4,258,336 | | | Dundee Precious Metals, Inc. (a)(b) | | | 18,502,994 | | | | 14,218,085 | | |
| | 1,925,130 | | | Osisko Mining Corporation (a)(b) | | | 8,882,462 | | | | 12,998,011 | | |
| | 835,000 | | | Eldorado Gold Corporation (a) | | | 9,860,059 | | | | 9,313,818 | | |
| | 4,228,830 | | | Anatolia Minerals Development
Limited (a)(b) | | | 8,933,864
| | | | 8,370,048
| | |
| | 2,128,370 | | | Northgate Minerals Corporation (a) | | | 5,838,825 | | | | 5,512,478 | | |
| | 98,763 | | | Agnico-Eagle Mines Limited | | | 841,823 | | | | 5,261,514 | | |
| | 1,787,980 | | | Richmont Mines, Inc. (a)(c) | | | 5,728,117 | | | | 4,845,340 | | |
| | 582,250 | | | Etruscan Resources, Inc. (a) | | | 1,451,640 | | | | 266,568 | | |
| | | | | | | | 425,665,212 | | | | 590,431,752 | | |
| Mexico 4.67% | | | |
| | 4,286,341 | | | Fresnillo PLC | | | 17,256,013 | | | | 52,256,380 | | |
| | 1,880,910 | | | Industrias Peñoles S.A.B. de C.V. | | | 6,134,596 | | | | 34,307,539 | | |
| | | | | | | | 23,390,609 | | | | 86,563,919 | | |
| Papua New Guinea 5.37% | | | |
| | 36,264,276 | | | Lihir Gold Limited (a) | | | 63,680,171 | | | | 99,445,922 | | |
See Notes to Financial Statements.
64
Schedule of Investments | Year Ended October 31, 2009
| NUMBER OF SHARES | | DESCRIPTION | | COST (NOTE 1) | | VALUE (NOTE 1) | |
| International Common Stocks—68.23%—(continued) | | | |
| Peru 0.36% | | | |
| | 198,050 | | | Cia de Minas Buenaventura SA , ADR | | $ | 3,760,655 | | | $ | 6,648,538 | | |
| South Africa 12.65% | | | |
| | 6,201,044 | | | Gold Fields Limited , ADR | | | 82,147,473 | | | | 79,063,311 | | |
| | 7,801,323 | | | Harmony Gold Mining Company
Limited , ADR | | | 82,299,085
| | | | 77,701,177
| | |
| | 1,679,219 | | | AngloGold Ashanti Limited , ADR | | | 49,612,110 | | | | 63,037,881 | | |
| | 9,844,550 | | | Great Basin Gold Limited (a) | | | 12,640,578 | | | | 14,477,280 | | |
| | | | | | | | 226,699,246 | | | | 234,279,649 | | |
| United Kingdom 0.82% | | | |
| | 416,864 | | | Anglo American PLC (a) | | | 19,462,003 | | | | 15,181,321 | | |
| | Total International Common Stocks | | | | | | 873,498,895 | | | | 1,263,943,109 | | |
| U.S. Common Stocks—7.85% | | | |
| Materials 7.85% | | | |
| | 1,832,017 | | | Newmont Mining Corporation | | | 74,771,970 | | | | 79,619,459 | | |
| | 1,489,601 | | | Royal Gold, Inc. | | | 35,733,298 | | | | 65,795,676 | | |
| | Total U.S. Common Stocks | | | | | | 110,505,268 | | | | 145,415,135 | | |
| | Total Common Stocks | | | | | | 984,004,163 | | | | 1,409,358,244 | | |
| Warrants—0.08% | | | |
| | 650,000 | | | Dundee Precious Metals, Inc.
Warrants exp 11/20/2015 (a)(b) | | | —
| | | | 901,776
| | |
| | 1,500,000 | | | Great Basin Gold Limited
Warrants exp 10/15/2010 (a) | | | —
| | | | 471,698
| | |
| | Total Warrants | | | | | | — | | | | 1,373,474 | | |
| OUNCES | | | | | | | |
| Commodity—18.23% | | | |
| | 322,873 | | | Gold bullion (a) | | | 139,679,146 | | | | 337,725,045 | | |
| PRINCIPAL AMOUNT | | | | | | | |
| Commercial Paper—6.29% | | | |
| International Commercial Paper—1.75% | | | |
| France 0.20% | | | |
| | 3,710,000
USD | | | Électricité de France
0.19% due 1/6/2010 | | | 3,708,708
| | | | 3,708,708
| | |
See Notes to Financial Statements.
65
Gold Fund
| PRINCIPAL AMOUNT | | DESCRIPTION | | COST (NOTE 1) | | VALUE (NOTE 1) | |
| International Commercial Paper—1.75%—(continued) | | | |
| Japan 1.10% | | | |
| | 15,000,000
USD | | | Panasonic Finance
0.21% due 12/2/2009 | | | $14,997,288
| | | | $14,997,288
| | |
| | 5,346,000
USD | | | Panasonic Finance
0.19% due 12/7/2009 | | | 5,344,984
| | | | 5,344,984
| | |
| Switzerland 0.45% | | | |
| | 8,326,000
USD | | | Nestlé Capital Corporation
0.21% due 11/4/2009 | | | 8,325,854
| | | | 8,325,854
| | |
| | Total International Commercial Paper | | | | | | 32,376,834 | | | | 32,376,834 | | |
| U.S. Commercial Paper—4.54% | | | |
| $ | 4,389,000 | | | Bemis Company, Inc. | | | 4,388,781 | | | | 4,388,781 | | |
| | | | | 0.20% due 11/10/2009 | | | | | | | | | |
| | 8,000,000 | | | E.I. du Pont de Nemours and Company
0.13% due 11/9/2009 | | | 7,999,769
| | | | 7,999,769
| | |
| | 5,150,000 | | | Microsoft Corporation
0.13% due 11/10/2009 | | | 5,149,833
| | | | 5,149,833
| | |
| | 8,792,000 | | | Moody's Corporation
0.32% due 12/21/2009 | | | 8,788,092
| | | | 8,788,092
| | |
| | 12,000,000 | | | Northern Illinois Gas Company
0.10% due 11/2/2009 | | | 11,999,967
| | | | 11,999,967
| | |
| | 9,942,000 | | | Time Warner, Inc.
0.30% due 11/4/2009 | | | 9,941,751
| | | | 9,941,751
| | |
| | 5,321,000 | | | Transocean, Inc.
0.30% due 11/2/2009 | | | 5,320,956
| | | | 5,320,956
| | |
| | 10,831,000 | | | Wal-Mart Stores, Inc.
0.12% due 11/17/2009 | | | 10,830,422
| | | | 10,830,422
| | |
| | 2,500,000 | | | WellPoint, Inc.
0.18% due 11/2/2009 | | | 2,499,988
| | | | 2,499,988
| | |
| | 5,610,000 | | | Wisconsin Electronic Power
0.12% due 11/2/2009 | | | 5,609,981
| | | | 5,609,981
| | |
| | 8,626,000 | | | Wisconsin Energy Corporation
0.20% due 11/20/2009 | | | 8,625,089
| | | | 8,625,089
| | |
| | 3,000,000 | | | Wisconsin Energy Corporation
0.15% due 11/2/2009 | | | 2,999,988
| | | | 2,999,988
| | |
| | | | | Total U.S. Commercial Paper | | | 84,154,617 | | | | 84,154,617 | | |
| | | | | Total Commercial Paper | | | 116,531,451 | | | | 116,531,451 | | |
| | | | | Total Investments—100.68% | | $ | 1,240,214,760 | | | | 1,864,988,214 | | |
| | | | | Liabilities in Excess of Other Assets—(0.68)% | | | | | | | (12,657,117 | ) | |
| | | | | Net Assets—100.00% | | | | | | $ | 1,852,331,097 | | |
(a) Non-income producing security/commodity.
(b) All or a portion of the security is exempt from registration under the Securities Act of 1933. Rule 144A securities may only be sold to qualified institutional buyers, pursuant to Rule 144A under the Securities Act of 1933.
See Notes to Financial Statements.
66
Schedule of Investments | Year Ended October 31, 2009
(c) An affiliate of the Fund as defined by the Investment Company Act of 1940. An affiliate is defined as a company in which the Fund directly or indirectly owns, controls, or holds power to vote 5% or more of the outstanding voting securities.
At October 31, 2009, aggregate cost for federal income tax purposes was $1,287,603,306; and net unrealized appreciation consisted of:
| Gross unrealized appreciation | | $ | 597,136,821 | | |
| Gross unrealized depreciation | | | (19,751,913 | ) | |
| Net unrealized appreciation | | $ | 577,384,908 | | |
Abbreviations Used in this Schedule Include:
ADR — American Depository Receipt
PLC — Public Limited Company
Currency
USD — United States Dollar
Affiliated Securities
| SECURITY | | SHARES
OCTOBER 31,
2008 | | GROSS
ADDITIONS | | GROSS
REDUCTIONS | | SHARES
OCTOBER 31,
2009 | | VALUE
OCTOBER 31,
2009 | | REALIZED
GAIN/
(LOSS) | | DIVIDEND
INCOME | |
Minefinders
Corporation | | | 2,136,414 | | | | 1,819,120 | | | | — | | | | 3,955,534 | | | $ | 37,426,113 | | | $ | — | | | $ | — | | |
Richmont
Mines, Inc. | | | 1,787,980 | | | | — | | | | — | | | | 1,787,980 | | | | 4,845,340 | | | | — | | | | — | | |
| Total | | $ | 42,271,453 | | | $ | — | | | $ | — | | |
| INDUSTRY DIVERSIFICATION FOR PORTFOLIO HOLDINGS | | PERCENT OF
NET ASSETS | |
| International Common Stocks | |
| Materials | | | 68.23 | % | |
| Total International Common Stocks | | | 68.23 | | |
| U.S. Common Stocks | |
| Materials | | | 7.85 | | |
| Total U.S. Common Stocks | | | 7.85 | | |
| Warrants | | | 0.08 | | |
| Commodity | | | 18.23 | | |
| Commercial Paper | |
| International Commercial Paper | | | 1.75 | | |
| U.S. Commercial Paper | | | 4.54 | | |
| Total Commercial Paper | | | 6.29 | | |
| Total Investments | | | 100.68 | % | |
See Notes to Financial Statements.
67
Management's Discussion of Fund Performance
First Eagle Fund of America Class Y increased 9.14% for the year ended October 31, 2009 versus an increase of 9.80% for the S&P 500 Index. The five largest contributors to the performance were Valeant Pharmaceuticals International, Ball Corporation, General Dynamics Corporation, Walter Energy, Inc. and Atlas Energy, Inc., collectively accounting for 7.17% of the Fund's performance. The five largest detractors were Leap Wireless International, Inc., Dean Foods Company, L-1 Identity Solutions, Inc., Biogen Idec, Inc. and General Communication, Inc., collectively subtracting 2.34% from the Fund's performance.
The good news is that the intensity of the economic downturn which began more than a year ago is clearly abating. Virtually every measure, whether in the financial or real economy, shows if not positive trends, at least less negative ones. Accordingly, equity prices have responded significantly, albeit off levels which we considered to be absurdly low. The bad news is that the cost of saving the system will be borne for many years both in actual current dollars as well as the willingness of the American taxpayer to tolerate government excess which in different times would not be allowed, the cost of which won't be felt until many years in the future.
Despite our views on our elected and unelected officials, we believe that economic conditions will continue to be favorable on a risk/reward basis for equities overall and in particular for our holdings. This is true on an absolute basis, and especially so considering the current unsustainable levels of fixed income securities which must be assuming trillion dollar plus deficits and multi-trillion dollar unfunded obligations, which are irrelevant to the future value of our currency.

Harold Levy
FIRST EAGLE FUNDS | ANNUAL REPORT | OCTOBER 31, 2009
68
First Eagle Fund of America
We believe that what we own is a portfolio comprised mostly of low leveraged companies with excellent free cash flows and demonstrated high quality managers who are generating cash for their owners. We are hopeful that this free cash flow will be reflected in the trading level of these equities over time or in their attractiveness to acquirers who try to take advantage of current mispricing by buying the entire enterprise.
We thank you for your continued confidence.

Harold Levy
Portfolio Manager
December 2009
Past performance is no guarantee of future results. The portfolio is actively managed. The portfolio and opinions expressed herein are subject to change. Current and future portfolio holdings are subject to risk.
FIRST EAGLE FUNDS | ANNUAL REPORT | OCTOBER 31, 2009
69

Fund Overview | Data as of October 31, 2009 (unaudited)
INVESTMENT OBJECTIVE
First Eagle Fund of America is a non-diversified U.S. equity fund that seeks capital appreciation by investing primarily in U.S. stocks and to a lesser extent in debt and foreign equity securities. The Fund has a unique event-driven bias that focuses on identifying companies poised to benefit from change that the market has not yet recognized.
Average Annual Returns
| | | ONE-YEAR | | FIVE-YEARS | | TEN-YEARS | |
First Eagle
Fund of America
(Y Shares) | | | 9.14 | % | | | 3.62 | % | | | 5.57 | % | |
Standard & Poor's
500 Index | | | 9.80 | | | | 0.33 | | | | -0.95 | | |
Asset Allocation
Sector/Industry*
| Health Care | | | 26.30 | % | |
| Materials | | | 18.98 | | |
| Industrials | | | 15.09 | | |
| Energy | | | 13.69 | | |
| Information Technology | | | 10.26 | | |
| Consumer Discretionary | | | 5.95 | | |
| Investment Company | | | 4.21 | | |
| Consumer Staples | | | 2.47 | | |
Telecommunication
Services | | | 1.21 | | |
* percentages exclude option positions
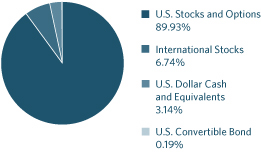
The Fund's portfolio composition (represented as a percentage of net assets) is subject to change at any time.
FIRST EAGLE FUNDS | ANNUAL REPORT | OCTOBER 31, 2009
70
Fund of America
Growth of a $10,000 Initial Investment
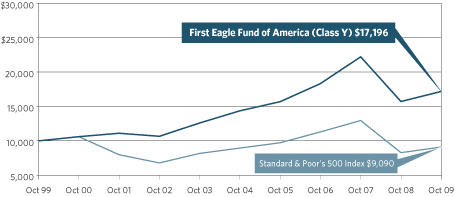
Performance data quoted herein represents past performance and should not be considered indicative of future results. Performance data quoted herein does not reflect the deduction of taxes that a shareholder would pay on Fund distributions or the sale of Fund shares.
The Fund's average annual returns shown above are historical and reflect changes in share price, reinvested dividends and is net of expenses.
The Standard & Poor's 500 Index is a widely recognized unmanaged index including a representative sample of 500 leading companies in leading sectors of the U.S. economy and is not available for purchase. Although the Standard & Poor's 500 Index focuses on the large-cap segment of the market, with approximately 75% coverage of U.S. equities, it is also considered a proxy for the total market.
As of September 1, 2005, First Eagle Fund of America Class Y is closed to new accounts.
Top 10 Holdings
| Valeant Pharmaceuticals International (pharmaceuticals company) | | | 5.54 | % | |
| Baxter International, Inc. (health technology company) | | | 5.17 | | |
| General Dynamics Corporation (aerospace and defense manufacturer) | | | 4.88 | | |
| Ball Corporation (containers and packaging manufacturer) | | | 4.45 | | |
| Amgen, Inc. (biotechnology company) | | | 4.23 | | |
| SPDR Gold Trust (exchange traded fund) | | | 4.21 | | |
| Dresser-Rand Group, Inc (oil field services and equipment) | | | 3.89 | | |
| Devon Energy Corporation (energy company) | | | 3.76 | | |
| Crown Holdings, Inc. (containers and packaging manufacturer) | | | 3.59 | | |
| Precision Castparts Corporation (metal components manufacturer) | | | 3.36 | | |
FIRST EAGLE FUNDS | ANNUAL REPORT | OCTOBER 31, 2009
71
First Eagle Fund of America
| NUMBER OF SHARES | | DESCRIPTION | | COST (NOTE 1) | | VALUE (NOTE 1) | |
| Common Stocks—93.51% | | | |
| U.S. Common Stocks—86.77% | | | |
| Consumer Discretionary 5.95% | | | |
| | 1,014,890 | | | The DIRECTV Group, Inc. (a) | | $ | 23,653,287 | | | $ | 26,691,607 | | |
| | 319,300 | | | The Sherwin-Williams Company (b) | | | 17,496,019 | | | | 18,212,872 | | |
| | 115,300 | | | McDonald's Corporation (b) | | | 6,815,759 | | | | 6,757,733 | | |
| | | | | | | | 47,965,065 | | | | 51,662,212 | | |
| Consumer Staples 2.47% | | | |
| | 1,179,090 | | | Dean Foods Company (a)(b) | | | 19,316,165 | | | | 21,494,811 | | |
| Energy 10.16% | | | |
| | 1,147,390 | | | Dresser-Rand Group, Inc. (a)(b) | | | 27,835,702 | | | | 33,813,583 | | |
| | 504,900 | | | Devon Energy Corporation (b) | | | 36,423,708 | | | | 32,672,079 | | |
| | 707,165 | | | Atlas Energy, Inc. | | | 22,671,620 | | | | 18,513,580 | | |
| | 434,050 | | | McMoRan Exploration Company (a) | | | 6,235,955 | | | | 3,337,845 | | |
| | | | | | | | 93,166,985 | | | | 88,337,087 | | |
| Health Care 25.24% | | | |
| | 1,637,770 | | | Valeant Pharmaceuticals
International (a)(b) | | | 27,657,926 | | | | 48,150,438 | | |
| | 831,090 | | | Baxter International, Inc. (b) | | | 43,823,367 | | | | 44,928,726 | | |
| | 683,940 | | | Amgen, Inc. (a)(b) | | | 37,994,236 | | | | 36,748,096 | | |
| | 523,040 | | | Chemed Corporation | | | 22,499,969 | | | | 23,704,173 | | |
| | 2,632,740 | | | PDL BioPharma, Inc. (b) | | | 19,837,521 | | | | 22,141,343 | | |
| | 416,700 | | | Biogen Idec, Inc. (a)(b) | | | 19,520,059 | | | | 17,555,571 | | |
| | 1,213,387 | | | Enzon Pharmaceuticals, Inc. (a) | | | 10,244,912 | | | | 10,180,317 | | |
| | 116,110 | | | Edwards Lifesciences Corporation (a) | | | 5,593,232 | | | | 8,933,503 | | |
| | 295,100 | | | Theravance, Inc. (a)(b) | | | 4,263,992 | | | | 4,122,547 | | |
| | 195,230 | | | Health Net, Inc. (a)(b) | | | 3,213,451 | | | | 2,910,879 | | |
| | | | | | | | 194,648,665 | | | | 219,375,593 | | |
| Industrials 15.09% | | | |
| | 675,990 | | | General Dynamics Corporation (b) | | | 39,264,265 | | | | 42,384,573 | | |
| | 305,500 | | | Precision Castparts Corporation (b) | | | 27,682,927 | | | | 29,184,415 | | |
| | 841,600 | | | Owens Corning, Inc. (a)(b) | | | 18,249,983 | | | | 18,607,776 | | |
| | 398,500 | | | Raytheon Company (b) | | | 18,420,006 | | | | 18,044,080 | | |
| | 942,730 | | | DynCorp International, Inc. (a) | | | 12,806,173 | | | | 16,026,410 | | |
| | 137,340 | | | Rockwell Collins, Inc. | | | 6,443,125 | | | | 6,919,189 | | |
| | | | | | | | 122,866,479 | | | | 131,166,443 | | |
See Notes to Financial Statements.
72
Schedule of Investments | Year Ended October 31, 2009
| NUMBER OF SHARES | | DESCRIPTION | | COST (NOTE 1) | | VALUE (NOTE 1) | |
| U.S. Common Stocks—86.77%—(continued) | |
| Information Technology 10.07% | |
| | 381,400 | | | Computer Sciences Corporation (a)(b) | | $ | 19,741,539 | | | $ | 19,340,794 | | |
| | 1,304,950 | | | Nvidia Corporation (a)(b) | | | 16,998,418 | | | | 15,607,202 | | |
| | 671,800 | | | CA, Inc. (b) | | | 14,737,791 | | | | 14,054,056 | | |
| | 499,720 | | | Agilent Technologies, Inc. (a) | | | 12,744,439 | | | | 12,363,073 | | |
| | 1,874,377 | | | L-1 Identity Solutions, Inc. (a)(c) | | | 24,318,664 | | | | 11,077,568 | | |
| | 1,612,356 | | | LSI Corporation (a) | | | 8,907,885 | | | | 8,255,263 | | |
| | 1,844,580 | | | Atmel Corporation (a) | | | 7,219,449 | | | | 6,861,837 | | |
| | | | | | 104,668,185 | | | | 87,559,793 | | |
| Materials 16.85% | |
| | 784,330 | | | Ball Corporation (b) | | | 28,029,590 | | | | 38,690,999 | | |
| | 1,171,070 | | | Crown Holdings, Inc. (a)(b) | | | 22,172,786 | | | | 31,209,015 | | |
| | 271,030 | | | Praxair, Inc. (b) | | | 19,652,077 | | | | 21,530,623 | | |
| | 736,770 | | | Valspar Corporation | | | 15,562,118 | | | | 18,691,855 | | |
| | 354,400 | | | Eastman Chemical Company (b) | | | 17,426,034 | | | | 18,609,544 | | |
| | 501,700 | | | Packaging Corporation of America (b) | | | 8,353,902 | | | | 9,171,076 | | |
| | 343,560 | | | Eagle Materials, Inc. | | | 14,006,979 | | | | 8,537,466 | | |
| | | | | | 125,203,486 | | | | 146,440,578 | | |
| Telecommunication Services 0.94% | |
| | 542,650 | | | Leap Wireless International, Inc. (a)(b) | | | 19,069,788 | | | | 7,173,833 | | |
| | 161,452 | | | General Communication, Inc. (a) | | | 1,044,143 | | | | 992,930 | | |
| | | | | | 20,113,931 | | | | 8,166,763 | | |
| Total U.S. Common Stocks | | | | | 727,948,961 | | | | 754,203,280 | | |
| International Common Stocks—6.74% | |
| Bahamas 2.26% | |
| | 945,590 | | | Teekay Corporation | | | 34,964,269 | | | | 19,620,993 | | |
| Bermuda 0.27% | |
| | 208,400 | | | Global Crossing Limited (a) | | | 4,266,319 | | | | 2,375,760 | | |
| Canada 4.21% | |
| | 641,500 | | | Teck Resources Limited (a)(b) | | | 16,778,094 | | | | 18,552,180 | | |
| | 1,155,552 | | | MDS, Inc. (a) | | | 14,582,709 | | | | 9,209,749 | | |
| | 4,692,800 | | | UTS Energy Corporation (a) | | | 18,746,923 | | | | 8,854,340 | | |
| | | | | | 50,107,726 | | | | 36,616,269 | | |
| | | Total International Common Stocks | | | 89,338,314 | | | | 58,613,022 | | |
| | | Total Common Stocks | | | 817,287,275 | | | | 812,816,302 | | |
See Notes to Financial Statements.
73
Fund of America
| NUMBER OF SHARES | | DESCRIPTION | | COST (NOTE 1) | | VALUE (NOTE 1) | |
| Limited Partnership—0.25% | | | |
| | 135,200 | | | Teekay Offshore Partners LP | | $ | 2,543,780 | | | $ | 2,199,704 | | |
| Investment Company—4.21% | | | |
| | 356,800 | | | SPDR Gold Trust (a)(b) | | | 32,829,035 | | | | 36,582,704 | | |
| PRINCIPAL AMOUNT | | | | | |
| U.S. Bond—0.19% | | | |
| Convertible Bond 0.19% | |
| $ | 1,800,000 | | | L-1 Identity Solutions, Inc. | | | 943,901 | | | | 1,624,500 | | |
| | | | | 3.75% due 5/15/2027 (d) | | | | | | | | | |
| Repurchase Agreement—3.81% | | | |
| | 33,089,281 | | | State Street Bank and Trust Company,
0.01% dated 10/30/09 due 11/2/09
(collateralized by United States Treasury Bill,
0.11% due 3/25/10 valued at $33,753,115);
proceeds $33,089,291 | | | 33,089,281
| | | | 33,089,281
| | |
| | | | | Total Investment Portfolio
Excluding Options Written—101.97% | | $ | | 886,693,272 | | $ | 886,312,491 | | |
| CONTRACTS | | | | STRIKE PRICE | | EXPIRATION DATE | | VALUE (NOTE 1) | |
| Covered Call Options Written—(1.30)% | | | |
| | 447 | | | Amgen, Inc. | | $ | 60.00 | | | Dec 2009 | | $ | (26,373 | ) | |
| | 184 | | | Amgen, inc. | | | 62.50 | | | Dec 2009 | | | (5,888 | ) | |
| | 216 | | | Amgen, Inc. | | | 62.50 | | | Jan 2010 | | | (13,824 | ) | |
| | 1,001 | | | Ball Corporation | | | 50.00 | | | Jan 2010 | | | (220,220 | ) | |
| | 1,100 | | | Baxter International, Inc. | | | 50.00 | | | Nov 2009 | | | (467,500 | ) | |
| | 810 | | | Baxter International, Inc. | | | 52.50 | | | Nov 2009 | | | (174,150 | ) | |
| | 114 | | | Baxter International, Inc. | | | 55.00 | | | Dec 2009 | | | (15,390 | ) | |
| | 739 | | | Baxter International, Inc. | | | 57.50 | | | Dec 2009 | | | (40,645 | ) | |
| | 168 | | | Baxter International, Inc. | | | 55.00 | | | Jan 2010 | | | (30,240 | ) | |
| | 897 | | | Baxter International, Inc. | | | 60.00 | | | Jan 2010 | | | (40,365 | ) | |
| | 364 | | | Biogen Idec, Inc. | | | 50.00 | | | Dec 2009 | | | (11,830 | ) | |
| | 204 | | | Biogen Idec, Inc. | | | 45.00 | | | Jan 2010 | | | (37,740 | ) | |
| | 2,220 | | | Biogen Idec, Inc. | | | 50.00 | | | Jan 2010 | | | (144,300 | ) | |
| | 172 | | | Biogen Idec, Inc. | | | 55.00 | | | Jan 2010 | | | (3,870 | ) | |
| | 407 | | | CA, Inc. | | | 20.00 | | | Nov 2009 | | | (61,050 | ) | |
| | 2,780 | | | CA, Inc. | | | 22.50 | | | Dec 2009 | | | (152,900 | ) | |
| | 718 | | | Computer Sciences Corporation | | | 52.50 | | | Nov 2009 | | | (71,800 | ) | |
See Notes to Financial Statements.
74
Schedule of Investments | Year Ended October 31, 2009
| CONTRACTS | | DESCRIPTION | | STRIKE PRICE | | EXPIRATION DATE | | VALUE (NOTE 1) | |
| Covered Call Options Written—(1.30)%—(continued) | | | |
| | 866 | | | Computer Sciences Corporation | | $ | 50.00 | | | Dec 2009 | | $ | (231,655 | ) | |
| | 2,032 | | | Computer Sciences Corporation | | | 55.00 | | | Dec 2009 | | | (147,320 | ) | |
| | 198 | | | Computer Sciences Corporation | | | 55.00 | | | Jan 2010 | | | (23,265 | ) | |
| | 244 | | | Crown Holdings, Inc. | | | 25.00 | | | Jan 2010 | | | (61,000 | ) | |
| | 474 | | | Dean Foods Company | | | 17.50 | | | Nov 2009 | | | (63,990 | ) | |
| | 1,104 | | | Dean Foods Company | | | 17.50 | | | Dec 2009 | | | (157,320 | ) | |
| | 446 | | | Devon Energy Corporation | | | 60.00 | | | Nov 2009 | | | (256,450 | ) | |
| | 1,508 | | | Dresser-Rand Group, Inc. | | | 30.00 | | | Dec 2009 | | | (214,890 | ) | |
| | 1,243 | | | Eastman Chemical Company | | | 50.00 | | | Dec 2009 | | | (559,350 | ) | |
| | 809 | | | Eastman Chemical Company | | | 55.00 | | | Dec 2009 | | | (202,250 | ) | |
| | 164 | | | Eastman Chemical Company | | | 55.00 | | | Jan 2010 | | | (41,820 | ) | |
| | 23 | | | General Dynamics Corporation | | | 55.00 | | | Nov 2009 | | | (18,055 | ) | |
| | 827 | | | General Dynamics Corporation | | | 65.00 | | | Nov 2009 | | | (64,092 | ) | |
| | 287 | | | General Dynamics Corporation | | | 65.00 | | | Jan 2010 | | | (67,445 | ) | |
| | 238 | | | General Dynamics Corporation | | | 70.00 | | | Jan 2010 | | | (16,660 | ) | |
| | 562 | | | Health Net, Inc. | | | 17.50 | | | Nov 2009 | | | (16,860 | ) | |
| | 431 | | | Leap Wireless International, Inc. | | | 20.00 | | | Nov 2009 | | | (4,310 | ) | |
| | 1,153 | | | McDonald's Corporation | | | 60.00 | | | Jan 2010 | | | (159,114 | ) | |
| | 2,619 | | | Nvidia Corporation | | | 13.00 | | | Dec 2009 | | | (117,855 | ) | |
| | 3,857 | | | Nvidia Corporation | | | 14.00 | | | Dec 2009 | | | (100,282 | ) | |
| | 579 | | | Nvidia Corporation | | | 14.00 | | | Jan 2010 | | | (23,160 | ) | |
| | 2,481 | | | Owens Corning, Inc. | | | 20.00 | | | Nov 2009 | | | (626,453 | ) | |
| | 3,847 | | | Owens Corning, Inc. | | | 22.50 | | | Nov 2009 | | | (307,760 | ) | |
| | 1,009 | | | Owens Corning, Inc. | | | 22.50 | | | Jan 2010 | | | (206,845 | ) | |
| | 465 | | | Packaging Corporation of America | | | 20.00 | | | Nov 2009 | | | (6,975 | ) | |
| | 1,040 | | | Packaging Corporation of America | | | 20.00 | | | Jan 2010 | | | (75,400 | ) | |
| | 3,656 | | | PDL BioPharma, Inc. | | | 7.50 | | | Nov 2009 | | | (420,440 | ) | |
| | 1,426 | | | PDL BioPharma, Inc. | | | 9.50 | | | Jan 2010 | | | (35,650 | ) | |
| | 231 | | | Praxair, Inc. | | | 80.00 | | | Nov 2009 | | | (49,665 | ) | |
| | 1,089 | | | Praxair, Inc. | | | 80.00 | | | Jan 2010 | | | (457,380 | ) | |
| | 1,049 | | | Precision Castparts Corporation | | | 100.00 | | | Dec 2009 | | | (298,965 | ) | |
| | 180 | | | Precision Castparts Corporation | | | 105.00 | | | Dec 2009 | | | (27,900 | ) | |
| | 477 | | | Precision Castparts Corporation | | | 100.00 | | | Jan 2010 | | | (193,185 | ) | |
| | 438 | | | Raytheon Company | | | 46.00 | | | Nov 2009 | | | (37,230 | ) | |
| | 2,762 | | | Raytheon Company | | | 47.50 | | | Nov 2009 | | | (116,004 | ) | |
| | 157 | | | Raytheon Company | | | 47.00 | | | Jan 2010 | | | (20,410 | ) | |
| | 1,602 | | | The Sherwin-Williams Company | | | 60.00 | | | Dec 2009 | | | (160,200 | ) | |
| | 154 | | | The Sherwin-Williams Company | | | 60.00 | | | Jan 2010 | | | (23,100 | ) | |
See Notes to Financial Statements.
75
Fund of America
| CONTRACTS | | DESCRIPTION | | STRIKE PRICE | | EXPIRATION DATE | | VALUE (NOTE 1) | |
| Covered Call Options Written—(1.30)%—(continued) | | | |
| | 62 | | | SPDR Gold Trust | | $ | 94.00 | | | Nov 2009 | | $ | (53,940 | ) | |
| | 45 | | | SPDR Gold Trust | | | 95.00 | | | Nov 2009 | | | (35,145 | ) | |
| | 58 | | | SPDR Gold Trust | | | 96.00 | | | Nov 2009 | | | (39,440 | ) | |
| | 87 | | | SPDR Gold Trust | | | 98.00 | | | Nov 2009 | | | (43,500 | ) | |
| | 22 | | | SPDR Gold Trust | | | 104.00 | | | Jan 2010 | | | (6,600 | ) | |
| | 3,641 | | | Teck Resources Limited | | | 25.00 | | | Nov 2009 | | | (1,602,040 | ) | |
| | 1,185 | | | Teck Resources Limited | | | 27.00 | | | Jan 2010 | | | (497,700 | ) | |
| | 656 | | | Teck Resources Limited | | | 28.00 | | | Jan 2010 | | | (242,720 | ) | |
| | 643 | | | Teck Resources Limited | | | 29.00 | | | Jan 2010 | | | (202,545 | ) | |
| | 290 | | | Teck Resources Limited | | | 30.00 | | | Jan 2010 | | | (81,200 | ) | |
| | 546 | | | Theravence, Inc. | | | 15.00 | | | Dec 2009 | | | (51,870 | ) | |
| | 557 | | | Theravence, Inc. | | | 17.50 | | | Dec 2009 | | | (22,280 | ) | |
| | 2,594 | | | Valeant Pharmaceuticals
International | | | 25.00 | | | Dec 2009
| | | (1,284,030)
| | |
| Total Covered Call Options Written (Premiums Received: $17,273,666) | | | | | (11,291,800 | ) | |
| Total Investments—100.67% (Cost: $869,419,606) | | | | | 875,020,691 | | |
| Liabilities in Excess of Other Assets—(0.67)% | | | | | (5,812,272 | ) | |
| Net Assets—100.00% | | | | $ | 869,208,419 | | |
(a) Non-income producing security/commodity.
(b) At October 31, 2009 all or a portion of this security was segregated to cover collateral requirement for options.
(c) All or a portion of the security is exempt from registration under the Securities Act of 1933. Rule 144A securities may only be sold to qualified institutional buyers, pursuant to Rule 144A under the Securities Act of 1933.
(d) This security is subject to a call feature and may be called in full or partially on or anytime after May 15, 2012.
At October 31, 2009, aggregate cost for federal income tax purposes, excluding options written, was $901,940,185; and net unrealized depreciation consisted of:
| Gross unrealized appreciation | | $ | 81,948,719 | | |
| Gross unrealized depreciation | | | (97,576,413 | ) | |
| Net unrealized depreciation | | $ | (15,627,694 | ) | |
Abbreviation Used in this Schedule Include:
SPDR — Standard & Poor's Depository Receipts, a gold-tracked Exchange Traded Fund.
See Notes to Financial Statements.
76
Schedule of Investments | Year Ended October 31, 2009
| INDUSTRY DIVERSIFICATION FOR PORTFOLIO HOLDINGS | | PERCENT OF
NET ASSETS | |
| U.S. Common Stocks | |
| Consumer Discretionary | | | 5.95 | % | |
| Consumer Staples | | | 2.47 | | |
| Energy | | | 10.16 | | |
| Health Care | | | 25.24 | | |
| Industrials | | | 15.09 | | |
| Information Technology | | | 10.07 | | |
| Materials | | | 16.85 | | |
| Telecommunication Services | | | 0.94 | | |
| Total U.S. Common Stocks | | | 86.77 | | |
| International Common Stocks | |
| Energy | | | 3.28 | | |
| Health Care | | | 1.06 | | |
| Materials | | | 2.13 | | |
| Telecommunication Services | | | 0.27 | | |
| Total International Common Stocks | | | 6.74 | | |
| Limited Partnership | | | 0.25 | | |
| Investment Company | | | 4.21 | | |
| U.S. Bond | |
| Information Technology | | | 0.19 | | |
| Total U.S. Bond | | | 0.19 | | |
| Repurchase Agreement | | | 3.81 | | |
| Covered Call Options | | | (1.30 | ) | |
| Total Investments | | | 100.67 | % | |
FIRST EAGLE FUNDS | ANNUAL REPORT | OCTOBER 31, 2009
77
Item 2. Code of Ethics.
The Registrant has adopted a code of ethics that applies to its principal executive officer and principal financial officer. Copies of the code of ethics may be requested free of charge by calling 1-800-334-2143 (toll free).
Item 3. Audit Committee Financial Expert.
The Board of Trustees of the registrant has designated Paul J. Lawler, William M. Kelly and Jean Hamilton as Audit Committee Financial Experts. Mr. Lawler, Mr. Kelly and Ms. Hamilton are considered by the Board to be independent trustees.
Item 4. Principal Accountant Fees and Services
(a) Audit Fees:
For the Fiscal years ended October 31, 2009 and October 31, 2008, the aggregate PricewaterhouseCoopers LLP (PwC) audit fees for professional services rendered to the registrant were approximately $247,700 and $363,177, respectively. Fees included in the audit fees category are those associated with the annual audits of the financial statements and services that are normally provided in connection with statutory and regulatory filings.
(b) Audit Related Fees:
For the fiscal years ended October 31, 2009 and October 31, 2008, the aggregate PwC fees for assurance and related services rendered to the registrant were approximately $16,800 and $16,800, respectively.
(c) Tax Fees:
In each fiscal year ended October 31, 2009 and October 31, 2008, the aggregate tax fees billed by PwC for professional services rendered to the registrant were approximately $219,000 and $168,478, respectively.
Fees included in the tax fees category comprise all services performed by professional staff in the independent accountant’s tax division except those services related to audits. This category comprises fees for tax compliance and preparation of tax returns.
(d) All Other Fees:
In each of the fiscal years ended October 31, 2009 and October 31, 2008, there were no fees billed by PwC for products and services, other than 4(a)-(c) above, rendered to the registrant.
(e)(1) The registrant’s audit committee has adopted a policy whereby audit and non-audit services performed by the registrant’s principal accountant for the registrant, its investment adviser, and any entity controlling, controlled by, or under common control with the investment adviser that provides ongoing services to the registrant require pre-approval by the committee or a designated member thereof. If such a service is required between regularly scheduled audit committee meetings, pre-approval may be authorized by one audit committee member with ratification at the next scheduled audit committee meeting. Waiver of pre-approval for audit and non-audit services requiring fees of a de minimis amount is not permitted.
(e)(2) No services included in (b) – (d) above were approved pursuant to paragraph (c)(7)(i)(C) of Rule 2-01 of Regulation S-X.
(f) According to PwC, for the fiscal year ended October 31, 2009, the percentage of hours spent on the audit of the registrant’s financial statements for the most recent fiscal year that were attributable to work performed by persons who are not full-time, permanent employees of PwC was 0%.
(g) Other than as described in the table above, the aggregate fees billed for the most recent fiscal year and the preceding fiscal year by the registrant’s principal accountant for non-audit services rendered to the registrant (“covered”), its investment adviser, and any entity controlling, controlled by, or under common control with the investment adviser (“non-covered”) that provides ongoing services to the registrant was $0 in 2009 and 2008.
(h) Not applicable.
Item 5. Audit Committee of Listed Registrants
Not applicable at this time.
Item 6. Schedule of Investments
Please see schedule of investments contained in the Report to Stockholders included under Item 1 of this Form N-CSR.
Item 7. Disclosure of Proxy Voting Policies and Procedures for Closed-End Management Investment Companies.
Not applicable.
Item 8. Portfolio Managers of Closed-End Investment companies.
Not applicable.
Item 9. Purchases of Equity Securities by Closed-End Management Investment Company and Affiliated Purchasers.
Not applicable.
Item 10. Submission of Matters to a Vote of Security Holders.
No material change to report at this time.
Item 11. Controls and Procedures.
(a) In the opinion of the principal executive officer and principal financial officer, based on their evaluation, the registrant’s disclosure controls and procedures are adequately designed and are operating effectively to ensure (i) that material information relating to the registrant, including its consolidated subsidiaries, is made known to them by others within those entities, particularly during the period in which this report is being prepared; and (ii) that information required to be disclosed by the registrant on Form N-CSR is recorded, processed, summarized and reported within the time periods specified in the Securities and Exchange Commission’s rules and forms.
(b) There were no changes in the registrant’s internal control over financial reporting that occurred during the registrant’s most recent fiscal half-year (the registrant’s second fiscal half-year in the case of an annual report) that have materially affected or are reasonably likely to materially affect, the registrant’s internal control over financial reporting.
Item 12. Exhibits.
(a)(1) Code of ethics required to be disclosed under Item 2 of Form N-CSR.
(a)(2) Certifications pursuant to Rule 30a-2(a) under the Investment Company Act of 1940 (17 CFR 270.30a-2(a)): Attached hereto.
(a)(3) Not applicable.
(b) Certification pursuant to Rule 30a-2(b) under the Investment Company Act of 1940 (17 CFR 270.30a-2(b)): Attached hereto.
SIGNATURES
Pursuant to the requirements of the Securities Exchange Act of 1934 and the Investment Company Act of 1940, the registrant has duly caused this report to be signed on its behalf by the undersigned, thereunto duly authorized.
(Registrant) | First Eagle Funds |
| |
By (Signature and Title)* | /s/ John P. Arnhold |
| |
| John P. Arnhold, President |
Date: January 8, 2010
Pursuant to the requirements of the Securities Exchange Act of 1934 and the Investment Company Act of 1940, this report has been signed below by the following persons on behalf of the registrant and in the capacities and on the dates indicated.
| |
By (Signature and Title)* | /s/ John P. Arnhold |
| |
| John P. Arnhold, Principal Executive Officer |
Date: January 8, 2010
By (Signature and Title)* | /s/ Joseph T. Malone |
| |
| Joseph T. Malone, Principal Financial Officer |
Date: January 8, 2010
* Print the name and title of each signing officer under his or her signature.