UNITED STATES
SECURITIES AND EXCHANGE COMMISSION
Washington, D.C. 20549
FORM N-CSR
CERTIFIED SHAREHOLDER REPORT OF REGISTERED
MANAGEMENT INVESTMENT COMPANIES
Investment Company Act file number | 811-7762 |
|
First Eagle Funds |
(Exact name of registrant as specified in charter) |
|
1345 Avenue of the Americas
New York, NY | | 10105-4300 |
(Address of principal executive offices) | | (Zip code) |
|
Robert Bruno
First Eagle Funds
1345 Avenue of the Americas
New York, NY 10105-4300 |
(Name and address of agent for service) |
|
Registrant’s telephone number, including area code: | 1-212-632-2700 | |
|
Date of fiscal year end: | October 31 | |
|
Date of reporting period: | October 31, 2011 | |
| | | | | | | | |
Form N-CSR is to be used by management investment companies to file reports with the Commission not later than 10 days after the transmission to stockholders of any report that is required to be transmitted to stockholders under Rule 30e-1 under the Investment Company Act of 1940 (17 CFR 270.30e-1). The Commission may use the information provided on Form N-CSR in its regulatory, disclosure review, inspection, and policymaking roles.
A registrant is required to disclose the information specified by Form N-CSR, and the Commission will make this information public. A registrant is not required to respond to the collection of information contained in Form N-CSR unless the Form displays a currently valid Office of Management and Budget (“OMB”) control number. Please direct comments concerning the accuracy of the information collection burden estimate and any suggestions for reducing the burden to Secretary, Securities and Exchange Commission, 450 Fifth Street, NW, Washington, DC 20549-0609. The OMB has reviewed this collection of information under the clearance requirements of 44 U.S.C. § 3507.
Item 1. Reports to Stockholders.
Annual Report
OCTOBER 31, 2011
Global Fund
Overseas Fund
U.S. Value Fund
Gold Fund
Fund of America
ADVISED BY FIRST EAGLE INVESTMENT MANAGEMENT, LLC

Forward-Looking Statement Disclosure
One of our most important responsibilities as mutual fund managers is to communicate with shareholders in an open and direct manner. Some of our comments in our letters to shareholders are based on current management expectations and are considered "forward-looking statements". Actual future results, however, may prove to be different from our expectations. You can identify forward-looking statements by words such as "may", "will", "believe", "attempt", "seem", "think", "ought", "try" and other similar terms. We cannot promise future returns. Our opinions are a reflection of our best judgment at the time this report is compiled, and we disclaim any obligation to update or alter forward-looking statements as a result of new information, future events, or otherwise.
Table of Contents
| Letter from the President | | | 4 | | |
|
| Letter from the Global Value Team Portfolio Managers | | | 6 | | |
|
Management's Discussion of Fund Performance: First Eagle Global,
Overseas, U.S. Value and Gold Funds | | | 11 | | |
|
| Performance Chart | | | 16 | | |
|
| First Eagle Global Fund: | |
|
| Fund Overview | | | 20 | | |
|
| Schedule of Investments | | | 22 | | |
|
| First Eagle Overseas Fund: | |
|
| Fund Overview | | | 42 | | |
|
| Schedule of Investments | | | 44 | | |
|
| First Eagle U.S. Value Fund: | |
|
| Fund Overview | | | 60 | | |
|
| Schedule of Investments | | | 62 | | |
|
| First Eagle Gold Fund: | |
|
| Fund Overview | | | 70 | | |
|
| Schedule of Investments | | | 72 | | |
|
| First Eagle Fund of America: | |
|
| Management's Discussion of Fund Performance | | | 77 | | |
|
| Fund Overview | | | 80 | | |
|
| Schedule of Investments | | | 82 | | |
|
| Statements of Assets and Liabilities | | | 90 | | |
|
| Statements of Operations | | | 94 | | |
|
| Statements of Changes in Net Assets | | | 96 | | |
|
| Financial Highlights | | | 100 | | |
|
| Notes to Financial Statements | | | 110 | | |
|
| Report of Independent Registered Public Accounting Firm | | | 140 | | |
|
| Fund Expenses | | | 141 | | |
|
| General Information | | | 145 | | |
|
| Tax Information | | | 146 | | |
|
| Privacy Notice | | | 147 | | |
|
| Additional Information | | | 149 | | |
|
Letter from the President

John P. Arnhold
Dear Fellow Shareholders,
Since my last letter in June, financial markets around the world have remained volatile. Year-to-date through October 31st, 2011, the S&P 500 Index is up while the MSCI World Index is down. Domestically, the U.S. credit downgrade heightened political as well as economic uncertainty. In addition, ongoing issues related to European sovereign debt and bank solvency continue to plague the markets.
As risks have become more obvious, outcomes have become less certain. With volatility rising to a level not seen since 2008, it is easy to be affected by daily market swings. We at First Eagle have often said that volatility is our friend, as it may offer us greater opportunities to effectively deploy capital. Rather than being distracted by market uncertainty, we maintained our core belief that buying quality companies at attractive prices is one of the best ways to protect our shareholders' purchasing power over time. In addition, we held gold and gold securities as a potential hedge against unforeseen events and the prospect of currency debasement, as well as cash to ensure we had buying power held in reserve. This core belief is the foundation of our long-term investment approach.
This fall First Eagle U.S. Value Fund celebrated its 10-year anniversary. Launched in September 2001, during a period of great uncertainty, the Fund has performed consistent with its absolute return objectives. In addition, we recently added an investment team dedicated to analyzing high yield credits. We have long been periodic investors in high yield securities, and our exposure to this investment class has varied over time. With a similar absolute return philosophy, fundamental bottom-up investment process, and prudent approach to risk, we believe the team is a natural fit for the firm.
FIRST EAGLE FUNDS | ANNUAL REPORT | OCTOBER 31, 2011
4
Letter from the President (continued)
Please be assured that your investments in our Funds will continue to be managed in the same manner as they have been for over 30 years. Our portfolio managers and other senior executives have substantial investments in many of our Funds alongside of yours, and we are grateful for your continued confidence.
Sincerely,

John P. Arnhold
President
December 2011
Past performance is no guarantee of future results. The portfolios are actively managed. The portfolio and opinions expressed herein are subject to change. Current and future portfolio holdings are subject to risk.
FIRST EAGLE FUNDS | ANNUAL REPORT | OCTOBER 31, 2011
5
Letter from the Global Value Team Portfolio Managers
Over the past fiscal year, the NAV of the Global Fund's Class A shares returned 7.2%, and over the past three fiscal years the annualized return was 14.6% — a long-term return consistent with our legacy. When we consider what has taken place in the world in 2011 — the sovereign crisis in Europe, the fiscal situation in the United States, the devastating earthquake in Japan, and the pro-democracy uprisings sweeping the Middle East and North Africa, it is clear that the past year has marked a time of significant global change. While 2011 was a year of great market volatility and uncertainty, as long-term investors who are focused on protecting our shareholders from the permanent impairment of capital, we continue to believe that selective purchase of equities embodying what we feel is an appropriate margin of safety is a sound choice for maintaining real wealth even though there may be stormy bouts — driven by unpredictable confidence swings, episodic fiscal tightening and energy price volatility — along the way.
The world is brimming with real economic challenges and fault lines in its financial architecture. Today, many investors discuss the macro environment as if it were comprised of inevitable outcomes. Nowhere is this more true than in the current dialogue surrounding "deleveraging". The problem with looking at aggregate debt to GDP numbers is that these numbers ignore the underlying reality that one person's debt is another person's asset. One can make a more informed judgment about the need for deleveraging by seeing whether debts are appropriately sized relative to cash flows and asset values across the private, corporate and government sectors.
While there are segments of the economy subject to deleveraging, there are also several trends that indicate that this may not lead to a viral outcome across the entire economy. First, we believe that the total level of mortgage debt is now more reasonable relative to the current realistic value of the majority of real estate, even though it is still quite elevated for a minority of homes that are valued at less than their mortgages. Furthermore, while some corporates need to delever (the European banks), the median company in the global mid and large cap publicly-traded equity universe has only one times EBITDA in net debt.1 However, in a deep confidence crisis — like the one we've been going through — the private sector retrenches so much that many governments, such the U.S., run truly spectacular deficits to maintain demand. Were it not for these deficits, the private sector would have more viral deleveraging.
Thus the deleveraging risk was not eliminated but rather transferred from the private to the public sector. Both the size and the duration of these fiscal deficits
FIRST EAGLE FUNDS | ANNUAL REPORT | OCTOBER 31, 2011
6

From left to right: Matthew McLennan, Abhay Deshpande, T. Kimball Brooker, Jr., Rachel Benepe and Matt Lamphier
risk the government's ability to sustain its finances. Given the average maturity profile of the U.S. debt is only a handful of years; the government would have to more than double its revenues or eliminate nearly all its expenses in order to pay off debt as it falls due. This is not feasible. Instead, the government must roll its debt and hope to get to a more sustainable stock of debt in the future by incrementally reducing its deficit toward 2-3% of GDP. This produces a twofold vulnerability, — tighten policy too much and risk recession, or tighten too slowly and risk a loss of faith in the monetary architecture. It is clear that the potential deleveraging threat today comes from the state of the developed world's government finances and the political uncertainty about the form of adjustment. As the world can now attest, aggregate levels of debt make a system more vulnerable to confidence shocks — but they do not necessarily mean that viral deleveraging will be inevitable. That is a big difference, and it is critical to our willingness to own equities.
In addition, whether it is practically achieved or not, the latent productive potential for the globe has never been better in terms of the speed of technology diffusion, improvements in public health, and the size of the market-based population and trade. Many of the economic drivers that come from this mix of ideas, longevity and property rights enhance the intangible capital stock of the world — and are not well captured in the tangible capital spending numbers that most macroeconomists focus on. At First Eagle, we believe that it is possible to selectively identify companies that participate in the growing pool of human potential. We believe that these equities have resilient business models and are valued conservatively today, while government bonds — which are not truly risk-free — are priced to provide very low real returns for some time to come.
So as investors, what do we do in that context? How is it that we think about investing? Three-quarters of our portfolio is invested in enterprise. The remainder is in bonds, cash, cash equivalents, commercial paper, and gold. We own the gold as a potential hedge against the frailties in our monetary architecture. If we're going to move out of cash, giving up price stability and taking on the risk of permanent capital impairment, we want to feel that we're buying into a security that embodies a margin of safety.
FIRST EAGLE FUNDS | ANNUAL REPORT | OCTOBER 31, 2011
7
Letter from the Global Value Team Portfolio Managers (continued)
In seeking margin of safety opportunities that provide the potential for long-term real returns through uncertain market cycles, there are three broad categories of businesses that we tend to own: businesses that we think of as (1) eclectic royalties, where we own part of a resilient business model that captures a small slice of the world economy and thereby have a degree of pricing power; (2) deep value opportunities, these more mundane firms are typically overlooked by the market due to accounting distortions or seasoned disappointment; and (3) supply constrained commodities, which are by their very nature long-duration investments, and favor our patient approach.
The portfolios under our care currently hold an interesting balance of businesses that we would categorize as eclectic royalties. These are attractive investments because, if the nominal stock of the world economy grows over time, be it through real economic growth or through inflation, these businesses hopefully offer the ability to grow their earnings power over time alongside this rising tide. The key here is to try to balance the mix of eclectic royalties between those that are resilient and defensive, which we believe will hold up in times of market crisis; and those that we believe will participate in "the march of man", which will benefit from the ongoing productivity improvements that happen around the world. The art is to buy them when they are not priced for growth.
Deep value opportunities are the second category of investments we seek. In this case, there is usually some form of accounting distortion or seasoned disappointment that obscures the true sustainable cash flow and economic value of a company. Many of our investments in holding companies or insurance companies with reserve float fall into this category. Others are pharmaceutical companies trading at a discount to the remaining cash flow from their existing drugs, thereby implying a negative pipeline value.
The third category of investments that we own are what we consider supply constrained commodities — businesses where the underlying commodity availability is not necessarily growing at a pace commensurate with the real economic growth trend in the world. The sustainable price for such commodities has tended to rise with incomes in order to dissuade demand. The key is to identify company opportunities where the equity price reflects a cyclically depressed underlying commodity value. Here patience is our core advantage.
It is possible that the combination of rational equity prices and well-below-average real yields on government bonds may already imply a sufficiently above-average risk premium on equities given the uncertain environment we
FIRST EAGLE FUNDS | ANNUAL REPORT | OCTOBER 31, 2011
8
Letter from the Global Value Team Portfolio Managers (continued)
face. We cannot know the future for sure. We believe that for long-term investors, equities selectively purchased with a margin of safety in price, business model and management remain a sound choice for preserving wealth in real terms even though there may be stormy bouts of deleveraging along the way. At First Eagle, we take the long view by owning businesses, yet we are psychologically prepared to invest more and endure if the environment is cloudy and wait with more cash if things get frothy. We kept a little deferred purchasing power in low- or no-yielding cash to take advantage of crises. And we have kept some gold as a potential hedge against any further deterioration in man-made money — while simultaneously recognizing that gold is not a panacea, because owning it already incorporates some degree of expectation about how bad things could be. Things may get worse, but this is by no means inevitable particularly, as human potential grows.
We appreciate your confidence and thank you for your support.
Sincerely,
 | |  | |
|
| Matthew McLennan | | T. Kimball Brooker, Jr. | |
|
Head of the Global Value Team
Portfolio Manager | | Portfolio Manager | |
|

Abhay Deshpande
Portfolio Manager
December 2011
FIRST EAGLE FUNDS | ANNUAL REPORT | OCTOBER 31, 2011
9
Letter from the Global Value Team Portfolio Managers (continued)
1Source: Factset and MSCI
The performance data quoted herein represents past performance and does not guarantee future results. Market volatility can dramatically impact the fund's short-term performance. Current performance may be lower or higher than figures shown. The investment return and principal value will fluctuate so that an investor's shares, when redeemed, may be worth more or less than their original cost. Past performance data through the most recent month end is available at firsteaglefunds.com or by calling 800.334.2143. The average annual returns for Class A Shares "with sales charge" of First Eagle Global, Overseas, U.S. Value and Gold Funds give effect to the deduction of the maximum sales charge of 5.00%.
There are risks associated with investing in funds that invest in securities of foreign countries, such as erratic market conditions, economic and political instability and fluctuations in currency exchange rates. Investment in gold and gold related investments present certain risks, and returns on gold related investments have traditionally been more volatile than investments in broader equity or debt markets.
The commentary represents the opinion of the Global Value Team Portfolio Managers as of December 2011 and is subject to change based on market and other conditions. The opinions expressed are not necessarily those of the firm. First Eagle Investment Management, LLC (FEIM) became investment adviser to the Global Fund commencing January 1, 2000. These materials are provided for informational purpose only. These opinions are not intended to be a forecast of future events, a guarantee of future results, or investment advice. Any statistics contained herein have been obtained from sources believed to be reliable, but the accuracy of this information cannot be guaranteed. The views expressed herein may change at any time subsequent to the date of issue hereof. The information provided is not to be construed as a recommendation or an offer to buy or sell or the solicitation of an offer to buy or sell any fund or security.
FIRST EAGLE FUNDS | ANNUAL REPORT | OCTOBER 31, 2011
10
Management's Discussion of Fund Performance
Global markets declined during the twelve-months ending October 2011 as the financial crisis in the Eurozone took its toll on overseas stocks. Concerns about Europe's ability to solve long-term structural problems negatively impacted many European economies. In France, the CAC 40 Index fell 15.4% while in Germany, the DAX Index fell 7.0% during the twelve-month period. In Japan, the Nikkei 225 Index fell 2.3%. The U.S. fared better with the S&P 500 Index increasing 8.1%. The U.S. Dollar fell 2.8% against the Japanese Yen and it rose a nominal 0.6% against the Euro. Crude oil rose 14.4% during the twelve months to $93 a barrel. Gold surged 26% to $1,715 an ounce providing evidence that investors sought a safe haven from global economic and political tensions.
First Eagle Global Fund
The net asset value ("NAV") of the Fund's Class 'A' shares rose 7.23% for the year ending October 31, 2011, while the MSCI World Index increased 1.76%. The Fund's position in cash and cash equivalents was 13.13% as of October 31, 2011.
The five largest contributors to the performance of the Fund over the period were Gold bullion (commodity, U.S.), Industrias Peñoles S.A.B. de C.V. (mining, Mexico), Sucriere de Pithiviers-Le-Vieil (sugar producer, France), ConocoPhillips (energy, U.S.), and FirstEnergy (utility, U.S.), collectively accounting for 2.77 percentage points of the year's performance.
The five largest detractors were Carrefour SA (supermarkets, France), NKSJ Holdings, Inc. (insurance, Japan), Alliant Techsystems, Inc. (defense manufacturer, U.S.), HeidelbergCement AG (cement manufacturer, Germany) and MS&AD Insurance Group Holdings (insurance, Japan). Their combined negative performance over the twelve month period subtracted 1.05 percentage points from the Fund's performance.
During the year, the Fund benefited from corporate activity with the take-outs of Sucriere de Pithiviers-Le-Vieil and Tognum AG.
As of October 31, 2011, the Fund was approximately 40% hedged versus the Japanese Yen and 40% hedged versus the Euro, slightly larger than average hedges during the previous year. Both currencies arguably warrant some premium to their long-term averages relative to the U.S. Dollar given their superior inflation and trade performance. However, in the case of the Japanese Yen, the premium ought to be moderated by their fiscal challenges. In the case of the Euro, the political disunity within Europe that is feeding a series of local
FIRST EAGLE FUNDS | ANNUAL REPORT | OCTOBER 31, 2011
11
Management's Discussion of Fund Performance (continued)
sovereign crises in peripheral markets could imperil the European financial architecture, thereby suggesting a smaller premium for the currency than is suggested by the consolidated fundamentals alone.
First Eagle Overseas Fund
The NAV of the Fund's Class 'A' shares rose 4.27% for the fiscal year ending October 31, 2011, while the MSCI EAFE Index decreased 4.08% over the same period. The Fund's position in cash and cash equivalents was 11.12% as of October 31, 2011.
The five largest contributors to the performance of the Fund over the period were Gold bullion (commodity, U.S.), Sucriere de Pithiviers-Le-Vieil (sugar producer, France), Industrias Peñoles S.A.B. de C.V. (mining, Mexico), Ono Pharmaceutical Company, Limited (pharmaceutical, Japan) and Fanuc Corporation (factory automation, Japan), collectively accounting for 3.24 percentage points of the year's performance.
The five largest detractors were NKSJ Holdings, Inc. (insurance, Japan), MS&AD Insurance Group Holdings (insurance, Japan), Carrefour SA (supermarkets, France), TNT Express NV (air freight, Netherlands) and Guoco Group Limited (diversified financial company, Hong Kong). Their combined negative performance over the twelve month period subtracted 1.26 percentage points from the Fund's performance.
During the year, the Fund benefited from corporate activity with the take-outs of Sucriere de Pithiviers-Le-Vieil, Société Vermandoise de Sucreries and Tognum AG.
As of October 31, 2011, the Fund was approximately 40% hedged versus the Japanese Yen and 40% hedged versus the Euro, slightly larger than average hedges during the previous year.
First Eagle U.S. Value Fund
The NAV of the Fund's Class 'A' shares increased 9.60% for the year ending October 31, 2011, while the S&P 500 Index rose 8.09%. The Fund's position in cash and cash equivalents was 15.90% as of October 31, 2011.
The five largest contributors to the performance of the Fund over the period were Gold bullion (commodity), ConocoPhillips (energy), Weyerhaeuser Company (forest products), Helmerich & Payne, Inc. (oil & gas drilling) and Comcast Corporation (cable), collectively accounting for 3.51 percentage points of the year's performance.
FIRST EAGLE FUNDS | ANNUAL REPORT | OCTOBER 31, 2011
12
First Eagle Global, Overseas, U.S. Value and Gold Funds
The five largest detractors were Bank of New York Mellon Corporation (bank), Alliant Techsystems, Inc. (defense manufacturer), Agnico-Eagle Mines Limited (gold mining), Catalyst Paper Corporation bonds (paper producer) and BB&T Corporation (commercial bank). Their combined negative performance over the twelve month period subtracted 1.38 percentage points from the Fund's performance.
First Eagle Gold Fund
The NAV of the Fund's Class 'A' shares rose 7.38% for the year ending October 31, 2011, while the FTSE Gold Mines Index increased 0.38%. The Fund's position in cash and cash equivalents was 5.24% as of October 31, 2011.
The five largest contributors to the performance of the First Eagle Gold Fund over the period were Gold bullion (U.S.), New Gold, Inc, (Canada), IAMGOLD Corporation (Canada), Industrias Peñoles S.A.B. de C.V. (Mexico) and Fresnillo PLC (Mexico), collectively accounting for 8.12 percentage points of the year's performance.
The five largest detractors to the Fund were Agnico-Eagle Mines Limited (Canada), Lake Shore Gold Corporation (Canada), Kinross Gold Corporation (Canada), Newcrest Mining Limited (Australia) and Great Basin Gold Limited (South Africa). Their combined negative performance over the twelve month period subtracted 4.44 percentage points from the Fund's performance.
We view gold as a hedge against "extreme outcomes," which might include such things as inflation, deflation or outright currency debasement. While we may view any of these outcomes as low probability, we believe gold can at least partially protect a portfolio against potential negative developments that these events could cause. The fiat currency system faces a number of challenges and appears to be fraying at the edges. Gold is playing the role of a substitute currency and has emerged as a viable alternative for central banks, institutional and individual investors worried about the current state of the Global monetary system. This year was marked by a divergence in the performance of gold bullion, which increased 26% versus equities (the FTSE Gold Mines Index increased 0.38%). This was due in part because many of the buyers of gold-related assets have no choice in terms of gold exposure. If you are a central banker, gold exposure is achieved through the physical metal itself. Institutional or individual investors, however, have a choice and the gold above ground isn't always the cheapest way to buy ounces. Gold mining companies can offer a call option on gold ounces. Gold is a scarce asset and as it comes to be hoarded by
FIRST EAGLE FUNDS | ANNUAL REPORT | OCTOBER 31, 2011
13
Management's Discussion of Fund Performance (continued)
both institutional investors and central banks, the only option of new supply is gold mining companies. Unlike man-made money, where the rate of increase can occur on a whim, gold is getting harder to find. Currently a number of gold mining stocks can be purchased at what we feel is an appropriate margin of safety. We continue to believe the strategy of finding the cheapest ounces, either below or above ground, has the potential to provide investors with a balanced hedge against extreme outcomes.
As always, we appreciate your confidence and thank you for your support.
 | |  | |
|
| Matthew McLennan | | Abhay Deshpande | |
|
Head of the Global Value Team
Portfolio Manager
Global, Overseas
and U.S. Value Funds | | Portfolio Manager
Global, Overseas,
U.S. Value and Gold Funds
| |
|
 | |  | |
|
| T. Kimball Brooker, Jr. | | Rachel Benepe | |
|
Portfolio Manager
Overseas and U.S. Value Funds
Associate Portfolio Manager
Global Fund | | Portfolio Manager
Gold Fund
| |
|
 | |  | |
|
| Matt Lamphier | | Chris Kwan | |
|
Associate Portfolio Manager
U.S. Value Fund | | Associate Portfolio Manager
Gold Fund | |
|
December 2011
FIRST EAGLE FUNDS | ANNUAL REPORT | OCTOBER 31, 2011
14
First Eagle Global, Overseas, U.S. Value and Gold Funds
Past performance is no guarantee of future results. The portfolios are actively managed. Current and future portfolio holdings are subject to risk.
There are risks associated with investing in funds that invest in securities of foreign countries, such as erratic market conditions, economic and political instability and fluctuations in currency exchange rates. Funds whose investments are concentrated in a specific industry or sector may be subject to a higher degree of risk than funds whose investments are diversified and may not be suitable for all investors. Hedging can reduce exposure to currency exchange movements, but cannot eliminate that exposure. It is possible to lose money under a hedge. Results from hedging transactions, which for the Funds are primarily currency forward contracts, are further described in the financial statements that follow this commentary.
The commentary represents the opinion of the Global Value Team Portfolio Managers as of December 2011 and is subject to change based on market and other conditions. These materials are provided for informational purposes only. These opinions are not intended to be a forecast of future events, a guarantee of future results, or investment advice. The views expressed herein may change at any time subsequent of the date of issue hereof. The information provided is not to be construed as a recommendation or an offer to buy or sell or the solicitation of an offer to buy or sell any fund or security.
Investment in gold and gold related investments present certain risks, including political and economic risks affecting the price of gold and other precious metals like changes in U.S. or foreign tax, currency or mining laws, increased environmental costs, international monetary and political policies, economic conditions within an individual country, trade imbalances and trade or currency restrictions between countries. Investment in gold and gold related investments may be speculative and may be subject to greater price volatility than investments in other assets and types of companies.
FIRST EAGLE FUNDS | ANNUAL REPORT | OCTOBER 31, 2011
15
Performance Chart1
Average Annual Returns as of October 31, 2011
| | | ONE-YEAR | | THREE-YEARS | | FIVE-YEARS | | TEN-YEARS | | SINCE
INCEPTION | | INCEPTION
DATE | |
| First Eagle Global Fund | |
| Class A (SGENX) | |
| without sales charge | | | 7.23 | % | | | 14.58 | % | | | 5.86 | % | | | 12.98 | % | | | 14.23 | % | | 01/01/792 | |
| with sales charge | | | 1.87 | | | | 12.64 | | | | 4.78 | | | | 12.40 | | | | 14.10 | | | 01/01/792 | |
| Class C (FESGX) | | | 5.45 | | | | 13.73 | | | | 5.07 | | | | 12.14 | | | | 11.53 | | | 06/05/00 | |
| Class I (SGIIX) | | | 7.52 | | | | 14.87 | | | | 6.13 | | | | 13.27 | | | | 12.04 | | | 07/31/98 | |
| MSCI World Index3 | | | 1.76 | | | | 10.75 | | | | –1.00 | | | | 4.54 | | | | 9.44 | | | 01/01/79 | |
| First Eagle Overseas Fund | |
| Class A (SGOVX) | |
| without sales charge | | | 4.27 | % | | | 14.58 | % | | | 5.02 | % | | | 13.66 | % | | | 12.06 | % | | 08/31/93 | |
| with sales charge | | | –0.94 | | | | 12.62 | | | | 3.94 | | | | 13.08 | | | | 11.83 | | | 08/31/93 | |
| Class C (FESOX) | | | 2.48 | | | | 13.69 | | | | 4.22 | | | | 12.81 | | | | 11.41 | | | 06/05/00 | |
| Class I (SGOIX) | | | 4.52 | | | | 14.84 | | | | 5.27 | | | | 13.94 | | | | 12.50 | | | 07/31/98 | |
| MSCI EAFE Index4 | | | –4.08 | | | | 9.90 | | | | –2.41 | | | | 5.73 | | | | 4.42 | | | 08/31/93 | |
| First Eagle U.S. Value Fund | |
| Class A (FEVAX) | |
| without sales charge | | | 9.60 | % | | | 12.57 | % | | | 4.78 | % | | | 9.09 | % | | | 9.12 | % | | 09/04/01 | |
| with sales charge | | | 4.12 | | | | 10.66 | | | | 3.71 | | | | 8.53 | | | | 8.57 | | | 09/04/01 | |
| Class C (FEVCX) | | | 7.85 | | | | 11.72 | | | | 4.00 | | | | 8.29 | | | | 8.30 | | | 09/04/01 | |
| Class I (FEVIX) | | | 9.92 | | | | 12.83 | | | | 5.04 | | | | 9.36 | | | | 9.38 | | | 09/04/01 | |
Standard & Poor's
500 Index5 | | | 8.09 | | | | 11.41 | | | | 0.25 | | | | 3.69 | | | | 2.97 | | | 09/04/01 | |
| First Eagle Gold Fund | |
| Class A (SGGDX) | |
| without sales charge | | | 7.38 | % | | | 37.31 | % | | | 15.79 | % | | | 23.92 | % | | | 11.04 | % | | 08/31/93 | |
| with sales charge | | | 2.01 | | | | 34.98 | | | | 14.60 | | | | 23.29 | | | | 10.81 | | | 08/31/93 | |
| Class C (FEGOX) | | | 5.61 | | | | 36.28 | | | | 14.93 | | | | — | | | | 17.51 | | | 05/15/03 | |
| Class I (FEGIX) | | | 7.66 | | | | 37.61 | | | | 16.08 | | | | — | | | | 18.68 | | | 05/15/03 | |
| FTSE Gold Mines Index6 | | | 0.38 | | | | 36.25 | | | | 10.11 | | | | 16.18 | | | | 3.90 | | | 08/31/93 | |
| MSCI World Index3 | | | 1.76 | | | | 10.75 | | | | –1.00 | | | | 4.54 | | | | 5.68 | | | 08/31/93 | |
Please see the following pages for important notes to this table.
FIRST EAGLE FUNDS | ANNUAL REPORT | OCTOBER 31, 2011
16
Performance Chart (continued)
| | | ONE-YEAR | | THREE-YEARS | | FIVE-YEARS | | TEN-YEARS | | SINCE
INCEPTION | | INCEPTION
DATE | |
| First Eagle Fund of America | |
| Class A (FEFAX) | |
| without sales charge | | | 4.22 | % | | | 12.30 | % | | | 3.99 | % | | | 7.19 | % | | | 7.01 | % | | 11/20/98 | |
| with sales charge | | | –0.99 | | | | 10.40 | | | | 2.93 | | | | 6.64 | | | | 6.59 | | | 11/20/98 | |
| Class C (FEAMX) | | | 2.43 | | | | 11.47 | | | | 3.21 | | | | 6.43 | | | | 6.31 | | | 03/02/98 | |
| Class Y (FEAFX)7 | | | 4.20 | | | | 12.28 | | | | 3.97 | | | | 7.21 | | | | 11.49 | | | 04/10/87 | |
Standard & Poor's
500 Index5 | | | 8.09 | | | | 11.41 | | | | 0.25 | | | | 3.69 | | | | 8.55 | | | 04/10/87 | |
1 The performance data quoted herein represents past performance and does not guarantee future results. Market volatility can dramatically impact the funds' short-term performance. Current performance may be lower or higher than figures shown. The investment return and principal value will fluctuate so that an investor's shares, when redeemed, may be worth more or less than their original cost. Past performance data through the most recent month end is available at www.firsteaglefunds.com or by calling 800.334.2143. The average annual returns shown on the prior page are historical and reflect changes in share price, reinvested dividends and are net of expenses. The average annual returns for Class A Shares "with sales charge'' of First Eagle Global Fund, First Eagle Overseas Fund, First Eagle U.S. Value Fund, First Eagle Gold Fund, and First Eagle Fund of America give effect to the deduction of the maximum sales charge of 5.00%.
The average annual returns for Class C Shares reflect the CDSC (Contingent Deferred Sales Charge) of 1.00% which pertains to the first year or less of investment only.
Class I Shares of First Eagle Global Fund, First Eagle Overseas Fund, First Eagle U.S. Value Fund, and First Eagle Gold Fund require $1mm minimum investment and are offered without sales charge.
Class Y Shares of First Eagle Fund of America are offered without charge.
2 Commencement of management by Jean-Marie Eveillard. Mr. Eveillard transitioned to senior adviser on March 26, 2009, a position he also held from January 2005 to March 2007, and continues to be a member of First Eagle Fund's Board of Trustees and a Senior Vice President of Arnhold and S. Bleichroeder Advisers, LLC. The Fund commenced operation April 28, 1970.
3 The MSCI World Index is a widely followed, unmanaged group of stocks from 23 international markets and is not available for purchase. The index provides total returns in U.S. dollars with net dividends reinvested.
4 The MSCI EAFE Index is a total return index, reported in U.S. dollars, based on share prices and reinvested net dividends of approximately 1,100 companies from 21 countries and is not available for purchase.
Please see the following page for important notes to this table.
FIRST EAGLE FUNDS | ANNUAL REPORT | OCTOBER 31, 2011
17
Performance Chart (continued)
5 The Standard & Poor's 500 Index is a widely recognized unmanaged index including a representative sample of 500 leading companies in leading sectors of the U.S. economy and is not available for purchase. Although the Standard & Poor's 500 Index focuses on the large-cap segment of the market, with approximately 75% coverage of U.S. equities, it is also considered a proxy for the total market. The Standard & Poor's 500 Index includes dividends reinvested.
6 The FTSE Gold Mines Index is an unmanaged index composed of approximately 19 mining companies and is only available without dividends reinvested and is not available for purchase.
7 As of September 1, 2005 First Eagle Fund of America Class Y is closed to new investors.
Expense Ratios As Stated In The Most Recent Prospectus
Total Annual Gross Operating Expense Ratios
| | | CLASS A | | CLASS C | | CLASS I | | CLASS Y | |
| First Eagle Global Fund | | | 1.16 | % | | | 1.91 | % | | | 0.91 | % | | | — | | |
| First Eagle Overseas Fund | | | 1.17 | | | | 1.92 | | | | 0.92 | | | | — | | |
| First Eagle U.S. Value Fund | | | 1.24 | | | | 1.99 | | | | 1.00 | | | | — | | |
| First Eagle Gold Fund | | | 1.22 | | | | 1.97 | | | | 0.97 | | | | — | | |
| First Eagle Fund of America | | | 1.49 | | | | 2.24 | | | | — | | | | 1.49 | % | |
These expense ratios are presented as of October 31, 2010 and may differ from corresponding ratios shown elsewhere in this report because of differing time periods (and/or, if applicable, because these expense ratios do not include expense credits or waivers).
There are risks associated with investing in funds that invest in securities of foreign countries, such as erratic market conditions, economic and political instability and fluctuations in currency exchange rates. Funds whose investments are concentrated in a specific industry or sector may be subject to a higher degree of risk than funds whose investments are diversified and may not be suitable for all investors.
Investment in gold and gold related investments present certain risks, including political and economic risks affecting the price of gold and other precious metals like changes in U.S. or foreign tax, currency or mining laws, increased environmental costs, international monetary and political policies, economic conditions within an individual country, trade imbalances, and trade or currency restrictions between countries. The price of gold, in turn, is likely to affect the market prices of securities of companies mining or processing gold, and accordingly, the value of investments in such securities may also be affected. Gold related investments as a group have not performed as well as the stock market in general during periods when the U.S. dollar is strong, inflation is low and general economic conditions are stable. In addition, returns on gold related investments have traditionally been more volatile than investments in broader equity or debt markets.
The event-driven investment style used by First Eagle Fund of America carries the additional risk that the event anticipated occurs later than expected, does not occur at all or does not have the desired effect on the market price of the securities.
FIRST EAGLE FUNDS | ANNUAL REPORT | OCTOBER 31, 2011
18
This page was intentionally left blank.

Fund Overview | Data as of October 31, 2011 (unaudited)
INVESTMENT OBJECTIVE
The First Eagle Global Fund seeks long-term growth of capital by investing in a wide range of asset classes from markets in the United States and around the world. This truly global fund is managed with a highly disciplined, bottom-up, value oriented style that helps minimize risk.
| Average Annual Returns | |
| | | ONE-YEAR | | FIVE-YEARS | | TEN-YEARS | |
First Eagle Global
Fund (A Shares) | |
| without sales load | | | 7.23 | % | | | 5.86 | % | | | 12.98 | % | |
| with sales load | | | 1.87 | | | | 4.78 | | | | 12.40 | | |
| MSCI World Index | | | 1.76 | | | | -1.00 | | | | 4.54 | | |
| Consumer Price Index | | | 3.53 | | | | 2.33 | | | | 2.45 | | |
Asset Allocation*
| Countries* | |
| United States | | | 40.80 | % | |
| Japan | | | 17.70 | | |
| France | | | 6.22 | | |
| Mexico | | | 2.72 | | |
| United Kingdom | | | 2.61 | | |
| Switzerland | | | 2.51 | | |
| Germany | | | 2.49 | | |
| South Korea | | | 1.76 | | |
| South Africa | | | 1.52 | | |
| Canada | | | 1.16 | | |
| Hong Kong | | | 1.12 | | |
| Singapore | | | 0.70 | | |
| Belgium | | | 0.70 | | |
| Malaysia | | | 0.56 | | |
| Australia | | | 0.56 | | |
| Spain | | | 0.52 | | |
| Thailand | | | 0.49 | | |
| Italy | | | 0.48 | | |
| Brazil | | | 0.46 | | |
| Austria | | | 0.44 | | |
| Netherlands | | | 0.40 | | |
| Taiwan | | | 0.39 | | |
| Sweden | | | 0.30 | | |
| Ireland | | | 0.22 | | |
| Norway | | | 0.04 | | |
* Asset allocation percentages are based on total investments in the portfolio. Country allocations exclude short term investments.
The Fund's portfolio composition is subject to change at any time.
FIRST EAGLE FUNDS | ANNUAL REPORT | OCTOBER 31, 2011
20
Global Fund
Growth of a $10,000 Initial Investment
Performance data quoted herein represents past performance and should not be considered indicative of future results. Performance data quoted herein does not reflect the deduction of taxes that a shareholder would pay on Fund distributions or the sale of Fund shares. The average annual returns shown above are historical and reflect changes in share price, reinvested dividends and are net of expenses.
The average annual returns for Class A Shares give effect to the deduction of the maximum sales charge of 5.00%.
The MSCI World Index is a widely followed, unmanaged group of stocks from 23 international markets and is not available for purchase. The index provides total returns in U.S. dollars with net dividends reinvested. The Consumer Price Index (CPI) represents the change in price of all goods and services purchased for consumption by urban households.
| Top 10 Holdings* | |
| Gold Bullion (precious metal) | | | 5.79 | % | |
| Cisco Systems, Inc. (U.S. computer communications company) | | | 1.87 | | |
| Secom Company, Limited (Japanese security services provider) | | | 1.76 | | |
| Fanuc Corporation (Japanese industrial manufacturing company) | | | 1.69 | | |
| Sysco Corporation (U.S. food services distributor) | | | 1.43 | | |
| FirstEnergy Corporation (U.S. diversified energy company) | | | 1.40 | | |
| SMC Corporation (Japanese automated control devices manufacturer) | | | 1.35 | | |
| Keyence Corporation (Japanese sensors manufacturer) | | | 1.29 | | |
| Comcast Corporation, Class 'A' (U.S. cable/satellite television company) | | | 1.28 | | |
| Microsoft Corporation (U.S. software developer) | | | 1.27 | | |
| Total | | | 19.13 | % | |
* Holdings in cash, commercial paper and money market funds have been excluded. Percentages are based on total net assets.
FIRST EAGLE FUNDS | ANNUAL REPORT | OCTOBER 31, 2011
21
First Eagle Global Fund
| SHARES | | DESCRIPTION | | COST (NOTE 1) | | VALUE (NOTE 1) | |
| Common Stocks — 76.32% | | | |
| U.S. Common Stocks — 34.24% | | | |
| Consumer Discretionary 2.78% | | | |
| | 17,414,912 | | | Comcast Corporation, Class 'A' | | $ | 296,976,000 | | | $ | 400,542,976 | | |
| | 6,208,490 | | | Omnicom Group, Inc. | | | 186,093,077 | | | | 276,153,635 | | |
| | 5,300,650 | | | Home Depot, Inc. | | | 131,119,192 | | | | 189,763,270 | | |
| | 2,485 | | | JG Boswell Company (a) | | | 573,840 | | | | 1,751,925 | | |
| | 184,753 | | | St. John Knits
International, Inc. (a)(b) | | | 3,174,837
| | | | 785,201
| | |
| | | | 617,936,946 | | | | 868,997,007 | | |
| Consumer Staples 3.07% | | | |
| | 16,020,971 | | | Sysco Corporation | | | 451,844,111 | | | | 444,101,316 | | |
| | 1,837,950 | | | Lorillard, Inc. | | | 135,716,878 | | | | 203,387,547 | | |
| | 2,132,090 | | | Colgate-Palmolive Company | | | 164,260,763 | | | | 192,676,973 | | |
| | 2,051,045 | | | Wal-Mart Stores, Inc. | | | 101,774,692 | | | | 116,335,273 | | |
| | | | 853,596,444 | | | | 956,501,109 | | |
| Energy 2.18% | | | |
| | 5,684,663 | | | ConocoPhillips | | | 292,995,737 | | | | 395,936,778 | | |
| | 1,442,501 | | | Apache Corporation | | | 90,693,919 | | | | 143,716,375 | | |
| | 3,975,644 | | | San Juan Basin Royalty Trust (c) | | | 141,567,358 | | | | 97,164,739 | | |
| | 806,395 | | | Helmerich & Payne, Inc. | | | 17,026,317 | | | | 42,884,086 | | |
| | | | 542,283,331 | | | | 679,701,978 | | |
| Financials 9.18% | | | |
| | 7,529,993 | | | American Express Company | | | 317,870,387 | | | | 381,168,246 | | |
| | 15,496,327 | | | Bank of New York Mellon Corporation | | | 395,738,590 | | | | 329,761,839 | | |
| | 2,714 | | | Berkshire Hathaway, Inc., Class 'A' (b) | | | 218,995,900 | | | | 317,402,300 | | |
| | 9,542,046 | | | Cincinnati Financial Corporation (c) | | �� | 244,508,555 | | | | 276,146,811 | | |
| | 13,224,085 | | | Weyerhaeuser Company REIT | | | 234,162,262 | | | | 237,769,048 | | |
| | 9,693,682 | | | BB&T Corporation | | | 245,863,323 | | | | 226,250,538 | | |
| | 5,719,208 | | | Plum Creek Timber
Company, Inc., REIT | | | 212,342,604
| | | | 215,385,373 | | |
| | 2,231,837 | | | Visa, Inc., Class 'A' | | | 164,736,476 | | | | 208,141,119 | | |
| | 7,819,459 | | | U.S. Bancorp | | | 192,949,644 | | | | 200,099,956 | | |
| | 567,206 | | | Mastercard, Inc., Class 'A' (d) | | | 115,777,627 | | | | 196,956,611 | | |
| | 4,386,051 | | | WR Berkley Corporation | | | 117,583,057 | | | | 152,678,435 | | |
| | 2,858,553 | | | Rayonier, Inc., REIT | | | 27,837,041 | | | | 119,287,417 | | |
| | 34,924 | | | Mills Music Trust (a)(c) | | | 1,055,337 | | | | 1,327,112 | | |
| | | | 2,489,420,803 | | | | 2,862,374,805 | | |
See Notes to Financial Statements.
FIRST EAGLE FUNDS | ANNUAL REPORT | OCTOBER 31, 2011
22
Schedule of Investments | Year Ended October 31, 2011
| SHARES | | DESCRIPTION | | COST (NOTE 1) | | VALUE (NOTE 1) | |
| U.S. Common Stocks — 34.24% — (continued) | | | |
| Health Care 0.79% | | | |
| | 2,594,970 | | | WellPoint, Inc. | | $ | 122,915,513 | | | $ | 178,793,433 | | |
| | 1,059,980 | | | Johnson & Johnson | | | 59,610,843 | | | | 68,252,112 | | |
| | | | 182,526,356 | | | | 247,045,545 | | |
| Industrials 4.96% | | | |
| | 13,051,511 | | | Cintas Corporation (c) | | | 438,387,413 | | | | 390,109,664 | | |
| | 4,069,880 | | | 3M Company | | | 315,646,157 | | | | 321,601,918 | | |
| | 3,069,252 | | | Lockheed Martin Corporation | | | 217,057,860 | | | | 232,956,227 | | |
| | 3,739,616 | | | Northrop Grumman Corporation | | | 224,083,655 | | | | 215,962,824 | | |
| | 3,337,753 | | | Alliant Techsystems, Inc. (c) | | | 300,315,627 | | | | 193,856,694 | | |
| | 7,574,592 | | | Blount International, Inc. (b)(c) | | | 91,585,822 | | | | 117,633,414 | | |
| | 1,381,358 | | | Unifirst Corporation | | | 30,865,195 | | | | 72,314,091 | | |
| | 149,923 | | | Huntington Ingalls Industries, Inc. (b) | | | 5,649,077 | | | | 4,422,728 | | |
| | | | 1,623,590,806 | | | | 1,548,857,560 | | |
| Information Technology 6.71% | | | |
| | 31,413,268 | | | Cisco Systems, Inc. | | | 527,420,636 | | | | 582,087,856 | | |
| | 14,892,064 | | | Microsoft Corporation | | | 365,199,954 | | | | 396,575,664 | | |
| | 12,418,960 | | | Intel Corporation | | | 210,916,626 | | | | 304,761,278 | | |
| | 8,019,789 | | | Linear Technology Corporation | | | 227,165,656 | | | | 259,119,383 | | |
| | 6,036,580 | | | Texas Instruments, Inc. | | | 154,258,826 | | | | 185,504,103 | | |
| | 3,010,552 | | | KLA-Tencor Corporation (d) | | | 86,433,227 | | | | 141,766,894 | | |
| | 2,365,411 | | | Automatic Data Processing, Inc. | | | 85,148,200 | | | | 123,781,958 | | |
| | 166,427 | | | Google, Inc., Class 'A' (b) | | | 79,879,690 | | | | 98,631,297 | | |
| | | | 1,736,422,815 | | | | 2,092,228,433 | | |
| Materials 2.13% | | | |
| | 3,170,962 | | | Ashland, Inc. | | | 164,743,808 | | | | 167,934,147 | | |
| | 4,387,079 | | | Vulcan Materials Company | | | 223,679,544 | | | | 137,271,702 | | |
| | 1,752,640 | | | Martin Marietta Materials, Inc. | | | 155,134,876 | | | | 126,488,029 | | |
| | 1,780,037 | | | Newmont Mining Corporation | | | 45,037,176 | | | | 118,959,873 | | |
| | 1,258,500 | | | Deltic Timber Corporation (c) | | | 62,903,243 | | | | 85,187,865 | | |
| | 591,920 | | | Scotts Miracle-Gro Company, Class 'A' | | | 26,180,805 | | | | 28,714,039 | | |
| | | | 677,679,452 | | | | 664,555,655 | | |
| Utilities 2.44% | | | |
| | 9,696,381 | | | FirstEnergy Corporation | | | 353,449,107 | | | | 435,949,290 | | |
| | 2,491,660 | | | Entergy Corporation | | | 164,249,120 | | | | 172,348,122 | | |
| | 3,760,485 | | | IDACorp, Inc. (c) | | | 124,066,738 | | | | 151,848,384 | | |
| | | | 641,764,965 | | | | 760,145,796 | | |
| Total U.S. Common Stocks | | | 9,365,221,918 | | | | 10,680,407,888 | | |
See Notes to Financial Statements.
FIRST EAGLE FUNDS | ANNUAL REPORT | OCTOBER 31, 2011
23
Global Fund
| SHARES | | DESCRIPTION | | COST (NOTE 1) | | VALUE (NOTE 1) | |
| International Common Stocks — 42.08% | | | |
| Australia 0.55% (e) | | | |
| | 4,843,236 | | | Newcrest Mining Limited | | $ | 163,187,463 | | | $ | 172,110,798 | | |
| Austria 0.43% (e) | | | |
| | 3,857,199 | | | OMV AG | | | 157,989,372 | | | | 135,453,305 | | |
| Belgium 0.69% (e) | | | |
| | 2,788,865 | | | Groupe Bruxelles Lambert SA | | | 234,732,253 | | | | 216,035,834 | | |
| Brazil 0.46% | | | |
| | 5,627,216 | | | Petroleo Brasileiro SA, ADR | | | 113,899,508 | | | | 142,312,293 | | |
| Canada 1.10% | | | |
| | 9,423,645 | | | Penn West Petroleum Limited | | | 175,578,987 | | | | 168,871,719 | | |
| | 4,207,036 | | | Cenovus Energy, Inc. | | | 112,423,564 | | | | 143,880,631 | | |
| | 2,927,036 | | | Postmedia Network,
Class 'NC' (a)(b)(f) | | | 18,719,012
| | | | 29,690,945
| | |
| | | | 306,721,563 | | | | 342,443,295 | | |
| France 5.96% | | | |
| | 4,179,227 | | | Sanofi (e) | | | 323,385,924 | | | | 301,300,343 | | |
| | 3,736,582 | | | Sodexo (e) | | | 100,240,083 | | | | 271,893,756 | | |
| | 6,020,905 | | | Bouygues SA (e) | | | 269,378,433 | | | | 226,620,126 | | |
| | 2,044,437 | | | Neopost SA (c)(e) | | | 184,799,958 | | | | 156,702,550 | | |
| | 11,533,583 | | | Société Télévision Francaise 1 (c)(e) | | | 182,093,691 | | | | 156,063,300 | | |
| | 2,923,549 | | | Total SA (e) | | | 160,184,051 | | | | 153,727,676 | | |
| | 63,019 | | | Sucrière de Pithiviers-Le-Vieil (c) | | | 35,947,627 | | | | 145,280,558 | | |
| | 956,044 | | | Guyenne et Gascogne SA (c)(e) | | | 108,257,344 | | | | 110,368,805 | | |
| | 3,733,423 | | | Carrefour SA (e) | | | 230,370,943 | | | | 99,546,264 | | |
| | 806,452 | | | Société BIC SA (e) | | | 38,193,195 | | | | 72,527,286 | | |
| | 921,669 | | | Wendel (e) | | | 19,716,342 | | | | 68,797,089 | | |
| | 504,923 | | | Rémy Cointreau SA (e) | | | 13,495,340 | | | | 41,685,611 | | |
| | 157,260 | | | Robertet SA (c)(e) | | | 20,623,058 | | | | 27,208,989 | | |
| | 385,000 | | | Sabeton SA (c)(e) | | | 4,841,233 | | | | 6,926,523 | | |
| | 12,000,000 | | | FINEL (a)(b)(c)(g)(h)(i) | | | — | | | | 6,024,021 | | |
| | 42,252 | | | Robertet SA CI (a)(g)(j) | | | 800,508 | | | | 5,040,458 | | |
| | 104,457 | | | Gaumont SA | | | 6,087,824 | | | | 4,967,006 | | |
| | 69,500 | | | NSC Groupe (a)(b)(c) | | | 12,298,421 | | | | 4,651,883 | | |
| | | | 1,710,713,975 | | | | 1,859,332,244 | | |
| Germany 2.05% (e) | | | |
| | 7,345,731 | | | HeidelbergCement AG | | | 415,128,999 | | | | 335,139,362 | | |
| | 3,784,413 | | | Daimler AG | | | 179,765,945 | | | | 193,699,956 | | |
See Notes to Financial Statements.
FIRST EAGLE FUNDS | ANNUAL REPORT | OCTOBER 31, 2011
24
Schedule of Investments | Year Ended October 31, 2011
| SHARES | | DESCRIPTION | | COST (NOTE 1) | | VALUE (NOTE 1) | |
| International Common Stocks — 42.08% — (continued) | | | |
| Germany 2.05% (e) — (continued) | | | |
| | 693,440 | | | Fraport AG | | $ | 20,976,007 | | | $ | 43,999,416 | | |
| | 382,160 | | | Pfeiffer Vacuum Technology AG | | | 30,965,774 | | | | 38,923,222 | | |
| | 773,684 | | | Hornbach Baumarkt AG | | | 21,504,161 | | | | 27,317,481 | | |
| | | | 668,340,886 | | | | 639,079,437 | | |
| Hong Kong 0.39% (e) | | | |
| | 12,693,580 | | | Guoco Group Limited | | | 115,086,260 | | | | 120,613,198 | | |
| | 20,738,780 | | | City e-Solutions Limited (a)(b)(c) | | | 936,898 | | | | 2,305,405 | | |
| | | | 116,023,158 | | | | 122,918,603 | | |
| Ireland 0.22% (e) | | | |
| | 3,763,310 | | | CRH PLC | | | 62,926,191 | | | | 68,616,992 | | |
| Italy 0.47% (e) | | | |
| | 18,139,395 | | | Italcementi S.p.A. RSP | | | 249,186,230 | | | | 57,261,258 | | |
| | 4,682,069 | | | Italcementi S.p.A. | | | 86,201,872 | | | | 31,378,400 | | |
| | 1,734,972 | | | Italmobiliare S.p.A. RSP | | | 121,356,934 | | | | 30,091,203 | | |
| | 1,021,137 | | | Italmobiliare S.p.A. | | | 107,360,738 | | | | 28,816,779 | | |
| | | | 564,105,774 | | | | 147,547,640 | | |
| Japan 17.46% (e) | | | |
| | 11,590,430 | | | Secom Company Limited | | | 528,330,685 | | | | 549,729,724 | | |
| | 3,248,400 | | | Fanuc Corporation | | | 285,730,293 | | | | 526,750,298 | | |
| | 2,693,956 | | | SMC Corporation | | | 294,992,485 | | | | 420,231,986 | | |
| | 1,571,990 | | | Keyence Corporation | | | 313,389,646 | | | | 400,770,079 | | |
| | 7,609,390 | | | Shimano, Inc. (c) | | | 189,904,791 | | | | 377,219,147 | | |
| | 8,977,860 | | | Astellas Pharma, Inc. | | | 362,418,345 | | | | 329,298,518 | | |
| | 5,211,900 | | | Ono Pharmaceutical Company Limited | | | 237,044,526 | | | | 273,550,957 | | |
| | 13,591,500 | | | NKSJ Holdings, Inc. | | | 376,845,758 | | | | 272,611,726 | | |
| | 12,811,860 | | | MISUMI Group, Inc. (c) | | | 221,342,849 | | | | 267,349,719 | | |
| | 12,970,300 | | | MS&AD Insurance Group Holdings | | | 325,978,421 | | | | 254,773,955 | | |
| | 4,896,260 | | | Canon, Inc. | | | 232,564,292 | | | | 222,921,018 | | |
| | 2,318,500 | | | Hirose Electric Company Limited (c) | | | 246,194,572 | | | | 222,822,977 | | |
| | 30,295 | | | KDDI Corporation | | | 192,498,177 | | | | 222,562,225 | | |
| | 12,493,780 | | | Mitsubishi Estate Company Limited | | | 189,561,430 | | | | 212,218,217 | | |
| | 3,901,770 | | | Nissin Foods Holdings
Company Limited | | | 138,227,494
| | | | 150,722,279
| | |
| | 6,136,140 | | | Hoya Corporation | | | 133,298,956 | | | | 134,441,699 | | |
| | 71,439 | | | NTT DoCoMo, Inc. | | | 108,868,051 | | | | 127,244,938 | | |
| | 6,109,710 | | | THK Company Limited | | | 106,814,295 | | | | 119,415,782 | | |
| | 3,526,280 | | | Chofu Seisakusho
Company Limited (c) | | | 64,322,537
| | | | 90,190,066
| | |
See Notes to Financial Statements.
FIRST EAGLE FUNDS | ANNUAL REPORT | OCTOBER 31, 2011
25
Global Fund
| SHARES | | DESCRIPTION | | COST (NOTE 1) | | VALUE (NOTE 1) | |
| International Common Stocks — 42.08% — (continued) | | | |
| Japan 17.46% (e) — (continued) | | | |
| | 5,147,000 | | | T. Hasegawa Company Limited (c) | | $ | 79,849,658 | | | $ | 81,766,918 | | |
| | 1,033,160 | | | Shin-Etsu Chemical Company Limited | | | 48,371,803 | | | | 53,210,833 | | |
| | 2,719,100 | | | Meitec Corporation (c) | | | 79,203,905 | | | | 50,780,109 | | |
| | 4,597 | | | Inpex Corporation | | | 22,079,788 | | | | 30,437,362 | | |
| | 1,725,100 | | | Ariake Japan Company Limited (c) | | | 29,754,119 | | | | 29,992,959 | | |
| | 2,002,100 | | | Seikagaku Corporation | | | 21,143,745 | | | | 21,777,069 | | |
| | 231,740 | | | Aderans Company Limited (b) | | | 5,260,612 | | | | 2,387,038 | | |
| | | | 4,833,991,233 | | | | 5,445,177,598 | | |
| Malaysia 0.56% (e) | | | |
| | 134,626,930 | | | Genting Malaysia Berhad | | | 116,786,948 | | | | 167,471,557 | | |
| | 1,621,965 | | | Genting Berhad | | | 2,671,766 | | | | 5,649,308 | | |
| | | | 119,458,714 | | | | 173,120,865 | | |
| Mexico 2.70% | | | |
| | 8,413,557 | | | Industrias Peñoles S.A.B. de C.V. | | | 12,663,840 | | | | 347,290,408 | | |
| | 15,044,166 | | | Grupo Televisa S.A.B., ADR | | | 289,394,928 | | | | 320,892,061 | | |
| | 6,399,253 | | | Fresnillo PLC (e) | | | 43,883,996 | | | | 174,050,971 | | |
| | | | 345,942,764 | | | | 842,233,440 | | |
| Netherlands 0.40% (e) | | | |
| | 12,052,607 | | | TNT Express NV | | | 141,073,113 | | | | 103,055,438 | | |
| | 4,391,426 | | | PostNL NV | | | 48,440,574 | | | | 22,408,232 | | |
| | | | 189,513,687 | | | | 125,463,670 | | |
| Singapore 0.21% (e) | | | |
| | 10,153,710 | | | Fraser and Neave Limited | | | 8,655,703 | | | | 49,549,780 | | |
| | 13,467,250 | | | ComfortDelgro Corporation Limited | | | 3,279,184 | | | | 14,951,750 | | |
| | | | 11,934,887 | | | | 64,501,530 | | |
| South Africa 1.50% | | | |
| | 20,830,304 | | | Gold Fields Limited, ADR | | | 231,208,540 | | | | 363,072,199 | | |
| | 8,092,307 | | | Harmony Gold Mining
Company Limited, ADR | | | 69,852,451
| | | | 106,251,991
| | |
| | | | 301,060,991 | | | | 469,324,190 | | |
| South Korea 1.05% | | | |
| | 3,476,566 | | | KT&G Corporation (e) | | | 187,647,559 | | | | 217,480,134 | | |
| | 51,900 | | | Lotte Confectionery
Company Limited (e) | | | 21,157,499
| | | | 81,154,333
| | |
| | 39,989 | | | Namyang Dairy Products
Company Limited (c) | | | 7,325,466
| | | | 28,218,190
| | |
| | | | 216,130,524 | | | | 326,852,657 | | |
See Notes to Financial Statements.
FIRST EAGLE FUNDS | ANNUAL REPORT | OCTOBER 31, 2011
26
Schedule of Investments | Year Ended October 31, 2011
| SHARES | | DESCRIPTION | | COST (NOTE 1) | | VALUE (NOTE 1) | |
| International Common Stocks — 42.08% — (continued) | | | |
| Spain 0.51% (e) | | | |
| | 3,295,234 | | | Red Electrica Corporation SA | | $ | 165,292,750 | | | $ | 159,975,344 | | |
| Sweden 0.30% (e) | | | |
| | 4,822,670 | | | Investor AB, Class 'A' | | | 97,284,489 | | | | 92,175,052 | | |
| Switzerland 2.49% (e) | | | |
| | 3,783,070 | | | Pargesa Holding SA | | | 237,781,696 | | | | 297,345,394 | | |
| | 5,091,560 | | | Nestlé SA | | | 146,056,200 | | | | 296,391,661 | | |
| | 33,300 | | | Lindt & Spruengli AG PC | | | 44,747,994 | | | | 103,429,266 | | |
| | 800 | | | Lindt & Spruengli AG | | | 16,046,392 | | | | 29,650,114 | | |
| | 388,803 | | | Kuehne & Nagel International AG | | | 7,503,142 | | | | 48,481,298 | | |
| | | | 452,135,424 | | | | 775,297,733 | | |
| Thailand 0.49% | | | |
| | 30,251,300 | | | Bangkok Bank PCL NVDR (e) | | | 98,647,613 | | | | 145,751,306 | | |
| | 577,000 | | | OHTL PCL (a) | | | 2,636,472 | | | | 7,505,691 | | |
| | | | 101,284,085 | | | | 153,256,997 | | |
| United Kingdom 2.09% | | | |
| | 9,342,277 | | | Berkeley Group
Holdings PLC (b)(c)(e) | | | 114,104,302
| | | | 187,944,733
| | |
| | 7,387,420 | | | GlaxoSmithKline PLC (e) | | | 140,774,624 | | | | 166,327,322 | | |
| | 3,387,940 | | | Willis Group Holdings PLC | | | 87,537,760 | | | | 123,016,102 | | |
| | 3,052,693 | | | Anglo American PLC (e) | | | 74,109,213 | | | | 112,275,125 | | |
| | 12,903,690 | | | WM Morrison
Supermarkets PLC (e) | | | 60,790,780
| | | | 62,777,862 | | |
| | | | 477,316,679 | | | | 652,341,144 | | |
| Total International Common Stocks | | | 11,409,986,370 | | | | 13,125,570,661 | | |
| Total Common Stocks | | | 20,775,208,288 | | | | 23,805,978,549 | | |
| Preferred Stocks — 1.09% | | | |
| U.S. Preferred Stock — 0.05% | | | |
| Utilities 0.05% | | | |
| | 335,000 | | | Calenergy Capital Trust III
6.50% (a)(k) | | | 14,782,812
| | | | 16,624,375
| | |
| International Preferred Stocks — 1.04% | | | |
| Germany 0.42% (e) | | | |
| | 1,754,484 | | | Hornbach Holding AG | | | 63,837,360 | | | | 129,919,412 | | |
See Notes to Financial Statements.
FIRST EAGLE FUNDS | ANNUAL REPORT | OCTOBER 31, 2011
27
Global Fund
| SHARES | | DESCRIPTION | | COST (NOTE 1) | | VALUE (NOTE 1) | |
| International Preferred Stocks — 1.04% — (continued) | | | |
| South Korea 0.62% (e) | | | |
| | 338,589 | | | Samsung Electronics Company Limited | | $ | 49,993,100 | | | $ | 193,181,566 | | |
| Total International Preferred Stocks | | | 113,830,460 | | | | 323,100,978 | | |
| Total Preferred Stocks | | | 128,613,272 | | | | 339,725,353 | | |
| Warrant — 0.20% | | | |
| United States — 0.20% | | | |
| | 5,806,899 | | | JPMorgan Chase & Co.
Warrant expire 10/28/18 (b) | | | 75,108,859
| | | | 60,972,439
| | |
| OUNCES | | | | | | | |
| Commodity — 5.79% | | | |
| | 1,051,086 | | | Gold bullion (b) | | | 586,146,006 | | | | 1,806,763,515 | | |
| PRINCIPAL | | | | | | | |
| Notes and Bonds — 2.74% | | | |
| U.S. Corporate Bonds — 0.17% | | | |
| $ | 5,467,000 | | | Bausch & Lomb, Inc.
7.125% due 08/01/28 (a) | | | 4,750,593
| | | | 4,264,260
| | |
| | 5,000,000 | | | Pulte Group, Inc.
5.20% due 02/15/15 | | | 4,516,569
| | | | 4,750,000
| | |
| | 10,238,000 | | | Vulcan Materials Company
6.50% due 12/01/16 | | | 9,449,721
| | | | 9,922,270
| | |
| | 12,554,000 | | | Yankee Candle Company, Inc.
Series 'B' 8.50% due 02/15/15 | | | 12,496,852
| | | | 12,867,850
| | |
| | 22,554,000 | | | Yankee Candle Company, Inc.
Series 'B' 9.75% due 02/15/17 | | | 21,972,083
| | | | 22,102,920
| | |
| Total U.S. Corporate Bonds | | | 53,185,818 | | | | 53,907,300 | | |
| International Notes and Bonds — 2.57% | | | |
| International Corporate Notes and Bonds — 0.30% | | | |
| Canada 0.05% | | | |
| 28,460,000
USD | | | Catalyst Paper Corporation
11.00% due 12/15/16 (a)(l) | | | 25,078,796
| | | | 16,649,100
| | |
| France 0.21% | | | |
| 15,000,000
EUR | | | Emin Leydier SA FRN
6.706% due 07/31/16 (a)(g)(h) | | | 21,410,094
| | | | 20,916,739
| | |
| 12,000,000
EUR | | | FINEL
9.50% due 06/30/17 (a)(g)(h) | | | 14,474,400
| | | | 12,550,043
| | |
| 12,050,000
EUR | | | Wendel SA
4.375% due 08/09/17 | | | 11,497,011
| | | | 14,219,635
| | |
See Notes to Financial Statements.
FIRST EAGLE FUNDS | ANNUAL REPORT | OCTOBER 31, 2011
28
Schedule of Investments | Year Ended October 31, 2011
| PRINCIPAL | | DESCRIPTION | | COST (NOTE 1) | | VALUE (NOTE 1) | |
| International Corporate Notes and Bonds — 0.30% — (continued) | | | |
| France 0.21% — (continued) | | | |
| 10,000,000
EUR | | | Wendel SA
4.875% due 09/21/15 (m) | | $ | 10,834,547
| | | $ | 13,456,435
| | |
| 3,500,000
EUR | | | Wendel SA
4.875% due 05/26/16 | | | 2,823,006
| | | | 4,441,321
| | |
| | | | 61,039,058 | | | | 65,584,173 | | |
| Norway 0.04% | | | |
| 3,170,000
USD | | | Den Norske Creditbank FRN
0.625% due 11/30/11 (a)(n) | | | 2,059,625
| | | | 1,600,850
| | |
| 3,500,000
USD | | | Den Norske Creditbank FRN
0.713% due 02/29/12 (a)(n) | | | 2,610,000
| | | | 1,767,500
| | |
| 5,500,000
USD | | | Den Norske Bank ASA FRN
0.688% due 02/28/12 (a)(n) | | | 3,888,750
| | | | 2,805,000
| | |
| 10,000,000
USD | | | Nordea Bank Norge ASA FRN
0.563% due 11/18/11 (a)(n) | | | 6,826,750
| | | | 5,900,000
| | |
| | | | 15,385,125 | | | | 12,073,350 | | |
| Total International Corporate Notes and Bonds | | | 101,502,979 | | | | 94,306,623 | | |
| International Government Bonds — 2.27% | | | |
| Hong Kong 0.72% | | | |
| 371,900,000
HKD | | | Hong Kong Government Bond
0.48% due 09/03/12 | | | 48,011,913
| | | | 48,005,406
| | |
| 732,250,000
HKD | | | Hong Kong Government Bond
2.66% due 12/17/12 | | | 96,988,508
| | | | 96,958,947
| | |
| 586,700,000
HKD | | | Hong Kong Government Bond
4.20% due 09/17/12 | | | 78,295,546
| | | | 78,239,757
| | |
| | | | 223,295,967 | | | | 223,204,110 | | |
| Japan 0.09% | | | |
| 2,183,247,000
JPY | | | Japanese Government CPI Linked Bond
1.40% due 06/10/18 (o) | | | 20,025,690
| | | | 28,855,801
| | |
| Singapore 0.49% | | | |
| 45,343,000
SGD | | | Singapore Government Bond
2.50% due 10/01/12 | | | 37,653,710
| | | | 36,953,993
| | |
| 141,626,000
SGD | | | Singapore Government Bond
3.50% due 07/01/12 | | | 117,822,839
| | | | 115,554,308
| | |
| | | | 155,476,549 | | | | 152,508,301 | | |
| South Korea 0.08% | | | |
| 25,051,740,000
KRW | | | Inflation Linked Korea Treasury Bond
2.75% due 03/10/17 (o) | | | 23,850,931
| | | | 24,690,025
| | |
See Notes to Financial Statements.
FIRST EAGLE FUNDS | ANNUAL REPORT | OCTOBER 31, 2011
29
Global Fund
| PRINCIPAL | | DESCRIPTION | | COST (NOTE 1) | | VALUE (NOTE 1) | |
| International Government Bonds — 2.27% — (continued) | | | |
| Taiwan 0.39% | | | |
| 1,767,500,000
TWD | | | Taiwan Government Bond
2.00% due 07/20/12 | | $ | 54,437,168
| | | $ | 59,668,456
| | |
| 1,826,000,000
TWD | | | Taiwan Government Bond
2.375% due 01/16/13 | | | 59,308,453
| | | | 62,265,575
| | |
| | | | 113,745,621 | | | | 121,934,031 | | |
| United Kingdom 0.50% | | | |
| 47,370,000
GBP | | | United Kingdom Gilt
5.00% due 03/07/12 | | | 76,950,394
| | | | 77,618,765
| | |
| 46,790,000
GBP | | | United Kingdom Gilt
5.25% due 06/07/12 | | | 76,910,018
| | | | 77,618,352
| | |
| | | | | | | | 153,860,412 | | | | 155,237,117 | | |
| Total International Government Bonds | | | 690,255,170 | | | | 706,429,385 | | |
| Total International Notes and Bonds | | | 791,758,149 | | | | 800,736,008 | | |
| Total Notes and Bonds | | | 844,943,967 | | | | 854,643,308 | | |
| Commercial Paper — 13.02% | | | |
| International Commercial Paper — 6.39% | | | |
| Belgium 0.57% | | | |
| 16,600,000
USD | | | Anheuser Busch InBev WorldWide, Inc.
0.22% due 11/01/11 | | | 16,600,000
| | | | 16,600,000
| | |
| 15,000,000
USD | | | Anheuser Busch InBev WorldWide, Inc.
0.30% due 12/19/11 | | | 14,994,000
| | | | 14,994,000
| | |
| 32,065,000
USD | | | Anheuser Busch InBev WorldWide, Inc.
0.30% due 12/21/11 | | | 32,051,639
| | | | 32,051,639
| | |
| 98,614,000
USD | | | Anheuser Busch InBev WorldWide, Inc.
0.30% due 01/11/12 | | | 98,555,654
| | | | 98,532,348
| | |
| 15,000,000
USD | | | Anheuser Busch InBev WorldWide, Inc.
0.30% due 01/20/12 | | | 14,990,000
| | | | 14,985,420
| | |
| France 0.80% | | | |
| 17,832,000
USD | | | Électricité de France
0.27% due 11/04/11 | | | 17,831,599
| | | | 17,831,599
| | |
| 55,417,000
USD | | | Électricité de France
0.34% due 12/02/11 | | | 55,401,253
| | | | 55,401,253
| | |
| 23,818,000
USD | | | Électricité de France
0.34% due 12/07/11 | | | 23,810,140
| | | | 23,810,140
| | |
| 20,000,000
USD | | | EI du Pont de Nemours & Company
0.17% due 01/17/12 | | | 19,992,728
| | | | 19,985,874
| | |
| 42,000,000
USD | | | Sanofi
0.13% due 12/14/11 | | | 41,993,478
| | | | 41,993,478
| | |
| 39,000,000
USD | | | Sanofi
0.13% due 12/20/11 | | | 38,993,099
| | | | 38,993,099
| | |
See Notes to Financial Statements.
FIRST EAGLE FUNDS | ANNUAL REPORT | OCTOBER 31, 2011
30
Schedule of Investments | Year Ended October 31, 2011
| PRINCIPAL | | DESCRIPTION | | COST (NOTE 1) | | VALUE (NOTE 1) | |
| International Commercial Paper — 6.39% — (continued) | | | |
| France 0.80% — (continued) | | | |
| 52,000,000
USD | | | Total SA
0.12% due 01/18/12 | | $ | 51,986,480
| | | $ | 51,965,997
| | |
| Germany 0.28% | | | |
| 10,400,000
USD | | | BMW
0.27% due 11/01/11 | | | 10,400,000
| | | | 10,400,000
| | |
| 27,967,000
USD | | | Siemens Company
0.11% due 12/23/11 | | | 27,962,556
| | | | 27,962,556
| | |
| 50,000,000
USD | | | Siemens Company
0.14% due 12/19/11 | | | 49,990,667
| | | | 49,990,667
| | |
| Italy 0.60% | | | |
| 30,000,000
USD | | | Eni S.p.A
0.22% due 11/02/11 | | | 29,999,817
| | | | 29,999,817
| | |
| 12,083,000
USD | | | Eni S.p.A
0.29% due 12/29/11 | | | 12,077,354
| | | | 12,077,354
| | |
| 10,000,000
USD | | | Eni S.p.A
0.30% due 12/12/11 | | | 9,996,583
| | | | 9,996,583
| | |
| 26,800,000
USD | | | Eni S.p.A
0.30% due 12/13/11 | | | 26,790,620
| | | | 26,790,620
| | |
| 56,168,000
USD | | | Eni S.p.A
0.34% due 12/15/11 | | | 56,145,346
| | | | 56,145,346
| | |
| 20,953,000
USD | | | Eni S.p.A
0.36% due 12/20/11 | | | 20,943,018
| | | | 20,943,018
| | |
| 30,000,000
USD | | | Eni S.p.A
0.43% due 01/04/12 | | | 29,977,600
| | | | 29,983,749
| | |
| Japan 2.43% | | | |
| 11,743,000
USD | | | Honda Corporation
0.14% due 11/09/11 | | | 11,742,635
| | | | 11,742,635
| | |
| 50,000,000
USD | | | Honda Corporation
0.14% due 01/06/12 | | | 49,987,167
| | | | 49,971,710
| | |
| 50,000,000
USD | | | Mitsubishi Company
0.20% due 11/22/11 | | | 49,994,167
| | | | 49,994,167
| | |
| 40,000,000
USD | | | Mitsubishi Company
0.23% due 02/15/12 | | | 39,972,911
| | | | 39,954,348
| | |
| 30,000,000
USD | | | Mitsubishi Company
0.27% due 11/04/11 | | | 29,999,325
| | | | 29,999,325
| | |
| 30,000,000
USD | | | Mitsui & Company, Limited
0.20% due 01/18/12 | | | 29,987,000
| | | | 29,978,406
| | |
| 38,663,000
USD | | | Mitsui & Company, Limited
0.22% due 11/04/11 | | | 38,662,291
| | | | 38,662,291
| | |
| 42,154,000
USD | | | Mitsui & Company, Limited
0.22% due 12/13/11 | | | 42,143,180
| | | | 42,143,180
| | |
| 50,000,000
USD | | | Mitsui & Company, Limited
0.24% due 11/09/11 | | | 49,997,333
| | | | 49,997,333
| | |
See Notes to Financial Statements.
FIRST EAGLE FUNDS | ANNUAL REPORT | OCTOBER 31, 2011
31
Global Fund
| PRINCIPAL | | DESCRIPTION | | COST (NOTE 1) | | VALUE (NOTE 1) | |
| International Commercial Paper — 6.39% — (continued) | | | |
| Japan 2.43% — (continued) | | | |
| 25,000,000
USD | | | Mitsui & Company, Limited
0.24% due 11/15/11 | | $ | 24,997,667
| | | $ | 24,997,667
| | |
| 50,000,000
USD | | | Mitsui & Company, Limited
0.26% due 12/09/11 | | | 49,986,278
| | | | 49,986,278
| | |
| 30,000,000
USD | | | Sumitomo Corporation
0.28% due 11/08/11 | | | 29,998,367
| | | | 29,998,367
| | |
| 12,911,000
USD | | | Sumitomo Corporation
0.28% due 11/15/11 | | | 12,909,594
| | | | 12,909,594
| | |
| 44,445,000
USD | | | Sumitomo Corporation
0.30% due 12/06/11 | | | 44,432,037
| | | | 44,432,037
| | |
| 50,000,000
USD | | | Toyota Motor Corporation
0.19% due 11/03/11 | | | 49,999,472
| | | | 49,999,472
| | |
| 35,000,000
USD | | | Toyota Motor Corporation
0.20% due 12/02/11 | | | 34,993,972
| | | | 34,993,972
| | |
| 25,000,000
USD | | | Toyota Motor Corporation
0.21% due 11/15/11 | | | 24,997,958
| | | | 24,997,958
| | |
| 40,949,000
USD | | | Toyota Motor Corporation
0.23% due 01/12/12 | | | 40,930,163
| | | | 40,932,809
| | |
| 40,000,000
USD | | | Toyota Motor Corporation
0.25% due 12/29/11 | | | 39,983,889
| | | | 39,983,889
| | |
| 35,000,000
USD | | | Toyota Motor Corporation
0.29% due 12/30/11 | | | 34,983,365
| | | | 34,983,365
| | |
| 4,941,000
USD | | | Toyota Motor Corporation
0.30% due 02/08/12 | | | 4,936,924
| | | | 4,937,390
| | |
| 20,500,000
USD | | | Toyota Motor Corporation
0.34% due 02/02/12 | | | 20,482,524
| | | | 20,486,671
| | |
| Switzerland 0.42% | | | |
| 12,697,000
USD | | | Nestlé SA
0.10% due 12/12/11 | | | 12,695,554
| | | | 12,695,554
| | |
| 30,000,000
USD | | | Nestlé SA
0.12% due 11/02/11 | | | 29,999,900
| | | | 29,999,900
| | |
| 36,622,000
USD | | | Nestlé SA
0.13% due 12/01/11 | | | 36,618,033
| | | | 36,618,033
| | |
| 8,093,000
USD | | | Nestlé SA
0.14% due 11/09/11 | | | 8,092,748
| | | | 8,092,748
| | |
| 44,100,000
USD | | | Novartis International AG
0.18% due 11/14/11 | | | 44,097,133
| | | | 44,097,133
| | |
| United Kingdom 1.29% | | | |
| 69,277,000
USD | | | BP PLC
0.20% due 01/13/12 | | | 69,248,904
| | | | 69,262,334
| | |
| 20,579,000
USD | | | BP PLC
0.20% due 03/26/12 | | | 20,562,308
| | | | 20,563,286
| | |
See Notes to Financial Statements.
FIRST EAGLE FUNDS | ANNUAL REPORT | OCTOBER 31, 2011
32
Schedule of Investments | Year Ended October 31, 2011
| PRINCIPAL | | DESCRIPTION | | COST (NOTE 1) | | VALUE (NOTE 1) | |
| International Commercial Paper — 6.39% — (continued) | | | |
| United Kingdom 1.29% — (continued) | | | |
| 30,000,000
USD | | | BP PLC
0.20% due 04/03/12 | | $ | 29,974,333
| | | $ | 29,975,457
| | |
| 30,000,000
USD | | | Diageo Capital PLC
0.41% due 11/29/11 | | | 29,990,667
| | | | 29,990,667
| | |
| 14,109,000
USD | | | Diageo Capital PLC
0.42% due 11/08/11 | | | 14,107,875
| | | | 14,107,875
| | |
| 50,000,000
USD | | | Diageo Capital PLC
0.44% due 11/18/11 | | | 49,989,847
| | | | 49,989,847
| | |
| 44,181,000
USD | | | Diageo Capital PLC
0.46% due 11/28/11 | | | 44,166,089
| | | | 44,166,089
| | |
| 50,000,000
USD | | | Diageo Capital PLC
0.47% due 12/12/11 | | | 49,973,805
| | | | 49,973,805
| | |
| 25,000,000
USD | | | Diageo Capital PLC
0.51% due 11/30/11 | | | 24,989,931
| | | | 24,989,931
| | |
| 50,000,000
USD | | | Reckitt Benckiser Group PLC
0.39% due 12/05/11 | | | 49,982,056
| | | | 49,982,056
| | |
| 20,000,000
USD | | | Reckitt Benckiser Group PLC
0.39% due 12/09/11 | | | 19,991,978
| | | | 19,991,978
| | |
| Total International Commercial Paper | | | 1,992,083,011 | | | | 1,992,014,114 | | |
| U.S. Commercial Paper — 6.63% | | | |
| $ | 9,250,000 | | | Avery Dennison Corporation
0.30% due 11/01/11 | | | 9,250,000
| | | | 9,250,000
| | |
| | 39,821,000 | | | Campbell Soup Company
0.20% due 01/09/12 | | | 39,805,735
| | | | 39,813,490
| | |
| | 4,000,000 | | | Caterpillar Corporation
0.09% due 12/20/11 | | | 3,999,510
| | | | 3,999,510
| | |
| | 32,246,000 | | | Caterpillar Corporation
0.09% due 12/22/11 | | | 32,241,889
| | | | 32,241,889
| | |
| | 34,463,000 | | | Coca-Cola Company
0.13% due 11/01/11 | | | 34,463,000
| | | | 34,463,000
| | |
| | 95,000,000 | | | Coca-Cola Company
0.13% due 12/14/11 | | | 94,985,249
| | | | 94,985,249
| | |
| | 37,500,000 | | | Coca-Cola Company
0.14% due 12/07/11 | | | 37,494,750
| | | | 37,494,750
| | |
| | 27,874,000 | | | Coca-Cola Company
0.14% due 01/10/12 | | | 27,866,412
| | | | 27,868,612
| | |
| | 50,000,000 | | | Coca-Cola Company
0.16% due 01/05/12 | | | 49,985,556
| | | | 49,991,750
| | |
| | 50,000,000 | | | Coca-Cola Company
0.16% due 01/19/12 | | | 49,982,444
| | | | 49,987,445
| | |
| | 19,528,000 | | | Coca-Cola Company
0.17% due 02/10/12 | | | 19,518,686
| | | | 19,520,144
| | |
See Notes to Financial Statements.
FIRST EAGLE FUNDS | ANNUAL REPORT | OCTOBER 31, 2011
33
Global Fund
| PRINCIPAL | | DESCRIPTION | | COST (NOTE 1) | | VALUE (NOTE 1) | |
| U.S. Commercial Paper — 6.63% — (continued) | | | |
| $ | 25,000,000 | | | ConocoPhillips
0.14% due 11/16/11 | | $ | 24,998,542
| | | $ | 24,998,542
| | |
| | 34,307,000 | | | ConocoPhillips
0.16% due 11/07/11 | | | 34,306,085
| | | | 34,306,085
| | |
| | 23,146,000 | | | ConocoPhillips
0.16% due 12/06/11 | | | 23,142,399
| | | | 23,142,399
| | |
| | 46,950,000 | | | ConocoPhillips
0.20% due 11/18/11 | | | 46,945,566
| | | | 46,945,566
| | |
| | 24,700,000 | | | ConocoPhillips
0.22% due 01/25/12 | | | 24,687,170
| | | | 24,692,743
| | |
| | 27,400,000 | | | ConocoPhillips
0.23% due 12/23/11 | | | 27,390,897
| | | | 27,390,897
| | |
| | 20,000,000 | | | ConocoPhillips
0.30% due 01/26/12 | | | 19,985,667
| | | | 19,993,958
| | |
| | 7,812,000 | | | ConocoPhillips
0.33% due 01/11/12 | | | 7,807,070
| | | | 7,810,438
| | |
| | 38,928,000 | | | Dell, Inc.
0.19% due 04/09/12 | | | 38,895,127
| | | | 38,838,341
| | |
| | 35,000,000 | | | Dell, Inc.
0.36% due 07/09/12 | | | 34,914,590
| | | | 34,834,380
| | |
| | 31,500,000 | | | Dell, Inc.
0.36% due 07/11/12 | | | 31,422,519
| | | | 31,348,425
| | |
| | 28,071,000 | | | Dell, Inc.
0.36% due 07/18/12 | | | 28,000,043
| | | | 27,927,931
| | |
| | 35,000,000 | | | Hewlett-Packard Company
0.16% due 11/01/11 | | | 35,000,000
| | | | 35,000,000
| | |
| | 15,000,000 | | | Hewlett-Packard Company
0.16% due 12/05/11 | | | 14,997,733
| | | | 14,997,733
| | |
| | 25,000,000 | | | Hewlett-Packard Company
0.17% due 01/03/12 | | | 24,992,562
| | | | 24,988,755
| | |
| | 25,000,000 | | | Hewlett-Packard Company
0.18% due 01/18/12 | | | 24,990,250
| | | | 24,985,572
| | |
| | 10,743,000 | | | Hewlett-Packard Company
0.18% due 01/20/12 | | | 10,738,703
| | | | 10,736,619
| | |
| | 12,171,000 | | | Hewlett-Packard Company
0.30% due 01/17/12 | | | 12,163,190
| | | | 12,164,090
| | |
| | 40,000,000 | | | Honeywell International, Inc.
0.14% due 03/30/12 | | | 39,976,667
| | | | 39,967,956
| | |
| | 3,000,000 | | | Kraft Foods, Inc.
0.15% due 11/01/11 | | | 3,000,000
| | | | 3,000,000
| | |
| | 50,000,000 | | | Kraft Foods, Inc.
0.36% due 11/21/11 | | | 49,990,278
| | | | 49,990,278
| | |
| | 35,000,000 | | | Kraft Foods, Inc.
0.36% due 11/28/11 | | | 34,990,812
| | | | 34,990,812
| | |
See Notes to Financial Statements.
FIRST EAGLE FUNDS | ANNUAL REPORT | OCTOBER 31, 2011
34
Schedule of Investments | Year Ended October 31, 2011
| PRINCIPAL | | DESCRIPTION | | COST (NOTE 1) | | VALUE (NOTE 1) | |
| U.S. Commercial Paper — 6.63% — (continued) | | | |
| $ | 3,600,000 | | | NYSE Euronext
0.28% due 11/01/11 | | $ | 3,600,000
| | | $ | 3,600,000
| | |
| | 40,000,000 | | | PepsiCo, Inc.
0.07% due 01/06/12 | | | 39,994,867
| | | | 39,993,152
| | |
| | 42,519,000 | | | Philip Morris International, Inc.
0.08% due 11/07/11 | | | 42,518,433
| | | | 42,518,433
| | |
| | 23,062,000 | | | Philip Morris International, Inc.
0.10% due 12/16/11 | | | 23,059,117
| | | | 23,059,117
| | |
| | 50,000,000 | | | Philip Morris International, Inc.
0.12% due 01/23/12 | | | 49,986,167
| | | | 49,960,565
| | |
| | 50,000,000 | | | Philip Morris International, Inc.
0.12% due 02/07/12 | | | 49,983,667
| | | | 49,949,400
| | |
| | 47,946,000 | | | Philip Morris International, Inc.
0.13% due 02/06/12 | | | 47,929,206
| | | | 47,898,231
| | |
| | 38,730,000 | | | Proctor & Gamble Company
0.10% due 02/13/12 | | | 38,718,811
| | | | 38,717,010
| | |
| | 25,000,000 | | | Proctor & Gamble Company
0.10% due 02/14/12 | | | 24,992,708
| | | | 24,991,460
| | |
| | 47,500,000 | | | Proctor & Gamble Company
0.10% due 02/21/12 | | | 47,485,222
| | | | 47,481,660
| | |
| | 35,500,000 | | | Proctor & Gamble Company
0.10% due 02/22/12 | | | 35,488,857
| | | | 35,486,059
| | |
| | 49,994,000 | | | Proctor & Gamble Company
0.10% due 03/01/12 | | | 49,977,196
| | | | 49,971,638
| | |
| | 15,000,000 | | | Proctor & Gamble Company
0.11% due 11/10/11 | | | 14,999,587
| | | | 14,999,587
| | |
| | 38,999,000 | | | Proctor & Gamble Company
0.11% due 11/16/11 | | | 38,997,213
| | | | 38,997,213
| | |
| | 44,000,000 | | | Proctor & Gamble Company
0.11% due 11/17/11 | | | 43,997,849
| | | | 43,997,849
| | |
| | 30,000,000 | | | Proctor & Gamble Company
0.12% due 11/10/11 | | | 29,999,100
| | | | 29,999,100
| | |
| | 48,345,000 | | | Questar Corporation
0.22% due 11/10/11 | | | 48,342,341
| | | | 48,342,341
| | |
| | 50,000,000 | | | Sherwin-Williams Company
0.22% due 01/25/12 | | | 49,974,028
| | | | 49,950,790
| | |
| | 58,000,000 | | | Sherwin-Williams Company
0.23% due 12/16/11 | | | 57,983,325
| | | | 57,983,325
| | |
| | 39,000,000 | | | Verizon Communications, Inc.
0.30% due 11/21/11 | | | 38,993,500
| | | | 38,993,500
| | |
| | 40,000,000 | | | Verizon Communications, Inc.
0.31% due 11/17/11 | | | 39,994,489
| | | | 39,994,489
| | |
| | 20,000,000 | | | Verizon Communications, Inc.
0.33% due 11/07/11 | | | 19,998,933
| | | | 19,998,933
| | |
See Notes to Financial Statements.
FIRST EAGLE FUNDS | ANNUAL REPORT | OCTOBER 31, 2011
35
Global Fund
| PRINCIPAL | | DESCRIPTION | | COST (NOTE 1) | | VALUE (NOTE 1) | |
| U.S. Commercial Paper — 6.63% — (continued) | | | |
| $ | 25,316,000 | | | Verizon Communications, Inc.
0.33% due 11/14/11 | | $ | 25,313,075
| | | $ | 25,313,075
| | |
| | 50,000,000 | | | Verizon Communications, Inc.
0.34% due 11/14/11 | | | 49,994,042
| | | | 49,994,042
| | |
| | 40,000,000 | | | Walt Disney Company
0.08% due 01/20/12 | | | 39,992,889
| | | | 39,987,040
| | |
| | 30,130,000 | | | Walt Disney Company
0.09% due 02/07/12 | | | 30,122,618
| | | | 30,117,074
| | |
| | 20,000,000 | | | WellPoint, Inc.
0.30% due 11/08/11 | | | 19,998,833
| | | | 19,998,833
| | |
| | 15,000,000 | | | WellPoint, Inc.
0.30% due 12/12/11 | | | 14,994,875
| | | | 14,994,875
| | |
| | 15,000,000 | | | WellPoint, Inc.
0.41% due 12/22/11 | | | 14,991,500
| | | | 14,991,500
| | |
| | 20,000,000 | | | WellPoint, Inc.
0.41% due 01/17/12 | | | 19,982,889
| | | | 19,989,514
| | |
| | 5,411,000 | | | WellPoint, Inc.
0.41% due 02/07/12 | | | 5,405,108
| | | | 5,407,191
| | |
| | 10,000,000 | | | WellPoint, Inc.
0.41% due 02/29/12 | | | 9,986,667
| | | | 9,990,891
| | |
| | 5,800,000 | | | Western Union Company
0.30% due 11/01/11 | | | 5,800,000
| | | | 5,800,000
| | |
| | 3,000,000 | | | Whirlpool Corporation
0.66% due 11/02/11 | | | 2,999,946
| | | | 2,999,946
| | |
| Total U.S. Commercial Paper | | | 2,069,526,159 | | | | 2,069,135,192 | | |
| Total Commercial Paper | | | 4,061,609,170 | | | | 4,061,149,306 | | |
Total Investment Portfolio
Excluding Options Written — 99.16% | | $ | 26,471,629,562 | | | $ | 30,929,232,470 | | |
| CONTRACTS | | | | STRIKE PRICE | | EXPIRATION DATE | | VALUE (NOTE 1) | |
| Covered Call Options Written — (0.01)% | |
| | 15,050 | | | KLA-Tencor Corporation | | $ | 55.00 | | | March 2012 | | $ | (1,881,250 | ) | |
| | 2,500 | | | Mastercard, Inc., Class 'A' | | | 390.00 | | | November 2011 | | | (487,500 | ) | |
| Total Covered Call Options Written (Premiums Received: $2,030,334) | | | | | | | | | (2,368,750 | ) | |
| Total Investments — 99.15% (Cost: $26,469,599,228) | | | | | | | | | 30,926,863,720 | | |
| Other Assets in Excess of Liabilities — 0.85% | | | | | | | | | 265,245,182 | | |
| Net Assets — 100.00% | | | | | | | | $ | 31,192,108,902 | | |
See Notes to Financial Statements.
FIRST EAGLE FUNDS | ANNUAL REPORT | OCTOBER 31, 2011
36
Schedule of Investments | Year Ended October 31, 2011
(a) Security is deemed illiquid. At October 31, 2011, the value of these securities amounted to $142,160,508 or 0.46% of net assets.
(b) Non-income producing security/commodity.
(c) An affiliate of the Fund as defined by the Investment Company Act of 1940. An affiliate is defined as a company in which the Fund directly or indirectly owns, controls, or holds power to vote 5% or more of the outstanding voting securities.
(d) At October 31, 2011, all or a portion of this security was segregated to cover collateral requirement for options.
(e) Securities with a total market value equal to $11,501,705,483 have been fair valued based on fair value adjustment factors at October 31, 2011.
(f) Represents variable voting shares.
(g) Securities valued in accordance with fair value procedures under the supervision of the Board of Trustees, representing $44,531,261 or 0.14% of net assets.
(h) Represents securities that are subject to legal or contractual restrictions on resale. At October 31, 2011, the value of these securities amounted to $39,490,803 or 0.13% of net assets.
(i) Held through Financiere Rouge, LLC, wholly owned holding company and disregarded entity for U.S. tax purposes.
(j) Represents non-voting class of shares.
(k) This security is convertible until September 1, 2027 and is subject to a call feature and may be called in full or partially on or anytime after November 21, 2011.
(l) All or a portion of the security is exempt from registration under the Securities Act of 1933. Rule 144A securities may only be sold to qualified institutional buyers, pursuant to Rule 144A under the Securities Act of 1933.
(m) Represents a security registered under Regulation S. Bonds sold under Regulation S may not be offered, sold or delivered within the U.S., or for the account or benefit of, U.S. persons, except pursuant to an exemption from, or in a transaction not subject to, the registration requirements of the Securities Act of 1933.
(n) Floating rate security. Rate shown is the rate in effect at October 31, 2011.
(o) Inflation protected security.
At October 31, 2011, aggregate cost for federal income tax purposes was $26,803,665,015. Net unrealized appreciation consisted of:
| Gross unrealized appreciation | | $ | 5,731,709,511 | | |
| Gross unrealized depreciation | | | (1,608,510,806 | ) | |
| Net unrealized appreciation | | $ | 4,123,198,705 | | |
Abbreviations used in this schedule include:
ADR — American Depository Receipt
CPI — Consumer Price Index
FRN — Floating Rate Note
NVDR — Non-Voting Depository Receipt
NYSE — New York Stock Exchange
PC — Participation Certificate
PCL — Public Company Limited
PLC — Public Limited Company
REIT — Real Estate Investment Trust
RSP — Represents Non-Voting Shares
See Notes to Financial Statements.
FIRST EAGLE FUNDS | ANNUAL REPORT | OCTOBER 31, 2011
37
Global Fund
Currencies
EUR — Euro
GBP — British Pound
HKD — Hong Kong Dollar
JPY — Japanese Yen
KRW — South Korean Won
SGD — Singapore Dollar
TWD — Taiwan Dollar
USD — United States Dollar
| RESTRICTED SECURITIES | | ACQUISITION
DATE | | COST | | CARRYING VALUE PER
SHARE/PRINCIPAL | |
| Emin Leydier SA FRN 6.71% due 7/31/16 | | 07/30/09 | | $ | 21,410,094 | | | $ | 1.39 | | |
| FINEL 9.50% due 6/30/17 | | 06/22/05 | | | 14,474,400 | | | | 1.05 | | |
| FINEL | | 07/30/09 | | | — | | | | 0.50 | | |
Foreign Currency Exchange Contracts — Sales
SETTLEMENT
DATES
THROUGH | | FOREIGN CURRENCY
TO BE DELIVERED | | U.S. $
TO BE
RECEIVED | | U.S. $ VALUE
AT OCTOBER 31,
2011 | | UNREALIZED
APPRECIATION
AT OCTOBER 31,
2011 | | UNREALIZED
DEPRECIATION
AT OCTOBER 31,
2011 | |
| 12/14/11 | | | 165,092,000 | | | Euro | | $ | 236,081,560 | | | $ | 230,128,837 | | | $ | 5,952,723 | | | $ | — | | |
| 02/15/12 | | | 293,676,000 | | | Euro | | | 416,426,299 | | | | 409,350,663 | | | | 7,075,636 | | | | — | | |
| 03/21/12 | | | 201,863,000 | | | Euro | | | 276,945,943 | | | | 281,306,705 | | | | — | | | | (4,360,762 | ) | |
| 04/18/12 | | | 303,458,000 | | | Euro | | | 420,963,919 | | | | 422,886,095 | | | | — | | | | (1,922,176 | ) | |
| 12/14/11 | | | 22,444,444,000 | | | Japanese Yen | | | 279,507,397 | | | | 288,145,028 | | | | — | | | | (8,637,631 | ) | |
| 02/15/12 | | | 50,563,655,000 | | | Japanese Yen | | | 651,642,709 | | | | 649,624,009 | | | | 2,018,700 | | | | — | | |
| 03/21/12 | | | 21,649,698,000 | | | Japanese Yen | | | 283,058,089 | | | | 278,498,401 | | | | 4,559,688 | | | | — | | |
| 04/18/12 | | | 78,299,847,000 | | | Japanese Yen | | | 1,002,613,410 | | | | 1,006,846,807 | | | | — | | | | (4,233,397 | ) | |
| | | | | | | $ | 3,567,239,326 | | | $ | 3,566,786,545 | | | $ | 19,606,747 | | | $ | (19,153,966 | ) | |
Affiliated Securities
AFFILIATED
SECURITIES | | SHARES
OCTOBER 31,
2010 | | GROSS
ADDITIONS | | GROSS
REDUCTIONS | | SHARES
OCTOBER 31,
2011 | | MARKET VALUE
OCTOBER 31,
2011 | | REALIZED
GAIN/(LOSS) | | DIVIDEND
INCOME | |
Alliant
Techsystems,
Inc. | | | 2,864,349 | | | | 473,404 | | | | — | | | | 3,337,753 | | | $ | 193,856,694 | | | $ | — | | | $ | 1,907,971 | | |
Ariake
Japan
Company
Limited | | | 1,725,100 | | | | — | | | | — | | | | 1,725,100 | | | | 29,992,959 | | | | — | | | | 809,860 | | |
Berkeley
Group
Holdings
PLC | | | 8,354,385 | | | | 987,892 | | | | — | | | | 9,342,277 | | | | 187,944,733 | | | | — | | | | — | | |
Blount
International,
Inc. | | | 9,778,961 | | | | — | | | | 2,204,369 | | | | 7,574,592 | | | | 117,633,414 | | | | 550,489 | | | | — | | |
See Notes to Financial Statements.
FIRST EAGLE FUNDS | ANNUAL REPORT | OCTOBER 31, 2011
38
Schedule of Investments | Year Ended October 31, 2011
Affiliated Securities — (continued)
AFFILIATED
SECURITIES | | SHARES
OCTOBER 31,
2010 | | GROSS
ADDITIONS | | GROSS
REDUCTIONS | | SHARES
OCTOBER 31,
2011 | | MARKET VALUE
OCTOBER 31,
2011 | | REALIZED
GAIN/(LOSS) | | DIVIDEND
INCOME | |
Chofu
Seisakusho
Company
Limited | | | 3,501,380 | | | | 24,900 | | | | — | | | | 3,526,280 | | | $ | 90,190,066 | | | $ | — | | | $ | 1,198,017 | | |
Cincinnati
Financial
Corporation | | | 8,975,246 | | | | 566,800 | | | | — | | | | 9,542,046 | | | | 276,146,811 | | | | — | | | | 14,610,969 | | |
Cintas
Corporation | | | 13,051,511 | | | | — | | | | — | | | | 13,051,511 | | | | 390,109,664 | | | | — | | | | 6,395,240 | | |
City
e-Solutions
Limited | | | 20,738,780 | | | | — | | | | — | | | | 20,738,780 | | | | 2,305,405 | | | | — | | | | — | | |
Deltic
Timber
Corporation | | | 1,258,500 | | | | — | | | | — | | | | 1,258,500 | | | | 85,187,865 | | | | — | | | | 377,550 | | |
| FINEL | | | 12,000,000 | | | | — | | | | — | | | | 12,000,000 | | | | 6,024,021 | | | | — | | | | — | | |
Guyenne et
Gascogne SA | | | 956,044 | | | | — | | | | — | | | | 956,044 | | | | 110,368,805 | | | | — | | | | 5,499,735 | | |
Hirose
Electric
Company
Limited | | | 1,775,270 | | | | 543,230 | | | | — | | | | 2,318,500 | | | | 222,822,977 | | | | — | | | | 3,752,580 | | |
IDACorp,
Inc. | | | 4,117,660 | | | | — | | | | 357,175 | | | | 3,760,485 | | | | 151,848,384 | | | | 1,768,353 | | | | 4,834,040 | | |
Meitec
Corporation | | | 2,719,100 | | | | — | | | | — | | | | 2,719,100 | | | | 50,780,109 | | | | — | | | | 1,803,040 | | |
Mills Music
Trust | | | 34,924 | | | | — | | | | — | | | | 34,924 | | | | 1,327,112 | | | | — | | | | 130,563 | | |
MISUMI
Group, Inc. | | | 13,629,830 | | | | — | | | | 817,970 | | | | 12,811,860 | | | | 267,349,719 | | | | 4,959,635 | | | | 1,520,619 | | |
Namyang
Dairy
Products
Company
Limited | | | 39,989 | | | | — | | | | — | | | | 39,989 | | | | 28,218,190 | | | | — | | | | 29,128 | | |
| Neopost SA | | | 2,306,626 | | | | — | | | | 262,189 | | | | 2,044,437 | | | | 156,702,550 | | | | (3,063,134 | ) | | | 9,747,125 | | |
| NSC Groupe | | | 69,500 | | | | — | | | | — | | | | 69,500 | | | | 4,651,883 | | | | — | | | | — | | |
Pfeiffer
Vacuum
Technology
AG* | | | 1,172,304 | | | | — | | | | 790,144 | | | | 382,160 | | | | 38,923,222 | | | | 23,916,680 | | | | 1,639,380 | | |
| Robertet SA | | | 160,048 | | | | — | | | | 2,788 | | | | 157,260 | | | | 27,208,989 | | | | (23,422 | ) | | | 518,377 | | |
| Sabeton SA | | | 385,000 | | | | — | | | | — | | | | 385,000 | | | | 6,926,523 | | | | — | | | | 102,820 | | |
San Juan
Basin
Royalty
Trust | | | 3,975,644 | | | | — | | | | — | | | | 3,975,644 | | | | 97,164,739 | | | | — | | | | 5,464,900 | | |
Shimano,
Inc. | | | 7,096,370 | | | | 513,020 | | | | — | | | | 7,609,390 | | | | 377,219,147 | | | | — | | | | 5,060,578 | | |
Société
Télévision
Francaise 1 | | | — | | | | 11,533,583 | | | | — | | | | 11,533,583 | | | | 156,063,300 | | | | — | | | | — | | |
See Notes to Financial Statements.
FIRST EAGLE FUNDS | ANNUAL REPORT | OCTOBER 31, 2011
39
Global Fund
Affiliated Securities — (continued)
AFFILIATED
SECURITIES | | SHARES
OCTOBER 31,
2010 | | GROSS
ADDITIONS | | GROSS
REDUCTIONS | | SHARES
OCTOBER 31,
2011 | | MARKET VALUE
OCTOBER 31,
2011 | | REALIZED
GAIN/(LOSS) | | DIVIDEND
INCOME | |
Sucrière de
Pithiviers-
Le-Vieil | | | 63,019 | | | | — | | | | — | | | | 63,019 | | | $ | 145,280,558 | | | $ | — | | | $ | 3,244,742 | | |
T. Hasegawa
Company
Limited | | | 5,147,000 | | | | — | | | | — | | | | 5,147,000 | | | | 81,766,918 | | | | — | | | | 1,521,925 | | |
| Total | | | | | | | | | | $ | 3,304,014,757 | | | $ | 28,108,601 | | | $ | 70,169,159 | | |
* Represents an unaffiliated issuer as of October 31, 2011, as such, amounts represented above will not agree to balances in the Statement of Assets and Liabilities and Statement of Operations.
| INDUSTRY DIVERSIFICATION FOR PORTFOLIO HOLDINGS | | PERCENT OF
NET ASSETS | |
| U.S. Common Stocks | |
| Consumer Discretionary | | | 2.78 | % | |
| Consumer Staples | | | 3.07 | | |
| Energy | | | 2.18 | | |
| Financials | | | 9.18 | | |
| Health Care | | | 0.79 | | |
| Industrials | | | 4.96 | | |
| Information Technology | | | 6.71 | | |
| Materials | | | 2.13 | | |
| Utilities | | | 2.44 | | |
| Total U.S. Common Stocks | | | 34.24 | | |
| International Common Stocks | |
| Consumer Discretionary | | | 5.82 | | |
| Consumer Staples | | | 4.51 | | |
| Energy | | | 2.58 | | |
| Financials | | | 5.58 | | |
| Health Care | | | 3.51 | | |
| Industrials | | | 8.43 | | |
| Information Technology | | | 3.64 | | |
| Materials | | | 6.38 | | |
| Telecommunication Services | | | 1.12 | | |
| Utilities | | | 0.51 | | |
| Total International Common Stocks | | | 42.08 | | |
See Notes to Financial Statements.
FIRST EAGLE FUNDS | ANNUAL REPORT | OCTOBER 31, 2011
40
Schedule of Investments | Year Ended October 31, 2011
| INDUSTRY DIVERSIFICATION FOR PORTFOLIO HOLDINGS — (CONTINUED) | | PERCENT OF
NET ASSETS | |
| U.S. Preferred Stock | |
| Utilities | | | 0.05 | % | |
| Total U.S. Preferred Stock | | | 0.05 | | |
| International Preferred Stocks | |
| Consumer Discretionary | | | 0.42 | | |
| Information Technology | | | 0.62 | | |
| Total International Preferred Stocks | | | 1.04 | | |
| Warrant | | | 0.20 | | |
| Commodity | | | 5.79 | | |
| U.S. Corporate Bonds | |
| Consumer Discretionary | | | 0.14 | | |
| Materials | | | 0.03 | | |
| Total U.S. Corporate Bonds | | | 0.17 | | |
| International Notes and Bonds | |
| Financials | | | 0.08 | | |
| Government Issues | | | 2.27 | | |
| Industrials | | | 0.10 | | |
| Materials | | | 0.12 | | |
| Total International Notes and Bonds | | | 2.57 | | |
| Commercial Paper | |
| International Commercial Paper | | | 6.39 | | |
| U.S. Commercial Paper | | | 6.63 | | |
| Total Commercial Paper | | | 13.02 | | |
| Covered Call Options Written | | | (0.01 | ) | |
| Total Investments | | | 99.15 | % | |
See Notes to Financial Statements.
FIRST EAGLE FUNDS | ANNUAL REPORT | OCTOBER 31, 2011
41

Fund Overview | Data as of October 31, 2011 (unaudited)
INVESTMENT OBJECTIVE
The First Eagle Overseas Fund seeks long-term growth of capital by investing primarily in equities issued by non-U.S. corporations. Management's research-driven process seeks to minimize risk by focusing on undervalued securities.
| Average Annual Returns | |
| | | ONE-YEAR | | FIVE-YEARS | | TEN-YEARS | |
First Eagle Overseas
Fund (A Shares) | |
| without sales load | | | 4.27 | % | | | 5.02 | % | | | 13.66 | % | |
| with sales load | | | -0.94 | | | | 3.94 | | | | 13.08 | | |
| MSCI EAFE Index | | | -4.08 | | | | -2.41 | | | | 5.73 | | |
| Consumer Price Index | | | 3.53 | | | | 2.33 | | | | 2.45 | | |
Asset Allocation*

| Countries* | |
| Japan | | | 30.06 | % | |
| France | | | 10.61 | | |
| United States | | | 7.97 | | |
| Germany | | | 5.23 | | |
| Switzerland | | | 4.22 | | |
| South Korea | | | 3.59 | | |
| Singapore | | | 3.35 | | |
| United Kingdom | | | 3.27 | | |
| Mexico | | | 2.76 | | |
| Hong Kong | | | 2.34 | | |
| Canada | | | 2.32 | | |
| South Africa | | | 1.78 | | |
| Thailand | | | 1.77 | | |
| Austria | | | 1.35 | | |
| Netherlands | | | 1.28 | | |
| Australia | | | 1.01 | | |
| Malaysia | | | 0.91 | | |
| Spain | | | 0.81 | | |
| Brazil | | | 0.80 | | |
| Taiwan | | | 0.80 | | |
| Bermuda | | | 0.50 | | |
| Italy | | | 0.48 | | |
| Sweden | | | 0.47 | | |
| Greece | | | 0.39 | | |
| Ireland | | | 0.36 | | |
| Belgium | | | 0.28 | | |
| Turkey | | | 0.17 | | |
* Asset allocation percentages are based on total investments in the portfolio. Country allocations exclude short term investments.
The Fund's portfolio composition is subject to change at any time.
FIRST EAGLE FUNDS | ANNUAL REPORT | OCTOBER 31, 2011
42
Overseas Fund
Growth of a $10,000 Initial Investment
Performance data quoted herein represents past performance and should not be considered indicative of future results. Performance data quoted herein does not reflect the deduction of taxes that a shareholder would pay on Fund distributions or the sale of Fund shares. The average annual returns shown above are historical and reflect changes in share price, reinvested dividends and are net of expenses.
The average annual returns for Class A Shares give effect to the deduction of the maximum sales charge of 5.00%.
The MSCI EAFE Index is a total return index, reported in U.S. Dollars, based on share prices and reinvested net dividends of approximately 1,100 companies from 21 countries and is not available for purchase. The Consumer Price Index (CPI) represents the change in price of all goods and services purchased for consumption by urban households.
| Top 10 Holdings* | |
| Gold Bullion (precious metal) | | | 7.45 | % | |
| Shimano, Inc. (Japanese bicycle parts manufacturer) | | | 2.38 | | |
| Fanuc Corporation (Japanese automated machine tools manufacturer) | | | 2.31 | | |
| Secom Company Limited (Japanese security services provider) | | | 1.94 | | |
| SMC Corporation (Japanese automated control devices manufacturer) | | | 1.83 | | |
| Pargesa Holding SA (Swiss diversified financials company) | | | 1.69 | | |
| Grupo Televisa S.A.B., ADR (Mexican media company) | | | 1.67 | | |
| HeidelbergCement AG (German building materials manufacturer) | | | 1.62 | | |
| Keyence Corporation (Japanese sensors manufacturer) | | | 1.53 | | |
| Nestlé SA (Swiss food product manufacturer) | | | 1.49 | | |
| Total | | | 23.91 | % | |
* Holdings in cash, commercial paper, and money market funds have been excluded. Percentages are based on total net assets.
FIRST EAGLE FUNDS | ANNUAL REPORT | OCTOBER 31, 2011
43
First Eagle Overseas Fund
| SHARES | | DESCRIPTION | | COST (NOTE 1) | | VALUE (NOTE 1) | |
| Common Stocks — 74.35% | | | |
| International Common Stocks — 73.90% | | | |
| Australia 1.00% (a) | | | |
| | 1,934,810 | | | Newcrest Mining Limited | | $ | 65,191,276 | | | $ | 68,756,033 | | |
| | 15,791,758 | | | Spotless Group Limited (b) | | | 38,417,424 | | | | 33,064,856 | | |
| | | | 103,608,700 | | | | 101,820,889 | | |
| Austria 1.34% (a) | | | |
| | 2,047,932 | | | OMV AG | | | 83,876,284 | | | | 71,917,253 | | |
| | 5,294,031 | | | Wienerberger AG | | | 82,217,732 | | | | 64,461,246 | | |
| | | | 166,094,016 | | | | 136,378,499 | | |
| Belgium 0.28% (a) | | | |
| | 366,943 | | | Groupe Bruxelles Lambert SA | | | 27,696,696 | | | | 28,424,767 | | |
| Bermuda 0.49% (a) | | | |
| | 994,200 | | | Jardine Matheson Holdings Limited | | | 29,348,034 | | | | 50,106,279 | | |
| Brazil 0.79% | | | |
| | 3,198,194 | | | Petroleo Brasileiro SA, ADR | | | 48,449,086 | | | | 80,882,326 | | |
| Canada 2.03% | | | |
| | 4,773,441 | | | Penn West Petroleum Limited | | | 91,218,197 | | | | 85,540,063 | | |
| | 1,914,012 | | | Cenovus Energy, Inc. | | | 38,341,076 | | | | 65,459,211 | | |
| | 1,100,050 | | | EnCana Corporation | | | 14,298,776 | | | | 23,871,085 | | |
| | 485,215 | | | Cogeco Cable, Inc. | | | 21,284,295 | | | | 23,124,746 | | |
| | 875,938 | | | Postmedia Network,
Class 'NC' (c)(d)(e) | | | 5,591,396
| | | | 8,885,243
| | |
| | | | 170,733,740 | | | | 206,880,348 | | |
| France 10.05% | | | |
| | 1,660,899 | | | Sodexo (a) | | | 46,115,630 | | | | 120,855,923 | | |
| | 1,660,633 | | | Sanofi (a) | | | 135,351,026 | | | | 119,722,928 | | |
| | 3,035,158 | | | Bouygues SA (a) | | | 135,899,173 | | | | 114,239,951 | | |
| | 39,143 | | | Sucrière de Pithiviers-Le-Vieil (b) | | | 15,598,306 | | | | 90,238,133 | | |
| | 1,534,380 | | | Total SA (a) | | | 90,001,276 | | | | 80,681,621 | | |
| | 5,831,713 | | | Société Télévision Francaise 1 (a) | | | 92,742,720 | | | | 78,910,116 | | |
| | 827,900 | | | Neopost SA (a) | | | 44,073,366 | | | | 63,457,099 | | |
| | 558,938 | | | Laurent-Perrier (a)(b) | | | 19,851,603 | | | | 58,029,688 | | |
| | 1,608,488 | | | Carrefour SA (a) | | | 69,265,330 | | | | 42,887,980 | | |
| | 235,837 | | | Robertet SA (a)(b) | | | 20,591,063 | | | | 40,804,314 | | |
| | 51,500 | | | Robertet SA CI (e)(f)(g) | | | 2,151,628 | | | | 6,143,699 | | |
| | 348,206 | | | Guyenne et Gascogne SA (a) | | | 40,270,290 | | | | 40,198,024 | | |
| | 895,904 | | | Fregate (b)(e)(f)(h) | | | 23,101,991 | | | | 37,941,018 | | |
See Notes to Financial Statements.
FIRST EAGLE FUNDS | ANNUAL REPORT | OCTOBER 31, 2011
44
Schedule of Investments | Year Ended October 31, 2011
| SHARES | | DESCRIPTION | | COST (NOTE 1) | | VALUE (NOTE 1) | |
| International Common Stocks — 73.90% — (continued) | | | |
| France 10.05% — (continued) | | | |
| | 505,501 | | | Wendel (a) | | $ | 10,862,584 | | | $ | 37,732,632 | | |
| | 297,268 | | | Société BIC SA (a) | | | 11,253,819 | | | | 26,734,438 | | |
| | 442,830 | | | Société Foncière Financière et de
Participations (a) | | | 29,139,582
| | | | 20,855,938
| | |
| | 364,373 | | | Gaumont SA | | | 21,698,753 | | | | 17,326,198 | | |
| | 176,658 | | | Rémy Cointreau SA (a) | | | 4,547,566 | | | | 14,584,594 | | |
| | 11,593,581 | | | FINEL (b)(c)(e)(f)(h)(i) | | | 9,152,131 | | | | 5,819,998 | | |
| | 1,000 | | | Société Vermandoise de
Sucreries (a)(e) | | | 854,846
| | | | 4,693,067
| | |
| | 100,000 | | | Sabeton SA (a) | | | 1,463,142 | | | | 1,799,097 | | |
| | | | 823,985,825 | | | | 1,023,656,456 | | |
| Germany 4.20% (a) | | | |
| | 3,619,240 | | | HeidelbergCement AG | | | 200,929,134 | | | | 165,123,088 | | |
| | 6,418,531 | | | Deutsche Wohnen AG (b) | | | 67,969,040 | | | | 95,236,453 | | |
| | 1,717,105 | | | Daimler AG | | | 82,782,102 | | | | 87,887,649 | | |
| | 1,517,790 | | | Hamburger Hafen und Logistik AG | | | 53,801,823 | | | | 47,027,445 | | |
| | 296,503 | | | Fraport AG | | | 8,930,449 | | | | 18,813,392 | | |
| | 137,466 | | | Pfeiffer Vacuum Technology AG | | | 3,635,898 | | | | 14,000,993 | | |
| | | | 418,048,446 | | | | 428,089,020 | | |
| Greece 0.39% (a) | | | |
| | 7,182,037 | | | Jumbo SA (b) | | | 47,401,214 | | | | 39,229,562 | | |
| Hong Kong 0.95% (a) | | | |
| | 7,806,340 | | | Guoco Group Limited | | | 57,283,838 | | | | 74,175,105 | | |
| | 8,166,100 | | | Hopewell Holdings Limited | | | 11,153,124 | | | | 21,207,967 | | |
| | 10,851,720 | | | City e-Solutions Limited (c)(e) | | | 323,358 | | | | 1,206,320 | | |
| | | | 68,760,320 | | | | 96,589,392 | | |
| Ireland 0.35% (a) | | | |
| | 1,970,920 | | | CRH PLC | | | 32,976,584 | | | | 35,936,078 | | |
| Italy 0.48% (a) | | | |
| | 7,315,306 | | | Italcementi S.p.A. RSP | | | 87,341,485 | | | | 23,092,480 | | |
| | 1,197,736 | | | Italmobiliare S.p.A. RSP | | | 50,324,930 | | | | 20,773,429 | | |
| | 168,142 | | | Italmobiliare S.p.A. | | | 19,250,153 | | | | 4,745,016 | | |
| | | | 156,916,568 | | | | 48,610,925 | | |
| Japan 29.81% (a) | | | |
| | 4,886,870 | | | Shimano, Inc. (b) | | | 81,201,320 | | | | 242,256,072 | | |
| | 1,451,840 | | | Fanuc Corporation | | | 133,535,622 | | | | 235,425,795 | | |
| | 4,170,700 | | | Secom Company Limited | | | 178,984,614 | | | | 197,814,728 | | |
See Notes to Financial Statements.
FIRST EAGLE FUNDS | ANNUAL REPORT | OCTOBER 31, 2011
45
Overseas Fund
| SHARES | | DESCRIPTION | | COST (NOTE 1) | | VALUE (NOTE 1) | |
| International Common Stocks — 73.90% — (continued) | | | |
| Japan 29.81% (a) — (continued) | | | |
| | 1,193,590 | | | SMC Corporation | | $ | 153,637,312 | | | $ | 186,188,897 | | |
| | 610,300 | | | Keyence Corporation | | | 120,033,342 | | | | 155,592,580 | | |
| | 7,175,100 | | | MS&AD Insurance Group Holdings | | | 169,497,975 | | | | 140,939,578 | | |
| | 6,858,800 | | | NKSJ Holdings, Inc. | | | 192,868,071 | | | | 137,570,489 | | |
| | 2,451,100 | | | Ono Pharmaceutical Company Limited | | | 100,329,417 | | | | 128,648,046 | | |
| | 3,260,440 | | | Astellas Pharma, Inc. | | | 133,084,592 | | | | 119,589,530 | | |
| | 15,600 | | | KDDI Corporation | | | 98,883,381 | | | | 114,605,404 | | |
| | 1,050,800 | | | Hirose Electric Company Limited | | | 115,774,722 | | | | 100,988,736 | | |
| | 2,035,070 | | | Canon, Inc. | | | 97,083,761 | | | | 92,654,368 | | |
| | 4,092,170 | | | MISUMI Group, Inc. | | | 70,195,915 | | | | 85,392,792 | | |
| | 2,107,490 | | | Nissin Foods Holdings Company Limited | | | 74,661,603 | | | | 81,410,666 | | |
| | 3,498,960 | | | Nomura Research Institute Limited | | | 68,063,992 | | | | 78,919,019 | | |
| | 4,400,050 | | | Mitsubishi Estate Company Limited | | | 65,929,737 | | | | 74,738,851 | | |
| | 7,627,430 | | | Kansai Paint Company Limited | | | 60,795,887 | | | | 71,805,193 | | |
| | 3,239,630 | | | Hoya Corporation | | | 70,381,030 | | | | 70,979,698 | | |
| | 2,657,590 | | | Nitto Kohki Company Limited (b) | | | 46,435,145 | | | | 60,375,543 | | |
| | 6,577,300 | | | Japan Wool Textile Company
Limited (b) | | | 49,871,284
| | | | 53,082,415
| | |
| | 2,023,800 | | | Chofu Seisakusho Company
Limited (b) | | | 33,120,144
| | | | 51,761,816
| | |
| | 3,206,911 | | | T. Hasegawa Company Limited (b) | | | 43,073,853 | | | | 50,946,032 | | |
| | 2,485,480 | | | Daiichikosho Company Limited | | | 27,081,144 | | | | 48,381,862 | | |
| | 26,230 | | | NTT DoCoMo, Inc. | | | 39,858,813 | | | | 46,720,065 | | |
| | 2,252,610 | | | THK Company Limited | | | 36,188,958 | | | | 44,027,816 | | |
| | 540,980 | | | Shin-Etsu Chemical Company Limited | | | 25,322,466 | | | | 27,862,089 | | |
| | 2,013,324 | | | Nagaileben Company Limited (b) | | | 19,961,972 | | | | 27,825,444 | | |
| | 1,570,700 | | | Ariake Japan Company Limited | | | 32,942,453 | | | | 27,308,528 | | |
| | 2,004,440 | | | OSG Corporation | | | 22,787,950 | | | | 25,759,430 | | |
| | 1,286,140 | | | As One Corporation (b) | | | 26,246,127 | | | | 24,646,251 | | |
| | 1,058,246 | | | Matsumoto Yushi-Seiyaku Company
Limited (b)(e) | | | 25,950,562
| | | | 24,262,761
| | |
| | 2,184,600 | | | Seikagaku Corporation | | | 17,648,500 | | | | 23,762,142 | | |
| | 2,535,900 | | | Yomeishu Seizo Company Limited (b) | | | 22,847,623 | | | | 23,416,589 | | |
| | 2,068,330 | | | Maezawa Kasei Industries Company
Limited (b) | | | 31,939,631
| | | | 22,357,474
| | |
| | 815,690 | | | Icom, Inc. (b) | | | 21,122,543 | | | | 19,994,264 | | |
| | 508,106 | | | SK Kaken Company Limited | | | 9,470,131 | | | | 18,949,279 | | |
| | 1,014,200 | | | Meitec Corporation | | | 29,317,475 | | | | 18,940,527 | | |
See Notes to Financial Statements.
FIRST EAGLE FUNDS | ANNUAL REPORT | OCTOBER 31, 2011
46
Schedule of Investments | Year Ended October 31, 2011
| SHARES | | DESCRIPTION | | COST (NOTE 1) | | VALUE (NOTE 1) | |
| International Common Stocks — 73.90% — (continued) | | | |
| Japan 29.81% (a) — (continued) | | | |
| | 3,296,040 | | | Okumura Corporation | | $ | 16,402,020 | | | $ | 13,046,679 | | |
| | 493,250 | | | Mandom Corporation | | | 6,249,764 | | | | 12,631,119 | | |
| | 1,907 | | | Inpex Corporation | | | 9,159,486 | | | | 12,626,506 | | |
| | 2,572,675 | | | TOMONY Holdings, Inc. | | | 17,372,742 | | | | 10,231,308 | | |
| | 806,280 | | | Chudenko Corporation | | | 12,295,496 | | | | 8,753,059 | | |
| | 453,900 | | | Fuji Seal International, Inc. | | | 8,026,006 | | | | 8,615,158 | | |
| | 1,215,770 | | | Sansei Yusoki Company Limited (b) | | | 10,175,013 | | | | 6,013,251 | | |
| | 1,424,100 | | | Shingakukai Company Limited (b) | | | 10,266,277 | | | | 4,988,869 | | |
| | 757,100 | | | Asahi Broadcasting Corporation | | | 4,045,203 | | | | 3,757,062 | | |
| | | | 2,640,121,074 | | | | 3,036,563,780 | | |
| Malaysia 0.90% (a) | | | |
| | 72,262,570 | | | Genting Malaysia Berhad | | | 62,743,594 | | | | 89,892,305 | | |
| | 594,690 | | | Genting Berhad | | | 979,066 | | | | 2,071,307 | | |
| | | | 63,722,660 | | | | 91,963,612 | | |
| Mexico 2.74% | | | |
| | 7,987,622 | | | Grupo Televisa S.A.B., ADR | | | 158,160,868 | | | | 170,375,977 | | |
| | 2,623,392 | | | Industrias Peñoles S.A.B. de C.V. | | | 2,199,981 | | | | 108,287,004 | | |
| | | | 160,360,849 | | | | 278,662,981 | | |
| Netherlands 1.27% (a) | | | |
| | 539,055 | | | HAL Trust | | | 18,095,972 | | | | 63,512,216 | | |
| | 6,299,709 | | | TNT Express NV | | | 73,564,025 | | | | 53,865,464 | | |
| | 2,340,827 | | | PostNL NV | | | 25,821,064 | | | | 11,944,593 | | |
| | | | 117,481,061 | | | | 129,322,273 | | |
| Singapore 2.36% (a) | | | |
| | 23,192,830 | | | Haw Par Corporation Limited (b) | | | 76,875,317 | | | | 103,374,204 | | |
| | 70,167,015 | | | ComfortDelgro Corporation Limited | | | 68,385,814 | | | | 77,901,551 | | |
| | 16,373,450 | | | Singapore Airport Terminal
Services Limited | | | 18,528,182
| | | | 31,964,489
| | |
| | 5,640,520 | | | Fraser and Neave Limited | | | 6,680,505 | | | | 27,525,557 | | |
| | | | 170,469,818 | | | | 240,765,801 | | |
| South Africa 1.77% | | | |
| | 7,868,291 | | | Gold Fields Limited, ADR | | | 99,463,345 | | | | 137,144,312 | | |
| | 3,275,059 | | | Harmony Gold Mining Company
Limited, ADR | | | 30,822,097
| | | | 43,001,525
| | |
| | | | 130,285,442 | | | | 180,145,837 | | |
See Notes to Financial Statements.
FIRST EAGLE FUNDS | ANNUAL REPORT | OCTOBER 31, 2011
47
Overseas Fund
| SHARES | | DESCRIPTION | | COST (NOTE 1) | | VALUE (NOTE 1) | |
| International Common Stocks — 73.90% — (continued) | | | |
| South Korea 2.45% | | | |
| | 1,318,522 | | | KT&G Corporation (a) | | $ | 70,025,885 | | | $ | 82,481,489 | | |
| | 35,325 | | | Lotte Confectionery Company
Limited (a) | | | 12,445,892
| | | | 55,236,548
| | |
| | 186,884 | | | Nong Shim Company Limited (a) | | | 43,886,371 | | | | 36,621,147 | | |
| | 119,080 | | | Amorepacific Group (a) | | | 18,151,496 | | | | 26,048,123 | | |
| | 872,463 | | | Fursys, Inc. (a)(b) | | | 10,110,165 | | | | 21,818,695 | | |
| | 22,950 | | | Namyang Dairy Products
Company Limited | | | 4,912,653
| | | | 16,194,640
| | |
| | 1,182,040 | | | Dong Ah Tire & Rubber
Company Limited (a) | | | 5,161,359
| | | | 9,410,476
| | |
| | 146,969 | | | Teems, Inc. (a)(b)(c) | | | 1,280,866 | | | | 1,443,520 | | |
| | | | 165,974,687 | | | | 249,254,638 | | |
| Spain 0.81% (a) | | | |
| | 1,688,700 | | | Red Electrica Corporation SA | | | 84,248,760 | | | | 81,982,149 | | |
| Sweden 0.47% (a) | | | |
| | 2,494,571 | | | Investor AB, Class 'A' | | | 50,462,756 | | | | 47,678,404 | | |
| Switzerland 4.19% (a) | | | |
| | 2,196,591 | | | Pargesa Holding SA | | | 115,479,876 | | | | 172,649,783 | | |
| | 2,610,500 | | | Nestlé SA | | | 79,226,015 | | | | 151,963,334 | | |
| | 193,016 | | | Rieter Holding AG (c) | | | 26,177,079 | | | | 40,418,728 | | |
| | 792 | | | Lindt & Spruengli AG | | | 5,105,206 | | | | 29,353,613 | | |
| | 137,452 | | | Kuehne & Nagel International AG | | | 1,733,811 | | | | 17,139,403 | | |
| | 225,026 | | | Autoneum Holding AG (c) | | | 12,062,900 | | | | 15,311,848 | | |
| | | | 239,784,887 | | | | 426,836,709 | | |
| Taiwan 0.41% (a) | | | |
| | 20,184,980 | | | Taiwan Secom Company Limited | | | 32,105,415 | | | | 36,421,138 | | |
| | 5,700,328 | | | Taiwan Sogo Shin Kong Security
Company Limited | | | 4,976,521
| | | | 4,889,739
| | |
| | | | 37,081,936 | | | | 41,310,877 | | |
| Thailand 1.75% | | | |
| | 466,542,885 | | | Thai Beverage PCL (a) | | | 82,863,046 | | | | 98,379,882 | | |
| | 15,979,859 | | | Bangkok Bank PCL NVDR (a) | | | 56,870,621 | | | | 76,991,247 | | |
| | 250,000 | | | OHTL PCL (e) | | | 1,152,072 | | | | 3,252,032 | | |
| | | | 140,885,739 | | | | 178,623,161 | | |
| Turkey 0.17% (a) | | | |
| | 3,205,889 | | | Yazicilar Holding AS | | | 21,541,251 | | | | 17,367,367 | | |
See Notes to Financial Statements.
FIRST EAGLE FUNDS | ANNUAL REPORT | OCTOBER 31, 2011
48
Schedule of Investments | Year Ended October 31, 2011
| SHARES | | DESCRIPTION | | COST (NOTE 1) | | VALUE (NOTE 1) | |
| International Common Stocks — 73.90% — (continued) | | | |
| United Kingdom 2.45% (a) | | | |
| | 3,995,640 | | | GlaxoSmithKline PLC | | $ | 76,140,895 | | | $ | 89,961,597 | | |
| | 3,378,628 | | | Berkeley Group Holdings PLC (c) | | | 41,275,902 | | | | 67,970,082 | | |
| | 1,295,388 | | | Anglo American PLC | | | 32,786,526 | | | | 47,643,130 | | |
| | 9,076,580 | | | WM Morrison Supermarkets PLC | | | 42,760,825 | | | | 44,158,554 | | |
| | | | 192,964,148 | | | | 249,733,363 | | |
| Total International Common Stocks | | | 6,309,404,297 | | | | 7,526,815,493 | | |
| U.S. Common Stock — 0.45% | | | |
| Materials 0.45% | | | |
| | 691,883 | | | Newmont Mining Corporation | | | 17,601,872 | | | | 46,238,541 | | |
| Total Common Stocks | | | 6,327,006,169 | | | | 7,573,054,034 | | |
| International Preferred Stocks — 1.96% | | | |
| Germany 0.85% (a) | | | |
| | 1,160,182 | | | Hornbach Holding AG | | | 39,421,559 | | | | 85,911,392 | | |
| South Korea 1.11% (a) | | | |
| | 186,879 | | | Samsung Electronics Company Limited | | | 23,663,909 | | | | 106,623,599 | | |
| | 27,183 | | | Namyang Dairy Products
Company Limited | | | 387,445
| | | | 6,619,580
| | |
| | | | 24,051,354 | | | | 113,243,179 | | |
| Total International Preferred Stocks | | | 63,472,913 | | | | 199,154,571 | | |
| OUNCES | | | | | | | |
| Commodity — 7.45% | | | |
| | 441,517 | | | Gold bullion (c) | | | 217,894,842 | | | | 758,946,085 | | |
| PRINCIPAL | | | | | | | |
| Term Loans — 0.14% | | | |
| Germany 0.14% | | | |
| 1,647,055
EUR | | | Pfleiderer AG Term 1A
due 12/31/13 (c)(j) | | | 1,639,424
| | | | 1,358,902
| | |
| 5,000,000
EUR | | | Pfleiderer AG Term Loan
due 12/31/13 (c)(j) | | | 5,391,975
| | | | 4,125,248
| | |
| 5,000,000
EUR | | | Pfleiderer AG Term Loan
due 12/31/13 (c)(j) | | | 5,003,535
| | | | 4,125,248
| | |
| 329,411
EUR | | | Pfleiderer AG Term Facility 1A
due 12/31/13 (c)(j) | | | 345,220
| | | | 271,781
| | |
| 2,488,890
CAD | | | Pfleiderer AG Term Facility 2A
due 12/31/13 (c)(j) | | | 1,853,608
| | | | 1,459,269
| | |
See Notes to Financial Statements.
FIRST EAGLE FUNDS | ANNUAL REPORT | OCTOBER 31, 2011
49
Overseas Fund
| PRINCIPAL | | DESCRIPTION | | COST (NOTE 1) | | VALUE (NOTE 1) | |
| Germany 0.14% — (continued) | | | |
| 1,860,000
EUR | | | Pfleiderer AG Revolving Credit Facility 1A
due 12/31/13 (c)(j) | | $ | 1,949,271
| | | $ | 1,534,592
| | |
| 1,180,000
EUR | | | Pfleiderer AG Revolving Credit Facility 2A
due 12/31/13 (c)(j) | | | 1,236,637
| | | | 973,559
| | |
| 319,240
USD | | | Pfleiderer AG Term Loan B
4.229% due 11/17/11 (f)(j)(k) | | | 321,218
| | | | 319,240
| | |
| 225,452
EUR | | | Pfleiderer AG Term Loan B
5.355% due 11/17/11 (f)(j)(k) | | | 323,267
| | | | 314,381
| | |
| Total Term Loans | | | 18,064,155 | | | | 14,482,220 | | |
| International Bonds — 4.26% | | | |
| International Corporate Bonds — 0.51% | | | |
| Canada 0.27% | | | |
| 33,554,000
USD | | | Catalyst Paper Corporation
7.375% due 03/01/14 (e) | | | 26,422,167
| | | | 7,633,535
| | |
| 34,110,000
USD | | | Catalyst Paper Corporation
11.00% due 12/15/16 (e)(l) | | | 30,789,756
| | | | 19,954,350
| | |
| | | | 57,211,923 | | | | 27,587,885 | | |
| France 0.24% | | | |
| 10,000,000
EUR | | | Emin Leydier SA FRN
6.706% due 07/31/16 (e)(f)(h)(k) | | | 14,273,396
| | | | 13,944,493
| | |
| 8,000,000
EUR | | | FINEL
9.50% due 06/30/17 (e)(f)(h) | | | 9,649,600
| | | | 8,366,695
| | |
| 1,950,000
EUR | | | Wendel SA
4.875% due 09/21/15 (m) | | | 1,694,081
| | | | 2,624,005
| | |
| | | | 25,617,077 | | | | 24,935,193 | | |
| Total International Corporate Bonds | | | 82,829,000 | | | | 52,523,078 | | |
| International Government Bonds — 3.75% | | | |
| France 0.23% | | | |
| 16,001,865
EUR | | | France Government Bond OAT
3.00% due 07/25/12 (n) | | | 19,420,699
| | | | 23,174,587
| | |
| Hong Kong 1.38% | | | |
| 137,300,000
HKD | | | Hong Kong Government Bond
0.48% due 09/03/12 | | | 17,725,290
| | | | 17,722,888
| | |
| 415,700,000
HKD | | | Hong Kong Government Bond
2.66% due 12/17/12 | | | 54,933,049
| | | | 55,043,816
| | |
| 359,500,000
HKD | | | Hong Kong Government Bond
4.20% due 09/17/12 | | | 47,872,546
| | | | 47,941,355
| | |
| 145,500,000
HKD | | | Hong Kong Government Bond
4.49% due 11/26/12 | | | 19,472,659
| | | | 19,607,172
| | |
| | | | 140,003,544 | | | | 140,315,231 | | |
See Notes to Financial Statements.
FIRST EAGLE FUNDS | ANNUAL REPORT | OCTOBER 31, 2011
50
Schedule of Investments | Year Ended October 31, 2011
| PRINCIPAL | | DESCRIPTION | | COST (NOTE 1) | | VALUE (NOTE 1) | |
| International Government Bonds — 3.75% — (continued) | | | |
| Singapore 0.96% | | | |
| 120,000,000
SGD | | | Singapore Government Bond
3.50% due 07/01/12 | | $ | 95,756,857
| | | $ | 97,909,402
| | |
| Taiwan 0.38% | | | |
| 582,300,000
TWD | | | Taiwan Government Bond
2.00% due 07/20/12 | | | 18,043,291
| | | | 19,657,676
| | |
| 574,500,000
TWD | | | Taiwan Government Bond
2.375% due 01/16/13 | | | 18,303,538
| | | | 19,590,127
| | |
| | | | 36,346,829 | | | | 39,247,803 | | |
| United Kingdom 0.80% | | | |
| 24,745,000
GBP | | | United Kingdom Gilt
5.00% due 03/07/12 | | | 40,197,118
| | | | 40,546,260
| | |
| 24,448,000
GBP | | | United Kingdom Gilt
5.25% due 06/07/12 | | | 40,185,855
| | | | 40,555,962
| | |
| | | | 80,382,973 | | | | 81,102,222 | | |
| Total International Government Bonds | | | 371,910,902 | | | | 381,749,245 | | |
| Total International Bonds | | | 454,739,902 | | | | 434,272,323 | | |
| Commercial Paper — 11.03% | | | |
| International Commercial Paper — 9.21% | | | |
| Belgium 0.54% | | | |
| 40,000,000
USD | | | Anheuser Busch InBev WorldWide, Inc.
0.30% due 12/19/11 | | | 39,984,000
| | | | 39,984,000
| | |
| 15,000,000
USD | | | Anheuser Busch InBev WorldWide, Inc.
0.30% due 01/11/12 | | | 14,991,125
| | | | 14,987,580
| | |
| France 1.35% | | | |
| 30,000,000
USD | | | Électricité de France
0.34% due 12/02/11 | | | 29,991,475
| | | | 29,991,475
| | |
| 15,810,000
USD | | | Électricité de France
0.34% due 12/07/11 | | | 15,804,783
| | | | 15,804,783
| | |
| 50,000,000
USD | | | Sanofi
0.13% due 12/14/11 | | | 49,992,236
| | | | 49,992,236
| | |
| 42,000,000
USD | | | Total SA
0.12% due 01/18/12 | | | 41,989,080
| | | | 41,972,536
| | |
| Germany 0.55% | | | |
| 10,400,000
USD | | | BMW
0.27% due 11/01/11 | | | 10,400,000
| | | | 10,400,000
| | |
| 22,033,000
USD | | | Siemens Company
0.11% due 12/23/11 | | | 22,029,499
| | | | 22,029,499
| | |
| 23,429,000
USD | | | Siemens Company
0.14% due 12/19/11 | | | 23,424,627
| | | | 23,424,627
| | |
See Notes to Financial Statements.
FIRST EAGLE FUNDS | ANNUAL REPORT | OCTOBER 31, 2011
51
Overseas Fund
| PRINCIPAL | | DESCRIPTION | | COST (NOTE 1) | | VALUE (NOTE 1) | |
| International Commercial Paper — 9.21% — (continued) | | | |
| Italy 0.62% | | | |
| 20,000,000
USD | | | Eni S.p.A
0.22% due 11/02/11 | | $ | 19,999,878
| | | $ | 19,999,878
| | |
| 20,000,000
USD | | | Eni S.p.A
0.30% due 12/12/11 | | | 19,993,166
| | | | 19,993,166
| | |
| 23,200,000
USD | | | Eni S.p.A
0.30% due 12/13/11 | | | 23,191,880
| | | | 23,191,880
| | |
| Japan 3.96% | | | |
| 15,000,000
USD | | | Honda Corporation
0.13% due 01/18/12 | | | 14,995,775
| | | | 14,989,203
| | |
| 35,000,000
USD | | | Mitsubishi Company
0.23% due 02/15/12 | | | 34,976,297
| | | | 34,960,054
| | |
| 44,000,000
USD | | | Mitsubishi Company
0.25% due 03/19/12 | | | 43,957,528
| | | | 43,919,577
| | |
| 20,000,000
USD | | | Mitsubishi Company
0.27% due 11/04/11 | | | 19,999,550
| | | | 19,999,550
| | |
| 50,533,000
USD | | | Mitsui & Company, Limited
0.18% due 01/31/12 | | | 50,510,008
| | | | 50,487,283
| | |
| 20,000,000
USD | | | Mitsui & Company, Limited
0.20% due 01/18/12 | | | 19,991,333
| | | | 19,985,604
| | |
| 50,000,000
USD | | | Mitsui & Company, Limited
0.22% due 12/12/11 | | | 49,987,472
| | | | 49,987,472
| | |
| 16,575,000
USD | | | Sumitomo Corporation
0.28% due 11/15/11 | | | 16,573,195
| | | | 16,573,195
| | |
| 18,373,000
USD | | | Sumitomo Corporation
0.32% due 11/25/11 | | | 18,369,203
| | | | 18,369,203
| | |
| 34,865,000
USD | | | Toyota Motor Corporation
0.20% due 11/15/11 | | | 34,862,288
| | | | 34,862,288
| | |
| 10,000,000
USD | | | Toyota Motor Corporation
0.20% due 12/02/11 | | | 9,998,278
| | | | 9,998,278
| | |
| 25,000,000
USD | | | Toyota Motor Corporation
0.23% due 11/10/11 | | | 24,998,563
| | | | 24,998,563
| | |
| 20,000,000
USD | | | Toyota Motor Corporation
0.25% due 12/29/11 | | | 19,991,944
| | | | 19,991,944
| | |
| 20,000,000
USD | | | Toyota Motor Corporation
0.34% due 02/02/12 | | | 19,982,950
| | | | 19,986,996
| | |
| 23,871,000
USD | | | Toyota Motor Corporation
0.36% due 02/06/12 | | | 23,848,488
| | | | 23,854,169
| | |
| Switzerland 0.74% | | | |
| | 10,000,000 | | | Nestlé SA
USD0.10% due 12/12/11 | | | 9,998,861
| | | | 9,998,861
| | |
| 13,000,000
USD | | | Nestlé SA
0.11% due 03/05/12 | | | 12,995,035
| | | | 12,993,812
| | |
| 20,000,000
USD | | | Nestlé SA
0.12% due 11/02/11 | | | 19,999,933
| | | | 19,999,933
| | |
See Notes to Financial Statements.
FIRST EAGLE FUNDS | ANNUAL REPORT | OCTOBER 31, 2011
52
Schedule of Investments | Year Ended October 31, 2011
| PRINCIPAL | | DESCRIPTION | | COST (NOTE 1) | | VALUE (NOTE 1) | |
| International Commercial Paper — 9.21% — (continued) | | | |
| Switzerland 0.74% — (continued) | | | |
| 21,907,000
USD | | | Nestlé SA
0.14% due 11/09/11 | | $ | 21,906,319
| | | $ | 21,906,319
| | |
| 10,000,000
USD | | | Novartis International AG
0.18% due 11/14/11 | | | 9,999,350
| | | | 9,999,350
| | |
| United Kingdom 1.45% | | | |
| 30,723,000
USD | | | BP PLC
0.20% due 01/13/12 | | | 30,710,540
| | | | 30,716,496
| | |
| 4,421,000
USD | | | BP PLC
0.20% due 03/26/12 | | | 4,417,414
| | | | 4,417,624
| | |
| 17,000,000
USD | | | BP PLC
0.20% due 04/03/12 | | | 16,985,456
| | | | 16,986,092
| | |
| 10,000,000
USD | | | Diageo Capital PLC
0.47% due 12/12/11 | | | 9,994,761
| | | | 9,994,761
| | |
| 47,000,000
USD | | | Diageo Capital PLC
0.47% due 12/14/11 | | | 46,974,176
| | | | 46,974,176
| | |
| 20,000,000
USD | | | Diageo Capital PLC
0.51% due 11/30/11 | | | 19,991,945
| | | | 19,991,945
| | |
| 18,700,000
USD | | | Reckitt Benckiser Group PLC
0.41% due 04/04/12 | | | 18,667,794
| | | | 18,658,836
| | |
| Total International Commercial Paper | | | 937,476,205 | | | | 937,373,244 | | |
| U.S. Commercial Paper — 1.82% | | | |
| $ | 9,250,000 | | | Avery Dennison Corporation
0.30% due 11/01/11 | | | 9,250,000
| | | | 9,250,000
| | |
| | 16,000,000 | | | Caterpillar Corporation
0.09% due 12/20/11 | | | 15,998,040
| | | | 15,998,040
| | |
| | 20,114,000 | | | ConocoPhillips
0.16% due 12/06/11 | | | 20,110,871
| | | | 20,110,871
| | |
| | 8,572,000 | | | Dell, Inc.
0.19% due 04/09/12 | | | 8,564,761
| | | | 8,552,257
| | |
| | 11,579,000 | | | Hewlett-Packard Company
0.30% due 01/17/12 | | | 11,571,570
| | | | 11,572,427
| | |
| | 3,797,000 | | | Kraft Foods, Inc.
0.15% due 11/01/11 | | | 3,797,000
| | | | 3,797,000
| | |
| | 6,500,000 | | | NYSE Euronext
0.28% due 11/01/11 | | | 6,500,000
| | | | 6,500,000
| | |
| | 22,942,000 | | | NYSE Euronext
0.28% due 11/18/11 | | | 22,938,966
| | | | 22,938,966
| | |
| | 2,054,000 | | | Philip Morris International, Inc.
0.13% due 02/06/12 | | | 2,053,281
| | | | 2,051,954
| | |
| | 10,000,000 | | | Proctor & Gamble Company
0.10% due 02/22/12 | | | 9,996,861
| | | | 9,996,073
| | |
| | 24,935,000 | | | Proctor & Gamble Company
0.15% due 12/16/11 | | | 24,930,325
| | | | 24,930,325
| | |
See Notes to Financial Statements.
FIRST EAGLE FUNDS | ANNUAL REPORT | OCTOBER 31, 2011
53
Overseas Fund
| PRINCIPAL | | DESCRIPTION | | COST (NOTE 1) | | VALUE (NOTE 1) | |
| U.S. Commercial Paper — 1.82% — (continued) | | | |
| $ | 10,000,000 | | | Verizon Communications, Inc.
0.33% due 11/07/11 | | $ | 9,999,467
| | | $ | 9,999,467
| | |
| | 34,127,000 | | | Walt Disney Company
0.09% due 02/07/12 | | | 34,118,639
| | | | 34,112,359
| | |
| | 5,800,000 | | | Western Union Company
0.30% due 11/01/11 | | | 5,800,000
| | | | 5,800,000
| | |
| Total U.S. Commercial Paper | | | 185,629,781 | | | | 185,609,739 | | |
| Total Commercial Paper | | | 1,123,105,986 | | | | 1,122,982,983 | | |
| Total Investments — 99.19% | | $ | 8,204,283,967 | | | | 10,102,892,216 | | |
| Other Assets in Excess of Liabilities — 0.81% | | | | | 82,624,338 | | |
| Net Assets — 100.00% | | | | $ | 10,185,516,554 | | |
(a) Securities with a total market value equal to $6,802,482,854 have been fair valued based on fair value adjustment factors at October 31, 2011.
(b) An affiliate of the Fund as defined by the Investment Company Act of 1940. An affiliate is defined as a company in which the Fund directly or indirectly owns, controls, or holds power to vote 5% or more of the outstanding voting securities.
(c) Non-income producing security/commodity.
(d) Represents variable voting shares.
(e) Security is deemed illiquid. At October 31, 2011, the value of these securities amounted to $142,103,211 or 1.40% of net assets.
(f) Securities valued in accordance with fair value procedures under the supervision of the Board of Trustees, representing $72,849,524 or 0.72% of net assets.
(g) Represents non-voting class of shares.
(h) Represents securities that are subject to legal or contractual restrictions on resale. At October 31, 2011, the value of these securities amounted to $66,072,204 or 0.65% of net assets.
(i) Held through Financiere Bleue, LLC, wholly owned holding company and disregarded entity for U.S. tax purposes.
(j) All or a portion of this position represents unsettled loan commitment.
(k) Floating rate security. Rate shown is the rate in effect at October 31, 2011.
(l) All or a portion of the security is exempt from registration under the Securities Act of 1933. Rule 144A securities may only be sold to qualified institutional buyers, pursuant to Rule 144A under the Securities Act of 1933.
(m) Represents a security registered under Regulation S. Bonds sold under Regulation S may not be offered, sold or delivered within the U.S., or for the account or benefit of, U.S. persons, except pursuant to an exemption from, or in a transaction not subject to, the registration requirements of the Securities Act of 1933.
(n) Inflation protected security.
At October 31, 2011, aggregate cost for federal income tax purposes was $8,544,348,957. Net unrealized appreciation consisted of:
| Gross unrealized appreciation | | $ | 2,116,679,111 | | |
| Gross unrealized depreciation | | | (558,135,852 | ) | |
| Net unrealized appreciation | | $ | 1,558,543,259 | | |
See Notes to Financial Statements.
FIRST EAGLE FUNDS | ANNUAL REPORT | OCTOBER 31, 2011
54
Schedule of Investments | Year Ended October 31, 2011
Abbreviations used in this schedule include:
ADR — American Depository Receipt
FRN — Floating Rate Note
NVDR — Non-Voting Depository Receipt
NYSE — New York Stock Exchange
OAT — French Treasury Obligation
PCL — Public Company Limited
PLC — Public Limited Company
RSP — Represents Non-Voting Shares
Currencies
CAD — Canadian Dollar
EUR — Euro
GBP — British Pound
HKD — Hong Kong Dollar
SGD — Singapore Dollar
TWD — Taiwan Dollar
USD — United States Dollar
| RESTRICTED SECURITIES | | ACQUISITION
DATE | | COST | | CARRYING VALUE PER
SHARE/PRINCIPAL | |
| Emin Leydier SA FRN 6.706% due 7/31/16 | | 07/30/09 | | $ | 14,273,396 | | | $ | 1.39 | | |
| FINEL 9.50% due 6/30/17 | | 06/22/05 | | | 9,649,600 | | | | 1.05 | | |
| FINEL | | 07/14/99 | | | 9,152,131 | | | | 0.50 | | |
| Fregate | | 04/30/04 | | | 23,101,991 | | | | 42.35 | | |
Foreign Currency Exchange Contracts — Sales
SETTLEMENT
DATES
THROUGH | | FOREIGN CURRENCY
TO BE DELIVERED | | U.S. $
TO BE
RECEIVED | | U.S. $ VALUE
AT OCTOBER 31,
2011 | | UNREALIZED
APPRECIATION
AT OCTOBER 31,
2011 | | UNREALIZED
DEPRECIATION
AT OCTOBER 31,
2011 | |
| 12/14/11 | | | 103,846,000 | | | Euro | | $ | 148,499,780 | | | $ | 144,755,404 | | | $ | 3,744,376 | | | $ | — | | |
| 02/15/12 | | | 205,901,000 | | | Euro | | | 291,662,901 | | | | 287,004,859 | | | | 4,658,042 | | | | — | | |
| 03/21/12 | | | 107,349,000 | | | Euro | | | 147,277,461 | | | | 149,596,476 | | | | — | | | | (2,319,015 | ) | |
| 04/18/12 | | | 157,533,000 | | | Euro | | | 218,155,956 | | | | 219,528,131 | | | | — | | | | (1,372,175 | ) | |
| 12/14/11 | | | 11,874,054,000 | | | Japanese Yen | | | 147,871,158 | | | | 152,440,828 | | | | — | | | | (4,569,670 | ) | |
| 02/15/12 | | | 28,271,631,000 | | | Japanese Yen | | | 363,008,766 | | | | 363,179,398 | | | | — | | | | (170,632 | ) | |
| 03/21/12 | | | 10,649,310,000 | | | Japanese Yen | | | 139,233,967 | | | | 136,991,094 | | | | 2,242,873 | | | | — | | |
| 04/18/12 | | | 45,792,812,000 | | | Japanese Yen | | | 585,838,917 | | | | 588,800,470 | | | | — | | | | (2,961,553 | ) | |
| | | | | | | $ | 2,041,548,906 | | | $ | 2,042,296,660 | | | $ | 10,645,291 | | | $ | (11,393,045 | ) | |
See Notes to Financial Statements.
FIRST EAGLE FUNDS | ANNUAL REPORT | OCTOBER 31, 2011
55
Overseas Fund
Affiliated Securities
AFFILIATED
SECURITIES | | SHARES
OCTOBER 31,
2010 | | GROSS
ADDITIONS | | GROSS
REDUCTIONS | | SHARES
OCTOBER 31,
2011 | | MARKET
VALUE
OCTOBER 31,
2011 | | REALIZED
GAIN/(LOSS) | | DIVIDEND
INCOME | |
As One
Corporation | | | 1,286,140 | | | | — | | | | — | | | | 1,286,140 | | | $ | 24,646,251 | | | $ | — | | | $ | 261,787 | | |
Chofu
Seisakusho
Company
Limited | | | 2,022,800 | | | | 1,000 | | | | — | | | | 2,023,800 | | | | 51,761,816 | | | | — | | | | 690,394 | | |
Deutsche
Wohnen AG | | | 6,418,531 | | | | — | | | | — | | | | 6,418,531 | | | | 95,236,453 | | | | — | | | | 1,851,810 | | |
| FINEL | | | 11,593,581 | | | | — | | | | — | | | | 11,593,581 | | | | 5,819,998 | | | | — | | | | — | | |
| Fregate | | | 895,904 | | | | — | | | | — | | | | 895,904 | | | | 37,941,018 | | | | — | | | | 988,172 | | |
| Fursys, Inc. | | | 948,330 | | | | — | | | | 75,867 | | | | 872,463 | | | | 21,818,695 | | | | — | | | | 444,851 | | |
Gewiss
S.p.A.* | | | 6,116,020 | | | | — | | | | 6,116,020 | | | | — | | | | — | | | | 21,355,659 | | | | — | | |
Haw Par
Corporation
Limited | | | 23,192,830 | | | | — | | | | — | | | | 23,192,830 | | | | 103,374,204 | | | | — | | | | 3,759,011 | | |
| Icom, Inc. | | | 861,660 | | | | — | | | | 45,970 | | | | 815,690 | | | | 19,994,264 | | | | (250,571 | ) | | | 202,236 | | |
Japan Wool
Textile
Company
Limited | | | 6,577,300 | | | | — | | | | — | | | | 6,577,300 | | | | 53,082,415 | | | | — | | | | 1,332,912 | | |
| Jumbo SA | | | 2,550,914 | | | | 4,631,123 | | | | — | | | | 7,182,037 | | | | 39,229,562 | | | | — | | | | 613,704 | | |
Laurent-
Perrier | | | 563,378 | | | | — | | | | 4,440 | | | | 558,938 | | | | 58,029,688 | | | | 189,298 | | | | 510,447 | | |
Maezawa
Kasei
Industries
Company
Limited | | | 2,068,330 | | | | — | | | | — | | | | 2,068,330 | | | | 22,357,474 | | | | — | | | | 606,870 | | |
Matsumoto
Yushi-
Seiyaku
Company
Limited | | | 1,058,246 | | | | — | | | | — | | | | 1,058,246 | | | | 24,262,761 | | | | — | | | | 596,864 | | |
Nagaileben
Company
Limited | | | 1,005,672 | | | | 1,007,652 | | | | — | | | | 2,013,324 | | | | 27,825,444 | | | | — | | | | 851,253 | | |
Nitto Kohki
Company
Limited | | | 2,832,150 | | | | — | | | | 174,560 | | | | 2,657,590 | | | | 60,375,543 | | | | 749,650 | | | | 1,021,406 | | |
Pfeiffer
Vacuum
Technology
AG* | | | 895,398 | | | | — | | | | 757,932 | | | | 137,466 | | | | 14,000,993 | | | | 55,918,804 | | | | 589,692 | | |
| Robertet SA | | | 235,944 | | | | — | | | | 107 | | | | 235,837 | | | | 40,804,314 | | | | (1,332 | ) | | | 777,392 | | |
Sansei Yusoki
Company
Limited | | | 1,223,670 | | | | — | | | | 7,900 | | | | 1,215,770 | | | | 6,013,251 | | | | (48,967 | ) | | | 200,388 | | |
| Shimano, Inc. | | | 4,886,870 | | | | — | | | | — | | | | 4,886,870 | | | | 242,256,072 | | | | — | | | | 3,399,527 | | |
See Notes to Financial Statements.
FIRST EAGLE FUNDS | ANNUAL REPORT | OCTOBER 31, 2011
56
Schedule of Investments | Year Ended October 31, 2011
Affiliated Securities — (continued)
AFFILIATED
SECURITIES | | SHARES
OCTOBER 31,
2010 | | GROSS
ADDITIONS | | GROSS
REDUCTIONS | | SHARES
OCTOBER 31,
2011 | | MARKET
VALUE
OCTOBER 31,
2011 | | REALIZED
GAIN/(LOSS) | | DIVIDEND
INCOME | |
Shingakukai
Company
Limited | | | 1,424,100 | | | | — | | | | — | | | | 1,424,100 | | | $ | 4,988,869 | | | $ | — | | | $ | 160,642 | | |
Spotless
Group
Limited | | | 10,471,542 | | | | 5,320,216 | | | | — | | | | 15,791,758 | | | | 33,064,856 | | | | — | | | | 1,413,375 | | |
Sucrière de
Pithiviers-
Le-Vieil | | | 39,143 | | | | — | | | | — | | | | 39,143 | | | | 90,238,133 | | | | — | | | | 2,015,407 | | |
T. Hasegawa
Company
Limited | | | 3,452,591 | | | | — | | | | 245,680 | | | | 3,206,911 | | | | 50,946,032 | | | | (112,995 | ) | | | 987,638 | | |
| Teems, Inc. | | | — | | | | 151,732 | | | | 4,763 | | | | 146,969 | | | | 1,443,520 | | | | (70,370 | ) | | | — | | |
Yomeishu
Seizo
Company
Limited | | | 2,535,900 | | | | — | | | | — | | | | 2,535,900 | | | | 23,416,589 | | | | — | | | | 514,900 | | |
| Total | | | | $ | 1,152,928,215 | | | $ | 77,729,176 | | | $ | 23,790,678 | | |
* Represents an unaffiliated issuer as of October 31, 2011, as such, amounts represented above will not agree to balances in the Statement of Assets and Liabilities and Statement of Operations.
| INDUSTRY DIVERSIFICATION FOR PORTFOLIO HOLDINGS | | PERCENT OF
NET ASSETS | |
| International Common Stocks | |
| Consumer Discretionary | | | 11.32 | % | |
| Consumer Staples | | | 9.20 | | |
| Energy | | | 4.21 | | |
| Financials | | | 9.69 | | |
| Health Care | | | 5.23 | | |
| Industrials | | | 17.24 | | |
| Information Technology | | | 5.72 | | |
| Materials | | | 8.89 | | |
| Telecommunication Services | | | 1.59 | | |
| Utilities | | | 0.81 | | |
| Total International Common Stocks | | | 73.90 | | |
| U.S. Common Stocks | |
| Materials | | | 0.45 | | |
| Total U.S. Common Stocks | | | 0.45 | | |
See Notes to Financial Statements.
FIRST EAGLE FUNDS | ANNUAL REPORT | OCTOBER 31, 2011
57
Overseas Fund
| INDUSTRY DIVERSIFICATION FOR PORTFOLIO HOLDINGS — (CONTINUED) | | PERCENT OF
NET ASSETS | |
| International Preferred Stocks | |
| Consumer Discretionary | | | 0.85 | % | |
| Consumer Staples | | | 0.06 | | |
| Information Technology | | | 1.05 | | |
| Total International Preferred Stocks | | | 1.96 | | |
| Commodity | | | 7.45 | | |
| Term Loans | | | 0.14 | | |
| International Bonds | |
| Financials | | | 0.08 | | |
| Government Issues | | | 3.75 | | |
| Industrials | | | 0.02 | | |
| Materials | | | 0.41 | | |
| Total International Bonds | | | 4.26 | | |
| Commercial Paper | |
| International Commercial Paper | | | 9.21 | | |
| U.S. Commercial Paper | | | 1.82 | | |
| Total Commercial Paper | | | 11.03 | | |
| Total Investments | | | 99.19 | % | |
See Notes to Financial Statements.
FIRST EAGLE FUNDS | ANNUAL REPORT | OCTOBER 31, 2011
58
This page was intentionally left blank.

Fund Overview | Data as of October 31, 2011 (unaudited)
INVESTMENT OBJECTIVE
The First Eagle U.S. Value Fund seeks long-term growth of capital by investing, under normal market conditions, primarily in equity and debt securities issued by U.S. corporations. Management utilizes a highly disciplined, bottom-up, value-oriented approach in achieving its investment objective.
| Average Annual Returns | |
| | | ONE-YEAR | | FIVE-YEARS | | TEN-YEARS | |
First Eagle U.S. Value
Fund (A Shares) | |
| without sales charge | | | 9.60 | % | | | 4.78 | % | | | 9.09 | % | |
| with sales charge | | | 4.12 | | | | 3.71 | | | | 8.53 | | |
Standard & Poor's
500 Index | | | 8.09 | | | | 0.25 | | | | 3.69 | | |
| Consumer Price Index | | | 3.53 | | | | 2.33 | | | | 2.45 | | |
Asset Allocation*

| Sector/Industry* | |
| Financials | | | 19.29 | % | |
| Information Technology | | | 15.36 | | |
| Industrials | | | 10.01 | | |
| Consumer Discretionary | | | 8.53 | | |
| Materials | | | 7.21 | | |
| Consumer Staples | | | 5.94 | | |
| Commodity (Gold Bullion) | | | 4.77 | | |
| Energy | | | 4.58 | | |
| Utilities | | | 3.94 | | |
| Health Care | | | 3.63 | | |
| Exchange Traded Fund | | | 0.47 | | |
| Warrant | | | 0.37 | | |
* percentages exclude option positions
* Asset allocation percentages are based on total investments in the portfolio. Sector/Industry allocations exclude short term investments.
The Fund's portfolio composition is subject to change at any time.
FIRST EAGLE FUNDS | ANNUAL REPORT | OCTOBER 31, 2011
60
U.S. Value Fund
Growth of a $10,000 Initial Investment
Performance data quoted herein represents past performance and should not be considered indicative of future results. Performance data quoted herein does not reflect the deduction of taxes that a shareholder would pay on Fund distributions or the sale of Fund shares. The average annual returns shown above are historical and reflect changes in share price, reinvested dividends and are net of expenses.
The average annual returns for Class A Shares with a sales charge gives effect to the deduction of the maximum sales charge of 5.00%.
The Standard & Poor's 500 Index is a widely recognized unmanaged index including a representative sample of 500 leading companies in leading sectors of the U.S. economy and is not available for purchase. Although the Standard & Poor's 500 Index focuses on the large-cap segment of the market, with approximately 75% coverage of U.S. equities, it is also considered a proxy for the total market. The Consumer Price Index (CPI) represents the change in price of all goods and services purchased for consumption by urban households.
| Top 10 Holdings* | |
| Gold Bullion (precious metal) | | | 4.70 | % | |
| Cisco Systems, Inc. (U.S. computer communications company) | | | 3.50 | | |
| Comcast Corporation, Class 'A' (U.S. cable/satellite television company) | | | 2.45 | | |
| Sysco Corporation (U.S. food services distributor) | | | 2.28 | | |
| ConocoPhillips (U.S. energy company) | | | 2.26 | | |
| Microsoft Corporation (U.S. software developer) | | | 2.17 | | |
| FirstEnergy Corporation (U.S. diversified energy company) | | | 2.14 | | |
| Bank of New York Mellon Corporation (U.S. financial services company) | | | 2.05 | | |
| 3M Company (U.S. industrial conglomerate) | | | 1.99 | | |
| Intel Corporation (U.S. semiconductor manufacturer) | | | 1.87 | | |
| Total | | | 25.41 | % | |
* Holdings in cash, commercial paper and money market funds have been excluded. Percentages are based on total net assets.
FIRST EAGLE FUNDS | ANNUAL REPORT | OCTOBER 31, 2011
61
First Eagle U.S. Value Fund
| SHARES | | DESCRIPTION | | COST (NOTE 1) | | VALUE (NOTE 1) | |
| Common Stocks — 73.36% | | | |
| U.S. Common Stocks — 69.12% | | | |
| Consumer Discretionary 6.39% | | | |
| | 2,039,046 | | | Comcast Corporation, Class 'A' | | $ | 35,171,456 | | | $ | 46,898,058 | | |
| | 702,480 | | | Omnicom Group, Inc. | | | 22,058,718 | | | | 31,246,310 | | |
| | 773,410 | | | Home Depot, Inc. | | | 17,857,208 | | | | 27,688,078 | | |
| | 687,396 | | | International Speedway
Corporation, Class 'A' | | | 22,522,330 | | | | 16,401,269 | | |
| | 590 | | | St. John Knits International, Inc. (a)(b) | | | 18,290 | | | | 2,508 | | |
| | | | 97,628,002 | | | | 122,236,223 | | |
| Consumer Staples 5.67% | | | |
| | 1,573,300 | | | Sysco Corporation | | | 44,694,726 | | | | 43,611,876 | | |
| | 199,910 | | | Lorillard, Inc. | | | 14,817,964 | | | | 22,122,041 | | |
| | 243,070 | | | Colgate-Palmolive Company | | | 18,724,902 | | | | 21,966,236 | | |
| | 365,334 | | | Wal-Mart Stores, Inc. | | | 17,331,187 | | | | 20,721,744 | | |
| | | | 95,568,779 | | | | 108,421,897 | | |
| Energy 4.07% | | | |
| | 620,408 | | | ConocoPhillips | | | 32,693,179 | | | | 43,211,417 | | |
| | 154,753 | | | Apache Corporation | | | 10,032,993 | | | | 15,418,041 | | |
| | 352,139 | | | San Juan Basin Royalty Trust | | | 10,234,184 | | | | 8,606,277 | | |
| | 66,671 | | | SEACOR Holdings, Inc. | | | 4,706,611 | | | | 5,677,036 | | |
| | 91,354 | | | Helmerich & Payne, Inc. | | | 1,684,414 | | | | 4,858,206 | | |
| | | | 59,351,381 | | | | 77,770,977 | | |
| Financials 18.29% | | | |
| | 1,842,004 | | | Bank of New York Mellon Corporation | | | 47,877,116 | | | | 39,197,845 | | |
| | 665,890 | | | American Express Company | | | 19,687,007 | | | | 33,707,352 | | |
| | 1,117,550 | | | Cincinnati Financial Corporation | | | 29,916,306 | | | | 32,341,897 | | |
| | 266 | | | Berkshire Hathaway, Inc., Class 'A' (a) | | | 24,377,896 | | | | 31,108,700 | | |
| | 1,115,686 | | | BB&T Corporation | | | 28,381,974 | | | | 26,040,111 | | |
| | 1,432,201 | | | Weyerhaeuser Company REIT | | | 23,323,018 | | | | 25,750,974 | | |
| | 980,843 | | | U.S. Bancorp | | | 24,033,674 | | | | 25,099,772 | | |
| | 262,172 | | | Visa, Inc., Class 'A' | | | 19,442,449 | | | | 24,450,161 | | |
| | 67,946 | | | Alleghany Corporation (a) | | | 19,608,686 | | | | 21,560,625 | | |
| | 58,559 | | | Mastercard, Inc., Class 'A' (c) | | | 12,460,464 | | | | 20,334,027 | | |
| | 579,535 | | | WR Berkley Corporation | | | 15,663,954 | | | | 20,173,613 | | |
| | 514,107 | | | Plum Creek Timber Company, Inc., REIT | | | 18,161,943 | | | | 19,361,270 | | |
| | 394,314 | | | Mercury General Corporation | | | 16,639,706 | | | | 17,073,796 | | |
| | 328,029 | | | Rayonier, Inc., REIT | | | 6,922,549 | | | | 13,688,650 | | |
| | | | 306,496,742 | | | | 349,888,793 | | |
See Notes to Financial Statements.
FIRST EAGLE FUNDS | ANNUAL REPORT | OCTOBER 31, 2011
62
Schedule of Investments | Year Ended October 31, 2011
| SHARES | | DESCRIPTION | | COST (NOTE 1) | | VALUE (NOTE 1) | |
| U.S. Common Stocks — 69.12% — (continued) | | | |
| Health Care 2.17% | | | |
| | 323,880 | | | WellPoint, Inc. | | $ | 15,299,202 | | | $ | 22,315,332 | | |
| | 296,570 | | | Johnson & Johnson | | | 17,865,833 | | | | 19,096,142 | | |
| | | | 33,165,035 | | | | 41,411,474 | | |
| Industrials 9.55% | | | |
| | 481,440 | | | 3M Company | | | 34,783,660 | | | | 38,043,389 | | |
| | 1,143,570 | | | Cintas Corporation | | | 34,510,670 | | | | 34,181,307 | | |
| | 381,695 | | | Lockheed Martin Corporation | | | 27,314,577 | | | | 28,970,650 | | |
| | 449,133 | | | Alliant Techsystems, Inc. | | | 35,333,538 | | | | 26,085,645 | | |
| | 439,785 | | | Northrop Grumman Corporation | | | 26,385,028 | | | | 25,397,584 | | |
| | 720,526 | | | Blount International, Inc. (a) | | | 6,982,391 | | | | 11,189,769 | | |
| | 816,751 | | | Insteel Industries, Inc. | | | 9,144,035 | | | | 8,420,703 | | |
| | 127,022 | | | Unifirst Corporation | | | 3,310,917 | | | | 6,649,602 | | |
| | 128,839 | | | Huntington Ingalls Industries, Inc. (a) | | | 4,027,079 | | | | 3,800,750 | | |
| | | | 181,791,895 | | | | 182,739,399 | | |
| Information Technology 14.35% | | | |
| | 3,611,902 | | | Cisco Systems, Inc. | | | 62,340,579 | | | | 66,928,544 | | |
| | 1,554,637 | | | Microsoft Corporation | | | 37,183,090 | | | | 41,399,983 | | |
| | 1,457,994 | | | Intel Corporation | | | 26,708,512 | | | | 35,779,173 | | |
| | 1,187,010 | | | Rofin-Sinar Technologies, Inc. (a) | | | 27,642,365 | | | | 30,862,260 | | |
| | 951,660 | | | Linear Technology Corporation | | | 24,854,279 | | | | 30,748,135 | | |
| | 750,030 | | | Texas Instruments, Inc. | | | 19,624,553 | | | | 23,048,422 | | |
| | 317,471 | | | Automatic Data Processing, Inc. | | | 11,701,372 | | | | 16,613,257 | | |
| | 332,733 | | | KLA-Tencor Corporation (c) | | | 9,552,516 | | | | 15,668,397 | | |
| | 19,150 | | | Google, Inc., Class 'A' (a) | | | 9,191,400 | | | | 11,349,056 | | |
| | 125,000 | | | Dell, Inc. (a)(c) | | | 1,470,868 | | | | 1,976,250 | | |
| | | | 230,269,534 | | | | 274,373,477 | | |
| Materials 4.98% | | | |
| | 521,812 | | | Newmont Mining Corporation | | | 24,247,219 | | | | 34,872,696 | | |
| | 378,379 | | | Ashland, Inc. | | | 19,781,932 | | | | 20,038,952 | | |
| | 216,880 | | | Martin Marietta Materials, Inc. | | | 19,018,983 | | | | 15,652,230 | | |
| | 458,372 | | | Vulcan Materials Company | | | 20,827,381 | | | | 14,342,460 | | |
| | 101,150 | | | Deltic Timber Corporation | | | 4,802,970 | | | | 6,846,843 | | |
| | 70,020 | | | Scotts Miracle-Gro Company, Class 'A' | | | 3,097,001 | | | | 3,396,670 | | |
| | | | 91,775,486 | | | | 95,149,851 | | |
See Notes to Financial Statements.
FIRST EAGLE FUNDS | ANNUAL REPORT | OCTOBER 31, 2011
63
U.S. Value Fund
| SHARES | | DESCRIPTION | | COST (NOTE 1) | | VALUE (NOTE 1) | |
| U.S. Common Stocks — 69.12% — (continued) | | | |
| Utilities 3.65% | | | |
| | 911,403 | | | FirstEnergy Corporation | | $ | 33,701,919 | | | $ | 40,976,679 | | |
| | 291,320 | | | Entergy Corporation | | | 19,215,087 | | | | 20,150,604 | | |
| | 216,687 | | | IDACorp, Inc. | | | 6,780,723 | | | | 8,749,821 | | |
| | | | 59,697,729 | | | | 69,877,104 | | |
| Total U.S. Common Stocks | | | 1,155,744,583 | | | | 1,321,869,195 | | |
| International Common Stocks — 4.24% | | | |
| Canada 1.35% | | | |
| | 394,620 | | | Agnico-Eagle Mines Limited | | | 22,934,738 | | | | 17,145,668 | | |
| | 478,402 | | | Penn West Petroleum Limited | | | 9,714,722 | | | | 8,572,964 | | |
| | | | 32,649,460 | | | | 25,718,632 | | |
| France 1.41% | | | |
| | 754,462 | | | Sanofi, ADR | | | 28,866,657 | | | | 26,972,017 | | |
| United Kingdom 1.48% | | | |
| | 496,990 | | | Amdocs Limited (a) | | | 11,894,360 | | | | 14,919,640 | | |
| | 370,363 | | | Willis Group Holdings PLC | | | 9,103,777 | | | | 13,447,880 | | |
| | | | 20,998,137 | | | | 28,367,520 | | |
| Total International Common Stocks | | | 82,514,254 | | | | 81,058,169 | | |
| Total Common Stocks | | | 1,238,258,837 | | | | 1,402,927,364 | | |
| U.S. Preferred Stocks — 0.42% | | | |
| Consumer Staples 0.19% | | | |
| | 168,915 | | | Seneca Foods Corporation,
Series '2003' (a)(b)(d)(e) | | | 2,542,171
| | | | 3,555,661
| | |
| Utilities 0.23% | | | |
| | 88,100 | | | Calenergy Capital Trust III
6.50% (b)(f)(g) | | | 3,778,987
| | | | 4,371,962
| | |
| Total U.S. Preferred Stocks | | | 6,321,158 | | | | 7,927,623 | | |
| Exchange Traded Fund — 0.47% | | | |
| | 292,960 | | | PowerShares DB Agriculture
Fund, ETF (a) | | | 7,191,808 | | | | 8,908,914 | | |
| Warrant — 0.36% | | | |
| United States 0.36% | | | |
| | 661,579 | | | JPMorgan Chase & Co.
Warrant expire 10/28/18 (a) | | | 8,575,941
| | | | 6,946,580
| | |
See Notes to Financial Statements.
FIRST EAGLE FUNDS | ANNUAL REPORT | OCTOBER 31, 2011
64
Schedule of Investments | Year Ended October 31, 2011
| OUNCES | | DESCRIPTION | | COST (NOTE 1) | | VALUE (NOTE 1) | |
| Commodity — 4.70% | | | |
| | 52,308 | | | Gold bullion (a) | | $ | 39,756,621 | | | $ | 89,914,608 | | |
| PRINCIPAL | | | | | | | |
| Bonds — 3.53% | | | |
| International Corporate Bond — 0.30% | | | |
| Canada 0.30% | | | |
| 10,000,000
USD | | | Catalyst Paper Corporation
11.00% due 12/15/16 (b)(h) | | | 8,811,945
| | | | 5,850,000
| | |
| U.S. Corporate Bonds — 3.23% | | | |
| $ | 600,000 | | | Bausch & Lomb, Inc.
7.125% due 08/01/28 (b) | | | 517,682
| | | | 468,000
| | |
| | 5,975,000 | | | Mueller Water Products, Inc.
7.375% due 06/01/17 | | | 4,858,153
| | | | 5,287,875
| | |
| | 2,000,000 | | | Pulte Homes, Inc.
6.25% due 02/15/13 | | | 1,932,838
| | | | 2,030,000
| | |
| | 446,000 | | | Sanmina-SCI Corporation
8.125% due 03/01/16 | | | 408,421
| | | | 457,150
| | |
| | 10,169,000 | | | Sealy Mattress Company
8.25% due 06/15/14 | | | 8,150,060
| | | | 10,194,422
| | |
| | 18,167,000 | | | Vulcan Materials Company
6.50% due 12/01/16 | | | 17,524,452
| | | | 17,606,748
| | |
| | 19,455,000 | | | Yankee Candle Company, Inc.
Series 'B' 8.50% due 02/15/15 | | | 19,913,940
| | | | 19,941,375
| | |
| | 5,877,000 | | | Yankee Candle Company, Inc.
Series 'B' 9.75% due 02/15/17 | | | 5,872,173
| | | | 5,759,460
| | |
| Total U.S. Corporate Bonds | | | 59,177,719 | | | | 61,745,030 | | |
| Total Bonds | | | 67,989,664 | | | | 67,595,030 | | |
| U.S. Treasury Bills — 3.40% | | | |
| | 20,000,000 | | | U.S. Treasury Bill
0.02% due 03/01/12 | | | 19,998,656
| | | | 19,998,656
| | |
| | 15,000,000 | | | U.S. Treasury Bill
0.08% due 12/15/11 | | | 14,998,533
| | | | 14,998,533
| | |
| | 15,000,000 | | | U.S. Treasury Bill
0.08% due 02/09/12 | | | 14,996,667
| | | | 14,999,475
| | |
| | 15,000,000 | | | U.S. Treasury Bill
0.09% due 01/12/12 | | | 14,997,300
| | | | 14,999,625
| | |
| Total U.S. Treasury Bills | | | 64,991,156 | | | | 64,996,289 | | |
See Notes to Financial Statements.
FIRST EAGLE FUNDS | ANNUAL REPORT | OCTOBER 31, 2011
65
U.S. Value Fund
| PRINCIPAL | | DESCRIPTION | | COST (NOTE 1) | | VALUE (NOTE 1) | |
| Commercial Paper — 12.26% | | | |
| International Commercial Paper — 1.27% | | | |
| Belgium 0.52% | | | |
| 10,000,000
USD | | | Anheuser Busch InBev WorldWide, Inc.
0.30% due 01/20/12 | | $ | 9,993,333
| | | $ | 9,990,280
| | |
| France 0.26% | | | |
| 5,000,000
USD | | | Électricité de France
0.17% due 01/17/12 | | | 4,998,182
| | | | 4,996,468
| | |
| Germany 0.49% | | | |
| 9,400,000
USD | | | BMW
0.27% due 11/01/11 | | | 9,400,000
| | | | 9,400,000
| | |
| Total International Commercial Paper | | | 24,391,515 | | | | 24,386,748 | | |
| U.S. Commercial Paper — 10.99% | | | |
| $ | 8,400,000 | | | Avery Dennison Corporation
0.30% due 11/01/11 | | | 8,400,000
| | | | 8,400,000
| | |
| | 5,000,000 | | | Coca-Cola Company
0.13% due 12/14/11 | | | 4,999,224
| | | | 4,999,224
| | |
| | 12,500,000 | | | Coca-Cola Company
0.14% due 12/07/11 | | | 12,498,250
| | | | 12,498,250
| | |
| | 5,472,000 | | | Coca-Cola Company
0.17% due 02/10/12 | | | 5,469,390
| | | | 5,469,798
| | |
| | 1,400,000 | | | Coca-Cola Company
0.18% due 11/01/11 | | | 1,400,000
| | | | 1,400,000
| | |
| | 10,000,000 | | | ConocoPhillips
0.14% due 11/16/11 | | | 9,999,417
| | | | 9,999,417
| | |
| | 15,000,000 | | | ConocoPhillips
0.20% due 11/18/11 | | | 14,998,583
| | | | 14,998,583
| | |
| | 10,000,000 | | | Dell, Inc.
0.19% due 04/09/12 | | | 9,991,555
| | | | 9,976,968
| | |
| | 10,000,000 | | | Dell, Inc.
0.36% due 07/11/12 | | | 9,975,403
| | | | 9,951,881
| | |
| | 15,000,000 | | | Hewlett-Packard Company
0.16% due 11/01/11 | | | 15,000,000
| | | | 15,000,000
| | |
| | 5,000,000 | | | Hewlett-Packard Company
0.18% due 12/12/11 | | | 4,998,975
| | | | 4,998,975
| | |
| | 10,000,000 | | | Honeywell International, Inc.
0.14% due 03/30/12 | | | 9,994,167
| | | | 9,991,989
| | |
| | 12,000,000 | | | Honeywell International, Inc.
0.15% due 03/30/12 | | | 11,992,500
| | | | 11,990,387
| | |
| | 3,160,000 | | | Kraft Foods, Inc.
0.15% due 11/01/11 | | | 3,160,000
| | | | 3,160,000
| | |
| | 5,900,000 | | | NYSE Euronext
0.28% due 11/01/11 | | | 5,900,000
| | | | 5,900,000
| | |
See Notes to Financial Statements.
FIRST EAGLE FUNDS | ANNUAL REPORT | OCTOBER 31, 2011
66
Schedule of Investments | Year Ended October 31, 2011
| PRINCIPAL | | DESCRIPTION | | COST (NOTE 1) | | VALUE (NOTE 1) | |
| U.S. Commercial Paper — 10.99% — (continued) | | | |
| $ | 10,000,000 | | | PepsiCo, Inc.
0.07% due 01/06/12 | | $ | 9,998,717
| | | $ | 9,998,288
| | |
| | 17,481,000 | | | Philip Morris International, Inc.
0.08% due 11/07/11 | | | 17,480,767
| | | | 17,480,767
| | |
| | 11,270,000 | | | Proctor & Gamble Company
0.10% due 02/13/12 | | | 11,266,744
| | | | 11,266,220
| | |
| | 10,065,000 | | | Proctor & Gamble Company
0.15% due 12/16/11 | | | 10,063,113
| | | | 10,063,113
| | |
| | 10,000,000 | | | Walt Disney Company
0.08% due 01/20/12 | | | 9,998,222
| | | | 9,996,760
| | |
| | 7,805,000 | | | Walt Disney Company
0.11% due 11/21/11 | | | 7,804,523
| | | | 7,804,523
| | |
| | 5,000,000 | | | WellPoint, Inc.
0.41% due 12/22/11 | | | 4,997,167
| | | | 4,997,167
| | |
| | 4,589,000 | | | WellPoint, Inc.
0.41% due 02/07/12 | | | 4,584,003
| | | | 4,585,769
| | |
| | 5,200,000 | | | Western Union Company
0.30% due 11/01/11 | | | 5,200,000
| | | | 5,200,000
| | |
| Total U.S. Commercial Paper | | | 210,170,720 | | | | 210,128,079 | | |
| Total Commercial Paper | | | 234,562,235 | | | | 234,514,827 | | |
Total Investment Portfolio
Excluding Options Written — 98.50% | | $ | 1,667,647,420 | | | $ | 1,883,731,235 | | |
| CONTRACTS | | | | STRIKE PRICE | | EXPIRATION DATE | | VALUE (NOTE 1) | |
| Covered Call Options Written — (0.02)% | | | |
| | 1,250 | | | Dell, Inc. | | $ | 16.00 | | | November 2011 | | $ | (72,500 | ) | |
| | 1,660 | | | KLA-Tencor Corporation | | | 55.00 | | | March 2012 | | | (207,500 | ) | |
| | 250 | | | Mastercard, Inc., Class 'A' | | | 390.00 | | | November 2011 | | | (48,750 | ) | |
| Total Covered Call Options Written (Premiums Received: $341,309) | | | | | | | (328,750 | ) | |
| Total Investments — 98.48% (Cost: $1,667,306,111) | | | | | | | 1,883,402,485 | | |
| Other Assets in Excess of Liabilities — 1.52% | | | | | | | 29,115,905 | | |
| Net Assets — 100.00% | | | | | | $ | 1,912,518,390 | | |
(a) Non-income producing security/commodity.
(b) Security is deemed illiquid. At October 31, 2011, the value of these securities amounted to $14,248,131 or 0.75% of net assets.
(c) At October 31, 2011, all or a portion of this security was segregated to cover collateral requirement for options.
(d) This security is convertible until December 31, 2049.
(e) Securities valued in accordance with fair value procedures under the supervision of the Board of Trustees, representing $3,555,661 or 0.19% of net assets.
See Notes to Financial Statements.
FIRST EAGLE FUNDS | ANNUAL REPORT | OCTOBER 31, 2011
67
U.S. Value Fund
(f) This security is convertible until September 1, 2027.
(g) This security is subject to a call feature and may be called in full or partially on or anytime after November 21, 2011.
(h) All or a portion of the security is exempt from registration under the Securities Act of 1933. Rule 144A securities may only be sold to qualified institutional buyers, pursuant to Rule 144A under the Securities Act of 1933.
At October 31, 2011, aggregate cost for federal income tax purposes was $1,666,576,755. Net unrealized appreciation consisted of:
| Gross unrealized appreciation | | $ | 271,740,034 | | |
| Gross unrealized depreciation | | | (54,914,304 | ) | |
| Net unrealized appreciation | | $ | 216,825,730 | | |
Abbreviations used in this schedule include:
ADR — American Depository Receipt
ETF — Exchange Traded Fund
NYSE — New York Stock Exchange
PLC — Public Limited Company
REIT — Real Estate Investment Trust
Currencies
USD — United States Dollar
| INDUSTRY DIVERSIFICATION FOR PORTFOLIO HOLDINGS | | PERCENT OF
NET ASSETS | |
| U.S. Common Stocks | |
| Consumer Discretionary | | | 6.39 | % | |
| Consumer Staples | | | 5.67 | | |
| Energy | | | 4.07 | | |
| Financials | | | 18.29 | | |
| Health Care | | | 2.17 | | |
| Industrials | | | 9.55 | | |
| Information Technology | | | 14.35 | | |
| Materials | | | 4.98 | | |
| Utilities | | | 3.65 | | |
| Total U.S. Common Stocks | | | 69.12 | | |
| International Common Stocks | |
| Energy | | | 0.45 | | |
| Financials | | | 0.70 | | |
| Health Care | | | 1.41 | | |
| Information Technology | | | 0.78 | | |
| Materials | | | 0.90 | | |
| Total International Common Stocks | | | 4.24 | | |
See Notes to Financial Statements.
FIRST EAGLE FUNDS | ANNUAL REPORT | OCTOBER 31, 2011
68
Schedule of Investments | Year Ended October 31, 2011
| INDUSTRY DIVERSIFICATION FOR PORTFOLIO HOLDINGS — (CONTINUED) | | PERCENT OF
NET ASSETS | |
| U.S. Preferred Stocks | |
| Consumer Staples | | | 0.19 | % | |
| Utilities | | | 0.23 | | |
| Total U.S. Preferred Stocks | | | 0.42 | | |
| Exchange Traded Fund | | | 0.47 | | |
| Warrant | | | 0.36 | | |
| Commodity | | | 4.70 | | |
| International Corporate Bond | |
| Materials | | | 0.30 | | |
| Total International Corporate Bond | | | 0.30 | | |
| U.S. Corporate Bonds | |
| Consumer Discretionary | | | 2.01 | | |
| Industrials | | | 0.30 | | |
| Materials | | | 0.92 | | |
| Total U.S. Corporate Bonds | | | 3.23 | | |
| U.S. Treasury Bills | | | 3.40 | | |
| Commercial Paper | |
| International Commercial Paper | | | 1.27 | | |
| U.S. Commercial Paper | | | 10.99 | | |
| Total Commercial Paper | | | 12.26 | | |
| Covered Call Options Written | | | (0.02) | | |
| Total Investments | | | 98.48 | % | |
See Notes to Financial Statements.
FIRST EAGLE FUNDS | ANNUAL REPORT | OCTOBER 31, 2011
69

Fund Overview | Data as of October 31, 2011 (unaudited)
INVESTMENT OBJECTIVE
The First Eagle Gold Fund is a non-diversified fund whose investment objective is to provide exposure to the investment characteristics of gold and, to a limited extent, other precious metals. In seeking to achieve its objective, the Fund invests primarily in gold, gold related securities and issuers principally engaged in the gold industry.
| Average Annual Returns | |
| | | ONE-YEAR | | FIVE-YEARS | | TEN-YEARS | |
First Eagle Gold
Fund (A Shares) | |
| without sales load | | | 7.38 | % | | | 15.79 | % | | | 23.92 | % | |
| with sales load | | | 2.01 | | | | 14.60 | | | | 23.29 | | |
| FTSE Gold Mines Index | | | 0.38 | | | | 10.11 | | | | 16.18 | | |
| MSCI World Index | | | 1.76 | | | | -1.00 | | | | 4.54 | | |
| Consumer Price Index | | | 3.53 | | | | 2.33 | | | | 2.45 | | |
Asset Allocation*
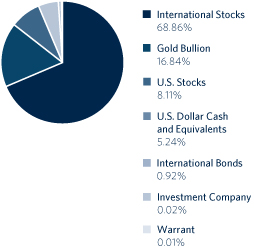
| Countries* | |
| Canada | | | 37.63 | % | |
| United States | | | 24.95 | | |
| South Africa | | | 12.69 | | |
| Australia | | | 8.27 | | |
| Mexico | | | 5.79 | | |
| Africa | | | 4.32 | | |
| United Kingdom | | | 1.09 | | |
* Asset allocation percentages are based on total investments in the portfolio. Country allocations exclude short term investments.
The Fund's portfolio composition is subject to change at any time.
FIRST EAGLE FUNDS | ANNUAL REPORT | OCTOBER 31, 2011
70
Gold Fund
Growth of a $10,000 Initial Investment
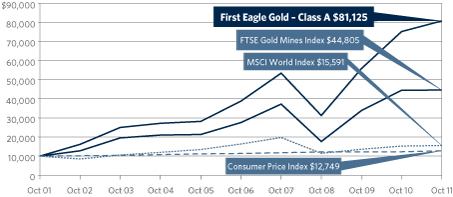
Performance data quoted herein represents past performance and should not be considered indicative of future results. Performance data quoted herein does not reflect the deduction of taxes that a shareholder would pay on Fund distributions or the sale of Fund shares. The average annual returns shown above are historical and reflect changes in share price, reinvested dividends and are net of expenses.
The average annual returns for Class A Shares with a sales charge give effect to the deduction of the maximum sales charge of 5.00%.
The MSCI World Index is a widely followed, unmanaged group of stocks from 23 international markets and is not available for purchase. The index provides total returns in U.S. dollars with net dividends reinvested. The FTSE Gold Mines Index is an unmanaged index composed of approximately 19 mining companies and is only available without dividends reinvested and is not available for purchase. The Consumer Price Index (CPI) represents the change in price of all goods and services purchased for consumption by urban households.
| Top 10 Holdings* | |
| Gold Bullion (United States) | | | 16.68 | % | |
| Goldcorp, Inc. (Canada) | | | 5.25 | | |
| IAMGOLD Corporation (Canada) | | | 5.16 | | |
| AngloGold Ashanti Limited, ADR (South Africa) | | | 5.16 | | |
| Newcrest Mining Limited (Australia) | | | 4.86 | | |
| Newmont Mining Corporation (United States) | | | 4.66 | | |
| Randgold Resources Limited, ADR (Africa) | | | 4.28 | | |
| Kinross Gold Corporation (Canada) | | | 4.25 | | |
| Barrick Gold Corporation (Canada) | | | 4.06 | | |
| Agnico-Eagle Mines Limited (Canada) | | | 4.00 | | |
| Total | | | 58.36 | % | |
* Holdings in cash, commercial paper and money market funds have been excluded. Percentages are based on total net assets.
FIRST EAGLE FUNDS | ANNUAL REPORT | OCTOBER 31, 2011
71
First Eagle Gold Fund
| SHARES | | DESCRIPTION | | COST (NOTE 1) | | VALUE (NOTE 1) | |
| Common Stocks — 76.10% | | | |
| International Common Stocks — 68.06% | | | |
| Africa 4.28% | | | |
| | 1,375,136 | | | Randgold Resources Limited, ADR | | $ | 34,055,314 | | | $ | 150,673,652 | | |
| Australia 8.19% | | | |
| | 4,818,953 | | | Newcrest Mining Limited | | | 146,512,280 | | | | 171,174,778 | | |
| | 3,418,481 | | | Kingsgate Consolidated Limited | | | 13,296,619 | | | | 27,133,015 | | |
| | 10,790,230 | | | CGA Mining Limited (a)(b) | | | 21,440,352 | | | | 26,888,837 | | |
| | 19,344,938 | | | Intrepid Mines Limited (a) | | | 27,857,087 | | | | 23,369,815 | | |
| | 2,613,520 | | | Medusa Mining Limited | | | 12,846,050 | | | | 18,417,494 | | |
| | 3,173,890 | | | Independence Group NL | | | 11,667,659 | | | | 17,893,141 | | |
| | 8,288,115 | | | St. Augustine Gold and Copper
Limited (a)(c) | | | 9,358,731
| | | | 3,372,876
| | |
| | | | 242,978,778 | | | | 288,249,956 | | |
| Canada 36.42% | | | |
| | 3,781,920 | | | Goldcorp, Inc. | | | 129,619,026 | | | | 184,708,973 | | |
| | 8,437,992 | | | IAMGOLD Corporation | | | 69,800,684 | | | | 181,698,320 | | |
| | 10,430,412 | | | Kinross Gold Corporation | | | 152,956,918 | | | | 149,676,412 | | |
| | 2,885,934 | | | Barrick Gold Corporation | | | 105,356,174 | | | | 142,853,733 | | |
| | 3,238,563 | | | Agnico-Eagle Mines Limited | | | 182,361,640 | | | | 140,710,876 | | |
| | 8,333,451 | | | New Gold, Inc. (a) | | | 18,188,041 | | | | 103,414,510 | | |
| | 8,351,290 | | | Gabriel Resources Limited (a) | | | 49,761,903 | | | | 59,412,312 | | |
| | 1,383,433 | | | Franco-Nevada Corporation | | | 27,818,391 | | | | 54,895,266 | | |
| | 3,478,980 | | | Osisko Mining Corporation (a)(b) | | | 29,875,365 | | | | 42,019,031 | | |
| | 3,380,100 | | | Alacer Gold Corporation (a) | | | 16,772,198 | | | | 39,058,632 | | |
| | 974,240 | | | Detour Gold Corporation (a)(b) | | | 23,293,051 | | | | 32,304,984 | | |
| | 2,651,590 | | | European Goldfields Limited (a) | | | 7,220,474 | | | | 29,894,333 | | |
| | 3,702,396 | | | Dundee Precious Metals, Inc. (a)(b) | | | 13,462,262 | | | | 29,762,026 | | |
| | 18,395,220 | | | Lake Shore Gold Corporation (a) | | | 56,235,954 | | | | 27,356,236 | | |
| | 3,342,550 | | | Aurizon Mines Limited (a) | | | 4,168,390 | | | | 18,942,908 | | |
| | 1,872,803 | | | Guyana Goldfields, Inc. (a) | | | 16,698,724 | | | | 16,484,882 | | |
| | 4,138,370 | | | Orezone Gold Corporation (a)(b) | | | 15,713,538 | | | | 14,969,988 | | |
| | 667,000 | | | Eldorado Gold Corporation | | | 7,971,450 | | | | 12,553,165 | | |
| | 552,000 | | | Eurasian Minerals, Inc. (a) | | | 1,623,583 | | | | 1,203,617 | | |
| | | | 928,897,766 | | | | 1,281,920,204 | | |
| Mexico 5.74% | | | |
| | 4,197,841 | | | Fresnillo PLC | | | 16,620,435 | | | | 114,980,772 | | |
| | 2,109,555 | | | Industrias Peñoles S.A.B. de C.V. | | | 10,573,599 | | | | 87,077,109 | | |
| | | | 27,194,034 | | | | 202,057,881 | | |
See Notes to Financial Statements.
FIRST EAGLE FUNDS | ANNUAL REPORT | OCTOBER 31, 2011
72
Consolidated Schedule of Investments | Year Ended October 31, 2011
| SHARES | | DESCRIPTION | | COST (NOTE 1) | | VALUE (NOTE 1) | |
| International Common Stocks — 68.06% — (continued) | | | |
| South Africa 12.34% | | | |
| | 4,016,189 | | | AngloGold Ashanti Limited, ADR | | $ | 148,557,972 | | | $ | 181,571,904 | | |
| | 6,921,044 | | | Gold Fields Limited, ADR | | | 93,344,394 | | | | 120,633,797 | | |
| | 9,080,083 | | | Harmony Gold Mining Company
Limited, ADR | | | 96,024,836
| | | | 119,221,490
| | |
| | 9,250,630 | | | Great Basin Gold Limited (a) | | | 11,638,630 | | | | 13,013,346 | | |
| | | | 349,565,832 | | | | 434,440,537 | | |
| United Kingdom 1.09% | | | |
| | 1,600,000 | | | Bumi PLC (a) | | | 24,085,668 | | | | 19,099,115 | | |
| | 514,864 | | | Anglo American PLC | | | 22,644,173 | | | | 19,048,151 | | |
| | | | 46,729,841 | | | | 38,147,266 | | |
| Total International Common Stocks | | | 1,629,421,565 | | | | 2,395,489,496 | | |
| U.S. Common Stocks — 8.04% | | | |
| Materials 8.04% | | | |
| | 2,452,777 | | | Newmont Mining Corporation | | | 108,247,852 | | | | 163,919,087 | | |
| | 1,184,501 | | | Royal Gold, Inc. | | | 25,284,174 | | | | 84,786,582 | | |
| | 1,816,240 | | | Tahoe Resources, Inc. (a)(b) | | | 24,746,012 | | | | 34,328,250 | | |
| Total U.S. Common Stocks | | | 158,278,038 | | | | 283,033,919 | | |
| Total Common Stocks | | | 1,787,699,603 | | | | 2,678,523,415 | | |
| International Preferred Stock — 0.17% | | | |
| South Africa 0.17% | | | |
| | 120,000 | | | AngloGold Ashanti Holdings Finance
PLC 6.00% (d) | | | 6,000,000
| | | | 6,151,200
| | |
| Investment Company — 0.02% | | | |
| | 559,329 | | | State Street Institutional
U.S. Government Money Market
Fund, Institutional Class | | | 559,329
| | | | 559,329
| | |
| Warrant — 0.01% | | | |
| Canada 0.01% | | | |
| | 666,680 | | | Primero Mining Corporation
Warrant expire 07/15/20 (a)(b) | | | 558,606
| | | | 261,259
| | |
See Notes to Financial Statements.
FIRST EAGLE FUNDS | ANNUAL REPORT | OCTOBER 31, 2011
73
Gold Fund
| OUNCES | | DESCRIPTION | | COST (NOTE 1) | | VALUE (NOTE 1) | |
| Commodity — 16.68% | | | |
| | 341,566 | | | Gold bullion (a) | | $ | 185,268,444 | | | $ | 587,135,293 | | |
| PRINCIPAL | | | | | | | |
| International Convertible Bonds — 0.91% | | | |
| Canada 0.85% | | | |
| 30,000,000
USD | | | Detour Gold Corporation
5.50% due 11/30/17 (e)(f) | | | 30,000,000
| | | | 30,000,000
| | |
| South Africa 0.06% | | | |
| 2,000,000
CAD | | | Great Basin Gold Limited
8.00% due 11/30/14 (b)(g) | | | 1,900,057
| | | | 2,110,129
| | |
| Total International Convertible Bonds | | | 31,900,057 | | | | 32,110,129 | | |
| Commercial Paper — 5.19% | | | |
| International Commercial Paper — 2.41% | | | |
| Belgium 0.57% | | | |
| 20,000,000
USD | | | Anheuser Busch InBev WorldWide, Inc.
0.30% due 12/19/11 | | | 19,992,000
| | | | 19,992,000
| | |
| Germany 0.31% | | | |
| 10,900,000
USD | | | BMW
0.27% due 11/01/11 | | | 10,900,000
| | | | 10,900,000
| | |
| Japan 1.47% | | | |
| 20,000,000
USD | | | Sumitomo Corporation
0.28% due 11/08/11 | | | 19,998,911
| | | | 19,998,911
| | |
| 9,051,000
USD | | | Toyota Motor Corporation
0.23% due 01/12/12 | | | 9,046,837
| | | | 9,047,421
| | |
| 22,559,000
USD | | | Toyota Motor Corporation
0.30% due 02/08/12 | | | 22,540,389
| | | | 22,542,519
| | |
| Switzerland 0.06% | | | |
| 2,303,000
USD | | | Nestlé SA
0.10% due 12/12/11 | | | 2,302,737
| | | | 2,302,737
| | |
| Total International Commercial Paper | | | 84,780,874 | | | | 84,783,588 | | |
| U.S. Commercial Paper — 2.78% | | | |
| $ | 9,700,000 | | | Avery Dennison Corporation
0.30% due 11/01/11 | | | 9,700,000
| | | | 9,700,000
| | |
| | 10,179,000 | | | Campbell Soup Company
0.20% due 01/09/12 | | | 10,175,098
| | | | 10,177,080
| | |
| | 24,000,000 | | | Coca-Cola Company
0.16% due 01/19/12 | | | 23,991,574
| | | | 23,993,974
| | |
See Notes to Financial Statements.
FIRST EAGLE FUNDS | ANNUAL REPORT | OCTOBER 31, 2011
74
Consolidated Schedule of Investments | Year Ended October 31, 2011
| PRINCIPAL | | DESCRIPTION | | COST (NOTE 1) | | VALUE (NOTE 1) | |
| U.S. Commercial Paper — 2.78% — (continued) | | | |
| $ | 20,500,000 | | | Dell, Inc.
0.36% due 07/09/12 | | $ | 20,449,974
| | | $ | 20,402,994
| | |
| | 10,000,000 | | | Hewlett-Packard Company
0.16% due 12/05/11 | | | 9,998,489
| | | | 9,998,489
| | |
| | 3,686,000 | | | Kraft Foods, Inc.
0.15% due 11/01/11 | | | 3,686,000
| | | | 3,686,000
| | |
| | 7,000,000 | | | Kraft Foods, Inc.
0.36% due 11/21/11 | | | 6,998,639
| | | | 6,998,639
| | |
| | 6,800,000 | | | NYSE Euronext
0.28% due 11/01/11 | | | 6,800,000
| | | | 6,800,000
| | |
| | 6,100,000 | | | Western Union Company
0.30% due 11/01/11 | | | 6,100,000
| | | | 6,100,000
| | |
| Total U.S. Commercial Paper | | | 97,899,774 | | | | 97,857,176 | | |
| Total Commercial Paper | | | 182,680,648 | | | | 182,640,764 | | |
| Total Investments — 99.08% | | $ | 2,194,666,687 | | | | 3,487,381,389 | | |
| Other Assets in Excess of Liabilities — 0.92% | | | | | 32,537,433 | | |
| Net Assets — 100.00% | | | | $ | 3,519,918,822 | | |
(a) Non-income producing security/commodity.
(b) All or a portion of the security is exempt from registration under the Securities Act of 1933. Rule 144A securities may only be sold to qualified institutional buyers, pursuant to Rule 144A under the Securities Act of 1933.
(c) Represents a security registered under Regulation D. Regulation D provides exemptions for small companies to offer and sell their securities without having to register the securities under the Securities Act of 1933.
(d) This security is convertible until August 9, 2013.
(e) Securities valued in accordance with fair value procedures under the supervision of the Board of Trustees, representing $30,000,000 or 0.85% of net assets.
(f) This security is convertible until November 30, 2017.
(g) This security is convertible until November 30, 2014.
At October 31, 2011, aggregate cost for federal income tax purposes was $2,315,877,132. Net unrealized appreciation consisted of:
| Gross unrealized appreciation | | $ | 1,265,881,015 | | |
| Gross unrealized depreciation | | | (94,376,758 | ) | |
| Net unrealized appreciation | | $ | 1,171,504,257 | | |
Abbreviations used in this schedule include:
ADR — American Depository Receipt
NYSE — New York Stock Exchange
PLC — Public Limited Company
Currencies
CAD — Canadian Dollar
USD — United States Dollar
See Notes to Financial Statements.
FIRST EAGLE FUNDS | ANNUAL REPORT | OCTOBER 31, 2011
75
Gold Fund
| INDUSTRY DIVERSIFICATION FOR PORTFOLIO HOLDINGS | | PERCENT OF
NET ASSETS | |
| International Common Stocks | |
| Energy | | | 0.55 | % | |
| Materials | | | 67.51 | | |
| Total International Common Stocks | | | 68.06 | | |
| U.S. Common Stocks | |
| Materials | | | 8.04 | | |
| Total U.S. Common Stocks | | | 8.04 | | |
| International Preferred Stock | |
| Materials | | | 0.17 | | |
| Total International Preferred Stock | | | 0.17 | | |
| Investment Company | | | 0.02 | | |
| Warrants | | | 0.01 | | |
| Commodity | | | 16.68 | | |
| International Convertible Bonds | |
| Materials | | | 0.91 | | |
| Total International Convertible Bonds | | | 0.91 | | |
| Commercial Paper | |
| International Commercial Paper | | | 2.41 | | |
| U.S. Commercial Paper | | | 2.78 | | |
| Total Commercial Paper | | | 5.19 | | |
| Total Investments | | | 99.08 | % | |
See Notes to Financial Statements.
FIRST EAGLE FUNDS | ANNUAL REPORT | OCTOBER 31, 2011
76
Management's Discussion of Fund Performance

Harold Levy
First Eagle Fund of America Class Y* (without sales charge) increased 4.20% for the year ended October 31, 2011 versus an increase of 8.09% for the S&P 500 Index. The five greatest contributors to performance were Valeant Pharmaceuticals International, Inc., Dresser-Rand Group, Inc., NVIDIA Corporation, AutoZone, Inc. and Atmel Corporation. Conversely, the five greatest detractors were AOL, Inc., Computer Sciences Corporation., Exterran Holdings, Inc., Enzon Pharmaceuticals, Inc., and Ingersoll-Rand PLC.
It would be nice to return to times when the results of investing were only determined by research, insight, actions of management or company fundamental analysis. While we believe those times may eventually return, for the moment markets are in the power of forces which, although not unanalyzable, are extraordinarily complex and reside outside the borders of this country. Will Greece default? Will European banks survive it? Will the Euro? And what will the cost be of its survival? Against this backdrop of global macroeconomic uncertainties, the company-specific details concerning how many aluminum cans Ball Corporation produces, how many G650 Gulfstream Jets General Dynamics Corporation sells or the significant free cash flow generated by Wyndham Worldwide Corporation can appear to fade into secondary importance. Despite the market's temporary focus on anxieties surrounding world events, we are unwavering in our long-term investment approach. Regardless of market manias or miseries, we maintain our primary focus on identifying quality companies trading at a discount to our estimates of intrinsic value. We believe, over time, that the market may reward these types of companies, and we seek to identify the catalysts that might bring this to fruition.
We have no particular insight into how the above events will play out or over what timeframe. But we are patient investors who take a long-term approach. Like the 2008 credit crisis in the U.S., we believe that eventually this crisis too shall pass, albeit with significant economic costs. We have chosen to maintain our focus on companies providing essential goods and services with strong balance sheets and great cash flow. Free cash flow yields on our equities are at
FIRST EAGLE FUNDS | ANNUAL REPORT | OCTOBER 31, 2011
77
First Eagle Fund of America
levels we believe are very attractive both absolutely and relative to fixed income alternatives. We have confidence these companies are building value, but predicting when markets will recognize this is not easy. We do know that free cash flow can ultimately help generate value for shareholders, and as patient investors, we are prepared to wait.
Thank you for your continued confidence.

Harold Levy
Portfolio Manager
December 2011
The performance data quoted herein represents past performance and does not guarantee future results. Market volatility can dramatically impact the fund's short-term performance. Current performance may be lower or higher than figures shown. The investment return and principal value will fluctuate so that an investor's shares, when redeemed, may be worth more or less than their original cost. Past performance data through the most recent month end is available at firsteaglefunds.com or by calling 800.334.2143.
*As of September 1, 2005, Class Y Shares are closed to new investors. Class Y shares are offered without sales charge. If sales charge was included returns would be lower. The portfolio is actively managed and holdings can change at any time. Current and future portfolio holdings are subject to risk.
FIRST EAGLE FUNDS | ANNUAL REPORT | OCTOBER 31, 2011
78
This page was intentionally left blank.

Fund Overview | Data as of October 31, 2011 (unaudited)
INVESTMENT OBJECTIVE
The First Eagle Fund of America is a non-diversified U.S. equity fund that seeks long-term capital appreciation by investing primarily in U.S. stocks and to a lesser extent in debt and foreign equity securities. The Fund has a unique event-driven bias that focuses on identifying companies poised to benefit from change that the market has not yet recognized.
| Average Annual Returns | |
| | | ONE-YEAR | | FIVE-YEARS | | TEN-YEARS | |
First Eagle
Fund of America
(Y Shares) | | | 4.20 | % | | | 3.97 | % | | | 7.21 | % | |
Standard & Poor's
500 Index | | | 8.09 | | | | 0.25 | | | | 3.69 | | |
Asset Allocation*
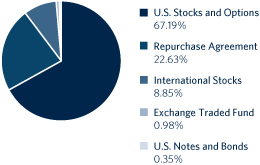
| Sector/Industry* | |
| Materials | | | 27.24 | % | |
| Health Care | | | 22.92 | | |
| Industrials | | | 10.66 | | |
| Consumer Discretionary | | | 6.23 | | |
| Information Technology | | | 6.03 | | |
| Energy | | | 4.61 | | |
| Exchange Traded Fund | | | 0.98 | | |
| Consumer Staples | | | 0.89 | | |
* percentages exclude option positions
* Asset allocation percentages are based on total investments in the portfolio. Sector/Industry allocations exclude short term investments.
The Fund's portfolio composition is subject to change at any time.
FIRST EAGLE FUNDS | ANNUAL REPORT | OCTOBER 31, 2011
80
Fund of America
Growth of a $10,000 Initial Investment
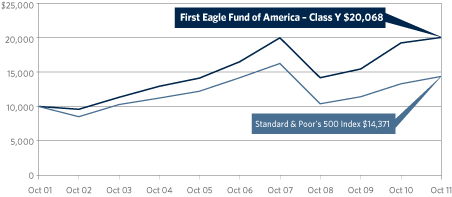
Performance data quoted herein represents past performance and should not be considered indicative of future results. Performance data quoted herein does not reflect the deduction of taxes that a shareholder would pay on Fund distributions or the sale of Fund shares.
The Fund's average annual returns shown above are historical and reflect changes in share price, reinvested dividends and is net of expenses.
The Standard & Poor's 500 Index is a widely recognized unmanaged index including a representative sample of 500 leading companies in leading sectors of the U.S. economy and is not available for purchase. Although the Standard & Poor's 500 Index focuses on the large-cap segment of the market, with approximately 75% coverage of U.S. equities, it is also considered a proxy for the total market.
| Top 10 Holdings* | |
| Eastman Chemical Company (chemicals company) | | | 5.19 | % | |
| Rockwood Holdings, Inc. (specialty chemicals manufacturer) | | | 5.14 | | |
| Wyndham Worldwide Corporation (hotel and resorts) | | | 4.73 | | |
| Tyco International Limited (industrial conglomerate) | | | 4.65 | | |
| Pfizer, Inc. (biopharmaceutical company) | | | 4.44 | | |
| Omnicare, Inc. (pharmaceutical company) | | | 3.97 | | |
| Ball Corporation (containers and packaging manufacturer) | | | 3.95 | | |
| Valeant Pharmaceuticals International, Inc. (pharmaceuticals company) | | | 3.76 | | |
| Packaging Corporation of America (containers and packaging manufacturer) | | | 3.69 | | |
| Baxter International, Inc. (health technology company) | | | 3.65 | | |
| Total | | | 43.17 | % | |
* Holdings in cash and repurchase agreements have been excluded. Percentages are based on total net assets.
FIRST EAGLE FUNDS | ANNUAL REPORT | OCTOBER 31, 2011
81
First Eagle Fund of America
| SHARES | | DESCRIPTION | | COST (NOTE 1) | | VALUE (NOTE 1) | |
| Common Stocks — 76.27% | | | |
| U.S. Common Stocks — 67.64% | | | |
| Consumer Discretionary 6.07% | | | |
| | 1,935,000 | | | Wyndham Worldwide Corporation (a) | | $ | 62,467,308 | | | $ | 65,151,450 | | |
| | 561,600 | | | Tenneco, Inc. (a)(b) | | | 23,139,779 | | | | 18,375,552 | | |
| | | | 85,607,087 | | | | 83,527,002 | | |
| Consumer Staples 0.87% | | | |
| | 670,030 | | | Sara Lee Corporation (a) | | | 11,245,108 | | | | 11,926,534 | | |
| Energy 4.49% | | | |
| | 1,375,400 | | | Atlas Energy L.P. (a) | | | 31,650,443 | | | | 32,638,242 | | |
| | 227,720 | | | Devon Energy Corporation (a) | | | 18,795,009 | | | | 14,790,414 | | |
| | 296,890 | | | Dresser-Rand Group, Inc. (a)(b) | | | 9,575,904 | | | | 14,369,476 | | |
| | | | 60,021,356 | | | | 61,798,132 | | |
| Health Care 22.01% | | | |
| | 3,173,700 | | | Pfizer, Inc. (a) | | | 63,434,206 | | | | 61,125,462 | | |
| | 1,832,100 | | | Omnicare, Inc. (a) | | | 48,404,959 | | | | 54,633,222 | | |
| | 1,308,842 | | | Valeant Pharmaceuticals
International, Inc. (a) | | | 26,928,550
| | | | 51,777,789
| | |
| | 913,800 | | | Baxter International, Inc. (a) | | | 48,540,986 | | | | 50,240,724 | | |
| | 1,438,460 | | | Health Net, Inc. (b) | | | 37,347,314 | | | | 39,974,804 | | |
| | 229,280 | | | Amgen, Inc. (a) | | | 12,982,765 | | | | 13,130,866 | | |
| | 1,213,387 | | | Enzon Pharmaceuticals, Inc. (b) | | | 10,244,912 | | | | 8,918,394 | | |
| | 513,371 | | | PharMerica Corporation (b) | | | 6,983,908 | | | | 8,008,588 | | |
| | 201,000 | | | Medicis Pharmaceutical Corporation,
Class 'A' (a) | | | 7,659,025
| | | | 7,696,290
| | |
| | 326,710 | | | Theravance, Inc. (b) | | | 6,029,781 | | | | 7,262,763 | | |
| | | | 268,556,406 | | | | 302,768,902 | | |
| Industrials 4.74% | | | |
| | 698,290 | | | General Dynamics Corporation (a) | | | 43,373,037 | | | | 44,823,235 | | |
| | 332,200 | | | Owens Corning, Inc. (a)(b) | | | 7,758,127 | | | | 9,427,836 | | |
| | 113,040 | | | Rockwell Collins, Inc. (a) | | | 5,547,480 | | | | 6,311,023 | | |
| | 20,490 | | | Precision Castparts Corporation (a) | | | 2,478,436 | | | | 3,342,944 | | |
| | 30,747 | | | Mueller Industries, Inc. | | | 1,210,817 | | | | 1,243,716 | | |
| | | | 60,367,897 | | | | 65,148,754 | | |
| Information Technology 2.90% | | | |
| | 1,782,836 | | | LSI Corporation (b) | | | 11,587,764 | | | | 11,142,725 | | |
| | 773,040 | | | AOL, Inc. (b) | | | 19,114,319 | | | | 10,915,325 | | |
| | 279,700 | | | Analog Devices, Inc. (a) | | | 9,822,542 | | | | 10,228,629 | | |
See Notes to Financial Statements.
FIRST EAGLE FUNDS | ANNUAL REPORT | OCTOBER 31, 2011
82
Schedule of Investments | Year Ended October 31, 2011
| SHARES | | DESCRIPTION | | COST (NOTE 1) | | VALUE (NOTE 1) | |
| U.S. Common Stocks — 67.64% — (continued) | | | |
| Information Technology 2.90% — (continued) | | | |
| | 473,250 | | | Seagate Technology PLC (a) | | $ | 7,477,757 | | | $ | 7,642,987 | | |
| | | | 48,002,382 | | | | 39,929,666 | | |
| Materials 26.56% | | | |
| | 1,818,800 | | | Eastman Chemical Company (a) | | | 59,368,062 | | | | 71,460,652 | | |
| | 1,536,070 | | | Rockwood Holdings, Inc. (a)(b) | | | 69,297,894 | | | | 70,720,663 | | |
| | 1,573,560 | | | Ball Corporation (a) | | | 35,929,837 | | | | 54,397,969 | | |
| | 1,944,600 | | | Packaging Corporation of America | | | 47,618,782 | | | | 50,715,168 | | |
| | 1,346,370 | | | Crown Holdings, Inc. (a)(b) | | | 30,669,425 | | | | 45,493,842 | | |
| | 914,650 | | | Valspar Corporation | | | 22,122,082 | | | | 31,893,846 | | |
| | 297,800 | | | Walter Energy, Inc. (a) | | | 23,394,978 | | | | 22,528,570 | | |
| | 378,400 | | | EI du Pont de Nemours & Company (a) | | | 17,113,653 | | | | 18,189,688 | | |
| | | | 305,514,713 | | | | 365,400,398 | | |
| Total U.S. Common Stocks | | | 839,314,949 | | | | 930,499,388 | | |
| International Common Stocks — 8.63% | | | |
| Ireland 1.00% | | | |
| | 442,900 | | | Ingersoll-Rand PLC (a) | | | 17,434,981 | | | | 13,787,477 | | |
| Switzerland 7.63% | | | |
| | 1,404,650 | | | Tyco International Limited (a) | | | 64,167,241 | | | | 63,981,807 | | |
| | 1,152,530 | | | TE Connectivity Limited | | | 37,000,760 | | | | 40,972,442 | | |
| | | | 101,168,001 | | | | 104,954,249 | | |
| Total International Common Stocks | | | 118,602,982 | | | | 118,741,726 | | |
| Total Common Stocks | | | 957,917,931 | | | | 1,049,241,114 | | |
| Exchange Traded Fund — 0.96% | | | |
| | 78,680 | | | SPDR Gold Trust (a)(b) | | | 12,250,373 | | | | 13,166,311 | | |
| PRINCIPAL | | | | | | | |
| Repurchase Agreement — 22.06% | | | |
| $ | 303,465,732
| | | State Street Bank and Trust Company,
0.01% dated 10/31/11 due 11/01/11
(collateralized by United States Treasury
Bill, 0.00% due 12/29/11 valued at
$309,535,047); proceeds $303,465,816 | | | 303,465,732
| | | | 303,465,732
| | |
See Notes to Financial Statements.
FIRST EAGLE FUNDS | ANNUAL REPORT | OCTOBER 31, 2011
83
Fund of America
| PRINCIPAL | | DESCRIPTION | | COST (NOTE 1) | | VALUE (NOTE 1) | |
| Bond — 0.34% | |
| U.S. Convertible Bond 0.34% | |
| $ | 3,730,000 | | | Omnicare, Inc.
3.750% due 12/15/25 (c) | | $ | 3,730,000
| | | $ | 4,657,838
| | |
| CONTRACTS | | | | STRIKE PRICE | | EXPIRATION DATE | | VALUE (NOTE 1) | |
| Call Option Purchased — 0.08% | | | |
| | 2,799 | | | Seagate Technology
(Cost: $1,113,812) | | $ | 12.50 | | | January 2012 | | $ | 1,161,585 | | |
Total Investment Portfolio
Excluding Options Written — 99.71% (Cost: $1,278,477,848) | | | | | | $ | 1,371,692,580 | | |
| Covered Call Options Written — (2.22)% | |
| | 1,540 | | | Amgen, Inc. | | $ | 55.00 | | | November 2011 | | $ | (425,040 | ) | |
| | 472 | | | Amgen, Inc. | | | 57.50 | | | November 2011 | | | (48,616 | ) | |
| | 265 | | | Amgen, Inc. | | | 57.50 | | | January 2012 | | | (55,120 | ) | |
| | 746 | | | Analog Devices, Inc. | | | 34.00 | | | November 2011 | | | (214,475 | ) | |
| | 1,492 | | | Analog Devices, Inc. | | | 35.00 | | | December 2011 | | | (417,760 | ) | |
| | 371 | | | Analog Devices, Inc. | | | 36.00 | | | December 2011 | | | (73,272 | ) | |
| | 188 | | | Analog Devices, Inc. | | | 37.50 | | | January 2012 | | | (32,900 | ) | |
| | 1,290 | | | Atlas Energy L.P. | | | 21.00 | | | January 2012 | | | (477,300 | ) | |
| | 1,826 | | | Atlas Energy L.P. | | | 22.50 | | | January 2012 | | | (529,540 | ) | |
| | 3,156 | | | Atlas Energy L.P. | | | 23.00 | | | November 2011 | | | (473,400 | ) | |
| | 2,063 | | | Atlas Energy L.P. | | | 23.00 | | | December 2011 | | | (433,230 | ) | |
| | 560 | | | Atlas Energy L.P. | | | 24.00 | | | January 2012 | | | (106,400 | ) | |
| | 1,342 | | | Ball Corporation | | | 35.00 | | | November 2011 | | | (114,070 | ) | |
| | 1,973 | | | Baxter International, Inc. | | | 52.50 | | | November 2011 | | | (633,333 | ) | |
| | 2,735 | | | Baxter International, Inc. | | | 55.00 | | | November 2011 | | | (363,755 | ) | |
| | 913 | | | Baxter International, Inc. | | | 55.00 | | | December 2011 | | | (177,122 | ) | |
| | 1,662 | | | Baxter International, Inc. | | | 57.50 | | | November 2011 | | | (46,536 | ) | |
| | 350 | | | Crown Holdings, Inc. | | | 32.00 | | | November 2011 | | | (79,625 | ) | |
| | 780 | | | Devon Energy Corporation | | | 60.00 | | | November 2011 | | | (478,920 | ) | |
| | 1,341 | | | Dresser-Rand Group, Inc. | | | 45.00 | | | November 2011 | | | (616,860 | ) | |
| | 1,044 | | | Dresser-Rand Group, Inc. | | | 45.00 | | | December 2011 | | | (600,300 | ) | |
| | 256 | | | Dresser-Rand Group, Inc. | | | 50.00 | | | November 2011 | | | (43,520 | ) | |
| | 327 | | | Dresser-Rand Group, Inc. | | | 50.00 | | | December 2011 | | | (90,743 | ) | |
| | 446 | | | Eastman Chemical Company | | | 37.50 | | | November 2011 | | | (115,960 | ) | |
See Notes to Financial Statements.
FIRST EAGLE FUNDS | ANNUAL REPORT | OCTOBER 31, 2011
84
Schedule of Investments | Year Ended October 31, 2011
| CONTRACTS | | | | STRIKE PRICE | | EXPIRATION DATE | | VALUE (NOTE 1) | |
| Covered Call Options Written — (2.22)% — (continued) | | | |
| | 450 | | | Eastman Chemical Company | | $ | 37.50 | | | December 2011 | | $ | (162,000 | ) | |
| | 825 | | | EI du Pont de Nemours & Company | | | 39.00 | | | November 2011 | | | (759,000 | ) | |
| | 1,240 | | | EI du Pont de Nemours & Company | | | 40.00 | | | November 2011 | | | (1,072,600 | ) | |
| | 710 | | | EI du Pont de Nemours & Company | | | 41.00 | | | November 2011 | | | (524,690 | ) | |
| | 709 | | | EI du Pont de Nemours & Company | | | 42.00 | | | November 2011 | | | (457,305 | ) | |
| | 300 | | | EI du Pont de Nemours & Company | | | 43.00 | | | November 2011 | | | (174,000 | ) | |
| | 698 | | | General Dynamics Corporation | | | 65.00 | | | November 2011 | | | (94,230 | ) | |
| | 349 | | | General Dynamics Corporation | | | 65.00 | | | December 2011 | | | (78,525 | ) | |
| | 349 | | | General Dynamics Corporation | | | 67.50 | | | December 2011 | | | (42,927 | ) | |
| | 678 | | | General Dynamics Corporation | | | 75.00 | | | November 2011 | | | (2,033 | ) | |
| | 1,942 | | | Ingersoll-Rand PLC | | | 28.00 | | | November 2011 | | | (689,410 | ) | |
| | 1,802 | | | Ingersoll-Rand PLC | | | 29.00 | | | November 2011 | | | (558,620 | ) | |
| | 685 | | | Ingersoll-Rand PLC | | | 30.00 | | | November 2011 | | | (143,850 | ) | |
| | 201 | | | Medicis Pharmaceutical Corporation | | | 36.00 | | | November 2011 | | | (60,300 | ) | |
| | 86 | | | Medicis Pharmaceutical Corporation | | | 37.00 | | | November 2011 | | | (22,145 | ) | |
| | 301 | | | Medicis Pharmaceutical Corporation | | | 37.00 | | | January 2012 | | | (99,330 | ) | |
| | 533 | | | Omnicare, Inc. | | | 22.00 | | | November 2011 | | | (413,075 | ) | |
| | 536 | | | Omnicare, Inc. | | | 24.00 | | | November 2011 | | | (308,200 | ) | |
| | 512 | | | Omnicare, Inc. | | | 25.00 | | | November 2011 | | | (256,000 | ) | |
| | 506 | | | Omnicare, Inc. | | | 25.00 | | | December 2011 | | | (260,590 | ) | |
| | 246 | | | Omnicare, Inc. | | | 27.00 | | | December 2011 | | | (86,100 | ) | |
| | 249 | | | Omnicare, Inc. | | | 28.00 | | | December 2011 | | | (65,985 | ) | |
| | 852 | | | Owens Corning, Inc. | | | 26.00 | | | December 2011 | | | (306,720 | ) | |
| | 115 | | | Owens Corning, Inc. | | | 39.00 | | | November 2011 | | | (1,150 | ) | |
| | 3,035 | | | Pfizer, Inc. | | | 17.00 | | | November 2011 | | | (786,065 | ) | |
| | 4,310 | | | Pfizer, Inc. | | | 18.00 | | | November 2011 | | | (607,710 | ) | |
| | 1,031 | | | Pfizer, Inc. | | | 19.00 | | | November 2011 | | | (61,860 | ) | |
| | 204 | | | Precision Castparts Corporation | | | 150.00 | | | November 2011 | | | (304,980 | ) | |
| | 186 | | | Rockwell Collins, Inc. | | | 50.00 | | | November 2011 | | | (117,180 | ) | |
| | 891 | | | Rockwell Collins, Inc. | | | 55.00 | | | November 2011 | | | (196,020 | ) | |
| | 1,477 | | | Rockwood Holdings, Inc. | | | 40.00 | | | November 2011 | | | (982,205 | ) | |
| | 400 | | | Rockwood Holdings, Inc. | | | 45.00 | | | November 2011 | | | (124,000 | ) | |
| | 310 | | | Rockwood Holdings, Inc. | | | 45.00 | | | December 2011 | | | (127,100 | ) | |
| | 670 | | | Sara Lee Corporation | | | 16.00 | | | November 2011 | | | (132,325 | ) | |
| | 1,892 | | | Sara Lee Corporation | | | 17.00 | | | November 2011 | | | (191,092 | ) | |
| | 7 | | | Seagate Technology | | | 10.00 | | | November 2011 | | | (4,445 | ) | |
| | 4 | | | Seagate Technology | | | 11.00 | | | November 2011 | | | (2,140 | ) | |
See Notes to Financial Statements.
FIRST EAGLE FUNDS | ANNUAL REPORT | OCTOBER 31, 2011
85
Fund of America
| CONTRACTS | | | | STRIKE PRICE | | EXPIRATION DATE | | VALUE (NOTE 1) | |
| Covered Call Options Written — (2.22)% — (continued) | | | |
| | 4 | | | Seagate Technology | | $ | 12.00 | | | November 2011 | | $ | (1,760 | ) | |
| | 1,253 | | | Seagate Technology | | | 16.00 | | | November 2011 | | | (112,770 | ) | |
| | 240 | | | SPDR Gold Trust | | | 156.00 | | | November 2011 | | | (290,400 | ) | |
| | 320 | | | SPDR Gold Trust | | | 160.00 | | | November 2011 | | | (268,160 | ) | |
| | 96 | | | SPDR Gold Trust | | | 161.00 | | | November 2011 | | | (76,800 | ) | |
| | 90 | | | SPDR Gold Trust | | | 162.00 | | | November 2011 | | | (62,370 | ) | |
| | 730 | | | Tenneco, Inc. | | | 33.00 | | | November 2011 | | | (116,800 | ) | |
| | 281 | | | Tenneco, Inc. | | | 33.00 | | | December 2011 | | | (77,977 | ) | |
| | 281 | | | Tenneco, Inc. | | | 34.00 | | | December 2011 | | | (72,358 | ) | |
| | 1,966 | | | Tenneco, Inc. | | | 35.00 | | | November 2011 | | | (216,260 | ) | |
| | 281 | | | Tenneco, Inc. | | | 35.00 | | | December 2011 | | | (51,985 | ) | |
| | 281 | | | Tenneco, Inc. | | | 36.00 | | | November 2011 | | | (18,265 | ) | |
| | 1,455 | | | Tyco International Limited | | | 40.00 | | | November 2011 | | | (887,550 | ) | |
| | 1,455 | | | Tyco International Limited | | | 41.00 | | | November 2011 | | | (763,875 | ) | |
| | 88 | | | Tyco International Limited | | | 41.00 | | | January 2012 | | | (52,580 | ) | |
| | 805 | | | Tyco International Limited | | | 42.00 | | | November 2011 | | | (342,125 | ) | |
| | 1,482 | | | Tyco International Limited | | | 43.00 | | | November 2011 | | | (474,240 | ) | |
| | 2,183 | | | Tyco International Limited | | | 45.00 | | | November 2011 | | | (360,195 | ) | |
| | 871 | | | Valeant Pharmaceuticals International | | | 34.00 | | | November 2011 | | | (574,860 | ) | |
| | 1,308 | | | Valeant Pharmaceuticals International | | | 35.00 | | | November 2011 | | | (745,560 | ) | |
| | 1,962 | | | Valeant Pharmaceuticals International | | | 36.00 | | | November 2011 | | | (922,140 | ) | |
| | 5,430 | | | Valeant Pharmaceuticals International | | | 37.00 | | | November 2011 | | | (2,036,250 | ) | |
| | 749 | | | Valeant Pharmaceuticals International | | | 38.00 | | | November 2011 | | | (230,318 | ) | |
| | 654 | | | Valeant Pharmaceuticals International | | | 39.00 | | | November 2011 | | | (160,230 | ) | |
| | 654 | | | Valeant Pharmaceuticals International | | | 41.00 | | | November 2011 | | | (112,488 | ) | |
| | 768 | | | Valeant Pharmaceuticals International | | | 42.00 | | | November 2011 | | | (88,320 | ) | |
| | 290 | | | Walter Energy, Inc. | | | 60.00 | | | November 2011 | | | (471,975 | ) | |
| | 300 | | | Walter Energy, Inc. | | | 65.00 | | | November 2011 | | | (386,250 | ) | |
| | 509 | | | Walter Energy, Inc. | | | 70.00 | | | November 2011 | | | (437,740 | ) | |
| | 279 | | | Walter Energy, Inc. | | | 75.00 | | | November 2011 | | | (168,237 | ) | |
| | 255 | | | Walter Energy, Inc. | | | 80.00 | | | November 2011 | | | (102,000 | ) | |
| | 170 | | | Walter Energy, Inc. | | | 80.00 | | | December 2011 | | | (114,750 | ) | |
| | 1,815 | | | Wyndham Worldwide Corporation | | | 29.00 | | | November 2011 | | | (971,025 | ) | |
| | 1,523 | | | Wyndham Worldwide Corporation | | | 30.00 | | | November 2011 | | | (670,120 | ) | |
| | 1,816 | | | Wyndham Worldwide Corporation | | | 31.00 | | | November 2011 | | | (640,140 | ) | |
| | 1,834 | | | Wyndham Worldwide Corporation | | | 33.00 | | | November 2011 | | | (330,120 | ) | |
See Notes to Financial Statements.
FIRST EAGLE FUNDS | ANNUAL REPORT | OCTOBER 31, 2011
86
Schedule of Investments | Year Ended October 31, 2011
| CONTRACTS | | | | STRIKE PRICE | | EXPIRATION DATE | | VALUE (NOTE 1) | |
| Covered Call Options Written — (2.22)% — (continued) | |
| | 403 | | | Wyndham Worldwide Corporation | | $ | 35.00 | | | January 2012 | | $ | (75,552 | ) | |
| | 795 | | | Wyndham Worldwide Corporation | | | 36.00 | | | January 2012 | | | (99,375 | ) | |
| Total Covered Call Options Written (Premiums Received: $20,894,677) | | | | | | | | | | | | | | | (30,507,624 | ) | |
| Total Investments — 97.49% (Cost: $1,257,583,171) | | | | | | | | | | | | | | | 1,341,184,956 | | |
| Other Assets in Excess of Liabilities — 2.51% | | | | | | | | | | | | | | | 34,560,468 | | |
| Net Assets — 100.00% | | | | | | | | | | | | | | $ | 1,375,745,424 | | |
(a) At October 31, 2011, all or a portion of this security was segregated to cover collateral requirement for options.
(b) Non-income producing security/commodity.
(c) This security is convertible until December 15, 2025.
At October 31, 2011, aggregate cost for federal income tax purposes, excluding options written, was $1,291,185,962. Net unrealized appreciation consisted of:
| Gross unrealized appreciation | | $ | 103,025,781 | | |
| Gross unrealized depreciation | | | (22,519,163 | ) | |
| Net unrealized appreciation | | $ | 80,506,618 | | |
Abbreviations used in this schedule include:
PLC — Public Limited Company
SPDR — Standard & Poor's Depository Receipts
See Notes to Financial Statements.
FIRST EAGLE FUNDS | ANNUAL REPORT | OCTOBER 31, 2011
87
Fund of America
| INDUSTRY DIVERSIFICATION FOR PORTFOLIO HOLDINGS | | PERCENT OF
NET ASSETS | |
| U.S. Common Stocks | |
| Consumer Discretionary | | | 6.07 | % | |
| Consumer Staples | | | 0.87 | | |
| Energy | | | 4.49 | | |
| Health Care | | | 22.01 | | |
| Industrials | | | 4.74 | | |
| Information Technology | | | 2.90 | | |
| Materials | | | 26.56 | | |
| Total U.S. Common Stocks | | | 67.64 | | |
| International Common Stocks | |
| Industrials | | | 5.65 | | |
| Information Technology | | | 2.98 | | |
| Total International Common Stocks | | | 8.63 | | |
| Exchange Traded Fund | | | 0.96 | | |
| Repurchase Agreement | | | 22.06 | | |
| U.S. Convertible Bond | |
| Health Care | | | 0.34 | | |
| Total U.S. Convertible Bond | | | 0.34 | | |
| Call Option Purchased | | | 0.08 | | |
| Covered Call Options Written | | | (2.22 | ) | |
| Total Investments | | | 97.49 | % | |
See Notes to Financial Statements.
FIRST EAGLE FUNDS | ANNUAL REPORT | OCTOBER 31, 2011
88
This page was intentionally left blank.
Statement of Assets and Liabilities
| | | FIRST EAGLE
GLOBAL FUND | | FIRST EAGLE
OVERSEAS FUND | | FIRST EAGLE
U.S. VALUE FUND | |
| Assets | |
| Investments, at Cost (Note 1) | |
| Unaffiliated issuers | | $ | 22,899,293,034 | | | $ | 7,233,828,511 | | | $ | 1,627,890,799 | | |
| Affiliated issuers | | | 2,986,190,522 | | | | 752,560,614 | | | | — | | |
| Gold bullion | | | 586,146,006 | | | | 217,894,842 | | | | 39,756,621 | | |
| Repurchase agreement | | | — | | | | — | | | | — | | |
| Foreign currency | | | 1,049 | | | | 587,635 | | | | 1 | | |
| Total Investments, at Cost | | | 26,471,630,611 | | | | 8,204,871,602 | | | | 1,667,647,421 | | |
| Investments, at Value (Note 1) | |
| Unaffiliated issuers | | | 25,857,377,420 | | | | 8,205,018,909 | | | | 1,793,816,627 | | |
| Affiliated issuers | | | 3,265,091,535 | | | | 1,138,927,222 | | | | — | | |
| Gold bullion | | | 1,806,763,515 | | | | 758,946,085 | | | | 89,914,608 | | |
| Repurchase agreement | | | — | | | | — | | | | — | | |
| Foreign currency | | | 1,050 | | | | 590,871 | | | | 1 | | |
| Total Investments, at Value | | | 30,929,233,520 | | | | 10,103,483,087 | | | | 1,883,731,236 | | |
| Cash | | | — | | | | 1,153,813 | | | | 305 | | |
| Restricted cash | | | — | | | | — | | | | — | | |
| Due from broker | | | — | | | | 4,996,220 | | | | — | | |
| Receivable for forward currency contracts held, at value (Note 1) | | | 19,606,747 | | | | 10,645,291 | | | | — | | |
| Receivable for investment securities sold | | | 111,793,327 | | | | 39,372,213 | | | | 12,908,869 | | |
| Receivable for premiums for written options | | | — | | | | — | | | | — | | |
| Receivable for Fund shares sold | | | 149,302,839 | | | | 38,049,332 | | | | 16,955,941 | | |
| Accrued interest and dividends receivable | | | 85,893,908 | | | | 43,514,119 | | | | 3,169,450 | | |
| Investment for trustee deferred compensation plan (Note 2) | | | 1,377,814 | | | | 1,496,941 | | | | 1,015,590 | | |
| Other assets | | | 199,729 | | | | 77,949 | | | | 18,970 | | |
| Total Assets | | | 31,297,407,884 | | | | 10,242,788,965 | | | | 1,917,800,361 | | |
| Liabilities | |
Option contracts written, at value (premiums received $2,030,334,
$0, $341,309, $0, and $20,894,677, respectively) (Note 1) | | | 2,368,750 | | | | — | | | | 328,750 | | |
| Payable for Fund shares redeemed | | | 41,695,622 | | | | 31,541,900 | | | | 1,759,018 | | |
| Payable for investment securities purchased | | | 115,856 | | | | 1,194,414 | | | | — | | |
| Payable for forward currency contracts held, at value (Note 1) | | | 19,153,966 | | | | 11,393,045 | | | | — | | |
| Investment advisory fees payable (Note 2) | | | 19,226,958 | | | | 6,336,309 | | | | 1,151,704 | | |
| Distribution fees payable (Note 3) | | | 8,143,368 | | | | 1,681,011 | | | | 440,094 | | |
| Services fees payable (Note 3) | | | 1,728,272 | | | | 214,341 | | | | 82,341 | | |
| Trustee deferred compensation plan (Note 2) | | | 1,377,814 | | | | 1,496,941 | | | | 1,015,590 | | |
| Administrative fees payable (Note 2) | | | 377,162 | | | | 137,513 | | | | 20,792 | | |
| Due to custodian | | | 158,780 | | | | — | | | | — | | |
| Trustee fees payable | | | 81,144 | | | | 31,935 | | | | 6,127 | | |
| Accrued expenses and other liabilities | | | 10,871,290 | | | | 3,245,002 | | | | 477,555 | | |
| Total Liabilities | | | 105,298,982 | | | | 57,272,411 | | | | 5,281,971 | | |
| Net Assets | | $ | 31,192,108,902 | | | $ | 10,185,516,554 | | | $ | 1,912,518,390 | | |
* First Eagle Gold Fund financial statements are shown on a consolidated basis and includes the balances of the First Eagle Gold Cayman Fund, Ltd.
** The amount of $705,000 represents restricted cash used as collateral for covered call options.
See Notes to Financial Statements.
FIRST EAGLE FUNDS | ANNUAL REPORT | OCTOBER 31, 2011
90
October 31, 2011
| | | FIRST EAGLE
GOLD FUND* | | FIRST EAGLE
FUND OF AMERICA | |
| Assets | |
| Investments, at Cost (Note 1) | |
| Unaffiliated issuers | | $ | 2,009,398,243 | | | $ | 975,012,116 | | |
| Affiliated issuers | | | — | | | | — | | |
| Gold bullion | | | 185,268,444 | | | | — | | |
| Repurchase agreement | | | — | | | | 303,465,732 | | |
| Foreign currency | | | 18 | | | | — | | |
| Total Investments, at Cost | | | 2,194,666,705 | | | | 1,278,477,848 | | |
| Investments, at Value (Note 1) | |
| Unaffiliated issuers | | | 2,900,246,096 | | | | 1,068,226,848 | | |
| Affiliated issuers | | | — | | | | — | | |
| Gold bullion | | | 587,135,293 | | | | — | | |
| Repurchase agreement | | | — | | | | 303,465,732 | | |
| Foreign currency | | | 18 | | | | — | | |
| Total Investments, at Value | | | 3,487,381,407 | | | | 1,371,692,580 | | |
| Cash | | | 113 | | | | 33,365 | | |
| Restricted cash | | | — | | | | 705,000 | ** | |
| Due from broker | | | — | | | | — | | |
| Receivable for forward currency contracts held, at value (Note 1) | | | — | | | | — | | |
| Receivable for investment securities sold | | | 39,996,104 | | | | 37,313,953 | | |
| Receivable for premiums for written options | | | — | | | | 75,552 | | |
| Receivable for Fund shares sold | | | 11,574,609 | | | | 5,388,620 | | |
| Accrued interest and dividends receivable | | | 760,356 | | | | 789,026 | | |
| Investment for trustee deferred compensation plan (Note 2) | | | 195,447 | | | | 531,582 | | |
| Other assets | | | 34,659 | | | | 17,301 | | |
| Total Assets | | | 3,539,942,695 | | | | 1,416,546,979 | | |
| Liabilities | |
Option contracts written, at value (premiums received $2,030,334,
$0, $341,309, $0, and $20,894,677, respectively) (Note 1) | | | — | | | | 30,507,624 | | |
| Payable for Fund shares redeemed | | | 6,534,426 | | | | 1,647,874 | | |
| Payable for investment securities purchased | | | 9,025,695 | | | | 6,268,902 | | |
| Payable for forward currency contracts held, at value (Note 1) | | | — | | | | — | | |
| Investment advisory fees payable (Note 2) | | | 2,143,765 | | | | 1,115,244 | | |
| Distribution fees payable (Note 3) | | | 792,720 | | | | 357,192 | | |
| Services fees payable (Note 3) | | | 139,627 | | | | 39,191 | | |
| Trustee deferred compensation plan (Note 2) | | | 195,447 | | | | 531,582 | | |
| Administrative fees payable (Note 2) | | | 41,323 | | | | 17,454 | | |
| Due to custodian | | | — | | | | — | | |
| Trustee fees payable | | | 43,064 | | | | 6,352 | | |
| Accrued expenses and other liabilities | | | 1,107,806 | | | | 310,140 | | |
| Total Liabilities | | | 20,023,873 | | | | 40,801,555 | | |
| Net Assets | | $ | 3,519,918,822 | | | $ | 1,375,745,424 | | |
FIRST EAGLE FUNDS | ANNUAL REPORT | OCTOBER 31, 2011
91
Statement of Assets and Liabilities (continued)
| | | FIRST EAGLE
GLOBAL FUND | | FIRST EAGLE
OVERSEAS FUND | | FIRST EAGLE
U.S. VALUE FUND | |
| Net Assets Consist of | |
| Capital stock (par value, $0.001 per share) | | $ | 667,925 | | | $ | 456,149 | | | $ | 111,614 | | |
| Capital surplus | | | 26,370,139,648 | | | | 8,185,491,894 | | | | 1,631,320,042 | | |
| Net unrealized appreciation (depreciation) on: | |
Investments (net of $5,883,639, $2,478,203, $0, $0, $0
deferred capital gain country tax, respectively) | | | 4,451,719,269 | | | | 1,896,130,046 | | | | 216,083,815 | | |
| Foreign currency and forward contract related translation | | | 2,006,902 | | | | (305,453 | ) | | | — | | |
| Written options | | | (338,416 | ) | | | — | | | | 12,559 | | |
| Undistributed net realized gains on investments | | | 383,004,927 | | | | 279,101,316 | | | | 50,806,970 | | |
| Undistributed net investment income (loss) | | | (15,091,353 | ) | | | (175,357,398 | ) | | | 14,183,390 | | |
| Net Assets | | $ | 31,192,108,902 | | | $ | 10,185,516,554 | | | $ | 1,912,518,390 | | |
| Class A | |
| Net assets | | $ | 14,351,986,680 | | | $ | 5,022,898,452 | | | $ | 966,529,946 | | |
| Shares outstanding | | | 305,981,717 | | | | 225,744,425 | | | | 56,448,105 | | |
| Net asset value per share and redemption proceeds per share | | $ | 46.90 | | | $ | 22.25 | | | $ | 17.12 | | |
| Offering price per share (NAV per share plus maximum sales charge)1 | | $ | 49.37 | | | $ | 23.42 | | | $ | 18.02 | | |
| Class C | |
| Net assets | | $ | 8,385,081,060 | | | $ | 1,026,694,835 | | | $ | 407,718,193 | | |
| Shares outstanding | | | 182,635,968 | | | | 47,517,524 | | | | 24,113,114 | | |
| Net asset value per share | | $ | 45.91 | | | $ | 21.61 | | | $ | 16.91 | | |
Redemption proceeds per share (NAV per share less maximum
contingent deferred sale charge)2 | | $ | 45.45 | | | $ | 21.39 | | | $ | 16.74 | | |
| Class I | |
| Net assets | | $ | 8,455,041,162 | | | $ | 4,135,923,267 | | | $ | 538,270,251 | | |
| Shares outstanding | | | 179,307,116 | | | | 182,887,494 | | | | 31,052,845 | | |
| Net asset value per share and redemption proceeds per share | | $ | 47.15 | | | $ | 22.61 | | | $ | 17.33 | | |
| Class Y | |
| Net assets | | | — | | | | — | | | | — | | |
| Shares outstanding | | | — | | | | — | | | | — | | |
| Net asset value per share and redemption proceeds per share | | | — | | | | — | | | | — | | |
* First Eagle Gold Fund financial statements are shown on a consolidated basis and includes the balances of the First Eagle Gold Cayman Fund, Ltd.
1 The maximum sales charge is 5.00% for Class A shares. Classes C, I and Y have no front-end sales charges.
2 The maximum CDSC (Contingent Deferred Sales Charge) is 1.00% for Class C shares, which is charged on the lesser of the offering price or the net asset value at the time of sale by shareholder. This pertains to investments of one year or less.
See Notes to Financial Statements.
FIRST EAGLE FUNDS | ANNUAL REPORT | OCTOBER 31, 2011
92
October 31, 2011
| | | FIRST EAGLE
GOLD FUND* | | FIRST EAGLE
FUND OF AMERICA | |
| Net Assets Consist of | |
| Capital stock (par value, $0.001 per share) | | $ | 104,161 | | | $ | 55,816 | | |
| Capital surplus | | | 2,215,981,654 | | | | 1,206,687,614 | | |
| Net unrealized appreciation (depreciation) on: | |
Investments (net of $5,883,639, $2,478,203, $0, $0, $0
deferred capital gain country tax, respectively) | | | 1,292,714,702 | | | | 93,214,732 | | |
| Foreign currency and forward contract related translation | | | (610 | ) | | | — | | |
| Written options | | | — | | | | (9,612,947 | ) | |
| Undistributed net realized gains on investments | | | 92,608,463 | | | | 85,526,171 | | |
| Undistributed net investment income (loss) | | | (81,489,548 | ) | | | (125,962 | ) | |
| Net Assets | | $ | 3,519,918,822 | | | $ | 1,375,745,424 | | |
| Class A | |
| Net assets | | $ | 1,833,944,948 | | | $ | 549,126,583 | | |
| Shares outstanding | | | 54,109,099 | | | | 22,043,141 | | |
| Net asset value per share and redemption proceeds per share | | $ | 33.89 | | | $ | 24.91 | | |
| Offering price per share (NAV per share plus maximum sales charge)1 | | $ | 35.67 | | | $ | 26.22 | | |
| Class C | |
| Net assets | | $ | 682,908,677 | | | $ | 193,628,034 | | |
| Shares outstanding | | | 20,835,781 | | | | 8,798,270 | | |
| Net asset value per share | | $ | 32.78 | | | $ | 22.01 | | |
Redemption proceeds per share (NAV per share less maximum
contingent deferred sale charge)2 | | $ | 32.45 | | | $ | 21.79 | | |
| Class I | |
| Net assets | | $ | 1,003,065,197 | | | | — | | |
| Shares outstanding | | | 29,215,646 | | | | — | | |
| Net asset value per share and redemption proceeds per share | | $ | 34.33 | | | | — | | |
| Class Y | |
| Net assets | | | — | | | $ | 632,990,807 | | |
| Shares outstanding | | | — | | | | 24,974,458 | | |
| Net asset value per share and redemption proceeds per share | | | — | | | $ | 25.35 | | |
FIRST EAGLE FUNDS | ANNUAL REPORT | OCTOBER 31, 2011
93
Statement of Operations
| | | FIRST EAGLE
GLOBAL FUND | | FIRST EAGLE
OVERSEAS FUND | | FIRST EAGLE
U.S. VALUE FUND | |
| Investment Income | |
Interest (net of $402,075, $129,178, $0, $4 and $0,
foreign taxes withheld, respectively) | | $ | 34,587,497 | | | $ | 16,158,721 | | | $ | 6,961,617 | | |
Dividends from: (net of $36,326,895, $19,464,958, $273,156,
$1,128,300 and $348,734, foreign taxes withheld, respectively) | |
| Unaffiliated issuers | | | 458,227,894 | | | | 155,966,608 | | | | 28,268,118 | | |
| Affiliated issuers | | | 68,529,779 | | | | 23,200,986 | | | | — | | |
| Other Income | | | 119,972 | | | | 56,756 | | | | 43,862 | | |
| Total Income | | | 561,465,142 | | | | 195,383,071 | | | | 35,273,597 | | |
| Expenses | |
| Investment advisory fees (Note 2) | | | 215,077,224 | | | | 75,921,191 | | | | 12,209,881 | | |
| Administrative costs (Note 2) | | | 4,161,753 | | | | 1,535,206 | | | | 235,071 | | |
| Distribution fees (Note 3) | |
| Class A | | | 34,980,473 | | | | 12,785,675 | | | | 2,109,365 | | |
| Class C | | | 58,710,022 | | | | 7,749,569 | | | | 2,768,756 | | |
| Class Y | | | — | | | | — | | | | — | | |
| Service fees - Class C (Note 3) | | | 19,570,007 | | | | 2,583,190 | | | | 922,919 | | |
| Shareholder servicing agent fees | | | 23,899,008 | | | | 7,738,540 | | | | 1,937,980 | | |
| Custodian and accounting fees | | | 4,464,356 | | | | 2,508,028 | | | | 179,397 | | |
| Shareholder reporting fees | | | 1,872,559 | | | | 655,480 | | | | 160,000 | | |
| Trustees' fees | | | 716,612 | | | | 258,932 | | | | 40,982 | | |
| Registration and filing fees | | | 1,344,169 | | | | 499,557 | | | | 234,414 | | |
| Professional fees | | | 652,239 | | | | 357,026 | | | | 139,437 | | |
| Other Expenses | | | 661,017 | | | | 253,192 | | | | 51,634 | | |
| Total Expenses | | | 366,109,439 | | | | 112,845,586 | | | | 20,989,836 | | |
| Expense reductions due to earnings credits (Note 1) | | | (2,824 | ) | | | (945 | ) | | | (394 | ) | |
| Net Expenses | | | 366,106,615 | | | | 112,844,641 | | | | 20,989,442 | | |
| Net Investment Income (Loss) (Note 1) | | | 195,358,527 | | | | 82,538,430 | | | | 14,284,155 | | |
Realized and Unrealized Gains (Losses) on Investments, Foreign
Currency Related Transactions and Written Options (Note 1) | |
| Net realized gains (losses) from: | |
| Investment transactions of unaffiliated issuers | | | 813,593,704 | | | | 329,133,952 | | | | 61,237,435 | | |
| Investment transactions of affiliated issuers | | | 4,191,921 | | | | 454,713 | | | | — | | |
| Commodity related transactions | | | 114,826,731 | | | | 45,691,878 | | | | 7,196,927 | | |
| Foreign currency and forward contract related transactions | | | (244,557,195 | ) | | | (136,578,451 | ) | | | 3,231 | | |
| Written options | | | 2,251,712 | | | | — | | | | 487,516 | | |
| Net increase from payments by affiliate (Note 2) | | | — | | | | 714,808 | | | | 7,854 | | |
| | | | 690,306,873 | | | | 239,416,900 | | | | 68,932,963 | | |
| Changes in unrealized appreciation (depreciation) of: | |
Investment transactions (net of decrease in deferred capital gain country
tax accruals of $683,624, $333,971, $0, $0, and $0, respectively) | | | 615,250,756 | | | | (73,551,397 | ) | | | 50,096,347 | | |
| Foreign currency and forward contract related translation | | | 183,933,325 | | | | 100,254,460 | | | | (234 | ) | |
| Written options | | | (338,416 | ) | | | — | | | | 12,559 | | |
| | | | 798,845,665 | | | | 26,703,063 | | | | 50,108,672 | | |
Net realized and unrealized gains on investments, foreign
currency and forward contract related transactions and written options | | | 1,489,152,538 | | | | 266,119,963 | | | | 119,041,635 | | |
| Net Increase in Net Assets Resulting from Operations | | $ | 1,684,511,065 | | | $ | 348,658,393 | | | $ | 133,325,790 | | |
* First Eagle Gold Fund financial statements are shown on a consolidated basis and includes the balances of the First Eagle Gold Cayman Fund, Ltd.
See Notes to Financial Statements.
FIRST EAGLE FUNDS | ANNUAL REPORT | OCTOBER 31, 2011
94
Year Ended October 31, 2011
| | | FIRST EAGLE
GOLD FUND* | | FIRST EAGLE
FUND OF AMERICA | |
| Investment Income | |
Interest (net of $402,075, $129,178, $0, $4 and $0,
foreign taxes withheld, respectively) | | $ | 1,991,132 | | | $ | 130,428 | | |
Dividends from: (net of $36,326,895, $19,464,958, $273,156,
$1,128,300 and $348,734, foreign taxes withheld, respectively) | |
| Unaffiliated issuers | | | 19,613,455 | | | | 14,741,465 | | |
| Affiliated issuers | | | — | | | | — | | |
| Other Income | | | 1,054 | | | | — | | |
| Total Income | | | 21,605,641 | | | | 14,871,893 | | |
| Expenses | |
| Investment advisory fees (Note 2) | | | 25,160,775 | | | | 13,396,787 | | |
| Administrative costs (Note 2) | | | 494,839 | | | | 196,854 | | |
| Distribution fees (Note 3) | |
| Class A | | | 4,686,155 | | | | 1,256,745 | | |
| Class C | | | 4,969,897 | | | | 1,287,421 | | |
| Class Y | | | — | | | | 1,663,311 | | |
| Service fees - Class C (Note 3) | | | 1,656,632 | | | | 429,140 | | |
| Shareholder servicing agent fees | | | 4,387,279 | | | | 1,481,342 | | |
| Custodian and accounting fees | | | 764,653 | | | | 181,985 | | |
| Shareholder reporting fees | | | 260,999 | | | | 110,078 | | |
| Trustees' fees | | | 110,328 | | | | 35,261 | | |
| Registration and filing fees | | | 320,616 | | | | 236,001 | | |
| Professional fees | | | 147,487 | | | | 158,343 | | |
| Other Expenses | | | 149,655 | | | | 50,226 | | |
| Total Expenses | | | 43,109,315 | | | | 20,483,494 | | |
| Expense reductions due to earnings credits (Note 1) | | | (588 | ) | | | (334 | ) | |
| Net Expenses | | | 43,108,727 | | | | 20,483,160 | | |
| Net Investment Income (Loss) (Note 1) | | | (21,503,086 | ) | | | (5,611,267 | ) | |
Realized and Unrealized Gains (Losses) on Investments, Foreign
Currency Related Transactions and Written Options (Note 1) | |
| Net realized gains (losses) from: | |
| Investment transactions of unaffiliated issuers | | | 153,837,648 | | | | 116,226,690 | | |
| Investment transactions of affiliated issuers | | | — | | | | — | | |
| Commodity related transactions | | | 12,449,692 | | | | — | | |
| Foreign currency and forward contract related transactions | | | 340,435 | | | | — | | |
| Written options | | | — | | | | 31,543 | | |
| Net increase from payments by affiliate (Note 2) | | | — | | | | 2,218 | | |
| | | | 166,627,775 | | | | 116,260,451 | | |
| Changes in unrealized appreciation (depreciation) of: | |
Investment transactions (net of decrease in deferred capital gain country
tax accruals of $683,624, $333,971, $0, $0, and $0, respectively) | | | 85,422,102 | | | | (88,585,137 | ) | |
| Foreign currency and forward contract related translation | | | (4,643 | ) | | | — | | |
| Written options | | | — | | | | 1,736,021 | | |
| | | | 85,417,459 | | | | (86,849,116 | ) | |
Net realized and unrealized gains on investments, foreign
currency and forward contract related transactions and written options | | | 252,045,234 | | | | 29,411,335 | | |
| Net Increase in Net Assets Resulting from Operations | | $ | 230,542,148 | | | $ | 23,800,068 | | |
FIRST EAGLE FUNDS | ANNUAL REPORT | OCTOBER 31, 2011
95
Statements of Changes in Net Assets
| | | FIRST EAGLE
GLOBAL FUND | | FIRST EAGLE
OVERSEAS FUND | |
| | | YEAR ENDED
OCTOBER 31,
2011 | | YEAR ENDED
OCTOBER 31,
2010 | | YEAR ENDED
OCTOBER 31,
2011 | | YEAR ENDED
OCTOBER 31,
2010 | |
| Operations | |
| Net investment income (loss) | | $ | 195,358,527 | | | $ | 261,070,340 | | | $ | 82,538,430 | | | $ | 59,676,774 | | |
Net realized gain from investments, foreign currency and
forward contract related transactions and written options | | | 690,306,873 | | | | 717,773,345 | | | | 239,416,900 | | | | 389,944,027 | | |
Change in unrealized appreciation (depreciation) of investments,
foreign currency and forward contract related transactions and
written options | | | 798,845,665 | | | | 2,170,300,536 | | | | 26,703,063 | | | | 680,529,450 | | |
| Net increase in net assets resulting from operations | | | 1,684,511,065 | | | | 3,149,144,221 | | | | 348,658,393 | | | | 1,130,150,251 | | |
| Distribution to Shareholders | |
| Dividends paid from net investment income | |
| Class A | | | (179,125,248 | ) | | | (156,973,830 | ) | | | (68,667,242 | ) | | | (124,712,908 | ) | |
| Class C | | | (53,722,987 | ) | | | (50,152,071 | ) | | | (7,990,749 | ) | | | (20,270,175 | ) | |
| Class I | | | (94,957,034 | ) | | | (56,542,814 | ) | | | (56,678,049 | ) | | | (71,876,457 | ) | |
| Class Y | | | — | | | | — | | | | — | | | | — | | |
Distributions paid from net realized gains from
investment transactions | |
| Class A | | | — | | | | — | | | | (44,782,633 | ) | | | — | | |
| Class C | | | — | | | | — | | | | (9,220,791 | ) | | | — | | |
| Class I | | | — | | | | — | | | | (31,995,749 | ) | | | — | | |
| Decrease in net assets resulting from distributions | | | (327,805,269 | ) | | | (263,668,715 | ) | | | (219,335,213 | ) | | | (216,859,540 | ) | |
| Fund Share Transactions (Note 6) | |
| Net proceeds from shares sold | | | 10,549,879,443 | | | | 5,983,606,868 | | | | 3,711,007,723 | | | | 2,718,513,835 | | |
Net asset value of shares issued for reinvested dividends and
distributions | | | 261,507,604 | | | | 216,340,170 | | | | 184,257,838 | | | | 182,833,092 | | |
| Cost of shares redeemed | | | (5,041,087,367 | ) | | | (4,080,271,834 | ) | | | (2,714,178,454 | ) | | | (1,967,558,448 | ) | |
| Redemption fees | | | 1,147,493 | | | | 580,971 | | | | 583,929 | | | | 545,912 | | |
| Increase in net assets from Fund share transactions | | | 5,771,447,173 | | | | 2,120,256,175 | | | | 1,181,671,036 | | | | 934,334,391 | | |
| Net increase in net assets | | | 7,128,152,969 | | | | 5,005,731,681 | | | | 1,310,994,216 | | | | 1,847,625,102 | | |
| Net Assets (Note 1) | |
| Beginning of year | | | 24,063,955,933 | | | | 19,058,224,252 | | | | 8,874,522,338 | | | | 7,026,897,236 | | |
| End of year | | $ | 31,192,108,902 | | | $ | 24,063,955,933 | | | $ | 10,185,516,554 | | | $ | 8,874,522,338 | | |
| Undistributed net investment income (loss) | | $ | (15,091,353 | ) | | $ | 70,024,942 | | | $ | (175,357,398 | ) | | $ | (151,617,074 | ) | |
* First Eagle Gold Fund financial statements are shown on a consolidated basis and includes the balances of the First Eagle Gold Cayman Fund, Ltd.
See Notes to Financial Statements.
FIRST EAGLE FUNDS | ANNUAL REPORT | OCTOBER 31, 2011
96
| | | FIRST EAGLE
U.S. VALUE FUND | | FIRST EAGLE
GOLD FUND* | |
| | | YEAR ENDED
OCTOBER 31,
2011 | | YEAR ENDED
OCTOBER 31,
2010 | | YEAR ENDED
OCTOBER 31,
2011 | | YEAR ENDED
OCTOBER 31,
2010 | |
| Operations | |
| Net investment income (loss) | | $ | 14,284,155 | | | $ | 23,706,578 | | | $ | (21,503,086 | ) | | $ | (16,630,800 | ) | |
Net realized gain from investments, foreign currency and
forward contract related transactions and written options | | | 68,932,963 | | | | 18,613,556 | | | | 166,627,775 | | | | 131,930,991 | | |
Change in unrealized appreciation (depreciation) of investments,
foreign currency and forward contract related transactions and
written options | | | 50,108,672 | | | | 102,060,384 | | | | 85,417,459 | | | | 582,457,912 | | |
| Net increase in net assets resulting from operations | | | 133,325,790 | | | | 144,380,518 | | | | 230,542,148 | | | | 697,758,103 | | |
| Distribution to Shareholders | |
| Dividends paid from net investment income | |
| Class A | | | (14,601,729 | ) | | | (7,510,123 | ) | | | (41,372,108 | ) | | | (19,206,629 | ) | |
| Class C | | | (4,588,209 | ) | | | (1,828,449 | ) | | | (10,828,155 | ) | | | (4,203,516 | ) | |
| Class I | | | (7,711,426 | ) | | | (3,213,302 | ) | | | (16,752,495 | ) | | | (4,149,787 | ) | |
| Class Y | | | — | | | | — | | | | — | | | | — | | |
Distributions paid from net realized gains from
investment transactions | |
| Class A | | | — | | | | — | | | | (68,368,215 | ) | | | — | | |
| Class C | | | — | | | | — | | | | (23,482,892 | ) | | | — | | |
| Class I | | | — | | | | — | | | | (25,391,355 | ) | | | — | | |
| Decrease in net assets resulting from distributions | | | (26,901,364 | ) | | | (12,551,874 | ) | | | (186,195,220 | ) | | | (27,559,932 | ) | |
| Fund Share Transactions (Note 6) | |
| Net proceeds from shares sold | | | 842,143,081 | | | | 486,075,265 | | | | 1,302,888,135 | | | | 1,391,677,772 | | |
Net asset value of shares issued for reinvested dividends and
distributions | | | 21,330,710 | | | | 10,092,866 | | | | 137,426,605 | | | | 22,128,723 | | |
| Cost of shares redeemed | | | (385,318,959 | ) | | | (309,421,451 | ) | | | (1,175,616,542 | ) | | | (726,113,835 | ) | |
| Redemption fees | | | — | | | | — | | | | 385,738 | | | | 266,030 | | |
| Increase in net assets from Fund share transactions | | | 478,154,832 | | | | 186,746,680 | | | | 265,083,936 | | | | 687,958,690 | | |
| Net increase in net assets | | | 584,579,258 | | | | 318,575,324 | | | | 309,430,864 | | | | 1,358,156,861 | | |
| Net Assets (Note 1) | |
| Beginning of year | | | 1,327,939,132 | | | | 1,009,363,808 | | | | 3,210,487,958 | | | | 1,852,331,097 | | |
| End of year | | $ | 1,912,518,390 | | | $ | 1,327,939,132 | | | $ | 3,519,918,822 | | | $ | 3,210,487,958 | | |
| Undistributed net investment income (loss) | | $ | 14,183,390 | | | $ | 19,911,665 | | | $ | (81,489,548 | ) | | $ | (61,733,741 | ) | |
FIRST EAGLE FUNDS | ANNUAL REPORT | OCTOBER 31, 2011
97
Statements of Changes in Net Assets (continued)
| | | FIRST EAGLE
FUND OF AMERICA | |
| | | YEAR ENDED
OCTOBER 31,
2011 | | YEAR ENDED
OCTOBER 31,
2010 | |
| Operations | |
| Net investment income (loss) | | $ | (5,611,267 | ) | | $ | 5,216,525 | | |
Net realized gain from investments, foreign currency
and forward contract related transactions and
written options | | | 116,260,451 | | | | 42,187,399 | | |
Change in unrealized appreciation (depreciation) of
investments, foreign currency and forward contract
related transactions and written options | | | (86,849,116 | ) | | | 164,849,816 | | |
| Net increase in net assets resulting from operations | | | 23,800,068 | | | | 212,253,740 | | |
| Distribution to Shareholders | |
| Dividends paid from net investment income | |
| Class A | | | (2,737,506 | ) | | | — | | |
| Class C | | | (253,288 | ) | | | — | | |
| Class I | | | — | | | | — | | |
| Class Y | | | (3,991,165 | ) | | | — | | |
Distributions paid from net realized gains from
investment transactions | |
| Class A | | | — | | | | — | | |
| Class C | | | — | | | | — | | |
| Class I | | | — | | | | — | | |
| Decrease in net assets resulting from distributions | | | (6,981,959 | ) | | | — | | |
| Fund Share Transactions (Note 6) | |
| Net proceeds from shares sold | | | 512,908,266 | | | | 195,796,652 | | |
Net asset value of shares issued for reinvested dividends
and distributions | | | 6,163,174 | | | | — | | |
| Cost of shares redeemed | | | (259,451,806 | ) | | | (177,951,130 | ) | |
| Redemption fees | | | — | | | | — | | |
| Increase in net assets from Fund share transactions | | | 259,619,634 | | | | 17,845,522 | | |
| Net increase in net assets | | | 276,437,743 | | | | 230,099,262 | | |
| Net Assets (Note 1) | |
| Beginning of year | | | 1,099,307,681 | | | | 869,208,419 | | |
| End of year | | $ | 1,375,745,424 | | | $ | 1,099,307,681 | | |
| Undistributed net investment income (loss) | | $ | (125,962 | ) | | $ | 7,825,067 | | |
See Notes to Financial Statements.
FIRST EAGLE FUNDS | ANNUAL REPORT | OCTOBER 31, 2011
98
This page was intentionally left blank.

Financial Highlights
| | | YEAR ENDED OCTOBER 31, | |
| | | 2011 | | 2010 | |
| | | CLASS A | | CLASS C | | CLASS I | | CLASS A | | CLASS C | | CLASS I | |
Selected data for a share of beneficial interest outstanding throughout
each year is presented below:* | |
Net asset value,
beginning of year ($) | | | 44.36 | | | | 43.47 | | | | 44.59 | | | | 38.74 | | | | 38.07 | | | | 38.92 | | |
| Income (loss) from investment operations: | |
| Net investment income ($) | | | 0.39 | | | | 0.04 | | | | 0.51 | | | | 0.56 | | | | 0.26 | | | | 0.69 | | |
Net realized and unrealized
gains (losses) on investments | | | 2.79 | | | | 2.75 | | | | 2.81 | | | | 5.63 | | | | 5.51 | | | | 5.63 | | |
Total income (loss) from
investment operations | | | 3.18 | | | | 2.79 | | | | 3.32 | | | | 6.19 | | | | 5.77 | | | | 6.32 | | |
| Less distributions: | |
Dividends from net
investment income ($) | | | -0.64 | | | | -0.35 | | | | -0.76 | | | | -0.57 | | | | -0.37 | | | | -0.65 | | |
Distributions from
capital gains | | | — | | | | — | | | | — | | | | — | | | | — | | | | — | | |
| Total distributions | | | -0.64 | | | | -0.35 | | | | -0.76 | | | | -0.57 | | | | -0.37 | | | | -0.65 | | |
Net asset value,
end of year ($) | | | 46.90 | | | | 45.91 | | | | 47.15 | | | | 44.36 | | | | 43.47 | | | | 44.59 | | |
| Total return(a) (%) | | | 7.23 | | | | 6.45 | | | | 7.52 | | | | 16.13 | | | | 15.23 | | | | 16.40 | | |
| Ratios and supplemental data | |
Net assets, end of year
(millions) ($) | | | 14,352 | | | | 8,385 | | | | 8,455 | | | | 12,195 | | | | 6,524 | | | | 5,345 | | |
Ratio of operating expenses
to average net assets
including earnings credits (%) | | | 1.13 | | | | 1.88 | | | | 0.88 | | | | 1.16 | | | | 1.91 | | | | 0.91 | | |
Ratio of operating expenses
to average net assets
excluding earnings credits (%) | | | 1.13 | | | | 1.88 | | | | 0.88 | | | | 1.16 | | | | 1.91 | | | | 0.91 | | |
Ratio of net investment
income to average net assets
including earnings credits (%) | | | 0.83 | | | | 0.08 | | | | 1.07 | | | | 1.36 | | | | 0.63 | | | | 1.68 | | |
Ratio of net investment
income to average net assets
excluding earnings credits (%) | | | 0.83 | | | | 0.08 | | | | 1.07 | | | | 1.36 | | | | 0.63 | | | | 1.68 | | |
| Portfolio turnover rate (%) | | | 11.57 | | | | 11.57 | | | | 11.57 | | | | 17.37 | | | | 17.37 | | | | 17.37 | | |
* Per share amounts have been calculated using the average shares method.
** Amount represents less than $0.01 per share.
(a) Does not take into account the sales charge of 5.00% for Class A and the CDSC (Contingent Deferred Sales Charge) of 1.00% for Class C shares.
See Notes to Financial Statements.
FIRST EAGLE FUNDS | ANNUAL REPORT | OCTOBER 31, 2011
100
Global Fund
| | | YEAR ENDED OCTOBER 31, | |
| | | 2009 | | 2008 | | 2007 | |
| | | CLASS A | | CLASS C | | CLASS I | | CLASS A | | CLASS C | | CLASS I | | CLASS A | | CLASS C | | CLASS I | |
Selected data for a share of beneficial interest outstanding throughout
each year is presented below:* | |
Net asset value,
beginning of year ($) | | | 34.45 | | | | 33.99 | | | | 34.62 | | | | 51.09 | | | | 50.46 | | | | 51.32 | | | | 48.36 | | | | 47.83 | | | | 48.56 | | |
| Income (loss) from investment operations: | |
| Net investment income ($) | | | 0.39 | | | | 0.13 | | | | 0.47 | | | | 0.64 | | | | 0.31 | | | | 0.76 | | | | 0.67 | | | | 0.31 | | | | 0.79 | | |
Net realized and unrealized
gains (losses) on investments | | | 6.35 | | | | 6.26 | | | | 6.39 | | | | -11.82 | | | | -11.69 | | | | -11.88 | | | | 6.91 | | | | 6.84 | | | | 6.94 | | |
Total income (loss) from
investment operations | | | 6.74 | | | | 6.39 | | | | 6.86 | | | | -11.18 | | | | -11.38 | | | | -11.12 | | | | 7.58 | | | | 7.15 | | | | 7.73 | | |
| Less distributions: | |
Dividends from net
investment income ($) | | | -0.14 | | | | -0.00 | ** | | | -0.25 | | | | -1.07 | | | | -0.70 | | | | -1.19 | | | | -1.22 | | | | -0.89 | | | | -1.34 | | |
Distributions from
capital gains | | | -2.31 | | | | -2.31 | | | | -2.31 | | | | -4.39 | | | | -4.39 | | | | -4.39 | | | | -3.63 | | | | -3.63 | | | | -3.63 | | |
| Total distributions | | | -2.45 | | | | -2.31 | | | | -2.56 | | | | -5.46 | | | | -5.09 | | | | -5.58 | | | | -4.85 | | | | -4.52 | | | | -4.97 | | |
Net asset value,
end of year ($) | | | 38.74 | | | | 38.07 | | | | 38.92 | | | | 34.45 | | | | 33.99 | | | | 34.62 | | | | 51.09 | | | | 50.46 | | | | 51.32 | | |
| Total return(a) (%) | | | 20.81 | | | | 19.93 | | | | 21.13 | | | | -24.41 | | | | -24.99 | | | | -24.21 | | | | 16.91 | | | | 16.03 | | | | 17.19 | | |
| Ratios and supplemental data | |
Net assets, end of year
(millions) ($) | | | 10,562 | | | | 5,158 | | | | 3,338 | | | | 9,784 | | | | 4,623 | | | | 2,898 | | | | 13,451 | | | | 5,593 | | | | 3,193 | | |
Ratio of operating expenses
to average net assets
including earnings credits (%) | | | 1.19 | | | | 1.94 | | | | 0.94 | | | | 1.14 | | | | 1.89 | | | | 0.89 | | | | 1.12 | | | | 1.87 | | | | 0.87 | | |
Ratio of operating expenses
to average net assets
excluding earnings credits (%) | | | 1.19 | | | | 1.94 | | | | 0.94 | | | | 1.14 | | | | 1.89 | | | | 0.89 | | | | 1.12 | | | | 1.87 | | | | 0.87 | | |
Ratio of net investment
income to average net assets
including earnings credits (%) | | | 1.14 | | | | 0.38 | | | | 1.37 | | | | 1.48 | | | | 0.73 | | | | 1.74 | | | | 1.40 | | | | 0.65 | | | | 1.64 | | |
Ratio of net investment
income to average net assets
excluding earnings credits (%) | | | 1.14 | | | | 0.38 | | | | 1.37 | | | | 1.48 | | | | 0.73 | | | | 1.74 | | | | 1.39 | | | | 0.64 | | | | 1.64 | | |
| Portfolio turnover rate (%) | | | 12.52 | | | | 12.52 | | | | 12.52 | | | | 29.69 | | | | 29.69 | | | | 29.69 | | | | 37.58 | | | | 37.58 | | | | 37.58 | | |
FIRST EAGLE FUNDS | ANNUAL REPORT | OCTOBER 31, 2011
101

Financial Highlights
| | | YEAR ENDED OCTOBER 31, | |
| | | 2011 | | 2010 | |
| | | CLASS A | | CLASS C | | CLASS I | | CLASS A | | CLASS C | | CLASS I | |
Selected data for a share of beneficial interest outstanding throughout
each year is presented below:* | |
Net asset value,
beginning of year ($) | | | 21.86 | | | | 21.26 | | | | 22.20 | | | | 19.51 | | | | 19.03 | | | | 19.80 | | |
| Income (loss) from investment operations: | |
| Net investment income ($) | | | 0.18 | | | | 0.01 | | | | 0.24 | | | | 0.15 | | | | 0.00 | ** | | | 0.21 | | |
Net realized and unrealized
gains (losses) on investments | | | 0.74 | | | | 0.73 | | | | 0.75 | | | | 2.80 | | | | 2.72 | | | | 2.82 | | |
Total income (loss) from
investment operations | | | 0.92 | | | | 0.74 | | | | 0.99 | | | | 2.95 | | | | 2.72 | | | | 3.03 | | |
| Less distributions: | |
Dividends from net
investment income ($) | | | -0.32 | | | | -0.18 | | | | -0.37 | | | | -0.60 | | | | -0.49 | | | | -0.63 | | |
Distributions from
capital gains | | | -0.21 | | | | -0.21 | | | | -0.21 | | | | — | | | | — | | | | — | | |
| Total distributions | | | -0.53 | | | | -0.39 | | | | -0.58 | | | | -0.60 | | | | -0.49 | | | | -0.63 | | |
Net asset value,
end of year ($) | | | 22.25 | | | | 21.61 | | | | 22.61 | | | | 21.86 | | | | 21.26 | | | | 22.20 | | |
| Total return(a) (%) | | | 4.27 | | | | 3.48 | | | | 4.52 | | | | 15.45 | | | | 14.55 | | | | 15.68 | | |
| Ratios and supplemental data | |
Net assets, end of year
(millions) ($) | | | 5,023 | | | | 1,027 | | | | 4,136 | | | | 4,676 | | | | 914 | | | | 3,284 | | |
Ratio of operating expenses
to average net assets
including earnings credits (%) | | | 1.14 | | | | 1.89 | | | | 0.89 | | | | 1.17 | | | | 1.92 | | | | 0.92 | | |
Ratio of operating expenses
to average net assets
excluding earnings credits (%) | | | 1.14 | | | | 1.89 | | | | 0.89 | | | | 1.17 | | | | 1.92 | | | | 0.92 | | |
Ratio of net investment
income to average net assets
including earnings credits (%) | | | 0.78 | | | | 0.04 | | | | 1.06 | | | | 0.76 | | | | 0.01 | | | | 1.03 | | |
Ratio of net investment
income to average net assets
excluding earnings credits (%) | | | 0.78 | | | | 0.04 | | | | 1.06 | | | | 0.76 | | | | 0.01 | | | | 1.03 | | |
| Portfolio turnover rate (%) | | | 12.22 | | | | 12.22 | | | | 12.22 | | | | 15.53 | | | | 15.53 | | | | 15.53 | | |
* Per share amounts have been calculated using the average shares method.
** Amount represents less than $0.01 per share.
(a) Does not take into account the sales charge of 5.00% for Class A shares and the CDSC (Contingent Deferred Sales Charge) of 1.00% for Class C shares.
See Notes to Financial Statements.
FIRST EAGLE FUNDS | ANNUAL REPORT | OCTOBER 31, 2011
102
Overseas Fund
| | | YEAR ENDED OCTOBER 31, | |
| | | 2009 | | 2008 | | 2007 | |
| | | CLASS A | | CLASS C | | CLASS I | | CLASS A | | CLASS C | | CLASS I | | CLASS A | | CLASS C | | CLASS I | |
Selected data for a share of beneficial interest outstanding throughout
each year is presented below:* | |
Net asset value,
beginning of year ($) | | | 17.21 | | | | 16.93 | | | | 17.41 | | | | 28.09 | | | | 27.66 | | | | 28.38 | | | | 26.70 | | | | 26.33 | | | | 26.94 | | |
| Income (loss) from investment operations: | |
| Net investment income ($) | | | 0.26 | | | | 0.13 | | | | 0.30 | | | | 0.35 | | | | 0.18 | | | | 0.40 | | | | 0.41 | | | | 0.21 | | | | 0.48 | | |
Net realized and unrealized
gains (losses) on investments | | | 3.72 | | | | 3.63 | | | | 3.78 | | | | -7.21 | | | | -7.10 | | | | -7.28 | | | | 4.05 | | | | 4.00 | | | | 4.10 | | |
Total income (loss) from
investment operations | | | 3.98 | | | | 3.76 | | | | 4.08 | | | | -6.86 | | | | -6.92 | | | | -6.88 | | | | 4.46 | | | | 4.21 | | | | 4.58 | | |
| Less distributions: | |
Dividends from net
investment income ($) | | | -0.02 | | | | 0.00 | ** | | | -0.03 | | | | -0.87 | | | | -0.66 | | | | -0.94 | | | | -0.87 | | | | -0.68 | | | | -0.94 | | |
Distributions from
capital gains | | | -1.66 | | | | -1.66 | | | | -1.66 | | | | -3.15 | | | | -3.15 | | | | -3.15 | | | | -2.20 | | | | -2.20 | | | | -2.20 | | |
| Total distributions | | | -1.68 | | | | -1.66 | | | | -1.69 | | | | -4.02 | | | | -3.81 | | | | -4.09 | | | | -3.07 | | | | -2.88 | | | | -3.14 | | |
Net asset value,
end of year ($) | | | 19.51 | | | | 19.03 | | | | 19.80 | | | | 17.21 | | | | 16.93 | | | | 17.41 | | | | 28.09 | | | | 27.66 | | | | 28.38 | | |
| Total return(a) (%) | | | 24.95 | | | | 23.96 | | | | 25.26 | | | | -28.15 | | | | -28.67 | | | | -27.97 | | | | 18.20 | | | | 17.31 | | | | 18.52 | | |
| Ratios and supplemental data | |
Net assets, end of year
(millions) ($) | | | 4,024 | | | | 792 | | | | 2,211 | | | | 3,518 | | | | 737 | | | | 1,968 | | | | 5,974 | | | | 1,203 | | | | 3,942 | | |
Ratio of operating expenses
to average net assets
including earnings credits (%) | | | 1.20 | | | | 1.95 | | | | 0.95 | | | | 1.15 | | | | 1.90 | | | | 0.90 | | | | 1.12 | | | | 1.87 | | | | 0.87 | | |
Ratio of operating expenses
to average net assets
excluding earnings credits (%) | | | 1.20 | | | | 1.95 | | | | 0.95 | | | | 1.15 | | | | 1.90 | | | | 0.90 | | | | 1.12 | | | | 1.87 | | | | 0.87 | | |
Ratio of net investment
income to average net assets
including earnings credits (%) | | | 1.51 | | | | 0.76 | | | | 1.75 | | | | 1.57 | | | | 0.82 | | | | 1.76 | | | | 1.54 | | | | 0.79 | | | | 1.80 | | |
Ratio of net investment
income to average net assets
excluding earnings credits (%) | | | 1.51 | | | | 0.76 | | | | 1.75 | | | | 1.57 | | | | 0.82 | | | | 1.76 | | | | 1.54 | | | | 0.78 | | | | 1.79 | | |
| Portfolio turnover rate (%) | | | 8.65 | | | | 8.65 | | | | 8.65 | | | | 15.72 | | | | 15.72 | | | | 15.72 | | | | 34.29 | | | | 34.29 | | | | 34.29 | | |
FIRST EAGLE FUNDS | ANNUAL REPORT | OCTOBER 31, 2011
103

Financial Highlights
| | | YEAR ENDED OCTOBER 31, | |
| | | 2011 | | 2010 | |
| | | CLASS A | | CLASS C | | CLASS I | | CLASS A | | CLASS C | | CLASS I | |
Selected data for a share of beneficial interest outstanding throughout
each year is presented below:* | |
Net asset value,
beginning of year ($) | | | 15.94 | | | | 15.75 | | | | 16.12 | | | | 14.21 | | | | 14.06 | | | | 14.37 | | |
| Income (loss) from investment operations: | |
| Net investment income ($) | | | 0.17 | | | | 0.04 | | | | 0.21 | | | | 0.32 | | | | 0.21 | | | | 0.38 | | |
Net realized and unrealized
gains (losses) on investments | | | 1.34 | | | | 1.34 | | | | 1.37 | | | | 1.60 | | | | 1.58 | | | | 1.59 | | |
Total income (loss) from
investment operations | | | 1.51 | | | | 1.38 | | | | 1.58 | | | | 1.92 | | | | 1.79 | | | | 1.97 | | |
| Less distributions: | |
Dividends from net
investment income ($) | | | -0.33 | | | | -0.22 | | | | -0.37 | | | | -0.19 | | | | -0.10 | | | | -0.22 | | |
Distributions from
capital gains | | | — | | | | — | | | | — | | | | — | | | | — | | | | — | | |
| Total distributions | | | -0.33 | | | | -0.22 | | | | -0.37 | | | | -0.19 | | | | -0.10 | | | | -0.22 | | |
Net asset value,
end of year ($) | | | 17.12 | | | | 16.91 | | | | 17.33 | | | | 15.94 | | | | 15.75 | | | | 16.12 | | |
| Total return(a) (%) | | | 9.60 | | | | 8.85 | | | | 9.92 | | | | 13.64 | | | | 12.75 | | | | 13.84 | | |
| Ratios and supplemental data | |
Net assets, end of year
(millions) ($) | | | 967 | | | | 408 | | | | 538 | | | | 680 | | | | 320 | | | | 328 | | |
Ratio of operating expenses
to average net assets
including earnings credits (%) | | | 1.18 | | | | 1.93 | | | | 0.93 | | | | 1.23 | | | | 1.98 | | | | 0.99 | | |
Ratio of operating expenses
to average net assets
excluding earnings credits (%) | | | 1.18 | | | | 1.93 | | | | 0.93 | | | | 1.23 | | | | 1.98 | | | | 0.99 | | |
Ratio of net investment
income to average net assets
including earnings credits (%) | | | 0.98 | | | | 0.24 | | | | 1.23 | | | | 2.15 | | | | 1.41 | | | | 2.46 | | |
Ratio of net investment
income to average net assets
excluding earnings credits (%) | | | 0.98 | | | | 0.24 | | | | 1.23 | | | | 2.15 | | | | 1.41 | | | | 2.46 | | |
| Portfolio turnover rate (%) | | | 18.54 | | | | 18.54 | | | | 18.54 | | | | 12.23 | | | | 12.23 | | | | 12.23 | | |
* Per share amounts have been calculated using the average shares method.
(a) Does not take into account the sales charge of 5.00% for Class A shares and the CDSC (Contingent Deferred Sales Charge) of 1.00% for Class C shares.
See Notes to Financial Statements.
FIRST EAGLE FUNDS | ANNUAL REPORT | OCTOBER 31, 2011
104
U.S. Value Fund
| | | YEAR ENDED OCTOBER 31, | |
| | | 2009 | | 2008 | | 2007 | |
| | | CLASS A | | CLASS C | | CLASS I | | CLASS A | | CLASS C | | CLASS I | | CLASS A | | CLASS C | | CLASS I | |
Selected data for a share of beneficial interest outstanding throughout
each year is presented below:* | |
Net asset value,
beginning of year ($) | | | 12.75 | | | | 12.63 | | | | 12.89 | | | | 17.01 | | | | 16.87 | | | | 17.19 | | | | 16.19 | | | | 16.08 | | | | 16.34 | | |
| Income (loss) from investment operations: | |
| Net investment income ($) | | | 0.21 | | | | 0.12 | | | | 0.24 | | | | 0.36 | | | | 0.24 | | | | 0.40 | | | | 0.33 | | | | 0.21 | | | | 0.38 | | |
Net realized and unrealized
gains (losses) on investments | | | 1.58 | | | | 1.56 | | | | 1.60 | | | | -3.65 | | | | -3.63 | | | | -3.69 | | | | 1.45 | | | | 1.44 | | | | 1.46 | | |
Total income (loss) from
investment operations | | | 1.79 | | | | 1.68 | | | | 1.84 | | | | -3.29 | | | | -3.39 | | | | -3.29 | | | | 1.78 | | | | 1.65 | | | | 1.84 | | |
| Less distributions: | |
Dividends from net
investment income ($) | | | -0.22 | | | | -0.14 | | | | -0.25 | | | | -0.31 | | | | -0.19 | | | | -0.35 | | | | -0.30 | | | | -0.20 | | | | -0.33 | | |
Distributions from
capital gains | | | -0.11 | | | | -0.11 | | | | -0.11 | | | | -0.66 | | | | -0.66 | | | | -0.66 | | | | -0.66 | | | | -0.66 | | | | -0.66 | | |
| Total distributions | | | -0.33 | | | | -0.25 | | | | -0.36 | | | | -0.97 | | | | -0.85 | | | | -1.01 | | | | -0.96 | | | | -0.86 | | | | -0.99 | | |
Net asset value,
end of year ($) | | | 14.21 | | | | 14.06 | | | | 14.37 | | | | 12.75 | | | | 12.63 | | | | 12.89 | | | | 17.01 | | | | 16.87 | | | | 17.19 | | |
| Total return(a) (%) | | | 14.52 | | | | 13.63 | | | | 14.78 | | | | -20.56 | | | | -21.17 | | | | -20.36 | | | | 11.47 | | | | 10.65 | | | | 11.78 | | |
| Ratios and supplemental data | |
Net assets, end of year
(millions) ($) | | | 547 | | | | 263 | | | | 199 | | | | 271 | | | | 167 | | | | 104 | | | | 324 | | | | 233 | | | | 104 | | |
Ratio of operating expenses
to average net assets
including earnings credits (%) | | | 1.26 | | | | 2.00 | | | | 1.01 | | | | 1.20 | | | | 1.96 | | | | 0.95 | | | | 1.20 | | | | 1.95 | | | | 0.95 | | |
Ratio of operating expenses
to average net assets
excluding earnings credits (%) | | | 1.26 | | | | 2.00 | | | | 1.01 | | | | 1.21 | | | | 1.96 | | | | 0.96 | | | | 1.20 | | | | 1.95 | | | | 0.96 | | |
Ratio of net investment
income to average net assets
including earnings credits (%) | | | 1.63 | | | | 0.93 | | | | 1.90 | | | | 2.28 | | | | 1.53 | | | | 2.53 | | | | 2.04 | | | | 1.29 | | | | 2.32 | | |
Ratio of net investment
income to average net assets
excluding earnings credits (%) | | | 1.63 | | | | 0.93 | | | | 1.90 | | | | 2.28 | | | | 1.52 | | | | 2.53 | | | | 2.04 | | | | 1.28 | | | | 2.32 | | |
| Portfolio turnover rate (%) | | | 14.88 | | | | 14.88 | | | | 14.88 | | | | 21.75 | | | | 21.75 | | | | 21.75 | | | | 32.54 | | | | 32.54 | | | | 32.54 | | |
FIRST EAGLE FUNDS | ANNUAL REPORT | OCTOBER 31, 2011
105

Financial Highlights
| | | YEAR ENDED OCTOBER 31, | |
| | | 2011 | | 2010 | |
| | | CLASS A | | CLASS C | | CLASS I | | CLASS A | | CLASS C | | CLASS I | |
Selected data for a share of beneficial interest outstanding throughout
each year is presented below:* | |
Net asset value,
beginning of year ($) | | | 33.42 | | | | 32.44 | | | | 33.81 | | | | 25.15 | | | | 24.52 | | | | 25.43 | | |
| Income (loss) from investment operations: | |
| Net investment loss ($) | | | -0.19 | | | | -0.42 | | | | -0.10 | | | | -0.17 | | | | -0.38 | | | | -0.11 | | |
Net realized and unrealized
gains (losses) on investments | | | 2.60 | | | | 2.53 | | | | 2.63 | | | | 8.82 | | | | 8.58 | | | | 8.92 | | |
Total income (loss) from
investment operations | | | 2.41 | | | | 2.11 | | | | 2.53 | | | | 8.65 | | | | 8.20 | | | | 8.81 | | |
| Less distributions: | |
Dividends from net
investment income ($) | | | -0.73 | | | | -0.56 | | | | -0.80 | | | | -0.38 | | | | -0.28 | | | | -0.43 | | |
Distributions from
capital gains | | | -1.21 | | | | -1.21 | | | | -1.21 | | | | — | | | | — | | | | — | | |
| Total distributions | | | -1.94 | | | | -1.77 | | | | -2.01 | | | | -0.38 | | | | -0.28 | | | | -0.43 | | |
Net asset value,
end of year ($) | | | 33.89 | | | | 32.78 | | | | 34.33 | | | | 33.42 | | | | 32.44 | | | | 33.81 | | |
| Total return(a) (%) | | | 7.38 | | | | 6.61 | | | | 7.66 | | | | 34.73 | | | | 33.66 | | | | 35.01 | | |
| Ratios and supplemental data | |
Net assets, end of year
(millions) ($) | | | 1,834 | | | | 683 | | | | 1,003 | | | | 1,900 | | | | 616 | | | | 695 | | |
Ratio of operating expenses
to average net assets
including earnings credits (%) | | | 1.20 | | | | 1.95 | | | | 0.95 | | | | 1.22 | | | | 1.97 | | | | 0.97 | | |
Ratio of operating expenses
to average net assets
excluding earnings credits (%) | | | 1.20 | | | | 1.95 | | | | 0.95 | | | | 1.22 | | | | 1.97 | | | | 0.97 | | |
Ratio of net investment
loss to average net assets
including earnings credits (%) | | | -0.56 | | | | -1.30 | | | | -0.30 | | | | -0.60 | | | | -1.35 | | | | -0.36 | | |
Ratio of net investment
loss to average net assets
excluding earnings credits (%) | | | -0.56 | | | | -1.30 | | | | -0.30 | | | | -0.60 | | | | -1.35 | | | | -0.36 | | |
| Portfolio turnover rate (%) | | | 13.26 | | | | 13.26 | | | | 13.26 | | | | 5.50 | | | | 5.50 | | | | 5.50 | | |
* Per share amounts have been calculated using the average shares method.
(a) Does not take into account the sales charge of 5.00% for Class A shares and the CDSC (Contingent Deferred Sales Charge) of 1.00% for Class C shares.
See Notes to Financial Statements.
FIRST EAGLE FUNDS | ANNUAL REPORT | OCTOBER 31, 2011
106
Gold Fund
| | | YEAR ENDED OCTOBER 31, | |
| | | 2009 | | 2008 | | 2007 | |
| | | CLASS A | | CLASS C | | CLASS I | | CLASS A | | CLASS C | | CLASS I | | CLASS A | | CLASS C | | CLASS I | |
Selected data for a share of beneficial interest outstanding throughout
each year is presented below:* | |
Net asset value,
beginning of year ($) | | | 14.85 | | | | 14.60 | | | | 14.98 | | | | 27.28 | | | | 26.86 | | | | 27.48 | | | | 23.48 | | | | 23.17 | | | | 23.62 | | |
| Income (loss) from investment operations: | |
| Net investment loss ($) | | | -0.14 | | | | -0.30 | | | | -0.09 | | | | -0.09 | | | | -0.27 | | | | -0.05 | | | | -0.12 | | | | -0.28 | | | | -0.07 | | |
Net realized and unrealized
gains (losses) on investments | | | 11.50 | | | | 11.28 | | | | 11.60 | | | | -10.61 | | | | -10.43 | | | | -10.66 | | | | 7.72 | | | | 7.61 | | | | 7.78 | | |
Total income (loss) from
investment operations | | | 11.36 | | | | 10.98 | | | | 11.51 | | | | -10.70 | | | | -10.70 | | | | -10.71 | | | | 7.60 | | | | 7.33 | | | | 7.71 | | |
| Less distributions: | |
Dividends from net
investment income ($) | | | — | | | | — | | | | — | | | | -0.78 | | | | -0.61 | | | | -0.84 | | | | -0.74 | | | | -0.58 | | | | -0.79 | | |
Distributions from
capital gains | | | -1.06 | | | | -1.06 | | | | -1.06 | | | | -0.95 | | | | -0.95 | | | | -0.95 | | | | -3.06 | | | | -3.06 | | | | -3.06 | | |
| Total distributions | | | -1.06 | | | | -1.06 | | | | -1.06 | | | | -1.73 | | | | -1.56 | | | | -1.79 | | | | -3.80 | | | | -3.64 | | | | -3.85 | | |
Net asset value,
end of year ($) | | | 25.15 | | | | 24.52 | | | | 25.43 | | | | 14.85 | | | | 14.60 | | | | 14.98 | | | | 27.28 | | | | 26.86 | | | | 27.48 | | |
| Total return(a) (%) | | | 78.93 | | | | 77.62 | | | | 79.27 | | | | -41.56 | | | | -41.99 | | | | -41.36 | | | | 37.57 | | | | 36.55 | | | | 37.93 | | |
| Ratios and supplemental data | |
Net assets, end of year
(millions) ($) | | | 1,325 | | | | 362 | | | | 165 | | | | 480 | | | | 109 | | | | 71 | | | | 890 | | | | 196 | | | | 166 | | |
Ratio of operating expenses
to average net assets
including earnings credits (%) | | | 1.26 | | | | 2.01 | | | | 1.01 | | | | 1.21 | | | | 1.96 | | | | 0.95 | | | | 1.20 | | | | 1.95 | | | | 0.95 | | |
Ratio of operating expenses
to average net assets
excluding earnings credits (%) | | | 1.26 | | | | 2.01 | | | | 1.01 | | | | 1.21 | | | | 1.96 | | | | 0.96 | | | | 1.20 | | | | 1.95 | | | | 0.95 | | |
Ratio of net investment
loss to average net assets
including earnings credits (%) | | | -0.65 | | | | -1.40 | | | | -0.40 | | | | -0.38 | | | | -1.13 | | | | -0.20 | | | | -0.55 | | | | -1.30 | | | | -0.30 | | |
Ratio of net investment
loss to average net assets
excluding earnings credits (%) | | | -0.65 | | | | -1.40 | | | | -0.40 | | | | -0.38 | | | | -1.14 | | | | -0.20 | | | | -0.56 | | | | -1.31 | | | | -0.31 | | |
| Portfolio turnover rate (%) | | | 3.00 | | | | 3.00 | | | | 3.00 | | | | 8.74 | | | | 8.74 | | | | 8.74 | | | | 16.37 | | | | 16.37 | | | | 16.37 | | |
FIRST EAGLE FUNDS | ANNUAL REPORT | OCTOBER 31, 2011
107

Financial Highlights
| | | YEAR ENDED OCTOBER 31, | |
| | | 2011 | | 2010 | |
| | | CLASS A | | CLASS C | | CLASS Y | | CLASS A | | CLASS C | | CLASS Y | |
Selected data for a share of beneficial interest outstanding throughout
each year is presented below:* | |
Net asset value,
beginning of year ($) | | | 24.06 | | | | 21.32 | | | | 24.47 | | | | 19.32 | | | | 17.25 | | | | 19.66 | | |
| Income (loss) from investment operations: | |
| Net investment income (loss) ($) | | | -0.09 | | | | -0.25 | | | | -0.08 | | | | 0.13 | | | | -0.03 | | | | 0.14 | | |
Net realized and unrealized
gains (losses) on investments | | | 1.11 | | | | 0.98 | | | | 1.12 | | | | 4.61 | | | | 4.10 | | | | 4.67 | | |
Total income (loss) from
investment operations | | | 1.02 | | | | 0.73 | | | | 1.04 | | | | 4.74 | | | | 4.07 | | | | 4.81 | | |
| Less distributions: | |
Dividends from net
investment income ($) | | | -0.17 | | | | -0.04 | | | | -0.16 | | | | — | | | | — | | | | — | | |
| Distributions from capital gains | | | — | | | | — | | | | — | | | | — | | | | — | | | | — | | |
| Total distributions | | | -0.17 | | | | -0.04 | | | | -0.16 | | | | — | | | | — | | | | — | | |
Net asset value,
end of year ($) | | | 24.91 | | | | 22.01 | | | | 25.35 | | | | 24.06 | | | | 21.32 | | | | 24.47 | | |
| Total return(a) (%) | | | 4.22 | | | | 3.43 | | | | 4.20 | | | | 24.53 | | | | 23.59 | | | | 24.47 | | |
| Ratios and supplemental data | |
Net assets, end of year
(millions) ($) | | | 549 | | | | 194 | | | | 633 | | | | 379 | | | | 122 | | | | 599 | | |
Ratio of operating expenses
to average net assets
including earnings credits (%) | | | 1.43 | | | | 2.18 | | | | 1.43 | | | | 1.47 | | | | 2.22 | | | | 1.47 | | |
Ratio of operating expenses
to average net assets
excluding earnings credits (%) | | | 1.43 | | | | 2.18 | | | | 1.43 | | | | 1.47 | | | | 2.22 | | | | 1.47 | | |
Ratio of net investment
income to average net assets
including earnings credits (%) | | | -0.33 | | | | -1.08 | | | | -0.31 | | | | 0.61 | | | | -0.14 | | | | 0.62 | | |
Ratio of net investment
income to average net assets
excluding earnings credits (%) | | | -0.33 | | | | -1.08 | | | | -0.31 | | | | 0.61 | | | | -0.14 | | | | 0.62 | | |
| Portfolio turnover rate (%) | | | 67.61 | | | | 67.61 | | | | 67.61 | | | | 40.00 | | | | 40.00 | | | | 40.00 | | |
* Per share amounts have been calculated using the average shares method.
(a) Does not take into account the sales charge of 5.00% for Class A shares and the CDSC (Contingent Deferred Sales Charge) of 1.00% for Class C shares.
(b) Investment income (loss) per share reflects special dividends received in Class A, C and Y which amounts to $0.13, $0.12, and $0.13 per share. Excluding the special dividend, the ratio of net investment income (loss) to average net assets both with and without the effect of earnings credits in Class A, C and Y would have been -0.31%, -1.00%, and -0.22%.
See Notes to Financial Statements.
FIRST EAGLE FUNDS | ANNUAL REPORT | OCTOBER 31, 2011
108
Fund of America
| | | YEAR ENDED OCTOBER 31, | |
| | | 2009 | | 2008 | | 2007 | |
| | | CLASS A | | CLASS C | | CLASS Y | | CLASS A | | CLASS C | | CLASS Y | | CLASS A | | CLASS C | | CLASS Y | |
Selected data for a share of beneficial interest outstanding throughout
each year is presented below:* | |
Net asset value,
beginning of year ($) | | | 18.92 | | | | 17.14 | | | | 19.23 | | | | 29.79 | | | | 27.39 | | | | 30.22 | | | | 27.92 | | | | 26.12 | | | | 28.28 | | |
| Income (loss) from investment operations: | |
| Net investment income (loss) ($) | | | -0.06 | | | | -0.18 | | | | -0.07 | | | | -0.06 | | | | -0.20 | | | | -0.01 | | | | 0.05 | (b) | | | -0.13 | (b) | | | 0.07 | (b) | |
Net realized and unrealized
gains (losses) on investments | | | 1.61 | | | | 1.44 | | | | 1.65 | | | | -7.85 | | | | -7.16 | | | | -8.03 | | | | 5.30 | | | | 4.88 | | | | 5.35 | | |
Total income (loss) from
investment operations | | | 1.55 | | | | 1.26 | | | | 1.58 | | | | -7.91 | | | | -7.36 | | | | -8.04 | | | | 5.35 | | | | 4.75 | | | | 5.42 | | |
| Less distributions: | |
Dividends from net
investment income ($) | | | — | | | | — | | | | — | | | | -0.07 | | | | — | | | | -0.06 | | | | — | | | | — | | | | — | | |
| Distributions from capital gains | | | -1.15 | | | | -1.15 | | | | -1.15 | | | | -2.89 | | | | -2.89 | | | | -2.89 | | | | -3.48 | | | | -3.48 | | | | -3.48 | | |
| Total distributions | | | -1.15 | | | | -1.15 | | | | -1.15 | | | | -2.96 | | | | -2.89 | | | | -2.95 | | | | -3.48 | | | | -3.48 | | | | -3.48 | | |
Net asset value,
end of year ($) | | | 19.32 | | | | 17.25 | | | | 19.66 | | | | 18.92 | | | | 17.14 | | | | 19.23 | | | | 29.79 | | | | 27.39 | | | | 30.22 | | |
| Total return(a) (%) | | | 9.13 | | | | 8.34 | | | | 9.14 | | | | -29.20 | | | | -29.74 | | | | -29.23 | | | | 21.28 | | | | 20.34 | | | | 21.25 | | |
| Ratios and supplemental data | |
Net assets, end of year
(millions) ($) | | | 276 | | | | 90 | | | | 503 | | | | 127 | | | | 61 | | | | 501 | | | | 82 | | | | 65 | | | | 756 | | |
Ratio of operating expenses
to average net assets
including earnings credits (%) | | | 1.50 | | | | 2.25 | | | | 1.50 | | | | 1.41 | | | | 2.16 | | | | 1.41 | | | | 1.40 | | | | 2.15 | | | | 1.40 | | |
Ratio of operating expenses
to average net assets
excluding earnings credits (%) | | | 1.50 | | | | 2.25 | | | | 1.50 | | | | 1.42 | | | | 2.17 | | | | 1.42 | | | | 1.41 | | | | 2.16 | | | | 1.41 | | |
Ratio of net investment
income to average net assets
including earnings credits (%) | | | -0.34 | | | | -1.10 | | | | -0.37 | | | | -0.23 | | | | -0.87 | | | | -0.06 | | | | 0.18 | (b) | | | -0.51 | (b) | | | 0.26 | (b) | |
Ratio of net investment
income to average net assets
excluding earnings credits (%) | | | -0.34 | | | | -1.10 | | | | -0.37 | | | | -0.24 | | | | -0.88 | | | | -0.07 | | | | 0.17 | (b) | | | -0.52 | (b) | | | 0.25 | (b) | |
| Portfolio turnover rate (%) | | | 40.41 | | | | 40.41 | | | | 40.41 | | | | 63.97 | | | | 63.97 | | | | 63.97 | | | | 50.26 | | | | 50.26 | | | | 50.26 | | |
FIRST EAGLE FUNDS | ANNUAL REPORT | OCTOBER 31, 2011
109
Notes to Financial Statements
Note 1 — Significant Accounting Policies
First Eagle Funds (the "Trust"), is an open-end management investment company registered under the Investment Company Act of 1940, as amended ("1940 Act"). The Trust consists of five separate portfolios, First Eagle Global Fund, First Eagle Overseas Fund, First Eagle U.S. Value Fund, First Eagle Gold Fund and First Eagle Fund of America (each individually a "Fund" or collectively the "Funds"). All the Funds are diversified mutual funds except for First Eagle Gold Fund and First Eagle Fund of America, which are non-diversified. The Trust is a Delaware statutory trust. The First Eagle Global Fund seeks long-term growth of capital by investing in a range of asset classes from markets in the United States and around the world. The First Eagle Overseas Fund seeks long-term growth of capital by investing primarily in equities issued by non-U.S. corporations. The First Eagle U.S. Value Fund seeks long-term growth of capital by investing, under normal market conditions, primarily in equity and debt securities issued by U.S. corporations. The First Eagle Gold Fund seeks to provide exposure to the investment characteristics of gold and, to a limited extent, other precious metals. The First Eagle Fund of America seeks capital appreciation by investing primarily in U.S. stocks and, to a lesser extent, in debt and international equity securities.
The following is a summary of significant accounting policies adhered to by the Funds and are in conformity with U.S. generally accepted accounting principles ("GAAP").
a) Investment in Subsidiary — The First Eagle Gold Fund (the "Gold Fund") may invest in certain precious metals through its investment in the First Eagle Gold Cayman Fund, Ltd., a wholly owned subsidiary (the "Subsidiary"). The Gold Fund may invest up to 25% of its total assets in shares of the Subsidiary. The Subsidiary has the ability to invest in commodities and securities consistent with the investment objective of the Gold Fund.
The Subsidiary, established on May 28, 2010, is an exempted company under the laws of the Cayman Islands. The consolidated financial statements include the accounts of the Gold Fund and the Subsidiary. All intercompany transactions and balances have been eliminated. As of October 31, 2011, the Subsidiary has $65,807,067 in net assets, representing 1.87% of the Gold Fund's net assets.
FIRST EAGLE FUNDS | ANNUAL REPORT | OCTOBER 31, 2011
110
(continued)
b) Investment valuation — Each Fund computes its net asset value once daily as of the close of trading on each day the New York Stock Exchange ("NYSE") is open for trading. The net asset value per share is computed by dividing the total current value of the assets of a Fund, less its liabilities, by the total number of shares outstanding at the time of such computation.
A portfolio security (including an option), other than a bond, which is traded on a U.S. national securities exchange or a securities exchange abroad is normally valued at the price of the last sale on the exchange as of the close of business on the date on which assets are valued. If there are no sales on such date, such portfolio investment will be valued at the mean between the closing bid and asked prices (and if there is only a bid or only an asked price on such date, valuation will be at such bid or asked price for long or short positions, respectively). Securities, other than bonds, traded in the over-the-counter market are valued at the mean between the last bid and asked prices prior to the time of valuation (and if there is only a bid or only an asked price on such date, valuation will be at such bid or asked price for long or short positions, respectively), except if such unlisted security traded on the NASDAQ, in which case it is valued at its last sale price (or, if available, the NASDAQ Official Closing Price).
Commodities (such as physical metals) are valued at the spot price at the time trading on the New York Stock Exchange closes (normally 4:00 p.m. E.S.T.).
Forward contracts are valued at the current cost of covering or offsetting such contracts.
All bonds, whether listed on an exchange or traded in the over-the-counter market (and except for short-term investments as described in the next sentence), for which market quotations are readily available are valued at the mean between the last bid and asked prices received from dealers in the over-the-counter market in the United States or abroad, except that when no asked price is available, bonds are valued at the last bid price alone. Broker-Dealers or pricing services use multiple valuation techniques to determine value. In instances where sufficient market activity exists, dealers or pricing services may utilize a market-based approach through which quotes from market makers are used to determine fair value. In instances where sufficient market activity may not exist or is limited, the dealers or pricing services also utilize proprietary valuation models which may consider market transactions
FIRST EAGLE FUNDS | ANNUAL REPORT | OCTOBER 31, 2011
111
Notes to Financial Statements
in comparable securities and the various relationships between securities in determining value and/or market characteristics such as benchmark yield curves, option-adjusted spreads, credit spreads, estimated default rates, coupon-rates, anticipated timing of principal repayments, underlying collateral, and other unique security features in order to estimate the relevant cash flows, which are then discounted to calculate the fair values. Short-term investments maturing in sixty days or less are valued at cost plus interest earned (or discount amortized, as the case may be), which is deemed to approximate value.
The 2:00 p.m. E.S.T. exchange rates typically are used to convert foreign security prices into U.S. dollars. Any security that is listed or traded on more than one exchange (or traded in multiple markets) is valued at the relevant quotation on the exchange or market deemed to be the primary trading venue for that security. In the absence of such a quotation, a quotation from the exchange or market deemed by the Adviser to be the secondary trading venue for the particular security shall be used. The Funds use pricing services to identify the market prices of publicly traded securities in their portfolios. When market prices are determined to be "stale" as a result of limited market activity for a particular holding, or in other circumstances when market prices are unavailable, such as for private placements, or determined to be unreliable for a particular holding, such holdings may be "fair valued" in accordance with procedures approved by the Board of Trustees ("Board"). Additionally, with respect to foreign holdings, specifically in circumstances leading the Adviser to believe that significant events occurring after the close of a foreign market have materially affected the value of a Fund's holdings in that market, such holdings may be fair valued to reflect the events in accordance with procedures approved by the Board. The determination of whether a particular foreign investment should be fair valued will be based on review of a number of factors, including developments in foreign markets, the performance of U.S. securities markets and security-specific events. The values assigned to a Fund's holdings therefore may differ on occasion from reported market values.
Certain Funds with non-U.S. holdings have adopted procedures under which movements in the prices for U.S. securities (beyond specified thresholds) occurring after the close of a foreign market may require fair valuation of
FIRST EAGLE FUNDS | ANNUAL REPORT | OCTOBER 31, 2011
112
(continued)
securities traded in that foreign market. The values assigned to a Fund's foreign holdings therefore may differ on occasion from reported market values. The Trust and the Adviser believe relying on the procedures as just described will result in prices that are more reflective of the actual market value of portfolio securities held by the Funds as of 4:00 p.m. E.S.T.
The Funds adopted provisions surrounding fair value measurements and disclosures that define fair value, establishes a framework for measuring fair value in generally accepted accounting principles and expands disclosures about fair value measurements. This applies to fair value measurements that are already required or permitted by other accounting standards and is intended to increase consistency of those measurements and applies broadly to securities and other types of assets and liabilities.
The Funds disclose the fair value of their investments in a hierarchy that prioritizes the inputs or assumptions to valuation techniques used to measure fair value. These inputs are used in determining the value of the Funds' investments and are summarized in the following fair value hierarchy:
Level 1 — Quoted prices in active markets for identical securities.
Level 2 — Other significant observable inputs (including quoted prices for similar securities, interest rates, prepayment speeds, credit risk, etc.).
Level 3 — Other significant unobservable inputs (including Fund's own assumption in determining the fair value of investments).
FIRST EAGLE FUNDS | ANNUAL REPORT | OCTOBER 31, 2011
113
Notes to Financial Statements
The following is a summary of the Funds' inputs used to value the Funds' investments as of October 31, 2011:
| First Eagle Global Fund | |
| DESCRIPTION | | LEVEL 1 | | LEVEL 2(a) | | LEVEL 3(b) | | TOTAL | |
| Assets: † | |
| U.S. Common Stocks | | $ | 10,676,543,650 | | | $ | 3,864,238 | | | $ | — | | | $ | 10,680,407,888 | | |
International
Common Stocks | | | 1,894,053,158 | | | | 11,220,453,024 | (c) | | | 11,064,479 | | | | 13,125,570,661 | | |
| U.S. Preferred Stocks | | | — | | | | 16,624,375 | | | | — | | | | 16,624,375 | | |
International
Preferred Stocks | | | — | | | | 323,100,978 | (c) | | | — | | | | 323,100,978 | | |
| Warrant | | | 60,972,439 | | | | — | | | | — | | | | 60,972,439 | | |
| Commodity* | | | 1,806,763,515 | | | | — | | | | — | | | | 1,806,763,515 | | |
| U.S. Corporate Bonds | | | — | | | | 53,907,300 | | | | — | | | | 53,907,300 | | |
International
Corporate Notes
and Bonds | | | — | | | | 60,839,841 | | | | 33,466,782 | | | | 94,306,623 | | |
International
Government Bonds | | | — | | | | 706,429,385 | | | | — | | | | 706,429,385 | | |
International
Commercial Paper | | | — | | | | 1,992,014,114 | | | | — | | | | 1,992,014,114 | | |
| U.S. Commercial Paper | | | — | | | | 2,069,135,192 | | | | — | | | | 2,069,135,192 | | |
Foreign Currency
Contracts** | | | — | | | | 19,606,747 | | | | — | | | | 19,606,747 | | |
| Total | | $ | 14,438,332,762 | | | $ | 16,465,975,194 | | | $ | 44,531,261 | | | $ | 30,948,839,217 | | |
| Liabilities: | |
Covered Call
Options Written | | $ | 2,368,750 | | | $ | — | | | $ | — | | | $ | 2,368,750 | | |
Foreign Currency
Contracts** | | | — | | | | 19,153,966 | | | | — | | | | 19,153,966 | | |
| Total | | $ | 2,368,750 | | | $ | 19,153,966 | | | $ | — | | | $ | 21,522,716 | | |
(a) Transfer into/out of Level 2 represent value as of the beginning of the period.
International common stocks and International preferred stocks valued at $9,670,118,632 and $263,450,486, respectively, were transferred from Level 1 to Level 2 as of October 31, 2011. At October 31, 2010, these securities were valued using quoted market prices in active markets; at October 31, 2011, these securities were valued based on fair value adjustment factors. Fair value factors may be applied during the year with respect to foreign holdings, specifically in circumstances leading the Adviser to believe that significant events occurred after the close of foreign markets. There were no transfers from Level 2 to Level 1 as of October 31, 2011.
(b) Level 3 securities are identified in the Schedule of Investments with footnote (g).
FIRST EAGLE FUNDS | ANNUAL REPORT | OCTOBER 31, 2011
114
(continued)
| First Eagle Global Fund — (continued) | |
(c) Amounts of $11,178,604,505 and $323,100,978 represent securities identified as Level 2 which are fair valued based on fair value adjustment factors in international common stocks and international preferred stocks, respectively. Refer to the Schedule of Investments footnote (e). Other amounts noted as Level 2 represent broker-dealers or pricing services use of multiple valuation techniques to determine fair value. In instances where sufficient market activity exists, the broker-dealer or pricing services may utilize a market-based approach through which quotes from market makers are used to determine fair value.
† See Schedule of Investments for additional detailed categorizations.
* Represents gold bullion.
** Foreign currency contracts are valued at net unrealized appreciation (depreciation) on the investment.
Fair Value Level 3 activity for the year ended October 31, 2011 was as follows:
| | | | | INTERNATIONAL | | INTERNATIONAL | | | |
| | | INTERNATIONAL | | PREFERRED | | CORPORATE | | | |
| | | COMMON STOCKS | | STOCKS | | BONDS | | TOTAL VALUE | |
Beginning Balance —
market value | | $ | 5,478,123 | | | $ | 26,991,080 | | | $ | 29,212,067 | | | $ | 61,681,270 | | |
| Purchases (Sales) | | | — | | | | — | | | | — | # | | | — | | |
| Transfer In — Level 3^ | | | — | | | | — | | | | — | | | | — | | |
| Transfer Out — Level 3^ | | | — | | | | (26,991,080 | ) | | | — | | | | (26,991,080 | ) | |
| Accrued Amortization | | | — | | | | — | | | | — | | | | — | | |
| Realized Gains (Losses) | | | — | | | | — | | | | (16,339,337 | ) | | | (16,339,337 | ) | |
Change in Unrealized
Appreciation (Depreciation) | | | 5,586,356 | | | | — | | | | 20,594,052 | | | | 26,180,408 | | |
Ending Balance —
market value | | $ | 11,064,479 | | | $ | — | | | $ | 33,466,782 | | | $ | 44,531,261 | | |
Change in unrealized gains or
(losses) relating to assets still
held at reporting date | | $ | 5,586,356 | | | $ | — | | | $ | 4,254,715 | | | $ | 9,841,071 | | |
^ Transfers into/out of Level 3 represents values as of the beginning of the period.
International Preferred Stocks valued at $26,991,080 were transferred from Level 3 to Level 2 during the year ended October 31, 2011. At October 31, 2010, these securities were valued based on the fair value procedures approved by the Board of Trustees; at October 31, 2011, these securities were no longer fair valued but were thinly traded in the active markets.
# Security was matured and written off, as such there was no sale amount associated with the realized gains (losses) balance.
FIRST EAGLE FUNDS | ANNUAL REPORT | OCTOBER 31, 2011
115
Notes to Financial Statements
| First Eagle Overseas Fund | |
| DESCRIPTION | | LEVEL 1 | | LEVEL 2(a) | | LEVEL 3(b) | | TOTAL | |
| Assets: † | |
International
Common Stocks | | $ | 861,445,220 | | | $ | 6,615,465,558 | (c) | | $ | 49,904,715 | | | $ | 7,526,815,493 | | |
| U.S. Common Stocks | | | 46,238,541 | | | | — | | | | — | | | | 46,238,541 | | |
International
Preferred Stocks | | | — | | | | 199,154,571 | (c) | | | — | | | | 199,154,571 | | |
| Commodity* | | | 758,946,085 | | | | — | | | | — | | | | 758,946,085 | | |
| Term Loans | | | — | | | | 13,848,599 | | | | 633,621 | | | | 14,482,220 | | |
International
Corporate Bonds | | | — | | | | 30,211,890 | | | | 22,311,188 | | | | 52,523,078 | | |
International
Government Bonds | | | — | | | | 381,749,245 | | | | — | | | | 381,749,245 | | |
International
Commercial Paper | | | — | | | | 937,373,244 | | | | — | | | | 937,373,244 | | |
| U.S. Commercial Paper | | | — | | | | 185,609,739 | | | | — | | | | 185,609,739 | | |
Foreign Currency
Contracts** | | | — | | | | 10,645,291 | | | | — | | | | 10,645,291 | | |
| Total | | $ | 1,666,629,846 | | | $ | 8,374,058,137 | | | $ | 72,849,524 | | | $ | 10,113,537,507 | | |
| Liabilities: | |
Foreign Currency
Contracts** | | $ | — | | | $ | 11,393,045 | | | $ | — | | | $ | 11,393,045 | | |
| Total | | $ | — | | | $ | 11,393,045 | | | $ | — | | | $ | 11,393,045 | | |
(a) Transfer into/out of Level 2 represent value as of the beginning of the period.
International common stocks and International preferred stocks valued at $5,449,671,146 and $161,896,587, respectively, were transferred from Level 1 to Level 2 as of October 31, 2011. At October 31, 2010, these securities were valued using quoted market prices in active markets; at October 31, 2011, these securities were valued based on fair value adjustment factors. Fair value factors may be applied during the year with respect to foreign holdings, specifically in circumstances leading the Adviser to believe that significant events occurred after the close of foreign markets. There were no transfers from Level 2 to Level 1 as of October 31, 2011.
(b) Level 3 securities are identified in the Schedule of Investments with footnote (f).
(c) Amounts of $6,603,328,283 and $199,154,571 represent securities identified as Level 2 which are fair valued based on fair value adjustment factors in international common stocks and international preferred stocks, respectively. Refer to the Schedule of Investments footnote (a). Other amounts noted as Level 2 represent broker-dealers or pricing services use of multiple valuation techniques to determine fair value. In instances where sufficient market activity exists, the broker-dealer or pricing services may utilize a market-based approach through which quotes from market makers are used to determine fair value.
† See Schedule of Investments for additional detailed categorizations.
* Represents gold bullion.
** Foreign currency contracts are valued at net unrealized appreciation (depreciation) on the investment.
FIRST EAGLE FUNDS | ANNUAL REPORT | OCTOBER 31, 2011
116
(continued)
Fair Value Level 3 activity for the year ended October 31, 2011 was as follows:
| First Eagle Overseas Fund — (continued) | |
| | | | | INTERNATIONAL | | INTERNATIONAL | | | | | |
| | | INTERNATIONAL | | PREFERRED | | CORPORATE | | | | | |
| | | COMMON STOCKS | | STOCKS | | BONDS | | TERM LOAN | | TOTAL VALUE | |
Beginning Balance —
market value | | $ | 39,030,672 | | | $ | 8,074,858 | | | $ | 19,474,711 | | | $ | — | | | $ | 66,580,241 | | |
| Purchases (Sales) | | | — | | | | — | | | | — | # | | | 645,313 | | | | 645,313 | | |
| Transfer In — Level 3^ | | | — | | | | — | | | | — | | | | — | | | | — | | |
Transfer Out —
Level 3^ | | | — | | | | (8,074,858 | ) | | | — | | | | — | | | | (8,074,858 | ) | |
| Accrued Amortization | | | — | | | | — | | | | — | | | | (828 | ) | | | (828 | ) | |
Realized Gains
(Losses) | | | — | | | | — | | | | (27,682,258 | ) | | | — | | | | (27,682,258 | ) | |
Change in Unrealized
Appreciation
(Depreciation) | | | 10,874,043 | | | | — | | | | 30,518,735 | | | | (10,864 | ) | | | 41,381,914 | | |
Ending Balance —
market value | | $ | 49,904,715 | | | $ | — | | | $ | 22,311,188 | | | $ | 633,621 | | | $ | 72,849,524 | | |
Change in unrealized
gains or (losses)
relating to assets
still held at
reporting date | | $ | 10,874,043 | | | $ | — | | | $ | 2,836,477 | | | $ | (10,864 | ) | | $ | 13,699,656 | | |
^ Transfers into/out of Level 3 represent values as of the beginning of the period.
International Preferred Stocks valued at $8,074,858 were transferred from Level 3 to Level 2 during the year ended October 31, 2011. At October 31, 2010 these securities were valued based on the fair value procedures approved by the Board of Trustees; at October 31, 2011, these securities were no longer fair valued but were thinly traded in the active markets.
# Security was matured and written off, as such there was no sale amount associated with the realized gains (losses) balance.
FIRST EAGLE FUNDS | ANNUAL REPORT | OCTOBER 31, 2011
117
Notes to Financial Statements
| First Eagle U.S. Value Fund | |
| DESCRIPTION | | LEVEL 1 | | LEVEL 2 | | LEVEL 3(a) | | TOTAL | |
| Assets: † | |
| U.S. Common Stocks | | $ | 1,321,866,687 | | | $ | 2,508 | | | $ | — | | | $ | 1,321,869,195 | | |
International
Common Stocks | | | 81,058,169 | | | | — | | | | — | | | | 81,058,169 | | |
| U.S. Preferred Stocks | | | — | | | | 4,371,962 | | | | 3,555,661 | | | | 7,927,623 | | |
| Exchange Traded Fund | | | 8,908,914 | | | | — | | | | — | | | | 8,908,914 | | |
| Warrant | | | 6,946,580 | | | | — | | | | — | | | | 6,946,580 | | |
| Commodity* | | | 89,914,608 | | | | — | | | | — | | | | 89,914,608 | | |
International
Corporate Bond | | | — | | | | 5,850,000 | | | | — | | | | 5,850,000 | | |
| U.S. Corporate Bonds | | | — | | | | 61,745,030 | | | | — | | | | 61,745,030 | | |
| U.S. Treasury Bills | | | — | | | | 64,996,289 | | | | — | | | | 64,996,289 | | |
International
Commercial Paper | | | — | | | | 24,386,748 | | | | — | | | | 24,386,748 | | |
| U.S. Commercial Paper | | | — | | | | 210,128,079 | | | | — | | | | 210,128,079 | | |
| Total | | $ | 1,508,694,958 | | | $ | 371,480,616 | | | $ | 3,555,661 | | | $ | 1,883,731,235 | | |
| Liabilities: | |
Covered Call
Options Written | | $ | 328,750 | | | $ | — | | | $ | — | | | $ | 328,750 | | |
| Total | | $ | 328,750 | | | $ | — | | | $ | — | | | $ | 328,750 | | |
(a) Level 3 securities are identified in the Schedule of Investments with footnote (e).
† See Schedule of Investments for additional detailed categorizations.
* Represents gold bullion.
For the year ended October 31, 2011, there was no security transfer activity from Level 1 to Level 2 and no security transfer activity from Level 2 to Level 1.
FIRST EAGLE FUNDS | ANNUAL REPORT | OCTOBER 31, 2011
118
(continued)
Fair Value Level 3 activity for the year ended October 31, 2011 was as follows:
| First Eagle U.S. Value Fund — (continued) | |
| | | U.S. PREFERED STOCKS | |
| Beginning Balance — market value | | $ | 3,901,937 | | |
| Purchases (Sales) | | | — | | |
| Transfer In — Level 3 | | | — | | |
| Transfer Out — Level 3 | | | — | | |
| Accrued Amortization | | | — | | |
| Realized Gains (Losses) | | | — | | |
| Change in Unrealized Appreciation (Depreciation) | | | (346,276 | ) | |
| Ending Balance — market value | | $ | 3,555,661 | | |
Change in unrealized gains or (losses) relating to assets still held at
reporting date | | $ | (346,276 | ) | |
| First Eagle Gold Fund | |
| DESCRIPTION | | LEVEL 1 | | LEVEL 2 | | LEVEL 3(a) | | TOTAL | |
| Assets: † | |
International
Common Stocks | | $ | 2,395,489,496 | | | $ | — | | | $ | — | | | $ | 2,395,489,496 | | |
| U.S. Common Stocks | | | 283,033,919 | | | | — | | | | — | | | | 283,033,919 | | |
International
Preferred Stock | | | 6,151,200 | | | | — | | | | — | | | | 6,151,200 | | |
| Investment Company | | | — | | | | 559,329 | | | | — | | | | 559,329 | | |
| Warrant | | | 261,259 | | | | — | | | | — | | | | 261,259 | | |
| Commodity* | | | 587,135,293 | | | | — | | | | — | | | | 587,135,293 | | |
International
Convertible Bonds | | | — | | | | 2,110,129 | | | | 30,000,000 | | | | 32,110,129 | | |
International
Commercial Paper | | | — | | | | 84,783,588 | | | | — | | | | 84,783,588 | | |
| U.S. Commercial Paper | | | — | | | | 97,857,176 | | | | — | | | | 97,857,176 | | |
| Total | | $ | 3,272,071,167 | | | $ | 185,310,222 | | | $ | 30,000,000 | | | $ | 3,487,381,389 | | |
(a) Level 3 securities are identified in the Schedule of Investments with footnote (e).
† See Consolidated Schedule of Investments for additional detailed categorizations.
* Represents gold bullion.
For the year ended October 31, 2011, there was no security transfer activity from Level 1 to Level 2 and no security transfer activity from Level 2 to Level 1.
FIRST EAGLE FUNDS | ANNUAL REPORT | OCTOBER 31, 2011
119
Notes to Financial Statements
Fair Value Level 3 activity for the year ended October 31, 2011 was as follows:
| First Eagle Gold Fund — (continued) | |
| | | INTERNATIONAL | |
| | | COVERTIBLE BONDS | |
| Beginning Balance — market value | | $ | — | | |
| Purchases (Sales) | | | 30,000,000 | | |
| Transfer In — Level 3 | | | — | | |
| Transfer Out — Level 3 | | | — | | |
| Accrued Amortization | | | — | | |
| Realized Gains (Losses) | | | — | | |
| Change in Unrealized Appreciation (Depreciation) | | | — | | |
| Ending Balance — market value | | $ | 30,000,000 | | |
Change in unrealized gains or (losses) relating to assets still held at
reporting date | | $ | — | | |
| First Eagle Fund of America | |
| DESCRIPTION | | LEVEL 1 | | LEVEL 2 | | LEVEL 3 | | TOTAL | |
| Assets: † | |
| U.S. Common Stocks | | $ | 930,499,388 | | | $ | — | | | $ | — | | | $ | 930,499,388 | | |
International
Common Stocks | | | 118,741,726 | | | | — | | | | — | | | | 118,741,726 | | |
| Exchange Traded Fund | | | 13,166,311 | | | | — | | | | — | | | | 13,166,311 | | |
| Repurchase Agreement | | | — | | | | 303,465,732 | | | | — | | | | 303,465,732 | | |
| U.S. Convertible Bond | | | — | | | | 4,657,838 | | | | — | | | | 4,657,838 | | |
| Call Option Purchased | | | 1,161,585 | | | | — | | | | — | | | | 1,161,585 | | |
| Total | | $ | 1,063,569,010 | | | $ | 308,123,570 | | | $ | — | | | $ | 1,371,692,580 | | |
| Liabilities: | |
Covered Call
Options Written | | $ | 30,507,624 | | | $ | — | | | $ | — | | | $ | 30,507,624 | | |
| Total | | $ | 30,507,624 | | | $ | — | | | $ | — | | | $ | 30,507,624 | | |
† See Schedule of Investments for additional detailed categorizations.
For the year ended October 31, 2011, there was no security transfer activity from Level 1 to Level 2 and no security transfer activity from Level 2 to Level 1.
FIRST EAGLE FUNDS | ANNUAL REPORT | OCTOBER 31, 2011
120
(continued)
c) Investment transactions and income — Investment transactions are accounted for on a trade date basis. The specific identification method is used in determining realized gains and losses from investment transactions. Dividend income is recorded on the ex-dividend date. Interest income is recorded daily on the accrual basis. In computing investment income, each Fund accretes discounts and amortizes premiums on debt obligations using the interest method. Investment income is allocated to each Fund's share class in proportion to its relative net assets. Payments received from certain investments held by the Funds may be comprised of dividends, capital gains and return of capital. The Funds originally estimate the expected classification of such payments. The amounts may subsequently be reclassified upon receipt of information from the issuer.
d) Expenses — Expenses arising in connection with a Fund are charged directly to that Fund. Expenses common to all Funds are generally allocated to each Fund in proportion to its relative net assets. Certain expenses are shared with the First Eagle Variable Funds, an affiliated fund group. Such costs are generally allocated using the ratio of the Fund's average daily net assets relative to the total average daily net assets of the First Eagle Variable Funds. Earnings credits may reduce shareholder servicing agent fees by the amount of interest earned on balances with such service provider.
e) Foreign currency translation — The books and records of the Funds are maintained in U.S. dollars. The market values of securities which are not traded in U.S. currency are recorded in the financial statements after translation to U.S. dollars based on the applicable exchange rates at the end of the period. The costs of such securities are translated at exchange rates prevailing when acquired. Related dividends, interest and withholding taxes are accrued at the rates of exchange prevailing on the respective dates of such transactions.
The net assets of each of the Funds are presented at the foreign exchange rates and market values at the close of the period. The Funds do not isolate that portion of gains and losses on investments which is due to changes in foreign exchange rates from that which is due to changes in market prices of the securities. However, for federal income tax purposes each Fund does isolate the effect of changes in foreign exchange rates from the changes in market prices for realized gains and losses on debt obligations.
FIRST EAGLE FUNDS | ANNUAL REPORT | OCTOBER 31, 2011
121
Notes to Financial Statements
f) Forward currency contracts — In connection with portfolio purchases and sales of securities denominated in foreign currencies, each Fund may enter into forward currency contracts. The First Eagle Global and Overseas Funds enter into foreign exchange contracts primarily to manage and/or gain exposure to certain foreign currencies. The Funds' currency transactions include portfolio hedging on portfolio positions. Portfolio hedging is the use of a forward contract (or other cash management position) with respect to one or more portfolio security positions denominated or quoted in a particular currency. Currency exchange transactions involve currencies of different countries that the Fund invest in and serves as hedges against possible variations in the exchange rates between these currencies and the U.S. dollar. Each Fund may engage in portfolio hedging with respect to the currency of a particular country in amounts approximating actual or anticipated positions in securities denominated in that currency. Hedging can reduce exposure to currency exchange movements, but cannot eliminate that exposure. It is possible to lose money under a hedge.
Funds' investing in foreign exchange contracts are exposed to risk if the value of the currency changes unfavorably, if the counterparties to the contracts are unable to meet the terms of their contracts or if the Fund is unable to enter into a closing position. Forward currency contracts outstanding at period end, if any, are listed after the Fund's portfolio. Outstanding contracts at period-end are indicative of the volume of activity during the period.
The Funds adopted provisions surrounding disclosures and derivative instruments and hedging activities which require qualitative disclosures about objectives and strategies for using derivatives, quantitative disclosures about fair value amounts of gains and losses on derivative instruments, and disclosures about currency-risk-related contingent features in derivative agreements.
FIRST EAGLE FUNDS | ANNUAL REPORT | OCTOBER 31, 2011
122
(continued)
At October 31, 2011, the Funds had the following foreign forward currency contracts grouped into appropriate risk categories illustrated below:
| First Eagle Global Fund | |
| | | | | | | GAIN OR (LOSS) ON
DERIVATIVES RECOGNIZED
IN INCOME | |
| RISK TYPE | | ASSET DERIVATIVE
FAIR VALUE1 | | LIABILITY DERIVATIVE
FAIR VALUE2 | | REALIZED
LOSS3 | | CHANGE IN
APPRECIATION4 | |
| Foreign Currency | | $ | 19,606,747 | | | $ | 19,153,966 | | | $ | (241,559,342 | ) | | $ | 184,970,176 | | |
| First Eagle Overseas Fund | |
| | | | | | | GAIN OR (LOSS) ON
DERIVATIVES RECOGNIZED
IN INCOME | |
| RISK TYPE | | ASSET DERIVATIVE
FAIR VALUE1 | | LIABILITY DERIVATIVE
FAIR VALUE2 | | REALIZED
LOSS3 | | CHANGE IN
APPRECIATION4 | |
| Foreign Currency | | $ | 10,645,291 | | | $ | 11,393,045 | | | $ | (133,807,257 | ) | | $ | 101,101,126 | | |
g) Options — In order to produce incremental earnings or protect against declines in the value of portfolio securities, First Eagle Global Fund, First Eagle U.S. Value Fund and First Eagle Fund of America write covered call options on portfolio securities. The Fund may also use options for speculative purposes, although it generally does not employ options for this purpose.
Options contracts are valued daily based upon the last sale price on the principal exchange on which the option is traded and unrealized appreciation/depreciation is recorded. If there is no sale on such day, the mean between the last bid and asked prices is used. When an option is exercised, the proceeds on the sale of a written call option is adjusted by the amount of premium received or paid. When a written option expires, the Fund will realize a gain equal to the amount of the premium received. When the Fund enters into a closing purchase transaction, the Fund will realize a gain (or loss, if the cost of the closing purchase transaction exceeds the premium
1 Statements of Assets and Liabilities location: Receivable for forward currency contracts held, at value.
2 Statements of Assets and Liabilities location: Payable for forward currency contracts held, at value.
3 Statements of Operations location: Net realized gains (losses) from: foreign currency and forward contract related transactions.
4 Statements of Operations location: Changes in unrealized appreciation (depreciation) of: foreign currency and forward contract related translation.
FIRST EAGLE FUNDS | ANNUAL REPORT | OCTOBER 31, 2011
123
Notes to Financial Statements
received when the option was written) without regard to any unrealized gain or loss on the underlying security and the liability related to such option is eliminated.
The Fund will earmark assets to cover its obligations under option contracts. A call option is covered if the Fund holds, on a share-for-share basis, either the underlying shares or a call on the same security as the call written where the exercise price of the call held is equal to or less than the exercise price of the call written (or greater than the exercise price of the call written if the difference is maintained by the Fund in cash, Treasury bills or other high grade short-term obligations in a segregated account with its custodian). One reason for writing options is to attempt to realize, through the receipt of premiums, a greater return than would be realized on the securities alone. Another reason for writing options is to hedge against a moderate decline in the value of securities owned by a Fund in the case of a call option. If an increase occurs in the underlying security or stock index sufficient to result in the exercise of a call written by the Fund, it may be required to deliver securities or cash and may thereby forego some or all of the gain that otherwise may have been realized on the securities underlying the call option. This "opportunity cost" may be partially or wholly offset by the premium received for the covered call written by the Fund. The risk in writing a covered call option is that the Fund gives up the opportunity for profit if the market price of the underlying security increases and the option is exercised. The Fund also has the additional risk of not being able to enter into a closing transaction if a liquid secondary market does not exist.
The Fund may also write over-the-counter options where the completion of the obligation is dependent upon the credit standing of the counterparty.
For the year ended October 31, 2011, First Eagle Global Fund, First Eagle U.S. Value Fund and First Eagle Fund of America had the following options transactions.
| First Eagle Global Fund | |
| WRITTEN OPTIONS | | NUMBER
OF CONTRACTS | | PREMIUMS
RECEIVED | |
| Options outstanding at October 31, 2010 | | | — | | | $ | — | | |
| Options written | | | 32,087 | | | | 5,702,313 | | |
| Options assigned | | | — | | | | — | | |
| Options expired/closed | | | (14,537 | ) | | | (3,671,979 | ) | |
| Options outstanding at October 31, 2011 | | | 17,550 | | | $ | 2,030,334 | | |
FIRST EAGLE FUNDS | ANNUAL REPORT | OCTOBER 31, 2011
124
(continued)
As of October 31, 2011, portfolio securities valued at $157,680,450 were segregated to cover collateral requirements for written options.
| First Eagle U.S. Value Fund | |
| WRITTEN OPTIONS | | NUMBER
OF CONTRACTS | | PREMIUMS
RECEIVED | |
| Options outstanding at October 31, 2010 | | | — | | | $ | — | | |
| Options written | | | 9,680 | | | | 1,018,602 | | |
| Options assigned | | | (1,030 | ) | | | (39,042 | ) | |
| Options expired/closed | | | (5,490 | ) | | | (638,251 | ) | |
| Options outstanding at October 31, 2011 | | | 3,160 | | | $ | 341,309 | | |
As of October 31, 2011, portfolio securities valued at $18,474,190 were segregated to cover collateral requirements for written options.
Outstanding contracts for First Eagle Global Fund and First Eagle U.S. Value Fund at period-end are indicative of the volume of activity, which commenced during the year.
| First Eagle Fund of America | |
| WRITTEN OPTIONS | | NUMBER
OF CONTRACTS | | PREMIUMS
RECEIVED | |
| Options outstanding at October 31, 2010 | | | 99,493 | | | $ | 19,064,884 | | |
| Options written | | | 731,606 | | | | 172,544,151 | | |
| Options assigned | | | (74,689 | ) | | | (17,822,480 | ) | |
| Options expired/closed | | | (664,305 | ) | | | (152,891,878 | ) | |
| Options outstanding at October 31, 2011 | | | 92,105 | | | $ | 20,894,677 | | |
| PURCHASED OPTIONS | | NUMBER
OF CONTRACTS | |
COST | |
| Options outstanding at October 31, 2010 | | | — | | | $ | — | | |
| Options purchased | | | 5,668 | | | | 1,806,590 | | |
| Options closed | | | (2,869 | ) | | | (692,778 | ) | |
| Options outstanding at October 31, 2011 | | | 2,799 | | | $ | 1,113,812 | | |
As of October 31, 2011, portfolio securities valued at $362,568,151 were segregated to cover collateral requirements for written options.
Outstanding contracts at period-end are indicative of the volume of activity during the period.
FIRST EAGLE FUNDS | ANNUAL REPORT | OCTOBER 31, 2011
125
Notes to Financial Statements
At October 31, 2011, the Funds had the following options grouped into appropriate risk categories illustrated below:
| First Eagle Global Fund | |
| | | | | GAIN OR (LOSS) ON
DERIVATIVES RECOGNIZED
IN INCOME | |
| RISK TYPE | | LIABILITY DERIVATIVE
FAIR VALUE2 | | REALIZED GAIN3 | | CHANGE IN
DEPRECIATION4 | |
| Equity — Covered call option written | | $ | 2,368,750 | | | $ | 2,251,712 | | | $ | (338,416 | ) | |
| First Eagle U.S. Value Fund | |
| | | | | GAIN OR (LOSS) ON
DERIVATIVES RECOGNIZED
IN INCOME | |
| RISK TYPE | | LIABILITY DERIVATIVE
FAIR VALUE2 | | REALIZED GAIN3 | | CHANGE IN
APPRECIATION4 | |
| Equity — Covered call option written | | $ | 328,750 | | | $ | 487,516 | | | $ | 12,559 | | |
| First Eagle Fund of America | |
| | | | | | | GAIN OR (LOSS) ON
DERIVATIVES RECOGNIZED
IN INCOME | |
| RISK TYPE | | ASSET DERIVATIVE
FAIR VALUE1 | | LIABILITY DERIVATIVE
FAIR VALUE2 | | REALIZED
GAIN (LOSS)3 | | CHANGE IN
APPRECIATION4 | |
Equity — Covered
call option written | | $ | — | | | $ | 30,507,624 | | | $ | 31,543 | | | $ | 1,736,021 | | |
Equity — Call
option purchased | | | 1,161,585 | | | | — | | | | — | | | | 47,773 | | |
h) Repurchase agreements — The Funds may enter into repurchase agreement transactions with institutions that meet the adviser's credit guidelines. Each repurchase agreement is valued at amortized cost. The Funds require that the collateral received in a repurchase agreement transaction be transferred to a custodian in a manner sufficient to enable the Funds to obtain collateral in the event of a counterparty default. If the counterparty defaults and the fair value of the collateral declines, realization of the collateral by the Funds may be delayed or limited.
1 Statements of Assets and Liabilities location: Investments, at value, Unaffiliated issuers.
2 Statements of Assets and Liabilities location: Option contracts written, at value.
3 Statements of Operations location: Net realized gains (losses) from: Written options & Investment transactions of unaffiliated issuers.
4 Statements of Operations location: Changes in unrealized appreciation (depreciation) of: Written options and Investment transactions.
FIRST EAGLE FUNDS | ANNUAL REPORT | OCTOBER 31, 2011
126
(continued)
i) Treasury Inflation-Protected Securities — The Funds invest in Treasury Inflation-Protected Securities ("TIPS") which are specially structured bonds in which the principal amount is adjusted to keep pace with inflation. The inflation (deflation) adjustment is applied to the principal of each bond on a monthly basis and is accounted for as interest income on the Statements of Operations. TIPS are subject to interest rate risk.
j) Restricted Securities — The Funds may invest in securities that are subject to legal or contractual restrictions on resale. These securities generally may be resold in transactions exempt from registration or to the public if the securities are registered. Disposal of these securities may involve time-consuming negotiations and expenses, and prompt sale at an acceptable price may be difficult. Information regarding restricted securities, if any, is included at the end of each Fund's Schedule of Investments.
k) United States income taxes — No provision has been made for U.S. federal income taxes since it is the intention of each Fund to distribute to shareholders all taxable net investment income and net realized gains on investments, if any, within the allowable time limit, and to comply with the provisions of the Code for a Regulated Investment Company. The Funds declare and pay such income, dividends and capital gains distributions on an annual basis.
The Funds adopted provisions surrounding income taxes, which require the tax effects of certain tax positions to be recognized. These tax positions must meet a "more likely than not" standard that based on their technical merits, have a more than 50% likelihood of being sustained upon examination. Management of the Trust has analyzed the Funds' tax positions taken on federal and state income tax returns for all open tax years (the current and the prior three tax years) and has concluded that no provision for income tax is required in the Funds' financial statements.
At October 31, 2011, the components of accumulated earnings on a tax basis were as follows:
| | | UNDISTRIBUTED
NET INVESTMENT
INCOME | | UNDISTRIBUTED
NET REALIZED
GAINS | | NET
UNREALIZED
(DEPRECIATION) | |
CAPITAL LOSS
CARRYFORWARD | |
| First Eagle Global Fund | | $ | 286,976,174 | | | $ | 411,966,907 | | | $ | 4,124,752,827 | | | $ | — | | |
| First Eagle Overseas Fund | | | 149,657,582 | | | | 291,926,132 | | | | 1,558,985,560 | | | | — | | |
| First Eagle U.S. Value Fund | | | 16,430,282 | | | | 47,941,486 | | | | 216,825,730 | | | | — | | |
| First Eagle Gold Fund | | | 38,645,397 | | | | 93,877,822 | | | | 1,171,503,647 | | | | — | | |
| First Eagle Fund of America | | | 23,769,208 | | | | 76,856,126 | | | | 70,893,671 | | | | — | | |
FIRST EAGLE FUNDS | ANNUAL REPORT | OCTOBER 31, 2011
127
Notes to Financial Statements
The differences between the components of distributable earnings on a tax basis and the amounts reflected in the Statements of Changes in Net Assets are primarily due to the treatment of passive foreign investment companies, distributions from real estate investment trusts, investments in partnerships and trusts, the treatment of foreign currency contracts and wash sales.
As of October 31, 2011, the First Eagle Funds had no estimated capital loss carryforwards for federal income tax purposes.
l) Reclassification of capital accounts — As a result of certain differences in the computation of net investment income and net realized capital gains under federal income tax rules and regulations versus generally accepted accounting principles, a reclassification has been made on the Statements of Assets and Liabilities to increase (decrease) undistributed net investment income, undistributed net realized gains on investments and capital surplus for the Funds as follows:
| | | UNDISTRIBUTED NET
INVESTMENT INCOME
(LOSS) | | UNDISTRIBUTED NET
REALIZED GAINS
(LOSSES) | |
CAPITAL SURPLUS | |
| First Eagle Global Fund | | $ | 47,330,447 | | | $ | (56,000,323 | ) | | $ | 8,669,876 | | |
| First Eagle Overseas Fund | | | 27,057,286 | | | | (45,986,586 | ) | | | 18,929,300 | | |
| First Eagle U.S. Value Fund | | | 6,888,934 | | | | (11,163,518 | ) | | | 4,274,584 | | |
| First Eagle Gold Fund | | | 70,700,037 | | | | (72,703,389 | ) | | | 2,003,352 | | |
| First Eagle Fund of America | | | 4,642,197 | | | | (4,854,748 | ) | | | 212,551 | | |
The primary permanent differences causing such reclassification include the tax treatment of currency gains and losses, dividend redesignations, distributions paid in connection with the redemption of Fund shares, investments in passive foreign investment companies, distributions from real estate investment trusts, investments in partnerships and the disallowance of net operating losses.
m) Distributions to shareholders — Distributions to shareholders during the fiscal year ended October 31, 2011, which are determined in accordance with income tax regulations, are recorded on ex-dividend date.
| | | ORDINARY INCOME | | LONG TERM CAPITAL GAINS | |
| | | 2011 | | 2010 | | 2011 | | 2010 | |
| First Eagle Global Fund | | $ | 327,805,269 | | | $ | 263,668,715 | | | $ | — | | | $ | — | | |
| First Eagle Overseas Fund | | | 133,336,040 | | | | 216,859,540 | | | | 85,999,173 | | | | — | | |
| First Eagle U.S. Value Fund | | | 26,901,364 | | | | 12,551,874 | | | | — | | | | — | | |
| First Eagle Gold Fund | | | 68,941,144 | | | | 27,559,932 | | | | 117,254,076 | | | | — | | |
| First Eagle Fund of America | | | 6,981,959 | | | | — | | | | — | | | | — | | |
FIRST EAGLE FUNDS | ANNUAL REPORT | OCTOBER 31, 2011
128
(continued)
n) Class Accounting — Investment income, common expenses and realized/unrealized gain or loss on investments are allocated to the various classes of the Fund on the basis of daily net assets of each class. Fees relating to a specific class are charged directly to that class.
o) Use of estimates — The preparation of financial statements in conformity with generally accepted accounting principles requires management to make estimates and assumptions that affect the reported amounts of assets and liabilities at the date of the financial statements and the reported amounts of revenues and expenses during the reporting period. Actual results could differ from those estimates.
p) Redemption Fee — A redemption fee of 2% will be applied to the First Eagle Global Fund, First Eagle Overseas Fund and First Eagle Gold Fund for the sale or exchange within 60 days of the purchase of such shares.
q) Foreign Taxes — The Funds may be subject to foreign taxes on income, gains on investments or currency purchases/repatriation, a portion of which may be recoverable. The Funds will accrue such taxes and recoveries as applicable, based upon their current interpretation of tax rules and regulations that exist in the markets in which they invest.
Note 2 — Investment Advisory, Custody and Administration Agreements; Transactions with Related Persons
First Eagle Investment Management, LLC (the "Adviser"), a subsidiary of Arnhold and S. Bleichroeder Holdings, Inc. ("ASB Holdings"), manages the Funds. For its services, the Adviser receives, pursuant to an Investment Advisory Agreement between the Funds and the Adviser (the "Advisory Agreement") an annual advisory fee as follows: First Eagle Global Fund, First Eagle Overseas Fund, First Eagle U.S. Value Fund and First Eagle Gold Fund at 0.75% of each Fund's average daily net assets and First Eagle Fund of America at 1% of the Fund's average daily net assets.
The Adviser also performs certain administrative, accounting, operations, compliance and other services on behalf of the Funds, and in accordance with its agreement with them, the Funds reimburse the Adviser for costs (including
FIRST EAGLE FUNDS | ANNUAL REPORT | OCTOBER 31, 2011
129
Notes to Financial Statements
personnel, related overhead and other costs) related to those services. For the year ended October 31, 2011, the Funds reimbursed and had payable to the Adviser amounts shown below:
| FUND | | PAID TO ADVISER | | PAYABLE TO ADVISER | |
| First Eagle Global Fund | | $ | 4,125,591 | | | $ | 377,162 | | |
| First Eagle Overseas Fund | | | 1,519,378 | | | | 137,513 | | |
| First Eagle U.S. Value Fund | | | 233,127 | | | | 20,792 | | |
| First Eagle Gold Fund | | | 498,193 | | | | 41,323 | | |
| First Eagle Fund of America | | | 195,146 | | | | 17,454 | | |
Pursuant to a subadvisory agreement, dated December 10, 2002 (agreement was amended and restated most recently in September 2009 ("Subadvisory Agreement") Iridian Asset Management LLC ("Iridian") manages the investments of the First Eagle Fund of America. The fees paid to Iridian by the Adviser under the Subadvisory Agreement are based on a reference amount equal to 50% of the combined (i) fees received by the Adviser for advisory services on behalf of the Fund and (ii) the fees received by the Fund's distributor for its shareholder liaison services on behalf of the Fund. These amounts are reduced by certain direct marketing costs borne by the Adviser in connection with the Fund and are further reduced by the amount paid by the Adviser for certain administrative expenses incurred in providing services to the Fund.
The Funds have entered into Custody Agreements with State Street Bank and Trust Co. ("SSB"). The Custody Agreements provide for an annual fee based on the amount of assets under custody plus transaction charges. SSB serves as custodian of the Funds' portfolio securities and other assets. SSB has directly entered into sub-custodial agreements to maintain the custody of gold bullion in the Funds. Under the terms of the Custody Agreement between the Funds and SSB, SSB maintains and deposits in separate accounts, cash, securities and other assets of the Funds. SSB is also required, upon the order of the Funds, to deliver securities held by SSB and the sub-custodian, and to make payments for securities purchased by the Funds. SSB has also entered into sub-custodian agreements with a number of foreign banks and clearing agencies, pursuant to which portfolio securities purchased outside the United States are maintained in the custody of these entities.
FIRST EAGLE FUNDS | ANNUAL REPORT | OCTOBER 31, 2011
130
(continued)
The Funds have also entered into an Administration Agreement with SSB, pursuant to which SSB provides certain tax-related and other administrative services. SSB, as the Funds' Administrator, receives annual fees separate from and in addition to the fees it receives for its services as the Funds' custodian.
FEF Distributors, LLC, a wholly owned subsidiary of the Advisor, serves as the Funds' principal underwriter. For the year ended October 31, 2011, FEF Distributors, LLC realized $3,043,973, $496,098, $244,543, $341,225 and $171,916, pertaining to the sales of shares of First Eagle Global Fund, First Eagle Overseas Fund, First Eagle U.S. Value Fund, First Eagle Gold Fund and First Eagle Fund of America, respectively.
The Trust adopted a Trustee Deferred Compensation Plan, which allows the independent Trustees to defer the receipt of all or a portion of compensation related to performance of their duties as a Trustee. The deferred fees are invested in various First Eagle Funds until distribution in accordance with the Trustee Deferred Compensation Plan. As of October 31, 2011, balances to the Plan are recorded on the Statements of Assets and Liabilities.
For the year ended October 31, 2011, the Adviser reimbursed First Eagle Overseas Fund, First Eagle U.S. Value Fund and First Eagle Fund of America $714,808, $7,854 and $2,218, respectively, for losses incurred in connection with trading errors.
Note 3 — Plans of Distribution
Under the terms of the Distribution Plans and Agreements ("the Plans") with FEF Distributors, LLC ("the Distributor"), pursuant to the provisions of Rule 12b-1 under the 1940 Act, the First Eagle Global Fund, First Eagle Overseas Fund, First Eagle U.S. Value Fund and First Eagle Gold Fund pay the Distributor monthly, a distribution fee with respect to Class A and Class C shares at an annual rate of up to 0.25% and 0.75%, respectively, of each Fund's average daily net assets. In the case of First Eagle Fund of America, it pays the Distributor monthly, a distribution fee with respect to Class A, Class C and Class Y shares at an annual rate of up to 0.25%, 0.75% and 0.25%, respectively of the average daily net assets. Under the Plans, the Distributor is obligated to use the amounts received under the Plans for payments to qualifying dealers for their assistance in the distribution of a Fund's shares and the provision of shareholder services and for other expenses such as advertising costs and the payment for the printing and distribution of prospectuses to prospective investors.
FIRST EAGLE FUNDS | ANNUAL REPORT | OCTOBER 31, 2011
131
Notes to Financial Statements
The Distributor bears distribution costs of a Fund to the extent they exceed payments received under the Plan. For the year ended October 31, 2011, the distribution fees incurred by the Funds are disclosed in the Statements of Operations.
The Distributor receives an annual service fee with respect to Class C at the annual rate of 0.25% of each Fund's average daily net assets, payable monthly to cover expenses incurred by the Distributor for providing shareholder liaison services, including assistance with subscriptions, redemptions and other shareholder questions. For the year ended October 31, 2011, the services fees incurred by the Funds are disclosed in the Statements of Operations.
Note 4 — Purchases and Sales of Securities
During the year ended October 31, 2011, the cost of purchases of investments, excluding U.S. Government and short-term securities, totaled $6,841,192,162, $2,247,506,338, $610,340,607, $427,828,489 and $851,685,881 for First Eagle Global Fund, First Eagle Overseas Fund, First Eagle U.S. Value Fund, First Eagle Gold Fund and First Eagle Fund of America, respectively. Proceeds from sales of investments, excluding U.S. government securities and short-term securities, totaled $2,627,909,284, $1,047,790,012, $203,771,916, $452,313,973 and $873,949,327 for First Eagle Global Fund, First Eagle Overseas Fund, First Eagle U.S. Value Fund, First Eagle Gold Fund and First Eagle Fund of America, respectively.
There were no purchases of U.S. Government securities, excluding short-term securities for First Eagle Global Fund, First Eagle Overseas Fund, First Eagle U.S. Value Fund, First Eagle Gold Fund and First Eagle Fund of America. Proceeds from sales of U.S. government securities totaled $225,124,227, $0, $39,628,601, $0 and $0 for First Eagle Global Fund, First Eagle Overseas Fund, First Eagle U.S. Value Fund, First Eagle Gold Fund and First Eagle Fund of America, respectively.
Note 5 — Line of Credit
As of October 4, 2011, the Board of Trustees approved a $300 million committed, unsecured line of credit ("Credit Facility") with State Street Bank and Trust Company for the Funds, to be utilized for temporarily financing the purchase or sale of securities for prompt delivery in the ordinary course of business or for temporarily financing the redemption of shares of each Fund at
FIRST EAGLE FUNDS | ANNUAL REPORT | OCTOBER 31, 2011
132
(continued)
the request of shareholders and other temporary or emergency purposes. Under the Credit Facility arrangement, each Fund has agreed to pay an annual commitment fee on the unused balance, allocated pro rata, based on the relative asset size of the Funds. Commitment fees related to the line of credit are paid by the Funds and are included in miscellaneous expenses in the Statements of Operations. During the year ended October 31, 2011, the Funds had borrowings under the agreement as follows:
| FUND | | AVERAGE
DAILY LOAN
BALANCE | | NUMBER OF DAYS
OUTSTANDING | | INTEREST
EXPENSE | | WEIGHTED
AVERAGE
ANNUALIZED
INTEREST RATE | |
| First Eagle Global Fund | | $ | 2,998,664 | | | | 4 | | | $ | 493 | | | | 1.48 | % | |
As of October 31, 2011 there were no outstanding borrowings from the credit facility.
Note 6 — Capital Stock
At October 31, 2011, the Funds have an unlimited number of shares authorized for issuance. The Funds have the ability to issue multiple classes of shares.
FIRST EAGLE FUNDS | ANNUAL REPORT | OCTOBER 31, 2011
133
Notes to Financial Statements
Transactions in shares of capital stock were as follows:
| | | YEAR ENDED OCTOBER 31, 2011 | |
| | | FIRST EAGLE GLOBAL FUND | |
| | | CLASS A | | CLASS C | | CLASS I | |
| Shares sold | | | 82,403,930 | | | | 52,534,770 | | | | 90,765,616 | | |
Shares issued for reinvested
dividends and distributions | | | 3,377,141 | | | | 815,954 | | | | 1,528,605 | | |
| Shares redeemed | | | (54,727,128 | ) | | | (20,788,828 | ) | | | (32,853,816 | ) | |
| Net increase | | | 31,053,943 | | | | 32,561,896 | | | | 59,440,405 | | |
| | | YEAR ENDED OCTOBER 31, 2011 | |
| | | FIRST EAGLE GOLD FUND | |
| | | CLASS A | | CLASS C | | CLASS I | |
| Shares sold | | | 17,323,860 | | | | 5,525,002 | | | | 15,889,989 | | |
Shares issued for reinvested
dividends and distributions | | | 2,866,928 | | | | 787,656 | | | | 535,343 | | |
| Shares redeemed | | | (22,945,298 | ) | | | (4,454,411 | ) | | | (7,752,658 | ) | |
| Net increase (decrease) | | | (2,754,510 | ) | | | 1,858,247 | | | | 8,672,674 | | |
| | | YEAR ENDED OCTOBER 31, 2010 | |
| | | FIRST EAGLE GLOBAL FUND | |
| | | CLASS A | | CLASS C | | CLASS I | |
| Shares sold | | | 56,104,057 | | | | 35,584,529 | | | | 54,269,413 | | |
Shares issued for reinvested
dividends and distributions | | | 3,444,109 | | | | 889,953 | | | | 1,030,798 | | |
| Shares redeemed | | | (57,239,727 | ) | | | (21,890,851 | ) | | | (21,198,794 | ) | |
| Net increase | | | 2,308,439 | | | | 14,583,631 | | | | 34,101,417 | | |
| | | YEAR ENDED OCTOBER 31, 2010 | |
| | | FIRST EAGLE GOLD FUND | |
| | | CLASS A | | CLASS C | | CLASS I | |
| Shares sold | | | 22,560,831 | | | | 7,211,831 | | | | 17,424,005 | | |
Shares issued for reinvested
dividends and distributions | | | 591,466 | | | | 116,850 | | | | 97,788 | | |
| Shares redeemed | | | (18,973,371 | ) | | | (3,103,005 | ) | | | (3,481,174 | ) | |
| Net increase (decrease) | | | 4,178,926 | | | | 4,225,676 | | | | 14,040,619 | | |
FIRST EAGLE FUNDS | ANNUAL REPORT | OCTOBER 31, 2011
134
(continued)
| | | YEAR ENDED OCTOBER 31, 2011 | |
| | | FIRST EAGLE OVERSEAS FUND | | FIRST EAGLE U.S. VALUE FUND | |
| | | CLASS A | | CLASS C | | CLASS I | | CLASS A | | CLASS C | | CLASS I | |
| Shares sold | | | 75,564,814 | | | | 11,307,075 | | | | 75,710,003 | | | | 25,183,381 | | | | 7,044,675 | | | | 17,859,980 | | |
Shares issued for reinvested
dividends and distributions | | | 4,608,501 | | | | 588,534 | | | | 3,075,256 | | | | 770,417 | | | | 204,916 | | | | 335,285 | | |
| Shares redeemed | | | (68,356,763 | ) | | | (7,372,637 | ) | | | (43,825,884 | ) | | | (12,196,811 | ) | | | (3,452,371 | ) | | | (7,453,323 | ) | |
| Net increase | | | 11,816,552 | | | | 4,522,972 | | | | 34,959,375 | | | | 13,756,987 | | | | 3,797,220 | | | | 10,741,942 | | |
| | | YEAR ENDED OCTOBER 31, 2011 | |
| | | FIRST EAGLE FUND OF AMERICA | |
| | | CLASS A | | CLASS C | | CLASS Y | |
| Shares sold | | | 11,550,839 | | | | 4,179,170 | | | | 4,218,795 | | |
Shares issued for reinvested
dividends and distributions | | | 91,034 | | | | 8,600 | | | | 142,915 | | |
| Shares redeemed | | | (5,339,481 | ) | | | (1,096,383 | ) | | | (3,858,781 | ) | |
| Net increase (decrease) | | | 6,302,392 | | | | 3,091,387 | | | | 502,929 | | |
| | | YEAR ENDED OCTOBER 31, 2010 | |
| | | FIRST EAGLE OVERSEAS FUND | | FIRST EAGLE U.S. VALUE FUND | |
| | | CLASS A | | CLASS C | | CLASS I | | CLASS A | | CLASS C | | CLASS I | |
| Shares sold | | | 63,800,432 | | | | 9,029,755 | | | | 61,460,804 | | | | 16,510,083 | | | | 5,318,538 | | | | 10,241,203 | | |
Shares issued for reinvested
dividends and distributions | | | 5,754,113 | | | | 784,521 | | | | 2,725,898 | | | | 441,268 | | | | 88,898 | | | | 146,754 | | |
| Shares redeemed | | | (61,841,533 | ) | | | (8,421,330 | ) | | | (27,960,441 | ) | | | (12,748,260 | ) | | | (3,838,500 | ) | | | (3,904,178 | ) | |
| Net increase | | | 7,713,012 | | | | 1,392,946 | | | | 36,226,261 | | | | 4,203,091 | | | | 1,568,936 | | | | 6,483,779 | | |
| | | YEAR ENDED OCTOBER 31, 2010 | |
| | | FIRST EAGLE FUND OF AMERICA | |
| | | CLASS A | | CLASS C | | CLASS Y | |
| Shares sold | | | 5,478,006 | | | | 1,552,419 | | | | 2,092,973 | | |
Shares issued for reinvested
dividends and distributions | | | — | | | | — | | | | — | | |
| Shares redeemed | | | (3,994,098 | ) | | | (1,083,277 | ) | | | (3,227,060 | ) | |
| Net increase (decrease) | | | 1,483,908 | | | | 469,142 | | | | (1,134,087 | ) | |
FIRST EAGLE FUNDS | ANNUAL REPORT | OCTOBER 31, 2011
135
Notes to Financial Statements
Transactions in dollars of capital stock were as follows:
| | | YEAR ENDED OCTOBER 31, 2011 | |
| | | FIRST EAGLE GLOBAL FUND | |
| | | CLASS A | | CLASS C | | CLASS I | |
| Shares sold | | $ | 3,869,277,750 | | | $ | 2,425,639,817 | | | $ | 4,254,961,876 | | |
Shares issued for reinvested
dividends and distributions | | | 154,537,968 | | | | 36,791,366 | | | | 70,178,270 | | |
| Shares redeemed | | | (2,551,569,341 | ) | | | (955,493,361 | ) | | | (1,532,877,172 | ) | |
| Net increase | | $ | 1,472,246,377 | | | $ | 1,506,937,822 | | | $ | 2,792,262,974 | | |
| | | YEAR ENDED OCTOBER 31, 2011 | |
| | | FIRST EAGLE U.S. VALUE FUND | |
| | | CLASS A | | CLASS C | | CLASS I | |
| Shares sold | | $ | 422,499,567 | | | $ | 117,098,665 | | | $ | 302,544,849 | | |
Shares issued for reinvested
dividends and distributions | | | 12,519,282 | | | | 3,309,400 | | | | 5,502,028 | | |
| Shares redeemed | | | (203,499,149 | ) | | | (57,256,894 | ) | | | (124,562,916 | ) | |
| Net increase (decrease) | | $ | 231,519,700 | | | $ | 63,151,171 | | | $ | 183,483,961 | | |
| | | YEAR ENDED OCTOBER 31, 2010 | |
| | | FIRST EAGLE GLOBAL FUND | |
| | | CLASS A | | CLASS C | | CLASS I | |
| Shares sold | | $ | 2,310,390,017 | | | $ | 1,440,881,738 | | | $ | 2,232,335,113 | | |
Shares issued for reinvested
dividends and distributions | | | 139,107,607 | | | | 35,464,634 | | | | 41,767,929 | | |
| Shares redeemed | | | (2,329,396,908 | ) | | | (881,251,536 | ) | | | (869,042,419 | ) | |
| Net increase | | $ | 120,100,716 | | | $ | 595,094,836 | | | $ | 1,405,060,623 | | |
| | | YEAR ENDED OCTOBER 31, 2010 | |
| | | FIRST EAGLE U.S. VALUE FUND | |
| | | CLASS A | | CLASS C | | CLASS I | |
| Shares sold | | $ | 249,887,613 | | | $ | 79,766,902 | | | $ | 156,420,750 | | |
Shares issued for reinvested
dividends and distributions | | | 6,570,564 | | | | 1,316,582 | | | | 2,205,720 | | |
| Shares redeemed | | | (192,467,396 | ) | | | (57,364,539 | ) | | | (59,589,516 | ) | |
| Net increase (decrease) | | $ | 63,990,781 | | | $ | 23,718,945 | | | $ | 99,036,954 | | |
FIRST EAGLE FUNDS | ANNUAL REPORT | OCTOBER 31, 2011
136
(continued)
| | | YEAR ENDED OCTOBER 31, 2011 | |
| | | FIRST EAGLE OVERSEAS FUND | |
| | | CLASS A | | CLASS C | | CLASS I | |
| Shares sold | | $ | 1,715,966,975 | | | $ | 250,653,639 | | | $ | 1,744,387,109 | | |
Shares issued for reinvested
dividends and distributions | | | 102,262,633 | | | | 12,771,196 | | | | 69,224,009 | | |
| Shares redeemed | | | (1,545,390,214 | ) | | | (162,706,611 | ) | | | (1,005,497,700 | ) | |
| Net increase | | $ | 272,839,394 | | | $ | 100,718,224 | | | $ | 808,113,418 | | |
| | | YEAR ENDED OCTOBER 31, 2011 | |
| | | FIRST EAGLE GOLD FUND | | FIRST EAGLE FUND OF AMERICA | |
| | | CLASS A | | CLASS C | | CLASS I | | CLASS A | | CLASS C | | CLASS Y | |
| Shares sold | | $ | 584,552,778 | | | $ | 181,475,181 | | | $ | 536,860,176 | | | $ | 302,143,282 | | | $ | 97,792,197 | | | $ | 112,972,787 | | |
Shares issued for reinvested
dividends and distributions | | | 94,379,255 | | | | 25,236,503 | | | | 17,810,847 | | | | 2,298,611 | | | | 193,070 | | | | 3,671,493 | | |
| Shares redeemed | | | (765,827,714 | ) | | | (143,628,830 | ) | | | (265,774,260 | ) | | | (135,242,015 | ) | | | (24,843,434 | ) | | | (99,366,357 | ) | |
| Net increase (decrease) | | $ | (86,895,681 | ) | | $ | 63,082,854 | | | $ | 288,896,763 | | | $ | 169,199,878 | | | $ | 73,141,833 | | | $ | 17,277,923 | | |
| | | YEAR ENDED OCTOBER 31, 2010 | |
| | | FIRST EAGLE OVERSEAS FUND | |
| | | CLASS A | | CLASS C | | CLASS I | |
| Shares sold | | $ | 1,285,277,712 | | | $ | 178,038,513 | | | $ | 1,255,197,610 | | |
Shares issued for reinvested
dividends and distributions | | | 113,298,593 | | | | 15,125,573 | | | | 54,408,926 | | |
| Shares redeemed | | | (1,235,178,673 | ) | | | (164,770,456 | ) | | | (567,063,407 | ) | |
| Net increase | | $ | 163,397,632 | | | $ | 28,393,630 | | | $ | 742,543,129 | | |
| | | YEAR ENDED OCTOBER 31, 2010 | |
| | | FIRST EAGLE GOLD FUND | | FIRST EAGLE FUND OF AMERICA | |
| | | CLASS A | | CLASS C | | CLASS I | | CLASS A | | CLASS C | | CLASS Y | |
| Shares sold | | $ | 650,143,781 | | | $ | 202,617,937 | | | $ | 538,916,054 | | | $ | 119,245,037 | | | $ | 30,126,386 | | | $ | 46,425,229 | | |
Shares issued for reinvested
dividends and distributions | | | 16,271,246 | | | | 3,140,932 | | | | 2,716,545 | | | | — | | | | — | | | | — | | |
| Shares redeemed | | | (537,112,467 | ) | | | (85,301,292 | ) | | | (103,434,046 | ) | | | (85,893,877 | ) | | | (20,888,300 | ) | | | (71,168,953 | ) | |
| Net increase (decrease) | | $ | 129,302,560 | | | $ | 120,457,577 | | | $ | 438,198,553 | | | $ | 33,351,160 | | | $ | 9,238,086 | | | $ | (24,743,724 | ) | |
FIRST EAGLE FUNDS | ANNUAL REPORT | OCTOBER 31, 2011
137
Notes to Financial Statements
Note 7 — Indemnification and Investment Risk
In the normal course of business, the Funds enter into contracts that contain a variety of representations which provide general indemnifications. Each Fund's maximum exposure under these arrangements is unknown, as this would involve future claims that may be made against each Fund that have not yet occurred. However, based on experience, the Funds expect the risk of loss to be remote. The Funds may have elements of risk not typically associated with investments in the United States of America due to their investments in foreign countries or regions. Such foreign investments may subject the Funds to additional risks resulting from political or economic conditions in such countries or regions and the possible imposition of adverse governmental laws or currency exchange restrictions could cause the securities and their markets to be less liquid and their prices to be more volatile than those of comparable U.S. securities. The securities markets in many emerging-market countries are substantially smaller, less developed, less liquid and more volatile than the securities markets of developed countries.
The Funds are subject to interest rate and credit risk. The value of debt securities may decline as interest rates increase. The Funds could lose money if the issuer of a fixed income security is unable to pay interest or repay principal when it is due. The ability of the issuers of debt to meet their obligations may be affected by the economic and political developments in a specific industry or region.
The Funds enter into derivatives which may represent off-balance sheet risk. Off-balance sheet risk exists when the maximum potential loss on a particular investment is greater than the value of such investment as reflected in the statement of assets and liabilities.
Note 8 — Redemption In-Kind Transactions
The redemption in-kind policy for all of the Funds reserves the right of the Funds to pay redemptions in-kind (i.e., payments in the form of marketable securities or, as needed, other traded assets, rather than cash) if the redemption request is large enough to affect a Fund's operations (for example, if it represents more than $250,000 or 1% of the Fund's assets). When receiving assets distributed in-kind, the recipient will bear applicable commissions or other costs on their sale. There have been no redemptions in-kind for the year ended October 31, 2011.
FIRST EAGLE FUNDS | ANNUAL REPORT | OCTOBER 31, 2011
138
(continued)
Note 9 — Accounting Pronouncement
In May 2011, the Financial Accounting Standard Board (FASB) issued Accounting Standards Update 2011-4, Amendment to Achieve Common Fair Value Measurement and Disclosures Requirements in U.S. GAAP and IFRS. This update contains amendments that will result in common fair value measurement and disclosure requirements in U.S. GAAP and IFRS. Consequently, the amendments change the wording used to describe many of the requirements in U.S. GAAP for measuring fair value and for disclosing information about fair value measurements. The amendments also clarify that a reporting entity should disclose quantitative information about the unobservable inputs used in a fair value measurement that is categorized within Level 3 of the fair value hierarchy. This update is effective during interim and annual periods beginning after December 15, 2011 for public entities and is to be applied prospectively. Early application is not permitted. Management of the Trust is currently evaluating the effect of this update to the Trust's financial statement.
Note 10 — Subsequent Events
In accordance with the provision surrounding Subsequent Events adopted by the Funds, management has evaluated the possibility of subsequent events existing in the Funds' financial statements. Management has determined that there are no material events that would require disclosures in the Funds' financial statements.
FIRST EAGLE FUNDS | ANNUAL REPORT | OCTOBER 31, 2011
139
Report of Independent Registered Public Accounting Firm
To the Board of Trustees and Shareholders of
First Eagle Funds:
In our opinion, the accompanying statements of assets and liabilities, including the schedules of investments, and the related statements of operations, of changes in net assets and the financial highlights present fairly, in all material respects, the financial position of First Eagle Global Fund, First Eagle Overseas Fund, First Eagle U.S. Value Fund, First Eagle Gold Fund (including its consolidated wholly owned subsidiary) and First Eagle Fund of America (collectively hereafter referred to as the "Funds") at October 31, 2011, the results of each of their operations for the year then ended, the changes in each of their net assets for each of the two years in the period then ended and the financial highlights for each of the five years in the period then ended, in conformity with accounting principles generally accepted in the United States of America. These financial statements and financial highlights (hereafter referred to as "financial statements") are the responsibility of the Funds' management. Our responsibility is to express an opinion on these financial statements based on our audits. We conducted our audits of these financial statements in accordance with the standards of the Public Company Accounting Oversight Board (United States). Those standards require that we plan and perform the audits to obtain reasonable assurance about whether the financial statements are free of material misstatement. An audit includes examining, on a test basis, evidence supporting the amounts and disclosures in the financial statements, assessing the accounting principles used and significant estimates made by management, and evaluating the overall financial statement presentation. We believe that our audits, which included confirmation of securities at October 31, 2011 by correspondence with custodians and brokers, provide a reasonable basis for our opinion.

PricewaterhouseCoopers LLP
New York, New York
December 29, 2011
FIRST EAGLE FUNDS | ANNUAL REPORT | OCTOBER 31, 2011
140
Fund Expenses (unaudited)
Example
As a shareholder of the First Eagle Funds, you may incur two types of costs: (1) transaction costs, including front-end and contingent deferred sales charges (loads), and (2) ongoing costs, including advisory fees; distribution (12b-1) and/or service fees; and other Fund expenses. This Example is intended to help you understand your ongoing costs (in dollars) of investing in each of the First Eagle Funds and to compare these costs with the ongoing costs of investing in other mutual funds.
This Example is based on an investment of $1,000 invested on May 1, 2011 and held for the six-months ended October 31, 2011.
Actual Expenses
The table titled "Based on Actual Total Return" provides information about actual account values and actual expenses. You may use the information provided in this table, together with the amount you invested, to estimate the expenses that you paid over the period. To estimate the expenses you paid on your account, divide your ending account value by $1,000 (for example, an $8,600 ending account value divided by $1,000 = 8.6), then multiply the result by the number under the column heading entitled "Expenses Paid During the Period".
FIRST EAGLE FUNDS | ANNUAL REPORT | OCTOBER 31, 2011
141
Fund Expenses (unaudited) (continued)
Based on Actual Total Return1
| | | ACTUAL TOTAL
RETURN
WITHOUT
SALES CHARGE2 | | BEGINNING
ACCOUNT
VALUE | | ENDING
ACCOUNT
VALUE | | ANNUALIZED
EXPENSE
RATIO | | EXPENSES
PAID
DURING THE
PERIOD3 | |
| First Eagle Global Fund | |
| Class A | | | –5.40 | % | | $ | 1,000.00 | | | $ | 946.00 | | | | 1.13 | % | | $ | 5.54 | | |
| Class C | | | –5.75 | | | | 1,000.00 | | | | 942.50 | | | | 1.88 | | | | 9.20 | | |
| Class I | | | –5.28 | | | | 1,000.00 | | | | 947.20 | | | | 0.88 | | | | 4.32 | | |
| First Eagle Overseas Fund | |
| Class A | | | –7.21 | | | | 1,000.00 | | | | 927.90 | | | | 1.13 | | | | 5.49 | | |
| Class C | | | –7.57 | | | | 1,000.00 | | | | 924.30 | | | | 1.88 | | | | 9.12 | | |
| Class I | | | –7.10 | | | | 1,000.00 | | | | 929.00 | | | | 0.88 | | | | 4.28 | | |
| First Eagle U.S. Value Fund | |
| Class A | | | –2.95 | | | | 1,000.00 | | | | 970.50 | | | | 1.18 | | | | 5.86 | | |
| Class C | | | –3.26 | | | | 1,000.00 | | | | 967.40 | | | | 1.93 | | | | 9.57 | | |
| Class I | | | –2.80 | | | | 1,000.00 | | | | 972.00 | | | | 0.93 | | | | 4.62 | | |
| First Eagle Gold Fund Consolidated | |
| Class A | | | –5.44 | | | | 1,000.00 | | | | 945.60 | | | | 1.22 | | | | 5.98 | | |
| Class C | | | –5.78 | | | | 1,000.00 | | | | 942.20 | | | | 1.98 | | | | 9.69 | | |
| Class I | | | –5.32 | | | | 1,000.00 | | | | 946.80 | | | | 0.97 | | | | 4.76 | | |
| First Eagle Fund of America | |
| Class A | | | –11.38 | | | | 1,000.00 | | | | 886.20 | | | | 1.44 | | | | 6.85 | | |
| Class C | | | –11.71 | | | | 1,000.00 | | | | 882.90 | | | | 2.19 | | | | 10.39 | | |
| Class Y | | | –11.43 | | | | 1,000.00 | | | | 885.70 | | | | 1.44 | | | | 6.84 | | |
1 For the six-months ended October 31, 2011.
2 Past performance does not guarantee future results. Assumes reinvestment of all dividends and capital gain distributions, if any, at net asset value and does not reflect the deduction of the applicable sales charge, exchange fees or redemption fees. Had the effect of sales charges been reflected, expenses would have been higher and returns lower. Total return is not annualized, as it may not be representative of the total return for the year.
3 Expenses are equal to the annualized expense ratio multiplied by the average account value over the period, multiplied by 184/365 (to reflect the one-half year period).
FIRST EAGLE FUNDS | ANNUAL REPORT | OCTOBER 31, 2011
142
(continued)
Hypothetical Example for Comparison Purposes
The table below titled "Based on Hypothetical Total Return" provides information about hypothetical account values and hypothetical expenses based on the actual expense ratios and an assumed rate of return of 5% per year before expenses, which is not the First Eagle Fund's actual return. The hypothetical account values and expenses may not be used to estimate the actual ending account balance or expenses you paid for the period. You may use the information provided in this table to compare the ongoing costs of investing in the First Eagle Funds and other funds. To do so, compare the 5% hypothetical example relating to the First Eagle Funds with the 5% hypothetical examples that appear in the shareholder reports of other funds.
This Example is based on an investment of $1,000 invested on May 1, 2011 and held for the six-months ended October 31, 2011.
Please note that the expenses shown in the table below are meant to highlight your ongoing costs only and do not reflect any transactional costs, such as front-end or back-end sales charges (loads). Therefore, the table is useful in comparing ongoing costs only, and will not help you determine the relative total costs of owning different funds. In addition, if these transaction costs were included, your costs would have been higher.
FIRST EAGLE FUNDS | ANNUAL REPORT | OCTOBER 31, 2011
143
Fund Expenses (unaudited) (continued)
Based on Hypothetical Total Return1
| | | HYPOTHETICAL
ANNUALIZED
TOTAL
RETURN | | BEGINNING
ACCOUNT
VALUE | | ENDING
ACCOUNT
VALUE | | ANNUALIZED
EXPENSE
RATIO | | EXPENSES
PAID
DURING THE
PERIOD2 | |
| First Eagle Global Fund | |
| Class A | | | 5.00 | % | | $ | 1,000.00 | | | $ | 1,019.51 | | | | 1.13 | % | | $ | 5.75 | | |
| Class C | | | 5.00 | | | | 1,000.00 | | | | 1,015.73 | | | | 1.88 | | | | 9.55 | | |
| Class I | | | 5.00 | | | | 1,000.00 | | | | 1,020.77 | | | | 0.88 | | | | 4.48 | | |
| First Eagle Overseas Fund | |
| Class A | | | 5.00 | | | | 1,000.00 | | | | 1,019.51 | | | | 1.13 | | | | 5.75 | | |
| Class C | | | 5.00 | | | | 1,000.00 | | | | 1,015.73 | | | | 1.88 | | | | 9.55 | | |
| Class I | | | 5.00 | | | | 1,000.00 | | | | 1,020.77 | | | | 0.88 | | | | 4.48 | | |
| First Eagle U.S. Value Fund | |
| Class A | | | 5.00 | | | | 1,000.00 | | | | 1,019.26 | | | | 1.18 | | | | 6.01 | | |
| Class C | | | 5.00 | | | | 1,000.00 | | | | 1,015.48 | | | | 1.93 | | | | 9.80 | | |
| Class I | | | 5.00 | | | | 1,000.00 | | | | 1,020.52 | | | | 0.93 | | | | 4.74 | | |
| First Eagle Gold Fund Consolidated | |
| Class A | | | 5.00 | | | | 1,000.00 | | | | 1,019.06 | | | | 1.22 | | | | 6.21 | | |
| Class C | | | 5.00 | | | | 1,000.00 | | | | 1,015.22 | | | | 1.98 | | | | 10.06 | | |
| Class I | | | 5.00 | | | | 1,000.00 | | | | 1,020.32 | | | | 0.97 | | | | 4.94 | | |
| First Eagle Fund of America | |
| Class A | | | 5.00 | | | | 1,000.00 | | | | 1,017.95 | | | | 1.44 | | | | 7.32 | | |
| Class C | | | 5.00 | | | | 1,000.00 | | | | 1,014.17 | | | | 2.19 | | | | 11.12 | | |
| Class Y | | | 5.00 | | | | 1,000.00 | | | | 1,017.95 | | | | 1.44 | | | | 7.32 | | |
1 For the six-months ended October 31, 2011.
2 Expenses are equal to the annualized expense ratio multiplied by the average account value over the period, multiplied by 184/365 (to reflect the one-half year period).
FIRST EAGLE FUNDS | ANNUAL REPORT | OCTOBER 31, 2011
144
General Information
Quarterly Form N-Q portfolio schedule
The First Eagle Funds file their complete schedule of portfolio holdings with the Securities and Exchange Commission ("SEC") for the first and third quarters of each fiscal year on Form N-Q. The Funds' Forms N-Q are available on the SEC's Web site at www.sec.gov. The Funds' Forms N-Q may be reviewed and copied at the SEC's Public Reference Room in Washington, D.C. Information on the operation of the SEC's Public Reference Room may be obtained by calling 1.800.SEC.0330. Additionally, you may obtain copies of Forms N-Q from the Funds upon request by calling 1.800.334.2143.
Proxy voting policies, procedures and record
You may obtain a description of the Funds' (1) proxy voting policies, (2) proxy voting procedures and (3) information regarding how the Funds voted any proxies related to portfolio securities during the most recent twelve-month period ended June 30 for which an SEC filing has been made, without charge, upon request by contacting the Funds directly at 1.800.334.2143 or on the EDGAR Database on the SEC's Web site at www.sec.gov.
FIRST EAGLE FUNDS | ANNUAL REPORT | OCTOBER 31, 2011
145
Tax Information Fiscal Year Ended October 31, 2011 (unaudited)
Each Fund designates the following amounts (or the maximum amount allowable) distributed during the fiscal year ended October 31, 2011, if any, as capital gain dividends, dividends eligible for the corporate dividends received deduction and/or qualified dividend income:
| | | % OF QUALIFYING | | % OF DIVIDENDS
ELIGIBLE FOR
THE DIVIDENDS
RECEIVED | |
LONG-TERM CAPITAL GAINS | |
| | | DIVIDEND INCOME | | DEDUCTION | | 15% | | 28% | |
| First Eagle Global Fund | | | 100.00 | % | | | 31.70 | % | | $ | 5,113,347 | | | $ | — | | |
| First Eagle Overseas Fund * | | | 74.80 | | | | 0.12 | | | | 96,634,968 | | | | 1,878,156 | | |
| First Eagle U.S. Value | | | 100.00 | | | | 55.15 | | | | 2,911,835 | | | | 474,862 | | |
| First Eagle Gold Fund | | | 19.83 | | | | 1.94 | | | | 118,552,255 | | | | 184,904 | | |
| First Eagle Fund of America | | | 100.00 | | | | 100.00 | | | | 146,226 | | | | 65,982 | | |
* First Eagle Overseas Fund paid foreign taxes of $17,825,585, and recognized foreign source income of $193,598,815. Pursuant to Section 853 of the Internal Revenue Code, each Fund designates such amounts (or the maximum amount allowable) as having been paid in connection with dividends distributed from investment company taxable income during the fiscal year ended October 31, 2011.
FIRST EAGLE FUNDS | ANNUAL REPORT | OCTOBER 31, 2011
146
Privacy Notice
The Trust is committed to protecting your privacy. We are providing you with this privacy notice to inform you of how we handle your personal information that we collect and may disclose to our affiliates. If the Trust changes its information practices, we will provide you with notice of any material changes. This privacy policy supersedes any of our previous policies relating to the information you disclose to us.
Why this Privacy Policy Applies to You
You obtained a financial product or service from or through us for personal, family or household purposes when you opened a shareholder account with the Trust, and are therefore covered by this privacy policy.
What We do to Protect Your Personal Information
We protect personal information provided to us by our individual shareholders according to strict standards of security and confidentiality. These standards apply to both our physical facilities and any online services we may provide. We maintain physical, electronic and procedural safeguards that comply with federal standards to guard consumer information. We permit only authorized individuals, who are trained in the proper handling of individual shareholder information and need to access this information to do their job, to have access to this information.
Personal Information that We Collect and May Disclose
As part of providing you with the Trust's products and services, we may obtain nonpublic personal information about you from the following sources:
• Information we receive from you on subscription applications or other forms, such as your name, address, telephone number, Social Security number, occupation, assets and income;
• Information about your transactions with us, our affiliates, or unaffiliated third parties, such as your account balances, payment history and account activity; and
• Information from public records we may access in the ordinary course of business.
Categories of Affiliates to Whom We May Disclose Personal Information
We may share personal information about you with affiliates. Our affiliates do business under names that include Arnhold and S. Bleichroeder Holdings, Inc., First Eagle Investment Management, LLC and FEF Distributors, LLC.
FIRST EAGLE FUNDS | ANNUAL REPORT | OCTOBER 31, 2011
147
Privacy Notice (continued)
You May Limit Marketing Solicitations by Choosing to Opt Out
We offer you the right to opt out from many types of marketing by our affiliates based on your personal information that we collect and share in accordance with this privacy policy. To limit those marketing solicitations, you may call 800.334.2143 indicating your desire not to receive marketing from our affiliates. Should you choose to opt out, your choice will remain in our records until you notify us otherwise, although we may choose to contact you in the future to modify your preference.
When We May Disclose Your Personal Information to Unaffiliated Third Parties
We will only share your personal information collected, as described above, with unaffiliated third parties:
• At your request;
• When you authorize us to process or service a transaction or product (unaffiliated third parties in this instance may include service providers such as the Trust's distributors, registrar and transfer agent for shareholder transactions, and other parties providing individual shareholder servicing, accounting and recordkeeping services);
• With companies that perform sales and marketing services on our behalf with whom we have agreements to protect the confidentiality of your information and to use the information only for the purposes for which we disclose the information to them; or
• When required by law to disclose such information to appropriate authorities.
We do not otherwise provide information about you to outside firms, organizations or individuals except to our attorneys, accountants and auditors and as permitted by law.
What We do with Personal Information about Our Former Customers
If you decide to discontinue doing business with us, the Trust will continue to adhere to this privacy policy with respect to the information we have in our possession about you and your account following the termination of our shareholder relationship.
FIRST EAGLE FUNDS | ANNUAL REPORT | OCTOBER 31, 2011
148
Additional Information (unaudited)
Management of the Trust
The business of the Trust is managed by its Board of Trustees, which elects officers responsible for the day to day operations of the Funds and for the execution of the policies formulated by the Board of Trustees.
Pertinent information regarding the members of the Board of Trustees and principal officers of the Trust is set forth below. Some of the Trustees and officers are employees of the Adviser and its affiliates. At least a majority of the Trust's Board of Trustees are not "interested persons" as that term is defined in the Investment Company Act.
Independent Trustees(1)(2)
Lisa Anderson | Trustee | December 2005 to present
1345 Avenue of the Americas | New York, New York | 10105
(born October 1950)
Principal Occupation(s) During Past 5 Years: President, American University of Cairo; Provost, American University in Cairo; James T. Shotwell Professor of International Relations and Dean, School of International and Public Affairs, Columbia University
Number of Portfolios in the Fund Complex Overseen by Trustee: 7
Other Directorships/Trusteeships Held by Trustee: Chair, Social Science Research Council; Member, Carnegie Council on Ethics and International Affairs; Member Emerita, Human Rights Watch; Trustee, First Eagle Variable Funds (1 portfolio)
(1) Trustees who are not "interested persons" of the Trust as defined in the Investment Company Act.
(2) The term of office of each Independent Trustee expires on his/her 70th birthday.
FIRST EAGLE FUNDS | ANNUAL REPORT | OCTOBER 31, 2011
149
Additional Information (unaudited) (continued)
Independent Trustees(1)(2)
Candace K. Beinecke(3) | Trustee (Chair) | December 1999 to present
One Battery Park Plaza | New York, New York | 10004
(born December 1946)
Principal Occupation(s) During Past 5 Years: Chair, Hughes Hubbard & Reed LLP
Number of Portfolios in the Fund Complex Overseen by Trustee: 7
Other Directorships/Trusteeships Held by Trustee: Director, ALSTOM; Trustee, Vornado Realty Trust; Director, Rockefeller Financial Services, Inc.; Director, Rockefeller & Company, Inc.; Trustee, Metropolitan Museum of Art; Trustee, The Wallace Foundation; Director and Vice Chair, Partnership for New York City; Board of Advisors, Yale Law School Center for the Study of Corporate Law; Director, Merce Cunningham Dance Foundation; Trustee, First Eagle Variable Funds (Chair) (1 portfolio)
Jean D. Hamilton | Trustee | March 2003 to present
1345 Avenue of the Americas | New York, New York | 10105
(born January 1947)
Principal Occupation(s) During Past 5 Years: Private Investor/ Independent Consultant/Member, Brock Capital Group LLC; prior to November 2002, Chief Executive Officer, Prudential Institutional; Executive Vice President, Prudential Financial, Inc.
Number of Portfolios in the Fund Complex Overseen by Trustee: 7
Other Directorships/Trusteeships Held by Trustee: Director, RenaissanceRe Holdings Ltd; Director, Four Nations; Trustee, First Eagle Variable Funds (1 portfolio)
(1) Trustees who are not "interested persons" of the Trust as defined in the Investment Company Act.
(2) The term of office of each Independent Trustee expires on his/her 70th birthday.
(3) Ms. Beinecke also served as a trustee of a predecessor fund to Fund of America since 1996.
FIRST EAGLE FUNDS | ANNUAL REPORT | OCTOBER 31, 2011
150
(continued)
Independent Trustees(1)(2)
James E. Jordan | Trustee | December 1999 to present
1345 Avenue of the Americas | New York, New York | 10105
(born April 1944)
Principal Occupation(s) During Past 5 Years: Private Investor and Independent Consultant; prior to July 2005, Managing Director, First Eagle Investment Management, LLC and Director, FEF Distributors, LLC and Director, ASB Advisers UK, Limited; prior to July 2002, private investor and consultant to The Jordan Company (private investment banking firm) since June 1997
Number of Portfolios in the Fund Complex Overseen by Trustee: 7
Other Directorships/Trusteeships Held by Trustee: Director, Leucadia National Corporation; Director, JZ Capital Partners, Plc. (Guernsey investment trust company); Trustee, World Monuments Fund; Chairman's Council, Conservation International; Trustee, First Eagle Variable Funds (1 portfolio)
William M. Kelly(4) | Trustee | December 1999 to present
1345 Avenue of the Americas | New York, New York | 10105
(born February 1944)
Principal Occupation(s) During Past 5 Years: Private Investor, prior to January 2010 President, Lingold Associates
Number of Portfolios in the Fund Complex Overseen by Trustee: 7
Other Directorships/Trusteeships Held by Trustee: Treasurer and Trustee, Black Rock Forest Preservation and Consortium; Trustee, St. Anselm College; Director, S. Zlinkoff Fund for Medical Research and Education; Trustee, First Eagle Variable Funds (1 portfolio)
(1) Trustees who are not "interested persons" of the Trust as defined in the Investment Company Act.
(2) The term of office of each Independent Trustee expires on his/her 70th birthday.
(4) Mr. Kelly also served as a trustee of a predecessor fund to Fund of America since 1998.
FIRST EAGLE FUNDS | ANNUAL REPORT | OCTOBER 31, 2011
151
Additional Information (unaudited) (continued)
Independent Trustees(1)(2)
Paul J. Lawler | Trustee | March 2002 to present
1345 Avenue of the Americas | New York, New York | 10105
(born May 1948)
Principal Occupation(s) During Past 5 Years: Private Investor, prior to January 2010 Vice President Investments and Chief Investment Officer, W.K. Kellogg Foundation
Number of Portfolios in the Fund Complex Overseen by Trustee: 7
Other Directorships/Trusteeships Held by Trustee: Finance and Investment Committee Member, Battle Creek Community Foundation; Trustee, Ravena Coeymans Historical Society; Trustee, Coeymans Heritage Society; Director, Council of Michigan Foundations; Custody Advisory Committee Member, The Bank of New York; Advisory Committee, Common Fund Capital; Advisory Committee, TA Realty Advisors; Trustee, First Eagle Variable Funds (1 portfolio)
Interested Trustees(5)
John P. Arnhold | President and Trustee | December 1999 to present
1345 Avenue of the Americas | New York, New York | 10105
(born December 1953)
Principal Occupation(s) During Past 5 Years: Co-President, Co-CEO and Director, Arnhold and S. Bleichroeder Holdings, Inc.; CEO, Chairman, Director, FEF Distributors, LLC; Chairman, CIO and Director, First Eagle Investment Management, LLC; prior to February 2010, CEO, First Eagle Investment Management, LLC; prior to March 2005, President and Director, Natexis Bleichroeder, Inc. and Natexis Bleichroeder, UK
Number of Portfolios in the Fund Complex Overseen by Trustee: 7
Other Directorships/Trusteeships Held by Trustee: Director, Arnhold Ceramics; Director, The Arnhold Foundation; Director, The Mulago Foundation; Director, Quantum Endowment Fund; Director, WNET.org; Trustee, Trinity Episcopal Schools Corp.; Trustee, Vassar College; Trustee, Jazz at Lincoln Center; Managing Member, New Eagle Management Company, LLC; Director, Aquila International Fund Limited; Director, International Tennis Hall of Fame; Director, Hanseatic Asset Management LBG; Trustee, Sports and Arts in Schools Foundation; President and Trustee, First Eagle Variable Funds (1 portfolio)
(1) Trustees who are not "interested persons" of the Trust as defined in the Investment Company Act.
(2) The term of office of each Independent Trustee expires on his/her 70th birthday.
(5) The term of office of each Interested Trustee is indefinite.
FIRST EAGLE FUNDS | ANNUAL REPORT | OCTOBER 31, 2011
152
(continued)
Interested Trustees(5) — (continued)
Jean-Marie Eveillard | Trustee | June 2008 to present
1345 Avenue of the Americas | New York, New York | 10105
(born January 1940)
Principal Occupation(s) During Past 5 Years: Senior Adviser to First Eagle Investment Management, LLC since March 2009; Senior Vice President, First Eagle Investment Management, LLC since January 2000; previously, Portfolio Manager of First Eagle Global Fund, First Eagle Overseas Fund, First Eagle U.S. Value Fund, First Eagle Gold Fund, and First Eagle Variable Funds (portfolio management tenure: 1979-2004, March 2007-March 2009)
Number of Portfolios in the Fund Complex Overseen by Trustee: 7
Other Directorships/Trusteeships Held by Trustee: Director, SocGen International SICAV (Luxembourg); Trustee, The Frick Collection; Director, Varenne Capital Partners; Director, Fregate-Legris Industries SA; Trustee, First Eagle Variable Funds (1 portfolio)
Officers(6)
John P. Arnhold | President and Trustee | December 1999 to present
1345 Avenue of the Americas | New York, New York | 10105
(born December 1953)
Principal Occupation(s) During Past Five (5) Years: See table on preceding page related to Interested Trustees
Robert Bruno | Senior Vice President | December 1999 to present
1345 Avenue of the Americas | New York, New York | 10105
(born June 1964)
Principal Occupation(s) During Past Five (5) Years: Senior Vice President, First Eagle Investment Management, LLC; President, FEF Distributors, LLC; Senior Vice President, First Eagle Variable Funds
(5) The term of office of each Interested Trustee is indefinite.
(6) The term of office of each officer is indefinite. Length of time served represents time served as an officer of the Trust (or its predecessor entities), although various positions may have been held during the period.
FIRST EAGLE FUNDS | ANNUAL REPORT | OCTOBER 31, 2011
153
Additional Information (unaudited) (continued)
Officers(6) — (continued)
Joseph T. Malone | Chief Financial Officer | September 2008 to present
1345 Avenue of the Americas | New York, New York | 10105
(born September 1967)
Principal Occupation(s) During Past Five (5) Years: Senior Vice President, First Eagle Investment Management, LLC; Chief Financial Officer, First Eagle Variable Funds; from September 2008; Chief Financial Officer and Treasurer, Aberdeen Funds from November 2007; Director, UBS Global Asset Management from October 2001; Global Fund Treasurer, UBS Global Asset Management from September 2006; Treasurer and Co-Head Mutual Fund Administration Group, UBS Global Asset Management from July 2005
Mark D. Goldstein | Chief Compliance Officer | February 2005 to present
1345 Avenue of the Americas | New York, New York | 10105
(born October 1964)
Principal Occupation(s) During Past Five (5) Years: General Counsel, Chief Compliance Officer and Senior Vice President, First Eagle Investment Management, LLC; Secretary, FEF Distributors, LLC; General Counsel and Secretary of Arnhold and S. Bleichroeder Holdings, Inc., and Chief Compliance Officer, First Eagle Variable Funds from February 2005; prior to March 2010, Chief Compliance Officer, Good Hope Advisers, LLC; Senior Counsel and Chief Compliance Officer, MacKay Shields LLC from April 2004
Suzan J. Afifi | Secretary and Vice President | December 1999 to present
1345 Avenue of the Americas | New York, New York | 10105
(born October 1952)
Principal Occupation(s) During Past Five (5) Years: Senior Vice President, First Eagle Investment Management, LLC; Vice President, FEF Distributors, LLC; Secretary and Vice President, First Eagle Variable Funds
Philip Santopadre | Treasurer | September 2005 to present
1345 Avenue of the Americas | New York, New York | 10105
(born August 1977)
(6) The term of office of each officer is indefinite. Length of time served represents time served as an officer of the Trust (or its predecessor entities), although various positions may have been held during the period.
FIRST EAGLE FUNDS | ANNUAL REPORT | OCTOBER 31, 2011
154
(continued)
Principal Occupation(s) During Past Five (5) Years: Vice President, First Eagle Investment Management, LLC; Treasurer, First Eagle Variable Funds
Officers(6) — (continued)
Michael Luzzatto | Vice President | December 2004 to present
1345 Avenue of the Americas | New York, New York | 10105
(born April 1977)
Principal Occupation(s) During Past Five (5) Years: Senior Vice President, First Eagle Investment Management, LLC; Vice President, FEF Distributors, LLC; Vice President, First Eagle Variable Funds
(6) The term of office of each officer is indefinite. Length of time served represents time served as an officer of the Trust (or its predecessor entities), although various positions may have been held during the period.
FIRST EAGLE FUNDS | ANNUAL REPORT | OCTOBER 31, 2011
155
First Eagle Funds
Trustees
Lisa Anderson
John P. Arnhold
Candace K. Beinecke (Chair)
Jean-Marie Eveillard
Jean D. Hamilton
James E. Jordan
William M. Kelly
Paul J. Lawler
Officers
John P. Arnhold
President
Robert Bruno
Senior Vice President
Joseph T. Malone
Chief Financial Officer
Mark D. Goldstein
Chief Compliance Officer
Suzan J. Afifi
Secretary & Vice President
Philip Santopadre
Treasurer
Michael Luzzatto
Vice President
Investment Adviser
First Eagle Investment Management, LLC
1345 Avenue of the Americas
New York, NY 10105
Legal Counsel
Shearman & Sterling LLP
599 Lexington Avenue
New York, NY 10022
Custodian
State Street Bank and Trust Company
801 Pennsylvania Avenue
Kansas City, MO 64105
Shareholder Servicing Agent
DST Systems, Inc.
330 West 9th Street
Kansas City, MO 64105
800.334.2143
Underwriter
FEF Distributors, LLC
1345 Avenue of the Americas
New York, NY 10105
Independent Registered
Public Accounting Firm
PricewaterhouseCoopers LLP
300 Madison Avenue
New York, NY 10017
This report is not authorized for distribution to prospective investors unless preceded or accompanied by a currently effective prospectus of First Eagle Funds.
FIRST EAGLE FUNDS | ANNUAL REPORT | OCTOBER 31, 2011
156
This page was intentionally left blank.
This page was intentionally left blank.
This page was intentionally left blank.
This page was intentionally left blank.
This page was intentionally left blank.
This page was intentionally left blank.
1345 Avenue of the Americas | New York, NY | 10105
800.334.2143 | firsteaglefunds.com

Item 2. Code of Ethics.
The Registrant has adopted a code of ethics that applies to its principal executive officer and principal financial officer. Copies of the code of ethics may be requested free of charge by calling 1-800-334-2143 (toll free).
Item 3. Audit Committee Financial Expert.
The Board of Trustees of the registrant has designated Paul J. Lawler, William M. Kelly and Jean Hamilton as Audit Committee Financial Experts. Mr. Lawler, Mr. Kelly and Ms. Hamilton are considered by the Board to be independent trustees.
Item 4. Principal Accountant Fees and Services
(a) Audit Fees:
For the Fiscal years ended October 31, 2011 and October 31, 2010, the aggregate PricewaterhouseCoopers LLP (PwC) audit fees for professional services rendered to the registrant were approximately $467,526 and $383,423, respectively. Fees included in the audit fees category are those associated with the annual audits of the financial statements and services that are normally provided in connection with statutory and regulatory filings.
(b) Audit Related Fees:
For the fiscal years ended October 31, 2011 and October 31, 2010, the aggregate PwC fees for assurance and related services rendered to the registrant were approximately $17,300 and $17,300, respectively.
(c) Tax Fees:
In each fiscal year ended October 31, 2011 and October 31, 2010, the aggregate tax fees billed by PwC for professional services rendered to the registrant were approximately $363,411 and $169,300, respectively.
Fees included in the tax fees category comprise all services performed by professional staff in the independent accountant’s tax division except those services related to audits. This category comprises fees for tax compliance, tax reclaims and preparation of tax returns.
(d) All Other Fees:
In each of the fiscal years ended October 31, 2011 and October 31, 2010, there were no fees billed by PwC for products and services, other than 4(a)-(c) above, rendered to the registrant.
(e)(1) The registrant’s audit committee has adopted a policy whereby audit and non-audit services performed by the registrant’s principal accountant for the registrant, its investment adviser, and any entity controlling, controlled by, or under common control with the investment adviser that provides ongoing services to the registrant require pre-approval by the committee or a designated member thereof. If such a service is required between regularly scheduled audit committee meetings, pre-approval may be authorized by one audit committee member with ratification at the next scheduled audit committee meeting. Waiver of pre-approval for audit and non-audit services requiring fees of a de minimis amount is not permitted.
(e)(2) No services included in (b) — (d) above were approved pursuant to paragraph (c)(7)(i)(C) of Rule 2-01 of Regulation S-X.
(f) According to PwC, for the fiscal year ended October 31, 2011, the percentage of hours spent on the audit of the registrant’s financial statements for the most recent fiscal year that were attributable to work performed by persons who are not full-time, permanent employees of PwC was 0%.
(g) Other than as described in the table above, the aggregate fees billed for the most recent fiscal year and the preceding fiscal year by the registrant’s principal accountant for non-audit services rendered to the registrant (“covered”), its investment adviser, and any entity controlling, controlled by, or under common control with the investment adviser (“non-covered”) that provides ongoing services to the registrant was $0 in 2011 and 2010.
(h) Not applicable.
Item 5. Audit Committee of Listed Registrants
Not applicable at this time.
Item 6. Schedule of Investments
Please see schedule of investments contained in the Report to Stockholders included under Item 1 of this Form N-CSR.
Item 7. Disclosure of Proxy Voting Policies and Procedures for Closed-End Management Investment Companies.
Not applicable.
Item 8. Portfolio Managers of Closed-End Investment companies.
Not applicable.
Item 9. Purchases of Equity Securities by Closed-End Management Investment Company and Affiliated Purchasers.
Not applicable.
Item 10. Submission of Matters to a Vote of Security Holders.
No material change to report at this time.
Item 11. Controls and Procedures.
(a) In the opinion of the principal executive officer and principal financial officer, based on their evaluation, the registrant’s disclosure controls and procedures are adequately designed and are operating effectively to ensure (i) that material information relating to the registrant, including its consolidated subsidiaries, is made known to them by others within those entities, particularly during the period in which this report is being prepared; and (ii) that information required to be disclosed by the registrant on Form N-CSR is recorded, processed, summarized and reported within the time periods specified in the Securities and Exchange Commission’s rules and forms.
(b) There were no changes in the registrant’s internal control over financial reporting that occurred during the registrant’s most recent fiscal half-year (the registrant’s second fiscal half-year in the case of an annual report) that have materially affected or are reasonably likely to materially affect, the registrant’s internal control over financial reporting.
Item 12. Exhibits.
(a)(1) Code of ethics required to be disclosed under Item 2 of Form N-CSR.
(a)(2) Certifications pursuant to Rule 30a-2(a) under the Investment Company Act of 1940 (17 CFR 270.30a-2(a)): Attached hereto.
(a)(3) Not applicable.
(b) Certification pursuant to Rule 30a-2(b) under the Investment Company Act of 1940 (17 CFR 270.30a-2(b)): Attached hereto.
SIGNATURES
Pursuant to the requirements of the Securities Exchange Act of 1934 and the Investment Company Act of 1940, the registrant has duly caused this report to be signed on its behalf by the undersigned, thereunto duly authorized.
(Registrant) | | First Eagle Funds |
| | |
By (Signature and Title)* | | /s/ John P. Arnhold |
| | John P. Arnhold, President |
| | |
Date: January 6, 2012 | | |
Pursuant to the requirements of the Securities Exchange Act of 1934 and the Investment Company Act of 1940, this report has been signed below by the following persons on behalf of the registrant and in the capacities and on the dates indicated.
By (Signature and Title)* | | /s/ John P. Arnhold |
| | John P. Arnhold, Principal Executive Officer |
| | |
Date: January 6, 2012 | | |
| | |
| | |
By (Signature and Title)* | | /s/ Joseph T. Malone |
| | Joseph T. Malone, Principal Financial Officer |
| | |
Date: January 6, 2012 | | |
* Print the name and title of each signing officer under his or her signature.