UNITED STATES
SECURITIES AND EXCHANGE COMMISSION
Washington, D.C. 20549
FORM N-CSR
CERTIFIED SHAREHOLDER REPORT OF REGISTERED
MANAGEMENT INVESTMENT COMPANIES
Investment Company Act file number | 811-7762 |
|
First Eagle Funds |
(Exact name of registrant as specified in charter) |
|
1345 Avenue of the Americas New York, NY | | 10105 |
(Address of principal executive offices) | | (Zip code) |
|
Robert Bruno First Eagle Funds 1345 Avenue of the Americas New York, NY 10105 |
(Name and address of agent for service) |
|
Registrant’s telephone number, including area code: | 1-212-632-2700 | |
|
Date of fiscal year end: | October 31 | |
|
Date of reporting period: | October 31, 2012 | |
| | | | | | | | |
Form N-CSR is to be used by management investment companies to file reports with the Commission not later than 10 days after the transmission to stockholders of any report that is required to be transmitted to stockholders under Rule 30e-1 under the Investment Company Act of 1940 (17 CFR 270.30e-1). The Commission may use the information provided on Form N-CSR in its regulatory, disclosure review, inspection, and policymaking roles.
A registrant is required to disclose the information specified by Form N-CSR, and the Commission will make this information public. A registrant is not required to respond to the collection of information contained in Form N-CSR unless the Form displays a currently valid Office of Management and Budget (“OMB”) control number. Please direct comments concerning the accuracy of the information collection burden estimate and any suggestions for reducing the burden to Secretary, Securities and Exchange Commission, 450 Fifth Street, NW, Washington, DC 20549-0609. The OMB has reviewed this collection of information under the clearance requirements of 44 U.S.C. § 3507.
Item 1. Reports to Stockholders.
Annual Report
OCTOBER 31, 2012
Global Fund
Overseas Fund
U.S. Value Fund
Gold Fund
Global Income Builder Fund
High Yield Fund
Fund of America
ADVISED BY FIRST EAGLE INVESTMENT MANAGEMENT, LLC

Forward-Looking Statement Disclosure
One of our most important responsibilities as mutual fund managers is to communicate with shareholders in an open and direct manner. Some of our comments in our letters to shareholders are based on current management expectations and are considered "forward-looking statements". Actual future results, however, may prove to be different from our expectations. You can identify forward-looking statements by words such as "may", "will", "believe", "attempt", "seem", "think", "ought", "try" and other similar terms. We cannot promise future returns. Our opinions are a reflection of our best judgment at the time this report is compiled, and we disclaim any obligation to update or alter forward-looking statements as a result of new information, future events, or otherwise.
Letter from the President | | | 4 | | |
Letter from the Global Value Team Portfolio Managers | | | 6 | | |
Management's Discussion of Fund Performance: First Eagle Global,
Overseas, U.S. Value, Gold and Global Income Builder Funds | | | 12 | | |
Performance Chart | | | 17 | | |
First Eagle Global Fund: | |
Fund Overview | | | 22 | | |
Schedule of Investments | | | 24 | | |
First Eagle Overseas Fund: | |
Fund Overview | | | 46 | | |
Schedule of Investments | | | 48 | | |
First Eagle U.S. Value Fund: | |
Fund Overview | | | 68 | | |
Schedule of Investments | | | 70 | | |
First Eagle Gold Fund: | |
Fund Overview | | | 86 | | |
Consolidated Schedule of Investments | | | 88 | | |
First Eagle Global Income Builder Fund: | |
Fund Overview | | | 98 | | |
Schedule of Investments | | | 100 | | |
First Eagle High Yield Fund: | |
Letter from the High Yield Team Portfolio Managers | | | 109 | | |
Management's Discussion of Fund Performance | | | 113 | | |
Fund Overview | | | 114 | | |
Schedule of Investments | | | 116 | | |
First Eagle Fund of America: | |
Letter from Fund of America Portfolio Manager | | | 126 | | |
Management's Discussion of Fund Performance | | | 128 | | |
Fund Overview | | | 130 | | |
Schedule of Investments | | | 132 | | |
Statements of Assets and Liabilities | | | 140 | | |
Statements of Operations | | | 148 | | |
Statements of Changes in Net Assets | | | 152 | | |
Financial Highlights | | | 156 | | |
Notes to Financial Statements | | | 170 | | |
Report of Independent Registered Public Accounting Firm | | | 208 | | |
Fund Expenses | | | 209 | | |
General Information | | | 213 | | |
Tax Information | | | 214 | | |
Privacy Notice | | | 215 | | |
Additional Information | | | 217 | | |
Letter from the President

Dear Fellow Shareholders,
Over the past year, market activity continued to be dominated by macro events: uncertainty over Europe's sovereign debt issues, the presidential election and "fiscal cliff" outcomes in the U.S., leadership changes and shifts in China's economic circumstances, and ongoing conflict in the Middle East.
For us, this period of persistent uncertainty confirms our approach to investing: the importance of seeking a margin of safety in each investment we make. As bottom-up fundamental investors pursuing absolute returns, we remain macro-aware but focus on intrinsic value rather than short-term stock price movements. Here at First Eagle Investment Management, we maintain a long-term perspective and continue to be guided by our primary goal: protecting and growing our shareholders' purchasing power over time.
In service of this goal, we recently launched First Eagle Global Income Builder Fund, which seeks current income generation and long-term growth of capital. The Fund is managed by Giorgio Caputo, Robert Hordon, Edward Meigs, and Sean Slein, and aims to deliver a meaningful but sustainable income stream across all market environments. We introduced this Fund as a response to our clients' need for income and the steadfast belief that our focus on seeking to invest with a margin of safety is critically important when evaluating income-generating securities. In this market environment, as low interest rates may tempt investors to reach for yield, we believe that seeking a margin of safety is one of the best means of avoiding permanent impairments to capital.
First Eagle Global, Overseas, and U.S. Value Funds continue to seek opportunities to invest in high-quality companies at attractive prices. Under the leadership of Matthew McLennan alongside Portfolio Managers Abhay Deshpande and Kimball Brooker, the team invests in companies one security at a time with what they feel is an appropriate margin of safety in price, capital structure, and management temperament. Portfolio Manager Rachel Benepe, who manages First Eagle Gold Fund, continues to view gold as a potential hedge against unforeseen events.
FIRST EAGLE FUNDS | ANNUAL REPORT | OCTOBER 31, 2012
4
Letter from the President (continued)
This year we celebrate the fifth anniversary of First Eagle High Yield Fund, which originally commenced operation at Dwight Asset Management in 2007. The Fund has been managed by Edward Meigs and Sean Slein since inception with the same absolute return orientation and focus on managing downside risks that characterize each of our investment products.
Another milestone event in 2012 was the 25th anniversary of First Eagle Fund of America. Led by Portfolio Manager Harold Levy of Iridian Asset Management, he continues to manage the Fund with the same disciplined philosophy and approach he has practiced for the past quarter of a century.
Please be assured that we remain dedicated to our goal of managing your investments in our Funds in the same prudent manner as we have for over three decades. Our portfolio managers and many senior executives have substantial investments alongside yours, and we are grateful for your continued confidence.
Sincerely,

John P. Arnhold
President
December 2012
Past performance is no guarantee of future results. The portfolios are actively managed. The portfolio and opinions expressed herein are subject to change. All investments involve the risk of loss of principal.
FIRST EAGLE FUNDS | ANNUAL REPORT | OCTOBER 31, 2012
5
Letter from the Global Value Team Portfolio Managers
Market Overview:
At First Eagle, we believe that investment focus should come from a firm philosophical foundation rather than a series of reactions to news flow or attempts to make outcomes stable at all moments through time. Events of the last year have provided much for the industry to talk about — from quantitative easing (QE 3) in the U.S. to long-term refinancing operations (LTRO) and outright monetary transactions (OMT) in Europe. Rather than analyze each monetary measure and acronym, it is worth pausing and reflecting on whether the goals of today's central bankers actually make sense.
The past fiscal year has been marked by monetary easing in one form or another across the globe under the banner of innovative, leading-edge academic and policy thinking. The prevailing consensus is that monetary stimulus represents a sensible path to promote year-over-year inflation stability despite cyclical fluctuations in the real economy. We believe that centuries of financial history have established beyond doubt that the act of printing money cannot solve real economic problems nor create real wealth. Furthermore, unwinding this stimulus will require extraordinary judgment on the part of policy makers. Real problems are solved by real adjustment: undistorted prices, debt restructuring and wage adjustment which ultimately lead to a recovery in confidence. Real wealth is created through accumulated savings augmented by efficiency- and quality-related improvements to competitiveness.
Easy money is designed to lift nominal growth in wages and spending. In current account deficit economies, raising wages worsens the relative competitiveness challenges and stimulating spending intensifies pre-existing savings shortfalls. A less competitive, lower-savings economy builds credit excesses. Over the past decade, we've seen these excesses build in the U.S. private sector only to move into the public sector as the government tried to sustain demand while companies and individuals repaired their balance sheets. Repairing the subsequent large fiscal deficits may either lead to growth shocks or an extended period of sub-par private sector investment and employment activity. One way to reconcile this tension may be for the U.S. dollar to depreciate. However, depreciation is not a free lunch; it exposes the economy to global commodity price shocks and reduces the perceived need for real adjustment. Currency depreciation also assumes willing counterparts who will not try to print money faster. By targeting short-term inflation stability in the U.S., we may have created an environment of fiscal and competitive weakness in the world's
FIRST EAGLE FUNDS | ANNUAL REPORT | OCTOBER 31, 2012
6

From left to right: Matthew McLennan, Abhay Deshpande, T. Kimball Brooker, Jr., Rachel Benepe and Matt Lamphier
reserve currency. If these trends continue, there will likely come a day and a market price at which it makes sense for investors to further diversify into other currencies.
Furthermore, since the U.S. dollar forms the cornerstone of the world reserve currency system, volatility in its monetary base ricochets throughout the global system. Corrupted money is contagious. Countries like China, that have pegged to the U.S. dollar at low levels and need to purchase U.S. dollar reserves to maintain their peg, have generated abnormally large savings. These excessive savings have been funneled into not just huge reserves of foreign currency yielding negative real returns but also into an epic stockpile of infrastructure investment and labor-intensive export capacity. As property vacancy rates rise and real wages grow in China, developer and exporter profits have come under pressure. The China growth miracle faces daunting adjustment challenges at this point in time.
Japan is currently (and Europe may be on a path to become) a current account surplus region despite floating currencies. Such surpluses reflect cautionary private sector savings and deleveraging. Attempting to balance budgets under these circumstances may continue to result in bursts of deflationary fear in these regions, given the private sector deleveraging already underway.
In addition, within Europe there are pegged exchange rates which have created first private sector then public sector credit crises in the deficit regions and fears about bank and central bank holdings of peripheral sovereign debt in the surplus regions. While the consolidated fundamentals of Europe look healthier than the United States, in terms of deficits and current account position, the architectural imperfection within Europe remains unresolved.
Finally, emerging markets such as India, Brazil and Turkey have also gone through monetary growth booms where, according to the Bank for International Settlements, their private sectors have experienced material balance sheet deterioration in terms of debt service ratios. This may not bode well for these emerging markets' growth prospects.
FIRST EAGLE FUNDS | ANNUAL REPORT | OCTOBER 31, 2012
7
Letter from the Global Value Team Portfolio Managers (continued)
We inhabit a world of imbalances, where policy-induced fragility in the financial architecture is aggravating the shifts in relative productivity, demographics and energy prices that have accumulated over the past decade. Instead of accepting cyclical variations in inflation and employment, we have obscured prices, built leverage in deficit countries, grown banking sector vulnerabilities and malinvestment in surplus savings regions, and stimulated credit booms in emerging markets. Add to this, contentious political situations around the globe and it appears that the road ahead is riddled with fault lines.
Portfolio Review
Despite these fault lines, we step back from the noise and focus on our investment method — to invest in real businesses purchased with what we feel is a margin of safety in price, to keep cash and cash equivalents as deferred purchasing power to endure and take advantage of windows of market distress, and to hold gold as a potential hedge against unforeseen and extreme market events. We feel this method provides the best way to sustain and enhance purchasing power over the long term.
The traditional investment landscape we've been taught to accept is one where owning a "risk free" instrument could preserve real purchasing power. On the other hand, owning "riskier" business securities provided the potential for enhanced real purchasing power. The defining feature of today's investment landscape is that there is no risk-free asset that will preserve real purchasing power. The reserve currency of the world issues credit instruments that support both the worst credit metrics in a generation and negative real returns. In this environment, we have invested the majority of our portfolio in equities in an attempt to both preserve and grow real wealth. In the process of investing in enterprise, we seek companies that embody some form of resilience. We feel such companies are less vulnerable to crises and are more likely to preserve their earnings power against monetary debasement. At the heart of such resilience must be some form of asset scarcity. It is a strange world we live in at the time of this writing — where the traditional risk-free asset has become vulnerable and abundant in supply while it is in the "risky" pool of enterprise securities that investors may potentially find resilience and scarcity.
It is asset scarcity that enables product prices and corporate earnings power to keep pace with monetary growth. It is this sustainable earnings power that gives companies the capital structures and margins to buffer and endure tough times. A scarce asset can be either intangible or tangible in nature. In our view, a
FIRST EAGLE FUNDS | ANNUAL REPORT | OCTOBER 31, 2012
8
Letter from the Global Value Team Portfolio Managers (continued)
stable, advantaged competitive position supported by an owner-minded culture that actively seeks to nurture and maintain that position is the most important scarce intangible asset a company can have. Our current portfolio contains a number of investments across economic sectors in companies that dominate their markets from operating systems to routers, from servo motors to pneumatics and from cable systems to distribution systems.
A scarce asset can also be tangible. Tangible scarcity principally applies to commodity reserves or real estate where supply growth is somewhat constrained relative to real economic activity. With such real assets, prices have a tendency to rise over business cycles despite cyclical fluctuations as the global monetary high water mark rises. We hold positions in a number of companies that own reserves of commodities ranging from oil to timberlands to quarry aggregates. We have also invested in companies that own well-located real estate.
Unfortunately, companies that control scarce assets, be they tangible or intangible, often trade at high valuations. The key to our approach is to have a wish list of these businesses and to wait patiently to buy them when we believe they are priced conservatively with a margin of safety in valuation, capital structure and management behavior. We will not always find businesses that embody scarcity at the right price. In these instances, we are pragmatic and focus on more ordinary businesses that are out of favor. In such cases, since the asset is not scarce, a deeper discount is needed to buffer the fault line risk. Sometimes we find these opportunities in holding companies with "double discounts", insurance companies with undervalued investment float or simply ordinary businesses with excess cash and securities that the market is discounting.
Our cash and cash equivalent levels have increased this year as we have trimmed some more fully valued positions. At First Eagle, we remain focused on making sure that we remain calm in the storm. We feel that one of our core advantages is our patient temperament. While our cash and cash equivalent holdings have recently impacted short-term returns, we believe that this deferred purchasing power provides an important source of funding for investments in our wish list of companies during windows of market distress. Our aim is to be more fully invested but only at the right price.
We also keep some of our portfolio in gold as a natural alternative to the human made financial architecture. Many have criticized gold as a useless commodity. Ironically, it is gold's inertness that is the root cause of both its more stable supply and more business-cycle resilient demand. Gold's higher density further
FIRST EAGLE FUNDS | ANNUAL REPORT | OCTOBER 31, 2012
9
Letter from the Global Value Team Portfolio Managers (continued)
reduces the cost of holding it relative to other commodities. This is why gold has been the real asset of choice to hoard in vaults — it simply has less opportunity cost. At First Eagle, we are not directionally bullish on gold — its price fluctuates depending on the health of our financial architecture — but we have always felt that gold is no ordinary commodity. Gold serves as a unique real monetary alternative and as such it provides us with a potential hedge against forces we cannot control.
Finally, one of the cornerstones of the First Eagle approach is the importance of team-based investing. We seek competing perspectives for each investment acknowledging that no-one has a monopoly on the truth. We believe there should be a high hurdle for securities to come into the portfolios and a low hurdle for them to exit. While basic analytical skills are required to invest successfully, the art of investing lies in the judgment and temperament needed to avoid overconfidence, to remain open-minded to both unexpected opportunities and causal relationships and to stay patient. This is what we seek from members of our investment team. At the heart of our temperament is the patience to wait for opportunity and the prudence to put a little aside for a rainy day.
We thank you for your support,

| | 
| |
Matthew McLennan | | T. Kimball Brooker, Jr. | |
Head of the Global Value Team
Portfolio Manager | | Portfolio Manager | |

Abhay Deshpande
Portfolio Manager
December 2012
FIRST EAGLE FUNDS | ANNUAL REPORT | OCTOBER 31, 2012
10
Letter from the Global Value Team Portfolio Managers (continued)
Past performance is no guarantee of future results. The portfolios are actively managed. Current and future portfolio holdings are subject to risk.
There are risks associated with investing in funds that invest in securities of foreign countries, such as erratic market conditions, economic and political instability and fluctuations in currency exchange rates. Investment in gold and gold related investments present certain risks, and returns on gold related investments have traditionally been more volatile than investments in broader equity or debt markets.
The commentary represents the opinion of the Global Value Team Portfolio Managers as of December 2012 and is subject to change based on market and other conditions. The opinions expressed are not necessarily those of the firm. First Eagle Investment Management, LLC (FEIM) became investment adviser to the Global Fund commencing January 1, 2000. These materials are provided for informational purpose only. These opinions are not intended to be a forecast of future events, a guarantee of future results, or investment advice. Any statistics contained herein have been obtained from sources believed to be reliable, but the accuracy of this information cannot be guaranteed. The views expressed herein may change at any time subsequent to the date of issue hereof. The information provided is not to be construed as a recommendation or an offer to buy or sell or the solicitation of an offer to buy or sell any fund or security.
FIRST EAGLE FUNDS | ANNUAL REPORT | OCTOBER 31, 2012
11
Management's Discussion of Fund Performance
The MSCI World Index rose 9.45% during the twelve months ending October 31, 2012. In the U.S., the S&P 500 Index increased 15.2% during the twelve-month period. In Germany, the DAX Index rose 18.2% while in France, the CAC 40 Index rose 5.7%. In Japan, the Nikkei 225 Index fell 0.7%. The U.S. Dollar rose 2.0% against the Japanese Yen and it rose 6.9% against the Euro. Crude oil fell 7.4% during the twelve months to $86 a barrel. Gold remained largely unchanged and ended the year at $1,721 an ounce.
First Eagle Global Fund
The net asset value ("NAV") of the Fund's Class 'A' shares rose 7.64% for the year ending October 31, 2012, while the MSCI World Index increased 9.45%. The Fund's cash and cash equivalents position was 18.8% as of October 31, 2012.
The five largest contributors to the performance of the First Eagle Global Fund over the period were Comcast Corporation (cable, U.S.), Cintas Corporation (uniform rentals, U.S.), Weyerhaeuser Company (forest products, U.S.), Astellas Pharma, Inc. (pharmaceuticals, Japan) and Cincinnati Financial Corporation (P&C Insurance, U.S.), which collectively added 2.55% of return to the fund's performance.
The five largest detractors were Gold Fields Limited (gold mining, South Africa), Bouygues SA (construction/telecom, France), Canon, Inc. (printing & imaging, Japan), Newcrest Mining Limited (gold mining, Australia) and Société Télévision Francaise 1 (media, France). Their combined negative performance over the twelve-month period subtracted 1.08% of return from the Fund's performance.
As of October 31, 2012, the First Eagle Global Fund was approximately 45% hedged against the Japanese Yen and 35% hedged against the Euro. These represent slightly larger than average hedges. Both currencies arguably warrant some premium to their long-term averages relative to the dollar given their superior inflation and trade performance. However, in the case of the Japanese Yen, the potential premium has been moderated by their fiscal challenges and in the case of the Euro, political disunity has fed a series of local sovereign crises in peripheral markets which could imperil the European financial architecture.
First Eagle Overseas Fund
The NAV of the Fund's Class 'A' shares rose 5.06% for the fiscal year ending October 31, 2012, while the MSCI EAFE Index increased 4.61% over the same period. The Fund's cash and cash equivalents position was 21.2% on October 31, 2012.
FIRST EAGLE FUNDS | ANNUAL REPORT | OCTOBER 31, 2012
12
First Eagle Global, Overseas, U.S. Value, Gold and Global Income Builder Funds
The five largest contributors to the performance of the First Eagle Overseas Fund over the period were Shimano, Inc. (bicycle parts, Japan), Agnico-Eagle Mines Limited (gold mining, Canada), Thai Beverage PCL (beverages, Thailand), Astellas Pharma, Inc. (pharmaceuticals, Japan) and Deutsche Wohnen AG (real estate services, Germany), which collectively added 2.95% of return to the fund's performance.
The five largest detractors were Bouygues SA (construction/telecom, France), Gold Fields Limited (gold mining, South Africa), Wienerberger AG (construction materials, Austria), Société Télévision Francaise 1 (media, France) and Canon, Inc. (printing and imaging, Japan). Their combined negative performance over the twelve-month period subtracted 1.52% of return from the Fund's performance.
As of October 31, 2012, the First Eagle Overseas Fund was also approximately 45% hedged against the Japanese Yen and 35% hedged against the Euro.
First Eagle U.S. Value Fund
The NAV of the First Eagle U.S. Value Fund's Class 'A' shares increased 10.63% for the year ending October 31, 2012, while the S&P 500 Index rose 15.21%. The Fund held 21.5% of its portfolio in cash and cash equivalents on October 31, 2012.
The five largest contributors to the performance of the First Eagle U.S. Value Fund over the period were Comcast Corporation (cable), Weyerhaeuser Company (forest products), Cintas Corporation (uniform rentals), Cincinnati Financial Corporation (P&C Insurance) and Home Depot, Inc. (home improvement retailer), which added 4.08% of return to the fund's performance.
The five largest detractors were Rofin-Sinar Technologies, Inc. (metal machinery manufacturing), Newcrest Mining Limited (gold mining), Newmont Mining Corporation (gold mining), Penn West Petroleum Limited (E&P) and San Juan Basin Royalty Trust (oil and gas trust). Their combined negative performance over the twelve-month period subtracted 1.44% of return from the Fund's performance.
First Eagle Gold Fund
The NAV of the First Eagle Gold Fund's Class 'A' shares fell -8.14% for the year ending October 31, 2012, while the FTSE Gold Mines Index decreased -14.81%. The Fund held 6.1% in cash and cash equivalents on October 31, 2012.
The five largest contributors to the performance of the First Eagle Gold Fund over the period were Agnico-Eagle Mines Limited (Canada), Randgold
FIRST EAGLE FUNDS | ANNUAL REPORT | OCTOBER 31, 2012
13
Management's Discussion of Fund Performance (continued)
Resources Limited (Africa), Royal Gold, Inc. (U.S.), Franco-Nevada Corporation (Canada) and Fresnillo PLC (Mexico), which collectively added 6.18% of return to the fund's performance.
The five largest detractors to the Fund were Newcrest Mining Limited (Australia), IAMGOLD Corporation (Canada), Harmony Gold Mining Company (South Africa), Kinross Gold Corporation (Canada), and AngloGold Ashanti Limited (South Africa). Their combined negative performance over the twelve-month period subtracted 6.93% of return from the Fund's performance.
First Eagle Global Income Builder
The NAV of the First Eagle Global Income Builder Fund's Class 'A' shares rose 4.37% from inception (May 1, 2012) through October 31, 2012, while the MSCI World Index returned 1.53% and the Barclays Capital U.S. Aggregate Bond Index rose 2.88% over the same period. The Fund held 5.6% in cash and cash equivalents on October 31, 2012.
The five largest contributors to the performance of the First Eagle Global Income Builder Fund over the period were Frasers Commercial Trust (REIT, Singapore), Sanofi (pharmaceuticals, France), Weyerhaeuser Company (forest products, U.S), Agnico-Eagle Mines Limited (gold mining, Canada) and Fresnillo PLC (silver mining, Mexico), which collectively added 1.35% of return to the fund's performance.
The five largest detractors to the fund were Intel (semiconductors, U.S.), Penn West Petroleum Limited (E&P, U.S), Bouygues SA (construction/telecom, France), Microsoft Corporation (software, U.S) and Italcementi SpA RSP (cement, Italy). Their combined negative performance over the twelve-month period subtracted 1.09% of return from the Fund's performance.
As of October 31, 2012, the First Eagle Global Income Builder Fund was approximately 35% hedged against the Euro on European equities and it was 100% hedged on Euro-denominated bonds.
FIRST EAGLE FUNDS | ANNUAL REPORT | OCTOBER 31, 2012
14
First Eagle Global, Overseas, U.S. Value, Gold and Global Income Builder Funds

| | 
| |
Matthew McLennan | | Abhay Deshpande | |
Head of the Global Value Team
Portfolio Manager
Global, Overseas
and U.S. Value Funds | | Portfolio Manager
Global, Overseas
and U.S. Value Funds
| |

| | 
| |
T. Kimball Brooker, Jr. | | Rachel Benepe | |
Portfolio Manager
Global, Overseas and U.S. Value Funds | | Portfolio Manager
Gold Fund | |

| |  | |
Giorgio Caputo | | Robert Hordon | |
Portfolio Manager
Global Income Builder Fund | | Portfolio Manager
Global Income Builder Fund | |

| |  | |
Edward Meigs | | Sean Slein | |
Portfolio Manager
Global Income Builder and High Yield Funds | | Portfolio Manager
Global Income Builder and High Yield Funds | |
December 2012
FIRST EAGLE FUNDS | ANNUAL REPORT | OCTOBER 31, 2012
15
Management's Discussion of Fund Performance (continued)
The performance data quoted herein represents past performance and does not guarantee future results. Market volatility can dramatically impact the fund's short-term performance. Current performance may be lower or higher than figures shown. The investment return and principal value will fluctuate so that an investor's shares, when redeemed, may be worth more or less than their original cost. Past performance data through the most recent month end is available at firsteaglefunds.com or by calling 800.334.2143. The average annual returns for Class A Shares "with sales charge" of First Eagle Global, Overseas, U.S. Value and Gold Funds give effect to the deduction of the maximum sales charge of 5.00%.
There are risks associated with investing in funds that invest in securities of foreign countries, such as erratic market conditions, economic and political instability and fluctuations in currency exchange rates. Funds whose investments are concentrated in a specific industry or sector may be subject to a higher degree of risk than funds whose investments are diversified and may not be suitable for all investors. Hedging can reduce exposure to currency exchange movements, but cannot eliminate that exposure. It is possible to lose money under a hedge. Results from hedging transactions, which for the Funds are primarily currency forward contracts, are further described in the financial statements that follow this commentary.
The commentary represents the opinion of the Global Value Team Portfolio Managers as of December 2012 and is subject to change based on market and other conditions. These materials are provided for informational purposes only. These opinions are not intended to be a forecast of future events, a guarantee of future results, or investment advice. The views expressed herein may change at any time subsequent of the date of issue hereof. The information provided is not to be construed as a recommendation or an offer to buy or sell or the solicitation of an offer to buy or sell any fund or security.
Investment in gold and gold related investments present certain risks, including political and economic risks affecting the price of gold and other precious metals like changes in U.S. or foreign tax, currency or mining laws, increased environmental costs, international monetary and political policies, economic conditions within an individual country, trade imbalances, and trade or currency restrictions between countries. The price of gold, in turn, is likely to affect the market prices of securities of companies mining or processing gold, and accordingly, the value of investments in such securities may also be affected. Gold related investments as a group have not performed as well as the stock market in general during periods when the U.S. dollar is strong, inflation is low and general economic conditions are stable. In addition, returns on gold related investments have traditionally been more volatile than investments in broader equity or debt markets.
The First Eagle Global Income Builder and High Yield Funds invests in high yield securities that are non-investment grade (commonly known as "junk bonds") which are generally considered speculative because they may be subject to greater levels of interest rate, credit (including issuer default) and liquidity risk than investment grade securities and may be subject to greater volatility. High yield securities are rated lower than investment-grade securities because there is a greater possibility that the issuer may be unable to make interest and principal payments on those securities.
The event-driven investment style used by First Eagle Fund of America carries the additional risk that the event anticipated occurs later than expected, does not occur at all or does not have the desired effect on the market price of the securities.
FIRST EAGLE FUNDS | ANNUAL REPORT | OCTOBER 31, 2012
16
Performance Chart1 Average Annual Returns as of October 31, 2012
| | | ONE-YEAR | | THREE-YEARS | | FIVE-YEARS | | TEN-YEARS | | SINCE
INCEPTION | | INCEPTION
DATE | |
First Eagle Global Fund | |
Class A (SGENX) | |
without sales charge | | | 7.64 | % | | | 10.26 | % | | | 4.13 | % | | | 12.76 | % | | | 14.03 | % | | 01/01/792 | |
with sales charge | | | 2.26 | | | | 8.39 | | | | 3.06 | | | | 12.18 | | | | 13.90 | | | 01/01/792 | |
Class C (FESGX) | | | 5.83 | | | | 9.43 | | | | 3.35 | | | | 11.92 | | | | 11.14 | | | 06/05/00 | |
Class I (SGIIX) | | | 7.90 | | | | 10.53 | | | | 4.39 | | | | 13.05 | | | | 11.74 | | | 07/31/98 | |
MSCI World Index3 | | | 9.45 | | | | 7.88 | | | | -2.87 | | | | 7.20 | | | | 9.44 | | | 01/01/79 | |
First Eagle Overseas Fund | |
Class A (SGOVX) | |
without sales charge | | | 5.06 | % | | | 8.14 | % | | | 2.57 | % | | | 13.03 | % | | | 11.69 | % | | 08/31/93 | |
with sales charge | | | -0.18 | | | | 6.30 | | | | 1.52 | | | | 12.45 | | | | 11.47 | | | 08/31/93 | |
Class C (FESOX) | | | 3.28 | | | | 7.32 | | | | 1.79 | | | | 12.18 | | | | 10.82 | | | 06/05/00 | |
Class I (SGOIX) | | | 5.36 | | | | 8.40 | | | | 2.82 | | | | 13.31 | | | | 11.99 | | | 07/31/98 | |
MSCI EAFE Index4 | | | 4.61 | | | | 2.83 | | | | -5.81 | | | | 7.73 | | | | 4.43 | | | 08/31/93 | |
First Eagle U.S. Value Fund | |
Class A (FEVAX) | |
without sales charge | | | 10.63 | % | | | 11.28 | % | | | 4.62 | % | | | 9.76 | % | | | 9.25 | % | | 09/04/01 | |
with sales charge | | | 5.10 | | | | 9.39 | | | | 3.55 | | | | 9.19 | | | | 8.75 | | | 09/04/01 | |
Class C (FEVCX) | | | 8.75 | | | | 10.44 | | | | 3.83 | | | | 8.92 | | | | 8.43 | | | 09/04/01 | |
Class I (FEVIX) | | | 10.86 | | | | 11.53 | | | | 4.87 | | | | 10.01 | | | | 9.51 | | | 09/04/01 | |
Standard & Poor's
500 Index5 | | | 15.21 | | | | 13.21 | | | | 0.36 | | | | 6.91 | | | | 4.01 | | | 09/04/01 | |
First Eagle Gold Fund | |
Class A (SGGDX) | |
without sales charge | | | -8.14 | % | | | 9.94 | % | | | 6.80 | % | | | 16.47 | % | | | 9.95 | % | | 08/31/93 | |
with sales charge | | | -12.72 | | | | 8.09 | | | | 5.71 | | | | 15.88 | | | | 9.73 | | | 08/31/93 | |
Class C (FEGOX) | | | -9.74 | | | | 9.10 | | | | 6.00 | | | | — | | | | 14.40 | | | 05/15/03 | |
Class I (FEGIX) | | | -7.89 | | | | 10.21 | | | | 7.07 | | | | — | | | | 15.54 | | | 05/15/03 | |
FTSE Gold Mines Index6 | | | -14.81 | | | | 3.91 | | | | 0.40 | | | | 11.60 | | | | 2.83 | | | 08/31/93 | |
MSCI World Index3 | | | 9.45 | | | | 7.88 | | | | -2.87 | | | | 7.20 | | | | 5.87 | | | 08/31/93 | |
Please see the following pages for important notes to this table.
FIRST EAGLE FUNDS | ANNUAL REPORT | OCTOBER 31, 2012
17
Performance Chart1 (continued)
| | | ONE-YEAR | | THREE-YEARS | | FIVE-YEARS | | TEN-YEARS | | SINCE
INCEPTION | | INCEPTION
DATE | |
First Eagle Global Income Builder Fund | |
Class A (FEBAX) | |
without sales charge | | | — | | | | — | | | | — | | | | — | | | | 4.37 | % | | 05/01/12 | |
with sales charge | | | — | | | | — | | | | — | | | | — | | | | -0.88 | | | 05/01/12 | |
Class C (FEBCX) | | | — | | | | — | | | | — | | | | — | | | | 3.00 | | | 05/01/12 | |
Class I (FEBIX) | | | — | | | | — | | | | — | | | | — | | | | 4.53 | | | 05/01/12 | |
MSCI World Index3 | | | — | | | | — | | | | — | | | | — | | | | 1.53 | | | 05/01/12 | |
Barclays Capital U.S.
Aggregate Bond Index10 | | | — | | | | — | | | | — | | | | — | | | | 2.88 | | | 05/01/12 | |
First Eagle High Yield Fund | |
Class A (FEHAX) | |
without sales charge | | | — | | | | — | | | | — | | | | — | | | | 11.35 | % | | 01/03/12 | |
with sales charge | | | — | | | | — | | | | — | | | | — | | | | 6.37 | | | 01/03/12 | |
Class C (FEHCX) | | | — | | | | — | | | | — | | | | — | | | | 9.51 | | | 01/03/12 | |
Class I (FEHIX) | | | 13.07 | % | | | 11.96 | % | | | — | | | | — | | | | 13.09 | | | 11/19/077 | |
Barclays Capital U.S.
Corporate High Yield
Index8 | | | 13.61 | | | | 12.56 | | | | — | | | | — | | | | 10.08 | | | 11/19/07 | |
First Eagle Fund of America | |
Class A (FEFAX) | |
without sales charge | | | 16.46 | % | | | 14.76 | % | | | 3.15 | % | | | 9.33 | % | | | 7.66 | % | | 11/20/98 | |
with sales charge | | | 10.64 | | | | 12.81 | | | | 2.10 | | | | 8.76 | | | | 7.27 | | | 11/20/98 | |
Class C (FEAMX) | | | 14.62 | | | | 13.91 | | | | 2.38 | | | | 8.53 | | | | 6.92 | | | 03/02/98 | |
Class Y (FEAFX)9 | | | 16.50 | | | | 14.75 | | | | 3.14 | | | | 9.33 | | | | 11.68 | | | 04/10/87 | |
Standard & Poor's
500 Index5 | | | 15.21 | | | | 13.21 | | | | 0.36 | | | | 6.91 | | | | 8.80 | | | 04/10/87 | |
1 The performance data quoted herein represents past performance and does not guarantee future results. Market volatility can dramatically impact the funds' short-term performance. Current performance may be lower or higher than figures shown. The investment return and principal value will fluctuate so that an investor's shares, when redeemed, may be worth more or less than their original cost. Past performance data through the most recent month end is available at www.firsteaglefunds.com or by calling 800.334.2143. Performance figures reflect certain fee waivers and/or expense limitations, without which returns may have been lower. The average annual returns for Class A Shares "with sales charge'' of First Eagle Global Fund, First Eagle Overseas Fund, First Eagle U.S. Value Fund, First Eagle Gold Fund, First Eagle Global Income Builder and First Eagle Fund of America give effect to the deduction of the maximum sales charge
Please see the following page for important notes to this table.
FIRST EAGLE FUNDS | ANNUAL REPORT | OCTOBER 31, 2012
18
Average Annual Returns as of October 31, 2012
of 5.00%. The average annual returns for Class A Shares "with sales charge" of First Eagle High Yield Fund gives effect to the deduction of maximum sales charge of 4.50%.
The average annual returns for Class C Shares reflect the CDSC (Contingent Deferred Sales Charge) of 1.00% which pertains to the first year or less of investment only.
Class I Shares of First Eagle Global Fund, First Eagle Overseas Fund, First Eagle U.S. Value Fund, First Eagle Gold Fund, First Eagle Global Income Builder Fund and First Eagle High Yield Fund require $1mm minimum investment and are offered without sales charge.
Class Y Shares of First Eagle Fund of America are offered without charge.
2 Commencement of management by Jean-Marie Eveillard. Mr. Eveillard transitioned to senior adviser on March 26, 2009, a position he also held from January 2005 to March 2007, and continues to be a member of First Eagle Fund's Board of Trustees and a Senior Adviser to First Eagle Investment Management, LLC. The Fund commenced operations April 28, 1970.
3 The MSCI World Index is a widely followed, unmanaged group of stocks from 23 international markets and is not available for purchase. The index provides total returns in U.S. dollars with net dividends reinvested.
4 The MSCI EAFE Index is a total return index, reported in U.S. dollars, based on share prices and reinvested net dividends of approximately 1,100 companies from 22 countries and is not available for purchase.
5 The Standard & Poor's 500 Index is a widely recognized unmanaged index including a representative sample of 500 leading companies in leading sectors of the U.S. economy and is not available for purchase. Although the Standard & Poor's 500 Index focuses on the large-cap segment of the market, with approximately 75% coverage of U.S. equities, it is also considered a proxy for the total market. The Standard & Poor's 500 Index includes dividends reinvested.
6 The FTSE Gold Mines Index is an unmanaged index composed of approximately 19 mining companies, is available without dividends reinvested, and is not available for purchase.
7 First Eagle High Yield Fund commenced operations in its present form on December 30, 2011, and is successor to another mutual fund pursuant to a reorganization December 30, 2011. Information prior to December 30, 2011 is for this predecessor fund. Immediately after the reorganization, changes in net asset value of the Class I shares were partially impacted by differences in how the Fund and the predecessor fund price portfolio securities.
8 The Barclays Capital U.S Corporate High Yield Bond Index is composed of fixed-rate, publicly issued, non-investment grade debt, is unmanaged, with dividends reinvested, and is not available for purchase. The index includes both corporate and non-corporate sectors. The corporate sectors are Industrial, Utility, and Finance, which include both U.S. and non-U.S. corporations. The index is presented here for comparison purposes only. One cannot invest directly in an index.
9 As of September 1, 2005, First Eagle Fund of America Class Y is closed to new accounts.
10 The Barclays Capital U.S. Aggregate Bond Index is an unmanaged broad-based benchmark that measures the investment grade, U.S. dollar-denominated, fixed-rate taxable bond market, including Treasuries, government-related and corporate securities, MBS (agency fixed-rate and hybrid ARM passthroughs), ABS, and CMBS and is not available for purchase.
FIRST EAGLE FUNDS | ANNUAL REPORT | OCTOBER 31, 2012
19
Performance Chart1 (continued)
Expense Ratios As Stated In The Most Recent Prospectus
Total Annual Gross Operating Expense Ratios
| | | CLASS A | | CLASS C | | CLASS I | | CLASS Y | |
First Eagle Global Fund | | | 1.13 | % | | | 1.88 | % | | | 0.88 | % | | | — | | |
First Eagle Overseas Fund | | | 1.14 | | | | 1.89 | | | | 0.89 | | | | — | | |
First Eagle U.S. Value Fund | | | 1.18 | | | | 1.93 | | | | 0.93 | | | | — | | |
First Eagle Gold Fund | | | 1.20 | | | | 1.95 | | | | 0.95 | | | | — | | |
First Eagle Global Income Builder* | | | 1.62 | | | | 2.37 | | | | 1.37 | | | | |
First Eagle High Yield Fund** | | | 1.12 | | | | 1.83 | | | | 1.05 | | | | |
First Eagle Fund of America | | | 1.45 | | | | 2.20 | | | | — | | | | 1.45 | % | |
* These are the actual fund operating expenses prior to the application of fee waivers and/or expense reimbursements. The Adviser has contractually agreed to limit operating expenses of the Fund to an annual rate of 1.30% for A Shares, 2.05% for C Shares, and 1.05% for I Shares with gross operating expenses of 1.62%, 2.37%, and 1.37% respectively. This limitation excludes certain expenses as described in the Fees and Expenses section of the prospectus. This limitation will continue until December 31, 2012. The expense limitation may be terminated by the Adviser in future years.
** These are the actual fund operating expenses prior to the application of fee waivers and/or expense reimbursements. The Adviser has contractually agreed to limit operating expenses of the Fund to an annual rate of 0.80% for I Shares, 1.25% for A Shares, and 2.00% for C Shares, with gross operating expenses of 1.05%, 1.12%, and 1.83% respectively. This limitation excludes certain expenses as described in the Fees and Expenses section of the prospectus. This limitation will continue until 2013 for I-Shares, and until 2012 for A and C Shares. The expense limitation may be terminated by the Adviser in future years.
These expense ratios are presented as of October 31, 2012 and may differ from corresponding ratios shown elsewhere in this report because of differing time periods (and/or, if applicable, because these expense ratios do not include expense credits or waivers).
There are risks associated with investing in funds that invest in securities of foreign countries, such as erratic market conditions, economic and political instability and fluctuations in currency exchange rates. Funds whose investments are concentrated in a specific industry or sector may be subject to a higher degree of risk than funds whose investments are diversified and may not be suitable for all investors.
Investment in gold and gold related investments present certain risks, including political and economic risks affecting the price of gold and other precious metals like changes in U.S. or foreign tax, currency or mining laws, increased environmental costs, international monetary and political policies, economic conditions within an individual country, trade imbalances, and trade or currency restrictions between countries. The price of gold, in turn, is likely to affect the market prices of securities of companies mining or processing gold, and accordingly, the value of investments in such securities may also be affected. Gold related investments as a group have not performed as well as the stock market in general during periods when the U.S. dollar is strong, inflation is low and general economic conditions are stable. In addition, returns on gold related investments have traditionally been more volatile than investments in broader equity or debt markets.
FIRST EAGLE FUNDS | ANNUAL REPORT | OCTOBER 31, 2012
20
Average Annual Returns as of October 31, 2012
The First Eagle Global Income Builder and High Yield Funds invests in high yield securities that are non-investment grade (commonly known as "junk bonds") which are generally considered speculative because they may be subject to greater levels of interest rate, credit (including issuer default) and liquidity risk than investment grade securities and may be subject to greater volatility. High yield securities are rated lower than investment-grade securities because there is a greater possibility that the issuer may be unable to make interest and principal payments on those securities.
The event-driven investment style used by First Eagle Fund of America carries the additional risk that the event anticipated occurs later than expected, does not occur at all or does not have the desired effect on the market price of the securities.
FIRST EAGLE FUNDS | ANNUAL REPORT | OCTOBER 31, 2012
21

Fund Overview | Data as of October 31, 2012 (unaudited)
INVESTMENT OBJECTIVE
The First Eagle Global Fund seeks long-term growth of capital by investing in a wide range of asset classes from markets in the United States and throughout the world. This truly global fund is managed with a highly disciplined, bottom-up, value oriented style.
Average Annual Returns | |
| | | ONE-YEAR | | FIVE-YEARS | | TEN-YEARS | |
First Eagle Global
Fund (A Shares) | |
without sales load | | | 7.64 | % | | | 4.13 | % | | | 12.76 | % | |
with sales load | | | 2.26 | | | | 3.06 | | | | 12.18 | | |
MSCI World Index | | | 9.45 | | | | -2.87 | | | | 7.20 | | |
Consumer Price Index | | | 2.16 | | | | 2.05 | | | | 2.46 | | |
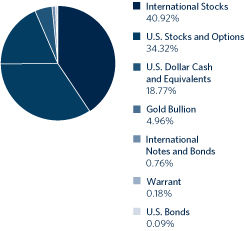
Countries** | |
United States | | | 39.55 | % | |
Japan | | | 16.83 | | |
France | | | 4.81 | | |
Canada | | | 2.47 | | |
Mexico | | | 2.38 | | |
Germany | | | 2.22 | | |
United Kingdom | | | 2.21 | | |
Switzerland | | | 1.95 | | |
South Korea | | | 1.22 | | |
Australia | | | 1.16 | | |
South Africa | | | 0.97 | | |
Hong Kong | | | 0.59 | | |
Belgium | | | 0.56 | | |
Sweden | | | 0.55 | | |
Thailand | | | 0.50 | | |
Bermuda | | | 0.49 | | |
Spain | | | 0.42 | | |
Malaysia | | | 0.42 | | |
Ireland | | | 0.41 | | |
Austria | | | 0.39 | | |
Netherlands | | | 0.33 | | |
Italy | | | 0.29 | | |
Israel | | | 0.27 | | |
Taiwan | | | 0.17 | | |
Singapore | | | 0.05 | | |
Norway | | | 0.03 | | |
* Asset Allocation and Countries percentages are based on total investments in the portfolio.
** Country allocations reflect country of the issuer (not currency of issue) and exclude short term investments and options positions. Bonds of non-U.S. issuers may be U.S. dollar denominated.
The Fund's portfolio composition is subject to change at any time.
FIRST EAGLE FUNDS | ANNUAL REPORT | OCTOBER 31, 2012
22
Growth of a $10,000 Initial Investment
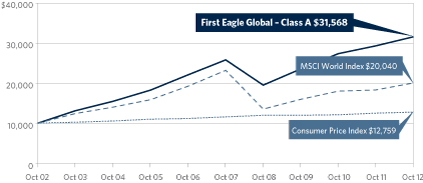
Performance data quoted herein represents past performance and should not be considered indicative of future results. Performance data quoted herein does not reflect the deduction of taxes that a shareholder would pay on Fund distributions or the sale of Fund shares. The average annual returns shown above are historical and reflect changes in share price, reinvested dividends and are net of expenses.
The average annual returns for Class A Shares give effect to the deduction of the maximum sales charge of 5.00%.
The MSCI World Index is a widely followed, unmanaged group of stocks from 23 international markets and is not available for purchase. The index provides total returns in U.S. dollars with net dividends reinvested. The Consumer Price Index (CPI) represents the change in price of all goods and services purchased for consumption by urban households.
| Top 10 Holdings* | |
| Gold Bullion (precious metal) | | | 4.98 | % | |
| Comcast Corporation, Class 'A' (U.S. cable/satellite television company) | | | 1.75 | | |
| Cisco Systems, Inc. (U.S. computer communications company) | | | 1.64 | | |
| Secom Company Limited (Japanese security services provider) | | | 1.62 | | |
| Cintas Corporation (U.S. commercial services equipment supplier) | | | 1.50 | | |
| Microsoft Corporation (U.S. software developer) | | | 1.50 | | |
| Sysco Corporation (U.S. food services distributor) | | | 1.49 | | |
| Keyence Corporation (Japanese sensors manufacturer) | | | 1.38 | | |
| Fanuc Limited (Japanese industrial manufacturing company) | | | 1.27 | | |
| Astellas Pharma, Inc. (Japanese pharmaceutical company) | | | 1.23 | | |
Total | | | 18.36 | % | |
* Holdings in cash, commercial paper and other short term cash equivalents have been excluded. Percentages are based on total net assets.
FIRST EAGLE FUNDS | ANNUAL REPORT | OCTOBER 31, 2012
23
SHARES | | DESCRIPTION | | COST (NOTE 1) | | VALUE (NOTE 1) | |
Common Stocks — 75.10% | | | |
U.S. Common Stocks — 34.45% | | | |
Consumer Discretionary 2.78% | | | |
| | 17,414,912 | | | Comcast Corporation, Class 'A' | | $ | 296,976,000 | | | $ | 634,599,393 | | |
| | 6,208,490 | | | Omnicom Group, Inc. | | | 186,093,077 | | | | 297,448,756 | | |
| | 4,259,656 | | | H&R Block, Inc. | | | 72,109,646 | | | | 75,395,911 | | |
| | 2,485 | | | JG Boswell Company (a) | | | 573,840 | | | | 2,159,465 | | |
| 184,753 | | | St. John Knits International,
Inc. (a)(b) | | | 3,174,837 | | | | 1,016,142 | | |
| | | | 558,927,400 | | | | 1,010,619,667 | | |
Consumer Staples 2.91% | | | |
| | 17,479,577 | | | Sysco Corporation | | | 495,705,689 | | | | 543,090,457 | | |
| | 1,876,550 | | | Lorillard, Inc. | | | 140,123,666 | | | | 217,698,566 | | |
| | 1,629,490 | | | Colgate-Palmolive Company | | | 125,309,064 | | | | 171,031,270 | | |
| | 1,693,404 | | | Wal-Mart Stores, Inc. | | | 82,465,011 | | | | 127,039,168 | | |
| | | | 843,603,430 | | | | 1,058,859,461 | | |
Energy 2.46% | | | |
| | 6,224,163 | | | ConocoPhillips | | | 250,797,600 | | | | 360,067,830 | | |
| | 3,080,340 | | | Devon Energy Corporation | | | 179,165,945 | | | | 179,306,591 | | |
| | 3,044,263 | | | Phillips 66 (c) | | | 76,218,314 | | | | 143,567,443 | | |
| | 1,442,501 | | | Apache Corporation | | | 90,693,919 | | | | 119,366,958 | | |
| | 3,908,035 | | | San Juan Basin Royalty Trust (d) | | | 138,744,050 | | | | 54,751,570 | | |
| | 806,395 | | | Helmerich & Payne, Inc. | | | 17,026,317 | | | | 38,545,681 | | |
| | | | 752,646,145 | | | | 895,606,073 | | |
Financials 8.88% | | | |
| 17,571,107 | | | Bank of New York
Mellon Corporation | | | 441,008,507 | | | | 434,182,054 | | |
| | 7,529,993 | | | American Express Company | | | 317,870,387 | | | | 421,453,708 | | |
| | 13,816,985 | | | Weyerhaeuser Company, REIT | | | 243,497,569 | | | | 382,592,315 | | |
| 2,714 | | | Berkshire Hathaway, Inc.,
Class 'A' (b) | | | 218,995,900 | | | | 351,476,570 | | |
| | 8,511,151 | | | Cincinnati Financial Corporation (d) | | | 215,946,733 | | | | 339,084,256 | | |
| | 9,693,682 | | | BB&T Corporation | | | 245,863,323 | | | | 280,632,094 | | |
| | 7,819,459 | | | U.S. Bancorp | | | 192,949,644 | | | | 259,684,233 | | |
| 5,719,208 | | | Plum Creek Timber Company,
Inc., REIT | | | 212,342,604 | | | | 251,073,231 | | |
| | 4,386,051 | | | WR Berkley Corporation | | | 117,583,057 | | | | 170,573,523 | | |
| | 2,858,553 | | | Rayonier, Inc., REIT | | | 27,837,041 | | | | 140,097,683 | | |
| | 743,437 | | | Visa, Inc., Class 'A' | | | 53,618,674 | | | | 103,159,318 | | |
See Notes to Financial Statements.
FIRST EAGLE FUNDS | ANNUAL REPORT | OCTOBER 31, 2012
24
Schedule of Investments | Year Ended October 31, 2012
SHARES | | DESCRIPTION | | COST (NOTE 1) | | VALUE (NOTE 1) | |
U.S. Common Stocks — 34.45% — (continued) | | | |
Financials 8.88% — (continued) | | | |
| | 202,406 | | | Mastercard, Inc., Class 'A' | | $ | 40,702,513 | | | $ | 93,294,998 | | |
| | 33,892 | | | Mills Music Trust (a)(d) | | | 1,015,863 | | | | 1,267,561 | | |
| | | | 2,329,231,815 | | | | 3,228,571,544 | | |
Health Care 0.96% | | | |
| | 4,469,770 | | | WellPoint, Inc. | | | 240,056,531 | | | | 273,907,505 | | |
| | 1,059,980 | | | Johnson & Johnson | | | 59,610,843 | | | | 75,067,784 | | |
| | | | 299,667,374 | | | | 348,975,289 | | |
Industrials 4.80% | | | |
| | 13,051,511 | | | Cintas Corporation (d) | | | 438,387,413 | | | | 545,683,675 | | |
| | 4,069,880 | | | 3M Company | | | 315,646,157 | | | | 356,521,488 | | |
| | 3,069,252 | | | Lockheed Martin Corporation | | | 217,057,860 | | | | 287,496,835 | | |
| | 3,867,416 | | | Northrop Grumman Corporation | | | 231,724,655 | | | | 265,652,805 | | |
| | 3,638,247 | | | Alliant Techsystems, Inc. (d) | | | 314,316,906 | | | | 208,435,171 | | |
| | 731,965 | | | Unifirst Corporation | | | 11,682,492 | | | | 50,922,805 | | |
| | 2,115,301 | | | Blount International, Inc. (b) | | | 21,886,852 | | | | 27,985,432 | | |
| | | | 1,550,702,335 | | | | 1,742,698,211 | | |
Information Technology 7.54% | | | |
| | 34,819,677 | | | Cisco Systems, Inc. | | | 583,213,397 | | | | 596,809,264 | | |
| | 19,051,934 | | | Microsoft Corporation | | | 477,924,373 | | | | 543,646,936 | | |
| | 13,004,217 | | | Oracle Corporation | | | 362,943,749 | | | | 403,780,938 | | |
| | 13,489,704 | | | Intel Corporation | | | 233,978,012 | | | | 291,714,849 | | |
| | 8,019,789 | | | Linear Technology Corporation | | | 227,165,656 | | | | 250,698,604 | | |
| | 8,748,867 | | | Texas Instruments, Inc. | | | 228,873,378 | | | | 245,755,674 | | |
| | 282,275 | | | Google, Inc., Class 'A' (b) | | | 149,382,648 | | | | 191,882,077 | | |
| | 2,365,411 | | | Automatic Data Processing, Inc. | | | 85,148,200 | | | | 136,697,102 | | |
| | 1,671,000 | | | KLA-Tencor Corporation (c) | | | 47,230,930 | | | | 77,734,920 | | |
| | | | 2,395,860,343 | | | | 2,738,720,364 | | |
Materials 1.94% | | | |
| | 4,387,079 | | | Vulcan Materials Company | | | 223,679,544 | | | | 201,674,022 | | |
| 4,172,577 | | | Scotts Miracle-Gro Company,
Class 'A' (d) | | | 182,102,946 | | | | 178,628,021 | | |
| | 1,752,640 | | | Martin Marietta Materials, Inc. | | | 155,134,877 | | | | 144,259,798 | | |
| | 1,780,037 | | | Newmont Mining Corporation | | | 45,037,176 | | | | 97,101,018 | | |
| | 1,249,382 | | | Deltic Timber Corporation (d) | | | 62,415,256 | | | | 84,783,063 | | |
| | | | 668,369,799 | | | | 706,445,922 | | |
See Notes to Financial Statements.
FIRST EAGLE FUNDS | ANNUAL REPORT | OCTOBER 31, 2012
25
SHARES | | DESCRIPTION | | COST (NOTE 1) | | VALUE (NOTE 1) | |
U.S. Common Stocks — 34.45% — (continued) | | | |
Utilities 2.18% | | | |
| | 9,696,381 | | | FirstEnergy Corporation | | $ | 353,449,107 | | | $ | 443,318,539 | | |
| | 2,491,660 | | | Entergy Corporation | | | 164,249,120 | | | | 180,844,683 | | |
| | 3,760,485 | | | IDACorp, Inc. (d) | | | 124,066,738 | | | | 168,168,889 | | |
| | | | 641,764,965 | | | | 792,332,111 | | |
Total U.S. Common Stocks | | | 10,040,773,606 | | | | 12,522,828,642 | | |
International Common Stocks — 40.65% | | | |
Australia 1.16% | | | |
| | 15,384,766 | | | Newcrest Mining Limited | | | 472,606,853 | | | | 422,091,115 | | |
Austria 0.39% | | | |
| | 3,857,199 | | | OMV AG | | | 157,989,372 | | | | 141,078,601 | | |
Belgium 0.57% | | | |
| | 2,788,865 | | | Groupe Bruxelles Lambert SA | | | 234,732,253 | | | | 206,033,320 | | |
Bermuda 0.49% | | | |
| 2,875,070 | | | Jardine Matheson
Holdings Limited | | | 141,681,818 | | | | 177,104,312 | | |
Canada 2.43% | | | |
| | 5,581,122 | | | Goldcorp, Inc. | | | 213,133,659 | | | | 252,434,148 | | |
| | 5,456,594 | | | Cenovus Energy, Inc. | | | 151,356,348 | | | | 192,672,334 | | |
| | 13,369,060 | | | Penn West Petroleum Limited | | | 229,548,818 | | | | 173,664,089 | | |
| | 1,669,132 | | | Agnico-Eagle Mines Limited | | | 54,454,117 | | | | 94,150,599 | | |
| | 3,839,385 | | | Nexen, Inc. | | | 60,117,890 | | | | 91,761,301 | | |
| 1,779,850 | | | Potash Corporation of
Saskatchewan, Inc. | | | 72,023,951 | | | | 71,852,545 | | |
| 2,927,036 | | | Postmedia Network Canada
Corporation (a)(b)(e) | | | 18,719,011 | | | | 5,855,829 | | |
| | 1,008,427 | | | Catalyst Paper Corporation (a)(b)(h) | | | 17,346 | | | | 1,058,848 | | |
| | | | 799,371,140 | | | | 883,449,693 | | |
France 4.64% | | | |
| | 4,179,227 | | | Sanofi | | | 323,385,924 | | | | 367,615,433 | | |
| | 3,330,779 | | | Sodexo | | | 88,582,313 | | | | 256,479,617 | | |
| | 4,702,249 | | | Total SA | | | 247,298,454 | | | | 236,756,081 | | |
| | 9,287,648 | | | Bouygues SA | | | 358,271,606 | | | | 223,515,011 | | |
| | 8,755,798 | | | Carrefour SA | | | 363,896,635 | | | | 211,680,879 | | |
| | 2,044,437 | | | Neopost SA (d) | | | 184,799,958 | | | | 111,991,799 | | |
| | 11,803,362 | | | Société Télévision Francaise 1 (d) | | | 184,371,882 | | | | 101,483,102 | | |
| | 921,669 | | | Wendel SA | | | 19,716,342 | | | | 81,275,568 | | |
| | 1,130,913 | | | Legrand SA | | | 35,203,833 | | | | 43,593,124 | | |
See Notes to Financial Statements.
FIRST EAGLE FUNDS | ANNUAL REPORT | OCTOBER 31, 2012
26
Schedule of Investments | Year Ended October 31, 2012
SHARES | | DESCRIPTION | | COST (NOTE 1) | | VALUE (NOTE 1) | |
International Common Stocks — 40.65% — (continued) | | | |
France 4.64% — (continued) | | | |
| | 157,260 | | | Robertet SA (b)(d) | | $ | 20,623,058 | | | $ | 26,311,643 | | |
| | 385,000 | | | Sabeton SA (b)(d) | | | 4,841,233 | | | | 6,141,944 | | |
| | 69,500 | | | NSC Groupe (a)(d) | | | 12,298,421 | | | | 5,850,184 | | |
| | 12,000,000 | | | FINEL (a)(b)(f) | | | — | | | | 5,603,040 | | |
| | 104,457 | | | Gaumont SA | | | 6,087,824 | | | | 5,350,134 | | |
| | 42,252 | | | Robertet SA CI (a)(b)(f)(g) | | | 800,508 | | | | 5,118,399 | | |
| | | | 1,850,177,991 | | | | 1,688,765,958 | | |
Germany 1.92% | | | |
| | 8,114,931 | | | HeidelbergCement AG | | | 447,784,386 | | | | 430,369,941 | | |
| | 4,285,909 | | | Daimler AG | | | 200,355,962 | | | | 200,256,640 | | |
| | 693,440 | | | Fraport AG | | | 20,976,007 | | | | 40,688,481 | | |
| | 773,684 | | | Hornbach Baumarkt AG | | | 21,504,161 | | | | 25,317,502 | | |
| | | | 690,620,516 | | | | 696,632,564 | | |
Hong Kong 0.33% | | | |
| | 12,693,580 | | | Guoco Group Limited | | | 115,086,260 | | | | 117,270,031 | | |
| | 20,738,780 | | | City e-Solutions Limited (a)(b)(d) | | | 936,898 | | | | 1,859,764 | | |
| | | | 116,023,158 | | | | 119,129,795 | | |
Ireland 0.41% | | | |
| | 7,968,210 | | | CRH PLC | | | 136,905,270 | | | | 148,357,225 | | |
Israel 0.27% | | | |
| | 7,864,560 | | | Israel Chemicals Limited | | | 81,267,220 | | | | 98,379,114 | | |
Italy 0.29% | | | |
| | 18,139,395 | | | Italcementi S.p.A. RSP | | | 249,186,230 | | | | 46,347,788 | | |
| | 4,682,069 | | | Italcementi S.p.A. | | | 86,201,872 | | | | 23,683,310 | | |
| | 1,734,972 | | | Italmobiliare S.p.A. RSP (b) | | | 121,356,934 | | | | 19,014,687 | | |
| | 1,021,137 | | | Italmobiliare S.p.A. (b) | | | 107,360,738 | | | | 15,734,047 | | |
| | | | 564,105,774 | | | | 104,779,832 | | |
Japan 16.90% | | | |
| | 11,590,430 | | | Secom Company Limited | | | 528,330,685 | | | | 590,045,059 | | |
| | 1,895,990 | | | Keyence Corporation | | | 351,946,352 | | | | 502,906,302 | | |
| | 2,888,400 | | | Fanuc Corporation | | | 255,486,281 | | | | 459,756,594 | | |
| | 8,977,860 | | | Astellas Pharma, Inc. | | | 362,418,345 | | | | 445,801,063 | | |
| | 6,969,690 | | | Shimano, Inc. (d) | | | 158,533,024 | | | | 439,042,463 | | |
| | 2,693,956 | | | SMC Corporation | | | 294,992,485 | | | | 424,420,369 | | |
| | 5,356,100 | | | KDDI Corporation | | | 342,370,670 | | | | 415,877,520 | | |
| | 12,811,860 | | | MISUMI Group, Inc. (d) | | | 221,342,849 | | | | 314,319,771 | | |
See Notes to Financial Statements.
FIRST EAGLE FUNDS | ANNUAL REPORT | OCTOBER 31, 2012
27
SHARES | | DESCRIPTION | | COST (NOTE 1) | | VALUE (NOTE 1) | |
International Common Stocks — 40.65% — (continued) | | | |
Japan 16.90% — (continued) | | | |
| | 4,933,000 | | | Ono Pharmaceutical
Company Limited | | $ | 222,260,661
| | | $ | 297,771,572
| | |
| | 14,441,180 | | | Mitsubishi Estate Company Limited | | | 219,465,631 | | | | 285,568,231 | | |
| | 14,917,300 | | | NKSJ Holdings, Inc. | | | 402,645,728 | | | | 271,818,053 | | |
| | 12,945,240 | | | Hoya Corporation | | | 280,406,180 | | | | 261,985,070 | | |
| 2,318,500 | | | Hirose Electric
Company Limited (d) | | | 246,194,572 | | | | 247,964,809 | | |
| | 14,618,720 | | | MS&AD Insurance Group Holdings | | | 356,085,457 | | | | 247,703,546 | | |
| 4,286,130 | | | Nissin Foods Holdings
Company Limited | | | 152,493,842 | | | | 162,105,355 | | |
| | 4,896,260 | | | Canon, Inc. | | | 232,564,293 | | | | 158,078,375 | | |
| | 6,177,710 | | | Nomura Research Institute Limited | | | 129,553,350 | | | | 131,136,111 | | |
| | 5,333,150 | | | THK Company Limited | | | 91,613,966 | | | | 88,629,807 | | |
| 1,569,860 | | | Shin-Etsu Chemical
Company Limited | | | 73,766,639 | | | | 88,470,507 | | |
| | 59,245 | | | NTT DoCoMo, Inc. | | | 90,107,766 | | | | 87,031,165 | | |
| 3,526,280 | | | Chofu Seisakusho
Company Limited (d) | | | 64,322,538 | | | | 81,124,313 | | |
| | 5,147,000 | | | T. Hasegawa Company Limited (d) | | | 79,849,658 | | | | 65,167,401 | | |
| | 1,271,000 | | | Ariake Japan Company Limited | | | 20,775,620 | | | | 27,091,321 | | |
| | 1,155,820 | | | Meitec Corporation | | | 32,963,240 | | | | 25,446,857 | | |
| | 2,002,100 | | | Seikagaku Corporation | | | 21,143,745 | | | | 22,942,035 | | |
| | | | 5,231,633,577 | | | | 6,142,203,669 | | |
Malaysia 0.42% | | | |
| | 129,221,380 | | | Genting Malaysia Berhad | | | 111,924,255 | | | | 152,299,657 | | |
Mexico 2.39% | | | |
| | 15,044,166 | | | Grupo Televisa S.A.B., ADR | | | 289,394,928 | | | | 339,998,151 | | |
| | 6,612,311 | | | Industrias Peñoles S.A.B. de C.V. | | | 7,723,116 | | | | 331,199,574 | | |
| | 6,399,253 | | | Fresnillo PLC | | | 43,883,996 | | | | 198,128,238 | | |
| | | | 341,002,040 | | | | 869,325,963 | | |
Netherlands 0.33% | | | |
| | 9,612,642 | | | TNT Express NV | | | 109,495,610 | | | | 101,311,694 | | |
| | 4,925,106 | | | PostNL NV (b) | | | 46,252,787 | | | | 19,431,878 | | |
| | | | 155,748,397 | | | | 120,743,572 | | |
Singapore 0.05% | | | |
| | 13,467,250 | | | ComfortDelGro Corporation Limited | | | 3,279,183 | | | | 18,658,512 | | |
See Notes to Financial Statements.
FIRST EAGLE FUNDS | ANNUAL REPORT | OCTOBER 31, 2012
28
Schedule of Investments | Year Ended October 31, 2012
SHARES | | DESCRIPTION | | COST (NOTE 1) | | VALUE (NOTE 1) | |
International Common Stocks — 40.65% — (continued) | | | |
South Africa 0.97% | | | |
| | 22,792,720 | | | Gold Fields Limited, ADR | | $ | 255,149,383 | | | $ | 285,136,927 | | |
| 8,092,307 | | | Harmony Gold Mining
Company Limited, ADR | | | 69,852,451 | | | | 67,166,148 | | |
| | | | 325,001,834 | | | | 352,303,075 | | |
South Korea 1.03% | | | |
| | 3,476,566 | | | KT&G Corporation | | | 187,647,559 | | | | 264,902,471 | | |
| 51,900 | | | Lotte Confectionery
Company Limited | | | 21,157,499 | | | | 74,761,507 | | |
| 39,989 | | | Namyang Dairy Products
Company Limited (d) | | | 7,325,466 | | | | 34,650,289 | | |
| | | | 216,130,524 | | | | 374,314,267 | | |
Spain 0.42% | | | |
| | 3,295,234 | | | Red Electrica Corporation SA | | | 165,292,750 | | | | 154,609,006 | | |
Sweden 0.56% | | | |
| | 5,939,940 | | | Investor AB, Class 'A' | | | 116,378,542 | | | | 127,029,256 | | |
| | 3,394,798 | | | Investor AB, Class 'B' | | | 63,888,333 | | | | 74,956,640 | | |
| | | | 180,266,875 | | | | 201,985,896 | | |
Switzerland 1.96% | | | |
| | 5,091,560 | | | Nestlé SA | | | 146,056,200 | | | | 323,334,439 | | |
| | 3,783,070 | | | Pargesa Holding SA | | | 237,781,696 | | | | 255,280,499 | | |
| | 27,925 | | | Lindt & Spruengli AG PC | | | 28,106,172 | | | | 88,307,393 | | |
| | 388,803 | | | Kuehne & Nagel International AG | | | 7,503,142 | | | | 45,412,224 | | |
| | | | 419,447,210 | | | | 712,334,555 | | |
Thailand 0.50% | | | |
| | 30,023,200 | | | Bangkok Bank PCL, NVDR | | | 97,800,376 | | | | 173,380,307 | | |
| | 577,000 | | | OHTL PCL (a) | | | 2,636,473 | | | | 9,036,215 | | |
| | | | 100,436,849 | | | | 182,416,522 | | |
United Kingdom 2.22% | | | |
| 9,342,277 | | | Berkeley Group
Holdings PLC (b)(d) | | | 114,104,302 | | | | 229,408,505 | | |
| | 44,700,255 | | | WM Morrison Supermarkets PLC | | | 200,556,555 | | | | 193,207,880 | | |
| | 7,387,420 | | | GlaxoSmithKline PLC | | | 140,774,624 | | | | 165,255,068 | | |
| | 3,693,540 | | | Willis Group Holdings PLC | | | 97,767,744 | | | | 124,361,492 | | |
| | 3,052,693 | | | Anglo American PLC | | | 74,109,213 | | | | 93,726,854 | | |
| | | | 627,312,438 | | | | 805,959,799 | | |
Total International Common Stocks | | | 13,122,957,297 | | | | 14,772,956,022 | | |
Total Common Stocks | | | 23,163,730,903 | | | | 27,295,784,664 | | |
See Notes to Financial Statements.
FIRST EAGLE FUNDS | ANNUAL REPORT | OCTOBER 31, 2012
29
SHARES | | DESCRIPTION | | COST (NOTE 1) | | VALUE (NOTE 1) | |
Preferred Stocks — 0.44% | | | |
International Preferred Stocks — 0.44% | | | |
Germany 0.32% | | | |
| | 1,754,484 | | | Hornbach Holding AG | | $ | 63,837,360 | | | $ | 114,711,273 | | |
South Korea 0.12% | | | |
| 60,212 | | | Samsung Electronics
Company Limited | | | 7,227,347 | | | | 43,726,301 | | |
Total International Preferred Stocks | | | 71,064,707 | | | | 158,437,574 | | |
Total Preferred Stocks | | | 71,064,707 | | | | 158,437,574 | | |
Warrant — 0.18% | | | |
United States — 0.18% | | | |
| | 5,806,899 | | | JPMorgan Chase & Company
Warrant expire 10/28/18 (b) | | | 75,108,859
| | | | 66,372,855
| | |
OUNCES | | | | | | | |
Commodity — 4.98% | | | |
| | 1,051,078 | | | Gold bullion (b) | | | 736,135,763 | | | | 1,809,221,276 | | |
PRINCIPAL | | | | | | | |
Notes and Bonds — 0.86% | | | |
U.S. Corporate Bonds — 0.09% | | | |
$ | 5,467,000 | | | Bausch & Lomb, Inc.
7.125% due 08/01/28 (a) | | | 4,770,807
| | | | 4,653,784
| | |
| | 5,000,000 | | | Pulte Group, Inc.
5.20% due 02/15/15 | | | 4,649,760
| | | | 5,375,000
| | |
| | 22,554,000 | | | Yankee Candle Company, Inc.
Series 'B' 9.75% due 02/15/17 | | | 22,057,284
| | | | 23,484,352
| | |
Total U.S. Corporate Bonds | | | 31,477,851 | | | | 33,513,136 | | |
International Notes and Bonds — 0.77% | | | |
International Corporate Notes and Bonds — 0.26% | | | |
Canada 0.05% | | | |
| | 17,593,454 | | | Catalyst Paper Corporation
USD11.00% due 10/30/17 (a)(h)(i) | | | 25,160,075
| | | | 14,470,616
| | |
| | 3,924,131 | | | Catalyst Paper Corporation FRN
USD10.313% due 09/13/16 (a)(h)(j)(k) | | | 3,345,321
| | | | 4,022,234
| | |
| | | | 28,505,396 | | | | 18,492,850 | | |
See Notes to Financial Statements.
FIRST EAGLE FUNDS | ANNUAL REPORT | OCTOBER 31, 2012
30
Schedule of Investments | Year Ended October 31, 2012
PRINCIPAL | | DESCRIPTION | | COST (NOTE 1) | | VALUE (NOTE 1) | |
International Corporate Notes and Bonds — 0.26% — (continued) | | | |
France 0.18% | | | |
| | 15,000,000 | | | Emin Leydier SA FRN
EUR7.358% due 07/31/16 (a)(f)(h)(k) | | $ | 21,437,036
| | | $ | 19,455,000
| | |
| | 12,000,000 | | | FINEL
EUR9.50% due 06/30/17 (a)(f)(h) | | | 14,495,954
| | | | 11,673,000
| | |
| | 12,050,000 | | | Wendel SA
EUR4.375% due 08/09/17 | | | 12,134,530
| | | | 15,921,892
| | |
| | 3,500,000 | | | Wendel SA
EUR4.875% due 05/26/16 | | | 3,097,551
| | | | 4,729,251
| | |
| | 10,000,000 | | | Wendel SA
EUR4.875% due 09/21/15 (l) | | | 11,448,989
| | | | 13,553,132
| | |
| | | | 62,614,060 | | | | 65,332,275 | | |
Norway 0.03% | | | |
| | 5,500,000 | | | Den Norske Bank ASA FRN
USD0.813% due 02/28/13 (a)(k) | | | 3,888,750
| | | | 2,970,000
| | |
| | 3,170,000 | | | Den Norske Creditbank FRN
USD0.75% due 11/30/12 (a)(k) | | | 2,059,625
| | | | 1,680,100
| | |
| | 3,500,000 | | | Den Norske Creditbank FRN
USD0.859% due 02/28/13 (a)(k) | | | 2,610,000
| | | | 1,802,500
| | |
| | 10,000,000 | | | Nordea Bank Norge ASA FRN
USD0.938% due 05/21/13 (a)(k) | | | 6,826,750
| | | | 4,600,000
| | |
| | | | 15,385,125 | | | | 11,052,600 | | |
Total International Corporate Notes and Bonds | | | 106,504,581 | | | | 94,877,725 | | |
International Government Bonds — 0.51% | | | |
Hong Kong 0.26% | | | |
| | 732,250,000 | | | Hong Kong Government Bond
HKD2.66% due 12/17/12 | | | 94,766,599
| | | | 94,785,897
| | |
South Korea 0.07% | | | |
| | 25,417,980,000 | | | Inflation Linked Korea Treasury Bond
KRW2.75% due 03/10/17 (m) | | | 24,207,126
| | | | 25,590,494
| | |
Taiwan 0.18% | | | |
| | 1,826,000,000 | | | Taiwan Government Bond
TWD2.375% due 01/16/13 | | | 59,391,781
| | | | 62,712,388
| | |
Total International Government Bonds | | | 178,365,506 | | | | 183,088,779 | | |
Total International Notes and Bonds | | | 284,870,087 | | | | 277,966,504 | | |
Total Notes and Bonds | | | 316,347,938 | | | | 311,479,640 | | |
U.S. Treasury Bills — 1.28% | | | |
$ | 113,419,000 | | | U.S. Treasury Bill
0.07% due 01/03/13 | | | 113,406,099
| | | | 113,403,575
| | |
See Notes to Financial Statements.
FIRST EAGLE FUNDS | ANNUAL REPORT | OCTOBER 31, 2012
31
PRINCIPAL | | DESCRIPTION | | COST (NOTE 1) | | VALUE (NOTE 1) | |
U.S. Treasury Bills — 1.28% — (continued) | | | |
$ | 64,076,000 | | | U.S. Treasury Bill
0.09% due 02/07/13 | | $ | 64,054,855
| | | $ | 64,056,841
| | |
| | 145,489,000 | | | U.S. Treasury Bill
0.10% due 11/29/12 | | | 145,478,250
| | | | 145,478,250
| | |
| | 71,596,000 | | | U.S. Treasury Bill
0.10% due 01/24/13 | | | 71,580,129
| | | | 71,580,535
| | |
| | 71,596,000 | | | U.S. Treasury Bill
0.11% due 02/21/13 | | | 71,571,498
| | | | 71,570,369
| | |
Total U.S. Treasury Bills | | | 466,090,831 | | | | 466,089,570 | | |
Commercial Paper — 17.56% | | | |
International Commercial Paper — 6.04% | | | |
Australia 0.05% | | | |
| | 17,974,000 | | | Telstra Corporation Limited
USD0.22% due 12/10/12 | | | 17,969,716
| | | | 17,969,716
| | |
Canada 0.15% | | | |
| | 26,033,000 | | | Suncor Energy, Inc.
USD0.32% due 11/16/12 | | | 26,029,529
| | | | 26,029,529
| | |
| | 26,693,000 | | | Suncor Energy, Inc.
USD0.36% due 12/17/12 | | | 26,681,062
| | | | 26,681,062
| | |
France 0.96% | | | |
| | 22,353,000 | | | EI du Pont de Nemours & Company
USD0.13% due 11/08/12 | | | 22,352,435
| | | | 22,352,435
| | |
| | 34,924,000 | | | GDF Suez SA
USD0.21% due 11/05/12 | | | 34,923,185
| | | | 34,923,185
| | |
| | 18,018,000 | | | GDF Suez SA
USD0.22% due 11/14/12 | | | 18,016,569
| | | | 18,016,569
| | |
| | 69,762,000 | | | Sanofi
USD0.14% due 11/07/12 | | | 69,760,372
| | | | 69,760,372
| | |
| | 32,541,000 | | | Sanofi
USD0.14% due 11/13/12 | | | 32,539,481
| | | | 32,539,481
| | |
| | 107,291,000 | | | Total SA
USD0.13% due 11/15/12 | | | 107,285,576
| | | | 107,285,576
| | |
| | 62,586,000 | | | Total SA
USD0.14% due 12/18/12 | | | 62,574,561
| | | | 62,574,561
| | |
Germany 1.29% | | | |
| | 98,556,000 | | | BASF AG
USD0.14% due 11/27/12 | | | 98,546,035
| | | | 98,546,035
| | |
| | 64,830,000 | | | BASF AG
USD0.15% due 12/17/12 | | | 64,817,574
| | | | 64,817,574
| | |
| | 34,539,000 | | | BASF AG
USD0.15% due 12/18/12 | | | 34,532,236
| | | | 34,532,236
| | |
See Notes to Financial Statements.
FIRST EAGLE FUNDS | ANNUAL REPORT | OCTOBER 31, 2012
32
Schedule of Investments | Year Ended October 31, 2012
PRINCIPAL | | DESCRIPTION | | COST (NOTE 1) | | VALUE (NOTE 1) | |
International Commercial Paper — 6.04% — (continued) | | | |
Germany 1.29% — (continued) | | | |
| | 33,788,000 | | | BASF AG
USD0.15% due 12/27/12 | | $ | 33,780,116
| | | $ | 33,780,116
| | |
| | 12,736,000 | | | Henkel Corporation
USD0.14% due 11/01/12 | | | 12,736,000
| | | | 12,736,000
| | |
| | 9,642,000 | | | Henkel Corporation
USD0.15% due 11/21/12 | | | 9,641,197
| | | | 9,641,197
| | |
| | 47,589,000 | | | Siemens Company
USD0.13% due 11/02/12 | | | 47,588,828
| | | | 47,588,828
| | |
| | 33,065,000 | | | Siemens Company
USD0.13% due 11/13/12 | | | 33,063,567
| | | | 33,063,567
| | |
| | 39,115,000 | | | Siemens Company
USD0.13% due 11/26/12 | | | 39,111,469
| | | | 39,111,469
| | |
| | 48,811,000 | | | Siemens Company
USD0.13% due 11/30/12 | | | 48,805,888
| | | | 48,805,888
| | |
| | 31,575,000 | | | Siemens Company
USD0.15% due 11/02/12 | | | 31,574,869
| | | | 31,574,869
| | |
| | 15,919,000 | | | Siemens Company
USD0.15% due 12/14/12 | | | 15,916,148
| | | | 15,916,148
| | |
Italy 0.48% | | | |
| | 11,344,000 | | | Eni S.p.A.
USD0.46% due 11/01/12 | | | 11,344,000
| | | | 11,344,000
| | |
| | 60,067,000 | | | Eni S.p.A.
USD0.58% due 11/05/12 | | | 60,063,196
| | | | 60,063,196
| | |
| | 41,909,000 | | | Eni S.p.A.
USD0.61% due 11/08/12 | | | 41,904,110
| | | | 41,904,110
| | |
| | 62,586,000 | | | Eni S.p.A.
USD0.65% due 11/20/12 | | | 62,564,860
| | | | 62,564,860
| | |
Japan 0.17% | | | |
| | 22,850,000 | | | Mitsubishi Company
USD0.23% due 11/09/12 | | | 22,848,832
| | | | 22,848,832
| | |
| | 22,158,000 | | | Mitsui & Company Limited
USD0.33% due 11/06/12 | | | 22,156,985
| | | | 22,156,985
| | |
| | 15,573,000 | | | Mitsui & Company Limited
USD0.34% due 11/26/12 | | | 15,569,323
| | | | 15,569,323
| | |
Switzerland 0.73% | | | |
| | 12,193,000 | | | ABB Limited
USD0.20% due 11/13/12 | | | 12,192,187
| | | | 12,192,187
| | |
| | 35,798,000 | | | ABB Limited
USD0.22% due 12/10/12 | | | 35,789,468
| | | | 35,789,468
| | |
| | 26,452,000 | | | ABB Limited
USD0.22% due 12/13/12 | | | 26,445,211
| | | | 26,445,211
| | |
| | 41,909,000 | | | ABB Limited
USD0.22% due 12/14/12 | | | 41,897,987
| | | | 41,897,987
| | |
See Notes to Financial Statements.
FIRST EAGLE FUNDS | ANNUAL REPORT | OCTOBER 31, 2012
33
PRINCIPAL | | DESCRIPTION | | COST (NOTE 1) | | VALUE (NOTE 1) | |
International Commercial Paper — 6.04% — (continued) | | | |
Switzerland 0.73% — (continued) | | | |
| | 15,573,000 | | | Nestlé SA
USD0.08% due 12/06/12 | | $ | 15,571,789
| | | $ | 15,571,789
| | |
| | 34,637,000 | | | Nestlé SA
USD0.15% due 01/15/13 | | | 34,626,176
| | | | 34,627,714
| | |
| | 27,809,000 | | | Nestlé SA
USD0.16% due 01/16/13 | | | 27,799,607
| | | | 27,801,386
| | |
| | 71,135,000 | | | Nestlé SA
USD0.16% due 01/29/13 | | | 71,106,862
| | | | 71,108,324
| | |
United Kingdom 2.21% | | | |
| | 75,000,000 | | | AstraZeneca PLC
USD0.12% due 11/13/12 | | | 74,997,000
| | | | 74,997,000
| | |
| | 33,603,000 | | | AstraZeneca PLC
USD0.13% due 12/04/12 | | | 33,598,996
| | | | 33,598,996
| | |
| | 50,348,000 | | | AstraZeneca PLC
USD0.14% due 11/27/12 | | | 50,342,909
| | | | 50,342,909
| | |
| | 28,998,000 | | | AstraZeneca PLC
USD0.14% due 12/11/12 | | | 28,993,489
| | | | 28,993,489
| | |
| | 52,387,000 | | | AstraZeneca PLC
USD0.14% due 12/18/12 | | | 52,377,425
| | | | 52,377,425
| | |
| | 43,961,000 | | | AstraZeneca PLC
USD0.15% due 11/05/12 | | | 43,960,267
| | | | 43,960,267
| | |
| | 17,884,000 | | | AstraZeneca PLC
USD0.15% due 11/14/12 | | | 17,883,031
| | | | 17,883,031
| | |
| | 22,794,000 | | | AstraZeneca PLC
USD0.15% due 11/16/12 | | | 22,792,575
| | | | 22,792,575
| | |
| | 36,848,000 | | | AstraZeneca PLC
USD0.16% due 01/22/13 | | | 36,834,571
| | | | 36,825,232
| | |
| | 71,596,000 | | | AstraZeneca PLC
USD0.16% due 01/29/13 | | | 71,567,680
| | | | 71,545,883
| | |
| | 57,915,000 | | | GlaxoSmithKline PLC
USD0.12% due 11/01/12 | | | 57,915,000
| | | | 57,915,000
| | |
| | 47,496,000 | | | GlaxoSmithKline PLC
USD0.12% due 11/05/12 | | | 47,495,367
| | | | 47,495,367
| | |
| | 62,684,000 | | | GlaxoSmithKline PLC
USD0.12% due 11/08/12 | | | 62,682,537
| | | | 62,682,537
| | |
| | 112,739,000 | | | GlaxoSmithKline PLC
USD0.12% due 11/09/12 | | | 112,735,994
| | | | 112,735,994
| | |
| | 71,388,000 | | | GlaxoSmithKline PLC
USD0.12% due 11/15/12 | | | 71,384,668
| | | | 71,384,668
| | |
| | 19,155,000 | | | Reed Elsevier, Inc.
USD0.40% due 11/19/12 | | | 19,151,265
| | | | 19,151,265
| | |
Total International Commercial Paper | | | 2,194,839,780 | | | | 2,194,813,423 | | |
See Notes to Financial Statements.
FIRST EAGLE FUNDS | ANNUAL REPORT | OCTOBER 31, 2012
34
Schedule of Investments | Year Ended October 31, 2012
PRINCIPAL | | DESCRIPTION | | COST (NOTE 1) | | VALUE (NOTE 1) | |
U.S. Commercial Paper — 11.52% | | | |
$ | 45,373,000 | | | Apache Corporation
0.41% due 11/01/12 | | $ | 45,373,000
| | | $ | 45,373,000
| | |
| | 13,215,000 | | | Apache Corporation
0.45% due 11/08/12 | | | 13,213,869
| | | | 13,213,869
| | |
| | 39,379,000 | | | AutoZone, Inc.
0.38% due 11/09/12 | | | 39,375,762
| | | | 39,375,762
| | |
| | 33,366,000 | | | Campbell Soup Company
0.19% due 11/14/12 | | | 33,363,711
| | | | 33,363,711
| | |
| | 108,781,000 | | | Chevron Corporation
0.09% due 11/01/12 | | | 108,781,000
| | | | 108,781,000
| | |
| | 42,079,000 | | | Chevron Corporation
0.11% due 11/09/12 | | | 42,077,971
| | | | 42,077,971
| | |
| | 33,381,000 | | | Chevron Corporation
0.11% due 11/16/12 | | | 33,379,470
| | | | 33,379,470
| | |
| | 35,798,000 | | | Chevron Corporation
0.12% due 01/02/13 | | | 35,790,602
| | | | 35,783,280
| | |
| | 60,965,000 | | | Chevron Corporation
0.13% due 01/08/13 | | | 60,950,030
| | | | 60,936,371
| | |
| | 59,764,000 | | | Chevron Corporation
0.13% due 01/16/13 | | | 59,747,598
| | | | 59,731,022
| | |
| | 28,949,000 | | | Chevron Corporation
0.14% due 12/03/12 | | | 28,945,397
| | | | 28,945,397
| | |
| | 34,637,000 | | | Church & Dwight Company, Inc.
0.43% due 11/02/12 | | | 34,636,596
| | | | 34,636,596
| | |
| | 18,624,000 | | | Coca-Cola Company
0.17% due 11/16/12 | | | 18,622,681
| | | | 18,622,681
| | |
| | 17,534,000 | | | Coca-Cola Company
0.18% due 11/29/12 | | | 17,531,545
| | | | 17,531,545
| | |
| | 69,273,000 | | | Coca-Cola Company
0.18% due 01/28/13 | | | 69,242,520
| | | | 69,242,513
| | |
| | 63,529,000 | | | Coca-Cola Company
0.19% due 01/10/13 | | | 63,505,530
| | | | 63,510,456
| | |
| | 62,291,000 | | | Coca-Cola Company
0.20% due 01/24/13 | | | 62,261,931
| | | | 62,265,704
| | |
| | 45,050,000 | | | Coca-Cola Company
0.20% due 02/07/13 | | | 45,025,473
| | | | 45,026,214
| | |
| | 26,950,000 | | | Coca-Cola Company
0.21% due 12/10/12 | | | 26,943,869
| | | | 26,943,869
| | |
| | 24,770,000 | | | Coca-Cola Company
0.21% due 12/11/12 | | | 24,764,220
| | | | 24,764,220
| | |
| | 54,391,000 | | | Coca-Cola Company
0.21% due 12/19/12 | | | 54,375,771
| | | | 54,375,771
| | |
| | 24,947,000 | | | ConocoPhillips
0.15% due 11/20/12 | | | 24,945,025
| | | | 24,945,025
| | |
See Notes to Financial Statements.
FIRST EAGLE FUNDS | ANNUAL REPORT | OCTOBER 31, 2012
35
PRINCIPAL | | DESCRIPTION | | COST (NOTE 1) | | VALUE (NOTE 1) | |
U.S. Commercial Paper — 11.52% — (continued) | | | |
$ | 26,901,000 | | | ConocoPhillips
0.16% due 11/06/12 | | $ | 26,900,402
| | | $ | 26,900,402
| | |
| | 30,327,000 | | | ConocoPhillips
0.19% due 01/18/13 | | | 30,314,515
| | | | 30,316,219
| | |
| | 14,082,000 | | | ConocoPhillips
0.22% due 11/21/12 | | | 14,080,279
| | | | 14,080,279
| | |
| | 26,693,000 | | | Dell, Inc.
0.14% due 11/16/12 | | | 26,691,443
| | | | 26,691,443
| | |
| | 4,991,000 | | | Devon Energy Corporation
0.30% due 11/01/12 | | | 4,991,000
| | | | 4,991,000
| | |
| | 48,425,000 | | | Devon Energy Corporation
0.30% due 11/02/12 | | | 48,424,597
| | | | 48,424,597
| | |
| | 18,627,000 | | | Devon Energy Corporation
0.30% due 11/08/12 | | | 18,625,913
| | | | 18,625,913
| | |
| | 15,788,000 | | | Devon Energy Corporation
0.32% due 11/09/12 | | | 15,786,877
| | | | 15,786,877
| | |
| | 83,894,000 | | | Devon Energy Corporation
0.32% due 11/19/12 | | | 83,880,577
| | | | 83,880,577
| | |
| | 23,219,000 | | | Devon Energy Corporation
0.35% due 01/03/13 | | | 23,205,185
| | | | 23,203,134
| | |
| | 18,314,000 | | | Emerson Electric Company
0.12% due 11/27/12 | | | 18,312,413
| | | | 18,312,413
| | |
| | 23,649,000 | | | Emerson Electric Company
0.12% due 11/28/12 | | | 23,646,872
| | | | 23,646,872
| | |
| | 31,293,000 | | | Emerson Electric Company
0.12% due 12/27/12 | | | 31,287,159
| | | | 31,287,159
| | |
| | 21,041,000 | | | Emerson Electric Company
0.14% due 11/13/12 | | | 21,040,018
| | | | 21,040,018
| | |
| | 22,411,000 | | | Emerson Electric Company
0.14% due 11/14/12 | | | 22,409,867
| | | | 22,409,867
| | |
| | 48,865,000 | | | Emerson Electric Company
0.15% due 01/23/13 | | | 48,848,101
| | | | 48,845,615
| | |
| | 16,626,000 | | | General Mills, Inc.
0.27% due 11/16/12 | | | 16,624,130
| | | | 16,624,130
| | |
| | 15,919,000 | | | General Mills, Inc.
0.29% due 11/26/12 | | | 15,915,794
| | | | 15,915,794
| | |
| | 40,668,000 | | | Google, Inc.
0.09% due 11/02/12 | | | 40,667,898
| | | | 40,667,898
| | |
| | 49,274,000 | | | Google, Inc.
0.09% due 11/13/12 | | | 49,272,522
| | | | 49,272,522
| | |
| | 29,610,000 | | | Google, Inc.
0.10% due 12/03/12 | | | 29,607,368
| | | | 29,607,368
| | |
| | 20,213,000 | | | Google, Inc.
0.12% due 11/20/12 | | | 20,211,720
| | | | 20,211,720
| | |
See Notes to Financial Statements.
FIRST EAGLE FUNDS | ANNUAL REPORT | OCTOBER 31, 2012
36
Schedule of Investments | Year Ended October 31, 2012
PRINCIPAL | | DESCRIPTION | | COST (NOTE 1) | | VALUE (NOTE 1) | |
U.S. Commercial Paper — 11.52% — (continued) | | | |
$ | 39,049,000 | | | Google, Inc.
0.12% due 12/05/12 | | $ | 39,044,574
| | | $ | 39,044,574
| | |
| | 74,769,000 | | | H.J. Heinz Company Limited
0.36% due 01/23/13 | | | 74,708,666
| | | | 74,710,030
| | |
| | 48,603,000 | | | Johnson & Johnson
0.10% due 11/01/12 | | | 48,603,000
| | | | 48,603,000
| | |
| | 64,283,000 | | | Johnson & Johnson
0.10% due 12/03/12 | | | 64,277,286
| | | | 64,277,286
| | |
| | 73,697,000 | | | Johnson & Johnson
0.10% due 12/04/12 | | | 73,690,244
| | | | 73,690,244
| | |
| | 37,917,000 | | | Johnson & Johnson
0.10% due 12/05/12 | | | 37,913,419
| | | | 37,913,419
| | |
| | 66,978,000 | | | Johnson & Johnson
0.11% due 01/07/13 | | | 66,964,288
| | | | 66,963,707
| | |
| | 68,830,000 | | | Johnson & Johnson
0.11% due 01/09/13 | | | 68,815,488
| | | | 68,814,341
| | |
| | 30,030,000 | | | Kinder Morgan, Inc.
0.44% due 11/07/12 | | | 30,027,848
| | | | 30,027,848
| | |
| | 34,637,000 | | | McDonald's Corporation
0.11% due 11/14/12 | | | 34,635,624
| | | | 34,635,624
| | |
| | 20,034,000 | | | McDonald's Corporation
0.15% due 12/10/12 | | | 20,030,745
| | | | 20,030,745
| | |
| | 19,110,000 | | | Medtronic, Inc.
0.14% due 01/25/13 | | | 19,103,683
| | | | 19,098,891
| | |
| | 44,162,000 | | | Medtronic, Inc.
0.15% due 12/13/12 | | | 44,154,272
| | | | 44,154,272
| | |
| | 86,353,000 | | | Medtronic, Inc.
0.16% due 01/03/13 | | | 86,328,821
| | | | 86,321,274
| | |
| | 36,848,000 | | | Merck & Company, Inc.
0.11% due 11/26/12 | | | 36,845,185
| | | | 36,845,185
| | |
| | 12,736,000 | | | Merck & Company, Inc.
0.13% due 12/05/12 | | | 12,734,436
| | | | 12,734,436
| | |
| | 110,692,000 | | | Merck & Company, Inc.
0.13% due 12/12/12 | | | 110,675,611
| | | | 110,675,611
| | |
| | 32,166,000 | | | Parker-Hannifin Corporation
0.13% due 11/06/12 | | | 32,165,419
| | | | 32,165,419
| | |
| | 32,766,000 | | | Philip Morris International, Inc.
0.08% due 11/14/12 | | | 32,765,053
| | | | 32,765,053
| | |
| | 37,542,000 | | | Philip Morris International, Inc.
0.09% due 11/08/12 | | | 37,541,343
| | | | 37,541,343
| | |
| | 21,524,000 | | | Philip Morris International, Inc.
0.11% due 11/20/12 | | | 21,522,750
| | | | 21,522,750
| | |
| | 34,637,000 | | | Philip Morris International, Inc.
0.13% due 11/16/12 | | | 34,635,124
| | | | 34,635,124
| | |
See Notes to Financial Statements.
FIRST EAGLE FUNDS | ANNUAL REPORT | OCTOBER 31, 2012
37
PRINCIPAL | | DESCRIPTION | | COST (NOTE 1) | | VALUE (NOTE 1) | |
U.S. Commercial Paper — 11.52% — (continued) | | | |
$ | 34,924,000 | | | Praxair, Inc.
0.10% due 11/15/12 | | $ | 34,922,642
| | | $ | 34,922,642
| | |
| | 42,304,000 | | | Praxair, Inc.
0.11% due 11/07/12 | | | 42,303,224
| | | | 42,303,224
| | |
| | 31,999,000 | | | Precision Castparts Corporation
0.15% due 11/02/12 | | | 31,998,867
| | | | 31,998,867
| | |
| | 41,296,000 | | | Precision Castparts Corporation
0.19% due 12/20/12 | | | 41,285,320
| | | | 41,285,320
| | |
| | 18,149,000 | | | Precision Castparts Corporation
0.20% due 11/01/12 | | | 18,149,000
| | | | 18,149,000
| | |
| | 52,387,000 | | | Proctor & Gamble Company
0.12% due 11/09/12 | | | 52,385,603
| | | | 52,385,603
| | |
| | 49,149,000 | | | Proctor & Gamble Company
0.13% due 11/19/12 | | | 49,145,805
| | | | 49,145,805
| | |
| | 41,909,000 | | | Stanley Black & Decker Inc.
0.31% due 11/06/12 | | | 41,907,196
| | | | 41,907,196
| | |
| | 36,579,000 | | | Stanley Black & Decker Inc.
0.33% due 11/06/12 | | | 36,577,323
| | | | 36,577,323
| | |
| | 12,830,000 | | | Stanley Black & Decker Inc.
0.33% due 11/07/12 | | | 12,829,294
| | | | 12,829,294
| | |
| | 103,624,000 | | | United Healthcare Company
0.35% due 11/05/12 | | | 103,619,970
| | | | 103,619,970
| | |
| | 24,917,000 | | | United Parcel Service, Inc.
0.04% due 11/19/12 | | | 24,916,502
| | | | 24,916,502
| | |
| | 32,038,000 | | | United Parcel Service, Inc.
0.05% due 12/05/12 | | | 32,036,487
| | | | 32,036,487
| | |
| | 69,848,000 | | | United Technologies Corporation
0.13% due 11/20/12 | | | 69,843,208
| | | | 69,843,208
| | |
| | 49,597,000 | | | United Technologies Corporation
0.13% due 11/26/12 | | | 49,592,523
| | | | 49,592,523
| | |
| | 45,622,000 | | | United Technologies Corporation
0.13% due 11/28/12 | | | 45,617,552
| | | | 45,617,552
| | |
| | 13,407,000 | | | United Technologies Corporation
0.13% due 12/05/12 | | | 13,405,354
| | | | 13,405,354
| | |
| | 23,240,000 | | | United Technologies Corporation
0.15% due 11/08/12 | | | 23,239,322
| | | | 23,239,322
| | |
| | 25,823,000 | | | United Technologies Corporation
0.15% due 11/28/12 | | | 25,820,095
| | | | 25,820,095
| | |
| | 48,084,000 | | | Verizon Communications, Inc.
0.33% due 11/13/12 | | | 48,078,711
| | | | 48,078,711
| | |
| | 17,194,000 | | | Verizon Communications, Inc.
0.36% due 11/13/12 | | | 17,191,994
| | | | 17,191,994
| | |
| | 43,273,000 | | | Verizon Communications, Inc.
0.36% due 12/04/12 | | | 43,259,117
| | | | 43,259,117
| | |
See Notes to Financial Statements.
FIRST EAGLE FUNDS | ANNUAL REPORT | OCTOBER 31, 2012
38
Schedule of Investments | Year Ended October 31, 2012
PRINCIPAL | | DESCRIPTION | | COST (NOTE 1) | | VALUE (NOTE 1) | |
U.S. Commercial Paper — 11.52% — (continued) | | | |
$ | 17,870,000 | | | Verizon Communications, Inc.
0.36% due 12/05/12 | | $ | 17,864,093
| | | $ | 17,864,093
| | |
| | 12,742,000 | | | Verizon Communications, Inc.
0.36% due 12/10/12 | | | 12,737,169
| | | | 12,737,169
| | |
| | 14,902,000 | | | Verizon Communications, Inc.
0.39% due 12/13/12 | | | 14,895,393
| | | | 14,895,393
| | |
| | 48,059,000 | | | Verizon Communications, Inc.
0.39% due 12/14/12 | | | 48,037,187
| | | | 48,037,187
| | |
| | 24,041,000 | | | Verizon Communications, Inc.
0.42% due 12/06/12 | | | 24,031,417
| | | | 24,031,417
| | |
| | 24,430,000 | | | Verizon Communications, Inc.
0.42% due 12/11/12 | | | 24,418,871
| | | | 24,418,871
| | |
| | 13,960,000 | | | Verizon Communications, Inc.
0.42% due 12/12/12 | | | 13,953,481
| | | | 13,953,481
| | |
| | 78,232,000 | | | Wal-Mart Stores, Inc.
0.11% due 11/06/12 | | | 78,230,805
| | | | 78,230,805
| | |
| | 45,305,000 | | | Wal-Mart Stores, Inc.
0.12% due 11/05/12 | | | 45,304,396
| | | | 45,304,396
| | |
| | 70,832,000 | | | Wal-Mart Stores, Inc.
0.12% due 11/16/12 | | | 70,828,458
| | | | 70,828,458
| | |
| | 31,478,000 | | | Walt Disney Company
0.12% due 11/14/12 | | | 31,476,636
| | | | 31,476,636
| | |
| | 74,599,000 | | | Walt Disney Company
0.12% due 12/20/12 | | | 74,586,816
| | | | 74,586,816
| | |
| | 73,014,000 | | | Walt Disney Company
0.13% due 12/28/12 | | | 72,998,971
| | | | 72,998,971
| | |
| | 38,847,000 | | | Walt Disney Company
0.14% due 12/13/12 | | | 38,840,655
| | | | 38,840,655
| | |
| | 31,478,000 | | | Walt Disney Company
0.15% due 12/17/12 | | | 31,471,967
| | | | 31,471,967
| | |
| | 62,955,000 | | | Walt Disney Company
0.15% due 12/21/12 | | | 62,941,884
| | | | 62,941,884
| | |
| | 12,656,000 | | | WellPoint, Inc.
0.25% due 01/14/13 | | | 12,649,496
| | | | 12,647,562
| | |
| | 17,318,000 | | | WellPoint, Inc.
0.25% due 01/16/13 | | | 17,308,860
| | | | 17,305,999
| | |
| | 35,050,000 | | | WellPoint, Inc.
0.41% due 12/03/12 | | | 35,037,538
| | | | 35,037,538
| | |
Total U.S. Commercial Paper | | | 4,186,520,302 | | | | 4,186,471,847 | | |
Total Commercial Paper | | | 6,381,360,082 | | | | 6,381,285,270 | | |
Total Investment Portfolio
Excluding Options Written — 100.40% | | $ | 31,209,839,083 | | | $ | 36,488,670,849 | | |
See Notes to Financial Statements.
FIRST EAGLE FUNDS | ANNUAL REPORT | OCTOBER 31, 2012
39
CONTRACTS | | DESCRIPTION | | STRIKE PRICE | | EXPIRATION DATE | | VALUE (NOTE 1) | |
Covered Call Options Written — (0.01)% | |
| | 16,710 | | | KLA-Tencor Corporation | | $ | 55.00 | | | January 2013 | | $ | (334,200 | ) | |
| | 15,221 | | | Phillips 66 | | | 49.00 | | | November 2012 | | | (1,217,680 | ) | |
Total Covered Call Options Written (Premiums Received: $6,108,142) | | | | | | | | | | | | | | | (1,551,880 | ) | |
Total Investments — 100.39% (Cost: $31,203,730,941) | | | | | | | | | | | | | | | 36,487,118,969 | | |
Liabilities in Excess of Other Assets — (0.39)% | | | | | | | | | | | | | | | (143,504,547 | ) | |
Net Assets — 100.00% | | | | | | | | | | | | | | $ | 36,343,614,422 | | |
(a) Security is deemed illiquid. At October 31, 2012, the value of these securities amounted to $104,152,681 or 0.29% of net assets.
(b) Non-income producing security/commodity.
(c) At October 31, 2012, all or a portion of this security was segregated to cover collateral requirement for options.
(d) An affiliate of the Fund as defined by the Investment Company Act of 1940. An affiliate is defined as a company in which the Fund directly or indirectly owns, controls, or holds power to vote 5% or more of the outstanding voting securities.
(e) Represents variable voting shares.
(f) Securities valued in accordance with fair value procedures under the supervision of the Board of Trustees, representing $41,849,439 or 0.12% of net assets.
(g) Represents non-voting class of shares.
Held through Financiere Rouge, LLC, wholly owned subsidiary and disregarded entity for U.S. tax purposes.
(h) Represents securities that are subject to legal or contractual restrictions on resale. At October 31, 2012, the value of these securities amounted to $56,282,738 or 0.14% of net assets.
(i) Payment-in-kind security.
(j) All or a portion of the security is exempt from registration under the Securities Act of 1933. Rule 144A securities may only be sold to qualified institutional buyers, pursuant to Rule 144A under the Securities Act of 1933.
(k) Floating rate security. Rate shown is the rate in effect at October 31, 2012.
(l) Represents a security registered under Regulation S. Bonds sold under Regulation S may not be offered, sold or delivered within the U.S., or for the account or benefit of, U.S. persons, except pursuant to an exemption from, or in a transaction not subject to, the registration requirements of the Securities Act of 1933.
(m) Inflation protected security.
See Notes to Financial Statements.
FIRST EAGLE FUNDS | ANNUAL REPORT | OCTOBER 31, 2012
40
Schedule of Investments | Year Ended October 31, 2012
At October 31, 2012, aggregate cost for federal income tax purposes, was $31,525,861,831. Net unrealized appreciation consisted of:
Gross unrealized appreciation | | $ | 6,685,944,338 | | |
Gross unrealized depreciation | | | (1,724,687,200 | ) | |
Net unrealized appreciation | | $ | 4,961,257,138 | | |
Abbreviations used in this schedule include:
ADR — American Depository Receipt
FRN — Floating Rate Note
NVDR — Non-Voting Depository Receipt
PC — Participation Certificate
PCL — Public Company Limited
PLC — Public Limited Company
REIT — Real Estate Investment Trust
RSP — Represents Non-Voting Shares
Currencies
EUR — Euro
HKD — Hong Kong Dollar
KRW — South Korean Won
TWD — Taiwan Dollar
USD — United States Dollar
RESTRICTED SECURITIES | | ACQUISITION
DATE | | COST | | CARRYING VALUE PER
SHARE/PRINCIPAL | |
Catalyst Paper Corporation | | 09/17/12 | | $ | 17,346 | | | $ | 1.05 | | |
Catalyst Paper Corporation 11.00% due 10/30/17 | | 09/17/12 | | | 25,160,075 | | | | 0.82 | | |
Catalyst Paper Corporation FRN 10.313%
due 09/13/16 | | 08/31/12 | | | 3,345,321 | | | | 1.02 | | |
Emin Leydier SA FRN 7.358% due 07/31/16 | | 07/30/09 | | | 21,437,036 | | | | 1.30 | | |
FINEL 9.50% due 06/30/17 | | 06/22/05 | | | 14,495,954 | | | | 0.97 | | |
FINEL | | 07/30/09 | | | — | | | | 0.47 | | |
Foreign Currency Exchange Contracts — Sales
SETTLEMENT
DATES
THROUGH | | FOREIGN CURRENCY
TO BE DELIVERED | | U.S. $
TO BE
RECEIVED | | U.S. $ VALUE
AT OCTOBER 31,
2012 | | UNREALIZED
APPRECIATION
AT OCTOBER 31,
2012 | | UNREALIZED
DEPRECIATION
AT OCTOBER 31,
2012 | |
01/16/13 | | | 235,489,000 | | | Euro | | $ | 290,567,838 | | | $ | 305,621,016 | | | $ | — | | | $ | (15,053,178 | ) | |
02/20/13 | | | 334,273,000 | | | Euro | | | 417,024,977 | | | | 433,914,221 | | | | — | | | | (16,889,244 | ) | |
03/21/13 | | | 228,250,000 | | | Euro | | | 288,606,148 | | | | 296,443,818 | | | | — | | | | (7,837,670 | ) | |
04/17/13 | | | 86,649,000 | | | Euro | | | 111,909,783 | | | | 112,565,470 | | | | — | | | | (655,687 | ) | |
12/12/12 | | | 51,309,629,000 | | | Japanese Yen | | | 645,012,462 | | | | 642,735,770 | | | | 2,276,692 | | | | — | | |
02/20/13 | | | 97,544,102,000 | | | Japanese Yen | | | 1,237,773,057 | | | | 1,222,776,951 | | | | 14,996,106 | | | | — | | |
03/21/13 | | | 35,204,492,000 | | | Japanese Yen | | | 447,143,372 | | | | 441,522,690 | | | | 5,620,682 | | | | — | | |
04/17/13 | | | 33,255,587,000 | | | Japanese Yen | | | 425,794,142 | | | | 417,204,903 | | | | 8,589,239 | | | | — | | |
| | | | | | | $ | 3,863,831,779 | | | $ | 3,872,784,839 | | | $ | 31,482,719 | | | $ | (40,435,779 | ) | |
See Notes to Financial Statements.
FIRST EAGLE FUNDS | ANNUAL REPORT | OCTOBER 31, 2012
41
Affiliated Securities
AFFILIATED
SECURITIES | | SHARES
OCTOBER 31,
2011 | | GROSS
ADDITIONS | | GROSS
REDUCTIONS | | SHARES
OCTOBER 31,
2012 | | MARKET VALUE
OCTOBER 31,
2012 | | REALIZED
GAIN/(LOSS) | | DIVIDEND
INCOME | |
Alliant
Techsystems,
Inc. | | | 3,337,753 | | | | 300,494 | | | | — | | | | 3,638,247 | | | $ | 208,435,171 | | | $ | — | | | $ | 2,705,451 | | |
Ariake Japan
Company
Limited* | | | 1,725,100 | | | | — | | | | 454,100 | | | | 1,271,000 | | | | 27,091,321 | | | | 938,571 | | | | 700,755 | | |
Berkeley
Group
Holdings PLC | | | 9,342,277 | | | | — | | | | — | | | | 9,342,277 | | | | 229,408,505 | | | | — | | | | — | | |
Blount
International,
Inc.* | | | 7,574,592 | | | | | | 5,459,291 | | | | 2,115,301 | | | | 27,985,432 | | | | 15,569,837 | | | | — | | |
Catalyst
Paper
Corporation | | | — | | | | 1,008,427 | | | | — | | | | 1,008,427 | | | | 1,058,848 | | | | — | | | | — | | |
Chofu
Seisakusho
Company
Limited | | | 3,526,280 | | | | — | | | | — | | | | 3,526,280 | | | | 81,124,313 | | | | — | | | | 1,248,075 | | |
Cincinnati
Financial
Corporation | | | 9,542,046 | | | | — | | | | 1,030,895 | | | | 8,511,151 | | | | 339,084,256 | | | | 11,650,013 | | | | 15,211,870 | | |
Cintas
Corporation | | | 13,051,511 | | | | — | | | | — | | | | 13,051,511 | | | | 545,683,675 | | | | — | | | | 7,047,816 | | |
City
e-Solutions
Limited | | | 20,738,780 | | | | — | | | | — | | | | 20,738,780 | | | | 1,859,764 | | | | — | | | | — | | |
Deltic
Timber
Corporation | | | 1,258,500 | | | | — | | | | 9,118 | | | | 1,249,382 | | | | 84,783,063 | | | | 147,613 | | | | 377,550 | | |
FINEL | | | 12,000,000 | | | | — | | | | — | | | | 12,000,000 | | | | 5,603,040 | | | | — | | | | — | | |
Guyenne et
Gascogne SA* | | | 956,044 | | | | | | 956,044 | | | | — | | | | — | | | | — | | | | 7,267,009 | | |
Hirose
Electric
Company
Limited | | | 2,318,500 | | | | — | | | | — | | | | 2,318,500 | | | | 247,964,809 | | | | — | | | | 3,372,549 | | |
IDACorp,
Inc. | | | 3,760,485 | | | | — | | | | — | | | | 3,760,485 | | | | 168,168,889 | | | | — | | | | 4,851,026 | | |
Meitec
Corporation* | | | 2,719,100 | | | | | | 1,563,280 | | | | 1,155,820 | | | | 25,446,857 | | | | (12,562,997 | ) | | | 1,259,531 | | |
Mills Music
Trust | | | 34,924 | | | | — | | | | 1,032 | | | | 33,892 | | | | 1,267,561 | | | | 2,054 | | | | 88,323 | | |
MISUMI
Group, Inc. | | | 12,811,860 | | | | — | | | | — | | | | 12,811,860 | | | | 314,319,771 | | | | — | | | | 5,476,826 | | |
Namyang
Dairy
Products
Company
Limited | | | 39,989 | | | | — | | | | — | | | | 39,989 | | | | 34,650,289 | | | | — | | | | 28,894 | | |
Neopost SA | | | 2,044,437 | | | | — | | | | — | | | | 2,044,437 | | | | 111,991,799 | | | | — | | | | 8,596,524 | | |
See Notes to Financial Statements.
FIRST EAGLE FUNDS | ANNUAL REPORT | OCTOBER 31, 2012
42
Schedule of Investments | Year Ended October 31, 2012
Affiliated Securities — (continued)
AFFILIATED
SECURITIES | | SHARES
OCTOBER 31,
2011 | | GROSS
ADDITIONS | | GROSS
REDUCTIONS | | SHARES
OCTOBER 31,
2012 | | MARKET VALUE
OCTOBER 31,
2012 | | REALIZED
GAIN/(LOSS) | | DIVIDEND
INCOME | |
NSC Groupe | | | 69,500 | | | | — | | | | — | | | | 69,500 | | | $ | 5,850,184 | | | $ | — | | | $ | 281,134 | | |
Robertet SA | | | 157,260 | | | | — | | | | — | | | | 157,260 | | | | 26,311,643 | | | | — | | | | 455,651 | | |
Sabeton SA | | | 385,000 | | | | — | | | | — | | | | 385,000 | | | | 6,141,944 | | | | — | | | | 89,785 | | |
San Juan
Basin
Royalty
Trust | | | 3,975,644 | | | | — | | | | 67,609 | | | | 3,908,035 | | | | 54,751,570 | | | | (1,199,360 | ) | | | 3,816,725 | | |
Scotts
Miracle-Gro
Company | | | 591,920 | | | | 3,580,657 | | | | — | | | | 4,172,577 | | | | 178,628,021 | | | | — | | | | 3,573,888 | | |
Shimano, Inc. | | | 7,609,390 | | | | — | | | | 639,700 | | | | 6,969,690 | | | | 439,042,463 | | | | 14,887,449 | | | | 6,096,943 | | |
Société
Télévision
Francaise 1 | | | 11,533,583 | | | | 342,719 | | | | 72,940 | | | | 11,803,362 | | | | 101,483,102 | | | | (633,504 | ) | | | 7,300,138 | | |
Sucrière de
Pithiviers-
Le-Vieil* | | | 63,019 | | | | | | 63,019 | | | | — | | | | — | | | | 105,965,690 | | | | — | | |
T. Hasegawa
Company
Limited | | | 5,147,000 | | | | — | | | | — | | | | 5,147,000 | | | | 65,167,401 | | | | — | | | | 1,501,115 | | |
Total | | | | | | | | | | $ | 3,333,303,691 | | | $ | 134,765,366 | | | $ | 81,347,578 | | |
* Represents an unaffiliated issuer as of October 31, 2012, as such, amounts represented above will not agree to balances in the Statements of Assets and Liabilities and Statements of Operations.
INDUSTRY DIVERSIFICATION FOR PORTFOLIO HOLDINGS | | PERCENT OF
NET ASSETS | |
U.S. Common Stocks | |
Consumer Discretionary | | | 2.78 | % | |
Consumer Staples | | | 2.91 | | |
Energy | | | 2.46 | | |
Financials | | | 8.88 | | |
Health Care | | | 0.96 | | |
Industrials | | | 4.80 | | |
Information Technology | | | 7.54 | | |
Materials | | | 1.94 | | |
Utilities | | | 2.18 | | |
Total U.S. Common Stocks | | | 34.45 | | |
See Notes to Financial Statements.
FIRST EAGLE FUNDS | ANNUAL REPORT | OCTOBER 31, 2012
43
INDUSTRY DIVERSIFICATION FOR PORTFOLIO HOLDINGS — (CONTINUED) | | PERCENT OF
NET ASSETS | |
International Common Stocks | |
Consumer Discretionary | | | 5.09 | % | |
Consumer Staples | | | 3.81 | | |
Energy | | | 2.30 | | |
Financials | | | 5.42 | | |
Health Care | | | 3.58 | | |
Industrials | | | 7.09 | | |
Information Technology | | | 3.89 | | |
Materials | | | 7.66 | | |
Telecommunication Services | | | 1.38 | | |
Utilities | | | 0.43 | | |
Total International Common Stocks | | | 40.65 | | |
International Preferred Stocks | |
Consumer Discretionary | | | 0.32 | | |
Information Technology | | | 0.12 | | |
Total International Preferred Stocks | | | 0.44 | | |
Warrant | | | 0.18 | | |
Commodity | | | 4.98 | | |
U.S. Corporate Bonds | |
Consumer Discretionary | | | 0.09 | | |
Total U.S. Corporate Bonds | | | 0.09 | | |
International Notes and Bonds | |
Financials | | | 0.16 | | |
Government Issues | | | 0.51 | | |
Materials | | | 0.10 | | |
Total International Notes and Bonds | | | 0.77 | | |
U.S. Treasury Bills | | | 1.28 | | |
See Notes to Financial Statements.
FIRST EAGLE FUNDS | ANNUAL REPORT | OCTOBER 31, 2012
44
Schedule of Investments | Year Ended October 31, 2012
INDUSTRY DIVERSIFICATION FOR PORTFOLIO HOLDINGS — (CONTINUED) | | PERCENT OF
NET ASSETS | |
Commercial Paper | |
International Commercial Paper | | | 6.04 | % | |
U.S. Commercial Paper | | | 11.52 | | |
Total Commercial Paper | | | 17.56 | | |
Covered Call Options Written | | | (0.01) | | |
Total Investments | | | 100.39 | % | |
See Notes to Financial Statements.
FIRST EAGLE FUNDS | ANNUAL REPORT | OCTOBER 31, 2012
45

Fund Overview | Data as of October 31, 2012 (unaudited)
INVESTMENT OBJECTIVE
The First Eagle Overseas Fund seeks long-term growth of capital by investing primarily in equities issued by non-U.S. corporations. Management's research-driven process seeks to minimize risk by focusing on undervalued securities.
Average Annual Returns | |
| | | ONE-YEAR | | FIVE-YEARS | | TEN-YEARS | |
First Eagle Overseas
Fund (A Shares) | |
without sales load | | | 5.06 | % | | | 2.57 | % | | | 13.03 | % | |
with sales load | | | –0.18 | | | | 1.52 | | | | 12.45 | | |
MSCI EAFE Index | | | 4.61 | | | | –5.81 | | | | 7.73 | | |
Consumer Price Index | | | 2.16 | | | | 2.05 | | | | 2.46 | | |
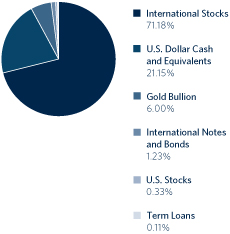
Countries** | |
Japan | | | 27.23 | % | |
France | | | 8.23 | | |
United States | | | 6.33 | | |
Germany | | | 5.07 | | |
Canada | | | 4.31 | | |
Switzerland | | | 3.51 | | |
United Kingdom | | | 2.67 | | |
Mexico | | | 2.59 | | |
South Korea | | | 2.47 | | |
Singapore | | | 2.28 | | |
Thailand | | | 2.09 | | |
Hong Kong | | | 1.55 | | |
South Africa | | | 1.11 | | |
Netherlands | | | 1.06 | | |
Austria | | | 1.04 | | |
Sweden | | | 0.86 | | |
Australia | | | 0.75 | | |
Spain | | | 0.70 | | |
Bermuda | | | 0.65 | | |
Greece | | | 0.63 | | |
Malaysia | | | 0.58 | | |
Ireland | | | 0.58 | | |
Norway | | | 0.57 | | |
Taiwan | | | 0.55 | | |
Belgium | | | 0.41 | | |
Italy | | | 0.40 | | |
Israel | | | 0.40 | | |
Turkey | | | 0.23 | | |
* Asset Allocation and Countries percentages are based on total investments in the portfolio.
** Country allocations reflect country of the issuer (not currency of issue) and exclude short term investments. Bonds of non-U.S. issuers may be U.S. dollar denominated.
The Fund's portfolio composition is subject to change at any time.
FIRST EAGLE FUNDS | ANNUAL REPORT | OCTOBER 31, 2012
46
Growth of a $10,000 Initial Investment
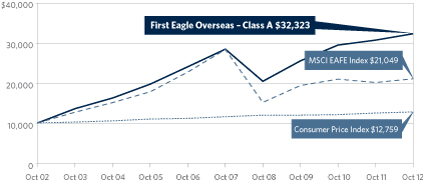
Performance data quoted herein represents past performance and should not be considered indicative of future results. Performance data quoted herein does not reflect the deduction of taxes that a shareholder would pay on Fund distributions or the sale of Fund shares. The average annual returns shown above are historical and reflect changes in share price, reinvested dividends and are net of expenses.
The average annual returns for Class A Shares give effect to the deduction of the maximum sales charge of 5.00%.
The MSCI EAFE Index is a total return index, reported in U.S. Dollars, based on share prices and reinvested net dividends of approximately 1,100 companies from 22 countries and is not available for purchase. The Consumer Price Index (CPI) represents the change in price of all goods and services purchased for consumption by urban households.
Top 10 Holdings* | |
| Gold Bullion (precious metal) | | | 5.99 | % | |
| Secom Company Limited (Japanese security services provider) | | | 1.87 | | |
| Fanuc Corporation (Japanese automated machine tools manufacturer) | | | 1.84 | | |
| Shimano, Inc. (Japanese bicycle parts manufacturer) | | | 1.77 | | |
| Keyence Corporation (Japanese sensors manufacturer) | | | 1.76 | | |
| HeidelbergCement AG (German cement company) | | | 1.69 | | |
| SMC Corporation (Japanese automated control devices manufacturer) | | | 1.66 | | |
| Grupo Televisa S.A.B., ADR (Mexican media company) | | | 1.59 | | |
| Agnico-Eagle Mines Limited (Canadian gold mining company) | | | 1.49 | | |
| Nestlé SA (Swiss food and nutrition company) | | | 1.46 | | |
Total | | | 21.12 | % | |
* Holdings in cash, commercial paper and other short term cash equivalents have been excluded. Percentages are based on total net assets.
FIRST EAGLE FUNDS | ANNUAL REPORT | OCTOBER 31, 2012
47
First Eagle Overseas Fund
SHARES | | DESCRIPTION | | COST (NOTE 1) | | VALUE (NOTE 1) | |
Common Stocks — 70.33% | | | |
International Common Stocks — 70.00% | | | |
Australia 0.75% | | | |
| | 3,089,899 | | | Newcrest Mining Limited | | $ | 101,305,087 | | | $ | 84,773,400 | | |
Austria 1.03% | | | |
| | 2,047,932 | | | OMV AG | | | 83,876,284 | | | | 74,903,934 | | |
| | 5,915,786 | | | Wienerberger AG (a) | | | 88,605,267 | | | | 42,445,790 | | |
| | | | 172,481,551 | | | | 117,349,724 | | |
Belgium 0.41% | | | |
| | 558,821 | | | Groupe Bruxelles Lambert SA | | | 41,955,690 | | | | 41,284,087 | | |
| | 57,420 | | | Sofina SA | | | 4,474,251 | | | | 4,878,030 | | |
| | | | 46,429,941 | | | | 46,162,117 | | |
Bermuda 0.65% | | | |
| | 1,192,400 | | | Jardine Matheson Holdings Limited | | | 38,970,319 | | | | 73,451,840 | | |
Canada 4.10% | | | |
| | 3,000,311 | | | Agnico-Eagle Mines Limited | | | 105,249,766 | | | | 169,238,309 | | |
| | 2,473,097 | | | Cenovus Energy, Inc. | | | 55,777,614 | | | | 87,325,055 | | |
| | 6,044,695 | | | Penn West Petroleum Limited | | | 108,406,936 | | | | 78,520,588 | | |
| | 1,753,368 | | | Nexen, Inc. | | | 27,495,899 | | | | 41,905,495 | | |
| | 832,760 | | | Potash Corporation of
Saskatchewan, Inc. | | | 33,698,719
| | | | 33,618,521
| | |
| | 690,927 | | | Cogeco Cable, Inc. | | | 28,978,874 | | | | 26,373,686 | | |
| | 1,100,050 | | | EnCana Corporation | | | 14,298,775 | | | | 24,806,128 | | |
| | 875,938 | | | Postmedia Network Canada
Corporation (b)(c)(d) | | | 5,591,396
| | | | 1,752,402
| | |
| | 1,217,500 | | | Catalyst Paper Corporation (a)(b)(c)(e) | | | 21,436 | | | | 1,278,375 | | |
| | | | 379,519,415 | | | | 464,818,559 | | |
France 8.01% | | | |
| | 1,660,633 | | | Sanofi | | | 135,351,026 | | | | 146,073,501 | | |
| | 1,472,625 | | | Sodexo | | | 40,712,418 | | | | 113,396,384 | | |
| | 2,216,680 | | | Total SA | | | 121,387,550 | | | | 111,608,822 | | |
| | 4,285,607 | | | Bouygues SA | | | 168,464,325 | | | | 103,136,714 | | |
| | 4,130,173 | | | Carrefour SA | | | 132,598,775 | | | | 99,851,396 | | |
| | 5,931,165 | | | Société Télévision Francaise 1 | | | 93,465,134 | | | | 50,995,049 | | |
| | 558,938 | | | Laurent-Perrier (a) | | | 19,851,603 | | | | 47,701,224 | | |
| | 827,900 | | | Neopost SA | | | 44,073,366 | | | | 45,351,366 | | |
| | 505,501 | | | Wendel SA | | | 10,862,584 | | | | 44,576,611 | | |
| | 235,837 | | | Robertet SA (a)(c) | | | 20,591,063 | | | | 39,458,597 | | |
| | 51,500 | | | Robertet SA CI (b)(c)(f)(g) | | | 2,151,628 | | | | 6,238,700 | | |
See Notes to Financial Statements.
FIRST EAGLE FUNDS | ANNUAL REPORT | OCTOBER 31, 2012
48
Schedule of Investments | Year Ended October 31, 2012
SHARES | | DESCRIPTION | | COST (NOTE 1) | | VALUE (NOTE 1) | |
International Common Stocks — 70.00% — (continued) | | | |
France 8.01% — (continued) | | | |
| | 896,416 | | | Fregate (a)(b)(e)(f) | | $ | 23,119,325 | | | $ | 25,252,792 | | |
| | 514,850 | | | Legrand SA | | | 16,026,208 | | | | 19,845,841 | | |
| | 364,373 | | | Gaumont SA | | | 21,698,753 | | | | 18,662,650 | | |
| | 442,830 | | | Société Foncière Financière et
de Participations | | | 29,139,582
| | | | 15,702,743
| | |
| | 146,562 | | | BioMerieux | | | 11,367,766 | | | | 14,199,792 | | |
| | 11,593,581 | | | FINEL (a)(b)(c)(e)(f)(h) | | | 9,166,547 | | | | 5,413,275 | | |
| | 100,000 | | | Sabeton SA (c) | | | 1,463,142 | | | | 1,595,310 | | |
| | | | 901,490,795 | | | | 909,060,767 | | |
Germany 4.28% | | | |
| | 3,619,240 | | | HeidelbergCement AG | | | 200,929,134 | | | | 191,943,974 | | |
| | 7,285,662 | | | Deutsche Wohnen AG | | | 77,645,322 | | | | 133,615,985 | | |
| | 1,913,346 | | | Daimler AG | | | 90,981,705 | | | | 89,399,994 | | |
| | 2,198,673 | | | Hamburger Hafen und Logistik AG | | | 70,127,833 | | | | 53,426,206 | | |
| | 296,503 | | | Fraport AG | | | 8,930,449 | | | | 17,397,694 | | |
| | | | 448,614,443 | | | | 485,783,853 | | |
Greece 0.62% | | | |
| | 10,722,438 | | | Jumbo SA (a) | | | 60,030,796 | | | | 70,925,713 | | |
Hong Kong 0.91% | | | |
| | 7,806,340 | | | Guoco Group Limited | | | 57,283,838 | | | | 72,119,113 | | |
| | 8,166,100 | | | Hopewell Holdings Limited | | | 11,153,124 | | | | 29,555,442 | | |
| | 10,851,720 | | | City e-Solutions Limited (b)(c) | | | 323,358 | | | | 973,135 | | |
| | 210,000 | | | Great Eagle Holdings Limited | | | 649,595 | | | | 621,859 | | |
| | | | 69,409,915 | | | | 103,269,549 | | |
Ireland 0.58% | | | |
| | 3,525,364 | | | CRH PLC | | | 60,343,070 | | | | 65,637,480 | | |
Israel 0.40% | | | |
| | 3,627,690 | | | Israel Chemicals Limited | | | 37,500,950 | | | | 45,379,389 | | |
Italy 0.40% | | | |
| | 7,315,306 | | | Italcementi S.p.A. RSP | | | 87,341,485 | | | | 18,691,266 | | |
| | 1,197,736 | | | Italmobiliare S.p.A. RSP (c) | | | 50,324,930 | | | | 13,126,768 | | |
| | 168,142 | | | Italmobiliare S.p.A. (c) | | | 19,250,153 | | | | 2,590,792 | | |
| | 1,385,400 | | | Recordati S.p.A. | | | 9,200,042 | | | | 11,095,634 | | |
| | | | 166,116,610 | | | | 45,504,460 | | |
Japan 27.17% | | | |
| | 4,170,700 | | | Secom Company Limited | | | 178,984,614 | | | | 212,321,797 | | |
| | 1,309,840 | | | Fanuc Corporation | | | 119,983,748 | | | | 208,491,752 | | |
See Notes to Financial Statements.
FIRST EAGLE FUNDS | ANNUAL REPORT | OCTOBER 31, 2012
49
SHARES | | DESCRIPTION | | COST (NOTE 1) | | VALUE (NOTE 1) | |
International Common Stocks — 70.00% — (continued) | | | |
Japan 27.17% — (continued) | | | |
| | 3,184,470 | | | Shimano, Inc. | | $ | 46,710,828 | | | $ | 200,599,676 | | |
| | 753,300 | | | Keyence Corporation | | | 138,894,513 | | | | 199,810,820 | | |
| | 1,193,590 | | | SMC Corporation | | | 153,637,312 | | | | 188,044,611 | | |
| | 2,105,700 | | | KDDI Corporation | | | 134,141,915 | | | | 163,498,309 | | |
| | 3,260,440 | | | Astellas Pharma, Inc. | | | 133,084,592 | | | | 161,899,118 | | |
| | 7,316,700 | | | NKSJ Holdings, Inc. | | | 201,780,857 | | | | 133,322,461 | | |
| | 7,730,800 | | | MS&AD Insurance Group Holdings | | | 179,151,117 | | | | 130,992,767 | | |
| | 5,910,230 | | | Hoya Corporation | | | 128,298,187 | | | | 119,610,917 | | |
| | 1,936,000 | | | Ono Pharmaceutical Company Limited | | | 74,685,086 | | | | 116,863,118 | | |
| | 1,050,800 | | | Hirose Electric Company Limited | | | 115,774,722 | | | | 112,383,619 | | |
| | 5,571,150 | | | Mitsubishi Estate Company Limited | | | 83,913,152 | | | | 110,167,137 | | |
| | 4,092,170 | | | MISUMI Group, Inc. | | | 70,195,915 | | | | 100,395,254 | | |
| | 2,150,230 | | | Nissin Foods Holdings
Company Limited | | | 76,236,479
| | | | 81,323,664
| | |
| | 3,498,960 | | | Nomura Research Institute Limited | | | 68,063,992 | | | | 74,273,478 | | |
| | 6,832,730 | | | Kansai Paint Company Limited | | | 53,674,114 | | | | 73,504,259 | | |
| | 2,035,070 | | | Canon, Inc. | | | 97,083,761 | | | | 65,703,325 | | |
| | 2,485,480 | | | Daiichikosho Company Limited | | | 27,081,143 | | | | 61,475,554 | | |
| | 2,657,590 | | | Nitto Kohki Company Limited (a) | | | 46,435,145 | | | | 60,041,232 | | |
| | 2,023,800 | | | Chofu Seisakusho Company Limited (a) | | | 33,120,144 | | | | 46,558,805 | | |
| | 6,577,300 | | | Japan Wool Textile
Company Limited (a) | | | 49,871,284
| | | | 45,139,141
| | |
| | 793,980 | | | Shin-Etsu Chemical Company Limited | | | 37,295,453 | | | | 44,745,272 | | |
| | 3,206,911 | | | T. Hasegawa Company Limited (a) | | | 43,073,853 | | | | 40,603,469 | | |
| | 1,966,300 | | | THK Company Limited | | | 31,346,808 | | | | 32,677,271 | | |
| | 21,981 | | | NTT DoCoMo, Inc. | | | 33,331,355 | | | | 32,290,185 | | |
| | 2,013,324 | | | Nagaileben Company Limited (a) | | | 19,961,972 | | | | 29,550,604 | | |
| | 1,286,140 | | | As One Corporation (a) | | | 26,246,127 | | | | 26,592,575 | | |
| | 2,184,600 | | | Seikagaku Corporation | | | 17,648,500 | | | | 25,033,300 | | |
| | 1,157,100 | | | Ariake Japan Company Limited | | | 23,845,406 | | | | 24,663,547 | | |
| | 2,535,900 | | | Yomeishu Seizo Company Limited (a) | | | 22,847,623 | | | | 22,389,599 | | |
| | 508,106 | | | SK Kaken Company Limited | | | 9,470,131 | | | | 21,762,336 | | |
| | 2,068,330 | | | Maezawa Kasei Industries
Company Limited (a) | | | 31,939,631
| | | | 21,576,943
| | |
| | 974,746 | | | Matsumoto Yushi-Seiyaku
Company Limited (a)(b) | | | 23,757,005
| | | | 21,118,480
| | |
| | 1,549,790 | | | OSG Corporation | | | 17,248,953 | | | | 20,282,161 | | |
See Notes to Financial Statements.
FIRST EAGLE FUNDS | ANNUAL REPORT | OCTOBER 31, 2012
50
Schedule of Investments | Year Ended October 31, 2012
SHARES | | DESCRIPTION | | COST (NOTE 1) | | VALUE (NOTE 1) | |
International Common Stocks — 70.00% — (continued) | | | |
Japan 27.17% — (continued) | | | |
| | 493,250 | | | Mandom Corporation | | $ | 6,249,764 | | | $ | 13,021,553 | | |
| | 2,387,843 | | | TOMONY Holdings, Inc. | | | 16,083,861 | | | | 10,017,876 | | |
| | 407,257 | | | Meitec Corporation | | | 11,586,523 | | | | 8,966,284 | | |
| | 765,880 | | | Chudenko Corporation | | | 11,647,223 | | | | 6,819,545 | | |
| | 1,305,700 | | | Shingakukai Company Limited (a) | | | 9,219,145 | | | | 4,643,942 | | |
| | 811,490 | | | Sansei Yusoki Company Limited | | | 6,041,923 | | | | 3,678,890 | | |
| | 140,500 | | | Icom, Inc. | | | 2,879,282 | | | | 2,934,928 | | |
| | 486,300 | | | Asahi Broadcasting Corporation | | | 2,159,349 | | | | 2,630,953 | | |
| | 410,170 | | | Okumura Corporation | | | 1,937,299 | | | | 1,320,147 | | |
| | | | 2,616,619,806 | | | | 3,083,740,674 | | |
Malaysia 0.58% | | | |
| | 55,981,850 | | | Genting Malaysia Berhad | | | 48,153,235 | | | | 65,979,922 | | |
Mexico 2.58% | | | |
| | 7,987,622 | | | Grupo Televisa S.A.B., ADR | | | 158,160,868 | | | | 180,520,257 | | |
| | 2,246,692 | | | Industrias Peñoles S.A.B. de C.V. | | | 1,833,690 | | | | 112,533,036 | | |
| | | | 159,994,558 | | | | 293,053,293 | | |
Netherlands 1.05% | | | |
| | 539,055 | | | HAL Trust | | | 18,095,972 | | | | 62,364,569 | | |
| | 4,441,109 | | | TNT Express NV | | | 49,251,096 | | | | 46,806,723 | | |
| | 2,625,301 | | | PostNL NV (c) | | | 24,654,873 | | | | 10,358,057 | | |
| | | | 92,001,941 | | | | 119,529,349 | | |
Norway 0.57% | | | |
| | 8,230,541 | | | Orkla ASA | | | 58,334,500 | | | | 65,097,226 | | |
Singapore 2.28% | | | |
| | 23,192,830 | | | Haw Par Corporation Limited (a) | | | 76,875,317 | | | | 123,968,890 | | |
| | 70,167,015 | | | ComfortDelGro Corporation Limited | | | 68,385,814 | | | | 97,214,507 | | |
| | 16,373,450 | | | Singapore Airport Terminal
Services Limited | | | 18,528,182
| | | | 37,450,340
| | |
| | | | 163,789,313 | | | | 258,633,737 | | |
South Africa 1.11% | | | |
| | 7,868,291 | | | Gold Fields Limited, ADR | | | 99,463,345 | | | | 98,432,320 | | |
| | 3,275,059 | | | Harmony Gold Mining
Company Limited, ADR | | | 30,822,097
| | | | 27,182,990
| | |
| | | | 130,285,442 | | | | 125,615,310 | | |
South Korea 2.09% | | | |
| | 1,318,522 | | | KT&G Corporation | | | 70,025,885 | | | | 100,466,879 | | |
| | 35,325 | | | Lotte Confectionery Company Limited | | | 12,445,892 | | | | 50,885,361 | | |
See Notes to Financial Statements.
FIRST EAGLE FUNDS | ANNUAL REPORT | OCTOBER 31, 2012
51
SHARES | | DESCRIPTION | | COST (NOTE 1) | | VALUE (NOTE 1) | |
International Common Stocks — 70.00% — (continued) | | | |
South Korea 2.09% — (continued) | | | |
| | 186,884 | | | Nong Shim Company Limited | | $ | 43,886,371 | | | $ | 44,210,593 | | |
| | 872,463 | | | Fursys, Inc. (a) | | | 10,110,166 | | | | 21,759,576 | | |
| | 22,950 | | | Namyang Dairy Products
Company Limited | | | 4,912,653
| | | | 19,886,072
| | |
| | | | 141,380,967 | | | | 237,208,481 | | |
Spain 0.70% | | | |
| | 1,688,700 | | | Red Electrica Corporation SA | | | 84,248,760 | | | | 79,232,075 | | |
Sweden 0.86% | | | |
| | 3,013,030 | | | Investor AB, Class 'A' | | | 59,333,861 | | | | 64,435,492 | | |
| | 1,515,198 | | | Investor AB, Class 'B' | | | 29,407,014 | | | | 33,455,349 | | |
| | | | 88,740,875 | | | | 97,890,841 | | |
Switzerland 3.51% | | | |
| | 2,610,500 | | | Nestlé SA | | | 79,226,015 | | | | 165,777,199 | | |
| | 2,196,591 | | | Pargesa Holding SA | | | 115,479,876 | | | | 148,225,342 | | |
| | 193,016 | | | Rieter Holding AG | | | 26,177,079 | | | | 30,757,291 | | |
| | 707 | | | Lindt & Spruengli AG | | | 4,541,472 | | | | 25,745,694 | | |
| | 137,452 | | | Kuehne & Nagel International AG | | | 1,733,811 | | | | 16,054,405 | | |
| | 225,026 | | | Autoneum Holding AG (c) | | | 12,062,900 | | | | 11,485,236 | | |
| | | | 239,221,153 | | | | 398,045,167 | | |
Taiwan 0.38% | | | |
| | 20,184,980 | | | Taiwan Secom Company Limited | | | 32,105,415 | | | | 42,978,374 | | |
Thailand 2.09% | | | |
| | 399,038,785 | | | Thai Beverage PCL | | | 68,219,877 | | | | 142,303,551 | | |
| | 15,684,559 | | | Bangkok Bank PCL, NVDR | | | 55,374,274 | | | | 90,576,409 | | |
| | 250,000 | | | OHTL PCL (b) | | | 1,152,072 | | | | 3,915,172 | | |
| | | | 124,746,223 | | | | 236,795,132 | | |
Turkey 0.23% | | | |
| | 3,205,889 | | | Yazicilar Holding AS | | | 21,541,251 | | | | 25,647,112 | | |
United Kingdom 2.66% | | | |
| | 20,894,498 | | | WM Morrison Supermarkets PLC | | | 94,636,856 | | | | 90,312,274 | | |
| | 3,995,640 | | | GlaxoSmithKline PLC | | | 76,140,895 | | | | 89,381,646 | | |
| | 3,378,628 | | | Berkeley Group Holdings PLC (c) | | | 41,275,902 | | | | 82,965,427 | | |
| | 1,295,388 | | | Anglo American PLC | | | 32,786,526 | | | | 39,772,306 | | |
| | | | 244,840,179 | | | | 302,431,653 | | |
Total International Common Stocks | | | 6,728,216,510 | | | | 7,943,995,197 | | |
See Notes to Financial Statements.
FIRST EAGLE FUNDS | ANNUAL REPORT | OCTOBER 31, 2012
52
Schedule of Investments | Year Ended October 31, 2012
SHARES | | DESCRIPTION | | COST (NOTE 1) | | VALUE (NOTE 1) | |
U.S. Common Stock — 0.33% | | | |
Materials 0.33% | | | |
| | 691,883 | | | Newmont Mining Corporation | | $ | 17,601,872 | | | $ | 37,742,218 | | |
Total Common Stock | | | 6,745,818,382 | | | | 7,981,737,415 | | |
International Preferred Stocks — 1.04% | | | |
Germany 0.67% | | | |
| | 1,160,182 | | | Hornbach Holding AG | | | 39,421,559 | | | | 75,854,755 | | |
South Korea 0.37% | | | |
| | 49,849 | | | Samsung Electronics Company Limited | | | 5,935,293 | | | | 36,200,631 | | |
| | 27,183 | | | Namyang Dairy Products
Company Limited | | | 387,445
| | | | 5,819,943
| | |
| | | | 6,322,738 | | | | 42,020,574 | | |
Total International Preferred Stocks | | | 45,744,297 | | | | 117,875,329 | | |
OUNCES | | | | | | | |
Commodity — 5.99% | | | |
| | 394,744 | | | Gold bullion (c) | | | 199,148,724 | | | | 679,473,229 | | |
PRINCIPAL | | | | | | | |
Term Loans — 0.11% | | | |
Germany 0.11% | | | |
| 218,754
CAD | | | Pfleiderer AG Revolving Credit Facility 1A
6.60% due 06/30/17 (b)(i) | | | 169,837
| | | | 131,459
| | |
| 701,307
EUR | | | Pfleiderer AG Revolving Credit Facility 1A
6.10% due 06/30/17 (b)(i) | | | 760,512
| | | | 421,445
| | |
| 1,299,726
USD | | | Pfleiderer AG Revolving Credit Facility 1A
5.83% due 06/30/17 (b)(i) | | | 994,175
| | | | 781,061
| | |
| 250,160
CAD | | | Pfleiderer AG Revolving Credit Facility 2A
6.60% due 06/30/17 (b)(i) | | | 194,220
| | | | 150,332
| | |
| 168,813
EUR | | | Pfleiderer AG Revolving Credit Facility 2A
6.10% due 06/30/17 (b)(i) | | | 179,165
| | | | 101,447
| | |
| 1,076,176
USD | | | Pfleiderer AG Revolving Credit Facility 2A
5.83% due 06/30/17 (b)(i) | | | 823,179
| | | | 646,721
| | |
| 1,976,466
EUR | | | Pfleiderer AG Term Facility 1A
7.36% due 06/30/17 (b)(i) | | | 2,063,186
| | | | 1,187,743
| | |
| 2,488,890
CAD | | | Pfleiderer AG Term Facility 2A
7.35% due 06/30/17 (b)(i) | | | 1,932,514
| | | | 1,495,681
| | |
| 10,000,000
EUR | | | Pfleiderer AG Term Loan
6.68% due 01/07/13 (b)(i) | | | 13,461,241
| | | | 6,009,429
| | |
See Notes to Financial Statements.
FIRST EAGLE FUNDS | ANNUAL REPORT | OCTOBER 31, 2012
53
PRINCIPAL | | DESCRIPTION | | COST (NOTE 1) | | VALUE (NOTE 1) | |
Germany 0.11% — (continued) | | | |
| 1,292,659
EUR | | | Pfleiderer AG Term Loan B
due 05/12/18 (b)(c)(i) | | $ | 1,805,127
| | | $ | 1,546,644
| | |
Total Term Loans | | | 22,383,156 | | | | 12,471,962 | | |
International Bonds — 1.22% | | | |
International Corporate Bonds — 0.41% | | | |
Canada 0.20% | | | |
| 33,554,000
USD | | | Catalyst Paper Corporation
7.375% due 03/01/14 (b)(i) | | | 24,961,832
| | | | 1,006,620
| | |
| 21,221,754
USD | | | Catalyst Paper Corporation
11.00% due 10/30/17 (b)(e)(j) | | | 30,984,846
| | | | 17,454,893
| | |
| 4,703,166
USD | | | Catalyst Paper Corporation FRN
10.313% due 09/13/16 (b)(e)(k)(l) | | | 4,009,448
| | | | 4,820,745
| | |
| | | | 59,956,126 | | | | 23,282,258 | | |
France 0.21% | | | |
| 10,000,000
EUR | | | Emin Leydier SA FRN
7.358% due 07/31/16 (b)(e)(f)(l) | | | 14,285,831
| | | | 12,970,000
| | |
| 8,000,000
EUR | | | FINEL
9.50% due 06/30/17 (b)(e)(f) | | | 9,659,548
| | | | 7,782,000
| | |
| 1,950,000
EUR | | | Wendel SA
4.875% due 09/21/15 (m) | | | 1,860,335
| | | | 2,642,861
| | |
| | | | 25,805,714 | | | | 23,394,861 | | |
Total International Corporate Bonds | | | 85,761,840 | | | | 46,677,119 | | |
International Government Bonds — 0.81% | | | |
Hong Kong 0.64% | | | |
| 415,700,000
HKD | | | Hong Kong Government Bond
2.66% due 12/17/12 | | | 53,693,180
| | | | 53,810,170
| | |
| 145,500,000
HKD | | | Hong Kong Government Bond
4.49% due 11/26/12 | | | 18,715,907
| | | | 18,832,104
| | |
| | | | 72,409,087 | | | | 72,642,274 | | |
Taiwan 0.17% | | | |
| 574,500,000
TWD | | | Taiwan Government Bond
2.375% due 01/16/13 | | | 17,949,383
| | | | 19,730,705
| | |
Total International Government Bonds | | | 90,358,470 | | | | 92,372,979 | | |
Total International Bonds | | | 176,120,310 | | | | 139,050,098 | | |
U.S. Treasury Bills — 1.49% | | | |
$ | 49,589,000
| | | U.S. Treasury Bill
0.07% due 01/03/13 | | | 49,583,360
| | | | 49,582,256
| | |
See Notes to Financial Statements.
FIRST EAGLE FUNDS | ANNUAL REPORT | OCTOBER 31, 2012
54
Schedule of Investments | Year Ended October 31, 2012
PRINCIPAL | | DESCRIPTION | | COST (NOTE 1) | | VALUE (NOTE 1) | |
U.S. Treasury Bills — 1.49% — (continued) | | | |
$ | 28,939,000
| | | U.S. Treasury Bill
0.09% due 02/07/13 | | $ | 28,931,910
| | | $ | 28,930,347
| | |
| 61,559,000
| | | U.S. Treasury Bill
0.10% due 11/29/12 | | | 61,554,451
| | | | 61,554,451
| | |
| 14,297,000
| | | U.S. Treasury Bill
0.10% due 01/24/13 | | | 14,293,831
| | | | 14,293,912
| | |
| 14,297,000
| | | U.S. Treasury Bill
0.11% due 02/21/13 | | | 14,292,107
| | | | 14,291,882
| | |
Total U.S. Treasury Bills | | | 168,655,659 | | | | 168,652,848 | | |
Commercial Paper — 19.63% | | | |
International Commercial Paper — 6.60% | | | |
Australia 0.06% | | | |
| 6,524,000
USD | | | Telstra Corporation Limited
0.22% due 12/10/12 | | | 6,522,445
| | | | 6,522,445
| | |
Canada 0.15% | | | |
| 7,955,000
USD | | | Suncor Energy, Inc.
0.32% due 11/16/12 | | | 7,953,939
| | | | 7,953,939
| | |
| 9,084,000
USD | | | Suncor Energy, Inc.
0.36% due 12/17/12 | | | 9,079,938
| | | | 9,079,938
| | |
France 1.12% | | | |
| 7,647,000
USD | | | EI du Pont de Nemours & Company
0.13% due 11/08/12 | | | 7,646,807
| | | | 7,646,807
| | |
| 13,305,000
USD | | | GDF Suez SA
0.21% due 11/05/12 | | | 13,304,689
| | | | 13,304,689
| | |
| 6,132,000
USD | | | GDF Suez SA
0.22% due 11/14/12 | | | 6,131,513
| | | | 6,131,513
| | |
| 29,287,000
USD | | | Sanofi
0.14% due 11/07/12 | | | 29,286,317
| | | | 29,286,317
| | |
| 9,944,000
USD | | | Sanofi
0.14% due 11/13/12 | | | 9,943,536
| | | | 9,943,536
| | |
| 38,445,000
USD | | | Total SA
0.13% due 11/15/12 | | | 38,443,056
| | | | 38,443,056
| | |
| 22,643,000
USD | | | Total SA
0.14% due 12/18/12 | | | 22,638,861
| | | | 22,638,861
| | |
Germany 1.40% | | | |
| | 34,987,000 | | | BASF AG
USD0.14% due 11/27/12 | | | 34,983,462
| | | | 34,983,462
| | |
| | 23,379,000 | | | BASF AG
USD0.15% due 12/17/12 | | | 23,374,519
| | | | 23,374,519
| | |
| | 10,886,000 | | | BASF AG
USD0.15% due 12/18/12 | | | 10,883,868
| | | | 10,883,868
| | |
See Notes to Financial Statements.
FIRST EAGLE FUNDS | ANNUAL REPORT | OCTOBER 31, 2012
55
PRINCIPAL | | DESCRIPTION | | COST (NOTE 1) | | VALUE (NOTE 1) | |
International Commercial Paper — 6.60% — (continued) | | | |
Germany 1.40% — (continued) | | | |
| 10,650,000
USD | | | BASF AG
0.15% due 12/27/12 | | $ | 10,647,515
| | | $ | 10,647,515
| | |
| 4,753,000
USD | | | Henkel Corporation
0.14% due 11/01/12 | | | 4,753,000
| | | | 4,753,000
| | |
| 3,914,000
USD | | | Henkel Corporation
0.15% due 11/21/12 | | | 3,913,674
| | | | 3,913,674
| | |
| 13,616,000
USD | | | Siemens Company
0.13% due 11/02/12 | | | 13,615,951
| | | | 13,615,951
| | |
| 10,465,000
USD | | | Siemens Company
0.13% due 11/13/12 | | | 10,464,547
| | | | 10,464,547
| | |
| 18,807,000
USD | | | Siemens Company
0.13% due 11/26/12 | | | 18,805,302
| | | | 18,805,302
| | |
| 10,077,000
USD | | | Siemens Company
0.13% due 11/30/12 | | | 10,075,945
| | | | 10,075,945
| | |
| 11,704,000
USD | | | Siemens Company
0.15% due 11/02/12 | | | 11,703,951
| | | | 11,703,951
| | |
| 5,942,000
USD | | | Siemens Company
0.15% due 12/14/12 | | | 5,940,935
| | | | 5,940,935
| | |
Italy 0.57% | | | |
| 2,871,000
USD | | | Eni S.p.A.
0.46% due 11/01/12 | | | 2,871,000
| | | | 2,871,000
| | |
| 18,933,000
USD | | | Eni S.p.A.
0.58% due 11/05/12 | | | 18,931,801
| | | | 18,931,801
| | |
| 20,151,000
USD | | | Eni S.p.A.
0.61% due 11/08/12 | | | 20,148,649
| | | | 20,148,649
| | |
| 22,643,000
USD | | | Eni S.p.A.
0.65% due 11/20/12 | | | 22,635,352
| | | | 22,635,352
| | |
Japan 0.20% | | | |
| 8,031,000
USD | | | Mitsubishi Company
0.23% due 11/09/12 | | | 8,030,589
| | | | 8,030,589
| | |
| 8,091,000
USD | | | Mitsui & Company, Limited
0.33% due 11/06/12 | | | 8,090,629
| | | | 8,090,629
| | |
| 6,808,000
USD | | | Mitsui & Company, Limited
0.34% due 11/26/12 | | | 6,806,393
| | | | 6,806,393
| | |
Switzerland 0.78% | | | |
| 5,731,000
USD | | | ABB Limited
0.20% due 11/13/12 | | | 5,730,618
| | | | 5,730,618
| | |
| 7,149,000
USD | | | ABB Limited
0.22% due 12/10/12 | | | 7,147,296
| | | | 7,147,296
| | |
| 8,372,000
USD | | | ABB Limited
0.22% due 12/13/12 | | | 8,369,851
| | | | 8,369,851
| | |
| 15,966,000
USD | | | ABB Limited
0.22% due 12/14/12 | | | 15,961,805
| | | | 15,961,805
| | |
See Notes to Financial Statements.
FIRST EAGLE FUNDS | ANNUAL REPORT | OCTOBER 31, 2012
56
Schedule of Investments | Year Ended October 31, 2012
PRINCIPAL | | DESCRIPTION | | COST (NOTE 1) | | VALUE (NOTE 1) | |
International Commercial Paper — 6.60% — (continued) | | | |
Switzerland 0.78% — (continued) | | | |
| 6,809,000
USD | | | Nestlé SA
0.08% due 12/06/12 | | $ | 6,808,470
| | | $ | 6,808,470
| | |
| 12,571,000
USD | | | Nestlé SA
0.15% due 01/15/13 | | | 12,567,072
| | | | 12,567,630
| | |
| 10,093,000
USD | | | Nestlé SA
0.16% due 01/16/13 | | | 10,089,591
| | | | 10,090,237
| | |
| 21,357,000
USD | | | Nestlé SA
0.16% due 01/29/13 | | | 21,348,552
| | | | 21,348,991
| | |
United Kingdom 2.32% | | | |
| 11,810,000
USD | | | AstraZeneca PLC
0.13% due 12/04/12 | | | 11,808,593
| | | | 11,808,593
| | |
| 19,373,000
USD | | | AstraZeneca PLC
0.14% due 11/27/12 | | | 19,371,041
| | | | 19,371,041
| | |
| 11,164,000
USD | | | AstraZeneca PLC
0.14% due 12/11/12 | | | 11,162,263
| | | | 11,162,263
| | |
| 19,957,000
USD | | | AstraZeneca PLC
0.14% due 12/18/12 | | | 19,953,352
| | | | 19,953,352
| | |
| 21,849,000
USD | | | AstraZeneca PLC
0.15% due 11/05/12 | | | 21,848,636
| | | | 21,848,636
| | |
| 5,234,000
USD | | | AstraZeneca PLC
0.15% due 11/14/12 | | | 5,233,717
| | | | 5,233,717
| | |
| 11,330,000
USD | | | AstraZeneca PLC
0.15% due 11/16/12 | | | 11,329,292
| | | | 11,329,292
| | |
| 11,081,000
USD | | | AstraZeneca PLC
0.16% due 01/22/13 | | | 11,076,961
| | | | 11,074,153
| | |
| 14,297,000
USD | | | AstraZeneca PLC
0.16% due 01/29/13 | | | 14,291,345
| | | | 14,286,992
| | |
| 27,222,000
USD | | | GlaxoSmithKline PLC
0.12% due 11/01/12 | | | 27,222,000
| | | | 27,222,000
| | |
| 22,837,000
USD | | | GlaxoSmithKline PLC
0.12% due 11/05/12 | | | 22,836,696
| | | | 22,836,696
| | |
| 26,316,000
USD | | | GlaxoSmithKline PLC
0.12% due 11/08/12 | | | 26,315,386
| | | | 26,315,386
| | |
| 34,155,000
USD | | | GlaxoSmithKline PLC
0.12% due 11/09/12 | | | 34,154,089
| | | | 34,154,089
| | |
| 21,097,000
USD | | | GlaxoSmithKline PLC
0.12% due 11/15/12 | | | 21,096,015
| | | | 21,096,015
| | |
| 5,845,000
USD | | | Reed Elsevier, Inc.
0.40% due 11/19/12 | | | 5,843,860
| | | | 5,843,860
| | |
Total International Commercial Paper | | | 749,194,684 | | | | 749,189,166 | | |
See Notes to Financial Statements.
FIRST EAGLE FUNDS | ANNUAL REPORT | OCTOBER 31, 2012
57
PRINCIPAL | | DESCRIPTION | | COST (NOTE 1) | | VALUE (NOTE 1) | |
U.S. Commercial Paper — 13.03% | | | |
$ | 11,485,000 | | | Apache Corporation
0.41% due 11/01/12 | | $ | 11,485,000
| | | $ | 11,485,000
| | |
| | 4,489,000 | | | Apache Corporation
0.45% due 11/08/12 | | | 4,488,616
| | | | 4,488,616
| | |
| | 7,863,000 | | | AutoZone, Inc.
0.38% due 11/09/12 | | | 7,862,353
| | | | 7,862,353
| | |
| | 11,355,000 | | | Campbell Soup Company
0.19% due 11/14/12 | | | 11,354,221
| | | | 11,354,221
| | |
| | 28,986,000 | | | Chevron Corporation
0.09% due 11/01/12 | | | 28,986,000
| | | | 28,986,000
| | |
| | 18,976,000 | | | Chevron Corporation
0.11% due 11/09/12 | | | 18,975,536
| | | | 18,975,536
| | |
| | 11,407,000 | | | Chevron Corporation
0.11% due 11/16/12 | | | 11,406,477
| | | | 11,406,477
| | |
| | 7,149,000 | | | Chevron Corporation
0.12% due 01/02/13 | | | 7,147,522
| | | | 7,146,060
| | |
| | 39,035,000 | | | Chevron Corporation
0.13% due 01/08/13 | | | 39,025,415
| | | | 39,016,669
| | |
| | 18,236,000 | | | Chevron Corporation
0.13% due 01/16/13 | | | 18,230,995
| | | | 18,225,937
| | |
| | 8,283,000 | | | Chevron Corporation
0.14% due 12/03/12 | | | 8,281,969
| | | | 8,281,969
| | |
| | 12,571,000 | | | Church & Dwight Company, Inc.
0.43% due 11/02/12 | | | 12,570,853
| | | | 12,570,853
| | |
| | 5,022,000 | | | Coca-Cola Company
0.17% due 11/16/12 | | | 5,021,644
| | | | 5,021,644
| | |
| | 5,131,000 | | | Coca-Cola Company
0.18% due 11/29/12 | | | 5,130,282
| | | | 5,130,282
| | |
| | 25,143,000 | | | Coca-Cola Company
0.18% due 01/28/13 | | | 25,131,937
| | | | 25,131,935
| | |
| | 16,471,000 | | | Coca-Cola Company
0.19% due 01/10/13 | | | 16,464,915
| | | | 16,466,192
| | |
| | 27,236,000 | | | Coca-Cola Company
0.20% due 01/24/13 | | | 27,223,290
| | | | 27,224,939
| | |
| | 14,200,000 | | | Coca-Cola Company
0.20% due 02/07/13 | | | 14,192,269
| | | | 14,192,502
| | |
| | 10,094,000 | | | Coca-Cola Company
0.21% due 12/10/12 | | | 10,091,704
| | | | 10,091,704
| | |
| | 9,190,000 | | | Coca-Cola Company
0.21% due 12/11/12 | | | 9,187,856
| | | | 9,187,856
| | |
| | 14,493,000 | | | Coca-Cola Company
0.21% due 12/19/12 | | | 14,488,942
| | | | 14,488,942
| | |
See Notes to Financial Statements.
FIRST EAGLE FUNDS | ANNUAL REPORT | OCTOBER 31, 2012
58
Schedule of Investments | Year Ended October 31, 2012
PRINCIPAL | | DESCRIPTION | | COST (NOTE 1) | | VALUE (NOTE 1) | |
U.S. Commercial Paper — 13.03% — (continued) | | | |
$ | 7,992,000 | | | ConocoPhillips
0.15% due 11/20/12 | | $ | 7,991,367
| | | $ | 7,991,367
| | |
| | 9,823,000 | | | ConocoPhillips
0.16% due 11/06/12 | | | 9,822,782
| | | | 9,822,782
| | |
| | 9,119,000 | | | ConocoPhillips
0.19% due 01/18/13 | | | 9,115,246
| | | | 9,115,758
| | |
| | 5,274,000 | | | ConocoPhillips
0.22% due 11/21/12 | | | 5,273,355
| | | | 5,273,355
| | |
| | 9,084,000 | | | Dell, Inc.
0.14% due 11/16/12 | | | 9,083,470
| | | | 9,083,470
| | |
| | 1,263,000 | | | Devon Energy Corporation
0.30% due 11/01/12 | | | 1,263,000
| | | | 1,263,000
| | |
| | 18,470,000 | | | Devon Energy Corporation
0.30% due 11/02/12 | | | 18,469,846
| | | | 18,469,846
| | |
| | 6,373,000 | | | Devon Energy Corporation
0.30% due 11/08/12 | | | 6,372,628
| | | | 6,372,628
| | |
| | 5,852,000 | | | Devon Energy Corporation
0.32% due 11/09/12 | | | 5,851,584
| | | | 5,851,584
| | |
| | 28,472,000 | | | Devon Energy Corporation
0.32% due 11/19/12 | | | 28,467,444
| | | | 28,467,444
| | |
| | 6,982,000 | | | Devon Energy Corporation
0.35% due 01/03/13 | | | 6,977,845
| | | | 6,977,229
| | |
| | 6,788,000 | | | Emerson Electric Company
0.12% due 11/27/12 | | | 6,787,412
| | | | 6,787,412
| | |
| | 8,767,000 | | | Emerson Electric Company
0.12% due 11/28/12 | | | 8,766,211
| | | | 8,766,211
| | |
| | 11,322,000 | | | Emerson Electric Company
0.12% due 12/27/12 | | | 11,319,887
| | | | 11,319,887
| | |
| | 6,157,000 | | | Emerson Electric Company
0.14% due 11/13/12 | | | 6,156,713
| | | | 6,156,713
| | |
| | 11,138,000 | | | Emerson Electric Company
0.14% due 11/14/12 | | | 11,137,437
| | | | 11,137,437
| | |
| | 36,135,000 | | | Emerson Electric Company
0.15% due 01/23/13 | | | 36,122,503
| | | | 36,120,665
| | |
| | 6,034,000 | | | General Mills, Inc.
0.27% due 11/16/12 | | | 6,033,321
| | | | 6,033,321
| | |
| | 5,942,000 | | | General Mills, Inc.
0.29% due 11/26/12 | | | 5,940,803
| | | | 5,940,803
| | |
| | 15,075,000 | | | Google, Inc.
0.09% due 11/02/12 | | | 15,074,962
| | | | 15,074,962
| | |
| | 18,259,000 | | | Google, Inc.
0.09% due 11/13/12 | | | 18,258,452
| | | | 18,258,452
| | |
See Notes to Financial Statements.
FIRST EAGLE FUNDS | ANNUAL REPORT | OCTOBER 31, 2012
59
PRINCIPAL | | DESCRIPTION | | COST (NOTE 1) | | VALUE (NOTE 1) | |
U.S. Commercial Paper — 13.03% — (continued) | | | |
$ | 11,051,000 | | | Google, Inc.
0.10% due 12/03/12 | | $ | 11,050,018
| | | $ | 11,050,018
| | |
| | 7,570,000 | | | Google, Inc.
0.12% due 11/20/12 | | | 7,569,521
| | | | 7,569,521
| | |
| | 11,932,000 | | | Google, Inc.
0.12% due 12/05/12 | | | 11,930,648
| | | | 11,930,648
| | |
| | 21,167,000 | | | H.J. Heinz Company Limited
0.36% due 01/23/13 | | | 21,149,919
| | | | 21,150,306
| | |
| | 20,564,000 | | | Johnson & Johnson
0.10% due 11/01/12 | | | 20,564,000
| | | | 20,564,000
| | |
| | 26,093,000 | | | Johnson & Johnson
0.10% due 12/03/12 | | | 26,090,681
| | | | 26,090,681
| | |
| | 22,161,000 | | | Johnson & Johnson
0.10% due 12/04/12 | | | 22,158,969
| | | | 22,158,969
| | |
| | 11,951,000 | | | Johnson & Johnson
0.10% due 12/05/12 | | | 11,949,871
| | | | 11,949,871
| | |
| | 21,698,000 | | | Johnson & Johnson
0.11% due 01/07/13 | | | 21,693,558
| | | | 21,693,370
| | |
| | 23,379,000 | | | Johnson & Johnson
0.11% due 01/09/13 | | | 23,374,071
| | | | 23,373,681
| | |
| | 10,219,000 | | | Kinder Morgan, Inc.
0.44% due 11/07/12 | | | 10,218,268
| | | | 10,218,268
| | |
| | 12,571,000 | | | McDonald's Corporation
0.11% due 11/14/12 | | | 12,570,501
| | | | 12,570,501
| | |
| | 4,966,000 | | | McDonald's Corporation
0.15% due 12/10/12 | | | 4,965,193
| | | | 4,965,193
| | |
| | 8,631,000 | | | Medtronic, Inc.
0.14% due 01/25/13 | | | 8,628,147
| | | | 8,625,983
| | |
| | 17,926,000 | | | Medtronic, Inc.
0.15% due 12/13/12 | | | 17,922,863
| | | | 17,922,863
| | |
| | 35,340,000 | | | Medtronic, Inc.
0.16% due 01/03/13 | | | 35,330,105
| | | | 35,327,016
| | |
| | 11,081,000 | | | Merck & Company, Inc.
0.11% due 11/26/12 | | | 11,080,154
| | | | 11,080,154
| | |
| | 4,753,000 | | | Merck & Company, Inc.
0.13% due 12/05/12 | | | 4,752,416
| | | | 4,752,416
| | |
| | 43,503,000 | | | Merck & Company, Inc.
0.13% due 12/12/12 | | | 43,496,559
| | | | 43,496,559
| | |
| | 9,203,000 | | | Parker-Hannifin Corporation
0.13% due 11/06/12 | | | 9,202,834
| | | | 9,202,834
| | |
| | 12,608,000 | | | Philip Morris International, Inc.
0.08% due 11/14/12 | | | 12,607,636
| | | | 12,607,636
| | |
See Notes to Financial Statements.
FIRST EAGLE FUNDS | ANNUAL REPORT | OCTOBER 31, 2012
60
Schedule of Investments | Year Ended October 31, 2012
PRINCIPAL | | DESCRIPTION | | COST (NOTE 1) | | VALUE (NOTE 1) | |
U.S. Commercial Paper — 13.03% — (continued) | | | |
$ | 11,833,000 | | | Philip Morris International, Inc.
0.09% due 11/08/12 | | $ | 11,832,793
| | | $ | 11,832,793
| | |
| | 8,033,000 | | | Philip Morris International, Inc.
0.11% due 11/20/12 | | | 8,032,534
| | | | 8,032,534
| | |
| | 12,571,000 | | | Philip Morris International, Inc.
0.13% due 11/16/12 | | | 12,570,319
| | | | 12,570,319
| | |
| | 13,305,000 | | | Praxair, Inc.
0.10% due 11/15/12 | | | 13,304,483
| | | | 13,304,483
| | |
| | 12,927,000 | | | Praxair, Inc.
0.11% due 11/07/12 | | | 12,926,763
| | | | 12,926,763
| | |
| | 12,640,000 | | | Precision Castparts Corporation
0.15% due 11/02/12 | | | 12,639,947
| | | | 12,639,947
| | |
| | 13,016,000 | | | Precision Castparts Corporation
0.19% due 12/20/12 | | | 13,012,634
| | | | 13,012,634
| | |
| | 4,594,000 | | | Precision Castparts Corporation
0.20% due 11/01/12 | | | 4,594,000
| | | | 4,594,000
| | |
| | 19,957,000 | | | Proctor & Gamble Company
0.12% due 11/09/12 | | | 19,956,468
| | | | 19,956,468
| | |
| | 18,912,000 | | | Proctor & Gamble Company
0.13% due 11/19/12 | | | 18,910,771
| | | | 18,910,771
| | |
| | 20,151,000 | | | Stanley Black & Decker Inc.
0.31% due 11/06/12 | | | 20,150,132
| | | | 20,150,132
| | |
| | 17,193,000 | | | Stanley Black & Decker Inc.
0.33% due 11/06/12 | | | 17,192,212
| | | | 17,192,212
| | |
| | 4,642,000 | | | Stanley Black & Decker Inc.
0.33% due 11/07/12 | | | 4,641,745
| | | | 4,641,745
| | |
| | 42,408,000 | | | United Healthcare Company
0.35% due 11/05/12 | | | 42,406,351
| | | | 42,406,351
| | |
| | 10,894,000 | | | United Parcel Service, Inc.
0.04% due 11/19/12 | | | 10,893,782
| | | | 10,893,782
| | |
| | 14,469,000 | | | United Parcel Service, Inc.
0.05% due 12/05/12 | | | 14,468,317
| | | | 14,468,317
| | |
| | 26,610,000 | | | United Technologies Corporation
0.13% due 11/20/12 | | | 26,608,174
| | | | 26,608,174
| | |
| | 15,697,000 | | | United Technologies Corporation
0.13% due 11/26/12 | | | 15,695,583
| | | | 15,695,583
| | |
| | 17,535,000 | | | United Technologies Corporation
0.13% due 11/28/12 | | | 17,533,290
| | | | 17,533,290
| | |
| | 2,768,000 | | | United Technologies Corporation
0.13% due 12/05/12 | | | 2,767,660
| | | | 2,767,660
| | |
| | 5,760,000 | | | United Technologies Corporation
0.15% due 11/08/12 | | | 5,759,832
| | | | 5,759,832
| | |
See Notes to Financial Statements.
FIRST EAGLE FUNDS | ANNUAL REPORT | OCTOBER 31, 2012
61
PRINCIPAL | | DESCRIPTION | | COST (NOTE 1) | | VALUE (NOTE 1) | |
U.S. Commercial Paper — 13.03% — (continued) | | | |
$ | 9,343,000 | | | United Technologies Corporation
0.15% due 11/28/12 | | $ | 9,341,949
| | | $ | 9,341,949
| | |
| | 18,862,000 | | | Verizon Communications, Inc.
0.33% due 11/13/12 | | | 18,859,925
| | | | 18,859,925
| | |
| | 6,161,000 | | | Verizon Communications, Inc.
0.36% due 11/13/12 | | | 6,160,281
| | | | 6,160,281
| | |
| | 16,041,000 | | | Verizon Communications, Inc.
0.36% due 12/04/12 | | | 16,035,854
| | | | 16,035,854
| | |
| | 5,130,000 | | | Verizon Communications, Inc.
0.36% due 12/05/12 | | | 5,128,304
| | | | 5,128,304
| | |
| | 3,658,000 | | | Verizon Communications, Inc.
0.36% due 12/10/12 | | | 3,656,613
| | | | 3,656,613
| | |
| | 5,098,000 | | | Verizon Communications, Inc.
0.39% due 12/13/12 | | | 5,095,740
| | | | 5,095,740
| | |
| | 21,704,000 | | | Verizon Communications, Inc.
0.39% due 12/14/12 | | | 21,694,149
| | | | 21,694,149
| | |
| | 5,959,000 | | | Verizon Communications, Inc.
0.42% due 12/06/12 | | | 5,956,625
| | | | 5,956,625
| | |
| | 7,676,000 | | | Verizon Communications, Inc.
0.42% due 12/11/12 | | | 7,672,503
| | | | 7,672,503
| | |
| | 4,387,000 | | | Verizon Communications, Inc.
0.42% due 12/12/12 | | | 4,384,952
| | | | 4,384,952
| | |
| | 28,304,000 | | | Wal-Mart Stores, Inc.
0.11% due 11/06/12 | | | 28,303,568
| | | | 28,303,568
| | |
| | 15,418,000 | | | Wal-Mart Stores, Inc.
0.12% due 11/05/12 | | | 15,417,794
| | | | 15,417,794
| | |
| | 22,418,000 | | | Wal-Mart Stores, Inc.
0.12% due 11/16/12 | | | 22,416,879
| | | | 22,416,879
| | |
| | 9,313,000 | | | Walt Disney Company
0.12% due 11/14/12 | | | 9,312,596
| | | | 9,312,596
| | |
| | 15,401,000 | | | Walt Disney Company
0.12% due 12/20/12 | | | 15,398,484
| | | | 15,398,484
| | |
| | 25,984,000 | | | Walt Disney Company
0.13% due 12/28/12 | | | 25,978,652
| | | | 25,978,652
| | |
| | 11,153,000 | | | Walt Disney Company
0.14% due 12/13/12 | | | 11,151,178
| | | | 11,151,178
| | |
| | 9,313,000 | | | Walt Disney Company
0.15% due 12/17/12 | | | 9,311,215
| | | | 9,311,215
| | |
| | 18,627,000 | | | Walt Disney Company
0.15% due 12/21/12 | | | 18,623,119
| | | | 18,623,119
| | |
| | 4,698,000 | | | WellPoint, Inc.
0.25% due 01/14/13 | | | 4,695,586
| | | | 4,694,868
| | |
See Notes to Financial Statements.
FIRST EAGLE FUNDS | ANNUAL REPORT | OCTOBER 31, 2012
62
Schedule of Investments | Year Ended October 31, 2012
PRINCIPAL | | DESCRIPTION | | COST (NOTE 1) | | VALUE (NOTE 1) | |
U.S. Commercial Paper — 13.03% — (continued) | |
$ | 6,286,000 | | | WellPoint, Inc.
0.25% due 01/16/13 | | $ | 6,282,682
| | | $ | 6,281,644
| | |
| | 12,247,000 | | | WellPoint, Inc.
0.41% due 12/03/12 | | | 12,242,646
| | | | 12,242,646
| | |
Total U.S. Commercial Paper | | | 1,478,359,080 | | | | 1,478,337,829 | | |
Total Commercial Paper | | | 2,227,553,764 | | | | 2,227,526,995 | | |
Total Investments — 99.81% | | $ | 9,585,424,292 | | | | 11,326,787,876 | | |
Other Assets in Excess of Liabilities — 0.19% | | | | | 21,990,169 | | |
Net Assets — 100.00% | | | | | | $ | 11,348,778,045 | | |
(a) An affiliate of the Fund as defined by the Investment Company Act of 1940. An affiliate is defined as a company in which the Fund directly or indirectly owns, controls, or holds power to vote 5% or more of the outstanding voting securities.
(b) Security is deemed illiquid. At October 31, 2012, the value of these securities amounted to $122,448,551 or 1.08% of net assets.
(c) Non-income producing security/commodity.
(d) Represents variable voting shares.
(e) Represents securities that are subject to legal or contractual restrictions on resale. At October 31, 2012, the value of these securities amounted to $74,972,080 or 0.66% of net assets.
(f) Securities valued in accordance with fair value procedures under the supervision of the Board of Trustees, representing $57,656,767 or 0.51% of net assets.
(g) Represents non-voting class of shares.
(h) Held through Financiere Bleue, LLC, wholly owned subsidiary and disregarded entity for U.S. tax purposes.
(i) Issuer is in default.
(j) Payment-in-kind security.
(k) All or a portion of the security is exempt from registration under the Securities Act of 1933. Rule 144A securities may only be sold to qualified institutional buyers, pursuant to Rule 144A under the Securities Act of 1933.
(l) Floating rate security. Rate shown is the rate in effect at October 31, 2012.
(m) Represents a security registered under Regulation S. Bonds sold under Regulation S may not be offered, sold or delivered within the U.S., or for the account or benefit of, U.S. persons, except pursuant to an exemption from, or in a transaction not subject to, the registration requirements of the Securities Act of 1933.
At October 31, 2012, aggregate cost for federal income tax purpose was $9,891,678,242. Net unrealized appreciation consisted of:
Gross unrealized appreciation | | $ | 2,149,012,603 | | |
Gross unrealized depreciation | | | (713,902,969 | ) | |
Net unrealized appreciation | | $ | 1,435,109,634 | | |
See Notes to Financial Statements.
FIRST EAGLE FUNDS | ANNUAL REPORT | OCTOBER 31, 2012
63
Abbreviations used in this schedule include:
ADR — American Depository Receipt
FRN — Floating Rate Note
NVDR — Non-Voting Depository Receipt
PCL — Public Company Limited
PLC — Public Limited Company
RSP — Represents Non-Voting Shares
Currencies
CAD — Canadian Dollar
EUR — Euro
HKD — Hong Kong Dollar
TWD — Taiwan Dollar
USD — United States Dollar
RESTRICTED SECURITIES | | ACQUISITION
DATE | | COST | | CARRYING VALUE PER
SHARE/PRINCIPAL | |
Catalyst Paper Corporation | | 09/17/12 | | $ | 21,436 | | | $ | 1.05 | | |
Catalyst Paper Corporation 11.00%
due 10/30/17 | | 09/17/12 | | | 30,984,846 | | | | 0.82 | | |
Catalyst Paper Corporation FRN 10.313%
due 09/13/16 | | 08/31/12 | | | 4,009,448 | | | | 1.02 | | |
Emin Leydier SA FRN 7.358% due 07/31/16 | | 07/30/09 | | | 14,285,831 | | | | 1.30 | | |
FINEL 9.50% due 06/30/17 | | 06/22/05 | | | 9,659,548 | | | | 0.97 | | |
FINEL | | 07/14/99 | | | 9,166,547 | | | | 0.47 | | |
Fregate | | 04/30/04 | | | 23,119,325 | | | | 28.17 | | |
Foreign Currency Exchange Contracts — Sales
SETTLEMENT
DATES
THROUGH | | FOREIGN CURRENCY
TO BE DELIVERED | | U.S. $
TO BE
RECEIVED | | U.S. $ VALUE
AT OCTOBER 31,
2012 | | UNREALIZED
APPRECIATION
AT OCTOBER 31,
2012 | | UNREALIZED
DEPRECIATION
AT OCTOBER 31,
2012 | |
01/16/13 | | | 156,358,000 | | | Euro | | $ | 192,957,451 | | | $ | 202,923,470 | | | $ | — | | | $ | (9,966,019 | ) | |
02/20/13 | | | 183,429,000 | | | Euro | | | 229,871,655 | | | | 238,085,219 | | | | — | | | | (8,213,564 | ) | |
03/21/13 | | | 129,224,000 | | | Euro | | | 163,394,702 | | | | 167,832,009 | | | | — | | | | (4,437,307 | ) | |
04/17/13 | | | 63,004,000 | | | Euro | | | 81,371,556 | | | | 81,848,317 | | | | — | | | | (476,761 | ) | |
12/12/12 | | | 22,599,758,000 | | | Japanese Yen | | | 284,042,287 | | | | 283,092,536 | | | | 949,751 | | | | — | | |
02/20/13 | | | 49,035,629,000 | | | Japanese Yen | | | 621,874,090 | | | | 614,677,062 | | | | 7,197,028 | | | | — | | |
03/21/13 | | | 22,147,627,000 | | | Japanese Yen | | | 281,304,006 | | | | 277,767,958 | | | | 3,536,048 | | | | — | | |
04/17/13 | | | 15,956,201,000 | | | Japanese Yen | | | 204,298,211 | | | | 200,177,050 | | | | 4,121,161 | | | | — | | |
| | | | | | | $ | 2,059,113,958 | | | $ | 2,066,403,621 | | | $ | 15,803,988 | | | $ | (23,093,651 | ) | |
See Notes to Financial Statements.
FIRST EAGLE FUNDS | ANNUAL REPORT | OCTOBER 31, 2012
64
Schedule of Investments | Year Ended October 31, 2012
Affiliated Securities
AFFILIATED
SECURITIES | | SHARES
OCTOBER 31,
2011 | | GROSS
ADDITIONS | | GROSS
REDUCTIONS | | SHARES
OCTOBER 31,
2012 | | MARKET VALUE
OCTOBER 31,
2012 | | REALIZED
GAIN/(LOSS) | | DIVIDEND
INCOME | |
AS One
Corporation | | | 1,286,140 | | | | — | | | | — | | | | 1,286,140 | | | $ | 26,592,575 | | | $ | — | | | $ | 1,135,486 | | |
Catalyst
Paper
Corporation | | | — | | | | 1,217,500 | | | | — | | | | 1,217,500 | | | | 1,278,375 | | | | — | | | | — | | |
Chofu
Seisakusho
Company
Limited | | | 2,023,800 | | | | — | | | | — | | | | 2,023,800 | | | | 46,558,805 | | | | — | | | | 716,294 | | |
Deutsche
Wohnen AG* | | | 6,418,531 | | | | 2,335,528 | | | | 1,468,397 | | | | 7,285,662 | | | | 133,615,985 | | | | 4,554,246 | | | | 2,318,286 | | |
FINEL | | | 11,593,581 | | | | — | | | | — | | | | 11,593,581 | | | | 5,413,275 | | | | — | | | | — | | |
Fregate | | | 895,904 | | | | 512 | | | | — | | | | 896,416 | | | | 25,252,792 | | | | — | | | | 13,724,302 | | |
Fursys, Inc. | | | 872,463 | | | | — | | | | — | | | | 872,463 | | | | 21,759,576 | | | | — | | | | 441,271 | | |
Haw Par
Corporation
Limited | | | 23,192,830 | | | | — | | | | — | | | | 23,192,830 | | | | 123,968,890 | | | | — | | | | 3,673,584 | | |
Icom, Inc.* | | | 815,690 | | | | — | | | | 675,190 | | | | 140,500 | | | | 2,934,928 | | | | (1,417,818 | ) | | | 43,551 | | |
Japan Wool
Textile
Company
Limited | | | 6,577,300 | | | | — | | | | — | | | | 6,577,300 | | | | 45,139,141 | | | | — | | | | 1,400,132 | | |
Jumbo SA | | | 7,182,037 | | | | 3,540,401 | | | | — | | | | 10,722,438 | | | | 70,925,713 | | | | — | | | | 2,074,071 | | |
Laurent-
Perrier | | | 558,938 | | | | — | | | | — | | | | 558,938 | | | | 47,701,224 | | | | — | | | | 581,519 | | |
Maezawa
Kasei
Industries
Company
Limited | | | 2,068,330 | | | | — | | | | — | | | | 2,068,330 | | | | 21,576,943 | | | | — | | | | 599,497 | | |
Matsumoto
Yushi-
Seiyaku
Company
Limited | | | 1,058,246 | | | | — | | | | 83,500 | | | | 974,746 | | | | 21,118,480 | | | | (274,430 | ) | | | 594,377 | | |
Nagaileben
Company
Limited | | | 2,013,324 | | | | — | | | | — | | | | 2,013,324 | | | | 29,550,604 | | | | — | | | | 832,227 | | |
Nitto Kohki
Company
Limited | | | 2,657,590 | | | | — | | | | — | | | | 2,657,590 | | | | 60,041,232 | | | | — | | | | 985,972 | | |
Robertet SA | | | 235,837 | | | | — | | | | — | | | | 235,837 | | | | 39,458,597 | | | | — | | | | 683,323 | | |
Sansei
Yusoki
Company
Limited* | | | 1,215,770 | | | | — | | | | 404,280 | | | | 811,490 | | | | 3,678,890 | | | | (2,130,127 | ) | | | 138,365 | | |
Shimano,
Inc.* | | | 4,886,870 | | | | — | | | | 1,702,400 | | | | 3,184,470 | | | | 200,599,676 | | | | 80,766,446 | | | | 3,723,269 | | |
Shingakukai
Company
Limited | | | 1,424,100 | | | | — | | | | 118,400 | | | | 1,305,700 | | | | 4,643,942 | | | | (598,622 | ) | | | 159,973 | | |
See Notes to Financial Statements.
FIRST EAGLE FUNDS | ANNUAL REPORT | OCTOBER 31, 2012
65
Affiliated Securities — (continued)
AFFILIATED
SECURITIES | | SHARES
OCTOBER 31,
2011 | | GROSS
ADDITIONS | | GROSS
REDUCTIONS | | SHARES
OCTOBER 31,
2012 | | MARKET VALUE
OCTOBER 31,
2012 | | REALIZED
GAIN/(LOSS) | | DIVIDEND
INCOME | |
Spotless
Group
Limited* | | | 15,791,758 | | | | — | | | | 15,791,758 | | | | — | | | $ | — | | | $ | 4,211,607 | | | $ | 1,358,730 | | |
Sucrière de
Pithiviers-
Le-Vieil* | | | 39,143 | | | | — | | | | 39,143 | | | | — | | | | — | | | | 72,548,333 | | | | — | | |
T. Hasegawa
Company
Limited | | | 3,206,911 | | | | — | | | | — | | | | 3,206,911 | | | | 40,603,469 | | | | — | | | | 935,289 | | |
Teems, Inc.* | | | 146,969 | | | | — | | | | 146,969 | | | | — | | | | — | | | | 233,723 | | | | 21,238 | | |
Wienerberger
AG | | | 5,294,031 | | | | 621,755 | | | | — | | | | 5,915,786 | | | | 42,445,790 | | | | — | | | | 770,856 | | |
Yomeishu
Seizo
Company
Limited | | | 2,535,900 | | | | — | | | | — | | | | 2,535,900 | | | | 22,389,599 | | | | — | | | | 512,755 | | |
Total | | | | | | | | | | $ | 1,037,248,501 | | | $ | 157,893,358 | | | $ | 37,424,367 | | |
* Represents an unaffiliated issuer as of October 31, 2012, as such, amounts represented above will not agree to balances in the Statements of Assets and Liabilities and Statements of Operations.
INDUSTRY DIVERSIFICATION FOR PORTFOLIO HOLDINGS | | PERCENT OF
NET ASSETS | |
International Common Stocks | |
Consumer Discretionary | | | 9.64 | % | |
Consumer Staples | | | 8.19 | | |
Energy | | | 3.69 | | |
Financials | | | 9.80 | | |
Health Care | | | 6.57 | | |
Industrials | | | 14.07 | | |
Information Technology | | | 5.46 | | |
Materials | | | 10.16 | | |
Telecommunication Services | | | 1.72 | | |
Utilities | | | 0.70 | | |
Total International Common Stocks | | | 70.00 | | |
U.S. Common Stocks | |
Materials | | | 0.33 | | |
Total U.S. Common Stocks | | | 0.33 | | |
See Notes to Financial Statements.
FIRST EAGLE FUNDS | ANNUAL REPORT | OCTOBER 31, 2012
66
Schedule of Investments | Year Ended October 31, 2012
INDUSTRY DIVERSIFICATION FOR PORTFOLIO HOLDINGS — (CONTINUED) | | PERCENT OF
NET ASSETS | |
International Preferred Stocks | |
Consumer Discretionary | | | 0.67 | % | |
Consumer Staples | | | 0.05 | | |
Information Technology | | | 0.32 | | |
Total International Preferred Stocks | | | 1.04 | | |
Commodity | | | 5.99 | | |
International Bonds | |
Financials | | | 0.09 | | |
Government Issues | | | 0.81 | | |
Materials | | | 0.32 | | |
Total International Bonds | | | 1.22 | | |
Term Loans | | | 0.11 | | |
U.S. Treasury Bills | | | 1.49 | | |
Commercial Paper | |
International Commercial Paper | | | 6.60 | | |
U.S. Commercial Paper | | | 13.03 | | |
Total Commercial Paper | | | 19.63 | | |
Total Investments | | | 99.81 | % | |
See Notes to Financial Statements.
FIRST EAGLE FUNDS | ANNUAL REPORT | OCTOBER 31, 2012
67

Fund Overview | Data as of October 31, 2012 (unaudited)
INVESTMENT OBJECTIVE
The First Eagle U.S. Value Fund seeks long-term growth of capital by investing, under normal market conditions, at least 80% of its assets in domestic and equity debt securities. Management utilizes a highly disciplined, bottom-up, value-oriented approach in achieving its investment objective.
Average Annual Returns | |
| | | ONE-YEAR | | FIVE-YEARS | | TEN-YEARS | |
First Eagle U.S. Value
Fund (A Shares) | |
without sales charge | | | 10.63 | % | | | 4.62 | % | | | 9.76 | % | |
with sales charge | | | 5.10 | | | | 3.55 | | | | 9.19 | | |
Standard & Poor's
500 Index | | | 15.21 | | | | 0.36 | | | | 6.91 | | |
Consumer Price Index | | | 2.16 | | | | 2.05 | | | | 2.46 | | |
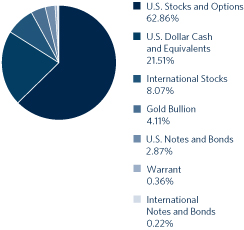
Sector/Industry** | |
Financials | | | 16.62 | % | |
Information Technology | | | 13.88 | | |
Industrials | | | 9.76 | | |
Materials | | | 9.17 | | |
Energy | | | 7.10 | | |
Consumer Discretionary | | | 5.75 | | |
Consumer Staples | | | 5.69 | | |
Commodity | | | 4.11 | | |
Health Care | | | 3.04 | | |
Utilities | | | 3.02 | | |
Warrants | | | 0.36 | | |
* Asset Allocation and Sector/Industry percentages are based on total investments in the portfolio.
** Sector/Industry allocations exclude short term investments and options positions.
The Fund's portfolio composition is subject to change at any time.
FIRST EAGLE FUNDS | ANNUAL REPORT | OCTOBER 31, 2012
68
Growth of a $10,000 Initial Investment
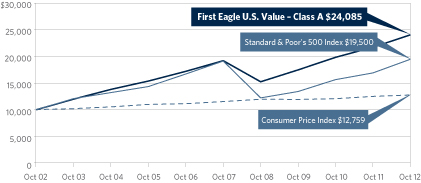
Performance data quoted herein represents past performance and should not be considered indicative of future results. Performance data quoted herein does not reflect the deduction of taxes that a shareholder would pay on Fund distributions or the sale of Fund shares. The average annual returns shown above are historical and reflect changes in share price, reinvested dividends and are net of expenses.
The average annual returns for Class A Shares with a sales charge gives effect to the deduction of the maximum sales charge of 5.00%.
The Standard & Poor's 500 Index is a widely recognized unmanaged index including a representative sample of 500 leading companies in leading sectors of the U.S. economy and is not available for purchase. Although the Standard & Poor's 500 Index focuses on the large-cap segment of the market, with approximately 75% coverage of U.S. equities, it is also considered a proxy for the total market. The Consumer Price Index (CPI) represents the change in price of all goods and services purchased for consumption by urban households.
Top 10 Holdings* | |
| Gold Bullion (precious metal) | | | 4.13 | % | |
| Comcast Corporation, Class 'A' (U.S. cable/satellite television company) | | | 2.97 | | |
| Sysco Corporation. (U.S. food services distributor) | | | 2.53 | | |
| Microsoft Corporation (U.S. software developer) | | | 2.52 | | |
| Cisco Systems, Inc. (U.S. computer communications company) | | | 2.48 | | |
| Bank of New York Mellon Corporation (U.S. financial services company) | | | 2.17 | | |
| ConocoPhillips (U.S. energy company) | | | 1.97 | | |
| Oracle Corporation (U.S. software developer) | | | 1.94 | | |
| 3M Company (U.S. industrial conglomerate) | | | 1.86 | | |
| FirstEnergy Corporation (U.S. diversified energy company) | | | 1.81 | | |
Total | | | 24.38 | % | |
* Holdings in cash, commercial paper and other short term cash equivalents have been excluded. Percentages are based on total net assets
FIRST EAGLE FUNDS | ANNUAL REPORT | OCTOBER 31, 2012
69
First Eagle U.S. Value Fund
SHARES | | DESCRIPTION | | COST (NOTE 1) | | VALUE (NOTE 1) | |
Common Stocks — 71.08% | | | |
U.S. Common Stocks — 62.97% | | | |
Consumer Discretionary 5.14% | | | |
| | 2,438,946 | | | Comcast Corporation, Class 'A' | | $ | 44,510,094 | | | $ | 88,875,192 | | |
| | 865,380 | | | Omnicom Group, Inc. | | | 29,142,116 | | | | 41,460,356 | | |
| | 693,566 | | | H&R Block, Inc. | | | 11,741,280 | | | | 12,276,118 | | |
| 441,276 | | | International Speedway
Corporation, Class 'A' | | | 13,039,953 | | | | 11,252,538 | | |
| | 590 | | | St. John Knits International, Inc. (a)(b) | | | 18,290 | | | | 3,245 | | |
| | | | 98,451,733 | | | | 153,867,449 | | |
Consumer Staples 5.09% | | | |
| | 2,440,500 | | | Sysco Corporation | | | 69,941,483 | | | | 75,826,335 | | |
| | 248,310 | | | Lorillard, Inc. | | | 20,261,253 | | | | 28,806,443 | | |
| | 271,170 | | | Colgate-Palmolive Company | | | 21,838,388 | | | | 28,462,003 | | |
| | 257,451 | | | Wal-Mart Stores, Inc. | | | 12,385,227 | | | | 19,313,974 | | |
| | | | 124,426,351 | | | | 152,408,755 | | |
Energy 4.81% | | | |
| | 1,017,408 | | | ConocoPhillips | | | 46,509,238 | | | | 58,857,053 | | |
| | 495,110 | | | Devon Energy Corporation | | | 28,777,022 | | | | 28,820,353 | | |
| | 468,076 | | | Phillips 66 (c) | | | 13,142,406 | | | | 22,074,464 | | |
| | 182,753 | | | Apache Corporation | | | 12,681,438 | | | | 15,122,811 | | |
| | 109,071 | | | SEACOR Holdings, Inc. (a) | | | 8,291,938 | | | | 9,566,618 | | |
| | 350,718 | | | San Juan Basin Royalty Trust | | | 10,175,122 | | | | 4,913,559 | | |
| | 94,454 | | | Helmerich & Payne, Inc. | | | 1,871,008 | | | | 4,514,901 | | |
| | | | 121,448,172 | | | | 143,869,759 | | |
Financials 16.13% | | | |
| | 2,634,204 | | | Bank of New York Mellon Corporation | | | 64,331,532 | | | | 65,091,181 | | |
| | 1,322,150 | | | Cincinnati Financial Corporation | | | 35,979,608 | | | | 52,674,456 | | |
| | 1,802,569 | | | Weyerhaeuser Company REIT | | | 29,787,045 | | | | 49,913,136 | | |
| | 362 | | | Berkshire Hathaway, Inc., Class 'A' (a) | | | 35,598,996 | | | | 46,880,810 | | |
| | 767,090 | | | American Express Company | | | 24,587,690 | | | | 42,934,027 | | |
| | 117,066 | | | Alleghany Corporation (a) | | | 34,293,700 | | | | 40,692,141 | | |
| | 1,388,386 | | | BB&T Corporation | | | 34,964,656 | | | | 40,193,775 | | |
| | 1,133,543 | | | U.S. Bancorp | | | 28,174,022 | | | | 37,644,963 | | |
| | 753,107 | | | Plum Creek Timber Company, Inc., REIT | | | 26,873,535 | | | | 33,061,397 | | |
| | 671,735 | | | WR Berkley Corporation | | | 18,780,775 | | | | 26,123,774 | | |
| | 370,729 | | | Rayonier, Inc., REIT | | | 8,796,435 | | | | 18,169,428 | | |
| | 111,272 | | | Visa, Inc., Class 'A' | | | 8,072,605 | | | | 15,440,103 | | |
See Notes to Financial Statements.
FIRST EAGLE FUNDS | ANNUAL REPORT | OCTOBER 31, 2012
70
Schedule of Investments | Year Ended October 31, 2012
SHARES | | DESCRIPTION | | COST (NOTE 1) | | VALUE (NOTE 1) | |
U.S. Common Stocks — 62.97% — (continued) | | | |
Financials 16.13% — (continued) | | | |
| | 30,859 | | | Mastercard, Inc., Class 'A' | | $ | 7,849,654 | | | $ | 14,223,839 | | |
| | | | 358,090,253 | | | | 483,043,030 | | |
Health Care 1.87% | | | |
| | 717,380 | | | WellPoint, Inc. | | | 40,049,472 | | | | 43,961,047 | | |
| | 169,270 | | | Johnson & Johnson | | | 10,123,420 | | | | 11,987,701 | | |
| | | | 50,172,892 | | | | 55,948,748 | | |
Industrials 8.92% | | | |
| | 636,940 | | | 3M Company | | | 47,534,193 | | | | 55,795,944 | | |
| | 893,622 | | | Alliant Techsystems, Inc. | | | 58,961,742 | | | | 51,195,604 | | |
| | 1,219,970 | | | Cintas Corporation | | | 36,915,327 | | | | 51,006,946 | | |
| | 655,085 | | | Northrop Grumman Corporation | | | 38,909,740 | | | | 44,997,789 | | |
| | 439,695 | | | Lockheed Martin Corporation | | | 31,929,898 | | | | 41,186,231 | | |
| | 887,051 | | | Insteel Industries, Inc. (d) | | | 9,879,258 | | | | 10,289,792 | | |
| | 129,522 | | | Unifirst Corporation | | | 3,733,728 | | | | 9,010,845 | | |
| | 259,306 | | | Blount International, Inc. (a) | | | 2,429,651 | | | | 3,430,618 | | |
| | | | 230,293,537 | | | | 266,913,769 | | |
Information Technology 13.94% | | | |
| | 2,648,054 | | | Microsoft Corporation | | | 67,504,693 | | | | 75,562,221 | | |
| | 4,334,693 | | | Cisco Systems, Inc. | | | 74,966,479 | | | | 74,296,638 | | |
| | 1,872,995 | | | Oracle Corporation | | | 52,483,105 | | | | 58,156,495 | | |
| | 1,435,476 | | | Texas Instruments, Inc. | | | 38,890,683 | | | | 40,322,521 | | |
| | 1,859,358 | | | Intel Corporation | | | 36,078,239 | | | | 40,208,617 | | |
| | 1,267,360 | | | Linear Technology Corporation | | | 34,323,276 | | | | 39,617,673 | | |
| | 1,840,310 | | | Rofin-Sinar Technologies, Inc. (a)(d) | | | 42,514,481 | | | | 33,512,045 | | |
| | 43,456 | | | Google, Inc., Class 'A' (a) | | | 23,794,562 | | | | 29,540,085 | | |
| | 353,471 | | | Automatic Data Processing, Inc. | | | 13,637,377 | | | | 20,427,089 | | |
| | 125,300 | | | KLA-Tencor Corporation (c) | | | 4,277,599 | | | | 5,828,956 | | |
| | | | 388,470,494 | | | | 417,472,340 | | |
Materials 4.04% | | | |
| | 598,612 | | | Newmont Mining Corporation | | | 29,016,804 | | | | 32,654,285 | | |
| | 672,467 | | | Scotts Miracle-Gro Company, Class 'A' | | | 29,427,519 | | | | 28,788,312 | | |
| | 624,872 | | | Vulcan Materials Company | | | 27,379,122 | | | | 28,725,366 | | |
| | 255,880 | | | Martin Marietta Materials, Inc. | | | 22,000,503 | | | | 21,061,483 | | |
| | 142,850 | | | Deltic Timber Corporation | | | 7,367,015 | | | | 9,693,801 | | |
| | | | 115,190,963 | | | | 120,923,247 | | |
See Notes to Financial Statements.
FIRST EAGLE FUNDS | ANNUAL REPORT | OCTOBER 31, 2012
71
SHARES | | DESCRIPTION | | COST (NOTE 1) | | VALUE (NOTE 1) | |
U.S. Common Stocks — 62.97% — (continued) | | | |
Utilities 3.03% | | | |
| | 1,184,103 | | | FirstEnergy Corporation | | $ | 45,783,800 | | | $ | 54,137,189 | | |
| | 371,420 | | | Entergy Corporation | | | 24,857,694 | | | | 26,957,663 | | |
| | 216,687 | | | IDACorp, Inc. | | | 6,780,723 | | | | 9,690,243 | | |
| | | | 77,422,217 | | | | 90,785,095 | | |
Total U.S. Common Stocks | | | 1,563,966,612 | | | | 1,885,232,192 | | |
International Common Stocks — 8.11% | | | |
Australia 1.18% | | | |
| | 1,284,080 | | | Newcrest Mining Limited | | | 43,119,800 | | | | 35,229,575 | | |
Canada 3.75% | | | |
| | 775,000 | | | Agnico-Eagle Mines Limited | | | 36,681,592 | | | | 43,715,365 | | |
| | 2,116,349 | | | Penn West Petroleum Limited | | | 35,508,505 | | | | 27,491,373 | | |
| | 625,881 | | | Nexen, Inc. | | | 9,805,840 | | | | 14,958,556 | | |
| | 310,000 | | | Goldcorp, Inc. | | | 10,799,107 | | �� | | 14,021,300 | | |
| 291,780 | | | Potash Corporation of
Saskatchewan, Inc. | | | 11,807,259 | | | | 11,779,159 | | |
| | 354,331 | | | Catalyst Paper Corporation (a)(b)(e) | | | 6,095 | | | | 372,047 | | |
| | | | 104,608,398 | | | | 112,337,800 | | |
Canada 1.18% | | | |
| | 808,762 | | | Sanofi, ADR | | | 30,754,162 | | | | 35,464,214 | | |
Mexico 0.57% | | | |
| | 552,000 | | | Fresnillo PLC | | | 15,192,578 | | | | 17,090,555 | | |
South Africa 0.87% | | | |
| | 2,069,494 | | | Gold Fields Limited, ADR | | | 30,030,064 | | | | 25,889,370 | | |
United Kingdom 0.56% | | | |
| | 494,263 | | | Willis Group Holdings PLC | | | 13,351,327 | | | | 16,641,835 | | |
Total International Common Stocks | | | 237,056,329 | | | | 242,653,349 | | |
Total Common Stocks | | | 1,801,022,941 | | | | 2,127,885,541 | | |
U.S. Preferred Stock — 0.16% | | | |
Consumer Staples 0.16% | | | |
| | 168,915 | | | Seneca Foods Corporation,
Series '2003' (a)(b)(f)(g) | | | 2,542,171
| | | | 4,828,435
| | |
See Notes to Financial Statements.
FIRST EAGLE FUNDS | ANNUAL REPORT | OCTOBER 31, 2012
72
Schedule of Investments | Year Ended October 31, 2012
SHARES | | DESCRIPTION | | COST (NOTE 1) | | VALUE (NOTE 1) | |
Warrant — 0.36% | | | |
United States 0.36% | | | |
| | 939,766 | | | JPMorgan Chase & Company
Warrant expire 10/28/18 (a) | | $ | 11,329,284
| | | $ | 10,741,526
| | |
OUNCES | | | | | | | |
Commodity — 4.13% | | | |
| | 71,834 | | | Gold bullion (a) | | | 81,518,317 | | | | 123,647,217 | | |
PRINCIPAL | | | | | | | |
Bonds — 3.10% | | | |
International Corporate Bonds — 0.22% | | | |
Canada 0.22% | | | |
| 6,181,818
USD | | | Catalyst Paper Corporation
11.00% due 10/30/17 (b)(e)(h) | | | 8,840,504
| | | | 5,084,545
| | |
| 1,378,823
USD | | | Catalyst Paper Corporation FRN
10.313% due 09/13/16 (b)(e)(i)(j) | | | 1,175,447
| | | | 1,413,294
| | |
Total International Bonds | | | 10,015,951 | | | | 6,497,839 | | |
U.S. Convertible Bond — 0.67% | | | |
$ | 21,612,000 | | | Advanced Micro Devices, Inc.
6.00% due 05/01/15 (k) | | | 20,153,440
| | | | 20,261,250
| | |
U.S. Corporate Bonds — 2.21% | | | |
| | 600,000 | | | Bausch & Lomb, Inc.
7.125% due 08/01/28 (b) | | | 519,993
| | | | 510,750
| | |
| | 23,411,000 | | | Citgo Petroleum Corporation
11.50% due 07/01/17 (i) | | | 25,842,166
| | | | 27,098,233
| | |
| | 5,975,000 | | | Mueller Water Products, Inc.
7.375% due 06/01/17 | | | 5,007,567
| | | | 6,184,125
| | |
| | 13,785,000 | | | New Albertsons, Inc.
7.25% due 05/01/13 | | | 13,828,798
| | | | 13,871,156
| | |
| | 2,000,000 | | | PulteGroup, Inc.
6.25% due 02/15/13 | | | 1,984,422
| | | | 2,040,000
| | |
| | 10,169,000 | | | Sealy Mattress Company
8.25% due 06/15/14 | | | 8,792,929
| | | | 10,270,690
| | |
| | 5,877,000 | | | Yankee Candle Company, Inc.
Series 'B' 9.75% due 02/15/17 | | | 5,872,910
| | | | 6,119,426
| | |
Total U.S. Corporate Bonds | | | 61,848,785 | | | | 66,094,380 | | |
Total Bonds | | | 92,018,176 | | | | 92,853,469 | | |
See Notes to Financial Statements.
FIRST EAGLE FUNDS | ANNUAL REPORT | OCTOBER 31, 2012
73
PRINCIPAL | | DESCRIPTION | | COST (NOTE 1) | | VALUE (NOTE 1) | |
U.S. Treasury Bills — 1.65% | | | |
$ | 11,812,000 | | | U.S. Treasury Bill
0.07% due 01/03/13 | | $ | 11,810,656
| | | $ | 11,810,394
| | |
| | 5,500,000 | | | U.S. Treasury Bill
0.09% due 02/07/13 | | | 5,498,653
| | | | 5,498,356
| | |
| | 14,725,000 | | | U.S. Treasury Bill
0.10% due 11/29/12 | | | 14,723,912
| | | | 14,723,912
| | |
| | 8,762,000 | | | U.S. Treasury Bill
0.10% due 01/24/13 | | | 8,760,058
| | | | 8,760,107
| | |
| | 8,762,000 | | | U.S. Treasury Bill
0.11% due 02/21/13 | | | 8,759,001
| | | | 8,758,863
| | |
Total U.S. Treasury Bills | | | 49,552,280 | | | | 49,551,632 | | |
Commercial Paper — 19.95% | | | |
International Commercial Paper — 7.25% | | | |
Australia 0.02% | | | |
| | 699,000 | | | Telstra Corporation Limited
USD0.22% due 12/10/12 | | | 698,833
| | | | 698,833
| | |
Canada 0.26% | | | |
| | 4,142,000 | | | Suncor Energy, Inc.
USD0.32% due 11/16/12 | | | 4,141,448
| | | | 4,141,448
| | |
| | 3,505,000 | | | Suncor Energy, Inc.
USD0.36% due 12/17/12 | | | 3,503,432
| | | | 3,503,432
| | |
France 1.21% | | | |
| | 1,771,000 | | | GDF Suez SA
USD0.21% due 11/05/12 | | | 1,770,959
| | | | 1,770,959
| | |
| | 2,365,000 | | | GDF Suez SA
USD0.22% due 11/14/12 | | | 2,364,812
| | | | 2,364,812
| | |
| | 10,345,000 | | | Sanofi
USD0.14% due 11/07/12 | | | 10,344,759
| | | | 10,344,759
| | |
| | 5,177,000 | | | Sanofi
USD0.14% due 11/13/12 | | | 5,176,758
| | | | 5,176,758
| | |
| | 6,820,000 | | | Total SA
USD0.13% due 11/15/12 | | | 6,819,655
| | | | 6,819,655
| | |
| | 9,872,000 | | | Total SA
USD0.14% due 12/18/12 | | | 9,870,196
| | | | 9,870,196
| | |
Germany 1.72% | | | |
| | 12,743,000 | | | BASF AG
USD0.14% due 11/27/12 | | | 12,741,712
| | | | 12,741,712
| | |
| | 11,791,000 | | | BASF AG
USD0.15% due 12/17/12 | | | 11,788,740
| | | | 11,788,740
| | |
See Notes to Financial Statements.
FIRST EAGLE FUNDS | ANNUAL REPORT | OCTOBER 31, 2012
74
Schedule of Investments | Year Ended October 31, 2012
PRINCIPAL | | DESCRIPTION | | COST (NOTE 1) | | VALUE (NOTE 1) | |
International Commercial Paper — 7.25% — (continued) | | | |
Germany 1.72% — (continued) | | | |
| | 575,000 | | | BASF AG
USD0.15% due 12/18/12 | | $ | 574,887
| | | $ | 574,887
| | |
| | 562,000 | | | BASF AG
USD0.15% due 12/27/12 | | | 561,869
| | | | 561,869
| | |
| | 763,000 | | | Henkel Corporation
USD0.14% due 11/01/12 | | | 763,000
| | | | 763,000
| | |
| | 1,192,000 | | | Henkel Corporation
USD0.15% due 11/21/12 | | | 1,191,901
| | | | 1,191,901
| | |
| | 5,378,000 | | | Siemens Company
USD0.13% due 11/02/12 | | | 5,377,981
| | | | 5,377,981
| | |
| | 4,852,000 | | | Siemens Company
USD0.13% due 11/13/12 | | | 4,851,790
| | | | 4,851,790
| | |
| | 9,089,000 | | | Siemens Company
USD0.13% due 11/26/12 | | | 9,088,179
| | | | 9,088,179
| | |
| | 3,586,000 | | | Siemens Company
USD0.15% due 11/02/12 | | | 3,585,985
| | | | 3,585,985
| | |
| | 954,000 | | | Siemens Company
USD0.15% due 12/14/12 | | | 953,829
| | | | 953,829
| | |
Italy 0.75% | | | |
| | 1,734,000 | | | Eni S.p.A.
USD0.46% due 11/01/12 | | | 1,734,000
| | | | 1,734,000
| | |
| | 1,000,000 | | | Eni S.p.A.
USD0.58% due 11/05/12 | | | 999,937
| | | | 999,937
| | |
| | 9,738,000 | | | Eni S.p.A.
USD0.61% due 11/08/12 | | | 9,736,864
| | | | 9,736,864
| | |
| | 9,872,000 | | | Eni S.p.A.
USD0.65% due 11/20/12 | | | 9,868,665
| | | | 9,868,665
| | |
Japan 0.24% | | | |
| | 2,427,000 | | | Mitsubishi Company
USD0.23% due 11/09/12 | | | 2,426,876
| | | | 2,426,876
| | |
| | 3,275,000 | | | Mitsui & Company Limited
USD0.33% due 11/06/12 | | | 3,274,850
| | | | 3,274,850
| | |
| | 1,622,000 | | | Mitsui & Company Limited
USD0.34% due 11/26/12 | | | 1,621,617
| | | | 1,621,617
| | |
Switzerland 0.73% | | | |
| | 1,570,000 | | | ABB Limited
USD0.20% due 11/13/12 | | | 1,569,895
| | | | 1,569,895
| | |
| | 4,381,000 | | | ABB Limited
USD0.22% due 12/10/12 | | | 4,379,956
| | | | 4,379,956
| | |
| | 3,881,000 | | | ABB Limited
USD0.22% due 12/13/12 | | | 3,880,004
| | | | 3,880,004
| | |
See Notes to Financial Statements.
FIRST EAGLE FUNDS | ANNUAL REPORT | OCTOBER 31, 2012
75
PRINCIPAL | | DESCRIPTION | | COST (NOTE 1) | | VALUE (NOTE 1) | |
International Commercial Paper — 7.25% — (continued) | | | |
Switzerland 0.73% — (continued) | | | |
| | 2,125,000 | | | ABB Limited
USD0.22% due 12/14/12 | | $ | 2,124,442
| | | $ | 2,124,442
| | |
| | 1,621,000 | | | Nestlé SA
USD0.08% due 12/06/12 | | | 1,620,874
| | | | 1,620,874
| | |
| | 1,468,000 | | | Nestlé SA
USD0.15% due 01/15/13 | | | 1,467,541
| | | | 1,467,606
| | |
| | 1,180,000 | | | Nestlé SA
USD0.16% due 01/16/13 | | | 1,179,601
| | | | 1,179,677
| | |
| | 5,650,000 | | | Nestlé SA
USD0.16% due 01/29/13 | | | 5,647,765
| | | | 5,647,881
| | |
United Kingdom 2.32% | | | |
| | 3,569,000 | | | AstraZeneca PLC
USD0.13% due 12/04/12 | | | 3,568,575
| | | | 3,568,575
| | |
| | 5,265,000 | | | AstraZeneca PLC
USD0.14% due 11/27/12 | | | 5,264,468
| | | | 5,264,468
| | |
| | 7,588,000 | | | AstraZeneca PLC
USD0.14% due 12/11/12 | | | 7,586,820
| | | | 7,586,820
| | |
| | 2,656,000 | | | AstraZeneca PLC
USD0.14% due 12/18/12 | | | 2,655,514
| | | | 2,655,514
| | |
| | 1,824,000 | | | AstraZeneca PLC
USD0.15% due 11/05/12 | | | 1,823,970
| | | | 1,823,970
| | |
| | 2,028,000 | | | AstraZeneca PLC
USD0.15% due 11/14/12 | | | 2,027,890
| | | | 2,027,890
| | |
| | 946,000 | | | AstraZeneca PLC
USD0.15% due 11/16/12 | | | 945,941
| | | | 945,941
| | |
| | 1,550,000 | | | AstraZeneca PLC
USD0.16% due 01/22/13 | | | 1,549,435
| | | | 1,549,042
| | |
| | 8,762,000 | | | AstraZeneca PLC
USD0.16% due 01/29/13 | | | 8,758,534
| | | | 8,755,866
| | |
| | 7,460,000 | | | GlaxoSmithKline PLC
USD0.12% due 11/01/12 | | | 7,460,000
| | | | 7,460,000
| | |
| | 11,037,000 | | | GlaxoSmithKline PLC
USD0.12% due 11/05/12 | | | 11,036,853
| | | | 11,036,853
| | |
| | 9,296,000 | | | GlaxoSmithKline PLC
USD0.12% due 11/08/12 | | | 9,295,783
| | | | 9,295,783
| | |
| | 2,324,000 | | | GlaxoSmithKline PLC
USD0.12% due 11/09/12 | | | 2,323,938
| | | | 2,323,938
| | |
| | 5,177,000 | | | GlaxoSmithKline PLC
USD0.12% due 11/15/12 | | | 5,176,758
| | | | 5,176,758
| | |
Total International Commercial Paper | | | 217,178,091 | | | | 217,175,287 | | |
See Notes to Financial Statements.
FIRST EAGLE FUNDS | ANNUAL REPORT | OCTOBER 31, 2012
76
Schedule of Investments | Year Ended October 31, 2012
PRINCIPAL | | DESCRIPTION | | COST (NOTE 1) | | VALUE (NOTE 1) | |
U.S. Commercial Paper — 12.70% | | | |
$ | 6,935,000 | | | Apache Corporation
0.41% due 11/01/12 | | $ | 6,935,000
| | | $ | 6,935,000
| | |
| | 1,496,000 | | | Apache Corporation
0.45% due 11/08/12 | | | 1,495,872
| | | | 1,495,872
| | |
| | 4,819,000 | | | AutoZone, Inc.
0.38% due 11/09/12 | | | 4,818,604
| | | | 4,818,604
| | |
| | 4,381,000 | | | Campbell Soup Company
0.19% due 11/14/12 | | | 4,380,699
| | | | 4,380,699
| | |
| | 12,233,000 | | | Chevron Corporation
0.09% due 11/01/12 | | | 12,233,000
| | | | 12,233,000
| | |
| | 13,098,000 | | | Chevron Corporation
0.11% due 11/09/12 | | | 13,097,680
| | | | 13,097,680
| | |
| | 4,495,000 | | | Chevron Corporation
0.11% due 11/16/12 | | | 4,494,794
| | | | 4,494,794
| | |
| | 4,381,000 | | | Chevron Corporation
0.12% due 01/02/13 | | | 4,380,095
| | | | 4,379,199
| | |
| | 3,271,000 | | | Chevron Corporation
0.14% due 12/03/12 | | | 3,270,593
| | | | 3,270,593
| | |
| | 1,468,000 | | | Church & Dwight Company, Inc.
0.43% due 11/02/12 | | | 1,467,983
| | | | 1,467,983
| | |
| | 1,354,000 | | | Coca-Cola Company
0.17% due 11/16/12 | | | 1,353,904
| | | | 1,353,904
| | |
| | 1,988,000 | | | Coca-Cola Company
0.18% due 11/29/12 | | | 1,987,722
| | | | 1,987,722
| | |
| | 2,937,000 | | | Coca-Cola Company
0.18% due 01/28/13 | | | 2,935,708
| | | | 2,935,707
| | |
| | 6,487,000 | | | Coca-Cola Company
0.20% due 01/24/13 | | | 6,483,973
| | | | 6,484,366
| | |
| | 750,000 | | | Coca-Cola Company
0.20% due 02/07/13 | | | 749,592
| | | | 749,604
| | |
| | 2,956,000 | | | Coca-Cola Company
0.21% due 12/10/12 | | | 2,955,328
| | | | 2,955,328
| | |
| | 6,040,000 | | | Coca-Cola Company
0.21% due 12/11/12 | | | 6,038,591
| | | | 6,038,591
| | |
| | 6,116,000 | | | Coca-Cola Company
0.21% due 12/19/12 | | | 6,114,288
| | | | 6,114,288
| | |
| | 3,554,000 | | | ConocoPhillips
0.15% due 11/20/12 | | | 3,553,719
| | | | 3,553,719
| | |
| | 3,977,000 | | | ConocoPhillips
0.16% due 11/06/12 | | | 3,976,912
| | | | 3,976,912
| | |
| | 1,275,000 | | | ConocoPhillips
0.19% due 01/18/13 | | | 1,274,475
| | | | 1,274,547
| | |
See Notes to Financial Statements.
FIRST EAGLE FUNDS | ANNUAL REPORT | OCTOBER 31, 2012
77
PRINCIPAL | | DESCRIPTION | | COST (NOTE 1) | | VALUE (NOTE 1) | |
U.S. Commercial Paper — 12.70% — (continued) | | | |
$ | 1,544,000 | | | ConocoPhillips
0.22% due 11/21/12 | | $ | 1,543,811
| | | $ | 1,543,811
| | |
| | 3,505,000 | | | Dell, Inc.
0.14% due 11/16/12 | | | 3,504,796
| | | | 3,504,796
| | |
| | 763,000 | | | Devon Energy Corporation
0.30% due 11/01/12 | | | 763,000
| | | | 763,000
| | |
| | 5,870,000 | | | Devon Energy Corporation
0.30% due 11/02/12 | | | 5,869,951
| | | | 5,869,951
| | |
| | 1,793,000 | | | Devon Energy Corporation
0.32% due 11/09/12 | | | 1,792,873
| | | | 1,792,873
| | |
| | 10,118,000 | | | Devon Energy Corporation
0.32% due 11/19/12 | | | 10,116,381
| | | | 10,116,381
| | |
| | 976,000 | | | Devon Energy Corporation
0.35% due 01/03/13 | | | 975,419
| | | | 975,333
| | |
| | 2,080,000 | | | Emerson Electric Company
0.12% due 11/27/12 | | | 2,079,820
| | | | 2,079,820
| | |
| | 2,686,000 | | | Emerson Electric Company
0.12% due 11/28/12 | | | 2,685,758
| | | | 2,685,758
| | |
| | 4,936,000 | | | Emerson Electric Company
0.12% due 12/27/12 | | | 4,935,079
| | | | 4,935,079
| | |
| | 2,385,000 | | | Emerson Electric Company
0.14% due 11/13/12 | | | 2,384,889
| | | | 2,384,889
| | |
| | 930,000 | | | Emerson Electric Company
0.14% due 11/14/12 | | | 929,953
| | | | 929,953
| | |
| | 629,000 | | | General Mills, Inc.
0.27% due 11/16/12 | | | 628,929
| | | | 628,929
| | |
| | 954,000 | | | General Mills, Inc.
0.29% due 11/26/12 | | | 953,808
| | | | 953,808
| | |
| | 4,619,000 | | | Google, Inc.
0.09% due 11/02/12 | | | 4,618,988
| | | | 4,618,988
| | |
| | 5,595,000 | | | Google, Inc.
0.09% due 11/13/12 | | | 5,594,832
| | | | 5,594,832
| | |
| | 1,774,000 | | | Google, Inc.
0.10% due 12/03/12 | | | 1,773,842
| | | | 1,773,842
| | |
| | 2,217,000 | | | Google, Inc.
0.12% due 11/20/12 | | | 2,216,860
| | | | 2,216,860
| | |
| | 6,213,000 | | | Google, Inc.
0.12% due 12/05/12 | | | 6,212,296
| | | | 6,212,296
| | |
| | 4,064,000 | | | H.J. Heinz Company Limited
0.36% due 01/23/13 | | | 4,060,721
| | | | 4,060,795
| | |
| | 4,919,000 | | | Johnson & Johnson
0.10% due 11/01/12 | | | 4,919,000
| | | | 4,919,000
| | |
See Notes to Financial Statements.
FIRST EAGLE FUNDS | ANNUAL REPORT | OCTOBER 31, 2012
78
Schedule of Investments | Year Ended October 31, 2012
PRINCIPAL | | DESCRIPTION | | COST (NOTE 1) | | VALUE (NOTE 1) | |
U.S. Commercial Paper — 12.70% — (continued) | | | |
$ | 7,944,000 | | | Johnson & Johnson
0.10% due 12/03/12 | | $ | 7,943,294
| | | $ | 7,943,294
| | |
| | 3,099,000 | | | Johnson & Johnson
0.10% due 12/04/12 | | | 3,098,716
| | | | 3,098,716
| | |
| | 632,000 | | | Johnson & Johnson
0.10% due 12/05/12 | | | 631,940
| | | | 631,940
| | |
| | 9,103,000 | | | Johnson & Johnson
0.11% due 01/07/13 | | | 9,101,136
| | | | 9,101,057
| | |
| | 7,791,000 | | | Johnson & Johnson
0.11% due 01/09/13 | | | 7,789,357
| | | | 7,789,228
| | |
| | 3,943,000 | | | Kinder Morgan, Inc.
0.44% due 11/07/12 | | | 3,942,717
| | | | 3,942,717
| | |
| | 1,468,000 | | | McDonald's Corporation
0.11% due 11/14/12 | | | 1,467,942
| | | | 1,467,942
| | |
| | 1,630,000 | | | Medtronic, Inc.
0.14% due 01/25/13 | | | 1,629,461
| | | | 1,629,052
| | |
| | 5,458,000 | | | Medtronic, Inc.
0.15% due 12/13/12 | | | 5,457,045
| | | | 5,457,045
| | |
| | 3,307,000 | | | Medtronic, Inc.
0.16% due 01/03/13 | | | 3,306,074
| | | | 3,305,785
| | |
| | 1,550,000 | | | Merck & Company, Inc.
0.11% due 11/26/12 | | | 1,549,882
| | | | 1,549,882
| | |
| | 763,000 | | | Merck & Company, Inc.
0.13% due 12/05/12 | | | 762,906
| | | | 762,906
| | |
| | 10,786,000 | | | Merck & Company, Inc.
0.13% due 12/12/12 | | | 10,784,403
| | | | 10,784,403
| | |
| | 3,635,000 | | | Parker-Hannifin Corporation
0.13% due 11/06/12 | | | 3,634,934
| | | | 3,634,934
| | |
| | 3,426,000 | | | Philip Morris International, Inc.
0.08% due 11/14/12 | | | 3,425,899
| | | | 3,425,899
| | |
| | 625,000 | | | Philip Morris International, Inc.
0.09% due 11/08/12 | | | 624,989
| | | | 624,989
| | |
| | 1,289,000 | | | Philip Morris International, Inc.
0.11% due 11/20/12 | | | 1,288,925
| | | | 1,288,925
| | |
| | 1,468,000 | | | Philip Morris International, Inc.
0.13% due 11/16/12 | | | 1,467,920
| | | | 1,467,920
| | |
| | 1,771,000 | | | Praxair, Inc.
0.10% due 11/15/12 | | | 1,770,931
| | | | 1,770,931
| | |
| | 6,730,000 | | | Praxair, Inc.
0.11% due 11/07/12 | | | 6,729,877
| | | | 6,729,877
| | |
| | 3,746,000 | | | Precision Castparts Corporation
0.15% due 11/02/12 | | | 3,745,984
| | | | 3,745,984
| | |
See Notes to Financial Statements.
FIRST EAGLE FUNDS | ANNUAL REPORT | OCTOBER 31, 2012
79
PRINCIPAL | | DESCRIPTION | | COST (NOTE 1) | | VALUE (NOTE 1) | |
U.S. Commercial Paper — 12.70% — (continued) | | | |
$ | 688,000 | | | Precision Castparts Corporation
0.19% due 12/20/12 | | $ | 687,822
| | | $ | 687,822
| | |
| | 2,774,000 | | | Precision Castparts Corporation
0.20% due 11/01/12 | | | 2,774,000
| | | | 2,774,000
| | |
| | 2,656,000 | | | Proctor & Gamble Company
0.12% due 11/09/12 | | | 2,655,929
| | | | 2,655,929
| | |
| | 5,139,000 | | | Proctor & Gamble Company
0.13% due 11/19/12 | | | 5,138,666
| | | | 5,138,666
| | |
| | 9,738,000 | | | Stanley Black & Decker Inc.
0.31% due 11/06/12 | | | 9,737,581
| | | | 9,737,581
| | |
| | 4,711,000 | | | Stanley Black & Decker Inc.
0.33% due 11/06/12 | | | 4,710,784
| | | | 4,710,784
| | |
| | 2,024,000 | | | Stanley Black & Decker Inc.
0.33% due 11/07/12 | | | 2,023,889
| | | | 2,023,889
| | |
| | 3,968,000 | | | United Healthcare Company
0.35% due 11/05/12 | | | 3,967,846
| | | | 3,967,846
| | |
| | 2,595,000 | | | United Parcel Service, Inc.
0.04% due 11/19/12 | | | 2,594,948
| | | | 2,594,948
| | |
| | 2,733,000 | | | United Parcel Service, Inc.
0.05% due 12/05/12 | | | 2,732,871
| | | | 2,732,871
| | |
| | 3,542,000 | | | United Technologies Corporation
0.13% due 11/20/12 | | | 3,541,757
| | | | 3,541,757
| | |
| | 7,278,000 | | | United Technologies Corporation
0.13% due 11/26/12 | | | 7,277,343
| | | | 7,277,343
| | |
| | 11,843,000 | | | United Technologies Corporation
0.13% due 11/28/12 | | | 11,841,845
| | | | 11,841,845
| | |
| | 4,073,000 | | | United Technologies Corporation
0.15% due 11/28/12 | | | 4,072,542
| | | | 4,072,542
| | |
| | 5,669,000 | | | Verizon Communications, Inc.
0.33% due 11/13/12 | | | 5,668,376
| | | | 5,668,376
| | |
| | 1,093,000 | | | Verizon Communications, Inc.
0.36% due 11/13/12 | | | 1,092,872
| | | | 1,092,872
| | |
| | 4,915,000 | | | Verizon Communications, Inc.
0.36% due 12/04/12 | | | 4,913,423
| | | | 4,913,423
| | |
| | 4,097,000 | | | Verizon Communications, Inc.
0.39% due 12/14/12 | | | 4,095,140
| | | | 4,095,140
| | |
| | 2,257,000 | | | Verizon Communications, Inc.
0.42% due 12/11/12 | | | 2,255,972
| | | | 2,255,972
| | |
| | 1,289,000 | | | Verizon Communications, Inc.
0.42% due 12/12/12 | | | 1,288,398
| | | | 1,288,398
| | |
| | 12,340,000 | | | Wal-Mart Stores, Inc.
0.11% due 11/06/12 | | | 12,339,811
| | | | 12,339,811
| | |
See Notes to Financial Statements.
FIRST EAGLE FUNDS | ANNUAL REPORT | OCTOBER 31, 2012
80
Schedule of Investments | Year Ended October 31, 2012
PRINCIPAL | | DESCRIPTION | | COST (NOTE 1) | | VALUE (NOTE 1) | |
U.S. Commercial Paper — 12.70% — (continued) | | | |
$ | 5,948,000 | | | Wal-Mart Stores, Inc.
0.12% due 11/05/12 | | $ | 5,947,921
| | | $ | 5,947,921
| | |
| | 10,393,000 | | | Wal-Mart Stores, Inc.
0.12% due 11/16/12 | | | 10,392,480
| | | | 10,392,480
| | |
| | 5,297,000 | | | Walt Disney Company
0.12% due 11/14/12 | | | 5,296,770
| | | | 5,296,770
| | |
| | 752,000 | | | Walt Disney Company
0.13% due 12/28/12 | | | 751,845
| | | | 751,845
| | |
| | 5,297,000 | | | Walt Disney Company
0.15% due 12/17/12 | | | 5,295,985
| | | | 5,295,985
| | |
| | 10,593,000 | | | Walt Disney Company
0.15% due 12/21/12 | | | 10,590,793
| | | | 10,590,793
| | |
| | 1,440,000 | | | WellPoint, Inc.
0.25% due 01/14/13 | | | 1,439,260
| | | | 1,439,040
| | |
| | 666,000 | | | WellPoint, Inc.
0.25% due 01/16/13 | | | 665,648
| | | | 665,538
| | |
| | 1,561,000 | | | WellPoint, Inc.
0.41% due 12/03/12 | | | 1,560,445
| | | | 1,560,445
| | |
Total U.S. Commercial Paper | | | 380,066,832 | | | | 380,065,164 | | |
Total Commercial Paper | | | 597,244,923 | | | | 597,240,451 | | |
Total Investment Portfolio
Excluding Options Written — 100.43% | | $ | 2,635,228,092 | | | $ | 3,006,748,271 | | |
CONTRACTS | | | | STRIKE PRICE | | EXPIRATION DATE | | VALUE (NOTE 1) | |
Covered Call Options Written — (0.01)% | |
| | 1,253 | | | KLA-Tencor Corporation | | $ | 55.00 | | | January 2013 | | $ | (25,060 | ) | |
| | 2,340 | | | Phillips 66 | | | 49.00 | | | November 2012 | | | (187,200 | ) | |
Total Covered Call Options Written (Premiums Received: $604,523) | | | | | | | | | (212,260 | ) | |
Total Investments — 100.42% (Cost: $2,634,623,569) | | | | | | | | $ | 3,006,536,011 | | |
Liabilities in Excess of Other Assets — (0.42)% | | | | | | | | | (12,715,071 | ) | |
Net Assets — 100.00% | | | | | | | | $ | 2,993,820,940 | | |
(a) Non-income producing security/commodity.
(b) Security is deemed illiquid. At October 31, 2012, the value of these securities amounted to $12,212,316 or 0.41% of net assets.
(c) At October 31, 2012, all or a portion of this security was segregated to cover collateral requirement for options.
(d) An affiliate of the Fund as defined by the Investment Company Act of 1940. An affiliate is defined as a company in which the Fund directly or indirectly owns, controls, or holds power to vote 5% or more of the outstanding voting securities.
(e) Represents securities that are subject to legal or contractual restrictions on resale. At October 31, 2012, the value of these securities amounted to $6,869,886 or 0.23% of net assets.
See Notes to Financial Statements.
FIRST EAGLE FUNDS | ANNUAL REPORT | OCTOBER 31, 2012
81
(f) Securities valued in accordance with fair value procedures under the supervision of the Board of Trustees, representing $4,828,435 or 0.16% of net assets.
(g) This security is convertible until December 31, 2049.
(h) Payment-in-kind security.
(i) All or a portion of the security is exempt from registration under the Securities Act of 1933. Rule 144A securities may only be sold to qualified institutional buyers, pursuant to Rule 144A under the Securities Act of 1933.
(j) Floating rate security. Rate shown is the rate in effect at October 31, 2012.
(k) This security is convertible until April 30, 2015.
At October 31, 2012, aggregate cost for federal income tax purposes was $2,630,924,212. Net unrealized appreciation consisted of:
Gross unrealized appreciation | | $ | 426,127,553 | | |
Gross unrealized depreciation | | | (50,515,754 | ) | |
Net unrealized appreciation | | $ | 375,611,799 | | |
Abbreviations used in this schedule include:
ADR — American Depository Receipt
FRN — Floating Rate Note
PLC — Public Limited Company
REIT — Real Estate Investment Trust
Currencies
USD — United States Dollar
RESTRICTED SECURITIES | | ACQUISITION
DATE | | COST | | CARRYING VALUE PER
SHARE/PRINCIPAL | |
Catalyst Paper Corporation | | 09/17/12 | | $ | 6,095 | | | $ | 1.05 | | |
Catalyst Paper Corporation
11.00% due 10/30/17 | | 09/17/12 | | | 8,840,504 | | | | 0.82 | | |
Catalyst Paper Corporation FRN
10.31% due 09/13/16 | | 08/31/12 | | | 1,175,447 | | | | 1.03 | | |
Affiliated Securities | |
AFFILIATED
SECURITIES | | SHARES
OCTOBER 31,
2011 | | GROSS
ADDITIONS | | GROSS
REDUCTIONS | | SHARES
OCTOBER 31,
2012 | | MARKET VALUE
OCTOBER 31,
2012 | | REALIZED
GAIN / (LOSS) | | DIVIDEND
INCOME | |
Insteel
Industries, Inc. | | | 816,751 | | | | 70,300 | | | | — | | | | 887,051 | | | $ | 10,289,792 | | | $ | — | | | $ | 105,606 | | |
Rofin-Sinar
Technologies, Inc. | | | 1,187,010 | | | | 653,300 | | | | — | | | | 1,840,310 | | | | 33,512,045 | | | | — | | | | — | | |
Total | | $ | 43,801,837 | | | $ | — | | | $ | 105,606 | | |
See Notes to Financial Statements.
FIRST EAGLE FUNDS | ANNUAL REPORT | OCTOBER 31, 2012
82
Schedule of Investments | Year Ended October 31, 2012
INDUSTRY DIVERSIFICATION FOR PORTFOLIO HOLDINGS | | PERCENT OF
NET ASSETS | |
U.S. Common Stocks | |
Consumer Discretionary | | | 5.14 | % | |
Consumer Staples | | | 5.09 | | |
Energy | | | 4.81 | | |
Financials | | | 16.13 | | |
Health Care | | | 1.87 | | |
Industrials | | | 8.92 | | |
Information Technology | | | 13.94 | | |
Materials | | | 4.04 | | |
Utilities | | | 3.03 | | |
Total U.S. Common Stocks | | | 62.97 | | |
International Common Stocks | |
Energy | | | 1.42 | | |
Financials | | | 0.56 | | |
Health Care | | | 1.18 | | |
Materials | | | 4.95 | | |
Total International Common Stocks | | | 8.11 | | |
U.S. Preferred Stock | |
Consumer Staples | | | 0.16 | | |
Total U.S. Preferred Stock | | | 0.16 | | |
Warrant | | | 0.36 | | |
Commodity | | | 4.13 | | |
International Corporate Bonds | |
Materials | | | 0.22 | | |
Total International Corporate Bonds | | | 0.22 | | |
See Notes to Financial Statements.
FIRST EAGLE FUNDS | ANNUAL REPORT | OCTOBER 31, 2012
83
INDUSTRY DIVERSIFICATION FOR PORTFOLIO HOLDINGS — (CONTINUED) | | PERCENT OF
NET ASSETS | |
U.S. Corporate Bonds | |
Consumer Discretionary | | | 0.63 | % | |
Consumer Staples | | | 0.46 | | |
Energy | | | 0.91 | | |
Industrials | | | 0.21 | | |
Total U.S. Corporate Bonds | | | 2.21 | | |
U.S. Convertible Bond | |
Industrials | | | 0.67 | | |
Total U.S. Convertible Bond | | | 0.67 | | |
U.S. Treasury Bills | | | 1.65 | | |
Commercial Paper | |
International Commercial Paper | | | 7.25 | | |
U.S. Commercial Paper | | | 12.70 | | |
Total Commercial Paper | | | 19.95 | | |
Covered Call Options Written | | | (0.01) | | |
Total Investments | | | 100.42 | % | |
See Notes to Financial Statements.
FIRST EAGLE FUNDS | ANNUAL REPORT | OCTOBER 31, 2012
84
This page was intentionally left blank.

Fund Overview | Data as of October 31, 2012 (unaudited)
INVESTMENT OBJECTIVE
The First Eagle Gold Fund seeks to provide investors the opportunity to participate in the investment characteristics of gold (and, to a limited extent, other precious metals) for a portion of their overall investment portfolio. In seeking to achieve its objective, the Fund invests primarily in gold, gold related securities and issuers principally engaged in the gold industry.
Average Annual Returns | |
| | | ONE-YEAR | | FIVE-YEARS | | TEN-YEARS | |
First Eagle Gold
Fund (A Shares) | |
without sales load | | | –8.14 | % | | | 6.80 | % | | | 16.47 | % | |
with sales load | | | –12.72 | | | | 5.71 | | | | 15.88 | | |
FTSE Gold Mines Index | | | –14.81 | | | | 0.40 | | | | 11.60 | | |
MSCI World Index | | | 9.45 | | | | –2.87 | | | | 7.20 | | |
Consumer Price Index | | | 2.16 | | | | 2.05 | | | | 2.46 | | |
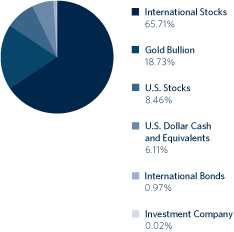
Countries** | |
Canada | | | 37.37 | % | |
United States | | | 27.21 | | |
South Africa | | | 9.81 | | |
Mexico | | | 7.33 | | |
Australia | | | 7.14 | | |
West Africa | | | 4.91 | | |
Channel Island | | | 0.12 | | |
* Asset Allocation and Countries percentages are based on total investments in the Portfolio.
** Country allocations reflect country of the issuer (not currency of issue) and exclude short term investments. Bonds of non-U.S. issuers may be U.S. dollar denominated.
The Fund's portfolio composition is subject to change at any time.
FIRST EAGLE FUNDS | ANNUAL REPORT | OCTOBER 31, 2012
86
Growth of a $10,000 Initial Investment
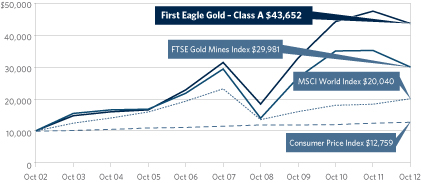
Performance data quoted herein represents past performance and should not be considered indicative of future results. Performance data quoted herein does not reflect the deduction of taxes that a shareholder would pay on Fund distributions or the sale of Fund shares. The average annual returns shown above are historical and reflect changes in share price, reinvested dividends and are net of expenses.
The average annual returns for Class A Shares with a sales charge give effect to the deduction of the maximum sales charge of 5.00%.
The MSCI World Index is a widely followed, unmanaged group of stocks from 23 international markets and is not available for purchase. The index provides total returns in U.S. dollars with net dividends reinvested. The FTSE Gold Mines Index is an unmanaged index composed of approximately 19 mining companies and is only available without dividends reinvested and is not available for purchase. The Consumer Price Index (CPI) represents the change in price of all goods and services purchased for consumption by urban households.
Top 10 Holdings* | |
| Gold Bullion (United States) | | | 18.76 | % | |
| Agnico-Eagle Mines Limited (Canada) | | | 7.52 | | |
| Goldcorp, Inc. (Canada) | | | 5.51 | | |
| Randgold Resources Limited, ADR (Africa) | | | 4.92 | | |
| AngloGold Ashanti Limited, ADR (South Africa) | | | 4.67 | | |
| Newcrest Mining Limited (Australia) | | | 4.56 | | |
| Kinross Gold Corporation (Canada) | | | 4.48 | | |
| Fresnillo PLC (Mexico) | | | 4.23 | | |
| Newmont Mining Corporation (United States) | | | 4.13 | | |
| Barrick Gold Corp. (Canada) | | | 3.91 | | |
Total | | | 62.69 | % | |
* Holdings in cash, commercial paper, money market funds and other short term cash equivalents have been excluded. Percentages are based on total net assets.
FIRST EAGLE FUNDS | ANNUAL REPORT | OCTOBER 31, 2012
87
SHARES | | DESCRIPTION | | COST (NOTE 1) | | VALUE (NOTE 1) | |
Common Stocks — 74.12% | | | |
International Common Stocks — 65.65% | | | |
Africa 4.92% | | | |
| | 1,264,736 | | | Randgold Resources Limited, ADR | | $ | 28,073,423 | | | $ | 151,249,778 | | |
Australia 7.15% | | | |
| | 5,106,092 | | | Newcrest Mining Limited | | | 155,393,729 | | | | 140,088,973 | | |
| | 10,490,230 | | | CGA Mining Limited (a)(b) | | | 20,802,617 | | | | 31,794,935 | | |
| | 4,118,481 | | | Kingsgate Consolidated Limited | | | 18,612,918 | | | | 23,470,782 | | |
| | 2,613,520 | | | Medusa Mining Limited | | | 12,846,050 | | | | 16,549,079 | | |
| | 11,322,505 | | | Intrepid Mines Limited (a) | | | 15,768,312 | | | | 3,996,130 | | |
| 9,288,115 | | | St. Augustine Gold and Copper
Limited (a)(c) | | | 9,748,196
| | | | 3,948,633 | | |
| | | | 233,171,822 | | | | 219,848,532 | | |
Canada 36.45% | | | |
| | 4,100,010 | | | Agnico-Eagle Mines Limited | | | 196,140,991 | | | | 231,268,945 | | |
| | 3,743,920 | | | Goldcorp, Inc. | | | 124,274,052 | | | | 169,337,502 | | |
| | 13,800,672 | | | Kinross Gold Corporation | | | 184,653,009 | | | | 137,868,713 | | |
| | 2,971,546 | | | Barrick Gold Corporation | | | 103,411,744 | | | | 120,347,613 | | |
| | 6,901,692 | | | IAMGOLD Corporation | | | 43,187,558 | | | | 107,008,329 | | |
| | 5,618,531 | | | New Gold, Inc. (a) | | | 9,958,018 | | | | 65,700,338 | | |
| | 1,003,033 | | | Franco-Nevada Corporation | | | 17,431,540 | | | | 57,701,738 | | |
| | 5,274,540 | | | Osisko Mining Corporation (a)(b) | | | 41,215,497 | | | | 51,758,765 | | |
| | 2,558,657 | | | Eldorado Gold Corporation | | | 23,877,785 | | | | 37,777,110 | | |
| | 2,369,196 | | | Dundee Precious Metals, Inc. (a)(b) | | | 4,668,150 | | | | 21,779,445 | | |
| | 744,260 | | | Detour Gold Corporation (a)(b) | | | 16,953,437 | | | | 20,949,761 | | |
| | 4,409,900 | | | SEMAFO, Inc. | | | 18,148,387 | | | | 17,644,893 | | |
| | 2,815,100 | | | Alacer Gold Corporation (a) | | | 12,734,387 | | | | 15,431,377 | | |
| | 2,794,800 | | | Rainy River Resources Limited (a) | | | 15,643,750 | | | | 15,208,275 | | |
| | 5,451,680 | | | Gabriel Resources Limited (a) | | | 32,031,903 | | | | 13,197,025 | | |
| | 13,688,820 | | | Lake Shore Gold Corporation (a) | | | 47,294,893 | | | | 10,954,342 | | |
| | 2,304,450 | | | Aurizon Mines Limited (a) | | | 2,313,396 | | | | 10,534,497 | | |
| | 3,328,213 | | | Guyana Goldfields, Inc. (a) | | | 15,755,624 | | | | 9,887,759 | | |
| | 3,307,970 | | | Orezone Gold Corporation (a)(b) | | | 12,434,320 | | | | 6,485,567 | | |
| | | | 922,128,441 | | | | 1,120,841,994 | | |
Channel Island 0.12% | | | |
| | 1,666,900 | | | Lydian International Limited (a) | | | 3,851,728 | | | | 3,851,695 | | |
See Notes to Financial Statements.
FIRST EAGLE FUNDS | ANNUAL REPORT | OCTOBER 31, 2012
88
Consolidated Schedule of Investments | Year Ended October 31, 2012
SHARES | | DESCRIPTION | | COST (NOTE 1) | | VALUE (NOTE 1) | |
International Common Stocks — 65.65% — (continued) | | | |
Mexico 7.35% | | | |
| | 4,197,841 | | | Fresnillo PLC | | $ | 16,620,435 | | | $ | 129,969,989 | | |
| | 1,915,577 | | | Industrias Peñoles S.A.B. de C.V. | | | 6,673,612 | | | | 95,948,041 | | |
| | | | 23,294,047 | | | | 225,918,030 | | |
South Africa 9.66% | | | |
| | 4,228,440 | | | AngloGold Ashanti Limited, ADR | | | 154,471,203 | | | | 143,682,391 | | |
| | 6,921,044 | | | Gold Fields Limited, ADR | | | 93,344,394 | | | | 86,582,260 | | |
| | 8,064,515 | | | Harmony Gold Mining Company
Limited, ADR | | | 81,951,256
| | | | 66,935,475
| | |
| | | | 329,766,853 | | | | 297,200,126 | | |
Total International Common Stocks | | | 1,540,286,314 | | | | 2,018,910,155 | | |
U.S. Common Stocks — 8.47% | | | |
Materials 8.47% | | | |
| | 2,330,777 | | | Newmont Mining Corporation | | | 101,476,524 | | | | 127,143,885 | | |
| | 867,401 | | | Royal Gold, Inc. | | | 14,962,981 | | | | 76,400,680 | | |
| | 2,796,540 | | | Tahoe Resources, Inc. (a)(b) | | | 38,160,239 | | | | 56,954,641 | | |
Total U.S. Common Stocks | | | 154,599,744 | | | | 260,499,206 | | |
Total Common Stocks | | | 1,694,886,058 | | | | 2,279,409,361 | | |
International Preferred Stock — 0.16% | | | |
South Africa 0.16% | | | |
| | 120,000 | | | AngloGold Ashanti Holdings
Finance PLC 6.00% (d) | | | 6,000,000
| | | | 4,851,600
| | |
Investment Company — 0.01% | | | |
| | 464,505 | | | State Street Institutional
U.S. Government Money Market
Fund, Institutional Class | | | 464,505
| | | | 464,505
| | |
Warrants — 0.00% | | | |
Canada — 0.00% | | | |
| | 5,500,000 | | | Great Basin Gold Limited Warrant
expire 03/30/14 (a)(h) | | | 664,820
| | | | 0
| | |
| | 500,000 | | | St. Augustine Gold & Copper Warrant
expire 11/17/12 (a)(c)(e) | | | 0
| | | | 0
| | |
Total Warrants | | | 664,820 | | | | 0 | | |
See Notes to Financial Statements.
FIRST EAGLE FUNDS | ANNUAL REPORT | OCTOBER 31, 2012
89
OUNCES | | DESCRIPTION | | COST (NOTE 1) | | VALUE (NOTE 1) | |
Commodity — 18.76% | | | |
| | 335,178 | | | Gold bullion (a) | | $ | 183,135,784 | | | $ | 576,941,473 | | |
PRINCIPAL | | | | | | | |
International Convertible Bonds — 0.98% | | | |
Canada 0.98% | | | |
| | 30,000,000 | | | Detour Gold Corporation
USD5.50% due 11/30/17 (e)(f) | | | 30,000,000
| | | | 30,000,000
| | |
South Africa 0.00% | | | |
| | 2,000,000 | | | Great Basin Gold Limited
CAD8.00% due 11/30/14 (b)(e)(g)(h)(i) | | | 1,900,057
| | | | 0
| | |
Total International Convertible Bonds | | | 31,900,057 | | | | 30,000,000 | | |
U.S. Treasury Bills — 0.44% | | | |
$ | 4,813,000 | | | U.S. Treasury Bill
0.07% due 01/03/13 | | | 4,812,453
| | | | 4,812,346
| | |
| | 1,485,000 | | | U.S. Treasury Bill
0.09% due 02/07/13 | | | 1,484,636
| | | | 1,484,556
| | |
| | 3,614,000 | | | U.S. Treasury Bill
0.10% due 01/24/13 | | | 3,613,199
| | | | 3,613,219
| | |
| | 3,614,000 | | | U.S. Treasury Bill
0.11% due 02/21/13 | | | 3,612,763
| | | | 3,612,706
| | |
Total U.S. Treasury Bills | | | 13,523,051 | | | | 13,522,827 | | |
Commercial Paper — 5.68% | | | |
International Commercial Paper — 1.66% | | | |
Australia 0.02% | | | |
| | 499,000 | | | Telstra Corporation Limited
USD0.22% due 12/10/12 | | | 498,881
| | | | 498,881
| | |
Canada 0.03% | | | |
| | 883,000 | | | Suncor Energy, Inc.
USD0.32% due 11/16/12 | | | 882,882
| | | | 882,882
| | |
France 0.20% | | | |
| | 1,104,000 | | | Sanofi
USD0.14% due 11/13/12 | | | 1,103,949
| | | | 1,103,949
| | |
| | 1,993,000 | | | Total SA
USD0.13% due 11/15/12 | | | 1,992,899
| | | | 1,992,899
| | |
| | 3,081,000 | | | Total SA
USD0.14% due 12/18/12 | | | 3,080,437
| | | | 3,080,437
| | |
See Notes to Financial Statements.
FIRST EAGLE FUNDS | ANNUAL REPORT | OCTOBER 31, 2012
90
Consolidated Schedule of Investments | Year Ended October 31, 2012
PRINCIPAL | | DESCRIPTION | | COST (NOTE 1) | | VALUE (NOTE 1) | |
International Commercial Paper — 1.66% — (continued) | | | |
Germany 0.60% | | | |
| | 2,164,000 | | | BASF AG
USD0.14% due 11/27/12 | | $ | 2,163,781
| | | $ | 2,163,781
| | |
| | 1,748,000 | | | Henkel Corporation
USD0.14% due 11/01/12 | | | 1,748,000
| | | | 1,748,000
| | |
| | 6,398,000 | | | Siemens Company
USD0.13% due 11/02/12 | | | 6,397,977
| | | | 6,397,977
| | |
| | 1,253,000 | | | Siemens Company
USD0.13% due 11/13/12 | | | 1,252,946
| | | | 1,252,946
| | |
| | 1,999,000 | | | Siemens Company
USD0.13% due 11/26/12 | | | 1,998,820
| | | | 1,998,820
| | |
| | 2,556,000 | | | Siemens Company
USD0.15% due 11/02/12 | | | 2,555,989
| | | | 2,555,989
| | |
| | 2,185,000 | | | Siemens Company
USD0.15% due 12/14/12 | | | 2,184,608
| | | | 2,184,608
| | |
Italy 0.29% | | | |
| | 3,789,000 | | | Eni S.p.A.
USD0.46% due 11/01/12 | | | 3,789,000
| | | | 3,789,000
| | |
| | 2,141,000 | | | Eni S.p.A.
USD0.61% due 11/08/12 | | | 2,140,750
| | | | 2,140,750
| | |
| | 3,081,000 | | | Eni S.p.A.
USD0.65% due 11/20/12 | | | 3,079,959
| | | | 3,079,959
| | |
Japan 0.02% | | | |
| | 661,000 | | | Mitsui & Company Limited
USD0.34% due 11/26/12 | | | 660,844
| | | | 660,844
| | |
Switzerland 0.21% | | | |
| | 1,807,000 | | | ABB Limited
USD0.22% due 12/10/12 | | | 1,806,569
| | | | 1,806,569
| | |
| | 1,003,000 | | | ABB Limited
USD0.22% due 12/13/12 | | | 1,002,743
| | | | 1,002,743
| | |
| | 661,000 | | | Nestlé SA
USD0.08% due 12/06/12 | | | 660,949
| | | | 660,949
| | |
| | 961,000 | | | Nestlé SA
USD0.15% due 01/15/13 | | | 960,700
| | | | 960,742
| | |
| | 771,000 | | | Nestlé SA
USD0.16% due 01/16/13 | | | 770,739
| | | | 770,789
| | |
| | 1,242,000 | | | Nestlé SA
USD0.16% due 01/29/13 | | | 1,241,509
| | | | 1,241,534
| | |
See Notes to Financial Statements.
FIRST EAGLE FUNDS | ANNUAL REPORT | OCTOBER 31, 2012
91
PRINCIPAL | | DESCRIPTION | | COST (NOTE 1) | | VALUE (NOTE 1) | |
International Commercial Paper — 1.66% — (continued) | | | |
United Kingdom 0.29% | | | |
| | 1,844,000 | | | AstraZeneca PLC
USD0.14% due 11/27/12 | | $ | 1,843,814
| | | $ | 1,843,814
| | |
| | 3,614,000 | | | AstraZeneca PLC
USD0.16% due 01/29/13 | | | 3,612,570
| | | | 3,611,470
| | |
| | 2,427,000 | | | GlaxoSmithKline PLC
USD0.12% due 11/05/12 | | | 2,426,968
| | | | 2,426,968
| | |
| | 1,104,000 | | | GlaxoSmithKline PLC
USD0.12% due 11/15/12 | | | 1,103,948
| | | | 1,103,948
| | |
Total International Commercial Paper | | | 50,962,231 | | | | 50,961,248 | | |
U.S. Commercial Paper — 4.02% | | | |
$ | 15,157,000 | | | Apache Corporation
0.41% due 11/01/12 | | | 15,157,000
| | | | 15,157,000
| | |
| | 1,987,000 | | | AutoZone, Inc.
0.38% due 11/09/12 | | | 1,986,837
| | | | 1,986,837
| | |
| | 1,807,000 | | | Chevron Corporation
0.12% due 01/02/13 | | | 1,806,626
| | | | 1,806,257
| | |
| | 3,892,000 | | | Chevron Corporation
0.14% due 12/03/12 | | | 3,891,516
| | | | 3,891,516
| | |
| | 961,000 | | | Church & Dwight Company, Inc.
0.43% due 11/02/12 | | | 960,989
| | | | 960,989
| | |
| | 1,921,000 | | | Coca-Cola Company
0.18% due 01/28/13 | | | 1,920,155
| | | | 1,920,155
| | |
| | 2,643,000 | | | Coca-Cola Company
0.20% due 01/24/13 | | | 2,641,767
| | | | 2,641,927
| | |
| | 522,000 | | | ConocoPhillips
0.15% due 11/20/12 | | | 521,959
| | | | 521,959
| | |
| | 1,667,000 | | | Devon Energy Corporation
0.30% due 11/01/12 | | | 1,667,000
| | | | 1,667,000
| | |
| | 1,382,000 | | | Devon Energy Corporation
0.30% due 11/02/12 | | | 1,381,988
| | | | 1,381,988
| | |
| | 1,278,000 | | | Devon Energy Corporation
0.32% due 11/09/12 | | | 1,277,909
| | | | 1,277,909
| | |
| | 1,253,000 | | | Devon Energy Corporation
0.32% due 11/19/12 | | | 1,252,799
| | | | 1,252,799
| | |
| | 1,482,000 | | | Emerson Electric Company
0.12% due 11/27/12 | | | 1,481,871
| | | | 1,481,871
| | |
| | 1,914,000 | | | Emerson Electric Company
0.12% due 11/28/12 | | | 1,913,828
| | | | 1,913,828
| | |
| | 1,541,000 | | | Emerson Electric Company
0.12% due 12/27/12 | | | 1,540,712
| | | | 1,540,712
| | |
See Notes to Financial Statements.
FIRST EAGLE FUNDS | ANNUAL REPORT | OCTOBER 31, 2012
92
Consolidated Schedule of Investments | Year Ended October 31, 2012
PRINCIPAL | | DESCRIPTION | | COST (NOTE 1) | | VALUE (NOTE 1) | |
U.S. Commercial Paper — 4.02% — (continued) | | | |
$ | 461,000 | | | General Mills, Inc.
0.27% due 11/16/12 | | $ | 460,948
| | | $ | 460,948
| | |
| | 2,185,000 | | | General Mills, Inc.
0.29% due 11/26/12 | | | 2,184,560
| | | | 2,184,560
| | |
| | 3,292,000 | | | Google, Inc.
0.09% due 11/02/12 | | | 3,291,992
| | | | 3,291,992
| | |
| | 3,987,000 | | | Google, Inc.
0.09% due 11/13/12 | | | 3,986,880
| | | | 3,986,880
| | |
| | 4,065,000 | | | Google, Inc.
0.10% due 12/03/12 | | | 4,064,639
| | | | 4,064,639
| | |
| | 1,325,000 | | | Google, Inc.
0.12% due 12/05/12 | | | 1,324,850
| | | | 1,324,850
| | |
| | 1,720,000 | | | Johnson & Johnson
0.11% due 01/07/13 | | | 1,719,648
| | | | 1,719,633
| | |
| | 961,000 | | | McDonald's Corporation
0.11% due 11/14/12 | | | 960,962
| | | | 960,962
| | |
| | 453,000 | | | Medtronic, Inc.
0.14% due 01/25/13 | | | 452,850
| | | | 452,737
| | |
| | 1,748,000 | | | Merck & Company, Inc.
0.13% due 12/05/12 | | | 1,747,785
| | | | 1,747,785
| | |
| | 8,741,000 | | | Merck & Company, Inc.
0.13% due 12/12/12 | | | 8,739,706
| | | | 8,739,706
| | |
| | 4,324,000 | | | Parker-Hannifin Corporation
0.13% due 11/06/12 | | | 4,323,922
| | | | 4,323,922
| | |
| | 1,200,000 | | | Philip Morris International, Inc.
0.08% due 11/14/12 | | | 1,199,965
| | | | 1,199,965
| | |
| | 2,954,000 | | | Philip Morris International, Inc.
0.11% due 11/20/12 | | | 2,953,828
| | | | 2,953,828
| | |
| | 961,000 | | | Philip Morris International, Inc.
0.13% due 11/16/12 | | | 960,948
| | | | 960,948
| | |
| | 1,435,000 | | | Praxair, Inc.
0.11% due 11/07/12 | | | 1,434,974
| | | | 1,434,974
| | |
| | 1,021,000 | | | Precision Castparts Corporation
0.15% due 11/02/12 | | | 1,020,996
| | | | 1,020,996
| | |
| | 6,063,000 | | | Precision Castparts Corporation
0.20% due 11/01/12 | | | 6,063,000
| | | | 6,063,000
| | |
| | 1,800,000 | | | Proctor & Gamble Company
0.13% due 11/19/12 | | | 1,799,883
| | | | 1,799,883
| | |
| | 2,141,000 | | | Stanley Black & Decker Inc.
0.31% due 11/06/12 | | | 2,140,908
| | | | 2,140,908
| | |
| | 631,000 | | | Stanley Black & Decker Inc.
0.33% due 11/07/12 | | | 630,965
| | | | 630,965
| | |
See Notes to Financial Statements.
FIRST EAGLE FUNDS | ANNUAL REPORT | OCTOBER 31, 2012
93
PRINCIPAL | | DESCRIPTION | | COST (NOTE 1) | | VALUE (NOTE 1) | |
U.S. Commercial Paper — 4.02% — (continued) | | | |
$ | 1,057,000 | | | United Parcel Service, Inc.
0.04% due 11/19/12 | | $ | 1,056,979
| | | $ | 1,056,979
| | |
| | 760,000 | | | United Parcel Service, Inc.
0.05% due 12/05/12 | | | 759,964
| | | | 759,964
| | |
| | 1,880,000 | | | United Technologies Corporation
0.13% due 11/26/12 | | | 1,879,830
| | | | 1,879,830
| | |
| | 1,271,000 | | | United Technologies Corporation
0.15% due 11/28/12 | | | 1,270,857
| | | | 1,270,857
| | |
| | 1,502,000 | | | Verizon Communications, Inc.
0.33% due 11/13/12 | | | 1,501,835
| | | | 1,501,835
| | |
| | 302,000 | | | Verizon Communications, Inc.
0.36% due 11/13/12 | | | 301,965
| | | | 301,965
| | |
| | 3,503,000 | | | Verizon Communications, Inc.
0.36% due 12/04/12 | | | 3,501,876
| | | | 3,501,876
| | |
| | 1,140,000 | | | Verizon Communications, Inc.
0.39% due 12/14/12 | | | 1,139,483
| | | | 1,139,483
| | |
| | 3,851,000 | | | Wal-Mart Stores, Inc.
0.11% due 11/06/12 | | | 3,850,941
| | | | 3,850,941
| | |
| | 2,685,000 | | | Wal-Mart Stores, Inc.
0.12% due 11/16/12 | | | 2,684,866
| | | | 2,684,866
| | |
| | 3,292,000 | | | Walt Disney Company
0.12% due 11/14/12 | | | 3,291,857
| | | | 3,291,857
| | |
| | 250,000 | | | Walt Disney Company
0.13% due 12/28/12 | | | 249,948
| | | | 249,948
| | |
| | 3,292,000 | | | Walt Disney Company
0.15% due 12/17/12 | | | 3,291,369
| | | | 3,291,369
| | |
| | 6,584,000 | | | Walt Disney Company
0.15% due 12/21/12 | | | 6,582,628
| | | | 6,582,628
| | |
| | 1,026,000 | | | WellPoint, Inc.
0.25% due 01/14/13 | | | 1,025,473
| | | | 1,025,316
| | |
| | 480,000 | | | WellPoint, Inc.
0.25% due 01/16/13 | | | 479,747
| | | | 479,667
| | |
Total U.S. Commercial Paper | | | 123,736,783 | | | | 123,736,209 | | |
Total Commercial Paper | | | 174,699,014 | | | | 174,697,457 | | |
Total Investments — 100.15% | | $ | 2,105,273,289 | | | | 3,079,887,223 | | |
Liabilities in Excess of Other Assets — (0.15)% | | | | | (4,626,858 | ) | |
Net Assets — 100.00% | | | | $ | 3,075,260,365 | | |
See Notes to Financial Statements.
FIRST EAGLE FUNDS | ANNUAL REPORT | OCTOBER 31, 2012
94
Consolidated Schedule of Investments | Year Ended October 31, 2012
(a) Non-income producing security/commodity.
(b) All or a portion of the security is exempt from registration under the Securities Act of 1933. Rule 144A securities may only be sold to qualified institutional buyers, pursuant to Rule 144A under the Securities Act of 1933.
(c) Represents a security registered under Regulation D. Regulation D provides exemptions for small companies to offer and sell their securities without having to register the securities under the Securities Act of 1933.
(d) This security is convertible until August 9, 2013.
(e) Securities valued in accordance with fair value procedures under the supervision of the Board of Trustees, representing $30,000,000 or 0.98% of net assets.
(f) This security is convertible until November 30, 2017.
(g) Security is deemed illiquid. At October 31, 2012, the value of these securities amounted to $0 or 0.00% of net assets.
(h) Issuer is in default.
(i) This security is convertible until November 30, 2014.
At October 31, 2012, aggregate cost for federal income tax purposes was $2,216,870,980. Net unrealized appreciation consisted of:
Gross unrealized appreciation | | $ | 1,046,890,172 | | |
Gross unrealized depreciation | | | (183,873,928 | ) | |
Net unrealized appreciation | | $ | 863,016,244 | | |
Abbreviations used in this schedule include:
ADR — American Depository Receipt
PLC — Public Limited Company
Currencies
CAD — Canadian Dollar
USD — United States Dollar
INDUSTRY DIVERSIFICATION FOR PORTFOLIO HOLDINGS | | PERCENT OF
NET ASSETS | |
International Common Stocks | |
Materials | | | 65.65 | % | |
Total International Common Stocks | | | 65.65 | | |
U.S. Common Stocks | |
Materials | | | 8.47 | | |
Total U.S. Common Stocks | | | 8.47 | | |
International Preferred Stock | |
Materials | | | 0.16 | | |
Total International Preferred Stock | | | 0.16 | | |
See Notes to Financial Statements.
FIRST EAGLE FUNDS | ANNUAL REPORT | OCTOBER 31, 2012
95
INDUSTRY DIVERSIFICATION FOR PORTFOLIO HOLDINGS — (CONTINUED) | | PERCENT OF
NET ASSETS | |
Investment Company | | | 0.01 | % | |
Warrants | | | 0.00 | | |
Commodity | | | 18.76 | | |
International Convertible Bonds | |
Materials | | | 0.98 | | |
Total International Convertible Bonds | | | 0.98 | | |
U.S. Treasury Bills | | | 0.44 | | |
Commercial Paper | |
International Commercial Paper | | | 1.66 | | |
U.S. Commercial Paper | | | 4.02 | | |
Total Commercial Paper | | | 5.68 | | |
Total Investments | | | 100.15 | % | |
See Notes to Financial Statements.
FIRST EAGLE FUNDS | ANNUAL REPORT | OCTOBER 31, 2012
96
This page was intentionally left blank.

Fund Overview | Data as of October 31, 2012 (unaudited)
INVESTMENT OBJECTIVE
First Eagle Global Income Builder seeks current income generation and long-term growth of capital. Fundamental research drives the identification of income-producing investment opportunities across all market environments.
| Average Annual Returns^ | |
| | | ONE-YEAR | | THREE-YEARS | | SINCE
INCEPTION
(05-01-12) | |
First Eagle Global Income
Builder (A Shares) | |
without sales load | | | — | | | | — | | | | 4.37 | % | |
with sales load | | | — | | | | — | | | | –0.88 | | |
MSCI World Index | | | 9.45 | % | | | 7.88 | % | | | 1.53 | | |
Barclays Capital U.S.
Corporate High Yield
Bond Index | | | 5.25 | | | | 6.08 | | | | 2.88 | | |
^ Performance figures reflect certain fee waivers and/or expense limitations, without which returns may have been lower.
* Asset Allocation and Countries percentages are based on total investments in the portfolio.
** Country allocations reflect country of the issuer (not currency of issue) and exclude short term investments. Bonds of non-U.S. issuers may be U.S. dollar denominated.
The Fund's portfolio composition is subject to change at any time.
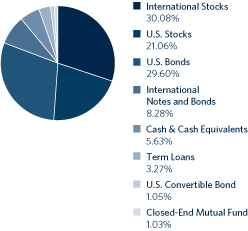
| Countries** | |
United States | | | 54.98 | % | |
France | | | 8.20 | | |
Canada | | | 3.98 | | |
United Kingdom | | | 3.68 | | |
Japan | | | 3.49 | | |
Netherlands | | | 3.09 | | |
Sweden | | | 2.08 | | |
Italy | | | 2.04 | | |
Switzerland | | | 1.76 | | |
Singapore | | | 1.60 | | |
Germany | | | 1.39 | | |
Norway | | | 1.06 | | |
Ireland | | | 1.01 | | |
Austria | | | 0.99 | | |
Hong Kong | | | 0.78 | | |
Bermuda | | | 0.67 | | |
Mexico | | | 0.63 | | |
Belgium | | | 0.57 | | |
Thailand | | | 0.50 | | |
Spain | | | 0.43 | | |
South Africa | | | 0.42 | | |
Australia | | | 0.38 | | |
South Korea | | | 0.31 | | |
Greece | | | 0.22 | | |
Israel | | | 0.13 | | |
FIRST EAGLE FUNDS | ANNUAL REPORT | OCTOBER 31, 2012
98
Global Income Builder Fund
Growth of a $10,000 Initial Investment

The Adviser has contractually agreed to limit operating expenses of the Fund to an annual rate of 1.30% for A Shares, 2.05% for C Shares, and 1.05% for I Shares with gross operating expenses of 1.62%, 2.37% and 1.37% respectively. This limitation excludes certain expenses as described in the Fees and Expenses section of the prospectus. This limitation will continue until December 2012. This expense limitation may be terminated by the Adviser in future years.
Performance data quoted herein represents past performance and should not be considered indicative of future results. Performance data quoted herein does not reflect the deduction of taxes that a shareholder would pay on Fund distributions or the sale of Fund shares. The average annual returns shown above are historical and reflect changes in share price, reinvested dividends and are net of expenses.
The average annual returns for Class A Shares give effect to the deduction of the maximum sales charge of 5.00%.
The MSCI World Index is a widely followed, unmanaged group of stocks from 23 international markets and is not available for purchase. The index provides total returns in U.S. dollars with net dividends reinvested. The Barclays Capital U.S. Aggregate Bond Index is a broad-based benchmark that measures the investment grade, U.S. dollar-denominated, fixed-rate taxable bond market, including Treasuries, government-related and corporate securities, MBS (agency fixed-rate and hybrad ARM passthroughs, ABS, and CMBS. The index is presented here for comparison purposes only. One cannot invest directly in an index.
| Top 10 Holdings** | |
| Bi-Lo LLC 9.25% due 02/15/19 (U.S. food-retail company) | | | 1.99 | % | |
| HeidelbergCement Finance BV 8.50% due 10/31/19 (German building materials manufacturer) | | | 1.88 | | |
| Toys R Us Property Company I 10.75% due 07/15/17 (U.S. real estate management company) | | | 1.85 | | |
| ConocoPhillips (U.S. energy company) | | | 1.72 | | |
| Nestlé SA (Swiss food product manufacturer) | | | 1.70 | | |
| Sysco Corporation (U.S. food services distributor) | | | 1.70 | | |
| FirstEnergy Corporation (U.S. diversified energy company) | | | 1.69 | | |
| Microsoft Corporation (U.S. software developer) | | | 1.66 | | |
| Bouygues SA (French industrial company) | | | 1.64 | | |
| Total SA (French energy company) | | | 1.64 | | |
Total | | | 17.47 | % | |
** Holdings in cash and commercial paper have been excluded. Percentages are based on total net assets.
FIRST EAGLE FUNDS | ANNUAL REPORT | OCTOBER 31, 2012
99
First Eagle Global Income Builder Fund
SHARES | | DESCRIPTION | | COST (NOTE 1) | | VALUE (NOTE 1) | |
Common Stocks — 49.18% | | | |
U.S. Common Stocks — 20.25% | | | |
Consumer Discretionary 0.31% | | | |
| | 19,094 | | | H&R Block, Inc. | | $ | 323,132 | | | $ | 337,964 | | |
Consumer Staples 3.35% | | | |
| | 58,603 | | | Sysco Corporation | | | 1,744,272 | | | | 1,820,795 | | |
| | 10,270 | | | Lorillard, Inc. | | | 1,263,252 | | | | 1,191,423 | | |
| | 5,541 | | | Colgate-Palmolive Company | | | 570,557 | | | | 581,583 | | |
| | | | 3,578,081 | | | | 3,593,801 | | |
Energy 2.09% | | | |
| | 31,936 | | | ConocoPhillips | | | 1,797,462 | | | | 1,847,498 | | |
| | 8,347 | | | Phillips 66 | | | 333,698 | | | | 393,644 | | |
| | | | 2,131,160 | | | | 2,241,142 | | |
Financials 3.44% | | | |
| | 1,227,500 | | | Frasers Commercial Trust, REIT | | | 1,053,968 | | | | 1,252,859 | | |
| | 19,411 | | | Plum Creek Timber Company, Inc., REIT | | | 778,152 | | | | 852,143 | | |
| | 26,201 | | | Weyerhaeuser Company, REIT | | | 576,075 | | | | 725,506 | | |
| | 12,869 | | | Cincinnati Financial Corporation | | | 468,217 | | | | 512,701 | | |
| | 7,067 | | | Rayonier, Inc., REIT | | | 331,861 | | | | 346,353 | | |
| | | | 3,208,273 | | | | 3,689,562 | | |
Industrials 2.03% | | | |
| | 9,505 | | | 3M Company | | | 853,538 | | | | 832,638 | | |
| | 8,831 | | | Lockheed Martin Corporation | | | 790,089 | | | | 827,200 | | |
| | 7,647 | | | Northrop Grumman Corporation | | | 498,140 | | | | 525,272 | | |
| | | | 2,141,767 | | | | 2,185,110 | | |
Information Technology 5.76% | | | |
| | 62,268 | | | Microsoft Corporation | | | 1,874,856 | | | | 1,776,817 | | |
| | 44,816 | | | Linear Technology Corporation | | | 1,429,921 | | | | 1,400,948 | | |
| | 61,589 | | | Intel Corporation | | | 1,549,157 | | | | 1,331,862 | | |
| | 25,600 | | | Texas Instruments, Inc. | | | 706,043 | | | | 719,104 | | |
| | 32,400 | | | Cisco Systems, Inc. | | | 599,569 | | | | 555,336 | | |
| | 6,883 | | | Automatic Data Processing, Inc. | | | 389,437 | | | | 397,769 | | |
| | | | 6,548,983 | | | | 6,181,836 | | |
Materials 0.77% | | | |
| | 15,083 | | | Newmont Mining Corporation | | | 722,331 | | | | 822,778 | | |
Utilities 2.50% | | | |
| | 39,676 | | | FirstEnergy Corporation | | | 1,828,539 | | | | 1,813,987 | | |
See Notes to Financial Statements.
FIRST EAGLE FUNDS | ANNUAL REPORT | OCTOBER 31, 2012
100
Schedule of Investments | Period Ended October 31, 2012
SHARES | | DESCRIPTION | | COST (NOTE 1) | | VALUE (NOTE 1) | |
U.S. Common Stocks — 20.25% — (continued) | | | |
Utilities 2.50% — (continued) | | | |
| | 12,043 | | | Entergy Corporation | | $ | 820,343 | | | $ | 874,081 | | |
| | | | 2,648,882 | | | | 2,688,068 | | |
Total U.S. Common Stocks | | | 21,302,609 | | | | 21,740,261 | | |
International Common Stocks — 28.93% | | | |
Australia 0.36% | | | |
| | 14,255 | | | Newcrest Mining Limited | | | 402,284 | | | | 391,095 | | |
Austria 0.96% | | | |
| | 17,373 | | | OMV AG | | | 586,251 | | | | 635,424 | | |
| | 3,948 | | | Mayr Melnhof Karton AG | | | 393,365 | | | | 390,750 | | |
| | | | 979,616 | | | | 1,026,174 | | |
Belgium 0.55% | | | |
| | 7,962 | | | Groupe Bruxelles Lambert SA | | | 556,656 | | | | 588,210 | | |
Canada 2.93% | | | |
| | 90,974 | | | Penn West Petroleum Limited | | | 1,353,012 | | | | 1,181,752 | | |
| | 20,295 | | | Barrick Gold Corporation | | | 760,429 | | | | 821,948 | | |
| | 10,836 | | | Agnico-Eagle Mines Limited | | | 474,537 | | | | 611,225 | | |
| | 11,813 | | | Goldcorp, Inc. | | | 462,555 | | | | 534,302 | | |
| | | | 3,050,533 | | | | 3,149,227 | | |
France 6.40% | | | |
| | 73,362 | | | Bouygues SA | | | 1,894,341 | | | | 1,765,518 | | |
| | 34,872 | | | Total SA | | | 1,695,221 | | | | 1,755,789 | | |
| | 16,129 | | | Sanofi | | | 1,275,123 | | | | 1,418,748 | | |
| | 12,477 | | | Neopost SA | | | 682,628 | | | | 683,475 | | |
| | 22,180 | | | Carrefour SA | | | 431,019 | | | | 536,225 | | |
| | 8,125 | | | Ciments Francais SA | | | 465,702 | | | | 494,765 | | |
| | 5,502 | | | Legrand SA | | | 177,909 | | | | 212,085 | | |
| | | | 6,621,943 | | | | 6,866,605 | | |
Germany 1.33% | | | |
| | 21,278 | | | Daimler AG | | | 1,058,190 | | | | 994,202 | | |
| | 18,014 | | | Hamburger Hafen und Logistik AG | | | 431,998 | | | | 437,728 | | |
| | | | 1,490,188 | | | | 1,431,930 | | |
Greece 0.21% | | | |
| | 33,961 | | | Jumbo SA | | | 148,295 | | | | 224,642 | | |
Hong Kong 0.75% | | | |
| | 136,000 | | | Hopewell Holdings Limited | | | 422,877 | | | | 492,223 | | |
| | 33,700 | | | Guoco Group Limited | | | 274,953 | | | | 311,339 | | |
See Notes to Financial Statements.
FIRST EAGLE FUNDS | ANNUAL REPORT | OCTOBER 31, 2012
101
Global Income Builder Fund
SHARES | | DESCRIPTION | | COST (NOTE 1) | | VALUE (NOTE 1) | |
International Common Stocks — 28.93% — (continued) | | | |
Hong Kong 0.75% — (continued) | | | |
| | 2,000 | | | Great Eagle Holdings Limited | | $ | 6,201 | | | $ | 5,922 | | |
| | | | 704,031 | | | | 809,484 | | |
Ireland 0.97% | | | |
| | 56,059 | | | CRH PLC | | | 1,023,605 | | | | 1,043,742 | | |
Israel 0.12% | | | |
| | 10,507 | | | Israel Chemicals Limited | | | 111,889 | | | | 131,434 | | |
Italy 1.96% | | | |
| | 44,465 | | | Eni S.p.A | | | 981,748 | | | | 1,021,355 | | |
| | 389,133 | | | Italcementi S.p.A. RSP | | | 1,014,887 | | | | 994,270 | | |
| | 11,171 | | | Recordati S.p.A. | | | 74,930 | | | | 89,468 | | |
| | | | 2,071,565 | | | | 2,105,093 | | |
Japan 3.36% | | | |
| | 66,700 | | | Hoya Corporation | | | 1,462,878 | | | | 1,349,871 | | |
| | 14,000 | | | Ono Pharmaceutical Company Limited | | | 827,532 | | | | 845,085 | | |
| | 17,000 | | | Astellas Pharma, Inc. | | | 777,775 | | | | 844,145 | | |
| | 31,100 | | | NKSJ Holdings, Inc. | | | 611,172 | | | | 566,694 | | |
| | | | 3,679,357 | | | | 3,605,795 | | |
Mexico 0.61% | | | |
| | 21,120 | | | Fresnillo PLC | | | 508,722 | | | | 653,900 | | |
Netherlands 1.09% | | | |
| | 7,854 | | | HAL Trust | | | 879,891 | | | | 908,648 | | |
| | 9,400 | | | Sligro Food Group NV | | | 242,931 | | | | 256,028 | | |
| | | | 1,122,822 | | | | 1,164,676 | | |
Norway 0.53% | | | |
| | 72,571 | | | Orkla ASA | | | 520,037 | | | | 573,981 | | |
Singapore 0.54% | | | |
| | 251,000 | | | Singapore Airport Terminal Services Limited | | | 548,026 | | | | 574,102 | | |
South Africa 0.41% | | | |
| | 12,788 | | | AngloGold Ashanti Limited, ADR | | | 433,827 | | | | 434,536 | | |
South Korea 0.30% | | | |
| | 4,200 | | | KT&G Corporation | | | 332,483 | | | | 320,026 | | |
Spain 0.41% | | | |
| | 9,368 | | | Red Electrica Corporation SA | | | 392,292 | | | | 439,537 | | |
Sweden 0.84% | | | |
| | 42,247 | | | Investor AB, Class 'A' | | | 822,278 | | | | 903,478 | | |
See Notes to Financial Statements.
FIRST EAGLE FUNDS | ANNUAL REPORT | OCTOBER 31, 2012
102
Schedule of Investments | Period Ended October 31, 2012
SHARES | | DESCRIPTION | | COST (NOTE 1) | | VALUE (NOTE 1) | |
International Common Stocks — 28.93% — (continued) | | | |
Switzerland 1.70% | | | |
| | 28,683 | | | Nestlé SA | | $ | 1,776,792 | | | $ | 1,821,485 | | |
Thailand 0.48% | | | |
| | 1,448,000 | | | Thai Beverage PCL | | | 400,136 | | | | 516,380 | | |
United Kingdom 2.12% | | | |
| | 284,075 | | | WM Morrison Supermarkets PLC | | | 1,273,192 | | | | 1,227,857 | | |
| | 47,040 | | | GlaxoSmithKline PLC | | | 1,086,558 | | | | 1,052,275 | | |
| | | | 2,359,750 | | | | 2,280,132 | | |
Total International Common Stocks | | | 30,057,127 | | | | 31,055,664 | | |
Total Common Stocks | | | 51,359,736 | | | | 52,795,925 | | |
Closed-End Mutual Fund — 0.99% | | | |
Singapore 0.99% | | | |
| | 2,314,200 | | | Macquarie International Infrastructure
Fund Limited | | | 1,030,804
| | | | 1,062,430
| | |
| PRINCIPAL | | | | | | | |
Bonds — 37.45% | | | |
U.S. Convertible Bond — 1.01% | | | |
$ | 1,153,000 | | | Advanced Micro Devices, Inc.
6.00% due 05/01/15 (a) | | | 1,075,184
| | | | 1,080,937
| | |
U.S. Corporate Bonds — 28.47% | | | |
| | 1,065,000 | | | Air Medical Group Holdings, Inc.
9.25% due 11/01/18 | | | 1,135,233
| | | | 1,152,863
| | |
| | 857,000 | | | Aleris International, Inc.
7.875% due 11/01/20 (b) | | | 857,000
| | | | 855,929
| | |
| | 900,000 | | | American Axle & Manufacturing, Inc.
6.625% due 10/15/22 | | | 911,733
| | | | 894,375
| | |
| | 575,000 | | | American Axle & Manufacturing, Inc.
7.875% due 03/01/17 | | | 593,852
| | | | 597,281
| | |
| | 1,075,000 | | | Basic Energy Services, Inc.
7.75% due 02/15/19 | | | 1,071,905
| | | | 1,075,000
| | |
| | 475,000 | | | Basic Energy Services, Inc.
7.75% due 10/15/22 (b) | | | 475,000
| | | | 463,125
| | |
| | 2,030,000 | | | Bi-Lo LLC
9.25% due 02/15/19 (b) | | | 2,168,215
| | | | 2,136,575
| | |
| | 500,000 | | | Carrizo Oil & Gas, Inc.
7.50% due 09/15/20 | | | 510,425
| | | | 512,500
| | |
| | 900,000 | | | Carrizo Oil & Gas, Inc.
8.625% due 10/15/18 | | | 947,622
| | | | 974,250
| | |
See Notes to Financial Statements.
FIRST EAGLE FUNDS | ANNUAL REPORT | OCTOBER 31, 2012
103
Global Income Builder Fund
PRINCIPAL | | DESCRIPTION | | COST (NOTE 1) | | VALUE (NOTE 1) | |
U.S. Corporate Bonds — 28.47% — (continued) | | | |
$ | 250,000 | | | CCO Holdings LLC
7.375% due 06/01/20 | | $ | 272,532
| | | $ | 281,250
| | |
| | 850,000 | | | Chesapeake Energy Corporation
9.50% due 02/15/15 | | | 907,153
| | | | 956,250
| | |
| | 780,000 | | | Citgo Petroleum Corporation
11.50% due 07/01/17 (b) | | | 875,555
| | | | 902,850
| | |
| | 1,355,000 | | | CommScope, Inc.
8.25% due 01/15/19 (b) | | | 1,448,793
| | | | 1,466,788
| | |
| | 1,450,000 | | | Drill Rigs Holdings, Inc.
6.50% due 10/01/17 (b) | | | 1,455,861
| | | | 1,450,000
| | |
| | 375,000 | | | Everest Acquisition LLC
6.875% due 05/01/19 (b) | | | 395,182
| | | | 406,875
| | |
| | 1,200,000 | | | Everest Acquisition LLC
7.75% due 09/01/22 (b) | | | 1,217,827
| | | | 1,248,000
| | |
| | 975,000 | | | Fiesta Restaurant Group, Inc.
8.875% due 08/15/16 | | | 1,039,498
| | | | 1,044,469
| | |
| | 750,000 | | | Frontier Communications Corporation
8.50% due 04/15/20 | | | 815,049
| | | | 870,000
| | |
| | 525,000 | | | Huntington Ingalls Industries, Inc.
7.125% due 03/15/21 | | | 558,505
| | | | 567,000
| | |
| | 550,000 | | | International Lease Finance Corporation
6.25% due 05/15/19 | | | 558,013
| | | | 595,513
| | |
| | 1,550,000 | | | Mead Products
6.75% due 04/30/20 (b) | | | 1,596,251
| | | | 1,590,687
| | |
| | 850,000 | | | PHH Corporation
7.375% due 09/01/19 | | | 857,752
| | | | 913,750
| | |
| | 350,000 | | | PHH Corporation
9.25% due 03/01/16 | | | 362,542
| | | | 406,000
| | |
| | 1,175,000 | | | SandRidge Energy, Inc.
7.50% due 02/15/23 (b) | | | 1,198,125
| | | | 1,222,000
| | |
| | 1,350,000 | | | STHI Holding Corporation
8.00% due 03/15/18 (b) | | | 1,454,524
| | | | 1,451,250
| | |
| | 1,800,000 | | | Taylor Morrison Communities, Inc.
7.75% due 04/15/20 (b) | | | 1,923,529
| | | | 1,926,000
| | |
| | 1,825,000 | | | Toys R Us Property Company I
10.75% due 07/15/17 | | | 1,984,574
| | | | 1,982,406
| | |
| | 455,000 | | | Toys R Us Property Company II
8.50% due 12/01/17 | | | 472,732
| | | | 490,831
| | |
| | 1,500,000 | | | Tronox Finance LLC
6.375% due 08/15/20 (b) | | | 1,517,673
| | | | 1,501,875
| | |
| | 600,000 | | | Wolverine World Wide, Inc.
6.125% due 10/15/20 (b) | | | 610,778
| | | | 627,750
| | |
| | | | 30,193,433 | | | | 30,563,442 | | |
Total U.S. Corporate Bonds | | | 31,268,617 | | | | 31,644,379 | | |
See Notes to Financial Statements.
FIRST EAGLE FUNDS | ANNUAL REPORT | OCTOBER 31, 2012
104
Schedule of Investments | Period Ended October 31, 2012
PRINCIPAL | | DESCRIPTION | | COST (NOTE 1) | | VALUE (NOTE 1) | |
International Corporate Bonds — 7.97% | | | |
Bermuda 0.64% | | | |
| 625,000
USD | | | Aircastle Limited
7.625% due 04/15/20 | | $ | 649,877
| | | $ | 693,750
| | |
Canada 0.90% | | | |
| 500,000
USD | | | New Gold, Inc.
7.00% due 04/15/20 (b) | | | 516,449
| | | | 532,500
| | |
| 400,000
USD | | | Precision Drilling Corporation
6.625% due 11/15/20 | | | 400,951
| | | | 430,000
| | |
| | | | 917,400 | | | | 962,500 | | |
France 1.49% | | | |
| 1,550,000
USD | | | Rexel SA
6.125% due 12/15/19 (b) | | | 1,592,357
| | | | 1,596,500
| | |
Netherlands 1.88% | | | |
| 1,300,000
EUR | | | HeidelbergCement Finance BV
8.50% due 10/31/19 | | | 1,904,125
| | | | 2,021,381
| | |
Norway 0.49% | | | |
| 550,000
USD | | | Eksportfinans ASA
2.00% due 09/15/15 | | | 497,892
| | | | 522,858
| | |
Sweden 1.16% | | | |
| 850,000
EUR | | | Eileme 2 AB
11.75% due 01/31/20 (b) | | | 1,171,168
| | | | 1,241,359
| | |
United Kingdom 1.41% | | | |
| 1,400,000
USD | | | Jaguar Land Rover PLC
8.125% due 05/15/21 (b) | | | 1,498,926
| | | | 1,515,500
| | |
Total International Corporate Bonds | | | 8,231,745 | | | | 8,553,848 | | |
Total Bonds | | | 39,500,362 | | | | 40,198,227 | | |
Term Loans — 3.14% | | | |
$ | 1,500,000 | | | Fortescue Metals Group
0.00% - 5.25% due 10/05/17 (c)(d) | | | 1,490,015
| | | | 1,496,250
| | |
| | 1,296,742 | | | Roundy's Supermarkets, Inc., Term Loan B
5.75% due 02/13/19 | | | 1,257,782
| | | | 1,265,620
| | |
| | 600,000 | | | Van Wagner Communications,
Term Loan B 8.25% due 08/03/18 | | | 588,243
| | | | 613,500
| | |
Total Term Loans | | | 3,336,040 | | | | 3,375,370 | | |
Commercial Paper — 5.41% | | | |
International Commercial Paper — 0.77% | | | |
Italy 0.77% | | | |
| 825,000
USD | | | Eni S.p.A.
0.46% due 11/01/12 | | | 825,000
| | | | 825,000
| | |
See Notes to Financial Statements.
FIRST EAGLE FUNDS | ANNUAL REPORT | OCTOBER 31, 2012
105
Global Income Builder Fund
PRINCIPAL | | DESCRIPTION | | COST (NOTE 1) | | VALUE (NOTE 1) | |
Commercial Paper — 5.41% — (continued) | | | |
U.S. Commercial Paper — 4.64% | | | |
$ | 3,302,000 | | | Apache Corporation
0.41% due 11/01/12 | | $ | 3,302,000
| | | $ | 3,302,000
| | |
| | 363,000 | | | Devon Energy Corporation
0.30% due 11/01/12 | | | 363,000
| | | | 363,000
| | |
| | 1,321,000 | | | Precision Castparts Corporation
0.20% due 11/01/12 | | | 1,321,000
| | | | 1,321,000
| | |
Total U.S. Commercial Paper | | | 4,986,000 | | | | 4,986,000 | | |
Total Commercial Paper | | | 5,811,000 | | | | 5,811,000 | | |
Total Investments — 96.17% | | $ | 101,037,942 | | | | 103,242,952 | | |
Other Assets in Excess of Liabilities — 3.83% | | | | | 4,110,446 | | |
Net Assets — 100.00% | | | | $ | 107,353,398 | | |
(a) This security is convertible until April 30, 2015.
(b) All or a portion of the security is exempt from registration under the Securities Act of 1933. Rule 144A securities may only be sold to qualified institutional buyers, pursuant to Rule 144A under the Securities Act of 1933.
(c) All or a portion of the security represents unsettled loan positions.
(d) At October 31, 2012, all or a portion of the security was segregated to cover collateral requirements for extended trade settlements.
At October 31, 2012, aggregate cost for federal income tax purposes was $101,449,073. Net unrealized appreciation consisted of:
Gross unrealized appreciation | | $ | 3,036,902 | | |
Gross unrealized depreciation | | | (1,243,023 | ) | |
Net unrealized appreciation | | $ | 1,793,879 | | |
Abbreviations used in this schedule include:
ADR — American Depository Receipt
PCL — Public Company Limited
PLC — Public Limited Company
REIT — Real Estate Investment Trust
RSP — Represents Non-Voting Shares
Currencies
EUR — Euro
USD — United States Dollar
See Notes to Financial Statements.
FIRST EAGLE FUNDS | ANNUAL REPORT | OCTOBER 31, 2012
106
Schedule of Investments | Period Ended October 31, 2012
Foreign Currency Exchange Contracts — Sales
SETTLEMENT
DATES
THROUGH | | FOREIGN CURRENCY
TO BE DELIVERED | | U.S. $
TO BE
RECEIVED | | U.S. $ VALUE
AT OCTOBER 31,
2012 | | UNREALIZED
APPRECIATION
AT OCTOBER 31,
2012 | | UNREALIZED
DEPRECIATION
AT OCTOBER 31,
2012 | |
02/20/13 | | | 1,216,000 | | | Euro | | $ | 1,534,913 | | | $ | 1,578,295 | | | $ | — | | | $ | (43,382 | ) | |
03/21/13 | | | 758,000 | | | Euro | | | 973,090 | | | | 984,466 | | | | — | | | | (11,376 | ) | |
04/17/13 | | | 864,000 | | | Euro | | | 1,118,893 | | | | 1,122,420 | | | | — | | | | (3,527 | ) | |
06/19/13 | | | 3,443,000 | | | Euro | | | 4,355,992 | | | | 4,473,540 | | | | — | | | | (117,548 | ) | |
| | | | | | | $ | 7,982,888 | | | $ | 8,158,721 | | | $ | — | | | $ | (175,833 | ) | |
INDUSTRY DIVERSIFICATION FOR PORTFOLIO HOLDINGS | | PERCENT OF
NET ASSETS | |
U.S. Common Stocks | |
Consumer Discretionary | | | 0.31 | % | |
Consumer Staples | | | 3.35 | | |
Energy | | | 2.09 | | |
Financials | | | 3.44 | | |
Industrials | | | 2.03 | | |
Information Technology | | | 5.76 | | |
Materials | | | 0.77 | | |
Utilities | | | 2.50 | | |
Total U.S. Common Stocks | | | 20.25 | | |
International Common Stocks | |
Consumer Discretionary | | | 1.13 | | |
Consumer Staples | | | 4.36 | | |
Energy | | | 4.28 | | |
Financials | | | 3.07 | | |
Health Care | | | 3.95 | | |
Industrials | | | 3.77 | | |
Information Technology | | | 1.90 | | |
Materials | | | 6.06 | | |
Utilities | | | 0.41 | | |
Total International Common Stocks | | | 28.93 | | |
Closed End Mutual Fund | | | 0.99 | | |
See Notes to Financial Statements.
FIRST EAGLE FUNDS | ANNUAL REPORT | OCTOBER 31, 2012
107
Global Income Builder Fund
INDUSTRY DIVERSIFICATION FOR PORTFOLIO HOLDINGS — (CONTINUED) | | PERCENT OF
NET ASSETS | |
U.S. Convertible Bond | |
Industrials | | | 1.01 | % | |
Total U.S. Convertible Bond | | | 1.01 | | |
U.S. Corporate Bonds | |
Consumer Discretionary | | | 6.68 | | |
Consumer Staples | | | 1.99 | | |
Energy | | | 8.58 | | |
Financials | | | 3.80 | | |
Health Care | | | 1.35 | | |
Industrials | | | 2.83 | | |
Materials | | | 0.80 | | |
Telecommunication Services | | | 2.44 | | |
Total U.S. Corporate Bonds | | | 28.47 | | |
International Corporate Bonds | |
Consumer Discretionary | | | 1.41 | | |
Energy | | | 0.40 | | |
Financials | | | 1.13 | | |
Industrials | | | 1.49 | | |
Materials | | | 2.38 | | |
Telecommunication Services | | | 1.16 | | |
Total International Corporate Bonds | | | 7.97 | | |
Term Loans | | | 3.14 | | |
Commercial Paper | |
International Commercial Paper | | | 0.77 | | |
U.S. Commercial Paper | | | 4.64 | | |
Total Commercial Paper | | | 5.41 | | |
Total Investments | | | 96.17 | % | |
See Notes to Financial Statements.
FIRST EAGLE FUNDS | ANNUAL REPORT | OCTOBER 31, 2012
108
Letter from the High Yield Team Portfolio Managers
Market Overview
The year that ended October 31, 2012 was a strong year for the high-yield market. Market returns, as measured by the Barclays High Yield Index, were 13.61% over the 12-month period. This performance was generated in an environment characterized by slow yet steady credit improvement, historically low U.S. corporate default rates (3.00%)1, an open primary issue market, and generally healthy deal structures which saw only marginal erosion through the year.
Despite the relatively low volatility versus recent years, spreads widened meaningfully this past May and early June following the failure of Greece to form a coalition government. This latest episode of European-generated market instability subsided in July when the chairman of the European Central Bank (ECB) said the ECB would do "whatever it takes" to save the Euro. While we still see the prospect of increasing volatility driven by negative news coming out of Europe, the potential for a disorderly sale of assets by European lenders appears to have moderated.
Primary market deal activity increased markedly through fiscal year end as spreads and risk tolerance returned to earlier pre-Greece levels. Accordingly, issuers and underwriters attempted to relax covenants and deal structures amid continued investor demand for yield. As a result, deal quality eroded somewhat as we began to see pockets of increased equity-friendly issues amid unattractive payment-in-kind ('PIK') and toggle structures. This is something that we expect to persist as we move through the credit cycle. All told, we believe deal quality is acceptable as the pace of quality erosion remains moderate.
Even with this relatively healthy environment, the latter half of this fiscal year was dominated by a debate regarding the health of the U.S. high yield market. Low yields led many to question whether this market was approaching bubble proportions. This is understandable given that yields are near all-time lows and bond issuance approached historic highs. While it is true that absolute yields are near lows, spreads over low-yielding treasuries approximated 540 bps, close to the long-term historic average. Bubble talk is a bit premature as we believe signs point to a continued benign credit environment with defaults remaining subdued, market risk remaining adequately priced and primary deal quality remaining satisfactory.
1 Standard and Poor's, U.S. Corporate Default Rate Forecasted To Rise To 3.7% By Third-Quarter 2013 November 2012. Standardandpoors.com
FIRST EAGLE FUNDS | ANNUAL REPORT | OCTOBER 31, 2012
109
Letter from the High Yield Team Portfolio Managers (continued)
In short, the year that ended October 31, 2012 was typical of the historical patterns in the stability phase of the credit cycle — a slow, gradual move towards tighter spreads and, eventually, a slow, incremental path towards eroding deal quality.
As we look towards next year, we remain optimistic about high yield as market conditions appear stable. The Fed has committed to remain accommodative until early 20152, deals continue to come to market with adequate covenant protection and structure and corporations generally remain cautious in their capital allocation decisions.
Nonetheless, we continue to monitor the global economic environment. Although factors as we understand them today point to a relatively stable high yield market, the future remains uncertain. To that end, we continue to monitor the potential for continued sovereign debt instability in the Eurozone. In China, we are paying close attention to the pace of economic weakness amid the leadership transfer. And in the U.S. we are hopeful that the Democrat-led Senate and Republican-led House of Representatives will develop a meaningful compromise that addresses the looming "fiscal cliff" and steers the country towards a future with less fiscal uncertainty.
While the general high yield investing environment remains strong, we continue to believe that returns could moderate in 2013. Given the bond price appreciation we saw during this fiscal year, it is likely that next year's high yield returns may be driven by the accrual of coupon income — as is typical in a stable yet benign credit environment.
Portfolio Review
As of October 31st, 2012, we favored B-rated issues, which accounted for more than half of the Fund's assets because the B credit tier is more credit sensitive than the more interest rate-sensitive BBs and has historically performed better

2 September 13, 2012 Federal Reserve Press Release http://www.federalreserve.gov/newsevents/press/monetary/20120913a.htm
FIRST EAGLE FUNDS | ANNUAL REPORT | OCTOBER 31, 2012
110
Letter from the High Yield Team Portfolio Managers (continued)
in a benign credit environment. Although we do not manage our investments on the basis of interest rate movements, we have found what we view as attractive opportunities in leveraged loans, which typically offer a floating interest rate tied to LIBOR. As of October 31st, our investments in loans accounted for 10% of the portfolio.
We continue to invest based on where we anticipate attractive returns with what we believe to be appropriate risk.
We also found opportunities in Europe. As the year closed, 16% of our portfolio was invested in Western and Northern European companies with significant global operations.
We appreciate your confidence and thank you for your support.

| |  | |
Edward Meigs | | Sean Slein | |
Portfolio Manager | | Portfolio Manager | |
December 2012
FIRST EAGLE FUNDS | ANNUAL REPORT | OCTOBER 31, 2012
111
Letter from the High Yield Team Portfolio Managers (continued)
The performance data quoted herein represents past performance and does not guarantee future results. Market volatility can dramatically impact the Fund's short-term performance. Current performance may be lower or higher than figures shown. The investment return and principal value will fluctuate so that an investor's shares, when redeemed, may be worth more or less than their original cost. Past performance data through the most recent month end is available at firsteaglefunds.com or by calling 800.334.2143.
The commentary represents the opinion of the First Eagle High Yield Fund Portfolio Managers as of December 2012 and is subject to change based on market and other conditions. The opinions expressed are not necessarily those of the firm. These materials are provided for informational purpose only. These opinions are not intended to be a forecast of future events, a guarantee of future results, or investment advice. Any statistics contained herein have been obtained from sources believed to be reliable, but the accuracy of this information cannot be guaranteed. The views expressed herein may change at any time subsequent to the date of issue hereof. The information provided is not to be construed as a recommendation or an offer to buy or sell or the solicitation of an offer to buy or sell any fund or security.
The portfolio is actively managed. The portfolio and opinions expressed herein are subject to change. Current and future portfolio holdings are subject to risk.
*Class I Shares require $1mm minimum investment, and are offered without sales charge. Had fees not been waived and/or expenses reimbursed, the performance would have been lower. The Adviser has contractually agreed to limit operating expenses of the Fund to an annual rate of 0.80% for I Shares, 1.25% for A Shares, and 2.00% for C Shares, with gross operating expenses of 1.26%, 1.51%, and 2.26% respectively. Gross operating expenses are the actual fund operating expenses prior to the application of fee waivers and/or expense reimbursements. This limitation excludes certain expenses as described in the Fees and Expenses section of the prospectus. This limitation will continue until 2013 for I-Shares, and until 2012 for A and C Shares. The expense limitation may be terminated by the Adviser in future years.
The Fund commenced operations in its present form on or about December 30, 2011, and is successor to another mutual fund pursuant to a reorganization on December 30, 2011. Information prior to December 30, 2011 is for the predecessor fund. Immediately after the reorganization, changes in net asset value of the Class I shares were partially impacted by differences in how the Fund and the predecessor fund price portfolio securities.
FIRST EAGLE FUNDS | ANNUAL REPORT | OCTOBER 31, 2012
112
Management's Discussion of Fund Performance
First Eagle High Yield Fund
The NAV of the First Eagle High Yield Fund's Class 'I' shares rose 13.07% through October 31, 2012, while the Barclays Capital U.S. Corporate High Yield Index rose 13.61% over the same period. The Fund held 3.93% in cash and cash equivalents on October 31, 2012.
The five largest contributors to the performance of the First Eagle High Yield Fund over the period were The Bon-Ton Department Stores, Inc., Alliance One International, Inc., Shea Homes LP, Cleaver-Brooks, Inc. and Bi-Lo LLC, collectively accounting for 1.55 percentage points of the year's performance.
The five largest detractors to the fund were Midwest Vanadium Pty Limited, FCC Holdings LLC, AK Steel Corporation, Navistar International Corporation and OGX Austria GmbH. Their combined negative performance over the twelve-month period subtracted 62 basis points from the Fund's performance.
As of October 31, 2012, the First Eagle High Yield Fund was 100% hedged against the Euro.
The Fund invests in high yield, fixed income securities that, at the time of purchase, are non-investment grade. High yield, lower rated securities involve greater price volatility and present greater risks than high rated fixed income securities. High yield securities are rated lower than investment-grade securities because there is a greater possibility that the issuer may be unable to make interest and principal payments on those securities. High yield securities involve greater risk than higher rated securities and portfolios that invest in them may be subject to greater levels of credit and liquidity risk than portfolios that do not.
There are risks associated with investing in securities of non-U.S. countries such as erratic market conditions, economic and political instability and fluctuations in currency exchange rates.
The Fund's investment strategies may result in high turnover rates. This may increase the Fund's brokerage commission costs, which would reduce performance. Rapid portfolio turnover also exposes shareholders to a higher current realization of short-term gains.
All investments involve the risk of loss.
Hedging can reduce exposure to currency exchange movements, but cannot eliminate that exposure. It is possible to lose money under a hedge. Results from hedging transactions, which for the Fund is primarily currency forward contracts, are further described in the financial statements that follow this commentary.
The Barclays Capital U.S. Corporate High Yield Bond Index is composed of fixed-rate, publicly issued, non-investment grade debt, is unmanaged, with dividends reinvested, and is not available for purchase. The index includes both corporate and non-corporate sectors. The corporate sectors are Industrial, Utility, and Finance, which include both U.S. and non-U.S. corporations. The index is presented here for comparison purposes only. One cannot invest directly in an index.
FIRST EAGLE FUNDS | ANNUAL REPORT | OCTOBER 31, 2012
113

Fund Overview | Data as of October 31, 2012 (unaudited)
INVESTMENT OBJECTIVE
First Eagle High Yield Fund seeks to provide investors with a high level of current income by investing at least 80% of its net assets in high yield, below investment-grade instruments, or other instruments.
| Average Annual Returns^ | |
| | | ONE-YEAR | | THREE-YEARS | | SINCE
INCEPTION
(11-19-07) | |
First Eagle
High Yield Fund
I Shares | | | 13.07 | % | | | 11.96 | % | | | 13.09 | % | |
Barclays Capital
U.S. Corporate
High Yield Bond Index | | | 13.61 | | | | 12.56 | | | | 10.08 | | |
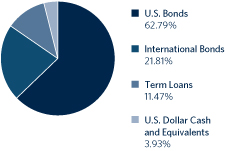
Countries** | |
United States | | | 71.61 | % | |
Bermuda | | | 3.28 | | |
Canada | | | 2.95 | | |
Cayman Islands | | | 2.85 | | |
United Kingdom | | | 2.63 | | |
Germany | | | 2.12 | | |
Australia | | | 1.99 | | |
Netherlands | | | 1.76 | | |
Norway | | | 1.61 | | |
Sweden | | | 1.52 | | |
Ireland | | | 1.32 | | |
Austria | | | 0.98 | | |
France | | | 0.78 | | |
Luxembourg | | | 0.67 | | |
^ Performance figures reflect certain fee waivers and/or expense limitations, without which returns may have been lower.
* Asset Allocation and Countries percentages are based on total investments in the portfolio.
** Country allocations reflect country of the issuer (not currency of issue) and exclude short term investments. Bonds of non-U.S. issuers may be U.S. dollar denominated.
The Fund's portfolio composition is subject to change at any time.
FIRST EAGLE FUNDS | ANNUAL REPORT | OCTOBER 31, 2012
114
Growth of a $10,000 Initial Investment*
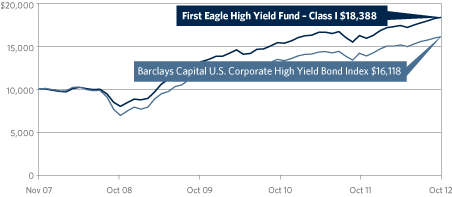
The Adviser has contractually agreed to limit operating expenses of the Fund to an annual rate of 0.80% for I Shares, 0.95% for A Shares, and 1.66% for C Shares, with gross operating expenses of 1.05%, 1.12%, and 1.83% respectively. This limitation excludes certain expenses as described in the Fees and Expenses section of the prospectus. This limitation will continue until 2013 for I-Shares, and until 2012 for A and C Shares. These expense limitations may be terminated by the Adviser in future years.
Performance data quoted herein represents past performance and should not be considered indicative of future results. Performance data quoted herein does not reflect the deduction of taxes that a shareholder would pay on Fund distributions or the sale of Fund shares. The average annual returns shown above are historical and reflect changes in share price, reinvested dividends and are net of expenses.
The average annual returns for Class I Shares do not give effect to the deduction of a maximum sales charge.
The Barclays Capital U.S. Corporate High Yield Bond Index is composed of fixed-rate, publicly issued, non-investment grade debt, is unmanaged, with dividends reinvested, and is not available for purchase. The index includes both corporate and non-corporate sectors. The corporate sectors are Industrial, Utility, and Finance, which include both U.S. and non-U.S. corporations. The index is presented here for comparison purposes only. One cannot invest directly in an index.
Top 10 Holdings* | |
| Bi-Lo LLC (U.S. food-retail company) | | | 2.07 | % | |
| Toys R Us Property Company I (U.S. real estate management company) | | | 1.95 | | |
| Citgo Petroleum Corporation (U.S. refiner and marketer of transportation fuels) | | | 1.77 | | |
| HeidelbergCement Finance BV (German building materials manufacturer) | | | 1.75 | | |
| Appleton Papers, Inc. (U.S. paper and related production manufacturer) | | | 1.69 | | |
| Tower Automotive Holdings USA (U.S. consumer discretionary-automotive company) | | | 1.62 | | |
| ROC Finance (U.S. special purpose finance company) | | | 1.60 | | |
| Eksportfinans ASA (Norwegian financing company) | | | 1.59 | | |
| Roundy's Supermarkets, Inc.,Term Loan B (U.S. wholesale grocery company) | | | 1.57 | | |
| Offshore Group Investment Limited (Cayman Island energy company) | | | 1.50 | | |
Total | | | 17.11 | % | |
* Holdings in cash and commercial paper have been excluded. Percentages are based on total net assets.
FIRST EAGLE FUNDS | ANNUAL REPORT | OCTOBER 31, 2012
115
First Eagle High Yield Fund
PRINCIPAL | | DESCRIPTION | | COST (NOTE 1) | | VALUE (NOTE 1) | |
Bonds — 83.83% | | | |
U.S. Convertible Bond — 0.95% | | | |
$ | 6,483,000 | | | Advanced Micro Devices, Inc.
6.00% due 05/01/15 (a) | | $ | 6,045,472
| | | $ | 6,077,813
| | |
U.S. Corporate Bonds — 61.27% | | | |
| | 1,847,000 | | | Air Lease Corporation
5.625% due 04/01/17 (b) | | | 1,845,886
| | | | 1,902,410
| | |
| | 4,485,000 | | | Air Medical Group Holdings, Inc.
9.25% due 11/01/18 | | | 4,775,224
| | | | 4,855,012
| | |
| | 2,800,000 | | | AK Steel Corporation
8.375% due 04/01/22 | | | 2,810,784
| | | | 2,380,000
| | |
| | 8,931,000 | | | Alliance One International, Inc.
10.00% due 07/15/16 | | | 8,951,623
| | | | 9,265,912
| | |
| | 4,821,000 | | | Aleris International, Inc.
7.875% due 11/01/20 (b) | | | 4,821,000
| | | | 4,814,974
| | |
| | 2,100,000 | | | American Axle & Manufacturing, Inc.
6.625% due 10/15/22 | | | 2,111,733
| | | | 2,086,875
| | |
| | 3,049,000 | | | American Axle & Manufacturing, Inc.
7.875% due 03/01/17 | | | 3,144,564
| | | | 3,167,149
| | |
| | 10,175,000 | | | Appleton Papers, Inc.
10.50% due 06/15/15 (b) | | | 10,677,561
| | | | 10,836,375
| | |
| | 2,950,000 | | | Atwood Oceanics, Inc.
6.50% due 02/01/20 | | | 3,086,741
| | | | 3,186,000
| | |
| | 5,238,000 | | | Basic Energy Services, Inc.
7.75% due 02/15/19 | | | 5,162,148
| | | | 5,238,000
| | |
| | 3,475,000 | | | Basic Energy Services, Inc.
7.75% due 10/15/22 (b) | | | 3,475,000
| | | | 3,388,125
| | |
| | 12,645,000 | | | Bi-Lo LLC
9.25% due 02/15/19 (b) | | | 13,431,891
| | | | 13,308,862
| | |
| | 1,951,000 | | | Bon-Ton Department Stores, Inc.
10.25% due 03/15/14 | | | 1,835,341
| | | | 1,916,858
| | |
| | 5,410,000 | | | Bon-Ton Stores, Inc.
10.625% due 07/15/17 (b) | | | 4,085,843
| | | | 4,983,962
| | |
| | 7,687,800 | | | Brickman Group Holdings, Inc.
9.125% due 11/01/18 (b) | | | 7,697,000
| | | | 7,889,605
| | |
| | 7,625,000 | | | Carrizo Oil & Gas, Inc.
8.625% due 10/15/18 | | | 7,939,329
| | | | 8,254,062
| | |
| | 441,000 | | | CCO Holdings LLC
6.625% due 01/31/22 | | | 457,504
| | | | 480,690
| | |
| | 4,150,000 | | | CCO Holdings LLC
7.375% due 06/01/20 | | | 4,464,287
| | | | 4,668,750
| | |
| | 8,365,000 | | | Chesapeake Energy Corporation
9.50% due 02/15/15 | | | 8,766,982
| | | | 9,410,625
| | |
See Notes to Financial Statements.
FIRST EAGLE FUNDS | ANNUAL REPORT | OCTOBER 31, 2012
116
Schedule of Investments | Period Ended October 31, 2012
PRINCIPAL | | DESCRIPTION | | COST (NOTE 1) | | VALUE (NOTE 1) | |
U.S. Corporate Bonds — 61.27% — (continued) | | | |
$ | 2,485,500 | | | Chesapeake Midstream Partners L.P.
6.125% due 07/15/22 | | $ | 2,413,077
| | | $ | 2,640,844
| | |
| | 9,810,000 | | | Citgo Petroleum Corporation
11.50% due 07/01/17 (b) | | | 10,917,408
| | | | 11,355,075
| | |
| | 4,600,000 | | | Clear Channel Worldwide Holdings, Inc.
Series 'B' 9.25% due 12/15/17 | | | 4,922,363
| | | | 4,945,000
| | |
| | 8,714,000 | | | Cleaver-Brooks, Inc.
12.25% due 05/01/16 (b) | | | 9,130,019
| | | | 9,378,442
| | |
| | 2,150,000 | | | Cloud Peak Energy Resources
8.25% due 12/15/17 | | | 2,283,131
| | | | 2,338,125
| | |
| | 110,000 | | | Cloud Peak Energy Resources
8.50% due 12/15/19 | | | 110,819
| | | | 121,825
| | |
| | 7,573,000 | | | CommScope, Inc.
8.25% due 01/15/19 (b) | | | 7,991,293
| | | | 8,197,772
| | |
| | 8,333,000 | | | Drill Rigs Holdings, Inc.
6.50% due 10/01/17 (b) | | | 8,430,009
| | | | 8,333,000
| | |
| | 4,400,000 | | | DriveTime Automotive Group, Inc.
12.625% due 06/15/17 | | | 4,777,246
| | | | 5,208,500
| | |
| | 2,800,000 | | | E*Trade Financial Corporation
6.75% due 06/01/16 | | | 2,829,500
| | | | 2,989,000
| | |
| | 1,325,000 | | | EP Energy LLC
6.875% due 05/01/19 (b) | | | 1,354,782
| | | | 1,437,625
| | |
| | 4,000,000 | | | EP Energy LLC
9.375% due 05/01/20 (b) | | | 4,053,514
| | | | 4,440,000
| | |
| | 3,671,000 | | | Equinox Holdings, Inc.
9.50% due 02/01/16 (b) | | | 3,860,212
| | | | 3,918,793
| | |
| | 6,320,000 | | | Fiesta Restaurant Group, Inc.
8.875% due 08/15/16 | | | 6,656,088
| | | | 6,770,300
| | |
| | 5,550,000 | | | Frontier Communications Corporation
8.50% due 04/15/20 | | | 5,802,358
| | | | 6,438,000
| | |
| | 6,107,000 | | | Goodman Networks, Inc.
12.375% due 07/01/18 (b) | | | 6,293,621
| | | | 6,725,334
| | |
| | 6,970,000 | | | Headwaters, Inc.
7.625% due 04/01/19 | | | 6,899,165
| | | | 7,161,675
| | |
| | 1,550,000 | | | Hughes Satellite Systems Corporation
6.50% due 06/15/19 | | | 1,606,158
| | | | 1,666,250
| | |
| | 3,000,000 | | | Huntington Ingalls Industries, Inc.
6.875% due 03/15/18 | | | 3,151,893
| | | | 3,255,000
| | |
| | 3,762,000 | | | Huntington Ingalls Industries, Inc.
7.125% due 03/15/21 | | | 3,963,204
| | | | 4,062,960
| | |
| | 3,350,000 | | | Interface, Inc.
7.625% due 12/01/18 | | | 3,595,752
| | | | 3,638,938
| | |
See Notes to Financial Statements.
FIRST EAGLE FUNDS | ANNUAL REPORT | OCTOBER 31, 2012
117
PRINCIPAL | | DESCRIPTION | | COST (NOTE 1) | | VALUE (NOTE 1) | |
U.S. Corporate Bonds — 61.27% — (continued) | | | |
$ | 2,000,000 | | | International Lease Finance Corporation
5.875% due 04/01/19 | | $ | 2,000,000
| | | $ | 2,128,838
| | |
| | 5,210,000 | | | International Lease Finance Corporation
6.25% due 05/15/19 | | | 5,321,447
| | | | 5,641,133
| | |
| | 2,000,000 | | | International Lease Finance Corporation
8.625% due 09/15/15 | | | 2,158,541
| | | | 2,259,500
| | |
| | 5,937,000 | | | JMC Steel Group
8.25% due 03/15/18 (b) | | | 6,081,652
| | | | 6,055,740
| | |
| | 8,373,000 | | | Kemet Corporation
10.50% due 05/01/18 | | | 8,625,186
| | | | 8,383,466
| | |
| | 3,646,000 | | | Kraton Polymers
6.75% due 03/01/19 | | | 3,735,834
| | | | 3,773,610
| | |
| | 3,500,000 | | | Landry's, Inc.
9.375% due 05/01/20 (b) | | | 3,530,868
| | | | 3,705,625
| | |
| | 2,300,000 | | | Linn Energy
6.25% due 11/01/19 (b) | | | 2,257,597
| | | | 2,311,500
| | |
| | 2,470,000 | | | Manitowoc Company, Inc.
9.50% due 02/15/18 | | | 2,682,653
| | | | 2,772,575
| | |
| | 5,040,000 | | | Mcron Finance Corporation
8.375% due 05/15/19 (b) | | | 5,111,476
| | | | 5,203,800
| | |
| | 4,400,000 | | | Mead Products
6.75% due 04/30/20 (b) | | | 4,526,569
| | | | 4,515,500
| | |
| | 3,626,000 | | | Midwest Gaming Borrower
11.625% due 04/15/16 (b) | | | 3,939,188
| | | | 3,988,600
| | |
| | 9,372,000 | | | New Albertsons, Inc.
7.25% due 05/01/13 | | | 9,280,395
| | | | 9,430,575
| | |
| | 311,000 | | | Omega Healthcare Investors, Inc.
6.75% due 10/15/22 | | | 309,795
| | | | 340,545
| | |
| | 2,000,000 | | | Omega Healthcare Investors, Inc.
7.50% due 02/15/20 | | | 2,144,794
| | | | 2,210,000
| | |
| | 4,300,000 | | | Parker Drilling Company
9.125% due 04/01/18 | | | 4,525,046
| | | | 4,622,500
| | |
| | 3,169,000 | | | PHH Corporation
9.25% due 03/01/16 | | | 3,209,696
| | | | 3,676,040
| | |
| | 1,600,000 | | | Polypore International, Inc.
7.50% due 11/15/17 | | | 1,665,520
| | | | 1,736,000
| | |
| | 3,750,000 | | | Post Holdings, Inc.
7.375% due 02/15/22 (b) | | | 3,891,719
| | | | 3,998,438
| | |
| | 3,729,000 | | | Quality Distribution
9.875% due 11/01/18 | | | 4,044,342
| | | | 4,092,578
| | |
| | 5,386,000 | | | Radio Systems Corporation
8.375% due 11/01/19 (b) | | | 5,473,737
| | | | 5,507,185
| | |
See Notes to Financial Statements.
FIRST EAGLE FUNDS | ANNUAL REPORT | OCTOBER 31, 2012
118
Schedule of Investments | Period Ended October 31, 2012
PRINCIPAL | | DESCRIPTION | | COST (NOTE 1) | | VALUE (NOTE 1) | |
U.S. Corporate Bonds — 61.27% — (continued) | | | |
$ | 8,846,000 | | | ROC Finance
12.125% due 09/01/18 (b) | | $ | 10,052,363
| | | $ | 10,261,360
| | |
| | 3,950,000 | | | Samson Investment Company
9.75% due 02/15/20 (b) | | | 4,072,901
| | | | 4,187,000
| | |
| | 6,025,000 | | | SandRidge Energy, Inc.
7.50% due 02/15/23 (b) | | | 6,049,610
| | | | 6,266,000
| | |
| | 2,690,000 | | | Shea Homes L.P.
8.625% due 05/15/19 | | | 2,724,303
| | | | 3,006,075
| | |
| | 5,495,326 | | | Sheridan Group, Inc.
12.50% due 04/15/14 | | | 4,808,384
| | | | 4,588,597
| | |
| | 2,982,000 | | | STHI Holding Corporation
8.00% due 03/15/18 (b) | | | 3,160,244
| | | | 3,205,650
| | |
| | 4,017,000 | | | Sugarhouse HSP Gaming Prop Mezz L.P.
8.625% due 04/15/16 (b) | | | 4,211,471
| | | | 4,323,296
| | |
| | 2,560,000 | | | Taminco Global Chemical Corporation
9.75% due 03/31/20 (b) | | | 2,643,156
| | | | 2,790,400
| | |
| | 7,776,000 | | | Taylor Morrison Communities, Inc.
7.75% due 04/15/20 (b) | | | 8,076,236
| | | | 8,320,320
| | |
| | 9,553,000 | | | Tower Automotive Holdings USA
10.625% due 09/01/17 (b) | | | 10,342,525
| | | | 10,424,711
| | |
| | 11,531,000 | | | Toys R Us Property Company I
10.75% due 07/15/17 | | | 12,492,745
| | | | 12,525,549
| | |
| | 1,745,000 | | | Toys R Us Property Company II
8.50% due 12/01/17 | | | 1,821,733
| | | | 1,882,419
| | |
| | 1,350,000 | | | Toys R Us, Inc.
7.375% due 10/15/18 | | | 1,205,286
| | | | 1,208,250
| | |
| | 1,913,000 | | | Toys R Us, Inc.
10.375% due 08/15/17 (b) | | | 1,969,764
| | | | 1,965,608
| | |
| | 8,432,000 | | | Tronox Finance LLC
6.375% due 08/15/20 (b) | | | 8,513,883
| | | | 8,442,540
| | |
| | 500,000 | | | United Rentals North America, Inc.
10.875% due 06/15/16 | | | 542,892
| | | | 557,500
| | |
| | 4,650,000 | | | UR Financing Escrow Corporation
7.375% due 05/15/20 (b) | | | 4,725,547
| | | | 5,051,062
| | |
| | 200,000 | | | UR Financing Escrow Corporation
7.625% due 04/15/22 (b) | | | 200,000
| | | | 219,750
| | |
| | 3,064,000 | | | Wolverine World Wide, Inc.
6.125% due 10/15/20 (b) | | | 3,119,037
| | | | 3,205,710
| | |
| | 4,333,000 | | | Yankee Candle Company, Inc. Series 'B'
9.75% due 02/15/17 | | | 4,511,591
| | | | 4,511,736
| | |
| | 2,839,000 | | | YCC Holdings
10.25% due 02/15/16 (c) | | | 2,819,128
| | | | 2,949,011
| | |
Total U.S. Corporate Bonds | | | 383,160,907 | | | | 393,302,996 | | |
See Notes to Financial Statements.
FIRST EAGLE FUNDS | ANNUAL REPORT | OCTOBER 31, 2012
119
PRINCIPAL | | DESCRIPTION | | COST (NOTE 1) | | VALUE (NOTE 1) | |
International Corporate Bonds — 21.61% | | | |
Australia 1.97% | | | |
| 5,700,000
USD | | | FMG Resources
8.25% due 11/01/19 (b) | | $ | 5,899,303
| | | $ | 5,728,500
| | |
| 6,706,000
USD | | | Nufarm Australia Limited
6.375% due 10/15/19 (b) | | | 6,864,600
| | | | 6,907,180
| | |
| | | | 12,763,903 | | | | 12,635,680 | | |
Austria 0.97% | | | |
| 2,326,000
USD | | | OGX Austria GmbH
8.375% due 04/01/22 (b) | | | 2,323,089
| | | | 1,959,655
| | |
| 4,889,000
USD | | | OGX Austria GmbH
8.50% due 06/01/18 (b) | | | 4,476,107
| | | | 4,290,097
| | |
| | | | 6,799,196 | | | | 6,249,752 | | |
Bermuda 3.25% | | | |
| 4,025,000
USD | | | Aircastle Limited
7.625% due 04/15/20 | | | 4,071,857
| | | | 4,467,750
| | |
| 2,305,000
USD | | | Aircastle Limited
9.75% due 08/01/18 | | | 2,511,010
| | | | 2,619,056
| | |
| 8,750,000
USD | | | Ship Finance International Limited
8.50% due 12/15/13 | | | 8,737,936
| | | | 8,804,687
| | |
| 4,785,000
USD | | | Viking Cruises, Limited
8.50% due 10/15/22 (b) | | | 4,827,925
| | | | 4,964,438
| | |
| | | | 20,148,728 | | | | 20,855,931 | | |
Canada 2.39% | | | |
| 1,914,000
USD | | | Mood Media Corporation
9.25% due 10/15/20 | | | 1,924,736
| | | | 1,947,495
| | |
| 3,792,000
USD | | | New Gold, Inc.
7.00% due 04/15/20 (b) | | | 3,861,986
| | | | 4,038,480
| | |
| 4,729,000
USD | | | PetroBakken Energy Limited
8.625% due 02/01/20 (b) | | | 4,735,816
| | | | 4,847,225
| | |
| 600,000
USD | | | Precision Drilling Corporation
6.50% due 12/15/21 | | | 607,665
| | | | 637,500
| | |
| 2,550,000
USD | | | Thompson Creek Metals Company, Inc.
7.375% due 06/01/18 | | | 2,229,196
| | | | 2,027,250
| | |
| 2,000,000
USD | | | Thompson Creek Metals Company, Inc.
12.50% due 05/01/19 | | | 2,016,530
| | | | 1,880,000
| | |
| | | | 15,375,929 | | | | 15,377,950 | | |
Cayman Islands 2.83% | | | |
| 4,850,000
USD | | | Marfrig Overseas Limited
9.50% due 05/04/20 (b) | | | 4,250,901
| | | | 4,316,500
| | |
| 9,700,000
USD | | | Offshore Group Investment Limited
7.50% due 11/01/19 (b) | | | 9,706,128
| | | | 9,603,000
| | |
See Notes to Financial Statements.
FIRST EAGLE FUNDS | ANNUAL REPORT | OCTOBER 31, 2012
120
Schedule of Investments | Period Ended October 31, 2012
PRINCIPAL | | DESCRIPTION | | COST (NOTE 1) | | VALUE (NOTE 1) | |
International Corporate Bonds — 21.61% — (continued) | | | |
Cayman Islands 2.83% — (continued) | | | |
| 3,730,000
USD | | | RDS Ultra-Deepwater Limited
11.875% due 03/15/17 (b) | | $ | 4,069,113
| | | $ | 4,224,225
| | |
| | | | 18,026,142 | | | | 18,143,725 | | |
France 0.77% | | | |
| 4,805,000
USD | | | Rexel SA
6.125% due 12/15/19 (b) | | | 4,861,395
| | | | 4,949,150
| | |
Ireland 1.31% | | | |
| 8,031,000
USD | | | Ardagh Packaging Finance PLC
9.125% due 10/15/20 (b) | | | 8,347,360
| | | | 8,402,395
| | |
Luxembourg 0.66% | | | |
| 3,990,000
USD | | | Dematic SA
8.75% due 05/01/16 (b) | | | 4,159,703
| | | | 4,254,337
| | |
Netherlands 1.75% | | | |
| 7,215,000
EUR | | | HeidelbergCement Finance BV
8.50% due 10/31/19 | | | 10,539,109
| | | | 11,218,665
| | |
Norway 1.59% | | | |
| 10,755,000
USD | | | Eksportfinans ASA
2.00% due 09/15/15 | | | 9,724,653
| | | | 10,224,252
| | |
Sweden 1.51% | | | |
| 642,275
USD | | | Eileme 1 AB
14.25% due 08/15/20 (b)(c) | | | 613,601
| | | | 677,600
| | |
| 2,850,000
USD | | | Eileme 2 AB
11.625% due 01/31/20 (b) | | | 2,950,419
| | | | 3,231,188
| | |
| 3,950,000
EUR | | | Eileme 2 AB
11.75% due 01/31/20 (b) | | | 5,218,827
| | | | 5,768,667
| | |
| | | | 8,782,847 | | | | 9,677,455 | | |
United Kingdom 2.61% | | | |
| 4,400,000
USD | | | Ineos Finance PLC
8.375% due 02/15/19 (b) | | | 4,587,687
| | | | 4,636,500
| | |
| 5,700,000
USD | | | Jaguar Land Rover PLC
8.125% due 05/15/21 (b) | | | 5,886,438
| | | | 6,170,250
| | |
| 5,200,000
USD | | | Viridian Group FundCo II
11.125% due 04/01/17 (b) | | | 5,016,908
| | | | 5,278,000
| | |
| | 500,000 | | | Viridian Group FundCo II
EUR11.125% due 04/01/17 (b) | | | 594,326
| | | | 674,440
| | |
| | | | 16,085,359 | | | | 16,759,190 | | |
Total International Corporate Bonds | | | 135,614,324 | | | | 138,748,482 | | |
Total Bonds | | | 524,820,703 | | | | 538,129,291 | | |
See Notes to Financial Statements.
FIRST EAGLE FUNDS | ANNUAL REPORT | OCTOBER 31, 2012
121
PRINCIPAL | | DESCRIPTION | | COST (NOTE 1) | | VALUE (NOTE 1) | |
Term Loans — 11.37% | | | |
$ | 478,000 | | | BJ's Wholesale Club, Inc.
9.75% due 09/18/20 | | $ | 473,252
| | | $ | 489,114
| | |
| | 2,887,500 | | | Cannery Casino Resorts LLC
Term Loan B 6.00% due 09/25/18 | | | 2,858,987
| | | | 2,905,547
| | |
| | 4,812,500 | | | Cannery Casino Resorts LLC,
Second Lien Term Loan
10.00% due 09/25/19 | | | 4,717,237
| | | | 4,692,187
| | |
| | 457,249 | | | Chesapeake Energy Corporation,
Unsecured Term Loan
8.50% due 12/02/17 | | | 444,286
| | | | 458,900
| | |
| | 3,342,000 | | | Essar Steel Algoma, Inc., ABL Term Loan
8.75% due 09/20/14 | | | 3,277,934
| | | | 3,383,775
| | |
| | 7,000,000 | | | Fortescue Metals Group
0.00% - 5.25% due 10/05/17 (d)(e) | | | 6,953,500
| | | | 6,982,500
| | |
| | 8,513,662 | | | Grohe Holding GMBH, Term Loan B
6.75% due 05/16/17 | | | 8,439,625
| | | | 8,556,231
| | |
| | 3,731,250 | | | Landry's Restaurants, Inc., Term Loan B
6.50% due 04/24/18 | | | 3,679,254
| | | | 3,777,115
| | |
| | 8,800,000 | | | Party City Holdings, Inc.
0.00% - 5.75% due 07/27/19 (d)(e) | | | 8,907,737
| | | | 8,895,700
| | |
| | 10,318,075 | | | Roundy's Supermarkets, Inc.,
Term Loan B 5.75% due 02/13/19 | | | 10,145,538
| | | | 10,070,441
| | |
| | 3,790,000 | | | Schaeffler AG, Term Loan C2
due 01/27/17 (d)(e) | | | 4,633,723
| | | | 4,946,353
| | |
| | 6,635,370 | | | Supervalu Inc., Term Loan B
8.00% due 08/30/18 | | | 6,511,834
| | | | 6,698,167
| | |
| | 4,250,000 | | | Van Wagner Communications,
Term Loan B 8.25% due 08/03/18 | | | 4,166,721
| | | | 4,345,625
| | |
| | 957,000 | | | Wilsonart International Holdings LLC
due 10/19/19 (d)(e) | | | 947,430
| | | | 961,486
| | |
| | 5,750,000 | | | Wilton Brands LLC
7.50% due 08/30/18 | | | 5,637,205
| | | | 5,811,094
| | |
Total Term Loans | | | 71,794,263 | | | | 72,974,235 | | |
Commercial Paper — 3.89% | | | |
International Commercial Paper — 0.67% | | | |
Canada 0.06% | | | |
| 360,000
USD | | | Suncor Energy, Inc.
0.32% due 11/16/12 | | | 359,952
| | | | 359,952
| | |
France 0.07% | | | |
| 450,000
USD | | | Sanofi
0.14% due 11/13/12 | | | 449,979
| | | | 449,979
| | |
See Notes to Financial Statements.
FIRST EAGLE FUNDS | ANNUAL REPORT | OCTOBER 31, 2012
122
Schedule of Investments | Period Ended October 31, 2012
PRINCIPAL | | DESCRIPTION | | COST (NOTE 1) | | VALUE (NOTE 1) | |
International Commercial Paper — 0.67% — (continued) | | | |
Germany 0.04% | | | |
| 252,000
USD | | | Henkel Corporation
0.15% due 11/21/12 | | $ | 251,979
| | | $ | 251,979
| | |
Italy 0.43% | | | |
| 2,772,000
USD | | | Eni S.p.A.
0.46% due 11/01/12 | | | 2,772,000
| | | | 2,772,000
| | |
United Kingdom 0.07% | | | |
| 450,000
USD | | | GlaxoSmithKline PLC
0.12% due 11/15/12 | | | 449,979
| | | | 449,979
| | |
Total International Commercial Paper | | | 4,283,889 | | | | 4,283,889 | | |
U.S. Commercial Paper — 3.22% | | | |
$ | 11,087,000 | | | Apache Corporation
0.41% due 11/01/12 | | | 11,087,000
| | | | 11,087,000
| | |
| | 1,220,000 | | | Devon Energy Corporation
0.30% due 11/01/12 | | | 1,220,000
| | | | 1,220,000
| | |
| | 540,000 | | | Google, Inc.
0.12% due 12/05/12 | | | 539,939
| | | | 539,939
| | |
| | 1,680,000 | | | Johnson & Johnson
0.10% due 12/03/12 | | | 1,679,851
| | | | 1,679,851
| | |
| | 1,154,000 | | | Medtronic, Inc.
0.15% due 12/13/12 | | | 1,153,798
| | | | 1,153,798
| | |
| | 585,000 | | | Praxair, Inc.
0.11% due 11/07/12 | | | 584,989
| | | | 584,989
| | |
| | 4,435,000 | | | Precision Castparts Corporation
0.20% due 11/01/12 | | | 4,435,000
| | | | 4,435,000
| | |
Total U.S. Commercial Paper | | | 20,700,577 | | | | 20,700,577 | | |
Total Commercial Paper | | | 24,984,466 | | | | 24,984,466 | | |
Total Investments — 99.09% (Cost: $621,599,432) | | $ | 621,599,432 | | | | 636,087,992 | | |
Other Assets in Excess of Liabilities — 0.91% | | | | | 5,811,722 | | |
Net Assets — 100.00% | | | | $ | 641,899,714 | | |
(a) This security is convertible until April 30, 2015.
(b) All or a portion of the security is exempt from registration under the Securities Act of 1933. Rule 144A securities may only be sold to qualified institutional buyers, pursuant to Rule 144A under the Securities Act of 1933.
(c) Payment-in-kind security.
(d) All or a portion of the security represents unsettled loan positions.
(e) At October 31, 2012, all or a portion of the security was segregated to cover collateral requirements for extended trade settlements.
See Notes to Financial Statements.
FIRST EAGLE FUNDS | ANNUAL REPORT | OCTOBER 31, 2012
123
At October 31, 2012, aggregate cost for federal income tax purposes was $621,601,894. Net unrealized appreciation consisted of:
Gross unrealized appreciation | | $ | 17,102,701 | | |
Gross unrealized depreciation | | | (2,616,603 | ) | |
Net unrealized appreciation | | $ | 14,486,098 | | |
Abbreviations used in this schedule include:
PLC — Public Limited Company
Currencies
EUR — Euro
USD — United States Dollar
Foreign Currency Exchange Contracts — Sales
SETTLEMENT
DATES
THROUGH | | FOREIGN CURRENCY
TO BE DELIVERED | | U.S. $
TO BE
RECEIVED | | U.S. $ VALUE
AT OCTOBER 31,
2012 | | UNREALIZED
APPRECIATION
AT OCTOBER 31,
2012 | | UNREALIZED
DEPRECIATION
AT OCTOBER 31,
2012 | |
06/19/13 | | | 16,821,000 | | | Euro | | $ | 21,172,452 | | | $ | 21,865,453 | | | $ | — | | | $ | (693,001 | ) | |
INDUSTRY DIVERSIFICATION FOR PORTFOLIO HOLDINGS | | PERCENT OF
NET ASSETS | |
U.S. Convertible Bonds | |
Industrials | | | 0.95 | % | |
Total U.S. Convertible Bonds | | | 0.95 | | |
U.S. Corporate Bonds | |
Consumer Discretionary | | | 13.77 | | |
Consumer Staples | | | 6.39 | | |
Energy | | | 12.08 | | |
Financials | | | 6.27 | | |
Health Care | | | 0.50 | | |
Industrials | | | 9.89 | | |
Materials | | | 7.21 | | |
Telecommunication Services | | | 5.16 | | |
Total U.S. Corporate Bonds | | | 61.27 | | |
See Notes to Financial Statements.
FIRST EAGLE FUNDS | ANNUAL REPORT | OCTOBER 31, 2012
124
Schedule of Investments | Period Ended October 31, 2012
INDUSTRY DIVERSIFICATION FOR PORTFOLIO HOLDINGS — (CONTINUED) | | PERCENT OF
NET ASSETS | |
International Corporate Bonds | |
Consumer Discretionary | | | 1.73 | % | |
Energy | | | 3.98 | | |
Financials | | | 2.70 | | |
Industrials | | | 4.79 | | |
Materials | | | 5.67 | | |
Telecommunication Services | | | 1.81 | | |
Utilities | | | 0.93 | | |
Total International Corporate Bonds | | | 21.61 | | |
Term Loans | | | 11.37 | | |
Commercial Paper | |
International Commercial Paper | | | 0.67 | | |
U.S. Commercial Paper | | | 3.22 | | |
Total Commercial Paper | | | 3.89 | | |
Total Investments | | | 99.09 | % | |
See Notes to Financial Statements.
FIRST EAGLE FUNDS | ANNUAL REPORT | OCTOBER 31, 2012
125
Letter from Fund of America Portfolio Manager
Market Overview:
Over the fiscal year ending October 31, 2012, political and economic uncertainties created a challenging environment for investors in the United States and around the world. In the U.S., the re-election of President Obama and retention of control by the Democrats and Republicans (in the Senate and House, respectively) means the political landscape in Washington remains unaltered. While ordinarily nothing happening in Washington might be a reasonable hope, with the looming fiscal cliff, persistently high unemployment and a sluggish economy, we believe nothing happening is a problem. We do not know if American politicians will be compelled to work together in order to avert a potential recession or if the gridlock that defined the last two years will continue. What is clear is that if the politicians do not address the fiscal cliff, the resulting cut in future spending and increase in taxes could reduce near-term GDP by a measurable amount. Alternatively, a continuation of entitlements as they exist today and a trillion-dollar deficit is likely to haunt us and our children for years to come.
Outside the United States, uncertainty also defined the past year. In no region was this more acute than in Europe, where major concerns about the long-term viability of the euro plagued investors throughout the year. With high unemployment and stagnant growth, southern European governments continued to face strong resistance to new austerity measures that the European Central Bank (ECB) has demanded in exchange for debt purchases. It would be hard to make a compelling case for the creation of the euro should it not exist, but the case for dismantling the euro today is also unpalatable to most. In addition, China and other faster-growing developing economies are not the engine of world-wide growth they once were.
We continue to believe that investors should focus on the Federal Reserve and other central bankers' desire to create inflation as a cure for our economic woes. We further believe that quantitative easing in the U.S. and accommodative monetary policies which are labeled by other names in different parts of the world will continue until successful.

FIRST EAGLE FUNDS | ANNUAL REPORT | OCTOBER 31, 2012
126
Letter from Fund of America Portfolio Manager (continued)
Portfolio Review
As a result of our views about inflation, protecting future purchasing power is currently our main concern. Our philosophy, process and long-term investing discipline has not changed. While challenges to corporate earnings remain, our primary focus is on investing in quality companies that are trading at a discount to our estimates of intrinsic value. We continue to seek strong balance sheets, attractive free cash flows and exceptional management teams that are determined to create value for their owners.
We are grateful for the trust our shareholders have placed in us and strive to earn it every day by continuing to adhere to the same philosophy we have practiced for more than 25 years.
Thank you for your continued confidence.

Harold Levy
Portfolio Manager
The performance data quoted herein represents past performance and does not guarantee future results. Market volatility can dramatically impact the Fund's short-term performance. Current performance may be lower or higher than figures shown. The investment return and principal value will fluctuate so that an investor's shares, when redeemed, may be worth more or less than their original cost. Past performance data through the most recent month end is available at firsteaglefunds.com or by calling 800.334.2143.
The commentary represents the opinion of the first Eagle Fund of America Portfolio Managers as of December 2012 and is subject to change based on market and other conditions. The opinions expressed are not necessarily those of the firm. These materials are provided for informational purpose only. These opinions are not intended to be a forecast of future events, a guarantee of future results, or investment advice. Any statistics contained herein have been obtained from sources believed to be reliable, but the accuracy of this information cannot be guaranteed. The views expressed herein may change at any time subsequent to the date of issue hereof. The information provided is not to be construed as a recommendation or an offer to buy or sell or the solicitation of an offer to buy or sell any fund or security.
The portfolio is actively managed. The portfolio and opinions expressed herein are subject to change. Current and future portfolio holdings are subject to risk.
FIRST EAGLE FUNDS | ANNUAL REPORT | OCTOBER 31, 2012
127
Management's Discussion of Fund Performance
The performance data quoted herein represents past performance and does not guarantee future results. Market volatility can dramatically impact the fund's short-term performance. Current performance may be lower or higher than figures shown. The investment return and principal value will fluctuate so that an investor's shares, when redeemed, may be worth more or less than their original cost. Past performance data through the most recent month end is available at firsteaglefunds.com or by calling 800.334.2143.
*As of September 1, 2005, Class Y Shares are closed to new investors. Class Y shares are offered without sales charge. If sales charge was included returns would be lower. The portfolio is actively managed and holdings can change at any time. Current and future portfolio holdings are subject to risk.
The NAV of the First Eagle Fund of America's Class 'Y' shares increased 16.50% for the year ending October 31, 2012, while the S&P 500 Index rose 15.21%.
The five largest contributors to the performance of the First Eagle Fund of America over the period were Eastman Chemical Company, Wyndham Worldwide Corporation, Pfizer, Inc., Valeant Pharmaceuticals International, Inc. and Valspar Corporation, accounting for 10.61% points of the year's performance.
The five largest detractors were Walter Energy, Inc., Occidental Petroleum Corporation, Health Net, Inc., TE Connectivity LTC and Medicis Pharmaceutical Corporation. Their combined negative performance over the twelve-month period subtracted 3.24% points from the Fund's performance.
FIRST EAGLE FUNDS | ANNUAL REPORT | OCTOBER 31, 2012
128
This page was intentionally left blank.

Fund Overview | Data as of October 31, 2012 (unaudited)
INVESTMENT OBJECTIVE
The First Eagle Fund of America seeks capital appreciation by investing primarily in domestic stocks and to a lesser extent in debt and foreign equity securities. The Fund has a unique event-driven bias that focuses on identifying companies poised to benefit from change that the market has not yet recognized.
Average Annual Returns | |
| | | ONE-YEAR | | FIVE-YEARS | | TEN-YEARS | |
First Eagle Fund
of America
(Y Shares) | | | 16.50 | % | | | 3.14 | % | | | 9.33 | % | |
Standard & Poor's
500 Index | | | 15.21 | | | | 0.36 | | | | 6.91 | | |
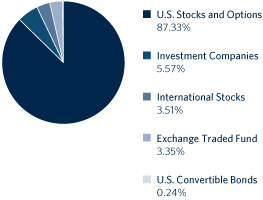
Sector/Industry** | |
Materials | | | 32.07 | % | |
Health Care | | | 24.03 | | |
Consumer Discretionary | | | 10.34 | | |
Information Technology | | | 10.21 | | |
Energy | | | 8.84 | | |
Industrials | | | 7.48 | | |
Exchange Traded Fund | | | 3.35 | | |
* Asset Allocation and Sector/Industry percentages are based on total investments in the portfolio.
** Sector/Industry allocations exclude short term investments and options positions.
The Fund's portfolio composition is subject to change at any time.
FIRST EAGLE FUNDS | ANNUAL REPORT | OCTOBER 31, 2012
130
Growth of a $10,000 Initial Investment
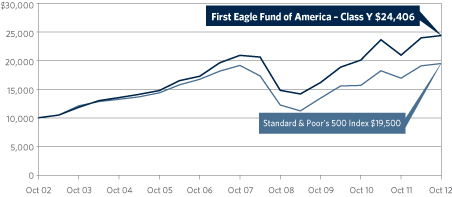
Performance data quoted herein represents past performance and should not be considered indicative of future results. Performance data quoted herein does not reflect the deduction of taxes that a shareholder would pay on Fund distributions or the sale of Fund shares. The Fund's average annual returns shown above are historical and reflect changes in share price, reinvested dividends and is net of expenses.
The Standard & Poor's 500 Index is a widely recognized unmanaged index including a representative sample of 500 leading companies in leading sectors of the U.S. economy and is not available for purchase. Although the Standard & Poor's 500 Index focuses on the large-cap segment of the market, with approximately 75% coverage of U.S. equities, it is also considered a proxy for the total market.
Top 10 Holdings* | |
| Eastman Chemical Company (chemicals company) | | | 6.50 | % | |
| Pfizer Inc. (biopharmaceutical company) | | | 6.12 | | |
| Wyndham Worldwide Corporation (hotel and resorts) | | | 5.64 | | |
| Valeant Pharmaceuticals International, Inc. (pharmaceuticals company) | | | 5.24 | | |
| Rockwood Holdings, Inc. (specialty chemicals manufacturer) | | | 4.83 | | |
| Baxter International, Inc. (health technology company) | | | 4.65 | | |
| Packaging Corporation of America (container and packaging manufacture) | | | 4.64 | | |
| Occidental Petroleum Corporation (oil and gas production and exploration) | | | 4.37 | | |
| Omnicare, Inc. (pharmaceutical company) | | | 4.29 | | |
| Ball Corporation. (metal packaging supplier) | | | 4.18 | | |
Total | | | 50.46 | % | |
* Holdings in cash and money market funds have been excluded. Percentages are based on total net assets.
FIRST EAGLE FUNDS | ANNUAL REPORT | OCTOBER 31, 2012
131
First Eagle Fund of America
SHARES | | DESCRIPTION | | COST (NOTE 1) | | VALUE (NOTE 1) | |
Common Stocks — 92.21% | | | |
U.S. Common Stocks — 88.72% | | | |
Consumer Discretionary 10.29% | | | |
| | 1,803,100 | | | Wyndham Worldwide Corporation (a) | | $ | 58,008,042 | | | $ | 90,876,240 | | |
| | 739,800 | | | Viacom, Inc., Class 'B' (a) | | | 36,426,095 | | | | 37,929,546 | | |
| | 3,653,470 | | | Interpublic Group of
Companies, Inc. (a) | | | 38,816,703
| | | | 36,900,047
| | |
| | | | 133,250,840 | | | | 165,705,833 | | |
Energy 8.79% | | | |
| | 891,500 | | | Occidental Petroleum Corporation (a) | | | 85,389,317 | | | | 70,392,840 | | |
| | 820,890 | | | Dresser-Rand Group, Inc. (a)(b) | | | 33,818,407 | | | | 42,300,461 | | |
| | 838,100 | | | Atlas Energy L.P. (a) | | | 16,956,151 | | | | 28,914,450 | | |
| | | | 136,163,875 | | | | 141,607,751 | | |
Health Care 22.70% | | | |
| | 3,964,400 | | | Pfizer, Inc. (a) | | | 80,099,782 | | | | 98,594,628 | | |
| | 1,509,242 | | | Valeant Pharmaceuticals
International, Inc. (a)(b) | | | 37,780,015
| | | | 84,411,905
| | |
| | 1,195,900 | | | Baxter International, Inc. (a) | | | 63,401,789 | | | | 74,899,217 | | |
| | 2,001,000 | | | Omnicare, Inc. (a) | | | 54,507,251 | | | | 69,094,530 | | |
| | 1,214,960 | | | Health Net, Inc. (a)(b) | | | 31,304,700 | | | | 26,145,939 | | |
| | 464,010 | | | Theravance, Inc. (a)(b) | | | 8,771,116 | | | | 10,444,865 | | |
| | 325,991 | | | Enzon Pharmaceuticals, Inc. (b) | | | 2,297,089 | | | | 2,141,761 | | |
| | | 278,161,742 | | | | 365,732,845 | | |
Industrials 4.90% | | | |
| | 762,325 | | | ADT Corporation (a)(b) | | | 22,284,659 | | | | 31,644,111 | | |
| | 180,400 | | | Flowserve Corporation (a) | | | 22,269,716 | | | | 24,442,396 | | |
| | 301,660 | | | General Dynamics Corporation (a) | | | 15,506,439 | | | | 20,537,013 | | |
| | 51,789 | | | Mueller Industries, Inc. | | | 2,323,346 | | | | 2,268,358 | | |
| | | | 62,384,160 | | | | 78,891,878 | | |
Information Technology 10.16% | | | |
| | 2,303,820 | | | Seagate Technology PLC (a) | | | 56,217,427 | | | | 62,940,363 | | |
| | 809,490 | | | Motorola Solutions, Inc. (a) | | | 40,431,489 | | | | 41,834,443 | | |
| | 1,017,340 | | | AOL, Inc. (a)(b) | | | 23,158,943 | | | | 34,925,282 | | |
| | 329,500 | | | Analog Devices, Inc. (a) | | | 11,253,630 | | | | 12,886,745 | | |
| | 519,800 | | | Lexmark International, Inc.,
Class 'A' (a) | | | 11,645,895
| | | | 11,050,948
| | |
| | | | 142,707,384 | | | | 163,637,781 | | |
See Notes to Financial Statements.
FIRST EAGLE FUNDS | ANNUAL REPORT | OCTOBER 31, 2012
132
Schedule of Investments | Year Ended October 31, 2012
SHARES | | DESCRIPTION | | COST (NOTE 1) | | VALUE (NOTE 1) | |
U.S. Common Stocks — 88.72% — (continued) | | | |
Materials 31.88% | | | |
| | 1,767,900 | | | Eastman Chemical Company (a) | | $ | 56,778,647 | | | $ | 104,730,396 | | |
| | 1,696,270 | | | Rockwood Holdings, Inc. (a) | | | 75,734,664 | | | | 77,858,793 | | |
| | 2,119,800 | | | Packaging Corporation of America (a) | | | 52,782,841 | | | | 74,765,346 | | |
| | 1,573,560 | | | Ball Corporation (a) | | | 35,929,837 | | | | 67,395,575 | | |
| | 917,500 | | | WR Grace & Company (a)(b) | | | 50,534,102 | | | | 58,866,800 | | |
| | 930,350 | | | Valspar Corporation (a) | | | 22,863,436 | | | | 52,127,510 | | |
| | 1,321,270 | | | Crown Holdings, Inc. (a)(b) | | | 29,670,944 | | | | 50,538,578 | | |
| | 512,000 | | | FMC Corporation (a) | | | 26,622,291 | | | | 27,402,240 | | |
| | | | 350,916,762 | | | | 513,685,238 | | |
Total U.S. Common Stocks | | | 1,103,584,763 | | | | 1,429,261,326 | | |
International Common Stocks — 3.49% | | | |
Switzerland 2.54% | | | |
| | 1,524,650 | | | Tyco International Limited | | | 34,653,873 | | | | 40,967,346 | | |
United Kingdom 0.95% | | | |
| | 341,600 | | | GlaxoSmithKline PLC, ADR (a) | | | 15,233,027 | | | | 15,337,840 | | |
Total International Common Stocks | | | 49,886,900 | | | | 56,305,186 | | |
Total Common Stocks | | | 1,153,471,663 | | | | 1,485,566,512 | | |
Exchange Traded Fund — 3.33% | | | |
| | 321,180 | | | SPDR Gold Trust (a)(b) | | | 52,703,972 | | | | 53,592,095 | | |
Investment Companies — 5.54% | | | |
| | 8,985,465 | | | State Street Institutional
Treasury Money Market
Fund, Institutional Class | | | 8,985,465
| | | | 8,985,465
| | |
| | 80,263,613 | | | State Street Institutional
U.S. Government Money
Market Fund, Institutional Class | | | 80,263,613
| | | | 80,263,613
| | |
Total Investment Companies | | | 89,249,078 | | | | 89,249,078 | | |
PRINCIPAL | | | | | | | |
Bond — 0.24% | | | |
U.S. Convertible Bond 0.24% | | | |
$ | 2,730,000 | | | Omnicare, Inc.
3.75% due 12/15/25 (c) | | | 2,730,000
| | | | 3,886,837
| | |
See Notes to Financial Statements.
FIRST EAGLE FUNDS | ANNUAL REPORT | OCTOBER 31, 2012
133
CONTRACTS | | DESCRIPTION | | STRIKE PRICE | | EXPIRATION DATE | | VALUE (NOTE 1) | |
Call Option Purchased — 0.02% | | | |
| | 1,500 | | | Baxter International, Inc.
(Cost: $309,736) | | $ | 65.00
| | | April 2013
| | $ | 315,000
| | |
Total Investment Portfolio
Excluding Options Written — 101.34% (Cost: $1,298,464,449) | | | | | | $1,632,609,522 | |
Covered Call Options Written — (1.89)% | | | |
| | 762 | | | ADT Corporation | | $ | 38.00 | | | November 2012 | | $ | (280,035 | ) | |
| | 762 | | | ADT Corporation | | | 39.00 | | | November 2012 | | | (228,600 | ) | |
| | 2,005 | | | Analog Devices, Inc. | | | 39.00 | | | December 2012 | | | (280,700 | ) | |
| | 1,290 | | | Analog Devices, Inc. | | | 40.00 | | | December 2012 | | | (96,750 | ) | |
| | 2,495 | | | AOL, Inc. | | | 35.00 | | | January 2013 | | | (386,725 | ) | |
| | 1,380 | | | AOL, Inc. | | | 36.00 | | | January 2013 | | | (162,150 | ) | |
| | 427 | | | Atlas Energy L.P. | | | 35.00 | | | November 2012 | | | (40,565 | ) | |
| | 465 | | | Atlas Energy L.P. | | | 35.00 | | | January 2013 | | | (79,050 | ) | |
| | 864 | | | Ball Corporation | | | 40.00 | | | November 2012 | | | (244,080 | ) | |
| | 865 | | | Ball Corporation | | | 41.00 | | | November 2012 | | | (204,140 | ) | |
| | 846 | | | Ball Corporation | | | 43.00 | | | November 2012 | | | (42,300 | ) | |
| | 1,600 | | | Baxter International, Inc. | | | 57.50 | | | November 2012 | | | (828,000 | ) | |
| | 597 | | | Baxter International, Inc. | | | 60.00 | | | November 2012 | | | (179,100 | ) | |
| | 500 | | | Baxter International, Inc. | | | 62.50 | | | February 2013 | | | (136,500 | ) | |
| | 1,823 | | | Crown Holdings, Inc. | | | 37.00 | | | January 2013 | | | (387,388 | ) | |
| | 1,000 | | | Dresser-Rand Group, Inc. | | | 45.00 | | | December 2012 | | | (810,000 | ) | |
| | 1,000 | | | Dresser-Rand Group, Inc. | | | 50.00 | | | December 2012 | | | (350,000 | ) | |
| | 2,100 | | | Dresser-Rand Group, Inc. | | | 55.00 | | | December 2012 | | | (267,750 | ) | |
| | 575 | | | Eastman Chemical Company | | | 50.00 | | | December 2012 | | | (563,500 | ) | |
| | 1,722 | | | Eastman Chemical Company | | | 52.50 | | | December 2012 | | | (1,291,500 | ) | |
| | 4,000 | | | Eastman Chemical Company | | | 55.00 | | | December 2012 | | | (2,120,000 | ) | |
| | 2,462 | | | Eastman Chemical Company | | | 57.50 | | | December 2012 | | | (888,782 | ) | |
| | 124 | | | Flowserve Corporation | | | 125.00 | | | January 2013 | | | (159,340 | ) | |
| | 251 | | | Flowserve Corporation | | | 130.00 | | | November 2012 | | | (188,250 | ) | |
| | 1,156 | | | Flowserve Corporation | | | 130.00 | | | January 2013 | | | (1,057,740 | ) | |
| | 246 | | | Flowserve Corporation | | | 135.00 | | | November 2012 | | | (73,800 | ) | |
| | 533 | | | FMC Corporation | | | 55.00 | | | November 2012 | | | (27,983 | ) | |
| | 2,263 | | | FMC Corporation | | | 55.00 | | | January 2013 | | | (435,628 | ) | |
| | 18 | | | FMC Corporation | | | 57.50 | | | January 2013 | | | (1,890 | ) | |
| | 1,313 | | | General Dynamics Corporation | | | 62.50 | | | November 2012 | | | (777,296 | ) | |
| | 1,703 | | | General Dynamics Corporation | | | 65.00 | | | November 2012 | | | (553,475 | ) | |
| | 1,860 | | | GlaxoSmithKline PLC | | | 47.00 | | | November 2012 | | | (5,580 | ) | |
| | 103 | | | Health Net, Inc. | | | 25.00 | | | January 2013 | | | (8,240 | ) | |
See Notes to Financial Statements.
FIRST EAGLE FUNDS | ANNUAL REPORT | OCTOBER 31, 2012
134
Schedule of Investments | Year Ended October 31, 2012
CONTRACTS | | DESCRIPTION | | STRIKE PRICE | | EXPIRATION DATE | | VALUE (NOTE 1) | |
Covered Call Options Written — (1.89)% — (continued) | | | |
| | 2,934 | | | Interpublic Group of
Companies, Inc. | | $ | 10.00
| | | November 2012
| | $ | (114,426
| ) | |
| | 3,954 | | | Interpublic Group of
Companies, Inc. | | | 11.00
| | | November 2012
| | | (29,655
| ) | |
| | 7,183 | | | Interpublic Group of
Companies, Inc. | | | 11.00
| | | January 2013
| | | (287,320
| ) | |
| | 6,926 | | | Interpublic Group of
Companies, Inc. | | | 12.00
| | | January 2013
| | | (138,520
| ) | |
| | 3,096 | | | Lexmark International, Inc. | | | 22.00 | | | January 2013 | | | (371,520 | ) | |
| | 1,420 | | | Lexmark International, Inc. | | | 23.00 | | | January 2013 | | | (132,060 | ) | |
| | 682 | | | Lexmark International, Inc. | | | 24.00 | | | January 2013 | | | (42,625 | ) | |
| | 966 | | | Motorola Solutions, Inc. | | | 50.00 | | | November 2012 | | | (193,200 | ) | |
| | 2,309 | | | Motorola Solutions, Inc. | | | 50.00 | | | January 2013 | | | (664,992 | ) | |
| | 1,275 | | | Motorola Solutions, Inc. | | | 52.50 | | | November 2012 | | | (73,950 | ) | |
| | 445 | | | Motorola Solutions, Inc. | | | 52.50 | | | January 2013 | | | (74,315 | ) | |
| | 56 | | | Occidental Petroleum Corporation | | | 80.00 | | | December 2012 | | | (13,858 | ) | |
| | 101 | | | Occidental Petroleum Corporation | | | 85.00 | | | December 2012 | | | (8,888 | ) | |
| | 557 | | | Occidental Petroleum Corporation | | | 85.00 | | | January 2013 | | | (85,221 | ) | |
| | 5,429 | | | Omnicare, Inc. | | | 34.00 | | | December 2012 | | | (895,785 | ) | |
| | 4,500 | | | Omnicare, Inc. | | | 35.00 | | | December 2012 | | | (517,500 | ) | |
| | 3,734 | | | Packaging Corporation of America | | | 35.00 | | | January 2013 | | | (550,765 | ) | |
| | 1,061 | | | Packaging Corporation of America | | | 37.50 | | | January 2013 | | | (53,050 | ) | |
| | 1,703 | | | Pfizer, Inc. | | | 23.00 | | | November 2012 | | | (337,194 | ) | |
| | 7,026 | | | Pfizer, Inc. | | | 24.00 | | | November 2012 | | | (709,626 | ) | |
| | 815 | | | Pfizer, Inc. | | | 24.00 | | | January 2013 | | | (101,671 | ) | |
| | 6,061 | | | Pfizer, Inc. | | | 26.00 | | | December 2012 | | | (133,342 | ) | |
| | 1,703 | | | Rockwood Holdings, Inc. | | | 45.00 | | | November 2012 | | | (289,510 | ) | |
| | 6,540 | | | Rockwood Holdings, Inc. | | | 50.00 | | | November 2012 | | | (65,400 | ) | |
| | 516 | | | Seagate Technology PLC | | | 27.00 | | | November 2012 | | | (49,020 | ) | |
| | 1,848 | | | Seagate Technology PLC | | | 28.00 | | | November 2012 | | | (88,704 | ) | |
| | 853 | | | Seagate Technology PLC | | | 29.00 | | | November 2012 | | | (17,060 | ) | |
| | 267 | | | Seagate Technology PLC | | | 31.00 | | | November 2012 | | | (1,068 | ) | |
| | 262 | | | Seagate Technology PLC | | | 31.00 | | | December 2012 | | | (8,646 | ) | |
| | 148 | | | Seagate Technology PLC | | | 32.00 | | | November 2012 | | | (148 | ) | |
| | 480 | | | SPDR Gold Trust | | | 163.00 | | | November 2012 | | | (206,400 | ) | |
| | 160 | | | SPDR Gold Trust | | | 165.00 | | | November 2012 | | | (46,880 | ) | |
| | 160 | | | SPDR Gold Trust | | | 165.00 | | | January 2013 | | | (89,363 | ) | |
| | 91 | | | SPDR Gold Trust | | | 170.00 | | | November 2012 | | | (6,734 | ) | |
| | 1,345 | | | Theravance, Inc. | | | 22.50 | | | December 2012 | | | (302,625 | ) | |
| 247 | | | Valeant Pharmaceuticals
International, Inc. | | | 55.00 | | | November 2012 | | | (74,100 | ) | |
See Notes to Financial Statements.
FIRST EAGLE FUNDS | ANNUAL REPORT | OCTOBER 31, 2012
135
CONTRACTS | | DESCRIPTION | | STRIKE PRICE | | EXPIRATION DATE | | VALUE (NOTE 1) | |
Covered Call Options Written — (1.89)% — (continued) | | | |
| | 2,267 | | | Valeant Pharmaceuticals
International, Inc. | | $ | 55.00
| | | January 2013
| | $ | (1,144,835
| ) | |
| | 754 | | | Valeant Pharmaceuticals
International, Inc. | | | 57.50
| | | November 2012
| | | (131,950
| ) | |
| | 882 | | | Valeant Pharmaceuticals
International, Inc. | | | 57.50
| | | January 2013
| | | (335,160
| ) | |
| | 396 | | | Valeant Pharmaceuticals
International, Inc. | | | 60.00
| | | November 2012
| | | (39,600
| ) | |
| | 3,000 | | | Valeant Pharmaceuticals
International, Inc. | | | 60.00
| | | January 2013
| | | (825,000
| ) | |
| | 4,048 | | | Valspar Corporation | | | 50.00 | | | November 2012 | | | (2,449,040 | ) | |
| | 236 | | | Valspar Corporation | | | 55.00 | | | January 2013 | | | (76,700 | ) | |
| | 237 | | | Valspar Corporation | | | 60.00 | | | January 2013 | | | (25,477 | ) | |
| | 2,964 | | | Viacom, Inc. | | | 50.00 | | | December 2012 | | | (770,640 | ) | |
| | 463 | | | Viacom, Inc. | | | 52.50 | | | December 2012 | | | (67,135 | ) | |
| | 884 | | | Viacom, Inc. | | | 55.00 | | | December 2012 | | | (57,460 | ) | |
| | 593 | | | Viacom, Inc. | | | 57.50 | | | December 2012 | | | (14,825 | ) | |
| | 1,572 | | | WR Grace & Company | | | 55.00 | | | December 2012 | | | (1,516,980 | ) | |
| | 2,115 | | | WR Grace & Company | | | 57.50 | | | December 2012 | | | (1,734,300 | ) | |
| | 364 | | | WR Grace & Company | | | 60.00 | | | December 2012 | | | (194,740 | ) | |
| | 268 | | | WR Grace & Company | | | 62.50 | | | November 2012 | | | (66,330 | ) | |
| | 134 | | | WR Grace & Company | | | 62.50 | | | March 2013 | | | (74,370 | ) | |
| | 6,531 | | | Wyndham Worldwide Corporation | | | 50.00 | | | November 2012 | | | (914,340 | ) | |
| | 160 | | | Wyndham Worldwide Corporation | | | 50.00 | | | December 2012 | | | (29,995 | ) | |
| | Total Covered Call Options Written (Premiums Received: $35,929,940) | | | | | | | | | | (30,400,855 | ) | |
Put Option Written — (0.01)% | | | |
| | 1,500 | | | Baxter International, Inc.
(Premium Received $292,762) | | $ | 55.00
| | | April 2013
| | $ | (199,500
| ) | |
Total Investments — 99.44% (Cost: $1,262,241,747) | | | | | | $1,602,009,167 | |
Other Assets in Excess of Liabilities — 0.56% | | | | | | 9,059,446 | |
Net Assets — 100.00% | | | | | | $1,611,068,613 | |
See Notes to Financial Statements.
FIRST EAGLE FUNDS | ANNUAL REPORT | OCTOBER 31, 2012
136
Schedule of Investments | Year Ended October 31, 2012
(a) At October 31, 2012, all or a portion of this security was segregated to cover collateral requirement for options.
(b) Non-income producing security/commodity.
(c) This security is convertible until December 15, 2025.
At October 31, 2012, aggregate cost for federal income tax purposes was $1,272,937,630. Net unrealized appreciation consisted of:
Gross unrealized appreciation | | $ | 357,491,242 | | |
Gross unrealized depreciation | | | (28,419,705 | ) | |
Net unrealized appreciation | | $ | 329,071,537 | | |
Abbreviations used in this schedule include:
ADR — American Depository Receipt
PLC — Public Limited Company
SPDR — Standard & Poor's Depository Receipts
INDUSTRY DIVERSIFICATION FOR PORTFOLIO HOLDINGS | | PERCENT OF
NET ASSETS | |
U.S. Common Stocks | |
Consumer Discretionary | | | 10.29 | % | |
Energy | | | 8.79 | | |
Health Care | | | 22.70 | | |
Industrials | | | 4.90 | | |
Information Technology | | | 10.16 | | |
Materials | | | 31.88 | | |
Total U.S. Common Stocks | | | 88.72 | | |
International Common Stocks | |
Health Care | | | 0.95 | | |
Industrials | | | 2.54 | | |
Total International Common Stocks | | | 3.49 | | |
Exchange Traded Fund | | | 3.33 | | |
Investment Companies | | | 5.54 | | |
U.S. Convertible Bond | |
Health Care | | | 0.24 | | |
Total U.S. Convertible Bond | | | 0.24 | | |
See Notes to Financial Statements.
FIRST EAGLE FUNDS | ANNUAL REPORT | OCTOBER 31, 2012
137
INDUSTRY DIVERSIFICATION FOR PORTFOLIO HOLDINGS — (CONTINUED) | | PERCENT OF
NET ASSETS | |
Call Option Purchased | | | 0.02 | % | |
Covered Call Options Written | | | (1.89 | ) | |
Put Option Written | | | (0.01 | ) | |
Total Investments | | | 99.44 | % | |
See Notes to Financial Statements.
FIRST EAGLE FUNDS | ANNUAL REPORT | OCTOBER 31, 2012
138
This page was intentionally left blank.
Statements of Assets and Liabilities
| | | FIRST EAGLE
GLOBAL FUND | | FIRST EAGLE
OVERSEAS FUND | | FIRST EAGLE
U.S. VALUE FUND | | FIRST EAGLE
GOLD FUND* | |
Assets | |
Investments, at Cost (Note 1) | |
Unaffiliated issuers | | $ | 27,697,146,210 | | | $ | 8,771,432,119 | | | $ | 2,501,316,036 | | | $ | 1,922,137,505 | | |
Affiliated issuers | | | 2,776,557,110 | | | | 614,843,449 | | | | 52,393,739 | | | | — | | |
Gold bullion | | | 736,135,763 | | | | 199,148,724 | | | | 81,518,317 | | | | 183,135,784 | | |
Foreign currency | | | — | | | | 1,027,914 | | | | 23 | | | | 101 | | |
Total Investments, at Cost | | | 31,209,839,083 | | | | 9,586,452,206 | | | | 2,635,228,115 | | | | 2,105,273,390 | | |
Investments, at Value (Note 1) | |
Unaffiliated issuers | | | 31,426,669,492 | | | | 9,950,895,625 | | | | 2,839,299,217 | | | | 2,502,945,751 | | |
Affiliated issuers | | | 3,252,780,081 | | | | 696,419,022 | | | | 43,801,837 | | | | — | | |
Gold bullion | | | 1,809,221,276 | | | | 679,473,229 | | | | 123,647,217 | | | | 576,941,473 | | |
Foreign currency | | | — | | | | 1,027,929 | | | | 23 | | | | 101 | | |
Total Investments, at Value | | | 36,488,670,849 | | | | 11,327,815,805 | | | | 3,006,748,294 | | | | 3,079,887,325 | | |
Cash | | | 168,643 | | | | 67,465 | | | | — | | | | 48,662 | | |
Receivable for forward currency contracts held, at value (Note 1) | | | 31,482,719 | | | | 15,803,988 | | | | — | | | | — | | |
Receivable for investment securities sold | | | — | | | | — | | | | — | | | | 1,106,359 | | |
Receivable for Fund shares sold | | | 87,854,359 | | | | 21,677,888 | | | | 12,633,980 | | | | 12,391,651 | | |
Accrued interest and dividends receivable | | | 98,813,032 | | | | 47,187,857 | | | | 4,816,551 | | | | 754,863 | | |
Investment for trustee deferred compensation plan (Note 2) | | | 1,913,987 | | | | 1,677,254 | | | | 1,262,520 | | | | 211,102 | | |
Other assets | | | 217,300 | | | | 72,739 | | | | 27,578 | | | | 26,568 | | |
Total Assets | | | 36,709,120,889 | | | | 11,414,302,996 | | | | 3,025,488,923 | | | | 3,094,426,530 | | |
Liabilities | |
Option contracts written, at value (premiums received $6,108,142,
$0, $604,523 and $0, respectively) (Note 1) | | | 1,551,880 | | | | — | | | | 212,260 | | | | — | | |
Payable for Fund shares redeemed | | | 55,013,105 | | | | 17,474,009 | | | | 4,245,961 | | | | 14,745,259 | | |
Payable for investment securities purchased | | | 214,827,819 | | | | 7,457,952 | | | | 22,247,991 | | | | 392,434 | | |
Payable for forward currency contracts held, at value (Note 1) | | | 40,435,779 | | | | 23,093,651 | | | | — | | | | — | | |
Investment advisory fees payable (Note 2) | | | 23,167,281 | | | | 7,223,328 | | | | 1,903,911 | | | | 1,957,301 | | |
Distribution fees payable (Note 3) | | | 9,333,258 | | | | 1,723,087 | | | | 705,544 | | | | 713,266 | | |
Services fees payable (Note 3) | | | 1,987,334 | | | | 211,168 | | | | 133,993 | | | | 128,942 | | |
Trustee deferred compensation plan (Note 2) | | | 1,913,987 | | | | 1,677,254 | | | | 1,262,520 | | | | 211,102 | | |
Administrative fees payable (Note 2) | | | 465,241 | | | | 148,424 | | | | 26,319 | | | | 92,488 | | |
Due to custodian | | | — | | | | — | | | | 244,701 | | | | — | | |
Trustee fees payable | | | 64,652 | | | | 21,170 | | | | 4,248 | | | | 12,134 | | |
Accrued expenses and other liabilities | | | 16,746,131 | | | | 6,494,908 | | | | 680,535 | | | | 913,239 | | |
Total Liabilities | | | 365,506,467 | | | | 65,524,951 | | | | 31,667,983 | | | | 19,166,165 | | |
Net Assets | | $ | 36,343,614,422 | | | $ | 11,348,778,045 | | | $ | 2,993,820,940 | | | $ | 3,075,260,365 | | |
* First Eagle Gold Fund financial statements are shown on a consolidated basis and includes the balances of the First Eagle Gold Cayman Fund, Ltd.
See Notes to Financial Statements.
FIRST EAGLE FUNDS | ANNUAL REPORT | OCTOBER 31, 2012
140
FIRST EAGLE FUNDS | ANNUAL REPORT | OCTOBER 31, 2012
141
Statements of Assets and Liabilities (continued)
| | | FIRST EAGLE
GLOBAL FUND | | FIRST EAGLE
OVERSEAS FUND | | FIRST EAGLE
U.S. VALUE FUND | | FIRST EAGLE
GOLD FUND* | |
Net Assets Consist of | |
Capital stock (par value, $0.001 per share) | | $ | 741,150 | | | $ | 507,332 | | | $ | 163,707 | | | $ | 103,291 | | |
Capital surplus | | | 29,886,701,357 | | | | 9,321,130,001 | | | | 2,536,062,371 | | | | 2,213,743,095 | | |
Net unrealized appreciation (depreciation) on: | |
Investments (net of $9,807,172, $4,500,030, $0 and $0
deferred capital gain country tax, respectively) | | | 5,269,024,594 | | | | 1,736,863,554 | | | | 371,520,179 | | | | 974,613,935 | | |
Foreign currency and forward contract related translation | | | (9,434,577 | ) | | | (7,856,771 | ) | | | — | | | | (483 | ) | |
Written options | | | 4,556,262 | | | | — | | | | 392,263 | | | | — | | |
Undistributed net realized gains on investments | | | 1,164,899,159 | | | | 448,701,836 | | | | 69,164,846 | | | | (13,012,285 | ) | |
Undistributed net investment income (loss) | | | 27,126,477 | | | | (150,567,907 | ) | | | 16,517,574 | | | | (100,187,188 | ) | |
Net Assets | | $ | 36,343,614,422 | | | $ | 11,348,778,045 | | | $ | 2,993,820,940 | | | $ | 3,075,260,365 | | |
Class A | |
Net assets | | $ | 15,839,802,717 | | | $ | 5,110,765,967 | | | $ | 1,424,612,975 | | | $ | 1,535,469,124 | | |
Shares outstanding | | | 321,704,897 | | | | 229,614,008 | | | | 77,992,431 | | | | 51,416,781 | | |
Net asset value per share and redemption proceeds per share | | $ | 49.24 | | | $ | 22.26 | | | $ | 18.27 | | | $ | 29.86 | | |
Offering price per share (NAV per share plus maximum sales charge) | | $ | 51.831 | | | $ | 23.431 | | | $ | 19.231 | | | $ | 31.431 | | |
Class C | |
Net assets | | $ | 9,321,789,453 | | | $ | 986,416,723 | | | $ | 630,738,515 | | | $ | 607,890,147 | | |
Shares outstanding | | | 193,560,458 | | | | 45,615,074 | | | | 34,999,390 | | | | 21,074,699 | | |
Net asset value per share | | $ | 48.16 | | | $ | 21.62 | | | $ | 18.02 | | | $ | 28.84 | | |
Redemption proceeds per share (NAV per share less maximum
contingent deferred sale charge)2 | | $ | 47.68 | | | $ | 21.40 | | | $ | 17.84 | | | $ | 28.55 | | |
Class I | |
Net assets | | $ | 11,182,022,252 | | | $ | 5,251,595,355 | | | $ | 938,469,450 | | | $ | 931,901,094 | | |
Shares outstanding | | | 225,884,934 | | | | 232,103,286 | | | | 50,715,129 | | | | 30,799,953 | | |
Net asset value per share and redemption proceeds per share | | $ | 49.50 | | | $ | 22.63 | | | $ | 18.50 | | | $ | 30.26 | | |
* First Eagle Gold Fund financial statements are shown on a consolidated basis and includes the balances of the First Eagle Gold Cayman Fund, Ltd.
1 The maximum sales charge is 5.00% for Class A shares. Classes C, I and Y have no front-end sales charges.
2 The maximum CDSC (Contingent Deferred Sales Charge) is 1.00% for Class C shares, which is charged on the lesser of the offering price or the net asset value at the time of sale by shareholder. This pertains to investments of one year or less.
See Notes to Financial Statements.
FIRST EAGLE FUNDS | ANNUAL REPORT | OCTOBER 31, 2012
142
FIRST EAGLE FUNDS | ANNUAL REPORT | OCTOBER 31, 2012
143
Statements of Assets and Liabilities (continued)
| | | FIRST EAGLE
GLOBAL INCOME
BUILDER FUND | | FIRST EAGLE
HIGH YIELD FUND | | FIRST EAGLE
FUND OF AMERICA | |
Assets | |
Investments, at Cost (Note 1) | |
Unaffiliated issuers | | $ | 101,037,942 | | | $ | 621,599,432 | | | $ | 1,298,464,449 | | |
Foreign currency | | | 16,641 | | | | 5,573,661 | | | | — | | |
Total Investments, at Cost | | | 101,054,583 | | | | 627,173,093 | | | | 1,298,464,449 | | |
Investments, at Value (Note 1) | |
Unaffiliated issuers | | | 103,242,952 | | | | 636,087,992 | | | | 1,632,609,522 | | |
Foreign currency | | | 16,641 | | | | 5,601,581 | | | | — | | |
Total Investments, at Value | | | 103,259,593 | | | | 641,689,573 | | | | 1,632,609,522 | | |
Cash | | | 10,349 | | | | 223 | | | | — | | |
Restricted cash | | | — | | | | — | | | | 8,662,500 | | |
Receivable for investment securities sold | | | — | | | | 961,420 | | | | 173,947 | | |
Receivable from investment adviser | | | 15,379 | | | | — | | | | — | | |
Receivable for premiums for written options | | | — | | | | — | | | | 255,590 | | |
Receivable for Fund shares sold | | | 5,304,020 | | | | 6,485,687 | | | | 4,748,871 | | |
Accrued interest and dividends receivable | | | 832,885 | | | | 11,333,377 | | | | 390,312 | | |
Investment for trustee deferred compensation plan (Note 2) | | | — | | | | — | | | | 706,347 | | |
Other assets | | | 14,596 | | | | 4,567 | | | | 16,073 | | |
Total Assets | | | 109,436,822 | | | | 660,474,847 | | | | 1,647,563,162 | | |
Liabilities | |
Option contracts written, at value (premiums received $0,
$0, and $36,222,702, respectively) (Note 1) | | | — | | | | — | | | | 30,600,355 | | |
Payable for Fund shares redeemed | | | 123,608 | | | | 1,009,631 | | | | 2,619,639 | | |
Payable for investment securities purchased | | | 1,642,239 | | | | 15,564,185 | | | | 263,367 | | |
Payable for forward currency contracts held, at value (Note 1) | | | 175,833 | | | | 693,001 | | | | — | | |
Payable for dividends to shareholders | | | — | | | | 776,958 | | | | — | | |
Investment advisory fees payable (Note 2) | | | — | | | | 224,299 | | | | 1,376,101 | | |
Distribution fees payable (Note 3) | | | 21,445 | | | | 114,078 | | | | 448,846 | | |
Services fees payable (Note 3) | | | 4,496 | | | | 22,983 | | | | 52,410 | | |
Trustee deferred compensation plan (Note 2) | | | — | | | | — | | | | 706,347 | | |
Administrative fees payable (Note 2) | | | 4,022 | | | | 9,114 | | | | 18,411 | | |
Trustee fees payable | | | 717 | | | | 31 | | | | 3,085 | | |
Accrued expenses and other liabilities | | | 111,064 | | | | 160,853 | | | | 405,988 | | |
Total Liabilities | | | 2,083,424 | | | | 18,575,133 | | | | 36,494,549 | | |
Net Assets | | $ | 107,353,398 | | | $ | 641,899,714 | | | $ | 1,611,068,613 | | |
** The amount of $8,662,500 represents restricted cash used as collateral for covered call options.
See Notes to Financial Statements.
FIRST EAGLE FUNDS | ANNUAL REPORT | OCTOBER 31, 2012
144
FIRST EAGLE FUNDS | ANNUAL REPORT | OCTOBER 31, 2012
145
Statements of Assets and Liabilities (continued)
| | | FIRST EAGLE
GLOBAL INCOME
BUILDER FUND | | FIRST EAGLE
HIGH YIELD FUND | | FIRST EAGLE
FUND OF AMERICA | |
Net Assets Consist of | |
Capital stock (par value, $0.001 per share) | | $ | 10,402 | | | $ | 64,345 | | | $ | 60,909 | | |
Capital surplus | | | 105,025,771 | | | | 626,665,907 | | | | 1,320,318,217 | | |
Net unrealized appreciation (depreciation) on: | |
Investments | | | 2,205,010 | | | | 14,488,560 | | | | 334,145,073 | | |
Foreign currency and forward contract related translation | | | (174,149 | ) | | | (962,816 | ) | | | — | | |
Written options | | | — | | | | — | | | | 5,622,347 | | |
Undistributed net realized gains (losses) on investments | | | 80,609 | | | | 1,348,189 | | | | (48,663,440 | ) | |
Undistributed net investment income (loss) | | | 205,755 | | | | 295,529 | | | | (414,493 | ) | |
Net Assets | | $ | 107,353,398 | | | $ | 641,899,714 | | | $ | 1,611,068,613 | | |
Class A | |
Net assets | | $ | 43,439,644 | | | $ | 219,769,252 | | | $ | 698,891,601 | | |
Shares outstanding | | | 4,207,883 | | | | 22,025,436 | | | | 26,015,544 | | |
Net asset value per share and redemption proceeds per share | | $ | 10.32 | | | $ | 9.98 | | | $ | 26.86 | | |
Offering price per share (NAV per share plus maximum sales charge) | | $ | 10.861 | | | $ | 10.452 | | | $ | 28.271 | | |
Class C | |
Net assets | | $ | 25,783,494 | | | $ | 113,497,609 | | | $ | 245,629,136 | | |
Shares outstanding | | | 2,503,488 | | | | 11,387,262 | | | | 10,539,819 | | |
Net asset value per share | | $ | 10.30 | | | $ | 9.97 | | | $ | 23.30 | | |
Redemption proceeds per share (NAV per share less maximum
contingent deferred sale charge)3 | | $ | 10.20 | | | $ | 9.87 | | | $ | 23.07 | | |
Class I | |
Net assets | | $ | 38,130,260 | | | $ | 308,632,853 | | | | — | | |
Shares outstanding | | | 3,690,822 | | | | 30,931,924 | | | | — | | |
Net asset value per share and redemption proceeds per share | | $ | 10.33 | | | $ | 9.98 | | | | — | | |
Class Y | |
Net assets | | | — | | | | — | | | $ | 666,547,876 | | |
Shares outstanding | | | — | | | | — | | | | 24,353,462 | | |
Net asset value per share and redemption proceeds per share | | | — | | | | — | | | $ | 27.37 | | |
1 The maximum sales charge is 5.00% for Class A shares. Classes C, I and Y have no front-end sales charges.
2 The maximum sales charge is 4.50% for Class A shares. Classes C, I and Y have no front-end sales charges.
3 The maximum CDSC (Contingent Deferred Sales Charge) is 1.00% for Class C shares, which is charged on the lesser of the offering price or the net asset value at the time of sale by shareholder. This pertains to investments of one year or less.
See Notes to Financial Statements.
FIRST EAGLE FUNDS | ANNUAL REPORT | OCTOBER 31, 2012
146
FIRST EAGLE FUNDS | ANNUAL REPORT | OCTOBER 31, 2012
147
| | | FIRST EAGLE
GLOBAL FUND | | FIRST EAGLE
OVERSEAS FUND | | FIRST EAGLE
U.S. VALUE FUND | | FIRST EAGLE
GOLD FUND* | |
Investment Income | |
Interest (net of $345,800, $110,682, $0 and $0, foreign taxes
withheld, respectively) | | $ | 24,941,933 | | | $ | 11,779,573 | | | $ | 6,151,105 | | | $ | 2,169,240 | | |
Dividends from: (net of $42,501,427, $23,070,803, $539,404
and $2,183,263, foreign taxes withheld, respectively) | |
Unaffiliated issuers | | | 610,047,845 | | | | 198,481,752 | | | | 45,561,109 | | | | 32,376,061 | | |
Affiliated issuers | | | 72,120,283 | | | | 29,820,928 | | | | 105,606 | | | | — | | |
Other Income | | | 245,150 | | | | 42,006 | | | | 299 | | | | 145,108 | | |
Total Income | | | 707,355,211 | | | | 240,124,259 | | | | 51,818,119 | | | | 34,690,409 | | |
Expenses | |
Investment advisory fees (Note 2) | | | 254,282,135 | | | | 78,522,326 | | | | 19,301,451 | | | | 22,339,381 | | |
Administrative costs (Note 2) | | | 3,868,601 | | | | 1,197,349 | | | | 282,469 | | | | 377,591 | | |
Distribution fees (Note 3) | |
Class A | | | 37,826,741 | | | | 12,501,819 | | | | 3,148,910 | | | | 3,784,177 | | |
Class C | | | 66,932,219 | | | | 7,464,591 | | | | 4,049,597 | | | | 4,413,682 | | |
Service fees - Class C (Note 3) | | | 22,310,740 | | | | 2,488,197 | | | | 1,349,866 | | | | 1,471,227 | | |
Shareholder servicing agent fees | | | 35,001,875 | | | | 12,534,695 | | | | 3,122,293 | | | | 4,212,468 | | |
Custodian and accounting fees | | | 4,380,780 | | | | 2,373,126 | | | | 221,363 | | | | 636,103 | | |
Shareholder reporting fees | | | 2,930,309 | | | | 893,830 | | | | 344,287 | | | | 407,536 | | |
Trustees' fees | | | 791,286 | | | | 241,378 | | | | 57,411 | | | | 86,164 | | |
Registration and filing fees | | | 1,213,182 | | | | 412,584 | | | | 295,227 | | | | 201,332 | | |
Professional fees | | | 530,214 | | | | 324,700 | | | | 127,162 | | | | 176,671 | | |
Other Expenses | | | 781,815 | | | | 266,965 | | | | 67,611 | | | | 102,888 | | |
Total Expenses | | | 430,849,897 | | | | 119,221,560 | | | | 32,367,647 | | | | 38,209,220 | | |
Expense reductions due to earnings credits (Note 1) | | | (2,896 | ) | | | (866 | ) | | | (334 | ) | | | (373 | ) | |
Net Expenses | | | 430,847,001 | | | | 119,220,694 | | | | 32,367,313 | | | | 38,208,847 | | |
Net Investment Income (Loss) (Note 1) | | | 276,508,210 | | | | 120,903,565 | | | | 19,450,806 | | | | (3,518,438 | ) | |
Realized and Unrealized Gains (Losses) on Investments, Foreign
Currency Related Transactions and Written Options (Note 1) | |
Net realized gains (losses) from: | |
Investment transactions of unaffiliated issuers | | | 1,001,271,222 | | | | 412,547,037 | | | | 65,691,414 | | | | 2,754,625 | | |
Investment transactions of affiliated issuers | | | 24,854,265 | | | | (873,052 | ) | | | — | | | | — | | |
Commodity related transactions | | | 153,129,198 | | | | 62,853,259 | | | | 9,190,661 | | | | 9,051,381 | | |
Foreign currency and forward contract related transactions | | | 168,812,409 | | | | 97,826,998 | | | | (3,719 | ) | | | (66,714 | ) | |
Written options | | | 5,939,832 | | | | — | | | | 695,340 | | | | — | | |
| | | | 1,354,006,926 | | | | 572,354,242 | | | | 75,573,696 | | | | 11,739,292 | | |
Changes in unrealized appreciation (depreciation) of: | |
Investment transactions (net of increase in deferred capital gain country
tax accruals of $3,923,533, $2,021,827, $0 and $0, respectively) | | | 817,305,325 | | | | (159,266,492 | ) | | | 155,436,364 | | | | (318,100,767 | ) | |
Foreign currency and forward contract related translation | | | (11,441,479 | ) | | | (7,551,318 | ) | | | — | | | | 127 | | |
Written options | | | 4,894,678 | | | | — | | | | 379,704 | | | | — | | |
| | | | 810,758,524 | | | | (166,817,810 | ) | | | 155,816,068 | | | | (318,100,640 | ) | |
Net realized and unrealized gains (losses) on investments, foreign
currency and forward contract related transactions and written options | | | 2,164,765,450 | | | | 405,536,432 | | | | 231,389,764 | | | | (306,361,348 | ) | |
Net Increase (Decrease) in Net Assets Resulting from Operations | | $ | 2,441,273,660 | | | $ | 526,439,997 | | | $ | 250,840,570 | | | $ | (309,879,786 | ) | |
* First Eagle Gold Fund financial statements are shown on a consolidated basis and includes the balances of the First Eagle Gold Cayman Fund, Ltd.
See Notes to Financial Statements.
FIRST EAGLE FUNDS | ANNUAL REPORT | OCTOBER 31, 2012
148
FIRST EAGLE FUNDS | ANNUAL REPORT | OCTOBER 31, 2012
149
Statements of Operations (continued)
| | | FIRST EAGLE
GLOBAL INCOME
BUILDER FUND^ | | FIRST EAGLE
HIGH YIELD FUND** | | FIRST EAGLE
HIGH YIELD FUND*** | | FIRST EAGLE
FUND OF AMERICA | |
Investment Income | |
Interest (net of $0, $3,088, $0 and $0, foreign taxes withheld, respectively) | | $ | 655,069 | | | $ | 18,132,745 | | | $ | 2,321,034 | | | $ | 153,501 | | |
Dividends from: (net of $35,792, $0, $0 and $18,370, foreign taxes
withheld, respectively) | |
Unaffiliated issuers | | | 562,490 | | | | — | | | | — | | | | 23,482,781 | | |
Other Income | | | — | | | | 114,702 | | | | 20,880 | | | | — | | |
Total Income | | | 1,217,559 | | | | 18,247,447 | | | | 2,341,914 | | | | 23,636,282 | | |
Expenses | |
Investment advisory fees (Note 2) | | | 204,649 | | | | 1,814,165 | | | | 216,063 | | | | 14,945,851 | | |
Administrative costs (Note 2) | | | 13,643 | | | | 31,471 | | | | — | | | | 169,922 | | |
Distribution fees (Note 3) | |
Class A | | | 19,200 | | | | 222,567 | | | | 12,552 | | | | 1,548,441 | | |
Class C | | | 31,703 | | | | 314,422 | | | | 17,067 | | | | 1,648,440 | | |
Class Y | | | — | | | | — | | | | — | | | | 1,638,542 | | |
Service fees - Class C (Note 3) | | | 10,568 | | | | 104,807 | | | | 5,689 | | | | 549,480 | | |
Shareholder servicing agent fees | | | 46,646 | | | | 232,918 | | | | 4,477 | | | | 1,883,107 | | |
Custodian and accounting fees | | | 67,883 | | | | 85,702 | | | | 4,103 | | | | 188,975 | | |
Shareholder reporting fees | | | 41,815 | | | | 72,118 | | | | 18,531 | | | | 154,349 | | |
Trustees' fees | | | 1,250 | | | | 4,354 | | | | 2,036 | | | | 35,932 | | |
Registration and filing fees | | | 41,261 | | | | 176,290 | | | | 30,060 | | | | 183,977 | | |
Professional fees | | | 136,082 | | | | 209,995 | | | | 30,135 | | | | 142,595 | | |
Other Expenses | | | 39,547 | | | | 48,150 | | | | 13,944 | | | | 50,437 | | |
Total Expenses | | | 654,247 | | | | 3,316,959 | | | | 354,657 | | | | 23,140,048 | | |
Investment Advisory Fee Waiver | | | (305,915 | ) | | | (324,266 | ) | | | (72,599 | ) | | | — | | |
Expense reductions due to earnings credits (Note 1) | | | (3 | ) | | | (19 | ) | | | — | | | | (197 | ) | |
Net Expenses | | | 348,329 | | | | 2,992,674 | | | | 282,058 | | | | 23,139,851 | | |
Net Investment Income (Note 1) | | | 869,230 | | | | 15,254,773 | | | | 2,059,856 | | | | 496,431 | | |
Realized and Unrealized Gains (Losses) on Investments, Foreign
Currency Related Transactions and Written Options (Note 1) | |
Net realized gains (losses) from: | |
Investment transactions of unaffiliated issuers | | | 34,834 | | | | 863,756 | | | | 369,783 | | | | (38,142,001 | ) | |
Foreign currency and forward contract related transactions | | | 50,233 | | | | 699,207 | | | | (49,154 | ) | | | — | | |
Payment from affiliates | | | 2,243 | | | | — | | | | — | | | | 11,219 | | |
Written options | | | — | | | | — | | | | — | | | | 3,335,303 | | |
| | | 87,310 | | | | 1,562,963 | | | | 320,629 | | | | (34,795,479 | ) | |
Changes in unrealized appreciation (depreciation) of: | |
Investment transactions | | | 2,205,010 | | | | 13,015,822 | | | | 1,573,567 | | | | 240,930,341 | | |
Foreign currency and forward contract related translation | | | (174,149 | ) | | | (947,825 | ) | | | (14,991 | ) | | | — | | |
Written options | | | — | | | | — | | | | — | | | | 15,235,294 | | |
| | | 2,030,861 | | | | 12,067,997 | | | | 1,558,576 | | | | 256,165,635 | | |
Net realized and unrealized gains on investments, foreign currency
and forward contract related transactions and written options | | | 2,118,171 | | | | 13,630,960 | | | | 1,879,205 | | | | 221,370,156 | | |
Net Increase in Net Assets Resulting from Operations | | $ | 2,987,401 | | | $ | 28,885,733 | | | $ | 3,939,061 | | | $ | 221,866,587 | | |
^ For the period May 1, 2012 to October 31, 2012.
** For the period April 1, 2012 to October 31, 2012.
*** For the fiscal year ended March 31, 2012.
See Notes to Financial Statements.
FIRST EAGLE FUNDS | ANNUAL REPORT | OCTOBER 31, 2012
150
FIRST EAGLE FUNDS | ANNUAL REPORT | OCTOBER 31, 2012
151
Statements of Changes in Net Assets
| | | FIRST EAGLE
GLOBAL FUND | | FIRST EAGLE
OVERSEAS FUND | | FIRST EAGLE
U.S. VALUE FUND | | FIRST EAGLE
GOLD FUND* | |
| | | YEAR ENDED
OCTOBER 31,
2012 | | YEAR ENDED
OCTOBER 31,
2011 | | YEAR ENDED
OCTOBER 31,
2012 | | YEAR ENDED
OCTOBER 31,
2011 | | YEAR ENDED
OCTOBER 31,
2012 | | YEAR ENDED
OCTOBER 31,
2011 | | YEAR ENDED
OCTOBER 31,
2012 | | YEAR ENDED
OCTOBER 31,
2011 | |
Operations | |
Net investment income (loss) | | $ | 276,508,210 | | | $ | 195,358,527 | | | $ | 120,903,565 | | | $ | 82,538,430 | | | $ | 19,450,806 | | | $ | 14,284,155 | | | $ | (3,518,438 | ) | | $ | (21,503,086 | ) | |
Net realized gain (loss) from investments, foreign currency and
forward contract related transactions and written options | | | 1,354,006,926 | | | | 690,306,873 | | | | 572,354,242 | | | | 239,416,900 | | | | 75,573,696 | | | | 68,932,963 | | | | 11,739,292 | | | | 166,627,775 | | |
Change in unrealized appreciation (depreciation) of investments,
foreign currency and forward contract related transactions and
written options | | | 810,758,524 | | | | 798,845,665 | | | | (166,817,810 | ) | | | 26,703,063 | | | | 155,816,068 | | | | 50,108,672 | | | | (318,100,640 | ) | | | 85,417,459 | | |
Net increase (decrease) in net assets resulting from operations | | | 2,441,273,660 | | | | 1,684,511,065 | | | | 526,439,997 | | | | 348,658,393 | | | | 250,840,570 | | | | 133,325,790 | | | | (309,879,786 | ) | | | 230,542,148 | | |
Distribution to Shareholders | |
Dividends paid from net investment income | |
Class A | | | (161,651,447 | ) | | | (179,125,248 | ) | | | (87,147,378 | ) | | | (68,667,242 | ) | | | (8,668,560 | ) | | | (14,601,729 | ) | | | (21,160,789 | ) | | | (41,372,108 | ) | |
Class C | | | (37,795,689 | ) | | | (53,722,987 | ) | | | (9,351,396 | ) | | | (7,990,749 | ) | | | (761,790 | ) | | | (4,588,209 | ) | | | (3,321,956 | ) | | | (10,828,155 | ) | |
Class I | | | (117,693,838 | ) | | | (94,957,034 | ) | | | (83,348,638 | ) | | | (56,678,049 | ) | | | (5,904,350 | ) | | | (7,711,426 | ) | | | (14,147,644 | ) | | | (16,752,495 | ) | |
Class Y | | | — | | | | — | | | | — | | | | — | | | | — | | | | — | | | | — | | | | — | | |
Distributions paid from net realized gains from
investment transactions | |
Class A | | | (187,416,480 | ) | | | — | | | | (144,484,153 | ) | | | (44,782,633 | ) | | | (27,270,843 | ) | | | — | | | | (48,611,807 | ) | | | (68,368,215 | ) | |
Class C | | | (112,464,797 | ) | | | — | | | | (30,206,608 | ) | | | (9,220,791 | ) | | | (11,485,203 | ) | | | — | | | | (18,719,722 | ) | | | (23,482,892 | ) | |
Class I | | | (111,887,923 | ) | | | — | | | | (117,992,781 | ) | | | (31,995,749 | ) | | | (14,754,342 | ) | | | — | | | | (26,628,986 | ) | | | (25,391,355 | ) | |
Class Y | | | — | | | | — | | | | — | | | | — | | | | — | | | | — | | | | — | | | | — | | |
Decrease in net assets resulting from distributions | | | (728,910,174 | ) | | | (327,805,269 | ) | | | (472,530,954 | ) | | | (219,335,213 | ) | | | (68,845,088 | ) | | | (26,901,364 | ) | | | (132,590,904 | ) | | | (186,195,220 | ) | |
Fund Share Transactions (Note 6) | |
Net proceeds from shares sold | | | 8,576,084,794 | | | | 10,549,879,443 | | | | 3,366,030,361 | | | | 3,711,007,723 | | | | 1,361,319,863 | | | | 842,143,081 | | | | 1,162,012,459 | | | | 1,302,888,135 | | |
Net asset value of shares issued for reinvested dividends and
distributions | | | 575,698,338 | | | | 261,507,604 | | | | 394,213,613 | | | | 184,257,838 | | | | 57,064,131 | | | | 21,330,710 | | | | 92,471,546 | | | | 137,426,605 | | |
Cost of shares redeemed | | | (5,713,371,171 | ) | | | (5,041,087,367 | ) | | | (2,651,211,522 | ) | | | (2,714,178,454 | ) | | | (519,076,926 | ) | | | (385,318,959 | ) | | | (1,256,911,726 | ) | | | (1,175,616,542 | ) | |
Redemption fees | | | 730,073 | | | | 1,147,493 | | | | 319,996 | | | | 583,929 | | | | — | | | | — | | | | 239,954 | | | | 385,738 | | |
Increase (decrease) in net assets from Fund share transactions | | | 3,439,142,034 | | | | 5,771,447,173 | | | | 1,109,352,448 | | | | 1,181,671,036 | | | | 899,307,068 | | | | 478,154,832 | | | | (2,187,767 | ) | | | 265,083,936 | | |
Net increase (decrease) in net assets | | | 5,151,505,520 | | | | 7,128,152,969 | | | | 1,163,261,491 | | | | 1,310,994,216 | | | | 1,081,302,550 | | | | 584,579,258 | | | | (444,658,457 | ) | | | 309,430,864 | | |
Net Assets (Note 1) | |
Beginning of year | | | 31,192,108,902 | | | | 24,063,955,933 | | | | 10,185,516,554 | | | | 8,874,522,338 | | | | 1,912,518,390 | | | | 1,327,939,132 | | | | 3,519,918,822 | | | | 3,210,487,958 | | |
End of year | | $ | 36,343,614,422 | | | $ | 31,192,108,902 | | | $ | 11,348,778,045 | | | $ | 10,185,516,554 | | | $ | 2,993,820,940 | | | $ | 1,912,518,390 | | | $ | 3,075,260,365 | | | $ | 3,519,918,822 | | |
Undistributed net investment income (loss) | | $ | 27,126,477 | | | $ | (15,091,353 | ) | | $ | (150,567,907 | ) | | $ | (175,357,398 | ) | | $ | 16,517,574 | | | $ | 14,183,390 | | | $ | (100,187,188 | ) | | $ | (81,489,548 | ) | |
* First Eagle Gold Fund financial statements are shown on a consolidated basis and includes the balances of the First Eagle Gold Cayman Fund, Ltd.
See Notes to Financial Statements.
FIRST EAGLE FUNDS | ANNUAL REPORT | OCTOBER 31, 2012
152
FIRST EAGLE FUNDS | ANNUAL REPORT | OCTOBER 31, 2012
153
Statements of Changes in Net Assets (continued)
| | | FIRST EAGLE
GLOBAL INCOME
BUILDER FUND | | FIRST EAGLE
HIGH YIELD FUND | | FIRST EAGLE
FUND OF AMERICA | |
| | | PERIOD
MAY 1, 2012 TO
OCTOBER 31, 2012 | | PERIOD
APRIL 1, 2012 TO
OCTOBER 31, 2012 | | YEAR ENDED
MARCH 31,
2012 | | YEAR ENDED
MARCH 31,
2011 | | YEAR ENDED
OCTOBER 31,
2012 | | YEAR ENDED
OCTOBER 31,
2011 | |
Operations | |
Net investment income (loss) | | $ | 869,230 | | | $ | 15,254,773 | | | $ | 2,059,856 | | | $ | 917,373 | | | $ | 496,431 | | | $ | (5,611,267 | ) | |
Net realized gain (loss) from investments, foreign currency and
forward contract related transactions and written options | | | 87,310 | | | | 1,562,963 | | | | 320,629 | | | | 631,187 | | | | (34,795,479 | ) | | | 116,260,451 | | |
Change in unrealized appreciation (depreciation) of investments,
foreign currency and forward contract related transactions and
written options | | | 2,030,861 | | | | 12,067,997 | | | | 1,558,576 | | | | (179,372 | ) | | | 256,165,635 | | | | (86,849,116 | ) | |
Net increase (decrease) in net assets resulting from operations | | | 2,987,401 | | | | 28,885,733 | | | | 3,939,061 | | | | 1,369,188 | | | | 221,866,587 | | | | 23,800,068 | | |
Distribution to Shareholders | |
Dividends paid from net investment income | |
Class A | | | (207,258 | ) | | | (5,146,846 | ) | | | (277,672 | ) | | | — | | | | — | | | | (2,737,506 | ) | |
Class C | | | (93,296 | ) | | | (2,099,621 | ) | | | (107,973 | ) | | | — | | | | — | | | | (253,288 | ) | |
Class I | | | (375,701 | ) | | | (8,021,377 | ) | | | (1,664,694 | ) | | | (914,365 | ) | | | — | | | | — | | |
Class Y | | | — | | | | — | | | | — | | | | — | | | | — | | | | (3,991,165 | ) | |
Distributions paid from net realized gains from
investment transactions | |
Class A | | | — | | | | — | | | | — | | | | — | | | | (39,934,200 | ) | | | — | | |
Class C | | | — | | | | — | | | | — | | | | — | | | | (15,978,381 | ) | | | — | | |
Class I | | | — | | | | — | | | | (579,534 | ) | | | (754,658 | ) | | | — | | | | — | | |
Class Y | | | — | | | | — | | | | — | | | | — | | | | (44,697,643 | ) | | | — | | |
Decrease in net assets resulting from distributions | | | (676,255 | ) | | | (15,267,844 | ) | | | (2,629,873 | ) | | | (1,669,023 | ) | | | (100,610,224 | ) | | | (6,981,959 | ) | |
Fund Share Transactions (Note 6) | |
Net proceeds from shares sold | | | 106,407,315 | | | | 448,132,515 | | | | 202,495,554 | | | | 2,265,250 | | | | 308,241,688 | | | | 512,908,266 | | |
Net asset value of shares issued for reinvested dividends and
distributions | | | 453,949 | | | | 11,996,758 | | | | 2,480,994 | | | | 1,669,125 | | | | 88,825,318 | | | | 6,163,174 | | |
Cost of shares redeemed | | | (1,819,012 | ) | | | (34,728,034 | ) | | | (14,567,403 | ) | | | (2,472,677 | ) | | | (283,000,180 | ) | | | (259,451,806 | ) | |
Redemption fees | | | — | | | | — | | | | — | | | | — | | | | — | | | | — | | |
Increase (decrease) in net assets from Fund share transactions | | | 105,042,252 | | | | 425,401,239 | | | | 190,409,145 | | | | 1,461,698 | | | | 114,066,826 | | | | 259,619,634 | | |
Net increase (decrease) in net assets | | | 107,353,398 | | | | 439,019,128 | | | | 191,718,333 | | | | 1,161,863 | | | | 235,323,189 | | | | 276,437,743 | | |
Net Assets (Note 1) | |
Beginning of year | | | — | | | | 202,880,586 | | | | 11,162,253 | | | | 10,000,390 | | | | 1,375,745,424 | | | | 1,099,307,681 | | |
End of year | | $ | 107,353,398 | | | $ | 641,899,714 | | | $ | 202,880,586 | | | $ | 11,162,253 | | | $ | 1,611,068,613 | | | $ | 1,375,745,424 | | |
Undistributed net investment income (loss) | | $ | 205,755 | | | $ | 295,529 | | | $ | (19,612 | ) | | $ | 20,120 | | | $ | (414,493 | ) | | $ | (125,962 | ) | |
See Notes to Financial Statements.
FIRST EAGLE FUNDS | ANNUAL REPORT | OCTOBER 31, 2012
154
FIRST EAGLE FUNDS | ANNUAL REPORT | OCTOBER 31, 2012
155

| | | YEAR ENDED OCTOBER 31, | |
| | | 2012 | | 2011 | |
| | | CLASS A | | CLASS C | | CLASS I | | CLASS A | | CLASS C | | CLASS I | |
Selected data for a share of beneficial interest outstanding throughout
each year is presented below:* | |
Net asset value,
beginning of year ($) | | | 46.90 | | | | 45.91 | | | | 47.15 | | | | 44.36 | | | | 43.47 | | | | 44.59 | | |
Income from investment operations: | |
Net investment income ($) | | | 0.45 | | | | 0.09 | | | | 0.57 | | | | 0.39 | | | | 0.04 | | | | 0.51 | | |
Net realized and unrealized
gains (losses) on investments | | | 3.03 | | | | 2.98 | | | | 3.03 | | | | 2.79 | | | | 2.75 | | | | 2.81 | | |
Total income (loss) from
investment operations | | | 3.48 | | | | 3.07 | | | | 3.60 | | | | 3.18 | | | | 2.79 | | | | 3.32 | | |
Less distributions: | |
Dividends from net
investment income ($) | | | -0.53 | | | | -0.21 | | | | -0.64 | | | | -0.64 | | | | -0.35 | | | | -0.76 | | |
Distributions from
capital gains | | | -0.61 | | | | -0.61 | | | | -0.61 | | | | — | | | | — | | | | — | | |
Total distributions | | | -1.14 | | | | -0.82 | | | | -1.25 | | | | -0.64 | | | | -0.35 | | | | -0.76 | | |
Net asset value,
end of year ($) | | | 49.24 | | | | 48.16 | | | | 49.50 | | | | 46.90 | | | | 45.91 | | | | 47.15 | | |
Total return(a) (%) | | | 7.64 | | | | 6.83 | | | | 7.90 | | | | 7.23 | | | | 6.45 | | | | 7.52 | | |
Ratios and supplemental data | |
Net assets, end of year
(millions) ($) | | | 15,840 | | | | 9,322 | | | | 11,182 | | | | 14,352 | | | | 8,385 | | | | 8,455 | | |
Ratio of operating expenses
to average net assets
including earnings credits (%) | | | 1.15 | | | | 1.89 | | | | 0.90 | | | | 1.13 | | | | 1.88 | | | | 0.88 | | |
Ratio of operating expenses
to average net assets
excluding earnings credits (%) | | | 1.15 | | | | 1.89 | | | | 0.90 | | | | 1.13 | | | | 1.88 | | | | 0.88 | | |
Ratio of net investment
income to average net assets
including earnings credits (%) | | | 0.94 | | | | 0.19 | | | | 1.19 | | | | 0.83 | | | | 0.08 | | | | 1.07 | | |
Ratio of net investment
income to average net assets
excluding earnings credits (%) | | | 0.94 | | | | 0.19 | | | | 1.19 | | | | 0.83 | | | | 0.08 | | | | 1.07 | | |
Portfolio turnover rate (%) | | | 11.29 | | | | 11.29 | | | | 11.29 | | | | 11.57 | | | | 11.57 | | | | 11.57 | | |
* Per share amounts have been calculated using the average shares method.
** Amount represents less than $0.01 per share.
(a) Does not take into account the sale charge of 5.00% for Class A and the CDSC (Contingent Deferred Sales Charge) of 1.00% for Class C shares.
See Notes to Financial Statements.
FIRST EAGLE FUNDS | ANNUAL REPORT | OCTOBER 31, 2012
156
Global Fund
| | YEAR ENDED OCTOBER 31, | |
| | | 2010 | | 2009 | | 2008 | |
| | | CLASS A | | CLASS C | | CLASS I | | CLASS A | | CLASS C | | CLASS I | | CLASS A | | CLASS C | | CLASS I | |
Selected data for a share of beneficial interest outstanding throughout
each year is presented below:* | |
Net asset value,
beginning of year ($) | | | 38.74 | | | | 38.07 | | | | 38.92 | | | | 34.45 | | | | 33.99 | | | | 34.62 | | | | 51.09 | | | | 50.46 | | | | 51.32 | | |
Income from investment operations: | |
Net investment income ($) | | | 0.56 | | | | 0.26 | | | | 0.69 | | | | 0.39 | | | | 0.13 | | | | 0.47 | | | | 0.64 | | | | 0.31 | | | | 0.76 | | |
Net realized and unrealized
gains (losses) on investments | | | 5.63 | | | | 5.51 | | | | 5.63 | | | | 6.35 | | | | 6.26 | | | | 6.39 | | | | -11.82 | | | | -11.69 | | | | -11.88 | | |
Total income (loss) from
investment operations | | | 6.19 | | | | 5.77 | | | | 6.32 | | | | 6.74 | | | | 6.39 | | | | 6.86 | | | | -11.18 | | | | -11.38 | | | | -11.12 | | |
Less distributions: | |
Dividends from net
investment income ($) | | | -0.57 | | | | -0.37 | | | | -0.65 | | | | -0.14 | | | | -0.00 | ** | | | -0.25 | | | | -1.07 | | | | -0.70 | | | | -1.19 | | |
Distributions from
capital gains | | | — | | | | — | | | | — | | | | -2.31 | | | | -2.31 | | | | -2.31 | | | | -4.39 | | | | -4.39 | | | | -4.39 | | |
Total distributions | | | -0.57 | | | | -0.37 | | | | -0.65 | | | | -2.45 | | | | -2.31 | | | | -2.56 | | | | -5.46 | | | | -5.09 | | | | -5.58 | | |
Net asset value,
end of year ($) | | | 44.36 | | | | 43.47 | | | | 44.59 | | | | 38.74 | | | | 38.07 | | | | 38.92 | | | | 34.45 | | | | 33.99 | | | | 34.62 | | |
Total return(a) (%) | | | 16.13 | | | | 15.23 | | | | 16.40 | | | | 20.81 | | | | 19.93 | | | | 21.13 | | | | -24.41 | | | | -24.99 | | | | -24.21 | | |
Ratios and supplemental data | |
Net assets, end of year
(millions) ($) | | | 12,195 | | | | 6,524 | | | | 5,345 | | | | 10,562 | | | | 5,158 | | | | 3,338 | | | | 9,784 | | | | 4,623 | | | | 2,898 | | |
Ratio of operating expenses
to average net assets
including earnings credits (%) | | | 1.16 | | | | 1.91 | | | | 0.91 | | | | 1.19 | | | | 1.94 | | | | 0.94 | | | | 1.14 | | | | 1.89 | | | | 0.89 | | |
Ratio of operating expenses
to average net assets
excluding earnings credits (%) | | | 1.16 | | | | 1.91 | | | | 0.91 | | | | 1.19 | | | | 1.94 | | | | 0.94 | | | | 1.14 | | | | 1.89 | | | | 0.89 | | |
Ratio of net investment
income to average net assets
including earnings credits (%) | | | 1.36 | | | | 0.63 | | | | 1.68 | | | | 1.14 | | | | 0.38 | | | | 1.37 | | | | 1.48 | | | | 0.73 | | | | 1.74 | | |
Ratio of net investment
income to average net assets
excluding earnings credits (%) | | | 1.36 | | | | 0.63 | | | | 1.68 | | | | 1.14 | | | | 0.38 | | | | 1.37 | | | | 1.48 | | | | 0.73 | | | | 1.74 | | |
Portfolio turnover rate (%) | | | 17.37 | | | | 17.37 | | | | 17.37 | | | | 12.52 | | | | 12.52 | | | | 12.52 | | | | 29.69 | | | | 29.69 | | | | 29.69 | | |
FIRST EAGLE FUNDS | ANNUAL REPORT | OCTOBER 31, 2012
157

| | | YEAR ENDED OCTOBER 31, | |
| | | 2012 | | 2011 | |
| | | CLASS A | | CLASS C | | CLASS I | | CLASS A | | CLASS C | | CLASS I | |
Selected data for a share of beneficial interest outstanding throughout
each year is presented below:* | |
Net asset value,
beginning of year ($) | | | 22.25 | | | | 21.61 | | | | 22.61 | | | | 21.86 | | | | 21.26 | | | | 22.20 | | |
Income (loss) from investment operations: | |
Net investment income ($) | | | 0.24 | | | | 0.08 | | | | 0.30 | | | | 0.18 | | | | 0.01 | | | | 0.24 | | |
Net realized and unrealized
gains (losses) on investments | | | 0.80 | | | | 0.77 | | | | 0.81 | | | | 0.74 | | | | 0.73 | | | | 0.75 | | |
Total income (loss) from
investment operations | | | 1.04 | | | | 0.85 | | | | 1.11 | | | | 0.92 | | | | 0.74 | | | | 0.99 | | |
Less distributions: | |
Dividends from net
investment income ($) | | | -0.39 | | | | -0.20 | | | | -0.45 | | | | -0.32 | | | | -0.18 | | | | -0.37 | | |
Distributions from
capital gains | | | -0.64 | | | | -0.64 | | | | -0.64 | | | | -0.21 | | | | -0.21 | | | | -0.21 | | |
Total distributions | | | -1.03 | | | | -0.84 | | | | -1.09 | | | | -0.53 | | | | -0.39 | | | | -0.58 | | |
Net asset value,
end of year ($) | | | 22.26 | | | | 21.62 | | | | 22.63 | | | | 22.25 | | | | 21.61 | | | | 22.61 | | |
Total return(a) (%) | | | 5.06 | | | | 4.28 | | | | 5.36 | | | | 4.27 | | | | 3.48 | | | | 4.52 | | |
Ratios and supplemental data | |
Net assets, end of year
(millions) ($) | | | 5,111 | | | | 986 | | | | 5,252 | | | | 5,023 | | | | 1,027 | | | | 4,136 | | |
Ratio of operating expenses
to average net assets
including earnings credits (%) | | | 1.17 | | | | 1.92 | | | | 0.92 | | | | 1.14 | | | | 1.89 | | | | 0.89 | | |
Ratio of operating expenses
to average net assets
excluding earnings credits (%) | | | 1.17 | | | | 1.92 | | | | 0.92 | | | | 1.14 | | | | 1.89 | | | | 0.89 | | |
Ratio of net investment
income to average net assets
including earnings credits (%) | | | 1.12 | | | | 0.37 | | | | 1.36 | | | | 0.78 | | | | 0.04 | | | | 1.06 | | |
Ratio of net investment
income to average net assets
excluding earnings credits (%) | | | 1.12 | | | | 0.37 | | | | 1.36 | | | | 0.78 | | | | 0.04 | | | | 1.06 | | |
Portfolio turnover rate (%) | | | 10.50 | | | | 10.50 | | | | 10.50 | | | | 12.22 | | | | 12.22 | | | | 12.22 | | |
* Per share amounts have been calculated using the average shares method.
** Amount represents less than $0.01 per share.
(a) Does not take into account the sales charge of 5.00% for Class A shares and the CDSC (Contingent Deferred Sales Charge) of 1.00% for Class C shares.
See Notes to Financial Statements.
FIRST EAGLE FUNDS | ANNUAL REPORT | OCTOBER 31, 2012
158
Overseas Fund
| | YEAR ENDED OCTOBER 31, | |
| | | 2010 | | 2009 | | 2008 | |
| | | CLASS A | | CLASS C | | CLASS I | | CLASS A | | CLASS C | | CLASS I | | CLASS A | | CLASS C | | CLASS I | |
Selected data for a share of beneficial interest outstanding throughout
each year is presented below:* | |
Net asset value,
beginning of year ($) | | | 19.51 | | | | 19.03 | | | | 19.80 | | | | 17.21 | | | | 16.93 | | | | 17.41 | | | | 28.09 | | | | 27.66 | | | | 28.38 | | |
Income (loss) from investment operations: | |
Net investment income ($) | | | 0.15 | | | | 0.00 | ** | | | 0.21 | | | | 0.26 | | | | 0.13 | | | | 0.30 | | | | 0.35 | | | | 0.18 | | | | 0.40 | | |
Net realized and unrealized
gains (losses) on investments | | | 2.80 | | | | 2.72 | | | | 2.82 | | | | 3.72 | | | | 3.63 | | | | 3.78 | | | | -7.21 | | | | -7.10 | | | | -7.28 | | |
Total income (loss) from
investment operations | | | 2.95 | | | | 2.72 | | | | 3.03 | | | | 3.98 | | | | 3.76 | | | | 4.08 | | | | -6.86 | | | | -6.92 | | | | -6.88 | | |
Less distributions: | |
Dividends from net
investment income ($) | | | -0.60 | | | | -0.49 | | | | -0.63 | | | | -0.02 | | | | 0.00 | ** | | | -0.03 | | | | -0.87 | | | | -0.66 | | | | -0.94 | | |
Distributions from
capital gains | | | — | | | | — | | | | — | | | | -1.66 | | | | -1.66 | | | | -1.66 | | | | -3.15 | | | | -3.15 | | | | -3.15 | | |
Total distributions | | | -0.60 | | | | -0.49 | | | | -0.63 | | | | -1.68 | | | | -1.66 | | | | -1.69 | | | | -4.02 | | | | -3.81 | | | | -4.09 | | |
Net asset value,
end of year ($) | | | 21.86 | | | | 21.26 | | | | 22.20 | | | | 19.51 | | | | 19.03 | | | | 19.80 | | | | 17.21 | | | | 16.93 | | | | 17.41 | | |
Total return(a) (%) | | | 15.45 | | | | 14.55 | | | | 15.68 | | | | 24.95 | | | | 23.96 | | | | 25.26 | | | | -28.15 | | | | -28.67 | | | | -27.97 | | |
Ratios and supplemental data | |
Net assets, end of year
(millions) ($) | | | 4,676 | | | | 914 | | | | 3,284 | | | | 4,024 | | | | 792 | | | | 2,211 | | | | 3,518 | | | | 737 | | | | 1,968 | | |
Ratio of operating expenses
to average net assets
including earnings credits (%) | | | 1.17 | | | | 1.92 | | | | 0.92 | | | | 1.20 | | | | 1.95 | | | | 0.95 | | | | 1.15 | | | | 1.90 | | | | 0.90 | | |
Ratio of operating expenses
to average net assets
excluding earnings credits (%) | | | 1.17 | | | | 1.92 | | | | 0.92 | | | | 1.20 | | | | 1.95 | | | | 0.95 | | | | 1.15 | | | | 1.90 | | | | 0.90 | | |
Ratio of net investment
income to average net assets
including earnings credits (%) | | | 0.76 | | | | 0.01 | | | | 1.03 | | | | 1.51 | | | | 0.76 | | | | 1.75 | | | | 1.57 | | | | 0.82 | | | | 1.76 | | |
Ratio of net investment
income to average net assets
excluding earnings credits (%) | | | 0.76 | | | | 0.01 | | | | 1.03 | | | | 1.51 | | | | 0.76 | | | | 1.75 | | | | 1.57 | | | | 0.82 | | | | 1.76 | | |
Portfolio turnover rate (%) | | | 15.53 | | | | 15.53 | | | | 15.53 | | | | 8.65 | | | | 8.65 | | | | 8.65 | | | | 15.72 | | | | 15.72 | | | | 15.72 | | |
FIRST EAGLE FUNDS | ANNUAL REPORT | OCTOBER 31, 2012
159

| | | YEAR ENDED OCTOBER 31, | |
| | | 2012 | | 2011 | |
| | | CLASS A | | CLASS C | | CLASS I | | CLASS A | | CLASS C | | CLASS I | |
Selected data for a share of beneficial interest outstanding throughout
each year is presented below:* | |
Net asset value,
beginning of year ($) | | | 17.12 | | | | 16.91 | | | | 17.33 | | | | 15.94 | | | | 15.75 | | | | 16.12 | | |
Income from investment operations: | |
Net investment income ($) | | | 0.15 | | | | 0.02 | | | | 0.19 | | | | 0.17 | | | | 0.04 | | | | 0.21 | | |
Net realized and unrealized
gains (losses) on investments | | | 1.59 | | | | 1.57 | | | | 1.61 | | | | 1.34 | | | | 1.34 | | | | 1.37 | | |
Total income (loss) from
investment operations | | | 1.74 | | | | 1.59 | | | | 1.80 | | | | 1.51 | | | | 1.38 | | | | 1.58 | | |
Less distributions: | |
Dividends from net
investment income ($) | | | -0.14 | | | | -0.03 | | | | -0.18 | | | | -0.33 | | | | -0.22 | | | | -0.37 | | |
Distributions from
capital gains | | | -0.45 | | | | -0.45 | | | | -0.45 | | | | — | | | | — | | | | — | | |
Total distributions | | | -0.59 | | | | -0.48 | | | | -0.63 | | | | -0.33 | | | | -0.22 | | | | -0.37 | | |
Net asset value,
end of year ($) | | | 18.27 | | | | 18.02 | | | | 18.50 | | | | 17.12 | | | | 16.91 | | | | 17.33 | | |
Total return(a) (%) | | | 10.63 | | | | 9.75 | | | | 10.86 | | | | 9.60 | | | | 8.85 | | | | 9.92 | | |
Ratios and supplemental data | |
Net assets, end of year
(millions) ($) | | | 1,425 | | | | 631 | | | | 938 | | | | 967 | | | | 408 | | | | 538 | | |
Ratio of operating expenses
to average net assets
including earnings credits (%) | | | 1.17 | | | | 1.92 | | | | 0.93 | | | | 1.18 | | | | 1.93 | | | | 0.93 | | |
Ratio of operating expenses
to average net assets
excluding earnings credits (%) | | | 1.17 | | | | 1.92 | | | | 0.93 | | | | 1.18 | | | | 1.93 | | | | 0.93 | | |
Ratio of net investment
income to average net assets
including earnings credits (%) | | | 0.84 | | | | 0.09 | | | | 1.08 | | | | 0.98 | | | | 0.24 | | | | 1.23 | | |
Ratio of net investment
income to average net assets
excluding earnings credits (%) | | | 0.84 | | | | 0.09 | | | | 1.08 | | | | 0.98 | | | | 0.24 | | | | 1.23 | | |
Portfolio turnover rate (%) | | | 14.34 | | | | 14.34 | | | | 14.34 | | | | 18.54 | | | | 18.54 | | | | 18.54 | | |
* Per share amounts have been calculated using the average shares method.
(a) Does not take into account the sales charge of 5.00% for Class A shares and the CDSC (Contingent Deferred Sales Charge) of 1.00% for Class C shares.
See Notes to Financial Statements.
FIRST EAGLE FUNDS | ANNUAL REPORT | OCTOBER 31, 2012
160
U.S. Value Fund
| | | YEAR ENDED OCTOBER 31, | |
| | | 2010 | | 2009 | | 2008 | |
| | | CLASS A | | CLASS C | | CLASS I | | CLASS A | | CLASS C | | CLASS I | | CLASS A | | CLASS C | | CLASS I | |
Selected data for a share of beneficial interest outstanding throughout
each year is presented below:* | |
Net asset value,
beginning of year ($) | | | 14.21 | | | | 14.06 | | | | 14.37 | | | | 12.75 | | | | 12.63 | | | | 12.89 | | | | 17.01 | | | | 16.87 | | | | 17.19 | | |
Income from investment operations: | |
Net investment income ($) | | | 0.32 | | | | 0.21 | | | | 0.38 | | | | 0.21 | | | | 0.12 | | | | 0.24 | | | | 0.36 | | | | 0.24 | | | | 0.40 | | |
Net realized and unrealized
gains (losses) on investments | | | 1.60 | | | | 1.58 | | | | 1.59 | | | | 1.58 | | | | 1.56 | | | | 1.60 | | | | -3.65 | | | | -3.63 | | | | -3.69 | | |
Total income (loss) from
investment operations | | | 1.92 | | | | 1.79 | | | | 1.97 | | | | 1.79 | | | | 1.68 | | | | 1.84 | | | | -3.29 | | | | -3.39 | | | | -3.29 | | |
Less distributions: | |
Dividends from net
investment income ($) | | | -0.19 | | | | -0.10 | | | | -0.22 | | | | -0.22 | | | | -0.14 | | | | -0.25 | | | | -0.31 | | | | -0.19 | | | | -0.35 | | |
Distributions from
capital gains | | | — | | | | — | | | | — | | | | -0.11 | | | | -0.11 | | | | -0.11 | | | | -0.66 | | | | -0.66 | | | | -0.66 | | |
Total distributions | | | -0.19 | | | | -0.10 | | | | -0.22 | | | | -0.33 | | | | -0.25 | | | | -0.36 | | | | -0.97 | | | | -0.85 | | | | -1.01 | | |
Net asset value,
end of year ($) | | | 15.94 | | | | 15.75 | | | | 16.12 | | | | 14.21 | | | | 14.06 | | | | 14.37 | | | | 12.75 | | | | 12.63 | | | | 12.89 | | |
Total return(a) (%) | | | 13.64 | | | | 12.75 | | | | 13.84 | | | | 14.52 | | | | 13.63 | | | | 14.78 | | | | -20.56 | | | | -21.17 | | | | -20.36 | | |
Ratios and supplemental data | |
Net assets, end of year
(millions) ($) | | | 680 | | | | 320 | | | | 328 | | | | 547 | | | | 263 | | | | 199 | | | | 271 | | | | 167 | | | | 104 | | |
Ratio of operating expenses
to average net assets
including earnings credits (%) | | | 1.23 | | | | 1.98 | | | | 0.99 | | | | 1.26 | | | | 2.00 | | | | 1.01 | | | | 1.20 | | | | 1.96 | | | | 0.95 | | |
Ratio of operating expenses
to average net assets
excluding earnings credits (%) | | | 1.23 | | | | 1.98 | | | | 0.99 | | | | 1.26 | | | | 2.00 | | | | 1.01 | | | | 1.21 | | | | 1.96 | | | | 0.96 | | |
Ratio of net investment
income to average net assets
including earnings credits (%) | | | 2.15 | | | | 1.41 | | | | 2.46 | | | | 1.63 | | | | 0.93 | | | | 1.90 | | | | 2.28 | | | | 1.53 | | | | 2.53 | | |
Ratio of net investment
income to average net assets
excluding earnings credits (%) | | | 2.15 | | | | 1.41 | | | | 2.46 | | | | 1.63 | | | | 0.93 | | | | 1.90 | | | | 2.28 | | | | 1.52 | | | | 2.53 | | |
Portfolio turnover rate (%) | | | 12.23 | | | | 12.23 | | | | 12.23 | | | | 14.88 | | | | 14.88 | | | | 14.88 | | | | 21.75 | | | | 21.75 | | | | 21.75 | | |
FIRST EAGLE FUNDS | ANNUAL REPORT | OCTOBER 31, 2012
161

| | | YEAR ENDED OCTOBER 31, | |
| | | 2012 | | 2011 | |
| | | CLASS A | | CLASS C | | CLASS I | | CLASS A | | CLASS C | | CLASS I | |
Selected data for a share of beneficial interest outstanding throughout
each year is presented below:* | |
Net asset value,
beginning of year ($) | | | 33.89 | | | | 32.78 | | | | 34.33 | | | | 33.42 | | | | 32.44 | | | | 33.81 | | |
Income from investment operations: | |
Net investment income (loss) ($) | | | -0.01 | | | | -0.22 | | | | 0.06 | | | | -0.19 | | | | -0.42 | | | | -0.10 | | |
Net realized and unrealized
gains (losses) on investments | | | -2.73 | | | | -2.66 | | | | -2.75 | | | | 2.60 | | | | 2.53 | | | | 2.63 | | |
Total income (loss) from
investment operations | | | -2.74 | | | | -2.88 | | | | -2.69 | | | | 2.41 | | | | 2.11 | | | | 2.53 | | |
Less distributions: | |
Dividends from net
investment income ($) | | | -0.39 | | | | -0.16 | | | | -0.48 | | | | -0.73 | | | | -0.56 | | | | -0.80 | | |
Distributions from
capital gains | | | -0.90 | | | | -0.90 | | | | -0.90 | | | | -1.21 | | | | -1.21 | | | | -1.21 | | |
Total distributions | | | -1.29 | | | | -1.06 | | | | -1.38 | | | | -1.94 | | | | -1.77 | | | | -2.01 | | |
Net asset value,
end of year ($) | | | 29.86 | | | | 28.84 | | | | 30.26 | | | | 33.89 | | | | 32.78 | | | | 34.33 | | |
Total return(a) (%) | | | -8.14 | | | | -8.86 | | | | -7.89 | | | | 7.38 | | | | 6.61 | | | | 7.66 | | |
Ratios and supplemental data | |
Net assets, end of year
(millions) ($) | | | 1,535 | | | | 608 | | | | 932 | | | | 1,834 | | | | 683 | | | | 1,003 | | |
Ratio of operating expenses
to average net assets
including earnings credits (%) | | | 1.21 | | | | 1.96 | | | | 0.96 | | | | 1.20 | | | | 1.95 | | | | 0.95 | | |
Ratio of operating expenses
to average net assets
excluding earnings credits (%) | | | 1.21 | | | | 1.96 | | | | 0.96 | | | | 1.20 | | | | 1.95 | | | | 0.95 | | |
Ratio of net investment income
(loss) to average net assets
including earnings credits (%) | | | -0.05 | | | | -0.80 | | | | 0.21 | | | | -0.56 | | | | -1.30 | | | | -0.30 | | |
Ratio of net investment income
(loss) to average net assets
excluding earnings credits (%) | | | -0.05 | | | | -0.80 | | | | 0.21 | | | | -0.56 | | | | -1.30 | | | | -0.30 | | |
Portfolio turnover rate (%) | | | 9.19 | | | | 9.19 | | | | 9.19 | | | | 13.26 | | | | 13.26 | | | | 13.26 | | |
* Per share amounts have been calculated using the average shares method.
(a) Does not take into account the sales charge of 5.00% for Class A shares and the CDSC (Contingent Deferred Sales Charge) of 1.00% for Class C shares.
See Notes to Financial Statements.
FIRST EAGLE FUNDS | ANNUAL REPORT | OCTOBER 31, 2012
162
Gold Fund
| | | YEAR ENDED OCTOBER 31, | |
| | | 2010 | | 2009 | | 2008 | |
| | | CLASS A | | CLASS C | | CLASS I | | CLASS A | | CLASS C | | CLASS I | | CLASS A | | CLASS C | | CLASS I | |
Selected data for a share of beneficial interest outstanding throughout
each year is presented below:* | |
Net asset value,
beginning of year ($) | | | 25.15 | | | | 24.52 | | | | 25.43 | | | | 14.85 | | | | 14.60 | | | | 14.98 | | | | 27.28 | | | | 26.86 | | | | 27.48 | | |
Income from investment operations: | |
Net investment income (loss) ($) | | | -0.17 | | | | -0.38 | | | | -0.11 | | | | -0.14 | | | | -0.30 | | | | -0.09 | | | | -0.09 | | | | -0.27 | | | | -0.05 | | |
Net realized and unrealized
gains (losses) on investments | | | 8.82 | | | | 8.58 | | | | 8.92 | | | | 11.50 | | | | 11.28 | | | | 11.60 | | | | -10.61 | | | | -10.43 | | | | -10.66 | | |
Total income (loss) from
investment operations | | | 8.65 | | | | 8.20 | | | | 8.81 | | | | 11.36 | | | | 10.98 | | | | 11.51 | | | | -10.70 | | | | -10.70 | | | | -10.71 | | |
Less distributions: | |
Dividends from net
investment income ($) | | | -0.38 | | | | -0.28 | | | | -0.43 | | | | — | | | | — | | | | — | | | | -0.78 | | | | -0.61 | | | | -0.84 | | |
Distributions from
capital gains | | | — | | | | — | | | | — | | | | -1.06 | | | | -1.06 | | | | -1.06 | | | | -0.95 | | | | -0.95 | | | | -0.95 | | |
Total distributions | | | -0.38 | | | | -0.28 | | | | -0.43 | | | | -1.06 | | | | -1.06 | | | | -1.06 | | | | -1.73 | | | | -1.56 | | | | -1.79 | | |
Net asset value,
end of year ($) | | | 33.42 | | | | 32.44 | | | | 33.81 | | | | 25.15 | | | | 24.52 | | | | 25.43 | | | | 14.85 | | | | 14.60 | | | | 14.98 | | |
Total return(a) (%) | | | 34.73 | | | | 33.66 | | | | 35.01 | | | | 78.93 | | | | 77.62 | | | | 79.27 | | | | -41.56 | | | | -41.99 | | | | -41.36 | | |
Ratios and supplemental data | |
Net assets, end of year
(millions) ($) | | | 1,900 | | | | 616 | | | | 695 | | | | 1,325 | | | | 362 | | | | 165 | | | | 480 | | | | 109 | | | | 71 | | |
Ratio of operating expenses
to average net assets
including earnings credits (%) | | | 1.22 | | | | 1.97 | | | | 0.97 | | | | 1.26 | | | | 2.01 | | | | 1.01 | | | | 1.21 | | | | 1.96 | | | | 0.95 | | |
Ratio of operating expenses
to average net assets
excluding earnings credits (%) | | | 1.22 | | | | 1.97 | | | | 0.97 | | | | 1.26 | | | | 2.01 | | | | 1.01 | | | | 1.21 | | | | 1.96 | | | | 0.96 | | |
Ratio of net investment income
(loss) to average net assets
including earnings credits (%) | | | -0.60 | | | | -1.35 | | | | -0.36 | | | | -0.65 | | | | -1.40 | | | | -0.40 | | | | -0.38 | | | | -1.13 | | | | -0.20 | | |
Ratio of net investment income
(loss) to average net assets
excluding earnings credits (%) | | | -0.60 | | | | -1.35 | | | | -0.36 | | | | -0.65 | | | | -1.40 | | | | -0.40 | | | | -0.38 | | | | -1.14 | | | | -0.20 | | |
Portfolio turnover rate (%) | | | 5.50 | | | | 5.50 | | | | 5.50 | | | | 3.00 | | | | 3.00 | | | | 3.00 | | | | 8.74 | | | | 8.74 | | | | 8.74 | | |
FIRST EAGLE FUNDS | ANNUAL REPORT | OCTOBER 31, 2012
163

| | | PERIOD MAY 1, 2012^ TO
OCTOBER 31, 2012 | |
| | | CLASS A | | CLASS C | | CLASS I | |
Selected data for a share of beneficial interest outstanding throughout
each year is presented below: | |
Net asset value, beginning of period ($) | | | 10.00 | | | | 10.00 | | | | 10.00 | | |
Income from investment operations: | |
Net investment income ($) | | | 0.15 | | | | 0.11 | | | | 0.18 | | |
Net realized and unrealized gains (losses) on investments | | | 0.28 | | | | 0.29 | | | | 0.27 | | |
Total income (loss) from investment operations | | | 0.43 | | | | 0.40 | | | | 0.45 | | |
Less distributions: | |
Dividends from net investment income ($) | | | -0.11 | | | | -0.10 | | | | -0.12 | | |
Total distributions | | | -0.11 | | | | -0.10 | | | | -0.12 | | |
Net asset value, end of period ($) | | | 10.32 | | | | 10.30 | | | | 10.33 | | |
Total return(c) (%) | | | 4.37 | (a) | | | 4.00 | (a) | | | 4.53 | (a) | |
Ratios and supplemental data | |
Net assets, end of period (millions) ($) | | | 43 | | | | 26 | | | | 38 | | |
Ratio of operating expenses to average net assets
including fee waivers and reimbursements (%) | | | 1.30 | (b)(d) | | | 2.05 | (b)(d) | | | 1.05 | (b)(d) | |
Ratio of operating expenses to average net assets
excluding fee waivers and reimbursements (%) | | | 2.13 | (b)(d) | | | 2.88 | (b)(d) | | | 2.20 | (b)(d) | |
Ratio of net investment income to average net assets
including fee waivers and reimbursements (%) | | | 2.89 | (b)(d) | | | 2.16 | (b)(d) | | | 3.56 | (b)(d) | |
Ratio of net investment income to average net assets
excluding fee waivers and reimbursements (%) | | | 2.06 | (b)(d) | | | 1.33 | (b)(d) | | | 2.40 | (b)(d) | |
Portfolio turnover rate (%) | | | 5.17 | (a) | | | 5.17 | (a) | | | 5.17 | (a)(d) | |
^ Commencement of operations
(a) Not Annualized
(b) Annualized
(c) Does not take into account the sales charge of 5.00% for Class A shares and the CDSC (Contingent Deferred Sales Charge) of 1.00% for Class C shares.
(d) Certain non-recurring expenses incurred by the Fund were not annualized for the period ended October 31, 2012.
See Notes to Financial Statements.
FIRST EAGLE FUNDS | ANNUAL REPORT | OCTOBER 31, 2012
164
This page was intentionally left blank.

^ The Fund commenced investment operations in its present form on December 30, 2011.
^^ Class A and Class C commenced operations on January 3, 2012.
^^^ The predecessor Fund, Old Mutual High Yield Fund, commenced operations on November 19, 2007.
* Per share amounts have been calculated using the average shares method.
(a) Not Annualized
(b) Annualized
(c) Does not take into account the sales charge of 4.50% for Class A shares and the CDSC (Contingent Deferred Sales Charge) of 1.00% for Class C shares.
(d) Certain non-recurring expenses incurred by the Fund were not annualized for the period ended October 31, 2012.
| | | PERIOD APRIL 1, 2012 TO | | YEAR ENDED MARCH 31, | |
| | | OCTOBER 31, 2012 | | 2012^ | |
| | | CLASS A | | CLASS C | | CLASS I | | CLASS A^^ | | CLASS C^^ | | CLASS I | |
Selected data for a share of beneficial interest outstanding throughout
each year is presented below:* | |
Net asset value,
beginning of year ($) | | | 9.75 | | | | 9.74 | | | | 9.75 | | | | 9.40 | | | | 9.40 | | | | 10.29 | | |
Income (loss) from investment operations: | |
Net investment income ($) | | | 0.33 | | | | 0.29 | | | | 0.36 | | | | 0.13 | | | | 0.11 | | | | 0.68 | | |
Net realized and unrealized
gains (losses) on investments | | | 0.24 | | | | 0.23 | | | | 0.23 | | | | 0.35 | | | | 0.34 | | | | -0.11 | | |
Total income (loss) from
investment operations | | | 0.57 | | | | 0.52 | | | | 0.59 | | | | 0.48 | | | | 0.45 | | | | 0.57 | | |
Less distributions: | |
Dividends from net
investment income ($) | | | -0.34 | | | | -0.29 | | | | -0.36 | | | | -0.13 | | | | -0.11 | | | | -0.83 | | |
Distributions from
capital gains | | | — | | | | — | | | | — | | | | — | | | | — | | | | -0.28 | | |
Total distributions | | | -0.34 | | | | -0.29 | | | | -0.36 | | | | -0.13 | | | | -0.11 | | | | -1.11 | | |
Net asset value,
end of year ($) | | | 9.98 | | | | 9.97 | | | | 9.98 | | | | 9.75 | | | | 9.74 | | | | 9.75 | | |
Total return(c) (%) | | | 5.94 | (a) | | | 5.47 | (a) | | | 6.20 | (a) | | | 5.11 | | | | 4.78 | | | | 6.11 | | |
Ratios and supplemental data | |
Net assets, end of year
(millions) ($) | | | 220 | | | | 113 | | | | 309 | | | | 60 | | | | 28 | | | | 115 | | |
Ratio of operating expenses to
average net assets including fee
waivers and reimbursements (%) | | | 1.25 | (b)(d) | | | 2.00 | (b)(d) | | | 0.80 | (b)(d) | | | 0.95 | (b) | | | 1.66 | (b) | | | 0.80 | | |
Ratio of operating expenses to
average net assets excluding fee
waivers and reimbursements (%) | | | 1.27 | (b)(d) | | | 2.02 | (b)(d) | | | 1.03 | (b)(d) | | | 1.12 | (b) | | | 1.83 | (b) | | | 1.05 | | |
Ratio of net investment income to
average net assets including fee
waivers and reimbursements (%) | | | 5.75 | (b)(d) | | | 4.98 | (b)(d) | | | 6.23 | (b)(d) | | | 5.48 | (b) | | | 4.74 | (b) | | | 6.98 | | |
Ratio of net investment income to
average net assets excluding fee
waivers and reimbursements (%) | | | 5.73 | (b)(d) | | | 4.96 | (b)(d) | | | 6.00 | (b)(d) | | | 5.31 | (b) | | | 4.57 | (b) | | | 6.73 | | |
Portfolio turnover rate (%) | | | 25.02 | (a) | | | 25.02 | (a) | | | 25.02 | (a) | | | 45.21 | | | | 45.21 | | | | 45.21 | | |
See Notes to Financial Statements.
FIRST EAGLE FUNDS | ANNUAL REPORT | OCTOBER 31, 2012
166
High Yield Fund
| | | YEAR ENDED MARCH 31, | |
| | | 2011 | | 2010 | | 2009 | | 2008^^^ | |
| | | CLASS I | | CLASS I | | CLASS I | | CLASS I | |
Selected data for a share of beneficial interest outstanding throughout
each year is presented below:* | |
Net asset value,
beginning of year ($) | | | 10.67 | | | | 7.72 | | | | 9.29 | | | | 10.00 | | |
Income (loss) from investment operations: | |
Net investment income ($) | | | 0.98 | | | | 1.31 | | | | 0.85 | | | | 0.36 | | |
Net realized and unrealized
gains (losses) on investments | | | 0.47 | | | | 3.07 | | | | -1.55 | | | | -0.69 | | |
Total income (loss) from
investment operations | | | 1.45 | | | | 4.38 | | | | -0.70 | | | | -0.33 | | |
Less distributions: | |
Dividends from net
investment income ($) | | | -0.98 | | | | -1.28 | | | | -0.87 | | | | -0.38 | | |
Distributions from
capital gains | | | -0.85 | | | | -0.15 | | | | — | | | | — | | |
Total distributions | | | -1.83 | | | | -1.43 | | | | -0.87 | | | | -0.38 | | |
Net asset value,
end of year ($) | | | 10.29 | | | | 10.67 | | | | 7.72 | | | | 9.29 | | |
Total return(c) (%) | | | 14.81 | | | | 59.30 | | | | -7.78 | | | | -3.39 | | |
Ratios and supplemental data | |
Net assets, end of year
(millions) ($) | | | 11 | | | | 10 | | | | 9 | | | | 9 | | |
Ratio of operating expenses to
average net assets including fee
waivers and reimbursements (%) | | | 0.80 | | | | 0.80 | | | | 0.80 | | | | 0.80 | | |
Ratio of operating expenses to
average net assets excluding fee
waivers and reimbursements (%) | | | 1.21 | | | | 1.04 | | | | 1.05 | | | | 1.86 | (b) | |
Ratio of net investment income to
average net assets including fee
waivers and reimbursements (%) | | | 9.33 | | | | 13.34 | | | | 10.04 | | | | 10.90 | (b) | |
Ratio of net investment income to
average net assets excluding fee
waivers and reimbursements (%) | | | 8.92 | | | | 13.10 | | | | 9.79 | | | | 9.84 | | |
Portfolio turnover rate (%) | | | 145.96 | | | | 292.11 | | | | 74.19 | | | | 10.78 | | |
FIRST EAGLE FUNDS | ANNUAL REPORT | OCTOBER 31, 2012
167

| | | YEAR ENDED OCTOBER 31, | |
| | | 2012 | | 2011 | |
| | | CLASS A | | CLASS C | | CLASS Y | | CLASS A | | CLASS C | | CLASS Y | |
Selected data for a share of beneficial interest outstanding throughout
each year is presented below:* | |
Net asset value,
beginning of year ($) | | | 24.91 | | | | 22.01 | | | | 25.35 | | | | 24.06 | | | | 21.32 | | | | 24.47 | | |
Income from investment operations: | |
Net investment income (loss) ($) | | | 0.04 | | | | -0.13 | | | | 0.04 | | | | -0.09 | | | | -0.25 | | | | -0.08 | | |
Net realized and unrealized
gains (losses) on investments | | | 3.73 | | | | 3.24 | | | | 3.80 | | | | 1.11 | | | | 0.98 | | | | 1.12 | | |
Total income (loss) from
investment operations | | | 3.77 | | | | 3.11 | | | | 3.84 | | | | 1.02 | | | | 0.73 | | | | 1.04 | | |
Less distributions: | |
Dividends from net
investment income ($) | | | — | | | | — | | | | — | | | | -0.17 | | | | -0.04 | | | | -0.16 | | |
Distributions from
capital gains | | | -1.82 | | | | -1.82 | | | | -1.82 | | | | — | | | | — | | | | — | | |
Total distributions | | | -1.82 | | | | -1.82 | | | | -1.82 | | | | -0.17 | | | | -0.04 | | | | -0.16 | | |
Net asset value,
end of year ($) | | | 26.86 | | | | 23.30 | | | | 27.37 | | | | 24.91 | | | | 22.01 | | | | 25.35 | | |
Total return(a) (%) | | | 16.46 | | | | 15.62 | | | | 16.50 | | | | 4.22 | | | | 3.43 | | | | 4.20 | | |
Ratios and supplemental data | |
Net assets, end of year
(millions) ($) | | | 699 | | | | 246 | | | | 667 | | | | 549 | | | | 194 | | | | 633 | | |
Ratio of operating expenses
to average net assets
including earnings credits (%) | | | 1.44 | | | | 2.19 | | | | 1.44 | | | | 1.43 | | | | 2.18 | | | | 1.43 | | |
Ratio of operating expenses
to average net assets
excluding earnings credits (%) | | | 1.44 | | | | 2.19 | | | | 1.44 | | | | 1.43 | | | | 2.18 | | | | 1.43 | | |
Ratio of net investment income
(loss) to average net assets
including earnings credits (%) | | | 0.14 | | | | -0.61 | | | | 0.14 | | | | -0.33 | | | | -1.08 | | | | -0.31 | | |
Ratio of net investment income
(loss) to average net assets
excluding earnings credits (%) | | | 0.14 | | | | -0.61 | | | | 0.14 | | | | -0.33 | | | | -1.08 | | | | -0.31 | | |
Portfolio turnover rate (%) | | | 31.48 | | | | 31.48 | | | | 31.48 | | | | 67.61 | | | | 67.61 | | | | 67.61 | | |
* Per share amounts have been calculated using the average shares method.
(a) Does not take into account the sales charge of 5.00% for Class A shares and the CDSC (Contingent Deferred Sales Charge) of 1.00% for Class C shares.
See Notes to Financial Statements.
FIRST EAGLE FUNDS | ANNUAL REPORT | OCTOBER 31, 2012
168
Fund of America
| | | YEAR ENDED OCTOBER 31, | |
| | | 2010 | | 2009 | | 2008 | |
| | | CLASS A | | CLASS C | | CLASS Y | | CLASS A | | CLASS C | | CLASS Y | | CLASS A | | CLASS C | | CLASS Y | |
Selected data for a share of beneficial interest outstanding throughout
each year is presented below:* | |
Net asset value,
beginning of year ($) | | | 19.32 | | | | 17.25 | | | | 19.66 | | | | 18.92 | | | | 17.14 | | | | 19.23 | | | | 29.79 | | | | 27.39 | | | | 30.22 | | |
Income from investment operations: | |
Net investment income (loss) ($) | | | 0.13 | | | | -0.03 | | | | 0.14 | | | | -0.06 | | | | -0.18 | | | | -0.07 | | | | -0.06 | | | | -0.20 | | | | -0.01 | | |
Net realized and unrealized
gains (losses) on investments | | | 4.61 | | | | 4.10 | | | | 4.67 | | | | 1.61 | | | | 1.44 | | | | 1.65 | | | | -7.85 | | | | -7.16 | | | | -8.03 | | |
Total income (loss) from
investment operations | | | 4.74 | | | | 4.07 | | | | 4.81 | | | | 1.55 | | | | 1.26 | | | | 1.58 | | | | -7.91 | | | | -7.36 | | | | -8.04 | | |
Less distributions: | |
Dividends from net
investment income ($) | | | — | | | | — | | | | — | | | | — | | | | — | | | | — | | | | -0.07 | | | | — | | | | -0.06 | | |
Distributions from
capital gains | | | — | | | | — | | | | — | | | | -1.15 | | | | -1.15 | | | | -1.15 | | | | -2.89 | | | | -2.89 | | | | -2.89 | | |
Total distributions | | | — | | | | — | | | | — | | | | -1.15 | | | | -1.15 | | | | -1.15 | | | | -2.96 | | | | -2.89 | | | | -2.95 | | |
Net asset value,
end of year ($) | | | 24.06 | | | | 21.32 | | | | 24.47 | | | | 19.32 | | | | 17.25 | | | | 19.66 | | | | 18.92 | | | | 17.14 | | | | 19.23 | | |
Total return(a) (%) | | | 24.53 | | | | 23.59 | | | | 24.47 | | | | 9.13 | | | | 8.34 | | | | 9.14 | | | | -29.20 | | | | -29.74 | | | | -29.23 | | |
Ratios and supplemental data | |
Net assets, end of year
(millions) ($) | | | 379 | | | | 122 | | | | 599 | | | | 276 | | | | 90 | | | | 503 | | | | 127 | | | | 61 | | | | 501 | | |
Ratio of operating expenses
to average net assets
including earnings credits (%) | | | 1.47 | | | | 2.22 | | | | 1.47 | | | | 1.50 | | | | 2.25 | | | | 1.50 | | | | 1.41 | | | | 2.16 | | | | 1.41 | | |
Ratio of operating expenses
to average net assets
excluding earnings credits (%) | | | 1.47 | | | | 2.22 | | | | 1.47 | | | | 1.50 | | | | 2.25 | | | | 1.50 | | | | 1.42 | | | | 2.17 | | | | 1.42 | | |
Ratio of net investment income
(loss) to average net assets
including earnings credits (%) | | | 0.61 | | | | -0.14 | | | | 0.62 | | | | -0.34 | | | | -1.10 | | | | -0.37 | | | | -0.23 | | | | -0.87 | | | | -0.06 | | |
Ratio of net investment income
(loss) to average net assets
excluding earnings credits (%) | | | 0.61 | | | | -0.14 | | | | 0.62 | | | | -0.34 | | | | -1.10 | | | | -0.37 | | | | -0.24 | | | | -0.88 | | | | -0.07 | | |
Portfolio turnover rate (%) | | | 40.00 | | | | 40.00 | | | | 40.00 | | | | 40.41 | | | | 40.41 | | | | 40.41 | | | | 63.97 | | | | 63.97 | | | | 63.97 | | |
FIRST EAGLE FUNDS | ANNUAL REPORT | OCTOBER 31, 2012
169
Notes to Financial Statements
Note 1 — Significant Accounting Policies
First Eagle Funds (the "Trust"), is an open-end management investment company registered under the Investment Company Act of 1940, as amended ("1940 Act"). The Trust consists of seven separate portfolios, First Eagle Global Fund, First Eagle Overseas Fund, First Eagle U.S. Value Fund, First Eagle Gold Fund, First Eagle Global Income Builder Fund, First Eagle High Yield Fund and First Eagle Fund of America (each individually a "Fund" or collectively the "Funds"). All the Funds are diversified mutual funds except for First Eagle Gold Fund and First Eagle Fund of America, which are non-diversified. The Trust is a Delaware statutory trust. The First Eagle Global Fund seeks long-term growth of capital by investing in a range of asset classes from markets in the United States and throughout the world. The First Eagle Overseas Fund seeks long-term growth of capital by investing primarily in equities issued by non-U.S. corporations. The First Eagle U.S. Value Fund seeks long-term growth of capital by investing, under normal market conditions, at least 80% of its assets in domestic equity and debt securities. The First Eagle Gold Fund seeks to provide investors the opportunity to participate in the investment characteristics of gold (and to a limited extent other precious metals) for a portion of their overall investment portfolio. The First Eagle Global Income Builder Fund (which commenced operations on May 1, 2012) seeks current income generation and long-term growth of capital. In seeking to achieve its objective, the Fund invests primarily in common stocks of U.S. and foreign companies that offer attractive dividend yields and a range of fixed income instruments, including high-yield, below investment grade, investment grade and sovereign debt, from markets in the United States and multiple countries around the world. The First Eagle High Yield Fund seeks to provide investors with a high level of current income. The First Eagle Fund of America seeks capital appreciation by investing primarily in domestic stocks and, to a lesser extent, in debt and international equity securities.
First Eagle Investment Management, LLC (the "Adviser"), a subsidiary of Arnhold and S. Bleichroeder Holdings, Inc. ("ASB Holdings"), manages the Funds.
The following is a summary of significant accounting policies adhered to by the Funds and are in conformity with U.S. generally accepted accounting principles ("GAAP").
a) Investment in Subsidiary — The First Eagle Gold Fund (the "Gold Fund") may invest in certain precious metals through its investment in the First Eagle Gold Cayman Fund, Ltd., a wholly owned subsidiary (the "Subsidiary"). The
FIRST EAGLE FUNDS | ANNUAL REPORT | OCTOBER 31, 2012
170
Gold Fund may invest up to 25% of its total assets in shares of the Subsidiary. The Subsidiary has the ability to invest in commodities and securities consistent with the investment objective of the Gold Fund.
The Subsidiary, established on May 28, 2010, is an exempted company under the laws of the Cayman Islands. The consolidated financial statements include the accounts of the Gold Fund and the Subsidiary. All intercompany transactions and balances have been eliminated. As of October 31, 2012, the Subsidiary has $65,844,703 in net assets, representing 2.14% of the Gold Fund's net assets.
b) Investment valuation — Each Fund computes its net asset value once daily as of the close of trading on each day the New York Stock Exchange ("NYSE") is open for trading. The net asset value per share is computed by dividing the total current value of the assets of a Fund, less its liabilities, by the total number of shares outstanding at the time of such computation.
A portfolio security (including an option), other than a bond, which is traded on a U.S. national securities exchange or a securities exchange abroad is normally valued at the price of the last sale on the exchange as of the close of business on the date on which assets are valued. If there are no sales on such date, such portfolio investment will be valued at the mean between the closing bid and asked prices (and if there is only a bid or only an asked price on such date, valuation will be at such bid or asked price for long or short positions, respectively). Securities, other than bonds, traded in the over-the-counter market are valued at the mean between the last bid and asked prices prior to the time of valuation (and if there is only a bid or only an asked price on such date, valuation will be at such bid or asked price for long or short positions, respectively), except if such unlisted security traded on the NASDAQ, in which case it is valued at its last sale price (or, if available, the NASDAQ Official Closing Price).
All bonds, whether listed on an exchange or traded in the over-the-counter market (and except for short-term investments as described in the next sentence), for which market quotations are readily available are valued at the mean between the last bid and asked prices received from dealers in the over-the-counter market in the United States or abroad, except that when no asked price is available, bonds are valued at the last bid price alone. Broker-Dealers or pricing services use multiple valuation techniques to determine value. In instances where sufficient market activity exists, dealers
FIRST EAGLE FUNDS | ANNUAL REPORT | OCTOBER 31, 2012
171
Notes to Financial Statements
or pricing services may utilize a market-based approach through which quotes from market makers are used to determine fair value. In instances where sufficient market activity may not exist or is limited, the dealers or pricing services also utilize proprietary valuation models which may consider market transactions in comparable securities and the various relationships between securities in determining value and/or market characteristics such as benchmark yield curves, option-adjusted spreads, credit spreads, estimated default rates, coupon-rates, anticipated timing of principal repayments, underlying collateral, and other unique security features in order to estimate the relevant cash flows, which are then discounted to calculate the fair values. Short-term investments maturing in sixty days or less are valued at cost plus interest earned (or discount amortized, as the case may be), which is deemed to approximate value.
Commodities (such as physical metals) are valued at the spot price at the time trading on the New York Stock Exchange closes (normally 4:00 p.m. E.S.T.).
Forward contracts are valued at the current cost of covering or offsetting such contracts.
The 2:00 p.m. E.S.T. exchange rates typically are used to convert foreign security prices into U.S. dollars. Any security that is listed or traded on more than one exchange (or traded in multiple markets) is valued at the relevant quotation on the exchange or market deemed to be the primary trading venue for that security. In the absence of such a quotation, a quotation from the exchange or market deemed by the Adviser to be the secondary trading venue for the particular security shall be used. The Funds use pricing services to identify the market prices of publicly traded securities in their portfolios. When market prices are determined to be "stale" as a result of limited market activity for a particular holding, or in other circumstances when market prices are unavailable, such as for private placements, or determined to be unreliable for a particular holding, such holdings may be "fair valued" in accordance with procedures approved by the Board of Trustees ("Board"). Additionally, with respect to foreign holdings, specifically in circumstances leading the Adviser to believe that significant events occurring after the close of a foreign market have materially affected the value of a Fund's holdings in that market, such holdings may be fair valued to reflect the events in accordance with procedures approved by the Board. The determination of whether a particular foreign investment should be fair valued will be based
FIRST EAGLE FUNDS | ANNUAL REPORT | OCTOBER 31, 2012
172
on review of a number of factors, including developments in foreign markets, the performance of U.S. securities markets and security-specific events. The values assigned to a Fund's holdings therefore may differ on occasion from reported market values.
Certain Funds with non-U.S. holdings have adopted procedures under which movements in the prices for U.S. securities (beyond specified thresholds) occurring after the close of a foreign market may require fair valuation of securities traded in that foreign market. The values assigned to a Fund's foreign holdings therefore may differ on occasion from reported market values. The Trust and the Adviser believe relying on the procedures as just described will result in prices that are more reflective of the actual market value of portfolio securities held by the Funds as of 4:00 p.m. E.S.T.
The Funds adopted provisions surrounding fair value measurements and disclosures that define fair value, establishes a framework for measuring fair value in GAAP and expands disclosures about fair value measurements. This applies to fair value measurements that are already required or permitted by other accounting standards and is intended to increase consistency of those measurements and applies broadly to securities and other types of assets and liabilities.
The Funds disclose the fair value of their investments in a hierarchy that prioritizes the inputs or assumptions to valuation techniques used to measure fair value. These inputs are used in determining the value of the Funds' investments and are summarized in the following fair value hierarchy:
Level 1 — Quoted prices in active markets for identical securities.
Level 2 — Other significant observable inputs (including quoted prices for similar securities, interest rates, prepayment speeds, credit risk, etc.).
Level 3 — Other significant unobservable inputs (including Fund's own assumption in determining the fair value of investments).
The significant unobservable inputs that may be used in determining valuations for investments identified within Level 3 are market comparables and the enterprise value of a company. Indications of value and quotations may be observable at any given time, but are currently treated by the Funds as unobservable. Significant changes in any of the unobservable inputs may significantly impact the fair value measurement. The impact is based on the relationship between each unobservable input and the fair value measurement.
FIRST EAGLE FUNDS | ANNUAL REPORT | OCTOBER 31, 2012
173
Notes to Financial Statements
Significant increases (decreases) in enterprise multiples may increase (decrease) the fair value measurement. Significant increases (decreases) in the discount for marketability, probability of insolvency and probability of default may decrease (increase) the fair value measurement.
Fair valuation of securities, other financial investments or other assets (collectively, "securities") held by the Funds shall be determined in good faith by or under the direction of the Board, generally acting through its designated Valuation Committee or Valuation Panel (collectively, the "Committees"). The Committees' responsibilities include making determinations regarding Level 3 fair value measurements and providing the results to the Board, in accordance with the Funds' valuation policies.
It is the policy of the Funds to recognize significant transfers between Levels 1, 2 and 3 and to disclose those transfers as of the date of the underlying event which caused the movement.
FIRST EAGLE FUNDS | ANNUAL REPORT | OCTOBER 31, 2012
174
The following is a summary of the Funds' inputs used to value the Funds' investments as of October 31, 2012:
First Eagle Global Fund | |
DESCRIPTION | | LEVEL 1 | | LEVEL 2(a) | | LEVEL 3(b) | | TOTAL | |
Assets: † | |
U.S. Common Stocks | | $ | 12,518,385,474 | | | $ | 4,443,168 | | | $ | — | | | $ | 12,522,828,642 | | |
International
Common Stocks | | | 14,738,573,743 | | | | 23,660,840 | | | | 10,721,439 | | | | 14,772,956,022 | | |
International
Preferred Stocks | | | 158,437,574 | | | | — | | | | — | | | | 158,437,574 | | |
Warrant | | | 66,372,855 | | | | — | | | | — | | | | 66,372,855 | | |
Commodity* | | | 1,809,221,276 | | | | — | | | | — | | | | 1,809,221,276 | | |
U.S. Corporate Bonds | | | — | | | | 33,513,136 | | | | — | | | | 33,513,136 | | |
International
Corporate Notes
and Bonds | | | — | | | | 63,749,725 | | | | 31,128,000 | | | | 94,877,725 | | |
International
Government Bonds | | | — | | | | 183,088,779 | | | | — | | | | 183,088,779 | | |
U.S. Treasury Bills | | | — | | | | 466,089,570 | | | | — | | | | 466,089,570 | | |
International
Commercial Paper | | | — | | | | 2,194,813,423 | | | | — | | | | 2,194,813,423 | | |
U.S. Commercial Paper | | | — | | | | 4,186,471,847 | | | | — | | | | 4,186,471,847 | | |
Foreign Currency
Contracts** | | | — | | | | 31,482,719 | | | | — | | | | 31,482,719 | | |
Total | | $ | 29,290,990,922 | | | $ | 7,187,313,207 | | | $ | 41,849,439 | | | $ | 36,520,153,568 | | |
Liabilities: | |
Covered Call
Options Written | | $ | 1,551,880 | | | $ | — | | | $ | — | | | $ | 1,551,880 | | |
Foreign Currency
Contracts** | | | — | | | | 40,435,779 | | | | — | | | | 40,435,779 | | |
Total | | $ | 1,551,880 | | | $ | 40,435,779 | | | $ | — | | | $ | 41,987,659 | | |
(a) Transfer into/out of Level 2 represent value as of the beginning of the period.
International common stocks and international preferred stocks valued at $10,795,120,576 and $323,100,978 were transferred from Level 2 to Level 1 during the twelve-month period ended October 31, 2012. At October 31, 2011, these securities were valued based on fair value adjustment factors; at October 31, 2012, these securities were valued using quoted market prices in active markets. There were no transfers from Level 1 to Level 2 as of the year ended October 31, 2012.
(b) Level 3 securities are identified in the Schedule of Investments with footnote (f).
† See Schedule of Investments for additional detailed categorizations.
* Represents gold bullion.
** Foreign currency contracts are valued at net unrealized appreciation (depreciation) on the investment.
FIRST EAGLE FUNDS | ANNUAL REPORT | OCTOBER 31, 2012
175
Notes to Financial Statements
Fair Value Level 3 activity for the year ended October 31, 2012 was as follows:
First Eagle Global Fund — (continued) | |
| | | INTERNATIONAL | | INTERNATIONAL | | | |
| | | COMMON STOCKS | | CORPORATE BONDS | | TOTAL VALUE | |
Beginning Balance — market value | | $ | 11,064,479 | | | $ | 33,466,782 | | | $ | 44,531,261 | | |
Purchases | | | — | | | | 48,495 | | | | 48,495 | | |
Sales | | | | | | | | | | | | | |
Transfer In — Level 3 | | | — | | | | — | | | | — | | |
Transfer Out — Level 3 | | | — | | | | — | | | | — | | |
Accrued Amortization | | | — | | | | — | | | | — | | |
Realized Gains (Losses) | | | — | | | | — | | | | — | | |
Change in Unrealized Appreciation
(Depreciation) | | | (343,040 | ) | | | (2,387,277 | ) | | | (2,730,317 | ) | |
Ending Balance — market value | | $ | 10,721,439 | | | $ | 31,128,000 | | | $ | 41,849,439 | | |
Change in unrealized gains or (losses)
relating to assets still held at reporting date | | $ | (343,040 | ) | | $ | (2,387,277 | ) | | $ | (2,730,317 | ) | |
FIRST EAGLE FUNDS | ANNUAL REPORT | OCTOBER 31, 2012
176
First Eagle Overseas Fund | |
DESCRIPTION | | LEVEL 1 | | LEVEL 2(a) | | LEVEL 3(b) | | TOTAL | |
Assets: † | |
International
Common Stocks | | $ | 7,878,052,866 | | | $ | 29,037,564 | | | $ | 36,904,767 | | | $ | 7,943,995,197 | | |
U.S. Common Stock | | | 37,742,218 | | | | — | | | | — | | | | 37,742,218 | | |
International
Preferred Stocks | | | 117,875,329 | | | | — | | | | — | | | | 117,875,329 | | |
Commodity* | | | 679,473,229 | | | | — | | | | — | | | | 679,473,229 | | |
Term Loans | | | — | | | | 12,471,962 | | | | — | | | | 12,471,962 | | |
International
Corporate Bonds | | | — | | | | 25,925,119 | | | | 20,752,000 | | | | 46,677,119 | | |
International
Government Bonds | | | — | | | | 92,372,979 | | | | — | | | | 92,372,979 | | |
U.S. Treasury Bills | | | — | | | | 168,652,848 | | | | — | | | | 168,652,848 | | |
International
Commercial Paper | | | — | | | | 749,189,166 | | | | — | | | | 749,189,166 | | |
U.S. Commercial Paper | | | — | | | | 1,478,337,829 | | | | — | | | | 1,478,337,829 | | |
Foreign Currency
Contracts** | | | — | | | | 15,803,988 | | | | — | | | | 15,803,988 | | |
Total | | $ | 8,713,143,642 | | | $ | 2,571,791,455 | | | $ | 57,656,767 | | | $ | 11,342,591,864 | | |
Liabilities: | |
Foreign Currency
Contracts** | | $ | — | | | $ | 23,093,651 | | | $ | — | | | $ | 23,093,651 | | |
Total | | $ | — | | | $ | 23,093,651 | | | $ | — | | | $ | 23,093,651 | | |
(a) Transfer into/out of Level 2 represent value as of the beginning of the period.
(b) Level 3 securities are identified in the Schedule of Investments with footnote (f).
† See Schedule of Investments for additional detailed categorizations.
* Represents gold bullion.
** Foreign currency contracts are value at net unrealized appreciation (depreciation) on the investment.
International common stocks and international preferred stocks valued at $6,351,952,843 and $199,154,571 were transferred from Level 2 to Level 1 during the twelve-month period ended October 31, 2012. At October 31, 2011, these securities were valued based on fair value adjustment factors; at October 31, 2012, these securities were valued using quoted market prices in active markets. There were no transfers from Level 1 to Level 2 as of twelve-month period ended October 31, 2012.
FIRST EAGLE FUNDS | ANNUAL REPORT | OCTOBER 31, 2012
177
Notes to Financial Statements
Fair Value Level 3 activity for the year ended October 31, 2012 was as follows:
First Eagle Overseas Fund — (continued) | |
| | | INTERNATIONAL | | INTERNATIONAL | | | | | |
| | | COMMON STOCKS | | CORPORATE BONDS | | TERM LOANS | | TOTAL VALUE | |
Beginning Balance —
market value | | $ | 49,904,715 | | | $ | 22,311,188 | | | $ | 633,621 | | | $ | 72,849,524 | | |
Purchases | | | 31,750 | | | | 22,383 | | | | — | | | | 54,133 | | |
Sales | | | — | | | | — | | | | (642,503 | ) | | | (642,503 | ) | |
Transfer In — Level 3 | | | — | | | | — | | | | — | | | | — | | |
Transfer Out — Level 3 | | | — | | | | — | | | | — | | | | — | | |
Accrued Amortization | | | — | | | | — | | | | (214 | ) | | | (214 | ) | |
Realized Gains (Losses) | | | — | | | | — | | | | (1,768 | ) | | | (1,768 | ) | |
Change in Unrealized
Appreciation (Depreciation) | | | (13,031,698 | ) | | | (1,581,571 | ) | | | 10,864 | | | | (14,602,405 | ) | |
Ending Balance —
market value | | $ | 36,904,767 | | | $ | 20,752,000 | | | $ | — | | | $ | 57,656,767 | | |
Change in unrealized gains or
(losses) relating to assets still
held at reporting date | | $ | (13,031,698 | ) | | $ | (1,581,571 | ) | | $ | — | | | $ | (14,613,269 | ) | |
FIRST EAGLE FUNDS | ANNUAL REPORT | OCTOBER 31, 2012
178
First Eagle U.S. Value Fund | |
DESCRIPTION | | LEVEL 1 | | LEVEL 2 | | LEVEL 3(a) | | TOTAL | |
Assets: † | |
U.S. Common Stocks | | $ | 1,885,228,947 | | | $ | 3,245 | | | $ | — | | | $ | 1,885,232,192 | | |
International
Common Stocks | | | 242,281,302 | | | | 372,047 | | | | — | | | | 242,653,349 | | |
U.S. Preferred Stock | | | — | | | | — | | | | 4,828,435 | | | | 4,828,435 | | |
Warrant | | | 10,741,526 | | | | — | | | | — | | | | 10,741,526 | | |
Commodity* | | | 123,647,217 | | | | — | | | | — | | | | 123,647,217 | | |
International
Corporate Bonds | | | | | | | 6,497,839 | | | | | | | | 6,497,839 | | |
U.S. Convertible Bond | | | — | | | | 20,261,250 | | | | — | | | | 20,261,250 | | |
U.S. Corporate Bonds | | | — | | | | 66,094,380 | | | | — | | | | 66,094,380 | | |
U.S. Treasury Bills | | | — | | | | 49,551,632 | | | | — | | | | 49,551,632 | | |
International
Commercial Paper | | | — | | | | 217,175,287 | | | | — | | | | 217,175,287 | | |
U.S. Commercial Paper | | | — | | | | 380,065,164 | | | | — | | | | 380,065,164 | | |
Total | | $ | 2,261,898,992 | | | $ | 740,020,844 | | | $ | 4,828,435 | | | $ | 3,006,748,271 | | |
Liabilities: | |
Covered Call
Options Written | | $ | 212,260 | | | $ | — | | | $ | — | | | $ | 212,260 | | |
Total | | $ | 212,260 | | | $ | — | | | $ | — | | | $ | 212,260 | | |
(a) Level 3 securities are identified in the Schedule of Investments with footnote (f).
† See Schedule of Investments for additional detailed categorizations.
* Represents gold bullion.
For the year ended October 31, 2012, there was no security transfer activity from Level 1 to Level 2 and no security transfer activity from Level 2 to Level 1.
FIRST EAGLE FUNDS | ANNUAL REPORT | OCTOBER 31, 2012
179
Notes to Financial Statements
Fair Value Level 3 activity for the year ended October 31, 2012 was as follows:
First Eagle U.S. Value Fund — (continued) | |
| | | U.S. PREFERED STOCK | |
Beginning Balance — market value | | $ | 3,555,661 | | |
Purchases | | | — | | |
Sales | | | — | | |
Transfer In — Level 3 | | | — | | |
Transfer Out — Level 3 | | | — | | |
Accrued Amortization | | | — | | |
Realized Gains (Losses) | | | — | | |
Change in Unrealized Appreciation (Depreciation) | | | 1,272,774 | | |
Ending Balance — market value | | $ | 4,828,435 | | |
Change in unrealized gains or (losses) relating to assets still held at
reporting date | | $ | 1,272,774 | | |
First Eagle Gold Fund | |
DESCRIPTION | | LEVEL 1 | | LEVEL 2 | | LEVEL 3(a) | | TOTAL | |
Assets: † | |
International
Common Stocks | | $ | 2,018,910,155 | | | $ | — | | | $ | — | | | $ | 2,018,910,155 | | |
U.S. Common Stocks | | | 260,499,206 | | | | — | | | | — | | | | 260,499,206 | | |
International
Preferred Stock | | | 4,851,600 | | | | — | | | | — | | | | 4,851,600 | | |
Investment Company | | | 464,505 | | | | — | | | | — | | | | 464,505 | | |
Warrants | | | — | | | | — | | | | — | | | | — | | |
Commodity* | | | 576,941,473 | | | | — | | | | — | | | | 576,941,473 | | |
International
Convertible Bonds | | | — | | | | — | | | | 30,000,000 | | | | 30,000,000 | | |
U.S. Treasury Bills | | | — | | | | 13,522,827 | | | | — | | | | 13,522,827 | | |
International
Commercial Paper | | | — | | | | 50,961,248 | | | | — | | | | 50,961,248 | | |
U.S. Commercial Paper | | | — | | | | 123,736,209 | | | | — | | | | 123,736,209 | | |
Total | | $ | 2,861,666,939 | | | $ | 188,220,284 | | | $ | 30,000,000 | | | $ | 3,079,887,223 | | |
(a) Level 3 securities are identified in the Schedule of Investments with footnote (e).
† See Consolidated Schedule of Investments for additional detailed categorizations.
* Represents gold bullion.
For the year ended October 31, 2012, there was no security transfer activity from Level 1 to Level 2 and no security transfer activity from Level 2 to Level 1.
FIRST EAGLE FUNDS | ANNUAL REPORT | OCTOBER 31, 2012
180
Fair Value Level 3 activity for the year ended October 31, 2012 was as follows:
First Eagle Gold Fund — (continued) | |
| | | INTERNATIONAL | | | | | |
| | | CONVERTIBLE BONDS | | WARRANTS | | TOTAL VALUE | |
Beginning Balance — market value | | $ | 30,000,000 | | | $ | — | | | $ | 30,000,000 | | |
Purchases | | | — | | | | 0 | | | | 0 | | |
Sales | | | — | | | | — | | | | — | | |
Transfer In — Level 3 | | | 2,110,129 | | | | — | | | | 2,110,129 | | |
Transfer Out — Level 3 | | | — | | | | — | | | | — | | |
Accrued Amortization | | | — | | | | — | | | | — | | |
Realized Gains (Losses) | | | — | | | | — | | | | — | | |
Change in Unrealized Appreciation
(Depreciation) | | | (2,110,129 | ) | | | 0 | | | | (2,110,129 | ) | |
Ending Balance — market value | | $ | 30,000,000 | | | $ | 0 | | | $ | 30,000,000 | | |
Change in unrealized gains or (losses)
relating to assets still held at reporting date | | $ | (2,110,129 | ) | | $ | 0 | | | $ | (2,110,129 | ) | |
First Eagle Global Income Builder Fund | |
DESCRIPTION | | LEVEL 1 | | LEVEL 2 | | LEVEL 3 | | TOTAL | |
Assets: † | |
U.S. Common Stocks | | $ | 21,740,261 | | | $ | — | | | $ | — | | | $ | 21,740,261 | | |
International Common Stocks | | | 31,055,664 | | | | — | | | | — | | | | 31,055,664 | | |
Closed-End Mutual Fund | | | 1,062,430 | | | | — | | | | — | | | | 1,062,430 | | |
U.S. Convertible Bond | | | — | | | | 1,080,937 | | | | — | | | | 1,080,937 | | |
U.S. Corporate Bonds | | | — | | | | 30,563,442 | | | | — | | | | 30,563,442 | | |
International Corporate Bonds | | | — | | | | 8,553,848 | | | | — | | | | 8,553,848 | | |
Term Loans | | | — | | | | 3,375,370 | | | | — | | | | 3,375,370 | | |
International Commercial Paper | | | — | | | | 825,000 | | | | — | | | | 825,000 | | |
U.S. Commercial Paper | | | — | | | | 4,986,000 | | | | — | | | | 4,986,000 | | |
Total | | $ | 53,858,355 | | | $ | 49,384,597 | | | $ | — | | | $ | 103,242,952 | | |
Liabilities: | |
Foreign Currency Contracts** | | $ | — | | | $ | 175,833 | | | $ | — | | | $ | 175,833 | | |
Total | | $ | — | | | $ | 175,833 | | | $ | — | | | $ | 175,833 | | |
† See Schedule of Investments for additional detailed categorizations.
For the period ended October 31, 2012, there was no security transfer activity from Level 1 to Level 2 and no security transfer activity from Level 2 to Level 1.
FIRST EAGLE FUNDS | ANNUAL REPORT | OCTOBER 31, 2012
181
Notes to Financial Statements
First Eagle High Yield Fund | |
DESCRIPTION | | LEVEL 1 | | LEVEL 2 | | LEVEL 3 | | TOTAL | |
Assets: † | |
U.S. Convertible Bond | | $ | — | | | $ | 6,077,813 | | | $ | — | | | $ | 6,077,813 | | |
U.S. Corporate Bonds | | | — | | | | 393,302,996 | | | | — | | | | 393,302,996 | | |
International Corporate Bonds | | | — | | | | 138,748,482 | | | | — | | | | 138,748,482 | | |
Term Loans | | | — | | | | 72,974,235 | | | | — | | | | 72,974,235 | | |
International Commercial Paper | | | — | | | | 4,283,889 | | | | — | | | | 4,283,889 | | |
U.S. Commercial Paper | | | — | | | | 20,700,577 | | | | — | | | | 20,700,577 | | |
Total | | $ | — | | | $ | 636,087,992 | | | $ | — | | | $ | 636,087,992 | | |
Liabilities: | |
Foreign Currency Contracts** | | $ | — | | | $ | 693,001 | | | $ | — | | | $ | 693,001 | | |
Total | | $ | — | | | $ | 693,001 | | | $ | — | | | $ | 693,001 | | |
† See Schedule of Investments for additional detailed categorizations.
** Foreign currency contracts are value at net unrealized appreciation (depreciation) on the investment.
For the period ended October 31, 2012, there was no security transfer activity from Level 1 to Level 2 and no security transfer activity from Level 2 to Level 1.
FIRST EAGLE FUNDS | ANNUAL REPORT | OCTOBER 31, 2012
182
First Eagle Fund of America | |
DESCRIPTION | | LEVEL 1 | | LEVEL 2 | | LEVEL 3 | | TOTAL | |
Assets: † | |
U.S. Common Stocks | | $ | 1,429,261,326 | | | $ | — | | | $ | — | | | $ | 1,429,261,326 | | |
International Common Stocks | | | 56,305,186 | | | | — | | | | — | | | | 56,305,186 | | |
Exchange Traded Fund | | | 53,592,095 | | | | — | | | | — | | | | 53,592,095 | | |
Investment Companies | | | 89,249,078 | | | | — | | | | — | | | | 89,249,078 | | |
U.S. Convertible Bond | | | — | | | | 3,886,837 | | | | — | | | | 3,886,837 | | |
Call Option Purchased | | | 315,000 | | | | — | | | | — | | | | 315,000 | | |
Total | | $ | 1,628,722,685 | | | $ | 3,886,837 | | | $ | — | | | $ | 1,632,609,522 | | |
Liabilities: | |
Covered Call Options Written | | $ | 30,400,855 | | | $ | — | | | $ | — | | | $ | 30,400,855 | | |
Put Option Written | | | 199,500 | | | | — | | | | — | | | | 199,500 | | |
Total | | $ | 30,600,355 | | | $ | — | | | $ | — | | | $ | 30,600,355 | | |
† See Schedule of Investments for additional detailed categorizations.
For the year ended October 31, 2012, there was no security transfer activity from Level 1 to Level 2 and no security transfer activity from Level 2 to Level 1.
FIRST EAGLE FUNDS | ANNUAL REPORT | OCTOBER 31, 2012
183
Notes to Financial Statements
c) Investment transactions and income — Investment transactions are accounted for on a trade date basis. The specific identification method is used in determining realized gains and losses from investment transactions. Dividend income is recorded on the ex-dividend date. Interest income is recorded daily on the accrual basis. In computing investment income, each Fund accretes discounts and amortizes premiums on debt obligations using the effective yield method. Investment income is allocated to each Fund's share class in proportion to its relative net assets. Payments received from certain investments held by the Funds may be comprised of dividends, capital gains and return of capital. The Funds originally estimate the expected classification of such payments. The amounts may subsequently be reclassified upon receipt of information from the issuer.
d) Expenses — Expenses arising in connection with a Fund are charged directly to that Fund. Expenses common to all Funds are generally allocated to each Fund in proportion to its relative net assets. Certain expenses are shared with the First Eagle Variable Funds, an affiliated fund group. Such costs are generally allocated using the ratio of the Fund's average daily net assets relative to the total average daily net assets of the First Eagle Variable Funds. Earnings credits may reduce shareholder servicing agent fees by the amount of interest earned on balances with such service provider.
e) Foreign currency translation — The books and records of the Funds are maintained in U.S. dollars. The market values of securities which are not traded in U.S. currency are recorded in the financial statements after translation to U.S. dollars based on the applicable exchange rates at the end of the period. The costs of such securities are translated at exchange rates prevailing when acquired. Related interest, dividends and withholding taxes are accrued at the rates of exchange prevailing on the respective dates of such transactions.
The net assets of each of the Funds are presented at the foreign exchange rates and market values at the close of the period. The Funds do not isolate that portion of gains and losses on investments which is due to changes in foreign exchange rates from that which is due to changes in market prices of the securities. However, for federal income tax purposes each Fund does isolate the effect of changes in foreign exchange rates from the changes in market prices for realized gains and losses on debt obligations.
f) Forward currency contracts — In connection with portfolio purchases and sales of securities denominated in foreign currencies, each Fund may enter into forward currency contracts. The First Eagle Global, Overseas, High Yield and Global Income Builder Funds enter into foreign exchange contracts
FIRST EAGLE FUNDS | ANNUAL REPORT | OCTOBER 31, 2012
184
primarily to manage and/or gain exposure to certain foreign currencies. The Funds' currency transactions include portfolio hedging on portfolio positions. Portfolio hedging is the use of a forward contract (or other cash management position) with respect to one or more portfolio security positions denominated or quoted in a particular currency. Currency exchange transactions involve currencies of different countries that the Funds invest in and serve as hedges against possible variations in the exchange rates between these currencies and the U.S. dollar. Each Fund may engage in portfolio hedging with respect to the currency of a particular country in amounts approximating actual or anticipated positions in securities denominated in that currency. Hedging can reduce exposure to currency exchange movements, but cannot eliminate that exposure. It is possible to lose money under a hedge.
Funds investing in foreign exchange contracts are exposed to risk if the value of the currency changes unfavorably, if the counterparties to the contracts are unable to meet the terms of their contracts or if the Fund is unable to enter into a closing position. Forward currency contracts outstanding at period end, if any, are listed after the Fund's portfolio. Outstanding contracts at period end are indicative of the volume of activity during the period.
The Funds adopted provisions surrounding disclosures and derivative instruments and hedging activities which require qualitative disclosures about objectives and strategies for using derivatives, quantitative disclosures about fair value amounts of gains and losses on derivative instruments, and disclosures about currency-risk-related contingent features in derivative agreements.
FIRST EAGLE FUNDS | ANNUAL REPORT | OCTOBER 31, 2012
185
Notes to Financial Statements
At October 31, 2012, the Funds had the following foreign forward currency contracts grouped into appropriate risk categories illustrated below:
First Eagle Global Fund | |
| | | | | | | GAIN OR (LOSS)
DERIVATIVE RECOGNIZED
IN INCOME | |
RISK TYPE | | ASSET DERIVATIVE
FAIR VALUE1 | | LIABILITY DERIVATIVE
FAIR VALUE2 | | REALIZED
GAIN3 | | CHANGE IN
DEPRECIATION4 | |
Foreign Currency | | $ | 31,482,719 | | | $ | 40,435,779 | | | $ | 170,287,310 | | | $ | (9,405,841 | ) | |
First Eagle Overseas Fund | |
| | | | | | | GAIN OR (LOSS)
DERIVATIVE RECOGNIZED
IN INCOME | |
RISK TYPE | | ASSET DERIVATIVE
FAIR VALUE1 | | LIABILITY DERIVATIVE
FAIR VALUE2 | | REALIZED
GAIN3 | | CHANGE IN
DEPRECIATION4 | |
Foreign Currency | | $ | 15,803,988 | | | $ | 23,093,651 | | | $ | 99,354,046 | | | $ | (6,541,909 | ) | |
First Eagle High Yield Fund | |
| | | | | | | GAIN OR (LOSS)
DERIVATIVE RECOGNIZED
IN INCOME | |
RISK TYPE | | ASSET DERIVATIVE
FAIR VALUE1 | | LIABILITY DERIVATIVE
FAIR VALUE2 | | REALIZED
GAIN3 | | CHANGE IN
DEPRECIATION4 | |
Foreign Currency | | $ | 0 | | | $ | 693,001 | | | $ | 385,237 | | | $ | (621,255 | ) | |
First Eagle Global Income Builder Fund | |
| | | | | | | GAIN OR (LOSS)
DERIVATIVE RECOGNIZED
IN INCOME | |
RISK TYPE | | ASSET DERIVATIVE
FAIR VALUE1 | | LIABILITY DERIVATIVE
FAIR VALUE2 | | REALIZED
GAIN3 | | CHANGE IN
DEPRECIATION4 | |
Foreign Currency | | $ | 0 | | | $ | 175,833 | | | $ | 52,532 | | | $ | (175,833 | ) | |
g) Options — In order to produce incremental earnings or protect against declines in the value of portfolio securities, First Eagle Global Fund, First Eagle U.S. Value Fund and First Eagle Fund of America write covered call options on portfolio securities. The Funds may also use options for speculative purposes, although they generally do not employ options for this purpose.
1 Statements of Assets and Liabilities location: Receivable for forward currency contracts held, at value.
2 Statements of Assets and Liabilities location: Payable for forward currency contracts held, at value.
3 Statements of Operations location: Net realized gains (losses) from: foreign currency and forward contract related transactions.
4 Statements of Operations location: Changes in unrealized appreciation (depreciation) of: foreign currency and forward contract related translation.
FIRST EAGLE FUNDS | ANNUAL REPORT | OCTOBER 31, 2012
186
Options contracts are valued daily based upon the last sale price on the principal exchange on which the option is traded and unrealized appreciation/depreciation is recorded. If there is no sale on such day, the mean between the last bid and asked prices is used. When an option is exercised, the proceeds on the sale of a written call option is adjusted by the amount of premium received or paid. When a written option expires, the Funds will realize a gain equal to the amount of the premium received. When the Funds enter into a closing purchase transaction, the Funds will realize a gain (or loss, if the cost of the closing purchase transaction exceeds the premium received when the option was written) without regard to any unrealized gain or loss on the underlying security and the liability related to such option is eliminated.
The Funds may be required to earmark assets to cover its obligations under option contracts. A call option is covered if the Funds hold, on a share-for-share basis, either the underlying shares or a call on the same security as the call written where the exercise price of the call held is equal to or less than the exercise price of the call written (or greater than the exercise price of the call written if the difference is maintained by the Funds in cash, Treasury bills or other high grade short-term obligations in a segregated account with its custodian). One reason for writing options is to attempt to realize, through the receipt of premiums, a greater return than would be realized on the securities alone. Another reason for writing options is to hedge against a moderate decline in the value of securities owned by the Funds in the case of a call option. If an increase occurs in the underlying security or stock index sufficient to result in the exercise of a call written by the Funds, it may be required to deliver securities or cash and may thereby forego some or all of the gain that otherwise may have been realized on the securities underlying the call option. This "opportunity cost" may be partially or wholly offset by the premium received for the covered call written by the Funds. The risk in writing a covered call option is that the Funds give up the opportunity for profit if the market price of the underlying security increases and the option is exercised. The Funds also have the additional risk of not being able to enter into a closing transaction if a liquid secondary market does not exist.
The Funds may also write over-the-counter options where the completion of the obligation is dependent upon the credit standing of the counterparty.
FIRST EAGLE FUNDS | ANNUAL REPORT | OCTOBER 31, 2012
187
Notes to Financial Statements
For the year ended October 31, 2012, First Eagle Global Fund, First Eagle U.S. Value Fund and First Eagle Fund of America had the following options transactions.
First Eagle Global Fund | |
WRITTEN OPTIONS | | NUMBER
OF CONTRACTS | | PREMIUM
RECEIVED | |
Options outstanding at October 31, 2011 | | | 17,550 | | | $ | 2,030,334 | | |
Options written | | | 47,479 | | | | 11,023,424 | | |
Options assigned | | | 0 | | | | 0 | | |
Options expired/closed | | | (33,098 | ) | | | (6,945,616 | ) | |
Options outstanding at October 31, 2012 | | | 31,931 | | | $ | 6,108,142 | | |
As of October 31, 2012, portfolio securities valued at $149,517,156 were segregated to cover collateral requirements for written options.
First Eagle U.S. Value Fund | |
WRITTEN OPTIONS | | NUMBER
OF CONTRACTS | | PREMIUM
RECEIVED | |
Options outstanding at October 31, 2011 | | | 3,160 | | | $ | 341,309 | | |
Options written | | | 4,990 | | | | 1,044,773 | | |
Options assigned | | | 0 | | | | 0 | | |
Options expired/closed | | | (4,557 | ) | | | (781,559 | ) | |
Options outstanding at October 31, 2012 | | | 3,593 | | | $ | 604,523 | | |
As of October 31, 2012, portfolio securities valued at $16,864,396 were segregated to cover collateral requirements for written options.
First Eagle Fund of America | |
WRITTEN OPTIONS | | NUMBER
OF CONTRACTS | | PREMIUM
RECEIVED | |
Options outstanding at October 31, 2011 | | | 92,105 | | | $ | 20,894,677 | | |
Options written | | | 888,748 | | | | 208,948,695 | | |
Options assigned | | | (75,487 | ) | | | (14,959,635 | ) | |
Options expired/closed | | | (760,035 | ) | | | (178,661,035 | ) | |
Options outstanding at October 31, 2012 | | | 145,331 | | | $ | 36,222,702 | | |
PURCHASED OPTIONS | | NUMBER
OF CONTRACTS | |
COST | |
Options outstanding at October 31, 2011 | | | 2,799 | | | $ | 1,113,812 | | |
Options purchased | | | 9,000 | | | | 1,411,776 | | |
Options closed | | | (10,299 | ) | | | (2,215,852 | ) | |
Options outstanding at October 31, 2012 | | | 1,500 | | | $ | 309,736 | | |
FIRST EAGLE FUNDS | ANNUAL REPORT | OCTOBER 31, 2012
188
As of October 31, 2012, portfolio securities valued at $586,801,551 were segregated to cover collateral requirements for written options.
Outstanding contracts at period-end are indicative of the volume of activity during the period.
At October 31, 2012, the Funds had the following options grouped into appropriate risk categories illustrated below:
First Eagle Global Fund | |
| | | | | GAIN OR (LOSS)
DERIVATIVE RECOGNIZED
IN INCOME | |
RISK TYPE | | LIABILITY DERIVATIVE
FAIR VALUE2 | | REALIZED
GAIN3 | | CHANGE IN
APPRECIATION4 | |
Equity —
Written options | | $ | 1,551,880 | | | $ | 5,939,832 | | | $ | 4,894,678 | | |
First Eagle U.S. Value Fund | |
| | | | | GAIN OR (LOSS)
DERIVATIVE RECOGNIZED
IN INCOME | |
RISK TYPE | | LIABILITY DERIVATIVE
FAIR VALUE2 | | REALIZED
GAIN3 | | CHANGE IN
APPRECIATION4 | |
Equity —
Written options | | $ | 212,260 | | | $ | 695,340 | | | $ | 379,704 | | |
First Eagle Fund of America | |
| | | | | | | GAIN OR (LOSS)
DERIVATIVE RECOGNIZED
IN INCOME | |
RISK TYPE | | ASSET DERIVATIVE
FAIR VALUE1 | | LIABILITY DERIVATIVE
FAIR VALUE2 | | REALIZED
GAIN (LOSS)3 | | CHANGE IN
APPRECIATION
(DEPRECIATION)4 | |
Equity —
Written options | | $ | — | | | $ | 30,600,355 | | | $ | 3,335,303 | | | $ | 15,235,294 | | |
Equity —
Purchased options | | | 315,000 | | | | — | | | | (483,237 | ) | | | (42,509 | ) | |
h) Repurchase agreements — The Funds may enter into repurchase agreement transactions with institutions that meet the adviser's credit guidelines. Each repurchase agreement is valued at amortized cost. The Funds require that the collateral received in a repurchase agreement transaction be transferred
1 Statements of Assets and Liabilities location: Investments, at value, Unaffiliated issuers.
2 Statements of Assets and Liabilities location: Option contracts written, at value.
3 Statements of Operations location: Net realized gains (losses) from: Written options & Investment transactions of unaffiliated issuers.
4 Statements of Operations location: Changes in unrealized appreciation (depreciation) of: Written options & Investment transactions.
FIRST EAGLE FUNDS | ANNUAL REPORT | OCTOBER 31, 2012
189
Notes to Financial Statements
to a custodian in a manner sufficient to enable the Funds to obtain collateral in the event of a counterparty default. If the counterparty defaults and the fair value of the collateral declines, realization of the collateral by the Funds may be delayed or limited.
i) Term Loans — A Fund may invest in term loans, which usually take the form of loan participations and assignments. Loan participations and assignments are agreements to make money available to U.S. or foreign corporations, partnerships or other business entities (the "Borrower") in a specified amount, at a specified rate and within a specified time. A loan is typically originated, negotiated and structured by a U.S. or foreign bank, insurance company or other financial institution (the "Agent") for a group of loan investors ("Loan Investors"). The Agent typically administers and enforces the loan on behalf of the other Loan Investors in the syndicate and may hold any collateral on behalf of the Loan Investors. Such loan participations and assignments are typically senior, secured and collateralized in nature. A Fund records an investment when the Borrower withdraws money and records interest as earned. The Fund generally has no right to enforce compliance with the terms of the loan agreement with the Borrower. As a result, the Fund assumes the credit risk of the Borrower, the selling participant and any intermediary between the Fund and the Borrower ("Intermediate Participants"). In the event that the Borrower, selling participant or Intermediate Participants become insolvent or enters into bankruptcy, each Fund may incur certain costs and delays in realizing payment or may suffer a loss of principal and/or interest.
j) Treasury Inflation-Protected Securities — The Funds invest in Treasury Inflation-Protected Securities ("TIPS") which are specially structured bonds in which the principal amount is adjusted to keep pace with inflation. The inflation (deflation) adjustment is applied to the principal of each bond on a monthly basis and is accounted for as interest income on the Statements of Operations. TIPS are subject to interest rate risk.
k) Restricted Securities — The Funds may invest in securities that are subject to legal or contractual restrictions on resale. These securities generally may be resold in transactions exempt from registration or to the public if the securities are registered. Disposal of these securities may involve time-consuming negotiations and expenses, and prompt sale at an acceptable price may be difficult. Information regarding restricted securities, if any, is included at the end of each Fund's Schedule of Investments.
FIRST EAGLE FUNDS | ANNUAL REPORT | OCTOBER 31, 2012
190
l) United States income taxes — No provision has been made for U.S. federal income taxes since it is the intention of each Fund to distribute to shareholders all taxable net investment income and net realized gains on investments, if any, within the allowable time limit, and to comply with the provisions of the Code for a Regulated Investment Company. The Funds declare and pay such income and capital gains on an annual basis except for the First Eagle High Yield Fund which declares income daily and pays monthly and the First Eagle Global Income Builder Fund which declares and pays income quarterly.
The Funds adopted provisions surrounding income taxes, which require the tax effects of certain tax positions to be recognized. These tax positions must meet a "more likely than not" standard that based on their technical merits, have a more than 50% likelihood of being sustained upon examination. Management of the Trust has analyzed the Funds' tax positions taken on federal and state income tax returns for all open tax years (the current and the prior three tax years) and has concluded that no provision for income tax is required in the Funds' financial statements.
At October 31, 2012, the components of accumulated earnings on a tax basis were as follows:
| | | UNDISTRIBUTED
NET INVESTMENT | | UNDISTRIBUTED
NET REALIZED | | NET
UNREALIZED | | CAPITAL LOSS CARRYFORWARD | |
| | | INCOME | | GAINS | | APPRECIATION | | SHORT-TERM | | LONG-TERM | |
First Eagle
Global Fund | | $ | 508,739,007 | | | $ | 999,371,760 | | | $ | 4,950,968,449 | | | $ | — | | | $ | — | | |
First Eagle
Overseas Fund | | | 191,223,600 | | | | 407,035,137 | | | | 1,430,042,496 | | | | — | | | | — | | |
First Eagle U.S.
Value Fund | | | 32,461,536 | | | | 49,669,543 | | | | 375,611,799 | | | | — | | | | — | | |
First Eagle
Gold Fund | | | 8,877,003 | | | | — | | | | 863,015,761 | | | | 10,237,540 | | | | — | | |
First Eagle
Global Income
Builder Fund | | | 615,045 | | | | — | | | | 1,795,563 | | | | 19,402 | | | | 73,981 | | |
First Eagle High
Yield Fund | | | 1,730,136 | | | | — | | | | 14,216,283 | | | | — | | | | — | | |
First Eagle Fund
of America | | | — | | | | — | | | | 310,294,432 | | | | 12,271,296 | | | | 6,783,958 | | |
The differences between the components of distributable earnings on a tax basis and the amounts reflected in the Statements of Changes in Net Assets
FIRST EAGLE FUNDS | ANNUAL REPORT | OCTOBER 31, 2012
191
Notes to Financial Statements
are primarily due to the treatment of passive foreign investment companies, distributions from real estate investment trusts, investments in partnerships and trusts, the treatment of foreign currencies and wash sales.
Under the Regulated Investment Company Modernization Act of 2010 (the "Act"), net capital losses recognized by the Funds after October 31, 2011, may get carried forward indefinitely, and retain their character as short-term and/or long-term losses. Prior to the Act, net capital losses incurred by the Funds were carried forward eight years and treated as short-term losses. The Act requires that post-enactment net capital losses be used before pre-enactment net capital losses. The Funds did not have capital losses to carry forward prior to the Act.
m) Reclassification of capital accounts — As a result of certain differences in the computation of net investment income and net realized capital gains under federal income tax rules and regulations versus GAAP, a reclassification has been made on the Statements of Assets and Liabilities to increase (decrease) undistributed net investment income, undistributed net realized gains on investments and capital surplus for the Funds as follows:
| | | UNDISTRIBUTED NET
INVESTMENT INCOME
(LOSS) | | UNDISTRIBUTED NET
REALIZED GAINS
(LOSSES) | |
CAPITAL SURPLUS | |
First Eagle Global Fund | | $ | 82,850,594 | | | $ | (160,343,494 | ) | | $ | 77,492,900 | | |
First Eagle Overseas Fund | | | 83,733,338 | | | | (110,070,180 | ) | | | 26,336,842 | | |
First Eagle U.S. Value Fund | | | (1,781,922 | ) | | | (3,705,432 | ) | | | 5,487,354 | | |
First Eagle Gold Fund | | | 23,451,187 | | | | (23,399,525 | ) | | | (51,662 | ) | |
First Eagle Global Income
Builder Fund | | | 12,780 | | | | (6,701 | ) | | | (6,079 | ) | |
First Eagle High Yield Fund | | | 328,212 | | | | (328,212 | ) | | | — | | |
First Eagle Fund of America | | | (784,962 | ) | | | 1,216,092 | | | | (431,130 | ) | |
The primary permanent differences causing such reclassification include the tax treatment of currency gains and losses, dividend redesignations, distributions paid in connection with the redemption of Fund shares, investments in passive foreign investment companies, distributions from real estate investment trusts, investments in partnerships and the disallowance of net operating losses.
FIRST EAGLE FUNDS | ANNUAL REPORT | OCTOBER 31, 2012
192
n) Distributions to shareholders — Distributions to shareholders during the fiscal year ended October 31, 2012 , which are determined in accordance with income tax regulations, are recorded on ex-dividend date.
| | | ORDINARY INCOME | | LONG TERM CAPITAL GAINS | |
| | | 2012 | | 2011 | | 2012 | | 2011 | |
First Eagle Global Fund | | $ | 316,943,267 | | | $ | 327,805,269 | | | $ | 411,966,907 | | | $ | — | | |
First Eagle Overseas Fund | | | 180,304,745 | | | | 133,336,040 | | | | 292,226,209 | | | | 85,999,173 | | |
First Eagle U.S. Value Fund | | | 20,650,956 | | | | 26,901,364 | | | | 48,194,132 | | | | — | | |
First Eagle Gold Fund | | | 38,713,082 | | | | 68,941,144 | | | | 93,877,822 | | | | 117,254,076 | | |
First Eagle Global Income Builder Fund | | | 676,255 | | | | — | | | | — | | | | — | | |
First Eagle High Yield Fund | | | 15,267,844 | | | | 2,433,849 | * | | | — | | | | 196,024 | * | |
First Eagle Fund of America | | | 23,575,876 | | | | 6,981,959 | | | | 77,034,348 | | | | — | | |
o) Class Accounting — Investment income, common expenses and realized/unrealized gain or loss on investments are allocated to the various classes of the Fund on the basis of daily net assets of each class. Fees relating to a specific class are charged directly to that class.
p) Use of estimates — The preparation of financial statements in conformity with GAAP requires management to make estimates and assumptions that affect the reported amounts of assets and liabilities at the date of the financial statements and the reported amounts of revenues and expenses during the reporting period. Actual results could differ from those estimates.
q) Redemption Fee — A redemption fee of 2% will be applied to the First Eagle Global Fund, First Eagle Overseas Fund and First Eagle Gold Fund for the sale or exchange within 60 days of the purchase of such shares.
r) Foreign Taxes — The Funds may be subject to foreign taxes on income, gains on investments or currency purchases/repatriation, a portion of which may be recoverable. The Funds will accrue such taxes and recoveries as applicable, based upon their current interpretation of tax rules and regulations that exist in the markets in which they invest.
Note 2 — Investment Advisory, Custody and Administration Agreements; Transactions with Related Persons
For its services, the Adviser receives, pursuant to an Investment Advisory Agreement between the Funds and the Adviser (the "Advisory Agreement") an annual advisory fee as follows: First Eagle Global Fund, First Eagle Overseas
* For the year ended March 31, 2012.
FIRST EAGLE FUNDS | ANNUAL REPORT | OCTOBER 31, 2012
193
Notes to Financial Statements
Fund, First Eagle U.S. Value Fund, First Eagle Gold Fund and First Eagle Global Income Builder Fund at 0.75% of each Fund's average daily net assets, First Eagle High Yield Fund at 0.70% of the Fund's average daily net assets and First Eagle Fund of America at 1% of the Fund's average daily net assets.
Pursuant to a subadvisory agreement, dated December 10, 2002 (agreement was amended and restated most recently in September 2009) ("Subadvisory Agreement") Iridian Asset Management LLC ("Iridian") manages the investments of the First Eagle Fund of America. The fees paid to Iridian by the Adviser under the Subadvisory Agreement are based on a reference amount equal to 50% of the combined (i) fees received by the Adviser for advisory services on behalf of the Fund and (ii) the fees received by the Fund's distributor for its shareholder liaison services on behalf of the Fund. These amounts are reduced by certain direct marketing costs borne by the Adviser in connection with the Fund and are further reduced by the amount paid by the Adviser for certain administrative expenses incurred in providing services to the Fund.
The Adviser has contractually agreed to waive its management fee and/or reimburse expenses, for the First Eagle High Yield Fund and First Eagle Global Income Builder Fund, as allowed by law, so that the total annual operating expenses (excluding certain items) of the First Eagle High Yield Fund's Class A and Class C shares do not exceed 1.25% and 2.00%, respectively, and the First Eagle Global Income Builder Fund's Class A, Class C, and Class I shares do not exceed 1.30%, 2.05%, and 1.05%, respectively, through December 31, 2012, and those of First Eagle High Yield Fund's Class I shares do not exceed 0.80% through December 31, 2013.
The Board of Trustees, at a meeting on December 13, 2012, agreed to continue the expense waivers for First Eagle High Yield Fund and First Eagle Global Income Builder Fund for one year.
The Adviser may seek reimbursement for fees waived and other expenses paid by the Adviser pursuant to the Fee Waiver and Expense Reimbursement Agreement ("Agreement"). A repayment should be payable only to the extent it can be made during the thirty-six months following the applicable period during which the Adviser waived fees or reimbursed operating expenses under
FIRST EAGLE FUNDS | ANNUAL REPORT | OCTOBER 31, 2012
194
the Agreement. As of October 31, 2012, the Adviser may seek reimbursement of previously waived and reimbursed fees as follows for the First Eagle High Yield Fund:
EXPIRATION | | AMOUNT | |
March 31, 2013 | | $ | 33,000 | | |
March 31, 2014 | | | 38,000 | | |
March 31, 2015 | | | 72,599 | | |
The Adviser also performs certain administrative, accounting, operations, compliance and other services on behalf of the Funds, and in accordance with its agreement with them, the Funds reimburse the Adviser for costs (including personnel, related overhead and other costs) related to those services. First Eagle Global Income Builder Fund pays the Adviser a monthly administration fee that is accrued daily at an annual rate of 0.05%.
The Adviser also performs certain administrative, accounting, operations, compliance and other services on behalf of the First Eagle High Yield Fund, and in accordance with the agreement between them, the Fund reimburses the Adviser for costs (including personnel, related overhead and other costs) related to those services. In accordance with the plan of reorganization, those reimbursements may not exceed an annual rate of 0.05% of the value of the Fund's average daily net assets. After December 31, 2013, the Fund will no longer reimburse these costs and instead will pay a fixed administrative services fee to the Adviser at an annual rate of 0.05% of the value of the Fund's average daily net assets.
For the year ended October 31, 2012, the Funds reimbursed, paid and had payable to the Adviser amounts shown below:
FUND | | REIMBURSED TO ADVISER | | PAYABLE TO ADVISER | |
First Eagle Global Fund | | $ | 3,865,193 | | | $ | 465,241 | | |
First Eagle Overseas Fund | | | 1,212,971 | | | | 148,424 | | |
First Eagle U.S. Value Fund | | | 334,879 | | | | 26,319 | | |
First Eagle Gold Fund | | | 282,783 | | | | 92,488 | | |
First Eagle Global Income Builder Fund | | | 9,621 | | | | 4,022 | | |
First Eagle High Yield Fund | | | 22,357 | | | | 9,114 | | |
First Eagle Fund of America | | | 172,675 | | | | 18,411 | | |
FIRST EAGLE FUNDS | ANNUAL REPORT | OCTOBER 31, 2012
195
Notes to Financial Statements
The Funds have entered into Custody Agreements with State Street Bank and Trust Company ("SSB"). The Custody Agreements provide for an annual fee based on the amount of assets under custody plus transaction charges. SSB serves as custodian of the Funds' portfolio securities and other assets. SSB has directly entered into sub-custodial agreements to maintain the custody of gold bullion in the Funds. Under the terms of the Custody Agreement between the Funds and SSB, SSB maintains and deposits in separate accounts, cash, securities and other assets of the Funds. SSB is also required, upon the order of the Funds, to deliver securities held by SSB and the sub-custodian, and to make payments for securities purchased by the Funds. SSB has also entered into sub-custodian agreements with a number of foreign banks and clearing agencies, pursuant to which portfolio securities purchased outside the United States are maintained in the custody of these entities.
The Funds have also entered into an Administration Agreement with SSB, pursuant to which SSB provides certain tax-related and other administrative services. SSB, as the Funds' Administrator, receives annual fees separate from and in addition to the fees it receives for its services as the Funds' custodian.
FEF Distributors, LLC, a wholly owned subsidiary of the Adviser, serves as the Funds' principal underwriter. For the year ended October 31, 2012, FEF Distributors, LLC realized $2,268,655, $238,763, $370,869, $282,992, $40,059*, $212,425** and $107,244, pertaining to the sales of shares of First Eagle Global Fund, First Eagle Overseas Fund, First Eagle U.S. Value Fund, First Eagle Gold Fund, First Eagle Global Income Builder Fund, First Eagle High Yield Fund and First Eagle Fund of America, respectively.
The Trust (except for the First Eagle Global Income Builder Fund and First Eagle High Yield Fund) adopted a Trustee Deferred Compensation Plan, which allows the independent Trustees to defer the receipt of all or a portion of compensation related to performance of their duties as a Trustee. The deferred fees are invested in various First Eagle Funds until distribution in accordance with the Trustee Deferred Compensation Plan. As of October 31, 2012, balances to the Plan are recorded on the Statements of Assets and Liabilities.
For the period and year ended October 31, 2012, the Adviser reimbursed First Eagle Global Income Builder Fund and First Eagle Fund of America $2,243 and $11,291, respectively, for losses incurred in connection with trading errors.
* Period from May 1, 2012 to October 31, 2012.
** Period from April 1, 2012 to October 31, 2012.
FIRST EAGLE FUNDS | ANNUAL REPORT | OCTOBER 31, 2012
196
Note 3 — Plans of Distribution
Under the terms of the Distribution Plans and Agreements ("the Plans") with FEF Distributors, LLC ("the Distributor"), pursuant to the provisions of Rule 12b-1 under the 1940 Act, the First Eagle Global Fund, First Eagle Overseas Fund, First Eagle U.S. Value Fund, First Eagle Gold Fund, First Eagle Global Income Builder Fund and First Eagle High Yield Fund pay the Distributor monthly, a distribution fee with respect to Class A and Class C shares at an annual rate of up to 0.25% and 0.75%, respectively, of each Fund's average daily net assets. In the case of First Eagle Fund of America, it pays the Distributor monthly, a distribution fee with respect to Class A, Class C and Class Y shares at an annual rate of up to 0.25%, 0.75% and 0.25%, respectively of the average daily net assets. Under the Plans, the Distributor is obligated to use the amounts received under the Plans for payments to qualifying dealers for their assistance in the distribution of a Fund's shares and the provision of shareholder services and for other expenses such as advertising costs and the payment for the printing and distribution of prospectuses to prospective investors.
The Distributor bears distribution costs of a Fund to the extent they exceed payments received under the Plan. For the year ended October 31, 2012, the distribution fees incurred by the Funds are disclosed in the Statements of Operations.
The Distributor receives an annual service fee with respect to Class C at the annual rate of 0.25% of each Fund's average daily net assets, payable monthly to cover expenses incurred by the Distributor for providing shareholder liaison services, including assistance with subscriptions, redemptions and other shareholder questions. For the year ended October 31, 2012, the services fees incurred by the Funds are disclosed in the Statements of Operations.
Note 4 — Purchases and Sales of Securities
During the year ended October 31, 2012, the cost of purchases of investments, excluding U.S. Government and short-term securities, totaled $3,976,306,236, $935,949,111, $825,126,837, $263,271,390, $98,162,345*, $505,444,262** and $714,471,493 for First Eagle Global Fund, First Eagle Overseas Fund, First Eagle U.S. Value Fund, First Eagle Gold Fund, First Eagle Global Income Builder
* Period from May 1, 2012 to October 31, 2012.
** Period from April 1, 2012 to October 31, 2012.
FIRST EAGLE FUNDS | ANNUAL REPORT | OCTOBER 31, 2012
197
Notes to Financial Statements
Fund, First Eagle High Yield Fund and First Eagle Fund of America, respectively. Proceeds from sales of investments, excluding U.S. Government securities and short-term securities, totaled $3,194,620,939, $1,183,482,848, $293,537,779, $369,898,224, $2,859,904* $99,582,232** and $442,709,026, for First Eagle Global Fund, First Eagle Overseas Fund, First Eagle U.S. Value Fund, First Eagle Gold Fund, First Eagle Global Income Builder Fund, First Eagle High Yield Fund and First Eagle Fund of America, respectively.
There were no purchases or sales of U.S. Government securities, excluding short-term securities, for First Eagle Global Fund, First Eagle Overseas Fund, First Eagle U.S. Value Fund, First Eagle Gold Fund, First Eagle Global Income Builder Fund, First Eagle High Yield Fund and First Eagle Fund of America.
Note 5 — Line of Credit
At a meeting on September 12, 2012, the Board of Trustees approved continuing a $300 million committed, unsecured line of credit ("Credit Facility") with State Street Bank and Trust Company for the Funds, to be utilized for temporarily financing the purchase or sale of securities for prompt delivery in the ordinary course of business or for temporarily financing the redemption of shares of each Fund at the request of shareholders and other temporary or emergency purposes. Under the Credit Facility arrangement, each Fund has agreed to pay an annual commitment fee on the unused balance, allocated pro rata, based on the relative asset size of the Funds. Commitment fees related to the line of credit are paid by the Funds and are included in miscellaneous expenses in the Statements of Operations. During the year ended October 31, 2012, the Funds had no borrowings under the agreement.
Note 6 — Capital Stock
At October 31, 2012, the Funds have an unlimited number of shares authorized for issuance. The Funds have the ability to issue multiple classes of shares.
* Period from May 1, 2012 to October 31, 2012.
** Period from April 1, 2012 to October 31, 2012.
FIRST EAGLE FUNDS | ANNUAL REPORT | OCTOBER 31, 2012
198
This page was intentionally left blank.
Notes to Financial Statements
Transactions in shares of capital stock were as follows:
| | | YEAR ENDED OCTOBER 31, 2012 | | YEAR ENDED OCTOBER 31, 2012 | |
| | | FIRST EAGLE GLOBAL FUND | | FIRST EAGLE OVERSEAS FUND | | FIRST EAGLE U.S. VALUE FUND | |
| | | CLASS A | | CLASS C | | CLASS I | | CLASS A | | CLASS C | | CLASS I | | CLASS A | | CLASS C | | CLASS I | |
Shares sold | | | 62,388,629 | | | | 35,230,795 | | | | 83,665,600 | | | | 55,443,712 | | | | 6,338,133 | | | | 93,794,727 | | | | 34,764,626 | | | | 14,439,563 | | | | 28,860,840 | | |
Shares issued for reinvested
dividends and distributions | | | 6,801,942 | | | | 2,393,384 | | | | 3,768,498 | | | | 10,323,759 | | | | 1,491,162 | | | | 7,558,176 | | | | 1,938,704 | | | | 561,949 | | | | 995,161 | | |
Shares redeemed | | | (53,467,391 | ) | | | (26,699,689 | ) | | | (40,856,280 | ) | | | (61,897,888 | ) | | | (9,731,745 | ) | | | (52,137,111 | ) | | | (15,159,004 | ) | | | (4,115,236 | ) | | | (10,193,717 | ) | |
Net increase (decrease) | | | 15,723,180 | | | | 10,924,490 | | | | 46,577,818 | | | | 3,869,583 | | | | (1,902,450 | ) | | | 49,215,792 | | | | 21,544,326 | | | | 10,886,276 | | | | 19,662,284 | | |
| | | YEAR ENDED OCTOBER 31, 2011 | | YEAR ENDED OCTOBER 31, 2011 | |
| | | FIRST EAGLE GLOBAL FUND | | FIRST EAGLE OVERSEAS FUND | | FIRST EAGLE U.S. VALUE FUND | |
| | | CLASS A | | CLASS C | | CLASS I | | CLASS A | | CLASS C | | CLASS I | | CLASS A | | CLASS C | | CLASS I | |
Shares sold | | | 82,403,930 | | | | 52,534,770 | | | | 90,765,616 | | | | 75,564,814 | | | | 11,307,075 | | | | 75,710,003 | | | | 25,183,381 | | | | 7,044,675 | | | | 17,859,980 | | |
Shares issued for reinvested
dividends and distributions | | | 3,377,141 | | | | 815,954 | | | | 1,528,605 | | | | 4,608,501 | | | | 588,534 | | | | 3,075,256 | | | | 770,417 | | | | 204,916 | | | | 335,285 | | |
Shares redeemed | | | (54,727,128 | ) | | | (20,788,828 | ) | | | (32,853,816 | ) | | | (68,356,763 | ) | | | (7,372,637 | ) | | | (43,825,884 | ) | | | (12,196,811 | ) | | | (3,452,371 | ) | | | (7,453,323 | ) | |
Net increase | | | 31,053,943 | | | | 32,561,896 | | | | 59,440,405 | | | | 11,816,552 | | | | 4,522,972 | | | | 34,959,375 | | | | 13,756,987 | | | | 3,797,220 | | | | 10,741,942 | | |
| | | YEAR ENDED OCTOBER 31, 2012 | | PERIOD ENDED OCTOBER 31, 2012 | |
| | | FIRST EAGLE GOLD FUND | | FIRST EAGLE GLOBAL INCOME BUILDER FUND* | | FIRST EAGLE HIGH YIELD FUND** | |
| | | CLASS A | | CLASS C | | CLASS I | | CLASS A | | CLASS C | | CLASS I | | CLASS A | | CLASS C | | CLASS I | |
Shares sold | | | 16,136,242 | | | | 4,442,711 | | | | 19,622,203 | | | | 4,289,987 | | | | 2,549,996 | | | | 3,695,841 | | | | 17,342,363 | | | | 8,932,758 | | | | 19,594,646 | | |
Shares issued for reinvested
dividends and distributions | | | 1,926,165 | | | | 553,133 | | | | 592,601 | | | | 16,856 | | | | 8,099 | | | | 19,628 | | | | 458,671 | | | | 149,881 | | | | 611,736 | | |
Shares redeemed | | | (20,754,725 | ) | | | (4,756,926 | ) | | | (18,630,497 | ) | | | (98,960 | ) | | | (54,607 | ) | | | (24,647 | ) | | | (1,973,303 | ) | | | (535,928 | ) | | | (1,046,409 | ) | |
Net increase (decrease) | | | (2,692,318 | ) | | | 238,918 | | | | 1,584,307 | | | | 4,207,883 | | | | 2,503,488 | | | | 3,690,822 | | | | 15,827,731 | | | | 8,546,711 | | | | 19,159,973 | | |
| | | YEAR ENDED OCTOBER 31, 2011 | | YEAR ENDED MARCH 31, 2012 | | YEAR ENDED OCTOBER 31, 2011 | |
| | | FIRST EAGLE GOLD FUND | | FIRST EAGLE HIGH YIELD FUND | | FIRST EAGLE FUND OF AMERICA | |
| | | CLASS A | | CLASS C | | CLASS I | | CLASS A | | CLASS C | | CLASS I | | CLASS A | | CLASS C | | CLASS Y | |
Shares sold | | | 17,323,860 | | | | 5,525,002 | | | | 15,889,989 | | | | 6,568,153 | | | | 2,846,517 | | | | 11,573,817 | | | | 11,550,839 | | | | 4,179,170 | | | | 4,218,795 | | |
Shares issued for reinvested
dividends and distributions | | | 2,866,928 | | | | 787,656 | | | | 535,343 | | | | 25,393 | | | | 9,640 | | | | 222,218 | | | | 91,034 | | | | 8,600 | | | | 142,915 | | |
Shares redeemed | | | (22,945,298 | ) | | | (4,454,411 | ) | | | (7,752,658 | ) | | | (395,841 | ) | | | (15,606 | ) | | | (1,108,713 | ) | | | (5,339,481 | ) | | | (1,096,383 | ) | | | (3,858,781 | ) | |
Net increase (decrease) | | | (2,754,510 | ) | | | 1,858,247 | | | | 8,672,674 | | | | 6,197,705 | | | | 2,840,551 | | | | 10,687,322 | | | | 6,302,392 | | | | 3,091,387 | | | | 502,929 | | |
FIRST EAGLE FUNDS | ANNUAL REPORT | OCTOBER 31, 2012
200
FIRST EAGLE FUNDS | ANNUAL REPORT | OCTOBER 31, 2012
201
Notes to Financial Statements
| | | YEAR ENDED
MARCH 31, 2011 | |
| | | FIRST EAGLE
HIGH YIELD
FUND | |
| | CLASS I | |
Shares sold | | | 219,201 | | |
Shares issued for reinvested
dividends and distributions | | | 162,273 | | |
Shares redeemed | | | (234,249 | ) | |
Net increase | | | 147,225 | | |
| | YEAR ENDED OCTOBER 31, 2012 | |
| | FIRST EAGLE FUND OF AMERICA | |
| | CLASS A | | CLASS C | | CLASS Y | |
Shares sold | | | 7,799,688 | | | | 2,865,457 | | | | 1,801,446 | | |
Shares issued for reinvested
dividends and distributions | | | 1,591,289 | | | | 631,712 | | | | 1,733,825 | | |
Shares redeemed | | | (5,418,574 | ) | | | (1,755,620 | ) | | | (4,156,267 | ) | |
Net increase | | | 3,972,403 | | | | 1,741,549 | | | | (620,996 | ) | |
* Represents the period May 1, 2012 to October 31, 2012.
** Represents the period April 1, 2012 to October 31, 2012.
Transactions in dollars of capital stock were as follows:
| | | YEAR ENDED OCTOBER 31, 2012 | | YEAR ENDED OCTOBER 31, 2012 | |
| | | FIRST EAGLE GLOBAL FUND | | FIRST EAGLE OVERSEAS FUND | |
| | | CLASS A | | CLASS C | | CLASS I | | CLASS A | | CLASS C | | CLASS I | |
Shares sold | | $ | 2,956,278,063 | | | $ | 1,637,915,493 | | | $ | 3,981,891,238 | | | $ | 1,189,229,650 | | | $ | 131,960,536 | | | $ | 2,044,840,175 | | |
Shares issued for reinvested
dividends and distributions | | | 302,618,460 | | | | 104,854,140 | | | | 168,225,738 | | | | 209,262,697 | | | | 29,554,809 | | | | 155,396,107 | | |
Shares redeemed | | | (2,527,517,394 | ) | | | (1,243,056,770 | ) | | | (1,942,066,934 | ) | | | (1,322,271,401 | ) | | | (202,837,114 | ) | | | (1,125,783,011 | ) | |
Net increase (decrease) | | $ | 731,379,129 | | | $ | 499,712,863 | | | $ | 2,208,050,042 | | | $ | 76,220,946 | | | $ | (41,321,769 | ) | | $ | 1,074,453,271 | | |
| | | YEAR ENDED OCTOBER 31, 2011 | | YEAR ENDED OCTOBER 31, 2011 | |
| | | FIRST EAGLE GLOBAL FUND | | FIRST EAGLE OVERSEAS FUND | |
| | | CLASS A | | CLASS C | | CLASS I | | CLASS A | | CLASS C | | CLASS I | |
Shares sold | | $ | 3,869,277,750 | | | $ | 2,425,639,817 | | | $ | 4,254,961,876 | | | $ | 1,715,966,975 | | | $ | 250,653,639 | | | $ | 1,744,387,109 | | |
Shares issued for reinvested
dividends and distributions | | | 154,537,968 | | | | 36,791,366 | | | | 70,178,270 | | | | 102,262,633 | | | | 12,771,196 | | | | 69,224,009 | | |
Shares redeemed | | | (2,551,569,341 | ) | | | (955,493,361 | ) | | | (1,532,877,172 | ) | | | (1,545,390,214 | ) | | | (162,706,611 | ) | | | (1,005,497,700 | ) | |
Net increase | | $ | 1,472,246,377 | | | $ | 1,506,937,822 | | | $ | 2,792,262,974 | | | $ | 272,839,394 | | | $ | 100,718,224 | | | $ | 808,113,418 | | |
FIRST EAGLE FUNDS | ANNUAL REPORT | OCTOBER 31, 2012
202
FIRST EAGLE FUNDS | ANNUAL REPORT | OCTOBER 31, 2012
203
Notes to Financial Statements
| | | YEAR ENDED OCTOBER 31, 2012 | | YEAR ENDED OCTOBER 31, 2012 | |
| | | FIRST EAGLE U.S. VALUE FUND | | FIRST EAGLE GOLD FUND | | FIRST EAGLE GLOBAL INCOME BUILDER FUND* | |
| | | CLASS A | | CLASS C | | CLASS I | | CLASS A | | CLASS C | | CLASS I | | CLASS A | | CLASS C | | CLASS I | |
Shares sold | | $ | 604,973,317 | | | $ | 248,353,887 | | | $ | 507,992,659 | | | $ | 471,675,630 | | | $ | 126,090,905 | | | $ | 564,245,924 | | | $ | 43,500,772 | | | $ | 25,874,606 | | | $ | 37,031,937 | | |
Shares issued for reinvested
dividends and distributions | | | 31,581,497 | | | | 9,092,330 | | | | 16,390,304 | | | | 58,150,919 | | | | 16,234,432 | | | | 18,086,195 | | | | 173,094 | | | | 83,136 | | | | 197,719 | | |
Shares redeemed | | | (266,732,905 | ) | | | (71,576,152 | ) | | | (180,767,869 | ) | | | (592,856,546 | ) | | | (131,067,219 | ) | | | (532,748,007 | ) | | | (1,010,534 | ) | | | (560,866 | ) | | | (247,612 | ) | |
Net increase (decrease) | | $ | 369,821,909 | | | $ | 185,870,065 | | | $ | 343,615,094 | | | $ | (63,029,997 | ) | | $ | 11,258,118 | | | $ | 49,584,112 | | | $ | 42,663,332 | | | $ | 25,396,876 | | | $ | 36,982,044 | | |
| | | YEAR ENDED OCTOBER 31, 2011 | | YEAR ENDED OCTOBER 31, 2011 | |
| | | FIRST EAGLE U.S. VALUE FUND | | FIRST EAGLE GOLD FUND | |
| | | CLASS A | | CLASS C | | CLASS I | | CLASS A | | CLASS C | | CLASS I | |
Shares sold | | $ | 422,499,567 | | | $ | 117,098,665 | | | $ | 302,544,849 | | | $ | 584,552,778 | | | $ | 181,475,181 | | | $ | 536,860,176 | | |
Shares issued for reinvested
dividends and distributions | | | 12,519,282 | | | | 3,309,400 | | | | 5,502,028 | | | | 94,379,255 | | | | 25,236,503 | | | | 17,810,847 | | |
Shares redeemed | | | (203,499,149 | ) | | | (57,256,894 | ) | | | (124,562,916 | ) | | | (765,827,714 | ) | | | (143,628,830 | ) | | | (265,774,260 | ) | |
Net increase (decrease) | | $ | 231,519,700 | | | $ | 63,151,171 | | | $ | 183,483,961 | | | $ | (86,895,681 | ) | | $ | 63,082,854 | | | $ | 288,896,763 | | |
| | PERIOD ENDED OCTOBER 31, 2012 | | YEAR ENDED OCTOBER 31, 2012 | |
| | | FIRST EAGLE HIGH YIELD FUND** | | FIRST EAGLE FUND OF AMERICA | |
| | | CLASS A | | CLASS C | | CLASS I | | CLASS A | | CLASS C | | CLASS Y | |
Shares sold | | $ | 169,517,068 | | | $ | 87,418,098 | | | $ | 191,197,349 | | | $ | 198,358,338 | | | $ | 63,407,921 | | | $ | 46,475,429 | | |
Shares issued for reinvested
dividends and distributions | | | 4,510,338 | | | | 1,472,774 | | | | 6,013,646 | | | | 36,154,075 | | | | 12,533,184 | | | | 40,138,059 | | |
Shares redeemed | | | (19,213,078 | ) | | | (5,270,289 | ) | | | (10,244,667 | ) | | | (136,684,626 | ) | | | (38,844,456 | ) | | | (107,471,098 | ) | |
Net increase (decrease) | | $ | 154,814,328 | | | $ | 83,620,583 | | | $ | 186,966,328 | | | $ | 97,827,787 | | | $ | 37,096,649 | | | $ | (20,857,610 | ) | |
| | | YEAR ENDED MARCH 31, 2012 | | YEAR ENDED OCTOBER 31, 2011 | |
| | | FIRST EAGLE HIGH YIELD FUND | | FIRST EAGLE FUND OF AMERICA | |
| | | CLASS A | | CLASS C | | CLASS I | | CLASS A | | CLASS C | | CLASS Y | |
Shares sold | | $ | 63,546,710 | | | $ | 27,547,011 | | | $ | 111,401,833 | | | $ | 302,143,282 | | | $ | 97,792,197 | | | $ | 112,972,787 | | |
Shares issued for reinvested
dividends and distributions | | | 247,405 | | | | 93,837 | | | | 2,139,752 | | | | 2,298,611 | | | | 193,070 | | | | 3,671,493 | | |
Shares redeemed | | | (3,817,412 | ) | | | (151,895 | ) | | | (10,598,096 | ) | | | (135,242,015 | ) | | | (24,843,434 | ) | | | (99,366,357 | ) | |
Net increase (decrease) | | $ | 59,976,703 | | | $ | 27,488,953 | | | $ | 102,943,489 | | | $ | 169,199,878 | | | $ | 73,141,833 | | | $ | 17,277,923 | | |
FIRST EAGLE FUNDS | ANNUAL REPORT | OCTOBER 31, 2012
204
FIRST EAGLE FUNDS | ANNUAL REPORT | OCTOBER 31, 2012
205
Notes to Financial Statements
| | | YEAR ENDED
MARCH 31, 2011 | |
| | | FIRST EAGLE
HIGH YIELD
FUND | |
| | CLASS I | |
Shares sold | | $ | 2,265,250 | | |
Shares issued for reinvested
dividends and distributions | | | 1,669,125 | | |
Shares redeemed | | | (2,472,677 | ) | |
Net increase | | $ | 1,461,698 | | |
* Represents the period May 1, 2012 to October 31, 2012.
** Represents the period April 1, 2012 to October 31, 2012.
At October 31, 2012, ASB Holdings, Arnhold Foundation, Inc. and Mulago Foundation owned more than 5% of the First Eagle Global Income Builder Fund Class I shares.
Note 7 — Indemnification and Investment Risk
In the normal course of business, the Funds enter into contracts that contain a variety of representations which provide general indemnifications. Each Fund's maximum exposure under these arrangements is unknown, as this would involve future claims that may be made against each Fund that have not yet occurred. However, based on experience, the Funds expect the risk of loss to be remote. The Funds may have elements of risk not typically associated with investments in the United States of America due to their investments in foreign countries or regions. Such foreign investments may subject the Funds to additional risks resulting from political or economic conditions in such countries or regions and the possible imposition of adverse governmental laws or currency exchange restrictions could cause the securities and their markets to be less liquid and their prices to be more volatile than those of comparable U.S. securities. The securities markets in many emerging-market countries are substantially smaller, less developed, less liquid and more volatile than the securities markets of developed countries.
The First Eagle High Yield Fund invests in high yield securities which may be subject to greater levels of interest rate, credit and liquidity risk than investment grade securities. These high yield securities may be considered speculative with respect to the issuer's continuing ability to make principal and interest payments and may be subject to significant price fluctuations.
FIRST EAGLE FUNDS | ANNUAL REPORT | OCTOBER 31, 2012
206
The Funds are subject to interest rate and credit risk. The value of debt securities may decline as interest rates increase. The Funds could lose money if the issuer of a fixed income security is unable to pay interest or repay principal when it is due. The ability of the issuers of debt to meet their obligations may be affected by the economic and political developments in a specific industry or region.
The Funds enter into derivatives which may represent off-balance sheet risk. Off-balance sheet risk exists when the maximum potential loss on a particular investment is greater than the value of such investment as reflected in the Statements of Assets and Liabilities.
Note 8 — Redemption In-Kind Transactions
The redemption in-kind policy for all of the Funds reserves the right of the Funds to pay redemptions in-kind (i.e., payments in the form of marketable securities or, as needed, other traded assets, rather than cash) if the redemption request is large enough to affect a Fund's operations (for example, if it represents more than $250,000 or 1% of the Fund's assets). When receiving assets distributed in-kind, the recipient will bear applicable commissions or other costs on their sale. There were no redemptions in-kind as of October 31, 2012.
Note 9 — Subsequent Events
In accordance with the provision surrounding Subsequent Events adopted by the Funds, management has evaluated the possibility of subsequent events existing in the Funds' financial statements. Management has determined that there are no material events that would require disclosure in the Funds' financial statements.
FIRST EAGLE FUNDS | ANNUAL REPORT | OCTOBER 31, 2012
207
Report of Independent Registered Public Accounting Firm
To the Board of Trustees of First Eagle Funds and the Shareholders of First Eagle Global Fund, First Eagle Overseas Fund, First Eagle U.S. Value Fund, First Eagle Gold Fund, First Eagle Global Income Builder Fund, First Eagle High Yield Fund, and First Eagle Fund of America:
In our opinion, the accompanying statements of assets and liabilities, including the schedules of investments, and the related statements of operations and of changes in net assets and the financial highlights present fairly, in all material respects, the financial position of First Eagle Global Fund, First Eagle Overseas Fund, First Eagle U.S. Value Fund, First Eagle Gold Fund (including its consolidated wholly owned subsidiary), First Eagle Global Income Builder Fund, First Eagle High Yield Fund, and First Eagle Fund of America (each a separate Fund of First Eagle Funds)(hereafter collectively referred to as the "Funds") at October 31, 2012, and the results of each of their operations, the changes in each of their net assets and the financial highlights for each of the periods presented, in conformity with accounting principles generally accepted in the United States of America. These financial statements and financial highlights (hereafter referred to as "financial statements") are the responsibility of the Funds' management. Our responsibility is to express an opinion on these financial statements based on our audits. We conducted our audits of these financial statements in accordance with the standards of the Public Company Accounting Oversight Board (United States). Those standards require that we plan and perform the audit to obtain reasonable assurance about whether the financial statements are free of material misstatement. An audit includes examining, on a test basis, evidence supporting the amounts and disclosures in the financial statements, assessing the accounting principles used and significant estimates made by management, and evaluating the overall financial statement presentation. We believe that our audits, which included confirmation of securities at October 31, 2012 by correspondence with the custodian and brokers, provide a reasonable basis for our opinion.

PricewaterhouseCoopers LLP
New York, New York
December 26, 2012
FIRST EAGLE FUNDS | ANNUAL REPORT | OCTOBER 31, 2012
208
Fund Expenses (unaudited)
Example
As a shareholder of the First Eagle Funds, you may incur two types of costs: (1) transaction costs including front-end and contingent deferred sales charges (loads), and (2) ongoing costs, including advisory fees; distribution fees (12b-1) and/or service fees; and other Fund expenses. This Example is intended to help you understand your ongoing costs (in dollars) of investing in the Funds and to compare these costs with the ongoing costs of investing in other mutual funds.
This Example is based on an investment of $1,000 invested on May 1, 2012 and held for the six-months ended October 31, 2012.
Actual Expenses
The table below titled "Based on Actual Total Return" provides information about actual account values and actual expenses. You may use the information provided in this table, together with the amount you invested, to estimate the expenses that you paid over the period. To estimate the expenses you paid on your account, divide your ending account value by $1,000 (for example, an $8,600 ending account value divided by $1,000 = 8.6), then multiply the result by the number under the heading entitled "Expenses Paid During the Period".
FIRST EAGLE FUNDS | ANNUAL REPORT | OCTOBER 31, 2012
209
Fund Expenses (unaudited)
Based on Actual Total Return1
| | | ACTUAL TOTAL
RETURN
WITHOUT
SALES CHARGES2 | | BEGINNING
ACCOUNT
VALUE | | ENDING
ACCOUNT
VALUE | | ANNUALIZED
EXPENSE
RATIO | | EXPENSES
PAID
DURING THE
PERIOD3 | |
First Eagle Global Fund | |
Class A | | | 1.99 | % | | $ | 1,000.00 | | | $ | 1,019.90 | | | | 1.16 | % | | $ | 5.89 | | |
Class C | | | 1.60 | | | | 1,000.00 | | | | 1,016.00 | | | | 1.91 | | | | 9.68 | | |
Class I | | | 2.10 | | | | 1,000.00 | | | | 1,021.00 | | | | 0.91 | | | | 4.62 | | |
First Eagle Overseas Fund | |
Class A | | | 2.25 | | | | 1,000.00 | | | | 1,022.50 | | | | 1.18 | | | | 6.00 | | |
Class C | | | 1.84 | | | | 1,000.00 | | | | 1,018.40 | | | | 1.92 | | | | 9.74 | | |
Class I | | | 2.40 | | | | 1,000.00 | | | | 1,024.00 | | | | 0.93 | | | | 4.73 | | |
First Eagle U.S. Value Fund | |
Class A | | | 2.41 | | | | 1,000.00 | | | | 1,024.10 | | | | 1.20 | | | | 6.11 | | |
Class C | | | 1.98 | | | | 1,000.00 | | | | 1,019.80 | | | | 1.95 | | | | 9.90 | | |
Class I | | | 2.49 | | | | 1,000.00 | | | | 1,024.90 | | | | 0.95 | | | | 4.84 | | |
First Eagle Gold Fund Consolidated | |
Class A | | | 10.23 | | | | 1,000.00 | | | | 1,102.30 | | | | 1.22 | | | | 6.45 | | |
Class C | | | 9.78 | | | | 1,000.00 | | | | 1,097.80 | | | | 1.97 | | | | 10.39 | | |
Class I | | | 10.40 | | | | 1,000.00 | | | | 1,104.00 | | | | 0.97 | | | | 5.13 | | |
First Eagle Global Income Builder Fund | |
Class A4 | | | 4.37 | | | | 1,000.00 | | | | 1,043.70 | | | | 1.28 | | | | 6.58 | | |
Class C4 | | | 4.00 | | | | 1,000.00 | | | | 1,040.00 | | | | 2.02 | | | | 10.36 | | |
Class I4 | | | 4.53 | | | | 1,000.00 | | | | 1,045.30 | | | | 1.05 | | | | 5.40 | | |
First Eagle High Yield Fund | |
Class A4 | | | 5.18 | | | | 1,000.00 | | | | 1,051.80 | | | | 1.27 | | | | 6.55 | | |
Class C4 | | | 4.78 | | | | 1,000.00 | | | | 1,047.80 | | | | 2.02 | | | | 10.40 | | |
Class I4 | | | 5.41 | | | | 1,000.00 | | | | 1,054.10 | | | | 0.80 | | | | 4.13 | | |
First Eagle Fund of America | |
Class A | | | 1.70 | | | | 1,000.00 | | | | 1,017.00 | | | | 1.44 | | | | 7.30 | | |
Class C | | | 1.35 | | | | 1,000.00 | | | | 1,013.50 | | | | 2.19 | | | | 11.08 | | |
Class Y | | | 1.71 | | | | 1,000.00 | | | | 1,017.10 | | | | 1.44 | | | | 7.30 | | |
1 For the six-months ended October 31, 2012.
2 Past performance does not guarantee future results. Assumes reinvestment of all dividends and capital gain distributions, if any, at net asset value and does not reflect the deduction of the applicable sales charge, exchange fees or redemption fees. Had the effect of sales charges been reflected, expenses would have been higher and returns lower. Total return is not annualized, as it may not be representative of the total return for the year.
3 Expenses are equal to the annualized expense ratio multiplied by the average account value over the period, multiplied by 184/366 (to reflect the one-half year period).
4 Expense and performance figures reflect certain fee waviers and/or expense limitations without which returns and expenses may have been lower or higher, respectively.
FIRST EAGLE FUNDS | ANNUAL REPORT | OCTOBER 31, 2012
210
Hypothetical Example for Comparison Purposes
The table below titled "Based on Hypothetical Total Return" provides information about hypothetical account values and hypothetical expenses based on the actual expense ratios and an assumed rate of return of 5% per year before expenses, which is not the First Eagle Funds' actual return. The hypothetical account values and expenses may not be used to estimate the actual ending account balance or expenses you paid for the period. You may use the information provided in this table to compare the ongoing costs of investing in the Funds and other funds. To do so, compare the 5% hypothetical example relating to the Funds with the 5% hypothetical examples that appear in the shareholder reports of other funds.
This Example is based on an investment of $1,000 invested on May 1, 2012 and held for the six-months ended October 31, 2012.
Please note that the expenses shown in the table below are meant to highlight your ongoing costs only and do not reflect any transactional costs, such as front-end or back-end sales charges (loads). Therefore, the table is useful in comparing ongoing costs only, and will not help you determine the relative total costs of owning different funds. In addition, if these transaction costs were included, your costs would have been higher.
FIRST EAGLE FUNDS | ANNUAL REPORT | OCTOBER 31, 2012
211
Fund Expenses (unaudited) (continued)
Based on Hypothetical Total Return1
| | | HYPOTHETICAL
ANNUALIZED
TOTAL
RETURN | | BEGINNING
ACCOUNT
VALUE | | ENDING
ACCOUNT
VALUE | | ANNUALIZED
EXPENSE
RATIO | | EXPENSES
PAID
DURING THE
PERIOD2 | |
First Eagle Global Fund | |
Class A | | | 5.00 | % | | $ | 1,000.00 | | | $ | 1,019.30 | | | | 1.16 | % | | $ | 5.89 | | |
Class C | | | 5.00 | | | | 1,000.00 | | | | 1,015.53 | | | | 1.91 | | | | 9.68 | | |
Class I | | | 5.00 | | | | 1,000.00 | | | | 1,020.56 | | | | 0.91 | | | | 4.62 | | |
First Eagle Overseas Fund | |
Class A | | | 5.00 | | | | 1,000.00 | | | | 1,019.20 | | | | 1.18 | | | | 5.99 | | |
Class C | | | 5.00 | | | | 1,000.00 | | | | 1,015.48 | | | | 1.92 | | | | 9.73 | | |
Class I | | | 5.00 | | | | 1,000.00 | | | | 1,020.46 | | | | 0.93 | | | | 4.72 | | |
First Eagle U.S. Value Fund | |
Class A | | | 5.00 | | | | 1,000.00 | | | | 1,019.10 | | | | 1.20 | | | | 6.09 | | |
Class C | | | 5.00 | | | | 1,000.00 | | | | 1,015.33 | | | | 1.95 | | | | 9.88 | | |
Class I | | | 5.00 | | | | 1,000.00 | | | | 1,020.36 | | | | 0.95 | | | | 4.82 | | |
First Eagle Gold Fund Consolidated | |
Class A | | | 5.00 | | | | 1,000.00 | | | | 1,019.00 | | | | 1.22 | | | | 6.19 | | |
Class C | | | 5.00 | | | | 1,000.00 | | | | 1,015.23 | | | | 1.97 | | | | 9.98 | | |
Class I | | | 5.00 | | | | 1,000.00 | | | | 1,020.26 | | | | 0.97 | | | | 4.93 | | |
First Eagle Global Income Builder Fund | |
Class A | | | 5.00 | | | | 1,000.00 | | | | 1,018.70 | | | | 1.28 | | | | 6.50 | | |
Class C | | | 5.00 | | | | 1,000.00 | | | | 1,014.98 | | | | 2.02 | | | | 10.23 | | |
Class I | | | 5.00 | | | | 1,000.00 | | | | 1,019.86 | | | | 1.05 | | | | 5.33 | | |
First Eagle High Yield Fund | |
Class A | | | 5.00 | | | | 1,000.00 | | | | 1,018.75 | | | | 1.27 | | | | 6.44 | | |
Class C | | | 5.00 | | | | 1,000.00 | | | | 1,014.98 | | | | 2.02 | | | | 10.23 | | |
Class I | | | 5.00 | | | | 1,000.00 | | | | 1,021.11 | | | | 0.80 | | | | 4.06 | | |
First Eagle Fund of America | |
Class A | | | 5.00 | | | | 1,000.00 | | | | 1,017.90 | | | | 1.44 | | | | 7.30 | | |
Class C | | | 5.00 | | | | 1,000.00 | | | | 1,014.13 | | | | 2.19 | | | | 11.09 | | |
Class Y | | | 5.00 | | | | 1,000.00 | | | | 1,017.90 | | | | 1.44 | | | | 7.30 | | |
1 For the six-months ended October 31, 2012.
2 Expenses are equal to the annualized expense ratio multiplied by the average account value over the period, multiplied by 184/366 (to reflect the one-half year period).
FIRST EAGLE FUNDS | ANNUAL REPORT | OCTOBER 31, 2012
212
Quarterly Form N-Q portfolio schedule
The First Eagle Funds file their complete schedule of portfolio holdings with the Securities and Exchange Commission ("SEC") for the first and third quarters of each fiscal year on Form N-Q. The Funds' Forms N-Q are available on the SEC's Web site at www.sec.gov. The Funds' Forms N-Q may be reviewed and copied at the SEC's Public Reference Room in Washington, D.C. Information on the operation of the SEC's Public Reference Room may be obtained by calling 1.800.SEC.0330. Additionally, you may obtain copies of Forms N-Q from the Funds upon request by calling 1.800.334.2143.
Proxy voting policies, procedures and record
You may obtain a description of the Funds' (1) proxy voting policies, (2) proxy voting procedures and (3) information regarding how the Funds voted any proxies related to portfolio securities during the most recent twelve-month period ended June 30 for which an SEC filing has been made, without charge, upon request by contacting the Funds directly at 1.800.334.2143 or on the EDGAR Database on the SEC's Web site at www.sec.gov.
FIRST EAGLE FUNDS | ANNUAL REPORT | OCTOBER 31, 2012
213
Tax Information Fiscal Year Ended October 31, 2012 (unaudited)
Each Fund designates the following amounts (or the maximum amount allowable) distributed during the fiscal year ended October 31, 2012, if any, as capital gain dividends, dividends eligible for the corporate dividends received deduction and/or qualified dividend income:
| | | % OF QUALIFYING | | % OF DIVIDENDS
ELIGIBLE FOR
THE DIVIDENDS
RECEIVED | |
LONG-TERM CAPITAL GAINS | |
| | | DIVIDEND INCOME | | DEDUCTION | | 15% | | 28% | |
First Eagle Global Fund | | | 100.00 | % | | | 63.96 | % | | $ | 449,300,607 | | | $ | 6,423,462 | | |
First Eagle Overseas Fund* | | | 84.50 | | | | 0.37 | | | | 263,680,904 | | | | 46,464,007 | | |
First Eagle U.S. Value | | | 100.00 | | | | 99.09 | | | | 43,898,627 | | | | 7,232,797 | | |
First Eagle Gold Fund | | | 49.74 | | | | 6.27 | | | | 82,173,534 | | | | 11,704,288 | | |
First Eagle Global Income Builder | | | 31.70 | | | | 12.13 | | | | — | | | | — | | |
First Eagle High Yield | | | — | | | | | | — | | | | — | | |
First Eagle Fund of America | | | 41.08 | | | | 23.89 | | | | 53,703,962 | | | | 23,330,386 | | |
* First Eagle Overseas Fund paid foreign taxes of $21,621,409, and recognized foreign source income of $174,169,047. Pursuant to Section 853 of the Internal Revenue Code, the First Eagle Overseas Fund designates such amounts (or the maximum amount allowable) as having been paid in connection with dividends distributed from investment company taxable income during the fiscal year ended October 31, 2012.
FIRST EAGLE FUNDS | ANNUAL REPORT | OCTOBER 31, 2012
214
The Trust is committed to protecting your privacy. We are providing you with this privacy notice to inform you of how we handle your personal information that we collect and may disclose to our affiliates. If the Trust changes its information practices, we will provide you with notice of any material changes. This privacy policy supersedes any of our previous policies relating to the information you disclose to us.
Why this Privacy Policy Applies to You
You obtained a financial product or service from or through us for personal, family or household purposes when you opened a shareholder account with the Trust, and are therefore covered by this privacy policy.
What We do to Protect Your Personal Information
We protect personal information provided to us by our individual shareholders according to strict standards of security and confidentiality. These standards apply to both our physical facilities and any online services we may provide. We maintain physical, electronic and procedural safeguards that comply with federal standards to guard consumer information. We permit only authorized individuals, who are trained in the proper handling of individual shareholder information and need to access this information to do their job, to have access to this information.
Personal Information that We Collect and May Disclose
As part of providing you with the Trust's products and services, we may obtain nonpublic personal information about you from the following sources:
• Information we receive from you on subscription applications or other forms, such as your name, address, telephone number, Social Security number, occupation, assets and income;
• Information about your transactions with us, our affiliates, or unaffiliated third parties, such as your account balances, payment history and account activity; and
• Information from public records we may access in the ordinary course of business.
Categories of Affiliates to Whom We May Disclose Personal Information
We may share personal information about you with affiliates. Our affiliates do business under names that include Arnhold and S. Bleichroeder Holdings, Inc., First Eagle Investment Management, LLC, FEF Distributors, LLC, and ASB Advisers.
FIRST EAGLE FUNDS | ANNUAL REPORT | OCTOBER 31, 2012
215
Privacy Notice (continued)
You May Limit Marketing Solicitations by Choosing to Opt Out
We offer you the right to opt out from many types of marketing by our affiliates based on your personal information that we collect and share in accordance with this privacy policy. To limit those marketing solicitations, you may call 800.334.2143 indicating your desire not to receive marketing from our affiliates. Should you choose to opt out, your choice will remain in our records until you notify us otherwise, although we may choose to contact you in the future to modify your preference.
When We May Disclose Your Personal Information to Unaffiliated Third Parties
We will only share your personal information collected, as described above, with unaffiliated third parties:
• At your request;
• When you authorize us to process or service a transaction or product (unaffiliated third parties in this instance may include service providers such as the Trust's distributors, registrar and transfer agent for shareholder transactions, and other parties providing individual shareholder servicing, accounting and recordkeeping services);
• With companies that perform sales and marketing services on our behalf with whom we have agreements to protect the confidentiality of your information and to use the information only for the purposes for which we disclose the information to them; or
• When required by law to disclose such information to appropriate authorities.
We do not otherwise provide information about you to outside firms, organizations or individuals except to our attorneys, accountants and auditors and as permitted by law.
What We do with Personal Information about Our Former Customers
If you decide to discontinue doing business with us, the Trust will continue to adhere to this privacy policy with respect to the information we have in our possession about you and your account following the termination of our shareholder relationship.
FIRST EAGLE FUNDS | ANNUAL REPORT | OCTOBER 31, 2012
216
Additional Information (unaudited)
Management of the Trust
The business of the Trust is managed by its Board of Trustees, which elects officers responsible for the day to day operations of the Funds and for the execution of the policies formulated by the Board of Trustees.
Pertinent information regarding the members of the Board of Trustees and principal officers of the Trust is set forth below. Some of the Trustees and officers are employees of the Adviser and its affiliates. At least a majority of the Trust's Board of Trustees are not "interested persons" as that term is defined in the Investment Company Act.
Independent Trustees(1)(2)
Lisa Anderson | Trustee | December 2005 to present
1345 Avenue of the Americas | New York, New York | 10105
(born October 1950)
Principal Occupation(s) During Past 5 Years: President, American University of Cairo; Provost, American University in Cairo; James T. Shotwell Professor of International Relations and Dean, School of International and Public Affairs, Columbia University
Number of Portfolios in the Fund Complex Overseen by Trustee: 8
Other Directorships/Trusteeships Held by Trustee: Chair, Social Science Research Council; Member, Carnegie Council on Ethics and International Affairs; Member Emerita, Human Rights Watch; Trustee, First Eagle Variable Funds (1 portfolio)
(1) Trustees who are not "interested persons" of the Trust as defined in the Investment Company Act.
(2) The term of office of each Independent Trustee expires on his/her 70th birthday.
FIRST EAGLE FUNDS | ANNUAL REPORT | OCTOBER 31, 2012
217
Additional Information (unaudited)
Independent Trustees(1)(2)
Candace K. Beinecke(3) | Trustee (Chair) | December 1999 to present
One Battery Park Plaza | New York, New York | 10004
(born December 1946)
Principal Occupation(s) During Past 5 Years: Chair, Hughes Hubbard & Reed LLP
Number of Portfolios in the Fund Complex Overseen by Trustee: 8
Other Directorships/Trusteeships Held by Trustee: Director, ALSTOM; Trustee, Vornado Realty Trust; Director, Rockefeller Financial Services, Inc.; Director, Rockefeller & Company, Inc.; Trustee, Metropolitan Museum of Art; Trustee, The Wallace Foundation; Director and Vice Chair, Partnership for New York City; Board of Advisors, Yale Law School Center for the Study of Corporate Law; Director, Merce Cunningham Dance Foundation; Trustee, First Eagle Variable Funds (Chair) (1 portfolio)
Jean D. Hamilton | Trustee | March 2003 to present
1345 Avenue of the Americas | New York, New York | 10105
(born January 1947)
Principal Occupation(s) During Past 5 Years: Private Investor/ Independent Consultant/Member, Brock Capital Group LLC; prior to November 2002, Chief Executive Officer, Prudential Institutional; Executive Vice President, Prudential Financial, Inc.
Number of Portfolios in the Fund Complex Overseen by Trustee: 7
Other Directorships/Trusteeships Held by Trustee: Director, RenaissanceRe Holdings Ltd; Director, Four Nations; Trustee, First Eagle Variable Funds (1 portfolio)
(1) Trustees who are not "interested persons" of the Trust as defined in the Investment Company Act.
(2) The term of office of each Independent Trustee expires on his/her 70th birthday.
(3) Ms. Beinecke also served as a trustee of a predecessor fund to Fund of America since 1996.
FIRST EAGLE FUNDS | ANNUAL REPORT | OCTOBER 31, 2012
218
Independent Trustees(1)(2)
James E. Jordan | Trustee | December 1999 to present
1345 Avenue of the Americas | New York, New York | 10105
(born April 1944)
Principal Occupation(s) During Past 5 Years: Private Investor and Independent Consultant; prior to July 2005, Managing Director, First Eagle Investment Management, LLC and Director, FEF Distributors, LLC and Director, ASB Advisers UK, Limited; prior to July 2002, private investor and consultant to The Jordan Company (private investment banking firm) since June 1997
Number of Portfolios in the Fund Complex Overseen by Trustee: 8
Other Directorships/Trusteeships Held by Trustee: Director, Leucadia National Corporation; Director, JZ Capital Partners, Plc. (Guernsey investment trust company); Trustee, World Monuments Fund; Chairman's Council, Conservation International; Trustee, First Eagle Variable Funds (1 portfolio)
William M. Kelly(4) | Trustee | December 1999 to present
1345 Avenue of the Americas | New York, New York | 10105
(born February 1944)
Principal Occupation(s) During Past 5 Years: Private Investor, prior to January 2010 President, Lingold Associates
Number of Portfolios in the Fund Complex Overseen by Trustee: 8
Other Directorships/Trusteeships Held by Trustee: Treasurer and Trustee, Black Rock Forest Preservation and Consortium; Trustee, St. Anselm College; Director, S. Zlinkoff Fund for Medical Research and Education; Trustee, First Eagle Variable Funds (1 portfolio)
(1) Trustees who are not "interested persons" of the Trust as defined in the Investment Company Act.
(2) The term of office of each Independent Trustee expires on his/her 70th birthday.
(4) Mr. Kelly also served as a trustee of a predecessor fund to Fund of America since 1998.
FIRST EAGLE FUNDS | ANNUAL REPORT | OCTOBER 31, 2012
219
Additional Information (unaudited)
Independent Trustees(1)(2)
Paul J. Lawler | Trustee | March 2002 to present
1345 Avenue of the Americas | New York, New York | 10105
(born May 1948)
Principal Occupation(s) During Past 5 Years: Private Investor, prior to January 2010 Vice President Investments and Chief Investment Officer, W.K. Kellogg Foundation
Number of Portfolios in the Fund Complex Overseen by Trustee: 8
Other Directorships/Trusteeships Held by Trustee: Finance and Investment Committee Member, Battle Creek Community Foundation; Trustee, Ravena Coeymans Historical Society; Trustee, Coeymans Heritage Society; Director, Council of Michigan Foundations; Custody Advisory Committee Member, The Bank of New York; Advisory Committee, Common Fund Capital; Advisory Committee, TA Realty Advisors; Trustee, First Eagle Variable Funds (1 portfolio)
Interested Trustees(5)
John P. Arnhold | President and Trustee | December 1999 to present
1345 Avenue of the Americas | New York, New York | 10105
(born December 1953)
Principal Occupation(s) During Past 5 Years: Co-President, Co-CEO and Director, Arnhold and S. Bleichroeder Holdings, Inc.; CEO, Chairman, Director, FEF Distributors, LLC; Chairman, CIO and Director, First Eagle Investment Management, LLC; prior to February 2010, CEO, First Eagle Investment Management, LLC; prior to March 2005, President and Director, Natexis Bleichroeder, Inc. and Natexis Bleichroeder, UK
Number of Portfolios in the Fund Complex Overseen by Trustee: 8
Other Directorships/Trusteeships Held by Trustee: Chairman and Director, Arnhold Ceramics; Director, The Arnhold Foundation; Director, The Mulago Foundation; Director, Quantum Endowment Fund; Director, WNET.org; Trustee, Trinity Episcopal Schools Corp.; Trustee, Vassar College; Trustee, Jazz at Lincoln Center; Managing Member, New Eagle Management Company, LLC; Director, Aquila International Fund Limited; Director, International Tennis Hall of Fame; Director, Hanseatic Asset Management LBG; Trustee, Sports and Arts in Schools Foundation; President and Trustee, First Eagle Variable Funds (1 portfolio)
(1) Trustees who are not "interested persons" of the Trust as defined in the Investment Company Act.
(2) The term of office of each Independent Trustee expires on his/her 70th birthday.
(5) The term of office of each Interested Trustee is indefinite.
FIRST EAGLE FUNDS | ANNUAL REPORT | OCTOBER 31, 2012
220
Interested Trustees(5) — (continued)
Jean-Marie Eveillard | Trustee | June 2008 to present
1345 Avenue of the Americas | New York, New York | 10105
(born January 1940)
Principal Occupation(s) During Past 5 Years: Senior Adviser to First Eagle Investment Management, LLC since March 2009; Senior Vice President, First Eagle Investment Management, LLC since January 2000; previously, Portfolio Manager of First Eagle Global Fund, First Eagle Overseas Fund, First Eagle U.S. Value Fund, First Eagle Gold Fund, and First Eagle Variable Funds (portfolio management tenure: 1979-2004, March 2007-March 2009)
Number of Portfolios in the Fund Complex Overseen by Trustee: 8
Other Directorships/Trusteeships Held by Trustee: Director, SocGen International SICAV (Luxembourg); Trustee, The Frick Collection; Director, Varenne Capital Partners; Director, Fregate-Legris Industries SA; Trustee, First Eagle Variable Funds (1 portfolio)
Officers(6)
John P. Arnhold | President and Trustee | December 1999 to present
1345 Avenue of the Americas | New York, New York | 10105
(born December 1953)
Principal Occupation(s) During Past Five (5) Years: See table on preceding page related to Interested Trustees
Robert Bruno | Senior Vice President | December 1999 to present
1345 Avenue of the Americas | New York, New York | 10105
(born June 1964)
Principal Occupation(s) During Past Five (5) Years: Senior Vice President, First Eagle Investment Management, LLC; President, FEF Distributors, LLC; Senior Vice President, First Eagle Variable Funds
(5) The term of office of each Interested Trustee is indefinite.
(6) The term of office of each officer is indefinite. Length of time served represents time served as an officer of the Trust (or its predecessor entities), although various positions may have been held during the period.
FIRST EAGLE FUNDS | ANNUAL REPORT | OCTOBER 31, 2012
221
Additional Information (unaudited)
Officers(6) — (continued)
Joseph T. Malone | Chief Financial Officer | September 2008 to present
1345 Avenue of the Americas | New York, New York | 10105
(born September 1967)
Principal Occupation(s) During Past Five (5) Years: Senior Vice President, First Eagle Investment Management, LLC; Chief Financial Officer, First Eagle Variable Funds; from September 2008; Chief Financial Officer and Treasurer, Aberdeen Funds from November 2007
Mark D. Goldstein | Chief Compliance Officer | February 2005 to present
1345 Avenue of the Americas | New York, New York | 10105
(born October 1964)
Principal Occupation(s) During Past Five (5) Years: General Counsel, Chief Compliance Officer and Senior Vice President, First Eagle Investment Management, LLC; Secretary, FEF Distributors, LLC; General Counsel and Secretary of Arnhold and S. Bleichroeder Holdings, Inc., and Chief Compliance Officer, First Eagle Variable Funds from February 2005; prior to March 2010, Chief Compliance Officer, Good Hope Advisers, LLC
Suzan J. Afifi | Secretary and Vice President | December 1999 to present
1345 Avenue of the Americas | New York, New York | 10105
(born October 1952)
Principal Occupation(s) During Past Five (5) Years: Senior Vice President, First Eagle Investment Management, LLC; Vice President, FEF Distributors, LLC; Secretary and Vice President, First Eagle Variable Funds
(6) The term of office of each officer is indefinite. Length of time served represents time served as an officer of the Trust (or its predecessor entities), although various positions may have been held during the period.
FIRST EAGLE FUNDS | ANNUAL REPORT | OCTOBER 31, 2012
222
Officers(6) — (continued)
Philip Santopadre | Treasurer | September 2005 to present
1345 Avenue of the Americas | New York, New York | 10105
(born August 1977)
Principal Occupation(s) During Past Five (5) Years: Vice President, First Eagle Investment Management, LLC; Treasurer, First Eagle Variable Funds
Michael Luzzatto | Vice President | December 2004 to present
1345 Avenue of the Americas | New York, New York | 10105
(born April 1977)
Principal Occupation(s) During Past Five (5) Years: Senior Vice President, First Eagle Investment Management, LLC; Vice President, FEF Distributors, LLC; Vice President, First Eagle Variable Funds
Meng Lam | Assistant Treasurer | March 2012 to present
1345 Avenue of the Americas | New York, New York | 10105
(born October 1980)
Principal Occupation(s) During Past Five (5) Years: Assistant Vice President, First Eagle Investment Management, LLC from February 2011; Advisory Manager, Ernst & Young LLP from January 2010; Audit Manager, Deloitte & Touche LLP from 2007
(6) The term of office of each officer is indefinite. Length of time served represents time served as an officer of the Trust (or its predecessor entities), although various positions may have been held during the period.
FIRST EAGLE FUNDS | ANNUAL REPORT | OCTOBER 31, 2012
223
Trustees
Lisa Anderson
John P. Arnhold
Candace K. Beinecke (Chair)
Jean-Marie Eveillard
Jean D. Hamilton
James E. Jordan
William M. Kelly
Paul J. Lawler
Officers
John P. Arnhold
President
Robert Bruno
Senior Vice President
Joseph T. Malone
Chief Financial Officer
Mark D. Goldstein
Chief Compliance Officer
Suzan J. Afifi
Secretary & Vice President
Philip Santopadre
Treasurer
Michael Luzzatto
Vice President
Meng Lam
Assistant Treasurer
Investment Adviser
First Eagle Investment Management, LLC
1345 Avenue of the Americas
New York, NY 10105
Legal Counsel
Shearman & Sterling LLP
599 Lexington Avenue
New York, NY 10022
Custodian
State Street Bank and Trust Company
801 Pennsylvania Avenue
Kansas City, MO 64105
Shareholder Servicing Agent
DST Systems, Inc.
330 West 9th Street
Kansas City, MO 64105
800.334.2143
Underwriter
FEF Distributors, LLC
1345 Avenue of the Americas
New York, NY 10105
Independent Registered
Public Accounting Firm
PricewaterhouseCoopers LLP
300 Madison Avenue
New York, NY 10017
This report is not authorized for distribution to prospective investors unless preceded or accompanied by a currently effective prospectus of First Eagle Funds.
FIRST EAGLE FUNDS | ANNUAL REPORT | OCTOBER 31, 2012
224
This page was intentionally left blank.
This page was intentionally left blank.
1345 Avenue of the Americas | New York, NY | 10105
800.334.2143 | firsteaglefunds.com

Item 2. Code of Ethics.
The Registrant has adopted a code of ethics that applies to its principal executive officer and principal financial officer. Copies of the code of ethics may be requested free of charge by calling 1-800-334-2143 (toll free).
Item 3. Audit Committee Financial Expert.
The Board of Trustees of the registrant has designated Paul J. Lawler, William M. Kelly and Jean Hamilton as Audit Committee Financial Experts. Mr. Lawler, Mr. Kelly and Ms. Hamilton are considered by the Board to be independent trustees.
Item 4. Principal Accountant Fees and Services
(a) Audit Fees:
For the Fiscal years ended October 31, 2012 and October 31, 2011, the aggregate PricewaterhouseCoopers LLP (PwC) audit fees for professional services rendered to the registrant were approximately $399,805 and $467,526, respectively. Fees included in the audit fees category are those associated with the annual audits of the financial statements and services that are normally provided in connection with statutory and regulatory filings.
(b) Audit Related Fees:
For the fiscal years ended October 31, 2012 and October 31, 2011, the aggregate PwC fees for assurance and related services rendered to the registrant were approximately $17,800 and $17,300, respectively.
(c) Tax Fees:
In each fiscal year ended October 31, 2012 and October 31, 2011, the aggregate tax fees billed by PwC for professional services rendered to the registrant were approximately $208,781 and $447,611, respectively.
Fees included in the tax fees category comprise all services performed by professional staff in the independent accountant’s tax division except those services related to audits. This category comprises fees for tax compliance and preparation of tax returns.
(d) All Other Fees:
In each of the fiscal years ended October 31, 2012 and October 31, 2011, there were no fees billed by PwC for products and services, other than 4(a)-(c) above, rendered to the registrant.
(e)(1) The registrant’s audit committee has adopted a policy whereby audit and non-audit services performed by the registrant’s principal accountant for the registrant, its investment adviser, and any entity controlling, controlled by, or under common control with the investment adviser that provides ongoing services to the registrant require pre-approval by the committee or a designated member thereof. If such a service is required between regularly scheduled audit committee meetings, pre-approval may be authorized by one audit committee member with ratification at the next scheduled audit committee meeting. Waiver of pre-approval for audit and non-audit services requiring fees of a de minimis amount is not permitted.
(e)(2) No services included in (b) — (d) above were approved pursuant to paragraph (c)(7)(i)(C) of Rule 2-01 of Regulation S-X.
(f) According to PwC, for the fiscal year ended October 31, 2012, the percentage of hours spent on the audit of the registrant’s financial statements for the most recent fiscal year that were attributable to work performed by persons who are not full-time, permanent employees of PwC was 0%.
(g) Other than as described in the table above, the aggregate fees billed for the most recent fiscal year and the preceding fiscal year by the registrant’s principal accountant for non-audit services rendered to the registrant (“covered”), its investment adviser, and any entity controlling, controlled by, or under common control with the investment adviser (“non-covered”) that provides ongoing services to the registrant was $0 in 2012 and 2011.
(h) Not applicable.
Item 5. Audit Committee of Listed Registrants
Not applicable at this time.
Item 6. Schedule of Investments
Please see schedule of investments contained in the Report to Stockholders included under Item 1 of this Form N-CSR.
Item 7. Disclosure of Proxy Voting Policies and Procedures for Closed-End Management Investment Companies.
Not applicable.
Item 8. Portfolio Managers of Closed-End Investment companies.
Not applicable.
Item 9. Purchases of Equity Securities by Closed-End Management Investment Company and Affiliated Purchasers.
Not applicable.
Item 10. Submission of Matters to a Vote of Security Holders.
No material change to report at this time.
Item 11. Controls and Procedures.
(a) In the opinion of the principal executive officer and principal financial officer, based on their evaluation, the registrant’s disclosure controls and procedures are adequately designed and are operating effectively to ensure (i) that material information relating to the registrant, including its consolidated subsidiaries, is made known to them by others within those entities, particularly during the period in which this report is being prepared; and (ii) that information required to be disclosed by the registrant on Form N-CSR is recorded, processed, summarized and reported within the time periods specified in the Securities and Exchange Commission’s rules and forms.
(b) There were no changes in the registrant’s internal control over financial reporting that occurred during the registrant’s most recent fiscal half-year (the registrant’s second fiscal half-year in the case of an annual report) that have materially affected or are reasonably likely to materially affect, the registrant’s internal control over financial reporting.
Item 12. Exhibits.
(a)(1) Code of ethics required to be disclosed under Item 2 of Form N-CSR.
(a)(2) Certifications pursuant to Rule 30a-2(a) under the Investment Company Act of 1940 (17 CFR 270.30a-2(a)): Attached hereto.
(a)(3) Not applicable.
(b) Certification pursuant to Rule 30a-2(b) under the Investment Company Act of 1940 (17 CFR 270.30a-2(b)): Attached hereto.
SIGNATURES
Pursuant to the requirements of the Securities Exchange Act of 1934 and the Investment Company Act of 1940, the registrant has duly caused this report to be signed on its behalf by the undersigned, thereunto duly authorized.
(Registrant) | First Eagle Funds |
| |
By (Signature and Title)* | /s/ John P. Arnhold |
| |
| John P. Arnhold, President |
Date: January 7, 2013
Pursuant to the requirements of the Securities Exchange Act of 1934 and the Investment Company Act of 1940, this report has been signed below by the following persons on behalf of the registrant and in the capacities and on the dates indicated.
| |
By (Signature and Title)* | /s/ John P. Arnhold |
| |
| John P. Arnhold, Principal Executive Officer |
Date: January 7, 2013
By (Signature and Title)* | /s/ Joseph T. Malone |
| |
| Joseph T. Malone, Principal Financial Officer |
Date: January 7, 2013
* Print the name and title of each signing officer under his or her signature.