UNITED STATES
SECURITIES AND EXCHANGE COMMISSION
Washington, D.C. 20549
FORM N-CSR
CERTIFIED SHAREHOLDER REPORT OF REGISTERED
MANAGEMENT INVESTMENT COMPANIES
Investment Company Act file number | 811-7762 |
|
First Eagle Funds |
(Exact name of registrant as specified in charter) |
|
1345 Avenue of the Americas New York, NY | | 10105 |
(Address of principal executive offices) | | (Zip code) |
|
Suzan Afifi First Eagle Funds 1345 Avenue of the Americas New York, NY 10105 |
(Name and address of agent for service) |
|
Registrant’s telephone number, including area code: | 1-212-632-2700 | |
|
Date of fiscal year end: | October 31 | |
|
Date of reporting period: | October 31, 2014 | |
| | | | | | | | |
Form N-CSR is to be used by management investment companies to file reports with the Commission not later than 10 days after the transmission to stockholders of any report that is required to be transmitted to stockholders under Rule 30e-1 under the Investment Company Act of 1940 (17 CFR 270.30e-1). The Commission may use the information provided on Form N-CSR in its regulatory, disclosure review, inspection, and policymaking roles.
A registrant is required to disclose the information specified by Form N-CSR, and the Commission will make this information public. A registrant is not required to respond to the collection of information contained in Form N-CSR unless the Form displays a currently valid Office of Management and Budget (“OMB”) control number. Please direct comments concerning the accuracy of the information collection burden estimate and any suggestions for reducing the burden to Secretary, Securities and Exchange Commission, 450 Fifth Street, NW, Washington, DC 20549-0609. The OMB has reviewed this collection of information under the clearance requirements of 44 U.S.C. § 3507.
Item 1. Reports to Stockholders.

First Eagle Global Fund
First Eagle Overseas Fund
First Eagle U.S. Value Fund
First Eagle Gold Fund
First Eagle Global Income Builder Fund
First Eagle High Yield Fund
First Eagle Fund of America

Advised by First Eagle Investment Management, LLC
Forward-Looking Statement Disclosure
One of our most important responsibilities as mutual fund managers is to communicate with shareholders in an open and direct manner. Some of our comments in our letters to shareholders are based on current management expectations and are considered "forward-looking statements". Actual future results, however, may prove to be different from our expectations. You can identify forward-looking statements by words such as "may", "will", "believe", "attempt", "seem", "think", "ought", "try" and other similar terms. We cannot promise future returns. Our opinions are a reflection of our best judgment at the time this report is compiled, and we disclaim any obligation to update or alter forward-looking statements as a result of new information, future events, or otherwise.
First Eagle Funds | Annual Report | October 31, 2014
2
Table of Contents
Letter from the President | | | 4 | | |
Management's Discussion of Fund Performance | | | 7 | | |
Performance Chart | | | 12 | | |
First Eagle Global Fund: | |
Fund Overview | | | 18 | | |
Consolidated Schedule of Investments | | | 20 | | |
First Eagle Overseas Fund: | |
Fund Overview | | | 48 | | |
Consolidated Schedule of Investments | | | 50 | | |
First Eagle U.S. Value Fund: | |
Fund Overview | | | 76 | | |
Consolidated Schedule of Investments | | | 78 | | |
First Eagle Gold Fund: | |
Fund Overview | | | 90 | | |
Consolidated Schedule of Investments | | | 92 | | |
First Eagle Global Income Builder Fund: | |
Fund Overview | | | 96 | | |
Schedule of Investments | | | 98 | | |
First Eagle High Yield Fund: | |
Fund Overview | | | 112 | | |
Schedule of Investments | | | 114 | | |
First Eagle Fund of America: | |
Fund Overview | | | 126 | | |
Schedule of Investments | | | 128 | | |
Statements of Assets and Liabilities | | | 136 | | |
Statements of Operations | | | 144 | | |
Statements of Changes in Net Assets | | | 148 | | |
Financial Highlights | | | 152 | | |
Notes to Financial Statements | | | 168 | | |
Report of Independent Registered Accounting Firm | | | 205 | | |
Fund Expenses | | | 206 | | |
General Information | | | 210 | | |
Tax Information | | | 211 | | |
Privacy Notice | | | 212 | | |
Additional Information | | | 214 | | |
First Eagle Funds | Annual Report | October 31, 2014
3
Letter from the President

Dear Fellow Shareholders,
At First Eagle, we remain committed to protecting and preserving our shareholders' purchasing power over time. Irrespective of short-term market events, swings in investor confidence or the pressure to follow a new market paradigm, our first priority is unwavering: to provide prudent stewardship of the assets you have placed in our care.
Market Overview
Since I last wrote to you in April, U.S. equity markets have remained strong, amidst continuing signs of an economic recovery. The U.S. dollar reached its highest levels in four years versus a basket of global currencies. Conversely, growth estimates have been reduced outside the U.S., leading to mixed market performance. In particular, European countries such as France and Italy have yet to find their footing while China shows signs of a slowdown. Adding to the uncertainty, we have seen a rise in geopolitical tensions, with a standoff in the Ukraine and increased instability in the Middle East. Yet asset prices and the appetite for risk remained relatively strong.
The MSCI World Index rose 8.7% in the 12 months ending October 31, 2014. In the U.S., the S&P 500 Index increased 17.3%. In Europe, the German DAX Index rose 3.2% but the French CAC 40 Index fell 3.7% during the period, reflecting the divergent health of these two economies. The Nikkei 225 Index increased 14.6% during the twelve month period. Dollar-linked commodity prices also suffered, as crude oil fell 16.4% to $81 a barrel, and the price of gold fell 11.3% to $1,173 an ounce as of October 31st. Over the twelve month period, the U.S. dollar strengthened 14.2% against the Japanese yen and the dollar strengthened 8.5% against the Euro.
During the same period, the Barclay's U.S. Aggregate Bond Index returned 4.1% while the Barclay's U.S. High Yield Corporate Index returned 5.8%. High yield spreads ended October at 430 basis points. Despite some intermittent volatility throughout the twelve month period, spreads are generally unchanged from their 436 basis point level a year ago.
First Eagle Funds | Annual Report | October 31, 2014
4
Letter from the President
While numerous signs point to a continued strengthening of the U.S. economy, we remain wary given the unresolved debt burdens at the Federal level. Another risk is weakening energy prices, which could slow the shale oil boom that has been a key driver of U.S. economic growth in recent quarters.
The strong rally by the U.S. dollar has led to soft performance for gold and other hard assets, but we hold firm in our conviction that gold may be a potential long-term hedge against extreme market events. At First Eagle, we always keep a watchful eye on what can go wrong, not only on what is going right. We will remain focused on delivering long-term absolute returns while also striving to avoid the permanent impairment of our clients' capital.
Global Value Team
The Global Value team remains cautious in the face of ongoing concerns regarding overly permissive monetary and fiscal policies by central bankers. The Portfolio Managers, Matthew McLennan, Kimball Brooker, Matt Lamphier, Giorgio Caputo, Robert Hordon, Edward Meigs and Sean Slein, feel the unwinding of these policies creates a cloudy outlook for economic growth and debt servicing ability. The rebound in the U.S. economy this year masks longer term concerns our Portfolio Managers hold regarding the shortage in savings by Americans relative to investment, and the artificial demand created by fiscal stimulus. Beyond the U.S., the absence of economic growth and high unemployment means the temptation persists for further rounds of stimulus.
In the face of these persistent macroeconomic imbalances, the Global Value team continues to diligently seek what they perceive as a margin of safety in each investment. In the absence of sufficient bottom-up opportunities the funds continue to maintain some cash on the sidelines until appropriate opportunities come along at what they believe are the right prices.
High Yield Team
After rallying in the first half of 2014, the high yield market experienced some volatility in recent months. Portfolio Managers Edward Meigs and Sean Slein feel the Fund's ongoing focus on credit risk rather than interest rate risk may stand investors in good stead over the long run. Corporate default rates remained low and we believe overall credit quality remains reasonable. We remain focused on investing in companies with strong balance sheets and a growth outlook robust enough to support their debt.
As of October 31st, we had allocated approximately 58% to single-B issues compared with about 29% allocated to double-B issues, which are historically longer maturity
First Eagle Funds | Annual Report | October 31, 2014
5
Letter from the President
and more sensitive to interest rates. This stands in contrast to an index allocation of 37% to single-B and 47% to double-B credits. We feel this allocation, along with the portfolio's duration of 3.3 years, will help minimize our exposure to increases in interest rates. The duration of the portfolio is less than that of the Barclays Capital U.S. Corporate High Yield Index, which is 4.3 years.1
Fund of America Team
Portfolio Managers Harold Levy, David Cohen and Eric Stone continue to focus on their core competency: identifying corporate change that can potentially unlock shareholder value. While the U.S. stock market is more expensive today than it was two or three years ago, they continue to find interesting investment opportunities within the current market.
Thank you for your continued confidence and support.
Sincerely,

John P. Arnhold
President
December 2014
First Eagle Funds | Annual Report | October 31, 2014
6
Management's Discussion of Fund Performance
First Eagle Global Fund
The net asset value ("NAV") of the Fund's Class A shares increased 4.6% for the year ending October 31, 2014 while the MSCI World Index rose 8.7%. The Fund's cash and cash equivalents position was 20.4% as of October 31, 2014.
The five largest contributors to the performance of First Eagle Global Fund over the period were Microsoft Corporation (software, U.S.), Intel Corporation (semiconductors, U.S.), Cintas Corporation (uniform rentals, U.S.), Shimano, Inc. (bicycle parts, Japan) and Hoya Corporation (optical products, Japan) collectively accounting for 2.3% points of this period's performance.
The five largest detractors were gold bullion, Kinross Gold Corporation (gold mining, Canada), AngloGold Ashanti Limited (gold mining, South Africa), Penn West Petroleum Limited (E&P, Canada) and Goldcorp, Inc. (gold mining, Canada). Their combined negative performance over the twelve months subtracted 1.3% points from the Fund's performance.
As of October 31, 2014, the Fund was approximately 30% hedged versus the British pound, 20% hedged versus the Japanese yen and 20% hedged versus the Euro.
First Eagle Overseas Fund
The NAV of the Fund's Class A shares rose 1.0% for the year ending October 31, 2014 while the MSCI EAFE Index fell 0.60%. The Fund's cash and cash equivalents position was 20.0% as of October 31, 2014.
The five largest contributors to the performance of First Eagle Overseas Fund over the period were Shimano, Inc. (bicycle parts, Japan), Hoya Corporation (optical products, Japan), Astellas Pharma, Inc. (pharmaceuticals, Japan), Grupo Televisa SA (media, Mexico) and SMC Corporation (pneumatic equipment, Japan) collectively accounting for 2.3% points of this period's performance.
The five largest detractors were Penn West Petroleum (E&P, Canada), gold bullion, WM Morrison Supermarkets PLC (supermarkets, UK), Kinross Gold Corporation (gold mining, Canada) and Goldcorp, Inc. (gold mining, Canada). Their combined negative performance over the twelve month period subtracted 1.5% points from the Fund's performance.
As of October 31, 2014, the Fund was approximately 30% hedged versus the British pound, 20% hedged versus the Japanese yen and 20% hedged versus the Euro.
First Eagle Funds | Annual Report | October 31, 2014
7
Management's Discussion of Fund Performance
First Eagle U.S. Value Fund
The NAV of the Fund's Class A shares increased 8.9% for the year ending October 31, 2014 while the S&P 500 Index rose 17.3%. The Fund's cash and cash equivalents position was 17.9% as of October 31, 2014.
The five largest contributors to the performance of First Eagle U.S. Value Fund over the period were Microsoft Corporation (software), Intel Corporation (semiconductors), Cintas Corporation (uniform rentals), Oracle Corporation (enterprise software) and Comcast Corporation (cable) collectively accounting for 4.2% points of this period's performance.
The five largest detractors were Penn West Petroleum Limited (E&P), gold bullion, Goldcorp, Inc. (gold mining), Rofin-Sinar Technologies, Inc. (laser-based products) and Fresnillo PLC (gold & silver mining). Their combined negative performance over the twelve month period subtracted 1.6% points from the Fund's performance.
First Eagle Gold Fund
The NAV of the Fund's Class A shares fell 21.0% for the year ending October 31, 2014 while the FTSE Gold Mines Index declined 31.8%. The Fund's cash and cash equivalents position was 1.6% as of October 31, 2014.
The five largest contributors to the performance of First Eagle Gold Fund over the period were Osisko Mining (Canada), Royal Gold, Inc. (U.S.), Franco-Nevada Corporation (Canada), Lydian International Limited (Channel Islands) and Continental Gold & Copper (Canada) collectively accounting for 2.1% points of the Fund's performance.
The five largest detractors were gold bullion, Kinross Gold Corporation (Canada), AngloGold Ashanti Limited (South Africa), Goldcorp (Canada) and Newmont Mining Corporation (U.S.). Their combined negative performance over the twelve month period subtracted 9.7% points from the Fund's performance.
First Eagle Global Income Builder Fund
The NAV of the Fund's Class A shares rose 4.7% for the year ending October 31, 2014 while the Barclays U.S. Aggregate Bond Index rose 4.1% and the MSCI World Index increased 8.7%. The Fund's cash and cash equivalents position was 6.9% as of October 31, 2014.
The five largest contributors to the performance of First Eagle Global Income Builder Fund over the period were Ciments Francais SA (cements & aggregates, France), Hoya Corporation (optical products, Japan), Microsoft Corporation
First Eagle Funds | Annual Report | October 31, 2014
8
Management's Discussion of Fund Performance
(software, U.S.), Intel Corporation (semiconductors, U.S.) and Lockheed Martin Corporation (defense systems, U.S.) collectively accounting for 2.4% points of this period's performance.
The five largest detractors were Penn West (E&P, Canada), WM Morrison Supermarkets PLC (supermarkets, UK), Goldcorp, Inc. (gold mining, Canada), Cenovus Energy, Inc. (integrated oil, Canada) and Eni S.p.A (integrated oil, Italy). Their combined negative performance over the twelve month period subtracted 1.4% points from the Fund's performance.
As of October 31, 2014, the Fund was approximately 30% hedged versus the British pound, 20% hedged versus the Japanese yen and 20% hedged versus the Euro on equities. The Fund was approximately 98% hedged on Euro-denominated bonds.
First Eagle High Yield Fund
The NAV of the First Eagle High Yield Fund's Class I shares increased 4.0% for the years ending October 31, 2014 versus 5.8% for the Barclays Capital U.S. Corporate High Yield Index. The Fund held 5.3% of cash and cash equivalents as of October 31, 2014.
The five largest contributors to the performance of the First Eagle High Yield Fund over the period were Kemet Corporation 10.50% due 05/01/2018, ACCO Brands Corporation 6.75% due 04/30/2020, CenturyLink, Inc. 6.75% due 12/01/2023, ROC Finance LLC 12.125% due 09/01/2019 and Frontier Communications Corporation 8.5% due 04/15/2020 collectively accounting for 0.7% points of the Fund's performance.
The five largest detractors were Offshore Group Investments Ltd. 7.5% due 11/01/2019, Bi-Lo LLC 8.625% due 09/15/2018, Parker Drilling Company 6.75% due 07/15/2022, Roundy's Supermarkets, Inc. 10.25% due 12/15/2020 and Drill Rigs Holding, Inc. 6.5% 10/01/2017. Their combined negative performance over the twelve-month period subtracted 0.5% points of the Fund's performance.
As of October 31, 2014 the Fund was approximately 100% hedged against the Euro.
First Eagle Fund of America
The NAV of the First Eagle Fund of America Class Y increased 12.9% for the year ending October 31, 2014 versus 17.3% for the S&P 500 Index. The Fund held 6.4% in a money market mutual fund as of October 31, 2014.
The five largest contributors to the performance of the First Eagle Fund of America over the period were Avis Budget Group, Inc. (automobile and truck rental services),
First Eagle Funds | Annual Report | October 31, 2014
9
Management's Discussion of Fund Performance
Forest Laboratories, Inc. (pharmaceuticals), Hewlett-Packard Company (technology software), Seagate Technology PLC (hard disk drive manufacturer) and Rockwood Holdings, Inc. (chemicals manufacturer), collectively accounting for 8.4% points of the Fund's performance.
The five largest detractors were Theravance, Inc. (pharmaceuticals), FMC Corporation (materials), Viacom, Inc. Class B (media) Hertz Global Holdings, Inc. (automobile and truck rental services) and SeaWorld Entertainment, Inc. (consumer services). Their combined negative performance over the twelve-month period subtracted 2.1% points from the Fund's total return.


Matthew McLennan
Head of the Global Value Team
Portfolio Manager
Global, Overseas,
U.S. Value and Gold Funds | | T. Kimball Brooker, Jr.
Portfolio Manager
Global, Overseas
and U.S. Value Funds
| |


Matt Lamphier
Portfolio Manager
U.S. Value Fund | | Giorgio Caputo
Portfolio Manager
Global Income Builder Fund | |


Robert Hordon
Portfolio Manager
Global Income Builder Fund
| | Edward Meigs
Portfolio Manager
Global Income Builder and
High Yield Funds | |
First Eagle Funds | Annual Report | October 31, 2014
10
Management's Discussion of Fund Performance


Sean Slein
Portfolio Manager
Global Income Builder and
High Yield Funds | | Harold Levy
Portfolio Manager
Fund of America
| |

Eric Stone
Portfolio Manager
Fund of America | |
December 2014
The performance data quoted herein represents past performance and does not guarantee future results. Market volatility can dramatically impact the fund's short-term performance. Current performance may be lower or higher than figures shown. The investment return and principal value will fluctuate so that an investor's shares, when redeemed, may be worth more or less than their original cost. Past performance data through the most recent month end is available at firsteaglefunds.com or by calling 800.334.2143.
The commentary represents the opinion of the Portfolio Management Teams as of December 2014 and is subject to change based on market and other conditions. These materials are provided for informational purposes only. These opinions are not intended to be a forecast of future events, a guarantee of future results, or investment advice. The views expressed herein may change at any time subsequent of the date of issue hereof. The information provided is not to be construed as a recommendation or an offer to buy or sell or the solicitation of an offer to buy or sell any fund or security.
First Eagle Funds | Annual Report | October 31, 2014
11
| | | One-
Year | | Three-
Years | | Five-
Years | | Ten-
Years | | Since
Inception | | Inception Date | |
First Eagle Global Fund | |
Class A (SGENX)
without sales charge | | | 4.64 | % | | | 9.47 | % | | | 10.32 | % | | | 9.54 | % | | | 13.83 | % | | 01/01/792 | |
with sales charge | | | -0.59 | | | | 7.62 | | | | 9.19 | | | | 8.98 | | | | 13.71 | | | 01/01/792 | |
| Class C (FESGX) | | | 2.85 | | | | 8.65 | | | | 9.49 | | | | 8.72 | | | | 10.93 | | | 06/05/00 | |
| Class I (SGIIX) | | | 4.90 | | | | 9.75 | | | | 10.59 | | | | 9.82 | | | | 11.61 | | | 07/31/98 | |
MSCI World Index3 | | | 8.67 | | | | 14.37 | | | | 11.41 | | | | 6.93 | | | | 9.84 | | | 01/01/79 | |
First Eagle Overseas Fund4 | |
Class A (SGOVX)
without sales charge | | | 1.00 | % | | | 7.02 | % | | | 8.09 | % | | | 8.78 | % | | | 11.34 | % | | 08/31/93 | |
with sales charge | | | -4.04 | | | | 5.21 | | | | 6.98 | | | | 8.22 | | | | 11.13 | | | 08/31/93 | |
| Class C (FESOX) | | | -0.67 | | | | 6.24 | | | | 7.29 | | | | 7.96 | | | | 10.31 | | | 06/05/00 | |
| Class I (SGOIX) | | | 1.23 | | | | 7.30 | | | | 8.35 | | | | 9.04 | | | | 11.52 | | | 07/31/98 | |
MSCI EAFE Index5 | | | -0.60 | | | | 9.68 | | | | 6.52 | | | | 5.81 | | | | 5.15 | | | 08/31/93 | |
First Eagle U.S. Value Fund | |
Class A (FEVAX)
without sales charge | | | 8.93 | % | | | 11.27 | % | | | 11.40 | % | | | 8.06 | % | | | 9.60 | % | | 09/04/01 | |
with sales charge | | | 3.46 | | | | 9.39 | | | | 10.26 | | | | 7.51 | | | | 9.17 | | | 09/04/01 | |
| Class C (FEVCX) | | | 7.09 | | | | 10.43 | | | | 10.57 | | | | 7.26 | | | | 8.78 | | | 09/04/01 | |
| Class I (FEVIX) | | | 9.19 | | | | 11.56 | | | | 11.68 | | | | 8.34 | | | | 9.87 | | | 09/04/01 | |
Standard & Poor's
500 Index6 | | | 17.27 | | | | 19.77 | | | | 16.69 | | | | 8.20 | | | | 6.57 | | | 09/04/01 | |
First Eagle Gold Fund | |
Class A (SGGDX)
without sales charge | | | -21.02 | % | | | -25.41 | % | | | -9.70 | % | | | 2.14 | % | | | 4.95 | % | | 08/31/93 | |
with sales charge | | | -24.99 | | | | -26.67 | | | | -10.62 | | | | 1.62 | | | | 4.76 | | | 08/31/93 | |
| Class C (FEGOX) | | | -22.35 | | | | -25.97 | | | | -10.38 | | | | 1.38 | | | | 4.13 | | | 05/15/03 | |
| Class I (FEGIX) | | | -20.81 | | | | -25.22 | | | | -9.48 | | | | 2.39 | | | | 5.16 | | | 05/15/03 | |
FTSE Gold
Mines Index7 | | | -31.76 | | | | -34.43 | | | | -17.97 | | | | -5.00 | | | | -2.66 | | | 08/31/93 | |
MSCI World Index3 | | | 8.67 | | | | 14.37 | | | | 11.41 | | | | 6.93 | | | | 6.87 | | | 08/31/93 | |
First Eagle Funds | Annual Report | October 31, 2014
12
| | | One-
Year | | Three-
Years | | Five-
Years | | Ten-
Years | | Since
Inception | | Inception Date | |
First Eagle Global Income Builder | |
Class A (FEBAX)
without sales charge | | | 4.67 | % | | | — | | | | — | | | | — | | | | 8.84 | % | | 05/01/12 | |
with sales charge | | | -0.55 | | | | — | | | | — | | | | — | | | | 6.61 | | | 05/01/12 | |
| Class C (FEBCX) | | | 2.90 | | | | — | | | | — | | | | — | | | | 8.02 | | | 05/01/12 | |
| Class I (FEBIX) | | | 5.00 | | | | — | | | | — | | | | — | | | | 9.13 | | | 05/01/12 | |
MSCI World Index3 | | | 8.67 | | | | — | | | | — | | | | — | | | | 13.93 | | | 05/01/12 | |
Barclays Capital
U.S. Aggregate
Bond Index8 | | | 4.14 | | | | — | | | | — | | | | — | | | | 2.34 | | | 05/01/12 | |
First Eagle High Yield | |
Class A (FEHAX)
without sales charge | | | 3.74 | % | | | — | | | | — | | | | — | | | | 7.96 | % | | 01/03/12 | |
with sales charge | | | -0.96 | | | | — | | | | — | | | | — | | | | 6.22 | | | 01/03/12 | |
| Class C (FEHCX) | | | 1.99 | | | | — | | | | — | | | | — | | | | 7.11 | | | 01/03/12 | |
| Class I (FEHIX) | | | 4.03 | | | | 8.25 | % | | | 9.51 | % | | | — | | | | 10.98 | | | 11/19/079 | |
Barclays Capital
U.S. Corporate
High Yield Index10 | | | 5.82 | | | | 9.39 | | | | 10.44 | | | | — | | | | 9.28 | | | 11/19/07 | |
First Eagle Fund of America | |
Class A (FEFAX)
without sales charge | | | 12.92 | % | | | 19.41 | % | | | 17.18 | % | | | 10.19 | % | | | 9.24 | % | | 11/20/98 | |
with sales charge | | | 7.28 | | | | 17.38 | | | | 15.98 | | | | 9.63 | | | | 8.89 | | | 11/20/98 | |
| Class C (FEAMX) | | | 11.06 | | | | 18.50 | | | | 16.30 | | | | 9.38 | | | | 8.41 | | | 03/02/98 | |
| Class I (FEAIX) | | | 13.20 | | | | — | | | | — | | | | — | | | | 16.96 | | | 03/08/13 | |
| Class Y (FEAFX)11 | | | 12.91 | | | | 19.41 | | | | 17.17 | | | | 10.19 | | | | 12.32 | | | 04/10/87 | |
Standard & Poor's
500 Index6 | | | 17.27 | | | | 19.77 | | | | 16.69 | | | | 8.20 | | | | 9.72 | | | 04/10/87 | |
First Eagle Funds | Annual Report | October 31, 2014
13
1 The performance data quoted herein represents past performance and does not guarantee future results. Market volatility can dramatically impact the fund's short-term performance. Current performance may be lower or higher than figures shown. The investment return and principal value will fluctuate so that an investor's shares, when redeemed, may be worth more or less than their original cost. Past performance data through the most recent month end is available at firsteaglefunds.com or by calling 800.334.2143. The average annual returns for Class A Shares "with sales charge" of First Eagle Global, Overseas, U.S. Value, Gold, Fund of America, and Global Income Builder give effect to the deduction of the maximum sales charge of 5.00%. The average annual returns for Class A Shares "with sales charge" of First Eagle High Yield gives effect to the deduction of the maximum sales charge of 4.50%.
The average annual returns for Class C Shares reflect the CDSC (Contingent Deferred Sales Charge) of 1.00% which pertains to the first year or less of investment only.
A contingent deferred sales charge of 1.00% may apply on redemptions of Class A shares made within 18 months following a purchase of $1,000,000 or more without an initial sales charge.
Class I Shares of First Eagle Global Fund, First Eagle Overseas Fund, First Eagle U.S. Value Fund, First Eagle Gold Fund, First Eagle Global Income Builder Fund, First Eagle High Yield Fund, and First Eagle Fund of America require $1mm minimum investment and are offered without a sales charge.
Class Y Shares of First Eagle Fund of America are offered without charge.
2 The Fund commenced operation April 28, 1970. Performance for periods prior to January 1, 2000 occurred while a prior portfolio manager of the fund was affiliated with another firm. Inception date shown is when this prior portfolio manager assumed portfolio management responsibilities.
3 The MSCI World Index is a widely followed, unmanaged group of stocks from 23 international markets and is not available for purchase. The index provides total returns in U.S. dollars with net dividends reinvested.
4 Effective as of the close of business on May 9, 2014, the First Eagle Overseas Fund is closed to certain investors. Please see the prospectus for more information.
5 The MSCI EAFE Index is an unmanaged total return index, reported in U.S. dollars, based on share prices and reinvested net dividends of approximately 1,100 companies from 22 countries and is not available for purchase.
6 The Standard & Poor's 500 Index is a widely recognized unmanaged index including a representative sample of 500 leading companies in leading sectors of the U.S. economy and is not available for purchase. Although the Standard & Poor's 500 Index focuses on the large-cap segment of the market, with approximately 80% coverage of U.S. equities, it is also considered a proxy for the total market. The Standard & Poor's 500 Index includes dividends reinvested.
7 The FTSE Gold Mines Index Series is designed to reflect the performance of the worldwide market in the shares of companies whose principal activity is the mining of gold. The FTSE Gold Mines Index encompasses all gold mining companies that have a sustainable, attributable gold production of at least 300,000 ounces a year and that derive 51% or more of their revenue from mined gold. The Index is unmanaged, is available with dividends reinvested and is not available for purchase.
8 The Barclays Capital U.S. Aggregate Bond Index is an unmanaged broad-based benchmark that measures the investment grade, U.S. dollar-denominated, fixed-rate taxable bond market, including Treasuries, government-related and corporate securities, MBS (agency fixed-rate and hybrid ARM passthroughs), ABS, and CMBS and is not available for purchase.
9 First Eagle High Yield Fund commenced operations in its present form on December 30, 2011, and is successor to another mutual fund pursuant to a reorganization December 30, 2011. Information prior to December 30, 2011 is for this predecessor fund. Immediately after the reorganization, changes in net asset value of the Class I shares were partially impacted by differences in how the Fund and the predecessor fund price portfolio securities.
First Eagle Funds | Annual Report | October 31, 2014
14
10 The Barclays Capital U.S. Corporate High Yield Bond Index is composed of fixed-rate, publicly issued, non-investment grade debt, is unmanaged, with dividends reinvested, and is not available for purchase. The index includes both corporate and non-corporate sectors. The corporate sectors are Industrial, Utility, and Finance, which include both U.S. and non-U.S. corporations. The index is presented here for comparison purposes only. One cannot invest directly in an index.
11 As of September 1, 2005 First Eagle Fund of America Class Y is closed to new accounts.
Expense Ratios As Stated In The Most Recent Prospectus
Total Annual Gross Operating Expense Ratios
| | | Class A | | Class C | | Class I | | Class Y | |
First Eagle Global Fund | | | 1.13 | % | | | 1.87 | % | | | 0.88 | % | | | — | | |
First Eagle Overseas Fund | | | 1.15 | | | | 1.90 | | | | 0.90 | | | | — | | |
First Eagle U.S. Value Fund | | | 1.16 | | | | 1.91 | | | | 0.91 | | | | — | | |
First Eagle Gold Fund | | | 1.25 | | | | 2.00 | | | | 1.00 | | | | — | | |
First Eagle Global Income Builder | | | 1.35 | | | | 2.09 | | | | 1.10 | | | | — | | |
First Eagle High Yield Fund | | | 1.13 | | | | 1.88 | | | | 0.88 | | | | — | | |
First Eagle Fund of America | | | 1.42 | | | | 2.17 | | | | 1.20 | | | | 1.42 | % | |
For the First Eagle High Yield and Global Income Builder funds had fees not been waived and/or expenses reimbursed in the past, returns would have been lower.
The expense ratios presented as of October 31, 2014 may differ from corresponding ratios shown elsewhere in this report because of differing time periods (and/or, if applicable, because these expense ratios do not include expense credits or waivers).
There are risks associated with investing in funds that invest in securities of foreign countries, such as erratic market conditions, economic and political instability and fluctuations in currency exchange rates. Funds whose investments are concentrated in a specific industry or sector may be subject to a higher degree of risk than funds whose investments are diversified and may not be suitable for all investors.
The principal risk of investing in value stocks is that the price of the security may not approach its anticipated value or may decline in price.
Investment in gold and gold related investments present certain risks, including political and economic risks affecting the price of gold and other precious metals like changes in U.S. or foreign tax, currency or mining laws, increased environmental costs, international monetary and political policies, economic conditions within an individual country, trade imbalances, and trade or currency restrictions between countries. The price of gold, in turn, is likely to affect the market prices of securities of companies mining or processing gold, and accordingly, the value of investments in such securities may also be affected. Gold related investments as a group have not performed as well as the stock market in general during periods when the U.S. dollar is strong, inflation is low and general economic conditions are stable. In addition, returns on gold related investments have traditionally been more volatile than investments in broader equity or debt markets.
The event-driven investment style used by First Eagle Fund of America carries the additional risk that the event anticipated occurs later than expected, does not occur at all or does not have the desired effect on the market price of the securities.
First Eagle High Yield and Global Income Builder Funds invest in high yield securities that are non-investment grade. High yield securities are rated lower than investment-grade securities because there is a greater possibility that the issuer may be unable to make interest and principal payments on those securities. High yield securities involve greater risk than higher rated securities and portfolios that invest in them may be subject to greater levels of credit and liquidity risk than portfolios that do not.
First Eagle Funds | Annual Report | October 31, 2014
15
The First Eagle High Yield Fund's investment strategies may result in high turnover rates. This may increase the Fund's brokerage transaction costs, which would reduce performance. Rapid portfolio turnover also exposes shareholders to a higher current realization of short-term gains, which could cause you to pay higher taxes.
Funds that invest in bonds are subject to interest-rate risk and can lose principal value when interest rates rise. Bonds are also subject to credit risk, in which the bond issuer may fail to pay interest and principal in a timely manner, or that negative perception of the issuer's ability to make such payments may cause the price of that bond to decline.
Income generation and dividends are not guaranteed. If dividend paying stocks in the fund's portfolio stop paying or reduce dividends the fund's ability to generate income will be adversely affected.
All investments involve the risk of loss.
First Eagle Funds | Annual Report | October 31, 2014
16
This page was intentionally left blank.
Data as of October 31, 2014 (unaudited)
Investment Objective
The First Eagle Global Fund seeks long-term growth of capital by investing in a range of asset classes from markets in the United States and around the world. This truly global fund is managed with a highly disciplined, bottom-up, value oriented style.
Average Annual Returns (%) | | | | | | One-Year | | Five-Years | | Ten-Years | |
First Eagle Global Fund | | Class A | | without sales load | | | 4.64 | | | | 10.32 | | | | 9.54 | | |
| | | | with sales load | | | -0.59 | | | | 9.19 | | | | 8.98 | | |
MSCI World Index | | | | | | | 8.67 | | | | 11.41 | | | | 6.93 | | |
Consumer Price Index | | | | | | | 1.66 | | | | 1.89 | | | | 2.21 | | |

Countries** (%)
United States | | | 40.69 | | |
Japan | | | 13.20 | | |
France | | | 6.61 | | |
Canada | | | 4.15 | | |
United Kingdom | | | 2.84 | | |
Mexico | | | 1.92 | | |
Germany | | | 1.67 | | |
Switzerland | | | 1.62 | | |
South Korea | | | 1.26 | | |
Sweden | | | 0.66 | | |
Australia | | | 0.61 | | |
Bermuda | | | 0.56 | | |
Belgium | | | 0.50 | | |
Ireland | | | 0.45 | | |
South Africa | | | 0.44 | | |
Hong Kong | | | 0.43 | | |
Thailand | | | 0.39 | | |
Italy | | | 0.35 | | |
Netherlands | | | 0.28 | | |
Russia | | | 0.25 | | |
Singapore | | | 0.24 | | |
Israel | | | 0.21 | | |
Austria | | | 0.17 | | |
Denmark | | | 0.15 | | |
* Asset Allocation and Countries percentages are based on total investments in the portfolio.
**Country allocations reflect country of the issuer (not currency of issue) and exclude short term investments. Bonds of non-U.S. issuers may be U.S. dollar denominated.
The Fund's portfolio composition is subject to change at any time.
First Eagle Funds | Annual Report | October 31, 2014
18
First Eagle Global Fund | Fund Overview
Growth of a $10,000 Initial Investment

Performance data quoted herein represents past performance and should not be considered indicative of future results. Performance data quoted herein does not reflect the deduction of taxes that a shareholder would pay on Fund distributions or the sale of Fund shares. The average annual returns shown above are historical and reflect changes in share price, reinvested dividends and are net of expenses.
The average annual returns for Class A Shares give effect to the deduction of the maximum sales charge of 5.00%.
The MSCI World Index is a widely followed, unmanaged group of stocks from 23 international markets and is not available for purchase. The index provides total returns in U.S. dollars with net dividends reinvested. The Consumer Price Index (CPI) represents the change in price of all goods and services purchased for consumption by urban households.
Top 10 Holdings* (%)
Gold Bullion** (precious metal) | | | 4.79 | | |
Microsoft Corporation (U.S. software developer) | | | 2.11 | | |
Intel Corporation (U.S. computer components and related products manufacturer) | | | 1.84 | | |
Oracle Corporation (U.S. provider of software/hardware products and services) | | | 1.80 | | |
Comcast Corporation Class 'A' (U.S. cable/satellite television company) | | | 1.80 | | |
Bank of New York Mellon Corporation (U.S. financial services company) | | | 1.45 | | |
SMC Corporation (Japanese automated control devices manufacturer) | | | 1.38 | | |
Secom Company Limited (Japanese security services provider) | | | 1.32 | | |
KDDI Corporation (Japanese telecommunications company) | | | 1.29 | | |
3M Company (U.S. industrial conglomerate) | | | 1.24 | | |
Total | | | 19.02 | | |
* Holdings in cash, commercial paper and other short term cash equivalents have been excluded.
**The Fund invests in gold and precious metals through investment in a wholly-owned subsidiary of the Fund organized under the laws of the Cayman Islands (the "Subsidiary"). Gold Bullion and commodities include the Fund's investment in the Subsidiary.
Percentages are based on total net assets.
First Eagle Funds | Annual Report | October 31, 2014
19
First Eagle Global Fund | Consolidated Schedule of Investments | Year Ended October 31, 2014
| Shares | | Description | | Cost (Note 1) | | Value (Note 1) | |
Common Stocks — 71.46% | | | |
U.S. Common Stocks — 33.42% | | | |
Consumer Discretionary — 4.15% | | | |
| | 16,502,976 | | | Comcast Corporation, Class 'A' | | $ | 348,272,491 | | | $ | 909,974,152 | | |
| | 7,367,580 | | | Omnicom Group, Inc. | | | 266,763,916 | | | | 529,434,371 | | |
| | 4,033,948 | | | McDonald's Corporation | | | 397,465,831 | | | | 378,102,040 | | |
| | 3,992,317 | | | H&R Block, Inc. | | | 67,554,206 | | | | 128,991,794 | | |
| | 1,265,679 | | | Bed Bath & Beyond, Inc. (a) | | | 77,330,447 | | | | 85,230,824 | | |
| | 707,230 | | | Ross Stores, Inc. | | | 45,657,932 | | | | 57,087,686 | | |
| | 2,484 | | | JG Boswell Company | | | 573,840 | | | | 2,422,875 | | |
| | 159,424 | | | St. John Knits International, Inc. (a)(b) | | | 2,583,585 | | | | 797,125 | | |
| | 31,592 | | | Mills Music Trust (b)(c) | | | 930,198 | | | | 621,099 | | |
| | | | 1,207,132,446 | | | | 2,092,661,966 | | |
Consumer Staples — 0.89% | | | |
| | 3,258,977 | | | Colgate-Palmolive Company | | | 125,309,064 | | | | 217,960,582 | | |
| | 1,693,401 | | | Wal-Mart Stores, Inc. | | | 82,465,011 | | | | 129,155,923 | | |
| | 2,680,106 | | | Sysco Corporation | | | 72,240,237 | | | | 103,291,401 | | |
| | | | 280,014,312 | | | | 450,407,906 | | |
Energy — 2.82% | | | |
| | 8,124,737 | | | National Oilwell Varco, Inc. | | | 579,277,775 | | | | 590,181,113 | | |
| | 6,000,259 | | | ConocoPhillips | | | 254,437,343 | | | | 432,918,687 | | |
| | 5,498,446 | | | Devon Energy Corporation | | | 312,965,847 | | | | 329,906,880 | | |
| | 3,908,035 | | | San Juan Basin Royalty Trust (c) | | | 138,744,050 | | | | 70,969,916 | | |
| | | | 1,285,425,015 | | | | 1,423,976,596 | | |
Financials — 8.79% | | | |
| | 18,950,899 | | | Bank of New York Mellon Corporation | | | 484,400,217 | | | | 733,778,848 | | |
| | 2,442 | | | Berkshire Hathaway, Inc., Class 'A' (a) | | | 193,617,046 | | | | 512,820,000 | | |
| | 5,480,658 | | | American Express Company | | | 226,378,297 | | | | 492,985,277 | | |
| | 9,693,681 | | | BB&T Corporation | | | 245,863,323 | | | | 367,196,674 | | |
| | 6,804,201 | | | Cincinnati Financial Corporation | | | 170,308,782 | | | | 343,408,075 | | |
| | 9,921,396 | | | Weyerhaeuser Company, REIT | | | 154,182,567 | | | | 335,938,502 | | |
| | 7,819,458 | | | U.S. Bancorp | | | 192,949,644 | | | | 333,108,953 | | |
| | 6,128,668 | | | Plum Creek Timber Company, Inc., REIT | | | 228,319,436 | | | | 251,336,716 | | |
| | 4,386,050 | | | WR Berkley Corporation | | | 117,583,057 | | | | 226,057,068 | | |
| | 3,365,437 | | | American International Group, Inc. | | | 177,995,460 | | | | 180,286,514 | | |
First Eagle Funds | Annual Report | October 31, 2014
20
First Eagle Global Fund | Consolidated Schedule of Investments | Year Ended October 31, 2014
| Shares | | Description | | Cost (Note 1) | | Value (Note 1) | |
U.S. Common Stocks — 33.42% (continued) | | | |
Financials — 8.79% (continued) | | | |
| | 743,437 | | | Visa, Inc., Class 'A' | | $ | 53,618,674 | | | $ | 179,487,995 | | |
| | 2,024,060 | | | Mastercard, Inc., Class 'A' | | | 40,702,513 | | | | 169,515,025 | | |
| | 299,496 | | | Alleghany Corporation (a) | | | 114,850,390 | | | | 133,060,083 | | |
| | 2,858,552 | | | Rayonier, Inc., REIT | | | 20,620,399 | | | | 95,675,769 | | |
| | 2,339,499 | | | Brown & Brown, Inc. | | | 71,192,895 | | | | 74,536,438 | | |
| | 277,374 | | | First American Financial Corporation | | | 6,437,306 | | | | 8,409,980 | | |
| | | | 2,499,020,006 | | | | 4,437,601,917 | | |
Health Care — 0.76% | | | |
| | 2,120,282 | | | WellPoint, Inc. | | | 99,704,333 | | | | 268,619,160 | | |
| | 1,059,976 | | | Johnson & Johnson | | | 59,610,842 | | | | 114,244,644 | | |
| | | | 159,315,175 | | | | 382,863,804 | | |
Industrials — 5.33% | | | |
| | 4,069,879 | | | 3M Company | | | 315,646,157 | | | | 625,825,448 | | |
| | 7,899,775 | | | Cintas Corporation (c) | | | 242,406,389 | | | | 578,579,521 | | |
| | 2,912,737 | | | Northrop Grumman Corporation | | | 171,493,693 | | | | 401,841,334 | | |
| | 2,066,103 | | | Lockheed Martin Corporation | | | 144,573,784 | | | | 393,737,439 | | |
| | 3,153,152 | | | Deere & Company | | | 261,701,559 | | | | 269,720,708 | | |
| | 2,087,657 | | | Alliant Techsystems, Inc. (c) | | | 149,814,061 | | | | 244,172,363 | | |
| | 5,851,664 | | | NOW, Inc. (a)(c) | | | 178,684,330 | | | | 175,901,020 | | |
| | | | 1,464,319,973 | | | | 2,689,777,833 | | |
Information Technology — 8.76% | | | |
| | 22,635,659 | | | Microsoft Corporation | | | 593,352,723 | | | | 1,062,744,237 | | |
| | 27,323,582 | | | Intel Corporation (d) | | | 535,572,888 | | | | 929,275,058 | | |
| | 23,323,188 | | | Oracle Corporation | | | 699,069,784 | | | | 910,770,491 | | |
| | 8,766,525 | | | Teradata Corporation (a)(c) | | | 369,529,577 | | | | 370,999,338 | | |
| | 8,019,788 | | | Linear Technology Corporation | | | 227,165,656 | | | | 343,567,761 | | |
| | 5,372,512 | | | Xilinx, Inc. | | | 216,416,093 | | | | 238,969,378 | | |
| | 2,135,631 | | | Automatic Data Processing, Inc. | | | 67,208,813 | | | | 174,651,985 | | |
| | 241,146 | | | Google, Inc., Class 'A' (a) | | | 62,240,364 | | | | 136,939,579 | | |
| | 241,146 | | | Google, Inc., Class 'C' (a) | | | 62,403,398 | | | | 134,819,906 | | |
| | 1,137,228 | | | NetApp, Inc. | | | 36,048,305 | | | | 48,673,401 | | |
| | 1,074,757 | | | CommVault Systems, Inc. (a) | | | 51,692,790 | | | | 47,654,770 | | |
| | 711,876 | | | CDK Global, Inc. (a) | | | 9,547,394 | | | | 23,919,067 | | |
| | | | 2,930,247,785 | | | | 4,422,984,971 | | |
First Eagle Funds | Annual Report | October 31, 2014
21
First Eagle Global Fund | Consolidated Schedule of Investments | Year Ended October 31, 2014
| Shares | | Description | | Cost (Note 1) | | Value (Note 1) | |
U.S. Common Stocks — 33.42% (continued) | | | |
Materials — 1.45% | | | |
| | 4,172,577 | | | Scotts Miracle-Gro Company,
Class 'A' (c) | | $ | 182,102,946
| | | $ | 247,183,461
| | |
| | 3,397,978 | | | Vulcan Materials Company | | | 156,102,690 | | | | 209,689,346 | | |
| | 1,752,638 | | | Martin Marietta Materials, Inc. | | | 155,134,877 | | | | 204,918,669 | | |
| | 811,480 | | | Deltic Timber Corporation (c) | | | 39,544,385 | | | | 52,819,233 | | |
| | 816,793 | | | Newmont Mining Corporation | | | 6,252,316 | | | | 15,323,074 | | |
| | | | 539,137,214 | | | | 729,933,783 | | |
Utilities — 0.47% | | | |
| | 3,760,485 | | | IDACorp, Inc. (c) | | | 124,066,738 | | | | 237,775,467 | | |
Total U.S. Common Stocks | | | 10,488,678,664 | | | | 16,867,984,243 | | |
International Common Stocks — 38.04% | | | |
Australia — 0.60% | | | |
| | 37,126,217 | | | Newcrest Mining Limited (a) | | | 792,366,434 | | | | 304,494,317 | | |
Austria — 0.17% | | | |
| | 2,762,699 | | | OMV AG | | | 111,424,751 | | | | 86,846,284 | | |
Belgium — 0.49% | | | |
| | 2,788,862 | | | Groupe Bruxelles Lambert SA | | | 234,732,253 | | | | 249,009,236 | | |
Bermuda — 0.56% | | | |
| | 4,676,068 | | | Jardine Matheson Holdings Limited | | | 236,801,754 | | | | 280,096,653 | | |
Canada — 4.13% | | | |
| | 20,171,095 | | | Cenovus Energy, Inc. | | | 566,078,237 | | | | 499,436,337 | | |
| | 13,299,223 | | | Canadian Natural Resources Limited | | | 382,681,555 | | | | 464,095,186 | | |
| | 18,731,917 | | | Goldcorp, Inc. | | | 599,128,363 | | | | 351,785,420 | | |
| 9,130,439 | | | Potash Corporation of Saskatchewan,
Inc. | | | 351,228,590 | | | | 311,987,101 | | |
| | 7,419,204 | | | Agnico-Eagle Mines Limited | | | 234,920,569 | | | | 174,840,565 | | |
| | 12,939,710 | | | Barrick Gold Corporation | | | 236,771,269 | | | | 153,594,358 | | |
| | 31,256,868 | | | Kinross Gold Corporation (a) | | | 153,179,049 | | | | 67,202,268 | | |
| | 12,974,989 | | | Penn West Petroleum Limited | | | 177,450,961 | | | | 58,646,950 | | |
| | | | 2,701,438,593 | | | | 2,081,588,185 | | |
Denmark — 0.15% | | | |
| | 2,651,397 | | | ISS AS (a) | | | 85,549,523 | | | | 73,924,041 | | |
France — 6.44% | | | |
| | 6,926,598 | | | Danone SA | | | 478,810,621 | | | | 470,633,234 | | |
First Eagle Funds | Annual Report | October 31, 2014
22
First Eagle Global Fund | Consolidated Schedule of Investments | Year Ended October 31, 2014
| Shares | | Description | | Cost (Note 1) | | Value (Note 1) | |
International Common Stocks — 38.04% (continued) | | | |
France — 6.44% (continued) | | | |
| | 7,202,806 | | | Total SA | | $ | 354,805,789 | | | $ | 428,022,267 | | |
| | 4,284,366 | | | Sanofi | | | 332,925,755 | | | | 395,477,130 | | |
| | 11,417,174 | | | Bouygues SA | | | 414,984,766 | | | | 394,169,808 | | |
| | 10,992,759 | | | Carrefour SA | | | 444,625,285 | | | | 321,935,266 | | |
| | 7,446,750 | | | Compagnie de Saint-Gobain | | | 323,552,273 | | | | 319,570,763 | | |
| | 9,843,860 | | | Vivendi SA (a) | | | 272,456,855 | | | | 240,240,396 | | |
| | 2,407,099 | | | Sodexo | | | 62,692,015 | | | | 231,875,001 | | |
| | 1,867,732 | | | Neopost SA (c) | | | 166,306,200 | | | | 129,689,795 | | |
| | 936,392 | | | Wendel SA | | | 21,286,521 | | | | 103,192,290 | | |
| | 5,126,327 | | | Société Télévision Francaise 1 | | | 66,985,673 | | | | 76,221,439 | | |
| | 1,401,821 | | | Legrand SA | | | 47,735,246 | | | | 75,432,360 | | |
| | 157,260 | | | Robertet SA (c) | | | 20,623,058 | | | | 32,516,614 | | |
| | 42,252 | | | Robertet SA CI (b)(e)(f) | | | 800,508 | | | | 5,956,661 | | |
| | 385,000 | | | Sabeton SA (c) | | | 4,841,233 | | | | 6,561,494 | | |
| | 12,000,000 | | | FINEL (a)(b)(c)(e)(h) | | | 0 | | | | 5,413,608 | | |
| | 104,457 | | | Gaumont SA | | | 6,087,824 | | | | 5,196,742 | | |
| | 66,717 | | | NSC Groupe (b)(c) | | | 11,738,587 | | | | 5,041,467 | | |
| | | | 3,031,258,209 | | | | 3,247,146,335 | | |
Germany — 1.40% | | | |
| | 7,775,691 | | | HeidelbergCement AG | | | 424,710,748 | | | | 529,299,947 | | |
| | 1,592,711 | | | Daimler AG | | | 66,823,238 | | | | 123,806,124 | | |
| | 693,439 | | | Fraport AG | | | 20,976,007 | | | | 42,858,311 | | |
| | 341,950 | | | Hornbach Baumarkt AG | | | 8,260,466 | | | | 12,152,712 | | |
| | | | 520,770,459 | | | | 708,117,094 | | |
Hong Kong — 0.43% | | | |
| | 12,693,579 | | | Guoco Group Limited | | | 115,086,260 | | | | 155,986,431 | | |
| | 13,182,921 | | | Hysan Development Company Limited | | | 62,292,222 | | | | 60,261,197 | | |
| | 10,855,273 | | | City e-Solutions Limited (a)(b) | | | 490,399 | | | | 2,141,618 | | |
| | | | 177,868,881 | | | | 218,389,246 | | |
Ireland — 0.44% | | | |
| | 10,094,911 | | | CRH PLC | | | 175,024,030 | | | | 223,822,935 | | |
Israel — 0.21% | | | |
| | 15,719,753 | | | Israel Chemicals Limited | | | 156,830,538 | | | | 105,599,441 | | |
First Eagle Funds | Annual Report | October 31, 2014
23
First Eagle Global Fund | Consolidated Schedule of Investments | Year Ended October 31, 2014
| Shares | | Description | | Cost (Note 1) | | Value (Note 1) | |
International Common Stocks — 38.04% (continued) | | | |
Italy — 0.35% | | | |
| | 21,398,654 | | | Italcementi S.p.A. (c) | | $ | 347,026,230 | | | $ | 122,172,446 | | |
| | 1,734,971 | | | Italmobiliare S.p.A. RSP | | | 121,356,934 | | | | 27,829,508 | | |
| | 1,021,136 | | | Italmobiliare S.p.A. | | | 107,360,738 | | | | 24,313,121 | | |
| | | | 575,743,902 | | | | 174,315,075 | | |
Japan — 13.13% | | | |
| | 2,508,756 | | | SMC Corporation | | | 271,030,820 | | | | 693,942,123 | | |
| | 11,121,730 | | | Secom Company Limited | | | 504,039,784 | | | | 668,442,459 | | |
| | 10,093,800 | | | KDDI Corporation | | | 320,858,498 | | | | 649,256,221 | | |
| | 1,307,090 | | | Keyence Corporation | | | 232,220,762 | | | | 610,692,928 | | |
| | 36,321,299 | | | Astellas Pharma, Inc. | | | 288,085,434 | | | | 549,386,946 | | |
| | 3,169,600 | | | Fanuc Corporation | | | 295,828,491 | | | | 539,530,398 | | |
| | 3,872,190 | | | Shimano, Inc. | | | 54,038,584 | | | | 505,375,521 | | |
| | 14,298,939 | | | Hoya Corporation | | | 305,848,299 | | | | 497,423,619 | | |
| | 14,917,299 | | | Sompo Japan Nipponkoa Holdings, Inc. | | | 402,645,728 | | | | 365,080,416 | | |
| | 13,217,880 | | | Mitsubishi Estate Company Limited | | | 232,209,618 | | | | 328,961,349 | | |
| | 14,618,719 | | | MS&AD Insurance Group Holdings | | | 356,085,457 | | | | 306,820,676 | | |
| | 2,190,800 | | | Hirose Electric Company Limited (c) | | | 230,434,913 | | | | 263,500,628 | | |
| | 3,308,230 | | | Nissin Foods Holdings Company Limited | | | 116,618,183 | | | | 172,590,499 | | |
| | 4,484,910 | | | Nomura Research Institute Limited | | | 92,604,811 | | | | 144,938,556 | | |
| | 3,526,280 | | | Chofu Seisakusho Company Limited (c) | | | 64,322,538 | | | | 104,069,603 | | |
| | 5,147,000 | | | T. Hasegawa Company Limited (c) | | | 79,849,658 | | | | 78,172,998 | | |
| | 924,660 | | | Shin-Etsu Chemical Company Limited | | | 43,043,581 | | | | 57,986,246 | | |
| | 632,500 | | | Nitori Holdings Company Limited | | | 26,796,871 | | | | 39,698,420 | | |
| | 1,147,200 | | | MISUMI Group, Inc. | | | 17,394,521 | | | | 35,235,611 | | |
| | 317,700 | | | FamilyMart Company Limited | | | 12,501,479 | | | | 12,529,811 | | |
| | | | 3,946,458,030 | | | | 6,623,635,028 | | |
Mexico — 1.91% | | | |
| | 16,713,543 | | | Grupo Televisa S.A.B., ADR | | | 327,870,823 | | | | 604,027,480 | | |
| | 19,043,914 | | | Fresnillo PLC | | | 258,153,252 | | | | 212,490,325 | | |
| | 6,401,019 | | | Industrias Peñoles S.A.B. de C.V. | | | 7,339,323 | | | | 144,978,082 | | |
| | | | 593,363,398 | | | | 961,495,887 | | |
First Eagle Funds | Annual Report | October 31, 2014
24
First Eagle Global Fund | Consolidated Schedule of Investments | Year Ended October 31, 2014
| Shares | | Description | | Cost (Note 1) | | Value (Note 1) | |
International Common Stocks — 38.04% (continued) | | | |
Netherlands — 0.28% | | | |
| | 24,582,669 | | | TNT Express NV | | $ | 226,206,927 | | | $ | 142,661,564 | | |
Russia — 0.25% | | | |
| | 19,361,263 | | | Gazprom OAO, ADR | | | 130,470,161 | | | | 128,326,478 | | |
South Africa — 0.43% | | | |
| | 16,836,511 | | | AngloGold Ashanti Limited, ADR (a) | | | 269,094,862 | | | | 139,237,963 | | |
| | 25,019,069 | | | Gold Fields Limited, ADR | | | 233,463,377 | | | | 79,810,836 | | |
| | | | 502,558,239 | | | | 219,048,799 | | |
South Korea — 1.20% | | | |
| | 3,898,596 | | | KT&G Corporation | | | 216,376,344 | | | | 346,548,441 | | |
| | 2,878,571 | | | Kia Motors Corporation | | | 162,911,561 | | | | 140,328,803 | | |
| | 51,899 | | | Lotte Confectionery Company Limited | | | 21,157,500 | | | | 93,336,764 | | |
| 39,989 | | | Namyang Dairy Products Company
Limited (c) | | | 7,325,466 | | | | 25,668,273 | | |
| | | | 407,770,871 | | | | 605,882,281 | | |
Sweden — 0.65% | | | |
| | 5,939,938 | | | Investor AB, Class 'A' | | | 116,378,542 | | | | 208,183,267 | | |
| | 3,394,796 | | | Investor AB, Class 'B' | | | 63,888,333 | | | | 121,463,626 | | |
| | | | 180,266,875 | | | | 329,646,893 | | |
Switzerland — 1.61% | | | |
| | 5,811,558 | | | Nestlé SA | | | 197,673,733 | | | | 425,228,732 | | |
| | 4,327,669 | | | Pargesa Holding SA | | | 272,881,781 | | | | 336,219,230 | | |
| | 388,802 | | | Kuehne & Nagel International AG | | | 7,503,142 | | | | 50,593,084 | | |
| | | | 478,058,656 | | | | 812,041,046 | | |
Thailand — 0.39% | | | |
| | 32,213,696 | | | Bangkok Bank PCL, NVDR | | | 109,267,553 | | | | 195,833,976 | | |
United Kingdom — 2.82% | | | |
| | 7,175,381 | | | Berkeley Group Holdings PLC (c) | | | 86,127,760 | | | | 261,708,907 | | |
| | 10,337,328 | | | GlaxoSmithKline PLC | | | 204,849,425 | | | | 234,406,741 | | |
| | 4,624,679 | | | Liberty Global PLC, Series 'C' (a) | | | 188,833,906 | | | | 205,659,475 | | |
| | 574,695 | | | Liberty Global PLC, Series 'A' (a) | | | 24,596,052 | | | | 26,131,382 | | |
| | 3,616,469 | | | British American Tobacco PLC | | | 192,774,624 | | | | 205,203,435 | | |
| | 4,355,040 | | | Willis Group Holdings PLC | | | 119,957,625 | | | | 176,509,771 | | |
| | 4,885,789 | | | Diageo PLC | | | 134,973,869 | | | | 143,654,420 | | |
| | 42,951,229 | | | WM Morrison Supermarkets PLC | | | 186,107,922 | | | | 106,361,695 | | |
First Eagle Funds | Annual Report | October 31, 2014
25
First Eagle Global Fund | Consolidated Schedule of Investments | Year Ended October 31, 2014
| Shares | | Description | | Cost (Note 1) | | Value (Note 1) | |
International Common Stocks — 38.04% (continued) | | | |
United Kingdom — 2.82% (continued) | | | |
| | 3,052,693 | | | Anglo American PLC | | $ | 74,109,213 | | | $ | 64,289,890 | | |
| | | | 1,212,330,396 | | | | 1,423,925,716 | | |
Total International Common Stocks | | | 16,586,560,433 | | | | 19,195,846,510 | | |
Total Common Stocks | | | 27,075,239,097 | | | | 36,063,830,753 | | |
International Preferred Stock — 0.26% | | | |
Germany — 0.26% | | | |
| | 1,590,953 | | | Hornbach Holding AG | | | 53,352,572 | | | | 132,595,078 | | |
Investment Company — 0.00% | | | |
| 434,056
| | | State Street Institutional
U.S.Government Money Market
Fund, Institutional Class | | | 434,056
| | | | 434,056
| | |
Warrant — 0.23% | | | |
United States — 0.23% | | | |
| 5,806,899 | | | JPMorgan Chase & Company
Warrant expire 10/28/18 (a) | | | 75,108,859 | | | | 114,976,600 | | |
| Ounces | | | | | | | |
Commodity — 4.79% | | | |
| | 2,063,285 | | | Gold bullion (a) | | | 2,036,115,803 | | | | 2,418,179,723 | | |
| Principal | | | | | | | |
Notes and Bonds — 2.43% | | | |
U.S. Bonds — 2.00% | | | |
Government Obligations — 1.99% | | | |
$ | 250,000,000
| | | U.S. Treasury Note
0.50% due 06/15/16 | | | 250,422,298
| | | | 250,664,000
| | |
| 250,000,000
| | | U.S. Treasury Note
0.625% due 12/15/16 | | | 249,551,228
| | | | 250,293,000
| | |
| 250,000,000
| | | U.S. Treasury Note
0.75% due 03/15/17 | | | 249,414,252
| | | | 250,527,250
| | |
| 250,000,000
| | | U.S. Treasury Note
0.875% due 09/15/16 | | | 251,550,542
| | | | 251,836,000
| | |
| | | | 1,000,938,320 | | | | 1,003,320,250 | | |
First Eagle Funds | Annual Report | October 31, 2014
26
First Eagle Global Fund | Consolidated Schedule of Investments | Year Ended October 31, 2014
Principal | | Description | | Cost (Note 1) | | Value (Note 1) | |
U.S. Bonds — 2.00% (continued) | | | |
U.S. Corporate Bond — 0.01% | | | |
$ | 5,467,000
| | | Bausch & Lomb, Inc.
7.125% due 08/01/28 (b) | | $ | 4,816,754
| | | $ | 5,439,665
| | |
Total U.S. Bonds | | | 1,005,755,074 | | | | 1,008,759,915 | | |
International Notes and Bonds — 0.43% | | | |
International Corporate Notes and Bonds — 0.14% | | | |
France — 0.14% | | | |
| 15,000,000
EUR | | | Emin Leydier SA FRN
8.272% due 07/31/16 (b)(e)(i) | | | 21,369,283 | | | | 18,797,252 | | |
| 17,256,032
EUR | | | FINEL
9.50% due 06/30/17 (b)(e)(g)(j) | | | 21,555,398 | | | | 16,218,299 | | |
| 12,050,000
EUR | | | Wendel SA
4.375% due 08/09/17 | | | 13,752,817 | | | | 16,532,435 | | |
| 10,000,000
EUR | | | Wendel SA
4.875% due 09/21/15 | | | 13,015,623 | | | | 13,010,204 | | |
| 3,500,000
EUR | | | Wendel SA
4.875% due 05/26/16 | | | 3,827,986 | | | | 4,674,968 | | |
Total International Corporate Notes and Bonds | | | 73,521,107 | | | | 69,233,158 | | |
International Government Bonds — 0.29% | | | |
Singapore — 0.24% | | | |
| 150,966,000
SGD | | | Singapore Government Bond
2.375% due 04/01/17 | | | 126,616,915 | | | | 122,642,513 | | |
South Korea — 0.05% | | | |
| 26,102,580,000
KRW | | | Inflation Linked Korea Treasury Bond
2.75% due 03/10/17 (k) | | | 24,912,616 | | | | 25,320,770 | | |
Total International Government Bonds | | | 151,529,531 | | | | 147,963,283 | | |
Total International Notes and Bonds | | | 225,050,638 | | | | 217,196,441 | | |
Total Notes and Bonds | | | 1,230,805,712 | | | | 1,225,956,356 | | |
Commercial Paper — 20.23% | | | |
International Commercial Paper — 7.50% | | | |
Australia — 0.58% | | | |
| 23,085,000
USD | | | Telstra Corporation Limited
0.12% due 12/17/14 | | | 23,079,767
| | | | 23,079,767
| | |
| 41,106,000
USD | | | Telstra Corporation Limited
0.12% due 01/05/15 | | | 41,097,094
| | | | 41,092,887
| | |
First Eagle Funds | Annual Report | October 31, 2014
27
First Eagle Global Fund | Consolidated Schedule of Investments | Year Ended October 31, 2014
| Principal | | Description | | Cost (Note 1) | | Value (Note 1) | |
International Commercial Paper — 7.50% (continued) | | | |
Australia — 0.58% (continued) | | | |
| 38,857,000
USD | | | Telstra Corporation Limited
0.12% due 01/06/15 | | $ | 38,848,452
| | | $ | 38,844,344
| | |
| 38,246,000
USD | | | Telstra Corporation Limited
0.12% due 01/12/15 | | | 38,236,821
| | | | 38,232,117
| | |
| 34,123,000
USD | | | Telstra Corporation Limited
0.13% due 01/13/15 | | | 34,114,005
| | | | 34,110,446
| | |
| 47,400,000
USD | | | Telstra Corporation Limited
0.14% due 01/20/15 | | | 47,385,253
| | | | 47,380,377
| | |
| 36,823,000
USD | | | Telstra Corporation Limited
0.15% due 01/13/15 | | | 36,811,800
| | | | 36,809,453
| | |
| 30,596,000
USD | | | Telstra Corporation Limited
0.16% due 01/22/15 | | | 30,584,849
| | | | 30,582,951
| | |
Canada — 0.46% | | | |
| 44,783,000
USD | | | Suncor Energy, Inc.
0.23% due 11/05/14 | | | 44,781,855
| | | | 44,781,855
| | |
| 29,927,000
USD | | | Suncor Energy, Inc.
0.23% due 11/10/14 | | | 29,925,279
| | | | 29,925,279
| | |
| 35,106,000
USD | | | Suncor Energy, Inc.
0.27% due 12/16/14 | | | 35,094,152
| | | | 35,094,152
| | |
| 33,537,000
USD | | | Suncor Energy, Inc.
0.28% due 12/05/14 | | | 33,528,131
| | | | 33,528,131
| | |
| 14,294,000
USD | | | Suncor Energy, Inc.
0.28% due 01/07/15 | | | 14,286,552
| | | | 14,286,576
| | |
| 22,293,000
USD | | | Suncor Energy, Inc.
0.30% due 01/20/15 | | | 22,278,138
| | | | 22,278,755
| | |
| 19,122,000
USD | | | Suncor Energy, Inc.
0.30% due 01/21/15 | | | 19,109,093
| | | | 19,109,586
| | |
| 33,377,000
USD | | | Total Capital Limited
0.10% due 11/26/14 | | | 33,374,682
| | | | 33,374,682
| | |
France — 1.16% | | | |
| 19,373,000
USD | | | Essilor International
0.09% due 11/17/14 | | | 19,372,225
| | | | 19,372,225
| | |
| 24,664,000
USD | | | Essilor International
0.09% due 12/15/14 | | | 24,661,287
| | | | 24,661,287
| | |
| 19,376,000
USD | | | Essilor International
0.12% due 11/18/14 | | | 19,374,902
| | | | 19,374,902
| | |
| 14,180,000
USD | | | Essilor International
0.12% due 12/17/14 | | | 14,177,826
| | | | 14,177,826
| | |
First Eagle Funds | Annual Report | October 31, 2014
28
First Eagle Global Fund | Consolidated Schedule of Investments | Year Ended October 31, 2014
| Principal | | Description | | Cost (Note 1) | | Value (Note 1) | |
International Commercial Paper — 7.50% (continued) | | | |
France — 1.16% (continued) | | | |
| 17,224,000
USD | | | GDF Suez SA
0.14% due 12/03/14 | | $ | 17,221,856
| | | $ | 17,221,856
| | |
| 42,549,000
USD | | | GDF Suez SA
0.15% due 11/19/14 | | | 42,545,809
| | | | 42,545,809
| | |
| 61,666,000
USD | | | GDF Suez SA
0.15% due 12/19/14 | | | 61,653,667
| | | | 61,653,667
| | |
| 39,009,000
USD | | | GDF Suez SA
0.15% due 01/07/15 | | | 38,998,110
| | | | 38,996,104
| | |
| 27,200,000
USD | | | GDF Suez SA
0.16% due 11/03/14 | | | 27,199,758
| | | | 27,199,758
| | |
| 34,594,000
USD | | | GDF Suez SA
0.16% due 11/06/14 | | | 34,593,231
| | | | 34,593,231
| | |
| 41,224,000
USD | | | GDF Suez SA
0.16% due 11/07/14 | | | 41,222,901
| | | | 41,222,901
| | |
| 52,732,000
USD | | | GDF Suez SA
0.16% due 12/09/14 | | | 52,723,094
| | | | 52,723,094
| | |
| 34,498,000
USD | | | GDF Suez SA
0.16% due 01/06/15 | | | 34,487,881
| | | | 34,486,764
| | |
| 11,750,000
USD | | | GDF Suez SA
0.17% due 11/10/14 | | | 11,749,501
| | | | 11,749,501
| | |
| 16,144,000
USD | | | L'Oreal USA, Inc.
0.08% due 11/03/14 | | | 16,143,928
| | | | 16,143,928
| | |
| 36,103,000
USD | | | Sanofi
0.09% due 12/31/14 | | | 36,097,584
| | | | 36,099,328
| | |
| 21,429,000
USD | | | Électricité de France SA
0.12% due 12/16/14 | | | 21,425,786
| | | | 21,425,786
| | |
| 71,355,000
USD | | | Électricité de France SA
0.16% due 12/04/14 | | | 71,344,534
| | | | 71,344,534
| | |
Germany — 1.06% | | | |
| 14,729,000
USD | | | BASF AG
0.08% due 12/16/14 | | | 14,727,527
| | | | 14,727,527
| | |
| 66,585,000
USD | | | BASF AG
0.09% due 12/09/14 | | | 66,578,674
| | | | 66,578,674
| | |
| 40,129,000
USD | | | BASF AG
0.09% due 12/16/14 | | | 40,124,486
| | | | 40,124,486
| | |
| 55,715,000
USD | | | BASF AG
0.09% due 12/17/14 | | | 55,708,593
| | | | 55,708,593
| | |
| 36,103,000
USD | | | BASF AG
0.10% due 12/15/14 | | | 36,098,587
| | | | 36,098,587
| | |
First Eagle Funds | Annual Report | October 31, 2014
29
First Eagle Global Fund | Consolidated Schedule of Investments | Year Ended October 31, 2014
| Principal | | Description | | Cost (Note 1) | | Value (Note 1) | |
International Commercial Paper — 7.50% (continued) | | | |
Germany — 1.06% (continued) | | | |
| 75,000,000
USD | | | Bayer AG
0.27% due 12/01/14 | | $ | 74,983,125
| | | $ | 74,983,125
| | |
| 153,634,000
USD | | | Siemens Company
0.09% due 12/08/14 | | | 153,619,789
| | | | 153,619,789
| | |
| 32,885,000
USD | | | Siemens Company
0.10% due 12/29/14 | | | 32,879,702
| | | | 32,879,702
| | |
| 61,660,000
USD | | | Siemens Company
0.10% due 12/30/14 | | | 61,649,895
| | | | 61,649,895
| | |
Italy — 0.28% | | | |
| 79,401,000
USD | | | Eni S.p.A.
0.30% due 11/24/14 | | | 79,385,781
| | | | 79,385,781
| | |
| 62,746,000
USD | | | Eni S.p.A.
0.30% due 12/11/14 | | | 62,725,085
| | | | 62,725,085
| | |
Japan — 0.34% | | | |
| 18,219,000
USD | | | Honda Corporation
0.11% due 01/13/15 | | | 18,214,936
| | | | 18,214,693
| | |
| 40,012,000
USD | | | Honda Corporation
0.11% due 01/21/15 | | | 40,002,097
| | | | 40,001,337
| | |
| 51,611,000
USD | | | Honda Corporation
0.12% due 12/11/14 | | | 51,604,119
| | | | 51,604,119
| | |
| 44,019,000
USD | | | Honda Corporation
0.13% due 11/12/14 | | | 44,017,251
| | | | 44,017,251
| | |
| 18,518,000
USD | | | Honda Corporation
0.14% due 11/07/14 | | | 18,517,568
| | | | 18,517,568
| | |
Switzerland — 1.55% | | | |
| 76,225,000
USD | | | Nestlé SA
0.03% due 12/16/14 | | | 76,222,142
| | | | 76,222,142
| | |
| 23,970,000
USD | | | Nestlé SA
0.06% due 11/10/14 | | | 23,969,640
| | | | 23,969,640
| | |
| 36,823,000
USD | | | Nestlé SA
0.07% due 11/21/14 | | | 36,821,670
| | | | 36,821,670
| | |
| 87,148,000
USD | | | Nestlé SA
0.08% due 11/21/14 | | | 87,144,127
| | | | 87,144,127
| | |
| 80,570,000
USD | | | Nestlé SA
0.09% due 12/10/14 | | | 80,562,144
| | | | 80,562,144
| | |
| 35,106,000
USD | | | Roche Holdings, Inc.
0.06% due 11/19/14 | | | 35,104,947
| | | | 35,104,947
| | |
First Eagle Funds | Annual Report | October 31, 2014
30
First Eagle Global Fund | Consolidated Schedule of Investments | Year Ended October 31, 2014
| Principal | | Description | | Cost (Note 1) | | Value (Note 1) | |
International Commercial Paper — 7.50% (continued) | | | |
Switzerland — 1.55% (continued) | | | |
| 26,039,000
USD | | | Roche Holdings, Inc.
0.06% due 12/19/14 | | $ | 26,036,917
| | | $ | 26,036,917
| | |
| 36,081,000
USD | | | Roche Holdings, Inc.
0.06% due 12/22/14 | | | 36,077,933
| | | | 36,077,933
| | |
| 16,201,000
USD | | | Roche Holdings, Inc.
0.07% due 11/17/14 | | | 16,200,496
| | | | 16,200,496
| | |
| 17,197,000
USD | | | Roche Holdings, Inc.
0.07% due 12/03/14 | | | 17,195,930
| | | | 17,195,930
| | |
| 20,251,000
USD | | | Roche Holdings, Inc.
0.07% due 12/09/14 | | | 20,249,504
| | | | 20,249,504
| | |
| 42,549,000
USD | | | Roche Holdings, Inc.
0.07% due 12/10/14 | | | 42,545,773
| | | | 42,545,773
| | |
| 32,288,000
USD | | | Roche Holdings, Inc.
0.08% due 12/11/14 | | | 32,285,130
| | | | 32,285,130
| | |
| 19,376,000
USD | | | Roche Holdings, Inc.
0.09% due 11/03/14 | | | 19,375,903
| | | | 19,375,903
| | |
| 19,376,000
USD | | | Roche Holdings, Inc.
0.09% due 11/04/14 | | | 19,375,855
| | | | 19,375,855
| | |
| 35,882,000
USD | | | Roche Holdings, Inc.
0.09% due 11/10/14 | | | 35,881,193
| | | | 35,881,193
| | |
| 41,144,000
USD | | | Roche Holdings, Inc.
0.09% due 11/12/14 | | | 41,142,868
| | | | 41,142,868
| | |
| 41,847,000
USD | | | Roche Holdings, Inc.
0.09% due 11/13/14 | | | 41,845,745
| | | | 41,845,745
| | |
| 58,283,000
USD | | | Roche Holdings, Inc.
0.09% due 11/14/14 | | | 58,281,106
| | | | 58,281,106
| | |
| 35,625,000
USD | | | Roche Holdings, Inc.
0.09% due 11/25/14 | | | 35,622,862
| | | | 35,622,862
| | |
United Kingdom — 2.07% | | | |
| 59,926,000
USD | | | AstraZeneca PLC
0.08% due 11/18/14 | | | 59,923,736
| | | | 59,923,736
| | |
| 56,325,000
USD | | | AstraZeneca PLC
0.08% due 11/19/14 | | | 56,322,747
| | | | 56,322,747
| | |
| 68,525,000
USD | | | AstraZeneca PLC
0.08% due 01/12/15 | | | 68,514,036
| | | | 68,504,299
| | |
| 44,008,000
USD | | | AstraZeneca PLC
0.08% due 01/15/15 | | | 44,000,665
| | | | 43,993,970
| | |
First Eagle Funds | Annual Report | October 31, 2014
31
First Eagle Global Fund | Consolidated Schedule of Investments | Year Ended October 31, 2014
| Principal | | Description | | Cost (Note 1) | | Value (Note 1) | |
International Commercial Paper — 7.50% (continued) | | | |
United Kingdom — 2.07% (continued) | | | |
| 37,559,000
USD | | | AstraZeneca PLC
0.09% due 12/01/14 | | $ | 37,556,183
| | | $ | 37,556,183
| | |
| 54,930,000
USD | | | AstraZeneca PLC
0.09% due 12/04/14 | | | 54,925,468
| | | | 54,925,468
| | |
| 69,406,000
USD | | | AstraZeneca PLC
0.09% due 01/05/15 | | | 69,394,722
| | | | 69,387,677
| | |
| 38,246,000
USD | | | AstraZeneca PLC
0.09% due 01/13/15 | | | 38,239,020
| | | | 38,234,285
| | |
| 58,622,000
USD | | | AstraZeneca PLC
0.09% due 01/26/15 | | | 58,609,396
| | | | 58,599,618
| | |
| 11,932,000
USD | | | Centrica PLC
0.37% due 12/31/14 | | | 11,924,841
| | | | 11,926,521
| | |
| 35,043,000
USD | | | Centrica PLC
0.49% due 11/03/14 | | | 35,042,066
| | | | 35,042,066
| | |
| 35,043,000
USD | | | Centrica PLC
0.50% due 11/17/14 | | | 35,035,368
| | | | 35,035,368
| | |
| 85,099,000
USD | | | GlaxoSmithKline PLC
0.10% due 11/06/14 | | | 85,097,818
| | | | 85,097,818
| | |
| 91,375,000
USD | | | GlaxoSmithKline PLC
0.11% due 12/02/14 | | | 91,366,345
| | | | 91,366,345
| | |
| 34,909,000
USD | | | GlaxoSmithKline PLC
0.11% due 12/04/14 | | | 34,905,480
| | | | 34,905,480
| | |
| 70,213,000
USD | | | GlaxoSmithKline PLC
0.13% due 12/15/14 | | | 70,201,844
| | | | 70,201,844
| | |
| 81,989,000
USD | | | GlaxoSmithKline PLC
0.17% due 01/22/15 | | | 81,957,252
| | | | 81,954,032
| | |
| 39,951,000
USD | | | Reed Elsevier, Inc.
0.19% due 11/17/14 | | | 39,947,626
| | | | 39,947,626
| | |
| 40,994,000
USD | | | Reed Elsevier, Inc.
0.22% due 12/18/14 | | | 40,982,226
| | | | 40,982,226
| | |
| 27,690,000
USD | | | Reed Elsevier, Inc.
0.26% due 01/05/15 | | | 27,677,001
| | | | 27,676,091
| | |
Total International Commercial Paper | | | 3,781,932,743 | | | | 3,781,865,356 | | |
U.S. Commercial Paper — 12.73% | | | |
$ | 13,649,000 | | | 3M Company
0.07% due 11/06/14 | | | 13,648,867
| | | | 13,648,867
| | |
| | 10,614,000 | | | Abbott Laboratories
0.07% due 11/17/14 | | | 10,613,670
| | | | 10,613,670
| | |
First Eagle Funds | Annual Report | October 31, 2014
32
First Eagle Global Fund | Consolidated Schedule of Investments | Year Ended October 31, 2014
| Principal | | Description | | Cost (Note 1) | | Value (Note 1) | |
U.S. Commercial Paper — 12.73% (continued) | | | |
$ | 5,191,000 | | | Abbott Laboratories
0.08% due 11/13/14 | | $ | 5,190,862
| | | $ | 5,190,862
| | |
| | 39,707,000 | | | Abbott Laboratories
0.10% due 11/04/14 | | | 39,706,669
| | | | 39,706,669
| | |
| | 63,707,000 | | | Abbott Laboratories
0.10% due 11/06/14 | | | 63,706,115
| | | | 63,706,115
| | |
| | 12,989,000 | | | Abbott Laboratories
0.10% due 11/07/14 | | | 12,988,784
| | | | 12,988,784
| | |
| | 47,688,000 | | | Abbott Laboratories
0.10% due 11/10/14 | | | 47,686,808
| | | | 47,686,808
| | |
| | 22,969,000 | | | Abbott Laboratories
0.10% due 11/14/14 | | | 22,968,171
| | | | 22,968,171
| | |
| | 33,377,000 | | | Abbott Laboratories
0.10% due 11/20/14 | | | 33,375,238
| | | | 33,375,238
| | |
| | 49,086,000 | | | Abbott Laboratories
0.10% due 12/01/14 | | | 49,081,910
| | | | 49,081,910
| | |
| | 26,733,000 | | | Abbott Laboratories
0.10% due 12/02/14 | | | 26,730,698
| | | | 26,730,698
| | |
| | 48,826,000 | | | Abbott Laboratories
0.10% due 12/12/14 | | | 48,820,439
| | | | 48,820,439
| | |
| | 34,703,000 | | | Abbott Laboratories
0.10% due 12/16/14 | | | 34,698,662
| | | | 34,698,662
| | |
| | 58,285,000 | | | Abbott Laboratories
0.10% due 01/05/15 | | | 58,274,476
| | | | 58,278,373
| | |
| | 36,140,000 | | | Abbott Laboratories
0.10% due 01/12/15 | | | 36,132,772
| | | | 36,135,309
| | |
| | 18,185,000 | | | Abbott Laboratories
0.10% due 01/20/15 | | | 18,180,959
| | | | 18,182,260
| | |
| | 29,450,000 | | | Air Liquide SA
0.12% due 01/23/15 | | | 29,441,852
| | | | 29,437,219
| | |
| | 29,346,000 | | | Apple, Inc.
0.09% due 11/06/14 | | | 29,345,633
| | | | 29,345,633
| | |
| | 38,281,000 | | | Apple, Inc.
0.09% due 11/13/14 | | | 38,279,852
| | | | 38,279,852
| | |
| | 53,107,000 | | | Apple, Inc.
0.09% due 11/14/14 | | | 53,105,274
| | | | 53,105,274
| | |
| | 31,417,000 | | | Apple, Inc.
0.09% due 11/17/14 | | | 31,415,743
| | | | 31,415,743
| | |
| | 27,607,000 | | | Apple, Inc.
0.09% due 11/18/14 | | | 27,605,827
| | | | 27,605,827
| | |
First Eagle Funds | Annual Report | October 31, 2014
33
First Eagle Global Fund | Consolidated Schedule of Investments | Year Ended October 31, 2014
| Principal | | Description | | Cost (Note 1) | | Value (Note 1) | |
U.S. Commercial Paper — 12.73% (continued) | | | |
$ | 22,753,000 | | | Apple, Inc.
0.09% due 11/19/14 | | $ | 22,751,976
| | | $ | 22,751,976
| | |
| | 35,625,000 | | | Apple, Inc.
0.09% due 12/02/14 | | | 35,622,239
| | | | 35,622,239
| | |
| | 20,894,000 | | | Apple, Inc.
0.11% due 12/15/14 | | | 20,891,191
| | | | 20,891,191
| | |
| | 61,933,000 | | | Apple, Inc.
0.11% due 12/17/14 | | | 61,924,295
| | | | 61,924,295
| | |
| | 35,450,000 | | | Apple, Inc.
0.11% due 01/05/15 | | | 35,442,959
| | | | 35,440,641
| | |
| | 10,616,000 | | | Autozone, Inc.
0.25% due 11/17/14 | | | 10,614,820
| | | | 10,614,820
| | |
| | 13,522,000 | | | Campbell Soup Company
0.25% due 11/06/14 | | | 13,521,531
| | | | 13,521,531
| | |
| | 37,550,000 | | | Campbell Soup Company
0.28% due 11/04/14 | | | 37,549,124
| | | | 37,549,124
| | |
| | 38,889,000 | | | Campbell Soup Company
0.31% due 12/08/14 | | | 38,876,610
| | | | 38,876,610
| | |
| | 26,027,000 | | | Campbell Soup Company
0.35% due 12/29/14 | | | 26,012,743
| | | | 26,012,743
| | |
| | 27,690,000 | | | Caterpillar Financial Services Company
0.10% due 01/06/15 | | | 27,684,924
| | | | 27,684,229
| | |
| | 76,493,000 | | | Caterpillar Financial Services Company
0.10% due 01/09/15 | | | 76,478,339
| | | | 76,476,195
| | |
| | 27,304,000 | | | Celgene Corporation
0.28% due 11/20/14 | | | 27,299,965
| | | | 27,299,965
| | |
| | 22,948,000 | | | Celgene Corporation
0.32% due 01/12/15 | | | 22,933,313
| | | | 22,935,018
| | |
| | 9,729,000 | | | Chevron Corporation
0.07% due 12/12/14 | | | 9,728,224
| | | | 9,728,224
| | |
| | 22,731,000 | | | Chevron Corporation
0.08% due 01/13/15 | | | 22,727,313
| | | | 22,724,038
| | |
| | 36,683,000 | | | Chevron Corporation
0.09% due 11/13/14 | | | 36,681,900
| | | | 36,681,900
| | |
| | 54,398,000 | | | Chevron Corporation
0.09% due 11/17/14 | | | 54,395,824
| | | | 54,395,824
| | |
| | 37,550,000 | | | Chevron Corporation
0.09% due 11/18/14 | | | 37,548,404
| | | | 37,548,404
| | |
| | 29,569,000 | | | Chevron Corporation
0.09% due 11/19/14 | | | 29,567,669
| | | | 29,567,669
| | |
First Eagle Funds | Annual Report | October 31, 2014
34
First Eagle Global Fund | Consolidated Schedule of Investments | Year Ended October 31, 2014
| Principal | | Description | | Cost (Note 1) | | Value (Note 1) | |
U.S. Commercial Paper — 12.73% (continued) | | | |
$ | 37,559,000 | | | Chevron Corporation
0.09% due 12/03/14 | | $ | 37,555,995
| | | $ | 37,555,995
| | |
| | 34,971,000 | | | Chevron Corporation
0.10% due 11/04/14 | | | 34,970,709
| | | | 34,970,709
| | |
| | 35,578,000 | | | Chevron Corporation
0.10% due 11/06/14 | | | 35,577,506
| | | | 35,577,506
| | |
| | 57,416,000 | | | Chevron Corporation
0.10% due 11/07/14 | | | 57,415,043
| | | | 57,415,043
| | |
| | 40,502,000 | | | Chevron Corporation
0.10% due 12/08/14 | | | 40,497,837
| | | | 40,497,837
| | |
| | 16,144,000 | | | Chevron Corporation
0.10% due 12/10/14 | | | 16,142,251
| | | | 16,142,251
| | |
| | 11,677,000 | | | Chevron Corporation
0.10% due 01/16/15 | | | 11,674,535
| | | | 11,673,228
| | |
| | 39,500,000 | | | Chevron Corporation
0.10% due 01/21/15 | | | 39,491,113
| | | | 39,486,053
| | |
| | 16,701,000 | | | Chevron Corporation
0.10% due 01/22/15 | | | 16,697,196
| | | | 16,695,031
| | |
| | 70,899,000 | | | Chevron Corporation
0.12% due 01/15/15 | | | 70,881,275
| | | | 70,876,397
| | |
| | 41,752,000 | | | Church & Dwight Company, Inc.
0.46% due 01/12/15 | | | 41,714,423
| | | | 41,728,381
| | |
| | 29,058,000 | | | Coca-Cola Company
0.10% due 11/13/14 | | | 29,057,031
| | | | 29,057,031
| | |
| | 19,429,000 | | | Coca-Cola Company
0.10% due 01/07/15 | | | 19,425,384
| | | | 19,425,586
| | |
| | 18,997,000 | | | Coca-Cola Company
0.10% due 01/15/15 | | | 18,993,042
| | | | 18,993,189
| | |
| | 19,750,000 | | | Coca-Cola Company
0.10% due 01/16/15 | | | 19,745,831
| | | | 19,745,945
| | |
| | 38,281,000 | | | Coca-Cola Company
0.11% due 11/13/14 | | | 38,279,596
| | | | 38,279,596
| | |
| | 39,951,000 | | | Coca-Cola Company
0.11% due 12/04/14 | | | 39,946,972
| | | | 39,946,972
| | |
| | 68,666,000 | | | Coca-Cola Company
0.12% due 11/05/14 | | | 68,665,084
| | | | 68,665,084
| | |
| | 33,089,000 | | | Coca-Cola Company
0.12% due 11/07/14 | | | 33,088,338
| | | | 33,088,338
| | |
| | 76,554,000 | | | Coca-Cola Company
0.13% due 11/20/14 | | | 76,548,748
| | | | 76,548,748
| | |
First Eagle Funds | Annual Report | October 31, 2014
35
First Eagle Global Fund | Consolidated Schedule of Investments | Year Ended October 31, 2014
| Principal | | Description | | Cost (Note 1) | | Value (Note 1) | |
U.S. Commercial Paper — 12.73% (continued) | | | |
$ | 30,669,000 | | | Colgate-Palmolive Company
0.05% due 11/20/14 | | $ | 30,668,191
| | | $ | 30,668,191
| | |
| | 7,428,000 | | | ConocoPhillips
0.10% due 12/12/14 | | | 7,427,154
| | | | 7,427,154
| | |
| | 21,134,000 | | | ConocoPhillips
0.12% due 01/22/15 | | | 21,128,223
| | | | 21,129,226
| | |
| | 25,051,000 | | | ConocoPhillips
0.12% due 01/23/15 | | | 25,044,069
| | | | 25,045,271
| | |
| | 15,310,000 | | | ConocoPhillips
0.13% due 11/07/14 | | | 15,309,668
| | | | 15,309,668
| | |
| | 19,503,000 | | | Corning, Inc.
0.21% due 11/21/14 | | | 19,500,725
| | | | 19,500,725
| | |
| | 20,497,000 | | | Corning, Inc.
0.21% due 11/24/14 | | | 20,494,250
| | | | 20,494,250
| | |
| | 15,800,000 | | | Corning, Inc.
0.21% due 11/28/14 | | | 15,797,512
| | | | 15,797,512
| | |
| | 14,697,000 | | | Corning, Inc.
0.22% due 11/25/14 | | | 14,694,844
| | | | 14,694,844
| | |
| | 36,823,000 | | | Dominion Resources, Inc.
0.25% due 12/01/14 | | | 36,815,329
| | | | 36,815,329
| | |
| | 16,827,000 | | | Dominion Resources, Inc.
0.26% due 12/05/14 | | | 16,822,868
| | | | 16,822,868
| | |
| | 14,507,000 | | | Dominion Resources, Inc.
0.30% due 01/07/15 | | | 14,498,900
| | | | 14,499,465
| | |
| | 26,027,000 | | | Duke Energy Corporation
0.27% due 11/20/14 | | | 26,023,291
| | | | 26,023,291
| | |
| | 15,574,000 | | | Duke Energy Corporation
0.30% due 01/05/15 | | | 15,565,564
| | | | 15,567,090
| | |
| | 35,734,000 | | | Duke Energy Corporation
0.33% due 01/14/15 | | | 35,709,761
| | | | 35,715,761
| | |
| | 42,549,000 | | | DuPont
0.07% due 11/03/14 | | | 42,548,835
| | | | 42,548,835
| | |
| | 63,122,000 | | | DuPont
0.07% due 11/07/14 | | | 63,121,264
| | | | 63,121,264
| | |
| | 10,978,000 | | | DuPont
0.08% due 11/04/14 | | | 10,977,927
| | | | 10,977,927
| | |
| | 63,215,000 | | | DuPont
0.08% due 11/05/14 | | | 63,214,438
| | | | 63,214,438
| | |
| | 42,621,000 | | | DuPont
0.08% due 11/10/14 | | | 42,620,148
| | | | 42,620,148
| | |
First Eagle Funds | Annual Report | October 31, 2014
36
First Eagle Global Fund | Consolidated Schedule of Investments | Year Ended October 31, 2014
| Principal | | Description | | Cost (Note 1) | | Value (Note 1) | |
U.S. Commercial Paper — 12.73% (continued) | | | |
$ | 10,828,000 | | | Emerson Electric Company
0.09% due 12/08/14 | | $ | 10,826,998
| | | $ | 10,826,998
| | |
| | 14,437,000 | | | Emerson Electric Company
0.09% due 12/11/14 | | | 14,435,556
| | | | 14,435,556
| | |
| | 21,407,000 | | | Emerson Electric Company
0.09% due 12/12/14 | | | 21,404,806
| | | | 21,404,806
| | |
| | 17,842,000 | | | Emerson Electric Company
0.10% due 01/30/15 | | | 17,837,540
| | | | 17,837,490
| | |
| | 39,217,000 | | | Emerson Electric Company
0.11% due 11/20/14 | | | 39,214,723
| | | | 39,214,723
| | |
| | 13,014,000 | | | Emerson Electric Company
0.11% due 12/24/14 | | | 13,011,892
| | | | 13,011,892
| | |
| | 52,810,000 | | | Exxon Mobil Corporation
0.06% due 12/26/14 | | | 52,805,159
| | | | 52,805,159
| | |
| | 37,550,000 | | | Exxon Mobil Corporation
0.07% due 11/12/14 | | | 37,549,197
| | | | 37,549,197
| | |
| | 37,550,000 | | | Exxon Mobil Corporation
0.07% due 11/13/14 | | | 37,549,124
| | | | 37,549,124
| | |
| | 11,677,000 | | | Exxon Mobil Corporation
0.07% due 12/02/14 | | | 11,676,296
| | | | 11,676,296
| | |
| | 35,106,000 | | | Exxon Mobil Corporation
0.08% due 12/03/14 | | | 35,103,504
| | | | 35,103,504
| | |
| | 25,900,000 | | | Exxon Mobil Corporation
0.08% due 12/18/14 | | | 25,897,295
| | | | 25,897,295
| | |
| | 51,356,000 | | | Google, Inc.
0.07% due 11/18/14 | | | 51,354,302
| | | | 51,354,302
| | |
| | 21,054,000 | | | Google, Inc.
0.08% due 11/12/14 | | | 21,053,485
| | | | 21,053,485
| | |
| | 32,915,000 | | | Google, Inc.
0.09% due 11/19/14 | | | 32,913,519
| | | | 32,913,519
| | |
| | 68,247,000 | | | Google, Inc.
0.09% due 01/14/15 | | | 68,234,374
| | | | 68,237,759
| | |
| | 16,144,000 | | | Honeywell International, Inc.
0.08% due 11/13/14 | | | 16,143,570
| | | | 16,143,570
| | |
| | 35,678,000 | | | Honeywell International, Inc.
0.09% due 12/05/14 | | | 35,674,967
| | | | 35,674,967
| | |
| | 36,620,000 | | | Honeywell International, Inc.
0.09% due 12/08/14 | | | 36,616,613
| | | | 36,616,613
| | |
| | 32,482,000 | | | Honeywell International, Inc.
0.10% due 12/04/14 | | | 32,479,022
| | | | 32,479,022
| | |
First Eagle Funds | Annual Report | October 31, 2014
37
First Eagle Global Fund | Consolidated Schedule of Investments | Year Ended October 31, 2014
| Principal | | Description | | Cost (Note 1) | | Value (Note 1) | |
U.S. Commercial Paper — 12.73% (continued) | | | |
$ | 106,349,000 | | | International Business Machines
Corporation
0.10% due 12/03/14 | | $ | 106,339,547
| | | $ | 106,339,547
| | |
| | 48,433,000 | | | International Business Machines
Corporation
0.10% due 12/10/14 | | | 48,427,753
| | | | 48,427,753
| | |
| | 83,472,000 | | | International Business Machines
Corporation
0.10% due 12/12/14 | | | 83,462,493
| | | | 83,462,493
| | |
| | 110,685,000 | | | International Business Machines
Corporation
0.10% due 12/17/14 | | | 110,670,857
| | | | 110,670,857
| | |
| | 48,826,000 | | | Medtronic, Inc.
0.08% due 11/04/14 | | | 48,825,675
| | | | 48,825,675
| | |
| | 84,072,000 | | | Medtronic, Inc.
0.08% due 11/18/14 | | | 84,068,824
| | | | 84,068,824
| | |
| | 25,000,000 | | | MetLife
0.12% due 11/03/14 | | | 24,999,833
| | | | 24,999,833
| | |
| | 45,505,000 | | | MetLife
0.12% due 11/05/14 | | | 45,504,393
| | | | 45,504,393
| | |
| | 50,667,000 | | | MetLife
0.12% due 12/09/14 | | | 50,660,582
| | | | 50,660,582
| | |
| | 25,085,000 | | | MetLife
0.12% due 01/05/15 | | | 25,079,565
| | | | 25,077,457
| | |
| | 23,700,000 | | | MetLife
0.12% due 01/06/15 | | | 23,694,786
| | | | 23,692,722
| | |
| | 28,865,000 | | | MetLife
0.12% due 01/07/15 | | | 28,858,554
| | | | 28,856,003
| | |
| | 19,155,000 | | | MetLife
0.13% due 11/24/14 | | | 19,153,409
| | | | 19,153,409
| | |
| | 58,509,000 | | | MetLife
0.13% due 12/15/14 | | | 58,499,704
| | | | 58,499,704
| | |
| | 20,474,000 | | | Microsoft Corporation
0.06% due 12/04/14 | | | 20,472,874
| | | | 20,472,874
| | |
| | 54,154,000 | | | Microsoft Corporation
0.07% due 11/19/14 | | | 54,152,105
| | | | 54,152,105
| | |
| | 41,752,000 | | | National Grid USA
0.39% due 01/22/15 | | | 41,715,861
| | | | 41,724,565
| | |
| | 54,154,000 | | | Omnicom Group, Inc.
0.30% due 12/01/14 | | | 54,140,462
| | | | 54,140,462
| | |
First Eagle Funds | Annual Report | October 31, 2014
38
First Eagle Global Fund | Consolidated Schedule of Investments | Year Ended October 31, 2014
| Principal | | Description | | Cost (Note 1) | | Value (Note 1) | |
U.S. Commercial Paper — 12.73% (continued) | | | |
$ | 16,857,000 | | | Omnicom Group, Inc.
0.30% due 12/02/14 | | $ | 16,852,645
| | | $ | 16,852,645
| | |
| | 54,307,000 | | | Omnicom Group, Inc.
0.30% due 12/04/14 | | | 54,292,066
| | | | 54,292,066
| | |
| | 34,262,000 | | | Omnicom Group, Inc.
0.30% due 12/18/14 | | | 34,248,581
| | | | 34,248,581
| | |
| | 55,235,000 | | | Pall Corporation
0.36% due 01/14/15 | | | 55,195,262
| | | | 55,202,781
| | |
| | 54,575,000 | | | PepsiCo, Inc.
0.07% due 12/11/14 | | | 54,570,755
| | | | 54,570,755
| | |
| | 63,521,000 | | | PepsiCo, Inc.
0.07% due 12/16/14 | | | 63,515,442
| | | | 63,515,442
| | |
| | 23,984,000 | | | PepsiCo, Inc.
0.07% due 12/18/14 | | | 23,981,808
| | | | 23,981,808
| | |
| | 38,856,000 | | | PepsiCo, Inc.
0.08% due 11/03/14 | | | 38,855,827
| | | | 38,855,827
| | |
| | 33,014,000 | | | PepsiCo, Inc.
0.08% due 11/04/14 | | | 33,013,780
| | | | 33,013,780
| | |
| | 30,039,000 | | | PepsiCo, Inc.
0.08% due 11/05/14 | | | 30,038,733
| | | | 30,038,733
| | |
| | 39,187,000 | | | PepsiCo, Inc.
0.08% due 11/10/14 | | | 39,186,216
| | | | 39,186,216
| | |
| | 72,440,000 | | | PepsiCo, Inc.
0.08% due 11/14/14 | | | 72,437,907
| | | | 72,437,907
| | |
| | 29,785,000 | | | PepsiCo, Inc.
0.08% due 11/17/14 | | | 29,783,941
| | | | 29,783,941
| | |
| | 28,351,000 | | | PepsiCo, Inc.
0.08% due 11/21/14 | | | 28,349,740
| | | | 28,349,740
| | |
| | 22,999,000 | | | PepsiCo, Inc.
0.08% due 12/11/14 | | | 22,996,956
| | | | 22,996,956
| | |
| | 53,174,000 | | | Philip Morris International, Inc.
0.07% due 11/03/14 | | | 53,173,793
| | | | 53,173,793
| | |
| | 34,703,000 | | | Philip Morris International, Inc.
0.07% due 11/21/14 | | | 34,701,650
| | | | 34,701,650
| | |
| | 44,133,000 | | | Philip Morris International, Inc.
0.07% due 12/05/14 | | | 44,130,082
| | | | 44,130,082
| | |
| | 50,000,000 | | | Philip Morris International, Inc.
0.07% due 12/11/14 | | | 49,996,111
| | | | 49,996,111
| | |
First Eagle Funds | Annual Report | October 31, 2014
39
First Eagle Global Fund | Consolidated Schedule of Investments | Year Ended October 31, 2014
| Principal | | Description | | Cost (Note 1) | | Value (Note 1) | |
U.S. Commercial Paper — 12.73% (continued) | | | |
$ | 75,000,000 | | | Philip Morris International, Inc.
0.08% due 12/10/14 | | $ | 74,993,500
| | | $ | 74,993,500
| | |
| | 64,206,000 | | | Philip Morris International, Inc.
0.08% due 12/12/14 | | | 64,200,150
| | | | 64,200,150
| | |
| | 65,348,000 | | | Philip Morris International, Inc.
0.09% due 12/05/14 | | | 65,342,445
| | | | 65,342,445
| | |
| | 34,262,000 | | | Philip Morris International, Inc.
0.09% due 12/10/14 | | | 34,258,659
| | | | 34,258,659
| | |
| | 61,660,000 | | | Philip Morris International, Inc.
0.10% due 12/12/14 | | | 61,652,978
| | | | 61,652,978
| | |
| | 38,246,000 | | | Philip Morris International, Inc.
0.10% due 12/24/14 | | | 38,240,369
| | | | 38,240,369
| | |
| | 23,353,000 | | | Philip Morris International, Inc.
0.11% due 12/18/14 | | | 23,349,646
| | | | 23,349,646
| | |
| | 36,823,000 | | | Philip Morris International, Inc.
0.11% due 12/22/14 | | | 36,817,262
| | | | 36,817,262
| | |
| | 19,975,000 | | | Precision Castparts Corporation
0.10% due 11/05/14 | | | 19,974,778
| | | | 19,974,778
| | |
| | 31,596,000 | | | Precision Castparts Corporation
0.10% due 11/17/14 | | | 31,594,596
| | | | 31,594,596
| | |
| | 15,602,000 | | | Precision Castparts Corporation
0.11% due 12/09/14 | | | 15,600,188
| | | | 15,600,188
| | |
| | 35,000,000 | | | Precision Castparts Corporation
0.11% due 12/22/14 | | | 34,994,546
| | | | 34,994,546
| | |
| | 25,000,000 | | | Precision Castparts Corporation
0.11% due 01/02/15 | | | 24,995,264
| | | | 24,992,475
| | |
| | 22,092,000 | | | Precision Castparts Corporation
0.11% due 01/06/15 | | | 22,087,545
| | | | 22,084,805
| | |
| | 25,776,000 | | | Precision Castparts Corporation
0.11% due 01/07/15 | | | 25,770,723
| | | | 25,767,478
| | |
| | 20,205,000 | | | Precision Castparts Corporation
0.12% due 11/10/14 | | | 20,204,394
| | | | 20,204,394
| | |
| | 35,882,000 | | | Procter & Gamble Company
0.10% due 11/13/14 | | | 35,880,804
| | | | 35,880,804
| | |
| | 58,283,000 | | | Procter & Gamble Company
0.10% due 11/14/14 | | | 58,280,895
| | | | 58,280,895
| | |
| | 18,310,000 | | | Procter & Gamble Company
0.10% due 12/01/14 | | | 18,308,474
| | | | 18,308,474
| | |
First Eagle Funds | Annual Report | October 31, 2014
40
First Eagle Global Fund | Consolidated Schedule of Investments | Year Ended October 31, 2014
| Principal | | Description | | Cost (Note 1) | | Value (Note 1) | |
U.S. Commercial Paper — 12.73% (continued) | | | |
$ | 73,240,000 | | | Schlumberger Investments SA
0.12% due 12/02/14 | | $ | 73,232,432
| | | $ | 73,232,432
| | |
| | 52,660,000 | | | Schlumberger Investments SA
0.12% due 12/15/14 | | | 52,652,277
| | | | 52,652,277
| | |
| | 40,994,000 | | | Schlumberger Investments SA
0.12% due 12/23/14 | | | 40,986,894
| | | | 40,986,894
| | |
| | 72,808,000 | | | Unilever Capital Corporation
0.09% due 11/12/14 | | | 72,805,998
| | | | 72,805,998
| | |
| | 78,090,000 | | | Unilever Capital Corporation
0.12% due 11/12/14 | | | 78,087,137
| | | | 78,087,137
| | |
| | 24,664,000 | | | United Healthcare Company
0.20% due 11/07/14 | | | 24,663,178
| | | | 24,663,178
| | |
| | 34,419,000 | | | United Healthcare Company
0.20% due 11/28/14 | | | 34,413,837
| | | | 34,413,837
| | |
| | 22,303,000 | | | United Parcel Service, Inc.
0.04% due 02/02/15 | | | 22,300,695
| | | | 22,297,119
| | |
| | 37,408,000 | | | United Parcel Service, Inc.
0.05% due 11/03/14 | | | 37,407,896
| | | | 37,407,896
| | |
| | 75,118,000 | | | United Parcel Service, Inc.
0.08% due 12/05/14 | | | 75,112,324
| | | | 75,112,324
| | |
| | 75,118,000 | | | United Parcel Service, Inc.
0.08% due 12/09/14 | | | 75,111,657
| | | | 75,111,657
| | |
| | 20,474,000 | | | Wal-Mart Stores, Inc.
0.08% due 12/01/14 | | | 20,472,635
| | | | 20,472,635
| | |
| | 62,628,000 | | | Walt Disney Company
0.07% due 01/16/15 | | | 62,618,745
| | | | 62,615,142
| | |
| | 26,405,000 | | | Walt Disney Company
0.08% due 12/19/14 | | | 26,402,183
| | | | 26,402,183
| | |
| | 39,006,000 | | | Whirlpool Corporation
0.33% due 11/04/14 | | | 39,004,927
| | | | 39,004,927
| | |
Total U.S. Commercial Paper | | | 6,425,254,059 | | | | 6,425,258,623 | | |
Total Commercial Paper | | | 10,207,186,802 | | | | 10,207,123,979 | | |
Total Investment Portfolio
Excluding Options Written — 99.40% | | $ | 40,678,242,901 | | | $ | 50,163,096,545 | | |
First Eagle Funds | Annual Report | October 31, 2014
41
First Eagle Global Fund | Consolidated Schedule of Investments | Year Ended October 31, 2014
| Contracts | | Description | | Strike Price | | Expiration Date | | Value (Note 1) | |
Covered Call Options Written — 0.00% | |
| | 40,500 | | | Intel Corporation
(Premium Received
$2,422,323) | | $ | 37.00
| | | January 2015
| | $ | (1,579,500
| ) | |
Total Investments — 99.40% (Cost: $40,675,820,578) | | | | | 50,161,517,045 | | |
Other Assets in Excess of Liabilities — 0.60% | | | | | 303,893,606 | | |
Net Assets — 100.00% | | | | $ | 50,465,410,651 | | |
(a) Non-income producing security/commodity.
(b) Security is deemed illiquid. At October 31, 2014, the value of these securities amounted to $60,426,794 or 0.12% of net assets.
(c) An affiliate of the Fund as defined by the Investment Company Act of 1940. An affiliate is defined as a company in which the Fund directly or indirectly owns, controls, or holds power to vote 5% or more of the outstanding voting securities.
(d) At October 31, 2014, all or a portion of this security was segregated to cover collateral requirement for options.
(e) Securities valued in accordance with fair value procedures under the supervision of the Board of Trustees, representing $46,385,820 or 0.09% of net assets.
(f) Represents non-voting class of shares.
(g) Represents securities that are subject to legal or contractual restrictions on resale. At October 31, 2014, the value of these securities amounted to $16,218,299 or 0.03% of net assets.
(h) Held through Financiere Rouge, LLC, wholly owned subsidiary and disregarded entity for U.S. tax purposes.
(i) Floating rate security. Rate shown is the rate in effect at October 31, 2014.
(j) Payment-in-kind security.
(k) Inflation protected security.
At October 31, 2014, aggregate cost for federal income tax purposes was $41,198,814,874. Net unrealized appreciation consisted of:
Gross unrealized appreciation | | $ | 11,598,400,351 | | |
Gross unrealized depreciation | | | (2,635,698,180 | ) | |
Net unrealized appreciation | | $ | 8,962,702,171 | | |
Abbreviations used in this schedule include:
ADR — American Depositary Receipt
FRN — Floating Rate Note
NVDR — Non-Voting Depository Receipt
PCL — Public Company Limited
PLC — Public Limited Company
REIT — Real Estate Investment Trust
RSP — Represents Savings Shares
Currencies
EUR — Euro
KRW — South Korean Won
SGD — Singapore Dollar
USD — United States Dollar
First Eagle Funds | Annual Report | October 31, 2014
42
First Eagle Global Fund | Consolidated Schedule of Investments | Year Ended October 31, 2014
Restricted Securities | | Acquisition Date | | Cost | | Carrying Value
Per
Share/Principal | |
Emin Leydier SA FRN 8.272% due 07/31/16 | | 07/30/09 | | $ | 21,369,283 | | | $ | 1.25 | | |
FINEL 9.50% due 06/30/17 | | 06/22/05 | | | 21,555,398 | | | | 0.94 | | |
FINEL | | 07/30/09 | | | — | | | | 0.45 | | |
Foreign Currency Exchange Contracts — Sales
Settlement
Dates
Through | | Foreign Currency
To be Delivered | | U.S. $
To be Received | | U.S. $ Value
At October 31,
2014 | | Unrealized
Appreciation
At October 31,
2014 | | Unrealized
Depreciation
At October 31,
2014 | |
12/17/14 | | | 17,335,000 | | | British Pound | | $ | 29,066,981 | | | $ | 27,721,301 | | | $ | 1,345,680 | | | $ | — | | |
01/14/15 | | | 8,921,000 | | | British Pound | | | 15,243,179 | | | | 14,262,846 | | | | 980,333 | | | | — | | |
02/12/15 | | | 36,113,000 | | | British Pound | | | 60,595,577 | | | | 57,739,466 | | | | 2,856,111 | | | | — | | |
03/18/15 | | | 5,332,000 | | | British Pound | | | 8,522,785 | | | | 8,519,470 | | | | 3,315 | | | | — | | |
04/15/15 | | | 1,364,000 | | | British Pound | | | 2,187,720 | | | | 2,178,763 | | | | 8,957 | | | | — | | |
12/17/14 | | | 19,495,000 | | | Euro | | | 26,386,483 | | | | 24,436,899 | | | | 1,949,584 | | | | — | | |
01/14/15 | | | 49,663,000 | | | Euro | | | 67,642,496 | | | | 62,264,345 | | | | 5,378,151 | | | | — | | |
02/12/15 | | | 454,633,000 | | | Euro | | | 614,808,350 | | | | 570,029,770 | | | | 44,778,580 | | | | — | | |
03/18/15 | | | 280,348,000 | | | Euro | | | 363,597,339 | | | | 351,641,439 | | | | 11,955,900 | | | | — | | |
04/15/15 | | | 153,046,000 | | | Euro | | | 194,279,653 | | | | 192,003,192 | | | | 2,276,461 | | | | — | | |
12/17/14 | | | 13,988,960,000 | | | Japanese Yen | | | 137,247,584 | | | | 124,595,885 | | | | 12,651,699 | | | | — | | |
01/14/15 | | | 33,384,250,000 | | | Japanese Yen | | | 329,970,299 | | | | 297,473,672 | | | | 32,496,627 | | | | — | | |
02/12/15 | | | 49,763,547,000 | | | Japanese Yen | | | 488,477,279 | | | | 443,263,928 | | | | 45,213,351 | | | | — | | |
03/18/15 | | | 41,961,082,000 | | | Japanese Yen | | | 393,686,560 | | | | 374,142,965 | | | | 19,543,595 | | | | — | | |
04/15/15 | | | 29,433,455,000 | | | Japanese Yen | | | 274,673,426 | | | | 262,522,992 | | | | 12,150,434 | | | | — | | |
| | | | | | | $ | 3,006,385,711 | | | $ | 2,812,796,933 | | | $ | 193,588,778 | | | $ | — | | |
Foreign Currency Exchange Contracts — Purchases
Settlement
Dates
Through | | Foreign Currency
To be Received | | U.S. $
To be Delivered | | U.S. $ Value
At October 31,
2014 | | Unrealized
Appreciation
At October 31,
2014 | | Unrealized
Depreciation
At October 31,
2014 | |
01/14/15 | | | 43,033,000 | | | Euro | | $ | 53,907,439 | | | $ | 53,952,068 | | | $ | 44,629 | | | $ | — | | |
02/12/15 | | | 162,570,000 | | | Euro | | | 205,858,058 | | | | 203,780,058 | | | | — | | | | (2,078,000 | ) | |
11/19/14 | | | 18,879,568,000 | | | Japanese Yen | | | 168,351,871 | | | | 168,097,509 | | | | — | | | | (254,362 | ) | |
| | | | | | | $ | 428,117,368 | | | $ | 425,829,635 | | | $ | 44,629 | | | $ | (2,332,362 | ) | |
First Eagle Funds | Annual Report | October 31, 2014
43
First Eagle Global Fund | Consolidated Schedule of Investments | Year Ended October 31, 2014
Affiliated Securities
Affiliated Securities | | Shares
October 31,
2013 | | Gross
Additions | | Gross
Reductions | | Shares
October 31,
2014 | | Market
Value
October 31,
2014 | | Realized
Gain /
(Loss) | | Dividend
Income | |
Alliant
Techsystems, Inc. | | | 2,319,923 | | | | — | | | | 232,266 | | | | 2,087,657 | | | $ | 244,172,363 | | | $ | 13,823,852 | | | $ | 2,681,656 | | |
Berkeley Group
Holdings PLC | | | 7,175,381 | | | | — | | | | — | | | | 7,175,381 | | | | 261,708,907 | | | | — | | | | 21,305,070 | | |
Catalyst Paper
Corporation* | | | 1,008,427 | | | | — | | | | 1,008,427 | | | | — | | | | — | | | | 2,425,027 | | | | — | | |
Chofu Seisakusho
Company Limited | | | 3,526,280 | | | | — | | | | — | | | | 3,526,280 | | | | 104,069,603 | | | | — | | | | 984,212 | | |
Cintas Corporation | | | 13,051,511 | | | | — | | | | 5,151,736 | | | | 7,899,775 | | | | 578,579,521 | | | | 132,596,763 | | | | 10,049,664 | | |
City e-Solutions
Limited* | | | 20,738,780 | | | | — | | | | 9,883,507 | | | | 10,855,273 | | | | 2,141,618 | | | | 1,850,567 | | | | — | | |
Deltic Timber
Corporation | | | 811,480 | | | | — | | | | — | | | | 811,480 | | | | 52,819,233 | | | | — | | | | 324,592 | | |
FINEL | | | 12,000,000 | | | | — | | | | — | | | | 12,000,000 | | | | 5,413,608 | | | | — | | | | — | | |
Hirose Electric
Company Limited | | | 2,224,800 | | | | — | | | | 34,000 | | | | 2,190,800 | | | | 263,500,628 | | | | 791,584 | | | | 4,200,220 | | |
IDACorp, Inc. | | | 3,760,485 | | | | — | | | | — | | | | 3,760,485 | | | | 237,775,467 | | | | — | | | | 6,468,034 | | |
Italcementi S.p.A. | | | 4,682,069 | | | | 18,210,203 | | | | 1,493,618 | | | | 21,398,654 | | | | 122,172,446 | | | | (14,001,344 | ) | | | 221,184 | | |
MISUMI Group,
Inc.* | | | 5,247,260 | | | | — | | | | 4,100,060 | | | | 1,147,200 | | | | 35,235,611 | | | | 56,396,256 | | | | 774,726 | | |
Mills Music Trust | | | 33,892 | | | | — | | | | 2,300 | | | | 31,592 | | | | 621,099 | | | | (35,002 | ) | | | 80,255 | | |
NOW, Inc. | | | — | | | | 5,851,664 | | | | — | | | | 5,851,664 | | | | 175,901,020 | | | | — | | | | — | | |
NSC Groupe | | | 69,500 | | | | — | | | | 2,783 | | | | 66,717 | | | | 5,041,467 | | | | (314,204 | ) | | | 172,606 | | |
Namyang Dairy
Products Company
Limited | | | 39,989 | | | | — | | | | — | | | | 39,989 | | | | 25,668,273 | | | | — | | | | 29,588 | | |
Neopost SA | | | 2,044,437 | | | | — | | | | 176,705 | | | | 1,867,732 | | | | 129,689,795 | | | | (2,832,533 | ) | | | 9,170,832 | | |
Robertet SA | | | 157,260 | | | | — | | | | — | | | | 157,260 | | | | 32,516,614 | | | | — | | | | 518,547 | | |
Sabeton SA | | | 385,000 | | | | — | | | | — | | | | 385,000 | | | | 6,561,494 | | | | — | | | | 97,996 | | |
San Juan Basin
Royalty Trust | | | 3,908,035 | | | | — | | | | — | | | | 3,908,035 | | | | 70,969,916 | | | | — | | | | 5,181,601 | | |
Scotts Miracle-Gro
Company | | | 4,172,577 | | | | — | | | | — | | | | 4,172,577 | | | | 247,183,461 | | | | — | | | | 15,699,321 | | |
Shimano, Inc.* | | | 4,713,690 | | | | — | | | | 841,500 | | | | 3,872,190 | | | | 505,375,521 | | | | 68,890,453 | | | | 3,717,328 | | |
Société Télévision
Francaise 1* | | | 8,653,008 | | | | — | | | | 3,526,681 | | | | 5,126,327 | | | | 76,221,439 | | | | 4,366,625 | | | | 4,453,068 | | |
T. Hasegawa
Company Limited | | | 5,147,000 | | | | — | | | | — | | | | 5,147,000 | | | | 78,172,998 | | | | — | | | | 1,557,450 | | |
First Eagle Funds | Annual Report | October 31, 2014
44
First Eagle Global Fund | Consolidated Schedule of Investments | Year Ended October 31, 2014
Affiliated Securities (continued)
Affiliated Securities | | Shares
October 31,
2013 | | Gross
Additions | | Gross
Reductions | | Shares
October 31,
2014 | | Market
Value
October 31,
2014 | | Realized
Gain /
(Loss) | | Dividend
Income | |
Teradata Corporation | | | — | | | | 8,766,525 | | | | — | | | | 8,766,525 | | | $ | 370,999,338 | | | $ | — | | | $ | — | | |
Total | | | | | | | | | | $ | 3,632,511,440 | | | $ | 263,958,044 | | | $ | 87,687,950 | | |
*Represents an unaffiliated issuer as of October 31, 2014, as such, amounts represented above will not agree to balances in the Statements of Assets and Liabilities and Statements of Operations.
Industry Diversification for Portfolio Holdings | | Percent of
Net Assets | |
International Common Stocks
Consumer Discretionary | | | 4.64 | % | |
Consumer Staples | | | 4.60 | | |
Energy | | | 3.30 | | |
Financials | | | 5.18 | | |
Health Care | | | 2.33 | | |
Industrials | | | 6.58 | | |
Information Technology | | | 3.27 | | |
Materials | | | 6.37 | | |
Telecommunication Services | | | 1.77 | | |
Total International Common Stocks | | | 38.04 | | |
U.S. Common Stocks
Consumer Discretionary | | | 4.15 | | |
Consumer Staples | | | 0.89 | | |
Energy | | | 2.82 | | |
Financials | | | 8.79 | | |
Health Care | | | 0.76 | | |
Industrials | | | 5.33 | | |
Information Technology | | | 8.76 | | |
Materials | | | 1.45 | | |
Utilities | | | 0.47 | | |
Total U.S. Common Stocks | | | 33.42 | | |
International Preferred Stocks
Consumer Discretionary | | | 0.26 | | |
Total International Preferred Stocks | | | 0.26 | | |
Investment Companies | | | 0.00 | | |
Warrants | | | 0.23 | | |
Commodities | | | 4.79 | | |
First Eagle Funds | Annual Report | October 31, 2014
45
First Eagle Global Fund | Consolidated Schedule of Investments | Year Ended October 31, 2014
Industry Diversification for Portfolio Holdings (continued) | | Percent of
Net Assets | |
U.S. Bonds
Consumer Discretionary | | | 0.01 | % | |
Government Issues | | | 1.99 | | |
Total U.S. Bonds | | | 2.00 | | |
International Notes and Bonds
Financials | | | 0.11 | | |
Government Issues | | | 0.29 | | |
Materials | | | 0.03 | | |
Total International Notes and Bonds | | | 0.43 | | |
Commercial Paper
International Commercial Paper | | | 7.50 | | |
U.S. Commercial Paper | | | 12.73 | | |
Total Commercial Paper | | | 20.23 | | |
Covered Call Options Written | | | 0.00 | | |
Total Investments | | | 99.40 | % | |
See Notes to Financial Statements.
First Eagle Funds | Annual Report | October 31, 2014
46
This page was intentionally left blank.
First Eagle Overseas Fund
Data as of October 31, 2014 (unaudited)
Investment Objective
The First Eagle Overseas Fund seeks long-term growth of capital by investing primarily in equities issued by non-U.S. corporations. Management's research-driven process focuses on undervalued securities.
Average Annual Returns (%) | | | | | | One-Year | | Five-Years | | Ten-Years | |
First Eagle Overseas Fund | | Class A | | without sales load | | | 1.00 | | | | 8.09 | | | | 8.78 | | |
| | | | | with sales load | | | -4.04 | | | | 6.98 | | | | 8.22 | | |
MSCI EAFE Index | | | | | | | -0.60 | | | | 6.52 | | | | 5.81 | | |
Consumer Price Index | | | | | | | 1.66 | | | | 1.89 | | | | 2.21 | | |

Countries** (%)
Japan | | | 23.43 | | |
France | | | 11.76 | | |
Canada | | | 5.93 | | |
United States | | | 4.87 | | |
United Kingdom | | | 4.39 | | |
Germany | | | 3.62 | | |
Switzerland | | | 3.10 | | |
Mexico | | | 3.06 | | |
South Korea | | | 2.83 | | |
Singapore | | | 2.54 | | |
Hong Kong | | | 2.10 | | |
Bermuda | | | 1.38 | | |
Sweden | | | 1.19 | | |
South Africa | | | 1.13 | | |
Thailand | | | 1.08 | | |
Netherlands | | | 1.03 | | |
Ireland | | | 0.84 | | |
Australia | | | 0.67 | | |
Austria | | | 0.65 | | |
Norway | | | 0.61 | | |
Italy | | | 0.60 | | |
Belgium | | | 0.56 | | |
Greece | | | 0.47 | | |
Chile | | | 0.39 | | |
Russia | | | 0.38 | | |
Denmark | | | 0.36 | | |
Israel | | | 0.35 | | |
Taiwan | | | 0.32 | | |
Turkey | | | 0.25 | | |
Mauritius | | | 0.12 | | |
* Asset Allocation and Countries percentages are based on total investments in the portfolio.
**Country allocations reflect country of the issuer (not currency of issue) and exclude short term investments. Bonds of non-U.S. issuers may be U.S. dollar denominated.
The Fund's portfolio composition is subject to change at any time.
First Eagle Funds | Annual Report | October 31, 2014
48
First Eagle Overseas Fund | Fund Overview
Growth of a $10,000 Initial Investment

Performance data quoted herein represents past performance and should not be considered indicative of future results. Performance data quoted herein does not reflect the deduction of taxes that a shareholder would pay on Fund distributions or the sale of Fund shares. The average annual returns shown above are historical and reflect changes in share price, reinvested dividends and are net of expenses.
The average annual returns for Class A Shares give effect to the deduction of the maximum sales charge of 5.00%.
The MSCI EAFE Index is a total return index, reported in U.S. Dollars, based on share prices and reinvested net dividends of approximately 1,100 companies from 22 countries and is not available for purchase. The Consumer Price Index (CPI) represents the change in price of all goods and services purchased for consumption by urban households.
Top 10 Holdings* (%)
Gold Bullion** (precious metal) | | | 4.77 | | |
Grupo Televisa S.A.B. ADR (Mexican media company) | | | 2.25 | | |
SMC Corporation (Japanese automated control devices manufacturer) | | | 2.16 | | |
KDDI Corporation (Japanese telecommunications company) | | | 1.88 | | |
Keyence Corporation (Japanese sensors manufacturer) | | | 1.82 | | |
Fanuc Corporation (Japanese automated machine tools manufacturer) | | | 1.80 | | |
Secom Company Limited (Japanese security services provider) | | | 1.72 | | |
Hoya Corporation (Japanese electronic/optical products) | | | 1.70 | | |
Shimano, Inc. (Japanese bicycle components manufacturer) | | | 1.54 | | |
Astellas Pharma, Inc. (Japanese pharmaceuticals) | | | 1.53 | | |
Total | | | 21.17 | | |
* Holdings in cash, commercial paper and other short term cash equivalents have been excluded.
**The Fund invests in gold and precious metals through investment in a wholly-owned subsidiary of the Fund organized under the laws of the Cayman Islands (the "Subsidiary"). Gold Bullion and commodities include the Fund's investment in the Subsidiary.
Percentages are based on total net assets.
First Eagle Funds | Annual Report | October 31, 2014
49
First Eagle Overseas Fund | Consolidated Schedule of Investments | Year Ended October 31, 2014
| Shares | | Description | | Cost (Note 1) | | Value (Note 1) | |
Common Stocks — 72.62% | | | |
International Common Stocks — 72.57% | | | |
Australia — 0.66% | | | |
| | 11,735,292 | | | Newcrest Mining Limited (a) | | $ | 249,853,632 | | | $ | 96,248,140 | | |
Austria — 0.65% | | | |
| | 4,585,138 | | | Wienerberger AG | | | 65,005,780 | | | | 55,447,609 | | |
| | 1,226,797 | | | OMV AG | | | 49,312,710 | | | | 38,564,695 | | |
| | | | 114,318,490 | | | | 94,012,304 | | |
Belgium — 0.56% | | | |
| | 788,508 | | | Groupe Bruxelles Lambert SA | | | 60,174,722 | | | | 70,403,471 | | |
| | 98,473 | | | Sofina SA | | | 8,428,556 | | | | 10,664,353 | | |
| | | | 68,603,278 | | | | 81,067,824 | | |
Bermuda — 1.37% | | | |
| | 2,105,100 | | | Jardine Matheson Holdings Limited | | | 87,210,493 | | | | 126,095,490 | | |
| | 6,683,413 | | | Hiscox Limited | | | 70,399,121 | | | | 72,808,838 | | |
| | | | 157,609,614 | | | | 198,904,328 | | |
Canada — 5.71% | | | |
| | 8,790,814 | | | Cenovus Energy, Inc. | | | 233,832,613 | | | | 217,660,555 | | |
| | 5,828,526 | | | Canadian Natural Resources Limited | | | 167,105,513 | | | | 203,394,639 | | |
| | 4,331,099 | | | Potash Corporation of Saskatchewan, Inc. | | | 166,886,332 | | | | 147,993,653 | | |
| | 5,924,954 | | | Goldcorp, Inc. | | | 175,235,189 | | | | 111,270,636 | | |
| | 3,533,546 | | | Agnico-Eagle Mines Limited | | | 123,390,960 | | | | 83,271,356 | | |
| | 5,820,676 | | | Penn West Petroleum Limited | | | 76,357,828 | | | | 26,309,456 | | |
| | 1,100,050 | | | EnCana Corporation | | | 14,298,776 | | | | 20,493,931 | | |
| | 9,511,350 | | | Kinross Gold Corporation (a) | | | 46,612,744 | | | | 20,449,402 | | |
| | | | 1,003,719,955 | | | | 830,843,628 | | |
Chile — 0.39% | | | |
| | 2,660,044 | | | Cia Cervecerias Unidas SA, ADR | | | 59,647,252 | | | | 56,685,538 | | |
Denmark — 0.35% | | | |
| | 1,830,465 | | | ISS AS (a) | | | 62,415,865 | | | | 51,035,441 | | |
France — 11.46% | | | |
| | 3,021,792 | | | Danone SA | | | 208,894,521 | | | | 205,318,071 | | |
| | 5,769,130 | | | Bouygues SA | | | 207,369,832 | | | | 199,175,091 | | |
| | 3,263,768 | | | Total SA | | | 159,199,332 | | | | 193,947,384 | | |
| | 1,732,226 | | | Sanofi | | | 141,847,046 | | | | 159,896,649 | | |
First Eagle Funds | Annual Report | October 31, 2014
50
First Eagle Overseas Fund | Consolidated Schedule of Investments | Year Ended October 31, 2014
| Shares | | Description | | Cost (Note 1) | | Value (Note 1) | |
International Common Stocks — 72.57% (continued) | | | |
France — 11.46% (continued) | | | |
| | 5,420,246 | | | Carrefour SA | | $ | 175,713,229 | | | $ | 158,737,964 | | |
| | 3,144,820 | | | Compagnie de Saint-Gobain | | | 136,527,801 | | | | 134,957,200 | | |
| | 4,414,524 | | | Vivendi SA (a) | | | 122,244,173 | | | | 107,736,892 | | |
| | 1,079,911 | | | Sodexo | | | 29,578,070 | | | | 104,027,447 | | |
| | 508,911 | | | Wendel SA | | | 11,226,254 | | | | 56,083,020 | | |
| | 801,693 | | | Neopost SA | | | 41,407,216 | | | | 55,667,195 | | |
| | 235,837 | | | Robertet SA (b) | | | 20,591,064 | | | | 48,763,962 | | |
| | 51,500 | | | Robertet SA CI (c)(d)(e) | | | 2,151,628 | | | | 7,260,438 | | |
| | 558,938 | | | Laurent-Perrier (b) | | | 19,851,603 | | | | 44,827,726 | | |
| | 2,746,782 | | | Société Télévision Francaise 1 | | | 37,251,797 | | | | 40,840,874 | | |
| | 648,834 | | | Legrand SA | | | 22,223,920 | | | | 34,913,930 | | |
| | 739,602 | | | Numericable Group SA (a) | | | 23,329,938 | | | | 27,341,554 | | |
| 442,830 | | | Société Foncière Financière et de
Participations (a) | | | 29,139,582 | | | | 26,836,534 | | |
| | 896,416 | | | Legris Industries SA (a)(b)(d)(e)(f) | | | 23,119,325 | | | | 18,928,343 | | |
| | 364,373 | | | Gaumont SA | | | 21,698,753 | | | | 18,127,578 | | |
| | 146,562 | | | BioMerieux | | | 11,367,766 | | | | 15,460,851 | | |
| | 11,593,581 | | | FINEL (a)(b)(d)(e)(g) | | | 9,166,547 | | | | 5,230,259 | | |
| | 100,000 | | | Sabeton SA | | | 1,463,142 | | | | 1,704,284 | | |
| | | | 1,455,362,539 | | | | 1,665,783,246 | | |
Germany — 3.11% | | | |
| | 2,840,411 | | | HeidelbergCement AG | | | 152,136,558 | | | | 193,349,940 | | |
| | 5,307,391 | | | Deutsche Wohnen AG | | | 53,250,796 | | | | 119,584,218 | | |
| | 2,985,955 | | | Hamburger Hafen und Logistik AG | | | 87,574,307 | | | | 65,351,407 | | |
| | 715,453 | | | Daimler AG | | | 30,368,244 | | | | 55,614,237 | | |
| | 296,503 | | | Fraport AG | | | 8,930,449 | | | | 18,325,476 | | |
| | | | 332,260,354 | | | | 452,225,278 | | |
Greece — 0.46% | | | |
| | 6,106,069 | | | Jumbo SA | | | 27,598,067 | | | | 66,953,434 | | |
Hong Kong — 2.08% | | | |
| | 27,079,164 | | | Hopewell Holdings Limited | | | 74,109,574 | | | | 96,198,135 | | |
| | 7,806,340 | | | Guoco Group Limited | | | 57,283,838 | | | | 95,929,054 | | |
| | 20,179,916 | | | Great Eagle Holdings Limited | | | 68,709,318 | | | | 67,915,618 | | |
First Eagle Funds | Annual Report | October 31, 2014
51
First Eagle Overseas Fund | Consolidated Schedule of Investments | Year Ended October 31, 2014
| Shares | | Description | | Cost (Note 1) | | Value (Note 1) | |
International Common Stocks — 72.57% (continued) | | | |
Hong Kong — 2.08% (continued) | | | |
| | 9,056,577 | | | Hysan Development Company
Limited | | $ | 42,818,692
| | | $ | 41,399,026
| | |
| | 3,429,976 | | | City e-Solutions Limited (a)(e) | | | 102,206 | | | | 676,694 | | |
| | 1,353,233 | | | Hopewell Highway Infrastructure Limited | | | 655,914 | | | | 654,355 | | |
| | | | 243,679,542 | | | | 302,772,882 | | |
Ireland — 0.83% | | | |
| | 5,148,559 | | | CRH PLC | | | 90,816,793 | | | | 114,153,075 | | |
| | 1,547,320 | | | Beazley PLC | | | 5,085,535 | | | | 6,485,151 | | |
| | | | 95,902,328 | | | | 120,638,226 | | |
Israel — 0.35% | | | |
| | 7,510,515 | | | Israel Chemicals Limited | | | 75,169,596 | | | | 50,452,827 | | |
Italy — 0.59% | | | |
| | 6,792,782 | | | Italcementi S.p.A. | | | 100,757,497 | | | | 38,782,383 | | |
| | 1,385,400 | | | Recordati S.p.A. | | | 9,200,042 | | | | 23,958,376 | | |
| | 1,197,736 | | | Italmobiliare S.p.A. RSP | | | 50,324,929 | | | | 19,212,070 | | |
| | 168,142 | | | Italmobiliare S.p.A. | | | 19,250,153 | | | | 4,003,436 | | |
| | | | 179,532,621 | | | | 85,956,265 | | |
Japan — 23.18% | | | |
| | 1,136,890 | | | SMC Corporation | | | 145,185,191 | | | | 314,472,934 | | |
| | 4,256,300 | | | KDDI Corporation | | | 138,369,614 | | | | 273,774,917 | | |
| | 567,000 | | | Keyence Corporation | | | 100,061,879 | | | | 264,911,284 | | |
| | 1,537,040 | | | Fanuc Corporation | | | 153,201,753 | | | | 261,635,476 | | |
| | 4,170,700 | | | Secom Company Limited | | | 178,984,614 | | | | 250,669,002 | | |
| | 7,118,930 | | | Hoya Corporation | | | 151,068,607 | | | | 247,649,401 | | |
| | 1,720,070 | | | Shimano, Inc. | | | 22,072,060 | | | | 224,493,445 | | |
| | 14,664,200 | | | Astellas Pharma, Inc. | | | 118,711,986 | | | | 221,807,040 | | |
| | 7,316,700 | | | Sompo Japan Nipponkoa Holdings, Inc. | | | 201,780,857 | | | | 179,066,177 | | |
| | 7,730,800 | | | MS&AD Insurance Group Holdings | | | 179,151,117 | | | | 162,255,606 | | |
| | 5,710,850 | | | Mitsubishi Estate Company Limited | | | 98,270,258 | | | | 142,129,367 | | |
| | 1,012,000 | | | Hirose Electric Company Limited | | | 111,070,731 | | | | 121,719,297 | | |
| | 1,719,030 | | | Nissin Foods Holdings Company Limited | | | 60,560,887 | | | | 89,681,868 | | |
| | 5,212,430 | | | Kansai Paint Company Limited | | | 39,682,655 | | | | 78,006,631 | | |
| | 2,175,460 | | | Nomura Research Institute Limited | | | 41,173,606 | | | | 70,304,205 | | |
| | 2,715,380 | | | Daiichikosho Company Limited | | | 33,513,866 | | | | 67,881,478 | | |
First Eagle Funds | Annual Report | October 31, 2014
52
First Eagle Overseas Fund | Consolidated Schedule of Investments | Year Ended October 31, 2014
| Shares | | Description | | Cost (Note 1) | | Value (Note 1) | |
International Common Stocks — 72.57% (continued) | | | |
Japan — 23.18% (continued) | | | |
| | 2,023,800 | | | Chofu Seisakusho Company
Limited (b) | | $ | 33,120,144
| | | $ | 59,727,549
| | |
| | 3,206,911 | | | T. Hasegawa Company Limited (b) | | | 43,073,853 | | | | 48,706,790 | | |
| | 6,095,200 | | | Japan Wool Textile Company Limited (b) | | | 45,629,408 | | | | 40,806,503 | | |
| | 508,106 | | | SK Kaken Company Limited | | | 9,470,131 | | | | 38,857,160 | | |
| | 1,299,640 | | | As One Corporation (b) | | | 26,525,156 | | | | 37,025,132 | | |
| | 1,742,124 | | | Nagaileben Company Limited | | | 16,719,913 | | | | 32,958,055 | | |
| | 488,980 | | | Shin-Etsu Chemical Company Limited | | | 22,769,653 | | | | 30,664,368 | | |
| 2,068,330 | | | Maezawa Kasei Industries Company
Limited (b) | | | 31,939,631 | | | | 21,010,145 | | |
| | 303,100 | | | Nitori Holdings Company Limited | | | 12,841,312 | | | | 19,023,859 | | |
| | 602,500 | | | MISUMI Group, Inc. | | | 9,440,529 | | | | 18,505,453 | | |
| | 945,500 | | | Nitto Kohki Company Limited | | | 13,446,515 | | | | 17,676,831 | | |
| 199,150 | | | Kobayashi Pharmaceutical
Company Limited | | | 9,171,366 | | | | 12,162,644 | | |
| | 287,200 | | | Mandom Corporation | | | 3,008,253 | | | | 9,524,327 | | |
| | 183,000 | | | FamilyMart Company Limited | | | 7,201,073 | | | | 7,217,360 | | |
| | 394,900 | | | Seikagaku Corporation | | | 2,283,043 | | | | 6,293,087 | | |
| | | | 2,059,499,661 | | | | 3,370,617,391 | | |
Mexico — 3.03% | | | |
| | 9,067,093 | | | Grupo Televisa S.A.B., ADR | | | 185,978,184 | | | | 327,684,741 | | |
| | 5,543,609 | | | Fresnillo PLC | | | 96,608,773 | | | | 61,855,097 | | |
| | 2,246,692 | | | Industrias Peñoles S.A.B. de C.V. | | | 1,833,690 | | | | 50,885,812 | | |
| | | | 284,420,647 | | | | 440,425,650 | | |
Netherlands — 1.02% | | | |
| | 560,446 | | | HAL Trust | | | 20,803,016 | | | | 84,981,079 | | |
| | 10,996,781 | | | TNT Express NV | | | 100,478,800 | | | | 63,818,038 | | |
| | | | 121,281,816 | | | | 148,799,117 | | |
Norway — 0.60% | | | |
| | 11,393,841 | | | Orkla ASA | | | 83,103,593 | | | | 87,080,335 | | |
Russia — 0.38% | | | |
| | 8,297,382 | | | Gazprom OAO, ADR | | | 55,920,439 | | | | 54,995,048 | | |
Singapore — 2.26% | | | |
| | 25,512,113 | | | Haw Par Corporation Limited (b) | | | 76,875,317 | | | | 169,590,912 | | |
| | 58,319,015 | | | ComfortDelGro Corporation Limited | | | 54,150,233 | | | | 119,842,920 | | |
First Eagle Funds | Annual Report | October 31, 2014
53
First Eagle Overseas Fund | Consolidated Schedule of Investments | Year Ended October 31, 2014
| Shares | | Description | | Cost (Note 1) | | Value (Note 1) | |
International Common Stocks — 72.57% (continued) | | | |
Singapore — 2.26% (continued) | | | |
| | 16,373,450 | | | Singapore Airport Terminal
Services Limited | | $ | 18,528,182
| | | $ | 39,509,376
| | |
| | | | 149,553,732 | | | | 328,943,208 | | |
South Africa — 0.57% | | | |
| | 5,312,877 | | | AngloGold Ashanti Limited, ADR (a) | | | 85,033,348 | | | | 43,937,493 | | |
| | 12,311,178 | | | Gold Fields Limited, ADR | | | 110,560,691 | | | | 39,272,658 | | |
| | | | 195,594,039 | | | | 83,210,151 | | |
South Korea — 2.75% | | | |
| | 2,079,636 | | | KT&G Corporation | | | 121,672,848 | | | | 184,859,993 | | |
| | 35,325 | | | Lotte Confectionery Company Limited | | | 12,445,892 | | | | 63,528,347 | | |
| | 1,293,738 | | | Kia Motors Corporation | | | 73,235,904 | | | | 63,069,016 | | |
| | 186,884 | | | Nong Shim Company Limited | | | 43,886,371 | | | | 46,689,087 | | |
| | 872,463 | | | Fursys, Inc. (b) | | | 10,110,165 | | | | 26,245,811 | | |
| 22,950 | | | Namyang Dairy Products
Company Limited | | | 4,912,653 | | | | 14,731,223 | | |
| | | | 266,263,833 | | | | 399,123,477 | | |
Sweden — 1.18% | | | |
| | 3,013,030 | | | Investor AB, Class 'A' | | | 59,333,861 | | | | 105,600,802 | | |
| | 1,846,088 | | | Investor AB, Class 'B' | | | 40,783,748 | | | | 66,051,807 | | |
| | | | 100,117,609 | | | | 171,652,609 | | |
Switzerland — 3.06% | | | |
| | 2,810,500 | | | Nestlé SA | | | 92,700,397 | | | | 205,642,779 | | |
| | 2,413,791 | | | Pargesa Holding SA | | | 129,478,662 | | | | 187,528,844 | | |
| | 134,216 | | | Rieter Holding AG (a) | | | 16,465,078 | | | | 24,732,627 | | |
| | 137,452 | | | Kuehne & Nagel International AG | | | 1,733,811 | | | | 17,885,974 | | |
| | 56,784 | | | Autoneum Holding AG (a) | | | 2,603,284 | | | | 9,442,852 | | |
| | | | 242,981,232 | | | | 445,233,076 | | |
Taiwan — 0.32% | | | |
| | 17,491,694 | | | Taiwan Secom Company Limited | | | 27,057,090 | | | | 46,350,847 | | |
Thailand — 1.06% | | | |
| | 14,930,059 | | | Bangkok Bank PCL, NVDR | | | 51,798,333 | | | | 90,763,023 | | |
| | 107,574,685 | | | Thai Beverage PCL | | | 17,893,710 | | | | 64,057,472 | | |
| | | | 69,692,043 | | | | 154,820,495 | | |
First Eagle Funds | Annual Report | October 31, 2014
54
First Eagle Overseas Fund | Consolidated Schedule of Investments | Year Ended October 31, 2014
| Shares | | Description | | Cost (Note 1) | | Value (Note 1) | |
International Common Stocks — 72.57% (continued) | | | |
Turkey — 0.25% | | | |
| | 3,744,290 | | | Yazicilar Holding AS | | $ | 25,779,871 | | | $ | 36,303,264 | | |
United Kingdom — 4.34% | | | |
| | 3,194,828 | | | Berkeley Group Holdings PLC | | | 38,894,900 | | | | 116,525,512 | | |
| | 4,574,853 | | | GlaxoSmithKline PLC | | | 88,721,598 | | | | 103,738,246 | | |
| | 250,568 | | | Liberty Global PLC, Series "A" (a) | | | 10,723,921 | | | | 11,393,327 | | |
| | 2,022,622 | | | Liberty Global PLC, Series "C" | | | 82,595,110 | | | | 89,946,000 | | |
| | 1,602,700 | | | British American Tobacco PLC | | | 85,388,590 | | | | 90,939,407 | | |
| | 1,647,580 | | | Willis Group Holdings PLC | | | 66,048,482 | | | | 66,776,418 | | |
| | 2,124,932 | | | Diageo PLC | | | 58,702,963 | | | | 62,478,304 | | |
| | 18,505,054 | | | WM Morrison Supermarkets PLC | | | 80,089,165 | | | | 45,824,739 | | |
| | 2,055,388 | | | Anglo American PLC | | | 51,610,549 | | | | 43,286,590 | | |
| | | | 562,775,278 | | | | 630,908,543 | | |
Total International Common Stocks | | | 8,369,714,016 | | | | 10,552,042,572 | | |
U.S. Common Stock — 0.05% | | | |
Materials — 0.05% | | | |
| | 405,000 | | | Newmont Mining Corporation | | | 6,339,157 | | | | 7,597,800 | | |
Total Common Stocks | | | 8,376,053,173 | | | | 10,559,640,372 | | |
International Preferred Stocks — 0.49% | | | |
Germany — 0.44% | | | |
| | 769,870 | | | Hornbach Holding AG | | | 19,562,235 | | | | 64,156,718 | | |
South Korea — 0.05% | | | |
| 27,183 | | | Namyang Dairy Products
Company Limited | | | 387,445 | | | | 7,744,915 | | |
Total International Preferred Stocks | | | 19,949,680 | | | | 71,901,633 | | |
Investment Company — 0.00% | | | |
| 96,753 | | | State Street Institutional U.S.
Government Money Market Fund,
Institutional Class | | | 96,753 | | | | 96,753 | | |
First Eagle Funds | Annual Report | October 31, 2014
55
First Eagle Overseas Fund | Consolidated Schedule of Investments | Year Ended October 31, 2014
| Shares | | Description | | Cost (Note 1) | | Value (Note 1) | |
Rights — 0.15% | | | |
Germany — 0.00% | | | |
| | 55,324 | | | Pfleiderer Atlantik Raco RI
Rights (a)(d)(e) | | $ | 16,617
| | | $ | 0
| | |
Canada — 0.15% | | | |
| | 739,602 | | | Numericable Group SA (a) | | | 18,850,006 | | | | 21,928,853 | | |
Total Rights | | | 18,866,623 | | | | 21,928,853 | | |
| Ounces | | | | | | | |
Commodity — 4.77% | | | |
| | 591,181 | | | Gold bullion (a) | | | 448,772,610 | | | | 692,811,472 | | |
| Principal | | | | | | | |
Term Loans — 0.03% | | | |
Germany — 0.03% | | | |
| 92
EUR | | | Atlantik Commitment Fee Facility
due 02/01/20 (a)(d)(e) | | | 0
| | | | 0
| | |
| 568,033
EUR | | | Atlantik Duration Fee Facility
due 02/01/20 (a)(d)(e) | | | 0
| | | | 0
| | |
| 28,263
EUR | | | Atlantik FX Repayment Facility
due 02/01/20 (a)(d)(e) | | | 0
| | | | 0
| | |
| 1,880,723
EUR | | | Atlantik Senior Debt 79.5M
6.00% due 02/01/20 (d)(e)(h) | | | 2,553,647
| | | | 2,356,828
| | |
| 371,719
EUR | | | Atlantik Senior Debt Term Facility 1A
6.00% due 02/01/20 (d)(e)(h) | | | 504,720
| | | | 465,820
| | |
| 364,387
EUR | | | Atlantik Senior Debt Term Facility 2A
6.00% due 02/01/20 (d)(e)(h) | | | 494,765
| | | | 456,631
| | |
| 346,348
EUR | | | Atlantik Senior Debt Term Facility 3A
6.00% due 02/01/20 (d)(e)(h) | | | 470,272
| | | | 434,026
| | |
| 219,842
EUR | | | Atlantik Senior Debt Term Facility 4A
6.00% due 02/01/20 (d)(e)(h) | | | 298,502
| | | | 275,495
| | |
| 1,952,268
EUR | | | Atlantik Standstill Accrued Interest Facility
due 02/01/20 (a)(d)(e) | | | 0
| | | | 0
| | |
| 4,000,000
EUR | | | Atlantik Subordinated Debt 79.5M
15.00% due 02/01/20 (d)(e)(h) | | | 5,431,204
| | | | 170,930
| | |
| 790,586
EUR | | | Atlantik Subordinated Debt Term Facility 1A
15.00% due 02/01/20 (d)(e)(h) | | | 1,073,458
| | | | 33,784
| | |
| 774,993
EUR | | | Atlantik Subordinated Debt Term Facility 2A
15.00% due 02/01/20 (d)(e)(h) | | | 1,052,286
| | | | 33,117
| | |
| 744,000
EUR | | | Atlantik Subordinated Debt Term Facility 3A
15.00% due 02/01/20 (d)(e)(h) | | | 1,003,825
| | | | 31,793
| | |
First Eagle Funds | Annual Report | October 31, 2014
56
First Eagle Overseas Fund | Consolidated Schedule of Investments | Year Ended October 31, 2014
| Principal | | Description | | Cost (Note 1) | | Value (Note 1) | |
Term Loans — 0.03% (continued) | | | |
Germany — 0.03% (continued) | | | |
| 472,000
EUR | | | Atlantik Subordinated Debt Term Facility 4A
15.00% due 02/01/20 (d)(e)(h) | | $ | 637,170
| | | $ | 20,170
| | |
Total Term Loans | | | 13,519,849 | | | | 4,278,594 | | |
International Bonds — 1.10% | | | |
International Convertible Bond — 0.13% | | | |
Mauritius — 0.13% | | | |
| 18,400,000
USD | | | Golden Agri-Resources Limited
2.50% due 10/04/17 (e)(i)(j) | | | 17,281,823
| | | | 17,940,000
| | |
International Corporate Bonds — 0.72% | | | |
France — 0.18% | | | |
| 10,000,000
EUR | | | Emin Leydier SA FRN
8.272% due 07/31/16 (d)(e)(k) | | | 14,240,891
| | | | 12,531,501
| | |
| 11,504,021
EUR | | | FINEL
9.50% due 06/30/17 (d)(e)(f)(h) | | | 14,365,843
| | | | 10,812,199
| | |
| 1,950,000
EUR | | | Wendel SA
4.875% due 09/21/15 | | | 2,298,106
| | | | 2,536,990
| | |
| | | | 30,904,840 | | | | 25,880,690 | | |
South Africa — 0.54% | | | |
| 73,500,000
USD | | | AngloGold Ashanti Holdings PLC
8.50% due 07/30/20 | | | 73,758,618
| | | | 79,288,125
| | |
Total International Corporate Bonds | | | 104,663,458 | | | | 105,168,815 | | |
International Government Bond — 0.25% | | | |
Singapore — 0.25% | | | |
| 45,219,000
SGD | | | Singapore Government Bond
2.375% due 04/01/17 | | | 37,925,695
| | | | 36,735,237
| | |
Total International Bonds | | | 159,870,976 | | | | 159,844,052 | | |
Commercial Paper — 19.78% | | | |
International Commercial Paper — 7.71% | | | |
Australia — 0.71% | | | |
| 26,915,000
USD | | | Telstra Corporation Limited
0.12% due 12/17/14 | | | 26,910,873
| | | | 26,910,873
| | |
| 8,894,000
USD | | | Telstra Corporation Limited
0.12% due 01/05/15 | | | 8,892,073
| | | | 8,891,163
| | |
First Eagle Funds | Annual Report | October 31, 2014
57
First Eagle Overseas Fund | Consolidated Schedule of Investments | Year Ended October 31, 2014
| Principal | | Description | | Cost (Note 1) | | Value (Note 1) | |
International Commercial Paper — 7.71% (continued) | | | |
Australia — 0.71% (continued) | | | |
| 9,728,000
USD | | | Telstra Corporation Limited
0.12% due 01/06/15 | | $ | 9,725,860
| | | $ | 9,724,832
| | |
| 11,754,000
USD | | | Telstra Corporation Limited
0.12% due 01/12/15 | | | 11,751,179
| | | | 11,749,733
| | |
| 10,190,000
USD | | | Telstra Corporation Limited
0.13% due 01/13/15 | | | 10,187,314
| | | | 10,186,251
| | |
| 12,600,000
USD | | | Telstra Corporation Limited
0.14% due 01/20/15 | | | 12,596,080
| | | | 12,594,784
| | |
| 13,177,000
USD | | | Telstra Corporation Limited
0.15% due 01/13/15 | | | 13,172,992
| | | | 13,172,152
| | |
| 9,404,000
USD | | | Telstra Corporation Limited
0.16% due 01/22/15 | | | 9,400,572
| | | | 9,399,989
| | |
Canada — 0.43% | | | |
| 9,031,000
USD | | | Suncor Energy, Inc.
0.23% due 11/05/14 | | | 9,030,769
| | | | 9,030,769
| | |
| 10,073,000
USD | | | Suncor Energy, Inc.
0.23% due 11/10/14 | | | 10,072,421
| | | | 10,072,421
| | |
| 8,523,000
USD | | | Suncor Energy, Inc.
0.27% due 12/16/14 | | | 8,520,123
| | | | 8,520,123
| | |
| 13,463,000
USD | | | Suncor Energy, Inc.
0.28% due 12/05/14 | | | 13,459,440
| | | | 13,459,440
| | |
| 6,852,000
USD | | | Suncor Energy, Inc.
0.30% due 01/20/15 | | | 6,847,432
| | | | 6,847,622
| | |
| 5,878,000
USD | | | Suncor Energy, Inc.
0.30% due 01/21/15 | | | 5,874,033
| | | | 5,874,184
| | |
| 8,391,000
USD | | | Total Capital Limited
0.10% due 11/26/14 | | | 8,390,417
| | | | 8,390,417
| | |
France — 1.23% | | | |
| 8,233,000
USD | | | Essilor International
0.09% due 11/17/14 | | | 8,232,671
| | | | 8,232,671
| | |
| 5,336,000
USD | | | Essilor International
0.09% due 12/15/14 | | | 5,335,413
| | | | 5,335,413
| | |
| 5,624,000
USD | | | Essilor International
0.12% due 11/18/14 | | | 5,623,681
| | | | 5,623,681
| | |
| 5,496,000
USD | | | Essilor International
0.12% due 12/17/14 | | | 5,495,157
| | | | 5,495,157
| | |
| 3,726,000
USD | | | GDF Suez SA
0.14% due 12/03/14 | | | 3,725,536
| | | | 3,725,536
| | |
| 7,451,000
USD | | | GDF Suez SA
0.15% due 11/19/14 | | | 7,450,441
| | | | 7,450,441
| | |
First Eagle Funds | Annual Report | October 31, 2014
58
First Eagle Overseas Fund | Consolidated Schedule of Investments | Year Ended October 31, 2014
| Principal | | Description | | Cost (Note 1) | | Value (Note 1) | |
International Commercial Paper — 7.71% (continued) | | | |
France — 1.23% (continued) | | | |
| 15,438,000
USD | | | GDF Suez SA
0.15% due 12/19/14 | | $ | 15,434,912
| | | $ | 15,434,912
| | |
| 11,991,000
USD | | | GDF Suez SA
0.15% due 01/07/15 | | | 11,987,653
| | | | 11,987,036
| | |
| 13,611,000
USD | | | GDF Suez SA
0.16% due 11/06/14 | | | 13,610,698
| | | | 13,610,698
| | |
| 13,876,000
USD | | | GDF Suez SA
0.16% due 11/07/14 | | | 13,875,630
| | | | 13,875,630
| | |
| 21,168,000
USD | | | GDF Suez SA
0.16% due 12/09/14 | | | 21,164,425
| | | | 21,164,425
| | |
| 10,602,000
USD | | | GDF Suez SA
0.16% due 01/06/15 | | | 10,598,890
| | | | 10,598,547
| | |
| 3,454,000
USD | | | GDF Suez SA
0.17% due 11/10/14 | | | 3,453,853
| | | | 3,453,853
| | |
| 6,861,000
USD | | | L'Oreal USA, Inc.
0.08% due 11/03/14 | | | 6,860,970
| | | | 6,860,970
| | |
| 13,897,000
USD | | | Sanofi
0.09% due 12/31/14 | | | 13,894,915
| | | | 13,895,587
| | |
| 3,271,000
USD | | | Électricité de France SA
0.12% due 12/16/14 | | | 3,270,509
| | | | 3,270,509
| | |
| 28,645,000
USD | | | Électricité de France SA
0.16% due 12/04/14 | | | 28,640,799
| | | | 28,640,799
| | |
Germany — 0.97% | | | |
| 5,271,000
USD | | | BASF AG
0.08% due 12/16/14 | | | 5,270,473
| | | | 5,270,473
| | |
| 38,537,000
USD | | | BASF AG
0.09% due 12/09/14 | | | 38,533,339
| | | | 38,533,339
| | |
| 9,871,000
USD | | | BASF AG
0.09% due 12/16/14 | | | 9,869,890
| | | | 9,869,890
| | |
| 13,705,000
USD | | | BASF AG
0.09% due 12/17/14 | | | 13,703,424
| | | | 13,703,424
| | |
| 13,897,000
USD | | | BASF AG
0.10% due 12/15/14 | | | 13,895,301
| | | | 13,895,301
| | |
| 39,995,000
USD | | | Siemens Company
0.09% due 12/08/14 | | | 39,991,300
| | | | 39,991,300
| | |
| 7,115,000
USD | | | Siemens Company
0.10% due 12/29/14 | | | 7,113,854
| | | | 7,113,854
| | |
| 13,340,000
USD | | | Siemens Company
0.10% due 12/30/14 | | | 13,337,814
| | | | 13,337,814
| | |
First Eagle Funds | Annual Report | October 31, 2014
59
First Eagle Overseas Fund | Consolidated Schedule of Investments | Year Ended October 31, 2014
| Principal | | Description | | Cost (Note 1) | | Value (Note 1) | |
International Commercial Paper — 7.71% (continued) | | | |
Italy — 0.32% | | | |
| 3,144,000
USD | | | Eni S.p.A.
0.19% due 11/03/14 | | $ | 3,143,967
| | | $ | 3,143,967
| | |
| 19,168,000
USD | | | Eni S.p.A.
0.30% due 11/24/14 | | | 19,164,326
| | | | 19,164,326
| | |
| 24,322,000
USD | | | Eni S.p.A.
0.30% due 12/11/14 | | | 24,313,892
| | | | 24,313,892
| | |
Japan — 0.34% | | | |
| 5,033,000
USD | | | Hitachi Limited
0.21% due 11/03/14 | | | 5,032,941
| | | | 5,032,941
| | |
| 4,418,000
USD | | | Hitachi Limited
0.24% due 11/03/14 | | | 4,417,941
| | | | 4,417,941
| | |
| 2,481,000
USD | | | Honda Corporation
0.11% due 01/13/15 | | | 2,480,447
| | | | 2,480,413
| | |
| 6,488,000
USD | | | Honda Corporation
0.11% due 01/21/15 | | | 6,486,394
| | | | 6,486,271
| | |
| 12,459,000
USD | | | Honda Corporation
0.12% due 12/11/14 | | | 12,457,339
| | | | 12,457,339
| | |
| 12,104,000
USD | | | Honda Corporation
0.13% due 11/12/14 | | | 12,103,519
| | | | 12,103,519
| | |
| 6,482,000
USD | | | Honda Corporation
0.14% due 11/07/14 | | | 6,481,849
| | | | 6,481,849
| | |
Switzerland — 1.44% | | | |
| 18,401,000
USD | | | Nestlé SA
0.03% due 12/16/14 | | | 18,400,310
| | | | 18,400,310
| | |
| 6,030,000
USD | | | Nestlé SA
0.06% due 11/10/14 | | | 6,029,910
| | | | 6,029,910
| | |
| 13,177,000
USD | | | Nestlé SA
0.07% due 11/21/14 | | | 13,176,524
| | | | 13,176,524
| | |
| 12,852,000
USD | | | Nestlé SA
0.08% due 11/21/14 | | | 12,851,429
| | | | 12,851,429
| | |
| 27,311,000
USD | | | Nestlé SA
0.09% due 12/10/14 | | | 27,308,337
| | | | 27,308,337
| | |
| 8,523,000
USD | | | Roche Holdings, Inc.
0.06% due 11/19/14 | | | 8,522,744
| | | | 8,522,744
| | |
| 7,819,000
USD | | | Roche Holdings, Inc.
0.06% due 12/19/14 | | | 7,818,375
| | | | 7,818,375
| | |
| 13,919,000
USD | | | Roche Holdings, Inc.
0.06% due 12/22/14 | | | 13,917,817
| | | | 13,917,817
| | |
First Eagle Funds | Annual Report | October 31, 2014
60
First Eagle Overseas Fund | Consolidated Schedule of Investments | Year Ended October 31, 2014
| Principal | | Description | | Cost (Note 1) | | Value (Note 1) | |
International Commercial Paper — 7.71% (continued) | | | |
Switzerland — 1.44% (continued) | | | |
| 3,799,000
USD | | | Roche Holdings, Inc.
0.07% due 11/17/14 | | $ | 3,798,882
| | | $ | 3,798,882
| | |
| 6,903,000
USD | | | Roche Holdings, Inc.
0.07% due 12/03/14 | | | 6,902,570
| | | | 6,902,570
| | |
| 4,749,000
USD | | | Roche Holdings, Inc.
0.07% due 12/09/14 | | | 4,748,649
| | | | 4,748,649
| | |
| 7,451,000
USD | | | Roche Holdings, Inc.
0.07% due 12/10/14 | | | 7,450,435
| | | | 7,450,435
| | |
| 13,722,000
USD | | | Roche Holdings, Inc.
0.08% due 12/11/14 | | | 13,720,780
| | | | 13,720,780
| | |
| 5,624,000
USD | | | Roche Holdings, Inc.
0.09% due 11/03/14 | | | 5,623,972
| | | | 5,623,972
| | |
| 5,624,000
USD | | | Roche Holdings, Inc.
0.09% due 11/04/14 | | | 5,623,958
| | | | 5,623,958
| | |
| 14,118,000
USD | | | Roche Holdings, Inc.
0.09% due 11/10/14 | | | 14,117,682
| | | | 14,117,682
| | |
| 8,856,000
USD | | | Roche Holdings, Inc.
0.09% due 11/12/14 | | | 8,855,756
| | | | 8,855,756
| | |
| 16,717,000
USD | | | Roche Holdings, Inc.
0.09% due 11/14/14 | | | 16,716,457
| | | | 16,716,457
| | |
| 14,375,000
USD | | | Roche Holdings, Inc.
0.09% due 11/25/14 | | | 14,374,138
| | | | 14,374,138
| | |
United Kingdom — 2.27% | | | |
| 15,074,000
USD | | | AstraZeneca PLC
0.08% due 11/18/14 | | | 15,073,430
| | | | 15,073,430
| | |
| 18,675,000
USD | | | AstraZeneca PLC
0.08% due 11/19/14 | | | 18,674,253
| | | | 18,674,253
| | |
| 20,577,000
USD | | | AstraZeneca PLC
0.08% due 01/12/15 | | | 20,573,708
| | | | 20,570,784
| | |
| 5,992,000
USD | | | AstraZeneca PLC
0.08% due 01/15/15 | | | 5,991,002
| | | | 5,990,090
| | |
| 10,703,000
USD | | | AstraZeneca PLC
0.09% due 12/01/14 | | | 10,702,197
| | | | 10,702,197
| | |
| 20,070,000
USD | | | AstraZeneca PLC
0.09% due 12/04/14 | | | 20,068,344
| | | | 20,068,344
| | |
| 10,594,000
USD | | | AstraZeneca PLC
0.09% due 01/05/15 | | | 10,592,279
| | | | 10,591,203
| | |
| 11,754,000
USD | | | AstraZeneca PLC
0.09% due 01/13/15 | | | 11,751,855
| | | | 11,750,400
| | |
First Eagle Funds | Annual Report | October 31, 2014
61
First Eagle Overseas Fund | Consolidated Schedule of Investments | Year Ended October 31, 2014
| Principal | | Description | | Cost (Note 1) | | Value (Note 1) | |
International Commercial Paper — 7.71% (continued) | | | |
United Kingdom — 2.27% (continued) | | | |
| 16,378,000
USD | | | AstraZeneca PLC
0.09% due 01/26/15 | | $ | 16,374,479
| | | $ | 16,371,747
| | |
| 3,668,000
USD | | | Centrica PLC
0.37% due 12/31/14 | | | 3,665,799
| | | | 3,666,316
| | |
| 14,957,000
USD | | | Centrica PLC
0.49% due 11/03/14 | | | 14,956,601
| | | | 14,956,601
| | |
| 14,957,000
USD | | | Centrica PLC
0.50% due 11/17/14 | | | 14,953,743
| | | | 14,953,743
| | |
| 14,901,000
USD | | | GlaxoSmithKline PLC
0.10% due 11/06/14 | | | 14,900,793
| | | | 14,900,793
| | |
| 43,625,000
USD | | | GlaxoSmithKline PLC
0.11% due 12/02/14 | | | 43,620,868
| | | | 43,620,868
| | |
| 40,091,000
USD | | | GlaxoSmithKline PLC
0.11% due 12/04/14 | | | 40,086,957
| | | | 40,086,957
| | |
| 17,045,000
USD | | | GlaxoSmithKline PLC
0.13% due 12/15/14 | | | 17,042,292
| | | | 17,042,292
| | |
| 12,447,000
USD | | | GlaxoSmithKline PLC
0.17% due 01/22/15 | | | 12,442,180
| | | | 12,441,691
| | |
| 10,049,000
USD | | | Reed Elsevier, Inc.
0.19% due 11/17/14 | | | 10,048,151
| | | | 10,048,151
| | |
| 6,224,000
USD | | | Reed Elsevier, Inc.
0.22% due 12/18/14 | | | 6,222,212
| | | | 6,222,212
| | |
| 22,310,000
USD | | | Reed Elsevier, Inc.
0.26% due 01/05/15 | | | 22,299,527
| | | | 22,298,794
| | |
Total International Commercial Paper | | | 1,121,285,136 | | | | 1,121,268,062 | | |
U.S. Commercial Paper — 12.07% | | | |
$ | 4,076,000 | | | 3M Company
0.07% due 11/06/14 | | | 4,075,960
| | | | 4,075,960
| | |
| | 4,086,000 | | | Abbott Laboratories
0.07% due 11/17/14 | | | 4,085,873
| | | | 4,085,873
| | |
| | 909,000 | | | Abbott Laboratories
0.08% due 11/13/14 | | | 908,976
| | | | 908,976
| | |
| | 20,293,000 | | | Abbott Laboratories
0.10% due 11/04/14 | | | 20,292,831
| | | | 20,292,831
| | |
| | 6,293,000 | | | Abbott Laboratories
0.10% due 11/06/14 | | | 6,292,913
| | | | 6,292,913
| | |
| | 5,111,000 | | | Abbott Laboratories
0.10% due 11/07/14 | | | 5,110,915
| | | | 5,110,915
| | |
First Eagle Funds | Annual Report | October 31, 2014
62
First Eagle Overseas Fund | Consolidated Schedule of Investments | Year Ended October 31, 2014
| Principal | | Description | | Cost (Note 1) | | Value (Note 1) | |
U.S. Commercial Paper — 12.07% (continued) | | | |
$ | 13,112,000 | | | Abbott Laboratories
0.10% due 11/10/14 | | $ | 13,111,672
| | | $ | 13,111,672
| | |
| | 5,023,000 | | | Abbott Laboratories
0.10% due 11/14/14 | | | 5,022,819
| | | | 5,022,819
| | |
| | 8,391,000 | | | Abbott Laboratories
0.10% due 11/20/14 | | | 8,390,557
| | | | 8,390,557
| | |
| | 15,222,000 | | | Abbott Laboratories
0.10% due 12/01/14 | | | 15,220,731
| | | | 15,220,731
| | |
| | 9,767,000 | | | Abbott Laboratories
0.10% due 12/02/14 | | | 9,766,159
| | | | 9,766,159
| | |
| | 13,914,000 | | | Abbott Laboratories
0.10% due 12/12/14 | | | 13,912,415
| | | | 13,912,415
| | |
| | 5,297,000 | | | Abbott Laboratories
0.10% due 12/16/14 | | | 5,296,338
| | | | 5,296,338
| | |
| | 14,592,000 | | | Abbott Laboratories
0.10% due 01/05/15 | | | 14,589,365
| | | | 14,590,341
| | |
| | 5,860,000 | | | Abbott Laboratories
0.10% due 01/12/15 | | | 5,858,828
| | | | 5,859,239
| | |
| | 15,398,000 | | | Abbott Laboratories
0.10% due 01/20/15 | | | 15,394,578
| | | | 15,395,680
| | |
| | 8,069,000 | | | Apple, Inc.
0.09% due 11/06/14 | | | 8,068,899
| | | | 8,068,899
| | |
| | 8,372,000 | | | Apple, Inc.
0.09% due 11/13/14 | | | 8,371,749
| | | | 8,371,749
| | |
| | 15,701,000 | | | Apple, Inc.
0.09% due 11/14/14 | | | 15,700,490
| | | | 15,700,490
| | |
| | 5,890,000 | | | Apple, Inc.
0.09% due 11/17/14 | | | 5,889,765
| | | | 5,889,765
| | |
| | 5,943,000 | | | Apple, Inc.
0.09% due 11/18/14 | | | 5,942,747
| | | | 5,942,747
| | |
| | 2,247,000 | | | Apple, Inc.
0.09% due 11/19/14 | | | 2,246,899
| | | | 2,246,899
| | |
| | 14,375,000 | | | Apple, Inc.
0.09% due 12/02/14 | | | 14,373,886
| | | | 14,373,886
| | |
| | 5,253,000 | | | Apple, Inc.
0.11% due 12/15/14 | | | 5,252,294
| | | | 5,252,294
| | |
| | 13,741,000 | | | Apple, Inc.
0.11% due 01/05/15 | | | 13,738,271
| | | | 13,737,372
| | |
| | 8,200,000 | | | Autozone, Inc.
0.25% due 11/17/14 | | | 8,199,089
| | | | 8,199,089
| | |
First Eagle Funds | Annual Report | October 31, 2014
63
First Eagle Overseas Fund | Consolidated Schedule of Investments | Year Ended October 31, 2014
| Principal | | Description | | Cost (Note 1) | | Value (Note 1) | |
U.S. Commercial Paper — 12.07% (continued) | | | |
$ | 3,878,000 | | | Campbell Soup Company
0.25% due 11/06/14 | | $ | 3,877,865
| | | $ | 3,877,865
| | |
| | 12,450,000 | | | Campbell Soup Company
0.28% due 11/04/14 | | | 12,449,709
| | | | 12,449,709
| | |
| | 15,611,000 | | | Campbell Soup Company
0.31% due 12/08/14 | | | 15,606,026
| | | | 15,606,026
| | |
| | 3,973,000 | | | Campbell Soup Company
0.35% due 12/29/14 | | | 3,970,824
| | | | 3,970,824
| | |
| | 22,310,000 | | | Caterpillar Financial Services Company
0.10% due 01/06/15 | | | 22,305,910
| | | | 22,305,351
| | |
| | 23,507,000 | | | Caterpillar Financial Services Company
0.10% due 01/09/15 | | | 23,502,494
| | | | 23,501,836
| | |
| | 6,673,000 | | | Celgene Corporation
0.28% due 11/20/14 | | | 6,672,014
| | | | 6,672,014
| | |
| | 7,052,000 | | | Celgene Corporation
0.32% due 01/12/15 | | | 7,047,487
| | | | 7,048,011
| | |
| | 8,238,000 | | | Chevron Corporation
0.07% due 12/12/14 | | | 8,237,343
| | | | 8,237,343
| | |
| | 19,247,000 | | | Chevron Corporation
0.08% due 01/13/15 | | | 19,243,878
| | | | 19,241,105
| | |
| | 10,086,000 | | | Chevron Corporation
0.09% due 11/13/14 | | | 10,085,697
| | | | 10,085,697
| | |
| | 15,602,000 | | | Chevron Corporation
0.09% due 11/17/14 | | | 15,601,376
| | | | 15,601,376
| | |
| | 12,450,000 | | | Chevron Corporation
0.09% due 11/18/14 | | | 12,449,471
| | | | 12,449,471
| | |
| | 11,931,000 | | | Chevron Corporation
0.09% due 11/19/14 | | | 11,930,463
| | | | 11,930,463
| | |
| | 10,703,000 | | | Chevron Corporation
0.09% due 12/03/14 | | | 10,702,144
| | | | 10,702,144
| | |
| | 10,281,000 | | | Chevron Corporation
0.10% due 11/04/14 | | | 10,280,914
| | | | 10,280,914
| | |
| | 11,740,000 | | | Chevron Corporation
0.10% due 11/06/14 | | | 11,739,837
| | | | 11,739,837
| | |
| | 11,579,000 | | | Chevron Corporation
0.10% due 11/07/14 | | | 11,578,807
| | | | 11,578,807
| | |
| | 9,498,000 | | | Chevron Corporation
0.10% due 12/08/14 | | | 9,497,024
| | | | 9,497,024
| | |
| | 6,861,000 | | | Chevron Corporation
0.10% due 12/10/14 | | | 6,860,257
| | | | 6,860,257
| | |
First Eagle Funds | Annual Report | October 31, 2014
64
First Eagle Overseas Fund | Consolidated Schedule of Investments | Year Ended October 31, 2014
| Principal | | Description | | Cost (Note 1) | | Value (Note 1) | |
U.S. Commercial Paper — 12.07% (continued) | | | |
$ | 2,416,000 | | | Chevron Corporation
0.10% due 01/16/15 | | $ | 2,415,490
| | | $ | 2,415,220
| | |
| | 10,500,000 | | | Chevron Corporation
0.10% due 01/21/15 | | | 10,497,638
| | | | 10,496,292
| | |
| | 3,299,000 | | | Chevron Corporation
0.10% due 01/22/15 | | | 3,298,249
| | | | 3,297,821
| | |
| | 27,482,000 | | | Chevron Corporation
0.12% due 01/15/15 | | | 27,475,129
| | | | 27,473,239
| | |
| | 8,248,000 | | | Church & Dwight Company, Inc.
0.46% due 01/12/15 | | | 8,240,577
| | | | 8,243,334
| | |
| | 14,365,000 | | | Coca-Cola Company
0.10% due 11/13/14 | | | 14,364,521
| | | | 14,364,521
| | |
| | 4,864,000 | | | Coca-Cola Company
0.10% due 01/07/15 | | | 4,863,095
| | | | 4,863,145
| | |
| | 3,753,000 | | | Coca-Cola Company
0.10% due 01/15/15 | | | 3,752,218
| | | | 3,752,247
| | |
| | 5,250,000 | | | Coca-Cola Company
0.10% due 01/16/15 | | | 5,248,892
| | | | 5,248,922
| | |
| | 8,372,000 | | | Coca-Cola Company
0.11% due 11/13/14 | | | 8,371,693
| | | | 8,371,693
| | |
| | 10,049,000 | | | Coca-Cola Company
0.11% due 12/04/14 | | | 10,047,987
| | | | 10,047,987
| | |
| | 23,480,000 | | | Coca-Cola Company
0.12% due 11/05/14 | | | 23,479,687
| | | | 23,479,687
| | |
| | 16,911,000 | | | Coca-Cola Company
0.12% due 11/07/14 | | | 16,910,662
| | | | 16,910,662
| | |
| | 15,438,000 | | | Coca-Cola Company
0.13% due 11/20/14 | | | 15,436,941
| | | | 15,436,941
| | |
| | 11,831,000 | | | Colgate-Palmolive Company
0.05% due 11/20/14 | | | 11,830,688
| | | | 11,830,688
| | |
| | 1,972,000 | | | ConocoPhillips
0.10% due 12/12/14 | | | 1,971,775
| | | | 1,971,775
| | |
| | 6,496,000 | | | ConocoPhillips
0.12% due 01/22/15 | | | 6,494,224
| | | | 6,494,533
| | |
| | 4,949,000 | | | ConocoPhillips
0.12% due 01/23/15 | | | 4,947,631
| | | | 4,947,868
| | |
| | 3,088,000 | | | ConocoPhillips
0.13% due 11/07/14 | | | 3,087,933
| | | | 3,087,933
| | |
| | 4,766,000 | | | Corning, Inc.
0.21% due 11/21/14 | | | 4,765,444
| | | | 4,765,444
| | |
First Eagle Funds | Annual Report | October 31, 2014
65
First Eagle Overseas Fund | Consolidated Schedule of Investments | Year Ended October 31, 2014
| Principal | | Description | | Cost (Note 1) | | Value (Note 1) | |
U.S. Commercial Paper — 12.07% (continued) | | | |
$ | 3,112,000 | | | Corning, Inc.
0.21% due 11/24/14 | | $ | 3,111,582
| | | $ | 3,111,582
| | |
| | 4,200,000 | | | Corning, Inc.
0.21% due 11/28/14 | | | 4,199,339
| | | | 4,199,339
| | |
| | 2,903,000 | | | Corning, Inc.
0.22% due 11/25/14 | | | 2,902,574
| | | | 2,902,574
| | |
| | 13,177,000 | | | Dominion Resources, Inc.
0.25% due 12/01/14 | | | 13,174,255
| | | | 13,174,255
| | |
| | 4,473,000 | | | Dominion Resources, Inc.
0.26% due 12/05/14 | | | 4,471,902
| | | | 4,471,902
| | |
| | 12,284,000 | | | Dominion Resources, Inc.
0.30% due 01/07/15 | | | 12,277,141
| | | | 12,277,620
| | |
| | 3,973,000 | | | Duke Energy Corporation
0.27% due 11/20/14 | | | 3,972,434
| | | | 3,972,434
| | |
| | 2,526,000 | | | Duke Energy Corporation
0.30% due 01/05/15 | | | 2,524,632
| | | | 2,524,879
| | |
| | 7,451,000 | | | DuPont
0.07% due 11/03/14 | | | 7,450,971
| | | | 7,450,971
| | |
| | 15,878,000 | | | DuPont
0.07% due 11/07/14 | | | 15,877,815
| | | | 15,877,815
| | |
| | 4,665,000 | | | DuPont
0.08% due 11/04/14 | | | 4,664,969
| | | | 4,664,969
| | |
| | 16,785,000 | | | DuPont
0.08% due 11/05/14 | | | 16,784,851
| | | | 16,784,851
| | |
| | 18,113,000 | | | DuPont
0.08% due 11/10/14 | | | 18,112,638
| | | | 18,112,638
| | |
| | 3,358,000 | | | Emerson Electric Company
0.09% due 12/08/14 | | | 3,357,689
| | | | 3,357,689
| | |
| | 4,477,000 | | | Emerson Electric Company
0.09% due 12/11/14 | | | 4,476,552
| | | | 4,476,552
| | |
| | 8,593,000 | | | Emerson Electric Company
0.09% due 12/12/14 | | | 8,592,119
| | | | 8,592,119
| | |
| | 13,782,000 | | | Emerson Electric Company
0.10% due 01/30/15 | | | 13,778,554
| | | | 13,778,516
| | |
| | 5,783,000 | | | Emerson Electric Company
0.11% due 11/20/14 | | | 5,782,664
| | | | 5,782,664
| | |
| | 1,986,000 | | | Emerson Electric Company
0.11% due 12/24/14 | | | 1,985,678
| | | | 1,985,678
| | |
| | 7,190,000 | | | Exxon Mobil Corporation
0.06% due 12/26/14 | | | 7,189,341
| | | | 7,189,341
| | |
First Eagle Funds | Annual Report | October 31, 2014
66
First Eagle Overseas Fund | Consolidated Schedule of Investments | Year Ended October 31, 2014
| Principal | | Description | | Cost (Note 1) | | Value (Note 1) | |
U.S. Commercial Paper — 12.07% (continued) | | | |
$ | 12,450,000 | | | Exxon Mobil Corporation
0.07% due 11/12/14 | | $ | 12,449,734
| | | $ | 12,449,734
| | |
| | 12,450,000 | | | Exxon Mobil Corporation
0.07% due 11/13/14 | | | 12,449,709
| | | | 12,449,709
| | |
| | 2,873,000 | | | Exxon Mobil Corporation
0.07% due 12/02/14 | | | 2,872,827
| | | | 2,872,827
| | |
| | 8,523,000 | | | Exxon Mobil Corporation
0.08% due 12/03/14 | | | 8,522,394
| | | | 8,522,394
| | |
| | 4,200,000 | | | Exxon Mobil Corporation
0.08% due 12/18/14 | | | 4,199,561
| | | | 4,199,561
| | |
| | 14,121,000 | | | Google, Inc.
0.07% due 11/18/14 | | | 14,120,533
| | | | 14,120,533
| | |
| | 5,296,000 | | | Google, Inc.
0.08% due 11/12/14 | | | 5,295,871
| | | | 5,295,871
| | |
| | 7,085,000 | | | Google, Inc.
0.09% due 11/19/14 | | | 7,084,681
| | | | 7,084,681
| | |
| | 20,379,000 | | | Google, Inc.
0.09% due 01/14/15 | | | 20,375,230
| | | | 20,376,241
| | |
| | 6,861,000 | | | Honeywell International, Inc.
0.08% due 11/13/14 | | | 6,860,817
| | | | 6,860,817
| | |
| | 14,322,000 | | | Honeywell International, Inc.
0.09% due 12/05/14 | | | 14,320,783
| | | | 14,320,783
| | |
| | 13,380,000 | | | Honeywell International, Inc.
0.09% due 12/08/14 | | | 13,378,762
| | | | 13,378,762
| | |
| | 7,618,000 | | | Honeywell International, Inc.
0.10% due 12/04/14 | | | 7,617,302
| | | | 7,617,302
| | |
| | 41,223,000 | | | International Business Machines
Corporation
0.10% due 12/03/14 | | | 41,219,336
| | | | 41,219,336
| | |
| | 20,582,000 | | | International Business Machines
Corporation
0.10% due 12/10/14 | | | 20,579,770
| | | | 20,579,770
| | |
| | 20,400,000 | | | International Business Machines
Corporation
0.10% due 12/12/14 | | | 20,397,677
| | | | 20,397,677
| | |
| | 16,804,000 | | | International Business Machines
Corporation
0.10% due 12/17/14 | | | 16,801,853
| | | | 16,801,853
| | |
| | 13,914,000 | | | Medtronic, Inc.
0.08% due 11/04/14 | | | 13,913,907
| | | | 13,913,907
| | |
First Eagle Funds | Annual Report | October 31, 2014
67
First Eagle Overseas Fund | Consolidated Schedule of Investments | Year Ended October 31, 2014
| Principal | | Description | | Cost (Note 1) | | Value (Note 1) | |
U.S. Commercial Paper — 12.07% (continued) | | | |
$ | 15,428,000 | | | Medtronic, Inc.
0.08% due 11/18/14 | | $ | 15,427,417
| | | $ | 15,427,417
| | |
| | 4,495,000 | | | MetLife
0.12% due 11/05/14 | | | 4,494,940
| | | | 4,494,940
| | |
| | 7,733,000 | | | MetLife
0.12% due 12/09/14 | | | 7,732,020
| | | | 7,732,020
| | |
| | 6,300,000 | | | MetLife
0.12% due 01/06/15 | | | 6,298,614
| | | | 6,298,065
| | |
| | 11,135,000 | | | MetLife
0.12% due 01/07/15 | | | 11,132,513
| | | | 11,131,529
| | |
| | 9,469,000 | | | MetLife
0.13% due 11/24/14 | | | 9,468,214
| | | | 9,468,214
| | |
| | 14,299,000 | | | MetLife
0.13% due 12/15/14 | | | 14,296,728
| | | | 14,296,728
| | |
| | 6,114,000 | | | Microsoft Corporation
0.06% due 12/04/14 | | | 6,113,664
| | | | 6,113,664
| | |
| | 20,846,000 | | | Microsoft Corporation
0.07% due 11/19/14 | | | 20,845,270
| | | | 20,845,270
| | |
| | 8,248,000 | | | National Grid USA
0.39% due 01/22/15 | | | 8,240,861
| | | | 8,242,580
| | |
| | 20,846,000 | | | Omnicom Group, Inc.
0.30% due 12/01/14 | | | 20,840,788
| | | | 20,840,788
| | |
| | 5,062,000 | | | Omnicom Group, Inc.
0.30% due 12/02/14 | | | 5,060,692
| | | | 5,060,692
| | |
| | 8,093,000 | | | Omnicom Group, Inc.
0.30% due 12/04/14 | | | 8,090,774
| | | | 8,090,774
| | |
| | 10,289,000 | | | Omnicom Group, Inc.
0.30% due 12/18/14 | | | 10,284,970
| | | | 10,284,970
| | |
| | 19,765,000 | | | Pall Corporation
0.36% due 01/14/15 | | | 19,750,780
| | | | 19,753,471
| | |
| | 13,425,000 | | | PepsiCo, Inc.
0.07% due 12/11/14 | | | 13,423,956
| | | | 13,423,956
| | |
| | 15,064,000 | | | PepsiCo, Inc.
0.07% due 12/16/14 | | | 15,062,682
| | | | 15,062,682
| | |
| | 7,202,000 | | | PepsiCo, Inc.
0.07% due 12/18/14 | | | 7,201,342
| | | | 7,201,342
| | |
| | 11,144,000 | | | PepsiCo, Inc.
0.08% due 11/03/14 | | | 11,143,950
| | | | 11,143,950
| | |
| | 9,078,000 | | | PepsiCo, Inc.
0.08% due 11/04/14 | | | 9,077,939
| | | | 9,077,939
| | |
First Eagle Funds | Annual Report | October 31, 2014
68
First Eagle Overseas Fund | Consolidated Schedule of Investments | Year Ended October 31, 2014
| Principal | | Description | | Cost (Note 1) | | Value (Note 1) | |
U.S. Commercial Paper — 12.07% (continued) | | | |
$ | 7,552,000 | | | PepsiCo, Inc.
0.08% due 11/05/14 | | $ | 7,551,933
| | | $ | 7,551,933
| | |
| | 15,813,000 | | | PepsiCo, Inc.
0.08% due 11/10/14 | | | 15,812,684
| | | | 15,812,684
| | |
| | 22,260,000 | | | PepsiCo, Inc.
0.08% due 11/14/14 | | | 22,259,357
| | | | 22,259,357
| | |
| | 5,215,000 | | | PepsiCo, Inc.
0.08% due 11/17/14 | | | 5,214,815
| | | | 5,214,815
| | |
| | 6,649,000 | | | PepsiCo, Inc.
0.08% due 11/21/14 | | | 6,648,704
| | | | 6,648,704
| | |
| | 6,868,000 | | | PepsiCo, Inc.
0.08% due 12/11/14 | | | 6,867,390
| | | | 6,867,390
| | |
| | 20,612,000 | | | Philip Morris International, Inc.
0.07% due 11/03/14 | | | 20,611,920
| | | | 20,611,920
| | |
| | 5,297,000 | | | Philip Morris International, Inc.
0.07% due 11/21/14 | | | 5,296,794
| | | | 5,296,794
| | |
| | 20,367,000 | | | Philip Morris International, Inc.
0.07% due 12/05/14 | | | 20,365,654
| | | | 20,365,654
| | |
| | 15,794,000 | | | Philip Morris International, Inc.
0.08% due 12/12/14 | | | 15,792,561
| | | | 15,792,561
| | |
| | 18,071,000 | | | Philip Morris International, Inc.
0.09% due 12/05/14 | | | 18,069,464
| | | | 18,069,464
| | |
| | 10,289,000 | | | Philip Morris International, Inc.
0.09% due 12/10/14 | | | 10,287,997
| | | | 10,287,997
| | |
| | 13,340,000 | | | Philip Morris International, Inc.
0.10% due 12/12/14 | | | 13,338,481
| | | | 13,338,481
| | |
| | 11,754,000 | | | Philip Morris International, Inc.
0.10% due 12/24/14 | | | 11,752,270
| | | | 11,752,270
| | |
| | 4,832,000 | | | Philip Morris International, Inc.
0.11% due 12/18/14 | | | 4,831,306
| | | | 4,831,306
| | |
| | 13,177,000 | | | Philip Morris International, Inc.
0.11% due 12/22/14 | | | 13,174,947
| | | | 13,174,947
| | |
| | 5,025,000 | | | Precision Castparts Corporation
0.10% due 11/05/14 | | | 5,024,944
| | | | 5,024,944
| | |
| | 7,670,000 | | | Precision Castparts Corporation
0.10% due 11/17/14 | | | 7,669,659
| | | | 7,669,659
| | |
| | 3,813,000 | | | Precision Castparts Corporation
0.11% due 12/09/14 | | | 3,812,557
| | | | 3,812,557
| | |
| | 3,008,000 | | | Precision Castparts Corporation
0.11% due 01/06/15 | | | 3,007,393
| | | | 3,007,020
| | |
First Eagle Funds | Annual Report | October 31, 2014
69
First Eagle Overseas Fund | Consolidated Schedule of Investments | Year Ended October 31, 2014
| Principal | | Description | | Cost (Note 1) | | Value (Note 1) | |
U.S. Commercial Paper — 12.07% (continued) | | | |
$ | 9,224,000 | | | Precision Castparts Corporation
0.11% due 01/07/15 | | $ | 9,222,112
| | | $ | 9,220,951
| | |
| | 5,795,000 | | | Precision Castparts Corporation
0.12% due 11/10/14 | | | 5,794,826
| | | | 5,794,826
| | |
| | 14,118,000 | | | Procter & Gamble Company
0.10% due 11/13/14 | | | 14,117,529
| | | | 14,117,529
| | |
| | 16,717,000 | | | Procter & Gamble Company
0.10% due 11/14/14 | | | 16,716,396
| | | | 16,716,396
| | |
| | 6,690,000 | | | Procter & Gamble Company
0.10% due 12/01/14 | | | 6,689,442
| | | | 6,689,442
| | |
| | 26,760,000 | | | Schlumberger Investments SA
0.12% due 12/02/14 | | | 26,757,235
| | | | 26,757,235
| | |
| | 12,784,000 | | | Schlumberger Investments SA
0.12% due 12/15/14 | | | 12,782,125
| | | | 12,782,125
| | |
| | 6,224,000 | | | Schlumberger Investments SA
0.12% due 12/23/14 | | | 6,222,921
| | | | 6,222,921
| | |
| | 7,192,000 | | | Unilever Capital Corporation
0.09% due 11/12/14 | | | 7,191,802
| | | | 7,191,802
| | |
| | 39,910,000 | | | Unilever Capital Corporation
0.12% due 11/12/14 | | | 39,908,537
| | | | 39,908,537
| | |
| | 5,336,000 | | | United Healthcare Company
0.20% due 11/07/14 | | | 5,335,822
| | | | 5,335,822
| | |
| | 5,581,000 | | | United Healthcare Company
0.20% due 11/28/14 | | | 5,580,163
| | | | 5,580,163
| | |
| | 17,227,000 | | | United Parcel Service, Inc.
0.04% due 02/02/15 | | | 17,225,220
| | | | 17,222,457
| | |
| | 12,592,000 | | | United Parcel Service, Inc.
0.05% due 11/03/14 | | | 12,591,965
| | | | 12,591,965
| | |
| | 21,406,000 | | | United Parcel Service, Inc.
0.08% due 12/05/14 | | | 21,404,383
| | | | 21,404,383
| | |
| | 21,406,000 | | | United Parcel Service, Inc.
0.08% due 12/09/14 | | | 21,404,192
| | | | 21,404,192
| | |
| | 6,114,000 | | | Wal-Mart Stores, Inc.
0.08% due 12/01/14 | | | 6,113,592
| | | | 6,113,592
| | |
| | 12,372,000 | | | Walt Disney Company
0.07% due 01/16/15 | | | 12,370,172
| | | | 12,369,460
| | |
| | 3,595,000 | | | Walt Disney Company
0.08% due 12/19/14 | | | 3,594,617
| | | | 3,594,617
| | |
First Eagle Funds | Annual Report | October 31, 2014
70
First Eagle Overseas Fund | Consolidated Schedule of Investments | Year Ended October 31, 2014
| Principal | | Description | | Cost (Note 1) | | Value (Note 1) | |
U.S. Commercial Paper — 12.07% (continued) | |
$ | 9,533,000 | | | Whirlpool Corporation
0.33% due 11/04/14 | | $ | 9,532,738
| | | $ | 9,532,738
| | |
Total U.S. Commercial Paper | | | 1,755,338,213 | | | | 1,755,335,382 | | |
Total Commercial Paper | | | 2,876,623,349 | | | | 2,876,603,444 | | |
Total Investments — 98.94% | | $ | 11,913,753,013 | | | | 14,387,105,173 | | |
Other Assets in Excess of Liabilities — 1.06% | | | | | 153,821,538 | | |
Net Assets — 100.00% | | | | $ | 14,540,926,711 | | |
(a) Non-income producing security/commodity.
(b) An affiliate of the Fund as defined by the Investment Company Act of 1940. An affiliate is defined as a company in which the Fund directly or indirectly owns, controls, or holds power to vote 5% or more of the outstanding voting securities.
(c) Represents non-voting class of shares.
(d) Securities valued in accordance with fair value procedures under the supervision of the Board of Trustees, representing $59,041,334 or 0.41% of net assets.
(e) Security is deemed illiquid. At October 31, 2014, the value of these securities amounted to $77,658,028 or 0.53% of net assets.
(f) Represents securities that are subject to legal or contractual restrictions on resale. At October 31, 2014, the value of these securities amounted to $29,740,542 or 0.20% of net assets.
(g) Held through Financiere Bleue, LLC, wholly owned holding company and disregarded entity for U.S. tax purposes.
(h) Payment-in-kind security.
(i) This security is convertible until September 27, 2017.
(j) Represents a security registered under Regulation S. Bonds sold under Regulation S may not be offered, sold or delivered within the U.S., or for the account or benefit of, U.S. persons, except pursuant to an exemption from, or in a transaction not subject to, the registration requirements of the Securities Act of 1933.
(k) Floating rate security. Rate shown is the rate in effect at October 31, 2014.
At October 31, 2014, aggregate cost for federal income tax purposes was $12,399,475,358. Net unrealized appreciation consisted of:
Gross unrealized appreciation | | $ | 2,916,146,297 | | |
Gross unrealized depreciation | | | (928,516,482 | ) | |
Net unrealized appreciation | | $ | 1,987,629,815 | | |
Abbreviations used in this schedule include:
ADR — American Depositary Receipt
FRN — Floating Rate Note
NVDR — Non-Voting Depository Receipt
PCL — Public Company Limited
PLC — Public Limited Company
RSP — Represents Savings Shares
Currencies
EUR — Euro
SGD — Singapore Dollar
USD — United States Dollar
First Eagle Funds | Annual Report | October 31, 2014
71
First Eagle Overseas Fund | Consolidated Schedule of Investments | Year Ended October 31, 2014
Restricted Securities | | Acquisition Date | | Cost | | Carrying Value
Per
Share/Principal | |
Emin Leydier SA FRN 8.272% due 07/31/16 | | 07/30/09 | | $ | 14,240,891 | | | $ | 1.25 | | |
FINEL 9.50% due 06/30/17 | | 06/22/05 | | | 14,365,843 | | | | 0.94 | | |
FINEL | | 07/14/09 | | | 9,166,547 | | | | 0.45 | | |
Legris Industries SA | | 04/30/04 | | | 23,119,325 | | | | 21.12 | | |
Foreign Currency Exchange Contracts — Sales
Settlement
Dates
Through | | Foreign Currency
To be Delivered | | U.S. $
To be Received | | U.S. $ Value
At October 31,
2014 | | Unrealized
Appreciation
At October 31,
2014 | | Unrealized
Depreciation
At October 31,
2014 | |
12/17/14 | | | 8,201,000 | | | British Pound | | $ | 13,751,273 | | | $ | 13,114,646 | | | $ | 636,627 | | | $ | — | | |
01/14/15 | | | 4,165,000 | | | British Pound | | | 7,116,673 | | | | 6,658,979 | | | | 457,694 | | | | — | | |
02/12/15 | | | 17,053,000 | | | British Pound | | | 28,615,385 | | | | 27,265,340 | | | | 1,350,045 | | | | — | | |
03/18/15 | | | 2,118,000 | | | British Pound | | | 3,379,756 | | | | 3,384,141 | | | | — | | | | (4,385 | ) | |
12/17/14 | | | 13,243,000 | | | Euro | | | 17,924,401 | | | | 16,600,044 | | | | 1,324,357 | | | | — | | |
01/14/15 | | | 57,343,000 | | | Euro | | | 78,102,886 | | | | 71,893,046 | | | | 6,209,840 | | | | — | | |
02/12/15 | | | 239,476,000 | | | Euro | | | 324,437,380 | | | | 300,252,543 | | | | 24,184,837 | | | | — | | |
03/18/15 | | | 145,121,000 | | | Euro | | | 188,214,681 | | | | 182,025,758 | | | | 6,188,923 | | | | — | | |
04/15/15 | | | 78,073,000 | | | Euro | | | 99,107,428 | | | | 97,946,142 | | | | 1,161,286 | | | | — | | |
12/17/14 | | | 5,731,657,000 | | | Japanese Yen | | | 56,234,064 | | | | 51,050,319 | | | | 5,183,745 | | | | — | | |
01/14/15 | | | 18,808,837,000 | | | Japanese Yen | | | 185,906,754 | | | | 167,598,008 | | | | 18,308,746 | | | | — | | |
02/12/15 | | | 25,690,129,000 | | | Japanese Yen | | | 252,236,941 | | | | 228,823,002 | | | | 23,413,939 | | | | — | | |
03/18/15 | | | 22,278,232,000 | | | Japanese Yen | | | 209,018,455 | | | | 198,642,251 | | | | 10,376,204 | | | | — | | |
04/15/15 | | | 14,082,404,000 | | | Japanese Yen | | | 131,417,197 | | | | 125,603,835 | | | | 5,813,362 | | | | — | | |
| | | | | | | $ | 1,595,463,274 | | | $ | 1,490,858,054 | | | $ | 104,609,605 | | | $ | (4,385 | ) | |
Foreign Currency Exchange Contracts — Purchases
Settlement
Dates
Through | | Foreign Currency
To be Received | | U.S. $
To be Delivered | | U.S. $ Value
At October 31,
2014 | | Unrealized
Appreciation
At October 31,
2014 | | Unrealized
Depreciation
At October 31,
2014 | |
02/12/15 | | | 1,075,000 | | | British Pound | | $ | 1,736,738 | | | $ | 1,718,571 | | | $ | — | | | $ | (18,167 | ) | |
01/14/15 | | | 17,516,000 | | | Euro | | | 21,942,293 | | | | 21,960,459 | | | | 18,166 | | | | — | | |
02/12/15 | | | 91,595,000 | | | Euro | | | 115,672,346 | | | | 114,808,396 | | | | — | | | | (863,950 | ) | |
11/19/14 | | | 10,458,179,000 | | | Japanese Yen | | | 93,257,113 | | | | 93,116,211 | | | | — | | | | (140,902 | ) | |
| | | | | | | $ | 232,608,490 | | | $ | 231,603,637 | | | $ | 18,166 | | | $ | (1,023,019 | ) | |
First Eagle Funds | Annual Report | October 31, 2014
72
First Eagle Overseas Fund | Consolidated Schedule of Investments | Year Ended October 31, 2014
Affiliated Securities
Affiliated Securities | | Shares
October 31,
2013 | | Gross
Additions | | Gross
Reductions | | Shares
October 31,
2014 | | Market
Value
October 31,
2014 | | Realized
Gain /
(Loss) | | Dividend
Income | |
As One
Corporation | | | 1,299,640 | | | | — | | | | — | | | | 1,299,640 | | | $ | 37,025,132 | | | $ | — | | | $ | 843,701 | | |
Catalyst Paper
Corporation* | | | 1,266,835 | | | | — | | | | 1,266,835 | | | | — | | | | — | | | | (24,518,725 | ) | | | — | | |
Chofu Seisakusho
Company Limited | | | 2,023,800 | | | | — | | | | — | | | | 2,023,800 | | | | 59,727,549 | | | | — | | | | 564,858 | | |
FINEL | | | 11,593,581 | | | | — | | | | — | | | | 11,593,581 | | | | 5,230,259 | | | | — | | | | — | | |
Fursys, Inc. | | | 872,463 | | | | — | | | | — | | | | 872,463 | | | | 26,245,811 | | | | — | | | | 451,873 | | |
Gaumont SA* | | | 364,373 | | | | — | | | | — | | | | 364,373 | | | | 18,127,578 | | | | — | | | | 429,841 | | |
Haw Par
Corporation
Limited | | | 25,512,113 | | | | — | | | | — | | | | 25,512,113 | | | | 169,590,912 | | | | — | | | | 4,076,741 | | |
Japan Wool
Textile Company
Limited | | | 6,407,900 | | | | — | | | | 312,700 | | | | 6,095,200 | | | | 40,806,503 | | | | (291,707 | ) | | | 998,838 | | |
Jumbo SA* | | | 9,086,616 | | | | 276,581 | | | | 3,257,128 | | | | 6,106,069 | | | | 66,953,434 | | | | 31,548,434 | | | | 1,251,861 | | |
Laurent-Perrier | | | 558,938 | | | | — | | | | — | | | | 558,938 | | | | 44,827,726 | | | | — | | | | 646,702 | | |
Legris Industries SA | | | 896,416 | | | | — | | | | — | | | | 896,416 | | | | 18,928,343 | | | | — | | | | — | | |
Maezawa Kasei
Industries
Company Limited | | | 2,068,330 | | | | — | | | | — | | | | 2,068,330 | | | | 21,010,145 | | | | — | | | | 486,185 | | |
Nitto Kohki
Company Limited* | | | 2,254,200 | | | | — | | | | 1,308,700 | | | | 945,500 | | | | 17,676,831 | | | | (119,527 | ) | | | 405,588 | | |
Robertet SA | | | 235,837 | | | | — | | | | — | | | | 235,837 | | | | 48,763,962 | | | | — | | | | 777,645 | | |
T. Hasegawa
Company Limited | | | 3,206,911 | | | | — | | | | — | | | | 3,206,911 | | | | 48,706,790 | | | | — | | | | 970,391 | | |
Wienerberger AG* | | | 5,915,786 | | | | — | | | | 1,330,648 | | | �� | 4,585,138 | | | | 55,447,609 | | | | 1,126,737 | | | | 640,517 | | |
Yomeishu Seizo
Company Limited* | | | 2,535,900 | | | | — | | | | 2,535,900 | | | | — | | | | — | | | | (4,587,274 | ) | | | — | | |
Total | | | | | | | | | | $ | 679,068,584 | | | $ | 3,157,938 | | | $ | 12,544,741 | | |
*Represents an unaffiliated issuer as of October 31, 2014, as such, amounts represented above will not agree to balances in the Statements of Assets and Liabilities and Statements of Operations.
First Eagle Funds | Annual Report | October 31, 2014
73
First Eagle Overseas Fund | Consolidated Schedule of Investments | Year Ended October 31, 2014
Industry Diversification for Portfolio Holdings | | Percent of
Net Assets | |
International Common Stocks
Consumer Discretionary | | | 9.24 | % | |
Consumer Staples | | | 9.98 | | |
Energy | | | 5.20 | | |
Financials | | | 11.54 | | |
Health Care | | | 5.30 | | |
Industrials | | | 14.02 | | |
Information Technology | | | 5.22 | | |
Materials | | | 9.45 | | |
Telecommunication Services | | | 2.62 | | |
Total International Common Stocks | | | 72.57 | | |
U.S. Common Stock
Materials | | | 0.05 | | |
Total U.S. Common Stock | | | 0.05 | | |
International Preferred Stocks
Consumer Discretionary | | | 0.44 | | |
Consumer Staples | | | 0.05 | | |
Total International Preferred Stocks | | | 0.49 | | |
Investment Company | | | 0.00 | | |
Rights | | | 0.15 | | |
Commodity | | | 4.77 | | |
Term Loans | | | 0.03 | | |
International Convertible Bond
Consumer Staples | | | 0.13 | | |
Total International Convertible Bond | | | 0.13 | | |
International Corporate Bonds
Financials | | | 0.09 | | |
Materials | | | 0.63 | | |
Total International Corporate Bonds | | | 0.72 | | |
International Government Bond
Government Issues | | | 0.25 | | |
Total International Government Bond | | | 0.25 | | |
Commercial Paper
International Commercial Paper | | | 7.71 | | |
U.S. Commercial Paper | | | 12.07 | | |
Total Commercial Paper | | | 19.78 | | |
Total Investments | | | 98.94 | % | |
See Notes to Financial Statements.
First Eagle Funds | Annual Report | October 31, 2014
74
This page was intentionally left blank.
First Eagle U.S. Value Fund
Data as of October 31, 2014 (unaudited)
Investment Objective
The First Eagle U.S. Value Fund seeks long-term growth of capital by investing, under normal market conditions, at least 80% of its assets in domestic equity and debt securities. Management utilizes a highly disciplined, bottom-up, value-oriented approach in achieving its investment objective.
Average Annual Returns (%) | | | | | | One-Year | | Five-Years | | Ten-Years | |
First Eagle U.S. Value Fund | | Class A | | without sales charge | | | 8.93 | | | | 11.40 | | | | 8.06 | | |
| | | | with sales charge | | | 3.46 | | | | 10.26 | | | | 7.51 | | |
Standard & Poor's 500 Index | | | | | | | 17.27 | | | | 16.69 | | | | 8.20 | | |
Consumer Price Index | | | | | | | 1.66 | | | | 1.89 | | | | 2.21 | | |
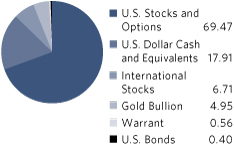
Sector/Industry** (%)
Information Technology | | | 24.31 | | |
Financials | | | 22.89 | | |
Industrials | | | 13.62 | | |
Energy | | | 10.05 | | |
Consumer Discretionary | | | 8.95 | | |
Materials | | | 8.71 | | |
Commodity | | | 6.03 | | |
Consumer Staples | | | 2.31 | | |
Health Care | | | 1.94 | | |
Warrant | | | 0.68 | | |
Utilities | | | 0.51 | | |
* Asset Allocation and Sector/Industry percentages are based on total investments in the portfolio.
**Sector/Industry allocations exclude short term investments and options positions.
The Fund's portfolio composition is subject to change at any time.
First Eagle Funds | Annual Report | October 31, 2014
76
First Eagle U.S. Value Fund | Fund Overview
Growth of a $10,000 Initial Investment

Performance data quoted herein represents past performance and should not be considered indicative of future results. Performance data quoted herein does not reflect the deduction of taxes that a shareholder would pay on Fund distributions or the sale of Fund shares. The average annual returns shown above are historical and reflect changes in share price, reinvested dividends and are net of expenses.
The average annual returns for Class A Shares with a sales charge gives effect to the deduction of the maximum sales charge of 5.00%.
The Standard & Poor's 500 Index is a widely recognized unmanaged index including a representative sample of 500 leading companies in leading sectors of the U.S. economy and is not available for purchase. Although the Standard & Poor's 500 Index focuses on the large-cap segment of the market, with approximately 80% coverage of U.S. equities, it is also considered a proxy for the total market. The Consumer Price Index (CPI) represents the change in price of all goods and services purchased for consumption by urban households.
Top 10 Holdings* (%)
Gold Bullion** (precious metal) | | | 4.94 | | |
Microsoft Corporation (U.S. software developer) | | | 4.11 | | |
Intel Corporation (U.S. computer components and related products manufacturer) | | | 3.65 | | |
Oracle Corporation (U.S. software developer) | | | 3.55 | | |
Comcast Corporation Class 'A' (U.S. cable/satellite television company) | | | 3.46 | | |
Bank of New York Mellon Corporation (U.S. financial services company) | | | 2.94 | | |
3M Company (U.S. industrial conglomerate) | | | 2.50 | | |
Cintas Corporation (U.S. commercial services provider) | | | 2.33 | | |
National Oilwell Varco, Inc. (U.S. energy & equipment services) | | | 2.30 | | |
Berkshire Hathaway, Inc. Class 'A' (U.S. holding company) | | | 2.04 | | |
Total | | | 31.82 | | |
* Holdings in cash, commercial paper and other short term cash equivalents have been excluded.
**The Fund invests in gold and precious metals through investment in a wholly-owned subsidiary of the Fund organized under the laws of the Cayman Islands (the "Subsidiary"). Gold Bullion and commodities include the Fund's investment in the Subsidiary.
Percentages are based on total net assets.
First Eagle Funds | Annual Report | October 31, 2014
77
First Eagle U.S. Value Fund | Consolidated Schedule of Investments | Year Ended October 31, 2014
| Shares | | Description | | Cost (Note 1) | | Value (Note 1) | |
Common Stocks — 76.06% | | | |
U.S. Common Stocks — 69.36% | | | |
Consumer Discretionary — 7.32% | | | |
| | 1,967,132 | | | Comcast Corporation, Class 'A' | | $ | 38,059,758 | | | $ | 108,467,659 | | |
| | 790,034 | | | Omnicom Group, Inc. | | | 25,724,873 | | | | 56,771,843 | | |
| | 374,011 | | | McDonald's Corporation | | | 36,900,898 | | | | 35,056,051 | | |
| | 489,138 | | | H&R Block, Inc. | | | 8,259,025 | | | | 15,804,049 | | |
| | 110,654 | | | Bed Bath & Beyond, Inc. (a) | | | 6,760,738 | | | | 7,451,440 | | |
| | 72,165 | | | Ross Stores, Inc. | | | 4,658,059 | | | | 5,825,159 | | |
| | 512 | | | St. John Knits International, Inc. (a)(b) | | | 15,872 | | | | 2,560 | | |
| | | | 120,379,223 | | | | 229,378,761 | | |
Consumer Staples — 1.89% | | | |
| | 396,024 | | | Colgate-Palmolive Company | | | 15,232,688 | | | | 26,486,085 | | |
| | 235,901 | | | Wal-Mart Stores, Inc. | | | 11,087,014 | | | | 17,992,169 | | |
| | 332,638 | | | Sysco Corporation | | | 9,037,687 | | | | 12,819,869 | | |
| | 77,388 | | | Limoneira Company | | | 1,488,691 | | | | 1,985,776 | | |
| | | | 36,846,080 | | | | 59,283,899 | | |
Energy — 6.21% | | | |
| | 993,377 | | | National Oilwell Varco, Inc. | | | 70,373,101 | | | | 72,158,905 | | |
| | 745,666 | | | ConocoPhillips | | | 32,965,299 | | | | 53,799,802 | | |
| | 675,280 | | | Devon Energy Corporation | | | 37,936,810 | | | | 40,516,800 | | |
| | 1,033,843 | | | San Juan Basin Royalty Trust | | | 20,806,015 | | | | 18,774,589 | | |
| | 114,653 | | | SEACOR Holdings, Inc. (a) | | | 7,325,758 | | | | 9,453,140 | | |
| | | | 169,406,983 | | | | 194,703,236 | | |
Financials — 18.05% | | | |
| | 2,380,687 | | | Bank of New York Mellon Corporation | | | 56,858,996 | | | | 92,180,201 | | |
| | 305 | | | Berkshire Hathaway, Inc., Class 'A' (a) | | | 28,875,333 | | | | 64,050,000 | | |
| | 117,066 | | | Alleghany Corporation (a) | | | 34,293,700 | | | | 52,010,082 | | |
| | 548,595 | | | American Express Company | | | 14,606,626 | | | | 49,346,120 | | |
| | 1,239,070 | | | BB&T Corporation | | | 30,832,769 | | | | 46,935,972 | | |
| | 987,039 | | | U.S. Bancorp | | | 24,193,098 | | | | 42,047,861 | | |
| | 829,682 | | | Cincinnati Financial Corporation | | | 21,162,974 | | | | 41,874,050 | | |
| | 1,206,038 | | | Weyerhaeuser Company, REIT | | | 18,797,826 | | | | 40,836,447 | | |
| | 613,629 | | | WR Berkley Corporation | | | 16,784,004 | | | | 31,626,439 | | |
| | 704,065 | | | Plum Creek Timber Company, Inc., REIT | | | 24,818,314 | | | | 28,873,706 | | |
First Eagle Funds | Annual Report | October 31, 2014
78
First Eagle U.S. Value Fund | Consolidated Schedule of Investments | Year Ended October 31, 2014
| Shares | | Description | | Cost (Note 1) | | Value (Note 1) | |
U.S. Common Stocks — 69.36% (continued) | | | |
Financials — 18.05% (continued) | | | |
| | 252,026 | | | Mastercard, Inc., Class 'A' | | $ | 5,790,386 | | | $ | 21,107,177 | | |
| | 84,477 | | | Visa, Inc., Class 'A' | | | 6,092,810 | | | | 20,395,282 | | |
| | 312,033 | | | American International Group, Inc. | | | 16,446,372 | | | | 16,715,608 | | |
| | 294,492 | | | Brown & Brown, Inc. | | | 8,961,636 | | | | 9,382,515 | | |
| | 211,098 | | | Rayonier, Inc., REIT | | | 3,114,239 | | | | 7,065,450 | | |
| | 40,290 | | | First American Financial Corporation | | | 935,052 | | | | 1,221,593 | | |
| | | | 312,564,135 | | | | 565,668,503 | | |
Health Care — 1.59% | | | |
| | 265,575 | | | WellPoint, Inc. | | | 11,395,889 | | | | 33,645,697 | | |
| | 149,770 | | | Johnson & Johnson | | | 8,850,248 | | | | 16,142,210 | | |
| | | | 20,246,137 | | | | 49,787,907 | | |
Industrials — 11.00% | | | |
| | 510,027 | | | 3M Company | | | 36,461,031 | | | | 78,426,852 | | |
| | 995,026 | | | Cintas Corporation | | | 28,203,047 | | | | 72,875,704 | | |
| | 372,827 | | | Northrop Grumman Corporation | | | 21,671,558 | | | | 51,435,213 | | |
| | 262,126 | | | Lockheed Martin Corporation | | | 18,533,193 | | | | 49,953,352 | | |
| | 344,610 | | | Alliant Techsystems, Inc. | | | 17,932,324 | | | | 40,305,585 | | |
| | 883,462 | | | NOW, Inc. (a) | | | 26,005,357 | | | | 26,556,868 | | |
| | 292,695 | | | Deere & Company | | | 24,304,617 | | | | 25,037,130 | | |
| | | | 173,111,127 | | | | 344,590,704 | | |
Information Technology — 19.91% | | | |
| | 2,742,890 | | | Microsoft Corporation | | | 70,849,511 | | | | 128,778,685 | | |
| | 3,358,862 | | | Intel Corporation (c) | | | 66,526,606 | | | | 114,234,897 | | |
| | 2,848,600 | | | Oracle Corporation | | | 84,318,056 | | | | 111,237,830 | | |
| | 1,189,368 | | | Teradata Corporation (a) | | | 50,817,091 | | | | 50,334,054 | | |
| | 1,191,749 | | | Comtech Telecommunications
Corporation (d) | | | 39,015,758
| | | | 45,369,884
| | |
| | 1,006,560 | | | Linear Technology Corporation | | | 25,870,008 | | | | 43,121,030 | | |
| | 1,667,965 | | | Rofin-Sinar Technologies, Inc. (a)(d) | | | 37,596,400 | | | | 37,345,736 | | |
| | 282,559 | | | Automatic Data Processing, Inc. | | | 8,953,685 | | | | 23,107,675 | | |
| | 500,691 | | | Xilinx, Inc. | | | 20,515,951 | | | | 22,270,736 | | |
| | 25,526 | | | Google, Inc., Class 'A' (a) | | | 6,486,951 | | | | 14,495,450 | | |
| | 25,526 | | | Google, Inc., Class 'C' (a) | | | 6,503,943 | | | | 14,271,076 | | |
| | 205,499 | | | CommVault Systems, Inc. (a) | | | 9,860,704 | | | | 9,111,826 | | |
First Eagle Funds | Annual Report | October 31, 2014
79
First Eagle U.S. Value Fund | Consolidated Schedule of Investments | Year Ended October 31, 2014
| Shares | | Description | | Cost (Note 1) | | Value (Note 1) | |
U.S. Common Stocks — 69.36% (continued) | | | |
Information Technology — 19.91% (continued) | | | |
| | 168,245 | | | NetApp, Inc. | | $ | 5,327,723 | | | $ | 7,200,886 | | |
| | 94,186 | | | CDK Global, Inc. (a) | | | 1,271,918 | | | | 3,164,650 | | |
| | | | 433,914,305 | | | | 624,044,415 | | |
Materials — 2.97% | | | |
| | 529,751 | | | Scotts Miracle-Gro Company, Class 'A' | | | 22,767,001 | | | | 31,382,449 | | |
| | 200,444 | | | Martin Marietta Materials, Inc. | | | 16,857,497 | | | | 23,435,912 | | |
| | 375,975 | | | Vulcan Materials Company | | | 14,819,697 | | | | 23,201,417 | | |
| | 116,400 | | | Deltic Timber Corporation | | | 5,718,194 | | | | 7,576,476 | | |
| | 121,990 | | | Royal Gold, Inc. | | | 7,901,549 | | | | 6,971,729 | | |
| | 17,800 | | | Newmont Mining Corporation | | | 310,851 | | | | 333,928 | | |
| | | | 68,374,789 | | | | 92,901,911 | | |
Utilities — 0.42% | | | |
| | 206,273 | | | IDACorp, Inc. | | | 6,422,914 | | | | 13,042,642 | | |
Total U.S. Common Stocks | | | | | 1,341,265,693 | | | | 2,173,401,978 | | |
International Common Stocks — 6.70% | | | |
Australia — 0.69% | | | |
| | 2,652,613 | | | Newcrest Mining Limited (a) | | | 61,341,378 | | | | 21,755,664 | | |
Canada — 4.65% | | | |
| | 1,450,750 | | | Canadian Natural Resources Limited | | | 41,684,927 | | | | 50,625,968 | | |
| | 1,143,141 | | | Potash Corporation of Saskatchewan, Inc. | | | 44,113,611 | | | | 39,061,128 | | |
| | 1,242,155 | | | Goldcorp, Inc. | | | 37,521,003 | | | | 23,327,671 | | |
| | 701,527 | | | Agnico-Eagle Mines Limited | | | 31,972,747 | | | | 16,532,148 | | |
| | 840,922 | | | Barrick Gold Corporation | | | 15,383,136 | | | | 9,981,744 | | |
| | 1,338,243 | | | Penn West Petroleum Limited | | | 16,814,906 | | | | 6,048,858 | | |
| | | | 187,490,330 | | | | 145,577,517 | | |
Mexico — 0.44% | | | |
| | 1,225,181 | | | Fresnillo PLC | | | 26,986,918 | | | | 13,670,461 | | |
South Africa — 0.21% | | | |
| | 2,054,350 | | | Gold Fields Limited, ADR | | | 25,582,311 | | | | 6,553,377 | | |
United Kingdom — 0.71% | | | |
| | 549,959 | | | Willis Group Holdings PLC | | | 15,120,837 | | | | 22,289,838 | | |
Total International Common Stocks | | | | | 316,521,774 | | | | 209,846,857 | | |
Total Common Stocks | | | | | 1,657,787,467 | | | | 2,383,248,835 | | |
First Eagle Funds | Annual Report | October 31, 2014
80
First Eagle U.S. Value Fund | Consolidated Schedule of Investments | Year Ended October 31, 2014
Shares | | Description | | Cost (Note 1) | | Value (Note 1) | |
Investment Company — 0.00% | | | |
| | 42,071 | | | State Street Institutional U.S.
Government Money Market Fund,
Institutional Class | | $ | 42,071
| | | $ | 42,071
| | |
Warrant — 0.56% | | | |
United States — 0.56% | | | |
| | 888,023 | | | JPMorgan Chase & Company Warrant
expire 10/28/18 (a) | | | 10,637,399
| | | | 17,582,855
| | |
Ounces | | | | | | | |
Commodity — 4.94% | | | |
| | 132,121 | | | Gold bullion (a) | | | 157,908,533 | | | | 154,834,322 | | |
Principal | | | | | | | |
Bonds — 0.40% | | | |
U.S. Corporate Bonds — 0.40% | | | |
$ | 600,000 | | | Bausch & Lomb, Inc.
7.125% due 08/01/28 (b) | | | 525,250
| | | | 597,000
| | |
| | 6,542,000 | | | Citgo Petroleum Corporation
6.25% due 08/15/22 (e) | | | 6,552,017
| | | | 6,689,195
| | |
| | 5,193,000 | | | Mueller Water Products, Inc.
7.375% due 06/01/17 | | | 4,653,215
| | | | 5,296,860
| | |
| | Total U.S. Corporate Bonds | | | | | | 11,730,482 | | | | 12,583,055 | | |
U.S. Treasury Bills — 4.15% | | | |
| | 40,000,000 | | | U.S. Treasury Bill
0.01% due 01/02/15 | | | 39,999,656
| | | | 39,999,320
| | |
| | 20,000,000 | | | U.S. Treasury Bill
0.01% due 11/06/14 | | | 19,999,945
| | | | 19,999,945
| | |
| | 30,000,000 | | | U.S. Treasury Bill
0.02% due 01/15/15 | | | 29,999,062
| | | | 29,999,400
| | |
| | 40,000,000 | | | U.S. Treasury Bill
0.02% due 01/22/15 | | | 39,998,633
| | | | 40,000,000
| | |
| | Total U.S. Treasury Bills | | | | | | 129,997,296 | | | | 129,998,665 | | |
First Eagle Funds | Annual Report | October 31, 2014
81
First Eagle U.S. Value Fund | Consolidated Schedule of Investments | Year Ended October 31, 2014
Principal | | Description | | Cost (Note 1) | | Value (Note 1) | |
Commercial Paper — 13.73% | | | |
International Commercial Paper — 4.17% | | | |
Australia — 0.23% | | | |
| 1,415,000
USD | | | Telstra Corporation Limited
0.12% due 01/06/15 | | $ | 1,414,689
| | | $ | 1,414,539
| | |
| 5,687,000
USD | | | Telstra Corporation Limited
0.13% due 01/13/15 | | | 5,685,501
| | | | 5,684,908
| | |
Canada — 0.71% | | | |
| 3,349,000
USD | | | Suncor Energy, Inc.
0.23% due 11/05/14 | | | 3,348,915
| | | | 3,348,915
| | |
| 4,821,000
USD | | | Suncor Energy, Inc.
0.27% due 12/16/14 | | | 4,819,373
| | | | 4,819,373
| | |
| 5,706,000
USD | | | Suncor Energy, Inc.
0.28% due 01/07/15 | | | 5,703,026
| | | | 5,703,036
| | |
| 8,232,000
USD | | | Total Capital Limited
0.10% due 11/26/14 | | | 8,231,428
| | | | 8,231,428
| | |
France — 0.38% | | | |
| 2,394,000
USD | | | Essilor International
0.09% due 11/17/14 | | | 2,393,904
| | | | 2,393,904
| | |
| 324,000
USD | | | Essilor International
0.12% due 12/17/14 | | | 323,950
| | | | 323,950
| | |
| 2,246,000
USD | | | GDF Suez SA
0.15% due 12/19/14 | | | 2,245,551
| | | | 2,245,551
| | |
| 3,417,000
USD | | | GDF Suez SA
0.16% due 11/03/14 | | | 3,416,970
| | | | 3,416,970
| | |
| 1,596,000
USD | | | GDF Suez SA
0.17% due 11/10/14 | | | 1,595,932
| | | | 1,595,932
| | |
| 1,995,000
USD | | | L'Oreal USA, Inc.
0.08% due 11/03/14 | | | 1,994,991
| | | | 1,994,991
| | |
Germany — 0.18% | | | |
| 878,000
USD | | | BASF AG
0.09% due 12/09/14 | | | 877,917
| | | | 877,917
| | |
| 4,821,000
USD | | | Siemens Company
0.09% due 12/08/14 | | | 4,820,554
| | | | 4,820,554
| | |
Italy — 0.26% | | | |
| 5,290,000
USD | | | Eni S.p.A.
0.19% due 11/03/14 | | | 5,289,944
| | | | 5,289,944
| | |
| 1,431,000
USD | | | Eni S.p.A.
0.30% due 11/24/14 | | | 1,430,726
| | | | 1,430,726
| | |
| 1,432,000
USD | | | Eni S.p.A.
0.30% due 12/11/14 | | | 1,431,522
| | | | 1,431,522
| | |
First Eagle Funds | Annual Report | October 31, 2014
82
First Eagle U.S. Value Fund | Consolidated Schedule of Investments | Year Ended October 31, 2014
Principal | | Description | | Cost (Note 1) | | Value (Note 1) | |
International Commercial Paper — 4.17% (continued) | | | |
Japan — 0.66% | | | |
| 8,468,000
USD | | | Hitachi Limited
0.21% due 11/03/14 | | $ | 8,467,901
| | | $ | 8,467,901
| | |
| 7,433,000
USD | | | Hitachi Limited
0.24% due 11/03/14 | | | 7,432,901
| | | | 7,432,901
| | |
| 930,000
USD | | | Honda Corporation
0.12% due 12/11/14 | | | 929,876
| | | | 929,876
| | |
| 3,877,000
USD | | | Honda Corporation
0.13% due 11/12/14 | | | 3,876,846
| | | | 3,876,846
| | |
Switzerland — 0.78% | | | |
| 1,374,000
USD | | | Nestlé SA
0.03% due 12/16/14 | | | 1,373,949
| | | | 1,373,949
| | |
| 5,019,000
USD | | | Nestlé SA
0.09% due 12/10/14 | | | 5,018,511
| | | | 5,018,511
| | |
| 4,821,000
USD | | | Roche Holdings, Inc.
0.06% due 11/19/14 | | | 4,820,855
| | | | 4,820,855
| | |
| 4,142,000
USD | | | Roche Holdings, Inc.
0.06% due 12/19/14 | | | 4,141,669
| | | | 4,141,669
| | |
| 3,990,000
USD | | | Roche Holdings, Inc.
0.08% due 12/11/14 | | | 3,989,645
| | | | 3,989,645
| | |
| 5,257,000
USD | | | Roche Holdings, Inc.
0.09% due 11/13/14 | | | 5,256,842
| | | | 5,256,842
| | |
United Kingdom — 0.97% | | | |
| 10,898,000
USD | | | AstraZeneca PLC
0.08% due 01/12/15 | | | 10,896,256
| | | | 10,894,708
| | |
| 1,381,000
USD | | | AstraZeneca PLC
0.09% due 12/01/14 | | | 1,380,896
| | | | 1,380,896
| | |
| 9,642,000
USD | | | GlaxoSmithKline PLC
0.13% due 12/15/14 | | | 9,640,468
| | | | 9,640,468
| | |
| 5,564,000
USD | | | GlaxoSmithKline PLC
0.17% due 01/22/15 | | | 5,561,846
| | | | 5,561,627
| | |
| 2,782,000
USD | | | Reed Elsevier, Inc.
0.22% due 12/18/14 | | | 2,781,201
| | | | 2,781,201
| | |
| | Total International Commercial Paper | | | | | | 130,594,555 | | | | 130,592,055 | | |
U.S. Commercial Paper — 9.56% | | | |
$ | 2,275,000 | | | 3M Company
0.07% due 11/06/14 | | | 2,274,978
| | | | 2,274,978
| | |
| | 4,200,000 | | | Abbott Laboratories
0.10% due 11/10/14 | | | 4,199,895
| | | | 4,199,895
| | |
First Eagle Funds | Annual Report | October 31, 2014
83
First Eagle U.S. Value Fund | Consolidated Schedule of Investments | Year Ended October 31, 2014
| Principal | | Description | | Cost (Note 1) | | Value (Note 1) | |
U.S. Commercial Paper — 9.56% (continued) | | | |
$ | 2,008,000 | | | Abbott Laboratories
0.10% due 11/14/14 | | $ | 2,007,928
| | | $ | 2,007,928
| | |
| | 8,232,000 | | | Abbott Laboratories
0.10% due 11/20/14 | | | 8,231,566
| | | | 8,231,566
| | |
| | 3,692,000 | | | Abbott Laboratories
0.10% due 12/01/14 | | | 3,691,692
| | | | 3,691,692
| | |
| | 1,795,000 | | | Abbott Laboratories
0.10% due 12/12/14 | | | 1,794,796
| | | | 1,794,796
| | |
| | 2,123,000 | | | Abbott Laboratories
0.10% due 01/05/15 | | | 2,122,617
| | | | 2,122,759
| | |
| | 6,417,000 | | | Abbott Laboratories
0.10% due 01/20/15 | | | 6,415,574
| | | | 6,416,033
| | |
| | 2,585,000 | | | Apple, Inc.
0.09% due 11/06/14 | | | 2,584,968
| | | | 2,584,968
| | |
| | 3,347,000 | | | Apple, Inc.
0.09% due 11/13/14 | | | 3,346,900
| | | | 3,346,900
| | |
| | 3,347,000 | | | Apple, Inc.
0.09% due 11/14/14 | | | 3,346,891
| | | | 3,346,891
| | |
| | 1,543,000 | | | Apple, Inc.
0.09% due 11/17/14 | | | 1,542,938
| | | | 1,542,938
| | |
| | 5,153,000 | | | Apple, Inc.
0.11% due 12/15/14 | | | 5,152,307
| | | | 5,152,307
| | |
| | 7,780,000 | | | Apple, Inc.
0.11% due 12/17/14 | | | 7,778,907
| | | | 7,778,907
| | |
| | 809,000 | | | Apple, Inc.
0.11% due 01/05/15 | | | 808,840
| | | | 808,786
| | |
| | 4,984,000 | | | Autozone, Inc.
0.25% due 11/17/14 | | | 4,983,446
| | | | 4,983,446
| | |
| | 507,000 | | | Celgene Corporation
0.28% due 11/20/14 | | | 506,925
| | | | 506,925
| | |
| | 3,433,000 | | | Chevron Corporation
0.07% due 12/12/14 | | | 3,432,726
| | | | 3,432,726
| | |
| | 8,022,000 | | | Chevron Corporation
0.08% due 01/13/15 | | | 8,020,699
| | | | 8,019,543
| | |
| | 3,231,000 | | | Chevron Corporation
0.09% due 11/13/14 | | | 3,230,903
| | | | 3,230,903
| | |
| | 1,381,000 | | | Chevron Corporation
0.09% due 12/03/14 | | | 1,380,890
| | | | 1,380,890
| | |
| | 4,748,000 | | | Chevron Corporation
0.10% due 11/04/14 | | | 4,747,960
| | | | 4,747,960
| | |
First Eagle Funds | Annual Report | October 31, 2014
84
First Eagle U.S. Value Fund | Consolidated Schedule of Investments | Year Ended October 31, 2014
| Principal | | Description | | Cost (Note 1) | | Value (Note 1) | |
U.S. Commercial Paper — 9.56% (continued) | | | |
$ | 2,682,000 | | | Chevron Corporation
0.10% due 11/06/14 | | $ | 2,681,963
| | | $ | 2,681,963
| | |
| | 4,291,000 | | | Chevron Corporation
0.10% due 11/07/14 | | | 4,290,928
| | | | 4,290,928
| | |
| | 1,995,000 | | | Chevron Corporation
0.10% due 12/10/14 | | | 1,994,784
| | | | 1,994,784
| | |
| | 7,035,000 | | | Chevron Corporation
0.10% due 01/16/15 | | | 7,033,515
| | | | 7,032,728
| | |
| | 1,619,000 | | | Chevron Corporation
0.12% due 01/15/15 | | | 1,618,595
| | | | 1,618,484
| | |
| | 707,000 | | | Coca-Cola Company
0.10% due 01/07/15 | | | 706,869
| | | | 706,876
| | |
| | 3,347,000 | | | Coca-Cola Company
0.11% due 11/13/14 | | | 3,346,877
| | | | 3,346,877
| | |
| | 5,364,000 | | | Coca-Cola Company
0.12% due 11/05/14 | | | 5,363,928
| | | | 5,363,928
| | |
| | 5,723,000 | | | Coca-Cola Company
0.13% due 11/20/14 | | | 5,722,607
| | | | 5,722,607
| | |
| | 1,145,000 | | | ConocoPhillips
0.13% due 11/07/14 | | | 1,144,975
| | | | 1,144,975
| | |
| | 362,000 | | | Corning, Inc.
0.21% due 11/21/14 | | | 361,958
| | | | 361,958
| | |
| | 1,391,000 | | | Corning, Inc.
0.21% due 11/24/14 | | | 1,390,813
| | | | 1,390,813
| | |
| | 5,119,000 | | | Dominion Resources, Inc.
0.30% due 01/07/15 | | | 5,116,142
| | | | 5,116,341
| | |
| | 14,266,000 | | | Duke Energy Corporation
0.33% due 01/14/15 | | | 14,256,323
| | | | 14,258,719
| | |
| | 1,357,000 | | | DuPont
0.08% due 11/04/14 | | | 1,356,991
| | | | 1,356,991
| | |
| | 5,266,000 | | | DuPont
0.08% due 11/10/14 | | | 5,265,895
| | | | 5,265,895
| | |
| | 814,000 | | | Emerson Electric Company
0.09% due 12/08/14 | | | 813,925
| | | | 813,925
| | |
| | 1,086,000 | | | Emerson Electric Company
0.09% due 12/11/14 | | | 1,085,891
| | | | 1,085,891
| | |
| | 8,376,000 | | | Emerson Electric Company
0.10% due 01/30/15 | | | 8,373,906
| | | | 8,373,883
| | |
| | 4,821,000 | | | Exxon Mobil Corporation
0.08% due 12/03/14 | | | 4,820,657
| | | | 4,820,657
| | |
First Eagle Funds | Annual Report | October 31, 2014
85
First Eagle U.S. Value Fund | Consolidated Schedule of Investments | Year Ended October 31, 2014
| Principal | | Description | | Cost (Note 1) | | Value (Note 1) | |
U.S. Commercial Paper — 9.56% (continued) | | | |
$ | 4,523,000 | | | Google, Inc.
0.07% due 11/18/14 | | $ | 4,522,851
| | | $ | 4,522,851
| | |
| | 11,374,000 | | | Google, Inc.
0.09% due 01/14/15 | | | 11,371,896
| | | | 11,372,460
| | |
| | 1,995,000 | | | Honeywell International, Inc.
0.08% due 11/13/14 | | | 1,994,947
| | | | 1,994,947
| | |
| | 2,428,000 | | | International Business Machines
Corporation
0.10% due 12/03/14 | | | 2,427,784
| | | | 2,427,784
| | |
| | 5,985,000 | | | International Business Machines
Corporation
0.10% due 12/10/14 | | | 5,984,352
| | | | 5,984,352
| | |
| | 1,551,000 | | | International Business Machines
Corporation
0.10% due 12/12/14 | | | 1,550,823
| | | | 1,550,823
| | |
| | 7,511,000 | | | International Business Machines
Corporation
0.10% due 12/17/14 | | | 7,510,040
| | | | 7,510,040
| | |
| | 1,795,000 | | | Medtronic, Inc.
0.08% due 11/04/14 | | | 1,794,988
| | | | 1,794,988
| | |
| | 10,015,000 | | | MetLife
0.12% due 01/05/15 | | | 10,012,830
| | | | 10,011,989
| | |
| | 1,087,000 | | | MetLife
0.13% due 12/15/14 | | | 1,086,827
| | | | 1,086,827
| | |
| | 3,412,000 | | | Microsoft Corporation
0.06% due 12/04/14 | | | 3,411,812
| | | | 3,411,812
| | |
| | 2,681,000 | | | Omnicom Group, Inc.
0.30% due 12/02/14 | | | 2,680,307
| | | | 2,680,307
| | |
| | 5,449,000 | | | Omnicom Group, Inc.
0.30% due 12/18/14 | | | 5,446,866
| | | | 5,446,866
| | |
| | 1,415,000 | | | PepsiCo, Inc.
0.07% due 12/16/14 | | | 1,414,876
| | | | 1,414,876
| | |
| | 3,814,000 | | | PepsiCo, Inc.
0.07% due 12/18/14 | | | 3,813,651
| | | | 3,813,651
| | |
| | 2,908,000 | | | PepsiCo, Inc.
0.08% due 11/04/14 | | | 2,907,981
| | | | 2,907,981
| | |
| | 7,409,000 | | | PepsiCo, Inc.
0.08% due 11/05/14 | | | 7,408,934
| | | | 7,408,934
| | |
| | 3,833,000 | | | PepsiCo, Inc.
0.08% due 12/11/14 | | | 3,832,659
| | | | 3,832,659
| | |
First Eagle Funds | Annual Report | October 31, 2014
86
First Eagle U.S. Value Fund | Consolidated Schedule of Investments | Year Ended October 31, 2014
| Principal | | Description | | Cost (Note 1) | | Value (Note 1) | |
U.S. Commercial Paper — 9.56% (continued) | | | |
$ | 1,214,000 | | | Philip Morris International, Inc.
0.07% due 11/03/14 | | $ | 1,213,995
| | | $ | 1,213,995
| | |
| | 6,581,000 | | | Philip Morris International, Inc.
0.09% due 12/05/14 | | | 6,580,441
| | | | 6,580,441
| | |
| | 5,449,000 | | | Philip Morris International, Inc.
0.09% due 12/10/14 | | | 5,448,469
| | | | 5,448,469
| | |
| | 14,071,000 | | | Philip Morris International, Inc.
0.11% due 12/18/14 | | | 14,068,979
| | | | 14,068,979
| | |
| | 4,339,000 | | | Precision Castparts Corporation
0.10% due 11/17/14 | | | 4,338,807
| | | | 4,338,807
| | |
| | 290,000 | | | Precision Castparts Corporation
0.11% due 12/09/14 | | | 289,966
| | | | 289,966
| | |
| | 7,231,000 | | | Schlumberger Investments SA
0.12% due 12/15/14 | | | 7,229,939
| | | | 7,229,939
| | |
| | 2,782,000 | | | Schlumberger Investments SA
0.12% due 12/23/14 | | | 2,781,518
| | | | 2,781,518
| | |
| | 10,470,000 | | | United Parcel Service, Inc.
0.04% due 02/02/15 | | | 10,468,918
| | | | 10,467,239
| | |
| | 2,761,000 | | | United Parcel Service, Inc.
0.08% due 12/05/14 | | | 2,760,791
| | | | 2,760,791
| | |
| | 2,761,000 | | | United Parcel Service, Inc.
0.08% due 12/09/14 | | | 2,760,767
| | | | 2,760,767
| | |
| | 3,412,000 | | | Wal-Mart Stores, Inc.
0.08% due 12/01/14 | | | 3,411,773
| | | | 3,411,773
| | |
| | 725,000 | | | Whirlpool Corporation
0.33% due 11/04/14 | | | 724,980
| | | | 724,980
| | |
Total U.S. Commercial Paper | | | | | 299,605,655 | | | | 299,604,771 | | |
Total Commercial Paper | | | | | 430,200,210 | | | | 430,196,826 | | |
Total Investment Portfolio
Excluding Options Written — 99.84% | | | | $ | 2,398,303,458 | | | $ | 3,128,486,629 | | |
| Contracts | | | | Strike Price | | Expiration Date | | Value (Note 1) | |
Covered Call Options Written — (0.01)% | |
| | 4,500 | | | Intel Corporation
(Premium Received
$269,147) | | $ | 37.00
| | | January 2015
| | $ | (175,500
| ) | |
Total Investments — 99.83% (Cost: $2,398,034,311) | | | | | | | | | 3,128,311,129 | | |
Other Assets in Excess of Liabilities — 0.17% | | | | | | | | | 5,317,258 | | |
Net Assets — 100.00% | | | | | | | | $ | 3,133,628,387 | | |
First Eagle Funds | Annual Report | October 31, 2014
87
First Eagle U.S. Value Fund | Consolidated Schedule of Investments | Year Ended October 31, 2014
(a) Non-income producing security/commodity.
(b) Security is deemed illiquid. At October 31, 2014, the value of these securities amounted to $599,560 or 0.02% of net assets.
(c) At October 31, 2014, all or a portion of this security was segregated to cover collateral requirement for options.
(d) An affiliate of the Fund as defined by the Investment Company Act of 1940. An affiliate is defined as a company in which the Fund directly or indirectly owns, controls, or holds power to vote 5% or more of the outstanding voting securities.
(e)All or a portion of the security is exempt from registration under the Securities Act of 1933. Rule 144A securities may only be sold to qualified institutional buyers, pursuant to Rule 144A under the Securities Act of 1933.
At October 31, 2014, aggregate cost for federal income tax purposes was $2,390,742,128. Net unrealized appreciation consisted of:
Gross unrealized appreciation | | $ | 869,737,652 | | |
Gross unrealized depreciation | | | (132,168,651 | ) | |
Net unrealized appreciation | | $ | 737,569,001 | | |
Abbreviations used in this schedule include:
ADR — American Depositary Receipt
PLC — Public Limited Company
REIT — Real Estate Investment Trust
Currency
USD — United States Dollar
Affiliated Securities
Affiliated Securities | | Shares
October 31,
2013 | | Gross
Additions | | Gross
Reductions | | Shares
October 31,
2014 | | Market
Value
October 31,
2014 | | Realized
Gain /
(Loss) | | Dividend
Income | |
Comtech
Telecommunications
Corporation | | | 16,709 | | | | 1,175,040 | | | | — | | | | 1,191,749 | | | $ | 45,369,884 | | | $ | — | | | $ | 1,043,989 | | |
Rofin-Sinar
Technologies, Inc. | | | 1,840,310 | | | | — | | | | 172,345 | | | | 1,667,965 | | | | 37,345,736 | | | | (828,375 | ) | | | — | | |
Total | | | | | | | | | | $ | 82,715,620 | | | $ | (828,375 | ) | | $ | 1,043,989 | | |
First Eagle Funds | Annual Report | October 31, 2014
88
First Eagle U.S. Value Fund | Consolidated Schedule of Investments | Year Ended October 31, 2014
Industry Diversification for Portfolio Holdings | | Percent of
Net Assets | |
U.S. Common Stocks
Consumer Discretionary | | | 7.32 | % | |
Consumer Staples | | | 1.89 | | |
Energy | | | 6.21 | | |
Financials | | | 18.05 | | |
Health Care | | | 1.59 | | |
Industrials | | | 11.00 | | |
Information Technology | | | 19.91 | | |
Materials | | | 2.97 | | |
Utilities | | | 0.42 | | |
Total U.S. Common Stocks | | | 69.36 | | |
International Common Stocks
Energy | | | 1.81 | | |
Financials | | | 0.71 | | |
Materials | | | 4.18 | | |
Total International Common Stocks | | | 6.70 | | |
Investment Company | | | 0.00 | * | |
Warrant | | | 0.56 | | |
Commodity | | | 4.94 | | |
U.S. Corporate Bonds
Consumer Discretionary | | | 0.02 | | |
Energy | | | 0.21 | | |
Industrials | | | 0.17 | | |
Total U.S. Corporate Bonds | | | 0.40 | | |
U.S. Treasury Bills | | | 4.15 | | |
Commercial Paper
International Commercial Paper | | | 4.17 | | |
U.S. Commercial Paper | | | 9.56 | | |
Total Commercial Paper | | | 13.73 | | |
Covered Call Options Written | | | (0.01 | ) | |
Total Investments | | | 99.83 | % | |
*Less then 0.01%
See Notes to Financial Statements.
First Eagle Funds | Annual Report | October 31, 2014
89
Data as of October 31, 2014 (unaudited)
Investment Objective
The First Eagle Gold Fund is a non-diversified fund. The Fund seeks to provide investors the opportunity to participate in the investment characteristics of gold (and, to a limited extent, other precious metals) for a portion of their overall investment portfolio. In seeking to achieve its objective, the Fund invests primarily in gold, gold related securities and issuers principally engaged in the gold industry.
Average Annual Returns (%) | | | | | | One-Year | | Five-Years | | Ten-Years | |
First Eagle Gold Fund | | Class A | | without sales load | | | -21.02 | | | | -9.70 | | | | 2.14 | | |
| | | | with sales load | | | -24.99 | | | | -10.62 | | | | 1.62 | | |
FTSE Gold Mines Index | | | | | | | -31.76 | | | | -17.97 | | | | -5.00 | | |
MSCI World Index | | | | | | | 8.67 | | | | 11.41 | | | | 6.93 | | |
Consumer Price Index | | | | | | | 1.66 | | | | 1.89 | | | | 2.21 | | |

Countries** (%)
United States | | | 39.23 | | |
Canada | | | 33.76 | | |
Mexico | | | 7.43 | | |
South Africa | | | 6.37 | | |
Africa | | | 6.09 | | |
Australia | | | 5.38 | | |
Channel Island | | | 0.15 | | |
* Asset Allocation and Countries percentages are based on total investments in the portfolio.
**Country allocations reflect country of the issuer (not currency of issue) and exclude short term investments. Bonds of non-U.S. issuers may be U.S. dollar denominated.
The Fund's portfolio composition is subject to change at any time.
First Eagle Funds | Annual Report | October 31, 2014
90
First Eagle Gold Fund | Fund Overview
Growth of a $10,000 Initial Investment

Performance data quoted herein represents past performance and should not be considered indicative of future results. Performance data quoted herein does not reflect the deduction of taxes that a shareholder would pay on Fund distributions or the sale of Fund shares. The average annual returns shown above are historical and reflect changes in share price, reinvested dividends and are net of expenses.
The average annual returns for Class A Shares with a sales charge give effect to the deduction of the maximum sales charge of 5.00%.
The MSCI World Index is a widely followed, unmanaged group of stocks from 23 international markets and is not available for purchase. The index provides total returns in U.S. dollars with net dividends reinvested. The FTSE Gold Mines Index Series is designed to reflect the performance of the worldwide market in the shares of companies whose principal activity is the mining of gold. The FTSE Gold Mines Index encompasses all gold mining companies that have a sustainable, attributable gold production of at least 300,000 ounces a year and that derive 51% or more of their revenue from mined gold. The Index is unmanaged, is available with dividends reinvested and is not available for purchase. The Consumer Price Index (CPI) represents the change in price of all goods and services purchased for consumption by urban households.
Top 10 Holdings* (%)
Gold Bullion** (United States) | | | 22.91 | | |
Randgold Resources Limited ADR (Africa) | | | 6.11 | | |
Goldcorp, Inc. (Canada) | | | 5.84 | | |
Agnico-Eagle Mines Limited (Canada) | | | 5.53 | | |
Newcrest Mining Limited (Australia) | | | 5.34 | | |
Royal Gold, Inc. (United States) | | | 5.26 | | |
Fresnillo PLC (Mexico) | | | 4.54 | | |
Franco-Nevada Corporation (Canada) | | | 4.53 | | |
Tahoe Resources, Inc. (United States) | | | 4.52 | | |
Gold Fields Limited ADR (South Africa) | | | 3.83 | | |
Total | | | 68.41 | | |
* Holdings in cash, commercial paper and other short term cash equivalents have been excluded.
**The Fund invests in gold and precious metals through investment in a wholly-owned subsidiary of the Fund organized under the laws of the Cayman Islands (the "Subsidiary"). Gold Bullion and commodities include the Fund's investment in the Subsidiary.
Percentages are based on total net assets.
First Eagle Funds | Annual Report | October 31, 2014
91
First Eagle Gold Fund | Consolidated Schedule of Investments | Year Ended October 31, 2014
| Shares | | Description | | Cost (Note 1) | | Value (Note 1) | |
Common Stocks — 70.18% | | | |
International Common Stocks — 56.64% | | | |
Africa — 6.11% | | | |
| | 1,050,128 | | | Randgold Resources Limited, ADR | | $ | 17,918,841 | | | $ | 61,127,951 | | |
Australia — 5.40% | | | |
| | 6,509,949 | | | Newcrest Mining Limited (a) | | | 169,218,516 | | | | 53,391,981 | | |
| | 6,800,000 | | | St. Augustine Gold and
Copper Limited (a)(b) | | | 6,754,606
| | | | 603,345
| | |
| | | | 175,973,122 | | | | 53,995,326 | | |
Canada — 31.13% | | | |
| | 3,107,527 | | | Goldcorp, Inc. | | | 94,710,184 | | | | 58,359,357 | | |
| | 2,346,710 | | | Agnico-Eagle Mines Limited | | | 83,643,576 | | | | 55,302,442 | | |
| | 968,033 | | | Franco-Nevada Corporation | | | 16,689,933 | | | | 45,316,021 | | |
| | 3,139,764 | | | Barrick Gold Corporation | | | 83,670,621 | | | | 37,268,999 | | |
| | 6,443,257 | | | Eldorado Gold Corporation | | | 64,771,164 | | | | 35,216,240 | | |
| | 6,359,731 | | | New Gold, Inc. (a) | | | 15,482,255 | | | | 23,079,100 | | |
| | 10,713,452 | | | Kinross Gold Corporation (a) | | | 118,992,331 | | | | 23,033,922 | | |
| | 1,516,060 | | | Detour Gold Corporation (a)(c) | | | 25,395,963 | | | | 8,878,041 | | |
| | 634,594 | | | Osisko Gold Royalties Limited (a) | | | 9,260,898 | | | | 7,927,850 | | |
| | 2,991,219 | | | IAMGOLD Corporation (a) | | | 11,101,092 | | | | 5,679,614 | | |
| | 415,900 | | | Virginia Mines, Inc. (a) | | | 4,817,485 | | | | 3,763,968 | | |
| | 1,300,000 | | | Dundee Precious Metals, Inc. (a)(c) | | | 1,969,513 | | | | 3,702,586 | | |
| | 1,071,100 | | | Primero Mining Corporation (a) | | | 6,046,087 | | | | 3,658,875 | | |
| | | | 536,551,102 | | | | 311,187,015 | | |
Channel Island — 0.15% | | | |
| | 3,066,400 | | | Lydian International Limited (a) | | | 6,767,759 | | | | 1,496,402 | | |
Mexico — 7.46% | | | |
| | 4,063,583 | | | Fresnillo PLC | | | 15,751,246 | | | | 45,341,098 | | |
| | 1,289,602 | | | Industrias Peñoles S.A.B. de C.V. | | | 2,490,226 | | | | 29,208,474 | | |
| | | | 18,241,472 | | | | 74,549,572 | | |
South Africa — 6.39% | | | |
| | 11,995,180 | | | Gold Fields Limited, ADR | | | 102,368,061 | | | | 38,264,624 | | |
| | 3,100,849 | | | AngloGold Ashanti Limited, ADR (a) | | | 86,438,026 | | | | 25,644,021 | | |
| | | | 188,806,087 | | | | 63,908,645 | | |
Total International Common Stocks | | | 944,258,383 | | | | 566,264,911 | | |
First Eagle Funds | Annual Report | October 31, 2014
92
First Eagle Gold Fund | Consolidated Schedule of Investments | Year Ended October 31, 2014
Shares | | Description | | Cost (Note 1) | | Value (Note 1) | |
U.S. Common Stocks — 13.54% | | | |
Materials — 13.54% | | | |
| | 920,991 | | | Royal Gold, Inc. | | $ | 18,434,118 | | | $ | 52,634,636 | | |
| | 2,609,390 | | | Tahoe Resources, Inc. (a)(b) | | | 35,373,418 | | | | 45,216,616 | | |
| | 2,001,277 | | | Newmont Mining Corporation | | | 72,227,236 | | | | 37,543,956 | | |
Total U.S. Common Stocks | | | 126,034,772 | | | | 135,395,208 | | |
Total Common Stocks | | | 1,070,293,155 | | | | 701,660,119 | | |
Investment Company — 0.02% | | | |
| | 160,878 | | | State Street Institutional U.S. Government
Money Market Fund, Institutional Class | | | 160,878
| | | | 160,878
| | |
Ounces | | | | | | | |
Commodities — 25.82% | | | |
| | 195,403 | | | Gold bullion (a) | | | 135,499,267 | | | | 228,995,040 | | |
| | 1,799,726 | | | Silver bullion (a) | | | 35,595,409 | | | | 29,093,459 | | |
Total Commodities | | | 171,094,676 | | | | 258,088,499 | | |
Principal | | | | | | | |
International Convertible Bonds — 2.76% | | | |
Canada — 2.76% | | | |
| 30,000,000
USD | | | Detour Gold Corporation
5.50% due 11/30/17 (d)(e)(f) | | | 30,000,000
| | | | 27,618,750
| | |
South Africa — 0.00% | | | |
| 1,916,047
CAD | | | Great Basin Gold Limited
8.00% due 11/30/14 (c)(d)(e)(g)(h) | | | 1,819,811
| | | | 0
| | |
Total International Bonds | | | 31,819,811 | | | | 27,618,750 | | |
International Commercial Paper — 1.59% | | | |
Italy — 0.40% | | | |
| 3,972,000
USD | | | Eni S.p.A.
0.19% due 11/03/14 | | | 3,971,958
| | | | 3,971,958
| | |
First Eagle Funds | Annual Report | October 31, 2014
93
First Eagle Gold Fund | Consolidated Schedule of Investments | Year Ended October 31, 2014
| Principal | | Description | | Cost (Note 1) | | Value (Note 1) | |
International Commercial Paper — 1.59% (continued) | | | |
Japan — 1.19% | | | |
| 6,359,000
USD | | | Hitachi Limited
0.21% due 11/03/14 | | $ | 6,358,926
| | | $ | 6,358,926
| | |
| 5,581,000
USD | | | Hitachi Limited
0.24% due 11/03/14 | | | 5,580,926
| | | | 5,580,926
| | |
Total International Commercial Paper | | | 15,911,810 | | | | 15,911,810 | | |
Total Investments — 100.37% | | | | $ | 1,289,280,330 | | | | 1,003,440,056 | | |
Liabilities in Excess of Other Assets — (0.37)% | | | | | | | (3,690,598 | ) | |
Net Assets — 100.00% | | | | | | $ | 999,749,458 | | |
(a) Non-income producing security/commodity.
(b) Represents a security registered under Regulation D. Regulation D provides exemptions for small companies to offer and sell their securities without having to register the securities under the Securities Act of 1933.
(c) All or a portion of the security is exempt from registration under the Securities Act of 1933. Rule 144A securities may only be sold to qualified institutional buyers, pursuant to Rule 144A under the Securities Act of 1933.
(d) Securities valued in accordance with fair value procedures under the supervision of the Board of Trustees, representing $27,618,750 or 2.76% of net assets.
(e) Security is deemed illiquid. At October 31, 2014, the value of these securities amounted to $27,618,750 or 2.76% of net assets.
(f) This security is convertible until November 30, 2017.
(g) Issuer is in default.
(h) This security is convertible until November 30, 2014.
At October 31, 2014, aggregate cost for federal income tax purposes was $1,358,405,211.
Net unrealized depreciation consisted of:
Gross unrealized appreciation | | $ | 205,887,824 | | |
Gross unrealized depreciation | | | (560,852,979 | ) | |
Net unrealized depreciation | | $ | (354,965,155 | ) | |
Abbreviations used in this schedule include:
ADR — American Depositary Receipt
PLC — Public Limited Company
Currencies
CAD — Canadian Dollar
USD — United States Dollar
First Eagle Funds | Annual Report | October 31, 2014
94
First Eagle Gold Fund | Consolidated Schedule of Investments | Year Ended October 31, 2014
Industry Diversification for Portfolio Holdings | | Percent of
Net Assets | |
International Common Stocks
Materials | | | 56.64 | % | |
Total International Common Stocks | | | 56.64 | | |
U.S. Common Stocks
Materials | | | 13.54 | | |
Total U.S. Common Stocks | | | 13.54 | | |
Investment Company | | | 0.02 | | |
Commodities | | | 25.82 | | |
International Convertible Bonds
Materials | | | 2.76 | | |
Total International Convertible Bonds | | | 2.76 | | |
International Commercial Paper | | | 1.59 | | |
Total Investments | | | 100.37 | % | |
See Notes to Financial Statements.
First Eagle Funds | Annual Report | October 31, 2014
95
First Eagle Global Income Builder Fund
Data as of October 31, 2014 (unaudited)
Investment Objective
First Eagle Global Income Builder Fund seeks current income generation and long-term growth of capital. Fundamental research drives the identification of income-producing investment opportunities across all market environments.
Average Annual Returns^ (%) | | | | | | One-Year | | Three-Years | | Since
Inception
(05/01/12) | |
First Eagle Global Income Builder | | Class A | | without sales load | | | 4.67 | | | | — | | | | 8.84 | | |
| | | | with sales load | | | -0.55 | | | | — | | | | 6.61 | | |
MSCI World Index | | | | | | | 8.67 | | | | 14.37 | | | | 13.93 | | |
Barclays Capital U.S. Aggregate Bond Index | | | | | | | 4.14 | | | | 2.73 | | | | 2.34 | | |

Countries** (%)
United States | | | 45.19 | | |
France | | | 9.40 | | |
Canada | | | 7.49 | | |
United Kingdom | | | 3.32 | | |
Japan | | | 3.24 | | |
Hong Kong | | | 3.09 | | |
Singapore | | | 2.49 | | |
Switzerland | | | 2.02 | | |
Netherlands | | | 1.70 | | |
Australia | | | 1.59 | | |
Sweden | | | 1.56 | | |
Ireland | | | 1.33 | | |
Italy | | | 1.12 | | |
Germany | | | 0.94 | | |
Austria | | | 0.93 | | |
Israel | | | 0.84 | | |
Norway | | | 0.74 | | |
Belgium | | | 0.69 | | |
South Korea | | | 0.59 | | |
Denmark | | | 0.46 | | |
Russia | | | 0.35 | | |
Chile | | | 0.35 | | |
South Africa | | | 0.34 | | |
Brazil | | | 0.23 | | |
Luxembourg | | | 0.18 | | |
Mexico | | | 0.18 | | |
Romania | | | 0.14 | | |
Thailand | | | 0.08 | | |
Mauritius | | | 0.06 | | |
^ Performance figures reflect certain fee waivers and/or expense limitations, without which returns may have been lower.
* Asset Allocation and Countries percentages are based on total investments in the portfolio.
**Country allocations reflect country of the issuer (not currency of issue) and exclude short term investments. Bonds of non-U.S. issuers may be U.S. dollar denominated.
The Fund's portfolio composition is subject to change at any time.
First Eagle Funds | Annual Report | October 31, 2014
96
First Eagle Global Income Builder Fund | Fund Overview
Growth of a $10,000 Initial Investment

Performance data quoted herein represents past performance and should not be considered indicative of future results. Performance data quoted herein does not reflect the deduction of taxes that a shareholder would pay on Fund distributions or the sale of Fund shares. The average annual returns shown above are historical and reflect changes in share price, reinvested dividends and are net of expenses.
The average annual returns for Class A Shares give effect to the deduction of the maximum sales charge of 5.00%.
The MSCI World Index is a widely followed, unmanaged group of stocks from 23 international markets and is not available for purchase. The index provides total returns in U.S. dollars with net dividends reinvested. The Barclays Capital U.S. Aggregate Bond Index is a broad-based benchmark that measures the investment grade, U.S. dollar-denominated, fixed-rate taxable bond market, including Treasuries, government-related and corporate securities, MBS (agency fixed-rate and hybrad ARM passthroughs, ABS, and CMBS. The index is presented here for comparison purposes only. One cannot invest directly in an index.
Top 10 Holdings* (%)
Bouygues SA (French holding company) | | | 1.64 | | |
Microsoft Corporation (U.S. software developer) | | | 1.57 | | |
GlaxoSmithKline PLC (U.K. pharmaceutical company) | | | 1.41 | | |
Mandarin Oriental International Limited (Hong Kong hotels & resorts operator) | | | 1.38 | | |
Intel Corporation (U.S. semiconductor manufactuer) | | | 1.32 | | |
Hoya Corporation (Japanese electronic/optical products) | | | 1.32 | | |
ACCO Brands Corporation (U.S. office supplies manufacturer) | | | 1.31 | | |
Nestlé SA (Swiss food and nutrition company) | | | 1.31 | | |
ConocoPhillips (U.S. energy company) | | | 1.24 | | |
Jardine Matheson Holdings Limited (Hong Kong industrials company) | | | 1.24 | | |
Total | | | 13.74 | | |
*Holdings in cash, commercial paper and other short term cash equivalents have been excluded.
Percentages are based on total net assets.
First Eagle Funds | Annual Report | October 31, 2014
97
First Eagle Global Income Builder Fund | Schedule of Investments | Year Ended October 31, 2014
| Shares | | Description | | Cost (Note 1) | | Value (Note 1) | |
Common Stocks — 52.29% | | | |
U.S. Common Stocks — 15.13% | | | |
Consumer Discretionary — 1.36% | | | |
| | 155,062 | | | McDonald's Corporation | | $ | 15,045,034 | | | $ | 14,533,961 | | |
| | 100,083 | | | H&R Block, Inc. | | | 2,262,066 | | | | 3,233,682 | | |
| | | | 17,307,100 | | | | 17,767,643 | | |
Consumer Staples — 0.92% | | | |
| | 57,957 | | | Wal-Mart Stores, Inc. | | | 4,382,312 | | | | 4,420,380 | | |
| | 101,562 | | | Sysco Corporation | | | 3,573,846 | | | | 3,914,200 | | |
| | 55,190 | | | Colgate-Palmolive Company | | | 3,193,019 | | | | 3,691,107 | | |
| | | | 11,149,177 | | | | 12,025,687 | | |
Energy — 2.22% | | | |
| | 224,872 | | | ConocoPhillips | | | 15,155,296 | | | | 16,224,515 | | |
| | 356,080 | | | San Juan Basin Royalty Trust | | | 6,002,453 | | | | 6,466,413 | | |
| | 87,144 | | | National Oilwell Varco, Inc. | | | 6,495,788 | | | | 6,330,140 | | |
| | | | 27,653,537 | | | | 29,021,068 | | |
Financials — 2.83% | | | |
| | 351,627 | | | Plum Creek Timber Company, Inc., REIT | | | 15,239,233 | | | | 14,420,223 | | |
| | 216,982 | | | Weyerhaeuser Company, REIT | | | 6,201,265 | | | | 7,347,010 | | |
| | 214,965 | | | Rayonier, Inc., REIT | | | 7,575,781 | | | | 7,194,879 | | |
| | 141,299 | | | BB&T Corporation | | | 5,038,849 | | | | 5,352,406 | | |
| | 54,038 | | | Cincinnati Financial Corporation | | | 2,380,622 | | | | 2,727,298 | | |
| | | | 36,435,750 | | | | 37,041,816 | | |
Industrials — 2.25% | | | |
| | 57,042 | | | Lockheed Martin Corporation | | | 6,624,962 | | | | 10,870,494 | | |
| | 78,985 | | | Deere & Company | | | 6,476,128 | | | | 6,756,377 | | |
| | 38,630 | | | 3M Company | | | 4,405,496 | | | | 5,940,135 | | |
| | 42,989 | | | Northrop Grumman Corporation | | | 4,560,359 | | | | 5,930,762 | | |
| | | | 22,066,945 | | | | 29,497,768 | | |
Information Technology — 5.55% | | | |
| | 436,562 | | | Microsoft Corporation | | | 14,874,211 | | | | 20,496,586 | | |
| | 509,667 | | | Intel Corporation | | | 12,400,539 | | | | 17,333,775 | | |
| | 410,673 | | | Comtech Telecommunications
Corporation | | | 13,924,189
| | | | 15,634,321
| | |
| | 205,352 | | | Xilinx, Inc. | | | 8,581,584 | | | | 9,134,057 | | |
First Eagle Funds | Annual Report | October 31, 2014
98
First Eagle Global Income Builder Fund | Schedule of Investments | Year Ended October 31, 2014
| Shares | | Description | | Cost (Note 1) | | Value (Note 1) | |
U.S. Common Stocks — 15.13% (continued) | | | |
Information Technology — 5.55% (continued) | | | |
| | 150,979 | | | Linear Technology Corporation | | $ | 5,879,420 | | | $ | 6,467,941 | | |
| | 37,881 | | | Automatic Data Processing, Inc. | | | 2,180,639 | | | | 3,097,908 | | |
| | 12,627 | | | CDK Global, Inc. (a) | | | 309,772 | | | | 424,267 | | |
| | | | 58,150,354 | | | | 72,588,855 | | |
Total U.S. Common Stocks | | | | | 172,762,863 | | | | 197,942,837 | | |
International Common Stocks — 37.16% | | | |
Australia — 0.13% | | | |
| | 199,905 | | | Newcrest Mining Limited (a) | | | 3,410,518 | | | | 1,639,540 | | |
Austria — 0.93% | | | |
| | 93,650 | | | Mayr Melnhof Karton AG | | | 10,892,292 | | | | 10,042,282 | | |
| | 66,274 | | | OMV AG | | | 2,576,229 | | | | 2,083,341 | | |
| | | | 13,468,521 | | | | 12,125,623 | | |
Belgium — 0.68% | | | |
| | 100,327 | | | Groupe Bruxelles Lambert SA | | | 8,638,231 | | | | 8,957,891 | | |
Bermuda — 1.75% | | | |
| | 270,400 | | | Jardine Matheson Holdings Limited | | | 15,184,157 | | | | 16,196,960 | | |
| | 610,721 | | | Hiscox Limited | | | 6,659,518 | | | | 6,653,171 | | |
| | | | 21,843,675 | | | | 22,850,131 | | |
Brazil — 0.23% | | | |
| | 2,327,300 | | | Brasil Brokers Participacoes SA | | | 3,646,490 | | | | 2,977,336 | | |
Canada — 4.12% | | | |
| | 637,347 | | | Cenovus Energy, Inc. | | | 18,238,183 | | | | 15,780,712 | | |
| | 478,005 | | | Goldcorp, Inc. | | | 12,478,029 | | | | 8,976,934 | | |
| | 810,875 | | | TransAlta Renewables, Inc. | | | 8,621,744 | | | | 8,741,521 | | |
| | 362,637 | | | Agnico-Eagle Mines Limited | | | 11,031,105 | | | | 8,545,884 | | |
| | 240,302 | | | Potash Corporation of Saskatchewan, Inc. | | | 8,495,874 | | | | 8,211,119 | | |
| | 802,054 | | | Penn West Petroleum Limited | | | 7,396,382 | | | | 3,625,284 | | |
| | | | 66,261,317 | | | | 53,881,454 | | |
Chile — 0.35% | | | |
| | 212,458 | | | Cia Cervecerias Unidas SA, ADR | | | 4,749,289 | | | | 4,527,480 | | |
Denmark — 0.46% | | | |
| | 214,857 | | | ISS AS (a) | | | 7,226,094 | | | | 5,990,457 | | |
First Eagle Funds | Annual Report | October 31, 2014
99
First Eagle Global Income Builder Fund | Schedule of Investments | Year Ended October 31, 2014
| Shares | | Description | | Cost (Note 1) | | Value (Note 1) | |
International Common Stocks — 37.16% (continued) | | | |
France — 7.71% | | | |
| | 622,282 | | | Bouygues SA | | $ | 20,578,568 | | | $ | 21,483,841 | | |
| | 262,122 | | | Total SA | | | 15,397,407 | | | | 15,576,437 | | |
| | 590,224 | | | Vivendi SA (a) | | | 15,854,588 | | | | 14,404,475 | | |
| | 152,429 | | | Sanofi | | | 14,870,336 | | | | 14,070,269 | | |
| | 236,284 | | | Compagnie de Saint-Gobain | | | 11,954,426 | | | | 10,139,921 | | |
| | 115,658 | | | Neopost SA | | | 7,812,283 | | | | 8,030,950 | | |
| | 269,264 | | | Carrefour SA | | | 8,593,170 | | | | 7,885,697 | | |
| | 87,000 | | | Danone SA | | | 5,989,108 | | | | 5,911,285 | | |
| | 43,918 | | | Legrand SA | | | 2,160,460 | | | | 2,363,239 | | |
| | 10,307 | | | Thermador Groupe | | | 944,745 | | | | 961,613 | | |
| | | | 104,155,091 | | | | 100,827,727 | | |
Germany — 0.94% | | | |
| | 197,473 | | | Hamburger Hafen und Logistik AG | | | 4,717,771 | | | | 4,321,947 | | |
| | 49,077 | | | HeidelbergCement AG | | | 3,224,022 | | | | 3,340,726 | | |
| | 31,212 | | | Daimler AG | | | 1,865,022 | | | | 2,426,199 | | |
| | 120,109 | | | SMT Scharf AG | | | 3,295,904 | | | | 2,241,915 | | |
| | | | 13,102,719 | | | | 12,330,787 | | |
Hong Kong — 3.09% | | | |
| | 10,249,000 | | | Mandarin Oriental International Limited | | | 18,027,085 | | | | 18,038,240 | | |
| | 3,209,081 | | | Hopewell Holdings Limited | | | 11,098,095 | | | | 11,400,190 | | |
| | 1,673,324 | | | Great Eagle Holdings Limited | | | 5,880,628 | | | | 5,631,581 | | |
| | 973,320 | | | Hysan Development Company Limited | | | 4,580,996 | | | | 4,449,197 | | |
| | 67,700 | | | Guoco Group Limited | | | 589,955 | | | | 831,939 | | |
| | 160,379 | | | Hopewell Highway Infrastructure Limited | | | 77,736 | | | | 77,551 | | |
| | | | 40,254,495 | | | | 40,428,698 | | |
Ireland — 1.33% | | | |
| | 674,069 | | | CRH PLC | | | 16,027,463 | | | | 14,945,356 | | |
| | 583,769 | | | Beazley PLC | | | 2,389,195 | | | | 2,446,702 | | |
| | | | 18,416,658 | | | | 17,392,058 | | |
Israel — 0.16% | | | |
| | 318,065 | | | Israel Chemicals Limited | | | 3,160,135 | | | | 2,136,642 | | |
First Eagle Funds | Annual Report | October 31, 2014
100
First Eagle Global Income Builder Fund | Schedule of Investments | Year Ended October 31, 2014
| Shares | | Description | | Cost (Note 1) | | Value (Note 1) | |
International Common Stocks — 37.16% (continued) | | | |
Italy — 1.12% | | | |
| | 585,468 | | | Eni S.p.A | | $ | 14,277,150 | | | $ | 12,472,548 | | |
| | 261,853 | | | Italcementi S.p.A. | | | 968,200 | | | | 1,495,011 | | |
| | 41,871 | | | Recordati S.p.A. | | | 355,865 | | | | 724,095 | | |
| | | | 15,601,215 | | | | 14,691,654 | | |
Japan — 3.24% | | | |
| | 495,900 | | | Hoya Corporation | | | 12,518,637 | | | | 17,251,095 | | |
| | 698,500 | | | Astellas Pharma, Inc. | | | 7,622,673 | | | | 10,565,337 | | |
| | 125,700 | | | KDDI Corporation | | | 7,315,410 | | | | 8,085,310 | | |
| | 232,400 | | | Sompo Japan Nipponkoa Holdings, Inc. | | | 5,520,885 | | | | 5,687,671 | | |
| | 20,700 | | | FamilyMart Company Limited | | | 814,546 | | | | 816,390 | | |
| | | | 33,792,151 | | | | 42,405,803 | | |
Mexico — 0.18% | | | |
| | 213,164 | | | Fresnillo PLC | | | 3,948,942 | | | | 2,378,465 | | |
Netherlands — 1.50% | | | |
| | 346,853 | | | Sligro Food Group NV | | | 12,977,618 | | | | 12,802,877 | | |
| | 45,303 | | | HAL Trust | | | 5,857,372 | | | | 6,869,347 | | |
| | | | 18,834,990 | | | | 19,672,224 | | |
Norway — 0.62% | | | |
| | 1,056,341 | | | Orkla ASA | | | 8,431,052 | | | | 8,073,355 | | |
Romania — 0.14% | | | |
| | 200,000 | | | Societatea Nationala de Gaze Naturale
ROMGAZ SA, GDR (b)(c)(d) | | | 1,850,000
| | | | 1,886,000
| | |
Russia — 0.35% | | | |
| | 687,492 | | | Gazprom OAO, ADR | | | 5,077,143 | | | | 4,556,697 | | |
Singapore — 2.32% | | | |
| | 12,482,500 | | | Frasers Commercial Trust, REIT | | | 12,785,664 | | | | 13,797,112 | | |
| | 18,854,398 | | | Asian Pay Television Trust | | | 12,212,398 | | | | 12,548,074 | | |
| | 2,892,000 | | | Overseas Education Limited | | | 2,149,480 | | | | 2,031,626 | | |
| | 828,000 | | | Singapore Airport Terminal Services
Limited | | | 1,962,072
| | | | 1,997,976
| | |
| | | | 29,109,614 | | | | 30,374,788 | | |
South Korea — 0.59% | | | |
| | 87,174 | | | KT&G Corporation | | | 6,866,244 | | | | 7,748,945 | | |
First Eagle Funds | Annual Report | October 31, 2014
101
First Eagle Global Income Builder Fund | Schedule of Investments | Year Ended October 31, 2014
| Shares | | Description | | Cost (Note 1) | | Value (Note 1) | |
International Common Stocks — 37.16% (continued) | | | |
Sweden — 0.67% | | | |
| | 249,166 | | | Investor AB, Class 'A' | | $ | 7,542,883 | | | $ | 8,732,781 | | |
Switzerland — 1.58% | | | |
| | 234,077 | | | Nestlé SA | | | 16,481,580 | | | | 17,127,289 | | |
| | 12,214 | | | APG SGA SA | | | 3,645,125 | | | | 3,554,456 | | |
| | | | 20,126,705 | | | | 20,681,745 | | |
Thailand — 0.08% | | | |
| | 1,762,000 | | | Thai Beverage PCL | | | 512,015 | | | | 1,049,218 | | |
United Kingdom — 2.89% | | | |
| | 817,123 | | | GlaxoSmithKline PLC | | | 20,233,808 | | | | 18,528,881 | | |
| | 191,462 | | | British American Tobacco PLC | | | 10,655,043 | | | | 10,863,818 | | |
| | 2,208,461 | | | WM Morrison Supermarkets PLC | | | 8,738,740 | | | | 5,468,892 | | |
| | 102,297 | | | Diageo PLC | | | 2,812,469 | | | | 3,007,787 | | |
| | | | 42,440,060 | | | | 37,869,378 | | |
Total International Common Stocks | | | | | 502,466,247 | | | | 486,186,877 | | |
Total Common Stocks | | | | | 675,229,110 | | | | 684,129,714 | | |
Closed-End Fund — 0.17% | | | |
Singapore — 0.17% | | | |
| | 30,818,200 | | | Macquarie International Infrastructure
Fund Limited | | | 3,229,698
| | | | 2,230,943
| | |
| Ounces | | | | | | | |
Commodity — 1.17% | | | |
| | 13,042 | | | Gold bullion (a) | | | 16,990,468 | | | | 15,284,397 | | |
| Principal | | | | | | | |
Bonds — 30.09% | | | |
U.S. Corporate Bonds — 19.97% | | | |
$ | 16,100,000 | | | ACCO Brands Corporation
6.75% due 04/30/20 | | | 16,660,473
| | | | 17,186,750
| | |
| | 852,000 | | | Air Medical Group Holdings, Inc.
9.25% due 11/01/18 | | | 882,315
| | | | 893,535
| | |
| | 4,860,000 | | | Aleris International, Inc.
7.625% due 02/15/18 | | | 4,991,424
| | | | 5,036,175
| | |
First Eagle Funds | Annual Report | October 31, 2014
102
First Eagle Global Income Builder Fund | Schedule of Investments | Year Ended October 31, 2014
Principal | | Description | | Cost (Note 1) | | Value (Note 1) | |
U.S. Corporate Bonds — 19.97% (continued) | | | |
$ | 5,990,000 | | | Aleris International, Inc.
7.875% due 11/01/20 | | $ | 6,048,158
| | | $ | 6,259,550
| | |
| | 881,000 | | | American Axle & Manufacturing, Inc.
6.25% due 03/15/21 | | | 881,000
| | | | 929,455
| | |
| | 2,522,000 | | | American Axle & Manufacturing, Inc.
6.625% due 10/15/22 | | | 2,564,557
| | | | 2,704,845
| | |
| | 2,475,000 | | | Basic Energy Services, Inc.
7.75% due 02/15/19 | | | 2,471,688
| | | | 2,425,500
| | |
| | 4,975,000 | | | Basic Energy Services, Inc.
7.75% due 10/15/22 | | | 5,024,565
| | | | 4,875,500
| | |
| | 13,350,000 | | | Bi-Lo LLC
9.25% due 02/15/19 (d) | | | 14,010,925
| | | | 13,283,250
| | |
| | 4,009,000 | | | Carrizo Oil & Gas, Inc.
7.50% due 09/15/20 (d) | | | 4,152,162
| | | | 4,069,135
| | |
| | 10,501,000 | | | Carrizo Oil & Gas, Inc.
8.625% due 10/15/18 | | | 10,930,306
| | | | 10,973,545
| | |
| | 6,000,000 | | | CCO Holdings LLC
7.375% due 06/01/20 | | | 6,424,075
| | | | 6,446,250
| | |
| | 6,958,000 | | | CCO Holdings LLC
8.125% due 04/30/20 | | | 7,366,424
| | | | 7,392,875
| | |
| | 6,624,000 | | | CenturyLink, Inc. Series 'W'
6.75% due 12/01/23 | | | 6,730,075
| | | | 7,377,480
| | |
| | 3,010,000 | | | Citgo Petroleum Corporation
6.25% due 08/15/22 (d) | | | 3,078,970
| | | | 3,077,725
| | |
| | 7,308,000 | | | Cloud Peak Energy Resources
6.375% due 03/15/24 | | | 7,519,373
| | | | 7,198,380
| | |
| | 1,750,000 | | | Cloud Peak Energy Resources
8.50% due 12/15/19 | | | 1,822,582
| | | | 1,828,750
| | |
| | 1,827,000 | | | Crestwood Midstream Partners L.P.
6.00% due 12/15/20 | | | 1,849,838
| | | | 1,858,973
| | |
| | 5,634,000 | | | Crestwood Midstream Partners L.P.
6.125% due 03/01/22 | | | 5,769,145
| | | | 5,718,510
| | |
| | 14,222,000 | | | Drill Rigs Holdings, Inc.
6.50% due 10/01/17 (d) | | | 14,333,614
| | | | 13,439,790
| | |
| | 9,347,000 | | | EP Energy LLC
9.375% due 05/01/20 | | | 10,470,941
| | | | 10,258,332
| | |
| | 375,000 | | | Everest Acquisition LLC
6.875% due 05/01/19 | | | 386,814
| | | | 391,875
| | |
| | 1,200,000 | | | Everest Acquisition LLC
7.75% due 09/01/22 | | | 1,214,137
| | | | 1,272,000
| | |
First Eagle Funds | Annual Report | October 31, 2014
103
First Eagle Global Income Builder Fund | Schedule of Investments | Year Ended October 31, 2014
Principal | | Description | | Cost (Note 1) | | Value (Note 1) | |
U.S. Corporate Bonds — 19.97% (continued) | | | |
$ | 1,000,000 | | | Frontier Communications Corporation
6.25% due 09/15/21 | | $ | 1,000,000
| | | $ | 1,035,625
| | |
| | 11,740,000 | | | Frontier Communications Corporation
8.50% due 04/15/20 | | | 13,155,697
| | | | 13,589,050
| | |
| | 7,052,000 | | | GameStop Corporation
5.50% due 10/01/19 (d) | | | 7,056,883
| | | | 7,140,150
| | |
| | 1,954,000 | | | GenCorp, Inc.
7.125% due 03/15/21 | | | 2,085,596
| | | | 2,085,895
| | |
| | 7,633,000 | | | Harland Clarke Holdings Corporation
6.875% due 03/01/20 (d) | | | 7,751,965
| | | | 7,881,072
| | |
| | 3,775,000 | | | Huntington Ingalls Industries, Inc.
7.125% due 03/15/21 | | | 4,038,396
| | | | 4,077,000
| | |
| | 8,289,000 | | | Landry's, Inc.
9.375% due 05/01/20 (d) | | | 8,990,616
| | | | 8,900,314
| | |
| | 5,000,000 | | | Outerwall, Inc.
5.875% due 06/15/21 (d) | | | 5,000,000
| | | | 4,850,000
| | |
| | 6,475,000 | | | Outerwall, Inc.
6.00% due 03/15/19 | | | 6,552,655
| | | | 6,426,437
| | |
| | 1,365,000 | | | Parker Drilling Company
6.75% due 07/15/22 | | | 1,414,995
| | | | 1,252,388
| | |
| | 5,820,000 | | | Parker Drilling Company
7.50% due 08/01/20 | | | 5,817,841
| | | | 5,659,950
| | |
| | 7,200,000 | | | PHH Corporation
6.375% due 08/15/21 | | | 7,305,097
| | | | 6,948,000
| | |
| | 1,850,000 | | | PHH Corporation
7.375% due 09/01/19 | | | 1,900,365
| | | | 1,956,375
| | |
| | 5,500,000 | | | Post Holdings, Inc.
6.75% due 12/01/21 (d) | | | 5,727,127
| | | | 5,506,875
| | |
| | 6,771,000 | | | Post Holdings, Inc.
7.375% due 02/15/22 | | | 7,237,938
| | | | 6,957,202
| | |
| | 10,435,000 | | | Rentech Nitrogen Partners L.P.
6.50% due 04/15/21 (d) | | | 10,508,963
| | | | 10,121,950
| | |
| | 4,693,000 | | | Roundy's Supermarkets, Inc.
10.25% due 12/15/20 (d) | | | 4,716,846
| | | | 4,270,630
| | |
| | 1,500,000 | | | Sprint Communications, Inc.
6.00% due 11/15/22 | | | 1,470,464
| | | | 1,501,875
| | |
| | 9,522,000 | | | Sprint Corporation
7.25% due 09/15/21 (d) | | | 10,013,364
| | | | 10,093,320
| | |
| | 2,350,000 | | | STHI Holding Corporation
8.00% due 03/15/18 (d) | | | 2,457,115
| | | | 2,470,438
| | |
First Eagle Funds | Annual Report | October 31, 2014
104
First Eagle Global Income Builder Fund | Schedule of Investments | Year Ended October 31, 2014
Principal | | Description | | Cost (Note 1) | | Value (Note 1) | |
U.S. Corporate Bonds — 19.97% (continued) | | | |
$ | 2,373,000 | | | Taylor Morrison Communities, Inc.
7.75% due 04/15/20 (d) | | $ | 2,494,942
| | | $ | 2,556,908
| | |
| | 11,109,000 | | | Toys R Us Property Company II
8.50% due 12/01/17 | | | 11,280,925
| | | | 11,164,545
| | |
Total U.S. Corporate Bonds | | | 263,561,351 | | | | 261,344,179 | | |
International Bonds — 10.12% | | | |
International Convertible Bond — 0.06% | | | |
Mauritius — 0.06% | | | |
| 800,000
USD | | | Golden Agri-Resources Limited
2.50% due 10/04/17 (c)(e)(f) | | | 751,176
| | | | 780,000
| | |
International Corporate Bonds — 10.06% | | | |
Australia — 1.47% | | | |
| 4,459,000
USD | | | Ausdrill Finance PTY Limited
6.875% due 11/01/19 (c)(d) | | | 4,268,795
| | | | 3,845,888
| | |
| 15,238,000
USD | | | Nufarm Australia Limited
6.375% due 10/15/19 (d) | | | 15,767,204
| | | | 15,371,332
| | |
| | | | 20,035,999 | | | | 19,217,220 | | |
Bermuda — 0.69% | | | |
| 891,000
USD | | | Aircastle Limited
4.625% due 12/15/18 | | | 891,000
| | | | 906,592
| | |
| 4,859,000
USD | | | Aircastle Limited
6.25% due 12/01/19 | | | 5,199,560
| | | | 5,199,130
| | |
| 2,525,000
USD | | | Aircastle Limited
7.625% due 04/15/20 | | | 2,703,163
| | | | 2,853,250
| | |
| | | | 8,793,723 | | | | 8,958,972 | | |
Canada — 3.37% | | | |
| 12,553,000
USD | | | Lightstream Resources Limited
8.625% due 02/01/20 (d) | | | 12,542,574
| | | | 11,611,525
| | |
| 7,000,000
USD | | | New Gold, Inc.
6.25% due 11/15/22 (d) | | | 6,928,226
| | | | 6,877,500
| | |
| 500,000
USD | | | New Gold, Inc.
7.00% due 04/15/20 (d) | | | 511,048
| | | | 510,000
| | |
| 4,000,000
USD | | | Precision Drilling Corporation
5.25% due 11/15/24 (d) | | | 4,000,000
| | | | 3,730,000
| | |
| 7,875,000
USD | | | Precision Drilling Corporation
6.50% due 12/15/21 | | | 8,157,380
| | | | 8,111,250
| | |
First Eagle Funds | Annual Report | October 31, 2014
105
First Eagle Global Income Builder Fund | Schedule of Investments | Year Ended October 31, 2014
Principal | | Description | | Cost (Note 1) | | Value (Note 1) | |
International Corporate Bonds — 10.06% (continued) | | | |
Canada — 3.37% (continued) | | | |
| 400,000
USD | | | Precision Drilling Corporation
6.625% due 11/15/20 | | $ | 400,676
| | | $ | 414,000
| | |
| 11,962,000
USD | | | Thompson Creek Metals Company, Inc.
9.75% due 12/01/17 | | | 12,813,249
| | | | 12,829,245
| | |
| | | | 45,353,153 | | | | 44,083,520 | | |
France — 1.69% | | | |
| 8,246,000
USD | | | Numericable Group SA
6.00% due 05/15/22 (d) | | | 8,330,049
| | | | 8,441,842
| | |
| 694,000
USD | | | Numericable Group SA
6.25% due 05/15/24 (d) | | | 694,000
| | | | 714,820
| | |
| 11,200,000
USD | | | Rexel SA
5.25% due 06/15/20 (d) | | | 11,366,400
| | | | 11,340,000
| | |
| 1,550,000
USD | | | Rexel SA
6.125% due 12/15/19 (d) | | | 1,577,174
| | | | 1,608,125
| | |
| | | | 21,967,623 | | | | 22,104,787 | | |
Israel — 0.67% | | | |
| 8,226,056
USD | | | B Communications Limited
7.375% due 02/15/21 (d) | | | 8,609,924
| | | | 8,802,703
| | |
Luxembourg — 0.18% | | | |
| 2,038,000
USD | | | Altice Finco SA
9.875% due 12/15/20 (d) | | | 2,300,380
| | | | 2,282,560
| | |
| 100,000
EUR | | | Altice SA
7.25% due 05/15/22 (d) | | | 138,165
| | | | 129,858
| | |
| | | | 2,438,545 | | | | 2,412,418 | | |
Netherlands — 0.20% | | | |
| 250,000
USD | | | Schaeffler Holding Finance BV
6.25% due 11/15/19 (d)(g) | | | 250,000
| | | | 260,000
| | |
| 2,249,000
USD | | | Schaeffler Holding Finance BV
6.875% due 08/15/18 (d)(g) | | | 2,326,932
| | | | 2,367,073
| | |
| | | | 2,576,932 | | | | 2,627,073 | | |
Norway — 0.13% | | | |
| 1,630,000
USD | | | Eksportfinans ASA
2.00% due 09/15/15 | | | 1,599,204
| | | | 1,633,651
| | |
South Africa — 0.34% | | | |
| 4,180,000
USD | | | AngloGold Ashanti Holdings PLC
8.50% due 07/30/20 | | | 4,194,707
| | | | 4,509,175
| | |
First Eagle Funds | Annual Report | October 31, 2014
106
First Eagle Global Income Builder Fund | Schedule of Investments | Year Ended October 31, 2014
Principal | | Description | | Cost (Note 1) | | Value (Note 1) | |
International Corporate Bonds — 10.06% (continued) | | | |
Sweden — 0.89% | | | |
| 5,170,000
USD | | | Perstorp Holding AB
8.75% due 05/15/17 (d) | | $ | 5,380,542
| | | $ | 5,273,400
| | |
| 3,950,000
EUR | | | Perstorp Holding AB
9.00% due 05/15/17 (d) | | | 5,303,155
| | | | 5,098,639
| | |
| 1,000,000
EUR | | | Perstorp Holding AB
9.00% due 05/15/17 (f) | | | 1,322,222
| | | | 1,290,795
| | |
| | | | 12,005,919 | | | | 11,662,834 | | |
United Kingdom — 0.43% | | | |
| 2,210,000
USD | | | Jaguar Land Rover PLC
5.625% due 02/01/23 (d) | | | 2,196,556
| | | | 2,306,687
| | |
| 2,940,000
USD | | | Jaguar Land Rover PLC
8.125% due 05/15/21 (d) | | | 3,169,965
| | | | 3,248,700
| | |
| | | | 5,366,521 | | | | 5,555,387 | | |
Total International Bonds | | | 133,693,426 | | | | 132,347,740 | | |
Total Bonds | | | 397,254,777 | | | | 393,691,919 | | |
Term Loans — 9.36% | | | |
Switzerland — 0.44% | | | |
| 5,732,195
USD | | | Virtuoso US LLC
4.75% due 02/11/21 | | | 5,763,784
| | | | 5,701,155
| | |
United States — 8.92% | | | |
| 1,396,615
USD | | | Ameriforge Group, Inc.,
First Lien Term Loan
5.00% due 12/19/19 | | | 1,391,953
| | | | 1,390,218
| | |
| 5,000,000
USD | | | Cactus Wellhead LLC
7.00% due 07/31/20 (c) | | | 4,903,526
| | | | 4,900,000
| | |
| 6,778,000
USD | | | Caelus Energy Alaska O3 LLC,
Second Lien Term Loan
8.75% due 04/15/21 (c) | | | 6,649,619
| | | | 6,625,495
| | |
| 6,559,665
USD | | | Caraustar Industry, Inc.
7.50% due 05/01/19 | | | 6,573,817
| | | | 6,612,962
| | |
| 9,403,000
USD | | | Citgo Petroleum Corporation,
Term Loan B
4.50% due 07/29/21 | | | 9,397,232
| | | | 9,414,754
| | |
| 8,501,264
USD | | | Fortescue Metals Group
3.75% due 06/30/19 | | | 8,498,599
| | | | 8,310,964
| | |
| 12,028,344
USD | | | JC Penney Corporation, Inc.
6.00% due 05/22/18 | | | 11,965,104
| | | | 11,898,077
| | |
First Eagle Funds | Annual Report | October 31, 2014
107
First Eagle Global Income Builder Fund | Schedule of Investments | Year Ended October 31, 2014
Principal | | Description | | Cost (Note 1) | | Value (Note 1) | |
Term Loans — 9.36% (continued) | | | |
United States — 8.92% (continued) | | | |
| 5,631,000
USD | | | Jonah Energy LLC,
Second Lien Term Loan
7.50% due 05/12/21 (c) | | $ | 5,606,259
| | | $ | 5,462,070
| | |
| 7,655,812
USD | | | Libbey Glass, Inc., Term Loan B
3.75% due 04/09/21 | | | 7,654,664
| | | | 7,550,545
| | |
| 10,091,000
USD | | | New Albertson's, Inc.
4.75% due 06/27/21 | | | 10,086,546
| | | | 9,990,140
| | |
| 1,652,858
USD | | | OSG Bulk Ships, Inc., Exit Term Loan
5.25% due 08/05/19 | | | 1,636,906
| | | | 1,644,593
| | |
| 5,433,000
USD | | | Osum Productions Corporation
6.50% due 07/28/20 (c) | | | 5,353,995
| | | | 5,433,000
| | |
| 9,144,000
USD | | | Red Lobster Management LLC,
Term Loan B
6.25% due 07/28/21 | | | 9,042,046
| | | | 9,155,430
| | |
| 16,900,065
USD | | | Roundy's Supermarkets, Inc.,
Term Loan B
5.75% due 03/03/21 | | | 16,941,515
| | | | 15,167,808
| | |
| 1,651,860
USD | | | Stater Bros. Markets, Term Loan B
4.75% due 05/12/21 | | | 1,643,994
| | | | 1,639,479
| | |
| 11,460,000
USD | | | Zebra Technologies Corporation,
Term Loan B due 09/30/21 (h) | | | 11,419,890
| | | | 11,559,072
| | |
| | | | 118,765,665 | | | | 116,754,607 | | |
Total Term Loans | | | 124,529,449 | | | | 122,455,762 | | |
International Commercial Paper — 6.93% | | | |
Italy — 1.73% | | | |
| 22,645,000
USD | | | Eni S.p.A.
0.19% due 11/03/14 | | | 22,644,761
| | | | 22,644,761
| | |
Japan — 5.20% | | | |
| 36,251,000
USD | | | Hitachi Limited
0.21% due 11/03/14 | | | 36,250,577
| | | | 36,250,577
| | |
| 31,821,000
USD | | | Hitachi Limited
0.24% due 11/03/14 | | | 31,820,576
| | | | 31,820,576
| | |
Total International Commercial Paper | | | 90,715,914 | | | | 90,715,914 | | |
Total Investments — 100.01% | | $ | 1,307,949,416 | | | | 1,308,508,649 | | |
Liabilities in Excess of Other Assets — (0.01)% | | | | | (130,700 | ) | |
Net Assets — 100.00% | | | | $ | 1,308,377,949 | | |
First Eagle Funds | Annual Report | October 31, 2014
108
First Eagle Global Income Builder Fund | Schedule of Investments | Year Ended October 31, 2014
(a) Non-income producing security/commodity.
(b) Securities valued in accordance with fair value procedures under the supervision of the Board of Trustees, representing $1,886,000 or 0.14% of net assets.
(c) Security is deemed illiquid. At October 31, 2014, the value of these securities amounted to $28,932,453 or 2.21% of net assets.
(d) All or a portion of the security is exempt from registration under the Securities Act of 1933. Rule 144A securities may only be sold to qualified institutional buyers, pursuant to Rule 144A under the Securities Act of 1933.
(e) This security is convertible until September 27, 2017.
(f) Represents a security registered under Regulation S. Bonds sold under Regulation S may not be offered, sold or delivered within the U.S., or for the account or benefit of, U.S. persons, except pursuant to an exemption from, or in a transaction not subject to, the registration requirements of the Securities Act of 1933.
(g) Payment-in-kind security.
(h) All or a portion of the security represents unsettled loan positions.
At October 31, 2014, aggregate cost for federal income tax purposes was $1,310,551,495. Net unrealized depreciation consisted of:
Gross unrealized appreciation | | $ | 47,309,862 | | |
Gross unrealized depreciation | | | (50,705,478 | ) | |
Net unrealized depreciation | | $ | (2,042,846 | ) | |
Abbreviations used in this schedule include:
ADR — American Depositary Receipt
GDR — Global Depositary Receipt
PCL — Public Company Limited
PLC — Public Limited Company
REIT — Real Estate Investment Trust
Currencies
EUR — Euro
USD — United States Dollar
Foreign Currency Exchange Contracts — Sales
Settlement
Dates
Through | | Foreign Currency
To be Delivered | | U.S. $
To be Received | | U.S. $ Value
At October 31,
2014 | | Unrealized
Appreciation
At October 31,
2014 | | Unrealized
Depreciation
At October 31,
2014 | |
12/17/14 | | | 643,000 | | | British Pound | | $ | 1,078,170 | | | $ | 1,028,255 | | | $ | 49,915 | | | $ | — | | |
01/14/15 | | | 336,000 | | | British Pound | | | 566,566 | | | | 537,196 | | | | 29,370 | | | | — | | |
02/12/15 | | | 808,000 | | | British Pound | | | 1,356,815 | | | | 1,291,917 | | | | 64,898 | | | | — | | |
03/18/15 | | | 654,000 | | | British Pound | | | 1,059,151 | | | | 1,044,961 | | | | 14,190 | | | | — | | |
04/15/15 | | | 276,000 | | | British Pound | | | 442,676 | | | | 440,864 | | | | 1,812 | | | | — | | |
12/17/14 | | | 10,216,000 | | | Euro | | | 13,553,493 | | | | 12,805,712 | | | | 747,781 | | | | — | | |
01/14/15 | | | 5,475,000 | | | Euro | | | 7,457,114 | | | | 6,864,210 | | | | 592,904 | | | | — | | |
02/12/15 | | | 14,646,000 | | | Euro | | | 19,906,804 | | | | 18,362,104 | | | | 1,544,700 | | | | — | | |
03/18/15 | | | 6,747,000 | | | Euro | | | 8,750,522 | | | | 8,462,785 | | | | 287,737 | | | | — | | |
First Eagle Funds | Annual Report | October 31, 2014
109
First Eagle Global Income Builder Fund | Schedule of Investments | Year Ended October 31, 2014
Foreign Currency Exchange Contracts — Sales (continued)
Settlement
Dates
Through | | Foreign Currency
To be Delivered | | U.S. $
To be Received | | U.S. $ Value
At October 31,
2014 | | Unrealized
Appreciation
At October 31,
2014 | | Unrealized
Depreciation
At October 31,
2014 | |
04/15/15 | | | 6,179,434 | | | Euro | | $ | 7,832,647 | | | $ | 7,751,456 | | | $ | 81,191 | | | $ | — | | |
12/17/14 | | | 196,883,000 | | | Japanese Yen | | | 1,931,646 | | | | 1,753,584 | | | | 178,062 | | | | — | | |
01/14/15 | | | 190,346,000 | | | Japanese Yen | | | 1,828,555 | | | | 1,696,096 | | | | 132,459 | | | | — | | |
02/12/15 | | | 308,697,000 | | | Japanese Yen | | | 3,027,107 | | | | 2,750,136 | | | | 276,971 | | | | — | | |
03/18/15 | | | 204,898,000 | | | Japanese Yen | | | 1,922,391 | | | | 1,826,959 | | | | 95,432 | | | | — | | |
04/15/15 | | | 143,272,000 | | | Japanese Yen | | | 1,337,016 | | | | 1,277,872 | | | | 59,144 | | | | — | | |
| | | | | | | $ | 72,050,673 | | | $ | 67,894,107 | | | $ | 4,156,566 | | | $ | — | | |
Foreign Currency Exchange Contracts — Purchases
Settlement
Dates
Through | | Foreign Currency
To be Received | | U.S. $
To be Delivered | | U.S. $ Value
At October 31,
2014 | | Unrealized
Appreciation
At October 31,
2014 | | Unrealized
Depreciation
At October 31,
2014 | |
11/03/14 | | | 663,434 | | | Euro | | $ | 830,301 | | | $ | 831,382 | | | $ | 1,081 | | | $ | — | | |
01/14/15 | | | 2,627,000 | | | Euro | | | 3,304,911 | | | | 3,293,081 | | | | — | | | | (11,830 | ) | |
02/12/15 | | | 8,428,000 | | | Euro | | | 10,687,331 | | | | 10,564,674 | | | | — | | | | (122,657 | ) | |
11/19/14 | | | 91,804,000 | | | Japanese Yen | | | 818,630 | | | | 817,393 | | | | — | | | | (1,237 | ) | |
| | | | | | | $ | 15,641,173 | | | $ | 15,506,530 | | | $ | 1,081 | | | $ | (135,724 | ) | |
Industry Diversification for Portfolio Holdings | | Percent of
Net Assets | |
U.S. Common Stocks
Consumer Discretionary | | | 1.36 | % | |
Consumer Staples | | | 0.92 | | |
Energy | | | 2.22 | | |
Financials | | | 2.83 | | |
Industrials | | | 2.25 | | |
Information Technology | | | 5.55 | | |
Total U.S. Common Stocks | | | 15.13 | | |
International Common Stocks
Consumer Discretionary | | | 2.96 | | |
Consumer Staples | | | 6.52 | | |
Energy | | | 4.27 | | |
Financials | | | 5.11 | | |
Health Care | | | 3.36 | | |
First Eagle Funds | Annual Report | October 31, 2014
110
First Eagle Global Income Builder Fund | Schedule of Investments | Year Ended October 31, 2014
Industry Diversification for Portfolio Holdings (continued) | | Percent of
Net Assets | |
Industrials | | | 5.90 | % | |
Information Technology | | | 1.94 | | |
Materials | | | 4.71 | | |
Telecommunication Services | | | 1.72 | | |
Utilities | | | 0.67 | | |
Total International Common Stocks | | | 37.16 | | |
Closed-End Fund | | | 0.17 | | |
Commodity | | | 1.17 | | |
U.S. Corporate Bonds
Consumer Discretionary | | | 4.39 | | |
Consumer Staples | | | 2.30 | | |
Energy | | | 5.69 | | |
Financials | | | 1.46 | | |
Health Care | | | 0.19 | | |
Industrials | | | 0.69 | | |
Materials | | | 1.63 | | |
Telecommunication Services | | | 3.62 | | |
Total U.S. Corporate Bonds | | | 19.97 | | |
International Convertible Bond
Consumer Staples | | | 0.06 | | |
Total International Convertible Bond | | | 0.06 | | |
International Corporate Bonds
Consumer Discretionary | | | 0.63 | | |
Energy | | | 1.54 | | |
Financials | | | 1.11 | | |
Industrials | | | 1.27 | | |
Information Technology | | | 0.70 | | |
Materials | | | 3.96 | | |
Telecommunication Services | | | 0.85 | | |
Total International Corporate Bonds | | | 10.06 | | |
Term Loans | | | 9.36 | | |
Commercial Paper
International Commercial Paper | | | 6.93 | | |
Total Investments | | | 100.01 | % | |
See Notes to Financial Statements.
First Eagle Funds | Annual Report | October 31, 2014
111
First Eagle High Yield Fund
Data as of October 31, 2014 (unaudited)
Investment Objective
First Eagle High Yield Fund seeks to provide investors with a high level of current income. To pursue its investment objective, the Fund normally invests at least 80% of its net assets in high yield, below investment-grade instruments.
Average Annual Returns^ (%) | | | |
One-Year | |
Five-Years | | Since
Inception
(11/19/07) | |
First Eagle High Yield Fund | | Class I | | | 4.03 | | | | 9.51 | | | | 10.98 | | |
Barclays Capital U.S. Corporate High Yield Bond Index | | | | | 5.82 | | | | 10.44 | | | | 9.28 | | |

Countries** (%)
United States | | | 69.84 | | |
Canada | | | 6.29 | | |
Bermuda | | | 3.26 | | |
Sweden | | | 3.14 | | |
United Kingdom | | | 2.14 | | |
Australia | | | 1.99 | | |
France | | | 1.80 | | |
Netherlands | | | 1.17 | | |
Hong Kong | | | 0.89 | | |
South Africa | | | 0.87 | | |
Switzerland | | | 0.86 | | |
Israel | | | 0.75 | | |
Cayman Islands | | | 0.68 | | |
Norway | | | 0.54 | | |
Luxembourg | | | 0.32 | | |
Mauritius | | | 0.17 | | |
^ Performance figures reflect certain fee waivers and/or expense limitations, without which returns may have been lower.
* Asset Allocation and Countries percentages are based on total investments in the portfolio.
**Country allocations reflect country of the issuer (not currency of issue) and exclude short term investments. Bonds of non-U.S. issuers may be U.S. dollar denominated.
The Fund's portfolio composition is subject to change at any time.
First Eagle Funds | Annual Report | October 31, 2014
112
First Eagle High Yield Fund | Fund Overview
Growth of a $10,000 Initial Investment
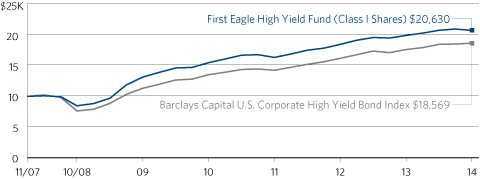
Performance data quoted herein represents past performance and should not be considered indicative of future results. Performance data quoted herein does not reflect the deduction of taxes that a shareholder would pay on Fund distributions or the sale of Fund shares. The average annual returns shown above are historical and reflect changes in share price, reinvested dividends and are net of expenses.
The average annual returns for Class I Shares do not give effect to the deduction of a maximum sales charge.
The Barclays Capital U.S. Corporate High Yield Bond Index is composed of fixed-rate, publicly issued, non-investment grade debt, is unmanaged, with dividends reinvested, and is not available for purchase. The index includes both corporate and non-corporate sectors. The corporate sectors are Industrial, Utility, and Finance, which include both U.S. and non-U.S. corporations. The index is presented here for comparison purposes only. One cannot invest directly in an index.
Top 10 Holdings* (%)
Bi-Lo LLC (Supermarket chain) | | | 1.40 | | |
Kemet Corporation (Capacitors manufacturer) | | | 1.36 | | |
Drill Rigs Holdings, Inc. (Energy transportation) | | | 1.35 | | |
Bon-Ton Department Stores, Inc. (U.S. retail store company) | | | 1.33 | | |
Roundy's Supermarkets, Inc. Term Loan B (Grocery retailer) | | | 1.33 | | |
Viking Cruises Limited (Cruise ship operator) | | | 1.33 | | |
CCO Holdings LLC (Communications & cable provider) | | | 1.27 | | |
Nufarm Australia Limited (Agricultural crop protection) | | | 1.27 | | |
American Achievement Corporation (Distributor of commemorative products) | | | 1.23 | | |
Frontier Communications Corporation (U.S. communications services provider) | | | 1.22 | | |
Total | | | 13.09 | | |
*Holdings in cash, commercial paper and other short term cash equivalents have been excluded.
Percentages are based on total net assets.
First Eagle Funds | Annual Report | October 31, 2014
113
First Eagle High Yield Fund | Schedule of Investments | Year Ended October 31, 2014
| Principal | | Description | | Cost (Note 1) | | Value (Note 1) | |
Bonds — 75.94% | | | |
U.S. Convertible Bond — 0.18% | | | |
$ | 1,915,000 | | | Headwaters, Inc.
8.75% due 02/01/16 (a) | | $ | 1,934,898
| | | $ | 2,039,475
| | |
U.S. Corporate Bonds — 51.85% | | | |
| | 12,794,000 | | | ACCO Brands Corporation
6.75% due 04/30/20 | | | 13,053,645
| | | | 13,657,595
| | |
| | 2,588,000 | | | Air Medical Group Holdings, Inc.
9.25% due 11/01/18 | | | 2,668,819
| | | | 2,714,165
| | |
| | 1,000,000 | | | Aleris International, Inc.
7.625% due 02/15/18 | | | 1,033,170
| | | | 1,036,250
| | |
| | 7,313,000 | | | Aleris International, Inc.
7.875% due 11/01/20 | | | 7,331,594
| | | | 7,642,085
| | |
| | 14,283,000 | | | American Achievement Corporation
10.875% due 04/15/16 (b) | | | 14,575,778
| | | | 14,068,755
| | |
| | 2,909,000 | | | American Axle & Manufacturing, Inc.
6.25% due 03/15/21 | | | 2,909,000
| | | | 3,068,995
| | |
| | 3,278,000 | | | American Axle & Manufacturing, Inc.
6.625% due 10/15/22 | | | 3,315,271
| | | | 3,515,655
| | |
| | 5,763,000 | | | Antero Resources Finance Corporation
5.375% due 11/01/21 | | | 5,820,634
| | | | 5,871,056
| | |
| | 7,126,000 | | | Ashtead Capital, Inc.
6.50% due 07/15/22 (b) | | | 7,540,958
| | | | 7,731,710
| | |
| | 11,518,000 | | | Atlas Energy Holdings
Operating Company LLC
7.75% due 01/15/21 | | | 11,590,898
| | | | 10,423,790
| | |
| | 700,000 | | | Atlas Energy Holdings Operating
Company LLC
7.75% due 01/15/21 (b) | | | 696,673
| | | | 633,500
| | |
| | 7,651,000 | | | Atlas Pipeline Partners L.P.
5.875% due 08/01/23 | | | 7,368,071
| | | | 7,976,168
| | |
| | 500,000 | | | Atlas Pipeline Partners L.P.
6.625% due 10/01/20 | | | 530,378
| | | | 532,500
| | |
| | 4,363,000 | | | Atwood Oceanics, Inc.
6.50% due 02/01/20 | | | 4,526,183
| | | | 4,406,630
| | |
| | 6,238,000 | | | Basic Energy Services, Inc.
7.75% due 02/15/19 | | | 6,176,951
| | | | 6,113,240
| | |
| | 4,583,000 | | | Basic Energy Services, Inc.
7.75% due 10/15/22 | | | 4,552,774
| | | | 4,491,340
| | |
| | 10,711,000 | | | Bi-Lo LLC
8.625% due 09/15/18 (b)(c) | | | 10,716,094
| | | | 9,666,678
| | |
First Eagle Funds | Annual Report | October 31, 2014
114
First Eagle High Yield Fund | Schedule of Investments | Year Ended October 31, 2014
| Principal | | Description | | Cost (Note 1) | | Value (Note 1) | |
U.S. Corporate Bonds — 51.85% (continued) | | | |
$ | 16,075,000 | | | Bi-Lo LLC
9.25% due 02/15/19 (b) | | $ | 16,706,212
| | | $ | 15,994,625
| | |
| | 15,081,000 | | | Bon-Ton Department Stores, Inc.
10.625% due 07/15/17 | | | 14,794,769
| | | | 15,194,107
| | |
| | 5,450,000 | | | Carrizo Oil & Gas, Inc.
7.50% due 09/15/20 (b) | | | 5,477,216
| | | | 5,531,750
| | |
| | 9,025,000 | | | Carrizo Oil & Gas, Inc.
8.625% due 10/15/18 | | | 9,277,699
| | | | 9,431,125
| | |
| | 2,841,000 | | | CCO Holdings LLC
6.625% due 01/31/22 | | | 2,909,919
| | | | 3,029,216
| | |
| | 13,460,000 | | | CCO Holdings LLC
7.375% due 06/01/20 | | | 14,285,791
| | | | 14,461,087
| | |
| | 9,608,000 | | | CCO Holdings LLC
8.125% due 04/30/20 | | | 10,169,899
| | | | 10,208,500
| | |
| | 9,971,000 | | | CEC Entertainment, Inc.
8.00% due 02/15/22 (b) | | | 10,043,168
| | | | 9,622,015
| | |
| | 3,984,000 | | | CenturyLink, Inc. Series 'S'
6.45% due 06/15/21 | | | 4,146,631
| | | | 4,382,400
| | |
| | 8,496,000 | | | CenturyLink, Inc. Series 'W'
6.75% due 12/01/23 | | | 8,615,173
| | | | 9,462,420
| | |
| | 3,148,000 | | | Citgo Petroleum Corporation
6.25% due 08/15/22 (b) | | | 3,161,428
| | | | 3,218,830
| | |
| | 11,722,000 | | | Claire's Stores, Inc.
9.00% due 03/15/19 (b) | | | 12,327,559
| | | | 12,044,355
| | |
| | 11,532,000 | | | Cleaver-Brooks, Inc.
8.75% due 12/15/19 (b) | | | 11,955,289
| | | | 12,598,710
| | |
| | 3,707,000 | | | Cloud Peak Energy Resources
6.375% due 03/15/24 | | | 3,723,299
| | | | 3,651,395
| | |
| | 6,755,000 | | | Crestwood Midstream Partners L.P.
6.125% due 03/01/22 | | | 6,916,378
| | | | 6,856,325
| | |
| | 12,216,000 | | | DFC Finance Corporation
10.50% due 06/15/20 (b) | | | 12,251,316
| | | | 12,002,220
| | |
| | 16,283,000 | | | Drill Rigs Holdings, Inc.
6.50% due 10/01/17 (b) | | | 16,383,327
| | | | 15,387,435
| | |
| | 12,615,000 | | | DriveTime Automotive Group, Inc.
8.00% due 06/01/21 (b) | | | 12,694,106
| | | | 12,425,775
| | |
| | 4,000,000 | | | EP Energy LLC
9.375% due 05/01/20 | | | 4,036,876
| | | | 4,390,000
| | |
| | 1,075,000 | | | Everest Acquisition LLC
6.875% due 05/01/19 | | | 1,090,953
| | | | 1,123,375
| | |
First Eagle Funds | Annual Report | October 31, 2014
115
First Eagle High Yield Fund | Schedule of Investments | Year Ended October 31, 2014
| Principal | | Description | | Cost (Note 1) | | Value (Note 1) | |
U.S. Corporate Bonds — 51.85% (continued) | | | |
$ | 2,894,000 | | | Frontier Communications Corporation
7.125% due 03/15/19 | | $ | 3,027,090
| | | $ | 3,205,105
| | |
| | 11,989,000 | | | Frontier Communications Corporation
8.50% due 04/15/20 | | | 12,944,654
| | | | 13,877,267
| | |
| | 2,924,000 | | | GameStop Corporation
5.50% due 10/01/19 (b) | | | 2,933,612
| | | | 2,960,550
| | |
| | 9,907,000 | | | GenCorp, Inc.
7.125% due 03/15/21 | | | 10,277,736
| | | | 10,575,723
| | |
| | 7,986,000 | | | Global Partners L.P.
6.25% due 07/15/22 (b) | | | 8,065,764
| | | | 7,946,070
| | |
| | 9,566,000 | | | Harland Clarke Holdings Corporation
6.875% due 03/01/20 (b) | | | 9,629,230
| | | | 9,876,895
| | |
| | 5,364,000 | | | Headwaters, Inc.
7.25% due 01/15/19 | | | 5,492,470
| | | | 5,524,920
| | |
| | 8,870,000 | | | Headwaters, Inc.
7.625% due 04/01/19 | | | 8,883,048
| | | | 9,313,500
| | |
| | 3,000,000 | | | Huntington Ingalls Industries, Inc.
6.875% due 03/15/18 | | | 3,086,850
| | | | 3,146,250
| | |
| | 6,226,000 | | | Huntington Ingalls Industries, Inc.
7.125% due 03/15/21 | | | 6,533,150
| | | | 6,724,080
| | |
| | 1,015,000 | | | Interface, Inc.
7.625% due 12/01/18 | | | 1,055,492
| | | | 1,058,950
| | |
| | 14,839,000 | | | Kemet Corporation
10.50% due 05/01/18 | | | 15,151,072
| | | | 15,580,950
| | |
| | 2,882,000 | | | Kinder Morgan, Inc.
5.625% due 11/15/23 (b) | | | 2,888,362
| | | | 3,184,610
| | |
| | 3,646,000 | | | Kraton Polymers
6.75% due 03/01/19 | | | 3,697,183
| | | | 3,785,004
| | |
| | 12,022,000 | | | Landry's, Inc.
9.375% due 05/01/20 (b) | | | 12,578,195
| | | | 12,908,622
| | |
| | 10,518,000 | | | Magnachip Semiconductor Corporation
6.625% due 07/15/21 | | | 10,487,134
| | | | 9,623,970
| | |
| | 4,548,000 | | | Mcron Finance Corporation
8.375% due 05/15/19 (b) | | | 4,599,112
| | | | 4,866,360
| | |
| | 762,000 | | | Milacron LLC
7.75% due 02/15/21 (b) | | | 762,000
| | | | 796,290
| | |
| | 5,000,000 | | | Outerwall, Inc.
5.875% due 06/15/21 (b) | | | 5,000,000
| | | | 4,850,000
| | |
| | 10,713,000 | | | Outerwall, Inc.
6.00% due 03/15/19 | | | 10,715,132
| | | | 10,632,652
| | |
First Eagle Funds | Annual Report | October 31, 2014
116
First Eagle High Yield Fund | Schedule of Investments | Year Ended October 31, 2014
| Principal | | Description | | Cost (Note 1) | | Value (Note 1) | |
U.S. Corporate Bonds — 51.85% (continued) | | | |
$ | 8,674,000 | | | Parker Drilling Company
6.75% due 07/15/22 | | $ | 8,834,373
| | | $ | 7,958,395
| | |
| | 1,107,000 | | | Parker Drilling Company
7.50% due 08/01/20 | | | 1,110,213
| | | | 1,076,558
| | |
| | 3,167,000 | | | PHH Corporation
6.375% due 08/15/21 | | | 3,120,676
| | | | 3,056,155
| | |
| | 6,020,000 | | | PHH Corporation
7.375% due 09/01/19 | | | 6,294,936
| | | | 6,366,150
| | |
| | 3,980,000 | | | Post Holdings, Inc.
6.75% due 12/01/21 (b) | | | 4,049,886
| | | | 3,984,975
| | |
| | 11,683,000 | | | Post Holdings, Inc.
7.375% due 02/15/22 | | | 12,220,231
| | | | 12,004,282
| | |
| | 7,428,000 | | | Quality Distribution
9.875% due 11/01/18 | | | 7,787,947
| | | | 7,836,540
| | |
| | 6,386,000 | | | Radio Systems Corporation
8.375% due 11/01/19 (b) | | | 6,497,852
| | | | 6,936,793
| | |
| | 11,243,000 | | | Rentech Nitrogen Partners L.P.
6.50% due 04/15/21 (b) | | | 11,311,023
| | | | 10,905,710
| | |
| | 3,592,000 | | | Rex Energy Corporation
6.25% due 08/01/22 (b) | | | 3,577,421
| | | | 3,389,950
| | |
| | 6,240,000 | | | Rex Energy Corporation
8.875% due 12/01/20 | | | 6,219,681
| | | | 6,614,400
| | |
| | 12,283,000 | | | ROC Finance
12.125% due 09/01/18 (b) | | | 13,240,881
| | | | 13,142,810
| | |
| | 10,537,000 | | | Roundy's Supermarkets, Inc.
10.25% due 12/15/20 (b) | | | 10,567,520
| | | | 9,588,670
| | |
| | 7,720,000 | | | Silgan Holdings, Inc.
5.50% due 02/01/22 | | | 7,689,842
| | | | 8,048,100
| | |
| | 5,000,000 | | | Sprint Communications, Inc.
6.00% due 11/15/22 | | | 4,915,782
| | | | 5,006,250
| | |
| | 7,250,000 | | | Sprint Communications, Inc.
7.00% due 08/15/20 | | | 7,551,855
| | | | 7,721,250
| | |
| | 788,000 | | | Sprint Corporation
7.125% due 06/15/24 (b) | | | 788,000
| | | | 812,625
| | |
| | 12,942,000 | | | Sprint Corporation
7.25% due 09/15/21 (b) | | | 13,118,479
| | | | 13,718,520
| | |
| | 1,907,000 | | | STHI Holding Corporation
8.00% due 03/15/18 (b) | | | 1,997,596
| | | | 2,004,734
| | |
| | 9,264,000 | | | Taylor Morrison Communities, Inc.
7.75% due 04/15/20 (b) | | | 9,690,456
| | | | 9,981,960
| | |
First Eagle Funds | Annual Report | October 31, 2014
117
First Eagle High Yield Fund | Schedule of Investments | Year Ended October 31, 2014
| Principal | | Description | | Cost (Note 1) | | Value (Note 1) | |
U.S. Corporate Bonds — 51.85% (continued) | | | |
$ | 3,148,000 | | | The Men's Wearhouse, Inc.
7.00% due 07/01/22 (b) | | $ | 3,196,399
| | | $ | 3,277,855
| | |
| | 4,833,000 | | | Time, Inc.
5.75% due 04/15/22 (b) | | | 4,833,000
| | | | 4,736,340
| | |
| | 9,860,000 | | | Toys R Us Property Company II
8.50% due 12/01/17 | | | 10,014,230
| | | | 9,909,300
| | |
| | 7,650,000 | | | United Rentals North America, Inc.
7.375% due 05/15/20 | | | 7,953,950
| | | | 8,338,500
| | |
| | 200,000 | | | United Rentals North America, Inc.
7.625% due 04/15/22 | | | 200,000
| | | | 224,000
| | |
Total U.S. Corporate Bonds | | | | | 589,963,414 | | | | 591,644,367 | | |
International Convertible Bond — 0.17% | | | |
Mauritius — 0.17% | | | |
| 2,000,000
USD | | | Golden Agri-Resources Limited
2.50% due 10/04/17 (d)(e)(f) | | | 1,878,452
| | | | 1,950,000
| | |
International Corporate Bonds — 23.74% | | | |
Australia — 1.98% | | | |
| 9,425,000
USD | | | Ausdrill Finance PTY Limited
6.875% due 11/01/19 (b)(e) | | | 9,351,830
| | | | 8,129,063
| | |
| 14,343,000
USD | | | Nufarm Australia Limited
6.375% due 10/15/19 (b) | | | 14,710,495
| | | | 14,468,501
| | |
| | | | 24,062,325 | | | | 22,597,564 | | |
Bermuda — 3.25% | | | |
| 1,707,000
USD | | | Aircastle Limited
4.625% due 12/15/18 | | | 1,707,000
| | | | 1,736,872
| | |
| 3,000,000
USD | | | Aircastle Limited
6.25% due 12/01/19 | | | 3,209,256
| | | | 3,210,000
| | |
| 5,825,000
USD | | | Aircastle Limited
7.625% due 04/15/20 | | | 6,004,974
| | | | 6,582,250
| | |
| 10,077,000
USD | | | Santa Maria Offshore Limited
8.875% due 07/03/18 (e)(f) | | | 10,186,453
| | | | 10,379,310
| | |
| 13,928,000
USD | | | Viking Cruises Limited
8.50% due 10/15/22 (b) | | | 14,804,027
| | | | 15,146,700
| | |
| | | | 35,911,710 | | | | 37,055,132 | | |
Canada — 6.26% | | | |
| 11,821,000
USD | | | Jupiter Resources, Inc.
8.50% due 10/01/22 (b) | | | 11,333,353
| | | | 10,491,137
| | |
| 8,271,000
USD | | | Lightstream Resources Limited
8.625% due 02/01/20 (b) | | | 8,111,909
| | | | 7,650,675
| | |
First Eagle Funds | Annual Report | October 31, 2014
118
First Eagle High Yield Fund | Schedule of Investments | Year Ended October 31, 2014
| Principal | | Description | | Cost (Note 1) | | Value (Note 1) | |
International Corporate Bonds — 23.74% (continued) | | | |
Canada — 6.26% (continued) | | | |
| 9,528,000
USD | | | MEG Energy Corporation
7.00% due 03/31/24 (b) | | $ | 9,685,011
| | | $ | 9,599,460
| | |
| 9,651,000
USD | | | Mood Media Corporation
9.25% due 10/15/20 (b) | | | 10,022,960
| | | | 8,010,330
| | |
| 5,730,000
USD | | | New Gold, Inc.
6.25% due 11/15/22 (b) | | | 5,594,252
| | | | 5,629,725
| | |
| 4,974,000
USD | | | New Gold, Inc.
7.00% due 04/15/20 (b) | | | 5,045,714
| | | | 5,073,480
| | |
| 5,186,000
USD | | | Northern Blizzard Resources, Inc.
7.25% due 02/01/22 (b) | | | 5,188,680
| | | | 4,952,630
| | |
| 6,056,000
USD | | | Precision Drilling Corporation
6.50% due 12/15/21 | | | 6,270,221
| | | | 6,237,680
| | |
| 2,550,000
USD | | | Thompson Creek Metals Company, Inc.
7.375% due 06/01/18 | | | 2,321,668
| | | | 2,358,750
| | |
| 8,719,000
USD | | | Thompson Creek Metals Company, Inc.
9.75% due 12/01/17 | | | 9,070,598
| | | | 9,351,128
| | |
| 2,000,000
USD | | | Thompson Creek Metals Company, Inc.
12.50% due 05/01/19 | | | 2,011,708
| | | | 2,120,000
| | |
| | | | 74,656,074 | | | | 71,474,995 | | |
Cayman Islands — 0.68% | | | |
| 2,000,000
USD | | | Offshore Group Investment Limited
7.125% due 04/01/23 | | | 2,046,246
| | | | 1,660,000
| | |
| 7,146,000
USD | | | Offshore Group Investment Limited
7.50% due 11/01/19 | | | 7,346,738
| | | | 6,127,695
| | |
| | | | 9,392,984 | | | | 7,787,695 | | |
France — 1.80% | | | |
| 9,277,000
USD | | | Numericable Group SA
6.00% due 05/15/22 (b) | | | 9,401,835
| | | | 9,497,329
| | |
| 1,031,000
USD | | | Numericable Group SA
6.25% due 05/15/24 (b) | | | 1,031,000
| | | | 1,061,930
| | |
| 4,900,000
USD | | | Rexel SA
5.25% due 06/15/20 (b) | | | 4,869,598
| | | | 4,961,250
| | |
| 4,805,000
USD | | | Rexel SA
6.125% due 12/15/19 (b) | | | 4,841,259
| | | | 4,985,187
| | |
| | | | 20,143,692 | | | | 20,505,696 | | |
Hong Kong — 0.89% | | | |
| 10,146,517
USD | | | Neptuno Finance Limited
9.75% due 11/07/19 (b)(e)(f)(g)(h) | | | 10,146,517
| | | | 10,108,468
| | |
First Eagle Funds | Annual Report | October 31, 2014
119
First Eagle High Yield Fund | Schedule of Investments | Year Ended October 31, 2014
| Principal | | Description | | Cost (Note 1) | | Value (Note 1) | |
International Corporate Bonds — 23.74% (continued) | | | |
Israel — 0.75% | | | |
| 7,999,000
USD | | | B Communications Limited
7.375% due 02/15/21 (b) | | $ | 8,281,886
| | | $ | 8,559,730
| | |
Luxembourg — 0.31% | | | |
| 3,026,000
USD | | | Altice Finco SA
9.875% due 12/15/20 (b) | | | 3,415,580
| | | | 3,389,120
| | |
| 150,000
EUR | | | Altice SA
7.25% due 05/15/22 (b) | | | 207,247
| | | | 194,787
| | |
| | | | 3,622,827 | | | | 3,583,907 | | |
Netherlands — 1.16% | | | |
| 2,083,000
USD | | | Schaeffler Holding Finance BV
6.875% due 08/15/18 (b)(c) | | | 2,155,180
| | | | 2,192,358
| | |
| 10,529,000
USD | | | VTR Finance BV
6.875% due 01/15/24 (b) | | | 10,781,951
| | | | 11,081,772
| | |
| | | | 12,937,131 | | | | 13,274,130 | | |
Norway — 0.54% | | | |
| 6,105,000
USD | | | Eksportfinans ASA
2.00% due 09/15/15 | | | 5,923,120
| | | | 6,118,675
| | |
South Africa — 0.87% | | | |
| 9,202,000
USD | | | AngloGold Ashanti Holdings PLC
8.50% due 07/30/20 | | | 9,234,371
| | | | 9,926,657
| | |
Sweden — 3.12% | | | |
| 10,280,000
USD | | | Perstorp Holding AB
8.75% due 05/15/17 (b) | | | 10,448,857
| | | | 10,485,600
| | |
| 1,750,000
EUR | | | Perstorp Holding AB
9.00% due 05/15/17 (b) | | | 2,355,261
| | | | 2,258,891
| | |
| 1,000,000
EUR | | | Perstorp Holding AB
9.00% due 05/15/17 (f) | | | 1,322,222
| | | | 1,290,795
| | |
| 12,930,000
USD | | | Stena AB
7.00% due 02/01/24 (b) | | | 13,055,847
| | | | 12,930,000
| | |
| 6,304,000
EUR | | | TVN Finance Corporation III AB
7.375% due 12/15/20 (b) | | | 8,662,050
| | | | 8,689,844
| | |
| | | | 35,844,237 | | | | 35,655,130 | | |
United Kingdom — 2.13% | | | |
| 7,462,000
USD | | | EnQuest PLC
7.00% due 04/15/22 (b) | | | 7,521,430
| | | | 6,715,800
| | |
| 4,400,000
USD | | | Ineos Finance PLC
8.375% due 02/15/19 (b) | | | 4,524,915
| | | | 4,735,500
| | |
First Eagle Funds | Annual Report | October 31, 2014
120
First Eagle High Yield Fund | Schedule of Investments | Year Ended October 31, 2014
| Principal | | Description | | Cost (Note 1) | | Value (Note 1) | |
International Corporate Bonds — 23.74% (continued) | | | |
United Kingdom — 2.13% (continued) | | | |
| 790,000
USD | | | Jaguar Land Rover PLC
5.625% due 02/01/23 (b) | | $ | 790,000
| | | $ | 824,562
| | |
| 5,550,000
USD | | | Jaguar Land Rover PLC
8.125% due 05/15/21 (b) | | | 5,687,382
| | | | 6,132,750
| | |
| 5,685,000
USD | | | Virgin Media Secured Finance PLC
5.50% due 01/15/25 (b) | | | 5,692,752
| | | | 5,883,975
| | |
| | | | 24,216,479 | | | | 24,292,587 | | |
Total International Corporate Bonds | | | | | 274,373,353 | | | | 270,940,366 | | |
Total Bonds | | | | | 868,150,117 | | | | 866,574,208 | | |
Term Loans — 18.37% | | | |
Switzerland — 0.85% | | | |
| 9,790,327
USD | | | Virtuoso US LLC
4.75% due 02/11/21 | | | 9,841,618
| | | | 9,737,312
| | |
United States — 17.52% | | | |
| 1,488,770
USD | | | Ameriforge Group, Inc., First Lien
Term Loan
5.00% due 12/19/19 | | | 1,482,675
| | | | 1,481,951
| | |
| 6,470,000
USD | | | Ameriforge Group, Inc., Second Lien
Term Loan
8.75% due 12/18/20 | | | 6,583,342
| | | | 6,470,000
| | |
| 11,264,149
USD | | | Atkins Nutritionals, Inc., First Lien
Term Loan
6.25% due 01/02/19 (e) | | | 11,215,097
| | | | 11,235,989
| | |
| 1,528,000
USD | | | Atkins Nutritionals, Inc., Second Lien
Term Loan
9.75% due 04/03/19 (e) | | | 1,503,745
| | | | 1,550,920
| | |
| 3,904,305
USD | | | BJ's Wholesale Club, Inc., First Lien
Term Loan
4.50% due 09/26/19 | | | 3,874,885
| | | | 3,872,232
| | |
| 3,930,000
USD | | | BJ's Wholesale Club, Inc., Second Lien
Term Loan
8.50% due 03/26/20 | | | 3,912,588
| | | | 3,941,476
| | |
| 9,572,000
USD | | | Cactus Wellhead LLC
7.00% due 07/31/20 (e) | | | 9,386,300
| | | | 9,380,560
| | |
| 10,402,000
USD | | | Caelus Energy Alaska O3 LLC,
Second Lien Term Loan
8.75% due 04/15/21 (e) | | | 10,204,978
| | | | 10,167,955
| | |
| 11,415,938
USD | | | Caraustar Industry, Inc.
7.50% due 05/01/19 | | | 11,513,952
| | | | 11,508,693
| | |
First Eagle Funds | Annual Report | October 31, 2014
121
First Eagle High Yield Fund | Schedule of Investments | Year Ended October 31, 2014
| Principal | | Description | | Cost (Note 1) | | Value (Note 1) | |
Term Loans — 18.37% (continued) | | | |
United States — 17.52% (continued) | | | |
| 7,343,000
USD | | | CBAC Borrower LLC, Term Loan B
8.25% due 07/02/20 (e) | | $ | 7,521,946
| | | $ | 7,434,788
| | |
| 2,500,000
USD | | | Citgo Petroleum Corporation,
Term Loan B
4.50% due 07/29/21 | | | 2,495,803
| | | | 2,503,125
| | |
| 8,366,311
USD | | | Fortescue Metals Group Term Loan B
3.75% due 06/30/19 | | | 8,329,189
| | | | 8,179,031
| | |
| 12,982,037
USD | | | Hostess Brands, Inc.
6.75% due 04/09/20 | | | 13,201,062
| | | | 13,249,856
| | |
| 13,955,481
USD | | | JC Penney Corporation, Inc.
6.00% due 05/22/18 | | | 14,030,779
| | | | 13,804,343
| | |
| 1,296,000
USD | | | Jonah Energy LLC, Second Lien
Term Loan
7.50% due 05/12/21 (e) | | | 1,277,508
| | | | 1,257,120
| | |
| 5,225,000
USD | | | New Albertson's, Inc.
4.75% due 06/27/21 | | | 5,236,766
| | | | 5,172,776
| | |
| 1,824,428
USD | | | OSG Bulk Ships, Inc, Exit Term Loan
5.25% due 08/05/19 | | | 1,806,820
| | | | 1,815,305
| | |
| 5,637,000
USD | | | Osum Productions Corporation
6.50% due 07/28/20 (e) | | | 5,555,029
| | | | 5,637,000
| | |
| 9,189,820
USD | | | Payless, Inc., First Lien Term Loan
5.00% due 03/11/21 | | | 9,156,243
| | | | 8,906,498
| | |
| 1,202,000
USD | | | Payless, Inc., Second Lien Term Loan
8.50% due 03/11/22 | | | 1,190,612
| | | | 1,148,661
| | |
| 10,037,000
USD | | | Red Lobster Management LLC,
Term Loan B
6.25% due 07/28/21 | | | 9,924,803
| | | | 10,049,546
| | |
| 6,242,940
USD | | | ROC Finance
5.00% due 06/20/19 | | | 6,038,977
| | | | 5,997,124
| | |
| 16,874,105
USD | | | Roundy's Supermarkets, Inc.,
Term Loan B
5.75% due 03/03/21 | | | 16,886,228
| | | | 15,144,510
| | |
| 2,289,262
USD | | | Stater Bros. Markets, Term Loan B
4.75% due 05/12/21 | | | 2,278,362
| | | | 2,272,104
| | |
| 10,494,497
USD | | | True Religion Apparel, Inc.,
First Lien Term Loan
5.875-7.125% due 07/30/19 (e) | | | 10,026,308
| | | | 9,651,684
| | |
| 11,143,440
USD | | | Water Pik Technologies, Inc.,
First Lien Term Loan
5.75% due 07/08/20 (e) | | | 10,964,059
| | | | 11,101,708
| | |
First Eagle Funds | Annual Report | October 31, 2014
122
First Eagle High Yield Fund | Schedule of Investments | Year Ended October 31, 2014
| Principal | | Description | | Cost (Note 1) | | Value (Note 1) | |
Term Loans — 18.37% (continued) | | | |
United States — 17.52% (continued) | | | |
| 6,882,115
USD | | | Wilton Brands LLC
7.50% due 08/30/18 | | $ | 6,808,803
| | | $ | 6,503,599
| | |
| 10,399,000
USD | | | Zebra Technologies Corporation,
Term Loan B due
09/30/21 (i) | | | 10,362,607
| | | | 10,488,899
| | |
| | | | 202,769,466 | | | | 199,927,453 | | |
Total Term Loans | | | | | 212,611,084 | | | | 209,664,765 | | |
International Commercial Paper — 5.27% | | | |
Italy — 1.32% | | | |
| 15,012,000
USD | | | Eni S.p.A.
0.19% due 11/03/14 | | | 15,011,842
| | | | 15,011,842
| | |
Japan — 3.95% | | | |
| 24,032,000
USD | | | Hitachi Limited
0.21% due 11/03/14 | | | 24,031,719
| | | | 24,031,719
| | |
| 21,095,000
USD | | | Hitachi Limited
0.24% due 11/03/14 | | | 21,094,719
| | | | 21,094,719
| | |
Total International Commercial Paper | | | 60,138,280 | | | | 60,138,280 | | |
Total Investments — 99.58% | | | | $ | 1,140,899,481 | | | | 1,136,377,253 | | |
Other Assets in Excess of Liabilities — 0.42% | | | | | 4,812,220 | | |
Net Assets — 100.00% | | | | $ | 1,141,189,473 | | |
(a) This security is convertible until January 27, 2016.
(b) All or a portion of the security is exempt from registration under the Securities Act of 1933. Rule 144A securities may only be sold to qualified institutional buyers, pursuant to Rule 144A under the Securities Act of 1933.
(c) Payment-in-kind security.
(d) This security is convertible until September 27, 2017.
(e) Security is deemed illiquid. At October 31, 2014, the value of these securities amounted to $97,984,565 or 8.59% of net assets.
(f) Represents a security registered under Regulation S. Bonds sold under Regulation S may not be offered, sold or delivered within the U.S., or for the account or benefit of, U.S. persons, except pursuant to an exemption from, or in a transaction not subject to, the registration requirements of the Securities Act of 1933.
(g) When-Issued security.
(h) Securities valued in accordance with fair value procedures under the supervision of the Board of Trustees, representing $10,108,468 or 0.89% of net assets.
(i) All or a portion of the security represents unsettled loan positions.
First Eagle Funds | Annual Report | October 31, 2014
123
First Eagle High Yield Fund | Schedule of Investments | Year Ended October 31, 2014
At October 31, 2014, aggregate cost for federal income tax purposes was $1,140,901,375 Net unrealized depreciation consisted of:
Gross unrealized appreciation | | $ | 17,365,208 | | |
Gross unrealized depreciation | | | (21,889,330 | ) | |
Net unrealized depreciation | | $ | (4,524,122 | ) | |
Abbreviations used in this schedule include:
PLC — Public Limited Company
Currencies
EUR — Euro
USD — United States Dollar
Foreign Currency Exchange Contracts — Sales
Settlement
Dates
Through | | Foreign Currency
To be Delivered | | U.S. $
To be Received | | U.S. $ Value
At October 31,
2014 | | Unrealized
Appreciation
At October 31,
2014 | | Unrealized
Depreciation
At October 31,
2014 | |
11/03/14 | | | 2,385,395 | | | Euro | | $ | 2,986,181 | | | $ | 2,989,258 | | | $ | — | | | $ | (3,077 | ) | |
12/17/14 | | | 17,297,000 | | | Euro | | | 23,364,315 | | | | 21,681,715 | | | | 1,682,600 | | | | — | | |
| | | | | | | $ | 26,350,496 | | | $ | 24,670,973 | | | $ | 1,682,600 | | | $ | (3,077 | ) | |
Foreign Currency Exchange Contracts — Purchases
Settlement
Dates
Through | | Foreign Currency
To be Received | | U.S. $
To be Delivered | | U.S. $ Value
At October 31,
2014 | | Unrealized
Appreciation
At October 31,
2014 | | Unrealized
Depreciation
At October 31,
2014 | |
11/03/14 | | | 2,385,395 | | | Euro | | $ | 2,985,370 | | | $ | 2,989,258 | | | $ | 3,888 | | | $ | — | | |
12/17/14 | | | 7,531,000 | | | Euro | | | 9,793,101 | | | | 9,440,076 | | | | — | | | | (353,025 | ) | |
| | | | | | | $ | 12,778,471 | | | $ | 12,429,334 | | | $ | 3,888 | | | $ | (353,025 | ) | |
Industry Diversification for Portfolio Holdings | | Percent of
Net Assets | |
U.S. Convertible Bond
Industrials | | | 0.18 | % | |
Total U.S. Convertible Bond | | | 0.18 | | |
U.S. Corporate Bonds
Consumer Discretionary | | | 13.09 | | |
Consumer Staples | | | 5.24 | | |
Energy | | | 9.84 | | |
Financials | | | 4.42 | | |
Health Care | | | 0.18 | | |
Industrials | | | 7.43 | | |
Materials | | | 2.87 | | |
Telecommunication Services | | | 8.78 | | |
Total U.S. Corporate Bonds | | | 51.85 | | |
First Eagle Funds | Annual Report | October 31, 2014
124
First Eagle High Yield Fund | Schedule of Investments | Year Ended October 31, 2014
Industry Diversification for Portfolio Holdings (continued) | | Percent of
Net Assets | |
International Convertible Bond
Consumer Staples | | | 0.17 | % | |
Total International Convertible Bond | | | 0.17 | | |
International Corporate Bonds
Consumer Discretionary | | | 3.02 | | |
Energy | | | 5.59 | | |
Financials | | | 2.26 | | |
Industrials | | | 0.88 | | |
Information Technology | | | 0.92 | | |
Materials | | | 5.93 | | |
Telecommunication Services | | | 4.01 | | |
Utilities | | | 1.13 | | |
Total International Corporate Bonds | | | 23.74 | | |
Term Loans | | | 18.37 | | |
Commercial Paper
International Commercial Paper | | | 5.27 | | |
Total Investments | | | 99.58 | % | |
See Notes to Financial Statements.
First Eagle Funds | Annual Report | October 31, 2014
125
First Eagle Fund of America
Data as of October 31, 2014 (unaudited)
Investment Objective
The First Eagle Fund of America is a non-diversified U.S. equity fund that seeks capital appreciation by investing primarily in U.S. stocks and to a lesser extent in debt and foreign equity securities. The Fund has a unique event-driven bias that focuses on identifying companies poised to benefit from change that the market has not yet recognized.
Average Annual Returns (%) | | | | One-Year | | Five-Years | | Ten-Years | |
First Eagle Fund of America | | Class Y | | | 12.91 | | | | 17.17 | | | | 10.19 | | |
Standard & Poor's 500 Index | | | | | 17.27 | | | | 16.69 | | | | 8.20 | | |

Sector/Industry** (%)
Information Technology | | | 22.93 | | |
Materials | | | 20.61 | | |
Health Care | | | 15.03 | | |
Consumer Discretionary | | | 14.78 | | |
Industrials | | | 12.66 | | |
Energy | | | 7.65 | | |
* Asset Allocation and Sector/Industry percentages are based on total investments in the portfolio.
**Sector/Industry allocations exclude short term investments and options positions.
The Fund's portfolio composition is subject to change at any time.
First Eagle Funds | Annual Report | October 31, 2014
126
First Eagle Fund of America | Fund Overview
Growth of a $10,000 Initial Investment
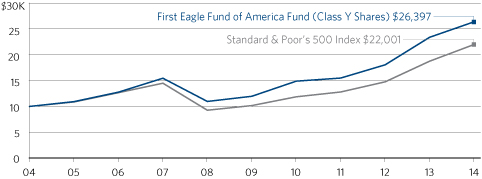
Performance data quoted herein represents past performance and should not be considered indicative of future results. Performance data quoted herein does not reflect the deduction of taxes that a shareholder would pay on Fund distributions or the sale of Fund shares.
The Fund's average annual returns shown above are historical and reflect changes in share price, reinvested dividends and is net of expenses.
The Standard & Poor's 500 Index is a widely recognized unmanaged index including a representative sample of 500 leading companies in leading sectors of the U.S. economy and is not available for purchase. Although the Standard & Poor's 500 Index focuses on the large-cap segment of the market, with approximately 80% coverage of U.S. equities, it is also considered a proxy for the total market.
Top 10 Holdings* (%)
Hewlett-Packard Company (technology software, solutions and services provider) | | | 5.56 | | |
Seagate Technology PLC (hard disk drive manufacturer) | | | 5.41 | | |
Sealed Air Corporation (containers & packaging company) | | | 4.79 | | |
Pitney Bowes, Inc. (mail processing equipment and solutions provider) | | | 4.78 | | |
Eastman Chemical Company (chemicals company) | | | 4.77 | | |
Wyndham Worldwide Corporation (hotel and resorts) | | | 4.51 | | |
Valeant Pharmaceuticals International, Inc. (pharmaceuticals company) | | | 4.28 | | |
SanDisk Corporation (electronic components) | | | 4.22 | | |
LyondellBasell Industries NV, Class 'A' (specialty chemicals company) | | | 4.02 | | |
WR Grace & Company (specialty chemicals company) | | | 3.98 | | |
Total | | | 46.32 | | |
*Holdings in cash, commercial paper and other short term cash equivalents have been excluded.
Percentages are based on total net assets.
First Eagle Funds | Annual Report | October 31, 2014
127
First Eagle Fund of America | Schedule of Investments | Year Ended October 31, 2014
| Shares | | Description | | Cost (Note 1) | | Value (Note 1) | |
Common Stocks — 95.77% | | | |
U.S. Common Stocks — 91.75% | | | |
Consumer Discretionary — 15.15% | | | |
| | 1,889,570 | | | Wyndham Worldwide Corporation (a) | | $ | 63,229,332 | | | $ | 146,762,902 | | |
| | 2,170,540 | | | Lowe's Companies, Inc. (a) | | | 97,341,372 | | | | 124,154,888 | | |
| | 1,326,710 | | | Viacom, Inc., Class 'B' (a) | | | 76,538,675 | | | | 96,425,283 | | |
| | 144,150 | | | AutoZone, Inc. (a)(b) | | | 63,631,406 | | | | 79,789,908 | | |
| | 347,480 | | | United Therapeutics Corporation (a)(b) | | | 43,416,609 | | | | 45,509,455 | | |
| | | | 344,157,394 | | | | 492,642,436 | | |
Energy — 7.84% | | | |
| | 1,417,660 | | | Occidental Petroleum Corporation (a) | | | 128,091,546 | | | | 126,072,504 | | |
| | 1,246,480 | | | Phillips 66 (a) | | | 103,832,487 | | | | 97,848,680 | | |
| | 348,580 | | | SemGroup Corporation, Class 'A' (a) | | | 27,643,064 | | | | 26,753,515 | | |
| | 50,000 | | | Dresser-Rand Group, Inc. (a)(b) | | | 3,020,099 | | | | 4,085,000 | | |
| | | | 262,587,196 | | | | 254,759,699 | | |
Health Care — 15.19% | | | |
| | 1,046,902 | | | Valeant Pharmaceuticals
International, Inc. (a)(b) | | | 31,147,594
| | | | 139,279,842
| | |
| | 1,970,540 | | | Teva Pharmaceutical Industries
Limited, ADR (a) | | | 105,193,266
| | | | 111,276,394
| | |
| | 401,095 | | | Actavis PLC (a)(b) | | | 66,971,653 | | | | 97,361,800 | | |
| | 844,500 | | | Omnicare, Inc. (a) | | | 20,665,173 | | | | 56,235,255 | | |
| | 3,990,480 | | | Halozyme Therapeutics, Inc. (a)(b) | | | 41,415,396 | | | | 38,388,418 | | |
| | 1,593,620 | | | Theravance, Inc. | | | 50,596,563 | | | | 25,529,792 | | |
| | 790,364 | | | Intrexon Corporation (a)(b) | | | 17,625,945 | | | | 17,640,925 | | |
| | 455,330 | | | Theravance Biopharma, Inc. (b) | | | 9,486,801 | | | | 8,332,539 | | |
| | | | 343,102,391 | | | | 494,044,965 | | |
Industrials — 12.97% | | | |
| | 6,280,045 | | | Pitney Bowes, Inc. (a) | | | 108,211,995 | | | | 155,368,314 | | |
| | 1,723,687 | | | Avis Budget Group, Inc. (a)(b) | | | 42,599,018 | | | | 96,095,550 | | |
| | 6,057,486 | | | Graphic Packaging Holding
Company (b) | | | 72,770,931
| | | | 73,477,305
| | |
| | 2,360,050 | | | Hertz Global Holdings, Inc. (a)(b) | | | 63,615,722 | | | | 51,732,296 | | |
| | 291,150 | | | Visteon Corporation (a)(b) | | | 28,470,484 | | | | 27,338,985 | | |
| | 151,300 | | | Alliant Techsystems, Inc. (a) | | | 19,922,938 | | | | 17,696,048 | | |
| | | | 335,591,088 | | | | 421,708,498 | | |
First Eagle Funds | Annual Report | October 31, 2014
128
First Eagle Fund of America | Schedule of Investments | Year Ended October 31, 2014
| Shares | | Description | | Cost (Note 1) | | Value (Note 1) | |
U.S. Common Stocks — 91.75% (continued) | | | |
Information Technology — 23.50% | | | |
| | 5,040,000 | | | Hewlett-Packard Company (a) | | $ | 108,005,173 | | | $ | 180,835,200 | | |
| | 2,799,820 | | | Seagate Technology PLC (a) | | | 78,784,982 | | | | 175,912,690 | | |
| | 1,457,100 | | | SanDisk Corporation (a) | | | 107,536,815 | | | | 137,171,394 | | |
| | 2,291,290 | | | AOL, Inc. (a)(b) | | | 64,142,964 | | | | 99,739,854 | | |
| | 2,113,520 | | | Lexmark International, Inc., Class 'A' (a) | | | 81,834,580 | | | | 91,219,523 | | |
| | 1,226,930 | | | Motorola Solutions, Inc. (a) | | | 64,145,674 | | | | 79,136,985 | | |
| | | | 504,450,188 | | | | 764,015,646 | | |
Materials — 17.10% | | | |
| | 4,299,805 | | | Sealed Air Corporation (a) | | | 123,104,880 | | | | 155,867,931 | | |
| | 1,919,400 | | | Eastman Chemical Company (a) | | | 68,087,316 | | | | 155,049,132 | | |
| | 1,367,750 | | | WR Grace & Company (a)(b) | | | 87,144,765 | | | | 129,389,150 | | |
| | 851,050 | | | Valspar Corporation (a) | | | 22,407,329 | | | | 69,922,268 | | |
| | 1,217,308 | | | Masco Corporation | | | 28,010,698 | | | | 26,865,988 | | |
| | 245,100 | | | Rockwood Holdings, Inc. (a) | | | 16,491,930 | | | | 18,850,641 | | |
| | | | 345,246,918 | | | | 555,945,110 | | |
Total U.S. Common Stocks | | | | | 2,135,135,175 | | | | 2,983,116,354 | | |
International Common Stock — 4.02% | | | |
Netherlands — 4.02% | | | |
| | 1,428,100 | | | LyondellBasell Industries NV,
Class 'A' (a) | | | 105,746,234
| | | | 130,856,803
| | |
Total Common Stocks | | | 2,240,881,409 | | | | 3,113,973,157 | | |
Investment Company — 6.50% | | | |
| 211,310,956 | | | State Street Institutional
U.S. Government Money
Market Fund, Institutional Class | | | 211,310,956 | | | | 211,310,956 | | |
| Principal | | | | | | | |
Bond — 0.21% | | | |
U.S. Convertible Bond — 0.21% | | | |
$ | 2,730,000 | | | Omnicare, Inc.
3.75% due 12/15/25 (c) | | | 2,730,000
| | | | 6,918,844
| | |
Total Investment Portfolio
Excluding Options Written — 102.48%
(Cost: $2,454,922,365) | | | | $ | 3,332,202,957 | | |
First Eagle Funds | Annual Report | October 31, 2014
129
First Eagle Fund of America | Schedule of Investments | Year Ended October 31, 2014
| Contracts | | Description | | Strike Price | | Expiration Date | | Value (Note 1) | |
Covered Call Options Written — (1.22)% | | | |
| | 75 | | | Actavis PLC | | $ | 230.00 | | | December 2014 | | $ | (147,375 | ) | |
| | 1,057 | | | Actavis PLC | | | 245.00 | | | January 2015 | | | (1,268,400 | ) | |
| | 66 | | | Actavis PLC | | | 250.00 | | | December 2014 | | | (51,480 | ) | |
| | 65 | | | Actavis PLC | | | 255.00 | | | December 2014 | | | (42,445 | ) | |
| | 259 | | | Alliant Techsystems, Inc. | | | 125.00 | | | November 2014 | | | (12,950 | ) | |
| | 381 | | | Alliant Techsystems, Inc. | | | 135.00 | | | November 2014 | | | (19,050 | ) | |
| | 115 | | | Alliant Techsystems, Inc. | | | 140.00 | | | November 2014 | | | (2,875 | ) | |
| | 46 | | | AOL, Inc. | | | 43.00 | | | January 2015 | | | (13,915 | ) | |
| | 612 | | | AOL, Inc. | | | 44.00 | | | January 2015 | | | (162,180 | ) | |
| | 42 | | | AutoZone, Inc. | | | 520.00 | | | December 2014 | | | (155,820 | ) | |
| | 144 | | | AutoZone, Inc. | | | 540.00 | | | December 2014 | | | (321,120 | ) | |
| | 1,000 | | | Avis Budget Group, Inc. | | | 49.00 | | | November 2014 | | | (745,000 | ) | |
| | 5,135 | | | Avis Budget Group, Inc. | | | 50.00 | | | January 2015 | | | (3,953,950 | ) | |
| | 4,221 | | | Avis Budget Group, Inc. | | | 52.50 | | | January 2015 | | | (2,469,285 | ) | |
| | 1,783 | | | Avis Budget Group, Inc. | | | 55.00 | | | November 2014 | | | (490,325 | ) | |
| | 3,000 | | | Avis Budget Group, Inc. | | | 55.00 | | | January 2015 | | | (1,320,000 | ) | |
| | 1,000 | | | Avis Budget Group, Inc. | | | 57.50 | | | January 2015 | | | (320,000 | ) | |
| | 500 | | | Dresser-Rand Group, Inc. | | | 80.00 | | | December 2014 | | | (80,000 | ) | |
| | 200 | | | Eastman Chemical Company | | | 75.00 | | | November 2014 | | | (122,000 | ) | |
| | 1,390 | | | Eastman Chemical Company | | | 77.50 | | | December 2014 | | | (430,900 | ) | |
| | 45 | | | Eastman Chemical Company | | | 80.00 | | | December 2014 | | | (13,725 | ) | |
| | 1,052 | | | Eastman Chemical Company | | | 80.00 | | | January 2015 | | | (383,980 | ) | |
| | 3,613 | | | Halozyme Therapeutics, Inc. | | | 9.00 | | | December 2014 | | | (433,560 | ) | |
| | 15,371 | | | Halozyme Therapeutics, Inc. | | | 10.00 | | | December 2014 | | | (922,260 | ) | |
| | 1,668 | | | Halozyme Therapeutics, Inc. | | | 10.00 | | | January 2015 | | | (166,800 | ) | |
| | 70 | | | Hertz Global Holdings, Inc. | | | 22.00 | | | December 2014 | | | (11,900 | ) | |
| | 6,091 | | | Hertz Global Holdings, Inc. | | | 31.00 | | | December 2014 | | | (30,455 | ) | |
| | 3,276 | | | Hertz Global Holdings, Inc. | | | 32.00 | | | December 2014 | | | (16,380 | ) | |
| | 317 | | | Hewlett-Packard Company | | | 34.00 | | | January 2015 | | | (82,420 | ) | |
| | 3,083 | | | Hewlett-Packard Company | | | 35.00 | | | January 2015 | | | (610,434 | ) | |
| | 445 | | | Hewlett-Packard Company | | | 36.00 | | | December 2014 | | | (54,290 | ) | |
| | 906 | | | Hewlett-Packard Company | | | 36.00 | | | January 2015 | | | (134,994 | ) | |
| | 878 | | | Hewlett-Packard Company | | | 37.00 | | | December 2014 | | | (71,996 | ) | |
| | 3,399 | | | Hewlett-Packard Company | | | 37.00 | | | January 2015 | | | (353,496 | ) | |
First Eagle Funds | Annual Report | October 31, 2014
130
First Eagle Fund of America | Schedule of Investments | Year Ended October 31, 2014
| Contracts | | Description | | Strike Price | | Expiration Date | | Value (Note 1) | |
Covered Call Options Written — (1.22)% (continued) | | | |
| | 748 | | | Intrexon Corporation | | $ | 20.00 | | | January 2015 | | $ | (287,980 | ) | |
| 379 | | | Lexmark International, Inc.,
Class 'A' | | | 41.00 | | | January 2015 | | | (100,435 | ) | |
| 1,502 | | | Lexmark International, Inc.,
Class 'A' | | | 42.00 | | | December 2014 | | | (326,685 | ) | |
| 447 | | | Lexmark International, Inc.,
Class 'A' | | | 42.00 | | | January 2015 | | | (91,635 | ) | |
| 1,474 | | | Lexmark International, Inc.,
Class 'A' | | | 43.00 | | | December 2014 | | | (209,308 | ) | |
| 1,128 | | | Lexmark International, Inc.,
Class 'A' | | | 43.00 | | | January 2015 | | | (191,760 | ) | |
| | 1,431 | | | Lowe's Companies, Inc. | | | 52.50 | | | January 2015 | | | (758,430 | ) | |
| | 1,175 | | | Lowe's Companies, Inc. | | | 55.00 | | | January 2015 | | | (405,375 | ) | |
| 2,480 | | | LyondellBasell Industries NV,
Class 'A' | | | 85.00 | | | November 2014 | | | (1,488,000 | ) | |
| 1,000 | | | LyondellBasell Industries NV,
Class 'A' | | | 85.00 | | | December 2014 | | | (750,000 | ) | |
| 180 | | | LyondellBasell Industries NV,
Class 'A' | | | 87.50 | | | December 2014 | | | (106,200 | ) | |
| 954 | | | LyondellBasell Industries NV,
Class 'A' | | | 90.00 | | | November 2014 | | | (317,682 | ) | |
| 1,354 | | | LyondellBasell Industries NV,
Class 'A' | | | 90.00 | | | December 2014 | | | (528,060 | ) | |
| 177 | | | LyondellBasell Industries NV,
Class 'A' | | | 90.00 | | | January 2015 | | | (93,810 | ) | |
| 663 | | | LyondellBasell Industries NV,
Class 'A' | | | 95.00 | | | December 2014 | | | (132,600 | ) | |
| 326 | | | LyondellBasell Industries NV,
Class 'A' | | | 95.00 | | | January 2015 | | | (91,280 | ) | |
| 339 | | | LyondellBasell Industries NV,
Class 'A' | | | 105.00 | | | January 2015 | | | (23,730 | ) | |
| | 22 | | | Motorola Solutions, Inc. | | | 65.00 | | | November 2014 | | | (4,708 | ) | |
| 1,418 | | | Occidental Petroleum
Corporation | | | 82.50 | | | November 2014 | | | (939,425 | ) | |
| 4,253 | | | Occidental Petroleum
Corporation | | | 85.00 | | | November 2014 | | | (1,552,345 | ) | |
| 1,276 | | | Occidental Petroleum
Corporation | | | 87.50 | | | November 2014 | | | (344,520 | ) | |
| 176 | | | Occidental Petroleum
Corporation | | | 95.00 | | | January 2015 | | | (19,360 | ) | |
First Eagle Funds | Annual Report | October 31, 2014
131
First Eagle Fund of America | Schedule of Investments | Year Ended October 31, 2014
| Contracts | | Description | | Strike Price | | Expiration Date | | Value (Note 1) | |
Covered Call Options Written — (1.22)% (continued) | | | |
| | 423 | | | Omnicare, Inc. | | $ | 65.00 | | | December 2014 | | $ | (120,555 | ) | |
| | 165 | | | Phillips 66 | | | 72.50 | | | November 2014 | | | (99,000 | ) | |
| | 193 | | | Phillips 66 | | | 75.00 | | | November 2014 | | | (79,130 | ) | |
| | 206 | | | Phillips 66 | | | 77.50 | | | December 2014 | | | (56,650 | ) | |
| | 1,567 | | | Phillips 66 | | | 77.50 | | | January 2015 | | | (564,120 | ) | |
| | 3,753 | | | Phillips 66 | | | 80.00 | | | January 2015 | | | (900,720 | ) | |
| | 2,524 | | | Pitney Bowes, Inc. | | | 24.00 | | | November 2014 | | | (227,160 | ) | |
| | 3,254 | | | Pitney Bowes, Inc. | | | 24.00 | | | December 2014 | | | (357,940 | ) | |
| | 718 | | | Pitney Bowes, Inc. | | | 24.00 | | | January 2015 | | | (94,776 | ) | |
| | 1,323 | | | Pitney Bowes, Inc. | | | 25.00 | | | December 2014 | | | (79,380 | ) | |
| | 1,289 | | | Pitney Bowes, Inc. | | | 25.00 | | | January 2015 | | | (96,675 | ) | |
| | 920 | | | Pitney Bowes, Inc. | | | 26.00 | | | January 2015 | | | (41,400 | ) | |
| | 2,451 | | | Rockwood Holdings, Inc. | | | 77.50 | | | November 2014 | | | (447,308 | ) | |
| | 555 | | | SanDisk Corporation | | | 85.00 | | | January 2015 | | | (594,405 | ) | |
| | 176 | | | SanDisk Corporation | | | 87.50 | | | January 2015 | | | (157,696 | ) | |
| | 705 | | | SanDisk Corporation | | | 90.00 | | | December 2014 | | | (440,625 | ) | |
| | 356 | | | SanDisk Corporation | | | 92.50 | | | January 2015 | | | (202,920 | ) | |
| | 707 | | | SanDisk Corporation | | | 95.00 | | | January 2015 | | | (300,475 | ) | |
| | 283 | | | Seagate Technology PLC | | | 52.50 | | | November 2014 | | | (283,000 | ) | |
| | 283 | | | Seagate Technology PLC | | | 55.00 | | | November 2014 | | | (211,967 | ) | |
| | 331 | | | Seagate Technology PLC | | | 55.00 | | | December 2014 | | | (250,567 | ) | |
| | 277 | | | Seagate Technology PLC | | | 57.50 | | | December 2014 | | | (152,350 | ) | |
| | 476 | | | Sealed Air Corporation | | | 33.00 | | | January 2015 | | | (171,360 | ) | |
| | 981 | | | Sealed Air Corporation | | | 34.00 | | | January 2015 | | | (294,300 | ) | |
| | 458 | | | Sealed Air Corporation | | | 35.00 | | | December 2014 | | | (90,455 | ) | |
| | 463 | | | Sealed Air Corporation | | | 35.00 | | | January 2015 | | | (103,017 | ) | |
| | 459 | | | Sealed Air Corporation | | | 36.00 | | | January 2015 | | | (76,882 | ) | |
| | 942 | | | Sealed Air Corporation | | | 37.00 | | | January 2015 | | | (108,330 | ) | |
| 1,942 | | | SemGroup Corporation,
Class 'A' | | | 90.00 | | | December 2014 | | | (194,200 | ) | |
| 1,172 | | | Teva Pharmaceutical
Industries Limited | | | 55.00 | | | December 2014 | | | (309,408 | ) | |
| 5,463 | | | Teva Pharmaceutical
Industries Limited | | | 55.00 | | | January 2015 | | | (1,693,530 | ) | |
| 569 | | | Teva Pharmaceutical
Industries Limited | | | 57.50 | | | December 2014 | | | (74,539 | ) | |
First Eagle Funds | Annual Report | October 31, 2014
132
First Eagle Fund of America | Schedule of Investments | Year Ended October 31, 2014
| Contracts | | Description | | Strike Price | | Expiration Date | | Value (Note 1) | |
Covered Call Options Written — (1.22)% (continued) | | | |
| 2,607 | | | Teva Pharmaceutical
Industries Limited | | $ | 57.50 | | | January 2015 | | $ | (482,295 | ) | |
| 244 | | | United Therapeutics
Corporation | | | 125.00 | | | November 2014 | | | (224,480 | ) | |
| 903 | | | United Therapeutics
Corporation | | | 130.00 | | | November 2014 | | | (568,890 | ) | |
| 365 | | | United Therapeutics
Corporation | | | 130.00 | | | January 2015 | | | (412,450 | ) | |
| 378 | | | United Therapeutics
Corporation | | | 135.00 | | | November 2014 | | | (189,000 | ) | |
| 123 | | | United Therapeutics
Corporation | | | 135.00 | | | December 2014 | | | (73,800 | ) | |
| 122 | | | United Therapeutics
Corporation | | | 135.00 | | | January 2015 | | | (108,580 | ) | |
| 446 | | | Valeant Pharmaceuticals
International, Inc. | | | 115.00 | | | January 2015 | | | (1,030,260 | ) | |
| 443 | | | Valeant Pharmaceuticals
International, Inc. | | | 120.00 | | | January 2015 | | | (854,990 | ) | |
| 355 | | | Valeant Pharmaceuticals
International, Inc. | | | 130.00 | | | January 2015 | | | (482,800 | ) | |
| 121 | | | Valeant Pharmaceuticals
International, Inc. | | | 135.00 | | | January 2015 | | | (122,210 | ) | |
| | 212 | | | Valspar Corporation | | | 80.00 | | | November 2014 | | | (65,190 | ) | |
| | 574 | | | Valspar Corporation | | | 80.00 | | | January 2015 | | | (226,730 | ) | |
| | 157 | | | Viacom, Inc., Class 'B' | | | 75.00 | | | December 2014 | | | (24,335 | ) | |
| | 1,233 | | | Visteon Corporation | | | 105.00 | | | December 2014 | | | (129,465 | ) | |
| | 260 | | | WR Grace & Company | | | 92.50 | | | December 2014 | | | (98,800 | ) | |
| | 212 | | | WR Grace & Company | | | 95.00 | | | December 2014 | | | (51,940 | ) | |
| 945 | | | Wyndham Worldwide
Corporation | | | 75.00 | | | November 2014 | | | (330,750 | ) | |
| 3,295 | | | Wyndham Worldwide
Corporation | | | 77.50 | | | November 2014 | | | (517,316 | ) | |
| 2,000 | | | Wyndham Worldwide
Corporation | | | 77.50 | | | January 2015 | | | (614,000 | ) | |
Total Covered Call Options Written
(Premiums Received: $33,572,744) | | | | | | | | | (39,662,209 | ) | |
Total Investments — 101.26%
(Cost: $2,421,349,621) | | | | | | | | | 3,292,540,748 | | |
Liabilities in Excess of Other Assets — (1.26)% | | | | | | | | | (41,104,757 | ) | |
Net Assets — 100.00% | | | | | | | | $ | 3,251,435,991 | | |
First Eagle Funds | Annual Report | October 31, 2014
133
First Eagle Fund of America | Schedule of Investments | Year Ended October 31, 2014
(a) At October 31, 2014, all or a portion of this security was segregated to cover collateral requirement for options.
(b) Non-income producing security/commodity.
(c) This security is convertible until December 15, 2025.
At October 31, 2014, aggregate cost for federal income tax purposes was $2,439,572,664. Net unrealized appreciation consisted of:
Gross unrealized appreciation | | $ | 919,572,048 | | |
Gross unrealized depreciation | | | (66,603,964 | ) | |
Net unrealized appreciation | | $ | 852,968,084 | | |
Abbreviations used in this schedule include:
ADR — American Depository Receipt
PLC — Public Limited Company
Industry Diversification for Portfolio Holdings | | Percent of
Net Assets | |
U.S. Common Stocks
Consumer Discretionary | | | 15.15 | % | |
Energy | | | 7.84 | | |
Health Care | | | 15.19 | | |
Industrials | | | 12.97 | | |
Information Technology | | | 23.50 | | |
Materials | | | 17.10 | | |
Total U.S. Common Stocks | | | 91.75 | | |
International Common Stock
Materials | | | 4.02 | | |
Investment Company | | | 6.50 | | |
U.S. Convertible Bond
Health Care | | | 0.21 | | |
Total U.S. Convertible Bond | | | 0.21 | | |
Covered Call Options Written | | | (1.22 | ) | |
Total Investments | | | 101.26 | % | |
See Notes to Financial Statements.
First Eagle Funds | Annual Report | October 31, 2014
134
This page was intentionally left blank.
Statements of Assets and Liabilities
| | | First Eagle
Global Fund* | | First Eagle
Overseas Fund* | |
Assets | |
Investments, at Cost (Note 1) | |
Unaffiliated issuers | | $ | 36,197,708,781 | | | $ | 11,124,978,190 | | |
Affiliated issuers | | | 2,444,418,317 | | | | 340,002,213 | | |
Gold bullion | | | 2,036,115,803 | | | | 448,772,610 | | |
Silver bullion | | | — | | | | — | | |
Foreign currency | | | 131 | | | | 2,132,468 | | |
Total Investments, at Cost | | | 40,678,243,032 | | | | 11,915,885,481 | | |
Investments, at Value (Note 1) | |
Unaffiliated issuers | | | 44,731,379,571 | | | | 13,173,430,569 | | |
Affiliated issuers | | | 3,013,537,251 | | | | 520,863,132 | | |
Gold bullion | | | 2,418,179,723 | | | | 692,811,472 | | |
Silver bullion | | | — | | | | — | | |
Foreign currency | | | 131 | | | | 2,132,252 | | |
Total Investments, at Value | | | 50,163,096,676 | | | | 14,389,237,425 | | |
Cash | | | 33,723 | | | | 31,159 | | |
Receivable for forward currency contracts held, at value (Note 1) | | | 193,633,407 | | | | 104,627,771 | | |
Receivable for investment securities sold | | | 118,224,187 | | | | 41,477,558 | | |
Receivable for Fund shares sold | | | 71,169,319 | | | | 23,719,964 | | |
Accrued interest and dividends receivable | | | 90,035,586 | | | | 43,615,740 | | |
Investment for trustee deferred compensation plan (Note 2) | | | 2,438,577 | | | | 2,052,708 | | |
Other assets | | | 134,398 | | | | 55,823 | | |
Total Assets | | | 50,638,765,873 | | | | 14,604,818,148 | | |
Liabilities | |
Option contracts written, at value (premiums received $2,422,323, $0,
$269,147 and $0, respectively) (Note 1) | | | 1,579,500 | | | | — | | |
Payable for Fund shares redeemed | | | 63,528,594 | | | | 22,809,178 | | |
Payable for investment securities purchased | | | 32,438,952 | | | | 16,753,167 | | |
Payable for forward currency contracts held, at value (Note 1) | | | 2,332,362 | | | | 1,027,404 | | |
Investment advisory fees payable (Note 2) | | | 31,622,623 | | | | 9,155,551 | | |
Distribution fees payable (Note 3) | | | 11,433,658 | | | | 1,666,128 | | |
Services fees payable (Note 3) | | | 2,576,063 | | | | 228,854 | | |
Trustee deferred compensation plan (Note 2) | | | 2,438,577 | | | | 2,052,708 | | |
Administrative fees payable (Note 2) | | | 399,807 | | | | 116,343 | | |
Due to custodian | | | — | | | | — | | |
Trustee fees payable | | | 75,366 | | | | 28,607 | | |
Accrued expenses and other liabilities | | | 24,929,720 | | | | 10,053,497 | | |
Total Liabilities | | | 173,355,222 | | | | 63,891,437 | | |
Net Assets | | $ | 50,465,410,651 | | | $ | 14,540,926,711 | | |
Net Assets Consist of | |
Capital stock (par value, $0.001 per share) | | $ | 922,577 | | | $ | 621,750 | | |
Capital surplus | | | 39,109,059,819 | | | | 11,894,264,623 | | |
Net unrealized appreciation (depreciation) on: | |
Investments (net of $12,003,493, $5,110,540, $0 and $0 deferred
capital gain country tax, respectively) | | | 9,472,850,151 | | | | 2,468,241,620 | | |
Foreign currency and forward contract related translation | | | 188,477,312 | | | | 102,096,743 | | |
Written options | | | 842,823 | | | | — | | |
Undistributed net realized gains (losses) on investments | | | 1,957,230,654 | | | | 408,035,775 | | |
Undistributed net investment income (loss) | | | (263,972,685 | ) | | | (332,333,800 | ) | |
Net Assets | | $ | 50,465,410,651 | | | $ | 14,540,926,711 | | |
First Eagle Funds | Annual Report | October 31, 2014
136
Year Ended October 31, 2014
| | | First Eagle
U.S. Value Fund* | | First Eagle
Gold Fund* | |
Assets | |
Investments, at Cost (Note 1) | |
Unaffiliated issuers | | $ | 2,163,782,767 | | | $ | 1,118,185,653 | | |
Affiliated issuers | | | 76,612,158 | | | | — | | |
Gold bullion | | | 157,908,533 | | | | 127,027,632 | | |
Silver bullion | | | — | | | | 35,595,409 | | |
Foreign currency | | | 32 | | | | — | | |
Total Investments, at Cost | | | 2,398,303,490 | | | | 1,280,808,694 | | |
Investments, at Value (Note 1) | |
Unaffiliated issuers | | | 2,890,936,687 | | | | 745,351,557 | | |
Affiliated issuers | | | 82,715,620 | | | | — | | |
Gold bullion | | | 154,834,322 | | | | 228,995,040 | | |
Silver bullion | | | — | | | | 29,093,459 | | |
Foreign currency | | | 30 | | | | — | | |
Total Investments, at Value | | | 3,128,486,659 | | | | 1,003,440,056 | | |
Cash | | | 25,597 | | | | 6,187 | | |
Receivable for forward currency contracts held, at value (Note 1) | | | — | | | | — | | |
Receivable for investment securities sold | | | 5,767,154 | | | | 8,021,529 | | |
Receivable for Fund shares sold | | | 3,976,817 | | | | 3,008,906 | | |
Accrued interest and dividends receivable | | | 3,014,008 | | | | 687,500 | | |
Investment for trustee deferred compensation plan (Note 2) | | | 1,516,549 | | | | 133,380 | | |
Other assets | | | 28,585 | | | | 23,809 | | |
Total Assets | | | 3,142,815,369 | | | | 1,015,321,367 | | |
Liabilities | |
Option contracts written, at value (premiums received $2,422,323, $0,
$269,147 and $0, respectively) (Note 1) | | | 175,500 | | | | — | | |
Payable for Fund shares redeemed | | | 3,646,677 | | | | 6,132,818 | | |
Payable for investment securities purchased | | | — | | | | — | | |
Payable for forward currency contracts held, at value (Note 1) | | | — | | | | — | | |
Investment advisory fees payable (Note 2) | | | 1,962,006 | | | | 766,022 | | |
Distribution fees payable (Note 3) | | | 698,571 | | | | 245,527 | | |
Services fees payable (Note 3) | | | 147,312 | | | | 44,977 | | |
Trustee deferred compensation plan (Note 2) | | | 1,516,549 | | | | 133,380 | | |
Administrative fees payable (Note 2) | | | 24,893 | | | | 10,447 | | |
Due to custodian | | | — | | | | 7,344,447 | | |
Trustee fees payable | | | 6,046 | | | | 4,474 | | |
Accrued expenses and other liabilities | | | 1,009,428 | | | | 889,817 | | |
Total Liabilities | | | 9,186,982 | | | | 15,571,909 | | |
Net Assets | | $ | 3,133,628,387 | | | $ | 999,749,458 | | |
Net Assets Consist of | |
Capital stock (par value, $0.001 per share) | | $ | 148,245 | | | $ | 74,556 | | |
Capital surplus | | | 2,213,969,292 | | | | 1,604,957,744 | | |
Net unrealized appreciation (depreciation) on: | |
Investments (net of $12,003,493, $5,110,540, $0 and $0 deferred
capital gain country tax, respectively) | | | 730,183,171 | | | | (277,368,638 | ) | |
Foreign currency and forward contract related translation | | | (2 | ) | | | — | | |
Written options | | | 93,647 | | | | — | | |
Undistributed net realized gains (losses) on investments | | | 173,629,809 | | | | (260,236,422 | ) | |
Undistributed net investment income (loss) | | | 15,604,225 | | | | (67,677,782 | ) | |
Net Assets | | $ | 3,133,628,387 | | | $ | 999,749,458 | | |
First Eagle Funds | Annual Report | October 31, 2014
137
Statements of Assets and Liabilities (continued)
| | | First Eagle
Global Fund* | | First Eagle
Overseas Fund* | |
Class A | |
Net assets | | $ | 17,734,528,800 | | | $ | 4,644,161,362 | | |
Shares outstanding | | | 323,022,030 | | | | 200,333,981 | | |
Net asset value per share and redemption proceeds per share | | $ | 54.90 | | | $ | 23.18 | | |
Offering price per share (NAV per share plus maximum sales charge)** | | $ | 57.79 | (1) | | $ | 24.40 | (1) | |
Class C | |
Net assets | | $ | 12,342,298,920 | | | $ | 1,085,639,445 | | |
Shares outstanding | | | 230,399,148 | | | | 48,428,625 | | |
Net asset value per share | | $ | 53.57 | | | $ | 22.42 | | |
Redemption proceeds per share (NAV per share less maximum contingent
deferred sale charge)(2) | | $ | 53.03 | | | $ | 22.20 | | |
Class I | |
Net assets | | $ | 20,388,582,931 | | | $ | 8,811,125,904 | | |
Shares outstanding | | | 369,155,831 | | | | 372,987,291 | | |
Net asset value per share and redemption proceeds per share | | $ | 55.23 | | | $ | 23.62 | | |
* First Eagle Global Fund, First Eagle Overseas Fund, First Eagle U.S. Value Fund and First Eagle Gold Fund financial statements are shown on a consolidated basis and includes the balances of the First Eagle Global Cayman Fund, Ltd., First Eagle Overseas Cayman Fund, Ltd., First Eagle U.S. Value Cayman Fund, Ltd., and First Eagle Gold Cayman Fund, Ltd., respectively.
** A contingent deferred sales charge of 1.00% may apply on redemptions of Class A shares made within 18 months following a purchase of $1,000,000 or more without an initial sales charge.
(1) The maximum sales charge is 5.00% for Class A shares. Classes C, I and Y have no front-end sales charges.
(2) The maximum CDSC (Contingent Deferred Sales Charge) is 1.00% for Class C shares, which is charged on the lesser of the offering price or the net asset value at the time of sale by shareholder. This pertains to investments of one year or less.
See Notes to Financial Statements.
First Eagle Funds | Annual Report | October 31, 2014
138
Year Ended October 31, 2014
| | | First Eagle
U.S. Value Fund* | | First Eagle
Gold Fund* | |
Class A | |
Net assets | | $ | 1,228,878,444 | | | $ | 448,012,589 | | |
Shares outstanding | | | 58,242,809 | | | | 33,300,816 | | |
Net asset value per share and redemption proceeds per share | | $ | 21.10 | | | $ | 13.45 | | |
Offering price per share (NAV per share plus maximum sales charge)** | | $ | 22.21 | (1) | | $ | 14.16 | (1) | |
Class C | |
Net assets | | $ | 705,076,369 | | | $ | 185,550,902 | | |
Shares outstanding | | | 33,933,533 | | | | 14,456,082 | | |
Net asset value per share | | $ | 20.78 | | | $ | 12.84 | | |
Redemption proceeds per share (NAV per share less maximum contingent
deferred sale charge)(2) | | $ | 20.57 | | | $ | 12.71 | | |
Class I | |
Net assets | | $ | 1,199,673,574 | | | $ | 366,185,967 | | |
Shares outstanding | | | 56,068,895 | | | | 26,799,397 | | |
Net asset value per share and redemption proceeds per share | | $ | 21.40 | | | $ | 13.66 | | |
First Eagle Funds | Annual Report | October 31, 2014
139
Statements of Assets and Liabilities (continued)
| | | First Eagle
Global Income Builder
Fund | | First Eagle
High Yield Fund | |
Assets | |
Investments, at Cost (Note 1) | |
Unaffiliated issuers | | $ | 1,290,958,948 | | | $ | 1,140,899,481 | | |
Gold bullion | | | 16,990,468 | | | | — | | |
Foreign currency | | | 281,156 | | | | 1 | | |
Total Investments, at Cost | | | 1,308,230,572 | | | | 1,140,899,482 | | |
Investments, at Value (Note 1) | |
Unaffiliated issuers | | | 1,293,224,252 | | | | 1,136,377,253 | | |
Gold bullion | | | 15,284,397 | | | | — | | |
Foreign currency | | | 280,929 | | | | 1 | | |
Total Investments, at Value | | | 1,308,789,578 | | | | 1,136,377,254 | | |
Cash | | | 114,173 | | | | — | | |
Receivable for forward currency contracts held, at value (Note 1) | | | 4,157,647 | | | | 1,686,488 | | |
Receivable for investment securities sold | | | 1,954,922 | | | | 11,980,872 | | |
Receivable for premiums for written options | | | — | | | | — | | |
Receivable for Fund shares sold | | | 7,746,707 | | | | 5,284,429 | | |
Accrued interest and dividends receivable | | | 9,258,007 | | | | 17,769,708 | | |
Investment for trustee deferred compensation plan (Note 2) | | | 144,415 | | | | 168,908 | | |
Other assets | | | 20,896 | | | | 20,434 | | |
Total Assets | | | 1,332,186,345 | | | | 1,173,288,093 | | |
Liabilities | |
Option contracts written, at value (premiums received $0, $0 and
$33,572,744, respectively) (Note 1) | | | — | | | | — | | |
Payable for Fund shares redeemed | | | 1,755,002 | | | | 6,097,715 | | |
Payable for investment securities purchased | | | 17,558,054 | | | | 22,150,972 | | |
Payable for forward currency contracts held, at value (Note 1) | | | 135,724 | | | | 356,102 | | |
Payable for dividends to shareholders | | | 2,436,651 | | | | 1,017,076 | | |
Investment advisory fees payable (Note 2) | | | 856,541 | | | | 674,433 | | |
Distribution fees payable (Note 3) | | | 325,661 | | | | 171,374 | | |
Services fees payable (Note 3) | | | 78,081 | | | | 39,078 | | |
Trustee deferred compensation plan (Note 2) | | | 144,415 | | | | 168,908 | | |
Administrative fees payable (Note 2) | | | 53,965 | | | | 9,176 | | |
Due to custodian | | | — | | | | 1,052,021 | | |
Trustee fees payable | | | 1,852 | | | | 2,005 | | |
Accrued expenses and other liabilities | | | 462,450 | | | | 359,760 | | |
Total Liabilities | | | 23,808,396 | | | | 32,098,620 | | |
Net Assets | | $ | 1,308,377,949 | | | $ | 1,141,189,473 | | |
Net Assets Consist of | |
Capital stock (par value, $0.001 per share) | | $ | 114,830 | | | $ | 114,596 | | |
Capital surplus | | | 1,290,894,947 | | | | 1,135,499,757 | | |
Net unrealized appreciation (depreciation) on: | |
Investments | | | 559,233 | | | | (4,522,228 | ) | |
Foreign currency and forward contract related translation | | | 3,960,720 | | | | 1,293,036 | | |
Written options | | | — | | | | — | | |
Undistributed net realized gains on investments | | | 13,161,576 | | | | 7,979,720 | | |
Undistributed net investment income (loss) | | | (313,357 | ) | | | 824,592 | | |
Net Assets | | $ | 1,308,377,949 | | | $ | 1,141,189,473 | | |
First Eagle Funds | Annual Report | October 31, 2014
140
Year Ended October 31, 2014
| | | First Eagle
Fund of America | |
Assets | |
Investments, at Cost (Note 1) | |
Unaffiliated issuers | | $ | 2,454,922,365 | | |
Gold bullion | | | — | | |
Foreign currency | | | — | | |
Total Investments, at Cost | | | 2,454,922,365 | | |
Investments, at Value (Note 1) | |
Unaffiliated issuers | | | 3,332,202,957 | | |
Gold bullion | | | — | | |
Foreign currency | | | — | | |
Total Investments, at Value | | | 3,332,202,957 | | |
Cash | | | — | | |
Receivable for forward currency contracts held, at value (Note 1) | | | — | | |
Receivable for investment securities sold | | | — | | |
Receivable for premiums for written options | | | 1,920,827 | | |
Receivable for Fund shares sold | | | 12,043,474 | | |
Accrued interest and dividends receivable | | | 2,052,728 | | |
Investment for trustee deferred compensation plan (Note 2) | | | 2,034,729 | | |
Other assets | | | 25,380 | | |
Total Assets | | | 3,350,280,095 | | |
Liabilities | |
Option contracts written, at value (premiums received $0, $0 and
$33,572,744, respectively) (Note 1) | | | 39,662,209 | | |
Payable for Fund shares redeemed | | | 4,160,430 | | |
Payable for investment securities purchased | | | 48,296,020 | | |
Payable for forward currency contracts held, at value (Note 1) | | | — | | |
Payable for dividends to shareholders | | | — | | |
Investment advisory fees payable (Note 2) | | | 2,537,507 | | |
Distribution fees payable (Note 3) | | | 735,167 | | |
Services fees payable (Note 3) | | | 127,420 | | |
Trustee deferred compensation plan (Note 2) | | | 2,034,729 | | |
Administrative fees payable (Note 2) | | | 25,110 | | |
Due to custodian | | | 266,338 | | |
Trustee fees payable | | | 5,418 | | |
Accrued expenses and other liabilities | | | 993,756 | | |
Total Liabilities | | | 98,844,104 | | |
Net Assets | | $ | 3,251,435,991 | | |
Net Assets Consist of | |
Capital stock (par value, $0.001 per share) | | $ | 86,313 | | |
Capital surplus | | | 2,164,053,982 | | |
Net unrealized appreciation (depreciation) on: | |
Investments | | | 877,280,592 | | |
Foreign currency and forward contract related translation | | | — | | |
Written options | | | (6,089,465 | ) | |
Undistributed net realized gains on investments | | | 209,083,003 | | |
Undistributed net investment income (loss) | | | 7,021,566 | | |
Net Assets | | $ | 3,251,435,991 | | |
First Eagle Funds | Annual Report | October 31, 2014
141
Statements of Assets and Liabilities (continued)
| | | First Eagle
Global Income Builder
Fund | | First Eagle
High Yield Fund | |
Class A | |
Net assets | | $ | 439,568,681 | | | $ | 246,954,541 | | |
Shares outstanding | | | 38,515,918 | | | | 24,793,550 | | |
Net asset value per share and redemption proceeds per share | | $ | 11.41 | | | $ | 9.96 | | |
Offering price per share (NAV per share plus maximum sales charge)* | | $ | 12.01 | (1) | | $ | 10.43 | (2) | |
Class C | |
Net assets | | $ | 379,187,852 | | | $ | 184,458,856 | | |
Shares outstanding | | | 33,312,986 | | | | 18,539,316 | | |
Net asset value per share | | $ | 11.38 | | | $ | 9.95 | | |
Redemption proceeds per share (NAV per share less maximum contingent
deferred sale charge)(3) | | $ | 11.27 | | | $ | 9.85 | | |
Class I | |
Net assets | | $ | 489,621,416 | | | $ | 709,776,076 | | |
Shares outstanding | | | 43,001,215 | | | | 71,263,479 | | |
Net asset value per share and redemption proceeds per share | | $ | 11.39 | | | $ | 9.96 | | |
Class Y | |
Net assets | | | — | | | | — | | |
Shares outstanding | | | — | | | | — | | |
Net asset value per share and redemption proceeds per share | | | — | | | | — | | |
* A contingent deferred sales charge of 1.00% may apply on redemptions of Class A shares made within 18 months following a purchase of $1,000,000 or more without an initial sales charge.
(1) The maximum sales charge is 5.00% for Class A shares. Classes C, I and Y have no front-end sales charges.
(2) The maximum sales charge is 4.50% for Class A shares. Classes C, I and Y have no front-end sales charges.
(3) The maximum CDSC (Contingent Deferred Sales Charge) is 1.00% for Class C shares, which is charged on the lesser of the offering price or the net asset value at the time of sale by shareholder. This pertains to investments of one year or less.
See Notes to Financial Statements.
First Eagle Funds | Annual Report | October 31, 2014
142
Year Ended October 31, 2014
| | | First Eagle
Fund of America | |
Class A | |
Net assets | | $ | 1,204,402,433 | | |
Shares outstanding | | | 31,218,782 | | |
Net asset value per share and redemption proceeds per share | | $ | 38.58 | | |
Offering price per share (NAV per share plus maximum sales charge)* | | $ | 40.61 | (1) | |
Class C | |
Net assets | | $ | 631,696,002 | | |
Shares outstanding | | | 19,151,446 | | |
Net asset value per share | | $ | 32.98 | | |
Redemption proceeds per share (NAV per share less maximum contingent
deferred sale charge)(3) | | $ | 32.65 | | |
Class I | |
Net assets | | $ | 887,506,699 | | |
Shares outstanding | | | 22,528,796 | | |
Net asset value per share and redemption proceeds per share | | $ | 39.39 | | |
Class Y | |
Net assets | | $ | 527,830,857 | | |
Shares outstanding | | | 13,414,125 | | |
Net asset value per share and redemption proceeds per share | | $ | 39.35 | | |
First Eagle Funds | Annual Report | October 31, 2014
143
| | | First Eagle
Global Fund* | | First Eagle
Overseas Fund* | |
Investment Income | |
Interest (net of $13, $10, $0 and $0 foreign taxes withheld, respectively) | | $ | 23,628,943 | | | $ | 15,440,676 | | |
Dividends from: (net of $54,254,743, $28,637,355, $1,002,810 and $780,667
foreign taxes withheld, respectively) | |
Unaffiliated issuers | | | 713,274,136 | | | | 235,229,014 | | |
Affiliated issuers | | | 78,742,828 | | | | 9,816,934 | | |
Other Income | | | 60 | | | | 91 | | |
Total Income | | | 815,645,967 | | | | 260,486,715 | | |
Expenses | |
Investment advisory fees (Note 2) | | | 370,186,470 | | | | 110,867,303 | | |
Administrative costs (Note 2) | | | 4,272,027 | | | | 1,305,494 | | |
Distribution fees (Note 3) | |
Class A | | | 48,468,999 | | | | 14,246,099 | | |
Class C | | | 91,414,686 | | | | 8,564,988 | | |
Class Y | | | — | | | | — | | |
Service fees - Class C (Note 3) | | | 30,471,562 | | | | 2,854,996 | | |
Shareholder servicing agent fees | | | 38,782,601 | | | | 14,171,320 | | |
Custodian and accounting fees | | | 5,077,024 | | | | 2,737,827 | | |
Professional fees | | | 865,529 | | | | 436,245 | | |
Shareholder reporting fees | | | 3,373,035 | | | | 1,583,002 | | |
Trustees' fees | | | 904,615 | | | | 289,113 | | |
Registration and filing fees | | | 1,415,716 | | | | 392,399 | | |
Other Expenses | | | 649,478 | | | | 244,997 | | |
Total Expenses | | | 595,881,742 | | | | 157,693,783 | | |
Expense reductions due to earnings credits (Note 1) | | | (3,053 | ) | | | (1,014 | ) | |
Net Expenses | | | 595,878,689 | | | | 157,692,769 | | |
Net Investment Income (Loss) (Note 1) | | | 219,767,278 | | | | 102,793,946 | | |
Realized and Unrealized Gains (Losses) on Investments, Foreign
Currency Related Transactions and Written Options (Note 1) | |
Net realized gains (losses) from: | |
Investment transactions of unaffiliated issuers | | | 1,652,113,562 | | | | 354,935,708 | | |
Investment transactions of affiliated issuers | | | 130,029,116 | | | | (291,707 | ) | |
Commodity related transactions | | | — | | | | — | | |
Foreign currency and forward contract related transactions | | | 139,149,321 | | | | 65,956,200 | | |
Payment from affiliates | | | 65,047 | | | | — | | |
Written options | | | 825,462 | | | | — | | |
| | | | 1,922,182,508 | | | | 420,600,201 | | |
Changes in unrealized appreciation (depreciation) of: | |
Investment transactions (net of decrease in deferred capital gain country tax
accruals of $1,330,695, $618,578, $0 and $0, respectively) | | | (289,720,154 | ) | | | (506,517,311 | ) | |
Foreign currency and forward contract related translation | | | 229,710,614 | | | | 127,723,173 | | |
Written options | | | 519,962 | | | | — | | |
| | | | (59,489,578 | ) | | | (378,794,138 | ) | |
Net realized and unrealized gains (losses) on investments, foreign currency and
forward contract related transactions and written options | | | 1,862,692,930 | | | | 41,806,063 | | |
Net Increase (Decrease) in Net Assets Resulting from Operations | | $ | 2,082,460,208 | | | $ | 144,600,009 | | |
* First Eagle Global Fund, First Eagle Overseas Fund, First Eagle U.S. Value Fund and First Eagle Gold Fund financial statements are shown on a consolidated basis and includes the balances of the First Eagle Global Cayman Fund, Ltd., First Eagle Overseas Cayman Fund, Ltd., First Eagle U.S. Value Cayman Fund, Ltd., and First Eagle Gold Cayman Fund, Ltd., respectively.
See Notes to Financial Statements.
First Eagle Funds | Annual Report | October 31, 2014
144
Year Ended October 31, 2014
| | | First Eagle
U.S. Value Fund* | | First Eagle
Gold Fund* | |
Investment Income | |
Interest (net of $13, $10, $0 and $0 foreign taxes withheld, respectively) | | $ | 3,959,516 | | | $ | 1,731,906 | | |
Dividends from: (net of $54,254,743, $28,637,355, $1,002,810 and $780,667
foreign taxes withheld, respectively) | |
Unaffiliated issuers | | | 51,300,865 | | | | 8,013,095 | | |
Affiliated issuers | | | 1,043,989 | | | | — | | |
Other Income | | | — | | | | 950 | | |
Total Income | | | 56,304,370 | | | | 9,745,951 | | |
Expenses | |
Investment advisory fees (Note 2) | | | 23,996,074 | | | | 10,066,417 | | |
Administrative costs (Note 2) | | | 297,536 | | | | 58,822 | | |
Distribution fees (Note 3) | |
Class A | | | 3,463,224 | | | | 1,615,297 | | |
Class C | | | 5,431,570 | | | | 1,821,105 | | |
Class Y | | | — | | | | — | | |
Service fees - Class C (Note 3) | | | 1,810,523 | | | | 607,035 | | |
Shareholder servicing agent fees | | | 2,989,361 | | | | 2,372,395 | | |
Custodian and accounting fees | | | 261,846 | | | | 360,409 | | |
Professional fees | | | 166,120 | | | | 194,510 | | |
Shareholder reporting fees | | | 284,432 | | | | 261,622 | | |
Trustees' fees | | | 69,157 | | | | 43,672 | | |
Registration and filing fees | | | 158,139 | | | | 154,055 | | |
Other Expenses | | | 103,396 | | | | 81,969 | | |
Total Expenses | | | 39,031,378 | | | | 17,637,308 | | |
Expense reductions due to earnings credits (Note 1) | | | (329 | ) | | | (300 | ) | |
Net Expenses | | | 39,031,049 | | | | 17,637,008 | | |
Net Investment Income (Loss) (Note 1) | | | 17,273,321 | | | | (7,891,057 | ) | |
Realized and Unrealized Gains (Losses) on Investments, Foreign
Currency Related Transactions and Written Options (Note 1) | |
Net realized gains (losses) from: | |
Investment transactions of unaffiliated issuers | | | 181,292,784 | | | | (210,066,125 | ) | |
Investment transactions of affiliated issuers | | | (828,375 | ) | | | — | | |
Commodity related transactions | | | (1,687,476 | ) | | | 53,030,180 | | |
Foreign currency and forward contract related transactions | | | (13,732 | ) | | | 152,721 | | |
Payment from affiliates | | | 3,562 | | | | — | | |
Written options | | | 233,563 | | | | — | | |
| | | | 179,000,326 | | | | (156,883,224 | ) | |
Changes in unrealized appreciation (depreciation) of: | |
Investment transactions (net of decrease in deferred capital gain country tax
accruals of $1,330,695, $618,578, $0 and $0, respectively) | | | 74,059,691 | | | | (143,277,335 | ) | |
Foreign currency and forward contract related translation | | | (3 | ) | | | (180 | ) | |
Written options | | | 40,470 | | | | — | | |
| | | | 74,100,158 | | | | (143,277,515 | ) | |
Net realized and unrealized gains (losses) on investments, foreign currency and
forward contract related transactions and written options | | | 253,100,484 | | | | (300,160,739 | ) | |
Net Increase (Decrease) in Net Assets Resulting from Operations | | $ | 270,373,805 | | | $ | (308,051,796 | ) | |
First Eagle Funds | Annual Report | October 31, 2014
145
Statements of Operations (continued)
| | | First Eagle
Global Income Builder
Fund | | First Eagle
High Yield Fund | |
Investment Income | |
Interest | | $ | 20,005,815 | | | $ | 71,906,961 | | |
Dividends from: (net of $1,413,366, $0 and $16,426, foreign taxes
withheld, respectively) | |
Unaffiliated issuers | | | 18,498,828 | | | | — | | |
Other Income | | | — | | | | 254,660 | | |
Total Income | | | 38,504,643 | | | | 72,161,621 | | |
Expenses | |
Investment advisory fees (Note 2) | | | 6,662,682 | | | | 8,065,680 | | |
Administrative costs/fees (Note 2) | | | 444,179 | | | | 99,809 | | |
Distribution fees (Note 3) | |
Class A | | | 892,530 | | | | 867,139 | | |
Class C | | | 1,901,276 | | | | 1,335,664 | | |
Class Y | | | — | | | | — | | |
Service fees - Class C (Note 3) | | | 633,759 | | | | 445,221 | | |
Shareholder servicing agent fees | | | 547,853 | | | | 766,174 | | |
Custodian and accounting fees | | | 340,232 | | | | 192,617 | | |
Professional fees | | | 167,313 | | | | 133,131 | | |
Shareholder reporting fees | | | 91,291 | | | | 103,508 | | |
Trustees' fees | | | 16,582 | | | | 22,361 | | |
Recoupment of previously reimbursed expenses | | | 434,251 | | | | 26,880 | | |
Registration and filing fees | | | 322,489 | | | | 174,406 | | |
Other Expenses | | | 75,144 | | | | 68,896 | | |
Total Expenses | | | 12,529,581 | | | | 12,301,486 | | |
Expense Waiver | | | — | | | | (44,141 | ) | |
Expense reductions due to earnings credits (Note 1) | | | (66 | ) | | | (73 | ) | |
Net Expenses | | | 12,529,515 | | | | 12,257,272 | | |
Net Investment Income (Note 1) | | | 25,975,128 | | | | 59,904,349 | | |
Realized and Unrealized Gains (Losses) on Investments, Foreign
Currency Related Transactions and Written Options (Note 1) | |
Net realized gains (losses) from: | |
Investment transactions of unaffiliated issuers | | | 13,607,999 | | | | 11,733,257 | | |
Foreign currency and forward contract related transactions | | | 594,082 | | | | (1,122,079 | ) | |
Payment from affiliates | | | 9,348 | | | | — | | |
Written options | | | — | | | | — | | |
| | | | 14,211,429 | | | | 10,611,178 | | |
Changes in unrealized appreciation (depreciation) of: | |
Investment transactions | | | (30,828,281 | ) | | | (31,154,102 | ) | |
Foreign currency and forward contract related translation | | | 4,755,176 | | | | 2,048,362 | | |
Written options | | | — | | | | — | | |
| | | | (26,073,105 | ) | | | (29,105,740 | ) | |
Net realized and unrealized gains (losses) on investments, foreign currency and
forward contract related transactions and written options | | | (11,861,676 | ) | | | (18,494,562 | ) | |
Net Increase in Net Assets Resulting from Operations | | $ | 14,113,452 | | | $ | 41,409,787 | | |
See Notes to Financial Statements.
First Eagle Funds | Annual Report | October 31, 2014
146
Year Ended October 31, 2014
| | | First Eagle
Fund of America | |
Investment Income | |
Interest | | $ | 102,375 | | |
Dividends from: (net of $1,413,366, $0 and $16,426, foreign taxes
withheld, respectively) | |
Unaffiliated issuers | | | 52,921,315 | | |
Other Income | | | — | | |
Total Income | | | 53,023,690 | | |
Expenses | |
Investment advisory fees (Note 2) | | | 28,461,249 | | |
Administrative costs/fees (Note 2) | | | 249,323 | | |
Distribution fees (Note 3) | |
Class A | | | 2,968,299 | | |
Class C | | | 4,189,440 | | |
Class Y | | | 1,337,748 | | |
Service fees - Class C (Note 3) | | | 1,396,480 | | |
Shareholder servicing agent fees | | | 2,851,808 | | |
Custodian and accounting fees | | | 186,795 | | |
Professional fees | | | 216,027 | | |
Shareholder reporting fees | | | 248,557 | | |
Trustees' fees | | | 54,423 | | |
Recoupment of previously reimbursed expenses | | | — | | |
Registration and filing fees | | | 340,208 | | |
Other Expenses | | | 88,668 | | |
Total Expenses | | | 42,589,025 | | |
Expense Waiver | | | — | | |
Expense reductions due to earnings credits (Note 1) | | | (274 | ) | |
Net Expenses | | | 42,588,751 | | |
Net Investment Income (Note 1) | | | 10,434,939 | | |
Realized and Unrealized Gains (Losses) on Investments, Foreign
Currency Related Transactions and Written Options (Note 1) | |
Net realized gains (losses) from: | |
Investment transactions of unaffiliated issuers | | | 311,197,275 | | |
Foreign currency and forward contract related transactions | | | — | | |
Payment from affiliates | | | 23,916 | | |
Written options | | | (69,712,637 | ) | |
| | | | 241,508,554 | | |
Changes in unrealized appreciation (depreciation) of: | |
Investment transactions | | | 65,806,194 | | |
Foreign currency and forward contract related translation | | | — | | |
Written options | | | 11,132,578 | | |
| | | | 76,938,772 | | |
Net realized and unrealized gains (losses) on investments, foreign currency and
forward contract related transactions and written options | | | 318,447,326 | | |
Net Increase in Net Assets Resulting from Operations | | $ | 328,882,265 | | |
First Eagle Funds | Annual Report | October 31, 2014
147
Statements of Changes in Net Assets
| | | First Eagle
Global Fund* | | First Eagle
Overseas Fund* | |
| | | Year Ended
October 31, 2014 | | Year Ended
October 31, 2013 | | Year Ended
October 31, 2014 | | Year Ended
October 31, 2013 | |
Operations | |
Net investment income (loss) | | $ | 219,767,278 | | | $ | 268,941,220 | | | $ | 102,793,946 | | | $ | 85,063,542 | | |
Net realized gain (loss) from investments, foreign currency and
forward contract related transactions and written options | | | 1,922,182,508 | | | | 1,443,674,876 | | | | 420,600,201 | | | | 553,743,834 | | |
Change in unrealized appreciation (depreciation) of investments,
foreign currency and forward contract related transactions and
written options | | | (59,489,578 | ) | | | 4,457,513,585 | | | | (378,794,138 | ) | | | 1,220,125,718 | | |
Net increase (decrease) in net assets resulting from operations | | | 2,082,460,208 | | | | 6,170,129,681 | | | | 144,600,009 | | | | 1,858,933,094 | | |
Distribution to Shareholders | |
Dividends paid from net investment income | |
Class A | | | (227,398,267 | ) | | | (163,784,329 | ) | | | (112,591,725 | ) | | | (59,747,911 | ) | |
Class C | | | (61,824,068 | ) | | | (31,090,001 | ) | | | (14,323,784 | ) | | | (5,650,460 | ) | |
Class I | | | (224,726,363 | ) | | | (144,298,326 | ) | | | (155,602,855 | ) | | | (73,001,519 | ) | |
Distributions paid from net realized gains from investment transactions | |
Class A | | | (615,281,136 | ) | | | (515,356,389 | ) | | | (232,225,033 | ) | | | (205,372,548 | ) | |
Class C | | | (381,040,149 | ) | | | (311,092,874 | ) | | | (45,536,166 | ) | | | (40,854,132 | ) | |
Class I | | | (508,789,469 | ) | | | (367,245,305 | ) | | | (285,819,836 | ) | | | (213,569,253 | ) | |
Decrease in net assets resulting from distributions | | | (2,019,059,452 | ) | | | (1,532,867,224 | ) | | | (846,099,399 | ) | | | (598,195,823 | ) | |
Fund Share Transactions (Note 6) | |
Net proceeds from shares sold | | | 12,375,187,925 | | | | 10,684,434,770 | | | | 4,358,933,849 | | | | 4,049,337,623 | | |
Net asset value of shares issued for reinvested dividends
and distributions | | | 1,598,705,920 | | | | 1,212,645,609 | | | | 715,496,649 | | | | 505,565,817 | | |
Cost of shares redeemed | | | (9,572,509,685 | ) | | | (6,877,542,066 | ) | | | (4,242,187,741 | ) | | | (2,754,246,104 | ) | |
Redemption fees | | | — | | | | 210,543 | | | | — | | | | 10,692 | | |
Increase in net assets from Fund share transactions | | | 4,401,384,160 | | | | 5,019,748,856 | | | | 832,242,757 | | | | 1,800,668,028 | | |
Net increase in net assets | | | 4,464,784,916 | | | | 9,657,011,313 | | | | 130,743,367 | | | | 3,061,405,299 | | |
Net Assets (Note 1) | |
Beginning of period | | | 46,000,625,735 | | | | 36,343,614,422 | | | | 14,410,183,344 | | | | 11,348,778,045 | | |
End of period | | $ | 50,465,410,651 | | | $ | 46,000,625,735 | | | $ | 14,540,926,711 | | | $ | 14,410,183,344 | | |
Undistributed net investment income (loss) | | $ | (263,972,685 | ) | | $ | (51,355,308 | ) | | $ | (332,333,800 | ) | | $ | (201,385,958 | ) | |
* First Eagle Global Fund, First Eagle Overseas Fund, First Eagle U.S. Value Fund and First Eagle Gold Fund financial statements are shown on a consolidated basis and includes the balances of the First Eagle Global Cayman Fund, Ltd., First Eagle Overseas Cayman Fund, Ltd., First Eagle U.S. Value Cayman Fund, Ltd., and First Eagle Gold Cayman Fund, Ltd., respectively.
See Notes to Financial Statements.
First Eagle Funds | Annual Report | October 31, 2014
148
Year Ended October 31, 2014
| | | First Eagle
U.S. Value Fund* | | First Eagle
Gold Fund* | |
| | | Year Ended
October 31, 2014 | | Year Ended
October 31, 2013 | | Year Ended
October 31, 2014 | | Year Ended
October 31, 2013 | |
Operations | |
Net investment income (loss) | | $ | 17,273,321 | | | $ | 26,967,686 | | | $ | (7,891,057 | ) | | $ | (3,834,376 | ) | |
Net realized gain (loss) from investments, foreign currency and
forward contract related transactions and written options | | | 179,000,326 | | | | 112,869,726 | | | | (156,883,224 | ) | | | (195,499,006 | ) | |
Change in unrealized appreciation (depreciation) of investments,
foreign currency and forward contract related transactions and
written options | | | 74,100,158 | | | | 284,264,216 | | | | (143,277,515 | ) | | | (1,108,704,575 | ) | |
Net increase (decrease) in net assets resulting from operations | | | 270,373,805 | | | | 424,101,628 | | | | (308,051,796 | ) | | | (1,308,037,957 | ) | |
Distribution to Shareholders | |
Dividends paid from net investment income | |
Class A | | | (10,460,091 | ) | | | (9,725,999 | ) | | | — | | | | (4,157,731 | ) | |
Class C | | | (143,705 | ) | | | (247,938 | ) | | | — | | | | (417 | ) | |
Class I | | | (10,220,051 | ) | | | (8,637,463 | ) | | | — | | | | (4,720,304 | ) | |
Distributions paid from net realized gains from investment transactions | |
Class A | | | (52,254,308 | ) | | | (32,729,995 | ) | | | — | | | | — | | |
Class C | | | (26,476,094 | ) | | | (14,995,424 | ) | | | — | | | | — | | |
Class I | | | (37,762,793 | ) | | | (21,670,124 | ) | | | — | | | | — | | |
Decrease in net assets resulting from distributions | | | (137,317,042 | ) | | | (88,006,943 | ) | | | — | | | | (8,878,452 | ) | |
Fund Share Transactions (Note 6) | |
Net proceeds from shares sold | | | 610,666,264 | | | | 834,733,529 | | | | 508,732,230 | | | | 907,417,003 | | |
Net asset value of shares issued for reinvested dividends
and distributions | | | 108,163,213 | | | | 71,620,315 | | | | — | | | | 5,750,551 | | |
Cost of shares redeemed | | | (1,003,791,714 | ) | | | (950,735,608 | ) | | | (757,212,365 | ) | | | (1,115,712,771 | ) | |
Redemption fees | | | — | | | | — | | | | 215,458 | | | | 267,192 | | |
Increase in net assets from Fund share transactions | | | (284,962,237 | ) | | | (44,381,764 | ) | | | (248,264,677 | ) | | | (202,278,025 | ) | |
Net increase in net assets | | | (151,905,474 | ) | | | 291,712,921 | | | | (556,316,473 | ) | | | (1,519,194,434 | ) | |
Net Assets (Note 1) | |
Beginning of period | | | 3,285,533,861 | | | | 2,993,820,940 | | | | 1,556,065,931 | | | | 3,075,260,365 | | |
End of period | | $ | 3,133,628,387 | | | $ | 3,285,533,861 | | | $ | 999,749,458 | | | $ | 1,556,065,931 | | |
Undistributed net investment income (loss) | | $ | 15,604,225 | | | $ | 21,385,150 | | | $ | (67,677,782 | ) | | $ | (101,546,800 | ) | |
First Eagle Funds | Annual Report | October 31, 2014
149
Statements of Changes in Net Assets (continued)
| | | First Eagle
Global Income Builder Fund | | First Eagle
High Yield Fund | |
| | | Year Ended
October 31, 2014 | | Year Ended
October 31, 2013 | | Year Ended
October 31, 2014 | | Year Ended
October 31, 2013 | |
Operations | |
Net investment income | | $ | 25,975,128 | | | $ | 11,585,054 | | | $ | 59,904,349 | | | $ | 49,165,802 | | |
Net realized gain (loss) from investments, foreign currency and
forward contract related transactions and written options | | | 14,211,429 | | | | (709,160 | ) | | | 10,611,178 | | | | (2,765,867 | ) | |
Change in unrealized appreciation (depreciation) of investments,
foreign currency and forward contract related transactions and
written options | | | (26,073,105 | ) | | | 28,562,197 | | | | (29,105,740 | ) | | | 12,350,804 | | |
Net increase in net assets resulting from operations | | | 14,113,452 | | | | 39,438,091 | | | | 41,409,787 | | | | 58,750,739 | | |
Distribution to Shareholders | |
Dividends paid from net investment income | |
Class A | | | (11,526,646 | ) | | | (5,328,442 | ) | | | (17,910,020 | ) | | | (17,581,864 | ) | |
Class C | | | (6,172,738 | ) | | | (2,750,710 | ) | | | (7,873,832 | ) | | | (7,437,383 | ) | |
Class I | | | (9,327,639 | ) | | | (3,433,692 | ) | | | (34,118,150 | ) | | | (24,148,637 | ) | |
Class Y | | | — | | | | — | | | | — | | | | — | | |
Distributions paid from net realized gains from investment transactions | |
Class A | | | — | | | | — | | | | — | | | | (236,977 | ) | |
Class C | | | — | | | | — | | | | — | | | | (125,800 | ) | |
Class I | | | — | | | | — | | | | — | | | | (322,171 | ) | |
Class Y | | | — | | | | — | | | | — | | | | — | | |
Decrease in net assets resulting from distributions | | | (27,027,023 | ) | | | (11,512,844 | ) | | | (59,902,002 | ) | | | (49,852,832 | ) | |
Fund Share Transactions (Note 6) | |
Net proceeds from shares sold | | | 990,441,183 | | | | 423,146,840 | | | | 654,736,971 | | | | 604,885,575 | | |
Net asset value of shares issued for reinvested dividends
and distributions | | | 19,704,051 | | | | 7,172,309 | | | | 43,147,832 | | | | 36,664,728 | | |
Cost of shares redeemed | | | (196,867,028 | ) | | | (57,584,480 | ) | | | (553,615,431 | ) | | | (276,935,608 | ) | |
Redemption fees | | | — | | | | — | | | | — | | | | — | | |
Increase (decrease) in net assets from Fund share transactions | | | 813,278,206 | | | | 372,734,669 | | | | 144,269,372 | | | | 364,614,695 | | |
Net increase (decrease) in net assets | | | 800,364,635 | | | | 400,659,916 | | | | 125,777,157 | | | | 373,512,602 | | |
Net Assets (Note 1) | |
Beginning of period | | | 508,013,314 | | | | 107,353,398 | | | | 1,015,412,316 | | | | 641,899,714 | | |
End of period | | $ | 1,308,377,949 | | | $ | 508,013,314 | | | $ | 1,141,189,473 | | | $ | 1,015,412,316 | | |
Undistributed net investment income (loss) | | $ | (313,357 | ) | | $ | 288,096 | | | $ | 824,592 | | | $ | (85,145 | ) | |
See Notes to Financial Statements.
First Eagle Funds | Annual Report | October 31, 2014
150
Year Ended October 31, 2014
| | | First Eagle
Fund of America | |
| | | Year Ended
October 31, 2014 | | Year Ended
October 31, 2013 | |
Operations | |
Net investment income | | $ | 10,434,939 | | | $ | 4,287,910 | | |
Net realized gain (loss) from investments, foreign currency and
forward contract related transactions and written options | | | 241,508,554 | | | | 54,012,239 | | |
Change in unrealized appreciation (depreciation) of investments,
foreign currency and forward contract related transactions and
written options | | | 76,938,772 | | | | 454,484,935 | | |
Net increase in net assets resulting from operations | | | 328,882,265 | | | | 512,785,084 | | |
Distribution to Shareholders | |
Dividends paid from net investment income | |
Class A | | | (2,659,824 | ) | | | (239,973 | ) | |
Class C | | | — | | | | — | | |
Class I | | | (2,364,371 | ) | | | — | | |
Class Y | | | (859,560 | ) | | | (211,957 | ) | |
Distributions paid from net realized gains from investment transactions | |
Class A | | | (15,778,835 | ) | | | — | | |
Class C | | | (8,199,122 | ) | | | — | | |
Class I | | | (7,391,919 | ) | | | — | | |
Class Y | | | (7,355,578 | ) | | | — | | |
Decrease in net assets resulting from distributions | | | (44,609,209 | ) | | | (451,930 | ) | |
Fund Share Transactions (Note 6) | |
Net proceeds from shares sold | | | 1,049,314,608 | | | | 1,131,507,230 | | |
Net asset value of shares issued for reinvested dividends
and distributions | | | 36,046,040 | | | | 389,689 | | |
Cost of shares redeemed | | | (605,344,079 | ) | | | (768,152,320 | ) | |
Redemption fees | | | — | | | | — | | |
Increase (decrease) in net assets from Fund share transactions | | | 480,016,569 | | | | 363,744,599 | | |
Net increase (decrease) in net assets | | | 764,289,625 | | | | 876,077,753 | | |
Net Assets (Note 1) | |
Beginning of period | | | 2,487,146,366 | | | | 1,611,068,613 | | |
End of period | | $ | 3,251,435,991 | | | $ | 2,487,146,366 | | |
Undistributed net investment income (loss) | | $ | 7,021,566 | | | $ | 3,185,692 | | |
First Eagle Funds | Annual Report | October 31, 2014
151
| | | Year Ended October 31, | |
| | | 2014 | | 2013 | |
| | | Class A | | Class C | | Class I | | Class A | | Class C | | Class I | |
Selected data for a share of beneficial interest outstanding throughout
each year is presented below:* | |
Net asset value, beginning of year ($) | | | 54.92 | | | | 53.67 | | | | 55.23 | | | | 49.24 | | | | 48.16 | | | | 49.50 | | |
Income (loss) from investment operations: | |
Net investment income (loss) ($) | | | 0.30 | | | | -0.11 | | | | 0.43 | | | | 0.39 | | | | 0.01 | | | | 0.52 | | |
Net realized and unrealized gains
(losses) on investments | | | 2.12 | | | | 2.08 | | | | 2.13 | | | | 7.41 | | | | 7.27 | | | | 7.45 | | |
Total income (loss) from investment
operations | | | 2.42 | | | | 1.97 | | | | 2.56 | | | | 7.80 | | | | 7.28 | | | | 7.97 | | |
Less distributions: | |
Dividends from net investment
income ($) | | | -0.66 | | | | -0.29 | | | | -0.78 | | | | -0.51 | | | | -0.16 | | | | -0.63 | | |
Distributions from capital gains | | | -1.78 | | | | -1.78 | | | | -1.78 | | | | -1.61 | | | | -1.61 | | | | -1.61 | | |
Total distributions | | | -2.44 | | | | -2.07 | | | | -2.56 | | | | -2.12 | | | | -1.77 | | | | -2.24 | | |
Net asset value, end of year ($) | | | 54.90 | | | | 53.57 | | | | 55.23 | | | | 54.92 | | | | 53.67 | | | | 55.23 | | |
Total return(a) (%) | | | 4.64 | | | | 3.85 | | | | 4.90 | | | | 16.47 | | | | 15.63 | | | | 16.78 | | |
Ratios and supplemental data | |
Net assets, end of year (millions) ($) | | | 17,735 | | | | 12,342 | | | | 20,389 | | | | 18,987 | | | | 11,436 | | | | 15,578 | | |
Ratio of operating expenses to
average net assets including earnings
credits (%) | | | 1.11 | | | | 1.86 | | | | 0.86 | | | | 1.13 | | | | 1.87 | | | | 0.88 | | |
Ratio of operating expenses to
average net assets excluding earnings
credits (%) | | | 1.11 | | | | 1.86 | | | | 0.86 | | | | 1.13 | | | | 1.87 | | | | 0.88 | | |
Ratio of net investment income (loss)
to average net assets including
earnings credits (%) | | | 0.55 | | | | -0.21 | | | | 0.78 | | | | 0.77 | | | | 0.02 | | | | 1.02 | | |
Ratio of net investment income (loss)
to average net assets excluding
earnings credits (%) | | | 0.55 | | | | -0.21 | | | | 0.78 | | | | 0.77 | | | | 0.02 | | | | 1.02 | | |
Portfolio turnover rate (%) | | | 15.36 | | | | 15.36 | | | | 15.36 | | | | 11.60 | | | | 11.60 | | | | 11.60 | | |
* Per share amounts have been calculated using the average shares method.
(a) Does not take into account the sales charge of 5.00% for Class A and the CDSC (Contingent Deferred Sales Charge) of 1.00% for Class C shares. A contingent deferred sales charge of 1.00% may apply on redemptions of Class A shares made within 18 months following a purchase of $1,000,000 or more without an initial sales charge.
See Notes to Financial Statements.
First Eagle Funds | Annual Report | October 31, 2014
152
| | Year Ended October 31, | |
| | | 2012 | | 2011 | | 2010 | |
| | | Class A | | Class C | | Class I | | Class A | | Class C | | Class I | | Class A | | Class C | | Class I | |
Selected data for a share of beneficial interest outstanding throughout
each year is presented below:* | |
Net asset value, beginning of year ($) | | | 46.90 | | | | 45.91 | | | | 47.15 | | | | 44.36 | | | | 43.47 | | | | 44.59 | | | | 38.74 | | | | 38.07 | | | | 38.92 | | |
Income (loss) from investment operations: | |
Net investment income (loss) ($) | | | 0.45 | | | | 0.09 | | | | 0.57 | | | | 0.39 | | | | 0.04 | | | | 0.51 | | | | 0.56 | | | | 0.26 | | | | 0.69 | | |
Net realized and unrealized gains
(losses) on investments | | | 3.03 | | | | 2.98 | | | | 3.03 | | | | 2.79 | | | | 2.75 | | | | 2.81 | | | | 5.63 | | | | 5.51 | | | | 5.63 | | |
Total income (loss) from investment
operations | | | 3.48 | | | | 3.07 | | | | 3.60 | | | | 3.18 | | | | 2.79 | | | | 3.32 | | | | 6.19 | | | | 5.77 | | | | 6.32 | | |
Less distributions: | |
Dividends from net investment
income ($) | | | -0.53 | | | | -0.21 | | | | -0.64 | | | | -0.64 | | | | -0.35 | | | | -0.76 | | | | -0.57 | | | | -0.37 | | | | -0.65 | | |
Distributions from capital gains | | | -0.61 | | | | -0.61 | | | | -0.61 | | | | — | | | | — | | | | — | | | | — | | | | — | | | | — | | |
Total distributions | | | -1.14 | | | | -0.82 | | | | -1.25 | | | | -0.64 | | | | -0.35 | | | | -0.76 | | | | -0.57 | | | | -0.37 | | | | -0.65 | | |
Net asset value, end of year ($) | | | 49.24 | | | | 48.16 | | | | 49.50 | | | | 46.90 | | | | 45.91 | | | | 47.15 | | | | 44.36 | | | | 43.47 | | | | 44.59 | | |
Total return(a) (%) | | | 7.64 | | | | 6.83 | | | | 7.90 | | | | 7.23 | | | | 6.45 | | | | 7.52 | | | | 16.13 | | | | 15.23 | | | | 16.40 | | |
Ratios and supplemental data | |
Net assets, end of year (millions) ($) | | | 15,840 | | | | 9,322 | | | | 11,182 | | | | 14,352 | | | | 8,385 | | | | 8,455 | | | | 12,195 | | | | 6,524 | | | | 5,345 | | |
Ratio of operating expenses to
average net assets including earnings
credits (%) | | | 1.15 | | | | 1.89 | | | | 0.90 | | | | 1.13 | | | | 1.88 | | | | 0.88 | | | | 1.16 | | | | 1.91 | | | | 0.91 | | |
Ratio of operating expenses to
average net assets excluding earnings
credits (%) | | | 1.15 | | | | 1.89 | | | | 0.90 | | | | 1.13 | | | | 1.88 | | | | 0.88 | | | | 1.16 | | | | 1.91 | | | | 0.91 | | |
Ratio of net investment income (loss)
to average net assets including
earnings credits (%) | | | 0.94 | | | | 0.19 | | | | 1.19 | | | | 0.83 | | | | 0.08 | | | | 1.07 | | | | 1.36 | | | | 0.63 | | | | 1.68 | | |
Ratio of net investment income (loss)
to average net assets excluding
earnings credits (%) | | | 0.94 | | | | 0.19 | | | | 1.19 | | | | 0.83 | | | | 0.08 | | | | 1.07 | | | | 1.36 | | | | 0.63 | | | | 1.68 | | |
Portfolio turnover rate (%) | | | 11.29 | | | | 11.29 | | | | 11.29 | | | | 11.57 | | | | 11.57 | | | | 11.57 | | | | 17.37 | | | | 17.37 | | | | 17.37 | | |
First Eagle Funds | Annual Report | October 31, 2014
153
First Eagle Overseas Fund
| | | Year Ended October 31, | |
| | | 2014 | | 2013 | |
| | | Class A | | Class C | | Class I | | Class A | | Class C | | Class I | |
Selected data for a share of beneficial interest outstanding throughout
each year is presented below:* | |
Net asset value, beginning of year ($) | | | 24.40 | | | | 23.64 | | | | 24.84 | | | | 22.26 | | | | 21.62 | | | | 22.63 | | |
Income (loss) from investment operations: | |
Net investment income (loss) ($) | | | 0.15 | | | | -0.03 | | | | 0.21 | | | | 0.13 | | | | -0.04 | | | | 0.20 | | |
Net realized and unrealized gains
(losses) on investments | | | 0.05 | | | | 0.07 | | | | 0.05 | | | | 3.17 | | | | 3.09 | | | | 3.22 | | |
Total income (loss) from investment
operations | | | 0.20 | | | | 0.04 | | | | 0.26 | | | | 3.30 | | | | 3.05 | | | | 3.42 | | |
Less distributions: | |
Dividends from net investment
income ($) | | | -0.46 | | | | -0.30 | | | | -0.52 | | | | -0.26 | | | | -0.13 | | | | -0.31 | | |
Distributions from capital gains | | | -0.96 | | | | -0.96 | | | | -0.96 | | | | -0.90 | | | | -0.90 | | | | -0.90 | | |
Total distributions | | | -1.42 | | | | -1.26 | | | | -1.48 | | | | -1.16 | | | | -1.03 | | | | -1.21 | | |
Net asset value, end of year ($) | | | 23.18 | | | | 22.42 | | | | 23.62 | | | | 24.40 | | | | 23.64 | | | | 24.84 | | |
Total return(a) (%) | | | 1.00 | | | | 0.28 | | | | 1.23 | | | | 15.52 | | | | 14.67 | | | | 15.82 | | |
Ratios and supplemental data | |
Net assets, end of year (millions) ($) | | | 4,644 | | | | 1,086 | | | | 8,811 | | | | 5,912 | | | | 1,120 | | | | 7,378 | | |
Ratio of operating expenses to
average net assets including earnings
credits (%) | | | 1.14 | | | | 1.89 | | | | 0.89 | | | | 1.15 | | | | 1.90 | | | | 0.90 | | |
Ratio of operating expenses to
average net assets excluding earnings
credits (%) | | | 1.14 | | | | 1.89 | | | | 0.89 | | | | 1.15 | | | | 1.90 | | | | 0.90 | | |
Ratio of net investment income (loss)
to average net assets including
earnings credits (%) | | | 0.62 | | | | -0.13 | | | | 0.87 | | | | 0.59 | | | | -0.17 | | | | 0.86 | | |
Ratio of net investment income (loss)
to average net assets excluding
earnings credits (%) | | | 0.62 | | | | -0.13 | | | | 0.87 | | | | 0.59 | | | | -0.17 | | | | 0.86 | | |
Portfolio turnover rate (%) | | | 12.01 | | | | 12.01 | | | | 12.01 | | | | 12.33 | | | | 12.33 | | | | 12.33 | | |
* Per share amounts have been calculated using the average shares method.
** Amount represents less than $0.01 per share.
(a) Does not take into account the sales charge of 5.00% for Class A and the CDSC (Contingent Deferred Sales Charge) of 1.00% for Class C shares. A contingent deferred sales charge of 1.00% may apply on redemptions of Class A shares made within 18 months following a purchase of $1,000,000 or more without an initial sales charge.
See Notes to Financial Statements.
First Eagle Funds | Annual Report | October 31, 2014
154
| | | Year Ended October 31, | |
| | | 2012 | | 2011 | | 2010 | |
| | | Class A | | Class C | | Class I | | Class A | | Class C | | Class I | | Class A | | Class C | | Class I | |
Selected data for a share of beneficial interest outstanding throughout
each year is presented below:* | |
Net asset value, beginning of year ($) | | | 22.25 | | | | 21.61 | | | | 22.61 | | | | 21.86 | | | | 21.26 | | | | 22.20 | | | | 19.51 | | | | 19.03 | | | | 19.80 | | |
Income (loss) from investment operations: | |
Net investment income (loss) ($) | | | 0.24 | | | | 0.08 | | | | 0.30 | | | | 0.18 | | | | 0.01 | | | | 0.24 | | | | 0.15 | | | | 0.00 | ** | | | 0.21 | | |
Net realized and unrealized gains
(losses) on investments | | | 0.80 | | | | 0.77 | | | | 0.81 | | | | 0.74 | | | | 0.73 | | | | 0.75 | | | | 2.80 | | | | 2.72 | | | | 2.82 | | |
Total income (loss) from investment
operations | | | 1.04 | | | | 0.85 | | | | 1.11 | | | | 0.92 | | | | 0.74 | | | | 0.99 | | | | 2.95 | | | | 2.72 | | | | 3.03 | | |
Less distributions: | |
Dividends from net investment
income ($) | | | -0.39 | | | | -0.20 | | | | -0.45 | | | | -0.32 | | | | -0.18 | | | | -0.37 | | | | -0.60 | | | | -0.49 | | | | -0.63 | | |
Distributions from capital gains | | | -0.64 | | | | -0.64 | | | | -0.64 | | | | -0.21 | | | | -0.21 | | | | -0.21 | | | | — | | | | — | | | | — | | |
Total distributions | | | -1.03 | | | | -0.84 | | | | -1.09 | | | | -0.53 | | | | -0.39 | | | | -0.58 | | | | -0.60 | | | | -0.49 | | | | -0.63 | | |
Net asset value, end of year ($) | | | 22.26 | | | | 21.62 | | | | 22.63 | | | | 22.25 | | | | 21.61 | | | | 22.61 | | | | 21.86 | | | | 21.26 | | | | 22.20 | | |
Total return(a) (%) | | | 5.06 | | | | 4.28 | | | | 5.36 | | | | 4.27 | | | | 3.48 | | | | 4.52 | | | | 15.45 | | | | 14.55 | | | | 15.68 | | |
Ratios and supplemental data | |
Net assets, end of year (millions) ($) | | | 5,111 | | | | 986 | | | | 5,252 | | | | 5,023 | | | | 1,027 | | | | 4,136 | | | | 4,676 | | | | 914 | | | | 3,284 | | |
Ratio of operating expenses to
average net assets including earnings
credits (%) | | | 1.17 | | | | 1.92 | | | | 0.92 | | | | 1.14 | | | | 1.89 | | | | 0.89 | | | | 1.17 | | | | 1.92 | | | | 0.92 | | |
Ratio of operating expenses to
average net assets excluding earnings
credits (%) | | | 1.17 | | | | 1.92 | | | | 0.92 | | | | 1.14 | | | | 1.89 | | | | 0.89 | | | | 1.17 | | | | 1.92 | | | | 0.92 | | |
Ratio of net investment income (loss)
to average net assets including
earnings credits (%) | | | 1.12 | | | | 0.37 | | | | 1.36 | | | | 0.78 | | | | 0.04 | | | | 1.06 | | | | 0.76 | | | | 0.01 | | | | 1.03 | | |
Ratio of net investment income (loss)
to average net assets excluding
earnings credits (%) | | | 1.12 | | | | 0.37 | | | | 1.36 | | | | 0.78 | | | | 0.04 | | | | 1.06 | | | | 0.76 | | | | 0.01 | | | | 1.03 | | |
Portfolio turnover rate (%) | | | 10.50 | | | | 10.50 | | | | 10.50 | | | | 12.22 | | | | 12.22 | | | | 12.22 | | | | 15.53 | | | | 15.53 | | | | 15.53 | | |
First Eagle Funds | Annual Report | October 31, 2014
155
First Eagle U.S. Value Fund
| | | Year Ended October 31, | |
| | | 2014 | | 2013 | |
| | | Class A | | Class C | | Class I | | Class A | | Class C | | Class I | |
Selected data for a share of beneficial interest outstanding throughout
each year is presented below:* | |
Net asset value, beginning of year ($) | | | 20.26 | | | | 19.97 | | | | 20.54 | | | | 18.27 | | | | 18.02 | | | | 18.50 | | |
Income (loss) from investment operations: | |
Net investment income (loss) ($) | | | 0.13 | | | | -0.03 | | | | 0.18 | | | | 0.18 | | | | 0.03 | | | | 0.23 | | |
Net realized and unrealized gains
(losses) on investments | | | 1.60 | | | | 1.58 | | | | 1.62 | | | | 2.36 | | | | 2.35 | | | | 2.40 | | |
Total income (loss) from investment
operations | | | 1.73 | | | | 1.55 | | | | 1.80 | | | | 2.54 | | | | 2.38 | | | | 2.63 | | |
Less distributions: | |
Dividends from net investment
income ($) | | | -0.15 | | | | -0.00 | ** | | | -0.20 | | | | -0.13 | | | | -0.01 | | | | -0.17 | | |
Distributions from capital gains | | | -0.74 | | | | -0.74 | | | | -0.74 | | | | -0.42 | | | | -0.42 | | | | -0.42 | | |
Total distributions | | | -0.89 | | | | -0.74 | | | | -0.94 | | | | -0.55 | | | | -0.43 | | | | -0.59 | | |
Net asset value, end of year ($) | | | 21.10 | | | | 20.78 | | | | 21.40 | | | | 20.26 | | | | 19.97 | | | | 20.54 | | |
Total return(a) (%) | | | 8.93 | | | | 8.09 | | | | 9.19 | | | | 14.32 | | | | 13.53 | | | | 14.69 | | |
Ratios and supplemental data | |
Net assets, end of year (millions) ($) | | | 1,229 | | | | 705 | | | | 1,200 | | | | 1,480 | | | | 725 | | | | 1,080 | | |
Ratio of operating expenses to
average net assets including earnings
credits (%) | | | 1.14 | | | | 1.89 | | | | 0.88 | | | | 1.16 | | | | 1.91 | | | | 0.91 | | |
Ratio of operating expenses to
average net assets excluding earnings
credits (%) | | | 1.14 | | | | 1.89 | | | | 0.88 | | | | 1.16 | | | | 1.91 | | | | 0.91 | | |
Ratio of net investment income (loss)
to average net assets including
earnings credits (%) | | | 0.63 | | | | -0.13 | | | | 0.87 | | | | 0.93 | | | | 0.18 | | | | 1.18 | | |
Ratio of net investment income (loss)
to average net assets excluding
earnings credits (%) | | | 0.63 | | | | -0.13 | | | | 0.87 | | | | 0.93 | | | | 0.18 | | | | 1.18 | | |
Portfolio turnover rate (%) | | | 15.64 | | | | 15.64 | | | | 15.64 | | | | 17.32 | | | | 17.32 | | | | 17.32 | | |
* Per share amounts have been calculated using the average shares method.
** Amount represents less than $0.01 per share.
(a) Does not take into account the sales charge of 5.00% for Class A and the CDSC (Contingent Deferred Sales Charge) of 1.00% for Class C shares. A contingent deferred sales charge of 1.00% may apply on redemptions of Class A shares made within 18 months following a purchase of $1,000,000 or more without an initial sales charge.
See Notes to Financial Statements.
First Eagle Funds | Annual Report | October 31, 2014
156
| | Year Ended October 31, | |
| | | 2012 | | 2011 | | 2010 | |
| | | Class A | | Class C | | Class I | | Class A | | Class C | | Class I | | Class A | | Class C | | Class I | |
Selected data for a share of beneficial interest outstanding throughout
each year is presented below:* | |
Net asset value, beginning of year ($) | | | 17.12 | | | | 16.91 | | | | 17.33 | | | | 15.94 | | | | 15.75 | | | | 16.12 | | | | 14.21 | | | | 14.06 | | | | 14.37 | | |
Income (loss) from investment operations: | |
Net investment income (loss) ($) | | | 0.15 | | | | 0.02 | | | | 0.19 | | | | 0.17 | | | | 0.04 | | | | 0.21 | | | | 0.32 | | | | 0.21 | | | | 0.38 | | |
Net realized and unrealized gains
(losses) on investments | | | 1.59 | | | | 1.57 | | | | 1.61 | | | | 1.34 | | | | 1.34 | | | | 1.37 | | | | 1.60 | | | | 1.58 | | | | 1.59 | | |
Total income (loss) from investment
operations | | | 1.74 | | | | 1.59 | | | | 1.80 | | | | 1.51 | | | | 1.38 | | | | 1.58 | | | | 1.92 | | | | 1.79 | | | | 1.97 | | |
Less distributions: | |
Dividends from net investment
income ($) | | | -0.14 | | | | -0.03 | | | | -0.18 | | | | -0.33 | | | | -0.22 | | | | -0.37 | | | | -0.19 | | | | -0.10 | | | | -0.22 | | |
Distributions from capital gains | | | -0.45 | | | | -0.45 | | | | -0.45 | | | | — | | | | — | | | | — | | | | — | | | | — | | | | — | | |
Total distributions | | | -0.59 | | | | -0.48 | | | | -0.63 | | | | -0.33 | | | | -0.22 | | | | -0.37 | | | | -0.19 | | | | -0.10 | | | | -0.22 | | |
Net asset value, end of year ($) | | | 18.27 | | | | 18.02 | | | | 18.50 | | | | 17.12 | | | | 16.91 | | | | 17.33 | | | | 15.94 | | | | 15.75 | | | | 16.12 | | |
Total return(a) (%) | | | 10.63 | | | | 9.75 | | | | 10.86 | | | | 9.60 | | | | 8.85 | | | | 9.92 | | | | 13.64 | | | | 12.75 | | | | 13.84 | | |
Ratios and supplemental data | |
Net assets, end of year (millions) ($) | | | 1,425 | | | | 631 | | | | 938 | | | | 967 | | | | 408 | | | | 538 | | | | 680 | | | | 320 | | | | 328 | | |
Ratio of operating expenses to
average net assets including earnings
credits (%) | | | 1.17 | | | | 1.92 | | | | 0.93 | | | | 1.18 | | | | 1.93 | | | | 0.93 | | | | 1.23 | | | | 1.98 | | | | 0.99 | | |
Ratio of operating expenses to
average net assets excluding earnings
credits (%) | | | 1.17 | | | | 1.92 | | | | 0.93 | | | | 1.18 | | | | 1.93 | | | | 0.93 | | | | 1.23 | | | | 1.98 | | | | 0.99 | | |
Ratio of net investment income (loss)
to average net assets including
earnings credits (%) | | | 0.84 | | | | 0.09 | | | | 1.08 | | | | 0.98 | | | | 0.24 | | | | 1.23 | | | | 2.15 | | | | 1.41 | | | | 2.46 | | |
Ratio of net investment income (loss)
to average net assets excluding
earnings credits (%) | | | 0.84 | | | | 0.09 | | | | 1.08 | | | | 0.98 | | | | 0.24 | | | | 1.23 | | | | 2.15 | | | | 1.41 | | | | 2.46 | | |
Portfolio turnover rate (%) | | | 14.34 | | | | 14.34 | | | | 14.34 | | | | 18.54 | | | | 18.54 | | | | 18.54 | | | | 12.23 | | | | 12.23 | | | | 12.23 | | |
First Eagle Funds | Annual Report | October 31, 2014
157
| | | Year Ended October 31, | |
| | | 2014 | | 2013 | |
| | | Class A | | Class C | | Class I | | Class A | | Class C | | Class I | |
Selected data for a share of beneficial interest outstanding throughout
each year is presented below:* | |
Net asset value, beginning of year ($) | | | 17.03 | | | | 16.37 | | | | 17.25 | | | | 29.86 | | | | 28.84 | | | | 30.26 | | |
Income (loss) from investment operations: | |
Net investment income (loss) ($) | | | -0.09 | | | | -0.20 | | | | -0.05 | | | | -0.02 | | | | -0.18 | | | | 0.03 | | |
Net realized and unrealized gains
(losses) on investments | | | -3.49 | | | | -3.33 | | | | -3.54 | | | | -12.73 | | | | -12.29 | | | | -12.89 | | |
Total income (loss) from investment
operations | | | -3.58 | | | | -3.53 | | | | -3.59 | | | | -12.75 | | | | -12.47 | | | | -12.86 | | |
Less distributions: | |
Dividends from net investment
income ($) | | | — | | | | — | | | | — | | | | -0.08 | | | | — | | | | -0.15 | | |
Distributions from capital gains | | | — | | | | — | | | | — | | | | — | | | | — | | | | — | | |
Total distributions | | | — | | | | — | | | | — | | | | -0.08 | | | | — | | | | -0.15 | | |
Net asset value, end of year ($) | | | 13.45 | | | | 12.84 | | | | 13.66 | | | | 17.03 | | | | 16.37 | | | | 17.25 | | |
Total return(a) (%) | | | -21.02 | | | | -21.56 | | | | -20.81 | | | | -42.80 | | | | -43.24 | | | | -42.68 | | |
Ratios and supplemental data | |
Net assets, end of year (millions) ($) | | | 448 | | | | 186 | | | | 366 | | | | 764 | | | | 284 | | | | 508 | | |
Ratio of operating expenses to
average net assets including earnings
credits (%) | | | 1.27 | | | | 2.02 | | | | 1.01 | | | | 1.25 | | | | 2.00 | | | | 1.00 | | |
Ratio of operating expenses to
average net assets excluding earnings
credits (%) | | | 1.27 | | | | 2.02 | | | | 1.01 | | | | 1.25 | | | | 2.00 | | | | 1.00 | | |
Ratio of net investment income (loss)
to average net assets including
earnings credits (%) | | | -0.54 | | | | -1.29 | | | | -0.29 | | | | -0.11 | | | | -0.87 | | | | 0.14 | | |
Ratio of net investment income (loss)
to average net assets excluding
earnings credits (%) | | | -0.54 | | | | -1.29 | | | | -0.29 | | | | -0.11 | | | | -0.87 | | | | 0.14 | | |
Portfolio turnover rate (%) | | | 13.33 | | | | 13.33 | | | | 13.33 | | | | 15.14 | | | | 15.14 | | | | 15.14 | | |
* Per share amounts have been calculated using the average shares method.
(a) Does not take into account the sales charge of 5.00% for Class A and the CDSC (Contingent Deferred Sales Charge) of 1.00% for Class C shares. A contingent deferred sales charge of 1.00% may apply on redemptions of Class A shares made within 18 months following a purchase of $1,000,000 or more without an initial sales charge.
See Notes to Financial Statements.
First Eagle Funds | Annual Report | October 31, 2014
158
| | | Year Ended October 31, | |
| | | 2012 | | 2011 | | 2010 | |
| | | Class A | | Class C | | Class I | | Class A | | Class C | | Class I | | Class A | | Class C | | Class I | |
Selected data for a share of beneficial interest outstanding throughout
each year is presented below:* | |
Net asset value, beginning of year ($) | | | 33.89 | | | | 32.78 | | | | 34.33 | | | | 33.42 | | | | 32.44 | | | | 33.81 | | | | 25.15 | | | | 24.52 | | | | 25.43 | | |
Income (loss) from investment operations: | |
Net investment income (loss) ($) | | | -0.01 | | | | -0.22 | | | | 0.06 | | | | -0.19 | | | | -0.42 | | | | -0.10 | | | | -0.17 | | | | -0.38 | | | | -0.11 | | |
Net realized and unrealized gains
(losses) on investments | | | -2.73 | | | | -2.66 | | | | -2.75 | | | | 2.60 | | | | 2.53 | | | | 2.63 | | | | 8.82 | | | | 8.58 | | | | 8.92 | | |
Total income (loss) from investment
operations | | | -2.74 | | | | -2.88 | | | | -2.69 | | | | 2.41 | | | | 2.11 | | | | 2.53 | | | | 8.65 | | | | 8.20 | | | | 8.81 | | |
Less distributions: | |
Dividends from net investment
income ($) | | | -0.39 | | | | -0.16 | | | | -0.48 | | | | -0.73 | | | | -0.56 | | | | -0.80 | | | | -0.38 | | | | -0.28 | | | | -0.43 | | |
Distributions from capital gains | | | -0.90 | | | | -0.90 | | | | -0.90 | | | | -1.21 | | | | -1.21 | | | | -1.21 | | | | — | | | | — | | | | — | | |
Total distributions | | | -1.29 | | | | -1.06 | | | | -1.38 | | | | -1.94 | | | | -1.77 | | | | -2.01 | | | | -0.38 | | | | -0.28 | | | | -0.43 | | |
Net asset value, end of year ($) | | | 29.86 | | | | 28.84 | | | | 30.26 | | | | 33.89 | | | | 32.78 | | | | 34.33 | | | | 33.42 | | | | 32.44 | | | | 33.81 | | |
Total return(a) (%) | | | -8.14 | | | | -8.86 | | | | -7.89 | | | | 7.38 | | | | 6.61 | | | | 7.66 | | | | 34.73 | | | | 33.66 | | | | 35.01 | | |
Ratios and supplemental data | |
Net assets, end of year (millions) ($) | | | 1,535 | | | | 608 | | | | 932 | | | | 1,834 | | | | 683 | | | | 1,003 | | | | 1,900 | | | | 616 | | | | 695 | | |
Ratio of operating expenses to
average net assets including earnings
credits (%) | | | 1.21 | | | | 1.96 | | | | 0.96 | | | | 1.20 | | | | 1.95 | | | | 0.95 | | | | 1.22 | | | | 1.97 | | | | 0.97 | | |
Ratio of operating expenses to
average net assets excluding earnings
credits (%) | | | 1.21 | | | | 1.96 | | | | 0.96 | | | | 1.20 | | | | 1.95 | | | | 0.95 | | | | 1.22 | | | | 1.97 | | | | 0.97 | | |
Ratio of net investment income (loss)
to average net assets including
earnings credits (%) | | | -0.05 | | | | -0.80 | | | | 0.21 | | | | -0.56 | | | | -1.30 | | | | -0.30 | | | | -0.60 | | | | -1.35 | | | | -0.36 | | |
Ratio of net investment income (loss)
to average net assets excluding
earnings credits (%) | | | -0.05 | | | | -0.80 | | | | 0.21 | | | | -0.56 | | | | -1.30 | | | | -0.30 | | | | -0.60 | | | | -1.35 | | | | -0.36 | | |
Portfolio turnover rate (%) | | | 9.19 | | | | 9.19 | | | | 9.19 | | | | 13.26 | | | | 13.26 | | | | 13.26 | | | | 5.50 | | | | 5.50 | | | | 5.50 | | |
First Eagle Funds | Annual Report | October 31, 2014
159
First Eagle Global Income Builder Fund
| | | Year Ended October 31, | |
| | | 2014 | | 2013 | |
| | | Class A | | Class C | | Class I | | Class A | | Class C | | Class I | |
Selected data for a share of beneficial interest outstanding throughout
each year is presented below:* | |
Net asset value, beginning of year ($) | | | 11.26 | | | | 11.23 | | | | 11.23 | | | | 10.32 | | | | 10.30 | | | | 10.33 | | |
Income (loss) from investment operations: | |
Net investment income ($) | | | 0.36 | | | | 0.27 | | | | 0.38 | | | | 0.42 | | | | 0.34 | | | | 0.44 | | |
Net realized and unrealized gains
(losses) on investments | | | 0.17 | | | | 0.17 | | | | 0.19 | | | | 0.91 | | | | 0.90 | | | | 0.91 | | |
Total income (loss) from investment
operations | | | 0.53 | | | | 0.44 | | | | 0.57 | | | | 1.33 | | | | 1.24 | | | | 1.35 | | |
Less distributions: | |
Dividends from net investment
income ($) | | | -0.38 | | | | -0.29 | | | | -0.41 | | | | -0.39 | | | | -0.31 | | | | -0.45 | | |
Total distributions | | | -0.38 | | | | -0.29 | | | | -0.41 | | | | -0.39 | | | | -0.31 | | | | -0.45 | | |
Net asset value, end of year ($) | | | 11.41 | | | | 11.38 | | | | 11.39 | | | | 11.26 | | | | 11.23 | | | | 11.23 | | |
Total return(c) (%) | | | 4.67 | | | | 3.90 | | | | 5.00 | | | | 13.14 | | | | 12.25 | | | | 13.36 | | |
Ratios and supplemental data | |
Net assets, end of year (millions) ($) | | | 440 | | | | 379 | | | | 490 | | | | 231 | | | | 148 | | | | 129 | | |
Ratio of operating expenses to average
net assets including fee waivers and
recoupments (%) | | | 1.26 | | | | 2.00 | | | | 1.05 | | | | 1.30 | | | | 2.04 | | | | 1.05 | | |
Ratio of operating expenses to average
net assets excluding fee waivers and
recoupments (%) | | | 1.23 | | | | 1.97 | | | | 0.97 | | | | 1.35 | | | | 2.09 | | | | 1.10 | | |
Ratio of net investment income to
average net assets including fee waivers
and recoupments (%) | | | 3.09 | | | | 2.31 | | | | 3.25 | | | | 3.85 | | | | 3.11 | | | | 4.11 | | |
Ratio of net investment income to
average net assets excluding fee waivers
and recoupments (%) | | | 3.12 | | | | 2.34 | | | | 3.33 | | | | 3.80 | | | | 3.06 | | | | 4.06 | | |
Portfolio turnover rate (%) | | | 18.45 | | | | 18.45 | | | | 18.45 | | | | 10.87 | | | | 10.87 | | | | 10.87 | | |
^ Commencement of investment operations
* Per share amounts have been calculated using the average shares method.
(a) Not Annualized
(b) Annualized
(c) Does not take into account the sales charge of 5.00% for Class A shares and the CDSC (Contingent Deferred Sales Charge) of 1.00% for Class C shares. A contingent deferred sales charge of 1.00% may apply on redemptions of Class A shares made within 18 months following a purchase of $1,000,000 or more without an initial sales charge.
(d) Certain non-recurring expenses incurred by the Fund were not annualized for the period ended October 31, 2012.
See Notes to Financial Statements.
First Eagle Funds | Annual Report | October 31, 2014
160
| | | Period May 1, 2012^ to | |
| | | October 31, 2012 | |
| | | Class A | | Class C | | Class I | |
Selected data for a share of beneficial interest outstanding throughout
each year is presented below:* | |
Net asset value, beginning of year ($) | | | 10.00 | | | | 10.00 | | | | 10.00 | | |
Income (loss) from investment operations: | |
Net investment income ($) | | | 0.15 | | | | 0.11 | | | | 0.18 | | |
Net realized and unrealized gains
(losses) on investments | | | 0.28 | | | | 0.29 | | | | 0.27 | | |
Total income (loss) from investment
operations | | | 0.43 | | | | 0.40 | | | | 0.45 | | |
Less distributions: | |
Dividends from net investment
income ($) | | | -0.11 | | | | -0.10 | | | | -0.12 | | |
Total distributions | | | -0.11 | | | | -0.10 | | | | -0.12 | | |
Net asset value, end of year ($) | | | 10.32 | | | | 10.30 | | | | 10.33 | | |
Total return(c) (%) | | | 4.37 | (a) | | | 4.00 | (a) | | | 4.53 | (a) | |
Ratios and supplemental data | |
Net assets, end of year (millions) ($) | | | 43 | | | | 26 | | | | 38 | | |
Ratio of operating expenses to average
net assets including fee waivers and
recoupments (%) | | | 1.30 | (b)(d) | | | 2.05 | (b)(d) | | | 1.05 | (b)(d) | |
Ratio of operating expenses to average
net assets excluding fee waivers and
recoupments (%) | | | 2.13 | (b)(d) | | | 2.88 | (b)(d) | | | 2.20 | (b)(d) | |
Ratio of net investment income to
average net assets including fee waivers
and recoupments (%) | | | 2.89 | (b)(d) | | | 2.16 | (b)(d) | | | 3.56 | (b)(d) | |
Ratio of net investment income to
average net assets excluding fee waivers
and recoupments (%) | | | 2.06 | (b)(d) | | | 1.33 | (b)(d) | | | 2.40 | (b)(d) | |
Portfolio turnover rate (%) | | | 5.17 | (a) | | | 5.17 | (a) | | | 5.17 | (a)(d) | |
First Eagle Funds | Annual Report | October 31, 2014
161
First Eagle High Yield Fund
| | | Year Ended October 31, | |
| | | 2014 | | 2013 | |
| | | Class A | | Class C | | Class I | | Class A | | Class C | | Class I | |
Selected data for a share of beneficial interest outstanding throughout
each year is presented below:* | |
Net asset value, beginning of year ($) | | | 10.11 | | | | 10.10 | | | | 10.11 | | | | 9.98 | | | | 9.97 | | | | 9.98 | | |
Income (loss) from investment operations: | |
Net investment income ($) | | | 0.53 | | | | 0.45 | | | | 0.55 | | | | 0.59 | | | | 0.51 | | | | 0.62 | | |
Net realized and unrealized gains
(losses) on investments | | | -0.15 | | | | -0.15 | | | | -0.14 | | | | 0.14 | | | | 0.14 | | | | 0.14 | | |
Total income (loss) from investment
operations | | | 0.38 | | | | 0.30 | | | | 0.41 | | | | 0.73 | | | | 0.65 | | | | 0.76 | | |
Less distributions: | |
Dividends from net investment
income ($) | | | -0.53 | | | | -0.45 | | | | -0.56 | | | | -0.59 | | | | -0.51 | | | | -0.62 | | |
Distributions from capital gains | | | — | | | | — | | | | — | | | | -0.01 | | | | -0.01 | | | | -0.01 | | |
Total distributions | | | -0.53 | | | | -0.45 | | | | -0.56 | | | | -0.60 | | | | -0.52 | | | | -0.63 | | |
Net asset value, end of year ($) | | | 9.96 | | | | 9.95 | | | | 9.96 | | | | 10.11 | | | | 10.10 | | | | 10.11 | | |
Total return(c) (%) | | | 3.74 | | | | 2.97 | | | | 4.03 | | | | 7.49 | | | | 6.69 | | | | 7.85 | | |
Ratios and supplemental data | |
Net assets, end of year (millions) ($) | | | 247 | | | | 184 | | | | 710 | | | | 346 | | | | 159 | | | | 511 | | |
Ratio of operating expenses to average
net assets including fee waivers and
reimbursements/(recoupments) (%) | | | 1.09 | | | | 1.84 | | | | 0.83 | | | | 1.13 | | | | 1.88 | | | | 0.80 | | |
Ratio of operating expenses to average
net assets excluding fee waivers and
reimbursements/(recoupments) (%) | | | 1.09 | | | | 1.83 | | | | 0.84 | | | | 1.13 | | | | 1.88 | | | | 0.88 | | |
Ratio of net investment income to
average net assets including fee waivers
and reimbursements/(recoupments) (%) | | | 5.17 | | | | 4.42 | | | | 5.43 | | | | 5.80 | | | | 5.07 | | | | 6.14 | | |
Ratio of net investment income to
average net assets excluding fee waivers
and reimbursements/(recoupments) (%) | | | 5.17 | | | | 4.43 | | | | 5.42 | | | | 5.80 | | | | 5.07 | | | | 6.06 | | |
Portfolio turnover rate (%) | | | 43.02 | | | | 43.02 | | | | 43.02 | | | | 49.71 | | | | 49.71 | | | | 49.71 | | |
^ The Fund commenced investment operations in its present form on December 30, 2011.
^^ Class A and Class C commenced operations on January 3, 2012.
* Per share amounts have been calculated using the average shares method.
(a) Not Annualized
(b) Annualized
(c) Does not take into account the sales charge of 4.50% for Class A and the CDSC (Contingent Deferred Sales Charge) of 1.00% for Class C shares. A contingent deferred sales charge of 1.00% may apply on redemptions of Class A shares made within 18 months following a purchase of $1,000,000 or more without an initial sales charge.
(d) Certain non-recurring expenses incurred by the Fund were not annualized for the period ended October 31, 2012.
See Notes to Financial Statements.
First Eagle Funds | Annual Report | October 31, 2014
162
| | | Period April 1, 2012 to | | Year Ended March 31, | |
| | | October 31, 2012 | | 2012^ | | 2011 | | 2010 | |
| | | Class A | | Class C | | Class I | | Class A^^ | | Class C^^ | | Class I | | Class I | | Class I | |
Selected data for a share of beneficial interest outstanding throughout
each year is presented below:* | |
Net asset value, beginning of year ($) | | | 9.75 | | | | 9.74 | | | | 9.75 | | | | 9.40 | | | | 9.40 | | | | 10.29 | | | | 10.67 | | | | 7.72 | | |
Income (loss) from investment operations: | |
Net investment income ($) | | | 0.33 | | | | 0.29 | | | | 0.36 | | | | 0.13 | | | | 0.11 | | | | 0.68 | | | | 0.98 | | | | 1.31 | | |
Net realized and unrealized gains
(losses) on investments | | | 0.24 | | | | 0.23 | | | | 0.23 | | | | 0.35 | | | | 0.34 | | | | -0.11 | | | | 0.47 | | | | 3.07 | | |
Total income (loss) from investment
operations | | | 0.57 | | | | 0.52 | | | | 0.59 | | | | 0.48 | | | | 0.45 | | | | 0.57 | | | | 1.45 | | | | 4.38 | | |
Less distributions: | |
Dividends from net investment
income ($) | | | -0.34 | | | | -0.29 | | | | -0.36 | | | | -0.13 | | | | -0.11 | | | | -0.83 | | | | -0.98 | | | | -1.28 | | |
Distributions from capital gains | | | — | | | | — | | | | — | | | | — | | | | — | | | | -0.28 | | | | -0.85 | | | | -0.15 | | |
Total distributions | | | -0.34 | | | | -0.29 | | | | -0.36 | | | | -0.13 | | | | -0.11 | | | | -1.11 | | | | -1.83 | | | | -1.43 | | |
Net asset value, end of year ($) | | | 9.98 | | | | 9.97 | | | | 9.98 | | | | 9.75 | | | | 9.74 | | | | 9.75 | | | | 10.29 | | | | 10.67 | | |
Total return(c) (%) | | | 5.94 | (a) | | | 5.47 | (a) | | | 6.20 | (a) | | | 5.11 | | | | 4.78 | | | | 6.11 | | | | 14.81 | | | | 59.30 | | |
Ratios and supplemental data | |
Net assets, end of year (millions) ($) | | | 220 | | | | 113 | | | | 309 | | | | 60 | | | | 28 | | | | 115 | | | | 11 | | | | 10 | | |
Ratio of operating expenses to average
net assets including fee waivers and
reimbursements/(recoupments) (%) | | | 1.25 | (b)(d) | | | 2.00 | (b)(d) | | | 0.80 | (b)(d) | | | 0.95 | (b) | | | 1.66 | (b) | | | 0.80 | | | | 0.80 | | | | 0.80 | | |
Ratio of operating expenses to average
net assets excluding fee waivers and
reimbursements/(recoupments) (%) | | | 1.27 | (b)(d) | | | 2.02 | (b)(d) | | | 1.03 | (b)(d) | | | 1.12 | (b) | | | 1.83 | (b) | | | 1.05 | | | | 1.21 | | | | 1.04 | | |
Ratio of net investment income to
average net assets including fee waivers
and reimbursements/(recoupments) (%) | | | 5.75 | (b)(d) | | | 4.98 | (b)(d) | | | 6.23 | (b)(d) | | | 5.48 | (b) | | | 4.74 | (b) | | | 6.98 | | | | 9.33 | | | | 13.34 | | |
Ratio of net investment income to
average net assets excluding fee waivers
and reimbursements/(recoupments) (%) | | | 5.73 | (b)(d) | | | 4.96 | (b)(d) | | | 6.00 | (b)(d) | | | 5.31 | (b) | | | 4.57 | (b) | | | 6.73 | | | | 8.92 | | | | 13.10 | | |
Portfolio turnover rate (%) | | | 25.02 | (a) | | | 25.02 | (a) | | | 25.02 | (a) | | | 45.21 | | | | 45.21 | | | | 45.21 | | | | 145.96 | | | | 292.11 | | |
First Eagle Funds | Annual Report | October 31, 2014
163
First Eagle Fund of America
| | | Year Ended October 31, | |
| | | 2014 | |
| | | Class A | | Class C | | Class I | | Class Y | |
Selected data for a share of beneficial interest outstanding throughout
each year is presented below:* | |
Net asset value, beginning of year ($) | | | 34.76 | | | | 29.94 | | | | 35.47 | | | | 35.42 | | |
Income (loss) from investment operations: | |
Net investment income (loss) ($) | | | 0.17 | | | | -0.10 | | | | 0.25 | | | | 0.17 | | |
Net realized and unrealized gains (losses) on investments | | | 4.26 | | | | 3.66 | | | | 4.36 | | | | 4.34 | | |
Total income (loss) from investment operations | | | 4.43 | | | | 3.56 | | | | 4.61 | | | | 4.51 | | |
Less distributions: | |
Dividends from net investment income ($) | | | -0.09 | | | | — | | | | -0.17 | | | | -0.06 | | |
Distributions from capital gains | | | -0.52 | | | | -0.52 | | | | -0.52 | | | | -0.52 | | |
Total distributions | | | -0.61 | | | | -0.52 | | | | -0.69 | | | | -0.58 | | |
Net asset value, end of year ($) | | | 38.58 | | | | 32.98 | | | | 39.39 | | | | 39.35 | | |
Total return(a) (%) | | | 12.92 | | | | 12.06 | | | | 13.20 | | | | 12.91 | | |
Ratios and supplemental data | |
Net assets, end of year (millions) ($) | | | 1,204 | | | | 632 | | | | 888 | | | | 528 | | |
Ratio of operating expenses to average net assets
including earnings credits (%) | | | 1.36 | | | | 2.11 | | | | 1.11 | | | | 1.36 | | |
Ratio of operating expenses to average net assets
excluding earnings credits (%) | | | 1.36 | | | | 2.11 | | | | 1.11 | | | | 1.36 | | |
Ratio of net investment income (loss) to average
net assets including earnings credits (%) | | | 0.45 | | | | -0.31 | | | | 0.66 | | | | 0.45 | | |
Ratio of net investment income (loss) to average
net assets excluding earnings credits (%) | | | 0.45 | | | | -0.31 | | | | 0.66 | | | | 0.45 | | |
Portfolio turnover rate (%) | | | 35.18 | | | | 35.18 | | | | 35.18 | | | | 35.18 | | |
^ Class I commenced investment operations on March 8, 2013.
* Per share amounts have been calculated using the average shares method.
(a) Does not take into account the sales charge of 5.00% for Class A and the CDSC (Contingent Deferred Sales Charge) of 1.00% for Class C shares. A contingent deferred sales charge of 1.00% may apply on redemptions of Class A shares made within 18 months following a purchase of $1,000,000 or more without an initial sales charge.
(b) Not Annualized.
(c) Annualized.
See Notes to Financial Statements.
First Eagle Funds | Annual Report | October 31, 2014
164
| | | Year Ended October 31, | |
| | | 2013 | | 2012 | |
| | | Class A | | Class C | | Class I^ | | Class Y | | Class A | | Class C | | Class Y | |
Selected data for a share of beneficial interest outstanding throughout
each year is presented below:* | |
Net asset value, beginning of year ($) | | | 26.86 | | | | 23.30 | | | | 31.01 | | | | 27.37 | | | | 24.91 | | | | 22.01 | | | | 25.35 | | |
Income (loss) from investment operations: | |
Net investment income (loss) ($) | | | 0.10 | | | | -0.12 | | | | 0.07 | | | | 0.12 | | | | 0.04 | | | | -0.13 | | | | 0.04 | | |
Net realized and unrealized gains (losses) on investments | | | 7.81 | | | | 6.76 | | | | 4.39 | | | | 7.94 | | | | 3.73 | | | | 3.24 | | | | 3.80 | | |
Total income (loss) from investment operations | | | 7.91 | | | | 6.64 | | | | 4.46 | | | | 8.06 | | | | 3.77 | | | | 3.11 | | | | 3.84 | | |
Less distributions: | |
Dividends from net investment income ($) | | | -0.01 | | | | — | | | | — | | | | -0.01 | | | | — | | | | — | | | | — | | |
Distributions from capital gains | | | — | | | | — | | | | — | | | | — | | | | -1.82 | | | | -1.82 | | | | -1.82 | | |
Total distributions | | | -0.01 | | | | — | | | | — | | | | -0.01 | | | | -1.82 | | | | -1.82 | | | | -1.82 | | |
Net asset value, end of year ($) | | | 34.76 | | | | 29.94 | | | | 35.47 | | | | 35.42 | | | | 26.86 | | | | 23.30 | | | | 27.37 | | |
Total return(a) (%) | | | 29.45 | | | | 28.44 | | | | 14.38 | (b) | | | 29.45 | | | | 16.46 | | | | 15.62 | | | | 16.50 | | |
Ratios and supplemental data | |
Net assets, end of year (millions) ($) | | | 1,036 | | | | 455 | | | | 491 | | | | 504 | | | | 699 | | | | 246 | | | | 667 | | |
Ratio of operating expenses to average net assets
including earnings credits (%) | | | 1.41 | | | | 2.16 | | | | 1.19 | (c) | | | 1.41 | | | | 1.44 | | | | 2.19 | | | | 1.44 | | |
Ratio of operating expenses to average net assets
excluding earnings credits (%) | | | 1.41 | | | | 2.16 | | | | 1.19 | (c) | | | 1.41 | | | | 1.44 | | | | 2.19 | | | | 1.44 | | |
Ratio of net investment income (loss) to average
net assets including earnings credits (%) | | | 0.31 | | | | -0.46 | | | | 0.34 | (c) | | | 0.39 | | | | 0.14 | | | | -0.61 | | | | 0.14 | | |
Ratio of net investment income (loss) to average
net assets excluding earnings credits (%) | | | 0.31 | | | | -0.46 | | | | 0.34 | (c) | | | 0.39 | | | | 0.14 | | | | -0.61 | | | | 0.14 | | |
Portfolio turnover rate (%) | | | 32.12 | | | | 32.12 | | | | 32.12 | (b) | | | 32.12 | | | | 31.48 | | | | 31.48 | | | | 31.48 | | |
First Eagle Funds | Annual Report | October 31, 2014
165
First Eagle Fund of America
Financial Highlights (continued)
| | | Year Ended October 31, | |
| | | 2011 | | 2010 | |
| | | Class A | | Class C | | Class Y | | Class A | | Class C | | Class Y | |
Selected data for a share of beneficial interest outstanding throughout
each year is presented below:* | |
Net asset value, beginning of year ($) | | | 24.06 | | | | 21.32 | | | | 24.47 | | | | 19.32 | | | | 17.25 | | | | 19.66 | | |
Income (loss) from investment operations: | |
Net investment income (loss) ($) | | | -0.09 | | | | -0.25 | | | | -0.08 | | | | 0.13 | | | | -0.03 | | | | 0.14 | | |
Net realized and unrealized gains
(losses) on investments | | | 1.11 | | | | 0.98 | | | | 1.12 | | | | 4.61 | | | | 4.10 | | | | 4.67 | | |
Total income (loss) from investment
operations | | | 1.02 | | | | 0.73 | | | | 1.04 | | | | 4.74 | | | | 4.07 | | | | 4.81 | | |
Less distributions: | |
Dividends from net investment
income ($) | | | -0.17 | | | | -0.04 | | | | -0.16 | | | | — | | | | — | | | | — | | |
Distributions from capital gains | | | — | | | | — | | | | — | | | | — | | | | — | | | | — | | |
Total distributions | | | -0.17 | | | | -0.04 | | | | -0.16 | | | | — | | | | — | | | | — | | |
Net asset value, end of year ($) | | | 24.91 | | | | 22.01 | | | | 25.35 | | | | 24.06 | | | | 21.32 | | | | 24.47 | | |
Total return(a) (%) | | | 4.22 | | | | 3.43 | | | | 4.20 | | | | 24.53 | | | | 23.59 | | | | 24.47 | | |
Ratios and supplemental data | |
Net assets, end of year (millions) ($) | | | 549 | | | | 194 | | | | 633 | | | | 379 | | | | 122 | | | | 599 | | |
Ratio of operating expenses to
average net assets including
earnings credits (%) | | | 1.43 | | | | 2.18 | | | | 1.43 | | | | 1.47 | | | | 2.22 | | | | 1.47 | | |
Ratio of operating expenses to
average net assets excluding
earnings credits (%) | | | 1.43 | | | | 2.18 | | | | 1.43 | | | | 1.47 | | | | 2.22 | | | | 1.47 | | |
Ratio of net investment income
(loss) to average net assets
including earnings credits (%) | | | -0.33 | | | | -1.08 | | | | -0.31 | | | | 0.61 | | | | -0.14 | | | | 0.62 | | |
Ratio of net investment income
(loss) to average net assets
excluding earnings credits (%) | | | -0.33 | | | | -1.08 | | | | -0.31 | | | | 0.61 | | | | -0.14 | | | | 0.62 | | |
Portfolio turnover rate (%) | | | 67.61 | | | | 67.61 | | | | 67.61 | | | | 40.00 | | | | 40.00 | | | | 40.00 | | |
* Per share amounts have been calculated using the average shares method.
(a) Does not take into account the sales charge of 5.00% for Class A and the CDSC (Contingent Deferred Sales Charge) of 1.00% for Class C shares. A contingent deferred sales charge of 1.00% may apply on redemptions of Class A shares made within 18 months following a purchase of $1,000,000 or more without an initial sales charge.
See Notes to Financial Statements.
First Eagle Funds | Annual Report | October 31, 2014
166
This page was intentionally left blank.
Notes to Financial Statements
Note 1 — Significant Accounting Policies
First Eagle Funds (the "Trust"), is an open-end management investment company registered under the Investment Company Act of 1940, as amended ("1940 Act"). The Trust consists of eight separate portfolios, First Eagle Global Fund, First Eagle Overseas Fund, First Eagle U.S. Value Fund, First Eagle Gold Fund, First Eagle Global Income Builder Fund, First Eagle High Yield Fund, First Eagle Fund of America and First Eagle Absolute Return Fund (each individually a "Fund" or collectively the "Funds"). All the Funds are diversified mutual funds except for First Eagle Gold Fund, First Eagle Absolute Return Fund and First Eagle Fund of America, which are non-diversified. The Trust is a Delaware statutory trust. The First Eagle Global Fund seeks long-term growth of capital by investing in a range of asset classes from markets in the United States and throughout the world. The First Eagle Overseas Fund seeks long-term growth of capital by investing primarily in equities issued by non-U.S. corporations. The First Eagle U.S. Value Fund seeks long-term growth of capital by investing, under normal market conditions, at least 80% of its assets in domestic equity and debt securities. The First Eagle Gold Fund seeks to provide investors the opportunity to participate in the investment characteristics of gold (and to a limited extent other precious metals) for a portion of their overall investment portfolio. The First Eagle Global Income Builder Fund (which commenced operations on May 1, 2012) seeks current income generation and long-term growth of capital. The First Eagle High Yield Fund seeks to provide investors with a high level of current income. The First Eagle Fund of America seeks capital appreciation by investing primarily in domestic stocks and, to a lesser extent, in debt and international equity securities. No results are presented in these financial statements for First Eagle Absolute Return Fund, which commenced operations on May 14, 2014 and is described in a prospectus and annual report separate from that for the other seven Funds discussed here.
Effective at the close of business on Friday, May 9, 2014, the First Eagle Overseas Fund is closed to new investors, subject to certain limited exceptions. Additional information can be found in the prospectus.
First Eagle Investment Management, LLC (the "Adviser"), a subsidiary of Arnhold and S. Bleichroeder Holdings, Inc. ("ASB Holdings"), manages the Funds.
The following is a summary of significant accounting policies that are adhered to by the Funds and that are in conformity with U.S. generally accepted accounting principles ("GAAP").
a) Investments in Subsidiaries — The First Eagle Global Fund (the "Global Fund"), First Eagle Overseas Fund (the "Overseas Fund"), First Eagle U.S. Value Fund (the "U.S. Value Fund"), and First Eagle Gold Fund (the "Gold Fund") may invest in certain precious metals through their investment in the First Eagle Global Cayman Fund, Ltd., First Eagle Overseas Cayman Fund, Ltd., First Eagle U.S. Value Cayman Fund, Ltd., and First Eagle Gold Cayman Fund, Ltd., respectively, each a wholly owned subsidiary (each referred to herein as a "Subsidiary" or collectively the "Subsidiaries"). Each Fund may invest up to 25% of its total assets in shares of its respective Subsidiary. Each Subsidiary has the ability to invest in commodities and securities consistent with the investment objective of its respective Fund. Substantially all of each Subsidiary's assets represent physical gold (bullion). Trading in bullion directly by the Funds
First Eagle Funds | Annual Report | October 31, 2014
168
Notes to Financial Statements
presents the risk of tax consequences (e.g., a change in the Funds' tax status subjecting the Funds to be taxed at the Fund level on all of their income if the Funds' "non-qualifying income" exceeds 10% of the Funds' gross income in any taxable year). Trading in bullion by the Subsidiaries generally does not present the same tax risks.
The First Eagle Global Cayman Fund, Ltd., established on October 18, 2013, is an exempted company under the laws of the Cayman Islands. The consolidated financial statements include the accounts of the Global Fund and the First Eagle Global Cayman Fund, Ltd. All intercompany transactions and balances have been eliminated. As of October 31, 2014, the First Eagle Global Cayman Fund, Ltd. has $2,061,504,760 in net assets, representing 4.08% of the Global Fund's net assets.
The First Eagle Overseas Cayman Fund, Ltd., established on October 18, 2013, is an exempted company under the laws of the Cayman Islands. The consolidated financial statements include the accounts of the Overseas Fund and the First Eagle Overseas Cayman Fund, Ltd. All intercompany transactions and balances have been eliminated. As of October 31, 2014, the First Eagle Overseas Cayman Fund, Ltd. has $459,096,269 in net assets, representing 3.16% of the Overseas Fund's net assets.
The First Eagle U.S. Value Cayman Fund, Ltd., established on January 24, 2012, is an exempted company under the laws of the Cayman Islands. The consolidated financial statements include the accounts of the U.S. Value Fund and the First Eagle U.S. Value Cayman Fund, Ltd. All intercompany transactions and balances have been eliminated. As of October 31, 2014, the First Eagle U.S. Value Cayman Fund, Ltd. has $154,844,211 in net assets, representing 4.94% of the U.S. Value Fund's net assets.
The First Eagle Gold Cayman Fund, Ltd., established on May 28, 2010, is an exempted company under the laws of the Cayman Islands. The consolidated financial statements include the accounts of the Gold Fund and the First Eagle Gold Cayman Fund, Ltd. All intercompany transactions and balances have been eliminated. As of October 31, 2014, the First Eagle Gold Cayman Fund, Ltd. has $258,151,637 in net assets, representing 25.82% of the Gold Fund's net assets.
b) Investment valuation — Each Fund computes its net asset value once daily as of the close of trading on each day the New York Stock Exchange ("NYSE") is open for trading. The net asset value per share is computed by dividing the total current value of the assets of a Fund, less its liabilities, by the total number of shares outstanding at the time of such computation.
A portfolio security (including an option), other than a bond, which is traded on a U.S. national securities exchange or a securities exchange abroad is normally valued at the price of the last sale on the exchange as of the close of business on the date on which assets are valued. If there are no sales on such date, such portfolio investment will be valued at the mean between the closing bid and asked prices (and if there is only a bid or only an asked price on such date, valuation will be at such bid or asked price for long or short positions, respectively). Securities, other than bonds, traded in the over-the-counter market are valued at the mean between the last bid and asked prices prior to the time of valuation (and if there is only a bid
First Eagle Funds | Annual Report | October 31, 2014
169
Notes to Financial Statements
or only an asked price on such date, valuation will be at such bid or asked price for long or short positions, respectively), except if such unlisted security traded on the NASDAQ, in which case it is valued at its last sale price (or, if available, the NASDAQ Official Closing Price).
All bonds, whether listed on an exchange or traded in the over-the-counter market, for which market quotations are readily available are valued at the mean between the last bid and asked prices received from dealers in the over-the-counter market in the United States or abroad, except that when no asked price is available, bonds are valued at the last bid price alone. Broker-Dealers or pricing services use multiple valuation techniques to determine value. In instances where sufficient market activity exists, dealers or pricing services may utilize a market-based approach through which quotes from market makers are used to determine fair value. In instances where sufficient market activity may not exist or is limited, the dealers or pricing services also utilize proprietary valuation models which may consider market transactions in comparable securities and the various relationships between securities in determining value and/or market characteristics such as benchmark yield curves, option-adjusted spreads, credit spreads, estimated default rates, coupon-rates, anticipated timing of principal repayments, underlying collateral, and other unique security features in order to estimate the relevant cash flows, which are then discounted to calculate the fair values. Effective December 15, 2014, short-term investments maturing in sixty days or less will be valued at market price. Prior to December 15, 2014 short-term investments maturing in sixty days or less were valued at cost plus interest earned (or discount amortized, as the case may be), which was deemed to approximate value.
Commodities (such as physical metals) are valued at the spot price at 4:00 p.m. E.S.T., as provided by an independent pricing source.
Forward contracts are valued at the current cost of covering or offsetting such contracts by reference to forward currency rates as of 4:00 p.m. E.S.T.
The 4:00 p.m. E.S.T. exchange rates are used to convert foreign security prices into U.S. dollars.
Any security that is listed or traded on more than one exchange (or traded in multiple markets) is valued at the relevant quotation on the exchange or market deemed by the Adviser to be the primary trading venue for that security. In the absence of such a quotation, a quotation from the exchange or market deemed by the Adviser to be the secondary trading venue for the particular security shall be used. The Funds use pricing services to identify the market prices of publicly traded securities in their portfolios. When market prices are determined to be "stale" as a result of limited market activity for a particular holding, or in other circumstances when market prices are unavailable, such as for private placements, or determined to be unreliable for a particular holding, such holdings may be "fair valued" in accordance with procedures approved by the Board of Trustees ("Board"). Additionally, with respect to foreign holdings, specifically in circumstances leading the Adviser to believe that significant events occurring after the close of a foreign market have materially affected the value of a Fund's holdings in that market, such holdings may be fair valued to reflect the events in accordance with procedures approved by the Board. The determination of whether a particular foreign investment should be fair valued will be based on review of a number of factors, including developments
First Eagle Funds | Annual Report | October 31, 2014
170
Notes to Financial Statements
in foreign markets, the performance of U.S. securities markets and security-specific events. The values assigned to a Fund's holdings therefore may differ on occasion from reported market values.
Certain Funds with non-U.S. holdings have adopted procedures under which movements in the prices for U.S. securities (beyond specified thresholds) occurring after the close of a foreign market may require fair valuation of securities traded in that foreign market. The values assigned to a Fund's foreign holdings therefore may differ on occasion from reported market values. The Trust and the Adviser believe relying on the procedures as just described will result in prices that are more reflective of the actual market value of portfolio securities held by the Funds as of 4:00 p.m. E.S.T.
The Funds adopted provisions surrounding fair value measurements and disclosures that define fair value, establish a framework for measuring fair value in GAAP and expand disclosures about fair value measurements. This applies to fair value measurements that are already required or permitted by other accounting standards and is intended to increase consistency of those measurements and applies broadly to securities and other types of assets and liabilities.
The Funds disclose the fair value of their investments in a hierarchy that prioritizes the inputs or assumptions to valuation techniques used to measure fair value. These inputs are used in determining the value of the Funds' investments and are summarized in the following fair value hierarchy:
Level 1 — Quoted prices in active markets for identical securities.
Level 2 — Other significant observable inputs (including quoted prices for similar securities, interest rates, prepayment speeds, credit risk, etc.).
Level 3 — Other significant unobservable inputs (including the Fund's own assumption in determining the fair value of investments).
The significant unobservable inputs that may be used in determining valuations for investments identified within Level 3 are market comparables and the enterprise value of a company. Indications of value and quotations may be observable at any given time, but are currently treated by the Funds as unobservable. Significant changes in any of the unobservable inputs may significantly impact the fair value measurement. The impact is based on the relationship between each unobservable input and the fair value measurement.
Significant increases (decreases) in enterprise multiples may increase (decrease) the fair value measurement. Significant increases (decreases) in the discount for marketability, probability of insolvency and probability of default may decrease (increase) the fair value measurement.
Fair valuation of securities, other financial investments or other assets (collectively, "securities") held by the Funds shall be determined in good faith by or under the direction of the Board, generally acting through its designated Board Valuation Committee or Valuation Committee (collectively, the "Committees"). The Committees' responsibilities include making determinations regarding Level 3 fair value measurements and providing the results to the Board, in accordance with the Funds' valuation policies.
First Eagle Funds | Annual Report | October 31, 2014
171
Notes to Financial Statements
It is the policy of the Funds to recognize significant transfers between Levels 1, 2 and 3 and to disclose those transfers as of the date of the underlying event which caused the movement.
The following is a summary of the Funds' inputs used to value the Funds' investments as of October 31, 2014:
First Eagle Global Fund
Description | | Level 1 | | Level 2 | | Level 3(a) | | Total | |
Assets:† | |
U.S. Common Stocks | | $ | 16,866,566,019 | | | $ | 1,418,224 | | | $ | — | | | $ | 16,867,984,243 | | |
International
Common Stocks | | | 19,177,293,156 | | | | 7,183,085 | | | | 11,370,269 | | | | 19,195,846,510 | | |
International Preferred Stock | | | 132,595,078 | | | | — | | | | — | | | | 132,595,078 | | |
Investment Company | | | 434,056 | | | | — | | | | — | | | | 434,056 | | |
Warrant | | | 114,976,600 | | | | — | | | | — | | | | 114,976,600 | | |
Commodity* | | | 2,418,179,723 | | | | — | | | | — | | | | 2,418,179,723 | | |
Government Obligations | | | — | | | | 1,003,320,250 | | | | — | | | | 1,003,320,250 | | |
U.S. Corporate Bond | | | — | | | | 5,439,665 | | | | — | | | | 5,439,665 | | |
International Corporate
Notes and Bonds | | | — | | | | 34,217,607 | | | | 35,015,551 | | | | 69,233,158 | | |
International Government
Bonds | | | — | | | | 147,963,283 | | | | — | ^ | | | 147,963,283 | | |
International Commercial
Paper | | | — | | | | 3,781,865,356 | | | | — | | | | 3,781,865,356 | | |
U.S. Commercial Paper | | | — | | | | 6,425,258,623 | | | | — | | | | 6,425,258,623 | | |
Foreign Currency Contracts** | | | — | | | | 193,633,407 | | | | — | | | | 193,633,407 | | |
Total | | $ | 38,710,044,632 | | | $ | 11,600,299,500 | | | $ | 46,385,820 | | | $ | 50,356,729,952 | | |
Liabilities: | |
Covered Call Options Written | | $ | 1,579,500 | | | $ | — | | | $ | — | | | $ | 1,579,500 | | |
Foreign Currency Contracts** | | | — | | | | 2,332,362 | | | | — | | | | 2,332,362 | | |
Total | | $ | 1,579,500 | | | $ | 2,332,362 | | | $ | — | | | $ | 3,911,862 | | |
(a) Level 3 securities are identified in the Schedule of Investments with the footnote (e).
† See Consolidated Schedule of Investments for additional detailed categorizations.
^ Fair value represents zero.
* Represents gold bullion.
** Foreign currency contracts are valued at net unrealized appreciation (depreciation) on the investment.
For the period ended October 31, 2014, there was no security transfer activity from Level 1 to Level 2 and no security transfer activity from Level 2 to Level 1.
First Eagle Funds | Annual Report | October 31, 2014
172
Notes to Financial Statements
Fair Value Level 3 activity for the period ended October 31, 2014 was as follows:
First Eagle Global Fund (continued)
| | | International
Common Stocks | | International
Corporate Bonds | | Total
Value | |
Beginning Balance — market value | | $ | 12,514,385 | | | $ | 38,819,641 | | | $ | 51,334,026 | | |
Purchases | | | — | | | | — | | | | — | | |
Sales | | | — | | | | (881,801 | )* | | | (881,801 | ) | |
Transfer In — Level 3 | | | — | | | | — | | | | — | | |
Transfer Out — Level 3 | | | — | | | | — | | | | — | | |
Accrued Amortization | | | — | | | | — | | | | — | | |
Realized Gains (Losses) | | | — | | | | (42,794 | )* | | | (42,794 | ) | |
Change in Unrealized Appreciation (Depreciation) | | | (1,144,116 | ) | | | (2,879,495 | ) | | | (4,023,611 | ) | |
Ending Balance — market value | | $ | 11,370,269 | | | $ | 35,015,551 | | | $ | 46,385,820 | | |
Change in unrealized gains or (losses) relating to
assets still held at reporting date | | $ | (1,144,116 | ) | | $ | (2,879,495 | ) | | $ | (4,023,611 | ) | |
*Related to a paydown of previously recapitalized interest receivable to principal.
First Eagle Funds | Annual Report | October 31, 2014
173
Notes to Financial Statements
First Eagle Overseas Fund
Description | | Level 1 | | Level 2(a) | | Level 3(b) | | Total | |
Assets:† | |
International Common Stocks | | $ | 10,519,946,838 | | | $ | 676,694 | | | $ | 31,419,040 | | | $ | 10,552,042,572 | | |
U.S. Common Stock | | | 7,597,800 | | | | — | | | | — | | | | 7,597,800 | | |
International Preferred Stocks | | | 71,901,633 | | | | — | | | | — | | | | 71,901,633 | | |
Investment Company | | | 96,753 | | | | — | | | | — | | | | 96,753 | | |
Rights | | | 21,928,853 | | | | — | | | | — | ^ | | | 21,928,853 | | |
Commodity* | | | 692,811,472 | | | | — | | | | — | | | | 692,811,472 | | |
Term Loans | | | — | | | | — | | | | 4,278,594 | | | | 4,278,594 | | |
International Convertible Bond | | | — | | | | 17,940,000 | | | | — | | | | 17,940,000 | | |
International Corporate Bonds | | | — | | | | 81,825,115 | | | | 23,343,700 | | | | 105,168,815 | | |
International Government Bond | | | — | | | | 36,735,237 | | | | — | | | | 36,735,237 | | |
International Commercial Paper | | | — | | | | 1,121,268,062 | | | | — | | | | 1,121,268,062 | | |
U.S. Commercial Paper | | | — | | | | 1,755,335,382 | | | | — | | | | 1,755,335,382 | | |
Foreign Currency Contracts** | | | — | | | | 104,627,771 | | | | — | | | | 104,627,771 | | |
Total | | $ | 11,314,283,349 | | | $ | 3,118,408,261 | | | $ | 59,041,334 | | | $ | 14,491,732,944 | | |
Liabilities: | |
Foreign Currency Contracts** | | $ | — | | | $ | 1,027,404 | | | $ | — | | | $ | 1,027,404 | | |
Total | | $ | — | | | $ | 1,027,404 | | | $ | — | | | $ | 1,027,404 | | |
(a) Transfer into/out of Level 2 represent value as of the beginning of the period.
Term Loans valued at $4,321,741 were transferred from Level 2 to Level 3 during the year ended October 31, 2014. At October 31, 2013, these securities were valued using broker quotes; at October 31, 2014, these securities were valued using other significant unobservable inputs. There was no security transfer activity from Level 1 to Level 2 and no security transfer activity from Level 2 to Level 1.
(b) Level 3 securities are identified in the Schedule of Investments with the footnote (d).
† See Consolidated Schedule of Investments for additional detailed categorizations.
^ Fair value represents zero.
* Represents gold bullion.
** Foreign currency contracts are valued at net unrealized appreciation (depreciation) on the investment.
First Eagle Funds | Annual Report | October 31, 2014
174
Notes to Financial Statements
Fair Value Level 3 activity for the period ended October 31, 2014 was as follows:
First Eagle Overseas Fund (continued)
| | | International
Common
Stocks | | Right | | International
Corporate
Bonds | | Term
Loans | | Total
Value | |
Beginning Balance —
market value | | $ | 34,181,929 | | | $ | — | ^ | | $ | 25,879,761 | | | $ | — | ^ | | $ | 60,061,690 | | |
Purchases | | | — | | | | 8,992 | | | | — | | | | — | | | | 8,992 | | |
Sales | | | — | | | | — | | | | (587,867 | )* | | | — | | | | (587,867 | ) | |
Transfer In — Level 3 | | | — | | | | — | | | | — | | | | 4,321,741 | | | | 4,321,741 | | |
Transfer Out — Level 3 | | | — | | | | — | | | | — | | | | — | | | | — | | |
Accrued Amortization | | | — | | | | — | | | | — | | | | — | | | | — | | |
Realized Gains (Losses) | | | — | | | | — | | | | (28,300 | )* | | | — | | | | (28,300 | ) | |
Change in Unrealized
Appreciation
(Depreciation) | | | (2,762,889 | ) | | | (8,992 | ) | | | (1,919,894 | ) | | | (43,147 | ) | | | (4,734,922 | ) | |
Ending Balance —
market value | | $ | 31,419,040 | | | $ | — | ^ | | $ | 23,343,700 | | | $ | 4,278,594 | | | $ | 59,041,334 | | |
Change in unrealized
gains or (losses) relating
to assets still held at
reporting date | | $ | (2,762,889 | ) | | $ | (8,992 | ) | | $ | (1,919,894 | ) | | $ | (43,147 | ) | | $ | (4,734,922 | ) | |
^Fair value represents zero.
*Related to a paydown of previously recapitalized interest receivable to principal.
First Eagle Funds | Annual Report | October 31, 2014
175
Notes to Financial Statements
First Eagle U.S. Value Fund
Description | | Level 1 | | Level 2 | | Level 3 | | Total | |
Assets:† | |
U.S. Common Stocks | | $ | 2,173,399,418 | | | $ | 2,560 | | | $ | — | | | $ | 2,173,401,978 | | |
International Common Stocks | | | 209,846,857 | | | | — | | | | — | | | | 209,846,857 | | |
Investment Company | | | 42,071 | | | | — | | | | — | | | | 42,071 | | |
Warrant | | | 17,582,855 | | | | — | | | | — | | | | 17,582,855 | | |
Commodity* | | | 154,834,322 | | | | — | | | | — | | | | 154,834,322 | | |
U.S. Corporate Bonds | | | — | | | | 12,583,055 | | | | — | | | | 12,583,055 | | |
U.S. Treasury Bills | | | — | | | | 129,998,665 | | | | — | | | | 129,998,665 | | |
International Commercial Paper | | | — | | | | 130,592,055 | | | | — | | | | 130,592,055 | | |
U.S. Commercial Paper | | | — | | | | 299,604,771 | | | | — | | | | 299,604,771 | | |
Total | | $ | 2,555,705,523 | | | $ | 572,781,106 | | | $ | — | | | $ | 3,128,486,629 | | |
Liabilities: | |
Covered Call Options Written | | $ | 175,500 | | | $ | — | | | $ | — | | | $ | 175,500 | | |
Total | | $ | 175,500 | | | $ | — | | | $ | — | | | $ | 175,500 | | |
†See Consolidated Schedule of Investments for additional detailed categorizations.
* Represents gold bullion.
For the year ended October 31, 2014, there was no security transfer activity from Level 1 to Level 2 and no security transfer activity from Level 2 to Level 1.
Fair Value Level 3 activity for the period ended October 31, 2014 was as follows:
| | | U.S. Preferred
Stock | |
Beginning Balance — market value | | $ | 4,952,588 | | |
Purchases | | | — | | |
Sales | | | (5,405,280 | ) | |
Transfer In — Level 3 | | | — | | |
Transfer Out — Level 3 | | | — | | |
Accrued Amortization | | | — | | |
Realized Gains (Losses) | | | 2,863,109 | | |
Change in Unrealized Appreciation (Depreciation) | | | (2,410,417 | ) | |
Ending Balance — market value | | $ | — | | |
Change in unrealized gains or (losses) relating to assets still held at reporting date | | $ | — | | |
First Eagle Funds | Annual Report | October 31, 2014
176
Notes to Financial Statements
First Eagle Gold Fund
Description | | Level 1 | | Level 2 | | Level 3(a) | | Total | |
Assets:† | |
International Common Stocks | | $ | 566,264,911 | | | $ | — | | | $ | — | | | $ | 566,264,911 | | |
U.S. Common Stocks | | | 135,395,208 | | | | — | | | | — | | | | 135,395,208 | | |
Investment Company | | | 160,878 | | | | — | | | | — | | | | 160,878 | | |
Commodities* | | | 258,088,499 | | | | — | | | | — | | | | 258,088,499 | | |
International Convertible Bonds | | | — | | | | — | | | | 27,618,750 | (b) | | | 27,618,750 | | |
International Commercial Paper | | | — | | | | 15,911,810 | | | | — | | | | 15,911,810 | | |
Total | | $ | 959,909,496 | | | $ | 15,911,810 | | | $ | 27,618,750 | | | $ | 1,003,440,056 | | |
(a) Level 3 securities are identified in the Schedule of Investments with the footnote (d).
(b) Represents a convertible bond that is fair valued using a comparable security from the same issuer that is publicly traded.
† See Consolidated Schedule of Investments for additional detailed categorizations.
* Represents gold bullion and silver bullion.
For the period ended October 31, 2014, there was no security transfer activity from Level 1 to Level 2 and no security transfer activity from Level 2 to Level 1.
Fair Value Level 3 activity for the period ended October 31, 2014 was as follows:
| | | International
Convertible Bonds | | Warrants | | Total Value | |
Beginning Balance — market value | | $ | 30,000,000 | | | $ | — | ^ | | $ | 30,000,000 | | |
Purchases | | | 10,039 | | | | — | | | | 10,039 | | |
Sales | | | (93,751 | ) | | | — | ^ | | | (93,751 | ) | |
Transfer In — Level 3 | | | — | | | | — | | | | — | | |
Transfer Out — Level 3 | | | — | | | | — | | | | — | | |
Accrued Amortization | | | — | | | | — | | | | — | | |
Realized Gains (Losses) | | | (1,773 | ) | | | — | | | | (1,773 | ) | |
Change in Unrealized Appreciation (Depreciation) | | | (2,295,765 | ) | | | — | | | | (2,295,765 | ) | |
Ending Balance — market value | | $ | 27,618,750 | | | $ | — | ^ | | $ | 27,618,750 | | |
Change in unrealized gains or (losses) relating to
assets still held at reporting date | | $ | (2,295,765 | ) | | $ | — | ^ | | $ | (2,295,765 | ) | |
^Fair value represents zero.
First Eagle Funds | Annual Report | October 31, 2014
177
Notes to Financial Statements
First Eagle Global Income Builder Fund
Description | | Level 1 | | Level 2 | | Level 3(a) | | Total | |
Assets:† | |
U.S. Common Stocks | | $ | 197,942,837 | | | $ | — | | | $ | — | | | $ | 197,942,837 | | |
International Common Stocks | | | 484,300,877 | | | | — | | | | 1,886,000 | | | | 486,186,877 | | |
Closed-End Mutual Fund | | | 2,230,943 | | | | — | | | | — | | | | 2,230,943 | | |
Commodity* | | | 15,284,397 | | | | — | | | | — | | | | 15,284,397 | | |
U.S. Corporate Bonds | | | — | | | | 261,344,179 | | | | — | | | | 261,344,179 | | |
International Convertible Bond | | | — | | | | 780,000 | | | | — | | | | 780,000 | | |
International Corporate Bonds | | | — | | | | 131,567,740 | | | | — | | | | 131,567,740 | | |
Term Loans | | | — | | | | 122,455,762 | | | | — | | | | 122,455,762 | | |
International Commercial Paper | | | — | | | | 90,715,914 | | | | — | | | | 90,715,914 | | |
Foreign Currency Contracts** | | | — | | | | 4,157,647 | | | | — | | | | 4,157,647 | | |
Total | | $ | 699,759,054 | | | $ | 611,021,242 | | | $ | 1,886,000 | | | $ | 1,312,666,296 | | |
Liabilities: | |
Foreign Currency Contracts** | | $ | — | | | $ | 135,724 | | | $ | — | | | $ | 135,724 | | |
Total | | $ | — | | | $ | 135,724 | | | $ | — | | | $ | 135,724 | | |
(a) Level 3 securities are identified in the Schedule of Investments with the footnote (b).
† See Schedule of Investments for additional detailed categorizations.
* Represents gold bullion.
** Foreign currency contracts are valued at net unrealized appreciation (depreciation) on the investment.
For the year ended October 31, 2014, there was no security transfer activity from Level 1 to Level 2 and no security transfer activity from Level 2 to Level 1.
| | | International
Common
Stocks | |
Beginning Balance — market value | | $ | — | | |
Purchases | | | 1,850,000 | | |
Sales | | | — | | |
Transfer In — Level 3 | | | — | | |
Transfer Out — Level 3 | | | — | | |
Accrued Amortization | | | — | | |
Realized Gains (Losses) | | | — | | |
Change in Unrealized Appreciation (Depreciation) | | | 36,000 | | |
Ending Balance — market value | | $ | 1,886,000 | | |
Change in unrealized gains or (losses) relating to assets still held at reporting date | | $ | 36,000 | | |
First Eagle Funds | Annual Report | October 31, 2014
178
Notes to Financial Statements
First Eagle High Yield Fund
Description | | Level 1 | | Level 2 | | Level 3(a) | | Total | |
Assets:† | |
U.S. Convertible Bond | | $ | — | | | $ | 2,039,475 | | | $ | — | | | $ | 2,039,475 | | |
U.S. Corporate Bonds | | | — | | | | 591,644,367 | | | | — | | | | 591,644,367 | | |
International Convertible Bonds | | | — | | | | 1,950,000 | | | | — | | | | 1,950,000 | | |
International Corporate Bonds | | | — | | | | 260,831,898 | | | | 10,108,468 | | | | 270,940,366 | | |
Term Loans | | | — | | | | 209,664,765 | | | | — | | | | 209,664,765 | | |
International Commercial Paper | | | — | | | | 60,138,280 | | | | — | | | | 60,138,280 | | |
Foreign Currency Contracts* | | | — | | | | 1,686,488 | | | | — | | | | 1,686,488 | | |
Total | | $ | — | | | $ | 1,127,955,273 | | | $ | 10,108,468 | | | $ | 1,138,063,741 | | |
Liabilities: | |
Foreign Currency Contracts* | | $ | — | | | $ | 356,102 | | | $ | — | | | $ | 356,102 | | |
Total | | $ | — | | | $ | 356,102 | | | $ | — | | | $ | 356,102 | | |
(a) Level 3 securities are identified in the Schedule of Investments with the footnote (h).
† See Schedule of Investments for additional detailed categorizations.
* Foreign currency contracts are valued at net unrealized appreciation (depreciation) on the investment.
For the period ended October 31, 2014, there was no security transfer activity from Level 1 to Level 2 and no security transfer activity from Level 2 to Level 1.
| | | International
Corporate
Bonds | |
Beginning Balance — market value | | $ | — | | |
Purchases | | | 10,146,517 | | |
Sales | | | — | | |
Transfer In — Level 3 | | | — | | |
Transfer Out — Level 3 | | | — | | |
Accrued Amortization | | | — | | |
Realized Gains (Losses) | | | — | | |
Change in Unrealized Appreciation (Depreciation) | | | (38,049 | ) | |
Ending Balance — market value | | $ | 10,108,468 | | |
Change in unrealized gains or (losses) relating to assets still held at reporting date | | $ | (38,049 | ) | |
First Eagle Funds | Annual Report | October 31, 2014
179
Notes to Financial Statements
First Eagle Fund of America
Description | | Level 1 | | Level 2 | | Level 3 | | Total | |
Assets:† | |
U.S. Common Stocks | | $ | 2,983,116,354 | | | $ | — | | | $ | — | | | $ | 2,983,116,354 | | |
International Common Stock | | | 130,856,803 | | | | — | | | | — | | | | 130,856,803 | | |
Investment Company | | | 211,310,956 | | | | — | | | | — | | | | 211,310,956 | | |
U.S. Convertible Bond | | | — | | | | 6,918,844 | | | | — | | | | 6,918,844 | | |
Total | | $ | 3,325,284,113 | | | $ | 6,918,844 | | | $ | — | | | $ | 3,332,202,957 | | |
Liabilities: | |
Covered Call Options Written | | $ | 39,662,209 | | | $ | — | | | $ | — | | | $ | 39,662,209 | | |
Total | | $ | 39,662,209 | | | $ | — | | | $ | — | | | $ | 39,662,209 | | |
†See Schedule of Investments for additional detailed categorizations.
For the period ended October 31, 2014, there was no security transfer activity from Level 1 to Level 2 and no security transfer activity from Level 2 to Level 1.
c) Investment transactions and income — Investment transactions are accounted for on a trade date basis. The specific identification method is used in determining realized gains and losses from investment transactions. Dividend income is recorded on the ex-dividend date. Interest income is recorded daily on the accrual basis. In computing investment income, each Fund accretes discounts and amortizes premiums on debt obligations using the effective yield method. Investment income is allocated to each Fund's share class in proportion to its relative net assets. Payments received from certain investments held by the Funds may be comprised of dividends, capital gains and return of capital. The Funds originally estimate the expected classification of such payments. The amounts may subsequently be reclassified upon receipt of information from the issuer.
d) Expenses — Expenses arising in connection with a Fund are charged directly to that Fund. Expenses common to all Funds are generally allocated to each Fund in proportion to its relative net assets. Certain expenses are shared with the First Eagle Variable Funds, an affiliated fund group. Such costs are generally allocated using the ratio of the Fund's average daily net assets relative to the total average daily net assets of the First Eagle Variable Funds. Earnings credits may reduce shareholder servicing agent fees by the amount of interest earned on balances with such service provider.
e) Foreign currency translation — The books and records of the Funds are maintained in U.S. dollars. The market values of securities which are not traded in U.S. currency are recorded in the financial statements after translation to U.S. dollars based on the applicable exchange rates at the end of the period. The costs of such securities are translated at exchange rates prevailing when acquired. Related interest, dividends and withholding taxes are accrued at the rates of exchange prevailing on the respective dates of such transactions.
First Eagle Funds | Annual Report | October 31, 2014
180
Notes to Financial Statements
The net assets of each of the Funds are presented at the foreign exchange rates and market values at the close of the period. The Funds do not isolate that portion of gains and losses on investments which is due to changes in foreign exchange rates from that which is due to changes in market prices of the securities. Accordingly, such foreign currency gains (losses) are included in the reported net realized and unrealized gains (losses) on investment transactions on the Statements of Operations. However, for federal income tax purposes each Fund does isolate the effect of changes in foreign exchange rates from the changes in market prices for realized gains and losses on debt obligations.
f) Forward currency contracts — In connection with portfolio purchases and sales of securities denominated in foreign currencies, each Fund may enter into forward currency contracts. The First Eagle Global Fund, First Eagle Overseas Fund, First Eagle Global Income Builder Fund and First Eagle High Yield Fund enter into foreign exchange contracts primarily to manage and/or gain exposure to certain foreign currencies. The Funds' currency transactions include portfolio hedging on portfolio positions. Portfolio hedging is the use of a forward contract (or other cash management position) with respect to one or more portfolio security positions denominated or quoted in a particular currency. Currency exchange transactions involve currencies of different countries that the Funds invest in and serve as hedges against possible variations in the exchange rates between these currencies and the U.S. dollar. Each Fund may engage in portfolio hedging with respect to the currency of a particular country in amounts approximating actual or anticipated positions in securities denominated in that currency. Hedging can reduce exposure to currency exchange movements, but cannot eliminate that exposure. It is possible to lose money under a hedge.
Funds investing in foreign exchange contracts are exposed to risk if the value of the currency changes unfavorably, if the counterparties to the contracts are unable to meet the terms of their contracts or if the Fund is unable to enter into a closing position. Forward currency contracts outstanding at period end, if any, are listed after each Fund's portfolio. Outstanding contracts at period end are indicative of the volume of activity during the period, proportionate to the net assets of the Fund.
The Funds adopted provisions surrounding disclosures and derivative instruments and hedging activities which require qualitative disclosures about objectives and strategies for using derivatives, quantitative disclosures about fair value amounts of gains and losses on derivative instruments, and disclosures about currency-risk-related contingent features in derivative agreements.
At October 31, 2014, the Funds had the following foreign forward currency contracts grouped into appropriate risk categories illustrated below:
First Eagle Global Fund
| | | | | | | Gain or (Loss)
Derivative Recognized
in Income | |
Risk Type | | Asset Derivative
Fair Value(1) | | Liability Derivative
Fair Value(2) | | Realized
Gain(3) | | Change in
Appreciation(4) | |
Foreign Currency | | $ | 193,633,407 | | | $ | 2,332,362 | | | $ | 141,918,761 | | | $ | 233,491,936 | | |
First Eagle Funds | Annual Report | October 31, 2014
181
Notes to Financial Statements
First Eagle Overseas Fund
| | | | | | | Gain or (Loss)
Derivative Recognized
in Income | |
Risk Type | | Asset Derivative
Fair Value(1) | | Liability Derivative
Fair Value(2) | | Realized
Gain(3) | | Change in
Appreciation(4) | |
Foreign Currency | | $ | 104,627,771 | | | $ | 1,027,404 | | | $ | 67,799,091 | | | $ | 129,760,854 | | |
First Eagle Global Income Builder Fund
| | | | | | | Gain or (Loss)
Derivative Recognized
in Income | |
Risk Type | | Asset Derivative
Fair Value(1) | | Liability Derivative
Fair Value(2) | | Realized
Gain(3) | | Change in
Appreciation(4) | |
Foreign Currency | | $ | 4,157,647 | | | $ | 135,724 | | | $ | 726,062 | | | $ | 4,832,354 | | |
First Eagle High Yield Fund
| | | | | | | Gain or (Loss)
Derivative Recognized
in Income | |
Risk Type | | Asset Derivative
Fair Value(1) | | Liability Derivative
Fair Value(2) | | Realized
Loss(3) | | Change in
Depreciation(4) | |
Foreign Currency | | $ | 1,686,488 | | | $ | 356,102 | | | $ | (950,552 | ) | | $ | 2,089,804 | | |
(1) Statements of Assets and Liabilities location: Receivable for forward currency contracts held, at value.
(2) Statements of Assets and Liabilities location: Payable for forward currency contracts held, at value.
(3) Statements of Operations location: Net realized gains (losses) from: foreign currency and forward contract related transactions.
(4) Statements of Operations location: Changes in unrealized appreciation (depreciation) of foreign currency and forward contract related translation.
First Eagle Funds | Annual Report | October 31, 2014
182
Notes to Financial Statements
The following tables present each Fund's gross derivative assets and liabilities by counterparty net of amounts available for offset under netting arrangements and any related collateral received or pledged by each Fund as of October 31, 2014:
First Eagle Global Fund
Counterparty | | Gross Amounts
of Assets
Presented in
Statements of
Assets and
Liabilities | | Derivatives
Available for
Offset | | Collateral
Received | | Net Amount
(Not Less
Than $0) | |
BNY Mellon | | $ | 92,848,043 | | | $ | (2,332,362 | ) | | $ | — | | | $ | 90,515,681 | | |
Goldman Sachs Capital
Markets LP | | | 31,502,810 | | | | — | | | | — | | | | 31,502,810 | | |
HSBC Bank USA | | | 15,991,592 | | | | — | | | | — | | | | 15,991,592 | | |
JPMorgan Chase Bank N.A. | | | 38,855,111 | | | | — | | | | — | | | | 38,855,111 | | |
UBS AG | | | 14,435,851 | | | | — | | | | — | | | | 14,435,851 | | |
| | | $ | 193,633,407 | | | $ | (2,332,362 | ) | | $ | — | | | $ | 191,301,045 | | |
Counterparty | | Gross Amounts
of Liabilities
Presented in
Statements of
Assets and
Liabilities | | Derivatives
Available for
Offset | | Collateral
Pledged | | Net Amount
(Not Less
Than $0) | |
BNY Mellon | | $ | 2,332,362 | | | $ | (2,332,362 | ) | | $ | — | | | $ | 0 | | |
First Eagle Overseas Fund
Counterparty | | Gross Amounts
of Assets
Presented in
Statements of
Assets and
Liabilities | | Derivatives
Available for
Offset | | Collateral
Received | | Net Amount
(Not Less
Than $0) | |
BNY Mellon | | $ | 48,948,822 | | | $ | (1,023,019 | ) | | $ | — | | | $ | 47,925,803 | | |
Goldman Sachs Capital
Markets LP | | | 16,565,127 | | | | (4,385 | ) | | | — | | | | 16,560,742 | | |
HSBC Bank USA | | | 7,162,894 | | | | — | | | | — | | | | 7,162,894 | | |
JPMorgan Chase Bank N.A. | | | 24,976,281 | | | | — | | | | — | | | | 24,976,281 | | |
UBS AG | | | 6,974,647 | | | | — | | | | — | | | | 6,974,647 | | |
| | | $ | 104,627,771 | | | $ | (1,027,404 | ) | | $ | — | | | $ | 103,600,367 | | |
First Eagle Funds | Annual Report | October 31, 2014
183
Notes to Financial Statements
First Eagle Overseas Fund (continued)
Counterparty | | Gross Amounts
of Liabilities
Presented in
Statements of
Assets and
Liabilities | | Derivatives
Available for
Offset | | Collateral
Pledged | | Net Amount
(Not Less
Than $0) | |
BNY Mellon | | $ | 1,023,019 | | | $ | (1,023,019 | ) | | $ | — | | | $ | 0 | | |
Goldman Sachs Capital
Markets LP | | | 4,385 | | | | (4,385 | ) | | | — | | | | 0 | | |
| | | $ | 1,027,404 | | | $ | (1,027,404 | ) | | $ | — | | | $ | 0 | | |
First Eagle Global Income Builder Fund
Counterparty | | Gross Amounts
of Assets
Presented in
Statements of
Assets and
Liabilities | | Derivatives
Available for
Offset | | Collateral
Received | | Net Amount
(Not Less
Than $0) | |
BNY Mellon | | $ | 1,886,569 | | | $ | (123,894 | ) | | $ | — | | | $ | 1,762,675 | | |
Goldman Sachs Capital
Markets LP | | | 397,359 | | | | — | | | | — | | | | 397,359 | | |
HSBC Bank USA | | | 975,758 | | | | (11,830 | ) | | | — | | | | 963,928 | | |
JPMorgan Chase Bank N.A. | | | 754,733 | | | | — | | | | — | | | | 754,733 | | |
UBS AG | | | 143,228 | | | | — | | | | — | | | | 143,228 | | |
| | | $ | 4,157,647 | | | $ | (135,724 | ) | | $ | — | | | $ | 4,021,923 | | |
Counterparty | | Gross Amounts
of Liabilities
Presented in
Statements of
Assets and
Liabilities | | Derivatives
Available for
Offset | | Collateral
Pledged | | Net Amount
(Not Less
Than $0) | |
BNY Mellon | | $ | 123,894 | | | $ | (123,894 | ) | | $ | — | | | $ | 0 | | |
HSBC Bank USA | | | 11,830 | | | | (11,830 | ) | | | — | | | | 0 | | |
| | | $ | 135,724 | | | $ | (135,724 | ) | | $ | — | | | $ | 0 | | |
First Eagle Funds | Annual Report | October 31, 2014
184
Notes to Financial Statements
First Eagle High Yield Fund
Counterparty | | Gross Amounts
of Assets
Presented in
Statements of
Assets and
Liabilities | | Derivatives
Available for
Offset | | Collateral
Received | | Net Amount
(Not Less
Than $0) | |
HSBC Bank USA | | $ | 1,682,600 | | | $ | (353,025 | ) | | $ | — | | | $ | 1,329,575 | | |
UBS AG | | | 3,888 | | | | (3,077 | ) | | | — | | | | 811 | | |
| | | $ | 1,686,488 | | | $ | (356,102 | ) | | $ | — | | | $ | 1,330,386 | | |
Counterparty | | Gross Amounts
of Liabilities
Presented in
Statements of
Assets and
Liabilities | | Derivatives
Available for
Offset | | Collateral
Pledged | | Net Amount
(Not Less
Than $0) | |
HSBC Bank USA | | $ | 353,025 | | | $ | (353,025 | ) | | $ | — | | | $ | 0 | | |
UBS AG | | | 3,077 | | | | (3,077 | ) | | | — | | | | 0 | | |
| | | $ | 356,102 | | | $ | (356,102 | ) | | $ | — | | | $ | 0 | | |
g) Options — In order to seek to produce incremental earnings or protect against declines in the value of portfolio securities, First Eagle Global Fund, First Eagle U.S. Value Fund and First Eagle Fund of America write covered call options on portfolio securities. The Funds may also use options for speculative purposes, although they generally do not employ options for this purpose.
Options contracts are valued daily based upon the last sale price on the principal exchange on which the option is traded and unrealized appreciation/depreciation is recorded. If there is no sale on such day, the mean between the last bid and asked prices is used. When an option is exercised, the proceeds on the sale of a written call option are adjusted by the amount of premium received or paid. When a written option expires, the Funds will realize a gain equal to the amount of the premium received. When the Funds enter into a closing purchase transaction, the Funds will realize a gain (or loss, if the cost of the closing purchase transaction exceeds the premium received when the option was written) without regard to any unrealized gain or loss on the underlying security and the liability related to such option is eliminated.
The Funds may be required to earmark assets to cover its obligations under option contracts. In general, a call option is covered if the Funds hold, on a share-for-share basis, either the underlying shares or a call on the same security as the call written where the exercise price of the call held is equal to or less than the exercise price of the call written (or greater than the exercise price of the call written if the difference is maintained by the Funds in cash, Treasury bills or other high grade short-term obligations earmarked with its custodian). One reason for
First Eagle Funds | Annual Report | October 31, 2014
185
Notes to Financial Statements
writing options is to attempt to realize, through the receipt of premiums, a greater return than would be realized on the securities alone. Another reason for writing options is to hedge against a moderate decline in the value of securities owned by the Funds in the case of a call option. If an increase occurs in the underlying security or stock index sufficient to result in the exercise of a call written by the Funds, it may be required to deliver securities or cash and may thereby forego some or all of the gain that otherwise may have been realized on the securities underlying the call option. This "opportunity cost" may be partially or wholly offset by the premium received for the covered call written by the Funds. The risk in writing a covered call option is that the Funds give up the opportunity for profit if the market price of the underlying security increases and the option is exercised. The Funds also have the additional risk of not being able to enter into a closing transaction if a liquid secondary market does not exist.
The Funds may also write over-the-counter options where the completion of the obligation is dependent upon the credit standing of the counterparty.
For the year ended October 31, 2014, First Eagle Global Fund, First Eagle U.S. Value Fund and First Eagle Fund of America had the following options transactions.
First Eagle Global Fund
Written Options | | Number of
Contracts | | Premium
Received | |
Options outstanding at October 31, 2013 | | | 8,500 | | | $ | 373,861 | | |
Options written | | | 81,000 | | | | 4,298,642 | | |
Options assigned | | | 0 | | | | 0 | | |
Options expired/closed | | | (49,000 | ) | | | (2,250,180 | ) | |
Options outstanding at October 31, 2014 | | | 40,500 | | | $ | 2,422,323 | | |
As of October 31, 2014, portfolio securities valued at $137,740,500 were earmarked to cover collateral requirements for written options.
First Eagle U.S. Value Fund
Written Options | | Number of
Contracts | | Premium
Received | |
Options outstanding at October 31, 2013 | | | 1,400 | | | $ | 61,577 | | |
Options written | | | 10,000 | | | | 599,435 | | |
Options assigned | | | (1,000 | ) | | | (121,808 | ) | |
Options expired/closed | | | (5,900 | ) | | | (270,057 | ) | |
Options outstanding at October 31, 2014 | | | 4,500 | | | $ | 269,147 | | |
First Eagle Funds | Annual Report | October 31, 2014
186
Notes to Financial Statements
As of October 31, 2014, portfolio securities valued at $15,304,500 were earmarked to cover collateral requirements for written options.
First Eagle Fund of America
Written Options | | Number of
Contracts | | Premium
Received | |
Options outstanding at October 31, 2013 | | | 165,214 | | | $ | 49,208,665 | | |
Options written | | | 988,159 | | | | 272,327,937 | | |
Options assigned | | | (29,831 | ) | | | (9,571,125 | ) | |
Options expired/closed | | | (988,956 | ) | | | (278,392,733 | ) | |
Options outstanding at October 31, 2014 | | | 134,586 | | | $ | 33,572,744 | | |
Purchased Options | | Number of
Contracts | | Cost | |
Options outstanding at October 31, 2013 | | | 0 | | | $ | 0 | | |
Options purchased | | | 806 | | | | 171,827 | | |
Options closed | | | (806 | ) | | | (171,827 | ) | |
Options outstanding at October 31, 2014 | | | 0 | | | $ | 0 | | |
As of October 31, 2014, portfolio securities valued at $736,979,282 were earmarked to cover collateral requirements for written options.
Outstanding contracts at period-end are indicative of the volume of activity during the period.
At October 31, 2014, the Funds had the following options grouped into appropriate risk categories illustrated below:
First Eagle Global Fund
| | | | | Gain or (Loss)
Derivative Recognized
in Income | |
Risk Type | | Liability Derivative
Fair Value(1) | | Realized
Gain(2) | | Change in
Appreciation(3) | |
Equity — Written options | | $ | 1,579,500 | | | $ | 825,462 | | | $ | 519,962 | | |
First Eagle U.S. Value Fund
| | | | | Gain or (Loss)
Derivative Recognized
in Income | |
Risk Type | | Liability Derivative
Fair Value(1) | | Realized
Gain(2) | | Change in
Appreciation(3) | |
Equity — Written options | | $ | 175,500 | | | $ | 233,563 | | | $ | 40,470 | | |
First Eagle Funds | Annual Report | October 31, 2014
187
Notes to Financial Statements
First Eagle Fund of America
| | | | | Gain or (Loss)
Derivative Recognized
in Income | |
Risk Type | | Liability Derivative
Fair Value(1) | | Realized
Gain (Loss)(2) | | Change in
Appreciation(3) | |
Equity — Written options | | $ | 39,662,209 | | | $ | (69,712,637 | ) | | $ | 11,132,578 | | |
Equity — Purchased options | | | 0 | | | | 8,677 | | | | 0 | | |
(1) Statements of Assets and Liabilities location: Option contracts written, at value.
(2) Statements of Operations location: Net realized gains (losses) from: Written options & Investment transactions of unaffiliated issuers.
(3) Statements of Operations location: Changes in unrealized appreciation (depreciation) of: Written options & Investment transactions.
h) Repurchase agreements — The Funds may enter into repurchase agreement transactions with institutions that meet the adviser's credit guidelines. Each repurchase agreement is valued at market. The Funds require that the collateral received in a repurchase agreement transaction be transferred to a custodian in a manner sufficient to enable the Funds to obtain collateral in the event of a counterparty default. If the counterparty defaults and the fair value of the collateral declines, realization of the collateral by the Funds may be delayed or limited.
i) Term Loans — A Fund may invest in term loans, which usually take the form of loan participations and assignments. Loan participations and assignments are agreements to make money available to U.S. or foreign corporations, partnerships or other business entities (the "Borrower") in a specified amount, at a specified rate and within a specified time. A loan is typically originated, negotiated and structured by a U.S. or foreign bank, insurance company or other financial institution (the "Agent") for a group of loan investors ("Loan Investors"). The Agent typically administers and enforces the loan on behalf of the other Loan Investors in the syndicate and may hold any collateral on behalf of the Loan Investors. Such loan participations and assignments are typically senior, secured and collateralized in nature. A Fund records an investment when the Borrower withdraws money and records interest as earned. The Fund generally has no right to enforce compliance with the terms of the loan agreement with the Borrower. As a result, the Fund assumes the credit risk of the Borrower, the selling participant and any intermediary between the Fund and the Borrower ("Intermediate Participants"). In the event that the Borrower, selling participant or Intermediate Participants become insolvent or enters into bankruptcy, each Fund may incur certain costs and delays in realizing payment or may suffer a loss of principal and/or interest.
j) Treasury Inflation-Protected Securities — The Funds may invest in Treasury Inflation-Protected Securities ("TIPS") which are specially structured bonds in which the principal amount is adjusted to keep pace with inflation. The inflation (deflation) adjustment is applied to the principal of each bond on a monthly basis and is accounted for as interest income on the Statements of Operations. TIPS are subject to interest rate risk.
First Eagle Funds | Annual Report | October 31, 2014
188
Notes to Financial Statements
k) Restricted Securities — The Funds may invest in securities that are subject to legal or contractual restrictions on resale. These securities generally may be resold in transactions exempt from registration or to the public if the securities are registered. Disposal of these securities may involve time-consuming negotiations and expenses, and prompt sale at an acceptable price may be difficult. Information regarding restricted securities, if any, is included at the end of each Fund's Schedule of Investments.
l) United States income taxes — No provision has been made for U.S. federal income taxes since it is the intention of each Fund to distribute to shareholders all taxable net investment income and net realized gains on investments, if any, within the allowable time limit, and to comply with the provisions of the Code for a Regulated Investment Company. The Funds declare and pay such income and capital gains on an annual basis except for the First Eagle High Yield Fund which declares income daily and pays monthly. First Eagle Global Income Builder Fund declared and paid income quarterly for the period October 1, 2012 to March 31, 2013. As of April 1, 2013, the First Eagle Global Income Builder Fund declares income daily and pays quarterly.
The Funds adopted provisions surrounding income taxes, which require the tax effects of certain tax positions to be recognized. These tax positions must meet a "more likely than not" standard that based on their technical merits, have a more than 50% likelihood of being sustained upon examination. Management of the Trust has analyzed the Funds' tax positions taken on federal and state income tax returns for all open tax years (the current and the prior three tax years) and has concluded that no provision for income tax is required in the Funds' financial statements.
At October 31, 2014, the components of accumulated earnings on a tax basis were as follows:
| | | Undistributed
Net Investment | | Undistributed
Net Realized | | Net
Unrealized | | Capital Loss
Carryforward | |
| | | Income | | Gains | | (Depreciation) | | Short-Term | | Long-Term | |
First Eagle Global Fund | | $ | 394,736,865 | | | $ | 2,016,784,016 | | | $ | 8,947,874,945 | | | $ | — | | | $ | — | | |
First Eagle Overseas
Fund | | | 211,554,032 | | | | 454,924,090 | | | | 1,981,015,656 | | | | — | | | | — | | |
First Eagle U.S.
Value Fund | | | 10,562,551 | | | | 171,604,801 | | | | 737,569,001 | | | | — | | | | — | | |
First Eagle Gold Fund | | | — | | | | — | | | | (354,000,444 | ) | | | 23,331,473 | | | | 227,659,228 | | |
First Eagle Global Income
Builder Fund | | | 8,993,212 | | | | 12,926,966 | | | | (2,104,049 | ) | | | — | | | | — | | |
First Eagle High Yield
Fund | | | 5,034,170 | | | | 6,140,033 | | | | (4,561,471 | ) | | | — | | | | — | | |
First Eagle Fund of
America | | | 7,227,890 | | | | 239,263,623 | | | | 841,010,507 | | | | — | | | | — | | |
The differences between the components of distributable earnings on a tax basis and the amounts reflected in the Statements of Changes in Net Assets are primarily due to the treatment of passive foreign investment companies, the treatment of foreign currencies and wash sales.
First Eagle Funds | Annual Report | October 31, 2014
189
Notes to Financial Statements
Under the Regulated Investment Company Modernization Act of 2010 (the "Act"), net capital losses recognized by the Fund after December 31, 2010 may get carried forward indefinitely, and retain their character as short-term and/or long-term losses. Prior to the Act, net capital losses incurred by the Fund were carried forward eight years and treated as short-term losses. The Act requires that post-enactment net capital losses be used before pre-enactment net capital losses. The Fund did not have capital losses to carry forward prior to the Act.
m) Reclassification of capital accounts — As a result of certain differences in the computation of net investment income and net realized capital gains under federal income tax rules and regulations versus GAAP, a reclassification has been made on the Statements of Assets and Liabilities to increase (decrease) undistributed net investment income, undistributed net realized gains on investments and capital surplus for the Funds as follows:
| | | Undistributed Net
Investment Income
(Loss) | | Undistributed Net
Realized Gains
(Losses) | | Capital Surplus | |
First Eagle Global Fund | | $ | 81,564,043 | | | $ | 23,974,566 | | | $ | (105,538,609 | ) | |
First Eagle Overseas Fund | | | 48,776,576 | | | | (22,000,379 | ) | | | (26,776,197 | ) | |
First Eagle U.S. Value Fund | | | (2,230,399 | ) | | | (5,030,539 | ) | | | 7,260,938 | | |
First Eagle Gold Fund | | | 41,760,075 | | | | (89,134,504 | ) | | | 47,374,429 | | |
First Eagle Global Income Builder Fund | | | 450,442 | | | | (411,171 | ) | | | (39,271 | ) | |
First Eagle High Yield Fund | | | 907,390 | | | | (907,390 | ) | | | — | | |
First Eagle Fund of America | | | (715,310 | ) | | | 715,309 | | | | 1 | | |
The primary permanent differences causing such reclassification include the tax treatment of currency gains and losses, dividend redesignations, distributions paid in connection with the redemption of Fund shares, investments in passive foreign investment companies, distributions from real estate investment trusts, investments in partnerships and differing book and tax treatment of transactions with the Subsidiary.
At the year ended October 31, 2014 the First Eagle Global Cayman Fund, Ltd., First Eagle Overseas Cayman Fund Ltd., First Eagle Gold Cayman Fund, Ltd. and First Eagle U.S. Value Cayman Fund, Ltd. had approximately $189,258,916, $38,294,514, $39,953,974 and $16,852,363 of unrealized losses, respectively, for tax purposes. The Subsidiaries' loss for the current year is not available to offset their future taxable income. The unrealized losses to be recognized for tax purposes in the future can only be utilized by the Funds to the extent of tax basis realized gains in the Subsidiaries in that same year. Given the uncertainty of their future use, tax losses have been reclassed to Capital Surplus.
First Eagle Funds | Annual Report | October 31, 2014
190
Notes to Financial Statements
n) Distributions to shareholders — Distributions to shareholders during the fiscal year ended October 31, 2014 , which are determined in accordance with income tax regulations, are recorded on ex-dividend date.
| | | Ordinary Income | | Long Term Capital Gains | |
| | | 2014 | | 2013 | | 2014 | | 2013 | |
First Eagle Global Fund | | $ | 792,924,146 | | | $ | 533,305,518 | | | $ | 1,226,135,307 | | | $ | 999,561,706 | | |
First Eagle Overseas Fund | | | 406,304,572 | | | | 191,296,768 | | | | 439,794,827 | | | | 406,899,055 | | |
First Eagle U.S. Value Fund | | | 37,060,380 | | | | 38,337,400 | | | | 100,256,661 | | | | 49,669,543 | | |
First Eagle Gold Fund | | | — | | | | 8,878,452 | | | | — | | | | — | | |
First Eagle Global Income
Builder Fund | | | 27,027,023 | | | | 11,512,844 | | | | — | | | | — | | |
First Eagle High Yield Fund | | | 59,902,003 | | | | 49,852,832 | | | | — | | | | — | | |
First Eagle Fund of America | | | 5,883,755 | | | | 451,930 | | | | 38,725,454 | | | | — | | |
o) Class Accounting — Investment income, common expenses and realized/unrealized gain or loss on investments are allocated to the various classes of the Fund on the basis of daily net assets of each class, in general. Fees relating to a specific class are charged directly to that class.
p) Use of estimates — The preparation of financial statements in conformity with GAAP requires management to make estimates and assumptions that affect the reported amounts of assets and liabilities at the date of the financial statements and the reported amounts of revenues and expenses during the reporting period. Actual results could differ from those estimates.
q) Redemption Fee — A redemption fee of 2% will be applied to the First Eagle Gold Fund for the sale or exchange within 60 days of the purchase of such shares. Effective March 1, 2013, the First Eagle Global Fund and First Eagle Overseas Fund no longer charge redemption fees.
r) Foreign Taxes — The Funds may be subject to foreign taxes on income, gains on investments or currency purchases/repatriation, a portion of which may be recoverable. The Funds will accrue such taxes and recoveries as applicable, based upon their current interpretation of tax rules and regulations that exist in the markets in which they invest.
Note 2 — Investment Advisory, Custody and Administration Agreements; Transactions with Related Persons
For its services, the Adviser receives, pursuant to an Investment Advisory Agreement between the Funds and the Adviser (the "Advisory Agreement") an annual advisory fee as follows:
Fund | | Management Fee
(% of Average Daily Net Assets) | |
First Eagle Global Fund | | | 0.75 | % | |
First Eagle Overseas Fund | | | 0.75 | | |
First Eagle U.S. Value Fund | | | 0.75 | | |
First Eagle Funds | Annual Report | October 31, 2014
191
Notes to Financial Statements
Fund | | Management Fee
(% of Average Daily Net Assets) | |
First Eagle Gold Fund | | | 0.75 | % | |
First Eagle Global Income Builder Fund | | | 0.75 | | |
First Eagle High Yield Fund | | | 0.70 | | |
First Eagle Fund of America | | | 1.00 | | |
The Adviser receives from First Eagle Fund of America an annual advisory fee at the rate of 1.00% of the first $1.5 billion of the average daily net assets, 0.95% of the next $1 billion of the average daily net assets; 0.90% on the next $2.5 billion of the average daily net assets and 0.85% in excess of $5 billion of the average daily net assets.
The Adviser has agreed to waive First Eagle High Yield Fund's management fee at an annual rate in the amount of 0.05% of the daily average net assets to 0.65% for the period January 1, 2015 to February 29, 2016.
Pursuant to a subadvisory agreement, dated December 10, 2002 (agreement was amended and restated most recently in September 2009) ("Subadvisory Agreement") Iridian Asset Management LLC ("Iridian" or "Sub-Adviser") manages the investments of the First Eagle Fund of America. The fees paid to Iridian by the Adviser under the Subadvisory Agreement are based on a reference amount equal to 50% of the combined (i) fees received by the Adviser for advisory services on behalf of the Fund and (ii) the fees received by the Fund's distributor for its shareholder liaison services on behalf of the Fund. These amounts are reduced by certain direct marketing costs borne by the Adviser in connection with the Fund and are further reduced by the amount paid by the Adviser for certain administrative expenses incurred in providing services to the Fund.
The Adviser had contractually agreed to waive its management fee and/or reimburse expenses, for the First Eagle High Yield Fund and First Eagle Global Income Builder Fund, as allowed by law, so that the total annual operating expenses (excluding certain items) of the First Eagle High Yield Fund's Class A, Class C and Class I shares did not exceed 1.25%, 2.00% and 0.80%, respectively, and the First Eagle Global Income Builder Fund's Class A, Class C and Class I shares do not exceed 1.30%, 2.05%, and 1.05%, respectively, through December 31, 2013.
The Adviser may seek reimbursement for fees waived and other expenses paid by the Adviser pursuant to the Fee Waiver and Expense Reimbursement Agreement ("Agreement"). A repayment should be payable only to the extent it can be made during the thirty-six months following the applicable period during which the Adviser waived fees or reimbursed operating expenses under the Agreement. As of October 31, 2014, the Adviser may seek reimbursement of the remaining waived and reimbursed fees as follows:
First Eagle Global Income Builder Fund
Expiration | | Amount | |
October 31, 2016 | | $ | 26,887 | | |
First Eagle Funds | Annual Report | October 31, 2014
192
Notes to Financial Statements
During the period ended October 31, 2014, the First Eagle Global Income Builder Fund made repayments to the Adviser for previously waived and reimbursed fees in the amount of $434,251.
First Eagle High Yield Fund
Expiration | | Amount | |
March 31, 2015 | | $ | 72,599 | | |
October 31, 2015 | | | 297,386 | | |
October 31, 2016 | | | 309,343 | | |
December 31, 2016 | | | 44,141 | | |
During the period ended October 31, 2014, the First Eagle High Yield Fund made repayments to the Adviser for previously waived and reimbursed fees in the amount of $26,880.
Effective January 1, 2015, the First Eagle High Yield Fund will pay the Adviser a monthly administration fee that is accrued daily at an annual rate of 0.05% of the Fund's average daily net assets.
The Adviser also performs certain administrative, accounting, operations, compliance and other services on behalf of the Funds, and in accordance with its agreement with them, the Funds reimburse the Adviser for costs (including personnel, related overhead and other costs) related to those services. These reimbursements may not exceed an annual rate of 0.05% of a Fund's average daily net assets.
First Eagle Global Income Builder Fund pays the Adviser a monthly administration fee that is accrued daily at an annual rate of 0.05% of the Fund's average daily net assets.
For the year ended October 31, 2014, the Funds paid/reimbursed and had payable to the Adviser amounts shown below:
Fund | | Paid/Reimbursed to Adviser | | Payable to Adviser | |
First Eagle Global Fund | | $ | 4,225,096 | | | $ | 399,807 | | |
First Eagle Overseas Fund | | | 1,295,389 | | | | 116,343 | | |
First Eagle U.S. Value Fund | | | 300,828 | | | | 24,893 | | |
First Eagle Gold Fund | | | 110,670 | | | | 10,447 | | |
First Eagle Global Income Builder Fund | | | 410,450 | | | | 53,965 | | |
First Eagle High Yield Fund | | | 94,961 | | | | 9,176 | | |
First Eagle Fund of America | | | 236,705 | | | | 25,110 | | |
The Funds have entered into Custody Agreements with State Street Bank and Trust Company ("SSB"). The Custody Agreements provide for an annual fee based on the amount of assets under custody plus transaction charges. SSB serves as custodian of the Funds' portfolio securities and other assets. SSB has directly entered into sub-custodial agreements to maintain the custody of gold bullion in the Funds. Under the terms of the Custody Agreement between the Funds and SSB, SSB maintains and deposits in separate accounts, cash, securities and other assets of the Funds. SSB is also required, upon the order of the Funds, to deliver securities held by SSB and the
First Eagle Funds | Annual Report | October 31, 2014
193
Notes to Financial Statements
sub-custodian, and to make payments for securities purchased by the Funds. SSB has also entered into sub-custodian agreements with a number of foreign banks and clearing agencies, pursuant to which portfolio securities purchased outside the United States are maintained in the custody of these entities.
The Funds have also entered into an Administration Agreement with SSB, pursuant to which SSB provides certain financial reporting and other administrative services. SSB, as the Funds' Administrator, receives annual fees separate from and in addition to the fees it receives for its services as the Funds' custodian.
FEF Distributors, LLC, a wholly owned subsidiary of the Adviser, serves as the Funds' principal underwriter. For the year ended October 31, 2014, FEF Distributors, LLC realized $2,198,353, $192,225, $129,206, $124,380, $289,646, $116,451 and $261,023, pertaining to the sales of shares of First Eagle Global Fund, First Eagle Overseas Fund, First Eagle U.S. Value Fund, First Eagle Gold Fund, First Eagle Global Income Builder Fund, First Eagle High Yield Fund and First Eagle Fund of America, respectively.
The Trust adopted a Trustee Deferred Compensation Plan (the "Plan"), which allows the independent Trustees to defer the receipt of all or a portion of compensation related to performance of their duties as a Trustee. The deferred fees are invested in various First Eagle Funds until distribution in accordance with the Trustee Deferred Compensation Plan. As of October 31, 2014, balances to the Plan are recorded on the Statements of Assets and Liabilities.
For the year ended October 31, 2014, the Adviser reimbursed $65,047, $3,562, $9,348 for losses incurred in connection with trading errors for First Eagle Global Fund, First Eagle U.S. Value Fund, First Eagle Global Income Builder Fund, respectively. The Sub-Adviser reimbursed $23,916 for losses incurred in connection with trading error for First Eagle Fund of America.
Note 3 — Plans of Distribution
Under the terms of the Distribution Plans and Agreements ("the Plans") with FEF Distributors, LLC ("the Distributor"), pursuant to the provisions of Rule 12b-1 under the 1940 Act, the First Eagle Global Fund, First Eagle Overseas Fund, First Eagle U.S. Value Fund, First Eagle Gold Fund, First Eagle Global Income Builder Fund and First Eagle High Yield Fund pay the Distributor monthly, a distribution fee with respect to Class A and Class C shares at an annual rate of up to 0.25% and 0.75%, respectively, of each Fund's average daily net assets. In the case of First Eagle Fund of America, it pays the Distributor monthly, a distribution fee with respect to Class A, Class C and Class Y shares at an annual rate of up to 0.25%, 0.75% and 0.25%, respectively of the average daily net assets. Under the Plans, the Distributor is obligated to use the amounts received under the Plans for, among other things, payments to qualifying dealers for their assistance in the distribution of a Fund's shares and the provision of shareholder services and for other expenses such as advertising costs and the payment for the printing and distribution of prospectuses to prospective investors.
First Eagle Funds | Annual Report | October 31, 2014
194
Notes to Financial Statements
The Distributor bears distribution costs of a Fund to the extent they exceed payments received under the Plan. For the year ended October 31, 2014, the distribution fees incurred by the Funds are disclosed in the Statements of Operations.
The Distributor receives an annual service fee with respect to Class C at the annual rate of 0.25% of each Fund's average daily net assets, payable monthly to cover expenses incurred by the Distributor for providing shareholder liaison services, including assistance with subscriptions, redemptions and other shareholder questions. For the year ended October 31, 2014, the services fees incurred by the Funds are disclosed in the Statements of Operations.
Note 4 — Purchases and Sales of Securities
During the year ended October 31, 2014, the cost of purchases of investments, excluding U.S. Government and short-term securities, totaled $7,237,846,650, $1,837,827,623, $413,737,849, $169,854,449, $922,624,115, $627,114,441 and $1,286,769,078 for First Eagle Global Fund, First Eagle Overseas Fund, First Eagle U.S. Value Fund, First Eagle Gold Fund, First Eagle Global Income Builder Fund, First Eagle High Yield Fund and First Eagle Fund of America, respectively. Proceeds from sales of investments, excluding U.S. Government securities and short-term securities, totaled $5,931,930,769, $1,393,127,386, $830,596,808, $348,336,503, $152,365,784, $460,391,174 and $1,015,405,144 for First Eagle Global Fund, First Eagle Overseas Fund, First Eagle U.S. Value Fund, First Eagle Gold Fund, First Eagle Global Income Builder Fund, First Eagle High Yield Fund and First Eagle Fund of America, respectively.
During the year ended October 31, 2014, the cost of purchases and proceeds from sales of U.S. Government securities, excluding short-term securities, for First Eagle Global Fund totaled $1,001,210,938 and $0, respectively. There were no purchases or sales of U.S. Government securities, excluding short-term securities, for First Eagle Overseas Fund, First Eagle U.S. Value Fund, First Eagle Gold Fund, First Eagle Global Income Builder Fund, First Eagle High Yield Fund and First Eagle Fund of America.
Note 5 — Line of Credit
At a meeting on September 10, 2014, the Board of Trustees approved a $200 million committed, unsecured line of credit ("Credit Facility") with State Street Bank and Trust Company for the Funds, to be utilized for temporarily financing the purchase or sale of securities for prompt delivery in the ordinary course of business or for temporarily financing the redemption of shares of each Fund at the request of shareholders and other temporary or emergency purposes. Under the Credit Facility arrangement, each Fund has agreed to pay an annual commitment fee on the unused balance, allocated pro rata, based on the relative asset size of the Funds. A portion of the
First Eagle Funds | Annual Report | October 31, 2014
195
Notes to Financial Statements
commitment fees related to the line of credit are paid by the Funds and are included in other expenses in the Statements of Operations. During the year ended October 31, 2014, the Funds had borrowings under the agreement as follows:
Fund | | Average
Daily Loan
Balance | | Number
of Days
Outstanding | | Interest
Expense | | Weighted
Average
Annualized
Interest Rate | |
First Eagle Overseas Fund | | $ | 6,704,000 | | | | 1 | | | $ | 251 | | | | 1.35 | % | |
First Eagle High Yield Fund | | | 6,414,000 | | | | 1 | | | | 239 | | | | 1.34 | | |
As of October 31, 2014 there were no outstanding borrowings from the credit facility.
Note 6 — Capital Stock
At October 31, 2014, the Funds have an unlimited number of shares authorized for issuance. The Funds have the ability to issue multiple classes of shares.
First Eagle Funds | Annual Report | October 31, 2014
196
This page was intentionally left blank.
Notes to Financial Statements
Transactions in shares of capital stock were as follows:
| | | Year Ended October 31, 2014 | |
| | | First Eagle Global Fund | |
| | | Class A | | Class C | | Class I | |
Shares sold | | | 56,330,185 | | | | 37,499,193 | | | | 130,935,364 | | |
Shares issued for reinvested
dividends and distributions | | | 14,186,701 | | | | 6,365,786 | | | | 10,283,937 | | |
Shares redeemed | | | (93,180,511 | ) | | | (26,552,294 | ) | | | (54,105,101 | ) | |
Net increase (decrease) | | | (22,663,625 | ) | | | 17,312,685 | | | | 87,114,200 | | |
| | | Year Ended October 31, 2013 | |
| | | First Eagle Global Fund | |
| | | Class A | | Class C | | Class I | |
Shares sold | | | 68,379,393 | | | | 40,520,480 | | | | 100,315,070 | | |
Shares issued for reinvested
dividends and distributions | | | 12,310,757 | | | | 5,240,753 | | | | 7,790,628 | | |
Shares redeemed | | | (56,709,392 | ) | | | (26,235,228 | ) | | | (51,949,001 | ) | |
Net increase (decrease) | | | 23,980,758 | | | | 19,526,005 | | | | 56,156,697 | | |
| | | Year Ended October 31, 2014 | |
| | | First Eagle Gold Fund | |
| | | Class A | | Class C | | Class I | |
Shares sold | | | 10,775,881 | | | | 2,859,756 | | | | 16,951,957 | | |
Shares issued for reinvested
dividends and distributions | | | — | | | | — | | | | — | | |
Shares redeemed | | | (22,330,740 | ) | | | (5,755,834 | ) | | | (19,623,775 | ) | |
Net increase (decrease) | | | (11,554,859 | ) | | | (2,896,078 | ) | | | (2,671,818 | ) | |
| | | Year Ended October 31, 2013 | |
| | | First Eagle Gold Fund | |
| | | Class A | | Class C | | Class I | |
Shares sold | | | 18,267,740 | | | | 4,405,851 | | | | 19,790,909 | | |
Shares issued for reinvested
dividends and distributions | | | 131,202 | | | | 42 | | | | 77,683 | | |
Shares redeemed | | | (24,960,048 | ) | | | (8,128,432 | ) | | | (21,197,330 | ) | |
Net increase (decrease) | | | (6,561,106 | ) | | | (3,722,539 | ) | | | (1,328,738 | ) | |
First Eagle Funds | Annual Report | October 31, 2014
198
Notes to Financial Statements
| | | Year Ended October 31, 2014 | |
| | | First Eagle Overseas Fund | | First Eagle U.S. Value Fund | |
| | | Class A | | Class C | | Class I | | Class A | | Class C | | Class I | |
Shares sold | | | 44,427,894 | | | | 6,352,502 | | | | 129,724,362 | | | | 8,486,374 | | | | 3,019,288 | | | | 17,742,100 | | |
Shares issued for reinvested
dividends and distributions | | | 13,900,662 | | | | 2,124,067 | | | | 15,541,229 | | | | 2,780,613 | | | | 1,074,165 | | | | 1,735,414 | | |
Shares redeemed | | | (100,279,490 | ) | | | (7,431,547 | ) | | | (69,353,379 | ) | | | (26,082,508 | ) | | | (6,465,684 | ) | | | (15,989,633 | ) | |
Net increase (decrease) | | | (41,950,934 | ) | | | 1,045,022 | | | | 75,912,212 | | | | (14,815,521 | ) | | | (2,372,231 | ) | | | 3,487,881 | | |
| | | Year Ended October 31, 2013 | |
| | | First Eagle Overseas Fund | | First Eagle U.S. Value Fund | |
| | | Class A | | Class C | | Class I | | Class A | | Class C | | Class I | |
Shares sold | | | 57,521,589 | | | | 7,771,516 | | | | 110,626,219 | | | | 17,823,128 | | | | 6,973,806 | | | | 19,342,095 | | |
Shares issued for reinvested
dividends and distributions | | | 11,078,284 | | | | 1,679,612 | | | | 10,459,996 | | | | 2,102,240 | | | | 661,755 | | | | 1,255,220 | | |
Shares redeemed | | | (55,928,966 | ) | | | (7,682,599 | ) | | | (56,114,422 | ) | | | (24,859,469 | ) | | | (6,329,187 | ) | | | (18,731,430 | ) | |
Net increase (decrease) | | | 12,670,907 | | | | 1,768,529 | | | | 64,971,793 | | | | (4,934,101 | ) | | | 1,306,374 | | | | 1,865,885 | | |
| | | Year Ended October 31, 2014 | |
| | | First Eagle Global Income Builder Fund | | First Eagle High Yield Fund | |
| | | Class A | | Class C | | Class I | | Class A | | Class C | | Class I | |
Shares sold | | | 27,926,819 | | | | 22,086,272 | | | | 34,790,012 | | | | 11,967,998 | | | | 6,703,909 | | | | 45,666,781 | | |
Shares issued for reinvested
dividends and distributions | | | 806,283 | | | | 394,580 | | | | 485,613 | | | | 1,489,044 | | | | 562,101 | | | | 2,190,022 | | |
Shares redeemed | | | (10,774,285 | ) | | | (2,306,375 | ) | | | (3,764,376 | ) | | | (22,873,104 | ) | | | (4,436,641 | ) | | | (27,126,153 | ) | |
Net increase (decrease) | | | 17,958,817 | | | | 20,174,477 | | | | 31,511,249 | | | | (9,416,062 | ) | | | 2,829,369 | | | | 20,730,650 | | |
| | | Year Ended October 31, 2013 | |
| | | First Eagle Global Income Builder Fund | | First Eagle High Yield Fund | |
| | | Class A | | Class C | | Class I | | Class A | | Class C | | Class I | |
Shares sold | | | 18,700,256 | | | | 11,383,991 | | | | 9,365,010 | | | | 23,301,354 | | | | 7,555,566 | | | | 29,103,039 | | |
Shares issued for reinvested
dividends and distributions | | | 355,012 | | | | 162,461 | | | | 154,687 | | | | 1,492,705 | | | | 532,373 | | | | 1,610,518 | | |
Shares redeemed | | | (2,706,050 | ) | | | (911,431 | ) | | | (1,720,553 | ) | | | (12,609,883 | ) | | | (3,765,254 | ) | | | (11,112,652 | ) | |
Net increase (decrease) | | | 16,349,218 | | | | 10,635,021 | | | | 7,799,144 | | | | 12,184,176 | | | | 4,322,685 | | | | 19,600,905 | | |
First Eagle Funds | Annual Report | October 31, 2014
199
Notes to Financial Statements
| | | Year Ended October 31, 2014 | |
| | | First Eagle Fund of America | |
| | | Class A | | Class C | | Class I | | Class Y | |
Shares sold | | | 9,923,882 | | | | 5,707,393 | | | | 11,178,474 | | | | 1,520,391 | | |
Shares issued for reinvested
dividends and distributions | | | 462,582 | | | | 212,967 | | | | 153,384 | | | | 222,650 | | |
Shares redeemed | | | (8,975,624 | ) | | | (1,975,846 | ) | | | (2,654,024 | ) | | | (2,571,984 | ) | |
Net increase (decrease) | | | 1,410,840 | | | | 3,944,514 | | | | 8,677,834 | | | | (828,943 | ) | |
| | | Year Ended October 31, 2013 | |
| | | First Eagle Fund of America | |
| | | Class A | | Class C | | Class I* | | Class Y | |
Shares sold | | | 13,566,134 | | | | 6,229,657 | | | | 14,822,594 | | | | 2,095,673 | | |
Shares issued for reinvested
dividends and distributions | | | 7,690 | | | | 40 | | | | 7 | | | | 6,187 | | |
Shares redeemed | | | (9,781,426 | ) | | | (1,562,584 | ) | | | (971,639 | ) | | | (12,212,254 | ) | |
Net increase (decrease) | | | 3,792,398 | | | | 4,667,113 | | | | 13,850,962 | | | | (10,110,394 | ) | |
*Represents the period March 8, 2013 to October 31, 2013.
Transactions in dollars of capital stock were as follows:
| | | Year Ended October 31, 2014 | |
| | | First Eagle Global Fund | |
| | | Class A | | Class C | | Class I | |
Shares sold | | $ | 3,086,829,620 | | | $ | 2,009,315,584 | | | $ | 7,279,042,721 | | |
Shares issued for reinvested
dividends and distributions | | | 737,283,068 | | | | 324,909,824 | | | | 536,513,028 | | |
Shares redeemed | | | (5,173,632,845 | ) | | | (1,427,791,292 | ) | | | (2,971,085,548 | ) | |
Net increase (decrease) | | $ | (1,349,520,157 | ) | | $ | 906,434,116 | | | $ | 4,844,470,201 | | |
| | | Year Ended October 31, 2013 | |
| | | First Eagle Global Fund | |
| | | Class A | | Class C | | Class I | |
Shares sold | | $ | 3,497,016,996 | | | $ | 2,031,735,222 | | | $ | 5,155,682,552 | | |
Shares issued for reinvested
dividends and distributions | | | 590,423,655 | | | | 247,259,012 | | | | 374,962,942 | | |
Shares redeemed | | | (2,893,674,604 | ) | | | (1,312,491,400 | ) | | | (2,671,165,519 | ) | |
Net increase (decrease) | | $ | 1,193,766,047 | | | $ | 966,502,834 | | | $ | 2,859,479,975 | | |
First Eagle Funds | Annual Report | October 31, 2014
200
Notes to Financial Statements
| | | Year Ended October 31, 2014 | |
| | | First Eagle Overseas Fund | |
| | | Class A | | Class C | | Class I | |
Shares sold | | $ | 1,055,459,444 | | | $ | 145,990,404 | | | $ | 3,157,484,001 | | |
Shares issued for reinvested
dividends and distributions | | | 313,042,960 | | | | 46,559,542 | | | | 355,894,147 | | |
Shares redeemed | | | (2,400,625,988 | ) | | | (171,346,340 | ) | | | (1,670,215,413 | ) | |
Net increase (decrease) | | $ | (1,032,123,584 | ) | | $ | 21,203,606 | | | $ | 1,843,162,735 | | |
| | | Year Ended October 31, 2013 | |
| | | First Eagle Overseas Fund | |
| | | Class A | | Class C | | Class I | |
Shares sold | | $ | 1,313,800,443 | | | $ | 172,795,866 | | | $ | 2,562,741,314 | | |
Shares issued for reinvested
dividends and distributions | | | 239,955,685 | | | | 35,490,217 | | | | 230,119,915 | | |
Shares redeemed | | | (1,277,148,265 | ) | | | (170,362,139 | ) | | | (1,306,725,008 | ) | |
Net increase (decrease) | | $ | 276,607,863 | | | $ | 37,923,944 | | | $ | 1,486,136,221 | | |
First Eagle Funds | Annual Report | October 31, 2014
201
Notes to Financial Statements
| | | Year Ended October 31, 2014 | |
| | | First Eagle U.S. Value Fund | |
| | | Class A | | Class C | | Class I | |
Shares sold | | $ | 174,417,356 | | | $ | 61,016,322 | | | $ | 375,232,586 | | |
Shares issued for reinvested
dividends and distributions | | | 53,693,682 | | | | 20,559,539 | | | | 33,909,992 | | |
Shares redeemed | | | (540,218,333 | ) | | | (131,547,884 | ) | | | (332,025,497 | ) | |
Net increase (decrease) | | $ | (312,107,295 | ) | | $ | (49,972,023 | ) | | $ | 77,117,081 | | |
| | | Year Ended October 31, 2013 | |
| | | First Eagle U.S. Value Fund | |
| | | Class A | | Class C | | Class I | |
Shares sold | | $ | 336,640,485 | | | $ | 129,653,115 | | | $ | 368,439,929 | | |
Shares issued for reinvested
dividends and distributions | | | 37,377,968 | | | | 11,673,473 | | | | 22,568,874 | | |
Shares redeemed | | | (471,429,277 | ) | | | (118,785,130 | ) | | | (360,521,201 | ) | |
Net increase (decrease) | | $ | (97,410,824 | ) | | $ | 22,541,458 | | | $ | 30,487,602 | | |
| | | Year Ended October 31, 2014 | |
| | | First Eagle High Yield Fund | |
| | | Class A | | Class C | | Class I | |
Shares sold | | $ | 121,926,325 | | | $ | 68,190,256 | | | $ | 464,620,390 | | |
Shares issued for reinvested
dividends and distributions | | | 15,172,616 | | | | 5,714,634 | | | | 22,260,582 | | |
Shares redeemed | | | (232,900,282 | ) | | | (45,101,192 | ) | | | (275,613,957 | ) | |
Net increase (decrease) | | $ | (95,801,341 | ) | | $ | 28,803,698 | | | $ | 211,267,015 | | |
| | | Year Ended October 31, 2013 | |
| | | First Eagle High Yield Fund | |
| | | Class A | | Class C | | Class I | |
Shares sold | | $ | 235,164,140 | | | $ | 76,205,397 | | | $ | 293,516,038 | | |
Shares issued for reinvested
dividends and distributions | | | 15,056,272 | | | | 5,363,858 | | | | 16,244,598 | | |
Shares redeemed | | | (126,959,400 | ) | | | (37,898,182 | ) | | | (112,078,026 | ) | |
Net increase (decrease) | | $ | 123,261,012 | | | $ | 43,671,073 | | | $ | 197,682,610 | | |
First Eagle Funds | Annual Report | October 31, 2014
202
Notes to Financial Statements
*Represents the period March 8, 2013 to October 31, 2013.
| | | Year Ended October 31, 2014 | |
| | | First Eagle Gold Fund | | First Eagle Global Income Builder Fund | |
| | | Class A | | Class C | | Class I | | Class A | | Class C | | Class I | |
Shares sold | | $ | 177,606,432 | | | $ | 45,271,555 | | | $ | 285,854,243 | | | $ | 325,859,860 | | | $ | 257,548,291 | | | $ | 407,033,032 | | |
Shares issued for reinvested
dividends and distributions | | | — | | | | — | | | | — | | | | 9,432,140 | | | | 4,605,185 | | | | 5,666,726 | | |
Shares redeemed | | | (362,140,244 | ) | | | (87,598,940 | ) | | | (307,257,723 | ) | | | (126,739,866 | ) | | | (26,641,785 | ) | | | (43,485,377 | ) | |
Net increase (decrease) | | $ | (184,533,812 | ) | | $ | (42,327,385 | ) | | $ | (21,403,480 | ) | | $ | 208,552,134 | | | $ | 235,511,691 | | | $ | 369,214,381 | | |
| | | Year Ended October 31, 2013 | |
| | | First Eagle Gold Fund | | First Eagle Global Income Builder Fund | |
| | | Class A | | Class C | | Class I | | Class A | | Class C | | Class I | |
Shares sold | | $ | 388,461,140 | | | $ | 93,817,364 | | | $ | 425,138,499 | | | $ | 200,840,624 | | | $ | 121,640,893 | | | $ | 100,665,323 | | |
Shares issued for reinvested
dividends and distributions | | | 3,597,270 | | | | 677 | | | | 2,152,604 | | | | 3,796,441 | | | | 1,730,539 | | | | 1,645,329 | | |
Shares redeemed | | | (511,378,497 | ) | | | (159,616,525 | ) | | | (444,450,557 | ) | | | (29,227,048 | ) | | | (9,817,681 | ) | | | (18,539,751 | ) | |
Net increase (decrease) | | $ | (119,320,087 | ) | | $ | (65,798,484 | ) | | $ | (17,159,454 | ) | | $ | 175,410,017 | | | $ | 113,553,751 | | | $ | 83,770,901 | | |
| | | Year Ended October 31, 2014 | |
| | | First Eagle Fund of America | |
| | | Class A | | Class C | | Class I | | Class Y | |
Shares sold | | $ | 372,435,762 | | | $ | 183,641,692 | | | $ | 435,311,387 | | | $ | 57,925,767 | | |
Shares issued for reinvested
dividends and distributions | | | 16,199,868 | | | | 6,418,865 | | | | 5,474,261 | | | | 7,953,046 | | |
Shares redeemed | | | (342,545,205 | ) | | | (63,631,853 | ) | | | (101,141,276 | ) | | | (98,025,745 | ) | |
Net increase (decrease) | | $ | 46,090,425 | | | $ | 126,428,704 | | | $ | 339,644,372 | | | $ | (32,146,932 | ) | |
| | | Year Ended October 31, 2013 | |
| | | First Eagle Fund of America | |
| | | Class A | | Class C | | Class I* | | Class Y | |
Shares sold | | $ | 417,540,709 | | | $ | 168,315,024 | | | $ | 480,472,160 | | | $ | 65,179,337 | | |
Shares issued for reinvested
dividends and distributions | | | 213,728 | | | | 1,145 | | | | 219 | | | | 174,597 | | |
Shares redeemed | | | (303,665,533 | ) | | | (41,563,487 | ) | | | (32,328,624 | ) | | | (390,594,676 | ) | |
Net increase (decrease) | | $ | 114,088,904 | | | $ | 126,752,682 | | | $ | 448,143,755 | | | $ | (325,240,742 | ) | |
First Eagle Funds | Annual Report | October 31, 2014
203
Notes to Financial Statements
At October 31, 2014, no shareholders owned more than 5% of any class of the First Eagle Funds.
Note 7 — Indemnification and Investment Risk
In the normal course of business, the Funds enter into contracts that contain a variety of representations which provide general indemnifications. Each Fund's maximum exposure under these arrangements is unknown, as this would involve future claims that may be made against each Fund that have not yet occurred. However, based on experience, the Funds expect the risk of loss to be remote. The Funds may have elements of risk not typically associated with investments in the United States of America due to their investments in foreign countries or regions. Such foreign investments may subject the Funds to additional risks resulting from political or economic conditions in such countries or regions and the possible imposition of adverse governmental laws or currency exchange restrictions could cause the securities and their markets to be less liquid and their prices to be more volatile than those of comparable U.S. securities. The securities markets in many emerging-market countries are substantially smaller, less developed, less liquid and more volatile than the securities markets of developed countries.
The First Eagle High Yield Fund and First Eagle Global Income Builder Fund invest in high yield securities which may be subject to greater levels of interest rate, credit and liquidity risk than investment grade securities. These high yield securities may be considered speculative with respect to the issuer's continuing ability to make principal and interest payments and may be subject to significant price fluctuations.
The Funds are subject to interest rate and credit risk. The value of debt securities may decline as interest rates increase. The Funds could lose money if the issuer of a fixed income security is unable to pay interest or repay principal when it is due. The ability of the issuers of debt to meet their obligations may be affected by the economic and political developments in a specific industry or region.
The Funds enter into derivatives which may represent off-balance sheet risk. Off-balance sheet risk exists when the maximum potential loss on a particular investment is greater than the value of such investment as reflected in the Statements of Assets and Liabilities.
Note 8 — Redemption In-Kind Transactions
The redemption in-kind policy for all of the Funds reserves the right of the Funds to pay redemptions in-kind (i.e., payments in the form of marketable securities or, as needed, other traded assets, rather than cash) if the redemption request is large enough to affect a Fund's operations (for example, if it represents more than $250,000 or 1% of the Fund's assets). When receiving assets distributed in-kind, the recipient will bear applicable commissions or other costs on their sale. There were no redemptions in-kind as of October 31, 2014.
Note 9 — Subsequent Events
In accordance with the provision surrounding Subsequent Events adopted by the Funds, management has evaluated the possibility of subsequent events existing in the Funds' financial statements. Management has determined that there are no material events that would require disclosures in the Funds' financial statements.
First Eagle Funds | Annual Report | October 31, 2014
204
Report of Independent Registered Public Accounting Firm
To the Board of Trustees of First Eagle Funds and the Shareholders of First Eagle Global Fund, First Eagle Overseas Fund, First Eagle U.S. Value Fund, First Eagle Gold Fund, First Eagle Global Income Builder Fund, First Eagle High Yield Fund and First Eagle Fund of America:
In our opinion, the accompanying statements of assets and liabilities, including the schedules of investments, and the related statements of operations, of changes in net assets and the financial highlights present fairly, in all material respects, the financial position of First Eagle Global Fund (including its consolidated wholly owned subsidiary), First Eagle Overseas Fund (including its consolidated wholly owned subsidiary), First Eagle U.S. Value Fund (including its consolidated wholly owned subsidiary), First Eagle Gold Fund (including its consolidated wholly owned subsidiary), First Eagle Global Income Builder Fund, First Eagle High Yield Fund and First Eagle Fund of America (collectively hereafter referred to as the "Funds") at October 31, 2014, the results of each of their operations for the year then ended, the changes in each of their net assets for each of the two years then ended and the financial highlights for each of the periods presented, in conformity with accounting principles generally accepted in the United States of America. These financial statements and financial highlights (hereafter referred to as "financial statements") are the responsibility of the Funds' management. Our responsibility is to express an opinion on these financial statements based on our audits. We conducted our audits of these financial statements in accordance with the standards of the Public Company Accounting Oversight Board (United States). Those standards require that we plan and perform the audits to obtain reasonable assurance about whether the financial statements are free of material misstatement. An audit includes examining, on a test basis, evidence supporting the amounts and disclosures in the financial statements, assessing the accounting principles used and significant estimates made by management, and evaluating the overall financial statement presentation. We believe that our audits, which included confirmation of securities at October 31, 2014 by correspondence with the custodian and brokers, provide a reasonable basis for our opinion.

PricewaterhouseCoopers LLP
New York, New York
December 29, 2014
First Eagle Funds | Annual Report | October 31, 2014
205
Fund Expenses (unaudited)
Example
As a shareholder of the First Eagle Funds, you may incur two types of costs: (1) transaction costs including front-end and contingent deferred sales charges (loads), and (2) ongoing costs, including advisory fees; distribution fees (12b-1) and/or service fees; and other Fund expenses. This Example is intended to help you understand your ongoing costs (in dollars) of investing in the Funds and to compare these costs with the ongoing costs of investing in other mutual funds.
This Example is based on an investment of $1,000 invested on May 1, 2014 and held for the six-months ended October 31, 2014.
Actual Expenses
The table below titled "Based on Actual Total Return" provides information about actual account values and actual expenses. You may use the information provided in this table, together with the amount you invested, to estimate the expenses that you paid over the period. To estimate the expenses you paid on your account, divide your ending account value by $1,000 (for example, an $8,600 ending account value divided by $1,000 = 8.6), then multiply the result by the number under the heading entitled "Expenses Paid During the Period".
First Eagle Funds | Annual Report | October 31, 2014
206
Fund Expenses (unaudited)
Based on Actual Total Return(1)
| | | Actual Total
Return without
Sales Charges(2) | | Beginning
Account
Value | | Ending
Account
Value | | Annualized
Expense
Ratio | | Expenses
Paid during
the Period(3) | |
First Eagle Global Fund Consolidated | |
Class A | | | -0.33 | % | | $ | 1,000.00 | | | $ | 996.70 | | | | 1.11 | % | | $ | 5.59 | | |
Class C | | | -0.70 | | | | 1,000.00 | | | | 993.00 | | | | 1.86 | | | | 9.34 | | |
Class I | | | -0.20 | | | | 1,000.00 | | | | 998.00 | | | | 0.86 | | | | 4.33 | | |
First Eagle Overseas Fund Consolidated | |
Class A | | | -3.30 | | | | 1,000.00 | | | | 967.00 | | | | 1.14 | | | | 5.65 | | |
Class C | | | -3.65 | | | | 1,000.00 | | | | 963.50 | | | | 1.89 | | | | 9.35 | | |
Class I | | | -3.20 | | | | 1,000.00 | | | | 968.00 | | | | 0.89 | | | | 4.41 | | |
First Eagle U.S. Value Fund Consolidated | |
Class A | | | 2.73 | | | | 1,000.00 | | | | 1,027.30 | | | | 1.11 | | | | 5.67 | | |
Class C | | | 2.36 | | | | 1,000.00 | | | | 1,023.60 | | | | 1.86 | | | | 9.49 | | |
Class I | | | 2.88 | | | | 1,000.00 | | | | 1,028.80 | | | | 0.86 | | | | 4.40 | | |
First Eagle Gold Fund Consolidated | |
Class A | | | -20.60 | | | | 1,000.00 | | | | 794.00 | | | | 1.22 | | | | 5.52 | | |
Class C | | | -20.84 | | | | 1,000.00 | | | | 791.60 | | | | 1.97 | | | | 8.90 | | |
Class I | | | -20.49 | | | | 1,000.00 | | | | 795.10 | | | | 0.96 | | | | 4.34 | | |
First Eagle Global Income Builder Fund | |
Class A | | | -1.80 | | | | 1,000.00 | | | | 982.00 | | | | 1.24 | | | | 6.19 | | |
Class C | | | -2.18 | | | | 1,000.00 | | | | 978.20 | | | | 1.98 | | | | 9.87 | | |
Class I | | | -1.62 | | | | 1,000.00 | | | | 983.80 | | | | 1.05 | | | | 5.25 | | |
First Eagle High Yield Fund | |
Class A | | | -0.28 | | | | 1,000.00 | | | | 997.20 | | | | 1.08 | | | | 5.44 | | |
Class C | | | -0.65 | | | | 1,000.00 | | | | 993.50 | | | | 1.83 | | | | 9.20 | | |
Class I | | | -0.14 | | | | 1,000.00 | | | | 998.60 | | | | 0.83 | | | | 4.18 | | |
First Eagle Fund of America | |
Class A | | | 2.63 | | | | 1,000.00 | | | | 1,026.30 | | | | 1.35 | | | | 6.90 | | |
Class C | | | 2.23 | | | | 1,000.00 | | | | 1,022.30 | | | | 2.10 | | | | 10.70 | | |
Class I | | | 2.77 | | | | 1,000.00 | | | | 1,027.70 | | | | 1.10 | | | | 5.62 | | |
Class Y | | | 2.63 | | | | 1,000.00 | | | | 1,026.30 | | | | 1.35 | | | | 6.89 | | |
(1) For the six-months ended October 31, 2014.
(2) Past performance does not guarantee future results. Assumes reinvestment of all dividends and capital gain distributions, if any, at net asset value and does not reflect the deduction of the applicable sales charge, exchange fees or redemption fees. Had the effect of sales charges been reflected, expenses would have been higher and returns lower. Total return is not annualized, as it may not be representative of the total return for the year.
(3) Expenses are equal to the annualized expense ratio multiplied by the average account value over the period, multiplied by 184/365 (to reflect the one-half year period).
First Eagle Funds | Annual Report | October 31, 2014
207
Fund Expenses (unaudited)
Hypothetical Example for Comparison Purposes
The table below titled "Based on Hypothetical Total Return" provides information about hypothetical account values and hypothetical expenses based on the actual expense ratios and an assumed rate of return of 5% per year before expenses, which is not the First Eagle Funds' actual return. The hypothetical account values and expenses may not be used to estimate the actual ending account balance or expenses you paid for the period. You may use the information provided in this table to compare the ongoing costs of investing in the Funds and other funds. To do so, compare the 5% hypothetical example relating to the Funds with the 5% hypothetical examples that appear in the shareholder reports of other funds.
This Example is based on an investment of $1,000 invested on May 1, 2014 and held for the six-months ended October 31, 2014.
Please note that the expenses shown in the table below are meant to highlight your ongoing costs only and do not reflect any transactional costs, such as front-end or back-end sales charges (loads). Therefore, the table is useful in comparing ongoing costs only, and will not help you determine the relative total costs of owning different funds. In addition, if these transaction costs were included, your costs would have been higher.
First Eagle Funds | Annual Report | October 31, 2014
208
Fund Expenses (unaudited)
Based on Hypothetical Total Return(1)
| | | Hypothetical
Annualized
Total
Return | | Beginning
Account
Value | | Ending
Account
Value | | Annualized
Expense
Ratio | | Expenses
Paid during
the Period(2) | |
First Eagle Global Fund Consolidated | |
Class A | | | 5.00 | % | | $ | 1,000.00 | | | $ | 1,019.61 | | | | 1.11 | % | | $ | 5.65 | | |
Class C | | | 5.00 | | | | 1,000.00 | | | | 1,015.83 | | | | 1.86 | | | | 9.45 | | |
Class I | | | 5.00 | | | | 1,000.00 | | | | 1,020.87 | | | | 0.86 | | | | 4.38 | | |
First Eagle Overseas Fund Consolidated | |
Class A | | | 5.00 | | | | 1,000.00 | | | | 1,019.46 | | | | 1.14 | | | | 5.80 | | |
Class C | | | 5.00 | | | | 1,000.00 | | | | 1,015.68 | | | | 1.89 | | | | 9.60 | | |
Class I | | | 5.00 | | | | 1,000.00 | | | | 1,020.72 | | | | 0.89 | | | | 4.53 | | |
First Eagle U.S. Value Fund Consolidated | |
Class A | | | 5.00 | | | | 1,000.00 | | | | 1,019.61 | | | | 1.11 | | | | 5.65 | | |
Class C | | | 5.00 | | | | 1,000.00 | | | | 1,015.83 | | | | 1.86 | | | | 9.45 | | |
Class I | | | 5.00 | | | | 1,000.00 | | | | 1,020.87 | | | | 0.86 | | | | 4.38 | | |
First Eagle Gold Fund Consolidated | |
Class A | | | 5.00 | | | | 1,000.00 | | | | 1,019.06 | | | | 1.22 | | | | 6.21 | | |
Class C | | | 5.00 | | | | 1,000.00 | | | | 1,015.27 | | | | 1.97 | | | | 10.01 | | |
Class I | | | 5.00 | | | | 1,000.00 | | | | 1,020.37 | | | | 0.96 | | | | 4.89 | | |
First Eagle Global Income Builder Fund | |
Class A | | | 5.00 | | | | 1,000.00 | | | | 1,018.95 | | | | 1.24 | | | | 6.31 | | |
Class C | | | 5.00 | | | | 1,000.00 | | | | 1,015.22 | | | | 1.98 | | | | 10.06 | | |
Class I | | | 5.00 | | | | 1,000.00 | | | | 1,019.91 | | | | 1.05 | | | | 5.35 | | |
First Eagle High Yield Fund | |
Class A | | | 5.00 | | | | 1,000.00 | | | | 1,019.76 | | | | 1.08 | | | | 5.50 | | |
Class C | | | 5.00 | | | | 1,000.00 | | | | 1,015.98 | | | | 1.83 | | | | 9.30 | | |
Class I | | | 5.00 | | | | 1,000.00 | | | | 1,021.02 | | | | 0.83 | | | | 4.23 | | |
First Eagle Fund of America | |
Class A | | | 5.00 | | | | 1,000.00 | | | | 1,018.40 | | | | 1.35 | | | | 6.87 | | |
Class C | | | 5.00 | | | | 1,000.00 | | | | 1,014.62 | | | | 2.10 | | | | 10.66 | | |
Class I | | | 5.00 | | | | 1,000.00 | | | | 1,019.66 | | | | 1.10 | | | | 5.60 | | |
Class Y | | | 5.00 | | | | 1,000.00 | | | | 1,018.40 | | | | 1.35 | | | | 6.87 | | |
(1) For the six-months ended October 31, 2014.
(2) Expenses are equal to the annualized expense ratio multiplied by the average account value over the period, multiplied by 184/365 (to reflect the one-half year period).
First Eagle Funds | Annual Report | October 31, 2014
209
Quarterly Form N-Q portfolio schedule
The First Eagle Funds file their complete schedule of portfolio holdings with the Securities and Exchange Commission ("SEC") for the first and third quarters of each fiscal year on Form N-Q. The Funds' Forms N-Q are available on the SEC's Web site at www.sec.gov. The Funds' Forms N-Q may be reviewed and copied at the SEC's Public Reference Room in Washington, D.C. Information on the operation of the SEC's Public Reference Room may be obtained by calling 1.800.SEC.0330. Additionally, you may obtain copies of Forms N-Q from the Funds upon request by calling 1.800.334.2143.
Proxy voting policies, procedures and record
You may obtain a description of the Funds' (1) proxy voting policies, (2) proxy voting procedures and (3) information regarding how the Funds voted any proxies related to portfolio securities during the most recent twelve-month period ended June 30 for which an SEC filing has been made, without charge, upon request by contacting the Funds directly at 1.800.334.2143 or on the EDGAR Database on the SEC's Web site at www.sec.gov.
First Eagle Funds | Annual Report | October 31, 2014
210
Fiscal Year Ended October 31, 2014 (unaudited)
Each Fund designates the following amounts (or the maximum amount allowable) distributed during the fiscal year ended October 31, 2014, if any, as capital gain dividends, dividends eligible for the corporate dividends received deduction and/or qualified dividend income:
| | | % of Qualifying
Dividend | | % of Dividends
Eligible for
the Dividends
Received | | Long-Term Capital Gains | |
| | | Income | | Deduction | | 15% | | 28% | |
First Eagle Global Fund | | | 85.85 | % | | | 39.16 | % | | | 1,152,245,365 | | | | 179,342,818 | | |
First Eagle Overseas Fund* | | | 44.74 | % | | | 0.25 | % | | | 399,474,789 | | | | 69,553,796 | | |
First Eagle U.S. Value | | | 100 | % | | | 100 | % | | | 106,592,181 | | | | 11,608,849 | | |
First Eagle Gold Fund | | | — | | | | — | | | | — | | | | — | | |
First Eagle Global Income Builder | | | 46.90 | % | | | 11.95 | % | | | — | | | | — | | |
First Eagle High Yield | | | — | | | | — | | | | — | | | | — | | |
First Eagle Fund of America | | | 100 | % | | | 100 | % | | | 38,725,454 | | | | — | | |
* First Eagle Overseas Fund paid foreign taxes of $28,138,723, and recognized foreign source income of $169,870,624. Pursuant to Section 853 of the Internal Revenue Code, the First Eagle Overseas Fund designates such amounts (of the maximum amount allowable) as having been paid in connection with dividends distributed from investment company taxable income during the fiscal year ended October 31, 2014.
First Eagle Funds | Annual Report | October 31, 2014
211
The Trust is committed to protecting your privacy. We are providing you with this privacy notice to inform you of how we handle your personal information that we collect and may disclose to our affiliates. If the Trust changes its information practices, we will provide you with notice of any material changes. This privacy policy supersedes any of our previous policies relating to the information you disclose to us.
Why this Privacy Policy Applies to You
You obtained a financial product or service from or through us for personal, family or household purposes when you opened a shareholder account with the Trust, and are therefore covered by this privacy policy.
What We do to Protect Your Personal Information
We protect personal information provided to us by our individual shareholders according to strict standards of security and confidentiality. These standards apply to both our physical facilities and any online services we may provide. We maintain physical, electronic and procedural safeguards that comply with federal standards to guard consumer information. We permit only authorized individuals, who are trained in the proper handling of individual shareholder information and need to access this information to do their job, to have access to this information.
Personal Information that We Collect and May Disclose
As part of providing you with the Trust's products and services, we may obtain nonpublic personal information about you from the following sources:
• Information we receive from you on subscription applications or other forms, such as your name, address, telephone number, Social Security number, occupation, assets and income;
• Information about your transactions with us, our affiliates, or unaffiliated third parties, such as your account balances, payment history and account activity; and
• Information from public records we may access in the ordinary course of business.
Categories of Affiliates to Whom We May Disclose Personal Information
We may share personal information about you with affiliates. Our affiliates do business under names that include Arnhold and S. Bleichroeder Holdings, Inc., First Eagle Investment Management, LLC, FEF Distributors, LLC, and ASB Advisers.
First Eagle Funds | Annual Report | October 31, 2014
212
You May Limit Marketing Solicitations by Choosing to Opt Out
We offer you the right to opt out from many types of marketing by our affiliates based on your personal information that we collect and share in accordance with this privacy policy. To limit those marketing solicitations, you may call 800.334.2143 indicating your desire not to receive marketing from our affiliates. Should you choose to opt out, your choice will remain in our records until you notify us otherwise, although we may choose to contact you in the future to modify your preference.
When We May Disclose Your Personal Information to Unaffiliated Third Parties
We will only share your personal information collected, as described above, with unaffiliated third parties:
• At your request;
• When you authorize us to process or service a transaction or product (unaffiliated third parties in this instance may include service providers such as the Trust's distributors, registrar and transfer agent for shareholder transactions, and other parties providing individual shareholder servicing, accounting and recordkeeping services);
• With companies that perform sales and marketing services on our behalf with whom we have agreements to protect the confidentiality of your information and to use the information only for the purposes for which we disclose the information to them; or
• When required by law to disclose such information to appropriate authorities.
We do not otherwise provide information about you to outside firms, organizations or individuals except to our attorneys, accountants and auditors and as permitted by law.
What We do with Personal Information about Our Former Customers
If you decide to discontinue doing business with us, the Trust will continue to adhere to this privacy policy with respect to the information we have in our possession about you and your account following the termination of our shareholder relationship.
First Eagle Funds | Annual Report | October 31, 2014
213
Additional Information (unaudited)
Management of the Trust
The business of the Trust is managed by its Board of Trustees, which elects officers responsible for the day to day operations of the Funds and for the execution of the policies formulated by the Board of Trustees.
Pertinent information regarding the members of the Board of Trustees and principal officers of the Trust is set forth below. Some of the Trustees and officers are employees of the Adviser and its affiliates. At least a majority of the Trust's Board of Trustees are not "interested persons" as that term is defined in the Investment Company Act.
Independent Trustees(1)
Lisa Anderson | Trustee | December 2005 to present
1345 Avenue of the Americas | New York, New York | 10105
(born October 1950)
Principal Occupation(s) During Past 5 Years: President, American University in Cairo; prior to December 2010, Provost, American University in Cairo; James T. Shotwell Professor of International Relations and Dean, School of International and Public Affairs, Columbia University
Number of Portfolios in the Fund Complex Overseen by Trustee: 9
Other Directorships/Trusteeships Held by Trustee: Director, Advisory Board Middle East Centre, London School of Economics; Member Emerita, Human Rights Watch; Trustee, First Eagle Variable Funds (1 portfolio)
Candace K. Beinecke(2) | Trustee (Chair) | December 1999 to present
One Battery Park Plaza | New York, New York | 10004
(born December 1946)
Principal Occupation(s) During Past 5 Years: Chair, Hughes Hubbard & Reed LLP
Number of Portfolios in the Fund Complex Overseen by Trustee: 9
Other Directorships/Trusteeships Held by Trustee: Director, ALSTOM; Trustee, Vornado Realty Trust; Director, Rockefeller Financial Services, Inc. and Rockefeller & Company, Inc.; Trustee, Metropolitan Museum of Art; Trustee, The Wallace Foundation; Director and Vice Chair, Partnership for New York City; Trustee, First Eagle Variable Funds (Chair) (1 portfolio)
(1) Trustees who are not "interested persons" of the Trust as defined in the Investment Company Act.
(2) Ms. Beinecke also served as trustee of a predecessor fund to Fund of America since 1996.
First Eagle Funds | Annual Report | October 31, 2014
214
Additional Information (unaudited)
Independent Trustees(1)—(continued)
Jean D. Hamilton | Trustee | March 2003 to present
1345 Avenue of the Americas | New York, New York | 10105
(born January 1947)
Principal Occupation(s) During Past 5 Years: Private Investor/Independent Consultant/Member, Brock Capital Group LLC;
Number of Portfolios in the Fund Complex Overseen by Trustee: 9
Other Directorships/Trusteeships Held by Trustee: Director, RenaissanceRe Holdings Ltd; prior to June 2012, Director, Four Nations; Trustee, First Eagle Variable Funds (1 portfolio)
James E. Jordan | Trustee | December 1999 to present
1345 Avenue of the Americas | New York, New York | 10105
(born April 1944)
Principal Occupation(s) During Past 5 Years: Private Investor and Independent Consultant
Number of Portfolios in the Fund Complex Overseen by Trustee: 9
Other Directorships/Trusteeships Held by Trustee: Director, JZ Capital Partners, Plc. (Guernsey investment trust company); Trustee, World Monuments Fund; Chairman's Council, Conservation International; Director, Alpha Andromeda Investment Trust Co., S.A.; prior to July 2013, Director, Leucadia National Corporation; Trustee, First Eagle Variable Funds (1 portfolio)
William M. Kelly(3) | Trustee | December 1999 to present
1345 Avenue of the Americas | New York, New York | 10105
(born February 1944)
Principal Occupation(s) During Past 5 Years: Private Investor, prior to January 2010 President, Lingold Associates
Number of Portfolios in the Fund Complex Overseen by Trustee: 9
Other Directorships/Trusteeships Held by Trustee: Trustee, St. Anselm College; Director, Sergi S. Zlinkoff Fund for Medical Research and Education; Prior to April, 2010, Treasurer and Trustee, Black Rock Forest Preservation and Consortium; Trustee, First Eagle Variable Funds (1 portfolio)
(1) Trustees who are not "interested persons" of the Trust as defined in the Investment Company Act.
(3) Mr. Kelly also served as trustee of a predecessor fund to Fund of America since 1998.
First Eagle Funds | Annual Report | October 31, 2014
215
Additional Information (unaudited)
Independent Trustees(1)—(continued)
Paul J. Lawler | Trustee | March 2002 to present
1345 Avenue of the Americas | New York, New York | 10105
(born May 1948)
Principal Occupation(s) During Past 5 Years: Private Investor, prior to January 2010, Vice President Investments and Chief Investment Officer, W.K. Kellogg Foundation
Number of Portfolios in the Fund Complex Overseen by Trustee: 9
Other Directorships/Trusteeships Held by Trustee: Trustee and Audit Chair, The American University in Cairo; Trustee, Blackstone Alternative Asset Fund; Trustee, Ravena Coeymans Historical Society; Trustee, Coeymans Heritage Society; Trustee, First Eagle Variable Funds (1 portfolio)
Interested Trustees(4)
John P. Arnhold | President and Trustee | December 1999 to present
1345 Avenue of the Americas | New York, New York | 10105
(born December 1953)
Principal Occupation(s) During Past 5 Years: Co-President, Co-CEO and Director, Arnhold and S. Bleichroeder Holdings, Inc.; CEO, Chairman, Director, FEF Distributors, LLC; Chairman, CIO and Director, First Eagle Investment Management, LLC; prior to February 2010, CEO, First Eagle Investment Management, LLC
Number of Portfolios in the Fund Complex Overseen by Trustee: 9
Other Directorships/Trusteeships Held by Trustee: Chairman and Director, Arnhold Ceramics; Director, The Arnhold Foundation; Director, The Mulago Foundation; Director, WNET.org; Trustee, Trinity Episcopal Schools Corp.; Trustee, Vassar College; Trustee, Jazz at Lincoln Center; Director, International Tennis Hall of Fame; Managing Member, New Eagle Holdings Management Company, LLC; Director, First Eagle Amundi SICAV; Trustee, UC Santa Barbara Foundation; prior to November, 2011, Director, Aquila International Fund Limited; prior to September, 2011 Director, Quantum Endowment Fund; President and Trustee, First Eagle Variable Funds (1 portfolio)
(1) Trustees who are not "interested persons" of the Trust as defined in the Investment Company Act.
(4) The term of office of each Interested Trustee is indefinite.
First Eagle Funds | Annual Report | October 31, 2014
216
Additional Information (unaudited)
Interested Trustees(5)—(continued)
Jean-Marie Eveillard | Trustee | June 2008 to present
1345 Avenue of the Americas | New York, New York | 10105
(born January 1940)
Principal Occupation(s) During Past 5 Years: Senior Adviser to First Eagle Investment Management, LLC since March 2009; formerly, Senior Vice President, First Eagle Investment Management, LLC since January 2000; previously, Portfolio Manager of First Eagle Global Fund, First Eagle Overseas Fund, First Eagle U.S. Value Fund, First Eagle Gold Fund, and First Eagle Variable Funds (portfolio management tenure: 1979-2004, March 2007-March 2009)
Number of Portfolios in the Fund Complex Overseen by Trustee: 9
Other Directorships/Trusteeships Held by Trustee: Trustee, The Frick Collection; Director, Varenne Capital Partners; prior to December 2011, Director Fregate-Legris Industries SA; Trustee, First Eagle Variable Funds (1 portfolio)
Officers(6)
John P. Arnhold | President and Trustee | December 1999 to present
1345 Avenue of the Americas | New York, New York | 10105
(born December 1953)
Principal Occupation(s) During Past Five (5) Years: See table on preceding page related to Interested Trustees
Robert Bruno | Senior Vice President | December 1999 to present
1345 Avenue of the Americas | New York, New York | 10105
(born June 1964)
Principal Occupation(s) During Past Five (5) Years: Senior Vice President, First Eagle Investment Management, LLC; President, FEF Distributors, LLC; Senior Vice President, First Eagle Variable Funds
Joseph T. Malone | Chief Financial Officer | September 2008 to present
1345 Avenue of the Americas | New York, New York | 10105
(born September 1967)
Principal Occupation(s) During Past Five (5) Years: Senior Vice President, First Eagle Investment Management, LLC; Chief Financial Officer, First Eagle Variable Funds; from September 2008
(5) The term of office of each Interested Trustee is indefinite.
(6) The term of office of each officer is indefinite. Length of time served represents time served as an officer of the Trust (or its predecessor entities), although various positions may have been held during the period.
First Eagle Funds | Annual Report | October 31, 2014
217
Additional Information (unaudited)
Officers(6)—(continued)
Mark D. Goldstein | Chief Compliance Officer | February 2005 to present
1345 Avenue of the Americas | New York, New York | 10105
(born October 1964)
Principal Occupation(s) During Past Five (5) Years: General Counsel, Chief Compliance Officer until June 2014, and Senior Vice President, First Eagle Investment Management, LLC; Secretary, FEF Distributors, LLC; Director, First Eagle Amundi SICAV; General Counsel and Secretary of Arnhold and S. Bleichroeder Holdings, Inc., and Chief Compliance Officer, First Eagle Variable Funds from February 2005
Suzan J. Afifi | Secretary and Vice President | December 1999 to present
1345 Avenue of the Americas | New York, New York | 10105
(born October 1952)
Principal Occupation(s) During Past Five (5) Years: Senior Vice President, First Eagle Investment Management, LLC; Vice President, FEF Distributors, LLC; Secretary and Vice President, First Eagle Variable Funds
Philip Santopadre | Treasurer | September 2005 to present
1345 Avenue of the Americas | New York, New York | 10105
(born August 1977)
Principal Occupation(s) During Past Five (5) Years: Vice President, First Eagle Investment Management, LLC; Treasurer, First Eagle Variable Funds
Michael Luzzatto | Vice President | December 2004 to present
1345 Avenue of the Americas | New York, New York | 10105
(born April 1977)
Principal Occupation(s) During Past Five (5) Years: Senior Vice President, First Eagle Investment Management, LLC; Vice President, FEF Distributors, LLC; Vice President, First Eagle Variable Funds
Meng Lam | Assistant Treasurer | March 2012 to present
1345 Avenue of the Americas | New York, New York | 10105
(born October 1980)
Principal Occupation(s) During Past Five (5) Years: Assistant Vice President, First Eagle Investment Management, LLC from February 2011; Advisory Manager, Ernst & Young LLP from January 2010; Audit Manager, Deloitte & Touche LLP from 2007; Assistant Treasurer, First Eagle Variable Funds
(6) The term of office of each officer is indefinite. Length of time served represents time served as an officer of the Trust (or its predecessor entities), although various positions may have been held during the period.
First Eagle Funds | Annual Report | October 31, 2014
218
Trustees
Lisa Anderson
John P. Arnhold
Candace K. Beinecke (Chair)
Jean-Marie Eveillard
Jean D. Hamilton
James E. Jordan
William M. Kelly
Paul J. Lawler
Officers
John P. Arnhold
President
Robert Bruno
Senior Vice President
Joseph T. Malone
Chief Financial Officer
Mark D. Goldstein
Chief Compliance Officer
Suzan J. Afifi
Secretary & Vice President
Philip Santopadre
Treasurer
Michael Luzzatto
Vice President
Meng Lam
Assistant Treasurer
Investment Adviser
First Eagle Investment Management, LLC
1345 Avenue of the Americas
New York, NY 10105
Legal Counsel
Shearman & Sterling LLP
599 Lexington Avenue
New York, NY 10022
Custodian
State Street Bank and Trust Company
801 Pennsylvania Avenue
Kansas City, MO 64105
Shareholder Servicing Agent
DST Systems, Inc.
330 West 9th Street
Kansas City, MO 64105
800.334.2143
Underwriter
FEF Distributors, LLC
1345 Avenue of the Americas
New York, NY 10105
Independent Registered Public
Accounting Firm
PricewaterhouseCoopers LLP
300 Madison Avenue
New York, NY 10017
This report is not authorized for distribution to prospective investors unless preceded or accompanied by a currently effective prospectus of First Eagle Funds.
First Eagle Funds | Annual Report | October 31, 2014
219
This page was intentionally left blank.
This page was intentionally left blank.
This page was intentionally left blank.
This page was intentionally left blank.
This page was intentionally left blank.
This page was intentionally left blank.
This page was intentionally left blank.


First Eagle Investment Management, LLC
1345 Avenue of the Americas, New York, NY 10105-0048
800.334.2143 www.feim.com
Item 2. Code of Ethics.
The Registrant has adopted a code of ethics that applies to its principal executive officer and principal financial officer. Copies of the code of ethics may be requested free of charge by calling 1-800-334-2143 (toll free).
Item 3. Audit Committee Financial Expert.
The Board of Trustees of the registrant has designated Paul J. Lawler, William M. Kelly and Jean Hamilton as Audit Committee Financial Experts. Mr. Lawler, Mr. Kelly and Ms. Hamilton are considered by the Board to be independent trustees.
Item 4. Principal Accountant Fees and Services
(a) Audit Fees:
For the Fiscal years ended October 31, 2014 and October 31, 2013, the aggregate PricewaterhouseCoopers LLP (PwC) audit fees for professional services rendered to the registrant were approximately $417,735 and $505,582, respectively. Fees included in the audit fees category are those associated with the annual audits of the financial statements and services that are normally provided in connection with statutory and regulatory filings.
(b) Audit Related Fees:
For the fiscal years ended October 31, 2014 and October 31, 2013, the aggregate PwC fees for assurance and related services rendered to the registrant were approximately $18,300 and $18,300, respectively.
(c) Tax Fees:
In each fiscal year ended October 31, 2014 and October 31, 2013, the aggregate tax fees billed by PwC for professional services rendered to the registrant were approximately $432,676 and $596,616, respectively.
Fees included in the tax fees category comprise all services performed by professional staff in the independent accountant’s tax division except those services related to audits. This category comprises fees for tax compliance and preparation of tax returns.
(d) All Other Fees:
In each of the fiscal years ended October 31, 2014 and October 31, 2013, there were no fees billed by PwC for products and services, other than 4(a)-(c) above, rendered to the registrant.
(e)(1) The registrant’s audit committee has adopted a policy whereby audit and non-audit services performed by the registrant’s principal accountant for the registrant, its investment adviser, and any entity controlling, controlled by, or under common control with the investment adviser that provides ongoing services to the registrant require pre-approval by the committee or a designated member thereof. If such a service is required between regularly scheduled audit committee meetings, pre-approval may be authorized by one audit committee member with ratification at the next scheduled audit committee meeting. Waiver of pre-approval for audit and non-audit services requiring fees of a de minimis amount is not permitted.
(e)(2) No services included in (b) — (d) above were approved pursuant to paragraph (c)(7)(i)(C) of Rule 2-01 of Regulation S-X.
(f) According to PwC, for the fiscal year ended October 31, 2014, the percentage of hours spent on the audit of the registrant’s financial statements for the most recent fiscal year that were attributable to work performed by persons who are not full-time, permanent employees of PwC was 0%.
(g) Other than as described in the table above, the aggregate fees billed for the most recent fiscal year and the preceding fiscal year by the registrant’s principal accountant for non-audit services rendered to the registrant (“covered”), its investment adviser, and any entity controlling, controlled by, or under common control with the investment adviser (“non-covered”) that provides ongoing services to the registrant was $0 in 2014 and 2013.
(h) Not applicable.
Item 5. Audit Committee of Listed Registrants
Not applicable at this time.
Item 6. Schedule of Investments
Please see schedule of investments contained in the Report to Stockholders included under Item 1 of this Form N-CSR.
Item 7. Disclosure of Proxy Voting Policies and Procedures for Closed-End Management Investment Companies.
Not applicable.
Item 8. Portfolio Managers of Closed-End Investment companies.
Not applicable.
Item 9. Purchases of Equity Securities by Closed-End Management Investment Company and Affiliated Purchasers.
Not applicable.
Item 10. Submission of Matters to a Vote of Security Holders.
No material change to report at this time.
Item 11. Controls and Procedures.
(a) In the opinion of the principal executive officer and principal financial officer, based on their evaluation, the registrant’s disclosure controls and procedures are adequately designed and are operating effectively to ensure (i) that material information relating to the registrant, including its consolidated subsidiaries, is made known to them by others within those entities, particularly during the period in which this report is being prepared; and (ii) that information required to be disclosed by the registrant on Form N-CSR is recorded, processed, summarized and reported within the time periods specified in the Securities and Exchange Commission’s rules and forms.
(b) There were no changes in the registrant’s internal control over financial reporting that occurred during the registrant’s most recent fiscal half-year (the registrant’s second fiscal half-year in the case of an annual report) that have materially affected or are reasonably likely to materially affect, the registrant’s internal control over financial reporting.
Item 12. Exhibits.
(a)(1) Code of ethics required to be disclosed under Item 2 of Form N-CSR.
(a)(2) Certifications pursuant to Rule 30a-2(a) under the Investment Company Act of 1940 (17 CFR 270.30a-2(a)): Attached hereto.
(a)(3) Not applicable.
(b) Certification pursuant to Rule 30a-2(b) under the Investment Company Act of 1940 (17 CFR 270.30a-2(b)): Attached hereto.
SIGNATURES
Pursuant to the requirements of the Securities Exchange Act of 1934 and the Investment Company Act of 1940, the registrant has duly caused this report to be signed on its behalf by the undersigned, thereunto duly authorized.
(Registrant) | First Eagle Funds |
| |
By (Signature and Title)* | /s/ John P. Arnhold |
| John P. Arnhold, President |
Date: January 7, 2015
Pursuant to the requirements of the Securities Exchange Act of 1934 and the Investment Company Act of 1940, this report has been signed below by the following persons on behalf of the registrant and in the capacities and on the dates indicated.
By (Signature and Title)* | /s/ John P. Arnhold |
| John P. Arnhold, Principal Executive Officer |
Date: January 7, 2015
By (Signature and Title)* | /s/ Joseph T. Malone |
| Joseph T. Malone, Principal Financial Officer |
Date: January 7, 2015
* Print the name and title of each signing officer under his or her signature.