UNITED STATES
SECURITIES AND EXCHANGE COMMISSION
Washington, D.C. 20549
FORM N-CSR
CERTIFIED SHAREHOLDER REPORT OF REGISTERED MANAGEMENT
INVESTMENT COMPANIES
Investment Company Act file number 811-7762
First Eagle Funds
(Exact name of registrant as specified in charter)
1345 Avenue of the Americas
New York, NY 10105
(Address of principal executive offices) (Zip code)
Sheelyn Michael
First Eagle Funds
1345 Avenue of the Americas
New York, NY 10105
(Name and address of agent for service)
Registrant’s telephone number, including area code: 1-212-632-2700
Date of fiscal year end: October 31
Date of reporting period: April 30, 2024
Form N-CSR is to be used by management investment companies to file reports with the Commission not later than 10 days after the transmission to stockholders of any report that is required to be transmitted to stockholders under Rule 30e-1 under the Investment Company Act of 1940 (17 CFR 270.30e-1). The Commission may use the information provided on Form N-CSR in its regulatory, disclosure review, inspection, and policymaking roles.
A registrant is required to disclose the information specified by Form N-CSR, and the Commission will make this information public. A registrant is not required to respond to the collection of information contained in Form N-CSR unless the Form displays a currently valid Office of Management and Budget (“OMB”) control number. Please direct comments concerning the accuracy of the information collection burden estimate and any suggestions for reducing the burden to Secretary, Securities and Exchange Commission, 450 Fifth Street, NW, Washington, DC 20549-0609. The OMB has reviewed this collection of information under the clearance requirements of 44 U.S.C. § 3507.
Item 1. Reports to Stockholders.

Semiannual Report
April 30, 2024
First Eagle Global Fund
First Eagle Overseas Fund
First Eagle U.S. Value Fund
First Eagle Gold Fund
First Eagle Global Income Builder Fund
First Eagle Rising Dividend Fund
First Eagle Small Cap Opportunity Fund
First Eagle U.S. Smid Cap Opportunity Fund
First Eagle Global Real Assets Fund
First Eagle High Yield Municipal Fund (formerly First Eagle High Income Fund)
First Eagle Short Duration High Yield Municipal Fund
Advised by First Eagle Investment Management, LLC

Forward-Looking Statement Disclosure
One of our most important responsibilities as mutual fund managers is to communicate with shareholders in an open and direct manner. Some of our comments in our letters to shareholders are based on current management expectations and are considered "forward-looking statements". Actual future results, however, may prove to be different from our expectations. You can identify forward-looking statements by words such as "may", "will", "believe", "attempt", "seek", "think", "ought", "try" and other similar terms. We cannot promise future returns. Our opinions are a reflection of our best judgment at the time this report is compiled, and we disclaim any obligation to update or alter forward-looking statements as a result of new information, future events, or otherwise.
First Eagle Funds | Semiannual Report | April 30, 2024
2
Table of Contents
Letter from the President | | | 6 | | |
Management's Discussion of Fund Performance | | | 8 | | |
Performance Chart | | | 18 | | |
First Eagle Global Fund | |
Fund Overview | | | 32 | | |
Consolidated Schedule of Investments | | | 34 | | |
First Eagle Overseas Fund | |
Fund Overview | | | 46 | | |
Consolidated Schedule of Investments | | | 48 | | |
First Eagle U.S. Value Fund | |
Fund Overview | | | 58 | | |
Consolidated Schedule of Investments | | | 60 | | |
First Eagle Gold Fund | |
Fund Overview | | | 66 | | |
Consolidated Schedule of Investments | | | 68 | | |
First Eagle Global Income Builder Fund | |
Fund Overview | | | 72 | | |
Schedule of Investments | | | 74 | | |
First Eagle Rising Dividend Fund | |
Fund Overview | | | 90 | | |
Schedule of Investments | | | 92 | | |
First Eagle Small Cap Opportunity Fund | |
Fund Overview | | | 96 | | |
Schedule of Investments | | | 98 | | |
First Eagle U.S. Smid Cap Opportunity Fund | |
Fund Overview | | | 110 | | |
Schedule of Investments | | | 112 | | |
First Eagle Global Real Assets Fund | |
Fund Overview | | | 118 | | |
Consolidated Schedule of Investments | | | 120 | | |
First Eagle High Yield Municipal Fund (formerly First Eagle High Income Fund) | |
Fund Overview | | | 124 | | |
Schedule of Investments | | | 126 | | |
First Eagle Short Duration High Yield Municipal Fund | |
Fund Overview | | | 156 | | |
Schedule of Investments | | | 158 | | |
First Eagle Funds | Semiannual Report | April 30, 2024
3
Statements of Assets and Liabilities | | | 164 | | |
Statements of Operations | | | 176 | | |
Statements of Changes in Net Assets | | | 188 | | |
Financial Highlights | | | 206 | | |
Notes to Financial Statements | | | 226 | | |
Fund Expenses | | | 260 | | |
General Information | | | 266 | | |
Board Considerations for Approval of Advisory Agreement | | | 267 | | |
First Eagle Funds | Semiannual Report | April 30, 2024
4
This page was intentionally left blank.
Letter from the President

Dear Fellow Shareholders,
As was the case in 2023, interest rate expectations continued to be the primary driver of financial markets through the first four months of 2024. While confidence in a potential Federal Reserve pivot fueled rallies across a range of equity and fixed income assets beginning in late 2023, "higher for longer" has reemerged as the dominant policy narrative in 2024 as macroeconomic readings have tempered expectations around the timing and magnitude of federal funds rate cuts. Even still, a number of equity markets ended the six-month period covered by this report at or near all-time highs.
Among the more curious recent developments has been the concurrent success of both equity markets and gold prices despite interest rates—both nominal and real—that persist at levels not seen since before the global financial crisis. High interest rates generally would be expected to weigh on equity valuation multiples, while the price of gold historically has been inversely related to changes in the real interest rate. However, we have seen the price of gold and valuation multiples increase in the face of higher interest rates. We think perhaps the most plausible explanation for this paradox is a fundamental shift to a higher rate of nominal growth in the global economy, which we attribute to the very large primary fiscal deficits currently facing many of its largest participants.
The world's largest economies—including the US, China, the euro zone, Japan and India—have been growing their government debt at a fairly rapid rate, continuing to run primary deficits even as mounting interest expenses drive total debt burdens still higher. The stimulative impact of this spending appears to have buoyed activity in general, with everything from equities and gold to wage growth and corporate earnings and revenues being marked higher. This nominal growth may also explain the persistent success of certain names in the US tech space, where multiples continue to expand for companies viewed as "staples" in today's high-tech world. It's reasonable to think that the persistence of higher levels of nominal growth in developed markets ultimately may result in a valuation increase for businesses well-positioned to benefit from such growth.
Tumultuous geopolitical conditions continue to feed into the investment environment from the top down, even without the emergence of a truly global conflagration. Deteriorating global relations have prompted ever-rising defense budgets across the developed world, for example, contributing to the deficit spending and nominal drift I mentioned above. These conditions are promoting a risk premium in oil prices, while supporting better-than-expected demand and sticky supply levels. And they also may be a key factor behind gold's resilience throughout the current rate-hike cycle; it's been our experience that the gold market sometimes serves as the metaphorical canary in the coalmine, sussing out
First Eagle Funds | Semiannual Report | April 30, 2024
6
Letter from the President
potential dangers before they manifest in asset prices more broadly. Meanwhile, there are significant elections scheduled for more than 70 countries in 2024, adding to the list of things that could potentially upend positive market momentum with little advance warning.1
For some time now, assets promising growth have been assigned premium valuations, suggesting a low level of risk aversion in the markets. Should the environment become more complex—if the soft-landing scenario fails to play out, or sovereign debt concerns promote a broad repricing of government paper, or if any one of the global military hotspots ignites into broader engagement, or conflict emerges in reaction to the outcome of an election in a major economy—the market may start to value potential resilience over expected growth. Resilience has traded at a premium in the past, and there's no reason to believe it won't do so again under the right circumstances. However these scenarios play out, First Eagle remains committed to preparing to defend against the permanent impairment of your capital across investment environments.
As always, I want to thank you for entrusting your assets to our stewardship.
Sincerely,

Mehdi Mahmud,
President
June 2024
1 Source: The Economist; data as of November 13, 2023.
First Eagle Funds | Semiannual Report | April 30, 2024
7
Management's Discussion of Fund Performance (unaudited)
GLOBAL EQUITIES
Equity-oriented funds managed by the Global Value team, listed below, delivered positive absolute returns in the six-month period covered in this report. Notably, the low level of risk aversion apparent in the markets buoyed growth stocks while serving as a headwind to the relative performance of more value-oriented names. Despite the rise in real interest rates and the US dollar, gold and gold-related equities played their part effectively as a potential hedge against extreme risk and market turbulence in many of our funds. We remain cautious amid persistent vulnerabilities and increasing uncertainty in global financial and geopolitical structures. As always, we continue to seek resilience in our funds from the bottom up, searching for cash flow-generative companies with strong market positions, healthy balance sheets and prudent management teams, and buying these stocks only when available at a "margin of safety" to our estimate of their intrinsic value.2
First Eagle Global Fund
The net asset value ("NAV") of the fund's Class A shares3 increased 13.86%4 for the six months ended April 30, 2024, while the MSCI World Index increased 20.29%. The fund's position in short-term investments5 was 9.5% as of April 30, 2024.
The five largest contributors to the performance of First Eagle Global Fund over the period were gold bullion, Meta Platforms, Inc., Class A (interactive media & services, United States), HCA Healthcare, Inc. (health care providers & services, United States), Taiwan Semiconductor Manufacturing Co. Ltd., ADR (semiconductors & semiconductor equipment, Taiwan) and MS&AD Insurance Group Holdings, Inc. (insurance, Japan). Collectively, they accounted for 4.48% of this period's performance.6
The five largest detractors during the first quarter were Schlumberger NV (energy equipment & services, United States), CH Robinson Worldwide, Inc. (air freight & logistics, United States), Reckitt Benckiser Group plc (household products, United Kingdom), Comcast Corp., Class A (media, United States) and NOV, Inc. (energy equipment & services, United States). In aggregate, they detracted 0.76% from fund performance in this period.6
First Eagle Overseas Fund
The NAV of the fund's Class A shares3 increased 11.69% for the six months ended April 30, 2024, while the MSCI EAFE Index increased 18.63%. The fund's position in short-term investments5 was 2.7% as of April 30, 2024.
The five largest contributors to the performance of First Eagle Overseas Fund over the period were gold bullion, Taiwan Semiconductor Manufacturing Co. Ltd., ADR (semiconductors & semiconductor equipment, Taiwan), Imperial Oil Ltd. (oil, gas & consumable fuels, Canada), MS&AD Insurance Group Holdings, Inc. (insurance, Japan) and Mitsubishi Electric Corp (electrical equipment, Japan). Collectively, they accounted for 4.61% of this period's performance.6
First Eagle Funds | Semiannual Report | April 30, 2024
8
Management's Discussion of Fund Performance (unaudited)
The five largest detractors were Reckitt Benckiser Group plc (household products, United Kingdom), Daiichikosho Co. Ltd. (entertainment, Japan), CK Asset Holdings Ltd. (real estate management & development, Hong Kong), Bangkok Bank PLC, NVDR (banks, Thailand) and Alibaba Group Holding Ltd. (broadline retail, China). In aggregate they detracted 0.68% from fund performance in this period.6
First Eagle U.S. Value Fund
The NAV of the fund's Class A shares3 increased 15.32% for the six months ended April 30, 2024, while the S&P 500 Index increased 20.98%. The fund's position in short-term investments5 was 10.4% as of April 30, 2024.
The five largest contributors to the performance of First Eagle U.S. Value Fund over the period were Meta Platforms, Inc., Class A (interactive media & services, United States), gold bullion, HCA Healthcare, Inc. (health care providers & services, United States), Bank of New York Mellon Corp. (The) (capital markets, United States) and Universal Health Services, Inc., Class B (health care providers & services, United States). Collectively, they accounted for 6.35% of this period's performance.6
The five largest detractors during the first quarter were Schlumberger NV (energy equipment & services, United States), CH Robinson Worldwide, Inc. (air freight & logistics, United States), Comcast Corp., Class A (media, United States), NOV, Inc. (energy equipment & services, United States) and Becton Dickinson & Co. (health care equipment & services, United States). In aggregate, they detracted 0.90% from fund performance in this period.6
First Eagle Gold Fund
The NAV of the fund's Class A shares3 increased 13.37%4 for the six months ended April 30, 2024, while the FTSE Gold Mines Index increased 17.19% and the MSCI World Index increased 20.29%. The fund's position in short-term investments5 was 6.3% as of April 30, 2024.
The five largest contributors to the performance of First Eagle Gold Fund over the period were Wheaton Precious Metals Corp. (metals & mining, Canada), gold bullion, Agnico Eagle Mines Ltd. (metals & mining, Canada), Anglogold Ashanti plc (metals & mining, United Kingdom) and Northern Star Resources Ltd. (metals & mining, Australia). Collectively, they accounted for 10.44% of this period's performance.6
The five largest detractors were Novagold Resources, Inc. (metals & mining, Canada), B2Gold Corp. (metals & mining, Canada), Newmont Corp. (metals & mining, United States), Fresnillo plc (metals & mining, Mexico) and Newmont Corp., ADR (metals & mining, Australia). In aggregate, they detracted 1.41% from fund performance in this period.6
First Eagle Global Income Builder Fund
The NAV of the fund's Class A shares3 increased 9.33% for the six months ended April 30, 2024, while the MSCI World Index increased 20.29% and the Bloomberg U.S. Aggregate Bond Index was up 4.97%. The composite index increased 14.00% over the same time period.7 The fund's position in short-term investments5 was 1.0% as of April 30, 2024.
The five largest contributors to the performance of First Eagle Global Income Builder Fund over the period were gold bullion, Colgate-Palmolive Company
First Eagle Funds | Semiannual Report | April 30, 2024
9
Management's Discussion of Fund Performance (unaudited)
(household products, United States), HCA Healthcare, Inc. (health care providers & services, United States), Exxon Mobil Corp. (oil, gas & consumable fuels, United States) and Bank of New York Mellon Corp. (The) (capital markets, United States). Collectively, they accounted for 2.38% of this period's performance.6
The five largest detractors were Reckitt Benckiser Group plc (household products, United Kingdom), CK Asset Holdings Ltd. (real estate management & development, Hong Kong), CH Robinson Worldwide, Inc. (air freight & logistics, United States), Comcast Corp., Class A (media, United States) and Schlumberger NV (energy equipment & services, United States). In aggregate, they detracted 0.46% from fund performance in this period.6
First Eagle Rising Dividend Fund
The NAV of the fund's Class A shares3 increased 14.59% for the six months ended April 30, 2024, while the S&P 500 Index increased 20.98%. The fund's position in short-term investments5 was 1.1% as of April 30, 2024.
The five largest contributors to the performance of First Eagle Rising Dividend Fund over the period were Alphabet, Inc., Class A (interactive media & services, United States), Texas Instruments, Inc. (semiconductors & semiconductor equipment, United States), Meta Platforms, Inc., Class A (interactive media & services, United States), HCA Healthcare, Inc. (health care providers & services, United States) and Schindler Holding AG (machinery, Switzerland). Collectively, they accounted for 6.63% of this period's performance.6
The five largest detractors were UnitedHealth Group, Inc. (health care providers & services, United States), Becton Dickinson & Co. (health care equipment & supplies, United States), Comcast Corp., Class A (media, United States), CH Robinson Worldwide, Inc. (air freight & logistics, United States) and Nestle SA (Registered) (food products, Switzerland). In aggregate, they detracted 2.08% from fund performance in this period.6
First Eagle Global Real Assets Fund
The NAV of the fund's Class I shares increased 10.84%4 for the six months ended April 30, 2024, while the MSCI World Index increased 20.29% and the Consumer Price Index for Urban Consumers (CPI-U) increased 1.85%. The fund's position in short-term investments5 was 6.2% as of April 30, 2024.
The five largest contributors to the performance of First Eagle Global Real Assets Fund over the period were Grupo Mexico SAB de CV, Series B (metals & mining, Mexico), TF Administradora Industrial S de RL de CV, REIT (industrial REITS, Mexico), gold bullion, HCA Healthcare, Inc. (health care providers & services, United States) and Extra Space Storage, Inc., REIT (specialized REITs, United States). Collectively, they accounted for 3.37% of this period's performance.6
The five largest detractors were Charter Communications, Inc., Class A (media, United States), Schlumberger NV (energy equipment & services, United States), NOV, Inc. (energy equipment & services, United States), CK Asset Holdings Ltd. (real estate management & development, Hong Kong) and Comcast Corp., Class A (media, United States). In aggregate, they detracted 1.47% from fund performance in this period.6
First Eagle Funds | Semiannual Report | April 30, 2024
10
Management's Discussion of Fund Performance (unaudited)
FIXED INCOME
While risk appetites in general remained intact over the last six months, interest rates since the start of 2024 have retraced some of their late-2023 rally across the entire yield curve. Longer-duration fixed income assets for the most part lost ground, and the bond market in general continues to be marked by minimal term premia for government paper and very tight spreads on credit, suggesting the possibility of insufficient compensation for additional risk. Municipal bonds—and high yield municipal bonds, in particular—have held up relatively well in a market not terribly supportive of fixed-rate assets, and we believe conditions continue to be favorable for investment in fixed-rate, tax-exempt bonds. In such an environment, we believe there are a number of unloved, overlooked or contrarian sectors in which fundamental, research-driven managers can uncover particularly attractive investment opportunities, particularly on the very short and long ends of the municipal bond yield curve. Through rigorous underwriting we seek to uncover what we consider hidden gems that are well-managed and well-positioned in their markets while offering favorable yields and dollar prices that we believe have the potential to compensate over the long term.
First Eagle High Yield Municipal Fund
The NAV of the fund's Class I shares increased 9.26% for the six months ended April 30, 2024, while the S&P Municipal Yield Index increased 11.60%, the S&P Municipal Bond Index increased 7.14%, and the Bloomberg U.S. Corporate High Yield Index increased 8.99%. The fund's short-term investments5 position was 0.0% as of April 30, 2024.
The five largest contributors to the performance of First Eagle High Yield Municipal Fund over the period were New Hope Cultural Education Facilities Finance Corp., Sanctuary LTC, Revenue, Series 2021 A-1, 5.50%, due 01/01/2057 (nursing home, United States); Iowa Finance Authority, Lifespace Communities, Inc. Obligated Group, Revenue, Series 2018 A, 5.00%, due 05/15/2048 (continuing care retirement community, United States); Hawaiian Brands Intellectual Property Ltd., 5.75%, due 1/20/2026 (passenger airlines, United States); Carnival Corp., 5.75%, due 3/1/2027 (hotel, restaurants & leisure, United States); and Florida Development Finance Corp. Brightline Trains Florida LLC, Revenue, AMT, Series 2019 B, 7.38%, due 01/01/2049 (public transportation, United States). Collectively, they accounted for 1.03% of this period's performance.6
The five largest detractors were Buckeye Ohio Tobacco Settlement Financing Authority, Revenue, Senior Lien, Refunding, Series 2020 B-3, Class 2, 0.00%, due 06/01/2057 (tobacco master settlement agreement, United States); District of Columbia, Tobacco Settlement Financing Corp., Revenue, Series 2006 A, 0.00%, due 06/15/2046 (tobacco master settlement agreement, United States); Southeastern Ohio Port Authority, Marietta Area Health Care, Inc. Obligated Group, Revenue, Refunding, Series 2015, 5.50%, due 12/01/2043 (hospital, United States); Public Financing Authority, Southeastern Regional Medical Center Obligated Group, Revenue, Refunding, Series 2021 A, 4.00%, due 02/01/2041 (hospital, United States); and Nassau County Tobacco Settlement Corp., Revenue, Series 2006 A-3, 5.13%, due 06/01/2046 (tobacco master settlement agreement, United States). In aggregate, they detracted 0.23% from fund performance in this period.6
First Eagle Funds | Semiannual Report | April 30, 2024
11
Management's Discussion of Fund Performance (unaudited)
First Eagle Short Duration High Yield Municipal Fund
The NAV of the fund's Class I shares increased 2.03% from its launch on January 2, 2024 through April 30, 2024, while the S&P Short Duration Municipal Yield Index increased 0.75% and the S&P Municipal Bond decreased 1.17%. The fund's short-term investments5 position was 0.1% as of April 30, 2024.
The five largest contributors to the performance of First Eagle Short Duration High Yield Municipal Fund over the period were County of Prince George's, Westphalia Town Center Development District, Tax Allocation, Series 2018, 5.00%, due 07/01/2030 (tax increment financing, United States); Florida Development Finance Corp., AAF Operations Holdings LLC, Revenue, AMT, Refunding, Series 2024, 12.00%, due 07/15/2032 (public transportation, United States); Bucks County Industrial Development Authority, Grand View Hospital/Sellersville Obligated Group, Revenue, Series 2021, 5.00%, due 07/01/2027 (hospital, United States); Florida Development Finance Corp., Brightline Trains Florida LLC, Revenue, AMT, Refunding, Series 2019 A, 6.50%, due 01/01/2049 (public transportation, United States); and City of Houston, Airport System, United Airlines, Inc., Revenue, AMT, Series 2018, 5.00%, due 07/15/2028 (economic/industrial development, United States). Collectively, they accounted for 0.43% of this period's performance.6
The five largest detractors were Abilene Convention Center Hotel Development Corp., City of Abilene Abilene Convention Center, Revenue, Second Lien, Series 2021 B, 3.75%, due 10/01/2031 (economic/industrial development, United States); Public Finance Authority, Guilford College, Revenue, Refunding, Series 2016, 5.00%, due 01/01/2026 (higher education, United States); Michigan Finance Authority, Aquinas College, Revenue, Refunding, Series 2021, 4.00%, due 05/01/2031 (higher education, United States); Reagan Hospital District of Reagan County, GO, Series 2014 A, 5.00%, due 02/01/2029 (general obligation hospital/health district, United States); and Suffolk Regional Off-Track Betting Co., Revenue, Series 2024, 6.00%, due 12/01/2053 (Indian tribal bond, United States). In aggregate, they detracted 0.19% from fund performance in this period.6
US SMALL CAP EQUITIES
The renewed enthusiasm for risk assets that emerged toward the end of 2023 persisted into 2024, but the pendulum swung back in favor of large-cap growth names more recently. While there are a number of ways in which our target universe may receive a boost from Fed rate cuts—from greater operational and financial flexibility to an uptick in mergers and acquisition activity—none of our investments are based on the assumption the much-anticipated central bank pivot will come to pass. Regardless of the Fed's actions in 2024, it seems likely companies that are cheap for a reason will continue to face a challenging operating environment, while many of those with solid businesses and catalysts for improvement may progress toward valuations more consistent with historical levels. By controlling what we pay for these assets, we seek to construct a portfolio that is a little cheaper than the market on a valuation basis while being well-positioned for strong upside should our investment theses play out.
First Eagle Funds | Semiannual Report | April 30, 2024
12
Management's Discussion of Fund Performance (unaudited)
First Eagle Small Cap Opportunity Fund
The NAV of the fund's Class I shares increased 19.00% for the six months ended April 30, 2024, while the Russell 2000® Value Index increased 18.09%, the Russell 2000® Index increased 19.66%. The fund's position in short-term investments5 was 7.2%, and the S&P 500 Index increased 20.98% as of April 30, 2024.
The five largest contributors to the performance of First Eagle Small Cap Opportunity Fund over the period were Tenet Healthcare Corp. (health care providers & services, United States), Century Aluminum Co. (metals & mining, United States), FTAI Aviation Ltd. (trading companies & distributors, United States), Chefs' Warehouse, Inc. (The) (consumer staples distribution & retail, United States) and Ultra Clean Holdings, Inc. (semiconductors & semiconductor equipment, United States). Collectively, they accounted for 2.51% of this period's performance.6
The five largest detractors were Comtech Telecommunications Corp. (communication equipment, United States), Oil States International, Inc. (energy equipment & services, United States), Hain Celestial Group, Inc. (food products, United States), QuidelOrtho Corp. (health care equipment & supplies, United States) and B Riley Financial, Inc. (capital markets, United States). In aggregate, they detracted 0.90% from fund performance in this period.6
First Eagle U.S. Smid Cap Opportunity Fund
The NAV of the fund's Class I shares increased 21.45% for the six months ended April 30, 2024, while the Russell 2500TM Value Index increased 19.80%, the Russell 2500TM Index increased 20.39%, and the S&P 500 Index increased 20.98%. The fund's position in short-term investments5 was 5.2% as of April 30, 2024.
The five largest contributors to the performance of First Eagle U.S. Smid Cap Opportunity Fund over the period Tenet Healthcare Corp. (health care providers & services, United States), MKS Instruments, Inc. (semiconductors & semiconductor equipment, United States), Onto Innovation, Inc. (semiconductors & semiconductor equipment, United States), XPO, Inc. (ground transportation, United States) and Ingersoll Rand, Inc. (machinery, United States). Collectively, they accounted for 6.06% of this period's performance.6
The five largest detractors were Bio-Rad Laboratories, Inc., Class A (life sciences tools & services, United States), Ameresco, Inc., Class A (construction & engineering, United States), QuidelOrtho Corp. (health care equipment & supplies, United States), Chuy's Holdings, Inc. (hotels, restaurants & leisure, United States) and Topgolf Callaway Brands Corp. (leisure products, United States). In aggregate they detracted 0.83% from fund performance in this period.6
First Eagle Funds | Semiannual Report | April 30, 2024
13
Management's Discussion of Fund Performance (unaudited)

| | 
| |
Matthew McLennan
Co-Head of the Global Value Team
Portfolio Manager
Global, Overseas and
U.S. Value Funds
| | T. Kimball Brooker, Jr.
Co-Head of the Global Value Team
Portfolio Manager
Global, Overseas,
U.S. Value and
Global Income Builder Funds | |

| | 
| |
Matt Lamphier
Portfolio Manager
U.S. Value Fund | | Thomas Kertsos
Portfolio Manager
Gold Fund | |

| | 
| |
Max Belmont
Portfolio Manager
Gold Fund | | Manish Gupta
Portfolio Manager
Global and Rising Dividend Funds | |

| | 
| |
Christian Heck
Portfolio Manager
Overseas and Rising Dividend Funds
| | Julien Albertini
Portfolio Manager
Global, Global Income Builder and
Rising Dividend Funds | |

| | 
| |
Alan Barr
Portfolio Manager
Overseas Fund | | Mark Wright
Portfolio Manager
U.S. Value Fund | |
First Eagle Funds | Semiannual Report | April 30, 2024
14
Management's Discussion of Fund Performance (unaudited)

| | 
| |
Idanna Appio
Portfolio Manager
Global Income Builder Fund
| | Bill Hench
Portfolio Manager
Small Cap Opportunity and U.S.
Smid Cap Opportunity Funds | |

| | 
| |
Benjamin Bahr
Portfolio Manager
Global Real Assets Fund | | John Masi
Portfolio Manager
Global Real Assets Fund | |

| | 
| |
George Ross
Portfolio Manager
Global Real Assets Fund | | David Wang
Portfolio Manager
Global Real Assets Fund | |

| | | |
John Miller
Head and Chief Investment
Officer of High Yield Municipal
Credit Team
Portfolio Manager
High Yield Municipal and Short
Duration High Yield Municipal Funds | | | |
2 First Eagle defines "margin of safety" as the difference between a company's market price and our estimate of its intrinsic value. "Intrinsic value" is based on our judgment of what a prudent and rational business buyer would pay in cash for all of the company in normal markets.
3 Reflects performance for Class A shares without the effect of sales charges and assumes all distributions have been reinvested; if sales charges were included, values would be lower.
4 The return shown is based on net asset values calculated for shareholder transactions and may differ from the return shown in the financial highlights, which reflect adjustments made to the net asset values in accordance with accounting principles generally accepted in the United States.
First Eagle Funds | Semiannual Report | April 30, 2024
15
Management's Discussion of Fund Performance (unaudited)
5 Includes short-term commercial paper that settles in 90 days or less, long-term commercial paper that settles in 91 days or greater and other short-term investments, such as U.S. treasury bills or money market funds.
6 Exact net returns for individual investments cannot be calculated due to the lack of a mechanism to precisely allocate fees and other expenses to individual investments.
7 The Composite Index consists of 60% of the MSCI World Index and 40% of the Bloomberg U.S. Aggregate Bond Index.
The performance data quoted herein represent past performance and do not guarantee future results. Market volatility can dramatically impact a fund's' short-term performance. Current performance may be lower or higher than figures shown. The investment return and principal value will fluctuate so that an investor's shares, when redeemed, may be worth more or less than their original cost. Past performance data through the most recent month-end are available by calling 800.334.2143.
The commentary represents the opinion of Mehdi Mahmud and the Portfolio Management team as of June 2024 and is subject to change based on market and other conditions. These materials are provided for informational purposes only. These opinions are not intended to be a forecast of future events, a guarantee of future results, or investment advice. The views expressed herein may change at any time subsequent to the date of issue hereof. The information provided is not to be construed as a recommendation or an offer to buy or sell or the solicitation of an offer to buy or sell any fund or security.
First Eagle Funds | Semiannual Report | April 30, 2024
16
Management's Discussion of Fund Performance (unaudited)
Duration is a measure of the sensitivity of the price of a bond or other debt instrument to a change in interest rates.
The federal funds rate is the interest rate at which depository institutions (banks and credit unions) lend reserve balances to other depository institutions overnight on an uncollateralized basis.
Sovereign debt is issued by a country's government to borrow money, and is also known as government debt, public debt and national debt.
Tax exempt means that the interest component of bond debt service payments is exempt from federal and sometimes state and local income taxes for the bond holder.
Term premium is the compensation that investors require for bearing the risk that interest rates may change over the life of the bond.
The yield curve measures the spread between yields on short- and long-term maturity bonds; an inverted yield curve occurs when longer-dated bond yields are lower than short-dated bond yields.
Indexes are unmanaged and one cannot invest directly in an index.
First Eagle Funds | Semiannual Report | April 30, 2024
17
Performance Chart1 (unaudited)
| | One
Year | | Five
Years | | Ten
Years | | Since
Inception | | Inception Date | |
First Eagle Global Fund | |
Class A
without sales charge | | | 9.15 | % | | | 7.49 | % | | | 6.26 | % | | | 12.28 | % | | 1/1/19792 | |
with sales charge | | | 3.69 | % | | | 6.40 | % | | | 5.71 | % | | | 12.15 | % | | 1/1/19792 | |
Class C
without sales charge | | | 8.30 | % | | | 6.68 | % | | | 5.46 | % | | | 8.87 | % | | 06/05/00 | |
with sales charge | | | 7.30 | % | | | 6.68 | % | | | 5.46 | % | | | 8.87 | % | | 06/05/00 | |
Class I | | | 9.40 | % | | | 7.77 | % | | | 6.53 | % | | | 9.86 | % | | 07/31/98 | |
Class R6 | | | 9.48 | % | | | 7.84 | % | | | — | | | | 7.02 | % | | 03/01/17 | |
MSCI World Index3 | | | 18.39 | % | | | 10.46 | % | | | 8.87 | % | | | 9.69 | % | | 01/01/79 | |
First Eagle Overseas Fund | |
Class A
without sales charge | | | 4.58 | % | | | 4.63 | % | | | 3.80 | % | | | 9.13 | % | | 08/31/93 | |
with sales charge | | | -0.64 | % | | | 3.56 | % | | | 3.27 | % | | | 8.95 | % | | 08/31/93 | |
Class C
without sales charge | | | 3.86 | % | | | 3.86 | % | | | 3.03 | % | | | 7.60 | % | | 06/05/00 | |
with sales charge | | | 2.86 | % | | | 3.86 | % | | | 3.03 | % | | | 7.60 | % | | 06/05/00 | |
Class I | | | 4.84 | % | | | 4.92 | % | | | 4.08 | % | | | 8.94 | % | | 07/31/98 | |
Class R6 | | | 4.93 | % | | | 5.00 | % | | | — | | | | 4.55 | % | | 03/01/17 | |
MSCI EAFE Index4 | | | 9.28 | % | | | 6.18 | % | | | 4.38 | % | | | 5.15 | % | | 08/31/93 | |
First Eagle U.S. Value Fund | |
Class A
without sales charge | | | 12.70 | % | | | 8.65 | % | | | 7.60 | % | | | 8.81 | % | | 09/04/01 | |
with sales charge | | | 7.06 | % | | | 7.55 | % | | | 7.05 | % | | | 8.56 | % | | 09/04/01 | |
Class C
without sales charge | | | 11.89 | % | | | 7.83 | % | | | 6.79 | % | | | 7.99 | % | | 09/04/01 | |
with sales charge | | | 10.89 | % | | | 7.83 | % | | | 6.79 | % | | | 7.99 | % | | 09/04/01 | |
Class I | | | 12.99 | % | | | 8.95 | % | | | 7.90 | % | | | 9.09 | % | | 09/04/01 | |
Class R6 | | | 13.02 | % | | | 9.00 | % | | | — | | | | 8.30 | % | | 03/01/17 | |
S&P 500 Index5 | | | 22.66 | % | | | 13.19 | % | | | 12.41 | % | | | 8.86 | % | | 09/04/01 | |
First Eagle Funds | Semiannual Report | April 30, 2024
18
Performance Chart1 (unaudited)
| | One
Year | | Five
Years | | Ten
Years | | Since
Inception | | Inception Date | |
First Eagle Gold Fund | |
Class A
without sales charge | | | -1.29 | % | | | 12.39 | % | | | 4.32 | % | | | 5.62 | % | | 08/31/93 | |
with sales charge | | | -6.23 | % | | | 11.24 | % | | | 3.79 | % | | | 5.44 | % | | 08/31/93 | |
Class C
without sales charge | | | -1.98 | % | | | 11.55 | % | | | 3.53 | % | | | 5.11 | % | | 05/15/03 | |
with sales charge | | | -2.96 | % | | | 11.55 | % | | | 3.53 | % | | | 5.11 | % | | 05/15/03 | |
Class I | | | -1.05 | % | | | 12.68 | % | | | 4.61 | % | | | 6.18 | % | | 05/15/03 | |
Class R6 | | | -0.91 | % | | | 12.78 | % | | | — | | | | 6.22 | % | | 03/01/17 | |
FTSE Gold Mines Index6 | | | -2.62 | % | | | 8.06 | % | | | 2.82 | % | | | 0.16 | % | | 08/31/93 | |
MSCI World Index3 | | | 18.39 | % | | | 10.46 | % | | | 8.87 | % | | | 7.56 | % | | 08/31/93 | |
First Eagle Global Income Builder Fund | |
Class A
without sales charge | | | 3.35 | % | | | 5.11 | % | | | 4.27 | % | | | 5.55 | % | | 05/01/12 | |
with sales charge | | | -1.86 | % | | | 4.03 | % | | | 3.74 | % | | | 5.10 | % | | 05/01/12 | |
Class C
without sales charge | | | 2.60 | % | | | 4.30 | % | | | 3.48 | % | | | 4.75 | % | | 05/01/12 | |
with sales charge | | | 1.60 | % | | | 4.30 | % | | | 3.48 | % | | | 4.75 | % | | 05/01/12 | |
Class I | | | 3.57 | % | | | 5.35 | % | | | 4.54 | % | | | 5.82 | % | | 05/01/12 | |
Class R6 | | | 3.65 | % | | | 5.41 | % | | | — | | | | 5.32 | % | | 03/01/17 | |
Composite Index7 | | | 10.16 | % | | | 6.41 | % | | | 5.98 | % | | | 6.78 | % | | 05/01/12 | |
MSCI World Index3 | | | 18.39 | % | | | 10.46 | % | | | 8.87 | % | | | 10.09 | % | | 05/01/12 | |
Bloomberg U.S. Aggregate
Bond Index8 | | | -1.47 | % | | | -0.16 | % | | | 1.20 | % | | | 1.28 | % | | 05/01/12 | |
First Eagle Funds | Semiannual Report | April 30, 2024
19
Performance Chart1 (unaudited)
| | One
Year | | Five
Years | | Ten
Years | | Since
Inception | | Inception Date | |
First Eagle Rising Dividend Fund9 | |
Class A
without sales charge | | | 13.19 | % | | | 6.74 | % | | | 4.61 | % | | | 7.47 | % | | 11/20/98 | |
with sales charge | | | 7.53 | % | | | 5.65 | % | | | 4.07 | % | | | 7.26 | % | | 11/20/98 | |
Class C
without sales charge | | | 12.30 | % | | | 5.94 | % | | | 3.82 | % | | | 6.71 | % | | 03/02/98 | |
with sales charge | | | 11.32 | % | | | 5.94 | % | | | 3.82 | % | | | 6.71 | % | | 03/02/98 | |
Class I | | | 13.43 | % | | | 7.03 | % | | | 4.90 | % | | | 6.58 | % | | 03/08/13 | |
Class R6 | | | 13.44 | % | | | 7.03 | % | | | — | | | | 5.51 | % | | 03/01/17 | |
S&P 500 Index5 | | | 22.66 | % | | | 13.19 | % | | | 12.41 | % | | | 7.92 | % | | 04/10/87 | |
First Eagle Small Cap Opportunity Fund | |
Class A
without sales charge | | | 11.35 | % | | | — | | | | — | | | | -1.33 | % | | 07/01/21 | |
with sales charge | | | 5.79 | % | | | — | | | | — | | | | -3.10 | % | | 07/01/21 | |
Class I | | | 11.54 | % | | | — | | | | — | | | | -0.04 | % | | 04/27/21 | |
Class R6 | | | 11.66 | % | | | — | | | | — | | | | -1.08 | % | | 07/01/21 | |
Russell 2000® Value Index10 | | | 14.03 | % | | | — | | | | — | | | | -0.88 | % | | 04/27/21 | |
Russell 2000® Index11 | | | 13.32 | % | | | — | | | | — | | | | -3.59 | % | | 04/27/21 | |
S&P 500 Index5 | | | 22.66 | % | | | — | | | | — | | | | 7.95 | % | | 04/27/21 | |
First Eagle U.S. Smid Cap Opportunity Fund | |
Class A
without sales charge | | | 15.85 | % | | | — | | | | — | | | | 3.28 | % | | 08/15/22 | |
with sales charge | | | 10.05 | % | | | — | | | | — | | | | 0.20 | % | | 08/15/22 | |
Class I | | | 16.25 | % | | | — | | | | — | | | | 3.61 | % | | 08/15/22 | |
Class R6 | | | 16.24 | % | | | — | | | | — | | | | 3.58 | % | | 08/15/22 | |
Russell 2500TM Value Index12 | | | 15.24 | % | | | — | | | | — | | | | 2.48 | % | | 08/15/22 | |
Russell 2500TM Index13 | | | 14.79 | % | | | — | | | | — | | | | 2.76 | % | | 08/15/22 | |
S&P 500 Index5 | | | 22.66 | % | | | — | | | | — | | | | 11.70 | % | | 08/15/22 | |
First Eagle Funds | Semiannual Report | April 30, 2024
20
Performance Chart1 (unaudited)
| | One
Year | | Five
Years | | Ten
Years | | Since
Inception | | Inception Date | |
First Eagle Global Real Assets Fund | |
Class A
without sales charge | | | 4.25 | % | | | — | | | | — | | | | 3.77 | % | | 11/30/21 | |
with sales charge | | | -0.99 | % | | | — | | | | — | | | | 1.58 | % | | 11/30/21 | |
Class I | | | 4.51 | % | | | — | | | | — | | | | 4.05 | % | | 11/30/21 | |
Class R6 | | | 4.64 | % | | | — | | | | — | | | | 4.07 | % | | 11/30/21 | |
MSCI World Index3 | | | 18.39 | % | | | — | | | | — | | | | 4.32 | % | | 11/30/21 | |
Consumer Price Index for
Urban Consumers (CPI-U)14 | | | 3.36 | % | | | — | | | | — | | | | 4.93 | % | | 11/30/21 | |
First Eagle High Yield Municipal Fund (formerly
First Eagle High Income Fund)15 | |
Class A
without sales charge | | | 9.11 | % | | | 3.45 | % | | | 3.03 | % | | | 4.29 | % | | 01/03/12 | |
with sales charge | | | 4.16 | % | | | 2.50 | % | | | 2.56 | % | | | 3.90 | % | | 01/03/12 | |
Class C
without sales charge | | | 8.18 | % | | | 2.65 | % | | | 2.26 | % | | | 3.50 | % | | 01/03/12 | |
with sales charge | | | 7.18 | % | | | 2.65 | % | | | 2.26 | % | | | 3.50 | % | | 01/03/12 | |
Class I | | | 9.21 | % | | | 3.69 | % | | | 3.31 | % | | | 6.60 | % | | 11/19/0716 | |
Class R6 | | | 9.53 | % | | | 3.77 | % | | | — | | | | 3.68 | % | | 03/01/17 | |
S&P Municipal Yield Index17 | | | 5.83 | % | | | 2.63 | % | | | 4.23 | % | | | 4.42 | % | | 11/19/07 | |
S&P Municipal Bond Index18 | | | 2.35 | % | | | 1.38 | % | | | 2.46 | % | | | 3.41 | % | | 11/19/07 | |
Bloomberg U.S. Corporate
High Yield Index19 | | | 9.02 | % | | | 3.72 | % | | | 4.28 | % | | | 6.39 | % | | 11/19/07 | |
First Eagle Funds | Semiannual Report | April 30, 2024
21
Performance Chart1 (unaudited)
| | One
Year | | Five
Years | | Ten
Years | | Since
Inception | | Inception Date | |
First Eagle Short Duration High Yield Municipal Fund | |
Class A
without sales charge | | | — | | | | — | | | | — | | | | 1.93 | % | | 1/2/24 | |
with sales charge | | | — | | | | — | | | | — | | | | -0.66 | % | | 1/2/24 | |
Class I | | | — | | | | — | | | | — | | | | 2.03 | % | | 1/2/24 | |
Class R6 | | | — | | | | — | | | | — | | | | 2.02 | % | | 1/2/24 | |
S&P Short Duration Municipal
Yield Index20 | | | — | | | | — | | | | — | | | | 0.75 | % | | 1/2/24 | |
S&P Municipal Bond Index18 | | | — | | | | — | | | | — | | | | -1.16 | % | | 1/2/24 | |
1 The performance data quoted herein represents past performance and does not guarantee future results. Market volatility can dramatically impact the fund's short-term performance. Current performance may be lower or higher than figures shown. The investment return and principal value will fluctuate so that an investor's shares, when redeemed, may be worth more or less than their original cost. Past performance data through the most recent month end is available at firsteagle.com or by calling 800.334.2143.
The average annual returns for Class A Shares "with sales charge" of First Eagle Global Fund, First Eagle Overseas Fund, First Eagle U.S. Value Fund, First Eagle Gold Fund, First Eagle Global Income Builder Fund, First Eagle Rising Dividend Fund, First Eagle Small Cap Opportunity Fund, First Eagle U.S. Smid Cap Opportunity Fund and First Eagle Global Real Assets Fund give effect to the deduction of the maximum sales charge of 5.00%. The average annual returns for Class A Shares "with sales charge" of First Eagle High Yield Municipal Fund gives effect to the deduction of the maximum sales charge of 4.50% (Effective March 1, 2024, the maximum sales charge changed to 2.50%). The average annual returns for Class A Shares "with sales charge" of First Eagle Short Duration High Yield Municipal Fund give effect to the deduction of the maximum sales charge of 2.50%.
The average annual returns for Class C Shares "with sales charge" reflect the maximum contingent deferred sales charge (CDSC), which is charged on the lesser of the original purchase price or the current market value at the time of sale. This pertains to the shares sold or redeemed within the first year of purchase.
For First Eagle Global Fund, First Eagle Overseas Fund, First Eagle U.S. Value Fund, First Eagle Gold Fund, First Eagle Rising Dividend Fund, First Eagle Small Cap Opportunity Fund, First Eagle U.S. Smid Cap Opportunity Fund and First Eagle Global Real Assets Fund, a CDSC of 1.00% may apply on redemptions of Class A shares made within 18 months following a purchase of $1 million or more without an initial sales charge.
With respect to the First Eagle Global Income Builder Fund, First Eagle High Yield Municipal Fund and First Eagle Short Duration High Yield Municipal Fund, a CDSC of 1.00% may apply on certain redemptions of Class A shares made within 18 months following a purchase of $250,000 or more without an initial sales charge.
Class I Shares of First Eagle Global Fund, First Eagle Overseas Fund, First Eagle U.S. Value Fund, First Eagle Gold Fund, First Eagle Global Income Builder Fund, First Eagle Rising Dividend Fund, First Eagle Small Cap Opportunity Fund, First Eagle U.S. Smid Cap Opportunity Fund, First Eagle Global Real Assets Fund, First Eagle High Yield Municipal Fund and First Eagle Short Duration High Yield Municipal Fund require $1 million minimum investment and are offered without a sales charge.
First Eagle Funds | Semiannual Report | April 30, 2024
22
Performance Chart1 (unaudited)
Class R6 Shares are offered without a sales charge.
2 First Eagle Global Fund commenced operations on April 28, 1970. Performance for periods prior to January 1, 2000, occurred while a prior portfolio manager of the fund was affiliated with another firm. Inception date shown is when this prior portfolio manager assumed portfolio management responsibilities.
3 The MSCI World Index captures large- and mid-cap representation across 23 developed markets countries. Developed markets countries include Australia, Austria, Belgium, Canada, Denmark, Finland, France, Germany, Hong Kong, Ireland, Israel, Italy, Japan, Netherlands, New Zealand, Norway, Portugal, Singapore, Spain, Sweden, Switzerland, the UK and the U.S. With 1,480 constituents, the index covers approximately 85% of the free float-adjusted market capitalization in each country.
4 The MSCI EAFE Index is an unmanaged total return index, reported in U.S. dollars, based on share prices and reinvested net dividends of companies from 21 developed market countries, excluding the United States and Canada.
5 The S&P 500 Index is a widely recognized unmanaged index including a representative sample of 500 leading companies in leading sectors of the U.S. economy. Although the S&P 500 Index focuses on the large-cap segment of the market, with approximately 80% coverage of U.S. equities, it is also considered a proxy for the total market. The S&P 500 Index includes dividends reinvested.
6 The FTSE Gold Mines Index is designed to reflect the performance of the worldwide market in the shares of companies whose principal activity is the mining of gold. The FTSE Gold Mines Index encompasses all gold mining companies that have a sustainable, attributable gold production of at least 300,000 ounces a year and that derive 51% or more of their revenue from mined gold. The Index is unmanaged, and includes dividends reinvested.
7 The Composite Index consists of 60% of the MSCI World Index and 40% of the Bloomberg U.S. Aggregate Bond Index.
8 The Bloomberg U.S. Aggregate Bond Index is an unmanaged broad-based benchmark that measures the investment grade, U.S. dollar-denominated, fixed-rate taxable bond market, including Treasuries, government-related and corporate securities, fixed-rate agency MBS, ABS and CMBS (agency and non-agency).
9 Effective March 1, 2023, First Eagle Rising Dividend Fund changed its name and principal investment strategy. Prior to August 14, 2020, the Fund pursued a different investment objective and principal investment strategy. Performance for the periods prior to March 1, 2023 and August 14, 2020 shown is based on the investment strategies utilized by the Fund at those times. The fund launched with share class Y on April 10, 1987. Class Y terminated in 2022.
10 The Russell 2000® Value Index is a widely followed, unmanaged index that measures the performance of small-cap value segment of the U.S. equity universe. It includes those Russell 2000® companies with lower price-to-book ratios and lower forecasted growth values. The Russell 2000® Value Index is completely reconstituted annually.
11 The Russell 2000® Index is a widely followed, unmanaged index that measures the performance of the small-cap segment of the U.S. equity universe. The Russell 2000® Index is a subset of the Russell 3000® Index representing approximately 10% of the total market capitalization of that index. It includes approximately 2,000 of the smallest securities based on a combination of their market cap and current index membership. The Russell 2000® Index is completely reconstituted annually.
12 The Russell 2500TM Value Index is a widely followed, unmanaged index that measures the performance of the small- to mid-cap value segment of the U.S. equity universe, commonly referred to as "smid" cap. It includes those Russell 2500TM companies with relatively low price-to-book ratios and lower forecasted growth values. The Russell 2500TM Value Index is completely reconstituted annually.
First Eagle Funds | Semiannual Report | April 30, 2024
23
Performance Chart1 (unaudited)
13 The Russell 2500TM Index is a widely followed, unmanaged index that measures the performance of the smid cap segment of the U.S. equity universe. The Russell 2500TM Index is a subset of the Russell 3000® Index. It includes approximately 2,500 of the smallest securities based on a combination of their market cap and current index membership. The Russell 2500TM Index is completely reconstituted annually.
14 The Consumer Price Index for Urban Consumers (CPI-U) is a measurement of changes in the cost of living, and is comprised of components such as housing, food transportation, and energy. It is calculated monthly by the U.S. Bureau of Labor Statistics and covers approximately 93% of the total U.S. population.
15 Effective December 27, 2023, First Eagle High Yield Municipal Fund changed its name and principal investment strategy. Performance for the periods prior to December 27, 2023 shown is based on the investment strategies utilized by the First Eagle High Income Fund.
16 First Eagle High Yield Municipal Fund commenced operations on December 30, 2011, and is the successor to another mutual fund pursuant to a reorganization on December 30, 2011. Information prior to December 30, 2011 is for this predecessor fund. Immediately after the reorganization, changes in net asset value of the Class I shares were partially impacted by differences in how the Fund and the predecessor fund price portfolio securities.
17 S&P Municipal Yield Index is a market value-weighted index that seeks to provide a measure of an investing strategy used in the municipal market that allocates a different percentage to bonds rated below investment grade and non-rated bonds than to bonds rated investment grade. The S&P Municipal Yield Index, whose constituents are derived from S&P Municipal Bond Index, incorporates a strategy of proportional investing in municipal bonds that typically have higher yields than other municipal bonds. Both tax-exempt bonds and bonds subject to the Alternative Minimum Tax (AMT) are included in the Index.
18 The S&P Municipal Bond Index is a broad, market value-weighted index that seeks to measure the performance of the U.S. municipal bond market. It tracks fixed-rate tax-free bonds and bonds subject to the alternative minimum tax (AMT).
19 The Bloomberg U.S. Corporate High Yield Index is composed of fixed-rate, publicly issued, non-investment grade debt and is unmanaged, with dividends reinvested. The index includes both corporate and non-corporate sectors. The corporate sectors are Industrial, Utility, and Finance, which include both U.S. and non-U.S. corporations.
20 The S&P Short Duration Municipal Yield Index measures the market-value-weighted performance of bonds issued by state and local municipalities in the U.S. and its territories with a minimum maturity of 6 months and a maximum maturity of 4 years.
Expense ratios as stated in the most recent prospectus.
| | Class A | | Class C | | Class I | | Class R6 | |
First Eagle Global Fund | | | 1.10 | % | | | 1.86 | % | | | 0.86 | % | | | 0.79 | % | |
First Eagle Overseas Fund | | | 1.15 | | | | 1.88 | | | | 0.88 | | | | 0.80 | | |
First Eagle U.S. Value Fund | | | 1.16 | | | | 1.91 | | | | 0.91 | | | | 0.84 | | |
First Eagle Gold Fund | | | 1.19 | | | | 1.92 | | | | 0.94 | | | | 0.85 | | |
First Eagle Global Income Builder Fund | | | 1.18 | | | | 1.94 | | | | 0.97 | | | | 0.89 | | |
First Eagle Funds | Semiannual Report | April 30, 2024
24
Performance Chart1 (unaudited)
| | | Class A | | Class C | | Class I | | Class R6 | |
First Eagle Rising Dividend Fund21,22 | | | 1.10 | % | | | 1.82 | % | | | 0.77 | % | | | 0.74 | % | |
First Eagle Small Cap Opportunity Fund21,23 | | | 1.33 | | | | — | | | | 1.10 | | | | 1.03 | | |
First Eagle U.S. Smid Cap Opportunity Fund21,24 | | | 7.09 | | | | — | | | | 2.97 | | | | 8.97 | | |
First Eagle Global Real Assets Fund21,25 | | | 5.91 | | | | — | | | | 5.46 | | | | 5.51 | | |
First Eagle High Yield Municipal Fund21,26 | | | 1.53 | | | | 2.28 | | | | 1.28 | | | | 1.28 | | |
First Eagle Short Duration High Yield Municipal Fund21,27 | | | 1.35 | | | | — | | | | 1.10 | | | | 1.10 | | |
21 For the First Eagle Rising Dividend Fund, First Eagle Small Cap Opportunity Fund, First Eagle U.S. Smid Cap Opportunity Fund, First Eagle Global Real Assets Fund, First Eagle High Yield Municipal Fund and First Eagle Short Duration High Yield Municipal Fund, had fees not been waived and/or expenses reimbursed, returns would have been lower.
22 These are the actual fund operating expenses prior to the application of fee waivers and/or expense reimbursements. The Adviser has contractually agreed to waive and/or reimburse certain fees and expenses of Classes A, C, I and R6 so that the total annual operating expenses (excluding interest, taxes, brokerage commissions, acquired fund fees and expenses, dividend and interest expenses relating to short sales, and extraordinary expenses, if any) ("annual operating expenses") of each class are limited to 0.90%, 1.65%, 0.65% and 0.65% of average net assets, respectively. Each of these undertakings lasts until February 28, 2025 and may not be terminated during its term without the consent of the Board of Trustees. The Fund has agreed that each of Classes A, C, I and R6 will repay the Adviser for fees and expenses waived or reimbursed for the class provided that repayment does not cause annual operating expenses (after the repayment is taken into account) to exceed the lesser of: (1) 0.90%, 1.65%, 0.65% and 0.65% of the class' average net assets, respectively; or (2) if applicable, the then-current expense limitations. Any such repayment must be made within three years after the year in which the Adviser incurred the expense.
23 These are the actual fund operating expenses prior to the application of fee waivers and/or expense reimbursements. The Adviser has contractually agreed to waive and/or reimburse certain fees and expenses of Classes A, I, and R6 so that the total annual operating expenses (excluding interest, taxes, brokerage commissions, acquired fund fees and expenses, dividend and interest expenses relating to short sales, and extraordinary expenses, if any) ("annual operating expenses") of each class are limited to 1.25%, 1.00% and 1.00% of average net assets, respectively. Each of these undertakings lasts until February 28, 2025 and may not be terminated during its term without the consent of the Board of Trustees. The Fund has agreed that each of Classes A, I and R6 will repay the Adviser for fees and expenses waived or reimbursed for the class provided that repayment does not cause annual operating expenses (after the repayment is taken into account) to exceed the lesser of: (1) 1.25%, 1.00% and 1.00% of the class' average net assets, respectively; or (2) if applicable, the then-current expense limitations. Any such repayment must be made within three years after the year in which the Adviser incurred the expense.
24 These are the actual fund operating expenses prior to the application of fee waivers and/or expense reimbursements. The Adviser has contractually agreed to waive and/ or reimburse certain fees and expenses of Classes A, I and R6 so that the total annual operating expenses (excluding interest, taxes, brokerage commissions, acquired fund fees and expenses, dividend and interest expenses relating to short sales, and extraordinary expenses, if any) ("annual operating expenses") of each class are limited to 1.20%, 0.95% and 0.95% of average net assets, respectively. Each of these undertakings lasts until February 28, 2025 and may not be terminated during its term without the consent of the Board of Trustees. The Fund has agreed that each of Classes A, I and R6 will repay the Adviser for fees and expenses waived or reimbursed for the class provided that repayment does not cause annual operating expenses (after the repayment is taken into account) to exceed the lesser of: (1) 1.20%, 0.95% and 0.95% of the class' average net assets, respectively; or (2) if applicable, the then-current expense limitations. Any such repayment must be made within three years after the year in which the Adviser incurred the expense.
First Eagle Funds | Semiannual Report | April 30, 2024
25
Performance Chart1 (unaudited)
25 These are the actual fund operating expenses prior to the application of fee waivers and/or expense reimbursements. The Adviser has contractually agreed to waive and/ or reimburse certain fees and expenses of Classes A, I and R6 so that the total annual operating expenses (excluding interest, taxes, brokerage commissions, acquired fund fees and expenses, dividend and interest expenses relating to short sales, and extraordinary expenses, if any) ("annual operating expenses") of each class are limited to 1.10%, 0.85% and 0.85% of average net assets, respectively. Each of these undertakings lasts until February 28, 2025 and may not be terminated during its term without the consent of the Board of Trustees. The Fund has agreed that each of Classes A, I and R6 will repay the Adviser for fees and expenses waived or reimbursed for the class provided that repayment does not cause annual operating expenses (after the repayment is taken into account) to exceed the lesser of: (1) 1.10%, 0.85% and 0.85% of the class' average net assets, respectively; or (2) if applicable, the then-current expense limitations. Any such repayment must be made within three years after the year in which the Adviser incurred the expense.
26 These are the actual fund operating expenses prior to the application of fee waivers and/or expense reimbursements. The Adviser has contractually agreed to waive and/or reimburse certain fees and expenses of Classes A, C, I and R6 so that the total annual operating expenses (excluding interest, taxes, brokerage commissions, acquired fund fees and expenses, dividend and interest expenses relating to short sales, and extraordinary expenses, if any) ("annual operating expenses") of each class are limited to 0.85%, 1.60%, 0.60% and 0.60% of average net assets, respectively. Each of these undertakings lasts until February 28, 2025 and may not be terminated during its term without the consent of the Board of Trustees. The Fund has agreed that each of Classes A, C, I and R6 will repay the Adviser for fees and expenses waived or reimbursed for the class provided that repayment does not cause annual operating expenses (after the repayment is taken into account) to exceed the lesser of: (1) 0.85%, 1.60%, 0.60% and 0.60% of the class' average net assets, respectively; or (2) if applicable, the then-current expense limitations. Any such repayment must be made within three years after the year in which the Adviser incurred the expense.
27 These are the actual fund operating expenses prior to the application of fee waivers and/or expense reimbursements. The Adviser has contractually agreed to waive and/ or reimburse certain fees and expenses of Classes A, I and R6 so that the total annual operating expenses (excluding interest, taxes, brokerage commissions, acquired fund fees and expenses, dividend and interest expenses relating to short sales, and extraordinary expenses, if any) ("annual operating expenses") of each class are limited to 0.85%, 0.60% and 0.60% of average net assets, respectively. Each of these undertakings lasts until February 28, 2025 and may not be terminated during its term without the consent of the Board of Trustees. The Fund has agreed that each of Classes A, I and R6 will repay the Adviser for fees and expenses waived or reimbursed for the class provided that repayment does not cause annual operating expenses (after the repayment is taken into account) to exceed the lesser of: (1) 0.85%, 0.60% and 0.60% of the class' average net assets, respectively; or (2) if applicable, the then-current expense limitations. Any such repayment must be made within three years after the year in which the Adviser incurred the expense.
These expense ratios are presented as of March 1, 2024 and may differ from corresponding ratios shown elsewhere in this report because of differing time periods (and/or, if applicable, because these expense ratios do not include expense credits or waivers).
There are risks associated with investing in funds that invest in securities of foreign companies, such as erratic market conditions, economic and political instability and fluctuations in currency exchange rates. These risks may be more pronounced with respect to investments in emerging markets. Funds whose investments are concentrated in a specific industry or sector may be subject to a higher degree of risk than funds whose investments are diversified and may not be suitable for all investors.
All securities may be subject to adverse market trends. The value and liquidity of a Fund's portfolio holdings may fluctuate in response to events specific to the companies or stock or bond markets in which a Fund invests, as well as economic, political, or social events in the United States or abroad. Markets may be volatile, and prices of individual securities and other investments including those of a
First Eagle Funds | Semiannual Report | April 30, 2024
26
Performance Chart1 (unaudited)
particular type, may decline significantly and rapidly. This may cause a Fund's portfolio to be worth less than the price originally paid for it, or less than it was worth at an earlier time. Market risk may affect a single issuer or the market as a whole. Recent market conditions and events, including a global public health crisis, wars and armed conflicts and actions taken by governments in response, may exacerbate volatility and may continue to negatively affect the price and liquidity of individual securities, national economies and global markets generally. Prices of individual securities and other investments, including those of a particular type, may decline significantly in response to adverse issuer, political, regulatory, market, economic or other developments, public perceptions concerning these developments, and adverse investor sentiment or publicity. Rapid changes in value or liquidity, which often are not anticipated and can relate to events not connected to particular investments, may limit the ability of a Fund to dispose of its assets at the price or time of its choosing and can result in losses. Changes in price may be temporary or may last for extended periods. If a Fund sells a portfolio position before it reaches its market peak, it may miss out on opportunities for better performance.
The COVID-19 pandemic and related quarantines and restrictions resulted in high unemployment, disruptions to supply chains and customer activity, and general concern and uncertainty, with corresponding impacts on financial markets worldwide. COVID-19 remains a risk with the potential that new variants could lead to increased government restrictions and consumer caution. Additionally, COVID-19 remains a challenge for global supply chain normalization. More recently, a number of major economies, including the United States, are adjusting to reduced levels of market and monetary support following periods of fiscal and monetary interventions, together with rising inflation and increases in interest rate targets by central banks. These circumstances have generated significant market stress and volatility, with market sentiment changing rapidly in response to changes in inflation or interest rate expectations.
To the extent a Fund invests a significant portion of its assets in the securities of companies of a single country or region, it is more likely to be impacted by events or conditions affecting that country or region. For example, political and economic conditions and changes in regulatory, tax, or economic policy in a country could significantly affect the market in that country and in surrounding or related countries and have a negative impact on a Fund's performance. Currency developments or restrictions, political and social instability, and changing economic conditions have resulted in significant market volatility. As of the date of this Semiannual Report, First Eagle Global Fund has significant exposure to Europe and Japan; the Overseas Fund has significant exposure to Canada, Europe and Japan; the Gold Fund has significant exposure to Australia and Canada; the Global Income Builder Fund has significant exposure to Europe and Canada; and the Real Assets Fund has significant exposure to Canada, Europe, and Mexico. A Fund's exposure to a particular county is determined in accordance with the Adviser's "country of risk" assessment. "Country of risk" is based on a multi-factor country of risk assessment determined by the Adviser, including factors such as an issuer's country of domicile, and the country of the stock exchange on which it trades, among others.
Investment in Australian issuers involve regulatory, political, currency, security, and economic risks specific to Australia. The Australian economy is susceptible to adverse changes in certain commodities markets, including those related to the mining and agricultural industries. The Australian economy is also becoming increasingly dependent on its growing services industry. The Australian economy is also heavily dependent on trading with key partners, including the U.S., China, Japan, South Korea, other Asian and certain European countries. Economic events in the U.S., Asia, or in other key trading countries can have a significant economic effect on the Australian economy. Reduction in spending on Australian products and services, or changes in any of the economies may cause an adverse impact on the Australian economy.
Canada is a significant exporter of natural resources, such as oil, natural gas and agricultural products. As a result, the Canadian economy is susceptible to adverse changes in certain commodities markets. It is also heavily dependent on trading with key partners, including the United States, Mexico, and China. Any reduction in trading with these key partners may adversely affect the Canadian economy. Canada's dependency on the economy of the United States, in particular, makes Canada's economy vulnerable to political and regulatory changes affecting the United States economy. These and other factors could negatively affect a Fund's performance.
First Eagle Funds | Semiannual Report | April 30, 2024
27
Performance Chart1 (unaudited)
A Fund's investments may subject it to the risks associated with investing in the European markets, including the risks associated with the United Kingdom's ("UK") exit from the European Union ("Brexit"). Investments in a single region, even though representing a number of different countries within the region, may be affected by common economic forces and other factors. Further, political or economic disruptions in European countries, even in countries in which a Fund is not invested, may adversely affect security values and thus a Fund's holdings.
The Japanese economy is heavily dependent upon international trade and may be subject to considerable degrees of economic, political and social instability, which could negatively affect a Fund. Japan has also experienced natural disasters, such as earthquakes and tidal waves, of varying degrees of severity, which also could negatively affect a Fund.
The Mexican economy is dependent upon external trade with other economies, specifically with the United States and certain Latin American countries. Mexico is an emerging market and demonstrates significantly higher volatility from time to time in comparison to developed markets. Mexico is dependent on, among other things, the U.S. economy and any change in the price or demand for Mexican exports may have an adverse impact on the Mexican economy. Recent political developments in the United States have raised potential implications for the current trade arrangements between the United States and Mexico, which could negatively affect the value of Mexican securities.
The value of a Fund's portfolio holdings may fluctuate in response to the risk that the prices of equity securities, including common stock, rise and fall daily. These price movements may result from factors affecting individual companies, industries or the securities market as a whole. In addition, equity markets tend to move in cycles, which may cause stock prices to fall over short or extended periods of time. Equity securities generally have greater price volatility than debt securities.
By investing in its Subsidiary, each of the First Eagle Global Fund, First Eagle Overseas Fund, First Eagle U.S. Value Fund, First Eagle Gold Fund and First Eagle Global Real Assets Fund is indirectly exposed to the risks associated with that Subsidiary's investments. The Subsidiaries are not registered under the 1940 Act and are not subject to all of the investor protections of the 1940 Act. Changes in the laws of the United States and/or the Cayman Islands could result in the inability of a Fund and/or a Subsidiary to operate as expected and could adversely affect the Fund.
In addition to investments in larger companies, each Fund may (and the First Eagle Small Cap Opportunity Fund and First Eagle U.S. Smid Cap Opportunity Fund generally will) invest in small and medium-size companies, which historically have been more volatile in price than larger company securities, especially over the short term. Positions in smaller companies, especially when a Fund is a large holder of a small company's securities, also may be more difficult or expensive to trade. Among the reasons for the greater price volatility are the less certain growth prospects of smaller companies, the lower degree of liquidity in the markets for such securities and the greater sensitivity of smaller companies to changing economic conditions. In addition, smaller companies may lack depth of management, they may be unable to generate funds necessary for growth or development, or they may be developing or marketing new products or services for which markets are not yet established and may never become established. Each Fund (except the First Eagle Small Cap Opportunity Fund and First Eagle U.S. Smid Cap Opportunity Fund) considers small companies to be companies with market capitalizations of less than $1 billion and medium-size companies to have market capitalizations of less than $10 billion. Larger, more established companies may be unable to respond quickly to new competitive challenges like changes in consumer tastes or innovative smaller competitors. The First Eagle Small Cap Opportunity Fund considers small companies to be companies with market capitalizations not greater than that of the largest company in the Russell 2000® Index at the time of investment. The First Eagle U.S. Smid Cap Opportunity Fund considers small and medium companies to be companies with market capitalizations not greater than that of the largest company in the Russell 2500TM Index at the time of investment. Larger companies are sometimes unable to attain the high growth rates of successful, smaller companies, especially during extended periods of economic expansion.
Holding illiquid securities restricts or otherwise limits the ability for a Fund to freely dispose of its investments for specific periods of time. A Fund might not be able to sell illiquid securities at its desired
First Eagle Funds | Semiannual Report | April 30, 2024
28
Performance Chart1 (unaudited)
price or time. Changes in the markets or in regulations governing the trading of illiquid instruments can cause rapid changes in the price or ability to sell an illiquid security. The market for lower-quality debt instruments, including junk bonds and leveraged loans, is generally less liquid than the market for higher-quality debt instruments.
Investment in gold and gold-related investments present certain risks, including political and economic risks affecting the price of gold and other precious metals including specific changes in U.S. and foreign regulatory policies, tax, currency or mining laws, increased environmental costs, international monetary and political policies, economic conditions within an individual country, trade imbalances, and trade or currency restrictions between countries. The price of gold, in turn, is likely to affect the market prices of securities of companies mining or processing gold, and accordingly, the value of investments in such securities may also be affected. Gold-related investments as a group have not performed as well as the stock market in general during periods when the U.S. dollar is strong, inflation is low and general economic conditions are stable. In addition, returns on gold-related investments have traditionally been more volatile than investments in broader equity or debt markets.
If one or more investors in a Fund initiate significant redemptions, it may be necessary to dispose of assets to meet the redemption request. This can make ordinary portfolio management and rebalancing decisions more complicated to implement and can result in a Fund's current expenses being allocated over a smaller asset base, which generally results in an increase in a Fund's expense ratio. The impact of these transactions is likely to be greater in highly volatile markets or less liquid markets when a significant investor purchases, redeems or owns a substantial portion of a Fund's shares.
First Eagle Global Income Builder Funds will invests in high yield instruments (commonly known as "high yield" or "junk" bonds) which may be subject to greater levels of interest rate, credit (including issuer default) and liquidity risk than investment grade securities and may experience extreme price fluctuations. The securities of such companies may be considered speculative and the ability of such companies to pay their debts on schedule may be uncertain.
First Eagle Global Income Builder Fund invests in bank loans. These investments potentially expose the Fund to the credit risk of the underlying borrower, and in certain cases, of the financial institution. The Fund's ability to receive payments in connection with the loan depends primarily on the financial condition of the borrower. The market for bank loans may be illiquid and the Fund may have difficulty selling them, especially in the case of leveraged loans, which can be difficult to value. In addition, bank loans often have contractual restrictions on resale, which can delay the sale and adversely impact the sale price. At times, the Fund may decline to receive non-public information relating to loans, which could disadvantage the Fund relative to other investors.
Funds that invest in bonds are subject to credit and interest rate risk. The value of a Fund's portfolio may fluctuate in response to the risk that the issuer of a bond or other instrument will not be able to make payments of interest and principal when due. In addition, fluctuations in interest rates can affect the value of debt instruments held by a Fund. An increase in interest rates tends to reduce the market value of debt instruments, while a decline in interest rates tends to increase their values. A debt instrument's "duration" is a way of measuring a debt instrument's sensitivity to a potential change in interest rates. Longer duration instruments tend to be more sensitive to interest rate changes than those with shorter durations. Generally, debt instruments with long maturities and low coupons have the longest durations. Recent market conditions and events, including a global public health crisis and actions taken by governments in response, may exacerbate the risk that borrowers will not be able to make payments of interest and principal when due. In addition, there is risk of significant future rate moves and related economic and markets impact.
Income generation and dividends are not guaranteed. If dividend paying stocks in a Fund's portfolio stop paying or reduce dividends, a Fund's ability to generate income will be adversely affected.
First Eagle Global Real Assets Fund will invest in companies operating in various industries related to real assets. To the extent there is a downturn in one or more of these industries, there would be a larger impact on the Fund than if the Fund's portfolio were more broadly diversified. Factors that may affect these industries include, but are not limited to, government regulation or deregulation, energy
First Eagle Funds | Semiannual Report | April 30, 2024
29
Performance Chart1 (unaudited)
conservation and supply/demand, raw material prices, commodities regulation, cost of transport, cost of labor, interest rates, and broad economic developments such as growth or contraction in different markets, currency valuation changes and central bank movements.
An investment strategy that employs a "value" approach may pose a risk to a Fund that such investment strategy may not be successfully achieved. In any Fund, an investment made at a perceived "margin of safety" or "discount to intrinsic or fundamental value" can trade at prices substantially lower than when an investment is made, so that any perceived "margin of safety" or "discount to value" is no guarantee against loss. "Value" investments, as a category, or entire industries or sectors associated with such investments, may lose favor with investors as compared to those that are more "growth" oriented. In such an event, a Fund's investment returns would be expected to lag relative to returns associated with more growth-oriented strategies.
Like other bonds, municipal bonds are subject to credit risk, interest rate risk, liquidity risk, and call risk. However, the obligations of some municipal issuers may not be enforceable through the exercise of traditional creditors' rights. The reorganization under federal bankruptcy laws of a municipal bond issuer may result in the bonds being cancelled without payment or repaid only in part, or in delays in collecting principal and interest. In the event of a default in the payment of interest and/or repayment of principal, a Fund may enforce its rights by taking possession of, and managing, the assets securing the issuer's obligations on such securities. These actions may increase a Fund's operating expenses. In addition, lawmakers may seek to extend the time for payment of principal or interest, or both, or to impose other constraints upon enforcement of such obligations. State or federal regulation with respect to a specific sector could impact the revenue stream for a given subset of the market. Municipal bonds may have lower overall liquidity than other types of bonds, and there may be less publicly available and timely information about the financial condition of municipal issuers than for issuers of other securities.
All investments involve the risk of loss.
First Eagle Funds | Semiannual Report | April 30, 2024
30
This page was intentionally left blank.
Data as of April 30, 2024 (unaudited)
Investment Objective
The First Eagle Global Fund seeks long-term growth of capital by investing in a range of asset classes from markets in the United States and throughout the world. This fund is managed with a highly disciplined, bottom-up, value-oriented style.
Average Annual Returns (%) | | | | | | One-Year | | Five-Years | | Ten-Years | |
First Eagle Global Fund | | Class A | | without sales load | | | 9.15 | | | | 7.49 | | | | 6.26 | | |
| | | | with sales load | | | 3.69 | | | | 6.40 | | | | 5.71 | | |
MSCI World Index | | | | | | | 18.39 | | | | 10.46 | | | | 8.87 | | |
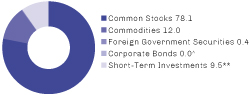
Sectors* (%)
Consumer Staples | | 13.0 | |
Commodities | | 12.0 | |
Financials | | 11.4 | |
Industrials | | 10.6 | |
Information Technology | | 8.0 | |
Health Care | | 7.6 | |
Energy | | 7.0 | |
Communication Services | | 7.0 | |
Consumer Discretionary | | 5.9 | |
Materials | | 4.5 | |
Real Estate | | 3.0 | |
Foreign Government Securities | | 0.4 | |
Utilities | | 0.1 | |
Short-Term Investments | | 9.5 | |
Countries*~ (%)
United States | | 53.4 | |
Japan | | 7.0 | |
United Kingdom | | 6.6 | |
Canada | | 4.8 | |
France | | 3.2 | |
Switzerland | | 2.8 | |
South Korea | | 1.8 | |
China | | 1.7 | |
Mexico | | 1.6 | |
Hong Kong | | 1.4 | |
Taiwan | | 1.2 | |
Brazil | | 1.1 | |
Sweden | | 1.0 | |
Belgium | | 1.0 | |
Germany | | 0.9 | |
Netherlands | | 0.5 | |
Thailand | | 0.3 | |
Norway | | 0.2 | |
Short-Term Investments | | 9.5 | |
^ Less than 0.05%.
* Asset Allocation, Sector and Countries percentages are based on total investments in the portfolio.
** Includes short-term commercial paper (3.3% of total investments) that settles in 90 days or less, long-term commercial paper (6.1% of total investments) that settles in 91 days or greater and other short-term investments (0.1% of total investments), such as U.S. treasury bills or money market funds.
~ Country allocations reflect country of risk (not currency of issue). Bonds of non-U.S. issuers may be U.S. dollar denominated.
The Fund's portfolio composition is subject to change at any time.
First Eagle Funds | Semiannual Report | April 30, 2024
32
First Eagle Global Fund | Fund Overview
Growth of a $10,000 Initial Investment
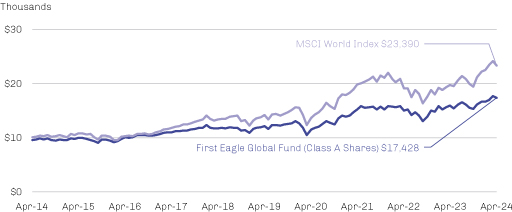
Performance data quoted herein represents past performance and should not be considered indicative of future results. Performance data quoted herein does not reflect the deduction of taxes that a shareholder would pay on Fund distributions or the sale of Fund shares. The average annual returns shown above are historical and reflect changes in share price, reinvested dividends and are net of expenses.
The average annual returns for Class A shares give effect to the deduction of the maximum sales charge of 5.00%.
The MSCI World Index captures large- and mid-cap representation across 23 developed markets countries. Developed markets countries include Australia, Austria, Belgium, Canada, Denmark, Finland, France, Germany, Hong Kong, Ireland, Israel, Italy, Japan, Netherlands, New Zealand, Norway, Portugal, Singapore, Spain, Sweden, Switzerland, the UK and the U.S. With 1,480 constituents, the index covers approximately 85% of the free float-adjusted market capitalization in each country. One cannot invest directly in an index.
Top 10 Holdings* (%)
Gold bullion** (Precious Metal) | | | 11.9 | | |
Oracle Corp. (Software, United States) | | | 2.2 | | |
Exxon Mobil Corp. (Oil, Gas & Consumable Fuels, United States) | | | 2.2 | | |
Meta Platforms, Inc., Class A (Interactive Media & Services, United States) | | | 2.2 | | |
HCA Healthcare, Inc. (Health Care Providers & Services, United States) | | | 1.9 | | |
Schlumberger NV (Energy Equipment & Services, United States) | | | 1.8 | | |
Comcast Corp., Class A (Media, United States) | | | 1.6 | | |
Elevance Health, Inc. (Health Care Providers & Services, United States) | | | 1.5 | | |
Imperial Oil Ltd. (Oil, Gas & Consumable Fuels, Canada) | | | 1.5 | | |
Alphabet, Inc., Class C (Interactive Media & Services, United States) | | | 1.4 | | |
Total | | | 28.2 | | |
* Holdings in cash, short-term commercial paper, long-term commercial paper and other short-term cash equivalents have been excluded.
** The Fund invests in gold and precious metals through investment in a wholly-owned subsidiary of the Fund organized under the laws of the Cayman Islands (the "Subsidiary"). Gold Bullion and commodities include the Fund's investment in the Subsidiary.
Percentages are based on total net assets
First Eagle Funds | Semiannual Report | April 30, 2024
33
First Eagle Global Fund | Consolidated Schedule of Investments | April 30, 2024 (unaudited)
Investments | | Shares | | Value ($) | |
Common Stocks — 77.9% | |
Belgium — 0.9% | |
Groupe Bruxelles Lambert NV | | | 6,469,396 | | | | 480,223,030 | | |
Brazil — 1.1% | |
Ambev SA, ADR | | | 149,620,059 | | | | 347,118,537 | | |
Itausa SA (Preference) | | | 103,903,979 | | | | 191,295,698 | | |
| | | 538,414,235 | | |
Canada — 4.8% | |
Agnico Eagle Mines Ltd. | | | 2,830,107 | | | | 179,224,006 | | |
Barrick Gold Corp. | | | 25,083,139 | | | | 417,383,433 | | |
Franco-Nevada Corp. | | | 1,260,834 | | | | 151,778,165 | | |
Imperial Oil Ltd. | | | 10,896,401 | | | | 749,169,618 | | |
Nutrien Ltd. | | | 4,461,321 | | | | 235,423,909 | | |
Power Corp. of Canada | | | 12,323,141 | | | | 328,342,580 | | |
Wheaton Precious Metals Corp. | | | 7,936,282 | | | | 413,797,743 | | |
| | | 2,475,119,454 | | |
China — 1.7% | |
Alibaba Group Holding Ltd. | | | 37,671,592 | | | | 352,721,548 | | |
Prosus NV | | | 15,821,294 | | | | 529,379,709 | | |
| | | | 882,101,257 | | |
France — 3.2% | |
Danone SA | | | 10,211,219 | | | | 639,092,854 | | |
Legrand SA | | | 1,954,335 | | | | 200,840,342 | | |
LVMH Moet Hennessy Louis Vuitton SE | | | 145,168 | | | | 119,246,270 | | |
Sanofi SA | | | 4,031,951 | | | | 398,328,595 | | |
Sodexo SA | | | 2,131,829 | | | | 185,625,741 | | |
Wendel SE | | | 867,489 | | | | 88,462,885 | | |
| | | 1,631,596,687 | | |
Germany — 0.9% | |
Brenntag SE | | | 1,126,149 | | | | 89,870,528 | | |
Henkel AG & Co. KGaA (Preference) | | | 3,516,726 | | | | 279,374,890 | | |
Merck KGaA | | | 597,571 | | | | 94,954,995 | | |
| | | | 464,200,413 | | |
Hong Kong — 1.4% | |
CK Asset Holdings Ltd. | | | 37,986,500 | | | | 162,034,309 | | |
Guoco Group Ltd. | | | 12,748,580 | | | | 121,411,943 | | |
First Eagle Funds | Semiannual Report | April 30, 2024
34
First Eagle Global Fund | Consolidated Schedule of Investments | April 30, 2024 (unaudited)
Investments | | Shares | | Value ($) | |
Hong Kong — 1.4% (continued) | |
Hongkong Land Holdings Ltd. | | | 31,759,300 | | | | 101,476,693 | | |
Hysan Development Co. Ltd. | | | 23,322,348 | | | | 36,349,842 | | |
Jardine Matheson Holdings Ltd. | | | 7,051,271 | | | | 270,557,268 | | |
| | | | 691,830,055 | | |
Japan — 7.0% | |
Chofu Seisakusho Co. Ltd. (a) | | | 3,136,200 | | | | 45,339,646 | | |
FANUC Corp. | | | 16,005,400 | | | | 474,068,717 | | |
Hirose Electric Co. Ltd. | | | 1,258,915 | | | | 133,628,587 | | |
Hoshizaki Corp. | | | 5,662,600 | | | | 195,125,940 | | |
Keyence Corp. | | | 263,400 | | | | 115,835,381 | | |
Komatsu Ltd. | | | 6,756,000 | | | | 201,708,136 | | |
Mitsubishi Electric Corp. | | | 24,592,300 | | | | 428,641,982 | | |
MS&AD Insurance Group Holdings, Inc. | | | 26,478,960 | | | | 476,066,428 | | |
Secom Co. Ltd. | | | 6,337,130 | | | | 440,192,907 | | |
Shimano, Inc. | | | 2,469,690 | | | | 401,356,770 | | |
SMC Corp. | | | 442,156 | | | | 232,294,025 | | |
Sompo Holdings, Inc. | | | 18,813,600 | | | | 372,323,616 | | |
T Hasegawa Co. Ltd. (a) | | | 3,002,800 | | | | 58,633,551 | | |
USS Co. Ltd. | | | 2,597,200 | | | | 19,840,777 | | |
| | | | 3,595,056,463 | | |
Mexico — 1.4% | |
Fomento Economico Mexicano SAB de CV, ADR | | | 4,913,976 | | | | 578,178,416 | | |
Fresnillo plc | | | 5,590,827 | | | | 38,720,855 | | |
Industrias Penoles SAB de CV* | | | 6,401,020 | | | | 92,894,800 | | |
| | | | 709,794,071 | | |
Netherlands — 0.5% | |
Heineken Holding NV | | | 2,538,232 | | | | 204,185,437 | | |
Pluxee NV* | | | 2,131,829 | | | | 65,727,290 | | |
| | | | 269,912,727 | | |
Norway — 0.2% | |
Orkla ASA | | | 16,166,787 | | | | 109,973,104 | | |
South Korea — 1.6% | |
Hyundai Mobis Co. Ltd. | | | 999,985 | | | | 163,596,850 | | |
KT&G Corp. | | | 5,242,098 | | | | 337,778,721 | | |
First Eagle Funds | Semiannual Report | April 30, 2024
35
First Eagle Global Fund | Consolidated Schedule of Investments | April 30, 2024 (unaudited)
Investments | | Shares | | Value ($) | |
South Korea — 1.6% (continued) | |
NAVER Corp. | | | 841,829 | | | | 111,036,870 | | |
Samsung Electronics Co. Ltd. (Preference) | | | 4,049,795 | | | | 189,089,467 | | |
| | | | 801,501,908 | | |
Sweden — 1.0% | |
Investor AB, Class A | | | 4,970,940 | | | | 121,074,735 | | |
Investor AB, Class B | | | 11,255,824 | | | | 275,686,195 | | |
Svenska Handelsbanken AB, Class A | | | 10,429,006 | | | | 89,432,137 | | |
| | | | 486,193,067 | | |
Switzerland — 2.8% | |
Cie Financiere Richemont SA (Registered) | | | 4,644,824 | | | | 642,040,223 | | |
Nestle SA (Registered) | | | 3,086,462 | | | | 309,881,397 | | |
Schindler Holding AG | | | 1,798,637 | | | | 448,321,825 | | |
Schindler Holding AG (Registered) | | | 211,870 | | | | 51,622,921 | | |
| | | 1,451,866,366 | | |
Taiwan — 1.2% | |
Taiwan Semiconductor Manufacturing Co. Ltd., ADR | | | 4,606,256 | | | | 632,623,199 | | |
Thailand — 0.3% | |
Bangkok Bank PCL, NVDR | | | 42,690,800 | | | | 157,503,801 | | |
United Kingdom — 6.6% | |
BAE Systems plc | | | 30,239,911 | | | | 502,956,744 | | |
Berkeley Group Holdings plc (a) | | | 6,766,463 | | | | 397,364,861 | | |
British American Tobacco plc | | | 20,559,170 | | | | 603,540,699 | | |
Derwent London plc, REIT | | | 3,397,186 | | | | 87,276,250 | | |
Diageo plc | | | 3,588,503 | | | | 124,017,509 | | |
Haleon plc | | | 83,820,988 | | | | 354,004,792 | | |
Lloyds Banking Group plc | | | 396,239,696 | | | | 255,726,550 | | |
Reckitt Benckiser Group plc | | | 7,178,278 | | | | 401,316,035 | | |
Unilever plc | | | 12,894,404 | | | | 667,004,063 | | |
| | | 3,393,207,503 | | |
United States — 41.3% | |
Alphabet, Inc., Class A* | | | 2,694,360 | | | | 438,587,921 | | |
Alphabet, Inc., Class C* | | | 4,503,302 | | | | 741,423,641 | | |
American Express Co. | | | 1,903,714 | | | | 445,526,187 | | |
Analog Devices, Inc. | | | 2,674,970 | | | | 536,625,732 | | |
First Eagle Funds | Semiannual Report | April 30, 2024
36
First Eagle Global Fund | Consolidated Schedule of Investments | April 30, 2024 (unaudited)
Investments | | Shares | | Value ($) | |
United States — 41.3% (continued) | |
Bank of New York Mellon Corp. (The) | | | 11,016,077 | | | | 622,298,190 | | |
Becton Dickinson & Co. | | | 1,479,983 | | | | 347,204,012 | | |
Berkshire Hathaway, Inc., Class A* | | | 675 | | | | 404,662,507 | | |
Boston Properties, Inc., REIT | | | 2,473,129 | | | | 153,061,954 | | |
Brown & Brown, Inc. | | | 2,287,048 | | | | 186,485,894 | | |
CH Robinson Worldwide, Inc (a) | | | 8,084,325 | | | | 573,987,075 | | |
Charles Schwab Corp. (The) | | | 2,570,105 | | | | 190,059,265 | | |
Colgate-Palmolive Co. | | | 6,917,501 | | | | 635,856,692 | | |
Comcast Corp., Class A | | | 21,961,227 | | | | 836,942,361 | | |
Cummins, Inc. | | | 1,455,755 | | | | 411,236,230 | | |
Deere & Co. | | | 381,724 | | | | 149,410,591 | | |
Dentsply Sirona, Inc. | | | 7,189,968 | | | | 215,770,940 | | |
Douglas Emmett, Inc., REIT (a) | | | 9,162,021 | | | | 125,611,308 | | |
Elevance Health, Inc. | | | 1,464,449 | | | | 774,078,452 | | |
Equity Residential, REIT | | | 6,189,955 | | | | 398,633,102 | | |
Expeditors International of Washington, Inc. | | | 1,961,371 | | | | 218,320,206 | | |
Extra Space Storage, Inc., REIT | | | 1,155,209 | | | | 155,121,464 | | |
Exxon Mobil Corp. | | | 9,538,191 | | | | 1,128,081,850 | | |
Fidelity National Financial, Inc. | | | 4,297,027 | | | | 212,702,836 | | |
Flowserve Corp. (a) | | | 7,892,216 | | | | 372,196,907 | | |
HCA Healthcare, Inc. | | | 3,109,934 | | | | 963,519,752 | | |
IPG Photonics Corp.* (a) | | | 3,097,302 | | | | 260,111,422 | | |
JG Boswell Co. | | | 2,485 | | | | 1,440,057 | | |
Kraft Heinz Co. (The) | | | 4,471,740 | | | | 172,653,881 | | |
Medtronic plc | | | 6,323,862 | | | | 507,426,687 | | |
Meta Platforms, Inc., Class A | | | 2,584,560 | | | | 1,111,800,175 | | |
Microsoft Corp. | | | 466,954 | | | | 181,799,201 | | |
Mills Music Trust (a) | | | 31,592 | | | | 1,103,509 | | |
Newmont Corp. | | | 8,257,354 | | | | 335,578,867 | | |
Noble Corp. plc | | | 2,010,900 | | | | 89,243,742 | | |
NOV, Inc. (a) | | | 26,905,276 | | | | 497,478,553 | | |
ONEOK, Inc. | | | 2,398,383 | | | | 189,760,063 | | |
Oracle Corp. | | | 10,164,584 | | | | 1,156,221,430 | | |
Philip Morris International, Inc. | | | 7,366,039 | | | | 699,331,743 | | |
First Eagle Funds | Semiannual Report | April 30, 2024
37
First Eagle Global Fund | Consolidated Schedule of Investments | April 30, 2024 (unaudited)
Investments | | Shares | | Value ($) | |
United States — 41.3% (continued) | |
PPG Industries, Inc. | | | 853,547 | | | | 110,107,563 | | |
Ross Stores, Inc. | | | 1,271,219 | | | | 164,686,421 | | |
Royal Gold, Inc. | | | 1,476,988 | | | | 177,430,568 | | |
RPM International, Inc. | | | 850,166 | | | | 90,891,247 | | |
Salesforce, Inc. | | | 1,385,077 | | | | 372,502,608 | | |
Schlumberger NV | | | 19,905,698 | | | | 945,122,541 | | |
Texas Instruments, Inc. | | | 2,800,783 | | | | 494,114,137 | | |
UGI Corp. | | | 2,435,845 | | | | 62,260,198 | | |
Universal Health Services, Inc., Class B | | | 3,368,166 | | | | 574,036,531 | | |
US Bancorp | | | 5,965,007 | | | | 242,358,234 | | |
Walmart, Inc. | | | 3,753,467 | | | | 222,768,266 | | |
Walt Disney Co. (The) | | | 2,946,738 | | | | 327,382,592 | | |
Weyerhaeuser Co., REIT | | | 10,347,140 | | | | 312,173,214 | | |
Willis Towers Watson plc | | | 2,814,965 | | | | 706,950,310 | | |
| | | 21,244,138,829 | | |
Total Common Stocks
(Cost $26,815,316,729) | | | 40,015,256,169 | | |
| | | Ounces | | | |
Commodities — 11.9% | |
Gold bullion*
(Cost $2,786,031,545) | | | 2,676,160 | | | | 6,132,020,318 | | |
| | | Principal Amount ($) | | | |
Foreign Government Securities — 0.4% | |
Mexico — 0.2% | |
Mex Bonos Desarr Fix Rt
Series M, 5.75%, 3/5/2026 | | MXN | 1,813,230,000 | | | | 97,103,583 | | |
South Korea — 0.2% | |
Republic of Korea
1.25%, 3/10/2026 | | KRW | 158,937,690,000 | | | | 110,337,807 | | |
Total Foreign Government Securities
(Cost 218,497,362) | | | 207,441,390 | | |
First Eagle Funds | Semiannual Report | April 30, 2024
38
First Eagle Global Fund | Consolidated Schedule of Investments | April 30, 2024 (unaudited)
Investments | | Principal Amount ($) | | Value ($) | |
Corporate Bonds — 0.0% (b) | |
United States — 0.0% (b) | |
Bausch & Lomb, Inc.
7.13%, 8/1/2028‡ (Cost $5,181,930) | | | 5,467,000 | | | | 4,933,968 | | |
Short-Term Investments — 9.5% | |
Commercial Paper — 9.4% | |
AES Corp. (The)
5.86%, 5/1/2024 (c) | | | 58,833,000 | | | | 58,823,391 | | |
BASF SE
5.49%, 6/12/2024 (c)(d) | | | 70,000,000 | | | | 69,547,524 | | |
5.51%, 7/30/2024 (c)(d) | | | 75,000,000 | | | | 73,970,689 | | |
BP Capital Markets plc
5.45%, 6/5/2024 (c) | | | 100,000,000 | | | | 99,458,400 | | |
5.46%, 6/10/2024 (c) | | | 120,000,000 | | | | 119,259,130 | | |
CVS Caremark Corp.
5.40%, 5/1/2024 (c) | | | 37,470,000 | | | | 37,464,388 | | |
Engie SA
5.39%, 5/9/2024 (c)(d) | | | 30,900,000 | | | | 30,859,241 | | |
5.39%, 5/14/2024 (c) | | | 70,000,000 | | | | 69,856,624 | | |
5.37%, 5/23/2024 (c) | | | 77,450,000 | | | | 77,190,567 | | |
5.35%, 5/28/2024 (c) | | | 50,000,000 | | | | 49,795,911 | | |
5.40%, 5/31/2024 (c) | | | 50,000,000 | | | | 49,773,772 | | |
5.40%, 7/8/2024 (c) | | | 50,000,000 | | | | 49,487,675 | | |
5.48%, 7/23/2024 (c) | | | 50,000,000 | | | | 49,375,133 | | |
5.43%, 7/29/2024 (c) | | | 50,000,000 | | | | 49,330,000 | | |
5.43%, 7/31/2024 (c) | | | 37,500,000 | | | | 36,986,103 | | |
Entergy Corp.
5.40%, 5/1/2024 (c) | | | 20,415,000 | | | | 20,411,943 | | |
Export Development Corp
5.25%, 7/23/2024 (c) | | | 41,700,000 | | | | 41,189,759 | | |
Export Development Corp.
5.25%, 7/22/2024 (c) | | | 50,000,000 | | | | 49,395,407 | | |
FMS Wertmanagement AöR
5.34%, 5/8/2024 (c)(d) | | | 64,810,000 | | | | 64,734,052 | | |
General Motors Financial Co., Inc.
5.43%, 5/1/2024 (c) | | | 80,917,000 | | | | 80,904,766 | | |
Global Payments, Inc.
5.96%, 5/1/2024 (c) | | | 25,797,000 | | | | 25,792,720 | | |
First Eagle Funds | Semiannual Report | April 30, 2024
39
First Eagle Global Fund | Consolidated Schedule of Investments | April 30, 2024 (unaudited)
Investments | | Principal Amount ($) | | Value ($) | |
Commercial Paper — 9.4% (continued) | |
Government of Quebec
5.30%, 6/11/2024 (c)(d) | | | 50,000,000 | | | | 49,688,966 | | |
5.31%, 7/11/2024 (c) | | | 70,650,000 | | | | 69,898,567 | | |
Hydro-Quebec
5.33%, 5/3/2024 (c)(d) | | | 33,000,000 | | | | 32,985,523 | | |
5.31%, 5/16/2024 (c) | | | 68,500,000 | | | | 68,339,167 | | |
5.30%, 6/25/2024 (c) | | | 67,470,000 | | | | 66,910,458 | | |
Intel Corp.
5.56%, 6/20/2024 (c) | | | 36,350,000 | | | | 36,068,266 | | |
Johnson & Johnson
5.32%, 7/2/2024 (c)(d) | | | 75,000,000 | | | | 74,300,831 | | |
5.33%, 7/5/2024 (c) | | | 50,000,000 | | | | 49,511,967 | | |
5.33%, 7/10/2024 (c)(d) | | | 92,500,000 | | | | 91,529,652 | | |
5.32%, 7/19/2024 (c) | | | 37,500,000 | | | | 37,057,500 | | |
Kreditanstalt fuer Wiederaufbau
5.29%, 5/2/2024 (c)(d) | | | 117,000,000 | | | | 116,966,181 | | |
5.31%, 5/10/2024 (c) | | | 35,906,000 | | | | 35,854,036 | | |
Lvmh Moet Hen Lv Se
5.36%, 6/26/2024 (c) | | | 40,000,000 | | | | 39,660,723 | | |
LVMH Moet Hennessy Louis Vuitton SE
5.36%, 7/2/2024 (c) | | | 50,000,000 | | | | 49,531,175 | | |
Microsoft Corp.
5.34%, 5/17/2024 (c)(d) | | | 67,700,000 | | | | 67,530,604 | | |
Nederlandse Waterschapsbank NV
5.36%, 5/6/2024 (c)(d) | | | 175,000,000 | | | | 174,844,624 | | |
5.37%, 5/9/2024 (c)(d) | | | 100,000,000 | | | | 99,866,706 | | |
5.35%, 5/17/2024 (c) | | | 50,000,000 | | | | 49,873,948 | | |
5.28%, 5/20/2024 (c) | | | 75,000,000 | | | | 74,777,452 | | |
NRW Bank
5.37%, 5/7/2024 (c)(d) | | | 75,000,000 | | | | 74,922,854 | | |
5.38%, 6/3/2024 (c)(d) | | | 50,000,000 | | | | 49,749,187 | | |
5.36%, 6/11/2024 (c) | | | 40,000,000 | | | | 39,752,013 | | |
5.39%, 7/17/2024 (c) | | | 90,000,000 | | | | 88,959,090 | | |
5.39%, 7/25/2024 (c) | | | 55,000,000 | | | | 54,297,595 | | |
5.39%, 7/26/2024 (c) | | | 75,000,000 | | | | 74,030,856 | | |
Oracle Corp.
5.45%, 7/25/2024 (c)(d) | | | 22,750,000 | | | | 22,458,228 | | |
5.48%, 7/26/2024 (c)(d) | | | 46,620,000 | | | | 46,015,102 | | |
First Eagle Funds | Semiannual Report | April 30, 2024
40
First Eagle Global Fund | Consolidated Schedule of Investments | April 30, 2024 (unaudited)
Investments | | Principal Amount ($) | | Value ($) | |
Commercial Paper — 9.4% (continued) | |
Philip Morris International, Inc.
5.35%, 5/10/2024 (c) | | | 97,000,000 | | | | 96,855,945 | | |
5.38%, 6/4/2024 (c)(d) | | | 50,000,000 | | | | 49,739,364 | | |
5.38%, 6/7/2024 (c) | | | 100,000,000 | | | | 99,433,941 | | |
Province of Quebec
5.36%, 5/13/2024 (c)(d) | | | 101,794,000 | | | | 101,598,985 | | |
5.34%, 5/22/2024 (c)(d) | | | 97,550,000 | | | | 97,233,278 | | |
PSP Capital, Inc.
5.30%, 5/3/2024 (c)(d) | | | 100,000,000 | | | | 99,955,762 | | |
5.35%, 5/24/2024 (c)(d) | | | 100,000,000 | | | | 99,647,911 | | |
5.35%, 6/17/2024 (c)(d) | | | 100,000,000 | | | | 99,292,800 | | |
5.36%, 6/18/2024 (c) | | | 48,000,000 | | | | 47,653,276 | | |
5.35%, 6/21/2024 (c)(d) | | | 50,000,000 | | | | 49,616,066 | | |
5.36%, 6/28/2024 (c) | | | 75,000,000 | | | | 74,343,994 | | |
Roche Holdings, Inc.
5.36%, 6/6/2024 (c)(d) | | | 50,000,000 | | | | 49,726,251 | | |
Sanofi SA
5.38%, 6/13/2024 (c) | | | 75,000,000 | | | | 74,510,133 | | |
5.42%, 7/24/2024 (c)(d) | | | 95,000,000 | | | | 93,798,469 | | |
Siemens Capital Co. LLC
5.34%, 6/20/2024 (c) | | | 50,984,000 | | | | 50,600,400 | | |
Svensk Exportkredit AB
5.34%, 5/14/2024 (c) | | | 75,000,000 | | | | 74,846,004 | | |
5.31%, 5/21/2024 (c) | | | 100,000,000 | | | | 99,691,883 | | |
5.30%, 5/28/2024 (c) | | | 100,000,000 | | | | 99,588,694 | | |
5.31%, 7/15/2024 (c) | | | 100,000,000 | | | | 98,879,141 | | |
Total Finance USA, Inc.
5.40%, 6/14/2024 (c) | | | 94,900,000 | | | | 94,262,391 | | |
5.42%, 6/20/2024 (c) | | | 50,000,000 | | | | 49,618,846 | | |
5.43%, 6/24/2024 (c)(d) | | | 100,000,000 | | | | 99,177,292 | | |
UnitedHealth Group, Inc.
5.37%, 8/1/2024 (c) | | | 65,000,000 | | | | 64,104,669 | | |
Total Commercial Paper
(Cost $4,804,055,248) | | | 4,803,163,961 | | |
First Eagle Funds | Semiannual Report | April 30, 2024
41
First Eagle Global Fund | Consolidated Schedule of Investments | April 30, 2024 (unaudited)
Investments | | Principal Amount ($) | | Value ($) | |
U.S. Treasury Obligations — 0.1% | |
U.S. Treasury Bills
5.29%, 6/13/2024 (c) | | | 20,000,000 | | | | 19,874,233 | | |
5.17%, 6/27/2024 (c) | | | 20,000,000 | | | | 19,833,037 | | |
5.22%, 9/5/2024 (c) | | | 20,000,000 | | | | 19,632,053 | | |
Total U.S. Treasury Obligations
(Cost $59,358,756) | | | 59,339,323 | | |
| | | Shares | | | |
Investment Companies — 0.0% (b) | |
JP Morgan U.S. Government Money Market Fund,
Capital Shares 5.33% (e) (Cost $544,072) | | | 544,072 | | | | 544,072 | | |
Total Short-Term Investments
(Cost $4,863,958,076) | | | 4,863,047,356 | | |
Total Investments — 99.7%
(Cost $34,688,985,642) | | | 51,222,699,201 | | |
Other Assets Less Liabilities — 0.3% | | | 142,245,116 | | |
Net Assets — 100.0% | | | 51,364,944,317 | | |
* Non-income producing security.
‡ Value determined using significant unobservable inputs.
(a) Affiliated company as defined under the Investment Company Act of 1940.
(b) Represents less than 0.05% of net assets.
(c) The rate shown was the current yield as of April 30, 2024.
(d) Securities exempt from registration under Rule 144A or section 4(a)2 of the Securities Act of 1933. Total value of all such securities at April 30, 2024 amounted to $1,979,756,142, which represents approximately 3.85% of net assets of the Fund.
(e) Represents 7-day effective yield as of April 30, 2024.
As of April 30, 2024, the gross unrealized appreciation (depreciation) of investments based on the aggregate cost of investment securities and derivative instruments, if applicable, for federal income tax purposes was as follows:
Aggregate gross unrealized appreciation | | $ | 18,502,045,381 | | |
Aggregate gross unrealized depreciation | | | (1,927,672,370 | ) | |
Net unrealized appreciation | | $ | 16,574,373,011 | | |
Federal income tax cost | | $ | 34,688,985,642 | | |
First Eagle Funds | Semiannual Report | April 30, 2024
42
First Eagle Global Fund | Consolidated Schedule of Investments | April 30, 2024 (unaudited)
Forward Foreign Currency Exchange Contracts outstanding as of April 30, 2024
Currency
Purchased | | Currency Sold | | Counterparty | | Settlement
Date | | Unrealized
Appreciation
(Depreciation) | |
USD | 227,334,564 | | | EUR | 207,940,000 | | | JPMorgan Chase Bank | | 6/5/2024 | | $ | 5,107,601 | | |
USD | 91,154,232 | | | GBP | 71,983,000 | | | JPMorgan Chase Bank | | 6/5/2024 | | | 1,191,371 | | |
USD | 109,862,487 | | | JPY | 15,953,736,000 | | | JPMorgan Chase Bank | | 6/5/2024 | | | 8,158,154 | | |
USD | 259,780,784 | | | EUR | 241,353,000 | | | UBS AG | | 7/3/2024 | | | 1,520,570 | | |
USD | 74,077,033 | | | JPY | 10,924,029,000 | | | UBS AG | | 7/3/2024 | | | 4,147,059 | | |
USD | 225,169,584 | | | EUR | 205,770,000 | | | Bank of New York Mellon | | 8/7/2024 | | | 4,595,975 | | |
USD | 108,731,543 | | | JPY | 15,907,827,000 | | | Bank of New York Mellon | | 8/7/2024 | | | 6,341,323 | | |
USD | 281,260,696 | | | EUR | 257,494,000 | | | Goldman Sachs | | 9/4/2024 | | | 4,863,416 | | |
USD | 106,835,859 | | | GBP | 84,149,000 | | | Goldman Sachs | | 9/4/2024 | | | 1,599,418 | | |
USD | 80,206,163 | | | JPY | 11,921,844,000 | | | Goldman Sachs | | 9/4/2024 | | | 3,134,565 | | |
Net unrealized appreciation | | | | | | | | $ | 40,659,452 | | |
Abbreviations
ADR — American Depositary Receipt
EUR — Euro
Fix Rt — Fixed Rate
GBP — British Pound
JPY — Japanese Yen
KRW — South Korean Won
MXN — Mexican Peso
NVDR — Non-Voting Depositary Receipt
Preference — A special type of equity investment that shares in the earnings of the company, has limited voting rights, and may have a dividend preference. Preference shares may also have liquidation preference.
REIT — Real Estate Investment Trust
USD — United States Dollar
First Eagle Funds | Semiannual Report | April 30, 2024
43
First Eagle Global Fund | Consolidated Schedule of Investments | April 30, 2024 (unaudited)
Affiliated Securities
Security Description | | Shares at
April 30, 2024 | | Market Value
October 31, 2023 | | Purchases at
Cost | | Proceeds from
Sales | |
Common Stocks — 4.6% | |
Japan — 0.2% | |
Chofu Seisakusho Co. Ltd. | | | 3,136,200 | | | $ | 44,698,784 | | | $ | — | | | $ | — | | |
T Hasegawa Co. Ltd. | | | 3,002,800 | | | | 62,909,936 | | | | — | | | | — | | |
| | | | | | 107,608,720 | | | | — | | | | — | | |
United Kingdom — 0.8% | |
Berkeley Group Holdings plc | | | 6,766,463 | | | | 332,616,729 | | | | — | | | | — | | |
United States — 3.6% | |
CH Robinson Worldwide, Inc. | | | 8,084,325 | | | | 547,603,660 | | | | 111,156,693 | | | | — | | |
Douglas Emmett, Inc., REIT | | | 9,162,021 | | | | 102,706,255 | | | | — | | | | — | | |
Flowserve Corp. | | | 7,892,216 | | | | 289,802,171 | | | | — | | | | — | | |
IPG Photonics Corp.* | | | 3,097,302 | | | | 266,058,242 | | | | — | | | | — | | |
Mills Music Trust | | | 31,592 | | | | 1,074,444 | | | | — | | | | — | | |
NOV, Inc. | | | 26,905,276 | | | | 537,029,309 | | | | — | | | | — | | |
| | | | | | 1,744,274,081 | | | | 111,156,693 | | | | — | | |
Total Common Stocks | | | | | 2,184,499,530 | | | | 111,156,693 | | | | — | | |
Total | | | | $ | 2,184,499,530 | | | $ | 111,156,693 | | | $ | — | | |
First Eagle Funds | Semiannual Report | April 30, 2024
44
First Eagle Global Fund | Consolidated Schedule of Investments | April 30, 2024 (unaudited)
Affiliated Securities (continued)
Security Description | | Net Realized
Gains
(Loss) | | Change in
Unrealized
Appreciation/
Depreciation | | Market Value
April 30, 2024 | | Dividend
Income | |
Common Stocks — 4.6% | |
Japan — 0.2% | |
Chofu Seisakusho Co. Ltd. | | $ | — | | | $ | 640,862 | | | $ | 45,339,646 | | | $ | 452,619 | | |
T Hasegawa Co. Ltd. | | | — | | | | (4,276,385 | ) | | | 58,633,551 | | | | 553,429 | | |
| | | | — | | | | (3,635,523 | ) | | | 103,973,197 | | | | 1,006,048 | | |
United Kingdom — 0.8% | |
Berkeley Group Holdings plc | | | — | | | | 64,748,132 | | | | 397,364,861 | | | | 2,860,164 | | |
United States — 3.6% | |
CH Robinson Worldwide, Inc. | | | — | | | | (84,773,278 | ) | | | 573,987,075 | | | | 9,013,538 | | |
Douglas Emmett, Inc., REIT | | | — | | | | 22,905,053 | | | | 125,611,308 | | | | 3,481,568 | | |
Flowserve Corp. | | | — | | | | 82,394,736 | | | | 372,196,907 | | | | 3,235,809 | | |
IPG Photonics Corp.* | | | — | | | | (5,946,820 | ) | | | 260,111,422 | | | | — | | |
Mills Music Trust | | | — | | | | 29,065 | | | | 1,103,509 | | | | 37,931 | | |
NOV, Inc. | | | — | | | | (39,550,756 | ) | | | 497,478,553 | | | | 2,690,528 | | |
| | | | — | | | | (24,942,000 | ) | | | 1,830,488,774 | | | | 18,459,374 | | |
Total Common Stocks | | | — | | | | 36,170,609 | | | | 2,331,826,832 | | | | 22,325,586 | | |
Total | | $ | — | | | $ | 36,170,609 | | | $ | 2,331,826,832 | | | $ | 22,325,586 | | |
* Non-income producing security.
See Notes to Financial Statements.
First Eagle Funds | Semiannual Report | April 30, 2024
45
First Eagle Overseas Fund
Data as of April 30, 2024 (unaudited)
Investment Objective
The First Eagle Overseas Fund seeks long-term growth of capital by investing primarily in equities issued by non-U.S. corporations. Management's research-driven process focuses on seeking securities that may be undervalued.
Average Annual Returns (%) | | | | | | One-Year | | Five-Years | | Ten-Years | |
First Eagle Overseas Fund | | Class A | | without sales load | | | 4.58 | | | | 4.63 | | | | 3.80 | | |
| | | | with sales load | | | -0.64 | | | | 3.56 | | | | 3.27 | | |
MSCI EAFE Index | | | | | | | 9.28 | | | | 6.18 | | | | 4.38 | | |
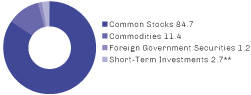
Sectors* (%)
Consumer Staples | | 20.1 | |
Industrials | | 15.3 | |
Financials | | 14.5 | |
Commodities | | 11.4 | |
Consumer Discretionary | | 8.8 | |
Materials | | 7.8 | |
Energy | | 6.6 | |
Information Technology | | 4.1 | |
Health Care | | 3.9 | |
Real Estate | | 2.6 | |
Foreign Government Securities | | 1.2 | |
Communication Services | | 1.0 | |
Short-Term Investments | | 2.7 | |
Countries*~ (%)
Japan | | 15.8 | |
United States | | 15.0 | |
United Kingdom | | 13.9 | |
Canada | | 9.0 | |
France | | 6.2 | |
Switzerland | | 4.6 | |
South Korea | | 4.3 | |
Hong Kong | | 3.4 | |
Mexico | | 3.1 | |
Sweden | | 3.0 | |
Taiwan | | 2.6 | |
China | | 2.6 | |
Germany | | 2.5 | |
Brazil | | 2.2 | |
Singapore | | 2.2 | |
Belgium | | 1.9 | |
Netherlands | | 1.5 | |
Chile | | 0.9 | |
Norway | | 0.8 | |
Thailand | | 0.8 | |
Turkey | | 0.6 | |
Faroe Islands | | 0.4 | |
Short-Term Investments | | 2.7 | |
* Asset Allocation, Sector and Countries percentages are based on total investments in the portfolio.
** Includes short-term commercial paper (1.7% of total investments) that settles in 90 days or less, long-term commercial paper (0.8% of total investments) that settles in 91 days or greater and other short-term investments (0.2% of total investments), such as U.S. treasury bills or money market funds.
~ Country allocations reflect country of risk (not currency of issue). Bonds of non-U.S. issuers may be U.S. dollar denominated.
The Fund's portfolio composition is subject to change at any time.
First Eagle Funds | Semiannual Report | April 30, 2024
46
First Eagle Overseas Fund | Fund Overview
Growth of a $10,000 Initial Investment
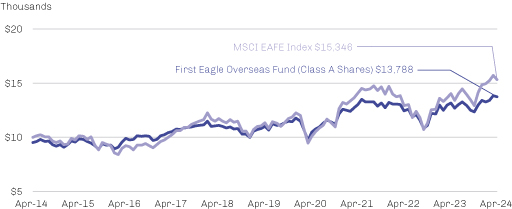
Performance data quoted herein represents past performance and should not be considered indicative of future results. Performance data quoted herein does not reflect the deduction of taxes that a shareholder would pay on Fund distributions or the sale of Fund shares. The average annual returns shown above are historical and reflect changes in share price, reinvested dividends and are net of expenses.
The average annual returns for Class A shares give effect to the deduction of the maximum sales charge of 5.00%.
The MSCI EAFE Index is an unmanaged total return index, reported in U.S. dollars, based on share prices and reinvested net dividends of companies from 21 developed market countries, excluding the United States and Canada. One cannot invest directly in an index.
Top 10 Holdings* (%)
Gold bullion** (Precious Metal) | | | 11.3 | | |
Imperial Oil Ltd. (Oil, Gas & Consumable Fuels, Canada) | | | 4.1 | | |
Shell plc (Oil, Gas & Consumable Fuels, United Kingdom) | | | 2.5 | | |
Danone SA (Food Products, France) | | | 2.4 | | |
Willis Towers Watson plc (Insurance, United States) | | | 2.4 | | |
Taiwan Semiconductor Manufacturing Co. Ltd., ADR (Semiconductors & Semiconductor Equipment, Taiwan) | | | 2.3 | | |
Unilever plc (Personal Care Products, United Kingdom) | | | 2.1 | | |
Fomento Economico Mexicano SAB de CV, ADR (Beverages, Mexico) | | | 2.1 | | |
Cie Financiere Richemont SA (Registered) (Textiles, Apparel & Luxury Goods, Switzerland) | | | 2.0 | | |
British American Tobacco plc (Tobacco, United Kingdom) | | | 1.9 | | |
Total | | | 33.1 | | |
* Holdings in cash, short-term commercial paper, long-term commercial paper and other short-term cash equivalents have been excluded.
** The Fund invests in gold and precious metals through investment in a wholly-owned subsidiary of the Fund organized under the laws of the Cayman Islands (the "Subsidiary"). Gold Bullion and commodities include the Fund's investment in the Subsidiary.
Percentages are based on total net assets.
First Eagle Funds | Semiannual Report | April 30, 2024
47
First Eagle Overseas Fund | Consolidated Schedule of Investments | April 30, 2024 (unaudited)
Investments | | Shares | | Value ($) | |
Common Stocks — 84.5% | |
Belgium — 2.0% | |
Groupe Bruxelles Lambert NV | | | 2,922,262 | | | | 216,919,402 | | |
Legris Industries SA*‡ (a)(b)(c) | | | 905,366 | | | | 21,865,255 | | |
| | | | 238,784,657 | | |
Brazil — 2.2% | |
Ambev SA, ADR | | | 74,789,315 | | | | 173,511,211 | | |
Itausa SA (Preference) | | | 51,723,362 | | | | 95,226,927 | | |
| | | 268,738,138 | | |
Canada — 8.9% | |
Agnico Eagle Mines Ltd. | | | 814,125 | | | | 51,556,618 | | |
Barrick Gold Corp. | | | 6,165,298 | | | | 102,590,559 | | |
Franco-Nevada Corp. | | | 316,575 | | | | 38,109,039 | | |
Imperial Oil Ltd. | | | 7,302,283 | | | | 502,060,136 | | |
Nutrien Ltd. | | | 2,436,243 | | | | 128,560,543 | | |
Power Corp. of Canada | | | 6,216,607 | | | | 165,637,704 | | |
Wheaton Precious Metals Corp. | | | 2,364,552 | | | | 123,287,741 | | |
| | | 1,111,802,340 | | |
Chile — 0.9% | |
Cia Cervecerias Unidas SA, ADR (c) | | | 9,392,572 | | | | 113,650,121 | | |
China — 2.5% | |
Alibaba Group Holding Ltd. | | | 13,666,828 | | | | 127,963,393 | | |
Prosus NV | | | 5,606,068 | | | | 187,578,756 | | |
| | | | 315,542,149 | | |
Faroe Islands — 0.4% | |
Bakkafrost P/F | | | 801,656 | | | | 48,687,873 | | |
France — 6.2% | |
Danone SA | | | 4,768,985 | | | | 298,478,001 | | |
Laurent-Perrier (c) | | | 558,938 | | | | 72,772,834 | | |
Legrand SA | | | 812,472 | | | | 83,494,976 | | |
LVMH Moet Hennessy Louis Vuitton SE | | | 33,358 | | | | 27,401,473 | | |
Sanofi SA | | | 1,679,882 | | | | 165,960,607 | | |
Sodexo SA | | | 801,545 | | | | 69,793,302 | | |
Wendel SE | | | 439,181 | | | | 44,785,834 | | |
| | | 762,687,027 | | |
First Eagle Funds | Semiannual Report | April 30, 2024
48
First Eagle Overseas Fund | Consolidated Schedule of Investments | April 30, 2024 (unaudited)
Investments | | Shares | | Value ($) | |
Germany — 2.5% | |
Brenntag SE | | | 557,632 | | | | 44,500,934 | | |
FUCHS SE (Preference) | | | 2,322,615 | | | | 108,464,449 | | |
Henkel AG & Co. KGaA (Preference) | | | 1,476,257 | | | | 117,276,449 | | |
Merck KGaA | | | 226,858 | | | | 36,048,102 | | |
| | | | 306,289,934 | | |
Hong Kong — 3.4% | |
CK Asset Holdings Ltd. | | | 19,475,000 | | | | 83,072,096 | | |
Great Eagle Holdings Ltd. | | | 22,777,700 | | | | 34,769,914 | | |
Guoco Group Ltd. | | | 7,806,340 | | | | 74,344,194 | | |
Hongkong Land Holdings Ltd. | | | 15,883,500 | | | | 50,750,648 | | |
Hysan Development Co. Ltd. | | | 17,500,405 | | | | 27,275,854 | | |
Jardine Matheson Holdings Ltd. | | | 3,779,100 | | | | 145,004,067 | | |
| | | | 415,216,773 | | |
Japan — 15.6% | |
As One Corp. | | | 2,756,760 | | | | 45,418,379 | | |
Chofu Seisakusho Co. Ltd. | | | 1,704,600 | | | | 24,643,186 | | |
Daiichikosho Co. Ltd. (c) | | | 5,732,560 | | | | 66,912,762 | | |
FANUC Corp. | | | 6,945,600 | | | | 205,723,798 | | |
Hirose Electric Co. Ltd. | | | 758,730 | | | | 80,536,031 | | |
Hoshizaki Corp. | | | 2,554,200 | | | | 88,014,459 | | |
Kansai Paint Co. Ltd. | | | 8,320,730 | | | | 108,320,735 | | |
Keyence Corp. | | | 74,800 | | | | 32,894,786 | | |
Komatsu Ltd. | | | 3,814,300 | | | | 113,880,305 | | |
MISUMI Group, Inc. | | | 830,100 | | | | 13,495,650 | | |
Mitsubishi Electric Corp. | | | 11,266,300 | | | | 196,370,781 | | |
MS&AD Insurance Group Holdings, Inc. | | | 9,761,400 | | | | 175,500,655 | | |
Nagaileben Co. Ltd. | | | 1,687,224 | | | | 25,169,487 | | |
Nihon Kohden Corp. | | | 2,470,100 | | | | 67,158,201 | | |
Pilot Corp. | | | 700,700 | | | | 18,754,064 | | |
Secom Co. Ltd. | | | 2,958,100 | | | | 205,477,028 | | |
Shimano, Inc. | | | 1,012,170 | | | | 164,490,799 | | |
SK Kaken Co. Ltd. | | | 437,805 | | | | 22,068,603 | | |
SMC Corp. | | | 195,690 | | | | 102,809,004 | | |
First Eagle Funds | Semiannual Report | April 30, 2024
49
First Eagle Overseas Fund | Consolidated Schedule of Investments | April 30, 2024 (unaudited)
Investments | | Shares | | Value ($) | |
Japan — 15.6% (continued) | |
Sompo Holdings, Inc. | | | 6,924,300 | | | | 137,032,807 | | |
T Hasegawa Co. Ltd. | | | 1,906,436 | | | | 37,225,627 | | |
TIS, Inc. | | | 121,100 | | | | 2,586,281 | | |
USS Co. Ltd. | | | 1,120,600 | | | | 8,560,594 | | |
| | | | 1,943,044,022 | | |
Mexico — 2.8% | |
Fomento Economico Mexicano SAB de CV, ADR | | | 2,174,086 | | | | 255,802,959 | | |
Fresnillo plc | | | 1,426,722 | | | | 9,881,167 | | |
Grupo Mexico SAB de CV, Series B | | | 6,905,948 | | | | 42,671,488 | | |
Industrias Penoles SAB de CV* | | | 2,246,692 | | | | 32,605,116 | | |
| | | | 340,960,730 | | |
Netherlands — 1.5% | |
HAL Trust | | | 644,459 | | | | 85,142,936 | | |
Heineken Holding NV | | | 973,676 | | | | 78,326,355 | | |
Pluxee NV* | | | 801,545 | | | | 24,712,761 | | |
| | | | 188,182,052 | | |
Norway — 0.8% | |
Orkla ASA | | | 14,829,598 | | | | 100,876,997 | | |
Singapore — 1.6% | |
Haw Par Corp. Ltd. (c) | | | 19,447,213 | | | | 139,677,817 | | |
UOL Group Ltd. | | | 15,047,300 | | | | 64,248,248 | | |
| | | | 203,926,065 | | |
South Korea — 4.0% | |
Fursys, Inc. (c) | | | 872,463 | | | | 23,786,563 | | |
Hyundai Mobis Co. Ltd. | | | 505,396 | | | | 82,682,434 | | |
KT&G Corp. | | | 2,451,893 | | | | 157,989,660 | | |
NAVER Corp. | | | 415,053 | | | | 54,745,306 | | |
NongShim Co. Ltd. | | | 203,663 | | | | 58,479,717 | | |
Samsung Electronics Co. Ltd. (Preference) | | | 2,345,824 | | | | 109,529,151 | | |
| | | | 487,212,831 | | |
Sweden — 3.0% | |
Industrivarden AB, Class A | | | 123,708 | | | | 3,983,836 | | |
Industrivarden AB, Class C | | | 1,572,517 | | | | 50,556,174 | | |
Investor AB, Class A | | | 1,542,690 | | | | 37,574,540 | | |
First Eagle Funds | Semiannual Report | April 30, 2024
50
First Eagle Overseas Fund | Consolidated Schedule of Investments | April 30, 2024 (unaudited)
Investments | | Shares | | Value ($) | |
Sweden — 3.0% (continued) | |
Investor AB, Class B | | | 8,384,352 | | | | 205,355,921 | | |
L E Lundbergforetagen AB, Class B | | | 296,080 | | | | 14,593,153 | | |
Svenska Handelsbanken AB, Class A | | | 6,838,494 | | | | 58,642,323 | | |
| | | | 370,705,947 | | |
Switzerland — 4.7% | |
Cie Financiere Richemont SA (Registered) | | | 1,767,922 | | | | 244,374,606 | | |
Nestle SA (Registered) | | | 1,236,148 | | | | 124,109,504 | | |
Schindler Holding AG | | | 724,861 | | | | 180,676,260 | | |
Schindler Holding AG (Registered) | | | 82,435 | | | | 20,085,597 | | |
| | | 569,245,967 | | |
Taiwan — 2.6% | |
Taiwan Secom Co. Ltd. | | | 8,545,694 | | | | 33,687,569 | | |
Taiwan Semiconductor Manufacturing Co. Ltd., ADR | | | 2,075,542 | | | | 285,054,938 | | |
| | | | 318,742,507 | | |
Thailand — 0.8% | |
Bangkok Bank PCL, NVDR | | | 20,440,959 | | | | 75,415,048 | | |
Thai Beverage PCL | | | 52,214,985 | | | | 18,907,825 | | |
| | | | 94,322,873 | | |
Turkey — 0.6% | |
AG Anadolu Grubu Holding A/S | | | 7,420,450 | | | | 74,407,847 | | |
United Kingdom — 13.9% | |
BAE Systems plc | | | 13,135,620 | | | | 218,474,474 | | |
Berkeley Group Holdings plc | | | 2,497,480 | | | | 146,666,108 | | |
Big Yellow Group plc, REIT | | | 2,602,379 | | | | 35,008,067 | | |
British American Tobacco plc | | | 8,042,810 | | | | 236,106,962 | | |
Diageo plc | | | 1,347,668 | | | | 46,574,973 | | |
Great Portland Estates plc, REIT | | | 4,895,618 | | | | 23,979,892 | | |
Haleon plc | | | 30,512,937 | | | | 128,866,602 | | |
Lloyds Banking Group plc | | | 189,904,219 | | | | 122,561,044 | | |
Reckitt Benckiser Group plc | | | 3,270,973 | | | | 182,870,309 | | |
Shell plc | | | 8,552,371 | | | | 305,608,736 | | |
Unilever plc | | | 5,122,575 | | | | 264,981,487 | | |
| | | 1,711,698,654 | | |
United States — 3.6% | |
Newmont Corp. | | | 2,558,784 | | | | 103,988,982 | | |
First Eagle Funds | Semiannual Report | April 30, 2024
51
First Eagle Overseas Fund | Consolidated Schedule of Investments | April 30, 2024 (unaudited)
Investments | | Shares | | Value ($) | |
United States — 3.6% (continued) | |
Royal Gold, Inc. | | | 454,973 | | | | 54,655,906 | | |
Willis Towers Watson plc | | | 1,164,307 | | | | 292,404,060 | | |
| | | 451,048,948 | | |
Total Common Stocks
(Cost $7,879,863,155) | | | 10,435,774,452 | | |
| | | Ounces | | | |
Commodities — 11.3% | |
Gold bullion*
(Cost $534,673,298) | | | 611,537 | | | | 1,401,246,132 | | |
| | | Principal Amount ($) | | | |
Foreign Government Securities — 1.2% | |
Mexico — 0.3% | |
Mex Bonos Desarr Fix Rt
Series M, 5.75%, 3/5/2026 | | MXN | 665,860,000 | | | | 35,658,682 | | |
Singapore — 0.6% | |
Republic of Singapore
1.25%, 11/1/2026 | | SGD | 108,048,000 | | | | 74,926,367 | | |
South Korea — 0.3% | |
Republic of Korea
1.25%, 3/10/2026 | | KRW | 59,926,230,000 | | | | 41,602,019 | | |
Total Foreign Government Securities
(Cost 157,228,153) | | | 152,187,068 | | |
Short-Term Investments — 2.6% | |
Commercial Paper — 2.4% | |
AES Corp. (The)
5.86%, 5/1/2024 (d) | | | 45,444,000 | | | | 45,436,578 | | |
BASF SE
5.49%, 6/12/2024 (d)(e) | | | 17,250,000 | | | | 17,138,497 | | |
CVS Caremark Corp.
5.40%, 5/1/2024 (d) | | | 28,944,000 | | | | 28,939,665 | | |
Engie SA
5.43%, 7/31/2024 (d) | | | 12,500,000 | | | | 12,328,701 | | |
First Eagle Funds | Semiannual Report | April 30, 2024
52
First Eagle Overseas Fund | Consolidated Schedule of Investments | April 30, 2024 (unaudited)
Investments | | Principal Amount ($) | | Value ($) | |
Commercial Paper — 2.4% (continued) | |
Entergy Corp.
5.40%, 5/1/2024 (d) | | | 15,769,000 | | | | 15,766,638 | | |
FMS Wertmanagement AöR
5.34%, 5/8/2024 (d)(e) | | | 10,190,000 | | | | 10,178,059 | | |
General Motors Financial Co., Inc.
5.43%, 5/1/2024 (d) | | | 62,503,000 | | | | 62,493,550 | | |
Global Payments, Inc.
5.96%, 5/1/2024 (d) | | | 19,927,000 | | | | 19,923,694 | | |
Hydro-Quebec
5.33%, 5/3/2024 (d)(e) | | | 22,000,000 | | | | 21,990,349 | | |
Kreditanstalt fuer Wiederaufbau
5.31%, 5/10/2024 (d) | | | 4,094,000 | | | | 4,088,075 | | |
Nederlandse Waterschapsbank NV
5.28%, 5/20/2024 (d) | | | 25,000,000 | | | | 24,925,817 | | |
NRW Bank
5.39%, 7/17/2024 (d) | | | 10,000,000 | | | | 9,884,343 | | |
5.39%, 7/25/2024 (d) | | | 20,000,000 | | | | 19,744,580 | | |
Province of Quebec
5.38%, 5/13/2024 (d)(e) | | | 5,906,000 | | | | 5,894,685 | | |
Siemens Capital Co. LLC
5.34%, 6/20/2024 (d) | | | 8,016,000 | | | | 7,955,688 | | |
Total Commercial Paper
(Cost $306,739,596) | | | 306,688,919 | | |
U.S. Treasury Obligations — 0.2% | |
U.S. Treasury Bills
5.29%, 6/13/2024 (d) | | | 10,000,000 | | | | 9,937,117 | | |
5.17%, 6/27/2024 (d) | | | 10,000,000 | | | | 9,916,519 | | |
5.22%, 9/5/2024 (d) | | | 10,000,000 | | | | 9,816,026 | | |
Total U.S. Treasury Obligations
(Cost $29,679,378) | | | 29,669,662 | | |
First Eagle Funds | Semiannual Report | April 30, 2024
53
First Eagle Overseas Fund | Consolidated Schedule of Investments | April 30, 2024 (unaudited)
Investments | | Shares | | Value ($) | |
Investment Companies — 0.0% (f) | |
JP Morgan U.S. Government Money Market Fund,
Capital Shares 5.33% (g) (Cost $185,361) | | | 185,361 | | | | 185,361 | | |
Total Short-Term Investments
(Cost $336,604,335) | | | 336,543,942 | | |
Total Investments — 99.6%
(Cost $8,908,368,941) | | | 12,325,751,594 | | |
Other Assets Less Liabilities — 0.4% | | | 45,754,682 | | |
Net Assets — 100.0% | | | 12,371,506,276 | | |
* Non-income producing security.
‡ Value determined using significant unobservable inputs.
(a) Represents a security that is subject to legal or contractual restrictions on resale. Total value of all such securities at April 30, 2024 amounted to $21,865,255, which represents approximately 0.18% of net assets of the Fund.
Restricted Securities | | Acquisition Date | | Cost | | Carrying Value
Per
Share/Principal | |
Legris Industries SA | | 04/30/04 | | $ | 23,433,066 | | | $ | 24.15 | | |
(b) Security fair valued as of April 30, 2024 in accordance with procedures approved by the Board of Trustees. Total value of all such securities at April 30, 2024 amounted to $21,865,255, which represents approximately 0.18% of net assets of the Fund.
(c) Affiliated company as defined under the Investment Company Act of 1940.
(d) The rate shown was the current yield as of April 30, 2024.
(e) Securities exempt from registration under Rule 144A or section 4(a)2 of the Securities Act of 1933. Total value of all such securities at April 30, 2024 amounted to $55,201,590, which represents approximately 0.45% of net assets of the Fund.
(f) Represents less than 0.05% of net assets.
(g) Represents 7-day effective yield as of April 30, 2024.
As of April 30, 2024, the gross unrealized appreciation (depreciation) of investments based on the aggregate cost of investment securities and derivative instruments, if applicable, for federal income tax purposes was as follows:
Aggregate gross unrealized appreciation | | $ | 4,201,127,059 | | |
Aggregate gross unrealized depreciation | | | (761,778,073 | ) | |
Net unrealized appreciation | | $ | 3,439,348,986 | | |
Federal income tax cost | | $ | 8,908,368,941 | | |
First Eagle Funds | Semiannual Report | April 30, 2024
54
First Eagle Overseas Fund | Consolidated Schedule of Investments | April 30, 2024 (unaudited)
Forward Foreign Currency Exchange Contracts outstanding as of April 30, 2024
Currency
Purchased | | Currency Sold | | Counterparty | | Settlement
Date | | Unrealized
Appreciation
(Depreciation) | |
USD | 127,105,757 | | | EUR | 116,262,000 | | | JPMorgan Chase Bank | | 6/5/2024 | | $ | 2,855,727 | | |
USD | 37,953,176 | | | GBP | 29,971,000 | | | JPMorgan Chase Bank | | 6/5/2024 | | | 496,042 | | |
USD | 62,014,275 | | | JPY | 9,005,434,000 | | | JPMorgan Chase Bank | | 6/5/2024 | | | 4,605,048 | | |
USD | 143,189,259 | | | EUR | 133,032,000 | | | UBS AG | | 7/3/2024 | | | 838,127 | | |
USD | 34,086,995 | | | JPY | 5,026,758,000 | | | UBS AG | | 7/3/2024 | | | 1,908,294 | | |
USD | 125,082,541 | | | EUR | 114,306,000 | | | Bank of New York Mellon | | 8/7/2024 | | | 2,553,081 | | |
USD | 55,680,109 | | | JPY | 8,146,206,000 | | | Bank of New York Mellon | | 8/7/2024 | | | 3,247,315 | | |
USD | 165,772,910 | | | EUR | 151,765,000 | | | Goldman Sachs | | 9/4/2024 | | | 2,866,460 | | |
USD | 43,895,830 | | | GBP | 34,579,000 | | | Goldman Sachs | | 9/4/2024 | | | 651,456 | | |
USD | 49,762,433 | | | JPY | 7,396,688,000 | | | Goldman Sachs | | 9/4/2024 | | | 1,944,783 | | |
Net unrealized appreciation | | | | | | | | $ | 21,966,333 | | |
Abbreviations
ADR — American Depositary Receipt
EUR — Euro
Fix Rt — Fixed Rate
GBP — British Pound
JPY — Japanese Yen
KRW — South Korean Won
MXN — Mexican Peso
NVDR — Non-Voting Depositary Receipt
Preference — A special type of equity investment that shares in the earnings of the company, has limited voting rights, and may have a dividend preference. Preference shares may also have liquidation preference.
REIT — Real Estate Investment Trust
SGD — Singapore Dollar
USD — United States Dollar
First Eagle Funds | Semiannual Report | April 30, 2024
55
First Eagle Overseas Fund | Consolidated Schedule of Investments | April 30, 2024 (unaudited)
Affiliated Securities
Security Description | | Shares at
April 30, 2024 | | Market Value
October 31, 2023 | | Purchases at
Cost | | Proceeds from
Sales | |
Common Stocks — 3.5% | |
Belgium — 0.2% | |
Legris Industries SA*‡ (a)(b) | | | 905,366 | | | $ | 15,384,962 | | | $ | — | | | $ | — | | |
Chile — 0.9% | |
Cia Cervecerias Unidas SA, ADR | | | 9,392,572 | | | | 105,666,435 | | | | — | | | | — | | |
France — 0.6% | |
Laurent-Perrier | | | 558,938 | | | | 69,786,652 | | | | — | | | | — | | |
Japan — 0.5% | |
Daiichikosho Co. Ltd. | | | 5,732,560 | | | | 84,735,608 | | | | — | | | | — | | |
Singapore — 1.1% | |
Haw Par Corp. Ltd. | | | 19,447,213 | | | | 135,861,236 | | | | — | | | | — | | |
South Korea — 0.2% | |
Fursys, Inc. | | | 872,463 | | | | 18,766,466 | | | | — | | | | — | | |
Total Common Stocks | | | | | 430,201,359 | | | | — | | | | — | | |
Total | | | | $ | 430,201,359 | | | $ | — | | | $ | — | | |
First Eagle Funds | Semiannual Report | April 30, 2024
56
First Eagle Overseas Fund | Consolidated Schedule of Investments | April 30, 2024 (unaudited)
Affiliated Securities (continued)
Security Description | | Net Realized
Gains
(Loss) | | Change in
Unrealized
Appreciation/
(Depreciation) | | Market Value
April 30, 2024 | | Dividend
Income | |
Common Stocks — 3.5% | |
Belgium — 0.2% | |
Legris Industries SA*‡ (a)(b) | | $ | — | | | $ | 6,480,293 | | | $ | 21,865,255 | | | $ | — | | |
Chile — 0.9% | |
Cia Cervecerias Unidas SA, ADR | | | — | | | | 7,983,686 | | | | 113,650,121 | | | | 2,363,311 | | |
France — 0.6% | |
Laurent-Perrier | | | — | | | | 2,986,182 | | | | 72,772,834 | | | | — | | |
Japan — 0.5% | |
Daiichikosho Co. Ltd. | | | — | | | | (17,822,846 | ) | | | 66,912,762 | | | | 988,372 | | |
Singapore — 1.1% | |
Haw Par Corp. Ltd. | | | — | | | | 3,816,581 | | | | 139,677,817 | | | | — | | |
South Korea — 0.2% | |
Fursys, Inc. | | | — | | | | 5,020,097 | | | | 23,786,563 | | | | 632,116 | | |
Total Common Stocks | | | — | | | | 8,463,993 | | | | 438,665,352 | | | | 3,983,799 | | |
Total | | $ | — | | | $ | 8,463,993 | | | $ | 438,665,352 | | | $ | 3,983,799 | | |
* Non-income producing security.
‡ Value determined using significant unobservable inputs.
(a) Security fair valued as of April 30, 2024 in accordance with procedures approved by the Board of Trustees. Total value of all such securities at April 30, 2024 amounted to $21,865,255, which represents approximately 0.18% of net assets of the Fund.
(b) Represents a security that is subject to legal or contractual restrictions on resale.
See Notes to Financial Statements.
First Eagle Funds | Semiannual Report | April 30, 2024
57
First Eagle U.S. Value Fund
Data as of April 30, 2024 (unaudited)
Investment Objective
The First Eagle U.S. Value Fund seeks long-term growth of capital by investing, under normal market conditions, at least 80% of its net assets (plus any borrowings for investment purposes) in domestic equity and debt securities. Management utilizes a highly disciplined, bottom-up, value-oriented approach in seeking to achieve its investment objective.
Average Annual Returns^ (%) | | | | | | One-Year | | Five-Years | | Ten-Years | |
First Eagle U.S. Value Fund | | Class A | | without sales charge | | | 12.70 | | | | 8.65 | | | | 7.60 | | |
| | | | with sales charge | | | 7.06 | | | | 7.55 | | | | 7.05 | | |
S&P 500 Index | | | | | | | 22.66 | | | | 13.19 | | | | 12.41 | | |
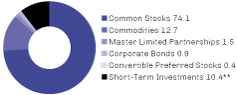
Sectors* (%)
Health Care | | | 12.8 | | |
Commodities | | | 12.7 | | |
Financials | | | 11.4 | | |
Communication Services | | | 11.0 | | |
Information Technology | | | 10.6 | | |
Energy | | | 8.9 | | |
Consumer Staples | | | 7.0 | | |
Industrials | | | 6.6 | | |
Materials | | | 4.1 | | |
Real Estate | | | 3.8 | | |
Consumer Discretionary | | | 0.5 | | |
Utilities | | | 0.2 | | |
Short-Term Investments | | | 10.4 | | |
^ Performance figures reflect certain fee waivers and/or expense limitations, without which returns may have been lower.
* Asset Allocation and Sector percentages are based on total investments in the portfolio.
** Includes short-term commercial paper (2.7% of total investments) that settles in 90 days or less, long-term commercial paper (4.7% of total investments) that settles in 91 days or greater and other short-term investments (3.0% of total investments), such as U.S. treasury bills or money market funds.
The Fund's portfolio composition is subject to change at any time.
First Eagle Funds | Semiannual Report | April 30, 2024
58
First Eagle U.S. Value Fund | Fund Overview
Growth of a $10,000 Initial Investment
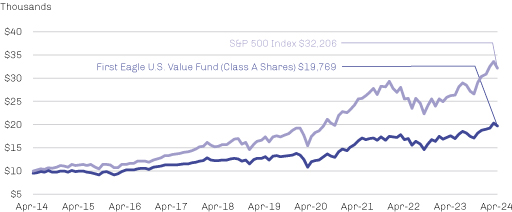
Performance data quoted herein represents past performance and should not be considered indicative of future results. Performance data quoted herein does not reflect the deduction of taxes that a shareholder would pay on Fund distributions or the sale of Fund shares. The average annual returns shown above are historical and reflect changes in share price, reinvested dividends and are net of expenses.
The average annual returns for Class A shares give effect to the deduction of the maximum sales charge of 5.00%.
The S&P 500 Index is a widely recognized unmanaged index including a representative sample of 500 leading companies in leading sectors of the U.S. economy. Although the S&P 500 Index focuses on the large-cap segment of the market, with approximately 80% coverage of U.S. equities, it is also considered a proxy for the total market. The S&P 500 Index includes dividends reinvested. One cannot invest directly in an index.
Top 10 Holdings* (%)
Gold bullion** (Precious Metal) | | | 12.7 | | |
HCA Healthcare, Inc. (Health Care Providers & Services, United States) | | | 3.9 | | |
Oracle Corp. (Software, United States) | | | 3.4 | | |
Meta Platforms, Inc., Class A (Interactive Media & Services, United States) | | | 3.3 | | |
Elevance Health, Inc. (Health Care Providers & Services, United States) | | | 3.1 | | |
Exxon Mobil Corp. (Oil, Gas & Consumable Fuels, United States) | | | 3.0 | | |
Philip Morris International, Inc. (Tobacco, United States) | | | 2.8 | | |
Comcast Corp., Class A (Media, United States) | | | 2.8 | | |
Colgate-Palmolive Co. (Household Products, United States) | | | 2.7 | | |
Bank of New York Mellon Corp. (The) (Capital Markets, United States) | | | 2.6 | | |
Total | | | 40.3 | | |
* Holdings in cash, short-term commercial paper, long-term commercial paper and other short-term cash equivalents have been excluded.
** The Fund invests in gold and precious metals through investment in a wholly-owned subsidiary of the Fund organized under the laws of the Cayman Islands (the "Subsidiary"). Gold Bullion and commodities include the Fund's investment in the Subsidiary.
Percentages are based on total net assets.
First Eagle Funds | Semiannual Report | April 30, 2024
59
First Eagle U.S. Value Fund | Consolidated Schedule of Investments | April 30, 2024 (unaudited)
Investments | | Shares | | Value ($) | |
Common Stocks — 74.2% | |
Air Freight & Logistics — 2.9% | |
CH Robinson Worldwide, Inc. | | | 362,126 | | | | 25,710,946 | | |
Expeditors International of Washington, Inc. | | | 98,323 | | | | 10,944,333 | | |
| | | | 36,655,279 | | |
Banks — 1.1% | |
US Bancorp | | | 330,658 | | | | 13,434,635 | | |
Capital Markets — 3.5% | |
Bank of New York Mellon Corp. (The) | | | 589,455 | | | | 33,298,313 | | |
Charles Schwab Corp. (The) | | | 143,493 | | | | 10,611,307 | | |
| | | | 43,909,620 | | |
Chemicals — 1.3% | |
Nutrien Ltd. (Canada) | | | 158,929 | | | | 8,386,684 | | |
PPG Industries, Inc. | | | 37,210 | | | | 4,800,090 | | |
RPM International, Inc. | | | 30,241 | | | | 3,233,065 | | |
| | | | 16,419,839 | | |
Consumer Finance — 1.5% | |
American Express Co. | | | 78,997 | | | | 18,487,668 | | |
Consumer Staples Distribution & Retail — 0.7% | |
Walmart, Inc. | | | 159,034 | | | | 9,438,668 | | |
Electronic Equipment, Instruments & Components — 1.2% | |
IPG Photonics Corp.* | | | 178,742 | | | | 15,010,753 | | |
Energy Equipment & Services — 3.5% | |
Noble Corp. plc | | | 73,511 | | | | 3,262,418 | | |
NOV, Inc. | | | 999,361 | | | | 18,478,185 | | |
Schlumberger NV | | | 471,530 | | | | 22,388,244 | | |
| | | | 44,128,847 | | |
Entertainment — 1.0% | |
Walt Disney Co. (The) | | | 109,127 | | | | 12,124,010 | | |
Financial Services — 1.5% | |
Berkshire Hathaway, Inc., Class A* | | | 32 | | | | 19,184,000 | | |
Food Products — 0.8% | |
Kraft Heinz Co. (The) | | | 262,298 | | | | 10,127,326 | | |
Gas Utilities — 0.2% | |
UGI Corp. | | | 101,078 | | | | 2,583,554 | | |
First Eagle Funds | Semiannual Report | April 30, 2024
60
First Eagle U.S. Value Fund | Consolidated Schedule of Investments | April 30, 2024 (unaudited)
Investments | | Shares | | Value ($) | |
Health Care Equipment & Supplies — 3.4% | |
Becton Dickinson & Co. | | | 56,173 | | | | 13,178,186 | | |
Dentsply Sirona, Inc. | | | 362,850 | | | | 10,889,129 | | |
Medtronic plc | | | 233,051 | | | | 18,700,012 | | |
| | | | 42,767,327 | | |
Health Care Providers & Services — 9.2% | |
Elevance Health, Inc. | | | 73,259 | | | | 38,723,242 | | |
HCA Healthcare, Inc. | | | 157,427 | | | | 48,774,032 | | |
Universal Health Services, Inc., Class B | | | 170,425 | | | | 29,045,533 | | |
| | | | 116,542,807 | | |
Household Products — 2.6% | |
Colgate-Palmolive Co. | | | 365,303 | | | | 33,578,652 | | |
Insurance — 3.2% | |
Brown & Brown, Inc. | | | 85,039 | | | | 6,934,080 | | |
Fidelity National Financial, Inc. | | | 158,855 | | | | 7,863,322 | | |
Willis Towers Watson plc | | | 104,185 | | | | 26,165,021 | | |
| | | | 40,962,423 | | |
Interactive Media & Services — 7.3% | |
Alphabet, Inc., Class A* | | | 126,759 | | | | 20,633,830 | | |
Alphabet, Inc., Class C* | | | 188,322 | | | | 31,005,334 | | |
Meta Platforms, Inc., Class A | | | 95,714 | | | | 41,173,291 | | |
| | | | 92,812,455 | | |
Machinery — 3.7% | |
Cummins, Inc. | | | 73,903 | | | | 20,876,858 | | |
Deere & Co. | | | 20,543 | | | | 8,040,736 | | |
Flowserve Corp. | | | 378,708 | | | | 17,859,869 | | |
| | | | 46,777,463 | | |
Media — 2.8% | |
Comcast Corp., Class A | | | 920,308 | | | | 35,072,938 | | |
Metals & Mining — 2.8% | |
Agnico Eagle Mines Ltd. (Canada) | | | 82,024 | | | | 5,194,387 | | |
Barrick Gold Corp. (Canada) | | | 619,890 | | | | 10,314,970 | | |
Franco-Nevada Corp. (Canada) | | | 31,259 | | | | 3,762,933 | | |
Newmont Corp. | | | 278,379 | | | | 11,313,322 | | |
First Eagle Funds | Semiannual Report | April 30, 2024
61
First Eagle U.S. Value Fund | Consolidated Schedule of Investments | April 30, 2024 (unaudited)
Investments | | Shares | | Value ($) | |
Metals & Mining — 2.8% (continued) | |
Royal Gold, Inc. | | | 38,764 | | | | 4,656,719 | | |
| | | | 35,242,331 | | |
Office REITs — 0.9% | |
Boston Properties, Inc., REIT | | | 102,688 | | | | 6,355,360 | | |
Douglas Emmett, Inc., REIT | | | 359,380 | | | | 4,927,100 | | |
| | | | 11,282,460 | | |
Oil, Gas & Consumable Fuels — 3.5% | |
Exxon Mobil Corp. | | | 317,531 | | | | 37,554,392 | | |
ONEOK, Inc. | | | 88,869 | | | | 7,031,315 | | |
| | | | 44,585,707 | | |
Residential REITs — 1.5% | |
Equity Residential, REIT | | | 296,839 | | | | 19,116,432 | | |
Semiconductors & Semiconductor Equipment — 4.0% | |
Analog Devices, Inc. | | | 132,445 | | | | 26,569,791 | | |
Texas Instruments, Inc. | | | 137,787 | | | | 24,308,383 | | |
| | | | 50,878,174 | | |
Software — 5.4% | |
Microsoft Corp. | | | 22,886 | | | | 8,910,207 | | |
Oracle Corp. | | | 376,864 | | | | 42,868,280 | | |
Salesforce, Inc. | | | 61,730 | | | | 16,601,666 | | |
| | | | 68,380,153 | | |
Specialized REITs — 1.4% | |
Extra Space Storage, Inc., REIT | | | 42,904 | | | | 5,761,149 | | |
Weyerhaeuser Co., REIT | | | 401,701 | | | | 12,119,319 | | |
| | | | 17,880,468 | | |
Specialty Retail — 0.5% | |
Ross Stores, Inc. | | | 46,793 | | | | 6,062,033 | | |
Tobacco — 2.8% | |
Philip Morris International, Inc. | | | 372,296 | | | | 35,345,782 | | |
Total Common Stocks
(Cost $524,548,683) | | | 938,791,804 | | |
| | | Ounces | | | |
Commodities — 12.7% | |
Gold bullion*
(Cost $76,000,336) | | | 70,320 | | | | 161,127,602 | | |
First Eagle Funds | Semiannual Report | April 30, 2024
62
First Eagle U.S. Value Fund | Consolidated Schedule of Investments | April 30, 2024 (unaudited)
Investments | | Shares | | Value ($) | |
Master Limited Partnerships — 1.5% | |
Oil, Gas & Consumable Fuels — 1.5% | |
Enterprise Products Partners LP
(Cost $14,041,160) | | | 685,243 | | | | 19,241,623 | | |
| | | Principal Amount ($) | | | |
Corporate Bonds — 0.9% | |
Banks — 0.1% | |
Manufacturers & Traders Trust Co.
4.65%, 1/27/2026 | | | 1,205,000 | | | | 1,173,292 | | |
Financial Services — 0.2% | |
Mexico Remittances Funding
Fiduciary Estate Management Sarl
4.88%, 1/15/2028‡ (a) | | | 3,099,000 | | | | 2,795,581 | | |
Health Care Equipment & Supplies — 0.2% | |
Bausch & Lomb, Inc.
7.13%, 8/1/2028‡ | | | 600,000 | | | | 541,500 | | |
Embecta Corp.
5.00%, 2/15/2030 (a) | | | 3,000,000 | | | | 2,312,853 | | |
| | | | 2,854,353 | | |
Oil, Gas & Consumable Fuels — 0.4% | |
Enterprise Products Operating LLC
Series E, (CME Term SOFR 3 Month + 3.29%),
5.25%, 8/16/2077 (b) | | | 2,600,000 | | | | 2,438,782 | | |
(CME Term SOFR 3 Month + 2.83%),
5.38%, 2/15/2078 (b) | | | 2,750,000 | | | | 2,546,789 | | |
| | | | 4,985,571 | | |
Total Corporate Bonds
(Cost $11,946,172) | | | 11,808,797 | | |
Convertible Preferred Stocks — 0.4% | |
Banks — 0.4% | |
Bank of America Corp.
Series L, 7.25%, (c)
(Cost $5,693,463) | | | 4,250 | | | | 4,887,500 | | |
First Eagle Funds | Semiannual Report | April 30, 2024
63
First Eagle U.S. Value Fund | Consolidated Schedule of Investments | April 30, 2024 (unaudited)
Investments | | Principal Amount ($) | | Value ($) | |
Short-Term Investments — 10.4% | |
Commercial Paper — 7.4% | |
AES Corp. (The)
5.86%, 5/1/2024 (d) | | | 8,822,000 | | | | 8,820,559 | | |
Coca-Cola Co. (The)
5.28%, 7/1/2024 (d) | | | 10,000,000 | | | | 9,908,952 | | |
CVS Caremark Corp.
5.40%, 5/1/2024 (d) | | | 5,619,000 | | | | 5,618,159 | | |
Entergy Corp.
5.40%, 5/1/2024 (d) | | | 3,061,000 | | | | 3,060,542 | | |
General Motors Financial Co., Inc.
5.43%, 5/1/2024 (d) | | | 12,134,000 | | | | 12,132,165 | | |
Global Payments, Inc.
5.96%, 5/1/2024 (d) | | | 3,868,000 | | | | 3,867,358 | | |
Intel Corp.
5.56%, 6/20/2024 (d) | | | 10,000,000 | | | | 9,922,494 | | |
Johnson & Johnson
5.32%, 7/19/2024 (d) | | | 12,500,000 | | | | 12,352,500 | | |
Microsoft Corp.
5.36%, 5/29/2024 (a)(d) | | | 8,000,000 | | | | 7,965,915 | | |
PepsiCo, Inc.
5.35%, 6/13/2024 (d) | | | 10,000,000 | | | | 9,935,279 | | |
UnitedHealth Group, Inc.
5.37%, 8/1/2024 (d) | | | 10,000,000 | | | | 9,862,257 | | |
Total Commercial Paper
(Cost $93,466,223) | | | 93,446,180 | | |
| | | Shares | | | |
Investment Companies — 0.0% (e) | |
JP Morgan U.S. Government Money Market Fund,
Capital Shares 5.33% (f) (Cost $29,273) | | | 29,273 | | | | 29,273 | | |
First Eagle Funds | Semiannual Report | April 30, 2024
64
First Eagle U.S. Value Fund | Consolidated Schedule of Investments | April 30, 2024 (unaudited)
Investments | | Principal Amount ($) | | Value ($) | |
U.S. Treasury Obligations — 3.0% | |
U.S. Treasury Bills
5.17%, 5/9/2024 (d) | | | 5,000,000 | | | | 4,994,132 | | |
5.29%, 6/13/2024 (d) | | | 5,000,000 | | | | 4,968,558 | | |
5.14%, 7/18/2024 (d) | | | 9,000,000 | | | | 8,897,625 | | |
5.22%, 8/15/2024 (d) | | | 5,000,000 | | | | 4,923,224 | | |
5.22%, 9/5/2024 (d) | | | 5,000,000 | | | | 4,908,013 | | |
5.24%, 9/19/2024 (d) | | | 9,100,000 | | | | 8,914,396 | | |
Total U.S. Treasury Obligations
(Cost $37,619,323) | | | 37,605,948 | | |
Total Short-Term Investments
(Cost $131,114,819) | | | 131,081,401 | | |
Total Investments — 100.1%
(Cost $763,344,633) | | | 1,266,938,727 | | |
Liabilities in Excess of Other Assets — (0.1%) | | | (1,145,407 | ) | |
Net Assets — 100.0% | | | 1,265,793,320 | | |
* Non-income producing security.
‡ Value determined using significant unobservable inputs.
(a) Securities exempt from registration under Rule 144A or section 4(a)2 of the Securities Act of 1933. Total value of all such securities at April 30, 2024 amounted to $13,074,349, which represents approximately 1.03% of net assets of the Fund.
(b) Variable or floating rate security, linked to the referenced benchmark. The interest rate shown is the rate in effect as of April 30, 2024.
(c) Perpetual security. The rate reflected was the rate in effect on April 30, 2024. The maturity date reflects the next call date.
(d) The rate shown was the current yield as of April 30, 2024.
(e) Represents less than 0.05% of net assets.
(f) Represents 7-day effective yield as of April 30, 2024.
As of April 30, 2024, the gross unrealized appreciation (depreciation) of investments based on the aggregate cost of investment securities and derivative instruments, if applicable, for federal income tax purposes was as follows:
Aggregate gross unrealized appreciation | | $ | 529,949,820 | | |
Aggregate gross unrealized depreciation | | | (26,355,726 | ) | |
Net unrealized appreciation | | $ | 503,594,094 | | |
Federal income tax cost | | $ | 763,344,633 | | |
Abbreviations
REIT — Real Estate Investment Trust
See Notes to Financial Statements.
First Eagle Funds | Semiannual Report | April 30, 2024
65
Data as of April 30, 2024 (unaudited)
Investment Objective
The First Eagle Gold Fund is a non-diversified fund that seeks to provide investors the opportunity to participate in the investment characteristics of gold (and to a limited extent other precious metals) for a portion of their overall investment portfolio. In seeking to achieve its objective, the Fund invests at least 80% of its net assets (plus any borrowings for investment purposes) in gold, and/or securities directly related to gold or issuers principally engaged in the gold industry.
Average Annual Returns (%) | | | | | | One-Year | | Five-Years | | Ten-Years | |
First Eagle Gold Fund | | Class A | | without sales load | | | -1.29 | | | | 12.39 | | | | 4.32 | | |
| | | | | with sales load | | | -6.23 | | | | 11.24 | | | | 3.79 | | |
FTSE Gold Mines Index | | | | | | | -2.62 | | | | 8.06 | | | | 2.82 | | |
MSCI World Index | | | | | | | 18.39 | | | | 10.46 | | | | 8.87 | | |

Sectors* (%)
Materials | | 75.2 | |
Commodities | | 18.5 | |
Short-Term Investments | | 6.3 | |
Countries*~ (%)
Canada | | 54.5 | |
United States | | 27.4 | |
Australia | | 5.7 | |
South Africa | | 3.1 | |
United Kingdom | | 1.7 | |
Mexico | | 1.3 | |
Short-Term Investments | | 6.3 | |
* Asset Allocation, Sector and Countries percentages are based on total investments in the portfolio.
** Includes short-term commercial paper (6.3% of total investments) that settles in 90 days or less, long-term commercial paper (0.0% of total investments) that settles in 91 days or greater and other short-term investments (0.0% of total investments), such as U.S. treasury bills or money market funds.
~ Country allocations reflect country of risk (not currency of issue). Bonds of non-U.S. issuers may be U.S. dollar denominated.
The Fund's portfolio composition is subject to change at any time.
First Eagle Funds | Semiannual Report | April 30, 2024
66
First Eagle Gold Fund | Fund Overview
Growth of a $10,000 Initial Investment
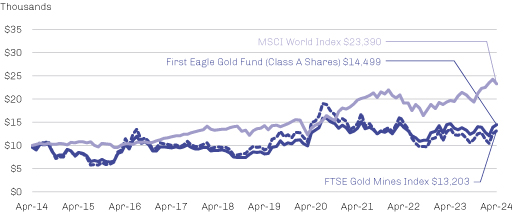
Performance data quoted herein represents past performance and should not be considered indicative of future results. Performance data quoted herein does not reflect the deduction of taxes that a shareholder would pay on Fund distributions or the sale of Fund shares. The average annual returns shown above are historical and reflect changes in share price, reinvested dividends and are net of expenses.
The average annual returns for Class A shares give effect to the deduction of the maximum sales charge of 5.00%.
The MSCI World Index captures large- and mid-cap representation across 23 developed markets countries. Developed markets countries include Australia, Austria, Belgium, Canada, Denmark, Finland, France, Germany, Hong Kong, Ireland, Israel, Italy, Japan, Netherlands, New Zealand, Norway, Portugal, Singapore, Spain, Sweden, Switzerland, the UK and the U.S. With 1,480 constituents, the index covers approximately 85% of the free float-adjusted market capitalization in each country. The FTSE Gold Mines Index is designed to reflect the performance of the worldwide market in the shares of companies whose principal activity is the mining of gold. The FTSE Gold Mines Index encompasses all gold mining companies that have a sustainable, attributable gold production of at least 300,000 ounces a year and that derive 51% or more of their revenue from mined gold. The Index is unmanaged, and includes dividends reinvested. One cannot invest directly in an index.
Top 10 Holdings* (%)
Gold bullion** (Precious Metal) | | | 17.5 | | |
Wheaton Precious Metals Corp. (Metals & Mining, Canada) | | | 14.2 | | |
Barrick Gold Corp. (Metals & Mining, Canada) | | | 11.5 | | |
Northern Star Resources Ltd. (Metals & Mining, Australia) | | | 5.7 | | |
Dundee Precious Metals, Inc. (Metals & Mining, Canada) | | | 4.9 | | |
Agnico Eagle Mines Ltd. (Metals & Mining, Canada) | | | 4.9 | | |
Alamos Gold, Inc., Class A (Metals & Mining, Canada) | | | 4.8 | | |
Royal Gold, Inc. (Metals & Mining, United States) | | | 4.6 | | |
Newmont Corp. (Metals & Mining, United States) | | | 4.3 | | |
Franco-Nevada Corp. (Metals & Mining, Canada) | | | 4.2 | | |
Total | | | 76.6 | | |
* Holdings in cash, short-term commercial paper, long-term commercial paper and other short-term cash equivalents have been excluded.
** The Fund invests in gold and precious metals through investment in a wholly-owned subsidiary of the Fund organized under the laws of the Cayman Islands (the "Subsidiary"). Gold Bullion and commodities include the Fund's investment in the Subsidiary.
Percentages are based on total net assets.
First Eagle Funds | Semiannual Report | April 30, 2024
67
First Eagle Gold Fund | Consolidated Schedule of Investments | April 30, 2024 (unaudited)
Investments | | Shares | | Value ($) | |
Common Stocks — 74.9% | |
Australia — 5.7% | |
Northern Star Resources Ltd. | | | 13,928,483 | | | | 132,024,378 | | |
Canada — 54.1% | |
Agnico Eagle Mines Ltd. | | | 1,793,824 | | | | 113,598,646 | | |
Alamos Gold, Inc., Class A | | | 7,665,172 | | | | 112,751,776 | | |
B2Gold Corp. | | | 17,553,298 | | | | 44,372,555 | | |
Barrick Gold Corp. | | | 16,161,427 | | | | 268,926,145 | | |
Dundee Precious Metals, Inc. (a) | | | 15,097,108 | | | | 114,271,504 | | |
Franco-Nevada Corp. | | | 821,800 | | | | 98,927,611 | | |
G Mining Ventures Corp.* | | | 4,988,627 | | | | 7,609,862 | | |
Kinross Gold Corp. | | | 3,900,000 | | | | 25,155,000 | | |
MAG Silver Corp.* (a) | | | 5,137,579 | | | | 63,181,791 | | |
Novagold Resources, Inc.* (a) | | | 17,740,710 | | | | 51,448,059 | | |
Orla Mining Ltd.* | | | 7,840,941 | | | | 30,471,823 | | |
Wheaton Precious Metals Corp. | | | 6,361,144 | | | | 331,670,049 | | |
| | | 1,262,384,821 | | |
Mexico — 1.3% | |
Fresnillo plc | | | 1,477,558 | | | | 10,233,246 | | |
Industrias Penoles SAB de CV* | | | 1,403,600 | | | | 20,369,744 | | |
| | | | 30,602,990 | | |
South Africa — 3.1% | |
Gold Fields Ltd., ADR | | | 4,469,810 | | | | 72,276,828 | | |
United Kingdom — 1.8% | |
Anglogold Ashanti plc | | | 1,766,965 | | | | 40,622,525 | | |
United States — 8.9% | |
Newmont Corp. | | | 2,473,906 | | | | 100,539,540 | | |
Royal Gold, Inc. | | | 891,278 | | | | 107,069,226 | | |
| | | | 207,608,766 | | |
Total Common Stocks
(Cost $1,172,073,110) | | | 1,745,520,308 | | |
| | | Ounces | | | |
Commodities — 18.4% | |
Gold bullion* | | | 178,417 | | | | 408,815,002 | | |
Silver bullion* | | | 806,263 | | | | 21,209,567 | | |
Total Commodities
(Cost $332,645,059) | | | 430,024,569 | | |
First Eagle Funds | Semiannual Report | April 30, 2024
68
First Eagle Gold Fund | Consolidated Schedule of Investments | April 30, 2024 (unaudited)
Investments | | Number of Rights | | Value ($) | |
Rights — 0.2% | |
Canada — 0.2% | |
Pan American Silver Corp., CVR, expiring 2/22/2029*
Cost $$45,973,716 | | | 6,835,667 | | | | 3,537,458 | | |
| | | Principal Amount ($) | | | |
Short-Term Investments — 6.3% | |
Commercial Paper — 6.3% | |
AES Corp. (The)
5.86%, 5/1/2024 (b) | | | 38,827,000 | | | | 38,820,658 | | |
CVS Caremark Corp.
5.40%, 5/1/2024 (b) | | | 24,729,000 | | | | 24,725,297 | | |
Entergy Corp.
5.40%, 5/1/2024 (b) | | | 13,473,000 | | | | 13,470,982 | | |
General Motors Financial Co., Inc.
5.43%, 5/1/2024 (b) | | | 53,403,000 | | | | 53,394,926 | | |
Global Payments, Inc.
5.96%, 5/1/2024 (b) | | | 17,025,000 | | | | 17,022,176 | | |
Total Commercial Paper
(Cost $147,457,000) | | | 147,434,039 | | |
| | | Shares | | | |
Investment Companies — 0.0% (c) | |
JP Morgan U.S. Government Money Market Fund,
Capital Shares 5.33% (d) (Cost $65,551) | | | 65,551 | | | | 65,551 | | |
Total Short-Term Investments
(Cost $147,522,551) | | | 147,499,590 | | |
Total Investments — 99.8%
(Cost $1,698,214,436) | | | 2,326,581,925 | | |
Other Assets Less Liabilities — 0.2% | | | 5,130,216 | | |
Net Assets — 100.0% | | | 2,331,712,141 | | |
* Non-income producing security.
(a) Affiliated company as defined under the Investment Company Act of 1940.
(b) The rate shown was the current yield as of April 30, 2024.
(c) Represents less than 0.05% of net assets.
(d) Represents 7-day effective yield as of April 30, 2024.
Abbreviations
ADR — American Depositary Receipt
CVR — Contingent Value Rights
First Eagle Funds | Semiannual Report | April 30, 2024
69
First Eagle Gold Fund | Consolidated Schedule of Investments | April 30, 2024 (unaudited)
As of April 30, 2024, the gross unrealized appreciation (depreciation) of investments based on the aggregate cost of investment securities and derivative instruments, if applicable, for federal income tax purposes was as follows:
Aggregate gross unrealized appreciation | | $ | 717,103,371 | | |
Aggregate gross unrealized depreciation | | | (88,735,882 | ) | |
Net unrealized appreciation | | $ | 628,367,489 | | |
Federal income tax cost | | $ | 1,698,214,436 | | |
Affiliated Securities
Security Description | | Shares at
April 30, 2024 | | Market Value
October 31, 2023 | | Purchases at
Cost | | Proceeds from
Sales | |
Common Stocks — 9.8% | |
Canada — 9.8% | |
Dundee Precious Metals, Inc. | | | 15,097,108 | | | $ | 93,341,751 | | | $ | 6,655,129 | | | $ | (784,914 | ) | |
MAG Silver Corp.*^ | | | 5,137,579 | | | | 54,322,011 | | | | 6,687,094 | | | | (11,382,104 | ) | |
Novagold Resources, Inc.* | | | 17,740,710 | | | | 62,447,299 | | | | — | | | | — | | |
Total Common Stocks | | | | | 210,111,061 | | | | 13,342,223 | | | | (12,167,018 | ) | |
Total | | | | $ | 210,111,061 | | | $ | 13,342,223 | | | $ | (12,167,018 | ) | |
Affiliated Securities (continued)
Security Description | | Net Realized
Gains
(Loss) | | Change in
Unrealized
Appreciation/
Depreciation | | Market Value
April 30, 2024 | | Dividend
Income | |
Common Stocks — 9.8% | |
Canada — 9.8% | |
Dundee Precious Metals, Inc. | | $ | 76,405 | | | $ | 14,983,133 | | | $ | 114,271,504 | | | $ | 1,036,632 | | |
MAG Silver Corp.*^ | | | (2,304,442 | ) | | | 15,859,232 | | | | 63,181,791 | | | | — | | |
Novagold Resources, Inc.* | | | — | | | | (10,999,240 | ) | | | 51,448,059 | | | | — | | |
Total Common Stocks | | | (2,228,037 | ) | | | 19,843,125 | | | | 228,901,354 | | | | 1,036,632 | | |
Total | | $ | (2,228,037 | ) | | $ | 19,843,125 | | | $ | 228,901,354 | | | $ | 1,036,632 | | |
* Non-income producing security.
^ Represents an unaffiliated issuer as of April 30, 2024.
See Notes to Financial Statements.
First Eagle Funds | Semiannual Report | April 30, 2024
70
This page was intentionally left blank.
First Eagle Global Income Builder Fund
Data as of April 30, 2024 (unaudited)
Investment Objective
The First Eagle Global Income Builder Fund seeks current income generation and long-term growth of capital. Fundamental research drives the identification of income-producing investment opportunities across all market environments.
Average Annual Returns (%) | | | | | | One-Year | | Five-Years | | Ten-Years | |
First Eagle Global Income Builder | | Class A | | without sales load | | | 3.35 | | | | 5.11 | | | | 4.27 | | |
| | | | with sales load | | | -1.86 | | | | 4.03 | | | | 3.74 | | |
Composite Index | | | | | | | 10.16 | | | | 6.41 | | | | 5.98 | | |
MSCI World Index | | | | | | | 18.39 | | | | 10.46 | | | | 8.87 | | |
Bloomberg U.S. Aggregate Index | | | | | | | -1.47 | | | | -0.16 | | | | 1.20 | | |
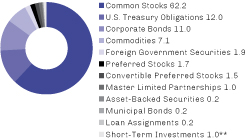
Sectors* (%)
Consumer Staples | | | 22.8 | | |
Financials | | | 13.2 | | |
U.S. Treasury Obligations | | | 12.0 | | |
Energy | | | 8.0 | | |
Industrials | | | 7.3 | | |
Health Care | | | 7.3 | | |
Commodities | | | 7.1 | | |
Materials | | | 4.8 | | |
Real Estate | | | 4.5 | | |
Consumer Discretionary | | | 4.5 | | |
Information Technology | | | 3.7 | | |
Foreign Government Securities | | | 1.9 | | |
Communication Services | | | 1.2 | | |
Utilities | | | 0.5 | | |
Asset-Backed Securities | | | 0.2 | | |
Short-Term Investments | | | 1.0 | | |
Countries*~ (%)
United States | | | 55.7 | | |
United Kingdom | | | 9.2 | | |
Canada | | | 5.1 | | |
Switzerland | | | 4.4 | | |
Mexico | | | 4.1 | | |
Japan | | | 3.2 | | |
Hong Kong | | | 3.1 | | |
South Korea | | | 2.4 | | |
France | | | 1.7 | | |
Brazil | | | 1.7 | | |
Germany | | | 1.6 | | |
Chile | | | 1.4 | | |
Netherlands | | | 1.0 | | |
Singapore | | | 0.9 | | |
Norway | | | 0.9 | | |
Thailand | | | 0.7 | | |
Sweden | | | 0.5 | | |
Taiwan | | | 0.4 | | |
Italy | | | 0.3 | | |
Australia | | | 0.2 | | |
Colombia | | | 0.2 | | |
Romania | | | 0.2 | | |
Saudi Arabia | | | 0.1 | | |
Poland | | | 0.0 | *** | |
Short-Term Investments | | | 1.0 | | |
* Asset Allocation, Sector and Countries percentages are based on total investments in the portfolio.
** Includes short-term commercial paper (1.0% of total investments) that settles in 90 days or less, long-term commercial paper (0.0% of total investments) that settles in 91 days or greater and other short-term investments (0.0% of total investments), such as U.S. treasury bills or money market funds.
*** Less than 0.05%.
~ Country allocations reflect country of risk (not currency of issue). Bonds of non-U.S. issuers may be U.S. dollar denominated.
The Fund's portfolio composition is subject to change at any time.
First Eagle Funds | Semiannual Report | April 30, 2024
72
First Eagle Global Income Builder Fund | Fund Overview
Growth of a $10,000 Initial Investment
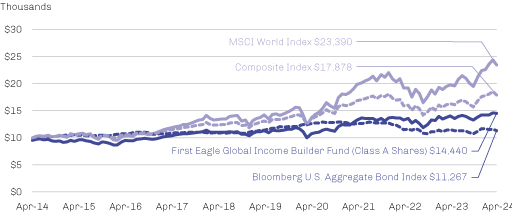
Performance data quoted herein represents past performance and should not be considered indicative of future results. Performance data quoted herein does not reflect the deduction of taxes that a shareholder would pay on Fund distributions or the sale of Fund shares. The average annual returns shown above are historical and reflect changes in share price, reinvested dividends and are net of expenses.
The average annual returns for Class A shares give effect to the deduction of the maximum sales charge of 5.00%.
The composite index consists of 60% of the MSCI World Index and 40% of the Bloomberg U.S. Aggregate Bond Index. The MSCI World Index captures large- and mid-cap representation across 23 developed markets countries. Developed markets countries include Australia, Austria, Belgium, Canada, Denmark, Finland, France, Germany, Hong Kong, Ireland, Israel, Italy, Japan, Netherlands, New Zealand, Norway, Portugal, Singapore, Spain, Sweden, Switzerland, the UK and the U.S. With 1,480 constituents, the index covers approximately 85% of the free float-adjusted market capitalization in each country. The Bloomberg U.S. Aggregate Bond Index is an unmanaged broad-based benchmark that measures the investment grade, U.S. dollar-denominated, fixed-rate taxable bond market, including Treasuries, government-related and corporate securities, fixed-rate agency MBS, ABS and CMBS (agency and non-agency). One cannot invest directly in an index.
Top 10 Holdings* (%)
Gold bullion (Precious Metal) | | | 7.1 | | |
Exxon Mobil Corp. (Oil, Gas & Consumable Fuels, United States) | | | 2.9 | | |
Unilever plc (Personal Care Products, United Kingdom) | | | 2.7 | | |
British American Tobacco plc (Tobacco, United Kingdom) | | | 2.2 | | |
Nestle SA (Registered) (Food Products, Switzerland) | | | 2.0 | | |
Colgate-Palmolive Co. (Household Products, United States) | | | 2.0 | | |
Philip Morris International, Inc. (Tobacco, United States) | | | 1.9 | | |
Jardine Matheson Holdings Ltd. (Industrial Conglomerates, Hong Kong) | | | 1.6 | | |
KT&G Corp. (Tobacco, South Korea) | | | 1.6 | | |
Power Corp. of Canada (Insurance, Canada) | | | 1.4 | | |
Total | | | 25.4 | | |
* Holdings in cash, short-term commercial paper, long-term commercial paper and other short-term cash equivalents have been excluded.
Percentages are based on total net assets.
First Eagle Funds | Semiannual Report | April 30, 2024
73
First Eagle Global Income Builder Fund | Schedule of Investments | April 30, 2024 (unaudited)
Investments | | Shares | | Value ($) | |
Common Stocks — 61.8% | |
Brazil — 1.4% | |
Ambev SA, ADR | | | 7,643,841 | | | | 17,733,711 | | |
Itausa SA (Preference) | | | 3,672,034 | | | | 6,760,514 | | |
| | | 24,494,225 | | |
Canada — 4.2% | |
Agnico Eagle Mines Ltd. | | | 16,806 | | | | 1,064,284 | | |
Barrick Gold Corp. | | | 90,496 | | | | 1,505,853 | | |
Franco-Nevada Corp. | | | 32,962 | | | | 3,968,625 | | |
Franco-Nevada Corp. | | | 42,649 | | | | 5,134,052 | | |
Imperial Oil Ltd. | | | 238,922 | | | | 16,426,810 | | |
Nutrien Ltd. | | | 87,298 | | | | 4,606,715 | | |
Power Corp. of Canada | | | 883,284 | | | | 23,534,564 | | |
Wheaton Precious Metals Corp. (a) | | | 281,516 | | | | 14,678,244 | | |
| | | 70,919,147 | | |
Chile — 1.4% | |
Cia Cervecerias Unidas SA, ADR | | | 1,327,830 | | | | 16,066,743 | | |
Quinenco SA | | | 2,083,758 | | | | 7,259,999 | | |
| | | | 23,326,742 | | |
France — 1.7% | |
Danone SA | | | 107,035 | | | | 6,699,034 | | |
Sanofi SA | | | 161,273 | | | | 15,932,646 | | |
Sodexo SA | | | 54,727 | | | | 4,765,270 | | |
Wendel SE | | | 19,995 | | | | 2,039,006 | | |
| | | 29,435,956 | | |
Germany — 1.3% | |
FUCHS SE (Preference) | | | 341,114 | | | | 15,929,778 | | |
Henkel AG & Co. KGaA (Preference) | | | 81,279 | | | | 6,456,947 | | |
| | | | 22,386,725 | | |
Hong Kong — 3.1% | |
CK Asset Holdings Ltd. | | | 2,483,000 | | | | 10,591,426 | | |
Great Eagle Holdings Ltd. | | | 1,203,774 | | | | 1,837,548 | | |
Hongkong Land Holdings Ltd. | | | 2,934,100 | | | | 9,374,979 | | |
Hysan Development Co. Ltd. | | | 1,027,083 | | | | 1,600,795 | | |
Jardine Matheson Holdings Ltd. | | | 720,400 | | | | 27,641,748 | | |
Mandarin Oriental International Ltd. | | | 1,047,200 | | | | 1,764,532 | | |
| | | | 52,811,028 | | |
First Eagle Funds | Semiannual Report | April 30, 2024
74
First Eagle Global Income Builder Fund | Schedule of Investments | April 30, 2024 (unaudited)
Investments | | Shares | | Value ($) | |
Japan — 3.1% | |
FANUC Corp. | | | 294,600 | | | | 8,725,845 | | |
MS&AD Insurance Group Holdings, Inc. | | | 471,200 | | | | 8,471,726 | | |
Nagaileben Co. Ltd. | | | 22,700 | | | | 338,632 | | |
Nohmi Bosai Ltd. | | | 70,300 | | | | 1,069,966 | | |
Secom Co. Ltd. | | | 176,700 | | | | 12,274,024 | | |
Shimano, Inc. | | | 91,300 | | | | 14,837,438 | | |
Sompo Holdings, Inc. | | | 204,800 | | | | 4,053,019 | | |
USS Co. Ltd. | | | 429,800 | | | | 3,283,369 | | |
| | | | 53,054,019 | | |
Mexico — 3.1% | |
Bolsa Mexicana de Valores SAB de CV | | | 403,523 | | | | 758,015 | | |
Coca-Cola Femsa SAB de CV, ADR (a) | | | 187,816 | | | | 18,621,956 | | |
Fomento Economico Mexicano SAB de CV, ADR (a) | | | 153,196 | | | | 18,025,041 | | |
GMexico Transportes SAB de CV (b) | | | 1,116,309 | | | | 2,382,398 | | |
Grupo Mexico SAB de CV, Series B | | | 2,026,562 | | | | 12,522,020 | | |
| | | | 52,309,430 | | |
Netherlands — 1.0% | |
HAL Trust | | | 40,521 | | | | 5,353,447 | | |
Heineken Holding NV | | | 113,543 | | | | 9,133,849 | | |
Pluxee NV* | | | 54,727 | | | | 1,687,310 | | |
| | | | 16,174,606 | | |
Norway — 0.9% | |
Orkla ASA | | | 2,142,238 | | | | 14,572,380 | | |
Singapore — 0.6% | |
United Overseas Bank Ltd. | | | 316,000 | | | | 7,012,294 | | |
UOL Group Ltd. | | | 764,200 | | | | 3,262,945 | | |
| | | | 10,275,239 | | |
South Korea — 2.2% | |
KT&G Corp. | | | 419,335 | | | | 27,020,182 | | |
Samsung Electronics Co. Ltd. (Preference) | | | 227,622 | | | | 10,627,926 | | |
| | | | 37,648,108 | | |
Sweden — 0.5% | |
Svenska Handelsbanken AB, Class A | | | 996,753 | | | | 8,547,483 | | |
First Eagle Funds | Semiannual Report | April 30, 2024
75
First Eagle Global Income Builder Fund | Schedule of Investments | April 30, 2024 (unaudited)
Investments | | Shares | | Value ($) | |
Switzerland — 4.4% | |
Cie Financiere Richemont SA (Registered) | | | 168,707 | | | | 23,319,867 | | |
Nestle SA (Registered) | | | 340,778 | | | | 34,214,179 | | |
Schindler Holding AG | | | 61,668 | | | | 15,371,145 | | |
Schindler Holding AG (Registered) | | | 7,544 | | | | 1,838,124 | | |
| | | 74,743,315 | | |
Taiwan — 0.4% | |
Taiwan Semiconductor Manufacturing Co. Ltd., ADR (a) | | | 47,844 | | | | 6,570,895 | | |
Thailand — 0.7% | |
Bangkok Bank PCL, NVDR | | | 1,467,900 | | | | 5,415,683 | | |
Thai Beverage PCL | | | 17,954,100 | | | | 6,501,447 | | |
| | | | 11,917,130 | | |
United Kingdom — 9.0% | |
BAE Systems plc | | | 807,624 | | | | 13,432,577 | | |
Berkeley Group Holdings plc | | | 222,665 | | | | 13,076,144 | | |
British American Tobacco plc | | | 1,251,219 | | | | 36,731,132 | | |
Diageo plc | | | 124,310 | | | | 4,296,114 | | |
Great Portland Estates plc, REIT | | | 327,228 | | | | 1,602,840 | | |
Haleon plc | | | 4,109,584 | | | | 17,356,183 | | |
Lloyds Banking Group plc | | | 11,546,087 | | | | 7,451,654 | | |
Reckitt Benckiser Group plc | | | 239,281 | | | | 13,377,484 | | |
Unilever plc | | | 871,901 | | | | 45,101,853 | | |
| | | 152,425,981 | | |
United States — 22.8% | |
Analog Devices, Inc. (a) | | | 73,648 | | | | 14,774,525 | | |
Bank of New York Mellon Corp. (The) (a) | | | 258,634 | | | | 14,610,235 | | |
Becton Dickinson & Co. (a) | | | 75,146 | | | | 17,629,252 | | |
Boston Properties, Inc., REIT (a) | | | 125,907 | | | | 7,792,384 | | |
CH Robinson Worldwide, Inc. | | | 150,984 | | | | 10,719,864 | | |
Colgate-Palmolive Co. (a) | | | 359,338 | | | | 33,030,349 | | |
Comcast Corp., Class A (a) | | | 541,473 | | | | 20,635,536 | | |
Douglas Emmett, Inc., REIT | | | 366,396 | | | | 5,023,289 | | |
Elevance Health, Inc. | | | 17,617 | | | | 9,311,994 | | |
Equity Residential, REIT | | | 345,193 | | | | 22,230,429 | | |
Exxon Mobil Corp. (a) | | | 412,370 | | | | 48,771,000 | | |
Fidelity National Financial, Inc. | | | 84,603 | | | | 4,187,848 | | |
First Eagle Funds | Semiannual Report | April 30, 2024
76
First Eagle Global Income Builder Fund | Schedule of Investments | April 30, 2024 (unaudited)
Investments | | Shares | | Value ($) | |
United States — 22.8% (continued) | |
Fidelity National Information Services, Inc. (a) | | | 51,600 | | | | 3,504,672 | | |
General Dynamics Corp. (a) | | | 7,297 | | | | 2,094,896 | | |
HCA Healthcare, Inc. (a) | | | 75,005 | | | | 23,238,049 | | |
IDACORP, Inc. | | | 62,953 | | | | 5,966,685 | | |
Kraft Heinz Co. (The) | | | 133,886 | | | | 5,169,338 | | |
Linde plc (a) | | | 6,853 | | | | 3,021,899 | | |
Medtronic plc | | | 224,887 | | | | 18,044,933 | | |
ONEOK, Inc. (a) | | | 126,214 | | | | 9,986,052 | | |
Oracle Corp. (a) | | | 29,638 | | | | 3,371,322 | | |
Philip Morris International, Inc. (a) | | | 345,552 | | | | 32,806,707 | | |
Royal Gold, Inc. (a) | | | 90,423 | | | | 10,862,515 | | |
Schlumberger NV | | | 153,224 | | | | 7,275,076 | | |
Texas Instruments, Inc. (a) | | | 121,579 | | | | 21,448,967 | | |
Truist Financial Corp. | | | 44 | | | | 1,652 | | |
UGI Corp. | | | 38,944 | | | | 995,409 | | |
Universal Health Services, Inc., Class B (a) | | | 19,258 | | | | 3,282,141 | | |
US Bancorp (a) | | | 326,193 | | | | 13,253,222 | | |
Walmart, Inc. (a) | | | 140,933 | | | | 8,364,374 | | |
Weyerhaeuser Co., REIT (a) | | | 129,131 | | | | 3,895,882 | | |
| | | 385,300,496 | | |
Total Common Stocks
(Cost $937,101,921) | | | 1,046,912,905 | | |
| | | Principal Amount ($) | | | |
U.S. Treasury Obligations — 11.9% | |
U.S. Treasury Bonds
6.63%, 2/15/2027 | | | 7,350,000 | | | | 7,702,283 | | |
6.13%, 11/15/2027 | | | 21,467,400 | | | | 22,375,572 | | |
U.S. Treasury Inflation Linked Notes
0.13%, 7/15/2024 | | | 13,800,000 | | | | 18,051,696 | | |
0.25%, 1/15/2025 | | | 11,300,000 | | | | 14,556,336 | | |
0.38%, 7/15/2025 | | | 13,375,000 | | | | 17,096,030 | | |
0.13%, 4/15/2027 | | | 14,230,800 | | | | 14,603,539 | | |
1.25%, 4/15/2028 | | | 13,225,000 | | | | 13,100,701 | | |
First Eagle Funds | Semiannual Report | April 30, 2024
77
First Eagle Global Income Builder Fund | Schedule of Investments | April 30, 2024 (unaudited)
Investments | | Principal Amount ($) | | Value ($) | |
U.S. Treasury Obligations — 11.9% (continued) | |
U.S. Treasury Notes
3.00%, 7/31/2024 | | | 4,300,000 | | | | 4,274,133 | | |
1.75%, 12/31/2024 | | | 17,647,000 | | | | 17,238,913 | | |
1.75%, 3/15/2025 | | | 10,680,000 | | | | 10,360,643 | | |
2.75%, 6/30/2025 | | | 17,750,000 | | | | 17,259,795 | | |
0.38%, 12/31/2025 | | | 21,807,700 | | | | 20,170,419 | | |
1.75%, 12/31/2026 | | | 9,260,000 | | | | 8,536,201 | | |
4.63%, 9/30/2028 | | | 3,350,000 | | | | 3,331,025 | | |
3.38%, 5/15/2033 | | | 12,050,000 | | | | 10,890,187 | | |
3.88%, 8/15/2033 | | | 2,700,000 | | | | 2,534,625 | | |
| | | | 202,082,098 | | |
Total U.S. Treasury Obligations
(Cost 205,514,453) | | | 202,082,098 | | |
Corporate Bonds — 10.9% | |
Australia — 0.2% | |
Coronado Finance Pty. Ltd.
10.75%, 5/15/2026 (c) | | | 1,459,000 | | | | 1,508,741 | | |
Nufarm Australia Ltd.
5.00%, 1/27/2030 (c) | | | 2,595,000 | | | | 2,369,032 | | |
| | | | 3,877,773 | | |
Canada — 0.8% | |
Nutrien Ltd.
4.90%, 3/27/2028 | | | 866,000 | | | | 847,521 | | |
TransCanada PipeLines Ltd.
(United States SOFR Compounded Index + 1.52%),
6.88%, 3/9/2026 (d) | | | 4,400,000 | | | | 4,404,385 | | |
Transcanada Trust
Series 16-A,
5.88%, 8/15/2076 | | | 9,142,000 | | | | 8,763,992 | | |
| | | | 14,015,898 | | |
Germany — 0.3% | |
IHO Verwaltungs GmbH
4.75%, (4.75% Cash or 5.50% PIK), 9/15/2026 (c)(e) | | | 3,879,000 | | | | 3,735,379 | | |
6.00%, (6.00% Cash or 6.75% PIK), 5/15/2027 (c)(e) | | | 1,336,632 | | | | 1,313,311 | | |
| | | | 5,048,690 | | |
First Eagle Funds | Semiannual Report | April 30, 2024
78
First Eagle Global Income Builder Fund | Schedule of Investments | April 30, 2024 (unaudited)
Investments | | Principal Amount ($) | | Value ($) | |
Mexico — 0.6% | |
Mexico Remittances Funding Fiduciary
Estate Management Sarl
4.88%, 1/15/2028‡ (c) | | | 11,835,000 | | | | 10,676,250 | | |
Poland — 0.0% (f) | |
Canpack SA
3.13%, 11/1/2025 (c) | | | 420,000 | | | | 401,600 | | |
United Kingdom — 0.2% | |
BAT Capital Corp.
3.22%, 9/6/2026 | | | 2,425,000 | | | | 2,294,182 | | |
United States — 8.8% | |
ACCO Brands Corp.
4.25%, 3/15/2029 (c) | | | 6,858,000 | | | | 5,963,665 | | |
American Airlines, Inc.
5.50%, 4/20/2026 (c) | | | 2,845,222 | | | | 2,812,215 | | |
5.75%, 4/20/2029 (c) | | | 502,000 | | | | 484,798 | | |
AMN Healthcare, Inc.
4.63%, 10/1/2027 (c) | | | 2,959,000 | | | | 2,779,483 | | |
Aramark Services, Inc.
5.00%, 2/1/2028 (c) | | | 1,800,000 | | | | 1,709,070 | | |
Ball Corp.
6.88%, 3/15/2028 | | | 4,152,000 | | | | 4,217,368 | | |
Bank of New York Mellon Corp. (The)
Series I, (US Treasury Yield Curve Rate T Note
Constant Maturity 5 Year + 2.63%), 3.75%,
12/20/2026 (d)(g) | | | 9,889,000 | | | | 8,886,315 | | |
Boston Properties LP
REIT, 3.20%, 1/15/2025 | | | 1,817,000 | | | | 1,781,443 | | |
Carnival Corp.
4.00%, 8/1/2028 (c) | | | 1,206,000 | | | | 1,102,653 | | |
Centene Corp.
4.25%, 12/15/2027 | | | 2,873,000 | | | | 2,709,271 | | |
4.63%, 12/15/2029 | | | 450,000 | | | | 419,048 | | |
Charles River Laboratories International, Inc.
4.25%, 5/1/2028 (c) | | | 2,282,000 | | | | 2,122,523 | | |
3.75%, 3/15/2029 (c) | | | 1,522,000 | | | | 1,367,195 | | |
CITGO Petroleum Corp.
7.00%, 6/15/2025 (c) | | | 9,457,000 | | | | 9,447,304 | | |
6.38%, 6/15/2026 (c) | | | 5,182,000 | | | | 5,173,978 | | |
First Eagle Funds | Semiannual Report | April 30, 2024
79
First Eagle Global Income Builder Fund | Schedule of Investments | April 30, 2024 (unaudited)
Investments | | Principal Amount ($) | | Value ($) | |
United States — 8.8% (continued) | |
Crown Americas LLC
4.75%, 2/1/2026 | | | 875,000 | | | | 856,215 | | |
5.25%, 4/1/2030 | | | 900,000 | | | | 857,592 | | |
CVS Health Corp.
3.88%, 7/20/2025 | | | 875,000 | | | | 855,851 | | |
1.30%, 8/21/2027 | | | 1,000,000 | | | | 874,970 | | |
4.30%, 3/25/2028 | | | 850,000 | | | | 815,620 | | |
DT Midstream, Inc.
4.13%, 6/15/2029 (c) | | | 2,433,000 | | | | 2,205,195 | | |
Edgewell Personal Care Co.
5.50%, 6/1/2028 (c) | | | 1,770,000 | | | | 1,707,980 | | |
4.13%, 4/1/2029 (c) | | | 1,557,000 | | | | 1,407,312 | | |
Embecta Corp.
5.00%, 2/15/2030 (c) | | | 4,893,000 | | | | 3,772,264 | | |
6.75%, 2/15/2030 (c) | | | 2,292,000 | | | | 1,959,206 | | |
Enterprise Products Operating LLC
Series E, (CME Term SOFR 3 Month + 3.29%),
5.25%, 8/16/2077 (d) | | | 3,600,000 | | | | 3,376,775 | | |
Fair Isaac Corp.
4.00%, 6/15/2028 (c) | | | 2,764,000 | | | | 2,545,829 | | |
GE HealthCare Technologies, Inc.
5.60%, 11/15/2025 | | | 2,525,000 | | | | 2,520,950 | | |
HCA, Inc.
5.38%, 2/1/2025 | | | 4,401,000 | | | | 4,381,269 | | |
5.88%, 2/15/2026 | | | 3,449,000 | | | | 3,450,605 | | |
3.50%, 9/1/2030 | | | 2,788,000 | | | | 2,458,073 | | |
Iron Mountain, Inc.
REIT, 4.88%, 9/15/2027 (c) | | | 3,609,000 | | | | 3,444,156 | | |
REIT, 5.25%, 3/15/2028 (c) | | | 1,005,000 | | | | 961,593 | | |
REIT, 5.00%, 7/15/2028 (c) | | | 1,596,000 | | | | 1,504,045 | | |
REIT, 4.88%, 9/15/2029 (c) | | | 1,322,000 | | | | 1,219,897 | | |
JPMorgan Chase & Co.
(SOFR + 0.92%), 2.60%, 2/24/2026 (d) | | | 1,750,000 | | | | 1,703,868 | | |
KeyBank NA
4.15%, 8/8/2025 | | | 2,575,000 | | | | 2,499,573 | | |
KFC Holding Co.
4.75%, 6/1/2027 (c) | | | 2,322,000 | | | | 2,241,111 | | |
Kraft Heinz Foods Co.
3.00%, 6/1/2026 | | | 1,800,000 | | | | 1,718,183 | | |
First Eagle Funds | Semiannual Report | April 30, 2024
80
First Eagle Global Income Builder Fund | Schedule of Investments | April 30, 2024 (unaudited)
Investments | | Principal Amount ($) | | Value ($) | |
United States — 8.8% (continued) | |
Laboratory Corp. of America Holdings
3.60%, 2/1/2025 | | | 2,625,000 | | | | 2,579,510 | | |
Lamb Weston Holdings, Inc.
4.13%, 1/31/2030 (c) | | | 2,583,000 | | | | 2,302,235 | | |
Manufacturers & Traders Trust Co.
4.65%, 1/27/2026 | | | 3,480,000 | | | | 3,388,428 | | |
4.70%, 1/27/2028 | | | 3,825,000 | | | | 3,621,235 | | |
Mileage Plus Holdings LLC
6.50%, 6/20/2027 (c) | | | 3,535,717 | | | | 3,541,688 | | |
MSCI, Inc.
4.00%, 11/15/2029 (c) | | | 4,725,000 | | | | 4,269,798 | | |
PRA Group, Inc.
7.38%, 9/1/2025 (c) | | | 2,123,000 | | | | 2,113,182 | | |
Roller Bearing Co. of America, Inc.
4.38%, 10/15/2029 (c) | | | 4,405,000 | | | | 3,981,082 | | |
Scripps Escrow II, Inc.
5.38%, 1/15/2031 (c) | | | 1,202,000 | | | | 709,216 | | |
Service Corp. International
4.63%, 12/15/2027 | | | 1,749,000 | | | | 1,664,811 | | |
5.13%, 6/1/2029 | | | 857,000 | | | | 818,262 | | |
Teleflex, Inc.
4.63%, 11/15/2027 | | | 2,919,000 | | | | 2,779,401 | | |
4.25%, 6/1/2028 (c) | | | 782,000 | | | | 722,624 | | |
Truist Financial Corp.
Series N, (US Treasury Yield Curve Rate T Note
Constant Maturity 5 Year + 3.00%),
4.80%, 9/1/2024 (d)(g) | | | 14,157,000 | | | | 13,697,172 | | |
WESCO Distribution, Inc.
7.25%, 6/15/2028 (c) | | | 2,136,000 | | | | 2,169,789 | | |
| | | | 148,672,894 | | |
Total Corporate Bonds
(Cost 187,983,534) | | | 184,987,287 | | |
| | | Ounces | | | |
Commodities — 7.1% | |
Gold bullion*
(Cost $64,357,110) | | | 52,290 | | | | 119,814,964 | | |
First Eagle Funds | Semiannual Report | April 30, 2024
81
First Eagle Global Income Builder Fund | Schedule of Investments | April 30, 2024 (unaudited)
Investments | | Principal Amount ($) | | Value ($) | |
Foreign Government Securities — 1.9% | |
Brazil — 0.3% | |
Notas do Tesouro Nacional
10.00%, 1/1/2025 | | BRL | 24,000,000 | | | | 4,605,107 | | |
Canada — 0.0% (f) | |
Province of Quebec
2.50%, 4/20/2026 | | | 893,000 | | | | 848,179 | | |
Colombia — 0.2% | |
Republic of Colombia
3.00%, 1/30/2030 | | | 4,290,000 | | | | 3,441,015 | | |
Italy — 0.3% | |
Republic of Italy
2.38%, 10/17/2024 | | | 5,300,000 | | | | 5,215,825 | | |
Mexico — 0.4% | |
Mex Bonos Desarr Fix Rt
Series M, 5.75%, 3/5/2026 | | MXN | 111,800,000 | | | | 5,987,206 | | |
Romania — 0.1% | |
Romania Government Bond
6.63%, 2/17/2028 (c) | | | 2,450,000 | | | | 2,478,175 | | |
Saudi Arabia — 0.1% | |
Kingdom of Saudi Arabia
4.75%, 1/18/2028 (c) | | | 1,750,000 | | | | 1,716,978 | | |
Singapore — 0.3% | |
Republic of Singapore
1.25%, 11/1/2026 | | SGD | 7,592,000 | | | | 5,264,706 | | |
South Korea — 0.2% | |
Republic of Korea
1.25%, 3/10/2026 | | KRW | 4,480,550,000 | | | | 3,110,490 | | |
Total Foreign Government Securities
(Cost 33,547,409) | | | 32,667,681 | | |
| | | Shares | | | |
Preferred Stocks — 1.7% | |
United States — 1.7% | |
Charles Schwab Corp. (The)
Series D, 5.95%, (g) | | | 46,239 | | | | 1,151,351 | | |
General American Investors Co., Inc.
Series B, 5.95%, (g) | | | 4,712 | | | | 116,672 | | |
First Eagle Funds | Semiannual Report | April 30, 2024
82
First Eagle Global Income Builder Fund | Schedule of Investments | April 30, 2024 (unaudited)
Investments | | Shares | | Value ($) | |
United States — 1.7% (continued) | |
MetLife, Inc.
Series A, (SOFR + 1.00%, 4.00% Floor),
6.59%, (d)(g) | | | 128,986 | | | | 3,125,331 | | |
Northern Trust Corp.
Series E, 4.70%, (g) | | | 135,349 | | | | 2,815,259 | | |
State Street Corp.
Series G, 5.35%, (d)(g) | | | 100,371 | | | | 2,386,822 | | |
Truist Financial Corp.
Series R, 4.75%, (g) | | | 499,123 | | | | 9,897,609 | | |
US Bancorp
Series A, (CME Term SOFR 3 Month + 1.28%),
6.61%, (d)(g) | | | 5,200 | | | | 4,482,400 | | |
Series B, (CME Term SOFR 3 Month + 0.86%, 1.02% Floor),
6.19%, (d)(g) | | | 213,750 | | | | 4,253,625 | | |
Total Preferred Stocks
(Cost 30,261,458) | | | 28,229,069 | | |
| | | Principal Amount ($) | | | |
Convertible Preferred Stocks — 1.5% | |
United States — 1.5% | |
Bank of America Corp.
Series L, 7.25%, (g) | | | 10,496 | | | | 12,070,400 | | |
Wells Fargo & Co.
Series L, 7.50%, (g) | | | 11,123 | | | | 12,740,729 | | |
Total Convertible Preferred Stocks
(Cost 30,438,618) | | | 24,811,129 | | |
| | | Shares | | | |
Master Limited Partnerships — 1.0% | |
United States — 1.0% | |
Enterprise Products Partners LP (Cost $11,024,328) | | | 612,186 | | | | 17,190,183 | | |
| | | Principal Amount ($) | | | |
Municipal Bonds — 0.2% | |
New York — 0.2% | |
Oneida Indian Nation of New York,
Revenue, Series 2024 A, 8.00%, 09/01/2040 (c)
(Cost $2,933,062) | | | 3,000,000 | | | | 2,848,398 | | |
First Eagle Funds | Semiannual Report | April 30, 2024
83
First Eagle Global Income Builder Fund | Schedule of Investments | April 30, 2024 (unaudited)
Investments | | Principal Amount ($) | | Value ($) | |
Loan Assignments — 0.2% | |
United States — 0.2% | |
Aramark Intermediate HoldCo Corp., Term Loan B-7
(SOFR 1 month + 2.00%),
7.32%, 4/6/2028 (d) (Cost $2,500,000) | | | 2,500,000 | | | | 2,504,437 | | |
Asset-Backed Securities — 0.2% | |
United States — 0.2% | |
United Airlines Pass-Through Trust
Series 2020-1, Class A,
5.88%, 10/15/2027 (Cost $3,647,663) | | | 3,661,121 | | | | 3,651,070 | | |
Short-Term Investments — 1.0% | |
Commercial Paper — 1.0% | |
AES Corp. (The)
5.86%, 5/1/2024 (h) | | | 4,325,000 | | | | 4,324,294 | | |
CVS Caremark Corp.
5.40%, 5/1/2024 (h) | | | 2,755,000 | | | | 2,754,587 | | |
Entergy Corp.
5.40%, 5/1/2024 (h) | | | 1,501,000 | | | | 1,500,775 | | |
General Motors Financial Co., Inc.
5.43%, 5/1/2024 (h) | | | 5,949,000 | | | | 5,948,101 | | |
Global Payments, Inc.
5.96%, 5/1/2024 (h) | | | 1,896,000 | | | | 1,895,685 | | |
Total Commercial Paper
(Cost $16,426,000) | | | 16,423,442 | | |
| | | Shares | | | |
Investment Companies — 0.0% (f) | |
JP Morgan U.S. Government Money Market Fund,
Capital Shares 5.33% (i) (Cost $4,527) | | | 4,527 | | | | 4,527 | | |
Total Short-Term Investments
(Cost $16,430,527) | | | 16,427,969 | | |
Total Investments — 99.4%
(Cost $1,525,740,083) | | | 1,682,127,190 | | |
Other Assets Less Liabilities — 0.6% | | | 10,648,173 | | |
Net Assets — 100.0% | | | 1,692,775,363 | | |
* Non-income producing security.
‡ Value determined using significant unobservable inputs.
First Eagle Funds | Semiannual Report | April 30, 2024
84
First Eagle Global Income Builder Fund | Schedule of Investments | April 30, 2024 (unaudited)
(a) All or a portion of the security pledged as collateral for call options written.
(b) Security exempt from registration pursuant to Regulation S under the Securities Act of 1933. Regulation S applies to securities offerings that are made outside of the United States and do not involve direct selling efforts in the United States and as such may have restrictions on resale.
(c) Securities exempt from registration under Rule 144A or section 4(a)2 of the Securities Act of 1933. Total value of all such securities at April 30, 2024 amounted to $102,788,950, which represents approximately 6.07% of net assets of the Fund.
(d) Variable or floating rate security, linked to the referenced benchmark. The interest rate shown is the rate in effect as of April 30, 2024.
(e) Security has the ability to pay in kind ("PIK") or pay income in cash. When applicable, separate rates of such payments are disclosed.
(f) Represents less than 0.05% of net assets.
(g) Perpetual security. The rate reflected was the rate in effect on April 30, 2024. The maturity date reflects the next call date.
(h) The rate shown was the current yield as of April 30, 2024.
(i) Represents 7-day effective yield as of April 30, 2024.
As of April 30, 2024, the gross unrealized appreciation (depreciation) of investments based on the aggregate cost of investment securities and derivative instruments, if applicable, for federal income tax purposes was as follows:
Aggregate gross unrealized appreciation | | $ | 261,801,797 | | |
Aggregate gross unrealized depreciation | | | (104,923,344 | ) | |
Net unrealized appreciation | | $ | 156,878,453 | | |
Federal income tax cost | | $ | 1,525,740,083 | | |
Forward Foreign Currency Exchange Contracts outstanding as of April 30, 2024
Currency
Purchased | | Currency Sold | | Counterparty | | Settlement
Date | | Unrealized
Appreciation
(Depreciation) | |
USD | 7,645,237 | | | EUR | 6,993,000 | | | JPMorgan Chase Bank | | 6/5/2024 | | $ | 171,768 | | |
USD | 3,084,780 | | | GBP | 2,436,000 | | | JPMorgan Chase Bank | | 6/5/2024 | | | 40,318 | | |
USD | 1,481,047 | | | JPY | 215,071,000 | | | JPMorgan Chase Bank | | 6/5/2024 | | | 109,980 | | |
USD | 6,650,779 | | | EUR | 6,179,000 | | | UBS AG | | 7/3/2024 | | | 38,929 | | |
USD | 820,257 | | | JPY | 120,962,000 | | | UBS AG | | 7/3/2024 | | | 45,920 | | |
USD | 6,008,681 | | | EUR | 5,491,000 | | | Bank of New York Mellon | | 8/7/2024 | | | 122,644 | | |
USD | 1,866,316 | | | JPY | 273,049,000 | | | Bank of New York Mellon | | 8/7/2024 | | | 108,845 | | |
USD | 7,801,207 | | | EUR | 7,142,000 | | | Goldman Sachs | | 9/4/2024 | | | 134,895 | | |
USD | 3,127,910 | | | GBP | 2,465,000 | | | Goldman Sachs | | 9/4/2024 | | | 45,189 | | |
USD | 1,490,924 | | | JPY | 221,611,000 | | | Goldman Sachs | | 9/4/2024 | | | 58,267 | | |
Net unrealized appreciation | | | | | | | | $ | 876,755 | | |
First Eagle Funds | Semiannual Report | April 30, 2024
85
First Eagle Global Income Builder Fund | Schedule of Investments | April 30, 2024 (unaudited)
Abbreviations
ADR — American Depositary Receipt
BRL — Brazilian Real
EUR — Euro
Fix Rt — Fixed Rate
GBP — British Pound
JPY — Japanese Yen
KRW — South Korean Won
MXN — Mexican Peso
NVDR — Non-Voting Depositary Receipt
PIK — Pay in Kind
Preference — A special type of equity investment that shares in the earnings of the company, has limited voting rights, and may have a dividend preference. Preference shares may also have liquidation preference.
REIT — Real Estate Investment Trust
SGD — Singapore Dollar
SOFR — Secured Overnight Financing Rate
USD — United States Dollar
Written Call Options Contracts as of April 30, 2024:
Description | | Counterparty | | Number of
Contracts | | Notional
Amount | | Exercise
Price | | Expiration
Date | | Value ($) | |
Analog
Devices, Inc. | | Exchange Traded | | | 92 | | | USD | (1,845,612 | ) | | USD | 220.00 | | | 6/21/2024 | | | (20,240 | ) | |
Analog
Devices, Inc. | | Exchange Traded | | | 87 | | | USD | (1,745,307 | ) | | USD | 240.00 | | | 6/21/2024 | | | (3,045 | ) | |
Bank of New York
Mellon Corp. (The) | | Exchange Traded | | | 330 | | | USD | (1,864,170 | ) | | USD | 60.00 | | | 6/21/2024 | | | (14,850 | ) | |
Bank of New York
Mellon Corp. (The) | | Exchange Traded | | | 329 | | | USD | (1,858,521 | ) | | USD | 60.00 | | | 7/19/2024 | | | (37,835 | ) | |
Bank of New York
Mellon Corp. (The) | | Exchange Traded | | | 702 | | | USD | (3,965,598 | ) | | USD | 60.00 | | | 12/20/2024 | | | (217,620 | ) | |
Bank of New York
Mellon Corp. (The) | | Exchange Traded | | | 314 | | | USD | (1,773,786 | ) | | USD | 65.00 | | | 6/21/2024 | | | (2,198 | ) | |
Bank of New York
Mellon Corp. (The) | | Exchange Traded | | | 304 | | | USD | (1,717,296 | ) | | USD | 65.00 | | | 7/19/2024 | | | (7,600 | ) | |
Bank of New York
Mellon Corp. (The) | | Exchange Traded | | | 311 | | | USD | (1,756,839 | ) | | USD | 75.00 | | | 1/17/2025 | | | (13,995 | ) | |
Becton
Dickinson & Co. | | Exchange Traded | | | 138 | | | USD | (3,237,480 | ) | | USD | 290.00 | | | 6/21/2024 | | | (4,140 | ) | |
Boston Properties,
Inc., REIT | | Exchange Traded | | | 237 | | | USD | (1,466,793 | ) | | USD | 90.00 | | | 7/19/2024 | | | (35,550 | ) | |
Boston Properties,
Inc., REIT | | Exchange Traded | | | 250 | | | USD | (1,547,250 | ) | | USD | 95.00 | | | 1/17/2025 | | | (16,250 | ) | |
Coca-Cola Femsa
SAB de CV, ADR | | Exchange Traded | | | 200 | | | USD | (1,983,000 | ) | | USD | 90.00 | | | 5/17/2024 | | | (191,000 | ) | |
First Eagle Funds | Semiannual Report | April 30, 2024
86
First Eagle Global Income Builder Fund | Schedule of Investments | April 30, 2024 (unaudited)
Written Call Options Contracts as of April 30, 2024: (continued)
Description | | Counterparty | | Number of
Contracts | | Notional
Amount | | Exercise
Price | | Expiration
Date | | Value ($) | |
Coca-Cola Femsa
SAB de CV, ADR | | Exchange Traded | | | 187 | | | USD | (1,854,105 | ) | | USD | 110.00 | | | 8/16/2024 | | | (24,310 | ) | |
Colgate-Palmolive
Co. | | Exchange Traded | | | 433 | | | USD | (3,980,136 | ) | | USD | 85.00 | | | 5/17/2024 | | | (303,966 | ) | |
Colgate-Palmolive
Co. | | Exchange Traded | | | 214 | | | USD | (1,967,088 | ) | | USD | 85.00 | | | 8/16/2024 | | | (177,620 | ) | |
Colgate-Palmolive
Co. | | Exchange Traded | | | 215 | | | USD | (1,976,280 | ) | | USD | 90.00 | | | 6/21/2024 | | | (75,250 | ) | |
Colgate-Palmolive
Co. | | Exchange Traded | | | 218 | | | USD | (2,003,856 | ) | | USD | 95.00 | | | 6/21/2024 | | | (18,530 | ) | |
Colgate-Palmolive
Co. | | Exchange Traded | | | 205 | | | USD | (1,884,360 | ) | | USD | 95.00 | | | 8/16/2024 | | | (39,975 | ) | |
Comcast Corp.,
Class A | | Exchange Traded | | | 400 | | | USD | (1,524,400 | ) | | USD | 55.00 | | | 6/21/2024 | | | (1,400 | ) | |
Comcast Corp.,
Class A | | Exchange Traded | | | 400 | | | USD | (1,524,400 | ) | | USD | 65.00 | | | 1/17/2025 | | | (7,200 | ) | |
Exxon Mobil Corp. | | Exchange Traded | | | 169 | | | USD | (1,998,763 | ) | | USD | 115.00 | | | 5/17/2024 | | | (67,938 | ) | |
Exxon Mobil Corp. | | Exchange Traded | | | 163 | | | USD | (1,927,801 | ) | | USD | 120.00 | | | 6/21/2024 | | | (44,825 | ) | |
Exxon Mobil Corp. | | Exchange Traded | | | 169 | | | USD | (1,998,763 | ) | | USD | 125.00 | | | 12/20/2024 | | | (99,710 | ) | |
Exxon Mobil Corp. | | Exchange Traded | | | 152 | | | USD | (1,797,704 | ) | | USD | 140.00 | | | 9/20/2024 | | | (13,376 | ) | |
Exxon Mobil Corp. | | Exchange Traded | | | 170 | | | USD | (2,010,590 | ) | | USD | 145.00 | | | 12/20/2024 | | | (24,055 | ) | |
Exxon Mobil Corp. | | Exchange Traded | | | 144 | | | USD | (1,703,088 | ) | | USD | 150.00 | | | 9/20/2024 | | | (4,320 | ) | |
Exxon Mobil Corp. | | Exchange Traded | | | 144 | | | USD | (1,703,088 | ) | | USD | 155.00 | | | 10/18/2024 | | | (4,320 | ) | |
Exxon Mobil Corp. | | Exchange Traded | | | 140 | | | USD | (1,655,780 | ) | | USD | 170.00 | | | 12/20/2024 | | | (3,010 | ) | |
Fidelity National
Information
Services, Inc. | | Exchange Traded | | | 516 | | | USD | (3,504,672 | ) | | USD | 72.50 | | | 10/18/2024 | | | (196,080 | ) | |
Fomento
Economico
Mexicano SAB de
CV, ADR | | Exchange Traded | | | 133 | | | USD | (1,564,878 | ) | | USD | 130.00 | | | 5/17/2024 | | | (9,975 | ) | |
Fomento
Economico
Mexicano SAB de
CV, ADR | | Exchange Traded | | | 140 | | | USD | (1,647,240 | ) | | USD | 130.00 | | | 7/19/2024 | | | (67,200 | ) | |
General Dynamics
Corp. | | Exchange Traded | | | 72 | | | USD | (2,067,048 | ) | | USD | 280.00 | | | 1/17/2025 | | | (182,160 | ) | |
HCA
Healthcare, Inc. | | Exchange Traded | | | 118 | | | USD | (3,655,876 | ) | | USD | 330.00 | | | 9/20/2024 | | | (146,910 | ) | |
HCA
Healthcare, Inc. | | Exchange Traded | | | 66 | | | USD | (2,044,812 | ) | | USD | 350.00 | | | 6/21/2024 | | | (4,290 | ) | |
First Eagle Funds | Semiannual Report | April 30, 2024
87
First Eagle Global Income Builder Fund | Schedule of Investments | April 30, 2024 (unaudited)
Written Call Options Contracts as of April 30, 2024: (continued)
Description | | Counterparty | | Number of
Contracts | | Notional
Amount | | Exercise
Price | | Expiration
Date | | Value ($) | |
HCA
Healthcare, Inc. | | Exchange Traded | | | 66 | | | USD | (2,044,812 | ) | | USD | 350.00 | | | 1/17/2025 | | | (97,680 | ) | |
HCA
Healthcare, Inc. | | Exchange Traded | | | 52 | | | USD | (1,611,064 | ) | | USD | 365.00 | | | 6/21/2024 | | | (7,800 | ) | |
HCA
Healthcare, Inc. | | Exchange Traded | | | 64 | | | USD | (1,982,848 | ) | | USD | 370.00 | | | 6/21/2024 | | | (6,080 | ) | |
HCA
Healthcare, Inc. | | Exchange Traded | | | 52 | | | USD | (1,611,064 | ) | | USD | 375.00 | | | 9/20/2024 | | | (11,700 | ) | |
HCA
Healthcare, Inc. | | Exchange Traded | | | 52 | | | USD | (1,611,064 | ) | | USD | 380.00 | | | 6/21/2024 | | | (4,940 | ) | |
HCA
Healthcare, Inc. | | Exchange Traded | | | 54 | | | USD | (1,673,028 | ) | | USD | 450.00 | | | 1/17/2025 | | | (4,995 | ) | |
Linde plc | | Exchange Traded | | | 68 | | | USD | (2,998,528 | ) | | USD | 370.00 | | | 6/21/2024 | | | (500,480 | ) | |
ONEOK, Inc. | | Exchange Traded | | | 217 | | | USD | (1,716,904 | ) | | USD | 90.00 | | | 7/19/2024 | | | (7,595 | ) | |
ONEOK, Inc. | | Exchange Traded | | | 487 | | | USD | (3,853,144 | ) | | USD | 90.00 | | | 10/18/2024 | | | (58,440 | ) | |
Oracle Corp. | | Exchange Traded | | | 155 | | | USD | (1,763,125 | ) | | USD | 150.00 | | | 6/21/2024 | | | (2,170 | ) | |
Philip Morris
International, Inc. | | Exchange Traded | | | 182 | | | USD | (1,727,908 | ) | | USD | 110.00 | | | 6/21/2024 | | | (1,820 | ) | |
Philip Morris
International, Inc. | | Exchange Traded | | | 187 | | | USD | (1,775,378 | ) | | USD | 120.00 | | | 1/17/2025 | | | (6,545 | ) | |
Royal Gold, Inc. | | Exchange Traded | | | 139 | | | USD | (1,669,807 | ) | | USD | 175.00 | | | 7/19/2024 | | | (5,560 | ) | |
Taiwan
Semiconductor
Manufacturing
Co. Ltd., ADR | | Exchange Traded | | | 122 | | | USD | (1,675,548 | ) | | USD | 180.00 | | | 5/17/2024 | | | (488 | ) | |
Taiwan
Semiconductor
Manufacturing
Co. Ltd., ADR | | Exchange Traded | | | 122 | | | USD | (1,675,548 | ) | | USD | 190.00 | | | 6/21/2024 | | | (1,586 | ) | |
Texas
Instruments, Inc. | | Exchange Traded | | | 96 | | | USD | (1,693,632 | ) | | USD | 220.00 | | | 6/21/2024 | | | (960 | ) | |
Texas
Instruments, Inc. | | Exchange Traded | | | 98 | | | USD | (1,728,916 | ) | | USD | 230.00 | | | 6/21/2024 | | | (2,499 | ) | |
Universal Health
Services, Inc.,
Class B | | Exchange Traded | | | 95 | | | USD | (1,619,085 | ) | | USD | 200.00 | | | 5/17/2024 | | | (12,825 | ) | |
US Bancorp | | Exchange Traded | | | 378 | | | USD | (1,535,814 | ) | | USD | 60.00 | | | 6/21/2024 | | | (28,350 | ) | |
US Bancorp | | Exchange Traded | | | 397 | | | USD | (1,613,011 | ) | | USD | 60.00 | | | 9/20/2024 | | | (2,581 | ) | |
Walmart, Inc. | | Exchange Traded | | | 333 | | | USD | (1,976,355 | ) | | USD | 61.67 | | | 5/17/2024 | | | (15,651 | ) | |
Walmart, Inc. | | Exchange Traded | | | 333 | | | USD | (1,976,355 | ) | | USD | 63.33 | | | 6/21/2024 | | | (15,984 | ) | |
Walmart, Inc. | | Exchange Traded | | | 321 | | | USD | (1,905,135 | ) | | USD | 65.00 | | | 6/21/2024 | | | (7,704 | ) | |
First Eagle Funds | Semiannual Report | April 30, 2024
88
First Eagle Global Income Builder Fund | Schedule of Investments | April 30, 2024 (unaudited)
Written Call Options Contracts as of April 30, 2024: (continued)
Description | | Counterparty | | Number of
Contracts | | Notional
Amount | | Exercise
Price | | Expiration
Date | | Value ($) | |
Weyerhaeuser
Co., REIT | | Exchange Traded | | | 475 | | | USD | (1,433,075 | ) | | USD | 40.00 | | | 7/19/2024 | | | (11,875 | ) | |
Wheaton Precious
Metals Corp. | | Exchange Traded | | | 339 | | | USD | (1,767,546 | ) | | USD | 70.00 | | | 9/20/2024 | | | (18,645 | ) | |
| | | | | | | | | | | | | | (2,915,696 | ) | |
Total Written Options Contracts (Premiums Received ($2,530,287)) | | | (2,915,696 | ) | |
See Notes to Financial Statements.
First Eagle Funds | Semiannual Report | April 30, 2024
89
First Eagle Rising Dividend Fund
Data as of April 30, 2024 (unaudited)
Investment Objective
The First Eagle Global Fund seeks long-term growth of capital by investing in a range of asset classes from markets in the United States and around the world. This truly global fund is managed with a highly disciplined, bottom-up, value oriented style.
Average Annual Returns^ (%) | | | | | | One-Year | | Five-Years | | Ten-Years | |
First Eagle Rising Dividend | | Class A | | without sales charge | | | 13.19 | | | | 6.74 | | | | 4.61 | | |
| | | | with sales charge | | | 7.53 | | | | 5.65 | | | | 4.07 | | |
S&P 500 Index | | | | | | | 22.66 | | | | 13.19 | | | | 12.41 | | |

Sectors* (%)
Information Technology | | | 20.5 | | |
Health Care | | | 18.3 | | |
Communication Services | | | 15.8 | | |
Consumer Staples | | | 11.8 | | |
Industrials | | | 9.4 | | |
Consumer Discretionary | | | 8.7 | | |
Energy | | | 7.8 | | |
Financials | | | 3.9 | | |
Real Estate | | | 2.7 | | |
Short-Term Investments | | | 1.1 | | |
^ Performance figures reflect certain fee waivers and/or expense limitations, without which returns may have been lower.
* Asset Allocation and Sector percentages are based on total investments in the portfolio.
** Includes short-term commercial paper (1.1% of total investments) that settles in 90 days or less, long-term commercial paper (0.0% of total investments) that settles in 91 days or greater and other short-term investments (0.0% of total investments), such as U.S. treasury bills or money market funds.
The Fund's portfolio composition is subject to change at any time.
First Eagle Funds | Semiannual Report | April 30, 2024
90
First Eagle Rising Dividend Fund | Fund Overview
Growth of a $10,000 Initial Investment
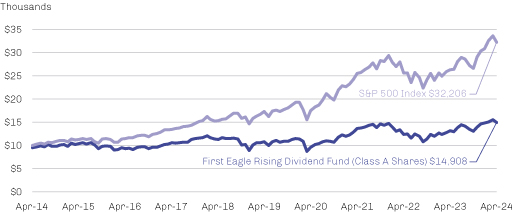
Performance data quoted herein represents past performance and should not be considered indicative of future results. Performance data quoted herein does not reflect the deduction of taxes that a shareholder would pay on Fund distributions or the sale of Fund shares.
The average annual returns shown above are historical and reflect changes in share price, reinvested dividends and are net of expenses.
The average annual returns for Class A shares give effect to the deduction of the maximum sales charge of 5.00%
The S&P 500 Index is a widely recognized unmanaged index including a representative sample of 500 leading companies in leading sectors of the U.S. economy. Although the S&P 500 Index focuses on the large-cap segment of the market, with approximately 80% coverage of U.S. equities, it is also considered a proxy for the total market. The S&P 500 Index includes dividends reinvested. One cannot invest directly in an index.
Top 10 Holdings* (%)
Texas Instruments, Inc. (Semiconductors & Semiconductor Equipment, United States) | | | 6.5 | | |
Alphabet, Inc., Class A (Interactive Media & Services, United States) | | | 6.2 | | |
Oracle Corp. (Software, United States) | | | 6.1 | | |
Medtronic plc (Health Care Equipment & Supplies, United States) | | | 5.6 | | |
Comcast Corp., Class A (Media, United States) | | | 5.5 | | |
UnitedHealth Group, Inc. (Health Care Providers & Services, United States) | | | 4.7 | | |
Home Depot, Inc. (The) (Specialty Retail, United States) | | | 4.7 | | |
TE Connectivity Ltd. (Electronic Equipment, Instruments & Components, United States) | | | 4.7 | | |
Schindler Holding AG (Machinery, Switzerland) | | | 4.3 | | |
Meta Platforms, Inc., Class A (Interactive Media & Services, United States) | | | 4.0 | | |
Total | | | 52.3 | | |
* Holdings in cash, short-term commercial paper, long-term commercial paper and other short-term cash equivalents have been excluded.
Percentages are based on total net assets.
First Eagle Funds | Semiannual Report | April 30, 2024
91
First Eagle Rising Dividend Fund | Schedule of Investments | April 30, 2024 (unaudited)
Investments | | Shares | | Value ($) | |
Common Stocks — 95.8% | |
Air Freight & Logistics — 5.1% | |
CH Robinson Worldwide, Inc. | | | 136,764 | | | | 9,710,244 | | |
Expeditors International of Washington, Inc. | | | 91,333 | | | | 10,166,276 | | |
| | | | 19,876,520 | | |
Beverages — 2.8% | |
PepsiCo, Inc. | | | 63,492 | | | | 11,168,878 | | |
Capital Markets — 2.7% | |
Bank of New York Mellon Corp. (The) | | | 187,882 | | | | 10,613,454 | | |
Electronic Equipment, Instruments & Components — 4.7% | |
TE Connectivity Ltd. | | | 129,703 | | | | 18,350,380 | | |
Food Products — 0.4% | |
Nestle SA (Registered) | | | 16,864 | | | | 1,693,149 | | |
Health Care Equipment & Supplies — 9.4% | |
Becton Dickinson & Co. | | | 65,039 | | | | 15,258,149 | | |
Medtronic plc | | | 273,442 | | | | 21,940,986 | | |
| | | | 37,199,135 | | |
Health Care Providers & Services — 8.5% | |
HCA Healthcare, Inc. | | | 48,384 | | | | 14,990,331 | | |
UnitedHealth Group, Inc. | | | 38,470 | | | | 18,607,939 | | |
| | | | 33,598,270 | | |
Hotels, Restaurants & Leisure — 1.1% | |
Starbucks Corp. | | | 50,446 | | | | 4,463,967 | | |
Household Products — 3.9% | |
Colgate-Palmolive Co. | | | 167,320 | | | | 15,380,054 | | |
Insurance — 1.2% | |
Fidelity National Financial, Inc. | | | 98,833 | | | | 4,892,234 | | |
Interactive Media & Services — 10.2% | |
Alphabet, Inc., Class A* | | | 150,817 | | | | 24,549,991 | | |
Meta Platforms, Inc., Class A | | | 36,292 | | | | 15,611,730 | | |
| | | | 40,161,721 | | |
IT Services — 0.2% | |
Accenture plc, Class A | | | 2,689 | | | | 809,147 | | |
Machinery — 4.3% | |
Schindler Holding AG (Switzerland) | | | 67,600 | | | | 16,849,734 | | |
First Eagle Funds | Semiannual Report | April 30, 2024
92
First Eagle Rising Dividend Fund | Schedule of Investments | April 30, 2024 (unaudited)
Investments | | Shares | | Value ($) | |
Media — 5.5% | |
Comcast Corp., Class A | | | 567,210 | | | | 21,616,373 | | |
Oil, Gas & Consumable Fuels — 5.3% | |
Exxon Mobil Corp. | | | 112,338 | | | | 13,286,215 | | |
ONEOK, Inc. | | | 93,731 | | | | 7,415,997 | | |
| | | | 20,702,212 | | |
Pharmaceuticals — 0.2% | |
Merck KGaA (Germany) | | | 4,233 | | | | 672,631 | | |
Semiconductors & Semiconductor Equipment — 7.9% | |
Taiwan Semiconductor Manufacturing Co. Ltd., ADR (Taiwan) | | | 40,257 | | | | 5,528,896 | | |
Texas Instruments, Inc. | | | 144,695 | | | | 25,527,092 | | |
| | | | 31,055,988 | | |
Software — 7.6% | |
Microsoft Corp. | | | 15,215 | | | | 5,923,656 | | |
Oracle Corp. | | | 212,025 | | | | 24,117,844 | | |
| | | | 30,041,500 | | |
Specialized REITs — 2.7% | |
Extra Space Storage, Inc., REIT | | | 78,725 | | | | 10,571,193 | | |
Specialty Retail — 7.5% | |
Home Depot, Inc. (The) | | | 55,628 | | | | 18,591,990 | | |
Ross Stores, Inc. | | | 84,625 | | | | 10,963,169 | | |
| | | | 29,555,159 | | |
Tobacco — 4.6% | |
British American Tobacco plc (United Kingdom) | | | 129,979 | | | | 3,815,699 | | |
Philip Morris International, Inc. | | | 151,420 | | | | 14,375,815 | | |
| | | | 18,191,514 | | |
Total Common Stocks
(Cost $298,404,312) | | | 377,463,213 | | |
Master Limited Partnerships — 2.5% | |
Oil, Gas & Consumable Fuels — 2.5% | |
Enterprise Products Partners LP
(Cost $8,768,243) | | | 350,759 | | | | 9,849,313 | | |
First Eagle Funds | Semiannual Report | April 30, 2024
93
First Eagle Rising Dividend Fund | Schedule of Investments | April 30, 2024 (unaudited)
Investments | | Principal Amount ($) | | Value ($) | |
Short-Term Investments — 1.1% | |
Commercial Paper — 1.1% | |
AES Corp. (The)
5.86%, 5/1/2024 (a) | | | 1,102,000 | | | | 1,101,820 | | |
CVS Caremark Corp.
5.40%, 5/1/2024 (a) | | | 703,000 | | | | 702,895 | | |
Entergy Corp.
5.40%, 5/1/2024 (a) | | | 383,000 | | | | 382,942 | | |
General Motors Financial Co., Inc.
5.43%, 5/1/2024 (a) | | | 1,517,000 | | | | 1,516,771 | | |
Global Payments, Inc.
5.96%, 5/1/2024 (a) | | | 484,000 | | | | 483,920 | | |
Total Commercial Paper
(Cost $4,189,000) | | | 4,188,348 | | |
| | | Shares | | | |
Investment Companies — 0.0% (b) | |
JP Morgan U.S. Government Money Market Fund,
Capital Shares 5.33% (c) (Cost $1,606) | | | 1,606 | | | | 1,606 | | |
Total Short-Term Investments
(Cost $4,190,606) | | | 4,189,954 | | |
Total Investments — 99.4%
(Cost $311,363,161) | | | 391,502,480 | | |
Other Assets Less Liabilities — 0.6% | | | 2,361,394 | | |
Net Assets — 100.0% | | | 393,863,874 | | |
* Non-income producing security.
(a) The rate shown was the current yield as of April 30, 2024.
(b) Represents less than 0.05% of net assets.
(c) Represents 7-day effective yield as of April 30, 2024.
Abbreviations
ADR — American Depositary Receipt
REIT — Real Estate Investment Trust
As of April 30, 2024, the gross unrealized appreciation (depreciation) of investments based on the aggregate cost of investment securities and derivative instruments, if applicable, for federal income tax purposes was as follows:
Aggregate gross unrealized appreciation | | $ | 87,468,905 | | |
Aggregate gross unrealized depreciation | | | (7,329,586 | ) | |
Net unrealized appreciation | | $ | 80,139,319 | | |
Federal income tax cost | | $ | 311,363,161 | | |
See Notes to Financial Statements.
First Eagle Funds | Semiannual Report | April 30, 2024
94
This page was intentionally left blank.
First Eagle Small Cap Opportunity Fund
Data as of April 30, 2024 (unaudited)
Investment Objective
The First Eagle Small Cap Opportunity Fund seeks long-term growth of capital.
Average Annual Returns^ (%) | | | | One-Year | | Since
Inception
(4/27/21) | |
First Eagle Small Cap Opportunity Fund | | Class I | | | 11.54 | | | | -0.04 | | |
Russell 2000® Value Index | | | | | 14.03 | | | | -0.88 | | |
Russell 2000® Index | | | | | 13.32 | | | | -3.59 | | |
S&P 500 Index | | | | | 22.66 | | | | 7.95 | | |
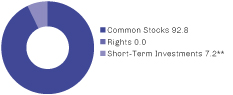
Sectors* (%)
Industrials | | | 20.8 | | |
Information Technology | | | 14.2 | | |
Consumer Discretionary | | | 12.5 | | |
Materials | | | 11.5 | | |
Financials | | | 10.2 | | |
Health Care | | | 9.7 | | |
Energy | | | 6.4 | | |
Consumer Staples | | | 2.8 | | |
Real Estate | | | 2.4 | | |
Communication Services | | | 1.5 | | |
Utilities | | | 0.8 | | |
Short-Term Investments | | | 7.2 | | |
^ Performance figures reflect certain fee waivers and/or expense limitations, without which returns may have been lower.
* Asset Allocation and Sector percentages are based on total investments in the portfolio.
** Includes short-term commercial paper (0.0% of total investments) that settles in 90 days or less, long-term commercial paper (0.0% of total investments) that settles in 91 days or greater and other short-term investments (7.2% of total investments), such as U.S. treasury bills or money market funds.
The Fund's portfolio composition is subject to change at any time.
First Eagle Funds | Semiannual Report | April 30, 2024
96
First Eagle Small Cap Opportunity Fund | Fund Overview
Growth of a $1,000,000 Initial Investment
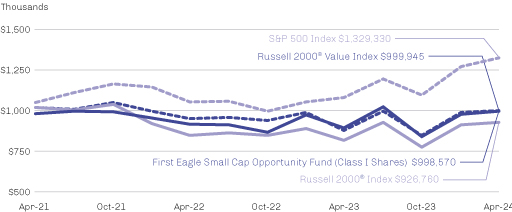
Performance data quoted herein represents past performance and should not be considered indicative of future results. Performance data quoted herein does not reflect the deduction of taxes that a shareholder would pay on Fund distributions or the sale of Fund shares. The average annual returns shown above are historical and reflect changes in share price, reinvested dividends and are net of expenses.
Class I Shares require $1 million minimum investment and are offered without a sales charge. If a sales charge was included values would be lower.
The Russell 2000® Value Index is a widely followed, unmanaged index that measures the performance of small-cap value segment of the U.S. equity universe. It includes those Russell 2000® companies with lower price-to-book ratios and lower forecasted growth values. The Russell 2000® Value Index is completely reconstituted annually. One cannot invest directly in an index.
The Russell 2000® Index is a widely followed, unmanaged index that measures the performance of the small-cap segment of the U.S. equity universe. The Russell 2000® Index is a subset of the Russell 3000® Index representing approximately 10% of the total market capitalization of that index. It includes approximately 2,000 of the smallest securities based on a combination of their market cap and current index membership. The Russell 2000® Index is completely reconstituted annually. One cannot invest directly in an index.
The S&P 500 Index is a widely recognized unmanaged index including a representative sample of 500 leading companies in leading sectors of the U.S. economy. Although the S&P 500 Index focuses on the large-cap segment of the market, with approximately 80% coverage of U.S. equities, it is also considered a proxy for the total market. The S&P 500 Index includes dividends reinvested. One cannot invest directly in an index.
Top 10 Holdings* (%)
Air Lease Corp. (Trading Companies & Distributors, United States) | | | 0.9 | | |
FTAI Aviation Ltd. (Trading Companies & Distributors, United States) | | | 0.8 | | |
Kemper Corp. (Insurance, United States) | | | 0.8 | | |
Black Hills Corp. (Multi-Utilities, United States) | | | 0.8 | | |
Matador Resources Co. (Oil, Gas & Consumable Fuels, United States) | | | 0.8 | | |
Tenet Healthcare Corp. (Health Care Providers & Services, United States) | | | 0.8 | | |
Amkor Technology, Inc. (Semiconductors & Semiconductor Equipment, United States) | | | 0.8 | | |
Kaiser Aluminum Corp. (Metals & Mining, United States) | | | 0.8 | | |
MKS Instruments, Inc. (Semiconductors & Semiconductor Equipment, United States) | | | 0.8 | | |
Chefs' Warehouse, Inc. (The) (Consumer Staples Distribution & Retail, United States) | | | 0.8 | | |
Total | | | 8.1 | | |
* Holdings in cash, short-term commercial paper, long-term commercial paper and other short-term cash equivalents have been excluded.
Percentages are based on total net assets.
First Eagle Funds | Semiannual Report | April 30, 2024
97
First Eagle Small Cap Opportunity Fund | Schedule of Investments | April 30, 2024 (unaudited)
Investments | | Shares | | Value ($) | |
Common Stocks — 92.7% | |
Aerospace & Defense — 4.2% | |
AAR Corp.* | | | 175,771 | | | | 12,152,807 | | |
Astronics Corp.* | | | 332,372 | | | | 5,573,878 | | |
Curtiss-Wright Corp. | | | 38,393 | | | | 9,729,554 | | |
Ducommun, Inc.* | | | 201,042 | | | | 10,874,362 | | |
Hexcel Corp. | | | 121,860 | | | | 7,824,630 | | |
Kratos Defense & Security Solutions, Inc.* | | | 340,468 | | | | 6,067,140 | | |
Leonardo DRS, Inc.* | | | 348,263 | | | | 7,494,620 | | |
Triumph Group, Inc.* | | | 594,530 | | | | 7,942,921 | | |
V2X, Inc.* | | | 165,434 | | | | 8,036,784 | | |
| | | | 75,696,696 | | |
Air Freight & Logistics — 1.0% | |
Air Transport Services Group, Inc.* | | | 447,377 | | | | 5,735,373 | | |
GXO Logistics, Inc.* | | | 206,586 | | | | 10,259,061 | | |
Radiant Logistics, Inc.* | | | 472,715 | | | | 2,335,212 | | |
| | | | 18,329,646 | | |
Automobile Components — 0.8% | |
Goodyear Tire & Rubber Co. (The)* | | | 868,317 | | | | 10,385,072 | | |
Modine Manufacturing Co.* | | | 51,402 | | | | 4,761,367 | | |
| | | | 15,146,439 | | |
Banks — 2.8% | |
Ameris Bancorp | | | 245,919 | | | | 11,676,234 | | |
Axos Financial, Inc.* | | | 183,534 | | | | 9,288,656 | | |
Dime Community Bancshares, Inc. | | | 364,656 | | | | 6,636,739 | | |
Old National Bancorp | | | 428,565 | | | | 7,088,465 | | |
Seacoast Banking Corp. of Florida | | | 508,703 | | | | 11,735,779 | | |
Valley National Bancorp | | | 538,519 | | | | 3,775,018 | | |
| | | | 50,200,891 | | |
Beverages — 0.2% | |
Duckhorn Portfolio, Inc. (The)* | | | 328,112 | | | | 2,779,109 | | |
Biotechnology — 0.8% | |
CareDx, Inc.* | | | 905,242 | | | | 7,024,678 | | |
Ironwood Pharmaceuticals, Inc.* | | | 932,893 | | | | 7,229,921 | | |
| | | | 14,254,599 | | |
First Eagle Funds | Semiannual Report | April 30, 2024
98
First Eagle Small Cap Opportunity Fund | Schedule of Investments | April 30, 2024 (unaudited)
Investments | | Shares | | Value ($) | |
Building Products — 2.5% | |
AZEK Co., Inc. (The)* | | | 118,589 | | | | 5,412,402 | | |
Gibraltar Industries, Inc.* | | | 86,413 | | | | 6,175,073 | | |
Insteel Industries, Inc. | | | 286,046 | | | | 9,182,077 | | |
Janus International Group, Inc.* | | | 696,472 | | | | 10,036,162 | | |
JELD-WEN Holding, Inc.* | | | 302,207 | | | | 6,195,243 | | |
Quanex Building Products Corp. | | | 218,914 | | | | 7,272,323 | | |
| | | | 44,273,280 | | |
Capital Markets — 1.2% | |
Evercore, Inc., Class A | | | 57,889 | | | | 10,506,854 | | |
Forge Global Holdings, Inc.* | | | 205,888 | | | | 376,775 | | |
Moelis & Co., Class A | | | 109,300 | | | | 5,364,444 | | |
Perella Weinberg Partners | | | 296,107 | | | | 4,417,916 | | |
| | | | 20,665,989 | | |
Chemicals — 4.9% | |
AdvanSix, Inc. | | | 434,903 | | | | 10,985,650 | | |
American Vanguard Corp. | | | 349,836 | | | | 3,984,632 | | |
Ashland, Inc. | | | 94,150 | | | | 8,975,320 | | |
Huntsman Corp. | | | 524,269 | | | | 12,509,058 | | |
Intrepid Potash, Inc.* | | | 511,005 | | | | 10,281,421 | | |
Kronos Worldwide, Inc. | | | 192,636 | | | | 2,205,682 | | |
LSB Industries, Inc.* | | | 1,108,868 | | | | 10,312,472 | | |
Mativ Holdings, Inc. | | | 374,681 | | | | 6,841,675 | | |
Minerals Technologies, Inc. | | | 69,174 | | | | 5,042,093 | | |
Stepan Co. | | | 65,010 | | | | 5,395,180 | | |
Tronox Holdings plc, Class A | | | 662,363 | | | | 11,253,547 | | |
| | | | 87,786,730 | | |
Commercial Services & Supplies — 2.5% | |
ARC Document Solutions, Inc. | | | 127,399 | | | | 336,333 | | |
CECO Environmental Corp.* | | | 568,839 | | | | 12,298,299 | | |
Driven Brands Holdings, Inc.* | | | 209,328 | | | | 2,999,670 | | |
Interface, Inc. | | | 128,479 | | | | 1,964,444 | | |
Performant Financial Corp.* | | | 2,022,609 | | | | 5,380,140 | | |
Quest Resource Holding Corp.* | | | 314,736 | | | | 3,191,423 | | |
Stericycle, Inc.* | | | 221,776 | | | | 9,920,041 | | |
First Eagle Funds | Semiannual Report | April 30, 2024
99
First Eagle Small Cap Opportunity Fund | Schedule of Investments | April 30, 2024 (unaudited)
Investments | | Shares | | Value ($) | |
Commercial Services & Supplies — 2.5% (continued) | |
VSE Corp. | | | 110,996 | | | | 8,665,458 | | |
| | | | 44,755,808 | | |
Communications Equipment — 1.7% | |
ADTRAN Holdings, Inc. | | | 372,639 | | | | 1,632,159 | | |
Aviat Networks, Inc.* | | | 177,151 | | | | 5,925,701 | | |
Ceragon Networks Ltd. (Israel)* | | | 495,552 | | | | 1,372,679 | | |
Digi International, Inc.* | | | 277,123 | | | | 8,496,591 | | |
Lantronix, Inc.* | | | 588,458 | | | | 2,212,602 | | |
NETGEAR, Inc.* | | | 109,800 | | | | 1,622,844 | | |
NetScout Systems, Inc.* | | | 206,813 | | | | 3,983,218 | | |
Viavi Solutions, Inc.* | | | 688,260 | | | | 5,437,254 | | |
| | | | 30,683,048 | | |
Construction & Engineering — 0.6% | |
Arcosa, Inc. | | | 124,209 | | | | 9,442,368 | | |
Orion Group Holdings, Inc.* | | | 269,034 | | | | 1,912,832 | | |
| | | | 11,355,200 | | |
Consumer Staples Distribution & Retail — 0.8% | |
Chefs' Warehouse, Inc. (The)* | | | 407,908 | | | | 13,493,597 | | |
Natural Grocers by Vitamin Cottage, Inc. | | | 77,243 | | | | 1,263,695 | | |
| | | | 14,757,292 | | |
Containers & Packaging — 0.9% | |
Sealed Air Corp. | | | 343,910 | | | | 10,826,287 | | |
TriMas Corp. | | | 180,902 | | | | 4,701,643 | | |
| | | | 15,527,930 | | |
Diversified Consumer Services — 0.9% | |
Chegg, Inc.* | | | 536,610 | | | | 2,774,274 | | |
Lincoln Educational Services Corp.* | | | 632,086 | | | | 6,738,037 | | |
Universal Technical Institute, Inc.* | | | 394,612 | | | | 6,005,994 | | |
| | | | 15,518,305 | | |
Diversified REITs — 0.5% | |
Armada Hoffler Properties, Inc., REIT | | | 890,332 | | | | 9,366,293 | | |
Electrical Equipment — 1.2% | |
Encore Wire Corp. | | | 7,456 | | | | 2,082,908 | | |
EnerSys | | | 47,003 | | | | 4,251,421 | | |
Generac Holdings, Inc.* | | | 48,255 | | | | 6,560,750 | | |
First Eagle Funds | Semiannual Report | April 30, 2024
100
First Eagle Small Cap Opportunity Fund | Schedule of Investments | April 30, 2024 (unaudited)
Investments | | Shares | | Value ($) | |
Electrical Equipment — 1.2% (continued) | |
LSI Industries, Inc. | | | 377,239 | | | | 5,507,690 | | |
Thermon Group Holdings, Inc.* | | | 92,254 | | | | 2,945,670 | | |
| | | | 21,348,439 | | |
Electronic Equipment, Instruments & Components — 4.2% | |
Advanced Energy Industries, Inc. | | | 96,169 | | | | 9,216,837 | | |
Airgain, Inc.* | | | 415,940 | | | | 2,179,525 | | |
Avnet, Inc. | | | 184,602 | | | | 9,021,500 | | |
Belden, Inc. | | | 86,846 | | | | 7,057,974 | | |
Benchmark Electronics, Inc. | | | 259,535 | | | | 7,840,552 | | |
Coherent Corp.* | | | 114,401 | | | | 6,249,727 | | |
Fabrinet (Thailand)* | | | 28,151 | | | | 4,872,093 | | |
Iteris, Inc.* | | | 468,714 | | | | 2,099,839 | | |
Plexus Corp.* | | | 45,509 | | | | 4,596,864 | | |
Sanmina Corp.* | | | 170,945 | | | | 10,371,233 | | |
SmartRent, Inc.* | | | 1,276,927 | | | | 2,962,471 | | |
TTM Technologies, Inc.* | | | 608,848 | | | | 9,090,101 | | |
| | | | 75,558,716 | | |
Energy Equipment & Services — 2.1% | |
Bristow Group, Inc.* | | | 76,854 | | | | 2,022,029 | | |
Helix Energy Solutions Group, Inc.* | | | 300,884 | | | | 3,231,494 | | |
Helmerich & Payne, Inc. | | | 93,631 | | | | 3,682,507 | | |
Liberty Energy, Inc., Class A | | | 153,363 | | | | 3,373,986 | | |
NOV, Inc. | | | 182,764 | | | | 3,379,306 | | |
Oil States International, Inc.* | | | 1,480,495 | | | | 5,907,175 | | |
ProPetro Holding Corp.* | | | 457,182 | | | | 3,986,627 | | |
RPC, Inc. | | | 270,656 | | | | 1,810,689 | | |
SEACOR Marine Holdings, Inc.* | | | 206,253 | | | | 2,520,412 | | |
US Silica Holdings, Inc.* | | | 457,629 | | | | 7,061,215 | | |
| | | | 36,975,440 | | |
Financial Services — 2.4% | |
Cantaloupe, Inc.* | | | 88,190 | | | | 510,620 | | |
International Money Express, Inc.* | | | 325,694 | | | | 6,588,790 | | |
MGIC Investment Corp. | | | 626,667 | | | | 12,708,807 | | |
NMI Holdings, Inc., Class A* | | | 369,139 | | | | 11,391,629 | | |
First Eagle Funds | Semiannual Report | April 30, 2024
101
First Eagle Small Cap Opportunity Fund | Schedule of Investments | April 30, 2024 (unaudited)
Investments | | Shares | | Value ($) | |
Financial Services — 2.4% (continued) | |
Radian Group, Inc. | | | 392,766 | | | | 11,731,920 | | |
| | | | 42,931,766 | | |
Food Products — 1.3% | |
Hain Celestial Group, Inc. (The)* | | | 598,490 | | | | 3,674,728 | | |
Ingredion, Inc. | | | 90,781 | | | | 10,402,595 | | |
Mama's Creations, Inc.* | | | 312,905 | | | | 1,858,656 | | |
Utz Brands, Inc. | | | 400,365 | | | | 7,218,581 | | |
| | | | 23,154,560 | | |
Ground Transportation — 0.9% | |
Heartland Express, Inc. | | | 610,974 | | | | 6,073,082 | | |
Werner Enterprises, Inc. | | | 300,531 | | | | 10,278,160 | | |
| | | | 16,351,242 | | |
Health Care Equipment & Supplies — 2.4% | |
Accuray, Inc.* | | | 892,460 | | | | 1,900,940 | | |
Artivion, Inc.* | | | 530,383 | | | | 10,406,115 | | |
Embecta Corp. | | | 351,908 | | | | 3,564,828 | | |
Enovis Corp.* | | | 227,438 | | | | 12,561,401 | | |
Neuronetics, Inc.* | | | 719,563 | | | | 2,424,927 | | |
Silk Road Medical, Inc.* | | | 160,727 | | | | 3,124,533 | | |
Varex Imaging Corp.* | | | 327,957 | | | | 5,329,301 | | |
Zimvie, Inc.* | | | 205,587 | | | | 3,124,922 | | |
| | | | 42,436,967 | | |
Health Care Providers & Services — 5.2% | |
Acadia Healthcare Co., Inc.* | | | 121,294 | | | | 8,968,478 | | |
AdaptHealth Corp.* | | | 690,706 | | | | 6,803,454 | | |
Addus HomeCare Corp.* | | | 27,487 | | | | 2,642,875 | | |
Brookdale Senior Living, Inc.* | | | 982,092 | | | | 6,668,405 | | |
Community Health Systems, Inc.* | | | 1,140,625 | | | | 3,764,063 | | |
InfuSystem Holdings, Inc.* | | | 555,014 | | | | 4,168,155 | | |
Option Care Health, Inc.* | | | 170,483 | | | | 5,095,737 | | |
Owens & Minor, Inc.* | | | 244,339 | | | | 6,044,947 | | |
Patterson Cos., Inc. | | | 198,269 | | | | 5,049,911 | | |
Pennant Group, Inc. (The)* | | | 354,669 | | | | 7,416,129 | | |
Quipt Home Medical Corp.* | | | 607,896 | | | | 2,188,426 | | |
First Eagle Funds | Semiannual Report | April 30, 2024
102
First Eagle Small Cap Opportunity Fund | Schedule of Investments | April 30, 2024 (unaudited)
Investments | | Shares | | Value ($) | |
Health Care Providers & Services — 5.2% (continued) | |
RadNet, Inc.* | | | 95,531 | | | | 4,633,254 | | |
Select Medical Holdings Corp. | | | 259,012 | | | | 7,348,170 | | |
Surgery Partners, Inc.* | | | 311,320 | | | | 7,767,434 | | |
Tenet Healthcare Corp.* | | | 127,177 | | | | 14,280,705 | | |
| | | | 92,840,143 | | |
Health Care REITs — 0.4% | |
Healthpeak Properties, Inc., REIT | | | 382,152 | | | | 7,111,849 | | |
Health Care Technology — 0.7% | |
HealthStream, Inc. | | | 476,372 | | | | 12,276,107 | | |
iCAD, Inc.* | | | 637,491 | | | | 911,612 | | |
| | | | 13,187,719 | | |
Hotels, Restaurants & Leisure — 3.7% | |
BJ's Restaurants, Inc.* | | | 134,654 | | | | 4,388,374 | | |
Bloomin' Brands, Inc. | | | 129,712 | | | | 3,345,272 | | |
Cheesecake Factory, Inc. (The) | | | 353,674 | | | | 12,208,826 | | |
Chuy's Holdings, Inc.* | | | 280,059 | | | | 8,250,538 | | |
Denny's Corp.* | | | 1,013,033 | | | | 8,124,525 | | |
Dine Brands Global, Inc. | | | 224,557 | | | | 9,902,964 | | |
El Pollo Loco Holdings, Inc.* | | | 133,843 | | | | 1,140,342 | | |
ONE Group Hospitality, Inc. (The)* | | | 702,504 | | | | 3,765,421 | | |
Potbelly Corp.* | | | 802,109 | | | | 8,173,491 | | |
Red Robin Gourmet Burgers, Inc.* (a) | | | 914,323 | | | | 6,903,139 | | |
| | | | 66,202,892 | | |
Household Durables — 3.7% | |
Beazer Homes USA, Inc.* | | | 323,278 | | | | 9,061,482 | | |
Cavco Industries, Inc.* | | | 11,266 | | | | 4,103,190 | | |
Century Communities, Inc. | | | 85,638 | | | | 6,792,806 | | |
Ethan Allen Interiors, Inc. | | | 67,095 | | | | 1,894,763 | | |
Helen of Troy Ltd.* | | | 48,821 | | | | 4,526,195 | | |
Installed Building Products, Inc. | | | 32,332 | | | | 7,621,623 | | |
LGI Homes, Inc.* | | | 75,971 | | | | 6,832,072 | | |
Skyline Champion Corp.* | | | 78,781 | | | | 5,907,787 | | |
Snap One Holdings Corp.* | | | 171,188 | | | | 1,811,169 | | |
Sonos, Inc.* | | | 325,052 | | | | 5,493,379 | | |
First Eagle Funds | Semiannual Report | April 30, 2024
103
First Eagle Small Cap Opportunity Fund | Schedule of Investments | April 30, 2024 (unaudited)
Investments | | Shares | | Value ($) | |
Household Durables — 3.7% (continued) | |
Taylor Morrison Home Corp.* | | | 104,024 | | | | 5,826,384 | | |
Universal Electronics, Inc.* | | | 173,856 | | | | 1,962,834 | | |
Vizio Holding Corp., Class A* | | | 449,130 | | | | 4,760,778 | | |
| | | | 66,594,462 | | |
Household Products — 0.6% | |
Spectrum Brands Holdings, Inc. | | | 123,569 | | | | 10,116,594 | | |
Insurance — 3.8% | |
Axis Capital Holdings Ltd. | | | 170,568 | | | | 10,460,935 | | |
Citizens, Inc.* | | | 344,214 | | | | 767,597 | | |
First American Financial Corp. | | | 166,601 | | | | 8,924,816 | | |
Kemper Corp. | | | 253,831 | | | | 14,800,886 | | |
Lincoln National Corp. | | | 380,904 | | | | 10,387,252 | | |
Old Republic International Corp. | | | 371,458 | | | | 11,091,736 | | |
Stewart Information Services Corp. | | | 182,546 | | | | 11,319,677 | | |
| | | | 67,752,899 | | |
Interactive Media & Services — 1.5% | |
Cars.com, Inc.* | | | 443,360 | | | | 7,408,545 | | |
DHI Group, Inc.* | | | 453,352 | | | | 1,060,844 | | |
EverQuote, Inc., Class A * | | | 489,569 | | | | 9,874,607 | | |
QuinStreet, Inc.* | | | 503,645 | | | | 9,110,938 | | |
| | | | 27,454,934 | | |
IT Services — 0.4% | |
Backblaze, Inc., Class A* | | | 788,984 | | | | 7,345,441 | | |
Brightcove, Inc.* | | | 401,456 | | | | 714,592 | | |
| | | | 8,060,033 | | |
Leisure Products — 0.3% | |
AMMO, Inc.* | | | 938,017 | | | | 2,382,563 | | |
Clarus Corp. | | | 492,715 | | | | 3,118,886 | | |
| | | | 5,501,449 | | |
Life Sciences Tools & Services — 0.6% | |
Fortrea Holdings, Inc.* | | | 269,500 | | | | 9,861,005 | | |
Machinery — 4.2% | |
Astec Industries, Inc. | | | 194,696 | | | | 8,138,293 | | |
Barnes Group, Inc. | | | 347,417 | | | | 12,062,318 | | |
First Eagle Funds | Semiannual Report | April 30, 2024
104
First Eagle Small Cap Opportunity Fund | Schedule of Investments | April 30, 2024 (unaudited)
Investments | | Shares | | Value ($) | |
Machinery — 4.2% (continued) | |
Columbus McKinnon Corp. | | | 169,077 | | | | 6,977,808 | | |
Enpro, Inc. | | | 59,908 | | | | 8,993,988 | | |
Gencor Industries, Inc.* | | | 65,306 | | | | 1,108,243 | | |
Graham Corp.* | | | 268,160 | | | | 7,465,574 | | |
John Bean Technologies Corp. | | | 62,518 | | | | 5,569,729 | | |
Luxfer Holdings plc (United Kingdom) | | | 224,365 | | | | 2,160,635 | | |
Manitex International, Inc.* | | | 276,030 | | | | 1,438,116 | | |
Mayville Engineering Co., Inc.* | | | 133,470 | | | | 1,836,547 | | |
Park-Ohio Holdings Corp. | | | 100,942 | | | | 2,577,049 | | |
Shyft Group, Inc. (The) | | | 435,826 | | | | 4,741,787 | | |
Trinity Industries, Inc. | | | 435,420 | | | | 11,329,629 | | |
| | | | 74,399,716 | | |
Metals & Mining — 5.1% | |
Arch Resources, Inc. | | | 50,028 | | | | 7,943,446 | | |
Carpenter Technology Corp. | | | 132,604 | | | | 11,364,163 | | |
Century Aluminum Co.* | | | 716,761 | | | | 12,435,803 | | |
Coeur Mining, Inc.* | | | 2,173,892 | | | | 9,825,992 | | |
Commercial Metals Co. | | | 201,081 | | | | 10,806,093 | | |
Compass Minerals International, Inc. | | | 111,176 | | | | 1,384,141 | | |
Ferroglobe plc | | | 1,491,701 | | | | 7,831,430 | | |
Haynes International, Inc. | | | 152,092 | | | | 9,148,334 | | |
Hecla Mining Co. | | | 1,357,343 | | | | 6,420,232 | | |
Kaiser Aluminum Corp. | | | 151,407 | | | | 13,700,820 | | |
| | | | 90,860,454 | | |
Multi-Utilities — 0.8% | |
Black Hills Corp. | | | 263,923 | | | | 14,489,373 | | |
Oil, Gas & Consumable Fuels — 4.4% | |
Dorian LPG Ltd. | | | 248,333 | | | | 10,261,119 | | |
Matador Resources Co. | | | 231,680 | | | | 14,433,664 | | |
Navigator Holdings Ltd. | | | 494,734 | | | | 7,430,905 | | |
PBF Energy, Inc., Class A | | | 217,402 | | | | 11,581,004 | | |
Permian Resources Corp. | | | 646,376 | | | | 10,826,798 | | |
Riley Exploration Permian, Inc. | | | 207,445 | | | | 5,379,049 | | |
SM Energy Co. | | | 167,137 | | | | 8,104,473 | | |
First Eagle Funds | Semiannual Report | April 30, 2024
105
First Eagle Small Cap Opportunity Fund | Schedule of Investments | April 30, 2024 (unaudited)
Investments | | Shares | | Value ($) | |
Oil, Gas & Consumable Fuels — 4.4% (continued) | |
Vital Energy, Inc.* | | | 194,032 | | | | 10,287,577 | | |
| | | | 78,304,589 | | |
Paper & Forest Products — 0.6% | |
Louisiana-Pacific Corp. | | | 143,215 | | | | 10,481,906 | | |
Passenger Airlines — 0.3% | |
Allegiant Travel Co. | | | 110,588 | | | | 6,033,681 | | |
Professional Services — 0.1% | |
Asure Software, Inc.* | | | 260,263 | | | | 1,923,344 | | |
Retail REITs — 1.0% | |
Macerich Co. (The), REIT | | | 290,077 | | | | 3,991,459 | | |
Tanger, Inc., REIT | | | 101,082 | | | | 2,865,675 | | |
Whitestone REIT, REIT | | | 999,478 | | | | 11,493,997 | | |
| | | | 18,351,131 | | |
Semiconductors & Semiconductor Equipment — 6.3% | |
Alpha & Omega Semiconductor Ltd.* | | | 408,825 | | | | 8,941,003 | | |
Amkor Technology, Inc. | | | 430,096 | | | | 13,913,606 | | |
Amtech Systems, Inc.* | | | 594,077 | | | | 2,863,451 | | |
Cohu, Inc.* | | | 198,842 | | | | 6,028,889 | | |
FormFactor, Inc.* | | | 140,121 | | | | 6,247,995 | | |
Ichor Holdings Ltd.* | | | 324,085 | | | | 12,568,016 | | |
inTEST Corp.* | | | 471,541 | | | | 5,314,267 | | |
Kulicke & Soffa Industries, Inc. (Singapore) | | | 187,528 | | | | 8,678,796 | | |
MKS Instruments, Inc. | | | 114,962 | | | | 13,678,179 | | |
Onto Innovation, Inc.* | | | 28,815 | | | | 5,344,894 | | |
SMART Global Holdings, Inc.* | | | 437,111 | | | | 7,986,018 | | |
Ultra Clean Holdings, Inc.* | | | 296,097 | | | | 12,385,738 | | |
Veeco Instruments, Inc.* | | | 272,557 | | | | 9,632,164 | | |
| | | | 113,583,016 | | |
Software — 1.5% | |
8x8, Inc.* | | | 730,627 | | | | 1,614,686 | | |
Everbridge, Inc.* | | | 140,942 | | | | 4,897,734 | | |
SecureWorks Corp., Class A* | | | 810,805 | | | | 4,937,802 | | |
Upland Software, Inc.* | | | 547,016 | | | | 1,181,555 | | |
Yext, Inc.* | | | 588,865 | | | | 3,232,869 | | |
First Eagle Funds | Semiannual Report | April 30, 2024
106
First Eagle Small Cap Opportunity Fund | Schedule of Investments | April 30, 2024 (unaudited)
Investments | | Shares | | Value ($) | |
Software — 1.5% (continued) | |
Zeta Global Holdings Corp., Class A* | | | 877,624 | | | | 10,847,433 | | |
| | | | 26,712,079 | | |
Specialized REITs — 0.4% | |
Outfront Media, Inc., REIT | | | 478,882 | | | | 7,595,068 | | |
Specialty Retail — 2.6% | |
Academy Sports & Outdoors, Inc. | | | 94,667 | | | | 5,519,086 | | |
CarParts.com, Inc.* | | | 549,898 | | | | 676,375 | | |
Lithia Motors, Inc., Class A | | | 12,829 | | | | 3,263,441 | | |
Monro, Inc. | | | 218,929 | | | | 5,965,815 | | |
National Vision Holdings, Inc.* | | | 310,588 | | | | 5,410,443 | | |
RH* | | | 12,850 | | | | 3,174,593 | | |
Shoe Carnival, Inc. | | | 323,339 | | | | 10,812,456 | | |
Tile Shop Holdings, Inc.* | | | 338,275 | | | | 2,273,208 | | |
Tilly's, Inc., Class A* | | | 391,574 | | | | 2,376,854 | | |
Zumiez, Inc.* | | | 431,661 | | | | 7,424,569 | | |
| | | | 46,896,840 | | |
Textiles, Apparel & Luxury Goods — 0.4% | |
Steven Madden Ltd. | | | 124,870 | | | | 5,045,996 | | |
Unifi, Inc.* | | | 485,373 | | | | 2,897,677 | | |
| | | | 7,943,673 | | |
Trading Companies & Distributors — 3.3% | |
Air Lease Corp. | | | 314,203 | | | | 15,785,559 | | |
Custom Truck One Source, Inc.* | | | 82,587 | | | | 412,109 | | |
DNOW, Inc.* | | | 238,081 | | | | 3,359,323 | | |
FTAI Aviation Ltd. | | | 214,459 | | | | 15,057,166 | | |
H&E Equipment Services, Inc. | | | 182,246 | | | | 8,800,659 | | |
Herc Holdings, Inc. | | | 51,487 | | | | 7,364,185 | | |
Titan Machinery, Inc.* | | | 222,545 | | | | 4,953,852 | | |
WESCO International, Inc. | | | 17,121 | | | | 2,615,233 | | |
| | | | 58,348,086 | | |
Total Common Stocks
(Cost $1,480,292,287) | | | 1,660,461,320 | | |
First Eagle Funds | Semiannual Report | April 30, 2024
107
First Eagle Small Cap Opportunity Fund | Schedule of Investments | April 30, 2024 (unaudited)
Investments | | Number of Rights | | Value ($) | |
Rights — 0.0% (b) | |
IT Services — 0.0% (b) | |
Flexion, Inc., CVR*‡ (c)
(Cost $27,802) | | | 44,841 | | | | — | | |
| | | Shares | | | |
Short-Term Investments — 7.1% | |
Investment Companies — 7.1% | |
JP Morgan U.S. Government Money Market Fund,
Capital Shares 5.33% (d) (Cost $127,923,513) | | | 127,923,513 | | | | 127,923,513 | | |
Total Investments — 99.8%
(Cost $1,608,243,602) | | | 1,788,384,833 | | |
Other Assets Less Liabilities — 0.2% | | | 2,913,694 | | |
Net Assets — 100.0% | | | 1,791,298,527 | | |
* Non-income producing security.
‡ Value determined using significant unobservable inputs.
(a) Affiliated company as defined under the Investment Company Act of 1940.
(b) Represents less than 0.05% of net assets.
(c) Security fair valued as of April 30, 2024 in accordance with procedures approved by the Board of Trustees. Total value of all such securities at April 30, 2024 amounted to $0, which represents approximately 0.00% of net assets of the Fund.
(d) Represents 7-day effective yield as of April 30, 2024.
Abbreviations
CVR — Contingent Value Rights
REIT — Real Estate Investment Trust
As of April 30, 2024, the gross unrealized appreciation (depreciation) of investments based on the aggregate cost of investments for federal income tax purposes was as follows:
Aggregate gross unrealized appreciation | | $ | 271,218,194 | | |
Aggregate gross unrealized depreciation | | | (91,076,963 | ) | |
Net unrealized appreciation | | $ | 180,141,231 | | |
Federal income tax cost of investments | | $ | 1,608,243,602 | | |
Affiliated Securities
Security Description | | Shares at
April 30, 2024 | | Market Value
October 31, 2023 | | Purchases at
Cost | | Proceeds from
Sales | |
Common Stocks — 0.4% | |
United States — 0.4% | |
Red Robin Gourmet Burgers, Inc.* | | | 914,323 | | | $ | 6,188,769 | | | $ | 1,380,551 | | | $ | — | | |
Total Common Stocks | | | | | 6,188,769 | | | | 1,380,551 | | | | — | | |
Total | | | | $ | 6,188,769 | | | $ | 1,380,551 | | | $ | — | | |
First Eagle Funds | Semiannual Report | April 30, 2024
108
First Eagle Small Cap Opportunity Fund | Schedule of Investments | April 30, 2024 (unaudited)
Affiliated Securities (continued)
Security Description | | Net Realized
Gains
(Loss) | | Change in
Unrealized
Appreciation/
Depreciation | | Market Value
April 30,
2024 | | Dividend
Income | |
Common Stocks — 0.4% | |
United States — 0.4% | |
Red Robin Gourmet Burgers, Inc.* | | $ | — | | | $ | (666,181 | ) | | $ | 6,903,139 | | | $ | — | | |
Total Common Stocks | | | — | | | | (666,181 | ) | | | 6,903,139 | | | | — | | |
Total | | $ | — | | | $ | (666,181 | ) | | $ | 6,903,139 | | | $ | — | | |
* Non-income producing security.
See Notes to Financial Statements.
First Eagle Funds | Semiannual Report | April 30, 2024
109
First Eagle U.S. Smid Cap Opportunity Fund
Fund Overview
Data as of April 30, 2024 (unaudited)
Investment Objective
The First Eagle U.S. Smid Cap Opportunity Fund seeks long-term growth of capital.
Average Annual Returns^ (%) | | | | One-Year | | Since
Inception
(8/15/22) | |
First Eagle U.S. Smid Cap Opportunity Fund | | Class I | | | 16.25 | | | | 3.61 | | |
Russell 2500TM Value Index | | | | | 15.24 | | | | 2.48 | | |
Russell 2500TM Index | | | | | 14.79 | | | | 2.76 | | |
S&P 500 Index | | | | | 22.66 | | | | 11.70 | | |

Sectors* (%)
Industrials | | | 24.0 | | |
Information Technology | | | 14.7 | | |
Health Care | | | 14.6 | | |
Financials | | | 11.3 | | |
Consumer Discretionary | | | 10.3 | | |
Energy | | | 7.2 | | |
Consumer Staples | | | 6.3 | | |
Materials | | | 5.9 | | |
Utilities | | | 0.5 | | |
Short-Term Investments | | | 5.2 | | |
^ Performance figures reflect certain fee waivers and/or expense limitations, without which returns may have been lower.
* Asset Allocation and Sector percentages are based on total investments in the portfolio.
** Includes short-term commercial paper (0.0% of total investments) that settles in 90 days or less, long-term commercial paper (0.0% of total investments) that settles in 91 days or greater and other short-term investments (5.2% of total investments), such as U.S. treasury bills or money market funds.
The Fund's portfolio composition is subject to change at any time.
First Eagle Funds | Semiannual Report | April 30, 2024
110
First Eagle U.S. Smid Cap Opportunity Fund | Fund Overview
Growth of a $1,000,000 Initial Investment
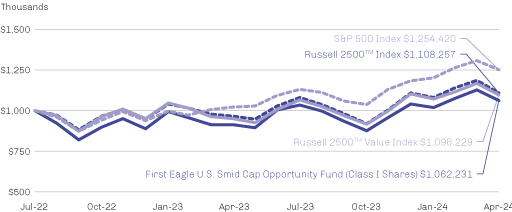
Performance data quoted herein represents past performance and should not be considered indicative of future results. Performance data quoted herein does not reflect the deduction of taxes that a shareholder would pay on Fund distributions or the sale of Fund shares. The average annual returns shown above are historical and reflect changes in share price, reinvested dividends and are net of expenses.
Class I Shares require $1 million minimum investment and are offered without a sales charge. If a sales charge was included values would be lower.
The Russell 2500TM Value Index is a widely followed, unmanaged index that measures the performance of the small- to mid-cap value segment of the U.S. equity universe, commonly referred to as "smid" cap. It includes those Russell 2500TM companies with relatively low price-to-book ratios and lower forecasted growth values. The Russell 2500TM Value Index is completely reconstituted annually. One cannot invest directly in an index.
The Russell 2500TM Index is a widely followed, unmanaged index that measures the performance of the smid cap segment of the U.S. equity universe. The Russell 2500TM Index is a subset of the Russell 3000® Index. It includes approximately 2,500 of the smallest securities based on a combination of their market cap and current index membership. The Russell 2500TM Index is completely reconstituted annually. One cannot invest directly in an index.
The S&P 500 Index is a widely recognized unmanaged index including a representative sample of 500 leading companies in leading sectors of the U.S. economy. Although the S&P 500 Index focuses on the large-cap segment of the market, with approximately 80% coverage of U.S. equities, it is also considered a proxy for the total market. The S&P 500 Index includes dividends reinvested. One cannot invest directly in an index.
Top 10 Holdings* (%)
Tenet Healthcare Corp. (Health Care Providers & Services, United States) | | | 2.8 | | |
Curtiss-Wright Corp. (Aerospace & Defense, United States) | | | 2.7 | | |
MKS Instruments, Inc. (Semiconductors & Semiconductor Equipment, United States) | | | 2.4 | | |
Cardinal Health, Inc. (Health Care Providers & Services, United States) | | | 2.4 | | |
Air Lease Corp. (Trading Companies & Distributors, United States) | | | 2.2 | | |
Performance Food Group Co. (Consumer Staples Distribution & Retail, United States) | | | 2.1 | | |
Evercore, Inc., Class A (Capital Markets, United States) | | | 2.0 | | |
Quanta Services, Inc. (Construction & Engineering, United States) | | | 1.9 | | |
Matador Resources Co. (Oil, Gas & Consumable Fuels, United States) | | | 1.9 | | |
Dover Corp. (Machinery, United States) | | | 1.9 | | |
Total | | | 22.3 | | |
* Holdings in cash, short-term commercial paper, long-term commercial paper and other short-term cash equivalents have been excluded.
Percentages are based on total net assets.
First Eagle Funds | Semiannual Report | April 30, 2024
111
First Eagle U.S. Smid Cap Opportunity Fund | Schedule of Investments | April 30, 2024 (unaudited)
Investments | | Shares | | Value ($) | |
Common Stocks — 95.4% | |
Aerospace & Defense — 4.0% | |
AAR Corp.* | | | 6,968 | | | | 481,768 | | |
Curtiss-Wright Corp. | | | 3,746 | | | | 949,311 | | |
| | | | 1,431,079 | | |
Air Freight & Logistics — 1.0% | |
GXO Logistics, Inc.* | | | 6,948 | | | | 345,038 | | |
Automobile Components — 1.1% | |
Goodyear Tire & Rubber Co. (The)* | | | 33,899 | | | | 405,432 | | |
Biotechnology — 1.3% | |
CareDx, Inc.* | | | 16,615 | | | | 128,932 | | |
Exelixis, Inc.* | | | 14,371 | | | | 337,144 | | |
| | | | 466,076 | | |
Building Products — 2.6% | |
AZEK Co., Inc. (The)* | | | 6,450 | | | | 294,378 | | |
Lennox International, Inc. | | | 1,337 | | | | 619,592 | | |
| | | | 913,970 | | |
Capital Markets — 3.4% | |
Evercore, Inc., Class A | | | 3,990 | | | | 724,185 | | |
Raymond James Financial, Inc. | | | 4,093 | | | | 499,346 | | |
| | | | 1,223,531 | | |
Chemicals — 4.0% | |
Huntsman Corp. | | | 16,072 | | | | 383,478 | | |
International Flavors & Fragrances, Inc. | | | 3,977 | | | | 336,653 | | |
Westlake Corp. | | | 4,652 | | | | 685,519 | | |
| | | | 1,405,650 | | |
Construction & Engineering — 1.9% | |
Quanta Services, Inc. | | | 2,668 | | | | 689,838 | | |
Consumer Staples Distribution & Retail — 4.8% | |
Casey's General Stores, Inc. | | | 1,823 | | | | 582,595 | | |
Chefs' Warehouse, Inc. (The)* | | | 11,279 | | | | 373,109 | | |
Performance Food Group Co.* | | | 10,850 | | | | 736,498 | | |
| | | | 1,692,202 | | |
Containers & Packaging — 0.8% | |
Sealed Air Corp. | | | 9,262 | | | | 291,568 | | |
First Eagle Funds | Semiannual Report | April 30, 2024
112
First Eagle U.S. Smid Cap Opportunity Fund | Schedule of Investments | April 30, 2024 (unaudited)
Investments | | Shares | | Value ($) | |
Electrical Equipment — 2.8% | |
EnerSys | | | 6,021 | | | | 544,599 | | |
Generac Holdings, Inc.* | | | 2,435 | | | | 331,063 | | |
NEXTracker, Inc., Class A* | | | 2,563 | | | | 109,671 | | |
| | | | 985,333 | | |
Electronic Equipment, Instruments & Components — 4.8% | |
Avnet, Inc. | | | 6,328 | | | | 309,249 | | |
Belden, Inc. | | | 4,625 | | | | 375,874 | | |
Coherent Corp.* | | | 4,081 | | | | 222,945 | | |
Fabrinet (Thailand)* | | | 1,536 | | | | 265,836 | | |
Flex Ltd.* | | | 11,848 | | | | 339,445 | | |
Trimble, Inc.* | | | 3,203 | | | | 192,404 | | |
| | | | 1,705,753 | | |
Financial Services — 4.2% | |
MGIC Investment Corp. | | | 15,325 | | | | 310,791 | | |
Radian Group, Inc. | | | 21,131 | | | | 631,183 | | |
Rocket Cos., Inc., Class A* | | | 43,300 | | | | 531,724 | | |
| | | | 1,473,698 | | |
Food Products — 1.6% | |
Ingredion, Inc. | | | 5,012 | | | | 574,325 | | |
Ground Transportation — 2.5% | |
Knight-Swift Transportation Holdings, Inc. | | | 5,095 | | | | 235,542 | | |
XPO, Inc.* | | | 5,935 | | | | 637,775 | | |
| | | | 873,317 | | |
Health Care Equipment & Supplies — 2.4% | |
Enovis Corp.* | | | 2,908 | | | | 160,609 | | |
Zimmer Biomet Holdings, Inc. | | | 5,627 | | | | 676,815 | | |
| | | | 837,424 | | |
Health Care Providers & Services — 7.5% | |
Amedisys, Inc.* | | | 3,430 | | | | 315,731 | | |
Cardinal Health, Inc. | | | 8,129 | | | | 837,612 | | |
Quest Diagnostics, Inc. | | | 3,935 | | | | 543,738 | | |
Tenet Healthcare Corp.* | | | 8,733 | | | | 980,629 | | |
| | | | 2,677,710 | | |
First Eagle Funds | Semiannual Report | April 30, 2024
113
First Eagle U.S. Smid Cap Opportunity Fund | Schedule of Investments | April 30, 2024 (unaudited)
Investments | | Shares | | Value ($) | |
Hotels, Restaurants & Leisure — 4.6% | |
Aramark | | | 11,985 | | | | 377,647 | | |
Cheesecake Factory, Inc. (The) | | | 14,715 | | | | 507,962 | | |
Chuy's Holdings, Inc.* | | | 10,633 | | | | 313,248 | | |
Denny's Corp.* | | | 31,848 | | | | 255,421 | | |
Vail Resorts, Inc. | | | 961 | | | | 181,985 | | |
| | | | 1,636,263 | | |
Household Durables — 2.8% | |
Beazer Homes USA, Inc.* | | | 11,412 | | | | 319,879 | | |
LGI Homes, Inc.* | | | 2,539 | | | | 228,332 | | |
Skyline Champion Corp.* | | | 1,395 | | | | 104,611 | | |
Toll Brothers, Inc. | | | 2,991 | | | | 356,258 | | |
| | | | 1,009,080 | | |
Insurance — 3.7% | |
Axis Capital Holdings Ltd. | | | 7,662 | | | | 469,910 | | |
First American Financial Corp. | | | 5,447 | | | | 291,796 | | |
Old Republic International Corp. | | | 18,860 | | | | 563,160 | | |
| | | | 1,324,866 | | |
IT Services — 0.6% | |
Amdocs Ltd. | | | 2,376 | | | | 199,560 | | |
Life Sciences Tools & Services — 3.5% | |
Avantor, Inc.* | | | 15,914 | | | | 385,596 | | |
Bio-Rad Laboratories, Inc., Class A* | | | 2,303 | | | | 621,235 | | |
Revvity, Inc. | | | 2,294 | | | | 235,066 | | |
| | | | 1,241,897 | | |
Machinery — 5.5% | |
Donaldson Co., Inc. | | | 8,321 | | | | 600,776 | | |
Dover Corp. | | | 3,826 | | | | 686,002 | | |
Ingersoll Rand, Inc. | | | 7,242 | | | | 675,823 | | |
| | | | 1,962,601 | | |
Metals & Mining — 1.1% | |
Cleveland-Cliffs, Inc.* | | | 23,153 | | | | 391,286 | | |
Multi-Utilities — 0.5% | |
Black Hills Corp. | | | 3,280 | | | | 180,072 | | |
First Eagle Funds | Semiannual Report | April 30, 2024
114
First Eagle U.S. Smid Cap Opportunity Fund | Schedule of Investments | April 30, 2024 (unaudited)
Investments | | Shares | | Value ($) | |
Oil, Gas & Consumable Fuels — 7.3% | |
Chesapeake Energy Corp. | | | 7,474 | | | | 671,763 | | |
HF Sinclair Corp. | | | 10,791 | | | | 585,412 | | |
Matador Resources Co. | | | 11,037 | | | | 687,605 | | |
Permian Resources Corp. | | | 37,671 | | | | 630,989 | | |
| | | | 2,575,769 | | |
Passenger Airlines — 1.6% | |
Delta Air Lines, Inc. | | | 11,194 | | | | 560,484 | | |
Semiconductors & Semiconductor Equipment — 9.5% | |
Amkor Technology, Inc. | | | 20,376 | | | | 659,164 | | |
Entegris, Inc. | | | 4,066 | | | | 540,453 | | |
MKS Instruments, Inc. | | | 7,147 | | | | 850,350 | | |
ON Semiconductor Corp.* | | | 8,963 | | | | 628,844 | | |
Onto Innovation, Inc.* | | | 3,693 | | | | 685,014 | | |
| | | | 3,363,825 | | |
Specialty Retail — 0.9% | |
Lithia Motors, Inc., Class A | | | 824 | | | | 209,609 | | |
RH* | | | 409 | | | | 101,043 | | |
| | | | 310,652 | | |
Textiles, Apparel & Luxury Goods — 0.9% | |
Steven Madden Ltd. | | | 8,278 | | | | 334,514 | | |
Trading Companies & Distributors — 2.2% | |
Air Lease Corp. | | | 15,792 | | | | 793,390 | | |
Total Common Stocks
(Cost $28,236,057) | | | 33,876,203 | | |
Short-Term Investments — 5.2% | |
Investment Companies — 5.2% | |
JP Morgan U.S. Government Money Market Fund,
Capital Shares 5.33% (a) (Cost $1,864,952) | | | 1,864,952 | | | | 1,864,952 | | |
Total Investments — 100.6%
(Cost $30,101,009) | | | 35,741,155 | | |
Liabilities in Excess of Other Assets — (0.6%) | | | (196,821 | ) | |
Net Assets — 100.0% | | | 35,544,334 | | |
* Non-income producing security.
(a) Represents 7-day effective yield as of April 30, 2024.
First Eagle Funds | Semiannual Report | April 30, 2024
115
First Eagle U.S. Smid Cap Opportunity Fund | Schedule of Investments | April 30, 2024 (unaudited)
As of April 30, 2024, the gross unrealized appreciation (depreciation) of investments based on the aggregate cost of investments for federal income tax purposes was as follows:
Aggregate gross unrealized appreciation | | $ | 6,441,324 | | |
Aggregate gross unrealized depreciation | | | (801,178 | ) | |
Net unrealized appreciation | | $ | 5,640,146 | | |
Federal income tax cost of investments | | $ | 30,101,009 | | |
See Notes to Financial Statements.
First Eagle Funds | Semiannual Report | April 30, 2024
116
This page was intentionally left blank.
First Eagle Global Real Assets Fund
Fund Overview
Data as of April 30, 2024 (unaudited)
Investment Objective
The First Eagle Global Real Assets Fund seeks long-term growth of capital.
Average Annual Returns^ (%) | | | | One-Year | | Since
Inception
(11/30/21) | |
First Eagle Global Real Assets | | Class I | | | 4.51 | | | | 4.05 | | |
MSCI World Index | | | | | 18.39 | | | | 4.32 | | |
Consumer Price Index for
Urban Consumers (CPI-U) | | | | | 3.36 | | | | 4.93 | | |

Sectors* (%)
Materials | | 23.2 | |
Real Estate | | 23.1 | |
Energy | | 16.3 | |
Industrials | | 11.3 | |
Utilities | | 6.1 | |
Consumer Staples | | 3.7 | |
Commodities | | 3.3 | |
Communication Services | | 2.0 | |
Health Care | | 1.9 | |
Investment Funds | | 1.1 | |
Information Technology | | 0.9 | |
Consumer Discretionary | | 0.9 | |
Short-Term Investments | | 6.2 | |
Countries*~ (%)
United States | | 45.2 | |
Canada | | 12.3 | |
United Kingdom | | 10.3 | |
Mexico | | 7.8 | |
Japan | | 3.3 | |
Hong Kong | | 3.2 | |
Germany | | 2.3 | |
Australia | | 2.3 | |
Singapore | | 1.9 | |
Belgium | | 1.2 | |
Spain | | 1.1 | |
France | | 1.0 | |
Faroe Islands | | 1.0 | |
South Korea | | 0.9 | |
Russia | | 0.0 | |
Short-Term Investments | | 6.2 | |
^ Performance figures reflect certain fee waivers and/or expense limitations, without which returns may have been lower.
* Asset Allocation, Sector and Countries percentages are based on total investments in the portfolio.
** Includes short-term commercial paper (0.0% of total investments) that settles in 90 days or less, long-term commercial paper (0.0% of total investments) that settles in 91 days or greater and other short-term investments (6.2% of total investments), such as U.S. treasury bills or money market funds.
~ Country allocations reflect country of risk (not currency of issue). Bonds of non-U.S. issuers may be U.S. dollar denominated.
The Fund's portfolio composition is subject to change at any time.
First Eagle Funds | Semiannual Report | April 30, 2024
118
First Eagle Global Real Assets Fund | Fund Overview
Growth of a $1,000,000 Initial Investment
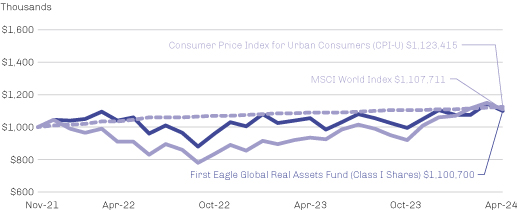
Performance data quoted herein represents past performance and should not be considered indicative of future results. Performance data quoted herein does not reflect the deduction of taxes that a shareholder would pay on Fund distributions or the sale of Fund shares. The average annual returns shown above are historical and reflect changes in share price, reinvested dividends and are net of expenses.
Class I Shares require $1 million minimum investment and are offered without a sales charge. If a sales charge was included values would be lower.
The MSCI World Index captures large- and mid-cap representation across 23 developed markets countries. Developed markets countries include Australia, Austria, Belgium, Canada, Denmark, Finland, France, Germany, Hong Kong, Ireland, Israel, Italy, Japan, Netherlands, New Zealand, Norway, Portugal, Singapore, Spain, Sweden, Switzerland, the UK and the U.S. With 1,480 constituents, the index covers approximately 85% of the free float-adjusted market capitalization in each country. The Consumer Price Index for Urban Consumers (CPI-U) is a measurement of changes in the cost of living, and is comprised of components such as housing, food transportation, and energy. It is calculated monthly by the U.S. Bureau of Labor Statistics and covers approximately 93% of the total U.S. population. One cannot invest directly in an index.
Top 10 Holdings* (%)
Gold bullion** (Precious Metal) | | | 3.4 | | |
Enterprise Products Partners LP (Oil, Gas & Consumable Fuels, United States) | | | 2.7 | | |
Shell plc (Oil, Gas & Consumable Fuels, United Kingdom) | | | 2.7 | | |
TF Administradora Industrial S de RL de CV, REIT (Industrial REITs, Mexico) | | | 2.7 | | |
Grupo Mexico SAB de CV, Series B (Metals & Mining, Mexico) | | | 2.6 | | |
Imperial Oil Ltd. (Oil, Gas & Consumable Fuels, Canada) | | | 2.5 | | |
United Utilities Group plc (Water Utilities, United Kingdom) | | | 2.5 | | |
CRH plc (Construction Materials, United States) | | | 2.5 | | |
FUCHS SE (Preference) (Chemicals, Germany) | | | 2.4 | | |
Glencore plc (Metals & Mining, Australia) | | | 2.4 | | |
Total | | | 26.4 | | |
* Holdings in cash, short-term commercial paper, long-term commercial paper and other short-term cash equivalents have been excluded.
** The Fund invests in gold and precious metals through investment in a wholly-owned subsidiary of the Fund organized under the laws of the Cayman Islands (the "Subsidiary"). Gold Bullion and commodities include the Fund's investment in the Subsidiary.
Percentages are based on total net assets.
First Eagle Funds | Semiannual Report | April 30, 2024
119
First Eagle Global Real Assets Fund | Consolidated Schedule of Investments | April 30, 2024 (unaudited)
Investments | | Shares | | Value ($) | |
Common Stocks — 89.1% | |
Australia — 2.4% | |
Glencore plc | | | 54,858 | | | | 319,195 | | |
Belgium — 1.2% | |
Shurgard Self Storage Ltd., REIT | | | 3,990 | | | | 163,515 | | |
Canada — 12.7% | |
Agnico Eagle Mines Ltd. | | | 2,173 | | | | 137,611 | | |
Canadian National Railway Co. | | | 1,722 | | | | 209,007 | | |
Canadian Pacific Kansas City Ltd. | | | 2,382 | | | | 186,871 | | |
Franco-Nevada Corp. | | | 949 | | | | 114,240 | | |
Imperial Oil Ltd. | | | 4,933 | | | | 339,163 | | |
Nutrien Ltd. | | | 5,605 | | | | 295,548 | | |
StorageVault Canada, Inc. | | | 30,197 | | | | 103,753 | | |
Wheaton Precious Metals Corp. | | | 6,002 | | | | 312,689 | | |
| | | 1,698,882 | | |
Faroe Islands — 1.1% | |
Bakkafrost P/F | | | 2,316 | | | | 140,660 | | |
France — 1.1% | |
Air Liquide SA | | | 731 | | | | 142,968 | | |
Germany — 2.4% | |
FUCHS SE (Preference) | | | 6,868 | | | | 320,731 | | |
Hong Kong — 3.3% | |
CK Asset Holdings Ltd. | | | 42,500 | | | | 181,287 | | |
Guoco Group Ltd. | | | 15,000 | | | | 142,853 | | |
Hongkong Land Holdings Ltd. | | | 38,000 | | | | 121,417 | | |
| | | | 445,557 | | |
Japan — 3.4% | |
Kansai Paint Co. Ltd. | | | 11,000 | | | | 143,200 | | |
Komatsu Ltd. | | | 7,700 | | | | 229,892 | | |
Shin-Etsu Chemical Co. Ltd. | | | 2,000 | | | | 77,418 | | |
| | | | 450,510 | | |
Mexico — 8.0% | |
FIBRA Macquarie Mexico, REIT (a) | | | 97,946 | | | | 176,215 | | |
Fibra MTY SAPI de CV, REIT | | | 103,204 | | | | 61,149 | | |
First Eagle Funds | Semiannual Report | April 30, 2024
120
First Eagle Global Real Assets Fund | Consolidated Schedule of Investments | April 30, 2024 (unaudited)
Investments | | Shares | | Value ($) | |
Mexico — 8.0% (continued) | |
GMexico Transportes SAB de CV (a) | | | 62,322 | | | | 133,006 | | |
Grupo Mexico SAB de CV, Series B | | | 55,722 | | | | 344,303 | | |
TF Administradora Industrial S de RL de CV, REIT | | | 144,894 | | | | 356,256 | | |
| | | | 1,070,929 | | |
Russia — 0.0% | |
Alrosa PJSC‡ (b) | | | 48,132 | | | | — | | |
Singapore — 2.0% | |
Sheng Siong Group Ltd. | | | 134,100 | | | | 152,014 | | |
UOL Group Ltd. | | | 27,400 | | | | 116,991 | | |
| | | | 269,005 | | |
South Korea — 1.0% | |
Samsung Electronics Co. Ltd. (Preference) | | | 2,795 | | | | 130,502 | | |
Spain — 1.2% | |
Aena SME SA (a) | | | 839 | | | | 152,899 | | |
United Kingdom — 10.6% | |
Ashtead Group plc | | | 3,052 | | | | 221,612 | | |
Berkeley Group Holdings plc | | | 2,145 | | | | 125,967 | | |
Big Yellow Group plc, REIT | | | 13,387 | | | | 180,086 | | |
Cranswick plc | | | 2,527 | | | | 135,713 | | |
Great Portland Estates plc, REIT | | | 12,442 | | | | 60,944 | | |
Shell plc | | | 9,974 | | | | 356,409 | | |
United Utilities Group plc | | | 25,524 | | | | 332,710 | | |
| | | 1,413,441 | | |
United States — 38.7% | |
American Homes 4 Rent, Class A, REIT | | | 5,618 | | | | 201,124 | | |
American Water Works Co., Inc. | | | 1,175 | | | | 143,726 | | |
Boston Properties, Inc., REIT | | | 3,481 | | | | 215,439 | | |
Charter Communications, Inc., Class A* | | | 211 | | | | 54,003 | | |
Comcast Corp., Class A | | | 5,731 | | | | 218,408 | | |
CRH plc | | | 4,294 | | | | 332,531 | | |
Cummins, Inc. | | | 492 | | | | 138,985 | | |
Deere & Co. | | | 347 | | | | 135,819 | | |
Diamond Offshore Drilling, Inc.* | | | 9,907 | | | | 121,262 | | |
Douglas Emmett, Inc., REIT | | | 11,816 | | | | 161,997 | | |
EastGroup Properties, Inc., REIT | | | 538 | | | | 83,584 | | |
First Eagle Funds | Semiannual Report | April 30, 2024
121
First Eagle Global Real Assets Fund | Consolidated Schedule of Investments | April 30, 2024 (unaudited)
Investments | | Shares | | Value ($) | |
United States — 38.7% (continued) | |
Equinix, Inc., REIT | | | 84 | | | | 59,733 | | |
Equity Residential, REIT | | | 3,986 | | | | 256,698 | | |
Extra Space Storage, Inc., REIT | | | 2,299 | | | | 308,710 | | |
Exxon Mobil Corp. | | | 1,024 | | | | 121,108 | | |
HCA Healthcare, Inc. | | | 869 | | | | 269,234 | | |
IDACORP, Inc. | | | 2,608 | | | | 247,186 | | |
Mid-America Apartment Communities, Inc., REIT | | | 739 | | | | 96,070 | | |
Noble Corp. plc | | | 4,647 | | | | 206,234 | | |
NOV, Inc. | | | 1,788 | | | | 33,060 | | |
ONEOK, Inc. | | | 3,821 | | | | 302,318 | | |
PPG Industries, Inc. | | | 702 | | | | 90,558 | | |
Reliance, Inc. | | | 660 | | | | 187,915 | | |
Royal Gold, Inc. | | | 1,613 | | | | 193,770 | | |
RPM International, Inc. | | | 1,778 | | | | 190,086 | | |
SBA Communications Corp., REIT | | | 892 | | | | 166,019 | | |
Schlumberger NV | | | 4,308 | | | | 204,544 | | |
Terreno Realty Corp., REIT | | | 1,975 | | | | 107,341 | | |
UGI Corp. | | | 4,792 | | | | 122,484 | | |
Walmart, Inc. | | | 1,329 | | | | 78,876 | | |
Williams Cos., Inc. (The) | | | 3,107 | | | | 119,185 | | |
| | | 5,168,007 | | |
Total Common Stocks
(Cost $11,532,822) | | | 11,886,801 | | |
| | | Ounces | | | |
Commodities — 3.4% | |
Gold bullion*
(Cost $348,267) | | | 197 | | | | 451,231 | | |
| | | Shares | | | |
Master Limited Partnerships — 3.3% | |
United States — 3.3% | |
Black Stone Minerals LP | | | 5,614 | | | | 89,543 | | |
Enterprise Products Partners LP | | | 12,711 | | | | 356,925 | | |
Total Master Limited Partnerships
(Cost 393,320) | | | 446,468 | | |
First Eagle Funds | Semiannual Report | April 30, 2024
122
First Eagle Global Real Assets Fund | Consolidated Schedule of Investments | April 30, 2024 (unaudited)
Investments | | Shares | | Value ($) | |
Exchange Traded Funds — 1.1% | |
United States | |
iShares Gold Trust
(Cost $134,961) | | | 3,393 | | | | 146,917 | | |
Short-Term Investment — 6.4% | |
Investment Companies — 6.4% | |
JP Morgan U.S. Government Money Market Fund,
Capital Shares 5.33% (c) (Cost $848,576) | | | 848,576 | | | | 848,576 | | |
Total Investments — 103.3%
(Cost $13,257,946) | | | 13,779,993 | | |
Liabilities in Excess of Other Assets — (3.3)% | | | (433,012 | ) | |
Net Assets — 100.0% | | | 13,346,981 | | |
* Non-income producing security.
‡ Value determined using significant unobservable inputs.
(a) Security exempt from registration pursuant to Regulation S under the Securities Act of 1933. Regulation S applies to securities offerings that are made outside of the United States and do not involve direct selling efforts in the United States and as such may have restrictions on resale.
(b) Security fair valued as of April 30, 2024 in accordance with procedures approved by the Board of Trustees. Total value of all such securities at April 30, 2024 amounted to $0, which represents approximately 0.00% of net assets of the Fund.
(c) Represents 7-day effective yield as of April 30, 2024.
As of April 30, 2024, the gross unrealized appreciation (depreciation) of investments based on the aggregate cost of investments for federal income tax purposes was as follows:
Aggregate gross unrealized appreciation | | $ | 1,424,393 | | |
Aggregate gross unrealized depreciation | | | (902,346 | ) | |
Net unrealized appreciation | | $ | 522,047 | | |
Federal income tax cost of investments | | $ | 13,257,946 | | |
Abbreviations
PJSC — Public Joint Stock Company
Preference — A special type of equity investment that shares in the earnings of the company, has limited voting rights, and may have a dividend preference. Preference shares may also have liquidation preference.
REIT — Real Estate Investment Trust
See Notes to Financial Statements.
First Eagle Funds | Semiannual Report | April 30, 2024
123
First Eagle High Yield Municipal Fund (formerly First Eagle High Income Fund)
Data as of April 30, 2024 (unaudited)
Investment Objective
The First Eagle High Yield Municipal Fund seeks to provide high current income exempt from regular federal income taxes; capital appreciation is a secondary objective when consistent with the Fund's primary objective.
Average Annual Returns^ (%) | | | | One-Year | | Five-Years | | Ten-Years | |
First Eagle High Yield Municipal Yield | | Class I | | | 9.21 | | | | 3.69 | | | | 3.31 | | |
S&P Municipal Yield Index | | | | | 5.83 | | | | 2.63 | | | | 4.23 | | |
S&P Municipal Bond Index | | | | | 2.35 | | | | 1.38 | | | | 2.46 | | |
Bloomberg U.S. Corporate High Yield Index | | | | | 9.02 | | | | 3.72 | | | | 4.28 | | |

Bond Credit Quality* (%)
AA | | | 2.3 | | |
A | | | 1.7 | | |
BBB | | | 7.7 | | |
BB or lower | | | 12.9 | | |
N/R (not rated) | | | 7.7 | | |
N/A (not applicable) | | | 67.7 | | |
Portfolio Composition* (%)
Hospital | | | 14.1 | | |
Public Transportation | | | 10.3 | | |
Community Development District | | | 9.7 | | |
Charter School | | | 7.9 | | |
Economic/Industrial Development | | | 7.3 | | |
State Multi-Family Housing | | | 7.3 | | |
Continuing Care Retirement Community | | | 6.6 | | |
Special Assessment Financing | | | 5.2 | | |
Nursing Home | | | 3.6 | | |
Tax Increment Financing | | | 3.5 | | |
Higher Education | | | 2.8 | | |
Local Multi-Family Housing | | | 2.7 | | |
Indian Tribal Bond | | | 2.3 | | |
Student Housing | | | 2.2 | | |
Tobacco Master Settlement Agreement | | | 2.1 | | |
General Obligation Hospital/Health District | | | 1.7 | | |
Public Power System | | | 1.5 | | |
Port/Marina | | | 1.2 | | |
Toll Highway/Bridge/Tunnel | | | 1.2 | | |
General Obligation | | | 1.0 | | |
Sales & Excise Tax | | | 1.0 | | |
Mello-Roos | | | 0.7 | | |
Private/Religious School | | | 0.7 | | |
Water & Sewer | | | 0.7 | | |
Metro Development District | | | 0.6 | | |
General Obligation District (Other) | | | 0.4 | | |
Assisted Living | | | 0.3 | | |
Miscellaneous Tax | | | 0.3 | | |
School District | | | 0.3 | | |
Appropriation | | | 0.2 | | |
Portfolio Composition* (%) (continued)
General Revenue Tax-Guaranteed | | | 0.2 | | |
Parking Facility | | | 0.2 | | |
Not-For-Profit Cultural Organization | | | 0.1 | | |
Telecom | | | 0.1 | | |
Airport | | | 0.0 | ‡ | |
Short-Term Investments | | | 0.0 | ‡ | |
States and Territories* (%)
Florida | | | 25.0 | | |
California | | | 12.4 | | |
Wisconsin | | | 9.1 | | |
Texas | | | 8.4 | | |
Ohio | | | 7.1 | | |
New York | | | 6.7 | | |
Georgia | | | 3.0 | | |
Pennsylvania | | | 2.6 | | |
Louisiana | | | 2.4 | | |
Utah | | | 2.1 | | |
Illinois | | | 2.0 | | |
Colorado | | | 1.7 | | |
Missouri | | | 1.5 | | |
District of Columbia | | | 1.4 | | |
Arkansas | | | 1.2 | | |
New Hampshire | | | 1.2 | | |
Puerto Rico | | | 1.2 | | |
Washington | | | 1.2 | | |
Arizona | | | 1.0 | | |
Idaho | | | 1.0 | | |
Iowa | | | 0.7 | | |
Kansas | | | 0.7 | | |
Minnesota | | | 0.7 | | |
New Jersey | | | 0.7 | | |
North Dakota | | | 0.7 | | |
Oklahoma | | | 0.7 | | |
Oregon | | | 0.6 | | |
Alabama | | | 0.5 | | |
Indiana | | | 0.5 | | |
Michigan | | | 0.4 | | |
Virginia | | | 0.4 | | |
Maryland | | | 0.3 | | |
Connecticut | | | 0.2 | | |
Delaware | | | 0.2 | | |
Virgin Islands | | | 0.2 | | |
Kentucky | | | 0.1 | | |
Nevada | | | 0.1 | | |
Rhode Island | | | 0.1 | | |
American Samoa | | | 0.0 | ‡ | |
Montana | | | 0.0 | ‡ | |
Short-Term Investments | | | 0.0 | ‡ | |
^ Performance figures reflect certain fee waivers and/or expense limitations, without which returns may have been lower.
‡ Less than 0.05%.
* Asset Allocation, Bond Credit Quality, Portfolio Composition and States and Territories percentages are based on total investments in the portfolio.
** Includes short-term commercial paper (0.0% of total investments) that settles in 90 days or less, longterm commercial paper (0.0% of total investments) that settles in 91 days or greater and other short-term investments (0.0% of total investments), such as U.S. treasury bills or money market funds.
The Fund's portfolio composition is subject to change at any time.
First Eagle Funds | Semiannual Report | April 30, 2024
124
First Eagle High Yield Municipal Fund | Fund Overview
Growth of a $1,000,000 Initial Investment
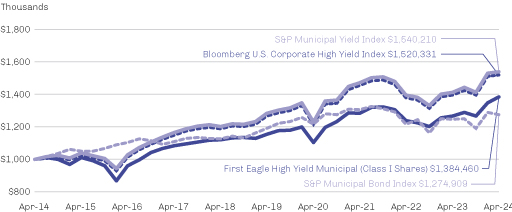
Performance data quoted herein represents past performance and should not be considered indicative of future results. Performance data quoted herein does not reflect the deduction of taxes that a shareholder would pay on Fund distributions or the sale of Fund shares. The average annual returns shown above are historical and reflect changes in share price, reinvested dividends and are net of expenses.
Class I Shares require $1 million minimum investment and are offered without a sales charge. If a sales charge was included values would be lower.
The Bloomberg U.S. Corporate High Yield Index is composed of fixed-rate, publicly issued, non-investment grade debt and is unmanaged, with dividends reinvested. The index includes both corporate and non-corporate sectors. The corporate sectors are Industrial, Utility, and Finance, which include both U.S. and non-U.S. corporations. One cannot invest directly in an index.
S&P Municipal Yield Index is a market value-weighted index that seeks to provide a measure of an investing strategy used in the municipal market that allocates a different percentage to bonds rated below investment grade and non-rated bonds than to bonds rated investment grade. The S&P Municipal Yield Index, whose constituents are derived from S&P Municipal Bond Index, incorporates a strategy of proportional investing in municipal bonds that typically have higher yields than other municipal bonds. Both tax-exempt bonds and bonds subject to the Alternative Minimum Tax (AMT) are included in the Index. One cannot invest directly in an index.
The S&P Municipal Bond Index is a broad, market value-weighted index that seeks to measure the performance of the U.S. municipal bond market. It tracks fixed-rate tax-free bonds and bonds subject to the alternative minimum tax (AMT). One cannot invest directly in an index.
First Eagle Funds | Semiannual Report | April 30, 2024
125
First Eagle High Yield Municipal Fund | Schedule of Investments | April 30, 2024 (unaudited)
Investments | | Principal Amount ($) | | Value ($) | |
Municipal Bonds — 112.4% | |
Alabama — 0.5% | |
Hoover Industrial Development Board,
United States Steel Corp., Revenue, AMT,
Series 2019, 5.75%, 10/01/2049 | | | 1,750,000 | | | | 1,794,821 | | |
Industrial Development Board of the
City of Mobile Alabama,
Alabama Power Co., Revenue, AMT,
Series 2001 A, 4.05%, 05/01/2024 (a)(b) | | | 890,000 | | | | 890,000 | | |
Walker County Economic & Industrial
Development Authority,
Alabama Power Co., Revenue, First Series, AMT,
Series 2023, 4.10%, 05/01/2024 (a)(b) | | | 1,865,000 | | | | 1,865,000 | | |
| | | | 4,549,821 | | |
American Samoa — 0.0% (c) | |
American Samoa Economic Development
Authority, Revenue,
Series 2018, 6.50%, 09/01/2028 (d) | | | 250,000 | | | | 259,879 | | |
Arizona — 1.0% | |
Maricopa County Industrial Development Authority,
Choice Academies, Inc., Revenue, Refunding,
Series 2022, 5.75%, 09/01/2045 (d) | | | 2,300,000 | | | | 2,266,317 | | |
Morrison Education Group Obligated Group,
Revenue, Refunding,
Series 2024 A, 6.75%, 07/01/2063 (d) | | | 2,000,000 | | | | 2,061,421 | | |
Prescott Valley Charter School, Revenue,
Series 2024, 6.50%, 07/01/2039 (d) | | | 380,000 | | | | 374,456 | | |
Prescott Valley Charter School, Revenue,
Series 2024, 7.13%, 07/01/2054 (d) | | | 2,000,000 | | | | 1,933,599 | | |
Prescott Valley Charter School, Revenue,
Series 2024, 7.38%, 07/01/2063 (d) | | | 1,850,000 | | | | 1,786,640 | | |
Superstition Vistas, Community Facilities District No. 1
Assessment Area 3, Special Assessment,
Series 2024, 5.80%, 07/01/2048 (e) | | | 348,000 | | | | 348,339 | | |
Tempe Industrial Development Authority,
Tempe Life Care Village Obligated Group,
Revenue, Refunding,
Series 2021 A, 4.00%, 12/01/2046 | | | 1,000,000 | | | | 799,619 | | |
| | | | 9,570,391 | | |
First Eagle Funds | Semiannual Report | April 30, 2024
126
First Eagle High Yield Municipal Fund | Schedule of Investments | April 30, 2024 (unaudited)
Investments | | Principal Amount ($) | | Value ($) | |
Arkansas — 1.4% | |
Arkansas Development Finance Authority,
Hybar LLC, Revenue, AMT,
Series 2023 B, 7.38%, 07/01/2048 (d)(f) | | | 11,250,000 | | | | 12,237,787 | | |
California — 13.9% | |
Antelope Valley Healthcare District,
Obligated Group, Revenue, Refunding,
Series 2016, 5.00%, 03/01/2031 | | | 2,765,000 | | | | 2,763,291 | | |
Obligated Group, Revenue, Refunding,
Series 2016, 5.25%, 03/01/2036 | | | 1,885,000 | | | | 1,879,474 | | |
Obligated Group, Revenue, Refunding,
Series 2016, 5.00%, 03/01/2041 | | | 2,280,000 | | | | 2,153,681 | | |
Obligated Group, Revenue, Refunding,
Series 2016, 5.00%, 03/01/2046 | | | 1,500,000 | | | | 1,357,875 | | |
Bay Area Toll Authority, Revenue, Refunding,
Series 2023 B, 3.85%, 05/01/2024 (a)(b) | | | 8,200,000 | | | | 8,200,000 | | |
California Community Housing Agency,
Brio Apartments & Next on Lex Apartments,
Revenue, Senior Lien,
Series 2021 A-1, 4.00%, 02/01/2056 (d) | | | 2,300,000 | | | | 1,879,232 | | |
Creekwood Apartments, Revenue,
Series 2021 A, 4.00%, 02/01/2056 (d) | | | 10,000,000 | | | | 6,561,140 | | |
California Infrastructure & Economic
Development Bank, WFCS Holdings II LLC, Revenue,
Series 2021 A-1, 5.00%, 01/01/2056 (d) | | | 1,800,000 | | | | 1,482,552 | | |
WFCS Holdings II LLC, Revenue,
Series 2021 B, 0.00%, 01/01/2061 (d)(g) | | | 10,200,000 | | | | 689,494 | | |
California Municipal Finance Authority,
Catalyst Impact Fund 1 LLC, Revenue,
Series 2024, Class I, 6.00%, 01/01/2039 (d) | | | 2,000,000 | | | | 2,060,407 | | |
City of Elk Grove Community Facilities
District No. G30 2023-7 Improvement
Area No. 1, Special Tax,
Series 2024, 5.00%, 09/01/2054 | | | 1,000,000 | | | | 987,065 | | |
Clinicas del Camino Real, Inc., Revenue,
Series 2020, 4.00%, 03/01/2050 | | | 4,000,000 | | | | 3,121,581 | | |
Special Tax, Series 2024 A, 5.00%, 09/01/2048 | | | 375,000 | | | | 356,658 | | |
Special Tax, Series 2024 A, 5.13%, 09/01/2054 | | | 1,000,000 | | | | 960,029 | | |
Westside Neighborhood School, Revenue,
Series 2024, 5.90%, 06/15/2044 (d)(e) | | | 775,000 | | | | 798,542 | | |
Westside Neighborhood School, Revenue,
Series 2024, 6.20%, 06/15/2054 (d)(e) | | | 1,600,000 | | | | 1,647,969 | | |
First Eagle Funds | Semiannual Report | April 30, 2024
127
First Eagle High Yield Municipal Fund | Schedule of Investments | April 30, 2024 (unaudited)
Investments | | Principal Amount ($) | | Value ($) | |
California — 13.9% (continued) | |
Westside Neighborhood School, Revenue,
Series 2024, 6.38%, 06/15/2064 (d)(e) | | | 3,250,000 | | | | 3,345,550 | | |
California School Finance Authority,
Harbor Springs Obligated Group, Revenue,
Series 2024 A, 5.63%, 07/01/2063 (d) | | | 1,000,000 | | | | 1,002,519 | | |
California Statewide Communities Development
Authority, Community Facilities District 2022-12
Improvement Area No. 1, Special Tax,
Series 2024, 5.00%, 09/01/2054 | | | 1,000,000 | | | | 964,600 | | |
Front Porch Communities & Services
Obligated Group, Revenue, Refunding,
Series 2021 A, 3.00%, 04/01/2051 | | | 3,000,000 | | | | 2,159,024 | | |
Loma Linda University Medical Center
Obligated Group, Revenue,
Series 2014 A, 5.50%, 12/01/2054 | | | 1,000,000 | | | | 1,003,032 | | |
California Statewide Financing Authority,
TSR Multi-County Special Purpose Trust, Revenue,
Series 2002 B, 6.00%, 05/01/2037 | | | 290,000 | | | | 296,409 | | |
California Statewide Financing Authority,
TSR Multi-County Special Purpose Trust, Revenue,
Series 2002 A, 6.00%, 05/01/2037 | | | 1,010,000 | | | | 1,032,319 | | |
TSR Multi-County Special Purpose Trust, Revenue,
Series 2002 A, 6.00%, 05/01/2043 | | | 800,000 | | | | 817,678 | | |
Chino Community Facilities District,
City of Chino Community Facilities District No. 2003-3
Improvement Area No. 10, Special Tax,
Series 2024, 5.00%, 09/01/2049 (e) | | | 680,000 | | | | 680,859 | | |
City of Chino Community Facilities District No. 2003-3
Improvement Area No. 10, Special Tax,
Series 2024, 5.00%, 09/01/2054 (e) | | | 745,000 | | | | 743,368 | | |
City of Long Beach,
Marina System, Revenue,
Series 2015, 5.00%, 05/15/2045 | | | 500,000 | | | | 498,229 | | |
City of Rancho Cordova,
Grantline 220 Community Facilities District No. 2023-1
Improvement Area No. 1, Special Tax,
Series 2024, 5.00%, 09/01/2049 | | | 550,000 | | | | 530,579 | | |
Grantline 220 Community Facilities District No. 2023-1
Improvement Area No. 1, Special Tax,
Series 2024, 5.00%, 09/01/2053 | | | 545,000 | | | | 523,611 | | |
CSCDA Community Improvement Authority,
CTR City Anaheim, Revenue,
Series 2020 A, 5.00%, 01/01/2054 (d) | | | 5,500,000 | | | | 4,358,061 | | |
First Eagle Funds | Semiannual Report | April 30, 2024
128
First Eagle High Yield Municipal Fund | Schedule of Investments | April 30, 2024 (unaudited)
Investments | | Principal Amount ($) | | Value ($) | |
California — 13.9% (continued) | |
Escondido Portfolio, Revenue, Senior Lien,
Series 2021 A-2, 4.00%, 06/01/2058 (d) | | | 5,875,000 | | | | 4,358,817 | | |
Link — Glendale (The), Revenue,
Series 2021 A-2, 4.00%, 07/01/2056 (d) | | | 510,000 | | | | 368,180 | | |
Millennium South Bay-Hawthorne, Revenue,
Series 2021 A-2, 3.25%, 07/01/2056 (d) | | | 11,365,000 | | | | 7,704,458 | | |
Monterey Station Apartments, Revenue, Senior Lien,
Series 2021 A-2, 3.13%, 07/01/2056 (d) | | | 6,250,000 | | | | 4,105,025 | | |
Oceanaire Apartments, Revenue,
Series 2021 A-2, 4.00%, 09/01/2056 (d) | | | 15,365,000 | | | | 10,995,008 | | |
Parrallel-Anaheim, Revenue,
Series 2021 A, 4.00%, 08/01/2056 (d) | | | 3,400,000 | | | | 2,829,705 | | |
Waterscape Apartments, Revenue, Senior Lien,
Series 2021 A, 3.00%, 09/01/2056 (d) | | | 2,310,000 | | | | 1,564,712 | | |
Westgate Apartments, Revenue, Senior Lien,
Series 2021 A-2, 3.13%, 06/01/2057 (d) | | | 17,090,000 | | | | 9,961,014 | | |
Wood Creek Apartments, Revenue, Senior Lien,
Series 2021 A-2, 4.00%, 12/01/2058 (d) | | | 22,450,000 | | | | 16,552,098 | | |
Folsom Ranch Financing Authority,
City of Folsom Community Facilities District No. 23
Improvement Area No. 2, Special Tax,
Series 2024, 5.00%, 09/01/2049 | | | 400,000 | | | | 396,951 | | |
City of Folsom Community Facilities District No. 23
Improvement Area No. 2, Special Tax,
Series 2024, 5.00%, 09/01/2053 | | | 460,000 | | | | 454,136 | | |
Kaweah Delta Health Care District Guild, Revenue,
Series 2015 B, 4.00%, 06/01/2037 | | | 290,000 | | | | 248,355 | | |
Revenue, Series 2015 B, 5.00%, 06/01/2040 | | | 375,000 | | | | 347,977 | | |
Revenue, Series 2015 B, 4.00%, 06/01/2045 | | | 2,405,000 | | | | 1,895,176 | | |
Palomar Health, Obligated Group, Revenue, Refunding,
Series 2016, 5.00%, 11/01/2031 | | | 2,485,000 | | | | 2,410,150 | | |
Obligated Group, Revenue, Refunding,
Series 2016, 5.00%, 11/01/2039 | | | 100,000 | | | | 94,131 | | |
Obligated Group, COP,
Series 2017, 5.00%, 11/01/2032 | | | 2,000,000 | | | | 1,945,038 | | |
Palomar Health Obligated Group, Revenue, Refunding,
Series 2016, 5.00%, 11/01/2036 | | | 750,000 | | | | 719,093 | | |
Palomar Health Obligated Group, Revenue, Refunding,
Series 2017, 5.00%, 11/01/2042 | | | 1,100,000 | | | | 1,020,730 | | |
First Eagle Funds | Semiannual Report | April 30, 2024
129
First Eagle High Yield Municipal Fund | Schedule of Investments | April 30, 2024 (unaudited)
Investments | | Principal Amount ($) | | Value ($) | |
California — 13.9% (continued) | |
Woodland-Davis Clean Water Agency,
Revenue, Sub. Lien, Refunding,
Series 2015 B, 4.70%, 03/01/2039 (d) | | | 1,590,952 | | | | 1,390,764 | | |
| | | | 124,216,346 | | |
Colorado — 2.0% | |
Colorado Educational & Cultural Facilities Authority,
Expeditionary Learning School Board of Cooperative
Educational Services, Revenue,
Series 2019, 5.00%, 03/01/2050 (d) | | | 2,000,000 | | | | 1,794,015 | | |
Colorado Health Facilities Authority,
BSLC Obligated Group, Revenue, Refunding,
Series 2018 A-1, 5.00%, 09/15/2048 | | | 7,000,000 | | | | 6,157,795 | | |
Hess Ranch Metropolitan District No. 5,
Special Improvement District No. 1, Special Assessment,
Series 2024 A-2, 6.50%, 12/01/2043 (e) | | | 2,250,000 | | | | 2,217,602 | | |
Special Improvement District No. 1, Special Assessment,
Series 2024 A-1, 6.00%, 12/01/2043 | | | 2,500,000 | | | | 2,462,342 | | |
Prairie Center Metropolitan District No. 3, GO,
Series 2024 B, 5.88%, 12/15/2046 | | | 1,000,000 | | | | 1,049,198 | | |
GO, Refunding,
Series 2024 A, 5.88%, 12/15/2046 | | | 2,125,000 | | | | 2,229,544 | | |
Sterling Ranch Community Authority Board,
Sterling Ranch Metropolitan District No. 1,
Special Assessment, Series 2024, 5.63%, 12/01/2043 | | | 1,500,000 | | | | 1,520,550 | | |
| | | | 17,431,046 | | |
Connecticut — 0.3% | |
Connecticut State Health & Educational
Facilities Authority,
University of Hartford (The), Revenue, Refunding,
Series 2019 N, 4.00%, 07/01/2049 | | | 3,415,000 | | | | 2,480,773 | | |
Delaware — 0.3% | |
Town of Bridgeville,
Heritage Shores Special Development District,
Special Tax, Series 2024, 5.25%, 07/01/2044 (d) | | | 875,000 | | | | 901,732 | | |
Heritage Shores Special Development District,
Special Tax, Series 2024, 5.63%, 07/01/2053 (d) | | | 1,535,000 | | | | 1,589,605 | | |
| | | | 2,491,337 | | |
First Eagle Funds | Semiannual Report | April 30, 2024
130
First Eagle High Yield Municipal Fund | Schedule of Investments | April 30, 2024 (unaudited)
Investments | | Principal Amount ($) | | Value ($) | |
District of Columbia — 1.6% | |
District of Columbia,
KIPP Obligated Group, Revenue, Refunding,
Series 2017 A, 5.00%, 07/01/2048 | | | 5,800,000 | | | | 5,832,277 | | |
Rocketship Obligated Group, Revenue,
Series 2024 A, 5.75%, 06/01/2054 | | | 3,100,000 | | | | 3,106,845 | | |
Rocketship Obligated Group, Revenue,
Series 2024 A, 6.00%, 06/01/2058 | | | 400,000 | | | | 405,643 | | |
Tobacco Settlement Financing Corp., Revenue,
Series 2006 A, 0.00%, 06/15/2046 (g) | | | 20,000,000 | | | | 4,655,328 | | |
| | | | 14,000,093 | | |
Florida — 27.9% | |
Academical Village Community Development District,
Special Assessment,
Series 2020, 3.63%, 05/01/2040 | | | 2,320,000 | | | | 1,948,870 | | |
Special Assessment,
Series 2020, 4.00%, 05/01/2051 | | | 3,000,000 | | | | 2,427,420 | | |
Bridgewater North Community Development District,
Special Assessment,
Series 2022, 4.00%, 05/01/2052 | | | 2,000,000 | | | | 1,543,030 | | |
Buckhead Trails Community Development District,
Special Assessment,
Series 2024, 5.60%, 05/01/2044 | | | 1,000,000 | | | | 983,420 | | |
Special Assessment,
Series 2024, 5.88%, 05/01/2054 | | | 1,675,000 | | | | 1,642,515 | | |
Capital Projects Finance Authority,
Kissimmee Charter Academy, Revenue,
Series 2024, 6.13%, 06/15/2044 (d) | | | 420,000 | | | | 420,579 | | |
Kissimmee Charter Academy, Revenue,
Series 2024, 6.50%, 06/15/2054 (d) | | | 235,000 | | | | 235,316 | | |
Kissimmee Charter Academy, Revenue,
Series 2024, 6.63%, 06/15/2059 (d) | | | 1,015,000 | | | | 1,016,352 | | |
Capital Trust Agency, Inc.,
Babcock Neighborhood School, Inc., Revenue,
Series 2021, 4.20%, 08/15/2056 (d) | | | 1,450,000 | | | | 1,112,974 | | |
Babcock Neighborhood School, Inc., Revenue,
Series 2021, 4.25%, 08/15/2061 (d) | | | 1,000,000 | | | | 757,809 | | |
Franklin Academy Obligated Group, Revenue,
Series 2020, 5.00%, 12/15/2035 (d) | | | 1,085,000 | | | | 1,051,131 | | |
Marie Selby Botanical Gardens, Inc. (The), Revenue,
Series 2021, 4.00%, 06/15/2051 (d) | | | 2,000,000 | | | | 1,469,434 | | |
First Eagle Funds | Semiannual Report | April 30, 2024
131
First Eagle High Yield Municipal Fund | Schedule of Investments | April 30, 2024 (unaudited)
Investments | | Principal Amount ($) | | Value ($) | |
Florida — 27.9% (continued) | |
WFCS Holdings II LLC, Revenue,
Series 2021 A-1, 5.00%, 01/01/2056 (d) | | | 3,250,000 | | | | 2,602,168 | | |
Capital Trust Authority,
IDEA Florida, Inc., Revenue, Refunding,
Series 2023 A, 6.38%, 06/15/2058 (d) | | | 1,500,000 | | | | 1,554,672 | | |
KIPP Miami Obligated Group, Revenue, Refunding,
Series 2024 A, 5.63%, 06/15/2044 (d) | | | 810,000 | | | | 817,538 | | |
KIPP Miami Obligated Group, Revenue, Refunding,
Series 2024 A, 6.00%, 06/15/2054 (d) | | | 1,250,000 | | | | 1,269,110 | | |
KIPP Miami Obligated Group, Revenue, Refunding,
Series 2024 A, 6.13%, 06/15/2060 (d) | | | 1,100,000 | | | | 1,118,504 | | |
Caymas Community Development District,
Assessment Area 1, Special Assessment,
Series 2024, 5.63%, 05/01/2054 | | | 1,000,000 | | | | 976,477 | | |
Chapel Creek Community Development District,
Assessment Area, Special Assessment,
Series 2024, 5.75%, 05/01/2054 | | | 1,000,000 | | | | 992,760 | | |
Charlotte County Industrial Development Authority,
MSKP Town & Country Utility LLC, Revenue, AMT,
Series 2021 A, 4.00%, 10/01/2051 (d) | | | 5,735,000 | | | | 4,675,871 | | |
Coral Creek Community Development District,
Special Assessment,
Series 2024, 5.75%, 05/01/2054 | | | 1,700,000 | | | | 1,694,884 | | |
Coral Lakes Community Development District,
Assessment Area 1, Special Assessment,
Series 2024, 5.75%, 11/01/2053 | | | 1,000,000 | | | | 1,006,948 | | |
Crosswinds East Community Development District,
Assessment Area 1, Special Assessment,
Series 2024, 5.75%, 05/01/2054 | | | 1,500,000 | | | | 1,491,246 | | |
Dowden West Community Development District,
Special Assessment,
Series 2024, 5.25%, 05/01/2044 | | | 495,000 | | | | 486,548 | | |
Special Assessment,
Series 2024, 5.55%, 05/01/2054 | | | 855,000 | | | | 837,815 | | |
Edgewater East Community Development District,
Assessment Area 1, Special Assessment,
Series 2021, 4.00%, 05/01/2051 | | | 1,210,000 | | | | 1,000,419 | | |
Epperson North Community Development District,
Assessment Area 3, Special Assessment,
Series 2021 A, 4.00%, 11/01/2051 | | | 2,185,000 | | | | 1,674,471 | | |
First Eagle Funds | Semiannual Report | April 30, 2024
132
First Eagle High Yield Municipal Fund | Schedule of Investments | April 30, 2024 (unaudited)
Investments | | Principal Amount ($) | | Value ($) | |
Florida — 27.9% (continued) | |
Everlands Community Development District,
Assessment Area 2, Special Assessment,
Series 2024, 5.55%, 06/15/2054 | | | 1,000,000 | | | | 992,521 | | |
Florida Development Finance Corp.,
AAF Operations Holdings LLC, Revenue, AMT, Refunding,
Series 2024, 12.00%, 07/15/2028 (b)(d)(f) | | | 41,500,000 | | | | 42,745,000 | | |
Assistance Unlimited, Inc., Revenue, Refunding,
Series 2022, 6.00%, 08/15/2057 (d) | | | 5,000,000 | | | | 4,818,183 | | |
Brightline Florida Holdings LLC,
Revenue, AMT, Refunding,
Series 2023 C, 8.25%, 08/15/2024 (b)(d)(f) | | | 20,000,000 | | | | 20,037,286 | | |
Brightline Trains Florida LLC, Revenue, AMT,
Series 2019 B, 7.38%, 01/01/2049 (d) | | | 21,350,000 | | | | 22,843,928 | | |
Brightline Trains Florida LLC, Revenue, AMT, Refunding,
Series 2019 A, 6.50%, 01/01/2029 (b)(d)(f) | | | 1,500,000 | | | | 1,517,031 | | |
Brightline Trains Florida LLC, Revenue, AMT, Refunding,
Series 2019 A-1, 7.38%, 01/01/2049 (d) | | | 5,000,000 | | | | 5,349,866 | | |
Brightline Trains Florida LLC, Revenue, AMT, Refunding,
Series 2024, 5.50%, 07/01/2053 | | | 10,000,000 | | | | 10,355,880 | | |
Downtown Doral Charter Elementary School, Inc.,
Revenue, Series 2017 C, 5.75%, 07/01/2047 (d) | | | 2,000,000 | | | | 2,001,255 | | |
Waste Pro USA, Inc., Revenue, AMT,
Series 2019, 5.00%, 05/01/2029 (d) | | | 2,300,000 | | | | 2,293,969 | | |
Waste Pro USA, Inc., Revenue, AMT,
Series 2021, 3.00%, 06/01/2032 | | | 5,000,000 | | | | 4,161,250 | | |
Waste Pro USA, Inc., Revenue, AMT,
Series 2023, 6.13%, 07/01/2026 (b)(d)(f) | | | 1,265,000 | | | | 1,290,639 | | |
Gracewater Sarasota Community Development District,
Assessments, Special Assessment,
Series 2021, 4.00%, 05/01/2052 | | | 2,710,000 | | | | 2,151,847 | | |
Hamilton Bluff Community Development District,
Assessment Area 1, Special Assessment,
Series 2024, 5.50%, 05/01/2044 | | | 1,360,000 | | | | 1,343,562 | | |
Assessment Area 1, Special Assessment,
Series 2024, 5.80%, 05/01/2054 | | | 2,000,000 | | | | 1,966,171 | | |
Highland Trails Community Development District,
Assessments, Special Assessment,
Series 2024, 5.85%, 05/01/2054 | | | 880,000 | | | | 876,150 | | |
Hillcrest Community Development District,
Special Assessment,
Series 2018, 5.00%, 11/01/2048 | | | 300,000 | | | | 290,483 | | |
First Eagle Funds | Semiannual Report | April 30, 2024
133
First Eagle High Yield Municipal Fund | Schedule of Investments | April 30, 2024 (unaudited)
Investments | | Principal Amount ($) | | Value ($) | |
Florida — 27.9% (continued) | |
Hills of Minneola Community Development District,
Special Assessment,
Series 2021, 4.00%, 05/01/2052 | | | 1,900,000 | | | | 1,534,320 | | |
South Parcel Assessment Area, Special Assessment,
Series 2020, 4.00%, 05/01/2050 (d) | | | 3,000,000 | | | | 2,457,402 | | |
Hobe-St. Lucie Conservancy District,
Unit of Development No. 1A, Special Assessment,
Series 2024, 5.60%, 05/01/2044 | | | 1,900,000 | | | | 1,926,976 | | |
Unit of Development No. 1A, Special Assessment,
Series 2024, 5.88%, 05/01/2055 | | | 2,690,000 | | | | 2,722,593 | | |
Lake Hideaway Community Development District,
Assessment Area 1, Special Assessment,
Series 2024, 5.65%, 05/01/2044 | | | 2,000,000 | | | | 1,960,030 | | |
Assessment Area 1, Special Assessment,
Series 2024, 5.90%, 05/01/2054 | | | 2,750,000 | | | | 2,666,903 | | |
Lake Mattie Preserve Community Development District,
Special Assessment,
Series 2024, 5.85%, 05/01/2054 | | | 570,000 | | | | 557,300 | | |
Lakewood Ranch Stewardship District,
Assessment Lorraine Lakes, Special Assessment,
Series 2020, 3.88%, 05/01/2051 (d) | | | 2,285,000 | | | | 1,848,035 | | |
Longleaf Community Development District,
Neighborhood 4 Assessment Area 1,
Special Assessment,
Series 2024, 5.75%, 05/01/2054 (d) | | | 1,000,000 | | | | 1,008,227 | | |
Los Cayos Community Development District,
Special Assessment,
Series 2024, 5.55%, 06/15/2054 | | | 800,000 | | | | 791,853 | | |
LT Ranch Community Development District,
Assessments, Special Assessment,
Series 2019, 4.00%, 05/01/2050 | | | 1,000,000 | | | | 821,750 | | |
Phase IIB Assessment Area, Special Assessment,
Series 2024, 5.50%, 05/01/2044 | | | 275,000 | | | | 273,665 | | |
Phase IIB Assessment Area, Special Assessment,
Series 2024, 5.85%, 05/01/2054 | | | 1,000,000 | | | | 994,248 | | |
LTC Ranch West Residential Community Development
District, Assessment Area 2, Special Assessment,
Series 2024 AA-2, 6.00%, 05/01/2054 | | | 605,000 | | | | 597,467 | | |
Assessment Area 3, Special Assessment,
Series 2024 AA-3, 6.05%, 05/01/2054 | | | 1,405,000 | | | | 1,387,584 | | |
First Eagle Funds | Semiannual Report | April 30, 2024
134
First Eagle High Yield Municipal Fund | Schedule of Investments | April 30, 2024 (unaudited)
Investments | | Principal Amount ($) | | Value ($) | |
Florida — 27.9% (continued) | |
Miami Health Facilities Authority,
Miami Jewish Health Systems Obligated Group,
Revenue, Refunding,
Series 2017, 5.00%, 07/01/2026 | | | 1,260,000 | | | | 1,230,951 | | |
Miami Jewish Health Systems Obligated Group,
Revenue, Refunding,
Series 2017, 5.00%, 07/01/2027 | | | 1,000,000 | | | | 971,425 | | |
Mirada Community Development District,
Assessment Area 3, Special Assessment, Refunding,
Series 2024, 6.00%, 05/01/2055 | | | 2,000,000 | | | | 1,972,102 | | |
North AR-1 Pasco Community Development District,
Assessment Area 4, Special Assessment,
Series 2024, 5.75%, 05/01/2054 | | | 1,140,000 | | | | 1,121,109 | | |
North AR-1 Pasco Community Development District,
Assessment Area 5, Special Assessment,
Series 2024 A, 5.75%, 05/01/2044 | | | 1,500,000 | | | | 1,494,653 | | |
North AR-1 Pasco Community Development District,
Assessment Area 5, Special Assessment,
Series 2024 A, 6.00%, 05/01/2054 | | | 2,000,000 | | | | 1,991,406 | | |
Palm Beach County Health Facilities Authority,
Federation CCRC Operations Corp. Obligated Group,
Revenue, Series 2020 A, 5.00%, 06/01/2055 | | | 145,000 | | | | 131,068 | | |
Federation CCRC Operations Corp. Obligated Group,
Revenue, Refunding, Series 2022, 4.00%, 06/01/2041 | | | 1,500,000 | | | | 1,279,567 | | |
Lifespace Communities, Inc. Obligated Group, Revenue,
Series 2019 B, 4.00%, 05/15/2053 | | | 150,000 | | | | 104,734 | | |
Parker Road Community Development District,
Assessment Area, Special Assessment, Refunding,
Series 2020, 4.10%, 05/01/2050 | | | 2,000,000 | | | | 1,519,145 | | |
Parrish Plantation Community Development District,
Assessment Area 3, Special Assessment,
Series 2024, 5.80%, 05/01/2044 | | | 700,000 | | | | 695,882 | | |
Assessment Area 3, Special Assessment,
Series 2024, 6.05%, 05/01/2054 | | | 1,545,000 | | | | 1,534,181 | | |
Peace Creek Village Community Development District,
Special Assessment,
Series 2024, 5.75%, 05/01/2054 | | | 905,000 | | | | 894,640 | | |
Pine Island Community Development District,
Special Assessment,
Series 2004, 5.75%, 05/01/2035 | | | 2,500,000 | | | | 2,500,057 | | |
Preston Cove Community Development District,
Assessments, Special Assessment,
Series 2022, 4.13%, 05/01/2052 | | | 1,870,000 | | | | 1,515,982 | | |
First Eagle Funds | Semiannual Report | April 30, 2024
135
First Eagle High Yield Municipal Fund | Schedule of Investments | April 30, 2024 (unaudited)
Investments | | Principal Amount ($) | | Value ($) | |
Florida — 27.9% (continued) | |
Regal Village Community Development District,
Special Assessment,
Series 2024, 5.50%, 05/01/2054 | | | 725,000 | | | | 711,372 | | |
River Hall Community Development District,
Assessment Area 3, Special Assessment,
Series 2020 A, 3.88%, 05/01/2051 | | | 3,690,000 | | | | 2,907,859 | | |
Saltleaf Community Development District,
Assessments, Special Assessment,
Series 2024, 5.63%, 05/01/2044 | | | 1,750,000 | | | | 1,703,698 | | |
Assessments, Special Assessment,
Series 2024, 6.00%, 05/01/2056 | | | 3,000,000 | | | | 2,928,977 | | |
Sawgrass Village Community Development District,
Assessment Area 3, Special Assessment,
Series 2024, 5.55%, 05/01/2044 (d) | | | 700,000 | | | | 690,981 | | |
Assessment Area 3, Special Assessment,
Series 2024, 5.88%, 05/01/2054 (d) | | | 1,380,000 | | | | 1,359,211 | | |
Shadowlawn Community Development District,
Special Assessment,
Series 2024, 5.50%, 05/01/2044 | | | 1,585,000 | | | | 1,556,634 | | |
Special Assessment,
Series 2024, 5.85%, 05/01/2054 | | | 1,500,000 | | | | 1,468,781 | | |
Silver Oaks Community Development District,
Special Assessment,
Series 2024, 5.85%, 05/01/2054 | | | 1,500,000 | | | | 1,497,908 | | |
Six Mile Creek Community Development District,
Assessment Area 2, Special Assessment, Refunding,
Series 2021, 4.00%, 05/01/2052 | | | 2,050,000 | | | | 1,636,504 | | |
Solaeris Community Development District,
Assessment Area 1, Special Assessment,
Series 2024, 5.20%, 05/01/2031 (e) | | | 500,000 | | | | 500,180 | | |
Assessment Area 1, Special Assessment,
Series 2024, 6.00%, 05/01/2044 (e) | | | 1,790,000 | | | | 1,791,589 | | |
Assessment Area 1, Special Assessment,
Series 2024, 6.25%, 05/01/2055 (e) | | | 2,750,000 | | | | 2,716,223 | | |
Southern Groves Community Development District No. 5,
Assessment Area, Special Assessment,
Series 2024, 5.45%, 05/01/2044 | | | 1,350,000 | | | | 1,341,810 | | |
Assessment Area, Special Assessment,
Series 2024, 5.70%, 05/01/2050 | | | 1,035,000 | | | | 1,027,987 | | |
Summit View Community Development District,
Assessment Area 2, Special Assessment,
Series 2024, 5.63%, 05/01/2044 | | | 1,025,000 | | | | 1,009,250 | | |
First Eagle Funds | Semiannual Report | April 30, 2024
136
First Eagle High Yield Municipal Fund | Schedule of Investments | April 30, 2024 (unaudited)
Investments | | Principal Amount ($) | | Value ($) | |
Florida — 27.9% (continued) | |
Assessment Area 2, Special Assessment,
Series 2024, 6.00%, 05/01/2054 | | | 1,425,000 | | | | 1,399,679 | | |
Tern Bay Community Development District,
Special Assessment,
Series 2022, 4.00%, 06/15/2052 | | | 1,000,000 | | | | 802,221 | | |
Triple Creek Community Development District,
Assessment Area, Special Assessment,
Series 2019 A, 4.75%, 05/01/2050 | | | 325,000 | | | | 293,522 | | |
Twisted Oaks Pointe Community Development District,
Assessment Area 3, Special Assessment,
Series 2024, 5.63%, 05/01/2044 | | | 1,065,000 | | | | 1,041,734 | | |
Assessment Area 3, Special Assessment,
Series 2024, 6.00%, 05/01/2055 | | | 1,375,000 | | | | 1,350,210 | | |
Veranda Community Development District II,
Assessment Area 5 Phase 2, Special Assessment,
Refunding, Series 2024, 5.63%, 05/01/2054 | | | 1,000,000 | | | | 994,797 | | |
Verano No. 2 Community Development District,
Pod D, Special Assessment,
Series 2024, 5.80%, 05/01/2054 | | | 1,000,000 | | | | 987,284 | | |
Villages of Westport Community Development District,
Assessments, Special Assessment,
Series 2005 A, 5.70%, 05/01/2035 | | | 3,225,000 | | | | 3,225,146 | | |
Villamar Community Development District,
Assessment Area 6, Special Assessment,
Series 2024, 5.75%, 05/01/2054 | | | 1,000,000 | | | | 1,004,432 | | |
West Villages Improvement District,
Unit of Development No. 7, Special Assessment,
Series 2019, 5.00%, 05/01/2050 | | | 2,500,000 | | | | 2,387,346 | | |
West Villages Improvement District,
Unit of Development No. 10 Assessment Area 1,
Special Assessment,
Series 2024, 5.38%, 05/01/2044 | | | 1,000,000 | | | | 981,933 | | |
Unit of Development No. 10 Assessment Area 1,
Special Assessment,
Series 2024, 5.63%, 05/01/2054 | | | 1,500,000 | | | | 1,452,283 | | |
Westside Haines City Community Development District,
Assessment Area 2, Special Assessment,
Series 2024, 6.00%, 05/01/2054 | | | 2,500,000 | | | | 2,482,536 | | |
Windsor Cay Community Development District,
Assessment Area 1, Special Assessment,
Series 2024, 5.75%, 05/01/2054 | | | 1,000,000 | | | | 983,015 | | |
First Eagle Funds | Semiannual Report | April 30, 2024
137
First Eagle High Yield Municipal Fund | Schedule of Investments | April 30, 2024 (unaudited)
Investments | | Principal Amount ($) | | Value ($) | |
Florida — 27.9% (continued) | |
Wiregrass Community Development District,
Assessment Area 2, Special Assessment,
Series 2016, 5.00%, 05/01/2047 | | | 1,020,000 | | | | 967,761 | | |
| | | | 247,551,420 | | |
Georgia — 3.3% | |
Bartow County Development Authority,
Georgia Power Co., Revenue, First Series, AMT,
Series 2022, 4.15%, 05/01/2024 (a)(b) | | | 900,000 | | | | 900,000 | | |
DeKalb County Development Authority,
GLOBE Academy, Inc. (The), Revenue,
Series 2024 A, 5.00%, 06/01/2063 | | | 1,320,000 | | | | 1,237,917 | | |
Development Authority of Burke County (The),
Georgia Power Co., Revenue, First Series,
Series 2009, 3.65%, 05/01/2024 (a)(b) | | | 8,320,000 | | | | 8,320,000 | | |
Georgia Power Co., Revenue, Third Series, AMT,
Series 2012, 4.15%, 05/01/2024 (a)(b) | | | 3,600,000 | | | | 3,600,000 | | |
Fulton County Residential Care Facilities for the
Elderly Authority, All Saints-St. Luke's Episcopal Home
for the Retired Obligated Group, Revenue, Refunding,
Series 2019 A-1, 5.00%, 04/01/2047 (d) | | | 2,000,000 | | | | 1,725,841 | | |
All Saints-St. Luke's Episcopal Home
for the Retired Obligated Group, Revenue,
Series 2021 A, 4.00%, 04/01/2056 (d) | | | 800,000 | | | | 549,887 | | |
George L Smith II Congress Center Authority,
Signia Hotel Management LLC, Revenue, Second Tier,
Series 2021 B, 3.63%, 01/01/2031 (d) | | | 2,000,000 | | | | 1,867,647 | | |
Signia Hotel Management LLC, Revenue, Second Tier,
Series 2021 B, 5.00%, 01/01/2054 (d) | | | 10,025,000 | | | | 8,904,816 | | |
Oconee County Industrial Development Authority,
Westminster Presbyterian Homes Obligated Group,
Revenue, Series 2018 A-1, 6.38%, 12/01/2053 | | | 3,000,000 | | | | 2,600,734 | | |
| | | | 29,706,842 | | |
Idaho — 1.2% | |
Spring Valley Community Infrastructure District No. 1,
Assessment Area 1, Special Assessment,
Series 2021, 3.75%, 09/01/2051 (d) | | | 1,413,000 | | | | 1,151,350 | | |
Assessment Area 2, Special Assessment,
Series 2024, 6.25%, 09/01/2053 (d) | | | 9,000,000 | | | | 9,127,061 | | |
| | | | 10,278,411 | | |
First Eagle Funds | Semiannual Report | April 30, 2024
138
First Eagle High Yield Municipal Fund | Schedule of Investments | April 30, 2024 (unaudited)
Investments | | Principal Amount ($) | | Value ($) | |
Illinois — 2.3% | |
Chicago Board of Education, GO,
Series 2022 A, 5.00%, 12/01/2047 | | | 1,000,000 | | | | 988,515 | | |
GO,
Series 2017 H, 5.00%, 12/01/2046 | | | 2,525,000 | | | | 2,474,677 | | |
Illinois Finance Authority,
Benedictine University, Revenue, Refunding,
Series 2017, 5.00%, 10/01/2038 | | | 2,070,000 | | | | 1,818,675 | | |
Columbia College Chicago, Revenue,
Series 2019, 5.00%, 12/01/2029 | | | 2,055,000 | | | | 2,017,060 | | |
Plymouth Place Obligated Group, Revenue, Refunding,
Series 2021 A, 5.00%, 05/15/2036 | | | 325,000 | | | | 296,373 | | |
Roosevelt University, Revenue, Refunding,
Series 2018 B, 6.00%, 04/01/2038 (d) | | | 1,290,000 | | | | 1,282,337 | | |
Washington and Jane Smith Community — Orland Park,
Revenue, Refunding,
Series 2022, 4.00%, 10/15/2037 | | | 7,000,000 | | | | 5,904,023 | | |
Westminster Village, Inc. Obligated Group,
Revenue, Refunding,
Series 2018 A, 5.00%, 05/01/2048 | | | 4,030,000 | | | | 3,408,043 | | |
Southwestern Illinois Development Authority,
United States Steel Corp., Revenue, AMT,
Series 2012, 5.75%, 08/01/2042 | | | 2,000,000 | | | | 2,000,221 | | |
| | | | 20,189,924 | | |
Indiana — 0.5% | |
City of Valparaiso,
Pratt Paper IN LLC, Revenue, AMT, Refunding,
Series 2024, 5.00%, 01/01/2054 (d) | | | 2,000,000 | | | | 2,024,306 | | |
Indiana Finance Authority,
Lutheran University Association, Inc. (The), Revenue,
Series 2014, 5.00%, 10/01/2039 | | | 750,000 | | | | 743,895 | | |
Rock Creek Community Academy, Inc., Revenue,
Series 2018 A-1, 5.88%, 07/01/2038 (d) | | | 1,800,000 | | | | 1,798,386 | | |
| | | | 4,566,587 | | |
Iowa — 0.8% | |
Iowa Finance Authority,
Lifespace Communities, Inc. Obligated Group,
Revenue, Refunding,
Series 2021 A, 4.00%, 05/15/2029 | | | 1,000,000 | | | | 949,110 | | |
Lifespace Communities, Inc. Obligated Group, Revenue,
Series 2018 A, 5.00%, 05/15/2048 | | | 7,105,000 | | | | 6,198,467 | | |
| | | | 7,147,577 | | |
First Eagle Funds | Semiannual Report | April 30, 2024
139
First Eagle High Yield Municipal Fund | Schedule of Investments | April 30, 2024 (unaudited)
Investments | | Principal Amount ($) | | Value ($) | |
Kansas — 0.8% | |
City of Colby,
Citizens Medical Center, Inc., Revenue,
Series 2024, 5.50%, 07/01/2026 | | | 7,000,000 | | | | 6,979,759 | | |
Kentucky — 0.2% | |
City of Campbellsville,
Campbellsville University, Inc., Revenue, Refunding,
Series 2017, 4.50%, 03/01/2047 | | | 840,000 | | | | 688,347 | | |
Louisville/Jefferson County Metropolitan Government,
Bellarmine University, Inc., Revenue, Refunding,
Series 2015, 5.00%, 05/01/2027 | | | 500,000 | | | | 489,874 | | |
| | | | 1,178,221 | | |
Louisiana — 2.7% | |
Calcasieu Parish Memorial Hospital Service District,
Southwest Louisiana Healthcare System Obligated
Group, Revenue, Refunding,
Series 2019, 5.00%, 12/01/2039 | | | 2,750,000 | | | | 2,579,765 | | |
Louisiana Local Government Environmental Facilities &
Community Development Authority,
Provident Group — ULM Properties LLC, Revenue,
Series 2019 A, 5.00%, 07/01/2029 (d) | | | 1,045,000 | | | | 1,030,923 | | |
Provident Group — ULM Properties LLC, Revenue,
Series 2019 A, 5.00%, 07/01/2039 (d) | | | 2,900,000 | | | | 2,654,166 | | |
Provident Group — ULM Properties LLC, Revenue,
Series 2019 A, 5.00%, 07/01/2054 (d) | | | 8,265,000 | | | | 6,947,504 | | |
Louisiana Public Facilities Authority,
Athlos Academy of Jefferson, Revenue,
Series 2024 A, 7.38%, 06/01/2054 (d) | | | 6,000,000 | | | | 6,052,535 | | |
Louisiana Public Facilities Authority,
Waste Pro USA, Inc., Revenue, AMT,
Series 2023 R-2, 6.50%, 10/01/2028 (b)(d)(f) | | | 3,745,000 | | | | 3,952,298 | | |
Parish of St. James,
NuStar Logistics LP, Revenue,
Series 2010, 6.35%, 07/01/2040 (d) | | | 1,000,000 | | | | 1,080,799 | | |
| | | | 24,297,990 | | |
Maryland — 0.3% | |
County of Prince George's,
Tax Allocation,
Series 2018, 5.25%, 07/01/2048 (d) | | | 3,000,000 | | | | 2,980,999 | | |
First Eagle Funds | Semiannual Report | April 30, 2024
140
First Eagle High Yield Municipal Fund | Schedule of Investments | April 30, 2024 (unaudited)
Investments | | Principal Amount ($) | | Value ($) | |
Michigan — 0.5% | |
Flint Hospital Building Authority,
Hurley Medical Center, Revenue,
Series 2013 A, 5.25%, 07/01/2039 | | | 2,000,000 | | | | 1,909,219 | | |
Michigan Finance Authority,
Provident Group — HFH Energy LLC, Revenue,
Series 2024, 5.50%, 02/28/2057 | | | 500,000 | | | | 534,700 | | |
Michigan Finance Authority,
Aquinas College, Revenue, Refunding,
Series 2021, 4.00%, 05/01/2031 | | | 1,080,000 | | | | 945,967 | | |
Michigan Strategic Fund,
United Methodist Retirement Communities, Inc.
Obligated Group, Revenue, Refunding,
Series 2020, 5.00%, 05/15/2044 | | | 1,000,000 | | | | 869,578 | | |
| | | | 4,259,464 | | |
Minnesota — 0.8% | |
City of Bethel Housing and Health Care Facilities,
Second Century Housing & Owatonna Senior Living LLC
Obligated Group, Revenue, Refunding,
Series 2024 A, 6.13%, 03/01/2044 | | | 1,250,000 | | | | 1,246,318 | | |
Second Century Housing & Owatonna Senior Living LLC
Obligated Group, Revenue, Refunding,
Series 2024 A, 6.13%, 03/01/2049 | | | 1,400,000 | | | | 1,352,280 | | |
City of Cologne,
Cologne Academy, Revenue,
Series 2014 A, 5.00%, 07/01/2045 | | | 3,565,000 | | | | 3,368,813 | | |
Minnesota Higher Education Facilities Authority,
University of St. Thomas, Revenue,
Series 2024 A, 4.13%, 10/01/2053 | | | 750,000 | | | | 709,923 | | |
| | | | 6,677,334 | | |
Missouri — 1.7% | |
Citizens Memorial Hospital District,
Revenue, Series 2024 D, 6.75%, 02/01/2053 | | | 475,000 | | | | 451,883 | | |
Grindstone Plaza Transportation Development District,
Revenue, Series 2006 A, 5.40%, 10/01/2026 | | | 365,000 | | | | 360,961 | | |
Revenue, Series 2006 A, 5.50%, 10/01/2031 | | | 2,280,000 | | | | 2,246,487 | | |
Revenue, Series 2006 A, 5.55%, 10/01/2036 | | | 1,840,000 | | | | 1,769,278 | | |
Kansas City Industrial Development Authority,
Ward Parkway Center Community Improvement
District, Revenue, Refunding,
Series 2016 A, 5.00%, 04/01/2046 (d) | | | 1,100,000 | | | | 961,331 | | |
First Eagle Funds | Semiannual Report | April 30, 2024
141
First Eagle High Yield Municipal Fund | Schedule of Investments | April 30, 2024 (unaudited)
Investments | | Principal Amount ($) | | Value ($) | |
Missouri — 1.7% (continued) | |
Lees Summit Industrial Development Authority,
John Knox Village Obligated Group, Revenue, Refunding,
Series 2024 A, 5.25%, 08/15/2044 (e) | | | 540,000 | | | | 541,227 | | |
John Knox Village Obligated Group, Revenue, Refunding,
Series 2024 A, 5.63%, 08/15/2054 (e) | | | 1,940,000 | | | | 1,949,561 | | |
John Knox Village Obligated Group, Revenue, Refunding,
Series 2024 A, 5.75%, 08/15/2059 (e) | | | 1,835,000 | | | | 1,841,861 | | |
Rolla Industrial Development Authority, Tax Allocation,
Series 2017 A, 5.38%, 05/01/2044 | | | 860,000 | | | | 827,595 | | |
St. Charles County Industrial Development Authority,
Economic Development Council of St. Charles County
Suemandy/Mid-Rivers Sales Tax, Revenue,
Series 2016, 4.00%, 10/01/2028 (d) | | | 45,000 | | | | 42,142 | | |
Economic Development Council of St. Charles County
Suemandy/Mid-Rivers Sales Tax, Revenue,
Series 2016, 4.25%, 10/01/2034 (d) | | | 1,325,000 | | | | 1,164,761 | | |
Economic Development Council of St. Charles County
Suemandy/Mid-Rivers Sales Tax, Revenue,
Series 2016, 5.00%, 10/01/2046 (d) | | | 3,775,000 | | | | 3,089,237 | | |
| | | | 15,246,324 | | |
Montana — 0.0% (c) | |
Montana Facility Finance Authority,
Montana Children's Home and Hospital, Revenue,
Series 2020 A, 4.00%, 07/01/2044 | | | 460,000 | | | | 331,244 | | |
Nevada — 0.1% | |
City of Las Vegas,
Special Improvement District No. 613,
Special Assessment,
Series 2024, 5.25%, 12/01/2047 | | | 550,000 | | | | 542,247 | | |
Special Improvement District No. 613,
Special Assessment,
Series 2024, 5.50%, 12/01/2053 | | | 600,000 | | | | 598,708 | | |
| | | | 1,140,955 | | |
New Hampshire — 1.3% | |
New Hampshire Business Finance Authority,
Covanta Holding Corp., Revenue, AMT, Refunding,
Series 2020 B, 3.75%, 07/02/2040 (b)(d)(f) | | | 5,000,000 | | | | 3,955,921 | | |
Covanta Holding Corp., Revenue, Refunding,
Series 2018 B, 4.63%, 11/01/2042 (d) | | | 7,495,000 | | | | 6,698,766 | | |
Covanta Holding Corp., Revenue, Refunding,
Series 2020 A, 3.63%, 07/02/2040 (b)(d)(f) | | | 250,000 | | | | 196,762 | | |
First Eagle Funds | Semiannual Report | April 30, 2024
142
First Eagle High Yield Municipal Fund | Schedule of Investments | April 30, 2024 (unaudited)
Investments | | Principal Amount ($) | | Value ($) | |
New Hampshire — 1.3% (continued) | |
Pennichuck Water Works, Inc., Revenue, AMT,
Series 2024 A, 5.38%, 04/01/2049 | | | 295,000 | | | | 289,937 | | |
Pennichuck Water Works, Inc., Revenue, AMT,
Series 2024 A, 5.50%, 04/01/2038 | | | 200,000 | | | | 211,122 | | |
Pennichuck Water Works, Inc., Revenue, AMT,
Series 2024 A, 5.50%, 04/01/2043 | | | 200,000 | | | | 205,120 | | |
Pennichuck Water Works, Inc., Revenue, AMT,
Series 2024 A, 5.50%, 04/01/2054 | | | 275,000 | | | | 269,357 | | |
Pennichuck Water Works, Inc., Revenue, AMT,
Series 2024 A, 5.63%, 04/01/2059 | | | 350,000 | | | | 343,813 | | |
| | | | 12,170,798 | | |
New Jersey — 0.8% | |
New Jersey Economic Development Authority,
Teaneck Community Charter School A New Jersey
Nonprofit Corp., Revenue, Refunding,
Series 2017 A, 5.00%, 09/01/2037 (d) | | | 1,120,000 | | | | 1,120,430 | | |
New Jersey Economic Development Authority,
United Airlines, Inc., Revenue, AMT, Refunding,
Series 2012, 5.75%, 09/15/2027 | | | 500,000 | | | | 500,296 | | |
New Jersey Economic Development Authority,
LEAP Academy University Charter School, Inc., Revenue,
Series 2014 A, 6.20%, 10/01/2044 (d) | | | 100,000 | | | | 100,198 | | |
New Jersey Educational Facilities Authority,
Rider University A New Jersey Non-Profit Corp., Revenue,
Series 2017 F, 5.00%, 07/01/2047‡ (h) | | | 3,250,000 | | | | 2,497,555 | | |
New Jersey Health Care Facilities Financing Authority,
RWJ Barnabas Health Obligated Group, Revenue,
Refunding, Series 2024 A, 4.25%, 07/01/2054 | | | 2,975,000 | | | | 2,890,044 | | |
| | | | 7,108,523 | | |
New York — 7.5% | |
Build NYC Resource Corp.,
Albert Einstein College of Medicine, Inc., Revenue,
Series 2015, 5.50%, 09/01/2045 (d) | | | 1,000,000 | | | | 999,867 | | |
City of New York, GO,
Series 2021-3, 3.90%, 05/07/2024 (a)(b) | | | 4,385,000 | | | | 4,385,000 | | |
City of New York, GO,
Series 2021-2, 3.90%, 05/07/2024 (a)(b) | | | 5,000,000 | | | | 5,000,000 | | |
Monroe County Industrial Development Corp.,
St. Ann's of Greater Rochester Obligated Group,
Revenue, Refunding,
Series 2019, 4.00%, 01/01/2030 | | | 800,000 | | | | 722,639 | | |
First Eagle Funds | Semiannual Report | April 30, 2024
143
First Eagle High Yield Municipal Fund | Schedule of Investments | April 30, 2024 (unaudited)
Investments | | Principal Amount ($) | | Value ($) | |
New York — 7.5% (continued) | |
St. Ann's of Greater Rochester Obligated Group,
Revenue, Refunding,
Series 2019, 5.00%, 01/01/2040 | | | 13,200,000 | | | | 11,329,225 | | |
Nassau County Tobacco Settlement Corp.,
Revenue, Series 2006 A-3, 5.13%, 06/01/2046 | | | 5,710,000 | | | | 5,205,506 | | |
New York Liberty Development Corp.,
3 World Trade Center LLC, Revenue, Refunding,
Series 2014, Class 3, 7.25%, 11/15/2044 (d) | | | 2,000,000 | | | | 2,011,561 | | |
New York State Dormitory Authority,
St. Joseph's College, Revenue,
Series 2021, 5.00%, 07/01/2051 | | | 1,750,000 | | | | 1,545,990 | | |
New York State Dormitory Authority,
Garnet Health Medical Center Obligated Group,
Revenue, Refunding,
Series 2017, 5.00%, 12/01/2031 (d) | | | 1,000,000 | | | | 953,740 | | |
Garnet Health Medical Center Obligated Group,
Revenue, Refunding,
Series 2017, 5.00%, 12/01/2032 (d) | | | 1,100,000 | | | | 1,040,522 | | |
Garnet Health Medical Center Obligated Group,
Revenue, Refunding,
Series 2017, 5.00%, 12/01/2037 (d) | | | 2,000,000 | | | | 1,755,668 | | |
New York State Dormitory Authority,
Montefiore Obligated Group, Revenue, Refunding,
Series 2018 A, 5.00%, 08/01/2024 | | | 5,000 | | | | 4,992 | | |
Oneida Indian Nation of New York,
Revenue, Series 2024 B, 6.00%, 09/01/2043 (d) | | | 3,500,000 | | | | 3,694,038 | | |
Suffolk Regional Off-Track Betting Co.,
Revenue, Series 2024, 5.75%, 12/01/2044 | | | 7,000,000 | | | | 7,072,439 | | |
Revenue, Series 2024, 6.00%, 12/01/2053 | | | 16,000,000 | | | | 16,150,445 | | |
Westchester County Local Development Corp.,
Westchester County Health Care Corp. Obligated
Group, Revenue, Refunding,
Series 2016, 3.75%, 11/01/2037 | | | 630,000 | | | | 536,353 | | |
Westchester County Local Development Corp.,
Purchase Senior Learning Community Obligated
Group, Revenue, Refunding,
Series 2021 A, 5.00%, 07/01/2046 (d) | | | 525,000 | | | | 495,421 | | |
Purchase Senior Learning Community Obligated
Group, Revenue, Refunding,
Series 2021 A, 5.00%, 07/01/2056 (d) | | | 4,385,000 | | | | 4,000,363 | | |
| | | | 66,903,769 | | |
First Eagle Funds | Semiannual Report | April 30, 2024
144
First Eagle High Yield Municipal Fund | Schedule of Investments | April 30, 2024 (unaudited)
Investments | | Principal Amount ($) | | Value ($) | |
North Dakota — 0.8% | |
City of Horace, GO, Refunding,
Series 2024 A, 5.38%, 05/01/2050 | | | 800,000 | | | | 782,854 | | |
County of Ward,
Trinity Health Obligated Group, Revenue,
Series 2017 C, 5.00%, 06/01/2029 | | | 1,300,000 | | | | 1,290,680 | | |
Trinity Health Obligated Group, Revenue,
Series 2017 C, 5.00%, 06/01/2031 | | | 1,665,000 | | | | 1,650,442 | | |
Trinity Health Obligated Group, Revenue,
Series 2017 C, 5.00%, 06/01/2048 | | | 3,500,000 | | | | 3,044,775 | | |
| | | | 6,768,751 | | |
Ohio — 8.1% | |
Buckeye Tobacco Settlement Financing Authority,
Revenue, Senior Lien, Refunding,
Series 2020 B-3, Class 2, 0.00%, 06/01/2057 (g) | | | 53,200,000 | | | | 5,257,623 | | |
County of Cuyahoga,
Eliza Jennings Obligated Group, Revenue, Refunding,
Series 2022 A, 5.00%, 05/15/2032 | | | 2,525,000 | | | | 2,461,400 | | |
County of Hamilton,
UC Health Obligated Group, Revenue,
Series 2020, 4.00%, 09/15/2050 | | | 3,175,000 | | | | 2,496,958 | | |
County of Hardin,
Ohio Northern University, Revenue, Refunding,
Series 2020, 4.00%, 05/01/2026 | | | 240,000 | | | | 233,430 | | |
Ohio Northern University, Revenue, Refunding,
Series 2020, 5.00%, 05/01/2030 | | | 1,000,000 | | | | 986,462 | | |
County of Lucas,
Promedica Healthcare Obligated Group, Revenue,
Series 2015 B, 4.00%, 11/15/2045 | | | 810,000 | | | | 614,175 | | |
County of Lucas,
Promedica Healthcare Obligated Group, Revenue,
Refunding, Series 2018 A, 5.25%, 11/15/2048 | | | 12,755,000 | | | | 12,666,900 | | |
County of Muskingum,
Genesis Healthcare System Obligated Group, Revenue,
Series 2013, 5.00%, 02/15/2044 | | | 1,190,000 | | | | 1,095,468 | | |
Genesis Healthcare System Obligated Group, Revenue,
Series 2013, 5.00%, 02/15/2048 | | | 1,000,000 | | | | 896,143 | | |
County of Washington,
Marietta Area Health Care, Inc. Obligated Group,
Revenue, Refunding,
Series 2022, 6.75%, 12/01/2052 | | | 11,700,000 | | | | 12,585,200 | | |
First Eagle Funds | Semiannual Report | April 30, 2024
145
First Eagle High Yield Municipal Fund | Schedule of Investments | April 30, 2024 (unaudited)
Investments | | Principal Amount ($) | | Value ($) | |
Ohio — 8.1% (continued) | |
Ohio Air Quality Development Authority,
Ohio Valley Electric Corp., Revenue,
Series 2009 C, 1.50%, 11/04/2025 (b)(f) | | | 1,035,000 | | | | 973,464 | | |
Ohio Air Quality Development Authority,
AMG Vanadium LLC, Revenue, AMT,
Series 2019, 5.00%, 07/01/2049 (d) | | | 4,500,000 | | | | 4,126,285 | | |
Southeastern Ohio Port Authority,
Marietta Area Health Care, Inc. Obligated Group,
Revenue, Refunding,
Series 2015, 5.00%, 12/01/2035 | | | 1,750,000 | | | | 1,641,511 | | |
Marietta Area Health Care, Inc. Obligated Group,
Revenue, Refunding,
Series 2015, 5.00%, 12/01/2043 | | | 6,695,000 | | | | 5,796,167 | | |
Marietta Area Health Care, Inc. Obligated Group,
Revenue, Refunding,
Series 2015, 5.50%, 12/01/2043 | | | 6,375,000 | | | | 5,877,890 | | |
State of Ohio, University Hospitals Health System, Inc.
Obligated Group, Revenue,
Series 2015 C, 4.05%, 05/01/2024 (a)(b) | | | 4,300,000 | | | | 4,300,000 | | |
University Hospitals Health System, Inc.
Obligated Group, Revenue, Refunding,
Series 2014 B, 3.97%, 05/07/2024 (a)(b) | | | 3,625,000 | | | | 3,625,000 | | |
University Hospitals Health System, Inc.
Obligated Group, Revenue, Refunding,
Series 2015 A, 3.97%, 05/07/2024 (a)(b) | | | 3,230,000 | | | | 3,230,000 | | |
Summit County Development Finance Authority,
UAkronPark, Inc., Revenue,
Series 2023, 5.63%, 12/01/2048 | | | 800,000 | | | | 843,239 | | |
UAkronPark, Inc., Revenue,
Series 2023, 5.75%, 12/01/2053 | | | 1,400,000 | | | | 1,477,959 | | |
| | | | 71,185,274 | | |
Oklahoma — 0.7% | |
Norman Regional Hospital Authority,
Obligated Group, Revenue,
Series 2019, 4.00%, 09/01/2045 | | | 630,000 | | | | 504,886 | | |
Oklahoma Development Finance Authority,
OU Medicine Obligated Group, Revenue,
Series 2018 B, 5.00%, 08/15/2038 | | | 1,500,000 | | | | 1,519,682 | | |
First Eagle Funds | Semiannual Report | April 30, 2024
146
First Eagle High Yield Municipal Fund | Schedule of Investments | April 30, 2024 (unaudited)
Investments | | Principal Amount ($) | | Value ($) | |
Oklahoma — 0.7% (continued) | |
Tulsa Airports Improvement Trust,
American Airlines, Inc., Revenue, AMT, Refunding,
Series 2001 B, 5.50%, 12/01/2035 | | | 2,800,000 | | | | 2,800,512 | | |
Tulsa Authority for Economic Opportunity,
Increment District No. 8, Tax Allocation,
Series 2021, 4.38%, 12/01/2041 (d) | | | 1,980,000 | | | | 1,752,065 | | |
| | | | 6,577,145 | | |
Oregon — 0.6% | |
Oregon State Facilities Authority,
Portland Village School, Revenue,
Series 2024 A, 6.75%, 12/15/2054 (d) | | | 2,000,000 | | | | 1,928,401 | | |
Portland Village School, Revenue,
Series 2024 A, 7.00%, 12/15/2060 (d) | | | 2,000,000 | | | | 1,958,381 | | |
Yamhill County Hospital Authority,
Friendsview Manor Obligated Group, Revenue,
Refunding, Series 2016 A, 5.00%, 11/15/2046 | | | 2,290,000 | | | | 1,845,004 | | |
| | | | 5,731,786 | | |
Pennsylvania — 2.9% | |
Bucks County Industrial Development Authority,
Grand View Hospital/Sellersville Obligated Group,
Revenue, Series 2021, 5.00%, 07/01/2027 | | | 275,000 | | | | 252,543 | | |
Grand View Hospital/Sellersville Obligated Group,
Revenue, Series 2021, 5.00%, 07/01/2028 | | | 525,000 | | | | 470,757 | | |
Grand View Hospital/Sellersville Obligated Group,
Revenue, Series 2021, 5.00%, 07/01/2029 | | | 550,000 | | | | 481,294 | | |
Grand View Hospital/Sellersville Obligated Group,
Revenue, Series 2021, 5.00%, 07/01/2032 | | | 1,000,000 | | | | 851,232 | | |
Grand View Hospital/Sellersville Obligated Group,
Revenue, Series 2021, 5.00%, 07/01/2033 | | | 1,150,000 | | | | 973,820 | | |
Grand View Hospital/Sellersville Obligated Group,
Revenue, Series 2021, 5.00%, 07/01/2034 | | | 1,355,000 | | | | 1,142,437 | | |
Grand View Hospital/Sellersville Obligated Group,
Revenue, Series 2021, 5.00%, 07/01/2035 | | | 1,100,000 | | | | 934,401 | | |
Grand View Hospital/Sellersville Obligated Group,
Revenue, Series 2021, 5.00%, 07/01/2036 | | | 1,250,000 | | | | 1,059,976 | | |
Grand View Hospital/Sellersville Obligated Group,
Revenue, Series 2021, 5.00%, 07/01/2037 | | | 2,650,000 | | | | 2,251,800 | | |
Grand View Hospital/Sellersville Obligated Group,
Revenue, Series 2021, 5.00%, 07/01/2038 | | | 1,725,000 | | | | 1,468,302 | | |
First Eagle Funds | Semiannual Report | April 30, 2024
147
First Eagle High Yield Municipal Fund | Schedule of Investments | April 30, 2024 (unaudited)
Investments | | Principal Amount ($) | | Value ($) | |
Pennsylvania — 2.9% (continued) | |
Grand View Hospital/Sellersville Obligated Group,
Revenue, Series 2021, 5.00%, 07/01/2039 | | | 2,930,000 | | | | 2,472,265 | | |
Grand View Hospital/Sellersville Obligated Group,
Revenue, Series 2021, 5.00%, 07/01/2040 | | | 3,000,000 | | | | 2,514,075 | | |
Grand View Hospital/Sellersville Obligated Group,
Revenue, Series 2021, 4.00%, 07/01/2046 | | | 8,275,000 | | | | 6,270,160 | | |
Grand View Hospital/Sellersville Obligated Group,
Revenue, Series 2021, 4.00%, 07/01/2051 | | | 3,480,000 | | | | 2,515,047 | | |
Pennsylvania Higher Educational Facilities Authority,
Foundation for Indiana University of Pennsylvania
Phase II Student Housing, Revenue, AGMC Insured,
Series 2007 A, (3-month SOFR + 0.91%),
4.40%, 07/01/2039 (f) | | | 500,000 | | | | 436,055 | | |
St. Mary Hospital Authority,
Trinity Health Corp. Obligated Group, Revenue,
Series 2007 F, (3-month SOFR + 1.09%),
4.56%, 11/15/2034 (f) | | | 2,035,000 | | | | 1,911,521 | | |
| | | | 26,005,685 | | |
Puerto Rico — 1.3% | |
Children's Trust Fund, Revenue,
Series 2002, 5.63%, 05/15/2043 | | | 295,000 | | | | 298,638 | | |
Puerto Rico Industrial Tourist Educational Medical &
Environmental Control Facilities Financing Authority,
San Juan Cruise Port LLC, Revenue, AMT,
Series 2023 A-1, 6.75%, 01/01/2045 | | | 5,000,000 | | | | 5,931,659 | | |
San Juan Cruise Port LLC, Revenue, AMT,
Series 2023 A-2, 6.75%, 01/01/2045 | | | 5,000,000 | | | | 5,931,659 | | |
| | | | 12,161,956 | | |
Rhode Island — 0.1% | |
Tobacco Settlement Financing Corp., Revenue,
Series 2007 A, 0.00%, 06/01/2052 (g) | | | 5,500,000 | | | | 950,098 | | |
Texas — 9.3% | |
Abilene Convention Center Hotel Development Corp.,
City of Abilene Abilene Convention Center,
Revenue, First Lien,
Series 2021 A, 4.00%, 10/01/2050 | | | 300,000 | | | | 233,812 | | |
Arlington Higher Education Finance Corp.,
Cypress Christian School, Inc., Revenue,
Series 2024, 5.75%, 06/01/2043 (d) | | | 1,500,000 | | | | 1,527,736 | | |
First Eagle Funds | Semiannual Report | April 30, 2024
148
First Eagle High Yield Municipal Fund | Schedule of Investments | April 30, 2024 (unaudited)
Investments | | Principal Amount ($) | | Value ($) | |
Texas — 9.3% (continued) | |
City of Celina, Celina Hills Public Improvement
District, Special Assessment,
Series 2022, 4.88%, 09/01/2042 (d) | | | 1,084,000 | | | | 1,020,238 | | |
Special Assessment,
Series 2024, 5.50%, 09/01/2044 (d) | | | 475,000 | | | | 472,204 | | |
Special Assessment,
Series 2024, 5.75%, 09/01/2054 (d) | | | 1,350,000 | | | | 1,343,564 | | |
City of Dayton, Westpointe Villages Public
Improvement District Improvement Area No. 2,
Special Assessment, Junior Lien,
Series 2024 B, 6.25%, 09/01/2054 (d) | | | 1,250,000 | | | | 1,198,678 | | |
Westpointe Villages Public Improvement District
Improvement Area No. 2, Special Assessment,
Senior Lien, Series 2024 A, 5.38%, 09/01/2044 (d) | | | 610,000 | | | | 579,371 | | |
Westpointe Villages Public Improvement District
Improvement Area No. 2, Special Assessment,
Senior Lien, Series 2024 A, 5.75%, 09/01/2054 (d) | | | 900,000 | | | | 858,666 | | |
City of Fate, Monterra Public Improvement District
Improvement Area No. 2, Special Assessment,
Series 2024, 5.38%, 08/15/2044 (d) | | | 900,000 | | | | 851,975 | | |
Monterra Public Improvement District Improvement
Area No. 2, Special Assessment,
Series 2024, 5.75%, 08/15/2054 (d) | | | 1,350,000 | | | | 1,280,883 | | |
City of Justin,
Timberbrook Public Improvement District No. 2
Area No. 1, Special Assessment,
Series 2024, 5.50%, 09/01/2044 (d) | | | 580,000 | | | | 581,069 | | |
Timberbrook Public Improvement District No. 2
Area No. 1, Special Assessment,
Series 2024, 5.75%, 09/01/2053 (d) | | | 1,000,000 | | | | 1,001,672 | | |
City of Lago Vista,
Tessera on Lake Travis Public Improvement District
Improvement Area No. 3, Special Assessment,
Series 2024, 6.00%, 09/01/2054 (d) | | | 1,000,000 | | | | 987,129 | | |
City of Plano,
Collin Creek West Public Improvement District,
Special Assessment,
Series 2021, 4.00%, 09/15/2051 (d) | | | 500,000 | | | | 377,782 | | |
City of Princeton,
Eastridge Public Improvement District Improvement
Area No. 2, Special Assessment,
Series 2023, 5.25%, 09/01/2043 (d) | | | 1,000,000 | | | | 965,770 | | |
First Eagle Funds | Semiannual Report | April 30, 2024
149
First Eagle High Yield Municipal Fund | Schedule of Investments | April 30, 2024 (unaudited)
Investments | | Principal Amount ($) | | Value ($) | |
Texas — 9.3% (continued) | |
City of Seagoville,
Santorini Public Improvement District Improvement
Area No. 1, Special Assessment,
Series 2024, 6.00%, 09/15/2044 (d) | | | 2,100,000 | | | | 2,025,791 | | |
Santorini Public Improvement District Improvement
Area No. 1, Special Assessment,
Series 2024, 6.25%, 09/15/2054 (d) | | | 2,500,000 | | | | 2,400,523 | | |
Santorini Public Improvement District Improvement
Area, Special Assessment,
Series 2024, 7.00%, 09/15/2054 (d) | | | 5,000,000 | | | | 4,757,220 | | |
Hidalgo County Regional Mobility Authority,
Revenue, Senior Lien,
Series 2022 A, 0.00%, 12/01/2048 (g) | | | 7,130,000 | | | | 1,938,171 | | |
Revenue, Senior Lien,
Series 2022 A, 0.00%, 12/01/2052 (g) | | | 1,075,000 | | | | 222,376 | | |
Revenue, Senior Lien,
Series 2022 A, 0.00%, 12/01/2054 (g) | | | 5,000,000 | | | | 915,340 | | |
Revenue, Senior Lien,
Series 2022 A, 0.00%, 12/01/2055 (g) | | | 6,100,000 | | | | 1,053,181 | | |
Lubbock Educational Facilities Authority, Inc.,
Lubbock Christian University, Revenue, Refunding,
Series 2016, 2.75%, 11/01/2031 | | | 2,585,000 | | | | 2,011,950 | | |
New Hope Cultural Education Facilities Finance Corp.,
Jubilee Academic Center, Inc., Revenue, Refunding,
Series 2021, 4.00%, 08/15/2041 (d) | | | 200,000 | | | | 166,969 | | |
Sanctuary LTC LLC, Revenue,
Series 2021 A-1, 5.00%, 01/01/2032 | | | 6,250,000 | | | | 5,866,329 | | |
Sanctuary LTC LLC, Revenue,
Series 2021 A-1, 5.25%, 01/01/2042 | | | 10,050,000 | | | | 8,750,300 | | |
Sanctuary LTC LLC, Revenue,
Series 2021 A-1, 5.50%, 01/01/2057 | | | 26,250,000 | | | | 21,705,652 | | |
Olney Hamilton Hospital District, GO,
Series 2024, 6.25%, 09/15/2054 (d) | | | 16,500,000 | | | | 17,042,005 | | |
Travis County Development Authority,
Bella Fortuna Public Improvement District,
Special Assessment,
Series 2024, 5.38%, 09/01/2044 (d) | | | 900,000 | | | | 866,240 | | |
Bella Fortuna Public Improvement District,
Special Assessment,
Series 2024, 5.63%, 09/01/2051 (d) | | | 765,000 | | | | 730,606 | | |
| | | | 83,733,202 | | |
First Eagle Funds | Semiannual Report | April 30, 2024
150
First Eagle High Yield Municipal Fund | Schedule of Investments | April 30, 2024 (unaudited)
Investments | | Principal Amount ($) | | Value ($) | |
Utah — 2.4% | |
Chelsey Public Infrastructure District No. 1,
Assessment Area 1, Special Assessment,
Series 2024, 7.00%, 12/01/2042 (d) | | | 1,350,000 | | | | 1,368,604 | | |
Firefly Public Infrastructure District No. 1,
Assessment Area 1, Special Assessment,
Series 2024 A-2, 5.63%, 12/01/2043 (d) | | | 1,805,000 | | | | 1,827,373 | | |
GO,
Series 2024 A-1, 6.63%, 03/01/2054 (d) | | | 3,645,000 | | | | 3,686,008 | | |
Military Installation Development Authority,
Military Recreation Assessment Area, Revenue,
Series 2021 A-2, 4.00%, 06/01/2041 | | | 3,215,000 | | | | 2,591,410 | | |
Military Recreation Assessment Area, Revenue,
Series 2021 A-2, 4.00%, 06/01/2052 | | | 2,280,000 | | | | 1,631,954 | | |
Utah Charter School Finance Authority,
Ascent Academies of Utah, Revenue, Refunding,
Series 2022, 5.00%, 06/15/2057 (d) | | | 2,000,000 | | | | 1,543,238 | | |
Utah Charter School Finance Authority,
Freedom Academy Foundation, Revenue,
Series 2021 A, 5.00%, 06/15/2052 (d) | | | 3,895,000 | | | | 3,222,893 | | |
Utah Charter School Finance Authority,
Freedom Academy Foundation, Revenue, Refunding,
Series 2017, 5.38%, 06/15/2048 (d) | | | 4,820,000 | | | | 4,315,927 | | |
Utah Infrastructure Agency, Revenue,
Series 2021, 3.00%, 10/15/2045 | | | 1,000,000 | | | | 671,248 | | |
| | | | 20,858,655 | | |
Virgin Islands — 0.3% | |
Virgin Islands Public Finance Authority,
United States Virgin Islands, Revenue, Refunding,
Series 2014 C, 5.00%, 10/01/2030 (d) | | | 2,500,000 | | | | 2,437,691 | | |
Virginia — 0.5% | |
Tobacco Settlement Financing Corp.,
Revenue, Senior Lien,
Series 2007 B-1, 5.00%, 06/01/2047 | | | 2,750,000 | | | | 2,534,241 | | |
Virginia College Building Authority,
Marymount University, Revenue, Refunding,
Series 2015 A, 5.00%, 07/01/2045 (d) | | | 1,000,000 | | | | 908,726 | | |
Virginia College Building Authority,
Marymount University, Revenue,
Series 2015 B, 5.00%, 07/01/2045 (d) | | | 1,000,000 | | | | 908,726 | | |
| | | | 4,351,693 | | |
First Eagle Funds | Semiannual Report | April 30, 2024
151
First Eagle High Yield Municipal Fund | Schedule of Investments | April 30, 2024 (unaudited)
Investments | | Principal Amount ($) | | Value ($) | |
Washington — 1.4% | |
King County Public Hospital District No. 4, Revenue,
Series 2015 A, 6.25%, 12/01/2045 | | | 1,300,000 | | | | 1,289,681 | | |
Washington State Housing Finance Commission,
Provident Group-SH I Properties LLC, Revenue,
Series 2024, 5.00%, 07/01/2054 | | | 4,305,000 | | | | 4,334,450 | | |
Provident Group-SH I Properties LLC, Revenue,
Series 2024, 5.50%, 07/01/2059 | | | 6,500,000 | | | | 6,775,591 | | |
| | | | 12,399,722 | | |
Wisconsin — 10.3% | |
Public Finance Authority,
Bonnie Cone Classical Academy, Inc., Revenue,
Series 2021 A, 4.00%, 06/15/2040 (d) | | | 2,020,000 | | | | 1,687,080 | | |
Southeastern Regional Medical Center Obligated
Group, Revenue, Refunding,
Series 2021 A, 4.00%, 02/01/2041 | | | 5,145,000 | | | | 3,994,297 | | |
Coral Academy of Science Las Vegas, Revenue,
Series 2021 A, 4.00%, 07/01/2041 | | | 1,000,000 | | | | 847,727 | | |
Washoe Barton Medical Clinic, Revenue, Refunding,
Series 2021 A, 4.00%, 12/01/2041 (d) | | | 250,000 | | | | 206,630 | | |
Rider University A New Jersey Non-Profit Corp.,
Revenue, Refunding,
Series 2021 A, 4.50%, 07/01/2048‡ (d)(h) | | | 6,920,000 | | | | 5,477,829 | | |
Bonnie Cone Classical Academy, Inc., Revenue,
Series 2021 A, 4.00%, 06/15/2050 (d) | | | 1,500,000 | | | | 1,120,973 | | |
Southeastern Regional Medical Center Obligated
Group, Revenue, Refunding,
Series 2021 A, 4.00%, 02/01/2051 | | | 2,000,000 | | | | 1,386,494 | | |
UNC Health Appalachian Obligated Group, Revenue,
Series 2021 A, 4.00%, 07/01/2051 | | | 1,675,000 | | | | 1,233,547 | | |
Bonnie Cone Classical Academy, Inc., Revenue,
Series 2021 A, 4.00%, 06/15/2056 (d) | | | 2,445,000 | | | | 1,754,496 | | |
Foundation of The University of North Carolina at
Charlotte, Inc. (The), Revenue,
Series 2021 A, 4.00%, 09/01/2056 (d) | | | 1,595,000 | | | | 1,110,480 | | |
Public Finance Authority,
WFCS Holdings LLC, Revenue,
Series 2020 A-1, 5.00%, 01/01/2055 (d) | | | 1,500,000 | | | | 1,238,226 | | |
Public Finance Authority,
Guilford College, Revenue, Refunding,
Series 2016, 5.00%, 01/01/2027 | | | 830,000 | | | | 822,805 | | |
First Eagle Funds | Semiannual Report | April 30, 2024
152
First Eagle High Yield Municipal Fund | Schedule of Investments | April 30, 2024 (unaudited)
Investments | | Principal Amount ($) | | Value ($) | |
Wisconsin — 10.3% (continued) | |
Public Finance Authority,
KIPP Charlotte, Inc. Obligated Group, Revenue,
Series 2020 A, 5.00%, 10/15/2050 (d) | | | 1,000,000 | | | | 876,516 | | |
Public Finance Authority,
Revenue, Series 2023-1, Class A, 5.75%, 07/01/2062 | | | 5,000,000 | | | | 5,360,447 | | |
Public Finance Authority,
Southeast Overtown Park West Community
Redevelopment Agency, Tax Allocation,
Series 2024 A, 5.00%, 06/01/2041 (d) | | | 9,000,000 | | | | 8,957,525 | | |
Public Finance Authority,
Dominium Holdings I LLC, Revenue,
Series 2024-1, Class B-1, 6.81%, 04/28/2036 (d) | | | 27,155,000 | | | | 27,145,379 | | |
Public Finance Authority,
Southeast Overtown Park West Community
Redevelopment Agency, Tax Allocation,
Series 2024 B, 8.00%, 06/15/2042 (d) | | | 21,000,000 | | | | 20,620,790 | | |
Public Finance Authority,
Austin FBO LLC, Revenue, AMT, Mandatory Put,
Series 2018 A, 7.05%, 09/01/2027 (b)(d)(f) | | | 250,000 | | | | 244,000 | | |
Wisconsin Health & Educational Facilities Authority,
Cedar Crest, Inc. Obligated Group, Revenue, Refunding,
Series 2022 A, 4.75%, 04/01/2057 | | | 2,920,000 | | | | 2,104,635 | | |
Wisconsin Health & Educational Facilities Authority,
Marshfield Clinic Health System Obligated Group,
Revenue, Refunding,
Series 2017 C, 3.25%, 02/15/2033 | | | 1,020,000 | | | | 888,965 | | |
Marshfield Clinic Health System Obligated Group,
Revenue, Refunding,
Series 2017 C, 3.50%, 02/15/2036 | | | 620,000 | | | | 534,939 | | |
Wisconsin Health & Educational Facilities Authority,
Wisconsin Masonic Home Obligated Group, Revenue,
Series 2024 A, 5.75%, 08/15/2059 | | | 3,000,000 | | | | 3,013,576 | | |
Wisconsin Health & Educational Facilities Authority,
Marshfield Clinic Health System Obligated Group,
Revenue, Series 2016 A, 3.50%, 02/15/2046 | | | 490,000 | | | | 358,503 | | |
| | | | 90,985,859 | | |
Total Municipal Bonds
(Cost $996,320,114) | | | 1,000,101,131 | | |
First Eagle Funds | Semiannual Report | April 30, 2024
153
First Eagle High Yield Municipal Fund | Schedule of Investments | April 30, 2024 (unaudited)
Investments | | Shares | | Value ($) | |
Short-Term Investments — 0.0% (c) | |
Investment Companies — 0.0% (c) | |
JP Morgan U.S. Government Money Market Fund,
Capital Shares 5.33% (i) (Cost $343,060) | | | 343,060 | | | | 343,060 | | |
Total Investments — 112.4%
(Cost $996,663,174) | | | 1,000,444,191 | | |
Liabilities in Excess of Other Assets — (12.4)% | | | (110,396,532 | ) | |
Net Assets — 100.0% | | | 890,047,659 | | |
‡ Value determined using significant unobservable inputs.
(a) Variable rate demand notes (VRDNs) are obligations which contain a floating or variable interest rate adjustment formula and an unconditional right of demand to receive payment of the principal balance plus accrued interest at specified dates. Unless otherwise noted, the coupon rate is determined based on factors including supply and demand, underlying credit, tax treatment, and current short term rates. The coupon rate shown represents the rate at period end.
(b) Security with "Put" features and resetting interest rates. Maturity dates disclosed are the puttable dates. Interest rate disclosed is that which is in effect on April 30, 2024.
(c) Represents less than 0.05% of net assets.
(d) Securities exempt from registration under Rule 144A or section 4(a)2 of the Securities Act of 1933. Total value of all such securities at April 30, 2024 amounted to $464,095,085, which represents approximately 52.14% of net assets of the Fund.
(e) When-issued security.
(f) Variable or floating rate security, linked to the referenced benchmark. The interest rate shown was the current rate as of April 30, 2024.
(g) Zero Coupon Security. Debt security that pays no cash income but is sold at substantial discount from its value at maturity.
(h) Represents a security that is subject to legal or contractual restrictions on resale. Total value of all such securities at April 30, 2024 amounted to $7,975,384, which represents approximately 0.90% of net assets of the Fund.
| Restricted Securities | | Acquisition Date | | Cost | | Carrying Value
Per
Share/Principal | |
New Jersey Educational Facilities
Authority, Rider University A New Jersey
Non-Profit Corp., Revenue, Series 2017 F | | 02/27/24 | | $ | 2,537,828 | | | $ | 76.85 | | |
Public Finance Authority, Rider University
A New Jersey Non-Profit Corp., Revenue,
Refunding, Series 2021 A | | 01/19/24 - 02/07/24 | | | 5,513,009 | | | | 79.16 | | |
Total | | | | $ | 8,050,837 | | | | |
(i) Represents 7-day effective yield as of April 30, 2024.
Abbreviations
AGMC — Insured by Assured Guaranty Municipal Corp.
AMT — Alternative Money Tax
GO — General Obligation
SOFR — Secured Overnight Financing Rate
First Eagle Funds | Semiannual Report | April 30, 2024
154
First Eagle High Yield Municipal Fund | Schedule of Investments | April 30, 2024 (unaudited)
As of April 30, 2024, the gross unrealized appreciation (depreciation) of investments based on the aggregate cost of investment securities and derivative instruments, if applicable, for federal income tax purposes was as follows:
Aggregate gross unrealized appreciation | | $ | 11,961,343 | | |
Aggregate gross unrealized depreciation | | | (8,180,326 | ) | |
Net unrealized appreciation | | $ | 3,781,017 | | |
Federal income tax cost | | $ | 996,663,174 | | |
See Notes to Financial Statements.
First Eagle Funds | Semiannual Report | April 30, 2024
155
First Eagle Short Duration High Yield Municipal Fund
Data as of April 30, 2024 (unaudited)
Investment Objective
The First Eagle Short Duration High Yield Municipal Fund seeks to provide high current income exempt from regular federal income taxes; capital appreciation is a secondary objective when consistent with the Fund's primary objective.
Average Annual Returns^ (%) | | | | Since
Inception
(1/2/2024) | |
First Eagle Short Duration High Yield Municipal Fund | | Class I | | | 2.03 | | |
S&P Short Duration Municipal Yield Index | | | | | 0.75 | | |
S&P Municipal Bond Index | | | | | -1.16 | | |

Bond Credit Quality* (%)
AA | | | 3.1 | | |
A | | | 0.9 | | |
BBB | | | 9.9 | | |
BB or lower | | | 18.0 | | |
N/R (not rated) | | | 10.1 | | |
N/A (not applicable) | | | 58.0 | | |
Portfolio Composition* (%)
Economic/Industrial Development | | | 13.1 | | |
Hospital | | | 12.9 | | |
Higher Education | | | 11.4 | | |
Charter School | | | 11.3 | | |
Public Transportation | | | 9.5 | | |
Tax Increment Financing | | | 5.6 | | |
Community Development District | | | 4.6 | | |
Special Assessment Financing | | | 4.2 | | |
Continuing Care Retirement Community | | | 3.8 | | |
Nursing Home | | | 3.3 | | |
General Obligation Hospital/Health
District | | | 3.2 | | |
Indian Tribal Bond | | | 3.2 | | |
Gas Forward Contract | | | 2.3 | | |
Not-For-Profit Cultural Organization | | | 2.1 | | |
Portfolio Composition* (%) (continued)
Secondary Education | | | 2.1 | | |
Local Multi-Family Housing | | | 1.9 | | |
Sales & Excise Tax | | | 1.9 | | |
Public Power System | | | 1.8 | | |
Tobacco Master Settlement Agreement | | | 0.9 | | |
Student Housing | | | 0.4 | | |
Toll Highway/Bridge/Tunnel | | | 0.4 | | |
Short-Term Investments | | | 0.1 | | |
States and Territories* (%)
Florida | | | 20.7 | | |
Texas | | | 14.9 | | |
Maryland | | | 9.1 | | |
New York | | | 7.9 | | |
Georgia | | | 6.1 | | |
Oklahoma | | | 5.6 | | |
Wisconsin | | | 5.0 | | |
Illinois | | | 4.7 | | |
Michigan | | | 4.3 | | |
Pennsylvania | | | 4.0 | | |
California | | | 3.2 | | |
Nevada | | | 2.6 | | |
Indiana | | | 2.5 | | |
Colorado | | | 2.0 | | |
Virginia | | | 1.6 | | |
Missouri | | | 1.4 | | |
Ohio | | | 1.4 | | |
Mississippi | | | 1.1 | | |
Arizona | | | 0.9 | | |
New Jersey | | | 0.5 | | |
Louisiana | | | 0.4 | | |
Short-Term Investments | | | 0.1 | | |
^ Performance figures reflect certain fee waivers and/or expense limitations, without which returns may have been lower.
* Asset Allocation, Bond Credit Quality, Portfolio Composition and States and Territories percentages are based on total investments in the portfolio.
** Includes short-term commercial paper (0.0% of total investments) that settles in 90 days or less, long-term commercial paper (0.0% of total investments) that settles in 91 days or greater and other short-term investments (0.1% of total investments), such as U.S. treasury bills or money market funds.
The Fund's portfolio composition is subject to change at any time.
First Eagle Funds | Semiannual Report | April 30, 2024
156
First Eagle Short Duration High Yield Municipal Fund | Fund Overview
Growth of a $1,000,000 Initial Investment

Performance data quoted herein represents past performance and should not be considered indicative of future results. Performance data quoted herein does not reflect the deduction of taxes that a shareholder would pay on Fund distributions or the sale of Fund shares. The average annual returns shown above are historical and reflect changes in share price, reinvested dividends and are net of expenses.
Class I Shares require $1 million minimum investment and are offered without a sales charge. If a sales charge was included values would be lower.
The S&P Municipal Bond Index is a broad, market value-weighted index that seeks to measure the performance of the U.S. municipal bond market. It tracks fixed-rate tax-free bonds and bonds subject to the alternative minimum tax (AMT). One cannot invest directly in an index.
The S&P Short Duration Municipal Yield Index measures the market-value-weighted performance of bonds issued by state and local municipalities in the U.S. and its territories with a minimum maturity of 6 months and a maximum maturity of 4 years. One cannot invest directly in an index.
First Eagle Funds | Semiannual Report | April 30, 2024
157
First Eagle Short Duration High Yield Municipal Fund | Schedule of Investments | April 30, 2024 (unaudited)
Investments | | Principal Amount ($) | | Value ($) | |
Municipal Bonds — 102.8% | |
Arizona — 0.9% | |
Arizona Industrial Development Authority,
Doral Academy of Northern Nevada Obligated Group,
Revenue, Refunding,
Series 2021 A, 4.00%, 07/15/2028 (a) | | | 200,000 | | | | 195,482 | | |
California — 3.3% | |
California Statewide Financing Authority,
TSR Multi-County Special Purpose Trust, Revenue,
Series 2002 A, 6.00%, 05/01/2043 | | | 200,000 | | | | 204,420 | | |
Palomar Health, Palomar Health Obligated Group,
Revenue, Refunding,
Series 2016, 5.00%, 11/01/2036 | | | 500,000 | | | | 479,395 | | |
| | | | 683,815 | | |
Colorado — 2.0% | |
Colorado Health Facilities Authority,
BSLC Obligated Group, Revenue, Refunding,
Series 2018 A-1, 5.00%, 03/15/2025 | | | 325,000 | | | | 324,298 | | |
Pueblo Urban Renewal Authority, City of Pueblo Sales
Tax, Revenue, Series 2017, 5.00%, 06/01/2036 | | | 100,000 | | | | 97,151 | | |
| | | | 421,449 | | |
Florida — 21.6% | |
Capital Trust Agency, Inc.,
Franklin Academy Obligated Group, Revenue,
Series 2020, 4.00%, 12/15/2024 (a) | | | 385,000 | | | | 381,386 | | |
Marie Selby Botanical Gardens, Inc. (The), Revenue,
Series 2021, 4.00%, 06/15/2031 (a) | | | 500,000 | | | | 457,276 | | |
Florida Development Finance Corp.,
Waste Pro USA, Inc., Revenue, AMT,
Series 2019, 5.00%, 05/01/2029 (a) | | | 140,000 | | | | 139,633 | | |
AAF Operations Holdings LLC, Revenue, AMT,
Refunding, Series 2024, 12.00%, 07/15/2028 (a)(b)(c) | | | 1,000,000 | | | | 1,030,000 | | |
Brightline Trains Florida LLC, Revenue, AMT,
Refunding, Series 2019 A, 6.50%, 01/01/2029 (a)(b)(c) | | | 1,000,000 | | | | 1,011,354 | | |
Majorca Isles Community Development District,
Special Assessment, Series 2015, 5.00%, 05/01/2025 | | | 165,000 | | | | 165,283 | | |
Orange County Health Facilities Authority,
Presbyterian Retirement Communities, Inc. Obligated
Group, Revenue, Series 2014, 5.00%, 08/01/2024 | | | 500,000 | | | | 500,176 | | |
Pine Island Community Development District, Special
Assessment, Series 2004, 5.75%, 05/01/2035 | | | 675,000 | | | | 675,015 | | |
First Eagle Funds | Semiannual Report | April 30, 2024
158
First Eagle Short Duration High Yield Municipal Fund | Schedule of Investments | April 30, 2024 (unaudited)
Investments | | Principal Amount ($) | | Value ($) | |
Florida — 21.6% (continued) | |
Sawgrass Village Community Development District,
Assessment Area 3, Special Assessment,
Series 2024, 4.70%, 05/01/2031 (a) | | | 100,000 | | | | 99,369 | | |
Villages of Westport Community Development District,
Assessments, Special Assessment,
Series 2005 A, 5.70%, 05/01/2035 | | | 45,000 | | | | 45,002 | | |
| | | | 4,504,494 | | |
Georgia — 6.2% | |
Development Authority of Burke County (The),
Georgia Power Co., Revenue, Refunding,
Series 2018, 4.25%, 05/01/2024 (c)(d) | | | 150,000 | | | | 150,000 | | |
Development Authority of The City of Marietta,
Life University, Inc., Revenue, Refunding,
Series 2017 A, 5.00%, 11/01/2027 (a) | | | 500,000 | | | | 502,367 | | |
George L Smith II Congress Center Authority,
Signia Hotel Management LLC, Revenue, Second Tier,
Series 2021 B, 3.63%, 01/01/2031 (a) | | | 185,000 | | | | 172,757 | | |
Main Street Natural Gas, Inc., Revenue, Mandatory Put,
Series 2022 C, 4.00%, 11/1/2027 (a)(b)(c) | | | 500,000 | | | | 485,345 | | |
| | | | 1,310,469 | | |
Illinois — 4.8% | |
Chicago Board of Education,
Dedicated Capital Improvement Tax, Revenue,
Series 2018, 5.00%, 04/01/2037 | | | 435,000 | | | | 447,521 | | |
Illinois Finance Authority, Acero Charter Schools, Inc.
Obligated Group, Revenue, Refunding,
Series 2021, 4.00%, 10/01/2028 (a) | | | 580,000 | | | | 562,060 | | |
| | | | 1,009,581 | | |
Indiana — 2.6% | |
Indiana Finance Authority,
Rock Creek Community Academy, Inc., Revenue,
Series 2018 A-1, 5.88%, 07/01/2038 (a) | | | 540,000 | | | | 539,516 | | |
Louisiana — 0.4% | |
Louisiana Local Government Environmental
Facilities & Community Development Authority,
Provident Group — ULM Properties LLC, Revenue,
Series 2019 A, 5.00%, 07/01/2039 (a) | | | 100,000 | | | | 91,523 | | |
Maryland — 9.3% | |
County of Frederick, Mount St Mary's University, Inc.,
Revenue, Refunding,
Series 2017 A, 5.00%, 09/01/2032 (a) | | | 740,000 | | | | 740,310 | | |
First Eagle Funds | Semiannual Report | April 30, 2024
159
First Eagle Short Duration High Yield Municipal Fund | Schedule of Investments | April 30, 2024 (unaudited)
Investments | | Principal Amount ($) | | Value ($) | |
Maryland — 9.3% (continued) | |
County of Prince George's, Westphalia Town Center
Development District, Tax Allocation,
Series 2018, 5.00%, 07/01/2030 (a) | | | 1,200,000 | | | | 1,214,493 | | |
| | | | 1,954,803 | | |
Michigan — 4.4% | |
Flint Hospital Building Authority,
Hurley Medical Center, Revenue, Refunding,
Series 2020, 5.00%, 07/01/2026 | | | 500,000 | | | | 497,745 | | |
Michigan Finance Authority, Aquinas College,
Revenue, Refunding, Series 2021, 4.00%, 05/01/2031 | | | 500,000 | | | | 437,948 | | |
| | | | 935,693 | | |
Mississippi — 1.2% | |
Mississippi Business Finance Corp.,
Mississippi Power Co., Revenue, First Series, AMT,
Series 2022, 4.00%, 05/01/2024 (c)(d) | | | 240,000 | | | | 240,000 | | |
Missouri — 1.4% | |
Grindstone Plaza Transportation Development District,
Revenue, Series 2006 A, 5.40%, 10/01/2026 | | | 305,000 | | | | 301,625 | | |
Nevada — 2.7% | |
City of Las Vegas, Special Improvement
District No. 812, Special Assessment,
Series 2015, 5.00%, 12/01/2031 | | | 555,000 | | | | 556,498 | | |
New Jersey — 0.5% | |
New Jersey Economic Development Authority,
United Airlines, Inc., Revenue, AMT, Refunding,
Series 2012, 5.75%, 09/15/2027 | | | 100,000 | | | | 100,059 | | |
New York — 8.2% | |
New York Liberty Development Corp.,
3 World Trade Center LLC, Revenue, Refunding,
Series 2014, Class 3, 7.25%, 11/15/2044 (a) | | | 500,000 | | | | 502,890 | | |
New York State Dormitory Authority,
Montefiore Obligated Group, Revenue, Refunding,
Series 2018 A, 5.00%, 08/01/2024 | | | 250,000 | | | | 249,618 | | |
New York Transportation Development Corp.,
American Airlines, Inc., Revenue, AMT, Refunding,
Series 2020, 5.25%, 08/01/2031 | | | 250,000 | | | | 262,264 | | |
Suffolk Regional Off-Track Betting Co., Revenue,
Series 2024, 6.00%, 12/01/2053 | | | 675,000 | | | | 681,347 | | |
| | | | 1,696,119 | | |
First Eagle Funds | Semiannual Report | April 30, 2024
160
First Eagle Short Duration High Yield Municipal Fund | Schedule of Investments | April 30, 2024 (unaudited)
Investments | | Principal Amount ($) | | Value ($) | |
Ohio — 1.5% | |
County of Hardin, Ohio Northern University, Revenue,
Refunding, Series 2020, 4.00%, 05/01/2026 | | | 100,000 | | | | 97,262 | | |
State of Ohio, University Hospitals Health System, Inc.
Obligated Group, Revenue,
Series 2015 C, 4.05%, 05/01/2024 (c)(d) | | | 200,000 | | | | 200,000 | | |
| | | | 297,262 | | |
Oklahoma — 5.7% | |
Oklahoma Development Finance Authority,
OU Medicine Obligated Group, Revenue,
Series 2018 B, 5.00%, 08/15/2027 | | | 500,000 | | | | 508,420 | | |
Tulsa Airports Improvement Trust,
American Airlines, Inc., Revenue, AMT, Refunding,
Series 2001 B, 5.50%, 12/01/2035 | | | 700,000 | | | | 700,128 | | |
| | | | 1,208,548 | | |
Pennsylvania — 4.1% | |
Bucks County Industrial Development Authority,
Grand View Hospital/Sellersville Obligated Group,
Revenue, Series 2021, 5.00%, 07/01/2027 | | | 200,000 | | | | 183,667 | | |
St. Mary Hospital Authority, Trinity Health Corp.
Obligated Group, Revenue, Series 2007 F, (3-month
SOFR + 1.09%) 4.56%, 11/15/2034 (b) | | | 715,000 | | | | 671,615 | | |
| | | | 855,282 | | |
Texas — 15.3% | |
Abilene Convention Center Hotel Development Corp.,
City of Abilene Abilene Convention Center, Revenue,
Second Lien, Series 2021 B, 3.75%, 10/01/2031 (a) | | | 500,000 | | | | 450,206 | | |
Arlington Higher Education Finance Corp., Newman
International Academy, Revenue,
Series 2021 A, 4.00%, 08/15/2031 | | | 350,000 | | | | 323,289 | | |
City of Houston, Airport System, United Airlines, Inc.,
Revenue, AMT, Series 2018, 5.00%, 07/15/2028 | | | 500,000 | | | | 509,949 | | |
Hidalgo County Regional Mobility Authority,
Revenue, Junior Lien, Refunding,
Series 2022 B, 4.00%, 12/01/2038 | | | 100,000 | | | | 92,658 | | |
New Hope Cultural Education Facilities Finance Corp.,
Jubilee Academic Center, Inc., Revenue, Refunding,
Series 2021, 4.00%, 08/15/2025 (a) | | | 440,000 | | | | 435,443 | | |
Sanctuary LTC LLC, Revenue,
Series 2021 A-1, 5.00%, 01/01/2032 | | | 750,000 | | | | 703,959 | | |
First Eagle Funds | Semiannual Report | April 30, 2024
161
First Eagle Short Duration High Yield Municipal Fund | Schedule of Investments | April 30, 2024 (unaudited)
Investments | | Principal Amount ($) | | Value ($) | |
Texas — 15.3% (continued) | |
Reagan Hospital District of Reagan County, GO,
Series 2014 A, 5.00%, 02/01/2029 | | | 700,000 | | | | 695,048 | | |
| | | | 3,210,552 | | |
Virginia — 1.6% | |
Lower Magnolia Green Community Development
Authority, Special Assessment,
Series 2015, 4.00%, 03/01/2025 (a) | | | 345,000 | | | | 342,024 | | |
Wisconsin — 5.1% | |
Public Finance Authority,
Guilford College, Revenue, Refunding,
Series 2016, 5.00%, 01/01/2026 | | | 685,000 | | | | 675,855 | | |
Dominium Holdings I LLC, Revenue,
Series 2024-1, Class B-1, 6.81%, 04/28/2036 (a) | | | 400,000 | | | | 399,858 | | |
| | | | 1,075,713 | | |
Total Municipal Bonds
(Cost $21,446,222) | | | 21,530,507 | | |
Investments | | Shares | | | |
Short-Term Investments — 0.1% | |
Investment Companies — 0.1% | |
JP Morgan U.S. Government Money Market Fund,
Capital Shares 5.33% (e) (Cost $23,763) | | | 23,763 | | | | 23,763 | | |
Total Investments — 102.9%
(Cost $21,469,985) | | | 21,554,270 | | |
Liabilities in Excess of Other Assets — (2.9%) | | | (612,826 | ) | |
Net Assets — 100.0% | | | 20,941,444 | | |
(a) Securities exempt from registration under Rule 144A or section 4(a)2 of the Securities Act of 1933. Total value of all such securities at April 30, 2024 amounted to $9,753,292, which represents approximately 46.57% of net assets of the Fund.
(b) Variable or floating rate security, linked to the referenced benchmark. The interest rate shown was the current rate as of April 30, 2024.
(c) Security with "Put" features and resetting interest rates. Maturity dates disclosed are the puttable dates. Interest rate disclosed is that which is in effect on April 30, 2024.
(d) Variable rate demand notes (VRDNs) are obligations which contain a floating or variable interest rate adjustment formula and an unconditional right of demand to receive payment of the principal balance plus accrued interest at specified dates. Unless otherwise noted, the coupon rate is determined based on factors including supply and demand, underlying credit, tax treatment, and current short term rates. The coupon rate shown represents the rate at period end.
(e) Represents 7-day effective yield as of April 30, 2024.
First Eagle Funds | Semiannual Report | April 30, 2024
162
First Eagle Short Duration High Yield Municipal Fund | Schedule of Investments | April 30, 2024 (unaudited)
Abbreviations
AMT — Alternative Money Tax
GO — General Obligation
SOFR — Secured Overnight Financing Rate
As of April 30, 2024, the gross unrealized appreciation (depreciation) of investments based on the aggregate cost of investments for federal income tax purposes was as follows:
Aggregate gross unrealized appreciation | | $ | 145,091 | | |
Aggregate gross unrealized depreciation | | | (60,806 | ) | |
Net unrealized appreciation | | $ | 84,285 | | |
Federal income tax cost of investments | | $ | 21,469,985 | | |
See Notes to Financial Statements.
First Eagle Funds | Semiannual Report | April 30, 2024
163
Statements of Assets and Liabilities
| | | First Eagle
Global Fund* | | First Eagle
Overseas Fund* | |
Assets | |
Investments, at Cost (Note 1) | |
Investments in non-affiliates | | $ | 29,372,748,406 | | | $ | 8,046,640,767 | | |
Investments in affiliates | | | 2,530,205,691 | | | | 327,054,876 | | |
Gold bullion | | | 2,786,031,545 | | | | 534,673,298 | | |
Silver bullion | | | — | | | | — | | |
Investments, at Value (Note 1) | |
Investments in non-affiliates | | | 42,758,852,051 | | | | 10,485,840,110 | | |
Investments in affiliates | | | 2,331,826,832 | | | | 438,665,352 | | |
Gold bullion | | | 6,132,020,318 | | | | 1,401,246,132 | | |
Silver bullion | | | — | | | | — | | |
Unrealized appreciation on forward foreign currency exchange contracts | | | 40,659,452 | | | | 21,966,333 | | |
Receivable for investment securities sold | | | — | | | | — | | |
Foreign tax reclaims receivable | | | 42,507,370 | | | | 19,446,290 | | |
Receivable for Fund shares sold | | | 42,892,481 | | | | 10,304,165 | | |
Accrued interest and dividends receivable | | | 127,232,668 | | | | 58,795,467 | | |
Investment for trustee deferred compensation plan (Note 2) | | | 7,271,300 | | | | 3,292,919 | | |
Due from advisor | | | — | | | | — | | |
Other assets | | | 1,011,657 | | | | 446,955 | | |
Total Assets | | | 51,484,274,129 | | | | 12,440,003,723 | | |
Liabilities | |
Investment advisory fees payable (Note 2) | | | 31,999,279 | | | | 7,648,659 | | |
Payable for investment securities purchased | | | 11,004,440 | | | | 2,627,469 | | |
Distribution fees payable (Note 3) | | | 3,864,200 | | | | 333,932 | | |
Administrative fees payable (Note 2) | | | 744,141 | | | | 174,215 | | |
Trustee deferred compensation plan (Note 2) | | | 7,271,300 | | | | 3,292,919 | | |
Service fees payable (Note 3) | | | 312,228 | | | | 14,157 | | |
Trustee fees payable | | | 191,752 | | | | 59,018 | | |
IRS compliance fees for foreign withholding tax claims payable | | | 20,941,890 | | | | 37,211,235 | | |
Payable for Fund shares redeemed | | | 32,175,767 | | | | 13,365,141 | | |
Accrued expenses and other liabilities | | | 10,824,815 | | | | 3,770,702 | | |
Total Liabilities | | | 119,329,812 | | | | 68,497,447 | | |
Commitments and contingent liabilities^ | | | — | | | | — | | |
Net Assets | | $ | 51,364,944,317 | | | $ | 12,371,506,276 | | |
Net Assets Consist of | |
Capital stock (par value, $0.001 per share) | | $ | 777,232 | | | $ | 485,662 | | |
Capital surplus | | | 33,700,723,230 | | | | 9,056,992,509 | | |
Total distributable earnings (losses) | | | 17,663,443,855 | | | | 3,314,028,105 | | |
Net Assets | | $ | 51,364,944,317 | | | $ | 12,371,506,276 | | |
First Eagle Funds | Semiannual Report | April 30, 2024
164
April 30, 2024 (unaudited)
| | First Eagle
U.S. Value Fund* | | First Eagle
Gold Fund* | |
Assets | |
Investments, at Cost (Note 1) | |
Investments in non-affiliates | | $ | 687,344,297 | | | $ | 1,213,522,217 | | |
Investments in affiliates | | | — | | | | 152,047,160 | | |
Gold bullion | | | 76,000,336 | | | | 322,905,396 | | |
Silver bullion | | | — | | | | 9,739,663 | | |
Investments, at Value (Note 1) | |
Investments in non-affiliates | | | 1,105,811,125 | | | | 1,730,837,793 | | |
Investments in affiliates | | | — | | | | 165,719,563 | | |
Gold bullion | | | 161,127,602 | | | | 408,815,002 | | |
Silver bullion | | | — | | | | 21,209,567 | | |
Unrealized appreciation on forward foreign currency exchange contracts | | | — | | | | — | | |
Receivable for investment securities sold | | | — | | | | 25,365,183 | | |
Foreign tax reclaims receivable | | | 19,118 | | | | 600,661 | | |
Receivable for Fund shares sold | | | 286,551 | | | | 2,893,480 | | |
Accrued interest and dividends receivable | | | 1,079,354 | | | | 63,432 | | |
Investment for trustee deferred compensation plan (Note 2) | | | 4,033,936 | | | | 319,537 | | |
Due from advisor | | | 4 | | | | — | | |
Other assets | | | 16,506 | | | | 21,765 | | |
Total Assets | | | 1,272,374,196 | | | | 2,355,845,983 | | |
Liabilities | |
Investment advisory fees payable (Note 2) | | | 796,140 | | | | 1,471,670 | | |
Payable for investment securities purchased | | | 479,813 | | | | 16,962,661 | | |
Distribution fees payable (Note 3) | | | 141,104 | | | | 197,738 | | |
Administrative fees payable (Note 2) | | | 36,962 | | | | 45,580 | | |
Trustee deferred compensation plan (Note 2) | | | 4,033,936 | | | | 319,537 | | |
Service fees payable (Note 3) | | | 6,290 | | | | 23,742 | | |
Trustee fees payable | | | 6,161 | | | | 7,903 | | |
IRS compliance fees for foreign withholding tax claims payable | | | — | | | | — | | |
Payable for Fund shares redeemed | | | 687,525 | | | | 4,286,327 | | |
Accrued expenses and other liabilities | | | 392,945 | | | | 818,684 | | |
Total Liabilities | | | 6,580,876 | | | | 24,133,842 | | |
Commitments and contingent liabilities^ | | | — | | | | — | | |
Net Assets | | $ | 1,265,793,320 | | | $ | 2,331,712,141 | | |
Net Assets Consist of | |
Capital stock (par value, $0.001 per share) | | $ | 62,542 | | | $ | 91,343 | | |
Capital surplus | | | 701,542,605 | | | | 2,251,638,590 | | |
Total distributable earnings (losses) | | | 564,188,173 | | | | 79,982,208 | | |
Net Assets | | $ | 1,265,793,320 | | | $ | 2,331,712,141 | | |
First Eagle Funds | Semiannual Report | April 30, 2024
165
Statements of Assets and Liabilities (continued)
| | | First Eagle
Global Fund* | | First Eagle
Overseas Fund* | |
Class A | |
Net assets | | $ | 14,073,437,221 | | | $ | 1,410,322,036 | | |
Shares outstanding | | | 213,599,455 | | | | 56,639,562 | | |
Net asset value per share and redemption proceeds per share | | $ | 65.89 | | | $ | 24.90 | | |
Offering price per share (NAV per share plus maximum sales charge)** | | $ | 69.36 | (1) | | $ | 26.21 | (1) | |
Class C | |
Net assets | | $ | 1,480,561,669 | | | $ | 67,240,577 | | |
Shares outstanding | | | 23,553,589 | | | | 2,847,301 | | |
Net asset value per share and redemption proceeds per share | | $ | 62.86 | | | $ | 23.62 | | |
Redemption proceeds per share (NAV per share less maximum contingent
deferred sale charge)(2) | | $ | 62.23 | | | $ | 23.38 | | |
Class I | |
Net assets | | $ | 33,419,262,252 | | | $ | 9,488,231,255 | | |
Shares outstanding | | | 504,020,850 | | | | 371,185,402 | | |
Net asset value per share and redemption proceeds per share | | $ | 66.31 | | | $ | 25.56 | | |
Class R6 | |
Net assets | | $ | 2,391,683,175 | | | $ | 1,405,712,408 | | |
Shares outstanding | | | 36,057,859 | | | | 54,990,216 | | |
Net asset value per share and redemption proceeds per share | | $ | 66.33 | | | $ | 25.56 | | |
* First Eagle Global Fund, First Eagle Overseas Fund, First Eagle U.S. Value Fund and First Eagle Gold Fund financial statements are shown on a consolidated basis and includes the balances of the First Eagle Global Cayman Fund, Ltd., First Eagle Overseas Cayman Fund, Ltd., First Eagle U.S. Value Cayman Fund, Ltd., and First Eagle Gold Cayman Fund, Ltd., respectively.
^ See Note 2 in the Notes to the Consolidated Financial Statements
** A contingent deferred sales charge (CDSC) of 1.00% may apply on redemptions of Class A shares made within 18 months following a purchase of $1,000,000 or more without an initial sales charge.
(1) The maximum sales charge is 5.00% for Class A shares. Classes C, I and R6 have no front-end sales charges.
(2) The maximum CDSC is 1.00% for Class C shares, which is charged on the lesser of the original purchase price or the current market value at the time of sale. This pertains to shares sold or redeemed within the first year of purchase.
See Notes to Financial Statements.
First Eagle Funds | Semiannual Report | April 30, 2024
166
April 30, 2024 (unaudited)
| | | First Eagle
U.S. Value Fund* | | First Eagle
Gold Fund* | |
Class A | |
Net assets | | $ | 582,917,754 | | | $ | 603,018,634 | | |
Shares outstanding | | | 29,128,772 | | | | 24,057,814 | | |
Net asset value per share and redemption proceeds per share | | $ | 20.01 | | | $ | 25.07 | | |
Offering price per share (NAV per share plus maximum sales charge)** | | $ | 21.06 | (1) | | $ | 26.39 | (1) | |
Class C | |
Net assets | | $ | 29,367,620 | | | $ | 112,191,623 | | |
Shares outstanding | | | 1,563,240 | | | | 4,951,745 | | |
Net asset value per share and redemption proceeds per share | | $ | 18.79 | | | $ | 22.66 | | |
Redemption proceeds per share (NAV per share less maximum contingent
deferred sale charge)(2) | | $ | 18.60 | | | $ | 22.43 | | |
Class I | |
Net assets | | $ | 616,476,368 | | | $ | 1,447,096,332 | | |
Shares outstanding | | | 30,045,014 | | | | 55,817,502 | | |
Net asset value per share and redemption proceeds per share | | $ | 20.52 | | | $ | 25.93 | | |
Class R6 | |
Net assets | | $ | 37,031,578 | | | $ | 169,405,552 | | |
Shares outstanding | | | 1,805,220 | | | | 6,516,109 | | |
Net asset value per share and redemption proceeds per share | | $ | 20.51 | | | $ | 26.00 | | |
First Eagle Funds | Semiannual Report | April 30, 2024
167
Statements of Assets and Liabilities (continued)
| | | First Eagle
Global Income
Builder Fund | | First Eagle
Rising
Dividend Fund | |
Assets | |
Investments, at Cost (Note 1) | |
Investments in non-affiliates | | $ | 1,461,382,973 | | | $ | 311,363,161 | | |
Investments in affiliates | | | — | | | | — | | |
Gold bullion | | | 64,357,110 | | | | — | | |
Investments, at Value (Note 1) | |
Investments in non-affiliates | | | 1,562,312,226 | | | | 391,502,480 | | |
Investments in affiliates | | | — | | | | — | | |
Gold bullion | | | 119,814,964 | | | | — | | |
Cash | | | 17,417 | | | | — | | |
Unrealized appreciation on forward foreign currency exchange contracts | | | 876,755 | | | | — | | |
Receivable for investment securities sold | | | 2,299,070 | | | | 2,392,399 | | |
Foreign tax reclaims receivable | | | 2,234,311 | | | | 202,169 | | |
Receivable for Fund shares sold | | | 2,850,337 | | | | 136,100 | | |
Accrued interest and dividends receivable | | | 10,854,590 | | | | 542,139 | | |
Investment for trustee deferred compensation plan (Note 2) | | | 824,137 | | | | 1,624,699 | | |
Due from advisor | | | — | | | | 54,486 | | |
Other assets | | | 75,314 | | | | 4,128 | | |
Total Assets | | | 1,702,159,121 | | | | 396,458,600 | | |
Liabilities | |
Investment advisory fees payable (Note 2) | | | 1,047,376 | | | | 164,582 | | |
Option contracts written, at value (premiums received $2,530,287, $—, $— and
$—, respectively) | | | 2,915,696 | | | | — | | |
Payable for investment securities purchased | | | — | | | | — | | |
Distribution fees payable (Note 3) | | | 180,003 | | | | 58,940 | | |
Administrative fees payable (Note 2) | | | 69,824 | | | | 40,101 | | |
Trustee deferred compensation plan (Note 2) | | | 824,137 | | | | 1,624,699 | | |
Service fees payable (Note 3) | | | 15,845 | | | | 1,320 | | |
Trustee fees payable | | | 5,478 | | | | 2,013 | | |
IRS compliance fees for foreign withholding tax claims payable | | | 276,252 | | | | — | | |
Payable for dividends to shareholders | | | 436,628 | | | | — | | |
Payable for Fund shares redeemed | | | 3,087,986 | | | | 360,031 | | |
Accrued expenses and other liabilities | | | 524,533 | | | | 343,040 | | |
Total Liabilities | | | 9,383,758 | | | | 2,594,726 | | |
Commitments and contingent liabilities^ | | | — | | | | — | | |
Net Assets | | $ | 1,692,775,363 | | | $ | 393,863,874 | | |
Net Assets Consist of | |
Capital stock (par value, $0.001 per share) | | $ | 132,330 | | | $ | 16,490 | | |
Capital surplus | | | 1,523,623,199 | | | | 308,185,319 | | |
Total distributable earnings (losses) | | | 169,019,834 | | | | 85,662,065 | | |
Net Assets | | $ | 1,692,775,363 | | | $ | 393,863,874 | | |
First Eagle Funds | Semiannual Report | April 30, 2024
168
April 30, 2024 (unaudited)
| | | First Eagle
Small Cap
Opportunity Fund | | First Eagle
U.S. Smid Cap
Opportunity Fund | |
Assets | |
Investments, at Cost (Note 1) | |
Investments in non-affiliates | | $ | 1,597,777,014 | | | $ | 30,101,009 | | |
Investments in affiliates | | | 10,466,588 | | | | — | | |
Gold bullion | | | — | | | | — | | |
Investments, at Value (Note 1) | |
Investments in non-affiliates | | | 1,781,481,694 | | | | 35,741,155 | | |
Investments in affiliates | | | 6,903,139 | | | | — | | |
Gold bullion | | | — | | | | — | | |
Cash | | | — | | | | — | | |
Unrealized appreciation on forward foreign currency exchange contracts | | | — | | | | — | | |
Receivable for investment securities sold | | | 3,587,193 | | | | 9,340 | | |
Foreign tax reclaims receivable | | | — | | | | — | | |
Receivable for Fund shares sold | | | 7,222,981 | | | | 23,677 | | |
Accrued interest and dividends receivable | | | 1,073,750 | | | | 9,573 | | |
Investment for trustee deferred compensation plan (Note 2) | | | 1,010,012 | | | | 98,032 | | |
Due from advisor | | | 40,863 | | | | 21,338 | | |
Other assets | | | 14,836 | | | | 1,501 | | |
Total Assets | | | 1,801,334,468 | | | | 35,904,616 | | |
Liabilities | |
Investment advisory fees payable (Note 2) | | | 1,263,270 | | | | 22,021 | | |
Option contracts written, at value (premiums received $2,530,287, $—, $— and
$—, respectively) | | | — | | | | — | | |
Payable for investment securities purchased | | | 5,993,206 | | | | 111,461 | | |
Distribution fees payable (Note 3) | | | 19,296 | | | | 49 | | |
Administrative fees payable (Note 2) | | | 109,569 | | | | 5,659 | | |
Trustee deferred compensation plan (Note 2) | | | 1,010,012 | | | | 98,032 | | |
Service fees payable (Note 3) | | | — | | | | — | | |
Trustee fees payable | | | — | | | | — | | |
IRS compliance fees for foreign withholding tax claims payable | | | — | | | | — | | |
Payable for dividends to shareholders | | | — | | | | — | | |
Payable for Fund shares redeemed | | | 1,530,248 | | | | — | | |
Accrued expenses and other liabilities | | | 110,340 | | | | 123,060 | | |
Total Liabilities | | | 10,035,941 | | | | 360,282 | | |
Commitments and contingent liabilities^ | | | — | | | | — | | |
Net Assets | | $ | 1,791,298,527 | | | $ | 35,544,334 | | |
Net Assets Consist of | |
Capital stock (par value, $0.001 per share) | | $ | 184,045 | | | $ | 3,370 | | |
Capital surplus | | | 1,703,733,169 | | | | 30,565,169 | | |
Total distributable earnings (losses) | | | 87,381,313 | | | | 4,975,795 | | |
Net Assets | | $ | 1,791,298,527 | | | $ | 35,544,334 | | |
First Eagle Funds | Semiannual Report | April 30, 2024
169
Statements of Assets and Liabilities (continued)
| | | First Eagle
Global Income
Builder Fund | | First Eagle
Rising
Dividend Fund | |
Class A | |
Net assets | | $ | 643,979,400 | | | $ | 262,650,283 | | |
Shares outstanding | | | 50,218,522 | | | | 11,068,417 | | |
Net asset value per share and redemption proceeds per share | | $ | 12.82 | | | $ | 23.73 | | |
Offering price per share (NAV per share plus maximum sales charge)* | | $ | 13.49 | (1) | | $ | 24.98 | (1) | |
Class C | |
Net assets | | $ | 76,049,553 | | | $ | 6,083,304 | | |
Shares outstanding | | | 5,891,614 | | | | 444,586 | | |
Net asset value per share and redemption proceeds per share | | $ | 12.91 | | | $ | 13.68 | | |
Redemption proceeds per share (NAV per share less maximum contingent
deferred sale charge)(2) | | $ | 12.78 | | | $ | 13.54 | | |
Class I | |
Net assets | | $ | 904,871,341 | | | $ | 117,808,119 | | |
Shares outstanding | | | 70,894,215 | | | | 4,685,495 | | |
Net asset value per share and redemption proceeds per share | | $ | 12.76 | | | $ | 25.14 | | |
Class R6 | |
Net assets | | $ | 67,875,069 | | | $ | 7,322,168 | | |
Shares outstanding | | | 5,325,971 | | | | 291,268 | | |
Net asset value per share and redemption proceeds per share | | $ | 12.74 | | | $ | 25.14 | | |
^ See Note 2 in the Notes to the Consolidated Financial Statements
* A contingent deferred sales charge (CDSC) of 1.00% may apply on redemptions of Class A shares made within 18 months following a purchase of $1,000,000 or more without an initial sales charge. With respect to the First Eagle Global Income Builder Fund, a contingent deferred sales charge of 1.00% may apply on certain redemptions of Class A shares made within 18 months following a purchase of $250,000 or more without an initial sales charge.
(1) The maximum sales charge is 5.00% for Class A shares. Classes C, I and R6 have no front-end sales charges.
(2) The maximum CDSC is 1.00% for Class C shares, which is charged on the lesser of the original purchase price or the current market value at the time of sale. This pertains to shares sold or redeemed within the first year of purchase.
See Notes to Financial Statements.
First Eagle Funds | Semiannual Report | April 30, 2024
170
April 30, 2024 (unaudited)
| | | First Eagle
Small Cap
Opportunity Fund | | First Eagle
U.S. Smid Cap
Opportunity Fund | |
Class A | |
Net assets | | $ | 91,820,250 | | | $ | 276,584 | | |
Shares outstanding | | | 9,466,426 | | | | 26,711 | | |
Net asset value per share and redemption proceeds per share | | $ | 9.70 | | | $ | 10.35 | | |
Offering price per share (NAV per share plus maximum sales charge)* | | $ | 10.21 | (1) | | $ | 10.89 | (1) | |
Class C | |
Net assets | | $ | — | | | $ | — | | |
Shares outstanding | | | — | | | | — | | |
Net asset value per share and redemption proceeds per share | | $ | — | | | $ | — | | |
Redemption proceeds per share (NAV per share less maximum contingent
deferred sale charge)(2) | | $ | — | | | $ | — | | |
Class I | |
Net assets | | $ | 1,606,915,484 | | | $ | 35,214,657 | | |
Shares outstanding | | | 165,075,509 | | | | 3,338,188 | | |
Net asset value per share and redemption proceeds per share | | $ | 9.73 | | | $ | 10.55 | | |
Class R6 | |
Net assets | | $ | 92,562,793 | | | $ | 53,093 | | |
Shares outstanding | | | 9,503,103 | | | | 5,200 | | |
Net asset value per share and redemption proceeds per share | | $ | 9.74 | | | $ | 10.21 | | |
First Eagle Funds | Semiannual Report | April 30, 2024
171
Statements of Assets and Liabilities (continued)
| | | First Eagle
Global Real
Assets Fund* | | First Eagle
High Yield
Municipal Fund** | |
Assets | |
Investments, at Cost (Note 1) | |
Investments in non-affiliates | | $ | 12,909,679 | | | $ | 996,663,174 | | |
Gold bullion | | | 348,267 | | | | — | | |
Investments, at Value (Note 1) | |
Investments in non-affiliates | | | 13,328,762 | | | | 1,000,444,191 | | |
Gold bullion | | | 451,231 | | | | — | | |
Receivable for investment securities sold | | | 23 | | | | — | | |
Foreign tax reclaims receivable | | | 4,224 | | | | — | | |
Receivable for Fund shares sold | | | 133,621 | | | | 25,174,570 | | |
Accrued interest and dividends receivable | | | 23,637 | | | | 11,649,858 | | |
Investment for trustee deferred compensation plan (Note 2) | | | 116,878 | | | | — | | |
Due from advisor | | | 64,356 | | | | 247,953 | | |
Other assets | | | 2,225 | | | | 3,578 | | |
Total Assets | | | 14,124,957 | | | | 1,037,520,150 | | |
Liabilities | |
Investment advisory fees payable (Note 2) | | | 6,982 | | | | 291,876 | | |
Due to custodian | | | 48 | | | | — | | |
Payable for investment securities purchased | | | 509,975 | | | | 145,343,934 | | |
Distribution fees payable (Note 3) | | | 392 | | | | 64,585 | | |
Administrative fees payable (Note 2) | | | 25,765 | | | | 4,775 | | |
Trustee deferred compensation plan (Note 2) | | | 116,878 | | | | — | | |
Service fees payable (Note 3) | | | — | | | | 4,103 | | |
Trustee fees payable | | | 13 | | | | — | | |
Payable for dividends to shareholders | | | — | | | | 44,140 | | |
Payable for Fund shares redeemed | | | — | | | | 1,682,826 | | |
Accrued expenses and other liabilities | | | 117,923 | | | | 36,252 | | |
Total Liabilities | | | 777,976 | | | | 147,472,491 | | |
Commitments and contingent liabilities^ | | | — | | | | — | | |
Net Assets | | $ | 13,346,981 | | | $ | 890,047,659 | | |
Net Assets Consist of | |
Capital stock (par value, $0.001 per share) | | $ | 1,261 | | | $ | 107,732 | | |
Capital surplus | | | 12,679,643 | | | | 1,017,553,431 | | |
Total distributable earnings (losses) | | | 666,077 | | | | (127,613,504 | ) | |
Net Assets | | $ | 13,346,981 | | | $ | 890,047,659 | | |
First Eagle Funds | Semiannual Report | April 30, 2024
172
April 30, 2024 (unaudited)
| | | First Eagle
Short Duration
High Yield
Municipal Fund | |
Assets | |
Investments, at Cost (Note 1) | |
Investments in non-affiliates | | $ | 21,469,985 | | |
Gold bullion | | | — | | |
Investments, at Value (Note 1) | |
Investments in non-affiliates | | | 21,554,270 | | |
Gold bullion | | | — | | |
Receivable for investment securities sold | | | — | | |
Foreign tax reclaims receivable | | | — | | |
Receivable for Fund shares sold | | | 252,516 | | |
Accrued interest and dividends receivable | | | 307,742 | | |
Investment for trustee deferred compensation plan (Note 2) | | | — | | |
Due from advisor | | | 38,045 | | |
Other assets | | | 2,341 | | |
Total Assets | | | 22,154,914 | | |
Liabilities | |
Investment advisory fees payable (Note 2) | | | 7,143 | | |
Due to custodian | | | — | | |
Payable for investment securities purchased | | | 980,000 | | |
Distribution fees payable (Note 3) | | | 319 | | |
Administrative fees payable (Note 2) | | | 6,823 | | |
Trustee deferred compensation plan (Note 2) | | | — | | |
Service fees payable (Note 3) | | | — | | |
Trustee fees payable | | | 2,060 | | |
Payable for dividends to shareholders | | | — | | |
Payable for Fund shares redeemed | | | 9,264 | | |
Accrued expenses and other liabilities | | | 207,861 | | |
Total Liabilities | | | 1,213,470 | | |
Commitments and contingent liabilities^ | | | — | | |
Net Assets | | $ | 20,941,444 | | |
Net Assets Consist of | |
Capital stock (par value, $0.001 per share) | | $ | 2,083 | | |
Capital surplus | | | 20,852,791 | | |
Total distributable earnings (losses) | | | 86,570 | | |
Net Assets | | $ | 20,941,444 | | |
First Eagle Funds | Semiannual Report | April 30, 2024
173
Statements of Assets and Liabilities (continued)
| | | First Eagle
Global Real
Assets Fund* | | First Eagle
High Yield
Municipal Fund** | |
Class A | |
Net assets | | $ | 1,866,127 | | | $ | 274,183,712 | | |
Shares outstanding | | | 175,112 | | | | 33,175,210 | | |
Net asset value per share and redemption proceeds per share | | $ | 10.66 | | | $ | 8.26 | | |
Offering price per share (NAV per share plus maximum sales charge)*** | | $ | 11.22 | (1) | | $ | 8.47 | (2) | |
Class C | |
Net assets | | $ | — | | | $ | 21,733,807 | | |
Shares outstanding | | | — | | | | 2,631,649 | | |
Net asset value per share and redemption proceeds per share | | $ | — | | | $ | 8.26 | | |
Redemption proceeds per share (NAV per share less maximum contingent
deferred sale charge)(3) | | $ | — | | | $ | 8.18 | | |
Class I | |
Net assets | | $ | 10,354,449 | | | $ | 592,484,251 | | |
Shares outstanding | | | 979,275 | | | | 71,726,359 | | |
Net asset value per share and redemption proceeds per share | | $ | 10.57 | | | $ | 8.26 | | |
Class R6 | |
Net assets | | $ | 1,126,405 | | | $ | 1,645,889 | | |
Shares outstanding | | | 106,567 | | | | 198,660 | | |
Net asset value per share and redemption proceeds per share | | $ | 10.57 | | | $ | 8.29 | (4) | |
* First Eagle Global Real Assets Fund financial statements are shown on a consolidated basis and includes the balances of the First Eagle Global Real Asset Cayman Fund, Ltd.
** First Eagle High Yield Municipal Fund was known as First Eagle High Income Fund prior to December 27, 2023.
*** A contingent deferred sales charge (CDSC) of 1.00% may apply on redemptions of Class A shares made within 18 months following a purchase of $1,000,000 or more without an initial sales charge. With respect to the First Eagle High Yield Municipal Fund and the First Eagle Short Duration High Yield Municipal Fund, a contingent deferred sales charge of 1.00% may apply on certain redemptions of Class A shares made within 18 months following a purchase of $250,000 or more without an initial sales charge.
^ See Note 2 in the Notes to the Consolidated Financial Statements
(1) The maximum sales charge is 5.00% for Class A shares. Classes C, I and R6 have no front-end sales charges.
(2) The maximum sales charge is 2.50% for Class A shares. Classes C, I and R6 have no front-end sales charges.
(3) The maximum CDSC is 1.00% for Class C shares, which is charged on the lesser of the original purchase price or the current market value at the time of sale. This pertains to shares sold or redeemed within the first year of purchase.
(4) Net asset value may not recalculate due to rounding of fractional shares.
See Notes to Financial Statements.
First Eagle Funds | Semiannual Report | April 30, 2024
174
April 30, 2024 (unaudited)
| | First Eagle
Short Duration
High Yield
Municipal Fund | |
Class A | |
Net assets | | $ | 1,584,254 | | |
Shares outstanding | | | 157,435 | | |
Net asset value per share and redemption proceeds per share | | $ | 10.06 | | |
Offering price per share (NAV per share plus maximum sales charge)*** | | $ | 10.32 | (2) | |
Class C | |
Net assets | | $ | — | | |
Shares outstanding | | | — | | |
Net asset value per share and redemption proceeds per share | | $ | — | | |
Redemption proceeds per share (NAV per share less maximum contingent
deferred sale charge)(3) | | $ | — | | |
Class I | |
Net assets | | $ | 18,336,684 | | |
Shares outstanding | | | 1,824,375 | | |
Net asset value per share and redemption proceeds per share | | $ | 10.05 | | |
Class R6 | |
Net assets | | $ | 1,020,506 | | |
Shares outstanding | | | 101,407 | | |
Net asset value per share and redemption proceeds per share | | $ | 10.06 | | |
First Eagle Funds | Semiannual Report | April 30, 2024
175
| | | First Eagle
Global Fund* | | First Eagle
Overseas Fund* | |
Investment Income | |
Interest (net of $170,004, $53,255, $— and $— foreign taxes withheld) | | $ | 127,120,830 | | | $ | 14,953,423 | | |
Dividends from: | | | | | |
Non-affiliates (net of $29,539,766, $15,283,240, $55,410 and $1,807,173
foreign taxes withheld) | | | 496,455,898 | | | | 158,697,042 | | |
Affiliated issuers (net of $112,900, $1,330,798, $— and $183,749 foreign
taxes withheld) | | | 22,325,586 | | | | 3,983,799 | | |
Total Income | | | 645,902,314 | | | | 177,634,264 | | |
Expenses | |
Investment advisory fees (Note 2) | | | 187,085,657 | | | | 46,173,062 | | |
Distributions fees (Note 3) | |
Class A | | | 17,236,073 | | | | 1,759,646 | | |
Class C | | | 5,727,348 | | | | 272,214 | | |
Class R3 | | | 10,962 | | | | 354 | | |
Class R4 | | | 587 | | | | 1,635 | | |
Shareholder servicing agent fees | | | 18,534,836 | | | | 5,420,838 | | |
Service fees (Note 3) | |
Class C | | | 1,909,116 | | | | 90,738 | | |
Class R3 | | | 4,348 | | | | 141 | | |
Administrative fees (Note 2) | | | 1,872,838 | | | | 523,944 | | |
Professional fees | | | 477,558 | | | | 284,309 | | |
Custodian and accounting fees | | | 2,988,773 | | | | 1,115,446 | | |
Shareholder reporting fees | | | 927,905 | | | | 295,861 | | |
Trustees' fees | | | 984,855 | | | | 266,309 | | |
Registration and filing fees | | | 379,660 | | | | 180,004 | | |
Other expenses | | | 506,981 | | | | 139,698 | | |
Total Expenses | | | 238,647,497 | | | | 56,524,199 | | |
Expense waiver (Note 2) | | | — | | | | — | | |
Expense reductions due to earnings credits (Note 1) | | | (760,966 | ) | | | (106,632 | ) | |
Net Expenses | | | 237,886,531 | | | | 56,417,567 | | |
Net Investment Income (Note 1) | | | 408,015,783 | | | | 121,216,697 | | |
Realized and Unrealized Gains (Losses) on Investments and Foreign
Currency Related Transactions (Note 1) | |
Net realized gains (losses) on: | |
Transactions from investments in non-affiliates | | | 1,185,388,323 | | | | 140,963,389 | | |
Transactions from investments in affiliates | | | — | | | | — | | |
Commodity related transactions | | | 92,192,754 | | | | 113,187,060 | | |
Settlement of foreign currency and foreign currency transactions | | | (787,941 | ) | | | (554,494 | ) | |
Settlement of forward foreign currency exchange contracts | | | 32,114,223 | | | | 18,724,784 | | |
| | | | 1,308,907,359 | | | | 272,320,739 | | |
First Eagle Funds | Semiannual Report | April 30, 2024
176
April 30, 2024 (unaudited)
| | | First Eagle
U.S. Value Fund* | | First Eagle
Gold Fund* | |
Investment Income | |
Interest (net of $170,004, $53,255, $— and $— foreign taxes withheld) | | $ | 3,780,221 | | | $ | 995,269 | | |
Dividends from: | | | | | |
Non-affiliates (net of $29,539,766, $15,283,240, $55,410 and $1,807,173
foreign taxes withheld) | | | 10,240,756 | | | | 15,683,964 | | |
Affiliated issuers (net of $112,900, $1,330,798, $— and $183,749 foreign
taxes withheld) | | | — | | | | 1,036,632 | | |
Total Income | | | 14,020,977 | | | | 17,715,865 | | |
Expenses | |
Investment advisory fees (Note 2) | | | 4,615,173 | | | | 8,227,113 | | |
Distributions fees (Note 3) | |
Class A | | | 715,524 | | | | 705,596 | | |
Class C | | | 113,641 | | | | 402,135 | | |
Class R3 | | | 63 | | | | 1,026 | | |
Class R4 | | | 15 | | | | 509 | | |
Shareholder servicing agent fees | | | 416,524 | | | | 1,143,499 | | |
Service fees (Note 3) | |
Class C | | | 37,880 | | | | 134,045 | | |
Class R3 | | | 25 | | | | 408 | | |
Administrative fees (Note 2) | | | 111,176 | | | | 137,095 | | |
Professional fees | | | 118,106 | | | | 131,383 | | |
Custodian and accounting fees | | | 117,253 | | | | 382,538 | | |
Shareholder reporting fees | | | 33,062 | | | | 81,735 | | |
Trustees' fees | | | 31,771 | | | | 52,079 | | |
Registration and filing fees | | | 58,458 | | | | 88,446 | | |
Other expenses | | | 17,556 | | | | 29,433 | | |
Total Expenses | | | 6,386,227 | | | | 11,517,040 | | |
Expense waiver (Note 2) | | | (198,502 | ) | | | — | | |
Expense reductions due to earnings credits (Note 1) | | | (52,436 | ) | | | (68,661 | ) | |
Net Expenses | | | 6,135,289 | | | | 11,448,379 | | |
Net Investment Income (Note 1) | | | 7,885,688 | | | | 6,267,486 | | |
Realized and Unrealized Gains (Losses) on Investments and Foreign
Currency Related Transactions (Note 1) | |
Net realized gains (losses) on: | |
Transactions from investments in non-affiliates | | | 49,855,326 | | | | 2,249,389 | | |
Transactions from investments in affiliates | | | — | | | | (2,228,037 | ) | |
Commodity related transactions | | | 2,431,621 | | | | 136,568,438 | | |
Settlement of foreign currency and foreign currency transactions | | | (30 | ) | | | 37,708 | | |
Settlement of forward foreign currency exchange contracts | | | — | | | | — | | |
| | | | 52,286,917 | | | | 136,627,498 | | |
First Eagle Funds | Semiannual Report | April 30, 2024
177
Statements of Operations (continued)
| | | First Eagle
Global Fund* | | First Eagle
Overseas Fund* | |
Changes in unrealized appreciation (depreciation) on: | |
Investment in non-affiliates and commodity related transactions (net of increase in
deferred capital gain country tax accruals of $2,916,269, $933,238, $— and $—) | | $ | 4,662,519,211 | | | $ | 975,870,128 | | |
Investment in affiliates | | | 36,170,609 | | | | 8,463,993 | | |
Foreign currency and foreign currency translations | | | (1,223,108 | ) | | | (539,127 | ) | |
Forward foreign currency exchange contracts | | | (4,947,748 | ) | | | (3,373,554 | ) | |
| | | | 4,692,518,964 | | | | 980,421,440 | | |
Net realized and unrealized gains (losses) on investments, commodity, foreign
currency and forward contract related transactions | | | 6,001,426,323 | | | | 1,252,742,179 | | |
Net Increase in Net Assets Resulting from Operations | | $ | 6,409,442,106 | | | $ | 1,373,958,876 | | |
* First Eagle Global Fund, First Eagle Overseas Fund, First Eagle U.S. Value Fund and First Eagle Gold Fund financial statements are shown on a consolidated basis and includes the balances of the First Eagle Global Cayman Fund, Ltd., First Eagle Overseas Cayman Fund, Ltd., First Eagle U.S. Value Cayman Fund, Ltd., and First Eagle Gold Cayman Fund, Ltd., respectively.
See Notes to Financial Statements.
First Eagle Funds | Semiannual Report | April 30, 2024
178
April 30, 2024 (unaudited)
| | | First Eagle
U.S. Value Fund* | | First Eagle
Gold Fund* | |
Changes in unrealized appreciation (depreciation) on: | |
Investment in non-affiliates and commodity related transactions (net of increase in
deferred capital gain country tax accruals of $2,916,269, $933,238, $— and $—) | | $ | 112,943,886 | | | $ | 115,204,562 | | |
Investment in affiliates | | | — | | | | 19,843,125 | | |
Foreign currency and foreign currency translations | | | (71 | ) | | | (12,819 | ) | |
Forward foreign currency exchange contracts | | | — | | | | — | | |
| | | | 112,943,815 | | | | 135,034,868 | | |
Net realized and unrealized gains (losses) on investments, commodity, foreign
currency and forward contract related transactions | | | 165,230,732 | | | | 271,662,366 | | |
Net Increase in Net Assets Resulting from Operations | | $ | 173,116,420 | | | $ | 277,929,852 | | |
First Eagle Funds | Semiannual Report | April 30, 2024
179
Statements of Operations (continued)
| | | First Eagle
Global Income
Builder Fund | | First Eagle
Rising
Dividend Fund | |
Investment Income | |
Interest (net of $79, $—, $— and $— foreign taxes withheld) | | $ | 12,056,256 | | | $ | 166,880 | | |
Dividends from: | | | | | |
Non-affiliates (net of $1,630,453, $76,003, $— and $— foreign taxes withheld) | | | 22,678,193 | | | | 4,782,028 | | |
Total Income | | | 34,734,449 | | | | 4,948,908 | | |
Expenses | |
Investment advisory fees (Note 2) | | | 6,375,484 | | | | 976,418 | | |
Distributions fees (Note 3) | |
Class A | | | 804,046 | | | | 331,339 | | |
Class C | | | 300,687 | | | | 27,852 | | |
Class R3 | | | 21 | | | | 21 | | |
Class R4 | | | 20 | | | | 14 | | |
Shareholder servicing agent fees | | | 569,547 | | | | 229,921 | | |
Service fees (Note 3) | |
Class C | | | 100,229 | | | | 9,284 | | |
Class R3 | | | 9 | | | | 9 | | |
Administrative fees (Note 2) | | | 425,028 | | | | 107,297 | | |
Professional fees | | | 255,625 | | | | 177,047 | | |
Custodian and accounting fees | | | 157,917 | | | | 64,213 | | |
Shareholder reporting fees | | | 39,959 | | | | 25,265 | | |
Trustees' fees | | | 33,751 | | | | 8,357 | | |
Registration and filing fees | | | 90,470 | | | | 49,519 | | |
Recoupment expense | | | — | | | | — | | |
Other expenses | | | 21,894 | | | | 8,835 | | |
Total Expenses | | | 9,174,687 | | | | 2,015,391 | | |
Expense waiver (Note 2) | | | — | | | | (331,406 | ) | |
Expense reductions due to earnings credits (Note 1) | | | (35,977 | ) | | | (44,031 | ) | |
Net Expenses | | | 9,138,710 | | | | 1,639,954 | | |
Net Investment Income (Note 1) | | | 25,595,739 | | | | 3,308,954 | | |
Realized and Unrealized Gains (Losses) on Investments and Foreign
Currency Related Transactions (Note 1) | |
Net realized gains (losses) on: | |
Transactions from investments in non-affiliates | | | 6,782,865 | | | | 3,879,933 | | |
Commodity related transactions | | | 2,617,456 | | | | — | | |
Settlement of foreign currency and foreign currency transactions | | | 13,535 | | | | (10,819 | ) | |
Settlement of forward foreign currency exchange contracts | | | 723,385 | | | | — | | |
Expiration or closing of option contracts written | | | 242,802 | | | | — | | |
| | | | 10,380,043 | | | | 3,869,114 | | |
First Eagle Funds | Semiannual Report | April 30, 2024
180
April 30, 2024 (unaudited)
| | | First Eagle
Small Cap
Opportunity Fund | | First Eagle
U.S. Smid Cap
Opportunity Fund | |
Investment Income | |
Interest (net of $79, $—, $— and $— foreign taxes withheld) | | $ | — | | | $ | — | | |
Dividends from: | | | | | |
Non-affiliates (net of $1,630,453, $76,003, $— and $— foreign taxes withheld) | | | 12,683,774 | | | | 216,725 | | |
Total Income | | | 12,683,774 | | | | 216,725 | | |
Expenses | |
Investment advisory fees (Note 2) | | | 7,059,438 | | | | 123,192 | | |
Distributions fees (Note 3) | |
Class A | | | 104,240 | | | | 164 | | |
Class C | | | — | | | | — | | |
Class R3 | | | — | | | | — | | |
Class R4 | | | — | | | | — | | |
Shareholder servicing agent fees | | | 882,553 | | | | 3,334 | | |
Service fees (Note 3) | |
Class C | | | — | | | | — | | |
Class R3 | | | — | | | | — | | |
Administrative fees (Note 2) | | | 193,110 | | | | 7,275 | | |
Professional fees | | | 81,504 | | | | 84,748 | | |
Custodian and accounting fees | | | 114,372 | | | | 40,748 | | |
Shareholder reporting fees | | | 43,874 | | | | 9,738 | | |
Trustees' fees | | | 16,538 | | | | 358 | | |
Registration and filing fees | | | 92,175 | | | | 22,261 | | |
Recoupment expense | | | 19,004 | | | | — | | |
Other expenses | | | 12,900 | | | | 2,432 | | |
Total Expenses | | | 8,619,708 | | | | 294,250 | | |
Expense waiver (Note 2) | | | (184,441 | ) | | | (136,316 | ) | |
Expense reductions due to earnings credits (Note 1) | | | (14,668 | ) | | | (1,492 | ) | |
Net Expenses | | | 8,420,599 | | | | 156,442 | | |
Net Investment Income (Note 1) | | | 4,263,175 | | | | 60,283 | | |
Realized and Unrealized Gains (Losses) on Investments and Foreign
Currency Related Transactions (Note 1) | |
Net realized gains (losses) on: | |
Transactions from investments in non-affiliates | | | (30,854,067 | ) | | | (601,792 | ) | |
Commodity related transactions | | | — | | | | — | | |
Settlement of foreign currency and foreign currency transactions | | | — | | | | — | | |
Settlement of forward foreign currency exchange contracts | | | — | | | | — | | |
Expiration or closing of option contracts written | | | — | | | | — | | |
| | | | (30,854,067 | ) | | | (601,792 | ) | |
First Eagle Funds | Semiannual Report | April 30, 2024
181
Statements of Operations (continued)
| | | First Eagle
Global Income
Builder Fund | | First Eagle
Rising
Dividend Fund | |
Changes in unrealized appreciation (depreciation) on: | |
Investment in non-affiliates and commodity related transactions (net of increase in
deferred capital gain country tax accruals of $34,451, $—, $— and $—) | | $ | 117,156,311 | | | $ | 44,073,750 | | |
Investment in affiliates | | | — | | | | — | | |
Foreign currency and foreign currency translations | | | (32,067 | ) | | | 9,956 | | |
Forward foreign currency exchange contracts | | | (319,329 | ) | | | — | | |
Option contracts written | | | (779,698 | ) | | | — | | |
| | | | 116,025,217 | | | | 44,083,706 | | |
Net realized and unrealized gains (losses) on investments, commodity, foreign
currency and forward contract related transactions and option contracts written | | | 126,405,260 | | | | 47,952,820 | | |
Net Increase in Net Assets Resulting from Operations | | $ | 152,000,999 | | | $ | 51,261,774 | | |
First Eagle Funds | Semiannual Report | April 30, 2024
182
April 30, 2024 (unaudited)
| | | First Eagle
Small Cap
Opportunity Fund | | First Eagle
U.S. Smid Cap
Opportunity Fund | |
Changes in unrealized appreciation (depreciation) on: | |
Investment in non-affiliates and commodity related transactions (net of increase in
deferred capital gain country tax accruals of $34,451, $—, $— and $—) | | $ | 283,861,911 | | | $ | 6,475,080 | | |
Investment in affiliates | | | (666,181 | ) | | | — | | |
Foreign currency and foreign currency translations | | | — | | | | — | | |
Forward foreign currency exchange contracts | | | — | | | | — | | |
Option contracts written | | | — | | | | — | | |
| | | | 283,195,730 | | | | 6,475,080 | | |
Net realized and unrealized gains (losses) on investments, commodity, foreign
currency and forward contract related transactions and option contracts written | | | 252,341,663 | | | | 5,873,288 | | |
Net Increase in Net Assets Resulting from Operations | | $ | 256,604,838 | | | $ | 5,933,571 | | |
First Eagle Funds | Semiannual Report | April 30, 2024
183
Statements of Operations (continued)
| | First Eagle
Global Real
Assets Fund* | | First Eagle
High Yield
Municipal Fund** | |
Investment Income | |
Interest (net of $—, $— and $— foreign taxes withheld) | | $ | — | | | $ | 9,814,588 | | |
Dividends from: | |
Non-affiliates (net of $10,943, $— and $— foreign taxes withheld) | | | 164,169 | | | | 113,643 | | |
Total Income | | | 164,169 | | | | 9,928,231 | | |
Expenses | |
Investment advisory fees (Note 2) | | | 40,045 | | | | 770,906 | | |
Distributions fees (Note 3) | |
Class A | | | 2,282 | | | | 157,360 | | |
Class C | | | — | | | | 35,537 | | |
Class R3 | | | — | | | | 282 | | |
Class R4 | | | — | | | | 2 | | |
Shareholder servicing agent fees | | | 2,862 | | | | 112,090 | | |
Service fees (Note 3) | |
Class C | | | — | | | | 11,846 | | |
Class R3 | | | — | | | | 113 | | |
Administrative fees (Note 2) | | | 32,620 | | | | 24,252 | | |
Professional fees | | | 97,579 | | | | 145,840 | | |
Custodian and accounting fees | | | 57,996 | | | | 72,250 | | |
Shareholder reporting fees | | | 7,188 | | | | 38,911 | | |
Trustees' fees | | | 15,906 | | | | 2,463 | | |
Registration and filing fees | | | 19,967 | | | | 62,145 | | |
Other expenses | | | 4,646 | | | | 20,801 | | |
Total Expenses | | | 281,091 | | | | 1,454,798 | | |
Expense waiver (Note 2) | | | (224,846 | ) | | | (965,610 | ) | |
Expense reductions due to earnings credits (Note 1) | | | (1,513 | ) | | | (21,685 | ) | |
Net Expenses | | | 54,732 | | | | 467,503 | | |
Net Investment Income (Note 1) | | | 109,437 | | | | 9,460,728 | | |
Realized and Unrealized Gains (Losses) on Investments and Foreign
Currency Related Transactions (Note 1) | |
Net realized gains (losses) on: | |
Transactions from investments in non-affiliates | | | 36,246 | | | | (6,527,928 | ) | |
Commodity related transactions | | | 111,816 | | | | — | | |
Settlement of foreign currency and foreign currency transactions | | | (7 | ) | | | 10 | | |
| | | | 148,055 | | | | (6,527,918 | ) | |
First Eagle Funds | Semiannual Report | April 30, 2024
184
April 30, 2024 (unaudited)
| | First Eagle
Short Duration
High Yield
Municipal Fund
For the Period of
1/2/24† -
4/30/24 | |
Investment Income | |
Interest (net of $—, $— and $— foreign taxes withheld) | | $ | 262,957 | | |
Dividends from: | |
Non-affiliates (net of $10,943, $— and $— foreign taxes withheld) | | | 10,678 | | |
Total Income | | | 273,635 | | |
Expenses | |
Investment advisory fees (Note 2) | | | 24,396 | | |
Distributions fees (Note 3) | |
Class A | | | 991 | | |
Class C | | | — | | |
Class R3 | | | — | | |
Class R4 | | | — | | |
Shareholder servicing agent fees | | | 54,120 | | |
Service fees (Note 3) | |
Class C | | | — | | |
Class R3 | | | — | | |
Administrative fees (Note 2) | | | 27,064 | | |
Professional fees | | | 79,661 | | |
Custodian and accounting fees | | | 42,714 | | |
Shareholder reporting fees | | | 26,955 | | |
Trustees' fees | | | 2,249 | | |
Registration and filing fees | | | 23,879 | | |
Other expenses | | | 11,257 | | |
Total Expenses | | | 293,286 | | |
Expense waiver (Note 2) | | | (259,670 | ) | |
Expense reductions due to earnings credits (Note 1) | | | — | | |
Net Expenses | | | 33,616 | | |
Net Investment Income (Note 1) | | | 240,019 | | |
Realized and Unrealized Gains (Losses) on Investments and Foreign
Currency Related Transactions (Note 1) | |
Net realized gains (losses) on: | |
Transactions from investments in non-affiliates | | | 11,649 | | |
Commodity related transactions | | | — | | |
Settlement of foreign currency and foreign currency transactions | | | — | | |
| | | | 11,649 | | |
First Eagle Funds | Semiannual Report | April 30, 2024
185
Statements of Operations (continued)
| | | First Eagle
Global Real
Assets Fund* | | First Eagle
High Yield
Municipal Fund** | |
Changes in unrealized appreciation (depreciation) on: | |
Investment in non-affiliates and commodity related transactions (net of increase
in deferred capital gain country tax accruals of $—, $— and $—) | | $ | 970,125 | | | $ | 17,385,076 | | |
Foreign currency and foreign currency translations | | | (303 | ) | | | — | | |
| | | | 969,822 | | | | 17,385,076 | | |
Net realized and unrealized gains (losses) on investments, commodity and foreign
currency related transactions | | | 1,117,877 | | | | 10,857,158 | | |
Net Increase in Net Assets Resulting from Operations | | $ | 1,227,314 | | | $ | 20,317,886 | | |
* First Eagle Global Real Assets Fund financial statements are shown on a consolidated basis and includes the balances of the First Eagle Global Real Asset Cayman Fund, Ltd.
** First Eagle High Yield Municipal Fund was known as First Eagle High Income Fund prior to December 27, 2023.
† Inception date.
See Notes to Financial Statements.
First Eagle Funds | Semiannual Report | April 30, 2024
186
April 30, 2024 (unaudited)
| | First Eagle
Short Duration
High Yield
Municipal Fund | |
Changes in unrealized appreciation (depreciation) on: | |
Investment in non-affiliates and commodity related transactions (net of increase
in deferred capital gain country tax accruals of $—, $— and $—) | | $ | 84,285 | | |
Foreign currency and foreign currency translations | | | — | | |
| | | | 84,285 | | |
Net realized and unrealized gains (losses) on investments, commodity and foreign
currency related transactions | | | 95,934 | | |
Net Increase in Net Assets Resulting from Operations | | $ | 335,953 | | |
First Eagle Funds | Semiannual Report | April 30, 2024
187
Statements of Changes in Net Assets
| | | First Eagle
Global Fund* | | First Eagle
Overseas Fund* | |
| | | For the
Six Months Ended
April 30, 2024
(unaudited) | | For the
Year Ended
October 31, 2023 | | For the
Six Months Ended
April 30, 2024
(unaudited) | | For the
Year Ended
October 31, 2023 | |
Operations | |
Net investment income | | $ | 408,015,783 | | | $ | 712,933,093 | | | $ | 121,216,697 | | | $ | 224,865,752 | | |
Net realized gain on investments, commodity, foreign currency
and forward contract related transactions | | | 1,308,907,359 | | | | 1,072,241,912 | | | | 272,320,739 | | | | 55,079,458 | | |
Change in unrealized appreciation (depreciation) on investments,
commodity, foreign currency and forward contract related translations | | | 4,692,518,964 | | | | 2,687,436,861 | | | | 980,421,440 | | | | 971,276,633 | | |
Net increase (decrease) in net assets resulting from operations | | | 6,409,442,106 | | | | 4,472,611,866 | | | | 1,373,958,876 | | | | 1,251,221,843 | | |
Distributions to Shareholders | |
Distributable earnings: | |
Class A | | | (476,472,548 | ) | | | (532,262,215 | ) | | | (31,790,527 | ) | | | (51,515,550 | ) | |
Class C | | | (43,860,612 | ) | | | (73,844,904 | ) | | | (1,164,501 | ) | | | (3,499,629 | ) | |
Class I | | | (1,170,598,120 | ) | | | (1,201,145,307 | ) | | | (235,095,957 | ) | | | (330,889,508 | ) | |
Class R3 | | | (467,966 | ) | | | (300,468 | ) | | | (8,462 | ) | | | (10,928 | ) | |
Class R4 | | | (65,416 | ) | | | (52,892 | ) | | | (114,289 | ) | | | (516,040 | ) | |
Class R5 | | | (7,978 | ) | | | (4,292 | ) | | | (1,027 | ) | | | (1,389 | ) | |
Class R6 | | | (84,348,552 | ) | | | (78,042,283 | ) | | | (34,779,408 | ) | | | (51,189,271 | ) | |
Decrease in net assets resulting from distributions | | | (1,775,821,192 | ) | | | (1,885,652,361 | ) | | | (302,954,171 | ) | | | (437,622,315 | ) | |
Fund Share Transactions | |
Class A | |
Net proceeds from shares sold | | | 480,415,270 | | | | 932,378,681 | | | | 56,201,394 | | | | 129,738,590 | | |
Net asset value of shares issued for reinvested dividends and distributions | | | 417,749,677 | | | | 462,969,675 | | | | 29,118,152 | | | | 46,987,934 | | |
Cost of shares redeemed | | | (1,092,845,679 | ) | | | (1,756,209,796 | ) | | | (159,093,926 | ) | | | (315,584,580 | ) | |
Increase (decrease) in net assets from Fund share transactions | | | (194,680,732 | ) | | | (360,861,440 | ) | | | (73,774,380 | ) | | | (138,858,056 | ) | |
Class C | |
Net proceeds from shares sold | | | 88,519,784 | | | | 159,243,316 | | | | 3,576,126 | | | | 10,028,422 | | |
Net asset value of shares issued for reinvested dividends and distributions | | | 41,505,889 | | | | 69,690,281 | | | | 1,096,427 | | | | 3,306,288 | | |
Cost of shares redeemed | | | (287,113,641 | ) | | | (577,794,408 | ) | | | (18,453,978 | ) | | | (38,244,224 | ) | |
Decrease in net assets from Fund share transactions | | | (157,087,968 | ) | | | (348,860,811 | ) | | | (13,781,425 | ) | | | (24,909,514 | ) | |
Class I | |
Net proceeds from shares sold | | | 2,583,382,185 | | | | 5,159,536,258 | | | | 831,123,948 | | | | 2,516,370,739 | | |
Net asset value of shares issued for reinvested dividends and distributions | | | 1,018,464,881 | | | | 1,040,505,108 | | | | 210,292,492 | | | | 293,043,001 | | |
Cost of shares redeemed | | | (3,103,051,974 | ) | | | (4,792,999,401 | ) | | | (1,497,586,029 | ) | | | (2,754,833,013 | ) | |
Increase (decrease) in net assets from Fund share transactions | | | 498,795,092 | | | | 1,407,041,965 | | | | (456,169,589 | ) | | | 54,580,727 | | |
Class R3^ | |
Net proceeds from shares sold | | | 800,063 | | | | 9,928,674 | | | | 16,549 | | | | 96,333 | | |
Net asset value of shares issued for reinvested dividends and distributions | | | 467,966 | | | | 300,468 | | | | 8,462 | | | | 10,928 | | |
Cost of shares redeemed | | | (14,441,911 | ) | | | (5,240,478 | ) | | | (449,739 | ) | | | (24,725 | ) | |
Increase (decrease) in net assets from Fund share transactions | | | (13,173,882 | ) | | | 4,988,664 | | | | (424,728 | ) | | | 82,536 | | |
First Eagle Funds | Semiannual Report | April 30, 2024
188
April 30, 2024 (unaudited)
| | | First Eagle
U.S. Value Fund* | | First Eagle
Gold Fund* | |
| | | For the
Six Months Ended
April 30, 2024
(unaudited) | | For the
Year Ended
October 31, 2023 | | For the
Six Months Ended
April 30, 2024
(unaudited) | | For the
Year Ended
October 31, 2023 | |
Operations | |
Net investment income | | $ | 7,885,688 | | | $ | 15,318,841 | | | $ | 6,267,486 | | | $ | 21,431,446 | | |
Net realized gain on investments, commodity, foreign currency
and forward contract related transactions | | | 52,286,917 | | | | 64,143,466 | | | | 136,627,498 | | | | 16,711,465 | | |
Change in unrealized appreciation (depreciation) on investments,
commodity, foreign currency and forward contract related translations | | | 112,943,815 | | | | 21,683,493 | | | | 135,034,868 | | | | 232,407,167 | | |
Net increase (decrease) in net assets resulting from operations | | | 173,116,420 | | | | 101,145,800 | | | | 277,929,852 | | | | 270,550,078 | | |
Distributions to Shareholders | |
Distributable earnings: | |
Class A | | | (35,915,770 | ) | | | (42,377,864 | ) | | | (5,154,188 | ) | | | — | | |
Class C | | | (1,826,542 | ) | | | (2,657,277 | ) | | | (253,973 | ) | | | — | | |
Class I | | | (37,008,037 | ) | | | (42,529,115 | ) | | | (15,422,133 | ) | | | — | | |
Class R3 | | | (4,458 | ) | | | (4,891 | ) | | | (3,861 | ) | | | — | | |
Class R4 | | | (2,849 | ) | | | (2,596 | ) | | | (14,386 | ) | | | — | | |
Class R5 | | | (5,868 | ) | | | (5,988 | ) | | | (5,118 | ) | | | — | | |
Class R6 | | | (2,193,025 | ) | | | (2,106,071 | ) | | | (1,860,249 | ) | | | — | | |
Decrease in net assets resulting from distributions | | | (76,956,549 | ) | | | (89,683,802 | ) | | | (22,713,908 | ) | | | — | | |
Fund Share Transactions | |
Class A | |
Net proceeds from shares sold | | | 15,838,325 | | | | 31,596,683 | | | | 49,952,757 | | | | 119,158,024 | | |
Net asset value of shares issued for reinvested dividends and distributions | | | 31,617,086 | | | | 37,419,319 | | | | 4,911,757 | | | | — | | |
Cost of shares redeemed | | | (45,333,895 | ) | | | (78,260,209 | ) | | | (67,957,283 | ) | | | (141,281,427 | ) | |
Increase (decrease) in net assets from Fund share transactions | | | 2,121,516 | | | | (9,244,207 | ) | | | (13,092,769 | ) | | | (22,123,403 | ) | |
Class C | |
Net proceeds from shares sold | | | 2,194,237 | | | | 4,437,835 | | | | 5,465,101 | | | | 16,654,612 | | |
Net asset value of shares issued for reinvested dividends and distributions | | | 1,664,563 | | | | 2,429,213 | | | | 241,570 | | | | — | | |
Cost of shares redeemed | | | (6,116,897 | ) | | | (12,768,012 | ) | | | (14,763,025 | ) | | | (29,044,356 | ) | |
Decrease in net assets from Fund share transactions | | | (2,258,097 | ) | | | (5,900,964 | ) | | | (9,056,354 | ) | | | (12,389,744 | ) | |
Class I | |
Net proceeds from shares sold | | | 61,415,538 | | | | 90,166,671 | | | | 171,193,531 | | | | 511,516,624 | | |
Net asset value of shares issued for reinvested dividends and distributions | | | 25,055,673 | | | | 28,326,301 | | | | 13,851,484 | | | | — | | |
Cost of shares redeemed | | | (57,537,379 | ) | | | (121,635,227 | ) | | | (244,671,932 | ) | | | (398,085,068 | ) | |
Increase (decrease) in net assets from Fund share transactions | | | 28,933,832 | | | | (3,142,255 | ) | | | (59,626,917 | ) | | | 113,431,556 | | |
Class R3^ | |
Net proceeds from shares sold | | | 200 | | | | 765 | | | | 45,937 | | | | 1,343,375 | | |
Net asset value of shares issued for reinvested dividends and distributions | | | 4,458 | | | | 4,890 | | | | 3,861 | | | | — | | |
Cost of shares redeemed | | | (79,036 | ) | | | (67 | ) | | | (1,247,931 | ) | | | (1,292,873 | ) | |
Increase (decrease) in net assets from Fund share transactions | | | (74,378 | ) | | | 5,588 | | | | (1,198,133 | ) | | | 50,502 | | |
First Eagle Funds | Semiannual Report | April 30, 2024
189
Statements of Changes in Net Assets (continued)
| | | First Eagle
Global Fund* | | First Eagle
Overseas Fund* | |
| | | For the
Six Months Ended
April 30, 2024
(unaudited) | | For the
Year Ended
October 31, 2023 | | For the
Six Months Ended
April 30, 2024
(unaudited) | | For the
Year Ended
October 31, 2023 | |
Class R4^ | |
Net proceeds from shares sold | | | 77,216 | | | | 578,415 | | | | 164,674 | | | | 1,937,720 | | |
Net asset value of shares issued for reinvested dividends and distributions | | | 65,416 | | | | 52,892 | | | | 114,289 | | | | 516,040 | | |
Cost of shares redeemed | | | (2,018,348 | ) | | | (216,094 | ) | | | (5,639,834 | ) | | | (11,386,911 | ) | |
Increase (decrease) in net assets from Fund share transactions | | | (1,875,716 | ) | | | 415,213 | | | | (5,360,871 | ) | | | (8,933,151 | ) | |
Class R5^ | |
Net proceeds from shares sold | | | 6,261 | | | | 137,361 | | | | 4,136 | | | | 14,664 | | |
Net asset value of shares issued for reinvested dividends and distributions | | | 4,799 | | | | 4,292 | | | | 1,027 | | | | 1,389 | | |
Cost of shares redeemed | | | (231,679 | ) | | | (37,471 | ) | | | (47,190 | ) | | | (17,469 | ) | |
Increase (decrease) in net assets from Fund share transactions | | | (220,619 | ) | | | 104,182 | | | | (42,027 | ) | | | (1,416 | ) | |
Class R6 | |
Net proceeds from shares sold | | | 359,796,944 | | | | 519,884,403 | | | | 88,967,753 | | | | 201,676,513 | | |
Net asset value of shares issued for reinvested dividends and distributions | | | 74,502,423 | | | | 69,480,659 | | | | 34,097,431 | | | | 50,566,252 | | |
Cost of shares redeemed | | | (316,756,089 | ) | | | (326,508,848 | ) | | | (125,476,649 | ) | | | (313,273,802 | ) | |
Increase (decrease) in net assets from Fund share transactions | | | 117,543,278 | | | | 262,856,214 | | | | (2,411,465 | ) | | | (61,031,037 | ) | |
Increase (decrease) in net assets from Fund share transactions | | | 249,299,453 | | | | 965,683,987 | | | | (551,964,485 | ) | | | (179,069,911 | ) | |
Net increase (decrease) in net assets | | | 4,882,920,367 | | | | 3,552,643,492 | | | | 519,040,220 | | | | 634,529,617 | | |
Net Assets (Note 1) | |
Beginning of period | | | 46,482,023,950 | | | | 42,929,380,458 | | | | 11,852,466,056 | | | | 11,217,936,439 | | |
End of period | | $ | 51,364,944,317 | | | $ | 46,482,023,950 | | | $ | 12,371,506,276 | | | $ | 11,852,466,056 | | |
Changes in Shares Outstanding | |
Class A | |
Shares outstanding, beginning of period | | | 216,362,656 | | | | 222,066,205 | | | | 59,656,595 | | | | 65,581,973 | | |
Shares sold | | | 7,530,873 | | | | 15,270,294 | | | | 2,321,695 | | | | 5,528,830 | | |
Shares issued on reinvestment of distributions | | | 6,858,477 | | | | 7,841,628 | | | | 1,243,303 | | | | 2,061,779 | | |
Shares redeemed | | | (17,152,551 | ) | | | (28,815,471 | ) | | | (6,582,031 | ) | | | (13,515,987 | ) | |
Shares outstanding, end of period | | | 213,599,455 | | | | 216,362,656 | | | | 56,639,562 | | | | 59,656,595 | | |
Class C | |
Shares outstanding, beginning of period | | | 26,084,098 | | | | 32,037,627 | | | | 3,444,418 | | | | 4,564,760 | | |
Shares sold | | | 1,451,030 | | | | 2,722,928 | | | | 156,150 | | | | 449,507 | | |
Shares issued on reinvestment of distributions | | | 712,058 | | | | 1,232,366 | | | | 49,211 | | | | 152,504 | | |
Shares redeemed | | | (4,693,597 | ) | | | (9,908,823 | ) | | | (802,478 | ) | | | (1,722,353 | ) | |
Shares outstanding, end of period | | | 23,553,589 | | | | 26,084,098 | | | | 2,847,301 | | | | 3,444,418 | | |
Class I | |
Shares outstanding, beginning of period | | | 495,595,080 | | | | 472,421,232 | | | | 389,313,607 | | | | 387,720,084 | | |
Shares sold | | | 40,251,997 | | | | 83,957,617 | | | | 33,468,122 | | | | 104,305,822 | | |
Shares issued on reinvestment of distributions | | | 16,630,713 | | | | 17,531,678 | | | | 8,754,891 | | | | 12,544,649 | | |
Shares redeemed | | | (48,456,940 | ) | | | (78,315,447 | ) | | | (60,351,218 | ) | | | (115,256,948 | ) | |
Shares outstanding, end of period | | | 504,020,850 | | | | 495,595,080 | | | | 371,185,402 | | | | 389,313,607 | | |
First Eagle Funds | Semiannual Report | April 30, 2024
190
April 30, 2024 (unaudited)
| | | First Eagle
U.S. Value Fund* | | First Eagle
Gold Fund* | |
| | | For the
Six Months Ended
April 30, 2024
(unaudited) | | For the
Year Ended
October 31, 2023 | | For the
Six Months Ended
April 30, 2024
(unaudited) | | For the
Year Ended
October 31, 2023 | |
Class R4^ | |
Net proceeds from shares sold | | | 1,297 | | | | 7,615 | | | | 77,494 | | | | 398,418 | | |
Net asset value of shares issued for reinvested dividends and distributions | | | 2,849 | | | | 2,596 | | | | 14,386 | | | | — | | |
Cost of shares redeemed | | | (49,419 | ) | | | (53 | ) | | | (1,551,853 | ) | | | (343,359 | ) | |
Increase (decrease) in net assets from Fund share transactions | | | (45,273 | ) | | | 10,158 | | | | (1,459,973 | ) | | | 55,059 | | |
Class R5^ | |
Net proceeds from shares sold | | | 6,722 | | | | 11,188 | | | | 45,674 | | | | 188,286 | | |
Net asset value of shares issued for reinvested dividends and distributions | | | 868 | | | | 928 | | | | 4,271 | | | | — | | |
Cost of shares redeemed | | | (96,780 | ) | | | (1,937 | ) | | | (479,637 | ) | | | (408,878 | ) | |
Increase (decrease) in net assets from Fund share transactions | | | (89,190 | ) | | | 10,179 | | | | (429,692 | ) | | | (220,592 | ) | |
Class R6 | |
Net proceeds from shares sold | | | 4,338,902 | | | | 10,454,050 | | | | 26,827,009 | | | | 61,445,816 | | |
Net asset value of shares issued for reinvested dividends and distributions | | | 2,189,335 | | | | 2,096,998 | | | | 1,748,970 | | | | — | | |
Cost of shares redeemed | | | (4,617,478 | ) | | | (6,373,402 | ) | | | (24,794,028 | ) | | | (35,549,281 | ) | |
Increase (decrease) in net assets from Fund share transactions | | | 1,910,759 | | | | 6,177,646 | | | | 3,781,951 | | | | 25,896,535 | | |
Increase (decrease) in net assets from Fund share transactions | | | 30,499,169 | | | | (12,083,855 | ) | | | (81,081,887 | ) | | | 104,699,913 | | |
Net increase (decrease) in net assets | | | 126,659,040 | | | | (621,857 | ) | | | 174,134,057 | | | | 375,249,991 | | |
Net Assets (Note 1) | |
Beginning of period | | | 1,139,134,280 | | | | 1,139,756,137 | | | | 2,157,578,084 | | | | 1,782,328,093 | | |
End of period | | $ | 1,265,793,320 | | | $ | 1,139,134,280 | | | $ | 2,331,712,141 | | | $ | 2,157,578,084 | | |
Changes in Shares Outstanding | |
Class A | |
Shares outstanding, beginning of period | | | 28,915,983 | | | | 29,351,025 | | | | 24,654,077 | | | | 25,679,365 | | |
Shares sold | | | 825,816 | | | | 1,704,389 | | | | 2,127,825 | | | | 5,013,496 | | |
Shares issued on reinvestment of distributions | | | 1,727,710 | | | | 2,066,224 | | | | 206,811 | | | | — | | |
Shares redeemed | | | (2,340,737 | ) | | | (4,205,655 | ) | | | (2,930,899 | ) | | | (6,038,784 | ) | |
Shares outstanding, end of period | | | 29,128,772 | | | | 28,915,983 | | | | 24,057,814 | | | | 24,654,077 | | |
Class C | |
Shares outstanding, beginning of period | | | 1,679,875 | | | | 2,009,999 | | | | 5,376,559 | | | | 5,969,493 | | |
Shares sold | | | 120,756 | | | | 253,839 | | | | 259,066 | | | | 769,747 | | |
Shares issued on reinvestment of distributions | | | 96,608 | | | | 141,976 | | | | 11,220 | | | | — | | |
Shares redeemed | | | (333,999 | ) | | | (725,939 | ) | | | (695,100 | ) | | | (1,362,681 | ) | |
Shares outstanding, end of period | | | 1,563,240 | | | | 1,679,875 | | | | 4,951,745 | | | | 5,376,559 | | |
Class I | |
Shares outstanding, beginning of period | | | 28,483,950 | | | | 28,579,801 | | | | 58,456,099 | | | | 54,080,450 | | |
Shares sold | | | 3,122,499 | | | | 4,743,922 | | | | 7,166,195 | | | | 20,867,430 | | |
Shares issued on reinvestment of distributions | | | 1,337,016 | | | | 1,529,498 | | | | 564,445 | | | | — | | |
Shares redeemed | | | (2,898,451 | ) | | | (6,369,271 | ) | | | (10,369,237 | ) | | | (16,491,781 | ) | |
Shares outstanding, end of period | | | 30,045,014 | | | | 28,483,950 | | | | 55,817,502 | | | | 58,456,099 | | |
First Eagle Funds | Semiannual Report | April 30, 2024
191
Statements of Changes in Net Assets (continued)
| | | First Eagle
Global Fund* | | First Eagle
Overseas Fund* | |
| | | For the
Six Months Ended
April 30, 2024
(unaudited) | | For the
Year Ended
October 31, 2023 | | For the
Six Months Ended
April 30, 2024
(unaudited) | | For the
Year Ended
October 31, 2023 | |
Class R3^ | |
Shares outstanding, beginning of period | | | 205,968 | | | | 126,209 | | | | 17,092 | | | | 13,692 | | |
Shares sold | | | 12,834 | | | | 161,680 | | | | 679 | | | | 3,975 | | |
Shares issued on reinvestment of distributions | | | 7,705 | | | | 5,091 | | | | 354 | | | | 469 | | |
Shares redeemed | | | (226,507 | ) | | | (87,012 | ) | | | (18,125 | ) | | | (1,044 | ) | |
Shares outstanding, end of period | | | — | | | | 205,968 | | | | — | | | | 17,092 | | |
Class R4^ | |
Shares outstanding, beginning of period | | | 29,134 | | | | 22,267 | | | | 216,836 | | | | 576,504 | | |
Shares sold | | | 1,226 | | | | 9,476 | | | | 6,744 | | | | 81,848 | | |
Shares issued on reinvestment of distributions | | | 1,068 | | | | 890 | | | | 4,766 | | | | 22,138 | | |
Shares redeemed | | | (31,428 | ) | | | (3,499 | ) | | | (228,346 | ) | | | (463,654 | ) | |
Shares outstanding, end of period | | | — | | | | 29,134 | | | | — | | | | 216,836 | | |
Class R5^ | |
Shares outstanding, beginning of period | | | 3,470 | | | | 1,782 | | | | 1,689 | | | | 1,735 | | |
Shares sold | | | 102 | | | | 2,209 | | | | 169 | | | | 604 | | |
Shares issued on reinvestment of distributions | | | 80 | | | | 73 | | | | 42 | | | | 60 | | |
Shares redeemed | | | (3,652 | ) | | | (594 | ) | | | (1,900 | ) | | | (710 | ) | |
Shares outstanding, end of period | | | — | | | | 3,470 | | | | — | | | | 1,689 | | |
Class R6 | |
Shares outstanding, beginning of period | | | 34,101,190 | | | | 29,816,528 | | | | 55,025,651 | | | | 57,482,854 | | |
Shares sold | | | 5,621,340 | | | | 8,429,172 | | | | 3,580,552 | | | | 8,315,489 | | |
Shares issued on reinvestment of distributions | | | 1,216,565 | | | | 1,170,694 | | | | 1,420,134 | | | | 2,165,578 | | |
Shares redeemed | | | (4,881,236 | ) | | | (5,315,204 | ) | | | (5,036,121 | ) | | | (12,938,270 | ) | |
Shares outstanding, end of period | | | 36,057,859 | | | | 34,101,190 | | | | 54,990,216 | | | | 55,025,651 | | |
* First Eagle Global Fund, First Eagle Overseas Fund, First Eagle U.S. Value Fund and First Eagle Gold Fund financial statements are shown on a consolidated basis and includes the balances of the First Eagle Global Cayman Fund, Ltd., First Eagle Overseas Cayman Fund, Ltd., First Eagle U.S. Value Cayman Fund, Ltd., and First Eagle Gold Cayman Fund, Ltd., respectively.
^ On February 29, 2024, Class R3, Class R4 and Class R5 shares converted into Class R6 shares. As a result, Class R3, Class R4 and Class R5 shares were terminated.
See Notes to Financial Statements.
First Eagle Funds | Semiannual Report | April 30, 2024
192
April 30, 2024 (unaudited)
| | | First Eagle
U.S. Value Fund* | | First Eagle
Gold Fund* | |
| | | For the
Six Months Ended
April 30, 2024
(unaudited) | | For the
Year Ended
October 31, 2023 | | For the
Six Months Ended
April 30, 2024
(unaudited) | | For the
Year Ended
October 31, 2023 | |
Class R3^ | |
Shares outstanding, beginning of period | | | 3,737 | | | | 3,437 | | | | 55,925 | | | | 51,308 | | |
Shares sold | | | 10 | | | | 40 | | | | 1,927 | | | | 59,899 | | |
Shares issued on reinvestment of distributions | | | 238 | | | | 264 | | | | 158 | | | | — | | |
Shares redeemed | | | (3,985 | ) | | | (4 | ) | | | (58,010 | ) | | | (55,282 | ) | |
Shares outstanding, end of period | | | — | | | | 3,737 | | | | — | | | | 55,925 | | |
Class R4^ | |
Shares outstanding, beginning of period | | | 2,281 | | | | 1,735 | | | | 68,292 | | | | 66,536 | | |
Shares sold | | | 67 | | | | 408 | | | | 3,345 | | | | 15,900 | | |
Shares issued on reinvestment of distributions | | | 152 | | | | 141 | | | | 586 | | | | — | | |
Shares redeemed | | | (2,500 | ) | | | (3 | ) | | | (72,223 | ) | | | (14,144 | ) | |
Shares outstanding, end of period | | | — | | | | 2,281 | | | | — | | | | 68,292 | | |
Class R5^ | |
Shares outstanding, beginning of period | | | 4,552 | | | | 4,005 | | | | 20,143 | | | | 29,137 | | |
Shares sold | | | 356 | | | | 594 | | | | 1,934 | | | | 7,209 | | |
Shares issued on reinvestment of distributions | | | 46 | | | | 50 | | | | 174 | | | | — | | |
Shares redeemed | | | (4,954 | ) | | | (97 | ) | | | (22,251 | ) | | | (16,203 | ) | |
Shares outstanding, end of period | | | — | | | | 4,552 | | | | — | | | | 20,143 | | |
Class R6 | |
Shares outstanding, beginning of period | | | 1,705,115 | | | | 1,375,767 | | | | 6,353,503 | | | | 5,291,172 | | |
Shares sold | | | 216,662 | | | | 546,773 | | | | 1,117,365 | | | | 2,500,821 | | |
Shares issued on reinvestment of distributions | | | 116,827 | | | | 113,290 | | | | 71,096 | | | | — | | |
Shares redeemed | | | (233,384 | ) | | | (330,715 | ) | | | (1,025,855 | ) | | | (1,438,490 | ) | |
Shares outstanding, end of period | | | 1,805,220 | | | | 1,705,115 | | | | 6,516,109 | | | | 6,353,503 | | |
First Eagle Funds | Semiannual Report | April 30, 2024
193
Statements of Changes in Net Assets (continued)
| | | First Eagle
Global Income Builder Fund | | First Eagle
Rising Dividend Fund | |
| | | For the
Six Months Ended
April 30, 2024
(unaudited) | | For the
Year Ended
October 31, 2023 | | For the
Six Months Ended
April 30, 2024
(unaudited) | | For the
Year Ended
October 31, 2023 | |
Operations | |
Net investment income | | $ | 25,595,739 | | | $ | 44,634,372 | | | $ | 3,308,954 | | | $ | 5,998,165 | | |
Net realized gain (loss) on investments, commodity, foreign currency
and forward contract related transactions and option contracts written | | | 10,380,043 | | | | 14,423,969 | | | | 3,869,114 | | | | 24,985,141 | | |
Change in unrealized appreciation (depreciation) on investments,
commodity, foreign currency and forward contract related translations
and option contracts written | | | 116,025,217 | | | | 30,873,761 | | | | 44,083,706 | | | | 19,172,197 | | |
Net increase (decrease) in net assets resulting from operations | | | 152,000,999 | | | | 89,932,102 | | | | 51,261,774 | | | | 50,155,503 | | |
Distributions to Shareholders | |
Distributable earnings: | |
Class A | | | (9,069,828 | ) | | | (23,879,471 | ) | | | (19,737,445 | ) | | | (8,920,725 | ) | |
Class C | | | (814,737 | ) | | | (2,938,884 | ) | | | (980,993 | ) | | | (717,656 | ) | |
Class I | | | (13,883,047 | ) | | | (35,201,941 | ) | | | (7,301,999 | ) | | | (3,513,420 | ) | |
Class R3 | | | (105 | ) | | | (2,189 | ) | | | (4,079 | ) | | | (1,757 | ) | |
Class R4 | | | (380 | ) | | | (2,016 | ) | | | (2,834 | ) | | | (1,175 | ) | |
Class R5 | | | (23 | ) | | | (456 | ) | | | (837 | ) | | | (399 | ) | |
Class R6 | | | (1,048,515 | ) | | | (2,430,376 | ) | | | (506,160 | ) | | | (203,647 | ) | |
Decrease in net assets resulting from distributions | | | (24,816,635 | ) | | | (64,455,333 | ) | | | (28,534,347 | ) | | | (13,358,779 | ) | |
Fund Share Transactions | |
Class A | |
Net proceeds from shares sold | | | 48,562,921 | | | | 158,702,246 | | | | 11,065,585 | | | | 18,109,802 | | |
Net asset value of shares issued for reinvested dividends and distributions | | | 8,334,379 | | | | 21,600,036 | | | | 18,672,928 | | | | 8,391,015 | | |
Cost of shares redeemed | | | (83,211,226 | ) | | | (108,924,372 | ) | | | (26,401,689 | ) | | | (54,121,330 | ) | |
Increase (decrease) in net assets from Fund share transactions | | | (26,313,926 | ) | | | 71,377,910 | | | | 3,336,824 | | | | (27,620,513 | ) | |
Class C | |
Net proceeds from shares sold | | | 3,393,454 | | | | 14,625,134 | | | | 333,549 | | | | 415,939 | | |
Net asset value of shares issued for reinvested dividends and distributions | | | 783,927 | | | | 2,788,213 | | | | 974,943 | | | | 712,791 | | |
Cost of shares redeemed | | | (16,483,780 | ) | | | (37,629,227 | ) | | | (3,439,591 | ) | | | (10,293,049 | ) | |
Decrease in net assets from Fund share transactions | | | (12,306,399 | ) | | | (20,215,880 | ) | | | (2,131,099 | ) | | | (9,164,319 | ) | |
Class I | |
Net proceeds from shares sold | | | 70,738,653 | | | | 286,707,410 | | | | 21,411,827 | | | | 6,842,143 | | |
Net asset value of shares issued for reinvested dividends and distributions | | | 12,514,790 | | | | 31,611,236 | | | | 4,201,186 | | | | 1,945,418 | | |
Cost of shares redeemed | | | (120,903,157 | ) | | | (206,948,702 | ) | | | (9,839,683 | ) | | | (20,221,706 | ) | |
Increase (decrease) in net assets from Fund share transactions | | | (37,649,714 | ) | | | 111,369,944 | | | | 15,773,330 | | | | (11,434,145 | ) | |
Class R3^ | |
Net proceeds from shares sold | | | — | | | | — | | | | 13 | | | | — | | |
Net asset value of shares issued for reinvested dividends and distributions | | | 37 | | | | 2,189 | | | | 4,079 | | | | 1,757 | | |
Cost of shares redeemed | | | (63,414 | ) | | | — | | | | (63,761 | ) | | | — | | |
Increase (decrease) in net assets from Fund share transactions | | | (63,377 | ) | | | 2,189 | | | | (59,669 | ) | | | 1,757 | | |
First Eagle Funds | Semiannual Report | April 30, 2024
194
April 30, 2024 (unaudited)
| | | First Eagle
Small Cap Opportunity Fund | | First Eagle
U.S. Smid Cap Opportunity Fund | |
| | | For the
Six Months Ended
April 30, 2024
(unaudited) | | For the
Year Ended
October 31, 2023 | | For the
Six Months Ended
April 30, 2024
(unaudited) | | For the
Year Ended
October 31, 2023 | |
Operations | |
Net investment income | | $ | 4,263,175 | | | $ | 2,965,536 | | | $ | 60,283 | | | $ | 80,149 | | |
Net realized gain (loss) on investments, commodity, foreign currency
and forward contract related transactions and option contracts written | | | (30,854,067 | ) | | | (46,405,081 | ) | | | (601,792 | ) | | | (71,616 | ) | |
Change in unrealized appreciation (depreciation) on investments,
commodity, foreign currency and forward contract related translations
and option contracts written | | | 283,195,730 | | | | (60,991,729 | ) | | | 6,475,080 | | | | (716,756 | ) | |
Net increase (decrease) in net assets resulting from operations | | | 256,604,838 | | | | (104,431,274 | ) | | | 5,933,571 | | | | (708,223 | ) | |
Distributions to Shareholders | |
Distributable earnings: | |
Class A | | | (331,193 | ) | | | — | | | | (1,661 | ) | | | (60 | ) | |
Class C | | | — | | | | — | | | | — | | | | — | | |
Class I | | | (8,732,209 | ) | | | (580,596 | ) | | | (117,436 | ) | | | (3,378 | ) | |
Class R3 | | | — | | | | — | | | | — | | | | — | | |
Class R4 | | | — | | | | — | | | | — | | | | — | | |
Class R5 | | | — | | | | — | | | | — | | | | — | | |
Class R6 | | | (479,410 | ) | | | (27,517 | ) | | | (1,676 | ) | | | (180 | ) | |
Decrease in net assets resulting from distributions | | | (9,542,812 | ) | | | (608,113 | ) | | | (120,773 | ) | | | (3,618 | ) | |
Fund Share Transactions | |
Class A | |
Net proceeds from shares sold | | | 24,256,085 | | | | 33,971,074 | | | | 202,176 | | | | 34,770 | | |
Net asset value of shares issued for reinvested dividends and distributions | | | 321,596 | | | | — | | | | 1,661 | | | | 60 | | |
Cost of shares redeemed | | | (6,339,366 | ) | | | (6,191,272 | ) | | | (19,499 | ) | | | — | | |
Increase (decrease) in net assets from Fund share transactions | | | 18,238,315 | | | | 27,779,802 | | | | 184,338 | | | | 34,830 | | |
Class C | |
Net proceeds from shares sold | | | — | | | | — | | | | — | | | | — | | |
Net asset value of shares issued for reinvested dividends and distributions | | | — | | | | — | | | | — | | | | — | | |
Cost of shares redeemed | | | — | | | | — | | | | — | | | | — | | |
Decrease in net assets from Fund share transactions | | | — | | | | — | | | | — | | | | — | | |
Class I | |
Net proceeds from shares sold | | | 462,496,874 | | | | 1,026,258,605 | | | | 1,800,260 | | | | 27,289,152 | | |
Net asset value of shares issued for reinvested dividends and distributions | | | 8,438,320 | | | | 551,566 | | | | 12,922 | | | | 3,378 | | |
Cost of shares redeemed | | | (270,426,565 | ) | | | (248,023,159 | ) | | | (22,564 | ) | | | (161 | ) | |
Increase (decrease) in net assets from Fund share transactions | | | 200,508,629 | | | | 778,787,012 | | | | 1,790,618 | | | | 27,292,369 | | |
Class R3^ | |
Net proceeds from shares sold | | | — | | | | — | | | | — | | | | — | | |
Net asset value of shares issued for reinvested dividends and distributions | | | — | | | | — | | | | — | | | | — | | |
Cost of shares redeemed | | | — | | | | — | | | | — | | | | — | | |
Increase (decrease) in net assets from Fund share transactions | | | — | | | | — | | | | — | | | | — | | |
First Eagle Funds | Semiannual Report | April 30, 2024
195
Statements of Changes in Net Assets (continued)
| | | First Eagle
Global Income Builder Fund | | First Eagle
Rising Dividend Fund | |
| | | For the
Six Months Ended
April 30, 2024
(unaudited) | | For the
Year Ended
October 31, 2023 | | For the
Six Months Ended
April 30, 2024
(unaudited) | | For the
Year Ended
October 31, 2023 | |
Class R4^ | |
Net proceeds from shares sold | | | 2,063 | | | | 6,730 | | | | 1,228 | | | | 3,450 | | |
Net asset value of shares issued for reinvested dividends and distributions | | | 300 | | | | 2,016 | | | | 2,834 | | | | 1,175 | | |
Cost of shares redeemed | | | (64,263 | ) | | | (97 | ) | | | (45,125 | ) | | | (40 | ) | |
Increase (decrease) in net assets from Fund share transactions | | | (61,900 | ) | | | 8,649 | | | | (41,063 | ) | | | 4,585 | | |
Class R5^ | |
Net proceeds from shares sold | | | — | | | | — | | | | 2 | | | | — | | |
Net asset value of shares issued for reinvested dividends and distributions | | | 7 | | | | 456 | | | | 837 | | | | 399 | | |
Cost of shares redeemed | | | (12,281 | ) | | | — | | | | (13,180 | ) | | | — | | |
Increase (decrease) in net assets from Fund share transactions | | | (12,274 | ) | | | 456 | | | | (12,341 | ) | | | 399 | | |
Class R6 | |
Net proceeds from shares sold | | | 9,704,846 | | | | 28,315,324 | | | | 828,949 | | | | 1,655,761 | | |
Net asset value of shares issued for reinvested dividends and distributions | | | 1,044,758 | | | | 2,421,057 | | | | 492,221 | | | | 199,816 | | |
Cost of shares redeemed | | | (10,343,085 | ) | | | (14,429,131 | ) | | | (865,636 | ) | | | (1,177,419 | ) | |
Increase in net assets from Fund share transactions | | | 406,519 | | | | 16,307,250 | | | | 455,534 | | | | 678,158 | | |
Increase (decrease) in net assets from Fund share transactions | | | (76,001,071 | ) | | | 178,850,518 | | | | 17,321,516 | | | | (47,534,078 | ) | |
Net increase (decrease) in net assets | | | 51,183,293 | | | | 204,327,287 | | | | 40,048,943 | | | | (10,737,354 | ) | |
Net Assets (Note 1) | |
Beginning of period | | | 1,641,592,070 | | | | 1,437,264,783 | | | | 353,814,931 | | | | 364,552,285 | | |
End of period | | $ | 1,692,775,363 | | | $ | 1,641,592,070 | | | $ | 393,863,874 | | | $ | 353,814,931 | | |
Changes in Shares Outstanding | |
Class A | |
Shares outstanding, beginning of period | | | 52,313,628 | | | | 46,560,925 | | | | 10,885,417 | | | | 12,125,113 | | |
Shares sold | | | 3,833,246 | | | | 12,771,686 | | | | 468,204 | | | | 797,792 | | |
Shares issued on reinvestment of distributions | | | 651,079 | | | | 1,754,983 | | | | 828,871 | | | | 383,785 | | |
Shares redeemed | | | (6,579,431 | ) | | | (8,773,966 | ) | | | (1,114,075 | ) | | | (2,421,273 | ) | |
Shares outstanding, end of period | | | 50,218,522 | | | | 52,313,628 | | | | 11,068,417 | | | | 10,885,417 | | |
Class C | |
Shares outstanding, beginning of period | | | 6,859,097 | | | | 8,456,225 | | | | 594,264 | | | | 1,267,183 | | |
Shares sold | | | 266,122 | | | | 1,173,224 | | | | 24,225 | | | | 29,623 | | |
Shares issued on reinvestment of distributions | | | 60,715 | | | | 225,272 | | | | 74,928 | | | | 53,658 | | |
Shares redeemed | | | (1,294,320 | ) | | | (2,995,624 | ) | | | (248,831 | ) | | | (756,200 | ) | |
Shares outstanding, end of period | | | 5,891,614 | | | | 6,859,097 | | | | 444,586 | | | | 594,264 | | |
Class I | |
Shares outstanding, beginning of period | | | 73,870,683 | | | | 64,970,999 | | | | 4,041,364 | | | | 4,542,657 | | |
Shares sold | | | 5,614,630 | | | | 23,208,393 | | | | 859,985 | | | | 283,305 | | |
Shares issued on reinvestment of distributions | | | 982,598 | | | | 2,579,194 | | | | 175,525 | | | | 84,287 | | |
Shares redeemed | | | (9,573,696 | ) | | | (16,887,903 | ) | | | (391,379 | ) | | | (868,885 | ) | |
Shares outstanding, end of period | | | 70,894,215 | | | | 73,870,683 | | | | 4,685,495 | | | | 4,041,364 | | |
First Eagle Funds | Semiannual Report | April 30, 2024
196
April 30, 2024 (unaudited)
| | | First Eagle
Small Cap Opportunity Fund | | First Eagle
U.S. Smid Cap Opportunity Fund | |
| | | For the
Six Months Ended
April 30, 2024
(unaudited) | | For the
Year Ended
October 31, 2023 | | For the
Six Months Ended
April 30, 2024
(unaudited) | | For the
Year Ended
October 31, 2023 | |
Class R4^ | |
Net proceeds from shares sold | | | — | | | | — | | | | — | | | | — | | |
Net asset value of shares issued for reinvested dividends and distributions | | | — | | | | — | | | | — | | | | — | | |
Cost of shares redeemed | | | — | | | | — | | | | — | | | | — | | |
Increase (decrease) in net assets from Fund share transactions | | | — | | | | — | | | | — | | | | — | | |
Class R5^ | |
Net proceeds from shares sold | | | — | | | | — | | | | — | | | | — | | |
Net asset value of shares issued for reinvested dividends and distributions | | | — | | | | — | | | | — | | | | — | | |
Cost of shares redeemed | | | — | | | | — | | | | — | | | | — | | |
Increase (decrease) in net assets from Fund share transactions | | | — | | | | — | | | | — | | | | — | | |
Class R6 | |
Net proceeds from shares sold | | | 24,617,378 | | | | 54,252,946 | | | | — | | | | — | | |
Net asset value of shares issued for reinvested dividends and distributions | | | 479,410 | | | | 27,517 | | | | 1,676 | | | | 180 | | |
Cost of shares redeemed | | | (9,304,214 | ) | | | (7,415,134 | ) | | | — | | | | — | | |
Increase in net assets from Fund share transactions | | | 15,792,574 | | | | 46,865,329 | | | | 1,676 | | | | 180 | | |
Increase (decrease) in net assets from Fund share transactions | | | 234,539,518 | | | | 853,432,143 | | | | 1,976,632 | | | | 27,327,379 | | |
Net increase (decrease) in net assets | | | 481,601,544 | | | | 748,392,756 | | | | 7,789,430 | | | | 26,615,538 | | |
Net Assets (Note 1) | |
Beginning of period | | | 1,309,696,983 | | | | 561,304,227 | | | | 27,754,904 | | | | 1,139,366 | | |
End of period | | $ | 1,791,298,527 | | | $ | 1,309,696,983 | | | $ | 35,544,334 | | | $ | 27,754,904 | | |
Changes in Shares Outstanding | |
Class A | |
Shares outstanding, beginning of period | | | 7,490,976 | | | | 4,392,441 | | | | 8,975 | | | | 5,413 | | |
Shares sold | | | 2,601,124 | | | | 3,798,896 | | | | 19,435 | | | | 3,556 | | |
Shares issued on reinvestment of distributions | | | 35,693 | | | | — | | | | 177 | | | | 6 | | |
Shares redeemed | | | (661,367 | ) | | | (700,361 | ) | | | (1,876 | ) | | | — | | |
Shares outstanding, end of period | | | 9,466,426 | | | | 7,490,976 | | | | 26,711 | | | | 8,975 | | |
Class C | |
Shares outstanding, beginning of period | | | — | | | | — | | | | — | | | | — | | |
Shares sold | | | — | | | | — | | | | — | | | | — | | |
Shares issued on reinvestment of distributions | | | — | | | | — | | | | — | | | | — | | |
Shares redeemed | | | — | | | | — | | | | — | | | | — | | |
Shares outstanding, end of period | | | — | | | | — | | | | — | | | | — | | |
Class I | |
Shares outstanding, beginning of period | | | 143,815,321 | | | | 58,977,677 | | | | 3,170,551 | | | | 116,486 | | |
Shares sold | | | 48,584,776 | | | | 112,506,979 | | | | 168,479 | | | | 3,053,725 | | |
Shares issued on reinvestment of distributions | | | 934,476 | | | | 61,765 | | | | 1,350 | | | | 357 | | |
Shares redeemed | | | (28,259,064 | ) | | | (27,731,100 | ) | | | (2,192 | ) | | | (17 | ) | |
Shares outstanding, end of period | | | 165,075,509 | | | | 143,815,321 | | | | 3,338,188 | | | | 3,170,551 | | |
First Eagle Funds | Semiannual Report | April 30, 2024
197
Statements of Changes in Net Assets (continued)
| | | First Eagle
Global Income Builder Fund | | First Eagle
Rising Dividend Fund** | |
| | | For the
Six Months Ended
April 30, 2024
(unaudited) | | For the
Year Ended
October 31, 2023 | | For the
Six Months Ended
April 30, 2024
(unaudited) | | For the
Year Ended
October 31, 2023 | |
Class R3^ | |
Shares outstanding, beginning of period | | | 5,010 | | | | 4,832 | | | | 2,445 | | | | 2,368 | | |
Shares issued on reinvestment of distributions | | | 3 | | | | 178 | | | | 174 | | | | 77 | | |
Shares redeemed | | | (5,013 | ) | | | — | | | | (2,619 | ) | | | — | | |
Shares outstanding, end of period | | | — | | | | 5,010 | | | | — | | | | 2,445 | | |
Class R4^ | |
Shares outstanding, beginning of period | | | 4,899 | | | | 4,202 | | | | 1,619 | | | | 1,425 | | |
Shares sold | | | 164 | | | | 541 | | | | 50 | | | | 145 | | |
Shares issued on reinvestment of distributions | | | 24 | | | | 164 | | | | 120 | | | | 51 | | |
Shares redeemed | | | (5,087 | ) | | | (8 | ) | | | (1,789 | ) | | | (2 | ) | |
Shares outstanding, end of period | | | — | | | | 4,899 | | | | — | | | | 1,619 | | |
Class R5^ | |
Shares outstanding, beginning of period | | | 973 | | | | 936 | | | | 501 | | | | 484 | | |
Shares issued on reinvestment of distributions | | | — | | | | 37 | | | | 35 | | | | 17 | | |
Shares redeemed | | | (973 | ) | | | — | | | | (536 | ) | | | — | | |
Shares outstanding, end of period | | | — | | | | 973 | | | | — | | | | 501 | | |
Class R6 | |
Shares outstanding, beginning of period | | | 5,292,142 | | | | 3,973,194 | | | | 272,124 | | | | 243,545 | | |
Shares sold | | | 771,034 | | | | 2,285,965 | | | | 33,068 | | | | 69,896 | | |
Shares issued on reinvestment of distributions | | | 82,152 | | | | 197,819 | | | | 20,603 | | | | 8,628 | | |
Shares redeemed | | | (819,357 | ) | | | (1,164,836 | ) | | | (34,527 | ) | | | (49,945 | ) | |
Shares outstanding, end of period | | | 5,325,971 | | | | 5,292,142 | | | | 291,268 | | | | 272,124 | | |
^ On February 29, 2024, Class R3, Class R4 and Class R5 shares converted into Class R6 shares. As a result, Class R3, Class R4 and Class R5 shares were terminated.
** First Eagle Rising Dividend Fund was known as First Eagle Fund of America prior to March 1, 2023.
First Eagle Funds | Semiannual Report | April 30, 2024
198
April 30, 2024 (unaudited)
| | First Eagle
Small Cap Opportunity Fund | | First Eagle
U.S. Smid Cap Opportunity Fund | |
| | | For the
Six Months Ended
April 30, 2024
(unaudited) | | For the
Year Ended
October 31, 2023 | | For the
Six Months Ended
April 30, 2024
(unaudited) | | For the
Year Ended
October 31, 2023 | |
Class R3^ | |
Shares outstanding, beginning of period | | | — | | | | — | | | | — | | | | — | | |
Shares issued on reinvestment of distributions | | | — | | | | — | | | | — | | | | — | | |
Shares redeemed | | | — | | | | — | | | | — | | | | — | | |
Shares outstanding, end of period | | | — | | | | — | | | | — | | | | — | | |
Class R4^ | |
Shares outstanding, beginning of period | | | — | | | | — | | | | — | | | | — | | |
Shares sold | | | — | | | | — | | | | — | | | | — | | |
Shares issued on reinvestment of distributions | | | — | | | | — | | | | — | | | | — | | |
Shares redeemed | | | — | | | | — | | | | — | | | | — | | |
Shares outstanding, end of period | | | — | | | | — | | | | — | | | | — | | |
Class R5^ | |
Shares outstanding, beginning of period | | | — | | | | — | | | | — | | | | — | | |
Shares issued on reinvestment of distributions | | | — | | | | — | | | | — | | | | — | | |
Shares redeemed | | | — | | | | — | | | | — | | | | — | | |
Shares outstanding, end of period | | | — | | | | — | | | | — | | | | — | | |
Class R6 | |
Shares outstanding, beginning of period | | | 7,850,147 | | | | 2,688,408 | | | | 5,019 | | | | 5,000 | | |
Shares sold | | | 2,567,666 | | | | 5,983,392 | | | | — | | | | — | | |
Shares issued on reinvestment of distributions | | | 53,032 | | | | 3,078 | | | | 181 | | | | 19 | | |
Shares redeemed | | | (967,742 | ) | | | (824,731 | ) | | | — | | | | — | | |
Shares outstanding, end of period | | | 9,503,103 | | | | 7,850,147 | | | | 5,200 | | | | 5,019 | | |
First Eagle Funds | Semiannual Report | April 30, 2024
199
Statements of Changes in Net Assets (continued)
| | | First Eagle
Global Real Assets Fund* | |
| | | For the
Six Months Ended
April 30, 2024
(unaudited) | | For the
Year Ended
October 31, 2023 | |
Operations | |
Net investment income | | $ | 109,437 | | | $ | 227,985 | | |
Net realized gain (loss) on investments, commodity and foreign currency
related transactions | | | 148,055 | | | | (36,039 | ) | |
Change in unrealized appreciation (depreciation) on investments,
commodity and foreign currency related translations | | | 969,822 | | | | 74,559 | | |
Net increase (decrease) in net assets resulting from operations | | | 1,227,314 | | | | 266,505 | | |
Distributions to Shareholders | |
Distributable earnings: | |
Class A | | | (29,923 | ) | | | (13,695 | ) | |
Class C | | | — | | | | — | | |
Class I | | | (189,360 | ) | | | (145,313 | ) | |
Class R3 | | | — | | | | — | | |
Class R4 | | | — | | | | — | | |
Class R5 | | | — | | | | — | | |
Class R6 | | | (22,956 | ) | | | (20,751 | ) | |
Decrease in net assets resulting from distributions | | | (242,239 | ) | | | (179,759 | ) | |
Fund Share Transactions | |
Class A | |
Net proceeds from shares sold | | | 6,459 | | | | 394,672 | | |
Net asset value of shares issued for reinvested dividends and distributions | | | 29,923 | | | | 13,695 | | |
Cost of shares redeemed | | | (23,481 | ) | | | (3,430 | ) | |
Increase (decrease) in net assets from Fund share transactions | | | 12,901 | | | | 404,937 | | |
Class C | |
Net proceeds from shares sold | | | — | | | | — | | |
Net asset value of shares issued for reinvested dividends and distributions | | | — | | | | — | | |
Cost of shares redeemed | | | — | | | | — | | |
Increase (decrease) in net assets from Fund share transactions | | | — | | | | — | | |
Class I | |
Net proceeds from shares sold | | | 898,057 | | | | 2,749,565 | | |
Net asset value of shares issued for reinvested dividends and distributions | | | 186,621 | | | | 145,313 | | |
Cost of shares redeemed | | | (45,761 | ) | | | (1,458,613 | ) | |
Increase (decrease) in net assets from Fund share transactions | | | 1,038,917 | | | | 1,436,265 | | |
Class R3^ | |
Net proceeds from shares sold | | | — | | | | — | | |
Net asset value of shares issued for reinvested dividends and distributions | | | — | | | | — | | |
Cost of shares redeemed | | | — | | | | — | | |
Increase (decrease) in net assets from Fund share transactions | | | — | | | | — | | |
First Eagle Funds | Semiannual Report | April 30, 2024
200
April 30, 2024 (unaudited)
| | | First Eagle
High Yield Municipal Fund** | | First Eagle
Short Duration
High Yield
Municipal Fund | |
| | | For the
Six Months Ended
April 30, 2024
(unaudited) | | For the
Year Ended
October 31, 2023 | | For the Period
1/02/24† -
4/30/24
(unaudited) | |
Operations | |
Net investment income | | $ | 9,460,728 | | | $ | 9,244,662 | | | $ | 240,019 | | |
Net realized gain (loss) on investments, commodity and foreign currency
related transactions | | | (6,527,918 | ) | | | (5,689,578 | ) | | | 11,649 | | |
Change in unrealized appreciation (depreciation) on investments,
commodity and foreign currency related translations | | | 17,385,076 | | | | 6,112,959 | | | | 84,285 | | |
Net increase (decrease) in net assets resulting from operations | | | 20,317,886 | | | | 9,668,043 | | | | 335,953 | | |
Distributions to Shareholders | |
Distributable earnings: | |
Class A | | | (3,437,679 | ) | | | (3,483,395 | ) | | | (16,154 | ) | |
Class C | | | (225,546 | ) | | | (280,628 | ) | | | — | | |
Class I | | | (6,036,116 | ) | | | (5,193,256 | ) | | | (219,075 | ) | |
Class R3 | | | (5,595 | ) | | | (22,398 | ) | | | — | | |
Class R4 | | | (81 | ) | | | (458 | ) | | | — | | |
Class R5 | | | (85 | ) | | | (561 | ) | | | — | | |
Class R6 | | | (149,388 | ) | | | (190,124 | ) | | | (14,154 | ) | |
Decrease in net assets resulting from distributions | | | (9,854,490 | ) | | | (9,170,820 | ) | | | (249,383 | ) | |
Fund Share Transactions | |
Class A | |
Net proceeds from shares sold | | | 228,000,038 | | | | 12,149,183 | | | | 1,561,225 | | |
Net asset value of shares issued for reinvested dividends and distributions | | | 3,352,062 | | | | 3,349,892 | | | | 16,154 | | |
Cost of shares redeemed | | | (25,643,047 | ) | | | (20,147,817 | ) | | | — | | |
Increase (decrease) in net assets from Fund share transactions | | | 205,709,053 | | | | (4,648,742 | ) | | | 1,577,379 | | |
Class C | |
Net proceeds from shares sold | | | 18,358,139 | | | | 1,457,329 | | | | — | | |
Net asset value of shares issued for reinvested dividends and distributions | | | 224,089 | | | | 279,899 | | | | — | | |
Cost of shares redeemed | | | (2,127,445 | ) | | | (4,216,419 | ) | | | — | | |
Increase (decrease) in net assets from Fund share transactions | | | 16,454,783 | | | | (2,479,191 | ) | | | — | | |
Class I | |
Net proceeds from shares sold | | | 570,118,924 | | | | 17,071,435 | | | | 19,017,244 | | |
Net asset value of shares issued for reinvested dividends and distributions | | | 5,841,294 | | | | 4,336,097 | | | | 219,075 | | |
Cost of shares redeemed | | | (65,002,116 | ) | | | (44,744,552 | ) | | | (972,978 | ) | |
Increase (decrease) in net assets from Fund share transactions | | | 510,958,102 | | | | (23,337,020 | ) | | | 18,263,341 | | |
Class R3^ | |
Net proceeds from shares sold | | | 4,090 | | | | 56,063 | | | | — | | |
Net asset value of shares issued for reinvested dividends and distributions | | | 5,368 | | | | 22,383 | | | | — | | |
Cost of shares redeemed | | | (511,451 | ) | | | (760 | ) | | | — | | |
Increase (decrease) in net assets from Fund share transactions | | | (501,993 | ) | | | 77,686 | | | | — | | |
First Eagle Funds | Semiannual Report | April 30, 2024
201
Statements of Changes in Net Assets (continued)
| | | First Eagle
Global Real Assets Fund* | |
| | | For the
Six Months Ended
April 30, 2024
(unaudited) | | For the
Year Ended
October 31, 2023 | |
Class R4^ | |
Net asset value of shares issued for reinvested dividends and distributions | | | — | | | | — | | |
Cost of shares redeemed | | | — | | | | — | | |
Increase (decrease) in net assets from Fund share transactions | | | — | | | | — | | |
Class R5^ | |
Net proceeds from shares sold | | | — | | | | — | | |
Net asset value of shares issued for reinvested dividends and distributions | | | — | | | | — | | |
Cost of shares redeemed | | | — | | | | — | | |
Increase (decrease) in net assets from Fund share transactions | | | — | | | | — | | |
Class R6 | |
Net proceeds from shares sold | | | 15,269 | | | | 4,549 | | |
Net asset value of shares issued for reinvested dividends and distributions | | | 22,956 | | | | 20,751 | | |
Cost of shares redeemed | | | (31,639 | ) | | | (10,141 | ) | |
Increase (decrease) in net assets from Fund share transactions | | | 6,586 | | | | 15,159 | | |
Increase (decrease) in net assets from Fund share transactions | | | 1,058,404 | | | | 1,856,361 | | |
Net increase (decrease) in net assets | | | 2,043,479 | | | | 1,943,107 | | |
Net Assets (Note 1) | |
Beginning of period | | | 11,303,502 | | | | 9,360,395 | | |
End of period | | $ | 13,346,981 | | | $ | 11,303,502 | | |
Changes in Shares Outstanding | |
Class A | |
Shares outstanding, beginning of period | | | 173,842 | | | | 134,467 | | |
Shares sold | | | 621 | | | | 38,372 | | |
Shares issued on reinvestment of distributions | | | 2,954 | | | | 1,338 | | |
Shares redeemed | | | (2,305 | ) | | | (335 | ) | |
Shares outstanding, end of period | | | 175,112 | | | | 173,842 | | |
Class C | |
Shares outstanding, beginning of period | | | — | | | | — | | |
Shares sold | | | — | | | | — | | |
Shares issued on reinvestment of distributions | | | — | | | | — | | |
Shares redeemed | | | — | | | | — | | |
Shares outstanding, end of period | | | — | | | | — | | |
Class I | |
Shares outstanding, beginning of period | | | 880,735 | | | | 737,628 | | |
Shares sold | | | 84,129 | | | | 276,322 | | |
Shares issued on reinvestment of distributions | | | 18,569 | | | | 14,288 | | |
Shares redeemed | | | (4,158 | ) | | | (147,503 | ) | |
Shares outstanding, end of period | | | 979,275 | | | | 880,735 | | |
First Eagle Funds | Semiannual Report | April 30, 2024
202
April 30, 2024 (unaudited)
| | | First Eagle
High Yield Municipal Fund** | | First Eagle
Short Duration
High Yield
Municipal Fund | |
| | | For the
Six Months Ended
April 30, 2024
(unaudited) | | For the
Year Ended
October 31, 2023 | | For the Period
1/02/24† -
4/30/24
(unaudited) | |
Class R4^ | |
Net asset value of shares issued for reinvested dividends and distributions | | | 47 | | | | 458 | | | | — | | |
Cost of shares redeemed | | | (10,902 | ) | | | — | | | | — | | |
Increase (decrease) in net assets from Fund share transactions | | | (10,855 | ) | | | 458 | | | | — | | |
Class R5^ | |
Net proceeds from shares sold | | | 1 | | | | — | | | | — | | |
Net asset value of shares issued for reinvested dividends and distributions | | | 50 | | | | 561 | | | | — | | |
Cost of shares redeemed | | | (11,190 | ) | | | — | | | | — | | |
Increase (decrease) in net assets from Fund share transactions | | | (11,139 | ) | | | 561 | | | | — | | |
Class R6 | |
Net proceeds from shares sold | | | 1,668,258 | | | | 7,992,381 | | | | 1,000,000 | | |
Net asset value of shares issued for reinvested dividends and distributions | | | 149,284 | | | | 189,821 | | | | 14,154 | | |
Cost of shares redeemed | | | (8,415,446 | ) | | | (1,193,607 | ) | | | — | | |
Increase (decrease) in net assets from Fund share transactions | | | (6,597,904 | ) | | | 6,988,595 | | | | 1,014,154 | | |
Increase (decrease) in net assets from Fund share transactions | | | 726,000,047 | | | | (23,397,653 | ) | | | 20,854,874 | | |
Net increase (decrease) in net assets | | | 736,463,443 | | | | (22,900,430 | ) | | | 20,941,444 | | |
Net Assets (Note 1) | |
Beginning of period | | | 153,584,216 | | | | 176,484,646 | | | | | | |
End of period | | $ | 890,047,659 | | | $ | 153,584,216 | | | $ | 20,941,444 | | |
Changes in Shares Outstanding | |
Class A | |
Shares outstanding, beginning of period | | | 8,207,087 | | | | 8,796,579 | | | | — | | |
Shares sold | | | 27,689,362 | | | | 1,538,050 | | | | 155,828 | | |
Shares issued on reinvestment of distributions | | | 406,587 | | | | 422,540 | | | | 1,607 | | |
Shares redeemed | | | (3,127,826 | ) | | | (2,550,082 | ) | | | — | | |
Shares outstanding, end of period | | | 33,175,210 | | | | 8,207,087 | | | | 157,435 | | |
Class C | |
Shares outstanding, beginning of period | | | 637,855 | | | | 949,515 | | | | — | | |
Shares sold | | | 2,227,179 | | | | 185,200 | | | | — | | |
Shares issued on reinvestment of distributions | | | 27,203 | | | | 35,330 | | | | — | | |
Shares redeemed | | | (260,588 | ) | | | (532,190 | ) | | | — | | |
Shares outstanding, end of period | | | 2,631,649 | | | | 637,855 | | | | — | | |
Class I | |
Shares outstanding, beginning of period | | | 9,828,992 | | | | 12,765,238 | | | | — | | |
Shares sold | | | 69,222,972 | | | | 2,150,591 | | | | 1,899,662 | | |
Shares issued on reinvestment of distributions | | | 706,879 | | | | 546,360 | | | | 21,802 | | |
Shares redeemed | | | (8,032,484 | ) | | | (5,633,197 | ) | | | (97,089 | ) | |
Shares outstanding, end of period | | | 71,726,359 | | | | 9,828,992 | | | | 1,824,375 | | |
First Eagle Funds | Semiannual Report | April 30, 2024
203
Statements of Changes in Net Assets (continued)
| | | First Eagle
Global Real Assets Fund* | |
| | | For the
Six Months Ended
April 30, 2024
(unaudited) | | For the
Year Ended
October 31, 2023 | |
Class R3^ | |
Shares outstanding, beginning of period | | | — | | | | — | | |
Shares sold | | | — | | | | — | | |
Shares issued on reinvestment of distributions | | | — | | | | — | | |
Shares redeemed | | | — | | | | — | | |
Shares outstanding, end of period | | | — | | | | — | | |
Class R4^ | |
Shares outstanding, beginning of period | | | — | | | | — | | |
Shares issued on reinvestment of distributions | | | — | | | | — | | |
Shares redeemed | | | — | | | | — | | |
Shares outstanding, end of period | | | — | | | | — | | |
Class R5^ | |
Shares outstanding, beginning of period | | | — | | | | — | | |
Shares issued on reinvestment of distributions | | | — | | | | — | | |
Shares redeemed | | | — | | | | — | | |
Shares outstanding, end of period | | | — | | | | — | | |
Class R6 | |
Shares outstanding, beginning of period | | | 105,765 | | | | 104,276 | | |
Shares sold | | | 1,486 | | | | 447 | | |
Shares issued on reinvestment of distributions | | | 2,287 | | | | 2,040 | | |
Shares redeemed | | | (2,971 | ) | | | (998 | ) | |
Shares outstanding, end of period | | | 106,567 | | | | 105,765 | | |
* First Eagle Global Real Assets Fund financial statements are shown on a consolidated basis and includes the balances of the First Eagle Global Real Asset Cayman Fund, Ltd.
** First Eagle High Yield Municipal Fund was known as First Eagle High Income Fund prior to December 27, 2023.
† Inception date.
^ On February 29, 2024, Class R3, Class R4 and Class R5 shares converted into Class R6 shares. As a result, Class R3, Class R4 and Class R5 shares were terminated.
See Notes to Financial Statements.
First Eagle Funds | Semiannual Report | April 30, 2024
204
April 30, 2024 (unaudited)
| | | First Eagle
High Yield Municipal Fund** | | First Eagle
Short Duration
High Yield
Municipal Fund | |
| | | For the
Six Months Ended
April 30, 2024
(unaudited) | | For the
Year Ended
October 31, 2023 | | For the Period
1/02/24† -
4/30/24
(unaudited) | |
Class R3^ | |
Shares outstanding, beginning of period | | | 61,473 | | | | 51,721 | | | | — | | |
Shares sold | | | 507 | | | | 7,027 | | | | — | | |
Shares issued on reinvestment of distributions | | | 664 | | | | 2,821 | | | | — | | |
Shares redeemed | | | (62,644 | ) | | | (96 | ) | | | — | | |
Shares outstanding, end of period | | | — | | | | 61,473 | | | | — | | |
Class R4^ | |
Shares outstanding, beginning of period | | | 1,336 | | | | 1,278 | | | | — | | |
Shares issued on reinvestment of distributions | | | 6 | | | | 58 | | | | — | | |
Shares redeemed | | | (1,342 | ) | | | — | | | | — | | |
Shares outstanding, end of period | | | — | | | | 1,336 | | | | — | | |
Class R5^ | |
Shares outstanding, beginning of period | | | 1,373 | | | | 1,302 | | | | — | | |
Shares issued on reinvestment of distributions | | | 6 | | | | 71 | | | | — | | |
Shares redeemed | | | (1,379 | ) | | | — | | | | — | | |
Shares outstanding, end of period | | | — | | | | 1,373 | | | | — | | |
Class R6 | |
Shares outstanding, beginning of period | | | 1,005,589 | | | | 128,496 | | | | — | | |
Shares sold | | | 204,834 | | | | 1,004,508 | | | | 99,999 | | |
Shares issued on reinvestment of distributions | | | 18,301 | | | | 23,948 | | | | 1,408 | | |
Shares redeemed | | | (1,030,064 | ) | | | (151,363 | ) | | | — | | |
Shares outstanding, end of period | | | 198,660 | | | | 1,005,589 | | | | 101,407 | | |
First Eagle Funds | Semiannual Report | April 30, 2024
205
| | Per share operating performance* | |
| | | | | Change in net assets resulting
from operations | | Less dividends and distributions | |
Selected per
share data for
the period ended: | | Net asset
value,
beginning
of period | | Net
investment
income/
loss | | Net
realized
and
unrealized
gains
(losses) on
investments | | Total
investment
operations | | From net
investment
income | | From
capital
gains | | Return of
capital | | Total
distributions | |
First Eagle Global Fund Class A*** | |
Six Months Ended
April 30, 2024
(unaudited) | | $ | 59.97 | | | | 0.47 | | | | 7.67 | | | | 8.14 | | | | (0.81 | ) | | | (1.41 | ) | | | — | | | | (2.22 | ) | |
October 31, 2023 | | $ | 56.57 | | | | 0.84 | | | | 4.98 | | | | 5.82 | | | | (0.06 | ) | | | (2.36 | ) | | | — | | | | (2.42 | ) | |
October 31, 2022 | | $ | 68.42 | | | | 0.51 | | | | (8.32 | ) | | | (7.81 | ) | | | (1.24 | ) | | | (2.80 | ) | | | — | | | | (4.04 | ) | |
October 31, 2021 | | $ | 55.42 | | | | 0.67 | (d) | | | 13.79 | | | | 14.46 | | | | (0.51 | ) | | | (0.95 | ) | | | — | | | | (1.46 | ) | |
October 31, 2020 | | $ | 59.15 | | | | 0.48 | | | | (1.03 | ) | | | (0.55 | ) | | | (0.73 | ) | | | (2.45 | ) | | | — | | | | (3.18 | ) | |
October 31, 2019 | | $ | 56.37 | | | | 0.64 | | | | 5.37 | | | | 6.01 | | | | (0.43 | ) | | | (2.80 | ) | | | — | | | | (3.23 | ) | |
First Eagle Global Fund Class C*** | |
Six Months Ended
April 30, 2024
(unaudited) | | $ | 57.05 | | | | 0.21 | | | | 7.32 | | | | 7.53 | | | | (0.31 | ) | | | (1.41 | ) | | | — | | | | (1.72 | ) | |
October 31, 2023 | | $ | 54.26 | | | | 0.35 | | | | 4.80 | | | | 5.15 | | | | — | | | | (2.36 | ) | | | — | | | | (2.36 | ) | |
October 31, 2022 | | $ | 65.60 | | | | 0.04 | | | | (7.99 | ) | | | (7.95 | ) | | | (0.59 | ) | | | (2.80 | ) | | | — | | | | (3.39 | ) | |
October 31, 2021 | | $ | 53.12 | | | | 0.15 | (d) | | | 13.28 | | | | 13.43 | | | | — | | | | (0.95 | ) | | | — | | | | (0.95 | ) | |
October 31, 2020 | | $ | 56.69 | | | | 0.07 | | | | (1.01 | ) | | | (0.94 | ) | | | (0.18 | ) | | | (2.45 | ) | | | — | | | | (2.63 | ) | |
October 31, 2019 | | $ | 54.11 | | | | 0.18 | | | | 5.20 | | | | 5.38 | | | | — | | | | (2.80 | ) | | | — | | | | (2.80 | ) | |
First Eagle Global Fund Class I*** | |
Six Months Ended
April 30, 2024
(unaudited) | | $ | 60.42 | | | | 0.55 | | | | 7.72 | | | | 8.27 | | | | (0.97 | ) | | | (1.41 | ) | | | — | | | | (2.38 | ) | |
October 31, 2023 | | $ | 56.98 | | | | 0.99 | | | | 5.02 | | | | 6.01 | | | | (0.21 | ) | | | (2.36 | ) | | | — | | | | (2.57 | ) | |
October 31, 2022 | | $ | 68.90 | | | | 0.67 | | | | (8.38 | ) | | | (7.71 | ) | | | (1.41 | ) | | | (2.80 | ) | | | — | | | | (4.21 | ) | |
October 31, 2021 | | $ | 55.79 | | | | 0.85 | (d) | | | 13.87 | | | | 14.72 | | | | (0.66 | ) | | | (0.95 | ) | | | — | | | | (1.61 | ) | |
October 31, 2020 | | $ | 59.52 | | | | 0.63 | | | | (1.03 | ) | | | (0.40 | ) | | | (0.88 | ) | | | (2.45 | ) | | | — | | | | (3.33 | ) | |
October 31, 2019 | | $ | 56.73 | | | | 0.78 | | | | 5.41 | | | | 6.19 | | | | (0.60 | ) | | | (2.80 | ) | | | — | | | | (3.40 | ) | |
First Eagle Global Fund Class R6*** | |
Six Months Ended
April 30, 2024
(unaudited) | | $ | 60.46 | | | | 0.58 | | | | 7.71 | | | | 8.29 | | | | (1.01 | ) | | | (1.41 | ) | | | — | | | | (2.42 | ) | |
October 31, 2023 | | $ | 57.02 | | | | 1.04 | | | | 5.01 | | | | 6.05 | | | | (0.25 | ) | | | (2.36 | ) | | | — | | | | (2.61 | ) | |
October 31, 2022 | | $ | 68.95 | | | | 0.71 | | | | (8.38 | ) | | | (7.67 | ) | | | (1.46 | ) | | | (2.80 | ) | | | — | | | | (4.26 | ) | |
October 31, 2021 | | $ | 55.83 | | | | 0.90 | (d) | | | 13.87 | | | | 14.77 | | | | (0.70 | ) | | | (0.95 | ) | | | — | | | | (1.65 | ) | |
October 31, 2020 | | $ | 59.55 | | | | 0.64 | | | | (0.99 | ) | | | (0.35 | ) | | | (0.92 | ) | | | (2.45 | ) | | | — | | | | (3.37 | ) | |
October 31, 2019 | | $ | 56.76 | | | | 0.82 | | | | 5.41 | | | | 6.23 | | | | (0.64 | ) | | | (2.80 | ) | | | — | | | | (3.44 | ) | |
First Eagle Funds | Semiannual Report | April 30, 2024
206
| | | | | | | | | Ratios/Supplemental data | | | |
| | | | | | | | | Ratios to Average Net Assets of: | | | |
Selected per
share data for
the period ended: | | Net asset
value, end
of period | | Total
return(a) | | Net assets,
end of
period
(thousands) | | Operating
expenses
excluding
earnings
credits
and/or fee
waivers | | Operating
expenses
including
earnings
credits
and/or fee
waivers | | Net
investment
income
excluding
earnings
credits
and/or fee
waivers | | Net
investment
income
including
earnings
credits
and/or fee
waivers | | Portfolio
turnover
rate | |
First Eagle Global Fund Class A*** | |
Six Months Ended
April 30, 2024
(unaudited) | | $ | 65.89 | | | | 13.88 | %(b) | | $ | 14,073,437 | | | | 1.10 | %(c) | | | 1.10 | %(c) | | | 1.48 | %(c) | | | 1.49 | %(c) | | | 2.77 | %(b) | |
October 31, 2023 | | $ | 59.97 | | | | 10.35 | % | | $ | 12,976,288 | | | | 1.10 | % | | | 1.10 | % | | | 1.36 | % | | | 1.37 | % | | | 6.00 | % | |
October 31, 2022 | | $ | 56.57 | | | | (11.90 | )% | | $ | 12,562,351 | | | | 1.11 | % | | | 1.11 | % | | | 0.84 | % | | | 0.84 | % | | | 10.87 | % | |
October 31, 2021 | | $ | 68.42 | | | | 26.49 | %(g) | | $ | 15,108,210 | | | | 1.11 | % | | | 1.11 | % | | | 1.03 | %(d) | | | 1.03 | %(d) | | | 7.29 | % | |
October 31, 2020 | | $ | 55.42 | | | | (1.12 | )% | | $ | 12,112,205 | | | | 1.11 | % | | | 1.11 | % | | | 0.87 | % | | | 0.87 | % | | | 10.84 | % | |
October 31, 2019 | | $ | 59.15 | | | | 11.44 | % | | $ | 13,638,545 | | | | 1.11 | % | | | 1.11 | % | | | 1.13 | % | | | 1.13 | % | | | 10.26 | % | |
First Eagle Global Fund Class C*** | |
Six Months Ended
April 30, 2024
(unaudited) | | $ | 62.86 | | | | 13.43 | %(b) | | $ | 1,480,562 | | | | 1.87 | %(c) | | | 1.87 | %(c) | | | 0.70 | %(c) | | | 0.70 | %(c) | | | 2.77 | %(b) | |
October 31, 2023 | | $ | 57.05 | | | | 9.53 | % | | $ | 1,488,095 | | | | 1.86 | % | | | 1.86 | % | | | 0.59 | % | | | 0.60 | % | | | 6.00 | % | |
October 31, 2022 | | $ | 54.26 | | | | (12.57 | )% | | $ | 1,738,497 | | | | 1.87 | % | | | 1.87 | % | | | 0.06 | % | | | 0.06 | % | | | 10.87 | % | |
October 31, 2021 | | $ | 65.60 | | | | 25.53 | %(g) | | $ | 2,623,491 | | | | 1.87 | % | | | 1.87 | % | | | 0.24 | %(d) | | | 0.24 | %(d) | | | 7.29 | % | |
October 31, 2020 | | $ | 53.12 | | | | (1.86 | )% | | $ | 3,423,967 | | | | 1.87 | % | | | 1.87 | % | | | 0.13 | % | | | 0.13 | % | | | 10.84 | % | |
October 31, 2019 | | $ | 56.69 | | | | 10.58 | % | | $ | 5,619,288 | | | | 1.87 | % | | | 1.86 | % | | | 0.33 | % | | | 0.33 | % | | | 10.26 | % | |
First Eagle Global Fund Class I*** | |
Six Months Ended
April 30, 2024
(unaudited) | | $ | 66.31 | | | | 14.00 | %(b) | | $ | 33,419,262 | | | | 0.86 | %(c) | | | 0.86 | %(c) | | | 1.73 | %(c) | | | 1.73 | %(c) | | | 2.77 | %(b) | |
October 31, 2023 | | $ | 60.42 | | | | 10.63 | % | | $ | 29,941,639 | | | | 0.86 | % | | | 0.86 | % | | | 1.60 | % | | | 1.61 | % | | | 6.00 | % | |
October 31, 2022 | | $ | 56.98 | | | | (11.69 | )% | | $ | 26,919,899 | | | | 0.86 | % | | | 0.86 | % | | | 1.09 | % | | | 1.09 | % | | | 10.87 | % | |
October 31, 2021 | | $ | 68.90 | | | | 26.82 | %(g) | | $ | 30,248,818 | | | | 0.86 | % | | | 0.86 | % | | | 1.29 | %(d) | | | 1.29 | %(d) | | | 7.29 | % | |
October 31, 2020 | | $ | 55.79 | | | | (0.86 | )% | | $ | 24,274,791 | | | | 0.86 | % | | | 0.86 | % | | | 1.14 | % | | | 1.14 | % | | | 10.84 | % | |
October 31, 2019 | | $ | 59.52 | | | | 11.72 | % | | $ | 30,133,165 | | | | 0.85 | % | | | 0.85 | % | | | 1.38 | % | | | 1.38 | % | | | 10.26 | % | |
First Eagle Global Fund Class R6*** | |
Six Months Ended
April 30, 2024
(unaudited) | | $ | 66.33 | | | | 14.04 | %(b) | | $ | 2,391,683 | | | | 0.79 | %(c) | | | 0.79 | %(c) | | | 1.80 | %(c) | | | 1.81 | %(c) | | | 2.77 | %(b) | |
October 31, 2023 | | $ | 60.46 | | | | 10.70 | % | | $ | 2,061,709 | | | | 0.79 | % | | | 0.79 | % | | | 1.68 | % | | | 1.68 | % | | | 6.00 | % | |
October 31, 2022 | | $ | 57.02 | | | | (11.62 | )% | | $ | 1,700,134 | | | | 0.79 | % | | | 0.79 | % | | | 1.15 | % | | | 1.15 | % | | | 10.87 | % | |
October 31, 2021 | | $ | 68.95 | | | | 26.91 | %(g) | | $ | 2,122,258 | | | | 0.78 | % | | | 0.78 | % | | | 1.38 | %(d) | | | 1.38 | %(d) | | | 7.29 | % | |
October 31, 2020 | | $ | 55.83 | | | | (0.79 | )% | | $ | 1,555,290 | | | | 0.79 | % | | | 0.79 | % | | | 1.15 | % | | | 1.15 | % | | | 10.84 | % | |
October 31, 2019 | | $ | 59.55 | | | | 11.79 | % | | $ | 944,249 | | | | 0.79 | % | | | 0.79 | % | | | 1.44 | % | | | 1.44 | % | | | 10.26 | % | |
First Eagle Funds | Semiannual Report | April 30, 2024
207
| | | Per share operating performance* | |
| | | | | Change in net assets resulting
from operations | | Less dividends and distributions | |
Selected per
share data for
the period ended: | | Net asset
value,
beginning
of period | | Net
investment
income/
loss | | Net
realized
and
unrealized
gains
(losses) on
investments | | Total
investment
operations | | From net
investment
income | | From
capital
gains | | Return of
capital | | Total
distributions | |
First Eagle Overseas Fund Class A*** | |
Six Months Ended
April 30, 2024
(unaudited) | | $ | 22.81 | | | | 0.21 | | | | 2.42 | | | | 2.63 | | | | (0.41 | ) | | | (0.13 | ) | | | — | | | | (0.54 | ) | |
October 31, 2023 | | $ | 21.26 | | | | 0.37 | | | | 1.99 | | | | 2.36 | | | | (0.02 | ) | | | (0.79 | ) | | | — | | | | (0.81 | ) | |
October 31, 2022 | | $ | 26.71 | | | | 0.30 | | | | (4.30 | ) | | | (4.00 | ) | | | (0.87 | ) | | | (0.58 | ) | | | — | | | | (1.45 | ) | |
October 31, 2021 | | $ | 22.80 | | | | 0.31 | (e) | | | 3.65 | | | | 3.96 | | | | (0.05 | ) | | | — | | | | — | | | | (0.05 | ) | |
October 31, 2020 | | $ | 24.65 | | | | 0.19 | | | | (0.71 | ) | | | (0.52 | ) | | | (0.50 | ) | | | (0.83 | ) | | | — | | | | (1.33 | ) | |
October 31, 2019 | | $ | 22.71 | | | | 0.32 | | | | 2.28 | | | | 2.60 | | | | (0.27 | ) | | | (0.39 | ) | | | — | | | | (0.66 | ) | |
First Eagle Overseas Fund Class C*** | |
Six Months Ended
April 30, 2024
(unaudited) | | $ | 21.55 | | | | 0.11 | | | | 2.31 | | | | 2.42 | | | | (0.22 | ) | | | (0.13 | ) | | | — | | | | (0.35 | ) | |
October 31, 2023 | | $ | 20.26 | | | | 0.18 | | | | 1.90 | | | | 2.08 | | | | — | | | | (0.79 | ) | | | — | | | | (0.79 | ) | |
October 31, 2022 | | $ | 25.44 | | | | 0.11 | | | | (4.09 | ) | | | (3.98 | ) | | | (0.62 | ) | | | (0.58 | ) | | | — | | | | (1.20 | ) | |
October 31, 2021 | | $ | 21.83 | | | | 0.10 | (e) | | | 3.51 | | | | 3.61 | | | | — | | | | — | | | | — | | | | — | | |
October 31, 2020 | | $ | 23.58 | | | | 0.02 | | | | (0.69 | ) | | | (0.67 | ) | | | (0.25 | ) | | | (0.83 | ) | | | — | | | | (1.08 | ) | |
October 31, 2019 | | $ | 21.73 | | | | 0.11 | | | | 2.22 | | | | 2.33 | | | | (0.09 | ) | | | (0.39 | ) | | | — | | | | (0.48 | ) | |
First Eagle Overseas Fund Class I*** | |
Six Months Ended
April 30, 2024
(unaudited) | | $ | 23.43 | | | | 0.25 | | | | 2.49 | | | | 2.74 | | | | (0.48 | ) | | | (0.13 | ) | | | — | | | | (0.61 | ) | |
October 31, 2023 | | $ | 21.83 | | | | 0.44 | | | | 2.03 | | | | 2.47 | | | | (0.08 | ) | | | (0.79 | ) | | | — | | | | (0.87 | ) | |
October 31, 2022 | | $ | 27.39 | | | | 0.37 | | | | (4.40 | ) | | | (4.03 | ) | | | (0.95 | ) | | | (0.58 | ) | | | — | | | | (1.53 | ) | |
October 31, 2021 | | $ | 23.38 | | | | 0.40 | (e) | | | 3.73 | | | | 4.13 | | | | (0.12 | ) | | | — | | | | — | | | | (0.12 | ) | |
October 31, 2020 | | $ | 25.24 | | | | 0.26 | | | | (0.72 | ) | | | (0.46 | ) | | | (0.57 | ) | | | (0.83 | ) | | | — | | | | (1.40 | ) | |
October 31, 2019 | | $ | 23.26 | | | | 0.39 | | | | 2.33 | | | | 2.72 | | | | (0.35 | ) | | | (0.39 | ) | | | — | | | | (0.74 | ) | |
First Eagle Overseas Fund Class R6*** | |
Six Months Ended
April 30, 2024
(unaudited) | | $ | 23.44 | | | | 0.26 | | | | 2.49 | | | | 2.75 | | | | (0.50 | ) | | | (0.13 | ) | | | — | | | | (0.63 | ) | |
October 31, 2023 | | $ | 21.84 | | | | 0.46 | | | | 2.03 | | | | 2.49 | | | | (0.10 | ) | | | (0.79 | ) | | | — | | | | (0.89 | ) | |
October 31, 2022 | | $ | 27.40 | | | | 0.39 | | | | (4.40 | ) | | | (4.01 | ) | | | (0.97 | ) | | | (0.58 | ) | | | — | | | | (1.55 | ) | |
October 31, 2021 | | $ | 23.39 | | | | 0.45 | (e) | | | 3.70 | | | | 4.15 | | | | (0.14 | ) | | | — | | | | — | | | | (0.14 | ) | |
October 31, 2020 | | $ | 25.25 | | | | 0.28 | | | | (0.72 | ) | | | (0.44 | ) | | | (0.59 | ) | | | (0.83 | ) | | | — | | | | (1.42 | ) | |
October 31, 2019 | | $ | 23.27 | | | | 0.41 | | | | 2.33 | | | | 2.74 | | | | (0.37 | ) | | | (0.39 | ) | | | — | | | | (0.76 | ) | |
First Eagle Funds | Semiannual Report | April 30, 2024
208
| | | | | | | | | Ratios/Supplemental data | | | |
| | | | | | | | | Ratios to Average Net Assets of: | | | |
Selected per
share data for
the period ended: | | Net asset
value, end
of period | | Total
return(a) | | Net assets,
end of
period
(thousands) | | Operating
expenses
excluding
earnings
credits
and/or fee
waivers | | Operating
expenses
including
earnings
credits
and/or fee
waivers | | Net
investment
income
excluding
earnings
credits
and/or fee
waivers | | Net
investment
income
including
earnings
credits
and/or fee
waivers | | Portfolio
turnover
rate | |
First Eagle Overseas Fund Class A*** | |
Six Months Ended
April 30, 2024
(unaudited) | | $ | 24.90 | | | | 11.69 | %(b) | | $ | 1,410,322 | | | | 1.16 | %(c) | | | 1.16 | %(c) | | | 1.73 | %(c) | | | 1.73 | %(c) | | | 2.20 | %(b) | |
October 31, 2023 | | $ | 22.81 | | | | 11.11 | % | | $ | 1,360,488 | | | | 1.15 | % | | | 1.15 | % | | | 1.56 | % | | | 1.56 | % | | | 3.98 | % | |
October 31, 2022 | | $ | 21.26 | | | | (15.62 | )% | | $ | 1,394,388 | | | | 1.15 | % | | | 1.15 | % | | | 1.24 | % | | | 1.24 | % | | | 8.99 | % | |
October 31, 2021 | | $ | 26.71 | | | | 17.35 | %(h) | | $ | 1,895,378 | | | | 1.16 | % | | | 1.16 | % | | | 1.20 | %(e) | | | 1.20 | %(e) | | | 9.93 | % | |
October 31, 2020 | | $ | 22.80 | | | | (2.35 | )% | | $ | 1,742,861 | | | | 1.15 | % | | | 1.15 | % | | | 0.82 | % | | | 0.82 | % | | | 13.20 | % | |
October 31, 2019 | | $ | 24.65 | | | | 11.82 | % | | $ | 2,125,742 | | | | 1.15 | % | | | 1.15 | % | | | 1.38 | % | | | 1.38 | % | | | 6.99 | % | |
First Eagle Overseas Fund Class C*** | |
Six Months Ended
April 30, 2024
(unaudited) | | $ | 23.62 | | | | 11.33 | %(b) | | $ | 67,241 | | | | 1.90 | %(c) | | | 1.90 | %(c) | | | 0.94 | %(c) | | | 0.94 | %(c) | | | 2.20 | %(b) | |
October 31, 2023 | | $ | 21.55 | | | | 10.26 | % | | $ | 74,231 | | | | 1.88 | % | | | 1.88 | % | | | 0.82 | % | | | 0.82 | % | | | 3.98 | % | |
October 31, 2022 | | $ | 20.26 | | | | (16.23 | )% | | $ | 92,476 | | | | 1.89 | % | | | 1.89 | % | | | 0.48 | % | | | 0.48 | % | | | 8.99 | % | |
October 31, 2021 | | $ | 25.44 | | | | 16.49 | %(h) | | $ | 157,203 | | | | 1.89 | % | | | 1.89 | % | | | 0.41 | %(e) | | | 0.41 | %(e) | | | 9.93 | % | |
October 31, 2020 | | $ | 21.83 | | | | (3.07 | )% | | $ | 228,072 | | | | 1.89 | % | | | 1.89 | % | | | 0.08 | % | | | 0.08 | % | | | 13.20 | % | |
October 31, 2019 | | $ | 23.58 | | | | 10.98 | % | | $ | 378,755 | | | | 1.89 | % | | | 1.89 | % | | | 0.50 | % | | | 0.50 | % | | | 6.99 | % | |
First Eagle Overseas Fund Class I*** | |
Six Months Ended
April 30, 2024
(unaudited) | | $ | 25.56 | | | | 11.86 | %(b) | | $ | 9,488,231 | | | | 0.89 | %(c) | | | 0.89 | %(c) | | | 1.99 | %(c) | | | 1.99 | %(c) | | | 2.20 | %(b) | |
October 31, 2023 | | $ | 23.43 | | | | 11.36 | % | | $ | 9,122,327 | | | | 0.88 | % | | | 0.88 | % | | | 1.84 | % | | | 1.84 | % | | | 3.98 | % | |
October 31, 2022 | | $ | 21.83 | | | | (15.40 | )% | | $ | 8,462,922 | | | | 0.89 | % | | | 0.89 | % | | | 1.49 | % | | | 1.49 | % | | | 8.99 | % | |
October 31, 2021 | | $ | 27.39 | | | | 17.71 | %(h) | | $ | 11,072,223 | | | | 0.88 | % | | | 0.88 | % | | | 1.49 | %(e) | | | 1.49 | %(e) | | | 9.93 | % | |
October 31, 2020 | | $ | 23.38 | | | | (2.06 | )% | | $ | 9,698,986 | | | | 0.87 | % | | | 0.87 | % | | | 1.11 | % | | | 1.11 | % | | | 13.20 | % | |
October 31, 2019 | | $ | 25.24 | | | | 12.12 | % | | $ | 10,694,125 | | | | 0.86 | % | | | 0.86 | % | | | 1.64 | % | | | 1.64 | % | | | 6.99 | % | |
First Eagle Overseas Fund Class R6*** | |
Six Months Ended
April 30, 2024
(unaudited) | | $ | 25.56 | | | | 11.91 | %(b) | | $ | 1,405,712 | | | | 0.80 | %(c) | | | 0.80 | %(c) | | | 2.10 | %(c) | | | 2.10 | %(c) | | | 2.20 | %(b) | |
October 31, 2023 | | $ | 23.44 | | | | 11.45 | % | | $ | 1,289,925 | | | | 0.80 | % | | | 0.80 | % | | | 1.91 | % | | | 1.92 | % | | | 3.98 | % | |
October 31, 2022 | | $ | 21.84 | | | | (15.32 | )% | | $ | 1,255,272 | | | | 0.80 | % | | | 0.80 | % | | | 1.58 | % | | | 1.58 | % | | | 8.99 | % | |
October 31, 2021 | | $ | 27.40 | | | | 17.78 | %(h) | | $ | 1,566,467 | | | | 0.79 | % | | | 0.79 | % | | | 1.65 | %(e) | | | 1.65 | %(e) | | | 9.93 | % | |
October 31, 2020 | | $ | 23.39 | | | | (1.99 | )% | | $ | 919,645 | | | | 0.80 | % | | | 0.80 | % | | | 1.19 | % | | | 1.19 | % | | | 13.20 | % | |
October 31, 2019 | | $ | 25.25 | | | | 12.21 | % | | $ | 759,773 | | | | 0.80 | % | | | 0.80 | % | | | 1.74 | % | | | 1.74 | % | | | 6.99 | % | |
First Eagle Funds | Semiannual Report | April 30, 2024
209
| | | Per share operating performance* | |
| | | | | Change in net assets resulting
from operations | | Less dividends and distributions | |
Selected per
share data for
the period ended: | | Net asset
value,
beginning
of period | | Net
investment
income/
loss | | Net
realized
and
unrealized
gains
(losses) on
investments | | Total
investment
operations | | From net
investment
income | | From
capital
gains | | Return of
capital | | Total
distributions | |
First Eagle U.S. Value Fund Class A*** | |
Six Months Ended
April 30, 2024
(unaudited) | | $ | 18.54 | | | | 0.11 | | | | 2.61 | | | | 2.72 | | | | (0.24 | ) | | | (1.01 | ) | | | — | | | | (1.25 | ) | |
October 31, 2023 | | $ | 18.41 | | | | 0.22 | | | | 1.37 | | | | 1.59 | | | | (0.10 | ) | | | (1.36 | ) | | | — | | | | (1.46 | ) | |
October 31, 2022 | | $ | 22.23 | | | | 0.13 | | | | (2.08 | ) | | | (1.95 | ) | | | (0.17 | ) | | | (1.70 | ) | | | — | | | | (1.87 | ) | |
October 31, 2021 | | $ | 16.97 | | | | 0.09 | | | | 5.49 | | | | 5.58 | | | | (0.20 | ) | | | (0.12 | ) | | | — | | | | (0.32 | ) | |
October 31, 2020 | | $ | 18.84 | | | | 0.14 | | | | (0.48 | ) | | | (0.34 | ) | | | (0.16 | ) | | | (1.37 | ) | | | — | | | | (1.53 | ) | |
October 31, 2019 | | $ | 19.89 | | | | 0.16 | | | | 1.44 | | | | 1.60 | | | | (0.12 | ) | | | (2.53 | ) | | | — | | | | (2.65 | ) | |
First Eagle U.S. Value Fund Class C*** | |
Six Months Ended
April 30, 2024
(unaudited) | | $ | 17.40 | | | | 0.03 | | | | 2.46 | | | | 2.49 | | | | (0.09 | ) | | | (1.01 | ) | | | — | | | | (1.10 | ) | |
October 31, 2023 | | $ | 17.39 | | | | 0.08 | | | | 1.29 | | | | 1.37 | | | | — | | | | (1.36 | ) | | | — | | | | (1.36 | ) | |
October 31, 2022 | | $ | 21.08 | | | | (0.02 | ) | | | (1.97 | ) | | | (1.99 | ) | | | — | | | | (1.70 | ) | | | — | | | | (1.70 | ) | |
October 31, 2021 | | $ | 16.06 | | | | (0.06 | ) | | | 5.22 | | | | 5.16 | | | | (0.02 | ) | | | (0.12 | ) | | | — | | | | (0.14 | ) | |
October 31, 2020 | | $ | 17.89 | | | | 0.01 | | | | (0.47 | ) | | | (0.46 | ) | | | — | | | | (1.37 | ) | | | — | | | | (1.37 | ) | |
October 31, 2019 | | $ | 19.03 | | | | 0.02 | | | | 1.37 | | | | 1.39 | | | | — | | | | (2.53 | ) | | | — | | | | (2.53 | ) | |
First Eagle U.S. Value Fund Class I*** | |
Six Months Ended
April 30, 2024
(unaudited) | | $ | 19.00 | | | | 0.14 | | | | 2.68 | | | | 2.82 | | | | (0.29 | ) | | | (1.01 | ) | | | — | | | | (1.30 | ) | |
October 31, 2023 | | $ | 18.84 | | | | 0.28 | | | | 1.39 | | | | 1.67 | | | | (0.15 | ) | | | (1.36 | ) | | | — | | | | (1.51 | ) | |
October 31, 2022 | | $ | 22.71 | | | | 0.19 | | | | (2.13 | ) | | | (1.94 | ) | | | (0.23 | ) | | | (1.70 | ) | | | — | | | | (1.93 | ) | |
October 31, 2021 | | $ | 17.32 | | | | 0.15 | | | | 5.61 | | | | 5.76 | | | | (0.25 | ) | | | (0.12 | ) | | | — | | | | (0.37 | ) | |
October 31, 2020 | | $ | 19.21 | | | | 0.20 | | | | (0.51 | ) | | | (0.31 | ) | | | (0.21 | ) | | | (1.37 | ) | | | — | | | | (1.58 | ) | |
October 31, 2019 | | $ | 20.23 | | | | 0.21 | | | | 1.48 | | | | 1.69 | | | | (0.18 | ) | | | (2.53 | ) | | | — | | | | (2.71 | ) | |
First Eagle U.S. Value Fund Class R6*** | |
Six Months Ended
April 30, 2024
(unaudited) | | $ | 19.00 | | | | 0.15 | | | | 2.67 | | | | 2.82 | | | | (0.30 | ) | | | (1.01 | ) | | | — | | | | (1.31 | ) | |
October 31, 2023 | | $ | 18.84 | | | | 0.29 | | | | 1.39 | | | | 1.68 | | | | (0.16 | ) | | | (1.36 | ) | | | — | | | | (1.52 | ) | |
October 31, 2022 | | $ | 22.71 | | | | 0.20 | | | | (2.13 | ) | | | (1.93 | ) | | | (0.24 | ) | | | (1.70 | ) | | | — | | | | (1.94 | ) | |
October 31, 2021 | | $ | 17.32 | | | | 0.16 | | | | 5.61 | | | | 5.77 | | | | (0.26 | ) | | | (0.12 | ) | | | — | | | | (0.38 | ) | |
October 31, 2020 | | $ | 19.22 | | | | 0.19 | | | | (0.50 | ) | | | (0.31 | ) | | | (0.22 | ) | | | (1.37 | ) | | | — | | | | (1.59 | ) | |
October 31, 2019 | | $ | 20.24 | | | | 0.21 | | | | 1.49 | | | | 1.70 | | | | (0.19 | ) | | | (2.53 | ) | | | — | | | | (2.72 | ) | |
First Eagle Funds | Semiannual Report | April 30, 2024
210
| | | | | | | | | Ratios/Supplemental data | | | |
| | | | | | | | | Ratios to Average Net Assets of: | | | |
Selected per
share data for
the period ended: | | Net asset
value, end
of period | | Total
return(a) | | Net assets,
end of
period
(thousands) | | Operating
expenses
excluding
earnings
credits
and/or fee
waivers | | Operating
expenses
including
earnings
credits
and/or fee
waivers | | Net
investment
income
excluding
earnings
credits
and/or fee
waivers | | Net
investment
income
including
earnings
credits
and/or fee
waivers | | Portfolio
turnover
rate | |
First Eagle U.S. Value Fund Class A*** | |
Six Months Ended
April 30, 2024
(unaudited) | | $ | 20.01 | | | | 15.32 | %(b) | | $ | 582,918 | | | | 1.16 | %(c) | | | 1.12 | %(c) | | | 1.12 | %(c) | | | 1.16 | %(c) | | | 3.17 | %(b) | |
October 31, 2023 | | $ | 18.54 | | | | 8.81 | % | | $ | 536,105 | | | | 1.16 | % | | | 1.10 | % | | | 1.14 | % | | | 1.19 | % | | | 6.62 | % | |
October 31, 2022 | | $ | 18.41 | | | | (9.12 | )% | | $ | 540,287 | | | | 1.16 | % | | | 1.11 | % | | | 0.60 | % | | | 0.65 | % | | | 10.33 | % | |
October 31, 2021 | | $ | 22.23 | | | | 33.28 | % | | $ | 638,937 | | | | 1.16 | % | | | 1.11 | % | | | 0.40 | % | | | 0.45 | % | | | 4.02 | % | |
October 31, 2020 | | $ | 16.97 | | | | (2.23 | )% | | $ | 485,589 | | | | 1.18 | % | | | 1.13 | % | | | 0.78 | % | | | 0.83 | % | | | 10.30 | % | |
October 31, 2019 | | $ | 18.84 | | | | 9.43 | % | | $ | 613,548 | | | | 1.16 | % | | | 1.11 | % | | | 0.81 | % | | | 0.86 | % | | | 8.65 | % | |
First Eagle U.S. Value Fund Class C*** | |
Six Months Ended
April 30, 2024
(unaudited) | | $ | 18.79 | | | | 14.91 | %(b) | | $ | 29,368 | | | | 1.93 | %(c) | | | 1.89 | %(c) | | | 0.34 | %(c) | | | 0.38 | %(c) | | | 3.17 | %(b) | |
October 31, 2023 | | $ | 17.40 | | | | 8.00 | % | | $ | 29,230 | | | | 1.91 | % | | | 1.86 | % | | | 0.37 | % | | | 0.43 | % | | | 6.62 | % | |
October 31, 2022 | | $ | 17.39 | | | | (9.82 | )% | | $ | 34,953 | | | | 1.92 | % | | | 1.87 | % | | | (0.18 | )% | | | (0.13 | )% | | | 10.33 | % | |
October 31, 2021 | | $ | 21.08 | | | | 32.29 | % | | $ | 53,912 | | | | 1.95 | % | | | 1.90 | % | | | (0.38 | )% | | | (0.33 | )% | | | 4.02 | % | |
October 31, 2020 | | $ | 16.06 | | | | (3.00 | )% | | $ | 101,600 | | | | 1.94 | % | | | 1.89 | % | | | 0.03 | % | | | 0.08 | % | | | 10.30 | % | |
October 31, 2019 | | $ | 17.89 | | | | 8.59 | % | | $ | 194,380 | | | | 1.92 | % | | | 1.87 | % | | | 0.06 | % | | | 0.11 | % | | | 8.65 | % | |
First Eagle U.S. Value Fund Class I*** | |
Six Months Ended
April 30, 2024
(unaudited) | | $ | 20.52 | | | | 15.49 | %(b) | | $ | 616,476 | | | | 0.89 | %(c) | | | 0.85 | %(c) | | | 1.39 | %(c) | | | 1.43 | %(c) | | | 3.17 | %(b) | |
October 31, 2023 | | $ | 19.00 | | | | 9.08 | % | | $ | 541,195 | | | | 0.91 | % | | | 0.86 | % | | | 1.38 | % | | | 1.44 | % | | | 6.62 | % | |
October 31, 2022 | | $ | 18.84 | | | | (8.88 | )% | | $ | 538,424 | | | | 0.88 | % | | | 0.83 | % | | | 0.88 | % | | | 0.93 | % | | | 10.33 | % | |
October 31, 2021 | | $ | 22.71 | | | | 33.72 | % | | $ | 584,344 | | | | 0.89 | % | | | 0.84 | % | | | 0.68 | % | | | 0.73 | % | | | 4.02 | % | |
October 31, 2020 | | $ | 17.32 | | | | (2.01 | )% | | $ | 505,997 | | | | 0.89 | % | | | 0.84 | % | | | 1.08 | % | | | 1.13 | % | | | 10.30 | % | |
October 31, 2019 | | $ | 19.21 | | | | 9.79 | % | | $ | 749,245 | | | | 0.88 | % | | | 0.83 | % | | | 1.09 | % | | | 1.14 | % | | | 8.65 | % | |
First Eagle U.S. Value Fund Class R6*** | |
Six Months Ended
April 30, 2024
(unaudited) | | $ | 20.51 | | | | 15.52 | %(b) | | $ | 37,032 | | | | 0.84 | %(c) | | | 0.80 | %(c) | | | 1.43 | %(c) | | | 1.48 | %(c) | | | 3.17 | %(b) | |
October 31, 2023 | | $ | 19.00 | | | | 9.14 | % | | $ | 32,405 | | | | 0.84 | % | | | 0.79 | % | | | 1.46 | % | | | 1.51 | % | | | 6.62 | % | |
October 31, 2022 | | $ | 18.84 | | | | (8.83 | )% | | $ | 25,921 | | | | 0.83 | % | | | 0.78 | % | | | 0.94 | % | | | 0.99 | % | | | 10.33 | % | |
October 31, 2021 | | $ | 22.71 | | | | 33.78 | % | | $ | 25,676 | | | | 0.84 | % | | | 0.79 | % | | | 0.72 | % | | | 0.77 | % | | | 4.02 | % | |
October 31, 2020 | | $ | 17.32 | | | | (2.02 | )% | | $ | 15,058 | | | | 0.86 | % | | | 0.81 | % | | | 1.03 | % | | | 1.08 | % | | | 10.30 | % | |
October 31, 2019 | | $ | 19.22 | | | | 9.83 | % | | $ | 15,949 | | | | 0.83 | % | | | 0.78 | % | | | 1.09 | % | | | 1.14 | % | | | 8.65 | % | |
First Eagle Funds | Semiannual Report | April 30, 2024
211
| | Per share operating performance* | |
| | | | | Change in net assets resulting
from operations | | Less dividends and distributions | |
Selected per
share data for
the period ended: | | Net asset
value,
beginning
of period | | Net
investment
income/
loss | | Net
realized
and
unrealized
gains
(losses) on
investments | | Total
investment
operations | | From net
investment
income | | From
capital
gains | | Return of
capital | | Total
distributions | |
First Eagle Gold Fund Class A*** | |
Six Months Ended
April 30, 2024
(unaudited) | | $ | 22.30 | | | | 0.05 | | | | 2.93 | | | | 2.98 | | | | (0.21 | ) | | | — | | | | — | | | | (0.21 | ) | |
October 31, 2023 | | $ | 19.25 | | | | 0.19 | | | | 2.86 | | | | 3.05 | | | | — | | | | — | | | | — | | | | — | | |
October 31, 2022 | | $ | 22.94 | | | | 0.05 | | | | (3.52 | ) | | | (3.47 | ) | | | (0.22 | ) | | | — | | | | — | | | | (0.22 | ) | |
October 31, 2021 | | $ | 26.28 | | | | (0.01 | ) | | | (3.01 | ) | | | (3.02 | ) | | | (0.32 | ) | | | — | | | | — | | | | (0.32 | ) | |
October 31, 2020 | | $ | 18.66 | | | | (0.12 | ) | | | 7.74 | | | | 7.62 | | | | — | | | | — | | | | — | | | | — | | |
October 31, 2019 | | $ | 13.08 | | | | (0.04 | ) | | | 5.62 | | | | 5.58 | | | | — | | | | — | | | | — | | | | — | | |
First Eagle Gold Fund Class C*** | |
Six Months Ended
April 30, 2024
(unaudited) | | $ | 20.10 | | | | (0.03 | ) | | | 2.64 | | | | 2.61 | | | | (0.05 | ) | | | — | | | | — | | | | (0.05 | ) | |
October 31, 2023 | | $ | 17.48 | | | | 0.01 | | | | 2.61 | | | | 2.62 | | | | — | | | | — | | | | — | | | | — | | |
October 31, 2022 | | $ | 20.82 | | | | (0.10 | ) | | | (3.19 | ) | | | (3.29 | ) | | | (0.05 | ) | | | — | | | | — | | | | (0.05 | ) | |
October 31, 2021 | | $ | 23.92 | | | | (0.17 | ) | | | (2.76 | ) | | | (2.93 | ) | | | (0.17 | ) | | | — | | | | — | | | | (0.17 | ) | |
October 31, 2020 | | $ | 17.11 | | | | (0.26 | ) | | | 7.07 | | | | 6.81 | | | | — | | | | — | | | | — | | | | — | | |
October 31, 2019 | | $ | 12.09 | | | | (0.15 | ) | | | 5.17 | | | | 5.02 | | | | — | | | | — | | | | — | | | | — | | |
First Eagle Gold Fund Class I*** | |
Six Months Ended
April 30, 2024
(unaudited) | | $ | 23.08 | | | | 0.08 | | | | 3.04 | | | | 3.12 | | | | (0.27 | ) | | | — | | | | — | | | | (0.27 | ) | |
October 31, 2023 | | $ | 19.88 | | | | 0.26 | | | | 2.94 | | | | 3.20 | | | | — | | | | — | | | | — | | | | — | | |
October 31, 2022 | | $ | 23.68 | | | | 0.12 | | | | (3.64 | ) | | | (3.52 | ) | | | (0.28 | ) | | | — | | | | — | | | | (0.28 | ) | |
October 31, 2021 | | $ | 27.13 | | | | 0.06 | | | | (3.13 | ) | | | (3.07 | ) | | | (0.38 | ) | | | — | | | | — | | | | (0.38 | ) | |
October 31, 2020 | | $ | 19.22 | | | | (0.06 | ) | | | 7.99 | | | | 7.93 | | | | (0.02 | ) | | | — | | | | — | | | | (0.02 | ) | |
October 31, 2019 | | $ | 13.44 | | | | 0.00 | ** | | | 5.78 | | | | 5.78 | | | | — | | | | — | | | | — | | | | — | | |
First Eagle Gold Fund Class R6*** | |
Six Months Ended
April 30, 2024
(unaudited) | | $ | 23.16 | | | | 0.09 | | | | 3.04 | | | | 3.13 | | | | (0.29 | ) | | | — | | | | — | | | | (0.29 | ) | |
October 31, 2023 | | $ | 19.93 | | | | 0.29 | | | | 2.94 | | | | 3.23 | | | | — | | | | — | | | | — | | | | — | | |
October 31, 2022 | | $ | 23.74 | | | | 0.13 | | | | (3.63 | ) | | | (3.50 | ) | | | (0.31 | ) | | | — | | | | — | | | | (0.31 | ) | |
October 31, 2021 | | $ | 27.19 | | | | 0.08 | | | | (3.13 | ) | | | (3.05 | ) | | | (0.40 | ) | | | — | | | | — | | | | (0.40 | ) | |
October 31, 2020 | | $ | 19.26 | | | | (0.03 | ) | | | 7.99 | | | | 7.96 | | | | (0.03 | ) | | | — | | | | — | | | | (0.03 | ) | |
October 31, 2019 | | $ | 13.46 | | | | 0.01 | | | | 5.79 | | | | 5.80 | | | | — | | | | — | | | | — | | | | — | | |
First Eagle Funds | Semiannual Report | April 30, 2024
212
| | | | | | | | | Ratios/Supplemental data | | | |
| | | | | | | | | Ratios to Average Net Assets of: | | | |
Selected per
share data for
the period ended: | | Net asset
value, end
of period | | Total
return(a) | | Net assets,
end of
period
(thousands) | | Operating
expenses
excluding
earnings
credits
and/or fee
waivers | | Operating
expenses
including
earnings
credits
and/or fee
waivers | | Net
investment
income
excluding
earnings
credits
and/or fee
waivers | | Net
investment
income
including
earnings
credits
and/or fee
waivers | | Portfolio
turnover
rate | |
First Eagle Gold Fund Class A*** | |
Six Months Ended
April 30, 2024
(unaudited) | | $ | 25.07 | | | | 13.41 | %(b) | | $ | 603,019 | | | | 1.18 | %(c) | | | 1.18 | %(c) | | | 0.44 | %(c) | | | 0.44 | %(c) | | | 40.04 | %(b) | |
October 31, 2023 | | $ | 22.30 | | | | 15.84 | % | | $ | 549,712 | | | | 1.19 | % | | | 1.18 | % | | | 0.81 | % | | | 0.81 | % | | | 16.39 | % | |
October 31, 2022 | | $ | 19.25 | | | | (15.24 | )% | | $ | 494,372 | | | | 1.19 | % | | | 1.19 | % | | | 0.24 | % | | | 0.24 | % | | | 17.78 | % | |
October 31, 2021 | | $ | 22.94 | | | | (11.60 | )% | | $ | 578,968 | | | | 1.22 | % | | | 1.22 | % | | | (0.03 | )% | | | (0.03 | )% | | | 5.13 | % | |
October 31, 2020 | | $ | 26.28 | | | | 40.84 | % | | $ | 643,945 | | | | 1.21 | % | | | 1.21 | % | | | (0.52 | )% | | | (0.52 | )% | | | 3.34 | % | |
October 31, 2019 | | $ | 18.66 | | | | 42.66 | % | | $ | 386,633 | | | | 1.29 | % | | | 1.29 | % | | | (0.27 | )% | | | (0.27 | )% | | | 20.01 | % | |
First Eagle Gold Fund Class C*** | |
Six Months Ended
April 30, 2024
(unaudited) | | $ | 22.66 | | | | 12.99 | %(b) | | $ | 112,192 | | | | 1.93 | %(c) | | | 1.93 | %(c) | | | (0.31 | )%(c) | | | (0.31 | )%(c) | | | 40.04 | %(b) | |
October 31, 2023 | | $ | 20.10 | | | | 14.99 | % | | $ | 108,058 | | | | 1.92 | % | | | 1.92 | % | | | 0.06 | % | | | 0.07 | % | | | 16.39 | % | |
October 31, 2022 | | $ | 17.48 | | | | (15.87 | )% | | $ | 104,359 | | | | 1.93 | % | | | 1.93 | % | | | (0.51 | )% | | | (0.51 | )% | | | 17.78 | % | |
October 31, 2021 | | $ | 20.82 | | | | (12.25 | )% | | $ | 144,502 | | | | 1.95 | % | | | 1.95 | % | | | (0.77 | )% | | | (0.77 | )% | | | 5.13 | % | |
October 31, 2020 | | $ | 23.92 | | | | 39.80 | % | | $ | 179,978 | | | | 1.95 | % | | | 1.95 | % | | | (1.25 | )% | | | (1.25 | )% | | | 3.34 | % | |
October 31, 2019 | | $ | 17.11 | | | | 41.52 | % | | $ | 115,624 | | | | 2.05 | % | | | 2.05 | % | | | (1.02 | )% | | | (1.02 | )% | | | 20.01 | % | |
First Eagle Gold Fund Class I*** | |
Six Months Ended
April 30, 2024
(unaudited) | | $ | 25.93 | | | | 13.58 | %(b) | | $ | 1,447,096 | | | | 0.95 | %(c) | | | 0.94 | %(c) | | | 0.66 | %(c) | | | 0.67 | %(c) | | | 40.04 | %(b) | |
October 31, 2023 | | $ | 23.08 | | | | 16.10 | % | | $ | 1,349,359 | | | | 0.94 | % | | | 0.94 | % | | | 1.07 | % | | | 1.07 | % | | | 16.39 | % | |
October 31, 2022 | | $ | 19.88 | | | | (15.00 | )% | | $ | 1,075,242 | | | | 0.94 | % | | | 0.94 | % | | | 0.50 | % | | | 0.50 | % | | | 17.78 | % | |
October 31, 2021 | | $ | 23.68 | | | | (11.41 | )% | | $ | 1,349,701 | | | | 0.96 | % | | | 0.96 | % | | | 0.23 | % | | | 0.23 | % | | | 5.13 | % | |
October 31, 2020 | | $ | 27.13 | | | | 41.29 | % | | $ | 1,424,181 | | | | 0.92 | % | | | 0.92 | % | | | (0.25 | )% | | | (0.25 | )% | | | 3.34 | % | |
October 31, 2019 | | $ | 19.22 | | | | 43.01 | % | | $ | 553,633 | | | | 0.99 | % | | | 0.99 | % | | | 0.01 | % | | | 0.01 | % | | | 20.01 | % | |
First Eagle Gold Fund Class R6*** | |
Six Months Ended
April 30, 2024
(unaudited) | | $ | 26.00 | | | | 13.60 | %(b) | | $ | 169,406 | | | | 0.85 | %(c) | | | 0.84 | %(c) | | | 0.78 | %(c) | | | 0.78 | %(c) | | | 40.04 | %(b) | |
October 31, 2023 | | $ | 23.16 | | | | 16.21 | % | | $ | 147,133 | | | | 0.85 | % | | | 0.84 | % | | | 1.18 | % | | | 1.19 | % | | | 16.39 | % | |
October 31, 2022 | | $ | 19.93 | | | | (14.91 | )% | | $ | 105,438 | | | | 0.85 | % | | | 0.85 | % | | | 0.59 | % | | | 0.59 | % | | | 17.78 | % | |
October 31, 2021 | | $ | 23.74 | | | | (11.33 | )% | | $ | 103,234 | | | | 0.85 | % | | | 0.85 | % | | | 0.31 | % | | | 0.31 | % | | | 5.13 | % | |
October 31, 2020 | | $ | 27.19 | | | | 41.42 | % | | $ | 209,208 | | | | 0.85 | % | | | 0.85 | % | | | (0.14 | )% | | | (0.14 | )% | | | 3.34 | % | |
October 31, 2019 | | $ | 19.26 | | | | 43.09 | % | | $ | 163,259 | | | | 0.89 | % | | | 0.89 | % | | | 0.03 | % | | | 0.03 | % | | | 20.01 | % | |
First Eagle Funds | Semiannual Report | April 30, 2024
213
| | | Per share operating performance* | |
| | | | | Change in net assets resulting
from operations | | Less dividends and distributions | |
Selected per
share data for
the period ended: | | Net asset
value,
beginning
of period | | Net
investment
income/
loss | | Net
realized
and
unrealized
gains
(losses) on
investments | | Total
investment
operations | | From net
investment
income | | From
capital
gains | | Return of
capital | | Total
distributions | |
First Eagle Global Income Builder Fund Class A | |
Six Months Ended
April 30, 2024
(unaudited) | | $ | 11.89 | | | | 0.18 | | | | 0.93 | | | | 1.11 | | | | (0.18 | ) | | | — | | | | — | | | | (0.18 | ) | |
October 31, 2023 | | $ | 11.62 | | | | 0.32 | | | | 0.43 | | | | 0.75 | | | | (0.29 | ) | | | (0.19 | ) | | | — | | | | (0.48 | ) | |
October 31, 2022 | | $ | 13.52 | | | | 0.27 | | | | (1.34 | ) | | | (1.07 | ) | | | (0.26 | ) | | | (0.57 | ) | | | — | | | | (0.83 | ) | |
October 31, 2021 | | $ | 11.47 | | | | 0.27 | (f) | | | 2.17 | | | | 2.44 | | | | (0.26 | ) | | | (0.13 | ) | | | — | | | | (0.39 | ) | |
October 31, 2020 | | $ | 12.15 | | | | 0.22 | | | | (0.64 | ) | | | (0.42 | ) | | | (0.22 | ) | | | (0.04 | ) | | | — | | | | (0.26 | ) | |
October 31, 2019 | | $ | 11.45 | | | | 0.25 | | | | 0.70 | | | | 0.95 | | | | (0.25 | ) | | | — | | | | — | | | | (0.25 | ) | |
First Eagle Global Income Builder Fund Class C | |
Six Months Ended
April 30, 2024
(unaudited) | | $ | 11.98 | | | | 0.13 | | | | 0.93 | | | | 1.06 | | | | (0.13 | ) | | | — | | | | — | | | | (0.13 | ) | |
October 31, 2023 | | $ | 11.70 | | | | 0.23 | | | | 0.44 | | | | 0.67 | | | | (0.20 | ) | | | (0.19 | ) | | | — | | | | (0.39 | ) | |
October 31, 2022 | | $ | 13.47 | | | | 0.17 | | | | (1.34 | ) | | | (1.17 | ) | | | (0.03 | ) | | | (0.57 | ) | | | — | | | | (0.60 | ) | |
October 31, 2021 | | $ | 11.44 | | | | 0.16 | (f) | | | 2.17 | | | | 2.33 | | | | (0.17 | ) | | | (0.13 | ) | | | — | | | | (0.30 | ) | |
October 31, 2020 | | $ | 12.11 | | | | 0.13 | | | | (0.63 | ) | | | (0.50 | ) | | | (0.13 | ) | | | (0.04 | ) | | | — | | | | (0.17 | ) | |
October 31, 2019 | | $ | 11.42 | | | | 0.16 | | | | 0.69 | | | | 0.85 | | | | (0.16 | ) | | | — | | | | — | | | | (0.16 | ) | |
First Eagle Global Income Builder Fund Class I | |
Six Months Ended
April 30, 2024
(unaudited) | | $ | 11.84 | | | | 0.20 | | | | 0.91 | | | | 1.11 | | | | (0.19 | ) | | | — | | | | — | | | | (0.19 | ) | |
October 31, 2023 | | $ | 11.56 | | | | 0.35 | | | | 0.43 | | | | 0.78 | | | | (0.31 | ) | | | (0.19 | ) | | | — | | | | (0.50 | ) | |
October 31, 2022 | | $ | 13.48 | | | | 0.30 | | | | (1.34 | ) | | | (1.04 | ) | | | (0.31 | ) | | | (0.57 | ) | | | — | | | | (0.88 | ) | |
October 31, 2021 | | $ | 11.45 | | | | 0.30 | (f) | | | 2.15 | | | | 2.45 | | | | (0.29 | ) | | | (0.13 | ) | | | — | | | | (0.42 | ) | |
October 31, 2020 | | $ | 12.12 | | | | 0.25 | | | | (0.63 | ) | | | (0.38 | ) | | | (0.25 | ) | | | (0.04 | ) | | | — | | | | (0.29 | ) | |
October 31, 2019 | | $ | 11.43 | | | | 0.28 | | | | 0.69 | | | | 0.97 | | | | (0.28 | ) | | | — | | | | — | | | | (0.28 | ) | |
First Eagle Global Income Builder Fund Class R6 | |
Six Months Ended
April 30, 2024
(unaudited) | | $ | 11.82 | | | | 0.20 | | | | 0.92 | | | | 1.12 | | | | (0.20 | ) | | | — | | | | — | | | | (0.20 | ) | |
October 31, 2023 | | $ | 11.55 | | | | 0.36 | | | | 0.42 | | | | 0.78 | | | | (0.32 | ) | | | (0.19 | ) | | | — | | | | (0.51 | ) | |
October 31, 2022 | | $ | 13.47 | | | | 0.31 | | | | (1.33 | ) | | | (1.02 | ) | | | (0.33 | ) | | | (0.57 | ) | | | — | | | | (0.90 | ) | |
October 31, 2021 | | $ | 11.44 | | | | 0.31 | (f) | | | 2.15 | | | | 2.46 | | | | (0.30 | ) | | | (0.13 | ) | | | — | | | | (0.43 | ) | |
October 31, 2020 | | $ | 12.11 | | | | 0.24 | | | | (0.62 | ) | | | (0.38 | ) | | | (0.25 | ) | | | (0.04 | ) | | | — | | | | (0.29 | ) | |
October 31, 2019 | | $ | 11.42 | | | | 0.27 | | | | 0.70 | | | | 0.97 | | | | (0.28 | ) | | | — | | | | — | | | | (0.28 | ) | |
First Eagle Funds | Semiannual Report | April 30, 2024
214
| | | | | | | | | Ratios/Supplemental data | | | |
| | | | | | | | | Ratios to Average Net Assets of: | | | |
Selected per
share data for
the period ended: | | Net asset
value, end
of period | | Total
return(a) | | Net assets,
end of
period
(thousands) | | Operating
expenses
excluding
earnings
credits
and/or fee
waivers | | Operating
expenses
including
earnings
credits
and/or fee
waivers | | Net
investment
income
excluding
earnings
credits
and/or fee
waivers | | Net
investment
income
including
earnings
credits
and/or fee
waivers | | Portfolio
turnover
rate | |
First Eagle Global Income Builder Fund Class A | |
Six Months Ended
April 30, 2024
(unaudited) | | $ | 12.82 | | | | 9.33 | %(b) | | $ | 643,979 | | | | 1.17 | %(c) | | | 1.16 | %(c) | | | 2.91 | %(c) | | | 2.91 | %(c) | | | 6.35 | %(b) | |
October 31, 2023 | | $ | 11.89 | | | | 6.35 | % | | $ | 622,236 | | | | 1.18 | % | | | 1.18 | % | | | 2.60 | % | | | 2.60 | % | | | 20.41 | % | |
October 31, 2022 | | $ | 11.62 | | | | (8.23 | )% | | $ | 541,002 | | | | 1.16 | % | | | 1.16 | % | | | 2.17 | % | | | 2.18 | % | | | 13.76 | % | |
October 31, 2021 | | $ | 13.52 | | | | 21.36 | %(i) | | $ | 492,402 | | | | 1.17 | % | | | 1.17 | % | | | 2.04 | %(f) | | | 2.04 | %(f) | | | 22.80 | % | |
October 31, 2020 | | $ | 11.47 | | | | (3.38 | )% | | $ | 359,442 | | | | 1.19 | % | | | 1.19 | % | | | 1.87 | % | | | 1.87 | % | | | 28.98 | % | |
October 31, 2019 | | $ | 12.15 | | | | 8.40 | % | | $ | 392,942 | | | | 1.18 | % | | | 1.18 | % | | | 2.10 | % | | | 2.10 | % | | | 25.54 | % | |
First Eagle Global Income Builder Fund Class C | |
Six Months Ended
April 30, 2024
(unaudited) | | $ | 12.91 | | | | 8.86 | %(b) | | $ | 76,050 | | | | 1.95 | %(c) | | | 1.95 | %(c) | | | 2.07 | %(c) | | | 2.07 | %(c) | | | 6.35 | %(b) | |
October 31, 2023 | | $ | 11.98 | | | | 5.65 | % | | $ | 82,141 | | | | 1.94 | % | | | 1.94 | % | | | 1.79 | % | | | 1.79 | % | | | 20.41 | % | |
October 31, 2022 | | $ | 11.70 | | | | (8.95 | )% | | $ | 98,977 | | | | 1.94 | % | | | 1.94 | % | | | 1.38 | % | | | 1.38 | % | | | 13.76 | % | |
October 31, 2021 | | $ | 13.47 | | | | 20.48 | %(i) | | $ | 153,654 | | | | 1.94 | % | | | 1.94 | % | | | 1.25 | %(f) | | | 1.25 | %(f) | | | 22.80 | % | |
October 31, 2020 | | $ | 11.44 | | | | (4.15 | )% | | $ | 186,154 | | | | 1.95 | % | | | 1.95 | % | | | 1.11 | % | | | 1.11 | % | | | 28.98 | % | |
October 31, 2019 | | $ | 12.11 | | | | 7.53 | % | | $ | 289,037 | | | | 1.94 | % | | | 1.94 | % | | | 1.36 | % | | | 1.36 | % | | | 25.54 | % | |
First Eagle Global Income Builder Fund Class I | |
Six Months Ended
April 30, 2024
(unaudited) | | $ | 12.76 | | | | 9.41 | %(b) | | $ | 904,871 | | | | 0.96 | %(c) | | | 0.95 | %(c) | | | 3.14 | %(c) | | | 3.14 | %(c) | | | 6.35 | %(b) | |
October 31, 2023 | | $ | 11.84 | | | | 6.69 | % | | $ | 874,530 | | | | 0.97 | % | | | 0.97 | % | | | 2.83 | % | | | 2.84 | % | | | 20.41 | % | |
October 31, 2022 | | $ | 11.56 | | | | (7.98 | )% | | $ | 751,297 | | | | 0.93 | % | | | 0.93 | % | | | 2.43 | % | | | 2.43 | % | | | 13.76 | % | |
October 31, 2021 | | $ | 13.48 | | | | 21.62 | %(i) | | $ | 668,678 | | | | 0.93 | % | | | 0.93 | % | | | 2.26 | %(f) | | | 2.26 | %(f) | | | 22.80 | % | |
October 31, 2020 | | $ | 11.45 | | | | (3.14 | )% | | $ | 630,351 | | | | 0.94 | % | | | 0.94 | % | | | 2.11 | % | | | 2.11 | % | | | 28.98 | % | |
October 31, 2019 | | $ | 12.12 | | | | 8.60 | % | | $ | 793,440 | | | | 0.93 | % | | | 0.93 | % | | | 2.36 | % | | | 2.36 | % | | | 25.54 | % | |
First Eagle Global Income Builder Fund Class R6 | |
Six Months Ended
April 30, 2024
(unaudited) | | $ | 12.74 | | | | 9.46 | %(b) | | $ | 67,875 | | | | 0.88 | %(c) | | | 0.88 | %(c) | | | 3.24 | %(c) | | | 3.24 | %(c) | | | 6.35 | %(b) | |
October 31, 2023 | | $ | 11.82 | | | | 6.68 | % | | $ | 62,556 | | | | 0.89 | % | | | 0.89 | % | | | 2.92 | % | | | 2.93 | % | | | 20.41 | % | |
October 31, 2022 | | $ | 11.55 | | | | (7.85 | )% | | $ | 45,873 | | | | 0.87 | % | | | 0.87 | % | | | 2.49 | % | | | 2.49 | % | | | 13.76 | % | |
October 31, 2021 | | $ | 13.47 | | | | 21.72 | %(i) | | $ | 24,506 | | | | 0.87 | % | | | 0.87 | % | | | 2.35 | %(f) | | | 2.35 | %(f) | | | 22.80 | % | |
October 31, 2020 | | $ | 11.44 | | | | (3.14 | )% | | $ | 15,649 | | | | 0.90 | % | | | 0.90 | % | | | 2.01 | % | | | 2.01 | % | | | 28.98 | % | |
October 31, 2019 | | $ | 12.11 | | | | 8.62 | % | | $ | 1,233 | | | | 0.93 | % | | | 0.93 | % | | | 2.31 | % | | | 2.31 | % | | | 25.54 | % | |
First Eagle Funds | Semiannual Report | April 30, 2024
215
| | | Per share operating performance* | |
| | | | | Change in net assets resulting
from operations | | Less dividends and distributions | |
Selected per
share data for
the period ended: | | Net asset
value,
beginning
of period | | Net
investment
income/
loss | | Net
realized
and
unrealized
gains
(losses) on
investments | | Total
investment
operations | | From net
investment
income | | From
capital
gains | | Return of
capital | | Total
distributions | |
First Eagle Rising Dividend Fund Class A | |
Six Months Ended
April 30, 2024
(unaudited) | | $ | 22.39 | | | | 0.19 | | | | 2.97 | (j) | | | 3.16 | | | | (0.15 | ) | | | (1.67 | ) | | | — | | | | (1.82 | ) | |
October 31, 2023 | | $ | 20.30 | | | | 0.35 | | | | 2.50 | (l) | | | 2.85 | | | | (0.26 | ) | | | (0.50 | ) | | | — | | | | (0.76 | ) | |
October 31, 2022 | | $ | 29.80 | | | | 0.16 | | | | (6.00 | ) | | | (5.84 | ) | | | (0.12 | ) | | | (3.54 | ) | | | — | | | | (3.66 | ) | |
October 31, 2021 | | $ | 25.84 | | | | 0.09 | | | | 8.37 | | | | 8.46 | | | | (0.06 | ) | | | (4.44 | ) | | | — | | | | (4.50 | ) | |
October 31, 2020 | | $ | 26.45 | | | | 0.01 | | | | (0.38 | ) | | | (0.37 | ) | | | (0.01 | ) | | | (0.23 | ) | | | — | | | | (0.24 | ) | |
October 31, 2019 | | $ | 30.53 | | | | 0.03 | | | | 1.50 | | | | 1.53 | | | | — | | | | (5.61 | ) | | | — | | | | (5.61 | ) | |
First Eagle Rising Dividend Fund Class C | |
Six Months Ended
April 30, 2024
(unaudited) | | $ | 13.63 | | | | 0.06 | | | | 1.76 | (j) | | | 1.82 | | | | (0.10 | ) | | | (1.67 | ) | | | — | | | | (1.77 | ) | |
October 31, 2023 | | $ | 12.63 | | | | 0.10 | | | | 1.56 | (l) | | | 1.66 | | | | (0.16 | ) | | | (0.50 | ) | | | — | | | | (0.66 | ) | |
October 31, 2022 | | $ | 20.00 | | | | (0.03 | ) | | | (3.76 | ) | | | (3.79 | ) | | | (0.04 | ) | | | (3.54 | ) | | | — | | | | (3.58 | ) | |
October 31, 2021 | | $ | 18.74 | | | | (0.07 | ) | | | 5.77 | | | | 5.70 | | | | — | | | | (4.44 | ) | | | — | | | | (4.44 | ) | |
October 31, 2020 | | $ | 19.37 | | | | (0.14 | ) | | | (0.26 | ) | | | (0.40 | ) | | | — | | | | (0.23 | ) | | | — | | | | (0.23 | ) | |
October 31, 2019 | | $ | 24.09 | | | | (0.12 | ) | | | 1.01 | | | | 0.89 | | | | — | | | | (5.61 | ) | | | — | | | | (5.61 | ) | |
First Eagle Rising Dividend Fund Class I | |
Six Months Ended
April 30, 2024
(unaudited) | | $ | 23.62 | | | | 0.23 | | | | 3.14 | (j) | | | 3.37 | | | | (0.18 | ) | | | (1.67 | ) | | | — | | | | (1.85 | ) | |
October 31, 2023 | | $ | 21.38 | | | | 0.43 | | | | 2.62 | (l) | | | 3.05 | | | | (0.31 | ) | | | (0.50 | ) | | | — | | | | (0.81 | ) | |
October 31, 2022 | | $ | 31.17 | | | | 0.21 | | | | (6.29 | ) | | | (6.08 | ) | | | (0.17 | ) | | | (3.54 | ) | | | — | | | | (3.71 | ) | |
October 31, 2021 | | $ | 26.91 | | | | 0.17 | | | | 8.72 | | | | 8.89 | | | | (0.19 | ) | | | (4.44 | ) | | | — | | | | (4.63 | ) | |
October 31, 2020 | | $ | 27.54 | | | | 0.09 | | | | (0.37 | ) | | | (0.28 | ) | | | (0.12 | ) | | | (0.23 | ) | | | — | | | | (0.35 | ) | |
October 31, 2019 | | $ | 31.46 | | | | 0.13 | | | | 1.56 | | | | 1.69 | | | | — | | | | (5.61 | ) | | | — | | | | (5.61 | ) | |
First Eagle Rising Dividend Fund Class R6 | |
Six Months Ended
April 30, 2024
(unaudited) | | $ | 23.62 | | | | 0.24 | | | | 3.13 | (j) | | | 3.37 | | | | (0.18 | ) | | | (1.67 | ) | | | — | | | | (1.85 | ) | |
October 31, 2023 | | $ | 21.37 | | | | 0.43 | | | | 2.63 | (l) | | | 3.06 | | | | (0.31 | ) | | | (0.50 | ) | | | — | | | | (0.81 | ) | |
October 31, 2022 | | $ | 31.17 | | | | 0.21 | | | | (6.30 | ) | | | (6.09 | ) | | | (0.17 | ) | | | (3.54 | ) | | | — | | | | (3.71 | ) | |
October 31, 2021 | | $ | 26.92 | | | | 0.17 | | | | 8.74 | | | | 8.91 | | | | (0.22 | ) | | | (4.44 | ) | | | — | | | | (4.66 | ) | |
October 31, 2020 | | $ | 27.57 | | | | 0.07 | | | | (0.37 | ) | | | (0.30 | ) | | | (0.12 | ) | | | (0.23 | ) | | | — | | | | (0.35 | ) | |
October 31, 2019 | | $ | 31.46 | | | | 0.09 | | | | 1.63 | | | | 1.72 | | | | — | | | | (5.61 | ) | | | — | | | | (5.61 | ) | |
First Eagle Funds | Semiannual Report | April 30, 2024
216
| | | | | | | | | Ratios/Supplemental data | | | |
| | | | | | | | | Ratios to Average Net Assets of: | | | |
Selected per
share data for
the period ended: | | Net asset
value, end
of period | | Total
return(a) | | Net assets,
end of
period
(thousands) | | Operating
expenses
excluding
earnings
credits
and/or fee
waivers | | Operating
expenses
including
earnings
credits
and/or fee
waivers | | Net
investment
income
excluding
earnings
credits
and/or fee
waivers | | Net
investment
income
including
earnings
credits
and/or fee
waivers | | Portfolio
turnover
rate | |
First Eagle Rising Dividend Fund Class A | |
Six Months Ended
April 30, 2024
(unaudited) | | $ | 23.73 | | | | 14.59 | %(b)(k) | | $ | 262,650 | | | | 1.11 | %(c) | | | 0.90 | %(c) | | | 1.42 | %(c) | | | 1.64 | %(c) | | | 5.22 | %(b) | |
October 31, 2023 | | $ | 22.39 | | | | 14.17 | %(m) | | $ | 243,724 | | | | 1.10 | % | | | 0.90 | % | | | 1.36 | % | | | 1.56 | % | | | 30.98 | % | |
October 31, 2022 | | $ | 20.30 | | | | (21.94 | )% | | $ | 246,151 | | | | 1.05 | % | | | 0.90 | % | | | 0.54 | % | | | 0.69 | % | | | 10.87 | % | |
October 31, 2021 | | $ | 29.80 | | | | 36.58 | % | | $ | 235,888 | | | | 1.04 | % | | | 0.90 | % | | | 0.20 | % | | | 0.34 | % | | | 40.70 | % | |
October 31, 2020 | | $ | 25.84 | | | | (1.43 | )% | | $ | 203,581 | | | | 1.34 | % | | | 1.28 | % | | | (0.04 | )% | | | 0.02 | % | | | 97.86 | % | |
October 31, 2019 | | $ | 26.45 | | | | 7.58 | % | | $ | 273,446 | | | | 1.38 | % | | | 1.37 | % | | | 0.11 | % | | | 0.13 | % | | | 26.42 | % | |
First Eagle Rising Dividend Fund Class C | |
Six Months Ended
April 30, 2024
(unaudited) | | $ | 13.68 | | | | 14.11 | %(b)(k) | | $ | 6,083 | | | | 1.92 | %(c) | | | 1.65 | %(c) | | | 0.57 | %(c) | | | 0.84 | %(c) | | | 5.22 | %(b) | |
October 31, 2023 | | $ | 13.63 | | | | 13.31 | %(m) | | $ | 8,098 | | | | 1.82 | % | | | 1.65 | % | | | 0.57 | % | | | 0.74 | % | | | 30.98 | % | |
October 31, 2022 | | $ | 12.63 | | | | (22.50 | )% | | $ | 16,002 | | | | 1.84 | % | | | 1.65 | % | | | (0.36 | )% | | | (0.17 | )% | | | 10.87 | % | |
October 31, 2021 | | $ | 20.00 | | | | 35.52 | % | | $ | 37,722 | | | | 1.79 | % | | | 1.65 | % | | | (0.54 | )% | | | (0.40 | )% | | | 40.70 | % | |
October 31, 2020 | | $ | 18.74 | | | | (2.12 | )% | | $ | 62,901 | | | | 2.09 | % | | | 2.03 | % | | | (0.79 | )% | | | (0.73 | )% | | | 97.86 | % | |
October 31, 2019 | | $ | 19.37 | | | | 6.77 | % | | $ | 115,146 | | | | 2.12 | % | | | 2.10 | % | | | (0.61 | )% | | | (0.60 | )% | | | 26.42 | % | |
First Eagle Rising Dividend Fund Class I | |
Six Months Ended
April 30, 2024
(unaudited) | | $ | 25.14 | | | | 14.72 | %(b)(k) | | $ | 117,808 | | | | 0.79 | %(c) | | | 0.65 | %(c) | | | 1.73 | %(c) | | | 1.88 | %(c) | | | 5.22 | %(b) | |
October 31, 2023 | | $ | 23.62 | | | | 14.43 | %(m) | | $ | 95,458 | | | | 0.77 | % | | | 0.65 | % | | | 1.68 | % | | | 1.81 | % | | | 30.98 | % | |
October 31, 2022 | | $ | 21.38 | | | | (21.71 | )% | | $ | 97,103 | | | | 0.74 | % | | | 0.65 | % | | | 0.77 | % | | | 0.86 | % | | | 10.87 | % | |
October 31, 2021 | | $ | 31.17 | | | | 36.88 | % | | $ | 162,113 | | | | 0.70 | % | | | 0.65 | % | | | 0.53 | % | | | 0.58 | % | | | 40.70 | % | |
October 31, 2020 | | $ | 26.91 | | | | (1.09 | )% | | $ | 167,093 | | | | 1.01 | % | | | 0.96 | % | | | 0.28 | % | | | 0.33 | % | | | 97.86 | % | |
October 31, 2019 | | $ | 27.54 | | | | 7.88 | % | | $ | 384,510 | | | | 1.05 | % | | | 1.03 | % | | | 0.45 | % | | | 0.46 | % | | | 26.42 | % | |
First Eagle Rising Dividend Fund Class R6 | |
Six Months Ended
April 30, 2024
(unaudited) | | $ | 25.14 | | | | 14.73 | %(b)(k) | | $ | 7,322 | | | | 0.76 | %(c) | | | 0.65 | %(c) | | | 1.78 | %(c) | | | 1.89 | %(c) | | | 5.22 | %(b) | |
October 31, 2023 | | $ | 23.62 | | | | 14.48 | %(m) | | $ | 6,427 | | | | 0.74 | % | | | 0.65 | % | | | 1.73 | % | | | 1.82 | % | | | 30.98 | % | |
October 31, 2022 | | $ | 21.37 | | | | (21.75 | )% | | $ | 5,206 | | | | 0.69 | % | | | 0.65 | % | | | 0.84 | % | | | 0.88 | % | | | 10.87 | % | |
October 31, 2021 | | $ | 31.17 | | | | 36.93 | % | | $ | 7,056 | | | | 0.67 | % | | | 0.65 | % | | | 0.57 | % | | | 0.59 | % | | | 40.70 | % | |
October 31, 2020 | | $ | 26.92 | | | | (1.13 | )% | | $ | 5,471 | | | | 1.00 | % | | | 0.95 | % | | | 0.20 | % | | | 0.26 | % | | | 97.86 | % | |
October 31, 2019 | | $ | 27.57 | | | | 8.00 | % | | $ | 2,656 | | | | 1.00 | % | | | 0.99 | % | | | 0.32 | % | | | 0.32 | % | | | 26.42 | % | |
First Eagle Funds | Semiannual Report | April 30, 2024
217
| | | Per share operating performance* | |
| | | | | Change in net assets resulting
from operations | | Less dividends and distributions | |
Selected per
share data for
the period ended: | | Net asset
value,
beginning
of period | | Net
investment
income/
loss | | Net
realized
and
unrealized
gains
(losses) on
investments | | Total
investment
operations | | From net
investment
income | | From
capital
gains | | Return of
capital | | Total
distributions | |
First Eagle Small Cap Opportunity Fund Class A | |
Six Months Ended
April 30, 2024
(unaudited) | | $ | 8.19 | | | | 0.01 | | | | 1.54 | | | | 1.55 | | | | (0.04 | ) | | | — | | | | — | | | | (0.04 | ) | |
October 31, 2023 | | $ | 8.47 | | | | 0.01 | | | | (0.29 | ) | | | (0.28 | ) | | | — | | | | — | | | | — | | | | — | | |
October 31, 2022 | | $ | 9.76 | | | | (0.02 | ) | | | (1.27 | ) | | | (1.29 | ) | | | — | | | | — | | | | — | | | | — | | |
For The Period
7/01/21^-
10/31/21 | | $ | 10.12 | | | | (0.02 | ) | | | (0.34 | ) | | | (0.36 | ) | | | — | | | | — | | | | — | | | | — | | |
First Eagle Small Cap Opportunity Fund Class I | |
Six Months Ended
April 30, 2024
(unaudited) | | $ | 8.23 | | | | 0.03 | | | | 1.53 | | | | 1.56 | | | | (0.06 | ) | | | — | | | | — | | | | (0.06 | ) | |
October 31, 2023 | | $ | 8.50 | | | | 0.03 | | | | (0.29 | ) | | | (0.26 | ) | | | (0.01 | ) | | | — | | | | — | | | | (0.01 | ) | |
October 31, 2022 | | $ | 9.77 | | | | 0.00 | ** | | | (1.27 | ) | | | (1.27 | ) | | | — | | | | — | | | | — | | | | — | | |
For The Period
4/27/21^-
10/31/21 | | $ | 10.00 | | | | (0.02 | ) | | | (0.02 | ) | | | (0.04 | ) | | | (0.00 | )** | | | (0.19 | ) | | | (0.00 | )** | | | (0.19 | ) | |
First Eagle Small Cap Opportunity Fund Class R6 | |
Six Months Ended
April 30, 2024
(unaudited) | | $ | 8.23 | | | | 0.03 | | | | 1.54 | | | | 1.57 | | | | (0.06 | ) | | | — | | | | — | | | | (0.06 | ) | |
October 31, 2023 | | $ | 8.50 | | | | 0.03 | | | | (0.29 | ) | | | (0.26 | ) | | | (0.01 | ) | | | — | | | | — | | | | (0.01 | ) | |
October 31, 2022 | | $ | 9.77 | | | | 0.00 | ** | | | (1.27 | ) | | | (1.27 | ) | | | — | | | | — | | | | — | | | | — | | |
For The Period
7/01/21^-
10/31/21 | | $ | 10.12 | | | | (0.01 | ) | | | (0.34 | ) | | | (0.35 | ) | | | — | | | | — | | | | — | | | | — | | |
First Eagle U.S. Smid Cap Opportunity Fund Class A | |
Six Months Ended
April 30, 2024
(unaudited) | | $ | 8.70 | | | | 0.00 | ** | | | 1.84 | | | | 1.84 | | | | (0.19 | ) | | | — | | | | — | | | | (0.19 | ) | |
October 31, 2023 | | $ | 8.97 | | | | 0.03 | | | | (0.29 | ) | | | (0.26 | ) | | | (0.01 | ) | | | — | | | | — | | | | (0.01 | ) | |
For The Period
8/15/22^-
10/31/22 | | $ | 10.00 | | | | 0.01 | | | | (1.04 | ) | | | (1.03 | ) | | | — | | | | — | | | | — | | | | — | | |
First Eagle U.S. Smid Cap Opportunity Fund Class I | |
Six Months Ended
April 30, 2024
(unaudited) | | $ | 8.72 | | | | 0.02 | | | | 1.85 | | | | 1.87 | | | | (0.04 | ) | | | — | | | | — | | | | (0.04 | ) | |
October 31, 2023 | | $ | 8.98 | | | | 0.04 | | | | (0.27 | ) | | | (0.23 | ) | | | (0.03 | ) | | | — | | | | — | | | | (0.03 | ) | |
For The Period
8/15/22^-
10/31/22 | | $ | 10.00 | | | | 0.01 | | | | (1.03 | ) | | | (1.02 | ) | | | — | | | | — | | | | — | | | | — | | |
First Eagle Funds | Semiannual Report | April 30, 2024
218
| | | | | | | | Ratios/Supplemental data | | | |
| | | | | | | | | Ratios to Average Net Assets of: | | | |
Selected per
share data for
the period ended: | | Net asset
value, end
of period | | Total
return(a) | | Net assets,
end of
period
(thousands) | | Operating
expenses
excluding
earnings
credits
and/or fee
waivers | | Operating
expenses
including
earnings
credits
and/or fee
waivers | | Net
investment
income
excluding
earnings
credits
and/or fee
waivers | | Net
investment
income
including
earnings
credits
and/or fee
waivers | | Portfolio
turnover
rate | |
First Eagle Small Cap Opportunity Fund Class A | |
Six Months Ended
April 30, 2024
(unaudited) | | $ | 9.70 | | | | 18.96 | %(b) | | $ | 91,820 | | | | 1.25 | %(c) | | | 1.25 | %(c) | | | 0.28 | %(c) | | | 0.28 | %(c) | | | 19.32 | %(b) | |
October 31, 2023 | | $ | 8.19 | | | | (3.31 | )% | | $ | 61,379 | | | | 1.32 | % | | | 1.25 | % | | | (0.01 | )% | | | 0.06 | % | | | 41.12 | % | |
October 31, 2022 | | $ | 8.47 | | | | (13.22 | )% | | $ | 37,220 | | | | 1.41 | % | | | 1.25 | % | | | (0.42 | )% | | | (0.26 | )% | | | 45.84 | % | |
For The Period
7/01/21^-
10/31/21 | | $ | 9.76 | | | | (3.56 | )%(b) | | $ | 10,060 | | | | 1.95 | %(c) | | | 1.25 | %(c) | | | (1.30 | )%(c) | | | (0.60 | )%(c) | | | 13.63 | %(b) | |
First Eagle Small Cap Opportunity Fund Class I | |
Six Months Ended
April 30, 2024
(unaudited) | | $ | 9.73 | | | | 19.00 | %(b) | | $ | 1,606,915 | | | | 1.03 | %(c) | | | 1.00 | %(c) | | | 0.50 | %(c) | | | 0.52 | %(c) | | | 19.32 | %(b) | |
October 31, 2023 | | $ | 8.23 | | | | (3.08 | )% | | $ | 1,183,672 | | | | 1.09 | % | | | 1.00 | % | | | 0.22 | % | | | 0.31 | % | | | 41.12 | % | |
October 31, 2022 | | $ | 8.50 | | | | (13.00 | )% | | $ | 501,227 | | | | 1.17 | % | | | 1.00 | % | | | (0.16 | )% | | | 0.01 | % | | | 45.84 | % | |
For The Period
4/27/21^-
10/31/21 | | $ | 9.77 | | | | (0.47 | )%(b) | | $ | 93,195 | | | | 2.07 | %(c) | | | 1.00 | %(c) | | | (1.37 | )%(c) | | | (0.30 | )%(c) | | | 13.63 | %(b) | |
First Eagle Small Cap Opportunity Fund Class R6 | |
Six Months Ended
April 30, 2024
(unaudited) | | $ | 9.74 | | | | 19.12 | %(b) | | $ | 92,563 | | | | 0.99 | %(c) | | | 0.99 | %(c) | | | 0.53 | %(c) | | | 0.53 | %(c) | | | 19.32 | %(b) | |
October 31, 2023 | | $ | 8.23 | | | | (3.08 | )% | | $ | 64,646 | | | | 1.02 | % | | | 1.00 | % | | | 0.29 | % | | | 0.31 | % | | | 41.12 | % | |
October 31, 2022 | | $ | 8.50 | | | | (13.00 | )% | | $ | 22,857 | | | | 1.28 | % | | | 1.00 | % | | | (0.23 | )% | | | 0.04 | % | | | 45.84 | % | |
For The Period
7/01/21^-
10/31/21 | | $ | 9.77 | | | | (3.46 | )%(b) | | $ | 1,236 | | | | 1.98 | %(c) | | | 1.00 | %(c) | | | (1.29 | )%(c) | | | (0.31 | )%(c) | | | 13.63 | %(b) | |
First Eagle U.S. Smid Cap Opportunity Fund Class A | |
Six Months Ended
April 30, 2024
(unaudited) | | $ | 10.35 | | | | 21.31 | %(b) | | $ | 277 | | | | 2.31 | %(c) | | | 1.20 | %(c) | | | (1.09 | )%(c) | | | 0.02 | %(c) | | | 11.07 | %(b) | |
October 31, 2023 | | $ | 8.70 | | | | (2.90 | )% | | $ | 78 | | | | 7.08 | % | | | 1.20 | % | | | (5.56 | )% | | | 0.31 | % | | | 30.48 | % | |
For The Period
8/15/22^-
10/31/22 | | $ | 8.97 | | | | (10.30 | )%(b) | | $ | 49 | | | | 57.34 | %(c) | | | 1.18 | %(c) | | | (55.81 | )%(c) | | | 0.35 | %(c) | | | 4.00 | %(b) | |
First Eagle U.S. Smid Cap Opportunity Fund Class I | |
Six Months Ended
April 30, 2024
(unaudited) | | $ | 10.55 | | | | 21.45 | %(b) | | $ | 35,215 | | | | 1.79 | %(c) | | | 0.95 | %(c) | | | (0.47 | )%(c) | | | 0.37 | %(c) | | | 11.07 | %(b) | |
October 31, 2023 | | $ | 8.72 | | | | (2.60 | )% | | $ | 27,633 | | | | 2.96 | % | | | 0.95 | % | | | (1.56 | )% | | | 0.44 | % | | | 30.48 | % | |
For The Period
8/15/22^-
10/31/22 | | $ | 8.98 | | | | (10.20 | )%(b) | | $ | 1,046 | | | | 46.97 | %(c) | | | 0.95 | %(c) | | | (45.46 | )%(c) | | | 0.56 | %(c) | | | 4.00 | %(b) | |
First Eagle Funds | Semiannual Report | April 30, 2024
219
| | | Per share operating performance* | |
| | | | | Change in net assets resulting
from operations | | Less dividends and distributions | |
Selected per
share data for
the period ended: | | Net asset
value,
beginning
of period | | Net
investment
income/
loss | | Net
realized
and
unrealized
gains
(losses) on
investments | | Total
investment
operations | | From net
investment
income | | From
capital
gains | | Return of
capital | | Total
distributions | |
First Eagle U.S. Smid Cap Opportunity Fund Class R6 | |
Six Months Ended
April 30, 2024
(unaudited) | | $ | 8.71 | | | | 0.02 | | | | 1.81 | | | | 1.83 | | | | (0.33 | ) | | | — | | | | — | | | | (0.33 | ) | |
October 31, 2023 | | $ | 8.98 | | | | 0.06 | | | | (0.29 | ) | | | (0.23 | ) | | | (0.04 | ) | | | — | | | | — | | | | (0.04 | ) | |
For The Period
8/15/22^-
10/31/22 | | $ | 10.00 | | | | 0.01 | | | | (1.03 | ) | | | (1.02 | ) | | | — | | | | — | | | | — | | | | — | | |
First Eagle Global Real Assets Fund Class A*** | |
Six Months Ended
April 30, 2024
(unaudited) | | $ | 9.78 | | | | 0.08 | | | | 0.97 | | | | 1.05 | | | | (0.17 | ) | | | — | | | | — | | | | (0.17 | ) | |
October 31, 2023 | | $ | 9.57 | | | | 0.19 | | | | 0.12 | | | | 0.31 | | | | (0.10 | ) | | | — | | | | — | | | | (0.10 | ) | |
For The Period
11/30/21^-
10/31/22 | | $ | 10.00 | | | | 0.13 | | | | (0.56 | ) | | | (0.43 | ) | | | — | | | | — | | | | — | | | | — | | |
First Eagle Global Real Assets Fund Class I*** | |
Six Months Ended
April 30, 2024
(unaudited) | | $ | 9.73 | | | | 0.09 | | | | 0.97 | | | | 1.06 | | | | (0.22 | ) | | | — | | | | — | | | | (0.22 | ) | |
October 31, 2023 | | $ | 9.59 | | | | 0.20 | | | | 0.14 | | | | 0.34 | | | | (0.20 | ) | | | — | | | | — | | | | (0.20 | ) | |
For The Period
11/30/21^-
10/31/22 | | $ | 10.00 | | | | 0.15 | | | | (0.56 | ) | | | (0.41 | ) | | | — | | | | — | | | | — | | | | — | | |
First Eagle Global Real Assets Fund Class R6*** | |
Six Months Ended
April 30, 2024
(unaudited) | | $ | 9.73 | | | | 0.09 | | | | 0.97 | | | | 1.06 | | | | (0.22 | ) | | | — | | | | — | | | | (0.22 | ) | |
October 31, 2023 | | $ | 9.59 | | | | 0.21 | | | | 0.13 | | | | 0.34 | | | | (0.20 | ) | | | — | | | | — | | | | (0.20 | ) | |
For The Period
11/30/21^-
10/31/22 | | $ | 10.00 | | | | 0.15 | | | | (0.56 | ) | | | (0.41 | ) | | | — | | | | — | | | | — | | | | — | | |
First Eagle High Yield Municipal Fund Class A (formerly named First Eagle High Income Fund) | |
Six Months Ended
April 30, 2024
(unaudited) | | $ | 7.78 | | | | 0.22 | | | | 0.48 | | | | 0.70 | | | | (0.22 | ) | | | — | | | | — | | | | (0.22 | ) | |
October 31, 2023 | | $ | 7.77 | | | | 0.41 | | | | 0.01 | | | | 0.42 | | | | (0.41 | ) | | | — | | | | — | | | | (0.41 | ) | |
October 31, 2022 | | $ | 8.98 | | | | 0.36 | | | | (1.21 | ) | | | (0.85 | ) | | | (0.36 | ) | | | — | | | | — | | | | (0.36 | ) | |
October 31, 2021 | | $ | 8.71 | | | | 0.33 | | | | 0.27 | | | | 0.60 | | | | (0.33 | ) | | | — | | | | — | | | | (0.33 | ) | |
October 31, 2020 | | $ | 8.71 | | | | 0.37 | | | | (0.01 | ) | | | 0.36 | | | | (0.36 | ) | | | — | | | | — | | | | (0.36 | ) | |
October 31, 2019 | | $ | 8.81 | | | | 0.41 | | | | (0.11 | ) | | | 0.30 | | | | (0.40 | ) | | | — | | | | — | | | | (0.40 | ) | |
First Eagle Funds | Semiannual Report | April 30, 2024
220
| | | | | | | | | Ratios/Supplemental data | | | |
| | | | | | | | | Ratios to Average Net Assets of: | | | |
Selected per
share data for
the period ended: | | Net asset
value, end
of period | | Total
return(a) | | Net assets,
end of
period
(thousands) | | Operating
expenses
excluding
earnings
credits
and/or fee
waivers | | Operating
expenses
including
earnings
credits
and/or fee
waivers | | Net
investment
income
excluding
earnings
credits
and/or fee
waivers | | Net
investment
income
including
earnings
credits
and/or fee
waivers | | Portfolio
turnover
rate | |
First Eagle U.S. Smid Cap Opportunity Fund Class R6 | |
Six Months Ended
April 30, 2024
(unaudited) | | $ | 10.21 | | | | 21.45 | %(b) | | $ | 53 | | | | 2.45 | %(c) | | | 0.95 | %(c) | | | (1.13 | )%(c) | | | 0.38 | %(c) | | | 11.07 | %(b) | |
October 31, 2023 | | $ | 8.71 | | | | (2.64 | )% | | $ | 44 | | | | 8.96 | % | | | 0.95 | % | | | (7.42 | )% | | | 0.60 | % | | | 30.48 | % | |
For The Period
8/15/22^-
10/31/22 | | $ | 8.98 | | | | (10.20 | )%(b) | | $ | 45 | | | | 47.13 | %(c) | | | 0.94 | %(c) | | | (45.59 | )%(c) | | | 0.60 | %(c) | | | 4.00 | %(b) | |
First Eagle Global Real Assets Fund Class A*** | |
Six Months Ended
April 30, 2024
(unaudited) | | $ | 10.66 | | | | 10.86 | %(b) | | $ | 1,866 | | | | 4.79 | %(c) | | | 1.10 | %(c) | | | (2.12 | )%(c) | | | 1.56 | %(c) | | | 26.43 | %(b) | |
October 31, 2023 | | $ | 9.78 | | | | 3.17 | % | | $ | 1,700 | | | | 5.91 | % | | | 1.09 | % | | | (3.00 | )% | | | 1.82 | % | | | 39.01 | % | |
For The Period
11/30/21^-
10/31/22 | | $ | 9.57 | | | | (4.30 | )%(b) | | $ | 1,286 | | | | 5.23 | %(c) | | | 1.09 | %(c) | | | (2.78 | )%(c) | | | 1.37 | %(c) | | | 12.37 | %(b) | |
First Eagle Global Real Assets Fund Class I*** | |
Six Months Ended
April 30, 2024
(unaudited) | | $ | 10.57 | | | | 10.96 | %(b) | | $ | 10,354 | | | | 4.51 | %(c) | | | 0.85 | %(c) | | | (1.85 | )%(c) | | | 1.81 | %(c) | | | 26.43 | %(b) | |
October 31, 2023 | | $ | 9.73 | | | | 3.43 | % | | $ | 8,574 | | | | 5.46 | % | | | 0.85 | % | | | (2.59 | )% | | | 2.01 | % | | | 39.01 | % | |
For The Period
11/30/21^-
10/31/22 | | $ | 9.59 | | | | (4.10 | )%(b) | | $ | 7,074 | | | | 4.85 | %(c) | | | 0.85 | %(c) | | | (2.34 | )%(c) | | | 1.65 | %(c) | | | 12.37 | %(b) | |
First Eagle Global Real Assets Fund Class R6*** | |
Six Months Ended
April 30, 2024
(unaudited) | | $ | 10.57 | | | | 10.98 | %(b) | | $ | 1,126 | | | | 4.57 | %(c) | | | 0.85 | %(c) | | | (1.91 | )%(c) | | | 1.81 | %(c) | | | 26.43 | %(b) | |
October 31, 2023 | | $ | 9.73 | | | | 3.45 | % | | $ | 1,029 | | | | 5.51 | % | | | 0.85 | % | | | (2.63 | )% | | | 2.03 | % | | | 39.01 | % | |
For The Period
11/30/21^-
10/31/22 | | $ | 9.59 | | | | (4.10 | )%(b) | | $ | 1,000 | | | | 4.86 | %(c) | | | 0.85 | %(c) | | | (2.38 | )%(c) | | | 1.63 | %(c) | | | 12.37 | %(b) | |
First Eagle High Yield Municipal Fund Class A (formerly named First Eagle High Income Fund) | |
Six Months Ended
April 30, 2024
(unaudited) | | $ | 8.26 | | | | 9.15 | %(b) | | $ | 274,184 | | | | 1.01 | %(c) | | | 0.40 | %(c) | | | 4.72 | %(c) | | | 5.34 | %(c) | | | 140.19 | %(b) | |
October 31, 2023 | | $ | 7.78 | | | | 5.37 | % | | $ | 63,824 | | | | 1.14 | % | | | 0.98 | % | | | 4.98 | % | | | 5.15 | % | | | 24.60 | % | |
October 31, 2022 | | $ | 7.77 | | | | (9.59 | )% | | $ | 68,391 | | | | 1.13 | % | | | 1.13 | % | | | 4.37 | % | | | 4.37 | % | | | 28.00 | % | |
October 31, 2021 | | $ | 8.98 | | | | 7.01 | % | | $ | 83,819 | | | | 1.23 | % | | | 1.16 | % | | | 3.56 | % | | | 3.63 | % | | | 64.11 | % | |
October 31, 2020 | | $ | 8.71 | | | | 4.39 | % | | $ | 73,112 | | | | 1.33 | % | | | 1.23 | % | | | 4.27 | % | | | 4.37 | % | | | 55.38 | % | |
October 31, 2019 | | $ | 8.71 | | | | 3.54 | % | | $ | 73,567 | | | | 1.34 | % | | | 1.24 | % | | | 4.55 | % | | | 4.65 | % | | | 24.19 | % | |
First Eagle Funds | Semiannual Report | April 30, 2024
221
| | | Per share operating performance* | |
| | | | | Change in net assets resulting
from operations | | Less dividends and distributions | |
Selected per
share data for
the period ended: | | Net asset
value,
beginning
of period | | Net
investment
income/
loss | | Net
realized
and
unrealized
gains
(losses) on
investments | | Total
investment
operations | | From net
investment
income | | From
capital
gains | | Return of
capital | | Total
distributions | |
First Eagle High Yield Municipal Fund Class C (formerly named First Eagle High Income Fund) | |
Six Months Ended
April 30, 2024
(unaudited) | | $ | 7.77 | | | | 0.19 | | | | 0.49 | | | | 0.68 | | | | (0.19 | ) | | | — | | | | — | | | | (0.19 | ) | |
October 31, 2023 | | $ | 7.77 | | | | 0.35 | | | | 0.00 | ** | | | 0.35 | | | | (0.35 | ) | | | — | | | | — | | | | (0.35 | ) | |
October 31, 2022 | | $ | 8.97 | | | | 0.30 | | | | (1.19 | ) | | | (0.89 | ) | | | (0.31 | ) | | | — | | | | — | | | | (0.31 | ) | |
October 31, 2021 | | $ | 8.70 | | | | 0.26 | | | | 0.28 | | | | 0.54 | | | | (0.27 | ) | | | — | | | | — | | | | (0.27 | ) | |
October 31, 2020 | | $ | 8.70 | | | | 0.31 | | | | (0.01 | ) | | | 0.30 | | | | (0.30 | ) | | | — | | | | — | | | | (0.30 | ) | |
October 31, 2019 | | $ | 8.80 | | | | 0.34 | | | | (0.10 | ) | | | 0.24 | | | | (0.34 | ) | | | — | | | | — | | | | (0.34 | ) | |
First Eagle High Yield Municipal Fund Class I (formerly named First Eagle High Income Fund) | |
Six Months Ended
April 30, 2024
(unaudited) | | $ | 7.78 | | | | 0.23 | | | | 0.49 | | | | 0.72 | | | | (0.24 | ) | | | — | | | | — | | | | (0.24 | ) | |
October 31, 2023 | | $ | 7.78 | | | | 0.43 | | | | (0.01 | ) | | | 0.42 | | | | (0.42 | ) | | | — | | | | — | | | | (0.42 | ) | |
October 31, 2022 | | $ | 8.98 | | | | 0.39 | | | | (1.21 | ) | | | (0.82 | ) | | | (0.38 | ) | | | — | | | | — | | | | (0.38 | ) | |
October 31, 2021 | | $ | 8.71 | | | | 0.35 | | | | 0.28 | | | | 0.63 | | | | (0.36 | ) | | | — | | | | — | | | | (0.36 | ) | |
October 31, 2020 | | $ | 8.71 | | | | 0.39 | | | | 0.00 | ** | | | 0.39 | | | | (0.39 | ) | | | — | | | | — | | | | (0.39 | ) | |
October 31, 2019 | | $ | 8.81 | | | | 0.43 | | | | (0.10 | ) | | | 0.33 | | | | (0.43 | ) | | | — | | | | — | | | | (0.43 | ) | |
First Eagle High Yield Municipal Fund Class R6 (formerly named First Eagle High Income Fund) | |
Six Months Ended
April 30, 2024
(unaudited) | | $ | 7.78 | | | | 0.23 | | | | 0.51 | | | | 0.74 | | | | (0.23 | ) | | | — | | | | — | | | | (0.23 | ) | |
October 31, 2023 | | $ | 7.78 | | | | 0.43 | | | | (0.01 | ) | | | 0.42 | | | | (0.42 | ) | | | — | | | | — | | | | (0.42 | ) | |
October 31, 2022 | | $ | 8.98 | | | | 0.39 | | | | (1.19 | ) | | | (0.80 | ) | | | (0.40 | ) | | | — | | | | — | | | | (0.40 | ) | |
October 31, 2021 | | $ | 8.71 | | | | 0.35 | | | | 0.28 | | | | 0.63 | | | | (0.36 | ) | | | — | | | | — | | | | (0.36 | ) | |
October 31, 2020 | | $ | 8.71 | | | | 0.39 | | | | (0.01 | ) | | | 0.38 | | | | (0.38 | ) | | | — | | | | — | | | | (0.38 | ) | |
October 31, 2019 | | $ | 8.82 | | | | 0.43 | | | | (0.11 | ) | | | 0.32 | | | | (0.43 | ) | | | — | | | | — | | | | (0.43 | ) | |
First Eagle Short Duration High Yield Municipal Fund Class A | |
For The Period
1/02/24^-4/30/24
(unaudited) | | $ | 10.00 | | | | 0.14 | | | | 0.05 | | | | 0.19 | | | | (0.13 | ) | | | — | | | | — | | | | (0.13 | ) | |
First Eagle Short Duration High Yield Municipal Fund Class I | |
For The Period
1/02/24^-4/30/24
(unaudited) | | $ | 10.00 | | | | 0.14 | | | | 0.06 | | | | 0.20 | | | | (0.15 | ) | | | — | | | | — | | | | (0.15 | ) | |
First Eagle Short Duration High Yield Municipal Fund Class R6 | |
For The Period
1/02/24^-4/30/24
(unaudited) | | $ | 10.00 | | | | 0.15 | | | | 0.05 | | | | 0.20 | | | | (0.14 | ) | | | — | | | | — | | | | (0.14 | ) | |
First Eagle Funds | Semiannual Report | April 30, 2024
222
| | | | | | | | | Ratios/Supplemental data | | | |
| | | | | | | | | Ratios to Average Net Assets of: | | | |
Selected per
share data for
the period ended: | | Net asset
value, end
of period | | Total
return(a) | | Net assets,
end of
period
(thousands) | | Operating
expenses
excluding
earnings
credits
and/or fee
waivers | | Operating
expenses
including
earnings
credits
and/or fee
waivers | | Net
investment
income
excluding
earnings
credits
and/or fee
waivers | | Net
investment
income
including
earnings
credits
and/or fee
waivers | | Portfolio
turnover
rate | |
First Eagle High Yield Municipal Fund Class C (formerly named First Eagle High Income Fund) | |
Six Months Ended
April 30, 2024
(unaudited) | | $ | 8.26 | | | | 8.77 | %(b) | | $ | 21,734 | | | | 1.76 | %(c) | | | 1.15 | %(c) | | | 4.00 | %(c) | | | 4.61 | %(c) | | | 140.19 | %(b) | |
October 31, 2023 | | $ | 7.77 | | | | 4.45 | % | | $ | 4,957 | | | | 1.89 | % | | | 1.74 | % | | | 4.24 | % | | | 4.39 | % | | | 24.60 | % | |
October 31, 2022 | | $ | 7.77 | | | | (10.15 | )% | | $ | 7,376 | | | | 1.88 | % | | | 1.88 | % | | | 3.55 | % | | | 3.55 | % | | | 28.00 | % | |
October 31, 2021 | | $ | 8.97 | | | | 6.20 | % | | $ | 15,129 | | | | 2.01 | % | | | 1.94 | % | | | 2.81 | % | | | 2.88 | % | | | 64.11 | % | |
October 31, 2020 | | $ | 8.70 | | | | 3.60 | % | | $ | 31,972 | | | | 2.10 | % | | | 2.00 | % | | | 3.53 | % | | | 3.63 | % | | | 55.38 | % | |
October 31, 2019 | | $ | 8.70 | | | | 2.77 | % | | $ | 50,100 | | | | 2.10 | % | | | 2.00 | % | | | 3.83 | % | | | 3.93 | % | | | 24.19 | % | |
First Eagle High Yield Municipal Fund Class I (formerly named First Eagle High Income Fund) | |
Six Months Ended
April 30, 2024
(unaudited) | | $ | 8.26 | | | | 9.26 | %(b) | | $ | 592,484 | | | | 0.68 | %(c) | | | 0.15 | %(c) | | | 5.04 | %(c) | | | 5.57 | %(c) | | | 140.19 | %(b) | |
October 31, 2023 | | $ | 7.78 | | | | 5.49 | % | | $ | 76,482 | | | | 0.89 | % | | | 0.73 | % | | | 5.23 | % | | | 5.39 | % | | | 24.60 | % | |
October 31, 2022 | | $ | 7.78 | | | | (9.23 | )% | | $ | 99,295 | | | | 0.86 | % | | | 0.86 | % | | | 4.62 | % | | | 4.62 | % | | | 28.00 | % | |
October 31, 2021 | | $ | 8.98 | | | | 7.29 | % | | $ | 132,026 | | | | 0.97 | % | | | 0.90 | % | | | 3.82 | % | | | 3.89 | % | | | 64.11 | % | |
October 31, 2020 | | $ | 8.71 | | | | 4.68 | % | | $ | 126,527 | | | | 1.04 | % | | | 0.94 | % | | | 4.54 | % | | | 4.64 | % | | | 55.38 | % | |
October 31, 2019 | | $ | 8.71 | | | | 3.84 | % | | $ | 144,532 | | | | 1.05 | % | | | 0.95 | % | | | 4.86 | % | | | 4.96 | % | | | 24.19 | % | |
First Eagle High Yield Municipal Fund Class R6 (formerly named First Eagle High Income Fund) | |
Six Months Ended
April 30, 2024
(unaudited) | | $ | 8.29 | | | | 9.60 | %(b) | | $ | 1,646 | | | | 1.03 | %(c) | | | 0.14 | %(c) | | | 4.84 | %(c) | | | 5.74 | %(c) | | | 140.19 | %(b) | |
October 31, 2023 | | $ | 7.78 | | | | 5.48 | % | | $ | 7,823 | | | | 0.81 | % | | | 0.70 | % | | | 5.32 | % | | | 5.44 | % | | | 24.60 | % | |
October 31, 2022 | | $ | 7.78 | | | | (9.16 | )% | | $ | 1,000 | | | | 0.78 | % | | | 0.78 | % | | | 4.74 | % | | | 4.74 | % | | | 28.00 | % | |
October 31, 2021 | | $ | 8.98 | | | | 7.34 | % | | $ | 1,066 | | | | 0.92 | % | | | 0.85 | % | | | 3.87 | % | | | 3.94 | % | | | 64.11 | % | |
October 31, 2020 | | $ | 8.71 | | | | 4.64 | % | | $ | 1,033 | | | | 1.07 | % | | | 0.97 | % | | | 4.47 | % | | | 4.57 | % | | | 55.38 | % | |
October 31, 2019 | | $ | 8.71 | | | | 3.75 | % | | $ | 1,907 | | | | 1.02 | % | | | 0.92 | % | | | 4.78 | % | | | 4.89 | % | | | 24.19 | % | |
First Eagle Short Duration High Yield Municipal Fund Class A | |
For The Period
1/02/24^-4/30/24
(unaudited) | | $ | 10.06 | | | | 1.93 | %(b) | | $ | 1,584 | | | | 5.49 | %(c) | | | 0.85 | %(c) | | | (0.45 | )%(c) | | | 4.19 | %(c) | | | 37.96 | %(b) | |
First Eagle Short Duration High Yield Municipal Fund Class I | |
For The Period
1/02/24^-4/30/24
(unaudited) | | $ | 10.05 | | | | 2.03 | %(b) | | $ | 18,337 | | | | 5.37 | %(c) | | | 0.60 | %(c) | | | (0.34 | )%(c) | | | 4.43 | %(c) | | | 37.96 | %(b) | |
First Eagle Short Duration High Yield Municipal Fund Class R6 | |
For The Period
1/02/24^-4/30/24
(unaudited) | | $ | 10.06 | | | | 2.02 | %(b) | | $ | 1,021 | | | | 5.65 | %(c) | | | 0.60 | %(c) | | | (0.61 | )%(c) | | | 4.44 | %(c) | | | 37.96 | %(b) | |
First Eagle Funds | Semiannual Report | April 30, 2024
223
^ Inception date.
* Per share amounts have been calculated using the average shares method.
** Amount represents less than $0.01 per share.
*** First Eagle Global Fund, First Eagle Overseas Fund, First Eagle U.S. Value Fund, First Eagle Gold Fund and First Eagle Global Real Assets Fund financial statements are shown on a consolidated basis and includes the balances of the First Eagle Global Cayman Fund, Ltd., First Eagle Overseas Cayman Fund, Ltd., First Eagle U.S. Value Cayman Fund, Ltd., First Eagle Gold Cayman Fund, Ltd., and First Eagle Global Real Assets Cayman Fund, Ltd., respectively.
(a) Does not take into account the sales charge of 5.00% for Class A shares for all Funds, except First Eagle High Yield Municipal Fund and First Eagle Short Duration High Yield Municipal Fund , which have a sales charge of 2.50% and the maximum contingent deferred sales charge (CDSC) of 1.00% for Class C Shares. Prior to December 27, 2023, the sales charge for Class A was 4.50% for First Eagle High Yield Municipal Fund, which was also not taken into account. A contingent deferred sales charge of 1.00% may apply on redemptions of Class A shares made within 18 months following a purchase of $1,000,000 or more without an initial sales charge for all funds, except First Eagle Global Income Builder Fund, First Eagle High Yield Municipal Fund, and First Eagle Short Duration High Yield Municipal Fund. With respect to the First Eagle Global Income Builder Fund, First Eagle High Yield Municipal Fund, and First Eagle Short Duration High Yield Municipal Fund, a CDSC of 1.00% may apply on certain redemptions of Class A shares made within 18 months following a purchase of $250,000 or more without an initial sales charge.
(b) Not Annualized.
(c) Annualized.
(d) Net investment income/loss includes income from foreign withholding tax claims less IRS compliance fees. Without these proceeds, the net investment income per share for First Eagle Global Fund would have been 0.44, (0.15), 0.62 and 0.67 for Class A, Class C, Class I and Class R6 shares, respectively. The net investment income excluding earnings credits and/or fee waivers ratios would have been 0.68%, (0.12)%, 0.93% and 1.02% for Class A, Class C, Class I and Class R6 shares, respectively.
(e) Net investment income/loss includes income from foreign withholding tax claims less IRS compliance fees. Without these proceeds, the net investment income per share for First Eagle Overseas Fund would have been 0.20, (0.03), 0.29 and 0.35 for Class A, Class C, Class I and Class R6 shares, respectively. The net investment income excluding earnings credits and/or fee waivers income ratios would have been 0.82%, 0.03%, 1.12% and 1.28% for Class A, Class C, Class I and Class R6 shares, respectively.
(f) Net investment income/loss includes income from foreign withholding tax claims less IRS compliance fees. Without these proceeds, the net investment income per share for First Eagle Global Income Builder Fund would have been 0.24, 0.13, 0.28 and 0.29 for Class A, Class C, Class I and Class R6 shares, respectively. The net investment income excluding earnings credits and/or fee waivers ratios would have been 1.85%, 1.06%, 2.08% and 2.16% for Class A, Class C, Class I and Class R6 shares, respectively.
(g) Total return includes income from foreign withholding tax claims less IRS compliance fees. Without these proceeds, the total returns for First Eagle Global Fund would have been 26.05%, 24.96%, 26.38% and 26.48% for Class A, Class C, Class I and Class R6 shares, respectively.
(h) Total return includes income from foreign withholding tax claims less IRS compliance fees. Without these proceeds, the total returns for First Eagle Overseas Fund would have been 16.90%, 15.94%, 17.24% and 17.35% for Class A, Class C, Class I and Class R6 shares, respectively.
(i) Total return includes income from foreign withholding tax claims less IRS compliance fees. Without these proceeds, the total returns for First Eagle Global Income Builder Fund would have been 21.09%, 20.21%, 21.44% and 21.54% for Class A, Class C, Class I and Class R6 shares, respectively.
(j) Net realized and unrealized gains (losses) includes litigation proceeds. Without these proceeds, the net realized and unrealized gains (losses) per share for First Eagle Rising Dividend Fund would have been 2.94, 1.75, 3.12 and 3.10 for Class A, Class C, Class I and Class R6 shares, respectively.
(k) Total return includes litigation proceeds. Without these proceeds, the total returns for First Eagle Rising Dividend Fund would have been 14.45%, 14.02%, 14.63% and 14.60% for Class A, Class C, Class I and Class R6 shares, respectively.
First Eagle Funds | Semiannual Report | April 30, 2024
224
(l) Net realized and unrealized gains (losses) includes litigation proceeds. Without these proceeds, the net realized and unrealized gains (losses) per share for First Eagle Rising Dividend Fund would have been 2.13, 1.23, 2.24 and 2.27 for Class A, Class C, Class I and Class R6 shares, respectively.
(m) Total return includes litigation proceeds. Without these proceeds, the total returns for First Eagle Rising Dividend Fund would have been 12.28%, 10.57%, 12.58% and 12.73% for Class A, Class C, Class I and Class R6 shares, respectively.
First Eagle Funds | Semiannual Report | April 30, 2024
225
Notes to Financial Statements
Note 1 — Significant Accounting Policies
First Eagle Funds (the "Trust"), is an open-end management investment company registered under the Investment Company Act of 1940, as amended ("1940 Act"). As of April 30, 2024, the Trust consists of eleven separate portfolios, the First Eagle Global Fund, First Eagle Overseas Fund, First Eagle U.S. Value Fund, First Eagle Gold Fund, First Eagle Global Income Builder Fund, First Eagle Rising Dividend Fund, First Eagle Small Cap Opportunity Fund, First Eagle U.S. Smid Cap Opportunity Fund, First Eagle Global Real Assets Fund, First Eagle High Yield Municipal Fund (formerly named First Eagle High Income Fund) and First Eagle Short Duration High Yield Municipal Fund (each individually a "Fund" or collectively the "Funds"). All the Funds are diversified mutual funds except for First Eagle Gold Fund and First Eagle Rising Dividend Fund, which are non-diversified. The Trust is a Delaware statutory trust. The First Eagle Global Fund seeks long-term growth of capital by investing in a range of asset classes from markets in the United States and throughout the world. The First Eagle Overseas Fund seeks long-term growth of capital by investing primarily in equities issued by non-U.S. corporations.The First Eagle U.S. Value Fund seeks long-term growth of capital by investing, under normal market conditions, at least 80% of its net assets (plus any borrowings for investment purposes) in domestic equity and debt securities. The First Eagle Gold Fund seeks to provide investors the opportunity to participate in the investment characteristics of gold (and to a limited extent other precious metals) for a portion of their overall investment portfolio. The First Eagle Global Income Builder Fund seeks current income generation and long-term growth of capital. The First Eagle Rising Dividend Fund seeks capital appreciation and current income by investing primarily in domestic stocks and, to a lesser extent, in debt and foreign equity instruments. The First Eagle Small Cap Opportunity Fund seeks long-term growth of capital. The First Eagle U.S. Smid Cap Opportunity Fund seeks long-term growth of capital by investing, under normal circumstances, in equity securities of small- and mid-cap ("smid cap") companies in an attempt to take advantage of what the Adviser believes are opportunistic situations for undervalued securities. The First Eagle Global Real Assets Fund seeks long-term growth of capital. The First Eagle High Yield Municipal Fund seeks to provide high current income exempt from regular federal income taxes; capital appreciation is a secondary objective when consistent with the Fund's primary objective. The First Eagle Short Duration High Yield Municipal Fund seeks to provide high current income exempt from regular federal income taxes; capital appreciation is a secondary objective when consistent with the Fund's primary objective. The First Eagle Short Duration High Yield Municipal Fund incepted on January 2, 2024.
The Funds generally offer up to four share classes, Class A shares, Class C shares, Class I shares and Class R6 shares, except for the First Eagle Small Cap Opportunity Fund, First Eagle U.S. Smid Cap Opportunity Fund, First Eagle Global Real Assets Fund and First Eagle Short Duration High Yield Municipal Fund, which
First Eagle Funds | Semiannual Report | April 30, 2024
226
Notes to Financial Statements
offer Class A shares, Class I shares and Class R6 shares only. On December 1, 2023, Class R3 Shares, Class R4 Shares, Class R5 Shares of the Funds were closed to new investors. On February 28, 2024, all remaining Class R3 shares, Class R4 shares, and Class R5 shares of the Funds converted into Class R6 shares. As a result, Class R3 shares, Class R4 shares, and Class R5 shares were terminated.
First Eagle Investment Management, LLC (the "Adviser"), a subsidiary of First Eagle Holdings, Inc. ("First Eagle Holdings"), manages the Funds. A controlling interest in First Eagle Holdings is owned by BCP CC Holdings L.P., a Delaware limited partnership ("BCP CC Holdings"). BCP CC Holdings GP L.L.C., a Delaware limited liability company ("BCP CC Holdings GP"), is the general partner of BCP CC Holdings and has two managing members, Blackstone Capital Partners VI L.P. ("BCP VI") and Corsair IV Financial Services Capital Partners L.P. ("Corsair IV"). BCP VI and Corsair IV are indirectly controlled by Blackstone Inc. ("Blackstone") and Corsair Capital LLC ("Corsair"), respectively. Investment vehicles indirectly controlled by Blackstone and Corsair and certain co-investors own a majority economic interest in First Eagle Holdings and the Adviser through BCP CC Holdings.
The following is a summary of significant accounting policies that are adhered to by the Funds. The Funds are investment companies and, accordingly, follow the investment company accounting and reporting guidance of the Financial Accounting Standards Board Accounting Standards Codification Topic 946 — Investment Companies, which is part of U.S. generally accepted accounting principles ("GAAP").
a) Investments in Subsidiaries — The First Eagle Global Fund (the "Global Fund"), First Eagle Overseas Fund (the "Overseas Fund"), First Eagle U.S. Value Fund (the "U.S. Value Fund"), First Eagle Gold Fund (the "Gold Fund") and First Eagle Global Real Assets Fund (the "Global Real Assets Fund") may invest in certain precious metals through their investment in the First Eagle Global Cayman Fund, Ltd., First Eagle Overseas Cayman Fund, Ltd., First Eagle U.S. Value Cayman Fund, Ltd., First Eagle Gold Cayman Fund, Ltd., and First Eagle Global Real Assets Cayman Fund, Ltd., respectively, each a wholly owned subsidiary (each referred to herein as a "Subsidiary" or collectively "the Subsidiaries"). Each Fund may invest up to 25% of its total assets in shares of its respective Subsidiary. Each Subsidiary has the ability to invest in commodities and securities consistent with the investment objective of its respective Fund. Substantially all of each Subsidiary's assets represent physical gold bullion, and First Eagle Gold Cayman Fund, Ltd. also holds physical silver. Trading in bullion directly by the Funds presents the risk of tax consequences (e.g., a change in the Funds' tax status subjecting the Funds to be taxed at the Fund level on all of their income if the Funds' "non-qualifying income" exceeds 10% of the Funds' gross income in any taxable year). Trading in bullion by the Subsidiaries generally does not present the same tax risks.
The First Eagle Global Cayman Fund, Ltd., established on October 18, 2013, is an exempted company under the laws of the Cayman Islands. The consolidated
First Eagle Funds | Semiannual Report | April 30, 2024
227
Notes to Financial Statements
financial statements include the accounts of the Global Fund and the First Eagle Global Cayman Fund, Ltd. All intercompany transactions and balances have been eliminated. As of April 30, 2024, the First Eagle Global Cayman Fund, Ltd. has $5,433,761,702 in net assets, representing 10.58% of the Global Fund's net assets.
The First Eagle Overseas Cayman Fund, Ltd., established on October 18, 2013, is an exempted company under the laws of the Cayman Islands. The consolidated financial statements include the accounts of the Overseas Fund and the First Eagle Overseas Cayman Fund, Ltd. All intercompany transactions and balances have been eliminated. As of April 30, 2024, the First Eagle Overseas Cayman Fund, Ltd. has $979,786,071 in net assets, representing 7.92% of the Overseas Fund's net assets.
The First Eagle U.S. Value Cayman Fund, Ltd., established on January 24, 2012, is an exempted company under the laws of the Cayman Islands. The consolidated financial statements include the accounts of the U.S. Value Fund and the First Eagle U.S. Value Cayman Fund, Ltd. All intercompany transactions and balances have been eliminated. As of April 30, 2024, the First Eagle U.S. Value Cayman Fund, Ltd. has $161,127,855 in net assets, representing 12.73% of the U.S. Value Fund's net assets.
The First Eagle Gold Cayman Fund, Ltd., established on May 28, 2010, is an exempted company under the laws of the Cayman Islands. The consolidated financial statements include the accounts of the Gold Fund and the First Eagle Gold Cayman Fund, Ltd. All intercompany transactions and balances have been eliminated. As of April 30, 2024, the First Eagle Gold Cayman Fund, Ltd. has $429,869,577 in net assets, representing 18.44% of the Gold Fund's net assets.
The First Eagle Global Real Assets Cayman Fund, Ltd., established on September 9, 2021, is an exempted company under the laws of the Cayman Islands. The consolidated financial statements include the accounts of the Global Real Assets Fund and the First Eagle Global Real Assets Cayman Fund, Ltd. All intercompany transactions and balances have been eliminated. As of April 30, 2024, the First Eagle Global Real Assets Cayman Fund, Ltd. has $594,264 in net assets, representing 4.45% of the Global Real Assets Fund's net assets.
b) Investment Valuation — Each Fund computes its net asset value once daily as of the close of trading on each day the New York Stock Exchange ("NYSE") is open for trading. The net asset value per share is computed by dividing the total current value of the assets of a Fund, less its liabilities, by the total number of shares outstanding at the time of such computation.
A portfolio security (including an option or warrant), other than a bond, which is traded on a U.S. national securities exchange or a securities exchange abroad is generally valued at the price of the official close (last quoted sales price if an official closing price is not available) as of the local market close on the primary exchange. If there are no round lot sales on such date, such security will be
First Eagle Funds | Semiannual Report | April 30, 2024
228
Notes to Financial Statements
valued at the mean between the closing bid and asked prices (and if there is only a bid or only an asked price on such date, valuation will be at such bid or asked price for long or short positions, respectively). Securities, other than bonds, traded in the over-the-counter market are valued at the mean between the last bid and asked prices prior to the time of valuation (and if there is only a bid or only an asked price on such date, valuation will be at such bid or asked price for long or short positions, respectively), except if such unlisted security is traded on the NASDAQ in which case it is valued at the NASDAQ Official Closing Price. Such prices are provided by approved pricing vendors or other independent pricing sources.
All bonds, whether listed on an exchange or traded in the over-counter-market for which market quotations are readily available are generally priced at the evaluated bid price provided by an approved pricing service as of the close of the NYSE (normally 4:00 p.m. Eastern Time), or dealers in the over-the-counter markets in the United States or abroad. Pricing services and broker-dealers use multiple valuation techniques to determine value. In instances where sufficient market activity exists, dealers or pricing services utilize a market-based approach through which quotes from market makers are used to determine fair value. In instances where sufficient market activity may not exist or is limited, the dealers or pricing services also utilize proprietary valuation models which may consider market transactions in comparable securities and the various relationships between securities in determining value and/or market characteristics such as benchmark yield curves, option-adjusted spreads, credit spreads, estimated default rates, coupon rates, anticipated timing of principal repayments, underlying collateral, and other unique security features in order to estimate the relevant cash flows, which are then discounted to calculate the fair values. The Adviser's Valuation Committee, at least annually, will review the pricing service's inputs, methods, models and assumptions for its evaluated prices. Short-term debt maturing in 60 days or less is valued at evaluated bid prices.
Commodities (such as physical metals) are valued at a calculated evaluated mean price, as provided by an independent price source as of the close of the NYSE.
Forward foreign currency exchange contracts are valued at the current cost of covering or offsetting such contracts, by reference to forward currency rates at the time the NYSE closes, as provided by an independent pricing source.
The spot exchange rates, as provided by an independent price source as of the close of the NYSE, are used to convert foreign security prices into U.S. dollars.
Any security that is listed or traded on more than one exchange (or traded in multiple markets) is valued at the official close on the primary exchange or market on which they are traded. In the absence of such a quotation, a security may be valued at the last quoted sales price on the most active exchange or market as determined by the independent pricing agent. The Funds use pricing services to identify the market prices of publicly traded securities in their portfolios. When market prices are determined to be "stale" as a result of limited
First Eagle Funds | Semiannual Report | April 30, 2024
229
Notes to Financial Statements
market activity for a particular holding or have been materially affected by events occurring after the close of trading on the exchange or market on which the security is principally traded but before the Fund's NAV is calculated, or in other circumstances when market quotations are not readily available within the meaning of applicable regulations, such as for private placements, or determined to be unreliable for a particular holding, such holdings may be "fair valued" in accordance with procedures adopted by the Board of Trustees ("Board") . The values assigned to a Fund's holdings therefore may differ on occasion from reported market values.
Additionally, trading of foreign equity securities on most foreign markets is completed before the close in trading in the U.S. markets. The Funds have implemented fair value pricing on a daily basis for all foreign securities, as available, to account for the market movement between the close of the foreign market and the close of the NYSE. The fair value pricing utilizes factors provided by an independent pricing service. The values assigned to a Fund's holdings therefore may differ on occasion from reported market values, especially during periods of higher market price volatility. The Board and the Adviser believe relying on the procedures as just described will result in prices that are more reflective of the actual market value of portfolio securities held by the Funds than relying solely on reported market values.
The Funds adopted provisions surrounding fair value measurements and disclosures that define fair value, establish a framework for measuring fair value in GAAP and expand disclosures about fair value measurements. This applies to fair value measurements that are already required or permitted by other accounting standards and is intended to increase consistency of those measurements and applies broadly to securities and other types of assets and liabilities.
The Funds disclose the fair value of their investments in a hierarchy that prioritizes the inputs or assumptions to valuation techniques used to measure fair value. These inputs are used in determining the value of the Funds' investments and are summarized in the following fair value hierarchy:
Level 1 — Quoted prices in active markets for identical securities.
Level 2 — Other significant observable inputs (including quoted prices for similar securities, interest rates, prepayment speeds, credit risk, etc.).
Level 3 — Other significant unobservable inputs (including the Fund's own assumption in determining the fair value of investments).
The significant unobservable inputs that may be used in determining valuations for investments identified within Level 3 are market comparables and the enterprise value of a company. Indications of value and quotations may be observable at any given time, but are currently treated by the Funds as unobservable. Significant changes in any of the unobservable inputs may significantly impact the fair value measurement. The impact is based on the relationship between each unobservable input and the fair value measurement.
First Eagle Funds | Semiannual Report | April 30, 2024
230
Notes to Financial Statements
Significant increases (decreases) in enterprise multiples may increase (decrease) the fair value measurement. Significant increases (decreases) in the discount for marketability, probability of insolvency and probability of default may decrease (increase) the fair value measurement.
Fair valuation of securities, other financial investments or other assets (collectively, "securities") held by the Funds are determined in good faith by the Adviser as "valuation designee" under the oversight of the Board. The Board Valuation, Liquidity and Allocations Committee (the "Committee") oversees the execution of the valuation and liquidity procedures for the Funds. In accordance with Rule 2a-5 under the 1940 Act, the Funds' Board has designated the Adviser the "valuation designee" to perform the Fund's fair value determinations. The Adviser's fair valuation process is subject to Board oversight and certain reporting and other requirements.
The following is a summary of the Funds' inputs used to value the Funds' investments as of April 30, 2024:
First Eagle Global Fund
Description† | | Level 1 | | Level 2 | | Level 3‡ | | Total | |
Assets: | |
Common Stocks | | $ | 26,105,238,175 | | | $ | 13,910,017,994 | (a) | | $ | — | | | $ | 40,015,256,169 | | |
Corporate Bonds | | | — | | | | — | | | | 4,933,968 | (b) | | | 4,933,968 | | |
Commodities* | | | — | | | | 6,132,020,318 | | | | — | | | | 6,132,020,318 | | |
Foreign Government Securities | | | — | | | | 207,441,390 | | | | — | | | | 207,441,390 | | |
Short-Term Investments | | | 544,072 | | | | 4,862,503,284 | | | | — | | | | 4,863,047,356 | | |
Forward Foreign Currency
Exchange Contracts** | | | — | | | | 40,659,452 | | | | — | | | | 40,659,452 | | |
Total | | $ | 26,105,782,247 | | | $ | 25,152,642,438 | | | $ | 4,933,968 | | | $ | 51,263,358,653 | | |
(a) The Fund has implemented fair value pricing on a daily basis for all foreign securities, as available, to account for the market movement between the close of the foreign market and the close of the NYSE. See Note 1(b) for additional details.
(b) These investments are valued by brokers and pricing services. The inputs for these investments are not readily available or cannot be reasonably estimated and are generally those inputs described in Note 1(b).
† See Consolidated Schedule of Investments for additional detailed categorizations.
‡ Value determined using significant unobservable inputs.
* Represents gold bullion.
** Forward Foreign Currency Exchange Contracts are valued at net unrealized appreciation (depreciation) on the contracts.
First Eagle Funds | Semiannual Report | April 30, 2024
231
Notes to Financial Statements
Fair Value Level 3 activity for the six-month period ended April 30, 2024 was as follows:
First Eagle Global Fund (continued)
| | | Corporate Bonds | |
Beginning Balance — market value | | $ | 4,954,469 | | |
Purchases(1) | | | — | | |
Sales(2) | | | — | | |
Transfer In — Level 3 | | | — | | |
Transfer Out — Level 3 | | | — | | |
Accrued discounts/(premiums) | | | 27,182 | | |
Realized Gains (Losses) | | | — | | |
Change in Unrealized Appreciation (Depreciation) | | | (47,683 | ) | |
Ending Balance — market value | | $ | 4,933,968 | | |
Change in unrealized gains or (losses) relating to assets still held at reporting date | | $ | (47,683 | ) | |
(1) Purchases include all purchases of securities and securities received in corporate actions.
(2) Sales include all sales of securities, maturities, paydowns and securities tendered in corporate actions.
First Eagle Overseas Fund
Description† | | Level 1 | | Level 2 | | Level 3‡ | | Total | |
Assets: | |
Common Stocks | | $ | 2,998,664,246 | | | $ | 7,415,244,951 | (a) | | $ | 21,865,255 | | | $ | 10,435,774,452 | | |
Commodities* | | | — | | | | 1,401,246,132 | | | | — | | | | 1,401,246,132 | | |
Foreign Government Securities | | | — | | | | 152,187,068 | | | | — | | | | 152,187,068 | | |
Short-Term Investments | | | 185,361 | | | | 336,358,581 | | | | — | | | | 336,543,942 | | |
Forward Foreign Currency
Exchange Contracts** | | | — | | | | 21,966,333 | | | | — | | | | 21,966,333 | | |
Total | | $ | 2,998,849,607 | | | $ | 9,327,003,065 | | | $ | 21,865,255 | | | $ | 12,347,717,927 | | |
(a) The Fund has implemented fair value pricing on a daily basis for all foreign securities, as available, to account for the market movement between the close of the foreign market and the close of the NYSE. See Note 1(b) for additional details.
† See Consolidated Schedule of Investments for additional detailed categorizations.
‡ Value determined using significant unobservable inputs.
* Represents gold bullion.
** Forward Foreign Currency Exchange Contracts are valued at net unrealized appreciation (depreciation) on the contracts.
First Eagle Funds | Semiannual Report | April 30, 2024
232
Notes to Financial Statements
Fair Value Level 3 activity for the six-month period ended April 30, 2024 was as follows:
First Eagle Overseas Fund (continued)
| | | Common Stocks | |
Beginning Balance — market value | | $ | 15,384,962 | | |
Purchases(1) | | | — | | |
Sales(2) | | | — | | |
Transfer In — Level 3 | | | — | | |
Transfer Out — Level 3 | | | — | | |
Accrued discounts/(premiums) | | | — | | |
Realized Gains (Losses) | | | — | | |
Change in Unrealized Appreciation (Depreciation) | | | 6,480,293 | | |
Ending Balance — market value | | $ | 21,865,255 | | |
Change in unrealized gains or (losses) relating to assets still held at reporting date | | $ | 6,480,293 | | |
(1) Purchases include all purchases of securities and securities received in corporate actions.
(2) Sales include all sales of securities, maturities, paydowns and securities tendered in corporate actions.
Quantitative Information about Level 3 Fair Value Measurements | |
| | Fair Value as of
April 30, 2024 | | Valuation
Technique(s) | | Unobservable
Input | | Range
(Weighted
Average) | | Direction
Change in Fair
Value Resulting
from Increase
in Unobservable
Input(a) | |
Common Stock | | $ | 21,865,255 | | | Market
Comparable
Companies | | Enterprise
Value
Multiple | | 0.29x -
10.08x (3.77x) | | Increase | |
(a) This column represents the direction change in the fair value of Level 3 securities that would result from an increase to the corresponding unobservable inputs. A decrease to the unobservable input would have the opposite effect. Significant increases and decreases of these inputs could result in significantly higher or lower fair value determination.
First Eagle Funds | Semiannual Report | April 30, 2024
233
Notes to Financial Statements
First Eagle U.S. Value Fund
Description† | | Level 1 | | Level 2 | | Level 3‡ | | Total | |
Assets: | |
Common Stocks | | $ | 938,791,804 | | | $ | — | | | $ | — | | | $ | 938,791,804 | | |
Convertible Preferred Stocks | | | 4,887,500 | | | | — | | | | — | | | | 4,887,500 | | |
Corporate Bonds | | | — | | | | 8,471,716 | | | | 3,337,081 | (b) | | | 11,808,797 | | |
Commodities* | | | — | | | | 161,127,602 | | | | — | | | | 161,127,602 | | |
Master Limited Partnerships | | | 19,241,623 | | | | — | | | | — | | | | 19,241,623 | | |
Short-Term Investments | | | 29,273 | | | | 131,052,128 | | | | — | | | | 131,081,401 | | |
Total | | $ | 962,950,200 | | | $ | 300,651,446 | | | $ | 3,337,081 | | | $ | 1,266,938,727 | | |
(b) These investments are valued by brokers and pricing services. The inputs for these investments are not readily available or cannot be reasonably estimated and are generally those inputs described in Note 1(b).
† See Consolidated Schedule of Investments for additional detailed categorizations.
‡ Value determined using significant unobservable inputs.
* Represents gold bullion.
Fair Value Level 3 activity for the six-month period ended April 30, 2024 was as follows:
First Eagle U.S. Value Fund (continued)
| | | Corporate Bonds | |
Beginning Balance — market value | | $ | 543,750 | | |
Purchases(1) | | | — | | |
Sales(2) | | | (413,200 | ) | |
Transfer In — Level 3 | | | 3,104,552 | (a) | |
Transfer Out — Level 3 | | | — | | |
Accrued discounts/ (premiums) | | | 103,058 | | |
Realized Gains (Losses) | | | — | | |
Change in Unrealized Appreciation (Depreciation) | | | (1,079 | ) | |
Ending Balance — market value | | $ | 3,337,081 | | |
Change in unrealized gains or (losses) relating to assets still held at reporting date | | $ | (1,079 | ) | |
(a) Transfers from Level 2 into Level 3 are due to a decrease in market activity, e.g. frequency of trades, which resulted in a decrease in available market inputs to determine the price.
(1) Purchases include all purchases of securities and securities received in corporate actions.
(2) Sales include all sales of securities, maturities, paydowns and securities tendered in corporate actions.
First Eagle Funds | Semiannual Report | April 30, 2024
234
Notes to Financial Statements
First Eagle Gold Fund
Description† | | Level 1 | | Level 2 | | Level 3 | | Total | |
Assets: | |
Common Stocks | | $ | 1,603,262,684 | | | $ | 142,257,624 | (a) | | $ | — | | | $ | 1,745,520,308 | | |
Commodities* | | | — | | | | 430,024,569 | | | | — | | | | 430,024,569 | | |
Rights | | | 3,537,458 | | | | — | | | | — | | | | 3,537,458 | | |
Short-Term Investments | | | 65,551 | | | | 147,434,039 | | | | — | | | | 147,499,590 | | |
Total | | $ | 1,606,865,693 | | | $ | 719,716,232 | | | $ | — | | | $ | 2,326,581,925 | | |
(a) The Fund has implemented fair value pricing on a daily basis for all foreign securities, as available, to account for the market movement between the close of the foreign market and the close of the NYSE. See Note 1(b) for additional details.
† See Consolidated Schedule of Investments for additional detailed categorizations.
* Represents gold and silver bullion.
First Eagle Global Income Builder Fund
Description† | | Level 1 | | Level 2 | | Level 3‡ | | Total | |
Assets: | |
Common Stocks | | $ | 595,617,365 | | | $ | 451,295,540 | (a) | | $ | — | | | $ | 1,046,912,905 | | |
Convertible Preferred Stocks | | | 24,811,129 | | | | — | | | | — | | | | 24,811,129 | | |
Corporate Bonds | | | — | | | | 174,311,037 | | | | 10,676,250 | (b) | | | 184,987,287 | | |
Asset-Backed Securities | | | — | | | | 3,651,070 | | | | — | | | | 3,651,070 | | |
Commodities* | | | — | | | | 119,814,964 | | | | — | | | | 119,814,964 | | |
Foreign Government Securities | | | — | | | | 32,667,681 | | | | — | | | | 32,667,681 | | |
Loan Assignments | | | — | | | | 2,504,437 | | | | — | | | | 2,504,437 | | |
Master Limited Partnerships | | | 17,190,183 | | | | — | | | | — | | | | 17,190,183 | | |
Municipal Bonds | | | — | | | | 2,848,398 | | | | — | | | | 2,848,398 | | |
Preferred Stocks | | | 28,229,069 | | | | — | | | | — | | | | 28,229,069 | | |
U.S. Treasury Obligations | | | — | | | | 202,082,098 | | | | — | | | | 202,082,098 | | |
Short-Term Investments | | | 4,527 | | | | 16,423,442 | | | | — | | | | 16,427,969 | | |
Forward Foreign Currency
Exchange Contracts** | | | — | | | | 876,755 | | | | — | | | | 876,755 | | |
Total | | $ | 665,852,273 | | | $ | 1,006,475,422 | | | $ | 10,676,250 | | | $ | 1,683,003,945 | | |
Liabilities: | |
Options Written | | $ | (2,915,696 | ) | | $ | — | | | $ | — | | | $ | (2,915,696 | ) | |
Total | | $ | (2,915,696 | ) | | $ | — | | | $ | — | | | $ | (2,915,696 | ) | |
First Eagle Funds | Semiannual Report | April 30, 2024
235
Notes to Financial Statements
(a) The Fund has implemented fair value pricing on a daily basis for all foreign securities, as available, to account for the market movement between the close of the foreign market and the close of the NYSE. See Note 1(b) for additional details.
(b) These investments are valued by brokers and pricing services. The inputs for these investments are not readily available or cannot be reasonably estimated and are generally those inputs described in Note 1(b).
† See Schedule of Investments for additional detailed categorizations.
‡ Value determined using significant unobservable inputs.
* Represents gold bullion.
** Forward Foreign Currency Exchange Contracts are valued at net unrealized appreciation (depreciation) on the contracts.
Fair Value Level 3 activity for the six-month period ended April 30, 2024 was as follows:
First Eagle Global Income Builder Fund (continued)
| | | Corporate Bonds | |
Beginning Balance — market value | | $ | — | | |
Purchases(1) | | | — | | |
Sales(2) | | | (1,578,000 | ) | |
Transfer In — Level 3 | | | 11,856,203 | (a) | |
Transfer Out — Level 3 | | | — | | |
Accrued discounts/(premiums) | | | 110,759 | | |
Realized Gains (Losses) | | | — | | |
Change in Unrealized Appreciation (Depreciation) | | | 287,288 | | |
Ending Balance — market value | | $ | 10,676,250 | | |
Change in unrealized gains or (losses) relating to assets still held at reporting date | | $ | 287,288 | | |
(a) Transfers from Level 2 into Level 3 are due to a decrease in market activity, e.g. frequency of trades, which resulted in a decrease in available market inputs to determine the price.
(1) Purchases include all purchases of securities and securities received in corporate actions.
(2) Sales include all sales of securities, maturities, paydowns and securities tendered in corporate actions.
First Eagle Rising Dividend Fund
Description† | | Level 1 | | Level 2 | | Level 3 | | Total | |
Assets: | |
Common Stocks | | $ | 354,432,000 | | | $ | 23,031,213 | (a) | | $ | — | | | $ | 377,463,213 | | |
Master Limited Partnerships | | | 9,849,313 | | | | — | | | | — | | | | 9,849,313 | | |
Short-Term Investments | | | 1,606 | | | | 4,188,348 | | | | — | | | | 4,189,954 | | |
Total | | $ | 364,282,919 | | | $ | 27,219,561 | | | $ | — | | | $ | 391,502,480 | | |
First Eagle Funds | Semiannual Report | April 30, 2024
236
Notes to Financial Statements
(a) The Fund has implemented fair value pricing on a daily basis for all foreign securities, as available, to account for the market movement between the close of the foreign market and the close of the NYSE. See Note 1(b) for additional details.
† See Schedule of Investments for additional detailed categorizations.
First Eagle Small Cap Opportunity Fund
Description† | | Level 1 | | Level 2 | | Level 3‡ | | Total | |
Assets: | |
Common Stocks | | $ | 1,660,461,320 | | | $ | — | | | $ | — | | | $ | 1,660,461,320 | | |
Rights | | | — | | | | — | | | | — | ^ | | | — | | |
Short-Term Investments | | | 127,923,513 | | | | — | | | | — | | | | 127,923,513 | | |
Total | | $ | 1,788,384,833 | | | $ | — | | | $ | — | | | $ | 1,788,384,833 | | |
† See Schedule of Investments for additional detailed categorizations.
‡ Value determined using significant unobservable inputs.
^ Fair value represents zero.
Fair Value Level 3 activity for the six-month period ended April 30, 2024 was as follows:
| | | Rights | |
Beginning Balance — market value | | $ | — | ^ | |
Purchases(1) | | | — | | |
Sales(2) | | | — | | |
Transfer In — Level 3 | | | — | | |
Transfer Out — Level 3 | | | — | | |
Accrued discounts/(premiums) | | | — | | |
Realized Gains (Losses) | | | — | | |
Change in Unrealized Appreciation (Depreciation) | | | — | | |
Ending Balance — market value | | $ | — | ^ | |
Change in unrealized gains or (losses) relating to assets still held at reporting date | | $ | — | | |
(1) Purchases include all purchases of securities and securities received in corporate actions.
(2) Sales include all sales of securities, maturities, paydowns and securities tendered in corporate actions.
^ Fair value represents zero.
First Eagle Funds | Semiannual Report | April 30, 2024
237
Notes to Financial Statements
Quantitative Information about Level 3 Fair Value Measurements | |
| | Fair Value as of
April 30, 2024 | | Valuation
Technique(s) | | Unobservable
Input | | Range
(Weighted
Average) | | Direction
Change in Fair
Value Resulting
from Increase
in Unobservable
Input(a) | |
| Rights | | $ | — | ^ | | Discounted
Cash Flow | | Estimated probability
of the company hitting
specified milestones | | | 0 | % (0%) | | Increase | |
(a) This column represents the direction change in the fair value of Level 3 securities that would result from an increase to the corresponding unobservable inputs. A decrease to the unobservable input would have the opposite effect. Significant increases and decreases of these inputs could result in significantly higher or lower fair value determination.
^ Fair value represents zero.
First Eagle U.S. Smid Cap Opportunity Fund
Description† | | Level 1 | | Level 2 | | Level 3 | | Total | |
Assets: | |
Common Stocks | | $ | 33,876,203 | | | $ | — | | | $ | — | | | $ | 33,876,203 | | |
Short-Term Investments | | | 1,864,952 | | | | — | | | | — | | | | 1,864,952 | | |
Total | | $ | 35,741,155 | | | $ | — | | | $ | — | | | $ | 35,741,155 | | |
† See Schedule of Investments for additional detailed categorizations.
First Eagle Global Real Assets Fund
Description† | | Level 1 | | Level 2 | | Level 3‡ | | Total | |
Assets: | |
Common Stocks | | $ | 7,809,084 | | | $ | 4,077,717 | (a) | | $ | — | ^ | | $ | 11,886,801 | | |
Commodities* | | | — | | | | 451,231 | | | | — | | | | 451,231 | | |
Exchange-Traded Funds | | | 146,917 | | | | — | | | | — | | | | 146,917 | | |
Master Limited Partnerships | | | 446,468 | | | | — | | | | — | | | | 446,468 | | |
Short-Term Investments | | | 848,576 | | | | — | | | | — | | | | 848,576 | | |
Total | | $ | 9,251,045 | | | $ | 4,528,948 | | | $ | — | | | $ | 13,779,993 | | |
(a) The Fund has implemented fair value pricing on a daily basis for all foreign securities, as available, to account for the market movement between the close of the foreign market and the close of the NYSE. See Note 1 for additional details.
† See Consolidated Schedule of Investments for additional detailed categorizations.
‡ Value determined using significant unobservable inputs.
* Represents gold bullion.
^ Fair value represents zero.
First Eagle Funds | Semiannual Report | April 30, 2024
238
Notes to Financial Statements
Fair Value Level 3 activity for the six-month period ended April 30, 2024 was as follows:
First Eagle Global Real Assets Fund (continued)
| | | Common Stocks | |
Beginning Balance — market value | | $ | — | ^ | |
Purchases(1) | | | — | | |
Sales(2) | | | — | | |
Transfer In — Level 3 | | | — | | |
Transfer Out — Level 3 | | | — | | |
Accrued discounts/(premiums) | | | — | | |
Realized Gains (Losses) | | | — | | |
Change in Unrealized Appreciation (Depreciation) | | | — | | |
Ending Balance — market value | | $ | — | ^ | |
Change in unrealized gains or (losses) relating to assets still held at reporting date | | $ | — | | |
(1) Purchases include all purchases of securities and securities received in corporate actions.
(2) Sales include all sales of securities, maturities, paydowns and securities tendered in corporate actions.
^ Fair value represents zero.
Quantitative Information about Level 3 Fair Value Measurements | |
| | Fair Value as of
April 30, 2024 | | Valuation
Technique(s) | | Unobservable
Input | | Range
(Weighted
Average) | | Direction
Change in Fair
Value Resulting
from Increase
in Unobservable
Input(a) | |
| Common Stock | | $ | — | ^ | | Discounted
Cash Flow | | Estimated
Recoverability | | | 0 | % (0%) | | Increase | |
(a) This column represents the direction change in the fair value of Level 3 securities that would result from an increase to the corresponding unobservable inputs. A decrease to the unobservable input would have the opposite effect. Significant increases and decreases of these inputs could result in significantly higher or lower fair value determination.
^ Fair value represents zero.
First Eagle High Yield Municipal Fund
Description† | | Level 1 | | Level 2 | | Level 3‡ | | Total | |
Assets: | |
Municipal Bonds | | $ | — | | | $ | 992,125,747 | | | $ | 7,975,384 | (b) | | $ | 1,000,101,131 | | |
Short-Term Investments | | | 343,060 | | | | — | | | | — | | | | 343,060 | | |
Total | | $ | 343,060 | | | $ | 992,125,747 | | | $ | 7,975,384 | | | $ | 1,000,444,191 | | |
First Eagle Funds | Semiannual Report | April 30, 2024
239
Notes to Financial Statements
† See Schedule of Investments for additional detailed categorizations.
‡ Value determined using significant unobservable inputs.
(b) These investments are valued by brokers and pricing services. The inputs for these investments are not readily available or cannot be reasonably estimated and are generally those inputs described in Note 1(b).
First Eagle High Yield Municipal Fund (continued)
| | | Municipal
Bonds | | Corporate
Bonds | | Total | |
Beginning Balance — market value | | $ | — | | | $ | 621,196 | | | $ | 621,196 | | |
Purchases(1) | | | 8,041,902 | | | | — | | | | 8,041,902 | | |
Sales(2) | | | — | | | | (620,610 | ) | | | (620,610 | ) | |
Transfer In — Level 3 | | | — | | | | — | | | | — | | |
Transfer Out — Level 3 | | | — | | | | — | | | | — | | |
Accrued discounts/(premiums) | | | 8,934 | | | | — | | | | 8,934 | | |
Realized Gains (Losses) | | | — | | | | 16,610 | | | | 16,610 | | |
Change in Unrealized Appreciation (Depreciation) | | | (75,452 | ) | | | (17,196 | ) | | | (92,648 | ) | |
Ending Balance — market value | | $ | 7,975,384 | | | $ | — | | | $ | 7,975,384 | | |
Change in unrealized gains or (losses) relating to assets
still held at reporting date | | $ | (75,452 | ) | | $ | — | | | $ | (75,452 | ) | |
(1) Purchases include all purchases of securities and securities received in corporate actions.
(2) Sales include all sales of securities, maturities, paydowns and securities tendered in corporate actions.
First Eagle Short Duration High Yield Municipal Fund
Description† | | Level 1 | | Level 2 | | Level 3 | | Total | |
Assets: | |
Municipal Bonds | | $ | — | | | $ | 21,530,507 | | | $ | — | | | $ | 21,530,507 | | |
Short-Term Investments | | | 23,763 | | | | — | | | | — | | | | 23,763 | | |
Total | | $ | 23,763 | | | $ | 21,530,507 | | | $ | — | | | $ | 21,554,270 | | |
† See Schedule of Investments for additional detailed categorizations.
c) Investment Transactions and Income — Investment transactions are accounted for on a trade date basis. The specific identification method is used in determining realized gains and losses from investment transactions. Dividend income is recorded on the ex-dividend date, except for certain dividends on foreign securities, which are recorded as soon as the Fund is informed after the ex-dividend date. The Funds may be subject to withholding tax on income, capital gains or repatriation taxes imposed by certain countries, a portion of which may be recoverable. Foreign taxes are recorded in accordance with the applicable
First Eagle Funds | Semiannual Report | April 30, 2024
240
Notes to Financial Statements
foreign tax regulations and rates that exist in the foreign jurisdictions in which a Fund invests. Investment income is recorded net of foreign withholding taxes. Foreign taxes are accrued based on gains realized by a Fund as a result of certain foreign security sales. In certain circumstances, estimated taxes are accrued based on unrealized appreciation of such securities. Interest income is recorded daily on the accrual basis. In computing investment income, each Fund accretes discounts and amortizes premiums on debt obligations using the effective yield method. Investment income is allocated to each Fund's share class in proportion to its relative net assets. Payments received from certain investments held by the Funds may be comprised of dividends, capital gains and return of capital. The Funds originally estimate the expected classification of such payments. The amounts may subsequently be reclassified upon receipt of information from the issuer.
d) Expenses — Expenses arising in connection with a Fund are charged directly to that Fund. Expenses common to all Funds may be allocated to each Fund in proportion to its relative net assets. Certain expenses are shared with the First Eagle Variable Funds, an affiliated fund group, and certain other funds also managed by the Adviser. Generally, expenses that do not pertain specifically to a Fund are allocated to each Fund based upon the percentage of net assets a Fund bears to the total net assets of all the Funds that share the expense. Earnings credits may reduce shareholder servicing agent fees by the amount of interest earned on balances with such service provider.
e) Foreign Currency Translation — The books and records of the Funds are maintained in U.S. dollars. The market values of securities which are not traded in U.S. currency are recorded in the financial statements after translation to U.S. dollars based on the applicable exchange rates at the end of the period. The costs of such securities are translated at exchange rates prevailing when acquired. Related interest, dividends and withholding taxes are accrued at the rates of exchange prevailing on the respective dates of such transactions.
The net assets of each of the Funds are presented at the foreign exchange rates and market values at the close of the period. The Funds do not isolate that portion of gains and losses on investments which is due to changes in foreign exchange rates from that which is due to changes in market prices of the securities. Accordingly, such foreign currency gains (losses) are included in the reported net realized and unrealized gains (losses) on investment transactions on the Statements of Operations. However, for federal income tax purposes each Fund does isolate the effect of changes in foreign exchange rates from the changes in market prices for realized gains and losses on debt obligations.
f) Forward Foreign Currency Exchange Contracts — In connection with portfolio purchases and sales of securities denominated in foreign currencies, each Fund may enter into forward foreign currency exchange contracts. The First Eagle Global Fund, First Eagle Overseas Fund and First Eagle Global Income Builder
First Eagle Funds | Semiannual Report | April 30, 2024
241
Notes to Financial Statements
Fund enter into forward foreign currency exchange contracts primarily to manage and/or gain exposure to certain foreign currencies. The Funds' currency transactions include portfolio hedging on portfolio positions. Portfolio hedging is the use of a forward foreign currency exchange contract (or other cash management position) with respect to one or more portfolio security positions denominated or quoted in a particular currency. Currency exchange transactions involve currencies of different countries that the Funds invest in and serve as hedges against possible variations in the exchange rates between these currencies and the U.S. dollar. Each Fund may engage in portfolio hedging with respect to the currency of a particular country in amounts approximating actual or anticipated positions in securities denominated in that currency. Hedging can reduce exposure to currency exchange movements, but cannot eliminate that exposure. It is possible to lose money under a hedge.
Funds investing in forward foreign currency exchange contracts are exposed to risk if the value of the currency changes unfavorably, if the counterparties to the contracts are unable to meet the terms of their contracts or if the Fund is unable to enter into a closing position. Forward foreign currency exchange contracts outstanding at period end, if any, are listed after each Fund's portfolio. For the six months ended April 30, 2024, the average monthly outstanding currency purchased or sold in U.S. dollars for forward foreign currency exchange contracts held by the Funds were as follows:
| | | First Eagle
Global
Fund | | First Eagle
Overseas
Fund | | First Eagle
Global
Income
Builder
Fund | |
Forward Foreign Currency Exchange Contracts: | |
Average Settlement Value — Purchased | | $ | 47,279,997 | | | $ | 4,475,620 | | | $ | 1,373,165 | | |
Average Settlement Value — Sold | | | 1,499,886,698 | | | | 805,916,727 | | | | 40,037,139 | | |
The Funds adopted provisions surrounding disclosures of derivative instruments and hedging activities which require qualitative disclosures about objectives and strategies for using derivatives, quantitative disclosures about fair value amounts of gains and losses on derivative instruments, and disclosures about currency-risk-related contingent features in derivative agreements.
In order to better define its contractual rights and to secure rights that may help the Funds mitigate counterparty risk, the Funds may enter into an International Swaps and Derivatives Association, Inc. Master Agreement ("ISDA Master Agreement") or similar agreement with derivative contract counterparties. An ISDA Master Agreement is a bilateral agreement between a Fund and a counterparty that governs over-the-counter ("OTC") derivatives and forward foreign currency exchange contracts and typically contains, among other things, collateral posting terms and netting provisions in the event of a default and/or termination event. Under an ISDA Master Agreement, the Funds may, under
First Eagle Funds | Semiannual Report | April 30, 2024
242
Notes to Financial Statements
certain circumstances, offset with the counterparty certain derivative financial instrument's payables and/or receivables with collateral held and/or posted and create one single net payment. With respect to certain counterparties, in accordance with the terms of the ISDA Master Agreement, the Funds may be required to post or receive collateral in the form of cash or debt securities issued by the U.S. Government or related agencies. Daily movement of cash collateral is subject to minimum threshold amounts. Cash collateral that has been pledged to cover obligations of a Fund, if any, is reported separately on the Statements of Assets and Liabilities as cash pledged. Non-cash collateral pledged by a Fund, if any, is noted in the Schedules of Investments. Collateral received by the Funds is held in a segregated account at the Funds' custodian bank. These amounts are not reflected on the Funds' Statements of Assets and Liabilities and are disclosed in the table below. The provisions of the ISDA Master Agreement typically permit a single net payment in the event of default (close-out netting) including the bankruptcy or insolvency of the counterparty. Note, however, that bankruptcy or insolvency laws of a particular jurisdiction may impose restrictions on or prohibitions against the right of offset in bankruptcy, insolvency or other events.
For financial reporting purposes, the Funds do not offset derivative assets and derivative liabilities that are subject to netting arrangements in the Statements of Asset and Liabilities.
At April 30, 2024, the Funds had the following forward foreign currency exchange contracts grouped into appropriate risk categories illustrated below:
First Eagle Global Fund
| | | | | | | Gain or (Loss)
Derivative Recognized
in Income | |
Risk Type | | Asset Derivative
Fair Value(1) | | Liability Derivative
Fair Value(2) | | Net Realized
Gains
(Losses)(3) | | Change in
Appreciation
(Depreciation)(4) | |
Foreign currency | | $ | 40,659,452 | | | $ | — | | | $ | 32,114,223 | | | $ | (4,947,748 | ) | |
First Eagle Overseas Fund
| | | | | | | Gain or (Loss)
Derivative Recognized
in Income | |
Risk Type | | Asset Derivative
Fair Value(1) | | Liability Derivative
Fair Value(2) | | Net Realized
Gains
(Losses)(3) | | Change in
Appreciation
(Depreciation)(4) | |
Foreign currency | | $ | 21,966,333 | | | $ | — | | | $ | 18,724,784 | | | $ | (3,373,554 | ) | |
First Eagle Funds | Semiannual Report | April 30, 2024
243
Notes to Financial Statements
First Eagle Global Income Builder Fund
| | | | | | | Gain or (Loss)
Derivative Recognized
in Income | |
Risk Type | | Asset Derivative
Fair Value(1) | | Liability Derivative
Fair Value(2) | | Net Realized
Gains
(Losses)(3) | | Change in
Appreciation
(Depreciation)(4) | |
Foreign currency | | $ | 876,755 | | | $ | — | | | $ | 723,385 | | | $ | (319,329 | ) | |
(1) Statement of Assets and Liabilities location: Unrealized appreciation on forward foreign currency exchange contracts.
(2) Statement of Assets and Liabilities location: Unrealized depreciation on forward foreign currency exchange contracts.
(3) Statement of Operations location: Net realized gains (losses) from settlement of forward foreign currency exchange contracts.
(4) Statement of Operations location: Changes in unrealized appreciation (depreciation) of forward foreign currency exchange contracts.
The following tables present each Fund's gross derivative assets and liabilities by counterparty net of amounts available for offset under netting arrangements and any related collateral received or pledged by each fund as of April 30, 2024:
First Eagle Global Fund
Counterparty | | Gross Amount
of Assets
Presented in
the Statement of
Assets and
Liabilities | | Derivatives
Available for
Offset | | Collateral
Received* | | Net Amount
(Not Less
Than $0) | |
Bank of New York Mellon | | $ | 10,937,298 | | | $ | — | | | $ | (10,714,331 | ) | | $ | 222,967 | | |
Goldman Sachs | | | 9,597,399 | | | | — | | | | (8,680,000 | ) | | | 917,399 | | |
JPMorgan Chase Bank | | | 14,457,126 | | | | — | | | | (14,457,126 | ) | | | — | | |
UBS AG | | | 5,667,629 | | | | — | | | | (5,667,629 | ) | | | — | | |
| | | $ | 40,659,452 | | | $ | — | | | $ | (39,519,086 | ) | | $ | 1,140,366 | | |
First Eagle Overseas Fund
Counterparty | | Gross Amount
of Assets
Presented in
the Statement of
Assets and
Liabilities | | Derivatives
Available for
Offset | | Collateral
Received* | | Net Amount
(Not Less
Than $0) | |
Bank of New York Mellon | | $ | 5,800,396 | | | $ | — | | | $ | (5,682,880 | ) | | $ | 117,516 | | |
Goldman Sachs | | | 5,462,699 | | | | — | | | | (5,310,000 | ) | | | 152,699 | | |
First Eagle Funds | Semiannual Report | April 30, 2024
244
Notes to Financial Statements
First Eagle Overseas Fund (continued)
Counterparty | | Gross Amount
of Assets
Presented in
the Statement of
Assets and
Liabilities | | Derivatives
Available for
Offset | | Collateral
Received* | | Net Amount
(Not Less
Than $0) | |
JPMorgan Chase Bank | | $ | 7,956,817 | | | $ | — | | | $ | (7,956,817 | ) | | $ | — | | |
UBS AG | | | 2,746,421 | | | | — | | | | (2,746,421 | ) | | | — | | |
| | | $ | 21,966,333 | | | $ | — | | | $ | (21,696,118 | ) | | $ | 270,215 | | |
First Eagle Global Income Builder Fund
Counterparty | | Gross Amount
of Assets
Presented in
the Statement of
Assets and
Liabilities | | Derivatives
Available for
Offset | | Collateral
Received* | | Net Amount
(Not Less
Than $0) | |
Bank of New York Mellon | | $ | 231,489 | | | $ | — | | | $ | (221,055 | ) | | $ | 10,434 | | |
Goldman Sachs | | | 238,351 | | | | — | | | | (180,000 | ) | | | 58,351 | | |
JPMorgan Chase Bank | | | 322,066 | | | | — | | | | (318,392 | ) | | | 3,674 | | |
UBS AG | | | 84,849 | | | | — | | | | — | | | | 84,849 | | |
| | | $ | 876,755 | | | $ | — | | | $ | (719,447 | ) | | $ | 157,308 | | |
* The actual collateral received/pledged may be more than the amount reported due to over collateralization.
g) Options — In order to seek to produce incremental earnings or protect against declines in the value of portfolio securities, each Fund may write "covered" call options on portfolio securities. The Funds may also use options for speculative purposes, although they generally do not employ options for this purpose.
Options contracts are valued daily based upon the official closing price on the relevant exchange on which the option is traded. If there is no official closing price, the mean between the last bid and asked prices may be used. When an option is exercised, the proceeds on the sale of a written call option are adjusted by the amount of premium received or paid. When a written option expires, the Funds will realize a gain equal to the amount of the premium received. When the Funds enter into a closing purchase transaction, the Funds will realize a gain (or loss, if the cost of the closing purchase transaction exceeds the premium received when the option was written) without regard to any unrealized gain or loss on the underlying security and the liability related to such option is eliminated.
In general, a call option is covered if a Fund holds, on a share-for-share basis, either the underlying shares or a call on the same security as the call written
First Eagle Funds | Semiannual Report | April 30, 2024
245
Notes to Financial Statements
where the exercise price of the call held is equal to or less than the exercise price of the call written (or greater than the exercise price of the call written if the difference is maintained by the Funds in cash, Treasury bills or other high grade short-term obligations earmarked with its custodian). One reason for writing options is to attempt to realize, through the receipt of premiums, a greater return than would be realized on the securities alone. Another reason for writing options is to hedge against a moderate decline in the value of securities owned by a Fund in the case of a call option. If an increase occurs in the underlying security or stock index sufficient to result in the exercise of a call written by a Fund, it may be required to deliver securities or cash and may thereby forego some or all of the gain that otherwise may have been realized on the securities underlying the call option. This "opportunity cost" may be partially or wholly offset by the premium received for the covered call written by a Fund. The risk in writing a covered call option is that a Fund gives up the opportunity for profit if the market price of the underlying security increases and the option is exercised. A Fund also has the additional risk of not being able to enter into a closing transaction if a liquid secondary market does not exist.
A Fund may also write over-the-counter options where the completion of the obligation is dependent upon the credit standing of the counterparty.
Rule 18f-4 under the 1940 Act permits the Funds to enter into Derivatives Transactions (as defined below) and certain other transactions notwithstanding the restrictions on the issuance of "senior securities" under Section 18 of the 1940 Act. Section 18 of the 1940 Act, among other things, prohibits open-end funds, including the Funds, from issuing or selling any "senior security," other than borrowing from a bank (subject to a requirement to maintain 300% "asset coverage").
Under Rule 18f-4, "Derivatives Transactions" include the following: (1) any swap, security-based swap (including a contract for differences), futures contract, forward contract, option (excluding purchased options), any combination of the foregoing, or any similar instrument, under which a Fund is or may be required to make any payment or delivery of cash or other assets during the life of the instrument or at maturity or early termination, whether as margin or settlement payment or otherwise; (2) any short sale borrowing; (3) reverse repurchase agreements and similar financing transactions (e.g., recourse and nonrecourse tender option bonds, and borrowed bonds), if a Fund elects to treat these transactions as Derivatives Transactions under Rule 18f-4; and (4) when issued or forward-settling securities (e.g., firm and standby commitments, including to-be-announced ("TBA") commitments, and dollar rolls) and nonstandard settlement cycle securities, unless a Fund intends to physically settle the transaction and the transaction will settle within 35 days of its trade date.
Unless a fund is relying on the Limited Derivatives User Exception (as defined below), a fund must comply with Rule 18f-4 with respect to its Derivatives Transactions. Rule 18f-4, among other things, requires a fund to adopt and
First Eagle Funds | Semiannual Report | April 30, 2024
246
Notes to Financial Statements
implement a comprehensive written derivatives risk management program ("DRMP") and comply with a relative or absolute limit on fund leverage risk calculated based on value-at-risk ("VaR"). The DRMP is administered by a "derivatives risk manager," who is appointed by the Board, including a majority of Independent Trustees, and periodically reviews the DRMP and reports to the Board.
Rule 18f-4 provides an exception from the DRMP, VaR limit and certain other requirements if the Fund's "derivatives exposure" (as defined in Rule 18f-4) is limited to 10% of its net assets (as calculated in accordance with Rule 18f-4) and the Fund adopts and implements written policies and procedures reasonably designed to manage its derivatives risks (the "Limited Derivatives User Exception"). As of the date hereof, each Fund is relying on the Limited Derivatives User Exception.
As of April 30, 2024, portfolio securities valued at $117,401,486 were earmarked to cover collateral requirements for written options for First Eagle Global Income Builder Fund.
For the six months ended April 30, 2024, the average monthly number of contracts outstanding for written options and purchased options held by the Funds were as follows:
| | | First Eagle
Global Income
Builder Fund | |
Options: | |
Average Number of Contracts — Written | | | 10,790 | | |
At April 30, 2024, the Funds had the following options grouped into appropriate risk categories illustrated below:
First Eagle Global Income Builder Fund
| | | | | | | Gain or (Loss)
Derivative Recognized
in Income | |
Risk Type | | Asset Derivative
Fair Value(1) | | Liability Derivative
Fair Value(2) | | Net Realized
Gains (Losses)(3) | | Change in
Appreciation
(Depreciation)(4) | |
Equity — Written options | | $ | — | | | $ | 2,915,696 | | | $ | 242,802 | | | $ | (779,698 | ) | |
(1) Statements of Assets and Liabilities location: Investments in securities of unaffiliated issuers.
(2) Statements of Assets and Liabilities location: Option contracts written, at value.
(3) Statements of Operations location: Net realized gains (losses) from expiration or closing of option contracts written.
(4) Statements of Operations location: Changes in unrealized appreciation (depreciation) of option contracts written.
First Eagle Funds | Semiannual Report | April 30, 2024
247
Notes to Financial Statements
h) Repurchase Agreements — The Funds may enter into repurchase agreement transactions with institutions that meet the Adviser's credit guidelines. Each repurchase agreement is valued at market. The Funds require that the collateral received in a repurchase agreement transaction be transferred to a custodian in a manner sufficient to enable the Funds to obtain collateral in the event of a counterparty default. If the counterparty defaults and the fair value of the collateral declines, realization of the collateral by the Funds may be delayed or limited.
i) Bank Loans — A Fund may invest in bank loans, which usually take the form of loan participations and assignments. Loan participations and assignments are agreements to make money available to U.S. or foreign corporations, partnerships or other business entities (the "Borrower") in a specified amount, at a specified rate and within a specified time. A loan is typically originated, negotiated and structured by a U.S. or foreign bank, insurance company or other financial institution (the "Agent") for a group of loan investors ("Loan Investors"). The Agent typically administers and enforces the loan on behalf of the other Loan Investors in the syndicate and may hold any collateral on behalf of the Loan Investors. Such loan participations and assignments are typically senior, secured and collateralized in nature. A Fund records an investment when the Borrower withdraws money and records interest as earned. A Fund generally has no right to enforce compliance with the terms of the loan agreement with the Borrower. As a result, a Fund assumes the credit risk of the Borrower, the selling participant and any intermediary between a Fund and the Borrower ("Intermediate Participants"). In the event that the Borrower, selling participant or Intermediate Participants becomes insolvent or enters into bankruptcy, each Fund may incur certain costs and delays in realizing payment or may suffer a loss of principal and/or interest.
j) Treasury Inflation-Protected Securities — The Funds may invest in Treasury Inflation-Protected Securities ("TIPS") which are specially structured bonds in which the principal amount is adjusted to keep pace with inflation. The principal value of TIPS will be adjusted upward or downward and any increase or decrease in the principal amount of TIPS will be included as interest income in the Statements of Operations, even though investors do not receive their principal until maturity. TIPS are subject to interest rate risk.
k) Restricted Securities — The Funds may invest in securities that are subject to legal or contractual restrictions on resale. These securities generally may be resold in transactions exempt from registration or to the public if the securities are registered. Disposal of these securities may involve time-consuming negotiations and expenses, and prompt sale at an acceptable price may be difficult. Information regarding restricted securities, if any, is included at the end of each Fund's Schedule of Investments.
l) New Accounting Pronouncements — In June 2022, FASB issued Accounting Standards Update ("ASU") 2022-03, Fair Value Measurement (Topic 820) — Fair Value Measurement of Equity Securities Subject to Contractual Sale Restrictions.
First Eagle Funds | Semiannual Report | April 30, 2024
248
Notes to Financial Statements
The amendments in the ASU clarify that a contractual restriction on the sale of an equity security is not considered part of the unit of account of the equity security and, therefore, should not be considered in measuring fair value. The ASU is effective for interim and annual reporting periods beginning after December 15, 2023, with the option of early adoption. There is no material impact to the financial statements and related disclosures.
m) United States Income Taxes — No provision has been made for U.S. federal income taxes since it is the intention of each Fund to distribute to shareholders all taxable net investment income and net realized gains on investments, if any, within the allowable time limit, and to comply with the provisions of Subchapter M of the Internal Revenue Code applicable to the regulated investment company. The Funds declare and pay such income and capital gains on an annual basis except for the First Eagle Global Income Builder Fund, the First Eagle High Yield Municipal Fund, and the First Eagle Short Duration High Yield Municipal Fund which declare income daily and pay monthly, and First Eagle Rising Dividend Fund which distributes income on a quarterly basis.
The Funds adopted provisions surrounding income taxes, which require the tax effects of certain tax positions to be recognized. These tax positions must meet a "more likely than not" standard that, based on their technical merits, have a more than 50% likelihood of being sustained upon examination. Management of the Trust has analyzed the Funds' tax positions taken on federal and state income tax returns for all open tax years (the current and the prior three tax years) and has concluded that no provision for income tax is required in the Funds' financial statements.
n) Class Accounting — Investment income, common expenses and realized/unrealized gain or loss on investments are allocated to the various classes of the Fund on the basis of daily net assets of each class. Fees relating to a specific class are charged directly to that class.
o) Use of Estimates — The preparation of financial statements in conformity with GAAP requires management to make estimates and assumptions that affect the reported amounts of assets and liabilities at the date of the financial statements and the reported amounts of revenues and expenses during the reporting period. Actual results could differ from those estimates.
p) Foreign Taxes — The Funds may be subject to foreign taxes on income, and gains on investments or currency purchases/repatriation, a portion of which may be recoverable. The Funds will accrue such taxes and recoveries as applicable, based upon their current interpretation of tax rules and regulations that exist in the markets in which they invest.
First Eagle Funds | Semiannual Report | April 30, 2024
249
Notes to Financial Statements
Note 2 — Investment Advisory, Custody and Administration Agreements; Transactions with Related Persons
For its services, the Adviser receives, pursuant to an Investment Advisory Agreement between the Funds and the Adviser (the "Advisory Agreement"), an annual advisory fee as follows:
Fund | | Management Fee
(% of Average Daily Net Assets) | |
First Eagle Global Fund | | | 0.75 | % | |
First Eagle Overseas Fund | | | 0.75 | | |
First Eagle U.S. Value Fund | | | 0.75 | (1) | |
First Eagle Gold Fund | | | 0.75 | | |
First Eagle Global Income Builder Fund | | | 0.75 | | |
First Eagle Rising Dividend Fund | | | 0.50 | (2) | |
First Eagle Small Cap Opportunity Fund | | | 0.85 | (3) | |
First Eagle U.S. Smid Cap Opportunity Fund | | | 0.75 | (4) | |
First Eagle Global Real Assets Fund | | | 0.65 | (5) | |
First Eagle High Yield Municipal Fund | | | 0.45 | (6) | |
First Eagle Short Duration High Yield Municipal Fund | | | 0.45 | (7) | |
(1) The Adviser has agreed to waive First Eagle U.S. Value Fund's management fee at an annual rate in the amount of 0.05% of the average daily value of the Fund's net assets for the period through February 29, 2024. This waiver has the effect of reducing the management fee shown in the table for the term of the waiver from 0.75% to 0.70%. For the six months ended April 30, 2024, the Adviser waived $198,502 advisory fee which are included under Expense waiver in the Statement of Operations. As of April 30, 2024, the Fund has $4 receivable from the Adviser for advisory fee waiver, which are included under due from adviser on its Statement of Assets and Liabilities.
(2) The Adviser has contractually agreed to waive and/or reimburse certain fees and expenses of Classes A, C, I, R3, R4, R5 and R6 for First Eagle Rising Dividend Fund so that the total annual operating expenses (excluding interest, taxes, brokerage commissions, acquired fund fees and expenses, dividend and interest expenses relating to short sales, and extraordinary expenses, if any) ("annual operating expenses") of each class are limited to 0.90%, 1.65%, 0.65%, 1.00%, 0.75%, 0.65% and 0.65% of average net assets, respectively. Each of these undertakings lasts until February 28, 2025 and may not be terminated during its term without the consent of the Board. First Eagle Rising Dividend Fund has agreed that each of Classes A, C, I, R3, R4, R5 and R6 will repay the Adviser for fees and expenses waived or reimbursed for the class provided that repayment does not cause annual operating expenses (after the repayment is taken into account) to exceed the lesser of: (1) 0.90%, 1.65%, 0.65%, 1.00%, 0.75%, 0.65% and 0.65% of the class' average net assets, respectively; or (2) if applicable, the then-current expense limitations. Any such repayment must be made within three years after the year in which the Adviser incurred the expense. Effective February 28, 2024, all of the issued and outstanding Class R3, Class R4 and Class R5 shares of the applicable funds were converted into Class R6 shares of the same Fund. For the six months ended April 30, 2024, the Adviser reimbursed $324,743 (Includes $16, $56, and $5 for R3, R4, and R5 respectively) in expenses which are included under Expense waiver in the Statement of Operations. As of April 30, 2024, the Fund has $52,335 receivable from the Adviser for reimbursement of expenses, which are included under due from adviser on its Statement of Assets and Liabilities.
First Eagle Funds | Semiannual Report | April 30, 2024
250
Notes to Financial Statements
For the six months ended April 30, 2024, the amounts available for potential future repayment by the Adviser and the expiration schedule are as follows:
| | | | Potential Recoupment
Amounts Expiring
October 31, | |
| | Total Eligible
for Recoupment | | 2024 | | 2025 | | 2026 | | 2027* | |
Class A | | $ | 1,299,445 | | | $ | 300,262 | | | $ | 305,896 | | | $ | 445,261 | | | $ | 248,026 | | |
Class C | | | 144,499 | | | | 77,110 | | | | 41,567 | | | | 16,714 | | | | 9,108 | | |
Class I | | | 316,986 | | | | 83,807 | | | | 75,472 | | | | 93,128 | | | | 64,579 | | |
Class R6 | | | 8,711 | | | | 1,244 | | | | 524 | | | | 3,990 | | | | 2,953 | | |
Total | | $ | 1,769,641 | | | $ | 462,423 | | | $ | 423,459 | | | $ | 559,093 | | | $ | 324,666 | | |
* Amounts included represent the amounts incurred for the period November 1, 2023 to April 30, 2024. The finalized amount available for potential future repayment by the Adviser expiring October 31, 2027 will be available as of October 31, 2024.
(3) The Adviser has contractually agreed to waive and/or reimburse certain fees and expenses of Classes A, I and R6 for First Eagle Small Cap Opportunity Fund so that the total annual operating expenses (excluding interest, taxes, brokerage commissions, acquired fund fees and expenses, dividend and interest expenses relating to short sales, and extraordinary expenses, if any) ("annual operating expenses") of each class are limited to 1.25%, 1.00% and 1.00% of average net assets, respectively. Each of these undertakings lasts until February 28, 2025 and may not be terminated during its term without the consent of the Board. The Fund has agreed that each of Classes A, I and R6 will repay the Adviser for fees and expenses waived or reimbursed for the class provided that repayment does not cause annual operating expenses (after the repayment is taken into account) to exceed the lesser of: (1) 1.25%, 1.00% and 1.00% of the class' average net assets, respectively; or (2) if applicable, the then current expense limitations. Any such repayment must be made within three years after the year in which the Adviser incurred the expense. For the six months ended April 30, 2024, the Adviser reimbursed $184,441 in expenses which are included under Expense waiver in the Statement of Operations. As of April 30, 2024, the Fund has $40,863 receivable from the Adviser for reimbursement of expenses, which are included under due from adviser on its Statement of Assets and Liabilities.
For the six months ended April 30, 2024, the amounts available for potential future repayment by the Adviser and the expiration schedule are as follows:
| | | | Potential Recoupment
Amounts Expiring
October 31, | |
| | Total Eligible
for Recoupment | | 2024 | | 2025 | | 2026 | | 2027* | |
Class A | | $ | 79,453 | | | $ | 8,976 | | | $ | 35,559 | | | $ | 34,918 | | | $ | — | | |
Class I | | | 1,655,649 | | | | 177,007 | | | | 467,141 | | | | 827,060 | | | | 184,441 | | |
Class R6 | | | 9,363 | | | | — | | | | 1,959 | | | | 7,404 | | | | — | | |
Total | | $ | 1,744,465 | | | $ | 185,983 | | | $ | 504,659 | | | $ | 869,382 | | | $ | 184,441 | | |
* Amounts included represent the amounts incurred for the period November 1, 2023 to April 30, 2024. The finalized amount available for potential future repayment by the Adviser expiring October 31, 2027 will be available as of October 31, 2024.
First Eagle Funds | Semiannual Report | April 30, 2024
251
Notes to Financial Statements
(4) The Adviser has contractually agreed to waive and/or reimburse certain fees and expenses of Classes A, I, and R6 for First Eagle U.S. Smid Cap Opportunity Fund so that the total annual operating expenses (excluding interest, taxes, brokerage commissions, acquired fund fees and expenses, dividend and interest expenses relating to short sales, and extraordinary expenses, if any) ("annual operating expenses") of each class are limited to 1.20%, 0.95% and 0.95% of average net assets, respectively. Each of these undertakings lasts until February 28, 2025 and may not be terminated during its term without the consent of the Board. The Fund has agreed that each of Classes A, I and R6 will repay the Adviser for fees and expenses waived or reimbursed for the class provided that repayment does not cause annual operating expenses (after the repayment is taken into account) to exceed the lesser of: (1) 1.20%, 0.90% and 0.95% of the class' average net assets, respectively; or (2) if applicable, the then current expense limitations. Any such repayment must be made within three years after the year in which the Adviser incurred the expense. For the six months ended April 30, 2024, the Adviser reimbursed $135,183 in expenses which are included under Expense waiver in the Statement of Operations. As of April 30, 2024, the Fund has $18,292 receivable from the Adviser for reimbursement of expenses, which are included under due from adviser on its Statement of Assets and Liabilities.
For the six months ended April 30, 2024, the amounts available for potential future repayment by the Adviser and the expiration schedule are as follows:
| | | | Potential Recoupment
Amounts Expiring
October 31, | |
| | Total Eligible
for Recoupment | | 2025 | | 2026 | | 2027* | |
Class A | | $ | 9,621 | | | $ | 5,340 | | | $ | 3,555 | | | $ | 726 | | |
Class I | | | 580,906 | | | | 98,971 | | | | 347,861 | | | | 134,074 | | |
Class R6 | | | 8,458 | | | | 4,332 | | | | 3,743 | | | | 383 | | |
Total | | $ | 598,985 | | | $ | 108,643 | | | $ | 355,159 | | | $ | 135,183 | | |
* Amounts included represent the amounts incurred for the period November 1, 2023 to April 30, 2024. The finalized amount available for potential future repayment by the Adviser expiring October 31, 2027 will be available as of October 31, 2024.
(5) Classes A, I, and R6 for First Eagle Global Real Assets Fund so that the total annual operating expenses (excluding interest, taxes, brokerage commissions, acquired fund fees and expenses, dividend and interest expenses relating to short sales, and extraordinary expenses, if any) ("annual operating expenses") of each class are limited to 1.10%, 0.85% and 0.85% of average net assets, respectively. Each of these undertakings lasts until February 28, 2025 and may not be terminated during its term without the consent of the Board. The Fund has agreed that each of Classes A, I and R6 will repay the Adviser for fees and expenses waived or reimbursed for the class provided that repayment does not cause annual operating expenses (after the repayment is taken into account) to exceed the lesser of: (1) 1.10%, 0.85% and 0.85% of the class' average net assets, respectively; or (2) if applicable, the then current expense limitations. Any such repayment must be made within three years after the year in which the Adviser incurred the expense. For the six months ended April 30, 2024, the Adviser reimbursed $195,133 in expenses which are included under Expense waiver in the Consolidated Statement of Operations. As of April 30, 2024, the Fund has $39,959 receivable from the Adviser for reimbursement of expenses, which are included under due from adviser on its Consolidated Statement of Assets and Liabilities.
First Eagle Funds | Semiannual Report | April 30, 2024
252
Notes to Financial Statements
For the six months ended April 30, 2024, the amounts available for potential future repayment by the Adviser and the expiration schedule are as follows:
| | | | Potential Recoupment
Amounts Expiring
October 31, | |
| | Total Eligible
for Recoupment | | 2025 | | 2026 | | 2027* | |
Class A | | $ | 133,313 | | | $ | 40,189 | | | $ | 64,115 | | | $ | 29,009 | | |
Class I | | | 750,318 | | | | 262,027 | | | | 339,917 | | | | 148,374 | | |
Class R6 | | | 98,069 | | | | 38,082 | | | | 42,237 | | | | 17,750 | | |
Total | | $ | 981,700 | | | $ | 340,298 | | | $ | 446,269 | | | $ | 195,133 | | |
* Amounts included represent the amounts incurred for the period November 1, 2023 to April 30, 2024. The finalized amount available for potential future repayment by the Adviser expiring October 31, 2027 will be available as of October 31, 2024.
(6) The Adviser has waived the Fund's management fees in full from November 1, 2023 through April 30, 2024. This waiver has the effect of reducing the management fee shown in the table for the term of the waiver from 0.45% to 0.00%. For the six months ended April 30, 2024, the Adviser waived $770,905 advisory fee which are included under Expense waiver in the Statement of Operations. As of April 30, 2024, the Fund has $291,876 receivable from the Adviser for advisory fee waiver, which are included under due from adviser on its Statement of Assets and Liabilities. Effective November 1, 2023, the Adviser has contractually agreed to waive and/or reimburse certain fees and expenses of Classes A, C, I, R3, R4, R5 and R6 for First Eagle High Yield Municipal Fund so that the total annual operating expenses (excluding interest, taxes, brokerage commissions, acquired fund fees and expenses, dividend and interest expenses relating to short sales, and extraordinary expenses, if any) ("annual operating expenses") of each class are limited to 0.85%, 1.60%, 0.60%, 0.95%, 0.70%, 0.60% and 0.60% of average net assets, respectively. Each of these undertakings lasts until February 28, 2025 and may not be terminated during its term without the consent of the Board. First Eagle High Yield Municipal Fund has agreed that each of Classes A, C, I, R3, R4, R5 and R6 will repay the Adviser for fees and expenses waived or reimbursed for the class provided that repayment does not cause annual operating expenses (after the repayment is taken into account) to exceed the lesser of: (1) 0.85%, 1.60%, 0.60%, 0.95%, 0.70%, 0.60% and 0.60% of the class' average net assets, respectively; or (2) if applicable, the then-current expense limitations. Any such repayment must be made within three years after the year in which the Adviser incurred the expense. Effective February 28, 2024, all of the issued and outstanding Class R3, Class R4 and Class R5 shares of the applicable funds were converted into Class R6 shares of the same Fund. For the six months ended April 30, 2024, the Adviser reimbursed $194,705 (Includes $743, $6 and $0, for R3, R4 and R5 respectively) in expenses which are included under Expense waiver in the Statement of Operations. As of April 30, 2024, the Fund has $43,923 payable to the Adviser for recoupment of expenses, which are included under due from adviser on its Statement of Assets and Liabilities.
For the six months ended April 30, 2024, the amounts available for potential future repayment by the Adviser and the expiration schedule are as follows:
| | | | Potential Recoupment
Amounts Expiring
October 31, | |
| | Total Eligible
for Recoupment | | 2026 | | 2027* | |
Class A | | $ | 200,621 | | | $ | 102,116 | | | $ | 98,505 | | |
Class C | | | 15,606 | | | | 8,380 | | | | 7,226 | | |
First Eagle Funds | Semiannual Report | April 30, 2024
253
Notes to Financial Statements
| | | | | Potential Recoupment
Amounts Expiring
October 31, | |
| | | Total Eligible
for Recoupment | | 2026 | | 2027* | |
Class I | | $ | 219,742 | | | $ | 142,781 | | | $ | 76,961 | | |
Class R6 | | | 14,649 | | | | 3,386 | | | | 11,263 | | |
Total | | $ | 450,618 | | | $ | 256,663 | | | $ | 193,955 | | |
* Amounts included represent the amounts incurred for the period November 1, 2023 to April 30, 2024. The finalized amount available for potential future repayment by the Adviser expiring October 31, 2027 will be available as of October 31, 2024.
(7) The Adviser has contractually agreed to waive and/or reimburse certain fees and expenses of Classes A, I, and R6 for First Eagle Short Duration High Yield Municipal Fund so that the total annual operating expenses (excluding interest, taxes, brokerage commissions, acquired fund fees and expenses, dividend and interest expenses relating to short sales, and extraordinary expenses, if any) ("annual operating expenses") of each class are limited to 0.85%, 0.60% and 0.60% of average net assets, respectively. Each of these undertakings lasts until February 28, 2025 and may not be terminated during its term without the consent of the Board. The Fund has agreed that each of Classes A, I and R6 will repay the Adviser for fees and expenses waived or reimbursed for the class provided that repayment does not cause annual operating expenses (after the repayment is taken into account) to exceed the lesser of: (1) 0.85%, 0.60% and 0.60% of the class' average net assets, respectively; or (2) if applicable, the then current expense limitations. Any such repayment must be made within three years after the year in which the Adviser incurred the expense. For the six months ended April 30, 2024, the Adviser reimbursed $235,495 in expenses which are included under Expense waiver in the Statement of Operations. As of April 30, 2024, the Fund has $32,014 receivable from the Adviser for reimbursement of expenses, which are included under due from adviser on its Statement of Assets and Liabilities.
For the six months ended April 30, 2024, the amounts available for potential future repayment by the Adviser and the expiration schedule are as follows:
| | | | Potential Recoupment
Amounts Expiring
October 31, | |
| | Total Eligible
for Recoupment | | 2027* | |
Class A | | $ | 16,696 | | | $ | 16,696 | | |
Class I | | | 203,690 | | | | 203,690 | | |
Class R6 | | | 15,109 | | | | 15,109 | | |
Total | | $ | 235,495 | | | $ | 235,495 | | |
* Amounts included represent the amounts incurred for the period November 1, 2023 to April 30, 2024. The finalized amount available for potential future repayment by the Adviser expiring October 31, 2027 will be available as of October 31, 2024.
The Adviser also performs certain administrative, accounting, operations, compliance and other services on behalf of the Funds, and in accordance with its agreement with the Adviser, the Funds (except for First Eagle Global Income Builder Fund and First Eagle High Yield Municipal Fund before December 27, 2023, which
First Eagle Funds | Semiannual Report | April 30, 2024
254
Notes to Financial Statements
pay the fee described in the next paragraphs) reimburse the Adviser for costs (including personnel and other costs) related to those services. These reimbursements may not exceed an annual rate of 0.05% of a Fund's average daily net assets.
Pursuant to Administrative Services Agreements between each of First Eagle Global Income Builder Fund and First Eagle High Yield Municipal Fund before it changed its name and strategy on December 27, 2023, and the Adviser, each pay the Adviser a monthly administration fee that is accrued daily at an annual rate of 0.05% of the Fund's average daily net assets.
For the six months ended April 30, 2024, The Adviser waived and the Funds had due from Adviser amounts shown below:
| | | Adviser Waived Amount | | Due From Adviser | |
First Eagle Global Fund | | $ | — | | | $ | — | | |
First Eagle Overseas Fund | | | — | | | | — | | |
First Eagle U.S. Value Fund | | | — | | | | 4 | | |
First Eagle Gold Fund | | | — | | | | — | | |
First Eagle Global Income Builder Fund | | | — | | | | — | | |
First Eagle Rising Dividend Fund | | | 6,663 | | | | 2,151 | | |
First Eagle Small Cap Opportunity Fund | | | — | | | | — | | |
First Eagle U.S. Smid Cap Opportunity Fund | | | 1,133 | | | | 3,046 | | |
First Eagle Global Real Assets Fund | | | 29,713 | | | | 24,397 | | |
First Eagle High Yield Municipal Fund | | | — | | | | — | | |
First Eagle Short Duration High Yield Municipal Fund | | | 24,175 | | | | 6,031 | | |
The Funds have entered into a custody agreement with J.P. Morgan Chase Bank, N.A. ("JPM"). The custody agreement provides for an annual fee based on the amount of assets under custody plus transaction charges. JPM serves as custodian of the Funds' portfolio securities and other assets. JPM has directly entered into sub-custodial agreements to maintain the custody of gold and silver bullion in the Funds. Under the terms of the custody agreement between the Funds and JPM, JPM maintains and deposits in separate accounts, cash, securities and other assets of the Funds. JPM is also required, upon the order of the Funds, to deliver securities held by JPM and the sub-custodian, and to make payments for securities purchased by the Funds. JPM has also entered into sub-custodian agreements with a number of foreign banks and clearing agencies, pursuant to which portfolio securities purchased outside the United States are maintained in the custody of these entities.
First Eagle Funds | Semiannual Report | April 30, 2024
255
Notes to Financial Statements
The Funds have also entered into an agreement for administrative services with JPM, pursuant to which JPM provides certain financial reporting and other administrative services. JPM, as the Funds' administrator, receives annual fees separate from and in addition to the fees it receives for its services as the Funds' custodian.
FEF Distributors, LLC, a wholly owned subsidiary of the Adviser, serves as the Funds' principal underwriter. For the six months ended April 30, 2024, FEF Distributors, LLC realized $172,739, $6,522, $7,584, $21,957, $7,322, $2,091, $17,636, $164, $36, $32,248 and $409 pertaining to the sales of shares of First Eagle Global Fund, First Eagle Overseas Fund, First Eagle U.S. Value Fund, First Eagle Gold Fund, First Eagle Global Income Builder Fund, First Eagle Rising Dividend Fund, First Eagle Small Cap Opportunity Fund, First Eagle U.S. Smid Cap Opportunity Fund, First Eagle Global Real Assets Fund, First Eagle High Yield Municipal Fund and First Eagle Short Duration High Yield Municipal Fund, respectively. For the six months ended April 30, 2024, FEF Distributors, LLC realized $50,171, $4,537, $545, $3,640, $1,144, $103 and $668 CDSC pertaining to the redemption of shares of First Eagle Global Fund, First Eagle Overseas Fund, First Eagle U.S. Value Fund, First Eagle Gold Fund, First Eagle Global Income Builder Fund, First Eagle Rising Dividend Fund and First Eagle High Yield Municipal Fund, respectively; and the adviser realized $17,075, $4,436, $327, $16,571, $71, $(1,606), and $15,650 CDSC pertaining to the redemption of shares of First Eagle Global Fund, First Eagle Overseas Fund, First Eagle Gold Fund, First Eagle Global Income Builder Fund, First Eagle Rising Dividend Fund, First Eagle Small Cap Opportunity Fund and First Eagle High Yield Municipal Fund, respectively.
The Trust adopted a Trustee Deferred Compensation Plan (the "Plan"), which allows the Independent Trustees to defer the receipt of all or a portion of compensation related to performance of their duties as a Trustee. The deferred fees are invested in various First Eagle Funds until distribution in accordance with the Trustee Deferred Compensation Plan. As of April 30, 2024, balances to the Plan are included in the fees payable to the Trustees on the Statements of Assets and Liabilities.
Note 3 — Plans of Distribution
Under the terms of the Distribution Plans and Agreements ("the Plans") with FEF Distributors, LLC (the "Distributor"), pursuant to the provisions of Rule 12b-1 under the 1940 Act, the First Eagle Global Fund, First Eagle Overseas Fund, First Eagle U.S. Value Fund, First Eagle Gold Fund, First Eagle Global Income Builder Fund, First Eagle Rising Dividend Fund, First Eagle Small Cap Opportunity Fund, First Eagle U.S. Smid Cap Opportunity Fund and First Eagle Global Real Assets Fund, First Eagle High Yield Municipal Fund, and First Eagle Short Duration High Yield Municipal Fund pay the Distributor monthly a distribution and/or service fee with respect to Class A, Class C, Class R3 and Class R4 shares based on each Fund's average daily net assets as shown in the table below. Under the Plans, the Distributor is obligated to use the amounts received under the Plans for, among other things, payments to
First Eagle Funds | Semiannual Report | April 30, 2024
256
Notes to Financial Statements
qualifying dealers for their assistance in the distribution of a Fund's shares and the provision of shareholder services and for other expenses such as advertising costs and the payment for the printing and distribution of prospectuses to prospective investors.
Fund | | Class A | | Class C | | Class R3 | | Class R4 | |
First Eagle Global Fund | | | 0.25 | % | | | 1.00 | % | | | 0.35 | % | | | 0.10 | % | |
First Eagle Overseas Fund | | | 0.25 | % | | | 1.00 | % | | | 0.35 | % | | | 0.10 | % | |
First Eagle U.S. Value Fund | | | 0.25 | % | | | 1.00 | % | | | 0.35 | % | | | 0.10 | % | |
First Eagle Gold Fund | | | 0.25 | % | | | 1.00 | % | | | 0.35 | % | | | 0.10 | % | |
First Eagle Global Income Builder Fund | | | 0.25 | % | | | 1.00 | % | | | 0.35 | % | | | 0.10 | % | |
First Eagle Rising Dividend Fund | | | 0.25 | % | | | 1.00 | % | | | 0.35 | % | | | 0.10 | % | |
First Eagle Small Cap Opportunity Fund | | | 0.25 | % | | | n/a | | | | n/a | | | | n/a | | |
First Eagle U.S. Smid Cap Opportunity Fund | | | 0.25 | % | | | n/a | | | | n/a | | | | n/a | | |
First Eagle Global Real Assets Fund | | | 0.25 | % | | | n/a | | | | n/a | | | | n/a | | |
First Eagle High Yield Municipal Fund | | | 0.25 | % | | | 1.00 | % | | | n/a | | | | n/a | | |
First Eagle Short Duration High Yield Municipal Fund | | | 0.25 | % | | | 1.00 | % | | | n/a | | | | n/a | | |
The Distributor bears distribution costs of a Fund to the extent they exceed payments received under the Plan. For the six months ended April 30, 2024, the distribution fees incurred by the Funds are disclosed in the Statements of Operations.
The Service fee covers expenses incurred by the Distributor for providing shareholder liaison services, including assistance with subscriptions, redemptions and other shareholder questions. For six months ended April 30, 2024, the services fees incurred by the Funds are disclosed in the Statements of Operations.
Note 4 — Purchases and Sales of Securities
For the six months ended April 30, 2024, purchases and proceeds from sales of investments, excluding short-term securities, were as follows:
Fund | | Purchases
excluding
U.S. Government
Securities | | Sales and
Maturities
excluding
U.S. Government
Securities | | Purchases of
U.S. Government
Securities | | Sales and
Maturities of
U.S. Government
Securities | |
First Eagle Global Fund | | $ | 1,256,294,939 | | | $ | 2,772,973,880 | | | $ | — | | | $ | — | | |
First Eagle Overseas Fund | | | 261,256,584 | | | | 743,258,698 | | | | — | | | | — | | |
First Eagle U.S. Value Fund | | | 34,969,340 | | | | 88,417,802 | | | | — | | | | — | | |
First Eagle Gold Fund | | | 857,927,635 | | | | 902,503,620 | | | | — | | | | — | | |
First Eagle Global Income
Builder Fund | | | 93,309,775 | | | | 112,633,755 | | | | 11,705,886 | | | | 48,936,646 | | |
First Eagle Funds | Semiannual Report | April 30, 2024
257
Notes to Financial Statements
Fund | | Purchases
excluding
U.S. Government
Securities | | Sales and
Maturities
excluding
U.S. Government
Securities | | Purchases of
U.S. Government
Securities | | Sales and
Maturities of
U.S. Government
Securities | |
First Eagle Rising Dividend
Fund | | $ | 20,040,115 | | | $ | 29,138,498 | | | $ | — | | | $ | — | | |
First Eagle Small Cap
Opportunity Fund | | | 508,653,812 | | | | 298,786,322 | | | | — | | | | — | | |
First Eagle U.S. Smid Cap
Opportunity Fund | | | 4,919,976 | | | | 3,491,062 | | | | — | | | | — | | |
First Eagle Global Real
Assets Fund | | | 3,918,188 | | | | 3,240,251 | | | | — | | | | — | | |
First Eagle High Yield
Municipal Fund | | | 1,410,250,042 | | | | 545,845,586 | | | | — | | | | — | | |
First Eagle Short Duration
High Yield Municipal Fund | | | 26,511,103 | | | | 6,213,507 | | | | — | | | | — | | |
Note 5 — Line of Credit
On June 26, 2023, the Funds renewed a $200 million committed, unsecured line of credit ("Credit Facility") with JPM for the First Eagle Funds and First Eagle Variable Funds to be utilized for temporarily financing the purchase or sale of securities for prompt delivery in the ordinary course of business or for temporarily financing the redemption of shares of each Fund at the request of shareholders and other temporary or emergency purposes with a termination date of June 25, 2024. Under the Credit Facility arrangement, each Fund has agreed to pay a per annum rate of interest for borrowings generally based on 1.00% plus the higher of Daily Simple Secured Overnight Financing Rate plus a ten basis point credit spread adjustment, Overnight Bank Funding Rate or Effective Federal Funds Rate and a commitment fee of 0.20% per annum on the unused portion of the Credit Facility. A portion of the commitment fees related to the Credit Facility are paid by the Funds and are included in other expenses in the Statements of Operations. During the period, the Funds had no borrowings under the agreement.
Note 6 — Indemnification and Investment Risk
In the normal course of business, the Funds enter into contracts that contain a variety of representations which provide general indemnifications. Each Fund's maximum exposure under these arrangements is unknown, as this would involve future claims that may be made against each Fund that have not yet occurred. However, based on experience, the Funds expect the risk of loss to be remote. The Funds may have elements of risk not typically associated with investments in the United States due to their investments in foreign countries or regions. Such foreign investments may subject the Funds to additional risks resulting from political or
First Eagle Funds | Semiannual Report | April 30, 2024
258
Notes to Financial Statements
economic conditions in such countries or regions and the possible imposition of adverse governmental laws or currency exchange restrictions could cause the securities and their markets to be less liquid and their prices to be more volatile than those of comparable U.S. securities. The securities markets in many emerging-market countries are substantially smaller, less developed, less liquid and more volatile than the securities markets of developed countries.
The First Eagle Global Income Builder Fund invests in high yield securities which may be subject to greater levels of interest rate, credit and liquidity risk than investment grade securities. These high yield securities may be considered speculative with respect to the issuer's continuing ability to make principal and interest payments and may be subject to significant price fluctuations.
The Funds are subject to interest rate and credit risk. The value of debt securities may decline as interest rates increase. The Funds could lose money if the issuer of a fixed income security is unable to pay interest or repay principal when it is due. The ability of the issuers of debt to meet their obligations may be affected by the economic and political developments in a specific industry or region.
The Funds enter into derivatives which may represent off-balance sheet risk. Off-balance sheet risk exists when the maximum potential loss on a particular investment is greater than the value of such investment as reflected in the Statements of Assets and Liabilities.
Note 7 — Redemption In-Kind Transactions
The redemption in-kind policy for all of the Funds reserves the right of the Funds to pay redemptions in-kind (i.e., payments in the form of marketable securities or, as needed, other traded assets, rather than cash) if the redemption request is large enough to affect a Fund's operations (for example, if it represents more than $250,000 or 1% of the Fund's assets). When receiving assets distributed in-kind, the recipient will bear applicable commissions or other costs on their sale. There were no redemptions in-kind during the six months ended April 30, 2024.
Note 8 — Subsequent Events
Effective May 1, 2024, First Eagle Investment Management, LLC (the "Adviser") has agreed to waive the First Eagle Short Duration High Yield Municipal Fund's management fees in full from May 1, 2024 through October 31, 2024, with the result that no management fees will be paid by the Fund during that period.
The First Eagle Global Income Builder Fund is in the process of establishing a wholly owned subsidiary, which will be an exempted company under the laws of the Cayman Islands.
First Eagle Funds | Semiannual Report | April 30, 2024
259
Fund Expenses (unaudited)
Example
As a shareholder of the First Eagle Funds, you may incur two types of costs: (1) transaction costs and (2) ongoing costs, including advisory fees; distribution fees (12b-1) and/or service fees; and other Fund expenses. This example is intended to help you understand your ongoing costs (in dollars) of investing in the Fund and to compare these costs with the ongoing costs of investing in other mutual funds.
This example is based on an investment of $1,000 invested on November 1, 2023 and held for the six-months ended April 30, 2024. (except for First Eagle Short Duration High Yield Municipal Fund, which is based on an investment of $1,000 invested on January 2, 2024 and held for the period ended April 30, 2024).
Actual Expenses
The table below titled "Based on Actual Total Return" provides information about actual account values and actual expenses. You may use the information provided in this table, together with the amount you invested, to estimate the expenses that you paid over the period. To estimate the expenses you paid on your account, divide your ending account value by $1,000 (for example, an $8,600 ending account value divided by $1,000 = 8.6), then multiply the result by the number under the heading entitled "Expenses Paid During the Period".
First Eagle Funds | Semiannual Report | April 30, 2024
260
Fund Expenses (unaudited)
Based on Actual Total Return(1)
| | | Actual Total
Return Without
Sales Charges(2) | | Beginning
Account
Date Value | | Ending
Account
Value
04/30/24 | | Annualized
Expense | | Expenses
Paid for
the Period(3) | |
First Eagle Global Fund* | |
Class A | | | 13.86 | % | | $ | 1,000 | | | $ | 1,138.60 | | | | 1.10 | % | | $ | 5.85 | | |
Class C | | | 13.43 | | | | 1,000 | | | | 1,134.30 | | | | 1.87 | | | | 9.92 | | |
Class I | | | 14.00 | | | | 1,000 | | | | 1,140.00 | | | | 0.86 | | | | 4.58 | | |
Class R6 | | | 14.04 | | | | 1,000 | | | | 1,140.40 | | | | 0.79 | | | | 4.20 | | |
First Eagle Overseas Fund* | |
Class A | | | 11.69 | | | | 1,000 | | | | 1,116.90 | | | | 1.16 | | | | 6.11 | | |
Class C | | | 11.33 | | | | 1,000 | | | | 1,113.30 | | | | 1.90 | | | | 9.98 | | |
Class I | | | 11.86 | | | | 1,000 | | | | 1,118.60 | | | | 0.89 | | | | 4.69 | | |
Class R6 | | | 11.91 | | | | 1,000 | | | | 1,119.10 | | | | 0.80 | | | | 4.22 | | |
First Eagle U.S. Value Fund* | |
Class A | | | 15.32 | | | | 1,000 | | | | 1,153.20 | | | | 1.12 | | | | 6.00 | | |
Class C | | | 14.91 | | | | 1,000 | | | | 1,149.10 | | | | 1.89 | | | | 10.10 | | |
Class I | | | 15.49 | | | | 1,000 | | | | 1,154.90 | | | | 0.85 | | | | 4.55 | | |
Class R6 | | | 15.52 | | | | 1,000 | | | | 1,155.20 | | | | 0.80 | | | | 4.29 | | |
First Eagle Gold Fund* | |
Class A | | | 13.37 | | | | 1,000 | | | | 1,133.70 | | | | 1.18 | | | | 6.26 | | |
Class C | | | 12.99 | | | | 1,000 | | | | 1,129.90 | | | | 1.93 | | | | 10.22 | | |
Class I | | | 13.53 | | | | 1,000 | | | | 1,135.30 | | | | 0.94 | | | | 4.99 | | |
Class R6 | | | 13.60 | | | | 1,000 | | | | 1,136.00 | | | | 0.84 | | | | 4.46 | | |
First Eagle Global Income Builder Fund | |
Class A | | | 9.33 | | | | 1,000 | | | | 1,093.30 | | | | 1.16 | | | | 6.04 | | |
Class C | | | 8.86 | | | | 1,000 | | | | 1,088.60 | | | | 1.95 | | | | 10.13 | | |
Class I | | | 9.41 | | | | 1,000 | | | | 1,094.10 | | | | 0.95 | | | | 4.95 | | |
Class R6 | | | 9.46 | | | | 1,000 | | | | 1,094.60 | | | | 0.88 | | | | 4.58 | | |
First Eagle Rising Dividend Fund | |
Class A | | | 14.59 | | | | 1,000 | | | | 1,145.90 | | | | 0.90 | | | | 4.80 | | |
Class C | | | 14.11 | | | | 1,000 | | | | 1,141.10 | | | | 1.65 | | | | 8.78 | | |
Class I | | | 14.72 | | | | 1,000 | | | | 1,147.20 | | | | 0.65 | | | | 3.47 | | |
Class R6 | | | 14.73 | | | | 1,000 | | | | 1,147.30 | | | | 0.65 | | | | 3.47 | | |
First Eagle Small Cap Opportunity Fund | |
Class A | | | 18.96 | | | | 1,000 | | | | 1,189.60 | | | | 1.25 | | | | 6.81 | | |
Class I | | | 19.00 | | | | 1,000 | | | | 1,190.00 | | | | 1.00 | | | | 5.45 | | |
Class R6 | | | 19.12 | | | | 1,000 | | | | 1,191.20 | | | | 0.99 | | | | 5.39 | | |
First Eagle Funds | Semiannual Report | April 30, 2024
261
Fund Expenses (unaudited)
| | | Actual Total
Return Without
Sales Charges(2) | | Beginning
Account
Date Value | | Ending
Account
Value
04/30/24 | | Annualized
Expense | | Expenses
Paid for
the Period(3) | |
First Eagle U.S. Smid Cap Opportunity Fund | |
Class A | | | 21.31 | % | | $ | 1,000 | | | $ | 1,213.10 | | | | 1.20 | % | | $ | 6.60 | | |
Class I | | | 21.45 | | | | 1,000 | | | | 1,214.50 | | | | 0.95 | | | | 5.23 | | |
Class R6 | | | 21.45 | | | | 1,000 | | | | 1,214.50 | | | | 0.95 | | | | 5.23 | | |
First Eagle Global Real Assets Fund* | |
Class A | | | 10.76 | | | | 1,000 | | | | 1,107.60 | | | | 1.10 | | | | 5.76 | | |
Class I | | | 10.84 | | | | 1,000 | | | | 1,108.40 | | | | 0.85 | | | | 4.46 | | |
Class R6 | | | 10.87 | | | | 1,000 | | | | 1,108.70 | | | | 0.85 | | | | 4.46 | | |
First Eagle High Yield Municipal Fund (formerly named First Eagle High Income Fund) | |
Class A | | | 9.15 | | | | 1,000 | | | | 1,091.50 | | | | 0.40 | | | | 2.08 | | |
Class C | | | 8.77 | | | | 1,000 | | | | 1,087.70 | | | | 1.15 | | | | 5.97 | | |
Class I | | | 9.26 | | | | 1,000 | | | | 1,092.60 | | | | 0.15 | | | | 0.78 | | |
Class R6 | | | 9.60 | | | | 1,000 | | | | 1,096.00 | | | | 0.14 | | | | 0.73 | | |
First Eagle Short Duration High Yield Municipal Fund(4) | |
Class A | | | 1.93 | | | | 1,000 | | | | 1,019.30 | | | | 0.85 | | | | 2.79 | | |
Class I | | | 2.03 | | | | 1,000 | | | | 1,020.30 | | | | 0.60 | | | | 1.97 | | |
Class R6 | | | 2.02 | | | | 1,000 | | | | 1,020.20 | | | | 0.60 | | | | 1.97 | | |
* Consolidated Financial Statements
(1) For the six-months ended April 30, 2024.
(2) Past performance does not guarantee future results. Assumes reinvestment of all dividends and capital gain distributions, if any, at net asset value. Total return is not annualized, as it may not be representative of the total return for the year
(3) Expenses are equal to the annualized expense ratio multiplied by the average account value over the period, multiplied by 182/366 (to reflect the one-half year period).
(4) For the period January 02, 2024 to April 30, 2024.
First Eagle Funds | Semiannual Report | April 30, 2024
262
Fund Expenses (unaudited)
Hypothetical Example for Comparison Purposes
The table below titled "Based on Hypothetical Total Return" provides information about hypothetical account values and hypothetical expenses based on the actual expense ratios and an assumed rate of return of 5% per year before expenses, which is not the First Eagle Funds' actual return. The hypothetical account values and expenses may not be used to estimate the actual ending account balance or expenses you paid for the period. You may use the information provided in this table to compare the ongoing costs of investing in the Funds and other funds. To do so, compare the 5% hypothetical example relating to the Fund with the 5% hypothetical examples that appear in the shareholder reports of other funds.
This example is based on an investment of $1,000 invested on November 1, 2024 and held for the six-months ended April 30, 2024. (except for First Eagle Short Duration High Yield Municipal Fund, which is based on an investment of $1,000 invested on January 2, 2024 and held for the period ended April 30, 2024).
Please note that the expenses shown in the table below are meant to highlight your ongoing costs only and do not reflect any transactional costs, such as front-end or back-end sales charges (loads). Therefore, the table is useful in comparing ongoing costs only, and will not help you determine the relative total costs of owning different funds. In addition, if these transaction costs were included, your costs would have been higher.
First Eagle Funds | Semiannual Report | April 30, 2024
263
Fund Expenses (unaudited)
Based on Hypothetical Total Return(1)
| | | Hypothetical
Annualized
Total
Return | | Beginning
Account
Date Value | | Ending
Account
Value | | Annualized
Expense | | Expenses
Paid for
the Period(2) | |
First Eagle Global Fund* | |
Class A | | | 5.00 | % | | $ | 1,000 | | | $ | 1,019.39 | | | | 1.10 | % | | $ | 5.52 | | |
Class C | | | 5.00 | | | | 1,000 | | | | 1,015.56 | | | | 1.87 | | | | 9.37 | | |
Class I | | | 5.00 | | | | 1,000 | | | | 1,020.59 | | | | 0.86 | | | | 4.32 | | |
Class R6 | | | 5.00 | | | | 1,000 | | | | 1,020.93 | | | | 0.79 | | | | 3.97 | | |
First Eagle Overseas Fund* | |
Class A | | | 5.00 | | | | 1,000 | | | | 1,019.10 | | | | 1.16 | | | | 5.82 | | |
Class C | | | 5.00 | | | | 1,000 | | | | 1,015.42 | | | | 1.90 | | | | 9.52 | | |
Class I | | | 5.00 | | | | 1,000 | | | | 1,020.44 | | | | 0.89 | | | | 4.47 | | |
Class R6 | | | 5.00 | | | | 1,000 | | | | 1,020.89 | | | | 0.80 | | | | 4.02 | | |
First Eagle U.S. Value Fund* | |
Class A | | | 5.00 | | | | 1,000 | | | | 1,019.29 | | | | 1.12 | | | | 5.62 | | |
Class C | | | 5.00 | | | | 1,000 | | | | 1,015.47 | | | | 1.89 | | | | 9.47 | | |
Class I | | | 5.00 | | | | 1,000 | | | | 1,020.64 | | | | 0.85 | | | | 4.27 | | |
Class R6 | | | 5.00 | | | | 1,000 | | | | 1,020.89 | | | | 0.80 | | | | 4.02 | | |
First Eagle Gold Fund* | |
Class A | | | 5.00 | | | | 1,000 | | | | 1,019.00 | | | | 1.18 | | | | 5.92 | | |
Class C | | | 5.00 | | | | 1,000 | | | | 1,015.27 | | | | 1.93 | | | | 9.67 | | |
Class I | | | 5.00 | | | | 1,000 | | | | 1,020.19 | | | | 0.94 | | | | 4.72 | | |
Class R6 | | | 5.00 | | | | 1,000 | | | | 1,020.69 | | | | 0.84 | | | | 4.22 | | |
First Eagle Global Income Builder Fund | |
Class A | | | 5.00 | | | | 1,000 | | | | 1,019.10 | | | | 1.16 | | | | 5.82 | | |
Class C | | | 5.00 | | | | 1,000 | | | | 1,015.17 | | | | 1.95 | | | | 9.77 | | |
Class I | | | 5.00 | | | | 1,000 | | | | 1,020.14 | | | | 0.95 | | | | 4.77 | | |
Class R6 | | | 5.00 | | | | 1,000 | | | | 1,020.49 | | | | 0.88 | | | | 4.42 | | |
First Eagle Rising Dividend Fund | |
Class A | | | 5.00 | | | | 1,000 | | | | 1,020.39 | | | | 0.90 | | | | 4.52 | | |
Class C | | | 5.00 | | | | 1,000 | | | | 1,016.66 | | | | 1.65 | | | | 8.27 | | |
Class I | | | 5.00 | | | | 1,000 | | | | 1,021.63 | | | | 0.65 | | | | 3.27 | | |
Class R6 | | | 5.00 | | | | 1,000 | | | | 1,021.63 | | | | 0.65 | | | | 3.27 | | |
First Eagle Small Cap Opportunity Fund | |
Class A | | | 5.00 | | | | 1,000 | | | | 1,018.65 | | | | 1.25 | | | | 6.27 | | |
Class I | | | 5.00 | | | | 1,000 | | | | 1,019.89 | | | | 1.00 | | | | 5.02 | | |
Class R6 | | | 5.00 | | | | 1,000 | | | | 1,019.94 | | | | 0.99 | | | | 4.97 | | |
First Eagle Funds | Semiannual Report | April 30, 2024
264
Fund Expenses (unaudited)
| | | Hypothetical
Annualized
Total
Return | | Beginning
Account
Date Value | | Ending
Account
Value | | Annualized
Expense | | Expenses
Paid for
the Period(2) | |
First Eagle U.S. Smid Cap Opportunity Fund | |
Class A | | | 5.00 | % | | $ | 1,000 | | | $ | 1,018.90 | | | | 1.20 | % | | $ | 6.02 | | |
Class I | | | 5.00 | | | | 1,000 | | | | 1,020.14 | | | | 0.95 | | | | 4.77 | | |
Class R6 | | | 5.00 | | | | 1,000 | | | | 1,020.14 | | | | 0.95 | | | | 4.77 | | |
First Eagle Global Real Assets Fund* | |
Class A | | | 5.00 | | | | 1,000 | | | | 1,019.39 | | | | 1.10 | | | | 5.52 | | |
Class I | | | 5.00 | | | | 1,000 | | | | 1,020.64 | | | | 0.85 | | | | 4.27 | | |
Class R6 | | | 5.00 | | | | 1,000 | | | | 1,020.64 | | | | 0.85 | | | | 4.27 | | |
First Eagle High Yield Municipal Fund (formerly named First Eagle High Income Fund) | |
Class A | | | 5.00 | | | | 1,000 | | | | 1,022.87 | | | | 0.40 | | | | 2.01 | | |
Class C | | | 5.00 | | | | 1,000 | | | | 1,019.14 | | | | 1.15 | | | | 5.77 | | |
Class I | | | 5.00 | | | | 1,000 | | | | 1,024.12 | | | | 0.15 | | | | 0.75 | | |
Class R6 | | | 5.00 | | | | 1,000 | | | | 1,024.17 | | | | 0.14 | | | | 0.70 | | |
First Eagle Short Duration High Yield Municipal Fund(3) | |
Class A | | | 5.00 | | | | 1,000 | | | | 1,020.64 | | | | 0.85 | | | | 4.27 | | |
Class I | | | 5.00 | | | | 1,000 | | | | 1,021.88 | | | | 0.60 | | | | 3.02 | | |
Class R6 | | | 5.00 | | | | 1,000 | | | | 1,021.88 | | | | 0.60 | | | | 3.02 | | |
* Consolidated Financial Statements
(1) For the six-months ended April 30, 2024.
(2) Expenses are equal to the annualized expense ratio multiplied by the average account value over the period, multiplied by 182/366 (to reflect the one-half year period).
(3) For the period January 02, 2024 to April 30, 2024.
First Eagle Funds | Semiannual Report | April 30, 2024
265
Form N-PORT portfolio schedule
The Funds file their complete schedule of portfolio holdings with the Securities and Exchange Commission ("SEC") for the first and third quarters of each fiscal year as an exhibit to its reports on Form N-PORT. The Funds' Form N-PORT is available on the SEC's Web site at www.sec.gov. Additionally, you may obtain copies of Form N-PORT from the Fund upon request by calling 1.800.334.2143.
Proxy voting policies, procedures and record
You may obtain (1) a description of the Funds' proxy voting policies, (2) a description of the Funds' proxy voting procedures and (3) information regarding how the Funds voted any proxies related to portfolio securities during the most recent twelve-month period ended June 30 for which an SEC filing has been made, without charge, upon request by contacting the Funds directly at 1.800.334.2143 or on the EDGAR Database on the SEC's Web site at www.sec.gov.
First Eagle Funds | Semiannual Report | April 30, 2024
266
Board Considerations for Approval of Advisory Agreement
At a meeting held on December 19, 2023, the Board of Trustees, including a majority of the independent trustees (the "Independent Trustees"), approved the First Eagle Short Duration High Yield Municipal Fund's (the "Fund") advisory agreement (the "Advisory Agreement").
In response to a letter sent to the Adviser on behalf of the Independent Trustees requesting information about the Advisory Agreement and other arrangements and plans, the Trustees received extensive materials from the Adviser, including reviews of expense information compared against the Fund's composites, benchmarks and peer groups compiled by an independent data provider. The Trustees also had the benefit of presentations from and discussions with management.
Prior to approving the Advisory Agreement, the Independent Trustees met in executive session with their independent counsel to discuss management's responses to their information request and reviewed their legal and fiduciary obligations and the factors relating to their evaluation and approval. In their deliberations, Trustees attributed different weights to the various factors, and no factor alone was considered dispositive. At the conclusion of their review, the Trustees determined that the advisory fee was fair and reasonable under the circumstances and within the range of what could be negotiated at arm's length, and that the Advisory Agreement should serve the best interests of the Fund and its shareholders. The Trustees considered the following topics in reaching their conclusion to approve the Advisory Agreement:
Nature, Quality, and Extent of Services to be Provided by Adviser
• The Trustees reviewed the services to be provided by the Adviser. The Adviser will provide the Fund with investment research, advice and supervision, and continuously furnish an investment portfolio for the Fund consistent with the Fund's investment objective, policies and restrictions as set forth in the Fund's Prospectus. The Trustees were assured that service levels for the Fund are not affected by the expense limitation agreement. The Trustees considered the commitment of the Adviser to provide high quality services to the Fund.
• The Trustees reviewed the Trust's long-standing historical relationship with the Adviser and the institutional resources available to the Fund under that relationship. Given the length of the relationship, the Trustees, in their deliberations, recognized that, for many of the First Eagle Funds' shareholders, a decision to purchase shares of the Fund could be guided by a decision to select the Adviser as the investment adviser and that there is a strong association in the minds of shareholders between the Adviser and the Fund.
• The Trustees commented on the background and experience of each of the Fund's Portfolio Managers and their informative meetings with them.
First Eagle Funds | Semiannual Report | April 30, 2024
267
Board Considerations for Approval of Advisory Agreement
Investment Performance
• No performance was presented for the Fund given that it was newly organized and had not yet commenced operations.
Costs of Services To Be Provided and Profits To Be Realized by Adviser and its Affiliates From Relationship with Fund; Economies of Scale; Fall-Out Benefits
• The Trustees reviewed the total compensation to be received by the Adviser and the Fund's total costs for using the Adviser's services, taking into account expenses incurred by the Adviser that are passed through to the Fund (e.g., under the administrative cost reimbursement program). They concluded that this compensation was commensurate with the nature, extent, and quality of the services provided and therefore fair and reasonable under the circumstances. As part of their analysis, the Trustees considered fees charged by investment advisers to peer mutual funds for services comparable to those provided by the Adviser and referred to a report specifically prepared by an independent third-party data provider in connection with the Trustees' review of the Advisory Agreement, together with a management summary of the same. They determined that the Adviser's fees were competitive. The Trustees also considered, where applicable and available, the advisory fees charged to other clients of the Adviser with similar investment objective(s) to the Fund.
• While analyzing the effects of direct and indirect compensation to the Adviser and its affiliates (sometimes referred to as "fall-out benefits"), the Trustees considered the absence of affiliated broker-dealer relationships and the effects of the administrative service reimbursements paid to the Adviser. The Trustees noted that the Adviser is absorbing soft dollar costs and paying them itself. With regard to other possible benefits associated with the Adviser's management of the Fund, the Trustees noted, among other things, that the Distributor is generally able to retain revenue associated with Rule 12b-1 fees on shareholders it services directly. The Trustees separately noted that the Adviser may be able to extend investment and operational efficiencies associated with the Fund to its management of other types of accounts.
• The Trustees reviewed the Fund's expected expense ratios, which were deemed reasonable both on an absolute basis and in comparison to peer funds. The Trustees noted the expected impact on expense ratios of the administrative reimbursements. While economies of scale can be complex to assess and typically are not directly measurable, the Trustees noted that the Adviser may be able to employ economies of scale in certain areas relating to the management of the Fund, potentially including investment management, trading, compliance and back-office operations. In the case of the administrative expense reimbursements, because they represent the provision of services at cost, any economies of scale realized are, by definition, for the benefit of the Fund.
First Eagle Funds | Semiannual Report | April 30, 2024
268
Board Considerations for Approval of Advisory Agreement
• The Trustees reviewed the Adviser's financial condition and profitability goals with respect to the Fund. The Trustees noted the cyclical and competitive nature of the global asset management industry and the related importance of profitability in maintaining the Adviser's culture and management continuity. The Trustees also noted that the Adviser has always shown the willingness to commit resources to support investment in the business and to maintain the generally high quality of the overall shareholder experience, such as attracting and retaining qualified personnel and investing in technology. Levels of support are not dependent on the profits realized. The Trustees also considered that certain personnel participate in equity ownership and other incentives tied to the financial results of the Adviser as a whole.
First Eagle Funds | Semiannual Report | April 30, 2024
269
Trustees
Lisa Anderson
John P. Arnhold
Candace K. Beinecke (Chair)
Peter Davidson
Jean D. Hamilton
William M. Kelly
Paul J. Lawler
Mehdi Mahmud
Mandakini Puri
Trustee Emeritus
Jean-Marie Eveillard*
Officers
Mehdi Mahmud
President
Robert Bruno
Senior Vice President
Brian Margulies
Chief Financial Officer
Seth Gelman
Chief Compliance Officer
David O'Connor
General Counsel
Sheelyn Michael
Secretary & Deputy General Counsel
Michael Luzzatto
Vice President
Shuang Wu
Treasurer
Investment Adviser
First Eagle Investment Management, LLC
1345 Avenue of the Americas
New York, NY 10105
Legal Counsel
Sidley Austin LLP
787 Seventh Avenue
New York, NY 10019
Custodian
JPMorgan Chase Bank, N.A.
4 Chase Metrotech Center, Floor 16,
Brooklyn, NY 11245
Shareholder Servicing Agent
SS&C GIDS, Inc.
330 West 9th Street
Kansas City, MO 64105
800.334.2143
Underwriter
FEF Distributors, LLC
1345 Avenue of the Americas
New York, NY 10105
Independent Registered Public
Accounting Firm
PricewaterhouseCoopers LLP
300 Madison Avenue
New York, NY 10017
Additional information about the Trustees and Officers is included in the Funds' Statement of Additional Information.
* Mr. Eveillard is a former member of the Board of Trustees and is invited to attend all Board meetings. He is not a Trustee for purposes of the Trust's Declaration of Trust, Delaware law or the Investment Company Act.
This report is not authorized for distribution to prospective investors unless preceded or accompanied by a currently effective prospectus of First Eagle Funds.
First Eagle Funds | Semiannual Report | April 30, 2024
270

First Eagle Funds are offered by FEF Distributors, LLC,
1345 Avenue of the Americas, New York, NY 10105.
First Eagle Investment Management, LLC
1345 Avenue of the Americas, New York, NY 10105-0048
800.334.2143 www.firsteagle.com
Item 2. Code of Ethics.
The Registrant has adopted a code of ethics that applies to its principal executive officer and principal financial officer. Copies of the code of ethics may be requested free of charge by calling 1-800-334-2143 (toll free).
Item 3. Audit Committee Financial Expert.
Not applicable to this semiannual report.
Item 4. Principal Accountant Fees and Services
Not applicable to this semiannual report.
Item 5. Audit Committee of Listed Registrants
Not applicable at this time.
Item 6. Schedule of Investments
Please see schedule of investments contained in the Report to Stockholders included under Item 1 of this Form N-CSR.
Item 7. Disclosure of Proxy Voting Policies and Procedures for Closed-End Management Investment Companies.
Not applicable.
Item 8. Portfolio Managers of Closed-End Investment companies.
Not applicable.
Item 9. Purchases of Equity Securities by Closed-End Management Investment Company and Affiliated Purchasers.
Not applicable.
Item 10. Submission of Matters to a Vote of Security Holders.
No material change to report at this time.
Item 11. Controls and Procedures.
(a) In the opinion of the principal executive officer and principal financial officer, based on their evaluation, the registrant's disclosure controls and procedures are adequately designed and are operating effectively to ensure (i) that material information relating to the registrant, including its consolidated subsidiaries, is made known to them by others within those entities, particularly during the period in which this report is being prepared; and (ii) that information required to be disclosed by the registrant on Form N-CSR is recorded, processed, summarized and reported within the time periods specified in the Securities and Exchange Commission's rules and forms.
(b) There were no changes in the registrant's internal control over financial reporting that occurred during the period covered by this report that have materially affected, or are reasonably likely to materially affect, the registrant's internal control over financial reporting.
Item 12. Disclosure of Securities Lending Activities for Closed End Management Investment Companies
Not applicable to this semiannual report.
Item 13. Exhibits.
(a)(1) Not applicable to this semi-annual report.
(a)(2) Certifications pursuant to Rule 30a-2(a) under the Investment Company Act of 1940 (17 CFR 270.30a-2(a)): Attached hereto.
(a)(3) Not applicable
(b) Certification pursuant to Rule 30a-2(b) under the Investment Company Act of 1940 (17 CFR 270.30a-2(b)): Attached hereto.
SIGNATURES
Pursuant to the requirements of the Securities Exchange Act of 1934 and the Investment Company Act of 1940, the registrant has duly caused this report to be signed on its behalf by the undersigned, thereunto duly authorized.
| (Registrant) | First Eagle Funds |
| | |
| By (Signature and Title)* | /s/ Mehdi Mahmud |
| | Mehdi Mahmud, President |
Date: July 5, 2024
Pursuant to the requirements of the Securities Exchange Act of 1934 and the Investment Company Act of 1940, this report has been signed below by the following persons on behalf of the registrant and in the capacities and on the dates indicated.
| By (Signature and Title)* | /s/ Mehdi Mahmud |
| | Mehdi Mahmud, Principal Executive Officer |
Date: July 5, 2024
| By (Signature and Title)* | /s/ Brian Margulies |
| | Brian Margulies, Principal Financial Officer |
Date: July 5, 2024
* Print the name and title of each signing officer under his or her signature.