UNITED STATES
SECURITIES AND EXCHANGE COMMISSION
Washington, D.C. 20549
FORM N-CSR
CERTIFIED SHAREHOLDER REPORT OF REGISTERED MANAGEMENT
INVESTMENT COMPANIES
Investment Company Act file number 811-7762
First Eagle Funds
(Exact name of registrant as specified in charter)
1345 Avenue of the Americas
New York, NY 10105
(Address of principal executive offices) (Zip code)
Sheelyn Michael
First Eagle Funds
1345 Avenue of the Americas
New York, NY 10105
(Name and address of agent for service)
Registrant’s telephone number, including area code: 1-212-632-2700
Date of fiscal year end: October 31
Date of reporting period: April 30, 2021
Form N-CSR is to be used by management investment companies to file reports with the Commission not later than 10 days after the transmission to stockholders of any report that is required to be transmitted to stockholders under Rule 30e-1 under the Investment Company Act of 1940 (17 CFR 270.30e-1). The Commission may use the information provided on Form N-CSR in its regulatory, disclosure review, inspection, and policymaking roles.
A registrant is required to disclose the information specified by Form N-CSR, and the Commission will make this information public. A registrant is not required to respond to the collection of information contained in Form N-CSR unless the Form displays a currently valid Office of Management and Budget (“OMB”) control number. Please direct comments concerning the accuracy of the information collection burden estimate and any suggestions for reducing the burden to Secretary, Securities and Exchange Commission, 450 Fifth Street, NW, Washington, DC 20549-0609. The OMB has reviewed this collection of information under the clearance requirements of 44 U.S.C. § 3507.
Item 1. Reports to Stockholders.

First Eagle Global Fund
First Eagle Overseas Fund
First Eagle U.S. Value Fund
First Eagle Gold Fund
First Eagle Global Income Builder Fund
First Eagle High Income Fund
First Eagle Fund of America

As permitted by regulations adopted by the Securities and Exchange Commission, paper copies of each Fund's shareholder reports will no longer be sent by mail, unless you specifically request paper copies of the reports from the Fund or from your financial intermediary, such as a broker-dealer or bank. Instead, the reports will be made available on www.feim.com, and you will be notified by mail each time a report is posted and provided with a website link to access the report.
If you already elected to receive shareholder reports electronically, you will not be affected by this change and you need not take any action. You may elect to receive shareholder reports and other communications from the Fund or your financial intermediary electronically by notifying your financial intermediary directly or, if you are a direct investor, by calling 800.334.2143 or by visiting www.Fundreports.com.
You may elect to receive all future reports in paper free of charge. If you invest through a financial intermediary, you can contact your financial intermediary to request that you continue to receive paper copies of your reports. If you invest directly with a Fund, you can call 800.334.2143 or visit www.Fundreports.com. Your election to receive reports in paper will apply to all funds held with First Eagle or your financial intermediary.
Advised by First Eagle Investment Management, LLC
Forward-Looking Statement Disclosure
One of our most important responsibilities as mutual fund managers is to communicate with shareholders in an open and direct manner. Some of our comments in our letters to shareholders are based on current management expectations and are considered "forward-looking statements". Actual future results, however, may prove to be different from our expectations. You can identify forward-looking statements by words such as "may", "will", "believe", "attempt", "seek", "think", "ought", "try" and other similar terms. We cannot promise future returns. Our opinions are a reflection of our best judgment at the time this report is compiled, and we disclaim any obligation to update or alter forward-looking statements as a result of new information, future events, or otherwise.
First Eagle Funds | Semiannual Report | April 30, 2021
2
Table of Contents
Letter from the President | | | 4 | | |
Management's Discussion of Fund Performance | | | 8 | | |
Performance Chart | | | 14 | | |
First Eagle Global Fund | |
Fund Overview | | | 24 | | |
Consolidated Schedule of Investments | | | 26 | | |
First Eagle Overseas Fund | |
Fund Overview | | | 42 | | |
Consolidated Schedule of Investments | | | 44 | | |
First Eagle U.S. Value Fund | |
Fund Overview | | | 58 | | |
Consolidated Schedule of Investments | | | 60 | | |
First Eagle Gold Fund | |
Fund Overview | | | 66 | | |
Consolidated Schedule of Investments | | | 68 | | |
First Eagle Global Income Builder Fund | |
Fund Overview | | | 72 | | |
Schedule of Investments | | | 74 | | |
First Eagle High Income Fund | |
Fund Overview | | | 90 | | |
Schedule of Investments | | | 92 | | |
First Eagle Fund of America | |
Fund Overview | | | 102 | | |
Schedule of Investments | | | 104 | | |
Statements of Assets and Liabilities | | | 108 | | |
Statements of Operations | | | 116 | | |
Statements of Changes in Net Assets | | | 120 | | |
Financial Highlights | | | 132 | | |
Notes to Financial Statements | | | 158 | | |
Fund Expenses | | | 186 | | |
General Information | | | 192 | | |
First Eagle Funds | Semiannual Report | April 30, 2021
3
Letter from the President (unaudited)

Dear Fellow Shareholders,
Do you feel that the always-irregular pace of history has accelerated of late? If so, you are not alone; it seems as if a decade's worth of events were squeezed into the last six months.
At the time of my last letter, the looming US presidential election—which was both hotly contested and ultimately hotly disputed—served as a daily reminder of the profound differences that continued to divide our nation even in the face of a virus that drew no ideological distinctions. Most of the global economy remained in a pandemic-induced shock, and public sentiment gyrated wildly with every bit of news about the spread of Covid-19 and efforts to contain it through the development and distribution of vaccines. At the time, I noted that the forced virtualization of the economy resulting from the onset of the pandemic had triggered an acceleration in extant underlying trends such as the shift toward online commerce and digital entertainment, and a reversal in others such as travel and urbanization. The equity market rally since the February/March selloff was bifurcated and tracked this dynamic.1 Markets seemed to overreact in response to the impacts of the pandemic; stocks perceived to benefit from a locked-down, quarantined world vastly outperformed names associated with the physical economy, resulting in valuations that implied an immediate and permanent shift in the nature of economic activity. For instance, valuations for e-commerce companies appeared to price a high likelihood that traditional retail would disappear altogether in the foreseeable future; similarly, valuations for energy stocks were beaten down to levels last seen in 2003, seemingly implying that transportation demand had been permanently decimated.2
Six months later, here in June, conditions are meaningfully different. In the United States, the trifecta of continued massive fiscal stimulus, sustained monetary support and a successful vaccination campaign has led to a reopening of the economy. Americans are moving more freely in public, and theaters, stadiums, shops and restaurants shuttered for over a year are opening their doors. New York City, which
1 Source: FactSet.
2 Source: FactSet.
First Eagle Funds | Semiannual Report | April 30, 2021
4
Letter from the President (unaudited)
was the epicenter of the pandemic only a year ago, is expected to be mostly reopened by the end of June! Countrywide, unemployment is declining, economic activity is rebounding, and consumers are starting to spend again after a year-plus of economic uncertainty and limited outlets for discretionary spending. There may be stops and starts in the normalization of economic activity, but the direction is encouraging.
In turn, market action in the US has mimicked the sunnier turn of events. Starting as early as September 2020, we saw equity market leadership begin to transition in favor of cyclical companies in sectors such as energy, financials and materials that stand to potentially profit from an economic revival. Generally, international equities have followed with strong returns, while bond yields have risen. While a number of the world's largest economies—including much of the euro zone, Japan, Brazil and India—continue to struggle to contain the virus's impact, progress appears likely on this front. Combined with globally coordinated monetary and fiscal stimulus, this may present opportunities to acquire stakes in high-quality businesses at attractive prices alongside the potential for currency tailwinds.
While we appreciate the joie de vivre of the season on many levels, we also are careful not to get carried away with unbounded enthusiasm. There remain risks on the horizon worthy of a wary eye, especially the fact that the Covid-19 pandemic remains unconquered. While the widespread distribution of vaccines is an important step toward herd immunity, it is no silver bullet; the virus continues to propagate and mutate, and we don't yet know the extent to which vaccinations will serve to contain death rates over the long term. Risks also persist on the economic horizon, with government debt burdens rising rapidly as a result of monetary and fiscal stimulus in reaction to the pandemic. In addition, rhetoric out of Washington points to the possibility of higher corporate tax rates and a generally less business-friendly environment, which could weigh on profit margins and discourage capital formation.
Further, there are signs inflation may reemerge as a risk after 40 years of moderation. While a near-term move higher in inflation may be attributed to base effects and price distortions that emerge as the economy reopens, there is the potential for a more durable shift as a result of a positive output gap in the economy and the uncertainties associated with the Federal Reserve's new average inflation-targeting policy framework. Many market participants believe the Fed's new approach may leave the central bank in a position of attempting to contain inflation after the fact, which historically has required more severe policy tightening than preemptive measures would have. Even more pernicious levels of inflation may result should we see a fiscal regime shift toward permanent deficit spending and a challenge to the Fed's ability to set monetary policy free from political interference.
First Eagle Funds | Semiannual Report | April 30, 2021
5
Letter from the President (unaudited)
On balance, our perspective is constructive, albeit with healthy wariness of potential risks. First Eagle's longstanding commitment to value-oriented investing benefitted our investors in this post-pandemic environment, and our outlook for such investments remains optimistic. While our strategic allocation to gold and gold-related equities dampened the performance of our stock holdings during the period covered by this report, we remain steadfast in our belief that gold serves as a potential hedge against a range of potential market and economic outcomes over the long term.
Global Value Team
The Global Value team has always emphasized stock picking as the core of its investment approach, and its skills in this area were on display during this period as investors showed renewed appreciation of well-positioned, well-financed and well-managed companies operating in the traditional, real-world economy. However, overall fund performance was tempered by our holdings of gold and gold-related equities—a potential hedge that served us in good stead during the pandemic sell-off but understandably lost ground when real interest rates subsequently rose. The Global Value team does not presume to predict the future of economies or markets, but it does believe that in markets where stock multiples are high and bond yields are low, it is prudent to anticipate more modest future returns. Unlike investment managers who approach alpha by seeking to overweight a sector or stock to capture a near-term earnings surprise, the Global Value team patiently pursues alpha over longer time horizons, searching for businesses in advantaged positions that they can expand at a measured pace.
High Income Team
Despite diminishing spreads and lax covenants, investors continued to pour money into the high yield market, and companies responded by issuing new bonds and loans at a pace that if continued will surpass the record set in 2020.3 Credit fundamentals are worrisome. Gross leverage is at a generational high, and the market reached this level before the pandemic and the recession it unleashed. Though many issuer balance sheets have been buffered by the large amounts of cash they were able to raise over the past year, gross leverage remains elevated. The high yield team has been focused on a sentiment expressed by Benjamin Franklin: "An ounce of prevention is worth a pound of cure." Seeking to be compensated for the risks it takes and to avoid risks for which the compensation is inadequate, the team continues to be biased toward higher ratings.
First Eagle Funds | Semiannual Report | April 30, 2021
6
Letter from the President (unaudited)
Fund of America Team
In August 2020, First Eagle replaced the previous subadvisor of the First Eagle Fund of America with an internal portfolio management team drawn from our Global Value team. At the same time, the Fund's investment objective was revised to include current income alongside capital appreciation, and by the end of 2020 the Fund of America team had completed the orderly transitioning of the portfolio to its new investment objective. The team focused on building resilience in the portfolio stock-by-stock from the bottom up, selectively targeting high-quality companies that possess a durable competitive advantage combined with a conservative capital structure, prudent management and attractive financial metrics. Such companies, in the team's view, are well positioned to potentially generate consistent free cash flow over time and return excess cash to shareholders in the form of dividends and/or share buybacks. This investment philosophy has resulted in a concentrated, benchmark-agnostic portfolio whose composition differs significantly from common market indexes, thus offering shareholders potential differentiated performance.
I thank you for entrusting your assets to our stewardship.
Sincerely,

Mehdi Mahmud,
President
June 2021
First Eagle Funds | Semiannual Report | April 30, 2021
7
Management's Discussion of Fund Performance (unaudited)
First Eagle Global Fund
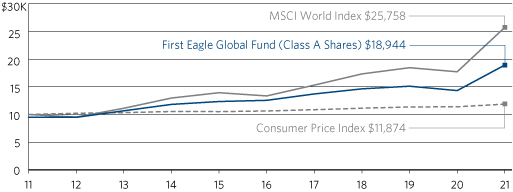
The net asset value ("NAV") of the Fund's Class A shares* increased 22.26% for the six months ended April 30, 2021, while the MSCI World Index increased 29.10%. The Fund's cash and cash equivalents position was 10.2% as of April 30, 2021.
The five largest contributors to the performance of First Eagle Global Fund over the period were Exxon Mobil Corp. (oil, gas & consumable fuels, United States), Oracle Corp. (software, United States), Comcast Corp., Class A (media, United States), Teradata Corp. (software, United States) and Deere & Co. (machinery, United States). Collectively, they accounted for 4.14% of this period's performance.
The five largest detractors during the first quarter were Fresnillo plc (metals & mining, Mexico), Wheaton Precious Metals Corp, (metals & mining, Brazil), Agnico Eagle Mines Ltd. (metals & mining, Canada), Barrick Gold Corp. (metals & mining, Canada) and gold bullion. Their combined negative performance over the period subtracted 1.12% from fund performance.
First Eagle Overseas Fund
The NAV of the Fund's Class A shares* increased 16.08% for the six months ended April 30, 2021, while the MSCI EAFE Index rose 28.84%. The Fund's cash and cash equivalents position was 15.4% as of April 30, 2021.
The five largest contributors to the performance of First Eagle Overseas Fund over the period were Imperial Oil Ltd. (oil, gas & consumable fuels, Canada), Cie Financiere Richemont SA (Registered) (textiles, apparel & luxury Goods, Switzerland), Jardine Matheson Holdings Ltd. (industrial conglomerates, Hong Kong), Groupe Bruxelles Lambert SA (diversified financial services, Belgium) and Nutrien Ltd. (chemicals, Canada). Collectively, they accounted for 3.93% of this period's performance.
The five largest detractors were Wheaton Precious Metals Corp. (metals & mining, Brazil), As One Corp. (health care providers & services, Japan), Agnico Eagle Mines Ltd. (metals & mining, Canada), Barrick Gold Corp. (metals & mining, Canada) and gold bullion. Their combined negative performance over the period subtracted 1.04% from fund performance.
First Eagle Funds | Semiannual Report | April 30, 2021
8
Management's Discussion of Fund Performance
First Eagle U.S. Value Fund
The NAV of the Fund's Class A shares* increased 26.87% for the six months ended April 30, 2021, while the S&P 500 Index increased 28.85%. The Fund's cash and cash equivalents position was 9.5% as of April 30, 2021.
The five largest contributors to the performance of First Eagle U.S. Value Fund over the period were Exxon Mobil Corp. (oil, gas & consumable fuels, United States), Oracle Corp. (software, United States), Comcast Corp., Class A (media, United States), Deere & Co. (machinery, United States) and Teradata Corp. (software, United States). Collectively, they accounted for 7.43% of this period's performance.
The five largest detractors were TechnipFMC plc (energy equipment & services, United Kingdom), Royal Gold, Inc. (metals & mining, United States), Agnico Eagle Mines Ltd. (metals & mining, Canada), Barrick Gold Corp. (metals & mining, Canada) and gold bullion. Their combined negative performance over the period subtracted 1.01% from fund performance.
First Eagle Gold Fund
The NAV of the Fund's Class A shares* decreased 7.40% for the six months ended April 30, 2021, while the FTSE Gold Mines Index declined 12.08%. The Fund's cash and cash equivalents position was 9.9% as of April 30, 2021.
The five largest contributors to the performance of First Eagle Gold Fund over the period were Dundee Precious Metals, Inc. (metals & mining, Canada), Newmont Corp. (metals & mining, United States), Franco-Nevada Corp. (metals & mining, Canada), Pan American Silver Corp., CVR expiring 2/22/29 (metals & mining, Canada) and Royal Gold, Inc. (metals & mining, United States). Collectively, they accounted for 0.71% of this period's performance.
The five largest detractors were Kirkland Lake Gold Ltd. (metals & mining, Canada), Agnico Eagle Mines Ltd. (metals & mining, Canada), gold bullion, B2Gold Corp. (metals & mining, Canada) and Barrick Gold Corp. (metals & mining, Canada). Their combined negative performance over the period subtracted 5.01% from fund performance.
First Eagle Global Income Builder Fund
The NAV of the Fund's Class A shares* increased 18.47% for the six months ended April 30, 2021, while the MSCI World Index increased 29.10% and the Bloomberg
* Reflects performance for Class A shares without the effect of sales charges and assumes all distributions have been reinvested; if sales charges were included, values would be lower.
First Eagle Funds | Semiannual Report | April 30, 2021
9
Management's Discussion of Fund Performance
Barclays U.S. Aggregate Bond Index decreased 1.52%. The composite index4 was up 16.11% over the same time period. The Fund's cash and cash equivalents position was 5.5% as of April 30, 2021.
The five largest contributors to the performance of First Eagle Global Income Builder Fund over the period were Exxon Mobil Corp, (oil, gas & consumable fuels, United States), Jardine Matheson Holdings Ltd. (industrial conglomerates, Hong Kong), Cie Financiere Richemont SA (Registered) (textiles, apparel & luxury Goods, Switzerland), Cia Cervecerias Unidas SA, ADR (Beverages, Chile) and Groupe Bruxelles Lambert SA (diversified financial services, Belgium). Collectively, they accounted for 4.34% of this period's performance.
The five largest detractors were Wheaton Precious Metals Corp. (metals & mining, Brazil), Unilever plc (personal products, United Kingdom), Fresnillo plc (metals & mining, Mexico), Agnico Eagle Mines Ltd. (metals & mining, Canada) and gold bullion. Their combined negative performance over the period subtracted 0.85% from fund performance.
First Eagle High Income Fund
The NAV of the Fund's Class I shares increased 3.96% for the six months ended April 30, 2021, while the Bloomberg Barclays U.S. Corporate High Yield Index increased 7.97%. The Fund's cash and cash equivalents position was 5.9% as of April 30, 2021.
The five largest contributors to the performance of First Eagle High Income Fund over the period were EnQuest Plc 7.0%, 4/15/2022 (oil, gas & consumable fuels, United Kingdom); Antero Resources Corp. 5.63%, 6/1/2023 (oil, gas & consumable fuels, United States); Meredith Corp. 6.88%, 2/1/2026 (media, United States); Precision Drilling Corp. 7.75%, 12/15/2023 (energy equipment & services, Canada); and Osum Production Corp. 1st Lien Term Loan B-EXT (ICE LIBOR USD 3 Month + 7.50%), 7/31/2022 (oil, gas & consumable fuels, United States). Collectively, they accounted for 2.13% of this period's performance.
The five largest detractors were Kronos Acquisition Holdings, Inc. 7.00%, 12/31/2027 (household products, Canada); SBA Communications Corp. REIT, 3.13%, 2/1/2029 (equity real estate investment trusts (REITs), United States); Valvoline, Inc. 3.63%, 6/15/2031 (chemicals, United States); Mexico Remittances Funding Fiduciary Estate Management Sarl 4.88%, 1/15/2028 (diversified financial
4 The composite index consists of 60% of the MSCI World Index and 40% of the Bloomberg Barclays U.S. Aggregate Bond Index.
First Eagle Funds | Semiannual Report | April 30, 2021
10
Management's Discussion of Fund Performance
services, Mexico); and Southeastern Grocers, Inc. (food & staples retailing, United States). Their combined negative performance over the period subtracted 1.29% from fund performance.
First Eagle Fund of America
The NAV of the Fund's Class Y shares increased 27.15% for the six months ended April 30, 2021, while the S&P 500 Index increased 28.85%. The Fund's cash and cash equivalents position was 0.9% as of April 30, 2021.
The five largest contributors to the performance of Fund of America over the period were Alphabet Inc. Class A, (interactive media & services, United States), Taiwan Semiconductor Manufacturing Company, Ltd. (semiconductors & semiconductor equipment, Taiwan), Ross Stores, Inc. (specialty retail, United States), Oracle Corp. (software, United States) and Comcast Corp., Class A (media, United States). Collectively, they accounted for 11.73% of this period's performance.
The five largest detractors were TE Connectivity Ltd. (electronic equipment, instruments & components, United States), Baxter International Inc. (health care equipment & supplies, United States), Aon Plc Class A (insurance, United States), Alibaba Group Holding Ltd. ADR (internet & direct marketing retail, China) and Unilever PLC (personal products, United Kingdom). Their combined negative performance subtracted 0.51% from fund performance.

| | 
| |
Matthew McLennan
Co-Head of the Global Value Team
Portfolio Manager
Global, Overseas,
U.S. Value and Gold Funds
| | T. Kimball Brooker, Jr.
Co-Head of the Global Value Team
Portfolio Manager
Global, Overseas,
U.S. Value and
Global Income Builder Funds | |

| | 
| |
Matt Lamphier
Portfolio Manager
U.S. Value Fund
| | Edward Meigs
Portfolio Manager
Global Income Builder and
High Income Funds | |
First Eagle Funds | Semiannual Report | April 30, 2021
11
Management's Discussion of Fund Performance

| | 
| |
Sean Slein
Portfolio Manager
Global Income Builder and
High Income Funds | | Thomas Kertsos
Portfolio Manager
Gold Fund
| |

| | 
| |
Manish Gupta
Portfolio Manager
Global Fund and
Fund of America | | Christian Heck
Portfolio Manager
Overseas Fund and
Fund of America | |

| | 
| |
Julien Albertini
Portfolio Manager
Global Fund,
Global Income Builder Fund and
Fund of America | | Alan Barr
Portfolio Manager
Overseas Fund
| |

| | 
| |
Mark Wright
Portfolio Manager
U.S. Value Fund
| | Idanna Appio
Portfolio Manager
Global Income
Builder Fund | |
June 2021
First Eagle Funds | Semiannual Report | April 30, 2021
12
Management's Discussion of Fund Performance
The performance data quoted herein represent past performance and do not guarantee future results. Market volatility can dramatically impact a fund's short-term performance. Current performance may be lower or higher than figures shown. The investment return and principal value will fluctuate so that an investor's shares, when redeemed, may be worth more or less than their original cost. Past performance data through the most recent month-end are available at www.feim.com or by calling 800.334.2143.
The commentary represents the opinion of Mehdi Mahmud and the portfolio management teams as of June 2021 and is subject to change based on market and other conditions. These materials are provided for informational purposes only. These opinions are not intended to be a forecast of future events, a guarantee of future results, or investment advice. The views expressed herein may change at any time subsequent to the date of issue hereof. The information provided is not to be construed as a recommendation or an offer to buy or sell or the solicitation of an offer to buy or sell any fund or security.
First Eagle Funds | Semiannual Report | April 30, 2021
13
Performance Chart1 (unaudited)
| | | One
Year | | Three
Years | | Five
Years | | Ten
Years | | Since
Inception | | Inception Date | |
First Eagle Global Fund | |
Class A (SGENX)
without sales charge | | | 32.23 | % | | | 8.97 | % | | | 8.57 | % | | | 7.15 | % | | | 12.84 | % | | 01/01/792 | |
with sales charge | | | 25.61 | % | | | 7.12 | % | | | 7.46 | % | | | 6.60 | % | | | 12.71 | % | | 01/01/792 | |
| Class C (FESGX) | | | 31.24 | % | | | 8.15 | % | | | 7.76 | % | | | 6.35 | % | | | 9.62 | % | | 06/05/00 | |
| Class I (SGIIX) | | | 32.57 | % | | | 9.26 | % | | | 8.86 | % | | | 7.43 | % | | | 10.53 | % | | 07/31/98 | |
| Class R3 (EARGX) | | | 31.93 | % | | | — | | | | — | | | | — | | | | 8.85 | % | | 05/01/18 | |
| Class R4 (EAGRX) | | | 32.36 | % | | | 9.13 | % | | | — | | | | — | | | | 6.87 | % | | 01/17/18 | |
| Class R5 (FRGLX) | | | 30.05 | % | | | — | | | | — | | | | — | | | | 10.77 | % | | 07/29/19 | |
| Class R6 (FEGRX) | | | 32.65 | % | | | 9.34 | % | | | — | | | | — | | | | 8.53 | % | | 03/01/17 | |
MSCI World Index3 | | | 45.33 | % | | | 14.10 | % | | | 14.03 | % | | | 9.92 | % | | | 9.98 | % | | 01/01/79 | |
First Eagle Overseas Fund | |
Class A (SGOVX)
without sales charge | | | 24.37 | % | | | 5.38 | % | | | 5.62 | % | | | 4.89 | % | | | 9.94 | % | | 08/31/93 | |
with sales charge | | | 18.15 | % | | | 3.60 | % | | | 4.54 | % | | | 4.36 | % | | | 9.74 | % | | 08/31/93 | |
| Class C (FESOX) | | | 23.47 | % | | | 4.61 | % | | | 4.84 | % | | | 4.12 | % | | | 8.55 | % | | 06/05/00 | |
| Class I (SGOIX) | | | 24.73 | % | | | 5.69 | % | | | 5.92 | % | | | 5.18 | % | | | 9.86 | % | | 07/31/98 | |
| Class R3 (EAROX) | | | 24.18 | % | | | — | | | | — | | | | — | | | | 5.29 | % | | 05/01/18 | |
| Class R4 (FIORX) | | | 24.68 | % | | | 5.53 | % | | | — | | | | — | | | | 3.79 | % | | 01/17/18 | |
| Class R5 (FEROX) | | | 24.15 | % | | | — | | | | — | | | | — | | | | 9.75 | % | | 03/11/19 | |
| Class R6 (FEORX) | | | 24.82 | % | | | 5.75 | % | | | — | | | | — | | | | 6.23 | % | | 03/01/17 | |
MSCI EAFE Index4 | | | 39.88 | % | | | 6.27 | % | | | 8.87 | % | | | 5.22 | % | | | 5.40 | % | | 08/31/93 | |
First Eagle Funds | Semiannual Report | April 30, 2021
14
| | | One
Year | | Three
Years | | Five
Years | | Ten
Years | | Since
Inception | | Inception Date | |
First Eagle U.S. Value Fund | |
Class A (FEVAX)
without sales charge | | | 37.39 | % | | | 10.45 | % | | | 10.17 | % | | | 8.50 | % | | | 9.21 | % | | 09/04/01 | |
with sales charge | | | 30.56 | % | | | 8.58 | % | | | 9.04 | % | | | 7.94 | % | | | 8.93 | % | | 09/04/01 | |
| Class C (FEVCX) | | | 36.32 | % | | | 9.59 | % | | | 9.32 | % | | | 7.68 | % | | | 8.39 | % | | 09/04/01 | |
| Class I (FEVIX) | | | 37.73 | % | | | 10.75 | % | | | 10.47 | % | | | 8.79 | % | | | 9.49 | % | | 09/04/01 | |
| Class R3 (EARVX) | | | 37.07 | % | | | — | | | | — | | | | — | | | | 10.28 | % | | 05/01/18 | |
| Class R4 (FIVRX) | | | 37.10 | % | | | — | | | | — | | | | — | | | | 12.16 | % | | 07/29/19 | |
| Class R5 (FERVX) | | | 37.36 | % | | | — | | | | — | | | | — | | | | 12.35 | % | | 07/29/19 | |
| Class R6 (FEVRX) | | | 37.79 | % | | | 10.79 | % | | | — | | | | — | | | | 9.59 | % | | 03/01/17 | |
S&P 500 Index5 | | | 45.98 | % | | | 18.67 | % | | | 17.42 | % | | | 14.17 | % | | | 9.01 | % | | 09/04/01 | |
First Eagle Gold Fund | |
Class A (SGGDX)
without sales charge | | | 6.92 | % | | | 15.19 | % | | | 5.97 | % | | | -3.37 | % | | | 6.02 | % | | 08/31/93 | |
with sales charge | | | 1.57 | % | | | 13.24 | % | | | 4.89 | % | | | -3.86 | % | | | 5.82 | % | | 08/31/93 | |
| Class C (FEGOX) | | | 6.14 | % | | | 14.32 | % | | | 5.16 | % | | | -4.11 | % | | | 5.76 | % | | 05/15/03 | |
| Class I (FEGIX) | | | 7.21 | % | | | 15.52 | % | | | 6.27 | % | | | -3.10 | % | | | 6.84 | % | | 05/15/03 | |
| Class R3 (EAURX) | | | 6.88 | % | | | — | | | | — | | | | — | | | | 15.22 | % | | 05/01/18 | |
| Class R4 (FIURX) | | | 7.16 | % | | | — | | | | — | | | | — | | | | 19.13 | % | | 07/29/19 | |
| Class R5 (FERUX) | | | 7.14 | % | | | — | | | | — | | | | — | | | | 19.07 | % | | 07/29/19 | |
| Class R6 (FEURX) | | | 7.30 | % | | | 15.60 | % | | | — | | | | — | | | | 9.06 | % | | 03/01/17 | |
FTSE Gold Mines | | | -1.70 | % | | | 15.04 | % | | | 5.20 | % | | | -5.80 | % | | | 0.57 | % | | 08/31/93
Index6 | |
MSCI World Index3 | | | 45.33 | % | | | 14.10 | % | | | 14.03 | % | | | 9.92 | % | | | 7.77 | % | | 08/31/93 | |
First Eagle Funds | Semiannual Report | April 30, 2021
15
| | | One
Year | | Three
Years | | Five
Years | | Ten
Years | | Since
Inception | | Inception Date | |
First Eagle Global Income Builder Fund | |
Class A (FEBAX)
without sales charge | | | 23.63 | % | | | 6.29 | % | | | 6.88 | % | | | — | | | | 6.41 | % | | 05/01/12 | |
with sales charge | | | 17.49 | % | | | 4.49 | % | | | 5.79 | % | | | — | | | | 5.81 | % | | 05/01/12 | |
| Class C (FEBCX) | | | 22.66 | % | | | 5.48 | % | | | 6.07 | % | | | — | | | | 5.61 | % | | 05/01/12 | |
| Class I (FEBIX) | | | 23.89 | % | | | 6.58 | % | | | 7.15 | % | | | — | | | | 6.69 | % | | 05/01/12 | |
| Class R3 (FBRRX) | | | 23.25 | % | | | — | | | | — | | | | — | | | | 6.15 | % | | 05/01/18 | |
| Class R4 (FIBRX) | | | 23.33 | % | | | — | | | | — | | | | — | | | | 8.26 | % | | 07/29/19 | |
| Class R5 (EABRX) | | | 23.46 | % | | | — | | | | — | | | | — | | | | 8.37 | % | | 07/29/19 | |
| Class R6 (FEBRX) | | | 23.96 | % | | | 6.60 | % | | | — | | | | — | | | | 6.78 | % | | 03/01/17 | |
Composite Index7 | | | 25.45 | % | | | 10.90 | % | | | 9.87 | % | | | — | | | | 8.37 | % | | 05/01/12 | |
MSCI World Index3 | | | 45.33 | % | | | 14.10 | % | | | 14.03 | % | | | — | | | | 11.63 | % | | 05/01/12 | |
Bloomberg Barclays
U.S. Aggregate Bond
Index8 | | | -0.27 | % | | | 5.19 | % | | | 3.19 | % | | | — | | | | 2.93 | % | | 05/01/12 | |
First Eagle High Income Fund | |
Class A (FEHAX)
without sales charge | | | 16.00 | % | | | 4.42 | % | | | 5.71 | % | | | — | | | | 4.93 | % | | 01/03/12 | |
with sales charge | | | 10.71 | % | | | 2.83 | % | | | 4.74 | % | | | — | | | | 4.41 | % | | 01/03/12 | |
| Class C (FEHCX) | | | 15.13 | % | | | 3.60 | % | | | 4.92 | % | | | — | | | | 4.13 | % | | 01/03/12 | |
| Class I (FEHIX) | | | 16.32 | % | | | 4.68 | % | | | 6.01 | % | | | 4.77 | % | | | 7.52 | % | | 11/19/079 | |
| Class R3 (EARHX) | | | 15.85 | % | | | — | | | | — | | | | — | | | | 4.31 | % | | 05/01/18 | |
| Class R4 (FIHRX) | | | 15.32 | % | | | — | | | | — | | | | — | | | | 4.33 | % | | 07/29/19 | |
| Class R5 (FERHX) | | | 15.91 | % | | | — | | | | — | | | | — | | | | 4.76 | % | | 07/29/19 | |
| Class R6 (FEHRX) | | | 16.27 | % | | | 4.67 | % | | | — | | | | — | | | | 4.37 | % | | 03/01/17 | |
Bloomberg Barclays
U.S. Corporate High
Yield Index10 | | | 19.67 | % | | | 7.00 | % | | | 7.46 | % | | | 6.43 | % | | | 7.32 | % | | 11/19/07 | |
First Eagle Funds | Semiannual Report | April 30, 2021
16
| | | One
Year | | Three
Years | | Five
Years | | Ten
Years | | Since
Inception | | Inception Date | |
First Eagle Fund of America11 | |
Class A (FEFAX)
without sales charge | | | 41.32 | % | | | 6.33 | % | | | 7.82 | % | | | 7.72 | % | | | 8.07 | % | | 11/20/98 | |
with sales charge | | | 34.27 | % | | | 4.53 | % | | | 6.72 | % | | | 7.16 | % | | | 7.82 | % | | 11/20/98 | |
| Class C (FEAMX) | | | 40.27 | % | | | 5.54 | % | | | 7.02 | % | | | 6.91 | % | | | 7.29 | % | | 03/02/98 | |
| Class I (FEAIX) | | | 41.73 | % | | | 6.66 | % | | | 8.14 | % | | | — | | | | 7.78 | % | | 03/08/13 | |
| Class Y (FEAFX)12 | | | 41.31 | % | | | 6.33 | % | | | 7.81 | % | | | 7.71 | % | | | 10.94 | % | | 04/10/87 | |
| Class R3 (EARFX) | | | 41.11 | % | | | — | | | | — | | | | — | | | | 6.27 | % | | 05/01/18 | |
| Class R4 (EAFRX) | | | 41.46 | % | | | — | | | | — | | | | — | | | | 12.34 | % | | 07/29/19 | |
| Class R5 (FERFX) | | | 41.61 | % | | | — | | | | — | | | | — | | | | 12.45 | % | | 07/29/19 | |
| Class R6 (FEFRX) | | | 41.72 | % | | | 6.69 | % | | | — | | | | — | | | | 7.07 | % | | 03/01/17 | |
S&P 500 Index5 | | | 45.98 | % | | | 18.67 | % | | | 17.42 | % | | | 14.17 | % | | | 10.54 | % | | 04/10/87 | |
1 The performance data quoted herein represents past performance and does not guarantee future results. Market volatility can dramatically impact the fund's short-term performance. Current performance may be lower or higher than figures shown. The investment return and principal value will fluctuate so that an investor's shares, when redeemed, may be worth more or less than their original cost. Past performance data through the most recent month end is available at feim.com or by calling 800.334.2143. The average annual returns for Class A Shares "with sales charge" of First Eagle Global Fund, First Eagle Overseas Fund, First Eagle U.S. Value Fund, First Eagle Gold Fund, First Eagle Global Income Builder Fund and First Eagle Fund of America give effect to the deduction of the maximum sales charge of 5.00%. The average annual returns for Class A Shares "with sales charge" of First Eagle High Income Fund gives effect to the deduction of the maximum sales charge of 4.50%.
The average annual returns for Class C Shares reflect the maximum contingent deferred sales charge (CDSC), which is charged on the lesser of the original purchase price or the current market value at the time of sale. This pertains to the shares sold or redeemed with the first year of purchase.
For First Eagle Global Fund, First Eagle Overseas Fund, First Eagle U.S. Value Fund, First Eagle Gold Fund and First Eagle Fund of America, a contingent deferred sales charge of 1.00% may apply on redemptions of Class A shares made within 18 months following a purchase of $1,000,000 or more without an initial sales charge.
With respect to the First Eagle Global Income Builder Fund and the First Eagle High Income Fund, a contingent deferred sales charge of 1.00% may apply on certain redemptions of Class A shares made within 18 months following a purchase of $250,000 or more without an initial sales charge.
Class I Shares of First Eagle Global Fund, First Eagle Overseas Fund, First Eagle U.S. Value Fund, First Eagle Gold Fund, First Eagle Global Income Builder Fund, First Eagle High Income Fund and First Eagle Fund of America require $1 million minimum investment and are offered without a sales charge.
Class Y Shares of First Eagle Fund of America are offered without a sales charge.
First Eagle Funds | Semiannual Report | April 30, 2021
17
Class R3 Shares, Class R4 Shares, Class R5 Shares and Class R6 Shares of First Eagle Global Fund, First Eagle Overseas Fund, First Eagle U.S. Value Fund, First Eagle Gold Fund, First Eagle Global Income Builder Fund, First Eagle High Income Fund and First Eagle Fund of America are offered without a sales charge.
2 The Fund commenced operations on April 28, 1970. Performance for periods prior to January 1, 2000, occurred while a prior portfolio manager of the fund was affiliated with another firm. Inception date shown is when this prior portfolio manager assumed portfolio management responsibilities.
3 The MSCI World Index is a widely followed, unmanaged group of stocks from 23 developed market countries. The index provides total returns in U.S. dollars with net dividends reinvested. One cannot invest directly in an index.
4 The MSCI EAFE Index is an unmanaged total return index, reported in U.S. dollars, based on share prices and reinvested net dividends of companies from 21 developed market countries, excluding the United States and Canada. One cannot invest directly in an index.
5 The S&P 500 Index is a widely recognized unmanaged index including a representative sample of 500 leading companies in leading sectors of the U.S. economy. Although the S&P 500 Index focuses on the large-cap segment of the market, with approximately 80% coverage of U.S. equities, it is also considered a proxy for the total market. The S&P 500 Index includes dividends reinvested. One cannot invest directly in an index.
6 The FTSE Gold Mines Index is designed to reflect the performance of the worldwide market in the shares of companies whose principal activity is the mining of gold. The FTSE Gold Mines Index encompasses all gold mining companies that have a sustainable, attributable gold production of at least 300,000 ounces a year and that derive 51% or more of their revenue from mined gold. The Index is unmanaged, and includes dividends reinvested. One cannot invest directly in an index.
7 The composite index consists of 60% of the MSCI World Index and 40% of the Bloomberg Barclays U.S. Aggregate Bond Index.
8 The Bloomberg Barclays U.S. Aggregate Bond Index is an unmanaged broad-based benchmark that measures the investment grade, U.S. dollar-denominated, fixed-rate taxable bond market, including Treasuries, government-related and corporate securities, MBS (agency fixed-rate and hybrid ARM passthroughs), ABS, and CMBS. One cannot invest directly in an index.
9 First Eagle High Income Fund commenced operations in its present form on December 30, 2011, and is successor to another mutual fund pursuant to a reorganization on December 30, 2011. Information prior to December 30, 2011 is for this predecessor fund. Immediately after the reorganization, changes in net asset value of the Class I shares were partially impacted by differences in how the Fund and the predecessor fund price portfolio securities.
10 The Bloomberg Barclays U.S. Corporate High Yield Index is composed of fixed-rate, publicly issued, non-investment grade debt and is unmanaged, with dividends reinvested. The index includes both corporate and non-corporate sectors. The corporate sectors are Industrial, Utility, and Finance, which include both U.S. and non-U.S. corporations. One cannot invest directly in an index.
11 Effective on August 14, 2020, Fund of America is managed by a portfolio management team at First Eagle Investment Management, LLC. Prior to that date, the Fund was managed by a third-party subadviser.
12 As of September 1, 2005, First Eagle Fund of America Class Y is closed to new accounts.
First Eagle Funds | Semiannual Report | April 30, 2021
18
Expense Ratios As Stated In The Most Recent Prospectus
| | | Class A | | Class C | | Class I | | Class Y | | Class R3 | | Class R4 | | Class R5 | | Class R6 | |
First Eagle Global Fund | | | 1.11 | % | | | 1.87 | % | | | 0.86 | % | | | — | | | | 1.18 | % | | | 0.96 | % | | | 2.29 | % | | | 0.79 | % | |
First Eagle Overseas Fund | | | 1.15 | | | | 1.89 | | | | 0.87 | | | | — | | | | 1.36 | | | | 0.91 | | | | 1.31 | | | | 0.80 | | |
First Eagle U.S. Value Fund13,14 | | | 1.18 | | | | 1.94 | | | | 0.89 | | | | — | | | | 1.36 | | | | 1.24 | | | | 1.09 | | | | 0.86 | | |
First Eagle Gold Fund | | | 1.21 | | | | 1.95 | | | | 0.92 | | | | — | | | | 1.25 | | | | 1.00 | | | | 0.98 | | | | 0.85 | | |
First Eagle Global Income
Builder Fund | | | 1.19 | | | | 1.95 | | | | 0.94 | | | | — | | | | 1.49 | | | | 1.25 | | | | 1.14 | | | | 0.90 | | |
First Eagle High Income
Fund13,15 | | | 1.33 | | | | 2.10 | | | | 1.04 | | | | — | | | | 1.45 | | | | 1.84 | | | | 1.25 | | | | 1.07 | | |
First Eagle Fund of America13,16 | | | 1.02 | | | | 1.76 | | | | 0.68 | | | | 1.02 | % | | | 1.17 | | | | 1.03 | | | | 0.93 | | | | 0.68 | | |
13 For the First Eagle U.S. Value Fund, First Eagle High Income Fund and First Eagle Fund of America, had fees not been waived and/or expenses reimbursed, returns would have been lower.
14 These are the actual fund operating expenses prior to the application of fee waivers and/or expense reimbursements. The Adviser has contractually agreed to waive its management fee at an annual rate in the amount of 0.05% of the average daily value of the Fund's net assets for the period through February 28, 2022. This waiver has the effect of reducing the management fee for the term of the waiver from 0.75% to 0.70% on First Eagle U.S. Value Fund.
15 These are the actual fund operating expenses prior to the application of fee waivers and/or expense reimbursements. The Adviser has contractually agreed to waive its management fee at an annual rate in the amount of 0.10% of the average daily value of the Fund's net assets for the period through February 28, 2022. This waiver has the effect of reducing the management fee for the term of the waiver from 0.70% to 0.60% on First Eagle High Income Fund.
16 These are the actual fund operating expenses prior to the application of fee waivers and/or expense reimbursements. The Adviser has contractually agreed to waive and/or reimburse certain fees and expenses of Classes A, C, Y, I, R3, R4, R5 and R6 so that the total annual operating expenses (excluding interest, taxes, brokerage commissions, acquired fund fees and expenses, dividend and interest expenses relating to short sales, and extraordinary expenses, if any) ("annual operating expenses") of each class are limited to 0.90%, 1.65%, 0.90%, 0.65%, 1.00%, 0.75%, 0.65% and 0.65% of average net assets, respectively. Each of these undertakings lasts until February 28, 2022 and may not be terminated during its term without the consent of the Board of Trustees. The Fund has agreed that each of Classes A, C, Y, I, R3, R4, R5 and R6 will repay the Adviser for fees and expenses waived or reimbursed for the class provided that repayment does not cause annual operating expenses (after the repayment is taken into account) to exceed either: (1) 0.90%, 1.65%, 0.90%, 0.65%, 1.00%, 0.75%, 0.65% and 0.65% of the class' average net assets, respectively; or (2) if applicable, the then-current expense limitations. Any such repayment must be made within three years after the year in which the Adviser incurred the expense.
These expense ratios are presented as of March 1, 2021 and may differ from corresponding ratios shown elsewhere in this report because of differing time periods (and/or, if applicable, because these expense ratios do not include expense credits or waivers).
First Eagle Funds | Semiannual Report | April 30, 2021
19
There are risks associated with investing in funds that invest in securities of foreign companies, such as erratic market conditions, economic and political instability and fluctuations in currency exchange rates. These risks may be more pronounced with respect to investments in emerging markets. Funds whose investments are concentrated in a specific industry or sector may be subject to a higher degree of risk than funds whose investments are diversified and may not be suitable for all investors.
All securities may be subject to adverse market trends. The value and liquidity of a Fund's portfolio holdings may fluctuate in response to events specific to the companies or stock or bond markets in which a Fund invests, as well as economic, political, or social events in the United States or abroad. Markets can be volatile, and values of individual securities and other investments at times may decline significantly and rapidly. This may cause a Fund's portfolio to be worth less than the price originally paid for it, or less than it was worth at an earlier time. Market risk may affect a single issuer or the market as a whole. As a result, a portfolio of such securities may underperform the market as a whole. Recent market conditions and events, including a global public health crisis and actions taken by governments in response, may exacerbate volatility. Rapid changes in value or liquidity, which often are not anticipated and can relate to events not connected to particular investments, may limit the ability of the Fund to dispose of its assets at the value or time of its choosing and can result in losses.
An outbreak of disease caused by a novel coronavirus (also known as "COVID-19") has developed into a global pandemic and resulted in, among other things, closing borders, quarantines, disruptions to supply chains and customer activity, as well as general concern and uncertainty. The impact of COVID-19, and other epidemics and pandemics that may arise in the future, has affected and may continue to affect the economies of many nations, individual companies and the global markets, including their liquidity, in ways that cannot necessarily be foreseen at the present time.
To the extent a Fund invests a significant portion of its assets in the securities of companies of a single country or region, it is more likely to be impacted by events or conditions affecting that country or region. For example, political and economic conditions and changes in regulatory, tax, or economic policy in a country could significantly affect the market in that country and in surrounding or related countries and have a negative impact on a Fund's performance. Currency developments or restrictions, political and social instability, and changing economic conditions have resulted in significant market volatility. Currently, a substantial portion of the companies in which the Gold Fund invests are domiciled in Canada, although the mining operations of such companies may take place in other countries. Currently, a substantial portion of the companies in which the Global Fund and Overseas Fund invest are domiciled in Japan, although the operations of such companies may take place in other countries.
Canada is a significant exporter of natural resources, such as oil, natural gas and agricultural products. As a result, the Canadian economy is susceptible to adverse changes in certain commodities markets. It is also heavily dependent on trading with key partners, including the United States, Mexico, and China. Any reduction in trading with these key partners may adversely affect the Canadian economy. Canada's dependency on the economy of the United States, in particular, makes Canada's economy vulnerable to political and regulatory changes affecting the United States economy. These and other factors could negatively affect a Fund's performance.
A Fund's investments may subject it to the risks associated with investing in the European markets, including the risks associated with the United Kingdom's (''UK'') exit from the European Union (''Brexit''). Investments in a single region, even though representing a number of different countries within the region, may be affected by common economic forces and other factors. A number of countries in the European Union (the "EU'') have experienced, and may continue to experience, severe economic and financial difficulties, increasing the risk of investing in the European markets.
First Eagle Funds | Semiannual Report | April 30, 2021
20
The Japanese economy is heavily dependent upon international trade and may be subject to considerable degrees of economic, political and social instability, which could negatively affect a Fund. Japan has also experienced natural disasters, such as earthquakes and tidal waves, of varying degrees of severity, which also could negatively affect a Fund.
The value of a Fund's portfolio holdings may fluctuate in response to the risk that the prices of equity securities, including common stock, rise and fall daily. These price movements may result from factors affecting individual companies, industries or the securities market as a whole. In addition, equity markets tend to move in cycles, which may cause stock prices to fall over short or extended periods of time. Equity securities generally have greater price volatility than debt securities.
By investing in its Subsidiary, each of the Global Fund, Overseas Fund, U.S. Value Fund, and Gold Fund are indirectly exposed to the risks associated with that Subsidiary's investments. The Subsidiaries are not registered under the 1940 Act and are not subject to all of the investor protections of the 1940 Act. Changes in the laws of the United States and/or the Cayman Islands could result in the inability of a Fund and/or a Subsidiary to operate as expected and could adversely affect the Fund.
In addition to investments in larger companies, each Fund may invest in small and medium-size companies, which historically have been more volatile in price than larger company securities, especially over the short term. Positions in smaller companies, especially when a Fund is a large holder of a small company's securities, also may be more difficult or expensive to trade. Among the reasons for the greater price volatility are the less certain growth prospects of smaller companies, the lower degree of liquidity in the markets for such securities and the greater sensitivity of smaller companies to changing economic conditions. In addition, smaller companies may lack depth of management, they may be unable to generate funds necessary for growth or development, or they may be developing or marketing new products or services for which markets are not yet established and may never become established. The Funds consider small companies to be companies with market capitalizations of less than $1 billion and medium-size companies to have market capitalizations of less than $10 billion. Larger, more established companies may be unable to respond quickly to new competitive challenges like changes in consumer tastes or innovative smaller competitors. Larger companies are sometimes unable to attain the high growth rates of successful, smaller companies, especially during extended periods of economic expansion. The Funds consider large companies to be companies with market capitalizations of $10 billion or greater.
Holding illiquid securities restricts or otherwise limits the ability for a Fund to freely dispose of its investments for specific periods of time. A Fund might not be able to sell illiquid securities at its desired price or time. Changes in the markets or in regulations governing the trading of illiquid instruments can cause rapid changes in the price or ability to sell an illiquid security. The market for lower-quality debt instruments, including junk bonds and leveraged loans, is generally less liquid than the market for higher-quality debt instruments.
Investment in gold and gold-related investments present certain risks, including political and economic risks affecting the price of gold and other precious metals including specific changes in U.S. and foreign regulatory policies, tax, currency or mining laws, increased environmental costs, international monetary and political policies, economic conditions within an individual country, trade imbalances, and trade or currency restrictions between countries. The price of gold, in turn, is likely to affect the market prices of securities of companies mining or processing gold, and accordingly, the value of investments in such securities may also be affected. Gold-related investments as a group have not performed as well as the stock market in general during periods when the U.S. dollar is strong, inflation is low and general economic conditions are stable. In addition, returns on gold-related investments have traditionally been more volatile than investments in broader equity or debt markets.
First Eagle Funds | Semiannual Report | April 30, 2021
21
First Eagle High Income and First Eagle Global Income Builder Funds will invest in high yield instruments (commonly known as "high yield" or "junk" bonds) which may be subject to greater levels of interest rate, credit (including issuer default) and liquidity risk than investment grade securities and may experience extreme price fluctuations. The securities of such companies may be considered speculative and the ability of such companies to pay their debts on schedule may be uncertain.
First Eagle High Income and Global Income Builder Funds invest in bank loans. These investments potentially expose a Fund to the credit risk of the underlying borrower, and in certain cases, of the financial institution. A Fund's ability to receive payments in connection with the loan depends primarily on the financial condition of the borrower. The market for bank loans may be illiquid and a Fund may have difficulty selling them, especially in the case of leveraged loans, which can be difficult to value. In addition, bank loans often have contractual restrictions on resale, which can delay the sale and adversely impact the sale price. At times, a Fund may decline to receive non-public information relating to loans, which could disadvantage the Fund relative to other investors.
Funds that invest in bonds are subject to credit and interest rate risk. The value of a Fund's portfolio may fluctuate in response to the risk that the issuer of a bond or other instrument will not be able to make payments of interest and principal when due. In addition, fluctuations in interest rates can affect the value of debt instruments held by a Fund. An increase in interest rates tends to reduce the market value of debt instruments, while a decline in interest rates tends to increase their values. A debt instrument's "duration" is a way of measuring a debt instrument's sensitivity to a potential change in interest rates. Longer duration instruments tend to be more sensitive to interest rate changes than those with shorter durations. Generally, debt instruments with long maturities and low coupons have the longest durations. Recent market conditions and events, including a global public health crisis and actions taken by governments in response, may exacerbate the risk that borrowers will not be able to make payments of interest and principal when due. In addition, with historically low interest rates in the United States and abroad, there is risk of significant future rate moves and related economic and markets impact.
Income generation and dividends are not guaranteed. If dividend paying stocks in the Fund's portfolio stop paying or reduce dividends a Fund's ability to generate income will be adversely affected.
An investment strategy that employs a "value" approach may pose a risk to a Fund that such investment strategy may not be successfully achieved. In any Fund, an investment made at a perceived "margin of safety" or "discount to intrinsic or fundamental value" can trade at prices substantially lower than when an investment is made, so that any perceived "margin of safety" or "discount to value" is no guarantee against loss. "Value" investments, as a category, or entire industries or sectors associated with such investments, may lose favor with investors as compared to those that are more "growth" oriented. In such an event, a Fund's investment returns would be expected to lag relative to returns associated with more growth-oriented strategies.
All investments involve the risk of loss.
First Eagle Funds | Semiannual Report | April 30, 2021
22
This page was intentionally left blank.
Data as of April 30, 2021 (unaudited)
Investment Objective
The First Eagle Global Fund seeks long-term growth of capital by investing in a range of asset classes from markets in the United States and throughout the world. This truly global fund is managed with a highly disciplined, bottom-up, value-oriented style.
Average Annual Returns (%) | | | | | | One Year | | Five Years | | Ten Years | |
First Eagle Global Fund | | Class A | | without sales load | | | 32.23 | | | | 8.57 | | | | 7.15 | | |
| | | | with sales load | | | 25.61 | | | | 7.46 | | | | 6.60 | | |
MSCI World Index | | | | | | | 45.33 | | | | 14.03 | | | | 9.92 | | |
Consumer Price Index | | | | | | | 4.16 | | | | 2.22 | | | | 1.73 | | |

Sectors* (%) | |
Financials | | | 14.0 | | |
Consumer Staples | | | 11.3 | | |
Industrials | | | 11.2 | | |
Commodities | | | 10.3 | | |
Information Technology | | | 10.2 | | |
Materials | | | 6.5 | | |
Communication Services | | | 5.6 | | |
Consumer Discretionary | | | 5.4 | | |
Health Care | | | 5.2 | | |
Energy | | | 4.5 | | |
Real Estate | | | 3.8 | | |
Foreign Government Securities | | | 1.2 | | |
Utilities | | | 0.6 | | |
Short-Term Investments | | | 10.2 | | |
Countries*~ (%)
United States | | | 51.9 | | |
Japan | | | 8.5 | | |
United Kingdom | | | 5.7 | | |
France | | | 4.5 | | |
Canada | | | 3.5 | | |
Switzerland | | | 2.3 | | |
Hong Kong | | | 2.2 | | |
South Korea | | | 1.8 | | |
Belgium | | | 1.5 | | |
Brazil | | | 1.2 | | |
Sweden | | | 1.2 | | |
Mexico | | | 1.2 | | |
Taiwan | | | 1.2 | | |
Germany | | | 0.7 | | |
Australia | | | 0.4 | | |
Thailand | | | 0.4 | | |
Singapore | | | 0.3 | | |
Ireland | | | 0.3 | | |
Norway | | | 0.3 | | |
China | | | 0.2 | | |
Malaysia | | | 0.2 | | |
Peru | | | 0.2 | | |
Indonesia | | | 0.1 | | |
Short-Term Investments | | | 10.2 | | |
^ Less than 0.05%.
* Asset Allocation, Sector and Countries percentages are based on total investments in the portfolio.
~ Country allocations reflect country of risk (not currency of issue). Bonds of non-U.S. issuers may be U.S. dollar denominated.
The Fund's portfolio composition is subject to change at any time.
First Eagle Funds | Semiannual Report | April 30, 2021
24
First Eagle Global Fund | Fund Overview
Growth of a $10,000 Initial Investment
Performance data quoted herein represents past performance and should not be considered indicative of future results. Performance data quoted herein does not reflect the deduction of taxes that a shareholder would pay on Fund distributions or the sale of Fund shares. The average annual returns shown above are historical and reflect changes in share price, reinvested dividends and are net of expenses.
The average annual returns for Class A shares give effect to the deduction of the maximum sales charge of 5.00%.
The MSCI World Index is a widely followed, unmanaged group of stocks from 23 developed market countries. The index provides total returns in U.S. dollars with net dividends reinvested. One cannot invest directly in an index. The Consumer Price Index (CPI) represents the change in price of all goods and services purchased for consumption by urban households.
Top 10 Holdings* (%)
Gold bullion** (Precious Metal) | | | 10.3 | | |
Oracle Corp. (Software, United States) | | | 2.9 | | |
Comcast Corp. (Media, United States) | | | 2.4 | | |
Exxon Mobil Corp. (Oil, Gas & Consumable Fuels, United States) | | | 2.1 | | |
Philip Morris International, Inc. (Tobacco, United States) | | | 1.6 | | |
Facebook, Inc. (Interactive Media & Services, United States) | | | 1.6 | | |
Groupe Bruxelles Lambert SA (Diversified Financial Services, Belgium) | | | 1.5 | | |
Danone SA (Food Products, France) | | | 1.5 | | |
British American Tobacco plc (Tobacco, United Kingdom) | | | 1.4 | | |
CH Robinson Worldwide, Inc. (Air Freight & Logistics, United States) | | | 1.4 | | |
Total | | | 26.7 | | |
* Holdings in cash, commercial paper and other short-term cash equivalents have been excluded.
**The Fund invests in gold and precious metals through investment in a wholly-owned subsidiary of the Fund organized under the laws of the Cayman Islands (the "Subsidiary"). Gold Bullion and commodities include the Fund's investment in the Subsidiary.
Percentages are based on total net assets
First Eagle Funds | Semiannual Report | April 30, 2021
25
First Eagle Global Fund | Consolidated Schedule of Investments | April 30, 2021 (unaudited)
Investments | | Shares | | Value ($) | |
Common Stocks — 78.1% | |
Australia — 0.4% | |
Newcrest Mining Ltd. | | | 9,296,442 | | | | 190,001,166 | | |
Belgium — 1.5% | |
Groupe Bruxelles Lambert SA | | | 6,813,598 | | | | 745,089,468 | | |
Brazil — 1.2% | |
Ambev SA, ADR | | | 103,309,902 | | | | 287,201,527 | | |
Cielo SA | | | 12,478,028 | | | | 7,925,037 | | |
Wheaton Precious Metals Corp. | | | 7,523,631 | | | | 310,876,433 | | |
| | | | 606,002,997 | | |
Canada — 3.5% | |
Agnico Eagle Mines Ltd. | | | 2,298,700 | | | | 143,665,243 | | |
Barrick Gold Corp. | | | 11,518,361 | | | | 244,765,171 | | |
Franco-Nevada Corp. | | | 769,497 | | | | 107,196,820 | | |
Imperial Oil Ltd. | | | 10,896,401 | | | | 314,707,103 | | |
Nutrien Ltd. | | | 9,580,588 | | | | 528,752,652 | | |
Power Corp. of Canada | | | 12,261,601 | | | | 357,129,167 | | |
| | | | 1,696,216,156 | | |
China — 0.2% | |
Alibaba Group Holding Ltd., ADR* | | | 500,220 | | | | 115,525,809 | | |
France — 4.5% | |
Danone SA | | | 10,211,219 | | | | 720,805,186 | | |
Legrand SA | | | 2,208,706 | | | | 214,995,241 | | |
LVMH Moet Hennessy Louis Vuitton SE | | | 227,447 | | | | 171,347,312 | | |
Rexel SA* | | | 5,900,612 | | | | 115,989,881 | | |
Saint Jean Groupe SA* | | | 93,252 | | | | 3,060,664 | | |
Sanofi | | | 4,486,722 | | | | 470,398,620 | | |
Sodexo SA* | | | 3,827,240 | | | | 382,908,758 | | |
Wendel SE | | | 1,067,994 | | | | 142,162,200 | | |
| | | | 2,221,667,862 | | |
Germany — 0.7% | |
Brenntag SE | | | 1,126,149 | | | | 101,099,742 | | |
Henkel AG & Co. KGaA (Preference) | | | 2,036,833 | | | | 233,970,414 | | |
| | | | 335,070,156 | | |
First Eagle Funds | Semiannual Report | Apirl 30, 2021
26
First Eagle Global Fund | Consolidated Schedule of Investments | April 30, 2021 (unaudited)
Investments | | Shares | | Value ($) | |
Hong Kong — 2.2% | |
CK Asset Holdings Ltd. | | | 29,853,500 | | | | 186,901,464 | | |
Guoco Group Ltd. | | | 12,748,580 | | | | 153,782,234 | | |
Hongkong Land Holdings Ltd. | | | 31,759,300 | | | | 157,056,561 | | |
Hysan Development Co. Ltd. | | | 23,322,348 | | | | 87,798,642 | | |
Jardine Matheson Holdings Ltd. | | | 6,979,771 | | | | 468,685,892 | | |
| | | | 1,054,224,793 | | |
Ireland — 0.3% | |
CRH plc | | | 3,284,015 | | | | 154,953,774 | | |
Japan — 8.5% | |
Chofu Seisakusho Co. Ltd. (a) | | | 3,224,200 | | | | 59,985,890 | | |
FANUC Corp. | | | 2,442,000 | | | | 562,350,910 | | |
Hirose Electric Co. Ltd. | | | 1,555,415 | | | | 247,943,601 | | |
Hoshizaki Corp. | | | 2,080,300 | | | | 184,810,215 | | |
Hoya Corp. | | | 1,355,340 | | | | 154,055,141 | | |
Keyence Corp. | | | 566,600 | | | | 271,998,075 | | |
Komatsu Ltd. | | | 6,756,000 | | | | 198,657,641 | | |
Mitsubishi Electric Corp. | | | 21,420,200 | | | | 330,049,965 | | |
Mitsubishi Estate Co. Ltd. | | | 19,435,380 | | | | 319,884,870 | | |
MS&AD Insurance Group Holdings, Inc. | | | 5,705,620 | | | | 161,872,031 | | |
Olympus Corp. | | | 2,001,224 | | | | 41,188,246 | | |
Secom Co. Ltd. | | | 6,337,130 | | | | 528,101,118 | | |
Shimano, Inc. | | | 1,551,090 | | | | 354,664,366 | | |
SMC Corp. | | | 518,356 | | | | 301,204,752 | | |
Sompo Holdings, Inc. | | | 9,373,500 | | | | 348,367,451 | | |
T Hasegawa Co. Ltd. (a) | | | 3,002,800 | | | | 56,102,091 | | |
USS Co. Ltd. | | | 997,600 | | | | 18,102,290 | | |
| | | | 4,139,338,653 | | |
Mexico — 0.8% | |
Fomento Economico Mexicano SAB de CV, ADR | | | 2,945,225 | | | | 228,254,938 | | |
Fresnillo plc | | | 8,143,450 | | | | 92,600,057 | | |
Industrias Penoles SAB de CV* | | | 6,401,020 | | | | 82,432,447 | | |
| | | | 403,287,442 | | |
First Eagle Funds | Semiannual Report | Apirl 30, 2021
27
First Eagle Global Fund | Consolidated Schedule of Investments | April 30, 2021 (unaudited)
Investments | | Shares | | Value ($) | |
Norway — 0.3% | |
Orkla ASA | | | 13,985,891 | | | | 142,559,849 | | |
South Korea — 1.8% | |
Hyundai Mobis Co. Ltd. | | | 612,650 | | | | 148,278,404 | | |
KT&G Corp. | | | 5,242,098 | | | | 387,915,059 | | |
Lotte Confectionery Co. Ltd. | | | 161,797 | | | | 19,738,514 | | |
Lotte Corp. | | | 913,277 | | | | 29,972,358 | | |
Namyang Dairy Products Co. Ltd. (a) | | | 38,332 | | | | 11,105,272 | | |
NAVER Corp. | | | 304,531 | | | | 98,065,699 | | |
Samsung Electronics Co. Ltd. (Preference) | | | 3,025,981 | | | | 198,668,992 | | |
| | | | 893,744,298 | | |
Sweden — 1.2% | |
Investor AB, Class A | | | 2,404,983 | | | | 204,268,406 | | |
Investor AB, Class B | | | 2,813,956 | | | | 238,867,122 | | |
Svenska Handelsbanken AB, Class A | | | 12,783,537 | | | | 148,036,756 | | |
| | | | 591,172,284 | | |
Switzerland — 2.2% | |
Cie Financiere Richemont SA (Registered) | | | 6,374,537 | | | | 654,198,169 | | |
Nestle SA (Registered) | | | 3,679,697 | | | | 439,100,832 | | |
| | | | 1,093,299,001 | | |
Taiwan — 1.2% | |
Taiwan Semiconductor Manufacturing Co. Ltd., ADR | | | 4,862,904 | | | | 567,695,413 | | |
Thailand — 0.4% | |
Bangkok Bank PCL, NVDR | | | 47,278,400 | | | | 184,169,416 | | |
United Kingdom — 5.7% | |
Berkeley Group Holdings plc | | | 5,151,125 | | | | 329,201,070 | | |
British American Tobacco plc | | | 18,940,473 | | | | 702,755,161 | | |
Diageo plc | | | 3,750,155 | | | | 168,349,771 | | |
GlaxoSmithKline plc | | | 14,146,132 | | | | 261,417,211 | | |
Linde plc | | | 722,535 | | | | 206,527,493 | | |
Linde plc | | | 828,640 | | | | 236,858,458 | | |
Lloyds Banking Group plc | | | 437,703,164 | | | | 274,474,892 | | |
Reckitt Benckiser Group plc | | | 573,355 | | | | 51,050,194 | | |
Unilever plc | | | 9,617,307 | | | | 561,701,754 | | |
| | | | 2,792,336,004 | | |
First Eagle Funds | Semiannual Report | Apirl 30, 2021
28
First Eagle Global Fund | Consolidated Schedule of Investments | April 30, 2021 (unaudited)
Investments | | Shares | | Value ($) | |
United States — 41.5% | |
Alleghany Corp.* | | | 362,794 | | | | 246,326,242 | | |
Alphabet, Inc., Class A* | | | 134,718 | | | | 317,058,813 | | |
Alphabet, Inc., Class C* | | | 148,554 | | | | 358,032,966 | | |
American Express Co. | | | 3,544,415 | | | | 543,536,040 | | |
Analog Devices, Inc. | | | 2,347,969 | | | | 359,614,932 | | |
Anthem, Inc. | | | 1,331,473 | | | | 505,147,541 | | |
Bank of New York Mellon Corp. (The) | | | 10,924,432 | | | | 544,910,668 | | |
Becton Dickinson and Co. | | | 829,006 | | | | 206,264,983 | | |
Berkshire Hathaway, Inc., Class A* | | | 728 | | | | 300,300,000 | | |
Booking Holdings, Inc.* | | | 165,236 | | | | 407,485,195 | | |
Boston Properties, Inc., REIT | | | 1,627,005 | | | | 177,912,997 | | |
Brown & Brown, Inc. | | | 5,841,695 | | | | 310,661,340 | | |
CH Robinson Worldwide, Inc. (a) | | | 7,172,180 | | | | 696,275,234 | | |
Charles Schwab Corp. (The) | | | 3,586,920 | | | | 252,519,168 | | |
Colgate-Palmolive Co. | | | 7,521,578 | | | | 606,991,345 | | |
Comcast Corp., Class A | | | 20,976,453 | | | | 1,177,827,836 | | |
Cummins, Inc. | | | 1,379,077 | | | | 347,582,567 | | |
Deere & Co. | | | 1,084,809 | | | | 402,301,418 | | |
DENTSPLY SIRONA, Inc. | | | 4,436,276 | | | | 299,492,993 | | |
Douglas Emmett, Inc., REIT | | | 4,485,027 | | | | 150,427,806 | | |
Equity Residential, REIT | | | 3,941,263 | | | | 292,559,953 | | |
Expeditors International of Washington, Inc. | | | 1,672,498 | | | | 183,740,630 | | |
Exxon Mobil Corp. | | | 17,715,752 | | | | 1,014,049,645 | | |
Facebook, Inc., Class A* | | | 2,379,256 | | | | 773,448,541 | | |
Flowserve Corp. (a) | | | 7,892,216 | | | | 312,847,442 | | |
General Dynamics Corp. | | | 242,088 | | | | 46,052,400 | | |
HCA Healthcare, Inc. | | | 1,502,337 | | | | 302,059,877 | | |
IPG Photonics Corp.* | | | 1,109,086 | | | | 240,793,661 | | |
J G Boswell Co. | | | 2,485 | | | | 1,828,960 | | |
Kraft Heinz Co. (The) | | | 4,743,185 | | | | 195,846,109 | | |
Microsoft Corp. | | | 2,016,253 | | | | 508,458,682 | | |
Mills Music Trust (a) | | | 31,592 | | | | 1,292,113 | | |
Newmont Corp. | | | 8,146,408 | | | | 508,417,323 | | |
NOV, Inc.* (a) | | | 24,797,848 | | | | 370,727,828 | | |
First Eagle Funds | Semiannual Report | Apirl 30, 2021
29
First Eagle Global Fund | Consolidated Schedule of Investments | April 30, 2021 (unaudited)
Investments | | Shares | | Value ($) | |
United States — 41.5% (continued) | |
Oracle Corp. | | | 18,452,220 | | | | 1,398,493,754 | | |
Philip Morris International, Inc. | | | 8,199,501 | | | | 778,952,595 | | |
PPG Industries, Inc. | | | 784,198 | | | | 134,286,066 | | |
Royal Gold, Inc. | | | 1,295,545 | | | | 144,919,664 | | |
salesforce.com, Inc.* | | | 1,339,249 | | | | 308,455,830 | | |
San Juan Basin Royalty Trust (a) | | | 3,908,035 | | | | 18,758,568 | | |
Schlumberger NV | | | 18,037,405 | | | | 487,911,805 | | |
Scotts Miracle-Gro Co. (The) | | | 53,401 | | | | 12,344,175 | | |
Teradata Corp.* (a) | | | 9,658,435 | | | | 477,802,779 | | |
Texas Instruments, Inc. | | | 2,221,032 | | | | 400,918,486 | | |
Travelers Cos., Inc. (The) | | | 2,167,437 | | | | 335,215,806 | | |
Truist Financial Corp. | | | 3,705,485 | | | | 219,772,315 | | |
UGI Corp. | | | 6,123,570 | | | | 267,661,245 | | |
Union Pacific Corp. | | | 1,349,610 | | | | 299,734,885 | | |
Universal Health Services, Inc., Class B | | | 2,116,279 | | | | 314,076,966 | | |
US Bancorp | | | 6,565,740 | | | | 389,676,669 | | |
W R Berkley Corp. | | | 3,504,173 | | | | 279,352,672 | | |
Wells Fargo & Co. | | | 6,712,587 | | | | 302,402,044 | | |
Weyerhaeuser Co., REIT | | | 12,883,978 | | | | 499,511,827 | | |
Willis Towers Watson plc | | | 1,183,807 | | | | 306,440,280 | | |
| | | | 20,339,481,679 | | |
Total Common Stocks
(Cost $23,810,147,313) | | | 38,265,836,220 | | |
| | | Ounces | | | |
Commodities — 10.3% | |
Gold bullion*
(Cost $3,015,662,623) | | | 2,848,707 | | | | 5,036,342,592 | | |
| | | Principal Amount ($) | | | |
Foreign Government Securities — 1.2% | |
Indonesia — 0.1% | |
Republic of Indonesia
8.38%, 3/15/2024 | | IDR | 853,795,000,000 | | | | 64,012,460 | | |
First Eagle Funds | Semiannual Report | Apirl 30, 2021
30
First Eagle Global Fund | Consolidated Schedule of Investments | April 30, 2021 (unaudited)
Investments | | Principal Amount ($) | | Value ($) | |
Malaysia — 0.2% | |
Malaysia Government Bond
3.42%, 8/15/2022 | | MYR | 443,682,000 | | | | 110,259,972 | | |
Mexico — 0.4% | |
Mex Bonos Desarr Fix Rt
6.50%, 6/9/2022 | | MXN | 1,940,060,000 | | | | 97,543,156 | | |
8.00%, 12/7/2023 | | MXN | 911,940,000 | | | | 48,044,207 | | |
10.00%, 12/5/2024 | | MXN | 536,240,000 | | | | 30,194,836 | | |
| | | | 175,782,199 | | |
Peru — 0.2% | |
Republic of Peru
8.20%, 8/12/2026 (b) | | PEN | 278,275,000 | | | | 93,092,294 | | |
Singapore — 0.3% | |
Republic of Singapore
2.25%, 6/1/2021 | | SGD | 214,847,000 | | | | 161,657,938 | | |
Total Foreign Government Securities
(Cost $611,356,961) | | | 604,804,863 | | |
Corporate Bonds — 0.0% (c) | |
United States — 0.0% (c) | |
Bausch & Lomb, Inc.
7.13%, 8/1/2028‡
(Cost $5,033,795) | | | 5,467,000 | | | | 5,665,179 | | |
| | | Number of Warrants | | | |
Warrants — 0.0% (c) | |
Switzerland — 0.0% (c) | |
Cie Financiere Richemont SA, expiring 11/22/2023*
(Cost $—) | | | 12,749,074 | | | | 5,444,444 | | |
| | | Principal Amount ($) | | | |
Short-Term Investments — 10.2% | |
Commercial Paper — 10.1% | |
Alphabet, Inc.
0.04%, 5/7/2021 (b)(d) | | | 50,000,000 | | | | 49,999,611 | | |
American Honda Finance Corp.
0.21%, 5/13/2021 (d) | | | 25,566,000 | | | | 25,564,984 | | |
0.21%, 5/19/2021 (d) | | | 116,690,000 | | | | 116,681,008 | | |
First Eagle Funds | Semiannual Report | Apirl 30, 2021
31
First Eagle Global Fund | Consolidated Schedule of Investments | April 30, 2021 (unaudited)
Investments | | Principal Amount ($) | | Value ($) | |
Commercial Paper — 10.1% (continued) | |
0.20%, 6/10/2021 (d) | | | 23,586,000 | | | | 23,580,520 | | |
0.21%, 6/16/2021 (d) | | | 28,594,000 | | | | 28,586,310 | | |
0.20%, 6/25/2021 (d) | | | 9,210,000 | | | | 9,207,006 | | |
0.22%, 7/7/2021 (d) | | | 16,447,000 | | | | 16,440,383 | | |
0.22%, 7/8/2021 (d) | | | 61,990,000 | | | | 61,964,693 | | |
Apple, Inc.
0.05%, 5/3/2021 (b)(d) | | | 42,267,000 | | | | 42,266,810 | | |
BASF SE
0.17%, 6/8/2021 (b)(d) | | | 64,464,000 | | | | 64,455,410 | | |
0.19%, 6/21/2021 (b)(d) | | | 60,000,000 | | | | 59,988,127 | | |
BNG Bank NV
0.09%, 5/4/2021 (b)(d) | | | 24,418,000 | | | | 24,417,837 | | |
0.09%, 5/6/2021 (b)(d) | | | 76,953,000 | | | | 76,952,231 | | |
0.08%, 5/7/2021 (b)(d) | | | 31,250,000 | | | | 31,249,635 | | |
0.07%, 5/20/2021 (b)(d) | | | 34,158,000 | | | | 34,156,615 | | |
0.07%, 5/21/2021 (b)(d) | | | 34,158,000 | | | | 34,156,526 | | |
0.07%, 6/3/2021 (b)(d) | | | 37,786,000 | | | | 37,782,895 | | |
0.09%, 6/9/2021 (b)(d) | | | 56,705,000 | | | | 56,698,888 | | |
0.12%, 6/16/2021 (b)(d) | | | 4,250,000 | | | | 4,249,406 | | |
0.09%, 6/17/2021 (b)(d) | | | 57,187,000 | | | | 57,178,765 | | |
Engie SA
0.19%, 5/5/2021 (d) | | | 37,840,000 | | | | 37,839,317 | | |
0.18%, 5/12/2021 (b)(d) | | | 32,272,000 | | | | 32,270,537 | | |
0.19%, 5/13/2021 (b)(d) | | | 34,929,000 | | | | 34,927,272 | | |
0.18%, 5/17/2021 (b)(d) | | | 43,650,000 | | | | 43,647,052 | | |
Entergy Corp.
0.10%, 5/3/2021 (b)(d) | | | 4,337,000 | | | | 4,336,962 | | |
Erste Abwicklungsanstalt
0.15%, 5/4/2021 (b)(d) | | | 71,411,000 | | | | 71,410,524 | | |
0.13%, 5/18/2021 (b)(d) | | | 28,590,000 | | | | 28,588,899 | | |
0.12%, 6/2/2021 (b)(d) | | | 60,000,000 | | | | 59,995,435 | | |
0.12%, 6/28/2021 (b)(d) | | | 34,158,000 | | | | 34,152,962 | | |
0.12%, 6/29/2021 (b)(d) | | | 34,158,000 | | | | 34,152,876 | | |
0.13%, 7/14/2021 (b)(d) | | | 57,286,000 | | | | 57,274,662 | | |
First Eagle Funds | Semiannual Report | Apirl 30, 2021
32
First Eagle Global Fund | Consolidated Schedule of Investments | April 30, 2021 (unaudited)
Investments | | Principal Amount ($) | | Value ($) | |
Commercial Paper — 10.1% (continued) | |
Export Development Corp.
0.07%, 5/12/2021 (d) | | | 38,350,000 | | | | 38,349,489 | | |
0.05%, 5/17/2021 (d) | | | 12,951,000 | | | | 12,950,737 | | |
0.06%, 6/3/2021 (d) | | | 31,250,000 | | | | 31,248,495 | | |
0.06%, 6/14/2021 (d) | | | 18,546,000 | | | | 18,544,725 | | |
0.06%, 6/15/2021 (d) | | | 31,130,000 | | | | 31,127,812 | | |
FMS Wertmanagement
0.14%, 5/5/2021 (b)(d) | | | 28,230,000 | | | | 28,229,804 | | |
0.14%, 5/6/2021 (b)(d) | | | 13,691,000 | | | | 13,690,886 | | |
0.12%, 5/11/2021 (b)(d) | | | 20,725,000 | | | | 20,724,683 | | |
0.12%, 5/18/2021 (b)(d) | | | 100,000,000 | | | | 99,997,400 | | |
0.12%, 5/21/2021 (d) | | | 33,238,000 | | | | 33,236,953 | | |
0.15%, 6/2/2021 (b)(d) | | | 37,043,000 | | | | 37,040,861 | | |
0.13%, 7/12/2021 (b)(d) | | | 38,191,000 | | | | 38,181,474 | | |
0.13%, 7/28/2021 (b)(d) | | | 38,892,000 | | | | 38,878,635 | | |
0.14%, 8/10/2021 (b)(d) | | | 25,526,000 | | | | 25,515,875 | | |
General Dynamics Corp.
0.10%, 6/23/2021 (b)(d) | | | 52,303,000 | | | | 52,293,272 | | |
General Motors Financial Co., Inc.
0.28%, 5/3/2021 (d) | | | 14,542,000 | | | | 14,541,632 | | |
Glencore Funding LLC
0.14%, 5/3/2021 (d) | | | 14,542,000 | | | | 14,541,837 | | |
Hitachi International Treasury Ltd.
0.11%, 5/3/2021 (d) | | | 49,762,000 | | | | 49,761,461 | | |
Hydro-Quebec
0.06%, 5/17/2021 (b)(d) | | | 35,822,000 | | | | 35,821,273 | | |
0.05%, 6/14/2021 (b)(d) | | | 28,594,000 | | | | 28,592,034 | | |
0.05%, 6/15/2021 (b)(d) | | | 16,746,000 | | | | 16,744,823 | | |
Kreditanstalt fuer Wiederaufbau
0.12%, 5/5/2021 (b)(d) | | | 56,460,000 | | | | 56,459,608 | | |
0.11%, 5/12/2021 (b)(d) | | | 18,919,000 | | | | 18,918,647 | | |
0.07%, 5/13/2021 (b)(d) | | | 30,000,000 | | | | 29,999,383 | | |
0.10%, 5/14/2021 (b)(d) | | | 108,845,000 | | | | 108,842,503 | | |
0.09%, 5/24/2021 (b)(d) | | | 48,981,000 | | | | 48,978,616 | | |
0.07%, 6/1/2021 (b)(d) | | | 37,737,000 | | | | 37,734,283 | | |
0.05%, 6/3/2021 (b)(d) | | | 19,984,000 | | | | 19,982,433 | | |
First Eagle Funds | Semiannual Report | Apirl 30, 2021
33
First Eagle Global Fund | Consolidated Schedule of Investments | April 30, 2021 (unaudited)
Investments | | Principal Amount ($) | | Value ($) | |
Commercial Paper — 10.1% (continued) | |
0.07%, 6/4/2021 (b)(d) | | | 55,250,000 | | | | 55,245,542 | | |
0.07%, 6/24/2021 (b)(d) | | | 55,361,000 | | | | 55,352,796 | | |
0.07%, 7/1/2021 (b)(d) | | | 63,978,000 | | | | 63,966,872 | | |
Linde, Inc.
0.05%, 6/10/2021 (d) | | | 85,709,000 | | | | 85,701,776 | | |
LVMH Moet Hennessy Louis Vuitton SE
0.12%, 5/10/2021 (b)(d) | | | 13,333,000 | | | | 13,332,778 | | |
LVMH Moet Hennessy Louis Vuitton, Inc.
0.15%, 5/4/2021 (b)(d) | | | 18,219,000 | | | | 18,218,887 | | |
Merck & Co., Inc.
0.06%, 5/27/2021 (d) | | | 65,882,000 | | | | 65,879,529 | | |
0.06%, 5/28/2021 (d) | | | 28,235,000 | | | | 28,233,902 | | |
MetLife Short Term Funding LLC
0.07%, 5/7/2021 (b)(d) | | | 28,235,000 | | | | 28,234,670 | | |
0.07%, 5/11/2021 (b)(d) | | | 50,000,000 | | | | 49,999,159 | | |
0.10%, 6/1/2021 (b)(d) | | | 65,000,000 | | | | 64,995,898 | | |
0.08%, 6/7/2021 (b)(d) | | | 82,220,000 | | | | 82,213,491 | | |
0.07%, 6/11/2021 (b)(d) | | | 39,872,000 | | | | 39,868,372 | | |
Mitsubishi International Corp.
0.16%, 5/3/2021 (b)(d) | | | 37,999,000 | | | | 37,998,683 | | |
Mitsui & Co. USA, Inc.
0.14%, 5/3/2021 (d) | | | 21,812,000 | | | | 21,811,764 | | |
Nederlandse Waterschapsbank NV
0.11%, 5/28/2021 (d) | | | 21,663,000 | | | | 21,661,467 | | |
0.13%, 7/12/2021 (b)(d) | | | 62,260,000 | | | | 62,243,714 | | |
0.13%, 7/14/2021 (b)(d) | | | 45,465,000 | | | | 45,452,687 | | |
0.12%, 7/19/2021 (b)(d) | | | 38,190,000 | | | | 38,178,712 | | |
0.11%, 7/27/2021 (b)(d) | | | 13,578,000 | | | | 13,573,386 | | |
Nestle Capital Corp.
0.06%, 5/10/2021 (d) | | | 37,043,000 | | | | 37,042,753 | | |
0.04%, 6/9/2021 (d) | | | 31,250,000 | | | | 31,248,507 | | |
0.04%, 6/23/2021 (b)(d) | | | 38,326,000 | | | | 38,323,585 | | |
0.06%, 7/13/2021 (b)(d) | | | 22,682,000 | | | | 22,679,902 | | |
Nestle Finance International Ltd.
0.06%, 5/4/2021 (b)(d) | | | 75,000,000 | | | | 74,999,866 | | |
Nordea Bank Abp
0.12%, 7/27/2021 (b)(d) | | | 59,384,000 | | | | 59,366,871 | | |
First Eagle Funds | Semiannual Report | Apirl 30, 2021
34
First Eagle Global Fund | Consolidated Schedule of Investments | April 30, 2021 (unaudited)
Investments | | Principal Amount ($) | | Value ($) | |
Commercial Paper — 10.1% (continued) | |
Novartis Finance Corp.
0.06%, 7/6/2021 (d) | | | 21,930,000 | | | | 21,927,143 | | |
Novartis Securities Investment Ltd.
0.07%, 6/22/2021 (b)(d) | | | 49,079,000 | | | | 49,074,809 | | |
0.07%, 6/23/2021 (b)(d) | | | 31,792,000 | | | | 31,789,234 | | |
NRW Bank
0.12%, 5/18/2021 (b)(d) | | | 1,717,000 | | | | 1,716,948 | | |
0.11%, 5/21/2021 (b)(d) | | | 25,566,000 | | | | 25,565,105 | | |
0.12%, 5/25/2021 (b)(d) | | | 19,163,000 | | | | 19,162,082 | | |
0.09%, 6/16/2021 (b)(d) | | | 44,223,000 | | | | 44,217,630 | | |
0.10%, 6/18/2021 (d) | | | 77,784,000 | | | | 77,773,942 | | |
0.11%, 7/6/2021 (b)(d) | | | 56,705,000 | | | | 56,693,180 | | |
0.12%, 7/9/2021 (b)(d) | | | 60,620,000 | | | | 60,606,681 | | |
0.12%, 7/21/2021 (b)(d) | | | 18,860,000 | | | | 18,854,974 | | |
Philip Morris International, Inc.
0.03%, 5/6/2021 (b)(d) | | | 32,654,000 | | | | 32,653,679 | | |
Province of Quebec Canada
0.03%, 7/20/2021 (b)(d) | | | 43,170,000 | | | | 43,166,892 | | |
0.03%, 7/29/2021 (b)(d) | | | 48,981,000 | | | | 48,978,551 | | |
PSP Capital, Inc.
0.07%, 5/19/2021 (b)(d) | | | 38,190,000 | | | | 38,188,932 | | |
0.11%, 6/1/2021 (b)(d) | | | 10,469,000 | | | | 10,468,423 | | |
0.09%, 6/4/2021 (b)(d) | | | 99,412,000 | | | | 99,405,718 | | |
0.07%, 6/11/2021 (b)(d) | | | 28,594,000 | | | | 28,591,598 | | |
QUALCOMM, Inc.
0.12%, 5/11/2021 (b)(d) | | | 25,634,000 | | | | 25,633,491 | | |
Reckitt Benckiser Treasury Services plc
0.20%, 5/12/2021 (b)(d) | | | 37,500,000 | | | | 37,497,925 | | |
Roche Holdings, Inc.
0.05%, 6/18/2021 (b)(d) | | | 24,904,000 | | | | 24,902,000 | | |
0.04%, 6/25/2021 (b)(d) | | | 23,335,000 | | | | 23,332,604 | | |
Sanofi
0.04%, 6/18/2021 (b)(d) | | | 17,215,000 | | | | 17,213,688 | | |
0.05%, 6/25/2021 (b)(d) | | | 32,894,000 | | | | 32,890,981 | | |
0.06%, 6/30/2021 (b)(d) | | | 31,250,000 | | | | 31,246,823 | | |
Total Capital Canada Ltd.
0.15%, 5/3/2021 (b)(d) | | | 99,510,000 | | | | 99,509,552 | | |
First Eagle Funds | Semiannual Report | Apirl 30, 2021
35
First Eagle Global Fund | Consolidated Schedule of Investments | April 30, 2021 (unaudited)
Investments | | Principal Amount ($) | | Value ($) | |
Commercial Paper — 10.1% (continued) | |
0.13%, 5/7/2021 (d) | | | 39,017,000 | | | | 39,016,545 | | |
0.14%, 5/10/2021 (b)(d) | | | 40,574,000 | | | | 40,573,369 | | |
0.13%, 5/17/2021 (b)(d) | | | 46,742,000 | | | | 46,740,874 | | |
0.13%, 6/8/2021 (d) | | | 17,205,000 | | | | 17,203,714 | | |
0.14%, 7/7/2021 (b)(d) | | | 34,159,000 | | | | 34,152,999 | | |
0.11%, 7/26/2021 (b)(d) | | | 37,774,000 | | | | 37,764,963 | | |
Unilever Capital Corp.
0.06%, 5/12/2021 (b)(d) | | | 26,521,000 | | | | 26,520,514 | | |
0.07%, 5/20/2021 (b)(d) | | | 48,058,000 | | | | 48,056,852 | | |
0.07%, 5/25/2021 (b)(d) | | | 20,938,000 | | | | 20,937,447 | | |
0.07%, 5/26/2021 (d) | | | 20,938,000 | | | | 20,937,456 | | |
0.05%, 6/15/2021 (b)(d) | | | 22,682,000 | | | | 22,680,638 | | |
0.05%, 6/22/2021 (b)(d) | | | 20,246,000 | | | | 20,244,092 | | |
UnitedHealth Group, Inc.
0.14%, 6/1/2021 (d) | | | 10,686,000 | | | | 10,684,832 | | |
0.14%, 6/7/2021 (d) | | | 38,892,000 | | | | 38,886,540 | | |
0.14%, 6/14/2021 (d) | | | 48,910,000 | | | | 48,901,135 | | |
Walgreens Boots Alliance, Inc.
0.30%, 5/6/2021 (b)(d) | | | 36,631,000 | | | | 36,629,901 | | |
Total Commercial Paper
(Cost $4,961,894,608) | | | 4,961,923,817 | | |
U.S. Treasury Obligations — 0.1% | |
U.S. Treasury Bills
0.09%, 5/20/2021 (d) | | | 15,000,000 | | | | 14,999,929 | | |
0.03%, 6/17/2021 (d) | | | 15,000,000 | | | | 14,999,765 | | |
Total U.S. Treasury Obligations
(Cost $29,998,739) | | | 29,999,694 | | |
First Eagle Funds | Semiannual Report | Apirl 30, 2021
36
First Eagle Global Fund | Consolidated Schedule of Investments | April 30, 2021 (unaudited)
Investments | | Shares | | Value ($) | |
Investment Companies — 0.0% (c) | |
JP Morgan U.S. Government Money Market Fund,
Capital Shares 0.03% (e)
(Cost $47,232) | | | 47,232 | | | | 47,232 | | |
Total Short-Term Investments
(Cost $4,991,940,579) | | | 4,991,970,743 | | |
Total Investments — 99.8%
(Cost $32,434,141,271) | | | 48,910,064,041 | | |
Other Assets Less Liabilities — 0.2% | | | 88,361,966 | | |
Net Assets — 100.0% | | | 48,998,426,007 | | |
* Non-income producing security.
‡ Value determined using significant unobservable inputs.
(a) Affiliated company as defined under the Investment Company Act of 1940.
(b) Securities exempt from registration under Rule 144A or section 4(a)2 of the Securities Act of 1933. Total value of all such securities at April 30, 2021 amounted to $3,923,937,746, which represents approximately 8.01% of net assets of the Fund.
(c) Represents less than 0.05% of net assets.
(d) The rate shown was the current yield as of April 30, 2021.
(e) Represents 7-day effective yield as of April 30, 2021.
As of April 30, 2021, the gross unrealized appreciation (depreciation) of investments based on the aggregate cost of investment securities and derivative instruments, if applicable, for federal income tax purposes was as follows:
Aggregate gross unrealized appreciation | | $ | 17,966,594,743 | | |
Aggregate gross unrealized depreciation | | | (1,486,612,920 | ) | |
Net unrealized appreciation | | $ | 16,479,981,823 | | |
Federal income tax cost | | $ | 32,434,141,271 | | |
First Eagle Funds | Semiannual Report | Apirl 30, 2021
37
First Eagle Global Fund | Consolidated Schedule of Investments | April 30, 2021 (unaudited)
Forward Foreign Currency Exchange Contracts outstanding as of April 30, 2021
Currency
Purchased | | Currency Sold | | Counterparty | | Settlement
Date | | Unrealized
Appreciation
(Depreciation) | |
USD | 173,437,380 | | | EUR | 142,366,000 | | | Goldman Sachs | | 5/19/2021 | | $ | 2,226,850 | | |
USD | 116,683,651 | | | GBP | 84,239,000 | | | Goldman Sachs | | 5/19/2021 | | | 341,644 | | |
USD | 11,851,617 | | | EUR | 9,632,000 | | | JPMorgan Chase Bank | | 6/16/2021 | | | 261,050 | | |
USD | 88,566,502 | | | EUR | 72,583,000 | | | JPMorgan Chase Bank | | 6/16/2021 | | | 1,224,499 | | |
USD | 121,927,138 | | | EUR | 100,241,000 | | | JPMorgan Chase Bank | | 7/14/2021 | | | 1,229,556 | | |
USD | 99,845,389 | | | EUR | 82,002,000 | | | HSBC Bank plc | | 8/18/2021 | | | 1,037,407 | | |
Total unrealized appreciation | | | 6,321,006 | | |
USD | 156,150,535 | | | EUR | 131,029,000 | | | UBS AG | | 9/15/2021 | | | (1,827,724 | ) | |
USD | 118,475,356 | | | GBP | 86,069,000 | | | UBS AG | | 9/15/2021 | | | (434,229 | ) | |
Total unrealized depreciation | | | (2,261,953 | ) | |
Net unrealized appreciation | | $ | 4,059,053 | | |
Abbreviations
ADR — American Depositary Receipt
EUR — Euro
Fix Rt — Fixed Rate
GBP — British Pound
IDR — Indonesian Rupiah
MXN — Mexican Peso
MYR — Malaysia Ringgit
NVDR — Non-Voting Depositary Receipt
PEN — Peruvian Sol
Preference — A special type of equity investment that shares in the earnings of the company, has limited voting rights, and may have a dividend preference. Preference shares may also have liquidation preference.
REIT — Real Estate Investment Trust
SGD — Singapore Dollar
USD — United States Dollar
Affiliated Securities
Security Description | | Shares at
April 30, 2021 | | Market Value
October 31, 2020 | | Purchases at
Cost | | Proceeds from
Sales | |
Common Stock — 4.5% | |
Japan — 0.7% | |
Chofu Seisakusho Co. Ltd. | | | 3,224,200 | | | $ | 65,662,564 | | | $ | — | | | $ | — | | |
Hirose Electric Co. Ltd.^ | | | 1,555,415 | | | | 276,532,947 | | | | — | | | | (61,053,991 | ) | |
T Hasegawa Co. Ltd. | | | 3,002,800 | | | | 58,518,604 | | | | — | | | | — | | |
| | | | | | 400,714,115 | | | | — | | | | (61,053,991 | ) | |
First Eagle Funds | Semiannual Report | Apirl 30, 2021
38
First Eagle Global Fund | Consolidated Schedule of Investments | April 30, 2021 (unaudited)
Affiliated Securities (continued)
Security Description | | Shares at
April 30, 2021 | | Market Value
October 31, 2020 | | Purchases at
Cost | | Proceeds from
Sales | |
South Korea — 0.0% (a) | |
Namyang Dairy Products
Co. Ltd. | | | 38,332 | | | $ | 9,013,160 | | | $ | — | | | $ | (650,692 | ) | |
United States — 3.8% | |
CH Robinson
Worldwide, Inc. | | | 7,172,180 | | | | 634,235,877 | | | | — | | | | — | | |
Flowserve Corp. | | | 7,892,216 | | | | 229,821,330 | | | | — | | | | — | | |
Mills Music Trust | | | 31,592 | | | | 1,168,904 | | | | — | | | | — | | |
NOV, Inc. * (b) | | | 24,797,848 | | | | 199,639,163 | | | | 15,533,251 | | | | — | | |
San Juan Basin Royalty Trust | | | 3,908,035 | | | | 12,818,355 | | | | — | | | | — | | |
Teradata Corp.* | | | 9,658,435 | | | | 177,425,451 | | | | — | | | | — | | |
| | | | | | 1,255,109,080 | | | | 15,533,251 | | | | — | | |
Total Common Stock | | | | | 1,664,836,355 | | | | 15,533,251 | | | | (61,704,683 | ) | |
Total | | | | $ | 1,664,836,355 | | | $ | 15,533,251 | | | $ | (61,704,683 | ) | |
Security Description | | Net Realized
Gain
(Loss) | | Change in
Unrealized
Appreciation/
(Depreciation) | | Market Value
April 30,
2021 | | Dividend
Income | |
Common Stock — 4.5% | |
Japan — 0.7% | |
Chofu Seisakusho Co. Ltd. | | $ | — | | | $ | (5,676,674 | ) | | $ | 59,985,890 | | | $ | 448,411 | | |
Hirose Electric Co. Ltd.^ | | | 17,005,952 | | | | 15,458,693 | | | | 247,943,601 | | | | 1,522,498 | | |
T Hasegawa Co. Ltd. | | | — | | | | (2,416,513 | ) | | | 56,102,091 | | | | 541,169 | | |
| | | | 17,005,952 | | | | 7,365,506 | | | | 364,031,582 | | | | 2,512,078 | | |
South Korea — 0.0% (a) | |
Namyang Dairy
Products Co. Ltd. | | | 274,107 | | | | 2,468,697 | | | | 11,105,272 | | | | 30,572 | | |
United States — 3.8% | |
CH Robinson Worldwide, Inc. | | | — | | | | 62,039,357 | | | | 696,275,234 | | | | 7,315,624 | | |
Flowserve Corp. | | | — | | | | 83,026,112 | | | | 312,847,442 | | | | 3,156,886 | | |
Mills Music Trust | | | — | | | | 123,209 | | | | 1,292,113 | | | | 49,089 | | |
NOV, Inc. * (b) | | | — | | | | 155,555,414 | | | | 370,727,828 | | | | — | | |
First Eagle Funds | Semiannual Report | Apirl 30, 2021
39
First Eagle Global Fund | Consolidated Schedule of Investments | April 30, 2021 (unaudited)
Affiliated Securities (continued)
Security Description | | Net Realized
Gain
(Loss) | | Change in
Unrealized
Appreciation/
(Depreciation) | | Market Value
April 30,
2021 | | Dividend
Income | |
San Juan Basin Royalty Trust | | $ | — | | | $ | 5,940,213 | | | $ | 18,758,568 | | | $ | 1,155,414 | | |
Teradata Corp.* | | | — | | | | 300,377,328 | | | | 477,802,779 | | | | — | | |
| | | | — | | | | 607,061,633 | | | | 1,877,703,964 | | | | 11,677,013 | | |
Total Common Stock | | | 17,280,059 | | | | 616,895,836 | | | | 2,252,840,818 | | | | 14,219,663 | | |
Total | | $ | 17,280,059 | | | $ | 616,895,836 | | | $ | 2,252,840,818 | | | $ | 14,219,663 | | |
* Non-income producing security.
^ Represents an unaffiliated issuer as of April 30, 2021.
(a) Represents less than 0.05% of net assets.
(b) Formerly known as National Oilwell Varco, Inc.
See Notes to Financial Statements
First Eagle Funds | Semiannual Report | Apirl 30, 2021
40
This page was intentionally left blank.
First Eagle Overseas Fund
Data as of April 30, 2021 (unaudited)
Investment Objective
The First Eagle Overseas Fund seeks long-term growth of capital by investing primarily in equities issued by non-U.S. corporations. Management's research-driven process focuses on undervalued securities.
Average Annual Returns (%) | | | | | | One Year | | Five Years | | Ten Years | |
| First Eagle Overseas Fund | | Class A | | without sales load | | | 24.37 | | | | 5.62 | | | | 4.89 | | |
| | | | | with sales load | | | 18.15 | | | | 4.54 | | | | 4.36 | | |
MSCI EAFE Index | | | | | | | 39.88 | | | | 8.87 | | | | 5.22 | | |
Consumer Price Index | | | | | | | 4.16 | | | | 2.22 | | | | 1.73 | | |
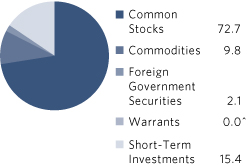
Sectors* (%) | |
Consumer Staples | | | 16.1 | | |
Financials | | | 13.1 | | |
Industrials | | | 11.7 | | |
Commodities | | | 9.8 | | |
Materials | | | 8.8 | | |
Consumer Discretionary | | | 6.5 | | |
Health Care | | | 4.9 | | |
Information Technology | | | 4.3 | | |
Real Estate | | | 4.1 | | |
Energy | | | 2.2 | | |
Foreign Government Securities | | | 2.1 | | |
Communication Services | | | 1.0 | | |
Short-Term Investments | | | 15.4 | | |
Countries*~ (%)
Japan | | | 16.7 | | |
United States | | | 12.4 | | |
United Kingdom | | | 8.8 | | |
France | | | 7.0 | | |
Canada | | | 5.8 | | |
Hong Kong | | | 4.5 | | |
South Korea | | | 3.9 | | |
Switzerland | | | 3.7 | | |
Sweden | | | 3.0 | | |
Singapore | | | 2.8 | | |
Belgium | | | 2.5 | | |
Taiwan | | | 1.9 | | |
Mexico | | | 1.9 | | |
Brazil | | | 1.8 | | |
Germany | | | 1.7 | | |
Netherlands | | | 1.3 | | |
Chile | | | 1.1 | | |
Norway | | | 0.9 | | |
Thailand | | | 0.8 | | |
Ireland | | | 0.5 | | |
China | | | 0.4 | | |
Australia | | | 0.4 | | |
Malaysia | | | 0.3 | | |
Peru | | | 0.3 | | |
Turkey | | | 0.1 | | |
Indonesia | | | 0.1 | | |
Short-Term Investments | | | 15.4 | | |
^ Less than 0.05%.
* Asset Allocation, Sector and Countries percentages are based on total investments in the portfolio.
~ Country allocations reflect country of risk (not currency of issue). Bonds of non-U.S. issuers may be U.S. dollar denominated.
The Fund's portfolio composition is subject to change at any time.
First Eagle Funds | Semiannual Report | April 30, 2021
42
First Eagle Overseas Fund | Fund Overview
Growth of a $10,000 Initial Investment
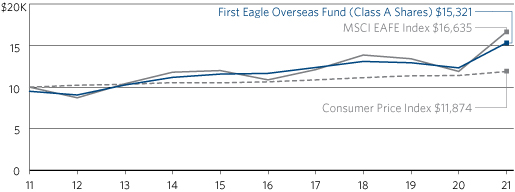
Performance data quoted herein represents past performance and should not be considered indicative of future results. Performance data quoted herein does not reflect the deduction of taxes that a shareholder would pay on Fund distributions or the sale of Fund shares. The average annual returns shown above are historical and reflect changes in share price, reinvested dividends and are net of expenses.
The average annual returns for Class A shares give effect to the deduction of the maximum sales charge of 5.00%.
The MSCI EAFE Index is an unmanaged total return index, reported in U.S. dollars, based on share prices and reinvested net dividends of companies from 21 developed market countries, excluding the United States and Canada. One cannot invest directly in an index. The Consumer Price Index (CPI) represents the change in price of all goods and services purchased for consumption in urban households.
Top 10 Holdings* (%)
Gold bullion** (Precious Metal) | | | 9.8 | | |
Danone SA (Food Products, France) | | | 2.4 | | |
Groupe Bruxelles Lambert SA (Diversified Financial Services, Belgium) | | | 2.4 | | |
British American Tobacco plc (Tobacco, United Kingdom) | | | 2.1 | | |
Nutrien Ltd. (Chemicals, Canada) | | | 1.9 | | |
Cie Financiere Richemont SA (Registered) (Textiles, Apparel & Luxury Goods, Switzerland) | | | 1.9 | | |
FANUC Corp. (Machinery, Japan) | | | 1.9 | | |
Unilever plc (Personal Products, United Kingdom) | | | 1.9 | | |
Nestle SA (Registered) (Food Products, Switzerland) | | | 1.8 | | |
Jardine Matheson Holdings Ltd. (Industrial Conglomerates, Hong Kong) | | | 1.7 | | |
Total | | | 27.8 | | |
* Holdings in cash, commercial paper and other short-term cash equivalents have been excluded.
**The Fund invests in gold and precious metals through investment in a wholly-owned subsidiary of the Fund organized under the laws of the Cayman Islands (the "Subsidiary"). Gold Bullion and commodities include the Fund's investment in the Subsidiary.
Percentages are based on total net assets.
First Eagle Funds | Semiannual Report | April 30, 2021
43
First Eagle Overseas Fund | Consolidated Schedule of Investments | April 30, 2021 (unaudited)
Investments | | Shares | | Value ($) | |
Common Stocks — 72.8% | |
Australia — 0.4% | |
Newcrest Mining Ltd. | | | 2,725,136 | | | | 55,696,472 | | |
Belgium — 2.5% | |
Groupe Bruxelles Lambert SA | | | 3,253,637 | | | | 355,795,963 | | |
Legris Industries SE*‡ (a)(b)(c) | | | 905,366 | | | | 18,166,669 | | |
| | | 373,962,632 | | |
Brazil — 1.9% | |
Ambev SA, ADR | | | 65,314,679 | | | | 181,574,808 | | |
Cielo SA | | | 5,136,230 | | | | 3,262,119 | | |
Wheaton Precious Metals Corp. | | | 2,256,314 | | | | 93,230,894 | | |
| | | | 278,067,821 | | |
Canada — 5.8% | |
Agnico Eagle Mines Ltd. | | | 717,589 | | | | 44,848,218 | | |
Barrick Gold Corp. | | | 3,513,293 | | | | 74,657,476 | | |
Franco-Nevada Corp. | | | 224,985 | | | | 31,342,132 | | |
Imperial Oil Ltd. | | | 8,488,821 | | | | 245,171,985 | | |
Nutrien Ltd. | | | 5,273,695 | | | | 291,055,227 | | |
Power Corp. of Canada | | | 6,484,234 | | | | 188,858,624 | | |
| | | | 875,933,662 | | |
Chile — 1.2% | |
Cia Cervecerias Unidas SA, ADR (b) | | | 9,392,572 | | | | 172,165,845 | | |
China — 0.4% | |
Alibaba Group Holding Ltd., ADR* | | | 260,044 | | | | 60,057,162 | | |
France — 7.0% | |
Danone SA | | | 5,117,957 | | | | 361,274,197 | | |
Laurent-Perrier (b) | | | 558,938 | | | | 56,446,590 | | |
Legrand SA | | | 851,876 | | | | 82,921,532 | | |
LVMH Moet Hennessy Louis Vuitton SE | | | 30,062 | | | | 22,647,223 | | |
Rexel SA* | | | 4,206,163 | | | | 82,681,652 | | |
Saint Jean Groupe SA* | | | 18,420 | | | | 604,571 | | |
Sanofi | | | 1,976,892 | | | | 207,262,066 | | |
Sodexo SA* | | | 1,804,517 | | | | 180,538,812 | | |
Wendel SE | | | 493,657 | | | | 65,711,385 | | |
| | | | 1,060,088,028 | | |
First Eagle Funds | Semiannual Report | April 30, 2021
44
First Eagle Overseas Fund | Consolidated Schedule of Investments | April 30, 2021 (unaudited)
Investments | | Shares | | Value ($) | |
Germany — 1.7% | |
Brenntag SE | | | 694,013 | | | | 62,304,842 | | |
FUCHS PETROLUB SE (Preference) | | | 1,453,499 | | | | 77,398,025 | | |
Henkel AG & Co. KGaA (Preference) | | | 1,038,687 | | | | 119,313,673 | | |
| | | | 259,016,540 | | |
Hong Kong — 4.5% | |
CK Asset Holdings Ltd. | | | 16,771,500 | | | | 105,000,014 | | |
Great Eagle Holdings Ltd. | | | 22,777,700 | | | | 80,222,375 | | |
Guoco Group Ltd. | | | 7,806,340 | | | | 94,165,499 | | |
Hongkong Land Holdings Ltd. | | | 15,371,500 | | | | 76,015,370 | | |
Hysan Development Co. Ltd. | | | 17,500,405 | | | | 65,881,522 | | |
Jardine Matheson Holdings Ltd. | | | 3,892,300 | | | | 261,364,749 | | |
| | | | 682,649,529 | | |
Ireland — 0.5% | |
CRH plc | | | 1,586,739 | | | | 74,869,084 | | |
Japan — 16.7% | |
As One Corp. | | | 709,140 | | | | 88,542,357 | | |
Chofu Seisakusho Co. Ltd. (b) | | | 1,829,100 | | | | 34,030,206 | | |
Daiichikosho Co. Ltd. (b) | | | 2,866,280 | | | | 106,907,544 | | |
FANUC Corp. | | | 1,241,140 | | | | 285,813,353 | | |
Hirose Electric Co. Ltd. | | | 919,830 | | | | 146,627,082 | | |
Hoshizaki Corp. | | | 932,800 | | | | 82,868,321 | | |
Hoya Corp. | | | 558,630 | | | | 63,496,852 | | |
Kansai Paint Co. Ltd. | | | 3,559,930 | | | | 89,635,540 | | |
Keyence Corp. | | | 255,000 | | | | 122,413,535 | | |
Komatsu Ltd. | | | 3,814,300 | | | | 112,158,058 | | |
Mitsubishi Electric Corp. | | | 10,867,500 | | | | 167,450,257 | | |
Mitsubishi Estate Co. Ltd. | | | 13,600,150 | | | | 223,843,435 | | |
MS&AD Insurance Group Holdings, Inc. | | | 2,490,000 | | | | 70,642,867 | | |
Nagaileben Co. Ltd. | | | 1,687,224 | | | | 39,550,111 | | |
Olympus Corp. | | | 840,372 | | | | 17,296,139 | | |
Pilot Corp. | | | 182,800 | | | | 5,840,290 | | |
Secom Co. Ltd. | | | 2,817,400 | | | | 234,786,424 | | |
Shimano, Inc. | | | 710,470 | | | | 162,452,464 | | |
SK Kaken Co. Ltd. | | | 87,561 | | | | 32,399,246 | | |
First Eagle Funds | Semiannual Report | April 30, 2021
45
First Eagle Overseas Fund | Consolidated Schedule of Investments | April 30, 2021 (unaudited)
Investments | | Shares | | Value ($) | |
Japan — 16.7% (continued) | |
SMC Corp. | | | 255,490 | | | | 148,459,364 | | |
Sompo Holdings, Inc. | | | 6,347,500 | | | | 235,905,734 | | |
T Hasegawa Co. Ltd. | | | 1,906,436 | | | | 35,618,438 | | |
USS Co. Ltd. | | | 425,500 | | | | 7,721,055 | | |
Yokogawa Electric Corp. | | | 13,600 | | | | 246,882 | | |
| | | | 2,514,705,554 | | |
Mexico — 1.4% | |
Fomento Economico Mexicano SAB de CV, ADR | | | 1,956,404 | | | | 151,621,310 | | |
Fresnillo plc | | | 2,382,799 | | | | 27,095,067 | | |
Grupo Mexico SAB de CV, Series B | | | 566,938 | | | | 2,562,794 | | |
Industrias Penoles SAB de CV* | | | 2,246,692 | | | | 28,932,939 | | |
| | | | 210,212,110 | | |
Netherlands — 1.3% | |
HAL Trust | | | 608,905 | | | | 109,030,244 | | |
Royal Dutch Shell plc, Class A | | | 4,680,050 | | | | 89,132,710 | | |
| | | | 198,162,954 | | |
Norway — 0.9% | |
Orkla ASA | | | 13,260,305 | | | | 135,163,865 | | |
Singapore — 1.9% | |
ComfortDelGro Corp. Ltd. | | | 20,481,815 | | | | 26,427,360 | | |
Haw Par Corp. Ltd. (b) | | | 19,447,213 | | | | 192,747,952 | | |
United Overseas Bank Ltd. | | | 828,500 | | | | 16,514,296 | | |
UOL Group Ltd. | | | 9,410,800 | | | | 54,301,973 | | |
| | | | 289,991,581 | | |
South Korea — 3.9% | |
Fursys, Inc. (b) | | | 872,463 | | | | 35,640,702 | | |
Hyundai Mobis Co. Ltd. | | | 383,757 | | | | 92,879,908 | | |
KT&G Corp. | | | 2,525,785 | | | | 186,907,997 | | |
Lotte Confectionery Co. Ltd. | | | 104,605 | | | | 12,761,345 | | |
Lotte Corp. | | | 772,717 | | | | 25,359,393 | | |
Namyang Dairy Products Co. Ltd. | | | 21,999 | | | | 6,373,392 | | |
Namyang Dairy Products Co. Ltd. (Preference) (b) | | | 27,183 | | | | 3,704,449 | | |
NAVER Corp. | | | 126,327 | | | | 40,680,080 | | |
NongShim Co. Ltd. | | | 203,663 | | | | 52,116,098 | | |
First Eagle Funds | Semiannual Report | April 30, 2021
46
First Eagle Overseas Fund | Consolidated Schedule of Investments | April 30, 2021 (unaudited)
Investments | | Shares | | Value ($) | |
South Korea — 3.9% (continued) | |
Samsung Electronics Co. Ltd. (Preference) | | | 1,863,921 | | | | 122,374,630 | | |
| | | | 578,797,994 | | |
Sweden — 3.0% | |
Industrivarden AB, Class C | | | 1,572,517 | | | | 56,720,998 | | |
Investor AB, Class A | | | 1,362,742 | | | | 115,745,157 | | |
Investor AB, Class B | | | 2,096,088 | | | | 177,929,757 | | |
Svenska Handelsbanken AB, Class A | | | 8,041,032 | | | | 93,117,288 | | |
| | | | 443,513,200 | | |
Switzerland — 3.7% | |
Cie Financiere Richemont SA (Registered) | | | 2,792,597 | | | | 286,595,222 | | |
Nestle SA (Registered) | | | 2,199,560 | | | | 262,475,042 | | |
| | | | 549,070,264 | | |
Taiwan — 1.9% | |
Taiwan Secom Co. Ltd.* | | | 8,545,694 | | | | 29,168,230 | | |
Taiwan Semiconductor Manufacturing Co. Ltd., ADR | | | 2,219,495 | | | | 259,103,846 | | |
| | | | 288,272,076 | | |
Thailand — 0.8% | |
Bangkok Bank PCL, NVDR | | | 21,880,059 | | | | 85,232,107 | | |
Thai Beverage PCL | | | 52,214,985 | | | | 28,031,794 | | |
| | | | 113,263,901 | | |
Turkey — 0.1% | |
AG Anadolu Grubu Holding A/S | | | 7,894,093 | | | | 20,514,128 | | |
United Kingdom — 8.8% | |
Berkeley Group Holdings plc | | | 1,972,051 | | | | 126,030,974 | | |
British American Tobacco plc | | | 8,470,873 | | | | 314,297,838 | | |
Diageo plc | | | 1,711,810 | | | | 76,845,576 | | |
GlaxoSmithKline plc | | | 7,145,873 | | | | 132,054,062 | | |
Great Portland Estates plc, REIT | | | 1,005,391 | | | | 9,623,481 | | |
Hiscox Ltd.* | | | 7,851,225 | | | | 87,881,480 | | |
Linde plc | | | 487,971 | | | | 139,480,340 | | |
Lloyds Banking Group plc | | | 217,111,612 | | | | 136,146,346 | | |
Reckitt Benckiser Group plc | | | 255,346 | | | | 22,735,413 | | |
Unilever plc | | | 4,869,464 | | | | 284,402,533 | | |
| | | | 1,329,498,043 | | |
First Eagle Funds | Semiannual Report | April 30, 2021
47
First Eagle Overseas Fund | Consolidated Schedule of Investments | April 30, 2021 (unaudited)
Investments | | Shares | | Value ($) | |
United States — 2.5% | |
Newmont Corp. | | | 2,780,992 | | | | 173,561,711 | | |
Royal Gold, Inc. | | | 407,717 | | | | 45,607,224 | | |
Willis Towers Watson plc | | | 632,084 | | | | 163,621,264 | | |
| | | | 382,790,199 | | |
Total Common Stocks
(Cost $7,157,608,561) | | | 10,946,462,644 | | |
| | | Ounces | | | |
Commodities — 9.8% | |
Gold bullion*
(Cost $799,500,107) | | | 836,267 | | | | 1,478,470,571 | | |
| | | Principal Amount ($) | | | |
Foreign Government Securities — 2.0% | |
Indonesia — 0.1% | |
Republic of Indonesia
8.38%, 3/15/2024 | | IDR | 267,431,000,000 | | | | 20,050,383 | | |
Malaysia — 0.3% | |
Malaysia Government Bond
3.42%, 8/15/2022 | | MYR | 181,499,000 | | | | 45,104,545 | | |
Mexico — 0.5% | |
Mex Bonos Desarr Fix Rt
6.50%, 6/9/2022 | | MXN | 668,090,000 | | | | 33,590,511 | | |
8.00%, 12/7/2023 | | MXN | 377,210,000 | | | | 19,872,749 | | |
10.00%, 12/5/2024 | | MXN | 366,710,000 | | | | 20,648,867 | | |
| | | | 74,112,127 | | |
Peru — 0.2% | |
Republic of Peru
8.20%, 8/12/2026 (d) | | PEN | 113,725,000 | | | | 38,044,816 | | |
Singapore — 0.9% | |
Republic of Singapore
2.25%, 6/1/2021 | | SGD | 85,183,000 | | | | 64,094,486 | | |
3.13%, 9/1/2022 | | SGD | 84,179,000 | | | | 65,546,707 | | |
| | | | 129,641,193 | | |
Total Foreign Government Securities
(Cost $307,564,876) | | | 306,953,064 | | |
First Eagle Funds | Semiannual Report | April 30, 2021
48
First Eagle Overseas Fund | Consolidated Schedule of Investments | April 30, 2021 (unaudited)
Investments | | Number of Warrants | | Value ($) | |
Warrants — 0.0% (e) | |
Switzerland — 0.0% (e) | |
Cie Financiere Richemont SA, expiring 11/22/2023*
(Cost $—) | | | 5,585,194 | | | | 2,385,136 | | |
| | | Principal Amount ($) | | | |
Short-Term Investments — 15.4% | |
Commercial Paper — 15.3% | |
American Honda Finance Corp.
0.21%, 5/13/2021 (f) | | | 8,730,000 | | | | 8,729,653 | | |
0.21%, 5/19/2021 (f) | | | 36,910,000 | | | | 36,907,156 | | |
0.20%, 6/10/2021 (f) | | | 16,414,000 | | | | 16,410,187 | | |
0.21%, 6/16/2021 (f) | | | 21,406,000 | | | | 21,400,243 | | |
0.20%, 6/25/2021 (f) | | | 11,790,000 | | | | 11,786,167 | | |
0.22%, 7/7/2021 (f) | | | 8,553,000 | | | | 8,549,559 | | |
0.22%, 7/8/2021 (f) | | | 10,635,000 | | | | 10,630,658 | | |
Apple, Inc.
0.05%, 5/3/2021 (d)(f) | | | 7,733,000 | | | | 7,732,965 | | |
BASF SE
0.17%, 6/8/2021 (d)(f) | | | 24,200,000 | | | | 24,196,775 | | |
0.19%, 6/21/2021 (d)(f) | | | 40,000,000 | | | | 39,992,085 | | |
BNG Bank NV
0.09%, 5/6/2021 (d)(f) | | | 19,716,000 | | | | 19,715,803 | | |
0.08%, 5/7/2021 (d)(f) | | | 18,750,000 | | | | 18,749,781 | | |
0.07%, 5/20/2021 (d)(f) | | | 15,060,000 | | | | 15,059,389 | | |
0.07%, 5/21/2021 (d)(f) | | | 15,060,000 | | | | 15,059,350 | | |
0.07%, 6/3/2021 (d)(f) | | | 12,214,000 | | | | 12,212,997 | | |
0.09%, 6/9/2021 (d)(f) | | | 68,295,000 | | | | 68,287,639 | | |
0.09%, 6/17/2021 (d)(f) | | | 42,813,000 | | | | 42,806,835 | | |
Engie SA
0.19%, 5/5/2021 (f) | | | 26,438,000 | | | | 26,437,523 | | |
0.18%, 5/12/2021 (d)(f) | | | 17,728,000 | | | | 17,727,196 | | |
0.19%, 5/13/2021 (d)(f) | | | 24,404,000 | | | | 24,402,793 | | |
Entergy Corp.
0.10%, 5/3/2021 (d)(f) | | | 1,527,000 | | | | 1,526,987 | | |
Erste Abwicklungsanstalt
0.15%, 5/4/2021 (d)(f) | | | 27,160,000 | | | | 27,159,819 | | |
First Eagle Funds | Semiannual Report | April 30, 2021
49
First Eagle Overseas Fund | Consolidated Schedule of Investments | April 30, 2021 (unaudited)
Investments | | Principal Amount ($) | | Value ($) | |
Commercial Paper — 15.3% (continued) | |
0.13%, 5/18/2021 (d)(f) | | | 15,705,000 | | | | 15,704,395 | | |
0.12%, 6/2/2021 (d)(f) | | | 51,060,000 | | | | 51,056,115 | | |
0.12%, 6/28/2021 (d)(f) | | | 15,060,000 | | | | 15,057,779 | | |
0.12%, 6/29/2021 (d)(f) | | | 15,060,000 | | | | 15,057,741 | | |
0.13%, 7/14/2021 (d)(f) | | | 17,714,000 | | | | 17,710,494 | | |
Export Development Corp.
0.06%, 5/12/2021 (f) | | | 13,095,000 | | | | 13,094,825 | | |
0.05%, 5/17/2021 (f) | | | 3,349,000 | | | | 3,348,932 | | |
0.06%, 6/3/2021 (f) | | | 18,750,000 | | | | 18,749,097 | | |
0.06%, 6/14/2021 (f) | | | 6,454,000 | | | | 6,453,556 | | |
0.06%, 6/15/2021 (f) | | | 13,649,000 | | | | 13,648,041 | | |
FMS Wertmanagement
0.14%, 5/5/2021 (d)(f) | | | 21,770,000 | | | | 21,769,849 | | |
0.14%, 5/6/2021 (d)(f) | | | 10,559,000 | | | | 10,558,912 | | |
0.12%, 5/11/2021 (d)(f) | | | 29,275,000 | | | | 29,274,553 | | |
0.12%, 5/21/2021 (f) | | | 29,012,000 | | | | 29,011,086 | | |
0.15%, 6/2/2021 (d)(f) | | | 12,957,000 | | | | 12,956,252 | | |
0.13%, 7/12/2021 (d)(f) | | | 24,809,000 | | | | 24,802,812 | | |
0.13%, 7/28/2021 (d)(f) | | | 11,108,000 | | | | 11,104,183 | | |
0.14%, 8/10/2021 (d)(f) | | | 13,274,000 | | | | 13,268,734 | | |
General Dynamics Corp.
0.10%, 6/23/2021 (d)(f) | | | 18,697,000 | | | | 18,693,522 | | |
General Motors Financial Co., Inc.
0.28%, 5/3/2021 (f) | | | 5,090,000 | | | | 5,089,871 | | |
Glencore Funding LLC
0.14%, 5/3/2021 (f) | | | 5,090,000 | | | | 5,089,943 | | |
Hitachi International Treasury Ltd.
0.11%, 5/3/2021 (f) | | | 17,407,000 | | | | 17,406,811 | | |
Hydro-Quebec
0.06%, 5/17/2021 (d)(f) | | | 19,678,000 | | | | 19,677,601 | | |
0.05%, 6/14/2021 (d)(f) | | | 21,406,000 | | | | 21,404,528 | | |
0.05%, 6/15/2021 (d)(f) | | | 11,654,000 | | | | 11,653,181 | | |
Kreditanstalt fuer Wiederaufbau
0.12%, 5/5/2021 (d)(f) | | | 43,540,000 | | | | 43,539,698 | | |
0.11%, 5/12/2021 (d)(f) | | | 6,460,000 | | | | 6,459,879 | | |
0.07%, 5/13/2021 (d)(f) | | | 20,000,000 | | | | 19,999,589 | | |
First Eagle Funds | Semiannual Report | April 30, 2021
50
First Eagle Overseas Fund | Consolidated Schedule of Investments | April 30, 2021 (unaudited)
Investments | | Principal Amount ($) | | Value ($) | |
Commercial Paper — 15.3% (continued) | |
0.09%, 5/14/2021 (d)(f) | | | 40,201,000 | | | | 40,200,078 | | |
0.07%, 6/1/2021 (d)(f) | | | 26,263,000 | | | | 26,261,109 | | |
0.05%, 6/3/2021 (d)(f) | | | 10,616,000 | | | | 10,615,168 | | |
0.07%, 6/4/2021 (d)(f) | | | 19,750,000 | | | | 19,748,406 | | |
0.07%, 6/24/2021 (d)(f) | | | 20,419,000 | | | | 20,415,974 | | |
0.07%, 7/1/2021 (d)(f) | | | 30,022,000 | | | | 30,016,778 | | |
LVMH Moet Hennessy Louis Vuitton SE
0.12%, 5/10/2021 (d)(f) | | | 11,347,000 | | | | 11,346,811 | | |
LVMH Moet Hennessy Louis Vuitton, Inc.
0.15%, 5/4/2021 (d)(f) | | | 10,281,000 | | | | 10,280,936 | | |
MetLife Short Term Funding LLC
0.09%, 6/7/2021 (d)(f) | | | 5,095,000 | | | | 5,094,597 | | |
0.07%, 6/11/2021 (d)(f) | | | 18,298,000 | | | | 18,296,335 | | |
Mitsubishi International Corp.
0.16%, 5/3/2021 (d)(f) | | | 12,001,000 | | | | 12,000,900 | | |
Mitsui & Co. USA, Inc.
0.14%, 5/3/2021 (f) | | | 7,635,000 | | | | 7,634,917 | | |
Nederlandse Waterschapsbank NV
0.11%, 5/28/2021 (f) | | | 14,837,000 | | | | 14,835,950 | | |
0.13%, 7/12/2021 (d)(f) | | | 27,298,000 | | | | 27,290,859 | | |
0.13%, 7/14/2021 (d)(f) | | | 29,535,000 | | | | 29,527,001 | | |
0.12%, 7/19/2021 (d)(f) | | | 11,810,000 | | | | 11,806,509 | | |
0.11%, 7/27/2021 (d)(f) | | | 17,972,000 | | | | 17,965,894 | | |
Nestle Capital Corp.
0.06%, 5/10/2021 (f) | | | 12,957,000 | | | | 12,956,914 | | |
0.04%, 6/9/2021 (f) | | | 18,750,000 | | | | 18,749,104 | | |
0.04%, 6/23/2021 (d)(f) | | | 11,674,000 | | | | 11,673,264 | | |
0.06%, 7/13/2021 (d)(f) | | | 27,318,000 | | | | 27,315,473 | | |
Nordea Bank Abp
0.12%, 7/27/2021 (d)(f) | | | 27,866,000 | | | | 27,857,962 | | |
Novartis Finance Corp.
0.06%, 7/6/2021 (f) | | | 28,070,000 | | | | 28,066,343 | | |
Novartis Securities Investment Ltd.
0.07%, 6/22/2021 (d)(f) | | | 26,183,000 | | | | 26,180,764 | | |
0.07%, 6/23/2021 (d)(f) | | | 8,220,000 | | | | 8,219,285 | | |
NRW Bank
0.12%, 5/18/2021 (d)(f) | | | 2,383,000 | | | | 2,382,929 | | |
First Eagle Funds | Semiannual Report | April 30, 2021
51
First Eagle Overseas Fund | Consolidated Schedule of Investments | April 30, 2021 (unaudited)
Investments | | Principal Amount ($) | | Value ($) | |
Commercial Paper — 15.3% (continued) | |
0.11%, 5/21/2021 (d)(f) | | | 8,730,000 | | | | 8,729,694 | | |
0.12%, 5/25/2021 (d)(f) | | | 5,837,000 | | | | 5,836,720 | | |
0.09%, 6/16/2021 (d)(f) | | | 30,777,000 | | | | 30,773,263 | | |
0.10%, 6/18/2021 (f) | | | 22,216,000 | | | | 22,213,127 | | |
0.11%, 7/6/2021 (d)(f) | | | 68,295,000 | | | | 68,280,765 | | |
0.12%, 7/9/2021 (d)(f) | | | 39,380,000 | | | | 39,371,347 | | |
0.12%, 7/21/2021 (d)(f) | | | 24,140,000 | | | | 24,133,567 | | |
Philip Morris International, Inc.
0.03%, 5/6/2021 (d)(f) | | | 17,346,000 | | | | 17,345,830 | | |
Province of Quebec Canada
0.02%, 7/20/2021 (d)(f) | | | 12,330,000 | | | | 12,329,112 | | |
0.03%, 7/29/2021 (d)(f) | | | 26,019,000 | | | | 26,017,699 | | |
PSP Capital, Inc.
0.10%, 5/7/2021 (d)(f) | | | 42,500,000 | | | | 42,499,669 | | |
0.07%, 5/19/2021 (d)(f) | | | 11,810,000 | | | | 11,809,670 | | |
0.11%, 6/1/2021 (d)(f) | | | 14,531,000 | | | | 14,530,199 | | |
0.09%, 6/4/2021 (d)(f) | | | 30,588,000 | | | | 30,586,067 | | |
0.07%, 6/11/2021 (d)(f) | | | 21,406,000 | | | | 21,404,202 | | |
QUALCOMM, Inc.
0.12%, 5/11/2021 (d)(f) | | | 8,966,000 | | | | 8,965,822 | | |
Reckitt Benckiser Treasury Services plc
0.20%, 5/12/2021 (d)(f) | | | 12,500,000 | | | | 12,499,308 | | |
Roche Holdings, Inc.
0.05%, 6/18/2021 (d)(f) | | | 10,919,000 | | | | 10,918,123 | | |
0.04%, 6/25/2021 (d)(f) | | | 6,665,000 | | | | 6,664,316 | | |
Sanofi
0.04%, 6/18/2021 (d)(f) | | | 22,785,000 | | | | 22,783,263 | | |
0.05%, 6/25/2021 (d)(f) | | | 17,106,000 | | | | 17,104,430 | | |
0.06%, 6/30/2021 (d)(f) | | | 18,750,000 | | | | 18,748,094 | | |
Total Capital Canada Ltd.
0.15%, 5/3/2021 (d)(f) | | | 69,180,000 | | | | 69,179,689 | | |
0.13%, 5/7/2021 (f) | | | 24,133,000 | | | | 24,132,718 | | |
0.14%, 5/10/2021 (d)(f) | | | 21,526,000 | | | | 21,525,665 | | |
0.13%, 5/17/2021 (d)(f) | | | 27,058,000 | | | | 27,057,349 | | |
0.13%, 6/8/2021 (f) | | | 6,458,000 | | | | 6,457,517 | | |
0.14%, 7/7/2021 (d)(f) | | | 41,141,000 | | | | 41,133,773 | | |
First Eagle Funds | Semiannual Report | April 30, 2021
52
First Eagle Overseas Fund | Consolidated Schedule of Investments | April 30, 2021 (unaudited)
Investments | | Principal Amount ($) | | Value ($) | |
Commercial Paper — 15.3% (continued) | |
0.11%, 7/26/2021 (d)(f) | | | 17,726,000 | | | | 17,721,759 | | |
Unilever Capital Corp.
0.06%, 5/12/2021 (d)(f) | | | 9,229,000 | | | | 9,228,831 | | |
0.07%, 5/20/2021 (d)(f) | | | 15,542,000 | | | | 15,541,629 | | |
0.07%, 5/25/2021 (d)(f) | | | 29,062,000 | | | | 29,061,233 | | |
0.07%, 5/26/2021 (f) | | | 29,062,000 | | | | 29,061,244 | | |
0.05%, 6/15/2021 (d)(f) | | | 27,318,000 | | | | 27,316,359 | | |
0.05%, 6/22/2021 (d)(f) | | | 10,754,000 | | | | 10,752,987 | | |
UnitedHealth Group, Inc.
0.14%, 6/1/2021 (f) | | | 4,714,000 | | | | 4,713,485 | | |
0.14%, 6/7/2021 (f) | | | 11,108,000 | | | | 11,106,440 | | |
0.14%, 6/14/2021 (f) | | | 22,446,000 | | | | 22,441,932 | | |
Walgreens Boots Alliance, Inc.
0.30%, 5/6/2021 (d)(f) | | | 11,569,000 | | | | 11,568,653 | | |
Total Commercial Paper
(Cost $2,295,395,526) | | | 2,295,409,349 | | |
U.S. Treasury Obligations — 0.1% | |
U.S. Treasury Bills
0.09%, 5/20/2021 (f) | | | 10,000,000 | | | | 9,999,953 | | |
0.03%, 6/17/2021 (f) | | | 10,000,000 | | | | 9,999,843 | | |
Total U.S. Treasury Obligations
(Cost $19,999,160) | | | 19,999,796 | | |
| | | Shares | | | |
Investment Companies — 0.0% (e) | |
JP Morgan U.S. Government Money Market Fund,
Capital Shares 0.03% (g)
(Cost $18,251) | | | 18,251 | | | | 18,251 | | |
Total Short-Term Investments
(Cost $2,315,412,937) | | | 2,315,427,396 | | |
Total Investments — 100.0%
(Cost $10,580,086,481) | | | 15,049,698,811 | | |
Other Assets Less Liabilities — 0.0% | | | 866,414 | | |
Net Assets — 100.0% | | | 15,050,565,225 | | |
First Eagle Funds | Semiannual Report | April 30, 2021
53
First Eagle Overseas Fund | Consolidated Schedule of Investments | April 30, 2021 (unaudited)
* Non-income producing security.
‡ Value determined using significant unobservable inputs.
(a) Security fair valued as of April 30, 2021 in accordance with procedures approved by the Board of Trustees. Total value of all such securities at April 30, 2021 amounted to $18,166,669, which represents approximately 0.12% of net assets of the Fund.
(b) Affiliated company as defined under the Investment Company Act of 1940.
(c) Represents a security that is subject to legal or contractual restrictions on resale.
(d) Securities exempt from registration under Rule 144A or section 4(a)2 of the Securities Act of 1933. Total value of all such securities at April 30, 2021 amounted to $1,878,341,165, which represents approximately 12.47% of net assets of the Fund.
(e) Represents less than 0.05% of net assets.
(f) The rate shown was the current yield as of April 30, 2021.
(g) Represents 7-day effective yield as of April 30, 2021.
As of April 30, 2021, the gross unrealized appreciation (depreciation) of investments based on the aggregate cost of investment securities and derivative instruments, if applicable, for federal income tax purposes was as follows:
Aggregate gross unrealized appreciation | | $ | 4,709,589,791 | | |
Aggregate gross unrealized depreciation | | | (237,826,470 | ) | |
Net unrealized appreciation | | $ | 4,471,763,321 | | |
Federal income tax cost | | $ | 10,580,086,481 | | |
Restricted Securities | | Acquisition Date | | Cost | | Carrying Value
Per
Share/Principal | |
Legris Industries SE | | 04/30/04 | | $ | 23,433,066 | | | $ | 20.07 | | |
Forward Foreign Currency Exchange Contracts outstanding as of April 30, 2021
Currency
Purchased | | Currency Sold | | Counterparty | | Settlement
Date | | Unrealized
Appreciation
(Depreciation) | |
USD | 93,662,715 | | | EUR | | | | | 76,883,000 | | | Goldman Sachs | | 5/19/2021 | | $ | 1,202,583 | | |
USD | 50,008,070 | | | GBP | | | | | 36,103,000 | | | Goldman Sachs | | 5/19/2021 | | | 146,421 | | |
USD | 5,781,847 | | | EUR | | | | | 4,699,000 | | | JPMorgan Chase Bank | | 6/16/2021 | | | 127,354 | | |
USD | 48,952,385 | | | EUR | | | | | 40,118,000 | | | JPMorgan Chase Bank | | 6/16/2021 | | | 676,804 | | |
USD | 64,007,460 | | | EUR | | | | | 52,623,000 | | | JPMorgan Chase Bank | | 7/14/2021 | | | 645,474 | | |
USD | 60,442,733 | | | EUR | | | | | 49,641,000 | | | HSBC Bank plc | | 8/18/2021 | | | 628,008 | | |
Total unrealized appreciation | | | 3,426,644 | | |
USD | 92,740,040 | | | EUR | | | | | 77,820,000 | | | UBS AG | | 9/15/2021 | | | (1,085,511 | ) | |
USD | 51,878,135 | | | GBP | | | | | 37,688,000 | | | UBS AG | | 9/15/2021 | | | (190,141 | ) | |
Total unrealized depreciation | | | (1,275,652 | ) | |
Net unrealized appreciation | | $ | 2,150,992 | | |
First Eagle Funds | Semiannual Report | April 30, 2021
54
First Eagle Overseas Fund | Consolidated Schedule of Investments | April 30, 2021 (unaudited)
Abbreviations
ADR — American Depositary Receipt
EUR — Euro
Fix Rt — Fixed Rate
GBP — British Pound
IDR — Indonesian Rupiah
MXN — Mexican Peso
MYR — Malaysia Ringgit
NVDR — Non-Voting Depositary Receipt
PEN — Peruvian Sol
Preference — A special type of equity investment that shares in the earnings of the company, has limited voting rights, and may have a dividend preference. Preference shares may also have liquidation preference.
REIT — Real Estate Investment Trust
SGD — Singapore Dollar
USD — United States Dollar
Affiliated Securities
Security Description | | Shares at
April 30, 2021 | | Market Value
October 31, 2020 | | Purchases at
Cost | | Proceeds from
Sales | |
Common Stock — 4.2% | |
Belgium — 0.1% | |
Legris Industries SE*‡ (a)(b) | | | 905,366 | | | $ | 8,129,690 | | | $ | — | | | $ | — | | |
Chile — 1.1% | |
Cia Cervecerias Unidas SA | | | 9,392,572 | | | | 101,064,075 | | | | — | | | | — | | |
France — 0.4% | |
Laurent-Perrier | | | 558,938 | | | | 45,954,829 | | | | — | | | | — | | |
Japan — 0.9% | |
Chofu Seisakusho Co. Ltd. | | | 1,829,100 | | | | 37,250,603 | | | | — | | | | — | | |
Daiichikosho Co. Ltd. | | | 2,866,280 | | | | 91,899,275 | | | | 5,851,903 | | | | — | | |
| | | | | | 129,149,878 | | | | 5,851,903 | | | | — | | |
Singapore — 1.3% | |
Haw Par Corp. Ltd. | | | 19,447,213 | | | | 133,533,111 | | | | — | | | | — | | |
South Korea — 0.3% | |
Fursys, Inc. | | | 872,463 | | | | 22,683,276 | | | | — | | | | — | | |
Namyang Dairy Products
Co. Ltd. (Preference) | | | 27,183 | | | | 3,228,542 | | | | — | | | | — | | |
| | | | | | 25,911,818 | | | | — | | | | — | | |
Total Common Stocks | | | | | 443,743,401 | | | | 5,851,903 | | | | — | | |
Total | | | | $ | 443,743,401 | | | $ | 5,851,903 | | | $ | — | | |
First Eagle Funds | Semiannual Report | April 30, 2021
55
First Eagle Overseas Fund | Consolidated Schedule of Investments | April 30, 2021 (unaudited)
Affiliated Securities (continued)
Security Description | | Net Realized
Gain
(Loss) | | Change in
Unrealized
Appreciation/
(Depreciation) | | Market Value
April 30,
2021 | | Dividend
Income | |
Common Stock — 4.2% | |
Belgium — 0.1% | |
Legris Industries SE*‡ (a)(b) | | $ | — | | | $ | 10,036,979 | | | $ | 18,166,669 | | | $ | — | | |
Chile — 1.1% | |
Cia Cervecerias Unidas SA | | | — | | | | 71,101,770 | | | | 172,165,845 | | | | 3,705,839 | | |
France — 0.4% | |
Laurent-Perrier | | | — | | | | 10,491,761 | | | | 56,446,590 | | | | — | | |
Japan — 0.9% | |
Chofu Seisakusho Co. Ltd. | | | — | | | | (3,220,397 | ) | | | 34,030,206 | | | | 254,385 | | |
Daiichikosho Co. Ltd. | | | — | | | | 9,156,366 | | | | 106,907,544 | | | | 1,332,670 | | |
| | | | — | | | | 5,935,969 | | | | 140,937,750 | | | | 1,587,055 | | |
Singapore — 1.3% | |
Haw Par Corp. Ltd. | | | — | | | | 59,214,841 | | | | 192,747,952 | | | | 2,192,059 | | |
South Korea — 0.3% | |
Fursys, Inc. | | | — | | | | 12,957,426 | | | | 35,640,702 | | | | 667,008 | | |
Namyang Dairy Products
Co. Ltd. (Preference) | | | — | | | | 475,907 | | | | 3,704,449 | | | | 21,821 | | |
| | | | — | | | | 13,433,333 | | | | 39,345,151 | | | | 688,829 | | |
Total Common Stocks | | | — | | | | 170,214,653 | | | | 619,809,957 | | | | 8,173,782 | | |
Total | | $ | — | | | $ | 170,214,653 | | | $ | 619,809,957 | | | $ | 8,173,782 | | |
* Non-income producing security.
‡ Value determined using significant unobservable inputs.
(a) Security fair valued as of April 30, 2021 in accordance with procedures approved by the Board of Trustees. Total value of all such securities at April 30, 2021 amounted to $18,166,669, which represents approximately 0.12% of net assets of the Fund.
(b) Represents a security that is subject to legal or contractual restrictions on resale.
See Notes to Financial Statements.
First Eagle Funds | Semiannual Report | April 30, 2021
56
This page was intentionally left blank.
First Eagle U.S. Value Fund
Data as of April 30, 2021 (unaudited)
Investment Objective
The First Eagle U.S. Value Fund seeks long-term growth of capital by investing, under normal market conditions, at least 80% of its net assets (plus any borrowings for investment purposes) in domestic equity and debt securities. Management utilizes a highly disciplined, bottom-up, value-oriented approach in seeking to achieve its investment objective.
Average Annual Returns^ (%) | | | | | | One Year | | Five Years | | Ten Years | |
First Eagle U.S. Value Fund | | Class A | | without sales charge | | | 37.39 | | | | 10.17 | | | | 8.50 | | |
| | | | | with sales charge | | | 30.56 | | | | 9.04 | | | | 7.94 | | |
S&P 500 Index | | | | | | | 45.98 | | | | 17.42 | | | | 14.17 | | |
Consumer Price Index | | | | | | | 4.16 | | | | 2.22 | | | | 1.73 | | |

Sectors* (%)
Financials | | | 15.4 | | |
Information Technology | | | 14.1 | | |
Commodities | | | 10.0 | | |
Communication Services | | | 9.8 | | |
Industrials | | | 9.0 | | |
Energy | | | 7.1 | | |
Health Care | | | 6.9 | | |
Consumer Staples | | | 6.8 | | |
Materials | | | 5.7 | | |
Real Estate | | | 3.4 | | |
Consumer Discretionary | | | 1.5 | | |
Utilities | | | 0.8 | | |
Short-Term Investments | | | 9.5 | | |
^ Performance figures reflect certain fee waivers and/or expense limitations, without which returns may have been lower.
† Less than 0.05%.
* Asset Allocation and Sector percentages are based on total investments in the portfolio.
The Fund's portfolio composition is subject to change at any time.
First Eagle Funds | Semiannual Report | April 30, 2021
58
First Eagle U.S. Value Fund | Fund Overview
Growth of a $10,000 Initial Investment
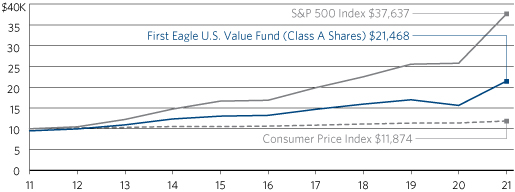
Performance data quoted herein represents past performance and should not be considered indicative of future results. Performance data quoted herein does not reflect the deduction of taxes that a shareholder would pay on Fund distributions or the sale of Fund shares. The average annual returns shown above are historical and reflect changes in share price, reinvested dividends and are net of expenses.
The average annual returns for Class A shares give effect to the deduction of the maximum sales charge of 5.00%.
The S&P 500 Index is a widely recognized unmanaged index including a representative sample of 500 leading companies in leading sectors of the U.S. economy. Although the S&P 500 Index focuses on the large-cap segment of the market, with approximately 80% coverage of U.S. equities, it is also considered a proxy for the total market. The S&P 500 Index includes dividends reinvested. One cannot invest directly in an index. The Consumer Price Index (CPI) represents the change in price of all goods and services purchased for consumption by urban households.
Top 10 Holdings* (%)
Gold bullion** (Precious Metal) | | | 10.0 | | |
Oracle Corp. (Software, United States) | | | 4.7 | | |
Comcast Corp. (Media, United States) | | | 4.1 | | |
Philip Morris International, Inc. (Tobacco, United States) | | | 3.2 | | |
Exxon Mobil Corp. (Oil, Gas & Consumable Fuels, United States) | | | 3.1 | | |
Facebook, Inc. (Interactive Media & Services, United States) | | | 3.0 | | |
Colgate-Palmolive Co. (Household Products, United States) | | | 3.0 | | |
Bank of New York Mellon Corp. (The) (Capital Markets, United States) | | | 2.5 | | |
CH Robinson Worldwide, Inc. (Air Freight & Logistics, United States) | | | 2.4 | | |
Microsoft Corp. (Software, United States) | | | 2.2 | | |
Total | | | 38.2 | | |
* Holdings in cash, commercial paper and other short-term cash equivalents have been excluded.
**The Fund invests in gold and precious metals through investment in a wholly-owned subsidiary of the Fund organized under the laws of the Cayman Islands (the "Subsidiary"). Gold Bullion and commodities include the Fund's investment in the Subsidiary.
Percentages are based on total net assets.
First Eagle Funds | Semiannual Report | April 30, 2021
59
First Eagle U.S. Value Fund | Consolidated Schedule of Investments | April 30, 2021 (unaudited)
Investments | | Shares | | Value ($) | |
Common Stocks — 79.2% | |
Aerospace & Defense — 0.2% | |
General Dynamics Corp. | | | 12,035 | | | | 2,289,418 | | |
Air Freight & Logistics — 3.2% | |
CH Robinson Worldwide, Inc. | | | 326,601 | | | | 31,706,425 | | |
Expeditors International of Washington, Inc. | | | 89,172 | | | | 9,796,436 | | |
| | | | 41,502,861 | | |
Banks — 3.3% | |
Truist Financial Corp. | | | 195,626 | | | | 11,602,578 | | |
US Bancorp | | | 345,798 | | | | 20,523,111 | | |
Wells Fargo & Co. | | | 247,457 | | | | 11,147,938 | | |
| | | | 43,273,627 | | |
Capital Markets — 3.5% | |
Bank of New York Mellon Corp. (The) | | | 662,458 | | | | 33,043,405 | | |
Charles Schwab Corp. (The) | | | 186,176 | | | | 13,106,790 | | |
| | | | 46,150,195 | | |
Chemicals — 2.6% | |
Linde plc (United Kingdom) | | | 40,456 | | | | 11,563,943 | | |
Nutrien Ltd. (Canada) | | | 291,774 | | | | 16,103,007 | | |
PPG Industries, Inc. | | | 36,734 | | | | 6,290,330 | | |
Scotts Miracle-Gro Co. (The) | | | 2,417 | | | | 558,714 | | |
| | | | 34,515,994 | | |
Consumer Finance — 1.7% | |
American Express Co. | | | 143,823 | | | | 22,055,257 | | |
Diversified Financial Services — 1.2% | |
Berkshire Hathaway, Inc., Class A* | | | 38 | | | | 15,675,000 | | |
Electronic Equipment, Instruments & Components — 1.0% | |
IPG Photonics Corp.* | | | 57,728 | | | | 12,533,326 | | |
Energy Equipment & Services — 2.6% | |
NOV, Inc.* | | | 998,989 | | | | 14,934,885 | | |
Schlumberger NV | | | 719,018 | | | | 19,449,437 | | |
| | | | 34,384,322 | | |
Equity Real Estate Investment Trusts (REITs) — 3.4% | |
Boston Properties, Inc. | | | 64,068 | | | | 7,005,836 | | |
Douglas Emmett, Inc. | | | 180,342 | | | | 6,048,671 | | |
First Eagle Funds | Semiannual Report | April 30, 2021
60
First Eagle U.S. Value Fund | Consolidated Schedule of Investments | April 30, 2021 (unaudited)
Investments | | Shares | | Value ($) | |
Equity Real Estate Investment Trusts (REITs) — 3.4% (continued) | |
Equity Residential | | | 161,312 | | | | 11,974,190 | | |
Weyerhaeuser Co. | | | 505,903 | | | | 19,613,859 | | |
| | | | 44,642,556 | | |
Food Products — 0.7% | |
Kraft Heinz Co. (The) | | | 206,681 | | | | 8,533,858 | | |
Gas Utilities — 0.8% | |
UGI Corp. | | | 242,612 | | | | 10,604,571 | | |
Health Care Equipment & Supplies — 2.0% | |
Becton Dickinson and Co. | | | 32,518 | | | | 8,090,804 | | |
DENTSPLY SIRONA, Inc. | | | 273,830 | | | | 18,486,263 | | |
| | | | 26,577,067 | | |
Health Care Providers & Services — 4.8% | |
Anthem, Inc. | | | 64,857 | | | | 24,606,097 | | |
HCA Healthcare, Inc. | | | 98,362 | | | | 19,776,664 | | |
Universal Health Services, Inc., Class B | | | 123,366 | | | | 18,308,748 | | |
| | | | 62,691,509 | | |
Hotels, Restaurants & Leisure — 1.5% | |
Booking Holdings, Inc.* | | | 8,032 | | | | 19,807,555 | | |
Household Products — 3.0% | |
Colgate-Palmolive Co. | | | 479,090 | | | | 38,662,563 | | |
Insurance — 5.7% | |
Alleghany Corp.* | | | 19,289 | | | | 13,096,652 | | |
Brown & Brown, Inc. | | | 396,625 | | | | 21,092,518 | | |
Travelers Cos., Inc. (The) | | | 113,399 | | | | 17,538,289 | | |
W R Berkley Corp. | | | 181,882 | | | | 14,499,633 | | |
Willis Towers Watson plc | | | 30,394 | | | | 7,867,791 | | |
| | | | 74,094,883 | | |
Interactive Media & Services — 5.7% | |
Alphabet, Inc., Class A* | | | 7,298 | | | | 17,175,843 | | |
Alphabet, Inc., Class C* | | | 7,454 | | | | 17,965,035 | | |
Facebook, Inc., Class A* | | | 120,766 | | | | 39,258,611 | | |
| | | | 74,399,489 | | |
First Eagle Funds | Semiannual Report | April 30, 2021
61
First Eagle U.S. Value Fund | Consolidated Schedule of Investments | April 30, 2021 (unaudited)
Investments | | Shares | | Value ($) | |
Machinery — 4.1% | |
Cummins, Inc. | | | 70,664 | | | | 17,810,155 | | |
Deere & Co. | | | 57,113 | | | | 21,180,356 | | |
Flowserve Corp. | | | 378,708 | | | | 15,011,985 | | |
| | | | 54,002,496 | | |
Media — 4.1% | |
Comcast Corp., Class A | | | 955,308 | | | | 53,640,544 | | |
Metals & Mining — 3.1% | |
Agnico Eagle Mines Ltd. (Canada) | | | 82,024 | | | | 5,126,375 | | |
Barrick Gold Corp. (Canada) | | | 311,133 | | | | 6,611,576 | | |
Franco-Nevada Corp. (Canada) | | | 21,527 | | | | 2,998,876 | | |
Newcrest Mining Ltd. (Australia) | | | 236,346 | | | | 4,830,452 | | |
Newmont Corp. | | | 261,386 | | | | 16,313,100 | | |
Royal Gold, Inc. | | | 38,764 | | | | 4,336,141 | | |
| | | | 40,216,520 | | |
Oil, Gas & Consumable Fuels — 3.1% | |
Exxon Mobil Corp. | | | 710,372 | | | | 40,661,693 | | |
Road & Rail — 1.5% | |
Union Pacific Corp. | | | 89,296 | | | | 19,831,749 | | |
Semiconductors & Semiconductor Equipment — 3.5% | |
Analog Devices, Inc. | | | 143,380 | | | | 21,960,081 | | |
Texas Instruments, Inc. | | | 128,555 | | | | 23,205,463 | | |
| | | | 45,165,544 | | |
Software — 9.7% | |
Microsoft Corp. | | | 115,611 | | | | 29,154,782 | | |
Oracle Corp. | | | 804,990 | | | | 61,010,192 | | |
salesforce.com, Inc.* | | | 58,794 | | | | 13,541,434 | | |
Teradata Corp.* | | | 463,744 | | | | 22,941,416 | | |
| | | | 126,647,824 | | |
Tobacco — 3.2% | |
Philip Morris International, Inc. | | | 435,178 | | | | 41,341,910 | | |
Total Common Stocks
(Cost $559,507,136) | | | 1,033,902,331 | | |
First Eagle Funds | Semiannual Report | April 30, 2021
62
First Eagle U.S. Value Fund | Consolidated Schedule of Investments | April 30, 2021 (unaudited)
Investments | | Ounces | | Value ($) | |
Commodities — 10.0% | |
Gold bullion
(Cost $79,442,806)* | | | 73,531 | | | | 129,998,225 | | |
| | | Shares | | | |
Master Limited Partnerships — 1.4% | |
Oil, Gas & Consumable Fuels — 1.4% | |
Enterprise Products Partners LP | | | 526,087 | | | | 12,105,262 | | |
Magellan Midstream Partners LP | | | 130,508 | | | | 6,103,859 | | |
Total Master Limited Partnerships
(Cost $15,806,262) | | | 18,209,121 | | |
| | | Principal Amount ($) | | | |
Corporate Bonds — 0.0% (a) | |
Health Care Equipment & Supplies — 0.0% (a) | |
Bausch & Lomb, Inc.
7.13%, 8/1/2028‡
(Cost $550,142) | | | 600,000 | | | | 621,750 | | |
Short-Term Investments — 9.5% | |
Commercial Paper — 4.9% | |
Entergy Corp.
0.10%, 5/3/2021 (b)(c) | | | 1,506,000 | | | | 1,505,987 | | |
General Motors Financial Co., Inc.
0.28%, 5/3/2021 (c) | | | 5,021,000 | | | | 5,020,873 | | |
Glencore Funding LLC (Australia)
0.14%, 5/3/2021 (c) | | | 5,021,000 | | | | 5,020,944 | | |
Hitachi International Treasury Ltd. (Japan)
0.11%, 5/3/2021 (c) | | | 17,171,000 | | | | 17,170,814 | | |
Kreditanstalt fuer Wiederaufbau (Germany)
0.07%, 6/24/2021 (b)(c) | | | 2,304,000 | | | | 2,303,658 | | |
Merck & Co., Inc.
0.06%, 5/27/2021 (c) | | | 4,118,000 | | | | 4,117,846 | | |
0.06%, 5/28/2021 (c) | | | 1,765,000 | | | | 1,764,931 | | |
MetLife Short Term Funding LLC
0.07%, 5/7/2021 (b)(c) | | | 1,765,000 | | | | 1,764,979 | | |
0.10%, 6/1/2021 (b)(c) | | | 10,000,000 | | | | 9,999,369 | | |
0.07%, 6/11/2021 (b)(c) | | | 3,456,000 | | | | 3,455,686 | | |
First Eagle Funds | Semiannual Report | April 30, 2021
63
First Eagle U.S. Value Fund | Consolidated Schedule of Investments | April 30, 2021 (unaudited)
Investments | | Principal Amount ($) | | Value ($) | |
Commercial Paper — 4.9% (continued) | |
Mitsui & Co. USA, Inc.
0.14%, 5/3/2021 (c) | | | 7,531,000 | | | | 7,530,918 | | |
UnitedHealth Group, Inc.
0.14%, 6/14/2021 (c) | | | 4,239,000 | | | | 4,238,232 | | |
Total Commercial Paper
(Cost $63,894,329) | | | 63,894,237 | | |
| | | Shares | | | |
Investment Companies — 0.0% (a) | |
JP Morgan U.S. Government Money Market Fund,
Capital Shares, 0.03% (d)
(Cost $17,801) | | | 17,801 | | | | 17,801 | | |
| | | Principal Amount ($) | | | |
U.S. Treasury Obligations — 4.6% | |
U.S. Treasury Bills
0.07%, 5/20/2021 (c) | | | 15,000,000 | | | | 14,999,929 | | |
0.03%, 6/17/2021 (c) | | | 20,000,000 | | | | 19,999,687 | | |
0.01%, 7/15/2021 (c) | | | 25,000,000 | | | | 24,999,303 | | |
Total U.S. Treasury Obligations
(Cost $59,997,881) | | | 59,998,919 | | |
Total Short-Term Investments
(Cost $123,910,011) | | | 123,910,957 | | |
Total Investments — 100.1%
(Cost $779,216,357) | | | 1,306,642,384 | | |
Liabilities in Excess of Other Assets — (0.1%) | | | (1,041,050 | ) | |
Net Assets — 100.0% | | | 1,305,601,334 | | |
* Non-income producing security.
‡ Value determined using significant unobservable inputs.
(a) Represents less than 0.05% of net assets.
(b) Securities exempt from registration under Rule 144A or section 4(a)2 of the Securities Act of 1933. Total value of all such securities at April 30, 2021 amounted to $19,029,679, which represents approximately 1.46% of net assets of the Fund.
(c) The rate shown was the current yield as of April 30, 2021.
(d) Represents 7-day effective yield as of April 30, 2021.
First Eagle Funds | Semiannual Report | April 30, 2021
64
First Eagle U.S. Value Fund | Consolidated Schedule of Investments | April 30, 2021 (unaudited)
As of April 30, 2021, the gross unrealized appreciation (depreciation) of investments based on the aggregate cost of investment securities and derivative instruments, if applicable, for federal income tax purposes was as follows:
Aggregate gross unrealized appreciation | | $ | 559,812,065 | | |
Aggregate gross unrealized depreciation | | | (32,386,038 | ) | |
Net unrealized appreciation | | $ | 527,426,027 | | |
Federal income tax cost | | $ | 779,216,357 | | |
See Notes to Financial Statements
First Eagle Funds | Semiannual Report | April 30, 2021
65
Data as of April 30, 2021 (unaudited)
Investment Objective
The First Eagle Gold Fund is a non-diversified fund that seeks to provide investors the opportunity to participate in the investment characteristics of gold (and to a limited extent other precious metals) for a portion of their overall investment portfolio. In seeking to achieve its objective, the Fund invests at least 80% of its net assets (plus any borrowings for investment purposes) in gold, and/or securities directly related to gold or issuers principally engaged in the gold industry.
Average Annual Returns (%) | | | | | | One Year | | Five Years | | Ten Years | |
First Eagle Gold Fund | | Class A | | without sales load | | | 6.92 | | | | 5.97 | | | | -3.37 | | |
| | | | | with sales load | | | 1.57 | | | | 4.89 | | | | -3.86 | | |
FTSE Gold Mines Index | | | | | | | -1.70 | | | | 5.20 | | | | -5.80 | | |
MSCI World Index | | | | | | | 45.33 | | | | 14.03 | | | | 9.92 | | |
Consumer Price Index | | | | | | | 4.16 | | | | 2.22 | | | | 1.73 | | |
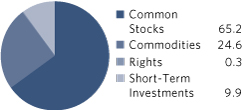
Sectors* (%)
Materials | | | 65.5 | | |
Commodities | | | 24.6 | | |
Short-Term Investments | | | 9.9 | | |
Countries*~ (%)
United States | | | 40.3 | | |
Canada | | | 36.1 | | |
Brazil | | | 5.9 | | |
Australia | | | 3.6 | | |
Mexico | | | 3.0 | | |
Tanzania, United Republic of | | | 1.2 | | |
Short-Term Investments | | | 9.9 | | |
* Asset Allocation, Sector and Countries percentages are based on total investments in the portfolio.
~Country allocations reflect country of risk (not currency of issue). Bonds of non-U.S. issuers may be U.S. dollar denominated.
The Fund's portfolio composition is subject to change at any time.
First Eagle Funds | Semiannual Report | April 30, 2021
66
First Eagle Gold Fund | Fund Overview
Growth of a $10,000 Initial Investment
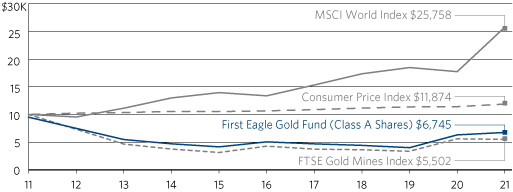
Performance data quoted herein represents past performance and should not be considered indicative of future results. Performance data quoted herein does not reflect the deduction of taxes that a shareholder would pay on Fund distributions or the sale of Fund shares. The average annual returns shown above are historical and reflect changes in share price, reinvested dividends and are net of expenses.
The average annual returns for Class A shares give effect to the deduction of the maximum sales charge of 5.00%.
The MSCI World Index is a widely followed, unmanaged group of stocks from 23 developed market countries. The index provides total returns in U.S. dollars with dividends reinvested. The FTSE Gold Mines Index is designed to reflect the performance of the worldwide market in the shares of companies whose principal activity is the mining of gold. The FTSE Gold Mines Index encompasses all gold mining companies that have a sustainable, attributable gold production of at least 300,000 ounces a year and that derive 51% or more of their revenue from mined gold. The index is unmanaged and includes dividends reinvested. One cannot invest directly in an index. The Consumer Price Index (CPI) represents the change in price of all goods and services purchased for consumption by urban households.
Top 10 Holdings* (%)
Gold bullion** (Precious Metal) | | | 21.3 | | |
Newmont Corp. (Metals & Mining, United States) | | | 10.9 | | |
Barrick Gold Corp. (Metals & Mining, Canada) | | | 6.4 | | |
Wheaton Precious Metals Corp. (Metals & Mining, Brazil) | | | 5.8 | | |
Royal Gold, Inc. (Metals & Mining, United States) | | | 4.7 | | |
Novagold Resources, Inc. (Metals & Mining, Canada) | | | 4.4 | | |
Kirkland Lake Gold Ltd. (Metals & Mining, Canada) | | | 4.4 | | |
Dundee Precious Metals, Inc. (Metals & Mining, Canada) | | | 4.0 | | |
B2Gold Corp. (Metals & Mining, Canada) | | | 3.7 | | |
Newcrest Mining Ltd. (Metals & Mining, Australia) | | | 3.6 | | |
Total | | | 69.2 | | |
* Holdings in cash, commercial paper and other short-term cash equivalents have been excluded.
**The Fund invests in gold and precious metals through investment in a wholly-owned subsidiary of the Fund organized under the laws of the Cayman Islands (the "Subsidiary"). Gold Bullion and commodities include the Fund's investment in the Subsidiary.
Percentages are based on total net assets.
First Eagle Funds | Semiannual Report | April 30, 2021
67
First Eagle Gold Fund | Consolidated Schedule of Investments | April 30, 2021 (unaudited)
Investments | | Shares | | Value ($) | |
Common Stocks — 64.9% | |
Australia — 3.6% | |
Newcrest Mining Ltd. | | | 4,036,076 | | | | 82,489,532 | | |
Brazil — 5.8% | |
Wheaton Precious Metals Corp. | | | 3,230,739 | | | | 133,494,135 | | |
Canada — 35.7% | |
Agnico Eagle Mines Ltd. | | | 1,068,425 | | | | 66,774,933 | | |
Alamos Gold, Inc., Class A | | | 9,110,996 | | | | 73,012,497 | | |
B2Gold Corp. | | | 17,612,461 | | | | 84,827,539 | | |
Barrick Gold Corp. | | | 6,871,570 | | | | 146,020,863 | | |
Dundee Precious Metals, Inc. (a) | | | 12,549,706 | | | | 90,359,108 | | |
Franco-Nevada Corp. | | | 427,322 | | | | 59,529,224 | | |
Kinross Gold Corp. | | | 2,275,478 | | | | 16,019,365 | | |
Kirkland Lake Gold Ltd. | | | 2,681,741 | | | | 99,642,120 | | |
MAG Silver Corp.* | | | 3,280,988 | | | | 56,482,696 | | |
Novagold Resources, Inc.* | | | 11,267,639 | | | | 101,296,075 | | |
Orla Mining Ltd.* | | | 5,510,928 | | | | 19,862,027 | | |
Orla Mining Ltd.* | | | 222,366 | | | | 985,081 | | |
| | | | 814,811,528 | | |
Mexico — 3.0% | |
Fresnillo plc | | | 4,409,090 | | | | 50,136,243 | | |
Industrias Penoles SAB de CV* | | | 1,403,600 | | | | 18,075,585 | | |
| | | | 68,211,828 | | |
Tanzania, United Republic of — 1.2% | |
AngloGold Ashanti Ltd., ADR | | | 1,286,240 | | | | 26,470,819 | | |
United States — 15.6% | |
Newmont Corp. | | | 3,988,123 | | | | 248,898,757 | | |
Royal Gold, Inc. | | | 955,142 | | | | 106,842,184 | | |
| | | | 355,740,941 | | |
Total Common Stocks
(Cost $891,703,138) | | | 1,481,218,783 | | |
| | | Ounces | | | |
Commodities — 24.4% | |
Gold bullion* | | | 275,076 | | | | 486,317,831 | | |
Silver bullion* | | | 2,776,530 | | | | 71,845,772 | | |
Total Commodities
(Cost $403,682,164) | | | 558,163,603 | | |
First Eagle Funds | Semiannual Report | April 30, 2021
68
First Eagle Gold Fund | Consolidated Schedule of Investments | April 30, 2021 (unaudited)
Investments | | Number of Rights | | Value ($) | |
Rights — 0.3% | |
Canada — 0.3% | |
Pan American Silver Corp., CVR, expiring 2/22/2029*
(Cost $45,973,715) | | | 6,835,667 | | | | 6,015,387 | | |
| | | Principal Amount ($) | | | |
Short-Term Investments — 9.9% | |
Commercial Paper — 9.9% | |
American Honda Finance Corp.
0.21%, 5/13/2021 (b) | | | 14,134,000 | | | | 14,133,439 | | |
Entergy Corp.
0.10%, 5/3/2021 (b)(c) | | | 2,960,000 | | | | 2,959,974 | | |
Export Development Corp.
0.06%, 5/12/2021 (b) | | | 21,200,000 | | | | 21,199,717 | | |
0.06%, 6/15/2021 (b) | | | 4,545,000 | | | | 4,544,681 | | |
General Motors Financial Co., Inc.
0.28%, 5/3/2021 (b) | | | 9,866,000 | | | | 9,865,750 | | |
Glencore Funding LLC
0.14%, 5/3/2021 (b) | | | 9,866,000 | | | | 9,865,890 | | |
Hitachi International Treasury Ltd.
0.11%, 5/3/2021 (b) | | | 33,743,000 | | | | 33,742,635 | | |
Kreditanstalt fuer Wiederaufbau
0.11%, 5/12/2021 (b)(c) | | | 10,459,000 | | | | 10,458,804 | | |
0.07%, 6/24/2021 (b)(c) | | | 8,916,000 | | | | 8,914,679 | | |
Linde, Inc.
0.05%, 6/10/2021 (b) | | | 14,291,000 | | | | 14,289,795 | | |
MetLife Short Term Funding LLC
0.08%, 6/7/2021 (b)(c) | | | 10,424,000 | | | | 10,423,175 | | |
0.07%, 6/11/2021 (b)(c) | | | 13,374,000 | | | | 13,372,783 | | |
Mitsui & Co. USA, Inc.
0.14%, 5/3/2021 (b) | | | 14,799,000 | | | | 14,798,840 | | |
Nederlandse Waterschapsbank NV
0.13%, 7/12/2021 (b)(c) | | | 9,091,000 | | | | 9,088,622 | | |
Novartis Securities Investment Ltd.
0.07%, 6/22/2021 (b)(c) | | | 13,230,000 | | | | 13,228,870 | | |
NRW Bank
0.11%, 5/21/2021 (b)(c) | | | 14,134,000 | | | | 14,133,505 | | |
Roche Holdings, Inc.
0.05%, 6/18/2021 (b)(c) | | | 3,636,000 | | | | 3,635,708 | | |
First Eagle Funds | Semiannual Report | April 30, 2021
69
First Eagle Gold Fund | Consolidated Schedule of Investments | April 30, 2021 (unaudited)
Investments | | Principal Amount ($) | | Value ($) | |
Commercial Paper — 9.9% (continued) | |
UnitedHealth Group, Inc.
0.14%, 6/14/2021 (b) | | | 16,405,000 | | | | 16,402,027 | | |
Total Commercial Paper
(Cost $225,059,061) | | | 225,058,894 | | |
| | | Shares | | | |
Investment Companies — 0.0% (d) | |
JP Morgan U.S. Government Money Market Fund,
Capital Shares 0.03% (e)
(Cost $7,016) | | | 7,016 | | | | 7,016 | | |
Total Short-Term Investments
(Cost $225,066,077) | | | 225,065,910 | | |
Total Investments — 99.5%
(Cost $1,566,425,094) | | | 2,270,463,683 | | |
Other assets less liabilities — 0.5% | | | 11,268,274 | | |
Net Assets — 100.0% | | | 2,281,731,957 | | |
* Non-income producing security.
(a) Affiliated company as defined under the Investment Company Act of 1940.
(b) The rate shown was the current yield as of April 30, 2021.
(c) Securities exempt from registration under Rule 144A or section 4(a)2 of the Securities Act of 1933. Total value of all such securities at April 30, 2021 amounted to $86,216,120, which represents approximately 3.78% of net assets of the Fund
(d) Represents less than 0.05% of net assets.
(e) Represents 7-day effective yield as of April 30, 2021.
As of April 30, 2021, the gross unrealized appreciation (depreciation) of investments based on the aggregate cost of investment securities and derivative instruments, if applicable, for federal income tax purposes was as follows:
Aggregate gross unrealized appreciation | | $ | 744,004,798 | | |
Aggregate gross unrealized depreciation | | | (39,966,209 | ) | |
Net unrealized appreciation | | $ | 704,038,589 | | |
Federal income tax cost | | $ | 1,566,425,094 | | |
Abbreviations
ADR — American Depositary Receipt
CVR — Contingent Value Rights
First Eagle Funds | Semiannual Report | April 30, 2021
70
First Eagle Gold Fund | Consolidated Schedule of Investments | April 30, 2021 (unaudited)
Affiliated Securities
Security Description | | Shares at
April 30, 2021 | | Market Value
October 31, 2020 | | Purchases at
Cost | | Proceeds from
Sales | |
Common Stock — 4.0% | |
Canada — 4.0% | |
Dundee Precious Metals, Inc. | | | 12,549,706 | | | $ | 75,809,420 | | | $ | 6,947,418 | | | $ | — | | |
Total Common Stock | | | | | 75,809,420 | | | | 6,947,418 | | | | — | | |
Total | | | | $ | 75,809,420 | | | $ | 6,947,418 | | | $ | — | | |
Security Description | | Net Realized
Gain
(Loss) | | Change in
Unrealized
Appreciation/
(Depreciation) | | Market Value
April 30,
2021 | | Dividend
Income | |
Common Stock — 4.0% | |
Canada — 4.0% | |
Dundee Precious Metals, Inc. | | $ | — | | | $ | 7,602,270 | | | $ | 90,359,108 | | | $ | 613,713 | | |
Total Common Stock | | | — | | | | 7,602,270 | | | | 90,359,108 | | | | 613,713 | | |
Total | | $ | — | | | $ | 7,602,270 | | | $ | 90,359,108 | | | $ | 613,713 | | |
See Notes to Financial Statements.
First Eagle Funds | Semiannual Report | April 30, 2021
71
First Eagle Global Income Builder Fund
Data as of April 30, 2021 (unaudited)
Investment Objective
The First Eagle Global Income Builder Fund seeks current income generation and long-term growth of capital. Fundamental research drives the identification of income-producing investment opportunities across all market environments.
Average Annual Returns^ (%) | | | | | | One Year | | Five Years | | Since
Inception
(5/1/2012) | |
First Eagle Global Income Builder | | Class A | | without sales load | | | 23.63 | | | | 6.88 | | | | 6.41 | | |
| | | | | with sales load | | | 17.49 | | | | 5.79 | | | | 5.81 | | |
Composite Index | | | | | | | 25.45 | | | | 9.87 | | | | 8.37 | | |
MSCI World Index | | | | | | | 45.33 | | | | 14.03 | | | | 11.63 | | |
Bloomberg Barclays U.S. Aggregate Bond Index | | | | | | | -0.27 | | | | 3.19 | | | | 2.93 | | |
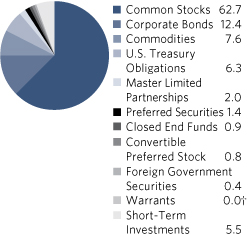
Sectors* (%) | |
Consumer Staples | | | 21.9 | | |
Financials | | | 15.7 | | |
Industrials | | | 10.0 | | |
Commodities | | | 7.6 | | |
Energy | | | 6.9 | | |
U.S. Treasury Obligations | | | 6.3 | | |
Real Estate | | | 5.6 | | |
Materials | | | 4.8 | | |
Information Technology | | | 4.7 | | |
Consumer Discretionary | | | 4.6 | | |
Health Care | | | 4.6 | | |
Communication Services | | | 0.9 | | |
Utilities | | | 0.5 | | |
Foreign Government Securities | | | 0.4 | | |
Investment Funds | | | 0.0 | † | |
Short-Term Investments | | | 5.5 | | |
Countries*~ (%)
United States | | | 47.7 | | |
United Kingdom | | | 9.5 | | |
Hong Kong | | | 5.2 | | |
France | | | 4.5 | | |
Switzerland | | | 3.7 | | |
Canada | | | 3.7 | | |
Japan | | | 2.8 | | |
Belgium | | | 2.3 | | |
Mexico | | | 2.2 | | |
Sweden | | | 2.1 | | |
South Korea | | | 2.0 | | |
Germany | | | 1.9 | | |
Chile | | | 1.4 | | |
Brazil | | | 1.1 | | |
Norway | | | 1.1 | | |
Netherlands | | | 0.9 | | |
Thailand | | | 0.8 | | |
Singapore | | | 0.4 | | |
Turkey | | | 0.3 | | |
Taiwan | | | 0.3 | | |
Spain | | | 0.2 | | |
Australia | | | 0.2 | | |
Indonesia | | | 0.1 | | |
Poland | | | 0.1 | | |
Short-Term Investments | | | 5.5 | | |
^ Performance figures reflect certain fee waivers and/or expense limitations, without which returns may have been lower.
† Less than 0.05%.
* Asset Allocation, Sector and Countries percentages are based on total investments in the portfolio.
~ Country allocations reflect country of risk (not currency of issue). Bonds of non-U.S. issuers may be U.S. dollar denominated.
The Fund's portfolio composition is subject to change at any time.
First Eagle Funds | Semiannual Report | April 30, 2021
72
First Eagle Global Income Builder Fund | Fund Overview
Growth of a $10,000 Initial Investment
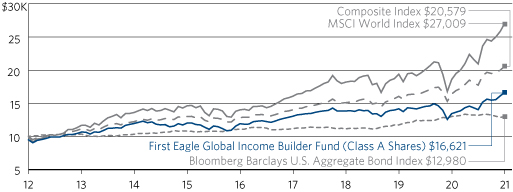
Performance data quoted herein represents past performance and should not be considered indicative of future results. Performance data quoted herein does not reflect the deduction of taxes that a shareholder would pay on Fund distributions or the sale of Fund shares. The average annual returns shown above are historical and reflect changes in share price, reinvested dividends and are net of expenses.
The average annual returns for Class A shares give effect to the deduction of the maximum sales charge of 5.00%.
The composite index consists of 60% of the MSCI World Index and 40% of the Bloomberg Barclays U.S. Aggregate Bond Index. The MSCI World Index is a widely followed, unmanaged group of stocks from 23 developed market countries. The index provides total returns in U.S. dollars with net dividends reinvested. The Bloomberg Barclays U.S. Aggregate Bond Index is an unmanaged broad-based benchmark that measures the investment grade, U.S. dollar-denominated, fixed-rate taxable bond market, including Treasuries, government-related and corporate securities, MBS (agency fixed-rate and hybrid ARM passthroughs), ABS and CMBS. One cannot invest directly in an index.
Top 10 Holdings* (%)
Gold bullion (Precious Metal) | | | 7.7 | | |
Jardine Matheson Holdings Ltd. (Industrial Conglomerates, Hong Kong) | | | 2.5 | | |
Exxon Mobil Corp. (Oil, Gas & Consumable Fuels, United States) | | | 2.4 | | |
Unilever plc (Personal Products, United Kingdom) | | | 2.3 | | |
Nestle SA (Registered) (Food Products, Switzerland) | | | 2.3 | | |
Groupe Bruxelles Lambert SA (Diversified Financial Services, Belgium) | | | 2.3 | | |
Danone SA (Food Products, France) | | | 2.1 | | |
British American Tobacco plc (Tobacco, United Kingdom) | | | 2.1 | | |
Philip Morris International, Inc. (Tobacco, United States) | | | 1.9 | | |
Colgate-Palmolive Co. (Household Products, United States) | | | 1.5 | | |
Total | | | 27.1 | | |
*Holdings in cash, commercial paper and other short-term cash equivalents have been excluded.
Percentages are based on total net assets.
First Eagle Funds | Semiannual Report | April 30, 2021
73
First Eagle Global Income Builder Fund | Schedule of Investments | April 30, 2021 (unaudited)
Investments | | Shares | | Value ($) | |
Common Stocks — 63.0% | |
Belgium — 2.3% | |
Groupe Bruxelles Lambert SA | | | 277,053 | | | | 30,296,662 | | |
Brazil — 1.1% | |
Ambev SA, ADR | | | 3,604,077 | | | | 10,019,334 | | |
Cielo SA | | | 371,809 | | | | 236,143 | | |
Wheaton Precious Metals Corp. (a) | | | 111,232 | | | | 4,596,106 | | |
| | | | 14,851,583 | | |
Canada — 3.6% | |
Agnico Eagle Mines Ltd. | | | 51,582 | | | | 3,223,796 | | |
Franco-Nevada Corp. | | | 38,495 | | | | 5,362,648 | | |
Imperial Oil Ltd. | | | 287,984 | | | | 8,317,481 | | |
Nutrien Ltd. (a) | | | 187,543 | | | | 10,350,498 | | |
Power Corp. of Canada | | | 692,979 | | | | 20,183,581 | | |
| | | | 47,438,004 | | |
Chile — 1.4% | |
Cia Cervecerias Unidas SA, ADR | | | 988,140 | | | | 18,112,606 | | |
Quinenco SA | | | 200,388 | | | | 414,462 | | |
| | | | 18,527,068 | | |
France — 4.5% | |
Danone SA | | | 394,081 | | | | 27,817,994 | | |
Sanofi | | | 151,208 | | | | 15,853,007 | | |
Sodexo SA* | | | 147,121 | | | | 14,719,202 | | |
Wendel SE | | | 15,480 | | | | 2,060,565 | | |
| | | | 60,450,768 | | |
Germany — 1.5% | |
Brenntag SE | | | 28,969 | | | | 2,600,684 | | |
FUCHS PETROLUB SE (Preference) | | | 155,774 | | | | 8,294,880 | | |
Henkel AG & Co. KGaA (Preference) | | | 74,528 | | | | 8,561,010 | | |
| | | | 19,456,574 | | |
First Eagle Funds | Semiannual Report | April 30, 2021
74
First Eagle Global Income Builder Fund | Schedule of Investments | April 30, 2021 (unaudited)
Investments | | Shares | | Value ($) | |
Hong Kong — 5.2% | |
CK Asset Holdings Ltd. | | | 2,196,000 | | | | 13,748,325 | | |
Great Eagle Holdings Ltd. | | | 1,749,774 | | | | 6,162,652 | | |
Guoco Group Ltd. | | | 184,700 | | | | 2,227,980 | | |
Hongkong Land Holdings Ltd. | | | 1,344,900 | | | | 6,650,819 | | |
Hysan Development Co. Ltd. | | | 1,193,083 | | | | 4,491,446 | | |
Jardine Matheson Holdings Ltd. | | | 505,700 | | | | 33,957,340 | | |
Mandarin Oriental International Ltd.* | | | 1,433,700 | | | | 2,790,283 | | |
| | | | 70,028,845 | | |
Japan — 2.8% | |
FANUC Corp. | | | 20,800 | | | | 4,789,885 | | |
Komatsu Ltd. | | | 101,500 | | | | 2,984,570 | | |
Mitsubishi Electric Corp. | | | 413,000 | | | | 6,363,649 | | |
MS&AD Insurance Group Holdings, Inc. | | | 24,300 | | | | 689,406 | | |
Secom Co. Ltd. | | | 186,500 | | | | 15,541,871 | | |
Sompo Holdings, Inc. | | | 162,600 | | | | 6,043,052 | | |
USS Co. Ltd. | | | 30,700 | | | | 557,077 | | |
Yokogawa Electric Corp. | | | 1,500 | | | | 27,230 | | |
| | | | 36,996,740 | | |
Mexico — 1.4% | |
Coca-Cola Femsa SAB de CV, ADR | | | 131,005 | | | | 6,153,305 | | |
Fomento Economico Mexicano SAB de CV, ADR | | | 109,992 | | | | 8,524,380 | | |
Fresnillo plc | | | 334,047 | | | | 3,798,485 | | |
Grupo Mexico SAB de CV, Series B | | | 37,296 | | | | 168,593 | | |
| | | | 18,644,763 | | |
Netherlands — 0.5% | |
HAL Trust | | | 38,287 | | | | 6,855,652 | | |
Norway — 1.0% | |
Orkla ASA | | | 1,384,485 | | | | 14,112,220 | | |
Singapore — 0.4% | |
ComfortDelGro Corp. Ltd. | | | 1,015,700 | | | | 1,310,542 | | |
UOL Group Ltd. | | | 666,500 | | | | 3,845,822 | | |
| | | | 5,156,364 | | |
First Eagle Funds | Semiannual Report | April 30, 2021
75
First Eagle Global Income Builder Fund | Schedule of Investments | April 30, 2021 (unaudited)
Investments | | Shares | | Value ($) | |
South Korea — 2.0% | |
KT&G Corp. | | | 277,804 | | | | 20,557,486 | | |
Samsung Electronics Co. Ltd. (Preference) | | | 91,052 | | | | 5,977,965 | | |
| | | | 26,535,451 | | |
Spain — 0.2% | |
Zardoya Otis SA | | | 466,424 | | | | 2,954,427 | | |
Sweden — 2.1% | |
Industrivarden AB, Class C | | | 189,168 | | | | 6,823,327 | | |
Investor AB, Class A | | | 160,579 | | | | 13,638,856 | | |
Svenska Handelsbanken AB, Class A | | | 630,573 | | | | 7,302,203 | | |
| | | | 27,764,386 | | |
Switzerland — 3.7% | |
Cie Financiere Richemont SA (Registered) | | | 186,050 | | | | 19,093,712 | | |
Nestle SA (Registered) | | | 256,690 | | | | 30,630,998 | | |
| | | | 49,724,710 | | |
Taiwan — 0.3% | |
Taiwan Semiconductor Manufacturing Co. Ltd., ADR (a) | | | 35,510 | | | | 4,145,437 | | |
Thailand — 0.8% | |
Bangkok Bank PCL, NVDR | | | 1,644,800 | | | | 6,407,193 | | |
Thai Beverage PCL | | | 7,735,100 | | | | 4,152,615 | | |
| | | | 10,559,808 | | |
Turkey — 0.3% | |
Coca-Cola Icecek A/S | | | 466,883 | | | | 4,437,278 | | |
United Kingdom — 8.5% | |
Berkeley Group Holdings plc | | | 157,614 | | | | 10,072,886 | | |
British American Tobacco plc | | | 745,163 | | | | 27,648,050 | | |
Diageo plc | | | 109,223 | | | | 4,903,175 | | |
GlaxoSmithKline plc | | | 739,627 | | | | 13,668,134 | | |
Great Portland Estates plc, REIT | | | 94,696 | | | | 906,419 | | |
Hiscox Ltd.* | | | 526,234 | | | | 5,890,319 | | |
Linde plc (a) | | | 21,286 | | | | 6,084,390 | | |
Linde plc | | | 19,984 | | | | 5,712,174 | | |
Lloyds Banking Group plc | | | 9,349,373 | | | | 5,862,805 | | |
Reckitt Benckiser Group plc | | | 15,472 | | | | 1,377,591 | | |
Unilever plc | | | 526,657 | | | | 30,759,563 | | |
| | | | 112,885,506 | | |
First Eagle Funds | Semiannual Report | April 30, 2021
76
First Eagle Global Income Builder Fund | Schedule of Investments | April 30, 2021 (unaudited)
Investments | | Shares | | Value ($) | |
United States — 19.4% | |
American Express Co. (a) | | | 23,781 | | | | 3,646,816 | | |
Analog Devices, Inc. (a) | | | 16,314 | | | | 2,498,652 | | |
Anthem, Inc. (a) | | | 27,144 | | | | 10,298,162 | | |
Bank of New York Mellon Corp. (The) (a) | | | 283,179 | | | | 14,124,969 | | |
Becton Dickinson and Co. | | | 22,311 | | | | 5,551,200 | | |
Boston Properties, Inc., REIT (a) | | | 58,543 | | | | 6,401,677 | | |
CH Robinson Worldwide, Inc. (a) | | | 115,489 | | | | 11,211,672 | | |
Colgate-Palmolive Co. (a) | | | 255,488 | | | | 20,617,882 | | |
Cummins, Inc. (a) | | | 9,924 | | | | 2,501,245 | | |
Deere & Co. | | | 19 | | | | 7,046 | | |
Douglas Emmett, Inc., REIT | | | 204,706 | | | | 6,865,839 | | |
Equity Residential, REIT (a) | | | 136,568 | | | | 10,137,443 | | |
Exxon Mobil Corp. (a) | | | 565,703 | | | | 32,380,840 | | |
General Dynamics Corp. (a) | | | 7,297 | | | | 1,388,108 | | |
HCA Healthcare, Inc. (a) | | | 35,562 | | | | 7,150,096 | | |
Kraft Heinz Co. (The) (a) | | | 148,824 | | | | 6,144,943 | | |
Microsoft Corp. (a) | | | 21,517 | | | | 5,426,157 | | |
Oracle Corp. (a) | | | 183,344 | | | | 13,895,642 | | |
Philip Morris International, Inc. (a) | | | 273,801 | | | | 26,011,095 | | |
PPG Industries, Inc. (a) | | | 13,417 | | | | 2,297,527 | | |
Royal Gold, Inc. (a) | | | 48,119 | | | | 5,382,591 | | |
Schlumberger NV (a) | | | 371,173 | | | | 10,040,230 | | |
Texas Instruments, Inc. (a) | | | 62,488 | | | | 11,279,709 | | |
Travelers Cos., Inc. (The) (a) | | | 39,804 | | | | 6,156,087 | | |
Truist Financial Corp. | | | 797 | | | | 47,270 | | |
UGI Corp. (a) | | | 152,737 | | | | 6,676,134 | | |
Union Pacific Corp. (a) | | | 11,663 | | | | 2,590,236 | | |
US Bancorp (a) | | | 116,912 | | | | 6,938,727 | | |
Wells Fargo & Co. (a) | | | 312,627 | | | | 14,083,846 | | |
Weyerhaeuser Co., REIT (a) | | | 165,431 | | | | 6,413,760 | | |
| | | | 258,165,601 | | |
Total Common Stocks
(Cost $695,350,887) | | | 839,987,847 | | |
First Eagle Funds | Semiannual Report | April 30, 2021
77
First Eagle Global Income Builder Fund | Schedule of Investments | April 30, 2021 (unaudited)
Investments | | Principal Amount ($) | | Value ($) | |
Corporate Bonds — 12.4% | |
Australia — 0.2% | |
Nufarm Australia Ltd.
5.75%, 4/30/2026 (b) | | | 2,633,000 | | | | 2,702,985 | | |
Canada — 0.1% | |
Open Text Corp.
3.88%, 2/15/2028 (b) | | | 1,106,000 | | | | 1,119,825 | | |
Open Text Holdings, Inc.
4.13%, 2/15/2030 (b) | | | 774,000 | | | | 782,692 | | |
| | | | 1,902,517 | | |
Germany — 0.4% | |
IHO Verwaltungs GmbH
4.75%, (4.75% Cash or 5.50% PIK), 9/15/2026 (b)(c) | | | 3,879,000 | | | | 3,978,303 | | |
6.00%, (6.00% Cash or 6.75% PIK), 5/15/2027 (b)(c) | | | 1,336,632 | | | | 1,407,139 | | |
| | | | 5,385,442 | | |
Mexico — 0.6% | |
Mexico Remittances Funding Fiduciary Estate Management Sarl
4.88%, 1/15/2028 (b) | | | 8,252,000 | | | | 7,766,906 | | |
Netherlands — 0.4% | |
NXP BV
4.63%, 6/1/2023 (b) | | | 4,400,000 | | | | 4,750,097 | | |
Poland — 0.1% | |
CANPACK SA
3.13%, 11/1/2025 (b) | | | 420,000 | | | | 426,563 | | |
2.38%, 11/1/2027‡ (b) | | | 601,000 | | | | 735,558 | | |
| | | | 1,162,121 | | |
United Kingdom — 0.1% | |
Lloyds Banking Group plc
(US Treasury Yield Curve Rate T Note Constant
Maturity 1 Year + 3.50%), 3.87%, 7/9/2025 (d) | | | 1,655,000 | | | | 1,799,542 | | |
United States — 10.5% | |
AbbVie, Inc.
(ICE LIBOR USD 3 Month + 0.35%),
0.53%, 5/21/2021‡ (d) | | | 2,699,000 | | | | 2,699,357 | | |
ACCO Brands Corp.
4.25%, 3/15/2029 (b) | | | 10,177,000 | | | | 10,011,624 | | |
Aircastle Ltd.
5.50%, 2/15/2022 | | | 4,919,000 | | | | 5,089,588 | | |
4.40%, 9/25/2023 | | | 984,000 | | | | 1,055,367 | | |
First Eagle Funds | Semiannual Report | April 30, 2021
78
First Eagle Global Income Builder Fund | Schedule of Investments | April 30, 2021 (unaudited)
Investments | | Principal Amount ($) | | Value ($) | |
United States — 10.5% (continued) | |
American Airlines, Inc.
5.50%, 4/20/2026 (b) | | | 502,000 | | | | 527,100 | | |
5.75%, 4/20/2029 (b) | | | 502,000 | | | | 537,893 | | |
American Tower Corp.
REIT, 2.40%, 3/15/2025 | | | 115,000 | | | | 120,122 | | |
AMN Healthcare, Inc.
4.63%, 10/1/2027 (b) | | | 1,109,000 | | | | 1,145,043 | | |
Andeavor Logistics LP
3.50%, 12/1/2022 | | | 111,000 | | | | 111,144 | | |
Aramark Services, Inc.
5.00%, 4/1/2025 (b) | | | 1,541,000 | | | | 1,581,451 | | |
4.75%, 6/1/2026 | | | 1,076,000 | | | | 1,101,555 | | |
5.00%, 2/1/2028 (b) | | | 194,000 | | | | 202,973 | | |
BWX Technologies, Inc.
5.38%, 7/15/2026 (b) | | | 704,000 | | | | 726,387 | | |
Carnival Corp.
11.50%, 4/1/2023 (b) | | | 738,000 | | | | 848,110 | | |
Centene Corp.
4.25%, 12/15/2027 | | | 1,355,000 | | | | 1,420,189 | | |
4.63%, 12/15/2029 | | | 684,000 | | | | 740,430 | | |
3.38%, 2/15/2030 | | | 1,113,000 | | | | 1,117,174 | | |
Charles River Laboratories International, Inc.
3.75%, 3/15/2029 (b) | | | 683,000 | | | | 694,953 | | |
Charter Communications Operating LLC
4.91%, 7/23/2025 | | | 1,021,000 | | | | 1,161,105 | | |
CITGO Petroleum Corp.
7.00%, 6/15/2025 (b) | | | 4,631,000 | | | | 4,775,719 | | |
6.38%, 6/15/2026 (b) | | | 4,041,000 | | | | 4,142,429 | | |
CommScope, Inc.
5.50%, 3/1/2024 (b) | | | 563,000 | | | | 580,250 | | |
Crown Americas LLC
4.50%, 1/15/2023 | | | 3,626,000 | | | | 3,829,527 | | |
DCP Midstream Operating LP
4.75%, 9/30/2021 (b) | | | 4,084,000 | | | | 4,099,315 | | |
6.45%, 11/3/2036 (b) | | | 1,545,000 | | | | 1,742,791 | | |
Dell International LLC
5.85%, 7/15/2025 (b) | | | 2,000,000 | | | | 2,345,032 | | |
6.02%, 6/15/2026 (b) | | | 3,103,000 | | | | 3,701,612 | | |
First Eagle Funds | Semiannual Report | April 30, 2021
79
First Eagle Global Income Builder Fund | Schedule of Investments | April 30, 2021 (unaudited)
Investments | | Principal Amount ($) | | Value ($) | |
United States — 10.5% (continued) | |
Delta Air Lines, Inc.
4.50%, 10/20/2025 (b) | | | 6,155,158 | | | | 6,602,341 | | |
Edgewell Personal Care Co.
4.13%, 4/1/2029 (b) | | | 2,339,000 | | | | 2,333,153 | | |
Energizer Holdings, Inc.
4.75%, 6/15/2028 (b) | | | 46,000 | | | | 47,035 | | |
4.38%, 3/31/2029 (b) | | | 354,000 | | | | 351,345 | | |
EW Scripps Co. (The)
5.13%, 5/15/2025 (b) | | | 3,870,000 | | | | 3,971,742 | | |
Foot Locker, Inc.
8.50%, 1/15/2022 | | | 2,494,000 | | | | 2,609,347 | | |
HCA, Inc.
4.50%, 2/15/2027 | | | 1,085,000 | | | | 1,225,092 | | |
Imola Merger Corp.
4.75%, 5/15/2029 (b) | | | 1,827,000 | | | | 1,897,705 | | |
Iron Mountain, Inc.
REIT, 5.25%, 7/15/2030 (b) | | | 7,522,000 | | | | 7,813,478 | | |
REIT, 4.50%, 2/15/2031 (b) | | | 1,151,000 | | | | 1,147,869 | | |
Lamb Weston Holdings, Inc.
4.63%, 11/1/2024 (b) | | | 4,015,000 | | | | 4,165,562 | | |
4.88%, 11/1/2026 (b) | | | 803,000 | | | | 833,113 | | |
Level 3 Financing, Inc.
3.75%, 7/15/2029 (b) | | | 128,000 | | | | 124,800 | | |
Lumen Technologies, Inc.
Series S, 6.45%, 6/15/2021 | | | 1,331,000 | | | | 1,337,655 | | |
Meredith Corp.
6.88%, 2/1/2026 | | | 1,378,000 | | | | 1,414,173 | | |
Mileage Plus Holdings LLC
6.50%, 6/20/2027 (b) | | | 3,324,031 | | | | 3,648,124 | | |
NortonLifeLock, Inc.
3.95%, 6/15/2022 | | | 1,020,000 | | | | 1,032,750 | | |
Pilgrim's Pride Corp.
5.88%, 9/30/2027 (b) | | | 3,343,000 | | | | 3,547,759 | | |
4.25%, 4/15/2031 (b) | | | 2,699,000 | | | | 2,726,826 | | |
SBA Communications Corp.
REIT, 3.13%, 2/1/2029 (b) | | | 715,000 | | | | 684,950 | | |
Scripps Escrow II, Inc.
5.38%, 1/15/2031 (b) | | | 64,000 | | | | 64,880 | | |
First Eagle Funds | Semiannual Report | April 30, 2021
80
First Eagle Global Income Builder Fund | Schedule of Investments | April 30, 2021 (unaudited)
Investments | | Principal Amount ($) | | Value ($) | |
United States — 10.5% (continued) | |
SEG Holding LLC
5.63%, 10/15/2028 (b) | | | 5,461,000 | | | | 5,747,703 | | |
Spectrum Brands, Inc.
5.75%, 7/15/2025 | | | 1,520,000 | | | | 1,564,688 | | |
Sprint Communications, Inc.
6.00%, 11/15/2022 | | | 1,800,000 | | | | 1,921,068 | | |
Taylor Morrison Communities, Inc.
5.88%, 4/15/2023 (b) | | | 3,107,000 | | | | 3,336,141 | | |
5.13%, 8/1/2030 (b) | | | 2,000,000 | | | | 2,202,920 | | |
Teleflex, Inc.
4.63%, 11/15/2027 | | | 824,000 | | | | 876,308 | | |
T-Mobile USA, Inc.
6.00%, 4/15/2024 | | | 2,698,000 | | | | 2,714,862 | | |
Truist Financial Corp.
Series N, (US Treasury Yield Curve Rate T Note
Constant Maturity 5 Year + 3.00%), 4.80%, 9/1/2024 (d)(e) | | | 2,170,000 | | | | 2,296,945 | | |
United Airlines Pass-Through Trust
Series 2020-1, Class A, 5.88%, 10/15/2027 | | | 3,944,589 | | | | 4,363,524 | | |
Valvoline, Inc.
4.25%, 2/15/2030 (b) | | | 224,000 | | | | 229,596 | | |
3.63%, 6/15/2031 (b) | | | 511,000 | | | | 499,502 | | |
WESCO Distribution, Inc.
5.38%, 6/15/2024 | | | 578,000 | | | | 588,982 | | |
7.13%, 6/15/2025 (b) | | | 1,780,000 | | | | 1,922,400 | | |
7.25%, 6/15/2028 (b) | | | 2,136,000 | | | | 2,370,960 | | |
Western Digital Corp.
4.75%, 2/15/2026 | | | 4,523,000 | | | | 5,014,876 | | |
| | | | 139,338,414 | | |
Total Corporate Bonds
(Cost $157,684,863) | | | 164,808,024 | | |
| | | Ounces | | | |
Commodities — 7.7% | |
Gold bullion*
(Cost $71,533,113) | | | 57,789 | | | | 102,166,753 | | |
First Eagle Funds | Semiannual Report | April 30, 2021
81
First Eagle Global Income Builder Fund | Schedule of Investments | April 30, 2021 (unaudited)
Investments | | Principal Amount ($) | | Value ($) | |
U.S. Treasury Obligations — 6.3% | |
U.S. Treasury Notes
1.13%, 6/30/2021 | | | 14,554,000 | | | | 14,579,061 | | |
1.63%, 12/15/2022 | | | 9,300,000 | | | | 9,525,234 | | |
2.63%, 6/30/2023 | | | 12,267,700 | | | | 12,913,192 | | |
2.63%, 12/31/2023 | | | 7,100,000 | | | | 7,542,641 | | |
2.50%, 1/31/2024 | | | 12,380,900 | | | | 13,131,008 | | |
1.75%, 6/30/2024 | | | 12,850,000 | | | | 13,403,654 | | |
1.75%, 12/31/2024 | | | 12,247,000 | | | | 12,797,637 | | |
| | | | 83,892,427 | | |
Total U.S. Treasury Obligations
(Cost $82,830,072) | | | 83,892,427 | | |
| | | Shares | | | |
Master Limited Partnerships — 2.0% | |
United States — 2.0% | |
Enterprise Products Partners LP (a) | | | 618,646 | | | | 14,235,044 | | |
Magellan Midstream Partners LP (a) | | | 272,923 | | | | 12,764,609 | | |
Total Master Limited Partnerships
(Cost $23,699,259) | | | 26,999,653 | | |
Preferred Stocks — 1.4% | |
United States — 1.4% | |
Charles Schwab Corp. (The),
Series C 6.00%, 06/01/21 (e) | | | 99,775 | | | | 2,529,296 | | |
Charles Schwab Corp. (The),
Series D 5.95%, 06/07/21 (e) | | | 46,239 | | | | 1,180,482 | | |
General American Investors Co., Inc.,
Series B 5.95%, 06/07/21 (e) | | | 4,712 | | | | 127,625 | | |
MetLife, Inc., Series A (ICE LIBOR USD 3 Month +
1.00%, 4.00% Floor), 4.00%, 06/07/21 (d)(e) | | | 67,936 | | | | 1,724,895 | | |
Northern Trust Corp., Series E 4.70%, 01/01/25 (e) | | | 101,453 | | | | 2,750,391 | | |
State Street Corp., Series G (ICE LIBOR USD 3 Month +
3.71%), 5.35%, 03/15/26 (d)(e) | | | 24,946 | | | | 728,922 | | |
Truist Financial Corp., Series R 4.75%, 09/01/25 (e) | | | 175,050 | | | | 4,642,326 | | |
US Bancorp, Series B (ICE LIBOR USD 3 Month + 0.60%),
3.50%, 06/07/21 (d)(e) | | | 90,050 | | | | 2,188,215 | | |
US Bancorp, Series F (ICE LIBOR USD 3 Month + 4.47%),
6.50%, 01/15/22 (d)(e) | | | 110,325 | | | | 2,870,656 | | |
Total Preferred Stocks
(Cost $18,192,168) | | | 18,742,808 | | |
First Eagle Funds | Semiannual Report | April 30, 2021
82
First Eagle Global Income Builder Fund | Schedule of Investments | April 30, 2021 (unaudited)
Investments | | Shares | | Value ($) | |
Closed End Funds — 0.9% | |
United Kingdom — 0.9% | |
Caledonia Investments plc
(Cost $10,284,424) | | | 291,700 | | | | 12,004,998 | | |
| | | Principal Amount ($) | | | |
Convertible Preferred Stocks — 0.8% | |
United States — 0.8% | |
Wells Fargo & Co.
Series L, 7.50%, (e) (Cost $11,028,654) | | | 7,708 | | | | 11,051,885 | | |
Foreign Government Securities — 0.4% | |
Indonesia — 0.1% | |
Republic of Indonesia
8.38%, 3/15/2024 | | IDR | 24,460,000,000 | | | | 1,833,865 | | |
Mexico — 0.3% | |
Mex Bonos Desarr Fix Rt
8.00%, 12/7/2023 | | MXN | 68,770,000 | | | | 3,623,045 | | |
Total Foreign Government Securities
(Cost $5,606,994) | | | 5,456,910 | | |
| | | Number of Warrants | | | |
Warrants — 0.0% (f) | |
Switzerland — 0.0% (f) | |
Cie Financiere Richemont SA, expiring 11/22/2023*
(Cost $—) | | | 391,032 | | | | 166,989 | | |
| | | Principal Amount ($) | | | |
Short-Term Investments — 5.6% | |
Commercial Paper — 5.5% | |
Entergy Corp.
0.10%, 5/3/2021 (b)(g) | | | 3,056,000 | | | | 3,055,973 | | |
General Motors Financial Co., Inc.
0.28%, 5/3/2021 (g) | | | 10,186,000 | | | | 10,185,742 | | |
Glencore Funding LLC
0.14%, 5/3/2021 (g) | | | 10,186,000 | | | | 10,185,886 | | |
Hitachi International Treasury Ltd.
0.11%, 5/3/2021 (g) | | | 34,836,000 | | | | 34,835,623 | | |
First Eagle Funds | Semiannual Report | April 30, 2021
83
First Eagle Global Income Builder Fund | Schedule of Investments | April 30, 2021 (unaudited)
Investments | | Principal Amount ($) | | Value ($) | |
Commercial Paper — 5.5% (continued) | |
Mitsui & Co. USA, Inc.
0.14%, 5/3/2021 (g) | | | 15,279,000 | | | | 15,278,835 | | |
Total Commercial Paper
(Cost $73,542,414) | | | 73,542,059 | | |
| | | Shares | | | |
Investment Companies — 0.1% | |
JP Morgan U.S. Government Money Market Fund,
Capital Shares 0.03% (h)
(Cost $725,706) | | | 725,706 | | | | 725,706 | | |
Total Short-Term Investments
(Cost $74,268,120) | | | 74,267,765 | | |
Total Investments — 100.5%
(Cost $1,150,478,554) | | | 1,339,546,059 | | |
Liabilities in Excess of Other Assets — (0.5)% | | | (7,289,912 | ) | |
Net Assets — 100.0% | | | 1,332,256,147 | | |
* Non-income producing security.
‡ Value determined using significant unobservable inputs.
(a) All or a portion of the security pledged as collateral for call options written.
(b) Securities exempt from registration under Rule 144A or section 4(a)2 of the Securities Act of 1933. Total value of all such securities at April 30, 2021 amounted to $120,658,627, which represents approximately 9.06% of net assets of the Fund.
(c) Security has the ability to pay in kind ("PIK") or pay income in cash. When applicable, separate rates of such payments are disclosed.
(d) Variable or floating rate security, linked to the referenced benchmark. The interest rate shown is the rate in effect as of April 30, 2021.
(e) Perpetual security. The rate reflected was the rate in effect on April 30, 2021. The maturity date reflects the next call date.
(f) Represents less than 0.05% of net assets.
(g) The rate shown was the current yield as of April 30, 2021.
(h) Represents 7-day effective yield as of April 30, 2021.
As of April 30, 2021, the gross unrealized appreciation (depreciation) of investments based on the aggregate cost of investment securities and derivative instruments, if applicable, for federal income tax purposes was as follows:
Aggregate gross unrealized appreciation | | $ | 225,233,739 | | |
Aggregate gross unrealized depreciation | | | (36,177,485 | ) | |
Net unrealized appreciation | | $ | 189,056,254 | | |
Federal income tax cost | | $ | 1,150,478,554 | | |
First Eagle Funds | Semiannual Report | April 30, 2021
84
First Eagle Global Income Builder Fund | Schedule of Investments | April 30, 2021 (unaudited)
Forward Foreign Currency Exchange Contracts outstanding as of April 30, 2021
Currency
Purchased | | Currency Sold | | Counterparty | | Settlement
Date | | Unrealized
Appreciation
(Depreciation) | |
USD | 6,690,629 | | | EUR | 5,492,000 | | | Goldman Sachs | | 5/19/2021 | | $ | 85,904 | | |
USD | 2,653,947 | | | GBP | 1,916,000 | | | Goldman Sachs | | 5/19/2021 | | | 7,771 | | |
USD | 314,993 | | | EUR | 256,000 | | | JPMorgan Chase Bank | | 6/16/2021 | | | 6,938 | | |
USD | 3,209,152 | | | EUR | 2,630,000 | | | JPMorgan Chase Bank | | 6/16/2021 | | | 44,369 | | |
USD | 5,001,590 | | | EUR | 4,112,000 | | | JPMorgan Chase Bank | | 7/14/2021 | | | 50,438 | | |
USD | 3,543,207 | | | EUR | 2,910,000 | | | HSBC Bank plc | | 8/18/2021 | | | 36,814 | | |
Total unrealized appreciation | | | 232,234 | | |
USD | 4,982,602 | | | EUR | 4,181,000 | | | UBS AG | | 9/15/2021 | | | (58,321 | ) | |
USD | 3,570,683 | | | GBP | 2,594,000 | | | UBS AG | | 9/15/2021 | | | (13,087 | ) | |
USD | 720,543 | | | EUR | 599,000 | | | JPMorgan Chase Bank | | 12/15/2021 | | | (3,249 | ) | |
Total unrealized depreciation | | | (74,657 | ) | |
Net unrealized appreciation | | $ | 157,577 | | |
Abbreviations
ADR — American Depositary Receipt
EUR — Euro
Fix Rt — Fixed Rate
GBP — British Pound
ICE — Intercontinental Exchange
IDR — Indonesian Rupiah
LIBOR — London Interbank Offered Rate
MXN — Mexican Peso
NVDR — Non-Voting Depositary Receipt
Preference — A special type of equity investment that shares in the earnings of the company, has limited voting rights, and may have a dividend preference. Preference shares may also have liquidation preference.
REIT — Real Estate Investment Trust
USD — United States Dollar
First Eagle Funds | Semiannual Report | April 30, 2021
85
First Eagle Global Income Builder Fund | Schedule of Investments | April 30, 2021 (unaudited)
Written Call Options Contracts as of April 30, 2021
Description | | Counterparty | | Number of
Contracts | | Notional
Amount | | Exercise
Price | | Expiration
Date | | Value ($) | |
American
Express Co. | | Exchange Traded | | | 86 | | | USD | (1,318,810 | ) | | USD | 160.00 | | | 6/18/2021 | | | (24,682 | ) | |
American
Express Co. | | Exchange Traded | | | 88 | | | USD | (1,349,480 | ) | | USD | 170.00 | | | 9/17/2021 | | | (35,200 | ) | |
Analog Devices, Inc. | | Exchange Traded | | | 80 | | | USD | (1,225,280 | ) | | USD | 190.00 | | | 9/17/2021 | | | (19,800 | ) | |
Anthem, Inc. | | Exchange Traded | | | 43 | | | USD | (1,631,377 | ) | | USD | 380.00 | | | 9/17/2021 | | | (104,060 | ) | |
Anthem, Inc. | | Exchange Traded | | | 40 | | | USD | (1,517,560 | ) | | USD | 390.00 | | | 6/18/2021 | | | (33,600 | ) | |
Anthem, Inc. | | Exchange Traded | | | 35 | | | USD | (1,327,865 | ) | | USD | 400.00 | | | 6/18/2021 | | | (16,520 | ) | |
Anthem, Inc. | | Exchange Traded | | | 40 | | | USD | (1,517,560 | ) | | USD | 420.00 | | | 6/18/2021 | | | (6,000 | ) | |
Anthem, Inc. | | Exchange Traded | | | 35 | | | USD | (1,327,865 | ) | | USD | 450.00 | | | 9/17/2021 | | | (13,300 | ) | |
Bank of New York
Mellon Corp. (The) | | Exchange Traded | | | 275 | | | USD | (1,371,700 | ) | | USD | 60.00 | | | 9/17/2021 | | | (12,375 | ) | |
Bank of New York
Mellon Corp. (The) | | Exchange Traded | | | 274 | | | USD | (1,366,712 | ) | | USD | 65.00 | | | 1/21/2022 | | | (17,810 | ) | |
Boston Properties,
Inc. | | Exchange Traded | | | 133 | | | USD | (1,454,355 | ) | | USD | 110.00 | | | 5/21/2021 | | | (30,590 | ) | |
CH Robinson
Worldwide, Inc. | | Exchange Traded | | | 146 | | | USD | (1,417,368 | ) | | USD | 120.00 | | | 5/21/2021 | | | (16,060 | ) | |
CH Robinson
Worldwide, Inc. | | Exchange Traded | | | 133 | | | USD | (1,291,164 | ) | | USD | 120.00 | | | 6/18/2021 | | | (21,945 | ) | |
CH Robinson
Worldwide, Inc. | | Exchange Traded | | | 139 | | | USD | (1,349,412 | ) | | USD | 120.00 | | | 8/20/2021 | | | (6,950 | ) | |
CH Robinson
Worldwide, Inc. | | Exchange Traded | | | 268 | | | USD | (2,601,744 | ) | | USD | 120.00 | | | 11/19/2021 | | | (20,770 | ) | |
CH Robinson
Worldwide, Inc. | | Exchange Traded | | | 126 | | | USD | (1,223,208 | ) | | USD | 120.00 | | | 1/21/2022 | | | (15,435 | ) | |
Colgate-Palmolive
Co. | | Exchange Traded | | | 143 | | | USD | (1,154,010 | ) | | USD | 95.00 | | | 5/21/2021 | | | (6,435 | ) | |
Colgate-Palmolive
Co. | | Exchange Traded | | | 160 | | | USD | (1,291,200 | ) | | USD | 95.00 | | | 11/19/2021 | | | (7,200 | ) | |
Colgate-Palmolive
Co. | | Exchange Traded | | | 150 | | | USD | (1,210,500 | ) | | USD | 100.00 | | | 5/21/2021 | | | (2,250 | ) | |
Colgate-Palmolive
Co. | | Exchange Traded | | | 166 | | | USD | (1,339,620 | ) | | USD | 100.00 | | | 1/21/2022 | | | (7,055 | ) | |
Cummins, Inc. | | Exchange Traded | | | 48 | | | USD | (1,209,792 | ) | | USD | 270.00 | | | 6/18/2021 | | | (12,960 | ) | |
Enterprise Products
Partners LP | | Exchange Traded | | | 582 | | | USD | (1,339,182 | ) | | USD | 25.00 | | | 6/18/2021 | | | (11,640 | ) | |
Enterprise Products
Partners LP | | Exchange Traded | | | 607 | | | USD | (1,396,707 | ) | | USD | 26.00 | | | 6/18/2021 | | | (5,463 | ) | |
Enterprise Products
Partners LP | | Exchange Traded | | | 526 | | | USD | (1,210,326 | ) | | USD | 30.00 | | | 9/17/2021 | | | (3,682 | ) | |
First Eagle Funds | Semiannual Report | April 30, 2021
86
First Eagle Global Income Builder Fund | Schedule of Investments | April 30, 2021 (unaudited)
Written Call Options Contracts as of April 30, 2021 (continued)
Description | | Counterparty | | Number of
Contracts | | Notional
Amount | | Exercise
Price | | Expiration
Date | | Value ($) | |
Equity Residential | | Exchange Traded | | | 194 | | | USD | (1,440,062 | ) | | USD | 75.00 | | | 7/16/2021 | | | (39,770 | ) | |
Equity Residential | | Exchange Traded | | | 182 | | | USD | (1,350,986 | ) | | USD | 95.00 | | | 1/21/2022 | | | (7,735 | ) | |
Exxon Mobil Corp. | | Exchange Traded | | | 627 | | | USD | (3,588,948 | ) | | USD | 60.00 | | | 5/21/2021 | | | (28,215 | ) | |
Exxon Mobil Corp. | | Exchange Traded | | | 320 | | | USD | (1,831,680 | ) | | USD | 65.00 | | | 5/21/2021 | | | (2,880 | ) | |
Exxon Mobil Corp. | | Exchange Traded | | | 320 | | | USD | (1,831,680 | ) | | USD | 65.00 | | | 6/18/2021 | | | (10,880 | ) | |
Exxon Mobil Corp. | | Exchange Traded | | | 262 | | | USD | (1,499,688 | ) | | USD | 70.00 | | | 6/18/2021 | | | (3,930 | ) | |
Exxon Mobil Corp. | | Exchange Traded | | | 235 | | | USD | (1,345,140 | ) | | USD | 70.00 | | | 9/17/2021 | | | (15,275 | ) | |
Exxon Mobil Corp. | | Exchange Traded | | | 492 | | | USD | (2,816,208 | ) | | USD | 75.00 | | | 5/21/2021 | | | (984 | ) | |
Exxon Mobil Corp. | | Exchange Traded | | | 262 | | | USD | (1,499,688 | ) | | USD | 75.00 | | | 6/18/2021 | | | (1,572 | ) | |
Exxon Mobil Corp. | | Exchange Traded | | | 230 | | | USD | (1,316,520 | ) | | USD | 80.00 | | | 6/18/2021 | | | (920 | ) | |
Exxon Mobil Corp. | | Exchange Traded | | | 231 | | | USD | (1,322,244 | ) | | USD | 80.00 | | | 1/21/2022 | | | (12,474 | ) | |
General Dynamics
Corp. | | Exchange Traded | | | 72 | | | USD | (1,369,656 | ) | | USD | 200.00 | | | 8/20/2021 | | | (32,760 | ) | |
HCA Healthcare, Inc. | | Exchange Traded | | | 73 | | | USD | (1,467,738 | ) | | USD | 220.00 | | | 6/18/2021 | | | (10,220 | ) | |
HCA Healthcare, Inc. | | Exchange Traded | | | 73 | | | USD | (1,467,738 | ) | | USD | 230.00 | | | 6/18/2021 | | | (4,745 | ) | |
HCA Healthcare, Inc. | | Exchange Traded | | | 73 | | | USD | (1,467,738 | ) | | USD | 230.00 | | | 9/17/2021 | | | (33,215 | ) | |
HCA Healthcare, Inc. | | Exchange Traded | | | 70 | | | USD | (1,407,420 | ) | | USD | 250.00 | | | 9/17/2021 | | | (10,325 | ) | |
Kraft Heinz Co. (The) | | Exchange Traded | | | 321 | | | USD | (1,325,409 | ) | | USD | 45.00 | | | 7/16/2021 | | | (14,124 | ) | |
Kraft Heinz Co. (The) | | Exchange Traded | | | 321 | | | USD | (1,325,409 | ) | | USD | 45.00 | | | 10/15/2021 | | | (37,236 | ) | |
Linde plc | | Exchange Traded | | | 44 | | | USD | (1,257,696 | ) | | USD | 310.00 | | | 7/16/2021 | | | (12,320 | ) | |
Linde plc | | Exchange Traded | | | 44 | | | USD | (1,257,696 | ) | | USD | 310.00 | | | 10/15/2021 | | | (33,660 | ) | |
Linde plc | | Exchange Traded | | | 44 | | | USD | (1,257,696 | ) | | USD | 310.00 | | | 12/17/2021 | | | (50,600 | ) | |
Linde plc | | Exchange Traded | | | 44 | | | USD | (1,257,696 | ) | | USD | 330.00 | | | 10/15/2021 | | | (15,180 | ) | |
Magellan Midstream
Partners LP | | Exchange Traded | | | 283 | | | USD | (1,323,591 | ) | | USD | 50.00 | | | 7/16/2021 | | | (14,150 | ) | |
Magellan Midstream
Partners LP | | Exchange Traded | | | 302 | | | USD | (1,412,454 | ) | | USD | 50.00 | | | 10/15/2021 | | | (31,710 | ) | |
Magellan Midstream
Partners LP | | Exchange Traded | | | 288 | | | USD | (1,346,976 | ) | | USD | 50.00 | | | 12/17/2021 | | | (36,720 | ) | |
Magellan Midstream
Partners LP | | Exchange Traded | | | 280 | | | USD | (1,309,560 | ) | | USD | 55.00 | | | 12/17/2021 | | | (14,000 | ) | |
Microsoft Corp. | | Exchange Traded | | | 54 | | | USD | (1,361,772 | ) | | USD | 275.00 | | | 6/18/2021 | | | (6,264 | ) | |
Microsoft Corp. | | Exchange Traded | | | 51 | | | USD | (1,286,118 | ) | | USD | 275.00 | | | 8/20/2021 | | | (25,755 | ) | |
Nutrien Ltd. | | Exchange Traded | | | 250 | | | USD | (1,379,750 | ) | | USD | 55.00 | | | 6/18/2021 | | | (63,750 | ) | |
Nutrien Ltd. | | Exchange Traded | | | 255 | | | USD | (1,407,345 | ) | | USD | 60.00 | | | 6/18/2021 | | | (17,850 | ) | |
Nutrien Ltd. | | Exchange Traded | | | 237 | | | USD | (1,308,003 | ) | | USD | 60.00 | | | 9/17/2021 | | | (49,177 | ) | |
First Eagle Funds | Semiannual Report | April 30, 2021
87
First Eagle Global Income Builder Fund | Schedule of Investments | April 30, 2021 (unaudited)
Written Call Options Contracts as of April 30, 2021 (continued)
Description | | Counterparty | | Number of
Contracts | | Notional
Amount | | Exercise
Price | | Expiration
Date | | Value ($) | |
Nutrien Ltd. | | Exchange Traded | | | 237 | | | USD | (1,308,003 | ) | | USD | 65.00 | | | 11/19/2021 | | | (33,180 | ) | |
Oracle Corp. | | Exchange Traded | | | 207 | | | USD | (1,568,853 | ) | | USD | 75.00 | | | 6/18/2021 | | | (64,170 | ) | |
Oracle Corp. | | Exchange Traded | | | 207 | | | USD | (1,568,853 | ) | | USD | 75.00 | | | 9/17/2021 | | | (103,500 | ) | |
Oracle Corp. | | Exchange Traded | | | 170 | | | USD | (1,288,430 | ) | | USD | 80.00 | | | 6/18/2021 | | | (18,870 | ) | |
Oracle Corp. | | Exchange Traded | | | 181 | | | USD | (1,371,799 | ) | | USD | 85.00 | | | 9/17/2021 | | | (28,417 | ) | |
Oracle Corp. | | Exchange Traded | | | 175 | | | USD | (1,326,325 | ) | | USD | 95.00 | | | 9/17/2021 | | | (9,625 | ) | |
Oracle Corp. | | Exchange Traded | | | 184 | | | USD | (1,394,536 | ) | | USD | 95.00 | | | 12/17/2021 | | | (21,252 | ) | |
Philip Morris
International, Inc. | | Exchange Traded | | | 155 | | | USD | (1,472,500 | ) | | USD | 100.00 | | | 6/18/2021 | | | (11,005 | ) | |
Philip Morris
International, Inc. | | Exchange Traded | | | 143 | | | USD | (1,358,500 | ) | | USD | 105.00 | | | 6/18/2021 | | | (2,574 | ) | |
Philip Morris
International, Inc. | | Exchange Traded | | | 143 | | | USD | (1,358,500 | ) | | USD | 105.00 | | | 9/17/2021 | | | (17,160 | ) | |
Philip Morris
International, Inc. | | Exchange Traded | | | 137 | | | USD | (1,301,500 | ) | | USD | 110.00 | | | 12/17/2021 | | | (20,482 | ) | |
PPG Industries, Inc. | | Exchange Traded | | | 88 | | | USD | (1,506,912 | ) | | USD | 165.00 | | | 5/21/2021 | | | (65,120 | ) | |
Royal Gold, Inc. | | Exchange Traded | | | 109 | | | USD | (1,219,274 | ) | | USD | 140.00 | | | 7/16/2021 | | | (4,088 | ) | |
Schlumberger NV | | Exchange Traded | | | 519 | | | USD | (1,403,895 | ) | | USD | 30.00 | | | 5/21/2021 | | | (11,418 | ) | |
Schlumberger NV | | Exchange Traded | | | 423 | | | USD | (1,144,215 | ) | | USD | 40.00 | | | 8/20/2021 | | | (9,306 | ) | |
Schlumberger NV | | Exchange Traded | | | 509 | | | USD | (1,376,845 | ) | | USD | 40.00 | | | 11/19/2021 | | | (22,905 | ) | |
Schlumberger NV | | Exchange Traded | | | 509 | | | USD | (1,376,845 | ) | | USD | 40.00 | | | 1/21/2022 | | | (36,139 | ) | |
Schlumberger NV | | Exchange Traded | | | 423 | | | USD | (1,144,215 | ) | | USD | 42.50 | | | 8/20/2021 | | | (5,922 | ) | |
Taiwan Semiconductor
Manufacturing
Co. Ltd. | | Exchange Traded | | | 115 | | | USD | (1,342,510 | ) | | USD | 115.00 | | | 10/15/2021 | | | (118,105 | ) | |
Taiwan Semiconductor
Manufacturing
Co. Ltd. | | Exchange Traded | | | 106 | | | USD | (1,237,444 | ) | | USD | 155.00 | | | 7/16/2021 | | | (4,240 | ) | |
Taiwan Semiconductor
Manufacturing
Co. Ltd. | | Exchange Traded | | | 113 | | | USD | (1,319,162 | ) | | USD | 170.00 | | | 10/15/2021 | | | (9,040 | ) | |
Texas Instruments,
Inc. | | Exchange Traded | | | 72 | | | USD | (1,299,672 | ) | | USD | 200.00 | | | 5/21/2021 | | | (1,440 | ) | |
Texas Instruments,
Inc. | | Exchange Traded | | | 69 | | | USD | (1,245,519 | ) | | USD | 220.00 | | | 7/16/2021 | | | (2,208 | ) | |
Texas Instruments,
Inc. | | Exchange Traded | | | 64 | | | USD | (1,155,264 | ) | | USD | 220.00 | | | 10/15/2021 | | | (13,952 | ) | |
Travelers Cos.,
Inc. (The) | | Exchange Traded | | | 96 | | | USD | (1,484,736 | ) | | USD | 150.00 | | | 7/16/2021 | | | (77,280 | ) | |
First Eagle Funds | Semiannual Report | April 30, 2021
88
First Eagle Global Income Builder Fund | Schedule of Investments | April 30, 2021 (unaudited)
Written Call Options Contracts as of April 30, 2021 (continued)
Description | | Counterparty | | Number of
Contracts | | Notional
Amount | | Exercise
Price | | Expiration
Date | | Value ($) | |
Travelers Cos.,
Inc. (The) | | Exchange Traded | | | 81 | | | USD | (1,252,746 | ) | | USD | 170.00 | | | 7/16/2021 | | | (8,302 | ) | |
UGI Corp. | | Exchange Traded | | | 295 | | | USD | (1,289,445 | ) | | USD | 50.00 | | | 10/15/2021 | | | (20,650 | ) | |
Union Pacific Corp. | | Exchange Traded | | | 57 | | | USD | (1,265,913 | ) | | USD | 240.00 | | | 8/20/2021 | | | (23,712 | ) | |
US Bancorp | | Exchange Traded | | | 228 | | | USD | (1,353,180 | ) | | USD | 65.00 | | | 9/17/2021 | | | (34,656 | ) | |
US Bancorp | | Exchange Traded | | | 225 | | | USD | (1,335,375 | ) | | USD | 70.00 | | | 9/17/2021 | | | (13,050 | ) | |
US Bancorp | | Exchange Traded | | | 225 | | | USD | (1,335,375 | ) | | USD | 75.00 | | | 9/17/2021 | | | (5,737 | ) | |
Wells Fargo & Co. | | Exchange Traded | | | 449 | | | USD | (2,022,745 | ) | | USD | 45.00 | | | 5/21/2021 | | | (53,431 | ) | |
Wells Fargo & Co. | | Exchange Traded | | | 449 | | | USD | (2,022,745 | ) | | USD | 45.00 | | | 6/18/2021 | | | (85,310 | ) | |
Wells Fargo & Co. | | Exchange Traded | | | 291 | | | USD | (1,310,955 | ) | | USD | 55.00 | | | 7/16/2021 | | | (9,894 | ) | |
Wells Fargo & Co. | | Exchange Traded | | | 331 | | | USD | (1,491,155 | ) | | USD | 55.00 | | | 9/17/2021 | | | (25,156 | ) | |
Weyerhaeuser Co. | | Exchange Traded | | | 397 | | | USD | (1,539,169 | ) | | USD | 37.00 | | | 7/16/2021 | | | (114,336 | ) | |
Weyerhaeuser Co. | | Exchange Traded | | | 336 | | | USD | (1,302,672 | ) | | USD | 50.00 | | | 1/21/2022 | | | (24,528 | ) | |
Wheaton Precious
Metals Corp. | | Exchange Traded | | | 312 | | | USD | (1,289,184 | ) | | USD | 60.00 | | | 12/17/2021 | | | (21,216 | ) | |
| | | | | | | | | | | | | | (2,241,554 | ) | |
Total Written Options Contracts (Premiums Received ($2,072,726)) | | | | | | | | | | | | | (2,241,554 | ) | |
See Notes to Financial Statements.
First Eagle Funds | Semiannual Report | April 30, 2021
89
First Eagle High Income Fund
Data as of April 30, 2021 (unaudited)
Investment Objective
The First Eagle High Income Fund seeks to provide investors with a high level of current income. To pursue this objective, the Fund normally invests at least 80% of its net assets (plus any borrowings for investment purposes) in high yield, below investment-grade instruments.
Average Annual Returns^ (%) | | | | One Year | | Five Years | | Ten Years | |
First Eagle High Income Fund | | Class I | | | 16.32 | | | | 6.01 | | | | 4.77 | | |
Bloomberg Barclays U.S. Corporate High Yield Index | | | | | 19.67 | | | | 7.46 | | | | 6.43 | | |
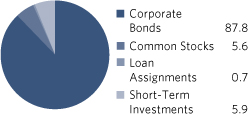
Sectors* (%)
Consumer Staples | | | 16.4 | | |
Consumer Discretionary | | | 13.8 | | |
Energy | | | 11.8 | | |
Industrials | | | 10.7 | | |
Materials | | | 8.9 | | |
Health Care | | | 8.5 | | |
Communication Services | | | 7.7 | | |
Information Technology | | | 7.3 | | |
Real Estate | | | 5.1 | | |
Financials | | | 3.9 | | |
Short-Term Investments | | | 5.9 | | |
Countries*~ (%)
United States | | | 82.4 | | |
Canada | | | 3.7 | | |
Germany | | | 3.7 | | |
United Kingdom | | | 2.0 | | |
Mexico | | | 1.0 | | |
Australia | | | 0.8 | | |
Singapore | | | 0.4 | | |
Poland | | | 0.1 | | |
Short-Term Investments | | | 5.9 | | |
^Performance figures reflect certain fee waivers and/or expense limitations, without which returns may have been lower.
* Asset Allocation, Sector and Countries percentages are based on total investments in the portfolio.
~Country allocations reflect country of risk (not currency of issue). Bonds of non-U.S. issuers may be U.S. dollar denominated.
The Fund's portfolio composition is subject to change at any time.
First Eagle Funds | Semiannual Report | April 30, 2021
90
First Eagle High Income Fund | Fund Overview
Growth of a $1,000,000 Initial Investment
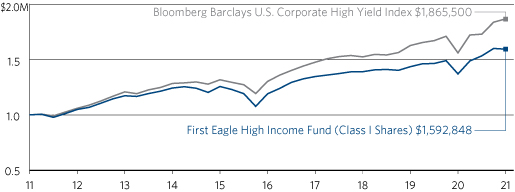
Performance data quoted herein represents past performance and should not be considered indicative of future results. Performance data quoted herein does not reflect the deduction of taxes that a shareholder would pay on Fund distributions or the sale of Fund shares. The average annual returns shown above are historical and reflect changes in share price, reinvested dividends and are net of expenses.
Class I Shares require $1 million minimum investment and are offered without a sales charge. If a sales charge was included values would be lower.
The Bloomberg Barclays U.S. Corporate High Yield Index is composed of fixed-rate, publicly issued, non-investment grade debt and is unmanaged, with dividends reinvested. The index includes both corporate and non-corporate sectors. The corporate sectors are Industrial, Utility, and Finance, which include both U.S. and non-U.S. corporations. One cannot invest directly in an index.
Top 10 Holdings* (%)
Southeastern Grocers, Inc. (Food & Staples Retailing, United States) | | | 5.6 | | |
Antero Resources Corp. (Oil, Gas & Consumable Fuels, United States) | | | 2.7 | | |
DCP Midstream Operating LP (Oil, Gas & Consumable Fuels, United States) | | | 2.2 | | |
Dell International LLC (Technology Hardware, Storage & Peripherals, United States) | | | 2.0 | | |
EnQuest plc (Oil, Gas & Consumable Fuels, United Kingdom) | | | 1.9 | | |
GLP Capital LP (Equity Real Estate Investment Trusts (REITs), United States) | | | 1.7 | | |
CITGO Petroleum Corp. (Oil, Gas & Consumable Fuels, United States) | | | 1.7 | | |
Qwest Corp. (Diversified Telecommunication Services, United States) | | | 1.7 | | |
Crown Americas LLC (Containers & Packaging, United States) | | | 1.6 | | |
IHO Verwaltungs GmbH (Auto Components, Germany) | | | 1.6 | | |
Total | | | 22.7 | | |
*Holdings in cash, commercial paper and other short-term cash equivalents have been excluded. Percentages are based on total net assets.
First Eagle Funds | Semiannual Report | April 30, 2021
91
First Eagle High Income Fund | Schedule of Investments | April 30, 2021 (unaudited)
Investments | | Principal Amount ($) | | Value ($) | |
Corporate Bonds — 87.2% | |
Australia — 0.7% | |
Nufarm Australia Ltd.
5.75%, 4/30/2026 (a) | | | 1,721,000 | | | | 1,766,744 | | |
Canada — 3.7% | |
Kinross Gold Corp.
4.50%, 7/15/2027 | | | 1,868,000 | | | | 2,124,831 | | |
Kronos Acquisition Holdings, Inc.
7.00%, 12/31/2027 (a) | | | 932,000 | | | | 903,928 | | |
MEG Energy Corp.
5.88%, 2/1/2029 (a) | | | 155,000 | | | | 158,875 | | |
Open Text Corp.
5.88%, 6/1/2026 (a) | | | 94,000 | | | | 96,937 | | |
3.88%, 2/15/2028 (a) | | | 2,190,000 | | | | 2,217,375 | | |
Precision Drilling Corp.
7.75%, 12/15/2023 | | | 2,688,000 | | | | 2,704,800 | | |
Ritchie Bros Auctioneers, Inc.
5.38%, 1/15/2025 (a) | | | 634,000 | | | | 652,386 | | |
| | | | 8,859,132 | | |
Germany — 3.7% | |
Cheplapharm Arzneimittel GmbH
5.50%, 1/15/2028 (a) | | | 2,140,000 | | | | 2,225,600 | | |
IHO Verwaltungs GmbH
4.75%, (4.75% Cash or 5.50% PIK), 9/15/2026 (a)(b) | | | 3,730,000 | | | | 3,825,488 | | |
6.00%, (6.00% Cash or 6.75% PIK), 5/15/2027 (a)(b) | | | 1,280,244 | | | | 1,347,777 | | |
Mercer International, Inc.
5.13%, 2/1/2029 (a) | | | 1,395,000 | | | | 1,442,081 | | |
| | | | 8,840,946 | | |
Mexico — 1.0% | |
Mexico Remittances Funding Fiduciary Estate Management Sarl
4.88%, 1/15/2028 (a) | | | 2,510,000 | | | | 2,362,450 | | |
Poland — 0.2% | |
CANPACK SA
3.13%, 11/1/2025 (a) | | | 200,000 | | | | 203,125 | | |
2.38%, 11/1/2027‡ (a) | | | 112,000 | | | | 137,076 | | |
| | | | 340,201 | | |
Singapore — 0.4% | |
Avation Capital SA
8.25%, (8.25% Cash or 9.00% PIK), 10/31/2026 (a)(b) | | | 1,216,000 | | | | 934,192 | | |
First Eagle Funds | Semiannual Report | April 30, 2021
92
First Eagle High Income Fund | Schedule of Investments | April 30, 2021 (unaudited)
Investments | | Principal Amount ($) | | Value ($) | |
United Kingdom — 1.9% | |
EnQuest plc
7.00%, 10/15/2023 (b)(c) | | | 5,431,561 | | | | 4,616,827 | | |
United States — 75.6% | |
ACCO Brands Corp.
4.25%, 3/15/2029 (a) | | | 3,372,000 | | | | 3,317,205 | | |
Adient US LLC
9.00%, 4/15/2025 (a) | | | 439,000 | | | | 486,522 | | |
American Airlines, Inc.
5.50%, 4/20/2026 (a) | | | 185,000 | | | | 194,250 | | |
5.75%, 4/20/2029 (a) | | | 185,000 | | | | 198,228 | | |
AMN Healthcare, Inc.
4.63%, 10/1/2027 (a) | | | 1,036,000 | | | | 1,069,670 | | |
4.00%, 4/15/2029 (a) | | | 2,109,000 | | | | 2,109,000 | | |
Antero Midstream Partners LP
7.88%, 5/15/2026 (a) | | | 615,000 | | | | 670,350 | | |
Antero Resources Corp.
5.63%, 6/1/2023 | | | 6,341,000 | | | | 6,364,779 | | |
8.38%, 7/15/2026 (a) | | | 932,000 | | | | 1,046,524 | | |
Aramark Services, Inc.
5.00%, 4/1/2025 (a) | | | 623,000 | | | | 639,354 | | |
6.38%, 5/1/2025 (a) | | | 1,163,000 | | | | 1,237,141 | | |
4.75%, 6/1/2026 | | | 1,556,000 | | | | 1,592,955 | | |
5.00%, 2/1/2028 (a) | | | 57,000 | | | | 59,636 | | |
Arcosa, Inc.
4.38%, 4/15/2029 (a) | | | 163,000 | | | | 166,702 | | |
Ardagh Metal Packaging Finance USA LLC
3.25%, 9/1/2028 (a) | | | 657,000 | | | | 647,966 | | |
4.00%, 9/1/2029 (a) | | | 657,000 | | | | 653,715 | | |
B&G Foods, Inc.
5.25%, 4/1/2025 | | | 1,152,000 | | | | 1,185,800 | | |
Ball Corp.
5.00%, 3/15/2022 | | | 1,163,000 | | | | 1,202,775 | | |
Boyd Gaming Corp.
8.63%, 6/1/2025 (a) | | | 726,000 | | | | 803,827 | | |
4.75%, 12/1/2027 | | | 872,000 | | | | 893,879 | | |
BWX Technologies, Inc.
5.38%, 7/15/2026 (a) | | | 168,000 | | | | 173,342 | | |
4.13%, 6/30/2028 (a) | | | 1,000,000 | | | | 1,017,500 | | |
4.13%, 4/15/2029 (a) | | | 653,000 | | | | 670,958 | | |
First Eagle Funds | Semiannual Report | April 30, 2021
93
First Eagle High Income Fund | Schedule of Investments | April 30, 2021 (unaudited)
Investments | | Principal Amount ($) | | Value ($) | |
United States — 75.6% (continued) | |
California Resources Corp.
7.13%, 2/1/2026 (a) | | | 155,000 | | | | 158,770 | | |
Carnival Corp.
11.50%, 4/1/2023 (a) | | | 1,156,000 | | | | 1,328,475 | | |
5.75%, 3/1/2027 (a) | | | 1,242,000 | | | | 1,309,540 | | |
CD&R Smokey Buyer, Inc.
6.75%, 7/15/2025 (a) | | | 162,000 | | | | 172,935 | | |
Centene Corp.
5.38%, 6/1/2026 (a) | | | 400,000 | | | | 416,720 | | |
5.38%, 8/15/2026 (a) | | | 279,000 | | | | 292,671 | | |
4.25%, 12/15/2027 | | | 2,641,000 | | | | 2,768,059 | | |
4.63%, 12/15/2029 | | | 1,228,000 | | | | 1,329,310 | | |
3.38%, 2/15/2030 | | | 190,000 | | | | 190,712 | | |
Central Garden & Pet Co.
4.13%, 4/30/2031 (a) | | | 548,000 | | | | 545,260 | | |
Charles River Laboratories International, Inc.
4.25%, 5/1/2028 (a) | | | 632,000 | | | | 658,116 | | |
3.75%, 3/15/2029 (a) | | | 134,000 | | | | 136,345 | | |
Cinemark USA, Inc.
8.75%, 5/1/2025 (a) | | | 1,127,000 | | | | 1,227,021 | | |
CITGO Petroleum Corp.
7.00%, 6/15/2025 (a) | | | 3,956,000 | | | | 4,079,625 | | |
6.38%, 6/15/2026 (a) | | | 802,000 | | | | 822,130 | | |
Clearwater Paper Corp.
4.75%, 8/15/2028 (a) | | | 305,000 | | | | 307,309 | | |
Cogent Communications Group, Inc.
3.50%, 5/1/2026 (a) | | | 648,000 | | | | 648,000 | | |
CommScope, Inc.
5.50%, 3/1/2024 (a) | | | 2,250,000 | | | | 2,318,940 | | |
Crestwood Midstream Partners LP
6.00%, 2/1/2029 (a) | | | 1,868,000 | | | | 1,931,045 | | |
Crocs, Inc.
4.25%, 3/15/2029 (a) | | | 131,000 | | | | 133,084 | | |
Crown Americas LLC
4.50%, 1/15/2023 | | | 3,692,000 | | | | 3,899,232 | | |
4.75%, 2/1/2026 | | | 1,844,000 | | | | 1,914,072 | | |
Dana, Inc.
5.38%, 11/15/2027 | | | 1,255,000 | | | | 1,335,910 | | |
4.25%, 9/1/2030 | | | 324,000 | | | | 327,240 | | |
First Eagle Funds | Semiannual Report | April 30, 2021
94
First Eagle High Income Fund | Schedule of Investments | April 30, 2021 (unaudited)
Investments | | Principal Amount ($) | | Value ($) | |
United States — 75.6% (continued) | |
DaVita, Inc.
4.63%, 6/1/2030 (a) | | | 734,000 | | | | 743,175 | | |
3.75%, 2/15/2031 (a) | | | 1,529,000 | | | | 1,452,550 | | |
DCP Midstream Operating LP
4.75%, 9/30/2021 (a) | | | 5,186,000 | | | | 5,205,447 | | |
Dell International LLC
7.13%, 6/15/2024 (a) | | | 4,740,000 | | | | 4,867,506 | | |
Delta Air Lines, Inc.
4.50%, 10/20/2025 (a) | | | 1,122,845 | | | | 1,204,422 | | |
7.38%, 1/15/2026 | | | 1,528,000 | | | | 1,794,826 | | |
Dycom Industries, Inc.
4.50%, 4/15/2029 (a) | | | 65,000 | | | | 65,975 | | |
Edgewell Personal Care Co.
4.13%, 4/1/2029 (a) | | | 1,824,000 | | | | 1,819,440 | | |
Energizer Holdings, Inc.
4.75%, 6/15/2028 (a) | | | 8,000 | | | | 8,180 | | |
4.38%, 3/31/2029 (a) | | | 63,000 | | | | 62,528 | | |
EW Scripps Co. (The)
5.13%, 5/15/2025 (a) | | | 1,578,000 | | | | 1,619,486 | | |
Fair Isaac Corp.
4.00%, 6/15/2028 (a) | | | 1,669,000 | | | | 1,691,949 | | |
FirstCash, Inc.
4.63%, 9/1/2028 (a) | | | 1,521,000 | | | | 1,562,828 | | |
Ford Motor Co.
8.50%, 4/21/2023 | | | 1,169,000 | | | | 1,309,280 | | |
Ford Motor Credit Co. LLC
5.88%, 8/2/2021 | | | 2,260,000 | | | | 2,281,470 | | |
Frontier Communications Corp.
5.88%, 10/15/2027 (a) | | | 914,000 | | | | 971,125 | | |
6.75%, 5/1/2029 (a) | | | 308,000 | | | | 324,466 | | |
Genesis Energy LP
8.00%, 1/15/2027 | | | 155,000 | | | | 159,684 | | |
G-III Apparel Group Ltd.
7.88%, 8/15/2025 (a) | | | 1,821,000 | | | | 1,966,680 | | |
GLP Capital LP
REIT, 5.25%, 6/1/2025 | | | 3,627,000 | | | | 4,094,665 | | |
GYP Holdings III Corp.
4.63%, 5/1/2029 (a) | | | 651,000 | | | | 651,950 | | |
Hawaiian Brand Intellectual Property Ltd.
5.75%, 1/20/2026 (a) | | | 1,240,000 | | | | 1,309,750 | | |
First Eagle Funds | Semiannual Report | April 30, 2021
95
First Eagle High Income Fund | Schedule of Investments | April 30, 2021 (unaudited)
Investments | | Principal Amount ($) | | Value ($) | |
United States — 75.6% (continued) | |
HCA, Inc.
5.88%, 5/1/2023 | | | 1,470,000 | | | | 1,604,252 | | |
3.50%, 9/1/2030 | | | 607,000 | | | | 623,905 | | |
Hill-Rom Holdings, Inc.
5.00%, 2/15/2025 (a) | | | 2,720,000 | | | | 2,792,624 | | |
4.38%, 9/15/2027 (a) | | | 306,000 | | | | 316,710 | | |
Howard Hughes Corp. (The)
4.38%, 2/1/2031 (a) | | | 62,000 | | | | 61,380 | | |
Imola Merger Corp.
4.75%, 5/15/2029 (a) | | | 691,000 | | | | 717,742 | | |
Interface, Inc.
5.50%, 12/1/2028 (a) | | | 1,294,000 | | | | 1,345,760 | | |
International Game Technology plc
5.25%, 1/15/2029 (a) | | | 967,000 | | | | 1,025,384 | | |
IQVIA, Inc.
5.00%, 10/15/2026 (a) | | | 800,000 | | | | 827,094 | | |
5.00%, 5/15/2027 (a) | | | 1,075,000 | | | | 1,124,719 | | |
Iron Mountain, Inc.
REIT, 5.25%, 7/15/2030 (a) | | | 1,303,000 | | | | 1,353,491 | | |
REIT, 4.50%, 2/15/2031 (a) | | | 940,000 | | | | 937,443 | | |
J2 Global, Inc.
4.63%, 10/15/2030 (a) | | | 1,827,000 | | | | 1,870,245 | | |
Jazz Securities DAC
4.38%, 1/15/2029 (a) | | | 200,000 | | | | 204,500 | | |
JBS USA LUX SA
6.75%, 2/15/2028 (a) | | | 1,993,000 | | | | 2,202,066 | | |
Kaiser Aluminum Corp.
6.50%, 5/1/2025 (a) | | | 292,000 | | | | 309,520 | | |
4.63%, 3/1/2028 (a) | | | 1,312,000 | | | | 1,348,080 | | |
Koppers, Inc.
6.00%, 2/15/2025 (a) | | | 1,389,000 | | | | 1,427,197 | | |
Lamb Weston Holdings, Inc.
4.63%, 11/1/2024 (a) | | | 1,939,000 | | | | 2,011,712 | | |
4.88%, 11/1/2026 (a) | | | 388,000 | | | | 402,550 | | |
4.88%, 5/15/2028 (a) | | | 581,000 | | | | 640,553 | | |
Level 3 Financing, Inc.
4.25%, 7/1/2028 (a) | | | 589,000 | | | | 593,482 | | |
3.75%, 7/15/2029 (a) | | | 24,000 | | | | 23,400 | | |
First Eagle Funds | Semiannual Report | April 30, 2021
96
First Eagle High Income Fund | Schedule of Investments | April 30, 2021 (unaudited)
Investments | | Principal Amount ($) | | Value ($) | |
United States — 75.6% (continued) | |
Lumen Technologies, Inc.
Series S, 6.45%, 6/15/2021 | | | 1,984,000 | | | | 1,993,920 | | |
Macy's Retail Holdings LLC
3.63%, 6/1/2024 | | | 552,000 | | | | 558,210 | | |
Meredith Corp.
6.88%, 2/1/2026 | | | 2,718,000 | | | | 2,789,348 | | |
MGIC Investment Corp.
5.75%, 8/15/2023 | | | 470,000 | | | | 508,187 | | |
5.25%, 8/15/2028 | | | 612,000 | | | | 645,660 | | |
Mileage Plus Holdings LLC
6.50%, 6/20/2027 (a) | | | 592,428 | | | | 650,190 | | |
Moog, Inc.
4.25%, 12/15/2027 (a) | | | 155,000 | | | | 159,263 | | |
NortonLifeLock, Inc.
3.95%, 6/15/2022 | | | 459,000 | | | | 464,737 | | |
Organon Finance 1 LLC
5.13%, 4/30/2031 (a) | | | 300,000 | | | | 311,280 | | |
Pilgrim's Pride Corp.
5.88%, 9/30/2027 (a) | | | 638,000 | | | | 677,077 | | |
4.25%, 4/15/2031 (a) | | | 847,000 | | | | 855,733 | | |
Post Holdings, Inc.
4.63%, 4/15/2030 (a) | | | 1,826,000 | | | | 1,844,260 | | |
Powdr Corp.
6.00%, 8/1/2025 (a) | | | 152,000 | | | | 159,980 | | |
Qwest Corp.
6.75%, 12/1/2021 | | | 3,947,000 | | | | 4,065,410 | | |
Radian Group, Inc.
4.50%, 10/1/2024 | | | 645,000 | | | | 678,862 | | |
Royal Caribbean Cruises Ltd.
10.88%, 6/1/2023 (a) | | | 1,163,000 | | | | 1,335,124 | | |
RP Escrow Issuer LLC
5.25%, 12/15/2025 (a) | | | 620,000 | | | | 645,364 | | |
SBA Communications Corp.
REIT, 4.88%, 9/1/2024 | | | 2,928,000 | | | | 2,997,540 | | |
REIT, 3.88%, 2/15/2027 | | | 609,000 | | | | 622,809 | | |
REIT, 3.13%, 2/1/2029 (a) | | | 1,242,000 | | | | 1,189,801 | | |
Scripps Escrow II, Inc.
5.38%, 1/15/2031 (a) | | | 2,452,000 | | | | 2,485,715 | | |
First Eagle Funds | Semiannual Report | April 30, 2021
97
First Eagle High Income Fund | Schedule of Investments | April 30, 2021 (unaudited)
Investments | | Principal Amount ($) | | Value ($) | |
United States — 75.6% (continued) | |
Sealed Air Corp.
4.00%, 12/1/2027 (a) | | | 1,252,000 | | | | 1,311,470 | | |
SEG Holding LLC
5.63%, 10/15/2028 (a) | | | 3,198,000 | | | | 3,365,895 | | |
Sensata Technologies, Inc.
3.75%, 2/15/2031 (a) | | | 1,221,000 | | | | 1,212,502 | | |
Shea Homes LP
4.75%, 2/15/2028 (a) | | | 1,668,000 | | | | 1,697,190 | | |
Silversea Cruise Finance Ltd.
7.25%, 2/1/2025 (a) | | | 1,488,000 | | | | 1,539,931 | | |
Spectrum Brands, Inc.
5.75%, 7/15/2025 | | | 2,968,000 | | | | 3,055,259 | | |
Sprint Communications, Inc.
6.00%, 11/15/2022 | | | 1,026,000 | | | | 1,095,009 | | |
Taylor Morrison Communities, Inc.
5.88%, 4/15/2023 (a) | | | 3,228,000 | | | | 3,466,065 | | |
5.75%, 1/15/2028 (a) | | | 918,000 | | | | 1,036,192 | | |
Teleflex, Inc.
4.63%, 11/15/2027 | | | 1,005,000 | | | | 1,068,797 | | |
4.25%, 6/1/2028 (a) | | | 58,000 | | | | 59,885 | | |
T-Mobile USA, Inc.
6.00%, 4/15/2024 | | | 973,000 | | | | 979,081 | | |
Triton Water Holdings, Inc.
6.25%, 4/1/2029 (a) | | | 1,638,000 | | | | 1,658,475 | | |
Turning Point Brands, Inc.
5.63%, 2/15/2026 (a) | | | 930,000 | | | | 960,225 | | |
United Airlines Pass-Through Trust
Series 2020-1, Class A, 5.88%, 10/15/2027 | | | 740,384 | | | | 819,016 | | |
United Airlines, Inc.
4.38%, 4/15/2026 (a) | | | 343,000 | | | | 355,938 | | |
4.63%, 4/15/2029 (a) | | | 229,000 | | | | 237,977 | | |
United Natural Foods, Inc.
6.75%, 10/15/2028 (a) | | | 1,530,000 | | | | 1,648,575 | | |
United Wholesale Mortgage LLC
5.50%, 4/15/2029 (a) | | | 326,000 | | | | 320,386 | | |
US Acute Care Solutions LLC
6.38%, 3/1/2026 (a) | | | 309,000 | | | | 322,596 | | |
Valvoline, Inc.
3.63%, 6/15/2031 (a) | | | 2,555,000 | | | | 2,497,513 | | |
First Eagle Funds | Semiannual Report | April 30, 2021
98
First Eagle High Income Fund | Schedule of Investments | April 30, 2021 (unaudited)
Investments | | Principal Amount ($) | | Value ($) | |
United States — 75.6% (continued) | |
VICI Properties LP
REIT, 4.25%, 12/1/2026 (a) | | | 245,000 | | | | 252,657 | | |
REIT, 3.75%, 2/15/2027 (a) | | | 305,000 | | | | 307,449 | | |
REIT, 4.13%, 8/15/2030 (a) | | | 305,000 | | | | 309,767 | | |
Vista Outdoor, Inc.
4.50%, 3/15/2029 (a) | | | 1,857,000 | | | | 1,855,849 | | |
WESCO Distribution, Inc.
7.13%, 6/15/2025 (a) | | | 1,542,000 | | | | 1,665,360 | | |
7.25%, 6/15/2028 (a) | | | 1,850,000 | | | | 2,053,500 | | |
Western Digital Corp.
4.75%, 2/15/2026 | | | 1,850,000 | | | | 2,051,187 | | |
White Cap Parent LLC
8.25%, 3/15/2026 (a)(b) | | | 1,972,000 | | | | 2,045,950 | | |
Wyndham Hotels & Resorts, Inc.
4.38%, 8/15/2028 (a) | | | 1,222,000 | | | | 1,261,348 | | |
Yum! Brands, Inc.
7.75%, 4/1/2025 (a) | | | 797,000 | | | | 870,723 | | |
| | | | 180,604,027 | | |
Total Corporate Bonds
(Cost $201,657,058) | | | 208,324,519 | | |
| | | Shares | | | |
Common Stocks — 5.6% | |
United States — 5.6% | |
Southeastern Grocers, Inc.*‡ (d) (Cost $7,050,606) | | | 1,002,366 | | | | 13,391,610 | | |
| | | Principal Amount ($) | | | |
Loan Assignments — 0.7% | |
United States — 0.7% | |
BJ's Wholesale Club, Inc., 1st Lien Term Loan B
(ICE LIBOR USD 1 Month + 2.00%),
2.11%, 2/3/2024 (e) (Cost $1,667,318) | | | 1,669,184 | | | | 1,667,098 | | |
Short-Term Investments — 5.8% | |
Commercial Paper — 4.9% | |
Entergy Corp.
0.10%, 5/3/2021 (a)(f) | | | 491,000 | | | | 490,996 | | |
First Eagle Funds | Semiannual Report | April 30, 2021
99
First Eagle High Income Fund | Schedule of Investments | April 30, 2021 (unaudited)
Investments | | Principal Amount ($) | | Value ($) | |
| Commercial Paper — 4.9% (continued) | |
General Motors Financial Co., Inc.
0.28%, 5/3/2021 (f) | | | 1,637,000 | | | | 1,636,959 | | |
Glencore Funding LLC
0.14%, 5/3/2021 (f) | | | 1,637,000 | | | | 1,636,982 | | |
Hitachi International Treasury Ltd.
0.11%, 5/3/2021 (f) | | | 5,599,000 | | | | 5,598,939 | | |
Mitsui & Co. USA, Inc.
0.14%, 5/3/2021 (f) | | | 2,456,000 | | | | 2,455,973 | | |
Total Commercial Paper
(Cost $11,819,906) | | | 11,819,849 | | |
| | | Shares | | | |
Investment Companies — 0.9% | |
JP Morgan U.S. Government Money Market Fund,
Capital Shares 0.03% (g) (Cost $2,170,829) | | | 2,170,829 | | | | 2,170,829 | | |
Total Short-Term Investments
(Cost $13,990,735) | | | 13,990,678 | | |
Total Investments — 99.3%
(Cost $224,365,717) | | | 237,373,905 | | |
Other Assets Less Liabilities — 0.7% | | | 1,601,208 | | |
Net Assets — 100.0% | | | 238,975,113 | | |
* Non-income producing security.
‡ Value determined using significant unobservable inputs.
(a) Securities exempt from registration under Rule 144A or section 4(a)2 of the Securities Act of 1933. Total value of all such securities at April 30, 2021 amounted to $140,103,218, which represents approximately 58.63% of net assets of the Fund.
(b) Security has the ability to pay in kind ("PIK") or pay income in cash. When applicable, separate rates of such payments are disclosed.
(c) Security exempt from registration pursuant to Regulation S under the Securities Act of 1933. Regulation S applies to securities offerings that are made outside of the United States and do not involve direct selling efforts in the United States and as such may have restrictions on resale.
(d) Security fair valued as of April 30, 2021 in accordance with procedures approved by the Board of Trustees. Total value of all such securities at April 30, 2021 amounted to $13,391,610, which represents approximately 5.60% of net assets of the Fund.
(e) Variable or floating rate security, linked to the referenced benchmark. The interest rate shown is the rate in effect as of April 30, 2021.
(f) The rate shown was the current yield as of April 30, 2021.
(g) Represents 7-day effective yield as of April 30, 2021.
First Eagle Funds | Semiannual Report | April 30, 2021
100
First Eagle High Income Fund | Schedule of Investments | April 30, 2021 (unaudited)
As of April 30, 2021, the gross unrealized appreciation (depreciation) of investments based on the aggregate cost of investment securities and derivative instruments, if applicable, for federal income tax purposes was as follows:
Aggregate gross unrealized appreciation | | $ | 13,885,238 | | |
Aggregate gross unrealized depreciation | | | (877,658 | ) | |
Net unrealized appreciation | | $ | 13,007,580 | | |
Federal income tax cost | | $ | 224,365,717 | | |
Forward Foreign Currency Exchange Contracts outstanding as of April 30, 2021
Currency
Purchased | | Currency Sold | | Counterparty | | Settlement
Date | | Unrealized
Appreciation
(Depreciation) | |
USD | | | | | 134,726 | | | EUR | | | | | 112,000 | | | JPMorgan Chase Bank | | 12/15/2021 | | $ | (608 | ) | |
Net unrealized depreciation | | | | | | | | | | | | $ | (608 | ) | |
Abbreviations
EUR — Euro
ICE — Intercontinental Exchange
LIBOR — London Interbank Offered Rate
REIT — Real Estate Investment Trust
USD — United States Dollar
See Notes to Financial Statements.
First Eagle Funds | Semiannual Report | April 30, 2021
101
First Eagle Fund of America
Data as of April 30, 2021 (unaudited)
Investment Objective
The First Eagle Fund of America is a non-diversified U.S. equity fund that seeks capital appreciation and current income by investing primarily in domestic stocks and, to a lesser extent, in debt and foreign equity instruments.
Average Annual Returns^ (%) | | | | One Year | | Five Years | | Ten Years | |
First Eagle Fund of America | | Class Y | | | 41.31 | | | | 7.81 | | | | 7.71 | | |
S&P 500 Index | | | | | 45.98 | | | | 17.42 | | | | 14.17 | | |

Sectors* (%)
Information Technology | | | 34.5 | | |
Communication Services | | | 22.2 | | |
Health Care | | | 15.0 | | |
Consumer Discretionary | | | 12.6 | | |
Consumer Staples | | | 7.4 | | |
Materials | | | 2.8 | | |
Industrials | | | 2.6 | | |
Financials | | | 2.0 | | |
Short-Term Investments | | | 0.9 | | |
^ Performance figures reflect certain fee waivers and/or expense limitations, without which returns may have been lower.
* Asset Allocation and Sector percentages are based on total investments in the portfolio.
The Fund's portfolio composition is subject to change at any time.
First Eagle Funds | Semiannual Report | April 30, 2021
102
First Eagle Fund of America | Fund Overview
Growth of a $10,000 Initial Investment

Performance data quoted herein represents past performance and should not be considered indicative of future results. Performance data quoted herein does not reflect the deduction of taxes that a shareholder would pay on Fund distributions or the sale of Fund shares.
The average annual returns shown above are historical and reflect changes in share price, reinvested dividends and are net of expenses.
The S&P 500 Index is a widely recognized unmanaged index including a representative sample of 500 leading companies in leading sectors of the U.S. economy. Although the S&P 500 Index focuses on the large-cap segment of the market, with approximately 80% coverage of U.S. equities, it is also considered a proxy for the total market. The S&P 500 Index includes dividends reinvested. One cannot invest directly in an index.
Top 10 Holdings* (%)
Facebook, Inc. (Interactive Media & Services, United States) | | | 8.4 | | |
Alphabet, Inc. (Interactive Media & Services, United States) | | | 8.2 | | |
UnitedHealth Group, Inc. (Health Care Providers & Services, United States) | | | 7.4 | | |
Taiwan Semiconductor Manufacturing Co. Ltd. (Semiconductors &
Semiconductor Equipment, Taiwan) | | | 6.7 | | |
Oracle Corp. (Software, United States) | | | 6.7 | | |
Ross Stores, Inc. (Specialty Retail, United States) | | | 5.8 | | |
Comcast Corp. (Media, United States) | | | 5.5 | | |
Medtronic plc (Health Care Equipment & Supplies, United States) | | | 4.8 | | |
Texas Instruments, Inc. (Semiconductors & Semiconductor Equipment,
United States) | | | 4.1 | | |
Analog Devices, Inc. (Semiconductors & Semiconductor Equipment, United States) | | | 3.8 | | |
Total | | | 61.4 | | |
*Holdings in cash, commercial paper and other short-term cash equivalents have been excluded. Percentages are based on total net assets.
First Eagle Funds | Semiannual Report | April 30, 2021
103
First Eagle Fund of America | Schedule of Investments | April 30, 2021 (unaudited)
Investments | | Shares | | Value ($) | |
Common Stocks — 98.9% | |
Air Freight & Logistics — 2.6% | |
CH Robinson Worldwide, Inc. | | | 30,594 | | | | 2,970,065 | | |
Expeditors International of Washington, Inc. | | | 108,280 | | | | 11,895,641 | | |
| | | | 14,865,706 | | |
Beverages — 3.6% | |
Diageo plc (United Kingdom) | | | 199,652 | | | | 8,962,661 | | |
PepsiCo, Inc. | | | 81,603 | | | | 11,763,889 | | |
| | | | 20,726,550 | | |
Capital Markets — 2.0% | |
S&P Global, Inc. | | | 29,969 | | | | 11,699,598 | | |
Chemicals — 2.8% | |
Linde plc (United Kingdom) | | | 10,111 | | | | 2,890,128 | | |
Sherwin-Williams Co. (The) | | | 47,565 | | | | 13,026,627 | | |
| | | | 15,916,755 | | |
Electronic Equipment, Instruments & Components — 3.3% | |
TE Connectivity Ltd. | | | 140,752 | | | | 18,926,921 | | |
Food Products — 0.5% | |
Nestle SA (Registered) (Switzerland) | | | 24,620 | | | | 2,937,922 | | |
Health Care Equipment & Supplies — 7.1% | |
Becton Dickinson and Co. | | | 53,089 | | | | 13,209,074 | | |
Medtronic plc | | | 210,312 | | | | 27,534,047 | | |
| | | | 40,743,121 | | |
Health Care Providers & Services — 7.9% | |
HCA Healthcare, Inc. | | | 15,229 | | | | 3,061,943 | | |
UnitedHealth Group, Inc. | | | 106,430 | | | | 42,444,284 | | |
| | | | 45,506,227 | | |
Hotels, Restaurants & Leisure — 1.9% | |
Booking Holdings, Inc.* | | | 2,678 | | | | 6,604,162 | | |
Starbucks Corp. | | | 38,166 | | | | 4,369,626 | | |
| | | | 10,973,788 | | |
Household Products — 3.3% | |
Colgate-Palmolive Co. | | | 234,623 | | | | 18,934,076 | | |
First Eagle Funds | Semiannual Report | April 30, 2021
104
First Eagle Fund of America | Schedule of Investments | April 30, 2021 (unaudited)
Investments | | Shares | | Value ($) | |
Interactive Media & Services — 16.6% | |
Alphabet, Inc., Class A* | | | 20,111 | | | | 47,331,238 | | |
Facebook, Inc., Class A* | | | 148,347 | | | | 48,224,643 | | |
| | | | 95,555,881 | | |
Internet & Direct Marketing Retail — 2.4% | |
Alibaba Group Holding Ltd., ADR (China)* | | | 60,756 | | | | 14,031,598 | | |
IT Services — 4.2% | |
Accenture plc, Class A | | | 27,531 | | | | 7,983,164 | | |
Visa, Inc., Class A | | | 68,331 | | | | 15,959,388 | | |
| | | | 23,942,552 | | |
Media — 5.5% | |
Comcast Corp., Class A | | | 569,225 | | | | 31,961,984 | | |
Semiconductors & Semiconductor Equipment — 14.6% | |
Analog Devices, Inc. | | | 142,522 | | | | 21,828,669 | | |
Taiwan Semiconductor Manufacturing Co. Ltd., ADR (Taiwan) | | | 331,009 | | | | 38,641,991 | | |
Texas Instruments, Inc. | | | 132,776 | | | | 23,967,396 | | |
| | | | 84,438,056 | | |
Software — 12.4% | |
Microsoft Corp. | | | 65,511 | | | | 16,520,564 | | |
Oracle Corp. | | | 508,440 | | | | 38,534,668 | | |
salesforce.com, Inc.* | | | 70,173 | | | | 16,162,245 | | |
| | | | 71,217,477 | | |
Specialty Retail — 8.2% | |
Home Depot, Inc. (The) | | | 43,467 | | | | 14,068,964 | | |
Ross Stores, Inc. | | | 253,645 | | | | 33,212,276 | | |
| | | | 47,281,240 | | |
Total Common Stocks
(Cost $449,917,474) | | | 569,659,452 | | |
| | | Principal Amount ($) | | | |
Short-Term Investments — 0.9% | |
Commercial Paper — 0.9% | |
Entergy Corp.
0.10%, 5/3/2021 (a)(b) | | | 250,000 | | | | 249,998 | | |
General Motors Financial Co., Inc.
0.28%, 5/3/2021 (b) | | | 748,000 | | | | 747,981 | | |
First Eagle Funds | Semiannual Report | April 30, 2021
105
First Eagle Fund of America | Schedule of Investments | April 30, 2021 (unaudited)
Investments | | Principal Amount ($) | | Value ($) | |
| Commercial Paper — 0.9% (continued) | |
Glencore Funding LLC
0.14%, 5/3/2021 (b) | | | 748,000 | | | | 747,992 | | |
Hitachi International Treasury Ltd.
0.11%, 5/3/2021 (b) | | | 2,530,000 | | | | 2,529,972 | | |
Mitsui & Co. USA, Inc.
0.14%, 5/3/2021 (b) | | | 1,122,000 | | | | 1,121,988 | | |
Total Commercial Paper
(Cost $5,397,957) | | | 5,397,931 | | |
| | | Shares | | | |
Investment Companies — 0.0% (c) | |
JP Morgan U.S. Government Money Market Fund,
Capital Shares, 0.03%, (Cost $1,239) (d) | | | 1,239 | | | | 1,239 | | |
Total Short-Term Investments
(Cost $5,399,196) | | | 5,399,170 | | |
Total Investments — 99.8%
(Cost $455,316,670) | | | 575,058,622 | | |
Other Assets Less Liabilities — 0.2% | | | 1,099,255 | | |
Net Assets — 100.0% | | | 576,157,877 | | |
* Non-income producing security.
(a) Securities exempt from registration under Rule 144A or section 4(a)2 of the Securities Act of 1933. Total value of all such securities at April 30, 2021 amounted to $249,998, which represents approximately 0.04% of net assets of the Fund.
(b) The rate shown was the current yield as of April 30, 2021.
(c) Represents less than 0.05% of net assets.
(d) Represents 7-day effective yield as of April 30, 2021.
Abbreviation
ADR — American Depositary Receipt
As of April 30, 2021, the gross unrealized appreciation (depreciation) of investments based on the aggregate cost of investment securities and derivative instruments, if applicable, for federal income tax purposes was as follows:
Aggregate gross unrealized appreciation | | $ | 120,234,731 | | |
Aggregate gross unrealized depreciation | | | (492,779 | ) | |
Net unrealized appreciation | | $ | 119,741,952 | | |
Federal income tax cost | | $ | 455,316,670 | | |
See Notes to Financial Statements.
First Eagle Funds | Semiannual Report | April 30, 2021
106
This page was intentionally left blank.
Statements of Assets and Liabilities
| | | First Eagle
Global Fund* | | First Eagle
Overseas Fund* | |
Assets | |
Investments, at Cost (Note 1) | |
Investments in securities of unaffiliated issuers | | $ | 27,290,011,423 | | | $ | 9,424,257,354 | | |
Investments in securities of affiliated issuers | | | 2,128,467,225 | | | | 356,329,020 | | |
Gold bullion | | | 3,015,662,623 | | | | 799,500,107 | | |
Silver bullion | | | — | | | | — | | |
Investments, at Value (Note 1) | |
Investments in securities of unaffiliated issuers | | | 41,868,824,232 | | | | 12,951,418,283 | | |
Investments in securities of affiliated issuers | | | 2,004,897,217 | | | | 619,809,957 | | |
Gold bullion | | | 5,036,342,592 | | | | 1,478,470,571 | | |
Silver bullion | | | — | | | | — | | |
Unrealized appreciation on forward foreign currency exchange contracts | | | 6,321,006 | | | | 3,426,644 | | |
Receivable for investment securities sold | | | 19,315,543 | | | | 3,750,429 | | |
Foreign tax reclaims receivable | | | 30,002,732 | | | | 15,268,514 | | |
Receivable for Fund shares sold | | | 50,082,594 | | | | 18,368,637 | | |
Accrued interest and dividends receivable | | | 98,034,448 | | | | 52,512,836 | | |
Investment for trustee deferred compensation plan (Note 2) | | | 5,876,274 | | | | 3,957,801 | | |
Other assets | | | 80,116 | | | | 30,423 | | |
Total Assets | | | 49,119,776,754 | | | | 15,147,014,095 | | |
Liabilities | |
Investment advisory fees payable (Note 2) | | | 29,980,147 | | | | 9,343,043 | | |
Payable for investment securities purchased | | | 35,487,145 | | | | 13,491,677 | | |
Distribution fees payable (Note 3) | | | 5,073,972 | | | | 536,656 | | |
Administrative fees payable (Note 2) | | | 826,501 | | | | 270,042 | | |
Trustee deferred compensation plan (Note 2) | | | 5,876,274 | | | | 3,957,801 | | |
Service fees payable (Note 3) | | | 715,122 | | | | 44,918 | | |
Trustee fees payable | | | — | | | | — | | |
Unrealized depreciation on forward foreign currency exchange contracts | | | 2,261,953 | | | | 1,275,652 | | |
Payable for Fund shares redeemed | | | 31,065,452 | | | | 64,536,638 | | |
Accrued expenses and other liabilities | | | 10,064,181 | | | | 2,992,443 | | |
Total Liabilities | | | 121,350,747 | | | | 96,448,870 | | |
Net Assets | | $ | 48,998,426,007 | | | $ | 15,050,565,225 | | |
Net Assets Consist of | |
Capital stock (par value, $0.001 per share) | | | 740,178 | | | | 558,953 | | |
Capital surplus | | | 30,623,605,111 | | | | 10,882,626,085 | | |
Total distributable earnings (losses) | | | 18,374,080,718 | | | | 4,167,380,187 | | |
Net Assets | | $ | 48,998,426,007 | | | $ | 15,050,565,225 | | |
First Eagle Funds | Semiannual Report | April 30, 2021
108
April 30, 2021 (unaudited)
| | First Eagle
U.S. Value Fund* | | First Eagle
Gold Fund* | |
Assets | |
Investments, at Cost (Note 1) | |
Investments in securities of unaffiliated issuers | | $ | 699,773,551 | | | $ | 1,123,668,062 | | |
Investments in securities of affiliated issuers | | | — | | | | 39,074,868 | | |
Gold bullion | | | 79,442,806 | | | | 362,478,188 | | |
Silver bullion | | | — | | | | 41,203,976 | | |
Investments, at Value (Note 1) | |
Investments in securities of unaffiliated issuers | | | 1,176,644,159 | | | | 1,621,940,971 | | |
Investments in securities of affiliated issuers | | | — | | | | 90,359,108 | | |
Gold bullion | | | 129,998,225 | | | | 486,317,832 | | |
Silver bullion | | | — | | | | 71,845,772 | | |
Unrealized appreciation on forward foreign currency exchange contracts | | | — | | | | — | | |
Receivable for investment securities sold | | | — | | | | 7,325,648 | | |
Foreign tax reclaims receivable | | | — | | | | — | | |
Receivable for Fund shares sold | | | 867,127 | | | | 9,702,401 | | |
Accrued interest and dividends receivable | | | 926,896 | | | | 1,036,137 | | |
Investment for trustee deferred compensation plan (Note 2) | | | 4,084,409 | | | | 233,899 | | |
Other assets | | | 64,568 | | | | 50,835 | | |
Total Assets | | | 1,312,585,384 | | | | 2,288,812,603 | | |
Liabilities | |
Investment advisory fees payable (Note 2) | | | 792,200 | | | | 1,412,454 | | |
Payable for investment securities purchased | | | 511,433 | | | | 2,891,337 | | |
Distribution fees payable (Note 3) | | | 183,010 | | | | 226,449 | | |
Administrative fees payable (Note 2) | | | 80,155 | | | | 99,207 | | |
Trustee deferred compensation plan (Note 2) | | | 4,084,409 | | | | 233,899 | | |
Service fees payable (Note 3) | | | 21,126 | | | | 34,952 | | |
Trustee fees payable | | | 6,660 | | | | — | | |
Unrealized depreciation on forward foreign currency exchange contracts | | | — | | | | — | | |
Payable for Fund shares redeemed | | | 851,361 | | | | 1,858,013 | | |
Accrued expenses and other liabilities | | | 453,696 | | | | 324,335 | | |
Total Liabilities | | | 6,984,050 | | | | 7,080,646 | | |
Net Assets | | $ | 1,305,601,334 | | | $ | 2,281,731,957 | | |
Net Assets Consist of | |
Capital stock (par value, $0.001 per share) | | | 61,392 | | | | 93,693 | | |
Capital surplus | | | 639,385,356 | | | | 2,285,588,669 | | |
Total distributable earnings (losses) | | | 666,154,586 | | | | (3,950,405 | ) | |
Net Assets | | $ | 1,305,601,334 | | | $ | 2,281,731,957 | | |
First Eagle Funds | Semiannual Report | April 30, 2021
109
Statements of Assets and Liabilities (continued)
| | | First Eagle
Global Fund* | | First Eagle
Overseas Fund* | |
Class A | |
Net assets | | $ | 14,376,436,202 | | | $ | 1,945,065,262 | | |
Shares outstanding | | | 217,357,575 | | | | 73,670,277 | | |
Net asset value per share and redemption proceeds per share | | | 66.14 | | | | 26.40 | | |
Offering price per share (NAV per share plus maximum sales charge)** | | | 69.62 | (1) | | | 27.79 | (1) | |
Class C | |
Net assets | | $ | 3,452,601,008 | | | $ | 213,672,666 | | |
Shares outstanding | | | 54,243,464 | | | | 8,466,464 | | |
Net asset value per share and redemption proceeds per share | | | 63.65 | | | | 25.24 | | |
Redemption proceeds per share (NAV per share less maximum contingent
deferred sale charge)(2) | | | 63.02 | | | | 24.99 | | |
Class I | |
Net assets | | $ | 29,123,581,628 | | | $ | 11,261,909,821 | | |
Shares outstanding | | | 437,830,696 | | | | 416,535,253 | | |
Net asset value per share and redemption proceeds per share | | | 66.52 | | | | 27.04 | | |
Class R3 | |
Net assets | | $ | 514,991 | | | $ | 374,724 | | |
Shares outstanding | | | 7,763 | | | | 13,900 | | |
Net asset value per share and redemption proceeds per share | | | 66.34 | | | | 26.96 | | |
Class R4 | |
Net assets | | $ | 2,255,472 | | | $ | 7,609,548 | | |
Shares outstanding | | | 33,950 | | | | 282,061 | | |
Net asset value per share and redemption proceeds per share | | | 66.43 | | | | 26.98 | | |
Class R5 | |
Net assets | | $ | 11,969 | | | $ | 58,788 | | |
Shares outstanding | | | 182 | | | | 2,181 | | |
Net asset value per share and redemption proceeds per share | | | 65.77 | | | | 26.95 | | |
Class R6 | |
Net assets | | $ | 2,043,024,737 | | | $ | 1,621,874,416 | | |
Shares outstanding | | | 30,704,458 | | | | 59,982,483 | | |
Net asset value per share and redemption proceeds per share | | | 66.54 | | | | 27.04 | | |
* First Eagle Global Fund, First Eagle Overseas Fund, First Eagle U.S. Value Fund and First Eagle Gold Fund financial statements are shown on a consolidated basis and includes the balances of the First Eagle Global Cayman Fund, Ltd., First Eagle Overseas Cayman Fund, Ltd., First Eagle U.S. Value Cayman Fund, Ltd., and First Eagle Gold Cayman Fund, Ltd., respectively.
** A contingent deferred sales charge of 1.00% may apply on redemptions of Class A shares made within 18 months following a purchase of $1,000,000 or more without an initial sales charge.
(1) The maximum sales charge is 5.00% for Class A shares. Classes C, I, R3, R4, R5 and R6 have no front-end sales charges.
(2) The maximum contingent deferred sales charge (CDSC) is 1.00% for Class C shares, which is charged on the lesser of the original purchase price or the current market value at the time of sale. This pertains to shares sold or redeemed within the first year of purchase.
See Notes to Financial Statements.
First Eagle Funds | Semiannual Report | April 30, 2021
110
April 30, 2021 (unaudited)
| | | First Eagle
U.S. Value Fund* | | First Eagle
Gold Fund* | |
Class A | |
Net assets | | $ | 592,870,847 | | | $ | 589,878,460 | | |
Shares outstanding | | | 28,024,135 | | | | 24,543,650 | | |
Net asset value per share and redemption proceeds per share | | | 21.16 | | | | 24.03 | | |
Offering price per share (NAV per share plus maximum sales charge)** | | | 22.27 | (1) | | | 25.30 | (1) | |
Class C | |
Net assets | | $ | 102,105,209 | | | $ | 168,428,949 | | |
Shares outstanding | | | 5,070,611 | | | | 7,690,130 | | |
Net asset value per share and redemption proceeds per share | | | 20.14 | | | | 21.90 | | |
Redemption proceeds per share (NAV per share less maximum contingent
deferred sale charge)(2) | | | 19.94 | | | | 21.69 | | |
Class I | |
Net assets | | $ | 589,627,386 | | | $ | 1,399,554,446 | | |
Shares outstanding | | | 27,324,061 | | | | 56,471,018 | | |
Net asset value per share and redemption proceeds per share | | | 21.58 | | | | 24.78 | | |
Class R3 | |
Net assets | | $ | 67,044 | | | $ | 1,315,973 | | |
Shares outstanding | | | 3,114 | | | | 53,248 | | |
Net asset value per share and redemption proceeds per share | | | 21.53 | | | | 24.71 | | |
Class R4 | |
Net assets | | $ | 12,232 | | | $ | 854,350 | | |
Shares outstanding | | | 568 | | | | 34,370 | | |
Net asset value per share and redemption proceeds per share | | | 21.53 | | | | 24.86 | | |
Class R5 | |
Net assets | | $ | 69,904 | | | $ | 433,609 | | |
Shares outstanding | | | 3,249 | | | | 17,485 | | |
Net asset value per share and redemption proceeds per share | | | 21.52 | | | | 24.80 | | |
Class R6 | |
Net assets | | $ | 20,848,712 | | | $ | 121,266,170 | | |
Shares outstanding | | | 966,240 | | | | 4,883,480 | | |
Net asset value per share and redemption proceeds per share | | | 21.58 | | | | 24.83 | | |
First Eagle Funds | Semiannual Report | April 30, 2021
111
Statements of Assets and Liabilities (continued)
| | | First Eagle
Global Income
Builder Fund | | First Eagle
High Income Fund | |
Assets | |
Investments, at Cost (Note 1) | |
Investments in securities of unaffiliated issuers | | $ | 1,078,945,441 | | | $ | 224,365,717 | | |
Gold bullion | | | 71,533,113 | | | | — | | |
Investments, at Value (Note 1) | |
Investments in securities of unaffiliated issuers | | | 1,237,379,306 | | | | 237,373,905 | | |
Gold bullion | | | 102,166,753 | | | | — | | |
Unrealized appreciation on forward foreign currency exchange contracts | | | 232,234 | | | | — | | |
Receivable for investment securities sold | | | 872,830 | | | | 933,281 | | |
Foreign tax reclaims receivable | | | 1,837,452 | | | | — | | |
Receivable for Fund shares sold | | | 2,013,588 | | | | 453,871 | | |
Accrued interest and dividends receivable | | | 5,605,968 | | | | 2,867,461 | | |
Due from custodian | | | — | | | | 223,836 | | |
Investment for trustee deferred compensation plan (Note 2) | | | 837,572 | | | | 265,524 | | |
Other assets | | | 9,633 | | | | 27,700 | | |
Total Assets | | | 1,350,955,336 | | | | 242,145,578 | | |
Liabilities | |
Investment advisory fees payable (Note 2) | | | 808,023 | | | | 138,790 | | |
Option contracts written, at value (premiums received $2,072,726, $— and
$—, respectively) | | | 2,241,554 | | | | — | | |
Payable for investment securities purchased | | | 11,994,708 | | | | 2,058,334 | | |
Distribution fees payable (Note 3) | | | 206,530 | | | | 32,589 | | |
Administrative fees payable (Note 2) | | | 53,870 | | | | 9,914 | | |
Trustee deferred compensation plan (Note 2) | | | 837,572 | | | | 265,524 | | |
Service fees payable (Note 3) | | | 38,968 | | | | 5,722 | | |
Trustee fees payable | | | — | | | | 716 | | |
Payable for dividends to shareholders | | | 305,197 | | | | 125,953 | | |
Unrealized depreciation on forward foreign currency exchange contracts | | | 74,657 | | | | 608 | | |
Payable for Fund shares redeemed | | | 1,743,485 | | | | 299,255 | | |
Accrued expenses and other liabilities | | | 394,625 | | | | 233,060 | | |
Total Liabilities | | | 18,699,189 | | | | 3,170,465 | | |
Net Assets | | $ | 1,332,256,147 | | | $ | 238,975,113 | | |
Net Assets Consist of | |
Capital stock (par value, $0.001 per share) | | | 100,184 | | | | 21,391 | | |
Capital surplus | | | 1,121,883,718 | | | | 351,038,046 | | |
Total distributable earnings (losses) | | | 210,272,245 | | | | (112,084,324 | ) | |
Net Assets | | $ | 1,332,256,147 | | | $ | 238,975,113 | | |
First Eagle Funds | Semiannual Report | April 30, 2021
112
April 30, 2021 (unaudited)
| | | First Eagle
Fund of America | |
Assets | |
Investments, at Cost (Note 1) | |
Investments in securities of unaffiliated issuers | | $ | 455,316,670 | | |
Gold bullion | | | — | | |
Investments, at Value (Note 1) | |
Investments in securities of unaffiliated issuers | | | 575,058,622 | | |
Gold bullion | | | — | | |
Unrealized appreciation on forward foreign currency exchange contracts | | | — | | |
Receivable for investment securities sold | | | 1,879,573 | | |
Foreign tax reclaims receivable | | | 22,242 | | |
Receivable for Fund shares sold | | | 152,573 | | |
Accrued interest and dividends receivable | | | 265,239 | | |
Due from custodian | | | — | | |
Investment for trustee deferred compensation plan (Note 2) | | | 1,852,086 | | |
Other assets | | | 42,549 | | |
Total Assets | | | 579,272,884 | | |
Liabilities | |
Investment advisory fees payable (Note 2) | | | 235,562 | | |
Option contracts written, at value (premiums received $2,072,726, $— and
$—, respectively) | | | — | | |
Payable for investment securities purchased | | | — | | |
Distribution fees payable (Note 3) | | | 107,117 | | |
Administrative fees payable (Note 2) | | | 38,275 | | |
Trustee deferred compensation plan (Note 2) | | | 1,852,086 | | |
Service fees payable (Note 3) | | | 11,963 | | |
Trustee fees payable | | | 20,187 | | |
Payable for dividends to shareholders | | | — | | |
Unrealized depreciation on forward foreign currency exchange contracts | | | — | | |
Payable for Fund shares redeemed | | | 293,155 | | |
Accrued expenses and other liabilities | | | 556,662 | | |
Total Liabilities | | | 3,115,007 | | |
Net Assets | | $ | 576,157,877 | | |
Net Assets Consist of | |
Capital stock (par value, $0.001 per share) | | | 26,865 | | |
Capital surplus | | | 386,626,526 | | |
Total distributable earnings (losses) | | | 189,504,486 | | |
Net Assets | | $ | 576,157,877 | | |
First Eagle Funds | Semiannual Report | April 30, 2021
113
Statements of Assets and Liabilities (continued)
| | | First Eagle
Global Income
Builder Fund | | First Eagle
High Income Fund | |
Class A | |
Net assets | | $ | 446,132,552 | | | $ | 75,042,091 | | |
Shares outstanding | | | 33,494,470 | | | | 8,460,101 | | |
Net asset value per share and redemption proceeds per share | | | 13.32 | | | | 8.87 | | |
Offering price per share (NAV per share plus maximum sales charge)* | | | 14.02 | (1) | | | 9.29 | (2) | |
Class C | |
Net assets | | $ | 187,951,583 | | | $ | 27,140,345 | | |
Shares outstanding | | | 14,148,485 | | | | 3,062,535 | | |
Net asset value per share and redemption proceeds per share | | | 13.28 | | | | 8.86 | | |
Redemption proceeds per share (NAV per share less maximum
contingent deferred sale charge)(3) | | | 13.15 | | | | 8.77 | | |
Class I | |
Net assets | | $ | 677,703,861 | | | $ | 135,197,386 | | |
Shares outstanding | | | 50,999,860 | | | | 15,234,024 | | |
Net asset value per share and redemption proceeds per share | | | 13.29 | | | | 8.87 | | |
Class Y | |
Net assets | | $ | — | | | $ | — | | |
Shares outstanding | | | — | | | | — | | |
Net asset value per share and redemption proceeds per share | | | — | | | | — | | |
Class R3 | |
Net assets | | $ | 59,784 | | | $ | 512,456 | | |
Shares outstanding | | | 4,500 | | | | 57,717 | | |
Net asset value per share and redemption proceeds per share | | | 13.29 | | | | 8.88 | | |
Class R4 | |
Net assets | | $ | 11,496 | | | $ | 10,771 | | |
Shares outstanding | | | 866 | | | | 1,213 | | |
Net asset value per share and redemption proceeds per share | | | 13.28 | | | | 8.88 | | |
Class R5 | |
Net assets | | $ | 11,518 | | | $ | 10,854 | | |
Shares outstanding | | | 867 | | | | 1,223 | | |
Net asset value per share and redemption proceeds per share | | | 13.28 | | | | 8.87 | | |
Class R6 | |
Net assets | | $ | 20,385,353 | | | $ | 1,061,210 | | |
Shares outstanding | | | 1,535,047 | | | | 119,582 | | |
Net asset value per share and redemption proceeds per share | | | 13.28 | | | | 8.87 | | |
* A contingent deferred sales charge of 1.00% may apply on redemptions of Class A shares made within 18 months following a purchase of $1,000,000 or more without an initial sales charge.
With respect to the First Eagle Global Income Builder Fund and the First Eagle High Income Fund, a contingent deferred sales charge of 1.00% may apply on certain redemptions of Class A shares made within 18 months following a purchase of $250,000 or more without an initial sales charge.
(1) The maximum sales charge is 5.00% for Class A shares. Classes C, I, Y (for First Eagle Fund of America only), R3, R4, R5 and R6 have no front-end sales charges.
(2) The maximum sales charge is 4.50% for Class A shares. Classes C, I, R3, R4, R5 and R6 have no front-end sales charges.
(3) The maximum contingent deferred sales charge (CDSC) is 1.00% for Class C shares, which is charged on the lesser of the original purchase price or the current market value at the time of sale. This pertains to shares sold or redeemed within the first year of purchase.
See Notes to Financial Statements.
First Eagle Funds | Semiannual Report | April 30, 2021
114
April 30, 2021 (unaudited)
| | | First Eagle
Fund of America | |
Class A | |
Net assets | | $ | 224,782,302 | | |
Shares outstanding | | | 8,091,775 | | |
Net asset value per share and redemption proceeds per share | | | 27.78 | | |
Offering price per share (NAV per share plus maximum sales charge)* | | | 29.24 | (1) | |
Class C | |
Net assets | | $ | 57,533,349 | | |
Shares outstanding | | | 3,078,259 | | |
Net asset value per share and redemption proceeds per share | | | 18.69 | | |
Redemption proceeds per share (NAV per share less maximum
contingent deferred sale charge)(3) | | | 18.51 | | |
Class I | |
Net assets | | $ | 162,343,861 | | |
Shares outstanding | | | 5,586,910 | | |
Net asset value per share and redemption proceeds per share | | | 29.06 | | |
Class Y | |
Net assets | | $ | 124,864,226 | | |
Shares outstanding | | | 4,334,420 | | |
Net asset value per share and redemption proceeds per share | | | 28.81 | | |
Class R3 | |
Net assets | | $ | 59,998 | | |
Shares outstanding | | | 2,078 | | |
Net asset value per share and redemption proceeds per share | | | 28.87 | | |
Class R4 | |
Net assets | | $ | 12,267 | | |
Shares outstanding | | | 423 | | |
Net asset value per share and redemption proceeds per share | | | 29.03 | | |
Class R5 | |
Net assets | | $ | 12,289 | | |
Shares outstanding | | | 423 | | |
Net asset value per share and redemption proceeds per share | | | 29.04 | | |
Class R6 | |
Net assets | | $ | 6,549,585 | | |
Shares outstanding | | | 225,407 | | |
Net asset value per share and redemption proceeds per share | | | 29.06 | | |
First Eagle Funds | Semiannual Report | April 30, 2021
115
| | | First Eagle
Global Fund* | | First Eagle
Overseas Fund* | |
Investment Income | |
Interest (net of $419,839, $142,591, $— and $—, foreign taxes withheld) | | $ | 14,115,930 | | | $ | 6,045,090 | | |
Dividends from: (net of $21,995,433, $14,411,791, $58,491 and $1,100,750
foreign taxes withheld) | |
Unaffiliated issuers | | | 386,320,139 | | | | 121,172,582 | | |
Affiliated issuers | | | 14,219,663 | | | | 8,173,782 | | |
Total Income | | | 414,655,732 | | | | 135,391,454 | | |
Expenses | |
Investment advisory fees (Note 2) | | | 172,136,188 | | | | 53,783,470 | | |
Distributions fees (Note 3) | |
Class A | | | 16,779,302 | | | | 2,367,245 | | |
Class C | | | 13,296,452 | | | | 862,266 | | |
Class R3 | | | 2,021 | | | | 351 | | |
Class R4 | | | 1,105 | | | | 4,209 | | |
Shareholder servicing agent fees | | | 14,664,504 | | | | 5,034,712 | | |
Service fees (Note 3) | |
Class C | | | 4,432,151 | | | | 287,422 | | |
Class R3 | | | 808 | | | | 140 | | |
Administrative costs (Note 2) | | | 1,968,377 | | | | 643,127 | | |
Professional fees | | | 422,272 | | | | 266,129 | | |
Custodian and accounting fees | | | 2,573,072 | | | | 1,006,206 | | |
Shareholder reporting fees | | | 1,389,239 | | | | 408,940 | | |
Trustees' fees | | | 689,903 | | | | 204,504 | | |
Registration and filing fees | | | 297,591 | | | | 196,901 | | |
Other expenses | | | 501,702 | | | | 154,356 | | |
Total Expenses | | | 229,154,687 | | | | 65,219,978 | | |
Expense waiver (Note 2) | | | — | | | | — | | |
Net Expenses | | | 229,154,687 | | | | 65,219,978 | | |
Net Investment Income (Loss) (Note 1) | | | 185,501,045 | | | | 70,171,476 | | |
Realized and Unrealized Gains (Losses) on Investments and Foreign
Currency Related Transactions (Note 1) | |
Net realized gains (losses) from: | |
Transactions in investment securities of unaffiliated issuers | | | 1,813,816,376 | | | | 176,898,257 | | |
Transactions in investment securities of affiliated issuers | | | 17,280,059 | | | | — | | |
Commodity related transactions | | | — | | | | — | | |
Settlement of foreign currency and foreign currency transactions | | | (1,745,465 | ) | | | (896,952 | ) | |
Settlement of forward foreign currency exchange contracts | | | (19,979,928 | ) | | | (9,267,900 | ) | |
| | | | 1,809,371,042 | | | | 166,733,405 | | |
Changes in unrealized appreciation (depreciation) of: | |
Investment securities of unaffiliated issuers and commodity related transactions
(net of decrease in deferred capital gain country tax accruals of
$1,506,019, $380,972, $— and $—) | | | 6,489,018,265 | | | | 1,652,028,576 | | |
Investment securities of affiliated issuers | | | 616,895,836 | | | | 170,214,653 | | |
Foreign currency and foreign currency translations | | | 615,128 | | | | 494,505 | | |
Forward foreign currency exchange contracts | | | 1,894,163 | | | | 1,043,841 | | |
| | | | 7,108,423,392 | | | | 1,823,781,575 | | |
Net realized and unrealized gains (losses) on investments, commodity,
foreign currency and forward contract related transactions | | | 8,917,794,434 | | | | 1,990,514,980 | | |
Net Increase (Decrease) in Net Assets Resulting from Operations | | $ | 9,103,295,479 | | | $ | 2,060,686,456 | | |
* First Eagle Global Fund, First Eagle Overseas Fund, First Eagle U.S. Value Fund and First Eagle Gold Fund financial statements are shown on a consolidated basis and includes the balances of the First Eagle Global Cayman Fund, Ltd., First Eagle Overseas Cayman Fund, Ltd., First Eagle U.S. Value Cayman Fund, Ltd., and First Eagle Gold Cayman Fund, Ltd., respectively.
See Notes to Financial Statements.
First Eagle Funds | Semiannual Report | April 30, 2021
116
April 30, 2021 (unaudited)
| | First Eagle
U.S. Value Fund* | | First Eagle
Gold Fund* | |
Investment Income | |
Interest (net of $419,839, $142,591, $— and $—, foreign taxes withheld) | | $ | 463,767 | | | $ | 180,709 | | |
Dividends from: (net of $21,995,433, $14,411,791, $58,491 and $1,100,750
foreign taxes withheld) | |
Unaffiliated issuers | | | 9,845,715 | | | | 11,475,820 | | |
Affiliated issuers | | | — | | | | 613,713 | | |
Total Income | | | 10,309,482 | | | | 12,270,242 | | |
Expenses | |
Investment advisory fees (Note 2) | | | 4,529,840 | | | | 8,705,562 | | |
Distributions fees (Note 3) | |
Class A | | | 675,161 | | | | 741,914 | | |
Class C | | | 387,955 | | | | 635,615 | | |
Class R3 | | | 76 | | | | 983 | | |
Class R4 | | | 5 | | | | 436 | | |
Shareholder servicing agent fees | | | 412,832 | | | | 1,125,453 | | |
Service fees (Note 3) | |
Class C | | | 129,318 | | | | 211,872 | | |
Class R3 | | | 30 | | | | 393 | | |
Administrative costs (Note 2) | | | 190,895 | | | | 236,270 | | |
Professional fees | | | 105,257 | | | | 113,085 | | |
Custodian and accounting fees | | | 101,774 | | | | 365,980 | | |
Shareholder reporting fees | | | 54,778 | | | | 73,857 | | |
Trustees' fees | | | 26,924 | | | | 47,305 | | |
Registration and filing fees | | | 62,405 | | | | 150,222 | | |
Other expenses | | | 27,524 | | | | 31,602 | | |
Total Expenses | | | 6,704,774 | | | | 12,440,549 | | |
Expense waiver (Note 2) | | | (301,994 | ) | | | — | | |
Net Expenses | | | 6,402,780 | | | | 12,440,549 | | |
Net Investment Income (Loss) (Note 1) | | | 3,906,702 | | | | (170,307 | ) | |
Realized and Unrealized Gains (Losses) on Investments and Foreign
Currency Related Transactions (Note 1) | |
Net realized gains (losses) from: | |
Transactions in investment securities of unaffiliated issuers | | | 98,479,735 | | | | 9,813,726 | | |
Transactions in investment securities of affiliated issuers | | | — | | | | — | | |
Commodity related transactions | | | 13,581,543 | | | | 2,009,429 | | |
Settlement of foreign currency and foreign currency transactions | | | (5,393 | ) | | | (14,986 | ) | |
Settlement of forward foreign currency exchange contracts | | | — | | | | — | | |
| | | | 112,055,885 | | | | 11,808,169 | | |
Changes in unrealized appreciation (depreciation) of: | |
Investment securities of unaffiliated issuers and commodity related transactions
(net of decrease in deferred capital gain country tax accruals of
$1,506,019, $380,972, $— and $—) | | | 170,845,591 | | | | (205,989,411 | ) | |
Investment securities of affiliated issuers | | | — | | | | 7,602,270 | | |
Foreign currency and foreign currency translations | | | — | | | | 5,165 | | |
Forward foreign currency exchange contracts | | | — | | | | — | | |
| | | | 170,845,591 | | | | (198,381,976 | ) | |
Net realized and unrealized gains (losses) on investments, commodity,
foreign currency and forward contract related transactions | | | 282,901,476 | | | | (186,573,807 | ) | |
Net Increase (Decrease) in Net Assets Resulting from Operations | | $ | 286,808,178 | | | $ | (186,744,114 | ) | |
First Eagle Funds | Semiannual Report | April 30, 2021
117
Statements of Operations (continued)
| | | First Eagle
Global Income
Builder Fund | | First Eagle
High Income Fund | |
Investment Income | |
Interest (net of $11,969, $— and $—, foreign taxes withheld) | | $ | 5,441,037 | | | $ | 5,987,235 | | |
Dividends from: (net of $1,013,900, $— and $80,794 foreign taxes withheld) | |
Unaffiliated issuers | | | 13,614,790 | | | | 15 | | |
Total Income | | | 19,055,827 | | | | 5,987,250 | | |
Expenses | |
Investment advisory fees (Note 2) | | | 4,769,676 | | | | 848,001 | | |
Distributions fees (Note 3) | |
Class A | | | 503,605 | | | | 94,590 | | |
Class C | | | 715,229 | | | | 112,788 | | |
Class Y | | | — | | | | — | | |
Class R3 | | | 70 | | | | 587 | | |
Class R4 | | | 5 | | | | 5 | | |
Shareholder servicing agent fees | | | 390,770 | | | | 107,133 | | |
Service fees (Note 3) | |
Class C | | | 238,410 | | | | 37,596 | | |
Class R3 | | | 28 | | | | 235 | | |
Administrative costs (Note 2) | | | 317,983 | | | | 60,572 | | |
Professional fees | | | 111,924 | | | | 118,712 | | |
Custodian and accounting fees | | | 125,820 | | | | 68,385 | | |
Shareholder reporting fees | | | 45,513 | | | | 16,867 | | |
Trustees' fees | | | 20,846 | | | | 3,750 | | |
Registration and filing fees | | | 80,682 | | | | 54,202 | | |
Other expenses | | | 27,938 | | | | 15,056 | | |
Total Expenses | | | 7,348,499 | | | | 1,538,479 | | |
Expense waiver (Note 2) | | | — | | | | (121,142 | ) | |
Net Expenses | | | 7,348,499 | | | | 1,417,337 | | |
Net Investment Income (Note 1) | | | 11,707,328 | | | | 4,569,913 | | |
Realized and Unrealized Gains (Losses) on Investments and Foreign
Currency Related Transactions (Note 1) | |
Net realized gains (losses) from: | |
Transactions in investment securities of unaffiliated issuers | | | 26,062,651 | | | | 1,232,035 | | |
Settlement of foreign currency and foreign currency transactions | | | (6,829 | ) | | | — | | |
Settlement of forward foreign currency exchange contracts | | | (601,078 | ) | | | (2,170 | ) | |
Expiration or closing of option contracts written | | | 1,009,106 | | | | — | | |
| | | | 26,463,850 | | | | 1,229,865 | | |
Changes in unrealized (depreciation) of: | |
Investment securities of unaffiliated issuers and commodity related transactions | | | 177,655,309 | | | | 3,282,468 | | |
Foreign currency and foreign currency translations | | | 3,297 | | | | — | | |
Forward foreign currency exchange contracts | | | 51,260 | | | | (1,466 | ) | |
Option contracts written | | | (534,431 | ) | | | — | | |
| | | | 177,175,435 | | | | 3,281,002 | | |
Net realized and unrealized gains (losses) on investments, commodity, foreign
currency and forward contract related transactions and option contracts written | | | 203,639,285 | | | | 4,510,867 | | |
Net Increase in Net Assets Resulting from Operations | | $ | 215,346,613 | | | $ | 9,080,780 | | |
See Notes to Financial Statements.
First Eagle Funds | Semiannual Report | April 30, 2021
118
April 30, 2021 (unaudited)
| | | First Eagle
Fund of America | |
Investment Income | |
Interest (net of $11,969, $— and $—, foreign taxes withheld) | | $ | 5,584 | | |
Dividends from: (net of $1,013,900, $— and $80,794 foreign taxes withheld) | |
Unaffiliated issuers | | | 3,720,167 | | |
Total Income | | | 3,725,751 | | |
Expenses | |
Investment advisory fees (Note 2) | | | 1,397,096 | | |
Distributions fees (Note 3) | |
Class A | | | 267,110 | | |
Class C | | | 228,172 | | |
Class Y | | | 147,604 | | |
Class R3 | | | 67 | | |
Class R4 | | | 5 | | |
Shareholder servicing agent fees | | | 286,071 | | |
Service fees (Note 3) | |
Class C | | | 76,057 | | |
Class R3 | | | 27 | | |
Administrative costs (Note 2) | | | 91,155 | | |
Professional fees | | | 134,210 | | |
Custodian and accounting fees | | | 68,597 | | |
Shareholder reporting fees | | | 44,328 | | |
Trustees' fees | | | 12,876 | | |
Registration and filing fees | | | 57,624 | | |
Other expenses | | | 22,364 | | |
Total Expenses | | | 2,833,363 | | |
Expense waiver (Note 2) | | | (295,712 | ) | |
Net Expenses | | | 2,537,651 | | |
Net Investment Income (Note 1) | | | 1,188,100 | | |
Realized and Unrealized Gains (Losses) on Investments and Foreign
Currency Related Transactions (Note 1) | |
Net realized gains (losses) from: | |
Transactions in investment securities of unaffiliated issuers | | | 56,522,549 | | |
Settlement of foreign currency and foreign currency transactions | | | (28,884 | ) | |
Settlement of forward foreign currency exchange contracts | | | — | | |
Expiration or closing of option contracts written | | | (257,843 | ) | |
| | | | 56,235,822 | | |
Changes in unrealized (depreciation) of: | |
Investment securities of unaffiliated issuers and commodity related transactions | | | 79,762,844 | | |
Foreign currency and foreign currency translations | | | 547 | | |
Forward foreign currency exchange contracts | | | — | | |
Option contracts written | | | (746,245 | ) | |
| | | | 79,017,146 | | |
Net realized and unrealized gains (losses) on investments, commodity, foreign
currency and forward contract related transactions and option contracts written | | | 135,252,968 | | |
Net Increase in Net Assets Resulting from Operations | | $ | 136,441,068 | | |
First Eagle Funds | Semiannual Report | April 30, 2021
119
Statements of Changes in Net Assets
| | | First Eagle
Global Fund* | | First Eagle
Overseas Fund* | |
| | | For the
Six Months Ended
April 30, 2021
(unaudited) | | For the
Year Ended
October 31, 2020 | | For the
Six Months Ended
April 30, 2021
(unaudited) | | For the
Year Ended
October 31, 2020 | |
Operations | |
Net investment income (loss) | | $ | 185,501,045 | | | $ | 432,765,895 | | | $ | 70,171,476 | | | $ | 135,310,003 | | |
Net realized gain (loss) from investments, commodity, foreign currency
and forward contract related transactions | | | 1,809,371,042 | | | | 1,030,461,859 | | | | 166,733,405 | | | | 38,021,236 | | |
Change in unrealized appreciation (depreciation) of investments,
commodity, foreign currency and forward contract related translations | | | 7,108,423,392 | | | | (2,559,097,696 | ) | | | 1,823,781,575 | | | | (543,067,200 | ) | |
Net increase (decrease) in net assets resulting from operations | | | 9,103,295,479 | | | | (1,095,869,942 | ) | | | 2,060,686,456 | | | | (369,735,961 | ) | |
Distributions to Shareholders | |
Distributable earnings: | |
Class A | | | (315,110,484 | ) | | | (727,157,248 | ) | | | (3,992,024 | ) | | | (112,662,006 | ) | |
Class C | | | (59,920,144 | ) | | | (253,451,927 | ) | | | — | | | | (16,616,159 | ) | |
Class I | | | (697,013,867 | ) | | | (1,680,013,813 | ) | | | (50,625,638 | ) | | | (586,922,532 | ) | |
Class R3 | | | (90,445 | ) | | | (627,346 | ) | | | (397 | ) | | | (4,784 | ) | |
Class R4 | | | (60,986 | ) | | | (115,672 | ) | | | (42,486 | ) | | | (4,920 | ) | |
Class R5 | | | (170 | ) | | | (554 | ) | | | (49 | ) | | | (963 | ) | |
Class R6 | | | (45,909,407 | ) | | | (53,668,468 | ) | | | (7,148,037 | ) | | | (41,868,450 | ) | |
Decrease in net assets resulting from distributions | | | (1,118,105,503 | ) | | | (2,715,035,028 | ) | | | (61,808,631 | ) | | | (758,079,814 | ) | |
Fund Share Transactions | |
Class A | |
Net proceeds from shares sold | | | 849,292,323 | | | | 1,852,600,955 | | | | 139,700,631 | | | | 271,320,769 | | |
Net asset value of shares issued for reinvested dividends and distributions | | | 270,175,828 | | | | 649,821,149 | | | | 3,615,181 | | | | 103,426,331 | | |
Cost of shares redeemed | | | (1,195,306,593 | ) | | | (3,050,252,521 | ) | | | (213,397,099 | ) | | | (584,171,239 | ) | |
Redemption fees | | | — | | | | — | | | | — | | | | — | | |
Increase (decrease) in net assets from Fund share transactions | | | (75,838,442 | ) | | | (547,830,417 | ) | | | (70,081,287 | ) | | | (209,424,139 | ) | |
Class C | |
Net proceeds from shares sold | | | 115,123,191 | | | | 253,103,922 | | | | 8,150,715 | | | | 18,717,342 | | |
Net asset value of shares issued for reinvested dividends and distributions | | | 56,376,781 | | | | 209,543,108 | | | | — | | | | 14,150,158 | | |
Cost of shares redeemed | | | (786,587,695 | ) | | | (2,271,836,086 | ) | | | (56,916,418 | ) | | | (154,219,857 | ) | |
Redemption fees | | | — | | | | — | | | | — | | | | — | | |
Increase (decrease) in net assets from Fund share transactions | | | (615,087,723 | ) | | | (1,809,189,056 | ) | | | (48,765,703 | ) | | | (121,352,357 | ) | |
Class I | |
Net proceeds from shares sold | | | 2,370,877,123 | | | | 4,893,149,557 | | | | 1,408,018,702 | | | | 2,859,277,683 | | |
Net asset value of shares issued for reinvested dividends and distributions | | | 588,547,599 | | | | 1,412,959,434 | | | | 45,022,820 | | | | 520,207,592 | | |
Cost of shares redeemed | | | (2,795,450,154 | ) | | | (9,763,811,531 | ) | | | (1,413,418,447 | ) | | | (3,495,483,508 | ) | |
Redemption fees | | | — | | | | — | | | | — | | | | — | | |
Increase (decrease) in net assets from Fund share transactions | | | 163,974,568 | | | | (3,457,702,540 | ) | | | 39,623,075 | | | | (115,998,233 | ) | |
First Eagle Funds | Semiannual Report | April 30, 2021
120
| | First Eagle
U.S. Value Fund* | | First Eagle
Gold Fund* | |
| | | For the
Six Months Ended
April 30, 2021
(unaudited) | | For the
Year Ended
October 31, 2020 | | For the
Six Months Ended
April 30, 2021
(unaudited) | | For the
Year Ended
October 31, 2020 | |
Operations | |
Net investment income (loss) | | $ | 3,906,702 | | | $ | 11,530,733 | | | $ | (170,307 | ) | | $ | (6,962,153 | ) | |
Net realized gain (loss) from investments, commodity, foreign currency
and forward contract related transactions | | | 112,055,885 | | | | 23,717,973 | | | | 11,808,169 | | | | 14,918,369 | | |
Change in unrealized appreciation (depreciation) of investments,
commodity, foreign currency and forward contract related translations | | | 170,845,591 | | | | (77,801,551 | ) | | | (198,381,976 | ) | | | 532,116,971 | | |
Net increase (decrease) in net assets resulting from operations | | | 286,808,178 | | | | (42,552,845 | ) | | | (186,744,114 | ) | | | 540,073,187 | | |
Distributions to Shareholders | |
Distributable earnings: | |
Class A | | | (9,095,373 | ) | | | (48,290,389 | ) | | | (7,576,869 | ) | | | — | | |
Class C | | | (833,896 | ) | | | (14,144,878 | ) | | | (1,315,313 | ) | | | — | | |
Class I | | | (10,728,386 | ) | | | (60,172,080 | ) | | | (20,539,044 | ) | | | (523,987 | ) | |
Class R3 | | | (883 | ) | | | (4,247 | ) | | | (5,218 | ) | | | (185 | ) | |
Class R4 | | | (164 | ) | | | (796 | ) | | | (12,726 | ) | | | — | | |
Class R5 | | | (1,064 | ) | | | (801 | ) | | | (15,658 | ) | | | (16 | ) | |
Class R6 | | | (331,599 | ) | | | (510,941 | ) | | | (2,703,539 | ) | | | (280,281 | ) | |
Decrease in net assets resulting from distributions | | | (20,991,365 | ) | | | (123,124,132 | ) | | | (32,168,367 | ) | | | (804,469 | ) | |
Fund Share Transactions | |
Class A | |
Net proceeds from shares sold | | | 43,634,365 | | | | 87,835,828 | | | | 88,939,129 | | | | 249,993,321 | | |
Net asset value of shares issued for reinvested dividends and distributions | | | 7,757,290 | | | | 43,613,086 | | | | 7,065,621 | | | | — | | |
Cost of shares redeemed | | | (62,547,546 | ) | | | (193,078,324 | ) | | | (94,235,717 | ) | | | (155,054,396 | ) | |
Redemption fees | | | — | | | | — | | | | — | | | | 57,766 | | |
Increase (decrease) in net assets from Fund share transactions | | | (11,155,891 | ) | | | (61,629,410 | ) | | | 1,769,033 | | | | 94,996,691 | | |
Class C | |
Net proceeds from shares sold | | | 3,348,879 | | | | 12,547,849 | | | | 25,191,637 | | | | 72,190,468 | | |
Net asset value of shares issued for reinvested dividends and distributions | | | 810,746 | | | | 11,984,426 | | | | 1,196,048 | | | | — | | |
Cost of shares redeemed | | | (27,199,074 | ) | | | (97,424,297 | ) | | | (22,375,521 | ) | | | (53,763,811 | ) | |
Redemption fees | | | — | | | | — | | | | — | | | | 8,266 | | |
Increase (decrease) in net assets from Fund share transactions | | | (23,039,449 | ) | | | (72,892,022 | ) | | | 4,012,164 | | | | 18,434,923 | | |
Class I | |
Net proceeds from shares sold | | | 37,368,271 | | | | 146,948,288 | | | | 398,370,106 | | | | 872,020,463 | | |
Net asset value of shares issued for reinvested dividends and distributions | | | 6,724,589 | | | | 43,787,753 | | | | 17,491,897 | | | | 415,493 | | |
Cost of shares redeemed | | | (80,403,434 | ) | | | (354,648,385 | ) | | | (310,822,958 | ) | | | (284,542,023 | ) | |
Redemption fees | | | — | | | | — | | | | — | | | | 44,222 | | |
Increase (decrease) in net assets from Fund share transactions | | | (36,310,574 | ) | | | (163,912,344 | ) | | | 105,039,045 | | | | 587,938,155 | | |
First Eagle Funds | Semiannual Report | April 30, 2021
121
Statements of Changes in Net Assets (continued)
| | | First Eagle
Global Fund* | | First Eagle
Overseas Fund* | |
| | | For the
Six Months Ended
April 30, 2021
(unaudited) | | For the
Year Ended
October 31, 2020 | | For the
Six Months Ended
April 30, 2021
(unaudited) | | For the
Year Ended
October 31, 2020 | |
Class R3 | |
Net proceeds from shares sold | | | 105,022 | | | | 1,198,217 | | | | 233,186 | | | | 94,597 | | |
Net asset value of shares issued for reinvested dividends and distributions | | | 90,445 | | | | 627,345 | | | | 397 | | | | 4,785 | | |
Cost of shares redeemed | | | (4,617,816 | ) | | | (7,963,480 | ) | | | (73,956 | ) | | | (2,101 | ) | |
Increase (decrease) in net assets from Fund share transactions | | | (4,422,349 | ) | | | (6,137,918 | ) | | | 159,627 | | | | 97,281 | | |
Class R4 | |
Net proceeds from shares sold | | | 181,887 | | | | 2,062,455 | | | | 904,385 | | | | 7,506,074 | | |
Net asset value of shares issued for reinvested dividends and distributions | | | 60,986 | | | | 115,672 | | | | 42,486 | | | | 4,921 | | |
Cost of shares redeemed | | | (542,542 | ) | | | (1,665,223 | ) | | | (1,838,272 | ) | | | (77,940 | ) | |
Increase (decrease) in net assets from Fund share transactions | | | (299,669 | ) | | | 512,904 | | | | (891,401 | ) | | | 7,433,055 | | |
Class R5 | |
Net proceeds from shares sold | | | — | | | | — | | | | 26,327 | | | | 20,586 | | |
Net asset value of shares issued for reinvested dividends and distributions | | | 171 | | | | 554 | | | | 36 | | | | 962 | | |
Cost of shares redeemed | | | — | | | | — | | | | (48 | ) | | | (9,551 | ) | |
Increase (decrease) in net assets from Fund share transactions | | | 171 | | | | 554 | | | | 26,315 | | | | 11,997 | | |
Class R6 | |
Net proceeds from shares sold | | | 310,316,798 | | | | 872,725,207 | | | | 698,030,899 | | | | 351,615,036 | | |
Net asset value of shares issued for reinvested dividends and distributions | | | 42,756,670 | | | | 52,477,319 | | | | 7,029,534 | | | | 41,799,858 | | |
Cost of shares redeemed | | | (181,092,537 | ) | | | (269,917,964 | ) | | | (170,544,408 | ) | | | (187,863,662 | ) | |
Redemption fees | | | — | | | | — | | | | — | | | | — | | |
Increase (decrease) in net assets from Fund share transactions | | | 171,980,931 | | | | 655,284,562 | | | | 534,516,025 | | | | 205,551,232 | | |
Increase (decrease) in net assets from Fund share transactions | | | (359,692,513 | ) | | | (5,165,061,911 | ) | | | 454,586,651 | | | | (233,681,164 | ) | |
Net increase (decrease) in net assets | | | 7,625,497,463 | | | | (8,975,966,881 | ) | | | 2,453,464,476 | | | | (1,361,496,939 | ) | |
Net Assets (Note 1) | |
Beginning of period | | | 41,372,928,544 | | | | 50,348,895,425 | | | | 12,597,100,749 | | | | 13,958,597,688 | | |
End of period | | $ | 48,998,426,007 | | | $ | 41,372,928,544 | | | $ | 15,050,565,225 | | | $ | 12,597,100,749 | | |
Changes in Shares Outstanding | |
Class A | |
Shares outstanding, beginning of period | | | 218,563,801 | | | | 230,587,736 | | | | 76,443,647 | | | | 86,231,883 | | |
Shares sold | | | 13,564,939 | | | | 33,348,811 | | | | 5,443,893 | | | | 11,972,562 | | |
Shares issued on reinvestment of distributions | | | 4,522,528 | | | | 11,307,136 | | | | 144,089 | | | | 4,345,644 | | |
Shares redeemed | | | (19,293,693 | ) | | | (56,679,882 | ) | | | (8,361,352 | ) | | | (26,106,442 | ) | |
Shares outstanding, end of period | | | 217,357,575 | | | | 218,563,801 | | | | 73,670,277 | | | | 76,443,647 | | |
Class C | |
Shares outstanding, beginning of period | | | 64,457,855 | | | | 99,119,725 | | | | 10,447,967 | | | | 16,062,430 | | |
Shares sold | | | 1,900,805 | | | | 4,737,739 | | | | 332,251 | | | | 871,934 | | |
Shares issued on reinvestment of distributions | | | 977,406 | | | | 3,778,956 | | | | — | | | | 617,102 | | |
Shares redeemed | | | (13,092,602 | ) | | | (43,178,565 | ) | | | (2,313,754 | ) | | | (7,103,499 | ) | |
Shares outstanding, end of period | | | 54,243,464 | | | | 64,457,855 | | | | 8,466,464 | | | | 10,447,967 | | |
First Eagle Funds | Semiannual Report | April 30, 2021
122
| | First Eagle
U.S. Value Fund* | | First Eagle
Gold Fund* | |
| | | For the
Six Months Ended
April 30, 2021
(unaudited) | | For the
Year Ended
October 31, 2020 | | For the
Six Months Ended
April 30, 2021
(unaudited) | | For the
Year Ended
October 31, 2020 | |
Class R3 | |
Net proceeds from shares sold | | | — | | | | — | | | | 896,858 | | | | 318,391 | | |
Net asset value of shares issued for reinvested dividends and distributions | | | 883 | | | | 4,248 | | | | 5,218 | | | | 185 | | |
Cost of shares redeemed | | | — | | | | — | | | | (34,674 | ) | | | (519,244 | ) | |
Increase (decrease) in net assets from Fund share transactions | | | 883 | | | | 4,248 | | | | 867,402 | | | | (200,668 | ) | |
Class R4 | |
Net proceeds from shares sold | | | — | | | | — | | | | 119,469 | | | | 1,018,776 | | |
Net asset value of shares issued for reinvested dividends and distributions | | | 163 | | | | 796 | | | | 12,726 | | | | — | | |
Cost of shares redeemed | | | — | | | | — | | | | (131,388 | ) | | | (345,313 | ) | |
Increase (decrease) in net assets from Fund share transactions | | | 163 | | | | 796 | | | | 807 | | | | 673,463 | | |
Class R5 | |
Net proceeds from shares sold | | | 4,060 | | | | 41,580 | | | | 462,685 | | | | 749,882 | | |
Net asset value of shares issued for reinvested dividends and distributions | | | 195 | | | | 801 | | | | 6,374 | | | | 9 | | |
Cost of shares redeemed | | | (201 | ) | | | (664 | ) | | | (633,592 | ) | | | (352,773 | ) | |
Increase (decrease) in net assets from Fund share transactions | | | 4,054 | | | | 41,717 | | | | (164,533 | ) | | | 397,118 | | |
Class R6 | |
Net proceeds from shares sold | | | 4,041,844 | | | | 11,318,144 | | | | 32,897,898 | | | | 102,328,069 | | |
Net asset value of shares issued for reinvested dividends and distributions | | | 331,191 | | | | 509,354 | | | | 2,615,039 | | | | 280,259 | | |
Cost of shares redeemed | | | (2,447,206 | ) | | | (12,599,924 | ) | | | (105,787,040 | ) | | | (104,546,761 | ) | |
Redemption fees | | | — | | | | — | | | | — | | | | 8,010 | | |
Increase (decrease) in net assets from Fund share transactions | | | 1,925,829 | | | | (772,426 | ) | | | (70,274,103 | ) | | | (1,930,423 | ) | |
Increase (decrease) in net assets from Fund share transactions | | | (68,574,985 | ) | | | (299,159,441 | ) | | | 41,249,815 | | | | 700,309,259 | | |
Net increase (decrease) in net assets | | | 197,241,828 | | | | (464,836,418 | ) | | | (177,662,666 | ) | | | 1,239,577,977 | | |
Net Assets (Note 1) | |
Beginning of period | | | 1,108,359,506 | | | | 1,573,195,924 | | | | 2,459,394,623 | | | | 1,219,816,646 | | |
End of period | | $ | 1,305,601,334 | | | $ | 1,108,359,506 | | | $ | 2,281,731,957 | | | $ | 2,459,394,623 | | |
Changes in Shares Outstanding | |
Class A | |
Shares outstanding, beginning of period | | | 28,622,135 | | | | 32,562,859 | | | | 24,499,606 | | | | 20,722,606 | | |
Shares sold | | | 2,259,232 | | | | 5,337,012 | | | | 3,621,625 | | | | 10,636,415 | | |
Shares issued on reinvestment of distributions | | | 424,359 | | | | 2,452,929 | | | | 283,988 | | | | — | | |
Shares redeemed | | | (3,281,591 | ) | | | (11,730,665 | ) | | | (3,861,569 | ) | | | (6,859,415 | ) | |
Shares outstanding, end of period | | | 28,024,135 | | | | 28,622,135 | | | | 24,543,650 | | | | 24,499,606 | | |
Class C | |
Shares outstanding, beginning of period | | | 6,326,967 | | | | 10,862,306 | | | | 7,523,782 | | | | 6,758,790 | | |
Shares sold | | | 178,317 | | | | 824,068 | | | | 1,117,949 | | | | 3,294,969 | | |
Shares issued on reinvestment of distributions | | | 46,435 | | | | 707,463 | | | | 52,597 | | | | — | | |
Shares redeemed | | | (1,481,108 | ) | | | (6,066,870 | ) | | | (1,004,198 | ) | | | (2,529,977 | ) | |
Shares outstanding, end of period | | | 5,070,611 | | | | 6,326,967 | | | | 7,690,130 | | | | 7,523,782 | | |
First Eagle Funds | Semiannual Report | April 30, 2021
123
Statements of Changes in Net Assets (continued)
| | | First Eagle
Global Fund* | | First Eagle
Overseas Fund* | |
| | | For the
Six Months Ended
April 30, 2021
(unaudited) | | For the
Year Ended
October 31, 2020 | | For the
Six Months Ended
April 30, 2021
(unaudited) | | For the
Year Ended
October 31, 2020 | |
Class I | |
Shares outstanding, beginning of period | | | 435,121,397 | | | | 506,278,698 | | | | 414,893,100 | | | | 423,625,800 | | |
Shares sold | | | 37,803,986 | | | | 89,336,919 | | | | 53,645,847 | | | | 125,439,685 | | |
Shares issued on reinvestment of distributions | | | 9,805,858 | | | | 24,479,547 | | | | 1,753,908 | | | | 21,372,539 | | |
Shares redeemed | | | (44,900,545 | ) | | | (184,973,767 | ) | | | (53,757,602 | ) | | | (155,544,924 | ) | |
Shares outstanding, end of period | | | 437,830,696 | | | | 435,121,397 | | | | 416,535,253 | | | | 414,893,100 | | |
Class R3 | |
Shares outstanding, beginning of period | | | 81,176 | | | | 199,079 | | | | 7,866 | | | | 3,807 | | |
Shares sold | | | 1,686 | | | | 21,167 | | | | 8,813 | | | | 3,962 | | |
Shares issued on reinvestment of distributions | | | 1,507 | | | | 10,897 | | | | 16 | | | | 196 | | |
Shares redeemed | | | (76,606 | ) | | | (149,967 | ) | | | (2,795 | ) | | | (99 | ) | |
Shares outstanding, end of period | | | 7,763 | | | | 81,176 | | | | 13,900 | | | | 7,866 | | |
Class R4 | |
Shares outstanding, beginning of period | | | 38,806 | | | | 30,686 | | | | 313,837 | | | | 3,611 | | |
Shares sold | | | 2,857 | | | | 36,088 | | | | 34,892 | | | | 313,274 | | |
Shares issued on reinvestment of distributions | | | 1,017 | | | | 2,005 | | | | 1,658 | | | | 202 | | |
Shares redeemed | | | (8,730 | ) | | | (29,973 | ) | | | (68,326 | ) | | | (3,250 | ) | |
Shares outstanding, end of period | | | 33,950 | | | | 38,806 | | | | 282,061 | | | | 313,837 | | |
Class R5 | |
Shares outstanding, beginning of period | | | 179 | | | | 170 | | | | 1,149 | | | | 651 | | |
Shares sold | | | — | | | | — | | | | 1,033 | | | | 869 | | |
Shares issued on reinvestment of distributions | | | 3 | | | | 9 | | | | 1 | | | | 40 | | |
Shares redeemed | | | — | | | | — | | | | (2 | ) | | | (411 | ) | |
Shares outstanding, end of period | | | 182 | | | | 179 | | | | 2,181 | | | | 1,149 | | |
Class R6 | |
Shares outstanding, beginning of period | | | 27,859,910 | | | | 15,855,426 | | | | 39,321,157 | | | | 30,086,600 | | |
Shares sold | | | 5,009,224 | | | | 15,953,142 | | | | 26,829,461 | | | | 15,448,992 | | |
Shares issued on reinvestment of distributions | | | 712,255 | | | | 909,013 | | | | 273,949 | | | | 1,717,332 | | |
Shares redeemed | | | (2,876,931 | ) | | | (4,857,671 | ) | | | (6,442,084 | ) | | | (7,931,767 | ) | |
Shares outstanding, end of period | | | 30,704,458 | | | | 27,859,910 | | | | 59,982,483 | | | | 39,321,157 | | |
* First Eagle Global Fund, First Eagle Overseas Fund, First Eagle U.S. Value Fund and First Eagle Gold Fund financial statements are shown on a consolidated basis and includes the balances of the First Eagle Global Cayman Fund, Ltd., First Eagle Overseas Cayman Fund, Ltd., First Eagle U.S. Value Cayman Fund, Ltd., and First Eagle Gold Cayman Fund, Ltd., respectively.
See Notes to Financial Statements.
First Eagle Funds | Semiannual Report | April 30, 2021
124
| | | First Eagle
U.S. Value Fund* | | First Eagle
Gold Fund* | |
| | | For the
Six Months Ended
April 30, 2021
(unaudited) | | For the
Year Ended
October 31, 2020 | | For the
Six Months Ended
April 30, 2021
(unaudited) | | For the
Year Ended
October 31, 2020 | |
Class I | |
Shares outstanding, beginning of period | | | 29,211,135 | | | | 39,001,968 | | | | 52,495,301 | | | | 28,802,758 | | |
Shares sold | | | 1,908,534 | | | | 9,294,883 | | | | 15,678,743 | | | | 35,825,014 | | |
Shares issued on reinvestment of distributions | | | 360,955 | | | | 2,417,877 | | | | 682,477 | | | | 21,618 | | |
Shares redeemed | | | (4,156,563 | ) | | | (21,503,593 | ) | | | (12,385,503 | ) | | | (12,154,089 | ) | |
Shares outstanding, end of period | | | 27,324,061 | | | | 29,211,135 | | | | 56,471,018 | | | | 52,495,301 | | |
Class R3 | |
Shares outstanding, beginning of period | | | 3,066 | | | | 2,832 | | | | 17,463 | | | | 25,614 | | |
Shares sold | | | — | | | | — | | | | 37,061 | | | | 14,635 | | |
Shares issued on reinvestment of distributions | | | 48 | | | | 234 | | | | 204 | | | | 10 | | |
Shares redeemed | | | — | | | | — | | | | (1,480 | ) | | | (22,796 | ) | |
Shares outstanding, end of period | | | 3,114 | | | | 3,066 | | | | 53,248 | | | | 17,463 | | |
Class R4 | |
Shares outstanding, beginning of period | | | 559 | | | | 515 | | | | 34,389 | | | | 539 | | |
Shares sold | | | — | | | | — | | | | 4,768 | | | | 49,072 | | |
Shares issued on reinvestment of distributions | | | 9 | | | | 44 | | | | 495 | | | | — | | |
Shares redeemed | | | — | | | | — | | | | (5,282 | ) | | | (15,222 | ) | |
Shares outstanding, end of period | | | 568 | | | | 559 | | | | 34,370 | | | | 34,389 | | |
Class R5 | |
Shares outstanding, beginning of period | | | 3,042 | | | | 515 | | | | 24,936 | | | | 8,627 | | |
Shares sold | | | 207 | | | | 2,522 | | | | 17,120 | | | | 35,912 | | |
Shares issued on reinvestment of distributions | | | 10 | | | | 44 | | | | 249 | | | | — | | |
Shares redeemed | | | (10 | ) | | | (39 | ) | | | (24,820 | ) | | | (19,603 | ) | |
Shares outstanding, end of period | | | 3,249 | | | | 3,042 | | | | 17,485 | | | | 24,936 | | |
Class R6 | |
Shares outstanding, beginning of period | | | 869,157 | | | | 830,020 | | | | 7,695,443 | | | | 8,475,720 | | |
Shares sold | | | 202,656 | | | | 673,656 | | | | 1,300,613 | | | | 3,854,823 | | |
Shares issued on reinvestment of distributions | | | 17,787 | | | | 28,126 | | | | 101,871 | | | | 14,566 | | |
Shares redeemed | | | (123,360 | ) | | | (662,645 | ) | | | (4,214,447 | ) | | | (4,649,666 | ) | |
Shares outstanding, end of period | | | 966,240 | | | | 869,157 | | | | 4,883,480 | | | | 7,695,443 | | |
First Eagle Funds | Semiannual Report | April 30, 2021
125
Statements of Changes in Net Assets (continued)
| | | First Eagle
Global Income Builder Fund | | First Eagle
High Income Fund | |
| | | For the
Six Months Ended
April 30, 2021
(unaudited) | | For the
Year Ended
October 31, 2020 | | For the
Six Months Ended
April 30, 2021
(unaudited) | | For the
Year Ended
October 31, 2020 | |
Operations | |
Net investment income | | $ | 11,707,328 | | | $ | 24,686,081 | | | $ | 4,569,913 | | | $ | 10,196,921 | | |
Net realized gain (loss) from investments, commodity, foreign currency
and forward contract related transactions and option contracts written | | | 26,463,850 | | | | 14,926,116 | | | | 1,229,865 | | | | (12,147,452 | ) | |
Change in unrealized appreciation (depreciation) of investments,
commodity, foreign currency and forward contract related translations
and option contracts written | | | 177,175,435 | | | | (97,256,194 | ) | | | 3,281,002 | | | | 11,617,191 | | |
Net increase (decrease) in net assets resulting from operations | | | 215,346,613 | | | | (57,643,997 | ) | | | 9,080,780 | | | | 9,666,660 | | |
Distributions to Shareholders | |
Distributable earnings: | |
Class A | | | (8,354,585 | ) | | | (8,328,144 | ) | | | (1,478,753 | ) | | | (2,969,744 | ) | |
Class C | | | (3,327,653 | ) | | | (3,582,822 | ) | | | (472,552 | ) | | | (1,426,602 | ) | |
Class I | | | (14,905,037 | ) | | | (17,577,014 | ) | | | (2,811,770 | ) | | | (5,568,397 | ) | |
Class Y | | | — | | | | — | | | | — | | | | — | | |
Class R3 | | | (1,115 | ) | | | (982 | ) | | | (9,088 | ) | | | (2,591 | ) | |
Class R4 | | | (215 | ) | | | (205 | ) | | | (179 | ) | | | (370 | ) | |
Class R5 | | | (220 | ) | | | (216 | ) | | | (206 | ) | | | (428 | ) | |
Class R6 | | | (398,282 | ) | | | (113,730 | ) | | | (22,063 | ) | | | (44,875 | ) | |
Decrease in net assets resulting from distributions | | | (26,987,107 | ) | | | (29,603,113 | ) | | | (4,794,611 | ) | | | (10,013,007 | ) | |
Fund Share Transactions | |
Class A | |
Net proceeds from shares sold | | | 74,473,943 | | | | 140,271,815 | | | | 8,308,102 | | | | 23,079,334 | | |
Net asset value of shares issued for reinvested dividends and distributions | | | 7,419,062 | | | | 7,478,008 | | | | 1,398,841 | | | | 2,818,700 | | |
Cost of shares redeemed | | | (53,885,611 | ) | | | (157,027,291 | ) | | | (9,134,745 | ) | | | (25,909,910 | ) | |
Increase (decrease) in net assets from Fund share transactions | | | 28,007,394 | | | | (9,277,468 | ) | | | 572,198 | | | | (11,876 | ) | |
Class C | |
Net proceeds from shares sold | | | 5,809,301 | | | | 23,537,223 | | | | 1,084,775 | | | | 3,866,847 | | |
Net asset value of shares issued for reinvested dividends and distributions | | | 3,157,108 | | | | 3,142,704 | | | | 469,092 | | | | 1,311,844 | | |
Cost of shares redeemed | | | (35,849,237 | ) | | | (114,330,966 | ) | | | (7,017,022 | ) | | | (22,618,745 | ) | |
Decrease in net assets from Fund share transactions | | | (26,882,828 | ) | | | (87,651,039 | ) | | | (5,463,155 | ) | | | (17,440,054 | ) | |
Class I | |
Net proceeds from shares sold | | | 61,080,337 | | | | 151,342,708 | | | | 24,117,929 | | | | 50,903,784 | | |
Net asset value of shares issued for reinvested dividends and distributions | | | 12,465,532 | | | | 14,303,065 | | | | 2,050,398 | | | | 4,436,961 | | |
Cost of shares redeemed | | | (124,564,031 | ) | | | (281,113,558 | ) | | | (19,767,293 | ) | | | (74,116,525 | ) | |
Increase (decrease) in net assets from Fund share transactions | | | (51,018,162 | ) | | | (115,467,785 | ) | | | 6,401,034 | | | | (18,775,780 | ) | |
First Eagle Funds | Semiannual Report | April 30, 2021
126
| | First Eagle
Fund of America | |
| | | For the
Six Months Ended
April 30, 2021
(unaudited) | | For the
Year Ended
October 31, 2020 | |
Operations | |
Net investment income | | $ | 1,188,100 | | | $ | 406,830 | | |
Net realized gain (loss) from investments, commodity, foreign currency
and forward contract related transactions and option contracts written | | | 56,235,822 | | | | 107,333,380 | | |
Change in unrealized appreciation (depreciation) of investments,
commodity, foreign currency and forward contract related translations
and option contracts written | | | 79,017,146 | | | | (121,550,427 | ) | |
Net increase (decrease) in net assets resulting from operations | | | 136,441,068 | | | | (13,810,217 | ) | |
Distributions to Shareholders | |
Distributable earnings: | |
Class A | | | (33,948,980 | ) | | | (2,425,525 | ) | |
Class C | | | (14,232,302 | ) | | | (1,289,937 | ) | |
Class I | | | (26,739,184 | ) | | | (4,713,124 | ) | |
Class Y | | | (18,283,361 | ) | | | (2,379,215 | ) | |
Class R3 | | | (7,863 | ) | | | (435 | ) | |
Class R4 | | | (1,618 | ) | | | (113 | ) | |
Class R5 | | | (1,631 | ) | | | (115 | ) | |
Class R6 | | | (926,407 | ) | | | (30,701 | ) | |
Decrease in net assets resulting from distributions | | | (94,141,346 | ) | | | (10,839,165 | ) | |
Fund Share Transactions | |
Class A | |
Net proceeds from shares sold | | | 13,830,264 | | | | 25,571,338 | | |
Net asset value of shares issued for reinvested dividends and distributions | | | 31,366,931 | | | | 2,293,351 | | |
Cost of shares redeemed | | | (41,735,861 | ) | | | (90,699,499 | ) | |
Increase (decrease) in net assets from Fund share transactions | | | 3,461,334 | | | | (62,834,810 | ) | |
Class C | |
Net proceeds from shares sold | | | 509,157 | | | | 3,677,577 | | |
Net asset value of shares issued for reinvested dividends and distributions | | | 14,128,456 | | | | 1,178,681 | | |
Cost of shares redeemed | | | (20,474,504 | ) | | | (53,781,315 | ) | |
Decrease in net assets from Fund share transactions | | | (5,836,891 | ) | | | (48,925,057 | ) | |
Class I | |
Net proceeds from shares sold | | | 14,389,692 | | | | 19,769,169 | | |
Net asset value of shares issued for reinvested dividends and distributions | | | 15,315,007 | | | | 3,209,604 | | |
Cost of shares redeemed | | | (47,765,584 | ) | | | (231,370,730 | ) | |
Increase (decrease) in net assets from Fund share transactions | | | (18,060,885 | ) | | | (208,391,957 | ) | |
First Eagle Funds | Semiannual Report | April 30, 2021
127
Statements of Changes in Net Assets (continued)
| | | First Eagle
Global Income Builder Fund | | First Eagle
High Income Fund | |
| | | For the
Six Months Ended
April 30, 2021
(unaudited) | | For the
Year Ended
October 31, 2020 | | For the
Six Months Ended
April 30, 2021
(unaudited) | | For the
Year Ended
October 31, 2020 | |
Class Y | |
Net proceeds from shares sold | | | — | | | | — | | | | — | | | | — | | |
Net asset value of shares issued for reinvested dividends and distributions | | | — | | | | — | | | | — | | | | — | | |
Cost of shares redeemed | | | — | | | | — | | | | — | | | | — | | |
Increase (decrease) in net assets from Fund share transactions | | | — | | | | — | | | | — | | | | — | | |
Class R3 | |
Net proceeds from shares sold | | | — | | | | — | | | | 65,981 | | | | 399,863 | | |
Net asset value of shares issued for reinvested dividends and distributions | | | 1,115 | | | | 982 | | | | 9,087 | | | | 2,591 | | |
Cost of shares redeemed | | | — | | | | — | | | | (23,258 | ) | | | — | | |
Increase in net assets from Fund share transactions | | | 1,115 | | | | 982 | | | | 51,810 | | | | 402,454 | | |
Class R4 | |
Net asset value of shares issued for reinvested dividends and distributions | | | 215 | | | | 206 | | | | 178 | | | | 370 | | |
Increase in net assets from Fund share transactions | | | 215 | | | | 206 | | | | 178 | | | | 370 | | |
Class R5 | |
Net asset value of shares issued for reinvested dividends and distributions | | | 220 | | | | 216 | | | | 206 | | | | 428 | | |
Increase in net assets from Fund share transactions | | | 220 | | | | 216 | | | | 206 | | | | 428 | | |
Class R6 | |
Net proceeds from shares sold | | | 3,731,071 | | | | 17,380,803 | | | | 29,894 | | | | 1,127,932 | | |
Net asset value of shares issued for reinvested dividends and distributions | | | 394,597 | | | | 113,664 | | | | 22,064 | | | | 44,255 | | |
Cost of shares redeemed | | | (2,002,022 | ) | | | (2,910,829 | ) | | | (42,515 | ) | | | (2,063,373 | ) | |
Increase (decrease) in net assets from Fund share transactions | | | 2,123,646 | | | | 14,583,638 | | | | 9,443 | | | | (891,186 | ) | |
Increase (decrease) in net assets from Fund share transactions | | | (47,768,400 | ) | | | (197,811,250 | ) | | | 1,571,714 | | | | (36,715,644 | ) | |
Net increase (decrease) in net assets | | | 140,591,106 | | | | (285,058,360 | ) | | | 5,857,883 | | | | (37,061,991 | ) | |
Net Assets (Note 1) | |
Beginning of period | | | 1,191,665,041 | | | | 1,476,723,401 | | | | 233,117,230 | | | | 270,179,221 | | |
End of period | | $ | 1,332,256,147 | | | $ | 1,191,665,041 | | | $ | 238,975,113 | | | $ | 233,117,230 | | |
Changes in Shares Outstanding | |
Class A | |
Shares outstanding, beginning of period | | | 31,324,150 | | | | 32,351,845 | | | | 8,395,840 | | | | 8,445,828 | | |
Shares sold | | | 5,824,545 | | | | 11,998,649 | | | | 931,526 | | | | 2,735,485 | | |
Shares issued on reinvestment of distributions | | | 589,106 | | | | 646,883 | | | | 156,688 | | | | 333,975 | | |
Shares redeemed | | | (4,243,331 | ) | | | (13,673,227 | ) | | | (1,023,953 | ) | | | (3,119,448 | ) | |
Shares outstanding, end of period | | | 33,494,470 | | | | 31,324,150 | | | | 8,460,101 | | | | 8,395,840 | | |
First Eagle Funds | Semiannual Report | April 30, 2021
128
| | | First Eagle
Fund of America | |
| | | For the
Six Months Ended
April 30, 2021
(unaudited) | | For the
Year Ended
October 31, 2020 | |
Class Y | |
Net proceeds from shares sold | | | 537,473 | | | | 3,883,413 | | |
Net asset value of shares issued for reinvested dividends and distributions | | | 17,218,342 | | | | 2,295,514 | | |
Cost of shares redeemed | | | (14,538,446 | ) | | | (137,098,467 | ) | |
Increase (decrease) in net assets from Fund share transactions | | | 3,217,369 | | | | (130,919,540 | ) | |
Class R3 | |
Net proceeds from shares sold | | | — | | | | — | | |
Net asset value of shares issued for reinvested dividends and distributions | | | 7,863 | | | | 435 | | |
Cost of shares redeemed | | | — | | | | — | | |
Increase in net assets from Fund share transactions | | | 7,863 | | | | 435 | | |
Class R4 | |
Net asset value of shares issued for reinvested dividends and distributions | | | 1,618 | | | | 113 | | |
Increase in net assets from Fund share transactions | | | 1,618 | | | | 113 | | |
Class R5 | |
Net asset value of shares issued for reinvested dividends and distributions | | | 1,631 | | | | 115 | | |
Increase in net assets from Fund share transactions | | | 1,631 | | | | 115 | | |
Class R6 | |
Net proceeds from shares sold | | | 880,225 | | | | 4,203,634 | | |
Net asset value of shares issued for reinvested dividends and distributions | | | 910,513 | | | | 30,700 | | |
Cost of shares redeemed | | | (1,241,164 | ) | | | (1,497,382 | ) | |
Increase (decrease) in net assets from Fund share transactions | | | 549,574 | | | | 2,736,952 | | |
Increase (decrease) in net assets from Fund share transactions | | | (16,658,387 | ) | | | (448,333,749 | ) | |
Net increase (decrease) in net assets | | | 25,641,335 | | | | (472,983,131 | ) | |
Net Assets (Note 1) | |
Beginning of period | | | 550,516,542 | | | | 1,023,499,673 | | |
End of period | | $ | 576,157,877 | | | $ | 550,516,542 | | |
Changes in Shares Outstanding | |
Class A | |
Shares outstanding, beginning of period | | | 7,878,416 | | | | 10,337,706 | | |
Shares sold | | | 538,654 | | | | 1,012,135 | | |
Shares issued on reinvestment of distributions | | | 1,286,135 | | | | 83,730 | | |
Shares redeemed | | | (1,611,430 | ) | | | (3,555,155 | ) | |
Shares outstanding, end of period | | | 8,091,775 | | | | 7,878,416 | | |
First Eagle Funds | Semiannual Report | April 30, 2021
129
Statements of Changes in Net Assets (continued)
| | | First Eagle
Global Income Builder Fund | | First Eagle
High Income Fund | |
| | | For the
Six Months Ended
April 30, 2021
(unaudited) | | For the
Year Ended
October 31, 2020 | | For the
Six Months Ended
April 30, 2021
(unaudited) | | For the
Year Ended
October 31, 2020 | |
Class C | |
Shares outstanding, beginning of period | | | 16,265,829 | | | | 23,864,750 | | | | 3,674,826 | | | | 5,756,398 | | |
Shares sold | | | 458,009 | | | | 2,073,899 | | | | 121,443 | | | | 468,740 | | |
Shares issued on reinvestment of distributions | | | 252,292 | | | | 272,926 | | | | 52,558 | | | | 155,661 | | |
Shares redeemed | | | (2,827,645 | ) | | | (9,945,746 | ) | | | (786,292 | ) | | | (2,705,973 | ) | |
Shares outstanding, end of period | | | 14,148,485 | | | | 16,265,829 | | | | 3,062,535 | | | | 3,674,826 | | |
Class I | |
Shares outstanding, beginning of period | | | 55,060,055 | | | | 65,476,769 | | | | 14,522,650 | | | | 16,584,726 | | |
Shares sold | | | 4,768,000 | | | | 13,196,284 | | | | 2,698,348 | | | | 6,177,369 | | |
Shares issued on reinvestment of distributions | | | 992,783 | | | | 1,238,136 | | | | 229,543 | | | | 524,656 | | |
Shares redeemed | | | (9,820,978 | ) | | | (24,851,134 | ) | | | (2,216,517 | ) | | | (8,764,101 | ) | |
Shares outstanding, end of period | | | 50,999,860 | | | | 55,060,055 | | | | 15,234,024 | | | | 14,522,650 | | |
Class Y | |
Shares outstanding, beginning of period | | | — | | | | — | | | | — | | | | — | | |
Shares sold | | | — | | | | — | | | | — | | | | — | | |
Shares issued on reinvestment of distributions | | | — | | | | — | | | | — | | | | — | | |
Shares redeemed | | | — | | | | — | | | | — | | | | — | | |
Shares outstanding, end of period | | | — | | | | — | | | | — | | | | — | | |
Class R3 | |
Shares outstanding, beginning of period | | | 4,411 | | | | 4,326 | | | | 51,915 | | | | 6,015 | | |
Shares sold | | | — | | | | — | | | | 7,407 | | | | 45,595 | | |
Shares issued on reinvestment of distributions | | | 89 | | | | 85 | | | | 1,017 | | | | 305 | | |
Shares redeemed | | | — | | | | — | | | | (2,622 | ) | | | — | | |
Shares outstanding, end of period | | | 4,500 | | | | 4,411 | | | | 57,717 | | | | 51,915 | | |
Class R4 | |
Shares outstanding, beginning of period | | | 848 | | | | 831 | | | | 1,193 | | | | 1,149 | | |
Shares issued on reinvestment of distributions | | | 18 | | | | 17 | | | | 20 | | | | 44 | | |
Shares outstanding, end of period | | | 866 | | | | 848 | | | | 1,213 | | | | 1,193 | | |
Class R5 | |
Shares outstanding, beginning of period | | | 850 | | | | 831 | | | | 1,200 | | | | 1,149 | | |
Shares issued on reinvestment of distributions | | | 17 | | | | 19 | | | | 23 | | | | 51 | | |
Shares outstanding, end of period | | | 867 | | | | 850 | | | | 1,223 | | | | 1,200 | | |
Class R6 | |
Shares outstanding, beginning of period | | | 1,367,750 | | | | 101,795 | | | | 118,516 | | | | 218,887 | | |
Shares sold | | | 293,799 | | | | 1,502,681 | | | | 3,330 | | | | 130,054 | | |
Shares issued on reinvestment of distributions | | | 31,398 | | | | 9,768 | | | | 2,470 | | | | 5,150 | | |
Shares redeemed | | | (157,900 | ) | | | (246,494 | ) | | | (4,734 | ) | | | (235,575 | ) | |
Shares outstanding, end of period | | | 1,535,047 | | | | 1,367,750 | | | | 119,582 | | | | 118,516 | | |
See Notes to Financial Statements.
First Eagle Funds | Semiannual Report | April 30, 2021
130
| | | First Eagle
Fund of America | |
| | | For the
Six Months Ended
April 30, 2021
(unaudited) | | For the
Year Ended
October 31, 2020 | |
Class C | |
Shares outstanding, beginning of period | | | 3,357,306 | | | | 5,943,338 | | |
Shares sold | | | 29,829 | | | | 211,141 | | |
Shares issued on reinvestment of distributions | | | 859,395 | | | | 58,964 | | |
Shares redeemed | | | (1,168,271 | ) | | | (2,856,137 | ) | |
Shares outstanding, end of period | | | 3,078,259 | | | | 3,357,306 | | |
Class I | |
Shares outstanding, beginning of period | | | 6,209,982 | | | | 13,959,992 | | |
Shares sold | | | 542,236 | | | | 741,746 | | |
Shares issued on reinvestment of distributions | | | 600,448 | | | | 112,855 | | |
Shares redeemed | | | (1,765,756 | ) | | | (8,604,611 | ) | |
Shares outstanding, end of period | | | 5,586,910 | | | | 6,209,982 | | |
Class Y | |
Shares outstanding, beginning of period | | | 4,180,448 | | | | 9,072,699 | | |
Shares sold | | | 20,735 | | | | 139,730 | | |
Shares issued on reinvestment of distributions | | | 680,870 | | | | 81,228 | | |
Shares redeemed | | | (547,633 | ) | | | (5,113,209 | ) | |
Shares outstanding, end of period | | | 4,334,420 | | | | 4,180,448 | | |
Class R3 | |
Shares outstanding, beginning of period | | | 1,768 | | | | 1,753 | | |
Shares sold | | | — | | | | — | | |
Shares issued on reinvestment of distributions | | | 310 | | | | 15 | | |
Shares redeemed | | | — | | | | — | | |
Shares outstanding, end of period | | | 2,078 | | | | 1,768 | | |
Class R4 | |
Shares outstanding, beginning of period | | | 359 | | | | 355 | | |
Shares issued on reinvestment of distributions | | | 64 | | | | 4 | | |
Shares outstanding, end of period | | | 423 | | | | 359 | | |
Class R5 | |
Shares outstanding, beginning of period | | | 359 | | | | 355 | | |
Shares issued on reinvestment of distributions | | | 64 | | | | 4 | | |
Shares outstanding, end of period | | | 423 | | | | 359 | | |
Class R6 | |
Shares outstanding, beginning of period | | | 203,180 | | | | 96,369 | | |
Shares sold | | | 32,451 | | | | 161,794 | | |
Shares issued on reinvestment of distributions | | | 35,696 | | | | 1,079 | | |
Shares redeemed | | | (45,920 | ) | | | (56,062 | ) | |
Shares outstanding, end of period | | | 225,407 | | | | 203,180 | | |
First Eagle Funds | Semiannual Report | April 30, 2021
131
| | | Per share operating performance* | |
| | | | | Change in Net Assets Resulting
from operations | | Less dividends and distributions | |
Selected per
share data for
the period ended:* | | Net assets
value,
beginning
of period | | Net
investment
income/
loss | | Net
realized
and
unrealized
gains
(losses) on
investments | | Total
investment
operations | | From net
investment
income | | From
capital
gains | | Return of
capital | | Total
distributions | |
First Eagle Global Fund Class A | |
Six Months Ended
April 30, 2021
(unaudited) | | $ | 55.42 | | | | 0.22 | | | | 11.96 | | | | 12.18 | | | | (0.51 | ) | | | (0.95 | ) | | | — | | | | (1.46 | ) | |
October 31, 2020 | | $ | 59.15 | | | | 0.48 | | | | (1.03 | ) | | | (0.55 | ) | | | (0.73 | ) | | | (2.45 | ) | | | — | | | | (3.18 | ) | |
October 31, 2019 | | $ | 56.37 | | | | 0.64 | | | | 5.37 | | | | 6.01 | | | | (0.43 | ) | | | (2.80 | ) | | | — | | | | (3.23 | ) | |
October 31, 2018 | | $ | 60.46 | | | | 0.49 | | | | (2.08 | ) | | | (1.59 | ) | | | (0.44 | ) | | | (2.06 | ) | | | — | | | | (2.50 | ) | |
October 31, 2017 | | $ | 56.36 | | | | 0.25 | | | | 6.41 | | | | 6.66 | | | | (0.21 | ) | | | (2.35 | ) | | | — | | | | (2.56 | ) | |
October 31, 2016 | | $ | 53.10 | | | | 0.30 | | | | 3.56 | | | | 3.86 | | | | (0.07 | ) | | | (0.53 | ) | | | — | | | | (0.60 | ) | |
First Eagle Global Fund Class C | |
Six Months Ended
April 30, 2021
(unaudited) | | $ | 53.12 | | | | (0.02 | ) | | | 11.50 | | | | 11.48 | | | | — | | | | (0.95 | ) | | | — | | | | (0.95 | ) | |
October 31, 2020 | | $ | 56.69 | | | | 0.07 | | | | (1.01 | ) | | | (0.94 | ) | | | (0.18 | ) | | | (2.45 | ) | | | — | | | | (2.63 | ) | |
October 31, 2019 | | $ | 54.11 | | | | 0.18 | | | | 5.20 | | | | 5.38 | | | | — | | | | (2.80 | ) | | | — | | | | (2.80 | ) | |
October 31, 2018 | | $ | 58.14 | | | | 0.05 | | | | (2.02 | ) | | | (1.97 | ) | | | — | | | | (2.06 | ) | | | — | | | | (2.06 | ) | |
October 31, 2017 | | $ | 54.47 | | | | (0.16 | ) | | | 6.18 | | | | 6.02 | | | | — | | | | (2.35 | ) | | | — | | | | (2.35 | ) | |
October 31, 2016 | | $ | 51.66 | | | | (0.11 | ) | | | 3.45 | | | | 3.34 | | | | — | | | | (0.53 | ) | | | — | | | | (0.53 | ) | |
First Eagle Global Fund Class I | |
Six Months Ended
April 30, 2021
(unaudited) | | $ | 55.79 | | | | 0.30 | | | | 12.04 | | | | 12.34 | | | | (0.66 | ) | | | (0.95 | ) | | | — | | | | (1.61 | ) | |
October 31, 2020 | | $ | 59.52 | | | | 0.63 | | | | (1.03 | ) | | | (0.40 | ) | | | (0.88 | ) | | | (2.45 | ) | | | — | | | | (3.33 | ) | |
October 31, 2019 | | $ | 56.73 | | | | 0.78 | | | | 5.41 | | | | 6.19 | | | | (0.60 | ) | | | (2.80 | ) | | | — | | | | (3.40 | ) | |
October 31, 2018 | | $ | 60.85 | | | | 0.66 | | | | (2.11 | ) | | | (1.45 | ) | | | (0.61 | ) | | | (2.06 | ) | | | — | | | | (2.67 | ) | |
October 31, 2017 | | $ | 56.70 | | | | 0.43 | | | | 6.42 | | | | 6.85 | | | | (0.35 | ) | | | (2.35 | ) | | | — | | | | (2.70 | ) | |
October 31, 2016 | | $ | 53.43 | | | | 0.44 | | | | 3.57 | | | | 4.01 | | | | (0.21 | ) | | | (0.53 | ) | | | — | | | | (0.74 | ) | |
First Eagle Global Fund Class R3 | |
Six Months Ended
April 30, 2021
(unaudited) | | $ | 55.47 | | | | 0.12 | | | | 12.00 | | | | 12.12 | | | | (0.30 | ) | | | (0.95 | ) | | | — | | | | (1.25 | ) | |
October 31, 2020 | | $ | 59.34 | | | | 0.48 | | | | (1.07 | ) | | | (0.59 | ) | | | (0.83 | ) | | | (2.45 | ) | | | — | | | | (3.28 | ) | |
October 31, 2019 | | $ | 56.62 | | | | 0.60 | | | | 5.38 | | | | 5.98 | | | | (0.46 | ) | | | (2.80 | ) | | | — | | | | (3.26 | ) | |
For The Period
5/01/18^-
10/31/18 | | $ | 58.95 | | | | 0.28 | | | | (2.61 | ) | | | (2.33 | ) | | | — | | | | — | | | | — | | | | — | | |
First Eagle Funds | Semiannual Report | April 30, 2021
132
| | | | | | | | | Ratios/Supplemental data | | | |
| | | | | | | | | Ratios to Average Net Assets of: | | | |
Selected per
share data for
the period ended:* | | Net assets
value, end
of period | | Total
return(a) | | Net assets,
end of
period
(thousands) | | Operating
expenses
excluding
earnings
credits
and/or fee
waivers | | Operating
expenses
including
earnings
credits
and/or fee
waivers | | Net
investment
income
excluding
earnings
credits
and/or fee
waivers | | Net
investment
income
including
earnings
credits
and/or fee
waivers | | Portfolio
turnover
rate | |
First Eagle Global Fund Class A | |
Six Months Ended
April 30, 2021
(unaudited) | | $ | 66.14 | | | | 22.26 | %(b) | | $ | 14,376,436 | | | | 1.10 | %(c) | | | 1.10 | %(c) | | | 0.70 | %(c) | | | 0.70 | %(c) | | | 1.95 | %(b) | |
October 31, 2020 | | $ | 55.42 | | | | (1.12 | )% | | $ | 12,112,205 | | | | 1.11 | % | | | 1.11 | % | | | 0.87 | % | | | 0.87 | % | | | 10.84 | % | |
October 31, 2019 | | $ | 59.15 | | | | 11.44 | % | | $ | 13,638,545 | | | | 1.11 | % | | | 1.11 | % | | | 1.13 | % | | | 1.13 | % | | | 10.26 | % | |
October 31, 2018 | | $ | 56.37 | | | | (2.82 | )% | | $ | 12,357,124 | | | | 1.11 | % | | | 1.11 | % | | | 0.84 | % | | | 0.84 | % | | | 14.91 | % | |
October 31, 2017 | | $ | 60.46 | | | | 12.35 | % | | $ | 14,907,330 | | | | 1.11 | % | | | 1.11 | % | | | 0.44 | % | | | 0.44 | % | | | 9.67 | % | |
October 31, 2016 | | $ | 56.36 | | | | 7.38 | % | | $ | 15,833,531 | | | | 1.10 | % | | | 1.10 | % | | | 0.55 | % | | | 0.55 | % | | | 11.54 | % | |
First Eagle Global Fund Class C | |
Six Months Ended
April 30, 2021
(unaudited) | | $ | 63.65 | | | | 21.80 | %(b) | | $ | 3,452,601 | | | | 1.87 | %(c) | | | 1.87 | %(c) | | | (0.08 | )%(c) | | | (0.08 | )%(c) | | | 1.95 | %(b) | |
October 31, 2020 | | $ | 53.12 | | | | (1.86 | )% | | $ | 3,423,967 | | | | 1.87 | % | | | 1.87 | % | | | 0.13 | % | | | 0.13 | % | | | 10.84 | % | |
October 31, 2019 | | $ | 56.69 | | | | 10.58 | % | | $ | 5,619,288 | | | | 1.87 | % | | | 1.86 | % | | | 0.33 | % | | | 0.33 | % | | | 10.26 | % | |
October 31, 2018 | | $ | 54.11 | | | | (3.54 | )% | | $ | 8,667,512 | | | | 1.86 | % | | | 1.86 | % | | | 0.09 | % | | | 0.09 | % | | | 14.91 | % | |
October 31, 2017 | | $ | 58.14 | | | | 11.52 | % | | $ | 10,589,991 | | | | 1.85 | % | | | 1.85 | % | | | (0.29 | )% | | | (0.29 | )% | | | 9.67 | % | |
October 31, 2016 | | $ | 54.47 | | | | 6.56 | % | | $ | 11,505,279 | | | | 1.86 | % | | | 1.86 | % | | | (0.21 | )% | | | (0.21 | )% | | | 11.54 | % | |
First Eagle Global Fund Class I | |
Six Months Ended
April 30, 2021
(unaudited) | | $ | 66.52 | | | | 22.43 | %(b) | | $ | 29,123,582 | | | | 0.84 | %(c) | | | 0.84 | %(c) | | | 0.96 | %(c) | | | 0.96 | %(c) | | | 1.95 | %(b) | |
October 31, 2020 | | $ | 55.79 | | | | (0.86 | )% | | $ | 24,274,791 | | | | 0.86 | % | | | 0.86 | % | | | 1.14 | % | | | 1.14 | % | | | 10.84 | % | |
October 31, 2019 | | $ | 59.52 | | | | 11.72 | % | | $ | 30,133,165 | | | | 0.85 | % | | | 0.85 | % | | | 1.38 | % | | | 1.38 | % | | | 10.26 | % | |
October 31, 2018 | | $ | 56.73 | | | | (2.54 | )% | | $ | 29,334,134 | | | | 0.84 | % | | | 0.84 | % | | | 1.11 | % | | | 1.11 | % | | | 14.91 | % | |
October 31, 2017 | | $ | 60.85 | | | | 12.64 | % | | $ | 30,858,477 | | | | 0.84 | % | | | 0.84 | % | | | 0.74 | % | | | 0.74 | % | | | 9.67 | % | |
October 31, 2016 | | $ | 56.70 | | | | 7.65 | % | | $ | 22,357,335 | | | | 0.84 | % | | | 0.84 | % | | | 0.81 | % | | | 0.81 | % | | | 11.54 | % | |
First Eagle Global Fund Class R3 | |
Six Months Ended
April 30, 2021
(unaudited) | | $ | 66.34 | | | | 22.09 | %(b) | | $ | 515 | | | | 1.21 | %(c) | | | 1.21 | %(c) | | | 0.40 | %(c) | | | 0.40 | %(c) | | | 1.95 | %(b) | |
October 31, 2020 | | $ | 55.47 | | | | (1.21 | )% | | $ | 4,503 | | | | 1.18 | % | | | 1.18 | % | | | 0.86 | % | | | 0.87 | % | | | 10.84 | % | |
October 31, 2019 | | $ | 59.34 | | | | 11.31 | % | | $ | 11,813 | | | | 1.14 | % | | | 1.14 | % | | | 1.03 | % | | | 1.03 | % | | | 10.26 | % | |
For The Period
5/01/18^-
10/31/18 | | $ | 56.62 | | | | (3.95 | )%(b) | | $ | 48 | | | | 1.25 | %(c) | | | 1.25 | %(c) | | | 0.95 | %(c) | | | 0.95 | %(c) | | | 14.91 | %(b) | |
First Eagle Funds | Semiannual Report | April 30, 2021
133
| | | Per share operating performance* | |
| | | | | Change in Net Assets Resulting
from operations | | Less dividends and distributions | |
Selected per
share data for
the period ended:* | | Net assets
value,
beginning
of period | | Net
investment
income/
loss | | Net
realized
and
unrealized
gains
(losses) on
investments | | Total
investment
operations | | From net
investment
income | | From
capital
gains | | Return of
capital | | Total
distributions | |
First Eagle Global Fund Class R4 | |
Six Months Ended
April 30, 2021
(unaudited) | | $ | 55.72 | | | | 0.24 | | | | 12.02 | | | | 12.26 | | | | (0.60 | ) | | | (0.95 | ) | | | — | | | | (1.55 | ) | |
October 31, 2020 | | $ | 59.48 | | | | 0.57 | | | | (1.02 | ) | | | (0.45 | ) | | | (0.86 | ) | | | (2.45 | ) | | | — | | | | (3.31 | ) | |
October 31, 2019 | | $ | 56.70 | | | | 0.74 | | | | 5.36 | | | | 6.10 | | | | (0.52 | ) | | | (2.80 | ) | | | — | | | | (3.32 | ) | |
For The Period
1/17/18^-
10/31/18 | | $ | 61.60 | | | | 0.55 | | | | (5.45 | ) | | | (4.90 | ) | | | — | | | | — | | | | — | | | | — | | |
First Eagle Global Fund Class R5 | |
Six Months Ended
April 30, 2021
(unaudited) | | $ | 54.98 | | | | (0.15 | ) | | | 11.89 | | | | 11.74 | | | | — | | | | (0.95 | ) | | | — | | | | (0.95 | ) | |
For The Year Ended
October 31, 2020 | | $ | 59.47 | | | | (0.16 | ) | | | (1.06 | ) | | | (1.22 | ) | | | (0.82 | ) | | | (2.45 | ) | | | — | | | | (3.27 | ) | |
For The Period
7/29/19^-
10/31/19 | | $ | 58.99 | | | | 0.12 | | | | 0.36 | | | | 0.48 | | | | — | | | | — | | | | — | | | | — | | |
First Eagle Global Fund Class R6 | |
Six Months Ended
April 30, 2021
(unaudited) | | $ | 55.83 | | | | 0.32 | | | | 12.04 | | | | 12.36 | | | | (0.70 | ) | | | (0.95 | ) | | | — | | | | (1.65 | ) | |
October 31, 2020 | | $ | 59.55 | | | | 0.64 | | | | (0.99 | ) | | | (0.35 | ) | | | (0.92 | ) | | | (2.45 | ) | | | — | | | | (3.37 | ) | |
October 31, 2019 | | $ | 56.76 | | | | 0.82 | | | | 5.41 | | | | 6.23 | | | | (0.64 | ) | | | (2.80 | ) | | | — | | | | (3.44 | ) | |
October 31, 2018 | | $ | 60.88 | | | | 0.72 | | | | (2.14 | ) | | | (1.42 | ) | | | (0.64 | ) | | | (2.06 | ) | | | — | | | | (2.70 | ) | |
For The Period
3/01/17^-
10/31/17 | | $ | 57.33 | | | | 0.37 | | | | 3.18 | | | | 3.55 | | | | — | | | | — | | | | — | | | | — | | |
First Eagle Overseas Fund Class A | |
Six Months Ended
April 30, 2021
(unaudited) | | $ | 22.80 | | | | 0.09 | | | | 3.56 | | | | 3.65 | | | | (0.05 | ) | | | — | | | | — | | | | (0.05 | ) | |
October 31, 2020 | | $ | 24.65 | | | | 0.19 | | | | (0.71 | ) | | | (0.52 | ) | | | (0.50 | ) | | | (0.83 | ) | | | — | | | | (1.33 | ) | |
October 31, 2019 | | $ | 22.71 | | | | 0.32 | | | | 2.28 | | | | 2.60 | | | | (0.27 | ) | | | (0.39 | ) | | | — | | | | (0.66 | ) | |
October 31, 2018 | | $ | 25.33 | | | | 0.25 | | | | (2.03 | ) | | | (1.78 | ) | | | (0.40 | ) | | | (0.44 | ) | | | — | | | | (0.84 | ) | |
October 31, 2017 | | $ | 23.86 | | | | 0.12 | | | | 2.16 | | | | 2.28 | | | | (0.26 | ) | | | (0.55 | ) | | | — | | | | (0.81 | ) | |
October 31, 2016 | | $ | 22.62 | | | | 0.19 | | | | 1.34 | | | | 1.53 | | | | (0.04 | ) | | | (0.25 | ) | | | — | | | | (0.29 | ) | |
First Eagle Funds | Semiannual Report | April 30, 2021
134
| | | | | | | | | Ratios/Supplemental data | | | |
| | | | | | | | | Ratios to Average Net Assets of: | | | |
Selected per
share data for
the period ended:* | | Net assets
value, end
of period | | Total
return(a) | | Net assets,
end of
period
(thousands) | | Operating
expenses
excluding
earnings
credits
and/or fee
waivers | | Operating
expenses
including
earnings
credits
and/or fee
waivers | | Net
investment
income
excluding
earnings
credits
and/or fee
waivers | | Net
investment
income
including
earnings
credits
and/or fee
waivers | | Portfolio
turnover
rate | |
First Eagle Global Fund Class R4 | |
Six Months Ended
April 30, 2021
(unaudited) | | $ | 66.43 | | | | 22.31 | %(b) | | $ | 2,255 | | | | 1.01 | %(c) | | | 1.01 | %(c) | | | 0.78 | %(c) | | | 0.78 | %(c) | | | 1.95 | %(b) | |
October 31, 2020 | | $ | 55.72 | | | | (0.95 | )% | | $ | 2,162 | | | | 0.96 | % | | | 0.96 | % | | | 1.04 | % | | | 1.04 | % | | | 10.84 | % | |
October 31, 2019 | | $ | 59.48 | | | | 11.53 | % | | $ | 1,825 | | | | 0.97 | % | | | 0.97 | % | | | 1.28 | % | | | 1.28 | % | | | 10.26 | % | |
For The Period
1/17/18^-
10/31/18 | | $ | 56.70 | | | | (7.95 | )%(b) | | $ | 117 | | | | 1.02 | %(c) | | | 1.02 | %(c) | | | 1.18 | %(c) | | | 1.18 | %(c) | | | 14.91 | %(b) | |
First Eagle Global Fund Class R5 | |
Six Months Ended
April 30, 2021
(unaudited) | | $ | 65.77 | | | | 21.53 | %(b) | | $ | 12 | | | | 2.30 | %(c) | | | 2.30 | %(c) | | | (0.50 | )%(c) | | | (0.50 | )%(c) | | | 1.95 | %(b) | |
For The Year Ended
October 31, 2020 | | $ | 54.98 | | | | (2.32 | )% | | $ | 10 | | | | 2.29 | % | | | 2.29 | % | | | (0.28 | )% | | | (0.28 | )% | | | 10.84 | % | |
For The Period
7/29/19^-
10/31/19 | | $ | 59.47 | | | | 0.81 | %(b) | | $ | 10 | | | | 1.35 | %(c) | | | 1.35 | %(c) | | | 0.82 | %(c) | | | 0.82 | %(c) | | | 10.26 | %(b) | |
First Eagle Global Fund Class R6 | |
Six Months Ended
April 30, 2021
(unaudited) | | $ | 66.54 | | | | 22.45 | %(b) | | $ | 2,043,025 | | | | 0.79 | %(c) | | | 0.79 | %(c) | | | 1.03 | %(c) | | | 1.03 | %(c) | | | 1.95 | %(b) | |
October 31, 2020 | | $ | 55.83 | | | | (0.79 | )% | | $ | 1,555,290 | | | | 0.79 | % | | | 0.79 | % | | | 1.15 | % | | | 1.15 | % | | | 10.84 | % | |
October 31, 2019 | | $ | 59.55 | | | | 11.79 | % | | $ | 944,249 | | | | 0.79 | % | | | 0.79 | % | | | 1.44 | % | | | 1.44 | % | | | 10.26 | % | |
October 31, 2018 | | $ | 56.76 | | | | (2.49 | )% | | $ | 782,213 | | | | 0.78 | % | | | 0.78 | % | | | 1.21 | % | | | 1.21 | % | | | 14.91 | % | |
For The Period
3/01/17^-
10/31/17 | | $ | 60.88 | | | | 6.19 | %(b) | | $ | 848,431 | | | | 0.78 | %(c) | | | 0.78 | %(c) | | | 0.94 | %(c) | | | 0.94 | %(c) | | | 9.67 | %(b) | |
First Eagle Overseas Fund Class A | |
Six Months Ended
April 30, 2021
(unaudited) | | $ | 26.40 | | | | 16.08 | %(b) | | $ | 1,945,065 | | | | 1.14 | %(c) | | | 1.14 | %(c) | | | 0.73 | %(c) | | | 0.73 | %(c) | | | 3.65 | %(b) | |
October 31, 2020 | | $ | 22.80 | | | | (2.35 | )% | | $ | 1,742,861 | | | | 1.15 | % | | | 1.15 | % | | | 0.82 | % | | | 0.82 | % | | | 13.20 | % | |
October 31, 2019 | | $ | 24.65 | | | | 11.82 | % | | $ | 2,125,742 | | | | 1.15 | % | | | 1.15 | % | | | 1.38 | % | | | 1.38 | % | | | 6.99 | % | |
October 31, 2018 | | $ | 22.71 | | | | (7.27 | )% | | $ | 2,173,765 | | | | 1.15 | % | | | 1.15 | % | | | 1.04 | % | | | 1.04 | % | | | 12.10 | % | |
October 31, 2017 | | $ | 25.33 | | | | 9.99 | % | | $ | 3,102,414 | | | | 1.15 | % | | | 1.15 | % | | | 0.51 | % | | | 0.51 | % | | | 8.45 | % | |
October 31, 2016 | | $ | 23.86 | | | | 6.90 | % | | $ | 3,654,512 | | | | 1.14 | % | | | 1.14 | % | | | 0.84 | % | | | 0.84 | % | | | 9.30 | % | |
First Eagle Funds | Semiannual Report | April 30, 2021
135
| | | Per share operating performance* | |
| | | | | Change in Net Assets Resulting
from operations | | Less dividends and distributions | |
Selected per
share data for
the period ended:* | | Net assets
value,
beginning
of period | | Net
investment
income/
loss | | Net
realized
and
unrealized
gains
(losses) on
investments | | Total
investment
operations | | From net
investment
income | | From
capital
gains | | Return of
capital | | Total
distributions | |
First Eagle Overseas Fund Class C | |
Six Months Ended
April 30, 2021
(unaudited) | | $ | 21.83 | | | | (0.01 | ) | | | 3.42 | | | | 3.41 | | | | — | | | | — | | | | — | | | | — | | |
October 31, 2020 | | $ | 23.58 | | | | 0.02 | | | | (0.69 | ) | | | (0.67 | ) | | | (0.25 | ) | | | (0.83 | ) | | | — | | | | (1.08 | ) | |
October 31, 2019 | | $ | 21.73 | | | | 0.11 | | | | 2.22 | | | | 2.33 | | | | (0.09 | ) | | | (0.39 | ) | | | — | | | | (0.48 | ) | |
October 31, 2018 | | $ | 24.29 | | | | 0.08 | | | | (1.95 | ) | | | (1.87 | ) | | | (0.25 | ) | | | (0.44 | ) | | | — | | | | (0.69 | ) | |
October 31, 2017 | | $ | 22.91 | | | | (0.05 | ) | | | 2.07 | | | | 2.02 | | | | (0.09 | ) | | | (0.55 | ) | | | — | | | | (0.64 | ) | |
October 31, 2016 | | $ | 21.84 | | | | 0.02 | | | | 1.30 | | | | 1.32 | | | | — | | | | (0.25 | ) | | | — | | | | (0.25 | ) | |
First Eagle Overseas Fund Class I | |
Six Months Ended
April 30, 2021
(unaudited) | | $ | 23.38 | | | | 0.13 | | | | 3.65 | | | | 3.78 | | | | (0.12 | ) | | | — | | | | — | | | | (0.12 | ) | |
October 31, 2020 | | $ | 25.24 | | | | 0.26 | | | | (0.72 | ) | | | (0.46 | ) | | | (0.57 | ) | | | (0.83 | ) | | | — | | | | (1.40 | ) | |
October 31, 2019 | | $ | 23.26 | | | | 0.39 | | | | 2.33 | | | | 2.72 | | | | (0.35 | ) | | | (0.39 | ) | | | — | | | | (0.74 | ) | |
October 31, 2018 | | $ | 25.91 | | | | 0.34 | | | | (2.08 | ) | | | (1.74 | ) | | | (0.47 | ) | | | (0.44 | ) | | | — | | | | (0.91 | ) | |
October 31, 2017 | | $ | 24.40 | | | | 0.21 | | | | 2.17 | | | | 2.38 | | | | (0.32 | ) | | | (0.55 | ) | | | — | | | | (0.87 | ) | |
October 31, 2016 | | $ | 23.12 | | | | 0.26 | | | | 1.38 | | | | 1.64 | | | | (0.11 | ) | | | (0.25 | ) | | | — | | | | (0.36 | ) | |
First Eagle Overseas Fund Class R3 | |
Six Months Ended
April 30, 2021
(unaudited) | | $ | 23.29 | | | | 0.10 | | | | 3.62 | | | | 3.72 | | | | (0.05 | ) | | | — | | | | — | | | | (0.05 | ) | |
October 31, 2020 | | $ | 25.13 | | | | 0.15 | | | | (0.74 | ) | | | (0.59 | ) | | | (0.42 | ) | | | (0.83 | ) | | | — | | | | (1.25 | ) | |
October 31, 2019 | | $ | 23.22 | | | | 0.44 | | | | 2.16 | | | | 2.60 | | | | (0.30 | ) | | | (0.39 | ) | | | — | | | | (0.69 | ) | |
For The Period
5/01/18^-
10/31/18 | | $ | 25.10 | | | | 0.16 | | | | (2.04 | ) | | | (1.88 | ) | | | — | | | | — | | | | — | | | | — | | |
First Eagle Overseas Fund Class R4 | |
Six Months Ended
April 30, 2021
(unaudited) | | $ | 23.34 | | | | 0.12 | | | | 3.65 | | | | 3.77 | | | | (0.13 | ) | | | — | | | | — | | | | (0.13 | ) | |
October 31, 2020 | | $ | 25.20 | | | | 0.16 | | | | (0.66 | ) | | | (0.50 | ) | | | (0.53 | ) | | | (0.83 | ) | | | — | | | | (1.36 | ) | |
October 31, 2019 | | $ | 23.23 | | | | 0.35 | | | | 2.33 | | | | 2.68 | | | | (0.32 | ) | | | (0.39 | ) | | | — | | | | (0.71 | ) | |
For The Period
1/17/18^-
10/31/18 | | $ | 26.15 | | | | 0.31 | | | | (3.23 | ) | | | (2.92 | ) | | | — | | | | — | | | | — | | | | — | | |
First Eagle Funds | Semiannual Report | April 30, 2021
136
| | | | | | | | | Ratios/Supplemental data | | | |
| | | | | | | | | Ratios to Average Net Assets of: | | | |
Selected per
share data for
the period ended:* | | Net assets
value, end
of period | | Total
return(a) | | Net assets,
end of
period
(thousands) | | Operating
expenses
excluding
earnings
credits
and/or fee
waivers | | Operating
expenses
including
earnings
credits
and/or fee
waivers | | Net
investment
income
excluding
earnings
credits
and/or fee
waivers | | Net
investment
income
including
earnings
credits
and/or fee
waivers | | Portfolio
turnover
rate | |
First Eagle Overseas Fund Class C | |
Six Months Ended
April 30, 2021
(unaudited) | | $ | 25.24 | | | | 15.67 | %(b) | | $ | 213,673 | | | | 1.89 | %(c) | | | 1.89 | %(c) | | | (0.07 | )%(c) | | | (0.07 | )%(c) | | | 3.65 | %(b) | |
October 31, 2020 | | $ | 21.83 | | | | (3.07 | )% | | $ | 228,072 | | | | 1.89 | % | | | 1.89 | % | | | 0.08 | % | | | 0.08 | % | | | 13.20 | % | |
October 31, 2019 | | $ | 23.58 | | | | 10.98 | % | | $ | 378,755 | | | | 1.89 | % | | | 1.89 | % | | | 0.50 | % | | | 0.50 | % | | | 6.99 | % | |
October 31, 2018 | | $ | 21.73 | | | | (7.92 | )% | | $ | 687,318 | | | | 1.88 | % | | | 1.88 | % | | | 0.32 | % | | | 0.32 | % | | | 12.10 | % | |
October 31, 2017 | | $ | 24.29 | | | | 9.14 | % | | $ | 899,654 | | | | 1.88 | % | | | 1.88 | % | | | (0.20 | )% | | | (0.20 | )% | | | 8.45 | % | |
October 31, 2016 | | $ | 22.91 | | | | 6.14 | % | | $ | 992,573 | | | | 1.89 | % | | | 1.89 | % | | | 0.10 | % | | | 0.10 | % | | | 9.30 | % | |
First Eagle Overseas Fund Class I | |
Six Months Ended
April 30, 2021
(unaudited) | | $ | 27.04 | | | | 16.25 | %(b) | | $ | 11,261,910 | | | | 0.86 | %(c) | | | 0.86 | %(c) | | | 1.02 | %(c) | | | 1.02 | %(c) | | | 3.65 | %(b) | |
October 31, 2020 | | $ | 23.38 | | | | (2.06 | )% | | $ | 9,698,986 | | | | 0.87 | % | | | 0.87 | % | | | 1.11 | % | | | 1.11 | % | | | 13.20 | % | |
October 31, 2019 | | $ | 25.24 | | | | 12.12 | % | | $ | 10,694,125 | | | | 0.86 | % | | | 0.86 | % | | | 1.64 | % | | | 1.64 | % | | | 6.99 | % | |
October 31, 2018 | | $ | 23.26 | | | | (6.98 | )% | | $ | 11,093,973 | | | | 0.86 | % | | | 0.86 | % | | | 1.35 | % | | | 1.35 | % | | | 12.10 | % | |
October 31, 2017 | | $ | 25.91 | | | | 10.24 | % | | $ | 13,831,360 | | | | 0.87 | % | | | 0.86 | % | | | 0.86 | % | | | 0.86 | % | | | 8.45 | % | |
October 31, 2016 | | $ | 24.40 | | | | 7.22 | % | | $ | 10,608,351 | | | | 0.87 | % | | | 0.87 | % | | | 1.12 | % | | | 1.12 | % | | | 9.30 | % | |
First Eagle Overseas Fund Class R3 | |
Six Months Ended
April 30, 2021
(unaudited) | | $ | 26.96 | | | | 16.02 | %(b) | | $ | 375 | | | | 1.27 | %(c) | | | 1.27 | %(c) | | | 0.78 | %(c) | | | 0.78 | %(c) | | | 3.65 | %(b) | |
October 31, 2020 | | $ | 23.29 | | | | (2.56 | )% | | $ | 183 | | | | 1.36 | % | | | 1.36 | % | | | 0.65 | % | | | 0.65 | % | | | 13.20 | % | |
October 31, 2019 | | $ | 25.13 | | | | 11.59 | % | | $ | 96 | | | | 1.32 | % | | | 1.32 | % | | | 1.84 | % | | | 1.84 | % | | | 6.99 | % | |
For The Period
5/01/18^-
10/31/18 | | $ | 23.22 | | | | (7.49 | )%(b) | | $ | 46 | | | | 1.21 | %(c) | | | 1.21 | %(c) | | | 1.32 | %(c) | | | 1.32 | %(c) | | | 12.10 | %(b) | |
First Eagle Overseas Fund Class R4 | |
Six Months Ended
April 30, 2021
(unaudited) | | $ | 26.98 | | | | 16.24 | %(b) | | $ | 7,610 | | | | 0.92 | %(c) | | | 0.92 | %(c) | | | 0.96 | %(c) | | | 0.96 | %(c) | | | 3.65 | %(b) | |
October 31, 2020 | | $ | 23.34 | | | | (2.22 | )% | | $ | 7,326 | | | | 0.91 | % | | | 0.91 | % | | | 0.69 | % | | | 0.69 | % | | | 13.20 | % | |
October 31, 2019 | | $ | 25.20 | | | | 11.92 | % | | $ | 91 | | | | 1.04 | % | | | 1.04 | % | | | 1.48 | % | | | 1.48 | % | | | 6.99 | % | |
For The Period
1/17/18^-
10/31/18 | | $ | 23.23 | | | | (11.17 | )%(b) | | $ | 78 | | | | 1.03 | %(c) | | | 1.03 | %(c) | | | 1.60 | %(c) | | | 1.60 | %(c) | | | 12.10 | %(b) | |
First Eagle Funds | Semiannual Report | April 30, 2021
137
| | | Per share operating performance* | |
| | | | | Change in Net Assets Resulting
from operations | | Less dividends and distributions | |
Selected per
share data for
the period ended:* | | Net assets
value,
beginning
of period | | Net
investment
income/
loss | | Net
realized
and
unrealized
gains
(losses) on
investments | | Total
investment
operations | | From net
investment
income | | From
capital
gains | | Return of
capital | | Total
distributions | |
First Eagle Overseas Fund Class R5 | |
Six Months Ended
April 30, 2021
(unaudited) | | $ | 23.27 | | | | 0.08 | | | | 3.63 | | | | 3.71 | | | | (0.03 | ) | | | — | | | | — | | | | (0.03 | ) | |
For The Year Ended
October 31, 2020 | | $ | 25.20 | | | | 0.18 | | | | (0.75 | ) | | | (0.57 | ) | | | (0.53 | ) | | | (0.83 | ) | | | — | | | | (1.36 | ) | |
For The Period
3/11/19^-
10/31/19 | | $ | 23.37 | | | | 0.28 | | | | 1.55 | | | | 1.83 | | | | — | | | | — | | | | — | | | | — | | |
First Eagle Overseas Fund Class R6 | |
Six Months Ended
April 30, 2021
(unaudited) | | $ | 23.39 | | | | 0.15 | | | | 3.64 | | | | 3.79 | | | | (0.14 | ) | | | — | | | | — | | | | (0.14 | ) | |
October 31, 2020 | | $ | 25.25 | | | | 0.28 | | | | (0.72 | ) | | | (0.44 | ) | | | (0.59 | ) | | | (0.83 | ) | | | — | | | | (1.42 | ) | |
October 31, 2019 | | $ | 23.27 | | | | 0.41 | | | | 2.33 | | | | 2.74 | | | | (0.37 | ) | | | (0.39 | ) | | | — | | | | (0.76 | ) | |
October 31, 2018 | | $ | 25.92 | | | | 0.36 | | | | (2.09 | ) | | | (1.73 | ) | | | (0.48 | ) | | | (0.44 | ) | | | — | | | | (0.92 | ) | |
For The Period
3/01/17^-
10/31/17 | | $ | 23.99 | | | | 0.17 | | | | 1.76 | | | | 1.93 | | | | — | | | | — | | | | — | | | | — | | |
First Eagle U.S. Value Fund Class A | |
Six Months Ended
April 30, 2021
(unaudited) | | $ | 16.97 | | | | 0.06 | | | | 4.45 | | | | 4.51 | | | | (0.20 | ) | | | (0.12 | ) | | | — | | | | (0.32 | ) | |
October 31, 2020 | | $ | 18.84 | | | | 0.14 | | | | (0.48 | ) | | | (0.34 | ) | | | (0.16 | ) | | | (1.37 | ) | | | — | | | | (1.53 | ) | |
October 31, 2019 | | $ | 19.89 | | | | 0.16 | | | | 1.44 | | | | 1.60 | | | | (0.12 | ) | | | (2.53 | ) | | | — | | | | (2.65 | ) | |
October 31, 2018 | | $ | 21.26 | | | | 0.11 | | | | 0.31 | | | | 0.42 | | | | (0.03 | ) | | | (1.76 | ) | | | — | | | | (1.79 | ) | |
October 31, 2017 | | $ | 20.08 | | | | 0.06 | | | | 2.80 | | | | 2.86 | | | | (0.04 | ) | | | (1.64 | ) | | | — | | | | (1.68 | ) | |
October 31, 2016 | | $ | 19.82 | | | | 0.08 | | | | 1.07 | | | | 1.15 | | | | (0.04 | ) | | | (0.85 | ) | | | — | | | | (0.89 | ) | |
First Eagle U.S. Value Fund Class C | |
Six Months Ended
April 30, 2021
(unaudited) | | $ | 16.06 | | | | (0.02 | ) | | | 4.24 | | | | 4.22 | | | | (0.02 | ) | | | (0.12 | ) | | | — | | | | (0.14 | ) | |
October 31, 2020 | | $ | 17.89 | | | | 0.01 | | | | (0.47 | ) | | | (0.46 | ) | | | — | | | | (1.37 | ) | | | — | | | | (1.37 | ) | |
October 31, 2019 | | $ | 19.03 | | | | 0.02 | | | | 1.37 | | | | 1.39 | | | | — | | | | (2.53 | ) | | | — | | | | (2.53 | ) | |
October 31, 2018 | | $ | 20.54 | | | | (0.04 | ) | | | 0.29 | | | | 0.25 | | | | — | | | | (1.76 | ) | | | — | | | | (1.76 | ) | |
October 31, 2017 | | $ | 19.55 | | | | (0.09 | ) | | | 2.72 | | | | 2.63 | | | | — | | | | (1.64 | ) | | | — | | | | (1.64 | ) | |
October 31, 2016 | | $ | 19.43 | | | | (0.07 | ) | | | 1.04 | | | | 0.97 | | | | — | | | | (0.85 | ) | | | — | | | | (0.85 | ) | |
First Eagle Funds | Semiannual Report | April 30, 2021
138
| | | | | | | | | Ratios/Supplemental data | | | |
| | | | | | | | | Ratios to Average Net Assets of: | | | |
Selected per
share data for
the period ended:* | | Net assets
value, end
of period | | Total
return(a) | | Net assets,
end of
period
(thousands) | | Operating
expenses
excluding
earnings
credits
and/or fee
waivers | | Operating
expenses
including
earnings
credits
and/or fee
waivers | | Net
investment
income
excluding
earnings
credits
and/or fee
waivers | | Net
investment
income
including
earnings
credits
and/or fee
waivers | | Portfolio
turnover
rate | |
First Eagle Overseas Fund Class R5 | |
Six Months Ended
April 30, 2021
(unaudited) | | $ | 26.95 | | | | 16.04 | %(b) | | $ | 59 | | | | 1.28 | %(c) | | | 1.28 | %(c) | | | 0.63 | %(c) | | | 0.63 | %(c) | | | 3.65 | %(b) | |
For The Year Ended
October 31, 2020 | | $ | 23.27 | | | | (2.51 | )% | | $ | 27 | | | | 1.31 | % | | | 1.31 | % | | | 0.77 | % | | | 0.77 | % | | | 13.20 | % | |
For The Period
3/11/19^-
10/31/19 | | $ | 25.20 | | | | 7.83 | %(b) | | $ | 16 | | | | 1.12 | %(c) | | | 1.12 | %(c) | | | 1.79 | %(c) | | | 1.79 | %(c) | | | 6.99 | %(b) | |
First Eagle Overseas Fund Class R6 | |
Six Months Ended
April 30, 2021
(unaudited) | | $ | 27.04 | | | | 16.28 | %(b) | | $ | 1,621,874 | | | | 0.79 | %(c) | | | 0.79 | %(c) | | | 1.18 | %(c) | | | 1.18 | %(c) | | | 3.65 | %(b) | |
October 31, 2020 | | $ | 23.39 | | | | (1.99 | )% | | $ | 919,645 | | | | 0.80 | % | | | 0.80 | % | | | 1.19 | % | | | 1.19 | % | | | 13.20 | % | |
October 31, 2019 | | $ | 25.25 | | | | 12.21 | % | | $ | 759,773 | | | | 0.80 | % | | | 0.80 | % | | | 1.74 | % | | | 1.74 | % | | | 6.99 | % | |
October 31, 2018 | | $ | 23.27 | | | | (6.92 | )% | | $ | 592,247 | | | | 0.80 | % | | | 0.80 | % | | | 1.44 | % | | | 1.44 | % | | | 12.10 | % | |
For The Period
3/01/17^-
10/31/17 | | $ | 25.92 | | | | 8.04 | %(b) | | $ | 544,632 | | | | 0.79 | %(c) | | | 0.79 | %(c) | | | 1.01 | %(c) | | | 1.01 | %(c) | | | 8.45 | %(b) | |
First Eagle U.S. Value Fund Class A | |
Six Months Ended
April 30, 2021
(unaudited) | | $ | 21.16 | | | | 26.87 | %(b) | | $ | 592,871 | | | | 1.17 | %(c) | | | 1.12 | %(c) | | | 0.53 | %(c) | | | 0.58 | %(c) | | | 1.80 | %(b) | |
October 31, 2020 | | $ | 16.97 | | | | (2.23 | )% | | $ | 485,589 | | | | 1.18 | % | | | 1.13 | % | | | 0.78 | % | | | 0.83 | % | | | 10.30 | % | |
October 31, 2019 | | $ | 18.84 | | | | 9.43 | % | | $ | 613,548 | | | | 1.16 | % | | | 1.11 | % | | | 0.81 | % | | | 0.86 | % | | | 8.65 | % | |
October 31, 2018 | | $ | 19.89 | | | | 2.01 | % | | $ | 590,922 | | | | 1.15 | % | | | 1.10 | % | | | 0.51 | % | | | 0.56 | % | | | 9.05 | % | |
October 31, 2017 | | $ | 21.26 | | | | 14.94 | % | | $ | 716,820 | | | | 1.14 | % | | | 1.09 | % | | | 0.24 | % | | | 0.29 | % | | | 5.85 | % | |
October 31, 2016 | | $ | 20.08 | | | | 6.21 | % | | $ | 817,481 | | | | 1.11 | % | | | 1.14 | % | | | 0.40 | % | | | 0.37 | % | | | 10.65 | % | |
First Eagle U.S. Value Fund Class C | |
Six Months Ended
April 30, 2021
(unaudited) | | $ | 20.14 | | | | 26.39 | %(b) | | $ | 102,105 | | | | 1.96 | %(c) | | | 1.91 | %(c) | | | (0.25 | )%(c) | | | (0.20 | )%(c) | | | 1.80 | %(b) | |
October 31, 2020 | | $ | 16.06 | | | | (3.00 | )% | | $ | 101,600 | | | | 1.94 | % | | | 1.89 | % | | | 0.03 | % | | | 0.08 | % | | | 10.30 | % | |
October 31, 2019 | | $ | 17.89 | | | | 8.59 | % | | $ | 194,380 | | | | 1.92 | % | | | 1.87 | % | | | 0.06 | % | | | 0.11 | % | | | 8.65 | % | |
October 31, 2018 | | $ | 19.03 | | | | 1.20 | % | | $ | 361,606 | | | | 1.90 | % | | | 1.85 | % | | | (0.24 | )% | | | (0.19 | )% | | | 9.05 | % | |
October 31, 2017 | | $ | 20.54 | | | | 14.13 | % | | $ | 448,462 | | | | 1.89 | % | | | 1.84 | % | | | (0.51 | )% | | | (0.46 | )% | | | 5.85 | % | |
October 31, 2016 | | $ | 19.55 | | | | 5.38 | % | | $ | 516,405 | | | | 1.87 | % | | | 1.90 | % | | | (0.37 | )% | | | (0.40 | )% | | | 10.65 | % | |
First Eagle Funds | Semiannual Report | April 30, 2021
139
| | | Per share operating performance* | |
| | | | | Change in Net Assets Resulting
from operations | | Less dividends and distributions | |
Selected per
share data for
the period ended:* | | Net assets
value,
beginning
of period | | Net
investment
income/
loss | | Net
realized
and
unrealized
gains
(losses) on
investments | | Total
investment
operations | | From net
investment
income | | From
capital
gains | | Return of
capital | | Total
distributions | |
First Eagle U.S. Value Fund Class I | |
Six Months Ended
April 30, 2021
(unaudited) | | $ | 17.32 | | | | 0.08 | | | | 4.55 | | | | 4.63 | | | | (0.25 | ) | | | (0.12 | ) | | | — | | | | (0.37 | ) | |
October 31, 2020 | | $ | 19.21 | | | | 0.20 | | | | (0.51 | ) | | | (0.31 | ) | | | (0.21 | ) | | | (1.37 | ) | | | — | | | | (1.58 | ) | |
October 31, 2019 | | $ | 20.23 | | | | 0.21 | | | | 1.48 | | | | 1.69 | | | | (0.18 | ) | | | (2.53 | ) | | | — | | | | (2.71 | ) | |
October 31, 2018 | | $ | 21.61 | | | | 0.18 | | | | 0.29 | | | | 0.47 | | | | (0.09 | ) | | | (1.76 | ) | | | — | | | | (1.85 | ) | |
October 31, 2017 | | $ | 20.38 | | | | 0.12 | | | | 2.84 | | | | 2.96 | | | | (0.09 | ) | | | (1.64 | ) | | | — | | | | (1.73 | ) | |
October 31, 2016 | | $ | 20.11 | | | | 0.13 | | | | 1.08 | | | | 1.21 | | | | (0.09 | ) | | | (0.85 | ) | | | — | | | | (0.94 | ) | |
First Eagle U.S. Value Fund Class R3 | |
Six Months Ended
April 30, 2021
(unaudited) | | $ | 17.25 | | | | 0.04 | | | | 4.53 | | | | 4.57 | | | | (0.17 | ) | | | (0.12 | ) | | | — | | | | (0.29 | ) | |
October 31, 2020 | | $ | 19.15 | | | | 0.11 | | | | (0.50 | ) | | | (0.39 | ) | | | (0.14 | ) | | | (1.37 | ) | | | — | | | | (1.51 | ) | |
October 31, 2019 | | $ | 20.20 | | | | 0.14 | | | | 1.48 | | | | 1.62 | | | | (0.14 | ) | | | (2.53 | ) | | | — | | | | (2.67 | ) | |
For The Period
5/01/18^-
10/31/18 | | $ | 20.37 | | | | 0.06 | | | | (0.23 | ) | | | (0.17 | ) | | | — | | | | — | | | | — | | | | — | | |
First Eagle U.S. Value Fund Class R4 | |
Six Months Ended
April 30, 2021
(unaudited) | | $ | 17.25 | | | | 0.05 | | | | 4.52 | | | | 4.57 | | | | (0.17 | ) | | | (0.12 | ) | | | — | | | | (0.29 | ) | |
For The Year Ended
October 31, 2020 | | $ | 19.18 | | | | 0.13 | | | | (0.51 | ) | | | (0.38 | ) | | | (0.18 | ) | | | (1.37 | ) | | | — | | | | (1.55 | ) | |
For The Period
7/29/19^-
10/31/19 | | $ | 19.40 | | | | 0.02 | | | | (0.24 | ) | | | (0.22 | ) | | | — | | | | — | | | | — | | | | — | | |
First Eagle U.S. Value Fund Class R5 | |
Six Months Ended
April 30, 2021
(unaudited) | | $ | 17.28 | | | | 0.05 | | | | 4.54 | | | | 4.59 | | | | (0.23 | ) | | | (0.12 | ) | | | — | | | | (0.35 | ) | |
For The Year Ended
October 31, 2020 | | $ | 19.18 | | | | 0.12 | | | | (0.46 | ) | | | (0.34 | ) | | | (0.19 | ) | | | (1.37 | ) | | | — | | | | (1.56 | ) | |
For The Period
7/29/19^-
10/31/19 | | $ | 19.40 | | | | 0.03 | | | | (0.25 | ) | | | (0.22 | ) | | | — | | | | — | | | | — | | | | — | | |
First Eagle Funds | Semiannual Report | April 30, 2021
140
| | | | | | | | | Ratios/Supplemental data | | | |
| | | | | | | | | Ratios to Average Net Assets of: | | | |
Selected per
share data for
the period ended:* | | Net assets
value, end
of period | | Total
return(a) | | Net assets,
end of
period
(thousands) | | Operating
expenses
excluding
earnings
credits
and/or fee
waivers | | Operating
expenses
including
earnings
credits
and/or fee
waivers | | Net
investment
income
excluding
earnings
credits
and/or fee
waivers | | Net
investment
income
including
earnings
credits
and/or fee
waivers | | Portfolio
turnover
rate | |
First Eagle U.S. Value Fund Class I | |
Six Months Ended
April 30, 2021
(unaudited) | | $ | 21.58 | | | | 27.07 | %(b) | | $ | 589,627 | | | | 0.89 | %(c) | | | 0.84 | %(c) | | | 0.81 | %(c) | | | 0.86 | %(c) | | | 1.80 | %(b) | |
October 31, 2020 | | $ | 17.32 | | | | (2.01 | )% | | $ | 505,997 | | | | 0.89 | % | | | 0.84 | % | | | 1.08 | % | | | 1.13 | % | | | 10.30 | % | |
October 31, 2019 | | $ | 19.21 | | | | 9.79 | % | | $ | 749,245 | | | | 0.88 | % | | | 0.83 | % | | | 1.09 | % | | | 1.14 | % | | | 8.65 | % | |
October 31, 2018 | | $ | 20.23 | | | | 2.24 | % | | $ | 875,239 | | | | 0.87 | % | | | 0.82 | % | | | 0.79 | % | | | 0.84 | % | | | 9.05 | % | |
October 31, 2017 | | $ | 21.61 | | | | 15.27 | % | | $ | 983,508 | | | | 0.86 | % | | | 0.81 | % | | | 0.51 | % | | | 0.56 | % | | | 5.85 | % | |
October 31, 2016 | | $ | 20.38 | | | | 6.49 | % | | $ | 841,199 | | | | 0.84 | % | | | 0.87 | % | | | 0.67 | % | | | 0.64 | % | | | 10.65 | % | |
First Eagle U.S. Value Fund Class R3 | |
Six Months Ended
April 30, 2021
(unaudited) | | $ | 21.53 | | | | 26.74 | %(b) | | $ | 67 | | | | 1.33 | %(c) | | | 1.28 | %(c) | | | 0.37 | %(c) | | | 0.42 | %(c) | | | 1.80 | %(b) | |
October 31, 2020 | | $ | 17.25 | | | | (2.46 | )% | | $ | 53 | | | | 1.36 | % | | | 1.31 | % | | | 0.59 | % | | | 0.64 | % | | | 10.30 | % | |
October 31, 2019 | | $ | 19.15 | | | | 9.37 | % | | $ | 54 | | | | 1.26 | % | | | 1.21 | % | | | 0.71 | % | | | 0.76 | % | | | 8.65 | % | |
For The Period
5/01/18^-
10/31/18 | | $ | 20.20 | | | | (0.83 | )%(b) | | $ | 50 | | | | 1.24 | %(c) | | | 1.19 | %(c) | | | 0.50 | %(c) | | | 0.55 | %(c) | | | 9.05 | %(b) | |
First Eagle U.S. Value Fund Class R4 | |
Six Months Ended
April 30, 2021
(unaudited) | | $ | 21.53 | | | | 26.77 | %(b) | | $ | 12 | | | | 1.28 | %(c) | | | 1.23 | %(c) | | | 0.42 | %(c) | | | 0.47 | %(c) | | | 1.80 | %(b) | |
For The Year Ended
October 31, 2020 | | $ | 17.25 | | | | (2.39 | )% | | $ | 10 | | | | 1.24 | % | | | 1.20 | % | | | 0.70 | % | | | 0.74 | % | | | 10.30 | % | |
For The Period
7/29/19^-
10/31/19 | | $ | 19.18 | | | | (1.13 | )%(b) | | $ | 10 | | | | 1.51 | %(c) | | | 1.47 | %(c) | | | 0.39 | %(c) | | | 0.43 | %(c) | | | 8.65 | %(b) | |
First Eagle U.S. Value Fund Class R5 | |
Six Months Ended
April 30, 2021
(unaudited) | | $ | 21.52 | | | | 26.87 | %(b) | | $ | 70 | | | | 1.20 | %(c) | | | 1.15 | %(c) | | | 0.50 | %(c) | | | 0.55 | %(c) | | | 1.80 | %(b) | |
For The Year Ended
October 31, 2020 | | $ | 17.28 | | | | (2.18 | )% | | $ | 53 | | | | 1.09 | % | | | 1.05 | % | | | 0.67 | % | | | 0.71 | % | | | 10.30 | % | |
For The Period
7/29/19^-
10/31/19 | | $ | 19.18 | | | | (1.13 | )%(b) | | $ | 10 | | | | 1.40 | %(c) | | | 1.36 | %(c) | | | 0.50 | %(c) | | | 0.54 | %(c) | | | 8.65 | %(b) | |
First Eagle Funds | Semiannual Report | April 30, 2021
141
| | | Per share operating performance* | |
| | | | | Change in Net Assets Resulting
from operations | | Less dividends and distributions | |
Selected per
share data for
the period ended:* | | Net assets
value,
beginning
of period | | Net
investment
income/
loss | | Net
realized
and
unrealized
gains
(losses) on
investments | | Total
investment
operations | | From net
investment
income | | From
capital
gains | | Return of
capital | | Total
distributions | |
First Eagle U.S. Value Fund Class R6 | |
Six Months Ended
April 30, 2021
(unaudited) | | $ | 17.32 | | | | 0.09 | | | | 4.55 | | | | 4.64 | | | | (0.26 | ) | | | (0.12 | ) | | | — | | | | (0.38 | ) | |
October 31, 2020 | | $ | 19.22 | | | | 0.19 | | | | (0.50 | ) | | | (0.31 | ) | | | (0.22 | ) | | | (1.37 | ) | | | — | | | | (1.59 | ) | |
October 31, 2019 | | $ | 20.24 | | | | 0.21 | | | | 1.49 | | | | 1.70 | | | | (0.19 | ) | | | (2.53 | ) | | | — | | | | (2.72 | ) | |
October 31, 2018 | | $ | 21.62 | | | | 0.18 | | | | 0.30 | | | | 0.48 | | | | (0.10 | ) | | | (1.76 | ) | | | — | | | | (1.86 | ) | |
For The Period
3/01/17^-
10/31/17 | | $ | 20.66 | | | | 0.09 | | | | 0.87 | | | | 0.96 | | | | — | | | | — | | | | — | | | | — | | |
First Eagle Gold Fund Class A | |
Six Months Ended
April 30, 2021
(unaudited) | | $ | 26.28 | | | | (0.02 | ) | | | (1.91 | ) | | | (1.93 | ) | | | (0.32 | ) | | | — | | | | — | | | | (0.32 | ) | |
October 31, 2020 | | $ | 18.66 | | | | (0.12 | ) | | | 7.74 | | | | 7.62 | | | | — | | | | — | | | | — | | | | — | | |
October 31, 2019 | | $ | 13.08 | | | | (0.04 | ) | | | 5.62 | | | | 5.58 | | | | — | | | | — | | | | — | | | | — | | |
October 31, 2018 | | $ | 16.50 | | | | (0.07 | ) | | | (3.35 | ) | | | (3.42 | ) | | | — | | | | — | | | | — | | | | — | | |
October 31, 2017 | | $ | 17.99 | | | | (0.09 | ) | | | (1.40 | ) | | | (1.49 | ) | | | — | | | | — | | | | — | | | | — | | |
October 31, 2016 | | $ | 12.36 | | | | (0.11 | ) | | | 5.74 | | | | 5.63 | | | | — | | | | — | | | | — | | | | — | | |
First Eagle Gold Fund Class C | |
Six Months Ended
April 30, 2021
(unaudited) | | $ | 23.92 | | | | (0.10 | ) | | | (1.75 | ) | | | (1.85 | ) | | | (0.17 | ) | | | — | | | | — | | | | (0.17 | ) | |
October 31, 2020 | | $ | 17.11 | | | | (0.26 | ) | | | 7.07 | | | | 6.81 | | | | — | | | | — | | | | — | | | | — | | |
October 31, 2019 | | $ | 12.09 | | | | (0.15 | ) | | | 5.17 | | | | 5.02 | | | | — | | | | — | | | | — | | | | — | | |
October 31, 2018 | | $ | 15.36 | | | | (0.17 | ) | | | (3.10 | ) | | | (3.27 | ) | | | — | | | | — | | | | — | | | | — | | |
October 31, 2017 | | $ | 16.89 | | | | (0.21 | ) | | | (1.32 | ) | | | (1.53 | ) | | | — | | | | — | | | | — | | | | — | | |
October 31, 2016 | | $ | 11.70 | | | | (0.22 | ) | | | 5.41 | | | | 5.19 | | | | — | | | | — | | | | — | | | | — | | |
First Eagle Gold Fund Class I | |
Six Months Ended
April 30, 2021
(unaudited) | | $ | 27.13 | | | | 0.02 | | | | (1.99 | ) | | | (1.97 | ) | | | (0.38 | ) | | | — | | | | — | | | | (0.38 | ) | |
October 31, 2020 | | $ | 19.22 | | | | (0.06 | ) | | | 7.99 | | | | 7.93 | | | | (0.02 | ) | | | — | | | | — | | | | (0.02 | ) | |
October 31, 2019 | | $ | 13.44 | | | | 0.00 | ** | | | 5.78 | | | | 5.78 | | | | — | | | | — | | | | — | | | | — | | |
October 31, 2018 | | $ | 16.90 | | | | (0.02 | ) | | | (3.44 | ) | | | (3.46 | ) | | | — | | | | — | | | | — | | | | — | | |
October 31, 2017 | | $ | 18.38 | | | | (0.04 | ) | | | (1.44 | ) | | | (1.48 | ) | | | — | | | | — | | | | — | | | | — | | |
October 31, 2016 | | $ | 12.59 | | | | (0.06 | ) | | | 5.85 | | | | 5.79 | | | | — | | | | — | | | | — | | | | — | | |
First Eagle Funds | Semiannual Report | April 30, 2021
142
| | | | | | | | | Ratios/Supplemental data | | | |
| | | | | | | | | Ratios to Average Net Assets of: | | | |
Selected per
share data for
the period ended:* | | Net assets
value, end
of period | | Total
return(a) | | Net assets,
end of
period
(thousands) | | Operating
expenses
excluding
earnings
credits
and/or fee
waivers | | Operating
expenses
including
earnings
credits
and/or fee
waivers | | Net
investment
income
excluding
earnings
credits
and/or fee
waivers | | Net
investment
income
including
earnings
credits
and/or fee
waivers | | Portfolio
turnover
rate | |
First Eagle U.S. Value Fund Class R6 | |
Six Months Ended
April 30, 2021
(unaudited) | | $ | 21.58 | | | | 27.13 | %(b) | | $ | 20,849 | | | | 0.86 | %(c) | | | 0.81 | %(c) | | | 0.85 | %(c) | | | 0.90 | %(c) | | | 1.80 | %(b) | |
October 31, 2020 | | $ | 17.32 | | | | (2.02 | )% | | $ | 15,058 | | | | 0.86 | % | | | 0.81 | % | | | 1.03 | % | | | 1.08 | % | | | 10.30 | % | |
October 31, 2019 | | $ | 19.22 | | | | 9.83 | % | | $ | 15,949 | | | | 0.83 | % | | | 0.78 | % | | | 1.09 | % | | | 1.14 | % | | | 8.65 | % | |
October 31, 2018 | | $ | 20.24 | | | | 2.28 | % | | $ | 1,362 | | | | 0.86 | % | | | 0.81 | % | | | 0.82 | % | | | 0.87 | % | | | 9.05 | % | |
For The Period
3/01/17^-
10/31/17 | | $ | 21.62 | | | | 4.65 | %(b) | | $ | 833 | | | | 0.85 | %(c) | | | 0.80 | %(c) | | | 0.56 | %(c) | | | 0.61 | %(c) | | | 5.85 | %(b) | |
First Eagle Gold Fund Class A | |
Six Months Ended
April 30, 2021
(unaudited) | | $ | 24.03 | | | | (7.40 | )%(b) | | $ | 589,878 | | | | 1.20 | %(c) | | | 1.20 | %(c) | | | (0.15 | )%(c) | | | (0.15 | )%(c) | | | 1.59 | %(b) | |
October 31, 2020 | | $ | 26.28 | | | | 40.84 | % | | $ | 643,945 | | | | 1.21 | % | | | 1.21 | % | | | (0.52 | )% | | | (0.52 | )% | | | 3.34 | % | |
October 31, 2019 | | $ | 18.66 | | | | 42.66 | % | | $ | 386,633 | | | | 1.29 | % | | | 1.29 | % | | | (0.27 | )% | | | (0.27 | )% | | | 20.01 | % | |
October 31, 2018 | | $ | 13.08 | | | | (20.73 | )% | | $ | 294,509 | | | | 1.29 | % | | | 1.29 | % | | | (0.45 | )% | | | (0.45 | )% | | | 9.43 | % | |
October 31, 2017 | | $ | 16.50 | | | | (8.28 | )% | | $ | 451,039 | | | | 1.26 | % | | | 1.26 | % | | | (0.53 | )% | | | (0.53 | )% | | | 7.90 | % | |
October 31, 2016 | | $ | 17.99 | | | | 45.55 | % | | $ | 566,708 | | | | 1.27 | % | | | 1.27 | % | | | (0.65 | )% | | | (0.65 | )% | | | 15.82 | % | |
First Eagle Gold Fund Class C | |
Six Months Ended
April 30, 2021
(unaudited) | | $ | 21.90 | | | | (7.74 | )%(b) | | $ | 168,429 | | | | 1.94 | %(c) | | | 1.94 | %(c) | | | (0.89 | )%(c) | | | (0.89 | )%(c) | | | 1.59 | %(b) | |
October 31, 2020 | | $ | 23.92 | | | | 39.80 | % | | $ | 179,978 | | | | 1.95 | % | | | 1.95 | % | | | (1.25 | )% | | | (1.25 | )% | | | 3.34 | % | |
October 31, 2019 | | $ | 17.11 | | | | 41.52 | % | | $ | 115,624 | | | | 2.05 | % | | | 2.05 | % | | | (1.02 | )% | | | (1.02 | )% | | | 20.01 | % | |
October 31, 2018 | | $ | 12.09 | | | | (21.29 | )% | | $ | 111,685 | | | | 2.05 | % | | | 2.05 | % | | | (1.21 | )% | | | (1.21 | )% | | | 9.43 | % | |
October 31, 2017 | | $ | 15.36 | | | | (9.06 | )% | | $ | 166,043 | | | | 2.04 | % | | | 2.03 | % | | | (1.30 | )% | | | (1.30 | )% | | | 7.90 | % | |
October 31, 2016 | | $ | 16.89 | | | | 44.36 | % | | $ | 206,225 | | | | 2.04 | % | | | 2.04 | % | | | (1.42 | )% | | | (1.42 | )% | | | 15.82 | % | |
First Eagle Gold Fund Class I | |
Six Months Ended
April 30, 2021
(unaudited) | | $ | 24.78 | | | | (7.29 | )%(b) | | $ | 1,399,554 | | | | 0.94 | %(c) | | | 0.94 | %(c) | | | 0.12 | %(c) | | | 0.12 | %(c) | | | 1.59 | %(b) | |
October 31, 2020 | | $ | 27.13 | | | | 41.29 | % | | $ | 1,424,181 | | | | 0.92 | % | | | 0.92 | % | | | (0.25 | )% | | | (0.25 | )% | | | 3.34 | % | |
October 31, 2019 | | $ | 19.22 | | | | 43.01 | % | | $ | 553,633 | | | | 0.99 | % | | | 0.99 | % | | | 0.01 | % | | | 0.01 | % | | | 20.01 | % | |
October 31, 2018 | | $ | 13.44 | | | | (20.47 | )% | | $ | 392,310 | | | | 1.00 | % | | | 1.00 | % | | | (0.15 | )% | | | (0.15 | )% | | | 9.43 | % | |
October 31, 2017 | | $ | 16.90 | | | | (8.05 | )% | | $ | 559,784 | | | | 0.99 | % | | | 0.99 | % | | | (0.25 | )% | | | (0.25 | )% | | | 7.90 | % | |
October 31, 2016 | | $ | 18.38 | | | | 45.99 | % | | $ | 509,635 | | | | 0.98 | % | | | 0.98 | % | | | (0.36 | )% | | | (0.36 | )% | | | 15.82 | % | |
First Eagle Funds | Semiannual Report | April 30, 2021
143
| | | Per share operating performance* | |
| | | | | Change in Net Assets Resulting
from operations | | Less dividends and distributions | |
Selected per
share data for
the period ended:* | | Net assets
value,
beginning
of period | | Net
investment
income/
loss | | Net
realized
and
unrealized
gains
(losses) on
investments | | Total
investment
operations | | From net
investment
income | | From
capital
gains | | Return of
capital | | Total
distributions | |
First Eagle Gold Fund Class R3 | |
Six Months Ended
April 30, 2021
(unaudited) | | $ | 26.99 | | | | 0.01 | | | | (2.00 | ) | | | (1.99 | ) | | | (0.29 | ) | | | — | | | | — | | | | (0.29 | ) | |
October 31, 2020 | | $ | 19.17 | | | | (0.12 | ) | | | 7.95 | | | | 7.83 | | | | (0.01 | ) | | | — | | | | — | | | | (0.01 | ) | |
October 31, 2019 | | $ | 13.44 | | | | (0.09 | ) | | | 5.82 | | | | 5.73 | | | | — | | | | — | | | | — | | | | — | | |
For The Period
5/01/18^-
10/31/18 | | $ | 16.35 | | | | (0.04 | ) | | | (2.87 | ) | | | (2.91 | ) | | | — | | | | — | | | | — | | | | — | | |
First Eagle Gold Fund Class R4 | |
Six Months Ended
April 30, 2021
(unaudited) | | $ | 27.19 | | | | 0.01 | | | | (1.97 | ) | | | (1.96 | ) | | | (0.37 | ) | | | — | | | | — | | | | (0.37 | ) | |
For The Year Ended
October 31, 2020 | | $ | 19.26 | | | | (0.08 | ) | | | 8.01 | | | | 7.93 | | | | — | | | | — | | | | — | | | | — | | |
For The Period
7/29/19^-
10/31/19 | | $ | 18.54 | | | | (0.04 | ) | | | 0.76 | | | | 0.72 | | | | — | | | | — | | | | — | | | | — | | |
First Eagle Gold Fund Class R5 | |
Six Months Ended
April 30, 2021
(unaudited) | | $ | 27.16 | | | | 0.01 | | | | (1.99 | ) | | | (1.98 | ) | | | (0.38 | ) | | | — | | | | — | | | | (0.38 | ) | |
For The Year Ended
October 31, 2020 | | $ | 19.28 | | | | (0.09 | ) | | | 7.99 | | | | 7.90 | | | | (0.02 | ) | | | — | | | | — | | | | (0.02 | ) | |
For The Period
7/29/19^-
10/31/19 | | $ | 18.54 | | | | (0.03 | ) | | | 0.77 | | | | 0.74 | | | | — | | | | — | | | | — | | | | — | | |
First Eagle Gold Fund Class R6 | |
Six Months Ended
April 30, 2021
(unaudited) | | $ | 27.19 | | | | 0.03 | | | | (1.99 | ) | | | (1.96 | ) | | | (0.40 | ) | | | — | | | | — | | | | (0.40 | ) | |
October 31, 2020 | | $ | 19.26 | | | | (0.03 | ) | | | 7.99 | | | | 7.96 | | | | (0.03 | ) | | | — | | | | — | | | | (0.03 | ) | |
October 31, 2019 | | $ | 13.46 | | | | 0.01 | | | | 5.79 | | | | 5.80 | | | | — | | | | — | | | | — | | | | — | | |
October 31, 2018 | | $ | 16.91 | | | | (0.02 | ) | | | (3.43 | ) | | | (3.45 | ) | | | — | | | | — | | | | — | | | | — | | |
For The Period
3/01/17^-
10/31/17 | | $ | 17.60 | | | | (0.06 | ) | | | (0.63 | ) | | | (0.69 | ) | | | — | | | | — | | | | — | | | | — | | |
First Eagle Funds | Semiannual Report | April 30, 2021
144
| | | | | | | | | Ratios/Supplemental data | | | |
| | | | | | | | | Ratios to Average Net Assets of: | | | |
Selected per
share data for
the period ended:* | | Net assets
value, end
of period | | Total
return(a) | | Net assets,
end of
period
(thousands) | | Operating
expenses
excluding
earnings
credits
and/or fee
waivers | | Operating
expenses
including
earnings
credits
and/or fee
waivers | | Net
investment
income
excluding
earnings
credits
and/or fee
waivers | | Net
investment
income
including
earnings
credits
and/or fee
waivers | | Portfolio
turnover
rate | |
First Eagle Gold Fund Class R3 | |
Six Months Ended
April 30, 2021
(unaudited) | | $ | 24.71 | | | | (7.41 | )%(b) | | $ | 1,316 | | | | 1.21 | %(c) | | | 1.21 | %(c) | | | 0.05 | %(c) | | | 0.05 | %(c) | | | 1.59 | %(b) | |
October 31, 2020 | | $ | 26.99 | | | | 40.84 | % | | $ | 471 | | | | 1.25 | % | | | 1.25 | % | | | (0.52 | )% | | | (0.52 | )% | | | 3.34 | % | |
October 31, 2019 | | $ | 19.17 | | | | 42.63 | % | | $ | 491 | | | | 1.25 | % | | | 1.25 | % | | | (0.51 | )% | | | (0.51 | )% | | | 20.01 | % | |
For The Period
5/01/18^-
10/31/18 | | $ | 13.44 | | | | (17.80 | )%(b) | | $ | 41 | | | | 1.32 | %(c) | | | 1.32 | %(c) | | | (0.59 | )%(c) | | | (0.59 | )%(c) | | | 9.43 | %(b) | |
First Eagle Gold Fund Class R4 | |
Six Months Ended
April 30, 2021
(unaudited) | | $ | 24.86 | | | | (7.27 | )%(b) | | $ | 854 | | | | 0.95 | %(c) | | | 0.95 | %(c) | | | 0.11 | %(c) | | | 0.11 | %(c) | | | 1.59 | %(b) | |
For The Year Ended
October 31, 2020 | | $ | 27.19 | | | | 41.17 | % | | $ | 935 | | | | 1.00 | % | | | 1.00 | % | | | (0.32 | )% | | | (0.32 | )% | | | 3.34 | % | |
For The Period
7/29/19^-
10/31/19 | | $ | 19.26 | | | | 3.88 | %(b) | | $ | 10 | | | | 1.49 | %(c) | | | 1.49 | %(c) | | | (0.84 | )%(c) | | | (0.84 | )%(c) | | | 20.01 | %(b) | |
First Eagle Gold Fund Class R5 | |
Six Months Ended
April 30, 2021
(unaudited) | | $ | 24.80 | | | | (7.30 | )%(b) | | $ | 434 | | | | 1.01 | %(c) | | | 1.01 | %(c) | | | 0.10 | %(c) | | | 0.10 | %(c) | | | 1.59 | %(b) | |
For The Year Ended
October 31, 2020 | | $ | 27.16 | | | | 40.94 | % | | $ | 677 | | | | 0.98 | % | | | 0.98 | % | | | (0.35 | )% | | | (0.35 | )% | | | 3.34 | % | |
For The Period
7/29/19^-
10/31/19 | | $ | 19.28 | | | | 3.99 | %(b) | | $ | 166 | | | | 0.96 | %(c) | | | 0.96 | %(c) | | | (0.65 | )%(c) | | | (0.64 | )%(c) | | | 20.01 | %(b) | |
First Eagle Gold Fund Class R6 | |
Six Months Ended
April 30, 2021
(unaudited) | | $ | 24.83 | | | | (7.26 | )%(b) | | $ | 121,266 | | | | 0.84 | %(c) | | | 0.84 | %(c) | | | 0.22 | %(c) | | | 0.22 | %(c) | | | 1.59 | %(b) | |
October 31, 2020 | | $ | 27.19 | | | | 41.42 | % | | $ | 209,208 | | | | 0.85 | % | | | 0.85 | % | | | (0.14 | )% | | | (0.14 | )% | | | 3.34 | % | |
October 31, 2019 | | $ | 19.26 | | | | 43.09 | % | | $ | 163,259 | | | | 0.89 | % | | | 0.89 | % | | | 0.03 | % | | | 0.03 | % | | | 20.01 | % | |
October 31, 2018 | | $ | 13.46 | | | | (20.40 | )% | | $ | 74,414 | | | | 0.91 | % | | | 0.91 | % | | | (0.14 | )% | | | (0.14 | )% | | | 9.43 | % | |
For The Period
3/01/17^-
10/31/17 | | $ | 16.91 | | | | (3.92 | )%(b) | | $ | 15,650 | | | | 0.90 | %(c) | | | 0.91 | %(c) | | | (0.51 | )%(c) | | | (0.51 | )%(c) | | | 7.90 | %(b) | |
First Eagle Funds | Semiannual Report | April 30, 2021
145
| | | Per share operating performance* | |
| | | | | Change in Net Assets Resulting
from operations | | Less dividends and distributions | |
Selected per
share data for
the period ended:* | | Net assets
value,
beginning
of period | | Net
investment
income/
loss | | Net
realized
and
unrealized
gains
(losses) on
investments | | Total
investment
operations | | From net
investment
income | | From
capital
gains | | Return of
capital | | Total
distributions | |
First Eagle Global Income Builder Fund Class A | |
Six Months Ended
April 30, 2021
(unaudited) | | $ | 11.47 | | | | 0.12 | | | | 2.00 | | | | 2.12 | | | | (0.14 | ) | | | (0.13 | ) | | | — | | | | (0.27 | ) | |
October 31, 2020 | | $ | 12.15 | | | | 0.22 | | | | (0.64 | ) | | | (0.42 | ) | | | (0.22 | ) | | | (0.04 | ) | | | — | | | | (0.26 | ) | |
October 31, 2019 | | $ | 11.45 | | | | 0.25 | | | | 0.70 | | | | 0.95 | | | | (0.25 | ) | | | — | | | | — | | | | (0.25 | ) | |
October 31, 2018 | | $ | 12.05 | | | | 0.25 | | | | (0.56 | ) | | | (0.31 | ) | | | (0.23 | ) | | | — | | | | (0.06 | ) | | | (0.29 | ) | |
October 31, 2017 | | $ | 10.99 | | | | 0.28 | | | | 1.07 | | | | 1.35 | | | | (0.29 | ) | | | — | | | | — | | | | (0.29 | ) | |
October 31, 2016 | | $ | 10.73 | | | | 0.34 | | | | 0.27 | | | | 0.61 | | | | (0.35 | ) | | | — | | | | — | | | | (0.35 | ) | |
First Eagle Global Income Builder Fund Class C | |
Six Months Ended
April 30, 2021
(unaudited) | | $ | 11.44 | | | | 0.07 | | | | 1.99 | | | | 2.06 | | | | (0.09 | ) | | | (0.13 | ) | | | — | | | | (0.22 | ) | |
October 31, 2020 | | $ | 12.11 | | | | 0.13 | | | | (0.63 | ) | | | (0.50 | ) | | | (0.13 | ) | | | (0.04 | ) | | | — | | | | (0.17 | ) | |
October 31, 2019 | | $ | 11.42 | | | | 0.16 | | | | 0.69 | | | | 0.85 | | | | (0.16 | ) | | | — | | | | — | | | | (0.16 | ) | |
October 31, 2018 | | $ | 12.02 | | | | 0.16 | | | | (0.56 | ) | | | (0.40 | ) | | | (0.14 | ) | | | — | | | | (0.06 | ) | | | (0.20 | ) | |
October 31, 2017 | | $ | 10.96 | | | | 0.19 | | | | 1.07 | | | | 1.26 | | | | (0.20 | ) | | | — | | | | — | | | | (0.20 | ) | |
October 31, 2016 | | $ | 10.71 | | | | 0.25 | | | | 0.26 | | | | 0.51 | | | | (0.26 | ) | | | — | | | | — | | | | (0.26 | ) | |
First Eagle Global Income Builder Fund Class I | |
Six Months Ended
April 30, 2021
(unaudited) | | $ | 11.45 | | | | 0.13 | | | | 1.99 | | | | 2.12 | | | | (0.15 | ) | | | (0.13 | ) | | | — | | | | (0.28 | ) | |
October 31, 2020 | | $ | 12.12 | | | | 0.25 | | | | (0.63 | ) | | | (0.38 | ) | | | (0.25 | ) | | | (0.04 | ) | | | — | | | | (0.29 | ) | |
October 31, 2019 | | $ | 11.43 | | | | 0.28 | | | | 0.69 | | | | 0.97 | | | | (0.28 | ) | | | — | | | | — | | | | (0.28 | ) | |
October 31, 2018 | | $ | 12.02 | | | | 0.28 | | | | (0.55 | ) | | | (0.27 | ) | | | (0.26 | ) | | | — | | | | (0.06 | ) | | | (0.32 | ) | |
October 31, 2017 | | $ | 10.96 | | | | 0.31 | | | | 1.07 | | | | 1.38 | | | | (0.32 | ) | | | — | | | | — | | | | (0.32 | ) | |
October 31, 2016 | | $ | 10.71 | | | | 0.36 | | | | 0.26 | | | | 0.62 | | | | (0.37 | ) | | | — | | | | — | | | | (0.37 | ) | |
First Eagle Global Income Builder Fund Class R3 | |
Six Months Ended
April 30, 2021
(unaudited) | | $ | 11.45 | | | | 0.10 | | | | 1.99 | | | | 2.09 | | | | (0.12 | ) | | | (0.13 | ) | | | — | | | | (0.25 | ) | |
October 31, 2020 | | $ | 12.12 | | | | 0.18 | | | | (0.62 | ) | | | (0.44 | ) | | | (0.19 | ) | | | (0.04 | ) | | | — | | | | (0.23 | ) | |
October 31, 2019 | | $ | 11.43 | | | | 0.23 | | | | 0.69 | | | | 0.92 | | | | (0.23 | ) | | | — | | | | — | | | | (0.23 | ) | |
For The Period
5/01/18^-
10/31/18 | | $ | 11.92 | | | | 0.13 | | | | (0.49 | ) | | | (0.36 | ) | | | (0.10 | ) | | | — | | | | (0.03 | ) | | | (0.13 | ) | |
First Eagle Funds | Semiannual Report | April 30, 2021
146
| | | | | | | | | Ratios/Supplemental data | | | |
| | | | | | | | | Ratios to Average Net Assets of: | | | |
Selected per
share data for
the period ended:* | | Net assets
value, end
of period | | Total
return(a) | | Net assets,
end of
period
(thousands) | | Operating
expenses
excluding
earnings
credits
and/or fee
waivers | | Operating
expenses
including
earnings
credits
and/or fee
waivers | | Net
investment
income
excluding
earnings
credits
and/or fee
waivers | | Net
investment
income
including
earnings
credits
and/or fee
waivers | | Portfolio
turnover
rate | |
First Eagle Global Income Builder Fund Class A | |
Six Months Ended
April 30, 2021
(unaudited) | | $ | 13.32 | | | | 18.47 | %(b) | | $ | 446,133 | | | | 1.17 | %(c) | | | 1.17 | %(c) | | | 1.84 | %(c) | | | 1.84 | %(c) | | | 11.52 | %(b) | |
October 31, 2020 | | $ | 11.47 | | | | (3.38 | )% | | $ | 359,442 | | | | 1.19 | % | | | 1.19 | % | | | 1.87 | % | | | 1.87 | % | | | 28.98 | % | |
October 31, 2019 | | $ | 12.15 | | | | 8.40 | % | | $ | 392,942 | | | | 1.18 | % | | | 1.18 | % | | | 2.10 | % | | | 2.10 | % | | | 25.54 | % | |
October 31, 2018 | | $ | 11.45 | | | | (2.64 | )% | | $ | 319,003 | | | | 1.18 | % | | | 1.18 | % | | | 2.11 | % | | | 2.11 | % | | | 22.15 | % | |
October 31, 2017 | | $ | 12.05 | | | | 12.39 | % | | $ | 339,792 | | | | 1.19 | % | | | 1.19 | % | | | 2.43 | % | | | 2.43 | % | | | 23.18 | % | |
October 31, 2016 | | $ | 10.99 | | | | 5.76 | % | | $ | 361,605 | | | | 1.18 | % | | | 1.18 | % | | | 3.16 | % | | | 3.16 | % | | | 29.76 | % | |
First Eagle Global Income Builder Fund Class C | |
Six Months Ended
April 30, 2021
(unaudited) | | $ | 13.28 | | | | 18.08 | %(b) | | $ | 187,952 | | | | 1.94 | %(c) | | | 1.94 | %(c) | | | 1.04 | %(c) | | | 1.04 | %(c) | | | 11.52 | %(b) | |
October 31, 2020 | | $ | 11.44 | | | | (4.15 | )% | | $ | 186,154 | | | | 1.95 | % | | | 1.95 | % | | | 1.11 | % | | | 1.11 | % | | | 28.98 | % | |
October 31, 2019 | | $ | 12.11 | | | | 7.53 | % | | $ | 289,037 | | | | 1.94 | % | | | 1.94 | % | | | 1.36 | % | | | 1.36 | % | | | 25.54 | % | |
October 31, 2018 | | $ | 11.42 | | | | (3.38 | )% | | $ | 297,716 | | | | 1.93 | % | | | 1.93 | % | | | 1.35 | % | | | 1.35 | % | | | 22.15 | % | |
October 31, 2017 | | $ | 12.02 | | | | 11.58 | % | | $ | 334,473 | | | | 1.94 | % | | | 1.94 | % | | | 1.69 | % | | | 1.69 | % | | | 23.18 | % | |
October 31, 2016 | | $ | 10.96 | | | | 4.87 | % | | $ | 344,660 | | | | 1.94 | % | | | 1.94 | % | | | 2.40 | % | | | 2.40 | % | | | 29.76 | % | |
First Eagle Global Income Builder Fund Class I | |
Six Months Ended
April 30, 2021
(unaudited) | | $ | 13.29 | | | | 18.66 | %(b) | | $ | 677,704 | | | | 0.93 | %(c) | | | 0.93 | %(c) | | | 2.06 | %(c) | | | 2.06 | %(c) | | | 11.52 | %(b) | |
October 31, 2020 | | $ | 11.45 | | | | (3.14 | )% | | $ | 630,351 | | | | 0.94 | % | | | 0.94 | % | | | 2.11 | % | | | 2.11 | % | | | 28.98 | % | |
October 31, 2019 | | $ | 12.12 | | | | 8.60 | % | | $ | 793,440 | | | | 0.93 | % | | | 0.93 | % | | | 2.36 | % | | | 2.36 | % | | | 25.54 | % | |
October 31, 2018 | | $ | 11.43 | | | | (2.31 | )% | | $ | 742,408 | | | | 0.92 | % | | | 0.92 | % | | | 2.38 | % | | | 2.38 | % | | | 22.15 | % | |
October 31, 2017 | | $ | 12.02 | | | | 12.71 | % | | $ | 717,643 | | | | 0.93 | % | | | 0.93 | % | | | 2.68 | % | | | 2.68 | % | | | 23.18 | % | |
October 31, 2016 | | $ | 10.96 | | | | 5.93 | % | | $ | 509,250 | | | | 0.92 | % | | | 0.92 | % | | | 3.39 | % | | | 3.39 | % | | | 29.76 | % | |
First Eagle Global Income Builder Fund Class R3 | |
Six Months Ended
April 30, 2021
(unaudited) | | $ | 13.29 | | | | 18.40 | %(b) | | $ | 60 | | | | 1.37 | %(c) | | | 1.37 | %(c) | | | 1.64 | %(c) | | | 1.64 | %(c) | | | 11.52 | %(b) | |
October 31, 2020 | | $ | 11.45 | | | | (3.67 | )% | | $ | 50 | | | | 1.49 | % | | | 1.49 | % | | | 1.58 | % | | | 1.58 | % | | | 28.98 | % | |
October 31, 2019 | | $ | 12.12 | | | | 8.12 | % | | $ | 52 | | | | 1.37 | % | | | 1.37 | % | | | 1.92 | % | | | 1.92 | % | | | 25.54 | % | |
For The Period
5/01/18^-
10/31/18 | | $ | 11.43 | | | | (3.02 | )%(b) | | $ | 48 | | | | 1.27 | %(c) | | | 1.27 | %(c) | | | 2.23 | %(c) | | | 2.23 | %(c) | | | 22.15 | %(b) | |
First Eagle Funds | Semiannual Report | April 30, 2021
147
| | | Per share operating performance* | |
| | | | | Change in Net Assets Resulting
from operations | | Less dividends and distributions | |
Selected per
share data for
the period ended:* | | Net assets
value,
beginning
of period | | Net
investment
income/
loss | | Net
realized
and
unrealized
gains
(losses) on
investments | | Total
investment
operations | | From net
investment
income | | From
capital
gains | | Return of
capital | | Total
distributions | |
First Eagle Global Income Builder Fund Class R4 | |
Six Months Ended
April 30, 2021
(unaudited) | | $ | 11.44 | | | | 0.11 | | | | 1.98 | | | | 2.09 | | | | (0.12 | ) | | | (0.13 | ) | | | — | | | | (0.25 | ) | |
For The Year Ended
October 31, 2020 | | $ | 12.11 | | | | 0.21 | | | | (0.63 | ) | | | (0.42 | ) | | | (0.21 | ) | | | (0.04 | ) | | | — | | | | (0.25 | ) | |
For The Period
7/29/19^-
10/31/19 | | $ | 12.08 | | | | 0.04 | | | | 0.03 | | | | 0.07 | | | | (0.04 | ) | | | — | | | | — | | | | (0.04 | ) | |
First Eagle Global Income Builder Fund Class R5 | |
Six Months Ended
April 30, 2021
(unaudited) | | $ | 11.44 | | | | 0.11 | | | | 1.99 | | | | 2.10 | | | | (0.13 | ) | | | (0.13 | ) | | | — | | | | (0.26 | ) | |
For The Year Ended
October 31, 2020 | | $ | 12.11 | | | | 0.23 | | | | (0.64 | ) | | | (0.41 | ) | | | (0.22 | ) | | | (0.04 | ) | | | — | | | | (0.26 | ) | |
For The Period
7/29/19^-
10/31/19 | | $ | 12.08 | | | | 0.04 | | | | 0.03 | | | | 0.07 | | | | (0.04 | ) | | | — | | | | — | | | | (0.04 | ) | |
First Eagle Global Income Builder Fund Class R6 | |
Six Months Ended
April 30, 2021
(unaudited) | | $ | 11.44 | | | | 0.13 | | | | 1.99 | | | | 2.12 | | | | (0.15 | ) | | | (0.13 | ) | | | — | | | | (0.28 | ) | |
October 31, 2020 | | $ | 12.11 | | | | 0.24 | | | | (0.62 | ) | | | (0.38 | ) | | | (0.25 | ) | | | (0.04 | ) | | | — | | | | (0.29 | ) | |
October 31, 2019 | | $ | 11.42 | | | | 0.27 | | | | 0.70 | | | | 0.97 | | | | (0.28 | ) | | | — | | | | — | | | | (0.28 | ) | |
October 31, 2018 | | $ | 12.01 | | | | 0.28 | | | | (0.54 | ) | | | (0.26 | ) | | | (0.27 | ) | | | — | | | | (0.06 | ) | | | (0.33 | ) | |
For The Period
3/01/17^-
10/31/17 | | $ | 11.37 | | | | 0.20 | | | | 0.67 | | | | 0.87 | | | | (0.23 | ) | | | — | | | | — | | | | (0.23 | ) | |
First Eagle High Income Fund Class A | |
Six Months Ended
April 30, 2021
(unaudited) | | $ | 8.71 | | | | 0.16 | | | | 0.17 | | | | 0.33 | | | | (0.17 | ) | | | — | | | | — | | | | (0.17 | ) | |
October 31, 2020 | | $ | 8.71 | | | | 0.37 | | | | (0.01 | ) | | | 0.36 | | | | (0.36 | ) | | | — | | | | — | | | | (0.36 | ) | |
October 31, 2019 | | $ | 8.81 | | | | 0.41 | | | | (0.11 | ) | | | 0.30 | | | | (0.40 | ) | | | — | | | | — | | | | (0.40 | ) | |
October 31, 2018 | | $ | 9.03 | | | | 0.47 | | | | (0.24 | ) | | | 0.23 | | | | (0.45 | ) | | | — | | | | — | | | | (0.45 | ) | |
October 31, 2017 | | $ | 8.99 | | | | 0.46 | | | | 0.04 | | | | 0.50 | | | | (0.45 | ) | | | — | | | | (0.01 | ) | | | (0.46 | ) | |
October 31, 2016 | | $ | 8.90 | | | | 0.55 | | | | 0.12 | | | | 0.67 | | | | (0.54 | ) | | | — | | | | (0.04 | ) | | | (0.58 | ) | |
First Eagle Funds | Semiannual Report | April 30, 2021
148
| | | | | | | | | Ratios/Supplemental data | | | |
| | | | | | | | | Ratios to Average Net Assets of: | | | |
Selected per
share data for
the period ended:* | | Net assets
value, end
of period | | Total
return(a) | | Net assets,
end of
period
(thousands) | | Operating
expenses
excluding
earnings
credits
and/or fee
waivers | | Operating
expenses
including
earnings
credits
and/or fee
waivers | | Net
investment
income
excluding
earnings
credits
and/or fee
waivers | | Net
investment
income
including
earnings
credits
and/or fee
waivers | | Portfolio
turnover
rate | |
First Eagle Global Income Builder Fund Class R4 | |
Six Months Ended
April 30, 2021
(unaudited) | | $ | 13.28 | | | | 18.42 | %(b) | | $ | 11 | | | | 1.31 | %(c) | | | 1.31 | %(c) | | | 1.68 | %(c) | | | 1.68 | %(c) | | | 11.52 | %(b) | |
For The Year Ended
October 31, 2020 | | $ | 11.44 | | | | (3.51 | )% | | $ | 10 | | | | 1.25 | % | | | 1.25 | % | | | 1.84 | % | | | 1.84 | % | | | 28.98 | % | |
For The Period
7/29/19^-
10/31/19 | | $ | 12.11 | | | | 0.59 | %(b) | | $ | 10 | | | | 1.49 | %(c) | | | 1.49 | %(c) | | | 1.34 | %(c) | | | 1.34 | %(c) | | | 25.54 | %(b) | |
First Eagle Global Income Builder Fund Class R5 | |
Six Months Ended
April 30, 2021
(unaudited) | | $ | 13.28 | | | | 18.48 | %(b) | | $ | 12 | | | | 1.21 | %(c) | | | 1.21 | %(c) | | | 1.78 | %(c) | | | 1.78 | %(c) | | | 11.52 | %(b) | |
For The Year Ended
October 31, 2020 | | $ | 11.44 | | | | (3.40 | )% | | $ | 10 | | | | 1.14 | % | | | 1.14 | % | | | 1.94 | % | | | 1.94 | % | | | 28.98 | % | |
For The Period
7/29/19^-
10/31/19 | | $ | 12.11 | | | | 0.62 | %(b) | | $ | 10 | | | | 1.38 | %(c) | | | 1.38 | %(c) | | | 1.45 | %(c) | | | 1.45 | %(c) | | | 25.54 | %(b) | |
First Eagle Global Income Builder Fund Class R6 | |
Six Months Ended
April 30, 2021
(unaudited) | | $ | 13.28 | | | | 18.70 | %(b) | | $ | 20,385 | | | | 0.88 | %(c) | | | 0.88 | %(c) | | | 2.14 | %(c) | | | 2.14 | %(c) | | | 11.52 | %(b) | |
October 31, 2020 | | $ | 11.44 | | | | (3.14 | )% | | $ | 15,649 | | | | 0.90 | % | | | 0.90 | % | | | 2.01 | % | | | 2.01 | % | | | 28.98 | % | |
October 31, 2019 | | $ | 12.11 | | | | 8.62 | % | | $ | 1,233 | | | | 0.93 | % | | | 0.93 | % | | | 2.31 | % | | | 2.31 | % | | | 25.54 | % | |
October 31, 2018 | | $ | 11.42 | | | | (2.27 | )% | | $ | 912 | | | | 0.88 | % | | | 0.88 | % | | | 2.38 | % | | | 2.38 | % | | | 22.15 | % | |
For The Period
3/01/17^-
10/31/17 | | $ | 12.01 | | | | 7.68 | %(b) | | $ | 965 | | | | 0.89 | %(c) | | | 0.89 | %(c) | | | 2.55 | %(c) | | | 2.55 | %(c) | | | 23.18 | %(b) | |
First Eagle High Income Fund Class A | |
Six Months Ended
April 30, 2021
(unaudited) | | $ | 8.87 | | | | 3.82 | %(b) | | $ | 75,042 | | | | 1.32 | %(c) | | | 1.22 | %(c) | | | 3.62 | %(c) | | | 3.72 | %(c) | | | 25.57 | %(b) | |
October 31, 2020 | | $ | 8.71 | | | | 4.39 | % | | $ | 73,112 | | | | 1.33 | % | | | 1.23 | % | | | 4.27 | % | | | 4.37 | % | | | 55.38 | % | |
October 31, 2019 | | $ | 8.71 | | | | 3.54 | % | | $ | 73,567 | | | | 1.34 | % | | | 1.24 | % | | | 4.55 | % | | | 4.65 | % | | | 24.19 | % | |
October 31, 2018 | | $ | 8.81 | | | | 2.56 | % | | $ | 78,360 | | | | 1.26 | % | | | 1.19 | % | | | 5.17 | % | | | 5.24 | % | | | 24.82 | % | |
October 31, 2017 | | $ | 9.03 | | | | 5.71 | % | | $ | 98,548 | | | | 1.21 | % | | | 1.16 | % | | | 5.02 | % | | | 5.07 | % | | | 25.77 | % | |
October 31, 2016 | | $ | 8.99 | | | | 8.24 | % | | $ | 158,102 | | | | 1.15 | % | | | 1.20 | % | | | 6.45 | % | | | 6.40 | % | | | 36.88 | % | |
First Eagle Funds | Semiannual Report | April 30, 2021
149
| | | Per share operating performance* | |
| | | | | Change in Net Assets Resulting
from operations | | Less dividends and distributions | |
Selected per
share data for
the period ended:* | | Net assets
value,
beginning
of period | | Net
investment
income/
loss | | Net
realized
and
unrealized
gains
(losses) on
investments | | Total
investment
operations | | From net
investment
income | | From
capital
gains | | Return of
capital | | Total
distributions | |
First Eagle High Income Fund Class C | |
Six Months Ended
April 30, 2021
(unaudited) | | $ | 8.70 | | | | 0.13 | | | | 0.17 | | | | 0.30 | | | | (0.14 | ) | | | — | | | | — | | | | (0.14 | ) | |
October 31, 2020 | | $ | 8.70 | | | | 0.31 | | | | (0.01 | ) | | | 0.30 | | | | (0.30 | ) | | | — | | | | — | | | | (0.30 | ) | |
October 31, 2019 | | $ | 8.80 | | | | 0.34 | | | | (0.10 | ) | | | 0.24 | | | | (0.34 | ) | | | — | | | | — | | | | (0.34 | ) | |
October 31, 2018 | | $ | 9.02 | | | | 0.40 | | | | (0.24 | ) | | | 0.16 | | | | (0.38 | ) | | | — | | | | — | | | | (0.38 | ) | |
October 31, 2017 | | $ | 8.98 | | | | 0.39 | | | | 0.05 | | | | 0.44 | | | | (0.39 | ) | | | — | | | | (0.01 | ) | | | (0.40 | ) | |
October 31, 2016 | | $ | 8.89 | | | | 0.49 | | | | 0.12 | | | | 0.61 | | | | (0.48 | ) | | | — | | | | (0.04 | ) | | | (0.52 | ) | |
First Eagle High Income Fund Class I | |
Six Months Ended
April 30, 2021
(unaudited) | | $ | 8.71 | | | | 0.18 | | | | 0.16 | | | | 0.34 | | | | (0.18 | ) | | | — | | | | — | | | | (0.18 | ) | |
October 31, 2020 | | $ | 8.71 | | | | 0.39 | | | | 0.00 | ** | | | 0.39 | | | | (0.39 | ) | | | — | | | | — | | | | (0.39 | ) | |
October 31, 2019 | | $ | 8.81 | | | | 0.43 | | | | (0.10 | ) | | | 0.33 | | | | (0.43 | ) | | | — | | | | — | | | | (0.43 | ) | |
October 31, 2018 | | $ | 9.04 | | | | 0.49 | | | | (0.25 | ) | | | 0.24 | | | | (0.47 | ) | | | — | | | | — | | | | (0.47 | ) | |
October 31, 2017 | | $ | 8.99 | | | | 0.49 | | | | 0.05 | | | | 0.54 | | | | (0.48 | ) | | | — | | | | (0.01 | ) | | | (0.49 | ) | |
October 31, 2016 | | $ | 8.90 | | | | 0.58 | | | | 0.12 | | | | 0.70 | | | | (0.57 | ) | | | — | | | | (0.04 | ) | | | (0.61 | ) | |
First Eagle High Income Fund Class R3 | |
Six Months Ended
April 30, 2021
(unaudited) | | $ | 8.72 | | | | 0.16 | | | | 0.17 | | | | 0.33 | | | | (0.17 | ) | | | — | | | | — | | | | (0.17 | ) | |
October 31, 2020 | | $ | 8.72 | | | | 0.35 | | | | 0.00 | ** | | | 0.35 | | | | (0.35 | ) | | | — | | | | — | | | | (0.35 | ) | |
October 31, 2019 | | $ | 8.82 | | | | 0.40 | | | | (0.11 | ) | | | 0.29 | | | | (0.39 | ) | | | — | | | | — | | | | (0.39 | ) | |
For The Period
5/01/18^-
10/31/18 | | $ | 8.91 | | | | 0.23 | | | | (0.10 | ) | | | 0.13 | | | | (0.22 | ) | | | — | | | | — | | | | (0.22 | ) | |
First Eagle High Income Fund Class R4 | |
Six Months Ended
April 30, 2021
(unaudited) | | $ | 8.72 | | | | 0.14 | | | | 0.17 | | | | 0.31 | | | | (0.15 | ) | | | — | | | | — | | | | (0.15 | ) | |
For The Year Ended
October 31, 2020 | | $ | 8.72 | | | | 0.33 | | | | (0.01 | ) | | | 0.32 | | | | (0.32 | ) | | | — | | | | — | | | | (0.32 | ) | |
For The Period
7/29/19^-
10/31/19 | | $ | 8.78 | | | | 0.08 | | | | (0.06 | ) | | | 0.02 | | | | (0.08 | ) | | | — | | | | — | | | | (0.08 | ) | |
First Eagle Funds | Semiannual Report | April 30, 2021
150
| | | | | | | | | Ratios/Supplemental data | | | |
| | | | | | | | | Ratios to Average Net Assets of: | | | |
Selected per
share data for
the period ended:* | | Net assets
value, end
of period | | Total
return(a) | | Net assets,
end of
period
(thousands) | | Operating
expenses
excluding
earnings
credits
and/or fee
waivers | | Operating
expenses
including
earnings
credits
and/or fee
waivers | | Net
investment
income
excluding
earnings
credits
and/or fee
waivers | | Net
investment
income
including
earnings
credits
and/or fee
waivers | | Portfolio
turnover
rate | |
First Eagle High Income Fund Class C | |
Six Months Ended
April 30, 2021
(unaudited) | | $ | 8.86 | | | | 3.43 | %(b) | | $ | 27,140 | | | | 2.10 | %(c) | | | 2.00 | %(c) | | | 2.84 | %(c) | | | 2.94 | %(c) | | | 25.57 | %(b) | |
October 31, 2020 | | $ | 8.70 | | | | 3.60 | % | | $ | 31,972 | | | | 2.10 | % | | | 2.00 | % | | | 3.53 | % | | | 3.63 | % | | | 55.38 | % | |
October 31, 2019 | | $ | 8.70 | | | | 2.77 | % | | $ | 50,100 | | | | 2.10 | % | | | 2.00 | % | | | 3.83 | % | | | 3.93 | % | | | 24.19 | % | |
October 31, 2018 | | $ | 8.80 | | | | 1.68 | % | | $ | 62,749 | | | | 2.01 | % | | | 1.94 | % | | | 4.43 | % | | | 4.50 | % | | | 24.82 | % | |
October 31, 2017 | | $ | 9.02 | | | | 5.06 | % | | $ | 87,479 | | | | 1.95 | % | | | 1.90 | % | | | 4.30 | % | | | 4.35 | % | | | 25.77 | % | |
October 31, 2016 | | $ | 8.98 | | | | 7.46 | % | | $ | 114,139 | | | | 1.89 | % | | | 1.94 | % | | | 5.74 | % | | | 5.69 | % | | | 36.88 | % | |
First Eagle High Income Fund Class I | |
Six Months Ended
April 30, 2021
(unaudited) | | $ | 8.87 | | | | 3.96 | %(b) | | $ | 135,197 | | | | 1.05 | %(c) | | | 0.95 | %(c) | | | 3.88 | %(c) | | | 3.98 | %(c) | | | 25.57 | %(b) | |
October 31, 2020 | | $ | 8.71 | | | | 4.68 | % | | $ | 126,527 | | | | 1.04 | % | | | 0.94 | % | | | 4.54 | % | | | 4.64 | % | | | 55.38 | % | |
October 31, 2019 | | $ | 8.71 | | | | 3.84 | % | | $ | 144,532 | | | | 1.05 | % | | | 0.95 | % | | | 4.86 | % | | | 4.96 | % | | | 24.19 | % | |
October 31, 2018 | | $ | 8.81 | | | | 2.74 | % | | $ | 184,351 | | | | 0.97 | % | | | 0.90 | % | | | 5.46 | % | | | 5.53 | % | | | 24.82 | % | |
October 31, 2017 | | $ | 9.04 | | | | 6.15 | % | | $ | 278,660 | | | | 0.91 | % | | | 0.86 | % | | | 5.33 | % | | | 5.38 | % | | | 25.77 | % | |
October 31, 2016 | | $ | 8.99 | | | | 8.54 | % | | $ | 315,023 | | | | 0.86 | % | | | 0.91 | % | | | 6.83 | % | | | 6.78 | % | | | 36.88 | % | |
First Eagle High Income Fund Class R3 | |
Six Months Ended
April 30, 2021
(unaudited) | | $ | 8.88 | | | | 3.80 | %(b) | | $ | 512 | | | | 1.35 | %(c) | | | 1.25 | %(c) | | | 3.59 | %(c) | | | 3.69 | %(c) | | | 25.57 | %(b) | |
October 31, 2020 | | $ | 8.72 | | | | 4.21 | % | | $ | 453 | | | | 1.45 | % | | | 1.35 | % | | | 4.04 | % | | | 4.14 | % | | | 55.38 | % | |
October 31, 2019 | | $ | 8.72 | | | | 3.44 | % | | $ | 52 | | | | 1.44 | % | | | 1.34 | % | | | 4.44 | % | | | 4.54 | % | | | 24.19 | % | |
For The Period
5/01/18^-
10/31/18 | | $ | 8.82 | | | | 1.41 | %(b) | | $ | 51 | | | | 1.36 | %(c) | | | 1.27 | %(c) | | | 4.99 | %(c) | | | 5.08 | %(c) | | | 24.82 | %(b) | |
First Eagle High Income Fund Class R4 | |
Six Months Ended
April 30, 2021
(unaudited) | | $ | 8.88 | | | | 3.54 | %(b) | | $ | 11 | | | | 1.80 | %(c) | | | 1.70 | %(c) | | | 3.12 | %(c) | | | 3.22 | %(c) | | | 25.57 | %(b) | |
For The Year Ended
October 31, 2020 | | $ | 8.72 | | | | 3.81 | % | | $ | 10 | | | | 1.84 | % | | | 1.74 | % | | | 3.74 | % | | | 3.84 | % | | | 55.38 | % | |
For The Period
7/29/19^-
10/31/19 | | $ | 8.72 | | | | 0.24 | %(b) | | $ | 10 | | | | 1.70 | %(c) | | | 1.59 | %(c) | | | 3.43 | %(c) | | | 3.54 | %(c) | | | 24.19 | %(b) | |
First Eagle Funds | Semiannual Report | April 30, 2021
151
| | | Per share operating performance* | |
| | | | | Change in Net Assets Resulting
from operations | | Less dividends and distributions | |
Selected per
share data for
the period ended:* | | Net assets
value,
beginning
of period | | Net
investment
income/
loss | | Net
realized
and
unrealized
gains
(losses) on
investments | | Total
investment
operations | | From net
investment
income | | From
capital
gains | | Return of
capital | | Total
distributions | |
First Eagle High Income Fund Class R5 | |
Six Months Ended
April 30, 2021
(unaudited) | | $ | 8.71 | | | | 0.16 | | | | 0.17 | | | | 0.33 | | | | (0.17 | ) | | | — | | | | — | | | | (0.17 | ) | |
For The Year Ended
October 31, 2020 | | $ | 8.71 | | | | 0.37 | | | | 0.00 | ** | | | 0.37 | | | | (0.37 | ) | | | — | | | | — | | | | (0.37 | ) | |
For The Period
7/29/19^-
10/31/19 | | $ | 8.78 | | | | 0.08 | | | | (0.07 | ) | | | 0.01 | | | | (0.08 | ) | | | — | | | | — | | | | (0.08 | ) | |
First Eagle High Income Fund Class R6 | |
Six Months Ended
April 30, 2021
(unaudited) | | $ | 8.71 | | | | 0.18 | | | | 0.17 | | | | 0.35 | | | | (0.19 | ) | | | — | | | | — | | | | (0.19 | ) | |
October 31, 2020 | | $ | 8.71 | | | | 0.39 | | | | (0.01 | ) | | | 0.38 | | | | (0.38 | ) | | | — | | | | — | | | | (0.38 | ) | |
October 31, 2019 | | $ | 8.82 | | | | 0.43 | | | | (0.11 | ) | | | 0.32 | | | | (0.43 | ) | | | — | | | | — | | | | (0.43 | ) | |
October 31, 2018 | | $ | 9.04 | | | | 0.49 | | | | (0.24 | ) | | | 0.25 | | | | (0.47 | ) | | | — | | | | — | | | | (0.47 | ) | |
For The Period
3/01/17^-
10/31/17 | | $ | 9.10 | | | | 0.32 | | | | (0.05 | ) | | | 0.27 | | | | (0.33 | ) | | | — | | | | (0.00 | ) ** | | | (0.33 | ) | |
First Eagle Fund of America Class A | |
Six Months Ended
April 30, 2021
(unaudited) | | $ | 25.84 | | | | 0.06 | | | | 6.34 | | | | 6.40 | | | | (0.02 | ) | | | (4.44 | ) | | | — | | | | (4.46 | ) | |
October 31, 2020 | | $ | 26.45 | | | | 0.01 | | | | (0.38 | ) | | | (0.37 | ) | | | (0.01 | ) | | | (0.23 | ) | | | — | | | | (0.24 | ) | |
October 31, 2019 | | $ | 30.53 | | | | 0.03 | | | | 1.50 | | | | 1.53 | | | | — | | | | (5.61 | ) | | | — | | | | (5.61 | ) | |
October 31, 2018 | | $ | 38.18 | | | | 0.08 | | | | (4.15 | ) | | | (4.07 | ) | | | — | | | | (3.58 | ) | | | — | | | | (3.58 | ) | |
October 31, 2017 | | $ | 32.93 | | | | (0.02 | ) | | | 7.41 | | | | 7.39 | | | | (0.07 | ) | | | (2.07 | ) | | | — | | | | (2.14 | ) | |
October 31, 2016 | | $ | 35.79 | | | | 0.14 | | | | (1.99 | ) | | | (1.85 | ) | | | (0.01 | ) | | | (1.00 | ) | | | — | | | | (1.01 | ) | |
First Eagle Fund of America Class C | |
Six Months Ended
April 30, 2021
(unaudited) | | $ | 18.74 | | | | (0.03 | ) | | | 4.42 | | | | 4.39 | | | | — | | | | (4.44 | ) | | | — | | | | (4.44 | ) | |
October 31, 2020 | | $ | 19.37 | | | | (0.14 | ) | | | (0.26 | ) | | | (0.40 | ) | | | — | | | | (0.23 | ) | | | — | | | | (0.23 | ) | |
October 31, 2019 | | $ | 24.09 | | | | (0.12 | ) | | | 1.01 | | | | 0.89 | | | | — | | | | (5.61 | ) | | | — | | | | (5.61 | ) | |
October 31, 2018 | | $ | 31.08 | | | | (0.14 | ) | | | (3.27 | ) | | | (3.41 | ) | | | — | | | | (3.58 | ) | | | — | | | | (3.58 | ) | |
October 31, 2017 | | $ | 27.32 | | | | (0.23 | ) | | | 6.06 | | | | 5.83 | | | | — | | | | (2.07 | ) | | | — | | | | (2.07 | ) | |
October 31, 2016 | | $ | 30.07 | | | | (0.10 | ) | | | (1.65 | ) | | | (1.75 | ) | | | — | | | | (1.00 | ) | | | — | | | | (1.00 | ) | |
First Eagle Funds | Semiannual Report | April 30, 2021
152
| | | | | | | | | Ratios/Supplemental data | | | |
| | | | | | | | | Ratios to Average Net Assets of: | | | |
Selected per
share data for
the period ended:* | | Net assets
value, end
of period | | Total
return(a) | | Net assets,
end of
period
(thousands) | | Operating
expenses
excluding
earnings
credits
and/or fee
waivers | | Operating
expenses
including
earnings
credits
and/or fee
waivers | | Net
investment
income
excluding
earnings
credits
and/or fee
waivers | | Net
investment
income
including
earnings
credits
and/or fee
waivers | | Portfolio
turnover
rate | |
First Eagle High Income Fund Class R5 | |
Six Months Ended
April 30, 2021
(unaudited) | | $ | 8.87 | | | | 3.80 | %(b) | | $ | 11 | | | | 1.31 | %(c) | | | 1.21 | %(c) | | | 3.61 | %(c) | | | 3.71 | %(c) | | | 25.57 | %(b) | |
For The Year Ended
October 31, 2020 | | $ | 8.71 | | | | 4.41 | % | | $ | 10 | | | | 1.25 | % | | | 1.15 | % | | | 4.33 | % | | | 4.43 | % | | | 55.38 | % | |
For The Period
7/29/19^-
10/31/19 | | $ | 8.71 | | | | 0.11 | %(b) | | $ | 10 | | | | 1.59 | %(c) | | | 1.48 | %(c) | | | 3.54 | %(c) | | | 3.65 | %(c) | | | 24.19 | %(b) | |
First Eagle High Income Fund Class R6 | |
Six Months Ended
April 30, 2021
(unaudited) | | $ | 8.87 | | | | 3.98 | %(b) | | $ | 1,061 | | | | 1.02 | %(c) | | | 0.92 | %(c) | | | 3.92 | %(c) | | | 4.02 | %(c) | | | 25.57 | %(b) | |
October 31, 2020 | | $ | 8.71 | | | | 4.64 | % | | $ | 1,033 | | | | 1.07 | % | | | 0.97 | % | | | 4.47 | % | | | 4.57 | % | | | 55.38 | % | |
October 31, 2019 | | $ | 8.71 | | | | 3.75 | % | | $ | 1,907 | | | | 1.02 | % | | | 0.92 | % | | | 4.78 | % | | | 4.89 | % | | | 24.19 | % | |
October 31, 2018 | | $ | 8.82 | | | | 2.80 | % | | $ | 401 | | | | 1.01 | % | | | 0.93 | % | | | 5.36 | % | | | 5.44 | % | | | 24.82 | % | |
For The Period
3/01/17^-
10/31/17 | | $ | 9.04 | | | | 2.99 | %(b) | | $ | 114 | | | | 0.92 | %(c) | | | 0.87 | %(c) | | | 5.29 | %(c) | | | 5.34 | %(c) | | | 25.77 | %(b) | |
First Eagle Fund of America Class A | |
Six Months Ended
April 30, 2021
(unaudited) | | $ | 27.78 | | | | 27.15 | %(b) | | $ | 224,782 | | | | 1.05 | %(c) | | | 0.90 | %(c) | | | 0.29 | %(c) | | | 0.44 | %(c) | | | 33.65 | %(b) | |
October 31, 2020 | | $ | 25.84 | | | | (1.43 | )% | | $ | 203,581 | | | | 1.34 | % | | | 1.28 | % | | | (0.04 | )% | | | 0.02 | % | | | 97.86 | % | |
October 31, 2019 | | $ | 26.45 | | | | 7.58 | % | | $ | 273,446 | | | | 1.38 | % | | | 1.37 | % | | | 0.11 | % | | | 0.13 | % | | | 26.42 | % | |
October 31, 2018 | | $ | 30.53 | | | | (11.84 | )% | | $ | 388,961 | | | | 1.32 | % | | | 1.32 | % | | | 0.23 | % | | | 0.23 | % | | | 60.29 | % | |
October 31, 2017 | | $ | 38.18 | | | | 23.56 | % | | $ | 622,389 | | | | 1.31 | % | | | 1.31 | % | | | (0.07 | )% | | | (0.07 | )% | | | 57.02 | % | |
October 31, 2016 | | $ | 32.93 | | | | (5.30 | )%(d) | | $ | 865,109 | | | | 1.32 | % | | | 1.32 | % | | | 0.43 | % | | | 0.43 | % | | | 55.06 | % | |
First Eagle Fund of America Class C | |
Six Months Ended
April 30, 2021
(unaudited) | | $ | 18.69 | | | | 26.64 | %(b) | | $ | 57,533 | | | | 1.80 | %(c) | | | 1.65 | %(c) | | | (0.47 | )%(c) | | | (0.32 | )%(c) | | | 33.65 | %(b) | |
October 31, 2020 | | $ | 18.74 | | | | (2.12 | )% | | $ | 62,901 | | | | 2.09 | % | | | 2.03 | % | | | (0.79 | )% | | | (0.73 | )% | | | 97.86 | % | |
October 31, 2019 | | $ | 19.37 | | | | 6.77 | % | | $ | 115,146 | | | | 2.12 | % | | | 2.10 | % | | | (0.61 | )% | | | (0.60 | )% | | | 26.42 | % | |
October 31, 2018 | | $ | 24.09 | | | | (12.48 | )% | | $ | 244,240 | | | | 2.06 | % | | | 2.06 | % | | | (0.51 | )% | | | (0.51 | )% | | | 60.29 | % | |
October 31, 2017 | | $ | 31.08 | | | | 22.61 | % | | $ | 401,699 | | | | 2.06 | % | | | 2.06 | % | | | (0.81 | )% | | | (0.81 | )% | | | 57.02 | % | |
October 31, 2016 | | $ | 27.32 | | | | (5.99 | )%(d) | | $ | 509,568 | | | | 2.08 | % | | | 2.08 | % | | | (0.35 | )% | | | (0.35 | )% | | | 55.06 | % | |
First Eagle Funds | Semiannual Report | April 30, 2021
153
| | | Per share operating performance* | |
| | | | | Change in Net Assets Resulting
from operations | | Less dividends and distributions | |
Selected per
share data for
the period ended:* | | Net assets
value,
beginning
of period | | Net
investment
income/
loss | | Net
realized
and
unrealized
gains
(losses) on
investments | | Total
investment
operations | | From net
investment
income | | From
capital
gains | | Return of
capital | | Total
distributions | |
First Eagle Fund of America Class I | |
Six Months Ended
April 30, 2021
(unaudited) | | $ | 26.91 | | | | 0.09 | | | | 6.62 | | | | 6.71 | | | | (0.12 | ) | | | (4.44 | ) | | | — | | | | (4.56 | ) | |
October 31, 2020 | | $ | 27.54 | | | | 0.09 | | | | (0.37 | ) | | | (0.28 | ) | | | (0.12 | ) | | | (0.23 | ) | | | — | | | | (0.35 | ) | |
October 31, 2019 | | $ | 31.46 | | | | 0.13 | | | | 1.56 | | | | 1.69 | | | | — | | | | (5.61 | ) | | | — | | | | (5.61 | ) | |
October 31, 2018 | | $ | 39.15 | | | | 0.21 | | | | (4.30 | ) | | | (4.09 | ) | | | (0.02 | ) | | | (3.58 | ) | | | — | | | | (3.60 | ) | |
October 31, 2017 | | $ | 33.72 | | | | 0.08 | | | | 7.59 | | | | 7.67 | | | | (0.17 | ) | | | (2.07 | ) | | | — | | | | (2.24 | ) | |
October 31, 2016 | | $ | 36.62 | | | | 0.24 | | | | (2.04 | ) | | | (1.80 | ) | | | (0.10 | ) | | | (1.00 | ) | | | — | | | | (1.10 | ) | |
First Eagle Fund of America Class R3 | |
Six Months Ended
April 30, 2021
(unaudited) | | $ | 26.71 | | | | 0.05 | | | | 6.56 | | | | 6.61 | | | | (0.01 | ) | | | (4.44 | ) | | | — | | | | (4.45 | ) | |
October 31, 2020 | | $ | 27.37 | | | | (0.04 | ) | | | (0.38 | ) | | | (0.42 | ) | | | (0.01 | ) | | | (0.23 | ) | | | — | | | | (0.24 | ) | |
October 31, 2019 | | $ | 31.40 | | | | 0.02 | | | | 1.56 | | | | 1.58 | | | | — | | | | (5.61 | ) | | | — | | | | (5.61 | ) | |
For The Period
5/01/18^-
10/31/18 | | $ | 35.19 | | | | 0.14 | | | | (3.93 | ) | | | (3.79 | ) | | | — | | | | — | | | | — | | | | — | | |
First Eagle Fund of America Class R4 | |
Six Months Ended
April 30, 2021
(unaudited) | | $ | 26.85 | | | | 0.08 | | | | 6.61 | | | | 6.69 | | | | (0.07 | ) | | | (4.44 | ) | | | — | | | | (4.51 | ) | |
For The Year Ended
October 31, 2020 | | $ | 27.52 | | | | 0.04 | | | | (0.40 | ) | | | (0.36 | ) | | | (0.08 | ) | | | (0.23 | ) | | | — | | | | (0.31 | ) | |
For The Period
7/29/19^-
10/31/19 | | $ | 28.16 | | | | (0.02 | ) | | | (0.62 | ) | | | (0.64 | ) | | | — | | | | — | | | | — | | | | — | | |
First Eagle Fund of America Class R5 | |
Six Months Ended
April 30, 2021
(unaudited) | | $ | 26.88 | | | | 0.09 | | | | 6.61 | | | | 6.70 | | | | (0.10 | ) | | | (4.44 | ) | | | — | | | | (4.54 | ) | |
For The Year Ended
October 31, 2020 | | $ | 27.53 | | | | 0.06 | | | | (0.39 | ) | | | (0.33 | ) | | | (0.09 | ) | | | (0.23 | ) | | | — | | | | (0.32 | ) | |
For The Period
7/29/19^-
10/31/19 | | $ | 28.16 | | | | (0.01 | ) | | | (0.62 | ) | | | (0.63 | ) | | | — | | | | — | | | | — | | | | — | | |
First Eagle Funds | Semiannual Report | April 30, 2021
154
| | | | | | | | | Ratios/Supplemental data | | | |
| | | | | | | | | Ratios to Average Net Assets of: | | | |
Selected per
share data for
the period ended:* | | Net assets
value, end
of period | | Total
return(a) | | Net assets,
end of
period
(thousands) | | Operating
expenses
excluding
earnings
credits
and/or fee
waivers | | Operating
expenses
including
earnings
credits
and/or fee
waivers | | Net
investment
income
excluding
earnings
credits
and/or fee
waivers | | Net
investment
income
including
earnings
credits
and/or fee
waivers | | Portfolio
turnover
rate | |
First Eagle Fund of America Class I | |
Six Months Ended
April 30, 2021
(unaudited) | | $ | 29.06 | | | | 27.30 | %(b) | | $ | 162,344 | | | | 0.72 | %(c) | | | 0.65 | %(c) | | | 0.61 | %(c) | | | 0.68 | %(c) | | | 33.65 | %(b) | |
October 31, 2020 | | $ | 26.91 | | | | (1.09 | )% | | $ | 167,093 | | | | 1.01 | % | | | 0.96 | % | | | 0.28 | % | | | 0.33 | % | | | 97.86 | % | |
October 31, 2019 | | $ | 27.54 | | | | 7.88 | % | | $ | 384,510 | | | | 1.05 | % | | | 1.03 | % | | | 0.45 | % | | | 0.46 | % | | | 26.42 | % | |
October 31, 2018 | | $ | 31.46 | | | | (11.53 | )% | | $ | 612,845 | | | | 1.02 | % | | | 1.02 | % | | | 0.58 | % | | | 0.58 | % | | | 60.29 | % | |
October 31, 2017 | | $ | 39.15 | | | | 23.91 | % | | $ | 829,414 | | | | 1.01 | % | | | 1.01 | % | | | 0.22 | % | | | 0.22 | % | | | 57.02 | % | |
October 31, 2016 | | $ | 33.72 | | | | (5.01 | )%(d) | | $ | 808,426 | | | | 1.03 | % | | | 1.03 | % | | | 0.71 | % | | | 0.71 | % | | | 55.06 | % | |
First Eagle Fund of America Class R3 | |
Six Months Ended
April 30, 2021
(unaudited) | | $ | 28.87 | | | �� | 27.05 | %(b) | | $ | 60 | | | | 1.15 | %(c) | | | 0.99 | %(c) | | | 0.19 | %(c) | | | 0.35 | %(c) | | | 33.65 | %(b) | |
October 31, 2020 | | $ | 26.71 | | | | (1.56 | )% | | $ | 47 | | | | 1.50 | % | | | 1.44 | % | | | (0.20 | )% | | | (0.14 | )% | | | 97.86 | % | |
October 31, 2019 | | $ | 27.37 | | | | 7.48 | % | | $ | 48 | | | | 1.44 | % | | | 1.42 | % | | | 0.04 | % | | | 0.06 | % | | | 26.42 | % | |
For The Period
5/01/18^-
10/31/18 | | $ | 31.40 | | | | (10.74 | )%(b) | | $ | 45 | | | | 1.38 | %(c) | | | 1.38 | %(c) | | | 0.79 | %(c) | | | 0.79 | %(c) | | | 60.29 | %(b) | |
First Eagle Fund of America Class R4 | |
Six Months Ended
April 30, 2021
(unaudited) | | $ | 29.03 | | | | 27.23 | %(b) | | $ | 12 | | | | 1.15 | %(c) | | | 0.75 | %(c) | | | 0.19 | %(c) | | | 0.59 | %(c) | | | 33.65 | %(b) | |
For The Year Ended
October 31, 2020 | | $ | 26.85 | | | | (1.35 | )% | | $ | 10 | | | | 1.36 | % | | | 1.16 | % | | | (0.06 | )% | | | 0.13 | % | | | 97.86 | % | |
For The Period
7/29/19^-
10/31/19 | | $ | 27.52 | | | | (2.27 | )%(b) | | $ | 10 | | | | 1.66 | %(c) | | | 1.62 | %(c) | | | (0.25 | )%(c) | | | (0.22 | )%(c) | | | 26.42 | %(b) | |
First Eagle Fund of America Class R5 | |
Six Months Ended
April 30, 2021
(unaudited) | | $ | 29.04 | | | | 27.28 | %(b) | | $ | 12 | | | | 1.36 | %(c) | | | 0.65 | %(c) | | | (0.02 | )%(c) | | | 0.69 | %(c) | | | 33.65 | %(b) | |
For The Year Ended
October 31, 2020 | | $ | 26.88 | | | | (1.25 | )% | | $ | 10 | | | | 1.26 | % | | | 1.06 | % | | | 0.04 | % | | | 0.24 | % | | | 97.86 | % | |
For The Period
7/29/19^-
10/31/19 | | $ | 27.53 | | | | (2.24 | )%(b) | | $ | 10 | | | | 1.55 | %(c) | | | 1.51 | %(c) | | | (0.14 | )%(c) | | | (0.10 | )%(c) | | | 26.42 | %(b) | |
First Eagle Funds | Semiannual Report | April 30, 2021
155
| | Per share operating performance* | |
| | | | | Change in Net Assets Resulting
from operations | | Less dividends and distributions | |
Selected per
share data for
the period ended:* | | Net assets
value,
beginning
of period | | Net
investment
income/
loss | | Net
realized
and
unrealized
gains
(losses) on
investments | | Total
investment
operations | | From net
investment
income | | From
capital
gains | | Return of
capital | | Total
distributions | |
First Eagle Fund of America Class R6 | |
Six Months Ended
April 30, 2021
(unaudited) | | $ | 26.92 | | | | 0.09 | | | | 6.63 | | | | 6.72 | | | | (0.14 | ) | | | (4.44 | ) | | | — | | | | (4.58 | ) | |
October 31, 2020 | | $ | 27.57 | | | | 0.07 | | | | (0.37 | ) | | | (0.30 | ) | | | (0.12 | ) | | | (0.23 | ) | | | — | | | | (0.35 | ) | |
October 31, 2019 | | $ | 31.46 | | | | 0.09 | | | | 1.63 | | | | 1.72 | | | | — | | | | (5.61 | ) | | | — | | | | (5.61 | ) | |
October 31, 2018 | | $ | 39.15 | | | | 0.65 | | | | (4.73 | ) | | | (4.08 | ) | | | (0.03 | ) | | | (3.58 | ) | | | — | | | | (3.61 | ) | |
For The Period
3/01/17^-
10/31/17 | | $ | 35.44 | | | | 0.02 | | | | 3.69 | | | | 3.71 | | | | — | | | | — | | | | — | | | | — | | |
First Eagle Fund of America Class Y | |
Six Months Ended
April 30, 2021
(unaudited) | | $ | 26.65 | | | | 0.06 | | | | 6.56 | | | | 6.62 | | | | (0.02 | ) | | | (4.44 | ) | | | — | | | | (4.46 | ) | |
October 31, 2020 | | $ | 27.30 | | | | 0.00 | ** | | | (0.39 | ) | | | (0.39 | ) | | | (0.03 | ) | | | (0.23 | ) | | | — | | | | (0.26 | ) | |
October 31, 2019 | | $ | 31.31 | | | | 0.04 | | | | 1.56 | | | | 1.60 | | | | — | | | | (5.61 | ) | | | — | | | | (5.61 | ) | |
October 31, 2018 | | $ | 39.07 | | | | 0.09 | | | | (4.27 | ) | | | (4.18 | ) | | | — | | | | (3.58 | ) | | | — | | | | (3.58 | ) | |
October 31, 2017 | | $ | 33.67 | | | | (0.03 | ) | | | 7.58 | | | | 7.55 | | | | (0.08 | ) | | | (2.07 | ) | | | — | | | | (2.15 | ) | |
October 31, 2016 | | $ | 36.56 | | | | 0.14 | | | | (2.03 | ) | | | (1.89 | ) | | | (0.00 | ) ** | | | (1.00 | ) | | | — | | | | (1.00 | ) | |
^ Commencement of investment operations.
* Per share amounts have been calculated using the average shares method.
** Amount represents less than $0.01 per share.
(a) Does not take into account the sales charge of 5.00% for Class A shares for all Funds, except First Eagle High Income Fund, which has a sales charge of 4.50% and the CDSC (Contingent Deferred Sales Charge) of 1.00% for Class C shares. A contingent deferred sales charge of 1.00% may apply on redemptions of Class A shares made within 18 months following a purchase of $1,000,000 or more without an initial sales charge. With respect to the First Eagle Global Income Builder Fund and the First Eagle High Income Fund, a contingent deferred sales charge of 1.00% may apply on certain redemptions of Class A shares made within 18 months following a purchase of $250,000 or more without an initial sales charge.
(b) Not Annualized
(c) Annualized
(d) In 2016, the Fund received a voluntary reimbursement by the subadviser for a realized investment loss. By excluding this reimbursement, total returns would have been -5.30%, -6.02%, -5.01% and -5.31% for Class A, Class C, Class I and Class Y, respectively.
See Notes to Financial Statements.
First Eagle Funds | Semiannual Report | April 30, 2021
156
| | | | | | | | | Ratios/Supplemental data | | | |
| | | | | | | | | Ratios to Average Net Assets of: | | | |
Selected per
share data for
the period ended:* | | Net assets
value, end
of period | | Total
return(a) | | Net assets,
end of
period
(thousands) | | Operating
expenses
excluding
earnings
credits
and/or fee
waivers | | Operating
expenses
including
earnings
credits
and/or fee
waivers | | Net
investment
income
excluding
earnings
credits
and/or fee
waivers | | Net
investment
income
including
earnings
credits
and/or fee
waivers | | Portfolio
turnover
rate | |
First Eagle Fund of America Class R6 | |
Six Months Ended
April 30, 2021
(unaudited) | | $ | 29.06 | | | | 27.34 | %(b) | | $ | 6,550 | | | | 0.68 | %(c) | | | 0.65 | %(c) | | | 0.65 | %(c) | | | 0.68 | %(c) | | | 33.65 | %(b) | |
October 31, 2020 | | $ | 26.92 | | | | (1.13 | )% | | $ | 5,471 | | | | 1.00 | % | | | 0.95 | % | | | 0.20 | % | | | 0.26 | % | | | 97.86 | % | |
October 31, 2019 | | $ | 27.57 | | | | 8.00 | % | | $ | 2,656 | | | | 1.00 | % | | | 0.99 | % | | | 0.32 | % | | | 0.32 | % | | | 26.42 | % | |
October 31, 2018 | | $ | 31.46 | | | | (11.53 | )% | | $ | 4,362 | | | | 0.98 | % | | | 0.98 | % | | | 1.85 | % | | | 1.86 | % | | | 60.29 | % | |
For The Period
3/01/17^-
10/31/17 | | $ | 39.15 | | | | 10.47 | %(b) | | $ | 397 | | | | 1.00 | %(c) | | | 1.00 | %(c) | | | 0.09 | %(c) | | | 0.09 | %(c) | | | 57.02 | %(b) | |
First Eagle Fund of America Class Y | |
Six Months Ended
April 30, 2021
(unaudited) | | $ | 28.81 | | | | 27.15 | %(b) | | $ | 124,864 | | | | 0.96 | %(c) | | | 0.90 | %(c) | | | 0.37 | %(c) | | | 0.43 | %(c) | | | 33.65 | %(b) | |
October 31, 2020 | | $ | 26.65 | | | | (1.46 | )% | | $ | 111,405 | | | | 1.36 | % | | | 1.30 | % | | | (0.06 | )% | | | (0.01 | )% | | | 97.86 | % | |
October 31, 2019 | | $ | 27.30 | | | | 7.62 | % | | $ | 247,674 | | | | 1.35 | % | | | 1.33 | % | | | 0.13 | % | | | 0.15 | % | | | 26.42 | % | |
October 31, 2018 | | $ | 31.31 | | | | (11.85 | )% | | $ | 280,977 | | | | 1.33 | % | | | 1.33 | % | | | 0.26 | % | | | 0.26 | % | | | 60.29 | % | |
October 31, 2017 | | $ | 39.07 | | | | 23.54 | % | | $ | 397,293 | | | | 1.31 | % | | | 1.31 | % | | | (0.09 | )% | | | (0.09 | )% | | | 57.02 | % | |
October 31, 2016 | | $ | 33.67 | | | | (5.28 | )%(d) | | $ | 385,995 | | | | 1.33 | % | | | 1.33 | % | | | 0.40 | % | | | 0.40 | % | | | 55.06 | % | |
First Eagle Funds | Semiannual Report | April 30, 2021
157
Notes to Financial Statements
Note 1 — Significant Accounting Policies
First Eagle Funds (the "Trust"), is an open-end management investment company registered under the Investment Company Act of 1940, as amended ("1940 Act"). The Trust consists of seven separate portfolios, First Eagle Global Fund, First Eagle Overseas Fund, First Eagle U.S. Value Fund, First Eagle Gold Fund, First Eagle Global Income Builder Fund, First Eagle High Income Fund and First Eagle Fund of America (each individually a "Fund" or collectively the "Funds"). A new series of the Trust, First Eagle Small Cap Opportunity Fund, was organized and commenced investment operations in April 2021. All the Funds are diversified mutual funds except for First Eagle Gold Fund and First Eagle Fund of America, which are non-diversified. The Trust is a Delaware statutory trust. The First Eagle Global Fund seeks long-term growth of capital by investing in a range of asset classes from markets in the United States and throughout the world. The First Eagle Overseas Fund seeks long-term growth of capital by investing primarily in equities issued by non-U.S. corporations. The First Eagle U.S. Value Fund seeks long-term growth of capital by investing, under normal market conditions, at least 80% of its net assets (plus any borrowings for investment purposes) in domestic equity and debt securities. The First Eagle Gold Fund seeks to provide investors the opportunity to participate in the investment characteristics of gold (and to a limited extent other precious metals) for a portion of their overall investment portfolio. The First Eagle Global Income Builder Fund seeks current income generation and long-term growth of capital. The First Eagle High Income Fund seeks to provide investors with a high level of current income. The First Eagle Fund of America seeks capital appreciation and current income by investing primarily in domestic stocks and, to a lesser extent, in debt and foreign equity instruments.
The Funds offer seven share classes, Class A shares, Class C shares, Class I shares, Class R3 shares, Class R4 shares, Class R5 shares and Class R6 shares. Additionally, First Eagle Fund of America also offers Class Y shares.
Class Y shares on First Eagle Fund of America are closed to new investors, subject to certain limited exceptions. Additional information can be found in the Fund's prospectus.
First Eagle Investment Management, LLC (the "Adviser"), a subsidiary of First Eagle Holdings, Inc. ("First Eagle Holdings"), manages the Funds. A controlling interest in First Eagle Holdings is owned by BCP CC Holdings L.P., a Delaware limited partnership ("BCP CC Holdings"). BCP CC Holdings GP L.L.C., a Delaware limited liability company ("BCP CC Holdings GP"), is the general partner of BCP CC Holdings and has two managing members, Blackstone Capital Partners VI L.P. ("BCP VI") and Corsair IV Financial Services Capital Partners L.P. ("Corsair IV"). BCP VI and Corsair IV are indirectly controlled by The Blackstone Group, Inc. ("Blackstone") and Corsair Capital LLC ("Corsair"), respectively. Investment vehicles indirectly controlled by Blackstone and Corsair and certain co-investors own a majority economic interest in First Eagle Holdings and the Adviser through BCP CC Holdings.
The following is a summary of significant accounting policies that are adhered to by the Funds. The Funds are investment companies and, accordingly, follow the investment company accounting and reporting guidance of the Financial Accounting Standards Board Accounting Standards Codification Topic 946 — Investment Companies, which is part of U.S. generally accepted accounting principles ("GAAP").
First Eagle Funds | Semiannual Report | April 30, 2021
158
Notes to Financial Statements
a) Investments in Subsidiaries — The First Eagle Global Fund (the "Global Fund"), First Eagle Overseas Fund (the "Overseas Fund"), First Eagle U.S. Value Fund (the "U.S. Value Fund"), and First Eagle Gold Fund (the "Gold Fund") may invest in certain precious metals through their investment in the First Eagle Global Cayman Fund, Ltd., First Eagle Overseas Cayman Fund, Ltd., First Eagle U.S. Value Cayman Fund, Ltd., and First Eagle Gold Cayman Fund, Ltd., respectively, each a wholly owned subsidiary (each referred to herein as a "Subsidiary" or collectively "the Subsidiaries"). Each Fund may invest up to 25% of its total assets in shares of its respective Subsidiary. Each Subsidiary has the ability to invest in commodities and securities consistent with the investment objective of its respective Fund. Substantially all of each Subsidiary's assets represent physical gold bullion, and First Eagle Gold Cayman Fund, Ltd. also holds physical silver. Trading in bullion directly by the Funds presents the risk of tax consequences (e.g., a change in the Funds' tax status subjecting the Funds to be taxed at the Fund level on all of their income if the Funds' "non-qualifying income" exceeds 10% of the Funds' gross income in any taxable year). Trading in bullion by the Subsidiaries generally does not present the same tax risks.
The First Eagle Global Cayman Fund, Ltd., established on October 18, 2013, is an exempted company under the laws of the Cayman Islands. The consolidated financial statements include the accounts of the First Eagle Global Fund and the First Eagle Global Cayman Fund, Ltd. All intercompany transactions and balances have been eliminated. As of April 30, 2021, the First Eagle Global Cayman Fund, Ltd. has $4,498,004,841 in net assets, representing 9.18% of the Global Fund's net assets.
The First Eagle Overseas Cayman Fund, Ltd., established on October 18, 2013, is an exempted company under the laws of the Cayman Islands. The consolidated financial statements include the accounts of the First Eagle Overseas Fund and the First Eagle Overseas Cayman Fund, Ltd. All intercompany transactions and balances have been eliminated. As of April 30, 2021, the First Eagle Overseas Cayman Fund, Ltd. has $1,125,845,507 in net assets, representing 7.48% of the Overseas Fund's net assets.
The First Eagle U.S. Value Cayman Fund, Ltd., established on January 24, 2012, is an exempted company under the laws of the Cayman Islands. The consolidated financial statements include the accounts of the First Eagle U.S. Value Fund and the First Eagle U.S. Value Cayman Fund, Ltd. All intercompany transactions and balances have been eliminated. As of April 30, 2021, the First Eagle U.S. Value Cayman Fund, Ltd. has $129,998,740 in net assets, representing 9.96% of the U.S. Value Fund's net assets.
The First Eagle Gold Cayman Fund, Ltd., established on May 28, 2010, is an exempted company under the laws of the Cayman Islands. The consolidated financial statements include the accounts of the First Eagle Gold Fund and the First Eagle Gold Cayman Fund, Ltd. All intercompany transactions and balances have been eliminated. As of April 30, 2021, the First Eagle Gold Cayman Fund, Ltd. has $558,158,246 in net assets, representing 24.46% of the Gold Fund's net assets.
First Eagle Funds | Semiannual Report | April 30, 2021
159
Notes to Financial Statements
b) Investment Valuation — Each Fund computes its net asset value once daily as of the close of trading on each day the New York Stock Exchange ("NYSE") is open for trading. The net asset value per share is computed by dividing the total current value of the assets of a Fund, less its liabilities, by the total number of shares outstanding at the time of such computation.
A portfolio security (including an option or warrant), other than a bond, which is traded on a U.S. national securities exchange or a securities exchange abroad is generally valued at the price of the official close (last quoted sales price if an official closing price is not available) as of the local market close on the primary exchange. If there are no round lot sales on such date, such security will be valued at the mean between the closing bid and asked prices (and if there is only a bid or only an asked price on such date, valuation will be at such bid or asked price for long or short positions, respectively). Securities, other than bonds, traded in the over-the-counter market are valued at the mean between the last bid and asked prices prior to the time of valuation (and if there is only a bid or only an asked price on such date, valuation will be at such bid or asked price for long or short positions, respectively), except if such unlisted security is traded on the NASDAQ in which case it is valued at the NASDAQ Official Closing Price. Such prices are provided by approved pricing vendors or other independent pricing sources.
All bonds, whether listed on an exchange or traded in the over-counter-market for which market quotations are readily available are generally priced at the evaluated bid price provided by an approved pricing service as of the close of the NYSE (normally 4:00 p.m. Eastern Time), or dealers in the over-the-counter markets in the United States or abroad. Pricing services and broker-dealers use multiple valuation techniques to determine value. In instances where sufficient market activity exists, dealers or pricing services utilize a market-based approach through which quotes from market makers are used to determine fair value. In instances where sufficient market activity may not exist or is limited, the dealers or pricing services also utilize proprietary valuation models which may consider market transactions in comparable securities and the various relationships between securities in determining value and/or market characteristics such as benchmark yield curves, option-adjusted spreads, credit spreads, estimated default rates, coupon-rates, anticipated timing of principal repayments, underlying collateral, and other unique security features in order to estimate the relevant cash flows, which are then discounted to calculate the fair values. The Adviser's Valuation Committee, at least annually, will review the pricing service's inputs, methods, models and assumptions for its evaluated prices. Short-term debt maturing in 60 days or less is valued at evaluated bid prices.
Commodities (such as physical metals) are valued at a calculated evaluated mean price, as provided by an independent price source as of the close of the NYSE.
Forward foreign currency exchange contracts are valued at the current cost of covering or offsetting such contracts, by reference to forward currency rates at the time the NYSE closes, as provided by an independent pricing source.
The spot exchange rates, as provided by an independent price source as of the close of the NYSE, are used to convert foreign security prices into U.S. dollars.
First Eagle Funds | Semiannual Report | April 30, 2021
160
Notes to Financial Statements
Any security that is listed or traded on more than one exchange (or traded in multiple markets) is valued at the official close on the primary exchange or market on which they are traded. In the absence of such a quotation, a security may be valued at the last quoted sales price on the most active exchange or market as determined by the independent pricing agent. The Funds use pricing services to identify the market prices of publicly traded securities in their portfolios. When market prices are determined to be "stale" as a result of limited market activity for a particular holding or have been materially affected by events occurring after the close of trading on the exchange or market on which the security is principally traded but before the Fund's NAV is calculated, or in other circumstances when market prices are unavailable, such as for private placements, or determined to be unreliable for a particular holding, such holdings may be "fair valued" in accordance with procedures approved by the Board of Trustees ("Board"). The values assigned to a Fund's holdings therefore may differ on occasion from reported market values.
Additionally, trading of foreign equity securities on most foreign markets is completed before the close in trading in the U.S. markets. The Funds have implemented fair value pricing on a daily basis for all foreign securities, as available, to account for the market movement between the close of the foreign market and the close of the NYSE. The fair value pricing utilizes factors provided by an independent pricing service. The values assigned to a Fund's holdings therefore may differ on occasion from reported market values, especially during periods of higher market price volatility. The Board and the Adviser believe relying on the procedures as just described will result in prices that are more reflective of the actual market value of portfolio securities held by the Funds than relying solely on reported market values.
The Funds adopted provisions surrounding fair value measurements and disclosures that define fair value, establish a framework for measuring fair value in GAAP and expand disclosures about fair value measurements. This applies to fair value measurements that are already required or permitted by other accounting standards and is intended to increase consistency of those measurements and applies broadly to securities and other types of assets and liabilities.
The Funds disclose the fair value of their investments in a hierarchy that prioritizes the inputs or assumptions to valuation techniques used to measure fair value. These inputs are used in determining the value of the Funds' investments and are summarized in the following fair value hierarchy:
Level 1 — Quoted prices in active markets for identical securities.
Level 2 — Other significant observable inputs (including quoted prices for similar securities, interest rates, prepayment speeds, credit risk, etc.).
Level 3 — Other significant unobservable inputs (including the Fund's own assumption in determining the fair value of investments).
The significant unobservable inputs that may be used in determining valuations for investments identified within Level 3 are market comparables and the enterprise value of a company. Indications of value and quotations may be observable at any given time, but are currently
First Eagle Funds | Semiannual Report | April 30, 2021
161
Notes to Financial Statements
treated by the Funds as unobservable. Significant changes in any of the unobservable inputs may significantly impact the fair value measurement. The impact is based on the relationship between each unobservable input and the fair value measurement.
Significant increases (decreases) in enterprise multiples may increase (decrease) the fair value measurement. Significant increases (decreases) in the discount for marketability, probability of insolvency and probability of default may decrease (increase) the fair value measurement.
Fair valuation of securities, other financial investments or other assets (collectively, "securities") held by the Funds are determined in good faith under the supervision and responsibility of the Board. The Board Valuation and Liquidity Committee (the "Committee") oversees the execution of the valuation and liquidity procedures for the Funds.
The following is a summary of the Funds' inputs used to value the Funds' investments as of April 30, 2021:
First Eagle Global Fund
Description | | Level 1 | | Level 2 | | Level 3‡ | | Total | |
Assets:† | |
Common Stocks | | $ | 24,589,720,435 | | | $ | 13,676,115,785 | (a) | | $ | — | | | $ | 38,265,836,220 | | |
Corporate Bond | | | — | | | | — | | | | 5,665,179 | (b) | | | 5,665,179 | | |
Commodities* | | | — | | | | 5,036,342,592 | | | | — | | | | 5,036,342,592 | | |
Foreign Government
Securities | | | — | | | | 604,804,863 | | | | — | | | | 604,804,863 | | |
Short-Term Investments | | | 47,232 | | | | 4,991,923,511 | | | | — | | | | 4,991,970,743 | | |
Warrants | | | 5,444,444 | | | | — | | | | — | | | | 5,444,444 | | |
Forward Foreign Currency
Exchange Contracts** | | | — | | | | 6,321,006 | | | | — | | | | 6,321,006 | | |
Total | | $ | 24,595,212,110 | | | $ | 24,315,507,758 | | | $ | 5,665,179 | | | $ | 48,916,385,047 | | |
Liabilities: | |
Forward Foreign Currency
Exchange Contracts** | | $ | — | | | $ | (2,261,953 | ) | | $ | — | | | $ | (2,261,953 | ) | |
Total | | $ | — | | | $ | (2,261,953 | ) | | $ | — | | | $ | (2,261,953 | ) | |
(a) The Fund has implemented fair value pricing on a daily basis for all foreign securities, as available, to account for the market movement between the close of the foreign market and the close of the NYSE. See Note 1(b) for additional details.
(b) These investments are valued by brokers and pricing services. The inputs for these investments are not readily available or cannot be reasonably estimated and are generally those inputs described in Note 1(b).
† See Consolidated Schedule of Investments for additional detailed categorizations.
‡ Value determined using significant unobservable inputs.
* Represents gold bullion.
** Forward Foreign Currency Exchange Contracts are valued at net unrealized appreciation (depreciation) on the contracts.
First Eagle Funds | Semiannual Report | April 30, 2021
162
Notes to Financial Statements
First Eagle Global Fund (continued)
Fair Value Level 3 activity for the six month period ended April 30, 2021 was as follows:
| | | Corporate
Bonds | |
Beginning Balance — market value | | $ | 5,549,005 | | |
Purchases(1) | | | — | | |
Sales(2) | | | — | | |
Transfer In — Level 3 | | | — | | |
Transfer Out — Level 3 | | | — | | |
Accrued discounts/(premiums) | | | 21,090 | | |
Realized Gains (Losses) | | | — | | |
Change in Unrealized Appreciation (Depreciation) | | | 95,084 | | |
Ending Balance — market value | | $ | 5,665,179 | | |
Change in unrealized gains or (losses) relating to assets still held at reporting date | | $ | 95,084 | | |
(1) Purchases include all purchases of securities and securities received in corporate actions.
(2) Sales include all sales of securities, maturities, paydowns and securities tendered in corporate actions
First Eagle Overseas Fund
Description | | Level 1 | | Level 2 | | Level 3‡ | | Total | |
Assets:† | |
Common Stocks | | $ | 2,646,854,770 | | | $ | 8,281,441,205 | (a) | | $ | 18,166,669 | | | $ | 10,946,462,644 | | |
Commodities* | | | — | | | | 1,478,470,571 | | | | — | | | | 1,478,470,571 | | |
Foreign Government
Securities | | | — | | | | 306,953,064 | | | | — | | | | 306,953,064 | | |
Short-Term Investments | | | 18,251 | | | | 2,315,409,145 | | | | — | | | | 2,315,427,396 | | |
Warrants | | | 2,385,136 | | | | — | | | | — | | | | 2,385,136 | | |
Forward Foreign Currency
Exchange Contracts** | | | — | | | | 3,426,644 | | | | — | | | | 3,426,644 | | |
Total | | $ | 2,649,258,157 | | | $ | 12,385,700,629 | | | $ | 18,166,669 | | | $ | 15,053,125,455 | | |
Liabilities: | |
Forward Foreign Currency
Exchange Contracts** | | $ | — | | | $ | (1,275,652 | ) | | $ | — | | | $ | (1,275,652 | ) | |
Total | | $ | — | | | $ | (1,275,652 | ) | | $ | — | | | $ | (1,275,652 | ) | |
(a) The Fund has implemented fair value pricing on a daily basis for all foreign securities, as available, to account for the market movement between the close of the foreign market and the close of the NYSE. See Note 1(b) for additional details.
† See Consolidated Schedule of Investments for additional detailed categorizations.
First Eagle Funds | Semiannual Report | April 30, 2021
163
Notes to Financial Statements
First Eagle Overseas Fund (continued)
‡ Value determined using significant unobservable inputs
* Represents gold bullion.
** Forward Foreign Currency Exchange Contracts are valued at net unrealized appreciation (depreciation) on the contracts.
Fair Value Level 3 activity for the six month period ended April 30, 2021 was as follows:
| | | Common Stocks | |
Beginning Balance — market value | | $ | 8,129,690 | | |
Purchases(1) | | | — | | |
Sales(2) | | | — | | |
Transfer In — Level 3 | | | — | | |
Transfer Out — Level 3 | | | — | | |
Accrued discounts/(premiums) | | | — | | |
Realized Gains (Losses) | | | — | | |
Change in Unrealized Appreciation (Depreciation) | | | 10,036,979 | | |
Ending Balance — market value | | $ | 18,166,669 | | |
Change in unrealized gains or (losses) relating to assets still held at reporting date | | $ | 10,036,979 | | |
(1) Purchases include all purchases of securities and securities received in corporate actions.
(2) Sales include all sales of securities, maturities, paydowns and securities tendered in corporate actions.
Quantitative Information about Level 3 Fair Value Measurements | |
| | Fair Value at
April 30, 2021 | | Valuation
Technique(s) | | Unobservable
Input | | Range
(Weighted
Average) | | Direction
Change in Fair
Value Resulting
from Increase
in Unobservable
Inputs(a) | |
| Common Stocks | | $ | 18,166,669 | | | Market
Comparable
Companies | | Enterprise
Value
Multiple | | | 0.31
15.28x (5.67x) | x - | | Increase | |
Total | | $ | 18,166,669 | | | | | | | | | | |
(a) This column represents the direction change in the fair value of Level 3 securities that would result from an increase to the corresponding unobservable inputs. A decrease to the unobservable input would have the opposite effect. Significant increases and decreases of these inputs could result in significantly higher or lower gain value determination.
First Eagle Funds | Semiannual Report | April 30, 2021
164
Notes to Financial Statements
First Eagle U.S. Value Fund
Description | | Level 1 | | Level 2 | | Level 3‡ | | Total | |
Assets:† | |
Common Stocks | | $ | 1,029,071,879 | | | $ | 4,830,452 | (a) | | $ | — | | | $ | 1,033,902,331 | | |
Corporate Bonds | | | — | | | | — | | | | 621,750 | (b) | | | 621,750 | | |
Commodities* | | | — | | | | 129,998,225 | | | | — | | | | 129,998,225 | | |
Master Limited Partnerships | | | 18,209,121 | | | | — | | | | — | | | | 18,209,121 | | |
Short-Term Investments | | | 17,801 | | | | 123,893,156 | | | | — | | | | 123,910,957 | | |
Total | | $ | 1,047,298,801 | | | $ | 258,721,833 | | | $ | 621,750 | | | $ | 1,306,642,384 | | |
(a) The Fund has implemented fair value pricing on a daily basis for all foreign securities, as available, to account for the market movement between the close of the foreign market and the close of the NYSE. See Note 1(b) for additional details.
(b) These investments are valued by brokers and pricing services. The inputs for these investments are not readily available or cannot be reasonably estimated and are generally those inputs described in Note 1(b).
† See Consolidated Schedule of Investments for additional detailed categorizations
‡ Value determined using significant unobservable inputs.
* Represents gold bullion.
Fair Value Level 3 activity for the six month period ended April 30, 2021 was as follows:
| | | Corporate Bonds | |
Beginning Balance — market value | | $ | 609,000 | | |
Purchases(1) | | | — | | |
Sales(2) | | | — | | |
Transfer In — Level 3 | | | — | | |
Transfer Out — Level 3 | | | — | | |
Accrued discounts/(premiums) | | | 2,422 | | |
Realized Gains (Losses) | | | — | | |
Change in Unrealized Appreciation (Depreciation) | | | 10,328 | | |
Ending Balance — market value | | $ | 621,750 | | |
Change in unrealized gains or (losses) relating to assets still held at reporting date | | $ | 10,328 | | |
(1) Purchases include all purchases of securities and securities received in corporate actions.
(2) Sales include all sales of securities, maturities, paydowns and securities tendered in corporate actions.
First Eagle Funds | Semiannual Report | April 30, 2021
165
Notes to Financial Statements
First Eagle Gold Fund
Description | | Level 1 | | Level 2 | | Level 3 | | Total | |
Assets:† | |
Common Stocks | | $ | 1,348,593,009 | | | $ | 132,625,774 | (a) | | $ | — | | | $ | 1,481,218,783 | | |
Commodities* | | | — | | | | 558,163,603 | | | | — | | | | 558,163,603 | | |
Rights | | | 6,015,387 | | | | — | | | | — | | | | 6,015,387 | | |
Short-Term Investments | | | 7,016 | | | | 225,058,894 | | | | — | | | | 225,065,910 | | |
Total | | $ | 1,354,615,412 | | | $ | 915,848,271 | | | $ | — | | | $ | 2,270,463,683 | | |
(a) The Fund has implemented fair value pricing on a daily basis for all foreign securities, as available, to account for the market movement between the close of the foreign market and the close of the NYSE. See Note 1(b) for additional details.
† See Consolidated Schedule of Investments for additional detailed categorizations.
* Represents gold and silver bullion.
First Eagle Funds | Semiannual Report | April 30, 2021
166
Notes to Financial Statements
First Eagle Global Income Builder Fund
Description | | Level 1 | | Level 2 | | Level 3‡ | | Total | |
Assets:† | |
Common Stocks | | $ | 397,045,905 | | | $ | 442,941,942 | (a) | | $ | — | | | $ | 839,987,847 | | |
Convertible Preferred Stock | | | 11,051,885 | | | | — | | | | — | | | | 11,051,885 | | |
Corporate Bonds | | | — | | | | 161,373,109 | | | | 3,434,915 | (b) | | | 164,808,024 | | |
Closed End Funds | | | 12,004,998 | | | | — | | | | — | | | | 12,004,998 | | |
Commodities* | | | — | | | | 102,166,753 | | | | — | | | | 102,166,753 | | |
Foreign Government Securities | | | — | | | | 5,456,910 | | | | — | | | | 5,456,910 | | |
Master Limited Partnerships | | | 26,999,653 | | | | — | | | | — | | | | 26,999,653 | | |
Preferred Stocks | | | 18,742,808 | | | | — | | | | — | | | | 18,742,808 | | |
Short-Term Investments | | | 725,706 | | | | 73,542,059 | | | | — | | | | 74,267,765 | | |
U.S. Treasury Obligations | | | — | | | | 83,892,427 | | | | — | | | | 83,892,427 | | |
Warrants | | | 166,989 | | | | — | | | | — | | | | 166,989 | | |
Forward Foreign Currency
Exchange Contracts** | | | — | | | | 232,234 | | | | — | | | | 232,234 | | |
Total | | $ | 466,737,944 | | | $ | 869,605,434 | | | $ | 3,434,915 | | | $ | 1,339,778,293 | | |
Liabilities: | |
Forward Foreign Currency
Exchange Contracts** | | $ | — | | | $ | (74,657 | ) | | $ | — | | | $ | (74,657 | ) | |
Written Options | | | (2,241,554 | ) | | | — | | | | — | | | | (2,241,554 | ) | |
Total | | $ | (1,879,282 | ) | | $ | (436,929 | ) | | $ | — | | | $ | (2,316,211 | ) | |
(a) The Fund has implemented fair value pricing on a daily basis for all foreign securities, as available, to account for the market movement between the close of the foreign market and the close of the NYSE. See Note 1(b) for additional details.
(b) These investments are valued by brokers and pricing services. The inputs for these investments are not readily available or cannot be reasonably estimated and are generally those inputs described in Note 1(b).
† See Schedule of Investments for additional detailed categorizations.
‡ Value determined using significant unobservable inputs.
* Represents gold bullion.
** Forward Foreign Currency Exchange Contracts are valued at net unrealized appreciation (depreciation) on the contracts.
First Eagle Funds | Semiannual Report | April 30, 2021
167
Notes to Financial Statements
First Eagle Global Income Builder Fund (continued)
Fair Value Level 3 activity for the six month period ended April 30, 2021 was as follows:
| | | Corporate
Bond | | Loan
Assignments | | Total
Value | |
Beginning Balance — market value | | $ | — | | | $ | 3,763,237 | | | $ | 3,763,237 | | |
Purchases(1) | | | 2,699,000 | | | | — | | | | 2,699,000 | | |
Sales(2) | | | — | | | | (4,276,406 | ) | | | (4,276,406 | ) | |
Transfer In — Level 3 | | | 701,704 | | | | — | | | | 701,704 | | |
Transfer Out — Level 3 | | | — | | | | — | | | | — | | |
Accrued discounts/(premiums) | | | — | | | | 8,110 | | | | 8,110 | | |
Realized Gains (Losses) | | | — | | | | 33,082 | | | | 33,082 | | |
Change in Unrealized Appreciation (Depreciation) | | | 34,211 | | | | 471,977 | | | | 506,188 | | |
Ending Balance — market value | | $ | 3,434,915 | | | $ | — | | | $ | 3,434,915 | | |
Change in unrealized gains or (losses) relating to
assets still held at reporting date | | $ | 34,211 | | | | — | | | $ | 34,211 | | |
(1) Purchases include all purchases of securities and securities received in corporate actions.
(2) Sales include all sales of securities, maturities, paydowns and securities tendered in corporate actions.
First Eagle High Income Fund
Description | | Level 1 | | Level 2 | | Level 3‡ | | Total | |
Assets:† | |
Common Stocks | | $ | — | | | $ | — | | | $ | 13,391,610 | | | $ | 13,391,610 | | |
Corporate Bonds | | | — | | | | 208,187,443 | | | | 137,076 | (a) | | | 208,324,519 | | |
Loan Assignments | | | — | | | | 1,667,098 | | | | — | | | | 1,667,098 | | |
Short-Term Investments | | | 2,170,829 | | | | 11,819,849 | | | | — | | | | 13,990,678 | | |
Total | | $ | 2,170,829 | | | $ | 221,674,390 | | | $ | 13,528,686 | | | $ | 237,373,905 | | |
Liabilities: | |
Forward Foreign Currency
Exchange Contracts** | | $ | — | | | $ | (608 | ) | | $ | — | | | $ | (608 | ) | |
Total | | $ | — | | | $ | (608 | ) | | $ | — | | | $ | (608 | ) | |
(a) These investments are valued by brokers and pricing services. The inputs for these investments are not readily available or cannot be reasonably estimated and are generally those inputs described in Note 1(b).
† See Schedule of Investments for additional detailed categorizations.
‡ Value determined using significant unobservable inputs.
** Forward Foreign Currency Exchange Contracts are valued at net unrealized appreciation (depreciation) on the contracts.
First Eagle Funds | Semiannual Report | April 30, 2021
168
Notes to Financial Statements
First Eagle High Income Fund (continued)
Fair Value Level 3 activity for the six month period ended April 30, 2021 was as follows:
| | | Common
Stocks | | Corporate
Bond | | Loan
Assignments | | Total
Value | |
Beginning Balance — market value | | $ | 16,460,676 | | | $ | — | | | $ | 4,692,435 | | | $ | 21,153,111 | | |
Purchases(1) | | | — | | | | — | | | | — | | | | — | | |
Sales(2) | | | — | | | | — | | | | (5,332,313 | ) | | | (5,332,313 | ) | |
Transfer In — Level 3 | | | — | | | | 130,767 | | | | — | | | | 130,767 | | |
Transfer Out — Level 3 | | | — | | | | — | | | | — | | | | — | | |
Accrued discounts/(premiums) | | | — | | | | — | | | | 16,376 | | | | 16,376 | | |
Realized Gains (Losses) | | | — | | | | — | | | | 70,746 | | | | 70,746 | | |
Change in Unrealized Appreciation
(Depreciation) | | | (3,069,066 | ) | | | 6,309 | | | | 552,756 | | | | (2,510,001 | ) | |
Ending Balance — market value | | $ | 13,391,610 | | | $ | 137,076 | | | $ | — | | | $ | 13,528,686 | | |
Change in unrealized gains or
(losses) relating to assets still
held at reporting date | | $ | (3,069,066 | ) | | $ | 6,309 | | | $ | — | | | $ | (3,062,757 | ) | |
(1) Purchases include all purchases of securities and securities received in corporate actions.
(2) Sales include all sales of securities, maturities, paydowns and securities tendered in corporate actions.
Quantitative Information about Level 3 Fair Value Measurements | |
| | Fair Value at
April 30, 2021 | | Valuation
Technique(s) | | Unobservable
Input | | Range
(Weighted
Average) | | Direction
Change in Fair
Value Resulting
from Increase
in Unobservable
Inputs(a) | |
| Common Stocks | | $ | 13,391,610 | | | Third-party
vendor pricing
service | | Indicative
Broker
Quotes (Mid) | | $ | 12.50 | | | Increase | |
| | | | Market
Comparable
Companies | | Enterprise
Value
Multiple | | | 4.23
7.30x (5.62x) | x - | | Increase | |
Total | | $ | 13,391,610 | | | | | | | | | | |
(a) This column represents the direction change in the fair value of Level 3 securities that would result from an increase to the corresponding unobservable inputs. A decrease to the unobservable input would have the opposite effect. Significant increases and decreases of these inputs could result in significantly higher or lower gain value determination.
First Eagle Funds | Semiannual Report | April 30, 2021
169
Notes to Financial Statements
First Eagle Fund of America
Description | | Level 1 | | Level 2 | | Level 3 | | Total | |
Assets:† | |
Common Stocks | | $ | 557,758,869 | | | $ | 11,900,583 | (a) | | $ | — | | | $ | 569,659,452 | | |
Short-Term Investments | | | 1,239 | | | | 5,397,931 | | | | — | | | | 5,399,170 | | |
Total | | $ | 557,760,108 | | | $ | 17,298,514 | | | $ | — | | | $ | 575,058,622 | | |
(a) The Fund has implemented fair value pricing on a daily basis for all foreign securities, as available, to account for the market movement between the close of the foreign market and the close of the NYSE. See Note 1(b) for additional details.
† See Schedule of Investments for additional detailed categorizations.
c) Investment Transactions and Income — Investment transactions are accounted for on a trade date basis. The specific identification method is used in determining realized gains and losses from investment transactions. Dividend income is recorded on the ex-dividend date. The Funds may be subject to withholding tax on income, capital gains or repatriation taxes imposed by certain countries, a portion of which may be recoverable. Foreign taxes are recorded in accordance with the applicable foreign tax regulations and rates that exist in the foreign jurisdictions in which a Fund invests. Investment income is recorded net of foreign withholding taxes. Foreign taxes are accrued based on gains realized by a Fund as a result of certain foreign security sales. In certain circumstances, estimated taxes are accrued based on unrealized appreciation of such securities. Interest income is recorded daily on the accrual basis. In computing investment income, each Fund accretes discounts and amortizes premiums on debt obligations using the effective yield method. Investment income is allocated to each Fund's share class in proportion to its relative net assets. Payments received from certain investments held by the Funds may be comprised of dividends, capital gains and return of capital. The Funds originally estimate the expected classification of such payments. The amounts may subsequently be reclassified upon receipt of information from the issuer.
d) Expenses — Expenses arising in connection with a Fund are charged directly to that Fund. Expenses common to all Funds may be allocated to each Fund in proportion to its relative net assets. Certain expenses are shared with the First Eagle Variable Funds, an affiliated fund group, and certain other funds also managed by the Adviser. Generally, expenses that do not pertain specifically to a Fund are allocated to each Fund based upon the percentage the net assets a Fund bears to the total net assets of all the Funds that share the expense. Earnings credits may reduce shareholder servicing agent fees by the amount of interest earned on balances with such service provider.
e) Foreign Currency Translation — The books and records of the Funds are maintained in U.S. dollars. The market values of securities which are not traded in U.S. currency are recorded in the financial statements after translation to U.S. dollars based on the applicable exchange rates at the end of the period. The costs of such securities are translated at exchange rates prevailing when acquired. Related interest, dividends and withholding taxes are accrued at the rates of exchange prevailing on the respective dates of such transactions.
First Eagle Funds | Semiannual Report | April 30, 2021
170
Notes to Financial Statements
The net assets of each of the Funds are presented at the foreign exchange rates and market values at the close of the period. The Funds do not isolate that portion of gains and losses on investments which is due to changes in foreign exchange rates from that which is due to changes in market prices of the securities. Accordingly, such foreign currency gains (losses) are included in the reported net realized and unrealized gains (losses) on investment transactions on the Statements of Operations. However, for federal income tax purposes each Fund does isolate the effect of changes in foreign exchange rates from the changes in market prices for realized gains and losses on debt obligations.
f) Forward Foreign Currency Exchange Contracts — In connection with portfolio purchases and sales of securities denominated in foreign currencies, each Fund may enter into forward foreign currency exchange contracts. The First Eagle Global Fund, First Eagle Overseas Fund, First Eagle Global Income Builder Fund and First Eagle High Income Fund enter into forward foreign currency exchange contracts primarily to manage and/or gain exposure to certain foreign currencies. The Funds' currency transactions include portfolio hedging on portfolio positions. Portfolio hedging is the use of a forward foreign currency exchange contract (or other cash management position) with respect to one or more portfolio security positions denominated or quoted in a particular currency. Currency exchange transactions involve currencies of different countries that the Funds invest in and serve as hedges against possible variations in the exchange rates between these currencies and the U.S. dollar. Each Fund may engage in portfolio hedging with respect to the currency of a particular country in amounts approximating actual or anticipated positions in securities denominated in that currency. Hedging can reduce exposure to currency exchange movements, but cannot eliminate that exposure. It is possible to lose money under a hedge.
Funds investing in forward foreign currency exchange contracts are exposed to risk if the value of the currency changes unfavorably, if the counterparties to the contracts are unable to meet the terms of their contracts or if the Fund is unable to enter into a closing position. Forward foreign currency exchange contracts outstanding at period end, if any, are listed after each Fund's portfolio. For the six-month period ended April 30, 2021, the average monthly outstanding currency purchased or sold in U.S. dollars for forward foreign currency exchange contracts held by the Funds were as follows:
| | | First Eagle
Global
Fund | | First Eagle
Overseas
Fund | | First Eagle
Global
Income
Builder
Fund | | First Eagle
High Income
Fund | |
Forward Foreign Currency Exchange Contracts: | |
Average Settlement
Value — Purchased | | $ | 109,527,398 | | | $ | 57,999,459 | | | $ | 1,110,299 | | | $ | — | | |
Average Settlement
Value — Sold | | | 731,396,418 | | | | 372,206,815 | | | | 25,465,984 | | | | 130,907 | | |
First Eagle Funds | Semiannual Report | April 30, 2021
171
Notes to Financial Statements
The Funds adopted provisions surrounding disclosures of derivative instruments and hedging activities which require qualitative disclosures about objectives and strategies for using derivatives, quantitative disclosures about fair value amounts of gains and losses on derivative instruments, and disclosures about currency-risk-related contingent features in derivative agreements.
In order to better define its contractual rights and to secure rights that may help the Funds mitigate counterparty risk, the Funds may enter into an International Swaps and Derivatives Association, Inc. Master Agreement ("ISDA Master Agreement") or similar agreement with derivative contract counterparties. An ISDA Master Agreement is a bilateral agreement between a Fund and a counterparty that governs over-the-counter ("OTC") derivatives and forward foreign currency exchange contracts and typically contains, among other things, collateral posting terms and netting provisions in the event of a default and/or termination event. Under an ISDA Master Agreement, the Funds may, under certain circumstances, offset with the counterparty certain derivative financial instrument's payables and/or receivables with collateral held and/or posted and create one single net payment. With respect to certain counterparties, in accordance with the terms of the ISDA Master Agreement, the Funds may be required to post or receive collateral in the form of cash or debt securities issued by the U.S. Government or related agencies. Daily movement of cash collateral is subject to minimum threshold amounts. Cash collateral that has been pledged to cover obligations of a Fund, if any, is reported separately on the Statements of Assets and Liabilities as cash pledged. Non-cash collateral pledged by a Fund, if any, is noted in the Schedules of Investments. Collateral received by the Funds is held in a segregated account at the Funds' custodian bank. These amounts are not reflected on the Funds' Statements of Assets and Liabilities and are disclosed in the table below. The provisions of the ISDA Master Agreement typically permit a single net payment in the event of default (close-out netting) including the bankruptcy or insolvency of the counterparty. Note, however, that bankruptcy or insolvency laws of a particular jurisdiction may impose restrictions on or prohibitions against the right of offset in bankruptcy, insolvency or other events.
For financial reporting purposes, the Funds do not offset derivative assets and derivative liabilities that are subject to netting arrangements in the Statements of Asset and Liabilities.
At April 30, 2021, the Funds had the following forward foreign currency exchange contracts grouped into appropriate risk categories illustrated below:
First Eagle Global Fund
| | | | | | | Gain or (Loss)
Derivative Recognized
in Income | |
Risk Type | | Asset Derivative
Fair Value(1) | | Liability Derivative
Fair Value(2) | | Net realized
Gains
(Losses)(3) | | Change in
Appreciation
(Depreciation)(4) | |
Foreign currency | | $ | 6,321,006 | | | $ | 2,261,953 | | | $ | (19,979,928 | ) | | $ | 1,894,163 | | |
First Eagle Funds | Semiannual Report | April 30, 2021
172
Notes to Financial Statements
First Eagle Overseas Fund
| | | | | | | Gain or (Loss)
Derivative Recognized
in Income | |
Risk Type | | Asset Derivative
Fair Value(1) | | Liability Derivative
Fair Value(2) | | Net realized
Gains
(Losses)(3) | | Change in
Appreciation
(Depreciation)(4) | |
Foreign currency | | $ | 3,426,644 | | | $ | 1,275,652 | | | $ | (9,267,900 | ) | | $ | 1,043,841 | | |
First Eagle Global Income Builder Fund
| | | | | | | Gain or (Loss)
Derivative Recognized
in Income | |
Risk Type | | Asset Derivative
Fair Value(1) | | Liability Derivative
Fair Value(2) | | Net realized
Gains
(Losses)(3) | | Change in
Appreciation
(Depreciation)(4) | |
Foreign currency | | $ | 232,234 | | | $ | 74,657 | | | $ | (601,078 | ) | | $ | 51,260 | | |
First Eagle High Income Fund
| | | | | | | Gain or (Loss)
Derivative Recognized
in Income | |
Risk Type | | Asset Derivative
Fair Value(1) | | Net realized
Liability Derivative
Fair Value(2) | | Change in
Gains
(Losses)(3) | | Appreciation
(Depreciation)(4) | |
Foreign currency | | $ | — | | | $ | 608 | | | $ | (2,170 | ) | | $ | (1,466 | ) | |
(1) Statement of Assets and Liabilities location: Unrealized appreciation on forward foreign currency exchange contracts.
(2) Statement of Assets and Liabilities location: Unrealized depreciation on forward foreign currency exchange contracts.
(3) Statement of Operations location: Net realized gains (losses) from settlement of forward foreign currency exchange contracts.
(4) Statement of Operations location: Changes in unrealized appreciation (depreciation) of forward foreign currency exchange contracts.
First Eagle Funds | Semiannual Report | April 30, 2021
173
Notes to Financial Statements
The following tables present each Fund's gross derivative assets and liabilities by counterparty net of amounts available for offset under netting arrangements and any related collateral received or pledged by each fund as of April 30, 2021:
First Eagle Global Fund
Counterparty | | Gross Amount
of Assets
Presented in the
Statement of
Assets and
Liabilities | | Derivatives
Available for
Offset | | Collateral
Received* | | Net Amount
(Not Less
Than $0) | |
Goldman Sachs | | $ | 2,568,494 | | | $ | — | | | $ | (2,568,494 | ) | | $ | — | | |
HSBC Bank plc | | | 1,037,407 | | | | — | | | | — | | | | 1,037,407 | | |
JPMorgan Chase Bank | | | 2,715,105 | | | | — | | | | (2,710,000 | ) | | | 5,105 | | |
| | | $ | 6,321,006 | | | $ | — | | | $ | (5,278,494 | ) | | $ | 1,042,512 | | |
Counterparty | | Gross Amount
of Liabilities
Presented in the
Statement of
Assets and
Liabilities | | Derivatives
Available for
Offset | | Collateral
Pledged* | | Net Amount
(Not Less
Than $0) | |
UBS AG | | $ | 2,261,953 | | | $ | — | | | $ | — | | | $ | 2,261,953 | | |
| | | $ | 2,261,953 | | | $ | — | | | $ | — | | | $ | 2,261,953 | | |
First Eagle Overseas Fund
Counterparty | | Gross Amount
of Assets
Presented in the
Statement of
Assets and
Liabilities | | Derivatives
Available for
Offset | | Collateral
Received* | | Net Amount
(Not Less
Than $0) | |
Goldman Sachs | | $ | 1,349,004 | | | $ | — | | | $ | (1,349,004 | ) | | $ | — | | |
HSBC Bank plc | | | 628,008 | | | | — | | | | — | | | | 628,008 | | |
JPMorgan Chase Bank | | | 1,449,632 | | | | — | | | | (1,449,632 | ) | | | — | | |
| | | $ | 3,426,644 | | | $ | — | | | $ | (2,798,636 | ) | | $ | 628,008 | | |
Counterparty | | Gross Amount
of Liabilities
Presented in the
Statement of
Assets and
Liabilities | | Derivatives
Available for
Offset | | Collateral
Pledged* | | Net Amount
(Not Less
Than $0) | |
UBS AG | | $ | 1,275,652 | | | $ | — | | | $ | — | | | $ | 1,275,652 | | |
| | | $ | 1,275,652 | | | $ | — | | | $ | — | | | $ | 1,275,652 | | |
First Eagle Funds | Semiannual Report | April 30, 2021
174
Notes to Financial Statements
First Eagle Global Income Builder Fund
Counterparty | | Gross Amount
of Assets
Presented in the
Statement of
Assets and
Liabilities | | Derivatives
Available for
Offset | | Collateral
Received* | | Net Amount
(Not Less
Than $0) | |
Goldman Sachs | | $ | 93,675 | | | $ | — | | | $ | (50,000 | ) | | $ | 43,675 | | |
HSBC Bank plc | | | 36,814 | | | | — | | | | — | | | | 36,814 | | |
JPMorgan Chase Bank | | | 101,745 | | | | (3,249 | ) | | | (30,000 | ) | | | 68,496 | | |
| | | $ | 232,234 | | | $ | (3,249 | ) | | $ | (80,000 | ) | | $ | 148,985 | | |
Counterparty | | Gross Amount
of Liabilities
Presented in the
Statement of
Assets and
Liabilities | | Derivatives
Available for
Offset | | Collateral
Pledged* | | Net Amount
(Not Less
Than $0) | |
JPMorgan Chase Bank | | $ | 3,249 | | | $ | (3,249 | ) | | $ | — | | | $ | — | | |
UBS AG | | | 71,408 | | | | — | | | | — | | | | 71,408 | | |
| | | $ | 74,657 | | | $ | (3,249 | ) | | $ | — | | | $ | 71,408 | | |
First Eagle High Income Fund
Counterparty | | Gross Amount
of Liabilities
Presented in the
Statement of
Assets and
Liabilities | | Derivatives
Available for
Offset | | Collateral
Received* | | Net Amount
(Not Less
Than $0) | |
JPMorgan Chase Bank | | $ | 608 | | | $ | — | | | $ | — | | | $ | 608 | | |
* The actual collateral received/pledged may be more than the amount reported due to over collateralization.
g) Options — In order to seek to produce incremental earnings or protect against declines in the value of portfolio securities, each Fund may write "covered" call options on portfolio securities. The Funds may also use options for speculative purposes, although they generally do not employ options for this purpose.
Options contracts are valued daily based upon the official closing price on the relevant exchange on which the option is traded. If there is no official closing price, the mean between the last bid and asked prices may be used. When an option is exercised, the proceeds on the sale of a written call option are adjusted by the amount of premium received or paid. When a written option expires, the Funds will realize a gain equal to the amount of the premium received. When the Funds enter into a closing purchase transaction, the Funds will realize a
First Eagle Funds | Semiannual Report | April 30, 2021
175
Notes to Financial Statements
gain (or loss, if the cost of the closing purchase transaction exceeds the premium received when the option was written) without regard to any unrealized gain or loss on the underlying security and the liability related to such option is eliminated.
A Fund may be required to segregate or earmark assets to cover its obligations under option contracts. In general, a call option is covered if the Funds hold, on a share-for-share basis, either the underlying shares or a call on the same security as the call written where the exercise price of the call held is equal to or less than the exercise price of the call written (or greater than the exercise price of the call written if the difference is maintained by the Funds in cash, Treasury bills or other high grade short-term obligations earmarked with its custodian). One reason for writing options is to attempt to realize, through the receipt of premiums, a greater return than would be realized on the securities alone. Another reason for writing options is to hedge against a moderate decline in the value of securities owned by the Funds in the case of a call option. If an increase occurs in the underlying security or stock index sufficient to result in the exercise of a call written by the Funds, it may be required to deliver securities or cash and may thereby forego some or all of the gain that otherwise may have been realized on the securities underlying the call option. This "opportunity cost" may be partially or wholly offset by the premium received for the covered call written by the Funds. The risk in writing a covered call option is that the Funds give up the opportunity for profit if the market price of the underlying security increases and the option is exercised. The Funds also have the additional risk of not being able to enter into a closing transaction if a liquid secondary market does not exist.
The Funds may also write over-the-counter options where the completion of the obligation is dependent upon the credit standing of the counterparty.
As of April 30, 2021, portfolio securities valued at $132,668,068 were earmarked to cover collateral requirements for written options for First Eagle Global Income Builder Fund.
For the six-month period ended April 30, 2021, the average monthly number of contracts outstanding for written options and purchased options held by the Funds were as follows:
| | | First Eagle
Global Income
Builder Fund | | First Eagle
Fund of
America | |
| Options: | |
Average Number of Contracts — Purchased | | | — | | | | 11,787 | | |
Average Number of Contracts — Written | | | 15,661 | | | | 6,447 | | |
First Eagle Funds | Semiannual Report | April 30, 2021
176
Notes to Financial Statements
At April 30, 2021, the Funds had the following options grouped into appropriate risk categories illustrated below:
First Eagle Global Income Builder Fund
| | | | | | | Gain or (Loss)
Derivative Recognized
in Income | |
Risk Type | | Asset Derivative
Fair Value(1) | | Liability Derivative
Fair Value(2) | | Net realized
Gains
(Losses)(3) | | Change in
Appreciation
(Depreciation)(4) | |
Equity — Written options | | $ | — | | | $ | 2,241,554 | | | $ | 1,009,106 | | | $ | (534,431 | ) | |
First Eagle Fund of America
| | | | | | | Gain or (Loss)
Derivative Recognized
in Income | |
Risk Type | | Asset Derivative
Fair Value(1) | | Liability Derivative
Fair Value(2) | | Net realized
Gains
(Losses)(3) | | Change in
Appreciation
(Depreciation)(4) | |
Equity — Written options | | $ | — | | | $ | — | | | $ | (257,843 | ) | | $ | (746,245 | ) | |
Equity — Purchased options | | | — | | | | — | | | | (3,933,449 | ) | | | 2,857,438 | | |
(1) Statements of Assets and Liabilities location: Investments in securities of unaffiliated issuers.
(2) Statements of Assets and Liabilities location: Option contracts written, at value.
(3) Statements of Operations location: Net realized gains (losses) from expiration or closing of option contracts written and transactions in investment securities of unaffiliated issuers.
(4) Statements of Operations location: Changes in unrealized appreciation (depreciation) of option contracts written and investment securities of unaffiliated issuers.
h) Repurchase Agreements — The Funds may enter into repurchase agreement transactions with institutions that meet the Adviser's credit guidelines. Each repurchase agreement is valued at market. The Funds require that the collateral received in a repurchase agreement transaction be transferred to a custodian in a manner sufficient to enable the Funds to obtain collateral in the event of a counterparty default. If the counterparty defaults and the fair value of the collateral declines, realization of the collateral by the Funds may be delayed or limited.
i) Bank Loans — A Fund may invest in bank loans, which usually take the form of loan participations and assignments. Loan participations and assignments are agreements to make money available to U.S. or foreign corporations, partnerships or other business entities (the "Borrower") in a specified amount, at a specified rate and within a specified time. A loan is typically originated, negotiated and structured by a U.S. or foreign bank, insurance company or other financial institution (the "Agent") for a group of loan investors ("Loan Investors"). The Agent typically administers and enforces the loan on behalf of the other Loan Investors in the syndicate and may hold any collateral on behalf of the Loan Investors. Such loan participations and assignments are typically senior, secured and collateralized in nature. A Fund records
First Eagle Funds | Semiannual Report | April 30, 2021
177
Notes to Financial Statements
an investment when the Borrower withdraws money and records interest as earned. The Fund generally has no right to enforce compliance with the terms of the loan agreement with the Borrower. As a result, the Fund assumes the credit risk of the Borrower, the selling participant and any intermediary between the Fund and the Borrower ("Intermediate Participants"). In the event that the Borrower, selling participant or Intermediate Participants becomes insolvent or enters into bankruptcy, each Fund may incur certain costs and delays in realizing payment or may suffer a loss of principal and/or interest.
j) Treasury Inflation-Protected Securities — The Funds may invest in Treasury Inflation-Protected Securities ("TIPS") which are specially structured bonds in which the principal amount is adjusted to keep pace with inflation. The principal value of TIPS will be adjusted upward or downward and any increase or decrease in the principal amount of TIPS will be included as interest income in the Statements of Operations, even though investors do not receive their principal until maturity. TIPS are subject to interest rate risk.
k) Restricted Securities — The Funds may invest in securities that are subject to legal or contractual restrictions on resale. These securities generally may be resold in transactions exempt from registration or to the public if the securities are registered. Disposal of these securities may involve time-consuming negotiations and expenses, and prompt sale at an acceptable price may be difficult. Information regarding restricted securities, if any, is included at the end of each Fund's Schedule of Investments.
l) United States Income Taxes — No provision has been made for U.S. federal income taxes since it is the intention of each Fund to distribute to shareholders all taxable net investment income and net realized gains on investments, if any, within the allowable time limit, and to comply with the provisions of Subchapter M of the Internal Revenue Code applicable to the regulated investment company. The Funds declare and pay such income and capital gains on an annual basis except for the First Eagle High Income Fund and the First Eagle Global Income Builder Fund which declare income daily and pay monthly, and First Eagle Fund of America which distributes income on a quarterly basis.
The Funds adopted provisions surrounding income taxes, which require the tax effects of certain tax positions to be recognized. These tax positions must meet a "more likely than not" standard that, based on their technical merits, have a more than 50% likelihood of being sustained upon examination. Management of the Trust has analyzed the Funds' tax positions taken on federal and state income tax returns for all open tax years (the current and the prior three tax years) and has concluded that no provision for income tax is required in the Funds' financial statements.
m) Class Accounting — Investment income, common expenses and realized/unrealized gain or loss on investments are allocated to the various classes of the Fund on the basis of daily net assets of each class. Fees relating to a specific class are charged directly to that class.
n) Use of Estimates — The preparation of financial statements in conformity with GAAP requires management to make estimates and assumptions that affect the reported amounts of
First Eagle Funds | Semiannual Report | April 30, 2021
178
Notes to Financial Statements
assets and liabilities at the date of the financial statements and the reported amounts of revenues and expenses during the reporting period. Actual results could differ from those estimates.
o) Foreign Taxes — The Funds may be subject to foreign taxes on income, and gains on investments or currency purchases/repatriation, a portion of which may be recoverable. The Funds will accrue such taxes and recoveries as applicable, based upon their current interpretation of tax rules and regulations that exist in the markets in which they invest.
Note 2 — Investment Advisory, Custody and Administration Agreements; Transactions with Related Persons
For its services, the Adviser receives, pursuant to an Investment Advisory Agreement between the Funds and the Adviser (the "Advisory Agreement"), an annual advisory fee as follows:
Fund | | Management Fee
(% of Average Daily Net Assets) | |
First Eagle Global Fund | | | 0.75 | % | |
First Eagle Overseas Fund | | | 0.75 | | |
First Eagle U.S. Value Fund | | | 0.75 | (1) | |
First Eagle Gold Fund | | | 0.75 | | |
First Eagle Global Income Builder Fund | | | 0.75 | | |
First Eagle High Income Fund | | | 0.70 | (2) | |
First Eagle Fund of America | | | 0.50 | (3) | |
(1) The Adviser has agreed to waive First Eagle U.S. Value Fund's management fee at an annual rate in the amount of 0.05% of the average daily value of the Fund's net assets for the period through February 28, 2022. This waiver has the effect of reducing the management fee shown in the table for the term of the waiver from 0.75% to 0.70%.
(2) The Adviser has agreed to waive First Eagle High Income Fund's management fee at an annual rate in the amount of 0.10% of the average daily value of the Fund's net assets for the period through February 28, 2022. This waiver has the effect of reducing the management fee shown in the table for the term of the waiver from 0.70% to 0.60%.
Effective July 1, 2021, the Adviser and the Board of Trustees on behalf of the Fund have agreed to reduce the management fee from the annual rate of 0.70% of the average daily value of the Fund's net assets to the annual rate of 0.45% of the average daily value of the Fund's net assets. This fee reduction supersedes the management fee waiver that had been in effect prior to July 1, 2021.
(3) The Adviser has contractually agreed to waive and/or reimburse certain fees and expenses of Classes A, C, Y, I, R3, R4, R5 and R6 for First Eagle Fund of America so that the total annual operating expenses (excluding interest, taxes, brokerage commissions, acquired fund fees and expenses, dividend and interest expenses relating to short sales, and extraordinary expenses, if any) ("annual operating expenses") of each class are limited to 0.90%, 1.65%, 0.90%, 0.65%, 1.00%, 0.75%, 0.65% and 0.65% of average net assets, respectively. Each of these undertakings lasts until February 28, 2022 and may not be terminated during its term without the consent of the Board of Trustees. First Eagle Fund of America has agreed that each of Classes A, C, Y, I, R3, R4, R5 and R6 will repay the Adviser for fees and expenses waived or reimbursed for the class provided that repayment does not cause annual operating expenses (after the repayment is taken into account) to exceed either: (1) 0.90%, 1.65%, 0.90%, 0.65%, 1.00%, 0.75%, 0.65% and 0.65% of the class' average net assets, respectively; or (2) if applicable, the then-current expense limitations. Any such repayment must be made
First Eagle Funds | Semiannual Report | April 30, 2021
179
Notes to Financial Statements
within three years after the year in which the Adviser incurred the expense. For the six-month period ended April, 30, 2021, FEIM reimbursed $295,712 in expenses which are included under Expense waiver in the Statement of Operations.
For the period ended April 30, 2021, the amounts available for potential future repayment by the Adviser and the expiration schedule are as follows:
| | | | Potential Repayment
Amounts Expiring
October 31, | |
| | Total Eligible
for Recoupment | | 2023 | | 2024 | |
Class A | | $ | 209,281 | | | $ | 52,249 | | | $ | 157,032 | | |
Class C | | | 61,409 | | | | 15,204 | | | | 46,205 | | |
Class I | | | 66,728 | | | | 12,160 | | | | 54,568 | | |
Class Y | | | 59,916 | | | | 23,004 | | | | 36,912 | | |
Class R3 | | | 54 | | | | 11 | | | | 43 | | |
Class R4 | | | 38 | | | | 16 | | | | 22 | | |
Class R5 | | | 55 | | | | 16 | | | | 39 | | |
Class R6 | | | 1,711 | | | | 820 | | | | 891 | | |
Total | | $ | 399,192 | | | $ | 103,480 | | | $ | 295,712 | | |
The Adviser also performs certain administrative, accounting, operations, compliance and other services on behalf of the Funds, and in accordance with its agreement with the Adviser, the Funds (except for First Eagle Global Income Builder Fund and First Eagle High Income Fund which pay the fee described in the next paragraphs) reimburse the Adviser for costs (including personnel and other costs) related to those services. These reimbursements may not exceed an annual rate of 0.05% of a Fund's average daily net assets.
Pursuant to Administrative Services Agreements between each of First Eagle Global Income Builder Fund and First Eagle High Income Fund, and the Adviser, each pay the Adviser a monthly administration fee that is accrued daily at an annual rate of 0.05% of the Fund's average daily net assets.
First Eagle Funds | Semiannual Report | April 30, 2021
180
Notes to Financial Statements
For the six-month period ended April 30, 2021, the Funds paid/reimbursed and had payable to the Adviser amounts shown below:
Fund | | Reimbursed to Adviser | | Payable to Adviser | |
First Eagle Global Fund | | $ | 1,479,001 | | | $ | 826,501 | | |
First Eagle Overseas Fund | | | 483,234 | | | | 270,042 | | |
First Eagle U.S. Value Fund | | | 143,435 | | | | 80,155 | | |
First Eagle Gold Fund | | | 177,529 | | | | 99,207 | | |
First Eagle Global Income Builder Fund | | | 316,312 | | | | 53,870 | | |
First Eagle High Income Fund | | | 60,440 | | | | 9,914 | | |
First Eagle Fund of America | | | 68,492 | | | | 38,275 | | |
The Funds have entered into a custody agreement with J.P. Morgan Chase Bank, N.A. ("JPM"). The custody agreement provides for an annual fee based on the amount of assets under custody plus transaction charges. JPM serves as custodian of the Funds' portfolio securities and other assets. JPM has directly entered into sub-custodial agreements to maintain the custody of gold and silver bullion in the Funds. Under the terms of the custody agreement between the Funds and JPM, JPM maintains and deposits in separate accounts, cash, securities and other assets of the Funds. JPM is also required, upon the order of the Funds, to deliver securities held by JPM and the sub-custodian, and to make payments for securities purchased by the Funds. JPM has also entered into sub-custodian agreements with a number of foreign banks and clearing agencies, pursuant to which portfolio securities purchased outside the United States are maintained in the custody of these entities.
The Funds have also entered into an agreement for administrative services with JPM, pursuant to which JPM provides certain financial reporting and other administrative services. JPM, as the Funds' administrator, receives annual fees separate from and in addition to the fees it receives for its services as the Funds' custodian.
FEF Distributors, LLC, a wholly owned subsidiary of the Adviser, serves as the Funds' principal underwriter. For the six-month period ended April 30, 2021, FEF Distributors, LLC realized $183,242, $17,686, $7,997, $62,600, $4,695, $2,364 and $3,590, pertaining to the sales of shares of First Eagle Global Fund, First Eagle Overseas Fund, First Eagle U.S. Value Fund, First Eagle Gold Fund, First Eagle Global Income Builder Fund, First Eagle High Income Fund and First Eagle Fund of America, respectively.
The Trust adopted a Trustee Deferred Compensation Plan (the "Plan"), which allows the Independent Trustees to defer the receipt of all or a portion of compensation related to performance of their duties as a Trustee. The deferred fees are invested in various First Eagle Funds until distribution in accordance with the Trustee Deferred Compensation Plan. As of April 30, 2021, balances to the Plan are included in the fees payable to the Trustees on the Statements of Assets and Liabilities.
First Eagle Funds | Semiannual Report | April 30, 2021
181
Notes to Financial Statements
Note 3 — Plans of Distribution
Under the terms of the Distribution Plans and Agreements ("the Plans") with FEF Distributors, LLC (the "Distributor"), pursuant to the provisions of Rule 12b-1 under the 1940 Act, the First Eagle Global Fund, First Eagle Overseas Fund, First Eagle U.S. Value Fund, First Eagle Gold Fund, First Eagle Global Income Builder Fund, First Eagle High Income Fund and First Eagle Fund of America pay the Distributor monthly a distribution and/or service fee with respect to Class A, Class C, Class Y, Class R3 and Class R4 shares based on each Fund's average daily net assets as shown in the table below. Under the Plans, the Distributor is obligated to use the amounts received under the Plans for, among other things, payments to qualifying dealers for their assistance in the distribution of a Fund's shares and the provision of shareholder services and for other expenses such as advertising costs and the payment for the printing and distribution of prospectuses to prospective investors.
Fund | | Class A | | Class C | | Class Y | | Class R3 | | Class R4 | |
First Eagle Global Fund | | | 0.25 | % | | | 1.00 | % | | | n/a | | | | 0.35 | % | | | 0.10 | % | |
First Eagle Overseas Fund | | | 0.25 | % | | | 1.00 | % | | | n/a | | | | 0.35 | % | | | 0.10 | % | |
First Eagle U.S. Value Fund | | | 0.25 | % | | | 1.00 | % | | | n/a | | | | 0.35 | % | | | 0.10 | % | |
First Eagle Gold Fund | | | 0.25 | % | | | 1.00 | % | | | n/a | | | | 0.35 | % | | | 0.10 | % | |
First Eagle Global Income Builder Fund | | | 0.25 | % | | | 1.00 | % | | | n/a | | | | 0.35 | % | | | 0.10 | % | |
First Eagle High Income Fund | | | 0.25 | % | | | 1.00 | % | | | n/a | | | | 0.35 | % | | | 0.10 | % | |
First Eagle Fund of America | | | 0.25 | % | | | 1.00 | % | | | 0.25 | % | | | 0.35 | % | | | 0.10 | % | |
The Distributor bears distribution costs of a Fund to the extent they exceed payments received under the Plan. For the six-month period ended April 30, 2021, the distribution fees incurred by the Funds are disclosed in the Statements of Operations.
The Service fee covers expenses incurred by the Distributor for providing shareholder liaison services, including assistance with subscriptions, redemptions and other shareholder questions. For the six-month period ended April 30, 2021, the services fees incurred by the Funds are disclosed in the Statements of Operations.
First Eagle Funds | Semiannual Report | April 30, 2021
182
Notes to Financial Statements
Note 4 — Purchases and Sales of Securities
For the six-month period ended April 30, 2021, purchases and proceeds from sales of investments, excluding short-term securities, were as follows:
Fund | | Purchases
Excluding
U.S. Government
Securities | | Sales and
Maturities
Excluding
U.S. Government
Securities | | Purchases of
U.S. Government
Securities | | Sales and
Maturities of
U.S. Government
Securities | |
First Eagle Global Fund | | $ | 810,573,060 | | | $ | 4,552,186,511 | | | $ | — | | | $ | — | | |
First Eagle Overseas Fund | | | 444,315,133 | | | | 769,000,836 | | | | — | | | | — | | |
First Eagle U.S. Value Fund | | | 20,059,499 | | | | 205,593,342 | | | | — | | | | — | | |
First Eagle Gold Fund | | | 112,910,501 | | | | 32,215,261 | | | | — | | | | — | | |
First Eagle Global Income
Builder Fund | | | 121,033,170 | | | | 190,844,117 | | | | 19,037,201 | | | | 26,514,558 | | |
First Eagle High Income Fund | | | 70,425,095 | | | | 56,450,400 | | | | — | | | | — | | |
First Eagle Fund of America | | | 184,636,432 | | | | 300,077,266 | | | | — | | | | — | | |
Note 5 — Line of Credit
On June 15, 2020, the Funds renewed a $200 million committed, unsecured line of credit ("Credit Facility") with JPM for the First Eagle Funds, to be utilized for temporarily financing the purchase or sale of securities for prompt delivery in the ordinary course of business or for temporarily financing the redemption of shares of each Fund at the request of shareholders and other temporary or emergency purposes. Under the Credit Facility arrangement, each Fund has agreed to pay an upfront fee and annual commitment fee on the unused balance, allocated pro rata, based on the relative asset size of the Funds. A portion of the upfront fee and commitment fees related to the Credit Facility are paid by the Funds and are included in other expenses in the Statements of Operations. During the period, the Funds had no borrowings under the agreement.
Note 6 — Indemnification and Investment Risk
In the normal course of business, the Funds enter into contracts that contain a variety of representations which provide general indemnifications. Each Fund's maximum exposure under these arrangements is unknown, as this would involve future claims that may be made against each Fund that have not yet occurred. However, based on experience, the Funds expect the risk of loss to be remote. The Funds may have elements of risk not typically associated with investments in the United States due to their investments in foreign countries or regions. Such foreign investments may subject the Funds to additional risks resulting from political or economic conditions in such countries or regions and the possible imposition of adverse governmental laws or currency exchange restrictions could cause the securities and their markets to be less liquid and their prices to be more volatile than those of comparable U.S. securities. The securities markets in many emerging-market countries are substantially smaller, less developed, less liquid and more volatile than the securities markets of developed countries.
First Eagle Funds | Semiannual Report | April 30, 2021
183
Notes to Financial Statements
An outbreak of disease caused by a novel coronavirus (also known as "COVID-19") has developed into a global pandemic and resulted in, among other things, closing borders, quarantines, disruptions to supply chains and customer activity, as well as general concern and uncertainty. The impact of COVID-19, and other epidemics and pandemics that may arise in the future, has affected and may continue to affect the economies of many nations, individual companies and the global markets, including their liquidity, in ways that cannot necessarily be foreseen at the present time.
The First Eagle High Income Fund and First Eagle Global Income Builder Fund invest in high yield securities which may be subject to greater levels of interest rate, credit and liquidity risk than investment grade securities. These high yield securities may be considered speculative with respect to the issuer's continuing ability to make principal and interest payments and may be subject to significant price fluctuations.
The Funds are subject to interest rate and credit risk. The value of debt securities may decline as interest rates increase. The Funds could lose money if the issuer of a fixed income security is unable to pay interest or repay principal when it is due. The ability of the issuers of debt to meet their obligations may be affected by the economic and political developments in a specific industry or region.
The Funds enter into derivatives which may represent off-balance sheet risk. Off-balance sheet risk exists when the maximum potential loss on a particular investment is greater than the value of such investment as reflected in the Statements of Assets and Liabilities.
Note 7 — Redemption In-Kind Transactions
The redemption in-kind policy for all of the Funds reserves the right of the Funds to pay redemptions in-kind (i.e., payments in the form of marketable securities or, as needed, other traded assets, rather than cash) if the redemption request is large enough to affect a Fund's operations (for example, if it represents more than $250,000 or 1% of the Fund's assets). When receiving assets distributed in-kind, the recipient will bear applicable commissions or other costs on their sale. There were no redemptions in-kind during the year ended April 30, 2021.
Note 8 — New Accounting Pronouncements and Regulations
In March 2020, the FASB issued ASU 2020-04, which provides optional guidance to ease the potential accounting burden associated with transitioning away from the London Interbank Offered Rate ("LIBOR") and other reference rates that are expected to be discontinued. The ASU is effective immediately upon release of the update on March 12, 2020 through December 31, 2022. At this time, management is evaluating implications of these changes on the financial statements.
Note 9 — Subsequent Events
First Eagle Global Fund, First Eagle Overseas Fund and First Eagle Global Income Builder Fund have received confirmation that a portion of the claims filed pursuant to Article 63 of the Treaty on the Functioning of the European Union (Article 63 EU Tax Reclaims) will be received from the French Tax Authorities along with interest for the time the claims were outstanding. Certain Funds elected to treat foreign source income or foreign withholding taxes paid by the Fund as income
First Eagle Funds | Semiannual Report | April 30, 2021
184
Notes to Financial Statements
taxes earned and paid by the shareholder, which potentially reduced the shareholders U.S. federal income taxes, and will result in an offsetting tax liability to the Funds when they receive a refund of any such foreign taxes. On June 16, 2021, the required accounting entries under U.S. GAAP were processed to the First Eagle Global Fund, First Eagle Overseas Fund and First Eagle Global Income Builder Fund. These accounting entries result in an increase in the net asset value per share of the applicable Fund and positively impacted the Fund's performance. The Article 63 EU Tax Reclaims amounts will be treated as income and may increase distributions to shareholders.
Effective July 1, 2021, FEIM and the Board of Trustees, on behalf of the First Eagle High Income Fund, have agreed to reduce the management fee from the annual rate of 0.70% of the average daily value of the Fund's net assets to the annual rate of 0.45% of the average daily value of the Fund's net assets. This fee reduction also supersedes an earlier management fee waiver that had been in effect prior to July 1, 2021.
First Eagle Funds | Semiannual Report | April 30, 2021
185
Fund Expenses (unaudited)
Example
As a shareholder of the First Eagle Funds, you may incur two types of costs: (1) transaction costs and (2) ongoing costs, including advisory fees; distribution fees (12b-1) and/or service fees; and other Fund expenses. This example is intended to help you understand your ongoing costs (in dollars) of investing in the Fund and to compare these costs with the ongoing costs of investing in other mutual funds.
This example is based on an investment of $1,000 invested on November 1, 2020 and held for the six-months ended April 30, 2021.
Actual Expenses
The table below titled "Based on Actual Total Return" provides information about actual account values and actual expenses. You may use the information provided in this table, together with the amount you invested, to estimate the expenses that you paid over the period. To estimate the expenses you paid on your account, divide your ending account value by $1,000 (for example, an $8,600 ending account value divided by $1,000 = 8.6), then multiply the result by the number under the heading entitled "Expenses Paid During the Period".
First Eagle Funds | Semiannual Report | April 30, 2021
186
Fund Expenses (unaudited)
Based on Actual Total Return(1)
| | | Actual Total
Return Without
Sales Charges(2) | | Beginning
Account
Date Value | | Ending
Account
Value
4/30/21 | | Annualized
Expense | | Expenses
Paid for
the Period(3) | |
First Eagle Global Fund* | |
Class A | | | 22.26 | % | | $ | 1,000 | | | $ | 1,222.60 | | | | 1.10 | % | | $ | 6.06 | | |
Class C | | | 21.80 | | | | 1,000 | | | | 1,218.00 | | | | 1.87 | | | | 10.28 | | |
Class I | | | 22.43 | | | | 1,000 | | | | 1,224.30 | | | | 0.84 | | | | 4.63 | | |
Class R3 | | | 22.09 | | | | 1,000 | | | | 1,220.90 | | | | 1.21 | | | | 6.72 | | |
Class R4 | | | 22.31 | | | | 1,000 | | | | 1,223.10 | | | | 1.01 | | | | 5.57 | | |
Class R5 | | | 21.53 | | | | 1,000 | | | | 1,215.30 | | | | 2.30 | | | | 12.63 | | |
Class R6 | | | 22.45 | | | | 1,000 | | | | 1,224.50 | | | | 0.79 | | | | 4.36 | | |
First Eagle Overseas Fund* | |
Class A | | | 16.08 | | | | 1,000 | | | | 1,160.80 | | | | 1.14 | | | | 6.11 | | |
Class C | | | 15.67 | | | | 1,000 | | | | 1,156.70 | | | | 1.89 | | | | 10.11 | | |
Class I | | | 16.25 | | | | 1,000 | | | | 1,162.50 | | | | 0.86 | | | | 4.61 | | |
Class R3 | | | 16.02 | | | | 1,000 | | | | 1,160.20 | | | | 1.27 | | | | 6.80 | | |
Class R4 | | | 16.24 | | | | 1,000 | | | | 1,162.40 | | | | 0.92 | | | | 4.93 | | |
Class R5 | | | 16.04 | | | | 1,000 | | | | 1,160.40 | | | | 1.28 | | | | 6.86 | | |
Class R6 | | | 16.28 | | | | 1,000 | | | | 1,162.80 | | | | 0.79 | | | | 4.24 | | |
First Eagle U.S. Value Fund* | |
Class A | | | 26.87 | | | | 1,000 | | | | 1,268.70 | | | | 1.12 | | | | 6.30 | | |
Class C | | | 26.39 | | | | 1,000 | | | | 1,263.90 | | | | 1.91 | | | | 10.72 | | |
Class I | | | 27.07 | | | | 1,000 | | | | 1,270.70 | | | | 0.84 | | | | 4.73 | | |
Class R3 | | | 26.74 | | | | 1,000 | | | | 1,267.40 | | | | 1.28 | | | | 7.20 | | |
Class R4 | | | 26.77 | | | | 1,000 | | | | 1,267.70 | | | | 1.23 | | | | 6.92 | | |
Class R5 | | | 26.87 | | | | 1,000 | | | | 1,268.70 | | | | 1.15 | | | | 6.47 | | |
Class R6 | | | 27.13 | | | | 1,000 | | | | 1,271.30 | | | | 0.81 | | | | 4.56 | | |
First Eagle Gold Fund* | |
Class A | | | -7.40 | | | | 1,000 | | | | 926.00 | | | | 1.20 | | | | 5.73 | | |
Class C | | | -7.74 | | | | 1,000 | | | | 922.60 | | | | 1.94 | | | | 9.25 | | |
Class I | | | -7.29 | | | | 1,000 | | | | 927.10 | | | | 0.94 | | | | 4.49 | | |
Class R3 | | | -7.41 | | | | 1,000 | | | | 925.90 | | | | 1.21 | | | | 5.78 | | |
Class R4 | | | -7.27 | | | | 1,000 | | | | 927.30 | | | | 0.95 | | | | 4.54 | | |
Class R5 | | | -7.30 | | | | 1,000 | | | | 927.00 | | | | 1.01 | | | | 4.83 | | |
Class R6 | | | -7.26 | | | | 1,000 | | | | 927.40 | | | | 0.84 | | | | 4.01 | | |
First Eagle Funds | Semiannual Report | April 30, 2021
187
Fund Expenses (unaudited)
Based on Actual Total Return(1)—(continued)
| | | Actual Total
Return Without
Sales Charges(2) | | Beginning
Account
Date Value | | Ending
Account
Value
4/30/21 | | Annualized
Expense | | Expenses
Paid for
the Period(3) | |
First Eagle Global Income Builder Fund | |
Class A | | | 18.47 | % | | $ | 1,000 | | | $ | 1,184.70 | | | | 1.17 | % | | $ | 6.34 | | |
Class C | | | 18.08 | | | | 1,000 | | | | 1,180.80 | | | | 1.94 | | | | 10.49 | | |
Class I | | | 18.66 | | | | 1,000 | | | | 1,186.60 | | | | 0.93 | | | | 5.04 | | |
Class R3 | | | 18.40 | | | | 1,000 | | | | 1,184.00 | | | | 1.37 | | | | 7.42 | | |
Class R4 | | | 18.42 | | | | 1,000 | | | | 1,184.20 | | | | 1.31 | | | | 7.09 | | |
Class R5 | | | 18.48 | | | | 1,000 | | | | 1,184.80 | | | | 1.21 | | | | 6.55 | | |
Class R6 | | | 18.70 | | | | 1,000 | | | | 1,187.00 | | | | 0.88 | | | | 4.77 | | |
First Eagle High Income Fund | |
Class A | | | 3.82 | | | | 1,000 | | | | 1,038.20 | | | | 1.22 | | | | 6.17 | | |
Class C | | | 3.43 | | | | 1,000 | | | | 1,034.30 | | | | 2.00 | | | | 10.09 | | |
Class I | | | 3.96 | | | | 1,000 | | | | 1,039.60 | | | | 0.95 | | | | 4.80 | | |
Class R3 | | | 3.80 | | | | 1,000 | | | | 1,038.00 | | | | 1.25 | | | | 6.32 | | |
Class R4 | | | 3.54 | | | | 1,000 | | | | 1,035.40 | | | | 1.70 | | | | 8.53 | | |
Class R5 | | | 3.80 | | | | 1,000 | | | | 1,038.00 | | | | 1.21 | | | | 6.11 | | |
Class R6 | | | 3.98 | | | | 1,000 | | | | 1,039.80 | | | | 0.92 | | | | 4.65 | | |
First Eagle Fund of America | |
Class A | | | 27.15 | | | | 1,000 | | | | 1,271.50 | | | | 0.90 | | | | 5.07 | | |
Class C | | | 26.64 | | | | 1,000 | | | | 1,266.40 | | | | 1.65 | | | | 9.27 | | |
Class I | | | 27.30 | | | | 1,000 | | | | 1,273.00 | | | | 0.65 | | | | 3.66 | | |
Class Y | | | 27.15 | | | | 1,000 | | | | 1,271.50 | | | | 0.90 | | | | 5.07 | | |
Class R3 | | | 27.05 | | | | 1,000 | | | | 1,270.50 | | | | 0.99 | | | | 5.57 | | |
Class R4 | | | 27.23 | | | | 1,000 | | | | 1,272.30 | | | | 0.75 | | | | 4.23 | | |
Class R5 | | | 27.28 | | | | 1,000 | | | | 1,272.80 | | | | 0.65 | | | | 3.66 | | |
Class R6 | | | 27.34 | | | | 1,000 | | | | 1,273.40 | | | | 0.65 | | | | 3.66 | | |
* Consolidated Financial Statements
(1) For the six-months ended April 30, 2021.
(2) Past performance does not guarantee future results. Assumes reinvestment of all dividends and capital gain distributions, if any, at net asset value. Total return is not annualized, as it may not be representative of the total return for the year.
(3) Expenses are equal to the annualized expense ratio multiplied by the average account value over the period, multiplied by 181/365 (to reflect the one-half year period).
First Eagle Funds | Semiannual Report | April 30, 2021
188
Fund Expenses (unaudited)
Hypothetical Example for Comparison Purposes
The table below titled "Based on Hypothetical Total Return" provides information about hypothetical account values and hypothetical expenses based on the actual expense ratios and an assumed rate of return of 5% per year before expenses, which is not the First Eagle Funds' actual return. The hypothetical account values and expenses may not be used to estimate the actual ending account balance or expenses you paid for the period. You may use the information provided in this table to compare the ongoing costs of investing in the Funds and other funds. To do so, compare the 5% hypothetical example relating to the Fund with the 5% hypothetical examples that appear in the shareholder reports of other funds.
This example is based on an investment of $1,000 invested on November 1, 2020 and held for the six-months ended April 30, 2021.
Please note that the expenses shown in the table below are meant to highlight your ongoing costs only and do not reflect any transactional costs, such as front-end or back-end sales charges (loads). Therefore, the table is useful in comparing ongoing costs only, and will not help you determine the relative total costs of owning different funds. In addition, if these transaction costs were included, your costs would have been higher.
First Eagle Funds | Semiannual Report | April 30, 2021
189
Fund Expenses (unaudited)
Based on Hypothetical Total Return(1)
| | | Hypothetical
Annualized
Total
Return | | Beginning
Account
Date Value | | Ending
Account
Value | | Annualized
Expense | | Expenses
Paid for
the Period(2) | |
First Eagle Global Fund* | |
Class A | | | 5.00 | | | $ | 1,000 | | | $ | 1,019.34 | | | | 1.10 | % | | $ | 5.51 | | |
Class C | | | 5.00 | | | | 1,000 | | | | 1,015.52 | | | | 1.87 | | | | 9.35 | | |
Class I | | | 5.00 | | | | 1,000 | | | | 1,020.63 | | | | 0.84 | | | | 4.21 | | |
Class R3 | | | 5.00 | | | | 1,000 | | | | 1,018.74 | | | | 1.21 | | | | 6.11 | | |
Class R4 | | | 5.00 | | | | 1,000 | | | | 1,019.79 | | | | 1.01 | | | | 5.06 | | |
Class R5 | | | 5.00 | | | | 1,000 | | | | 1,013.39 | | | | 2.30 | | | | 11.48 | | |
Class R6 | | | 5.00 | | | | 1,000 | | | | 1,020.88 | | | | 0.79 | | | | 3.96 | | |
First Eagle Overseas Fund* | |
Class A | | | 5.00 | | | | 1,000 | | | | 1,019.14 | | | | 1.14 | | | | 5.71 | | |
Class C | | | 5.00 | | | | 1,000 | | | | 1,015.42 | | | | 1.89 | | | | 9.44 | | |
Class I | | | 5.00 | | | | 1,000 | | | | 1,020.53 | | | | 0.86 | | | | 4.31 | | |
Class R3 | | | 5.00 | | | | 1,000 | | | | 1,018.50 | | | | 1.27 | | | | 6.36 | | |
Class R4 | | | 5.00 | | | | 1,000 | | | | 1,020.23 | | | | 0.92 | | | | 4.61 | | |
Class R5 | | | 5.00 | | | | 1,000 | | | | 1,018.45 | | | | 1.28 | | | | 6.41 | | |
Class R6 | | | 5.00 | | | | 1,000 | | | | 1,020.88 | | | | 0.79 | | | | 3.96 | | |
First Eagle U.S. Value Fund* | |
Class A | | | 5.00 | | | | 1,000 | | | | 1,019.24 | | | | 1.12 | | | | 5.61 | | |
Class C | | | 5.00 | | | | 1,000 | | | | 1,015.32 | | | | 1.91 | | | | 9.54 | | |
Class I | | | 5.00 | | | | 1,000 | | | | 1,020.63 | | | | 0.84 | | | | 4.21 | | |
Class R3 | | | 5.00 | | | | 1,000 | | | | 1,018.45 | | | | 1.28 | | | | 6.41 | | |
Class R4 | | | 5.00 | | | | 1,000 | | | | 1,018.70 | | | | 1.23 | | | | 6.16 | | |
Class R5 | | | 5.00 | | | | 1,000 | | | | 1,019.09 | | | | 1.15 | | | | 5.76 | | |
Class R6 | | | 5.00 | | | | 1,000 | | | | 1,020.78 | | | | 0.81 | | | | 4.06 | | |
First Eagle Gold Fund* | |
Class A | | | 5.00 | | | | 1,000 | | | | 1,018.84 | | | | 1.20 | | | | 6.01 | | |
Class C | | | 5.00 | | | | 1,000 | | | | 1,015.17 | | | | 1.94 | | | | 9.69 | | |
Class I | | | 5.00 | | | | 1,000 | | | | 1,020.13 | | | | 0.94 | | | | 4.71 | | |
Class R3 | | | 5.00 | | | | 1,000 | | | | 1,018.79 | | | | 1.21 | | | | 6.06 | | |
Class R4 | | | 5.00 | | | | 1,000 | | | | 1,020.08 | | | | 0.95 | | | | 4.76 | | |
Class R5 | | | 5.00 | | | | 1,000 | | | | 1,019.79 | | | | 1.01 | | | | 5.06 | | |
Class R6 | | | 5.00 | | | | 1,000 | | | | 1,020.63 | | | | 0.84 | | | | 4.21 | | |
First Eagle Funds | Semiannual Report | April 30, 2021
190
Fund Expenses (unaudited)
Based on Hypothetical Total Return(1)—(continued)
| | | Hypothetical
Annualized
Total
Return | | Beginning
Account
Date Value | | Ending
Account
Value | | Annualized
Expense | | Expenses
Paid for
the Period(2) | |
First Eagle Global Income Builder Fund | |
Class A | | | 5.00 | | | $ | 1,000 | | | $ | 1,018.99 | | | | 1.17 | % | | $ | 5.86 | | |
Class C | | | 5.00 | | | | 1,000 | | | | 1,015.17 | | | | 1.94 | | | | 9.69 | | |
Class I | | | 5.00 | | | | 1,000 | | | | 1,020.18 | | | | 0.93 | | | | 4.66 | | |
Class R3 | | | 5.00 | | | | 1,000 | | | | 1,018.00 | | | | 1.37 | | | | 6.85 | | |
Class R4 | | | 5.00 | | | | 1,000 | | | | 1,018.30 | | | | 1.31 | | | | 6.56 | | |
Class R5 | | | 5.00 | | | | 1,000 | | | | 1,018.79 | | | | 1.21 | | | | 6.06 | | |
Class R6 | | | 5.00 | | | | 1,000 | | | | 1,020.43 | | | | 0.88 | | | | 4.41 | | |
First Eagle High Income Fund | |
Class A | | | 5.00 | | | | 1,000 | | | | 1,018.74 | | | | 1.22 | | | | 6.11 | | |
Class C | | | 5.00 | | | | 1,000 | | | | 1,014.88 | | | | 2.00 | | | | 9.99 | | |
Class I | | | 5.00 | | | | 1,000 | | | | 1,020.08 | | | | 0.95 | | | | 4.76 | | |
Class R3 | | | 5.00 | | | | 1,000 | | | | 1,018.60 | | | | 1.25 | | | | 6.26 | | |
Class R4 | | | 5.00 | | | | 1,000 | | | | 1,016.41 | | | | 1.70 | | | | 8.45 | | |
Class R5 | | | 5.00 | | | | 1,000 | | | | 1,018.79 | | | | 1.21 | | | | 6.06 | | |
Class R6 | | | 5.00 | | | | 1,000 | | | | 1,020.23 | | | | 0.92 | | | | 4.61 | | |
First Eagle Fund of America | |
Class A | | | 5.00 | | | | 1,000 | | | | 1,020.33 | | | | 0.90 | | | | 4.51 | | |
Class C | | | 5.00 | | | | 1,000 | | | | 1,016.61 | | | | 1.65 | | | | 8.25 | | |
Class I | | | 5.00 | | | | 1,000 | | | | 1,021.57 | | | | 0.65 | | | | 3.26 | | |
Class Y | | | 5.00 | | | | 1,000 | | | | 1,020.33 | | | | 0.90 | | | | 4.51 | | |
Class R3 | | | 5.00 | | | | 1,000 | | | | 1,019.59 | | | | 0.99 | | | | 5.26 | | |
Class R4 | | | 5.00 | | | | 1,000 | | | | 1,021.08 | | | | 0.75 | | | | 3.76 | | |
Class R5 | | | 5.00 | | | | 1,000 | | | | 1,021.57 | | | | 0.65 | | | | 3.26 | | |
Class R6 | | | 5.00 | | | | 1,000 | | | | 1,021.57 | | | | 0.65 | | | | 3.26 | | |
* Consolidated Financial Statements
(1) For the six-months ended April 30, 2021.
(2) Expenses are equal to the annualized expense ratio multiplied by the average account value over the period, multiplied by 181/365 (to reflect the one-half year period).
First Eagle Funds | Semiannual Report | April 30, 2021
191
Form N-PORT portfolio schedule
The First Eagle Funds file their complete schedule of portfolio holdings with the Securities and Exchange Commission ("SEC") for the first and third quarters of each fiscal year as an exhibit to its reports on Form N-PORT. The Funds' Form N-PORT is available on the SEC's Web site at www.sec.gov. Additionally, you may obtain copies of Form N-PORT from the Fund upon request by calling 1.800.334.2143.
Proxy voting policies, procedures and record
You may obtain (1) a description of the Funds' proxy voting policies, (2) a description of the Funds' proxy voting procedures and (3) information regarding how the Funds voted any proxies related to portfolio securities during the most recent twelve-month period ended June 30 for which an SEC filing has been made, without charge, upon request by contacting the Funds directly at 1.800.334.2143 or on the EDGAR Database on the SEC's Web site at www.sec.gov.
First Eagle Funds | Semiannual Report | April 30, 2021
192
Trustees
Lisa Anderson
John P. Arnhold
Candace K. Beinecke (Chair)
Peter Davidson
Jean D. Hamilton
James E. Jordan
William M. Kelly
Paul J. Lawler
Mehdi Mahmud
Trustee Emeritus
Jean-Marie Eveillard*
Officers
Mehdi Mahmud
President
Robert Bruno
Senior Vice President
Joseph T. Malone
Chief Financial Officer
Albert Pisano
Chief Compliance Officer
David O'Connor
General Counsel
Sheelyn Michael
Secretary & Deputy General Counsel
Tricia Larkin
Treasurer
Michael Luzzatto
Vice President
Thomas Meyer
Assistant Treasurer
Investment Adviser
First Eagle Investment Management, LLC
1345 Avenue of the Americas
New York, NY 10105
Legal Counsel
Sidley Austin LLP
787 Seventh Avenue
New York, NY 10019
Custodian
JPMorgan Chase Bank, N.A.
4 Chase Metrotech Center, Floor 16,
Brooklyn, NY 11245
Shareholder Servicing Agent
DST Systems, Inc.
330 West 9th Street
Kansas City, MO 64105
800.334.2143
Underwriter
FEF Distributors, LLC
1345 Avenue of the Americas
New York, NY 10105
Independent Registered Public
Accounting Firm
PricewaterhouseCoopers LLP
300 Madison Avenue
New York, NY 10017
Additional information about the Trustees and Officers is included in the Funds' Statement of Additional Information.
* Mr. Eveillard is a former member of the Board of Trustees and is invited to attend all Board meetings. He is not a Trustee for purposes of the Trust's Declaration of Trust, Delaware law or the Investment Company Act.
This report is not authorized for distribution to prospective investors unless preceded or accompanied by a currently effective prospectus of First Eagle Funds.
First Eagle Funds | Semiannual Report | April 30, 2021
193


First Eagle Investment Management, LLC
1345 Avenue of the Americas, New York, NY 10105-0048
800.334.2143 www.feim.com
Item 2. Code of Ethics.
The Registrant has adopted a code of ethics that applies to its principal executive officer and principal financial officer. Copies of the code of ethics may be requested free of charge by calling 1-800-334-2143 (toll free).
Item 3. Audit Committee Financial Expert.
Not applicable to this semiannual report.
Item 4. Principal Accountant Fees and Services
Not applicable to this semiannual report.
Item 5. Audit Committee of Listed Registrants
Not applicable at this time.
Item 6. Schedule of Investments
Please see schedule of investments contained in the Report to Stockholders included under Item 1 of this Form N-CSR.
Item 7. Disclosure of Proxy Voting Policies and Procedures for Closed-End Management Investment Companies.
Not applicable.
Item 8. Portfolio Managers of Closed-End Investment companies.
Not applicable.
Item 9. Purchases of Equity Securities by Closed-End Management Investment Company and Affiliated Purchasers.
Not applicable.
Item 10. Submission of Matters to a Vote of Security Holders.
No material change to report at this time.
Item 11. Controls and Procedures.
(a) In the opinion of the principal executive officer and principal financial officer, based on their evaluation, the registrant's disclosure controls and procedures are adequately designed and are operating effectively to ensure (i) that material information relating to the registrant, including its consolidated subsidiaries, is made known to them by others within those entities, particularly during the period in which this report is being prepared; and (ii) that information required to be disclosed by the registrant on Form N-CSR is recorded, processed, summarized and reported within the time periods specified in the Securities and Exchange Commission's rules and forms.
(b) There were no changes in the registrant's internal control over financial reporting that occurred during the registrant's most recent fiscal half-year (the registrant's second fiscal half-year in the case of an annual report) that have materially affected or are reasonably likely to materially affect, the registrant's internal control over financial reporting.
Item 12. Disclosure of Securities Lending Activities for Closed End Management Investment Companies
(a)(1) Not applicable to this semiannual report.
Item 13. Exhibits.
(a)(1) Code of ethics required to be disclosed under Item 2 of Form N-CSR.
(a)(2) Certifications pursuant to Rule 30a-2(a) under the Investment Company Act of 1940 (17 CFR 270.30a-2(a)): Attached hereto.
(a)(3) Not applicable.
(b) Certification pursuant to Rule 30a-2(b) under the Investment Company Act of 1940 (17 CFR 270.30a-2(b)): Attached hereto.
SIGNATURES
Pursuant to the requirements of the Securities Exchange Act of 1934 and the Investment Company Act of 1940, the registrant has duly caused this report to be signed on its behalf by the undersigned, thereunto duly authorized.
| (Registrant) | | First Eagle Funds |
By (Signature and Title)* | |
/s/ Mehdi Mahmud |
| | | |
| | | Mehdi Mahmud, President |
Date: July 6, 2021
Pursuant to the requirements of the Securities Exchange Act of 1934 and the Investment Company Act of 1940, this report has been signed below by the following persons on behalf of the registrant and in the capacities and on the dates indicated.
By (Signature and Title)* | |
/s/ Mehdi Mahmud |
| | | |
| | | Mehdi Mahmud, Principal Executive Officer |
Date: July 6, 2021
By (Signature and Title)* | |
/s/ Joseph T. Malone |
| | | |
| | | Joseph T. Malone, Principal Financial Officer |
Date: July 6, 2021
* Print the name and title of each signing officer under his or her signature.