UNITED STATES
SECURITIES AND EXCHANGE COMMISSION
Washington, D.C. 20549
FORM N-CSR
CERTIFIED SHAREHOLDER REPORT OF REGISTERED
MANAGEMENT INVESTMENT COMPANIES
Investment Company Act file number | 811-7762 |
|
First Eagle Funds |
(Exact name of registrant as specified in charter) |
|
1345 Avenue of the Americas
New York, NY | | 10105 |
(Address of principal executive offices) | | (Zip code) |
|
Suzan Afifi
First Eagle Funds
1345 Avenue of the Americas
New York, NY 10105 |
(Name and address of agent for service) |
|
Registrant’s telephone number, including area code: | 1-212-632-2700 | |
|
Date of fiscal year end: | October 31 | |
|
Date of reporting period: | April 30, 2018 | |
| | | | | | | | |
Form N-CSR is to be used by management investment companies to file reports with the Commission not later than 10 days after the transmission to stockholders of any report that is required to be transmitted to stockholders under Rule 30e-1 under the Investment Company Act of 1940 (17 CFR 270.30e-1). The Commission may use the information provided on Form N-CSR in its regulatory, disclosure review, inspection, and policymaking roles.
A registrant is required to disclose the information specified by Form N-CSR, and the Commission will make this information public. A registrant is not required to respond to the collection of information contained in Form N-CSR unless the Form displays a currently valid Office of Management and Budget (“OMB”) control number. Please direct comments concerning the accuracy of the information collection burden estimate and any suggestions for reducing the burden to Secretary, Securities and Exchange Commission, 450 Fifth Street, NW, Washington, DC 20549-0609. The OMB has reviewed this collection of information under the clearance requirements of 44 U.S.C. § 3507.
Item 1. Reports to Stockholders.

First Eagle Global Fund
First Eagle Overseas Fund
First Eagle U.S. Value Fund
First Eagle Gold Fund
First Eagle Global Income Builder Fund
First Eagle High Yield Fund
First Eagle Fund of America

Advised by First Eagle Investment Management, LLC
Forward-Looking Statement Disclosure
One of our most important responsibilities as mutual fund managers is to communicate with shareholders in an open and direct manner. Some of our comments in our letters to shareholders are based on current management expectations and are considered "forward-looking statements". Actual future results, however, may prove to be different from our expectations. You can identify forward-looking statements by words such as "may", "will", "believe", "attempt", "seem", "think", "ought", "try" and other similar terms. We cannot promise future returns. Our opinions are a reflection of our best judgment at the time this report is compiled, and we disclaim any obligation to update or alter forward-looking statements as a result of new information, future events, or otherwise.
First Eagle Funds | Semi-Annual Report | April 30, 2018
2
Table of Contents
Letter from the President | | | 4 | | |
Management's Discussion of Fund Performance | | | 6 | | |
Performance Chart | | | 11 | | |
First Eagle Global Fund: | |
Fund Overview | | | 18 | | |
Consolidated Schedule of Investments | | | 20 | | |
First Eagle Overseas Fund: | |
Fund Overview | | | 38 | | |
Consolidated Schedule of Investments | | | 40 | | |
First Eagle U.S. Value Fund: | |
Fund Overview | | | 56 | | |
Consolidated Schedule of Investments | | | 58 | | |
First Eagle Gold Fund: | |
Fund Overview | | | 66 | | |
Consolidated Schedule of Investments | | | 68 | | |
First Eagle Global Income Builder Fund: | |
Fund Overview | | | 72 | | |
Schedule of Investments | | | 74 | | |
First Eagle High Yield Fund: | |
Fund Overview | | | 88 | | |
Schedule of Investments | | | 90 | | |
First Eagle Fund of America: | |
Fund Overview | | | 98 | | |
Schedule of Investments | | | 100 | | |
Statements of Assets and Liabilities | | | 106 | | |
Statements of Operations | | | 114 | | |
Statements of Changes in Net Assets | | | 118 | | |
Financial Highlights | | | 130 | | |
Notes to Financial Statements | | | 146 | | |
Fund Expenses | | | 173 | | |
General Information | | | 179 | | |
First Eagle Funds | Semi-Annual Report | April 30, 2018
3
Letter from the President

Dear Fellow Shareholders,
When I wrote six months ago, investment markets were generally buoyant and the CBOE Volatility Index (VIX) had progressively reached record lows over the course of 2017. This pattern continued into January 2018 but changed abruptly in February, and 2018 has been marked by market swings of wider amplitude than investors have been used to in recent months. Although volatility only reverted to levels consistent with history, the impact on investor sentiment was dramatic when it happened—an indication, I believe, of just how sanguine investors have been.
Although an economic crisis may not be imminent, we have to question the widespread assumption that synchronized global economic growth will continue into the indefinite future and at a sufficient pace to justify current valuations. There is ample evidence to the contrary. Economic activity in the eurozone appears to be slowing despite maximally stimulative monetary policy. Equity and fixed income asset prices have softened in emerging markets coincident with a strengthening of the US dollar—a development that may indicate greater fragility in these economies than investors generally recognize.
In the United States, economic growth has been reasonable in our view, but it has taken unprecedented levels of monetary and fiscal stimulus to get there. US labor markets are tight, but the majority of workers are spending more than they are earning, i.e., they have a negative savings rate, which is unsustainable. At whatever pace the Federal Reserve ("Fed") unwinds quantitative easing and normalizes interest rates, we are entering a period where the pressure on rates appears higher rather than lower. It is difficult to imagine benign markets and further appreciation in asset valuations as the stimulus fades.
In addition, geopolitical events during the November-April period reinforced our sense that risks are elevated. Most striking to us was the Chinese government's decision in March to abolish presidential term limits. We are inclined to interpret this as a sign that China's leaders believe their country needs strong centralized authority to address daunting economic and other challenges in the years ahead. We have serious concerns about debt levels not just in China but around the world. Meanwhile, Italy's general election, also in March, brought to the fore populist candidates who
First Eagle Funds | Semi-Annual Report | April 30, 2018
4
Letter from the President
want to rewrite the EU's policies on monetary union and immigration. These developments, among others, convince us that this remains a time for prudence, and we believe that our teams and products are positioned appropriately.
Global Value Team
The Global Value team maintained a cautious posture, holding approximately 30% of the Global, Overseas and U.S. Value funds in cash, cash equivalents, bonds, gold and gold-related investments, and 12% of the Global Income Builder Fund in cash, cash equivalents and gold. In the volatile markets of March and April, some share prices fell to attractive levels, and the team was able to enlarge existing positions in companies in diverse sectors, including consumer staples, consumer discretionary, health care, real estate, energy and materials.
High Yield Team
Like the equity market, the fixed-income market saw a resurgence of volatility during this period. Yields of ten-year Treasuries rose (and prices fell) as the market began to transition to more normal monetary policy from a period of unprecedented accommodation. The high yield team continued its efforts to minimize exposure to risks for which the market was not providing adequate compensation. It kept duration short and emphasized bonds that were relatively high in credit quality, including a sizable allocation to investment-grade bonds. It avoided smaller issues that could, potentially, be subject to liquidity constraints. It also maintained a substantial allocation to cash.
Fund of America Team
In an environment changed by the removal of Fed accommodation, a lack of spare capacity due to full employment and a reassessment of trading relationships with leading counterparties, the Fund of America team reminded itself that the market climbs a wall of worry. It focused on areas where it expected change catalysts to be robust, such as stories of management change or impending spinoffs. It also sought companies that could deploy a large amount of financial self-help to take advantage of market volatility.
Thank you for your confidence in our stewardship of your assets.
Sincerely,
Mehdi Mahmud
President
June 2018
First Eagle Funds | Semi-Annual Report | April 30, 2018
5
Management's Discussion of Fund Performance*
First Eagle Global Fund
The net asset value ("NAV") of the Fund's Class A shares increased 1.16% for the six months ending April 30, 2018 while the MSCI World Index increased 3.40%. The Fund's cash and cash equivalents position was 18.0% as of April 30, 2018.
The five largest contributors to the performance of First Eagle Global Fund over the period were Microsoft Corp. (software, US), gold bullion, ConocoPhillips (oil, gas & consumable fuels, US), TechnipFMC plc (energy equipment & services, UK), Teradata Corp. (IT services, US) collectively accounting for 1.04% points of this period's performance.
The five largest detractors were Oracle Corp. (software, US), 3M Co. (industrial conglomerates, US), Comcast Corp. (media, US), Nutrien Ltd. (chemicals, Canada) and Sanofi (pharmaceuticals, France). Their combined negative performance over the six months subtracted 0.83% points from performance.
First Eagle Overseas Fund
The NAV of the Fund's Class A shares increased 0.45% for the six months ending April 30, 2018 while the MSCI EAFE Index increased 3.41%. The Fund's cash and cash equivalents position was 17.5% as of April 30, 2018.
The five largest contributors to the performance of First Eagle Overseas Fund over the period were TechnipFMC plc (energy equipment & services, UK), gold bullion, Haw Par Corp. Ltd. (pharmaceuticals, Singapore), Keyence Corp. (electronic equipment, instruments & components, Japan) and Robertet SA (chemicals, France) collectively accounting for 1.14% points of this period's performance.
The five largest detractors were Nutrien Ltd. (chemicals, Canada), Sanofi (pharmaceuticals, France), Sodexo SA (hotels, restaurants & leisure, France), FANUC Corp. (machinery, Japan) and Grupo Televisa (media, Mexico). Their combined negative performance over the six months subtracted 1.00% points from performance.
First Eagle U.S. Value Fund
The NAV of the Fund's Class A shares increased 2.77% for the six months ending April 30, 2018 while the S&P 500 Index increased 3.82%. The Fund's cash and cash equivalents position was 16.8% as of April 30, 2018.
* Performance information for Class A Shares is without the effect of sales charges and assumes all distributions have been reinvested. If a sales charge was included values would be lower.
First Eagle Funds | Semi-Annual Report | April 30, 2018
6
Management's Discussion of Fund Performance
The five largest contributors to the performance of First Eagle U.S. Value Fund over the period were Microsoft Corp. (software, US), Teradata Corp. (IT services, US), gold bullion, ConocoPhillips (oil, gas & consumable fuels, US) and Union Pacific Corp. (road & rail, US) collectively accounting for 1.80% points of this period's performance.
The five largest detractors were Oracle Corp. (software, US), Comcast Corp. (media, US), 3M Co. (industrial conglomerates, US), Nutrien Ltd. (chemicals, Canada), Xilinx, Inc. (semiconductors & semiconductor equipment, US). Their combined negative performance subtracted 1.37% points from performance.
First Eagle Gold Fund
The NAV of the Fund's Class A shares decreased 3.52% for the six months ending April 30, 2018 while the FTSE Gold Mines Index decreased 0.82%. The Fund's cash and cash equivalents position was 1.7% as of April 30, 2018.
The five largest contributors to the performance of First Eagle Gold Fund over the period were gold bullion, Newmont Mining Corp. (metals & mining, US), Royal Gold, Inc. (metals & mining, US), Novagold Resources Inc. (metals & mining, Canada) and B2Gold Corp. (metals & mining, Canada) collectively accounting for 1.89% points of this period's performance.
The five largest detractors were Detour Gold Corp. (metals & mining, Canada), Osisko Gold Royalties Ltd. (metals & mining, Canada), New Gold, Inc. (metals & mining, Canada), Randgold Resources Ltd. (metals & mining, Africa) and Newcrest Mining Ltd. (metals & mining, Australia). Their combined negative performance subtracted 4.02% points from performance.
First Eagle Global Income Builder Fund
The NAV of the Fund's Class A shares increased 0.59% for the six months ending April 30, 2018 while the composite index1 increased 1.34%. The Bloomberg Barclays US Aggregate Bond Index decreased 1.87% while the MSCI World Index increased 3.40%. The Fund's cash and cash equivalents position was 5.5% as of April 30, 2018.
The five largest contributors to the performance of First Eagle Global Income Builder Fund over the period were Microsoft Corp. (software, US), ConocoPhillips (oil, gas & consumable fuels, US), GlaxoSmithKline plc (pharmaceuticals, UK), Berkeley Group Holdings plc (household durables, UK) and gold bullion collectively accounting for 0.84% points of this period's performance.
1 The composite index consists of 60% of the MSCI World Index and 40% of the Bloomberg Barclays U.S. Aggregate Bond Index.
First Eagle Funds | Semi-Annual Report | April 30, 2018
7
Management's Discussion of Fund Performance
The five largest detractors were Sanofi (pharmaceuticals, France), Nutrien Ltd. (chemicals, Canada), British American Tobacco plc (tobacco, UK), 3M Co. (industrial conglomerates, US), Sodexo SA (hotels, restaurants & leisure, France). Their combined negative performance subtracted 0.71% points from performance.
First Eagle High Yield Fund
The NAV of the Fund's Class I shares increased 1.22% for the six months ending April 30, 2018 while the Bloomberg Barclays U.S. Corporate High Yield Index decreased 0.17%. The Fund's cash and cash equivalents position was 6.1% as of April 30, 2018.
The five largest contributors to the performance of First Eagle High Yield Fund over the period were BI-LO LLC 8.63% due 09/15/2018 (food & staples retailing, US), EnQuest plc 7.00% due 04/15/2022 (oil, gas & consumable fuels, UK), BI-LO LLC 9.25% due 02/15/2019 (food & staples retailing, US), California Resources Corp. 8.00% due 12/15/2022 (oil, gas & consumable fuels, US) and Caelus Energy Alaska LLC Term Loan 8.82% due 04/15/2020 (oil, gas & consumable fuels, US) collectively accounting for 2.51% points of this period's performance.
The five largest detractors were Jupiter Resources, Inc. 8.50% due 10/01/2022 (oil, gas & consumable fuels, US), Ultra Resources, Inc. 7.13% due 04/15/2025 (oil, gas & consumable fuels, US), Payless LLC (specialty retail, US), B&G Foods, Inc. 5.25% due 04/01/2025 (food products, US), Virgin Media Secured Finance plc 5.50% due 01/15/2025 (diversified telecommunication services, US). Their combined negative performance subtracted 0.64% points from performance.
First Eagle Fund of America
The NAV of the Fund's Class A shares decreased 1.12% for the six months ending April 30, 2018 while the S&P 500 Index increased 3.82%. The Fund's cash and cash equivalents position was 1.0% as of April 30, 2018.
The five largest contributors to the performance of Fund of America over the period were KLX, Inc. (aerospace & defense, US), Marathon Petroleum Corp. (oil, gas & consumable fuels, US), Halozyme Therapeutics, Inc. (biotechnology, US), Chipotle Mexican Grill, Inc. (hotels, restaurants & leisure, US) and La Quinta Holdings, Inc. (hotels, restaurants & leisure, US) collectively accounting for 2.88% points of this period's performance.
The five largest detractors were Albemarle Corp. (chemicals, US), Adient plc (auto components, US), Martin Marietta Materials, Inc. (construction materials, US), Olin Corp. (chemicals, US) and Western Digital Corp. (technology hardware, storage & peripherals, US). Their combined negative performance subtracted 3.00% points from performance.
First Eagle Funds | Semi-Annual Report | April 30, 2018
8
Management's Discussion of Fund Performance

| | 
| |
Matthew McLennan
Head of the Global Value Team
Portfolio Manager
Global, Overseas,
U.S. Value and Gold Funds | | T. Kimball Brooker, Jr.
Portfolio Manager
Global, Overseas,
U.S. Value and
Global Income Builder Funds | |
 | | 
| |
Matt Lamphier
Portfolio Manager
U.S. Value Fund
| | Edward Meigs
Portfolio Manager
Global Income Builder and
High Yield Funds | |

| | 
| |
Sean Slein
Portfolio Manager
Global Income Builder and
High Yield Funds | | Thomas Kertsos
Portfolio Manager
Gold Fund
| |

| | 
| |
Harold Levy
Portfolio Manager
Fund of America | | Eric Stone
Portfolio Manager
Fund of America | |

| | | |
Lukasz Thieme
Portfolio Manager
Fund of America | | | |
June 2018 | | | |
First Eagle Funds | Semi-Annual Report | April 30, 2018
9
Management's Discussion of Fund Performance
The performance data quoted herein represents past performance and does not guarantee future results. Market volatility can dramatically impact a fund's short-term performance. Current performance may be lower or higher than figures shown. The investment return and principal value will fluctuate so that an investor's shares, when redeemed, may be worth more or less than their original cost. Past performance data through the most recent month end is available at feim.com or by calling 800.334.2143.
The commentary represents the opinion of Mehdi Mahmud and the Portfolio Management Teams as of June 2018 and is subject to change based on market and other conditions. These materials are provided for informational purposes only. These opinions are not intended to be a forecast of future events, a guarantee of future results, or investment advice. The views expressed herein may change at any time subsequent to the date of issue hereof. The information provided is not to be construed as a recommendation or an offer to buy or sell or the solicitation of an offer to buy or sell any fund or security.
First Eagle Funds | Semi-Annual Report | April 30, 2018
10
Performance Chart1 (unaudited)
| | | One-
Year | | Three-
Years | | Five-
Years | | Ten-
Years | | Since
Inception | | Inception Date | |
First Eagle Global Fund | |
Class A (SGENX)
without sales charge | | | 6.74 | % | | | 5.85 | % | | | 6.55 | % | | | 6.38 | % | | | 13.15 | % | | 01/01/792 | |
with sales charge | | | 1.39 | % | | | 4.05 | % | | | 5.46 | % | | | 5.84 | % | | | 13.04 | % | | 01/01/792 | |
| Class C (FESGX) | | | 4.94 | % | | | 5.06 | % | | | 5.75 | % | | | 5.59 | % | | | 9.87 | % | | 06/05/00 | |
| Class I (SGIIX) | | | 7.00 | % | | | 6.13 | % | | | 6.82 | % | | | 6.65 | % | | | 10.72 | % | | 07/31/98 | |
| Class R4 (EAGRX) | | | — | | | | — | | | | — | | | | — | | | | -4.30 | % | | 01/17/18 | |
| Class R6 (FEGRX) | | | 7.08 | % | | | — | | | | — | | | | — | | | | 6.50 | % | | 03/01/17 | |
MSCI World Index3 | | | 13.22 | % | | | 7.55 | % | | | 9.28 | % | | | 5.48 | % | | | 9.67 | % | | 01/01/79 | |
First Eagle Overseas Fund4 | |
Class A (SGOVX)
without sales charge | | | 5.88 | % | | | 4.20 | % | | | 4.99 | % | | | 5.06 | % | | | 10.51 | % | | 08/31/93 | |
with sales charge | | | 0.60 | % | | | 2.44 | % | | | 3.92 | % | | | 4.53 | % | | | 10.34 | % | | 08/31/93 | |
| Class C (FESOX) | | | 4.11 | % | | | 3.42 | % | | | 4.22 | % | | | 4.28 | % | | | 9.23 | % | | 06/05/00 | |
| Class I (SGOIX) | | | 6.15 | % | | | 4.48 | % | | | 5.28 | % | | | 5.33 | % | | | 10.51 | % | | 07/31/98 | |
| Class R4 (FIORX) | | | — | | | | — | | | | — | | | | — | | | | -3.86 | % | | 01/17/18 | |
| Class R6 (FEORX) | | | 6.26 | % | | | — | | | | — | | | | — | | | | 7.46 | % | | 03/01/17 | |
MSCI EAFE Index5 | | | 14.51 | % | | | 4.94 | % | | | 5.90 | % | | | 2.43 | % | | | 5.30 | % | | 08/31/93 | |
First Eagle U.S. Value Fund | |
Class A (FEVAX)
without sales charge | | | 8.54 | % | | | 6.91 | % | | | 7.81 | % | | | 6.94 | % | | | 8.99 | % | | 09/04/01 | |
with sales charge | | | 3.11 | % | | | 5.10 | % | | | 6.71 | % | | | 6.39 | % | | | 8.65 | % | | 09/04/01 | |
| Class C (FEVCX) | | | 6.78 | % | | | 6.11 | % | | | 7.00 | % | | | 6.15 | % | | | 8.17 | % | | 09/04/01 | |
| Class I (FEVIX) | | | 8.84 | % | | | 7.20 | % | | | 8.10 | % | | | 7.22 | % | | | 9.26 | % | | 09/04/01 | |
| Class R6 (FEVRX) | | | 8.83 | % | | | — | | | | — | | | | — | | | | 6.55 | % | | 03/01/17 | |
S&P 500 Index6 | | | 13.27 | % | | | 10.57 | % | | | 12.96 | % | | | 9.02 | % | | | 7.35 | % | | 09/04/01 | |
First Eagle Funds | Semi-Annual Report | April 30, 2018
11
Performance Chart (unaudited)
| | | One-
Year | | Three-
Years | | Five-
Years | | Ten-
Years | | Since
Inception | | Inception Date | |
First Eagle Gold Fund | |
Class A (SGGDX)
without sales charge | | | -5.80 | % | | | 2.12 | % | | | -4.20 | % | | | -2.38 | % | | | 4.95 | % | | 08/31/93 | |
with sales charge | | | -10.51 | % | | | 0.38 | % | | | -5.18 | % | | | -2.88 | % | | | 4.79 | % | | 08/31/93 | |
| Class C (FEGOX) | | | -7.45 | % | | | 1.30 | % | | | -4.95 | % | | | -3.13 | % | | | 4.12 | % | | 05/15/03 | |
| Class I (FEGIX) | | | -5.55 | % | | | 2.42 | % | | | -3.94 | % | | | -2.13 | % | | | 5.18 | % | | 05/15/03 | |
| Class R6 (FEURX) | | | -5.44 | % | | | — | | | | — | | | | — | | | | -6.13 | % | | 03/01/17 | |
FTSE Gold
Mines Index7 | | | -3.30 | % | | | 4.90 | % | | | -4.90 | % | | | -6.24 | % | | | -1.06 | % | | 08/31/93 | |
MSCI World Index3 | | | 13.22 | % | | | 7.55 | % | | | 9.28 | % | | | 5.48 | % | | | 7.02 | % | | 08/31/93 | |
First Eagle Global Income Builder | |
Class A (FEBAX)
without sales charge | | | 6.07 | % | | | 4.82 | % | | | 5.36 | % | | | — | | | | 6.48 | % | | 05/01/12 | |
with sales charge | | | 0.76 | % | | | 3.03 | % | | | 4.29 | % | | | — | | | | 5.56 | % | | 05/01/12 | |
| Class C (FEBCX) | | | 4.31 | % | | | 4.03 | % | | | 4.58 | % | | | — | | | | 5.68 | % | | 05/01/12 | |
| Class I (FEBIX) | | | 6.36 | % | | | 5.09 | % | | | 5.64 | % | | | — | | | | 6.74 | % | | 05/01/12 | |
| Class R6 (FEBRX) | | | 6.32 | % | | | — | | | | — | | | | — | | | | 7.24 | % | | 03/01/17 | |
Composite Index8 | | | 7.71 | % | | | 5.06 | % | | | 6.23 | % | | | — | | | | 7.09 | % | | 05/01/12 | |
MSCI World Index3 | | | 13.22 | % | | | 7.55 | % | | | 9.28 | % | | | — | | | | 10.41 | % | | 05/01/12 | |
Bloomberg Barclays
U.S. Aggregate
Bond Index9 | | | -0.32 | % | | | 1.07 | % | | | 1.47 | % | | | — | | | | 1.85 | % | | 05/01/12 | |
First Eagle Funds | Semi-Annual Report | April 30, 2018
12
Performance Chart (unaudited)
| | | One-
Year | | Three-
Years | | Five-
Years | | Ten-
Years | | Since
Inception | | Inception Date | |
First Eagle High Yield | |
Class A (FEHAX)
without sales charge | | | 2.92 | % | | | 3.09 | % | | | 3.13 | % | | | — | | | | 5.17 | % | | 01/03/12 | |
with sales charge | | | -1.72 | % | | | 1.50 | % | | | 2.19 | % | | | — | | | | 4.41 | % | | 01/03/12 | |
| Class C (FEHCX) | | | 1.20 | % | | | 2.37 | % | | | 2.39 | % | | | — | | | | 4.39 | % | | 01/03/12 | |
| Class I (FEHIX) | | | 3.23 | % | | | 3.42 | % | | | 3.45 | % | | | 8.66 | % | | | 8.35 | % | | 11/19/0710 | |
| Class R6 (FEHRX) | | | 3.21 | % | | | — | | | | — | | | | — | | | | 3.63 | % | | 03/01/17 | |
Bloomberg Barclays
U.S. Corporate
High Yield Index11 | | | 3.26 | % | | | 4.98 | % | | | 4.75 | % | | | 7.88 | % | | | 7.72 | % | | 11/19/07 | |
First Eagle Fund of America | |
Class A (FEFAX)
without sales charge | | | 6.58 | % | | | 3.06 | % | | | 8.01 | % | | | 7.21 | % | | | 8.34 | % | | 11/20/98 | |
with sales charge | | | 1.26 | % | | | 1.31 | % | | | 6.90 | % | | | 6.66 | % | | | 8.05 | % | | 11/20/98 | |
| Class C (FEAMX) | | | 4.88 | % | | | 2.29 | % | | | 7.20 | % | | | 6.41 | % | | | 7.55 | % | | 03/02/98 | |
| Class I (FEAIX) | | | 6.91 | % | | | 3.36 | % | | | 8.30 | % | | | — | | | | 8.43 | % | | 03/08/13 | |
| Class Y (FEAFX)12 | | | 6.57 | % | | | 3.05 | % | | | 8.00 | % | | | 7.21 | % | | | 11.39 | % | | 04/10/87 | |
| Class R6 (FEFRX) | | | 6.91 | % | | | — | | | | — | | | | — | | | | 8.03 | % | | 03/01/17 | |
S&P 500 Index6 | | | 13.27 | % | | | 10.57 | % | | | 12.96 | % | | | 9.02 | % | | | 9.79 | % | | 04/10/87 | |
1 The performance data quoted herein represents past performance and does not guarantee future results. Market volatility can dramatically impact the fund's short-term performance. Current performance may be lower or higher than figures shown. The investment return and principal value will fluctuate so that an investor's shares, when redeemed, may be worth more or less than their original cost. Past performance data through the most recent month end is available at feim.com or by calling 800.334.2143. The average annual returns for Class A Shares "with sales charge" of First Eagle Global, Overseas, U.S. Value, Gold, Fund of America, and Global Income Builder give effect to the deduction of the maximum sales charge of 5.00%. The average annual returns for Class A Shares "with sales charge" of First Eagle High Yield gives effect to the deduction of the maximum sales charge of 4.50%.
The average annual returns for Class C Shares reflect the contingent deferred sales charge (CDSC) of 1.00% which pertains to the first year or less of investment only.
A contingent deferred sales charge of 1.00% may apply on redemptions of Class A shares made within 18 months following a purchase of $1,000,000 or more without an initial sales charge.
First Eagle Funds | Semi-Annual Report | April 30, 2018
13
Performance Chart (unaudited)
Class I Shares of First Eagle Global Fund, First Eagle Overseas Fund, First Eagle U.S. Value Fund, First Eagle Gold Fund, First Eagle Global Income Builder Fund, First Eagle High Yield Fund, and First Eagle Fund of America require $1 million minimum investment and are offered without a sales charge.
Class Y Shares of First Eagle Fund of America are offered without a sales charge.
Class R4 Shares of First Eagle Global Fund and First Eagle Overseas Fund are offered without a sales charge.
Class R6 Shares of First Eagle Global Fund, First Eagle Overseas Fund, First Eagle U.S. Value Fund, First Eagle Gold Fund, First Eagle Global Income Builder Fund, First Eagle High Yield Fund, and First Eagle Fund of America are offered without a sales charge.
2 The Fund commenced operation April 28, 1970. Performance for periods prior to January 1, 2000 occurred while a prior portfolio manager of the fund was affiliated with another firm. Inception date shown is when this prior portfolio manager assumed portfolio management responsibilities.
3 The MSCI World Index is a widely followed, unmanaged group of stocks from 23 developed international markets. The index provides total returns in U.S. dollars with net dividends reinvested. One cannot invest directly in an index.
4 Effective May 9, 2014, the First Eagle Overseas Fund is closed to certain investors. Please see prospectus for more information.
5 The MSCI EAFE Index is an unmanaged total return index, reported in U.S. dollars, based on share prices and reinvested net dividends of approximately 1,100 companies from 21 developed market countries. One cannot invest directly in an index.
6 The S&P 500 Index is a widely recognized unmanaged index including a representative sample of 500 leading companies in leading sectors of the U.S. economy. Although the S&P 500 Index focuses on the large-cap segment of the market, with approximately 80% coverage of U.S. equities, it is also considered a proxy for the total market. The S&P 500 Index includes dividends reinvested. One cannot invest directly in an index.
7 The FTSE Gold Mines Index is designed to reflect the performance of the worldwide market in the shares of companies whose principal activity is the mining of gold. The FTSE Gold Mines Index encompasses all gold mining companies that have a sustainable, attributable gold production of at least 300,000 ounces a year and that derive 51% or more of their revenue from mined gold. The Index is unmanaged, and includes dividends reinvested. One cannot invest directly in an index.
8 The composite index consists of 60% of the MSCI World Index and 40% of the Bloomberg Barclays U.S. Aggregate Bond Index.
9 The Bloomberg Barclays U.S. Aggregate Bond Index is an unmanaged broad-based benchmark that measures the investment grade, U.S. dollar-denominated, fixed-rate taxable bond market, including Treasuries, government-related and corporate securities, MBS (agency fixed-rate and hybrid ARM passthroughs), ABS, and CMBS. One cannot invest directly in an index.
10 First Eagle High Yield Fund commenced operations in its present form on December 30, 2011, and is successor to another mutual fund pursuant to a reorganization on December 30, 2011. Information prior to December 30, 2011 is for this predecessor fund. Immediately after the reorganization, changes in net asset value of the Class I shares were partially impacted by differences in how the Fund and the predecessor fund price portfolio securities.
11 The Bloomberg Barclays U.S. Corporate High Yield Index is composed of fixed-rate, publicly issued, noninvestment grade debt and is unmanaged, with dividends reinvested. The index includes both corporate and non-corporate sectors. The corporate sectors are Industrial, Utility, and Finance, which include both U.S. and non-U.S. corporations. One cannot invest directly in an index.
First Eagle Funds | Semi-Annual Report | April 30, 2018
14
Performance Chart (unaudited)
12 As of September 1, 2005 First Eagle Fund of America Class Y is closed to new accounts.
Expense Ratios As Stated In The Most Recent Prospectus16
Class A | | Class C | | Class I | | Class Y | | Class R413 | | Class R6 | |
| First Eagle Global Fund 1.11% | | | 1.85 | % | | | 0.84 | % | | | — | | | | 1.04 | % | | | 0.78 | % | |
| First Eagle Overseas Fund 1.15 | | | 1.88 | | | | 0.87 | | | | — | | | | 1.05 | | | | 0.79 | | |
| First Eagle U.S. Value Fund14,15 1.14 | | | 1.89 | | | | 0.86 | | | | — | | | | N/A | | | | 0.85 | | |
| First Eagle Gold Fund 1.26 | | | 2.04 | | | | 0.99 | | | | — | | | | N/A | | | | 0.90 | | |
First Eagle Global Income
Builder Fund 1.19 | | | 1.94 | | | | 0.93 | | | | — | | | | N/A | | | | 0.89 | | |
| First Eagle High Yield Fund14,15 1.21 | | | 1.95 | | | | 0.91 | | | | — | | | | N/A | | | | 0.92 | | |
| First Eagle Fund of America 1.31 | | | 2.06 | | | | 1.01 | | | | 1.31 | % | | | N/A | | | | 1.00 | | |
13 Class R4 Shares commenced investment operations on January 17, 2018 for the First Eagle Global and Overseas Funds. The percentages shown above are based on anticipated expenses of Class R4 for the first fiscal year. However, the rate at which expenses are accrued during the fiscal year may not be constant and, at any particular point, may be greater or less than the stated average percentage.
14 For the First Eagle U.S. Value Fund and High Yield Funds, had fees not been waived and/or expenses reimbursed, returns would have been lower.
15 These are the actual fund operating expenses prior to the application of fee waivers and/or expense reimbursements. The Adviser has contractually agreed to waive its management fee at an annual rate in the amount of 0.05% of the average daily value of the Fund's net assets for the period through February 28, 2019. This waiver has the effect of reducing the management fee for the term of the waiver from 0.75% to 0.70% on First Eagle U.S. Value Fund and from 0.70% to 0.65% on First Eagle High Yield Fund.
16 Certain other share classes were newly organized during the period but did not yet have assets or expenses during the period.
These expense ratios are presented as of March 1, 2018 and may differ from corresponding ratios shown elsewhere in this report because of differing time periods (and/or, if applicable, because these expense ratios do not include expense credits or waivers).
There are risks associated with investing in funds that invest in securities of foreign countries, such as erratic market conditions, economic and political instability and fluctuations in currency exchange rates. These risks may be more pronounced with respect to investments in emerging markets. Funds whose investments are concentrated in a specific industry or sector may be subject to a higher degree of risk than funds whose investments are diversified and may not be suitable for all investors.
All securities may be subject to adverse market trends. The value of a Fund's portfolio holdings may fluctuate in response to events specific to the companies or stock or bond markets in which a Fund invests, as well as economic, political, or social events in the United States or abroad. This may cause a Fund's portfolio to be worth less than the price originally paid for it, or less than it was worth at an earlier time. Market risk may affect a single issuer or the market as a whole. As a result, a portfolio of such securities may underperform the market as a whole.
In addition to investments in larger companies, each Fund may invest in small and medium-size companies, which historically have been more volatile in price than larger company securities, especially over the short term. Positions in smaller companies, especially when the Fund is a large holder of a small company's securities, also may be more difficult or expensive to trade. Among the reasons for the greater price volatility are the less certain growth prospects of smaller companies, the lower degree of liquidity in the markets for such securities and the greater sensitivity of smaller companies to changing
First Eagle Funds | Semi-Annual Report | April 30, 2018
15
Performance Chart (unaudited)
economic conditions. In addition, smaller companies may lack depth of management, they may be unable to generate funds necessary for growth or development, or they may be developing or marketing new products or services for which markets are not yet established and may never become established. The Funds consider small companies to be companies with market capitalizations of less than $1 billion and medium-size companies to have market capitalizations of less than $10 billion.
Holding illiquid securities restricts or otherwise limits the ability for a Fund to freely dispose of its investments for specific periods of time. A Fund might not be able to sell illiquid securities at its desired price or time. Changes in the markets or in regulations governing the trading of illiquid instruments can cause rapid changes in the price or ability to sell an illiquid security. The market for lower-quality debt instruments, including junk bonds and leveraged loans, is generally less liquid than the market for higher-quality debt instruments.
Investment in gold and gold-related investments present certain risks, including political and economic risks affecting the price of gold and other precious metals like changes in U.S. or foreign regulatory policies, tax, currency or mining laws, increased environmental costs, international monetary and political policies, economic conditions within an individual country, trade imbalances, and trade or currency restrictions between countries. The price of gold, in turn, is likely to affect the market prices of securities of companies mining or processing gold, and accordingly, the value of investments in such securities may also be affected. Gold-related investments as a group have not performed as well as the stock market in general during periods when the U.S. dollar is strong, inflation is low and general economic conditions are stable. In addition, returns on gold-related investments have traditionally been more volatile than investments in broader equity or debt markets.
The event-driven investment style of the First Eagle Fund of America carries the additional risk that the event anticipated occurs later than expected, does not occur at all, or does not have the desired effect on the market price of the securities.
First Eagle High Yield and Global Income Builder Funds invest in high yield instruments (commonly known as "junk bonds") which may be subject to greater levels of interest rate, credit (including issuer default) and liquidity risk than investment grade instruments and may experience extreme price fluctuations. The securities of such companies may be considered speculative and the ability of such companies to pay their debts on schedule may be uncertain.
First Eagle High Yield and Global Income Builder Funds invest in bank loans. These investments potentially expose a fund to the credit risk of the underlying borrower, and in certain cases, of the financial institution. The fund's ability to receive payments in connection with the loan depends primarily on the financial condition of the borrower. The market for bank loans may be illiquid and the fund may have difficulty selling them, especially in the case of leveraged loans, which can be difficult to value. In addition, bank loans often have contractual restrictions on resale, which can delay the sale and adversely impact the sale price. At times, a fund may decline to receive non-public information relating to loans, which could disadvantage the fund relative to other investors.
Funds that invest in bonds are subject to credit and interest rate risk. The value of a fund's portfolio may fluctuate in response to the risk that the issuer of a bond or other instrument will not be able to make payments of interest and principal when due. In addition, fluctuations in interest rates can affect the value of debt instruments held by a fund. An increase in interest rates tends to reduce the market value of debt instruments, while a decline in interest rates tends to increase their values. Longer duration instruments tend to be more sensitive to interest rate changes than those with shorter durations.
Income generation and dividends are not guaranteed. If dividend paying stocks in the fund's portfolio stop paying or reduce dividends the fund's ability to generate income will be adversely affected.
An investment made at a perceived "margin of safety" or "discount to intrinsic or fundamental value" can trade at prices substantially lower than when an investment is made, so that any perceived "margin of safety" or "discount to value" is no guarantee against loss.
All investments involve the risk of loss.
First Eagle Funds | Semi-Annual Report | April 30, 2018
16
This page was intentionally left blank.
Data as of April 30, 2018 (unaudited)
Investment Objective
The First Eagle Global Fund seeks long-term growth of capital by investing in a range of asset classes from markets in the United States and throughout the world. This truly global fund is managed with a highly disciplined, bottom-up, value-oriented style.
Average Annual Returns (%) | | | | | | One-Year | | Five-Years | | Ten-Years | |
First Eagle Global Fund | | Class A | | without sales load | | | 6.74 | | | | 6.55 | | | | 6.38 | | |
| | | | with sales load | | | 1.39 | | | | 5.46 | | | | 5.84 | | |
MSCI World Index | | | | | | | 13.22 | | | | 9.28 | | | | 5.48 | | |
Consumer Price Index | | | | | | | 2.46 | | | | 1.51 | | | | 1.55 | | |
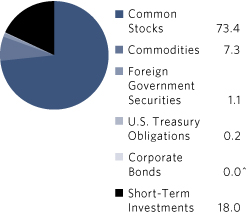
Sectors* (%) | |
Financials | | | 13.5 | | |
Industrials | | | 12.1 | | |
Information Technology | | | 10.0 | | |
Materials | | | 7.6 | | |
Energy | | | 7.4 | | |
Commodities | | | 7.3 | | |
Consumer Discretionary | | | 7.1 | | |
Consumer Staples | | | 5.3 | | |
Health Care | | | 4.2 | | |
Real Estate | | | 3.5 | | |
Telecommunication Services | | | 2.3 | | |
Foreign Government Securities | | | 1.1 | | |
Utilities | | | 0.4 | | |
U.S. Treasury Obligations | | | 0.2 | | |
Short-Term Investments | | | 18.0 | | |
Countries*~ (%)
United States | | | 43.3 | | |
Japan | | | 12.2 | | |
France | | | 5.1 | | |
United Kingdom | | | 4.3 | | |
Canada | | | 4.2 | | |
Hong Kong | | | 2.0 | | |
South Korea | | | 1.7 | | |
Switzerland | | | 1.7 | | |
Germany | | | 1.6 | | |
Mexico | | | 1.3 | | |
Sweden | | | 0.7 | | |
Australia | | | 0.6 | | |
Belgium | | | 0.6 | | |
Thailand | | | 0.6 | | |
Brazil | | | 0.5 | | |
Singapore | | | 0.4 | | |
Ireland | | | 0.3 | | |
Denmark | | | 0.2 | | |
Poland | | | 0.2 | | |
Russia | | | 0.1 | | |
Israel | | | 0.1 | | |
Italy | | | 0.1 | | |
Africa | | | 0.1 | | |
Indonesia | | | 0.1 | | |
Norway | | | 0.0 | ^ | |
Malaysia | | | 0.0 | ^ | |
Venezuela | | | — | | |
Short-Term Investments | | | 18.0 | | |
^ Less than 0.05%
* Asset Allocation, Sector and Countries percentages are based on total investments in the portfolio.
~ Country allocations reflect country of risk (not currency of issue). Bonds of non-U.S. issuers may be U.S. dollar denominated.
The Fund's portfolio composition is subject to change at any time.
First Eagle Funds | Semi-Annual Report | April 30, 2018
18
First Eagle Global Fund | Fund Overview
Growth of a $10,000 Initial Investment
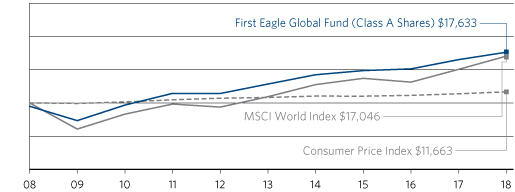
Performance data quoted herein represents past performance and should not be considered indicative of future results. Performance data quoted herein does not reflect the deduction of taxes that a shareholder would pay on Fund distributions or the sale of Fund shares. The average annual returns shown above are historical and reflect changes in share price, reinvested dividends and are net of expenses.
The average annual returns for Class A Shares give effect to the deduction of the maximum sales charge of 5.00%.
The MSCI World Index is a widely followed, unmanaged group of stocks from 23 developed international markets. The index provides total returns in U.S. dollars with net dividends reinvested. One cannot invest directly in an index. The Consumer Price Index (CPI) represents the change in price of all goods and services purchased for consumption by urban households.
Top 10 Holdings* (%)
Gold bullion** (Precious Metal) | | | 7.3 | | |
Oracle Corp. (Software, United States) | | | 2.2 | | |
FANUC Corp. (Machinery, Japan) | | | 1.6 | | |
Exxon Mobil Corp. (Oil, Gas & Consumable Fuels, United States) | | | 1.6 | | |
American Express Co. (Consumer Finance, United States) | | | 1.6 | | |
Weyerhaeuser Co. (Equity Real Estate Investment Trusts (REITs), United States) | | | 1.6 | | |
Schlumberger Ltd. (Energy Equipment & Services, United States) | | | 1.5 | | |
KDDI Corp. (Wireless Telecommunication Services, Japan) | | | 1.5 | | |
Microsoft Corp. (Software, United States) | | | 1.5 | | |
Omnicom Group, Inc. (Media, United States) | | | 1.3 | | |
Total | | | 21.7 | | |
* Holdings in cash, commercial paper and other short-term cash equivalents have been excluded.
**The Fund invests in gold and precious metals through investment in a wholly-owned subsidiary of the Fund organized under the laws of the Cayman Islands (the "Subsidiary"). Gold Bullion and commodities include the Fund's investment in the Subsidiary.
Percentages are based on total net assets.
First Eagle Funds | Semi-Annual Report | April 30, 2018
19
First Eagle Global Fund | Consolidated Schedule of Investments | April 30, 2018 (unaudited)
Investments | | Shares | | Value ($) | |
Common Stocks — 73.3% | |
Africa — 0.1% | |
Randgold Resources Ltd., ADR | | | 413,501 | | | | 33,534,931 | | |
Australia — 0.6% | |
Newcrest Mining Ltd. | | | 22,277,117 | | | | 353,091,424 | | |
Belgium — 0.6% | |
Groupe Bruxelles Lambert SA | | | 2,788,865 | | | | 318,786,707 | | |
Brazil — 0.5% | |
Cielo SA | | | 50,066,318 | | | | 274,398,637 | | |
Canada — 4.1% | |
Agnico Eagle Mines Ltd. | | | 5,969,324 | | | | 251,195,589 | | |
Barrick Gold Corp. | | | 20,378,638 | | | | 274,500,254 | | |
Canadian Natural Resources Ltd. | | | 2,388,401 | | | | 86,164,363 | | |
Cenovus Energy, Inc. | | | 15,294,201 | | | | 153,400,836 | | |
Franco-Nevada Corp. | | | 2,615,497 | | | | 185,516,034 | | |
Goldcorp, Inc. | | | 14,579,998 | | | | 193,768,174 | | |
Imperial Oil Ltd. | | | 9,729,552 | | | | 302,582,664 | | |
Nutrien Ltd. | | | 12,347,604 | | | | 562,186,410 | | |
Suncor Energy, Inc. | | | 1,054,556 | | | | 40,327,660 | | |
Wheaton Precious Metals Corp. | | | 13,305,261 | | | | 276,616,376 | | |
| | | | 2,326,258,360 | | |
Denmark — 0.2% | |
ISS A/S | | | 3,009,360 | | | | 104,948,872 | | |
France — 5.1% | |
Bouygues SA | | | 5,688,713 | | | | 290,153,605 | | |
Carrefour SA | | | 5,993,157 | | | | 122,964,097 | | |
Cie de Saint-Gobain | | | 7,208,725 | | | | 377,168,140 | | |
Danone SA | | | 8,040,001 | | | | 651,286,817 | | |
Legrand SA | | | 1,401,821 | | | | 109,079,848 | | |
LVMH Moet Hennessy Louis Vuitton SE | | | 404,478 | | | | 140,763,257 | | |
Neopost SA | | | 152,262 | | | | 4,108,528 | | |
NSC Groupe (a) | | | 64,717 | | | | 6,408,485 | | |
Rexel SA | | | 11,789,132 | | | | 182,752,389 | | |
Robertet SA | | | 157,260 | | | | 94,573,774 | | |
Robertet SA CI (non-voting)‡ (b) | | | 42,252 | | | | 17,786,797 | | |
First Eagle Funds | Semi-Annual Report | April 30, 2018
20
First Eagle Global Fund | Consolidated Schedule of Investments | April 30, 2018 (unaudited)
Investments | | Shares | | Value ($) | |
France — 5.1% (continued) | |
Sabeton SA (a) | | | 385,000 | | | | 11,437,180 | | |
Sanofi | | | 5,286,679 | | | | 417,977,124 | | |
Sodexo SA | | | 3,369,352 | | | | 333,661,664 | | |
Wendel SA | | | 851,019 | | | | 128,531,821 | | |
| | | | 2,888,653,526 | | |
Germany — 1.6% | |
HeidelbergCement AG | | | 5,883,039 | | | | 575,285,747 | | |
Hornbach Baumarkt AG | | | 29,871 | | | | 1,004,611 | | |
Hornbach Holding AG & Co. KGaA (a) | | | 1,181,422 | | | | 94,934,984 | | |
Linde AG* | | | 938,751 | | | | 207,966,636 | | |
| | | | 879,191,978 | | |
Hong Kong — 2.0% | |
CK Asset Holdings Ltd. | | | 10,174,468 | | | | 87,835,842 | | |
Guoco Group Ltd. | | | 12,693,580 | | | | 168,318,042 | | |
Hang Lung Properties Ltd. | | | 125,232,969 | | | | 296,373,120 | | |
Hysan Development Co. Ltd. | | | 23,163,348 | | | | 134,814,696 | | |
Jardine Matheson Holdings Ltd. | | | 6,864,471 | | | | 415,669,330 | | |
Jardine Strategic Holdings Ltd. | | | 520,800 | | | | 19,709,861 | | |
| | | | 1,122,720,891 | | |
Ireland — 0.3% | |
CRH plc | | | 4,704,407 | | | | 166,964,514 | | |
Israel — 0.1% | |
Israel Chemicals Ltd. | | | 12,448,757 | | | | 55,631,733 | | |
Italy — 0.1% | |
Italmobiliare SpA | | | 1,889,410 | | | | 51,223,077 | | |
Japan — 12.3% | |
Astellas Pharma, Inc. | | | 14,011,000 | | | | 204,928,168 | | |
Chofu Seisakusho Co. Ltd. (a) | | | 3,351,250 | | | | 79,597,527 | | |
FANUC Corp. | | | 4,251,100 | | | | 910,630,836 | | |
Hirose Electric Co. Ltd. (a) | | | 2,564,415 | | | | 360,872,936 | | |
Hoya Corp. | | | 8,345,640 | | | | 445,864,549 | | |
KDDI Corp. | | | 31,838,200 | | | | 854,652,067 | | |
Keyence Corp. | | | 1,008,100 | | | | 614,718,831 | | |
Mitsubishi Estate Co. Ltd. | | | 30,826,080 | | | | 563,271,105 | | |
First Eagle Funds | Semi-Annual Report | April 30, 2018
21
First Eagle Global Fund | Consolidated Schedule of Investments | April 30, 2018 (unaudited)
Investments | | Shares | | Value ($) | |
Japan — 12.3% (continued) | |
MS&AD Insurance Group Holdings, Inc. | | | 9,086,420 | | | | 306,178,186 | | |
Nissin Foods Holdings Co. Ltd. | | | 2,006,030 | | | | 147,712,402 | | |
NTT DOCOMO, Inc. | | | 16,534,400 | | | | 427,149,857 | | |
Secom Co. Ltd. | | | 9,186,430 | | | | 689,200,782 | | |
Shimano, Inc. | | | 1,892,590 | | | | 251,655,255 | | |
SMC Corp. | | | 698,556 | | | | 265,446,355 | | |
Sompo Holdings, Inc. | | | 17,037,000 | | | | 713,341,181 | | |
T Hasegawa Co. Ltd. (a) | | | 3,061,300 | | | | 65,803,955 | | |
| | | | 6,901,023,992 | | |
Mexico — 0.8% | |
Fresnillo plc | | | 18,230,274 | | | | 319,978,090 | | |
Industrias Penoles SAB de CV | | | 6,401,020 | | | | 134,351,924 | | |
| | | | 454,330,014 | | |
Norway — 0.0% (c) | |
Orkla ASA | | | 2,000,066 | | | | 18,510,990 | | |
Russia — 0.1% | |
Gazprom PJSC, ADR | | | 15,687,012 | | | | 72,387,623 | | |
South Korea — 1.7% | |
Hyundai Mobis Co. Ltd. | | | 795,007 | | | | 184,110,591 | | |
Kia Motors Corp. | | | 8,545,697 | | | | 263,845,747 | | |
KT&G Corp. | | | 4,321,898 | | | | 395,204,450 | | |
Lotte Confectionery Co. Ltd. | | | 153,688 | | | | 27,278,437 | | |
Lotte Corp.* | | | 913,277 | | | | 55,488,257 | | |
Namyang Dairy Products Co. Ltd. (a) | | | 39,989 | | | | 25,385,087 | | |
| | | | 951,312,569 | | |
Sweden — 0.7% | |
Investor AB, Class A | | | 5,939,940 | | | | 254,218,136 | | |
Investor AB, Class B | | | 3,394,798 | | | | 147,789,153 | | |
| | | | 402,007,289 | | |
Switzerland — 1.7% | |
Cie Financiere Richemont SA (Registered) | | | 550,340 | | | | 52,314,629 | | |
Nestle SA (Registered) | | | 6,313,950 | | | | 489,142,293 | | |
Pargesa Holding SA | | | 4,327,670 | | | | 405,025,395 | | |
| | | | 946,482,317 | | |
First Eagle Funds | Semi-Annual Report | April 30, 2018
22
First Eagle Global Fund | Consolidated Schedule of Investments | April 30, 2018 (unaudited)
Investments | | Shares | | Value ($) | |
Thailand — 0.6% | |
Bangkok Bank PCL, NVDR | | | 51,812,900 | | | | 315,468,606 | | |
Bangkok Bank PCL | | | 36,500 | | | | 232,465 | | |
| | | | 315,701,071 | | |
United Kingdom — 4.3% | |
Berkeley Group Holdings plc (a) | | | 6,719,082 | | | | 376,161,072 | | |
British American Tobacco plc | | | 6,527,406 | | | | 358,011,966 | | |
BT Group plc | | | 495,434 | | | | 1,700,499 | | |
Diageo plc | | | 8,034,220 | | | | 286,618,317 | | |
GlaxoSmithKline plc | | | 14,471,132 | | | | 290,249,910 | | |
Liberty Global plc, Class C* | | | 5,645,208 | | | | 164,275,553 | | |
Lloyds Banking Group plc | | | 273,586,862 | | | | 242,657,109 | | |
TechnipFMC plc | | | 15,536,847 | | | | 512,094,477 | | |
Unilever NV, CVA | | | 865,611 | | | | 49,624,256 | | |
WPP plc | | | 6,155,655 | | | | 105,631,834 | | |
| | | | 2,387,024,993 | | |
United States — 35.8% | |
3M Co. | | | 2,815,173 | | | | 547,241,480 | | |
Alleghany Corp. | | | 418,350 | | | | 240,413,194 | | |
Alphabet, Inc., Class A* | | | 134,718 | | | | 137,221,060 | | |
Alphabet, Inc., Class C* | | | 163,012 | | | | 165,836,998 | | |
American Express Co. | | | 8,849,838 | | | | 873,921,503 | | |
Analog Devices, Inc. | | | 2,275,357 | | | | 198,752,434 | | |
Anthem, Inc. | | | 1,884,793 | | | | 444,792,300 | | |
Automatic Data Processing, Inc. | | | 1,027,905 | | | | 121,375,022 | | |
Bank of New York Mellon Corp. (The) | | | 13,360,022 | | | | 728,254,799 | | |
BB&T Corp. | | | 10,500,485 | | | | 554,425,608 | | |
Berkshire Hathaway, Inc., Class A* | | | 1,088 | | | | 316,227,200 | | |
Brown & Brown, Inc. | | | 9,778,706 | | | | 266,274,164 | | |
CH Robinson Worldwide, Inc. | | | 4,158,442 | | | | 382,701,417 | | |
Cincinnati Financial Corp. | | | 1,900,903 | | | | 133,709,517 | | |
Cintas Corp. | | | 1,059,896 | | | | 180,500,289 | | |
Colgate-Palmolive Co. | | | 5,506,298 | | | | 359,175,819 | | |
Comcast Corp., Class A | | | 22,106,304 | | | | 693,916,883 | | |
ConocoPhillips | | | 6,618,073 | | | | 433,483,782 | | |
First Eagle Funds | Semi-Annual Report | April 30, 2018
23
First Eagle Global Fund | Consolidated Schedule of Investments | April 30, 2018 (unaudited)
Investments | | Shares | | Value ($) | |
United States — 35.8% (continued) | |
Cummins, Inc. | | | 1,378,153 | | | | 220,311,539 | | |
Deere & Co. | | | 3,176,107 | | | | 429,822,560 | | |
Devon Energy Corp. | | | 3,449,156 | | | | 125,307,837 | | |
Exxon Mobil Corp. | | | 11,628,713 | | | | 904,132,436 | | |
Facebook, Inc., Class A* | | | 930,632 | | | | 160,068,704 | | |
Flowserve Corp. (a) | | | 8,414,508 | | | | 373,688,300 | | |
H&R Block, Inc. | | | 3,992,318 | | | | 110,387,593 | | |
HCA Healthcare, Inc. | | | 1,327,633 | | | | 127,107,583 | | |
JG Boswell Co. | | | 2,485 | | | | 1,694,770 | | |
Mastercard, Inc., Class A | | | 1,133,715 | | | | 202,107,373 | | |
Microsoft Corp. | | | 8,977,773 | | | | 839,601,331 | | |
Mills Music Trust (a) | | | 31,592 | | | | 714,295 | | |
National Oilwell Varco, Inc. | | | 17,895,308 | | | | 692,011,560 | | |
Newmont Mining Corp. | | | 4,534,880 | | | | 178,175,435 | | |
NOW, Inc.* (a) | | | 5,851,664 | | | | 70,980,684 | | |
Omnicom Group, Inc. | | | 10,111,773 | | | | 744,833,199 | | |
Oracle Corp. | | | 27,002,083 | | | | 1,233,185,131 | | |
Orbital ATK, Inc. (a) | | | 3,694,106 | | | | 489,025,752 | | |
Praxair, Inc. | | | 1,061,412 | | | | 161,886,558 | | |
Royal Gold, Inc. | | | 1,260,596 | | | | 111,940,925 | | |
San Juan Basin Royalty Trust (a) | | | 3,908,035 | | | | 26,887,281 | | |
Schlumberger Ltd. | | | 12,656,668 | | | | 867,741,158 | | |
Scotts Miracle-Gro Co. (The) | | | 1,614,331 | | | | 134,925,785 | | |
Synchrony Financial | | | 11,102,151 | | | | 368,258,349 | | |
Teradata Corp.* (a) | | | 12,190,179 | | | | 498,822,125 | | |
Texas Instruments, Inc. | | | 2,158,760 | | | | 218,963,027 | | |
Tiffany & Co. | | | 2,478,615 | | | | 254,875,980 | | |
Travelers Cos., Inc. (The) | | | 332,055 | | | | 43,698,438 | | |
UGI Corp. | | | 4,874,044 | | | | 235,854,989 | | |
Union Pacific Corp. | | | 4,056,411 | | | | 542,058,202 | | |
Universal Health Services, Inc., Class B | | | 357,823 | | | | 40,863,387 | | |
US Bancorp | | | 7,819,459 | | | | 394,491,707 | | |
Varex Imaging Corp.* | | | 1,256,253 | | | | 45,212,545 | | |
Varian Medical Systems, Inc.* | | | 3,140,634 | | | | 363,025,884 | | |
First Eagle Funds | Semi-Annual Report | April 30, 2018
24
First Eagle Global Fund | Consolidated Schedule of Investments | April 30, 2018 (unaudited)
Investments | | Shares | | Value ($) | |
United States — 35.8% (continued) | |
Visa, Inc., Class A | | | 1,265,285 | | | | 160,539,361 | | |
Vista Outdoor, Inc.* (a) | | | 3,252,457 | | | | 54,478,655 | | |
Weyerhaeuser Co., REIT | | | 23,709,923 | | | | 872,050,968 | | |
Willis Towers Watson plc | | | 2,058,297 | | | | 305,677,687 | | |
WR Berkley Corp. | | | 4,386,051 | | | | 327,023,963 | | |
Xilinx, Inc. | | | 6,088,374 | | | | 391,117,146 | | |
| | | | 20,101,773,671 | | |
Total Common Stocks
(Cost $28,107,859,689) | | | 41,125,959,179 | | |
| | | Ounces | | | |
Commodities — 7.3% | |
Gold bullion*
(Cost $3,289,770,460) | | | 3,110,306 | | | | 4,088,715,166 | | |
| | | Principal Amount ($) | | | |
Foreign Government Securities — 1.1% | |
Indonesia — 0.0% (c) | |
Indonesia Treasury Bond
8.25%, 7/15/2021 | | IDR | 345,617,000,000 | | | | 26,084,302 | | |
Malaysia — 0.0% (c) | |
Malaysia Government Bond
3.66%, 10/15/2020 | | MYR | 54,021,000 | | | | 13,767,555 | | |
Mexico — 0.5% | |
Mexican Bonos
4.75%, 6/14/2018 | | MXN | 2,559,090,000 | | | | 136,212,134 | | |
5.00%, 12/11/2019 | | MXN | 764,192,000 | | | | 39,425,942 | | |
6.50%, 6/10/2021 | | MXN | 1,813,760,000 | | | | 94,628,131 | | |
| | | | 270,266,207 | | |
Poland — 0.2% | |
Poland Government Bond
3.25%, 7/25/2019 | | PLN | 306,347,000 | | | | 89,289,565 | | |
Singapore — 0.4% | |
Singapore Government Bond
3.25%, 9/1/2020 | | SGD | 119,604,000 | | | | 92,826,414 | | |
2.25%, 6/1/2021 | | SGD | 147,741,000 | | | | 111,986,787 | | |
| | | | 204,813,201 | | |
First Eagle Funds | Semi-Annual Report | April 30, 2018
25
First Eagle Global Fund | Consolidated Schedule of Investments | April 30, 2018 (unaudited)
Investments | | Principal Amount ($) | | Value ($) | |
Venezuela, Bolivarian Republic of — 0.0% | |
Venezuela Government Bond
(Oil-Linked Payment Obligation)
Zero Coupon, 4/15/2020‡ (b)(d)(i) | | | 53,230 | | | | — | | |
Total Foreign Government Securities
(Cost $632,665,031) | | | 604,220,830 | | |
U.S. Treasury Obligations — 0.2% | |
U.S. Treasury Notes
1.13%, 1/15/2019 (e)
(Cost $113,462,290) | | | 114,023,000 | | | | 113,176,735 | | |
Corporate Bonds — 0.0% (c) | |
United States — 0.0% (c) | |
Bausch & Lomb, Inc.
7.13%, 8/1/2028
(Cost $4,918,586) | | | 5,467,000 | | | | 5,425,998 | | |
Short-Term Investments — 18.0% | |
Commercial Paper — 18.0% | |
American Honda Finance Corp.
1.69%, 5/4/2018 (f) | | | 40,458,000 | | | | 40,450,174 | | |
2.01%, 6/6/2018 (f) | | | 48,214,000 | | | | 48,120,890 | | |
2.01%, 6/13/2018 (f) | | | 87,461,000 | | | | 87,258,216 | | |
2.01%, 6/18/2018 (f) | | | 81,683,000 | | | | 81,470,536 | | |
2.06%, 6/19/2018 (f) | | | 63,501,000 | | | | 63,332,282 | | |
2.16%, 7/6/2018 (f) | | | 78,799,000 | | | | 78,510,679 | | |
2.18%, 7/10/2018 (f) | | | 21,395,000 | | | | 21,311,452 | | |
Apple, Inc.
1.61%, 5/2/2018 (f)(g) | | | 63,540,000 | | | | 63,533,900 | | |
1.62%, 5/7/2018 (f)(g) | | | 100,000,000 | | | | 99,966,167 | | |
1.64%, 5/8/2018 (f)(g) | | | 57,265,000 | | | | 57,242,820 | | |
1.62%, 5/10/2018 (f)(g) | | | 76,523,000 | | | | 76,485,865 | | |
1.70%, 5/21/2018 (f)(g) | | | 34,111,000 | | | | 34,075,581 | | |
1.66%, 5/22/2018 (f)(g) | | | 25,435,000 | | | | 25,407,286 | | |
1.75%, 5/23/2018 (f)(g) | | | 61,666,000 | | | | 61,595,597 | | |
1.88%, 6/5/2018 (f)(g) | | | 62,025,000 | | | | 61,911,742 | | |
1.86%, 6/11/2018 (f)(g) | | | 100,000,000 | | | | 99,785,100 | | |
First Eagle Funds | Semi-Annual Report | April 30, 2018
26
First Eagle Global Fund | Consolidated Schedule of Investments | April 30, 2018 (unaudited)
Investments | | Principal Amount ($) | | Value ($) | |
Commercial Paper — 18.0% (continued) | |
1.90%, 6/12/2018 (f)(g) | | | 37,025,000 | | | | 36,943,406 | | |
1.93%, 6/18/2018 (f)(g) | | | 25,000,000 | | | | 24,936,674 | | |
1.92%, 6/20/2018 (f)(g) | | | 18,183,000 | | | | 18,134,933 | | |
1.96%, 7/13/2018 (f)(g) | | | 78,531,000 | | | | 78,217,675 | | |
AstraZeneca Pharmaceuticals LP
2.33%, 6/14/2018 (f) | | | 37,411,000 | | | | 37,319,109 | | |
AstraZeneca plc
2.03%, 5/1/2018 (f) | | | 3,069,000 | | | | 3,068,852 | | |
2.22%, 5/10/2018 (f) | | | 34,607,000 | | | | 34,589,802 | | |
2.21%, 6/5/2018 (f) | | | 35,114,000 | | | | 35,046,581 | | |
2.21%, 6/6/2018 (f) | | | 66,117,000 | | | | 65,986,190 | | |
2.27%, 6/8/2018 (f) | | | 78,123,000 | | | | 77,959,235 | | |
2.24%, 6/11/2018 (f) | | | 57,835,000 | | | | 57,703,425 | | |
2.37%, 6/19/2018 (f) | | | 35,426,000 | | | | 35,328,086 | | |
2.47%, 7/19/2018 (f) | | | 33,543,000 | | | | 33,381,025 | | |
BASF SE
1.98%, 6/1/2018 (f) | | | 35,842,000 | | | | 35,782,582 | | |
1.99%, 6/12/2018 (f) | | | 43,431,000 | | | | 43,332,695 | | |
1.99%, 6/13/2018 (f) | | | 43,431,000 | | | | 43,330,303 | | |
BP Capital Markets plc | |
2.21%, 7/12/2018 (f) | | | 38,552,000 | | | | 38,377,592 | | |
2.21%, 7/19/2018 (f) | | | 33,032,000 | | | | 32,865,959 | | |
2.21%, 7/23/2018 (f) | | | 33,543,000 | | | | 33,364,629 | | |
Campbell Soup Co.
1.88%, 5/15/2018 (f) | | | 40,000,000 | | | | 39,962,500 | | |
CenterPoint Energy, Inc.
2.10%, 5/1/2018 (f) | | | 1,162,000 | | | | 1,161,930 | | |
Chevron Corp.
1.73%, 5/25/2018 (f) | | | 82,221,000 | | | | 82,118,738 | | |
Coca-Cola Co. (The)
1.62%, 5/1/2018 (f) | | | 61,238,000 | | | | 61,235,071 | | |
1.63%, 5/3/2018 (f) | | | 96,240,000 | | | | 96,226,086 | | |
1.72%, 5/14/2018 (f) | | | 37,202,000 | | | | 37,175,900 | | |
1.76%, 5/17/2018 (f) | | | 25,394,000 | | | | 25,372,211 | | |
1.75%, 5/18/2018 (f) | | | 115,000,000 | | | | 114,895,350 | | |
1.96%, 6/21/2018 (f) | | | 25,200,000 | | | | 25,130,148 | | |
First Eagle Funds | Semi-Annual Report | April 30, 2018
27
First Eagle Global Fund | Consolidated Schedule of Investments | April 30, 2018 (unaudited)
Investments | | Principal Amount ($) | | Value ($) | |
Commercial Paper — 18.0% (continued) | |
1.95%, 6/22/2018 (f) | | | 117,793,000 | | | | 117,459,865 | | |
2.03%, 6/25/2018 (f) | | | 55,537,000 | | | | 55,370,352 | | |
1.96%, 6/26/2018 (f) | | | 31,634,000 | | | | 31,537,232 | | |
1.95%, 6/27/2018 (f) | | | 42,249,000 | | | | 42,117,289 | | |
2.07%, 7/11/2018 (f) | | | 88,000,000 | | | | 87,650,816 | | |
2.04%, 7/16/2018 (f) | | | 51,910,000 | | | | 51,687,718 | | |
Diageo Capital plc
2.21%, 6/1/2018 (f) | | | 66,117,000 | | | | 65,979,477 | | |
2.21%, 6/5/2018 (f) | | | 27,740,000 | | | | 27,674,534 | | |
2.41%, 6/11/2018 (f) | | | 55,144,000 | | | | 54,990,240 | | |
2.52%, 6/14/2018 (f) | | | 50,541,000 | | | | 50,389,061 | | |
Eli Lilly & Co.
1.80%, 5/11/2018 (f) | | | 43,431,000 | | | | 43,407,577 | | |
1.80%, 5/14/2018 (f) | | | 43,431,000 | | | | 43,400,869 | | |
Engie SA
1.65%, 5/2/2018 (f) | | | 33,092,000 | | | | 33,088,803 | | |
1.66%, 5/9/2018 (f) | | | 39,027,000 | | | | 39,009,614 | | |
1.69%, 5/10/2018 (f) | | | 42,158,000 | | | | 42,137,050 | | |
1.70%, 5/30/2018 (f) | | | 41,111,000 | | | | 41,046,250 | | |
1.87%, 6/15/2018 (f) | | | 30,000,000 | | | | 29,924,483 | | |
2.16%, 7/16/2018 (f) | | | 62,290,000 | | | | 62,000,888 | | |
2.14%, 7/19/2018 (f) | | | 84,267,000 | | | | 83,856,339 | | |
Eni Finance USA, Inc.
2.19%, 5/1/2018 (f) | | | 1,151,000 | | | | 1,150,937 | | |
Erste Abwicklungsanstalt
1.76%, 5/2/2018 (f)(g) | | | 31,455,000 | | | | 31,451,996 | | |
Essilor International SA
1.86%, 5/29/2018 (f) | | | 45,000,000 | | | | 44,931,669 | | |
Export Development Corp.
1.66%, 5/18/2018 (f) | | | 52,101,000 | | | | 52,054,109 | | |
1.99%, 6/28/2018 (f) | | | 35,114,000 | | | | 35,003,681 | | |
Henkel of America, Inc.
1.95%, 5/9/2018 (f) | | | 86,850,000 | | | | 86,811,308 | | |
2.09%, 7/18/2018 (f) | | | 27,386,000 | | | | 27,255,770 | | |
HP, Inc.
2.67%, 6/8/2018 (f) | | | 36,100,000 | | | | 36,026,320 | | |
2.72%, 6/15/2018 (f) | | | 74,543,000 | | | | 74,361,740 | | |
First Eagle Funds | Semi-Annual Report | April 30, 2018
28
First Eagle Global Fund | Consolidated Schedule of Investments | April 30, 2018 (unaudited)
Investments | | Principal Amount ($) | | Value ($) | |
Commercial Paper — 18.0% (continued) | |
Intel Corp.
1.96%, 6/21/2018 (f) | | | 74,049,000 | | | | 73,845,884 | | |
John Deere Financial Ltd.
1.82%, 5/11/2018 (f) | | | 44,139,000 | | | | 44,114,926 | | |
1.93%, 5/17/2018 (f) | | | 54,712,000 | | | | 54,665,055 | | |
2.08%, 6/12/2018 (f) | | | 35,426,000 | | | | 35,345,814 | | |
Kreditanstalt fuer Wiederaufbau
1.70%, 5/8/2018 (f) | | | 70,045,000 | | | | 70,019,146 | | |
2.02%, 6/7/2018 (f) | | | 59,465,000 | | | | 59,348,878 | | |
2.19%, 7/5/2018 (f) | | | 60,995,000 | | | | 60,773,476 | | |
2.11%, 7/11/2018 (f) | | | 91,993,000 | | | | 91,619,692 | | |
LVMH Moet Hennessy Louis Vuitton, Inc.
1.86%, 5/15/2018 (f) | | | 35,269,000 | | | | 35,241,666 | | |
1.86%, 5/17/2018 (f) | | | 59,054,000 | | | | 59,001,936 | | |
MetLife Short Term Funding LLC
1.64%, 5/1/2018 (f) | | | 82,938,000 | | | | 82,934,176 | | |
1.66%, 5/7/2018 (f) | | | 5,222,000 | | | | 5,220,254 | | |
1.91%, 5/22/2018 (f) | | | 54,883,000 | | | | 54,820,918 | | |
2.05%, 6/1/2018 (f) | | | 68,266,000 | | | | 68,147,976 | | |
2.01%, 6/5/2018 (f) | | | 4,376,000 | | | | 4,367,449 | | |
2.13%, 6/11/2018 (f) | | | 28,268,000 | | | | 28,203,097 | | |
2.12%, 6/12/2018 (f) | | | 75,000,000 | | | | 74,823,520 | | |
2.15%, 6/14/2018 (f) | | | 87,663,000 | | | | 87,446,582 | | |
2.14%, 6/15/2018 (f) | | | 34,459,000 | | | | 34,371,819 | | |
2.17%, 6/18/2018 (f) | | | 86,729,000 | | | | 86,493,494 | | |
2.21%, 6/21/2018 (f) | | | 64,823,000 | | | | 64,634,797 | | |
2.25%, 7/11/2018 (f) | | | 79,024,000 | | | | 78,682,300 | | |
Mitsubishi International Corp.
1.94%, 6/1/2018 (f) | | | 62,460,000 | | | | 62,354,123 | | |
2.07%, 6/14/2018 (f) | | | 64,323,000 | | | | 64,166,213 | | |
2.24%, 6/29/2018 (f) | | | 37,025,000 | | | | 36,901,584 | | |
Mitsui & Co. USA, Inc.
1.83%, 5/1/2018 (f) | | | 1,220,000 | | | | 1,219,933 | | |
Nestle Capital Corp.
1.73%, 5/10/2018 (f) | | | 19,420,000 | | | | 19,410,781 | | |
1.76%, 5/15/2018 (f) | | | 39,013,000 | | | | 38,984,716 | | |
First Eagle Funds | Semi-Annual Report | April 30, 2018
29
First Eagle Global Fund | Consolidated Schedule of Investments | April 30, 2018 (unaudited)
Investments | | Principal Amount ($) | | Value ($) | |
Commercial Paper — 18.0% (continued) | |
1.78%, 5/16/2018 (f) | | | 44,503,000 | | | | 44,468,545 | | |
1.83%, 6/4/2018 (f) | | | 88,277,000 | | | | 88,124,832 | | |
2.01%, 6/15/2018 (f) | | | 37,411,000 | | | | 37,324,811 | | |
2.00%, 6/18/2018 (f) | | | 7,220,000 | | | | 7,202,203 | | |
Novartis Finance Corp.
1.93%, 5/16/2018 (f) | | | 40,000,000 | | | | 39,968,124 | | |
1.94%, 5/21/2018 (f) | | | 40,000,000 | | | | 39,957,767 | | |
NRW Bank
1.76%, 5/3/2018 (f) | | | 31,455,000 | | | | 31,450,712 | | |
1.81%, 5/10/2018 (f) | | | 31,722,000 | | | | 31,707,073 | | |
2.09%, 7/9/2018 (f) | | | 68,859,000 | | | | 68,573,943 | | |
2.14%, 7/12/2018 (f) | | | 41,527,000 | | | | 41,347,217 | | |
2.14%, 7/13/2018 (f) | | | 39,266,000 | | | | 39,093,515 | | |
2.14%, 7/18/2018 (f) | | | 63,201,000 | | | | 62,903,091 | | |
2.14%, 7/19/2018 (f) | | | 44,555,000 | | | | 44,342,126 | | |
2.14%, 7/20/2018 (f) | | | 67,086,000 | | | | 66,761,170 | | |
2.14%, 7/23/2018 (f) | | | 77,549,000 | | | | 77,158,515 | | |
2.14%, 7/24/2018 (f) | | | 77,549,000 | | | | 77,153,500 | | |
Ontario Teachers' Finance Trust
1.87%, 7/25/2018 (f)(g) | | | 72,918,000 | | | | 72,527,285 | | |
1.85%, 7/27/2018 (f)(g) | | | 69,662,000 | | | | 69,277,667 | | |
Pfizer, Inc.
1.86%, 6/4/2018 (f) | | | 31,634,000 | | | | 31,577,010 | | |
1.89%, 6/12/2018 (f) | | | 91,890,000 | | | | 91,684,205 | | |
1.91%, 6/13/2018 (f) | | | 91,890,000 | | | | 91,679,194 | | |
1.91%, 6/14/2018 (f) | | | 21,660,000 | | | | 21,609,099 | | |
2.01%, 7/2/2018 (f) | | | 20,658,000 | | | | 20,588,192 | | |
2.02%, 7/12/2018 (f) | | | 54,478,000 | | | | 54,260,596 | | |
2.02%, 7/13/2018 (f) | | | 61,815,000 | | | | 61,564,557 | | |
Philip Morris International, Inc.
1.83%, 5/11/2018 (f) | | | 43,339,000 | | | | 43,315,561 | | |
Procter & Gamble Co. (The)
1.64%, 5/3/2018 (f) | | | 89,372,000 | | | | 89,359,227 | | |
1.67%, 5/4/2018 (f) | | | 55,803,000 | | | | 55,792,329 | | |
1.67%, 5/7/2018 (f) | | | 30,321,000 | | | | 30,310,742 | | |
First Eagle Funds | Semi-Annual Report | April 30, 2018
30
First Eagle Global Fund | Consolidated Schedule of Investments | April 30, 2018 (unaudited)
Investments | | Principal Amount ($) | | Value ($) | |
Commercial Paper — 18.0% (continued) | |
Province of Quebec Canada
1.96%, 7/3/2018 (f) | | | 60,995,000 | | | | 60,785,177 | | |
1.95%, 7/5/2018 (f) | | | 64,694,000 | | | | 64,463,668 | | |
1.96%, 7/6/2018 (f) | | | 20,747,000 | | | | 20,671,860 | | |
1.96%, 7/10/2018 (f) | | | 52,884,000 | | | | 52,679,574 | | |
1.99%, 7/16/2018 (f) | | | 65,405,000 | | | | 65,127,730 | | |
1.97%, 7/17/2018 (f) | | | 107,281,000 | | | | 106,819,370 | | |
2.00%, 7/19/2018 (f) | | | 25,591,000 | | | | 25,477,660 | | |
2.00%, 7/20/2018 (f) | | | 77,549,000 | | | | 77,200,553 | | |
1.99%, 7/23/2018 (f) | | | 31,485,000 | | | | 31,337,482 | | |
2.00%, 7/24/2018 (f) | | | 23,379,000 | | | | 23,267,937 | | |
PSP Capital, Inc.
1.64%, 5/2/2018 (f)(g) | | | 25,949,000 | | | | 25,946,522 | | |
1.75%, 5/11/2018 (f)(g) | | | 31,718,000 | | | | 31,700,797 | | |
1.75%, 5/14/2018 (f)(g) | | | 31,718,000 | | | | 31,695,871 | | |
1.70%, 5/22/2018 (f)(g) | | | 27,395,000 | | | | 27,364,313 | | |
2.06%, 6/19/2018 (f)(g) | | | 67,383,000 | | | | 67,198,633 | | |
2.00%, 6/20/2018 (f)(g) | | | 112,050,000 | | | | 111,736,493 | | |
2.06%, 7/9/2018 (f)(g) | | | 68,859,000 | | | | 68,579,566 | | |
2.11%, 7/16/2018 (f)(g) | | | 30,627,000 | | | | 30,487,272 | | |
QUALCOMM, Inc.
1.65%, 5/8/2018 (f) | | | 83,790,000 | | | | 83,756,931 | | |
1.73%, 5/15/2018 (f) | | | 56,719,000 | | | | 56,675,988 | | |
1.96%, 5/16/2018 (f) | | | 135,131,000 | | | | 135,021,394 | | |
2.16%, 6/5/2018 (f) | | | 75,000,000 | | | | 74,856,000 | | |
2.26%, 6/6/2018 (f) | | | 40,325,000 | | | | 40,245,218 | | |
2.23%, 6/8/2018 (f) | | | 54,712,000 | | | | 54,597,310 | | |
Roche Holdings, Inc.
1.83%, 5/14/2018 (f) | | | 47,279,000 | | | | 47,246,199 | | |
Sanofi
1.80%, 5/3/2018 (f) | | | 49,360,000 | | | | 49,352,945 | | |
1.76%, 5/4/2018 (f) | | | 107,648,000 | | | | 107,627,416 | | |
1.78%, 5/7/2018 (f) | | | 133,688,000 | | | | 133,642,769 | | |
1.74%, 5/11/2018 (f) | | | 44,783,000 | | | | 44,758,848 | | |
1.87%, 6/8/2018 (f) | | | 74,404,000 | | | | 74,251,336 | | |
First Eagle Funds | Semi-Annual Report | April 30, 2018
31
First Eagle Global Fund | Consolidated Schedule of Investments | April 30, 2018 (unaudited)
Investments | | Principal Amount ($) | | Value ($) | |
Commercial Paper — 18.0% (continued) | |
Schlumberger Holdings Corp.
1.91%, 5/1/2018 (f) | | | 27,681,000 | | | | 27,679,476 | | |
2.11%, 5/14/2018 (f) | | | 44,139,000 | | | | 44,103,571 | | |
2.31%, 6/4/2018 (f) | | | 52,671,000 | | | | 52,560,135 | | |
Suncor Energy, Inc.
2.04%, 5/14/2018 (f) | | | 25,282,000 | | | | 25,259,937 | | |
Total Capital Canada Ltd.
1.74%, 5/9/2018 (f) | | | 111,958,000 | | | | 111,908,263 | | |
1.99%, 6/7/2018 (f) | | | 142,557,000 | | | | 142,258,905 | | |
2.11%, 7/6/2018 (f) | | | 119,702,000 | | | | 119,246,195 | | |
2.13%, 7/10/2018 (f) | | | 52,735,000 | | | | 52,521,165 | | |
2.13%, 7/18/2018 (f) | | | 136,238,000 | | | | 135,617,943 | | |
Unilever Capital Corp.
1.84%, 5/24/2018 (f) | | | 88,277,000 | | | | 88,168,713 | | |
2.00%, 6/4/2018 (f) | | | 54,660,000 | | | | 54,560,466 | | |
1.98%, 6/5/2018 (f) | | | 28,930,000 | | | | 28,875,727 | | |
2.06%, 7/17/2018 (f) | | | 44,645,000 | | | | 44,450,958 | | |
2.06%, 7/20/2018 (f) | | | 39,512,000 | | | | 39,332,685 | | |
UnitedHealth Group, Inc.
1.86%, 5/2/2018 (f) | | | 61,666,000 | | | | 61,659,186 | | |
1.93%, 5/18/2018 (f) | | | 76,353,000 | | | | 76,273,440 | | |
2.06%, 6/6/2018 (f) | | | 79,286,000 | | | | 79,108,762 | | |
2.16%, 6/13/2018 (f) | | | 65,747,000 | | | | 65,569,410 | | |
2.20%, 6/15/2018 (f) | | | 107,627,000 | | | | 107,321,698 | | |
VW Credit, Inc.
2.02%, 5/1/2018 (f) | | | 67,062,000 | | | | 67,057,972 | | |
Walmart, Inc.
1.92%, 5/21/2018 (f) | | | 28,485,000 | | | | 28,454,260 | | |
Walt Disney Co. (The)
1.66%, 5/15/2018 (f) | | | 43,539,000 | | | | 43,506,164 | | |
1.76%, 5/31/2018 (f) | | | 40,300,000 | | | | 40,235,349 | | |
2.06%, 7/20/2018 (f) | | | 11,974,000 | | | | 11,919,659 | | |
2.19%, 7/30/2018 (f) | | | 39,788,000 | | | | 39,581,218 | | |
2.19%, 7/31/2018 (f) | | | 39,788,000 | | | | 39,578,233 | | |
Total Commercial Paper
(Cost $10,100,936,507) | | | 10,100,806,296 | | |
First Eagle Funds | Semi-Annual Report | April 30, 2018
32
First Eagle Global Fund | Consolidated Schedule of Investments | April 30, 2018 (unaudited)
Investments | | Principal Amount ($) | | Value ($) | |
Investment Companies — 0.0% (c) | |
JP Morgan U.S. Government Money Market Fund,
Agency Shares 1.52% (h)
(Cost $238,452) | | | 238,452 | | | | 238,452 | | |
Total Short-Term Investments
(Cost $10,101,174,959) | | | 10,101,044,748 | | |
Total Investments — 99.9%
(Cost $42,249,851,015) | | | 56,038,542,656 | | |
Other Assets Less Liabilities — 0.1% | | | 79,194,743 | | |
Net Assets — 100.0% | | | 56,117,737,399 | | |
* Non-income producing security.
‡ Value determined using significant unobservable inputs.
(a) Affiliated company as defined under the Investment Company Act of 1940.
(b) Security fair valued as of April 30, 2018 in accordance with procedures approved by the Board of Trustees. Total value of all such securities at April 30, 2018 amounted to $17,786,797, which represents approximately 0.03% of net assets of the Fund.
(c) Represents less than 0.05% of net assets.
(d) Variable or floating rate security, linked to the referenced benchmark. The interest rate shown is the rate in effect as of April 30, 2018.
(e) All or a portion of this security is pledged with the custodian for current or potential holdings of forward foreign currency exchange contracts.
(f) The rate shown was the current yield as of April 30, 2018.
(g) Securities exempt from registration under Rule 144A or section 4(2), of the Securities Act of 1933. Under procedures approved by the Board of Trustees, such securities have been determined to be liquid by the investment adviser and may be resold, normally to qualified institutional buyers in transactions exempt from registration.
(h) Represents 7-day effective yield as of April 30, 2018.
(i) Defaulted security.
As of April 30, 2018, the gross unrealized appreciation (depreciation) of investments based on the aggregate cost of investment securities and derivative instruments, if applicable, for federal income tax purposes was as follows:
Aggregate gross unrealized appreciation | | $ | 15,282,065,465 | | |
Aggregate gross unrealized depreciation | | | (1,453,603,761 | ) | |
Net unrealized appreciation | | $ | 13,828,461,704 | | |
Federal income tax cost | | $ | 42,249,851,015 | | |
Forward Foreign Currency Exchange Contracts outstanding as of April 30, 2018:
Currency
Purchased | | Currency Sold | | Counterparty | | Settlement
Date | | Unrealized
Appreciation
(Depreciation) | |
USD | 33,820,757 | | | GBP | 24,132,000 | | | Bank of New York Mellon | | 5/16/2018 | | $ | 576,493 | | |
USD | 194,005,565 | | | JPY | 21,056,491,000 | | | Bank of New York Mellon | | 5/16/2018 | | | 1,211,070 | | |
First Eagle Funds | Semi-Annual Report | April 30, 2018
33
First Eagle Global Fund | Consolidated Schedule of Investments | April 30, 2018 (unaudited)
Forward Foreign Currency Exchange Contracts outstanding as of April 30, 2018 (continued)
Currency
Purchased | | Currency Sold | | Counterparty | | Settlement
Date | | Unrealized
Appreciation
(Depreciation) | |
USD | 443,519,763 | | | EUR | 365,592,000 | | | Goldman Sachs | | 6/13/2018 | | $ | 587,141 | | |
USD | 31,803,918 | | | GBP | 22,532,000 | | | Goldman Sachs | | 6/13/2018 | | | 719,628 | | |
USD | 194,230,154 | | | JPY | 21,056,491,000 | | | Goldman Sachs | | 6/13/2018 | | | 1,048,830 | | |
USD | 180,052,128 | | | EUR | 144,924,000 | | | JPMorgan Chase Bank | | 7/18/2018 | | | 3,971,475 | | |
USD | 62,165,690 | | | GBP | 44,576,000 | | | JPMorgan Chase Bank | | 7/18/2018 | | | 561,926 | | |
USD | 422,808,611 | | | JPY | 45,088,604,000 | | | JPMorgan Chase Bank | | 7/18/2018 | | | 8,101,531 | | |
USD | 38,937,415 | | | EUR | 30,974,000 | | | UBS AG | | 8/15/2018 | | | 1,217,098 | | |
USD | 92,294,219 | | | GBP | 64,722,000 | | | UBS AG | | 8/15/2018 | | | 2,726,362 | | |
USD | 423,191,829 | | | JPY | 44,218,891,000 | | | UBS AG | | 8/15/2018 | | | 15,632,369 | | |
USD | 207,104,302 | | | EUR | 166,128,000 | | | HSBC Bank plc | | 9/19/2018 | | | 4,187,627 | | |
USD | 291,732,051 | | | JPY | 30,946,936,000 | | | HSBC Bank plc | | 9/19/2018 | | | 5,725,699 | | |
Total unrealized appreciation | | | 46,267,249 | | |
USD | 194,581,542 | | | EUR | 163,193,000 | | | Bank of New York Mellon | | 5/16/2018 | | | (2,694,139 | ) | |
USD | 123,948,887 | | | JPY | 13,827,242,000 | | | Bank of New York Mellon | | 5/16/2018 | | | (2,654,171 | ) | |
USD | 82,039,186 | | | JPY | 9,067,381,000 | | | Goldman Sachs | | 6/13/2018 | | | (1,148,876 | ) | |
Total unrealized depreciation | | | (6,497,186 | ) | |
Net unrealized appreciation | | $ | 39,770,063 | | |
Abbreviations
ADR — American Depositary Receipt
CVA — Dutch Certification
EUR — Euro
GBP — British Pound
IDR — Indonesian Rupiah
JPY — Japanese Yen
MXN — Mexican Peso
MYR — Malaysian Ringgit
NVDR — Non-Voting Depositary Receipt
PJSC — Public Joint Stock Company
PLN — Polish Zloty
REIT — Real Estate Investment Trust
SGD — Singapore Dollar
USD — United States Dollar
Affiliated Securities
Security Description | | Shares at
April 30, 2018 | | Market Value
October 31, 2017 | | Purchases at
Cost | | Proceeds from
Sales | |
Berkeley Group
Holdings plc | | | 6,719,082 | | | $ | 366,860,523 | | | $ | — | | | $ | (37,763,694 | ) | |
Chofu Seisakusho
Co. Ltd. | | | 3,351,250 | | | | 83,273,333 | | | | — | | | | (1,446,361 | ) | |
First Eagle Funds | Semi-Annual Report | April 30, 2018
34
First Eagle Global Fund | Consolidated Schedule of Investments | April 30, 2018 (unaudited)
Affiliated Securities (continued)
Security Description | | Shares at
April 30, 2018 | | Market Value
October 31, 2017 | | Purchases at
Cost | | Proceeds from
Sales | |
Emin Leydier SA^ | | | — | | | $ | 53,816,069 | | | $ | — | | | $ | (84,400,895 | ) | |
Flowserve Corp. | | | 8,414,508 | | | | 370,827,368 | | | | — | | | | — | | |
Hirose Electric
Co. Ltd. | | | 2,564,415 | | | | 367,409,683 | | | | — | | | | — | | |
Hornbach Holding
AG & Co. KGaA | | | 1,181,422 | | | | 101,162,948 | | | | — | | | | — | | |
Mills Music Trust | | | 31,592 | | | | 770,845 | | | | — | | | | — | | |
Namyang Dairy
Products Co. Ltd. | | | 39,989 | | | | 23,439,818 | | | | — | | | | — | | |
NOW, Inc.* | | | 5,851,664 | | | | 73,262,833 | | | | — | | | | — | | |
NSC Groupe | | | 64,717 | | | | 5,740,670 | | | | — | | | | — | | |
Orbital ATK, Inc. | | | 3,694,106 | | | | 491,057,511 | | | | — | | | | — | | |
Sabeton SA | | | 385,000 | | | | 11,077,141 | | | | — | | | | — | | |
San Juan Basin
Royalty Trust | | | 3,908,035 | | | | 29,427,504 | | | | — | | | | — | | |
T Hasegawa Co. Ltd. | | | 3,061,300 | | | | 67,686,317 | | | | — | | | | (5,664,046 | ) | |
Teradata Corp.* | | | 12,190,179 | | | | 407,761,488 | | | | — | | | | — | | |
Vista Outdoor, Inc.* | | | 3,252,457 | | | | 68,008,876 | | | | — | | | | — | | |
Total | | | | $ | 2,521,582,927 | | | $ | — | | | $ | (129,274,996 | ) | |
Security Description | | Net Realized
Gain
(Loss) | | Change in
Unrealized
Appreciation/
(Depreciation) | | Market Value
April 30,
2018 | | Dividend/
Interest
Income | | Capital Gain
Distributions | |
Berkeley Group
Holdings plc | | $ | 21,607,307 | | | $ | 25,456,936 | | | $ | 376,161,072 | | | $ | 5,252,898 | | | $ | — | | |
Chofu Seisakusho
Co. Ltd. | | | 123,043 | | | | (2,352,488 | ) | | | 79,597,527 | | | | 432,004 | | | | — | | |
Emin Leydier SA^ | | | 84,411,612 | | | | (53,826,786 | ) | | | — | | | | 110,565 | | | | — | | |
Flowserve Corp. | | | — | | | | 2,860,932 | | | | 373,688,300 | | | | 3,197,513 | | | | — | | |
Hirose Electric Co. Ltd. | | | — | | | | (6,536,747 | ) | | | 360,872,936 | | | | 4,931,403 | | | | — | | |
Hornbach Holding
AG & Co. KGaA | | | — | | | | (6,227,964 | ) | | | 94,934,984 | | | | — | | | | — | | |
Mills Music Trust | | | — | | | | (56,550 | ) | | | 714,295 | | | | 34,010 | | | | — | | |
Namyang Dairy
Products Co. Ltd. | | | — | | | | 1,945,269 | | | | 25,385,087 | | | | 29,151 | | | | — | | |
NOW, Inc.* | | | — | | | | (2,282,149 | ) | | | 70,980,684 | | | | — | | | | — | | |
NSC Groupe | | | — | | | | 667,815 | | | | 6,408,485 | | | | — | | | | — | | |
Orbital ATK, Inc. | | | — | | | | (2,031,759 | ) | | | 489,025,752 | | | | 2,364,228 | | | | — | | |
First Eagle Funds | Semi-Annual Report | April 30, 2018
35
First Eagle Global Fund | Consolidated Schedule of Investments | April 30, 2018 (unaudited)
Affiliated Securities (continued)
Security Description | | Net Realized
Gain
(Loss) | | Change in
Unrealized
Appreciation/
(Depreciation) | | Market Value
April 30,
2018 | | Dividend/
Interest
Income | | Capital Gain
Distributions | |
Sabeton SA | | $ | — | | | $ | 360,039 | | | $ | 11,437,180 | | | $ | — | | | $ | — | | |
San Juan Basin
Royalty Trust | | | — | | | | (2,540,223 | ) | | | 26,887,281 | | | | 1,243,427 | | | | — | | |
T Hasegawa Co. Ltd. | | | 1,399,654 | | | | 2,382,030 | | | | 65,803,955 | | | | 520,198 | | | | — | | |
Teradata Corp.* | | | — | | | | 91,060,637 | | | | 498,822,125 | | | | — | | | | — | | |
Vista Outdoor, Inc.* | | | — | | | | (13,530,221 | ) | | | 54,478,655 | | | | — | | | | — | | |
Total | | $ | 107,541,616 | | | $ | 35,348,771 | | | $ | 2,535,198,318 | | | $ | 18,115,397 | | | $ | — | | |
* Non-income producing security.
^ Represents an unaffiliated issuer as of April 30, 2018.
See Notes to Financial Statements.
First Eagle Funds | Semi-Annual Report | April 30, 2018
36
This page was intentionally left blank.
First Eagle Overseas Fund
Data as of April 30, 2018 (unaudited)
Investment Objective
The First Eagle Overseas Fund seeks long-term growth of capital by investing primarily in equities issued by non-U.S. corporations. Management's research-driven process focuses on undervalued securities.
Average Annual Returns (%) | | | | | | One-Year | | Five-Years | | Ten-Years | |
| First Eagle Overseas Fund | | Class A | | without sales load | | | 5.88 | | | | 4.99 | | | | 5.06 | | |
| | | | with sales load | | | 0.60 | | | | 3.92 | | | | 4.53 | | |
MSCI EAFE Index | | | | | | | 14.51 | | | | 5.90 | | | | 2.43 | | |
Consumer Price Index | | | | | | | 2.46 | | | | 1.51 | | | | 1.55 | | |
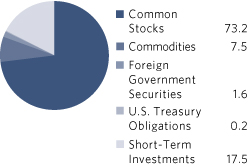
Sectors* (%) | |
Industrials | | | 11.6 | | |
Financials | | | 10.8 | | |
Materials | | | 10.8 | | |
Consumer Staples | | | 10.5 | | |
Commodities | | | 7.5 | | |
Consumer Discretionary | | | 6.5 | | |
Health Care | | | 6.3 | | |
Real Estate | | | 4.6 | | |
Energy | | | 4.4 | | |
Telecommunication Services | | | 4.3 | | |
Information Technology | | | 3.4 | | |
Foreign Government Securities | | | 1.6 | | |
U.S. Treasury Obligations | | | 0.2 | | |
Short-Term Investments | | | 17.5 | | |
Countries*~ (%)
Japan | | | 21.8 | | |
United States | | | 9.1 | | |
France | | | 9.0 | | |
United Kingdom | | | 8.4 | | |
Canada | | | 6.2 | | |
Hong Kong | | | 5.0 | | |
Switzerland | | | 3.3 | | |
South Korea | | | 3.3 | | |
Germany | | | 3.0 | | |
Singapore | | | 2.3 | | |
Mexico | | | 1.7 | | |
Sweden | | | 1.3 | | |
Thailand | | | 1.1 | | |
Chile | | | 0.8 | | |
Brazil | | | 0.8 | | |
Belgium | | | 0.7 | | |
Norway | | | 0.7 | | |
Australia | | | 0.6 | | |
Netherlands | | | 0.6 | | |
Denmark | | | 0.5 | | |
Greece | | | 0.5 | | |
Ireland | | | 0.4 | | |
Poland | | | 0.3 | | |
Russia | | | 0.2 | | |
Israel | | | 0.2 | | |
Turkey | | | 0.2 | | |
Taiwan | | | 0.2 | | |
Italy | | | 0.1 | | |
Indonesia | | | 0.1 | | |
Africa | | | 0.1 | | |
Malaysia | | | 0.0 | ^ | |
Short-Term Investments | | | 17.5 | | |
^ Less than 0.05%
* Asset Allocation, Sector and Countries percentages are based on total investments in the portfolio.
~ Country allocations reflect country of risk (not currency of issue). Bonds of non-U.S. issuers may be U.S. dollar denominated.
The Fund's portfolio composition is subject to change at any time.
First Eagle Funds | Semi-Annual Report | April 30, 2018
38
First Eagle Overseas Fund | Fund Overview
Growth of a $10,000 Initial Investment
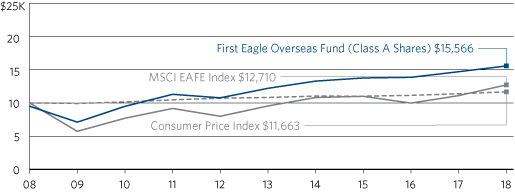
Performance data quoted herein represents past performance and should not be considered indicative of future results. Performance data quoted herein does not reflect the deduction of taxes that a shareholder would pay on Fund distributions or the sale of Fund shares. The average annual returns shown above are historical and reflect changes in share price, reinvested dividends and are net of expenses.
The average annual returns for Class A Shares give effect to the deduction of the maximum sales charge of 5.00%.
The MSCI EAFE Index is an unmanaged total return index, reported in U.S. dollars, based on share prices and reinvested net dividends of approximately 1,100 companies from 21 developed market countries. One cannot invest directly in an index. The Consumer Price Index (CPI) represents the change in price of all goods and services purchased for consumption by urban households.
Top 10 Holdings* (%)
Gold bullion** (Precious Metal) | | | 7.5 | | |
KDDI Corp. (Wireless Telecommunication Services, Japan) | | | 2.6 | | |
FANUC Corp. (Machinery, Japan) | | | 2.5 | | |
TechnipFMC plc (Energy Equipment & Services, United Kingdom) | | | 2.1 | | |
Sompo Holdings, Inc. (Insurance, Japan) | | | 1.9 | | |
Danone SA (Food Products, France) | | | 1.9 | | |
Nestle SA (Registered) (Food Products, Switzerland) | | | 1.9 | | |
Secom Co. Ltd. (Commercial Services & Supplies, Japan) | | | 1.9 | | |
Nutrien Ltd. (Chemicals, Canada) | | | 1.8 | | |
Mitsubishi Estate Co. Ltd. (Real Estate Management & Development, Japan) | | | 1.7 | | |
Total | | | 25.8 | | |
* Holdings in cash, commercial paper and other short-term cash equivalents have been excluded.
**The Fund invests in gold and precious metals through investment in a wholly-owned subsidiary of the Fund organized under the laws of the Cayman Islands (the "Subsidiary"). Gold Bullion and commodities include the Fund's investment in the Subsidiary.
Percentages are based on total net assets.
First Eagle Funds | Semi-Annual Report | April 30, 2018
39
First Eagle Overseas Fund | Consolidated Schedule of Investments | April 30, 2018 (unaudited)
Investments | | Shares | | Value ($) | |
Common Stocks — 72.7% | |
Africa — 0.1% | |
Randgold Resources Ltd., ADR | | | 118,663 | | | | 9,623,569 | | |
Australia — 0.6% | |
Newcrest Mining Ltd. | | | 7,061,240 | | | | 111,920,375 | | |
Belgium — 0.7% | |
Groupe Bruxelles Lambert SA | | | 907,727 | | | | 103,759,523 | | |
Sofina SA | | | 98,473 | | | | 17,189,889 | | |
| | | | 120,949,412 | | |
Brazil — 0.8% | |
Cielo SA | | | 24,763,630 | | | | 135,722,110 | | |
Canada — 6.2% | |
Agnico Eagle Mines Ltd. | | | 1,977,932 | | | | 83,233,511 | | |
Barrick Gold Corp. | | | 4,694,846 | | | | 63,239,576 | | |
Canadian Natural Resources Ltd. | | | 1,096,974 | | | | 39,574,622 | | |
Cenovus Energy, Inc. | | | 9,854,984 | | | | 98,845,489 | | |
Franco-Nevada Corp. | | | 882,841 | | | | 62,619,518 | | |
Goldcorp, Inc. | | | 7,294,482 | | | | 96,943,666 | | |
Imperial Oil Ltd. | | | 6,877,585 | | | | 213,888,367 | | |
Nutrien Ltd. | | | 7,058,038 | | | | 321,352,470 | | |
Suncor Energy, Inc. | | | 659,849 | | | | 25,233,526 | | |
Wheaton Precious Metals Corp. | | | 4,232,770 | | | | 87,999,288 | | |
| | | | 1,092,930,033 | | |
Chile — 0.8% | |
Cia Cervecerias Unidas SA, ADR | | | 5,109,630 | | | | 141,127,981 | | |
Denmark — 0.5% | |
ISS A/S | | | 2,727,957 | | | | 95,135,181 | | |
France — 9.0% | |
Bouygues SA | | | 2,770,374 | | | | 141,303,315 | | |
Carrefour SA | | | 2,899,191 | | | | 59,483,909 | | |
Cie de Saint-Gobain | | | 3,533,820 | | | | 184,893,212 | | |
Danone SA | | | 4,221,140 | | | | 341,936,877 | | |
Laurent-Perrier (a) | | | 558,938 | | | | 70,623,939 | | |
Legrand SA | | | 648,834 | | | | 50,487,697 | | |
Legris Industries SA‡ (a)(b)(c) | | | 905,366 | | | | 36,538,754 | | |
Neopost SA | | | 71,800 | | | | 1,937,399 | | |
First Eagle Funds | Semi-Annual Report | April 30, 2018
40
First Eagle Overseas Fund | Consolidated Schedule of Investments | April 30, 2018 (unaudited)
Investments | | Shares | | Value ($) | |
France — 9.0% (continued) | |
Rexel SA | | | 7,346,731 | | | | 113,887,320 | | |
Robertet SA (a) | | | 196,831 | | | | 118,371,172 | | |
Robertet SA CI (non-voting)‡ (b) | | | 51,500 | | | | 21,679,922 | | |
Sabeton SA | | | 100,000 | | | | 2,970,696 | | |
Sanofi | | | 2,558,177 | | | | 202,255,417 | | |
Sodexo SA | | | 1,610,285 | | | | 159,464,007 | | |
Wendel SA | | | 493,657 | | | | 74,558,421 | | |
| | | | 1,580,392,057 | | |
Germany — 3.0% | |
Hamburger Hafen und Logistik AG | | | 1,449,647 | | | | 34,809,543 | | |
HeidelbergCement AG | | | 2,786,826 | | | | 272,515,833 | | |
Hornbach Holding AG & Co. KGaA | | | 385,305 | | | | 30,961,776 | | |
Linde AG* | | | 434,377 | | | | 96,229,909 | | |
Telefonica Deutschland Holding AG | | | 19,522,787 | | | | 93,172,981 | | |
| | | | 527,690,042 | | |
Greece — 0.5% | |
JUMBO SA | | | 5,079,219 | | | | 92,972,461 | | |
Hong Kong — 5.0% | |
CK Asset Holdings Ltd. | | | 5,217,582 | | | | 45,043,211 | | |
Great Eagle Holdings Ltd. | | | 22,777,700 | | | | 115,056,930 | | |
Guoco Group Ltd. | | | 7,806,340 | | | | 103,512,788 | | |
Hang Lung Properties Ltd. | | | 78,545,392 | | | | 185,883,502 | | |
Hopewell Holdings Ltd. | | | 21,050,581 | | | | 74,673,053 | | |
Hysan Development Co. Ltd. | | | 17,500,405 | | | | 101,855,387 | | |
Jardine Matheson Holdings Ltd. | | | 3,632,500 | | | | 219,961,428 | | |
Jardine Strategic Holdings Ltd. | | | 233,600 | | | | 8,840,675 | | |
Swire Properties Ltd. | | | 5,454,119 | | | | 19,359,345 | | |
| | | | 874,186,319 | | |
Ireland — 0.4% | |
CRH plc | | | 2,108,597 | | | | 74,836,398 | | |
Israel — 0.2% | |
Israel Chemicals Ltd. | | | 7,510,515 | | | | 33,563,428 | | |
Italy — 0.1% | |
Italmobiliare SpA | | | 575,830 | | | | 15,611,108 | | |
First Eagle Funds | Semi-Annual Report | April 30, 2018
41
First Eagle Overseas Fund | Consolidated Schedule of Investments | April 30, 2018 (unaudited)
Investments | | Shares | | Value ($) | |
Japan — 21.7% | |
As One Corp. (a) | | | 1,299,640 | | | | 88,271,610 | | |
Astellas Pharma, Inc. | | | 6,366,400 | | | | 93,116,458 | | |
Chofu Seisakusho Co. Ltd. (a) | | | 1,845,000 | | | | 43,821,690 | | |
Daiichikosho Co. Ltd. | | | 2,715,380 | | | | 142,467,824 | | |
FANUC Corp. | | | 2,072,940 | | | | 444,045,796 | | |
Hirose Electric Co. Ltd. | | | 1,140,930 | | | | 160,555,432 | | |
Hoya Corp. | | | 4,065,130 | | | | 217,178,953 | | |
Kansai Paint Co. Ltd. | | | 3,559,930 | | | | 79,990,715 | | |
KDDI Corp. | | | 16,995,400 | | | | 456,217,805 | | |
Keyence Corp. | | | 478,700 | | | | 291,901,502 | | |
Maezawa Kasei Industries Co. Ltd. (a) | | | 924,200 | | | | 10,172,746 | | |
Mitsubishi Estate Co. Ltd. | | | 16,844,350 | | | | 307,789,237 | | |
MS&AD Insurance Group Holdings, Inc. | | | 4,625,500 | | | | 155,861,957 | | |
Nagaileben Co. Ltd. | | | 1,687,224 | | | | 44,621,704 | | |
Nissin Foods Holdings Co. Ltd. | | | 1,056,530 | | | | 77,796,735 | | |
NTT DOCOMO, Inc. | | | 7,882,300 | | | | 203,631,418 | | |
Secom Co. Ltd. | | | 4,481,900 | | | | 336,249,118 | | |
Shimano, Inc. | | | 835,470 | | | | 111,091,370 | | |
SK Kaken Co. Ltd. | | | 437,806 | | | | 44,653,649 | | |
SMC Corp. | | | 332,490 | | | | 126,343,856 | | |
Sompo Holdings, Inc. | | | 8,193,900 | | | | 343,079,551 | | |
T Hasegawa Co. Ltd. | | | 1,943,011 | | | | 41,765,854 | | |
| | | | 3,820,624,980 | | |
Mexico — 0.8% | |
Fresnillo plc | | | 5,813,900 | | | | 102,045,675 | | |
Industrias Penoles SAB de CV | | | 2,246,692 | | | | 47,156,140 | | |
| | | | 149,201,815 | | |
Netherlands — 0.6% | |
HAL Trust | | | 571,392 | | | | 105,555,134 | | |
Norway — 0.7% | |
Orkla ASA | | | 13,188,419 | | | | 122,061,319 | | |
Russia — 0.2% | |
Gazprom PJSC, ADR | | | 8,419,603 | | | | 38,852,207 | | |
First Eagle Funds | Semi-Annual Report | April 30, 2018
42
First Eagle Overseas Fund | Consolidated Schedule of Investments | April 30, 2018 (unaudited)
Investments | | Shares | | Value ($) | |
Singapore — 1.8% | |
ComfortDelGro Corp. Ltd. | | | 32,779,415 | | | | 55,324,731 | | |
Haw Par Corp. Ltd. (a) | | | 25,512,113 | | | | 268,011,866 | | |
| | | | 323,336,597 | | |
South Korea — 3.3% | |
Fursys, Inc. (a) | | | 872,463 | | | | 25,159,740 | | |
Hyundai Mobis Co. Ltd. | | | 373,109 | | | | 86,405,929 | | |
Kia Motors Corp. | | | 4,849,974 | | | | 149,741,444 | | |
KT&G Corp. | | | 2,026,271 | | | | 185,286,954 | | |
Lotte Confectionery Co. Ltd. | | | 104,605 | | | | 18,566,583 | | |
Lotte Corp.* | | | 621,610 | | | | 37,767,354 | | |
Namyang Dairy Products Co. Ltd. | | | 22,950 | | | | 14,568,700 | | |
Namyang Dairy Products Co. Ltd. (Preference) | | | 27,183 | | | | 5,471,977 | | |
NongShim Co. Ltd. | | | 203,663 | | | | 61,557,241 | | |
| | | | 584,525,922 | | |
Sweden — 1.3% | |
Investor AB, Class A | | | 3,013,030 | | | | 128,951,954 | | |
Investor AB, Class B | | | 2,096,088 | | | | 91,251,105 | | |
| | | | 220,203,059 | | |
Switzerland — 3.3% | |
Cie Financiere Richemont SA (Registered) | | | 252,160 | | | | 23,970,013 | | |
Nestle SA (Registered) | | | 4,343,839 | | | | 336,517,611 | | |
Pargesa Holding SA | | | 2,413,791 | | | | 225,906,008 | | |
| | | | 586,393,632 | | |
Taiwan — 0.1% | |
Taiwan Secom Co. Ltd. | | | 8,545,694 | | | | 25,684,491 | | |
Thailand — 1.1% | |
Bangkok Bank PCL, NVDR | | | 25,121,159 | | | | 152,952,971 | | |
Bangkok Bank PCL | | | 15,000 | | | | 95,534 | | |
Thai Beverage PCL | | | 52,214,985 | | | | 33,568,329 | | |
| | | | 186,616,834 | | |
Turkey — 0.2% | |
AG Anadolu Grubu Holding A/S | | | 5,893,909 | | | | 31,761,154 | | |
United Kingdom — 8.4% | |
Berkeley Group Holdings plc | | | 3,051,776 | | | | 170,850,621 | | |
First Eagle Funds | Semi-Annual Report | April 30, 2018
43
First Eagle Overseas Fund | Consolidated Schedule of Investments | April 30, 2018 (unaudited)
Investments | | Shares | | Value ($) | |
United Kingdom — 8.4% (continued) | |
British American Tobacco plc | | | 3,110,617 | | | | 170,609,597 | | |
BT Group plc | | | 234,265 | | | | 804,078 | | |
Diageo plc | | | 5,378,305 | | | | 191,869,370 | | |
GlaxoSmithKline plc | | | 8,720,208 | | | | 174,902,667 | | |
Hiscox Ltd. | | | 5,881,403 | | | | 120,266,181 | | |
Liberty Global plc, Class C* | | | 2,684,482 | | | | 78,118,426 | | |
Lloyds Banking Group plc | | | 130,723,190 | | | | 115,944,571 | | |
TechnipFMC plc | | | 11,366,709 | | | | 374,646,729 | | |
Unilever NV, CVA | | | 405,816 | | | | 23,264,858 | | |
WPP plc | | | 3,299,895 | | | | 56,626,624 | | |
| | | | 1,477,903,722 | | |
United States — 1.3% | |
Newmont Mining Corp. | | | 1,435,420 | | | | 56,397,652 | | |
Royal Gold, Inc. | | | 551,449 | | | | 48,968,671 | | |
Willis Towers Watson plc | | | 841,188 | | | | 124,924,831 | | |
| | | | 230,291,154 | | |
Total Common Stocks
(Cost $9,098,896,545) | | | 12,809,672,494 | | |
| | | Ounces | | | |
Commodities — 7.5% | |
Gold bullion*
(Cost $943,895,802) | | | 1,003,583 | | | | 1,319,279,858 | | |
| | | Principal Amount ($) | | | |
Foreign Government Securities — 1.6% | |
Indonesia — 0.1% | |
Indonesia Treasury Bond
8.25%, 7/15/2021 | | IDR | 152,606,000,000 | | | | 11,517,434 | | |
Malaysia — 0.0% (d) | |
Malaysia Government Bond
3.66%, 10/15/2020 | | MYR | 25,956,000 | | | | 6,615,032 | | |
Mexico — 0.8% | |
Mexican Bonos
4.75%, 6/14/2018 | | MXN | 1,249,660,000 | | | | 66,515,384 | | |
First Eagle Funds | Semi-Annual Report | April 30, 2018
44
First Eagle Overseas Fund | Consolidated Schedule of Investments | April 30, 2018 (unaudited)
Investments | | Principal Amount ($) | | Value ($) | |
Mexico — 0.8% (continued) | |
5.00%, 12/11/2019 | | MXN | 480,074,000 | | | | 24,767,820 | | |
6.50%, 6/10/2021 | | MXN | 1,025,590,000 | | | | 53,507,446 | | |
| | | | 144,790,650 | | |
Poland — 0.3% | |
Poland Government Bond
3.25%, 7/25/2019 | | PLN | 157,760,000 | | | | 45,981,589 | | |
Singapore — 0.4% | |
Singapore Government Bond
3.25%, 9/1/2020 | | SGD | 53,521,000 | | | | 41,538,431 | | |
2.25%, 6/1/2021 | | SGD | 46,160,000 | | | | 34,989,002 | | |
| | | | 76,527,433 | | |
Total Foreign Government Securities
(Cost $298,160,684) | | | 285,432,138 | | |
U.S. Treasury Obligations — 0.2% | |
U.S. Treasury Notes
1.13%, 1/15/2019 (e)
(Cost $35,800,083) | | | 35,977,000 | | | | 35,709,983 | | |
Short-Term Investments — 17.4% | |
Commercial Paper — 17.4% | |
American Honda Finance Corp.
1.69%, 5/4/2018 (f) | | | 4,542,000 | | | | 4,541,121 | | |
2.01%, 6/6/2018 (f) | | | 6,786,000 | | | | 6,772,895 | | |
2.01%, 6/13/2018 (f) | | | 17,539,000 | | | | 17,498,335 | | |
2.00%, 6/18/2018 (f) | | | 19,317,000 | | | | 19,266,755 | | |
2.06%, 6/19/2018 (f) | | | 26,124,000 | | | | 26,054,590 | | |
2.16%, 7/6/2018 (f) | | | 21,201,000 | | | | 21,123,427 | | |
2.18%, 7/10/2018 (f) | | | 28,105,000 | | | | 27,995,250 | | |
Apple, Inc.
1.61%, 5/2/2018 (f)(g) | | | 37,460,000 | | | | 37,456,404 | | |
1.64%, 5/8/2018 (f)(g) | | | 17,735,000 | | | | 17,728,131 | | |
1.62%, 5/10/2018 (f)(g) | | | 23,477,000 | | | | 23,465,607 | | |
1.70%, 5/21/2018 (f)(g) | | | 10,889,000 | | | | 10,877,693 | | |
1.66%, 5/22/2018 (f)(g) | | | 10,765,000 | | | | 10,753,270 | | |
1.75%, 5/23/2018 (f)(g) | | | 13,334,000 | | | | 13,318,777 | | |
First Eagle Funds | Semi-Annual Report | April 30, 2018
45
First Eagle Overseas Fund | Consolidated Schedule of Investments | April 30, 2018 (unaudited)
Investments | | Principal Amount ($) | | Value ($) | |
Commercial Paper — 17.4% (continued) | |
1.88%, 6/5/2018 (f)(g) | | | 12,975,000 | | | | 12,951,308 | | |
1.90%, 6/12/2018 (f)(g) | | | 12,975,000 | | | | 12,946,406 | | |
1.92%, 6/20/2018 (f)(g) | | | 4,667,000 | | | | 4,654,663 | | |
1.96%, 7/13/2018 (f)(g) | | | 21,469,000 | | | | 21,383,342 | | |
AstraZeneca Pharmaceuticals LP
2.33%, 6/14/2018 (f) | | | 12,589,000 | | | | 12,558,078 | | |
AstraZeneca plc
2.03%, 5/1/2018 (f) | | | 31,012,000 | | | | 31,010,508 | | |
2.22%, 5/10/2018 (f) | | | 15,393,000 | | | | 15,385,351 | | |
2.21%, 6/5/2018 (f) | | | 14,886,000 | | | | 14,857,419 | | |
2.21%, 6/6/2018 (f) | | | 33,883,000 | | | | 33,815,963 | | |
2.25%, 6/8/2018 (f) | | | 21,877,000 | | | | 21,831,140 | | |
2.24%, 6/11/2018 (f) | | | 17,165,000 | | | | 17,125,950 | | |
2.37%, 6/19/2018 (f) | | | 14,574,000 | | | | 14,533,719 | | |
2.47%, 7/19/2018 (f) | | | 16,457,000 | | | | 16,377,531 | | |
BASF SE
1.98%, 6/1/2018 (f) | | | 10,212,000 | | | | 10,195,071 | | |
1.99%, 6/12/2018 (f) | | | 6,569,000 | | | | 6,554,131 | | |
1.99%, 6/13/2018 (f) | | | 6,569,000 | | | | 6,553,769 | | |
BP Capital Markets plc
2.21%, 7/12/2018 (f) | | | 7,198,000 | | | | 7,165,437 | | |
2.21%, 7/19/2018 (f) | | | 8,768,000 | | | | 8,723,926 | | |
2.21%, 7/23/2018 (f) | | | 16,457,000 | | | | 16,369,487 | | |
CenterPoint Energy, Inc.
2.10%, 5/1/2018 (f) | | | 11,759,000 | | | | 11,758,294 | | |
Chevron Corp.
1.73%, 5/25/2018 (f) | | | 17,779,000 | | | | 17,756,887 | | |
Coca-Cola Co. (The)
1.62%, 5/1/2018 (f) | | | 16,762,000 | | | | 16,761,198 | | |
1.63%, 5/3/2018 (f) | | | 19,960,000 | | | | 19,957,114 | | |
1.72%, 5/14/2018 (f) | | | 12,798,000 | | | | 12,789,022 | | |
1.76%, 5/17/2018 (f) | | | 8,106,000 | | | | 8,099,045 | | |
1.94%, 6/22/2018 (f) | | | 25,457,000 | | | | 25,385,004 | | |
2.03%, 6/25/2018 (f) | | | 19,463,000 | | | | 19,404,598 | | |
1.96%, 6/26/2018 (f) | | | 11,443,000 | | | | 11,407,996 | | |
1.95%, 6/27/2018 (f) | | | 21,651,000 | | | | 21,583,503 | | |
First Eagle Funds | Semi-Annual Report | April 30, 2018
46
First Eagle Overseas Fund | Consolidated Schedule of Investments | April 30, 2018 (unaudited)
Investments | | Principal Amount ($) | | Value ($) | |
Commercial Paper — 17.4% (continued) | |
2.04%, 7/16/2018 (f) | | | 23,090,000 | | | | 22,991,127 | | |
Diageo Capital plc
2.21%, 6/1/2018 (f) | | | 33,883,000 | | | | 33,812,523 | | |
2.21%, 6/5/2018 (f) | | | 11,760,000 | | | | 11,732,247 | | |
2.41%, 6/11/2018 (f) | | | 18,556,000 | | | | 18,504,260 | | |
2.52%, 6/14/2018 (f) | | | 19,459,000 | | | | 19,400,501 | | |
Eli Lilly & Co.
1.80%, 5/11/2018 (f) | | | 6,569,000 | | | | 6,565,457 | | |
1.80%, 5/14/2018 (f) | | | 6,569,000 | | | | 6,564,443 | | |
Engie SA
1.65%, 5/2/2018 (f) | | | 16,908,000 | | | | 16,906,366 | | |
1.66%, 5/9/2018 (f) | | | 11,973,000 | | | | 11,967,666 | | |
1.69%, 5/10/2018 (f) | | | 17,842,000 | | | | 17,833,134 | | |
1.70%, 5/30/2018 (f) | | | 8,889,000 | | | | 8,875,000 | | |
2.16%, 7/16/2018 (f) | | | 12,710,000 | | | | 12,651,008 | | |
2.14%, 7/19/2018 (f) | | | 15,733,000 | | | | 15,656,328 | | |
Eni Finance USA, Inc.
2.19%, 5/1/2018 (f) | | | 11,630,000 | | | | 11,629,360 | | |
Erste Abwicklungsanstalt
1.76%, 5/2/2018 (f)(g) | | | 18,545,000 | | | | 18,543,229 | | |
Export Development Corp.
1.66%, 5/18/2018 (f) | | | 5,849,000 | | | | 5,843,736 | | |
1.99%, 6/28/2018 (f) | | | 14,886,000 | | | | 14,839,232 | | |
Henkel of America, Inc.
1.96%, 5/9/2018 (f) | | | 11,194,000 | | | | 11,189,013 | | |
2.09%, 7/18/2018 (f) | | | 7,929,000 | | | | 7,891,295 | | |
HP, Inc.
2.67%, 6/8/2018 (f) | | | 13,900,000 | | | | 13,871,630 | | |
2.72%, 6/15/2018 (f) | | | 25,457,000 | | | | 25,395,099 | | |
Intel Corp.
1.96%, 6/21/2018 (f) | | | 25,951,000 | | | | 25,879,816 | | |
John Deere Financial Ltd.
1.82%, 5/11/2018 (f) | | | 4,887,000 | | | | 4,884,335 | | |
1.93%, 5/17/2018 (f) | | | 20,288,000 | | | | 20,270,592 | | |
2.08%, 6/12/2018 (f) | | | 14,574,000 | | | | 14,541,012 | | |
Kreditanstalt fuer Wiederaufbau
1.70%, 5/8/2018 (f) | | | 61,210,000 | | | | 61,187,407 | | |
First Eagle Funds | Semi-Annual Report | April 30, 2018
47
First Eagle Overseas Fund | Consolidated Schedule of Investments | April 30, 2018 (unaudited)
Investments | | Principal Amount ($) | | Value ($) | |
Commercial Paper — 17.4% (continued) | |
2.02%, 6/7/2018 (f) | | | 15,535,000 | | | | 15,504,663 | | |
2.19%, 7/5/2018 (f) | | | 34,883,000 | | | | 34,756,311 | | |
2.11%, 7/11/2018 (f) | | | 33,007,000 | | | | 32,873,058 | | |
LVMH Moet Hennessy Louis Vuitton, Inc.
1.86%, 5/15/2018 (f) | | | 13,411,000 | | | | 13,400,606 | | |
1.86%, 5/17/2018 (f) | | | 22,799,000 | | | | 22,778,900 | | |
MetLife Short Term Funding LLC
1.64%, 5/1/2018 (f) | | | 7,062,000 | | | | 7,061,674 | | |
1.66%, 5/7/2018 (f) | | | 3,078,000 | | | | 3,076,971 | | |
1.91%, 5/22/2018 (f) | | | 20,117,000 | | | | 20,094,244 | | |
2.06%, 6/1/2018 (f) | | | 19,234,000 | | | | 19,200,747 | | |
2.13%, 6/11/2018 (f) | | | 10,482,000 | | | | 10,457,933 | | |
2.15%, 6/14/2018 (f) | | | 12,337,000 | | | | 12,306,543 | | |
2.14%, 6/15/2018 (f) | | | 3,041,000 | | | | 3,033,306 | | |
2.17%, 6/18/2018 (f) | | | 14,771,000 | | | | 14,730,891 | | |
2.21%, 6/21/2018 (f) | | | 31,377,000 | | | | 31,285,902 | | |
2.25%, 7/11/2018 (f) | | | 20,976,000 | | | | 20,885,300 | | |
Mitsubishi International Corp.
1.94%, 6/1/2018 (f) | | | 21,890,000 | | | | 21,852,894 | | |
2.07%, 6/14/2018 (f) | | | 5,677,000 | | | | 5,663,162 | | |
2.24%, 6/29/2018 (f) | | | 12,975,000 | | | | 12,931,750 | | |
Mitsui & Co. USA, Inc.
1.83%, 5/1/2018 (f) | | | 12,327,000 | | | | 12,326,321 | | |
Nestle Capital Corp.
1.73%, 5/10/2018 (f) | | | 6,680,000 | | | | 6,676,829 | | |
1.76%, 5/15/2018 (f) | | | 22,487,000 | | | | 22,470,697 | | |
1.78%, 5/16/2018 (f) | | | 27,947,000 | | | | 27,925,363 | | |
1.83%, 6/4/2018 (f) | | | 9,774,000 | | | | 9,757,152 | | |
2.01%, 6/15/2018 (f) | | | 12,589,000 | | | | 12,559,997 | | |
2.00%, 6/18/2018 (f) | | | 2,780,000 | | | | 2,773,147 | | |
NRW Bank
1.76%, 5/3/2018 (f) | | | 18,545,000 | | | | 18,542,472 | | |
1.81%, 5/10/2018 (f) | | | 18,278,000 | | | | 18,269,399 | | |
2.09%, 7/9/2018 (f) | | | 31,141,000 | | | | 31,012,085 | | |
2.14%, 7/12/2018 (f) | | | 8,473,000 | | | | 8,436,318 | | |
First Eagle Funds | Semi-Annual Report | April 30, 2018
48
First Eagle Overseas Fund | Consolidated Schedule of Investments | April 30, 2018 (unaudited)
Investments | | Principal Amount ($) | | Value ($) | |
Commercial Paper — 17.4% (continued) | |
2.14%, 7/13/2018 (f) | | | 10,734,000 | | | | 10,686,849 | | |
2.14%, 7/18/2018 (f) | | | 11,799,000 | | | | 11,743,383 | | |
2.14%, 7/19/2018 (f) | | | 30,445,000 | | | | 30,299,540 | | |
2.14%, 7/20/2018 (f) | | | 32,914,000 | | | | 32,754,630 | | |
2.14%, 7/23/2018 (f) | | | 22,451,000 | | | | 22,337,952 | | |
2.14%, 7/24/2018 (f) | | | 22,451,000 | | | | 22,336,500 | | |
Ontario Teachers' Finance Trust
1.52%, 5/17/2018 (f)(g) | | | 48,300,000 | | | | 48,257,600 | | |
1.53%, 6/7/2018 (f)(g) | | | 21,232,000 | | | | 21,188,073 | | |
1.87%, 7/25/2018 (f)(g) | | | 17,082,000 | | | | 16,990,470 | | |
1.85%, 7/27/2018 (f)(g) | | | 10,338,000 | | | | 10,280,964 | | |
Pfizer, Inc.
1.86%, 6/4/2018 (f) | | | 11,443,000 | | | | 11,422,385 | | |
1.89%, 6/12/2018 (f) | | | 8,110,000 | | | | 8,091,837 | | |
1.91%, 6/13/2018 (f) | | | 8,110,000 | | | | 8,091,395 | | |
1.91%, 6/14/2018 (f) | | | 8,340,000 | | | | 8,320,401 | | |
2.01%, 7/2/2018 (f) | | | 9,342,000 | | | | 9,310,431 | | |
2.02%, 7/12/2018 (f) | | | 20,522,000 | | | | 20,440,104 | | |
2.02%, 7/13/2018 (f) | | | 18,185,000 | | | | 18,111,323 | | |
Philip Morris International, Inc.
1.83%, 5/11/2018 (f) | | | 11,661,000 | | | | 11,654,693 | | |
Procter & Gamble Co. (The)
1.64%, 5/3/2018 (f) | | | 10,628,000 | | | | 10,626,481 | | |
1.67%, 5/4/2018 (f) | | | 19,197,000 | | | | 19,193,329 | | |
1.67%, 5/7/2018 (f) | | | 9,679,000 | | | | 9,675,726 | | |
Province of Quebec Canada
1.96%, 7/3/2018 (f) | | | 34,883,000 | | | | 34,763,003 | | |
1.95%, 7/5/2018 (f) | | | 17,406,000 | | | | 17,344,029 | | |
1.96%, 7/6/2018 (f) | | | 27,253,000 | | | | 27,154,297 | | |
1.96%, 7/10/2018 (f) | | | 23,916,000 | | | | 23,823,551 | | |
1.99%, 7/16/2018 (f) | | | 13,345,000 | | | | 13,288,427 | | |
1.97%, 7/17/2018 (f) | | | 47,719,000 | | | | 47,513,665 | | |
2.00%, 7/19/2018 (f) | | | 7,409,000 | | | | 7,376,187 | | |
2.00%, 7/20/2018 (f) | | | 22,451,000 | | | | 22,350,122 | | |
1.99%, 7/23/2018 (f) | | | 21,515,000 | | | | 21,414,195 | | |
2.00%, 7/24/2018 (f) | | | 11,471,000 | | | | 11,416,506 | | |
First Eagle Funds | Semi-Annual Report | April 30, 2018
49
First Eagle Overseas Fund | Consolidated Schedule of Investments | April 30, 2018 (unaudited)
Investments | | Principal Amount ($) | | Value ($) | |
Commercial Paper — 17.4% (continued) | |
PSP Capital, Inc.
1.64%, 5/2/2018 (f)(g) | | | 3,851,000 | | | | 3,850,632 | | |
1.75%, 5/11/2018 (f)(g) | | | 18,282,000 | | | | 18,272,085 | | |
1.75%, 5/14/2018 (f)(g) | | | 18,282,000 | | | | 18,269,245 | | |
1.70%, 5/22/2018 (f)(g) | | | 8,405,000 | | | | 8,395,585 | | |
2.06%, 6/19/2018 (f)(g) | | | 32,617,000 | | | | 32,527,756 | | |
2.01%, 6/20/2018 (f)(g) | | | 33,950,000 | | | | 33,855,011 | | |
2.06%, 7/9/2018 (f)(g) | | | 31,141,000 | | | | 31,014,628 | | |
2.11%, 7/16/2018 (f)(g) | | | 8,373,000 | | | | 8,334,800 | | |
QUALCOMM, Inc.
1.65%, 5/8/2018 (f) | | | 16,210,000 | | | | 16,203,603 | | |
1.73%, 5/15/2018 (f) | | | 32,681,000 | | | | 32,656,217 | | |
1.73%, 5/16/2018 (f) | | | 14,869,000 | | | | 14,856,940 | | |
2.26%, 6/6/2018 (f) | | | 5,675,000 | | | | 5,663,772 | | |
2.23%, 6/8/2018 (f) | | | 20,288,000 | | | | 20,245,471 | | |
Roche Holdings, Inc.
1.83%, 5/14/2018 (f) | | | 12,721,000 | | | | 12,712,174 | | |
Sanofi
1.80%, 5/3/2018 (f) | | | 20,890,000 | | | | 20,887,015 | | |
1.77%, 5/4/2018 (f) | | | 73,245,000 | | | | 73,230,994 | | |
1.78%, 5/7/2018 (f) | | | 28,902,000 | | | | 28,892,222 | | |
1.74%, 5/11/2018 (f) | | | 15,217,000 | | | | 15,208,793 | | |
1.87%, 6/8/2018 (f) | | | 25,596,000 | | | | 25,543,481 | | |
Schlumberger Holdings Corp.
1.91%, 5/1/2018 (f) | | | 16,319,000 | | | | 16,318,101 | | |
2.11%, 5/14/2018 (f) | | | 4,887,000 | | | | 4,883,077 | | |
2.31%, 6/4/2018 (f) | | | 22,329,000 | | | | 22,282,001 | | |
Suncor Energy, Inc.
2.04%, 5/14/2018 (f) | | | 17,181,000 | | | | 17,166,007 | | |
Total Capital Canada Ltd.
1.74%, 5/9/2018 (f) | | | 38,042,000 | | | | 38,025,100 | | |
1.99%, 6/7/2018 (f) | | | 37,243,000 | | | | 37,165,123 | | |
2.11%, 7/6/2018 (f) | | | 20,298,000 | | | | 20,220,709 | | |
2.13%, 7/10/2018 (f) | | | 19,865,000 | | | | 19,784,449 | | |
2.13%, 7/18/2018 (f) | | | 44,762,000 | | | | 44,558,275 | | |
Unilever Capital Corp.
1.84%, 5/24/2018 (f) | | | 9,774,000 | | | | 9,762,010 | | |
First Eagle Funds | Semi-Annual Report | April 30, 2018
50
First Eagle Overseas Fund | Consolidated Schedule of Investments | April 30, 2018 (unaudited)
Investments | | Principal Amount ($) | | Value ($) | |
Commercial Paper — 17.4% (continued) | |
2.00%, 6/4/2018 (f) | | | 25,340,000 | | | | 25,293,857 | | |
1.98%, 6/5/2018 (f) | | | 11,070,000 | | | | 11,049,233 | | |
2.06%, 7/17/2018 (f) | | | 12,205,000 | | | | 12,151,953 | | |
2.06%, 7/20/2018 (f) | | | 10,488,000 | | | | 10,440,403 | | |
UnitedHealth Group, Inc.
1.86%, 5/2/2018 (f) | | | 13,334,000 | | | | 13,332,526 | | |
1.93%, 5/18/2018 (f) | | | 23,647,000 | | | | 23,622,360 | | |
2.06%, 6/6/2018 (f) | | | 20,714,000 | | | | 20,667,695 | | |
2.16%, 6/13/2018 (f) | | | 9,253,000 | | | | 9,228,007 | | |
2.20%, 6/15/2018 (f) | | | 42,373,000 | | | | 42,252,802 | | |
VW Credit, Inc.
2.02%, 5/1/2018 (f) | | | 8,074,000 | | | | 8,073,515 | | |
Walmart, Inc.
1.92%, 5/21/2018 (f) | | | 10,493,000 | | | | 10,481,676 | | |
Walt Disney Co. (The)
1.66%, 5/15/2018 (f) | | | 6,461,000 | | | | 6,456,128 | | |
2.06%, 7/20/2018 (f) | | | 5,326,000 | | | | 5,301,829 | | |
2.19%, 7/30/2018 (f) | | | 10,212,000 | | | | 10,158,927 | | |
2.19%, 7/31/2018 (f) | | | 10,212,000 | | | | 10,158,161 | | |
Total Commercial Paper
(Cost $3,056,563,545) | | | 3,056,530,962 | | |
Investment Companies — 0.0% (d) | |
JP Morgan U.S. Government Money Market Fund,
Agency Shares, 1.52% (h)
(Cost $101,647) | | | 101,647 | | | | 101,647 | | |
Total Short-Term Investments
(Cost $3,056,665,192) | | | 3,056,632,609 | | |
Total Investments — 99.4%
(Cost $13,433,418,306) | | | 17,506,727,082 | | |
Other Assets Less Liabilities — 0.6% | | | 104,096,401 | | |
Net Assets — 100.0% | | | 17,610,823,483 | | |
* Non-income producing security.
‡ Value determined using significant unobservable inputs.
(a) Affiliated company as defined under the Investment Company Act of 1940.
First Eagle Funds | Semi-Annual Report | April 30, 2018
51
First Eagle Overseas Fund | Consolidated Schedule of Investments | April 30, 2018 (unaudited)
(b) Security fair valued as of April 30, 2018 in accordance with procedures approved by the Board of Trustees. Total value of all such securities at April 30, 2018 amounted to $58,218,676, which represents approximately 0.33% of net assets of the Fund.
(c) Represents a security that is subject to legal or contractual restrictions on resale.
(d) Represents less than 0.05% of net assets.
(e) All or a portion of this security is pledged with the custodian for current or potential holdings of forward foreign currency exchange contracts.
(f) The rate shown was the current yield as of April 30, 2018.
(g) Securities exempt from registration under Rule 144A or section 4(2), of the Securities Act of 1933. Under procedures approved by the Board of Trustees, such securities have been determined to be liquid by the investment adviser and may be resold, normally to qualified institutional buyers in transactions exempt from registration.
(h) Represents 7-day effective yield as of April 30, 2018.
As of April 30, 2018, the gross unrealized appreciation (depreciation) of investments based on the aggregate cost of investment securities and derivative instruments, if applicable, for federal income tax purposes was as follows:
Aggregate gross unrealized appreciation | | $ | 4,619,397,809 | | |
Aggregate gross unrealized depreciation | | | (525,398,762 | ) | |
Net unrealized appreciation | | $ | 4,093,999,047 | | |
Federal income tax cost | | $ | 13,433,418,306 | | |
Restricted Securities | | Acquisition Date | | Cost | | Carrying Value
Per
Share/Principal | |
Legris Industries SA | | 04/30/04 | | $ | 23,433,066 | | | $ | 40.36 | | |
Forward Foreign Currency Contracts outstanding as of April 30, 2018
Currency
Purchased | | Currency Sold | | Counterparty | | Settlement
Date | | Unrealized
Appreciation
(Depreciation) | |
USD | 16,484,325 | | | GBP | 11,762,000 | | | Bank of New York Mellon | | 5/16/2018 | | $ | 280,984 | | |
USD | 109,033,127 | | | JPY | 11,833,965,000 | | | Bank of New York Mellon | | 5/16/2018 | | | 680,634 | | |
USD | 270,733,736 | | | EUR | 223,165,000 | | | Goldman Sachs | | 6/13/2018 | | | 358,403 | | |
USD | 19,888,035 | | | GBP | 14,090,000 | | | Goldman Sachs | | 6/13/2018 | | | 450,007 | | |
USD | 109,159,349 | | | JPY | 11,833,965,000 | | | Goldman Sachs | | 6/13/2018 | | | 589,453 | | |
USD | 98,542,648 | | | EUR | 79,317,000 | | | JPMorgan Chase Bank | | 7/18/2018 | | | 2,173,591 | | |
USD | 26,847,445 | | | GBP | 19,251,000 | | | JPMorgan Chase Bank | | 7/18/2018 | | | 242,679 | | |
USD | 225,423,205 | | | JPY | 24,036,482,000 | | | JPMorgan Chase Bank | | 7/18/2018 | | | 4,345,186 | | |
USD | 14,726,927 | | | EUR | 11,715,000 | | | UBS AG | | 8/15/2018 | | | 460,331 | | |
USD | 38,860,199 | | | GBP | 27,251,000 | | | UBS AG | | 8/15/2018 | | | 1,147,926 | | |
USD | 227,206,405 | | | JPY | 23,740,570,000 | | | UBS AG | | 8/15/2018 | | | 8,392,823 | | |
USD | 117,826,351 | | | EUR | 94,514,000 | | | HSBC Bank plc | | 9/19/2018 | | | 2,382,436 | | |
First Eagle Funds | Semi-Annual Report | April 30, 2018
52
First Eagle Overseas Fund | Consolidated Schedule of Investments | April 30, 2018 (unaudited)
Forward Foreign Currency Contracts outstanding as of April 30, 2018 (continued)
Currency
Purchased | | Currency Sold | | Counterparty | | Settlement
Date | | Unrealized
Appreciation
(Depreciation) | |
USD | 164,620,004 | | | JPY | 17,462,890,000 | | | HSBC Bank plc | | 9/19/2018 | | $ | 3,230,926 | | |
Total unrealized appreciation | | | | | | | | | 24,735,379 | | |
USD | 129,750,439 | | | EUR | 108,820,000 | | | Bank of New York Mellon | | 5/16/2018 | | | (1,796,500 | ) | |
USD | 71,775,342 | | | JPY | 8,006,970,000 | | | Bank of New York Mellon | | 5/16/2018 | | | (1,536,956 | ) | |
USD | 50,817,833 | | | JPY | 5,616,641,000 | | | Goldman Sachs | | 6/13/2018 | | | (711,652 | ) | |
Total unrealized depreciation | | | | | | | | | (4,045,108 | ) | |
Net unrealized appreciation | | | | | | | | $ | 20,690,271 | | |
Abbreviations
ADR — American Depositary Receipt
CVA — Dutch Certification
EUR — Euro
GBP — British Pound
IDR — Indonesian Rupiah
JPY — Japanese Yen
MXN — Mexican Peso
MYR — Malaysian Ringgit
NVDR — Non-Voting Depositary Receipt
PJSC — Public Joint Stock Company
PLN — Polish Zloty
Preference — A special type of equity investment that shares in the earnings of the company, has limited voting rights, and may have a dividend preference. Preference shares may also have liquidation preference.
SGD — Singapore Dollar
USD — United States Dollar
Affiliated Securities
Security Description | | Shares at
April 30, 2018 | | Market Value
October 31, 2017 | | Purchases at
Cost | | Proceeds from
Sales | |
As One Corp. | | | 1,299,640 | | | $ | 71,451,190 | | | $ | — | | | $ | — | | |
Chofu Seisakusho
Co. Ltd. | | | 1,845,000 | | | | 45,665,265 | | | | — | | | | (616,561 | ) | |
Emin Leydier SA^ | | | — | | | | 51,993,413 | | | | — | | | | (82,309,418 | ) | |
Fursys, Inc. | | | 872,463 | | | | 26,243,587 | | | | — | | | | — | | |
Haw Par Corp. Ltd. | | | 25,512,113 | | | | 228,338,184 | | | | — | | | | — | | |
Laurent-Perrier | | | 558,938 | | | | 52,418,364 | | | | — | | | | — | | |
Legris Industries
SA‡ (b)(c) | | | 905,366 | | | | 34,348,829 | | | | — | | | | — | | |
Maezawa Kasei
Industries Co. Ltd. | | | 924,200 | | | | 12,682,521 | | | | — | | | | (2,415,994 | ) | |
Robertet SA | | | 196,831 | | | | 108,188,782 | | | | — | | | | (18,076,730 | ) | |
Total | | | | $ | 631,330,135 | | | $ | — | | | $ | (103,418,703 | ) | |
First Eagle Funds | Semi-Annual Report | April 30, 2018
53
First Eagle Overseas Fund | Consolidated Schedule of Investments | April 30, 2018 (unaudited)
Affiliated Securities (continued)
Security Description | | Net Realized
Gain
(Loss) | | Change in
Unrealized
Appreciation/
(Depreciation) | | Market Value
April 30,
2018 | | Dividend/
Interest
Income | | Capital Gain
Distributions | |
As One Corp. | | $ | — | | | $ | 16,820,420 | | | $ | 88,271,610 | | | $ | 656,046 | | | $ | — | | |
Chofu Seisakusho
Co. Ltd. | | | 50,113 | | | | (1,277,127 | ) | | | 43,821,690 | | | | 237,828 | | | | — | | |
Emin Leydier SA^ | | | 73,229,746 | | | | (42,913,741 | ) | | | — | | | | — | | | | — | | |
Fursys, Inc. | | | — | | | | (1,083,847 | ) | | | 25,159,740 | | | | 508,865 | | | | — | | |
Haw Par Corp. Ltd. | | | — | | | | 39,673,682 | | | | 268,011,866 | | | | — | | | | — | | |
Laurent-Perrier | | | — | | | | 18,205,575 | | | | 70,623,939 | | | | — | | | | — | | |
Legris Industries
SA‡ (b)(c) | | | — | | | | 2,189,925 | | | | 36,538,754 | | | | — | | | | — | | |
Maezawa Kasei
Industries Co. Ltd. | | | (700,949 | ) | | | 607,168 | | | | 10,172,746 | | | | 117,211 | | | | — | | |
Robertet SA | | | 12,854,681 | | | | 15,404,439 | | | | 118,371,172 | | | | — | | | | — | | |
Total | | $ | 85,433,591 | | | $ | 47,626,494 | | | $ | 660,971,517 | | | $ | 1,519,950 | | | $ | — | | |
^ Represents an unaffiliated issuer as of April 30, 2018.
‡ Value determined using significant unobservable inputs.
(b) Security fair valued as of April 30, 2018 in accordance with procedures approved by the Board of Trustees. Total value of all such securities at April 30, 2018 amounted to $36,538,754, which represents approximately 0.21% of net assets of the Fund.
(c) Represents a security that is subject to legal or contractual restrictions on resale.
See Notes to Financial Statements.
First Eagle Funds | Semi-Annual Report | April 30, 2018
54
This page was intentionally left blank.
First Eagle U.S. Value Fund
Data as of April 30, 2018 (unaudited)
Investment Objective
The First Eagle U.S. Value Fund seeks long-term growth of capital by investing, under normal market conditions, at least 80% of its net assets (plus any borrowings for investment purposes) in domestic equity and debt securities. Management utilizes a highly disciplined, bottom-up, value-oriented approach in seeking to achieve its investment objective.
Average Annual Returns^ (%) | | | | | | One-Year | | Five-Years | | Ten-Years | |
First Eagle U.S. Value Fund | | Class A | | without sales charge | | | 8.54 | | | | 7.81 | | | | 6.94 | | |
| | | | with sales charge | | | 3.11 | | | | 6.71 | | | | 6.39 | | |
S&P 500 Index | | | | | | | 13.27 | | | | 12.96 | | | | 9.02 | | |
Consumer Price Index | | | | | | | 2.46 | | | | 1.51 | | | | 1.55 | | |
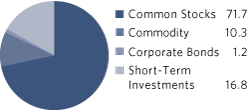
Sectors* (%)
Financials | | | 16.9 | | |
Information Technology | | | 14.3 | | |
Energy | | | 10.8 | | |
Industrials | | | 10.6 | | |
Commodities | | | 10.4 | | |
Consumer Discretionary | | | 6.6 | | |
Materials | | | 5.0 | | |
Real Estate | | | 3.3 | | |
Health Care | | | 3.0 | | |
Consumer Staples | | | 1.3 | | |
Utilities | | | 1.0 | | |
Short-Term Investments | | | 16.8 | | |
^ Performance figures reflect certain fee waivers and/or expense limitations, without which returns may have been lower.
* Asset Allocation and Sector percentages are based on total investments in the portfolio.
The Fund's portfolio composition is subject to change at any time.
First Eagle Funds | Semi-Annual Report | April 30, 2018
56
First Eagle U.S. Value Fund | Fund Overview
Growth of a $10,000 Initial Investment
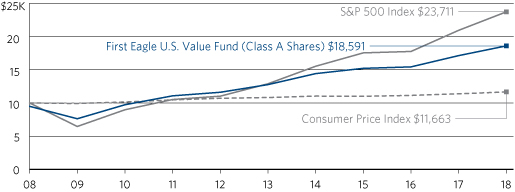
Performance data quoted herein represents past performance and should not be considered indicative of future results. Performance data quoted herein does not reflect the deduction of taxes that a shareholder would pay on Fund distributions or the sale of Fund shares. The average annual returns shown above are historical and reflect changes in share price, reinvested dividends and are net of expenses.
The average annual returns for Class A Shares give effect to the deduction of the maximum sales charge of 5.00%.
The S&P 500 Index is a widely recognized unmanaged index including a representative sample of 500 leading companies in leading sectors of the U.S. economy. Although the S&P 500 Index focuses on the large-cap segment of the market, with approximately 80% coverage of U.S. equities, it is also considered a proxy for the total market. The S&P 500 Index includes dividends reinvested. One cannot invest directly in an index. The Consumer Price Index (CPI) represents the change in price of all goods and services purchased for consumption by urban households.
Top 10 Holdings* (%)
Gold bullion** (Precious Metal) | | | 10.4 | | |
Oracle Corp. (Software, United States) | | | 4.2 | | |
Weyerhaeuser Co. (Equity Real Estate Investment Trusts (REITs), United States) | | | 3.3 | | |
Omnicom Group, Inc. (Media, United States) | | | 2.9 | | |
Alleghany Corp. (Insurance, United States) | | | 2.7 | | |
American Express Co. (Consumer Finance, United States) | | | 2.5 | | |
Schlumberger Ltd. (Energy Equipment & Services, United States) | | | 2.4 | | |
Teradata Corp. (IT Services, United States) | | | 2.4 | | |
Microsoft Corp. (Software, United States) | | | 2.3 | | |
National Oilwell Varco, Inc. (Energy Equipment & Services, United States) | | | 2.2 | | |
Total | | | 35.3 | | |
* Holdings in cash, commercial paper and other short-term cash equivalents have been excluded.
**The Fund invests in gold and precious metals through investment in a wholly-owned subsidiary of the Fund organized under the laws of the Cayman Islands (the "Subsidiary"). Gold Bullion and commodities include the Fund's investment in the Subsidiary.
Percentages are based on total net assets.
First Eagle Funds | Semi-Annual Report | April 30, 2018
57
First Eagle U.S. Value Fund | Consolidated Schedule of Investments | April 30, 2018 (unaudited)
Investments | | Shares | | Value ($) | |
Common Stocks — 71.9% | |
Aerospace & Defense — 1.4% | |
Orbital ATK, Inc. | | | 211,151 | | | | 27,952,169 | | |
Air Freight & Logistics — 1.1% | |
CH Robinson Worldwide, Inc. | | | 240,725 | | | | 22,153,922 | | |
Banks — 3.3% | |
BB&T Corp. | | | 729,608 | | | | 38,523,302 | | |
US Bancorp | | | 520,595 | | | | 26,264,018 | | |
| | | | 64,787,320 | | |
Capital Markets — 2.0% | |
Bank of New York Mellon Corp. (The) | | | 728,362 | | | | 39,703,013 | | |
Chemicals — 1.9% | |
Nutrien Ltd. (Canada) | | | 468,667 | | | | 21,338,408 | | |
Praxair, Inc. | | | 60,413 | | | | 9,214,191 | | |
Scotts Miracle-Gro Co. (The) | | | 88,434 | | | | 7,391,314 | | |
| | | | 37,943,913 | | |
Commercial Services & Supplies — 0.5% | |
Cintas Corp. | | | 56,714 | | | | 9,658,394 | | |
Consumer Finance — 3.6% | |
American Express Co. | | | 509,838 | | | | 50,346,503 | | |
Synchrony Financial | | | 652,277 | | | | 21,636,028 | | |
| | | | 71,982,531 | | |
Diversified Consumer Services — 0.4% | |
H&R Block, Inc. | | | 300,081 | | | | 8,297,240 | | |
Diversified Financial Services — 1.0% | |
Berkshire Hathaway, Inc., Class A* | | | 66 | | | | 19,182,900 | | |
Energy Equipment & Services — 6.2% | |
National Oilwell Varco, Inc. | | | 1,145,097 | | | | 44,280,901 | | |
Schlumberger Ltd. | | | 697,928 | | | | 47,849,944 | | |
SEACOR Holdings, Inc.* | | | 96,554 | | | | 5,295,021 | | |
SEACOR Marine Holdings, Inc.* | | | 97,076 | | | | 2,299,730 | | |
TechnipFMC plc (United Kingdom) | | | 710,652 | | | | 23,423,090 | | |
| | | | 123,148,686 | | |
Equity Real Estate Investment Trusts (REITs) — 3.3% | |
Weyerhaeuser Co. | | | 1,773,946 | | | | 65,245,734 | | |
First Eagle Funds | Semi-Annual Report | April 30, 2018
58
First Eagle U.S. Value Fund | Consolidated Schedule of Investments | April 30, 2018 (unaudited)
Investments | | Shares | | Value ($) | |
Gas Utilities — 1.0% | |
UGI Corp. | | | 394,669 | | | | 19,098,033 | | |
Health Care Equipment & Supplies — 1.4% | |
Varex Imaging Corp.* | | | 93,178 | | | | 3,353,476 | | |
Varian Medical Systems, Inc.* | | | 203,945 | | | | 23,574,003 | | |
| | | | 26,927,479 | | |
Health Care Providers & Services — 1.7% | |
Anthem, Inc. | | | 109,314 | | | | 25,797,011 | | |
HCA Healthcare, Inc. | | | 70,585 | | | | 6,757,808 | | |
Universal Health Services, Inc., Class B | | | 18,950 | | | | 2,164,090 | | |
| | | | 34,718,909 | | |
Household Products — 1.3% | |
Colgate-Palmolive Co. | | | 391,155 | | | | 25,515,041 | | |
Industrial Conglomerates — 1.5% | |
3M Co. | | | 155,288 | | | | 30,186,434 | | |
Insurance — 6.4% | |
Alleghany Corp. | | | 92,464 | | | | 53,136,287 | | |
Brown & Brown, Inc. | | | 621,754 | | | | 16,930,361 | | |
Cincinnati Financial Corp. | | | 124,524 | | | | 8,759,018 | | |
Travelers Cos., Inc. (The) | | | 20,331 | | | | 2,675,560 | | |
Willis Towers Watson plc | | | 161,294 | | | | 23,953,772 | | |
WR Berkley Corp. | | | 282,471 | | | | 21,061,038 | | |
| | | | 126,516,036 | | |
Internet Software & Services — 1.3% | |
Alphabet, Inc., Class A* | | | 7,298 | | | | 7,433,597 | | |
Alphabet, Inc., Class C* | | | 9,165 | | | | 9,323,829 | | |
Facebook, Inc., Class A* | | | 48,712 | | | | 8,378,464 | | |
| | | | 25,135,890 | | |
IT Services — 3.8% | |
Automatic Data Processing, Inc. | | | 59,406 | | | | 7,014,660 | | |
Mastercard, Inc., Class A | | | 62,464 | | | | 11,135,457 | | |
Teradata Corp.* | | | 1,158,000 | | | | 47,385,360 | | |
Visa, Inc., Class A | | | 70,652 | | | | 8,964,326 | | |
| | | | 74,499,803 | | |
First Eagle Funds | Semi-Annual Report | April 30, 2018
59
First Eagle U.S. Value Fund | Consolidated Schedule of Investments | April 30, 2018 (unaudited)
Investments | | Shares | | Value ($) | |
Leisure Products — 0.3% | |
Vista Outdoor, Inc.* | | | 326,357 | | | | 5,466,480 | | |
Machinery — 3.8% | |
Cummins, Inc. | | | 84,917 | | | | 13,574,831 | | |
Deere & Co. | | | 188,587 | | | | 25,521,479 | | |
Flowserve Corp. | | | 817,802 | | | | 36,318,587 | | |
| | | | 75,414,897 | | |
Media — 5.1% | |
Comcast Corp., Class A | | | 1,363,769 | | | | 42,808,709 | | |
Omnicom Group, Inc. | | | 787,030 | | | | 57,972,630 | | |
| | | | 100,781,339 | | |
Metals & Mining — 3.1% | |
Agnico Eagle Mines Ltd. (Canada) | | | 205,280 | | | | 8,638,404 | | |
Franco-Nevada Corp. (Canada) | | | 155,814 | | | | 11,051,817 | | |
Goldcorp, Inc. (Canada) | | | 740,683 | | | | 9,843,677 | | |
Newcrest Mining Ltd. (Australia) | | | 1,024,323 | | | | 16,310,067 | | |
Newmont Mining Corp. | | | 55,767 | | | | 2,191,085 | | |
Randgold Resources Ltd., ADR (Africa) | | | 21,756 | | | | 1,764,412 | | |
Royal Gold, Inc. | | | 121,921 | | | | 10,826,585 | | |
Tahoe Resources, Inc. | | | 325,000 | | | | 1,637,719 | | |
| | | | 62,263,766 | | |
Oil, Gas & Consumable Fuels — 4.4% | |
Canadian Natural Resources Ltd. (Canada) | | | 142,767 | | | | 5,150,487 | | |
ConocoPhillips | | | 383,495 | | | | 25,118,922 | | |
Devon Energy Corp. | | | 185,963 | | | | 6,756,036 | | |
Exxon Mobil Corp. | | | 417,478 | | | | 32,458,915 | | |
Imperial Oil Ltd. (Canada) | | | 297,287 | | | | 9,245,430 | | |
San Juan Basin Royalty Trust | | | 595,832 | | | | 4,099,324 | | |
Suncor Energy, Inc. (Canada) | | | 88,140 | | | | 3,370,594 | | |
| | | | 86,199,708 | | |
Road & Rail — 2.1% | |
Union Pacific Corp. | | | 312,435 | | | | 41,750,689 | | |
Semiconductors & Semiconductor Equipment — 2.5% | |
Analog Devices, Inc. | | | 127,503 | | | | 11,137,387 | | |
Texas Instruments, Inc. | | | 117,378 | | | | 11,905,650 | | |
First Eagle Funds | Semi-Annual Report | April 30, 2018
60
First Eagle U.S. Value Fund | Consolidated Schedule of Investments | April 30, 2018 (unaudited)
Investments | | Shares | | Value ($) | |
Semiconductors & Semiconductor Equipment — 2.5% (continued) | |
Xilinx, Inc. | | | 405,225 | | | | 26,031,654 | | |
| | | | 49,074,691 | | |
Software — 6.5% | |
Microsoft Corp. | | | 484,938 | | | | 45,351,402 | | |
Oracle Corp. | | | 1,821,262 | | | | 83,177,035 | | |
| | | | 128,528,437 | | |
Specialty Retail — 0.8% | |
Tiffany & Co. | | | 159,599 | | | | 16,411,565 | | |
Trading Companies & Distributors — 0.2% | |
NOW, Inc.* | | | 293,998 | | | | 3,566,195 | | |
Total Common Stocks
(Cost $893,932,624) | | | 1,422,111,214 | | |
| | | Ounces | | | |
Commodities — 10.4% | |
Gold bullion*
(Cost $186,047,980) | | | 156,194 | | | | 205,328,273 | | |
| | | Principal Amount ($) | | | |
Corporate Bonds — 1.2% | |
Banks — 0.6% | |
Wachovia Capital Trust III
(ICE LIBOR USD 3 Month + 0.93%, 5.57% Floor),
5.57%, 6/4/2018 (a)(b) | | | 12,404,000 | | | | 12,295,465 | | |
Health Care Equipment & Supplies — 0.0% (c) | |
Bausch & Lomb, Inc.
7.13%, 8/1/2028 | | | 600,000 | | | | 595,500 | | |
Oil, Gas & Consumable Fuels — 0.3% | |
CITGO Petroleum Corp.
6.25%, 8/15/2022 (d) | | | 6,542,000 | | | | 6,542,000 | | |
Software — 0.3% | |
Veritas US, Inc.
7.50%, 2/1/2023 (d) | | | 4,945,000 | | | | 4,771,925 | | |
Total Corporate Bonds
(Cost $24,075,227) | | | 24,204,890 | | |
First Eagle Funds | Semi-Annual Report | April 30, 2018
61
First Eagle U.S. Value Fund | Consolidated Schedule of Investments | April 30, 2018 (unaudited)
Investments | | Principal Amount ($) | | Value ($) | |
Short-Term Investments — 16.8% | |
Commercial Paper — 4.7% | |
AstraZeneca plc
2.03%, 5/1/2018 (e) | | | 17,738,000 | | | | 17,737,147 | | |
CenterPoint Energy, Inc.
2.10%, 5/1/2018 (e) | | | 6,726,000 | | | | 6,725,596 | | |
Coca-Cola Co. (The)
1.96%, 6/26/2018 (e) | | | 6,923,000 | | | | 6,901,823 | | |
Eni Finance USA, Inc. (Italy)
2.19%, 5/1/2018 (e) | | | 6,652,000 | | | | 6,651,634 | | |
Henkel of America, Inc. (Germany)
1.91%, 5/9/2018 (e) | | | 756,000 | | | | 755,663 | | |
John Deere Financial Ltd.
1.82%, 5/11/2018 (e) | | | 974,000 | | | | 973,469 | | |
Kreditanstalt fuer Wiederaufbau (Germany)
1.70%, 5/8/2018 (e) | | | 7,745,000 | | | | 7,742,141 | | |
MetLife Short Term Funding LLC
2.01%, 6/5/2018 (e) | | | 20,624,000 | | | | 20,583,701 | | |
Mitsui & Co. USA, Inc.
1.83%, 5/1/2018 (e) | | | 7,051,000 | | | | 7,050,612 | | |
Nestle Capital Corp. (Switzerland)
1.83%, 6/4/2018 (e) | | | 1,949,000 | | | | 1,945,640 | | |
Pfizer, Inc.
1.86%, 6/4/2018 (e) | | | 6,923,000 | | | | 6,910,528 | | |
Schlumberger Holdings Corp.
2.11%, 5/14/2018 (e) | | | 974,000 | | | | 973,218 | | |
Unilever Capital Corp. (United Kingdom)
1.84%, 5/24/2018 (e) | | | 1,949,000 | | | | 1,946,609 | | |
Walmart, Inc.
1.92%, 5/21/2018 (e) | | | 6,872,000 | | | | 6,864,584 | | |
Total Commercial Paper
(Cost $93,765,789) | | | 93,762,365 | | |
Investment Companies — 0.0% (c) | |
JP Morgan U.S. Government Money Market Fund,
Agency Shares, 1.52% (f)
(Cost $46,667) | | | 46,667 | | | | 46,667 | | |
First Eagle Funds | Semi-Annual Report | April 30, 2018
62
First Eagle U.S. Value Fund | Consolidated Schedule of Investments | April 30, 2018 (unaudited)
Investments | | Principal Amount ($) | | Value ($) | |
U.S. Treasury Obligations — 12.1% | |
U.S. Treasury Bills
1.57%, 5/3/2018 (e) | | | 30,000,000 | | | | 29,997,398 | | |
1.62%, 5/10/2018 (e) | | | 30,000,000 | | | | 29,988,487 | | |
1.62%, 5/17/2018 (e) | | | 30,000,000 | | | | 29,978,733 | | |
1.70%, 6/7/2018 (e) | | | 30,000,000 | | | | 29,949,472 | | |
1.64%, 6/14/2018 (e) | | | 20,000,000 | | | | 19,959,728 | | |
1.69%, 6/21/2018 (e) | | | 30,000,000 | | | | 29,928,281 | | |
1.67%, 7/5/2018 (e) | | | 30,000,000 | | | | 29,905,289 | | |
1.70%, 7/12/2018 (e) | | | 20,000,000 | | | | 19,930,450 | | |
1.80%, 7/26/2018 (e) | | | 20,000,000 | | | | 19,914,896 | | |
Total U.S. Treasury Obligations
(Cost $239,556,772) | | | 239,552,734 | | |
Total Short-Term Investments
(Cost $333,369,228) | | | 333,361,766 | | |
Total Investments — 100.3%
(Cost $1,437,425,059) | | | 1,985,006,143 | | |
Liabilities in excess of other assets — (0.3%) | | | (6,202,815 | ) | |
Net Assets — 100.0% | | | 1,978,803,328 | | |
* Non-income producing security.
(a) Perpetual security. The rate reflected was the rate in effect on April 30, 2018. The maturity date reflects the next call date.
(b) Variable or floating rate security, linked to the referenced benchmark. The interest rate shown is the rate in effect as of April 30, 2018.
(c) Represents less than 0.05% of net assets.
(d) Securities exempt from registration under Rule 144A or section 4(2), of the Securities Act of 1933. Under procedures approved by the Board of Trustees, such securities have been determined to be liquid by the investment adviser and may be resold, normally to qualified institutional buyers in transactions exempt from registration.
(e) The rate shown was the current yield as of April 30, 2018.
(f) Represents 7-day effective yield as of April 30, 2018.
Abbreviations
ADR — American Depositary Receipt
ICE — Intercontinental Exchange
LIBOR — London Interbank Offered Rate
USD — United States Dollar
First Eagle Funds | Semi-Annual Report | April 30, 2018
63
First Eagle U.S. Value Fund | Consolidated Schedule of Investments | April 30, 2018 (unaudited)
As of April 30, 2018, the gross unrealized appreciation (depreciation) of investments based on the aggregate cost of investment securities and derivative instruments, if applicable, for federal income tax purposes was as follows:
Aggregate gross unrealized appreciation | | $ | 607,910,024 | | |
Aggregate gross unrealized depreciation | | | (60,328,940 | ) | |
Net unrealized appreciation | | $ | 547,581,084 | | |
Federal income tax cost | | $ | 1,437,425,059 | | |
See Notes to Financial Statements.
First Eagle Funds | Semi-Annual Report | April 30, 2018
64
This page was intentionally left blank.
Data as of April 30, 2018 (unaudited)
Investment Objective
The First Eagle Gold Fund is a non-diversified fund. The Fund's investment objective seeks to provide investors the opportunity to participate in the investment characteristics of gold (and to a limited extent other precious metals) for a portion of their overall investment portfolio. In seeking to achieve its objective, the Fund invests at least 80% of its net assets (plus any borrowings for investment purposes) in gold, and/or securities directly related to gold or issuers principally engaged in the gold industry.
Average Annual Returns (%) | | | | | | One-Year | | Five-Years | | Ten-Years | |
First Eagle Gold Fund | | Class A | | without sales load | | | -5.80 | | | | -4.20 | | | | -2.38 | | |
| | | | with sales load | | | -10.51 | | | | -5.18 | | | | -2.88 | | |
FTSE Gold Mines Index | | | | | | | -3.30 | | | | -4.90 | | | | -6.24 | | |
MSCI World Index | | | | | | | 13.22 | | | | 9.28 | | | | 5.48 | | |
Consumer Price Index | | | | | | | 2.46 | | | | 1.51 | | | | 1.55 | | |
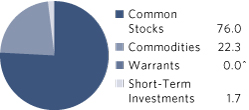
Sectors* (%)
Materials | | | 76.0 | | |
Commodities | | | 22.3 | | |
Short-Term Investments | | | 1.7 | | |
Countries*~ (%)
Canada | | | 40.9 | | |
United States | | | 37.0 | | |
Mexico | | | 8.7 | | |
Australia | | | 6.3 | | |
Africa | | | 3.9 | | |
South Africa | | | 1.5 | | |
Short-Term Investments | | | 1.7 | | |
^ Less than 0.05%
* Asset Allocation, Sector and Countries percentages are based on total investments in the portfolio.
~ Country allocations reflect country of risk (not currency of issue). Bonds of non-U.S. issuers may be U.S. dollar denominated.
The Fund's portfolio composition is subject to change at any time.
First Eagle Funds | Semi-Annual Report | April 30, 2018
66
First Eagle Gold Fund | Fund Overview
Growth of a $10,000 Initial Investment
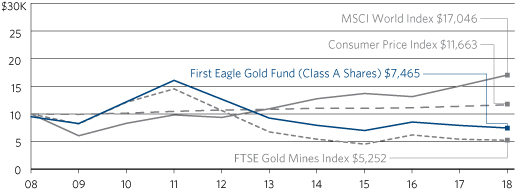
Performance data quoted herein represents past performance and should not be considered indicative of future results. Performance data quoted herein does not reflect the deduction of taxes that a shareholder would pay on Fund distributions or the sale of Fund shares. The average annual returns shown above are historical and reflect changes in share price, reinvested dividends and are net of expenses.
The average annual returns for Class A Shares give effect to the deduction of the maximum sales charge of 5.00%.
The MSCI World Index is a widely followed, unmanaged group of stocks from 23 developed international markets. The index provides total returns in U.S. dollars with net dividends reinvested. The FTSE Gold Mines Index is designed to reflect the performance of the worldwide market in the shares of companies whose principal activity is the mining of gold. The FTSE Gold Mines Index encompasses all gold mining companies that have a sustainable, attributable gold production of at least 300,000 ounces a year and that derive 51% or more of their revenue from mined gold. The Index is unmanaged, is available with dividends reinvested. One cannot invest directly in an index. The Consumer Price Index (CPI) represents the change in price of all goods and services purchased for consumption by urban households.
Top 10 Holdings* (%)
Gold bullion** (Precious Metal) | | | 17.4 | | |
Royal Gold, Inc. (Metals & Mining, United States) | | | 6.1 | | |
Newcrest Mining Ltd. (Metals & Mining, Australia) | | | 6.0 | | |
Newmont Mining Corp. (Metals & Mining, United States) | | | 5.6 | | |
Fresnillo plc (Metals & Mining, Mexico) | | | 5.4 | | |
Wheaton Precious Metals Corp. (Metals & Mining, Canada) | | | 4.9 | | |
Silver bullion (Precious Metal) | | | 4.8 | | |
Goldcorp, Inc. (Metals & Mining, Canada) | | | 4.4 | | |
Franco-Nevada Corp. (Metals & Mining, Canada) | | | 4.3 | | |
Agnico Eagle Mines Ltd. (Metals & Mining, Canada) | | | 4.3 | | |
Total | | | 63.2 | | |
* Holdings in cash, commercial paper and other short-term cash equivalents have been excluded.
**The Fund invests in gold and precious metals through investment in a wholly-owned subsidiary of the Fund organized under the laws of the Cayman Islands (the "Subsidiary"). Gold Bullion and commodities include the Fund's investment in the Subsidiary.
Percentages are based on total net assets.
First Eagle Funds | Semi-Annual Report | April 30, 2018
67
First Eagle Gold Fund | Consolidated Schedule of Investments | April 30, 2018 (unaudited)
Investments | | Shares | | Value ($) | |
Common Stocks — 76.0% | |
Africa — 3.9% | |
Randgold Resources Ltd., ADR | | | 545,974 | | | | 44,278,492 | | |
Australia — 6.3% | |
Newcrest Mining Ltd. | | | 4,233,004 | | | | 67,401,178 | | |
OceanaGold Corp. | | | 1,406,000 | | | | 3,788,902 | | |
| | | | 71,190,080 | | |
Canada — 40.8% | |
Agnico Eagle Mines Ltd. | | | 1,142,787 | | | | 48,089,709 | | |
Alamos Gold, Inc., Class A | | | 2,964,338 | | | | 16,022,825 | | |
B2Gold Corp.* | | | 12,170,500 | | | | 34,977,332 | | |
Barrick Gold Corp. | | | 3,270,338 | | | | 44,051,453 | | |
Detour Gold Corp.* | | | 4,368,049 | | | | 31,570,929 | | |
Dundee Precious Metals, Inc.* | | | 5,093,970 | | | | 12,933,792 | | |
Eldorado Gold Corp.* | | | 7,718,257 | | | | 7,333,832 | | |
Franco-Nevada Corp. | | | 679,943 | | | | 48,228,053 | | |
Goldcorp, Inc. | | | 3,715,245 | | | | 49,375,606 | | |
Guyana Goldfields, Inc.* | | | 1,852,133 | | | | 7,183,786 | | |
Kinross Gold Corp.* | | | 2,797,363 | | | | 10,853,768 | | |
MAG Silver Corp.* | | | 2,399,467 | | | | 26,668,012 | | |
Mandalay Resources Corp. | | | 12,678,371 | | | | 2,073,646 | | |
New Gold, Inc.* | | | 10,007,331 | | | | 23,460,467 | | |
Novagold Resources, Inc.* | | | 5,495,440 | | | | 26,268,203 | | |
Orla Mining Ltd.* | | | 2,310,100 | | | | 2,446,930 | | |
Osisko Gold Royalties Ltd. | | | 1,444,217 | | | | 14,094,037 | | |
Wheaton Precious Metals Corp. | | | 2,661,126 | | | | 55,324,810 | | |
| | | | 460,957,190 | | |
Mexico — 8.7% | |
Fresnillo plc | | | 3,473,953 | | | | 60,978,036 | | |
Industrias Penoles SAB de CV | | | 1,756,596 | | | | 36,869,445 | | |
| | | | 97,847,481 | | |
South Africa — 1.5% | |
AngloGold Ashanti Ltd., ADR | | | 1,840,964 | | | | 16,531,857 | | |
First Eagle Funds | Semi-Annual Report | April 30, 2018
68
First Eagle Gold Fund | Consolidated Schedule of Investments | April 30, 2018 (unaudited)
Investments | | Shares | | Value ($) | |
United States — 14.8% | |
Newmont Mining Corp. | | | 1,623,421 | | | | 63,784,211 | | |
Royal Gold, Inc. | | | 771,654 | | | | 68,522,875 | | |
Tahoe Resources, Inc. | | | 6,835,667 | | | | 34,445,863 | | |
| | | | 166,752,949 | | |
Total Common Stocks
(Cost $877,996,769) | | | 857,558,049 | | |
| | | Ounces | | | |
Commodities — 22.2% | |
Gold bullion* | | | 149,579 | | | | 196,631,573 | | |
Silver bullion* | | | 3,325,060 | | | | 54,298,229 | | |
Total Commodities
(Cost $171,543,553) | | | 250,929,802 | | |
| | | Number of Warrants | | | |
Warrants — 0.0% (a) | |
Canada — 0.0% (a) | |
Osisko Gold Royalties Ltd., expiring 2/26/2019*
(Cost $81,620) | | | 59,602 | | | | 25,531 | | |
| | | Principal Amount ($) | | | |
Short-Term Investments — 1.7% | |
Commercial Paper — 1.7% | |
AstraZeneca plc
2.03%, 5/1/2018 (b) | | | 8,938,000 | | | | 8,937,570 | | |
CenterPoint Energy, Inc.
2.10%, 5/1/2018 (b) | | | 3,389,000 | | | | 3,388,796 | | |
Eni Finance USA, Inc.
2.19%, 5/1/2018 (b) | | | 3,348,000 | | | | 3,347,816 | | |
Mitsui & Co. USA, Inc.
1.83%, 5/1/2018 (b) | | | 3,553,000 | | | | 3,552,804 | | |
Total Commercial Paper
(Cost $19,228,000) | | | 19,226,986 | | |
First Eagle Funds | Semi-Annual Report | April 30, 2018
69
First Eagle Gold Fund | Consolidated Schedule of Investments | April 30, 2018 (unaudited)
Investments | | Principal Amount ($) | | Value ($) | |
Investment Companies — 0.0% (a) | |
JP Morgan U.S. Government Money Market Fund,
Agency Shares, 1.52% (c)
(Cost $67,337) | | | 67,337 | | | | 67,337 | | |
Total Short-Term Investments
(Cost $19,295,337) | | | 19,294,323 | | |
Total Investments — 99.9%
(Cost $1,068,917,279) | | | 1,127,807,705 | | |
Other Assets Less Liabilities — 0.1% | | | 1,268,299 | | |
Net Assets — 100.0% | | | 1,129,076,004 | | |
* Non-income producing security.
(a) Represents less than 0.05% of net assets.
(b) The rate shown was the current yield as of April 30, 2018.
(c) Represents 7-day effective yield as of April 30, 2018.
Abbreviations
ADR — American Depositary Receipt
As of April 30, 2018, the gross unrealized appreciation (depreciation) of investments based on the aggregate cost of investment securities and derivative instruments, if applicable, for federal income tax purposes was as follows:
Aggregate gross unrealized appreciation | | $ | 328,663,802 | | |
Aggregate gross unrealized depreciation | | | (269,773,376 | ) | |
Net unrealized appreciation | | $ | 58,890,426 | | |
Federal income tax cost | | $ | 1,068,917,279 | | |
See Notes to Financial Statements.
First Eagle Funds | Semi-Annual Report | April 30, 2018
70
This page was intentionally left blank.
First Eagle Global Income Builder Fund
Data as of April 30, 2018 (unaudited)
Investment Objective
The First Eagle Global Income Builder Fund seeks current income generation and long-term growth of capital. Fundamental research drives the identification of income-producing investment opportunities across all market environments.
Average Annual Returns^ (%) | | | | | | One-Year | | Since
Five-Years | | Inception
(5/1/2012) | |
First Eagle Global Income Builder | | Class A | | without sales load | | | 6.07 | | | | 5.36 | | | | 6.48 | | |
| | | | | with sales load | | | 0.76 | | | | 4.29 | | | | 5.56 | | |
Composite Index | | | | | | | 7.71 | | | | 6.23 | | | | 7.09 | | |
MSCI World Index | | | | | | | 13.22 | | | | 9.28 | | | | 10.41 | | |
Bloomberg Barclays U.S. Aggregate Bond Index | | | | | | | -0.32 | | | | 1.47 | | | | 1.85 | | |
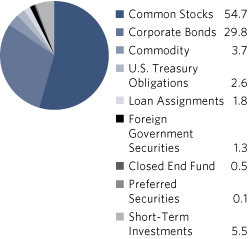
Sectors* (%) | |
Industrials | | | 14.0 | | |
Consumer Staples | | | 12.2 | | |
Financials | | | 10.1 | | |
Consumer Discretionary | | | 9.6 | | |
Energy | | | 8.5 | | |
Materials | | | 8.4 | | |
Information Technology | | | 7.6 | | |
Health Care | | | 7.3 | | |
Real Estate | | | 4.4 | | |
Telecommunication Services | | | 4.3 | | |
Commodities | | | 3.7 | | |
U.S. Treasury Obligations | | | 2.6 | | |
Foreign Government Securities | | | 1.3 | | |
Utilities | | | 0.5 | | |
Short-Term Investments | | | 5.5 | | |
Countries*~ (%)
United States | | | 49.9 | | |
United Kingdom | | | 7.1 | | |
France | | | 6.0 | | |
Japan | | | 5.0 | | |
Hong Kong | | | 5.0 | | |
Canada | | | 4.2 | | |
Germany | | | 3.2 | | |
Switzerland | | | 2.1 | | |
South Korea | | | 1.3 | | |
Singapore | | | 1.3 | | |
Mexico | | | 1.2 | | |
Belgium | | | 1.2 | | |
Netherlands | | | 1.1 | | |
Australia | | | 0.9 | | |
Chile | | | 0.8 | | |
Norway | | | 0.6 | | |
Thailand | | | 0.6 | | |
Sweden | | | 0.6 | | |
Brazil | | | 0.5 | | |
Denmark | | | 0.5 | | |
Austria | | | 0.4 | | |
Russia | | | 0.2 | | |
Ireland | | | 0.2 | | |
New Zealand | | | 0.2 | | |
Poland | | | 0.2 | | |
Malaysia | | | 0.1 | | |
Israel | | | 0.1 | | |
Italy | | | 0.0 | ** | |
Short-Term Investments | | | 5.5 | | |
^ Performance figures reflect certain fee waivers and/or expense limitations, without which returns may have been lower.
* Asset Allocation, Sector and Countries percentages are based on total investments in the portfolio.
** Less than 0.05%
~ Country allocations reflect country of risk (not currency of issue). Bonds of non-U.S. issuers may be U.S. dollar denominated.
The Fund's portfolio composition is subject to change at any time.
First Eagle Funds | Semi-Annual Report | April 30, 2018
72
First Eagle Global Income Builder Fund | Fund Overview
Growth of a $10,000 Initial Investment
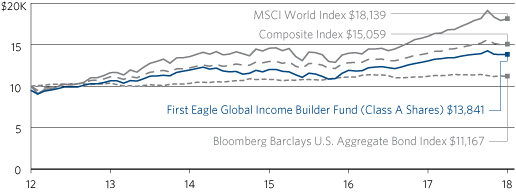
Performance data quoted herein represents past performance and should not be considered indicative of future results. Performance data quoted herein does not reflect the deduction of taxes that a shareholder would pay on Fund distributions or the sale of Fund shares. The average annual returns shown above are historical and reflect changes in share price, reinvested dividends and are net of expenses.
The average annual returns for Class A Shares give effect to the deduction of the maximum sales charge of 5.00%.
The composite index consists of 60% of the MSCI World Index and 40% of the Bloomberg Barclays U.S. Aggregate Bond Index. The MSCI World Index is a widely followed, unmanaged group of stocks from 23 developed international markets. The index provides total returns in U.S. dollars with net dividends reinvested. The Bloomberg Barclays U.S. Aggregate Bond Index is an unmanaged broad-based benchmark that measure the investment grade, U.S. dollar-denominated, fixed-rate taxable bond market, including Treasuries, government-related and corporate securities, MBS (agency fixed-rate and hybrid ARM passthroughs), ABS, and CMBS. One cannot invest directly in an index.
Top 10 Holdings* (%)
Gold bullion (Precious Metal) | | | 3.7 | | |
Nestle SA (Registered) (Food Products, Switzerland) | | | 1.9 | | |
Exxon Mobil Corp. (Oil, Gas & Consumable Fuels, United States) | | | 1.6 | | |
Weyerhaeuser Co. (Equity Real Estate Investment Trusts (REITs), United States) | | | 1.5 | | |
Jardine Matheson Holdings Ltd. (Industrial Conglomerates, Hong Kong) | | | 1.5 | | |
Microsoft Corp. (Software, United States) | | | 1.4 | | |
KDDI Corp. (Wireless Telecommunication Services, Japan) | | | 1.4 | | |
Danone SA (Food Products, France) | | | 1.2 | | |
British American Tobacco plc (Tobacco, United Kingdom) | | | 1.2 | | |
Groupe Bruxelles Lambert SA (Diversified Financial Services, Belgium) | | | 1.2 | | |
Total | | | 16.6 | | |
*Holdings in cash, commercial paper and other short-term cash equivalents have been excluded.
Percentages are based on total net assets.
First Eagle Funds | Semi-Annual Report | April 30, 2018
73
First Eagle Global Income Builder Fund | Schedule of Investments | April 30, 2018 (unaudited)
Investments | | Shares | | Value ($) | |
Common Stocks — 54.2% | |
Austria — 0.4% | |
Mayr Melnhof Karton AG | | | 39,074 | | | | 5,921,201 | | |
Belgium — 1.2% | |
Groupe Bruxelles Lambert SA | | | 151,111 | | | | 17,273,041 | | |
Brazil — 0.5% | |
Cielo SA | | | 1,311,273 | | | | 7,186,698 | | |
Canada — 2.7% | |
Agnico Eagle Mines Ltd. | | | 159,945 | | | | 6,730,658 | | |
Franco-Nevada Corp. | | | 49,135 | | | | 3,485,124 | | |
Goldcorp, Inc. | | | 644,005 | | | | 8,558,826 | | |
Nutrien Ltd. | | | 318,641 | | | | 14,507,725 | | |
Suncor Energy, Inc. | | | 27,609 | | | | 1,055,806 | | |
Wheaton Precious Metals Corp. | | | 260,483 | | | | 5,415,441 | | |
| | | | 39,753,580 | | |
Chile — 0.7% | |
Cia Cervecerias Unidas SA, ADR | | | 373,175 | | | | 10,307,093 | | |
Quinenco SA | | | 200,388 | | | | 656,678 | | |
| | | | 10,963,771 | | |
Denmark — 0.5% | |
ISS A/S | | | 202,239 | | | | 7,052,913 | | |
France — 5.2% | |
Bouygues SA | | | 140,537 | | | | 7,168,109 | | |
Carrefour SA | | | 144,931 | | | | 2,973,610 | | |
Cie de Saint-Gobain | | | 168,390 | | | | 8,810,343 | | |
Danone SA | | | 225,059 | | | | 18,231,087 | | |
Legrand SA | | | 43,918 | | | | 3,417,390 | | |
LVMH Moet Hennessy Louis Vuitton SE | | | 4,980 | | | | 1,733,101 | | |
Neopost SA | | | 3,739 | | | | 100,890 | | |
Rexel SA | | | 519,216 | | | | 8,048,766 | | |
Sanofi | | | 186,655 | | | | 14,757,378 | | |
Sodexo SA | | | 84,551 | | | | 8,372,953 | | |
Thermador Groupe | | | 18,996 | | | | 2,741,279 | | |
| | | | 76,354,906 | | |
First Eagle Funds | Semi-Annual Report | April 30, 2018
74
First Eagle Global Income Builder Fund | Schedule of Investments | April 30, 2018 (unaudited)
Investments | | Shares | | Value ($) | |
Germany — 2.0% | |
Hamburger Hafen und Logistik AG | | | 95,685 | | | | 2,297,629 | | |
HeidelbergCement AG | | | 145,035 | | | | 14,182,563 | | |
Linde AG* | | | 21,487 | | | | 4,760,132 | | |
Telefonica Deutschland Holding AG | | | 1,590,230 | | | | 7,589,412 | | |
| | | | 28,829,736 | | |
Hong Kong — 4.9% | |
CK Asset Holdings Ltd. | | | 623,936 | | | | 5,386,419 | | |
Great Eagle Holdings Ltd. | | | 1,749,774 | | | | 8,838,628 | | |
Guoco Group Ltd. | | | 67,700 | | | | 897,708 | | |
Hang Lung Properties Ltd. | | | 4,629,534 | | | | 10,956,136 | | |
Hopewell Holdings Ltd. | | | 1,513,190 | | | | 5,367,762 | | |
Hysan Development Co. Ltd. | | | 1,193,083 | | | | 6,943,950 | | |
Jardine Matheson Holdings Ltd. | | | 355,800 | | | | 21,545,018 | | |
Mandarin Oriental International Ltd. | | | 4,571,900 | | | | 10,929,735 | | |
Swire Properties Ltd. | | | 442,645 | | | | 1,571,164 | | |
| | | | 72,436,520 | | |
Ireland — 0.2% | |
CRH plc | | | 77,242 | | | | 2,741,403 | | |
Israel — 0.1% | |
Israel Chemicals Ltd. | | | 318,065 | | | | 1,421,387 | | |
Japan — 5.0% | |
Astellas Pharma, Inc. | | | 338,400 | | | | 4,949,518 | | |
FANUC Corp. | | | 40,300 | | | | 8,632,688 | | |
Hoya Corp. | | | 145,800 | | | | 7,789,343 | | |
KDDI Corp. | | | 747,500 | | | | 20,065,595 | | |
Mitsubishi Estate Co. Ltd. | | | 137,600 | | | | 2,514,303 | | |
NTT DOCOMO, Inc. | | | 421,700 | | | | 10,894,202 | | |
Secom Co. Ltd. | | | 145,700 | | | | 10,930,966 | | |
Sompo Holdings, Inc. | | | 163,900 | | | | 6,862,512 | | |
Weathernews, Inc. | | | 16,000 | | | | 505,164 | | |
| | | | 73,144,291 | | |
Malaysia — 0.1% | |
British American Tobacco Malaysia Bhd. | | | 255,200 | | | | 1,593,577 | | |
First Eagle Funds | Semi-Annual Report | April 30, 2018
75
First Eagle Global Income Builder Fund | Schedule of Investments | April 30, 2018 (unaudited)
Investments | | Shares | | Value ($) | |
Mexico — 0.4% | |
Fresnillo plc | | | 291,865 | | | | 5,122,820 | | |
Netherlands — 0.5% | |
HAL Trust | | | 39,656 | | | | 7,325,784 | | |
New Zealand — 0.2% | |
SKY Network Television Ltd. | | | 1,633,505 | | | | 2,610,886 | | |
Norway — 0.6% | |
Orkla ASA | | | 993,802 | | | | 9,197,826 | | |
Russia — 0.2% | |
Gazprom PJSC, ADR | | | 687,492 | | | | 3,172,428 | | |
Singapore — 1.0% | |
ComfortDelGro Corp. Ltd. | | | 3,305,600 | | | | 5,579,155 | | |
Frasers Commercial Trust, REIT | | | 6,024,500 | | | | 6,346,670 | | |
Overseas Education Ltd. | | | 8,325,700 | | | | 2,323,159 | | |
| | | | 14,248,984 | | |
South Korea — 1.3% | |
Kia Motors Corp. | | | 185,168 | | | | 5,717,005 | | |
KT&G Corp. | | | 143,173 | | | | 13,092,073 | | |
| | | | 18,809,078 | | |
Sweden — 0.6% | |
Investor AB, Class A | | | 210,953 | | | | 9,028,387 | | |
Switzerland — 2.0% | |
Cie Financiere Richemont SA (Registered) | | | 13,550 | | | | 1,288,046 | | |
Nestle SA (Registered) | | | 368,179 | | | | 28,522,861 | | |
| | | | 29,810,907 | | |
Thailand — 0.6% | |
Bangkok Bank PCL, NVDR | | | 1,343,800 | | | | 8,181,876 | | |
Thai Beverage PCL | | | 1,762,000 | | | | 1,132,767 | | |
| | | | 9,314,643 | | |
United Kingdom — 5.5% | |
Berkeley Group Holdings plc | | | 254,543 | | | | 14,250,335 | | |
British American Tobacco plc | | | 326,092 | | | | 17,885,334 | | |
BT Group plc | | | 12,926 | | | | 44,366 | | |
Diageo plc | | | 238,505 | | | | 8,508,592 | | |
Domino's Pizza Group plc | | | 323,029 | | | | 1,610,146 | | |
First Eagle Funds | Semi-Annual Report | April 30, 2018
76
First Eagle Global Income Builder Fund | Schedule of Investments | April 30, 2018 (unaudited)
Investments | | Shares | | Value ($) | |
United Kingdom — 5.5% (continued) | |
GlaxoSmithKline plc | | | 819,716 | | | | 16,441,181 | | |
Hiscox Ltd. | | | 475,905 | | | | 9,731,569 | | |
Lloyds Banking Group plc | | | 6,797,878 | | | | 6,029,359 | | |
Unilever NV, CVA | | | 22,367 | | | | 1,282,268 | | |
Victrex plc | | | 55,225 | | | | 1,988,408 | | |
WPP plc | | | 161,137 | | | | 2,765,132 | | |
| | | | 80,536,690 | | |
United States — 17.8% | |
3M Co. | | | 47,526 | | | | 9,238,579 | | |
American Express Co. | | | 32,262 | | | | 3,185,872 | | |
Analog Devices, Inc. | | | 29,648 | | | | 2,589,753 | | |
Anthem, Inc. | | | 43,513 | | | | 10,268,633 | | |
Automatic Data Processing, Inc. | | | 23,240 | | | | 2,744,179 | | |
Bank of New York Mellon Corp. (The) | | | 63,500 | | | | 3,461,385 | | |
BB&T Corp. | | | 243,499 | | | | 12,856,747 | | |
CH Robinson Worldwide, Inc. | | | 100,369 | | | | 9,236,959 | | |
Cincinnati Financial Corp. | | | 43,369 | | | | 3,050,575 | | |
Colgate-Palmolive Co. | | | 139,398 | | | | 9,092,932 | | |
ConocoPhillips | | | 166,859 | | | | 10,929,265 | | |
Deere & Co. | | | 72,671 | | | | 9,834,566 | | |
Exxon Mobil Corp. | | | 299,494 | | | | 23,285,659 | | |
Flowserve Corp. | | | 86,042 | | | | 3,821,125 | | |
H&R Block, Inc. | | | 100,083 | | | | 2,767,295 | | |
Microsoft Corp. | | | 224,876 | | | | 21,030,404 | | |
National Oilwell Varco, Inc. | | | 181,871 | | | | 7,032,952 | | |
Omnicom Group, Inc. | | | 175,959 | | | | 12,961,140 | | |
Oracle Corp. | | | 255,663 | | | | 11,676,129 | | |
Praxair, Inc. | | | 27,686 | | | | 4,222,669 | | |
Royal Gold, Inc. | | | 38,328 | | | | 3,403,526 | | |
San Juan Basin Royalty Trust | | | 356,080 | | | | 2,449,830 | | |
Schlumberger Ltd. | | | 228,518 | | | | 15,667,194 | | |
Synchrony Financial | | | 119,394 | | | | 3,960,299 | | |
Texas Instruments, Inc. | | | 53,785 | | | | 5,455,413 | | |
Tiffany & Co. | | | 60,610 | | | | 6,232,526 | | |
First Eagle Funds | Semi-Annual Report | April 30, 2018
77
First Eagle Global Income Builder Fund | Schedule of Investments | April 30, 2018 (unaudited)
Investments | | Shares | | Value ($) | |
United States — 17.8% (continued) | |
UGI Corp. | | | 127,584 | | | | 6,173,790 | | |
Union Pacific Corp. | | | 72,028 | | | | 9,625,102 | | |
US Bancorp | | | 29,088 | | | | 1,467,490 | | |
Weyerhaeuser Co., REIT | | | 604,889 | | | | 22,247,817 | | |
Willis Towers Watson plc | | | 14,861 | | | | 2,207,007 | | |
Xilinx, Inc. | | | 144,989 | | | | 9,314,093 | | |
| | | | 261,490,905 | | |
Total Common Stocks
(Cost $685,625,432) | | | 795,342,362 | | |
| | | Principal Amount ($) | | | |
Corporate Bonds — 29.5% | |
Australia — 0.9% | |
Ausdrill Finance Pty. Ltd.
6.88%, 11/1/2019‡ (a) | | | 2,795,000 | | | | 2,822,950 | | |
Nufarm Australia Ltd.
6.38%, 10/15/2019 (a) | | | 8,933,000 | | | | 9,078,161 | | |
5.75%, 4/30/2026 (a) | | | 1,742,000 | | | | 1,737,645 | | |
| | | | 13,638,756 | | |
Canada — 1.4% | |
Alimentation Couche-Tard, Inc.
2.35%, 12/13/2019 (a) | | | 2,901,000 | | | | 2,862,138 | | |
Methanex Corp.
3.25%, 12/15/2019 | | | 7,800,000 | | | | 7,740,137 | | |
New Gold, Inc.
6.25%, 11/15/2022 (a) | | | 2,476,000 | | | | 2,525,520 | | |
Open Text Corp.
5.63%, 1/15/2023 (a) | | | 7,627,000 | | | | 7,903,479 | | |
| | | | 21,031,274 | | |
France — 0.8% | |
Altice France SA
6.00%, 5/15/2022 (a) | | | 10,468,000 | | | | 10,317,470 | | |
Electricite de France SA
2.15%, 1/22/2019 (a) | | | 514,000 | | | | 511,062 | | |
6.50%, 1/26/2019 (a) | | | 629,000 | | | | 646,062 | | |
| | | | 11,474,594 | | |
First Eagle Funds | Semi-Annual Report | April 30, 2018
78
First Eagle Global Income Builder Fund | Schedule of Investments | April 30, 2018 (unaudited)
Investments | | Principal Amount ($) | | Value ($) | |
Germany — 1.2% | |
Fresenius Medical Care US Finance II, Inc.
5.63%, 7/31/2019 (a) | | | 9,929,000 | | | | 10,213,961 | | |
Fresenius Medical Care US Finance, Inc.
5.75%, 2/15/2021 (a) | | | 2,494,000 | | | | 2,626,431 | | |
IHO Verwaltungs GmbH
4.12%, 9/15/2021 (a)(b) | | | 1,950,000 | | | | 1,955,704 | | |
4.50%, 9/15/2023 (a)(b) | | | 3,455,216 | | | | 3,394,750 | | |
| | | | 18,190,846 | | |
Italy — 0.0% (c) | |
Telecom Italia Capital SA
7.00%, 6/4/2018 | | | 480,000 | | | | 481,546 | | |
Netherlands — 0.6% | |
NXP BV
4.13%, 6/1/2021 (a) | | | 2,953,000 | | | | 2,960,383 | | |
4.63%, 6/1/2023 (a) | | | 4,847,000 | | | | 4,880,323 | | |
Shell International Finance BV
1.38%, 9/12/2019 | | | 426,000 | | | | 418,455 | | |
| | | | 8,259,161 | | |
United Kingdom — 1.1% | |
Inmarsat Finance plc
4.88%, 5/15/2022 (a) | | | 1,645,000 | | | | 1,587,425 | | |
6.50%, 10/1/2024 (a) | | | 3,780,000 | | | | 3,704,400 | | |
Jaguar Land Rover Automotive plc
4.13%, 12/15/2018 (a) | | | 4,480,000 | | | | 4,485,600 | | |
5.63%, 2/1/2023 (a) | | | 2,457,000 | | | | 2,484,641 | | |
Lloyds Banking Group plc
3.00%, 1/11/2022 | | | 1,250,000 | | | | 1,226,334 | | |
(ICE LIBOR USD 3 Month + 0.81%), 2.91%, 11/7/2023 (d) | | | 2,090,000 | | | | 2,012,459 | | |
| | | | 15,500,859 | | |
United States — 23.5% | |
AbbVie, Inc.
2.00%, 11/6/2018 | | | 12,623,000 | | | | 12,585,011 | | |
ACCO Brands Corp.
5.25%, 12/15/2024 (a) | | | 10,340,000 | | | | 10,340,000 | | |
Aircastle Ltd.
4.63%, 12/15/2018 | | | 891,000 | | | | 897,683 | | |
6.25%, 12/1/2019 | | | 4,859,000 | | | | 5,047,286 | | |
First Eagle Funds | Semi-Annual Report | April 30, 2018
79
First Eagle Global Income Builder Fund | Schedule of Investments | April 30, 2018 (unaudited)
Investments | | Principal Amount ($) | | Value ($) | |
United States — 23.5% (continued) | |
7.63%, 4/15/2020 | | | 2,525,000 | | | | 2,701,750 | | |
5.50%, 2/15/2022 | | | 4,919,000 | | | | 5,140,355 | | |
American Axle & Manufacturing, Inc.
6.63%, 10/15/2022 | | | 4,269,000 | | | | 4,413,079 | | |
6.25%, 3/15/2026 | | | 2,351,000 | | | | 2,327,490 | | |
American Express Co.
1.55%, 5/22/2018 | | | 3,618,000 | | | | 3,616,614 | | |
American Express Credit Corp.
1.70%, 10/30/2019 | | | 4,038,000 | | | | 3,970,822 | | |
Andeavor
4.75%, 12/15/2023 | | | 3,219,000 | | | | 3,362,399 | | |
5.13%, 12/15/2026 | | | 1,609,000 | | | | 1,698,537 | | |
Andeavor Logistics LP
3.50%, 12/1/2022 | | | 111,000 | | | | 109,199 | | |
Anthem, Inc.
2.25%, 8/15/2019 | | | 7,516,000 | | | | 7,441,137 | | |
Aramark Services, Inc.
5.13%, 1/15/2024 | | | 5,970,000 | | | | 6,074,475 | | |
5.00%, 4/1/2025 (a) | | | 1,343,000 | | | | 1,351,394 | | |
4.75%, 6/1/2026 | | | 1,076,000 | | | | 1,043,720 | | |
5.00%, 2/1/2028 (a) | | | 194,000 | | | | 188,907 | | |
Berry Global, Inc.
5.50%, 5/15/2022 | | | 1,145,000 | | | | 1,174,346 | | |
BI-LO LLC
9.25%, 2/15/2019 (a) | | | 10,918,000 | | | | 10,931,648 | | |
Block Financial LLC
4.13%, 10/1/2020 | | | 2,474,000 | | | | 2,505,667 | | |
CCO Holdings LLC
5.25%, 9/30/2022 | | | 1,459,000 | | | | 1,481,797 | | |
Centene Corp.
4.75%, 5/15/2022 | | | 2,036,000 | | | | 2,056,360 | | |
4.75%, 1/15/2025 | | | 2,941,000 | | | | 2,860,122 | | |
Charles River Laboratories International, Inc.
5.50%, 4/1/2026 (a) | | | 350,000 | | | | 356,020 | | |
Charter Communications Operating LLC
4.46%, 7/23/2022 | | | 2,306,000 | | | | 2,351,041 | | |
4.91%, 7/23/2025 | | | 3,845,000 | | | | 3,906,797 | | |
CITGO Petroleum Corp.
6.25%, 8/15/2022 (a) | | | 13,847,000 | | | | 13,847,000 | | |
First Eagle Funds | Semi-Annual Report | April 30, 2018
80
First Eagle Global Income Builder Fund | Schedule of Investments | April 30, 2018 (unaudited)
Investments | | Principal Amount ($) | | Value ($) | |
United States — 23.5% (continued) | |
Cloud Peak Energy Resources LLC
12.00%, 11/1/2021 | | | 7,707,000 | | | | 7,764,803 | | |
CNH Industrial Capital LLC
3.88%, 10/15/2021 | | | 3,225,000 | | | | 3,233,320 | | |
CVS Health Corp.
(ICE LIBOR USD 3 Month + 0.72%),
2.78%, 3/9/2021 (d) | | | 963,000 | | | | 971,850 | | |
DCP Midstream Operating LP
5.35%, 3/15/2020 (a) | | | 8,902,000 | | | | 9,162,205 | | |
4.75%, 9/30/2021 (a) | | | 2,859,000 | | | | 2,891,164 | | |
6.45%, 11/3/2036 (a) | | | 1,545,000 | | | | 1,647,356 | | |
Dell International LLC
3.48%, 6/1/2019 (a) | | | 1,610,000 | | | | 1,613,610 | | |
4.42%, 6/15/2021 (a) | | | 4,220,000 | | | | 4,298,907 | | |
6.02%, 6/15/2026 (a) | | | 3,103,000 | | | | 3,290,863 | | |
Diamond Offshore Drilling, Inc.
7.88%, 8/15/2025 | | | 1,619,000 | | | | 1,661,499 | | |
Discover Bank
2.60%, 11/13/2018 | | | 2,921,000 | | | | 2,920,059 | | |
Dollar Tree, Inc.
(ICE LIBOR USD 3 Month + 0.70%),
3.06%, 4/17/2020 (d) | | | 95,000 | | | | 95,272 | | |
5.75%, 3/1/2023 | | | 13,511,000 | | | | 14,094,675 | | |
3.70%, 5/15/2023 | | | 95,000 | | | | 94,307 | | |
EW Scripps Co. (The)
5.13%, 5/15/2025 (a) | | | 3,493,000 | | | | 3,248,490 | | |
GameStop Corp.
5.50%, 10/1/2019 (a) | | | 13,340,000 | | | | 13,340,000 | | |
GLP Capital LP
4.38%, 11/1/2018 | | | 74,000 | | | | 74,000 | | |
Harland Clarke Holdings Corp.
6.88%, 3/1/2020 (a) | | | 3,133,000 | | | | 3,172,163 | | |
HCA, Inc.
3.75%, 3/15/2019 | | | 1,938,000 | | | | 1,942,845 | | |
6.50%, 2/15/2020 | | | 2,154,000 | | | | 2,250,930 | | |
IQVIA, Inc.
4.88%, 5/15/2023 (a) | | | 6,321,000 | | | | 6,400,013 | | |
John Deere Capital Corp.
1.75%, 8/10/2018 | | | 8,067,000 | | | | 8,052,580 | | |
First Eagle Funds | Semi-Annual Report | April 30, 2018
81
First Eagle Global Income Builder Fund | Schedule of Investments | April 30, 2018 (unaudited)
Investments | | Principal Amount ($) | | Value ($) | |
United States — 23.5% (continued) | |
KFC Holding Co.
5.00%, 6/1/2024 (a) | | | 600,000 | | | | 600,000 | | |
KLX, Inc.
5.88%, 12/1/2022 (a) | | | 3,408,000 | | | | 3,557,100 | | |
Kroger Co. (The)
2.30%, 1/15/2019 | | | 12,700,000 | | | | 12,661,337 | | |
Lamb Weston Holdings, Inc.
4.63%, 11/1/2024 (a) | | | 4,015,000 | | | | 3,979,869 | | |
4.88%, 11/1/2026 (a) | | | 803,000 | | | | 795,974 | | |
Lennar Corp.
4.13%, 12/1/2018 | | | 1,815,000 | | | | 1,815,000 | | |
Lockheed Martin Corp.
1.85%, 11/23/2018 | | | 12,000,000 | | | | 11,956,560 | | |
Meredith Corp.
6.88%, 2/1/2026 (a) | | | 1,716,000 | | | | 1,735,219 | | |
NBCUniversal Enterprise, Inc.
1.97%, 4/15/2019 (a) | | | 2,500,000 | | | | 2,482,047 | | |
Philip Morris International, Inc.
5.65%, 5/16/2018 | | | 14,094,000 | | | | 14,112,474 | | |
Pilgrim's Pride Corp.
5.75%, 3/15/2025 (a) | | | 2,516,000 | | | | 2,459,390 | | |
5.88%, 9/30/2027 (a) | | | 3,343,000 | | | | 3,192,565 | | |
Plantronics, Inc.
5.50%, 5/31/2023 (a) | | | 8,542,000 | | | | 8,542,000 | | |
Post Holdings, Inc.
5.50%, 3/1/2025 (a) | | | 1,076,000 | | | | 1,057,170 | | |
Spectrum Brands, Inc.
5.75%, 7/15/2025 | | | 1,520,000 | | | | 1,518,556 | | |
Sprint Capital Corp.
6.90%, 5/1/2019 | | | 3,774,000 | | | | 3,887,220 | | |
Sprint Spectrum Co. LLC
3.36%, 9/20/2021 (a) | | | 3,270,750 | | | | 3,258,877 | | |
Symantec Corp.
3.95%, 6/15/2022 | | | 2,040,000 | | | | 2,039,825 | | |
Synchrony Financial
2.60%, 1/15/2019 | | | 7,042,000 | | | | 7,029,672 | | |
3.00%, 8/15/2019 | | | 1,977,000 | | | | 1,972,523 | | |
Targa Resources Partners LP
4.13%, 11/15/2019 | | | 4,787,000 | | | | 4,814,142 | | |
First Eagle Funds | Semi-Annual Report | April 30, 2018
82
First Eagle Global Income Builder Fund | Schedule of Investments | April 30, 2018 (unaudited)
Investments | | Principal Amount ($) | | Value ($) | |
United States — 23.5% (continued) | |
Taylor Morrison Communities, Inc.
5.88%, 4/15/2023 (a) | | | 3,107,000 | | | | 3,176,908 | | |
Teleflex, Inc.
5.25%, 6/15/2024 | | | 1,428,000 | | | | 1,449,420 | | |
4.63%, 11/15/2027 | | | 824,000 | | | | 786,920 | | |
UnitedHealth Group, Inc.
1.70%, 2/15/2019 | | | 845,000 | | | | 839,167 | | |
1.95%, 10/15/2020 | | | 2,092,000 | | | | 2,041,696 | | |
USG Corp.
4.88%, 6/1/2027 (a) | | | 850,000 | | | | 850,000 | | |
Valvoline, Inc.
4.38%, 8/15/2025 | | | 979,000 | | | | 939,840 | | |
Veritas US, Inc.
7.50%, 2/1/2023 (a) | | | 1,710,000 | | | | 1,650,150 | | |
Vulcan Materials Co.
(ICE LIBOR USD 3 Month + 0.65%),
2.57%, 3/1/2021 (d) | | | 3,834,000 | | | | 3,840,350 | | |
4.50%, 4/1/2025 | | | 10,940,000 | | | | 11,185,362 | | |
Wachovia Capital Trust III
(ICE LIBOR USD 3 Month + 0.93%, 5.57% Floor),
5.57%, 6/4/2018 (d)(e) | | | 6,773,000 | | | | 6,713,736 | | |
WESCO Distribution, Inc.
5.38%, 12/15/2021 | | | 4,695,000 | | | | 4,765,425 | | |
5.38%, 6/15/2024 | | | 2,693,000 | | | | 2,719,930 | | |
Western Digital Corp.
4.75%, 2/15/2026 | | | 4,523,000 | | | | 4,455,155 | | |
| | | | 344,883,146 | | |
Total Corporate Bonds
(Cost $430,180,497) | | | 433,460,182 | | |
| | | Ounces | | | |
Commodities — 3.7% | |
Gold bullion*
(Cost $50,870,820) | | | 40,872 | | | | 53,729,586 | | |
| | | Principal Amount ($) | | | |
U.S. Treasury Obligations — 2.6% | |
U.S. Treasury Notes
1.63%, 6/30/2019 | | | 9,640,000 | | | | 9,561,299 | | |
First Eagle Funds | Semi-Annual Report | April 30, 2018
83
First Eagle Global Income Builder Fund | Schedule of Investments | April 30, 2018 (unaudited)
Investments | | Principal Amount ($) | | Value ($) | |
U.S. Treasury Obligations — 2.6% (continued) | |
1.63%, 6/30/2020 | | | 9,650,000 | | | | 9,466,801 | | |
1.13%, 6/30/2021 | | | 9,770,000 | | | | 9,315,084 | | |
2.13%, 6/30/2022 (f) | | | 9,588,000 | | | | 9,358,412 | | |
Total U.S. Treasury Obligations
(Cost $38,638,538) | | | 37,701,596 | | |
Loan Assignments — 1.8% | |
United States — 1.8% | |
Caelus Energy Alaska 03 LLC, Second Lien Term Loan
(ICE LIBOR USD 3 Month + 7.50%),
9.68%, 4/15/2020 ‡(d) | | | 6,778,000 | | | | 6,053,635 | | |
OSG Bulk Ships, Inc., First Lien Term Loan B
(ICE LIBOR USD 3 Month + 4.25%),
6.04%, 8/5/2019 ‡(d) | | | 5,103,195 | | | | 4,937,341 | | |
Osum Productions Corp., Term Loan
(ICE LIBOR USD 3 Month + 5.50%),
7.80%, 7/31/2020 ‡(d) | | | 5,956,654 | | | | 5,003,589 | | |
Zebra Technologies Corp., Term Loan B
(ICE LIBOR USD 3 Month + 2.00%),
4.36%, 10/27/2021 (d) | | | 10,190,583 | | | | 10,257,128 | | |
Total Loan Assignments
(Cost $27,909,454) | | | 26,251,693 | | |
Foreign Government Securities — 1.3% | |
Mexico — 0.8% | |
Mexican Bonos
4.75%, 6/14/2018 | | MXN | 129,730,000 | | | | 6,905,111 | | |
6.50%, 6/10/2021 | | MXN | 103,280,000 | | | | 5,388,361 | | |
| | | | 12,293,472 | | |
Poland — 0.2% | |
Poland Government Bond
3.25%, 7/25/2019 | | PLN | 7,185,000 | | | | 2,094,179 | | |
Singapore — 0.3% | |
Singapore Government Bond
3.25%, 9/1/2020 | | SGD | 1,568,000 | | | | 1,216,948 | | |
2.25%, 6/1/2021 | | SGD | 3,839,000 | | | | 2,909,939 | | |
| | | | 4,126,887 | | |
Total Foreign Government Securities
(Cost $20,109,589) | | | 18,514,538 | | |
First Eagle Funds | Semi-Annual Report | April 30, 2018
84
First Eagle Global Income Builder Fund | Schedule of Investments | April 30, 2018 (unaudited)
Investments | | Shares | | Value ($) | |
Closed End Funds — 0.5% | |
United Kingdom — 0.5% | |
Caledonia Investments plc
(Cost $6,917,624) | | | 196,518 | | | | 7,313,985 | | |
Preferred Stocks — 0.1% | |
United States — 0.1% | |
General American Investors Co., Inc., Series B 5.95% (e) | | | 4,712 | | | | 122,041 | | |
MetLife, Inc., Series A(ICE LIBOR USD 3 Month + 1.00%,
4.00% Floor), 4.00% (d)(e) | | | 67,936 | | | | 1,699,759 | | |
Total Preferred Stocks
(Cost $1,760,123) | | | 1,821,800 | | |
| | | Principal Amount ($) | | | |
Short-Term Investments — 5.5% | |
Commercial Paper — 3.4% | |
AstraZeneca plc
2.03%, 5/1/2018 (g) | | | 23,394,000 | | | | 23,392,875 | | |
CenterPoint Energy, Inc.
2.10%, 5/1/2018 (g) | | | 8,870,000 | | | | 8,869,467 | | |
Eni Finance USA, Inc.
2.19%, 5/1/2018 (g) | | | 8,773,000 | | | | 8,772,517 | | |
Mitsui & Co. USA, Inc.
1.83%, 5/1/2018 (g) | | | 9,299,000 | | | | 9,298,488 | | |
Total Commercial Paper
(Cost $50,336,000) | | | 50,333,347 | | |
U.S. Treasury Obligations — 2.1% | |
U.S. Treasury Bills
1.69%, 6/21/2018 (g) | | | 15,000,000 | | | | 14,964,140 | | |
1.80%, 7/26/2018 (g) | | | 15,000,000 | | | | 14,936,172 | | |
Total U.S. Treasury Obligations
(Cost $29,900,158) | | | 29,900,312 | | |
First Eagle Funds | Semi-Annual Report | April 30, 2018
85
First Eagle Global Income Builder Fund | Schedule of Investments | April 30, 2018 (unaudited)
Investments | | Principal Amount ($) | | Value ($) | |
Investment Companies — 0.0% (c) | |
JP Morgan U.S. Government Money Market Fund,
Agency Shares 1.52% (h)
(Cost $9,086) | | | 9,086 | | | | 9,086 | | |
Total Short-Term Investments
(Cost $80,245,244) | | | 80,242,745 | | |
Total Investments — 99.2%
(Cost $1,342,257,321) | | | 1,454,378,487 | | |
Other Assets Less Liabilities — 0.8% | | | 12,473,021 | | |
Net Assets — 100.0% | | | 1,466,851,508 | | |
* Non-income producing security.
‡ Value determined using significant unobservable inputs.
(a) Securities exempt from registration under Rule 144A or section 4(2), of the Securities Act of 1933. Under procedures approved by the Board of Trustees, such securities have been determined to be liquid by the investment adviser and may be resold, normally to qualified institutional buyers in transactions exempt from registration.
(b) Payment in-kind security.
(c) Represents less than 0.05% of net assets.
(d) Variable or floating rate security, linked to the referenced benchmark. The interest rate shown is the rate in effect as of April 30, 2018.
(e) Perpetual security. The rate reflected was the rate in effect on April 30, 2018. The maturity date reflects the next call date.
(f) All or a portion of this security is pledged with the custodian for current or potential holdings of forward foreign currency exchange contracts.
(g) The rate shown was the current yield as of April 30, 2018.
(h) Represents 7-day effective yield as of April 30, 2018.
As of April 30, 2018, the gross unrealized appreciation (depreciation) of investments based on the aggregate cost of investment securities and derivative instruments, if applicable, for federal income tax purposes was as follows:
Aggregate gross unrealized appreciation | | $ | 160,821,229 | | |
Aggregate gross unrealized depreciation | | | (47,865,482 | ) | |
Net unrealized appreciation | | $ | 112,955,747 | | |
Federal income tax cost | | $ | 1,342,257,321 | | |
First Eagle Funds | Semi-Annual Report | April 30, 2018
86
First Eagle Global Income Builder Fund | Schedule of Investments | April 30, 2018 (unaudited)
Forward Foreign Currency Exchange Contracts outstanding as of April 30, 2018
Currency
Purchased | | Currency Sold | | Counterparty | | Settlement
Date | | Unrealized
Appreciation
(Depreciation) | |
USD | 1,486,981 | | | GBP | 1,061,000 | | | Bank of New York Mellon | | 5/16/2018 | | $ | 25,346 | | |
USD | 1,879,053 | | | JPY | 203,944,000 | | | Bank of New York Mellon | | 5/16/2018 | | | 11,730 | | |
USD | 8,297,980 | | | EUR | 6,840,000 | | | Goldman Sachs | | 6/13/2018 | | | 10,985 | | |
USD | 1,822,247 | | | GBP | 1,291,000 | | | Goldman Sachs | | 6/13/2018 | | | 41,232 | | |
USD | 1,881,229 | | | JPY | 203,944,000 | | | Goldman Sachs | | 6/13/2018 | | | 10,159 | | |
USD | 6,752,390 | | | EUR | 5,435,000 | | | JPMorgan Chase Bank | | 7/18/2018 | | | 148,940 | | |
USD | 2,518,648 | | | GBP | 1,806,000 | | | JPMorgan Chase Bank | | 7/18/2018 | | | 22,767 | | |
USD | 4,279,199 | | | JPY | 456,913,000 | | | JPMorgan Chase Bank | | 7/18/2018 | | | 76,694 | | |
USD | 3,737,358 | | | EUR | 2,973,000 | | | UBS AG | | 8/15/2018 | | | 116,822 | | |
USD | 4,868,398 | | | GBP | 3,414,000 | | | UBS AG | | 8/15/2018 | | | 143,812 | | |
USD | 3,958,723 | | | JPY | 413,643,000 | | | UBS AG | | 8/15/2018 | | | 146,232 | | |
USD | 8,508,420 | | | EUR | 6,825,000 | | | HSBC Bank plc | | 9/19/2018 | | | 172,039 | | |
USD | 3,352,866 | | | JPY | 355,672,000 | | | HSBC Bank plc | | 9/19/2018 | | | 65,805 | | |
Total unrealized appreciation | | | 992,563 | | |
USD | 7,528,435 | | | EUR | 6,314,000 | | | Bank of New York Mellon | | 5/16/2018 | | | (104,238 | ) | |
USD | 1,481,615 | | | JPY | 165,283,000 | | | Bank of New York Mellon | | 5/16/2018 | | | (31,726 | ) | |
USD | 1,572,278 | | | JPY | 173,776,000 | | | Goldman Sachs | | 6/13/2018 | | | (22,018 | ) | |
Total unrealized depreciation | | | (157,982 | ) | |
Net unrealized appreciation | | $ | 834,581 | | |
Abbreviations
ADR — American Depositary Receipt
CVA — Dutch Certification
EUR — Euro
GBP — British Pounds
ICE — Intercontinental Exchange
JPY — Japanese Yen
LIBOR — London Interbank Offered Rate
MXN — Mexican Peso
NVDR — Non-Voting Depositary Receipt
PJSC — Public Joint Stock Company
PLN — Polish Zloty
REIT — Real Estate Investment Trust
SGD — Singapore Dollar
USD — United States Dollar
See Notes to Financial Statements.
First Eagle Funds | Semi-Annual Report | April 30, 2018
87
First Eagle High Yield Fund
Data as of April 30, 2018 (unaudited)
Investment Objective
The First Eagle High Yield Fund seeks to provide investors with a high level of current income. To pursue this objective, the Fund normally invests at least 80% of its net assets (plus any borrowings for investment purposes) in high yield, below investment-grade instruments.
Average Annual Returns^ (%) | | | | | | One-Year | | Five-Years | | Ten-Years | |
First Eagle High Yield Fund | | Class I | | | | | | | 3.23 | | | | 3.45 | | | | 8.66 | | |
Bloomberg Barclays U.S. Corporate High Yield Index | | | | | | | 3.26 | | | | 4.75 | | | | 7.88 | | |

Sectors* (%) | |
Energy | | | 18.8 | | |
Industrials | | | 13.5 | | |
Consumer Discretionary | | | 11.9 | | |
Consumer Staples | | | 11.0 | | |
Materials | | | 10.9 | | |
Telecommunication Services | | | 9.5 | | |
Information Technology | | | 8.9 | | |
Health Care | | | 7.8 | | |
Foreign Government Securities | | | 0.9 | | |
Financials | | | 0.7 | | |
Short-Term Investments | | | 6.1 | | |
Countries*~ (%)
United States | | | 71.7 | | |
Canada | | | 5.3 | | |
United Kingdom | | | 5.0 | | |
Australia | | | 3.6 | | |
Germany | | | 3.2 | | |
France | | | 1.3 | | |
Brazil | | | 1.3 | | |
Netherlands | | | 1.1 | | |
Mexico | | | 0.8 | | |
South Korea | | | 0.6 | | |
Short-Term Investments | | | 6.1 | | |
^ Performance figures reflect certain fee waivers and/or expense limitations, without which returns may have been lower.
* Asset Allocation, Sector and Countries percentages are based on total investments in the portfolio.
~ Country allocations reflect country of risk (not currency of issue). Bonds of non-U.S. issuers may be U.S. dollar denominated.
The Fund's portfolio composition is subject to change at any time.
First Eagle Funds | Semi-Annual Report | April 30, 2018
88
First Eagle High Yield Fund | Fund Overview
Growth of a $10,000 Initial Investment

Performance data quoted herein represents past performance and should not be considered indicative of future results. Performance data quoted herein does not reflect the deduction of taxes that a shareholder would pay on Fund distributions or the sale of Fund shares. The average annual returns shown above are historical and reflect changes in share price, reinvested dividends and are net of expenses.
Class I Shares require $1 million minimum investment and are offered without a sales charge. If a sales charge was included values would be lower.
The Bloomberg Barclays U.S. Corporate High Yield Index is composed of fixed-rate, publicly issued, noninvestment grade debt and is unmanaged, with dividends reinvested. The index includes both corporate and non-corporate sectors. The corporate sectors are Industrial, Utility, and Finance, which include both U.S. and non-U.S. corporations. One cannot invest directly in an index.
Top 10 Holdings* (%)
BI-LO LLC, 8.63%, 9/15/2018 (Food & Staples Retailing, United States) | | | 3.0 | | |
Caelus Energy Alaska O3 LLC, Second Lien Term Loan (Oil, Gas & Consumable Fuels,
United States) | | | 2.7 | | |
HCA, Inc. (Health Care Providers & Services, United States) | | | 2.4 | | |
Nufarm Australia Ltd. (Chemicals, Australia) | | | 2.3 | | |
Cloud Peak Energy Resources LLC (Oil, Gas & Consumable Fuels, United States) | | | 2.2 | | |
BI-LO LLC, 9.25%, 2/15/2019 (Food & Staples Retailing, United States) | | | 2.1 | | |
GameStop Corp. (Specialty Retail, United States) | | | 2.0 | | |
CITGO Petroleum Corp. (Oil, Gas & Consumable Fuels, United States) | | | 1.9 | | |
Aircastle Ltd. (Trading Companies & Distributors, United States) | | | 1.9 | | |
Sprint Capital Corp. (Diversified Telecommunication Services, United States) | | | 1.8 | | |
Total | | | 22.3 | | |
*Holdings in cash, commercial paper and other short-term cash equivalents have been excluded.
Percentages are based on total net assets.
First Eagle Funds | Semi-Annual Report | April 30, 2018
89
First Eagle High Yield Fund | Schedule of Investments | April 30, 2018 (unaudited)
Investments | | Principal Amount ($) | | Value ($) | |
Corporate Bonds — 84.5% | |
Australia — 3.6% | |
Ausdrill Finance Pty. Ltd.
6.88%, 11/1/2019 ‡(a) | | | 4,114,000 | | | | 4,155,140 | | |
Nufarm Australia Ltd.
6.38%, 10/15/2019 (a) | | | 8,149,000 | | | | 8,281,421 | | |
5.75%, 4/30/2026 (a) | | | 426,000 | | | | 424,935 | | |
| | | | 12,861,496 | | |
Brazil — 1.3% | |
JBS USA LUX SA
6.75%, 2/15/2028 (a) | | | 4,607,000 | | | | 4,422,720 | | |
Canada — 5.2% | |
Clearwater Seafoods, Inc.
6.88%, 5/1/2025 (a) | | | 1,876,000 | | | | 1,791,580 | | |
Kinross Gold Corp.
4.50%, 7/15/2027 (a) | | | 1,868,000 | | | | 1,755,920 | | |
Mercer International, Inc.
5.50%, 1/15/2026 (a) | | | 924,000 | | | | 907,830 | | |
New Gold, Inc.
6.25%, 11/15/2022 (a) | | | 5,338,000 | | | | 5,444,760 | | |
Open Text Corp.
5.63%, 1/15/2023 (a) | | | 5,500,000 | | | | 5,699,375 | | |
Precision Drilling Corp.
7.75%, 12/15/2023 | | | 2,068,000 | | | | 2,153,305 | | |
Ritchie Bros Auctioneers, Inc.
5.38%, 1/15/2025 (a) | | | 942,000 | | | | 937,290 | | |
| | | | 18,690,060 | | |
France — 1.3% | |
Altice France SA
6.00%, 5/15/2022 (a) | | | 4,769,000 | | | | 4,700,422 | | |
Germany — 3.1% | |
Fresenius Medical Care US Finance II, Inc.
6.50%, 9/15/2018 (a) | | | 4,778,000 | | | | 4,839,324 | | |
5.63%, 7/31/2019 (a) | | | 3,790,000 | | | | 3,898,772 | | |
IHO Verwaltungs GmbH
4.12%, 9/15/2021 (a)(b) | | | 800,000 | | | | 802,340 | | |
4.50%, 9/15/2023 (a)(b) | | | 1,609,174 | | | | 1,581,014 | | |
| | | | 11,121,450 | | |
First Eagle Funds | Semi-Annual Report | April 30, 2018
90
First Eagle High Yield Fund | Schedule of Investments | April 30, 2018 (unaudited)
Investments | | Principal Amount ($) | | Value ($) | |
Netherlands — 1.1% | |
NXP BV
4.63%, 6/1/2023 (a) | | | 4,013,000 | | | | 4,040,589 | | |
South Korea — 0.6% | |
MagnaChip Semiconductor Corp.
6.63%, 7/15/2021 | | | 2,202,000 | | | | 2,119,425 | | |
United Kingdom — 4.9% | |
CNH Industrial NV
4.50%, 8/15/2023 | | | 1,880,000 | | | | 1,905,869 | | |
EnQuest plc
7.00%, 4/15/2022 (b)(c) | | | 6,898,957 | | | | 6,243,556 | | |
Inmarsat Finance plc
4.88%, 5/15/2022 (a) | | | 3,593,000 | | | | 3,467,245 | | |
6.50%, 10/1/2024 (a) | | | 948,000 | | | | 929,040 | | |
Jaguar Land Rover Automotive plc
5.63%, 2/1/2023 (a) | | | 790,000 | | | | 798,887 | | |
Virgin Media Secured Finance plc
5.50%, 1/15/2025 (a) | | | 4,285,000 | | | | 4,167,163 | | |
| | | | 17,511,760 | | |
United States — 63.4% | |
ACCO Brands Corp.
5.25%, 12/15/2024 (a) | | | 4,362,000 | | | | 4,362,000 | | |
AECOM
5.13%, 3/15/2027 | | | 188,000 | | | | 180,659 | | |
Aircastle Ltd.
4.63%, 12/15/2018 | | | 6,732,000 | | | | 6,782,490 | | |
7.63%, 4/15/2020 | | | 4,515,000 | | | | 4,831,050 | | |
American Axle & Manufacturing, Inc.
6.63%, 10/15/2022 | | | 3,278,000 | | | | 3,388,632 | | |
6.25%, 3/15/2026 | | | 2,996,000 | | | | 2,966,040 | | |
AMN Healthcare, Inc.
5.13%, 10/1/2024 (a) | | | 6,161,000 | | | | 6,091,689 | | |
Antero Resources Corp.
5.38%, 11/1/2021 | | | 2,259,000 | | | | 2,285,091 | | |
5.63%, 6/1/2023 | | | 4,082,000 | | | | 4,168,742 | | |
5.00%, 3/1/2025 | | | 942,000 | | | | 938,468 | | |
Aramark Services, Inc.
5.13%, 1/15/2024 | | | 3,003,000 | | | | 3,055,552 | | |
5.00%, 4/1/2025 (a) | | | 584,000 | | | | 587,650 | | |
First Eagle Funds | Semi-Annual Report | April 30, 2018
91
First Eagle High Yield Fund | Schedule of Investments | April 30, 2018 (unaudited)
Investments | | Principal Amount ($) | | Value ($) | |
United States — 63.4% (continued) | |
4.75%, 6/1/2026 | | | 1,556,000 | | | | 1,509,320 | | |
5.00%, 2/1/2028 (a) | | | 57,000 | | | | 55,504 | | |
B&G Foods, Inc.
5.25%, 4/1/2025 | | | 3,669,000 | | | | 3,357,135 | | |
BBA US Holdings, Inc.
5.38%, 5/1/2026 (a) | | | 287,000 | | | | 288,601 | | |
Berry Global, Inc.
5.50%, 5/15/2022 | | | 332,000 | | | | 340,509 | | |
BI-LO LLC
8.63%, 9/15/2018 (a)(b) | | | 18,429,449 | | | | 10,781,228 | | |
9.25%, 2/15/2019 (a) | | | 7,388,000 | | | | 7,397,235 | | |
California Resources Corp.
8.00%, 12/15/2022 (a) | | | 4,244,000 | | | | 3,649,840 | | |
CCO Holdings LLC
5.25%, 9/30/2022 | | | 427,000 | | | | 433,672 | | |
Centene Corp.
5.63%, 2/15/2021 | | | 2,258,000 | | | | 2,317,272 | | |
4.75%, 5/15/2022 | | | 3,271,000 | | | | 3,303,710 | | |
CenturyLink, Inc.
Series S, 6.45%, 6/15/2021 | | | 1,984,000 | | | | 2,027,400 | | |
Series W, 6.75%, 12/1/2023 | | | 2,968,000 | | | | 2,945,740 | | |
Charles River Laboratories International, Inc.
5.50%, 4/1/2026 (a) | | | 89,000 | | | | 90,531 | | |
Charter Communications Operating LLC
4.91%, 7/23/2025 | | | 465,000 | | | | 472,473 | | |
Chemours Co. (The)
6.63%, 5/15/2023 | | | 4,257,000 | | | | 4,475,171 | | |
CITGO Petroleum Corp.
6.25%, 8/15/2022 (a) | | | 6,799,000 | | | | 6,799,000 | | |
Cloud Peak Energy Resources LLC
12.00%, 11/1/2021 | | | 7,629,000 | | | | 7,686,217 | | |
CNH Industrial Capital LLC
3.88%, 10/15/2021 | | | 1,559,000 | | | | 1,563,022 | | |
Cornerstone Chemical Co.
6.75%, 8/15/2024 (a) | | | 1,400,000 | | | | 1,386,000 | | |
Crown Americas LLC
4.50%, 1/15/2023 | | | 3,692,000 | | | | 3,632,005 | | |
4.75%, 2/1/2026 (a) | | | 1,844,000 | | | | 1,779,460 | | |
First Eagle Funds | Semi-Annual Report | April 30, 2018
92
First Eagle High Yield Fund | Schedule of Investments | April 30, 2018 (unaudited)
Investments | | Principal Amount ($) | | Value ($) | |
United States — 63.4% (continued) | |
DCP Midstream Operating LP
4.75%, 9/30/2021 (a) | | | 5,186,000 | | | | 5,244,342 | | |
Dell International LLC
3.48%, 6/1/2019 (a) | | | 835,000 | | | | 836,872 | | |
4.42%, 6/15/2021 (a) | | | 3,670,000 | | | | 3,738,623 | | |
7.13%, 6/15/2024 (a) | | | 4,740,000 | | | | 5,048,100 | | |
Diamond Offshore Drilling, Inc.
7.88%, 8/15/2025 | | | 982,000 | | | | 1,007,778 | | |
Dollar Tree, Inc.
5.75%, 3/1/2023 | | | 4,533,000 | | | | 4,728,826 | | |
EW Scripps Co. (The)
5.13%, 5/15/2025 (a) | | | 1,489,000 | | | | 1,384,770 | | |
FirstCash, Inc.
5.38%, 6/1/2024 (a) | | | 1,596,000 | | | | 1,619,940 | | |
Frontier Communications Corp.
7.13%, 3/15/2019 | | | 2,894,000 | | | | 2,879,530 | | |
8.50%, 4/1/2026 (a) | | | 584,000 | | | | 567,940 | | |
GameStop Corp.
5.50%, 10/1/2019 (a) | | | 7,251,000 | | | | 7,251,000 | | |
6.75%, 3/15/2021 (a) | | | 200,000 | | | | 202,500 | | |
Genesis Energy LP
6.00%, 5/15/2023 | | | 3,702,000 | | | | 3,618,705 | | |
6.50%, 10/1/2025 | | | 1,421,000 | | | | 1,396,133 | | |
GLP Capital LP
4.38%, 11/1/2018 | | | 553,000 | | | | 553,000 | | |
Harland Clarke Holdings Corp.
6.88%, 3/1/2020 (a) | | | 4,364,000 | | | | 4,418,550 | | |
HCA, Inc.
3.75%, 3/15/2019 | | | 8,500,000 | | | | 8,521,250 | | |
IQVIA, Inc.
4.88%, 5/15/2023 (a) | | | 2,928,000 | | | | 2,964,600 | | |
5.00%, 10/15/2026 (a) | | | 800,000 | | | | 789,000 | | |
KFC Holding Co.
5.00%, 6/1/2024 (a) | | | 3,845,000 | | | | 3,845,000 | | |
5.25%, 6/1/2026 (a) | | | 600,000 | | | | 603,000 | | |
KLX, Inc.
5.88%, 12/1/2022 (a) | | | 2,310,000 | | | | 2,411,063 | | |
Koppers, Inc.
6.00%, 2/15/2025 (a) | | | 471,000 | | | | 479,243 | | |
First Eagle Funds | Semi-Annual Report | April 30, 2018
93
First Eagle High Yield Fund | Schedule of Investments | April 30, 2018 (unaudited)
Investments | | Principal Amount ($) | | Value ($) | |
United States — 63.4% (continued) | |
Lamb Weston Holdings, Inc.
4.63%, 11/1/2024 (a) | | | 1,939,000 | | | | 1,922,034 | | |
4.88%, 11/1/2026 (a) | | | 388,000 | | | | 384,605 | | |
Men's Wearhouse, Inc. (The)
7.00%, 7/1/2022 | | | 2,871,000 | | | | 2,946,364 | | |
Meredith Corp.
6.88%, 2/1/2026 (a) | | | 245,000 | | | | 247,744 | | |
MGIC Investment Corp.
5.75%, 8/15/2023 | | | 470,000 | | | | 480,575 | | |
NGL Energy Partners LP
7.50%, 11/1/2023 | | | 2,936,000 | | | | 2,928,660 | | |
Pilgrim's Pride Corp.
5.75%, 3/15/2025 (a) | | | 358,000 | | | | 349,945 | | |
5.88%, 9/30/2027 (a) | | | 638,000 | | | | 609,290 | | |
Plantronics, Inc.
5.50%, 5/31/2023 (a) | | | 3,674,000 | | | | 3,674,000 | | |
Post Holdings, Inc.
5.50%, 3/1/2025 (a) | | | 430,000 | | | | 422,475 | | |
Radian Group, Inc.
4.50%, 10/1/2024 | | | 233,000 | | | | 222,515 | | |
Shea Homes LP
5.88%, 4/1/2023 (a) | | | 4,705,000 | | | | 4,746,169 | | |
Silgan Holdings, Inc.
5.50%, 2/1/2022 | | | 4,720,000 | | | | 4,790,800 | | |
Spectrum Brands, Inc.
5.75%, 7/15/2025 | | | 2,968,000 | | | | 2,965,180 | | |
Sprint Capital Corp.
6.90%, 5/1/2019 | | | 6,349,000 | | | | 6,539,470 | | |
Sprint Communications, Inc.
7.00%, 8/15/2020 | | | 2,000,000 | | | | 2,107,740 | | |
Sprint Spectrum Co. LLC
3.36%, 9/20/2021 (a) | | | 2,542,750 | | | | 2,533,520 | | |
Symantec Corp.
3.95%, 6/15/2022 | | | 918,000 | | | | 917,921 | | |
Taylor Morrison Communities, Inc.
5.88%, 4/15/2023 (a) | | | 3,228,000 | | | | 3,300,630 | | |
Teleflex, Inc.
5.25%, 6/15/2024 | | | 472,000 | | | | 479,080 | | |
4.63%, 11/15/2027 | | | 264,000 | | | | 252,120 | | |
First Eagle Funds | Semi-Annual Report | April 30, 2018
94
First Eagle High Yield Fund | Schedule of Investments | April 30, 2018 (unaudited)
Investments | | Principal Amount ($) | | Value ($) | |
United States — 63.4% (continued) | |
Tennant Co.
5.63%, 5/1/2025 | | | 235,000 | | | | 239,449 | | |
Ultra Resources, Inc.
7.13%, 4/15/2025 (a) | | | 3,868,000 | | | | 2,579,473 | | |
USG Corp.
4.88%, 6/1/2027 (a) | | | 360,000 | | | | 360,000 | | |
Valvoline, Inc.
5.50%, 7/15/2024 | | | 233,000 | | | | 238,825 | | |
4.38%, 8/15/2025 | | | 362,000 | | | | 347,520 | | |
Veritas US, Inc.
7.50%, 2/1/2023 (a) | | | 1,531,000 | | | | 1,477,415 | | |
Weight Watchers International, Inc.
8.63%, 12/1/2025 (a) | | | 2,774,000 | | | | 2,982,050 | | |
WESCO Distribution, Inc.
5.38%, 12/15/2021 | | | 4,523,000 | | | | 4,590,845 | | |
Western Digital Corp.
4.75%, 2/15/2026 | | | 531,000 | | | | 523,035 | | |
| | | | 226,198,322 | | |
Total Corporate Bonds
(Cost $304,617,082) | | | 301,666,244 | | |
Loan Assignments — 7.5% | |
United States — 7.5% | |
BJ's Wholesale Club, Inc., Second Lien Term Loan
(ICE LIBOR USD 1 Month + 7.50%),
9.39%, 2/3/2025 (d) | | | 3,764,000 | | | | 3,796,935 | | |
Caelus Energy Alaska O3 LLC, Second Lien Term Loan
(ICE LIBOR USD 3 Month + 7.50%),
9.68%, 4/15/2020 ‡(d) | | | 10,782,000 | | | | 9,629,728 | | |
OSG Bulk Ships, Inc., First Lien Term Loan B
(ICE LIBOR USD 3 Month + 4.25%),
6.04%, 8/5/2019 ‡(d) | | | 3,310,048 | | | | 3,202,471 | | |
Osum Productions Corp., Term Loan
(ICE LIBOR USD 3 Month + 5.50%),
7.80%, 7/31/2020 ‡(d) | | | 7,427,440 | | | | 6,239,050 | | |
Zebra Technologies Corp., Term Loan B
(ICE LIBOR USD 3 Month + 2.00%),
4.36%, 10/27/2021 (d) | | | 3,825,673 | | | | 3,850,654 | | |
Total Loan Assignments
(Cost $28,731,340) | | | 26,718,838 | | |
First Eagle Funds | Semi-Annual Report | April 30, 2018
95
First Eagle High Yield Fund | Schedule of Investments | April 30, 2018 (unaudited)
Investments | | Principal Amount ($) | | Value ($) | |
Foreign Government Securities — 0.9% | |
Mexico — 0.9% | |
Mexican Bonos
4.75%, 6/14/2018
(Cost $2,891,130) | | MXN | 57,560,000 | | | | 3,063,733 | | |
Short-Term Investments — 6.0% | |
Commercial Paper — 6.0% | |
AstraZeneca plc
2.03%, 5/1/2018 (e) | | | 9,997,000 | | | | 9,996,519 | | |
CenterPoint Energy, Inc.
2.10%, 5/1/2018 (e) | | | 3,791,000 | | | | 3,790,772 | | |
Eni Finance USA, Inc.
2.19%, 5/1/2018 (e) | | | 3,749,000 | | | | 3,748,794 | | |
Mitsui & Co. USA, Inc.
1.83%, 5/1/2018 (e) | | | 3,974,000 | | | | 3,973,781 | | |
Total Commercial Paper
(Cost $21,511,000) | | | 21,509,866 | | |
Investment Companies — 0.0% (f) | |
JP Morgan U.S. Government Money Market Fund,
Agency Shares 1.52% (g)
(Cost $5,763) | | | 5,763 | | | | 5,763 | | |
Total Short-Term Investments
(Cost $21,516,763) | | | 21,515,629 | | |
Total Investments — 98.9%
(Cost $357,756,315) | | | 352,964,444 | | |
Other Assets Less Liabilities — 1.1% | | | 3,897,096 | | |
Net Assets — 100.0% | | | 356,861,540 | | |
‡ Value determined using significant unobservable inputs.
(a) Securities exempt from registration under Rule 144A or section 4(2), of the Securities Act of 1933. Under procedures approved by the Board of Trustees, such securities have been determined to be liquid by the investment adviser and may be resold, normally to qualified institutional buyers in transactions exempt from registration.
(b) Payment in-kind security.
(c) Security exempt from registration pursuant to Regulation S under the Securities Act of 1933. Regulation S applies to securities offerings that are made outside of the United States and do not involve direct selling efforts in the United States and as such may have restrictions on resale.
(d) Variable or floating rate security, linked to the referenced benchmark. The interest rate shown is the rate in effect as of April 30, 2018.
First Eagle Funds | Semi-Annual Report | April 30, 2018
96
First Eagle High Yield Fund | Schedule of Investments | April 30, 2018 (unaudited)
(e) The rate shown was the current yield as of April 30, 2018.
(f) Represents less than 0.05% of net assets.
(g) Represents 7-day effective yield as of April 30, 2018.
Abbreviations
ICE — Intercontinental Exchange
LIBOR — London Interbank Offered Rate
MXN — Mexican Peso
USD — United States Dollar
As of April 30, 2018, the gross unrealized appreciation (depreciation) of investments based on the aggregate cost of investment securities and derivative instruments, if applicable, for federal income tax purposes was as follows:
Aggregate gross unrealized appreciation | | $ | 8,169,883 | | |
Aggregate gross unrealized depreciation | | | (12,961,754 | ) | |
Net unrealized depreciation | | $ | (4,791,871 | ) | |
Federal income tax cost | | $ | 357,756,315 | | |
See Notes to Financial Statements.
First Eagle Funds | Semi-Annual Report | April 30, 2018
97
First Eagle Fund of America
Data as of April 30, 2018 (unaudited)
Investment Objective
The First Eagle Fund of America is a non-diversified U.S. equity fund that seeks capital appreciation by investing primarily in domestic stocks and, to a lesser extent, in debt and foreign equity securities. The Fund has a unique event-driven bias that focuses on identifying companies poised to benefit from change that the market has not yet recognized.
Average Annual Returns (%) | | | | | | One-Year | | Five-Years | | Ten-Years | |
First Eagle Fund of America | | Class Y | | | | | 6.57 | | | | 8.00 | | | | 7.21 | | |
S&P 500 Index | | | | | | | 13.27 | | | | 12.96 | | | | 9.02 | | |
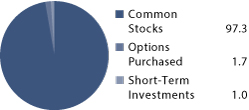
Sectors* (%)
Materials | | | 30.7 | | |
Industrials | | | 18.2 | | |
Consumer Discretionary | | | 17.3 | | |
Information Technology | | | 14.5 | | |
Health Care | | | 7.1 | | |
Consumer Staples | | | 5.7 | | |
Telecommunication Services | | | 2.6 | | |
Financials | | | 1.2 | | |
Options Purchased | | | 1.7 | | |
Short-Term Investments | | | 1.0 | | |
* Asset Allocation and Sector percentages are based on total investments in the portfolio.
The Fund's portfolio composition is subject to change at any time.
First Eagle Funds | Semi-Annual Report | April 30, 2018
98
First Eagle Fund of America | Fund Overview
Growth of a $10,000 Initial Investment
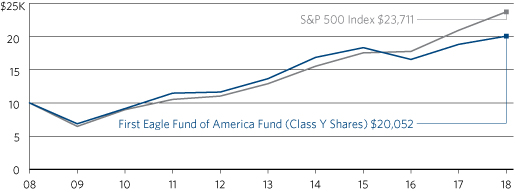
Performance data quoted herein represents past performance and should not be considered indicative of future results. Performance data quoted herein does not reflect the deduction of taxes that a shareholder would pay on Fund distributions or the sale of Fund shares.
The Fund's average annual returns shown above are historical and reflect changes in share price, reinvested dividends and are net of expenses.
The S&P 500 Index is a widely recognized unmanaged index including a representative sample of 500 leading companies in leading sectors of the U.S. economy. Although the S&P 500 Index focuses on the large-cap segment of the market, with approximately 80% coverage of U.S. equities, it is also considered a proxy for the total market. The S&P 500 Index includes dividends reinvested. One cannot invest directly in an index.
Top 10 Holdings* (%)
Packaging Corp. of America (Containers & Packaging, United States) | | | 5.9 | | |
Martin Marietta Materials, Inc. (Construction Materials, United States) | | | 5.0 | | |
Wyndham Worldwide Corp. (Hotels, Restaurants & Leisure, United States) | | | 4.7 | | |
General Dynamics Corp. (Aerospace & Defense, United States) | | | 4.7 | | |
HP, Inc. (Technology Hardware, Storage & Peripherals, United States) | | | 4.5 | | |
La Quinta Holdings, Inc. (Hotels, Restaurants & Leisure, United States) | | | 4.1 | | |
Visteon Corp. (Auto Components, United States) | | | 3.9 | | |
KLX, Inc. (Aerospace & Defense, United States) | | | 3.6 | | |
Armstrong World Industries, Inc. (Building Products, United States) | | | 3.5 | | |
Tyson Foods, Inc. (Food Products, United States) | | | 3.4 | | |
Total | | | 43.3 | | |
*Holdings in cash, commercial paper and other short-term cash equivalents have been excluded. Percentages are based on total net assets.
First Eagle Funds | Semi-Annual Report | April 30, 2018
99
First Eagle Fund of America | Schedule of Investments | April 30, 2018 (unaudited)
Investments | | Shares | | Value ($) | |
Common Stocks — 95.9% | |
Aerospace & Defense — 8.3% | |
General Dynamics Corp. (a) | | | 468,190 | | | | 94,251,329 | | |
KLX, Inc.* (a) | | | 912,694 | | | | 71,400,051 | | |
| | | | 165,651,380 | | |
Auto Components — 4.8% | |
Adient plc (a) | | | 276,205 | | | | 16,928,604 | | |
Visteon Corp.* (a) | | | 631,315 | | | | 78,560,839 | | |
| | | | 95,489,443 | | |
Biotechnology — 4.8% | |
Alexion Pharmaceuticals, Inc.* | | | 91,071 | | | | 10,712,682 | | |
Eagle Pharmaceuticals, Inc.* | | | 267,608 | | | | 13,918,292 | | |
Halozyme Therapeutics, Inc.* (a) | | | 2,704,753 | | | | 51,200,974 | | |
Intrexon Corp.* | | | 1,102,004 | | | | 20,034,433 | | |
| | | | 95,866,381 | | |
Building Products — 3.5% | |
Armstrong World Industries, Inc.* (a) | | | 1,245,178 | | | | 69,729,968 | | |
Capital Markets — 1.2% | |
Intercontinental Exchange, Inc. | | | 328,150 | | | | 23,777,749 | | |
Chemicals — 11.0% | |
Albemarle Corp. (a) | | | 493,915 | | | | 47,889,998 | | |
Chemours Co. (The) (a) | | | 1,394,007 | | | | 67,483,879 | | |
GCP Applied Technologies, Inc.* | | | 433,712 | | | | 12,425,849 | | |
Huntsman Corp. (a) | | | 1,473,653 | | | | 43,870,650 | | |
Olin Corp. (a) | | | 1,652,968 | | | | 49,903,104 | | |
| | | | 221,573,480 | | |
Construction Materials — 5.0% | |
Martin Marietta Materials, Inc. | | | 519,735 | | | | 101,228,786 | | |
Containers & Packaging — 11.2% | |
Ball Corp. | | | 1,161,245 | | | | 46,554,312 | | |
International Paper Co. | | | 1,168,935 | | | | 60,270,289 | | |
Packaging Corp. of America (a) | | | 1,018,060 | | | | 117,779,361 | | |
| | | | 224,603,962 | | |
Diversified Consumer Services — 2.3% | |
ServiceMaster Global Holdings, Inc.* (a) | | | 905,390 | | | | 45,812,734 | | |
First Eagle Funds | Semi-Annual Report | April 30, 2018
100
First Eagle Fund of America | Schedule of Investments | April 30, 2018 (unaudited)
Investments | | Shares | | Value ($) | |
Food Products — 5.6% | |
Post Holdings, Inc.* (a) | | | 546,253 | | | | 43,465,351 | | |
Tyson Foods, Inc., Class A (a) | | | 987,056 | | | | 69,192,626 | | |
| | | | 112,657,977 | | |
Hotels, Restaurants & Leisure — 9.9% | |
Chipotle Mexican Grill, Inc.* (a) | | | 50,402 | | | | 21,336,679 | | |
La Quinta Holdings, Inc.* | | | 4,252,788 | | | | 83,099,478 | | |
Wyndham Worldwide Corp. (a) | | | 830,664 | | | | 94,870,135 | | |
| | | | 199,306,292 | | |
Internet Software & Services — 2.5% | |
eBay, Inc.* | | | 1,302,973 | | | | 49,356,617 | | |
Machinery — 2.7% | |
Pentair plc (United Kingdom) | | | 798,944 | | | | 53,752,952 | | |
Metals & Mining — 3.0% | |
Allegheny Technologies, Inc.* (a) | | | 2,230,848 | | | | 59,273,631 | | |
Pharmaceuticals — 2.1% | |
Innoviva, Inc.* (a) | | | 1,364,550 | | | | 19,785,975 | | |
Medicines Co. (The)* | | | 459,045 | | | | 13,812,664 | | |
TherapeuticsMD, Inc.* | | | 1,747,336 | | | | 9,610,348 | | |
| | | | 43,208,987 | | |
Professional Services — 0.1% | |
Equifax, Inc. | | | 25,661 | | | | 2,875,315 | | |
Semiconductors & Semiconductor Equipment — 1.6% | |
Versum Materials, Inc. (a) | | | 915,515 | | | | 32,207,818 | | |
Software — 2.5% | |
BlackBerry Ltd. (Canada)* (a) | | | 4,748,919 | | | | 49,721,182 | | |
Technology Hardware, Storage & Peripherals — 7.8% | |
HP, Inc. (a) | | | 4,176,131 | | | | 89,745,055 | | |
Western Digital Corp. (a) | | | 835,249 | | | | 65,809,269 | | |
| | | | 155,554,324 | | |
Trading Companies & Distributors — 3.4% | |
HD Supply Holdings, Inc.* | | | 679,384 | | | | 26,298,955 | | |
Univar, Inc.* (a) | | | 1,496,472 | | | | 41,242,768 | | |
| | | | 67,541,723 | | |
First Eagle Funds | Semi-Annual Report | April 30, 2018
101
First Eagle Fund of America | Schedule of Investments | April 30, 2018 (unaudited)
Investments | | Shares | | Value ($) | |
Wireless Telecommunication Services — 2.6% | |
T-Mobile US, Inc.* (a) | | | 850,559 | | | | 51,467,325 | | |
Total Common Stocks
(Cost $1,482,387,425) | | | 1,920,658,026 | | |
| | | No. of Contracts | | | |
Options Purchased — 1.7% | |
Call Options — 1.7% | |
Exchange Traded | |
Airlines — 0.1% | |
Delta Air Lines, Inc. 01/18/2019 at USD 40
Notional Amount: USD 10,444,000 | | | 2,000 | | | | 2,635,000 | | |
Capital Markets — 0.5% | |
Intercontinental Exchange, Inc. 01/18/2019 at USD 50
Notional Amount: USD 28,984,000 | | | 4,000 | | | | 9,400,000 | | |
Intercontinental Exchange, Inc. 01/18/2019 at USD 55
Notional Amount: USD 3,623,000 | | | 500 | | | | 947,500 | | |
| | | | 10,347,500 | | |
Chemicals — 0.2% | |
Albemarle Corp. 01/18/2019 at USD 80
Notional Amount: USD 14,544,000 | | | 1,500 | | | | 3,277,500 | | |
Containers & Packaging — 0.1% | |
Ball Corp. 01/18/2019 at USD 32.5
Notional Amount: USD 2,136,797 | | | 533 | | | | 461,045 | | |
International Paper Co. 01/18/2019 at USD 50
Notional Amount: USD 15,468,000 | | | 3,000 | | | | 1,410,000 | | |
| | | | 1,871,045 | | |
Food & Staples Retailing — 0.2% | |
Casey's General Stores, Inc. 08/17/2018 at USD 80
Notional Amount: USD 16,083,900 | | | 1,665 | | | | 3,013,650 | | |
Food Products — 0.1% | |
Post Holdings, Inc. 01/18/2019 at USD 50
Notional Amount: USD 3,978,500 | | | 500 | | | | 1,567,500 | | |
Tyson Foods, Inc. 01/17/2020 at USD 60
Notional Amount: USD 1,752,500 | | | 250 | | | | 371,250 | | |
| | | | 1,938,750 | | |
First Eagle Funds | Semi-Annual Report | April 30, 2018
102
First Eagle Fund of America | Schedule of Investments | April 30, 2018 (unaudited)
Investments | | No. of Contracts | | Value ($) | |
Professional Services — 0.5% | |
Equifax, Inc. 01/17/2020 at USD 80
Notional Amount: USD 28,012,500 | | | 2,500 | | | | 9,275,000 | | |
Equifax, Inc. 01/17/2020 at USD 85
Notional Amount: USD 5,602,500 | | | 500 | | | | 1,677,500 | | |
| | | | 10,952,500 | | |
Total Call Options | | | 34,035,945 | | |
Total Options Purchased
(Cost $44,226,727) | | | 34,035,945 | | |
| | | Shares | | | |
Short-Term Investments — 0.9% | |
Investment Companies — 0.9% | |
JP Morgan U.S. Government Money Market Fund,
Agency Shares, 1.52% (b)
(Cost $18,833,101) | | | 18,833,101 | | | | 18,833,101 | | |
Total Investments — 98.5%
(Cost $1,545,447,253) | | | 1,973,527,072 | | |
Other Assets Less Liabilities — 1.5% | | | 30,407,745 | | |
Net Assets — 100.0% | | | 2,003,934,817 | | |
* Non-income producing security.
(a) All or a portion of the security pledged as collateral for call options written.
(b) Represents 7-day effective yield as of April 30, 2018.
As of April 30, 2018, the gross unrealized appreciation (depreciation) of investments based on the aggregate cost of investment securities and derivative instruments, if applicable, for federal income tax purposes was as follows:
Aggregate gross unrealized appreciation | | $ | 477,741,230 | | |
Aggregate gross unrealized depreciation | | | (49,079,155 | ) | |
Net unrealized appreciation | | $ | 428,662,075 | | |
Federal income tax cost | | $ | 1,545,447,253 | | |
Written Call Options Contracts as of April 30, 2018:
Description | | Counterparty | | Number of
Contracts | | Notional
Amount | | Exercise
Price | | Expiration
Date | | Value ($) | |
Adient plc | | Exchange Traded | | | 143 | | | USD | (876,447 | ) | | USD | 60.00 | | | 5/18/2018 | | | (47,190 | ) | |
Albemarle Corp. | | Exchange Traded | | | 263 | | | USD | (2,550,048 | ) | | USD | 100.00 | | | 6/15/2018 | | | (100,466 | ) | |
Allegheny
Technologies, Inc. | | Exchange Traded | | | 4,886 | | | USD | (12,982,102 | ) | | USD | 27.50 | | | 7/20/2018 | | | (796,418 | ) | |
Armstrong World
Industries, Inc. | | Exchange Traded | | | 80 | | | USD | (448,000 | ) | | USD | 60.00 | | | 6/15/2018 | | | (2,800 | ) | |
BlackBerry Ltd. | | Exchange Traded | | | 2,481 | | | USD | (2,597,607 | ) | | USD | 10.00 | | | 6/15/2018 | | | (200,961 | ) | |
Chemours Co. (The) | | Exchange Traded | | | 259 | | | USD | (1,253,819 | ) | | USD | 50.00 | | | 5/18/2018 | | | (33,670 | ) | |
First Eagle Funds | Semi-Annual Report | April 30, 2018
103
First Eagle Fund of America | Schedule of Investments | April 30, 2018 (unaudited)
Written Call Options Contracts as of April 30, 2018 (continued)
Description | | Counterparty | | Number of
Contracts | | Notional
Amount | | Exercise
Price | | Expiration
Date | | Value ($) | |
Chemours Co. (The) | | Exchange Traded | | | 285 | | | USD | (1,379,685 | ) | | USD | 52.50 | | | 5/18/2018 | | | (19,950 | ) | |
Chipotle Mexican
Grill, Inc. | | Exchange Traded | | | 19 | | | USD | (804,327 | ) | | USD | 325.00 | | | 5/18/2018 | | | (192,660 | ) | |
Chipotle Mexican
Grill, Inc. | | Exchange Traded | | | 155 | | | USD | (6,561,615 | ) | | USD | 340.00 | | | 5/18/2018 | | | (1,340,750 | ) | |
General
Dynamics Corp. | | Exchange Traded | | | 347 | | | USD | (6,985,457 | ) | | USD | 205.00 | | | 6/15/2018 | | | (165,866 | ) | |
General
Dynamics Corp. | | Exchange Traded | | | 89 | | | USD | (1,791,659 | ) | | USD | 215.00 | | | 6/15/2018 | | | (12,638 | ) | |
Halozyme
Therapeutics, Inc. | | Exchange Traded | | | 5,351 | | | USD | (10,129,443 | ) | | USD | 19.00 | | | 6/15/2018 | | | (588,610 | ) | |
Halozyme
Therapeutics, Inc. | | Exchange Traded | | | 2,000 | | | USD | (3,786,000 | ) | | USD | 20.00 | | | 6/15/2018 | | | (145,000 | ) | |
HP, Inc. | | Exchange Traded | | | 1,829 | | | USD | (3,930,521 | ) | | USD | 21.00 | | | 5/18/2018 | | | (137,175 | ) | |
Huntsman Corp. | | Exchange Traded | | | 70 | | | USD | (208,390 | ) | | USD | 28.00 | | | 5/18/2018 | | | (18,900 | ) | |
Innoviva, Inc. | | Exchange Traded | | | 2,728 | | | USD | (3,955,600 | ) | | USD | 15.00 | | | 6/15/2018 | | | (166,408 | ) | |
KLX, Inc. | | Exchange Traded | | | 2,776 | | | USD | (21,716,648 | ) | | USD | 70.00 | | | 11/16/2018 | | | (2,887,040 | ) | |
KLX, Inc. | | Exchange Traded | | | 710 | | | USD | (5,554,330 | ) | | USD | 72.50 | | | 11/16/2018 | | | (592,850 | ) | |
KLX, Inc. | | Exchange Traded | | | 710 | | | USD | (5,554,330 | ) | | USD | 75.00 | | | 11/16/2018 | | | (422,450 | ) | |
Olin Corp. | | Exchange Traded | | | 71 | | | USD | (214,349 | ) | | USD | 29.00 | | | 5/18/2018 | | | (13,845 | ) | |
Packaging Corp.
of America | | Exchange Traded | | | 926 | | | USD | (10,712,894 | ) | | USD | 120.00 | | | 7/20/2018 | | | (231,500 | ) | |
Post Holdings, Inc. | | Exchange Traded | | | 26 | | | USD | (206,882 | ) | | USD | 80.00 | | | 6/15/2018 | | | (8,580 | ) | |
Servicemaster
Global Holdings, Inc. | | Exchange Traded | | | 25 | | | USD | (126,500 | ) | | USD | 50.00 | | | 5/18/2018 | | | (4,500 | ) | |
T-Mobile US, Inc. | | Exchange Traded | | | 52 | | | USD | (314,652 | ) | | USD | 60.00 | | | 5/18/2018 | | | (11,284 | ) | |
Tyson Foods, Inc. | | Exchange Traded | | | 400 | | | USD | (2,804,000 | ) | | USD | 75.00 | | | 7/20/2018 | | | (42,000 | ) | |
Univar, Inc. | | Exchange Traded | | | 177 | | | USD | (487,812 | ) | | USD | 30.00 | | | 6/15/2018 | | | (7,080 | ) | |
Versum
Materials, Inc. | | Exchange Traded | | | 2,065 | | | USD | (7,264,670 | ) | | USD | 37.50 | | | 6/15/2018 | | | (113,575 | ) | |
Visteon Corp. | | Exchange Traded | | | 255 | | | USD | (3,173,220 | ) | | USD | 125.00 | | | 6/15/2018 | | | (122,400 | ) | |
Western
Digital Corp. | | Exchange Traded | | | 480 | | | USD | (3,781,920 | ) | | USD | 90.00 | | | 7/20/2018 | | | (55,680 | ) | |
Western
Digital Corp. | | Exchange Traded | | | 245 | | | USD | (1,930,355 | ) | | USD | 95.00 | | | 7/20/2018 | | | (14,700 | ) | |
Wyndham
Worldwide Corp. | | Exchange Traded | | | 615 | | | USD | (7,023,915 | ) | | USD | 110.00 | | | 5/18/2018 | | | (375,150 | ) | |
Total Written Options Contracts (Premiums Received ($9,454,352)) | | | | | | | | | | | | | (8,872,096 | ) | |
Abbreviations
USD United States Dollar
See Notes to Financial Statements.
First Eagle Funds | Semi-Annual Report | April 30, 2018
104
This page was intentionally left blank.
Statements of Assets and Liabilities
| | | First Eagle
Global Fund* | | First Eagle
Overseas Fund* | |
Assets | |
Investments, at Cost (Note 1) | |
Investments in securities of unaffiliated issuers | | $ | 37,059,507,123 | | | $ | 12,276,147,717 | | |
Investments in securities of affiliated issuers | | | 1,900,573,432 | | | | 213,374,787 | | |
Gold bullion | | | 3,289,770,460 | | | | 943,895,802 | | |
Silver bullion | | | — | | | | — | | |
Foreign currency | | | — | | | | 19 | | |
Investments, at Value (Note 1) | |
Investments in securities of unaffiliated issuers | | | 49,414,629,172 | | | | 15,526,475,707 | | |
Investments in securities of affiliated issuers | | | 2,535,198,318 | | | | 660,971,517 | | |
Gold bullion | | | 4,088,715,166 | | | | 1,319,279,858 | | |
Silver bullion | | | — | | | | — | | |
Foreign currency | | | — | | | | 19 | | |
Cash | | | — | | | | 1,186 | | |
Accrued interest and dividends receivable | | | 144,410,202 | | | | 80,433,255 | | |
Receivable for Fund shares sold | | | 48,536,604 | | | | 23,391,584 | | |
Unrealized appreciation on forward foreign currency exchange contracts | | | 46,267,249 | | | | 24,735,379 | | |
Foreign tax reclaims receivable | | | 34,042,297 | | | | 19,203,573 | | |
Receivable for investment securities sold | | | 13,747,520 | | | | 5,275,879 | | |
Investment for trustee deferred compensation plan (Note 2) | | | 3,663,814 | | | | 3,210,812 | | |
Other assets | | | 29,907,082 | | | | 9,330,785 | | |
Total Assets | | | 56,359,117,424 | | | | 17,672,309,554 | | |
Liabilities | |
Investment advisory fees payable (Note 2) | | | 34,652,741 | | | | 10,879,044 | | |
Payable for investment securities purchased | | | 108,964,711 | | | | 10,636,714 | | |
Payable for Fund shares redeemed | | | 53,290,986 | | | | 20,649,499 | | |
Distribution fees payable (Note 3) | | | 9,100,378 | | | | 1,106,200 | | |
Unrealized depreciation on forward foreign currency exchange contracts | | | 6,497,186 | | | | 4,045,108 | | |
Trustee deferred compensation plan (Note 2) | | | 3,663,814 | | | | 3,210,812 | | |
Service fees payable (Note 3) | | | 2,067,252 | | | | 174,287 | | |
Administrative fees payable (Note 2) | | | 403,821 | | | | 154,922 | | |
Trustee fees payable | | | 119,326 | | | | 31,040 | | |
Due to custodian | | | 5,118 | | | | — | | |
Accrued expenses and other liabilities | | | 22,614,692 | | | | 10,598,445 | | |
Total Liabilities | | | 241,380,025 | | | | 61,486,071 | | |
Net Assets | | $ | 56,117,737,399 | | | $ | 17,610,823,483 | | |
Net Assets Consist of | |
Capital stock (par value, $0.001 per share) | | $ | 960,177 | | | $ | 704,810 | | |
Capital surplus | | | 41,900,791,779 | | | | 14,006,297,042 | | |
Net unrealized appreciation (depreciation) in value of investments
(net of $13,488,858, $6,173,324, $— and $— deferred capital gain
country tax, respectively) | | | 13,813,792,471 | | | | 4,087,261,659 | | |
Accumulated undistributed net realized gains (losses) on investments | | | 870,938,449 | | | | 98,413,512 | | |
Accumulated undistributed net investment income (loss) | | | (468,745,477 | ) | | | (581,853,540 | ) | |
Net Assets | | $ | 56,117,737,399 | | | $ | 17,610,823,483 | | |
First Eagle Funds | Semi-Annual Report | April 30, 2018
106
April 30, 2018 (unaudited)
| | | First Eagle
U.S. Value Fund* | | First Eagle
Gold Fund* | |
Assets | |
Investments, at Cost (Note 1) | |
Investments in securities of unaffiliated issuers | | $ | 1,251,377,079 | | | $ | 897,373,726 | | |
Investments in securities of affiliated issuers | | | — | | | | — | | |
Gold bullion | | | 186,047,980 | | | | 110,134,621 | | |
Silver bullion | | | — | | | | 61,408,932 | | |
Foreign currency | | | — | | | | 36,737 | | |
Investments, at Value (Note 1) | |
Investments in securities of unaffiliated issuers | | | 1,779,677,870 | | | | 876,877,903 | | |
Investments in securities of affiliated issuers | | | — | | | | — | | |
Gold bullion | | | 205,328,273 | | | | 196,631,573 | | |
Silver bullion | | | — | | | | 54,298,229 | | |
Foreign currency | | | — | | | | 36,737 | | |
Cash | | | — | | | | — | | |
Accrued interest and dividends receivable | | | 1,394,681 | | | | 2,424,988 | | |
Receivable for Fund shares sold | | | 1,128,868 | | | | 1,632,977 | | |
Unrealized appreciation on forward foreign currency exchange contracts | | | — | | | | — | | |
Foreign tax reclaims receivable | | | — | | | | — | | |
Receivable for investment securities sold | | | 37,027 | | | | — | | |
Investment for trustee deferred compensation plan (Note 2) | | | 3,054,695 | | | | 154,384 | | |
Other assets | | | 117,776 | | | | 26,323 | | |
Total Assets | | | 1,990,739,190 | | | | 1,132,083,114 | | |
Liabilities | |
Investment advisory fees payable (Note 2) | | | 1,225,485 | | | | 712,494 | | |
Payable for investment securities purchased | | | 4,196,372 | | | | 1,400 | | |
Payable for Fund shares redeemed | | | 2,399,731 | | | | 1,236,239 | | |
Distribution fees payable (Note 3) | | | 389,494 | | | | 178,491 | | |
Unrealized depreciation on forward foreign currency exchange contracts | | | — | | | | — | | |
Trustee deferred compensation plan (Note 2) | | | 3,054,695 | | | | 154,384 | | |
Service fees payable (Note 3) | | | 84,834 | | | | 31,432 | | |
Administrative fees payable (Note 2) | | | 46,458 | | | | 42,507 | | |
Trustee fees payable | | | 7,351 | | | | 3,852 | | |
Due to custodian | | | 2,117 | | | | 35,748 | | |
Accrued expenses and other liabilities | | | 529,325 | | | | 610,563 | | |
Total Liabilities | | | 11,935,862 | | | | 3,007,110 | | |
Net Assets | | $ | 1,978,803,328 | | | $ | 1,129,076,004 | | |
Net Assets Consist of | |
Capital stock (par value, $0.001 per share) | | $ | 98,866 | | | $ | 70,729 | | |
Capital surplus | | | 1,290,396,022 | | | | 1,610,793,971 | | |
Net unrealized appreciation (depreciation) in value of investments
(net of $13,488,858, $6,173,324, $— and $— deferred capital gain
country tax, respectively) | | | 547,578,701 | | | | 58,880,580 | | |
Accumulated undistributed net realized gains (losses) on investments | | | 133,475,477 | | | | (480,399,690 | ) | |
Accumulated undistributed net investment income (loss) | | | 7,254,262 | | | | (60,269,586 | ) | |
Net Assets | | $ | 1,978,803,328 | | | $ | 1,129,076,004 | | |
First Eagle Funds | Semi-Annual Report | April 30, 2018
107
Statements of Assets and Liabilities (continued)
| | | First Eagle
Global Fund* | | First Eagle
Overseas Fund* | |
Class A | |
Net assets | | $ | 14,052,894,264 | | | $ | 2,813,461,199 | | |
Shares outstanding | | | 239,533,794 | | | | 114,382,343 | | |
Net asset value per share and redemption proceeds per share | | $ | 58.67 | | | $ | 24.60 | | |
Offering price per share (NAV per share plus maximum sales charge)** | | $ | 61.76 | (1) | | $ | 25.89 | (1) | |
Class C | |
Net assets | | $ | 9,998,264,239 | | | $ | 844,087,114 | | |
Shares outstanding | | | 176,846,916 | | | | 35,739,206 | | |
Net asset value per share and redemption proceeds per share | | $ | 56.54 | | | $ | 23.62 | | |
Redemption proceeds per share (NAV per share less maximum contingent
deferred sale charge)(2) | | $ | 55.98 | | | $ | 23.38 | | |
Class I | |
Net assets | | $ | 31,108,477,201 | | | $ | 13,248,190,785 | | |
Shares outstanding | | | 527,551,919 | | | | 526,664,107 | | |
Net asset value per share and redemption proceeds per share | | $ | 58.97 | | | $ | 25.15 | | |
Class R4 | |
Net assets | | $ | 103,770 | | | $ | 82,544 | | |
Shares outstanding | | | 1,760 | | | | 3,283 | | |
Net asset value per share and redemption proceeds per share | | $ | 58.95 | | | $ | 25.14 | | |
Class R6 | |
Net assets | | $ | 957,997,925 | | | $ | 705,001,841 | | |
Shares outstanding | | | 16,242,596 | | | | 28,021,457 | | |
Net asset value per share and redemption proceeds per share | | $ | 58.98 | | | $ | 25.16 | | |
* First Eagle Global Fund, First Eagle Overseas Fund, First Eagle U.S. Value Fund and First Eagle Gold Fund financial statements are shown on a consolidated basis and includes the balances of the First Eagle Global Cayman Fund, Ltd., First Eagle Overseas Cayman Fund, Ltd., First Eagle U.S. Value Cayman Fund, Ltd., and First Eagle Gold Cayman Fund, Ltd., respectively.
** A contingent deferred sales charge of 1.00% may apply on redemptions of Class A shares made within 18 months following a purchase of $1,000,000 or more without an initial sales charge.
(1) The maximum sales charge is 5.00% for Class A shares. Classes C, I, Y and R6 have no front-end sales charges.
(2) The maximum contingent deferred sales charge (CDSC) is 1.00% for Class C shares, which is charged on the lesser of the original purchase price or the current market value at the time of sale. This pertains to shares sold or redeemed within the first year of purchase.
See Notes to Financial Statements.
First Eagle Funds | Semi-Annual Report | April 30, 2018
108
April 30, 2018 (unaudited)
| | | First Eagle
U.S. Value Fund* | | First Eagle
Gold Fund* | |
Class A | |
Net assets | | $ | 652,065,909 | | | $ | 397,952,620 | | |
Shares outstanding | | | 32,541,800 | | | | 24,994,178 | | |
Net asset value per share and redemption proceeds per share | | $ | 20.04 | | | $ | 15.92 | | |
Offering price per share (NAV per share plus maximum sales charge)** | | $ | 21.09 | (1) | | $ | 16.76 | (1) | |
Class C | |
Net assets | | $ | 408,451,224 | | | $ | 149,668,522 | | |
Shares outstanding | | | 21,221,772 | | | | 10,133,411 | | |
Net asset value per share and redemption proceeds per share | | $ | 19.25 | | | $ | 14.77 | | |
Redemption proceeds per share (NAV per share less maximum contingent
deferred sale charge)(2) | | $ | 19.06 | | | $ | 14.62 | | |
Class I | |
Net assets | | $ | 917,200,724 | | | $ | 553,971,690 | | |
Shares outstanding | | | 45,048,903 | | | | 33,920,651 | | |
Net asset value per share and redemption proceeds per share | | $ | 20.36 | | | $ | 16.33 | | |
Class R4 | |
Net assets | | $ | — | | | $ | — | | |
Shares outstanding | | | — | | | | — | | |
Net asset value per share and redemption proceeds per share | | $ | — | | | $ | — | | |
Class R6 | |
Net assets | | $ | 1,085,471 | | | $ | 27,483,172 | | |
Shares outstanding | | | 53,309 | | | | 1,680,618 | | |
Net asset value per share and redemption proceeds per share | | $ | 20.36 | | | $ | 16.35 | | |
First Eagle Funds | Semi-Annual Report | April 30, 2018
109
Statements of Assets and Liabilities (continued)
| | | First Eagle
Global Income
Builder Fund | | First Eagle
High Yield Fund | |
Assets | |
Investments, at Cost (Note 1) | |
Investments in securities of unaffiliated issuers | | $ | 1,291,386,501 | | | $ | 357,756,315 | | |
Gold bullion | | | 50,870,820 | | | | — | | |
Foreign currency | | | 11,793 | | | | — | | |
Investments, at Value (Note 1) | |
Investments in securities of unaffiliated issuers | | | 1,400,648,901 | | | | 352,964,444 | | |
Gold bullion | | | 53,729,586 | | | | — | | |
Foreign currency | | | 11,700 | | | | — | | |
Cash | | | 4,278 | | | | 1,791 | | |
Accrued interest and dividends receivable | | | 9,923,165 | | | | 5,246,041 | | |
Receivable for Fund shares sold | | | 4,111,747 | | | | 298,153 | | |
Foreign tax reclaims receivable | | | 1,274,129 | | | | — | | |
Unrealized appreciation on forward foreign currency exchange contracts | | | 992,563 | | | | — | | |
Receivable for investment securities sold | | | 838,060 | | | | — | | |
Investment for trustee deferred compensation plan (Note 2) | | | 272,416 | | | | 218,722 | | |
Other assets | | | 826,158 | | | | 71,448 | | |
Total Assets | | | 1,472,632,703 | | | | 358,800,599 | | |
Liabilities | |
Investment advisory fees payable (Note 2) | | | 903,642 | | | | 207,793 | | |
Payable for Fund shares redeemed | | | 1,581,731 | | | | 971,194 | | |
Payable for investment securities purchased | | | 1,488,982 | | | | 1,791 | | |
Payable for dividends to shareholders | | | 627,269 | | | | 263,174 | | |
Distribution fees payable (Note 3) | | | 273,808 | | | | 62,879 | | |
Trustee deferred compensation plan (Note 2) | | | 272,416 | | | | 218,722 | | |
Unrealized depreciation on forward foreign currency exchange contracts | | | 157,982 | | | | — | | |
Service fees payable (Note 3) | | | 67,493 | | | | 15,136 | | |
Trustee fees payable | | | 4,246 | | | | 2,620 | | |
Option contracts written, at value (premiums received $—, $— and
$9,454,352, respectively) | | | — | | | | — | | |
Administrative fees payable (Note 2) | | | 60,245 | | | | 14,843 | | |
Accrued expenses and other liabilities | | | 343,381 | | | | 180,907 | | |
Total Liabilities | | | 5,781,195 | | | | 1,939,059 | | |
Net Assets | | $ | 1,466,851,508 | | | $ | 356,861,540 | | |
Net Assets Consist of | |
Capital stock (par value, $0.001 per share) | | $ | 122,782 | | | $ | 40,077 | | |
Capital surplus | | | 1,398,296,301 | | | | 465,690,161 | | |
Net unrealized appreciation (depreciation) in value of investments
(net of $61,073, $— and $— deferred capital gain country tax, respectively) | | | 112,877,151 | | | | (4,791,787 | ) | |
Accumulated undistributed net realized gains (losses) on investments | | | (34,710,565 | ) | | | (104,476,890 | ) | |
Accumulated undistributed net investment income (loss) | | | (9,734,161 | ) | | | 399,979 | | |
Net Assets | | $ | 1,466,851,508 | | | $ | 356,861,540 | | |
First Eagle Funds | Semi-Annual Report | April 30, 2018
110
April 30, 2018 (unaudited)
| | | First Eagle
Fund of America | |
Assets | |
Investments, at Cost (Note 1) | |
Investments in securities of unaffiliated issuers | | $ | 1,545,447,253 | | |
Gold bullion | | | — | | |
Foreign currency | | | — | | |
Investments, at Value (Note 1) | |
Investments in securities of unaffiliated issuers | | | 1,973,527,072 | | |
Gold bullion | | | — | | |
Foreign currency | | | — | | |
Cash | | | — | | |
Accrued interest and dividends receivable | | | 808,671 | | |
Receivable for Fund shares sold | | | 732,469 | | |
Foreign tax reclaims receivable | | | — | | |
Unrealized appreciation on forward foreign currency exchange contracts | | | — | | |
Receivable for investment securities sold | | | 54,712,370 | | |
Investment for trustee deferred compensation plan (Note 2) | | | 1,633,225 | | |
Other assets | | | 39,162 | | |
Total Assets | | | 2,031,452,969 | | |
Liabilities | |
Investment advisory fees payable (Note 2) | | | 1,497,026 | | |
Payable for Fund shares redeemed | | | 3,168,512 | | |
Payable for investment securities purchased | | | 11,218,385 | | |
Payable for dividends to shareholders | | | — | | |
Distribution fees payable (Note 3) | | | 400,266 | | |
Trustee deferred compensation plan (Note 2) | | | 1,633,225 | | |
Unrealized depreciation on forward foreign currency exchange contracts | | | — | | |
Service fees payable (Note 3) | | | 71,657 | | |
Trustee fees payable | | | 8,233 | | |
Option contracts written, at value (premiums received $—, $— and
$9,454,352, respectively) | | | 8,872,096 | | |
Administrative fees payable (Note 2) | | | 49,112 | | |
Accrued expenses and other liabilities | | | 599,640 | | |
Total Liabilities | | | 27,518,152 | | |
Net Assets | | $ | 2,003,934,817 | | |
Net Assets Consist of | |
Capital stock (par value, $0.001 per share) | | $ | 60,267 | | |
Capital surplus | | | 1,424,706,960 | | |
Net unrealized appreciation (depreciation) in value of investments
(net of $61,073, $— and $— deferred capital gain country tax, respectively) | | | 428,662,075 | | |
Accumulated undistributed net realized gains (losses) on investments | | | 158,042,817 | | |
Accumulated undistributed net investment income (loss) | | | (7,537,302 | ) | |
Net Assets | | $ | 2,003,934,817 | | |
First Eagle Funds | Semi-Annual Report | April 30, 2018
111
Statements of Assets and Liabilities (continued)
| | | First Eagle
Global Income
Builder Fund | | First Eagle
High Yield Fund | |
Class A | |
Net assets | | $ | 346,678,685 | | | $ | 84,420,700 | | |
Shares outstanding | | | 28,963,879 | | | | 9,482,036 | | |
Net asset value per share and redemption proceeds per share | | $ | 11.97 | | | $ | 8.90 | | |
Offering price per share (NAV per share plus maximum sales charge)* | | $ | 12.60 | (1) | | $ | 9.32 | (2) | |
Class C | |
Net assets | | $ | 327,480,156 | | | $ | 72,106,088 | | |
Shares outstanding | | | 27,434,159 | | | | 8,105,528 | | |
Net asset value per share and redemption proceeds per share | | $ | 11.94 | | | $ | 8.90 | | |
Redemption proceeds per share (NAV per share less maximum
contingent deferred sale charge)(3) | | $ | 11.82 | | | $ | 8.81 | | |
Class I | |
Net assets | | $ | 791,692,133 | | | $ | 200,216,777 | | |
Shares outstanding | | | 66,299,741 | | | | 22,476,402 | | |
Net asset value per share and redemption proceeds per share | | $ | 11.94 | | | $ | 8.91 | | |
Class Y | |
Net assets | | $ | — | | | $ | — | | |
Shares outstanding | | | — | | | | — | | |
Net asset value per share and redemption proceeds per share | | $ | — | | | $ | — | | |
Class R6 | |
Net assets | | $ | 1,000,534 | | | $ | 117,975 | | |
Shares outstanding | | | 83,831 | | | | 13,238 | | |
Net asset value per share and redemption proceeds per share | | $ | 11.94 | | | $ | 8.91 | | |
* A contingent deferred sales charge of 1.00% may apply on redemptions of Class A shares made within 18 months following a purchase of $1,000,000 or more without an initial sales charge.
(1) The maximum sales charge is 5.00% for Class A shares. Classes C, I, Y and R6 have no front-end sales charges.
(2) The maximum sales charge is 4.50% for Class A shares. Classes C, I, Y and R6 have no front-end sales charges.
(3) The maximum contingent deferred sales charge (CDSC) is 1.00% for Class C shares, which is charged on the lesser of the original purchase price or the current market value at the time of sale. This pertains to shares sold or redeemed within the first year of purchase.
See Notes to Financial Statements.
First Eagle Funds | Semi-Annual Report | April 30, 2018
112
April 30, 2018 (unaudited)
| | | First Eagle
Fund of America | |
Class A | |
Net assets | | $ | 542,136,844 | | |
Shares outstanding | | | 15,833,593 | | |
Net asset value per share and redemption proceeds per share | | $ | 34.24 | | |
Offering price per share (NAV per share plus maximum sales charge)* | | $ | 36.04 | (1) | |
Class C | |
Net assets | | $ | 342,788,500 | | |
Shares outstanding | | | 12,640,694 | | |
Net asset value per share and redemption proceeds per share | | $ | 27.12 | | |
Redemption proceeds per share (NAV per share less maximum
contingent deferred sale charge)(3) | | $ | 26.85 | | |
Class I | |
Net assets | | $ | 766,911,235 | | |
Shares outstanding | | | 21,767,792 | | |
Net asset value per share and redemption proceeds per share | | $ | 35.23 | | |
Class Y | |
Net assets | | $ | 351,684,585 | | |
Shares outstanding | | | 10,013,219 | | |
Net asset value per share and redemption proceeds per share | | $ | 35.12 | | |
Class R6 | |
Net assets | | $ | 413,653 | | |
Shares outstanding | | | 11,742 | | |
Net asset value per share and redemption proceeds per share | | $ | 35.23 | | |
First Eagle Funds | Semi-Annual Report | April 30, 2018
113
| | | First Eagle
Global Fund* | | First Eagle
Overseas Fund* | |
Investment Income | |
Interest (net of $159,043, $93,130, $— and $—, foreign taxes withheld) | | $ | 96,687,182 | | | $ | 32,165,505 | | |
Dividends from: (net of $20,257,336, $13,219,719, $98,327 and $237,780
foreign taxes withheld) | |
Unaffiliated issuers | | | 389,849,816 | | | | 138,119,263 | | |
Affiliated issuers | | | 18,004,832 | | | | 1,519,950 | | |
Total Income | | | 504,541,830 | | | | 171,804,718 | | |
Expenses | |
Investment advisory fees (Note 2) | | | 213,342,823 | | | | 67,430,978 | | |
Distributions fees (Note 3) | |
Class A | | | 18,153,792 | | | | 3,686,575 | | |
Class C | | | 38,842,653 | | | | 3,265,116 | | |
Class R4 | | | 28 | | | | 23 | | |
Shareholder servicing agent fees | | | 18,382,751 | | | | 6,719,867 | | |
Service fees - Class C (Note 3) | | | 12,947,551 | | | | 1,088,372 | | |
Administrative Costs (Note 2) | | | 1,416,426 | | | | 548,270 | | |
Professional fees | | | 485,098 | | | | 292,068 | | |
Custodian and accounting fees | | | 3,484,281 | | | | 1,571,637 | | |
Shareholder reporting fees | | | 1,415,192 | | | | 508,945 | | |
Trustees' fees | | | 600,525 | | | | 188,959 | | |
Registration and filing fees | | | 322,900 | | | | 403,696 | | |
Other expenses | | | 440,210 | | | | 148,467 | | |
Total Expenses | | | 309,834,230 | | | | 85,852,973 | | |
Expense waiver | | | — | | | | — | | |
Expense reductions due to earnings credits (Note 1) | | | (139,079 | ) | | | (26,792 | ) | |
Net Expenses | | | 309,695,151 | | | | 85,826,181 | | |
Net Investment Income (Loss) (Note 1) | | | 194,846,679 | | | | 85,978,537 | | |
Realized and Unrealized Gains (Losses) on Investments and Foreign
Currency Related Transactions (Note 1) | |
Net realized gains (losses) from: | |
Transactions in investment securities of unaffiliated issuers | | | 962,015,899 | | | | 148,065,299 | | |
Transactions in investment securities of affiliated issuers | | | 23,130,004 | | | | 12,203,845 | | |
Commodity related transactions | | | — | | | | — | | |
Settlement of foreign currency and foreign currency transactions | | | (797,767 | ) | | | (1,170,296 | ) | |
Settlement of forward foreign currency exchange contracts | | | (58,816,261 | ) | | | (32,176,047 | ) | |
| | | | 925,531,875 | | | | 126,922,801 | | |
Changes in unrealized appreciation (depreciation) of: | |
Investment securities of unaffiliated issuers and commodity related transactions
(net of increase in deferred capital gain country tax accruals of
$1,992,782, $943,672, $— and $—) | | | (479,451,818 | ) | | | (163,627,488 | ) | |
Investment securities of affiliated issuers | | | 35,533,615 | | | | 47,805,079 | | |
Foreign currency and foreign currency translations | | | (9,419,581 | ) | | | (3,952,700 | ) | |
Forward foreign currency exchange contracts | | | 9,884,389 | | | | 4,978,432 | | |
| | | | (443,453,395 | ) | | | (114,796,677 | ) | |
Net realized and unrealized gains (losses) on investments, commodity,
foreign currency and forward contract related transactions | | | 482,078,480 | | | | 12,126,124 | | |
Net Increase (Decrease) in Net Assets Resulting from Operations | | $ | 676,925,159 | | | $ | 98,104,661 | | |
* First Eagle Global Fund, First Eagle Overseas Fund, First Eagle U.S. Value Fund and First Eagle Gold Fund financial statements are shown on a consolidated basis and includes the balances of the First Eagle Global Cayman Fund, Ltd., First Eagle Overseas Cayman Fund, Ltd., First Eagle U.S. Value Cayman Fund, Ltd., and First Eagle Gold Cayman Fund, Ltd., respectively.
See Notes to Financial Statements.
First Eagle Funds | Semi-Annual Report | April 30, 2018
114
| | | First Eagle
U.S. Value Fund* | | First Eagle
Gold Fund* | |
Investment Income | |
Interest (net of $159,043, $93,130, $— and $—, foreign taxes withheld) | | $ | 3,228,162 | | | $ | 278,653 | | |
Dividends from: (net of $20,257,336, $13,219,719, $98,327 and $237,780
foreign taxes withheld) | |
Unaffiliated issuers | | | 14,479,096 | | | | 5,156,668 | | |
Affiliated issuers | | | — | | | | — | | |
Total Income | | | 17,707,258 | | | | 5,435,321 | | |
Expenses | |
Investment advisory fees (Note 2) | | | 7,734,662 | | | | 4,329,237 | | |
Distributions fees (Note 3) | |
Class A | | | 858,328 | | | | 526,155 | | |
Class C | | | 1,621,747 | | | | 590,113 | | |
Class R4 | | | — | | | | — | | |
Shareholder servicing agent fees | | | 770,033 | | | | 761,497 | | |
Service fees - Class C (Note 3) | | | 540,582 | | | | 196,704 | | |
Administrative Costs (Note 2) | | | 159,480 | | | | 150,743 | | |
Professional fees | | | 107,004 | | | | 118,454 | | |
Custodian and accounting fees | | | 146,205 | | | | 282,809 | | |
Shareholder reporting fees | | | 98,960 | | | | 97,959 | | |
Trustees' fees | | | 30,115 | | | | 19,155 | | |
Registration and filing fees | | | 57,866 | | | | 39,679 | | |
Other expenses | | | 29,958 | | | | 20,078 | | |
Total Expenses | | | 12,154,940 | | | | 7,132,583 | | |
Expense waiver | | | (515,659 | ) | | | — | | |
Expense reductions due to earnings credits (Note 1) | | | (6,793 | ) | | | (9,546 | ) | |
Net Expenses | | | 11,632,488 | | | | 7,123,037 | | |
Net Investment Income (Loss) (Note 1) | | | 6,074,770 | | | | (1,687,716 | ) | |
Realized and Unrealized Gains (Losses) on Investments and Foreign
Currency Related Transactions (Note 1) | |
Net realized gains (losses) from: | |
Transactions in investment securities of unaffiliated issuers | | | 133,874,129 | | | | 6,807,071 | | |
Transactions in investment securities of affiliated issuers | | | — | | | | — | | |
Commodity related transactions | | | — | | | | 13,608,348 | | |
Settlement of foreign currency and foreign currency transactions | | | 1,099 | | | | 13,759 | | |
Settlement of forward foreign currency exchange contracts | | | — | | | | (20,453 | ) | |
| | | | 133,875,228 | | | | 20,408,725 | | |
Changes in unrealized appreciation (depreciation) of: | |
Investment securities of unaffiliated issuers and commodity related transactions
(net of increase in deferred capital gain country tax accruals of
$1,992,782, $943,672, $— and $—) | | | (81,198,194 | ) | | | (61,206,761 | ) | |
Investment securities of affiliated issuers | | | — | | | | — | | |
Foreign currency and foreign currency translations | | | (2,399 | ) | | | (9,645 | ) | |
Forward foreign currency exchange contracts | | | — | | | | — | | |
| | | | (81,200,593 | ) | | | (61,216,406 | ) | |
Net realized and unrealized gains (losses) on investments, commodity,
foreign currency and forward contract related transactions | | | 52,674,635 | | | | (40,807,681 | ) | |
Net Increase (Decrease) in Net Assets Resulting from Operations | | $ | 58,749,405 | | | $ | (42,495,397 | ) | |
April 30, 2018 (unaudited)
First Eagle Funds | Semi-Annual Report | April 30, 2018
115
Statements of Operations (continued)
| | | First Eagle
Global Income
Builder Fund | | First Eagle
High Yield Fund | |
Investment Income | |
Interest | | $ | 12,294,144 | | | $ | 12,738,458 | | |
Non-cash interest income from non-affiliates | | | — | | | | 841,833 | | |
Dividends from: (net of $586,918, $— and $— foreign taxes withheld) | |
Unaffiliated issuers | | | 10,427,945 | | | | 4,469 | | |
Total Income | | | 22,722,089 | | | | 13,584,760 | | |
Expenses | |
Investment advisory fees (Note 2) | | | 5,391,526 | | | | 1,423,619 | | |
Distributions fees (Note 3) | |
Class A | | | 430,556 | | | | 112,450 | | |
Class C | | | 1,242,433 | | | | 295,914 | | |
Class Y | | | — | | | | — | | |
Shareholder servicing agent fees | | | 422,868 | | | | 168,981 | | |
Service fees - Class C (Note 3) | | | 414,145 | | | | 98,638 | | |
Administrative Costs (Note 2) | | | 359,446 | | | | 101,690 | | |
Professional fees | | | 105,420 | | | | 102,824 | | |
Custodian and accounting fees | | | 148,878 | | | | 70,354 | | |
Shareholder reporting fees | | | 64,899 | | | | 46,115 | | |
Trustees' fees | | | 16,123 | | | | 6,485 | | |
Registration and filing fees | | | 78,407 | | | | 25,854 | | |
Other expenses | | | 24,547 | | | | 11,956 | | |
Total Expenses | | | 8,699,248 | | | | 2,464,880 | | |
Expense waiver | | | — | | | | (101,690 | ) | |
Expense reductions due to earnings credits (Note 1) | | | (2,817 | ) | | | (1,805 | ) | |
Net Expenses | | | 8,696,431 | | | | 2,361,385 | | |
Net Investment Income (Loss) (Note 1) | | | 14,025,658 | | | | 11,223,375 | | |
Realized and Unrealized Gains (Losses) on Investments and Foreign
Currency Related Transactions (Note 1) | |
Net realized gains (losses) from: | |
Transactions in investment securities of unaffiliated issuers | | | 13,853,095 | | | | (11,064,411 | ) | |
Settlement of foreign currency and foreign currency transactions | | | 8,726 | | | | (3,266 | ) | |
Settlement of forward foreign currency exchange contracts | | | (1,938,677 | ) | | | — | | |
Expiration or closing of option contracts written | | | — | | | | — | | |
| | | | 11,923,144 | | | | (11,067,677 | ) | |
Changes in unrealized appreciation (depreciation) of: | |
Investment securities of unaffiliated issuers and commodity related transactions
(net of increase in deferred capital gain country tax accruals of $28,920,
$— and $—) | | | (18,833,134 | ) | | | 4,030,524 | | |
Foreign currency and foreign currency translations | | | 19,702 | | | | 3,468 | | |
Forward foreign currency exchange contracts | | | 616,781 | | | | — | | |
Option contracts written | | | — | | | | — | | |
| | | | (18,196,651 | ) | | | 4,033,992 | | |
Net realized and unrealized gains (losses) on investments, commodity, foreign
currency, forward contract related transactions and option contracts written | | | (6,273,507 | ) | | | (7,033,685 | ) | |
Net Increase (Decrease) in Net Assets Resulting from Operations | | $ | 7,752,151 | | | $ | 4,189,690 | | |
See Notes to Financial Statements.
First Eagle Funds | Semi-Annual Report | April 30, 2018
116
April 30, 2018 (unaudited)
| | | First Eagle
Fund of America | |
Investment Income | |
Interest | | $ | — | | |
Non-cash interest income from non-affiliates | | | — | | |
Dividends from: (net of $586,918, $— and $— foreign taxes withheld) | |
Unaffiliated issuers | | | 11,795,392 | | |
Total Income | | | 11,795,392 | | |
Expenses | |
Investment advisory fees (Note 2) | | | 9,683,931 | | |
Distributions fees (Note 3) | |
Class A | | | 737,266 | | |
Class C | | | 1,417,945 | | |
Class Y | | | 468,922 | | |
Shareholder servicing agent fees | | | 923,638 | | |
Service fees - Class C (Note 3) | | | 472,648 | | |
Administrative Costs (Note 2) | | | 168,939 | | |
Professional fees | | | 133,075 | | |
Custodian and accounting fees | | | 96,416 | | |
Shareholder reporting fees | | | 130,360 | | |
Trustees' fees | | | 26,728 | | |
Registration and filing fees | | | 43,173 | | |
Other expenses | | | 30,021 | | |
Total Expenses | | | 14,333,062 | | |
Expense waiver | | | — | | |
Expense reductions due to earnings credits (Note 1) | | | (7,969 | ) | |
Net Expenses | | | 14,325,093 | | |
Net Investment Income (Loss) (Note 1) | | | (2,529,701 | ) | |
Realized and Unrealized Gains (Losses) on Investments and Foreign
Currency Related Transactions (Note 1) | |
Net realized gains (losses) from: | |
Transactions in investment securities of unaffiliated issuers | | | 151,978,604 | | |
Settlement of foreign currency and foreign currency transactions | | | — | | |
Settlement of forward foreign currency exchange contracts | | | — | | |
Expiration or closing of option contracts written | | | 12,766,219 | | |
| | | | 164,744,823 | | |
Changes in unrealized appreciation (depreciation) of: | |
Investment securities of unaffiliated issuers and commodity related transactions
(net of increase in deferred capital gain country tax accruals of $28,920,
$— and $—) | | | (201,235,919 | ) | |
Foreign currency and foreign currency translations | | | — | | |
Forward foreign currency exchange contracts | | | — | | |
Option contracts written | | | 19,648,426 | | |
| | | | (181,587,493 | ) | |
Net realized and unrealized gains (losses) on investments, commodity, foreign
currency, forward contract related transactions and option contracts written | | | (16,842,670 | ) | |
Net Increase (Decrease) in Net Assets Resulting from Operations | | $ | (19,372,371 | ) | |
First Eagle Funds | Semi-Annual Report | April 30, 2018
117
Statements of Changes in Net Assets
| | | First Eagle
Global Fund* | | First Eagle
Overseas Fund* | |
| | | For the
Six-Months Ended
April 30, 2018
(unaudited) | | For the
Year Ended
October 31, 2017 | | For the
Six-Months Ended
April 30, 2018
(unaudited) | | For the
Year Ended
October 31, 2017 | |
Operations | |
Net investment income (loss) | | $ | 194,846,679 | | | $ | 236,849,953 | | | $ | 85,978,537 | | | $ | 123,383,935 | | |
Net realized gain (loss) from investments, commodity, foreign currency
and forward contract related transactions | | | 925,531,875 | | | | 2,083,625,061 | | | | 126,922,801 | | | | 336,933,456 | | |
Change in unrealized appreciation (depreciation) of investments,
commodity, foreign currency and forward contract related translations | | | (443,453,395 | ) | | | 3,897,988,176 | | | | (114,796,677 | ) | | | 1,197,561,090 | | |
Net increase (decrease) in net assets resulting from operations | | | 676,925,159 | | | | 6,218,463,190 | | | | 98,104,661 | | | | 1,657,878,481 | | |
Distributions to Shareholders | |
Dividends paid from net investment income | |
Class A | | | (105,744,206 | ) | | | (57,446,218 | ) | | | (48,045,133 | ) | | | (38,288,285 | ) | |
Class C | | | — | | | | — | | | | (9,244,528 | ) | | | (3,735,207 | ) | |
Class I | | | (308,207,031 | ) | | | (141,298,463 | ) | | | (247,321,721 | ) | | | (144,034,028 | ) | |
Class R6 | | | (7,963,294 | ) | | | — | | | | (12,084,099 | ) | | | — | | |
Distributions paid from net realized gains from investment transactions | |
Class A | | | (501,008,759 | ) | | | (653,197,715 | ) | | | (52,478,225 | ) | | | (80,568,972 | ) | |
Class C | | | (370,678,418 | ) | | | (487,764,922 | ) | | | (16,004,360 | ) | | | (23,123,783 | ) | |
Class I | | | (1,049,941,637 | ) | | | (953,068,311 | ) | | | (231,963,413 | ) | | | (243,029,909 | ) | |
Class R6 | | | (25,644,295 | ) | | | — | | | | (10,980,986 | ) | | | — | | |
Decrease in net assets resulting from distributions | | | (2,369,187,640 | ) | | | (2,292,775,629 | ) | | | (628,122,465 | ) | | | (532,780,184 | ) | |
Fund Share Transactions | |
Class A | |
Net proceeds from shares sold | | | 674,959,943 | | | | 2,239,895,559 | | | | 160,178,626 | | | | 529,453,901 | | |
Net asset value of shares issued for reinvested dividends and distributions | | | 544,414,820 | | | | 638,085,356 | | | | 93,872,682 | | | | 111,162,700 | | |
Cost of shares redeemed | | | (1,649,107,323 | ) | | | (4,880,034,139 | ) | | | (457,650,031 | ) | | | (1,379,970,033 | ) | |
Redemption fees | | | 339 | | | | — | | | | — | | | | — | | |
Decrease in net assets from Fund share transactions | | | (429,732,221 | ) | | | (2,002,053,224 | ) | | | (203,598,723 | ) | | | (739,353,432 | ) | |
Class C | |
Net proceeds from shares sold | | | 419,560,057 | | | | 1,116,551,788 | | | | 39,913,132 | | | | 117,061,472 | | |
Net asset value of shares issued for reinvested dividends and distributions | | | 317,172,136 | | | | 382,599,134 | | | | 22,590,698 | | | | 22,220,344 | | |
Cost of shares redeemed | | | (1,047,109,440 | ) | | | (3,133,222,946 | ) | | | (93,879,587 | ) | | | (286,365,623 | ) | |
Redemption fees | | | — | | | | — | | | | — | | | | — | | |
Decrease in net assets from Fund share transactions | | | (310,377,247 | ) | | | (1,634,072,024 | ) | | | (31,375,757 | ) | | | (147,083,807 | ) | |
Class I | |
Net proceeds from shares sold | | | 3,528,671,443 | | | | 10,305,344,539 | | | | 1,698,534,925 | | | | 4,802,530,508 | | |
Net asset value of shares issued for reinvested dividends and distributions | | | 1,111,628,598 | | | | 900,996,012 | | | | 415,932,681 | | | | 342,899,769 | | |
Cost of shares redeemed | | | (3,428,347,193 | ) | | | (4,798,591,803 | ) | | | (2,300,153,780 | ) | | | (2,789,737,757 | ) | |
Redemption fees | | | — | | | | — | | | | — | | | | — | | |
Increase (decrease) in net assets from Fund share transactions | | | 1,211,952,848 | | | | 6,407,748,748 | | | | (185,686,174 | ) | | | 2,355,692,520 | | |
First Eagle Funds | Semi-Annual Report | April 30, 2018
118
| | First Eagle
U.S. Value Fund* | | First Eagle
Gold Fund* | |
| | | For the
Six-Months Ended
April 30, 2018
(unaudited) | | For the
Year Ended
October 31, 2017 | | For the
Six-Months Ended
April 30, 2018
(unaudited) | | For the
Year Ended
October 31, 2017 | |
Operations | |
Net investment income (loss) | | $ | 6,074,770 | | | $ | 5,227,948 | | | $ | (1,687,716 | ) | | $ | (6,302,265 | ) | |
Net realized gain (loss) from investments, commodity, foreign currency
and forward contract related transactions | | | 133,875,228 | | | | 192,760,506 | | | | 20,408,725 | | | | 839,314 | | |
Change in unrealized appreciation (depreciation) of investments,
commodity, foreign currency and forward contract related translations | | | (81,200,593 | ) | | | 108,231,973 | | | | (61,216,406 | ) | | | (106,978,992 | ) | |
Net increase (decrease) in net assets resulting from operations | | | 58,749,405 | | | | 306,220,427 | | | | (42,495,397 | ) | | | (112,441,943 | ) | |
Distributions to Shareholders | |
Dividends paid from net investment income | |
Class A | | | (947,816 | ) | | | (1,396,770 | ) | | | — | | | | — | | |
Class C | | | — | | | | — | | | | — | | | | — | | |
Class I | | | (4,039,586 | ) | | | (3,689,314 | ) | | | — | | | | — | | |
Class R6 | | | (3,853 | ) | | | — | | | | — | | | | — | | |
Distributions paid from net realized gains from investment transactions | |
Class A | | | (57,555,284 | ) | | | (65,355,106 | ) | | | — | | | | — | | |
Class C | | | (37,627,194 | ) | | | (42,476,226 | ) | | | — | | | | — | | |
Class I | | | (76,491,526 | ) | | | (68,628,153 | ) | | | — | | | | — | | |
Class R6 | | | (67,178 | ) | | | — | | | | — | | | | — | | |
Decrease in net assets resulting from distributions | | | (176,732,437 | ) | | | (181,545,569 | ) | | | — | | | | — | | |
Fund Share Transactions | |
Class A | |
Net proceeds from shares sold | | | 21,316,407 | | | | 82,727,632 | | | | 39,295,171 | | | | 110,635,120 | | |
Net asset value of shares issued for reinvested dividends and distributions | | | 52,538,244 | | | | 59,840,597 | | | | — | | | | 35 | | |
Cost of shares redeemed | | | (99,934,105 | ) | | | (286,594,995 | ) | | | (77,745,403 | ) | | | (179,964,453 | ) | |
Redemption fees | | | — | | | | — | | | | 41,533 | | | | 66,076 | | |
Decrease in net assets from Fund share transactions | | | (26,079,454 | ) | | | (144,026,766 | ) | | | (38,408,699 | ) | | | (69,263,222 | ) | |
Class C | |
Net proceeds from shares sold | | | 8,976,348 | | | | 27,574,152 | | | | 9,036,707 | | | | 26,139,387 | | |
Net asset value of shares issued for reinvested dividends and distributions | | | 33,057,577 | | | | 34,634,629 | | | | — | | | | — | | |
Cost of shares redeemed | | | (55,341,910 | ) | | | (153,626,770 | ) | | | (19,247,407 | ) | | | (47,914,073 | ) | |
Redemption fees | | | — | | | | — | | | | 4,447 | | | | 6,498 | | |
Decrease in net assets from Fund share transactions | | | (13,307,985 | ) | | | (91,417,989 | ) | | | (10,206,253 | ) | | | (21,768,188 | ) | |
Class I | |
Net proceeds from shares sold | | | 64,483,620 | | | | 299,984,767 | | | | 121,707,524 | | | | 318,561,550 | | |
Net asset value of shares issued for reinvested dividends and distributions | | | 60,673,897 | | | | 52,602,873 | | | | — | | | | — | | |
Cost of shares redeemed | | | (138,915,824 | ) | | | (268,071,184 | ) | | | (106,732,040 | ) | | | (221,458,786 | ) | |
Redemption fees | | | — | | | | — | | | | 7,399 | | | | 121,602 | | |
Increase (decrease) in net assets from Fund share transactions | | | (13,758,307 | ) | | | 84,516,456 | | | | 14,982,883 | | | | 97,224,366 | | |
First Eagle Funds | Semi-Annual Report | April 30, 2018
119
Statements of Changes in Net Assets (continued)
| | | First Eagle
Global Fund* | | First Eagle
Overseas Fund* | |
| | | For the
Six-Months Ended
April 30, 2018
(unaudited) | | For the
Year Ended
October 31, 2017 | | For the
Six-Months Ended
April 30, 2018
(unaudited) | | For the
Year Ended
October 31, 2017 | |
Class R4^ | |
Net proceeds from shares sold | | $ | 108,452 | | | $ | — | | | $ | 85,862 | | | $ | — | | |
Cost of shares redeemed | | | (108 | ) | | | — | | | | (67 | ) | | | — | | |
Increase in net assets from Fund share transactions | | | 108,344 | | | | — | | | | 85,795 | | | | — | | |
Class R6^^ | |
Net proceeds from shares sold | | | 243,385,250 | | | | 820,033,768 | | | | 302,110,309 | | | | 540,062,232 | | |
Net asset value of shares issued for reinvested dividends and distributions | | | 33,558,622 | | | | — | | | | 23,065,085 | | | | — | | |
Cost of shares redeemed | | | (143,124,171 | ) | | | (9,261,788 | ) | | | (141,817,959 | ) | | | (11,793,007 | ) | |
Redemption fees | | | — | | | | — | | | | — | | | | — | | |
Increase in net assets from Fund share transactions | | | 133,819,701 | | | | 810,771,980 | | | | 183,357,435 | | | | 528,269,225 | | |
Increase (decrease) in net assets from Fund share transactions | | | 605,771,425 | | | | 3,582,395,480 | | | | (237,217,424 | ) | | | 1,997,524,506 | | |
Net increase (decrease) in net assets | | | (1,086,491,056 | ) | | | 7,508,083,041 | | | | (767,235,228 | ) | | | 3,122,622,803 | | |
Net Assets (Note 1) | |
Beginning of period | | | 57,204,228,455 | | | | 49,696,145,414 | | | | 18,378,058,711 | | | | 15,255,435,908 | | |
End of period | | $ | 56,117,737,399 | | | $ | 57,204,228,455 | | | $ | 17,610,823,483 | | | $ | 18,378,058,711 | | |
Accumulated undistributed net investment income (loss) | | $ | (468,745,477 | ) | | $ | (241,677,625 | ) | | $ | (581,853,540 | ) | | $ | (351,136,596 | ) | |
Changes in Shares Outstanding | |
Class A | |
Shares outstanding, beginning of period | | | 246,545,224 | | | | 280,933,042 | | | | 122,500,903 | | | | 153,138,562 | | |
Shares sold | | | 11,329,709 | | | | 39,204,294 | | | | 6,440,600 | | | | 22,144,084 | | |
Shares issued on reinvestment of distributions | | | 9,295,122 | | | | 11,746,785 | | | | 3,834,666 | | | | 4,984,874 | | |
Shares redeemed | | | (27,636,261 | ) | | | (85,338,897 | ) | | | (18,393,826 | ) | | | (57,766,617 | ) | |
Shares outstanding, end of period | | | 239,533,794 | | | | 246,545,224 | | | | 114,382,343 | | | | 122,500,903 | | |
Class C | |
Shares outstanding, beginning of period | | | 182,160,833 | | | | 211,222,427 | | | | 37,041,061 | | | | 43,332,631 | | |
Shares sold | | | 7,305,960 | | | | 20,312,161 | | | | 1,670,658 | | | | 5,083,647 | | |
Shares issued on reinvestment of distributions | | | 5,603,815 | | | | 7,277,898 | | | | 958,525 | | | | 1,032,544 | | |
Shares redeemed | | | (18,223,692 | ) | | | (56,651,653 | ) | | | (3,931,038 | ) | | | (12,407,761 | ) | |
Shares outstanding, end of period | | | 176,846,916 | | | | 182,160,833 | | | | 35,739,206 | | | | 37,041,061 | | |
Class I | |
Shares outstanding, beginning of period | | | 507,106,244 | | | | 394,308,490 | | | | 533,805,436 | | | | 434,854,042 | | |
Shares sold | | | 58,748,742 | | | | 179,518,720 | | | | 66,495,726 | | | | 197,313,320 | | |
Shares issued on reinvestment of distributions | | | 18,902,049 | | | | 16,519,912 | | | | 16,630,658 | | | | 15,065,895 | | |
Shares redeemed | | | (57,205,116 | ) | | | (83,240,878 | ) | | | (90,267,713 | ) | | | (113,427,821 | ) | |
Shares outstanding, end of period | | | 527,551,919 | | | | 507,106,244 | | | | 526,664,107 | | | | 533,805,436 | | |
Class R4^ | |
Shares outstanding, beginning of period | | | — | | | | — | | | | — | | | | — | | |
Shares sold | | | 1,762 | | | | — | | | | 3,286 | | | | — | | |
Shares redeemed | | | (2 | ) | | | — | | | | (3 | ) | | | — | | |
Shares outstanding, end of period | | | 1,760 | | | | — | | | | 3,283 | | | | — | | |
First Eagle Funds | Semi-Annual Report | April 30, 2018
120
| | | First Eagle
U.S. Value Fund* | | First Eagle
Gold Fund* | |
| | | For the
Six-Months Ended
April 30, 2018
(unaudited) | | For the
Year Ended
October 31, 2017 | | For the
Six-Months Ended
April 30, 2018
(unaudited) | | For the
Year Ended
October 31, 2017 | |
Class R4^ | |
Net proceeds from shares sold | | $ | — | | | $ | — | | | $ | — | | | $ | — | | |
Cost of shares redeemed | | | — | | | | — | | | | — | | | | — | | |
Increase in net assets from Fund share transactions | | | — | | | | — | | | | — | | | | — | | |
Class R6^^ | |
Net proceeds from shares sold | | | 268,468 | | | | 836,047 | | | | 13,013,062 | | | | 16,243,055 | | |
Net asset value of shares issued for reinvested dividends and distributions | | | 71,031 | | | | — | | | | — | | | | — | | |
Cost of shares redeemed | | | (29,168 | ) | | | (45,596 | ) | | | (325,448 | ) | | | (46,839 | ) | |
Redemption fees | | | — | | | | — | | | | 308 | | | | — | | |
Increase in net assets from Fund share transactions | | | 310,331 | | | | 790,451 | | | | 12,687,922 | | | | 16,196,216 | | |
Increase (decrease) in net assets from Fund share transactions | | | (52,835,415 | ) | | | (150,137,848 | ) | | | (20,944,147 | ) | | | 22,389,172 | | |
Net increase (decrease) in net assets | | | (170,818,447 | ) | | | (25,462,990 | ) | | | (63,439,544 | ) | | | (90,052,771 | ) | |
Net Assets (Note 1) | |
Beginning of period | | | 2,149,621,775 | | | | 2,175,084,765 | | | | 1,192,515,548 | | | | 1,282,568,319 | | |
End of period | | $ | 1,978,803,328 | | | $ | 2,149,621,775 | | | $ | 1,129,076,004 | | | $ | 1,192,515,548 | | |
Accumulated undistributed net investment income (loss) | | $ | 7,254,262 | | | $ | 6,170,747 | | | $ | (60,269,586 | ) | | $ | (58,581,870 | ) | |
Changes in Shares Outstanding | |
Class A | |
Shares outstanding, beginning of period | | | 33,712,629 | | | | 40,709,944 | | | | 27,337,437 | | | | 31,497,163 | | |
Shares sold | | | 1,050,821 | | | | 4,101,533 | | | | 2,396,549 | | | | 6,635,824 | | |
Shares issued on reinvestment of distributions | | | 2,650,765 | | | | 3,065,602 | | | | — | | | | 2 | | |
Shares redeemed | | | (4,872,415 | ) | | | (14,164,450 | ) | | | (4,739,808 | ) | | | (10,795,552 | ) | |
Shares outstanding, end of period | | | 32,541,800 | | | | 33,712,629 | | | | 24,994,178 | | | | 27,337,437 | | |
Class C | |
Shares outstanding, beginning of period | | | 21,838,438 | | | | 26,415,358 | | | | 10,807,036 | | | | 12,212,791 | | |
Shares sold | | | 462,752 | | | | 1,414,994 | | | | 591,992 | | | | 1,645,536 | | |
Shares issued on reinvestment of distributions | | | 1,731,670 | | | | 1,824,796 | | | | — | | | | — | | |
Shares redeemed | | | (2,811,088 | ) | | | (7,816,710 | ) | | | (1,265,617 | ) | | | (3,051,291 | ) | |
Shares outstanding, end of period | | | 21,221,772 | | | | 21,838,438 | | | | 10,133,411 | | | | 10,807,036 | | |
Class I | |
Shares outstanding, beginning of period | | | 45,508,156 | | | | 41,273,073 | | | | 33,122,412 | | | | 27,731,345 | | |
Shares sold | | | 3,132,198 | | | | 14,624,892 | | | | 7,145,811 | | | | 18,423,884 | | |
Shares issued on reinvestment of distributions | | | 3,015,601 | | | | 2,656,711 | | | | — | | | | — | | |
Shares redeemed | | | (6,607,052 | ) | | | (13,046,520 | ) | | | (6,347,572 | ) | | | (13,032,817 | ) | |
Shares outstanding, end of period | | | 45,048,903 | | | | 45,508,156 | | | | 33,920,651 | | | | 33,122,412 | | |
Class R4^ | |
Shares outstanding, beginning of period | | | — | | | | — | | | | — | | | | — | | |
Shares sold | | | — | | | | — | | | | — | | | | — | | |
Shares redeemed | | | — | | | | — | | | | — | | | | — | | |
Shares outstanding, end of period | | | — | | | | — | | | | — | | | | — | | |
First Eagle Funds | Semi-Annual Report | April 30, 2018
121
Statements of Changes in Net Assets (continued)
| | | First Eagle
Global Fund* | | First Eagle
Overseas Fund* | |
| | | For the
Six-Months Ended
April 30, 2018
(unaudited) | | For the
Year Ended
October 31, 2017 | | For the
Six-Months Ended
April 30, 2018
(unaudited) | | For the
Year Ended
October 31, 2017 | |
Class R6^^ | |
Shares outstanding, beginning of period | | | 13,935,723 | | | | — | | | | 21,010,387 | | | | — | | |
Shares sold | | | 4,081,078 | | | | 14,091,924 | | | | 11,665,557 | | | | 21,470,832 | | |
Shares issued on reinvestment of distributions | | | 570,628 | | | | — | | | | 922,603 | | | | — | | |
Shares redeemed | | | (2,344,833 | ) | | | (156,201 | ) | | | (5,577,090 | ) | | | (460,445 | ) | |
Shares outstanding, end of period | | | 16,242,596 | | | | 13,935,723 | | | | 28,021,457 | | | | 21,010,387 | | |
* First Eagle Global Fund, First Eagle Overseas Fund, First Eagle U.S. Value Fund and First Eagle Gold Fund financial statements are shown on a consolidated basis and includes the balances of the First Eagle Global Cayman Fund, Ltd., First Eagle Overseas Cayman Fund, Ltd., First Eagle U.S. Value Cayman Fund, Ltd., and First Eagle Gold Cayman Fund, Ltd., respectively.
^ Represents the period from January 17, 2018 to April 30, 2018.
^^ Represents the period from March 1, 2017 to October 31, 2017.
See Notes to Financial Statements.
First Eagle Funds | Semi-Annual Report | April 30, 2018
122
| | | First Eagle
U.S. Value Fund* | | First Eagle
Gold Fund* | |
| | | For the
Six-Months Ended
April 30, 2018
(unaudited) | | For the
Year Ended
October 31, 2017 | | For the
Six-Months Ended
April 30, 2018
(unaudited) | | For the
Year Ended
October 31, 2017 | |
Class R6^^ | |
Shares outstanding, beginning of period | | | 38,511 | | | | — | | | | 925,271 | | | | — | | |
Shares sold | | | 12,646 | | | | 40,699 | | | | 774,799 | | | | 927,928 | | |
Shares issued on reinvestment of distributions | | | 3,530 | | | | — | | | | — | | | | — | | |
Shares redeemed | | | (1,378 | ) | | | (2,188 | ) | | | (19,452 | ) | | | (2,657 | ) | |
Shares outstanding, end of period | | | 53,309 | | | | 38,511 | | | | 1,680,618 | | | | 925,271 | | |
First Eagle Funds | Semi-Annual Report | April 30, 2018
123
Statements of Changes in Net Assets (continued)
| | | First Eagle
Global Income Builder Fund | | First Eagle
High Yield Fund | |
| | | For the
Six-Months Ended
April 30, 2018
(unaudited) | | For the
Year Ended
October 31, 2017 | | For the
Six-Months Ended
April 30, 2018
(unaudited) | | For the
Year Ended
October 31, 2017 | |
Operations | |
Net investment income (loss) | | $ | 14,025,658 | | | $ | 30,245,828 | | | $ | 11,223,375 | | | $ | 26,857,566 | | |
Net realized gain (loss) from investments, commodity,
foreign currency and forward contract related transactions | | | 11,923,144 | | | | 2,170,196 | | | | (11,067,677 | ) | | | (7,754,905 | ) | |
Change in unrealized appreciation (depreciation) of investments,
commodity, foreign currency, forward contract related translations
and option contracts written | | | (18,196,651 | ) | | | 116,253,951 | | | | 4,033,992 | | | | 10,480,426 | | |
Net increase (decrease) in net assets resulting from operations | | | 7,752,151 | | | | 148,669,975 | | | | 4,189,690 | | | | 29,583,087 | | |
Distributions to Shareholders | |
Dividends paid from net investment income | |
Class A | | | (4,334,746 | ) | | | (8,595,355 | ) | | | (2,279,298 | ) | | | (6,417,565 | ) | |
Class C | | | (2,938,463 | ) | | | (5,780,705 | ) | | | (1,715,103 | ) | | | (4,390,518 | ) | |
Class I | | | (10,600,664 | ) | | | (16,454,712 | ) | | | (6,373,701 | ) | | | (15,922,037 | ) | |
Class Y | | | — | | | | — | | | | — | | | | — | | |
Class R6 | | | (13,810 | ) | | | (5,986 | ) | | | (3,152 | ) | | | (3,782 | ) | |
Distributions paid from net realized gains from investment transactions | |
Class A | | | — | | | | — | | | | — | | | | — | | |
Class C | | | — | | | | — | | | | — | | | | — | | |
Class I | | | — | | | | — | | | | — | | | | — | | |
Class Y | | | — | | | | — | | | | — | | | | — | | |
Class R6 | | | — | | | | — | | | | — | | | | — | | |
Return of capital | |
Class A | | | — | | | | — | | | | — | | | | (81,183 | ) | |
Class C | | | — | | | | — | | | | — | | | | (64,871 | ) | |
Class I | | | — | | | | — | | | | — | | | | (189,825 | ) | |
Class Y | | | — | | | | — | | | | — | | | | — | | |
Class R6 | | | — | | | | — | | | | — | | | | (45 | ) | |
Decrease in net assets resulting from distributions | | | (17,887,683 | ) | | | (30,836,758 | ) | | | (10,371,254 | ) | | | (27,069,826 | ) | |
Fund Share Transactions | |
Class A | |
Net proceeds from shares sold | | | 40,162,800 | | | | 75,702,126 | | | | 4,869,362 | | | | 17,911,494 | | |
Net asset value of shares issued for reinvested dividends and distributions | | | 3,914,372 | | | | 8,110,881 | | | | 2,118,378 | | | | 5,785,013 | | |
Cost of shares redeemed | | | (34,864,622 | ) | | | (137,575,268 | ) | | | (19,807,535 | ) | | | (83,897,639 | ) | |
Increase (decrease) in net assets from Fund share transactions | | | 9,212,550 | | | | (53,762,261 | ) | | | (12,819,795 | ) | | | (60,201,132 | ) | |
Class C | |
Net proceeds from shares sold | | | 26,743,147 | | | | 51,798,601 | | | | 1,902,509 | | | | 7,035,964 | | |
Net asset value of shares issued for reinvested dividends and distributions | | | 2,576,197 | | | | 5,316,367 | | | | 1,488,099 | | | | 3,750,850 | | |
Cost of shares redeemed | | | (34,196,200 | ) | | | (97,877,052 | ) | | | (17,612,071 | ) | | | (38,026,963 | ) | |
Decrease in net assets from Fund share transactions | | | (4,876,856 | ) | | | (40,762,084 | ) | | | (14,221,463 | ) | | | (27,240,149 | ) | |
First Eagle Funds | Semi-Annual Report | April 30, 2018
124
| | | First Eagle
Fund of America | |
| | | For the
Six-Months Ended
April 30, 2018
(unaudited) | | For the
Year Ended
October 31, 2017 | |
Operations | |
Net investment income (loss) | | $ | (2,529,701 | ) | | $ | (2,693,864 | ) | |
Net realized gain (loss) from investments, commodity,
foreign currency and forward contract related transactions | | | 164,744,823 | | | | 243,250,787 | | |
Change in unrealized appreciation (depreciation) of investments,
commodity, foreign currency, forward contract related translations
and option contracts written | | | (181,587,493 | ) | | | 253,857,254 | | |
Net increase (decrease) in net assets resulting from operations | | | (19,372,371 | ) | | | 494,414,177 | | |
Distributions to Shareholders | |
Dividends paid from net investment income | |
Class A | | | — | | | | (1,539,695 | ) | |
Class C | | | — | | | | — | | |
Class I | | | (378,462 | ) | | | (3,803,398 | ) | |
Class Y | | | — | | | | (864,309 | ) | |
Class R6 | | | (284 | ) | | | — | | |
Distributions paid from net realized gains from investment transactions | |
Class A | | | (56,857,513 | ) | | | (48,961,943 | ) | |
Class C | | | (45,042,463 | ) | | | (35,895,467 | ) | |
Class I | | | (75,271,781 | ) | | | (45,181,742 | ) | |
Class Y | | | (35,245,286 | ) | | | (22,904,206 | ) | |
Class R6 | | | (36,324 | ) | | | — | | |
Return of capital | |
Class A | | | — | | | | — | | |
Class C | | | — | | | | — | | |
Class I | | | — | | | | — | | |
Class Y | | | — | | | | — | | |
Class R6 | | | — | | | | — | | |
Decrease in net assets resulting from distributions | | | (212,832,113 | ) | | | (159,150,760 | ) | |
Fund Share Transactions | |
Class A | |
Net proceeds from shares sold | | | 25,514,467 | | | | 60,979,259 | | |
Net asset value of shares issued for reinvested dividends and distributions | | | 52,769,121 | | | | 45,456,382 | | |
Cost of shares redeemed | | | (96,712,443 | ) | | | (450,589,468 | ) | |
Increase (decrease) in net assets from Fund share transactions | | | (18,428,855 | ) | | | (344,153,827 | ) | |
Class C | |
Net proceeds from shares sold | | | 14,788,950 | | | | 21,919,416 | | |
Net asset value of shares issued for reinvested dividends and distributions | | | 41,134,387 | | | | 31,319,863 | | |
Cost of shares redeemed | | | (65,343,693 | ) | | | (217,206,105 | ) | |
Decrease in net assets from Fund share transactions | | | (9,420,356 | ) | | | (163,966,826 | ) | |
First Eagle Funds | Semi-Annual Report | April 30, 2018
125
Statements of Changes in Net Assets (continued)
| | | First Eagle
Global Income Builder Fund | | First Eagle
High Yield Fund | |
| | | For the
Six-Months Ended
April 30, 2018
(unaudited) | | For the
Year Ended
October 31, 2017 | | For the
Six-Months Ended
April 30, 2018
(unaudited) | | For the
Year Ended
October 31, 2017 | |
Class I | |
Net proceeds from shares sold | | $ | 136,668,658 | | | $ | 261,613,144 | | | $ | 24,375,804 | | | $ | 66,144,568 | | |
Net asset value of shares issued for reinvested dividends and distributions | | | 8,231,915 | | | | 13,694,130 | | | | 4,791,360 | | | | 12,432,294 | | |
Cost of shares redeemed | | | (65,163,728 | ) | | | (122,200,049 | ) | | | (103,890,021 | ) | | | (116,226,126 | ) | |
Increase (decrease) in net assets from Fund share transactions | | | 79,736,845 | | | | 153,107,225 | | | | (74,722,857 | ) | | | (37,649,264 | ) | |
Class Y | |
Net proceeds from shares sold | | | — | | | | — | | | | — | | | | — | | |
Net asset value of shares issued for reinvested dividends and distributions | | | — | | | | — | | | | — | | | | — | | |
Cost of shares redeemed | | | — | | | | — | | | | — | | | | — | | |
Decrease in net assets from Fund share transactions | | | — | | | | — | | | | — | | | | — | | |
Class R6^^ | |
Net proceeds from shares sold | | | 33,542 | | | | 936,167 | | | | 9,133 | | | | 115,681 | | |
Net asset value of shares issued for reinvested dividends and distributions | | | 13,810 | | | | 5,470 | | | | 3,151 | | | | 3,379 | | |
Cost of shares redeemed | | | (5,357 | ) | | | (414 | ) | | | (6,793 | ) | | | (4,177 | ) | |
Increase in net assets from Fund share transactions | | | 41,995 | | | | 941,223 | | | | 5,491 | | | | 114,883 | | |
Increase (decrease) in net assets from Fund share transactions | | | 84,114,534 | | | | 59,524,103 | | | | (101,758,624 | ) | | | (124,975,662 | ) | |
Net increase (decrease) in net assets | | | 73,979,002 | | | | 177,357,320 | | | | (107,940,188 | ) | | | (122,462,401 | ) | |
Net Assets (Note 1) | |
Beginning of period | | | 1,392,872,506 | | | | 1,215,515,186 | | | | 464,801,728 | | | | 587,264,129 | | |
End of period | | $ | 1,466,851,508 | | | $ | 1,392,872,506 | | | $ | 356,861,540 | | | $ | 464,801,728 | | |
Accumulated undistributed net investment income (loss) | | $ | (9,734,161 | ) | | $ | (5,872,136 | ) | | $ | 399,979 | | | $ | (452,142 | ) | |
Changes in Shares Outstanding | |
Class A | |
Shares outstanding, beginning of period | | | 28,201,813 | | | | 32,908,379 | | | | 10,912,189 | | | | 17,592,315 | | |
Shares sold | | | 3,316,453 | | | | 6,621,083 | | | | 543,899 | | | | 1,980,975 | | |
Shares issued on reinvestment of distributions | | | 324,360 | | | | 703,233 | | | | 236,574 | | | | 639,586 | | |
Shares redeemed | | | (2,878,747 | ) | | | (12,030,882 | ) | | | (2,210,626 | ) | | | (9,300,687 | ) | |
Shares outstanding, end of period | | | 28,963,879 | | | | 28,201,813 | | | | 9,482,036 | | | | 10,912,189 | | |
Class C | |
Shares outstanding, beginning of period | | | 27,835,245 | | | | 31,450,181 | | | | 9,694,123 | | | | 12,710,582 | | |
Shares sold | | | 2,215,765 | | | | 4,535,093 | | | | 212,596 | | | | 780,696 | | |
Shares issued on reinvestment of distributions | | | 214,387 | | | | 462,182 | | | | 166,339 | | | | 415,040 | | |
Shares redeemed | | | (2,831,238 | ) | | | (8,612,211 | ) | | | (1,967,530 | ) | | | (4,212,195 | ) | |
Shares outstanding, end of period | | | 27,434,159 | | | | 27,835,245 | | | | 8,105,528 | | | | 9,694,123 | | |
Class I | |
Shares outstanding, beginning of period | | | 59,703,331 | | | | 46,454,190 | | | | 30,840,541 | | | | 35,036,376 | | |
Shares sold | | | 11,308,598 | | | | 22,772,722 | | | | 2,714,987 | | | | 7,304,360 | | |
Shares issued on reinvestment of distributions | | | 683,673 | | | | 1,186,990 | | | | 534,858 | | | | 1,373,916 | | |
Shares redeemed | | | (5,395,861 | ) | | | (10,710,571 | ) | | | (11,613,984 | ) | | | (12,874,111 | ) | |
Shares outstanding, end of period | | | 66,299,741 | | | | 59,703,331 | | | | 22,476,402 | | | | 30,840,541 | | |
First Eagle Funds | Semi-Annual Report | April 30, 2018
126
| | | First Eagle
Fund of America | |
| | | For the
Six-Months Ended
April 30, 2018
(unaudited) | | For the
Year Ended
October 31, 2017 | |
Class I | |
Net proceeds from shares sold | | $ | 72,242,291 | | | $ | 218,003,463 | | |
Net asset value of shares issued for reinvested dividends and distributions | | | 49,666,258 | | | | 30,660,041 | | |
Cost of shares redeemed | | | (102,034,667 | ) | | | (347,167,463 | ) | |
Increase (decrease) in net assets from Fund share transactions | | | 19,873,882 | | | | (98,503,959 | ) | |
Class Y | |
Net proceeds from shares sold | | | 6,849,282 | | | | 22,567,234 | | |
Net asset value of shares issued for reinvested dividends and distributions | | | 33,494,417 | | | | 22,537,453 | | |
Cost of shares redeemed | | | (47,479,645 | ) | | | (92,019,919 | ) | |
Decrease in net assets from Fund share transactions | | | (7,135,946 | ) | | | (46,915,232 | ) | |
Class R6^^ | |
Net proceeds from shares sold | | | 20,772 | | | | 371,417 | | |
Net asset value of shares issued for reinvested dividends and distributions | | | 36,608 | | | | — | | |
Cost of shares redeemed | | | — | | | | — | | |
Increase in net assets from Fund share transactions | | | 57,380 | | | | 371,417 | | |
Increase (decrease) in net assets from Fund share transactions | | | (15,053,895 | ) | | | (653,168,427 | ) | |
Net increase (decrease) in net assets | | | (247,258,379 | ) | | | (317,905,010 | ) | |
Net Assets (Note 1) | |
Beginning of period | | | 2,251,193,196 | | | | 2,569,098,206 | | |
End of period | | $ | 2,003,934,817 | | | $ | 2,251,193,196 | | |
Accumulated undistributed net investment income (loss) | | $ | (7,537,302 | ) | | $ | (4,628,855 | ) | |
Changes in Shares Outstanding | |
Class A | |
Shares outstanding, beginning of period | | | 16,302,212 | | | | 26,267,874 | | |
Shares sold | | | 712,997 | | | | 1,770,634 | | |
Shares issued on reinvestment of distributions | | | 1,511,576 | | | | 1,400,381 | | |
Shares redeemed | | | (2,693,192 | ) | | | (13,136,677 | ) | |
Shares outstanding, end of period | | | 15,833,593 | | | | 16,302,212 | | |
Class C | |
Shares outstanding, beginning of period | | | 12,924,139 | | | | 18,654,550 | | |
Shares sold | | | 523,914 | | | | 785,855 | | |
Shares issued on reinvestment of distributions | | | 1,483,925 | | | | 1,177,881 | | |
Shares redeemed | | | (2,291,284 | ) | | | (7,694,147 | ) | |
Shares outstanding, end of period | | | 12,640,694 | | | | 12,924,139 | | |
Class I | |
Shares outstanding, beginning of period | | | 21,188,008 | | | | 23,972,780 | | |
Shares sold | | | 1,956,240 | | | | 6,151,299 | | |
Shares issued on reinvestment of distributions | | | 1,384,232 | | | | 923,773 | | |
Shares redeemed | | | (2,760,688 | ) | | | (9,859,844 | ) | |
Shares outstanding, end of period | | | 21,767,792 | | | | 21,188,008 | | |
First Eagle Funds | Semi-Annual Report | April 30, 2018
127
Statements of Changes in Net Assets (continued)
| | | First Eagle
Global Income Builder Fund | | First Eagle
High Yield Fund | |
| | | For the
Six-Months Ended
April 30, 2018
(unaudited) | | For the
Year Ended
October 31, 2017 | | For the
Six-Months Ended
April 30, 2018
(unaudited) | | For the
Year Ended
October 31, 2017 | |
Class Y | |
Shares outstanding, beginning of period | | | — | | | | — | | | | — | | | | — | | |
Shares sold | | | — | | | | — | | | | — | | | | — | | |
Shares issued on reinvestment of distributions | | | — | | | | — | | | | — | | | | — | | |
Shares redeemed | | | — | | | | — | | | | — | | | | — | | |
Shares outstanding, end of period | | | — | | | | — | | | | — | | | | — | | |
Class R6^^ | |
Shares outstanding, beginning of period | | | 80,353 | | | | — | | | | 12,629 | | | | — | | |
Shares sold | | | 2,775 | | | | 79,927 | | | | 1,018 | | | | 12,718 | | |
Shares issued on reinvestment of distributions | | | 1,147 | | | | 461 | | | | 352 | | | | 373 | | |
Shares redeemed | | | (444 | ) | | | (35 | ) | | | (761 | ) | | | (462 | ) | |
Shares outstanding, end of period | | | 83,831 | | | | 80,353 | | | | 13,238 | | | | 12,629 | | |
^^ Represents the period from March 1, 2017 to October 31, 2017.
See Notes to Financial Statements.
First Eagle Funds | Semi-Annual Report | April 30, 2018
128
| | | First Eagle
Fund of America | |
| | | For the
Six-Months Ended
April 30, 2018
(unaudited) | | For the
Year Ended
October 31, 2017 | |
Class Y | |
Shares outstanding, beginning of period | | | 10,169,352 | | | | 11,465,333 | | |
Shares sold | | | 186,993 | | | | 630,347 | | |
Shares issued on reinvestment of distributions | | | 935,598 | | | | 678,635 | | |
Shares redeemed | | | (1,278,724 | ) | | | (2,604,963 | ) | |
Shares outstanding, end of period | | | 10,013,219 | | | | 10,169,352 | | |
Class R6^^ | |
Shares outstanding, beginning of period | | | 10,147 | | | | — | | |
Shares sold | | | 574 | | | | 10,147 | | |
Shares issued on reinvestment of distributions | | | 1,021 | | | | — | | |
Shares redeemed | | | — | | | | — | | |
Shares outstanding, end of period | | | 11,742 | | | | 10,147 | | |
First Eagle Funds | Semi-Annual Report | April 30, 2018
129
| | Per share operating performance* | |
| | | | | Investment operations | | Less dividends and distributions | |
Selected per
share data for
the period ended: | | Net asset
value,
beginning
of period | | Net
investment
income/
loss | | Net
realized
and
unrealized
gains
(losses) on
investments | | Total
investment
operations | | From net
investment
income | | From
capital
gains | | Return of
capital | | Total
distributions | |
First Eagle Global Fund Class A | |
Six-Months Ended
April 30, 2018
(unaudited) | | $ | 60.46 | | | | 0.20 | | | | 0.51 | | | | 0.71 | | | | (0.44 | ) | | | (2.06 | ) | | | — | | | | (2.50 | ) | |
October 31, 2017 | | $ | 56.36 | | | | 0.25 | | | | 6.41 | | | | 6.66 | | | | (0.21 | ) | | | (2.35 | ) | | | — | | | | (2.56 | ) | |
October 31, 2016 | | $ | 53.10 | | | | 0.30 | | | | 3.56 | | | | 3.86 | | | | (0.07 | ) | | | (0.53 | ) | | | — | | | | (0.60 | ) | |
October 31, 2015 | | $ | 54.90 | | | | 0.28 | | | | 0.60 | | | | 0.88 | | | | (0.30 | ) | | | (2.38 | ) | | | — | | | | (2.68 | ) | |
October 31, 2014 | | $ | 54.92 | | | | 0.30 | | | | 2.12 | | | | 2.42 | | | | (0.66 | ) | | | (1.78 | ) | | | — | | | | (2.44 | ) | |
October 31, 2013 | | $ | 49.24 | | | | 0.39 | | | | 7.41 | | | | 7.80 | | | | (0.51 | ) | | | (1.61 | ) | | | — | | | | (2.12 | ) | |
First Eagle Global Fund Class C | |
Six-Months Ended
April 30, 2018
(unaudited) | | $ | 58.14 | | | | (0.02 | ) | | | 0.48 | | | | 0.46 | | | | — | | | | (2.06 | ) | | | — | | | | (2.06 | ) | |
October 31, 2017 | | $ | 54.47 | | | | (0.16 | ) | | | 6.18 | | | | 6.02 | | | | — | | | | (2.35 | ) | | | — | | | | (2.35 | ) | |
October 31, 2016 | | $ | 51.66 | | | | (0.11 | ) | | | 3.45 | | | | 3.34 | | | | — | | | | (0.53 | ) | | | — | | | | (0.53 | ) | |
October 31, 2015 | | $ | 53.57 | | | | (0.12 | ) | | | 0.59 | | | | 0.47 | | | | — | | | | (2.38 | ) | | | — | | | | (2.38 | ) | |
October 31, 2014 | | $ | 53.67 | | | | (0.11 | ) | | | 2.08 | | | | 1.97 | | | | (0.29 | ) | | | (1.78 | ) | | | — | | | | (2.07 | ) | |
October 31, 2013 | | $ | 48.16 | | | | 0.01 | | | | 7.27 | | | | 7.28 | | | | (0.16 | ) | | | (1.61 | ) | | | — | | | | (1.77 | ) | |
First Eagle Global Fund Class I | |
Six-Months Ended
April 30, 2018
(unaudited) | | $ | 60.85 | | | | 0.28 | | | | 0.51 | | | | 0.79 | | | | (0.61 | ) | | | (2.06 | ) | | | — | | | | (2.67 | ) | |
October 31, 2017 | | $ | 56.70 | | | | 0.43 | | | | 6.42 | | | | 6.85 | | | | (0.35 | ) | | | (2.35 | ) | | | — | | | | (2.70 | ) | |
October 31, 2016 | | $ | 53.43 | | | | 0.44 | | | | 3.57 | | | | 4.01 | | | | (0.21 | ) | | | (0.53 | ) | | | — | | | | (0.74 | ) | |
October 31, 2015 | | $ | 55.23 | | | | 0.43 | | | | 0.60 | | | | 1.03 | | | | (0.45 | ) | | | (2.38 | ) | | | — | | | | (2.83 | ) | |
October 31, 2014 | | $ | 55.23 | | | | 0.43 | | | | 2.13 | | | | 2.56 | | | | (0.78 | ) | | | (1.78 | ) | | | — | | | | (2.56 | ) | |
October 31, 2013 | | $ | 49.50 | | | | 0.52 | | | | 7.45 | | | | 7.97 | | | | (0.63 | ) | | | (1.61 | ) | | | — | | | | (2.24 | ) | |
First Eagle Global Fund Class R4 | |
For The Period
1/17/18^-4/30/18
(unaudited) | | $ | 61.60 | | | | 0.37 | | | | (3.02 | ) | | | (2.65 | ) | | | — | | | | — | | | | — | | | | — | | |
First Eagle Global Fund Class R6 | |
Six-Months Ended
April 30, 2018
(unaudited) | | $ | 60.88 | | | | 0.31 | | | | 0.49 | | | | 0.80 | | | | (0.64 | ) | | | (2.06 | ) | | | — | | | | (2.70 | ) | |
For The Period
3/01/17^^-
10/31/17 | | $ | 57.33 | | | | 0.37 | | | | 3.18 | | | | 3.55 | | | | — | | | | — | | | | — | | | | — | | |
First Eagle Funds | Semi-Annual Report | April 30, 2018
130
| | | | | | | | | Ratios/Supplemental data | | | |
| | | | | | | | | Ratios to Average Net Assets of: | | | |
Selected per
share data for
the period ended: | | Net asset
value, end
of period | | Total
Return(a) | | Net assets,
end of
period
(thousands) | | Operating
expenses
excluding
earnings
credits
and/or fee
waivers | | Operating
expenses
including
earnings
credits
and/or fee
waivers | | Net
investment
income
excluding
earnings
credits
and/or fee
waivers | | Net
investment
income
including
earnings
credits
and/or fee
waivers | | Portfolio
turnover
rate | |
First Eagle Global Fund Class A | |
Six-Months Ended
April 30, 2018
(unaudited) | | $ | 58.67 | | | | 1.16 | %(b) | | $ | 14,052,894 | | | | 1.11 | %(d) | | | 1.10 | %(d) | | | 0.66 | %(d) | | | 0.66 | %(d) | | | 5.81 | %(b) | |
October 31, 2017 | | $ | 60.46 | | | | 12.35 | % | | $ | 14,907,330 | | | | 1.11 | % | | | 1.11 | % | | | 0.44 | % | | | 0.44 | % | | | 9.67 | % | |
October 31, 2016 | | $ | 56.36 | | | | 7.38 | % | | $ | 15,833,531 | | | | 1.10 | % | | | 1.10 | % | | | 0.55 | % | | | 0.55 | % | | | 11.54 | % | |
October 31, 2015 | | $ | 53.10 | | | | 1.78 | % | | $ | 16,274,867 | | | | 1.11 | % | | | 1.11 | % | | | 0.52 | % | | | 0.52 | % | | | 11.28 | % | |
October 31, 2014 | | $ | 54.90 | | | | 4.64 | % | | $ | 17,734,529 | | | | 1.11 | % | | | 1.11 | % | | | 0.55 | % | | | 0.55 | % | | | 15.36 | % | |
October 31, 2013 | | $ | 54.92 | | | | 16.47 | % | | $ | 18,986,635 | | | | 1.13 | % | | | 1.13 | % | | | 0.77 | % | | | 0.77 | % | | | 11.60 | % | |
First Eagle Global Fund Class C | |
Six-Months Ended
April 30, 2018
(unaudited) | | $ | 56.54 | | | | 0.79 | %(b) | | $ | 9,998,264 | | | | 1.85 | %(d) | | | 1.85 | %(d) | | | (0.08 | )%(d) | | | (0.08 | )%(d) | | | 5.81 | %(b) | |
October 31, 2017 | | $ | 58.14 | | | | 11.52 | % | | $ | 10,589,991 | | | | 1.85 | % | | | 1.85 | % | | | (0.29 | )% | | | (0.29 | )% | | | 9.67 | % | |
October 31, 2016 | | $ | 54.47 | | | | 6.56 | % | | $ | 11,505,279 | | | | 1.86 | % | | | 1.86 | % | | | (0.21 | )% | | | (0.21 | )% | | | 11.54 | % | |
October 31, 2015 | | $ | 51.66 | | | | 1.02 | % | | $ | 11,662,706 | | | | 1.86 | % | | | 1.86 | % | | | (0.23 | )% | | | (0.23 | )% | | | 11.28 | % | |
October 31, 2014 | | $ | 53.57 | | | | 3.85 | % | | $ | 12,342,299 | | | | 1.86 | % | | | 1.86 | % | | | (0.21 | )% | | | (0.21 | )% | | | 15.36 | % | |
October 31, 2013 | | $ | 53.67 | | | | 15.63 | % | | $ | 11,435,543 | | | | 1.87 | % | | | 1.87 | % | | | 0.02 | % | | | 0.02 | % | | | 11.60 | % | |
First Eagle Global Fund Class I | |
Six-Months Ended
April 30, 2018
(unaudited) | | $ | 58.97 | | | | 1.30 | %(b) | | $ | 31,108,477 | | | | 0.84 | %(d) | | | 0.84 | %(d) | | | 0.94 | %(d) | | | 0.94 | %(d) | | | 5.81 | %(b) | |
October 31, 2017 | | $ | 60.85 | | | | 12.64 | % | | $ | 30,858,477 | | | | 0.84 | % | | | 0.84 | % | | | 0.74 | % | | | 0.74 | % | | | 9.67 | % | |
October 31, 2016 | | $ | 56.70 | | | | 7.65 | % | | $ | 22,357,335 | | | | 0.84 | % | | | 0.84 | % | | | 0.81 | % | | | 0.81 | % | | | 11.54 | % | |
October 31, 2015 | | $ | 53.43 | | | | 2.07 | % | | $ | 19,998,978 | | | | 0.84 | % | | | 0.84 | % | | | 0.79 | % | | | 0.79 | % | | | 11.28 | % | |
October 31, 2014 | | $ | 55.23 | | | | 4.90 | % | | $ | 20,388,583 | | | | 0.86 | % | | | 0.86 | % | | | 0.78 | % | | | 0.78 | % | | | 15.36 | % | |
October 31, 2013 | | $ | 55.23 | | | | 16.78 | % | | $ | 15,578,448 | | | | 0.88 | % | | | 0.88 | % | | | 1.02 | % | | | 1.02 | % | | | 11.60 | % | |
First Eagle Global Fund Class R4 | |
For The Period
1/17/18^-4/30/18
(unaudited) | | $ | 58.95 | | | | (4.30 | )%(b) | | $ | 104 | | | | 0.97 | %(d) | | | 0.97 | %(d) | | | 1.25 | %(d) | | | 1.25 | %(d) | | | 5.81 | %(b) | |
First Eagle Global Fund Class R6 | |
Six-Months Ended
April 30, 2018
(unaudited) | | $ | 58.98 | | | | 1.33 | %(b) | | $ | 957,998 | | | | 0.78 | %(d) | | | 0.78 | %(d) | | | 1.03 | %(d) | | | 1.03 | %(d) | | | 5.81 | %(b) | |
For The Period
3/01/17^^-
10/31/17 | | $ | 60.88 | | | | 6.19 | %(b) | | $ | 848,431 | | | | 0.78 | %(d) | | | 0.78 | %(d) | | | 0.94 | %(d) | | | 0.94 | %(d) | | | 9.67 | %(b) | |
First Eagle Funds | Semi-Annual Report | April 30, 2018
131
| | Per share operating performance* | |
| | | | | Investment operations | | Less dividends and distributions | |
Selected per
share data for
the period ended: | | Net asset
value,
beginning
of period | | Net
investment
income/
loss | | Net
realized
and
unrealized
gains
(losses) on
investments | | Total
investment
operations | | From net
investment
income | | From
capital
gains | | Return of
capital | | Total
distributions | |
First Eagle Overseas Fund Class A | |
Six-Months Ended
April 30, 2018
(unaudited) | | $ | 25.33 | | | | 0.09 | | | | 0.02 | | | | 0.11 | | | | (0.40 | ) | | | (0.44 | ) | | | — | | | | (0.84 | ) | |
October 31, 2017 | | $ | 23.86 | | | | 0.12 | | | | 2.16 | | | | 2.28 | | | | (0.26 | ) | | | (0.55 | ) | | | — | | | | (0.81 | ) | |
October 31, 2016 | | $ | 22.62 | | | | 0.19 | | | | 1.34 | | | | 1.53 | | | | (0.04 | ) | | | (0.25 | ) | | | — | | | | (0.29 | ) | |
October 31, 2015 | | $ | 23.18 | | | | 0.14 | | | | 0.39 | | | | 0.53 | | | | (0.23 | ) | | | (0.86 | ) | | | — | | | | (1.09 | ) | |
October 31, 2014 | | $ | 24.40 | | | | 0.15 | | | | 0.05 | | | | 0.20 | | | | (0.46 | ) | | | (0.96 | ) | | | — | | | | (1.42 | ) | |
October 31, 2013 | | $ | 22.26 | | | | 0.13 | | | | 3.17 | | | | 3.30 | | | | (0.26 | ) | | | (0.90 | ) | | | — | | | | (1.16 | ) | |
First Eagle Overseas Fund Class C | |
Six-Months Ended
April 30, 2018
(unaudited) | | $ | 24.29 | | | | (0.00 | )** | | | 0.02 | | | | 0.02 | | | | (0.25 | ) | | | (0.44 | ) | | | — | | | | (0.69 | ) | |
October 31, 2017 | | $ | 22.91 | | | | (0.05 | ) | | | 2.07 | | | | 2.02 | | | | (0.09 | ) | | | (0.55 | ) | | | — | | | | (0.64 | ) | |
October 31, 2016 | | $ | 21.84 | | | | 0.02 | | | | 1.30 | | | | 1.32 | | | | — | | | | (0.25 | ) | | | — | | | | (0.25 | ) | |
October 31, 2015 | | $ | 22.42 | | | | (0.03 | ) | | | 0.39 | | | | 0.36 | | | | (0.08 | ) | | | (0.86 | ) | | | — | | | | (0.94 | ) | |
October 31, 2014 | | $ | 23.64 | | | | (0.03 | ) | | | 0.07 | | | | 0.04 | | | | (0.30 | ) | | | (0.96 | ) | | | — | | | | (1.26 | ) | |
October 31, 2013 | | $ | 21.62 | | | | (0.04 | ) | | | 3.09 | | | | 3.05 | | | | (0.13 | ) | | | (0.90 | ) | | | — | | | | (1.03 | ) | |
First Eagle Overseas Fund Class I | |
Six-Months Ended
April 30, 2018
(unaudited) | | $ | 25.91 | | | | 0.13 | | | | 0.02 | | | | 0.15 | | | | (0.47 | ) | | | (0.44 | ) | | | — | | | | (0.91 | ) | |
October 31, 2017 | | $ | 24.40 | | | | 0.21 | | | | 2.17 | | | | 2.38 | | | | (0.32 | ) | | | (0.55 | ) | | | — | | | | (0.87 | ) | |
October 31, 2016 | | $ | 23.12 | | | | 0.26 | | | | 1.38 | | | | 1.64 | | | | (0.11 | ) | | | (0.25 | ) | | | — | | | | (0.36 | ) | |
October 31, 2015 | | $ | 23.62 | | | | 0.20 | | | | 0.41 | | | | 0.61 | | | | (0.25 | ) | | | (0.86 | ) | | | — | | | | (1.11 | ) | |
October 31, 2014 | | $ | 24.84 | | | | 0.21 | | | | 0.05 | | | | 0.26 | | | | (0.52 | ) | | | (0.96 | ) | | | — | | | | (1.48 | ) | |
October 31, 2013 | | $ | 22.63 | | | | 0.20 | | | | 3.22 | | | | 3.42 | | | | (0.31 | ) | | | (0.90 | ) | | | — | | | | (1.21 | ) | |
First Eagle Overseas Fund Class R4 | |
For The Period
1/17/18^-4/30/18
(unaudited) | | $ | 26.15 | | | | 0.23 | | | | (1.24 | ) | | | (1.01 | ) | | | — | | | | — | | | | — | | | | — | | |
First Eagle Overseas Fund Class R6 | |
Six-Months Ended
April 30, 2018
(unaudited) | | $ | 25.92 | | | | 0.15 | | | | 0.01 | | | | 0.16 | | | | (0.48 | ) | | | (0.44 | ) | | | — | | | | (0.92 | ) | |
For The Period
3/01/17^^-
10/31/17 | | $ | 23.99 | | | | 0.17 | | | | 1.76 | | | | 1.93 | | | | — | | | | — | | | | — | | | | — | | |
First Eagle Funds | Semi-Annual Report | April 30, 2018
132
| | | | | | | | | Ratios/Supplemental data | | | |
| | | | | | | | | Ratios to Average Net Assets of: | | | |
Selected per
share data for
the period ended: | | Net asset
value, end
of period | | Total
Return(a) | | Net assets,
end of
period
(thousands) | | Operating
expenses
excluding
earnings
credits
and/or fee
waivers | | Operating
expenses
including
earnings
credits
and/or fee
waivers | | Net
investment
income
excluding
earnings
credits
and/or fee
waivers | | Net
investment
income
including
earnings
credits
and/or fee
waivers | | Portfolio
turnover
rate | |
First Eagle Overseas Fund Class A | |
Six-Months Ended
April 30, 2018
(unaudited) | | $ | 24.60 | | | | 0.45 | %(b) | | $ | 2,813,461 | | | | 1.15 | %(d) | | | 1.15 | %(d) | | | 0.75 | %(d) | | | 0.75 | %(d) | | | 5.34 | %(b) | |
October 31, 2017 | | $ | 25.33 | | | | 9.99 | % | | $ | 3,102,414 | | | | 1.15 | % | | | 1.15 | % | | | 0.51 | % | | | 0.51 | % | | | 8.45 | % | |
October 31, 2016 | | $ | 23.86 | | | | 6.90 | % | | $ | 3,654,512 | | | | 1.14 | % | | | 1.14 | % | | | 0.84 | % | | | 0.84 | % | | | 9.30 | % | |
October 31, 2015 | | $ | 22.62 | | | | 2.59 | % | | $ | 4,142,588 | | | | 1.16 | % | | | 1.16 | % | | | 0.60 | % | | | 0.60 | % | | | 12.95 | % | |
October 31, 2014 | | $ | 23.18 | | | | 1.00 | % | | $ | 4,644,161 | | | | 1.14 | % | | | 1.14 | % | | | 0.62 | % | | | 0.62 | % | | | 12.01 | % | |
October 31, 2013 | | $ | 24.40 | | | | 15.52 | % | | $ | 5,911,791 | | | | 1.15 | % | | | 1.15 | % | | | 0.59 | % | | | 0.59 | % | | | 12.33 | % | |
First Eagle Overseas Fund Class C | |
Six-Months Ended
April 30, 2018
(unaudited) | | $ | 23.62 | | | | 0.09 | %(b) | | $ | 844,087 | | | | 1.87 | %(d) | | | 1.87 | %(d) | | | 0.03 | %(d) | | | 0.03 | %(d) | | | 5.34 | %(b) | |
October 31, 2017 | | $ | 24.29 | | | | 9.14 | % | | $ | 899,654 | | | | 1.88 | % | | | 1.88 | % | | | (0.20 | )% | | | (0.20 | )% | | | 8.45 | % | |
October 31, 2016 | | $ | 22.91 | | | | 6.14 | % | | $ | 992,573 | | | | 1.89 | % | | | 1.89 | % | | | 0.10 | % | | | 0.10 | % | | | 9.30 | % | |
October 31, 2015 | | $ | 21.84 | | | | 1.82 | % | | $ | 1,036,295 | | | | 1.89 | % | | | 1.89 | % | | | (0.13 | )% | | | (0.13 | )% | | | 12.95 | % | |
October 31, 2014 | | $ | 22.42 | | | | 0.28 | % | | $ | 1,085,640 | | | | 1.89 | % | | | 1.89 | % | | | (0.13 | )% | | | (0.13 | )% | | | 12.01 | % | |
October 31, 2013 | | $ | 23.64 | | | | 14.67 | % | | $ | 1,120,378 | | | | 1.90 | % | | | 1.90 | % | | | (0.17 | )% | | | (0.17 | )% | | | 12.33 | % | |
First Eagle Overseas Fund Class I | |
Six-Months Ended
April 30, 2018
(unaudited) | | $ | 25.15 | | | | 0.58 | %(b) | | $ | 13,248,191 | | | | 0.86 | %(d) | | | 0.86 | %(d) | | | 1.05 | %(d) | | | 1.05 | %(d) | | | 5.34 | %(b) | |
October 31, 2017 | | $ | 25.91 | | | | 10.24 | % | | $ | 13,831,360 | | | | 0.87 | % | | | 0.86 | % | | | 0.86 | % | | | 0.86 | % | | | 8.45 | % | |
October 31, 2016 | | $ | 24.40 | | | | 7.22 | % | | $ | 10,608,351 | | | | 0.87 | % | | | 0.87 | % | | | 1.12 | % | | | 1.12 | % | | | 9.30 | % | |
October 31, 2015 | | $ | 23.12 | | | | 2.88 | % | | $ | 8,702,209 | | | | 0.88 | % | | | 0.88 | % | | | 0.88 | % | | | 0.88 | % | | | 12.95 | % | |
October 31, 2014 | | $ | 23.62 | | | | 1.23 | % | | $ | 8,811,126 | | | | 0.89 | % | | | 0.89 | % | | | 0.87 | % | | | 0.87 | % | | | 12.01 | % | |
October 31, 2013 | | $ | 24.84 | | | | 15.82 | % | | $ | 7,378,014 | | | | 0.90 | % | | | 0.90 | % | | | 0.86 | % | | | 0.86 | % | | | 12.33 | % | |
First Eagle Overseas Fund Class R4 | |
For The Period
1/17/18^-4/30/18
(unaudited) | | $ | 25.14 | | | | (3.86 | )%(b) | | $ | 83 | | | | 1.01 | %(d) | | | 1.01 | %(d) | | | 1.83 | %(d) | | | 1.83 | %(d) | | | 5.34 | %(b) | |
First Eagle Overseas Fund Class R6 | |
Six-Months Ended
April 30, 2018
(unaudited) | | $ | 25.16 | | | | 0.64 | %(b) | | $ | 705,002 | | | | 0.79 | %(d) | | | 0.79 | %(d) | | | 1.17 | %(d) | | | 1.17 | %(d) | | | 5.34 | %(b) | |
For The Period
3/01/17^^-
10/31/17 | | $ | 25.92 | | | | 8.04 | %(b) | | $ | 544,632 | | | | 0.79 | %(d) | | | 0.79 | %(d) | | | 1.01 | %(d) | | | 1.01 | %(d) | | | 8.45 | %(b) | |
First Eagle Funds | Semi-Annual Report | April 30, 2018
133
| | Per share operating performance* | |
| | | | | Investment operations | | Less dividends and distributions | |
Selected per
share data for
the period ended: | | Net asset
value,
beginning
of period | | Net
investment
income/
loss | | Net
realized
and
unrealized
gains
(losses) on
investments | | Total
investment
operations | | From net
investment
income | | From
capital
gains | | Return of
capital | | Total
distributions | |
First Eagle U.S. Value Fund Class A | |
Six-Months Ended
April 30, 2018
(unaudited) | | $ | 21.26 | | | | 0.06 | | | | 0.51 | | | | 0.57 | | | | (0.03 | ) | | | (1.76 | ) | | | — | | | | (1.79 | ) | |
October 31, 2017 | | $ | 20.08 | | | | 0.06 | | | | 2.80 | | | | 2.86 | | | | (0.04 | ) | | | (1.64 | ) | | | — | | | | (1.68 | ) | |
October 31, 2016 | | $ | 19.82 | | | | 0.08 | | | | 1.07 | | | | 1.15 | | | | (0.04 | ) | | | (0.85 | ) | | | — | | | | (0.89 | ) | |
October 31, 2015 | | $ | 21.10 | | | | 0.10 | | | | (0.10 | ) | | | (0.00 | )** | | | (0.08 | ) | | | (1.20 | ) | | | — | | | | (1.28 | ) | |
October 31, 2014 | | $ | 20.26 | | | | 0.13 | | | | 1.60 | | | | 1.73 | | | | (0.15 | ) | | | (0.74 | ) | | | — | | | | (0.89 | ) | |
October 31, 2013 | | $ | 18.27 | | | | 0.18 | | | | 2.36 | | | | 2.54 | | | | (0.13 | ) | | | (0.42 | ) | | | — | | | | (0.55 | ) | |
First Eagle U.S. Value Fund Class C | |
Six-Months Ended
April 30, 2018
(unaudited) | | $ | 20.54 | | | | (0.01 | ) | | | 0.48 | | | | 0.47 | | | | — | | | | (1.76 | ) | | | — | | | | (1.76 | ) | |
October 31, 2017 | | $ | 19.55 | | | | (0.09 | ) | | | 2.72 | | | | 2.63 | | | | — | | | | (1.64 | ) | | | — | | | | (1.64 | ) | |
October 31, 2016 | | $ | 19.43 | | | | (0.07 | ) | | | 1.04 | | | | 0.97 | | | | — | | | | (0.85 | ) | | | — | | | | (0.85 | ) | |
October 31, 2015 | | $ | 20.78 | | | | (0.05 | ) | | | (0.10 | ) | | | (0.15 | ) | | | — | | | | (1.20 | ) | | | — | | | | (1.20 | ) | |
October 31, 2014 | | $ | 19.97 | | | | (0.03 | ) | | | 1.58 | | | | 1.55 | | | | (0.00 | )** | | | (0.74 | ) | | | — | | | | (0.74 | ) | |
October 31, 2013 | | $ | 18.02 | | | | 0.03 | | | | 2.35 | | | | 2.38 | | | | (0.01 | ) | | | (0.42 | ) | | | — | | | | (0.43 | ) | |
First Eagle U.S. Value Fund Class I | |
Six-Months Ended
April 30, 2018
(unaudited) | | $ | 21.61 | | | | 0.09 | | | | 0.51 | | | | 0.60 | | | | (0.09 | ) | | | (1.76 | ) | | | — | | | | (1.85 | ) | |
October 31, 2017 | | $ | 20.38 | | | | 0.12 | | | | 2.84 | | | | 2.96 | | | | (0.09 | ) | | | (1.64 | ) | | | — | | | | (1.73 | ) | |
October 31, 2016 | | $ | 20.11 | | | | 0.13 | | | | 1.08 | | | | 1.21 | | | | (0.09 | ) | | | (0.85 | ) | | | — | | | | (0.94 | ) | |
October 31, 2015 | | $ | 21.40 | | | | 0.16 | | | | (0.12 | ) | | | 0.04 | | | | (0.13 | ) | | | (1.20 | ) | | | — | | | | (1.33 | ) | |
October 31, 2014 | | $ | 20.54 | | | | 0.18 | | | | 1.62 | | | | 1.80 | | | | (0.20 | ) | | | (0.74 | ) | | | — | | | | (0.94 | ) | |
October 31, 2013 | | $ | 18.50 | | | | 0.23 | | | | 2.40 | | | | 2.63 | | | | (0.17 | ) | | | (0.42 | ) | | | — | | | | (0.59 | ) | |
First Eagle U.S. Value Fund Class R6 | |
Six-Months Ended
April 30, 2018
(unaudited) | | $ | 21.62 | | | | 0.10 | | | | 0.50 | | | | 0.60 | | | | (0.10 | ) | | | (1.76 | ) | | | — | | | | (1.86 | ) | |
For The Period
3/01/17^^-
10/31/17 | | $ | 20.66 | | | | 0.09 | | | | 0.87 | | | | 0.96 | | | | — | | | | — | | | | — | | | | — | | |
First Eagle Funds | Semi-Annual Report | April 30, 2018
134
| | | | | | | | | Ratios/Supplemental data | | | |
| | | | | | | | | Ratios to Average Net Assets of: | | | |
Selected per
share data for
the period ended: | | Net asset
value, end
of period | | Total
Return(a) | | Net assets,
end of
period
(thousands) | | Operating
expenses
excluding
earnings
credits
and/or fee
waivers | | Operating
expenses
including
earnings
credits
and/or fee
waivers | | Net
investment
income
excluding
earnings
credits
and/or fee
waivers | | Net
investment
income
including
earnings
credits
and/or fee
waivers | | Portfolio
turnover
rate | |
First Eagle U.S. Value Fund Class A | |
Six-Months Ended
April 30, 2018
(unaudited) | | $ | 20.04 | | | | 2.77 | %(b) | | $ | 652,066 | | | | 1.15 | %(d) | | | 1.10 | %(d) | | | 0.57 | %(d) | | | 0.62 | %(d) | | | 2.34 | %(b) | |
October 31, 2017 | | $ | 21.26 | | | | 14.94 | % | | $ | 716,820 | | | | 1.14 | % | | | 1.09 | % | | | 0.24 | % | | | 0.29 | % | | | 5.85 | % | |
October 31, 2016 | | $ | 20.08 | | | | 6.21 | % | | $ | 817,481 | | | | 1.11 | % | | | 1.14 | % | | | 0.40 | % | | | 0.37 | % | | | 10.65 | % | |
October 31, 2015 | | $ | 19.82 | | | | 0.04 | % | | $ | 966,396 | | | | 1.14 | % | | | 1.14 | % | | | 0.49 | % | | | 0.49 | % | | | 15.14 | % | |
October 31, 2014 | | $ | 21.10 | | | | 8.93 | % | | $ | 1,228,878 | | | | 1.14 | % | | | 1.14 | % | | | 0.63 | % | | | 0.63 | % | | | 15.64 | % | |
October 31, 2013 | | $ | 20.26 | | | | 14.32 | % | | $ | 1,480,493 | | | | 1.16 | % | | | 1.16 | % | | | 0.93 | % | | | 0.93 | % | | | 17.32 | % | |
First Eagle U.S. Value Fund Class C | |
Six-Months Ended
April 30, 2018
(unaudited) | | $ | 19.25 | | | | 2.36 | %(b) | | $ | 408,451 | | | | 1.90 | %(d) | | | 1.85 | %(d) | | | (0.18 | )%(d) | | | (0.13 | )%(d) | | | 2.34 | %(b) | |
October 31, 2017 | | $ | 20.54 | | | | 14.13 | % | | $ | 448,462 | | | | 1.89 | % | | | 1.84 | % | | | (0.51 | )% | | | (0.46 | )% | | | 5.85 | % | |
October 31, 2016 | | $ | 19.55 | | | | 5.38 | % | | $ | 516,405 | | | | 1.87 | % | | | 1.90 | % | | | (0.37 | )% | | | (0.40 | )% | | | 10.65 | % | |
October 31, 2015 | | $ | 19.43 | | | | (0.70 | )% | | $ | 592,960 | | | | 1.90 | % | | | 1.90 | % | | | (0.27 | )% | | | (0.27 | )% | | | 15.14 | % | |
October 31, 2014 | | $ | 20.78 | | | | 8.09 | % | | $ | 705,076 | | | | 1.89 | % | | | 1.89 | % | | | (0.13 | )% | | | (0.13 | )% | | | 15.64 | % | |
October 31, 2013 | | $ | 19.97 | | | | 13.53 | % | | $ | 725,019 | | | | 1.91 | % | | | 1.91 | % | | | 0.18 | % | | | 0.18 | % | | | 17.32 | % | |
First Eagle U.S. Value Fund Class I | |
Six-Months Ended
April 30, 2018
(unaudited) | | $ | 20.36 | | | | 2.90 | %(b) | | $ | 917,201 | | | | 0.87 | %(d) | | | 0.82 | %(d) | | | 0.85 | %(d) | | | 0.90 | %(d) | | | 2.34 | %(b) | |
October 31, 2017 | | $ | 21.61 | | | | 15.27 | % | | $ | 983,508 | | | | 0.86 | % | | | 0.81 | % | | | 0.51 | % | | | 0.56 | % | | | 5.85 | % | |
October 31, 2016 | | $ | 20.38 | | | | 6.49 | % | | $ | 841,199 | | | | 0.84 | % | | | 0.87 | % | | | 0.67 | % | | | 0.64 | % | | | 10.65 | % | |
October 31, 2015 | | $ | 20.11 | | | | 0.28 | % | | $ | 942,370 | | | | 0.87 | % | | | 0.87 | % | | | 0.76 | % | | | 0.76 | % | | | 15.14 | % | |
October 31, 2014 | | $ | 21.40 | | | | 9.19 | % | | $ | 1,199,674 | | | | 0.88 | % | | | 0.88 | % | | | 0.87 | % | | | 0.87 | % | | | 15.64 | % | |
October 31, 2013 | | $ | 20.54 | | | | 14.69 | % | | $ | 1,080,022 | | | | 0.91 | % | | | 0.91 | % | | | 1.18 | % | | | 1.18 | % | | | 17.32 | % | |
First Eagle U.S. Value Fund Class R6 | |
Six-Months Ended
April 30, 2018
(unaudited) | | $ | 20.36 | | | | 2.89 | %(b) | | $ | 1,085 | | | | 0.84 | %(d) | | | 0.79 | %(d) | | | 0.88 | %(d) | | | 0.93 | %(d) | | | 2.34 | %(b) | |
For The Period
3/01/17^^-
10/31/17 | | $ | 21.62 | | | | 4.65 | %(b) | | $ | 833 | | | | 0.85 | %(d) | | | 0.80 | %(d) | | | 0.56 | %(d) | | | 0.61 | %(d) | | | 5.85 | %(b) | |
First Eagle Funds | Semi-Annual Report | April 30, 2018
135
| | Per share operating performance* | |
| | | | | Investment operations | | Less dividends and distributions | |
Selected per
share data for
the period ended: | | Net asset
value,
beginning
of period | | Net
investment
income/
loss | | Net
realized
and
unrealized
gains
(losses) on
investments | | Total
investment
operations | | From net
investment
income | | From
capital
gains | | Return of
capital | | Total
distributions | |
First Eagle Gold Fund Class A | |
Six-Months Ended
April 30, 2018
(unaudited) | | $ | 16.50 | | | | (0.03 | ) | | | (0.55 | ) | | | (0.58 | ) | | | — | | | | — | | | | — | | | | — | | |
October 31, 2017 | | $ | 17.99 | | | | (0.09 | ) | | | (1.40 | ) | | | (1.49 | ) | | | — | | | | — | | | | — | | | | — | | |
October 31, 2016 | | $ | 12.36 | | | | (0.11 | ) | | | 5.74 | | | | 5.63 | | | | — | | | | — | | | | — | | | | — | | |
October 31, 2015 | | $ | 13.45 | | | | (0.08 | ) | | | (1.01 | ) | | | (1.09 | ) | | | — | | | | — | | | | — | | | | — | | |
October 31, 2014 | | $ | 17.03 | | | | (0.09 | ) | | | (3.49 | ) | | | (3.58 | ) | | | — | | | | — | | | | — | | | | — | | |
October 31, 2013 | | $ | 29.86 | | | | (0.02 | ) | | | (12.73 | ) | | | (12.75 | ) | | | (0.08 | ) | | | — | | | | — | | | | (0.08 | ) | |
First Eagle Gold Fund Class C | |
Six-Months Ended
April 30, 2018
(unaudited) | | $ | 15.36 | | | | (0.08 | ) | | | (0.51 | ) | | | (0.59 | ) | | | — | | | | — | | | | — | | | | — | | |
October 31, 2017 | | $ | 16.89 | | | | (0.21 | ) | | | (1.32 | ) | | | (1.53 | ) | | | — | | | | — | | | | — | | | | — | | |
October 31, 2016 | | $ | 11.70 | | | | (0.22 | ) | | | 5.41 | | | | 5.19 | | | | — | | | | — | | | | — | | | | — | | |
October 31, 2015 | | $ | 12.84 | | | | (0.18 | ) | | | (0.96 | ) | | | (1.14 | ) | | | — | | | | — | | | | — | | | | — | | |
October 31, 2014 | | $ | 16.37 | | | | (0.20 | ) | | | (3.33 | ) | | | (3.53 | ) | | | — | | | | — | | | | — | | | | — | | |
October 31, 2013 | | $ | 28.84 | | | | (0.18 | ) | | | (12.29 | ) | | | (12.47 | ) | | | — | | | | — | | | | — | | | | — | | |
First Eagle Gold Fund Class I | |
Six-Months Ended
April 30, 2018
(unaudited) | | $ | 16.90 | | | | (0.00 | )** | | | (0.57 | ) | | | (0.57 | ) | | | — | | | | — | | | | — | | | | — | | |
October 31, 2017 | | $ | 18.38 | | | | (0.04 | ) | | | (1.44 | ) | | | (1.48 | ) | | | — | | | | — | | | | — | | | | — | | |
October 31, 2016 | | $ | 12.59 | | | | (0.06 | ) | | | 5.85 | | | | 5.79 | | | | — | | | | — | | | | — | | | | — | | |
October 31, 2015 | | $ | 13.66 | | | | (0.04 | ) | | | (1.03 | ) | | | (1.07 | ) | | | — | | | | — | | | | — | | | | — | | |
October 31, 2014 | | $ | 17.25 | | | | (0.05 | ) | | | (3.54 | ) | | | (3.59 | ) | | | — | | | | — | | | | — | | | | — | | |
October 31, 2013 | | $ | 30.26 | | | | 0.03 | | | | (12.89 | ) | | | (12.86 | ) | | | (0.15 | ) | | | — | | | | — | | | | (0.15 | ) | |
First Eagle Gold Fund Class R6 | |
Six-Months Ended
April 30, 2018
(unaudited) | | $ | 16.91 | | | | 0.01 | | | | (0.57 | ) | | | (0.56 | ) | | | — | | | | — | | | | — | | | | — | | |
For The Period
3/01/17^^-
10/31/17 | | $ | 17.60 | | | | (0.06 | ) | | | (0.63 | ) | | | (0.69 | ) | | | — | | | | — | | | | — | | | | — | | |
First Eagle Funds | Semi-Annual Report | April 30, 2018
136
| | | | | | | | | Ratios/Supplemental data | | | |
| | | | | | | | | Ratios to Average Net Assets of: | | | |
Selected per
share data for
the period ended: | | Net asset
value, end
of period | | Total
Return(a) | | Net assets,
end of
period
(thousands) | | Operating
expenses
excluding
earnings
credits
and/or fee
waivers | | Operating
expenses
including
earnings
credits
and/or fee
waivers | | Net
investment
income
excluding
earnings
credits
and/or fee
waivers | | Net
investment
income
including
earnings
credits
and/or fee
waivers | | Portfolio
turnover
rate | |
First Eagle Gold Fund Class A | |
Six-Months Ended
April 30, 2018
(unaudited) | | $ | 15.92 | | | | (3.52 | )%(b) | | $ | 397,953 | | | | 1.28 | %(d) | | | 1.28 | %(d) | | | (0.35 | )%(d) | | | (0.35 | )%(d) | | | 6.39 | %(b) | |
October 31, 2017 | | $ | 16.50 | | | | (8.28 | )% | | $ | 451,039 | | | | 1.26 | % | | | 1.26 | % | | | (0.53 | )% | | | (0.53 | )% | | | 7.90 | % | |
October 31, 2016 | | $ | 17.99 | | | | 45.55 | % | | $ | 566,708 | | | | 1.27 | % | | | 1.27 | % | | | (0.65 | )% | | | (0.65 | )% | | | 15.82 | % | |
October 31, 2015 | | $ | 12.36 | | | | (8.10 | )% | | $ | 390,521 | | | | 1.33 | % | | | 1.33 | % | | | (0.57 | )% | | | (0.57 | )% | | | 12.47 | % | |
October 31, 2014 | | $ | 13.45 | | | | (21.02 | )% | | $ | 448,012 | | | | 1.27 | % | | | 1.27 | % | | | (0.54 | )% | | | (0.54 | )% | | | 13.33 | % | |
October 31, 2013 | | $ | 17.03 | | | | (42.80 | )% | | $ | 763,731 | | | | 1.25 | % | | | 1.25 | % | | | (0.11 | )% | | | (0.11 | )% | | | 15.14 | % | |
First Eagle Gold Fund Class C | |
Six-Months Ended
April 30, 2018
(unaudited) | | $ | 14.77 | | | | (3.84 | )%(b) | | $ | 149,669 | | | | 2.04 | %(d) | | | 2.04 | %(d) | | | (1.10 | )%(d) | | | (1.10 | )%(d) | | | 6.39 | %(b) | |
October 31, 2017 | | $ | 15.36 | | | | (9.06 | )% | | $ | 166,043 | | | | 2.04 | % | | | 2.03 | % | | | (1.30 | )% | | | (1.30 | )% | | | 7.90 | % | |
October 31, 2016 | | $ | 16.89 | | | | 44.36 | % | | $ | 206,225 | | | | 2.04 | % | | | 2.04 | % | | | (1.42 | )% | | | (1.42 | )% | | | 15.82 | % | |
October 31, 2015 | | $ | 11.70 | | | | (8.88 | )% | | $ | 148,119 | | | | 2.14 | % | | | 2.14 | % | | | (1.39 | )% | | | (1.39 | )% | | | 12.47 | % | |
October 31, 2014 | | $ | 12.84 | | | | (21.56 | )% | | $ | 185,551 | | | | 2.02 | % | | | 2.02 | % | | | (1.29 | )% | | | (1.29 | )% | | | 13.33 | % | |
October 31, 2013 | | $ | 16.37 | | | | (43.24 | )% | | $ | 284,037 | | | | 2.00 | % | | | 2.00 | % | | | (0.87 | )% | | | (0.87 | )% | | | 15.14 | % | |
First Eagle Gold Fund Class I | |
Six-Months Ended
April 30, 2018
(unaudited) | | $ | 16.33 | | | | (3.37 | )%(b) | | $ | 553,972 | | | | 0.99 | %(d) | | | 0.99 | %(d) | | | (0.04 | )%(d) | | | (0.04 | )%(d) | | | 6.39 | %(b) | |
October 31, 2017 | | $ | 16.90 | | | | (8.05 | )% | | $ | 559,784 | | | | 0.99 | % | | | 0.99 | % | | | (0.25 | )% | | | (0.25 | )% | | | 7.90 | % | |
October 31, 2016 | | $ | 18.38 | | | | 45.99 | % | | $ | 509,635 | | | | 0.98 | % | | | 0.98 | % | | | (0.36 | )% | | | (0.36 | )% | | | 15.82 | % | |
October 31, 2015 | | $ | 12.59 | | | | (7.83 | )% | | $ | 306,131 | | | | 1.03 | % | | | 1.03 | % | | | (0.27 | )% | | | (0.27 | )% | | | 12.47 | % | |
October 31, 2014 | | $ | 13.66 | | | | (20.81 | )% | | $ | 366,186 | | | | 1.01 | % | | | 1.01 | % | | | (0.29 | )% | | | (0.29 | )% | | | 13.33 | % | |
October 31, 2013 | | $ | 17.25 | | | | (42.68 | )% | | $ | 508,298 | | | | 1.00 | % | | | 1.00 | % | | | 0.14 | % | | | 0.14 | % | | | 15.14 | % | |
First Eagle Gold Fund Class R6 | |
Six-Months Ended
April 30, 2018
(unaudited) | | $ | 16.35 | | | | (3.31 | )%(b) | | $ | 27,483 | | | | 0.88 | %(d) | | | 0.88 | %(d) | | | 0.10 | %(d) | | | 0.10 | %(d) | | | 6.39 | %(b) | |
For The Period
3/01/17^^-
10/31/17 | | $ | 16.91 | | | | (3.92 | )%(b) | | $ | 15,650 | | | | 0.90 | %(d) | | | 0.91 | %(d) | | | (0.51 | )%(d) | | | (0.51 | )%(d) | | | 7.90 | %(b) | |
First Eagle Funds | Semi-Annual Report | April 30, 2018
137
| | Per share operating performance* | |
| | | | | Investment operations | | Less dividends and distributions | |
Selected per
share data for
the period ended: | | Net asset
value,
beginning
of period | | Net
investment
income/
loss | | Net
realized
and
unrealized
gains
(losses) on
investments | | Total
investment
operations | | From net
investment
income | | From
capital
gains | | Return of
capital | | Total
distributions | |
First Eagle Global Income Builder Fund Class A | |
Six-Months Ended
April 30, 2018
(unaudited) | | $ | 12.05 | | | | 0.12 | | | | (0.05 | ) | | | 0.07 | | | | (0.15 | ) | | | — | | | | — | | | | (0.15 | ) | |
October 31, 2017 | | $ | 10.99 | | | | 0.28 | | | | 1.07 | | | | 1.35 | | | | (0.29 | ) | | | — | | | | — | | | | (0.29 | ) | |
October 31, 2016 | | $ | 10.73 | | | | 0.34 | | | | 0.27 | | | | 0.61 | | | | (0.35 | ) | | | — | | | | — | | | | (0.35 | ) | |
October 31, 2015 | | $ | 11.41 | | | | 0.35 | | | | (0.51 | ) | | | (0.16 | ) | | | (0.37 | ) | | | (0.15 | ) | | | — | | | | (0.52 | ) | |
October 31, 2014 | | $ | 11.26 | | | | 0.36 | | | | 0.17 | | | | 0.53 | | | | (0.38 | ) | | | — | | | | — | | | | (0.38 | ) | |
October 31, 2013 | | $ | 10.32 | | | | 0.42 | | | | 0.91 | | | | 1.33 | | | | (0.39 | ) | | | — | | | | — | | | | (0.39 | ) | |
First Eagle Global Income Builder Fund Class C | |
Six-Months Ended
April 30, 2018
(unaudited) | | $ | 12.02 | | | | 0.07 | | | | (0.04 | ) | | | 0.03 | | | | (0.11 | ) | | | — | | | | — | | | | (0.11 | ) | |
October 31, 2017 | | $ | 10.96 | | | | 0.19 | | | | 1.07 | | | | 1.26 | | | | (0.20 | ) | | | — | | | | — | | | | (0.20 | ) | |
October 31, 2016 | | $ | 10.71 | | | | 0.25 | | | | 0.26 | | | | 0.51 | | | | (0.26 | ) | | | — | | | | — | | | | (0.26 | ) | |
October 31, 2015 | | $ | 11.38 | | | | 0.26 | | | | (0.50 | ) | | | (0.24 | ) | | | (0.28 | ) | | | (0.15 | ) | | | — | | | | (0.43 | ) | |
October 31, 2014 | | $ | 11.23 | | | | 0.27 | | | | 0.17 | | | | 0.44 | | | | (0.29 | ) | | | — | | | | — | | | | (0.29 | ) | |
October 31, 2013 | | $ | 10.30 | | | | 0.34 | | | | 0.90 | | | | 1.24 | | | | (0.31 | ) | | | — | | | | — | | | | (0.31 | ) | |
First Eagle Global Income Builder Fund Class I | |
Six-Months Ended
April 30, 2018
(unaudited) | | $ | 12.02 | | | | 0.14 | | | | (0.05 | ) | | | 0.09 | | | | (0.17 | ) | | | — | | | | — | | | | (0.17 | ) | |
October 31, 2017 | | $ | 10.96 | | | | 0.31 | | | | 1.07 | | | | 1.38 | | | | (0.32 | ) | | | — | | | | — | | | | (0.32 | ) | |
October 31, 2016 | | $ | 10.71 | | | | 0.36 | | | | 0.26 | | | | 0.62 | | | | (0.37 | ) | | | — | | | | — | | | | (0.37 | ) | |
October 31, 2015 | | $ | 11.39 | | | | 0.38 | | | | (0.52 | ) | | | (0.14 | ) | | | (0.39 | ) | | | (0.15 | ) | | | — | | | | (0.54 | ) | |
October 31, 2014 | | $ | 11.23 | | | | 0.38 | | | | 0.19 | | | | 0.57 | | | | (0.41 | ) | | | — | | | | — | | | | (0.41 | ) | |
October 31, 2013 | | $ | 10.33 | | | | 0.44 | | | | 0.91 | | | | 1.35 | | | | (0.45 | ) | | | — | | | | — | | | | (0.45 | ) | |
First Eagle Global Income Builder Fund Class R6 | |
Six-Months Ended
April 30, 2018
(unaudited) | | $ | 12.01 | | | | 0.14 | | | | (0.04 | ) | | | 0.10 | | | | (0.17 | ) | | | — | | | | — | | | | (0.17 | ) | |
For The Period
3/01/17^^-
10/31/17 | | $ | 11.37 | | | | 0.20 | | | | 0.67 | | | | 0.87 | | | | (0.23 | ) | | | — | | | | — | | | | (0.23 | ) | |
First Eagle Funds | Semi-Annual Report | April 30, 2018
138
| | | | | | | | | Ratios/Supplemental data | | | |
| | | | | | | | | Ratios to Average Net Assets of: | | | |
Selected per
share data for
the period ended: | | Net asset
value, end
of period | | Total
Return(a) | | Net assets,
end of
period
(thousands) | | Operating
expenses
excluding
earnings
credits
and/or fee
waivers | | Operating
expenses
including
earnings
credits
and/or fee
waivers | | Net
investment
income
excluding
earnings
credits
and/or fee
waivers | | Net
investment
income
including
earnings
credits
and/or fee
waivers | | Portfolio
turnover
rate | |
First Eagle Global Income Builder Fund Class A | |
Six-Months Ended
April 30, 2018
(unaudited) | | $ | 11.97 | | | | 0.59 | %(b) | | $ | 346,679 | | | | 1.17 | %(d) | | | 1.17 | %(d) | | | 1.98 | %(d) | | | 1.98 | %(d) | | | 10.40 | %(b) | |
October 31, 2017 | | $ | 12.05 | | | | 12.39 | % | | $ | 339,792 | | | | 1.19 | % | | | 1.19 | % | | | 2.43 | % | | | 2.43 | % | | | 23.18 | % | |
October 31, 2016 | | $ | 10.99 | | | | 5.76 | % | | $ | 361,605 | | | | 1.18 | % | | | 1.18 | % | | | 3.16 | % | | | 3.16 | % | | | 29.76 | % | |
October 31, 2015 | | $ | 10.73 | | | | (1.39 | )% | | $ | 410,153 | | | | 1.19 | % | | | 1.19 | % | | | 3.16 | % | | | 3.16 | % | | | 29.68 | % | |
October 31, 2014 | | $ | 11.41 | | | | 4.67 | % | | $ | 439,569 | | | | 1.26 | % | | | 1.23 | % | | | 3.09 | % | | | 3.12 | % | | | 18.45 | % | |
October 31, 2013 | | $ | 11.26 | | | | 13.14 | % | | $ | 231,432 | | | | 1.30 | % | | | 1.35 | % | | | 3.85 | % | | | 3.80 | % | | | 10.87 | % | |
First Eagle Global Income Builder Fund Class C | |
Six-Months Ended
April 30, 2018
(unaudited) | | $ | 11.94 | | | | 0.22 | %(b) | | $ | 327,480 | | | | 1.93 | %(d) | | | 1.93 | %(d) | | | 1.22 | %(d) | | | 1.22 | %(d) | | | 10.40 | %(b) | |
October 31, 2017 | | $ | 12.02 | | | | 11.58 | % | | $ | 334,473 | | | | 1.94 | % | | | 1.94 | % | | | 1.69 | % | | | 1.69 | % | | | 23.18 | % | |
October 31, 2016 | | $ | 10.96 | | | | 4.87 | % | | $ | 344,660 | | | | 1.94 | % | | | 1.94 | % | | | 2.40 | % | | | 2.40 | % | | | 29.76 | % | |
October 31, 2015 | | $ | 10.71 | | | | (2.07 | )% | | $ | 382,467 | | | | 1.96 | % | | | 1.96 | % | | | 2.41 | % | | | 2.41 | % | | | 29.68 | % | |
October 31, 2014 | | $ | 11.38 | | | | 3.90 | % | | $ | 379,188 | | | | 2.00 | % | | | 1.97 | % | | | 2.31 | % | | | 2.34 | % | | | 18.45 | % | |
October 31, 2013 | | $ | 11.23 | | | | 12.25 | % | | $ | 147,521 | | | | 2.04 | % | | | 2.09 | % | | | 3.11 | % | | | 3.06 | % | | | 10.87 | % | |
First Eagle Global Income Builder Fund Class I | |
Six-Months Ended
April 30, 2018
(unaudited) | | $ | 11.94 | | | | 0.72 | %(b) | | $ | 791,692 | | | | 0.91 | %(d) | | | 0.91 | %(d) | | | 2.26 | %(d) | | | 2.26 | %(d) | | | 10.40 | %(b) | |
October 31, 2017 | | $ | 12.02 | | | | 12.71 | % | | $ | 717,643 | | | | 0.93 | % | | | 0.93 | % | | | 2.68 | % | | | 2.68 | % | | | 23.18 | % | |
October 31, 2016 | | $ | 10.96 | | | | 5.93 | % | | $ | 509,250 | | | | 0.92 | % | | | 0.92 | % | | | 3.39 | % | | | 3.39 | % | | | 29.76 | % | |
October 31, 2015 | | $ | 10.71 | | | | (1.14 | )% | | $ | 470,802 | | | | 0.94 | % | | | 0.94 | % | | | 3.41 | % | | | 3.41 | % | | | 29.68 | % | |
October 31, 2014 | | $ | 11.39 | | | | 5.00 | % | | $ | 489,621 | | | | 1.05 | % | | | 0.97 | % | | | 3.25 | % | | | 3.33 | % | | | 18.45 | % | |
October 31, 2013 | | $ | 11.23 | | | | 13.36 | % | | $ | 129,060 | | | | 1.05 | % | | | 1.10 | % | | | 4.11 | % | | | 4.06 | % | | | 10.87 | % | |
First Eagle Global Income Builder Fund Class R6 | |
Six-Months Ended
April 30, 2018
(unaudited) | | $ | 11.94 | | | | 0.74 | %(b) | | $ | 1,001 | | | | 0.87 | %(d) | | | 0.87 | %(d) | | | 2.29 | %(d) | | | 2.29 | %(d) | | | 10.40 | %(b) | |
For The Period
3/01/17^^-
10/31/17 | | $ | 12.01 | | | | 7.68 | %(b) | | $ | 965 | | | | 0.89 | %(d) | | | 0.89 | %(d) | | | 2.55 | %(d) | | | 2.55 | %(d) | | | 23.18 | %(b) | |
First Eagle Funds | Semi-Annual Report | April 30, 2018
139
| | Per share operating performance* | |
| | | | | Investment operations | | Less dividends and distributions | |
Selected per
share data for
the period ended: | | Net asset
value,
beginning
of period | | Net
investment
income/
loss | | Net
realized
and
unrealized
gains
(losses) on
investments | | Total
investment
operations | | From net
investment
income | | From
capital
gains | | Return of
capital | | Total
distributions | |
First Eagle High Yield Fund Class A | |
Six-Months Ended
April 30, 2018
(unaudited) | | $ | 9.03 | | | | 0.24 | | | | (0.14 | ) | | | 0.10 | | | | (0.23 | ) | | | — | | | | — | | | | (0.23 | ) | |
October 31, 2017 | | $ | 8.99 | | | | 0.46 | | | | 0.04 | | | | 0.50 | | | | (0.45 | ) | | | — | | | | (0.01 | ) | | | (0.46 | ) | |
October 31, 2016 | | $ | 8.90 | | | | 0.55 | | | | 0.12 | | | | 0.67 | | | | (0.54 | ) | | | — | | | | (0.04 | ) | | | (0.58 | ) | |
October 31, 2015 | | $ | 9.96 | | | | 0.55 | | | | (0.96 | ) | | | (0.41 | ) | | | (0.56 | ) | | | (0.09 | ) | | | — | | | | (0.65 | ) | |
October 31, 2014 | | $ | 10.11 | | | | 0.53 | | | | (0.15 | ) | | | 0.38 | | | | (0.53 | ) | | | — | | | | — | | | | (0.53 | ) | |
October 31, 2013 | | $ | 9.98 | | | | 0.59 | | | | 0.14 | | | | 0.73 | | | | (0.59 | ) | | | (0.01 | ) | | | — | | | | (0.60 | ) | |
First Eagle High Yield Fund Class C | |
Six-Months Ended
April 30, 2018
(unaudited) | | $ | 9.02 | | | | 0.21 | | | | (0.14 | ) | | | 0.07 | | | | (0.19 | ) | | | — | | | | — | | | | (0.19 | ) | |
October 31, 2017 | | $ | 8.98 | | | | 0.39 | | | | 0.05 | | | | 0.44 | | | | (0.39 | ) | | | — | | | | (0.01 | ) | | | (0.40 | ) | |
October 31, 2016 | | $ | 8.89 | | | | 0.49 | | | | 0.12 | | | | 0.61 | | | | (0.48 | ) | | | — | | | | (0.04 | ) | | | (0.52 | ) | |
October 31, 2015 | | $ | 9.95 | | | | 0.48 | | | | (0.96 | ) | | | (0.48 | ) | | | (0.49 | ) | | | (0.09 | ) | | | — | | | | (0.58 | ) | |
October 31, 2014 | | $ | 10.10 | | | | 0.45 | | | | (0.15 | ) | | | 0.30 | | | | (0.45 | ) | | | — | | | | — | | | | (0.45 | ) | |
October 31, 2013 | | $ | 9.97 | | | | 0.51 | | | | 0.14 | | | | 0.65 | | | | (0.51 | ) | | | (0.01 | ) | | | — | | | | (0.52 | ) | |
First Eagle High Yield Fund Class I | |
Six-Months Ended
April 30, 2018
(unaudited) | | $ | 9.04 | | | | 0.26 | | | | (0.15 | ) | | | 0.11 | | | | (0.24 | ) | | | — | | | | — | | | | (0.24 | ) | |
October 31, 2017 | | $ | 8.99 | | | | 0.49 | | | | 0.05 | | | | 0.54 | | | | (0.48 | ) | | | — | | | | (0.01 | ) | | | (0.49 | ) | |
October 31, 2016 | | $ | 8.90 | | | | 0.58 | | | | 0.12 | | | | 0.70 | | | | (0.57 | ) | | | — | | | | (0.04 | ) | | | (0.61 | ) | |
October 31, 2015 | | $ | 9.96 | | | | 0.58 | | | | (0.96 | ) | | | (0.38 | ) | | | (0.59 | ) | | | (0.09 | ) | | | — | | | | (0.68 | ) | |
October 31, 2014 | | $ | 10.11 | | | | 0.55 | | | | (0.14 | ) | | | 0.41 | | | | (0.56 | ) | | | — | | | | — | | | | (0.56 | ) | |
October 31, 2013 | | $ | 9.98 | | | | 0.62 | | | | 0.14 | | | | 0.76 | | | | (0.62 | ) | | | (0.01 | ) | | | — | | | | (0.63 | ) | |
First Eagle High Yield Fund Class R6 | |
Six-Months Ended
April 30, 2018
(unaudited) | | $ | 9.04 | | | | 0.26 | | | | (0.15 | ) | | | 0.11 | | | | (0.24 | ) | | | — | | | | — | | | | (0.24 | ) | |
For The Period
3/01/17^^-
10/31/17 | | $ | 9.10 | | | | 0.32 | | | | (0.05 | ) | | | 0.27 | | | | (0.33 | ) | | | — | | | | (0.00 | )** | | | (0.33 | ) | |
First Eagle Funds | Semi-Annual Report | April 30, 2018
140
| | | | | | | | | Ratios/Supplemental data | | | |
| | | | | | | | | Ratios to Average Net Assets of: | | | |
Selected per
share data for
the period ended: | | Net asset
value, end
of period | | Total
Return(a) | | Net assets,
end of
period
(thousands) | | Operating
expenses
excluding
earnings
credits
and/or fee
waivers | | Operating
expenses
including
earnings
credits
and/or fee
waivers | | Net
investment
income
excluding
earnings
credits
and/or fee
waivers | | Net
investment
income
including
earnings
credits
and/or fee
waivers | | Portfolio
turnover
rate | |
First Eagle High Yield Fund Class A | |
Six-Months Ended
April 30, 2018
(unaudited) | | $ | 8.90 | | | | 1.07 | %(b) | | $ | 84,421 | | | | 1.25 | %(d) | | | 1.20 | %(d) | | | 5.44 | %(d) | | | 5.49 | %(d) | | | 11.70 | %(b) | |
October 31, 2017 | | $ | 9.03 | | | | 5.71 | % | | $ | 98,548 | | | | 1.21 | % | | | 1.16 | % | | | 5.02 | % | | | 5.07 | % | | | 25.77 | % | |
October 31, 2016 | | $ | 8.99 | | | | 8.24 | % | | $ | 158,102 | | | | 1.15 | % | | | 1.20 | % | | | 6.45 | % | | | 6.40 | % | | | 36.88 | % | |
October 31, 2015 | | $ | 8.90 | | | | (4.24 | )% | | $ | 201,685 | | | | 1.12 | % | | | 1.16 | % | | | 5.81 | % | | | 5.77 | % | | | 31.62 | % | |
October 31, 2014 | | $ | 9.96 | | | | 3.74 | % | | $ | 246,954 | | | | 1.09 | % | | | 1.09 | % | | | 5.17 | % | | | 5.17 | % | | | 43.02 | % | |
October 31, 2013 | | $ | 10.11 | | | | 7.49 | % | | $ | 345,859 | | | | 1.13 | % | | | 1.13 | % | | | 5.80 | % | | | 5.80 | % | | | 49.71 | % | |
First Eagle High Yield Fund Class C | |
Six-Months Ended
April 30, 2018
(unaudited) | | $ | 8.90 | | | | 0.71 | %(b) | | $ | 72,106 | | | | 1.98 | %(d) | | | 1.93 | %(d) | | | 4.72 | %(d) | | | 4.77 | %(d) | | | 11.70 | %(b) | |
October 31, 2017 | | $ | 9.02 | | | | 5.06 | % | | $ | 87,479 | | | | 1.95 | % | | | 1.90 | % | | | 4.30 | % | | | 4.35 | % | | | 25.77 | % | |
October 31, 2016 | | $ | 8.98 | | | | 7.46 | % | | $ | 114,139 | | | | 1.89 | % | | | 1.94 | % | | | 5.74 | % | | | 5.69 | % | | | 36.88 | % | |
October 31, 2015 | | $ | 8.89 | | | | (4.96 | )% | | $ | 129,214 | | | | 1.87 | % | | | 1.91 | % | | | 5.07 | % | | | 5.03 | % | | | 31.62 | % | |
October 31, 2014 | | $ | 9.95 | | | | 2.97 | % | | $ | 184,459 | | | | 1.84 | % | | | 1.83 | % | | | 4.42 | % | | | 4.43 | % | | | 43.02 | % | |
October 31, 2013 | | $ | 10.10 | | | | 6.69 | % | | $ | 158,660 | | | | 1.88 | % | | | 1.88 | % | | | 5.07 | % | | | 5.07 | % | | | 49.71 | % | |
First Eagle High Yield Fund Class I | |
Six-Months Ended
April 30, 2018
(unaudited) | | $ | 8.91 | | | | 1.22 | %(b) | | $ | 200,217 | | | | 0.94 | %(d) | | | 0.89 | %(d) | | | 5.74 | %(d) | | | 5.79 | %(d) | | | 11.70 | %(b) | |
October 31, 2017 | | $ | 9.04 | | | | 6.15 | % | | $ | 278,660 | | | | 0.91 | % | | | 0.86 | % | | | 5.33 | % | | | 5.38 | % | | | 25.77 | % | |
October 31, 2016 | | $ | 8.99 | | | | 8.54 | % | | $ | 315,023 | | | | 0.86 | % | | | 0.91 | % | | | 6.83 | % | | | 6.78 | % | | | 36.88 | % | |
October 31, 2015 | | $ | 8.90 | | | | (3.97 | )% | | $ | 472,930 | | | | 0.83 | % | | | 0.87 | % | | | 6.10 | % | | | 6.06 | % | | | 31.62 | % | |
October 31, 2014 | | $ | 9.96 | | | | 4.03 | % | | $ | 709,776 | | | | 0.83 | % | | | 0.84 | % | | | 5.43 | % | | | 5.42 | % | | | 43.02 | % | |
October 31, 2013 | | $ | 10.11 | | | | 7.85 | % | | $ | 510,893 | | | | 0.80 | % | | | 0.88 | % | | | 6.14 | % | | | 6.06 | % | | | 49.71 | % | |
First Eagle High Yield Fund Class R6 | |
Six-Months Ended
April 30, 2018
(unaudited) | | $ | 8.91 | | | | 1.21 | %(b) | | $ | 118 | | | | 0.96 | %(d) | | | 0.91 | %(d) | | | 5.72 | %(d) | | | 5.77 | %(d) | | | 11.70 | %(b) | |
For The Period
3/01/17^^-
10/31/17 | | $ | 9.04 | | | | 2.99 | %(b) | | $ | 114 | | | | 0.92 | %(d) | | | 0.87 | %(d) | | | 5.29 | %(d) | | | 5.34 | %(d) | | | 25.77 | %(b) | |
First Eagle Funds | Semi-Annual Report | April 30, 2018
141
| | Per share operating performance* | |
| | | | | Investment operations | | Less dividends and distributions | |
Selected per
share data for
the period ended: | | Net asset
value,
beginning
of period | | Net
investment
income/
loss | | Net
realized
and
unrealized
gains
(losses) on
investments | | Total
investment
operations | | From net
investment
income | | From
capital
gains | | Return of
capital | | Total
distributions | |
First Eagle Fund of America Class A | |
Six-Months Ended
April 30, 2018
(unaudited) | | $ | 38.18 | | | | (0.04 | ) | | | (0.32 | ) | | | (0.36 | ) | | | — | | | | (3.58 | ) | | | — | | | | (3.58 | ) | |
October 31, 2017 | | $ | 32.93 | | | | (0.02 | ) | | | 7.41 | | | | 7.39 | | | | (0.07 | ) | | | (2.07 | ) | | | — | | | | (2.14 | ) | |
October 31, 2016 | | $ | 35.79 | | | | 0.14 | | | | (1.99 | ) | | | (1.85 | ) | | | (0.01 | ) | | | (1.00 | ) | | | — | | | | (1.01 | ) | |
October 31, 2015 | | $ | 38.58 | | | | 0.05 | | | | (0.01 | ) | | | 0.04 | | | | (0.12 | ) | | | (2.71 | ) | | | — | | | | (2.83 | ) | |
October 31, 2014 | | $ | 34.76 | | | | 0.17 | | | | 4.26 | | | | 4.43 | | | | (0.09 | ) | | | (0.52 | ) | | | — | | | | (0.61 | ) | |
October 31, 2013 | | $ | 26.86 | | | | 0.10 | | | | 7.81 | | | | 7.91 | | | | (0.01 | ) | | | — | | | | — | | | | (0.01 | ) | |
First Eagle Fund of America Class C | |
Six-Months Ended
April 30, 2018
(unaudited) | | $ | 31.08 | | | | (0.14 | ) | | | (0.24 | ) | | | (0.38 | ) | | | — | | | | (3.58 | ) | | | — | | | | (3.58 | ) | |
October 31, 2017 | | $ | 27.32 | | | | (0.23 | ) | | | 6.06 | | | | 5.83 | | | | — | | | | (2.07 | ) | | | — | | | | (2.07 | ) | |
October 31, 2016 | | $ | 30.07 | | | | (0.10 | ) | | | (1.65 | ) | | | (1.75 | ) | | | — | | | | (1.00 | ) | | | — | | | | (1.00 | ) | |
October 31, 2015 | | $ | 32.98 | | | | (0.20 | ) | | | (0.00 | )** | | | (0.20 | ) | | | — | | | | (2.71 | ) | | | — | | | | (2.71 | ) | |
October 31, 2014 | | $ | 29.94 | | | | (0.10 | ) | | | 3.66 | | | | 3.56 | | | | — | | | | (0.52 | ) | | | — | | | | (0.52 | ) | |
October 31, 2013 | | $ | 23.30 | | | | (0.12 | ) | | | 6.76 | | | | 6.64 | | | | — | | | | — | | | | — | | | | — | | |
First Eagle Fund of America Class I | |
Six-Months Ended
April 30, 2018
(unaudited) | | $ | 39.15 | | | | 0.01 | | | | (0.33 | ) | | | (0.32 | ) | | | (0.02 | ) | | | (3.58 | ) | | | — | | | | (3.60 | ) | |
October 31, 2017 | | $ | 33.72 | | | | 0.08 | | | | 7.59 | | | | 7.67 | | | | (0.17 | ) | | | (2.07 | ) | | | — | | | | (2.24 | ) | |
October 31, 2016 | | $ | 36.62 | | | | 0.24 | | | | (2.04 | ) | | | (1.80 | ) | | | (0.10 | ) | | | (1.00 | ) | | | — | | | | (1.10 | ) | |
October 31, 2015 | | $ | 39.39 | | | | 0.16 | | | | (0.00 | )** | | | 0.16 | | | | (0.22 | ) | | | (2.71 | ) | | | — | | | | (2.93 | ) | |
October 31, 2014 | | $ | 35.47 | | | | 0.25 | | | | 4.36 | | | | 4.61 | | | | (0.17 | ) | | | (0.52 | ) | | | — | | | | (0.69 | ) | |
For The Period
3/08/13^^^-
10/31/13 | | $ | 31.01 | | | | 0.07 | | | | 4.39 | | | | 4.46 | | | | — | | | | — | | | | — | | | | — | | |
First Eagle Fund of America Class Y | |
Six-Months Ended
April 30, 2018
(unaudited) | | $ | 39.07 | | | | (0.04 | ) | | | (0.33 | ) | | | (0.37 | ) | | | — | | | | (3.58 | ) | | | — | | | | (3.58 | ) | |
October 31, 2017 | | $ | 33.67 | | | | (0.03 | ) | | | 7.58 | | | | 7.55 | | | | (0.08 | ) | | | (2.07 | ) | | | — | | | | (2.15 | ) | |
October 31, 2016 | | $ | 36.56 | | | | 0.14 | | | | (2.03 | ) | | | (1.89 | ) | | | (0.00 | )** | | | (1.00 | ) | | | — | | | | (1.00 | ) | |
October 31, 2015 | | $ | 39.35 | | | | 0.05 | | | | (0.02 | ) | | | 0.03 | | | | (0.11 | ) | | | (2.71 | ) | | | — | | | | (2.82 | ) | |
October 31, 2014 | | $ | 35.42 | | | | 0.17 | | | | 4.34 | | | | 4.51 | | | | (0.06 | ) | | | (0.52 | ) | | | — | | | | (0.58 | ) | |
October 31, 2013 | | $ | 27.37 | | | | 0.12 | | | | 7.94 | | | | 8.06 | | | | (0.01 | ) | | | — | | | | — | | | | (0.01 | ) | |
First Eagle Funds | Semi-Annual Report | April 30, 2018
142
| | | | | | | | | Ratios/Supplemental data | | | |
| | | | | | | | | Ratios to Average Net Assets of: | | | |
Selected per
share data for
the period ended: | | Net asset
value, end
of period | | Total
Return(a) | | Net assets,
end of
period
(thousands) | | Operating
expenses
excluding
earnings
credits
and/or fee
waivers | | Operating
expenses
including
earnings
credits
and/or fee
waivers | | Net
investment
income
excluding
earnings
credits
and/or fee
waivers | | Net
investment
income
including
earnings
credits
and/or fee
waivers | | Portfolio
turnover
rate | |
First Eagle Fund of America Class A | |
Six-Months Ended
April 30, 2018
(unaudited) | | $ | 34.24 | | | | (1.12 | )%(b) | | $ | 542,137 | | | | 1.32 | %(d) | | | 1.32 | %(d) | | | (0.22 | )%(d) | | | (0.22 | )%(d) | | | 21.82 | %(b) | |
October 31, 2017 | | $ | 38.18 | | | | 23.56 | % | | $ | 622,389 | | | | 1.31 | % | | | 1.31 | % | | | (0.07 | )% | | | (0.07 | )% | | | 57.02 | % | |
October 31, 2016 | | $ | 32.93 | | | | (5.30 | )%(c) | | $ | 865,109 | | | | 1.32 | % | | | 1.32 | % | | | 0.43 | % | | | 0.43 | % | | | 55.06 | % | |
October 31, 2015 | | $ | 35.79 | | | | 0.19 | % | | $ | 1,331,912 | | | | 1.35 | % | | | 1.35 | % | | | 0.12 | % | | | 0.12 | % | | | 32.23 | % | |
October 31, 2014 | | $ | 38.58 | | | | 12.92 | % | | $ | 1,204,402 | | | | 1.36 | % | | | 1.36 | % | | | 0.45 | % | | | 0.45 | % | | | 35.18 | % | |
October 31, 2013 | | $ | 34.76 | | | | 29.45 | % | | $ | 1,036,124 | | | | 1.41 | % | | | 1.41 | % | | | 0.31 | % | | | 0.31 | % | | | 32.12 | % | |
First Eagle Fund of America Class C | |
Six-Months Ended
April 30, 2018
(unaudited) | | $ | 27.12 | | | | (1.47 | )%(b) | | $ | 342,789 | | | | 2.07 | %(d) | | | 2.06 | %(d) | | | (0.97 | )%(d) | | | (0.97 | )%(d) | | | 21.82 | %(b) | |
October 31, 2017 | | $ | 31.08 | | | | 22.61 | % | | $ | 401,699 | | | | 2.06 | % | | | 2.06 | % | | | (0.81 | )% | | | (0.81 | )% | | | 57.02 | % | |
October 31, 2016 | | $ | 27.32 | | | | (5.99 | )%(c) | | $ | 509,568 | | | | 2.08 | % | | | 2.08 | % | | | (0.35 | )% | | | (0.35 | )% | | | 55.06 | % | |
October 31, 2015 | | $ | 30.07 | | | | (0.55 | )% | | $ | 742,365 | | | | 2.10 | % | | | 2.10 | % | | | (0.63 | )% | | | (0.63 | )% | | | 32.23 | % | |
October 31, 2014 | | $ | 32.98 | | | | 12.06 | % | | $ | 631,696 | | | | 2.11 | % | | | 2.11 | % | | | (0.31 | )% | | | (0.31 | )% | | | 35.18 | % | |
October 31, 2013 | | $ | 29.94 | | | | 28.44 | % | | $ | 455,286 | | | | 2.16 | % | | | 2.16 | % | | | (0.46 | )% | | | (0.46 | )% | | | 32.12 | % | |
First Eagle Fund of America Class I | |
Six-Months Ended
April 30, 2018
(unaudited) | | $ | 35.23 | | | | (0.96 | )%(b) | | $ | 766,911 | | | | 1.02 | %(d) | | | 1.02 | %(d) | | | 0.08 | %(d) | | | 0.08 | %(d) | | | 21.82 | %(b) | |
October 31, 2017 | | $ | 39.15 | | | | 23.91 | % | | $ | 829,414 | | | | 1.01 | % | | | 1.01 | % | | | 0.22 | % | | | 0.22 | % | | | 57.02 | % | |
October 31, 2016 | | $ | 33.72 | | | | (5.01 | )%(c) | | $ | 808,426 | | | | 1.03 | % | | | 1.03 | % | | | 0.71 | % | | | 0.71 | % | | | 55.06 | % | |
October 31, 2015 | | $ | 36.62 | | | | 0.48 | % | | $ | 1,167,750 | | | | 1.05 | % | | | 1.05 | % | | | 0.41 | % | | | 0.41 | % | | | 32.23 | % | |
October 31, 2014 | | $ | 39.39 | | | | 13.20 | % | | $ | 887,507 | | | | 1.11 | % | | | 1.11 | % | | | 0.66 | % | | | 0.66 | % | | | 35.18 | % | |
For The Period
3/08/13^^^-
10/31/13 | | $ | 35.47 | | | | 14.38 | %(b) | | $ | 491,315 | | | | 1.19 | %(d) | | | 1.19 | %(d) | | | 0.34 | %(d) | | | 0.34 | %(d) | | | 32.12 | %(b) | |
First Eagle Fund of America Class Y | |
Six-Months Ended
April 30, 2018
(unaudited) | | $ | 35.12 | | | | (1.12 | )%(b) | | $ | 351,685 | | | | 1.30 | %(d) | | | 1.30 | %(d) | | | (0.20 | )%(d) | | | (0.20 | )%(d) | | | 21.82 | %(b) | |
October 31, 2017 | | $ | 39.07 | | | | 23.54 | % | | $ | 397,293 | | | | 1.31 | % | | | 1.31 | % | | | (0.09 | )% | | | (0.09 | )% | | | 57.02 | % | |
October 31, 2016 | | $ | 33.67 | | | | (5.28 | )%(c) | | $ | 385,995 | | | | 1.33 | % | | | 1.33 | % | | | 0.40 | % | | | 0.40 | % | | | 55.06 | % | |
October 31, 2015 | | $ | 36.56 | | | | 0.18 | % | | $ | 495,822 | | | | 1.36 | % | | | 1.36 | % | | | 0.12 | % | | | 0.12 | % | | | 32.23 | % | |
October 31, 2014 | | $ | 39.35 | | | | 12.91 | % | | $ | 527,831 | | | | 1.36 | % | | | 1.36 | % | | | 0.45 | % | | | 0.45 | % | | | 35.18 | % | |
October 31, 2013 | | $ | 35.42 | | | | 29.45 | % | | $ | 504,421 | | | | 1.41 | % | | | 1.41 | % | | | 0.39 | % | | | 0.39 | % | | | 32.12 | % | |
First Eagle Funds | Semi-Annual Report | April 30, 2018
143
| | Per share operating performance* | |
| | | | | Investment operations | | Less dividends and distributions | |
Selected per
share data for
the period ended: | | Net asset
value,
beginning
of period | | Net
investment
income/
loss | | Net
realized
and
unrealized
gains
(losses) on
investments | | Total
investment
operations | | From net
investment
income | | From
capital
gains | | Return of
capital | | Total
distributions | |
First Eagle Fund of America Class R6 | |
Six-Months Ended
April 30, 2018
(unaudited) | | $ | 39.15 | | | | 0.02 | | | | (0.33 | ) | | | (0.31 | ) | | | (0.03 | ) | | | (3.58 | ) | | | — | | | | (3.61 | ) | |
For The Period
3/01/17^^-
10/31/17 | | $ | 35.44 | | | | 0.02 | | | | 3.69 | | | | 3.71 | | | | — | | | | — | | | | — | | | | — | | |
^ Class R4 commenced investment operations on January 17, 2018.
^^ Class R6 commenced investment operations on March 1, 2017.
^^^ Class I commenced investment operations on March 8, 2013.
* Per share amounts have been calculated using the average shares method.
** Amount represents less than $0.01 per share.
(a) Does not take into account the sales charge of 5.00% for Class A shares for all Funds, except First Eagle High Yield Fund, which has a sales charge of 4.50% and the CDSC (Contingent Deferred Sales Charge) of 1.00% for Class C shares. A contingent deferred sales charge of 1.00% may apply on redemptions of Class A shares made within 18 months following a purchase of $1,000,000 or more without an initial sales charge.
(b) Not Annualized
(c) In 2016, the Fund received a voluntary reimbursement by the subadviser for a realized investment loss. By excluding this reimbursement, total returns would have been -5.30%, -6.02%, -5.01% and -5.31% for Class A, Class C, Class I and Class Y, respectively.
(d) Annualized
See Notes to Financial Statements.
First Eagle Funds | Semi-Annual Report | April 30, 2018
144
| | | | | | | | | Ratios/Supplemental data | | | |
| | | | | | | | | Ratios to Average Net Assets of: | | | |
Selected per
share data for
the period ended: | | Net asset
value, end
of period | | Total
Return(a) | | Net assets,
end of
period
(thousands) | | Operating
expenses
excluding
earnings
credits
and/or fee
waivers | | Operating
expenses
including
earnings
credits
and/or fee
waivers | | Net
investment
income
excluding
earnings
credits
and/or fee
waivers | | Net
investment
income
including
earnings
credits
and/or fee
waivers | | Portfolio
turnover
rate | |
First Eagle Fund of America Class R6 | |
Six-Months Ended
April 30, 2018
(unaudited) | | $ | 35.23 | | | | (0.96 | )%(b) | | $ | 414 | | | | 0.98 | %(d) | | | 0.98 | %(d) | | | 0.11 | %(d) | | | 0.11 | %(d) | | | 21.82 | %(b) | |
For The Period
3/01/17^^-
10/31/17 | | $ | 39.15 | | | | 10.47 | %(b) | | $ | 397 | | | | 1.00 | %(d) | | | 1.00 | %(d) | | | 0.09 | %(d) | | | 0.09 | %(d) | | | 57.02 | %(b) | |
First Eagle Funds | Semi-Annual Report | April 30, 2018
145
Notes to Financial Statements (unaudited)
Note 1 — Significant Accounting Policies
First Eagle Funds (the "Trust"), is an open-end management investment company registered under the Investment Company Act of 1940, as amended ("1940 Act"). The Trust consists of seven separate portfolios, First Eagle Global Fund, First Eagle Overseas Fund, First Eagle U.S. Value Fund, First Eagle Gold Fund, First Eagle Global Income Builder Fund, First Eagle High Yield Fund and First Eagle Fund of America (each individually a "Fund" or collectively the "Funds"). All the Funds are diversified mutual funds except for First Eagle Gold Fund and First Eagle Fund of America, which are non-diversified. The Trust is a Delaware statutory trust. The First Eagle Global Fund seeks long-term growth of capital by investing in a range of asset classes from markets in the United States and throughout the world. The First Eagle Overseas Fund seeks long-term growth of capital by investing primarily in equities issued by non-U.S. corporations. The First Eagle U.S. Value Fund seeks long-term growth of capital by investing, under normal market conditions, at least 80% of its net assets (plus any borrowings for investment purposes) in domestic equity and debt securities. The First Eagle Gold Fund seeks to provide investors the opportunity to participate in the investment characteristics of gold (and to a limited extent other precious metals) for a portion of their overall investment portfolio. The First Eagle Global Income Builder Fund seeks current income generation and long-term growth of capital. The First Eagle High Yield Fund seeks to provide investors with a high level of current income. The First Eagle Fund of America seeks capital appreciation by investing primarily in domestic stocks and, to a lesser extent, in debt and foreign equity securities.
The Funds offer seven share classes, Class A shares, Class C shares, Class I shares, Class R3 shares, Class R4 shares, Class R5 shares and Class R6 shares. Additionally, First Eagle Fund of America also offers Class Y shares. Class R3 shares, Class R4 shares (except for First Eagle Global Fund and First Eagle Overseas Fund) and Class R5 shares (which collectively launched on March 1, 2017 together with Class R6 shares) are not currently funded, but are available for investment.
Effective at the close of business on Friday, May 9, 2014, the First Eagle Overseas Fund is closed to new investors, subject to certain limited exceptions. Additionally, Class Y on First Eagle Fund of America is closed to new investors, subject to certain limited exceptions. Additional information can be found in the Funds' prospectus.
First Eagle Investment Management, LLC (the "Adviser"), a subsidiary of First Eagle Holdings, Inc. ("First Eagle Holdings"), manages the Funds. Investment funds managed by The Blackstone Group, LP and Corsair Capital LLC and certain co-investors own a controlling interest in First Eagle Holdings and the Adviser through BCP CC Holdings L.P.
The following is a summary of significant accounting policies that are adhered to by the Funds. The Funds are investment companies and, accordingly, follow the investment company accounting and reporting guidance of the Financial Accounting Standards Board Accounting Standards Codification Topic 946—Investment Companies, which is part of U.S. generally accepted accounting principles ("GAAP").
a) Investments in Subsidiaries — The First Eagle Global Fund (the "Global Fund"), First Eagle Overseas Fund (the "Overseas Fund"), First Eagle U.S. Value Fund (the "U.S. Value Fund"),
First Eagle Funds | Semi-Annual Report | April 30, 2018
146
Notes to Financial Statements (unaudited)
and First Eagle Gold Fund (the "Gold Fund") may invest in certain precious metals through their investment in the First Eagle Global Cayman Fund, Ltd., First Eagle Overseas Cayman Fund, Ltd., First Eagle U.S. Value Cayman Fund, Ltd., and First Eagle Gold Cayman Fund, Ltd., respectively, each a wholly owned subsidiary (each referred to herein as a "Subsidiary" or collectively "the Subsidiaries"). Each Fund may invest up to 25% of its total assets in shares of its respective Subsidiary. Each Subsidiary has the ability to invest in commodities and securities consistent with the investment objective of its respective Fund. Substantially all of each Subsidiary's assets represent physical gold bullion, and First Eagle Gold Cayman Fund, Ltd. also holds physical silver. Trading in bullion directly by the Funds presents the risk of tax consequences (e.g., a change in the Funds' tax status subjecting the Funds to be taxed at the Fund level on all of their income if the Funds' "non-qualifying income" exceeds 10% of the Funds' gross income in any taxable year). Trading in bullion by the Subsidiaries generally does not present the same tax risks.
The First Eagle Global Cayman Fund, Ltd., established on October 18, 2013, is an exempted company under the laws of the Cayman Islands. The consolidated financial statements include the accounts of the Global Fund and the First Eagle Global Cayman Fund, Ltd. All intercompany transactions and balances have been eliminated. As of April 30, 2018, the First Eagle Global Cayman Fund, Ltd. has $3,688,333,301 in net assets, representing 6.57% of the Global Fund's net assets.
The First Eagle Overseas Cayman Fund, Ltd., established on October 18, 2013, is an exempted company under the laws of the Cayman Islands. The consolidated financial statements include the accounts of the Overseas Fund and the First Eagle Overseas Cayman Fund, Ltd. All intercompany transactions and balances have been eliminated. As of April 30, 2018, the First Eagle Overseas Cayman Fund, Ltd. has $1,057,116,204 in net assets, representing 6.00% of the Overseas Fund's net assets.
The First Eagle U.S. Value Cayman Fund, Ltd., established on January 24, 2012, is an exempted company under the laws of the Cayman Islands. The consolidated financial statements include the accounts of the U.S. Value Fund and the First Eagle U.S. Value Cayman Fund, Ltd. All intercompany transactions and balances have been eliminated. As of April 30, 2018, the First Eagle U.S. Value Cayman Fund, Ltd. has $205,341,249 in net assets, representing 10.38% of the U.S. Value Fund's net assets.
The First Eagle Gold Cayman Fund, Ltd., established on May 28, 2010, is an exempted company under the laws of the Cayman Islands. The consolidated financial statements include the accounts of the Gold Fund and the First Eagle Gold Cayman Fund, Ltd. All intercompany transactions and balances have been eliminated. As of April 30, 2018, the First Eagle Gold Cayman Fund, Ltd. has $250,871,329 in net assets, representing 22.22% of the Gold Fund's net assets.
b) Investment valuation — Each Fund computes its net asset value once daily as of the close of trading on each day the New York Stock Exchange ("NYSE") is open for trading. The net asset value per share is computed by dividing the total current value of the assets of a Fund, less its liabilities, by the total number of shares outstanding at the time of such computation.
First Eagle Funds | Semi-Annual Report | April 30, 2018
147
Notes to Financial Statements (unaudited)
A portfolio security (including an option), other than a bond, which is traded on a U.S. national securities exchange or a securities exchange abroad is generally valued at the price of the official closing price (last sales price if an official closing price is not available) on the primary trading exchange as of the close of business. If there are no round lot sales on such date, such portfolio investment will be valued at the mean between the closing bid and asked prices (and if there is only a bid or only an asked price on such date, valuation will be at such bid or asked price for long or short positions, respectively). Securities, other than bonds, traded in the over-the-counter market are valued at the mean between the last bid and asked prices prior to the time of valuation (and if there is only a bid or only an asked price on such date, valuation will be at such bid or asked price for long or short positions, respectively), except if such unlisted security is traded on the NASDAQ in which case it is valued at the NASDAQ Official Closing Price. Such prices are provided by approved pricing vendors or other independent pricing sources.
All bonds, whether listed on an exchange or traded in the over-counter-market for which market quotations are readily available are generally priced at the evaluated bid price provided by an approved pricing service, or dealers in the over-the-counter markets in the United States or abroad. Pricing services and broker-dealers use multiple valuation techniques to determine value. In instances where sufficient market activity exists, dealers or pricing services may utilize a market-based approach through which quotes from market makers are used to determine fair value. In instances where sufficient market activity may not exist or is limited, the dealers or pricing services also utilize proprietary valuation models which may consider market transactions in comparable securities and the various relationships between securities in determining value and/or market characteristics such as benchmark yield curves, option-adjusted spreads, credit spreads, estimated default rates, coupon-rates, anticipated timing of principal repayments, underlying collateral, and other unique security features in order to estimate the relevant cash flows, which are then discounted to calculate the fair values. Short-term investments are valued at evaluated bid prices.
Commodities (such as physical metals) are valued at the indicative mean of the best-bid/best-offer immediately prior to the time trading on the NYSE closes (normally 4:00 p.m. Eastern Time), as provided by an independent pricing source.
Forward foreign currency exchange contracts are valued at the current cost of covering or offsetting such contracts, by reference to forward currency rates at the time the NYSE closes (normally 4:00 p.m. Eastern Time), as provided by an independent pricing source.
The exchange rates as of the NYSE Close (normally 4:00 p.m. Eastern Time) are used to convert foreign security prices into U.S. dollars.
Any security that is listed or traded on more than one exchange (or traded in multiple markets) is valued at the official close on the primary exchange or market on which they are traded. In the absence of such a quotation, a security may be valued at the last quoted sales price on the most active exchange or market as determined by the independent pricing agent. The Funds use pricing services to identify the market prices of publicly traded securities in their portfolios. When market prices are determined to be "stale" as a result of limited market activity for a
First Eagle Funds | Semi-Annual Report | April 30, 2018
148
Notes to Financial Statements (unaudited)
particular holding, or in other circumstances when market prices are unavailable, such as for private placements, or determined to be unreliable for a particular holding, such holdings may be "fair valued" in accordance with procedures approved by the Board of Trustees ("Board"). The values assigned to a Fund's holdings therefore may differ on occasion from reported market values.
Certain Funds with non-U.S. holdings have adopted procedures under which movements in the prices for U.S. securities (beyond specified thresholds) occurring after the close of a foreign market may require fair valuation of securities traded in that foreign market. The determination of whether a particular foreign investment should be fair valued will be based on review of a number of factors, including developments in foreign markets and security-specific events. The values assigned to a Fund's holdings therefore may differ on occasion from reported market values, especially during periods of higher market price volatility. The Board and the Adviser believe relying on the procedures as just described will result in prices that are more reflective of the actual market value of portfolio securities held by the Funds than relying solely on reported market values.
The Funds adopted provisions surrounding fair value measurements and disclosures that define fair value, establish a framework for measuring fair value in GAAP and expand disclosures about fair value measurements. This applies to fair value measurements that are already required or permitted by other accounting standards and is intended to increase consistency of those measurements and applies broadly to securities and other types of assets and liabilities.
The Funds disclose the fair value of their investments in a hierarchy that prioritizes the inputs or assumptions to valuation techniques used to measure fair value. These inputs are used in determining the value of the Funds' investments and are summarized in the following fair value hierarchy:
Level 1 — Quoted prices in active markets for identical securities.
Level 2 — Other significant observable inputs (including quoted prices for similar securities, interest rates, prepayment speeds, credit risk, etc.).
Level 3 — Other significant unobservable inputs (including the Fund's own assumption in determining the fair value of investments).
The significant unobservable inputs that may be used in determining valuations for investments identified within Level 3 are market comparables and the enterprise value of a company. Indications of value and quotations may be observable at any given time, but are currently treated by the Funds as unobservable. Significant changes in any of the unobservable inputs may significantly impact the fair value measurement. The impact is based on the relationship between each unobservable input and the fair value measurement.
Significant increases (decreases) in enterprise multiples may increase (decrease) the fair value measurement. Significant increases (decreases) in the discount for marketability, probability of insolvency and probability of default may decrease (increase) the fair value measurement.
First Eagle Funds | Semi-Annual Report | April 30, 2018
149
Notes to Financial Statements (unaudited)
Fair valuation of securities, other financial investments or other assets (collectively, "securities") held by the Funds shall be determined in good faith under the supervision and responsibility of the Board. The Board has created a Board Valuation Committee (the "Committee") to oversee the execution of the valuation and liquidity procedures for the Funds.
It is the policy of the Funds to recognize significant transfers between Levels 1, 2 and 3 and to value those transfers as of the beginning of the period.
The following is a summary of the Funds' inputs used to value the Funds' investments as of April 30, 2018:
First Eagle Global Fund
Description | | Level 1 | | Level 2(a) | | Level 3‡ | | Total | |
Assets:† | |
Common Stocks | | $ | 23,736,005,471 | | | $ | 17,372,166,911 | | | $ | 17,786,797 | | | $ | 41,125,959,179 | | |
Corporate Bond | | | — | | | | 5,425,998 | | | | — | | | | 5,425,998 | | |
Commodities* | | | 4,088,715,166 | | | | — | | | | — | | | | 4,088,715,166 | | |
Foreign Government
Securities | | | — | | | | 604,220,830 | | | | — | ^ | | | 604,220,830 | | |
Short-Term Investments | | | 238,452 | | | | 10,100,806,296 | | | | — | | | | 10,101,044,748 | | |
U.S. Treasury Obligations | | | — | | | | 113,176,735 | | | | — | | | | 113,176,735 | | |
Forward Foreign Currency
Exchange Contracts** | | | — | | | | 46,267,249 | | | | — | | | | 46,267,249 | | |
Total | | $ | 27,824,959,089 | | | $ | 28,242,064,019 | | | $ | 17,786,797 | | | $ | 56,084,809,905 | | |
Liabilities: | |
Forward Foreign Currency
Exchange Contracts** | | $ | — | | | $ | (6,497,186 | ) | | $ | — | | | $ | (6,497,186 | ) | |
Total | | $ | — | | | $ | (6,497,186 | ) | | $ | — | | | $ | (6,497,186 | ) | |
(a) Transfers into/out of Level 2 represent value as of the beginning of the period. Common stocks valued at $1,165,127,229 were transferred from Level 1 to Level 2 during the six-month period ended April 30, 2018. At October 31, 2017, these securities were valued using quoted market prices in active markets; at April 30, 2018, these securities were valued based on fair value adjustment factors. Common stocks valued at $80,025,207 were transferred from Level 2 to Level 1 during the six-month period ended April 30, 2018. At October 31, 2017, these securities were valued based on fair value adjustment factors; at April 30, 2018, these securities were valued using quoted market prices in active markets.
† See Consolidated Schedule of Investments for additional detailed categorizations.
‡ Value determined using significant unobservable inputs.
* Represents gold bullion.
** Forward Foreign Currency Exchange Contracts are valued at net unrealized appreciation (depreciation) on the investment.
^ Fair value represents zero.
First Eagle Funds | Semi-Annual Report | April 30, 2018
150
Notes to Financial Statements (unaudited)
Fair Value Level 3 activity for the six-month period ended April 30, 2018 was as follows:
First Eagle Global Fund (continued)
| | | Common
Stocks | | Corporate
Bonds | | Foreign
Government
Securities | | Total
Value | |
Beginning Balance — market value | | $ | 67,646,852 | | | $ | 24,461,850 | | | $ | — | ^ | | $ | 92,108,702 | | |
Purchases(1) | | | — | | | | — | | | | — | | | | — | | |
Sales(2) | | | (84,400,895 | ) | | | (42,881,063 | ) | | | — | | | | (127,281,958 | ) | |
Transfer In — Level 3 | | | — | | | | — | | | | — | | | | — | | |
Transfer Out — Level 3 | | | — | | | | — | | | | — | | | | — | | |
Accrued Amortization | | | — | | | | — | | | | — | | | | — | | |
Realized Gains (Losses) | | | 84,411,612 | | | | 14,236,093 | | | | — | | | | 98,647,705 | | |
Change in Unrealized Appreciation
(Depreciation) | | | (49,870,772 | ) | | | 4,183,120 | | | | — | | | | (45,687,652 | ) | |
Ending Balance — market value | | $ | 17,786,797 | | | $ | — | | | $ | — | ^ | | $ | 17,786,797 | | |
Change in unrealized gains or
(losses) relating to assets still
held at reporting date | | $ | (49,870,772 | ) | | $ | — | | | $ | — | | | $ | (49,870,772 | ) | |
^ Fair value represents zero.
(1) Purchases include all purchases of securities and securities received in corporate actions.
(2) Sales include all sales of securities, maturities, paydowns and securities tendered in corporate actions.
Quantitative Information about Level 3 Fair Value Measurements | |
| | Fair Value at
April 30, 2018 | | Valuation
Technique(s) | | Unobservable
Input | | Range
(Weighted
Average) | |
| Common Stocks | | $ | 17,786,797 | | | Comparable
Security | | Market
Discount | | | 30 | % (30%) | |
Foreign Government
Securities | | $ | — | | | Discounted
Cash Flow | | Estimated
Recoverability | | | 0 | % (0%) | |
Total | | $ | 17,786,797 | | | | | | | | | | | | | | |
The significant unobservable inputs used in the fair value measurement of the Fund's investments are listed above. Generally, a change in the assumptions used in any input in isolation may be accompanied by a change in another input. Significant changes in any of the unobservable inputs may significantly impact the fair value measurement. The impact is based on the relationship between each unobservable input and the fair value measurement. Significant increases (decreases) in market discount may decrease (increase) the fair value measurement. Significant increases (decreases) in estimated recoverability may increase (decrease) the fair value measurement.
First Eagle Funds | Semi-Annual Report | April 30, 2018
151
Notes to Financial Statements (unaudited)
First Eagle Overseas Fund
Description | | Level 1 | | Level 2(a) | | Level 3‡ | | Total | |
Assets:† | |
Common Stocks | | $ | 2,604,435,049 | | | $ | 10,147,018,769 | | | $ | 58,218,676 | | | $ | 12,809,672,494 | | |
Commodities* | | | 1,319,279,858 | | | | — | | | | — | | | | 1,319,279,858 | | |
Foreign Government
Securities | | | — | | | | 285,432,138 | | | | — | | | | 285,432,138 | | |
Short-Term Investments | | | 101,647 | | | | 3,056,530,962 | | | | — | | | | 3,056,632,609 | | |
U.S. Treasury Obligations | | | — | | | | 35,709,983 | | | | — | | | | 35,709,983 | | |
Forward Foreign Currency
Exchange Contracts** | | | — | | | | 24,735,379 | | | | — | | | | 24,735,379 | | |
Total | | $ | 3,923,816,554 | | | $ | 13,549,427,231 | | | $ | 58,218,676 | | | $ | 17,531,462,461 | | |
Liabilities: | |
Forward Foreign Currency
Exchange Contracts** | | $ | — | | | $ | (4,045,108 | ) | | $ | — | | | $ | (4,045,108 | ) | |
Total | | $ | — | | | $ | (4,045,108 | ) | | $ | — | | | $ | (4,045,108 | ) | |
(a) Transfers into/out of Level 2 represent value as of the beginning of the period. Common stocks valued at $998,183,433 were transferred from Level 1 to Level 2 during the six-month period ended April 30, 2018. At October 31, 2017, these securities were valued using quoted market prices in active markets; at April 30, 2018, these securities were valued based on fair value adjustment factors. Common stocks valued at $28,948,092 were transferred from Level 2 to Level 1 during the six-month period ended April 30, 2018. At October 31, 2017, these securities were valued based on fair value adjustment factors; at April 30, 2018, these securities were valued using quoted market prices in active markets.
† See Consolidated Schedule of Investments for additional detailed categorizations.
‡ Value determined using significant unobservable inputs.
* Represents gold bullion.
** Forward Foreign Currency Exchange Contracts are valued at net unrealized appreciation (depreciation) on the investment.
First Eagle Funds | Semi-Annual Report | April 30, 2018
152
Notes to Financial Statements (unaudited)
Fair Value Level 3 activity for the six-month period ended April 30, 2018 was as follows:
First Eagle Overseas Fund (continued)
| | | Common
Stocks | | Corporate
Bonds | | Total
Value | |
Beginning Balance — market value | | $ | 103,200,268 | | | $ | 16,307,900 | | | $ | 119,508,168 | | |
Purchases(1) | | | — | | | | — | | | | — | | |
Sales(2) | | | (82,309,418 | ) | | | (28,679,939 | ) | | | (110,989,357 | ) | |
Transfer In — Level 3 | | | — | | | | — | | | | — | | |
Transfer Out — Level 3 | | | — | | | | — | | | | — | | |
Accrued Amortization | | | — | | | | — | | | | — | | |
Realized Gains (Losses) | | | 73,229,746 | | | | 9,593,347 | | | | 82,823,093 | | |
Change in Unrealized Appreciation (Depreciation) | | | (35,901,920 | ) | | | 2,778,692 | | | | (33,123,228 | ) | |
Ending Balance — market value | | $ | 58,218,676 | | | $ | — | | | $ | 58,218,676 | | |
Change in unrealized gains or (losses)
relating to assets still held at reporting date | | $ | (35,901,920 | ) | | $ | — | | | $ | (35,901,920 | ) | |
(1) Purchases include all purchases of securities and securities received in corporate actions.
(2) Sales include all sales of securities, maturities, paydowns and securities tendered in corporate actions
Quantitative Information about Level 3 Fair Value Measurements | |
| | Fair Value at
April 30, 2018 | | Valuation
Technique(s) | | Unobservable
Input | | Range
(Weighted
Average) | |
| | $ | 21,679,922 | | | Comparable
Security | | Market
Discount | | | 30 | % (30%) | |
| | | | Price of Recent
Transaction | | Recent
Transaction | | | 30.85€ | (30.85€) | |
| | $ | 36,538,754 | | | Market
Comparable
Companies | | Enterprise
Value
Multiple | | | 0.82
(2.79x) | x - 8.42x | |
Common Stocks | | $ | 58,218,676 | | | | | | | | | | | | | | |
Total | | $ | 58,218,676 | | | | | | | | | | | | | | |
The significant unobservable inputs used in the fair value measurement of the Fund's investments are listed above. Generally, a change in the assumptions used in any input in isolation may be accompanied by a change in another input. Significant changes in any of the unobservable inputs may significantly impact the fair value measurement. The impact is based on the relationship between each unobservable input and the fair value measurement. Significant increases (decreases) in enterprise multiples may increase (decrease) the fair value measurement. Significant increases (decreases) in market discount may decrease (increase) the fair value measurement. Significant increases (decreases) in recent transaction may increase (decrease) the fair value measurement.
First Eagle Funds | Semi-Annual Report | April 30, 2018
153
Notes to Financial Statements (unaudited)
First Eagle U.S. Value Fund
Description | | Level 1 | | Level 2 | | Level 3 | | Total | |
Assets:† | |
Common Stocks | | $ | 1,422,111,214 | | | $ | — | | | $ | — | | | $ | 1,422,111,214 | | |
Corporate Bonds | | | — | | | | 24,204,890 | | | | — | | | | 24,204,890 | | |
Commodities* | | | 205,328,273 | | | | — | | | | — | | | | 205,328,273 | | |
Short-Term Investments | | | 46,667 | | | | 333,315,099 | | | | — | | | | 333,361,766 | | |
Total | | $ | 1,627,486,154 | | | $ | 357,519,989 | | | $ | — | | | $ | 1,985,006,143 | | |
† See Consolidated Schedule of Investments for additional detailed categorizations.
* Represents gold bullion.
For the six-month period ended April 30, 2018, there was no security transfer activity from Level 1 to Level 2 and no security transfer activity from Level 2 to Level 1.
First Eagle Gold Fund
Description | | Level 1 | | Level 2 | | Level 3 | | Total | |
Assets:† | |
Common Stocks | | $ | 857,558,049 | | | $ | — | | | $ | — | | | $ | 857,558,049 | | |
Commodities* | | | 250,929,802 | | | | — | | | | — | | | | 250,929,802 | | |
Short-Term Investments | | | 67,337 | | | | 19,226,986 | | | | — | | | | 19,294,323 | | |
Warrants | | | 25,531 | | | | — | | | | — | | | | 25,531 | | |
Total | | $ | 1,108,580,719 | | | $ | 19,226,986 | | | $ | — | | | $ | 1,127,807,705 | | |
† See Consolidated Schedule of Investments for additional detailed categorizations.
* Represents gold and silver bullion.
For the six-month period ended April 30, 2018, there was no security transfer activity from Level 1 to Level 2 and no security transfer activity from Level 2 to Level 1.
First Eagle Funds | Semi-Annual Report | April 30, 2018
154
Notes to Financial Statements (unaudited)
Fair Value Level 3 activity for the six-month period ended April 30, 2018 was as follows:
First Eagle Gold Fund (continued)
| | | Convertible
Bond | |
Beginning Balance — market value | | $ | 15,000,000 | | |
Purchases(1) | | | — | | |
Sales(2) | | | (15,000,000 | ) | |
Transfer In — Level 3 | | | — | | |
Transfer Out — Level 3 | | | — | | |
Accrued Amortization | | | — | | |
Realized Gains (Losses) | | | — | | |
Change in Unrealized Appreciation (Depreciation) | | | — | | |
Ending Balance — market value | | $ | — | | |
Change in unrealized gains or (losses) relating to assets still held at reporting date | | $ | — | | |
(1) Purchases include all purchases of securities and securities received in corporate actions.
(2) Sales include all sales of securities, maturities, paydowns and securities tendered in corporate actions
First Eagle Global Income Builder Fund
Description | | Level 1 | | Level 2(a) | | Level 3‡ | | Total | |
Assets:† | |
Common Stocks | | $ | 326,052,969 | | | $ | 469,289,393 | | | $ | — | | | $ | 795,342,362 | | |
Corporate Bonds | | | — | | | | 430,637,232 | | | | 2,822,950 | (b) | | | 433,460,182 | | |
Closed End Fund | | | — | | | | 7,313,985 | | | | — | | | | 7,313,985 | | |
Commodities* | | | 53,729,586 | | | | — | | | | — | | | | 53,729,586 | | |
Foreign Government
Securities | | | — | | | | 18,514,538 | | | | — | | | | 18,514,538 | | |
Loan Assignments | | | — | | | | 10,257,128 | | | | 15,994,565 | (b) | | | 26,251,693 | | |
Preferred Stocks | | | 1,821,800 | | | | — | | | | — | | | | 1,821,800 | | |
Short-Term Investments | | | 9,086 | | | | 80,233,659 | | | | — | | | | 80,242,745 | | |
U.S. Treasury Obligations | | | — | | | | 37,701,596 | | | | — | | | | 37,701,596 | | |
Forward Foreign Currency
Exchange Contracts** | | | — | | | | 992,563 | | | | — | | | | 992,563 | | |
Total | | $ | 381,613,441 | | | $ | 1,054,940,094 | | | $ | 18,817,515 | | | $ | 1,455,371,050 | | |
First Eagle Funds | Semi-Annual Report | April 30, 2018
155
Notes to Financial Statements (unaudited)
First Eagle Global Income Builder Fund (continued)
Description | | Level 1 | | Level 2(a) | | Level 3‡ | | Total | |
Liabilities: | |
Forward Foreign Currency
Exchange Contracts** | | $ | — | | | $ | (157,982 | ) | | $ | — | | | $ | (157,982 | ) | |
Total | | $ | — | | | $ | (157,982 | ) | | $ | — | | | $ | (157,982 | ) | |
(a) Transfers into/out of Level 2 represent value as of the beginning of the period. Common stocks valued at $54,311,921 were transferred from Level 1 to Level 2 during the six-month period ended April 30, 2018. At October 31, 2017, these securities were valued using quoted market prices in active markets; at April 30, 2018, these securities were valued based on fair value adjustment factors. Closed End Fund valued at $6,911,422 was transferred from Level 1 to Level 2 during the six-month period ended April 30, 2018. At October 31, 2017, these securities were valued using quoted market prices in active markets; at April 30, 2018, these securities were valued based on fair value adjustment factors. There was no security transfer activity from Level 2 to Level 1 for the six-month period ended April 30, 2018.
(b) These investments are valued by brokers and pricing services. The inputs for these investments are not readily available or cannot be reasonably estimated and are generally those inputs described in Note 1 (b).
† See Schedule of Investments for additional detailed categorizations.
‡ Value determined using significant unobservable inputs.
* Represents gold bullion.
** Forward Foreign Currency Exchange Contracts are valued at net unrealized appreciation (depreciation) on the investment.
Fair Value Level 3 activity for the six-month period ended April 30, 2018 was as follows:
| | | Corporate
Bonds | | Loan
Assignments | | Total
Value | |
Beginning Balance — market value | | $ | 2,840,419 | | | $ | 16,763,123 | | | $ | 19,603,542 | | |
Purchases(1) | | | — | | | | — | | | | — | | |
Sales(2) | | | — | | | | (1,039,973 | ) | | | (1,039,973 | ) | |
Transfer In — Level 3 | | | — | | | | — | | | | — | | |
Transfer Out — Level 3 | | | — | | | | — | | | | — | | |
Accrued Amortization | | | 19,389 | | | | 30,666 | | | | 50,055 | | |
Realized Gains (Losses) | | | — | | | | 1,528 | | | | 1,528 | | |
Change in Unrealized Appreciation (Depreciation) | | | (36,858 | ) | | | 239,221 | | | | 202,363 | | |
Ending Balance — market value | | $ | 2,822,950 | | | $ | 15,994,565 | | | $ | 18,817,515 | | |
Change in unrealized gains or (losses)
relating to assets still held at reporting date | | $ | (36,858 | ) | | $ | 239,221 | | | $ | 202,363 | | |
(1) Purchases include all purchases of securities and securities received in corporate actions.
(2) Sales include all sales of securities, maturities, paydowns and securities tendered in corporate actions
First Eagle Funds | Semi-Annual Report | April 30, 2018
156
Notes to Financial Statements (unaudited)
First Eagle High Yield Fund
Description | | Level 1 | | Level 2(a) | | Level 3‡ | | Total | |
Assets:† | |
Corporate Bonds | | $ | — | | | $ | 297,511,104 | | | $ | 4,155,140 | (b) | | $ | 301,666,244 | | |
Foreign Government Securities | | | — | | | | 3,063,733 | | | | — | | | | 3,063,733 | | |
Loan Assignments | | | — | | | | 7,647,589 | | | | 19,071,249 | (b) | | | 26,718,838 | | |
Short-Term Investments | | | 5,763 | | | | 21,509,866 | | | | — | | | | 21,515,629 | | |
Total | | $ | 5,763 | | | $ | 329,732,292 | | | $ | 23,226,389 | | | $ | 352,964,444 | | |
(a) Transfers into/out of Level 2 represent value as of the beginning of the period. There was no security transfer activity from Level 1 to Level 2 and no security transfer activity from Level 2 to Level 1 as of the six-month period ended April 30, 2018.
(b) These investments are valued by brokers and pricing services. The inputs for these investments are not readily available or cannot be reasonably estimated and are generally those inputs described in Note 1 (b).
† See Schedule of Investments for additional detailed categorizations.
‡ Value determined using significant unobservable inputs.
Fair Value Level 3 activity for the six-month period ended April 30, 2018 was as follows:
| | | Common
Stocks | | Corporate
Bonds | | Loan
Assignments | | Total
Value | |
Beginning Balance — market value | | $ | 2,603,164 | | | $ | 9,726,191 | | | $ | 23,239,667 | | | $ | 35,569,022 | | |
Purchases(1) | | | — | | | | 825,199 | | | | 1,068,750 | | | | 1,893,949 | | |
Sales(2) | | | (1,333,116 | ) | | | (16,647,220 | ) | | | (5,425,126 | ) | | | (23,405,462 | ) | |
Transfer In — Level 3 | | | — | | | | — | | | | — | | | | — | | |
Transfer Out — Level 3 | | | — | | | | — | | | | — | | | | — | | |
Accrued Amortization | | | — | | | | (1,036,007 | ) | | | (84,212 | ) | | | (1,120,219 | ) | |
Realized Gains (Losses) | | | (3,604,000 | ) | | | — | | | | (2,869,261 | ) | | | (6,473,261 | ) | |
Change in Unrealized Appreciation
(Depreciation) | | | 2,333,952 | | | | 11,286,977 | | | | 3,141,431 | | | | 16,762,360 | | |
Ending Balance — market value | | $ | — | | | $ | 4,155,140 | | | $ | 19,071,249 | | | $ | 23,226,389 | | |
Change in unrealized gains or
(losses) relating to assets still held
at reporting date | | $ | — | | | $ | 11,286,977 | | | $ | 3,141,431 | | | $ | 14,428,408 | | |
(1) Purchases include all purchases of securities and securities received in corporate actions.
(2) Sales include all sales of securities, maturities, paydowns and securities tendered in corporate actions
First Eagle Funds | Semi-Annual Report | April 30, 2018
157
Notes to Financial Statements (unaudited)
First Eagle Fund of America
Description | | Level 1 | | Level 2 | | Level 3 | | Total | |
Assets:† | |
Common Stocks | | $ | 1,920,658,026 | | | $ | — | | | $ | — | | | $ | 1,920,658,026 | | |
Options Purchased | | | 34,035,945 | | | | — | | | | — | | | | 34,035,945 | | |
Short-Term Investments | | | 18,833,101 | | | | — | | | | — | | | | 18,833,101 | | |
Total | | $ | 1,973,527,072 | | | $ | — | | | $ | — | | | $ | 1,973,527,072 | | |
Liabilities: | |
Written Options (Sold Short) | | $ | (8,872,096 | ) | | $ | — | | | $ | — | | | $ | (8,872,096 | ) | |
Total | | $ | (8,872,096 | ) | | $ | — | | | $ | — | | | $ | (8,872,096 | ) | |
† See Schedule of Investments for additional detailed categorizations.
For the six-month period ended April 30, 2018, there was no security transfer activity from Level 1 to Level 2 and no security transfer activity from Level 2 to Level 1.
c) Investment transactions and income — Investment transactions are accounted for on a trade date basis. The specific identification method is used in determining realized gains and losses from investment transactions. Dividend income is recorded on the ex-dividend date. Interest income is recorded daily on the accrual basis. In computing investment income, each Fund accretes discounts and amortizes premiums on debt obligations using the effective yield method. Investment income is allocated to each Fund's share class in proportion to its relative net assets. Payments received from certain investments held by the Funds may be comprised of dividends, capital gains and return of capital. The Funds originally estimate the expected classification of such payments. The amounts may subsequently be reclassified upon receipt of information from the issuer.
d) Expenses — Expenses arising in connection with a Fund are charged directly to that Fund. Expenses common to all Funds may be allocated to each Fund in proportion to its relative net assets. Certain expenses are shared with the First Eagle Variable Funds, an affiliated fund group. Such costs are generally allocated using the ratio of the Fund's average daily net assets relative to the total average daily net assets of the First Eagle Variable Funds. Earnings credits may reduce shareholder servicing agent fees by the amount of interest earned on balances with such service provider.
e) Foreign currency translation — The books and records of the Funds are maintained in U.S. dollars. The market values of securities which are not traded in U.S. currency are recorded in the financial statements after translation to U.S. dollars based on the applicable exchange rates at the end of the period. The costs of such securities are translated at exchange rates prevailing when acquired. Related interest, dividends and withholding taxes are accrued at the rates of exchange prevailing on the respective dates of such transactions.
First Eagle Funds | Semi-Annual Report | April 30, 2018
158
Notes to Financial Statements (unaudited)
The net assets of each of the Funds are presented at the foreign exchange rates and market values at the close of the period. The Funds do not isolate that portion of gains and losses on investments which is due to changes in foreign exchange rates from that which is due to changes in market prices of the securities. Accordingly, such foreign currency gains (losses) are included in the reported net realized and unrealized gains (losses) on investment transactions on the Statements of Operations. However, for federal income tax purposes each Fund does isolate the effect of changes in foreign exchange rates from the changes in market prices for realized gains and losses on debt obligations.
f) Forward Foreign Currency Exchange Contracts — In connection with portfolio purchases and sales of securities denominated in foreign currencies, each Fund may enter into forward foreign currency exchange contracts. The First Eagle Global Fund, First Eagle Overseas Fund, First Eagle Global Income Builder Fund and First Eagle High Yield Fund enter into forward foreign currency exchange contracts primarily to manage and/or gain exposure to certain foreign currencies. The Funds' currency transactions include portfolio hedging on portfolio positions. Portfolio hedging is the use of a forward foreign currency exchange contract (or other cash management position) with respect to one or more portfolio security positions denominated or quoted in a particular currency. Currency exchange transactions involve currencies of different countries that the Funds invest in and serve as hedges against possible variations in the exchange rates between these currencies and the U.S. dollar. Each Fund may engage in portfolio hedging with respect to the currency of a particular country in amounts approximating actual or anticipated positions in securities denominated in that currency. Hedging can reduce exposure to currency exchange movements, but cannot eliminate that exposure. It is possible to lose money under a hedge.
Funds investing in forward foreign currency exchange contracts are exposed to risk if the value of the currency changes unfavorably, if the counterparties to the contracts are unable to meet the terms of their contracts or if the Fund is unable to enter into a closing position. Forward foreign currency exchange contracts outstanding at period end, if any, are listed after each Fund's portfolio. For the six-month period ended April 30, 2018, the average monthly outstanding currency purchased or sold in U.S. dollars for forward foreign currency exchange contracts held by the Funds were as follows:
| | | First Eagle
Global Fund | | First Eagle
Overseas Fund | | First Eagle
Global Income
Builder Fund | |
Forward Foreign Currency Exchange Contracts: | |
Average Settlement Value — Purchased | | $ | — | | | $ | 7,387,553 | | | $ | 535,652 | | |
Average Settlement Value — Sold | | | 2,533,158,789 | | | | 1,431,812,881 | | | | 56,860,496 | | |
The Funds adopted provisions surrounding disclosures of derivative instruments and hedging activities which require qualitative disclosures about objectives and strategies for using derivatives, quantitative disclosures about fair value amounts of gains and losses on derivative instruments, and disclosures about currency-risk-related contingent features in derivative agreements.
First Eagle Funds | Semi-Annual Report | April 30, 2018
159
Notes to Financial Statements (unaudited)
In order to better define its contractual rights and to secure rights that may help the Fund mitigate its counterparty risk, the Fund may enter into an International Swaps and Derivatives Association, Inc. Master Agreement ("ISDA Master Agreement") or similar agreement with its derivative contract counterparties. An ISDA Master Agreement is a bilateral agreement between the Fund and a counterparty that governs over-the-counter ("OTC") derivatives and forward foreign currency exchange contracts and typically contains, among other things, collateral posting terms and netting provisions in the event of a default and/or termination event. Under an ISDA Master Agreement, the Fund may, under certain circumstances, offset with the counterparty certain derivative financial instrument's payables and/or receivables with collateral held and/or posted and create one single net payment. With respect to certain counterparties, in accordance with the terms of the ISDA Master Agreement, the Funds may be required to post or receive collateral in the form of cash or debt securities issued by the U.S. Government or related agencies. Daily movement of cash collateral is subject to minimum threshold amounts. Cash collateral that has been pledged to cover obligations of a Fund, if any, is reported separately on the Statements of Assets and Liabilities as cash pledged. Non-cash collateral pledged by the Fund, if any, is noted in the Schedules of Investments. Collateral received by the Funds is held in a segregated account at the Funds' custodian bank. These amounts are not reflected on the Funds' Statements of Assets and Liabilities and are disclosed in the table below. The provisions of the ISDA Master Agreement typically permit a single net payment in the event of default (close-out netting) including the bankruptcy or insolvency of the counterparty. Note, however, that bankruptcy or insolvency laws of a particular jurisdiction may impose restrictions on or prohibitions against the right of offset in bankruptcy, insolvency or other events.
For financial reporting purposes, the Fund does not offset derivative assets and derivative liabilities that are subject to netting arrangements in the Statements of Asset and Liabilities.
At April 30, 2018, the Funds had the following forward foreign currency exchange contracts grouped into appropriate risk categories illustrated below:
First Eagle Global Fund
| | | | | | | Gain or (Loss)
Derivative Recognized
in Income | |
Risk Type | | Asset Derivative
Fair Value(1) | | Liability Derivative
Fair Value(2) | | Net realized
Gains (Losses)(3) | | Change in
Appreciation
(Depreciation)(4) | |
Foreign
currency | | $ | 46,267,249 | | | $ | 6,497,186 | | | $ | (58,816,261 | ) | | $ | 9,884,389 | | |
First Eagle Funds | Semi-Annual Report | April 30, 2018
160
Notes to Financial Statements (unaudited)
First Eagle Overseas Fund
| | | | | | | Gain or (Loss)
Derivative Recognized
in Income | |
Risk Type | | Asset Derivative
Fair Value(1) | | Liability Derivative
Fair Value(2) | | Net realized
Gains (Losses)(3) | | Change in
Appreciation
(Depreciation)(4) | |
Foreign
currency | | $ | 24,735,379 | | | $ | 4,045,108 | | | $ | (32,176,047 | ) | | $ | 4,978,432 | | |
First Eagle Gold Fund
| | | | | | | Gain or (Loss)
Derivative Recognized
in Income | |
Risk Type | | Asset Derivative
Fair Value(1) | | Liability Derivative
Fair Value(2) | | Net realized
Gains (Losses)(3) | | Change in
Appreciation
(Depreciation)(4) | |
Foreign
currency | | $ | — | | | $ | — | | | $ | (20,453 | ) | | $ | — | | |
First Eagle Global Income Builder Fund
| | | | | | | Gain or (Loss)
Derivative Recognized
in Income | |
Risk Type | | Asset Derivative
Fair Value(1) | | Liability Derivative
Fair Value(2) | | Net realized
Gains (Losses)(3) | | Change in
Appreciation
(Depreciation)(4) | |
Foreign
currency | | $ | 992,563 | | | $ | 157,982 | | | $ | (1,938,677 | ) | | $ | 616,781 | | |
(1) Statement of Assets and Liabilities location: Unrealized appreciation on forward foreign currency exchange contracts.
(2) Statement of Assets and Liabilities location: Unrealized depreciation on forward foreign currency exchange contracts.
(3) Statement of Operations location: Net realized gains (losses) from settlement of forward foreign currency exchange contracts.
(4) Statement of Operations location: Changes in unrealized appreciation (depreciation) of forward foreign currency exchange contracts.
First Eagle Funds | Semi-Annual Report | April 30, 2018
161
Notes to Financial Statements (unaudited)
The following tables present each Fund's gross derivative assets and liabilities by counterparty net of amounts available for offset under netting arrangements and any related collateral received or pledged by each Fund as of April 30, 2018:
First Eagle Global Fund
Counterparty | | Gross Amounts
of Assets
Presented in
Statement of
Assets and
Liabilities | | Derivatives
Available for
Offset | | Collateral
Received | | Net Amount
(Not Less
Than $0) | |
Bank of New York Mellon | | $ | 1,787,563 | | | $ | (1,787,563 | ) | | $ | — | | | $ | — | | |
Goldman Sachs | | | 2,355,599 | | | | (1,148,876 | ) | | | (1,080,000 | ) | | | 126,723 | | |
HSBC Bank plc | | | 9,913,326 | | | | — | | | | — | | | | 9,913,326 | | |
JPMorgan Chase Bank | | | 12,634,932 | | | | — | | | | — | | | | 12,634,932 | | |
UBS AG | | | 19,575,829 | | | | — | | | | — | | | | 19,575,829 | | |
| | | $ | 46,267,249 | | | $ | (2,936,439 | ) | | $ | (1,080,000 | ) | | $ | 42,250,810 | | |
Counterparty | | Gross Amounts
of Liabilities
Presented in
Statement of
Assets and
Liabilities | | Derivatives
Available for
Offset | | Collateral
Pledged | | Net Amount
(Not Less
Than $0) | |
Bank of New York Mellon | | $ | 5,348,310 | | | $ | (1,787,563 | ) | | $ | — | | | $ | 3,560,747 | | |
Goldman Sachs | | | 1,148,876 | | | | (1,148,876 | ) | | | — | | | | — | | |
| | | $ | 6,497,186 | | | $ | (2,936,439 | ) | | $ | — | | | $ | 3,560,747 | | |
First Eagle Overseas Fund
Counterparty | | Gross Amounts
of Assets
Presented in
Statement of
Assets and
Liabilities | | Derivatives
Available for
Offset | | Collateral
Received | | Net Amount
(Not Less
Than $0) | |
Bank of New York Mellon | | $ | 961,618 | | | $ | (961,618 | ) | | $ | — | | | $ | — | | |
Goldman Sachs | | | 1,397,863 | | | | (711,652 | ) | | | (610,000 | ) | | | 76,211 | | |
HSBC Bank plc | | | 5,613,362 | | | | — | | | | — | | | | 5,613,362 | | |
JPMorgan Chase Bank | | | 6,761,456 | | | | — | | | | — | | | | 6,761,456 | | |
UBS AG | | | 10,001,080 | | | | — | | | | — | | | | 10,001,080 | | |
| | | $ | 24,735,379 | | | $ | (1,673,270 | ) | | $ | (610,000 | ) | | $ | 22,452,109 | | |
First Eagle Funds | Semi-Annual Report | April 30, 2018
162
Notes to Financial Statements (unaudited)
First Eagle Overseas Fund (continued)
Counterparty | | Gross Amounts
of Liabilities
Presented in
Statement of
Assets and
Liabilities | | Derivatives
Available for
Offset | | Collateral
Pledged | | Net Amount
(Not Less
Than $0) | |
Bank of New York Mellon | | $ | 3,333,456 | | | $ | (961,618 | ) | | $ | — | | | $ | 2,371,838 | | |
Goldman Sachs | | | 711,652 | | | | (711,652 | ) | | | — | | | | — | | |
| | | $ | 4,045,108 | | | $ | (1,673,270 | ) | | $ | — | | | $ | 2,371,838 | | |
First Eagle Global Income Builder Fund
Counterparty | | Gross Amounts
of Assets
Presented in
Statement of
Assets and
Liabilities | | Derivatives
Available for
Offset | | Collateral
Received | | Net Amount
(Not Less
Than $0) | |
Bank of New York Mellon | | $ | 37,076 | | | $ | (37,076 | ) | | $ | — | | | $ | — | | |
Goldman Sachs | | | 62,376 | | | | (22,018 | ) | | | — | | | | 40,358 | | |
HSBC Bank plc | | | 237,844 | | | | — | | | | — | | | | 237,844 | | |
JPMorgan Chase Bank | | | 248,401 | | | | — | | | | — | | | | 248,401 | | |
UBS AG | | | 406,866 | | | | — | | | | — | | | | 406,866 | | |
| | $ | 992,563 | | | $ | (59,094 | ) | | $ | — | | | $ | 933,469 | | |
Counterparty | | Gross Amounts
of Liabilities
Presented in
Statement of
Assets and
Liabilities | | Derivatives
Available for
Offset | | Collateral
Pledged | | Net Amount
(Not Less
Than $0) | |
Bank of New York Mellon | | $ | 135,964 | | | $ | (37,076 | ) | | $ | — | | | $ | 98,888 | | |
Goldman Sachs | | | 22,018 | | | | (22,018 | ) | | | — | | | | — | | |
| | | $ | 157,982 | | | $ | (59,094 | ) | | $ | — | | | $ | 98,888 | | |
g) Options — In order to seek to produce incremental earnings or protect against declines in the value of portfolio securities, First Eagle Global Fund, First Eagle U.S. Value Fund, First Eagle Global Income Builder Fund and First Eagle Fund of America may write covered call options on portfolio securities. The Funds may also use options for speculative purposes, although they generally do not employ options for this purpose.
Options contracts are valued daily based upon the official closing price on the relevant exchange on which the option is traded. If there is no official closing price, the mean between the last bid and asked prices may be used. When an option is exercised, the proceeds on the
First Eagle Funds | Semi-Annual Report | April 30, 2018
163
Notes to Financial Statements (unaudited)
sale of a written call option are adjusted by the amount of premium received or paid. When a written option expires, the Funds will realize a gain equal to the amount of the premium received. When the Funds enter into a closing purchase transaction, the Funds will realize a gain (or loss, if the cost of the closing purchase transaction exceeds the premium received when the option was written) without regard to any unrealized gain or loss on the underlying security and the liability related to such option is eliminated.
The Funds may be required to segregate or earmark assets to cover its obligations under option contracts. In general, a call option is covered if the Funds hold, on a share-for-share basis, either the underlying shares or a call on the same security as the call written where the exercise price of the call held is equal to or less than the exercise price of the call written (or greater than the exercise price of the call written if the difference is maintained by the Funds in cash, Treasury bills or other high grade short-term obligations earmarked with its custodian). One reason for writing options is to attempt to realize, through the receipt of premiums, a greater return than would be realized on the securities alone. Another reason for writing options is to hedge against a moderate decline in the value of securities owned by the Funds in the case of a call option. If an increase occurs in the underlying security or stock index sufficient to result in the exercise of a call written by the Funds, it may be required to deliver securities or cash and may thereby forego some or all of the gain that otherwise may have been realized on the securities underlying the call option. This "opportunity cost" may be partially or wholly offset by the premium received for the covered call written by the Funds. The risk in writing a covered call option is that the Funds give up the opportunity for profit if the market price of the underlying security increases and the option is exercised. The Funds also have the additional risk of not being able to enter into a closing transaction if a liquid secondary market does not exist.
The Funds may also write over-the-counter options where the completion of the obligation is dependent upon the credit standing of the counterparty.
As of April 30, 2018 for First Eagle Fund of America, portfolio securities valued at $132,800,517 were earmarked to cover collateral requirements for written options.
For the six-month period ended April 30, 2018 for First Eagle Fund of America, the average monthly outstanding contract amount for written options and purchased options totaled 98,666 and 16,308 respectively.
First Eagle Funds | Semi-Annual Report | April 30, 2018
164
Notes to Financial Statements (unaudited)
At April 30, 2018, the First Eagle Fund of America had the following options grouped into appropriate risk categories illustrated below:
First Eagle Fund of America Fund
| | | | | | | Gain or (Loss)
Derivative Recognized
in Income | |
Risk Type | | Asset Derivative
Fair Value(1) | | Liability Derivative
Fair Value(2) | | Net realized
Gains (Losses)(3) | | Change in
Appreciation
(Depreciation)(4) | |
Equity —
Written
options | | $ | — | | | $ | 8,872,096 | | | $ | 12,766,219 | | | $ | 19,648,426 | | |
Equity —
Purchased
options | | | 34,035,945 | | | | — | | | | (3,819,586 | ) | | | (14,611,901 | ) | |
(1) Statements of Assets and Liabilities location: Investments in securities of unaffiliated issuers.
(2) Statements of Assets and Liabilities location: Option contracts written, at value.
(3) Statements of Operations location: Net realized gains (losses) from expiration or closing of option contracts written and transactions in investment securities of unaffiliated issuers.
(4) Statements of Operations location: Changes in unrealized appreciation (depreciation) of option contracts written and investment securities of unaffiliated issuers.
h) Repurchase agreements — The Funds may enter into repurchase agreement transactions with institutions that meet the adviser's credit guidelines. Each repurchase agreement is valued at market. The Funds require that the collateral received in a repurchase agreement transaction be transferred to a custodian in a manner sufficient to enable the Funds to obtain collateral in the event of a counterparty default. If the counterparty defaults and the fair value of the collateral declines, realization of the collateral by the Funds may be delayed or limited.
i) Bank Loans — A Fund may invest in bank loans, which usually take the form of loan participations and assignments. Loan participations and assignments are agreements to make money available to U.S. or foreign corporations, partnerships or other business entities (the "Borrower") in a specified amount, at a specified rate and within a specified time. A loan is typically originated, negotiated and structured by a U.S. or foreign bank, insurance company or other financial institution (the "Agent") for a group of loan investors ("Loan Investors"). The Agent typically administers and enforces the loan on behalf of the other Loan Investors in the syndicate and may hold any collateral on behalf of the Loan Investors. Such loan participations and assignments are typically senior, secured and collateralized in nature. A Fund records an investment when the Borrower withdraws money and records interest as earned. The Fund generally has no right to enforce compliance with the terms of the loan agreement with the Borrower. As a result, the Fund assumes the credit risk of the Borrower, the selling participant and any intermediary between the Fund and the Borrower ("Intermediate Participants"). In the event that the Borrower, selling participant or Intermediate Participants becomes insolvent
First Eagle Funds | Semi-Annual Report | April 30, 2018
165
Notes to Financial Statements (unaudited)
or enters into bankruptcy, each Fund may incur certain costs and delays in realizing payment or may suffer a loss of principal and/or interest.
j) Treasury Inflation-Protected Securities — The Funds may invest in Treasury Inflation-Protected Securities ("TIPS") which are specially structured bonds in which the principal amount is adjusted to keep pace with inflation. The principal value of TIPS will be adjusted upward or downward and any increase or decrease in the principal amount of TIPS will be included as interest income in the Statements of Operations, even though investors do not receive their principal until maturity. TIPS are subject to interest rate risk.
k) Restricted Securities — The Funds may invest in securities that are subject to legal or contractual restrictions on resale. These securities generally may be resold in transactions exempt from registration or to the public if the securities are registered. Disposal of these securities may involve time-consuming negotiations and expenses, and prompt sale at an acceptable price may be difficult. Information regarding restricted securities, if any, is included at the end of each Fund's Schedule of Investments.
l) United States income taxes — No provision has been made for U.S. federal income taxes since it is the intention of each Fund to distribute to shareholders all taxable net investment income and net realized gains on investments, if any, within the allowable time limit, and to comply with the provisions of Subchapter M of the Internal Revenue Code applicable to the regulated investment company. The Funds declare and pay such income and capital gains on an annual basis except for the First Eagle High Yield Fund and the First Eagle Global Income Builder Fund which declare income daily and pay monthly.
The Funds adopted provisions surrounding income taxes, which require the tax effects of certain tax positions to be recognized. These tax positions must meet a "more likely than not" standard that, based on their technical merits, have a more than 50% likelihood of being sustained upon examination. Management of the Trust has analyzed the Funds' tax positions taken on federal and state income tax returns for all open tax years (the current and the prior three tax years) and has concluded that no provision for income tax is required in the Funds' financial statements.
m) Class Accounting — Investment income, common expenses and realized/unrealized gain or loss on investments are allocated to the various classes of the Fund on the basis of daily net assets of each class. Fees relating to a specific class are charged directly to that class.
n) Use of estimates — The preparation of financial statements in conformity with GAAP requires management to make estimates and assumptions that affect the reported amounts of assets and liabilities at the date of the financial statements and the reported amounts of revenues and expenses during the reporting period. Actual results could differ from those estimates.
o) Redemption Fee — A redemption fee of 2% will be applied to the First Eagle Gold Fund for the sale or exchange within 60 days of the purchase of such shares.
p) Foreign Taxes — The Funds may be subject to foreign taxes on income, and gains on investments or currency purchases/repatriation, a portion of which may be recoverable. The Funds
First Eagle Funds | Semi-Annual Report | April 30, 2018
166
Notes to Financial Statements (unaudited)
will accrue such taxes and recoveries as applicable, based upon their current interpretation of tax rules and regulations that exist in the markets in which they invest.
Note 2 — Investment Advisory, Custody and Administration Agreements; Transactions with Related Persons
For its services, the Adviser receives, pursuant to an Investment Advisory Agreement between the Funds and the Adviser (the "Advisory Agreement"), an annual advisory fee as follows:
Fund | | Management Fee
(% of Average Daily Net Assets) | |
First Eagle Global Fund | | | 0.75 | % | |
First Eagle Overseas Fund | | | 0.75 | | |
First Eagle U.S. Value Fund | | | 0.75 | (1) | |
First Eagle Gold Fund | | | 0.75 | | |
First Eagle Global Income Builder Fund | | | 0.75 | | |
First Eagle High Yield Fund | | | 0.70 | (2) | |
First Eagle Fund of America | | | 0.90 | (3) | |
(1) The Adviser has agreed to waive First Eagle U.S. Value Fund's management fee at an annual rate in the amount of 0.05% of the average daily value of the Fund's net assets for the period through February 28, 2019. This waiver has the effect of reducing the management fee shown in the table for the term of the waiver from 0.75% to 0.70%.
(2) The Adviser has agreed to waive First Eagle High Yield Fund's management fee at an annual rate in the amount of 0.05% of the average daily value of the Fund's net assets for the period through February 28, 2019. This waiver has the effect of reducing the management fee shown in the table for the term of the waiver from 0.70% to 0.65%. Effective July 1, 2018, the Adviser has agreed to waive First Eagle High Yield Fund's management fee at an annual rate in the amount of 0.10% of the average daily value of the Fund's net assets for the period through February 29, 2020. This waiver has the effect of reducing the management fee shown in the table for the term of the waiver from 0.70% to 0.60%.
(3) The Adviser received an annual advisory fee at the rate of 0.90% of the first $2.25 billion of the Fund's average daily net assets, 0.85% of the next $2.75 billion of the average daily net assets and 0.80% in excess of $5 billion of the average daily net assets. For the six-month period ended April 30, 2018 the effective rate was 0.90%.
Pursuant to a subadvisory agreement, dated December 1, 2015 ("Subadvisory Agreement") Iridian Asset Management LLC ("Iridian" or "Sub-Adviser") manages the investments of the First Eagle Fund of America. The fees paid to Iridian by the Adviser under the Subadvisory Agreement are based on a reference amount equal to 50% of the combined (i) fees received by the Adviser for advisory services on behalf of the Fund and (ii) fees received by the Fund's distributor for its shareholder liaison services on behalf of the Fund. These amounts are reduced by certain direct marketing costs borne by the Adviser in connection with the Fund and are further reduced by the amount paid by the Adviser for certain administrative expenses incurred in providing services to the Fund.
First Eagle Funds | Semi-Annual Report | April 30, 2018
167
Notes to Financial Statements (unaudited)
The Adviser had contractually agreed to waive its management fee and/or reimburse expenses, for the First Eagle High Yield Fund and First Eagle Global Income Builder Fund, so that the total annual operating expenses (excluding certain items) of the First Eagle High Yield Fund's Class A, Class C and Class I shares did not exceed 1.25%, 2.00% and 0.80%, respectively, and the First Eagle Global Income Builder Fund's Class A, Class C and Class I shares did not exceed 1.30%, 2.05%, and 1.05%, respectively, through December 31, 2013. These waivers are no longer in effect.
The Adviser also performs certain administrative, accounting, operations, compliance and other services on behalf of the Funds, and in accordance with its agreement with the Adviser, the Funds (except for First Eagle Global Income Builder Fund and First Eagle High Yield Fund which pay the fee described in the next paragraph) reimburse the Adviser for costs (including personnel and other costs) related to those services. These reimbursements may not exceed an annual rate of 0.05% of a Fund's average daily net assets.
Pursuant to Administrative Services Agreements between each of First Eagle Global Income Builder Fund and First Eagle High Yield Fund, and the Adviser, each pay the Adviser a monthly administration fee that is accrued daily at an annual rate of 0.05% of the Fund's average daily net assets.
For the six-month period ended April 30, 2018, the Funds paid/reimbursed and had payable to the Adviser amounts shown below:
Fund | | Reimbursed to Adviser | | Payable to Adviser | |
First Eagle Global Fund | | $ | 1,211,462 | | | $ | 403,821 | | |
First Eagle Overseas Fund | | | 464,766 | | | | 154,922 | | |
First Eagle U.S. Value Fund | | | 139,374 | | | | 46,458 | | |
First Eagle Gold Fund | | | 127,520 | | | | 42,507 | | |
First Eagle Global Income Builder Fund | | | 357,979 | | | | — | | |
First Eagle High Yield Fund | | | 106,708 | | | | — | | |
First Eagle Fund of America | | | 147,335 | | | | 49,112 | | |
The Funds have entered into a custody agreement with J.P. Morgan Chase Bank, N.A. ("JPM"). The custody agreement provides for an annual fee based on the amount of assets under custody plus transaction charges. JPM serves as custodian of the Funds' portfolio securities and other assets. JPM has directly entered into sub-custodial agreements to maintain the custody of gold and silver bullion in the Funds. Under the terms of the custody agreement between the Funds and JPM, JPM maintains and deposits in separate accounts, cash, securities and other assets of the Funds. JPM is also required, upon the order of the Funds, to deliver securities held by JPM and the sub-custodian, and to make payments for securities purchased by the Funds. JPM has also entered into sub-custodian agreements with a number of foreign banks and clearing agencies, pursuant to which portfolio securities purchased outside the United States are maintained in the custody of these entities.
First Eagle Funds | Semi-Annual Report | April 30, 2018
168
Notes to Financial Statements (unaudited)
The Funds have also entered into an agreement for administrative services with JPM, pursuant to which JPM provides certain financial reporting and other administrative services. JPM, as the Funds' administrator, receives annual fees separate from and in addition to the fees it receives for its services as the Funds' custodian.
FEF Distributors, LLC, a wholly owned subsidiary of the Adviser, serves as the Funds' principal underwriter. For the six-month period ended April 30, 2018, FEF Distributors, LLC realized $495,434, $39,790, $14,974, $18,160, $37,413, $4,211 and $20,186, pertaining to the sales of shares of First Eagle Global Fund, First Eagle Overseas Fund, First Eagle U.S. Value Fund, First Eagle Gold Fund, First Eagle Global Income Builder Fund, First Eagle High Yield Fund and First Eagle Fund of America, respectively.
The Trust adopted a Trustee Deferred Compensation Plan (the "Plan"), which allows the Independent Trustees to defer the receipt of all or a portion of compensation related to performance of their duties as a Trustee. The deferred fees are invested in various First Eagle Funds until distribution in accordance with the Trustee Deferred Compensation Plan. As of April 30, 2018, balances to the Plan are included in the fees payable to the Trustees on the Statements of Assets and Liabilities.
Note 3 — Plans of Distribution
Under the terms of the Distribution Plans and Agreements ("the Plans") with FEF Distributors, LLC (the "Distributor"), pursuant to the provisions of Rule 12b-1 under the 1940 Act, the First Eagle Global Fund, First Eagle Overseas Fund, First Eagle U.S. Value Fund, First Eagle Gold Fund, First Eagle Global Income Builder Fund, First Eagle High Yield Fund and First Eagle Fund of America pay the Distributor monthly a distribution and/or service fee with respect to Class A, Class C, Class Y, Class R3 and Class R4 shares based on each Fund's average daily net assets as shown in the table below. Under the Plans, the Distributor is obligated to use the amounts received under the Plans for, among other things, payments to qualifying dealers for their assistance in the distribution of a Fund's shares and the provision of shareholder services and for other expenses such as advertising costs and the payment for the printing and distribution of prospectuses to prospective investors.
Fund | | Class A | | Class C | | Class Y | | Class R3 | | Class R4 | |
First Eagle Global Fund | | | 0.25 | % | | | 1.00 | % | | | n/a | | | | 0.35 | % | | | 0.10 | % | |
First Eagle Overseas Fund | | | 0.25 | % | | | 1.00 | % | | | n/a | | | | 0.35 | % | | | 0.10 | % | |
First Eagle U.S. Value Fund | | | 0.25 | % | | | 1.00 | % | | | n/a | | | | 0.35 | % | | | 0.10 | % | |
First Eagle Gold Fund | | | 0.25 | % | | | 1.00 | % | | | n/a | | | | 0.35 | % | | | 0.10 | % | |
First Eagle Global Income Builder Fund | | | 0.25 | % | | | 1.00 | % | | | n/a | | | | 0.35 | % | | | 0.10 | % | |
First Eagle High Yield Fund | | | 0.25 | % | | | 1.00 | % | | | n/a | | | | 0.35 | % | | | 0.10 | % | |
First Eagle Fund of America | | | 0.25 | % | | | 1.00 | % | | | 0.25 | % | | | 0.35 | % | | | 0.10 | % | |
The Distributor bears distribution costs of a Fund to the extent they exceed payments received under the Plan. For the six-month period ended April 30, 2018, the distribution fees incurred by the Funds are disclosed in the Statements of Operations.
First Eagle Funds | Semi-Annual Report | April 30, 2018
169
Notes to Financial Statements (unaudited)
The Service fee covers expenses incurred by the Distributor for providing shareholder liaison services, including assistance with subscriptions, redemptions and other shareholder questions. For the six-month period ended April 30, 2018, the services fees incurred by the Funds are disclosed in the Statements of Operations.
Note 4 — Purchases and Sales of Securities
For the six-month period ended April 30, 2018, purchases and proceeds from sales of investments, excluding short-term securities, were as follows:
Fund | | Purchases
excluding
U.S. Government | | Sales and
Maturities
excluding
U.S. Government | | Purchases of
U.S. Government | | Sales and
Maturities of
U.S. Government | |
First Eagle Global Fund | | $ | 2,565,148,537 | | | $ | 2,707,682,865 | | | $ | 113,225,730 | | | $ | — | | |
First Eagle Overseas Fund | | | 747,066,914 | | | | 928,845,275 | | | | 35,725,442 | | | | — | | |
First Eagle U.S. Value Fund | | | 40,378,972 | | | | 246,826,015 | | | | — | | | | — | | |
First Eagle Gold Fund | | | 72,597,546 | | | | 96,035,917 | | | | — | | | | — | | |
First Eagle Global Income
Builder Fund | | | 177,317,632 | | | | 133,041,758 | | | | — | | | | — | | |
First Eagle High Yield Fund | | | 42,397,142 | | | | 110,209,572 | | | | — | | | | — | | |
First Eagle Fund of America | | | 467,619,597 | | | | 742,743,798 | | | | — | | | | — | | |
Note 5 — Line of Credit
On June 5, 2017, the Funds entered into a $200 million committed, unsecured line of credit ("Credit Facility") with JPM for the Funds, to be utilized for temporarily financing the purchase or sale of securities for prompt delivery in the ordinary course of business or for temporarily financing the redemption of shares of each Fund at the request of shareholders and other temporary or emergency purposes. Under the Credit Facility arrangement, each Fund has agreed to pay an annual commitment fee on the unused balance, allocated pro rata, based on the relative asset size of the Funds. A portion of the commitment fees related to the line of credit are paid by the Funds and are included in other expenses in the Statements of Operations. During the six-month period ended April 30, 2018, the Funds did not have any borrowings under the agreements.
Note 6 — Indemnification and Investment Risk
In the normal course of business, the Funds enter into contracts that contain a variety of representations which provide general indemnifications. Each Fund's maximum exposure under these arrangements is unknown, as this would involve future claims that may be made against each Fund that have not yet occurred. However, based on experience, the Funds expect the risk of loss to be remote. The Funds may have elements of risk not typically associated with investments in the United States due to their investments in foreign countries or regions. Such foreign investments may subject the Funds to additional risks resulting from political or economic conditions in
First Eagle Funds | Semi-Annual Report | April 30, 2018
170
Notes to Financial Statements (unaudited)
such countries or regions and the possible imposition of adverse governmental laws or currency exchange restrictions could cause the securities and their markets to be less liquid and their prices to be more volatile than those of comparable U.S. securities. The securities markets in many emerging-market countries are substantially smaller, less developed, less liquid and more volatile than the securities markets of developed countries.
The First Eagle High Yield Fund and First Eagle Global Income Builder Fund invest in high yield securities which may be subject to greater levels of interest rate, credit and liquidity risk than investment grade securities. These high yield securities may be considered speculative with respect to the issuer's continuing ability to make principal and interest payments and may be subject to significant price fluctuations.
The Funds are subject to interest rate and credit risk. The value of debt securities may decline as interest rates increase. The Funds could lose money if the issuer of a fixed income security is unable to pay interest or repay principal when it is due. The ability of the issuers of debt to meet their obligations may be affected by the economic and political developments in a specific industry or region.
The Funds enter into derivatives which may represent off-balance sheet risk. Off-balance sheet risk exists when the maximum potential loss on a particular investment is greater than the value of such investment as reflected in the Statements of Assets and Liabilities.
Note 7 — Redemption In-Kind Transactions
The redemption in-kind policy for all of the Funds reserves the right of the Funds to pay redemptions in-kind (i.e., payments in the form of marketable securities or, as needed, other traded assets, rather than cash) if the redemption request is large enough to affect a Fund's operations (for example, if it represents more than $250,000 or 1% of the Fund's assets). When receiving assets distributed in-kind, the recipient will bear applicable commissions or other costs on their sale. There were no redemptions in-kind during the six-month period ended April 30, 2018.
Note 8 — New Accounting Pronouncements
In October 2016, the Securities and Exchange Commission ("SEC") released its Final Rules on Investment Company Reporting Modernization (the "Rules"). The Rules which introduce two new regulatory reporting forms for investment companies—Form N-PORT and Form N-CEN—also contain amendments to Regulation S-X which require standardized, enhanced disclosures about derivatives in investment company financial statements, as well as other amendments. The Regulation S-X amendments had a compliance date of August 1, 2017, and are reflected in these financial statements. The Funds' compliance date for Form N-PORT is June 1, 2018, but the Funds will not be required to make their initial filing on Form N-PORT until the period ending March 31, 2019. The Funds' compliance date for Form N-CEN is June 1, 2018, and the Funds will make their initial filing on Form N-CEN for the period ending October 31, 2018. The adoption will have no effect on the Funds' net assets or results of operations.
First Eagle Funds | Semi-Annual Report | April 30, 2018
171
Notes to Financial Statements (unaudited)
Note 9 — Subsequent Events
Effective July 1, 2018, the Adviser has agreed to waive First Eagle High Yield Fund's management fee at an annual rate in the amount of 0.10% of the average daily value of the Fund's net assets for the period through February 29, 2020. This waiver has the effect of reducing the management fee shown in the table for the term of the waiver from 0.70% to 0.60%.
First Eagle Funds | Semi-Annual Report | April 30, 2018
172
Fund Expenses (unaudited)
Example
As a shareholder of the First Eagle Funds, you may incur two types of costs: (1) transaction costs and (2) ongoing costs, including advisory fees; distribution fees (12b-1) and/or service fees; and other Fund expenses. This example is intended to help you understand your ongoing costs (in dollars) of investing in the Fund and to compare these costs with the ongoing costs of investing in other mutual funds.
This example is based on an investment of $1,000 invested on November 1, 2017 and held for the six-months ended April 30, 2018.
Actual Expenses
The table below titled "Based on Actual Total Return" provides information about actual account values and actual expenses. You may use the information provided in this table, together with the amount you invested, to estimate the expenses that you paid over the period. To estimate the expenses you paid on your account, divide your ending account value by $1,000 (for example, an $8,600 ending account value divided by $1,000 = 8.6), then multiply the result by the number under the heading entitled "Expenses Paid During the Period".
First Eagle Funds | Semi-Annual Report | April 30, 2018
173
Fund Expenses (unaudited)
Based on Actual Total Return(1)
| | | Actual Total
Return without
Sales Charges(2) | | Beginning
Account
Value | | Ending
Account
Value | | Annualized
Expense | | Expenses
Paid for
the Period(3) | |
First Eagle Global Fund Consolidated | |
Class A | | | 1.16 | % | | $ | 1,000.00 | | | $ | 1,011.60 | | | | 1.10 | % | | $ | 5.49 | | |
Class C | | | 0.79 | | | | 1,000.00 | | | | 1,007.90 | | | | 1.85 | | | | 9.21 | | |
Class I | | | 1.30 | | | | 1,000.00 | | | | 1,013.00 | | | | 0.84 | | | | 4.19 | | |
Class R4(4) | | | (4.30 | ) | | | 1,000.00 | | | | 957.00 | | | | 0.97 | | | | 2.68 | (5) | |
Class R6 | | | 1.33 | | | | 1,000.00 | | | | 1,013.30 | | | | 0.78 | | | | 3.89 | | |
First Eagle Overseas Fund Consolidated | |
Class A | | | 0.45 | | | | 1,000.00 | | | | 1,004.50 | | | | 1.15 | | | | 5.72 | | |
Class C | | | 0.09 | | | | 1,000.00 | | | | 1,000.90 | | | | 1.87 | | | | 9.28 | | |
Class I | | | 0.58 | | | | 1,000.00 | | | | 1,005.80 | | | | 0.86 | | | | 4.28 | | |
Class R4(4) | | | (3.86 | ) | | | 1,000.00 | | | | 961.40 | | | | 1.01 | | | | 2.80 | (5) | |
Class R6 | | | 0.64 | | | | 1,000.00 | | | | 1,006.40 | | | | 0.79 | | | | 3.93 | | |
First Eagle U.S. Value Fund Consolidated | |
Class A | | | 2.77 | | | | 1,000.00 | | | | 1,027.70 | | | | 1.10 | | | | 5.53 | | |
Class C | | | 2.36 | | | | 1,000.00 | | | | 1,023.60 | | | | 1.85 | | | | 9.28 | | |
Class I | | | 2.90 | | | | 1,000.00 | | | | 1,029.00 | | | | 0.82 | | | | 4.13 | | |
Class R6 | | | 2.89 | | | | 1,000.00 | | | | 1,028.90 | | | | 0.79 | | | | 3.97 | | |
First Eagle Gold Fund Consolidated | |
Class A | | | (3.52 | ) | | | 1,000.00 | | | | 964.80 | | | | 1.28 | | | | 6.24 | | |
Class C | | | (3.84 | ) | | | 1,000.00 | | | | 961.60 | | | | 2.04 | | | | 9.92 | | |
Class I | | | (3.37 | ) | | | 1,000.00 | | | | 966.30 | | | | 0.99 | | | | 4.83 | | |
Class R6 | | | (3.31 | ) | | | 1,000.00 | | | | 966.90 | | | | 0.88 | | | | 4.29 | | |
First Eagle Global Income Builder Fund | |
Class A | | | 0.59 | | | | 1,000.00 | | | | 1,005.90 | | | | 1.17 | | | | 5.82 | | |
Class C | | | 0.22 | | | | 1,000.00 | | | | 1,002.20 | | | | 1.93 | | | | 9.58 | | |
Class I | | | 0.72 | | | | 1,000.00 | | | | 1,007.20 | | | | 0.91 | | | | 4.53 | | |
Class R6 | | | 0.74 | | | | 1,000.00 | | | | 1,007.40 | | | | 0.87 | | | | 4.33 | | |
First Eagle High Yield Fund | |
Class A | | | 1.07 | | | | 1,000.00 | | | | 1,010.70 | | | | 1.20 | | | | 5.98 | | |
Class C | | | 0.71 | | | | 1,000.00 | | | | 1,007.10 | | | | 1.93 | | | | 9.60 | | |
Class I | | | 1.22 | | | | 1,000.00 | | | | 1,012.20 | | | | 0.89 | | | | 4.44 | | |
Class R6 | | | 1.21 | | | | 1,000.00 | | | | 1,012.10 | | | | 0.91 | | | | 4.54 | | |
First Eagle Fund of America | |
Class A | | | (1.12 | ) | | | 1,000.00 | | | | 988.80 | | | | 1.32 | | | | 6.51 | | |
Class C | | | (1.47 | ) | | | 1,000.00 | | | | 985.30 | | | | 2.06 | | | | 10.14 | | |
Class I | | | (0.96 | ) | | | 1,000.00 | | | | 990.40 | | | | 1.02 | | | | 5.03 | | |
Class R6 | | | (0.96 | ) | | | 1,000.00 | | | | 990.40 | | | | 0.98 | | | | 4.84 | | |
Class Y | | | (1.12 | ) | | | 1,000.00 | | | | 988.80 | | | | 1.30 | | | | 6.41 | | |
First Eagle Funds | Semi-Annual Report | April 30, 2018
174
Fund Expenses (unaudited)
(1) For the six-months ended April 30, 2018.
(2) Past performance does not guarantee future results. Assumes reinvestment of all dividends and capital gain distributions, if any, at net asset value. Total return is not annualized, as it may not be representative of the total return for the year.
(3) Expenses are equal to the annualized expense ratio multiplied by the average account value over the period, multiplied by 181/365 (to reflect the one-half year period).
(4) Class R4 commenced investment operations on January 17, 2018.
(5) Expenses are equal to the annualized expense ratio multiplied by the average account value over the period, multiplied by 103/365 (to reflect the actual days in the period).
First Eagle Funds | Semi-Annual Report | April 30, 2018
175
Fund Expenses (unaudited)
Hypothetical Example for Comparison Purposes
The table below titled "Based on Hypothetical Total Return" provides information about hypothetical account values and hypothetical expenses based on the actual expense ratios and an assumed rate of return of 5% per year before expenses, which is not the First Eagle Funds' actual return. The hypothetical account values and expenses may not be used to estimate the actual ending account balance or expenses you paid for the period. You may use the information provided in this table to compare the ongoing costs of investing in the Funds and other funds. To do so, compare the 5% hypothetical example relating to the Fund with the 5% hypothetical examples that appear in the shareholder reports of other funds.
This example is based on an investment of $1,000 invested on November 1, 2017 and held for the six-months ended April 30, 2018.
Please note that the expenses shown in the table below are meant to highlight your ongoing costs only and do not reflect any transactional costs, such as front-end or back-end sales charges (loads). Therefore, the table is useful in comparing ongoing costs only, and will not help you determine the relative total costs of owning different funds. In addition, if these transaction costs were included, your costs would have been higher.
First Eagle Funds | Semi-Annual Report | April 30, 2018
176
Fund Expenses (unaudited)
Based on Hypothetical Total Return(1)
| | | Hypothetical
Annualized
Total
Return | | Beginning
Account
Value | | Ending
Account
Value | | Annualized
Expense | | Expenses
Paid for
the Period(2) | |
First Eagle Global Fund Consolidated | |
Class A | | | 5.00 | % | | $ | 1,000.00 | | | $ | 1019.34 | | | | 1.10 | % | | $ | 5.51 | | |
Class C | | | 5.00 | | | | 1,000.00 | | | | 1,015.62 | | | | 1.85 | | | | 9.25 | | |
Class I | | | 5.00 | | | | 1,000.00 | | | | 1,020.63 | | | | 0.84 | | | | 4.21 | | |
Class R4(3) | | | 5.00 | | | | 1,000.00 | | | | 1,019.98 | | | | 0.97 | | | | 4.86 | | |
Class R6 | | | 5.00 | | | | 1,000.00 | | | | 1,020.93 | | | | 0.78 | | | | 3.91 | | |
First Eagle Overseas Fund Consolidated | |
Class A | | | 5.00 | | | | 1,000.00 | | | | 1,019.09 | | | | 1.15 | | | | 5.76 | | |
Class C | | | 5.00 | | | | 1,000.00 | | | | 1,015.52 | | | | 1.87 | | | | 9.35 | | |
Class I | | | 5.00 | | | | 1,000.00 | | | | 1,020.53 | | | | 0.86 | | | | 4.31 | | |
Class R4(3) | | | 5.00 | | | | 1,000.00 | | | | 1,019.79 | | | | 1.01 | | | | 5.06 | | |
Class R6 | | | 5.00 | | | | 1,000.00 | | | | 1,020.88 | | | | 0.79 | | | | 3.96 | | |
First Eagle U.S. Value Fund Consolidated | |
Class A | | | 5.00 | | | | 1,000.00 | | | | 1,019.34 | | | | 1.10 | | | | 5.51 | | |
Class C | | | 5.00 | | | | 1,000.00 | | | | 1,015.62 | | | | 1.85 | | | | 9.25 | | |
Class I | | | 5.00 | | | | 1,000.00 | | | | 1,020.73 | | | | 0.82 | | | | 4.11 | | |
Class R6 | | | 5.00 | | | | 1,000.00 | | | | 1,020.88 | | | | 0.79 | | | | 3.96 | | |
First Eagle Gold Fund Consolidated | |
Class A | | | 5.00 | | | | 1,000.00 | | | | 1,018.45 | | | | 1.28 | | | | 6.41 | | |
Class C | | | 5.00 | | | | 1,000.00 | | | | 1,014.68 | | | | 2.04 | | | | 10.19 | | |
Class I | | | 5.00 | | | | 1,000.00 | | | | 1,019.89 | | | | 0.99 | | | | 4.96 | | |
Class R6 | | | 5.00 | | | | 1,000.00 | | | | 1,020.43 | | | | 0.88 | | | | 4.41 | | |
First Eagle Global Income Builder Fund | |
Class A | | | 5.00 | | | | 1,000.00 | | | | 1,018.99 | | | | 1.17 | | | | 5.86 | | |
Class C | | | 5.00 | | | | 1,000.00 | | | | 1,015.22 | | | | 1.93 | | | | 9.64 | | |
Class I | | | 5.00 | | | | 1,000.00 | | | | 1,020.28 | | | | 0.91 | | | | 4.56 | | |
Class R6 | | | 5.00 | | | | 1,000.00 | | | | 1,020.48 | | | | 0.87 | | | | 4.36 | | |
First Eagle High Yield Fund | |
Class A | | | 5.00 | | | | 1,000.00 | | | | 1,018.84 | | | | 1.20 | | | | 6.01 | | |
Class C | | | 5.00 | | | | 1,000.00 | | | | 1,015.22 | | | | 1.93 | | | | 9.64 | | |
Class I | | | 5.00 | | | | 1,000.00 | | | | 1,020.38 | | | | 0.89 | | | | 4.46 | | |
Class R6 | | | 5.00 | | | | 1,000.00 | | | | 1,020.28 | | | | 0.91 | | | | 4.56 | | |
First Eagle Fund of America | |
Class A | | | 5.00 | | | | 1,000.00 | | | | 1,018.25 | | | | 1.32 | | | | 6.61 | | |
Class C | | | 5.00 | | | | 1,000.00 | | | | 1,014.58 | | | | 2.06 | | | | 10.29 | | |
Class I | | | 5.00 | | | | 1,000.00 | | | | 1,019.74 | | | | 1.02 | | | | 5.11 | | |
Class R6 | | | 5.00 | | | | 1,000.00 | | | | 1,019.93 | | | | 0.98 | | | | 4.91 | | |
Class Y | | | 5.00 | | | | 1,000.00 | | | | 1,018.35 | | | | 1.30 | | | | 6.51 | | |
First Eagle Funds | Semi-Annual Report | April 30, 2018
177
Fund Expenses (unaudited)
(1) For the six-months ended April 30, 2018.
(2) Expenses are equal to the annualized expense ratio multiplied by the average account value over the period, multiplied by 181/365 (to reflect the one-half year period).
(3) Class R4 commenced investment operations on January 17, 2018.
First Eagle Funds | Semi-Annual Report | April 30, 2018
178
Quarterly Form N-Q portfolio schedule
The First Eagle Funds file their complete schedule of portfolio holdings with the Securities and Exchange Commission ("SEC") for the first and third quarters of each fiscal year on Form N-Q. The Funds' Forms N-Q are available on the SEC's Web site at www.sec.gov. The Funds' Forms N-Q may be reviewed and copied at the SEC's Public Reference Room in Washington, D.C. Information on the operation of the SEC's Public Reference Room may be obtained by calling 1.800.SEC.0330. Additionally, you may obtain copies of Form N-Q from the Fund upon request by calling 1.800.334.2143.
Proxy voting policies, procedures and record
You may obtain (1) a description of the Funds' proxy voting policies, (2) a description of the Funds' proxy voting procedures and (3) information regarding how the Funds voted any proxies related to portfolio securities during the most recent twelve-month period ended June 30 for which an SEC filing has been made, without charge, upon request by contacting the Funds directly at 1.800.334.2143 or on the EDGAR Database on the SEC's Web site at www.sec.gov.
First Eagle Funds | Semi-Annual Report | April 30, 2018
179
Trustees
Lisa Anderson
John P. Arnhold
Candace K. Beinecke (Chair)
Jean-Marie Eveillard
Jean D. Hamilton
James E. Jordan
William M. Kelly
Paul J. Lawler
Officers
Mehdi Mahmud
President
Robert Bruno
Senior Vice President
Joseph T. Malone
Chief Financial Officer
Albert Pisano
Chief Compliance Officer
David O'Connor
General Counsel
Sheelyn Michael
Secretary & Deputy General Counsel
Tricia Larkin
Treasurer
Michael Luzzatto
Vice President
Neal Ashinsky
Assistant Treasurer
Thomas Meyer
Assistant Treasurer
Investment Adviser
First Eagle Investment Management, LLC
1345 Avenue of the Americas
New York, NY 10105
Legal Counsel
Shearman & Sterling LLP
599 Lexington Avenue
New York, NY 10022
Custodian
JPMorgan Chase Bank, N.A.
4 Chase Metrotech Center, Floor 16,
Brooklyn, New York, 11245
Shareholder Servicing Agent
DST Systems, Inc.
330 West 9th Street
Kansas City, MO 64105
800.334.2143
Underwriter
FEF Distributors, LLC
1345 Avenue of the Americas
New York, NY 10105
Independent Registered Public
Accounting Firm
PricewaterhouseCoopers LLP
300 Madison Avenue
New York, NY 10017
This report is not authorized for distribution to prospective investors unless preceded or accompanied by a currently effective prospectus of First Eagle Funds.
First Eagle Funds | Semi-Annual Report | April 30, 2018
180
This page was intentionally left blank.
This page was intentionally left blank.
This page was intentionally left blank.
This page was intentionally left blank.
This page was intentionally left blank.
This page was intentionally left blank.


First Eagle Investment Management, LLC
1345 Avenue of the Americas, New York, NY 10105-0048
800.334.2143 www.feim.com
Item 2. Code of Ethics.
The Registrant has adopted a code of ethics that applies to its principal executive officer and principal financial officer. Copies of the code of ethics may be requested free of charge by calling 1-800-334-2143 (toll free).
Item 3. Audit Committee Financial Expert.
Not applicable to this semi-annual report.
Item 4. Principal Accountant Fees and Services
Not applicable to this semi-annual report.
Item 5. Audit Committee of Listed Registrants
Not applicable at this time.
Item 6. Schedule of Investments.
Please see schedule of investments contained in the Report to Stockholders included under Item 1 of this Form N-CSR.
Item 7. Disclosure of Proxy Voting Policies and Procedures for Closed-End Management Investment Companies.
Not applicable at this time.
Item 8. Portfolio Managers of Closed-End Management Investment Companies.
Not applicable at this time.
Item 9. Purchases of Equity Securities by Close-End Management Investment Company and Affiliated Purchasers.
Not applicable at this time.
Item 10. Submission of Matters to a Vote of Security Holders.
Not applicable at this time.
Item 11. Controls and Procedures.
(a) In the opinion of the principal executive officer and principal financial officer, based on their evaluation, the registrant’s disclosure controls and procedures are adequately designed and are operating effectively to ensure (i) that material information relating to the registrant, including its consolidated subsidiaries, is made known to them by others within those entities, particularly during the period in which this report is being prepared; and (ii) that information required to be disclosed by the registrant on Form N-CSR is recorded, processed, summarized and reported within the time periods specified in the Securities and Exchange Commission’s rules and forms.
(b) There were no changes in the registrant’s internal control over financial reporting that occurred during the registrant’s most recent fiscal half-year (the registrant’s second fiscal half-year in the case of an annual report) that have materially affected or are reasonably likely to materially affect, the registrant’s internal control over financial reporting.
Item 12. Exhibits.
(a)(1) Not applicable to this semi-annual report.
(a)(2) Certifications pursuant to Rule 30a-2(a) under the Investment Company Act of 1940 (17 CFR 270.30a-2(a)): Attached hereto.
(a)(3) Not applicable.
(b) Certification pursuant to Rule 30a-2(b) under the Investment Company Act of 1940 (17 CFR 270.30a-2(b)): Attached hereto.
SIGNATURES
Pursuant to the requirements of the Securities Exchange Act of 1934 and the Investment Company Act of 1940, the registrant has duly caused this report to be signed on its behalf by the undersigned, thereunto duly authorized.
(Registrant) | First Eagle Funds |
| |
By (Signature and Title)* | /s/ Mehdi Mahmud |
| |
| Mehdi Mahmud, President |
Date: July 3, 2018
Pursuant to the requirements of the Securities Exchange Act of 1934 and the Investment Company Act of 1940, this report has been signed below by the following persons on behalf of the registrant and in the capacities and on the dates indicated.
By (Signature and Title)* | /s/ Mehdi Mahmud |
| |
| Mehdi Mahmud, Principal Executive Officer |
Date: July 3, 2018
By (Signature and Title)* | /s/ Joseph T. Malone |
| |
| Joseph T. Malone, Principal Financial Officer |
Date: July 3, 2018
* Print the name and title of each signing officer under his or her signature.