UNITED STATES
SECURITIES AND EXCHANGE COMMISSION
Washington, D.C. 20549
FORM N-CSR
CERTIFIED SHAREHOLDER REPORT OF REGISTERED
MANAGEMENT INVESTMENT COMPANIES
Investment Company Act file number | 811-7762 |
|
First Eagle Funds |
(Exact name of registrant as specified in charter) |
|
1345 Avenue of the Americas New York, NY | | 10105 |
(Address of principal executive offices) | | (Zip code) |
|
Suzan Afifi First Eagle Funds 1345 Avenue of the Americas New York, NY 10105 |
(Name and address of agent for service) |
|
Registrant’s telephone number, including area code: | 1-212-632-2700 | |
|
Date of fiscal year end: | October 31 | |
|
Date of reporting period: | April 30, 2016 | |
| | | | | | | | |
Form N-CSR is to be used by management investment companies to file reports with the Commission not later than 10 days after the transmission to stockholders of any report that is required to be transmitted to stockholders under Rule 30e-1 under the Investment Company Act of 1940 (17 CFR 270.30e-1). The Commission may use the information provided on Form N-CSR in its regulatory, disclosure review, inspection, and policymaking roles.
A registrant is required to disclose the information specified by Form N-CSR, and the Commission will make this information public. A registrant is not required to respond to the collection of information contained in Form N-CSR unless the Form displays a currently valid Office of Management and Budget (“OMB”) control number. Please direct comments concerning the accuracy of the information collection burden estimate and any suggestions for reducing the burden to Secretary, Securities and Exchange Commission, 450 Fifth Street, NW, Washington, DC 20549-0609. The OMB has reviewed this collection of information under the clearance requirements of 44 U.S.C. § 3507.
Item 1. Reports to Stockholders.

First Eagle Global Fund
First Eagle Overseas Fund
First Eagle U.S. Value Fund
First Eagle Gold Fund
First Eagle Global Income Builder Fund
First Eagle High Yield Fund
First Eagle Fund of America

Advised by First Eagle Investment Management, LLC
Forward-Looking Statement Disclosure
One of our most important responsibilities as mutual fund managers is to communicate with shareholders in an open and direct manner. Some of our comments in our letters to shareholders are based on current management expectations and are considered "forward-looking statements". Actual future results, however, may prove to be different from our expectations. You can identify forward-looking statements by words such as "may", "will", "believe", "attempt", "seem", "think", "ought", "try" and other similar terms. We cannot promise future returns. Our opinions are a reflection of our best judgment at the time this report is compiled, and we disclaim any obligation to update or alter forward-looking statements as a result of new information, future events, or otherwise.
First Eagle Funds | Semi-Annual Report | April 30, 2016
2
Table of Contents
Letter from the President | | | 4 | | |
Management's Discussion of Fund Performance | | | 7 | | |
Performance Chart | | | 12 | | |
First Eagle Global Fund: | |
Fund Overview | | | 18 | | |
Consolidated Schedule of Investments | | | 20 | | |
First Eagle Overseas Fund: | |
Fund Overview | | | 42 | | |
Consolidated Schedule of Investments | | | 44 | | |
First Eagle U.S. Value Fund: | |
Fund Overview | | | 66 | | |
Consolidated Schedule of Investments | | | 68 | | |
First Eagle Gold Fund: | |
Fund Overview | | | 78 | | |
Consolidated Schedule of Investments | | | 80 | | |
First Eagle Global Income Builder Fund: | |
Fund Overview | | | 84 | | |
Schedule of Investments | | | 86 | | |
First Eagle High Yield Fund: | |
Fund Overview | | | 100 | | |
Schedule of Investments | | | 102 | | |
First Eagle Fund of America: | |
Fund Overview | | | 112 | | |
Schedule of Investments | | | 114 | | |
Statements of Assets and Liabilities | | | 120 | | |
Statements of Operations | | | 128 | | |
Statements of Changes in Net Assets | | | 132 | | |
Financial Highlights | | | 136 | | |
Notes to Financial Statements | | | 162 | | |
Fund Expenses | | | 197 | | |
General Information | | | 201 | | |
First Eagle Funds | Semi-Annual Report | April 30, 2016
3
Letter from the President

Dear Fellow Shareholders,
The half year following my last letter in December was a turbulent period in world markets. Prices of equities, commodities and high-yield bonds all fell sharply from late December 2015 through February 11, 2016, only to recover in whole or in part by April 30. The S&P 500 Index was down -11.43% on February 11 but ended the period with a gain of 0.43%. The MSCI World and EAFE indices were off -13.51% and -15.29% on February 11 but recovered to finish down -1.05% and -3.07%, respectively. The price of WTI crude oil dropped from $46.59 a barrel on October 30, bottomed at $26.21 a barrel on February 11, and climbed back to $45.92 by April 30. Starting October 30, the Barclays US High Yield Corporate Index returned -9.60% through February 11 but rose 2.37% through April 30. Meanwhile, gold rose from $1,142.16 an ounce on October 30 to a high of $1,292.99 at the end of the period.
In our experience, this kind of volatility is an inevitable but unpredictable feature of the investment markets. Knowing that we cannot foresee short-term market moves, we have developed a long-term investment approach that does not require a crystal ball. Our philosophy is based on discipline, rigorous bottom-up research and patience. We aim to purchase securities of companies we consider attractive when they are trading at a discount to our estimate of their intrinsic value—a perceived discount we call a "margin of safety." In a bear market, when these discounts may proliferate, we are generally net purchasers of stocks. In a bull market, when a margin of safety becomes scarce, we generally accumulate cash.1 These portfolio shifts are not based on macroeconomic judgments. They result from our bottom-up research process, which either does or does not find attractive securities that are trading at attractive prices.
As you would expect from our past letters, we continue to be concerned about macroeconomic and geopolitical challenges around the world. In addition to these issues, there are now mounting political uncertainties. A sizable proportion of world GDP resides in countries, including the United States, where leadership changes are impending. Here, too, we do not attempt to predict outcomes. Rather, we strive to build portfolios durable enough to participate in the upside of rising markets while also providing some protection in distressed markets.
1 References to cash include both cash and cash equivalents
First Eagle Funds | Semi-Annual Report | April 30, 2016
4
Global Value Team
Excess debt levels around the world continued to concern the Global Value team. In January, a collapse in commodity prices and in European bank stocks and strengthening in the price of gold seemed to be signs that a necessary process of deleveraging had finally commenced. However, as global stock prices deteriorated, central banks responded with the same experimental measures—quantitative easing and zero interest rates—that they introduced at the time of the Global Financial Crisis. While the markets responded positively, it remained unclear how central banks will extricate themselves from this cycle of trying to cure too much debt with even more debt.
In this uncertain environment, the Global Value team perceived opportunities in four areas:
• Individual stock selection—focusing on what it considers persistent businesses with decent free-cash-flow yields and attractive trading multiples;
• Cash—deploying its cash in periods of market crisis with a goal of earning a real return through the cycle;
• Currencies—seeking opportunities to diversify cash held in US dollars by investing in the sovereign debt of countries where we do not consider the debt levels excessive;
• Gold—holding bullion and gold-mining shares as a potential hedge against extreme market outcomes.
In the six-month period from November through April, the Global Value team passed through two distinct market phases. When stock prices were falling, it was able to buy shares of companies that had been on its wish list for some time, and its allocation to cash shrank. When the market recovered, the team sold shares of some companies that no longer offered a margin of safety—including a number of long-term holdings—and its cash position expanded once again.
High Yield Team
The high yield market weakened dramatically in the early part of this period, especially in commodity-related sectors, and then recovered sharply after February 11, 2016, when the price of crude oil began to climb. The energy and metals & mining sectors, which had been under intense pressure, recovered to some degree but still faced headwinds. Some energy-related issues that were priced at bankruptcy-like levels in early February subsequently recovered to somewhat higher, although still distressed, prices. The High Yield team expects headwinds to persist for the energy sector as long the prices of crude oil and natural gas remain volatile.
First Eagle Funds | Semi-Annual Report | April 30, 2016
5
Market liquidity was scarce during the period, and with relatively few bonds and loans actually changing hands in the market during the period, prices moved up or down on very little volume. This helped drive volatility to surprisingly high levels. Larger-sized bond issues generally outperformed smaller ones.
Energy company bonds and loans detracted from the High Yield Fund's performance in this period. Even issues from companies that are expected to withstand several more years of subdued energy markets declined sharply. In many cases, the High Yield team believed investors were overreacting to fears about this sector.
Fund of America Team
While the Fund of America team was encouraged by the broadening of stock market performance in the latter part of this period, it also believed that the market would likely continue to trade within a range, pending greater clarity on the path of interest rates and the outcome of the US elections. In this environment, the team believed that the new names it added to the portfolio were relatively low on the risk spectrum. While it was cautious due to the extended nature of the economic expansion and the fragile global macro environment, the Fund of America team sought to construct a portfolio that may perform well should the market continue its slow unsteady grind higher.
I thank you for your confidence and support.
Sincerely,

John P. Arnhold
President
June 2016
First Eagle Funds | Semi-Annual Report | April 30, 2016
6
Management's Discussion of Fund Performance
First Eagle Global Fund
The net asset value ("NAV") of the Fund's Class A shares increased 4.70% for the six months ended April 30, 2016 while the MSCI World Index decreased 1.05%. The Fund's cash and cash equivalents position was 14.01% as of April 30, 2016.
The five largest contributors to the performance of First Eagle Global Fund over the period were gold bullion, Barrick Gold Corporation (mining, Canada), Newcrest Mining Limited (mining, Australia), KDDI Corporation (telecommunications, Japan) and Goldcorp Inc. (mining, Canada) collectively accounting for 2.84% points of this period's performance.
The five largest detractors were Sanofi (pharmaceuticals, France), Comcast Corporation (cable, US), American Express Company (financials, US), Fanuc Corporation (robotics, Japan), Sompo Japan Nipponkoa Holdings, Inc. (insurance, Japan). Their combined negative performance over the six months subtracted 0.83% points from performance.
As of April 30, 2016, the Fund was approximately 10% hedged versus the Yen, 10% hedged versus the Euro and 25% hedged versus the British Pound on certain securities.
First Eagle Overseas Fund
The NAV of the Fund's Class A shares increased 5.15% for the six months ended April 30, 2016 while the MSCI EAFE Index decreased 3.07%. The Fund's cash and cash equivalents position was 16.21% as of April 30, 2016.
The five largest contributors to the performance of First Eagle Overseas Fund over the period were gold bullion, KDDI Corporation (telecommunications, Japan), Newcrest Mining Limited (mining, Australia), Agnico-Eagle Mines Limited (mining, Canada) and Barrick Gold Corporation (mining, Canada) collectively accounting for 2.74% points of this period's performance.
The five largest detractors were Fanuc Corporation (robotics, Japan), Sanofi (pharmaceuticals, France), Sompo Japan Nipponkoa Holdings, Inc. (insurance, Japan), Carrefour SA (retailer, France) and Kia Motors Corporation (automobiles, South Korea). Their combined negative performance over the six months subtracted 1.16% points from performance.
As of April 30, 2016, the Fund was approximately 10% hedged versus the Yen, 10% hedged versus the Euro and 25% hedged versus the British Pound on certain securities.
First Eagle Funds | Semi-Annual Report | April 30, 2016
7
Management's Discussion of Fund Performance
First Eagle U.S. Value Fund
The NAV of the Fund's Class A shares increased 4.14% for the six months ended April 30, 2016 while the S&P 500 Index increased 0.43%. The Fund's cash and cash equivalents position was 16.43% as of April 30, 2016.
The five largest contributors to the performance of First Eagle U.S. Value Fund were gold bullion, Weyerhaeuser Company (forest products), Agnico-Eagle Mines Limited (mining, Canada), Omnicom Group (advertising), and Newcrest Mining Limited (mining, Australia) collectively accounting for 3.23% points of this period's performance.
The five largest detractors were American Express Company (financials), Comcast Corporation (cable), H&R Block, Inc. (financials), Devon Energy Corporation (oil and gas) and Plum Creek Timber Company, Inc. (forest products). Their combined negative performance subtracted 1.36% points from performance.
First Eagle Gold Fund
The NAV of the Fund's Class A shares increased 47.33% while the FTSE Gold Mines Index increased 81.05% for the six months ended April 30, 2016. The Fund's cash and cash equivalents position was 5.47% as of April 30, 2016.
The five largest contributors to the performance of First Eagle Gold Fund were Barrick Gold Corporation (Canada), Randgold Resources Limited (Channel Islands), Newcrest Mining Limited (Australia), Agnico-Eagle Mines (Canada), and Goldcorp, Inc. (Canada) collectively accounting for 20.37% points of this period's performance.
There were only four detractors to performance during the period: Primero Mining Corporation (Canada), Industrias Penoles (Mexico), Eldorado Gold Corporation (Canada), and St. Augustine Gold & Copper Ltd. (BVI). Their combined negative performance subtracted 0.24% points from performance.
First Eagle Global Income Builder Fund
The NAV of the Fund's Class A shares increased 2.96% while the composite index2 increased 0.62% for the six months ended April 30, 2016. The MSCI World Index and the Barclays U.S. Aggregate Bond Index returned -1.05% and 2.82% respectively during the same time period. The Fund's cash and cash equivalents position was 9.42% as of April 30, 2016.
2 Effective March 1, 2016, the Fund is compared against a composite index, 60% of which consists of the MSCI World Index and 40% of which consists of the Barclays U.S. Aggregate Bond Index. The Fund believes this composite index provides a useful comparison against the performance of the Fund, which currently invests in both equity and fixed income securities.
First Eagle Funds | Semi-Annual Report | April 30, 2016
8
Management's Discussion of Fund Performance
The five largest contributors to the performance of First Eagle Global Income Builder Fund were Goldcorp, Inc. (mining, Canada), Weyerhaeuser Company (forest products, US), Agnico-Eagle Mines Limited (mining, Canada), TransAlta Renewables, Inc. (energy, Canada) and Roundy's Supermarkets, Inc. Term Loan B 5.75% due 03/03/2021(supermarkets, US) collectively accounting for 1.89% points of this period's performance.
The five largest detractors were Sprint Corporation 7.25% due 09/15/2021 (telecommunications, US), EP Energy Corporation 9.375% due 05/01/2020 (oil and gas, US), Sanofi (pharmaceuticals, France), Osum Productions Corporation Term Loan 6.50% due 07/28/2020 (oil and gas, Canada) and Jonah Energy LLC Second Lien Term Loan 7.50% due 05/12/2021 (oil and gas, US). Their combined negative performance subtracted 1.11% points from performance.
As of April 30, 2016, the Fund was approximately 10% hedged versus the Yen, 15% hedged versus the Euro and 25% hedged versus the British Pound on certain securities.
First Eagle High Yield Fund
The NAV of the Fund's Class I shares decreased 0.10% while the Barclay's U.S. Corporate High Yield Index increased 2.37% for the six months ended April 30, 2016. The Fund's cash and cash equivalents position was 9.44% as of April 30, 2016.
The five largest contributors to the performance of First Eagle High Yield Fund were Roundy's Supermarkets, Inc. 10.25% due 12/15/2020 (supermarkets, US), Jupiter Resources, Inc. 8.5% due 10/01/2022 (oil and gas, Canada), Roundy's Supermarkets, Inc. Tranche B Term Loan 5.75% due 03/03/2021 (supermarkets, US), Sprint Capital Corporation 6.9% due 05/01/2019 (telecom, U.S.) and California Resources Corporation 8.0% 12/15/2022 (oil and gas, US) collectively accounting for 2.21% points of this period's performance.
The five largest detractors to performance were Bi-lo Holdings LLC 8.625% due 09/15/2018 (supermarkets, US), Ameriforge Group, Inc. Term Loan 8.75% due 01/22/2021 (oil and gas, US), Sprint Corporation 7.25% 09/15/2021 (oil and gas, US), OSUM Production Corporation Term Loan 6.50% due 07/28/2020 (oil and gas, Canada), and Lightstream Resources Ltd. 8.625% 02/01/2020 (oil and gas, Canada). Their combined negative performance subtracted 1.87% points from performance.
First Eagle Fund of America
The NAV of the Fund's Class Y Shares decreased 4.52% versus the S&P 500 Index increase of 0.43% for the six months ended April 30, 2016. The Fund's cash and cash equivalents position was 8.90% as of April 30, 2016.
First Eagle Funds | Semi-Annual Report | April 30, 2016
9
Management's Discussion of Fund Performance
The five largest contributors to the performance for First Eagle Fund of America were Tyson Foods, Inc. (food manufacturer), Hewlett Packard Company (technology services and equipment), Lexmark International, Inc. (printing solutions), Valspar Corporation (paints) and Eastman Chemical Company (chemicals) collectively accounting for 4.17% points of this period's performance.
The five largest detractors were Valeant Pharmaceuticals International, Inc. (pharmaceuticals), Allergan PLC (pharmaceuticals), Seagate Technology PLC (hard disk drive manufacturer), Delta Air Lines, Inc. (airlines), and Halozyme Therapeutics, Inc. (biopharmaceutical). Their combined negative performance subtracted 7.12% points from performance.

| | 
| |
Matthew McLennan
Head of the Global Value Team
Portfolio Manager
Global, Overseas,
U.S. Value and Gold Funds | | T. Kimball Brooker, Jr.
Portfolio Manager
Global, Overseas
and U.S. Value Funds
| |

| | 
| |
Matt Lamphier
Portfolio Manager
U.S. Value Fund | | Giorgio Caputo
Portfolio Manager
Global Income Builder Fund | |

| | 
| |
Robert Hordon
Portfolio Manager
Global Income Builder Fund
| | Edward Meigs
Portfolio Manager
Global Income Builder and
High Yield Funds | |
First Eagle Funds | Semi-Annual Report | April 30, 2016
10
Management's Discussion of Fund Performance

| | 
| |
Sean Slein
Portfolio Manager
Global Income Builder and
High Yield Funds | | Harold Levy
Portfolio Manager
Fund of America
| |

| | | |
Eric Stone
Portfolio Manager
Fund of America | |
| |
June 2016
The performance data quoted herein represents past performance and does not guarantee future results. Market volatility can dramatically impact a fund's short-term performance. Current performance may be lower or higher than figures shown. The investment return and principal value will fluctuate so that an investor's shares, when redeemed, may be worth more or less than their original cost. Past performance data through the most recent month end is available at feim.com or by calling 800.334.2143.
The commentary represents the opinion of John Arnhold and the Portfolio Management Teams as of June 2016 and is subject to change based on market and other conditions. These materials are provided for informational purposes only. These opinions are not intended to be a forecast of future events, a guarantee of future results, or investment advice. The views expressed herein may change at any time subsequent to the date of issue hereof. The information provided is not to be construed as a recommendation or an offer to buy or sell or the solicitation of an offer to buy or sell any fund or security.
First Eagle Funds | Semi-Annual Report | April 30, 2016
11
Performance Chart1 (unaudited)
| | | One-
Year | | Three-
Years | | Five-
Years | | Ten-
Years | | Since
Inception | | Inception Date | |
First Eagle Global Fund | |
Class A (SGENX)
without sales charge | | | 1.75 | % | | | 5.61 | % | | | 5.75 | % | | | 6.76 | % | | | 13.43 | % | | 01/01/792 | |
with sales charge | | | -3.35 | | | | 3.82 | | | | 4.67 | | | | 6.21 | | | | 13.31 | | | 01/01/792 | |
| Class C (FESGX) | | | -0.02 | | | | 4.82 | | | | 4.96 | | | | 5.96 | | | | 10.21 | | | 06/05/00 | |
| Class I (SGIIX) | | | 2.01 | | | | 5.88 | | | | 6.02 | | | | 7.03 | | | | 11.00 | | | 07/31/98 | |
MSCI World Index3 | | | -4.17 | | | | 6.28 | | | | 5.96 | | | | 4.13 | | | | 9.45 | | | 01/01/79 | |
First Eagle Overseas Fund4 | |
Class A (SGOVX)
without sales charge | | | 0.74 | % | | | 4.34 | % | | | 4.18 | % | | | 5.53 | % | | | 10.92 | % | | 08/31/93 | |
with sales charge | | | -4.29 | | | | 2.58 | | | | 3.11 | | | | 4.99 | | | | 10.73 | | | 08/31/93 | |
| Class C (FESOX) | | | -1.00 | | | | 3.58 | | | | 3.41 | | | | 4.74 | | | | 9.75 | | | 06/05/00 | |
| Class I (SGOIX) | | | 1.01 | | | | 4.63 | | | | 4.45 | | | | 5.79 | | | | 11.00 | | | 07/31/98 | |
MSCI EAFE Index5 | | | -9.32 | | | | 1.48 | | | | 1.69 | | | | 1.61 | | | | 4.65 | | | 08/31/93 | |
First Eagle U.S. Value Fund | |
Class A (FEVAX)
without sales charge | | | 1.43 | % | | | 6.53 | % | | | 6.85 | % | | | 6.67 | % | | | 8.89 | % | | 09/04/01 | |
with sales charge | | | -3.64 | | | | 4.72 | | | | 5.76 | | | | 6.12 | | | | 8.50 | | | 09/04/01 | |
| Class C (FEVCX) | | | -0.26 | | | | 5.74 | | | | 6.07 | | | | 5.87 | | | | 8.07 | | | 09/04/01 | |
| Class I (FEVIX) | | | 1.72 | | | | 6.81 | | | | 7.13 | | | | 6.93 | | | | 9.15 | | | 09/04/01 | |
Standard & Poor's
500 Index6 | | | 1.21 | | | | 11.26 | | | | 11.02 | | | | 6.91 | | | | 6.28 | | | 09/04/01 | |
First Eagle Gold Fund | |
Class A (SGGDX)
without sales charge | | | 21.81 | % | | | -2.64 | % | | | -11.88 | % | | | 0.55 | % | | | 6.03 | % | | 08/31/93 | |
with sales charge | | | 15.69 | | | | -4.29 | | | | -12.78 | | | | 0.03 | | | | 5.85 | | | 08/31/93 | |
| Class C (FEGOX) | | | 19.76 | | | | -3.41 | | | | -12.57 | | | | -0.22 | | | | 5.99 | | | 05/15/03 | |
| Class I (FEGIX) | | | 22.17 | | | | -2.38 | | | | -11.66 | | | | 0.80 | | | | 7.06 | | | 05/15/03 | |
FTSE Gold
Mines Index7 | | | 36.39 | | | | -2.78 | | | | -15.65 | | | | -4.30 | | | | -0.43 | | | 08/31/93 | |
MSCI World Index3 | | | -4.17 | | | | 6.28 | | | | 5.96 | | | | 4.13 | | | | 6.43 | | | 08/31/93 | |
First Eagle Funds | Semi-Annual Report | April 30, 2016
12
Performance Chart (unaudited)
| | | One-
Year | | Three-
Years | | Five-
Years | | Ten-
Years | | Since
Inception | | Inception Date | |
First Eagle Global Income Builder | |
Class A (FEBAX)
without sales charge | | | -0.82 | % | | | 3.80 | % | | | — | | | | — | | | | 5.85 | % | | 05/01/12 | |
with sales charge | | | -5.81 | | | | 2.05 | | | | — | | | | — | | | | 4.49 | | | 05/01/12 | |
| Class C (FEBCX) | | | -2.55 | | | | 3.02 | | | | — | | | | — | | | | 5.05 | | | 05/01/12 | |
| Class I (FEBIX) | | | -0.48 | | | | 4.09 | | | | — | | | | — | | | | 6.12 | | | 05/01/12 | |
Composite Index8 | | | -1.21 | | | | 4.84 | | | | | | | | | | | | 6.45 | | | | | | |
MSCI World Index3 | | | -4.17 | | | | 6.28 | | | | — | | | | — | | | | 8.70 | | | 05/01/12 | |
Barclays
U.S. Aggregate
Bond Index9 | | | 2.72 | | | | 2.29 | | | | — | | | | — | | | | 2.66 | | | 05/01/12 | |
First Eagle High Yield | |
Class A (FEHAX)
without sales charge | | | -5.49 | % | | | 0.22 | % | | | — | | | | — | | | | 4.03 | % | | 01/03/12 | |
with sales charge | | | -9.78 | | | | -1.30 | | | | — | | | | — | | | | 2.94 | | | 01/03/12 | |
| Class C (FEHCX) | | | -7.08 | | | | -0.53 | | | | — | | | | — | | | | 3.23 | | | 01/03/12 | |
| Class I (FEHIX) | | | -5.23 | | | | 0.50 | | | | 3.54 | % | | | — | | | | 8.42 | | | 11/19/0710 | |
Barclays
U.S. Corporate
High Yield Index11 | | | -1.12 | | | | 2.54 | | | | 5.41 | | | | — | | | | 7.62 | | | 11/19/07 | |
First Eagle Fund of America | |
Class A (FEFAX)
without sales charge | | | -9.67 | % | | | 6.65 | % | | | 7.61 | % | | | 7.56 | % | | | 8.14 | % | | 11/20/98 | |
with sales charge | | | -14.18 | | | | 4.84 | | | | 6.52 | | | | 7.01 | | | | 7.82 | | | 11/20/98 | |
| Class C (FEAMX) | | | -11.24 | | | | 5.83 | | | | 6.80 | | | | 6.75 | | | | 7.36 | | | 03/02/98 | |
| Class I (FEAIX) | | | -9.41 | | | | 6.93 | | | | — | | | | — | | | | 7.20 | | | 03/08/13 | |
| Class Y (FEAFX)12 | | | -9.69 | | | | 6.63 | | | | 7.60 | | | | 7.55 | | | | 11.48 | | | 04/10/87 | |
Standard & Poor's
500 Index6 | | | 1.21 | | | | 11.26 | | | | 11.02 | | | | 6.91 | | | | 9.40 | | | 04/10/87 | |
First Eagle Funds | Semi-Annual Report | April 30, 2016
13
Performance Chart (unaudited)
1 The performance data quoted herein represents past performance and does not guarantee future results. Market volatility can dramatically impact the fund's short-term performance. Current performance may be lower or higher than figures shown. The investment return and principal value will fluctuate so that an investor's shares, when redeemed, may be worth more or less than their original cost. Past performance data through the most recent month end is available at feim.com or by calling 800.334.2143. The average annual returns for Class A Shares "with sales charge" of First Eagle Global, Overseas, U.S. Value, Gold, Fund of America, and Global Income Builder give effect to the deduction of the maximum sales charge of 5.00%. The average annual returns for Class A Shares "with sales charge" of First Eagle High Yield gives effect to the deduction of the maximum sales charge of 4.50%.
The average annual returns for Class C Shares reflect the contingent deferred sales charge (CDSC) of 1.00% which pertains to the first year or less of investment only.
A contingent deferred sales charge of 1.00% may apply on redemptions of Class A shares made within 18 months following a purchase of $1,000,000 or more without an initial sales charge.
Class I Shares of First Eagle Global Fund, First Eagle Overseas Fund, First Eagle U.S. Value Fund, First Eagle Gold Fund, First Eagle Global Income Builder Fund, First Eagle High Yield Fund, and First Eagle Fund of America require $1 million minimum investment and are offered without a sales charge.
Class Y Shares of First Eagle Fund of America are offered without a sales charge.
2 The Fund commenced operation April 28, 1970. Performance for periods prior to January 1, 2000 occurred while a prior portfolio manager of the fund was affiliated with another firm. Inception date shown is when this prior portfolio manager assumed portfolio management responsibilities.
3 The MSCI World Index is a widely followed, unmanaged group of stocks from 23 developed international markets. The index provides total returns in U.S. dollars with net dividends reinvested. One cannot invest directly in an index.
4 Effective May 9, 2014, the First Eagle Overseas Fund is closed to certain investors. Please see prospectus for more information.
5 The MSCI EAFE Index is an unmanaged total return index, reported in U.S. dollars, based on share prices and reinvested net dividends of approximately 1,100 companies from 21 developed market countries. One cannot invest directly in an index.
6 The Standard & Poor's 500 Index is a widely recognized unmanaged index including a representative sample of 500 leading companies in leading sectors of the U.S. economy. Although the Standard & Poor's 500 Index focuses on the large-cap segment of the market, with approximately 80% coverage of U.S. equities, it is also considered a proxy for the total market. The Standard & Poor's 500 Index includes dividends reinvested. One cannot invest directly in an index.
7 The FTSE Gold Mines Index Series is designed to reflect the performance of the worldwide market in the shares of companies whose principal activity is the mining of gold. The FTSE Gold Mines Index encompasses all gold mining companies that have a sustainable, attributable gold production of at least 300,000 ounces a year and that derive 51% or more of their revenue from mined gold. The Index is unmanaged, is available with dividends reinvested and is not available for purchase.
8 Effective March 1, 2016 the Fund is compared against a composite index, 60% of which consists of the MSCI World Index and 40% of which consists of the Barclays U.S. Aggregate Bond Index. The Fund believes this composite index provides a useful comparison against the performance of the Fund, which currently invests in both equity and fixed income securities.
9 The Barclays U.S. Aggregate Bond Index is an unmanaged broad-based benchmark that measures the investment grade, U.S. dollar-denominated, fixed-rate taxable bond market, including Treasuries, government-related and corporate securities, MBS (agency fixed-rate and hybrid ARM passthroughs), ABS, and CMBS and is not available for purchase.
First Eagle Funds | Semi-Annual Report | April 30, 2016
14
Performance Chart (unaudited)
10 First Eagle High Yield Fund commenced operations in its present form on December 30, 2011, and is successor to another mutual fund pursuant to a reorganization on December 30, 2011. Information prior to December 30, 2011 is for this predecessor fund. Immediately after the reorganization, changes in net asset value of the Class I shares were partially impacted by differences in how the Fund and the predecessor fund price portfolio securities.
11 The Barclays U.S Corporate High Yield Index is composed of fixed-rate, publicly issued, noninvestment grade debt and is unmanaged, with dividends reinvested. The index includes both corporate and non-corporate sectors. The corporate sectors are Industrial, Utility, and Finance, which include both U.S. and non-U.S. corporations. The index is presented here for comparison purposes only. One cannot invest directly in an index.
12 As of September 1, 2005 First Eagle Fund of America Class Y is closed to new accounts.
Expense Ratios As Stated In The Most Recent Prospectus
Total Annual Gross Operating Expense Ratios
| | | Class A | | Class C | | Class I | | Class Y | |
First Eagle Global Fund | | | 1.11 | % | | | 1.86 | % | | | 0.84 | % | | | — | | |
First Eagle Overseas Fund | | | 1.16 | | | | 1.89 | | | | 0.88 | | | | — | | |
First Eagle U.S. Value Fund13,14 | | | 1.14 | | | | 1.90 | | | | 0.87 | | | | — | | |
First Eagle Gold Fund | | | 1.33 | | | | 2.14 | | | | 1.03 | | | | — | | |
First Eagle Global Income Builder | | | 1.19 | | | | 1.96 | | | | 0.94 | | | | — | | |
First Eagle High Yield Fund13,14 | | | 1.16 | | | | 1.91 | | | | 0.87 | | | | — | | |
First Eagle Fund of America15 | | | 1.30 | | | | 2.05 | | | | 1.00 | | | | 1.31 | % | |
13 For the First Eagle U.S. Value Fund and High Yield Funds, had fees not been waived and/or expenses reimbursed in the past, returns would have been lower.
14 These are the actual fund operating expenses prior to the application of fee waivers and/or expense reimbursements. The Adviser has contractually agreed to waive its management fee at an annual rate in the amount of 0.05% of the average daily value of the Fund's net assets for the period March 1, 2016 to February 28, 2017. This waiver has the effect of reducing the management fee for the term of the waiver from 0.75% to 0.70% on First Eagle U.S. Value Fund and from 0.70% to 0.65% on First Eagle High Yield Fund.
15 The ratios provided are reflective of a lower management fee rate implemented March 1, 2016, with a rate of 0.90% of the first $5 billion of the average daily net assets, and 0.85% in excess of $5 billion of the average daily net assets.
These expense ratios are presented as of October 31, 2015 and may differ from corresponding ratios shown elsewhere in this report because of differing time periods (and/or, if applicable, because these expense ratios do not include expense credits or waivers).
There are risks associated with investing in funds that invest in securities of foreign countries, such as erratic market conditions, economic and political instability and fluctuations in currency exchange rates. These risks may be more pronounced with respect to investments in emerging markets. Funds whose investments are concentrated in a specific industry or sector may be subject to a higher degree of risk than funds whose investments are diversified and may not be suitable for all investors.
The principal risk of investing in value stocks is that the price of the security may not approach its anticipated value or may decline in price.
First Eagle Funds | Semi-Annual Report | April 30, 2016
15
Performance Chart (unaudited)
Investment in gold and gold related investments present certain risks, including political and economic risks affecting the price of gold and other precious metals like changes in U.S. or foreign tax, currency or mining laws, increased environmental costs, international monetary and political policies, economic conditions within an individual country, trade imbalances, and trade or currency restrictions between countries. The price of gold, in turn, is likely to affect the market prices of securities of companies mining or processing gold, and accordingly, the value of investments in such securities may also be affected. Gold related investments as a group have not performed as well as the stock market in general during periods when the U.S. dollar is strong, inflation is low and general economic conditions are stable. In addition, returns on gold related investments have traditionally been more volatile than investments in broader equity or debt markets.
The event-driven investment style used by First Eagle Fund of America carries the additional risk that the event anticipated occurs later than expected, does not occur at all or does not have the desired effect on the market price of the securities.
First Eagle High Yield and Global Income Builder Funds invest in high yield securities that are non-investment grade. High yield securities are rated lower than investment-grade securities because there is a greater possibility that the issuer may be unable to make interest and principal payments on those securities. High yield securities involve greater risk than higher rated securities and portfolios that invest in them may be subject to greater levels of credit and liquidity risk than portfolios that do not.
For the First Eagle High Yield and Global Income Builder Funds, bank loans are often less liquid than other types of debt instruments. There is no assurance that the liquidation of any collateral from a secured bank loan would satisfy the borrower's obligation or that such collateral could be liquidated.
The First Eagle High Yield Fund's investment strategies may result in high turnover rates. This may increase the Fund's brokerage commission costs, which would reduce performance. Rapid portfolio turnover also exposes shareholders to a higher current realization of short-term gains, which could cause you to pay higher taxes.
Funds that invest in bonds are subject to interest-rate risk and can lose principal value when interest rates rise. Bonds are also subject to credit risk, in which the bond issuer may fail to pay interest and principal in a timely manner, or that negative perception of the issuer's ability to make such payments may cause the price of that bond to decline.
Income generation and dividends are not guaranteed. If dividend paying stocks in the fund's portfolio stop paying or reduce dividends the fund's ability to generate income will be adversely affected.
The First Eagle Global Income Builder Fund may also invest in small and medium-sized companies, derivatives, illiquid investments and real estate, which have additional risks.
An investment made at a perceived "margin of safety" or "discount to intrinsic or fundamental value" can trade at prices substantially lower than when an investment is made, so that any perceived "margin or safety" or "discount to value" is no guarantee against loss.
All investments involve the risk of loss.
First Eagle Funds | Semi-Annual Report | April 30, 2016
16
This page was intentionally left blank.
Data as of April 30, 2016 (unaudited)
Investment Objective
The First Eagle Global Fund seeks long-term growth of capital by investing in a range of asset classes from markets in the United States and throughout the world. This truly global fund is managed with a highly disciplined, bottom-up, value oriented style.
Average Annual Returns (%) | | | | | | One-Year | | Five-Years | | Ten-Years | |
First Eagle Global Fund | | Class A | | without sales load | | | 1.75 | | | | 5.75 | | | | 6.76 | | |
| | | | with sales load | | | -3.35 | | | | 4.67 | | | | 6.21 | | |
MSCI World Index | | | | | | | -4.17 | | | | 5.96 | | | | 4.13 | | |
Consumer Price Index | | | | | | | 1.13 | | | | 1.25 | | | | 1.73 | | |
Countries** (%)
United States | | | 45.05 | | |
Japan | | | 12.46 | | |
France | | | 6.02 | | |
Canada | | | 4.44 | | |
United Kingdom | | | 3.71 | | |
Mexico | | | 2.34 | | |
South Korea | | | 1.71 | | |
Germany | | | 1.70 | | |
Switzerland | | | 1.54 | | |
Australia | | | 1.12 | | |
Hong Kong | | | 1.01 | | |
Bermuda | | | 0.77 | | |
Sweden | | | 0.71 | | |
Singapore | | | 0.67 | | |
Italy | | | 0.63 | | |
Belgium | | | 0.51 | | |
Thailand | | | 0.51 | | |
Ireland | | | 0.33 | | |
Denmark | | | 0.24 | | |
Russia | | | 0.21 | | |
Israel | | | 0.16 | | |
Africa | | | 0.09 | | |
Norway | | | 0.04 | | |
Indonesia | | | 0.02 | | |
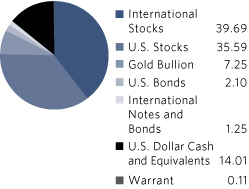
* Asset Allocation and Countries percentages are based on total investments in the portfolio.
**Country allocations reflect country of the issuer (not currency of issue) and exclude short term investments. Bonds of non-U.S. issuers may be U.S. dollar denominated.
The Fund's portfolio composition is subject to change at any time.
First Eagle Funds | Semi-Annual Report | April 30, 2016
18
First Eagle Global Fund | Fund Overview
Growth of a $10,000 Initial Investment
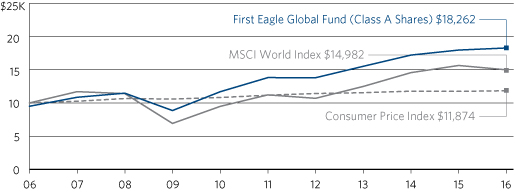
Performance data quoted herein represents past performance and should not be considered indicative of future results. Performance data quoted herein does not reflect the deduction of taxes that a shareholder would pay on Fund distributions or the sale of Fund shares. The average annual returns shown above are historical and reflect changes in share price, reinvested dividends and are net of expenses.
The average annual returns for Class A Shares give effect to the deduction of the maximum sales charge of 5.00%.
The MSCI World Index is a widely followed, unmanaged group of stocks from 23 developed international markets. The index provides total returns in U.S. dollars with net dividends reinvested. One cannot invest directly in an index. The Consumer Price Index (CPI) represents the change in price of all goods and services purchased for consumption by urban households.
Top 10 Holdings* (%)
Gold Bullion** (precious metal) | | | 7.23 | | |
Oracle Corporation (U.S. provider of software/hardware products and services) | | | 2.24 | | |
Comcast Corporation Class 'A' (U.S. cable/satellite television company) | | | 2.09 | | |
KDDI Corporation (Japanese telecommunications company) | | | 1.96 | | |
Microsoft Corporation (U.S. software developer) | | | 1.70 | | |
Weyerhaeuser Company REIT (U.S. forest products company) | | | 1.58 | | |
Omnicom Group, Inc. (U.S. advertising & marketing services provider) | | | 1.54 | | |
Secom Company Limited (Japanese security services provider) | | | 1.52 | | |
American Express Company (U.S. global payments and travel company) | | | 1.51 | | |
Bank of New York Mellon Corporation (U.S. financial services company) | | | 1.40 | | |
Total | | | 22.77 | | |
* Holdings in cash, commercial paper and other short term cash equivalents have been excluded.
**The Fund invests in gold and precious metals through investment in a wholly-owned subsidiary of the Fund organized under the laws of the Cayman Islands (the "Subsidiary"). Gold Bullion and commodities include the Fund's investment in the Subsidiary.
Percentages are based on total net assets.
First Eagle Funds | Semi-Annual Report | April 30, 2016
19
First Eagle Global Fund | Consolidated Schedule of Investments | Six-Month Period Ended April 30, 2016 (unaudited)
| Shares | | Description | | Cost (Note 1) | | Value (Note 1) | |
Common Stocks — 75.12% | | | |
International Common Stocks — 39.60% | | | |
Africa — 0.09% | | | |
| | 413,501 | | | Randgold Resources Limited, ADR | | $ | 24,650,966 | | | $ | 41,556,850 | | |
Australia — 1.11% | | | |
| | 37,118,561 | | | Newcrest Mining Limited (a) | | | 658,816,545 | | | | 535,392,084 | | |
Belgium — 0.51% | | | |
| | 2,788,865 | | | Groupe Bruxelles Lambert SA (b) | | | 234,732,253 | | | | 246,306,248 | | |
Bermuda — 0.77% | | | |
| | 6,516,471 | | | Jardine Matheson Holdings Limited | | | 333,620,326 | | | | 360,360,846 | | |
| | 297,300 | | | Jardine Strategic Holdings Limited | | | 8,012,551 | | | | 8,606,835 | | |
| | | | 341,632,877 | | | | 368,967,681 | | |
Canada — 4.43% | | | |
| | 22,175,338 | | | Barrick Gold Corporation | | | 275,861,925 | | | | 429,536,297 | | |
| | 20,403,775 | | | Goldcorp, Inc. | | | 537,369,500 | | | | 411,136,066 | | |
| | 7,419,204 | | | Agnico-Eagle Mines Limited | | | 234,920,569 | | | | 350,707,730 | | |
| 14,875,206
| | | Potash Corporation of Saskatchewan,
Inc. | | | 511,765,800
| | | | 263,588,650
| | |
| | 3,490,459 | | | Franco-Nevada Corporation | | | 148,910,524 | | | | 245,086,027 | | |
| | 12,398,563 | | | Cenovus Energy, Inc. | | | 338,639,157 | | | | 196,393,238 | | |
| | 3,570,888 | | | Suncor Energy, Inc. | | | 89,457,482 | | | | 104,818,526 | | |
| | 3,233,834 | | | Canadian Natural Resources Limited | | | 90,646,443 | | | | 97,115,538 | | |
| | 978,038 | | | Imperial Oil Limited | | | 28,980,782 | | | | 32,434,974 | | |
| | | | 2,256,552,182 | | | | 2,130,817,046 | | |
Denmark — 0.23% | | | |
| | 2,987,524 | | | ISS AS | | | 94,568,138 | | | | 113,439,224 | | |
France — 5.91% | | | |
| | 7,997,502 | | | Danone SA | | | 546,102,434 | | | | 560,166,899 | | |
| | 11,417,175 | | | Bouygues SA | | | 414,984,766 | | | | 380,692,774 | | |
| | 4,014,366 | | | Sanofi | | | 309,476,282 | | | | 331,464,534 | | |
| | 7,208,725 | | | Cie de Saint-Gobain | | | 311,259,631 | | | | 330,132,867 | | |
| | 10,592,606 | | | Carrefour SA | | | 415,884,904 | | | | 300,133,783 | | |
| | 2,173,169 | | | Sodexo SA | | | 56,283,339 | | | | 219,450,942 | | |
| | 4,139,835 | | | Total SA | | | 199,719,996 | | | | 208,242,246 | | |
| | 11,789,132 | | | Rexel SA | | | 172,974,551 | | | | 178,593,759 | | |
| | 851,019 | | | Wendel SA | | | 19,376,060 | | | | 98,322,979 | | |
First Eagle Funds | Semi-Annual Report | April 30, 2016
20
First Eagle Global Fund | Consolidated Schedule of Investments | Six-Month Period Ended April 30, 2016 (unaudited)
| Shares | | Description | | Cost (Note 1) | | Value (Note 1) | |
International Common Stocks — 39.60% (continued) | | | |
France — 5.91% (continued) | | | |
| | 1,401,821 | | | Legrand SA | | $ | 47,735,246 | | | $ | 79,840,445 | | |
| | 157,260 | | | Robertet SA (b)(c) | | | 20,623,058 | | | | 46,256,543 | | |
| | 42,252 | | | Robertet SA CI (b)(d)(e) | | | 800,508 | | | | 8,585,392 | | |
| | 1,867,732 | | | Neopost SA (c) | | | 166,306,200 | | | | 45,724,279 | | |
| | 12,000,000 | | | Emin Leydier SA (a)(b)(c)(d)(f)(g)(h) | | | — | | | | 36,137,791 | | |
| | 385,000 | | | Sabeton SA (b)(c) | | | 4,841,233 | | | | 5,951,399 | | |
| | 104,457 | | | Gaumont SA (b) | | | 6,087,824 | | | | 5,557,012 | | |
| | 66,717 | | | NSC Groupe (b)(c) | | | 11,738,587 | | | | 5,409,482 | | |
| | | | 2,704,194,619 | | | | 2,840,663,126 | | |
Germany — 1.70% | | | |
| | 7,521,717 | | | HeidelbergCement AG | | | 408,184,254 | | | | 668,262,892 | | |
| 1,339,934
| | | Hornbach Holding AG & Company
KGaA (b)(c) | | | 41,310,978
| | | | 87,454,642
| | |
| | 693,440 | | | Fraport AG | | | 20,976,007 | | | | 41,972,096 | | |
| | 127,857 | | | Linde AG | | | 16,977,405 | | | | 19,530,121 | | |
| | 29,871 | | | Hornbach Baumarkt AG | | | 560,239 | | | | 926,068 | | |
| | | | 488,008,883 | | | | 818,145,819 | | |
Hong Kong — 1.01% | | | |
| | 121,474,969 | | | Hang Lung Properties Limited | | | 297,864,935 | | | | 242,420,622 | | |
| | 12,693,580 | | | Guoco Group Limited (b) | | | 115,086,260 | | | | 139,914,282 | | |
| | 23,163,348 | | | Hysan Development Company Limited | | | 104,471,981 | | | | 102,574,611 | | |
| | | | 517,423,176 | | | | 484,909,515 | | |
Ireland — 0.33% | | | |
| | 5,421,344 | | | CRH PLC | | | 91,266,860 | | | | 157,477,467 | | |
Israel — 0.16% (i) | | | |
| | 15,719,757 | | | Israel Chemicals Limited | | | 156,830,538 | | | | 78,315,127 | | |
Italy — 0.63% | | | |
| | 17,017,170 | | | Italcementi S.p.A. | | | 230,422,418 | | | | 201,869,960 | | |
| | 1,734,972 | | | Italmobiliare S.p.A. RSP (b) | | | 121,356,934 | | | | 55,903,779 | | |
| | 1,021,137 | | | Italmobiliare S.p.A. (b) | | | 107,360,738 | | | | 44,431,627 | | |
| | | | 459,140,090 | | | | 302,205,366 | | |
Japan — 12.43% | | | |
| | 31,699,800 | | | KDDI Corporation | | | 366,987,357 | | | | 944,141,600 | | |
| | 9,186,430 | | | Secom Company Limited | | | 405,509,768 | | | | 729,129,712 | | |
First Eagle Funds | Semi-Annual Report | April 30, 2016
21
First Eagle Global Fund | Consolidated Schedule of Investments | Six-Month Period Ended April 30, 2016 (unaudited)
| Shares | | Description | | Cost (Note 1) | | Value (Note 1) | |
International Common Stocks — 39.60% (continued) | | | |
Japan — 12.43% (continued) | | | |
| | 1,018,190 | | | Keyence Corporation | | $ | 201,993,285 | | | $ | 642,684,590 | | |
| | 3,617,800 | | | Fanuc Corporation | | | 355,319,438 | | | | 561,201,024 | | |
| | 1,867,656 | | | SMC Corporation | | | 202,080,867 | | | | 479,991,103 | | |
| | 14,917,300 | | | Sompo Japan Nipponkoa Holdings, Inc. | | | 402,645,728 | | | | 412,258,653 | | |
| | 9,923,440 | | | Hoya Corporation | | | 208,313,700 | | | | 397,403,927 | | |
| | 17,333,880 | | | Mitsubishi Estate Company Limited | | | 308,415,483 | | | | 345,537,213 | | |
| | 2,442,300 | | | Hirose Electric Company Limited (c) | | | 245,404,954 | | | | 310,107,829 | | |
| | 21,930,600 | | | Astellas Pharma, Inc. | | | 166,711,913 | | | | 308,553,649 | | |
| | 1,892,590 | | | Shimano, Inc. | | | 23,499,497 | | | | 286,023,000 | | |
| | 10,038,320 | | | MS&AD Insurance Group Holdings, Inc. | | | 216,945,743 | | | | 280,063,467 | | |
| | 2,250,030 | | | Nissin Foods Holdings Company Limited | | | 78,827,717 | | | | 107,426,244 | | |
| | 5,147,000 | | | T. Hasegawa Company Limited (b)(c) | | | 79,849,658 | | | | 86,637,942 | | |
| 3,526,280
| | | Chofu Seisakusho Company
Limited (b)(c) | | | 64,322,537
| | | | 84,809,685
| | |
| | | | 3,326,827,645 | | | | 5,975,969,638 | | |
Mexico — 1.93% | | | |
| | 17,765,033 | | | Grupo Televisa S.A.B., ADR | | | 356,198,593 | | | | 519,271,914 | | |
| | 19,043,916 | | | Fresnillo PLC | | | 258,153,252 | | | | 309,703,774 | | |
| | 6,401,020 | | | Industrias Peñoles S.A.B. de C.V. | | | 7,339,323 | | | | 100,003,788 | | |
| | | | 621,691,168 | | | | 928,979,476 | | |
Norway — 0.04% | | | |
| | 2,000,066 | | | Orkla ASA | | | 13,269,921 | | | | 17,462,402 | | |
Russia — 0.21% | | | |
| | 19,361,267 | | | Gazprom PAO, ADR | | | 130,470,161 | | | | 100,059,028 | | |
South Korea — 1.66% | | | |
| | 3,453,745 | | | KT&G Corporation | | | 186,257,900 | | | | 372,837,138 | | |
| | 6,824,723 | | | Kia Motors Corporation | | | 326,127,925 | | | | 286,909,103 | | |
| 51,900
| | | Lotte Confectionery Company
Limited (b)(d) | | | 21,157,499
| | | | 113,378,276
| | |
| 39,989
| | | Namyang Dairy Products Company
Limited (b)(c) | | | 7,325,466
| | | | 26,076,730
| | |
| | | | 540,868,790 | | | | 799,201,247 | | |
Sweden — 0.70% | | | |
| | 5,939,940 | | | Investor AB, Class 'A' (b) | | | 116,378,542 | | | | 214,802,231 | | |
First Eagle Funds | Semi-Annual Report | April 30, 2016
22
First Eagle Global Fund | Consolidated Schedule of Investments | Six-Month Period Ended April 30, 2016 (unaudited)
| Shares | | Description | | Cost (Note 1) | | Value (Note 1) | |
International Common Stocks — 39.60% (continued) | | | |
Sweden — 0.70% (continued) | | | |
| | 3,394,798 | | | Investor AB, Class 'B' | | $ | 63,888,333 | | | $ | 124,581,682 | | |
| | | | 180,266,875 | | | | 339,383,913 | | |
Switzerland — 1.54% | | | |
| | 5,888,845 | | | Nestlé SA | | | 203,277,198 | | | | 438,916,312 | | |
| | 4,327,670 | | | Pargesa Holding SA | | | 272,881,781 | | | | 300,676,749 | | |
| | | | 476,158,979 | | | | 739,593,061 | | |
Thailand — 0.51% | | | |
| | 51,812,900 | | | Bangkok Bank PCL, NVDR | | | 214,262,825 | | | | 243,266,980 | | |
| | 36,500 | | | Bangkok Bank PCL | | | 154,243 | | | | 173,461 | | |
| | | | 214,417,068 | | | | 243,440,441 | | |
United Kingdom — 3.70% | | | |
| | 6,958,558 | | | Berkeley Group Holdings PLC (c) | | | 83,354,228 | | | | 304,516,727 | | |
| | 8,158,967 | | | Liberty Global PLC, Series 'C' (a) | | | 311,269,115 | | | | 298,618,192 | | |
| | 574,695 | | | Liberty Global PLC, Series 'A' (a) | | | 23,606,055 | | | | 21,683,242 | | |
| | 244,959 | | | Liberty Global PLC LiLAC, Series 'C' (a) | | | 9,760,127 | | | | 9,947,785 | | |
| | 28,734 | | | Liberty Global PLC LiLAC, Series 'A' (a) | | | 989,971 | | | | 1,078,387 | | |
| | 4,778,582 | | | British American Tobacco PLC | | | 257,800,241 | | | | 291,158,969 | | |
| | 12,196,447 | | | GlaxoSmithKline PLC | | | 243,907,853 | | | | 260,006,198 | | |
| | 1,985,123 | | | Willis Towers Watson PLC | | | 158,261,037 | | | | 247,941,863 | | |
| | 8,034,220 | | | Diageo PLC | | | 217,243,860 | | | | 216,705,779 | | |
| | 38,971,195 | | | WM Morrison Supermarkets PLC | | | 167,931,902 | | | | 108,817,686 | | |
| | 1,654,701 | | | Anglo American PLC | | | 33,638,356 | | | | 18,457,241 | | |
| | | | 1,507,762,745 | | | | 1,778,932,069 | | |
Total International Common Stocks | | | 15,039,550,479 | | | | 19,041,216,828 | | |
U.S. Common Stocks — 35.52% | | | |
Consumer Discretionary — 4.33% | | | |
| | 16,502,977 | | | Comcast Corporation, Class 'A' | | | 348,272,491 | | | | 1,002,720,882 | | |
| | 8,915,482 | | | Omnicom Group, Inc. | | | 382,904,586 | | | | 739,717,542 | | |
| | 4,228,800 | | | Vista Outdoor, Inc. (a)(c) | | | 82,968,266 | | | | 202,897,824 | | |
| | 3,992,318 | | | H&R Block, Inc. | | | 67,554,206 | | | | 80,804,516 | | |
| | 757,468 | | | Tiffany & Company | | | 46,011,301 | | | | 54,045,342 | | |
| | 2,485 | | | JG Boswell Company (b) | | | 573,840 | | | | 1,570,520 | | |
| | 31,592 | | | Mills Music Trust (b)(c)(d) | | | 930,198 | | | | 608,146 | | |
| | | | 929,214,888 | | | | 2,082,364,772 | | |
First Eagle Funds | Semi-Annual Report | April 30, 2016
23
First Eagle Global Fund | Consolidated Schedule of Investments | Six-Month Period Ended April 30, 2016 (unaudited)
| Shares | | Description | | Cost (Note 1) | | Value (Note 1) | |
U.S. Common Stocks — 35.52% (continued) | | | |
Consumer Staples — 0.72% | | | |
| | 3,258,980 | | | Colgate-Palmolive Company | | $ | 125,309,064 | | | $ | 231,126,862 | | |
| | 1,693,404 | | | Wal-Mart Stores, Inc. | | | 82,465,011 | | | | 113,237,925 | | |
| | | | 207,774,075 | | | | 344,364,787 | | |
Energy — 3.17% | | | |
| | 16,072,766 | | | National Oilwell Varco, Inc. | | | 948,102,059 | | | | 579,262,486 | | |
| | 10,763,867 | | | FMC Technologies, Inc. (a) | | | 384,945,324 | | | | 328,190,305 | | |
| | 5,864,214 | | | ConocoPhillips | | | 207,807,820 | | | | 280,250,787 | | |
| | 6,897,775 | | | Devon Energy Corporation | | | 365,559,270 | | | | 239,214,837 | | |
| | 867,954 | | | Phillips 66 | | | 68,629,773 | | | | 71,267,703 | | |
| | 3,908,035 | | | San Juan Basin Royalty Trust (b)(c) | | | 138,744,050 | | | | 27,004,522 | | |
| | | | 2,113,788,296 | | | | 1,525,190,640 | | |
Financials — 9.79% | | | |
| | 23,709,923 | | | Weyerhaeuser Company, REIT | | | 483,947,523 | | | | 761,562,727 | | |
| | 11,091,922 | | | American Express Company | | | 629,675,876 | | | | 725,744,456 | | |
| | 16,705,583 | | | Bank of New York Mellon Corporation | | | 416,480,491 | | | | 672,232,660 | | |
| | 10,500,485 | | | BB&T Corporation | | | 271,359,274 | | | | 371,507,159 | | |
| | 7,819,459 | | | U.S. Bancorp | | | 192,949,644 | | | | 333,812,705 | | |
| | 5,950,232 | | | American International Group, Inc. | | | 312,971,301 | | | | 332,141,950 | | |
| | 8,381,915 | | | Synchrony Financial (a) | | | 255,270,498 | | | | 256,235,141 | | |
| | 4,386,051 | | | WR Berkley Corporation | | | 117,583,057 | | | | 245,618,856 | | |
| | 1,088 | | | Berkshire Hathaway, Inc., Class 'A' (a) | | | 78,430,920 | | | | 238,272,000 | | |
| | 369,089 | | | Alleghany Corporation (a) | | | 148,299,805 | | | | 192,398,714 | | |
| | 4,889,353 | | | Brown & Brown, Inc. | | | 152,411,545 | | | | 171,665,184 | | |
| | 2,546,467 | | | Cincinnati Financial Corporation | | | 61,187,920 | | | | 168,092,287 | | |
| | 1,222,123 | | | Mastercard, Inc., Class 'A' | | | 24,535,794 | | | | 118,533,710 | | |
| | 1,517,758 | | | Visa, Inc., Class 'A' | | | 27,354,307 | | | | 117,231,628 | | |
| | | | 3,172,457,955 | | | | 4,705,049,177 | | |
Health Care — 0.70% | | | |
| | 2,290,255 | | | Varian Medical Systems, Inc. (a) | | | 174,504,960 | | | | 185,922,901 | | |
| | 1,065,236 | | | Anthem, Inc. | | | 49,376,896 | | | | 149,953,272 | | |
| | | | 223,881,856 | | | | 335,876,173 | | |
Industrials — 6.86% | | | |
| | 3,021,884 | | | 3M Company | | | 262,937,615 | | | | 505,802,944 | | |
| | 4,644,505 | | | Cintas Corporation (c) | | | 126,801,570 | | | | 416,983,659 | | |
First Eagle Funds | Semi-Annual Report | April 30, 2016
24
First Eagle Global Fund | Consolidated Schedule of Investments | Six-Month Period Ended April 30, 2016 (unaudited)
| Shares | | Description | | Cost (Note 1) | | Value (Note 1) | |
U.S. Common Stocks — 35.52% (continued) | | | |
Industrials — 6.86% (continued) | | | |
| | 8,414,508 | | | Flowserve Corporation (c) | | $ | 398,851,750 | | | $ | 410,712,135 | | |
| | 4,056,411 | | | Union Pacific Corporation | | | 332,054,346 | | | | 353,840,732 | | |
| | 3,666,754 | | | Deere & Company | | | 299,308,247 | | | | 308,410,679 | | |
| | 1,268,564 | | | WW Grainger, Inc. | | | 270,731,659 | | | | 297,503,629 | | |
| | 2,682,396 | | | Orbital ATK, Inc. | | | 106,416,234 | | | | 233,368,452 | | |
| | 910,600 | | | Northrop Grumman Corporation | | | 49,789,166 | | | | 187,820,356 | | |
| | 722,681 | | | Lockheed Martin Corporation | | | 50,032,817 | | | | 167,936,611 | | |
| | 1,378,153 | | | Cummins, Inc. | | | 122,205,130 | | | | 161,285,246 | | |
| | 4,133,029 | | | Timken Company | | | 158,386,035 | | | | 147,259,823 | | |
| | 5,851,664 | | | NOW, Inc. (a)(c) | | | 178,684,330 | | | | 105,681,052 | | |
| | | | 2,356,198,899 | | | | 3,296,605,318 | | |
Information Technology — 7.74% | | | |
| | 27,002,083 | | | Oracle Corporation | | | 856,422,677 | | | | 1,076,303,028 | | |
| | 16,419,091 | | | Microsoft Corporation | | | 402,143,883 | | | | 818,820,068 | | |
| | 9,803,351 | | | Linear Technology Corporation | | | 294,903,483 | | | | 436,053,053 | | |
| | 8,166,351 | | | Xilinx, Inc. | | | 329,367,112 | | | | 351,806,401 | | |
| | 12,051,787 | | | Teradata Corporation (a)(c) | | | 482,435,213 | | | | 304,910,211 | | |
| | 2,530,508 | | | Texas Instruments, Inc. | | | 119,204,422 | | | | 144,340,176 | | |
| | 1,366,412 | | | Automatic Data Processing, Inc. | | | 42,661,146 | | | | 120,845,477 | | |
| | 1,088,460 | | | F5 Networks, Inc. (a) | | | 97,135,264 | | | | 114,016,185 | | |
| | 163,012 | | | Alphabet, Inc., Class 'C' (a) | | | 39,031,290 | | | | 112,968,946 | | |
| | 134,718 | | | Alphabet, Inc., Class 'A' (a) | | | 75,360,379 | | | | 95,364,178 | | |
| | 3,211,806 | | | Intel Corporation | | | 78,183,809 | | | | 97,253,486 | | |
| | 1,074,758 | | | CommVault Systems, Inc. (a) | | | 51,692,790 | | | | 47,042,158 | | |
| | | | 2,868,541,468 | | | | 3,719,723,367 | | |
Materials — 1.63% | | | |
| 4,172,577
| | | Scotts Miracle-Gro Company,
Class 'A' (c) | | | 182,102,946
| | | | 295,335,000
| | |
| | 1,061,412 | | | Praxair, Inc. | | | 109,485,246 | | | | 124,673,454 | | |
| | 705,960 | | | Martin Marietta Materials, Inc. | | | 58,804,524 | | | | 119,469,611 | | |
| | 1,889,994 | | | Royal Gold, Inc. | | | 115,602,277 | | | | 118,351,424 | | |
| | 877,330 | | | Vulcan Materials Company | | | 32,356,460 | | | | 94,427,028 | | |
| | 543,021 | | | Deltic Timber Corporation | | | 26,175,935 | | | | 33,938,812 | | |
| | | | 524,527,388 | | | | 786,195,329 | | |
First Eagle Funds | Semi-Annual Report | April 30, 2016
25
First Eagle Global Fund | Consolidated Schedule of Investments | Six-Month Period Ended April 30, 2016 (unaudited)
| Shares | | Description | | Cost (Note 1) | | Value (Note 1) | |
U.S. Common Stocks — 35.52% (continued) | | | |
Utilities — 0.58% | | | |
| | 4,874,044 | | | UGI Corporation | | $ | 161,805,549 | | | $ | 196,131,530 | | |
| | 1,165,086 | | | IDACorp, Inc. (c) | | | 36,204,704 | | | | 84,736,705 | | |
| | | | 198,010,253 | | | | 280,868,235 | | |
Total U.S. Common Stocks | | | 12,594,395,078 | | | | 17,076,237,798 | | |
Total Common Stocks | | | 27,633,945,557 | | | | 36,117,454,626 | | |
Investment Company — 0.00*% | | | |
| 139,031
| | | State Street Institutional
U.S. Government Money Market
Fund, Premier Class | | | 139,031
| | | | 139,031
| | |
Warrant — 0.11% | | | |
United States — 0.11% | | | |
| | 2,427,136 |
| | JPMorgan Chase & Company
Warrant expire 10/28/18 (a)(b) | | | 30,405,920
| | | | 52,304,780
| | |
| Ounces | | | | | | | |
Commodity — 7.23% | | | |
| | 2,688,447 | | | Gold bullion (a) | | | 2,770,072,512 | | | | 3,476,215,602 | | |
| Principal | | | | | | | |
Notes and Bonds — 3.34% | | | |
U.S. Bonds — 2.09% | | | |
Government Obligations — 2.08% | | | |
$ | 250,000,000
| | | U.S. Treasury Note
0.50% due 06/15/16 | | | 250,032,121
| | | | 250,080,500
| | |
| 250,000,000
| | | U.S. Treasury Note
0.625% due 12/15/16 | | | 249,867,471
| | | | 250,156,250
| | |
| 250,000,000
| | | U.S. Treasury Note
0.75% due 03/15/17 (j) | | | 249,783,093
| | | | 250,400,500
| | |
| 250,000,000
| | | U.S. Treasury Note
0.875% due 09/15/16 | | | 250,309,830
| | | | 250,459,000
| | |
| | | | 999,992,515 | | | | 1,001,096,250 | | |
First Eagle Funds | Semi-Annual Report | April 30, 2016
26
First Eagle Global Fund | Consolidated Schedule of Investments | Six-Month Period Ended April 30, 2016 (unaudited)
| Principal | | Description | | Cost (Note 1) | | Value (Note 1) | |
U.S. Bonds — 2.09% (continued) | | | |
U.S. Corporate Bond — 0.01% | | | |
$ | 5,467,000
| | | Bausch & Lomb, Inc.
7.125% due 08/01/28 (b) | | $ | 4,856,624
| | | $ | 4,900,827
| | |
Total U.S. Bonds | | | 1,004,849,139 | | | | 1,005,997,077 | | |
International Notes and Bonds — 1.25% | | | |
International Corporate Notes and Bonds — 0.11% | | | |
France — 0.11% | | | |
| 12,000,000
EUR | | | Emin Leydier SA FRN
7.96% due 11/30/20 (b)(d)(f)(h)(k) | | | 14,476,149
| | | | 13,740,605
| | |
| 15,000,000
EUR | | | Emin Leydier SA FRN
7.96% due 11/30/20 (b)(d)(f)(h)(k) | | | 21,341,293
| | | | 17,175,756
| | |
| 12,050,000
EUR | | | Wendel SA
4.375% due 08/09/17 | | | 15,047,151
| | | | 14,483,059
| | |
| 3,500,000
EUR | | | Wendel SA
4.875% due 05/26/16 | | | 4,442,775
| | | | 4,019,699
| | |
Total International Corporate Notes and Bonds | | | 55,307,368 | | | | 49,419,119 | | |
International Government Bonds — 1.14% | | | |
Indonesia — 0.02% | | | |
| 103,496,000,000
IDR | | | Indonesia Treasury Bond
8.25% due 07/15/21 (b) | | | 8,089,962
| | | | 8,118,331
| | |
Mexico — 0.40% | | | |
| 2,559,090,000
MXN | | | Mexican Bonos
4.75% due 06/14/18 | | | 161,306,281
| | | | 149,700,365
| | |
| 764,192,000
MXN | | | Mexican Bonos
5.00% due 12/11/19 | | | 56,075,658
| | | | 44,459,290
| | |
| | | | 217,381,939 | | | | 194,159,655 | | |
Singapore — 0.67% | | | |
| 154,398,000
SGD | | | Singapore Government Bond
0.50% due 04/01/18 | | | 117,087,820
| | | | 113,711,598
| | |
| 150,966,000
SGD | | | Singapore Government Bond
2.375% due 04/01/17 | | | 123,388,340
| | | | 113,791,892
| | |
| 119,604,000
SGD | | | Singapore Government Bond
3.25% due 09/01/20 | | | 92,673,934
| | | | 95,738,340
| | |
| | | | 333,150,094 | | | | 323,241,830 | | |
First Eagle Funds | Semi-Annual Report | April 30, 2016
27
First Eagle Global Fund | Consolidated Schedule of Investments | Six-Month Period Ended April 30, 2016 (unaudited)
| Principal | | Description | | Cost (Note 1) | | Value (Note 1) | |
International Government Bonds — 1.14% (continued) | | | |
South Korea — 0.05% | | | |
| 26,408,550,000
KRW | | | Inflation Linked Korea Treasury Bond
2.75% due 03/10/17 (b)(l) | | $ | 25,224,486
| | | $ | 23,575,460
| | |
Total International Government Bonds | | | 583,846,481 | | | | 549,095,276 | | |
Total International Notes and Bonds | | | 639,153,849 | | | | 598,514,395 | | |
Total Notes and Bonds | | | 1,644,002,988 | | | | 1,604,511,472 | | |
Commercial Paper — 13.98% | | | |
International Commercial Paper — 5.71% | | | |
Canada — 0.40% | | | |
| 24,430,000
USD | | | Suncor Energy, Inc.
0.86% due 05/02/16 | | | 24,429,423
| | | | 24,429,053
| | |
| 43,889,000
USD | | | Total Capital Limited
0.46% due 05/16/16 | | | 43,880,771
| | | | 43,881,601
| | |
| 59,709,000
USD | | | Total Capital Limited
0.58% due 07/21/16 | | | 59,632,423
| | | | 59,645,951
| | |
| 63,701,000
USD | | | Total Capital Limited
0.60% due 07/15/16 | | | 63,622,701
| | | | 63,639,961
| | |
France — 0.47% | | | |
| 38,091,000
USD | | | Engie
0.66% due 05/09/16 | | | 38,085,498
| | | | 38,087,043
| | |
| 29,560,000
USD | | | Engie
0.67% due 05/09/16 | | | 29,555,665
| | | | 29,556,929
| | |
| 36,709,000
USD | | | Engie
0.78% due 07/06/16 | | | 36,657,179
| | | | 36,676,896
| | |
| 27,016,000
USD | | | Essilor International
0.48% due 06/02/16 | | | 27,004,713
| | | | 27,005,411
| | |
| 29,731,000
USD | | | Essilor International
0.49% due 05/10/16 | | | 29,727,432
| | | | 29,727,593
| | |
| 34,096,000
USD | | | Sanofi
0.43% due 06/14/16 | | | 34,078,497
| | | | 34,077,571
| | |
| 33,738,000
USD | | | Sanofi
0.49% due 06/30/16 | | | 33,711,010
| | | | 33,710,459
| | |
Germany — 0.55% | | | |
| 31,494,000
USD | | | BASF AG
0.43% due 06/01/16 | | | 31,482,610
| | | | 31,482,048
| | |
| 20,845,000
USD | | | BASF AG
0.46% due 05/12/16 | | | 20,842,134
| | | | 20,842,162
| | |
First Eagle Funds | Semi-Annual Report | April 30, 2016
28
First Eagle Global Fund | Consolidated Schedule of Investments | Six-Month Period Ended April 30, 2016 (unaudited)
| Principal | | Description | | Cost (Note 1) | | Value (Note 1) | |
International Commercial Paper — 5.71% (continued) | | | |
Germany — 0.55% (continued) | | | |
| 34,614,000
USD | | | BASF AG
0.51% due 07/01/16 | | $ | 34,584,674
| | | $ | 34,586,439
| | |
| 39,346,000
USD | | | Henkel Corporation
0.54% due 06/17/16 | | | 39,318,775
| | | | 39,322,704
| | |
| 27,083,000
USD | | | Henkel Corporation
0.60% due 07/08/16 | | | 27,052,817
| | | | 27,058,407
| | |
| 47,241,000
USD | | | Siemens Company
0.47% due 06/17/16 | | | 47,212,629
| | | | 47,214,958
| | |
| 33,738,000
USD | | | Siemens Company
0.48% due 06/20/16 | | | 33,715,977
| | | | 33,718,068
| | |
| 30,406,000
USD | | | Siemens Company
0.48% due 06/21/16 | | | 30,385,755
| | | | 30,387,602
| | |
Italy — 0.08% | | | |
| 9,346,000
USD | | | Eni S.p.A.
0.61% due 05/02/16 | | | 9,345,844
| | | | 9,345,786
| | |
| 28,123,000
USD | | | Eni S.p.A.
0.90% due 05/10/16 | | | 28,116,813
| | | | 28,120,207
| | |
Japan — 0.36% | | | |
| 3,849,000
USD | | | Hitachi Limited
0.56% due 05/02/16 | | | 3,848,941
| | | | 3,848,851
| | |
| 55,174,000
USD | | | Honda Corporation
0.44% due 05/18/16 | | | 55,162,797
| | | | 55,161,479
| | |
| 46,774,000
USD | | | Honda Corporation
0.49% due 06/08/16 | | | 46,750,301
| | | | 46,749,054
| | |
| 39,305,000
USD | | | Honda Corporation
0.49% due 06/13/16 | | | 39,282,465
| | | | 39,280,925
| | |
| 22,483,000
USD | | | Mitsui & Company Limited
0.51% due 05/17/16 | | | 22,478,004
| | | | 22,478,616
| | |
| 5,499,000
USD | | | Mitsui & Company Limited
0.52% due 05/02/16 | | | 5,498,922
| | | | 5,498,833
| | |
New Zealand — 0.40% | | | |
| 80,258,000
USD | | | Alpha Finance Corporation Limited
0.44% due 06/09/16 | | | 80,220,613
| | | | 80,221,895
| | |
| 22,390,000
USD | | | Alpha Finance Corporation Limited
0.44% due 07/14/16 | | | 22,370,210
| | | | 22,368,871
| | |
| 61,897,000
USD | | | Alpha Finance Corporation Limited
0.45% due 06/21/16 | | | 61,858,418
| | | | 61,859,547
| | |
| 28,000,000
USD | | | Alpha Finance Corporation Limited
0.46% due 05/18/16 | | | 27,994,050
| | | | 27,994,636
| | |
First Eagle Funds | Semi-Annual Report | April 30, 2016
29
First Eagle Global Fund | Consolidated Schedule of Investments | Six-Month Period Ended April 30, 2016 (unaudited)
| Principal | | Description | | Cost (Note 1) | | Value (Note 1) | |
International Commercial Paper — 5.71% (continued) | | | |
Switzerland — 1.44% | | | |
| 35,182,000
USD | | | Nestlé SA
0.45% due 05/17/16 | | $ | 35,175,120
| | | $ | 35,176,213
| | |
| 56,896,000
USD | | | Nestlé SA
0.47% due 06/07/16 | | | 56,869,101
| | | | 56,871,530
| | |
| 83,394,000
USD | | | Nestlé SA
0.58% due 07/18/16 | | | 83,291,008
| | | | 83,295,965
| | |
| 27,080,000
USD | | | Novartis International AG
0.45% due 05/06/16 | | | 27,078,345
| | | | 27,078,210
| | |
| 110,000,000
USD | | | Novartis International AG
0.46% due 05/11/16 | | | 109,986,250
| | | | 109,986,616
| | |
| 40,479,000
USD | | | Novartis International AG
0.47% due 06/10/16 | | | 40,458,311
| | | | 40,457,560
| | |
| 48,575,000
USD | | | Novartis International AG
0.47% due 06/13/16 | | | 48,548,311
| | | | 48,547,069
| | |
| 41,380,000
USD | | | Novartis International AG
0.48% due 05/19/16 | | | 41,370,276
| | | | 41,371,563
| | |
| 31,014,000
USD | | | Roche Holdings, Inc.
0.41% due 05/11/16 | | | 31,010,554
| | | | 31,010,423
| | |
| 31,262,000
USD | | | Roche Holdings, Inc.
0.42% due 07/01/16 | | | 31,240,282
| | | | 31,238,749
| | |
| 11,636,000
USD | | | Roche Holdings, Inc.
0.43% due 06/03/16 | | | 11,631,520
| | | | 11,631,622
| | |
| 51,128,000
USD | | | Roche Holdings, Inc.
0.43% due 06/17/16 | | | 51,099,965
| | | | 51,099,816
| | |
| 73,408,000
USD | | | Roche Holdings, Inc.
0.45% due 07/19/16 | | | 73,337,120
| | | | 73,332,849
| | |
| 52,390,000
USD | | | Roche Holdings, Inc.
0.45% due 07/22/16 | | | 52,337,493
| | | | 52,333,768
| | |
United Kingdom — 2.01% | | | |
| 29,605,000
USD | | | AstraZeneca PLC
0.71% due 05/16/16 | | | 29,596,365
| | | | 29,599,590
| | |
| 51,288,000
USD | | | AstraZeneca PLC
0.73% due 05/09/16 | | | 51,279,794
| | | | 51,282,672
| | |
| 32,011,000
USD | | | AstraZeneca PLC
0.73% due 06/17/16 | | | 31,980,910
| | | | 31,992,047
| | |
| 29,367,000
USD | | | AstraZeneca PLC
0.73% due 06/20/16 | | | 29,337,633
| | | | 29,348,378
| | |
| 40,942,000
USD | | | AstraZeneca PLC
0.76% due 05/12/16 | | | 40,932,617
| | | | 40,936,426
| | |
First Eagle Funds | Semi-Annual Report | April 30, 2016
30
First Eagle Global Fund | Consolidated Schedule of Investments | Six-Month Period Ended April 30, 2016 (unaudited)
| Principal | | Description | | Cost (Note 1) | | Value (Note 1) | |
International Commercial Paper — 5.71% (continued) | | | |
United Kingdom — 2.01% (continued) | | | |
| 61,412,000
USD | | | AstraZeneca PLC
0.76% due 05/13/16 | | $ | 61,396,647
| | | $ | 61,402,949
| | |
| 36,364,000
USD | | | AstraZeneca PLC
0.76% due 06/16/16 | | | 36,329,151
| | | | 36,342,957
| | |
| 36,634,000
USD | | | BP Capital Markets PLC
0.71% due 05/05/16 | | | 36,631,151
| | | | 36,630,874
| | |
| 36,634,000
USD | | | BP Capital Markets PLC
0.71% due 05/06/16 | | | 36,630,438
| | | | 36,630,331
| | |
| 37,194,000
USD | | | BP Capital Markets PLC
0.71% due 07/15/16 | | | 37,139,759
| | | | 37,134,733
| | |
| 29,605,000
USD | | | British American Tobacco PLC
0.90% due 06/15/16 | | | 29,572,435
| | | | 29,584,399
| | |
| 29,605,000
USD | | | British American Tobacco PLC
0.90% due 06/16/16 | | | 29,571,711
| | | | 29,583,921
| | |
| 41,035,000
USD | | | British American Tobacco PLC
0.90% due 06/20/16 | | | 40,984,846
| | | | 41,003,052
| | |
| 37,174,000
USD | | | British American Tobacco PLC
0.97% due 07/13/16 | | | 37,102,388
| | | | 37,129,469
| | |
| 46,385,000
USD | | | GlaxoSmithKline PLC
0.44% due 05/17/16 | | | 46,376,135
| | | | 46,375,955
| | |
| 36,364,000
USD | | | GlaxoSmithKline PLC
0.49% due 06/07/16 | | | 36,346,060
| | | | 36,347,375
| | |
| 87,579,000
USD | | | GlaxoSmithKline PLC
0.49% due 06/09/16 | | | 87,533,459
| | | | 87,536,609
| | |
| 51,215,000
USD | | | GlaxoSmithKline PLC
0.49% due 06/16/16 | | | 51,183,588
| | | | 51,185,363
| | |
| 41,035,000
USD | | | GlaxoSmithKline PLC
0.56% due 07/19/16 | | | 40,985,473
| | | | 40,990,221
| | |
| 79,593,000
USD | | | GlaxoSmithKline PLC
0.57% due 07/12/16 | | | 79,503,856
| | | | 79,515,613
| | |
| 36,704,000
USD | | | GlaxoSmithKline PLC
0.58% due 07/25/16 | | | 36,654,603
| | | | 36,660,093
| | |
| 23,436,000
USD | | | Royal Dutch Shell PLC
0.44% due 06/27/16 | | | 23,420,044
| | | | 23,418,063
| | |
| 34,365,000
USD | | | Royal Dutch Shell PLC
0.45% due 06/27/16 | | | 34,341,059
| | | | 34,338,698
| | |
Total International Commercial Paper | | | 2,746,171,839 | | | | 2,746,381,297 | | |
First Eagle Funds | Semi-Annual Report | April 30, 2016
31
First Eagle Global Fund | Consolidated Schedule of Investments | Six-Month Period Ended April 30, 2016 (unaudited)
| Principal | | Description | | Cost (Note 1) | | Value (Note 1) | |
U.S. Commercial Paper — 8.27% | | | |
$ | 85,000,000
| | | Abbott Laboratories
0.51% due 05/03/16 | | $ | 84,997,639
| | | $ | 84,994,371
| | |
| 14,116,000
| | | Abbott Laboratories
0.55% due 05/10/16 | | | 14,114,094
| | | | 14,113,391
| | |
| 28,495,000
| | | Abbott Laboratories
0.56% due 05/23/16 | | | 28,485,422
| | | | 28,483,032
| | |
| 21,795,000
| | | Abbott Laboratories
0.61% due 06/14/16 | | | 21,779,017
| | | | 21,776,285
| | |
| 47,258,000
| | | Abbott Laboratories
0.62% due 06/03/16 | | | 47,231,575
| | | | 47,227,814
| | |
| 37,793,000
| | | Abbott Laboratories
0.62% due 06/08/16 | | | 37,768,665
| | | | 37,765,159
| | |
| 28,612,000
| | | Abbott Laboratories
0.65% due 06/22/16 | | | 28,585,550
| | | | 28,582,472
| | |
| 24,295,000
| | | Abbott Laboratories
0.67% due 06/06/16 | | | 24,278,965
| | | | 24,278,049
| | |
| 81,883,000
| | | Air Products & Chemicals, Inc.
0.46% due 05/20/16 | | | 81,863,553
| | | | 81,863,894
| | |
| 33,738,000
| | | Altria Group, Inc.
0.68% due 05/10/16 | | | 33,732,349
| | | | 33,733,103
| | |
| 38,268,000
| | | Apple, Inc.
0.36% due 06/01/16 | | | 38,256,466
| | | | 38,254,530
| | |
| 31,890,000
| | | Apple, Inc.
0.36% due 06/02/16 | | | 31,880,079
| | | | 31,878,405
| | |
| 34,927,000
| | | Apple, Inc.
0.36% due 06/03/16 | | | 34,915,794
| | | | 34,913,859
| | |
| 23,611,000
| | | Apple, Inc.
0.37% due 06/06/16 | | | 23,602,500
| | | | 23,601,255
| | |
| 28,495,000
| | | Apple, Inc.
0.38% due 05/05/16 | | | 28,493,829
| | | | 28,493,390
| | |
| 31,014,000
| | | Apple, Inc.
0.39% due 05/03/16 | | | 31,013,345
| | | | 31,012,842
| | |
| 40,129,000
| | | Apple, Inc.
0.39% due 05/06/16 | | | 40,126,882
| | | | 40,126,347
| | |
| 34,096,000
| | | Apple, Inc.
0.43% due 07/05/16 | | | 34,070,144
| | | | 34,068,587
| | |
| 41,035,000
| | | Apple, Inc.
0.44% due 07/13/16 | | | 40,999,220
| | | | 40,996,957
| | |
| 83,394,000
| | | Apple, Inc.
0.44% due 07/14/16 | | | 83,320,289
| | | | 83,315,304
| | |
First Eagle Funds | Semi-Annual Report | April 30, 2016
32
First Eagle Global Fund | Consolidated Schedule of Investments | Six-Month Period Ended April 30, 2016 (unaudited)
| Principal | | Description | | Cost (Note 1) | | Value (Note 1) | |
U.S. Commercial Paper — 8.27% (continued) | | | |
$ | 39,806,000
| | | Apple, Inc.
0.46% due 07/22/16 | | $ | 39,765,199
| | | $ | 39,763,275
| | |
| 26,230,000
| | | Caterpillar Financial Services Company
0.46% due 06/10/16 | | | 26,216,885
| | | | 26,215,189
| | |
| 40,642,000
| | | Chevron Corporation
0.36% due 05/13/16 | | | 40,637,258
| | | | 40,636,484
| | |
| 26,634,000
| | | Chevron Corporation
0.46% due 05/16/16 | | | 26,629,006
| | | | 26,629,510
| | |
| 46,775,000
| | | Chevron Corporation
0.48% due 05/05/16 | | | 46,772,557
| | | | 46,772,357
| | |
| 50,775,000
| | | Chevron Corporation
0.48% due 05/06/16 | | | 50,771,685
| | | | 50,771,643
| | |
| 34,812,000
| | | Church & Dwight Company, Inc.
0.81% due 06/06/16 | | | 34,784,150
| | | | 34,792,856
| | |
| 36,847,000
| | | Coca-Cola Company
0.41% due 05/27/16 | | | 36,836,355
| | | | 36,835,078
| | |
| 28,495,000
| | | Coca-Cola Company
0.47% due 06/14/16 | | | 28,478,979
| | | | 28,478,506
| | |
| 55,174,000
| | | Coca-Cola Company
0.47% due 06/15/16 | | | 55,142,275
| | | | 55,141,081
| | |
| 26,634,000
| | | Coca-Cola Company
0.48% due 06/13/16 | | | 26,619,048
| | | | 26,619,018
| | |
| 41,697,000
| | | Coca-Cola Company
0.51% due 07/14/16 | | | 41,654,145
| | | | 41,650,170
| | |
| 40,252,000
| | | ConocoPhillips
0.92% due 05/04/16 | | | 40,248,981
| | | | 40,250,211
| | |
| 32,971,000
| | | Duke Energy Corporation
0.92% due 05/09/16 | | | 32,964,406
| | | | 32,966,659
| | |
| 39,378,000
| | | Duke Energy Corporation
0.92% due 05/13/16 | | | 39,366,187
| | | | 39,370,665
| | |
| 27,148,000
| | | DuPont
0.90% due 06/06/16 | | | 27,124,110
| | | | 27,131,494
| | |
| 31,856,000
| | | Emerson Electric Company
0.44% due 06/23/16 | | | 31,835,833
| | | | 31,832,493
| | |
| 39,394,000
| | | Entergy Corporation
1.19% due 06/03/16 | | | 39,351,028
| | | | 39,367,305
| | |
| 37,174,000
| | | Entergy Corporation
1.19% due 06/10/16 | | | 37,124,848
| | | | 37,143,381
| | |
| 59,878,000
| | | Exxon Mobil Corporation
0.43% due 06/14/16 | | | 59,847,263
| | | | 59,847,319
| | |
First Eagle Funds | Semi-Annual Report | April 30, 2016
33
First Eagle Global Fund | Consolidated Schedule of Investments | Six-Month Period Ended April 30, 2016 (unaudited)
| Principal | | Description | | Cost (Note 1) | | Value (Note 1) | |
U.S. Commercial Paper — 8.27% (continued) | | | |
$ | 23,645,000
| | | General Electric Company
0.35% due 06/13/16 | | $ | 23,635,397
| | | $ | 23,633,178
| | |
| 17,694,000
| | | General Electric Company
0.35% due 06/22/16 | | | 17,685,310
| | | | 17,683,065
| | |
| 16,966,000
| | | Honeywell International, Inc.
0.42% due 05/02/16 | | | 16,965,807
| | | | 16,965,505
| | |
| 20,518,000
| | | International Business Machines
Corporation
0.45% due 06/22/16 | | | 20,504,960
| | | | 20,504,150
| | |
| 40,129,000
| | | MetLife
0.48% due 05/12/16 | | | 40,123,237
| | | | 40,123,276
| | |
| 24,739,000
| | | MetLife
0.48% due 05/17/16 | | | 24,733,832
| | | | 24,733,990
| | |
| 40,942,000
| | | MetLife
0.48% due 05/26/16 | | | 40,928,637
| | | | 40,929,011
| | |
| 36,779,000
| | | MetLife
0.48% due 05/31/16 | | | 36,764,595
| | | | 36,764,811
| | |
| 55,058,000
| | | MetLife
0.56% due 07/20/16 | | | 54,990,707
| | | | 54,988,648
| | |
| 17,698,000
| | | Microsoft Corporation
0.33% due 05/18/16 | | | 17,695,326
| | | | 17,694,637
| | |
| 68,624,000
| | | Microsoft Corporation
0.39% due 05/11/16 | | | 68,616,756
| | | | 68,616,566
| | |
| 59,067,000
| | | Microsoft Corporation
0.39% due 06/01/16 | | | 59,047,672
| | | | 59,045,559
| | |
| 78,481,000
| | | Microsoft Corporation
0.41% due 05/04/16 | | | 78,478,384
| | | | 78,477,839
| | |
| 42,481,000
| | | Microsoft Corporation
0.43% due 06/08/16 | | | 42,462,167
| | | | 42,461,647
| | |
| 31,658,000
| | | Microsoft Corporation
0.43% due 07/13/16 | | | 31,631,038
| | | | 31,625,023
| | |
| 37,238,000
| | | National Oilwell Varco, Inc.
1.05% due 06/02/16 | | | 37,203,244
| | | | 37,223,405
| | |
| 37,140,000
| | | National Oilwell Varco, Inc.
1.05% due 06/23/16 | | | 37,082,588
| | | | 37,114,863
| | |
| 21,374,000
| | | PepsiCo, Inc.
0.31% due 05/04/16 | | | 21,373,466
| | | | 21,373,050
| | |
| 60,726,000
| | | PepsiCo, Inc.
0.41% due 06/21/16 | | | 60,691,589
| | | | 60,683,355
| | |
| 5,026,000
| | | Pfizer, Inc.
0.41% due 05/26/16 | | | 5,024,604
| | | | 5,024,556
| | |
First Eagle Funds | Semi-Annual Report | April 30, 2016
34
First Eagle Global Fund | Consolidated Schedule of Investments | Six-Month Period Ended April 30, 2016 (unaudited)
| Principal | | Description | | Cost (Note 1) | | Value (Note 1) | |
U.S. Commercial Paper — 8.27% (continued) | | | |
$ | 41,035,000
| | | Pfizer, Inc.
0.43% due 06/20/16 | | $ | 41,011,063
| | | $ | 41,008,742
| | |
| 72,000,000
| | | Pfizer, Inc.
0.48% due 05/23/16 | | | 71,979,320
| | | | 71,981,904
| | |
| 28,691,000
| | | Pfizer, Inc.
0.48% due 05/24/16 | | | 28,682,385
| | | | 28,683,449
| | |
| 28,691,000
| | | Pfizer, Inc.
0.48% due 05/25/16 | | | 28,682,010
| | | | 28,683,105
| | |
| 61,846,000
| | | Pfizer, Inc.
0.48% due 06/10/16 | | | 61,813,703
| | | | 61,816,128
| | |
| 59,067,000
| | | Pfizer, Inc.
0.48% due 06/22/16 | | | 59,026,900
| | | | 59,027,130
| | |
| 39,305,000
| | | Pfizer, Inc.
0.48% due 06/23/16 | | | 39,277,803
| | | | 39,277,798
| | |
| 43,568,000
| | | Pfizer, Inc.
0.48% due 07/11/16 | | | 43,527,615
| | | | 43,524,180
| | |
| 43,076,000
| | | Pfizer, Inc.
0.49% due 05/05/16 | | | 43,073,703
| | | | 43,073,882
| | |
| 65,506,000
| | | Pfizer, Inc.
0.51% due 07/18/16 | | | 65,435,035
| | | | 65,431,760
| | |
| 33,738,000
| | | Philip Morris International, Inc.
0.42% due 05/19/16 | | | 33,731,084
| | | | 33,730,559
| | |
| 34,927,000
| | | Philip Morris International, Inc.
0.44% due 06/02/16 | | | 34,913,650
| | | | 34,913,311
| | |
| 64,524,000
| | | Philip Morris International, Inc.
0.46% due 06/15/16 | | | 64,487,705
| | | | 64,487,524
| | |
| 31,890,000
| | | Philip Morris International, Inc.
0.49% due 06/28/16 | | | 31,865,338
| | | | 31,866,083
| | |
| 31,890,000
| | | Philip Morris International, Inc.
0.49% due 06/29/16 | | | 31,864,913
| | | | 31,865,576
| | |
| 31,494,000
| | | Praxair, Inc.
0.39% due 06/02/16 | | | 31,483,362
| | | | 31,481,656
| | |
| 31,494,000
| | | Praxair, Inc.
0.39% due 06/03/16 | | | 31,483,030
| | | | 31,481,232
| | |
| 28,781,000
| | | Precision Castparts Corporation
0.41% due 05/02/16 | | | 28,780,680
| | | | 28,780,125
| | |
| 43,311,000
| | | Qualcomm, Inc.
0.39% due 06/01/16 | | | 43,296,828
| | | | 43,295,755
| | |
| 37,238,000
| | | Qualcomm, Inc.
0.43% due 06/07/16 | | | 37,221,926
| | | | 37,222,186
| | |
First Eagle Funds | Semi-Annual Report | April 30, 2016
35
First Eagle Global Fund | Consolidated Schedule of Investments | Six-Month Period Ended April 30, 2016 (unaudited)
| Principal | | Description | | Cost (Note 1) | | Value (Note 1) | |
U.S. Commercial Paper — 8.27% (continued) | | | |
$ | 37,238,000
| | | Qualcomm, Inc.
0.43% due 06/08/16 | | $ | 37,221,491
| | | $ | 37,221,739
| | |
| 39,241,000
| | | Qualcomm, Inc.
0.49% due 05/19/16 | | | 39,231,582
| | | | 39,232,999
| | |
| 20,242,000
| | | Qualcomm, Inc.
0.49% due 07/20/16 | | | 20,220,409
| | | | 20,220,929
| | |
| 29,363,000
| | | Qualcomm, Inc.
0.49% due 07/21/16 | | | 29,331,288
| | | | 29,331,995
| | |
| 50,000,000
| | | Qualcomm, Inc.
0.50% due 05/10/16 | | | 49,993,875
| | | | 49,994,729
| | |
| 43,655,000
| | | Qualcomm, Inc.
0.51% due 05/03/16 | | | 43,653,787
| | | | 43,653,370
| | |
| 28,691,000
| | | Schlumberger Investments SA
0.87% due 05/02/16 | | | 28,690,323
| | | | 28,690,199
| | |
| 28,691,000
| | | Schlumberger Investments SA
0.87% due 05/03/16 | | | 28,689,645
| | | | 28,689,929
| | |
| 58,861,000
| | | Schlumberger Investments SA
0.87% due 05/04/16 | | | 58,856,831
| | | | 58,858,245
| | |
| 34,901,000
| | | Schlumberger Investments SA
0.87% due 06/06/16 | | | 34,871,334
| | | | 34,886,596
| | |
| 60,562,000
| | | Syngenta Wilmington
0.97% due 05/02/16 | | | 60,560,402
| | | | 60,559,431
| | |
| 22,729,000
| | | Syngenta Wilmington
0.97% due 05/04/16 | | | 22,727,201
| | | | 22,727,371
| | |
| 37,174,000
| | | Syngenta Wilmington
1.30% due 06/13/16 | | | 37,116,277
| | | | 37,143,796
| | |
| 67,750,000
| | | United Healthcare Company
0.66% due 05/18/16 | | | 67,729,204
| | | | 67,733,445
| | |
| 26,634,000
| | | United Technologies Corporation
0.78% due 05/10/16 | | | 26,628,873
| | | | 26,630,134
| | |
| 33,595,000
| | | Walt Disney Company
0.49% due 05/16/16 | | | 33,588,281
| | | | 33,588,972
| | |
| 30,856,000
| | | Walt Disney Company
0.49% due 05/20/16 | | | 30,848,183
| | | | 30,848,800
| | |
| 50,000,000
| | | Walt Disney Company
0.49% due 06/20/16 | | | 49,966,667
| | | | 49,965,839
| | |
| 25,650,000
| | | Walt Disney Company
0.49% due 06/21/16 | | | 25,632,558
| | | | 25,631,987
| | |
| 42,476,000
| | | Walt Disney Company
0.49% due 06/24/16 | | | 42,445,417
| | | | 42,443,822
| | |
First Eagle Funds | Semi-Annual Report | April 30, 2016
36
First Eagle Global Fund | Consolidated Schedule of Investments | Six-Month Period Ended April 30, 2016 (unaudited)
| Principal | | Description | | Cost (Note 1) | | Value (Note 1) | |
U.S. Commercial Paper — 8.27% (continued) | |
$ | 70,042,000
| | | Walt Disney Company
0.49% due 07/08/16 | | $ | 69,978,495
| | | $ | 69,971,180
| | |
Total U.S. Commercial Paper | | | 3,976,945,067 | | | | 3,977,017,466 | | |
Total Commercial Paper | | | 6,723,116,906 | | | | 6,723,398,763 | | |
Total Investments — 99.78% (Cost: $38,801,682,914) | | | | | 47,974,024,274 | | |
Other Assets in Excess of Liabilities — 0.22% | | | | | 103,372,931 | | |
Net Assets — 100.00% | | | | $ | 48,077,397,205 | | |
* Less than 0.01%
(a) Non-income producing security/commodity.
(b) Security is deemed illiquid. At April 30, 2016, the value of these securities amounted to $1,356,612,008 or 2.82% of net assets.
(c) An affiliate of the Fund as defined by the Investment Company Act of 1940. An affiliate is defined as a company in which the Fund directly or indirectly owns, controls, or holds power to vote 5% or more of the outstanding voting securities.
(d) Securities valued in accordance with fair value procedures under the supervision of the Board of Trustees, representing $189,625,966 or 0.39% of net assets.
(e) Represents non-voting class of shares.
(f) Represents securities that are subject to legal or contractual restrictions on resale. At April 30, 2016, the value of these securities amounted to $67,054,152 or 0.14% of net assets.
(g) Held through Financiere Rouge, LLC, wholly owned subsidiary and disregarded entity for U.S. tax purposes.
(h) On November 30, 2015, during a shareholder and bondholder meeting, a merger was approved between FINEL SA and Emin Leydier SAS, effective December 1, 2015. The merger provided that FINEL SA absorbed Emin Leydier SAS, and changed its name to Emin Leydier SA.
(i) Securities with a total market value equal to $78,315,127 have been fair valued based on fair value adjustment factors at April 30, 2016.
(j) This security, in part or in entirety, was pledged and segregated with the custodian for collateral on certain derivative contracts at the close of the reporting period.
(k) Floating rate security. Rate shown is the rate in effect at April 30, 2016.
(l) Inflation protected security.
At April 30, 2016, cost is substantially identical for both book and federal income tax purposes. Net unrealized appreciation consisted of:
Gross unrealized appreciation | | $ | 11,515,909,903 | | |
Gross unrealized depreciation | | | (2,343,568,543 | ) | |
Net unrealized appreciation | | $ | 9,172,341,360 | | |
First Eagle Funds | Semi-Annual Report | April 30, 2016
37
First Eagle Global Fund | Consolidated Schedule of Investments | Six-Month Period Ended April 30, 2016 (unaudited)
Abbreviations used in this schedule include:
ADR — American Depositary Receipt
AG — Aktien Gesellschaft
AS — Anonim Sirket
ASA — Norwegian Public Limited Company
FRN — Floating Rate Note
NVDR — Non-Voting Depository Receipt
PAO — Russian Public Joint Stock Company
PCL — Public Company Limited
PLC — Public Limited Company
REIT — Real Estate Investment Trust
RSP — Represents Savings Shares
SA — Société Anonyme
SAS — Société par Actions Simplifiée
S.p.A. — Società per Azioni
Currencies
EUR — Euro
IDR — Indonesian Rupiah
KRW — South Korean Won
MXN — Mexican Peso
SGD — Singapore Dollar
USD — United States Dollar
Restricted Securities | | Acquisition Date | | Cost | | Carrying Value
Per
Share/Principal | |
Emin Leydier SA FRN 7.96% due 11/30/20# | | 06/22/05 | | $ | 14,476,149 | | | $ | 1.15 | | |
Emin Leydier SA FRN 7.96% due 11/30/20 | | 07/30/09 | | | 21,341,293 | | | | 1.15 | | |
Emin Leydier SA | | 07/30/09 | | | — | | | | 3.01 | | |
#Formerly known as FINEL.
Foreign Currency Exchange Contracts — Sales
Settlement
Dates
Through | | Foreign Currency
To be Delivered | | U.S. $
To be Received | | U.S. $ Value
At April 30,
2016 | | Unrealized
Appreciation
At April 30,
2016 | | Unrealized
Depreciation
At April 30,
2016 | |
05/18/16 | | | 75,785,000 | | | Euro | | $ | 85,098,977 | | | $ | 86,815,024 | | | $ | — | | | $ | (1,716,047 | ) | |
06/15/16 | | | 78,477,000 | | | Euro | | | 88,173,618 | | | | 89,975,753 | | | | — | | | | (1,802,135 | ) | |
07/13/16 | | | 78,477,000 | | | Euro | | | 88,168,125 | | | | 90,057,192 | | | | — | | | | (1,889,067 | ) | |
08/17/16 | | | 82,975,000 | | | Euro | | | 91,333,072 | | | | 95,326,943 | | | | — | | | | (3,993,871 | ) | |
09/14/16 | | | 43,319,000 | | | Euro | | | 49,464,233 | | | | 49,816,465 | | | | — | | | | (352,232 | ) | |
05/18/16 | | | 32,082,000 | | | British Pound | | | 45,562,215 | | | | 46,878,297 | | | | — | | | | (1,316,082 | ) | |
06/15/16 | | | 45,719,000 | | | British Pound | | | 64,493,279 | | | | 66,809,800 | | | | — | | | | (2,316,521 | ) | |
06/15/16 | | | 12,239,400,000 | | | Japanese Yen | | | 113,755,772 | | | | 115,150,558 | | | | — | | | | (1,394,786 | ) | |
07/13/16 | | | 12,239,400,000 | | | Japanese Yen | | | 113,886,365 | | | | 115,261,991 | | | | — | | | | (1,375,626 | ) | |
08/17/16 | | | 12,239,400,000 | | | Japanese Yen | | | 113,966,221 | | | | 115,383,747 | | | | — | | | | (1,417,526 | ) | |
09/14/16 | | | 12,239,400,000 | | | Japanese Yen | | | 114,099,069 | | | | 115,503,508 | | | | — | | | | (1,404,439 | ) | |
First Eagle Funds | Semi-Annual Report | April 30, 2016
38
First Eagle Global Fund | Consolidated Schedule of Investments | Six-Month Period Ended April 30, 2016 (unaudited)
Foreign Currency Exchange Contracts — Sales (continued)
Settlement
Dates
Through | | Foreign Currency
To be Delivered | | U.S. $
To be Received | | U.S. $ Value
At April 30,
2016 | | Unrealized
Appreciation
At April 30,
2016 | | Unrealized
Depreciation
At April 30,
2016 | |
10/19/16 | | | 12,239,400,000 | | | Japanese Yen | | $ | 113,966,302 | | | $ | 115,357,472 | | | $ | — | | | $ | (1,391,170 | ) | |
| | | | | | | $ | 1,081,967,248 | | | $ | 1,102,336,750 | | | $ | — | | | $ | (20,369,502 | ) | |
Affiliated Securities
Affiliated Securities | | Shares
October 31,
2015 | | Gross
Additions | | Gross
Reductions | | Shares
April 30,
2016 | | Market
Value
April 30,
2016 | | Realized
Gain /
(Loss) | | Dividend
Income | |
Berkeley Group
Holdings PLC | | | 7,041,897 | | | | — | | | | 83,339 | | | | 6,958,558 | | | $ | 304,516,727 | | | $ | 3,181,593 | | | $ | 10,355,028 | | |
Chofu Seisakusho
Company Limited | | | 3,526,280 | | | | — | | | | — | | | | 3,526,280 | | | | 84,809,685 | | | | — | | | | 421,818 | | |
Cintas Corporation* | | | 5,828,568 | | | | — | | | | 1,184,063 | | | | 4,644,505 | | | | 416,983,659 | | | | 66,838,272 | | | | 6,008,208 | | |
Emin Leydier SA# | | | 12,000,000 | | | | — | | | | — | | | | 12,000,000 | | | | 36,137,791 | | | | — | | | | — | | |
Flowserve
Corporation | | | 6,170,798 | | | | 2,243,710 | | | | — | | | | 8,414,508 | | | | 410,712,135 | | | | — | | | | 2,839,910 | | |
Hirose Electric
Company Limited | | | 2,217,600 | | | | 224,700 | | | | — | | | | 2,442,300 | | | | 310,107,829 | | | | — | | | | 2,203,720 | | |
Hornbach Holding
AG & Company
KGaA | | | 1,339,934 | | | | — | | | | — | | | | 1,339,934 | | | | 87,454,642 | | | | — | | | | — | | |
IDACorp, Inc.* | | | 3,760,485 | | | | — | | | | 2,595,399 | | | | 1,165,086 | | | | 84,736,705 | | | | 96,094,979 | | | | 3,219,625 | | |
Italmobiliare S.p.A.
RSP | | | 1,734,972 | | | | — | | | | — | | | | 1,734,972 | | | | 55,903,779 | | | | — | | | | — | | |
Mills Music Trust | | | 31,592 | | | | — | | | | — | | | | 31,592 | | | | 608,146 | | | | — | | | | 30,964 | | |
NOW, Inc. | | | 5,851,664 | | | | — | | | | — | | | | 5,851,664 | | | | 105,681,052 | | | | — | | | | — | | |
NSC Groupe | | | 66,717 | | | | — | | | | — | | | | 66,717 | | | | 5,409,482 | | | | — | | | | — | | |
Namyang Dairy
Products Company
Limited | | | 39,989 | | | | — | | | | — | | | | 39,989 | | | | 26,076,730 | | | | — | | | | 26,669 | | |
Neopost SA | | | 1,867,732 | | | | — | | | | — | | | | 1,867,732 | | | | 45,724,279 | | | | — | | | | 1,414,781 | | |
Robertet SA | | | 157,260 | | | | — | | | | — | | | | 157,260 | | | | 46,256,543 | | | | — | | | | — | | |
Sabeton SA | | | 385,000 | | | | — | | | | — | | | | 385,000 | | | | 5,951,399 | | | | — | | | | — | | |
San Juan Basin
Royalty Trust | | | 3,908,035 | | | | — | | | | — | | | | 3,908,035 | | | | 27,004,522 | | | | — | | | | 339,284 | | |
Scotts Miracle-Gro
Company | | | 4,172,577 | | | | — | | | | — | | | | 4,172,577 | | | | 295,335,000 | | | | — | | | | 3,922,222 | | |
T. Hasegawa
Company Limited | | | 5,147,000 | | | | — | | | | — | | | | 5,147,000 | | | | 86,637,942 | | | | — | | | | 615,103 | | |
First Eagle Funds | Semi-Annual Report | April 30, 2016
39
First Eagle Global Fund | Consolidated Schedule of Investments | Six-Month Period Ended April 30, 2016 (unaudited)
Affiliated Securities (continued)
Affiliated Securities | | Shares
October 31,
2015 | | Gross
Additions | | Gross
Reductions | | Shares
April 30,
2016 | | Market
Value
April 30,
2016 | | Realized
Gain /
(Loss) | | Dividend
Income | |
Teradata
Corporation | | | 12,051,787 | | | | — | | | | — | | | | 12,051,787 | | | $ | 304,910,211 | | | $ | — | | | $ | — | | |
Timken Company | | | 4,133,029 | | | | — | | | | — | | | | 4,133,029 | | | | 147,259,823 | | | | — | | | | 2,149,175 | | |
Vista Outdoor, Inc. | | | 4,424,582 | | | | — | | | | 195,782 | | | | 4,228,800 | | | | 202,897,824 | | | | 3,316,096 | | | | — | | |
Total | | | | | | | | | | $ | 3,091,115,905 | | | $ | 169,430,940 | | | $ | 33,546,507 | | |
#Formerly known as FINEL.
*Represents an unaffiliated issuer as of April 30, 2016, as such, amounts represented above will not agree to balances in the Statements of Assets and Liabilities and Statements of Operations.
Industry Diversification for Portfolio Holdings | | Percent of
Net Assets | |
International Common Stocks
Consumer Discretionary | �� | | 4.41 | % | |
Consumer Staples | | | 5.31 | | |
Energy | | | 1.54 | | |
Financials | | | 6.32 | | |
Health Care | | | 2.70 | | |
Industrials | | | 6.81 | | |
Information Technology | | | 2.08 | | |
Materials | | | 8.47 | | |
Telecommunication Services | | | 1.96 | | |
Total International Common Stocks | | | 39.60 | | |
U.S. Common Stocks
Consumer Discretionary | | | 4.33 | | |
Consumer Staples | | | 0.72 | | |
Energy | | | 3.17 | | |
Financials | | | 9.79 | | |
Health Care | | | 0.70 | | |
Industrials | | | 6.86 | | |
Information Technology | | | 7.74 | | |
Materials | | | 1.63 | | |
Utilities | | | 0.58 | | |
Total U.S. Common Stocks | | | 35.52 | | |
First Eagle Funds | Semi-Annual Report | April 30, 2016
40
First Eagle Global Fund | Consolidated Schedule of Investments | Six-Month Period Ended April 30, 2016 (unaudited)
Industry Diversification for Portfolio Holdings (continued) | | Percent of
Net Assets | |
Investment Company | | | 0.00 | %* | |
Warrant | | | 0.11 | | |
Commodity | | | 7.23 | | |
U.S. Bonds
Consumer Discretionary | | | 0.01 | | |
Government Issues | | | 2.08 | | |
Total U.S. Bonds | | | 2.09 | | |
International Notes and Bonds
Financials | | | 0.04 | | |
Government Issues | | | 1.14 | | |
Materials | | | 0.07 | | |
Total International Notes and Bonds | | | 1.25 | | |
Commercial Paper
International Commercial Paper | | | 5.71 | | |
U.S. Commercial Paper | | | 8.27 | | |
Total Commercial Paper | | | 13.98 | | |
Total Investments | | | 99.78 | % | |
*Less than 0.01%
See Notes to Consolidated Financial Statements.
First Eagle Funds | Semi-Annual Report | April 30, 2016
41
First Eagle Overseas Fund
Data as of April 30, 2016 (unaudited)
Investment Objective
The First Eagle Overseas Fund seeks long-term growth of capital by investing primarily in equities issued by non-U.S. corporations. Management's research-driven process focuses on undervalued securities.
Average Annual Returns (%) | | | | | | One-Year | | Five-Years | | Ten-Years | |
First Eagle Overseas Fund | | Class A | | without sales load | | | 0.74 | | | | 4.18 | | | | 5.53 | | |
| | | | | with sales load | | | -4.29 | | | | 3.11 | | | | 4.99 | | |
MSCI EAFE Index | | | | | | | -9.32 | | | | 1.69 | | | | 1.61 | | |
Consumer Price Index | | | | | | | 1.13 | | | | 1.25 | | | | 1.73 | | |
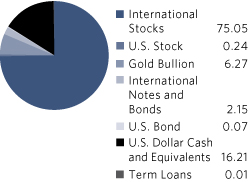
Countries** (%)
Japan | | | 21.44 | | |
France | | | 12.06 | | |
United States | | | 6.58 | | |
Canada | | | 5.88 | | |
United Kingdom | | | 5.78 | | |
Germany | | | 3.64 | | |
Hong Kong | | | 3.54 | | |
South Korea | | | 3.46 | | |
Mexico | | | 3.39 | | |
Switzerland | | | 2.92 | | |
Singapore | | | 2.69 | | |
Bermuda | | | 1.73 | | |
Sweden | | | 1.24 | | |
Australia | | | 1.19 | | |
Italy | | | 1.13 | | |
Thailand | | | 1.10 | | |
Netherlands | | | 0.85 | | |
Norway | | | 0.70 | | |
Belgium | | | 0.65 | | |
Chile | | | 0.62 | | |
Greece | | | 0.57 | | |
Denmark | | | 0.51 | | |
Ireland | | | 0.50 | | |
Austria | | | 0.35 | | |
Taiwan | | | 0.33 | | |
Russia | | | 0.30 | | |
Israel | | | 0.26 | | |
Turkey | | | 0.23 | | |
Africa | | | 0.08 | | |
Poland | | | 0.04 | | |
Indonesia | | | 0.03 | | |
* Asset Allocation and Countries percentages are based on total investments in the portfolio.
**Country allocations reflect country of the issuer (not currency of issue) and exclude short term investments. Bonds of non-U.S. issuers may be U.S. dollar denominated.
The Fund's portfolio composition is subject to change at any time.
First Eagle Funds | Semi-Annual Report | April 30, 2016
42
First Eagle Overseas Fund | Fund Overview
Growth of a $10,000 Initial Investment
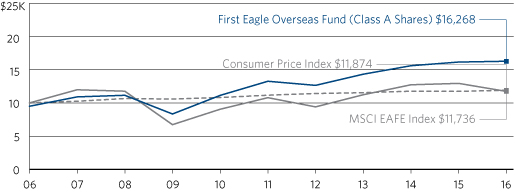
Performance data quoted herein represents past performance and should not be considered indicative of future results. Performance data quoted herein does not reflect the deduction of taxes that a shareholder would pay on Fund distributions or the sale of Fund shares. The average annual returns shown above are historical and reflect changes in share price, reinvested dividends and are net of expenses.
The average annual returns for Class A Shares give effect to the deduction of the maximum sales charge of 5.00%.
The MSCI EAFE Index is an unmanaged total return index, reported in U.S. Dollars, based on share prices and reinvested net dividends of approximately 1,100 companies from 21 developed market countries. One cannot invest directly in an index. The Consumer Price Index (CPI) represents the change in price of all goods and services purchased for consumption by urban households.
Top 10 Holdings* (%)
Gold Bullion** (precious metal) | | | 6.22 | | |
KDDI Corporation (Japanese telecommunications company) | | | 2.90 | | |
Secom Company Limited (Japanese security services provider) | | | 2.16 | | |
HeidelbergCement AG (German cement company) | | | 2.05 | | |
Keyence Corporation (Japanese automation sensor manufacturer) | | | 2.04 | | |
Grupo Televisa S.A.B. ADR (Mexican media company) | | | 1.91 | | |
Danone SA (French food processing company) | | | 1.84 | | |
Fanuc Corporation (Japanese automated machine tools manufacturer) | | | 1.73 | | |
Nestlé SA (Swiss food manufacturer) | | | 1.54 | | |
SMC Corporation (Japanese automatic control equipment manufacturer) | | | 1.49 | | |
Total | | | 23.88 | | |
* Holdings in cash, commercial paper and other short term cash equivalents have been excluded.
**The Fund invests in gold and precious metals through investment in a wholly-owned subsidiary of the Fund organized under the laws of the Cayman Islands (the "Subsidiary"). Gold Bullion and commodities include the Fund's investment in the Subsidiary.
Percentages are based on total net assets.
First Eagle Funds | Semi-Annual Report | April 30, 2016
43
First Eagle Overseas Fund | Consolidated Schedule of Investments | Six-Month Period Ended April 30, 2016 (unaudited)
| Shares | | Description | | Cost (Note 1) | | Value (Note 1) | |
Common Stocks — 74.73% | | | |
International Common Stocks — 74.49% | | | |
Africa — 0.08% | | | |
| | 118,663 | | | Randgold Resources Limited, ADR | | $ | 7,074,131 | | | $ | 11,925,632 | | |
Australia — 1.18% | | | |
| | 11,717,071 | | | Newcrest Mining Limited (a) | | | 210,554,749 | | | | 169,005,125 | | |
Austria — 0.35% | | | |
| | 2,552,584 | | | Wienerberger AG | | | 31,893,213 | | | | 50,433,558 | | |
Belgium — 0.65% | | | |
| | 907,727 | | | Groupe Bruxelles Lambert SA (b) | | | 69,227,228 | | | | 80,168,395 | | |
| | 98,473 | | | Sofina SA | | | 8,428,556 | | | | 12,544,166 | | |
| | | | 77,655,784 | | | | 92,712,561 | | |
Bermuda — 1.72% | | | |
| | 2,998,400 | | | Jardine Matheson Holdings Limited | | | 133,424,811 | | | | 165,811,520 | | |
| | 5,881,403 | | | Hiscox Limited | | | 70,399,116 | | | | 77,385,525 | | |
| | 132,100 | | | Jardine Strategic Holdings Limited | | | 3,560,288 | | | | 3,824,295 | | |
| | | | 207,384,215 | | | | 247,021,340 | | |
Canada — 5.69% | | | |
| | 3,306,324 | | | Agnico-Eagle Mines Limited | | | 110,909,233 | | | | 156,290,808 | | |
| | 6,044,482 | | | Goldcorp, Inc. | | | 159,971,703 | | | | 121,796,312 | | |
| 6,848,207 | | | Potash Corporation of
Saskatchewan, Inc. | | | 238,001,625 | | | | 121,350,228 | | |
| | 7,645,847 | | | Cenovus Energy, Inc. | | | 186,103,811 | | | | 121,110,217 | | |
| | 4,694,846 | | | Barrick Gold Corporation | | | 50,363,489 | | | | 90,939,167 | | |
| | 1,054,193 | | | Franco-Nevada Corporation | | | 44,943,106 | | | | 74,021,203 | | |
| | 2,106,982 | | | Suncor Energy, Inc. | | | 52,774,137 | | | | 61,847,571 | | |
| | 1,442,331 | | | Canadian Natural Resources Limited | | | 37,182,714 | | | | 43,314,762 | | |
| | 519,958 | | | Imperial Oil Limited | | | 15,407,202 | | | | 17,243,526 | | |
| | 1,100,050 | | | EnCana Corporation | | | 14,298,776 | | | | 8,426,383 | | |
| | | | 909,955,796 | | | | 816,340,177 | | |
Chile — 0.61% | | | |
| | 3,925,749 | | | Cia Cervecerias Unidas SA, ADR | | | 84,378,900 | | | | 88,015,293 | | |
Denmark — 0.51% | | | |
| | 1,927,059 | | | ISS AS | | | 65,007,600 | | | | 73,172,325 | | |
First Eagle Funds | Semi-Annual Report | April 30, 2016
44
First Eagle Overseas Fund | Consolidated Schedule of Investments | Six-Month Period Ended April 30, 2016 (unaudited)
| Shares | | Description | | Cost (Note 1) | | Value (Note 1) | |
International Common Stocks — 74.49% (continued) | | | |
France — 11.83% | | | |
| | 3,775,773 | | | Danone SA | | $ | 256,132,626 | | | $ | 264,465,461 | | |
| | 5,945,130 | | | Bouygues SA | | | 213,738,152 | | | | 198,233,629 | | |
| | 5,549,093 | | | Carrefour SA | | | 179,909,286 | | | | 157,229,512 | | |
| | 3,233,820 | | | Cie de Saint-Gobain | | | 138,658,254 | | | | 148,096,962 | | |
| | 1,732,226 | | | Sanofi | | | 141,847,046 | | | | 143,029,181 | | |
| | 2,421,629 | | | Total SA | | | 115,717,408 | | | | 121,812,938 | | |
| | 1,125,050 | | | Sodexo SA | | | 39,996,849 | | | | 113,609,794 | | |
| | 6,886,731 | | | Rexel SA | | | 99,926,196 | | | | 104,327,204 | | |
| | 2,324,457 | | | Numericable-SFR SAS | | | 77,416,208 | | | | 76,082,420 | | |
| | 235,837 | | | Robertet SA (b)(c) | | | 20,591,064 | | | | 69,369,224 | | |
| | 51,500 | | | Robertet SA CI (b)(d)(e) | | | 2,151,628 | | | | 10,464,538 | | |
| | 493,657 | | | Wendel SA | | | 10,886,846 | | | | 57,034,951 | | |
| | 558,938 | | | Laurent-Perrier (b)(c) | | | 19,851,603 | | | | 47,520,905 | | |
| | 648,834 | | | Legrand SA | | | 22,223,920 | | | | 36,954,215 | | |
| | 11,593,581 | | | Emin Leydier SA (a)(b)(c)(e)(f)(g)(h) | | | 9,166,547 | | | | 34,913,867 | | |
| 442,830 | | | Société Foncière Financière et de
Participations (b) | | | 29,139,582 | | | | 34,211,518 | | |
| | 896,416 | | | Legris Industries SA (a)(b)(c)(e)(h) | | | 23,119,325 | | | | 21,288,397 | | |
| | 801,693 | | | Neopost SA | | | 41,407,216 | | | | 19,626,389 | | |
| | 364,373 | | | Gaumont SA (b)(c) | | | 21,698,753 | | | | 19,384,294 | | |
| | 146,562 | | | BioMerieux | | | 11,367,766 | | | | 18,905,022 | | |
| | 100,000 | | | Sabeton SA (b) | | | 1,463,143 | | | | 1,545,818 | | |
| | | | 1,476,409,418 | | | | 1,698,106,239 | | |
Germany — 3.60% | | | |
| | 3,308,644 | | | HeidelbergCement AG | | | 185,693,220 | | | | 293,954,693 | | |
| | 2,938,242 | | | Deutsche Wohnen AG | | | 27,929,638 | | | | 89,981,819 | | |
| | 2,985,955 | | | Hamburger Hafen und Logistik AG | | | 87,574,307 | | | | 46,841,245 | | |
| 664,606 | | | Hornbach Holding AG &
Company KGaA (b) | | | 15,728,733 | | | | 43,377,420 | | |
| | 4,868,198 | | | Telefonica Deutschland Holding AG | | | 23,645,718 | | | | 24,716,588 | | |
| | 296,503 | | | Fraport AG | | | 8,930,449 | | | | 17,946,545 | | |
| | 1,004 | | | Linde AG | | | 139,360 | | | | 153,361 | | |
| | | | 349,641,425 | | | | 516,971,671 | | |
First Eagle Funds | Semi-Annual Report | April 30, 2016
45
First Eagle Overseas Fund | Consolidated Schedule of Investments | Six-Month Period Ended April 30, 2016 (unaudited)
| Shares | | Description | | Cost (Note 1) | | Value (Note 1) | |
International Common Stocks — 74.49% (continued) | | | |
Greece — 0.56% | | | |
| | 6,144,609 | | | Jumbo SA (a) | | $ | 27,916,825 | | | $ | 80,701,624 | | |
Hong Kong — 3.52% | | | |
| | 70,862,940 | | | Hang Lung Properties Limited | | | 168,597,144 | | | | 141,417,101 | | |
| | 33,586,303 | | | Hopewell Holdings Limited | | | 96,856,757 | | | | 113,442,372 | | |
| | 22,777,700 | | | Great Eagle Holdings Limited | | | 76,569,942 | | | | 92,497,976 | | |
| | 7,806,340 | | | Guoco Group Limited (b) | | | 57,283,838 | | | | 86,044,950 | | |
| | 15,997,405 | | | Hysan Development Company Limited | | | 72,338,811 | | | | 70,841,556 | | |
| 1,353,233 | | | Hopewell Highway Infrastructure
Limited | | | 655,914 | | | | 675,142 | | |
| | | | 472,302,406 | | | | 504,919,097 | | |
Ireland — 0.49% | | | |
| | 2,430,840 | | | CRH PLC | | | 40,784,092 | | | | 70,610,263 | | |
Israel 0.26% (i) | | | |
| | 7,510,515 | | | Israel Chemicals Limited | | | 75,169,596 | | | | 37,417,050 | | |
Italy — 1.13% | | | |
| | 6,781,606 | | | Italcementi S.p.A. | | | 100,399,041 | | | | 80,448,308 | | |
| | 1,197,736 | | | Italmobiliare S.p.A. RSP (b)(c) | | | 50,324,929 | | | | 38,593,112 | | |
| | 168,142 | | | Italmobiliare S.p.A. (b) | | | 19,250,153 | | | | 7,316,181 | | |
| | 1,385,400 | | | Recordati S.p.A. | | | 9,200,042 | | | | 35,201,169 | | |
| | | | 179,174,165 | | | | 161,558,770 | | |
Japan — 21.30% | | | |
| | 13,970,900 | | | KDDI Corporation | | | 167,226,856 | | | | 416,106,975 | | |
| | 3,895,800 | | | Secom Company Limited | | | 165,603,656 | | | | 309,210,818 | | |
| | 464,000 | | | Keyence Corporation | | | 90,273,591 | | | | 292,878,195 | | |
| | 1,603,540 | | | Fanuc Corporation | | | 162,028,612 | | | | 248,744,621 | | |
| | 834,190 | | | SMC Corporation | | | 113,502,737 | | | | 214,388,398 | | |
| | 7,316,700 | | | Sompo Japan Nipponkoa Holdings, Inc. | | | 201,780,857 | | | | 202,206,357 | | |
| | 4,584,130 | | | Hoya Corporation | | | 94,756,773 | | | | 183,580,620 | | |
| | 7,687,850 | | | Mitsubishi Estate Company Limited | | | 134,996,641 | | | | 153,251,220 | | |
| | 9,902,500 | | | Astellas Pharma, Inc. | | | 77,766,636 | | | | 139,323,708 | | |
| | 4,973,200 | | | MS&AD Insurance Group Holdings, Inc. | | | 98,914,606 | | | | 138,749,476 | | |
| | 1,086,600 | | | Hirose Electric Company Limited | | | 113,363,708 | | | | 137,969,605 | | |
| | 835,470 | | | Shimano, Inc. | | | 10,069,760 | | | | 126,262,759 | | |
First Eagle Funds | Semi-Annual Report | April 30, 2016
46
First Eagle Overseas Fund | Consolidated Schedule of Investments | Six-Month Period Ended April 30, 2016 (unaudited)
| Shares | | Description | | Cost (Note 1) | | Value (Note 1) | |
International Common Stocks — 74.49% (continued) | | | |
Japan — 21.30% (continued) | | | |
| | 2,715,380 | | | Daiichikosho Company Limited | | $ | 33,513,866 | | | $ | 116,883,838 | | |
| | 3,559,930 | | | Kansai Paint Company Limited | | | 26,253,316 | | | | 64,975,414 | | |
| | 1,331,930 | | | Nissin Foods Holdings Company Limited | | | 46,731,909 | | | | 63,592,147 | | |
| | 3,206,911 | | | T. Hasegawa Company Limited (b)(c) | | | 43,073,853 | | | | 53,980,992 | | |
| | 1,299,640 | | | As One Corporation (b)(c) | | | 26,525,156 | | | | 48,370,060 | | |
| 1,926,100 | | | Chofu Seisakusho Company
Limited (b)(c) | | | 30,977,252 | | | | 46,324,153 | | |
| | 508,106 | | | SK Kaken Company Limited (b) | | | 9,470,131 | | | | 43,098,277 | | |
| | 1,742,124 | | | Nagaileben Company Limited | | | 16,719,913 | | | | 36,921,895 | | |
| 2,045,420 | | | Maezawa Kasei Industries Company
Limited (b)(c) | | | 31,490,225 | | | | 19,319,992 | | |
| | | | 1,695,040,054 | | | | 3,056,139,520 | | |
Mexico — 2.79% | | | |
| | 9,388,464 | | | Grupo Televisa S.A.B., ADR | | | 195,988,481 | | | | 274,424,803 | | |
| | 5,543,609 | | | Fresnillo PLC | | | 96,608,773 | | | | 90,153,549 | | |
| | 2,246,692 | | | Industrias Peñoles S.A.B. de C.V. | | | 1,833,689 | | | | 35,100,298 | | |
| | | | 294,430,943 | | | | 399,678,650 | | |
Netherlands — 0.85% | | | |
| | 560,446 | | | HAL Trust (b) | | | 20,803,015 | | | | 121,275,821 | | |
Norway — 0.69% | | | |
| | 11,393,841 | | | Orkla ASA | | | 83,103,593 | | | | 99,478,632 | | |
Poland — 0.04% | | | |
| | 571,220 | | | Pfleiderer Grajewo SA (a)(b) | | | 3,567,238 | | | | 4,788,913 | | |
| 109,275 | | | Pfleiderer Grajewo Senior Debt
Interest Claims (b)(h)(j) | | | 636,263 | | | | 870,318 | | |
| | | | 4,203,501 | | | | 5,659,231 | | |
Russia — 0.30% | | | |
| | 8,297,382 | | | Gazprom PAO, ADR | | | 55,920,439 | | | | 42,880,870 | | |
Singapore — 1.68% | | | |
| | 25,512,113 | | | Haw Par Corporation Limited (b)(c) | | | 76,875,317 | | | | 170,542,362 | | |
| | 32,779,415 | | | ComfortDelGro Corporation Limited | | | 24,022,250 | | | | 70,440,949 | | |
| | | | 100,897,567 | | | | 240,983,311 | | |
South Korea — 3.39% | | | |
| | 1,590,828 | | | KT&G Corporation | | | 87,968,056 | | | | 171,732,354 | | |
First Eagle Funds | Semi-Annual Report | April 30, 2016
47
First Eagle Overseas Fund | Consolidated Schedule of Investments | Six-Month Period Ended April 30, 2016 (unaudited)
| Shares | | Description | | Cost (Note 1) | | Value (Note 1) | |
International Common Stocks — 74.49% (continued) | | | |
South Korea — 3.39% (continued) | | | |
| | 3,195,175 | | | Kia Motors Corporation | | $ | 151,464,351 | | | $ | 134,324,102 | | |
| 35,325 | | | Lotte Confectionery Company
Limited (b)(e) | | | 12,445,892 | | | | 77,169,318 | | |
| | 186,884 | | | Nong Shim Company Limited | | | 43,886,371 | | | | 61,261,343 | | |
| | 872,463 | | | Fursys, Inc. (b)(c) | | | 10,110,165 | | | | 27,259,683 | | |
| 22,950 | | | Namyang Dairy Products
Company Limited (b) | | | 4,912,653 | | | | 14,965,640 | | |
| | | | 310,787,488 | | | | 486,712,440 | | |
Sweden — 1.23% | | | |
| | 3,013,030 | | | Investor AB, Class 'A' (b) | | | 59,333,861 | | | | 108,958,267 | | |
| | 1,846,088 | | | Investor AB, Class 'B' | | | 40,783,748 | | | | 67,747,403 | | |
| | | | 100,117,609 | | | | 176,705,670 | | |
Switzerland — 2.90% | | | |
| | 2,972,836 | | | Nestlé SA | | | 104,479,365 | | | | 221,575,914 | | |
| | 2,413,791 | | | Pargesa Holding SA | | | 129,478,662 | | | | 167,704,754 | | |
| | 128,462 | | | Rieter Holding AG | | | 15,740,421 | | | | 26,594,968 | | |
| | | | 249,698,448 | | | | 415,875,636 | | |
Taiwan — 0.32% | | | |
| | 11,509,694 | | | Taiwan Secom Company Limited | | | 17,429,499 | | | | 32,402,574 | | |
| 603,122 | | | Taiwan Semiconductor Manufacturing
Company Limited, ADR | | | 12,120,237 | | | | 14,227,648 | | |
| | | | 29,549,736 | | | | 46,630,222 | | |
Thailand — 1.09% | | | |
| | 22,779,459 | | | Bangkok Bank PCL, NVDR | | | 93,410,526 | | | | 106,951,940 | | |
| | 15,000 | | | Bangkok Bank PCL | | | 63,387 | | | | 71,285 | | |
| | 89,484,885 | | | Thai Beverage PCL | | | 14,845,370 | | | | 49,571,506 | | |
| | | | 108,319,283 | | | | 156,594,731 | | |
Turkey — 0.23% | | | |
| | 5,893,909 | | | Yazicilar Holding AS | | | 38,350,989 | | | | 32,481,800 | | |
United Kingdom — 5.50% | | | |
| | 2,239,901 | | | British American Tobacco PLC | | | 120,857,366 | | | | 136,477,153 | | |
| | 3,116,891 | | | Berkeley Group Holdings PLC | | | 37,886,190 | | | | 136,399,732 | | |
| | 3,601,188 | | | Liberty Global PLC, Series 'C' (a) | | | 138,406,335 | | | | 131,803,481 | | |
| | 250,568 | | | Liberty Global PLC, Series 'A' (a) | | | 10,292,280 | | | | 9,453,931 | | |
First Eagle Funds | Semi-Annual Report | April 30, 2016
48
First Eagle Overseas Fund | Consolidated Schedule of Investments | Six-Month Period Ended April 30, 2016 (unaudited)
| Shares | | Description | | Cost (Note 1) | | Value (Note 1) | |
International Common Stocks — 74.49% (continued) | | | |
United Kingdom — 5.50% (continued) | | | |
| | 106,725 | | | Liberty Global PLC LiLAC, Series 'C' (a) | | $ | 4,250,965 | | | $ | 4,334,102 | | |
| | 12,528 | | | Liberty Global PLC LiLAC, Series 'A' (a) | | | 431,626 | | | | 470,176 | | |
| | 5,994,554 | | | GlaxoSmithKline PLC | | | 117,733,473 | | | | 127,793,053 | | |
| | 3,826,139 | | | Diageo PLC | | | 103,252,677 | | | | 103,201,858 | | |
| | 638,277 | | | Willis Towers Watson PLC | | | 67,880,455 | | | | 79,720,797 | | |
| | 16,879,160 | | | WM Morrison Supermarkets PLC | | | 72,644,948 | | | | 47,130,993 | | |
| | 1,114,116 | | | Anglo American PLC | | | 23,690,455 | | | | 12,427,324 | | |
| | | | 697,326,770 | | | | 789,212,600 | | |
Total International Common Stocks | | | 8,003,851,750 | | | | 10,689,219,859 | | |
U.S. Common Stock — 0.24% | | | |
Materials — 0.24% | | | |
| | 551,449 | | | Royal Gold, Inc. | | | 33,723,128 | | | | 34,531,736 | | |
Total Common Stocks | | | 8,037,574,878 | | | | 10,723,751,595 | | |
International Preferred Stock — 0.05% | | | |
South Korea — 0.05% | | | |
| 27,183
| | | Namyang Dairy Products Company
Limited (b) | | | 387,444
| | | | 6,417,612
| | |
Investment Company — 0.00*% | | | |
| 52,824
| | | State Street Institutional U.S.
Government Money Market Fund,
Premier Class | | | 52,824
| | | | 52,824
| | |
Right — 0.00% | | | |
| 55,055
| | | Pfleiderer Atlantik Raco
RI Rights (a)(b)(e) | | | 16,536
| | | | —
| | |
| Ounces | | | | | | | |
Commodity — 6.22% | | | |
| | 690,811 | | | Gold bullion (a) | | | 563,993,676 | | | | 893,232,420 | | |
First Eagle Funds | Semi-Annual Report | April 30, 2016
49
First Eagle Overseas Fund | Consolidated Schedule of Investments | Six-Month Period Ended April 30, 2016 (unaudited)
| Principal | | Description | | Cost (Note 1) | | Value (Note 1) | |
Term Loans — 0.01% | | | |
Germany — 0.01% | | | |
| 72
EUR | | | Atlantik Commitment Fee Facility
due 02/01/20 (a)(b)(e)(h)(j) | | $ | —
| | | $ | 14
| | |
| 609,010
EUR | | | Atlantik Duration Fee Facility
due 02/01/20 (a)(b)(e)(h)(j) | | | —
| | | | 122,730
| | |
| 28,263
EUR | | | Atlantik FX Repayment Facility
due 02/01/20 (a)(b)(e)(h)(j) | | | —
| | | | 5,696
| | |
| 1,996,448
EUR
| | | Atlantik Standstill Accrued Interest
Facility
due 02/01/20 (b)(e)(h)(j)(k) | | | —
| | | | 402,331
| | |
| 4,000,000
EUR | | | Atlantik Subordinated Debt 79.5M
15.00% due 02/01/20 (b)(e)(h)(j)(k) | | | 5,431,204
| | | | 806,093
| | |
| 790,586
EUR
| | | Atlantik Subordinated Debt
Term Facility 1A
15.00% due 02/01/20 (b)(e)(h)(j)(k) | | | 1,073,459
| | | | 159,321
| | |
| 774,993
EUR
| | | Atlantik Subordinated Debt Term
Facility 2A
15.00% due 02/01/20 (b)(e)(h)(j)(k) | | | 1,052,286
| | | | 156,179
| | |
| 739,302
EUR
| | | Atlantik Subordinated Debt Term
Facility 3A
15.00% due 02/01/20 (b)(e)(h)(j)(k) | | | 997,446
| | | | 148,987
| | |
| 469,266
EUR
| | | Atlantik Subordinated Debt Term
Facility 4A
15.00% due 02/01/20 (b)(e)(h)(j)(k) | | | 633,457
| | | | 94,568
| | |
Total Term Loans | | | 9,187,852 | | | | 1,895,919 | | |
Notes and Bonds — 2.20% | | | |
U.S. Bond — 0.07% | | | |
Government Obligation — 0.07% | | | |
$ | 10,000,000
| | | U.S. Treasury Note
0.75% due 03/15/17 (l) | | | 10,013,808
| | | | 10,016,020
| | |
Total U.S. Bond | | | 10,013,808 | | | | 10,016,020 | | |
International Notes and Bonds — 2.13% | | | |
International Corporate Notes and Bonds — 0.14% | | | |
France — 0.14% | | | |
| 8,000,000
EUR | | | Emin Leydier SA FRN
7.96% due 11/30/20 (b)(e)(g)(h)(m) | | | 9,650,406
| | | | 9,160,403
| | |
First Eagle Funds | Semi-Annual Report | April 30, 2016
50
First Eagle Overseas Fund | Consolidated Schedule of Investments | Six-Month Period Ended April 30, 2016 (unaudited)
| Principal | | Description | | Cost (Note 1) | | Value (Note 1) | |
International Corporate Notes and Bonds — 0.14% (continued) | | | |
France — 0.14% (continued) | | | |
| 10,000,000
EUR | | | Emin Leydier SA FRN
7.96% due 11/30/20 (b)(e)(g)(h)(m) | | $ | 14,227,973
| | | $ | 11,450,504
| | |
Total International Corporate Notes and Bonds | | | 23,878,379 | | | | 20,610,907 | | |
International Government Bonds — 1.99% | | | |
Australia — 0.00% | | | |
|
AUD | | | Australia Government Bond
6.00% due 02/15/17 (n) | | | 7,662
| | | | —
| | |
Canada — 0.16% | | | |
| 27,880,000
CAD | | | Canadian Government Bond
1.25% due 08/01/17 | | | 21,497,575
| | | | 22,383,771
| | |
Indonesia — 0.02% | | | |
| 45,698,000,000
IDR | | | Indonesia Treasury Bond
8.25% due 07/15/21 (b) | | | 3,572,071
| | | | 3,584,597
| | |
Mexico — 0.58% | | | |
| 1,094,660,000
MXN | | | Mexican Bonos
4.75% due 06/14/18 | | | 69,165,063
| | | | 64,034,873
| | |
| 330,074,000
MXN | | | Mexican Bonos
5.00% due 12/11/19 | | | 24,220,507
| | | | 19,203,100
| | |
| | | | 93,385,570 | | | | 83,237,973 | | |
Singapore — 0.99% | | | |
| 88,530,000
SGD | | | Singapore Government Bond
0.50% due 04/01/18 | | | 67,138,755
| | | | 65,200,895
| | |
| 45,219,000
SGD | | | Singapore Government Bond
2.375% due 04/01/17 | | | 36,958,617
| | | | 34,084,202
| | |
| 53,521,000
SGD | | | Singapore Government Bond
3.25% due 09/01/20 | | | 41,409,106
| | | | 42,841,474
| | |
| | | | 145,506,478 | | | | 142,126,571 | | |
United Kingdom — 0.24% | | | |
| 23,026,000
GBP | | | United Kingdom Gilt
1.00% due 09/07/17 (n) | | | 35,750,233
| | | | 33,876,070
| | |
Total International Government Bonds | | | 299,719,589 | | | | 285,208,982 | | |
Total International Notes and Bonds | | | 323,597,968 | | | | 305,819,889 | | |
Total Notes and Bonds | | | 333,611,776 | | | | 315,835,909 | | |
First Eagle Funds | Semi-Annual Report | April 30, 2016
51
First Eagle Overseas Fund | Consolidated Schedule of Investments | Six-Month Period Ended April 30, 2016 (unaudited)
| Principal | | Description | | Cost (Note 1) | | Value (Note 1) | |
Commercial Paper — 16.10% | | | |
International Commercial Paper — 7.13% | | | |
Canada — 0.48% | | | |
| 10,570,000
USD | | | Suncor Energy, Inc.
0.86% due 05/02/16 | | $ | 10,569,751
| | | $ | 10,569,590
| | |
| 9,711,000
USD | | | Total Capital Limited
0.46% due 05/16/16 | | | 9,709,179
| | | | 9,709,363
| | |
| 15,291,000
USD | | | Total Capital Limited
0.58% due 07/21/16 | | | 15,271,389
| | | | 15,274,853
| | |
| 34,099,000
USD | | | Total Capital Limited
0.60% due 07/15/16 | | | 34,057,087
| | | | 34,066,326
| | |
France — 0.69% | | | |
| 16,909,000
USD | | | Engie
0.66% due 05/09/16 | | | 16,906,558
| | | | 16,907,243
| | |
| 10,440,000
USD | | | Engie
0.67% due 05/09/16 | | | 10,438,469
| | | | 10,438,915
| | |
| 13,291,000
USD | | | Engie
0.78% due 07/06/16 | | | 13,272,238
| | | | 13,279,376
| | |
| 7,984,000
USD | | | Essilor International
0.48% due 06/02/16 | | | 7,980,664
| | | | 7,980,871
| | |
| 18,044,000
USD | | | Essilor International
0.49% due 05/10/16 | | | 18,041,835
| | | | 18,041,933
| | |
| 15,904,000
USD | | | Sanofi
0.43% due 06/14/16 | | | 15,895,836
| | | | 15,895,404
| | |
| 16,262,000
USD | | | Sanofi
0.49% due 06/30/16 | | | 16,248,990
| | | | 16,248,725
| | |
Germany — 0.76% | | | |
| 12,361,000
USD | | | BASF AG
0.43% due 06/01/16 | | | 12,356,529
| | | | 12,356,309
| | |
| 17,713,000
USD | | | BASF AG
0.46% due 05/12/16 | | | 17,710,564
| | | | 17,710,589
| | |
| 16,076,000
USD | | | BASF AG
0.51% due 07/01/16 | | | 16,062,380
| | | | 16,063,200
| | |
| 14,754,000
USD | | | Henkel Corporation
0.54% due 06/17/16 | | | 14,743,791
| | | | 14,745,264
| | |
| 4,539,000
USD | | | Henkel Corporation
0.60% due 07/08/16 | | | 4,533,942
| | | | 4,534,878
| | |
| 18,543,000
USD | | | Siemens Company
0.47% due 06/17/16 | | | 18,531,864
| | | | 18,532,778
| | |
First Eagle Funds | Semi-Annual Report | April 30, 2016
52
First Eagle Overseas Fund | Consolidated Schedule of Investments | Six-Month Period Ended April 30, 2016 (unaudited)
| Principal | | Description | | Cost (Note 1) | | Value (Note 1) | |
International Commercial Paper — 7.13% (continued) | | | |
Germany — 0.76% (continued) | | | |
| 16,262,000
USD | | | Siemens Company
0.48% due 06/20/16 | | $ | 16,251,385
| | | $ | 16,252,393
| | |
| 8,392,000
USD | | | Siemens Company
0.48% due 06/21/16 | | | 8,386,412
| | | | 8,386,922
| | |
Italy — 0.08% | | | |
| 9,998,000
USD | | | Eni S.p.A.
0.61% due 05/02/16 | | | 9,997,833
| | | | 9,997,771
| | |
| 1,877,000
USD | | | Eni S.p.A.
0.90% due 05/10/16 | | | 1,876,587
| | | | 1,876,813
| | |
Japan — 0.48% | | | |
| 4,117,000
USD | | | Hitachi Limited
0.56% due 05/02/16 | | | 4,116,937
| | | | 4,116,841
| | |
| 24,826,000
USD | | | Honda Corporation
0.44% due 05/18/16 | | | 24,820,959
| | | | 24,820,366
| | |
| 9,429,000
USD | | | Honda Corporation
0.49% due 06/08/16 | | | 9,424,223
| | | | 9,423,971
| | |
| 7,924,000
USD | | | Honda Corporation
0.49% due 06/13/16 | | | 7,919,457
| | | | 7,919,147
| | |
| 16,967,000
USD | | | Mitsui & Company Limited
0.51% due 05/17/16 | | | 16,963,229
| | | | 16,963,691
| | |
| 5,881,000
USD | | | Mitsui & Company Limited
0.52% due 05/02/16 | | | 5,880,917
| | | | 5,880,821
| | |
New Zealand — 0.47% | | | |
| 19,742,000
USD | | | Alpha Finance Corporation Limited
0.44% due 06/09/16 | | | 19,732,803
| | | | 19,733,119
| | |
| 7,515,000
USD | | | Alpha Finance Corporation Limited
0.44% due 07/14/16 | | | 7,508,358
| | | | 7,507,909
| | |
| 18,103,000
USD | | | Alpha Finance Corporation Limited
0.45% due 06/21/16 | | | 18,091,716
| | | | 18,092,046
| | |
| 22,000,000
USD | | | Alpha Finance Corporation Limited
0.46% due 05/18/16 | | | 21,995,325
| | | | 21,995,785
| | |
Switzerland — 1.55% | | | |
| 15,618,000
USD | | | Nestlé SA
0.45% due 05/17/16 | | | 15,614,946
| | | | 15,615,431
| | |
| 38,844,000
USD | | | Nestlé SA
0.47% due 06/07/16 | | | 38,825,635
| | | | 38,827,294
| | |
| 16,606,000
USD | | | Nestlé SA
0.58% due 07/18/16 | | | 16,585,492
| | | | 16,586,479
| | |
First Eagle Funds | Semi-Annual Report | April 30, 2016
53
First Eagle Overseas Fund | Consolidated Schedule of Investments | Six-Month Period Ended April 30, 2016 (unaudited)
| Principal | | Description | | Cost (Note 1) | | Value (Note 1) | |
International Commercial Paper — 7.13% (continued) | | | |
Switzerland — 1.55% (continued) | | | |
| 12,920,000
USD | | | Novartis International AG
0.45% due 05/06/16 | | $ | 12,919,210
| | | $ | 12,919,146
| | |
| 9,521,000
USD | | | Novartis International AG
0.47% due 06/10/16 | | | 9,516,134
| | | | 9,515,957
| | |
| 11,425,000
USD | | | Novartis International AG
0.47% due 06/13/16 | | | 11,418,723
| | | | 11,418,430
| | |
| 18,620,000
USD | | | Novartis International AG
0.48% due 05/19/16 | | | 18,615,624
| | | | 18,616,203
| | |
| 16,666,000
USD | | | Roche Holdings, Inc.
0.41% due 05/11/16 | | | 16,664,148
| | | | 16,664,078
| | |
| 18,738,000
USD | | | Roche Holdings, Inc.
0.42% due 07/01/16 | | | 18,724,982
| | | | 18,724,063
| | |
| 4,364,000
USD | | | Roche Holdings, Inc.
0.43% due 06/03/16 | | | 4,362,320
| | | | 4,362,358
| | |
| 19,280,000
USD | | | Roche Holdings, Inc.
0.43% due 06/17/16 | | | 19,269,428
| | | | 19,269,372
| | |
| 24,639,000
USD | | | Roche Holdings, Inc.
0.45% due 07/19/16 | | | 24,615,210
| | | | 24,613,776
| | |
| 15,427,000
USD | | | Roche Holdings, Inc.
0.45% due 07/22/16 | | | 15,411,539
| | | | 15,410,442
| | |
United Kingdom — 2.62% | | | |
| 18,195,000
USD | | | AstraZeneca PLC
0.71% due 05/16/16 | | | 18,189,693
| | | | 18,191,675
| | |
| 11,589,000
USD | | | AstraZeneca PLC
0.73% due 06/17/16 | | | 11,578,106
| | | | 11,582,138
| | |
| 14,155,000
USD | | | AstraZeneca PLC
0.73% due 05/09/16 | | | 14,152,735
| | | | 14,153,529
| | |
| 10,633,000
USD | | | AstraZeneca PLC
0.73% due 06/20/16 | | | 10,622,367
| | | | 10,626,258
| | |
| 9,058,000
USD | | | AstraZeneca PLC
0.76% due 05/12/16 | | | 9,055,924
| | | | 9,056,767
| | |
| 13,588,000
USD | | | AstraZeneca PLC
0.76% due 05/13/16 | | | 13,584,603
| | | | 13,585,997
| | |
| 13,636,000
USD | | | AstraZeneca PLC
0.76% due 06/16/16 | | | 13,622,932
| | | | 13,628,109
| | |
| 10,111,000
USD | | | BP Capital Markets PLC
0.71% due 05/05/16 | | | 10,110,214
| | | | 10,110,137
| | |
| 10,111,000
USD | | | BP Capital Markets PLC
0.71% due 05/06/16 | | | 10,110,017
| | | | 10,109,988
| | |
First Eagle Funds | Semi-Annual Report | April 30, 2016
54
First Eagle Overseas Fund | Consolidated Schedule of Investments | Six-Month Period Ended April 30, 2016 (unaudited)
| Principal | | Description | | Cost (Note 1) | | Value (Note 1) | |
International Commercial Paper — 7.13% (continued) | | | |
United Kingdom — 2.62% (continued) | | | |
| 7,406,000
USD | | | BP Capital Markets PLC
0.71% due 07/15/16 | | $ | 7,395,200
| | | $ | 7,394,199
| | |
| 18,195,000
USD | | | British American Tobacco PLC
0.90% due 06/15/16 | | | 18,174,985
| | | | 18,182,339
| | |
| 18,195,000
USD | | | British American Tobacco PLC
0.90% due 06/16/16 | | | 18,174,541
| | | | 18,182,045
| | |
| 6,877,000
USD | | | British American Tobacco PLC
0.90% due 06/20/16 | | | 6,868,595
| | | | 6,871,646
| | |
| 10,429,000
USD | | | British American Tobacco PLC
0.97% due 07/13/16 | | | 10,408,910
| | | | 10,416,507
| | |
| 28,615,000
USD | | | GlaxoSmithKline PLC
0.44% due 05/17/16 | | | 28,609,531
| | | | 28,609,420
| | |
| 13,636,000
USD | | | GlaxoSmithKline PLC
0.49% due 06/07/16 | | | 13,629,273
| | | | 13,629,766
| | |
| 37,421,000
USD | | | GlaxoSmithKline PLC
0.49% due 06/09/16 | | | 37,401,541
| | | | 37,402,887
| | |
| 23,785,000
USD | | | GlaxoSmithKline PLC
0.49% due 06/16/16 | | | 23,770,412
| | | | 23,771,236
| | |
| 44,771,000
USD | | | GlaxoSmithKline PLC
0.51% due 06/16/16 | | | 44,742,396
| | | | 44,745,092
| | |
| 6,877,000
USD | | | GlaxoSmithKline PLC
0.56% due 07/19/16 | | | 6,868,700
| | | | 6,869,496
| | |
| 20,407,000
USD | | | GlaxoSmithKline PLC
0.57% due 07/12/16 | | | 20,384,144
| | | | 20,387,159
| | |
| 12,320,000
USD | | | GlaxoSmithKline PLC
0.58% due 07/25/16 | | | 12,303,419
| | | | 12,305,262
| | |
| 15,635,000
USD | | | Royal Dutch Shell PLC
0.45% due 06/27/16 | | | 15,624,108
| | | | 15,623,034
| | |
Total International Commercial Paper | | | 1,023,222,944 | | | | 1,023,300,927 | | |
U.S. Commercial Paper — 8.97% | | | |
$ | 12,384,000
| | | Abbott Laboratories
0.55% due 05/10/16 | | | 12,382,328
| | | | 12,381,711
| | |
| 21,505,000
| | | Abbott Laboratories
0.56% due 05/23/16 | | | 21,497,772
| | | | 21,495,968
| | |
| 10,505,000
| | | Abbott Laboratories
0.61% due 06/14/16 | | | 10,497,296
| | | | 10,495,980
| | |
| 13,043,000
| | | Abbott Laboratories
0.62% due 06/03/16 | | | 13,035,707
| | | | 13,034,669
| | |
First Eagle Funds | Semi-Annual Report | April 30, 2016
55
First Eagle Overseas Fund | Consolidated Schedule of Investments | Six-Month Period Ended April 30, 2016 (unaudited)
| Principal | | Description | | Cost (Note 1) | | Value (Note 1) | |
U.S. Commercial Paper — 8.97% (continued) | | | |
$ | 14,834,000
| | | Abbott Laboratories
0.62% due 06/08/16 | | $ | 14,824,449
| | | $ | 14,823,072
| | |
| 13,288,000
| | | Abbott Laboratories
0.65% due 06/22/16 | | | 13,275,716
| | | | 13,274,287
| | |
| 7,105,000
| | | Abbott Laboratories
0.67% due 06/06/16 | | | 7,100,311
| | | | 7,100,043
| | |
| 18,117,000
| | | Air Products & Chemicals, Inc.
0.46% due 05/20/16 | | | 18,112,697
| | | | 18,112,773
| | |
| 16,262,000
| | | Altria Group, Inc.
0.68% due 05/10/16 | | | 16,259,276
| | | | 16,259,640
| | |
| 14,460,000
| | | Apple, Inc.
0.36% due 06/01/16 | | | 14,455,642
| | | | 14,454,910
| | |
| 12,050,000
| | | Apple, Inc.
0.36% due 06/02/16 | | | 12,046,251
| | | | 12,045,619
| | |
| 10,284,000
| | | Apple, Inc.
0.36% due 06/03/16 | | | 10,280,701
| | | | 10,280,131
| | |
| 6,952,000
| | | Apple, Inc.
0.37% due 06/06/16 | | | 6,949,497
| | | | 6,949,131
| | |
| 21,505,000
| | | Apple, Inc.
0.38% due 05/05/16 | | | 21,504,116
| | | | 21,503,785
| | |
| 16,666,000
| | | Apple, Inc.
0.39% due 05/03/16 | | | 16,665,648
| | | | 16,665,378
| | |
| 9,871,000
| | | Apple, Inc.
0.39% due 05/06/16 | | | 9,870,479
| | | | 9,870,347
| | |
| 15,904,000
| | | Apple, Inc.
0.43% due 07/05/16 | | | 15,891,940
| | | | 15,891,213
| | |
| 6,877,000
| | | Apple, Inc.
0.44% due 07/13/16 | | | 6,871,004
| | | | 6,870,624
| | |
| 16,606,000
| | | Apple, Inc.
0.44% due 07/14/16 | | | 16,591,322
| | | | 16,590,329
| | |
| 10,194,000
| | | Apple, Inc.
0.46% due 07/22/16 | | | 10,183,551
| | | | 10,183,058
| | |
| 16,121,000
| | | Caterpillar Financial Services Company
0.46% due 06/10/16 | | | 16,112,940
| | | | 16,111,897
| | |
| 8,193,000
| | | Chevron Corporation
0.36% due 05/13/16 | | | 8,192,044
| | | | 8,191,888
| | |
| 23,366,000
| | | Chevron Corporation
0.46% due 05/16/16 | | | 23,361,619
| | | | 23,362,061
| | |
| 12,825,000
| | | Chevron Corporation
0.48% due 05/05/16 | | | 12,824,330
| | | | 12,824,275
| | |
First Eagle Funds | Semi-Annual Report | April 30, 2016
56
First Eagle Overseas Fund | Consolidated Schedule of Investments | Six-Month Period Ended April 30, 2016 (unaudited)
| Principal | | Description | | Cost (Note 1) | | Value (Note 1) | |
U.S. Commercial Paper — 8.97% (continued) | | | |
$ | 24,225,000
| | | Chevron Corporation
0.48% due 05/06/16 | | $ | 24,223,419
| | | $ | 24,223,399
| | |
| 8,188,000
| | | Church & Dwight Company, Inc.
0.81% due 06/06/16 | | | 8,181,450
| | | | 8,183,497
| | |
| 8,153,000
| | | Coca-Cola Company
0.41% due 05/27/16 | | | 8,150,645
| | | | 8,150,362
| | |
| 21,505,000
| | | Coca-Cola Company
0.47% due 06/14/16 | | | 21,492,909
| | | | 21,492,552
| | |
| 24,826,000
| | | Coca-Cola Company
0.47% due 06/15/16 | | | 24,811,725
| | | | 24,811,188
| | |
| 23,366,000
| | | Coca-Cola Company
0.48% due 06/13/16 | | | 23,352,883
| | | | 23,352,857
| | |
| 8,303,000
| | | Coca-Cola Company
0.51% due 07/14/16 | | | 8,294,466
| | | | 8,293,675
| | |
| 9,748,000
| | | ConocoPhillips
0.92% due 05/04/16 | | | 9,747,269
| | | | 9,747,567
| | |
| 9,100,000
| | | Duke Energy Corporation
0.92% due 05/09/16 | | | 9,098,180
| | | | 9,098,802
| | |
| 1,202,000
| | | Duke Energy Corporation
0.92% due 05/13/16 | | | 1,201,639
| | | | 1,201,776
| | |
| 10,656,000
| | | DuPont
0.90% due 06/06/16 | | | 10,646,623
| | | | 10,649,521
| | |
| 22,844,000
| | | Emerson Electric Company
0.44% due 06/23/16 | | | 22,829,539
| | | | 22,827,143
| | |
| 6,602,000
| | | Entergy Corporation
1.19% due 06/03/16 | | | 6,594,798
| | | | 6,597,526
| | |
| 10,429,000
| | | Entergy Corporation
1.19% due 06/10/16 | | | 10,415,211
| | | | 10,420,410
| | |
| 20,522,000
| | | Exxon Mobil Corporation
0.43% due 06/14/16 | | | 20,511,465
| | | | 20,511,485
| | |
| 16,955,000
| | | General Electric Company
0.35% due 06/13/16 | | | 16,948,114
| | | | 16,946,523
| | |
| 10,606,000
| | | General Electric Company
0.35% due 06/22/16 | | | 10,600,791
| | | | 10,599,445
| | |
| 7,634,000
| | | Honeywell International, Inc.
0.42% due 05/02/16 | | | 7,633,913
| | | | 7,633,777
| | |
| 3,439,000
| | | International Business Machines
Corporation
0.45% due 06/22/16 | | | 3,436,814
| | | | 3,436,679
| | |
First Eagle Funds | Semi-Annual Report | April 30, 2016
57
First Eagle Overseas Fund | Consolidated Schedule of Investments | Six-Month Period Ended April 30, 2016 (unaudited)
| Principal | | Description | | Cost (Note 1) | | Value (Note 1) | |
U.S. Commercial Paper — 8.97% (continued) | | | |
$ | 9,871,000
| | | MetLife
0.48% due 05/12/16 | | $ | 9,869,582
| | | $ | 9,869,592
| | |
| 15,261,000
| | | MetLife
0.48% due 05/17/16 | | | 15,257,812
| | | | 15,257,910
| | |
| 9,058,000
| | | MetLife
0.48% due 05/26/16 | | | 9,055,044
| | | | 9,055,126
| | |
| 1,123,000
| | | MetLife
0.48% due 05/31/16 | | | 1,122,560
| | | | 1,122,567
| | |
| 7,163,000
| | | MetLife
0.56% due 07/20/16 | | | 7,154,245
| | | | 7,153,977
| | |
| 8,052,000
| | | Microsoft Corporation
0.33% due 05/18/16 | | | 8,050,783
| | | | 8,050,470
| | |
| 31,376,000
| | | Microsoft Corporation
0.39% due 05/11/16 | | | 31,372,688
| | | | 31,372,601
| | |
| 1,803,000
| | | Microsoft Corporation
0.39% due 06/01/16 | | | 1,802,410
| | | | 1,802,346
| | |
| 21,519,000
| | | Microsoft Corporation
0.41% due 05/04/16 | | | 21,518,283
| | | | 21,518,133
| | |
| 4,119,000
| | | Microsoft Corporation
0.43% due 07/13/16 | | | 4,115,492
| | | | 4,114,709
| | |
| 12,762,000
| | | National Oilwell Varco, Inc.
1.05% due 06/02/16 | | | 12,750,089
| | | | 12,756,998
| | |
| 42,860,000
| | | National Oilwell Varco, Inc.
1.05% due 06/23/16 | | | 42,793,746
| | | | 42,830,992
| | |
| 1,426,000
| | | PepsiCo, Inc.
0.31% due 05/04/16 | | | 1,425,964
| | | | 1,425,937
| | |
| 7,900,000
| | | PepsiCo, Inc.
0.41% due 06/21/16 | | | 7,895,523
| | | | 7,894,452
| | |
| 2,174,000
| | | Pfizer, Inc.
0.41% due 05/26/16 | | | 2,173,396
| | | | 2,173,376
| | |
| 6,877,000
| | | Pfizer, Inc.
0.43% due 06/20/16 | | | 6,872,988
| | | | 6,872,599
| | |
| 21,309,000
| | | Pfizer, Inc.
0.48% due 05/24/16 | | | 21,302,601
| | | | 21,303,392
| | |
| 21,309,000
| | | Pfizer, Inc.
0.48% due 05/25/16 | | | 21,302,323
| | | | 21,303,136
| | |
| 38,154,000
| | | Pfizer, Inc.
0.48% due 06/10/16 | | | 38,134,075
| | | | 38,135,572
| | |
| 1,803,000
| | | Pfizer, Inc.
0.48% due 06/22/16 | | | 1,801,776
| | | | 1,801,783
| | |
First Eagle Funds | Semi-Annual Report | April 30, 2016
58
First Eagle Overseas Fund | Consolidated Schedule of Investments | Six-Month Period Ended April 30, 2016 (unaudited)
| Principal | | Description | | Cost (Note 1) | | Value (Note 1) | |
U.S. Commercial Paper — 8.97% (continued) | | | |
$ | 7,924,000
| | | Pfizer, Inc.
0.48% due 06/23/16 | | $ | 7,918,517
| | | $ | 7,918,516
| | |
| 12,223,000
| | | Pfizer, Inc.
0.48% due 07/11/16 | | | 12,211,670
| | | | 12,210,706
| | |
| 31,924,000
| | | Pfizer, Inc.
0.49% due 05/05/16 | | | 31,922,297
| | | | 31,922,430
| | |
| 13,044,000
| | | Pfizer, Inc.
0.51% due 07/18/16 | | | 13,029,869
| | | | 13,029,217
| | |
| 16,262,000
| | | Philip Morris International, Inc.
0.42% due 05/19/16 | | | 16,258,666
| | | | 16,258,413
| | |
| 10,284,000
| | | Philip Morris International, Inc.
0.44% due 06/02/16 | | | 10,280,069
| | | | 10,279,969
| | |
| 15,176,000
| | | Philip Morris International, Inc.
0.46% due 06/15/16 | | | 15,167,464
| | | | 15,167,421
| | |
| 12,050,000
| | | Philip Morris International, Inc.
0.49% due 06/28/16 | | | 12,040,681
| | | | 12,040,963
| | |
| 12,050,000
| | | Philip Morris International, Inc.
0.49% due 06/29/16 | | | 12,040,521
| | | | 12,040,771
| | |
| 12,361,000
| | | Praxair, Inc.
0.39% due 06/02/16 | | | 12,356,825
| | | | 12,356,155
| | |
| 12,361,000
| | | Praxair, Inc.
0.39% due 06/03/16 | | | 12,356,694
| | | | 12,355,989
| | |
| 15,466,000
| | | Precision Castparts Corporation
0.41% due 05/02/16 | | | 15,465,828
| | | | 15,465,530
| | |
| 14,537,000
| | | Qualcomm, Inc.
0.39% due 06/01/16 | | | 14,532,243
| | | | 14,531,883
| | |
| 12,762,000
| | | Qualcomm, Inc.
0.43% due 06/07/16 | | | 12,756,491
| | | | 12,756,580
| | |
| 12,762,000
| | | Qualcomm, Inc.
0.43% due 06/08/16 | | | 12,756,342
| | | | 12,756,427
| | |
| 10,759,000
| | | Qualcomm, Inc.
0.49% due 05/19/16 | | | 10,756,418
| | | | 10,756,806
| | |
| 2,633,000
| | | Qualcomm, Inc.
0.49% due 07/20/16 | | | 2,630,191
| | | | 2,630,259
| | |
| 9,856,000
| | | Qualcomm, Inc.
0.49% due 07/21/16 | | | 9,845,356
| | | | 9,845,593
| | |
| 5,055,000
| | | Qualcomm, Inc.
0.51% due 05/03/16 | | | 5,054,860
| | | | 5,054,811
| | |
| 1,564,000
| | | Royal Dutch Shell PLC
0.44% due 06/27/16 | | | 1,562,935
| | | | 1,562,803
| | |
First Eagle Funds | Semi-Annual Report | April 30, 2016
59
First Eagle Overseas Fund | Consolidated Schedule of Investments | Six-Month Period Ended April 30, 2016 (unaudited)
| Principal | | Description | | Cost (Note 1) | | Value (Note 1) | |
U.S. Commercial Paper — 8.97% (continued) | | | |
$ | 21,309,000
| | | Schlumberger Investments SA
0.87% due 05/02/16 | | $ | 21,308,497
| | | $ | 21,308,405
| | |
| 21,309,000
| | | Schlumberger Investments SA
0.87% due 05/03/16 | | | 21,307,994
| | | | 21,308,205
| | |
| 16,139,000
| | | Schlumberger Investments SA
0.87% due 05/04/16 | | | 16,137,857
| | | | 16,138,245
| | |
| 15,099,000
| | | Schlumberger Investments SA
0.87% due 06/06/16 | | | 15,086,166
| | | | 15,092,768
| | |
| 14,438,000
| | | Syngenta Wilmington
0.97% due 05/02/16 | | | 14,437,619
| | | | 14,437,388
| | |
| 7,271,000
| | | Syngenta Wilmington
0.97% due 05/04/16 | | | 7,270,424
| | | | 7,270,479
| | |
| 10,429,000
| | | Syngenta Wilmington
1.30% due 06/13/16 | | | 10,412,806
| | | | 10,420,526
| | |
| 17,350,000
| | | United Healthcare Company
0.66% due 05/18/16 | | | 17,344,675
| | | | 17,345,760
| | |
| 23,366,000
| | | United Technologies Corporation
0.78% due 05/10/16 | | | 23,361,502
| | | | 23,362,609
| | |
| 16,405,000
| | | Walt Disney Company
0.49% due 05/16/16 | | | 16,401,719
| | | | 16,402,056
| | |
| 22,644,000
| | | Walt Disney Company
0.49% due 05/20/16 | | | 22,638,264
| | | | 22,638,716
| | |
| 17,958,000
| | | Walt Disney Company
0.49% due 07/08/16 | | | 17,941,718
| | | | 17,939,842
| | |
Total U.S. Commercial Paper | | | 1,287,323,047 | | | | 1,287,372,882 | | |
Total Commercial Paper | | | 2,310,545,991 | | | | 2,310,673,809 | | |
Total Investments — 99.31% (Cost: $11,255,370,977) | | | | | 14,251,860,088 | | |
Other Assets in Excess of Liabilities — 0.69% | | | | | 98,800,095 | | |
Net Assets — 100.00% | | | | $ | 14,350,660,183 | | |
* Less than 0.01%
(a) Non-income producing security/commodity.
(b) Security is deemed illiquid. At April 30, 2016, the value of these securities amounted to $1,263,631,450 or 8.81% of net assets.
(c) An affiliate of the Fund as defined by the Investment Company Act of 1940. An affiliate is defined as a company in which the Fund directly or indirectly owns, controls, or holds power to vote 5% or more of the outstanding voting securities.
(d) Represents non-voting class of shares.
(e) Securities valued in accordance with fair value procedures under the supervision of the Board of Trustees, representing $166,342,946 or 1.16% of net assets.
First Eagle Funds | Semi-Annual Report | April 30, 2016
60
First Eagle Overseas Fund | Consolidated Schedule of Investments | Six-Month Period Ended April 30, 2016 (unaudited)
(f) Held through Financiere Bleue, LLC, wholly owned holding company and disregarded entity for U.S. tax purposes.
(g) On November 30, 2015, during a shareholder and bondholder meeting, a merger was approved between FINEL SA and Emin Leydier SAS, effective December 1, 2015. The merger provided that FINEL SA absorbed Emin Leydier SAS, and changed its name to Emin Leydier SA.
(h) Represents securities that are subject to legal or contractual restrictions on resale. At April 30, 2016, the value of these securities amounted to $79,579,408 or 0.55% of net assets.
(i) Securities with a total market value equal to $37,417,050 have been fair valued based on fair value adjustment factors at April 30, 2016.
(j) On December 3, 2015, Atlantik SA reorganized and merged, via a reverse merger, with Grajewo SA to form Pfleiderer Grajewo SA. As part of the restructuring, the existing debt positions have, and are expected, to be redeemed in kind to Pfleiderer Grajewo SA common stock, which publicly trades on the Warsaw Stock Exchange.
(k) Payment-in-kind security.
(l) This security, in part or in entirety, was pledged and segregated with the custodian for collateral on certain derivative contracts at the close of the reporting period.
(m) Floating rate security. Rate shown is the rate in effect at April 30, 2016.
(n) Represents a security registered under Regulation S. Bonds sold under Regulation S may not be offered, sold or delivered within the U.S., or for the account or benefit of, U.S. persons, except pursuant to an exemption from, or in a transaction not subject to, the registration requirements of the Securities Act of 1933.
At April 30, 2016, cost is substantially identical for both book and federal income tax purposes. Net unrealized appreciation consisted of:
Gross unrealized appreciation | | $ | 3,606,888,501 | | |
Gross unrealized depreciation | | | (610,399,390 | ) | |
Net unrealized appreciation | | $ | 2,996,489,111 | | |
Abbreviations used in this schedule include:
ADR — American Depositary Receipt
AG — Aktien Gesellschaft
AS — Anonim Sirket
ASA — Norwegian Public Limited Company
FRN — Floating Rate Note
NVDR — Non-Voting Depository Receipt
PAO — Russian Public Joint Stock Company
PCL — Public Company Limited
PLC — Public Limited Company
RSP — Represents Savings Shares
SA — Société Anonyme
SAS — Société par Actions Simplifiée
S.p.A. — Società per Azioni
Currencies
AUD — Australian Dollar
CAD — Canadian Dollar
EUR — Euro
GBP — British Pound
IDR — Indonesian Rupiah
MXN — Mexican Peso
SGD — Singapore Dollar
USD — United States Dollar
First Eagle Funds | Semi-Annual Report | April 30, 2016
61
First Eagle Overseas Fund | Consolidated Schedule of Investments | Six-Month Period Ended April 30, 2016 (unaudited)
Restricted Securities | | Acquisition Date | | Cost | | Carrying Value
Per
Share/Principal | |
Emin Leydier SA FRN 7.96% due 11/30/20# | | 06/22/05 | | $ | 9,650,406 | | | $ | 1.15 | | |
Emin Leydier SA FRN 7.96% due 11/30/20 | | 07/30/09 | | | 14,227,973 | | | | 1.15 | | |
Emin Leydier SA# | | 07/14/09 | | | 9,166,547 | | | | 3.01 | | |
Legris Industries SA | | 04/30/04 | | | 23,119,325 | | | | 23.75 | | |
#Formerly known as FINEL.
Foreign Currency Exchange Contracts — Sales
Settlement
Dates
Through | | Foreign Currency
To Be Delivered | | U.S. $
To Be Received | | U.S. $ Value
At April 30,
2016 | | Unrealized
Appreciation
At April 30,
2016 | | Unrealized
Depreciation
At April 30,
2016 | |
05/18/16 | | | 46,667,000 | | | Euro | | $ | 52,402,374 | | | $ | 53,459,084 | | | $ | — | | | $ | (1,056,710 | ) | |
06/15/16 | | | 50,597,000 | | | Euro | | | 56,848,765 | | | | 58,010,667 | | | | — | | | | (1,161,902 | ) | |
07/13/16 | | | 50,597,000 | | | Euro | | | 56,845,224 | | | | 58,063,175 | | | | — | | | | (1,217,951 | ) | |
08/17/16 | | | 55,587,000 | | | Euro | | | 61,186,279 | | | | 63,861,872 | | | | — | | | | (2,675,593 | ) | |
09/14/16 | | | 28,686,000 | | | Euro | | | 32,755,396 | | | | 32,988,646 | | | | — | | | | (233,250 | ) | |
05/18/16 | | | 14,460,000 | | | British Pound | | | 20,535,803 | | | | 21,128,988 | | | | — | | | | (593,185 | ) | |
06/15/16 | | | 20,091,000 | | | British Pound | | | 28,341,269 | | | | 29,359,253 | | | | — | | | | (1,017,984 | ) | |
06/15/16 | | | 6,310,664,000 | | | Japanese Yen | | | 58,652,749 | | | | 59,371,904 | | | | — | | | | (719,155 | ) | |
07/13/16 | | | 6,310,664,000 | | | Japanese Yen | | | 58,720,083 | | | | 59,429,359 | | | | — | | | | (709,276 | ) | |
08/17/16 | | | 6,310,664,000 | | | Japanese Yen | | | 58,761,257 | | | | 59,492,137 | | | | — | | | | (730,880 | ) | |
09/14/16 | | | 6,310,664,000 | | | Japanese Yen | | | 58,829,753 | | | | 59,553,884 | | | | — | | | | (724,131 | ) | |
10/19/16 | | | 6,310,664,000 | | | Japanese Yen | | | 58,761,299 | | | | 59,478,590 | | | | — | | | | (717,291 | ) | |
| | | | | | | $ | 602,640,251 | | | $ | 614,197,559 | | | $ | — | | | $ | (11,557,308 | ) | |
Affiliated Securities
Affiliated Securities | | Shares
October 31,
2015 | | Gross
Additions | | Gross
Reductions | | Shares
April 30,
2016 | | Market
Value
April 30,
2016 | | Realized
Gain /
(Loss) | | Dividend
Income | |
As One Corporation | | | 1,299,640 | | | | — | | | | — | | | | 1,299,640 | | | $ | 48,370,060 | | | $ | — | | | $ | 538,444 | | |
Chofu Seisakusho
Company Limited | | | 2,023,800 | | | | — | | | | 97,700 | | | | 1,926,100 | | | | 46,324,153 | | | | 163,637 | | | | 242,089 | | |
Emin Leydier SA# | | | 11,593,581 | | | | — | | | | — | | | | 11,593,581 | | | | 34,913,867 | | | | — | | | | — | | |
Fursys, Inc. | | | 872,463 | | | | — | | | | — | | | | 872,463 | | | | 27,259,683 | | | | — | | | | 407,289 | | |
Gaumont SA | | | 364,373 | | | | — | | | | — | | | | 364,373 | | | | 19,384,294 | | | | — | | | | — | | |
First Eagle Funds | Semi-Annual Report | April 30, 2016
62
First Eagle Overseas Fund | Consolidated Schedule of Investments | Six-Month Period Ended April 30, 2016 (unaudited)
Affiliated Securities (continued)
Affiliated Securities | | Shares
October 31,
2015 | | Gross
Additions | | Gross
Reductions | | Shares
April 30,
2016 | | Market
Value
April 30,
2016 | | Realized
Gain /
(Loss) | | Dividend
Income | |
Haw Par
Corporation
Limited | | | 25,512,113 | | | | — | | | | — | | | | 25,512,113 | | | $ | 170,542,362 | | | $ | — | | | $ | — | | |
Italmobiliare
S.p.A. RSP | | | 1,197,736 | | | | — | | | | — | | | | 1,197,736 | | | | 38,593,112 | | | | — | | | | — | | |
Laurent-Perrier | | | 558,938 | | | | — | | | | — | | | | 558,938 | | | | 47,520,905 | | | | — | | | | — | | |
Legris Industries SA | | | 896,416 | | | | — | | | | — | | | | 896,416 | | | | 21,288,397 | | | | — | | | | — | | |
Maezawa Kasei
Industries Company
Limited | | | 2,045,420 | | | | — | | | | — | | | | 2,045,420 | | | | 19,319,992 | | | | — | | | | 244,442 | | |
Robertet SA | | | 235,837 | | | | — | | | | — | | | | 235,837 | | | | 69,369,224 | | | | — | | | | — | | |
T. Hasegawa
Company Limited | | | 3,206,911 | | | | — | | | | — | | | | 3,206,911 | | | | 53,980,992 | | | | — | | | | 383,249 | | |
Total | | | | | | | | | | $ | 596,867,041 | | | $ | 163,637 | | | $ | 1,815,513 | | |
#Formerly known as FINEL.
Industry Diversification for Portfolio Holdings | | Percent of
Net Assets | |
International Common Stocks | |
Consumer Discretionary | | | 9.13 | % | |
Consumer Staples | | | 11.18 | | |
Energy | | | 2.90 | | |
Financials | | | 13.56 | | |
Health Care | | | 6.31 | | |
Industrials | | | 13.53 | | |
Information Technology | | | 3.24 | | |
Materials | | | 11.57 | | |
Telecommunication Services | | | 3.07 | | |
Total International Common Stocks | | | 74.49 | | |
U.S. Common Stock | |
Materials | | | 0.24 | | |
Total U.S. Common Stock | | | 0.24 | | |
International Preferred Stock | |
Consumer Staples | | | 0.05 | | |
Total International Preferred Stock | | | 0.05 | | |
First Eagle Funds | Semi-Annual Report | April 30, 2016
63
First Eagle Overseas Fund | Consolidated Schedule of Investments | Six-Month Period Ended April 30, 2016 (unaudited)
Industry Diversification for Portfolio Holdings (continued) | | Percent of
Net Assets | |
Investment Company | | | 0.00 | %* | |
Right | | | 0.00 | | |
Commodity | | | 6.22 | | |
Term Loans | | | 0.01 | | |
U.S Bond | |
Government Issues | | | 0.07 | | |
Total U.S Bond | | | 0.07 | | |
International Notes and Bonds | |
Government Issues | | | 1.99 | | |
Materials | | | 0.14 | | |
Total International Notes and Bonds | | | 2.13 | | |
Commercial Paper | |
International Commercial Paper | | | 7.13 | | |
U.S. Commercial Paper | | | 8.97 | | |
Total Commercial Paper | | | 16.10 | | |
Total Investments | | | 99.31 | % | |
*Less than 0.01%
See Notes to Consolidated Financial Statements.
First Eagle Funds | Semi-Annual Report | April 30, 2016
64
This page was intentionally left blank.
First Eagle U.S. Value Fund
Data as of April 30, 2016 (unaudited)
Investment Objective
The First Eagle U.S. Value Fund seeks long-term growth of capital by investing, under normal market conditions, at least 80% of its assets in domestic equity and debt securities. Management utilizes a highly disciplined, bottom-up, value-oriented approach in seeking to achieve its investment objective.
Average Annual Returns (%) | | | | | | One-Year | | Five-Years | | Ten-Years | |
First Eagle U.S. Value Fund | | Class A | | without sales charge | | | 1.43 | | | | 6.85 | | | | 6.67 | | |
| | | | with sales charge | | | -3.64 | | | | 5.76 | | | | 6.12 | | |
Standard & Poor's 500 Index | | | | | | | 1.21 | | | | 11.02 | | | | 6.91 | | |
Consumer Price Index | | | | | | | 1.13 | | | | 1.25 | | | | 1.73 | | |
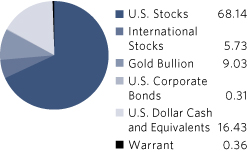
Sector/Industry** (%)
Financials | | | 20.45 | | |
Information Technology | | | 14.93 | | |
Industrials | | | 12.50 | | |
Commodity | | | 9.03 | | |
Consumer Discretionary | | | 8.71 | | |
Materials | | | 7.06 | | |
Energy | | | 6.55 | | |
Consumer Staples | | | 1.50 | | |
Health Care | | | 1.40 | | |
Utilities | | | 1.08 | | |
Warrant | | | 0.36 | | |
* Asset Allocation and Sector/Industry percentages are based on total investments in the portfolio.
**Sector/Industry allocations exclude short term investments.
The Fund's portfolio composition is subject to change at any time.
First Eagle Funds | Semi-Annual Report | April 30, 2016
66
First Eagle U.S. Value Fund | Fund Overview
Growth of a $10,000 Initial Investment
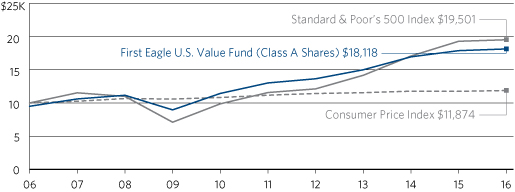
Performance data quoted herein represents past performance and should not be considered indicative of future results. Performance data quoted herein does not reflect the deduction of taxes that a shareholder would pay on Fund distributions or the sale of Fund shares. The average annual returns shown above are historical and reflect changes in share price, reinvested dividends and are net of expenses.
The average annual returns for Class A Shares with a sales charge gives effect to the deduction of the maximum sales charge of 5.00%.
The Standard & Poor's 500 Index is a widely recognized unmanaged index including a representative sample of 500 leading companies in leading sectors of the U.S. economy and is not available for purchase. Although the Standard & Poor's 500 Index focuses on the large-cap segment of the market, with approximately 80% coverage of U.S. equities, it is also considered a proxy for the total market. The Standard & Poor's 500 Index includes dividends reinvested. One cannot invest directly in an index. The Consumer Price Index (CPI) represents the change in price of all goods and services purchased for consumption by urban households.
Top 10 Holdings* (%)
Gold Bullion** (precious metal) | | | 9.03 | | |
Oracle Corporation (U.S. software developer) | | | 4.10 | | |
Comcast Corporation Class 'A' (U.S. cable/satellite television company) | | | 3.92 | | |
Omnicom Group, Inc. (U.S. advertising & marketing services provider) | | | 3.32 | | |
Weyerhaeuser Company REIT (U.S. forest products company) | | | 3.03 | | |
Bank of New York Mellon Corporation (U.S. financial services company) | | | 3.00 | | |
Microsoft Corporation (U.S. software developer) | | | 2.72 | | |
American Express Company (U.S. financial services company) | | | 2.57 | | |
Alleghany Corporation (U.S. insurance company) | | | 2.15 | | |
National Oilwell Varco, Inc. (U.S. oil and gas equipment manufacturer) | | | 1.95 | | |
Total | | | 35.79 | | |
* Holdings in cash, commercial paper and other short term cash equivalents have been excluded.
**The Fund invests in gold and precious metals through investment in a wholly-owned subsidiary of the Fund organized under the laws of the Cayman Islands (the "Subsidiary"). Gold Bullion and commodities include the Fund's investment in the Subsidiary.
Percentages are based on total net assets.
First Eagle Funds | Semi-Annual Report | April 30, 2016
67
First Eagle U.S. Value Fund | Consolidated Schedule of Investments | Six-Month Period Ended April 30, 2016 (unaudited)
| Shares | | Description | | Cost (Note 1) | | Value (Note 1) | |
Common Stocks — 73.80% | | | |
U.S. Common Stocks — 68.08% | | | |
Consumer Discretionary — 8.67% | | | |
| | 1,444,082 | | | Comcast Corporation, Class 'A' | | $ | 22,263,225 | | | $ | 87,742,422 | | |
| | 896,174 | | | Omnicom Group, Inc. | | | 33,547,273 | | | | 74,355,557 | | |
| | 435,102 | | | Vista Outdoor, Inc. (a) | | | 5,993,086 | | | | 20,876,194 | | |
| | 359,081 | | | H&R Block, Inc. | | | 6,046,002 | | | | 7,267,799 | | |
| | 54,090 | | | Tiffany & Company | | | 3,282,579 | | | | 3,859,322 | | |
| | | | 71,132,165 | | | | 194,101,294 | | |
Consumer Staples — 1.50% | | | |
| | 290,726 | | | Colgate-Palmolive Company | | | 11,156,933 | | | | 20,618,288 | | |
| | 173,177 | | | Wal-Mart Stores, Inc. | | | 7,728,121 | | | | 11,580,346 | | |
| | 77,388 | | | Limoneira Company | | | 1,488,691 | | | | 1,384,471 | | |
| | | | 20,373,745 | | | | 33,583,105 | | |
Energy — 5.69% | | | |
| | 1,213,178 | | | National Oilwell Varco, Inc. | | | 76,683,561 | | | | 43,722,935 | | |
| | 929,473 | | | FMC Technologies, Inc. (a) | | | 32,748,194 | | | | 28,339,632 | | |
| | 414,278 | | | ConocoPhillips | | | 14,687,730 | | | | 19,798,346 | | |
| | 533,372 | | | Devon Energy Corporation | | | 29,680,933 | | | | 18,497,341 | | |
| | 874,689 | | | San Juan Basin Royalty Trust (b) | | | 14,844,140 | | | | 6,044,101 | | |
| | 96,554 | | | SEACOR Holdings, Inc. (a) | | | 6,036,566 | | | | 5,674,478 | | |
| | 63,037 | | | Phillips 66 | | | 4,957,476 | | | | 5,175,968 | | |
| | | | 179,638,600 | | | | 127,252,801 | | |
Financials — 19.53% | | | |
| | 2,107,946 | | | Weyerhaeuser Company, REIT | | | 41,062,509 | | | | 67,707,226 | | |
| | 1,666,394 | | | Bank of New York Mellon Corporation | | | 37,021,955 | | | | 67,055,695 | | |
| | 879,403 | | | American Express Company | | | 40,907,769 | | | | 57,539,338 | | |
| | 92,464 | | | Alleghany Corporation (a) | | | 26,401,085 | | | | 48,199,634 | | |
| | 909,608 | | | BB&T Corporation | | | 21,844,946 | | | | 32,181,931 | | |
| | 724,595 | | | U.S. Bancorp | | | 17,621,199 | | | | 30,932,961 | | |
| | 450,471 | | | WR Berkley Corporation | | | 12,069,597 | | | | 25,226,376 | | |
| | 437,493 | | | American International Group, Inc. | | | 22,781,145 | | | | 24,420,859 | | |
| | 614,999 | | | Synchrony Financial (a) | | | 18,851,568 | | | | 18,800,519 | | |
| | 78 | | | Berkshire Hathaway, Inc., Class 'A' (a) | | | 5,963,923 | | | | 17,082,000 | | |
| | 485,877 | | | Brown & Brown, Inc. | | | 15,072,951 | | | | 17,059,141 | | |
First Eagle Funds | Semi-Annual Report | April 30, 2016
68
First Eagle U.S. Value Fund | Consolidated Schedule of Investments | Six-Month Period Ended April 30, 2016 (unaudited)
| Shares | | Description | | Cost (Note 1) | | Value (Note 1) | |
U.S. Common Stocks — 68.08% (continued) | | | |
Financials — 19.53% (continued) | | | |
| | 201,716 | | | Cincinnati Financial Corporation | | $ | 4,801,492 | | | $ | 13,315,273 | | |
| | 90,481 | | | Mastercard, Inc., Class 'A' | | | 1,815,907 | | | | 8,775,752 | | |
| | 112,369 | | | Visa, Inc., Class 'A' | | | 2,025,047 | | | | 8,679,382 | | |
| | | | 268,241,093 | | | | 436,976,087 | | |
Health Care — 1.40% | | | |
| | 113,913 | | | Anthem, Inc. | | | 4,173,976 | | | | 16,035,533 | | |
| | 188,709 | | | Varian Medical Systems, Inc. (a) | | | 14,401,931 | | | | 15,319,397 | | |
| | | | 18,575,907 | | | | 31,354,930 | | |
Industrials — 12.49% | | | |
| | 817,802 | | | Flowserve Corporation | | | 38,937,371 | | | | 39,916,916 | | |
| | 215,916 | | | 3M Company | | | 13,213,970 | | | | 36,140,020 | | |
| | 394,900 | | | Cintas Corporation | | | 8,980,357 | | | | 35,454,122 | | |
| | 312,435 | | | Union Pacific Corporation | | | 25,564,175 | | | | 27,253,705 | | |
| | 298,869 | | | Orbital ATK, Inc. | | | 7,807,202 | | | | 26,001,603 | | |
| | 271,895 | | | Deere & Company | | | 22,113,579 | | | | 22,869,088 | | |
| | 96,076 | | | WW Grainger, Inc. | | | 20,956,664 | | | | 22,531,744 | | |
| | 486,109 | | | Timken Company | | | 19,040,145 | | | | 17,320,064 | | |
| | 741,908 | | | NOW, Inc. (a) | | | 21,646,553 | | | | 13,398,858 | | |
| | 64,939 | | | Northrop Grumman Corporation | | | 3,395,404 | | | | 13,394,318 | | |
| | 103,917 | | | Cummins, Inc. | | | 9,221,673 | | | | 12,161,407 | | |
| | 51,091 | | | Lockheed Martin Corporation | | | 3,536,076 | | | | 11,872,527 | | |
| | 11,401 | | | Unifirst Corporation | | | 1,160,746 | | | | 1,235,640 | | |
| | | | 195,573,915 | | | | 279,550,012 | | |
Information Technology — 14.92% | | | |
| | 2,299,321 | | | Oracle Corporation | | | 66,498,422 | | | | 91,650,935 | | |
| | 1,220,064 | | | Microsoft Corporation | | | 28,336,700 | | | | 60,844,592 | | |
| | 738,921 | | | Linear Technology Corporation | | | 18,027,441 | | | | 32,867,206 | | |
| | 1,295,305 | | | Teradata Corporation (a) | | | 52,590,563 | | | | 32,771,216 | | |
| | 590,022 | | | Xilinx, Inc. | | | 23,817,911 | | | | 25,418,148 | | |
| 893,884
| | | Comtech Telecommunications
Corporation (c) | | | 27,986,154
| | | | 21,631,993
| | |
| | 133,795 | | | Automatic Data Processing, Inc. | | | 4,162,893 | | | | 11,832,830 | | |
| | 14,594 | | | Alphabet, Inc., Class 'A' (a) | | | 8,157,701 | | | | 10,330,801 | | |
First Eagle Funds | Semi-Annual Report | April 30, 2016
69
First Eagle U.S. Value Fund | Consolidated Schedule of Investments | Six-Month Period Ended April 30, 2016 (unaudited)
| Shares | | Description | | Cost (Note 1) | | Value (Note 1) | |
U.S. Common Stocks — 68.08% (continued) | | | |
Information Technology — 14.92% (continued) | | | |
| | 15,888 | | | Alphabet, Inc., Class 'C' (a) | | $ | 3,787,101 | | | $ | 11,010,543 | | |
| | 193,008 | | | Texas Instruments, Inc. | | | 9,095,627 | | | | 11,009,176 | | |
| | 98,562 | | | F5 Networks, Inc. (a) | | | 8,795,776 | | | | 10,324,369 | | |
| | 162,313 | | | CommVault Systems, Inc. (a) | | | 7,749,772 | | | | 7,104,440 | | |
| | 230,363 | | | Intel Corporation | | | 3,575,542 | | | | 6,975,392 | | |
| | | | 262,581,603 | | | | 333,771,641 | | |
Materials — 2.80% | | | |
| | 308,043 | | | Scotts Miracle-Gro Company, Class 'A' | | | 12,914,322 | | | | 21,803,284 | | |
| | 79,413 | | | Praxair, Inc. | | | 8,186,437 | | | | 9,327,851 | | |
| | 49,909 | | | Martin Marietta Materials, Inc. | | | 3,828,305 | | | | 8,446,100 | | |
| | 121,921 | | | Royal Gold, Inc. | | | 7,844,609 | | | | 7,634,693 | | |
| | 62,631 | | | Vulcan Materials Company | | | 2,273,368 | | | | 6,740,974 | | |
| | 325,000 | | | Tahoe Resources, Inc. | | | 2,498,865 | | | | 4,589,942 | | |
| | 65,603 | | | Deltic Timber Corporation | | | 2,989,875 | | | | 4,100,187 | | |
| | | | 40,535,781 | | | | 62,643,031 | | |
Utilities — 1.08% | | | |
| | 445,669 | | | UGI Corporation | | | 14,796,530 | | | | 17,933,720 | | |
| | 84,216 | | | IDACorp, Inc. | | | 2,454,194 | | | | 6,125,030 | | |
| | | | 17,250,724 | | | | 24,058,750 | | |
Total U.S. Common Stocks | | | 1,073,903,533 | | | | 1,523,291,651 | | |
International Common Stocks — 5.72% | | | |
Africa — 0.10% | | | |
| | 21,756 | | | Randgold Resources Limited, ADR | | | 1,296,964 | | | | 2,186,478 | | |
Australia — 0.93% | | | |
| | 1,444,573 | | | Newcrest Mining Limited (a) | | | 20,119,755 | | | | 20,836,286 | | |
Canada — 3.79% | | | |
| | 481,259 | | | Agnico-Eagle Mines Limited | | | 18,495,461 | | | | 22,749,240 | | |
| | 1,189,170 | | | Potash Corporation of Saskatchewan, Inc. | | | 43,376,968 | | | | 21,072,093 | | |
| | 867,976 | | | Goldcorp, Inc. | | | 24,213,068 | | | | 17,489,716 | | |
| | 155,814 | | | Franco-Nevada Corporation | | | 6,600,119 | | | | 10,940,634 | | |
| | 228,777 | | | Canadian Natural Resources Limited | | | 6,377,426 | | | | 6,870,421 | | |
| | 152,263 | | | Suncor Energy, Inc. | | | 3,811,531 | | | | 4,469,472 | | |
| | 41,526 | | | Imperial Oil Limited | | | 1,230,500 | | | | 1,377,106 | | |
| | | | 104,105,073 | | | | 84,968,682 | | |
First Eagle Funds | Semi-Annual Report | April 30, 2016
70
First Eagle U.S. Value Fund | Consolidated Schedule of Investments | Six-Month Period Ended April 30, 2016 (unaudited)
| Shares | | Description | | Cost (Note 1) | | Value (Note 1) | |
International Common Stocks — 5.72% (continued) | | | |
United Kingdom — 0.90% | | | |
| | 161,294 | | | Willis Towers Watson PLC | | $ | 11,232,685 | | | $ | 20,145,620 | | |
Total International Common Stocks | | | 136,754,477 | | | | 128,137,066 | | |
Total Common Stocks | | | 1,210,658,010 | | | | 1,651,428,717 | | |
Investment Company — 0.00*% | | | |
| 11,773
| | | State Street Institutional U.S.
Government Money Market Fund,
Premier Class | | | 11,773
| | | | 11,773
| | |
Warrant — 0.36% | | | |
United States — 0.36% | | | |
| 371,133
| | | JPMorgan Chase & Company
Warrant expire 10/28/18 (a)(b) | | | 3,885,193
| | | | 7,997,916
| | |
| Ounces | | | | | | | |
Commodity — 9.03% | | | |
| | 156,194 | | | Gold bullion (a) | | | 186,047,980 | | | | 201,962,287 | | |
| Principal | | | | | | | |
U.S. Corporate Bonds — 0.31% | | | |
$ | 6,542,000
| | | Citgo Petroleum Corporation
6.25% due 08/15/22 (d) | | | 6,549,740
| | | | 6,378,450
| | |
| 600,000
| | | Bausch & Lomb, Inc.
7.125% due 08/01/28 (b) | | | 529,816
| | | | 537,863
| | |
Total U.S. Corporate Bonds | | | 7,079,556 | | | | 6,916,313 | | |
U.S. Treasury Bills — 4.47% | | | |
| 40,000,000
| | | U.S. Treasury Bill
0.23% due 07/21/16 | | | 39,979,750
| | | | 39,983,320
| | |
| 30,000,000
| | | U.S. Treasury Bill
0.27% due 05/12/16 | | | 29,997,571
| | | | 29,998,800
| | |
| 30,000,000
| | | U.S. Treasury Bill
0.30% due 05/19/16 | | | 29,995,575
| | | | 29,997,810
| | |
Total U.S. Treasury Bills | | | 99,972,896 | | | | 99,979,930 | | |
First Eagle Funds | Semi-Annual Report | April 30, 2016
71
First Eagle U.S. Value Fund | Consolidated Schedule of Investments | Six-Month Period Ended April 30, 2016 (unaudited)
| Principal | | Description | | Cost (Note 1) | | Value (Note 1) | |
Commercial Paper — 11.94% | | | |
International Commercial Paper — 4.69% | | | |
Canada — 0.05% | | | |
| 1,047,000
USD | | | Total Capital Limited
0.60% due 07/15/16 | | $ | 1,045,713
| | | $ | 1,045,997
| | |
France — 0.10% | | | |
| 2,225,000
USD | | | Essilor International
0.49% due 05/10/16 | | | 2,224,733
| | | | 2,224,745
| | |
Germany — 0.54% | | | |
| 3,047,000
USD | | | BASF AG
0.43% due 06/01/16 | | | 3,045,898
| | | | 3,045,844
| | |
| 1,942,000
USD | | | BASF AG
0.46% due 05/12/16 | | | 1,941,733
| | | | 1,941,735
| | |
| 1,378,000
USD | | | Henkel Corporation
0.60% due 07/08/16 | | | 1,376,464
| | | | 1,376,749
| | |
| 4,570,000
USD | | | Siemens Company
0.47% due 06/17/16 | | | 4,567,256
| | | | 4,567,481
| | |
| 1,293,000
USD | | | Siemens Company
0.48% due 06/21/16 | | | 1,292,139
| | | | 1,292,217
| | |
Italy — 0.93% | | | |
| 20,822,000
USD | | | Eni S.p.A.
0.61% due 05/02/16 | | | 20,821,653
| | | | 20,821,523
| | |
Japan — 1.20% | | | |
| 8,574,000
USD | | | Hitachi Limited
0.56% due 05/02/16 | | | 8,573,869
| | | | 8,573,668
| | |
| 3,297,000
USD | | | Honda Corporation
0.49% due 06/08/16 | | | 3,295,330
| | | | 3,295,242
| | |
| 2,771,000
USD | | | Honda Corporation
0.49% due 06/13/16 | | | 2,769,411
| | | | 2,769,303
| | |
| 12,248,000
USD | | | Mitsui & Company Limited
0.52% due 05/02/16 | | | 12,247,826
| | | | 12,247,627
| | |
New Zealand — 0.03% | | | |
| 595,000
USD | | | Alpha Finance Corporation Limited
0.44% due 07/14/16 | | | 594,474
| | | | 594,438
| | |
Switzerland — 1.13% | | | |
| 4,260,000
USD | | | Nestlé SA
0.47% due 06/07/16 | | | 4,257,986
| | | | 4,258,168
| | |
| 2,320,000
USD | | | Roche Holdings, Inc.
0.41% due 05/11/16 | | | 2,319,742
| | | | 2,319,733
| | |
First Eagle Funds | Semi-Annual Report | April 30, 2016
72
First Eagle U.S. Value Fund | Consolidated Schedule of Investments | Six-Month Period Ended April 30, 2016 (unaudited)
| Principal | | Description | | Cost (Note 1) | | Value (Note 1) | |
International Commercial Paper — 4.69% (continued) | | | |
Switzerland — 1.13% (continued) | | | |
| 9,592,000
USD | | | Roche Holdings, Inc.
0.43% due 06/17/16 | | $ | 9,586,741
| | | $ | 9,586,712
| | |
| 1,953,000
USD | | | Roche Holdings, Inc.
0.45% due 07/19/16 | | | 1,951,114
| | | | 1,951,001
| | |
| 7,183,000
USD | | | Roche Holdings, Inc.
0.45% due 07/22/16 | | | 7,175,801
| | | | 7,175,290
| | |
United Kingdom — 0.71% | | | |
| 1,047,000
USD | | | AstraZeneca PLC
0.71% due 05/16/16 | | | 1,046,695
| | | | 1,046,809
| | |
| 2,180,000
USD | | | AstraZeneca PLC
0.73% due 05/09/16 | | | 2,179,651
| | | | 2,179,774
| | |
| 1,557,000
USD | | | BP Capital Markets PLC
0.71% due 05/05/16 | | | 1,556,879
| | | | 1,556,867
| | |
| 1,557,000
USD | | | BP Capital Markets PLC
0.71% due 05/06/16 | | | 1,556,849
| | | | 1,556,844
| | |
| 1,047,000
USD | | | British American Tobacco PLC
0.90% due 06/15/16 | | | 1,045,848
| | | | 1,046,271
| | |
| 1,047,000
USD | | | British American Tobacco PLC
0.90% due 06/16/16 | | | 1,045,823
| | | | 1,046,255
| | |
| 2,088,000
USD | | | British American Tobacco PLC
0.90% due 06/20/16 | | | 2,085,448
| | | | 2,086,374
| | |
| 2,397,000
USD | | | British American Tobacco PLC
0.97% due 07/13/16 | | | 2,392,382
| | | | 2,394,129
| | |
| 2,088,000
USD | | | GlaxoSmithKline PLC
0.56% due 07/19/16 | | | 2,085,480
| | | | 2,085,721
| | |
| 976,000
USD | | | GlaxoSmithKline PLC
0.58% due 07/25/16 | | | 974,686
| | | | 974,832
| | |
Total International Commercial Paper | | | 105,057,624 | | | | 105,061,349 | | |
U.S. Commercial Paper — 7.25% | | | |
$ | 2,009,000
| | | Abbott Laboratories
0.62% due 06/03/16 | | | 2,007,877
| | | | 2,007,717
| | |
| 3,656,000
| | | Abbott Laboratories
0.62% due 06/08/16 | | | 3,653,646
| | | | 3,653,307
| | |
| 7,272,000
| | | Apple, Inc.
0.36% due 06/01/16 | | | 7,269,808
| | | | 7,269,440
| | |
| 6,060,000
| | | Apple, Inc.
0.36% due 06/02/16 | | | 6,058,115
| | | | 6,057,797
| | |
| 4,789,000
| | | Apple, Inc.
0.36% due 06/03/16 | | | 4,787,463
| | | | 4,787,198
| | |
First Eagle Funds | Semi-Annual Report | April 30, 2016
73
First Eagle U.S. Value Fund | Consolidated Schedule of Investments | Six-Month Period Ended April 30, 2016 (unaudited)
| Principal | | Description | | Cost (Note 1) | | Value (Note 1) | |
U.S. Commercial Paper — 7.25% (continued) | | | |
$ | 3,237,000
| | | Apple, Inc.
0.37% due 06/06/16 | | $ | 3,235,835
| | | $ | 3,235,664
| | |
| 2,320,000
| | | Apple, Inc.
0.39% due 05/03/16 | | | 2,319,951
| | | | 2,319,913
| | |
| 2,088,000
| | | Apple, Inc.
0.44% due 07/13/16 | | | 2,086,179
| | | | 2,086,064
| | |
| 927,000
| | | Caterpillar Financial Services Company
0.46% due 06/10/16 | | | 926,536
| | | | 926,477
| | |
| 2,865,000
| | | Chevron Corporation
0.36% due 05/13/16 | | | 2,864,666
| | | | 2,864,611
| | |
| 1,402,000
| | | Duke Energy Corporation
0.92% due 05/09/16 | | | 1,401,720
| | | | 1,401,815
| | |
| 9,420,000
| | | Duke Energy Corporation
0.92% due 05/13/16 | | | 9,417,174
| | | | 9,418,245
| | |
| 2,626,000
| | | DuPont
0.90% due 06/06/16 | | | 2,623,689
| | | | 2,624,403
| | |
| 2,004,000
| | | Entergy Corporation
1.19% due 06/03/16 | | | 2,001,814
| | | | 2,002,642
| | |
| 2,397,000
| | | Entergy Corporation
1.19% due 06/10/16 | | | 2,393,831
| | | | 2,395,026
| | |
| 1,043,000
| | | International Business
Machines Corporation
0.45% due 06/22/16 | | | 1,042,337
| | | | 1,042,296
| | |
| 8,798,000
| | | MetLife
0.48% due 05/31/16 | | | 8,794,554
| | | | 8,794,606
| | |
| 5,779,000
| | | MetLife
0.56% due 07/20/16 | | | 5,771,937
| | | | 5,771,721
| | |
| 14,130,000
| | | Microsoft Corporation
0.39% due 06/01/16 | | | 14,125,376
| | | | 14,124,871
| | |
| 7,519,000
| | | Microsoft Corporation
0.43% due 06/08/16 | | | 7,515,667
| | | | 7,515,575
| | |
| 3,323,000
| | | Microsoft Corporation
0.43% due 07/13/16 | | | 3,320,170
| | | | 3,319,539
| | |
| 6,374,000
| | | PepsiCo, Inc.
0.41% due 06/21/16 | | | 6,370,388
| | | | 6,369,524
| | |
| 2,088,000
| | | Pfizer, Inc.
0.43% due 06/20/16 | | | 2,086,782
| | | | 2,086,664
| | |
| 14,130,000
| | | Pfizer, Inc.
0.48% due 06/22/16 | | | 14,120,407
| | | | 14,120,462
| | |
First Eagle Funds | Semi-Annual Report | April 30, 2016
74
First Eagle U.S. Value Fund | Consolidated Schedule of Investments | Six-Month Period Ended April 30, 2016 (unaudited)
| Principal | | Description | | Cost (Note 1) | | Value (Note 1) | |
U.S. Commercial Paper — 7.25% (continued) | | | |
$ | 2,771,000
| | | Pfizer, Inc.
0.48% due 06/23/16 | | $ | 2,769,083
| | | $ | 2,769,082
| | |
| 2,809,000
| | | Pfizer, Inc.
0.48% due 07/11/16 | | | 2,806,396
| | | | 2,806,175
| | |
| 4,789,000
| | | Philip Morris International, Inc.
0.44% due 06/02/16 | | | 4,787,169
| | | | 4,787,123
| | |
| 6,060,000
| | | Philip Morris International, Inc.
0.49% due 06/28/16 | | | 6,055,314
| | | | 6,055,455
| | |
| 6,060,000
| | | Philip Morris International, Inc.
0.49% due 06/29/16 | | | 6,055,233
| | | | 6,055,359
| | |
| 3,047,000
| | | Praxair, Inc.
0.39% due 06/02/16 | | | 3,045,971
| | | | 3,045,806
| | |
| 3,047,000
| | | Praxair, Inc.
0.39% due 06/03/16 | | | 3,045,939
| | | | 3,045,765
| | |
| 2,153,000
| | | Precision Castparts Corporation
0.41% due 05/02/16 | | | 2,152,976
| | | | 2,152,934
| | |
| 1,152,000
| | | Qualcomm, Inc.
0.39% due 06/01/16 | | | 1,151,623
| | | | 1,151,594
| | |
| 2,125,000
| | | Qualcomm, Inc.
0.49% due 07/20/16 | | | 2,122,733
| | | | 2,122,788
| | |
| 781,000
| | | Qualcomm, Inc.
0.49% due 07/21/16 | | | 780,156
| | | | 780,175
| | |
| 1,290,000
| | | Qualcomm, Inc.
0.51% due 05/03/16 | | | 1,289,964
| | | | 1,289,952
| | |
| 2,397,000
| | | Syngenta Wilmington
1.30% due 06/13/16 | | | 2,393,278
| | | | 2,395,052
| | |
| 7,524,000
| | | Walt Disney Company
0.49% due 06/24/16 | | | 7,518,583
| | | | 7,518,300
| | |
Total U.S. Commercial Paper | | | 162,170,340 | | | | 162,171,137 | | |
Total Commercial Paper | | | 267,227,964 | | | | 267,232,486 | | |
Total Investments — 99.91% (Cost: $1,774,883,372) | | | 2,235,529,422 | | |
Other Assets in Excess of Liabilities — 0.09% | | | 1,992,567 | | |
Net Assets — 100.00% | | $ | 2,237,521,989 | | |
* Less than 0.01%
(a) Non-income producing security/commodity.
(b) Security is deemed illiquid. At April 30, 2016, the value of these securities amounted to $14,579,880 or 0.65% of net assets.
First Eagle Funds | Semi-Annual Report | April 30, 2016
75
First Eagle U.S. Value Fund | Consolidated Schedule of Investments | Six-Month Period Ended April 30, 2016 (unaudited)
(c) An affiliate of the Fund as defined by the Investment Company Act of 1940. An affiliate is defined as a company in which the Fund directly or indirectly owns, controls, or holds power to vote 5% or more of the outstanding voting securities.
(d) All or a portion of the security is exempt from registration under the Securities Act of 1933. Rule 144A securities may only be sold to qualified institutional buyers, pursuant to Rule 144A under the Securities Act of 1933.
At April 30, 2016, cost is substantially identical for both book and federal income tax purposes. Net unrealized appreciation consisted of:
Gross unrealized appreciation | | $ | 584,719,098 | | |
Gross unrealized depreciation | | | (124,073,048 | ) | |
Net unrealized appreciation | | $ | 460,646,050 | | |
Abbreviations used in this schedule include:
ADR — American Depositary Receipt
AG — Aktien Gesellschaft
PLC — Public Limited Company
REIT — Real Estate Investment Trust
SA — Société Anonyme
S.p.A. — Società per Azioni
Currencies
USD — United States Dollar
Affiliated Securities
Affiliated Securities | | Shares
October 31,
2015 | | Gross
Additions | | Gross
Reductions | | Shares
April 30,
2016 | | Market
Value
April 30,
2016 | | Realized
Gain/
(Loss) | | Dividend
Income | |
Comtech
Telecommunications
Corporation | | | 1,191,749 | | | | — | | | | 297,865 | | | | 893,884 | | | $ | 21,631,993 | | | $ | (4,897,849 | ) | | $ | 625,690 | | |
Industry Diversification for Portfolio Holdings | | Percent of
Net Assets | |
U.S. Common Stocks | |
Consumer Discretionary | | | 8.67 | % | |
Consumer Staples | | | 1.50 | | |
Energy | | | 5.69 | | |
Financials | | | 19.53 | | |
Health Care | | | 1.40 | | |
Industrials | | | 12.49 | | |
Information Technology | | | 14.92 | | |
Materials | | | 2.80 | | |
Utilities | | | 1.08 | | |
Total U.S. Common Stocks | | | 68.08 | | |
First Eagle Funds | Semi-Annual Report | April 30, 2016
76
First Eagle U.S. Value Fund | Consolidated Schedule of Investments | Six-Month Period Ended April 30, 2016 (unaudited)
Industry Diversification for Portfolio Holdings (continued) | | Percent of
Net Assets | |
International Common Stocks | |
Energy | | | 0.57 | % | |
Financials | | | 0.90 | | |
Materials | | | 4.25 | | |
Total International Common Stocks | | | 5.72 | | |
Investment Company | | | 0.00 | * | |
Warrant | | | 0.36 | | |
Commodity | | | 9.03 | | |
U.S. Corporate Bonds | |
Consumer Discretionary | | | 0.02 | | |
Energy | | | 0.29 | | |
Total U.S. Corporate Bonds | | | 0.31 | | |
U.S. Treasury Bills | | | 4.47 | | |
Commercial Paper | |
International Commercial Paper | | | 4.69 | | |
U.S. Commercial Paper | | | 7.25 | | |
Total Commercial Paper | | | 11.94 | | |
Total Investments | | | 99.91 | % | |
*Less than 0.01%
See Notes to Consolidated Financial Statements.
First Eagle Funds | Semi-Annual Report | April 30, 2016
77
Data as of April 30, 2016 (unaudited)
Investment Objective
The First Eagle Gold Fund is a non-diversified fund. The Fund's investment objective is to provide investors the opportunity to participate in the investment characteristics of gold (and to a limited extent other precious metals) for a portion of their overall investment portfolio. In seeking to achieve its objective, the Fund invests primarily in gold, and/or securities directly related to gold or issuers principally engaged in the gold industry.
Average Annual Returns (%) | | | | | | One-Year | | Five-Years | | Ten-Years | |
First Eagle Gold Fund | | Class A | | without sales load | | | 21.81 | | | | -11.88 | | | | 0.55 | | |
| | | | with sales load | | | 15.69 | | | | -12.78 | | | | 0.03 | | |
FTSE Gold Mines Index | | | | | | | 36.39 | | | | -15.65 | | | | -4.30 | | |
MSCI World Index | | | | | | | -4.17 | | | | 5.96 | | | | 4.13 | | |
Consumer Price Index | | | | | | | 1.13 | | | | 1.25 | | | | 1.73 | | |
Asset Allocation* (%)
Countries** (%)
Canada | | | 39.96 | | |
United States | | | 31.88 | | |
Mexico | | | 7.60 | | |
Africa | | | 5.83 | | |
Australia | | | 5.54 | | |
South Africa | | | 3.72 | | |

* Asset Allocation and Countries percentages are based on total investments in the portfolio.
**Country allocations reflect country of the issuer (not currency of issue) and exclude short term investments. Bonds of non-U.S. issuers may be U.S. dollar denominated.
The Fund's portfolio composition is subject to change at any time.
First Eagle Funds | Semi-Annual Report | April 30, 2016
78
First Eagle Gold Fund | Fund Overview
Growth of a $10,000 Initial Investment
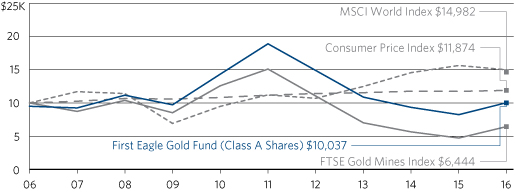
Performance data quoted herein represents past performance and should not be considered indicative of future results. Performance data quoted herein does not reflect the deduction of taxes that a shareholder would pay on Fund distributions or the sale of Fund shares. The average annual returns shown above are historical and reflect changes in share price, reinvested dividends and are net of expenses.
The average annual returns for Class A Shares with a sales charge give effect to the deduction of the maximum sales charge of 5.00%.
The MSCI World Index is a widely followed, unmanaged group of stocks from 23 developed international markets. The index provides total returns in U.S. dollars with net dividends reinvested. The FTSE Gold Mines Index Series is designed to reflect the performance of the worldwide market in the shares of companies whose principal activity is the mining of gold. The FTSE Gold Mines Index encompasses all gold mining companies that have a sustainable, attributable gold production of at least 300,000 ounces a year and that derive 51% or more of their revenue from mined gold. The Index is unmanaged, is available with dividends reinvested. One cannot invest directly in an index. The Consumer Price Index (CPI) represents the change in price of all goods and services purchased for consumption by urban households.
Top 10 Holdings* (%)
Gold Bullion** (United States) | | | 14.81 | | |
Goldcorp, Inc. (Canada) | | | 6.11 | | |
Randgold Resources Limited ADR (Africa) | | | 5.84 | | |
Fresnillo PLC (Mexico) | | | 5.79 | | |
Franco-Nevada Corporation (Canada) | | | 5.55 | | |
Newcrest Mining Limited (Australia) | | | 5.51 | | |
Barrick Gold Corporation (Canada) | | | 4.95 | | |
Tahoe Resources, Inc. (United States) | | | 4.81 | | |
Royal Gold, Inc. (United States) | | | 4.76 | | |
Agnico-Eagle Mines Limited (Canada) | | | 4.64 | | |
Total | | | 62.77 | | |
* Holdings in cash, commercial paper and other short term cash equivalents have been excluded.
**The Fund invests in gold and precious metals through investment in a wholly-owned subsidiary of the Fund organized under the laws of the Cayman Islands (the "Subsidiary"). Gold Bullion and commodities include the Fund's investment in the Subsidiary.
Percentages are based on total net assets.
First Eagle Funds | Semi-Annual Report | April 30, 2016
79
First Eagle Gold Fund | Consolidated Schedule of Investments | Six-Month Period Ended April 30, 2016 (unaudited)
| Shares | | Description | | Cost (Note 1) | | Value (Note 1) | |
Common Stocks — 75.26% | | | |
International Common Stocks — 61.59% | | | |
Africa — 5.85% | | | |
| | 713,177 | | | Randgold Resources Limited, ADR | | $ | 11,769,834 | | | $ | 71,674,288 | | |
Australia — 5.56% | | | |
| | 4,688,004 | | | Newcrest Mining Limited (a) | | | 113,771,023 | | | | 67,619,007 | | |
| 6,800,000
| | | St. Augustine Gold and
Copper Limited (a)(b)(c) | | | 6,754,606
| | | | 514,864
| | |
| | | | 120,525,629 | | | | 68,133,871 | | |
Canada — 38.82% | | | |
| | 3,715,245 | | | Goldcorp, Inc. | | | 91,988,621 | | | | 74,862,186 | | |
| | 968,861 | | | Franco-Nevada Corporation | | | 18,633,337 | | | | 68,029,532 | | |
| | 3,130,401 | | | Barrick Gold Corporation | | | 75,081,978 | | | | 60,635,867 | | |
| | 1,203,963 | | | Agnico-Eagle Mines Limited | | | 39,293,081 | | | | 56,911,649 | | |
| | 9,407,331 | | | New Gold, Inc. (a) | | | 22,269,492 | | | | 44,236,274 | | |
| | 4,801,889 | | | Kinross Gold Corporation (a) | | | 37,650,637 | | | | 27,370,767 | | |
| | 6,443,257 | | | Eldorado Gold Corporation | | | 64,771,164 | | | | 27,165,721 | | |
| | 7,904,996 | | | IAMGOLD Corporation (a) | | | 20,994,354 | | | | 26,902,314 | | |
| | 1,519,097 | | | Osisko Gold Royalties Limited | | | 19,423,862 | | | | 20,340,185 | | |
| | 1,490,600 | | | MAG Silver Corporation (a) | | | 9,705,164 | | | | 19,340,853 | | |
| | 851,221 | | | Detour Gold Corporation (a) | | | 10,114,628 | | | | 18,256,441 | | |
| | 7,700,300 | | | B2Gold Corporation (a) | | | 10,477,836 | | | | 17,122,688 | | |
| | 5,093,970 | | | Dundee Precious Metals, Inc. (a) | | | 9,291,866 | | | | 11,327,151 | | |
| | 1,620,300 | | | Primero Mining Corporation (a) | | | 7,188,626 | | | | 3,047,667 | | |
| | 71,634 | | | Novagold Resources, Inc. (a) | | | 316,228 | | | | 464,905 | | |
| | | | 437,200,874 | | | | 476,014,200 | | |
Mexico — 7.62% | | | |
| | 4,368,583 | | | Fresnillo PLC | | | 19,185,204 | | | | 71,044,560 | | |
| | 1,434,150 | | | Industrias Peñoles S.A.B. de C.V. | | | 4,579,993 | | | | 22,405,872 | | |
| | | | 23,765,197 | | | | 93,450,432 | | |
South Africa — 3.74% | | | |
| | 2,019,555 | | | AngloGold Ashanti Limited, ADR (a) | | | 45,864,060 | | | | 33,221,680 | | |
| | 2,681,635 | | | Gold Fields Limited, ADR | | | 11,637,005 | | | | 12,603,684 | | |
| | | | 57,501,065 | | | | 45,825,364 | | |
Total International Common Stocks | | | 650,762,599 | | | | 755,098,155 | | |
First Eagle Funds | Semi-Annual Report | April 30, 2016
80
First Eagle Gold Fund | Consolidated Schedule of Investments | Six-Month Period Ended April 30, 2016 (unaudited)
| Shares | | Description | | Cost (Note 1) | | Value (Note 1) | |
U.S. Common Stocks — 13.67% | | | |
Materials — 13.67% | | | |
| | 4,174,549 | | | Tahoe Resources, Inc. (b) | | $ | 46,716,395 | | | $ | 58,956,729 | | |
| | 932,171 | | | Royal Gold, Inc. | | | 17,941,213 | | | | 58,372,548 | | |
| | 1,438,306 | | | Newmont Mining Corporation | | | 48,693,959 | | | | 50,297,561 | | |
Total U.S. Common Stocks | | | 113,351,567 | | | | 167,626,838 | | |
Total Common Stocks | | | 764,114,166 | | | | 922,724,993 | | |
Investment Company — 0.00*% | | | |
| 19,155
| | | State Street Institutional U.S.
Government Money Market Fund,
Premier Class | | | 19,155
| | | | 19,155
| | |
Warrant — 0.01% | | | |
Canada — 0.01% | | | |
| 59,602
| | | Osisko Gold Royalties, Limited
Warrant expire 02/26/19 (a) | | | 81,620
| | | | 158,660
| | |
| Ounces | | | | | | | |
Commodities — 18.31% | | | |
| | 140,395 | | | Gold bullion (a) | | | 81,800,172 | | | | 181,533,507 | | |
| | 2,410,530 | | | Silver bullion (a) | | | 45,269,152 | | | | 42,984,562 | | |
Total Commodities | | | 127,069,324 | | | | 224,518,069 | | |
| Principal | | | | | | | |
International Convertible Bond — 1.26% | | | |
Canada — 1.26% | | | |
| 15,000,000
USD | | | Detour Gold Corporation
5.50% due 11/30/17 (c)(d)(e) | | | 15,000,000
| | | | 15,440,625
| | |
Commercial Paper — 5.49% | | | |
International Commercial Paper — 5.19% | | | |
Germany — 0.12% | | | |
| 1,409,000
USD | | | Siemens Company
0.48% due 06/21/16 | | | 1,408,062
| | | | 1,408,148
| | |
First Eagle Funds | Semi-Annual Report | April 30, 2016
81
First Eagle Gold Fund | Consolidated Schedule of Investments | Six-Month Period Ended April 30, 2016 (unaudited)
Principal | | Description | | Cost (Note 1) | | Value (Note 1) | |
International Commercial Paper — 5.19% (continued) | | | |
Italy — 2.30% | | | |
| 28,204,000
USD | | | Eni S.p.A.
0.61% due 05/02/16 | | $ | 28,203,530
| | | $ | 28,203,354
| | |
Japan — 2.30% | | | |
| 11,613,000
USD | | | Hitachi Limited
0.56% due 05/02/16 | | | 11,612,823
| | | | 11,612,550
| | |
| 16,590,000
USD | | | Mitsui & Company Limited
0.52% due 05/02/16 | | | 16,589,765
| | | | 16,589,495
| | |
United Kingdom — 0.47% | | | |
| 2,377,000
USD | | | AstraZeneca PLC
0.73% due 05/09/16 | | | 2,376,619
| | | | 2,376,753
| | |
| 1,698,000
USD | | | BP Capital Markets PLC
0.71% due 05/05/16 | | | 1,697,868
| | | | 1,697,855
| | |
| 1,698,000
USD | | | BP Capital Markets PLC
0.71% due 05/06/16 | | | 1,697,835
| | | | 1,697,830
| | |
Total International Commercial Paper | | | 63,586,502 | | | | 63,585,985 | | |
U.S. Commercial Paper — 0.30% | | | |
$ | 2,190,000
| | | Abbott Laboratories
0.62% due 06/03/16 | | | 2,188,775
| | | | 2,188,601
| | |
| 1,527,000
| | | Duke Energy Corporation
0.92% due 05/09/16 | | | 1,526,695
| | | | 1,526,799
| | |
Total U.S. Commercial Paper | | | 3,715,470 | | | | 3,715,400 | | |
Total Commercial Paper | | | 67,301,972 | | | | 67,301,385 | | |
Total Investments — 100.33% (Cost: $973,586,237) | | | 1,230,162,887 | | |
Liabilities in Excess of Other Assets — (0.33)% | | | (4,025,910 | ) | |
Net Assets — 100.00% | | $ | 1,226,136,977 | | |
* Less than 0.01%
(a) Non-income producing security/commodity.
(b) Represents a security registered under Regulation D. Regulation D provides exemptions for small companies to offer and sell their securities without having to register the securities under the Securities Act of 1933.
(c) Security is deemed illiquid. At April 30, 2016, the value of these securities amounted to $15,955,489 or 1.30% of net assets.
(d) Securities valued in accordance with fair value procedures under the supervision of the Board of Trustees, representing $15,440,625 or 1.26% of net assets.
(e) This security is convertible until November 30, 2017.
First Eagle Funds | Semi-Annual Report | April 30, 2016
82
First Eagle Gold Fund | Consolidated Schedule of Investments | Six-Month Period Ended April 30, 2016 (unaudited)
At April 30, 2016, cost is substantially identical for both book and federal income tax purposes. Net unrealized appreciation consisted of:
Gross unrealized appreciation | | $ | 407,495,107 | | |
Gross unrealized depreciation | | | (150,918,457 | ) | |
Net unrealized appreciation | | $ | 256,576,650 | | |
Abbreviations used in this schedule include:
ADR — American Depositary Receipt
PLC — Public Limited Company
S.p.A. — Società per Azioni
Currency
USD — United States Dollar
Industry Diversification for Portfolio Holdings | | Percent of
Net Assets | |
International Common Stocks | |
Materials | | | 61.59 | % | |
Total International Common Stocks | | | 61.59 | | |
U.S. Common Stocks | |
Materials | | | 13.67 | | |
Total U.S. Common Stocks | | | 13.67 | | |
Investment Company | | | 0.00 | * | |
Warrant | | | 0.01 | | |
Commodities | | | 18.31 | | |
International Convertible Bond | |
Materials | | | 1.26 | | |
Total International Convertible Bond | | | 1.26 | | |
Commercial Paper | | | |
International Commercial Paper | | | 5.19 | | |
U.S. Commercial Paper | | | 0.30 | | |
Total Commercial Paper | | | 5.49 | | |
Total Investments | | | 100.33 | % | |
*Less than 0.01%
See Notes to Consolidated Financial Statements.
First Eagle Funds | Semi-Annual Report | April 30, 2016
83
First Eagle Global Income Builder
Data as of April 30, 2016 (unaudited)
Investment Objective
First Eagle Global Income Builder Fund seeks current income generation and long-term growth of capital. Fundamental research drives the identification of income-producing investment opportunities across all market environments.
Average Annual Returns (%) | |
| |
| |
One-Year | | Since
Inception
(05/01/12)^ | |
First Eagle Global Income Builder | | Class A | | without sales load | | | -0.82 | | | | 5.85 | | |
| | | | with sales load | | | -5.81 | | | | 4.49 | | |
Composite Index | | | | | | | -1.21 | | | | 6.45 | | |
MSCI World Index | | | | | | | -4.17 | | | | 8.70 | | |
Barclays U.S. Aggregate Bond Index | | | | | | | 2.72 | | | | 2.66 | | |

Countries** (%)
United States | | | 40.74 | | |
France | | | 8.64 | | |
Canada | | | 6.85 | | |
Hong Kong | | | 4.72 | | |
United Kingdom | | | 4.47 | | |
Netherlands | | | 3.16 | | |
Singapore | | | 2.85 | | |
Japan | | | 2.74 | | |
Bermuda | | | 2.56 | | |
Germany | | | 1.78 | | |
Switzerland | | | 1.76 | | |
Sweden | | | 1.63 | | |
Australia | | | 1.51 | | |
Mexico | | | 1.01 | | |
Austria | | | 0.90 | | |
Belgium | | | 0.75 | | |
Norway | | | 0.73 | | |
Chile | | | 0.63 | | |
South Korea | | | 0.62 | | |
Thailand | | | 0.46 | | |
Italy | | | 0.43 | | |
Denmark | | | 0.35 | | |
New Zealand | | | 0.33 | | |
Russia | | | 0.30 | | |
Ireland | | | 0.24 | | |
Brazil | | | 0.19 | | |
Israel | | | 0.13 | | |
Romania | | | 0.10 | | |
^ Performance figures reflect certain fee waivers and/or expense limitations, without which returns may have been lower.
* Asset Allocation and Countries percentages are based on total investments in the portfolio.
**Country allocations reflect country of the issuer (not currency of issue) and exclude short term investments. Bonds of non-U.S. issuers may be U.S. dollar denominated.
The Fund's portfolio composition is subject to change at any time.
First Eagle Funds | Semi-Annual Report | April 30, 2016
84
First Eagle Global Income Builder Fund | Fund Overview
Growth of a $10,000 Initial Investment

Performance data quoted herein represents past performance and should not be considered indicative of future results. Performance data quoted herein does not reflect the deduction of taxes that a shareholder would pay on Fund distributions or the sale of Fund shares. The average annual returns shown above are historical and reflect changes in share price, reinvested dividends and are net of expenses.
The average annual returns for Class A Shares give effect to the deduction of the maximum sales charge of 5.00%.
Effective March 1, 2016 the Fund is compared against a composite index, 60% of which consists of the MSCI World Index and 40% of which consists of the Barclays U.S. Aggregate Bond Index. The Fund believes this composite index provides a useful comparison against the performance of the Fund, which currently invests in both equity and fixed income securities. The MSCI World Index is a widely followed, unmanaged group of stocks from 23 developed international markets. The index provides total returns in U.S. dollars with net dividends reinvested. The Barclays U.S. Aggregate Bond Index is an unmanaged broad-based benchmark that measure the investment grade, U.S. dollar-denominated, fixed-rate taxable bond market, including Treasuries, government-related and corporate securities, MBS (agency fixed-rate and hybrid ARM passthroughs), ABS, and CMBS. One cannot invest directly in an index.
Top 10 Holdings* (%)
Weyerhaeuser Company REIT (U.S. forest products company) | | | 1.68 | | |
Mandarin Oriental International Limited (Hong Kong hotels & resorts operator) | | | 1.64 | | |
Gold Bullion (precious metal) | | | 1.56 | | |
ACCO Brands Corporation (U.S. office supplies manufacturer) | | | 1.54 | | |
Nestlé SA (Swiss food and nutrition company) | | | 1.53 | | |
GlaxoSmithKline PLC (U.K. pharmaceutical company) | | | 1.46 | | |
Bi-Lo LLC (U.S. supermarket chain) | | | 1.45 | | |
Microsoft Corporation (U.S. software developer) | | | 1.41 | | |
Danone SA (French food processing company) | | | 1.30 | | |
HeidelbergCement AG (German cement company) | | | 1.22 | | |
Total | | | 14.79 | | |
*Holdings in cash, commercial paper and other short term cash equivalents have been excluded.
Percentages are based on total net assets.
First Eagle Funds | Semi-Annual Report | April 30, 2016
85
First Eagle Global Income Builder Fund | Schedule of Investments | Six-Month Period Ended April 30, 2016 (unaudited)
| Shares | | Description | | Cost (Note 1) | | Value (Note 1) | |
Common Stocks — 53.61% | | | |
International Common Stocks — 38.51% | | | |
Austria — 0.90% | | | |
| | 90,832 | | | Mayr Melnhof Karton AG | | $ | 10,042,057 | | | $ | 10,660,740 | | |
Belgium — 0.75% | | | |
| | 100,327 | | | Groupe Bruxelles Lambert SA (a) | | | 8,638,231 | | | | 8,860,654 | | |
Bermuda — 1.34% | | | |
| | 160,000 | | | Jardine Matheson Holdings Limited | | | 8,396,815 | | | | 8,848,000 | | |
| | 537,434 | | | Hiscox Limited | | | 6,659,513 | | | | 7,071,376 | | |
| | | | 15,056,328 | | | | 15,919,376 | | |
Brazil — 0.19% | | | |
| | 4,245,517 | | | Brasil Brokers Participacoes SA (a)(b) | | | 5,221,651 | | | | 2,259,009 | | |
Canada — 4.51% | | | |
| | 703,505 | | | Goldcorp, Inc. | | | 16,611,038 | | | | 14,175,625 | | |
| | 1,094,626 | | | TransAlta Renewables, Inc. | | | 11,445,462 | | | | 10,800,566 | | |
| | 213,376 | | | Agnico-Eagle Mines Limited | | | 5,743,368 | | | | 10,086,340 | | |
| | 348,482 | | | Potash Corporation of Saskatchewan, Inc. | | | 11,814,061 | | | | 6,175,101 | | |
| | 315,020 | | | Cenovus Energy, Inc. | | | 8,750,879 | | | | 4,989,917 | | |
| | 63,658 | | | Franco-Nevada Corporation | | | 2,551,899 | | | | 4,469,809 | | |
| | 95,933 | | | Suncor Energy, Inc. | | | 2,403,325 | | | | 2,815,982 | | |
| | | | 59,320,032 | | | | 53,513,340 | | |
Chile — 0.62% | | | |
| | 312,465 | | | Cia Cervecerias Unidas SA, ADR | | | 6,593,140 | | | | 7,005,465 | | |
| | 200,388 | | | Quinenco SA | | | 413,623 | | | | 394,301 | | |
| | | | 7,006,763 | | | | 7,399,766 | | |
Denmark — 0.35% | | | |
| | 109,595 | | | ISS AS | | | 3,464,789 | | | | 4,161,430 | | |
France — 6.62% | | | |
| | 219,363 | | | Danone SA | | | 14,766,930 | | | | 15,364,784 | | |
| | 407,222 | | | Bouygues SA | | | 12,251,175 | | | | 13,578,357 | | |
| | 152,429 | | | Sanofi | | | 14,870,336 | | | | 12,585,999 | | |
| | 205,882 | | | Cie de Saint-Gobain | | | 10,141,898 | | | | 9,428,632 | | |
| | 518,267 | | | Rexel SA | | | 7,819,474 | | | | 7,851,236 | | |
| | 218,406 | | | Carrefour SA | | | 6,622,071 | | | | 6,188,375 | | |
| | 104,101 | | | Total SA | | | 5,196,326 | | | | 5,236,495 | | |
First Eagle Funds | Semi-Annual Report | April 30, 2016
86
First Eagle Global Income Builder Fund | Schedule of Investments | Six-Month Period Ended April 30, 2016 (unaudited)
| Shares | | Description | | Cost (Note 1) | | Value (Note 1) | |
International Common Stocks — 38.51% (continued) | | | |
France — 6.62% (continued) | | | |
| | 39,029 | | | Thermador Groupe | | $ | 3,288,696 | | | $ | 3,568,957 | | |
| | 43,918 | | | Legrand SA | | | 2,160,460 | | | | 2,501,341 | | |
| | 91,258 | | | Neopost SA | | | 5,941,904 | | | | 2,234,103 | | |
| | | | 83,059,270 | | | | 78,538,279 | | |
Germany — 1.77% | | | |
| | 163,286 | | | HeidelbergCement AG | | | 12,287,862 | | | | 14,507,057 | | |
| | 197,473 | | | Hamburger Hafen und Logistik AG | | | 4,717,771 | | | | 3,097,796 | | |
| | 371,436 | | | Telefonica Deutschland Holding AG | | | 1,810,477 | | | | 1,885,838 | | |
| | 120,109 | | | SMT Scharf AG (a)(b) | | | 3,295,905 | | | | 1,512,839 | | |
| | | | 22,112,015 | | | | 21,003,530 | | |
Hong Kong — 4.71% | | | |
| | 12,987,500 | | | Mandarin Oriental International Limited | | | 22,128,977 | | | | 19,481,250 | | |
| | 3,554,651 | | | Hopewell Holdings Limited | | | 12,187,528 | | | | 12,006,324 | | |
| | 4,629,534 | | | Hang Lung Properties Limited | | | 11,596,245 | | | | 9,238,895 | | |
| | 1,749,774 | | | Great Eagle Holdings Limited | | | 5,919,319 | | | | 7,105,658 | | |
| | 1,193,083 | | | Hysan Development Company Limited | | | 5,499,319 | | | | 5,283,348 | | |
| | 3,954,292 | | | Hopewell Highway Infrastructure Limited | | | 1,911,217 | | | | 1,972,838 | | |
| | 67,700 | | | Guoco Group Limited (a) | | | 589,955 | | | | 746,220 | | |
| | | | 59,832,560 | | | | 55,834,533 | | |
Ireland — 0.23% | | | |
| | 95,834 | | | CRH PLC | | | 2,244,815 | | | | 2,783,755 | | |
Israel — 0.13% (c) | | | |
| | 318,065 | | | Israel Chemicals Limited | | | 3,160,135 | | | | 1,584,586 | | |
Italy — 0.43% | | | |
| | 261,853 | | | Italcementi S.p.A. | | | 968,200 | | | | 3,106,290 | | |
| | 41,871 | | | Recordati S.p.A. | | | 355,865 | | | | 1,063,886 | | |
| | 53,369 | | | Eni S.p.A | | | 861,148 | | | | 867,765 | | |
| | | | 2,185,213 | | | | 5,037,941 | | |
Japan — 2.73% | | | |
| | 463,800 | | | KDDI Corporation | | | 9,272,975 | | | | 13,813,743 | | |
| | 438,000 | | | Astellas Pharma, Inc. | | | 4,337,675 | | | | 6,162,462 | | |
| | 115,900 | | | Hoya Corporation | | | 2,425,256 | | | | 4,641,446 | | |
| | 153,700 | | | Sompo Japan Nipponkoa Holdings, Inc. | | | 3,442,413 | | | | 4,247,696 | | |
First Eagle Funds | Semi-Annual Report | April 30, 2016
87
First Eagle Global Income Builder Fund | Schedule of Investments | Six-Month Period Ended April 30, 2016 (unaudited)
| Shares | | Description | | Cost (Note 1) | | Value (Note 1) | |
International Common Stocks — 38.51% (continued) | | | |
Japan — 2.73% (continued) | | | |
| | 17,100 | | | Fanuc Corporation | | $ | 2,279,364 | | | $ | 2,652,589 | | |
| | 108,500 | | | Dexerials Corporation | | | 1,158,337 | | | | 915,724 | | |
| | | | 22,916,020 | | | | 32,433,660 | | |
Mexico — 0.37% | | | |
| | 270,387 | | | Fresnillo PLC | | | 4,330,289 | | | | 4,397,198 | | |
Netherlands — 1.69% | | | |
| | 291,766 | | | Sligro Food Group NV | | | 10,728,966 | | | | 11,636,242 | | |
| | 38,897 | | | HAL Trust (a) | | | 4,970,303 | | | | 8,416,985 | | |
| | | | 15,699,269 | | | | 20,053,227 | | |
New Zealand — 0.33% | | | |
| | 1,038,935 | | | SKY Network Television Limited | | | 4,011,307 | | | | 3,866,575 | | |
Norway — 0.73% | | | |
| | 993,802 | | | Orkla ASA | | | 7,859,231 | | | | 8,676,799 | | |
Romania — 0.10% | | | |
| 200,000
| | | Societatea Nationala de Gaze Naturale
ROMGAZ SA, GDR (a)(d)(e) | | | 1,850,000
| | | | 1,192,000
| | |
Russia — 0.30% | | | |
| | 687,492 | | | Gazprom PAO, ADR | | | 5,077,143 | | | | 3,552,959 | | |
Singapore — 1.97% | | | |
| | 24,584,698 | | | Asian Pay Television Trust | | | 15,163,351 | | | | 10,968,375 | | |
| | 10,157,800 | | | Frasers Commercial Trust, REIT | | | 10,283,730 | | | | 9,781,277 | | |
| | 8,325,700 | | | Overseas Education Limited (a) | | | 5,229,085 | | | | 2,600,137 | | |
| | | | 30,676,166 | | | | 23,349,789 | | |
South Korea — 0.62% | | | |
| | 67,813 | | | KT&G Corporation | | | 5,066,454 | | | | 7,320,519 | | |
Sweden — 0.64% | | | |
| | 210,953 | | | Investor AB, Class 'A' (a) | | | 6,088,519 | | | | 7,628,558 | | |
Switzerland — 1.76% | | | |
| | 243,184 | | | Nestlé SA | | | 17,068,987 | | | | 18,125,358 | | |
| | 6,486 | | | APG SGA SA | | | 1,895,793 | | | | 2,717,994 | | |
| | | | 18,964,780 | | | | 20,843,352 | | |
Thailand — 0.46% | | | |
| | 952,800 | | | Bangkok Bank PCL, NVDR | | | 5,265,666 | | | | 4,473,496 | | |
| | 1,762,000 | | | Thai Beverage PCL | | | 512,015 | | | | 976,086 | | |
| | | | 5,777,681 | | | | 5,449,582 | | |
First Eagle Funds | Semi-Annual Report | April 30, 2016
88
First Eagle Global Income Builder Fund | Schedule of Investments | Six-Month Period Ended April 30, 2016 (unaudited)
| Shares | | Description | | Cost (Note 1) | | Value (Note 1) | |
International Common Stocks — 38.51% (continued) | | | |
United Kingdom — 4.26% | | | |
| | 812,871 | | | GlaxoSmithKline PLC | | $ | 19,711,937 | | | $ | 17,328,940 | | |
| | 160,862 | | | British American Tobacco PLC | | | 8,720,206 | | | | 9,801,321 | | |
| | 1,559,205 | | | Mitie Group PLC | | | 6,660,589 | | | | 6,180,848 | | |
| | 1,987,947 | | | WM Morrison Supermarkets PLC | | | 7,720,984 | | | | 5,550,864 | | |
| | 203,891 | | | Diageo PLC | | | 5,467,516 | | | | 5,499,520 | | |
| | 782,467 | | | esure Group PLC | | | 2,527,920 | | | | 3,068,623 | | |
| | 15,942 | | | Willis Towers Watson PLC | | | 1,787,756 | | | | 1,991,156 | | |
| | 447,029 | | | Brammer PLC | | | 1,267,359 | | | | 1,139,794 | | |
| | | | 53,864,267 | | | | 50,561,066 | | |
Total International Common Stocks | | | 463,524,985 | | | | 456,882,223 | | |
U.S. Common Stocks — 15.10% | | | |
Consumer Discretionary — 1.00% | | | |
| | 81,133 | | | Omnicom Group, Inc. | | | 6,041,414 | | | | 6,731,605 | | |
| | 100,083 | | | H&R Block, Inc. | | | 2,262,066 | | | | 2,025,680 | | |
| | 13,891 | | | McDonald's Corporation | | | 1,254,974 | | | | 1,757,073 | | |
| | 19,743 | | | Tiffany & Company | | | 1,199,244 | | | | 1,408,663 | | |
| | | | 10,757,698 | | | | 11,923,021 | | |
Consumer Staples — 0.81% | | | |
| | 93,798 | | | Wal-Mart Stores, Inc. | | | 7,054,864 | | | | 6,272,272 | | |
| | 46,656 | | | Colgate-Palmolive Company | | | 2,612,501 | | | | 3,308,844 | | |
| | | | 9,667,365 | | | | 9,581,116 | | |
Energy — 1.45% | | | |
| | 145,467 | | | ConocoPhillips | | | 8,904,714 | | | | 6,951,868 | | |
| | 157,585 | | | National Oilwell Varco, Inc. | | | 9,011,365 | | | | 5,679,363 | | |
| | 356,080 | | | San Juan Basin Royalty Trust (a) | | | 6,002,453 | | | | 2,460,513 | | |
| | 25,373 | | | Phillips 66 | | | 1,996,685 | | | | 2,083,377 | | |
| | | | 25,915,217 | | | | 17,175,121 | | |
Financials — 2.61% | | | |
| | 620,016 | | | Weyerhaeuser Company, REIT | | | 16,278,902 | | | | 19,914,914 | | |
| | 155,799 | | | BB&T Corporation | | | 5,504,246 | | | | 5,512,168 | | |
| | 43,969 | | | Cincinnati Financial Corporation | | | 1,888,063 | | | | 2,902,394 | | |
| | 40,067 | | | American Express Company | | | 2,239,196 | | | | 2,621,584 | | |
| | | | 25,910,407 | | | | 30,951,060 | | |
First Eagle Funds | Semi-Annual Report | April 30, 2016
89
First Eagle Global Income Builder Fund | Schedule of Investments | Six-Month Period Ended April 30, 2016 (unaudited)
| Shares | | Description | | Cost (Note 1) | | Value (Note 1) | |
U.S. Common Stocks — 15.10% (continued) | | | |
Industrials — 3.64% | | | |
| | 95,254 | | | Deere & Company | | $ | 7,677,276 | | | $ | 8,011,814 | | |
| | 47,526 | | | 3M Company | | | 5,932,657 | | | | 7,954,902 | | |
| | 72,028 | | | Union Pacific Corporation | | | 5,901,724 | | | | 6,283,002 | | |
| | 25,361 | | | WW Grainger, Inc. | | | 5,539,276 | | | | 5,947,662 | | |
| | 111,960 | | | Flowserve Corporation | | | 4,484,064 | | | | 5,464,768 | | |
| | 111,023 | | | Timken Company | | | 4,164,578 | | | | 3,955,749 | | |
| | 15,646 | | | Northrop Grumman Corporation | | | 1,689,070 | | | | 3,227,144 | | |
| | 10,234 | | | Lockheed Martin Corporation | | | 884,494 | | | | 2,378,177 | | |
| | | | 36,273,139 | | | | 43,223,218 | | |
Information Technology — 4.65% | | | |
| | 336,175 | | | Microsoft Corporation | | | 10,783,452 | | | | 16,765,047 | | |
| | 219,609 | | | Xilinx, Inc. | | | 9,018,972 | | | | 9,460,756 | | |
| | 225,889 | | | Oracle Corporation | | | 9,541,921 | | | | 9,003,936 | | |
| | 282,630 | | | Comtech Telecommunications Corporation | | | 9,139,381 | | | | 6,839,646 | | |
| | 127,742 | | | Linear Technology Corporation | | | 4,746,932 | | | | 5,681,964 | | |
| | 70,601 | | | Texas Instruments, Inc. | | | 3,327,465 | | | | 4,027,081 | | |
| | 23,240 | | | Automatic Data Processing, Inc. | | | 1,181,513 | | | | 2,055,346 | | |
| | 43,626 | | | Intel Corporation | | | 927,230 | | | | 1,320,995 | | |
| | | | 48,666,866 | | | | 55,154,771 | | |
Materials — 0.51% | | | |
| | 27,686 | | | Praxair, Inc. | | | 2,859,576 | | | | 3,251,997 | | |
| | 44,253 | | | Royal Gold, Inc. | | | 2,247,976 | | | | 2,771,123 | | |
| | | | 5,107,552 | | | | 6,023,120 | | |
Utilities — 0.43% | | | |
| | 127,584 | | | UGI Corporation | | | 4,234,335 | | | | 5,133,980 | | |
Total U.S. Common Stocks | | | 166,532,579 | | | | 179,165,407 | | |
Total Common Stocks | | | 630,057,564 | | | | 636,047,630 | | |
U.S. Preferred Stocks — 0.15% | | | |
Financials — 0.15% | | | |
| | 67,936 | | | MetLife, Inc., Series 'A' (a) | | | 1,637,203 | | | | 1,705,873 | | |
| 4,712
| | | General American Investors Company,
Inc., Series 'B' | | | 122,920
| | | | 126,234
| | |
Total U.S. Preferred Stocks | | | 1,760,123 | | | | 1,832,107 | | |
First Eagle Funds | Semi-Annual Report | April 30, 2016
90
First Eagle Global Income Builder Fund | Schedule of Investments | Six-Month Period Ended April 30, 2016 (unaudited)
| Shares | | Description | | Cost (Note 1) | | Value (Note 1) | |
Investment Company — 0.00*% | | | |
| 28,661
| | | State Street Institutional
U.S. Government Money Market
Fund, Premier Class | | $ | 28,661
| | | $ | 28,661
| | |
| Ounces | | | | | | | |
Commodity — 1.56% | | | |
| | 14,343 | | | Gold bullion (b) | | | 18,411,922 | | | | 18,545,146 | | |
| Principal | | | | | | | |
Bonds — 32.06% | | | |
U.S. Corporate Bonds — 20.87% | | | |
$ | 17,249,000
| | | ACCO Brands Corporation
6.75% due 04/30/20 | | | 17,661,953
| | | | 18,283,940
| | |
| 7,668,000
| | | Aerojet Rocketdyne Holdings, Inc.
7.125% due 03/15/21 | | | 7,933,130
| | | | 8,089,740
| | |
| 2,281,000
| | | American Axle & Manufacturing, Inc.
6.25% due 03/15/21 | | | 2,333,918
| | | | 2,372,240
| | |
| 4,392,000
| | | American Axle & Manufacturing, Inc.
6.625% due 10/15/22 | | | 4,466,564
| | | | 4,644,540
| | |
| 17,718,000
| | | Bi-Lo LLC
9.25% due 02/15/19 (d) | | | 17,641,778
| | | | 17,142,165
| | |
| 6,624,000
| | | CenturyLink, Inc. Series 'W'
6.75% due 12/01/23 | | | 6,716,524
| | | | 6,524,640
| | |
| 10,827,000
| | | Citgo Petroleum Corporation
6.25% due 08/15/22 (d) | | | 10,753,243
| | | | 10,556,325
| | |
| 2,114,000
| | | Cloud Peak Energy Resources LLC
6.375% due 03/15/24 | | | 2,142,077
| | | | 729,330
| | |
| 10,497,000
| | | Cloud Peak Energy Resources LLC
8.50% due 12/15/19 | | | 7,666,417
| | | | 4,776,135
| | |
| 5,903,000
| | | Crestwood Midstream Partners L.P.
6.00% due 12/15/20 | | | 4,447,832
| | | | 5,593,093
| | |
| 2,859,000
| | | DCP Midstream LLC
4.75% due 09/30/21 (d) | | | 2,116,583
| | | | 2,601,690
| | |
| 8,902,000
| | | DCP Midstream LLC
5.35% due 03/15/20 (d) | | | 8,317,815
| | | | 8,456,900
| | |
| 1,545,000
| | | DCP Midstream LLC
6.45% due 11/03/36 (d) | | | 1,209,164
| | | | 1,303,594
| | |
| 6,633,000
| | | Dollar Tree, Inc.
5.75% due 03/01/23 (d) | | | 6,886,109
| | | | 7,082,717
| | |
First Eagle Funds | Semi-Annual Report | April 30, 2016
91
First Eagle Global Income Builder Fund | Schedule of Investments | Six-Month Period Ended April 30, 2016 (unaudited)
| Principal | | Description | | Cost (Note 1) | | Value (Note 1) | |
U.S. Corporate Bonds — 20.87% (continued) | | | |
$ | 13,351,000
| | | Frontier Communications Corporation
8.875% due 09/15/20 (d) | | $ | 13,360,247
| | | $ | 14,135,371
| | |
| 12,646,000
| | | GameStop Corporation
5.50% due 10/01/19 (d) | | | 12,623,801
| | | | 12,361,465
| | |
| 8,813,000
| | | Harland Clarke Holdings Corporation
9.75% due 08/01/18 (d) | | | 8,655,774
| | | | 8,813,000
| | |
| 2,626,000
| | | Huntington Ingalls Industries, Inc.
5.00% due 12/15/21 (d) | | | 2,643,741
| | | | 2,752,389
| | |
| 2,516,000
| | | Joy Global, Inc.
5.125% due 10/15/21 | | | 1,855,349
| | | | 2,276,980
| | |
| 10,530,000
| | | KLX, Inc.
5.875% due 12/01/22 (d) | | | 10,480,787
| | | | 10,595,812
| | |
| 8,096,000
| | | Landry's, Inc.
9.375% due 05/01/20 (d) | | | 8,445,809
| | | | 8,510,920
| | |
| 6,475,000
| | | Outerwall, Inc.
6.00% due 03/15/19 | | | 6,512,843
| | | | 5,778,938
| | |
| 3,292,000
| | | Parker Drilling Company
6.75% due 07/15/22 | | | 2,992,063
| | | | 2,567,760
| | |
| 3,927,000
| | | Plantronics, Inc.
5.50% due 05/31/23 (d) | | | 3,920,521
| | | | 3,936,818
| | |
| 3,500,000
| | | Post Holdings, Inc.
6.75% due 12/01/21 (d) | | | 3,585,559
| | | | 3,668,455
| | |
| 5,548,000
| | | Post Holdings, Inc.
7.375% due 02/15/22 | | | 5,679,737
| | | | 5,846,205
| | |
| 3,935,000
| | | Quintiles Transnational Corporation
4.875% due 05/15/23 (d) | | | 3,940,157
| | | | 4,028,456
| | |
| 1,520,000
| | | Spectrum Brands, Inc.
5.75% due 07/15/25 | | | 1,520,000
| | | | 1,612,188
| | |
| 13,774,000
| | | Sprint Capital Corporation
6.90% due 05/01/19 | | | 10,413,819
| | | | 12,603,210
| | |
| 6,339,000
| | | Sprint Communications, Inc.
6.00% due 12/01/16 | | | 6,336,542
| | | | 6,370,695
| | |
| 4,616,000
| | | Taylor Morrison Communities, Inc.
5.875% due 04/15/23 (d) | | | 4,630,825
| | | | 4,604,460
| | |
| 6,321,000
| | | Toys R Us Property Company II LLC
8.50% due 12/01/17 | | | 6,302,503
| | | | 6,115,568
| | |
| 7,389,000
| | | Vista Outdoor, Inc.
5.875% due 10/01/23 (d) | | | 7,426,807
| | | | 7,758,450
| | |
| 7,092,000
| | | Vulcan Materials Company
4.50% due 04/01/25 | | | 7,116,570
| | | | 7,552,980
| | |
First Eagle Funds | Semi-Annual Report | April 30, 2016
92
First Eagle Global Income Builder Fund | Schedule of Investments | Six-Month Period Ended April 30, 2016 (unaudited)
| Principal | | Description | | Cost (Note 1) | | Value (Note 1) | |
U.S. Corporate Bonds — 20.87% (continued) | | | |
$ | 6,868,000
| | | Western Digital Corporation
7.375% due 04/01/23 (d) | | $ | 7,001,842
| | | $ | 6,932,387
| | |
| 4,356,000
| | | Western Digital Corporation
10.50% due 04/01/24 (d) | | | 4,370,201
| | | | 4,236,210
| | |
| 5,353,000
| | | Zebra Technologies Corporation
7.25% due 10/15/22 | | | 5,841,461
| | | | 5,795,158
| | |
| 509,000
| | | ZF North America Capital, Inc.
4.00% due 04/29/20 (d) | | | 506,677
| | | | 531,905
| | |
Total U.S. Corporate Bonds | | | 246,456,742 | | | | 247,542,829 | | |
International Bonds — 11.19% | | | |
International Corporate Bonds — 9.68% | | | |
Australia — 1.51% | | | |
| 4,459,000
USD | | | Ausdrill Finance PTY Limited
6.875% due 11/01/19 (d) | | | 4,316,914
| | | | 3,801,298
| | |
| 13,933,000
USD | | | Nufarm Australia Limited
6.375% due 10/15/19 (d) | | | 14,233,457
| | | | 14,107,162
| | |
| | | | 18,550,371 | | | | 17,908,460 | | |
Bermuda — 1.21% | | | |
| 891,000
USD | | | Aircastle Limited
4.625% due 12/15/18 | | | 891,000
| | | | 922,185
| | |
| 4,919,000
USD | | | Aircastle Limited
5.50% due 02/15/22 | | | 5,048,099
| | | | 5,232,586
| | |
| 4,859,000
USD | | | Aircastle Limited
6.25% due 12/01/19 | | | 5,107,186
| | | | 5,332,753
| | |
| 2,525,000
USD | | | Aircastle Limited
7.625% due 04/15/20 | | | 2,659,701
| | | | 2,865,875
| | |
| | | | 13,705,986 | | | | 14,353,399 | | |
Canada — 2.32% | | | |
| 10,031,000
USD | | | New Gold, Inc.
6.25% due 11/15/22 (d) | | | 9,594,497
| | | | 9,228,520
| | |
| 500,000
USD | | | New Gold, Inc.
7.00% due 04/15/20 (d) | | | 506,546
| | | | 487,500
| | |
| 7,627,000
USD | | | Open Text Corporation
5.625% due 01/15/23 (d) | | | 7,631,190
| | | | 7,817,675
| | |
| 11,175,000
USD | | | Precision Drilling Corporation
6.50% due 12/15/21 | | | 11,215,983
| | | | 9,610,500
| | |
First Eagle Funds | Semi-Annual Report | April 30, 2016
93
First Eagle Global Income Builder Fund | Schedule of Investments | Six-Month Period Ended April 30, 2016 (unaudited)
| Principal | | Description | | Cost (Note 1) | | Value (Note 1) | |
International Corporate Bonds — 9.68% (continued) | | | |
Canada — 2.32% (continued) | | | |
| 400,000
USD | | | Precision Drilling Corporation
6.625% due 11/15/20 | | $ | 400,445
| | | $ | 356,500
| | |
| | | | 29,348,661 | | | | 27,500,695 | | |
France — 2.00% | | | |
| 3,000,000
USD | | | Numericable-SFR SAS
4.875% due 05/15/19 (d) | | | 2,962,792
| | | | 3,111,000
| | |
| 9,846,000
USD | | | Numericable-SFR SAS
6.00% due 05/15/22 (d) | | | 9,882,598
| | | | 9,858,800
| | |
| 10,427,000
USD | | | Rexel SA
5.25% due 06/15/20 (d) | | | 10,519,126
| | | | 10,765,877
| | |
| | | | 23,364,516 | | | | 23,735,677 | | |
Netherlands — 1.46% | | | |
| 4,590,000
USD | | | Schaeffler Holding Finance BV
6.25% due 11/15/19 (d)(f) | | | 4,780,061
| | | | 4,785,075
| | |
| 4,455,000
USD | | | Schaeffler Holding Finance BV
6.75% due 11/15/22 (d)(f) | | | 4,887,135
| | | | 4,847,597
| | |
| 7,449,000
USD | | | Schaeffler Holding Finance BV
6.875% due 08/15/18 (d)(f) | | | 7,589,303
| | | | 7,672,470
| | |
| | | | 17,256,499 | | | | 17,305,142 | | |
Sweden — 0.98% | | | |
| 6,019,000
USD | | | Perstorp Holding AB
8.75% due 05/15/17 (d) | | | 6,022,818
| | | | 6,003,953
| | |
| 3,950,000
EUR | | | Perstorp Holding AB
9.00% due 05/15/17 (d) | | | 5,152,075
| | | | 4,522,949
| | |
| 1,000,000
EUR | | | Perstorp Holding AB
9.00% due 05/15/17 (g) | | | 1,285,940
| | | | 1,145,050
| | |
| | | | 12,460,833 | | | | 11,671,952 | | |
United Kingdom — 0.20% | | | |
| 2,210,000
USD | | | Jaguar Land Rover Automotive PLC
5.625% due 02/01/23 (d) | | | 2,198,556
| | | | 2,331,550
| | |
Total International Corporate Bonds | | | 116,885,422 | | | | 114,806,875 | | |
International Government Bonds — 1.51% | | | |
Mexico — 0.64% | | | |
| 129,730,000
MXN | | | Mexican Bonos
4.75% due 06/14/18 | | | 8,522,740
| | | | 7,588,880
| | |
First Eagle Funds | Semi-Annual Report | April 30, 2016
94
First Eagle Global Income Builder Fund | Schedule of Investments | Six-Month Period Ended April 30, 2016 (unaudited)
| Principal | | Description | | Cost (Note 1) | | Value (Note 1) | |
International Government Bonds — 1.51% (continued) | | | |
Singapore — 0.87% | | | |
| 12,124,000
SGD | | | Singapore Government Bond
2.375% due 04/01/17 | | $ | 9,249,873
| | | $ | 9,138,567
| | |
| 1,568,000
SGD | | | Singapore Government Bond
3.25% due 09/01/20 | | | 1,242,047
| | | | 1,255,123
| | |
| | | | 10,491,920 | | | | 10,393,690 | | |
Total International Government Bonds | | | 19,014,660 | | | | 17,982,570 | | |
Total International Bonds | | | 135,900,082 | | | | 132,789,445 | | |
Total Bonds | | | 382,356,824 | | | | 380,332,274 | | |
Term Loans — 2.95% | | | |
United States — 2.95% | | | |
| 4,917,568
USD | | | Cactus Wellhead LLC
7.00% due 07/31/20 (a) | | | 4,843,327
| | | | 3,196,419
| | |
| 6,778,000
USD
| | | Caelus Energy Alaska O3 LLC, Second Lien
Term Loan
8.75% due 04/15/20 (a) | | | 6,680,039
| | | | 3,727,900
| | |
| 11,820,690
USD
| | | JC Penney Corporation, Inc., First Lien
Term Loan
6.00% due 05/22/18 | | | 11,732,103
| | | | 11,839,130
| | |
| 7,278,618
USD | | | Libbey Glass, Inc., Term Loan B
3.75% due 04/09/21 | | | 7,277,361
| | | | 7,260,422
| | |
| 6,904,387
USD | | | OSG Bulk Ships, Inc., Exit Term Loan
5.25% due 08/05/19 (a) | | | 6,888,045
| | | | 6,541,907
| | |
| 6,080,108
USD | | | Osum Productions Corporation
6.50% due 07/28/20 (a) | | | 5,964,376
| | | | 2,432,043
| | |
Total Term Loans | | | 43,385,251 | | | | 34,997,821 | | |
International Commercial Paper — 9.40% | | | |
Italy — 4.70% | | | |
| 55,744,000
USD | | | Eni S.p.A.
0.61% due 05/02/16 | | | 55,743,071
| | | | 55,742,723
| | |
Japan — 4.70% | | | |
| 22,953,000
USD | | | Hitachi Limited
0.56% due 05/02/16 | | | 22,952,649
| | | | 22,952,111
| | |
First Eagle Funds | Semi-Annual Report | April 30, 2016
95
First Eagle Global Income Builder Fund | Schedule of Investments | Six-Month Period Ended April 30, 2016 (unaudited)
| Principal | | Description | | Cost (Note 1) | | Value (Note 1) | |
International Commercial Paper — 9.40% (continued) | |
Japan — 4.70% (continued) | |
| 32,790,000
USD | | | Mitsui & Company Limited
0.52% due 05/02/16 | | $ | 32,789,536
| | | $ | 32,789,002
| | |
Total International Commercial Paper | | | 111,485,256 | | | | 111,483,836 | | |
Total Investments — 99.73% (Cost: $1,187,485,601) | | | | | 1,183,267,475 | | |
Other Assets in Excess of Liabilities — 0.27% | | | | | 3,154,858 | | |
Net Assets — 100.00% | | $ | 1,186,422,333 | | |
* Less than 0.01%
(a) Security is deemed illiquid. At April 30, 2016, the value of these securities amounted to $53,281,057 or 4.49% of net assets.
(b) Non-income producing security/commodity.
(c) Securities with a total market value equal to $1,584,586 have been fair valued based on fair value adjustment factors at April 30, 2016.
(d) All or a portion of the security is exempt from registration under the Securities Act of 1933. Rule 144A securities may only be sold to qualified institutional buyers, pursuant to Rule 144A under the Securities Act of 1933.
(e) Securities valued in accordance with fair value procedures under the supervision of the Board of Trustees, representing $1,192,000 or 0.10% of net assets.
(f) Payment-in-kind security.
(g) Represents a security registered under Regulation S. Bonds sold under Regulation S may not be offered, sold or delivered within the U.S., or for the account or benefit of, U.S. persons, except pursuant to an exemption from, or in a transaction not subject to, the registration requirements of the Securities Act of 1933.
At April 30, 2016, cost is substantially identical for both book and federal income tax purposes. Net unrealized depreciation consisted of:
Gross unrealized appreciation | | $ | 77,649,484 | | |
Gross unrealized depreciation | | | (81,867,610 | ) | |
Net unrealized depreciation | | $ | (4,218,126 | ) | |
Abbreviations used in this schedule include:
ADR — American Depositary Receipt
AG — Aktien Gesellschaft
AS — Anonim Sirket
ASA — Norwegian Public Limited Company
GDR — Global Depositary Receipt
NVDR — Non-Voting Depository Receipt
PAO — Russian Public Joint Stock Company
PCL — Public Company Limited
PLC — Public Limited Company
REIT — Real Estate Investment Trust
SA — Société Anonyme
S.p.A. — Società per Azioni
SAS — Société par Actions Simplifiée
First Eagle Funds | Semi-Annual Report | April 30, 2016
96
First Eagle Global Income Builder Fund | Schedule of Investments | Six-Month Period Ended April 30, 2016 (unaudited)
Currencies
EUR — Euro
MXN — Mexican Peso
SGD — Singapore Dollar
USD — United States Dollar
Foreign Currency Exchange Contracts — Sales
Settlement
Dates
Through | | Foreign Currency
To be Delivered | | U.S. $
To be Received | | U.S. $ Value
At April 30,
2016 | | Unrealized
Appreciation
At April 30,
2016 | | Unrealized
Depreciation
At April 30,
2016 | |
05/18/16 | | | 7,225,000 | | | Euro | | $ | 8,112,953 | | | $ | 8,276,553 | | | $ | — | | | $ | (163,600 | ) | |
06/15/16 | | | 5,406,000 | | | Euro | | | 6,073,965 | | | | 6,198,108 | | | | — | | | | (124,143 | ) | |
08/17/16 | | | 3,968,000 | | | Euro | | | 4,367,697 | | | | 4,558,690 | | | | — | | | | (190,993 | ) | |
09/14/16 | | | 6,648,000 | | | Euro | | | 7,591,085 | | | | 7,645,141 | | | | — | | | | (54,056 | ) | |
05/18/16 | | | 1,727,000 | | | British Pound | | | 2,452,651 | | | | 2,523,497 | | | | — | | | | (70,846 | ) | |
06/15/16 | | | 594,000 | | | British Pound | | | 837,923 | | | | 868,020 | | | | — | | | | (30,097 | ) | |
06/15/16 | | | 68,204,000 | | | Japanese Yen | | | 633,904 | | | | 641,676 | | | | — | | | | (7,772 | ) | |
07/13/16 | | | 68,204,000 | | | Japanese Yen | | | 634,631 | | | | 642,297 | | | | — | | | | (7,666 | ) | |
08/17/16 | | | 68,204,000 | | | Japanese Yen | | | 635,076 | | | | 642,975 | | | | — | | | | (7,899 | ) | |
09/14/16 | | | 68,204,000 | | | Japanese Yen | | | 635,816 | | | | 643,642 | | | | — | | | | (7,826 | ) | |
10/19/16 | | | 68,204,000 | | | Japanese Yen | | | 635,077 | | | | 642,830 | | | | — | | | | (7,753 | ) | |
| | | | | | | $ | 32,610,778 | | | $ | 33,283,429 | | | $ | — | | | $ | (672,651 | ) | |
Industry Diversification for Portfolio Holdings | | Percent of
Net Assets | |
International Common Stocks | |
Consumer Discretionary | | | 3.35 | % | |
Consumer Staples | | | 8.10 | | |
Energy | | | 1.58 | | |
Financials | | | 6.77 | | |
Health Care | | | 3.52 | | |
Industrials | | | 6.64 | | |
Information Technology | | | 0.27 | | |
Materials | | | 6.05 | | |
Telecommunication Services | | | 1.32 | | |
Utilities | | | 0.91 | | |
Total International Common Stocks | | | 38.51 | | |
U.S. Common Stocks | |
Consumer Discretionary | | | 1.00 | | |
Consumer Staples | | | 0.81 | | |
Energy | | | 1.45 | | |
First Eagle Funds | Semi-Annual Report | April 30, 2016
97
First Eagle Global Income Builder Fund | Schedule of Investments | Six-Month Period Ended April 30, 2016 (unaudited)
Industry Diversification for Portfolio Holdings (continued) | | Percent of
Net Assets | |
Financials | | | 2.61 | % | |
Industrials | | | 3.64 | | |
Information Technology | | | 4.65 | | |
Materials | | | 0.51 | | |
Utilities | | | 0.43 | | |
Total U.S. Common Stocks | | | 15.10 | | |
U.S. Preferred Stocks | |
Financials | | | 0.15 | | |
Total U.S. Preferred Stocks | | | 0.15 | | |
Investment Company | | | 0.00 | * | |
Commodity | | | 1.56 | | |
U.S. Corporate Bonds | |
Consumer Discretionary | | | 6.05 | | |
Consumer Staples | | | 2.39 | | |
Energy | | | 3.08 | | |
Financials | | | 1.23 | | |
Industrials | | | 3.51 | | |
Information Technology | | | 0.94 | | |
Telecommunication Services | | | 3.67 | | |
Total U.S. Corporate Bonds | | | 20.87 | | |
International Corporate Bonds | |
Consumer Discretionary | | | 1.25 | | |
Consumer Staples | | | 0.41 | | |
Energy | | | 0.84 | | |
Financials | | | 1.53 | | |
Industrials | | | 0.91 | | |
Information Technology | | | 1.75 | | |
Materials | | | 2.99 | | |
Total International Corporate Bonds | | | 9.68 | | |
International Government Bonds | |
Government Issues | | | 1.51 | | |
Total International Government Bonds | | | 1.51 | | |
Term Loans | | | 2.95 | | |
International Commercial Paper | | | 9.40 | | |
Total Investments | | | 99.73 | % | |
*Less than 0.01%
See Notes to Financial Statements.
First Eagle Funds | Semi-Annual Report | April 30, 2016
98
This page was intentionally left blank.
First Eagle High Yield Fund
Data as of April 30, 2016 (unaudited)
Investment Objective
First Eagle High Yield Fund seeks to provide investors with a high level of current income. To pursue this objective, the Fund normally invests at least 80% of its net assets in high yield, below investment-grade instruments.
Average Annual Returns^ (%) | |
| |
| | One-Year | | Five-Years | | Since
Inception
(11/19/07) | |
First Eagle High Yield Fund | | Class I | | | | | -5.23 | | | | 3.54 | | | | 8.42 | | |
Barclays U.S. Corporate High Yield Bond Index | | | | | | | | | -1.12 | | | | 5.41 | | | | 7.62 | | |
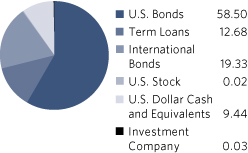
Countries** (%)
United States | | | 71.23 | | |
Canada | | | 6.69 | | |
Australia | | | 2.81 | | |
France | | | 2.28 | | |
United Kingdom | | | 2.19 | | |
Netherlands | | | 2.08 | | |
Bermuda | | | 1.34 | | |
Sweden | | | 1.19 | | |
Italy | | | 0.53 | | |
Ireland | | | 0.22 | | |
^ Performance figures reflect certain fee waivers and/or expense limitations, without which returns may have been lower.
* Asset Allocation and Countries percentages are based on total investments in the portfolio.
**Country allocations reflect country of the issuer (not currency of issue) and exclude short term investments. Bonds of non-U.S. issuers may be U.S. dollar denominated.
The Fund's portfolio composition is subject to change at any time.
First Eagle Funds | Semi-Annual Report | April 30, 2016
100
First Eagle High Yield Fund | Fund Overview
Growth of a $10,000 Initial Investment
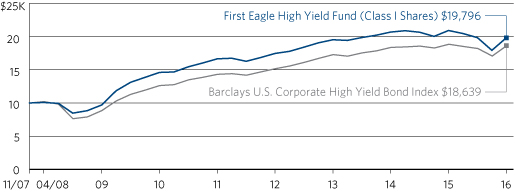
Performance data quoted herein represents past performance and should not be considered indicative of future results. Performance data quoted herein does not reflect the deduction of taxes that a shareholder would pay on Fund distributions or the sale of Fund shares. The average annual returns shown above are historical and reflect changes in share price, reinvested dividends and are net of expenses.
Class I Shares require $1 million minimum investment and are offered without a sales charge. Performance information is for Class I Shares and assumes all distributions have been reinvested and if a sales charge was included values would be lower. Had fees not been waived and/or expenses reimbursed, the performance would have been lower.
The Barclays U.S. Corporate High Yield Index is composed of fixed-rate, publicly issued, non-investment grade debt and is unmanaged, with dividends reinvested. The index includes both corporate and non-corporate sectors. The corporate sectors are Industrial, Utility, and Finance, which include both U.S. and non-U.S. corporations. One cannot invest directly in an index.
Top 10 Holdings* (%)
Bi-Lo LLC, Senior Unsecured (Supermarket chain) | | | 2.10 | | |
ACCO Brands Corporation (Office equipment & supplies) | | | 1.94 | | |
Post Holdings, Inc. (Cereal products manufacturer) | | | 1.80 | | |
Bi-Lo LLC, Senior Secured (Supermarket chain) | | | 1.80 | | |
JC Penney Corporation, Inc. First Lien Term Loan (Department store) | | | 1.80 | | |
Bon-Ton Department Stores, Inc. (U.S. retail store company) | | | 1.76 | | |
Outerwall, Inc. (Automated retail solutions) | | | 1.66 | | |
Thompson Creek Metals Company, Inc. (Mineral mining) | | | 1.56 | | |
Aerojet Rocketdyne Holdings, Inc. (Aerospace and defense products) | | | 1.49 | | |
HCA, Inc. (Electronic components manufacturer) | | | 1.46 | | |
Total | | | 17.37 | | |
*Holdings in cash, commercial paper and other short term cash equivalents have been excluded.
Percentages are based on total net assets.
First Eagle Funds | Semi-Annual Report | April 30, 2016
101
First Eagle High Yield Fund | Schedule of Investments | Six-Month Period Ended April 30, 2016 (unaudited)
| Shares | | Description | | Cost (Note 1) | | Value (Note 1) | |
U.S. Common Stock — 0.02% | | | |
Industrials — 0.02% | | | |
| | 119,580 | | | Rex Energy Corporation (a)(b)(c)(h) | | $ | 596,638 | | | $ | 114,737 | | |
| Principal | | | | | | | |
Bonds — 76.99% | | | |
U.S. Corporate Bonds — 57.86% | | | |
$ | 10,940,000
| | | ACCO Brands Corporation
6.75% due 04/30/20 (d) | | | 11,101,072
| | | | 11,596,400
| | |
| 8,407,000
| | | Aerojet Rocketdyne Holdings, Inc.
7.125% due 03/15/21 | | | 8,628,345
| | | | 8,869,385
| | |
| 7,161,000
| | | Alliance One International, Inc.
9.875% due 07/15/21 | | | 6,095,928
| | | | 5,961,532
| | |
| 2,909,000
| | | American Axle & Manufacturing, Inc.
6.25% due 03/15/21 | | | 2,909,000
| | | | 3,025,360
| | |
| 3,278,000
| | | American Axle & Manufacturing, Inc.
6.625% due 10/15/22 | | | 3,307,136
| | | | 3,466,485
| | |
| 3,763,000
| | | Antero Resources Corporation
5.375% due 11/01/21 | | | 3,789,335
| | | | 3,640,703
| | |
| 8,582,000
| | | Antero Resources Corporation
5.625% due 06/01/23 | | | 8,587,135
| | | | 8,324,540
| | |
| 5,156,000
| | | Ashtead Capital, Inc.
6.50% due 07/15/22 (e) | | | 5,391,351
| | | | 5,439,580
| | |
| 6,685,000
| | | Atlas Energy Holdings
Operating Company LLC
7.75% due 01/15/21 (b) | | | 6,731,629
| | | | 1,069,600
| | |
| 5,533,000
| | | Atlas Energy Holdings
Operating Company LLC
9.25% due 08/15/21 (b) | | | 2,452,259
| | | | 885,280
| | |
| 6,458,000
| | | Atwood Oceanics, Inc.
6.50% due 02/01/20 | | | 5,224,219
| | | | 4,229,990
| | |
| 3,031,000
| | | Basic Energy Services, Inc.
7.75% due 10/15/22 | | | 3,031,000
| | | | 962,343
| | |
| 16,673,000
| | | Bi-Lo LLC
8.625% due 09/15/18 (e)(f) | | | 15,249,017
| | | | 12,504,750
| | |
| 11,088,000
| | | Bi-Lo LLC
9.25% due 02/15/19 (e) | | | 11,254,742
| | | | 10,727,640
| | |
| 12,954,000
| | | Bon-Ton Department Stores, Inc.
10.625% due 07/15/17 | | | 12,882,671
| | | | 10,492,740
| | |
| 3,600,000
| | | California Resources Corporation
8.00% due 12/15/22 (e) | | | 907,493
| | | | 2,475,000
| | |
First Eagle Funds | Semi-Annual Report | April 30, 2016
102
First Eagle High Yield Fund | Schedule of Investments | Six-Month Period Ended April 30, 2016 (unaudited)
| Principal | | Description | | Cost (Note 1) | | Value (Note 1) | |
U.S. Corporate Bonds — 57.86% (continued) | | | |
$ | 2,841,000
| | | CCO Holdings LLC
6.625% due 01/31/22 | | $ | 2,892,331
| | | $ | 3,018,563
| | |
| 465,000
| | | CCO Safari II LLC
4.908% due 07/23/25 (e) | | | 465,000
| | | | 501,292
| | |
| 2,309,000
| | | CEC Entertainment, Inc.
8.00% due 02/15/22 | | | 2,315,573
| | | | 2,078,100
| | |
| 4,123,000
| | | Centene Escrow Corporation
5.625% due 02/15/21 (e) | | | 4,267,141
| | | | 4,339,458
| | |
| 3,984,000
| | | CenturyLink, Inc. Series 'S'
6.45% due 06/15/21 | | | 4,114,948
| | | | 4,063,680
| | |
| 6,468,000
| | | CenturyLink, Inc. Series 'W'
6.75% due 12/01/23 | | | 6,543,109
| | | | 6,370,980
| | |
| 6,444,000
| | | Citgo Petroleum Corporation
6.25% due 08/15/22 (e) | | | 6,370,843
| | | | 6,282,900
| | |
| 10,945,000
| | | Cloud Peak Energy Resources LLC
8.50% due 12/15/19 | | | 7,878,953
| | | | 4,979,975
| | |
| 3,499,000
| | | CNH Industrial Capital LLC
6.25% due 11/01/16 | | | 3,575,809
| | | | 3,564,606
| | |
| 600,000
| | | Crestwood Midstream Partners L.P.
6.00% due 12/15/20 | | | 578,006
| | | | 568,500
| | |
| 6,755,000
| | | Crestwood Midstream Partners L.P.
6.125% due 03/01/22 | | | 6,872,428
| | | | 6,163,937
| | |
| 3,692,000
| | | Crown Americas LLC
4.50% due 01/15/23 | | | 3,788,741
| | | | 3,765,840
| | |
| 4,372,000
| | | DaVita HealthCare Partners, Inc.
5.00% due 05/01/25 | | | 4,389,576
| | | | 4,372,000
| | |
| 6,386,000
| | | DCP Midstream LLC
4.75% due 09/30/21 (e) | | | 4,494,935
| | | | 5,811,260
| | |
| 9,524,000
| | | DFC Finance Corporation
10.50% due 06/15/20 (e) | | | 9,561,741
| | | | 5,988,215
| | |
| 1,767,000
| | | Dollar Tree, Inc.
5.75% due 03/01/23 (e) | | | 1,843,798
| | | | 1,886,803
| | |
| 7,129,000
| | | DriveTime Automotive Group, Inc.
8.00% due 06/01/21 (e) | | | 7,150,043
| | | | 6,416,100
| | |
| 7,344,000
| | | EP Energy LLC
9.375% due 05/01/20 | | | 6,661,850
| | | | 4,787,407
| | |
| 2,894,000
| | | Frontier Communications Corporation
7.125% due 03/15/19 | | | 2,985,221
| | | | 3,053,170
| | |
| 5,421,000
| | | Frontier Communications Corporation
8.50% due 04/15/20 | | | 5,977,346
| | | | 5,732,707
| | |
First Eagle Funds | Semi-Annual Report | April 30, 2016
103
First Eagle High Yield Fund | Schedule of Investments | Six-Month Period Ended April 30, 2016 (unaudited)
| Principal | | Description | | Cost (Note 1) | | Value (Note 1) | |
U.S. Corporate Bonds — 57.86% (continued) | | | |
$ | 3,698,000
| | | Frontier Communications Corporation
8.875% due 09/15/20 (e) | | $ | 3,733,643
| | | $ | 3,915,258
| | |
| 5,005,000
| | | GameStop Corporation
5.50% due 10/01/19 (e) | | | 5,000,468
| | | | 4,892,387
| | |
| 3,244,000
| | | Genesis Energy L.P.
6.00% due 05/15/23 | | | 3,244,000
| | | | 3,000,700
| | |
| 6,986,000
| | | Global Partners L.P.
6.25% due 07/15/22 | | | 7,045,475
| | | | 5,728,520
| | |
| 6,461,000
| | | Harland Clarke Holdings Corporation
6.875% due 03/01/20 (e) | | | 6,480,975
| | | | 5,879,510
| | |
| 4,247,000
| | | Harland Clarke Holdings Corporation
9.75% due 08/01/18 (e) | | | 4,181,987
| | | | 4,247,000
| | |
| 8,500,000
| | | HCA, Inc.
3.75% due 03/15/19 | | | 8,646,065
| | | | 8,733,750
| | |
| 5,052,000
| | | Headwaters, Inc.
7.25% due 01/15/19 | | | 5,113,514
| | | | 5,203,560
| | |
| 1,249,000
| | | Joy Global, Inc.
5.125% due 10/15/21 | | | 920,599
| | | | 1,130,345
| | |
| 10,867,000
| | | Kemet Corporation
10.50% due 05/01/18 | | | 10,863,850
| | | | 8,476,260
| | |
| 4,583,000
| | | KLX, Inc.
5.875% due 12/01/22 (e) | | | 4,585,939
| | | | 4,611,644
| | |
| 7,922,000
| | | Landry's, Inc.
9.375% due 05/01/20 (e) | | | 8,208,141
| | | | 8,328,002
| | |
| 5,327,000
| | | Magnachip Semiconductor Corporation
6.625% due 07/15/21 | | | 5,308,043
| | | | 3,915,345
| | |
| 11,071,000
| | | Outerwall, Inc.
6.00% due 03/15/19 | | | 10,967,791
| | | | 9,880,867
| | |
| 4,048,000
| | | Parker Drilling Company
6.75% due 07/15/22 | | | 4,119,931
| | | | 3,157,440
| | |
| 134,000
| | | Parker Drilling Company
7.50% due 08/01/20 | | | 134,000
| | | | 111,220
| | |
| 1,370,000
| | | Plantronics, Inc.
5.50% due 05/31/23 (e) | | | 1,374,180
| | | | 1,373,425
| | |
| 980,000
| | | Post Holdings, Inc.
6.75% due 12/01/21 (e) | | | 988,432
| | | | 1,027,167
| | |
| 10,198,000
| | | Post Holdings, Inc.
7.375% due 02/15/22 | | | 10,568,430
| | | | 10,746,142
| | |
| 715,000
| | | Quintiles Transnational Corporation
4.875% due 05/15/23 (e) | | | 715,000
| | | | 731,981
| | |
First Eagle Funds | Semi-Annual Report | April 30, 2016
104
First Eagle High Yield Fund | Schedule of Investments | Six-Month Period Ended April 30, 2016 (unaudited)
| Principal | | Description | | Cost (Note 1) | | Value (Note 1) | |
U.S. Corporate Bonds — 57.86% (continued) | | | |
$ | 5,386,000
| | | Radio Systems Corporation
8.375% due 11/01/19 (e) | | $ | 5,427,614
| | | $ | 5,601,440
| | |
| 7,972,000
| | | Rex Energy Corporation
1.00% due 10/01/20 (b)(e)(g) | | | 7,193,620
| | | | 1,155,940
| | |
| 4,720,000
| | | Silgan Holdings, Inc.
5.50% due 02/01/22 | | | 4,699,529
| | | | 4,873,400
| | |
| 2,699,000
| | | Southwestern Energy Co.
7.50% due 02/01/18 | | | 2,178,363
| | | | 2,651,768
| | |
| 3,968,000
| | | Spectrum Brands, Inc.
5.75% due 07/15/25 | | | 4,039,078
| | | | 4,208,659
| | |
| 8,108,000
| | | Sprint Capital Corporation
6.90% due 05/01/19 | | | 6,157,000
| | | | 7,418,820
| | |
| 4,529,000
| | | Sprint Communications, Inc.
6.00% due 12/01/16 | | | 4,542,692
| | | | 4,551,645
| | |
| 7,500,000
| | | Sprint Communications, Inc.
7.00% due 08/15/20 | | | 7,741,829
| | | | 6,225,000
| | |
| 4,079,000
| | | Sprint Corporation
7.25% due 09/15/21 | | | 4,213,170
| | | | 3,293,793
| | |
| 3,228,000
| | | Taylor Morrison Communities, Inc.
5.875% due 04/15/23 (e) | | | 3,238,360
| | | | 3,219,930
| | |
| 4,841,000
| | | The Men's Wearhouse, Inc.
7.00% due 07/01/22 | | | 4,363,269
| | | | 4,235,875
| | |
| 4,833,000
| | | Time, Inc.
5.75% due 04/15/22 (e) | | | 4,833,000
| | | | 4,604,302
| | |
| 4,436,000
| | | Toys R Us Property Company II LLC
8.50% due 12/01/17 | | | 4,427,483
| | | | 4,291,830
| | |
| 4,887,000
| | | Vista Outdoor, Inc.
5.875% due 10/01/23 (e) | | | 4,912,003
| | | | 5,131,350
| | |
| 2,254,000
| | | Vizient, Inc.
10.375% due 03/01/24 (e) | | | 2,254,000
| | | | 2,434,320
| | |
| 3,386,000
| | | Western Digital Corporation
7.375% due 04/01/23 (e) | | | 3,451,949
| | | | 3,417,744
| | |
| 2,142,000
| | | Western Digital Corporation
10.50% due 04/01/24 (e) | | | 2,148,989
| | | | 2,083,095
| | |
| 2,721,000
| | | Zebra Technologies Corporation
7.25% due 10/15/22 | | | 2,969,291
| | | | 2,945,755
| | |
| 341,000
| | | ZF North America Capital, Inc.
4.00% due 04/29/20 (e) | | | 339,444
| | | | 356,345
| | |
Total U.S. Corporate Bonds | | | 381,600,870 | | | | 345,208,355 | | |
First Eagle Funds | Semi-Annual Report | April 30, 2016
105
First Eagle High Yield Fund | Schedule of Investments | Six-Month Period Ended April 30, 2016 (unaudited)
| Principal | | Description | | Cost (Note 1) | | Value (Note 1) | |
International Corporate Bonds — 19.13% | | | |
Australia — 2.78% | | | |
| 9,400,000
USD | | | Ausdrill Finance PTY Limited
6.875% due 11/01/19 (e) | | $ | 8,927,552
| | | $ | 8,013,500
| | |
| 8,469,000
USD | | | Nufarm Australia Limited
6.375% due 10/15/19 (e) | | | 8,617,845
| | | | 8,574,862
| | |
| | | | 17,545,397 | | | | 16,588,362 | | |
Bermuda — 1.33% | | | |
| 1,707,000
USD | | | Aircastle Limited
4.625% due 12/15/18 | | | 1,707,000
| | | | 1,766,745
| | |
| 1,000,000
USD | | | Aircastle Limited
6.75% due 04/15/17 | | | 1,029,096
| | | | 1,032,700
| | |
| 4,515,000
USD | | | Aircastle Limited
7.625% due 04/15/20 | | | 4,642,882
| | | | 5,124,525
| | |
| | | | 7,378,978 | | | | 7,923,970 | | |
Canada — 6.62% | | | |
| 10,821,000
USD | | | Jupiter Resources, Inc.
8.50% due 10/01/22 (e) | | | 10,434,067
| | | | 6,871,335
| | |
| 7,176,000
USD | | | New Gold, Inc.
6.25% due 11/15/22 (e) | | | 6,973,034
| | | | 6,601,920
| | |
| 1,974,000
USD | | | New Gold, Inc.
7.00% due 04/15/20 (e) | | | 1,987,385
| | | | 1,924,650
| | |
| 8,500,000
USD | | | Open Text Corporation
5.625% due 01/15/23 (e) | | | 8,559,031
| | | | 8,712,500
| | |
| 7,056,000
USD | | | Precision Drilling Corporation
6.50% due 12/15/21 | | | 7,152,950
| | | | 6,068,160
| | |
| 9,684,000
USD | | | Thompson Creek Metals Company, Inc.
9.75% due 12/01/17 | | | 9,666,582
| | | | 9,284,535
| | |
| | | | 44,773,049 | | | | 39,463,100 | | |
France — 2.25% | | | |
| 4,000,000
USD | | | Numericable-SFR SAS
4.875% due 05/15/19 (e) | | | 3,976,061
| | | | 4,148,000
| | |
| 4,221,000
USD | | | Numericable-SFR SAS
6.00% due 05/15/22 (e) | | | 4,279,577
| | | | 4,226,487
| | |
| 4,900,000
USD | | | Rexel SA
5.25% due 06/15/20 (e) | | | 4,876,773
| | | | 5,059,250
| | |
| | | | 13,132,411 | | | | 13,433,737 | | |
First Eagle Funds | Semi-Annual Report | April 30, 2016
106
First Eagle High Yield Fund | Schedule of Investments | Six-Month Period Ended April 30, 2016 (unaudited)
| Principal | | Description | | Cost (Note 1) | | Value (Note 1) | |
International Corporate Bonds — 19.13% (continued) | | | |
Ireland — 0.22% | | | |
| 1,000,000
USD | | | Ardagh Packaging Finance PLC 144A
3.89% due 05/15/21 (e) | | $ | 995,000
| | | $ | 995,000
| | |
| 300,000
USD | | | Ardagh Packaging Finance PLC 144A
4.625% due 05/15/23 (e) | | | 300,000
| | | | 300,000
| | |
| | | | 1,295,000 | | | | 1,295,000 | | |
Italy — 0.52% | | | |
| 2,705,000
EUR | | | Onorato Armatori S.p.A.
7.75% due 02/15/23 (e) | | | 3,018,374
| | | | 3,128,335
| | |
Netherlands — 2.06% | | | |
| 2,228,000
USD | | | Schaeffler Holding Finance BV
6.75% due 11/15/22 (e)(f) | | | 2,444,116
| | | | 2,424,342
| | |
| 4,683,000
USD | | | Schaeffler Holding Finance BV
6.875% due 08/15/18 (e)(f) | | | 4,775,605
| | | | 4,823,490
| | |
| 5,033,000
USD | | | VTR Finance BV
6.875% due 01/15/24 (e) | | | 5,117,792
| | | | 5,026,709
| | |
| | | | 12,337,513 | | | | 12,274,541 | | |
Sweden — 1.18% | | | |
| 6,780,000
USD | | | Perstorp Holding AB
8.75% due 05/15/17 (e) | | | 6,784,343
| | | | 6,763,050
| | |
| 250,000
EUR | | | Perstorp Holding AB
9.00% due 05/15/17 (e) | | | 317,495
| | | | 286,263
| | |
| | | | 7,101,838 | | | | 7,049,313 | | |
United Kingdom — 2.17% | | | |
| 13,136,000
USD | | | EnQuest PLC
7.00% due 04/15/22 (e) | | | 10,876,429
| | | | 7,323,320
| | |
| 790,000
USD | | | Jaguar Land Rover Automotive PLC
5.625% due 02/01/23 (e) | | | 790,000
| | | | 833,450
| | |
| 4,685,000
USD | | | Virgin Media Secured Finance PLC
5.50% due 01/15/25 (e) | | | 4,691,108
| | | | 4,790,413
| | |
| | | | 16,357,537 | | | | 12,947,183 | | |
Total International Corporate Bonds | | | 122,940,097 | | | | 114,103,541 | | |
Total Bonds | | | 504,540,967 | | | | 459,311,896 | | |
Term Loans — 12.54% | | | |
United States — 12.54% | | | |
| 7,217,834
USD
| | | BJ's Wholesale Club, Inc.,
Second Lien Term Loan
8.50% due 03/26/20 | | | 7,203,575
| | | | 6,977,264
| | |
First Eagle Funds | Semi-Annual Report | April 30, 2016
107
First Eagle High Yield Fund | Schedule of Investments | Six-Month Period Ended April 30, 2016 (unaudited)
| Principal | | Description | | Cost (Note 1) | | Value (Note 1) | |
Term Loans — 12.54% (continued) | | | |
United States — 12.54% (continued) | | | |
| 11,103,092
USD | | | Cactus Wellhead LLC
7.00% due 07/31/20 (b) | | $ | 9,821,376
| | | $ | 7,217,010
| | |
| 10,892,000
USD
| | | Caelus Energy Alaska O3 LLC,
Second Lien Term Loan
8.75% due 04/15/20 (b) | | | 10,678,103
| | | | 5,990,600
| | |
| 6,103,823
USD | | | CBAC Borrower LLC, Term Loan B
8.25% due 07/02/20 (b) | | | 6,153,508
| | | | 5,630,776
| | |
| 6,486,000
USD
| | | Hostess Brands, LLC,
Second Lien Term Loan
8.50% due 08/03/23 (b) | | | 6,490,487
| | | | 6,356,280
| | |
| 10,693,174
USD
| | | JC Penney Corporation, Inc.,
First Lien Term Loan
6.00% due 05/22/18 | | | 10,750,713
| | | | 10,709,856
| | |
| 4,478,342
USD | | | OSG Bulk Ships, Inc., Exit Term Loan
5.25% due 08/05/19 (b) | | | 4,465,257
| | | | 4,243,229
| | |
| 6,308,767
USD | | | Osum Productions Corporation
6.50% due 07/28/20 (b) | | | 6,188,660
| | | | 2,523,507
| | |
| 11,821,280
USD | | | Payless, Inc., First Lien Term Loan
5.00% due 03/11/21 (b) | | | 10,627,583
| | | | 6,974,555
| | |
| 1,202,000
USD | | | Payless, Inc., Second Lien Term Loan
8.50% due 03/11/22 (b) | | | 1,192,392
| | | | 288,480
| | |
| 1,811,709
USD | | | Peabody Energy Corporation, Term Loan B
4.25% due 09/24/20 | | | 886,882
| | | | 784,325
| | |
| 6,148,350
USD | | | ROC Finance LLC
5.00% due 06/20/19 (b) | | | 6,006,667
| | | | 5,830,665
| | |
| 10,467,379
USD
| | | True Religion Apparel, Inc.,
First Lien Term Loan
5.88% due 07/30/19 (b) | | | 10,131,507
| | | | 4,640,503
| | |
| 6,695,629
USD
| | | Water Pik Technologies, Inc.,
First Lien Term Loan
5.75% due 07/08/20 (b) | | | 6,608,692
| | | | 6,670,520
| | |
Total Term Loans | | | 97,205,402 | | | | 74,837,570 | | |
International Commercial Paper — 9.34% | | | |
Italy — 4.67% | | | |
| 27,846,000
USD | | | Eni S.p.A.
0.61% due 05/02/16 | | | 27,845,536
| | | | 27,845,362
| | |
Japan — 4.67% | | | |
| 11,466,000
USD | | | Hitachi Limited
0.56% due 05/02/16 | | | 11,465,825
| | | | 11,465,555
| | |
First Eagle Funds | Semi-Annual Report | April 30, 2016
108
First Eagle High Yield Fund | Schedule of Investments | Six-Month Period Ended April 30, 2016 (unaudited)
Principal | | Description | | Cost (Note 1) | | Value (Note 1) | |
International Commercial Paper — 9.34% (continued) | | | |
Japan — 4.67% (continued) | | | |
| 16,380,000
USD | | | Mitsui & Company Limited
0.52% due 05/02/16 | | $ | 16,379,768
| | | $ | 16,379,502
| | |
Total International Commercial Paper | | | 55,691,129 | | | | 55,690,419 | | |
Shares | | | | | | | |
Investment Company — 0.03% | | | |
| 202,307
| | | State Street Institutional
U.S. Government Money Market Fund,
Premier Class | | | 202,307
| | | | 202,307
| | |
Total Investments — 98.92% (Cost: $658,236,443) | | | 590,156,929 | | |
Other Assets in Excess of Liabilities — 1.08% | | | 6,453,003 | | |
Net Assets — 100.00% | | $ | 596,609,932 | | |
(a) Represents securities that are subject to legal or contractual restrictions on resale. At April 30, 2016, the value of these securities amounted to $114,737 or 0.02% of net assets.
(b) Security is deemed illiquid. At April 30, 2016, the value of these securities amounted to $59,591,682 or 9.99% of net assets.
(c) Non-income producing security/commodity.
(d) At April 30, 2016, all or a portion of the security was segregated to cover collateral requirements for extended trade settlements.
(e) All or a portion of the security is exempt from registration under the Securities Act of 1933. Rule 144A securities may only be sold to qualified institutional buyers, pursuant to Rule 144A under the Securities Act of 1933.
(f) Payment-in-kind security.
(g) Multi-step—Coupon rate changes in predetermined increments to maturity. Rate disclosed is as of April 30, 2016. Maturity date disclosed is the ultimate maturity date.
(h) Securities valued in accordance with fair value procedures under the supervision of the Board of Trustees, representing $114,737 or 0.02% of net assets.
At April 30, 2016, cost is substantially identical for both book and federal income tax purposes. Net unrealized depreciation consisted of:
Gross unrealized appreciation | | $ | 9,396,362 | | |
Gross unrealized depreciation | | | (77,475,876 | ) | |
Net unrealized depreciation | | $ | (68,079,514 | ) | |
Abbreviations used in this schedule include:
PLC — Public Limited Company
SA — Société Anonyme
SAS — Société par Actions Simplifiée
S.p.A. — Società per Azioni
Currencies
EUR — Euro
USD — United States Dollar
First Eagle Funds | Semi-Annual Report | April 30, 2016
109
First Eagle High Yield Fund | Schedule of Investments | Six-Month Period Ended April 30, 2016 (unaudited)
Restricted Securities | | Acquisition Date | | Cost | | Carrying Value
Per
Share/Principal | |
Rex Energy Corporation | | 03/31/16 | | $ | 596,638 | | | $ | 0.96 | | |
Foreign Currency Exchange Contracts — Sales
Settlement
Dates
Through | | Foreign Currency
To be Delivered | | U.S. $
To be Received | | U.S. $ Value
At April 30,
2016 | | Unrealized
Appreciation
At April 30,
2016 | | Unrealized
Depreciation
At April 30,
2016 | |
08/17/16 | | | 3,021,000 | | | Euro | | $ | 3,329,764 | | | $ | 3,470,717 | | | $ | — | | | $ | (140,953 | ) | |
Foreign Currency Exchange Contracts — Purchases
Settlement
Dates
Through | | Foreign Currency
To be Received | | U.S. $
To be Delivered | | U.S. $ Value
At April 30,
2016 | | Unrealized
Appreciation
At April 30,
2016 | | Unrealized
Depreciation
At April 30,
2016 | |
08/17/16 | | | 86,000 | | | Euro | | $ | 98,394 | | | $ | 98,802 | | | $ | 408 | | | $ | — | | |
Industry Diversification for Portfolio Holdings | | Percent of
Net Assets | |
U.S. Common Stock | |
Industrials | | | 0.02 | % | |
Total U.S. Common Stock | | | 0.02 | | |
U.S. Corporate Bonds | |
Consumer Discretionary | | | 14.69 | | |
Consumer Staples | | | 6.99 | | |
Energy | | | 9.90 | | |
Financials | | | 4.36 | | |
Health Care | | | 2.92 | | |
Industrials | | | 8.36 | | |
Information Technology | | | 1.00 | | |
Telecommunication Services | | | 9.64 | | |
Total U.S. Corporate Bonds | | | 57.86 | | |
First Eagle Funds | Semi-Annual Report | April 30, 2016
110
First Eagle High Yield Fund | Schedule of Investments | Six-Month Period Ended April 30, 2016 (unaudited)
Industry Diversification for Portfolio Holdings (continued) | | Percent of
Net Assets | |
International Corporate Bonds | |
Consumer Discretionary | | | 0.95 | % | |
Consumer Staples | | | 0.41 | | |
Energy | | | 3.40 | | |
Financials | | | 2.67 | | |
Industrials | | | 1.59 | | |
Information Technology | | | 2.86 | | |
Materials | | | 5.61 | | |
Telecommunication Services | | | 1.64 | | |
Total International Corporate Bonds | | | 19.13 | | |
Term Loans | | | 12.54 | | |
International Commercial Paper | | | 9.34 | | |
Investment Company | | | 0.03 | | |
Total Investments | | | 98.92 | % | |
See Notes to Financial Statements.
First Eagle Funds | Semi-Annual Report | April 30, 2016
111
First Eagle Fund of America
Data as of April 30, 2016 (unaudited)
Investment Objective
The First Eagle Fund of America is a non-diversified U.S. equity fund that seeks capital appreciation by investing primarily in domestic stocks and, to a lesser extent, in debt and foreign equity securities. The Fund has a unique event-driven bias that focuses on identifying companies poised to benefit from change that the market has not yet recognized.
Average Annual Returns (%) | | | | | | One-Year | | Five-Years | | Ten-Years | |
First Eagle Fund of America | | Class Y | | | | | -9.69 | | | | 7.60 | | | | 7.55 | | |
Standard & Poor's 500 Index | | | | | | | 1.21 | | | | 11.02 | | | | 6.91 | | |

Sector/Industry** (%)
Materials | | | 36.52 | | |
Industrials | | | 13.37 | | |
Information Technology | | | 12.59 | | |
Consumer Discretionary | | | 11.57 | | |
Health Care | | | 9.45 | | |
Consumer Staples | | | 5.10 | | |
Energy | | | 3.91 | | |
Telecommunication Services | | | 0.77 | | |
* Asset Allocation and Sector/Industry percentages are based on total investments in the portfolio.
**Sector/Industry allocations exclude short term investments and options positions.
The Fund's portfolio composition is subject to change at any time.
First Eagle Funds | Semi-Annual Report | April 30, 2016
112
First Eagle Fund of America | Fund Overview
Growth of a $10,000 Initial Investment
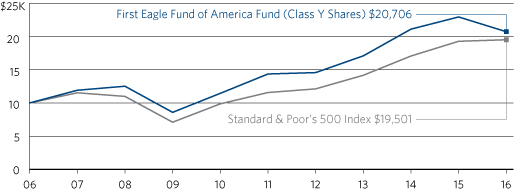
Performance data quoted herein represents past performance and should not be considered indicative of future results. Performance data quoted herein does not reflect the deduction of taxes that a shareholder would pay on Fund distributions or the sale of Fund shares.
The Fund's average annual returns shown above are historical and reflect changes in share price, reinvested dividends and is net of expenses.
The Standard & Poor's 500 Index is a widely recognized unmanaged index including a representative sample of 500 leading companies in leading sectors of the U.S. economy. Although the Standard & Poor's 500 Index focuses on the large-cap segment of the market, with approximately 80% coverage of U.S. equities, it is also considered a proxy for the total market. The Standard & Poor's 500 Index includes dividends reinvested. One cannot invest directly in an index.
Top 10 Holdings* (%)
Eastman Chemical Company (specialty chemicals company) | | | 5.44 | | |
Tyson Foods, Inc. Class 'A' (food production company) | | | 5.15 | | |
Lowe's Companies, Inc. (home improvement retailer) | | | 5.08 | | |
Pitney Bowes, Inc. (mail processing equipment and solutions provider) | | | 4.89 | | |
Wyndham Worldwide Corporation (hotel and resorts) | | | 4.83 | | |
Sealed Air Corporation (containers & packaging company) | | | 4.70 | | |
Hewlett-Packard Enterprise Company (technology software, soluctions and
services provider) | | | 4.59 | | |
LyondellBasell Industries NV Class 'A' (chemicals and plastics producer) | | | 4.06 | | |
Graphic Packaging Holding Company (packaging solutions company) | | | 3.98 | | |
Phillips 66 (energy manufacturing and logistics company) | | | 3.94 | | |
Total | | | 46.66 | | |
*Holdings in cash, commercial paper and other short term cash equivalents have been excluded.
Percentages are based on total net assets.
First Eagle Funds | Semi-Annual Report | April 30, 2016
113
First Eagle Fund of America | Schedule of Investments | Six-Month Period Ended April 30, 2016 (unaudited)
| | | Shares | | Description | | Cost (Note 1) | | Value (Note 1) | |
Common Stocks — 94.16% | |
U.S. Common Stocks — 90.10% | |
Consumer Discretionary — 11.68% | |
| | | | 2,170,440 | | | Lowe's Companies, Inc. (a) | | $ | 97,336,454 | | | $ | 164,996,849 | | |
| | | | 2,210,275 | | | Wyndham Worldwide Corporation (a) | | | 92,751,948 | | | | 156,819,011 | | |
| | | | 722,322 | | | Visteon Corporation (a) | | | 47,357,802 | | | | 57,547,394 | | |
| | | | 237,446,204 | | | | 379,363,254 | | |
Consumer Staples — 5.15% | |
| | | | 2,541,695 | | | Tyson Foods, Inc., Class 'A' (a) | | | 108,097,336 | | | | 167,294,365 | | |
Energy — 3.94% | |
| | | | 1,559,250 | | | Phillips 66 (a) | | | 126,851,017 | | | | 128,030,017 | | |
Health Care — 9.54% | |
| | | | 5,963,023 | | | Allscripts Healthcare Solutions, Inc. (b) | | | 81,447,687 | | | | 79,904,508 | | |
| | | | 7,101,000 | | | Halozyme Therapeutics, Inc. (a)(b) | | | 73,204,358 | | | | 74,915,550 | | |
| | | | 224,085 | | | Biogen, Inc. (a)(b) | | | 64,607,309 | | | | 61,621,134 | | |
| | | | 3,355,791 | | | Innoviva, Inc. (a) | | | 71,788,141 | | | | 41,410,461 | | |
| | | | 1,042,419 | | | Intrexon Corporation (a)(b) | | | 25,525,141 | | | | 27,863,860 | | |
| | | | 719,832
| | | Valeant Pharmaceuticals
International, Inc. (a)(b) | | | 8,346,624
| | | | 24,013,596
| | |
| | | | 324,919,260 | | | | 309,729,109 | | |
Industrials — 13.50% | |
| | | | 7,574,575 | | | Pitney Bowes, Inc. | | | 137,016,589 | | | | 158,838,838 | | |
| | | | 2,953,880 | | | Delta Air Lines, Inc. (a) | | | 128,861,201 | | | | 123,088,180 | | |
| | | | 679,835 | | | General Dynamics Corporation (a) | | | 91,507,383 | | | | 95,530,414 | | |
| | | | 1,985,550 | | | Masco Corporation (a) | | | 40,962,279 | | | | 60,976,240 | | |
| | | | 398,347,452 | | | | 438,433,672 | | |
Information Technology — 12.71% | |
| | | | 8,955,630 | | | Hewlett-Packard Enterprise Company (a) | | | 116,734,769 | | | | 149,200,796 | | |
| | | | 2,440,132 | | | Lexmark International, Inc., Class 'A' | | | 90,730,410 | | | | 94,189,095 | | |
| | | | 367,865 | | | MicroStrategy, Inc., Class 'A' (a)(b) | | | 64,166,529 | | | | 65,965,552 | | |
| | | | 2,928,550 | | | Seagate Technology PLC (a) | | | 79,757,253 | | | | 63,754,533 | | |
| | | | 273,935 | | | Autodesk, Inc. (a)(b) | | | 16,678,333 | | | | 16,386,792 | | |
| | | | 660,405 | | | eBay, Inc. (b) | | | 16,842,758 | | | | 16,133,694 | | |
| | | | 481,400 | | | Twitter, Inc. (a)(b) | | | 8,390,802 | | | | 7,038,068 | | |
| | | | 393,300,854 | | | | 412,668,530 | | |
First Eagle Funds | Semi-Annual Report | April 30, 2016
114
First Eagle Fund of America | Schedule of Investments | Six-Month Period Ended April 30, 2016 (unaudited)
| Shares | | Description | | Cost (Note 1) | | Value (Note 1) | |
U.S. Common Stocks — 90.10% (continued) | | | |
Materials — 32.80% | | | |
| | 2,314,990 | | | Eastman Chemical Company (a) | | $ | 96,334,153 | | | $ | 176,818,936 | | |
| | 3,221,470 | | | Sealed Air Corporation | | | 86,485,570 | | | | 152,568,819 | | |
| | 9,727,259 | | | Graphic Packaging Holding Company | | | 121,830,576 | | | | 129,178,000 | | |
| | 1,509,725 | | | WR Grace & Company (a)(b) | | | 79,092,654 | | | | 115,765,713 | | |
| | 1,741,000 | | | Packaging Corporation of America (a) | | | 101,449,775 | | | | 112,956,080 | | |
| | 601,235 | | | Martin Marietta Materials, Inc. (a) | | | 88,174,425 | | | | 101,746,999 | | |
| | 2,968,635 | | | Axalta Coating Systems, Limited (a)(b) | | | 84,792,310 | | | | 84,517,038 | | |
| | 526,605 | | | Air Products & Chemicals, Inc. (a) | | | 76,802,966 | | | | 76,826,403 | | |
| | 2,341,650 | | | GCP Applied Technologies, Inc. (a)(b) | | | 37,645,716 | | | | 51,820,715 | | |
| | 566,430 | | | Albemarle Corporation (a) | | | 37,256,520 | | | | 37,475,009 | | |
| | 1,179,354 | | | Olin Corporation (a) | | | 23,834,520 | | | | 25,698,124 | | |
| | | | 833,699,185 | | | | 1,065,371,836 | | |
Telecommunication Services — 0.78% | | | |
| | 690,945 | | | Yahoo!, Inc. (a)(b) | | | 25,455,806 | | | | 25,288,587 | | |
Total U.S. Common Stocks | | | 2,448,117,114 | | | | 2,926,179,370 | | |
International Common Stock — 4.06% | | | |
Netherlands — 4.06% | | | |
| | 1,594,445 | | | LyondellBasell Industries NV, Class 'A' (a) | | | 120,243,618 | | | | 131,812,768 | | |
Total Common Stocks | | | 2,568,360,732 | | | | 3,057,992,138 | | |
Investment Company — 8.98% | | | |
| 291,731,263
| | | State Street Institutional
U.S. Government Money Market
Fund, Premier Class | | | 291,731,263
| | | | 291,731,263
| | |
Total Investment Portfolio
Excluding Options Written — 103.14%
(Cost: $2,860,091,995) | | $ | 3,349,723,401 | | |
Contracts | | | | Strike Price | | Expiration Date | | | |
Covered Call Options Written — (2.19)% | | | |
| 1,171
| | | Air Products &
Chemicals, Inc. | | $ | 140.00
| | | June 2016
| | $ | (971,930
| ) | |
| | 597 |
| | Air Products &
Chemicals, Inc. | | | 145.00
| | | June 2016
| | | (295,515
| ) | |
| | 500 |
| | Air Products &
Chemicals, Inc. | | | 150.00
| | | September 2016
| | | (292,500
| ) | |
First Eagle Funds | Semi-Annual Report | April 30, 2016
115
First Eagle Fund of America | Schedule of Investments | Six-Month Period Ended April 30, 2016 (unaudited)
| | | Contracts | | | | Strike Price | | Expiration Date | | Value (Note 1) | |
Covered Call Options Written — (2.19)% (continued) | |
| | | | 3,109 | | | Albemarle Corporation | | $ | 65.00 | | | September 2016 | | $ | (1,663,315 | ) | |
| | | | 497 | | | Albemarle Corporation | | | 67.50 | | | June 2016 | | | (109,340 | ) | |
| | | | 273 | | | Autodesk, Inc. | | | 60.00 | | | June 2016 | | | (83,265 | ) | |
| | | | 1,929 | | | Autodesk, Inc. | | | 62.50 | | | June 2016 | | | (478,392 | ) | |
| | | | 1,670
| | | Axalta Coating Systems,
Limited | | | 29.00
| | | July 2016
| | | (200,400
| ) | |
| | | | 6,568
| | | Axalta Coating Systems,
Limited | | | 30.00
| | | July 2016
| | | (525,440
| ) | |
| | | | 38 | | | Biogen, Inc. | | | 275.00 | | | June 2016 | | | (51,300 | ) | |
| | | | 44 | | | Biogen, Inc. | | | 285.00 | | | August 2016 | | | (79,200 | ) | |
| | | | 2,372 | | | Delta Air Lines, Inc. | | | 45.00 | | | June 2016 | | | (177,900 | ) | |
| | | | 815
| | | Eastman Chemical
Company | | | 65.00
| | | June 2016
| | | (945,400
| ) | |
| | | | 7,369
| | | Eastman Chemical
Company | | | 70.00
| | | June 2016
| | | (3,979,260
| ) | |
| | | | 2,652
| | | Eastman Chemical
Company | | | 72.50
| | | September 2016
| | | (1,644,240
| ) | |
| | | | 772
| | | GCP Applied
Technologies, Inc. | | | 20.00
| | | May 2016
| | | (212,300
| ) | |
| | | | 5,819
| | | General Dynamics
Corporation | | | 140.00
| | | August 2016
| | | (3,258,640
| ) | |
| | | | 252
| | | General Dynamics
Corporation | | | 145.00
| | | August 2016
| | | (83,916
| ) | |
| | | | 2,986 | | | Halozyme
Therapeutics, Inc. | | | 9.00
| | | June 2016
| | | (671,850
| ) | |
| | | | 5,554
| | | Halozyme
Therapeutics, Inc. | | | 10.00
| | | June 2016
| | | (860,870
| ) | |
| | | | 2,146
| | | Halozyme
Therapeutics, Inc. | | | 10.00
| | | January 2017
| | | (606,245
| ) | |
| | | | 6,892
| | | Halozyme
Therapeutics, Inc. | | | 11.00
| | | September 2016
| | | (1,171,640
| ) | |
| | | | 2,929
| | | Halozyme
Therapeutics, Inc. | | | 12.00
| | | June 2016
| | | (226,998
| ) | |
| | | | 7,444
| | | Halozyme
Therapeutics, Inc. | | | 12.00
| | | September 2016
| | | (893,280
| ) | |
| | | | 2,000
| | | Hewlett-Packard
Enterprise Company | | | 16.00
| | | August 2016
| | | (340,000
| ) | |
| | | | 7,000
| | | Hewlett-Packard
Enterprise Company | | | 17.00
| | | August 2016
| | | (770,000
| ) | |
First Eagle Funds | Semi-Annual Report | April 30, 2016
116
First Eagle Fund of America | Schedule of Investments | Six-Month Period Ended April 30, 2016 (unaudited)
| | | Contracts | | | | Strike Price | | Expiration Date | | Value (Note 1) | |
Covered Call Options Written — (2.19)% (continued) | |
| | | | 8,000
Enterprise Company | | | Hewlett-Packard
| | $ | 18.00
| | | August 2016
| | $ | (568,000
| ) | |
| | | | 11,262 | | | Innoviva, Inc. | | | 12.00 | | | June 2016 | | | (1,069,890 | ) | |
| | | | 2,687 | | | Innoviva, Inc. | | | 13.00 | | | June 2016 | | | (141,068 | ) | |
| | | | 287 | | | Intrexon Corporation | | | 35.00 | | | May 2016 | | | (8,610 | ) | |
| | | | 1,000 | | | Intrexon Corporation | | | 35.00 | | | June 2016 | | | (80,000 | ) | |
| | | | 1,195 | | | Intrexon Corporation | | | 35.00 | | | July 2016 | | | (164,910 | ) | |
| | | | 1,000 | | | Intrexon Corporation | | | 35.00 | | | October 2016 | | | (270,000 | ) | |
| | | | 468 | | | Intrexon Corporation | | | 37.00 | | | June 2016 | | | (25,740 | ) | |
| | | | 452 | | | Intrexon Corporation | | | 37.00 | | | July 2016 | | | (56,500 | ) | |
| | | | 698 | | | Intrexon Corporation | | | 39.00 | | | July 2016 | | | (54,095 | ) | |
| | | | 2,816 | | | Lowe's Companies, Inc. | | | 72.50 | | | July 2016 | | | (1,239,040 | ) | |
| | | | 3,633 | | | Lowe's Companies, Inc. | | | 75.00 | | | July 2016 | | | (1,246,119 | ) | |
| | | | 2,809
| | | LyondellBasell
Industries NV | | | 85.00
| | | June 2016
| | | (646,070
| ) | |
| | | | 2,000
| | | LyondellBasell
Industries NV | | | 85.00
| | | September 2016
| | | (940,000
| ) | |
| | | | 5,945
| | | LyondellBasell
Industries NV | | | 87.50
| | | September 2016
| | | (1,961,850
| ) | |
| | | | 2,533
| | | LyondellBasell
Industries NV | | | 90.00
| | | September 2016
| | | (582,590
| ) | |
| | | | 1,040
| | | Martin Marietta
Materials, Inc. | | | 145.00
| | | July 2016
| | | (2,698,800
| ) | |
| | | | 127
| | | Martin Marietta
Materials, Inc. | | | 155.00
| | | July 2016
| | | (212,090
| ) | |
| | | | 735
| | | Martin Marietta
Materials, Inc. | | | 160.00
| | | July 2016
| | | (1,001,070
| ) | |
| | | | 3,029
| | | Martin Marietta
Materials, Inc. | | | 165.00
| | | October 2016
| | | (4,534,413
| ) | |
| | | | 6,321 | | | Masco Corporation | | | 29.00 | | | July 2016 | | | (1,517,040 | ) | |
| | | | 13,534 | | | Masco Corporation | | | 30.00 | | | July 2016 | | | (2,233,110 | ) | |
| | | | 100 | | | MicroStrategy, Inc. | | | 175.00 | | | July 2016 | | | (116,500 | ) | |
| | | | 191 | | | MicroStrategy, Inc. | | | 180.00 | | | July 2016 | | | (169,035 | ) | |
| | | | 184 | | | MicroStrategy, Inc. | | | 185.00 | | | July 2016 | | | (119,600 | ) | |
| | | | 1,342 | | | MicroStrategy, Inc. | | | 190.00 | | | July 2016 | | | (664,290 | ) | |
| | | | 4,432 | | | Olin Corporation | | | 20.00 | | | August 2016 | | | (1,218,800 | ) | |
| | | | 3,225 | | | Olin Corporation | | | 21.00 | | | August 2016 | | | (725,625 | ) | |
First Eagle Funds | Semi-Annual Report | April 30, 2016
117
First Eagle Fund of America | Schedule of Investments | Six-Month Period Ended April 30, 2016 (unaudited)
| | | Contracts | | | | Strike Price | | Expiration Date | | Value (Note 1) | |
Covered Call Options Written — (2.19)% (continued) | |
| | | | 745 | | | Olin Corporation | | $ | 23.00 | | | June 2016 | | $ | (57,737 | ) | |
| | | | 350
| | | Packaging Corporation
of America | | | 47.50
| | | July 2016
| | | (644,000
| ) | |
| | | | 639
| | | Packaging Corporation
of America | | | 52.50
| | | July 2016
| | | (853,065
| ) | |
| | | | 905
| | | Packaging Corporation
of America | | | 55.00
| | | July 2016
| | | (945,725
| ) | |
| | | | 227
| | | Packaging Corporation
of America | | | 57.50
| | | July 2016
| | | (197,490
| ) | |
| | | | 5,224 | | | Packaging Corporation
of America | | | 60.00
| | | October 2016
| | | (4,205,320
| ) | |
| | | | 2,288
| | | Packaging Corporation
of America | | | 62.50
| | | October 2016
| | | (1,327,040
| ) | |
| | | | 1,500
| | | Packaging Corporation
of America | | | 65.00
| | | October 2016
| | | (690,000
| ) | |
| | | | 5,121 | | | Phillips 66 | | | 85.00 | | | August 2016 | | | (1,843,560 | ) | |
| | | | 8,415 | | | Phillips 66 | | | 87.50 | | | August 2016 | | | (1,893,375 | ) | |
| | | | 183 | | | Seagate Technology PLC | | | 28.00 | | | June 2016 | | | (2,196 | ) | |
| | | | 4,814 | | | Twitter, Inc. | | | 19.00 | | | September 2016 | | | (298,468 | ) | |
| | | | 3,218 | | | Tyson Foods, Inc. | | | 62.50 | | | July 2016 | | | (1,705,540 | ) | |
| | | | 13,769 | | | Tyson Foods, Inc. | | | 65.00 | | | July 2016 | | | (5,163,375 | ) | |
| | | | 500
| | | Valeant Pharmaceuticals
International, Inc. | | | 35.00
| | | June 2016
| | | (189,500
| ) | |
| | | | 2,000
| | | Valeant Pharmaceuticals
International, Inc. | | | 35.00
| | | October 2016
| | | (1,384,000
| ) | |
| | | | 1,696
| | | Valeant Pharmaceuticals
International, Inc. | | | 37.50
| | | June 2016
| | | (474,880
| ) | |
| | | | 2,000
| | | Valeant Pharmaceuticals
International, Inc. | | | 37.50
| | | October 2016
| | | (1,112,000
| ) | |
| | | | 1,000
| | | Valeant Pharmaceuticals
International, Inc. | | | 40.00
| | | October 2016
| | | (510,000
| ) | |
| | | | 656 | | | Visteon Corporation | | | 76.60 | | | June 2016 | | | (295,200 | ) | |
| | | | 3,030 | | | WR Grace & Company | | | 70.00 | | | June 2016 | | | (2,151,300 | ) | |
| | | | 1,105
| | | Wyndham Worldwide
Corporation | | | 75.00
| | | August 2016
| | | (209,950
| ) | |
First Eagle Funds | Semi-Annual Report | April 30, 2016
118
First Eagle Fund of America | Schedule of Investments | Six-Month Period Ended April 30, 2016 (unaudited)
| Contracts | | | | Strike Price | | Expiration Date | | Value (Note 1) | |
Covered Call Options Written — (2.19)% (continued) | |
| | 2,301 | | | Yahoo!, Inc. | | $ | 39.00 | | | June 2016 | | $ | (250,809 | ) | |
Total Covered Call Options Written
(Premiums Received: $78,848,370) | | | (71,262,521 | ) | |
Total Investments — 100.95%
(Cost: $2,781,243,625) | | | 3,278,460,880 | | |
Liabilities in Excess of Other Assets — (0.95)% | | | (30,792,706 | ) | |
Net Assets — 100.00% | | $ | 3,247,668,174 | | |
(a) At April 30, 2016, all or a portion of this security was segregated to cover collateral requirement for options.
(b) Non-income producing security/commodity.
At April 30, 2016, cost is substantially identical for both book and federal income tax purposes. Net unrealized appreciation consisted of:
Gross unrealized appreciation | | $ | 568,389,259 | | |
Gross unrealized depreciation | | | (71,172,004 | ) | |
Net unrealized appreciation | | $ | 497,217,255 | | |
Abbreviations used in this schedule include:
PLC — Public Limited Company
Industry Diversification for Portfolio Holdings | | Percent of
Net Assets | |
U.S. Common Stocks | |
Consumer Discretionary | | | 11.68 | % | |
Consumer Staples | | | 5.15 | | |
Energy | | | 3.94 | | |
Health Care | | | 9.54 | | |
Industrials | | | 13.50 | | |
Information Technology | | | 12.71 | | |
Materials | | | 32.80 | | |
Telecommunication Services | | | 0.78 | | |
Total U.S. Common Stocks | | | 90.10 | | |
International Common Stock | |
Materials | | | 4.06 | | |
Total International Common Stock | | | 4.06 | | |
Investment Company | | | 8.98 | | |
Covered Call Options Written | | | (2.19 | ) | |
Total Investments | | | 100.95 | % | |
See Notes to Financial Statements.
First Eagle Funds | Semi-Annual Report | April 30, 2016
119
Statements of Assets and Liabilities
| | | First Eagle
Global Fund* | | First Eagle
Overseas Fund* | |
Assets | |
Investments, at Cost (Note 1) | |
Unaffiliated issuers | | $ | 33,562,073,781 | | | $ | 10,327,573,112 | | |
Affiliated issuers | | | 2,469,536,621 | | | | 363,804,189 | | |
Gold bullion | | | 2,770,072,512 | | | | 563,993,676 | | |
Silver bullion | | | — | | | | — | | |
Foreign currency | | | 562,693 | | | | 198,107 | | |
Total Investments, at Cost | | | 38,802,245,607 | | | | 11,255,569,084 | | |
Investments, at Value (Note 1) | |
Unaffiliated issuers | | | 41,908,413,131 | | | | 12,761,760,627 | | |
Affiliated issuers | | | 2,589,395,541 | | | | 596,867,041 | | |
Gold bullion | | | 3,476,215,602 | | | | 893,232,420 | | |
Silver bullion | | | — | | | | — | | |
Foreign currency | | | 562,700 | | | | 198,116 | | |
Total Investments, at Value | | | 47,974,586,974 | | | | 14,252,058,204 | | |
Cash | | | — | | | | — | | |
Receivable for investment securities sold | | | 74,629,162 | | | | 56,543,858 | | |
Receivable for Fund shares sold | | | 102,950,939 | | | | 45,125,272 | | |
Accrued interest and dividends receivable | | | 113,846,657 | | | | 51,182,305 | | |
Investment for trustee deferred compensation plan (Note 2) | | | 6,018,122 | | | | 2,204,190 | | |
Other assets | | | 525,130 | | | | 174,095 | | |
Total Assets | | | 48,272,556,984 | | | | 14,407,287,924 | | |
Liabilities | |
Payable for Fund shares redeemed | | | 73,619,448 | | | | 25,977,110 | | |
Payable for investment securities purchased | | | 38,031,042 | | | | 209,858 | | |
Payable for forward currency contracts held, at value (Note 1) | | | 20,369,502 | | | | 11,557,308 | | |
Investment advisory fees payable (Note 2) | | | 28,904,307 | | | | 8,582,155 | | |
Distribution fees payable (Note 3) | | | 10,286,714 | | | | 1,398,567 | | |
Services fees payable (Note 3) | | | 2,348,212 | | | | 206,171 | | |
Trustee deferred compensation plan (Note 2) | | | 6,018,122 | | | | 2,204,190 | | |
Administrative fees payable (Note 2) | | | 643,430 | | | | 215,616 | | |
Trustee fees payable | | | 48,416 | | | | 6,219 | | |
Accrued expenses and other liabilities | | | 14,890,586 | | | | 6,270,547 | | |
Total Liabilities | | | 195,159,779 | | | | 56,627,741 | | |
Net Assets | | $ | 48,077,397,205 | | | $ | 14,350,660,183 | | |
Net Assets Consist of | |
Capital stock (par value, $0.001 per share) | | $ | 879,783 | | | $ | 604,866 | | |
Capital surplus | | | 36,941,399,696 | | | | 11,552,027,457 | | |
Net unrealized appreciation (depreciation) on: | |
Investments (net of $4,661,283, $1,925,281, $0, and $0 deferred
capital gain country tax, respectively) | | | 9,167,680,077 | | | | 2,994,563,830 | | |
Foreign currency and forward contract related translation | | | (18,841,021 | ) | | | (10,774,855 | ) | |
Undistributed net realized gains (losses) on investments | | | 2,296,528,020 | | | | 182,752,232 | | |
Undistributed net investment income (loss) | | | (310,249,350 | ) | | | (368,513,347 | ) | |
Net Assets | | $ | 48,077,397,205 | | | $ | 14,350,660,183 | | |
First Eagle Funds | Semi-Annual Report | April 30, 2016
120
April 30, 2016 (unaudited)
| | | First Eagle
U.S. Value Fund* | | First Eagle
Gold Fund* | |
Assets | |
Investments, at Cost (Note 1) | |
Unaffiliated issuers | | $ | 1,560,849,238 | | | $ | 846,516,913 | | |
Affiliated issuers | | | 27,986,154 | | | | — | | |
Gold bullion | | | 186,047,980 | | | | 81,800,172 | | |
Silver bullion | | | — | | | | 45,269,152 | | |
Foreign currency | | | 40 | | | | 125,881 | | |
Total Investments, at Cost | | | 1,774,883,412 | | | | 973,712,118 | | |
Investments, at Value (Note 1) | |
Unaffiliated issuers | | | 2,011,935,142 | | | | 1,005,644,818 | | |
Affiliated issuers | | | 21,631,993 | | | | — | | |
Gold bullion | | | 201,962,287 | | | | 181,533,507 | | |
Silver bullion | | | — | | | | 42,984,562 | | |
Foreign currency | | | 41 | | | | 125,881 | | |
Total Investments, at Value | | | 2,235,529,463 | | | | 1,230,288,768 | | |
Cash | | | — | | | | 5 | | |
Receivable for investment securities sold | | | 6,739,709 | | | | — | | |
Receivable for Fund shares sold | | | 1,630,139 | | | | 4,380,960 | | |
Accrued interest and dividends receivable | | | 1,541,019 | | | | 971,867 | | |
Investment for trustee deferred compensation plan (Note 2) | | | 318,208 | | | | 406,895 | | |
Other assets | | | 47,201 | | | | 30,730 | | |
Total Assets | | | 2,245,805,739 | | | | 1,236,079,225 | | |
Liabilities | |
Payable for Fund shares redeemed | | | 5,162,700 | | | | 7,824,595 | | |
Payable for investment securities purchased | | | — | | | | — | | |
Payable for forward currency contracts held, at value (Note 1) | | | — | | | | — | | |
Investment advisory fees payable (Note 2) | | | 1,270,829 | | | | 667,426 | | |
Distribution fees payable (Note 3) | | | 509,076 | | | | 220,724 | | |
Services fees payable (Note 3) | | | 110,958 | | | | 38,871 | | |
Trustee deferred compensation plan (Note 2) | | | 318,208 | | | | 406,895 | | |
Administrative fees payable (Note 2) | | | 62,857 | | | | 29,564 | | |
Trustee fees payable | | | 5,518 | | | | 1,960 | | |
Accrued expenses and other liabilities | | | 843,604 | | | | 752,213 | | |
Total Liabilities | | | 8,283,750 | | | | 9,942,248 | | |
Net Assets | | $ | 2,237,521,989 | | | $ | 1,226,136,977 | | |
Net Assets Consist of | |
Capital stock (par value, $0.001 per share) | | $ | 113,698 | | | $ | 67,585 | | |
Capital surplus | | | 1,553,579,044 | | | | 1,543,549,139 | | |
Net unrealized appreciation (depreciation) on: | |
Investments (net of $4,661,283, $1,925,281, $0, and $0 deferred
capital gain country tax, respectively) | | | 460,646,050 | | | | 256,576,650 | | |
Foreign currency and forward contract related translation | | | 1 | | | | 2,851 | | |
Undistributed net realized gains (losses) on investments | | | 215,393,837 | | | | (505,496,972 | ) | |
Undistributed net investment income (loss) | | | 7,789,359 | | | | (68,562,276 | ) | |
Net Assets | | $ | 2,237,521,989 | | | $ | 1,226,136,977 | | |
First Eagle Funds | Semi-Annual Report | April 30, 2016
121
Statements of Assets and Liabilities (continued)
| | | First Eagle
Global Fund* | | First Eagle
Overseas Fund* | |
Class A | |
Net assets | | $ | 16,132,138,167 | | | $ | 3,866,590,476 | | |
Shares outstanding | | | 293,611,641 | | | | 164,758,599 | | |
Net asset value per share and redemption proceeds per share | | $ | 54.94 | | | $ | 23.47 | | |
Offering price per share (NAV per share plus maximum sales charge)** | | $ | 57.83 | (1) | | $ | 24.71 | (1) | |
Class C | |
Net assets | | $ | 11,686,085,086 | | | $ | 1,027,993,696 | | |
Shares outstanding | | | 219,215,018 | | | | 45,457,904 | | |
Net asset value per share | | $ | 53.31 | | | $ | 22.61 | | |
Redemption proceeds per share (NAV per share less maximum contingent
deferred sale charge)(2) | | $ | 52.78 | | | $ | 22.38 | | |
Class I | |
Net assets | | $ | 20,259,173,952 | | | $ | 9,456,076,011 | | |
Shares outstanding | | | 366,955,848 | | | | 394,649,292 | | |
Net asset value per share and redemption proceeds per share | | $ | 55.21 | | | $ | 23.96 | | |
* First Eagle Global Fund, First Eagle Overseas Fund, First Eagle U.S. Value Fund and First Eagle Gold Fund financial statements are shown on a consolidated basis and includes the balances of the First Eagle Global Cayman Fund, Ltd., First Eagle Overseas Cayman Fund, Ltd., First Eagle U.S. Value Cayman Fund, Ltd., and First Eagle Gold Cayman Fund, Ltd., respectively.
** A contingent deferred sales charge of 1.00% may apply on redemptions of Class A shares made within 18 months following a purchase of $1,000,000 or more without an initial sales charge.
(1) The maximum sales charge is 5.00% for Class A shares. Classes C, I and Y have no front-end sales charges.
(2) The maximum contingent deferred sales charge (CDSC) is 1.00% for Class C shares, which is charged on the lesser of the original purchase price or the current market value at the time of sale. This pertains to shares sold or redeemed within the first year of purchase.
See Notes to Financial Statements.
First Eagle Funds | Semi-Annual Report | April 30, 2016
122
April 30, 2016 (unaudited)
| | | First Eagle
U.S. Value Fund* | | First Eagle
Gold Fund* | |
Class A | |
Net assets | | $ | 868,362,823 | | | $ | 577,224,461 | | |
Shares outstanding | | | 44,094,635 | | | | 31,699,743 | | |
Net asset value per share and redemption proceeds per share | | $ | 19.69 | | | $ | 18.21 | | |
Offering price per share (NAV per share plus maximum sales charge)** | | $ | 20.73 | (1) | | $ | 19.17 | (1) | |
Class C | |
Net assets | | $ | 547,742,777 | | | $ | 213,387,211 | | |
Shares outstanding | | | 28,456,847 | | | | 12,437,244 | | |
Net asset value per share | | $ | 19.25 | | | $ | 17.16 | | |
Redemption proceeds per share (NAV per share less maximum contingent
deferred sale charge)(2) | | $ | 19.06 | | | $ | 16.99 | | |
Class I | |
Net assets | | $ | 821,416,389 | | | $ | 435,525,305 | | |
Shares outstanding | | | 41,146,790 | | | | 23,448,167 | | |
Net asset value per share and redemption proceeds per share | | $ | 19.96 | | | $ | 18.57 | | |
First Eagle Funds | Semi-Annual Report | April 30, 2016
123
Statements of Assets and Liabilities (continued)
| | | First Eagle
Global Income Builder
Fund | | First Eagle
High Yield Fund | |
Assets | |
Investments, at Cost (Note 1) | |
Unaffiliated issuers | | $ | 1,169,073,679 | | | $ | 658,236,443 | | |
Gold bullion | | | 18,411,922 | | | | — | | |
Foreign currency | | | 59,436 | | | | — | | |
Total Investments, at Cost | | | 1,187,545,037 | | | | 658,236,443 | | |
Investments, at Value (Note 1) | |
Unaffiliated issuers | | | 1,164,722,329 | | | | 590,156,929 | | |
Gold bullion | | | 18,545,146 | | | | — | | |
Foreign currency | | | 59,486 | | | | — | | |
Total Investments, at Value | | | 1,183,326,961 | | | | 590,156,929 | | |
Cash | | | — | | | | — | | |
Receivable for forward currency contracts held, at value (Note 1) | | | — | | | | 408 | | |
Receivable for investment securities sold | | | 11,959,661 | | | | 9,698,591 | | |
Receivable for premiums for written options | | | — | | | | — | | |
Receivable for Fund shares sold | | | 4,715,141 | | | | 1,825,033 | | |
Accrued interest and dividends receivable | | | 10,514,305 | | | | 11,506,132 | | |
Investment for trustee deferred compensation plan (Note 2) | | | 30,854 | | | | 37,651 | | |
Other assets | | | 26,939 | | | | 12,705 | | |
Total Assets | | | 1,210,573,861 | | | | 613,237,449 | | |
Liabilities | |
Option contracts written, at value (premiums received $0, $0 and
$78,848,370, respectively) (Note 1) | | | — | | | | — | | |
Payable for Fund shares redeemed | | | 4,770,251 | | | | 4,524,566 | | |
Payable for investment securities purchased | | | 13,516,354 | | | | 10,429,837 | | |
Payable for forward currency contracts held, at value (Note 1) | | | 672,651 | | | | 140,953 | | |
Payable for dividends to shareholders | | | 3,597,961 | | | | 722,781 | | |
Investment advisory fees payable (Note 2) | | | 716,119 | | | | 308,670 | | |
Distribution fees payable (Note 3) | | | 294,100 | | | | 95,647 | | |
Services fees payable (Note 3) | | | 73,015 | | | | 21,739 | | |
Trustee deferred compensation plan (Note 2) | | | 30,854 | | | | 37,651 | | |
Administrative fees payable (Note 2) | | | 47,741 | | | | 34,273 | | |
Trustee fees payable | | | 1,697 | | | | 3,041 | | |
Accrued expenses and other liabilities | | | 430,785 | | | | 308,359 | | |
Total Liabilities | | | 24,151,528 | | | | 16,627,517 | | |
Net Assets | | $ | 1,186,422,333 | | | $ | 596,609,932 | | |
Net Assets Consist of | |
Capital stock (par value, $0.001 per share) | | $ | 109,326 | | | $ | 70,036 | | |
Capital surplus | | | 1,239,007,067 | | | | 737,024,572 | | |
Net unrealized appreciation (depreciation) on: | |
Investments | | | (4,218,126 | ) | | | (68,079,514 | ) | |
Foreign currency and forward contract related translation | | | (664,944 | ) | | | (138,863 | ) | |
Written options | | | — | | | | — | | |
Undistributed net realized gains (losses) on investments | | | (44,654,120 | ) | | | (68,962,845 | ) | |
Undistributed net investment income (loss) | | | (3,156,870 | ) | | | (3,303,454 | ) | |
Net Assets | | $ | 1,186,422,333 | | | $ | 596,609,932 | | |
First Eagle Funds | Semi-Annual Report | April 30, 2016
124
April 30, 2016 (unaudited)
| | | First Eagle
Fund of America | |
Assets | |
Investments, at Cost (Note 1) | |
Unaffiliated issuers | | $ | 2,860,091,995 | | |
Gold bullion | | | — | | |
Foreign currency | | | — | | |
Total Investments, at Cost | | | 2,860,091,995 | | |
Investments, at Value (Note 1) | |
Unaffiliated issuers | | | 3,349,723,401 | | |
Gold bullion | | | — | | |
Foreign currency | | | — | | |
Total Investments, at Value | | | 3,349,723,401 | | |
Cash | | | 140,228 | | |
Receivable for forward currency contracts held, at value (Note 1) | | | — | | |
Receivable for investment securities sold | | | 22,951,132 | | |
Receivable for premiums for written options | | | 169,328 | | |
Receivable for Fund shares sold | | | 4,449,470 | | |
Accrued interest and dividends receivable | | | 1,634,828 | | |
Investment for trustee deferred compensation plan (Note 2) | | | 293,381 | | |
Other assets | | | 45,732 | | |
Total Assets | | | 3,379,407,500 | | |
Liabilities | |
Option contracts written, at value (premiums received $0, $0 and
$78,848,370, respectively) (Note 1) | | | 71,262,521 | | |
Payable for Fund shares redeemed | | | 8,806,202 | | |
Payable for investment securities purchased | | | 46,866,699 | | |
Payable for forward currency contracts held, at value (Note 1) | | | — | | |
Payable for dividends to shareholders | | | — | | |
Investment advisory fees payable (Note 2) | | | 2,482,439 | | |
Distribution fees payable (Note 3) | | | 746,505 | | |
Services fees payable (Note 3) | | | 137,433 | | |
Trustee deferred compensation plan (Note 2) | | | 293,381 | | |
Administrative fees payable (Note 2) | | | 61,927 | | |
Trustee fees payable | | | — | | |
Accrued expenses and other liabilities | | | 1,082,219 | | |
Total Liabilities | | | 131,739,326 | | |
Net Assets | | $ | 3,247,668,174 | | |
Net Assets Consist of | |
Capital stock (par value, $0.001 per share) | | $ | 100,757 | | |
Capital surplus | | | 2,709,640,647 | | |
Net unrealized appreciation (depreciation) on: | |
Investments | | | 489,631,406 | | |
Foreign currency and forward contract related translation | | | — | | |
Written options | | | 7,585,849 | | |
Undistributed net realized gains (losses) on investments | | | 36,155,320 | | |
Undistributed net investment income (loss) | | | 4,554,195 | | |
Net Assets | | $ | 3,247,668,174 | | |
First Eagle Funds | Semi-Annual Report | April 30, 2016
125
Statements of Assets and Liabilities (continued)
| | | First Eagle
Global Income Builder
Fund | | First Eagle
High Yield Fund | |
Class A | |
Net assets | | $ | 376,043,565 | | | $ | 153,147,941 | | |
Shares outstanding | | | 34,592,613 | | | | 17,980,408 | | |
Net asset value per share and redemption proceeds per share | | $ | 10.87 | | | $ | 8.52 | | |
Offering price per share (NAV per share plus maximum sales charge)* | | $ | 11.44 | (1) | | $ | 8.92 | (2) | |
Class C | |
Net assets | | $ | 360,225,607 | | | $ | 109,092,500 | | |
Shares outstanding | | | 33,226,059 | | | | 12,818,258 | | |
Net asset value per share | | $ | 10.84 | | | $ | 8.51 | | |
Redemption proceeds per share (NAV per share less maximum contingent
deferred sale charge)(3) | | $ | 10.73 | | | $ | 8.42 | | |
Class I | |
Net assets | | $ | 450,153,161 | | | $ | 334,369,491 | | |
Shares outstanding | | | 41,507,268 | | | | 39,237,778 | | |
Net asset value per share and redemption proceeds per share | | $ | 10.85 | | | $ | 8.52 | | |
Class Y | |
Net assets | | $ | — | | | $ | — | | |
Shares outstanding | | | — | | | | — | | |
Net asset value per share and redemption proceeds per share | | | — | | | | — | | |
* A contingent deferred sales charge of 1.00% may apply on redemptions of Class A shares made within 18 months following a purchase of $1,000,000 or more without an initial sales charge.
(1) The maximum sales charge is 5.00% for Class A shares. Classes C, I and Y have no front-end sales charges.
(2) The maximum sales charge is 4.50% for Class A shares. Classes C, I and Y have no front-end sales charges.
(3) The maximum contingent deferred sales charge (CDSC) is 1.00% for Class C shares, which is charged on the lesser of the original purchase price or the current market value at the time of sale. This pertains to shares sold or redeemed within the first year of purchase.
See Notes to Financial Statements.
First Eagle Funds | Semi-Annual Report | April 30, 2016
126
April 30, 2016 (unaudited)
| | | First Eagle
Fund of America | |
Class A | |
Net assets | | $ | 1,137,776,375 | | |
Shares outstanding | | | 34,274,534 | | |
Net asset value per share and redemption proceeds per share | | $ | 33.20 | | |
Offering price per share (NAV per share plus maximum sales charge)* | | $ | 34.95 | (1) | |
Class C | |
Net assets | | $ | 644,375,604 | | |
Shares outstanding | | | 23,309,431 | | |
Net asset value per share | | $ | 27.64 | | |
Redemption proceeds per share (NAV per share less maximum contingent
deferred sale charge)(3) | | $ | 27.36 | | |
Class I | |
Net assets | | | 1,026,285,160 | | |
Shares outstanding | | | 30,231,125 | | |
Net asset value per share and redemption proceeds per share | | | 33.95 | | |
Class Y | |
Net assets | | $ | 439,231,035 | | |
Shares outstanding | | | 12,942,409 | | |
Net asset value per share and redemption proceeds per share | | $ | 33.94 | | |
First Eagle Funds | Semi-Annual Report | April 30, 2016
127
| | | First Eagle
Global Fund* | | First Eagle
Overseas Fund* | |
Investment Income | |
Interest (net of $38,160, $16,849, $0 and $0, foreign taxes withheld, respectively) | | $ | 22,892,994 | | | $ | 5,121,912 | | |
Dividends from: (net of $20,671,847, $12,256,973, $189,344, and $263,688
foreign taxes withheld, respectively) | |
Unaffiliated issuers | | | 349,731,371 | | | | 114,437,287 | | |
Affiliated issuers | | | 24,318,674 | | | | 1,815,513 | | |
Total Income | | | 396,943,039 | | | | 121,374,712 | | |
Expenses | |
Investment advisory fees (Note 2) | | | 170,508,252 | | | | 49,868,929 | | |
Administrative costs (Note 2) | | | 1,154,574 | | | | 466,878 | | |
Distribution fees (Note 3) | |
Class A | | | 19,258,884 | | | | 4,748,532 | | |
Class C | | | 41,683,952 | | | | 3,681,757 | | |
Service fees - Class C (Note 3) | | | 13,894,651 | | | | 1,227,252 | | |
Shareholder servicing agent fees | | | 18,129,226 | | | | 7,022,032 | | |
Custodian and accounting fees | | | 2,861,664 | | | | 1,328,964 | | |
Professional fees | | | 552,684 | | | | 213,062 | | |
Shareholder reporting fees | | | 1,632,514 | | | | 557,908 | | |
Trustees' fees | | | 523,697 | | | | 155,090 | | |
Registration and filing fees | | | 180,544 | | | | 96,460 | | |
Other Expenses | | | 441,509 | | | | 139,137 | | |
Total Expenses | | | 270,822,151 | | | | 69,506,001 | | |
Expense Waiver | | | — | | | | — | | |
Expense reductions due to earnings credits (Note 1) | | | (1,194 | ) | | | (290 | ) | |
Net Expenses | | | 270,820,957 | | | | 69,505,711 | | |
Net Investment Income (Loss) (Note 1) | | | 126,122,082 | | | | 51,869,001 | | |
Realized and Unrealized Gains (Losses) on Investments and Foreign
Currency Related Transactions (Note 1) | |
Net realized gains (losses) from: | |
Investment transactions | | | 2,312,256,899 | | | | 197,409,257 | | |
Investment transactions of affiliated issuers | | | 6,497,689 | | | | 163,637 | | |
Commodity related transactions | | | — | | | | — | | |
Foreign currency and forward contract related transactions | | | 10,451,767 | | | | 5,051,252 | | |
| | | | 2,329,206,355 | | | | 202,624,146 | | |
Changes in unrealized appreciation (depreciation) of: | |
Investment transactions (net of increase in deferred capital gain country tax
accruals of $706,294, $312,652, $0 and $0, respectively) | | | (371,849,592 | ) | | | 466,171,465 | | |
Foreign currency and forward contract related translation | | | (21,632,272 | ) | | | (12,855,357 | ) | |
| | | | (393,481,864 | ) | | | 453,316,108 | | |
Net realized and unrealized gains (losses) on investments, foreign currency and
forward contract related transactions | | | 1,935,724,491 | | | | 655,940,254 | | |
Net Increase (Decrease) in Net Assets Resulting from Operations | | $ | 2,061,846,573 | | | $ | 707,809,255 | | |
*First Eagle Global Fund, First Eagle Overseas Fund, First Eagle U.S. Value Fund and First Eagle Gold Fund financial statements are shown on a consolidated basis and includes the balances of the First Eagle Global Cayman Fund, Ltd., First Eagle Overseas Cayman Fund, Ltd., First Eagle U.S. Value Cayman Fund, Ltd., and First Eagle Gold Cayman Fund, Ltd., respectively.
See Notes to Financial Statements.
First Eagle Funds | Semi-Annual Report | April 30, 2016
128
April 30, 2016 (unaudited)
| | | First Eagle
U.S. Value Fund* | | First Eagle
Gold Fund* | |
Investment Income | |
Interest (net of $38,160, $16,849, $0 and $0, foreign taxes withheld, respectively) | | $ | 778,479 | | | $ | 748,960 | | |
Dividends from: (net of $20,671,847, $12,256,973, $189,344, and $263,688
foreign taxes withheld, respectively) | |
Unaffiliated issuers | | | 18,033,730 | | | | 2,734,862 | | |
Affiliated issuers | | | 625,690 | | | | — | | |
Total Income | | | 19,437,899 | | | | 3,483,822 | | |
Expenses | |
Investment advisory fees (Note 2) | | | 8,370,029 | | | | 3,221,621 | | |
Administrative costs (Note 2) | | | 177,966 | | | | 71,632 | | |
Distribution fees (Note 3) | |
Class A | | | 1,082,629 | | | | 507,423 | | |
Class C | | | 2,025,152 | | | | 574,959 | | |
Service fees - Class C (Note 3) | | | 675,051 | | | | 191,653 | | |
Shareholder servicing agent fees | | | 1,182,818 | | | | 896,877 | | |
Custodian and accounting fees | | | 142,922 | | | | 208,260 | | |
Professional fees | | | 103,138 | | | | 116,360 | | |
Shareholder reporting fees | | | 112,242 | | | | 98,566 | | |
Trustees' fees | | | 29,580 | | | | 11,977 | | |
Registration and filing fees | | | 54,548 | | | | 59,514 | | |
Other Expenses | | | 37,889 | | | | 20,993 | | |
Total Expenses | | | 13,993,964 | | | | 5,979,835 | | |
Expense Waiver | | | (183,804 | ) | | | — | | |
Expense reductions due to earnings credits (Note 1) | | | (104 | ) | | | (85 | ) | |
Net Expenses | | | 13,810,056 | | | | 5,979,750 | | |
Net Investment Income (Loss) (Note 1) | | | 5,627,843 | | | | (2,495,928 | ) | |
Realized and Unrealized Gains (Losses) on Investments and Foreign
Currency Related Transactions (Note 1) | |
Net realized gains (losses) from: | |
Investment transactions | | | 222,022,327 | | | | (37,507,099 | ) | |
Investment transactions of affiliated issuers | | | (4,897,849 | ) | | | — | | |
Commodity related transactions | | | — | | | | (6,409,832 | ) | |
Foreign currency and forward contract related transactions | | | (3,075 | ) | | | (11,718 | ) | |
| | | | 217,121,403 | | | | (43,928,649 | ) | |
Changes in unrealized appreciation (depreciation) of: | |
Investment transactions (net of increase in deferred capital gain country tax
accruals of $706,294, $312,652, $0 and $0, respectively) | | | (143,513,866 | ) | | | 426,757,325 | | |
Foreign currency and forward contract related translation | | | 2 | | | | 2,852 | | |
| | | | (143,513,864 | ) | | | 426,760,177 | | |
Net realized and unrealized gains (losses) on investments, foreign currency and
forward contract related transactions | | | 73,607,539 | | | | 382,831,528 | | |
Net Increase (Decrease) in Net Assets Resulting from Operations | | $ | 79,235,382 | | | $ | 380,335,600 | | |
First Eagle Funds | Semi-Annual Report | April 30, 2016
129
Statements of Operations (continued)
| | | First Eagle
Global Income Builder
Fund | | First Eagle
High Yield Fund | |
Investment Income | |
Interest | | $ | 15,797,357 | | | $ | 26,560,988 | | |
Dividends from: (net of $706,823, $0 and $306,586, foreign taxes
withheld, respectively) | |
Unaffiliated issuers | | | 10,456,887 | | | | 227 | | |
Other Income | | | — | | | | 122,180 | | |
Total Income | | | 26,254,244 | | | | 26,683,395 | | |
Expenses | |
Investment advisory fees (Note 2) | | | 4,368,489 | | | | 2,171,477 | | |
Administrative costs (Note 2) | | | 291,233 | | | | 155,105 | | |
Distribution fees (Note 3) | |
Class A | | | 460,513 | | | | 189,907 | | |
Class C | | | 1,331,961 | | | | 411,461 | | |
Class Y | | | — | | | | — | | |
Service fees - Class C (Note 3) | | | 443,987 | | | | 137,154 | | |
Shareholder servicing agent fees | | | 467,014 | | | | 334,380 | | |
Custodian and accounting fees | | | 150,644 | | | | 83,618 | | |
Professional fees | | | 80,192 | | | | 85,216 | | |
Shareholder reporting fees | | | 51,896 | | | | 36,868 | | |
Trustees' fees | | | 14,120 | | | | 8,238 | | |
Registration and filing fees | | | 56,784 | | | | 45,864 | | |
Other Expenses | | | 24,323 | | | | 15,372 | | |
Total Expenses | | | 7,741,156 | | | | 3,674,660 | | |
Expense Waiver | | | — | | | | (155,105 | ) | |
Expense reductions due to earnings credits (Note 1) | | | (28 | ) | | | (20 | ) | |
Net Expenses | | | 7,741,128 | | | | 3,519,535 | | |
Net Investment Income (Note 1) | | | 18,513,116 | | | | 23,163,860 | | |
Realized and Unrealized Gains (Losses) on Investments, Foreign
Currency Related Transactions and Written Options (Note 1) | |
Net realized gains (losses) from: | |
Investment transactions | | | (26,963,150 | ) | | | (55,245,447 | ) | |
Foreign currency and forward contract related transactions | | | 381,003 | | | | 176,531 | | |
Written options | | | — | | | | — | | |
| | | | (26,582,147 | ) | | | (55,068,916 | ) | |
Changes in unrealized appreciation (depreciation) of: | |
Investment transactions | | | 36,905,631 | | | | 19,726,965 | | |
Foreign currency and forward contract related translation | | | (1,162,778 | ) | | | (213,488 | ) | |
Written options | | | — | | | | — | | |
| | | | 35,742,853 | | | | 19,513,477 | | |
Net realized and unrealized gains (losses) on investments, foreign currency and
forward contract related transactions and written options | | | 9,160,706 | | | | (35,555,439 | ) | |
Net Increase (Decrease) in Net Assets Resulting from Operations | | $ | 27,673,822 | | | $ | (12,391,579 | ) | |
See Notes to Financial Statements.
First Eagle Funds | Semi-Annual Report | April 30, 2016
130
April 30, 2016 (unaudited)
| | | First Eagle
Fund of America | |
Investment Income | |
Interest | | $ | 62,523 | | |
Dividends from: (net of $706,823, $0 and $306,586, foreign taxes
withheld, respectively) | |
Unaffiliated issuers | | | 33,341,312 | | |
Other Income | | | — | | |
Total Income | | | 33,403,835 | | |
Expenses | |
Investment advisory fees (Note 2) | | | 16,140,800 | | |
Administrative costs (Note 2) | | | 162,227 | | |
Distribution fees (Note 3) | |
Class A | | | 1,521,666 | | |
Class C | | | 2,583,220 | | |
Class Y | | | 571,105 | | |
Service fees - Class C (Note 3) | | | 861,073 | | |
Shareholder servicing agent fees | | | 1,789,365 | | |
Custodian and accounting fees | | | 103,420 | | |
Professional fees | | | 136,130 | | |
Shareholder reporting fees | | | 147,550 | | |
Trustees' fees | | | 42,447 | | |
Registration and filing fees | | | 96,824 | | |
Other Expenses | | | 42,055 | | |
Total Expenses | | | 24,197,882 | | |
Expense Waiver | | | — | | |
Expense reductions due to earnings credits (Note 1) | | | (149 | ) | |
Net Expenses | | | 24,197,733 | | |
Net Investment Income (Note 1) | | | 9,206,102 | | |
Realized and Unrealized Gains (Losses) on Investments, Foreign
Currency Related Transactions and Written Options (Note 1) | |
Net realized gains (losses) from: | |
Investment transactions | | | 97,155,331 | | |
Foreign currency and forward contract related transactions | | | — | | |
Written options | | | (26,939,169 | ) | |
| | | | 70,216,162 | | |
Changes in unrealized appreciation (depreciation) of: | |
Investment transactions | | | (271,373,330 | ) | |
Foreign currency and forward contract related translation | | | — | | |
Written options | | | 23,418,194 | | |
| | | | (247,955,136 | ) | |
Net realized and unrealized gains (losses) on investments, foreign currency and
forward contract related transactions and written options | | | (177,738,974 | ) | |
Net Increase (Decrease) in Net Assets Resulting from Operations | | $ | (168,532,872 | ) | |
First Eagle Funds | Semi-Annual Report | April 30, 2016
131
Statements of Changes in Net Assets
| | | First Eagle
Global Fund | | First Eagle
Overseas Fund | |
| | | Six-Months Ended
April 30,
2016 (unaudited) | | Year Ended
October 31,
2015 | | Six-Months Ended
April 30,
2016 (unaudited) | | Year Ended
October 31,
2015 | |
Operations | |
Net investment income (loss) | | $ | 126,122,082 | | | $ | 224,039,048 | | | $ | 51,869,001 | | | $ | 102,853,718 | | |
Net realized gain (loss) from investments, foreign currency and
forward contract related transactions and written options | | | 2,329,206,355 | | | | 702,228,616 | | | | 202,624,146 | | | | 291,387,294 | | |
Change in unrealized (depreciation) of investments, foreign currency
and forward contract related transactions | | | (393,481,864 | ) | | | (119,849,366 | ) | | | 453,316,108 | | | | (39,865,496 | ) | |
Net increase (decrease) in net assets resulting from operations | | | 2,061,846,573 | | | | 806,418,298 | | | | 707,809,255 | | | | 354,375,516 | | |
Distribution to Shareholders | |
Dividends paid from net investment income | |
Class A | | | (20,540,653 | ) | | | (94,351,754 | ) | | | (7,782,215 | ) | | | (46,032,316 | ) | |
Class C | | | — | | | | — | | | | — | | | | (3,667,856 | ) | |
Class I | | | (75,943,676 | ) | | | (163,763,434 | ) | | | (39,432,818 | ) | | | (92,281,699 | ) | |
Class Y | | | — | | | | — | | | | — | | | | — | | |
Distributions paid from net realized gains from investment transactions | |
Class A | | | (159,791,472 | ) | | | (760,954,296 | ) | | | (43,688,520 | ) | | | (169,970,080 | ) | |
Class C | | | (118,177,672 | ) | | | (543,612,985 | ) | | | (11,525,934 | ) | | | (41,124,624 | ) | |
Class I | | | (193,145,973 | ) | | | (875,458,228 | ) | | | (91,886,402 | ) | | | (317,655,154 | ) | |
Class Y | | | — | | | | — | | | | — | | | | — | | |
Decrease in net assets resulting from distributions | | | (567,599,446 | ) | | | (2,438,140,697 | ) | | | (194,315,889 | ) | | | (670,731,729 | ) | |
Fund Share Transactions (Note 6) | |
Net proceeds from shares sold | | | 3,612,759,175 | | | | 7,237,206,433 | | | | 1,724,067,360 | | | | 2,954,088,005 | | |
Net asset value of shares issued for reinvested dividends
and distributions | | | 466,192,057 | | | | 1,946,656,388 | | | | 172,547,622 | | | | 571,713,378 | | |
Cost of shares redeemed | | | (5,432,351,739 | ) | | | (10,081,000,488 | ) | | | (1,940,540,517 | ) | | | (3,869,279,529 | ) | |
Redemption Fees | | | — | | | | — | | | | | | — | | |
Increase (decrease) in net assets from Fund share transactions | | | (1,353,400,507 | ) | | | (897,137,667 | ) | | | (43,925,535 | ) | | | (343,478,146 | ) | |
Net increase (decrease) in net assets | | | 140,846,620 | | | | (2,528,860,066 | ) | | | 469,567,831 | | | | (659,834,359 | ) | |
Net Assets (Note 1) | |
Beginning of period | | | 47,936,550,585 | | | | 50,465,410,651 | | | | 13,881,092,352 | | | | 14,540,926,711 | | |
End of period | | $ | 48,077,397,205 | | | $ | 47,936,550,585 | | | $ | 14,350,660,183 | | | $ | 13,881,092,352 | | |
Undistributed net investment income (loss) | | $ | (310,249,350 | ) | | $ | (339,887,103 | ) | | $ | (368,513,347 | ) | | $ | (373,167,315 | ) | |
* First Eagle Global Fund, First Eagle Overseas Fund, First Eagle U.S. Value Fund and First Eagle Gold Fund financial statements are shown on a consolidated basis and includes the balances of the First Eagle Global Cayman Fund, Ltd., First Eagle Overseas Cayman Fund, Ltd., First Eagle U.S. Value Cayman Fund, Ltd., and First Eagle Gold Cayman Fund, Ltd., respectively.
First Eagle Funds | Semi-Annual Report | April 30, 2016
132
| | | First Eagle
U.S. Value Fund* | | First Eagle
Gold Fund* | |
| | | Six-Months Ended
April 30,
2016 (unaudited) | | Year Ended
October 31,
2015 | | Six-Months Ended
April 30,
2016 (unaudited) | | Year Ended
October 31,
2015 | |
Operations | |
Net investment income (loss) | | $ | 5,627,843 | | | $ | 12,155,170 | | | $ | (2,495,928 | ) | | $ | (6,049,648 | ) | |
Net realized gain (loss) from investments, foreign currency and
forward contract related transactions and written options | | | 217,121,403 | | | | 115,007,165 | | | | (43,928,649 | ) | | | (180,523,091 | ) | |
Change in unrealized (depreciation) of investments, foreign currency
and forward contract related transactions | | | (143,513,864 | ) | | | (126,116,901 | ) | | | 426,760,177 | | | | 107,187,962 | | |
Net increase (decrease) in net assets resulting from operations | | | 79,235,382 | | | | 1,045,434 | | | | 380,335,600 | | | | (79,384,777 | ) | |
Distribution to Shareholders | |
Dividends paid from net investment income | |
Class A | | | (1,671,959 | ) | | | (4,276,875 | ) | | | — | | | | — | | |
Class C | | | — | | | | — | | | | — | | | | — | | |
Class I | | | (4,132,607 | ) | | | (7,291,523 | ) | | | — | | | | — | | |
Class Y | | | — | | | | — | | | | — | | | | — | | |
Distributions paid from net realized gains from investment transactions | |
Class A | | | (39,449,441 | ) | | | (68,208,361 | ) | | | — | | | | — | | |
Class C | | | (24,900,242 | ) | | | (40,092,964 | ) | | | — | | | | — | | |
Class I | | | (37,324,644 | ) | | | (65,388,758 | ) | | | — | | | | — | | |
Class Y | | | — | | | | — | | | | — | | | | — | | |
Decrease in net assets resulting from distributions | | | (107,478,893 | ) | | | (185,258,481 | ) | | | — | | | | — | | |
Fund Share Transactions (Note 6) | |
Net proceeds from shares sold | | | 101,788,295 | | | | 376,416,087 | | | | 217,468,325 | | | | 377,231,787 | | |
Net asset value of shares issued for reinvested dividends
and distributions | | | 87,427,775 | | | | 146,429,880 | | | | 500 | | | | 2,933 | | |
Cost of shares redeemed | | | (425,176,908 | ) | | | (970,534,969 | ) | | | (216,568,775 | ) | | | (452,926,090 | ) | |
Redemption Fees | | | — | | | | — | | | | 130,646 | | | | 97,370 | | |
Increase (decrease) in net assets from Fund share transactions | | | (235,960,838 | ) | | | (447,689,002 | ) | | | 1,030,696 | | | | (75,594,000 | ) | |
Net increase (decrease) in net assets | | | (264,204,349 | ) | | | (631,902,049 | ) | | | 381,366,296 | | | | (154,978,777 | ) | |
Net Assets (Note 1) | |
Beginning of period | | | 2,501,726,338 | | | | 3,133,628,387 | | | | 844,770,681 | | | | 999,749,458 | | |
End of period | | $ | 2,237,521,989 | | | $ | 2,501,726,338 | | | $ | 1,226,136,977 | | | $ | 844,770,681 | | |
Undistributed net investment income (loss) | | $ | 7,789,359 | | | $ | 7,966,082 | | | $ | (68,562,276 | ) | | $ | (66,066,348 | ) | |
First Eagle Funds | Semi-Annual Report | April 30, 2016
133
Statements of Changes in Net Assets (continued)
| | | First Eagle
Global Income Builder Fund | | First Eagle
High Yield Fund | |
| | | Six-Months Ended
April 30,
2016 (unaudited) | | Year Ended
October 31,
2015 | | Six-Months Ended
April 30,
2016 (unaudited) | | Year Ended
October 31,
2015 | |
Operations | |
Net investment income | | $ | 18,513,116 | | | $ | 38,839,615 | | | $ | 23,163,860 | | | $ | 53,184,439 | | |
Net realized gain (loss) from investments, foreign currency and
forward contract related transactions and written options | | | (26,582,147 | ) | | | (14,936,565 | ) | | | (55,068,916 | ) | | | (12,822,861 | ) | |
Change in unrealized (depreciation) of investments, foreign currency
and forward contract related transactions | | | 35,742,853 | | | | (45,145,876 | ) | | | 19,513,477 | | | | (84,502,662 | ) | |
Net increase (decrease) in net assets resulting from operations | | | 27,673,822 | | | | (21,242,826 | ) | | | (12,391,579 | ) | | | (44,141,084 | ) | |
Distribution to Shareholders | |
Dividends paid from net investment income | |
Class A | | | (6,088,435 | ) | | | (14,186,018 | ) | | | (6,235,717 | ) | | | (12,173,874 | ) | |
Class C | | | (4,543,650 | ) | | | (9,978,926 | ) | | | (4,164,873 | ) | | | (8,080,947 | ) | |
Class I | | | (7,881,031 | ) | | | (16,674,671 | ) | | | (15,263,330 | ) | | | (34,229,618 | ) | |
Class Y | | | — | | | | — | | | | — | | | | — | | |
Distributions paid from net realized gains from investment transactions | |
Class A | | | — | | | | (5,760,732 | ) | | | — | | | | (2,046,517 | ) | |
Class C | | | — | | | | (5,130,068 | ) | | | — | | | | (1,588,861 | ) | |
Class I | | | — | | | | (6,259,206 | ) | | | — | | | | (5,743,396 | ) | |
Class Y | | | — | | | | — | | | | — | | | | — | | |
Decrease in net assets resulting from distributions | | | (18,513,116 | ) | | | (57,989,621 | ) | | | (25,663,920 | ) | | | (63,863,213 | ) | |
Fund Share Transactions (Note 6) | |
Net proceeds from shares sold | | | 189,739,933 | | | | 423,687,654 | | | | 95,277,465 | | | | 344,872,964 | | |
Net asset value of shares issued for reinvested dividends
and distributions | | | 13,033,918 | | | | 45,444,967 | | | | 20,342,518 | | | | 51,177,189 | | |
Cost of shares redeemed | | | (288,934,602 | ) | | | (434,855,745 | ) | | | (284,783,694 | ) | | | (625,406,187 | ) | |
Redemption Fees | | | — | | | | — | | | | — | | | | — | | |
Increase (decrease) in net assets from Fund share transactions | | | (86,160,751 | ) | | | 34,276,876 | | | | (169,163,711 | ) | | | (229,356,034 | ) | |
Net increase (decrease) in net assets | | | (77,000,045 | ) | | | (44,955,571 | ) | | | (207,219,210 | ) | | | (337,360,331 | ) | |
Net Assets (Note 1) | |
Beginning of period | | | 1,263,422,378 | | | | 1,308,377,949 | | | | 803,829,142 | | | | 1,141,189,473 | | |
End of period | | $ | 1,186,422,333 | | | $ | 1,263,422,378 | | | $ | 596,609,932 | | | $ | 803,829,142 | | |
Undistributed net investment income (loss) | | $ | (3,156,870 | ) | | $ | (3,156,870 | ) | | $ | (3,303,454 | ) | | $ | (803,394 | ) | |
First Eagle Funds | Semi-Annual Report | April 30, 2016
134
| | | First Eagle
Fund of America | |
| | | Six-Months Ended
April 30,
2016 (unaudited) | | Year Ended
October 31,
2015 | |
Operations | |
Net investment income | | $ | 9,206,102 | | | $ | 2,210,625 | | |
Net realized gain (loss) from investments, foreign currency and
forward contract related transactions and written options | | | 70,216,162 | | | | 106,885,654 | | |
Change in unrealized (depreciation) of investments, foreign currency
and forward contract related transactions | | | (247,955,136 | ) | | | (126,018,736 | ) | |
Net increase (decrease) in net assets resulting from operations | | | (168,532,872 | ) | | | (16,922,457 | ) | |
Distribution to Shareholders | |
Dividends paid from net investment income | |
Class A | | | (366,132 | ) | | | (3,778,293 | ) | |
Class C | | | (76 | ) | | | — | | |
Class I | | | (3,230,265 | ) | | | (5,021,220 | ) | |
Class Y | | | (40,046 | ) | | | (1,525,229 | ) | |
Distributions paid from net realized gains from investment transactions | |
Class A | | | (36,560,686 | ) | | | (85,878,012 | ) | |
Class C | | | (24,299,388 | ) | | | (54,000,038 | ) | |
Class I | | | (31,330,431 | ) | | | (63,244,020 | ) | |
Class Y | | | (13,335,526 | ) | | | (36,180,308 | ) | |
Decrease in net assets resulting from distributions | | | (109,162,550 | ) | | | (249,627,120 | ) | |
Fund Share Transactions (Note 6) | |
Net proceeds from shares sold | | | 290,387,820 | | | | 1,250,888,863 | | |
Net asset value of shares issued for reinvested dividends
and distributions | | | 89,261,869 | | | | 202,439,475 | | |
Cost of shares redeemed | | | (592,134,945 | ) | | | (700,365,900 | ) | |
Redemption Fees | | | — | | | | — | | |
Increase (decrease) in net assets from Fund share transactions | | | (212,485,256 | ) | | | 752,962,438 | | |
Net increase (decrease) in net assets | | | (490,180,678 | ) | | | 486,412,861 | | |
Net Assets (Note 1) | |
Beginning of period | | | 3,737,848,852 | | | | 3,251,435,991 | | |
End of period | | $ | 3,247,668,174 | | | $ | 3,737,848,852 | | |
Undistributed net investment income (loss) | | $ | 4,554,195 | | | $ | (1,015,388 | ) | |
First Eagle Funds | Semi-Annual Report | April 30, 2016
135
| | | Six-Months Ended | | Year Ended October 31, | |
| | | April 30, 2016 (unaudited) | | 2015 | |
| | | Class A | | Class C | | Class I | | Class A | | Class C | | Class I | |
Selected data for a share of beneficial interest outstanding throughout
each period is presented below:* | |
Net asset value, beginning of period ($) | | | 53.10 | | | | 51.66 | | | | 53.43 | | | | 54.90 | | | | 53.57 | | | | 55.23 | | |
Income (loss) from investment operations: | |
Net investment income (loss) ($) | | | 0.16 | | | | -0.03 | | | | 0.23 | | | | 0.28 | | | | -0.12 | | | | 0.43 | | |
Net realized and unrealized gains
(losses) on investments | | | 2.28 | | | | 2.21 | | | | 2.29 | | | | 0.60 | | | | 0.59 | | | | 0.60 | | |
Total income (loss) from investment
operations | | | 2.44 | | | | 2.18 | | | | 2.52 | | | | 0.88 | | | | 0.47 | | | | 1.03 | | |
Less distributions: | |
Dividends from net investment
income ($) | | | -0.07 | | | | — | | | | -0.21 | | | | -0.30 | | | | — | | | | -0.45 | | |
Distributions from capital gains | | | -0.53 | | | | -0.53 | | | | -0.53 | | | | -2.38 | | | | -2.38 | | | | -2.38 | | |
Total distributions | | | -0.60 | | | | -0.53 | | | | -0.74 | | | | -2.68 | | | | -2.38 | | | | -2.83 | | |
Net asset value, end of period ($) | | | 54.94 | | | | 53.31 | | | | 55.21 | | | | 53.10 | | | | 51.66 | | | | 53.43 | | |
Total return(c) (%) | | | 4.70 | (a) | | | 4.29 | (a) | | | 4.82 | (a) | | | 1.78 | | | | 1.02 | | | | 2.07 | | |
Ratios and supplemental data | |
Net assets, end of period (millions) ($) | | | 16,132 | | | | 11,686 | | | | 20,259 | | | | 16,275 | | | | 11,663 | | | | 19,999 | | |
Ratio of operating expenses to
average net assets including earnings
credits (%) | | | 1.13 | (b) | | | 1.87 | (b) | | | 0.85 | (b) | | | 1.11 | | | | 1.86 | | | | 0.84 | | |
Ratio of operating expenses to
average net assets excluding earnings
credits (%) | | | 1.13 | (b) | | | 1.87 | (b) | | | 0.85 | (b) | | | 1.11 | | | | 1.86 | | | | 0.84 | | |
Ratio of net investment income (loss)
to average net assets including
earnings credits (%) | | | 0.62 | (b) | | | -0.12 | (b) | | | 0.90 | (b) | | | 0.52 | | | | -0.23 | | | | 0.79 | | |
Ratio of net investment income (loss)
to average net assets
excluding earnings credits (%) | | | 0.62 | (b) | | | -0.12 | (b) | | | 0.90 | (b) | | | 0.52 | | | | -0.23 | | | | 0.79 | | |
Portfolio turnover rate (%) | | | 6.05 | (a) | | | 6.05 | (a) | | | 6.05 | (a) | | | 11.28 | | | | 11.28 | | | | 11.28 | | |
* Per share amounts have been calculated using the average shares method.
(a) Not Annualized
(b) Annualized
(c) Does not take into account the sales charge of 5.00% for Class A and the contingent deferred sales charge (CDSC) of 1.00% for Class C shares. A contingent deferred sales charge of 1.00% may apply on redemptions of Class A shares made within 18 months following a purchase of $1,000,000 or more without an initial sales charge.
See Notes to Financial Statements.
First Eagle Funds | Semi-Annual Report | April 30, 2016
136
| | | Year Ended October 31, | |
| | | 2014 | | 2013 | | 2012 | |
| | | Class A | | Class C | | Class I | | Class A | | Class C | | Class I | | Class A | | Class C | | Class I | |
Selected data for a share of beneficial interest outstanding throughout
each period is presented below:* | |
Net asset value, beginning of period ($) | | | 54.92 | | | | 53.67 | | | | 55.23 | | | | 49.24 | | | | 48.16 | | | | 49.50 | | | | 46.90 | | | | 45.91 | | | | 47.15 | | |
Income (loss) from investment operations: | |
Net investment income (loss) ($) | | | 0.30 | | | | -0.11 | | | | 0.43 | | | | 0.39 | | | | 0.01 | | | | 0.52 | | | | 0.45 | | | | 0.09 | | | | 0.57 | | |
Net realized and unrealized gains
(losses) on investments | | | 2.12 | | | | 2.08 | | | | 2.13 | | | | 7.41 | | | | 7.27 | | | | 7.45 | | | | 3.03 | | | | 2.98 | | | | 3.03 | | |
Total income (loss) from investment
operations | | | 2.42 | | | | 1.97 | | | | 2.56 | | | | 7.80 | | | | 7.28 | | | | 7.97 | | | | 3.48 | | | | 3.07 | | | | 3.60 | | |
Less distributions: | |
Dividends from net investment
income ($) | | | -0.66 | | | | -0.29 | | | | -0.78 | | | | -0.51 | | | | -0.16 | | | | -0.63 | | | | -0.53 | | | | -0.21 | | | | -0.64 | | |
Distributions from capital gains | | | -1.78 | | | | -1.78 | | | | -1.78 | | | | -1.61 | | | | -1.61 | | | | -1.61 | | | | -0.61 | | | | -0.61 | | | | -0.61 | | |
Total distributions | | | -2.44 | | | | -2.07 | | | | -2.56 | | | | -2.12 | | | | -1.77 | | | | -2.24 | | | | -1.14 | | | | -0.82 | | | | -1.25 | | |
Net asset value, end of period ($) | | | 54.90 | | | | 53.57 | | | | 55.23 | | | | 54.92 | | | | 53.67 | | | | 55.23 | | | | 49.24 | | | | 48.16 | | | | 49.50 | | |
Total return(c) (%) | | | 4.64 | | | | 3.85 | | | | 4.90 | | | | 16.47 | | | | 15.63 | | | | 16.78 | | | | 7.64 | | | | 6.83 | | | | 7.90 | | |
Ratios and supplemental data | |
Net assets, end of period (millions) ($) | | | 17,735 | | | | 12,342 | | | | 20,389 | | | | 18,987 | | | | 11,436 | | | | 15,578 | | | | 15,840 | | | | 9,322 | | | | 11,182 | | |
Ratio of operating expenses to
average net assets including earnings
credits (%) | | | 1.11 | | | | 1.86 | | | | 0.86 | | | | 1.13 | | | | 1.87 | | | | 0.88 | | | | 1.15 | | | | 1.89 | | | | 0.90 | | |
Ratio of operating expenses to
average net assets excluding earnings
credits (%) | | | 1.11 | | | | 1.86 | | | | 0.86 | | | | 1.13 | | | | 1.87 | | | | 0.88 | | | | 1.15 | | | | 1.89 | | | | 0.90 | | |
Ratio of net investment income (loss)
to average net assets including
earnings credits (%) | | | 0.55 | | | | -0.21 | | | | 0.78 | | | | 0.77 | | | | 0.02 | | | | 1.02 | | | | 0.94 | | | | 0.19 | | | | 1.19 | | |
Ratio of net investment income (loss)
to average net assets
excluding earnings credits (%) | | | 0.55 | | | | -0.21 | | | | 0.78 | | | | 0.77 | | | | 0.02 | | | | 1.02 | | | | 0.94 | | | | 0.19 | | | | 1.19 | | |
Portfolio turnover rate (%) | | | 15.36 | | | | 15.36 | | | | 15.36 | | | | 11.60 | | | | 11.60 | | | | 11.60 | | | | 11.29 | | | | 11.29 | | | | 11.29 | | |
First Eagle Funds | Semi-Annual Report | April 30, 2016
137
Financial Highlights (continued)
| | | Year Ended October 31, | |
| | | 2011 | |
| | | Class A | | Class C | | Class I | |
Selected data for a share of beneficial interest outstanding throughout
each period is presented below:* | |
Net asset value, beginning of period ($) | | | 44.36 | | | | 43.47 | | | | 44.59 | | |
Income (loss) from investment operations: | |
Net investment income (loss) ($) | | | 0.39 | | | | 0.04 | | | | 0.51 | | |
Net realized and unrealized gains (losses) on investments | | | 2.79 | | | | 2.75 | | | | 2.81 | | |
Total income (loss) from investment operations | | | 3.18 | | | | 2.79 | | | | 3.32 | | |
Less distributions: | |
Dividends from net investment income ($) | | | -0.64 | | | | -0.35 | | | | -0.76 | | |
Distributions from capital gains | | | — | | | | — | | | | — | | |
Total distributions | | | -0.64 | | | | -0.35 | | | | -0.76 | | |
Net asset value, end of period ($) | | | 46.90 | | | | 45.91 | | | | 47.15 | | |
Total return(c) (%) | | | 7.23 | | | | 6.45 | | | | 7.52 | | |
Ratios and supplemental data | |
Net assets, end of period (millions) ($) | | | 14,352 | | | | 8,385 | | | | 8,455 | | |
Ratio of operating expenses to average net assets including earnings
credits (%) | | | 1.13 | | | | 1.88 | | | | 0.88 | | |
Ratio of operating expenses to average net assets excluding earnings
credits (%) | | | 1.13 | | | | 1.88 | | | | 0.88 | | |
Ratio of net investment income (loss) to average net assets including
earnings credits (%) | | | 0.83 | | | | 0.08 | | | | 1.07 | | |
Ratio of net investment income (loss) to average net assets excluding
earnings credits (%) | | | 0.83 | | | | 0.08 | | | | 1.07 | | |
Portfolio turnover rate (%) | | | 11.57 | | | | 11.57 | | | | 11.57 | | |
* Per share amounts have been calculated using the average shares method.
(c) Does not take into account the sales charge of 5.00% for Class A and the contingent deferred sales charge (CDSC) of 1.00% for Class C shares. A contingent deferred sales charge of 1.00% may apply on redemptions of Class A shares made within 18 months following a purchase of $1,000,000 or more without an initial sales charge.
See Notes to Financial Statements.
First Eagle Funds | Semi-Annual Report | April 30, 2016
138
This page was intentionally left blank.
First Eagle Overseas Fund
| | | Six-Months Ended | | Year Ended October 31, | |
| | | April 30, 2016 (unaudited) | | 2015 | |
| | | Class A | | Class C | | Class I | | Class A | | Class C | | Class I | |
Selected data for a share of beneficial interest outstanding throughout
each period is presented below:* | |
Net asset value, beginning of period ($) | | | 22.62 | | | | 21.84 | | | | 23.12 | | | | 23.18 | | | | 22.42 | | | | 23.62 | | |
Income (loss) from investment operations: | |
Net investment income (loss) ($) | | | 0.07 | | | | -0.01 | | | | 0.11 | | | | 0.14 | | | | -0.03 | | | | 0.20 | | |
Net realized and unrealized gains
(losses) on investments | | | 1.07 | | | | 1.03 | | | | 1.09 | | | | 0.39 | | | | 0.39 | | | | 0.41 | | |
Total income from investment
operations | | | 1.14 | | | | 1.02 | | | | 1.20 | | | | 0.53 | | | | 0.36 | | | | 0.61 | | |
Less distributions: | |
Dividends from net investment
income ($) | | | -0.04 | | | | — | | | | -0.11 | | | | -0.23 | | | | -0.08 | | | | -0.25 | | |
Distributions from capital gains | | | -0.25 | | | | -0.25 | | | | -0.25 | | | | -0.86 | | | | -0.86 | | | | -0.86 | | |
Total distributions | | | -0.29 | | | | -0.25 | | | | -0.36 | | | | -1.09 | | | | -0.94 | | | | -1.11 | | |
Net asset value, end of period ($) | | | 23.47 | | | | 22.61 | | | | 23.96 | | | | 22.62 | | | | 21.84 | | | | 23.12 | | |
Total return(c) (%) | | | 5.15 | (a) | | | 4.79 | (a) | | | 5.29 | (a) | | | 2.59 | | | | 1.82 | | | | 2.88 | | |
Ratios and supplemental data | |
Net assets, end of period (millions) ($) | | | 3,867 | | | | 1,028 | | | | 9,456 | | | | 4,143 | | | | 1,036 | | | | 8,702 | | |
Ratio of operating expenses to
average net assets including earnings
credits (%) | | | 1.18 | (b) | | | 1.90 | (b) | | | 0.89 | (b) | | | 1.16 | | | | 1.89 | | | | 0.88 | | |
Ratio of operating expenses to
average net assets excluding earnings
credits (%) | | | 1.18 | (b) | | | 1.90 | (b) | | | 0.89 | (b) | | | 1.16 | | | | 1.89 | | | | 0.88 | | |
Ratio of net investment income (loss)
to average net assets including
earnings credits (%) | | | 0.62 | (b) | | | -0.08 | (b) | | | 0.95 | (b) | | | 0.60 | | | | -0.13 | | | | 0.88 | | |
Ratio of net investment income (loss)
to average net assets
excluding earnings credits (%) | | | 0.62 | (b) | | | -0.08 | (b) | | | 0.95 | (b) | | | 0.60 | | | | -0.13 | | | | 0.88 | | |
Portfolio turnover rate (%) | | | 3.32 | (a) | | | 3.32 | (a) | | | 3.32 | (a) | | | 12.95 | | | | 12.95 | | | | 12.95 | | |
* Per share amounts have been calculated using the average shares method.
(a) Not Annualized
(b) Annualized
(c) Does not take into account the sales charge of 5.00% for Class A and the contingent deferred sales charge (CDSC) of 1.00% for Class C shares. A contingent deferred sales charge of 1.00% may apply on redemptions of Class A shares made within 18 months following a purchase of $1,000,000 or more without an initial sales charge.
See Notes to Financial Statements.
First Eagle Funds | Semi-Annual Report | April 30, 2016
140
| | | Year Ended October 31, | |
| | | 2014 | | 2013 | | 2012 | |
| | | Class A | | Class C | | Class I | | Class A | | Class C | | Class I | | Class A | | Class C | | Class I | |
Selected data for a share of beneficial interest outstanding throughout
each period is presented below:* | |
Net asset value, beginning of period ($) | | | 24.40 | | | | 23.64 | | | | 24.84 | | | | 22.26 | | | | 21.62 | | | | 22.63 | | | | 22.25 | | | | 21.61 | | | | 22.61 | | |
Income (loss) from investment operations: | |
Net investment income (loss) ($) | | | 0.15 | | | | -0.03 | | | | 0.21 | | | | 0.13 | | | | -0.04 | | | | 0.20 | | | | 0.24 | | | | 0.08 | | | | 0.30 | | |
Net realized and unrealized gains
(losses) on investments | | | 0.05 | | | | 0.07 | | | | 0.05 | | | | 3.17 | | | | 3.09 | | | | 3.22 | | | | 0.80 | | | | 0.77 | | | | 0.81 | | |
Total income from investment
operations | | | 0.20 | | | | 0.04 | | | | 0.26 | | | | 3.30 | | | | 3.05 | | | | 3.42 | | | | 1.04 | | | | 0.85 | | | | 1.11 | | |
Less distributions: | |
Dividends from net investment
income ($) | | | -0.46 | | | | -0.30 | | | | -0.52 | | | | -0.26 | | | | -0.13 | | | | -0.31 | | | | -0.39 | | | | -0.20 | | | | -0.45 | | |
Distributions from capital gains | | | -0.96 | | | | -0.96 | | | | -0.96 | | | | -0.90 | | | | -0.90 | | | | -0.90 | | | | -0.64 | | | | -0.64 | | | | -0.64 | | |
Total distributions | | | -1.42 | | | | -1.26 | | | | -1.48 | | | | -1.16 | | | | -1.03 | | | | -1.21 | | | | -1.03 | | | | -0.84 | | | | -1.09 | | |
Net asset value, end of period ($) | | | 23.18 | | | | 22.42 | | | | 23.62 | | | | 24.40 | | | | 23.64 | | | | 24.84 | | | | 22.26 | | | | 21.62 | | | | 22.63 | | |
Total return(c) (%) | | | 1.00 | | | | 0.28 | | | | 1.23 | | | | 15.52 | | | | 14.67 | | | | 15.82 | | | | 5.06 | | | | 4.28 | | | | 5.36 | | |
Ratios and supplemental data | |
Net assets, end of period (millions) ($) | | | 4,644 | | | | 1,086 | | | | 8,811 | | | | 5,912 | | | | 1,120 | | | | 7,378 | | | | 5,111 | | | | 986 | | | | 5,252 | | |
Ratio of operating expenses to
average net assets including earnings
credits (%) | | | 1.14 | | | | 1.89 | | | | 0.89 | | | | 1.15 | | | | 1.90 | | | | 0.90 | | | | 1.17 | | | | 1.92 | | | | 0.92 | | |
Ratio of operating expenses to
average net assets excluding earnings
credits (%) | | | 1.14 | | | | 1.89 | | | | 0.89 | | | | 1.15 | | | | 1.90 | | | | 0.90 | | | | 1.17 | | | | 1.92 | | | | 0.92 | | |
Ratio of net investment income (loss)
to average net assets including
earnings credits (%) | | | 0.62 | | | | -0.13 | | | | 0.87 | | | | 0.59 | | | | -0.17 | | | | 0.86 | | | | 1.12 | | | | 0.37 | | | | 1.36 | | |
Ratio of net investment income (loss)
to average net assets
excluding earnings credits (%) | | | 0.62 | | | | -0.13 | | | | 0.87 | | | | 0.59 | | | | -0.17 | | | | 0.86 | | | | 1.12 | | | | 0.37 | | | | 1.36 | | |
Portfolio turnover rate (%) | | | 12.01 | | | | 12.01 | | | | 12.01 | | | | 12.33 | | | | 12.33 | | | | 12.33 | | | | 10.50 | | | | 10.50 | | | | 10.50 | | |
First Eagle Funds | Semi-Annual Report | April 30, 2016
141
First Eagle Overseas Fund
Financial Highlights (continued)
| | | Year Ended October 31, | |
| | | 2011 | |
| | | Class A | | Class C | | Class I | |
Selected data for a share of beneficial interest outstanding throughout
each period is presented below:* | |
Net asset value, beginning of period ($) | | | 21.86 | | | | 21.26 | | | | 22.20 | | |
Income (loss) from investment operations: | |
Net investment income (loss) ($) | | | 0.18 | | | | 0.01 | | | | 0.24 | | |
Net realized and unrealized gains (losses) on investments | | | 0.74 | | | | 0.73 | | | | 0.75 | | |
Total income from investment operations | | | 0.92 | | | | 0.74 | | | | 0.99 | | |
Less distributions: | |
Dividends from net investment income ($) | | | -0.32 | | | | -0.18 | | | | -0.37 | | |
Distributions from capital gains | | | -0.21 | | | | -0.21 | | | | -0.21 | | |
Total distributions | | | -0.53 | | | | -0.39 | | | | -0.58 | | |
Net asset value, end of period ($) | | | 22.25 | | | | 21.61 | | | | 22.61 | | |
Total return(c) (%) | | | 4.27 | | | | 3.48 | | | | 4.52 | | |
Ratios and supplemental data | |
Net assets, end of period (millions) ($) | | | 5,023 | | | | 1,027 | | | | 4,136 | | |
Ratio of operating expenses to average net assets including earnings
credits (%) | | | 1.14 | | | | 1.89 | | | | 0.89 | | |
Ratio of operating expenses to average net assets excluding earnings
credits (%) | | | 1.14 | | | | 1.89 | | | | 0.89 | | |
Ratio of net investment income (loss) to average net assets including
earnings credits (%) | | | 0.78 | | | | 0.04 | | | | 1.06 | | |
Ratio of net investment income (loss) to average net assets excluding
earnings credits (%) | | | 0.78 | | | | 0.04 | | | | 1.06 | | |
Portfolio turnover rate (%) | | | 12.22 | | | | 12.22 | | | | 12.22 | | |
* Per share amounts have been calculated using the average shares method.
(c) Does not take into account the sales charge of 5.00% for Class A and the contingent deferred sales charge (CDSC) of 1.00% for Class C shares. A contingent deferred sales charge of 1.00% may apply on redemptions of Class A shares made within 18 months following a purchase of $1,000,000 or more without an initial sales charge.
See Notes to Financial Statements.
First Eagle Funds | Semi-Annual Report | April 30, 2016
142
This page was intentionally left blank.
First Eagle U.S. Value Fund
| | | Six-Months Ended | | Year Ended October 31, | |
| | | April 30, 2016 (unaudited) | | 2015 | |
| | | Class A | | Class C | | Class I | | Class A | | Class C | | Class I | |
Selected data for a share of beneficial interest outstanding throughout
each period is presented below:* | |
Net asset value, beginning of period ($) | | | 19.82 | | | | 19.43 | | | | 20.11 | | | | 21.10 | | | | 20.78 | | | | 21.40 | | |
Income (loss) from investment operations: | |
Net investment income (loss) ($) | | | 0.05 | | | | -0.02 | | | | 0.08 | | | | 0.10 | | | | -0.05 | | | | 0.16 | | |
Net realized and unrealized gains
(losses) on investments | | | 0.71 | | | | 0.69 | | | | 0.71 | | | | -0.10 | | | | -0.10 | | | | -0.12 | | |
Total income (loss) from investment
operations | | | 0.76 | | | | 0.67 | | | | 0.79 | | | | 0.00 | ** | | | -0.15 | | | | 0.04 | | |
Less distributions: | |
Dividends from net investment
income ($) | | | -0.04 | | | | — | | | | -0.09 | | | | -0.08 | | | | — | | | | -0.13 | | |
Distributions from capital gains | | | -0.85 | | | | -0.85 | | | | -0.85 | | | | -1.20 | | | | -1.20 | | | | -1.20 | | |
Total distributions | | | -0.89 | | | | -0.85 | | | | -0.94 | | | | -1.28 | | | | -1.20 | | | | -1.33 | | |
Net asset value, end of period ($) | | | 19.69 | | | | 19.25 | | | | 19.96 | | | | 19.82 | | | | 19.43 | | | | 20.11 | | |
Total return(c) (%) | | | 4.14 | (a) | | | 3.76 | (a) | | | 4.30 | (a) | | | 0.04 | | | | -0.70 | | | | 0.28 | | |
Ratios and supplemental data | |
Net assets, end of period (millions) ($) | | | 868 | | | | 548 | | | | 821 | | | | 966 | | | | 593 | | | | 942 | | |
Ratio of operating expenses to average
net assets including fee waivers and
reimbursements/(recoupments) (%) | | | 1.16 | (b) | | | 1.91 | (b) | | | 0.88 | (b) | | | 1.14 | | | | 1.90 | | | | 0.87 | | |
Ratio of operating expenses to average
net assets excluding fee waivers and
reimbursements/(recoupments) (%) | | | 1.18 | (b) | | | 1.92 | (b) | | | 0.89 | (b) | | | 1.14 | | | | 1.90 | | | | 0.87 | | |
Ratio of net investment income to average
net assets including fee waivers and
reimbursements/(recoupments) (%) | | | 0.58 | (b) | | | -0.17 | (b) | | | 0.87 | (b) | | | 0.49 | | | | -0.27 | | | | 0.76 | | |
Ratio of net investment income to average
net assets excluding fee waivers and
reimbursements/(recoupments) (%) | | | 0.56 | (b) | | | -0.19 | (b) | | | 0.85 | (b) | | | 0.49 | | | | -0.27 | | | | 0.76 | | |
Portfolio turnover rate (%) | | | 5.71 | (a) | | | 5.71 | (a) | | | 5.71 | (a) | | | 15.14 | | | | 15.14 | | | | 15.14 | | |
* Per share amounts have been calculated using the average shares method.
** Amount represents less than $0.01 per share.
(a) Not Annualized
(b) Annualized
(c) Does not take into account the sales charge of 5.00% for Class A and the contingent deferred sales charge (CDSC) of 1.00% for Class C shares. A contingent deferred sales charge of 1.00% may apply on redemptions of Class A shares made within 18 months following a purchase of $1,000,000 or more without an initial sales charge.
See Notes to Financial Statements.
First Eagle Funds | Semi-Annual Report | April 30, 2016
144
| | | Year Ended October 31, | |
| | | 2014 | | 2013 | | 2012 | |
| | | Class A | | Class C | | Class I | | Class A | | Class C | | Class I | | Class A | | Class C | | Class I | |
Selected data for a share of beneficial interest outstanding throughout
each period is presented below:* | |
Net asset value, beginning of period ($) | | | 20.26 | | | | 19.97 | | | | 20.54 | | | | 18.27 | | | | 18.02 | | | | 18.50 | | | | 17.12 | | | | 16.91 | | | | 17.33 | | |
Income (loss) from investment operations: | |
Net investment income (loss) ($) | | | 0.13 | | | | -0.03 | | | | 0.18 | | | | 0.18 | | | | 0.03 | | | | 0.23 | | | | 0.15 | | | | 0.02 | | | | 0.19 | | |
Net realized and unrealized gains
(losses) on investments | | | 1.60 | | | | 1.58 | | | | 1.62 | | | | 2.36 | | | | 2.35 | | | | 2.40 | | | | 1.59 | | | | 1.57 | | | | 1.61 | | |
Total income (loss) from investment
operations | | | 1.73 | | | | 1.55 | | | | 1.80 | | | | 2.54 | | | | 2.38 | | | | 2.63 | | | | 1.74 | | | | 1.59 | | | | 1.80 | | |
Less distributions: | |
Dividends from net investment
income ($) | | | -0.15 | | | | -0.00 | ** | | | -0.20 | | | | -0.13 | | | | -0.01 | | | | -0.17 | | | | -0.14 | | | | -0.03 | | | | -0.18 | | |
Distributions from capital gains | | | -0.74 | | | | -0.74 | | | | -0.74 | | | | -0.42 | | | | -0.42 | | | | -0.42 | | | | -0.45 | | | | -0.45 | | | | -0.45 | | |
Total distributions | | | -0.89 | | | | -0.74 | | | | -0.94 | | | | -0.55 | | | | -0.43 | | | | -0.59 | | | | -0.59 | | | | -0.48 | | | | -0.63 | | |
Net asset value, end of period ($) | | | 21.10 | | | | 20.78 | | | | 21.40 | | | | 20.26 | | | | 19.97 | | | | 20.54 | | | | 18.27 | | | | 18.02 | | | | 18.50 | | |
Total return(c) (%) | | | 8.93 | | | | 8.09 | | | | 9.19 | | | | 14.32 | | | | 13.53 | | | | 14.69 | | | | 10.63 | | | | 9.75 | | | | 10.86 | | |
Ratios and supplemental data | |
Net assets, end of period (millions) ($) | | | 1,229 | | | | 705 | | | | 1,200 | | | | 1,480 | | | | 725 | | | | 1,080 | | | | 1,425 | | | | 631 | | | | 938 | | |
Ratio of operating expenses to average
net assets including fee waivers and
reimbursements/(recoupments) (%) | | | 1.14 | | | | 1.89 | | | | 0.88 | | | | 1.16 | | | | 1.91 | | | | 0.91 | | | | 1.17 | | | | 1.92 | | | | 0.93 | | |
Ratio of operating expenses to average
net assets excluding fee waivers and
reimbursements/(recoupments) (%) | | | 1.14 | | | | 1.89 | | | | 0.88 | | | | 1.16 | | | | 1.91 | | | | 0.91 | | | | 1.17 | | | | 1.92 | | | | 0.93 | | |
Ratio of net investment income to average
net assets including fee waivers and
reimbursements/(recoupments) (%) | | | 0.63 | | | | -0.13 | | | | 0.87 | | | | 0.93 | | | | 0.18 | | | | 1.18 | | | | 0.84 | | | | 0.09 | | | | 1.08 | | |
Ratio of net investment income to average
net assets excluding fee waivers and
reimbursements/(recoupments) (%) | | | 0.63 | | | | -0.13 | | | | 0.87 | | | | 0.93 | | | | 0.18 | | | | 1.18 | | | | 0.84 | | | | 0.09 | | | | 1.08 | | |
Portfolio turnover rate (%) | | | 15.64 | | | | 15.64 | | | | 15.64 | | | | 17.32 | | | | 17.32 | | | | 17.32 | | | | 14.34 | | | | 14.34 | | | | 14.34 | | |
First Eagle Funds | Semi-Annual Report | April 30, 2016
145
First Eagle U.S. Value Fund
Financial Highlights (continued)
| | | Year Ended October 31, | |
| | | 2011 | |
| | | Class A | | Class C | | Class I | |
Selected data for a share of beneficial interest outstanding throughout
each period is presented below:* | |
Net asset value, beginning of period ($) | | | 15.94 | | | | 15.75 | | | | 16.12 | | |
Income (loss) from investment operations: | |
Net investment income (loss) ($) | | | 0.17 | | | | 0.04 | | | | 0.21 | | |
Net realized and unrealized gains (losses) on investments | | | 1.34 | | | | 1.34 | | | | 1.37 | | |
Total income (loss) from investment operations | | | 1.51 | | | | 1.38 | | | | 1.58 | | |
Less distributions: | |
Dividends from net investment income ($) | | | -0.33 | | | | -0.22 | | | | -0.37 | | |
Distributions from capital gains | | | — | | | | — | | | | — | | |
Total distributions | | | -0.33 | | | | -0.22 | | | | -0.37 | | |
Net asset value, end of period ($) | | | 17.12 | | | | 16.91 | | | | 17.33 | | |
Total return(c) (%) | | | 9.60 | | | | 8.85 | | | | 9.92 | | |
Ratios and supplemental data | |
Net assets, end of period (millions) ($) | | | 967 | | | | 408 | | | | 538 | | |
Ratio of operating expenses to average net assets including
fee waivers and reimbursements/(recoupments) (%) | | | 1.18 | | | | 1.93 | | | | 0.93 | | |
Ratio of operating expenses to average net assets excluding
fee waivers and reimbursements/(recoupments) (%) | | | 1.18 | | | | 1.93 | | | | 0.93 | | |
Ratio of net investment income to average net assets including
fee waivers and reimbursements/(recoupments) (%) | | | 0.98 | | | | 0.24 | | | | 1.23 | | |
Ratio of net investment income to average net assets excluding
fee waivers and reimbursements/(recoupments) (%) | | | 0.98 | | | | 0.24 | | | | 1.23 | | |
Portfolio turnover rate (%) | | | 18.54 | | | | 18.54 | | | | 18.54 | | |
* Per share amounts have been calculated using the average shares method.
(c) Does not take into account the sales charge of 5.00% for Class A and the contingent deferred sales charge (CDSC) of 1.00% for Class C shares. A contingent deferred sales charge of 1.00% may apply on redemptions of Class A shares made within 18 months following a purchase of $1,000,000 or more without an initial sales charge.
See Notes to Financial Statements.
First Eagle Funds | Semi-Annual Report | April 30, 2016
146
This page was intentionally left blank.
| | | Six-Months Ended | | Year Ended October 31, | |
| | | April 30, 2016 (unaudited) | | 2015 | |
| | | Class A | | Class C | | Class I | | Class A | | Class C | | Class I | |
Selected data for a share of beneficial interest outstanding throughout
each period is presented below:* | |
Net asset value, beginning of period ($) | | | 12.36 | | | | 11.70 | | | | 12.59 | | | | 13.45 | | | | 12.84 | | | | 13.66 | | |
Income (loss) from investment operations: | |
Net investment income (loss) ($) | | | -0.04 | | | | -0.08 | | | | -0.02 | | | | -0.08 | | | | -0.18 | | | | -0.04 | | |
Net realized and unrealized gains
(losses) on investments | | | 5.89 | | | | 5.54 | | | | 6.00 | | | | -1.01 | | | | -0.96 | | | | -1.03 | | |
Total income (loss) from investment
operations | | | 5.85 | | | | 5.46 | | | | 5.98 | | | | -1.09 | | | | -1.14 | | | | -1.07 | | |
Less distributions: | |
Dividends from net investment
income ($) | | | — | | | | — | | | | — | | | | — | | | | — | | | | — | | |
Distributions from capital gains | | | — | | | | — | | | | — | | | | — | | | | — | | | | — | | |
Total distributions | | | — | | | | — | | | | — | | | | — | | | | — | | | | — | | |
Net asset value, end of period ($) | | | 18.21 | | | | 17.16 | | | | 18.57 | | | | 12.36 | | | | 11.70 | | | | 12.59 | | |
Total return(c) (%) | | | 47.33 | (a) | | | 46.67 | (a) | | | 47.50 | (a) | | | -8.10 | | | | -8.88 | | | | -7.83 | | |
Ratios and supplemental data | |
Net assets, end of period (millions) ($) | | | 577 | | | | 213 | | | | 436 | | | | 391 | | | | 148 | | | | 306 | | |
Ratio of operating expenses to
average net assets including earnings
credits (%) | | | 1.35 | (b) | | | 2.14 | (b) | | | 1.05 | (b) | | | 1.33 | | | | 2.14 | | | | 1.03 | | |
Ratio of operating expenses to
average net assets excluding earnings
credits (%) | | | 1.35 | (b) | | | 2.14 | (b) | | | 1.05 | (b) | | | 1.33 | | | | 2.14 | | | | 1.03 | | |
Ratio of net investment income (loss)
to average net assets including
earnings credits (%) | | | -0.55 | (b) | | | -1.33 | (b) | | | -0.24 | (b) | | | -0.57 | | | | -1.39 | | | | -0.27 | | |
Ratio of net investment income (loss)
to average net assets excluding
earnings credits (%) | | | -0.55 | (b) | | | -1.33 | (b) | | | -0.24 | (b) | | | -0.57 | | | | -1.39 | | | | -0.27 | | |
Portfolio turnover rate (%) | | | 7.77 | (a) | | | 7.77 | (a) | | | 7.77 | (a) | | | 12.47 | | | | 12.47 | | | | 12.47 | | |
* Per share amounts have been calculated using the average shares method.
(a) Not Annualized
(b) Annualized
(c) Does not take into account the sales charge of 5.00% for Class A and the contingent deferred sales charge (CDSC) of 1.00% for Class C shares. A contingent deferred sales charge of 1.00% may apply on redemptions of Class A shares made within 18 months following a purchase of $1,000,000 or more without an initial sales charge.
See Notes to Financial Statements.
First Eagle Funds | Semi-Annual Report | April 30, 2016
148
| | | Year Ended October 31, | |
| | | 2014 | | 2013 | | 2012 | |
| | | Class A | | Class C | | Class I | | Class A | | Class C | | Class I | | Class A | | Class C | | Class I | |
Selected data for a share of beneficial interest outstanding throughout
each period is presented below:* | |
Net asset value, beginning of period ($) | | | 17.03 | | | | 16.37 | | | | 17.25 | | | | 29.86 | | | | 28.84 | | | | 30.26 | | | | 33.89 | | | | 32.78 | | | | 34.33 | | |
Income (loss) from investment operations: | |
Net investment income (loss) ($) | | | -0.09 | | | | -0.20 | | | | -0.05 | | | | -0.02 | | | | -0.18 | | | | 0.03 | | | | -0.01 | | | | -0.22 | | | | 0.06 | | |
Net realized and unrealized gains
(losses) on investments | | | -3.49 | | | | -3.33 | | | | -3.54 | | | | -12.73 | | | | -12.29 | | | | -12.89 | | | | -2.73 | | | | -2.66 | | | | -2.75 | | |
Total income (loss) from investment
operations | | | -3.58 | | | | -3.53 | | | | -3.59 | | | | -12.75 | | | | -12.47 | | | | -12.86 | | | | -2.74 | | | | -2.88 | | | | -2.69 | | |
Less distributions: | |
Dividends from net investment
income ($) | | | — | | | | — | | | | — | | | | -0.08 | | | | — | | | | -0.15 | | | | -0.39 | | | | -0.16 | | | | -0.48 | | |
Distributions from capital gains | | | — | | | | — | | | | — | | | | — | | | | — | | | | — | | | | -0.90 | | | | -0.90 | | | | -0.90 | | |
Total distributions | | | — | | | | — | | | | — | | | | -0.08 | | | | — | | | | -0.15 | | | | -1.29 | | | | -1.06 | | | | -1.38 | | |
Net asset value, end of period ($) | | | 13.45 | | | | 12.84 | | | | 13.66 | | | | 17.03 | | | | 16.37 | | | | 17.25 | | | | 29.86 | | | | 28.84 | | | | 30.26 | | |
Total return(c) (%) | | | -21.02 | | | | -21.56 | | | | -20.81 | | | | -42.80 | | | | -43.24 | | | | -42.68 | | | | -8.14 | | | | -8.86 | | | | -7.89 | | |
Ratios and supplemental data | |
Net assets, end of period (millions) ($) | | | 448 | | | | 186 | | | | 366 | | | | 764 | | | | 284 | | | | 508 | | | | 1,535 | | | | 608 | | | | 932 | | |
Ratio of operating expenses to
average net assets including earnings
credits (%) | | | 1.27 | | | | 2.02 | | | | 1.01 | | | | 1.25 | | | | 2.00 | | | | 1.00 | | | | 1.21 | | | | 1.96 | | | | 0.96 | | |
Ratio of operating expenses to
average net assets excluding earnings
credits (%) | | | 1.27 | | | | 2.02 | | | | 1.01 | | | | 1.25 | | | | 2.00 | | | | 1.00 | | | | 1.21 | | | | 1.96 | | | | 0.96 | | |
Ratio of net investment income (loss)
to average net assets including
earnings credits (%) | | | -0.54 | | | | -1.29 | | | | -0.29 | | | | -0.11 | | | | -0.87 | | | | 0.14 | | | | -0.05 | | | | -0.80 | | | | 0.21 | | |
Ratio of net investment income (loss)
to average net assets excluding
earnings credits (%) | | | -0.54 | | | | -1.29 | | | | -0.29 | | | | -0.11 | | | | -0.87 | | | | 0.14 | | | | -0.05 | | | | -0.80 | | | | 0.21 | | |
Portfolio turnover rate (%) | | | 13.33 | | | | 13.33 | | | | 13.33 | | | | 15.14 | | | | 15.14 | | | | 15.14 | | | | 9.19 | | | | 9.19 | | | | 9.19 | | |
First Eagle Funds | Semi-Annual Report | April 30, 2016
149
Financial Highlights (continued)
| | | Year Ended October 31, | |
| | | 2011 | |
| | | Class A | | Class C | | Class I | |
Selected data for a share of beneficial interest outstanding throughout
each period is presented below:* | |
Net asset value, beginning of period ($) | | | 33.42 | | | | 32.44 | | | | 33.81 | | |
Income (loss) from investment operations: | |
Net investment income (loss) ($) | | | -0.19 | | | | -0.42 | | | | -0.10 | | |
Net realized and unrealized gains (losses) on investments | | | 2.60 | | | | 2.53 | | | | 2.63 | | |
Total income (loss) from investment operations | | | 2.41 | | | | 2.11 | | | | 2.53 | | |
Less distributions: | |
Dividends from net investment income ($) | | | -0.73 | | | | -0.56 | | | | -0.80 | | |
Distributions from capital gains | | | -1.21 | | | | -1.21 | | | | -1.21 | | |
Total distributions | | | -1.94 | | | | -1.77 | | | | -2.01 | | |
Net asset value, end of period ($) | | | 33.89 | | | | 32.78 | | | | 34.33 | | |
Total return(c) (%) | | | 7.38 | | | | 6.61 | | | | 7.66 | | |
Ratios and supplemental data | |
Net assets, end of period (millions) ($) | | | 1,834 | | | | 683 | | | | 1,003 | | |
Ratio of operating expenses to average net assets including earnings
credits (%) | | | 1.20 | | | | 1.95 | | | | 0.95 | | |
Ratio of operating expenses to average net assets excluding earnings
credits (%) | | | 1.20 | | | | 1.95 | | | | 0.95 | | |
Ratio of net investment income (loss) to average net assets including
earnings credits (%) | | | -0.56 | | | | -1.30 | | | | -0.30 | | |
Ratio of net investment income (loss) to average net assets excluding
earnings credits (%) | | | -0.56 | | | | -1.30 | | | | -0.30 | | |
Portfolio turnover rate (%) | | | 13.26 | | | | 13.26 | | | | 13.26 | | |
* Per share amounts have been calculated using the average shares method.
(c) Does not take into account the sales charge of 5.00% for Class A and the contingent deferred sales charge (CDSC) of 1.00% for Class C shares. A contingent deferred sales charge of 1.00% may apply on redemptions of Class A shares made within 18 months following a purchase of $1,000,000 or more without an initial sales charge.
See Notes to Financial Statements.
First Eagle Funds | Semi-Annual Report | April 30, 2016
150
This page was intentionally left blank.
First Eagle Global Income Builder Fund
| | | Six-Months Ended | | Year Ended October 31, | |
| | | April 30, 2016 (unaudited) | | 2015 | |
| | | Class A | | Class C | | Class I | | Class A | | Class C | | Class I | |
Selected data for a share of beneficial interest outstanding throughout
each period is presented below:* | |
Net asset value, beginning of period ($) | | | 10.73 | | | | 10.71 | | | | 10.71 | | | | 11.41 | | | | 11.38 | | | | 11.39 | | |
Income (loss) from investment operations: | |
Net investment income ($) | | | 0.17 | | | | 0.13 | | | | 0.18 | | | | 0.35 | | | | 0.26 | | | | 0.38 | | |
Net realized and unrealized gains
(losses) on investments | | | 0.14 | | | | 0.13 | | | | 0.14 | | | | -0.51 | | | | -0.50 | | | | -0.52 | | |
Total income (loss) from investment
operations | | | 0.31 | | | | 0.26 | | | | 0.32 | | | | -0.16 | | | | -0.24 | | | | -0.14 | | |
Less distributions: | |
Dividends from net investment
income ($) | | | -0.17 | | | | -0.13 | | | | -0.18 | | | | -0.37 | | | | -0.28 | | | | -0.39 | | |
Distributions from capital gains | | | — | | | | — | | | | — | | | | -0.15 | | | | -0.15 | | | | -0.15 | | |
Total distributions | | | -0.17 | | | | -0.13 | | | | -0.18 | | | | -0.52 | | | | -0.43 | | | | -0.54 | | |
Net asset value, end of period ($) | | | 10.87 | | | | 10.84 | | | | 10.85 | | | | 10.73 | | | | 10.71 | | | | 10.71 | | |
Total return(c) (%) | | | 2.96 | (a) | | | 2.49 | (a) | | | 3.09 | (a) | | | -1.39 | | | | -2.07 | | | | -1.14 | | |
Ratios and supplemental data | |
Net assets, end of period (millions) ($) | | | 376 | | | | 360 | | | | 450 | | | | 410 | | | | 382 | | | | 471 | | |
Ratio of operating expenses to
average net assets including fee
waivers and recoupments (%) | | | 1.20 | (b) | | | 1.96 | (b) | | | 0.93 | (b) | | | 1.19 | | | | 1.96 | | | | 0.94 | | |
Ratio of operating expenses to
average net assets excluding fee
waivers and recoupments (%) | | | 1.20 | (b) | | | 1.96 | (b) | | | 0.93 | (b) | | | 1.19 | | | | 1.96 | | | | 0.94 | | |
Ratio of net investment income to
average net assets including fee
waivers and recoupments (%) | | | 3.31 | (b) | | | 2.56 | (b) | | | 3.57 | (b) | | | 3.16 | | | | 2.41 | | | | 3.41 | | |
Ratio of net investment income to
average net assets excluding fee
waivers and recoupments (%) | | | 3.31 | (b) | | | 2.56 | (b) | | | 3.57 | (b) | | | 3.16 | | | | 2.41 | | | | 3.41 | | |
Portfolio turnover rate (%) | | | 15.83 | (a) | | | 15.83 | (a) | | | 15.83 | (a) | | | 29.68 | | | | 29.68 | | | | 29.68 | | |
^ Commencement of operations
* Per share amounts have been calculated using the average shares method.
(a) Not Annualized
(b) Annualized
(c) Does not take into account the sales charge of 5.00% for Class A shares and the contingent deferred sales charge (CDSC) of 1.00% for Class C shares. A contingent deferred sales charge of 1.00% may apply on redemptions of Class A shares made within 18 months following a purchase of $1,000,000 or more without an initial sales charge.
(d) Certain non-recurring expenses incurred by the Fund were not annualized for the period ended October 31, 2012.
See Notes to Financial Statements.
First Eagle Funds | Semi-Annual Report | April 30, 2016
152
| | | Year Ended October 31, | | Period May 1, 2012^ to | |
| | | 2014 | | 2013 | | October 31, 2012 | |
| | | Class A | | Class C | | Class I | | Class A | | Class C | | Class I | | Class A | | Class C | | Class I | |
Selected data for a share of beneficial interest outstanding throughout
each period is presented below:* | |
Net asset value, beginning of period ($) | | | 11.26 | | | | 11.23 | | | | 11.23 | | | | 10.32 | | | | 10.30 | | | | 10.33 | | | | 10.00 | | | | 10.00 | | | | 10.00 | | |
Income (loss) from investment operations: | |
Net investment income ($) | | | 0.36 | | | | 0.27 | | | | 0.38 | | | | 0.42 | | | | 0.34 | | | | 0.44 | | | | 0.15 | | | | 0.11 | | | | 0.18 | | |
Net realized and unrealized gains
(losses) on investments | | | 0.17 | | | | 0.17 | | | | 0.19 | | | | 0.91 | | | | 0.90 | | | | 0.91 | | | | 0.28 | | | | 0.29 | | | | 0.27 | | |
Total income (loss) from investment
operations | | | 0.53 | | | | 0.44 | | | | 0.57 | | | | 1.33 | | | | 1.24 | | | | 1.35 | | | | 0.43 | | | | 0.40 | | | | 0.45 | | |
Less distributions: | |
Dividends from net investment
income ($) | | | -0.38 | | | | -0.29 | | | | -0.41 | | | | -0.39 | | | | -0.31 | | | | -0.45 | | | | -0.11 | | | | -0.10 | | | | -0.12 | | |
Distributions from capital gains | | | — | | | | — | | | | — | | | | — | | | | — | | | | — | | | | — | | | | — | | | | — | | |
Total distributions | | | -0.38 | | | | -0.29 | | | | -0.41 | | | | -0.39 | | | | -0.31 | | | | -0.45 | | | | -0.11 | | | | -0.10 | | | | -0.12 | | |
Net asset value, end of period ($) | | | 11.41 | | | | 11.38 | | | | 11.39 | | | | 11.26 | | | | 11.23 | | | | 11.23 | | | | 10.32 | | | | 10.30 | | | | 10.33 | | |
Total return(c) (%) | | | 4.67 | | | | 3.90 | | | | 5.00 | | | | 13.14 | | | | 12.25 | | | | 13.36 | | | | 4.37 | (a) | | | 4.00 | (a) | | | 4.53 | (a) | |
Ratios and supplemental data | |
Net assets, end of period (millions) ($) | | | 440 | | | | 379 | | | | 490 | | | | 231 | | | | 148 | | | | 129 | | | | 43 | | | | 26 | | | | 38 | | |
Ratio of operating expenses to
average net assets including fee
waivers and recoupments (%) | | | 1.26 | | | | 2.00 | | | | 1.05 | | | | 1.30 | | | | 2.04 | | | | 1.05 | | | | 1.30 | (b)(d) | | | 2.05 | (b)(d) | | | 1.05 | (b)(d) | |
Ratio of operating expenses to
average net assets excluding fee
waivers and recoupments (%) | | | 1.23 | | | | 1.97 | | | | 0.97 | | | | 1.35 | | | | 2.09 | | | | 1.10 | | | | 2.13 | (b)(d) | | | 2.88 | (b)(d) | | | 2.20 | (b)(d) | |
Ratio of net investment income to
average net assets including fee
waivers and recoupments (%) | | | 3.09 | | | | 2.31 | | | | 3.25 | | | | 3.85 | | | | 3.11 | | | | 4.11 | | | | 2.89 | (b)(d) | | | 2.16 | (b)(d) | | | 3.56 | (b)(d) | |
Ratio of net investment income to
average net assets excluding fee
waivers and recoupments (%) | | | 3.12 | | | | 2.34 | | | | 3.33 | | | | 3.80 | | | | 3.06 | | | | 4.06 | | | | 2.06 | (b)(d) | | | 1.33 | (b)(d) | | | 2.40 | (b)(d) | |
Portfolio turnover rate (%) | | | 18.45 | | | | 18.45 | | | | 18.45 | | | | 10.87 | | | | 10.87 | | | | 10.87 | | | | 5.17 | (a) | | | 5.17 | (a) | | | 5.17 | (a)(d) | |
First Eagle Funds | Semi-Annual Report | April 30, 2016
153
First Eagle High Yield Fund
| | | Six-Months Ended | | Year Ended October 31, | |
| | | April 30, 2016 (unaudited) | | 2015 | |
| | | Class A | | Class C | | Class I | | Class A | | Class C | | Class I | |
Selected data for a share of beneficial interest outstanding throughout
each period is presented below:* | |
Net asset value, beginning of period ($) | | | 8.90 | | | | 8.89 | | | | 8.90 | | | | 9.96 | | | | 9.95 | | | | 9.96 | | |
Income (loss) from investment operations: | |
Net investment income ($) | | | 0.30 | | | | 0.28 | | | | 0.32 | | | | 0.55 | | | | 0.48 | | | | 0.58 | | |
Net realized and unrealized gains
(losses) on investments | | | -0.34 | | | | -0.35 | | | | -0.35 | | | | -0.96 | | | | -0.96 | | | | -0.96 | | |
Total income (loss) from investment
operations | | | -0.04 | | | | -0.07 | | | | -0.03 | | | | -0.41 | | | | -0.48 | | | | -0.38 | | |
Less distributions: | |
Dividends from net investment income ($) | | | -0.34 | | | | -0.31 | | | | -0.35 | | | | -0.56 | | | | -0.49 | | | | -0.59 | | |
Distributions from capital gains | | | — | | | | — | | | | — | | | | -0.09 | | | | -0.09 | | | | -0.09 | | |
Total distributions | | | -0.34 | | | | -0.31 | | | | -0.35 | | | | -0.65 | | | | -0.58 | | | | -0.68 | | |
Net asset value, end of period ($) | | | 8.52 | | | | 8.51 | | | | 8.52 | | | | 8.90 | | | | 8.89 | | | | 8.90 | | |
Total return(c) (%) | | | -0.23 | (a) | | | -0.59 | (a) | | | -0.10 | (a) | | | -4.24 | | | | -4.96 | | | | -3.97 | | |
Ratios and supplemental data | |
Net assets, end of period (millions) ($) | | | 153 | | | | 109 | | | | 334 | | | | 202 | | | | 129 | | | | 473 | | |
Ratio of operating expenses to average
net assets including fee waivers and
reimbursements/(recoupments) (%) | | | 1.18 | (b) | | | 1.91 | (b) | | | 0.88 | (b) | | | 1.12 | | | | 1.87 | | | | 0.83 | | |
Ratio of operating expenses to average
net assets excluding fee waivers and
reimbursements/(recoupments) (%) | | | 1.23 | (b) | | | 1.96 | (b) | | | 0.93 | (b) | | | 1.16 | | | | 1.91 | | | | 0.87 | | |
Ratio of net investment income to average
net assets including fee waivers and
reimbursements/(recoupments) (%) | | | 7.43 | (b) | | | 6.75 | (b) | | | 7.73 | (b) | | | 5.81 | | | | 5.07 | | | | 6.10 | | |
Ratio of net investment income to average
net assets excluding fee waivers and
reimbursements/(recoupments) (%) | | | 7.38 | (b) | | | 6.70 | (b) | | | 7.68 | (b) | | | 5.77 | | | | 5.03 | | | | 6.06 | | |
Portfolio turnover rate (%) | | | 13.30 | (a) | | | 13.30 | (a) | | | 13.30 | (a) | | | 31.62 | | | | 31.62 | | | | 31.62 | | |
* Per share amounts have been calculated using the average shares method.
(a) Not Annualized
(b) Annualized
(c) Does not take into account the sales charge of 4.50% for Class A shares and the contingent deferred sales charge (CDSC) of 1.00% for Class C shares. A contingent deferred sales charge of 1.00% may apply on redemptions of Class A shares made within 18 months following a purchase of $1,000,000 or more without an initial sales charge.
(d)Certain non-recurring expenses incurred by the Fund were not annualized for the period ended October 31, 2012.
See Notes to Financial Statements.
First Eagle Funds | Semi-Annual Report | April 30, 2016
154
| | | Year Ended October 31, | | Period April 1, 2012 to | |
| | | 2014 | | 2013 | | October 31, 2012 | |
| | | Class A | | Class C | | Class I | | Class A | | Class C | | Class I | | Class A | | Class C | | Class I | |
Selected data for a share of beneficial interest outstanding throughout
each period is presented below:* | |
Net asset value, beginning of period ($) | | | 10.11 | | | | 10.10 | | | | 10.11 | | | | 9.98 | | | | 9.97 | | | | 9.98 | | | | 9.75 | | | | 9.74 | | | | 9.75 | | |
Income (loss) from investment operations: | |
Net investment income ($) | | | 0.53 | | | | 0.45 | | | | 0.55 | | | | 0.59 | | | | 0.51 | | | | 0.62 | | | | 0.33 | | | | 0.29 | | | | 0.36 | | |
Net realized and unrealized gains
(losses) on investments | | | -0.15 | | | | -0.15 | | | | -0.14 | | | | 0.14 | | | | 0.14 | | | | 0.14 | | | | 0.24 | | | | 0.23 | | | | 0.23 | | |
Total income (loss) from investment
operations | | | 0.38 | | | | 0.30 | | | | 0.41 | | | | 0.73 | | | | 0.65 | | | | 0.76 | | | | 0.57 | | | | 0.52 | | | | 0.59 | | |
Less distributions: | |
Dividends from net investment income ($) | | | -0.53 | | | | -0.45 | | | | -0.56 | | | | -0.59 | | | | -0.51 | | | | -0.62 | | | | -0.34 | | | | -0.29 | | | | -0.36 | | |
Distributions from capital gains | | | — | | | | — | | | | — | | | | -0.01 | | | | -0.01 | | | | -0.01 | | | | — | | | | — | | | | — | | |
Total distributions | | | -0.53 | | | | -0.45 | | | | -0.56 | | | | -0.60 | | | | -0.52 | | | | -0.63 | | | | -0.34 | | | | -0.29 | | | | -0.36 | | |
Net asset value, end of period ($) | | | 9.96 | | | | 9.95 | | | | 9.96 | | | | 10.11 | | | | 10.10 | | | | 10.11 | | | | 9.98 | | | | 9.97 | | | | 9.98 | | |
Total return(c) (%) | | | 3.74 | | | | 2.97 | | | | 4.03 | | | | 7.49 | | | | 6.69 | | | | 7.85 | | | | 5.94 | (a) | | | 5.47 | (a) | | | 6.20 | (a) | |
Ratios and supplemental data | |
Net assets, end of period (millions) ($) | | | 247 | | | | 184 | | | | 710 | | | | 346 | | | | 159 | | | | 511 | | | | 220 | | | | 113 | | | | 309 | | |
Ratio of operating expenses to average
net assets including fee waivers and
reimbursements/(recoupments) (%) | | | 1.09 | | | | 1.84 | | | | 0.83 | | | | 1.13 | | | | 1.88 | | | | 0.80 | | | | 1.25 | (b)(d) | | | 2.00 | (b)(d) | | | 0.80 | (b)(d) | |
Ratio of operating expenses to average
net assets excluding fee waivers and
reimbursements/(recoupments) (%) | | | 1.09 | | | | 1.83 | | | | 0.84 | | | | 1.13 | | | | 1.88 | | | | 0.88 | | | | 1.27 | (b)(d) | | | 2.02 | (b)(d) | | | 1.03 | (b)(d) | |
Ratio of net investment income to average
net assets including fee waivers and
reimbursements/(recoupments) (%) | | | 5.17 | | | | 4.42 | | | | 5.43 | | | | 5.80 | | | | 5.07 | | | | 6.14 | | | | 5.75 | (b)(d) | | | 4.98 | (b)(d) | | | 6.23 | (b)(d) | |
Ratio of net investment income to average
net assets excluding fee waivers and
reimbursements/(recoupments) (%) | | | 5.17 | | | | 4.43 | | | | 5.42 | | | | 5.80 | | | | 5.07 | | | | 6.06 | | | | 5.73 | (b)(d) | | | 4.96 | (b)(d) | | | 6.00 | (b)(d) | |
Portfolio turnover rate (%) | | | 43.02 | | | | 43.02 | | | | 43.02 | | | | 49.71 | | | | 49.71 | | | | 49.71 | | | | 25.02 | (a) | | | 25.02 | (a) | | | 25.02 | (a) | |
First Eagle Funds | Semi-Annual Report | April 30, 2016
155
First Eagle High Yield Fund
Financial Highlights (continued)
| | | Year Ended March 31, | |
| | | 2012^ | | 2011 | |
| | | Class A^^ | | Class C^^ | | Class I | | Class I | |
Selected data for a share of beneficial interest outstanding throughout
each period is presented below:* | |
Net asset value, beginning of period ($) | | | 9.40 | | | | 9.40 | | | | 10.29 | | | | 10.67 | | |
Income (loss) from investment operations: | |
Net investment income ($) | | | 0.13 | | | | 0.11 | | | | 0.68 | | | | 0.98 | | |
Net realized and unrealized gains (losses) on investments | | | 0.35 | | | | 0.34 | | | | -0.11 | | | | 0.47 | | |
Total income (loss) from investment operations | | | 0.48 | | | | 0.45 | | | | 0.57 | | | | 1.45 | | |
Less distributions: | |
Dividends from net investment income ($) | | | -0.13 | | | | -0.11 | | | | -0.83 | | | | -0.98 | | |
Distributions from capital gains | | | — | | | | — | | | | -0.28 | | | | -0.85 | | |
Total distributions | | | -0.13 | | | | -0.11 | | | | -1.11 | | | | -1.83 | | |
Net asset value, end of period ($) | | | 9.75 | | | | 9.74 | | | | 9.75 | | | | 10.29 | | |
Total return(c) (%) | | | 5.11 | | | | 4.78 | | | | 6.11 | | | | 14.81 | | |
Ratios and supplemental data | |
Net assets, end of period (millions) ($) | | | 60 | | | | 28 | | | | 115 | | | | 11 | | |
Ratio of operating expenses to average net assets
including fee waivers and reimbursements/
(recoupments) (%) | | | 0.95 | (b) | | | 1.66 | (b) | | | 0.80 | | | | 0.80 | | |
Ratio of operating expenses to average net assets
excluding fee waivers and reimbursements/
(recoupments) (%) | | | 1.12 | (b) | | | 1.83 | (b) | | | 1.05 | | | | 1.21 | | |
Ratio of net investment income to average net assets
including fee waivers and reimbursements/
(recoupments) (%) | | | 5.48 | (b) | | | 4.74 | (b) | | | 6.98 | | | | 9.33 | | |
Ratio of net investment income to average net assets
excluding fee waivers and reimbursements/
(recoupments) (%) | | | 5.31 | (b) | | | 4.57 | (b) | | | 6.73 | | | | 8.92 | | |
Portfolio turnover rate (%) | | | 45.21 | | | | 45.21 | | | | 45.21 | | | | 145.96 | | |
^ The Fund commenced investment operations in its present form on December 30, 2011.
^^ Class A and Class C commenced operations on January 3, 2012.
* Per share amounts have been calculated using the average shares method.
(b) Annualized
(c) Does not take into account the sales charge of 4.50% for Class A shares and the contingent deferred sales charge (CDSC) of 1.00% for Class C shares. A contingent deferred sales charge of 1.00% may apply on redemptions of Class A shares made within 18 months following a purchase of $1,000,000 or more without an initial sales charge.
See Notes to Financial Statements.
First Eagle Funds | Semi-Annual Report | April 30, 2016
156
This page was intentionally left blank.
First Eagle Fund of America
| | | Six-Months Ended | |
| | | April 30, 2016 (unaudited) | |
| | | Class A | | Class C | | Class I | | Class Y | |
Selected data for a share of beneficial interest outstanding throughout
each period is presented below:* | |
Net asset value, beginning of period ($) | | | 35.79 | | | | 30.07 | | | | 36.62 | | | | 36.56 | | |
Income (loss) from investment operations: | |
Net investment income (loss) ($) | | | 0.10 | | | | -0.02 | | | | 0.15 | | | | 0.10 | | |
Net realized and unrealized gains (losses) on
investments | | | -1.68 | | | | -1.41 | | | | -1.72 | | | | -1.72 | | |
Total income (loss) from investment operations | | | -1.58 | | | | -1.43 | | | | -1.57 | | | | -1.62 | | |
Less distributions: | |
Dividends from net investment income ($) | | | -0.01 | | | | — | | | | -0.10 | | | | 0.00 | ** | |
Distributions from capital gains | | | -1.00 | | | | -1.00 | | | | -1.00 | | | | -1.00 | | |
Total distributions | | | -1.01 | | | | -1.00 | | | | -1.10 | | | | -1.00 | | |
Net asset value, end of period ($) | | | 33.20 | | | | 27.64 | | | | 33.95 | | | | 33.94 | | |
Total return(c) (%) | | | -4.52 | (a) | | | -4.89 | (a) | | | -4.36 | (a) | | | -4.52 | (a) | |
Ratios and supplemental data | |
Net assets, end of period (millions) ($) | | | 1,138 | | | | 644 | | | | 1,026 | | | | 439 | | |
Ratio of operating expenses to average net assets
including earnings credits (%) | | | 1.36 | (b) | | | 2.10 | (b) | | | 1.04 | (b) | | | 1.36 | (b) | |
Ratio of operating expenses to average net assets
excluding earnings credits (%) | | | 1.36 | (b) | | | 2.10 | (b) | | | 1.04 | (b) | | | 1.36 | (b) | |
Ratio of net investment income (loss) to average
net assets including earnings credits (%) | | | 0.59 | (b) | | | -0.15 | (b) | | | 0.90 | (b) | | | 0.58 | (b) | |
Ratio of net investment income (loss) to average
net assets excluding earnings credits (%) | | | 0.59 | (b) | | | -0.15 | (b) | | | 0.90 | (b) | | | 0.58 | (b) | |
Portfolio turnover rate (%) | | | 22.63 | (a) | | | 22.63 | (a) | | | 22.63 | (a) | | | 22.63 | (a) | |
* Per share amounts have been calculated using the average shares method.
** Amount represents less than $0.01 per share.
(a) Not Annualized
(b) Annualized
(c) Does not take into account the sales charge of 5.00% for Class A and the contingent deferred sales charge (CDSC) of 1.00% for Class C shares. A contingent deferred sales charge of 1.00% may apply on redemptions of Class A shares made within 18 months following a purchase of $1,000,000 or more without an initial sales charge.
See Notes to Financial Statements.
First Eagle Funds | Semi-Annual Report | April 30, 2016
158
| | | Year Ended October 31, | |
| | | 2015 | | 2014 | |
| | | Class A | | Class C | | Class I | | Class Y | | Class A | | Class C | | Class I | | Class Y | |
Selected data for a share of beneficial interest outstanding throughout
each period is presented below:* | |
Net asset value, beginning of period ($) | | | 38.58 | | | | 32.98 | | | | 39.39 | | | | 39.35 | | | | 34.76 | | | | 29.94 | | | | 35.47 | | | | 35.42 | | |
Income (loss) from investment operations: | |
Net investment income (loss) ($) | | | 0.05 | | | | -0.20 | | | | 0.16 | | | | 0.05 | | | | 0.17 | | | | -0.10 | | | | 0.25 | | | | 0.17 | | |
Net realized and unrealized gains (losses) on
investments | | | -0.01 | | | | -0.00 | ** | | | -0.00 | ** | | | -0.02 | | | | 4.26 | | | | 3.66 | | | | 4.36 | | | | 4.34 | | |
Total income (loss) from investment operations | | | 0.04 | | | | -0.20 | | | | 0.16 | | | | 0.03 | | | | 4.43 | | | | 3.56 | | | | 4.61 | | | | 4.51 | | |
Less distributions: | |
Dividends from net investment income ($) | | | -0.12 | | | | — | | | | -0.22 | | | | -0.11 | | | | -0.09 | | | | — | | | | -0.17 | | | | -0.06 | | |
Distributions from capital gains | | | -2.71 | | | | -2.71 | | | | -2.71 | | | | -2.71 | | | | -0.52 | | | | -0.52 | | | | -0.52 | | | | -0.52 | | |
Total distributions | | | -2.83 | | | | -2.71 | | | | -2.93 | | | | -2.82 | | | | -0.61 | | | | -0.52 | | | | -0.69 | | | | -0.58 | | |
Net asset value, end of period ($) | | | 35.79 | | | | 30.07 | | | | 36.62 | | | | 36.56 | | | | 38.58 | | | | 32.98 | | | | 39.39 | | | | 39.35 | | |
Total return(c) (%) | | | 0.19 | | | | -0.55 | | | | 0.48 | | | | 0.18 | | | | 12.92 | | | | 12.06 | | | | 13.20 | | | | 12.91 | | |
Ratios and supplemental data | |
Net assets, end of period (millions) ($) | | | 1,332 | | | | 742 | | | | 1,168 | | | | 496 | | | | 1,204 | | | | 632 | | | | 888 | | | | 528 | | |
Ratio of operating expenses to average net assets
including earnings credits (%) | | | 1.35 | | | | 2.10 | | | | 1.05 | | | | 1.36 | | | | 1.36 | | | | 2.11 | | | | 1.11 | | | | 1.36 | | |
Ratio of operating expenses to average net assets
excluding earnings credits (%) | | | 1.35 | | | | 2.10 | | | | 1.05 | | | | 1.36 | | | | 1.36 | | | | 2.11 | | | | 1.11 | | | | 1.36 | | |
Ratio of net investment income (loss) to average
net assets including earnings credits (%) | | | 0.12 | | | | -0.63 | | | | 0.41 | | | | 0.12 | | | | 0.45 | | | | -0.31 | | | | 0.66 | | | | 0.45 | | |
Ratio of net investment income (loss) to average
net assets excluding earnings credits (%) | | | 0.12 | | | | -0.63 | | | | 0.41 | | | | 0.12 | | | | 0.45 | | | | -0.31 | | | | 0.66 | | | | 0.45 | | |
Portfolio turnover rate (%) | | | 32.23 | | | | 32.23 | | | | 32.23 | | | | 32.23 | | | | 35.18 | | | | 35.18 | | | | 35.18 | | | | 35.18 | | |
First Eagle Funds | Semi-Annual Report | April 30, 2016
159
First Eagle Fund of America
Financial Highlights (continued)
| | | Year Ended October 31, | |
| | | 2013 | |
| | | Class A | | Class C | | Class I^ | | Class Y | |
Selected data for a share of beneficial interest outstanding throughout
each period is presented below:* | |
Net asset value, beginning of period ($) | | | 26.86 | | | | 23.30 | | | | 31.01 | | | | 27.37 | | |
Income (loss) from investment operations: | |
Net investment income (loss) ($) | | | 0.10 | | | | -0.12 | | | | 0.07 | | | | 0.12 | | |
Net realized and unrealized gains (losses) on investments | | | 7.81 | | | | 6.76 | | | | 4.39 | | | | 7.94 | | |
Total income (loss) from investment operations | | | 7.91 | | | | 6.64 | | | | 4.46 | | | | 8.06 | | |
Less distributions: | |
Dividends from net investment income ($) | | | -0.01 | | | | — | | | | — | | | | -0.01 | | |
Distributions from capital gains | | | — | | | | — | | | | — | | | | — | | |
Total distributions | | | -0.01 | | | | — | | | | — | | | | -0.01 | | |
Net asset value, end of period ($) | | | 34.76 | | | | 29.94 | | | | 35.47 | | | | 35.42 | | |
Total return(c) (%) | | | 29.45 | | | | 28.44 | | | | 14.38 | (a) | | | 29.45 | | |
Ratios and supplemental data | |
Net assets, end of period (millions) ($) | | | 1,036 | | | | 455 | | | | 491 | | | | 504 | | |
Ratio of operating expenses to average net assets
including earnings credits (%) | | | 1.41 | | | | 2.16 | | | | 1.19 | (b) | | | 1.41 | | |
Ratio of operating expenses to average net assets
excluding earnings credits (%) | | | 1.41 | | | | 2.16 | | | | 1.19 | (b) | | | 1.41 | | |
Ratio of net investment income (loss) to average
net assets including earnings credits (%) | | | 0.31 | | | | -0.46 | | | | 0.34 | (b) | | | 0.39 | | |
Ratio of net investment income (loss) to average
net assets excluding earnings credits (%) | | | 0.31 | | | | -0.46 | | | | 0.34 | (b) | | | 0.39 | | |
Portfolio turnover rate (%) | | | 32.12 | | | | 32.12 | | | | 32.12 | (a) | | | 32.12 | | |
^ Class I commenced investment operations on March 8, 2013.
* Per share amounts have been calculated using the average shares method.
(a) Not Annualized
(b) Annualized
(c) Does not take into account the sales charge of 5.00% for Class A and the contingent deferred sales charge (CDSC) of 1.00% for Class C shares. A contingent deferred sales charge of 1.00% may apply on redemptions of Class A shares made within 18 months following a purchase of $1,000,000 or more without an initial sales charge.
See Notes to Financial Statements.
First Eagle Funds | Semi-Annual Report | April 30, 2016
160
| | | Year Ended October 31, | |
| | | 2012 | | 2011 | |
| | | Class A | | Class C | | Class Y | | Class A | | Class C | | Class Y | |
Selected data for a share of beneficial interest outstanding throughout
each period is presented below:* | |
Net asset value, beginning of period ($) | | | 24.91 | | | | 22.01 | | | | 25.35 | | | | 24.06 | | | | 21.32 | | | | 24.47 | | |
Income (loss) from investment operations: | |
Net investment income (loss) ($) | | | 0.04 | | | | -0.13 | | | | 0.04 | | | | -0.09 | | | | -0.25 | | | | -0.08 | | |
Net realized and unrealized gains (losses) on investments | | | 3.73 | | | | 3.24 | | | | 3.80 | | | | 1.11 | | | | 0.98 | | | | 1.12 | | |
Total income (loss) from investment operations | | | 3.77 | | | | 3.11 | | | | 3.84 | | | | 1.02 | | | | 0.73 | | | | 1.04 | | |
Less distributions: | |
Dividends from net investment income ($) | | | — | | | | — | | | | — | | | | -0.17 | | | | -0.04 | | | | -0.16 | | |
Distributions from capital gains | | | -1.82 | | | | -1.82 | | | | -1.82 | | | | — | | | | — | | | | — | | |
Total distributions | | | -1.82 | | | | -1.82 | | | | -1.82 | | | | -0.17 | | | | -0.04 | | | | -0.16 | | |
Net asset value, end of period ($) | | | 26.86 | | | | 23.30 | | | | 27.37 | | | | 24.91 | | | | 22.01 | | | | 25.35 | | |
Total return(c) (%) | | | 16.46 | | | | 15.62 | | | | 16.50 | | | | 4.22 | | | | 3.43 | | | | 4.20 | | |
Ratios and supplemental data | |
Net assets, end of period (millions) ($) | | | 699 | | | | 246 | | | | 667 | | | | 549 | | | | 194 | | | | 633 | | |
Ratio of operating expenses to average net assets
including earnings credits (%) | | | 1.44 | | | | 2.19 | | | | 1.44 | | | | 1.43 | | | | 2.18 | | | | 1.43 | | |
Ratio of operating expenses to average net assets
excluding earnings credits (%) | | | 1.44 | | | | 2.19 | | | | 1.44 | | | | 1.43 | | | | 2.18 | | | | 1.43 | | |
Ratio of net investment income (loss) to average
net assets including earnings credits (%) | | | 0.14 | | | | -0.61 | | | | 0.14 | | | | -0.33 | | | | -1.08 | | | | -0.31 | | |
Ratio of net investment income (loss) to average
net assets excluding earnings credits (%) | | | 0.14 | | | | -0.61 | | | | 0.14 | | | | -0.33 | | | | -1.08 | | | | -0.31 | | |
Portfolio turnover rate (%) | | | 31.48 | | | | 31.48 | | | | 31.48 | | | | 67.61 | | | | 67.61 | | | | 67.61 | | |
First Eagle Funds | Semi-Annual Report | April 30, 2016
161
Notes to Financial Statements (unaudited)
Note 1 — Significant Accounting Policies
First Eagle Funds (the "Trust"), is an open-end management investment company registered under the Investment Company Act of 1940, as amended ("1940 Act"). The Trust consists of eight separate portfolios, First Eagle Global Fund, First Eagle Overseas Fund, First Eagle U.S. Value Fund, First Eagle Gold Fund, First Eagle Global Income Builder Fund, First Eagle High Yield Fund, First Eagle Fund of America and First Eagle Absolute Return Fund (each individually a "Fund" or collectively the "Funds"). All the Funds are diversified mutual funds except for First Eagle Gold Fund, First Eagle Absolute Return Fund and First Eagle Fund of America, which are non-diversified. The Trust is a Delaware statutory trust. The First Eagle Global Fund seeks long-term growth of capital by investing in a range of asset classes from markets in the United States and throughout the world. The First Eagle Overseas Fund seeks long-term growth of capital by investing primarily in equities issued by non-U.S. corporations. The First Eagle U.S. Value Fund seeks long-term growth of capital by investing, under normal market conditions, at least 80% of its assets in domestic equity and debt securities. The First Eagle Gold Fund seeks to provide investors the opportunity to participate in the investment characteristics of gold (and to a limited extent other precious metals) for a portion of their overall investment portfolio. The First Eagle Global Income Builder Fund seeks current income generation and long-term growth of capital. The First Eagle High Yield Fund seeks to provide investors with a high level of current income. The First Eagle Fund of America seeks capital appreciation by investing primarily in domestic stocks and, to a lesser extent, in debt and equity securities. No results are presented in these financial statements for First Eagle Absolute Return Fund, which is described in a prospectus and annual report separate from that for the other seven Funds discussed here. The Board of Trustees of the Trust voted on June 9, 2016 to liquidate and dissolve the First Eagle Absolute Return Fund.
Effective at the close of business on Friday, May 9, 2014, the First Eagle Overseas Fund is closed to new investors, subject to certain limited exceptions. Additionally, Class Y on First Eagle Fund of America is closed to new investors, subject to certain limited exceptions. Additional information can be found in the prospectus.
First Eagle Investment Management, LLC (the "Adviser"), a subsidiary of First Eagle Holdings, Inc. ("First Eagle Holdings"), manages the Funds. Private equity funds managed by The Blackstone Group, LP and Corsair Capital LLC and certain co-investors own a controlling interest in First Eagle Holdings.
The following is a summary of significant accounting policies that are adhered to by the Funds. The Funds are investment companies and, accordingly, follow the investment company accounting and reporting guidance of the Financial Accounting Standards Board Accounting Standards Codification Topic 946—Investment Companies, which is part of U.S. generally accepted accounting principles ("GAAP").
a) Investments in Subsidiaries — The First Eagle Global Fund (the "Global Fund"), First Eagle Overseas Fund (the "Overseas Fund"), First Eagle U.S. Value Fund (the "U.S. Value Fund"), and First Eagle Gold Fund (the "Gold Fund") may invest in certain precious metals through their investment in the First Eagle Global Cayman Fund, Ltd., First Eagle Overseas Cayman
First Eagle Funds | Semi-Annual Report | April 30, 2016
162
Notes to Financial Statements (unaudited)
Fund, Ltd., First Eagle U.S. Value Cayman Fund, Ltd., and First Eagle Gold Cayman Fund, Ltd., respectively, each a wholly owned subsidiary (each referred to herein as a "Subsidiary" or collectively " the Subsidiaries"). Each Fund may invest up to 25% of its total assets in shares of its respective Subsidiary. Each Subsidiary has the ability to invest in commodities and securities consistent with the investment objective of its respective Fund. Substantially all of each Subsidiary's assets represent physical gold (bullion). Trading in bullion directly by the Funds presents the risk of tax consequences (e.g., a change in the Funds' tax status subjecting the Funds to be taxed at the Fund level on all of their income if the Funds' "non-qualifying income" exceeds 10% of the Funds' gross income in any taxable year). Trading in bullion by the Subsidiaries generally does not present the same tax risks.
The First Eagle Global Cayman Fund, Ltd., established on October 18, 2013, is an exempted company under the laws of the Cayman Islands. The consolidated financial statements include the accounts of the Global Fund and the First Eagle Global Cayman Fund, Ltd. All intercompany transactions and balances have been eliminated. As of April 30, 2016, the First Eagle Global Cayman Fund, Ltd. has $3,082,349,069 in net assets, representing 6.41% of the Global Fund's net assets.
The First Eagle Overseas Cayman Fund, Ltd., established on October 18, 2013, is an exempted company under the laws of the Cayman Islands. The consolidated financial statements include the accounts of the Overseas Fund and the First Eagle Overseas Cayman Fund, Ltd. All intercompany transactions and balances have been eliminated. As of April 30, 2016, the First Eagle Overseas Cayman Fund, Ltd. has $635,312,257 in net assets, representing 4.43% of the Overseas Fund's net assets.
The First Eagle U.S. Value Cayman Fund, Ltd., established on January 24, 2012, is an exempted company under the laws of the Cayman Islands. The consolidated financial statements include the accounts of the U.S. Value Fund and the First Eagle U.S. Value Cayman Fund, Ltd. All intercompany transactions and balances have been eliminated. As of April 30, 2016, the First Eagle U.S. Value Cayman Fund, Ltd. has $201,952,623 in net assets, representing 9.03% of the U.S. Value Fund's net assets.
The First Eagle Gold Cayman Fund, Ltd., established on May 28, 2010, is an exempted company under the laws of the Cayman Islands. The consolidated financial statements include the accounts of the Gold Fund and the First Eagle Gold Cayman Fund, Ltd. All intercompany transactions and balances have been eliminated. As of April 30, 2016, the First Eagle Gold Cayman Fund, Ltd. has $224,481,331 in net assets, representing 18.31% of the Gold Fund's net assets.
b) Investment valuation — Each Fund computes its net asset value once daily as of the close of trading on each day the New York Stock Exchange ("NYSE") is open for trading. The net asset value per share is computed by dividing the total current value of the assets of a Fund, less its liabilities, by the total number of shares outstanding at the time of such computation.
A portfolio security (including an option), other than a bond, which is traded on a U.S. national securities exchange or a securities exchange abroad is generally valued at the price of the last sale on the exchange as of the close of business on the date on which assets are valued.
First Eagle Funds | Semi-Annual Report | April 30, 2016
163
Notes to Financial Statements (unaudited)
If there are no sales on such date, such portfolio investment will be valued at the mean between the closing bid and asked prices (and if there is only a bid or only an asked price on such date, valuation will be at such bid or asked price for long or short positions, respectively). Securities, other than bonds, traded in the over-the-counter market are valued at the mean between the last bid and asked prices prior to the time of valuation (and if there is only a bid or only an asked price on such date, valuation will be at such bid or asked price for long or short positions, respectively), except if such unlisted security traded on the NASDAQ, in which case it is valued at its last sale price (or, if available, the NASDAQ Official Closing Price).
Prior to December 31, 2015, all bonds, whether listed on an exchange or traded in the over-the-counter market, for which market quotations were readily available were valued at the mean between the bid and ask prices provided by an approved pricing service, or received from dealers in the over-the-counter market in the United States or abroad. Effective December 31, 2015, all bonds, whether listed on an exchange or traded in the over-counter-market, for which market quotations are readily available, are generally priced at the evaluated bid price. Broker-Dealers or pricing services use multiple valuation techniques to determine value. In instances where sufficient market activity exists, dealers or pricing services may utilize a market-based approach through which quotes from market makers are used to determine fair value. In instances where sufficient market activity may not exist or is limited, the dealers or pricing services also utilize proprietary valuation models which may consider market transactions in comparable securities and the various relationships between securities in determining value and/or market characteristics such as benchmark yield curves, option-adjusted spreads, credit spreads, estimated default rates, coupon-rates, anticipated timing of principal repayments, underlying collateral, and other unique security features in order to estimate the relevant cash flows, which are then discounted to calculate the fair values. Between December 15, 2014 and December 31, 2015, short-term investments, maturing in sixty days or less, were valued at market price; prior to December 15, 2014, they were valued at amortized cost. Effective December 31, 2015, short-term investments, maturing in sixty days or less, are valued at evaluated bid prices.
Commodities (such as physical metals) are valued at the spot price at the time trading on the NYSE closes (normally 4:00 p.m. E.S.T.), as provided by an independent pricing source.
Forward contracts are valued at the current cost of covering or offsetting such contracts by reference to forward currency rates at the time the NYSE closes (normally 4:00 p.m. E.S.T.).
The 4:00 p.m. E.S.T. exchange rates are used to convert foreign security prices into U.S. dollars.
Any security that is listed or traded on more than one exchange (or traded in multiple markets) is valued at the relevant quotation on the primary exchange or market on which they are traded. In the absence of such a quotation, a security may be valued at the last quoted sales price on the most active exchange or market. The Funds use pricing services to identify the market prices of publicly traded securities in their portfolios. When market prices are determined to be "stale" as a result of limited market activity for a particular holding, or in other circumstances when market prices are unavailable, such as for private placements, or determined to be unreliable for a particular holding, such holdings may be "fair valued" in accordance with procedures approved
First Eagle Funds | Semi-Annual Report | April 30, 2016
164
Notes to Financial Statements (unaudited)
by the Board of Trustees ("Board"). Additionally, with respect to foreign holdings, specifically in circumstances leading the Adviser to believe that significant events occurring after the close of a foreign market have materially affected the value of a Fund's holdings in that market, such holdings may be fair valued to reflect the events in accordance with procedures approved by the Board. The determination of whether a particular foreign investment should be fair valued will be based on review of a number of factors, including developments in foreign markets, the performance of U.S. securities markets and security-specific events. The values assigned to a Fund's holdings therefore may differ on occasion from reported market values.
Certain Funds with non-U.S. holdings have adopted procedures under which movements in the prices for U.S. securities (beyond specified thresholds) occurring after the close of a foreign market may require fair valuation of securities traded in that foreign market. The values assigned to a Fund's foreign holdings therefore may differ on occasion from reported market values. The Board and the Adviser believe relying on the procedures as just described will result in prices that are more reflective of the actual market value of portfolio securities held by the Funds as of 4:00 p.m. E.S.T.
The Funds adopted provisions surrounding fair value measurements and disclosures that define fair value, establish a framework for measuring fair value in GAAP and expand disclosures about fair value measurements. This applies to fair value measurements that are already required or permitted by other accounting standards and is intended to increase consistency of those measurements and applies broadly to securities and other types of assets and liabilities.
The Funds disclose the fair value of their investments in a hierarchy that prioritizes the inputs or assumptions to valuation techniques used to measure fair value. These inputs are used in determining the value of the Funds' investments and are summarized in the following fair value hierarchy:
Level 1 — Quoted prices in active markets for identical securities.
Level 2 — Other significant observable inputs (including quoted prices for similar securities, interest rates, prepayment speeds, credit risk, etc.).
Level 3 — Other significant unobservable inputs (including the Fund's own assumption in determining the fair value of investments).
The significant unobservable inputs that may be used in determining valuations for investments identified within Level 3 are market comparables and the enterprise value of a company. Indications of value and quotations may be observable at any given time, but are currently treated by the Funds as unobservable. Significant changes in any of the unobservable inputs may significantly impact the fair value measurement. The impact is based on the relationship between each unobservable input and the fair value measurement.
Significant increases (decreases) in enterprise multiples may increase (decrease) the fair value measurement. Significant increases (decreases) in the discount for marketability, probability of insolvency and probability of default may decrease (increase) the fair value measurement.
First Eagle Funds | Semi-Annual Report | April 30, 2016
165
Notes to Financial Statements (unaudited)
Fair valuation of securities, other financial investments or other assets (collectively, "securities") held by the Funds shall be determined in good faith under the supervision and responsibility of the Board. The Board has created a Board Valuation Committee (the "Committee") to oversee the execution of the valuation and liquidity procedures for the Fund.
It is the policy of the Funds to recognize significant transfers between Levels 1, 2 and 3 and to disclose those transfers as of the date of the underlying event which caused the movement.
The following is a summary of the Funds' inputs used to value the Funds' investments as of April 30, 2016:
First Eagle Global Fund
Description | | Level 1 | | Level 2(a) | | Level 3 | | Total | |
Assets:† | |
International
Common Stocks | | $ | 18,804,800,242 | | | $ | 78,315,127 | | | $ | 158,101,459 | | | $ | 19,041,216,828 | | |
U.S. Common Stocks | | | 17,075,629,652 | | | | 608,146 | | | | — | | | | 17,076,237,798 | | |
Investment Company | | | 139,031 | | | | — | | | | — | | | | 139,031 | | |
Warrant | | | 52,304,780 | | | | — | | | | — | | | | 52,304,780 | | |
Commodity* | | | 3,476,215,602 | | | | — | | | | — | | | | 3,476,215,602 | | |
Government Obligations | | | — | | | | 1,001,096,250 | | | | — | | | | 1,001,096,250 | | |
U.S. Corporate Bond | | | — | | | | 4,900,827 | | | | — | | | | 4,900,827 | | |
International Corporate
Notes and Bonds | | | — | | | | 18,502,758 | | | | 30,916,361 | | | | 49,419,119 | | |
International Government
Bonds | | | — | | | | 549,095,276 | | | | — | | | | 549,095,276 | | |
International Commercial
Paper | | | — | | | | 2,746,381,297 | | | | — | | | | 2,746,381,297 | | |
U.S. Commercial Paper | | | — | | | | 3,977,017,466 | | | | — | | | | 3,977,017,466 | | |
Total | | $ | 39,409,089,307 | | | $ | 8,375,917,147 | | | $ | 189,017,820 | | | $ | 47,974,024,274 | | |
Liabilities: | |
Foreign Currency Contracts** | | $ | — | | | $ | 20,369,502 | | | $ | — | | | $ | 20,369,502 | | |
Total | | $ | — | | | $ | 20,369,502 | | | $ | — | | | $ | 20,369,502 | | |
(a) Transfers into/out of Level 2 represent value as of the beginning of the period. An international common stock valued at $86,985,513 was transferred from Level 1 to Level 2 during the six-month period ended April 30, 2016. At October 31, 2015, this security was valued using quoted market prices in active markets; at April 30, 2016, this security was valued based on fair value adjustment factors. An international common stock valued at $90,547,871 was transferred from Level 1 to Level 3 during the six-month period ended April 30, 2016. At October 31, 2015, this security was valued using quoted market prices in active markets; at April 30, 2016, this security was valued using other significant unobservable inputs. There was no security transfer activity from Level 2 to Level 1 as of the six-month period ended April 30, 2016.
First Eagle Funds | Semi-Annual Report | April 30, 2016
166
Notes to Financial Statements (unaudited)
† See Consolidated Schedule of Investments for additional detailed categorizations.
* Represents gold bullion.
** Foreign currency contracts are valued at net unrealized appreciation (depreciation) on the investment.
Fair Value Level 3 activity for the period ended April 30, 2016 was as follows:
First Eagle Global Fund (continued)
| | | International
Common Stocks | | International
Corporate
Notes and Bonds | | Total
Value | |
Beginning Balance — market value | | $ | 9,098,334 | | | $ | 35,470,356 | | | $ | 44,568,690 | | |
Purchases | | | — | | | | 35,817,442 | | | | 35,817,442 | | |
Sales | | | — | | | | (41,444,027 | ) | | | (41,444,027 | ) | |
Transfer In — Level 3 | | | 90,547,871 | | | | — | | | | 90,547,871 | | |
Transfer Out — Level 3 | | | — | | | | — | | | | — | | |
Accrued Amortization | | | — | | | | — | | | | — | | |
Realized Gains (Losses) | | | — | | | | (1,480,654 | ) | | | (1,480,654 | ) | |
Change in Unrealized Appreciation (Depreciation) | | | 58,455,254 | | | | 2,553,244 | | | | 61,008,498 | | |
Ending Balance — market value | | $ | 158,101,459 | | | $ | 30,916,361 | | | $ | 189,017,820 | | |
Change in unrealized gains or (losses) relating to
assets still held at reporting date | | $ | 58,455,254 | | | $ | 2,553,244 | | | $ | 61,008,498 | | |
First Eagle Funds | Semi-Annual Report | April 30, 2016
167
Notes to Financial Statements (unaudited)
First Eagle Overseas Fund
Description | | Level 1 | | Level 2(a) | | Level 3 | | Total | |
Assets:† | |
International Common
Stocks | | $ | 10,507,096,371 | | | $ | 37,417,050 | | | $ | 144,706,438 | | | $ | 10,689,219,859 | | |
U.S. Common Stock | | | 34,531,736 | | | | — | | | | — | | | | 34,531,736 | | |
International Preferred Stock | | | 6,417,612 | | | | — | | | | — | | | | 6,417,612 | | |
Investment Company | | | 52,824 | | | | — | | | | — | | | | 52,824 | | |
Right | | | — | | | | — | | | | — | ^ | | | — | ^ | �� |
Commodity* | | | 893,232,420 | | | | — | | | | — | | | | 893,232,420 | | |
Term Loans | | | — | | | | — | | | | 1,895,919 | | | | 1,895,919 | | |
Government Obligation | | | — | | | | 10,016,020 | | | | — | | | | 10,016,020 | | |
International Corporate
Bonds | | | — | | | | — | | | | 20,610,907 | | | | 20,610,907 | | |
International Government
Bonds | | | — | | | | 285,208,982 | | | | — | | | | 285,208,982 | | |
International Commercial
Paper | | | — | | | | 1,023,300,927 | | | | — | | | | 1,023,300,927 | | |
U.S. Commercial Paper | | | — | | | | 1,287,372,882 | | | | — | | | | 1,287,372,882 | | |
Total | | $ | 11,441,330,963 | | | $ | 2,643,315,861 | | | $ | 167,213,264 | | | $ | 14,251,860,088 | | |
Liabilities: | |
Foreign Currency Contracts** | | $ | — | | | $ | 11,557,308 | | | $ | — | | | $ | 11,557,308 | | |
Total | | $ | — | | | $ | 11,557,308 | | | $ | — | | | $ | 11,557,308 | | |
(a) Transfers into/out of Level 2 represent value as of the beginning of the period. An international common stock valued at $41,559,548 was transferred from Level 1 to Level 2 during the six-month period ended April 30, 2016. At October 31, 2015, this security was valued using quoted market prices in active markets; at April 30, 2016, this security was valued based on fair value adjustment factors. An international common stock valued at $61,630,126 was transferred from Level 1 to Level 3 during the six-month period ended April 30, 2016. At October 31, 2015, this security was valued using quoted market prices in active markets; at April 30, 2016, this security was valued using other significant unobservable inputs. There was no security transfer activity from Level 2 to Level 1 as of the six-month period ended April 30, 2016.
† See Consolidated Schedule of Investments for additional detailed categorizations.
^ Fair value represents zero.
* Represents gold bullion.
** Foreign currency contracts are valued at net unrealized appreciation (depreciation) on the investment.
First Eagle Funds | Semi-Annual Report | April 30, 2016
168
Notes to Financial Statements (unaudited)
Fair Value Level 3 activity for the period ended April 30, 2016 was as follows:
First Eagle Overseas Fund (continued)
| | | International
Common
Stocks | | Right | | Term
Loans | | International
Corporate
Notes and
Bonds | | Total
Value | |
Beginning Balance —
market value | | $ | 31,100,511 | | | $ | — | ^ | | $ | 2,975,177 | | | $ | 23,646,904 | | | $ | 57,722,592 | | |
Purchases | | | 636,263 | | | | | | | | — | | | | 23,878,379 | | | | 24,514,642 | | |
Sales | | | — | | | | — | | | | (3,461,056 | ) | | | (27,621,564 | ) | | | (31,082,620 | ) | |
Transfer In — Level 3 | | | 61,630,126 | | | | — | | | | — | | | | — | | | | 61,630,126 | | |
Transfer Out — Level 3 | | | — | | | | — | | | | — | | | | — | | | | — | | |
Accrued Amortization | | | — | | | | — | | | | — | | | | — | | | | — | | |
Realized Gains (Losses) | | | — | | | | — | | | | (870,941 | ) | | | (985,169 | ) | | | (1,856,110 | ) | |
Change in Unrealized
Appreciation (Depreciation) | | | 51,339,538 | | | | — | | | | 3,252,739 | | | | 1,692,357 | | | | 56,284,634 | | |
Ending Balance —
market value | | $ | 144,706,438 | | | $ | — | ^ | | $ | 1,895,919 | | | $ | 20,610,907 | | | $ | 167,213,264 | | |
Change in unrealized gains or
(losses) relating to assets still
held at reporting date | | $ | 51,339,538 | | | $ | — | | | $ | 1,906,010 | | | $ | 1,692,357 | | | $ | 54,937,905 | | |
^Fair value represents zero.
First Eagle Funds | Semi-Annual Report | April 30, 2016
169
Notes to Financial Statements (unaudited)
First Eagle U.S. Value Fund
Description | | Level 1 | | Level 2 | | Level 3 | | Total | |
Assets:† | |
U.S. Common Stocks | | $ | 1,523,291,651 | | | $ | — | | | $ | — | | | $ | 1,523,291,651 | | |
International Common Stocks | | | 128,137,066 | | | | — | | | | — | | | | 128,137,066 | | |
Investment Company | | | 11,773 | | | | — | | | | — | | | | 11,773 | | |
Warrant | | | 7,997,916 | | | | — | | | | — | | | | 7,997,916 | | |
Commodity* | | | 201,962,287 | | | | — | | | | — | | | | 201,962,287 | | |
U.S. Corporate Bonds | | | — | | | | 6,916,313 | | | | — | | | | 6,916,313 | | |
U.S. Treasury Bills | | | — | | | | 99,979,930 | | | | — | | | | 99,979,930 | | |
International Commercial Paper | | | — | | | | 105,061,349 | | | | — | | | | 105,061,349 | | |
U.S. Commercial Paper | | | — | | | | 162,171,137 | | | | — | | | | 162,171,137 | | |
Total | | $ | 1,861,400,693 | | | $ | 374,128,729 | | | $ | — | | | $ | 2,235,529,422 | | |
†See Consolidated Schedule of Investments for additional detailed categorizations.
* Represents gold bullion.
For the six-month period ended April 30, 2016, there was no security transfer activity from Level 1 to Level 2 and no security transfer activity from Level 2 to Level 1.
First Eagle Gold Fund
Description | | Level 1 | | Level 2 | | Level 3 | | Total | |
Assets:† | |
International Common Stocks | | $ | 755,098,155 | | | $ | — | | | $ | — | | | $ | 755,098,155 | | |
U.S. Common Stocks | | | 167,626,838 | | | | — | | | | — | | | | 167,626,838 | | |
Investment Company | | | 19,155 | | | | — | | | | — | | | | 19,155 | | |
Warrant | | | 158,660 | | | | — | | | | — | | | | 158,660 | | |
Commodities* | | | 224,518,069 | | | | — | | | | — | | | | 224,518,069 | | |
International Convertible Bond | | | — | | | | — | | | | 15,440,625 | (a) | | | 15,440,625 | | |
International Commercial Paper | | | — | | | | 63,585,985 | | | | — | | | | 63,585,985 | | |
U.S. Commercial Paper | | | — | | | | 3,715,400 | | | | — | | | | 3,715,400 | | |
Total | | $ | 1,147,420,877 | | | $ | 67,301,385 | | | $ | 15,440,625 | | | $ | 1,230,162,887 | | |
(a) Represents an international convertible bond that is fair valued using a comparable security from the same issuer that is publicly traded.
† See Consolidated Schedule of Investments for additional detailed categorizations.
* Represents gold and silver bullion.
For the six-month period ended April 30, 2016, there was no security transfer activity from Level 1 to Level 2 and no security transfer activity from Level 2 to Level 1.
First Eagle Funds | Semi-Annual Report | April 30, 2016
170
Notes to Financial Statements (unaudited)
Fair Value Level 3 activity for the period ended April 30, 2016 was as follows:
First Eagle Gold Fund (continued)
| | | International
Convertible Bond | |
Beginning Balance — market value | | $ | 24,140,625 | | |
Purchases | | | — | | |
Sales | | | (9,800,000 | ) | |
Transfer In — Level 3 | | | — | | |
Transfer Out — Level 3 | | | — | | |
Accrued Amortization | | | — | | |
Realized Gains (Losses) | | | (200,000 | ) | |
Change in Unrealized Appreciation (Depreciation) | | | 1,300,000 | | |
Ending Balance — market value | | $ | 15,440,625 | | |
Change in unrealized gains or (losses) relating to assets still held at reporting date | | $ | 1,300,000 | | |
First Eagle Funds | Semi-Annual Report | April 30, 2016
171
Notes to Financial Statements (unaudited)
First Eagle Global Income Builder Fund
Description | | Level 1 | | Level 2(a) | | Level 3 | | Total | |
Assets:† | |
International Common Stocks | | $ | 454,105,637 | | | $ | 1,584,586 | | | $ | 1,192,000 | (b) | | $ | 456,882,223 | | |
U.S. Common Stocks | | | 179,165,407 | | | | — | | | | — | | | | 179,165,407 | | |
U.S. Preferred Stocks | | | 1,832,107 | | | | — | | | | — | | | | 1,832,107 | | |
Investment Company | | | 28,661 | | | | — | | | | — | | | | 28,661 | | |
Commodity* | | | 18,545,146 | | | | — | | | | — | | | | 18,545,146 | | |
U.S. Corporate Bonds | | | — | | | | 247,542,829 | | | | — | | | | 247,542,829 | | |
International Corporate Bonds | | | — | | | | 114,806,875 | | | | — | | | | 114,806,875 | | |
International Government Bonds | | | — | | | | 17,982,570 | | | | — | | | | 17,982,570 | | |
Term Loans | | | — | | | | 11,839,130 | | | | 23,158,691 | (c) | | | 34,997,821 | | |
International Commercial Paper | | | — | | | | 111,483,836 | | | | — | | | | 111,483,836 | | |
Total | | $ | 653,676,958 | | | $ | 505,239,826 | | | $ | 24,350,691 | | | $ | 1,183,267,475 | | |
Liabilities: | |
Foreign Currency Contracts** | | $ | — | | | $ | 672,651 | | | $ | — | | | $ | 672,651 | | |
Total | | $ | — | | | $ | 672,651 | | | $ | — | | | $ | 672,651 | | |
(a) Transfers into/out of Level 2 represent value as of the beginning of the period. An international common stock valued at $1,760,018 was transferred from Level 1 to Level 2 during the six-month period ended April 30, 2016. At October 31, 2015, this security was valued using quoted market prices in active markets; at April 30, 2016, this security was valued based on fair value adjustment factors. Term loans valued at $19,658,309 were transferred from Level 2 to Level 3 during the six-month period ended April 30, 2016. At October 31, 2015, these securities were valued by brokers and pricing services; at April 30, 2016, these securities were valued using other significant unobservable inputs. There was no security transfer activity from Level 2 to Level 1 as of the six-month period ended April 30, 2016.
(b) Represents an international common stock that is fair valued using a comparable security from the same issuer that is publicly traded.
(c) These investments are valued by brokers and pricing services. The inputs for these investments are not readily available or cannot be reasonably estimated and are generally those inputs described in Note (b).
† See Schedule of Investments for additional detailed categorizations.
* Represents gold bullion.
** Foreign currency contracts are valued at net unrealized appreciation (depreciation) on the investment.
First Eagle Funds | Semi-Annual Report | April 30, 2016
172
Notes to Financial Statements (unaudited)
Fair Value Level 3 activity for the period ended April 30, 2016 was as follows:
First Eagle Global Income Builder Fund (continued)
| | | International
Common Stock | | Term
Loans | | Total
Value | |
Beginning Balance — market value | | $ | 1,490,000 | | | $ | 8,549,033 | | | $ | 10,039,033 | | |
Purchases | | | — | | | | — | | | | — | | |
Sales | | | — | | | | (912,313 | ) | | | (912,313 | ) | |
Transfer In — Level 3 | | | — | | | | 19,658,309 | | | | 19,658,309 | | |
Transfer Out — Level 3 | | | — | | | | — | | | | — | | |
Accrued Amortization | | | — | | | | 31,199 | | | | 31,199 | | |
Realized Gains (Losses) | | | — | | | | 3,714 | | | | 3,714 | | |
Change in Unrealized Appreciation (Depreciation) | | | (298,000 | ) | | | (4,171,251 | ) | | | (4,469,251 | ) | |
Ending Balance — market value | | $ | 1,192,000 | | | $ | 23,158,691 | | | $ | 24,350,691 | | |
Change in unrealized gains or (losses) relating to
assets still held at reporting date | | $ | (298,000 | ) | | $ | (4,171,251 | ) | | $ | (4,469,251 | ) | |
First Eagle Funds | Semi-Annual Report | April 30, 2016
173
Notes to Financial Statements (unaudited)
First Eagle High Yield Fund
Description | | Level 1 | | Level 2(a) | | Level 3 | | Total | |
Assets:† | |
U.S. Common Stock | | $ | — | | | $ | 114,737 | | | $ | — | | | $ | 114,737 | | |
U.S. Corporate Bonds | | | — | | | | 327,689,450 | | | | 17,518,905 | (b) | | | 345,208,355 | | |
International Corporate Bonds | | | — | | | | 114,103,541 | | | | — | | | | 114,103,541 | | |
Term Loans | | | — | | | | 48,943,968 | | | | 25,893,602 | (b) | | | 74,837,570 | | |
International Commercial Paper | | | — | | | | 55,690,419 | | | | — | | | | 55,690,419 | | |
Investment Company | | | 202,307 | | | | — | | | | — | | | | 202,307 | | |
Foreign Currency Contracts* | | | — | | | | 408 | | | | — | | | | 408 | | |
Total | | $ | 202,307 | | | $ | 546,542,523 | | | $ | 43,412,507 | | | $ | 590,157,337 | | |
Liabilities: | |
Foreign Currency Contracts* | | $ | — | | | $ | 140,953 | | | $ | — | | | $ | 140,953 | | |
Total | | $ | — | | | $ | 140,953 | | | $ | — | | | $ | 140,953 | | |
(a) Transfers into/out of Level 2 represent value as of the beginning of the period. U.S. corporate bonds valued at $22,174,381 were transferred from Level 2 to Level 3 during the six-month period ended April 30, 2016. At October 31, 2015, these securities were valued by brokers and pricing services; at April 30, 2016, these securities were valued using other significant unobservable inputs. Term loans valued at $12,477,675 were transferred from Level 2 to Level 3 during the six-month period ended April 30, 2016. At October 31, 2015, these securities were valued by brokers and pricing services; at April 30, 2016, these securities were valued using other significant unobservable inputs. Term loans valued at $13,026,247 were transferred from Level 3 to Level 2 during the six-month period ended April 30, 2016. At October 31, 2015, these securities were valued using other significant unobservable inputs; at April 30, 2016, these securities were valued by brokers and pricing services. There was no security transfer activity from Level 1 to Level 2 and no security transfer activity from Level 2 to Level 1 as of the six-month period ended April 30, 2016.
(b) These investments are valued by brokers and pricing services. The inputs for these investments are not readily available or cannot be reasonably estimated and are generally those inputs described in Note (b).
† See Schedule of Investments for additional detailed categorizations.
* Foreign currency contracts are valued at net unrealized appreciation (depreciation) on the investment.
First Eagle Funds | Semi-Annual Report | April 30, 2016
174
Notes to Financial Statements (unaudited)
Fair Value Level 3 activity for the period ended April 30, 2016 was as follows:
First Eagle High Yield Fund (continued)
| | | U.S. Corporate
Bonds | | International
Corporate
Bonds | | Term
Loans | | Total
Value | |
Beginning Balance — market value | | $ | 1,490,680 | | | $ | 12,494,111 | | | $ | 34,957,320 | | | $ | 48,942,111 | | |
Purchases | | | 1,036,360 | | | | — | | | | 523,559 | | | | 1,559,919 | | |
Sales | | | (4,273,082 | ) | | | (9,371,054 | ) | | | (3,602,517 | ) | | | (17,246,653 | ) | |
Transfer In — Level 3 | | | 22,174,381 | | | | — | | | | 12,477,675 | | | | 34,652,056 | | |
Transfer Out — Level 3 | | | — | | | | — | | | | (13,026,247 | ) | | | (13,026,247 | ) | |
Accrued Amortization | | | 177,694 | | | | 10,810 | | | | 36,397 | | | | 224,901 | | |
Realized Gains (Losses) | | | (300,852 | ) | | | (10,930,397 | ) | | | (155,471 | ) | | | (11,386,720 | ) | |
Change in Unrealized Appreciation
(Depreciation) | | | (2,786,276 | ) | | | 7,796,530 | | | | (5,317,114 | ) | | | (306,860 | ) | |
Ending Balance — market value | | $ | 17,518,905 | | | $ | — | | | $ | 25,893,602 | | | $ | 43,412,507 | | |
Change in unrealized gains or
(losses) relating to assets still
held at reporting date | | $ | (4,874,527 | ) | | $ | — | | | $ | (5,317,114 | ) | | $ | (10,191,641 | ) | |
First Eagle Fund of America
Description | | Level 1 | | Level 2 | | Level 3 | | Total | |
Assets:† | |
U.S. Common Stocks | | $ | 2,926,179,370 | | | $ | — | | | $ | — | | | $ | 2,926,179,370 | | |
International Common Stock | | | 131,812,768 | | | | — | | | | — | | | | 131,812,768 | | |
Investment Company | | | 291,731,263 | | | | — | | | | — | | | | 291,731,263 | | |
Total | | $ | 3,349,723,401 | | | $ | — | | | $ | — | | | $ | 3,349,723,401 | | |
Liabilities: | |
Covered Call Options Written | | $ | 71,262,521 | | | $ | — | | | $ | — | | | $ | 71,262,521 | | |
Total | | $ | 71,262,521 | | | $ | — | | | $ | — | | | $ | 71,262,521 | | |
†See Schedule of Investments for additional detailed categorizations.
For the six-month period ended April 30, 2016, there was no security transfer activity from Level 1 to Level 2 and no security transfer activity from Level 2 to Level 1.
The significant unobservable inputs used in the fair value measurement of the Funds' investments are disclosed after each table, if applicable. Generally, a change in the assumptions used in any input in isolation may be accompanied by a change in another input. Significant changes in any of the unobservable inputs may significantly impact the fair value measurement. The impact is based on the relationship between each unobservable input and the fair value measurement.
First Eagle Funds | Semi-Annual Report | April 30, 2016
175
Notes to Financial Statements (unaudited)
c) Investment transactions and income — Investment transactions are accounted for on a trade date basis. The specific identification method is used in determining realized gains and losses from investment transactions. Dividend income is recorded on the ex-dividend date. Interest income is recorded daily on the accrual basis. In computing investment income, each Fund accretes discounts and amortizes premiums on debt obligations using the effective yield method. Investment income is allocated to each Fund's share class in proportion to its relative net assets. Payments received from certain investments held by the Funds may be comprised of dividends, capital gains and return of capital. The Funds originally estimate the expected classification of such payments. The amounts may subsequently be reclassified upon receipt of information from the issuer.
d) Expenses — Expenses arising in connection with a Fund are charged directly to that Fund. Expenses common to all Funds may be allocated to each Fund in proportion to its relative net assets. Certain expenses are shared with the First Eagle Absolute Return Fund and the First Eagle Variable Funds, an affiliated fund group. Such costs are generally allocated using the ratio of the Fund's average daily net assets relative to the total average daily net assets of the First Eagle Absolute Return Fund and the First Eagle Variable Funds. Earnings credits may reduce shareholder servicing agent fees by the amount of interest earned on balances with such service provider.
e) Foreign currency translation — The books and records of the Funds are maintained in U.S. dollars. The market values of securities which are not traded in U.S. currency are recorded in the financial statements after translation to U.S. dollars based on the applicable exchange rates at the end of the period. The costs of such securities are translated at exchange rates prevailing when acquired. Related interest, dividends and withholding taxes are accrued at the rates of exchange prevailing on the respective dates of such transactions.
The net assets of each of the Funds are presented at the foreign exchange rates and market values at the close of the period. The Funds do not isolate that portion of gains and losses on investments which is due to changes in foreign exchange rates from that which is due to changes in market prices of the securities. Accordingly, such foreign currency gains (losses) are included in the reported net realized and unrealized gains (losses) on investment transactions on the Statements of Operations. However, for federal income tax purposes each Fund does isolate the effect of changes in foreign exchange rates from the changes in market prices for realized gains and losses on debt obligations.
f) Forward currency contracts — In connection with portfolio purchases and sales of securities denominated in foreign currencies, each Fund may enter into forward currency contracts. The First Eagle Global Fund, First Eagle Overseas Fund, First Eagle Global Income Builder Fund and First Eagle High Yield Fund enter into foreign exchange contracts primarily to manage and/or gain exposure to certain foreign currencies. The Funds' currency transactions include portfolio hedging on portfolio positions. Portfolio hedging is the use of a forward contract (or other cash management position) with respect to one or more portfolio security positions denominated or quoted in a particular currency. Currency exchange transactions involve currencies of different countries that the Funds invest in and serve as hedges against possible
First Eagle Funds | Semi-Annual Report | April 30, 2016
176
Notes to Financial Statements (unaudited)
variations in the exchange rates between these currencies and the U.S. dollar. Each Fund may engage in portfolio hedging with respect to the currency of a particular country in amounts approximating actual or anticipated positions in securities denominated in that currency. Hedging can reduce exposure to currency exchange movements, but cannot eliminate that exposure. It is possible to lose money under a hedge.
Funds investing in foreign exchange contracts are exposed to risk if the value of the currency changes unfavorably, if the counterparties to the contracts are unable to meet the terms of their contracts or if the Fund is unable to enter into a closing position. Forward currency contracts outstanding at period end, if any, are listed after each Fund's portfolio. Outstanding contracts at period end are indicative of the volume of activity during the period, proportionate to the net assets of the Fund.
The Funds adopted provisions surrounding disclosures of derivative instruments and hedging activities which require qualitative disclosures about objectives and strategies for using derivatives, quantitative disclosures about fair value amounts of gains and losses on derivative instruments, and disclosures about currency-risk-related contingent features in derivative agreements.
In order to better define its contractual rights and to secure rights that may help the Fund mitigate its counterparty risk, the Fund may enter into an International Swaps and Derivatives Association, Inc. Master Agreement ("ISDA Master Agreement") or similar agreement with its derivative contract counterparties. An ISDA Master Agreement is a bilateral agreement between the Fund and a counterparty that governs over-the-counter ("OTC") derivatives and foreign exchange contracts and typically contains, among other things, collateral posting terms and netting provisions in the event of a default and/or termination event. Under an ISDA Master Agreement, the Fund may, under certain circumstances, offset with the counterparty certain derivative financial instrument's payables and/or receivables with collateral held and/or posted and create one single net payment. With respect to certain counterparties, in accordance with the terms of the ISDA Master Agreement, collateral pledged by the Fund is segregated by the Fund's custodian and identified in the Fund's portfolio. Collateral can be in the form of cash or debt securities issued by the U.S. Government or related agencies. Cash collateral that has been pledged to cover obligations of a Fund and cash collateral received from the counterparty, if any, is reported separately on the Statement of Assets and Liabilities as cash pledged. Non-cash collateral pledged by the Fund, if any, is noted in the Schedule of Investments. The provisions of the ISDA Master Agreement typically permit a single net payment in the event of default (close-out netting) including the bankruptcy or insolvency of the counterparty. Note, however, that bankruptcy or insolvency laws of a particular jurisdiction may impose restrictions on or prohibitions against the right of offset in bankruptcy, insolvency or other events.
For financial reporting purposes, the Fund does not offset derivative assets and derivative liabilities that are subject to netting arrangements in the Statement of Asset and Liabilities.
First Eagle Funds | Semi-Annual Report | April 30, 2016
177
Notes to Financial Statements (unaudited)
At April 30, 2016, the Funds had the following foreign forward currency contracts grouped into appropriate risk categories illustrated below:
First Eagle Global Fund
| | | | | | | Gain or (Loss)
Derivative Recognized
in Income | |
Risk Type | | Asset Derivative
Fair Value(1) | | Liability Derivative
Fair Value(2) | | Realized
Gain(3) | | Change in
Appreciation
(Depreciation)(4) | |
Foreign Currency | | $ | — | | | $ | 20,369,502 | | | $ | 12,218,720 | | | $ | (25,544,227 | ) | |
First Eagle Overseas Fund
| | | | | | | Gain or (Loss)
Derivative Recognized
in Income | |
Risk Type | | Asset Derivative
Fair Value(1) | | Liability Derivative
Fair Value(2) | | Realized
Gain(3) | | Change in
Appreciation
(Depreciation)(4) | |
Foreign Currency | | $ | — | | | $ | 11,557,308 | | | $ | 6,045,871 | | | $ | (14,877,543 | ) | |
First Eagle Global Income Builder Fund
| | | | | | | Gain or (Loss)
Derivative Recognized
in Income | |
Risk Type | | Asset Derivative
Fair Value(1) | | Liability Derivative
Fair Value(2) | | Realized
Gain(3) | | Change in
Appreciation
(Depreciation)(4) | |
Foreign Currency | | $ | — | | | $ | 672,651 | | | $ | 434,572 | | | $ | (1,221,684 | ) | |
First Eagle High Yield Fund
| | | | | | | Gain or (Loss)
Derivative Recognized
in Income | |
Risk Type | | Asset Derivative
Fair Value(1) | | Liability Derivative
Fair Value(2) | | Realized
Gain(3) | | Change in
Appreciation
(Depreciation)(4) | |
Foreign Currency | | $ | 408 | | | $ | 140,953 | | | $ | 182,251 | | | $ | (217,064 | ) | |
(1) Statements of Assets and Liabilities location: Receivable for forward currency contracts held, at value.
(2) Statements of Assets and Liabilities location: Payable for forward currency contracts held, at value.
(3) Statements of Operations location: Net realized gains (losses) from foreign currency and forward contract related transactions.
First Eagle Funds | Semi-Annual Report | April 30, 2016
178
Notes to Financial Statements (unaudited)
(4) Statements of Operations location: Changes in unrealized appreciation (depreciation) of foreign currency and forward contract related translation.
The following tables present each Fund's gross derivative assets and liabilities by counterparty net of amounts available for offset under netting arrangements and any related collateral received or pledged by each Fund as of April 30, 2016:
First Eagle Global Fund
Counterparty | | Gross Amounts
of Liabilities
Presented in
Statements of
Assets and
Liabilities | | Derivatives
Available for
Offset | | Collateral
Pledged(1) | | Net Amount
(Not Less
Than $0) | |
BNY Mellon | | $ | 1,756,671 | | | $ | — | | | $ | — | | | $ | 1,756,671 | | |
Goldman Sachs Capital
Markets LP | | | 4,423,299 | | | | — | | | | (2,250,000 | ) | | | 2,173,299 | | |
HSBC Bank USA | | | 5,411,397 | | | | — | | | | — | | | | 5,411,397 | | |
JPMorgan Chase Bank N.A. | | | 5,513,442 | | | | — | | | | — | | | | 5,513,442 | | |
UBS AG | | | 3,264,693 | | | | — | | | | — | | | | 3,264,693 | | |
| | | $ | 20,369,502 | | | $ | — | | | $ | (2,250,000 | ) | | $ | 18,119,502 | | |
First Eagle Overseas Fund
Counterparty | | Gross Amounts
of Liabilities
Presented in
Statements of
Assets and
Liabilities | | Derivatives
Available for
Offset | | Collateral
Pledged(1) | | Net Amount
(Not Less
Than $0) | |
BNY Mellon | | $ | 957,381 | | | $ | — | | | $ | — | | | $ | 957,381 | | |
Goldman Sachs Capital
Markets LP | | | 2,367,186 | | | | — | | | | (1,170,000 | ) | | | 1,197,186 | | |
HSBC Bank USA | | | 3,406,473 | | | | — | | | | — | | | | 3,406,473 | | |
JPMorgan Chase Bank N.A. | | | 2,899,041 | | | | — | | | | — | | | | 2,899,041 | | |
UBS AG | | | 1,927,227 | | | | — | | | | — | | | | 1,927,227 | | |
| | | $ | 11,557,308 | | | $ | — | | | $ | (1,170,000 | ) | | $ | 10,387,308 | | |
First Eagle Funds | Semi-Annual Report | April 30, 2016
179
Notes to Financial Statements (unaudited)
First Eagle Global Income Builder Fund
Counterparty | | Gross Amounts
of Liabilities
Presented in
Statements of
Assets and
Liabilities | | Derivatives
Available for
Offset | | Collateral
Pledged | | Net Amount
(Not Less
Than $0) | |
BNY Mellon | | $ | 61,882 | | | $ | — | | | $ | — | | | $ | 61,882 | | |
Goldman Sachs Capital
Markets LP | | | 242,199 | | | | — | | | | — | | | | 242,199 | | |
HSBC Bank USA | | | 198,892 | | | | — | | | | — | | | | 198,892 | | |
JPMorgan Chase Bank N.A. | | | 162,012 | | | | — | | | | — | | | | 162,012 | | |
UBS AG | | | 7,666 | | | | — | | | | — | | | | 7,666 | | |
| | | $ | 672,651 | | | $ | — | | | $ | — | | | $ | 672,651 | | |
First Eagle High Yield Fund
Counterparty | | Gross Amounts
of Assets
Presented in
Statements of
Assets and
Liabilities | | Derivatives
Available for
Offset | | Collateral
Received | | Net Amount
(Not Less
Than $0) | |
HSBC Bank USA | | $ | 408 | | | $ | (408 | ) | | $ | — | | | $ | 0 | | |
Counterparty | | Gross Amounts
of Liabilities
Presented in
Statements of
Assets and
Liabilities | | Derivatives
Available for
Offset | | Collateral
Pledged | | Net Amount
(Not Less
Than $0) | |
HSBC Bank USA | | $ | 140,953 | | | $ | (408 | ) | | $ | — | | | $ | 140,545 | | |
(1) In some instances, the actual collateral pledged may be more than the amount shown here due to overcollateralization.
g) Options — In order to seek to produce incremental earnings or protect against declines in the value of portfolio securities, First Eagle Global Fund, First Eagle U.S. Value Fund, First Eagle Global Income Builder Fund and First Eagle Fund of America may write covered call options on portfolio securities. The Funds may also use options for speculative purposes, although they generally do not employ options for this purpose.
Options contracts are valued daily based upon the last sale price on the principal exchange on which the option is traded and unrealized appreciation/depreciation is recorded. If there is no sale on such day, the mean between the last bid and asked prices is used. When an option is exercised, the proceeds on the sale of a written call option are adjusted by the amount of premium received or paid. When a written option expires, the Funds will realize a gain equal
First Eagle Funds | Semi-Annual Report | April 30, 2016
180
Notes to Financial Statements (unaudited)
to the amount of the premium received. When the Funds enter into a closing purchase transaction, the Funds will realize a gain (or loss, if the cost of the closing purchase transaction exceeds the premium received when the option was written) without regard to any unrealized gain or loss on the underlying security and the liability related to such option is eliminated.
The Funds may be required to segregate or earmark assets to cover its obligations under option contracts. In general, a call option is covered if the Funds hold, on a share-for-share basis, either the underlying shares or a call on the same security as the call written where the exercise price of the call held is equal to or less than the exercise price of the call written (or greater than the exercise price of the call written if the difference is maintained by the Funds in cash, Treasury bills or other high grade short-term obligations earmarked with its custodian). One reason for writing options is to attempt to realize, through the receipt of premiums, a greater return than would be realized on the securities alone. Another reason for writing options is to hedge against a moderate decline in the value of securities owned by the Funds in the case of a call option. If an increase occurs in the underlying security or stock index sufficient to result in the exercise of a call written by the Funds, it may be required to deliver securities or cash and may thereby forego some or all of the gain that otherwise may have been realized on the securities underlying the call option. This "opportunity cost" may be partially or wholly offset by the premium received for the covered call written by the Funds. The risk in writing a covered call option is that the Funds give up the opportunity for profit if the market price of the underlying security increases and the option is exercised. The Funds also have the additional risk of not being able to enter into a closing transaction if a liquid secondary market does not exist.
The Funds may also write over-the-counter options where the completion of the obligation is dependent upon the credit standing of the counterparty.
For the six-month period ended April 30, 2016, First Eagle Fund of America had the following options transactions.
First Eagle Fund of America
Written Options | | Number of
Contracts | | Premium
Received | |
Options outstanding at October 31, 2015 | | | 100,114 | | | $ | 31,309,788 | | |
Options written | | | 640,917 | | | | 223,011,780 | | |
Options assigned | | | (42,090 | ) | | | (9,825,935 | ) | |
Options expired/closed | | | (482,812 | ) | | | (165,647,263 | ) | |
Options outstanding at April 30, 2016 | | | 216,129 | | | $ | 78,848,370 | | |
Purchased Options | | Number of
Contracts | | Cost | |
Options outstanding at October 31, 2015 | | | 7,335 | | | $ | 6,499,487 | | |
Options purchased | | | 39,970 | | | | 16,772,624 | | |
Options expired/closed | | | (47,305 | ) | | | (23,272,111 | ) | |
Options outstanding at April 30, 2016 | | | 0 | | | $ | 0 | | |
First Eagle Funds | Semi-Annual Report | April 30, 2016
181
Notes to Financial Statements (unaudited)
As of April 30, 2016, portfolio securities valued at $1,111,070,295 were earmarked to cover collateral requirements for written options.
Outstanding contracts at period-end are indicative of the volume of activity during the period.
At April 30, 2016, the Funds had the following options grouped into appropriate risk categories illustrated below:
First Eagle Fund of America
| | | | | Gain or (Loss)
Derivative Recognized
in Income | |
Risk Type | | Liability Derivative
Fair Value(1) | | Realized
Loss(2) | | Change in
Appreciation
(Depreciation)(3) | |
Equity — Written options | | $ | 71,262,521 | | | $ | (26,939,169 | ) | | $ | 23,418,194 | | |
Equity — Purchased options | | | — | | | | (8,346,560 | ) | | | 484,852 | | |
(1) Statements of Assets and Liabilities location: Option contracts written, at value.
(2) Statements of Operations location: Net realized gains (losses) from written options & investment transactions of unaffiliated issuers.
(3) Statements of Operations location: Changes in unrealized appreciation (depreciation) of written options & investment transactions.
h) Repurchase agreements — The Funds may enter into repurchase agreement transactions with institutions that meet the adviser's credit guidelines. Each repurchase agreement is valued at market. The Funds require that the collateral received in a repurchase agreement transaction be transferred to a custodian in a manner sufficient to enable the Funds to obtain collateral in the event of a counterparty default. If the counterparty defaults and the fair value of the collateral declines, realization of the collateral by the Funds may be delayed or limited.
i) Term Loans — A Fund may invest in term loans, which usually take the form of loan participations and assignments. Loan participations and assignments are agreements to make money available to U.S. or foreign corporations, partnerships or other business entities (the "Borrower") in a specified amount, at a specified rate and within a specified time. A loan is typically originated, negotiated and structured by a U.S. or foreign bank, insurance company or other financial institution (the "Agent") for a group of loan investors ("Loan Investors"). The Agent typically administers and enforces the loan on behalf of the other Loan Investors in the syndicate and may hold any collateral on behalf of the Loan Investors. Such loan participations and assignments are typically senior, secured and collateralized in nature. A Fund records an investment when the Borrower withdraws money and records interest as earned. The Fund generally has no right to enforce compliance with the terms of the loan agreement with the Borrower. As a result, the Fund assumes the credit risk of the Borrower, the selling participant and any intermediary between the Fund and the Borrower ("Intermediate Participants"). In
First Eagle Funds | Semi-Annual Report | April 30, 2016
182
Notes to Financial Statements (unaudited)
the event that the Borrower, selling participant or Intermediate Participants become insolvent or enters into bankruptcy, each Fund may incur certain costs and delays in realizing payment or may suffer a loss of principal and/or interest.
j) Treasury Inflation-Protected Securities — The Funds may invest in Treasury Inflation-Protected Securities ("TIPS") which are specially structured bonds in which the principal amount is adjusted to keep pace with inflation. The inflation (deflation) adjustment is applied to the principal of each bond on a daily basis and is accounted for as interest income on the Statements of Operations. TIPS are subject to interest rate risk.
k) Restricted Securities — The Funds may invest in securities that are subject to legal or contractual restrictions on resale. These securities generally may be resold in transactions exempt from registration or to the public if the securities are registered. Disposal of these securities may involve time-consuming negotiations and expenses, and prompt sale at an acceptable price may be difficult. Information regarding restricted securities, if any, is included at the end of each Fund's Schedule of Investments.
l) United States income taxes — No provision has been made for U.S. federal income taxes since it is the intention of each Fund to distribute to shareholders all taxable net investment income and net realized gains on investments, if any, within the allowable time limit, and to comply with the provisions of the Code for a Regulated Investment Company. The Funds declare and pay such income and capital gains on an annual basis except for the First Eagle High Yield Fund which declares income daily and pays monthly and First Eagle Global Income Builder Fund which declares income daily and pays quarterly.
The Funds adopted provisions surrounding income taxes, which require the tax effects of certain tax positions to be recognized. These tax positions must meet a "more likely than not" standard that, based on their technical merits, have a more than 50% likelihood of being sustained upon examination. Management of the Trust has analyzed the Funds' tax positions taken on federal and state income tax returns for all open tax years (the current and the prior three tax years) and has concluded that no provision for income tax is required in the Funds' financial statements.
m) Class Accounting — Investment income, common expenses and realized/unrealized gain or loss on investments are allocated to the various classes of the Fund on the basis of daily net assets of each class. Fees relating to a specific class are charged directly to that class.
n) Use of estimates — The preparation of financial statements in conformity with GAAP requires management to make estimates and assumptions that affect the reported amounts of assets and liabilities at the date of the financial statements and the reported amounts of revenues and expenses during the reporting period. Actual results could differ from those estimates.
o) Redemption Fee — A redemption fee of 2% will be applied to the First Eagle Gold Fund for the sale or exchange within 60 days of the purchase of such shares.
First Eagle Funds | Semi-Annual Report | April 30, 2016
183
Notes to Financial Statements (unaudited)
p) Foreign Taxes — The Funds may be subject to foreign taxes on income, and gains on investments or currency purchases/repatriation, a portion of which may be recoverable. The Funds will accrue such taxes and recoveries as applicable, based upon their current interpretation of tax rules and regulations that exist in the markets in which they invest.
Note 2 — Investment Advisory, Custody and Administration Agreements; Transactions with Related Persons
For its services, the Adviser receives, pursuant to an Investment Advisory Agreement between the Funds and the Adviser (the "Advisory Agreement") an annual advisory fee as follows:
Fund | | Management Fee
(% of Average Daily Net Assets) | |
First Eagle Global Fund | | | 0.75 | % | |
First Eagle Overseas Fund | | | 0.75 | | |
First Eagle U.S. Value Fund | | | 0.75 | (1) | |
First Eagle Gold Fund | | | 0.75 | | |
First Eagle Global Income Builder Fund | | | 0.75 | | |
First Eagle High Yield Fund | | | 0.70 | (2) | |
First Eagle Fund of America | | | 0.90 | (3) | |
(1) The Adviser has agreed to waive First Eagle U.S. Value Fund's management fee at an annual rate in the amount of 0.05% of the daily average net assets to 0.70% for the period March 1, 2016 to February 28, 2017.
(2) The Adviser has agreed to waive First Eagle High Yield Fund's management fee at an annual rate in the amount of 0.05% of the daily average net assets to 0.65% for the period March 1, 2016 to February 28, 2017.
(3) Effective March 1, 2016, the Adviser receives from First Eagle Fund of America an annual advisory fee at the rate of 0.90% of the first $5 billion of the average daily net assets, and 0.85% in excess of $5 billion of the average daily net assets. Prior to March 1, 2016, the Adviser received an annual advisory fee at the rate of 1.00% of the first $1.5 billion of the average daily net assets, 0.95% of the next $1 billion of the average daily net assets; 0.90% on the next $2.5 billion of the average daily net assets and 0.85% in excess of $5 billion of the average daily net assets. For the period ended April 30, 2016 the effective rate was 0.94%.
Pursuant to a subadvisory agreement, dated December 1, 2015 ("Subadvisory Agreement") Iridian Asset Management LLC ("Iridian" or "Sub-Adviser") manages the investments of the First Eagle Fund of America. The fees paid to Iridian by the Adviser under the Subadvisory Agreement are based on a reference amount equal to 50% of the combined (i) fees received by the Adviser for advisory services on behalf of the Fund and (ii) the fees received by the Fund's distributor for its shareholder liaison services on behalf of the Fund. These amounts are reduced by certain direct marketing costs borne by the Adviser in connection with the Fund and are further reduced by the amount paid by the Adviser for certain administrative expenses incurred in providing services to the Fund.
First Eagle Funds | Semi-Annual Report | April 30, 2016
184
Notes to Financial Statements (unaudited)
The Adviser had contractually agreed to waive its management fee and/or reimburse expenses, for the First Eagle High Yield Fund and First Eagle Global Income Builder Fund, as allowed by law, so that the total annual operating expenses (excluding certain items) of the First Eagle High Yield Fund's Class A, Class C and Class I shares did not exceed 1.25%, 2.00% and 0.80%, respectively, and the First Eagle Global Income Builder Fund's Class A, Class C and Class I shares did not exceed 1.30%, 2.05%, and 1.05%, respectively, through December 31, 2013.
The Adviser may seek reimbursement for fees waived and other expenses paid by the Adviser pursuant to the Fee Waiver and Expense Reimbursement Agreement ("Agreement"). A recoupment payment should be payable only to the extent it can be made during the thirty-six months following the applicable period during which the Adviser waived fees or reimbursed operating expenses under the Agreement. As of April 30, 2016, the Adviser may seek reimbursement of the remaining waived fees and reimbursed expenses as follows:
First Eagle Global Income Builder Fund
Expiration | | Amount | |
October 31, 2016 | | $ | 15 | | |
During the period ended April 30, 2016, the First Eagle Global Income Builder Fund did not make any repayments to the Adviser for previously waived and reimbursed fees.
First Eagle High Yield Fund
Expiration | | Amount | |
October 31, 2016 | | $ | 309,343 | | |
December 31, 2016 | | | 44,141 | | |
During the period ended April 30, 2016, the First Eagle High Yield Fund did not make any repayments to the Adviser for previously waived and reimbursed fees.
The Adviser also performs certain administrative, accounting, operations, compliance and other services on behalf of the Funds, and in accordance with its agreement with them, the Funds (except for First Eagle Global Income Builder Fund and First Eagle High Yield Fund which pay the fee described in the next paragraph) reimburse the Adviser for costs (including personnel, related overhead and other costs) related to those services. These reimbursements may not exceed an annual rate of 0.05% of a Fund's average daily net assets.
First Eagle Global Income Builder Fund and, effective January 1, 2015, First Eagle High Yield Fund, each pay the Adviser a monthly administration fee that is accrued daily at an annual rate of 0.05% of the Fund's average daily net assets.
First Eagle Funds | Semi-Annual Report | April 30, 2016
185
Notes to Financial Statements (unaudited)
For the six-month period ended April 30, 2016, the Funds paid/reimbursed and had payable to the Adviser amounts shown below:
Fund | | Reimbursed to Adviser | | Payable to Adviser | |
First Eagle Global Fund | | $ | 1,168,952 | | | $ | 643,430 | | |
First Eagle Overseas Fund | | | 457,116 | | | | 215,616 | | |
First Eagle U.S. Value Fund | | | 165,022 | | | | 62,857 | | |
First Eagle Gold Fund | | | 53,872 | | | | 29,564 | | |
First Eagle Global Income Builder Fund | | | 296,740 | | | | 47,741 | | |
First Eagle High Yield Fund | | | 164,882 | | | | 34,273 | | |
First Eagle Fund of America | | | 141,193 | | | | 61,927 | | |
The Funds have entered into custody agreements with State Street Bank and Trust Company ("SSB"). The custody agreements provide for an annual fee based on the amount of assets under custody plus transaction charges. SSB serves as custodian of the Funds' portfolio securities and other assets. SSB has directly entered into sub-custodial agreements to maintain the custody of gold bullion in the Funds. Under the terms of the custody agreement between the Funds and SSB, SSB maintains and deposits in separate accounts, cash, securities and other assets of the Funds. SSB is also required, upon the order of the Funds, to deliver securities held by SSB and the sub-custodian, and to make payments for securities purchased by the Funds. SSB has also entered into sub-custodian agreements with a number of foreign banks and clearing agencies, pursuant to which portfolio securities purchased outside the United States are maintained in the custody of these entities.
The Funds have also entered into an agreement for administrative services with SSB, pursuant to which SSB provides certain financial reporting and other administrative services. SSB, as the Funds' administrator, receives annual fees separate from and in addition to the fees it receives for its services as the Funds' custodian.
FEF Distributors, LLC, a wholly owned subsidiary of the Adviser, serves as the Funds' principal underwriter. For the six-month period ended April 30, 2016, FEF Distributors, LLC realized $476,843, $37,624, $22,897, $36,910, $21,722, $18,448 and $58,051, pertaining to the sales of shares of First Eagle Global Fund, First Eagle Overseas Fund, First Eagle U.S. Value Fund, First Eagle Gold Fund, First Eagle Global Income Builder Fund, First Eagle High Yield Fund and First Eagle Fund of America, respectively.
The Trust adopted a Trustee Deferred Compensation Plan (the "Plan"), which allows the Independent Trustees to defer the receipt of all or a portion of compensation related to performance of their duties as a Trustee. The deferred fees are invested in various First Eagle Funds until distribution in accordance with the Trustee Deferred Compensation Plan. As of April 30, 2016, balances to the Plan are recorded on the Statements of Assets and Liabilities.
First Eagle Funds | Semi-Annual Report | April 30, 2016
186
Notes to Financial Statements (unaudited)
Note 3 — Plans of Distribution
Under the terms of the Distribution Plans and Agreements ("the Plans") with FEF Distributors, LLC ("the Distributor"), pursuant to the provisions of Rule 12b-1 under the 1940 Act, the First Eagle Global Fund, First Eagle Overseas Fund, First Eagle U.S. Value Fund, First Eagle Gold Fund, First Eagle Global Income Builder Fund and First Eagle High Yield Fund pay the Distributor monthly, a distribution fee with respect to Class A and Class C shares at an annual rate of up to 0.25% and 0.75%, respectively, of each Fund's average daily net assets. In the case of First Eagle Fund of America, it pays the Distributor monthly, a distribution fee with respect to Class A, Class C and Class Y shares at an annual rate of up to 0.25%, 0.75% and 0.25%, respectively of the average daily net assets. Under the Plans, the Distributor is obligated to use the amounts received under the Plans for, among other things, payments to qualifying dealers for their assistance in the distribution of a Fund's shares and the provision of shareholder services and for other expenses such as advertising costs and the payment for the printing and distribution of prospectuses to prospective investors.
The Distributor bears distribution costs of a Fund to the extent they exceed payments received under the Plan. For the six-month period ended April 30, 2016, the distribution fees incurred by the Funds are disclosed in the Statements of Operations.
The Distributor receives an annual service fee with respect to Class C at the annual rate of 0.25% of each Fund's average daily net assets, payable monthly to cover expenses incurred by the Distributor for providing shareholder liaison services, including assistance with subscriptions, redemptions and other shareholder questions. For the six-month period ended April 30, 2016, the services fees incurred by the Funds are disclosed in the Statements of Operations.
Note 4 — Purchases and Sales of Securities
During the six-month period ended April 30, 2016, the cost of purchases of investments, excluding U.S. Government and short-term securities, totaled $2,448,557,701, $378,154,120, $112,053,474, $65,946,090, $172,341,898, $77,335,971 and $763,956,639 for First Eagle Global Fund, First Eagle Overseas Fund, First Eagle U.S. Value Fund, First Eagle Gold Fund, First Eagle Global Income Builder Fund, First Eagle High Yield Fund and First Eagle Fund of America, respectively. Proceeds from sales of investments, excluding U.S. Government securities and short-term securities, totaled $5,343,569,823, $718,761,738, $509,208,057, $82,786,376, $291,959,182, $249,545,874 and $1,142,962,217 for First Eagle Global Fund, First Eagle Overseas Fund, First Eagle U.S. Value Fund, First Eagle Gold Fund, First Eagle Global Income Builder Fund, First Eagle High Yield Fund and First Eagle Fund of America, respectively.
During the six-month period ended April 30, 2016, there were no purchases or sales of U.S. Government securities, excluding short-term securities, for First Eagle Global Fund, First Eagle Overseas Fund, First Eagle U.S. Value Fund, First Eagle Gold Fund, First Eagle Global Income Builder Fund, First Eagle High Yield Fund and First Eagle Fund of America.
First Eagle Funds | Semi-Annual Report | April 30, 2016
187
Notes to Financial Statements (unaudited)
Note 5 — Line of Credit
At a meeting on October 2, 2015, the Board of Trustees approved continuing a $200 million committed, unsecured line of credit ("Credit Facility") with State Street Bank and Trust Company for the Funds, to be utilized for temporarily financing the purchase or sale of securities for prompt delivery in the ordinary course of business or for temporarily financing the redemption of shares of each Fund at the request of shareholders and other temporary or emergency purposes. Under the Credit Facility arrangement, each Fund has agreed to pay an annual commitment fee on the unused balance, allocated pro rata, based on the relative asset size of the Funds. A portion of the commitment fees related to the line of credit are paid by the Funds and are included in other expenses in the Statements of Operations. During the six-month period ended April 30, 2016, the Funds had borrowings under the agreement as follows:
Fund | | Average
Daily Loan
Balance | | Number
of Days
Outstanding | | Interest
Expense | | Weighted
Average
Annualized
Interest Rate | |
First Eagle Overseas Fund | | $ | 296,923 | | | | 3 | | | $ | 13 | | | | 1.63 | % | |
First Eagle Global Income
Builder Fund | | | 279,506 | | | | 3 | | | | 13 | | | | 1.65 | | |
First Eagle High Yield Fund | | | 1,570,556 | | | | 1 | | | | 71 | | | | 1.64 | | |
First Eagle Fund of America | | | 5,165,245 | | | | 1 | | | | 235 | | | | 1.64 | | |
As of April 30, 2016 there were no outstanding borrowings from the credit facility.
Note 6 — Capital Stock
At April 30, 2016, the Funds have an unlimited number of shares authorized for issuance. The Funds have the ability to issue multiple classes of shares.
First Eagle Funds | Semi-Annual Report | April 30, 2016
188
This page was intentionally left blank.
Notes to Financial Statements (unaudited)
Transactions in shares of capital stock were as follows:
| | | Six-Month Period Ended April 30, 2016 | |
| | | First Eagle Global Fund | |
| | | Class A | | Class C | | Class I | |
Shares sold | | | 16,209,943 | | | | 11,096,797 | | | | 42,804,763 | | |
Shares issued for reinvested
dividends and distributions | | | 3,132,435 | | | | 1,824,708 | | | | 4,215,745 | | |
Shares redeemed | | | (32,203,748 | ) | | | (19,460,957 | ) | | | (54,387,549 | ) | |
Net increase (decrease) | | | (12,861,370 | ) | | | (6,539,452 | ) | | | (7,367,041 | ) | |
| | | Year Ended October 31, 2015 | |
| | | First Eagle Global Fund | |
| | | Class A | | Class C | | Class I | |
Shares sold | | | 35,268,493 | | | | 23,699,677 | | | | 76,913,336 | | |
Shares issued for reinvested
dividends and distributions | | | 14,471,183 | | | | 8,073,955 | | | | 15,651,689 | | |
Shares redeemed | | | (66,288,695 | ) | | | (36,418,310 | ) | | | (87,397,967 | ) | |
Net increase (decrease) | | | (16,549,019 | ) | | | (4,644,678 | ) | | | 5,167,058 | | |
| | | Six-Month Period Ended April 30, 2016 | |
| | | First Eagle Gold Fund | |
| | | Class A | | Class C | | Class I | |
Shares sold | | | 5,627,489 | | | | 1,691,420 | | | | 8,776,668 | | |
Shares issued for reinvested
dividends and distributions | | | 27 | | | | 12 | | | | — | | |
Shares redeemed | | | (5,512,581 | ) | | | (1,915,772 | ) | | | (9,636,374 | ) | |
Net increase (decrease) | | | 114,935 | | | | (224,340 | ) | | | (859,706 | ) | |
| | | Year Ended October 31, 2015 | |
| | | First Eagle Gold Fund | |
| | | Class A | | Class C | | Class I | |
Shares sold | | | 11,930,370 | | | | 2,434,131 | | | | 12,736,019 | | |
Shares issued for reinvested
dividends and distributions | | | 130 | | | | 67 | | | | — | | |
Shares redeemed | | | (13,646,508 | ) | | | (4,228,696 | ) | | | (15,227,543 | ) | |
Net increase (decrease) | | | (1,716,008 | ) | | | (1,794,498 | ) | | | (2,491,524 | ) | |
First Eagle Funds | Semi-Annual Report | April 30, 2016
190
Notes to Financial Statements (unaudited)
| | | Six-Month Period Ended April 30, 2016 | |
| | | First Eagle Overseas Fund | | First Eagle U.S. Value Fund | |
| | | Class A | | Class C | | Class I | | Class A | | Class C | | Class I | |
Shares sold | | | 13,121,633 | | | | 2,359,484 | | | | 62,185,417 | | | | 1,995,305 | | | | 993,939 | | | | 2,468,879 | | |
Shares issued for reinvested
dividends and distributions | | | 2,198,810 | | | | 447,973 | | | | 5,223,533 | | | | 1,976,887 | | | | 1,114,239 | | | | 1,682,512 | | |
Shares redeemed | | | (33,724,121 | ) | | | (4,806,110 | ) | | | (49,221,156 | ) | | | (8,632,469 | ) | | | (4,174,168 | ) | | | (9,857,618 | ) | |
Net increase (decrease) | | | (18,403,678 | ) | | | (1,998,653 | ) | | | 18,187,794 | | | | (4,660,277 | ) | | | (2,065,990 | ) | | | (5,706,227 | ) | |
| | | Year Ended October 31, 2015 | |
| | | First Eagle Overseas Fund | | First Eagle U.S. Value Fund | |
| | | Class A | | Class C | | Class I | | Class A | | Class C | | Class I | |
Shares sold | | | 30,427,100 | | | | 5,758,589 | | | | 91,897,145 | | | | 5,458,592 | | | | 3,003,940 | | | | 10,302,661 | | |
Shares issued for reinvested
dividends and distributions | | | 9,073,023 | | | | 1,704,684 | | | | 15,678,736 | | | | 3,143,567 | | | | 1,622,912 | | | | 2,708,050 | | |
Shares redeemed | | | (56,671,827 | ) | | | (8,435,341 | ) | | | (104,101,674 | ) | | | (18,090,056 | ) | | | (8,037,548 | ) | | | (22,226,589 | ) | |
Net increase (decrease) | | | (17,171,704 | ) | | | (972,068 | ) | | | 3,474,207 | | | | (9,487,897 | ) | | | (3,410,696 | ) | | | (9,215,878 | ) | |
| | | Six-Month Period Ended April 30, 2016 | |
| | | First Eagle Global Income Builder Fund | | First Eagle High Yield Fund | |
| | | Class A | | Class C | | Class I | | Class A | | Class C | | Class I | |
Shares sold | | | 5,013,206 | | | | 3,729,886 | | | | 9,572,546 | | | | 3,516,912 | | | | 1,468,477 | | | | 6,636,859 | | |
Shares issued for reinvested
dividends and distributions | | | 436,789 | | | | 308,766 | | | | 501,264 | | | | 646,557 | | | | 412,820 | | | | 1,420,517 | | |
Shares redeemed | | | (9,064,544 | ) | | | (6,536,027 | ) | | | (12,526,877 | ) | | | (8,844,148 | ) | | | (3,597,101 | ) | | | (21,960,244 | ) | |
Net increase (decrease) | | | (3,614,549 | ) | | | (2,497,375 | ) | | | (2,453,067 | ) | | | (4,680,679 | ) | | | (1,715,804 | ) | | | (13,902,868 | ) | |
| | | Year Ended October 31, 2015 | |
| | | First Eagle Global Income Builder Fund | | First Eagle High Yield Fund | |
| | | Class A | | Class C | | Class I | | Class A | | Class C | | Class I | |
Shares sold | | | 11,704,029 | | | | 9,577,337 | | | | 17,154,498 | | | | 7,817,319 | | | | 2,463,611 | | | | 26,240,158 | | |
Shares issued for reinvested
dividends and distributions | | | 1,502,646 | | | | 1,118,542 | | | | 1,589,567 | | | | 1,247,845 | | | | 785,317 | | | | 3,416,032 | | |
Shares redeemed | | | (13,515,431 | ) | | | (8,285,431 | ) | | | (17,784,945 | ) | | | (11,197,627 | ) | | | (7,254,182 | ) | | | (47,779,023 | ) | |
Net increase (decrease) | | | (308,756 | ) | | | 2,410,448 | | | | 959,120 | | | | (2,132,463 | ) | | | (4,005,254 | ) | | | (18,122,833 | ) | |
First Eagle Funds | Semi-Annual Report | April 30, 2016
191
Notes to Financial Statements (unaudited)
| | | Six-Month Period Ended April 30, 2016 | |
| | | First Eagle Fund of America | |
| | | Class A | | Class C | | Class I | | Class Y | |
Shares sold | | | 3,211,635 | | | | 1,722,564 | | | | 3,477,818 | | | | 391,028 | | |
Shares issued for reinvested
dividends and distributions | | | 956,739 | | | | 693,935 | | | | 670,632 | | | | 362,436 | | |
Shares redeemed | | | (7,106,802 | ) | | | (3,790,931 | ) | | | (5,805,830 | ) | | | (1,371,650 | ) | |
Net increase (decrease) | | | (2,938,428 | ) | | | (1,374,432 | ) | | | (1,657,380 | ) | | | (618,186 | ) | |
| | | Year Ended October 31, 2015 | |
| | | First Eagle Fund of America | |
| | | Class A | | Class C | | Class I | | Class Y | |
Shares sold | | | 11,375,895 | | | | 7,673,674 | | | | 13,562,817 | | | | 1,557,773 | | |
Shares issued for reinvested
dividends and distributions | | | 2,232,595 | | | | 1,412,932 | | | | 1,259,320 | | | | 999,228 | | |
Shares redeemed | | | (7,614,310 | ) | | | (3,554,189 | ) | | | (5,462,428 | ) | | | (2,410,531 | ) | |
Net increase (decrease) | | | 5,994,180 | | | | 5,532,417 | | | | 9,359,709 | | | | 146,470 | | |
Transactions in dollars of capital stock were as follows:
| | | Six-Month Period Ended April 30, 2016 | |
| | | First Eagle Global Fund | |
| | | Class A | | Class C | | Class I | |
Shares sold | | $ | 838,104,563 | | | $ | 556,857,346 | | | $ | 2,217,797,266 | | |
Shares issued for reinvested
dividends and distributions | | | 159,785,585 | | | | 90,560,292 | | | | 215,846,180 | | |
Shares redeemed | | | (1,654,563,010 | ) | | | (974,566,310 | ) | | | (2,803,222,419 | ) | |
Net increase (decrease) | | $ | (656,672,862 | ) | | $ | (327,148,672 | ) | | $ | (369,578,973 | ) | |
| | | Year Ended October 31, 2015 | |
| | | First Eagle Global Fund | |
| | | Class A | | Class C | | Class I | |
Shares sold | | $ | 1,882,683,045 | | | $ | 1,233,690,921 | | | $ | 4,120,832,467 | | |
Shares issued for reinvested
dividends and distributions | | | 739,622,809 | | | | 404,101,868 | | | | 802,931,711 | | |
Shares redeemed | | | (3,524,237,211 | ) | | | (1,893,659,710 | ) | | | (4,663,103,567 | ) | |
Net increase (decrease) | | $ | (901,931,357 | ) | | $ | (255,866,921 | ) | | $ | 260,660,611 | | |
First Eagle Funds | Semi-Annual Report | April 30, 2016
192
Notes to Financial Statements (unaudited)
| | | Six-Month Period Ended April 30, 2016 | |
| | | First Eagle Overseas Fund | |
| | | Class A | | Class C | | Class I | |
Shares sold | | $ | 286,316,316 | | | $ | 50,049,119 | | | $ | 1,387,701,925 | | |
Shares issued for reinvested
dividends and distributions | | | 47,670,300 | | | | 9,385,037 | | | | 115,492,285 | | |
Shares redeemed | | | (738,563,532 | ) | | | (101,865,764 | ) | | | (1,100,111,221 | ) | |
Net increase (decrease) | | $ | (404,576,916 | ) | | $ | (42,431,608 | ) | | $ | 403,082,989 | | |
| | | Year Ended October 31, 2015 | |
| | | First Eagle Overseas Fund | |
| | | Class A | | Class C | | Class I | |
Shares sold | | $ | 694,012,785 | | | $ | 127,322,462 | | | $ | 2,132,752,758 | | |
Shares issued for reinvested
dividends and distributions | | | 194,162,834 | | | | 35,440,449 | | | | 342,110,095 | | |
Shares redeemed | | | (1,286,051,819 | ) | | | (185,324,821 | ) | | | (2,397,902,889 | ) | |
Net increase (decrease) | | $ | (397,876,200 | ) | | $ | (22,561,910 | ) | | $ | 76,959,964 | | |
First Eagle Funds | Semi-Annual Report | April 30, 2016
193
Notes to Financial Statements (unaudited)
| | | Six-Month Period Ended April 30, 2016 | |
| | | First Eagle U.S. Value Fund | |
| | | Class A | | Class C | | Class I | |
Shares sold | | $ | 36,923,822 | | | $ | 18,081,916 | | | $ | 46,782,557 | | |
Shares issued for reinvested
dividends and distributions | | | 36,216,601 | | | | 20,000,582 | | | | 31,210,592 | | |
Shares redeemed | | | (161,410,356 | ) | | | (76,699,535 | ) | | | (187,067,017 | ) | |
Net increase (decrease) | | $ | (88,269,933 | ) | | $ | (38,617,037 | ) | | $ | (109,073,868 | ) | |
| | | Year Ended October 31, 2015 | |
| | | First Eagle U.S. Value Fund | |
| | | Class A | | Class C | | Class I | |
Shares sold | | $ | 109,557,157 | | | $ | 59,254,394 | | | $ | 207,604,536 | | |
Shares issued for reinvested
dividends and distributions | | | 61,488,226 | | | | 31,322,256 | | | | 53,619,398 | | |
Shares redeemed | | | (361,075,493 | ) | | | (158,755,123 | ) | | | (450,704,353 | ) | |
Net increase (decrease) | | $ | (190,030,110 | ) | | $ | (68,178,473 | ) | | $ | (189,480,419 | ) | |
| | | Six-Month Period Ended April 30, 2016 | |
| | | First Eagle High Yield Fund | |
| | | Class A | | Class C | | Class I | |
Shares sold | | $ | 28,625,319 | | | $ | 12,085,802 | | | $ | 54,566,344 | | |
Shares issued for reinvested
dividends and distributions | | | 5,308,532 | | | | 3,376,678 | | | | 11,657,308 | | |
Shares redeemed | | | (74,043,418 | ) | | | (29,519,688 | ) | | | (181,220,588 | ) | |
Net increase (decrease) | | $ | (40,109,567 | ) | | $ | (14,057,208 | ) | | $ | (114,996,936 | ) | |
| | | Year Ended October 31, 2015 | |
| | | First Eagle High Yield Fund | |
| | | Class A | | Class C | | Class I | |
Shares sold | | $ | 72,157,346 | | | $ | 23,208,644 | | | $ | 249,506,974 | | |
Shares issued for reinvested
dividends and distributions | | | 11,715,193 | | | | 7,364,603 | | | | 32,097,393 | | |
Shares redeemed | | | (106,008,862 | ) | | | (68,215,333 | ) | | | (451,181,992 | ) | |
Net increase (decrease) | | $ | (22,136,323 | ) | | $ | (37,642,086 | ) | | $ | (169,577,625 | ) | |
First Eagle Funds | Semi-Annual Report | April 30, 2016
194
Notes to Financial Statements (unaudited)
| | | Six-Month Period Ended April 30, 2016 | |
| | | First Eagle Gold Fund | | First Eagle Global Income Builder Fund | |
| | | Class A | | Class C | | Class I | | Class A | | Class C | | Class I | |
Shares sold | | $ | 76,879,567 | | | $ | 21,273,114 | | | $ | 119,315,644 | | | $ | 52,262,255 | | | $ | 38,603,533 | | | $ | 98,874,145 | | |
Shares issued for reinvested
dividends and distributions | | | 364 | | | | 136 | | | | — | | | | 4,572,226 | | | | 3,226,797 | | | | 5,234,895 | | |
Shares redeemed | | | (69,962,865 | ) | | | (23,071,245 | ) | | | (123,404,019 | ) | | | (93,705,187 | ) | | | (67,107,395 | ) | | | (128,122,020 | ) | |
Net increase (decrease) | | $ | 6,917,066 | | | $ | (1,797,995 | ) | | $ | (4,088,375 | ) | | $ | (36,870,706 | ) | | $ | (25,277,065 | ) | | $ | (24,012,980 | ) | |
| | | Year Ended October 31, 2015 | |
| | | First Eagle Gold Fund | | First Eagle Global Income Builder Fund | |
| | | Class A | | Class C | | Class I | | Class A | | Class C | | Class I | |
Shares sold | | $ | 166,942,899 | | | $ | 32,311,867 | | | $ | 177,977,021 | | | $ | 129,455,279 | | | $ | 105,893,330 | | | $ | 188,339,045 | | |
Shares issued for reinvested
dividends and distributions | | | 2,027 | | | | 906 | | | | — | | | | 16,244,858 | | | | 12,057,152 | | | | 17,142,957 | | |
Shares redeemed | | | (184,532,240 | ) | | | (55,581,885 | ) | | | (212,714,595 | ) | | | (148,722,401 | ) | | | (90,789,241 | ) | | | (195,344,103 | ) | |
Net increase (decrease) | | $ | (17,587,314 | ) | | $ | (23,269,112 | ) | | $ | (34,737,574 | ) | | $ | (3,022,264 | ) | | $ | 27,161,241 | | | $ | 10,137,899 | | |
| | | Six-Month Period Ended April 30, 2016 | |
| | | First Eagle Fund of America | |
| | | Class A | | Class C | | Class I | | Class Y | |
Shares sold | | $ | 108,214,264 | | | $ | 48,943,110 | | | $ | 119,719,172 | | | $ | 13,511,274 | | |
Shares issued for reinvested
dividends and distributions | | | 32,950,087 | | | | 19,957,567 | | | | 23,592,833 | | | | 12,761,382 | | |
Shares redeemed | | | (238,364,760 | ) | | | (106,253,816 | ) | | | (200,282,079 | ) | | | (47,234,290 | ) | |
Net increase (decrease) | | $ | (97,200,409 | ) | | $ | (37,353,139 | ) | | $ | (56,970,074 | ) | | $ | (20,961,634 | ) | |
| | | Year Ended October 31, 2015 | |
| | | First Eagle Fund of America | |
| | | Class A | | Class C | | Class I | | Class Y | |
Shares sold | | $ | 427,786,509 | | | $ | 243,686,750 | | | $ | 519,384,321 | | | $ | 60,031,283 | | |
Shares issued for reinvested
dividends and distributions | | | 78,833,583 | | | | 42,190,415 | | | | 45,373,323 | | | | 36,042,154 | | |
Shares redeemed | | | (285,495,070 | ) | | | (112,903,474 | ) | | | (208,926,563 | ) | | | (93,040,793 | ) | |
Net increase (decrease) | | $ | 221,125,022 | | | $ | 172,973,691 | | | $ | 355,831,081 | | | $ | 3,032,644 | | |
First Eagle Funds | Semi-Annual Report | April 30, 2016
195
Notes to Financial Statements (unaudited)
Note 7 — Indemnification and Investment Risk
In the normal course of business, the Funds enter into contracts that contain a variety of representations which provide general indemnifications. Each Fund's maximum exposure under these arrangements is unknown, as this would involve future claims that may be made against each Fund that have not yet occurred. However, based on experience, the Funds expect the risk of loss to be remote. The Funds may have elements of risk not typically associated with investments in the United States due to their investments in foreign countries or regions. Such foreign investments may subject the Funds to additional risks resulting from political or economic conditions in such countries or regions and the possible imposition of adverse governmental laws or currency exchange restrictions could cause the securities and their markets to be less liquid and their prices to be more volatile than those of comparable U.S. securities. The securities markets in many emerging-market countries are substantially smaller, less developed, less liquid and more volatile than the securities markets of developed countries.
The First Eagle High Yield Fund and First Eagle Global Income Builder Fund invest in high yield securities which may be subject to greater levels of interest rate, credit and liquidity risk than investment grade securities. These high yield securities may be considered speculative with respect to the issuer's continuing ability to make principal and interest payments and may be subject to significant price fluctuations.
The Funds are subject to interest rate and credit risk. The value of debt securities may decline as interest rates increase. The Funds could lose money if the issuer of a fixed income security is unable to pay interest or repay principal when it is due. The ability of the issuers of debt to meet their obligations may be affected by the economic and political developments in a specific industry or region.
The Funds enter into derivatives which may represent off-balance sheet risk. Off-balance sheet risk exists when the maximum potential loss on a particular investment is greater than the value of such investment as reflected in the Statements of Assets and Liabilities.
Note 8 — Redemption In-Kind Transactions
The redemption in-kind policy for all of the Funds reserves the right of the Funds to pay redemptions in-kind (i.e., payments in the form of marketable securities or, as needed, other traded assets, rather than cash) if the redemption request is large enough to affect a Fund's operations (for example, if it represents more than $250,000 or 1% of the Fund's assets). When receiving assets distributed in-kind, the recipient will bear applicable commissions or other costs on their sale. There were no redemptions in-kind as of April 30, 2016.
Note 9 — Subsequent Events
In accordance with the provision surrounding Subsequent Events adopted by the Funds, management has evaluated the possibility of subsequent events existing in the Funds' financial statements. Management has determined that there are no material events that would require disclosures in the Funds' financial statements.
First Eagle Funds | Semi-Annual Report | April 30, 2016
196
Fund Expenses (unaudited)
Example
As a shareholder of the First Eagle Funds, you may incur two types of costs: (1) transaction costs including front-end and contingent deferred sales charges (loads), and (2) ongoing costs, including advisory fees; distribution fees (12b-1) and/or service fees; and other Fund expenses. This example is intended to help you understand your ongoing costs (in dollars) of investing in the Funds and to compare these costs with the ongoing costs of investing in other mutual funds.
This example is based on an investment of $1,000 invested on November 1, 2015 and held for the six-months ended April 30, 2016.
Actual Expenses
The table below titled "Based on Actual Total Return" provides information about actual account values and actual expenses. You may use the information provided in this table, together with the amount you invested, to estimate the expenses that you paid over the period. To estimate the expenses you paid on your account, divide your ending account value by $1,000 (for example, an $8,600 ending account value divided by $1,000 = 8.6), then multiply the result by the number under the heading entitled "Expenses Paid During the Period".
First Eagle Funds | Semi-Annual Report | April 30, 2016
197
Fund Expenses (unaudited)
Based on Actual Total Return(1)
| | | Actual Total
Return without
Sales Charges(2) | | Beginning
Account
Value | | Ending
Account
Value | | Annualized
Expense
Ratio | | Expenses
Paid during
the Period(3) | |
First Eagle Global Fund Consolidated | |
Class A | | | 4.70 | % | | $ | 1,000.00 | | | $ | 1,047.00 | | | | 1.13 | % | | $ | 5.75 | | |
Class C | | | 4.29 | | | | 1,000.00 | | | | 1,042.90 | | | | 1.87 | | | | 9.50 | | |
Class I | | | 4.82 | | | | 1,000.00 | | | | 1,048.20 | | | | 0.85 | | | | 4.33 | | |
First Eagle Overseas Fund Consolidated | |
Class A | | | 5.15 | | | | 1,000.00 | | | | 1,051.50 | | | | 1.18 | | | | 6.02 | | |
Class C | | | 4.79 | | | | 1,000.00 | | | | 1,047.90 | | | | 1.90 | | | | 9.67 | | |
Class I | | | 5.29 | | | | 1,000.00 | | | | 1,052.90 | | | | 0.89 | | | | 4.54 | | |
First Eagle U.S. Value Fund Consolidated | |
Class A | | | 4.14 | | | | 1,000.00 | | | | 1,041.40 | | | | 1.16 | | | | 5.89 | | |
Class C | | | 3.76 | | | | 1,000.00 | | | | 1,037.60 | | | | 1.91 | | | | 9.68 | | |
Class I | | | 4.30 | | | | 1,000.00 | | | | 1,043.00 | | | | 0.88 | | | | 4.47 | | |
First Eagle Gold Fund Consolidated | |
Class A | | | 47.33 | | | | 1,000.00 | | | | 1,473.30 | | | | 1.35 | | | | 8.30 | | |
Class C | | | 46.67 | | | | 1,000.00 | | | | 1,466.70 | | | | 2.14 | | | | 13.12 | | |
Class I | | | 47.50 | | | | 1,000.00 | | | | 1,475.00 | | | | 1.05 | | | | 6.46 | | |
First Eagle Global Income Builder Fund | |
Class A | | | 2.96 | | | | 1,000.00 | | | | 1,029.60 | | | | 1.20 | | | | 6.06 | | |
Class C | | | 2.49 | | | | 1,000.00 | | | | 1,024.90 | | | | 1.96 | | | | 9.87 | | |
Class I | | | 3.09 | | | | 1,000.00 | | | | 1,030.90 | | | | 0.93 | | | | 4.70 | | |
First Eagle High Yield Fund | |
Class A | | | -0.23 | | | | 1,000.00 | | | | 997.70 | | | | 1.18 | | | | 5.86 | | |
Class C | | | -0.59 | | | | 1,000.00 | | | | 994.10 | | | | 1.91 | | | | 9.47 | | |
Class I | | | -0.10 | | | | 1,000.00 | | | | 999.00 | | | | 0.88 | | | | 4.37 | | |
First Eagle Fund of America | |
Class A | | | -4.52 | | | | 1,000.00 | | | | 954.80 | | | | 1.36 | | | | 6.61 | | |
Class C | | | -4.89 | | | | 1,000.00 | | | | 951.10 | | | | 2.10 | | | | 10.19 | | |
Class I | | | -4.36 | | | | 1,000.00 | | | | 956.40 | | | | 1.04 | | | | 5.06 | | |
Class Y | | | -4.52 | | | | 1,000.00 | | | | 954.80 | | | | 1.36 | | | | 6.61 | | |
(1) For the six-months ended April 30, 2016.
(2) Past performance does not guarantee future results. Assumes reinvestment of all dividends and capital gain distributions, if any, at net asset value and does not reflect the deduction of the applicable sales charge, exchange fees or redemption fees. Had the effect of sales charges been reflected, expenses would have been higher and returns lower. Total return is not annualized, as it may not be representative of the total return for the year.
(3) Expenses are equal to the annualized expense ratio multiplied by the average account value over the period, multiplied by 182/366 (to reflect the one-half year period).
First Eagle Funds | Semi-Annual Report | April 30, 2016
198
Fund Expenses (unaudited)
Hypothetical Example for Comparison Purposes
The table below titled "Based on Hypothetical Total Return" provides information about hypothetical account values and hypothetical expenses based on the actual expense ratios and an assumed rate of return of 5% per year before expenses, which is not the First Eagle Funds' actual return. The hypothetical account values and expenses may not be used to estimate the actual ending account balance or expenses you paid for the period. You may use the information provided in this table to compare the ongoing costs of investing in the Funds and other funds. To do so, compare the 5% hypothetical example relating to the Funds with the 5% hypothetical examples that appear in the shareholder reports of other funds.
This example is based on an investment of $1,000 invested on November 1, 2015 and held for the six-months ended April 30, 2016.
Please note that the expenses shown in the table below are meant to highlight your ongoing costs only and do not reflect any transactional costs, such as front-end or back-end sales charges (loads). Therefore, the table is useful in comparing ongoing costs only, and will not help you determine the relative total costs of owning different funds. In addition, if these transaction costs were included, your costs would have been higher.
First Eagle Funds | Semi-Annual Report | April 30, 2016
199
Fund Expenses (unaudited)
Based on Hypothetical Total Return(1)
| | | Hypothetical
Annualized
Total
Return | | Beginning
Account
Value | | Ending
Account
Value | | Annualized
Expense
Ratio | | Expenses
Paid during
the Period(2) | |
First Eagle Global Fund Consolidated | |
Class A | | | 5.00 | % | | $ | 1,000.00 | | | $ | 1,019.24 | | | | 1.13 | % | | $ | 5.67 | | |
Class C | | | 5.00 | | | | 1,000.00 | | | | 1,015.56 | | | | 1.87 | | | | 9.37 | | |
Class I | | | 5.00 | | | | 1,000.00 | | | | 1,020.64 | | | | 0.85 | | | | 4.27 | | |
First Eagle Overseas Fund Consolidated | |
Class A | | | 5.00 | | | | 1,000.00 | | | | 1,019.00 | | | | 1.18 | | | | 5.92 | | |
Class C | | | 5.00 | | | | 1,000.00 | | | | 1,015.42 | | | | 1.90 | | | | 9.52 | | |
Class I | | | 5.00 | | | | 1,000.00 | | | | 1,020.44 | | | | 0.89 | | | | 4.47 | | |
First Eagle U.S. Value Fund Consolidated | |
Class A | | | 5.00 | | | | 1,000.00 | | | | 1,019.10 | | | | 1.16 | | | | 5.82 | | |
Class C | | | 5.00 | | | | 1,000.00 | | | | 1,015.37 | | | | 1.91 | | | | 9.57 | | |
Class I | | | 5.00 | | | | 1,000.00 | | | | 1,020.49 | | | | 0.88 | | | | 4.42 | | |
First Eagle Gold Fund Consolidated | |
Class A | | | 5.00 | | | | 1,000.00 | | | | 1,018.15 | | | | 1.35 | | | | 6.77 | | |
Class C | | | 5.00 | | | | 1,000.00 | | | | 1,014.22 | | | | 2.14 | | | | 10.72 | | |
Class I | | | 5.00 | | | | 1,000.00 | | | | 1,019.64 | | | | 1.05 | | | | 5.27 | | |
First Eagle Global Income Builder Fund | |
Class A | | | 5.00 | | | | 1,000.00 | | | | 1,018.90 | | | | 1.20 | | | | 6.02 | | |
Class C | | | 5.00 | | | | 1,000.00 | | | | 1,015.12 | | | | 1.96 | | | | 9.82 | | |
Class I | | | 5.00 | | | | 1,000.00 | | | | 1,020.24 | | | | 0.93 | | | | 4.67 | | |
First Eagle High Yield Fund | |
Class A | | | 5.00 | | | | 1,000.00 | | | | 1,019.00 | | | | 1.18 | | | | 5.92 | | |
Class C | | | 5.00 | | | | 1,000.00 | | | | 1,015.37 | | | | 1.91 | | | | 9.57 | | |
Class I | | | 5.00 | | | | 1,000.00 | | | | 1,020.49 | | | | 0.88 | | | | 4.42 | | |
First Eagle Fund of America | |
Class A | | | 5.00 | | | | 1,000.00 | | | | 1,018.10 | | | | 1.36 | | | | 6.82 | | |
Class C | | | 5.00 | | | | 1,000.00 | | | | 1,014.42 | | | | 2.10 | | | | 10.52 | | |
Class I | | | 5.00 | | | | 1,000.00 | | | | 1,019.69 | | | | 1.04 | | | | 5.22 | | |
Class Y | | | 5.00 | | | | 1,000.00 | | | | 1,018.10 | | | | 1.36 | | | | 6.82 | | |
(1) For the six-months ended April 30, 2016.
(2) Expenses are equal to the annualized expense ratio multiplied by the average account value over the period, multiplied by 182/366 (to reflect the one-half year period).
First Eagle Funds | Semi-Annual Report | April 30, 2016
200
Quarterly Form N-Q portfolio schedule
The First Eagle Funds file their complete schedule of portfolio holdings with the Securities and Exchange Commission ("SEC") for the first and third quarters of each fiscal year on Form N-Q. The Funds' Forms N-Q are available on the SEC's Web site at www.sec.gov. The Funds' Forms N-Q may be reviewed and copied at the SEC's Public Reference Room in Washington, D.C. Information on the operation of the SEC's Public Reference Room may be obtained by calling 1.800.SEC.0330. Additionally, you may obtain copies of Forms N-Q from the Funds upon request by calling 1.800.334.2143.
Proxy voting policies, procedures and record
You may obtain (1) a description of the Funds' proxy voting policies, (2) a description of the Funds' proxy voting procedures and (3) information regarding how the Funds voted any proxies related to portfolio securities during the most recent twelve-month period ended June 30 for which an SEC filing has been made, without charge, upon request by contacting the Funds directly at 1.800.334.2143 or on the EDGAR Database on the SEC's Web site at www.sec.gov.
First Eagle Funds | Semi-Annual Report | April 30, 2016
201
Trustees
Lisa Anderson
John P. Arnhold
Candace K. Beinecke (Chair)
Jean-Marie Eveillard
Jean D. Hamilton
James E. Jordan
William M. Kelly
Paul J. Lawler
Officers
John P. Arnhold
President
Robert Bruno
Senior Vice President
Joseph T. Malone
Chief Financial Officer
Albert Pisano
Chief Compliance Officer
Suzan J. Afifi
Secretary & Vice President
Tricia Larkin
Treasurer
Michael Luzzatto
Vice President
Neal Ashinsky
Assistant Treasurer
Investment Adviser
First Eagle Investment Management, LLC
1345 Avenue of the Americas
New York, NY 10105
Legal Counsel
Shearman & Sterling LLP
599 Lexington Avenue
New York, NY 10022
Custodian
State Street Bank and Trust Company
801 Pennsylvania Avenue
Kansas City, MO 64105
Shareholder Servicing Agent
DST Systems, Inc.
330 West 9th Street
Kansas City, MO 64105
800.334.2143
Underwriter
FEF Distributors, LLC
1345 Avenue of the Americas
New York, NY 10105
Independent Registered Public
Accounting Firm
PricewaterhouseCoopers LLP
300 Madison Avenue
New York, NY 10017
This report is not authorized for distribution to prospective investors unless preceded or accompanied by a currently effective prospectus of First Eagle Funds.
First Eagle Funds | Semi-Annual Report | April 30, 2016
202


First Eagle Investment Management, LLC
1345 Avenue of the Americas, New York, NY 10105-0048
800.334.2143 www.feim.com
Item 2. Code of Ethics.
The Registrant has adopted a code of ethics that applies to its principal executive officer and principal financial officer. Copies of the code of ethics may be requested free of charge by calling 1-800-334-2143 (toll free).
Item 3. Audit Committee Financial Expert.
Not applicable to this semi-annual report.
Item 4. Principal Accountant Fees and Services
Not applicable to this semi-annual report.
Item 5. Audit Committee of Listed Registrants
Not applicable at this time.
Item 6. Schedule of Investments.
Please see schedule of investments contained in the Report to Stockholders included under Item 1 of this Form N-CSR.
Item 7. Disclosure of Proxy Voting Policies and Procedures for Closed-End Management Investment Companies.
Not applicable at this time.
Item 8. Portfolio Managers of Closed-End Management Investment Companies.
Not applicable at this time.
Item 9. Purchases of Equity Securities by Close-End Management Investment Company and Affiliated Purchasers.
Not applicable at this time.
Item 10. Submission of Matters to a Vote of Security Holders.
Not applicable at this time.
Item 11. Controls and Procedures.
(a) In the opinion of the principal executive officer and principal financial officer, based on their evaluation, the registrant’s disclosure controls and procedures are adequately designed and are operating effectively to ensure (i) that material information relating to the registrant, including its consolidated subsidiaries, is made known to them by others within those entities, particularly during the period in which this report is being prepared; and (ii) that information required to be disclosed by the registrant on Form N-CSR is recorded, processed, summarized and reported within the time periods specified in the Securities and Exchange Commission’s rules and forms.
(b) There were no changes in the registrant’s internal control over financial reporting that occurred during the registrant’s most recent fiscal half-year (the registrant’s second fiscal half-year in the case of an annual report) that have materially affected or are reasonably likely to materially affect, the registrant’s internal control over financial reporting.
Item 12. Exhibits.
(a)(1) Not applicable to this semi-annual report.
(a)(2) Certifications pursuant to Rule 30a-2(a) under the Investment Company Act of 1940 (17 CFR 270.30a-2(a)): Attached hereto.
(a)(3) Not applicable.
(b) Certification pursuant to Rule 30a-2(b) under the Investment Company Act of 1940 (17 CFR 270.30a-2(b)): Attached hereto.
SIGNATURES
Pursuant to the requirements of the Securities Exchange Act of 1934 and the Investment Company Act of 1940, the registrant has duly caused this report to be signed on its behalf by the undersigned, thereunto duly authorized.
(Registrant) | First Eagle Funds |
| |
By (Signature and Title)* | /s/ John P. Arnhold |
| John P. Arnhold, President |
Date: July 6, 2016
Pursuant to the requirements of the Securities Exchange Act of 1934 and the Investment Company Act of 1940, this report has been signed below by the following persons on behalf of the registrant and in the capacities and on the dates indicated.
By (Signature and Title)* | /s/ John P. Arnhold |
| John P. Arnhold, Principal Executive Officer |
Date: July 6, 2016
By (Signature and Title)* | /s/ Joseph T. Malone |
| Joseph T. Malone, Principal Financial Officer |
Date: July 6, 2016
* Print the name and title of each signing officer under his or her signature.