UNITED STATES
SECURITIES AND EXCHANGE COMMISSION
Washington, D.C. 20549
FORM N-CSR
CERTIFIED SHAREHOLDER REPORT OF REGISTERED
MANAGEMENT INVESTMENT COMPANIES
|
| | | | | | |
| Investment Company Act file number | 811-07820 |
| | |
| AMERICAN CENTURY CAPITAL PORTFOLIOS, INC. |
| (Exact name of registrant as specified in charter) |
| | |
| 4500 MAIN STREET, KANSAS CITY, MISSOURI | 64111 |
| (Address of principal executive offices) | (Zip Code) |
| | |
CHARLES A. ETHERINGTON 4500 MAIN STREET, KANSAS CITY, MISSOURI 64111 |
| (Name and address of agent for service) |
| | |
| Registrant’s telephone number, including area code: | 816-531-5575 |
| | |
| Date of fiscal year end: | 03-31 |
| | |
| Date of reporting period: | 03-31-2016 |
ITEM 1. REPORTS TO STOCKHOLDERS.
|
| |
| | |
| | Annual Report |
| | |
| | March 31, 2016 |
| | |
| | Equity Income Fund |
|
| | |
| President’s Letter | 2 |
|
| Performance | 3 |
|
| Portfolio Commentary | |
|
| Fund Characteristics | |
|
| Shareholder Fee Example | |
|
| Schedule of Investments | |
|
| Statement of Assets and Liabilities | |
|
| Statement of Operations | |
|
| Statement of Changes in Net Assets | |
|
| Notes to Financial Statements | |
|
| Financial Highlights | |
|
| Report of Independent Registered Public Accounting Firm | |
|
| Management | |
|
| Additional Information | |
|
Any opinions expressed in this report reflect those of the author as of the date of the report, and do not necessarily represent the opinions of American Century Investments® or any other person in the American Century Investments organization. Any such opinions are subject to change at any time based upon market or other conditions and American Century Investments disclaims any responsibility to update such opinions. These opinions may not be relied upon as investment advice and, because investment decisions made by American Century Investments funds are based on numerous factors, may not be relied upon as an indication of trading intent on behalf of any American Century Investments fund. Security examples are used for representational purposes only and are not intended as recommendations to purchase or sell securities. Performance information for comparative indices and securities is provided to American Century Investments by third party vendors. To the best of American Century Investments’ knowledge, such information is accurate at the time of printing.
|
| |
| Dear Investor:
Thank you for reviewing this annual report for the 12 months ended March 31, 2016. It provides investment performance and portfolio information for the reporting period, plus longer-term historical performance data.
Annual reports help convey information about fund performance, including market and economic factors that affected returns during the reporting period. For additional, updated investment and market insights, we encourage you to visit our website, americancentury.com.
|
| Jonathan Thomas |
Divergence in Economic Growth and Monetary Policies, Combined With China Turmoil, Triggered Market Volatility
Divergence between the U.S. and the rest of the world—along with China’s struggles, plunging commodity prices, capital market volatility, and risk-off trading—were dominant themes during the reporting period. Global divergence described not only the relatively stronger economic growth enjoyed by the U.S. compared with most of the world, but also the related contrast between the U.S. Federal Reserve’s (the Fed’s) unwinding of monetary stimulus versus the continuation and expansion of stimulus by other major central banks.
Two months in particular captured the volatility and risk-off trading of the 12-month period. Last August, China’s economic slowdown (which rippled across the global economy) triggered Chinese stock market volatility, increasingly stimulative Chinese central bank monetary policy, and currency devaluations. Burdened further with oil market volatility, equity and higher-risk bond markets declined globally. Five months later, in January, investor sentiment plunged again as global economic growth decelerated, China devalued its currency again, and oil prices dropped below $30 a barrel. In addition, the Fed, in December, executed its first rate hike since 2006. Central bank policies showed less divergence thereafter, with the Bank of Japan suddenly resorting to negative interest rates, the Fed holding rates steady while reducing its rate hike projections, and the European Central Bank announcing significant additional stimulus.
Bonds (and more bond-like stock sectors, such as utilities and REITs) generally outperformed the broad stock market for the reporting period. In terms of stock style and size, growth generally outperformed value, and large cap generally outperformed small cap. In the bond market, higher quality (investment-grade) generally outperformed lower quality (high-yield). We expect continued economic and monetary policy divergence between the U.S. and non-U.S. economies in 2016, accompanied by further market volatility. This could present both challenges and opportunities for active investment managers. Looking ahead, we continue to believe in a disciplined, diversified, risk-aware investment approach, using professionally managed portfolios to meet financial goals. We appreciate your trust in us.
Sincerely,
Jonathan Thomas
President and Chief Executive Officer
American Century Investments
|
| | | | | | |
| Total Returns as of March 31, 2016 |
| | | | Average Annual Returns | |
| | Ticker Symbol | 1 year | 5 years | 10 years | Since Inception | Inception Date |
| Investor Class | TWEIX | 6.78% | 9.84% | 6.96% | — | 8/1/94 |
| Russell 3000 Value Index | — | -2.05% | 9.94% | 5.60% | — | — |
| S&P 500 Index | — | 1.78% | 11.57% | 7.00% | — | — |
| Institutional Class | ACIIX | 7.11% | 10.05% | 7.18% | — | 7/8/98 |
| A Class | TWEAX | | | | | 3/7/97 |
| No sales charge | | 6.51% | 9.57% | 6.70% | — | |
| With sales charge | | 0.40% | 8.29% | 6.07% | — | |
| C Class | AEYIX | 5.72% | 8.73% | 5.91% | — | 7/13/01 |
| R Class | AEURX | 6.27% | 9.30% | 6.45% | — | 8/29/03 |
| R6 Class | AEUDX | 7.14% | — | — | 8.78% | 7/26/13 |
Sales charges include initial sales charges and contingent deferred sales charges (CDSCs), as applicable. A Class shares have a 5.75% maximum initial sales charge and may be subject to a maximum CDSC of 1.00%. C Class shares redeemed within 12 months of purchase are subject to a maximum CDSC of 1.00%. The SEC requires that mutual funds provide performance information net of maximum sales charges in all cases where charges could be applied.
Average annual returns since inception are presented when ten years of performance history is not available.
Prior to September 4, 2007, the A Class was referred to as the Advisor Class and did not have a front-end sales charge. Performance prior to that date has been adjusted to reflect this charge.
Data presented reflect past performance. Past performance is no guarantee of future results. Current performance may be higher or lower than the performance shown. Total returns for periods less than one year are not annualized. Investment return and principal value will fluctuate, and redemption value may be more or less than original cost. Data assumes reinvestment of dividends and capital gains, and none of the charts reflect the deduction of taxes that a shareholder would pay on fund distributions or the redemption of fund shares. To obtain performance data current to the most recent month end, please call 1-800-345-2021 or visit americancentury.com. For additional information about the fund, please consult the prospectus.
|
|
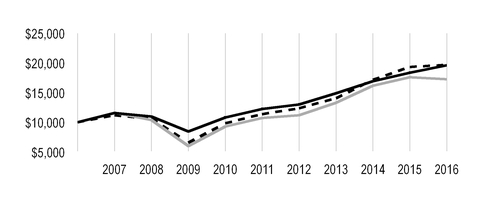
| Growth of $10,000 Over 10 Years |
| $10,000 investment made March 31, 2006 |
Performance for other share classes will vary due to differences in fee structure.
|
|
| |
| Value on March 31, 2016 |
| | Investor Class — $19,615 |
| |
| | Russell 3000 Value Index — $17,249 |
| |
| | S&P 500 Index — $19,687 |
| |
|
| | | | | |
| Total Annual Fund Operating Expenses | | |
| Investor Class | Institutional Class | A Class | C Class | R Class | R6 Class |
| 0.93% | 0.73% | 1.18% | 1.93% | 1.43% | 0.58% |
The total annual fund operating expenses shown is as stated in the fund’s prospectus current as of the date of this report. The prospectus may vary from the expense ratio shown elsewhere in this report because it is based on a different time period, includes acquired fund fees and expenses, and, if applicable, does not include fee waivers or expense reimbursements.
Data presented reflect past performance. Past performance is no guarantee of future results. Current performance may be higher or lower than the performance shown. Total returns for periods less than one year are not annualized. Investment return and principal value will fluctuate, and redemption value may be more or less than original cost. Data assumes reinvestment of dividends and capital gains, and none of the charts reflect the deduction of taxes that a shareholder would pay on fund distributions or the redemption of fund shares. To obtain performance data current to the most recent month end, please call 1-800-345-2021 or visit americancentury.com. For additional information about the fund, please consult the prospectus.
Portfolio Managers: Phil Davidson, Kevin Toney, Michael Liss, and Dan Gruemmer
In February 2016, portfolio manager Dan Gruemmer joined the Equity Income management team.
Performance Summary
Equity Income returned 6.78%* for the 12 months ended March 31, 2016. By comparison, its benchmark, the Russell 3000 Value Index, declined -2.05%. The fund’s return reflects operating expenses, while index returns do not.
Volatility reigned over much of the 12-month period. Economic growth in the U.S. continued at a moderate pace, and the domestic employment market continued to post encouraging gains. Yet, continued weakness in oil prices and Chinese economic activity worried investors, spurring a significant pullback in stocks in the third quarter of 2015. Facing market anxiety, the Federal Reserve (Fed) delayed the first interest rate increase. The market rallied in the fourth quarter, with sufficient strength that the Fed finally enacted the first rate increase in nine years.
The first quarter of 2016 was a shorter version of the same cycle, with stocks pulling back alongside falling oil prices, then recovering when the Fed announced a slower pace for interest rate increases. The energy sector continued to struggle; worries about souring loans to the sector spilled over to the financials sector as well. Growth stocks outperformed value stocks among large caps; among small and mid caps, the trend was reversed. Among value stocks, large caps outperformed mid caps, while small caps posted the biggest declines.
Equity Income outperformed its benchmark, primarily because of its positioning in financials, utilities and energy stocks. Holdings in industrials and consumer discretionary stocks also boosted relative performance. Stock selection across the portfolio was particularly strong, although sector allocation also contributed to relative performance. The portfolio’s stance in telecommunication services and materials detracted slightly from relative returns.
Financials Boosted Performance
Stock selection and an underweight to the financials sector both contributed to relative performance. Selection in banks, where the portfolio is overweight, was especially strong; convertible holdings in Bank of America and Wells Fargo added to relative returns. We have used select convertible positions of banks that have unique terms which skew the risk-reward to our favor. The portfolio also benefited from avoiding the common stocks of Citigroup and Wells Fargo. Some large-cap banks struggled as the pace of interest rate increases stalled over the last 12 months, lowering earnings expectations for banks. Credit exposure to the energy sector was also a growing concern over the period, as oil prices generally continued to fall.
Utilities Contributed to Outperformance
Overall selection also had a positive effect in utilities, as did the portfolio’s overweight allocation to the sector, which was one of the top performers in the benchmark over the 12-month period. The portfolio’s overweight to gas utilities added to relative performance, as did selection in the industry. Gas utility ONE Gas was the top contributor; the company continued to exceed expectations, raising its dividend and long-term outlook in the period.
*All fund returns referenced in this commentary are for Investor Class shares. Performance for other share classes will vary due to differences in fee structure; when Investor Class performance exceeds that of the fund's benchmark, other share classes may not. See page 3 for returns for all share classes.
Energy Added to Relative Performance
Selection in the struggling energy sector also contributed to the portfolio’s outperformance, though a slight overweight in the sector detracted marginally from returns. Selection in the oil, gas and consumable fuels industry added to performance, due to the avoidance of a number of energy companies that underperformed, including Kinder Morgan, ConocoPhillips and Anadarko Petroleum. Relative performance was also boosted by the portfolio’s selection in energy equipment and services, as well as by an underweight to the industry.
Telecommunication Services and Materials Weighed on Results
Selection and an underweight allocation in the telecommunication services sector weighed slightly on relative performance. The sector was the top performer in the benchmark over the 12-month period; the portfolio’s avoidance of benchmark name AT&T hindered results. Telecommunications services performed well as investors sought stability during periodic market volatility. Selection in the materials sector also detracted a bit from overall performance. Chemicals manufacturer Potash Corp. of Saskatchewan weighed on results. Potash suffered lower pricing power from oversupply and weakening demand, particularly in China.
Outlook
We will continue to follow our disciplined, bottom-up investment process, selecting companies one at a time for the portfolio. The portfolio continues to be notably overweight in consumer staples companies. A position in beverage maker PepsiCo was recently trimmed, after the stock held up well on a relative basis during the market decline in the first quarter of 2016. We also trimmed food distributor Sysco as the stock outperformed, and the company announced an acquisition that will materially increase leverage. The portfolio moved from a slight underweight in information technology to a moderate overweight following purchases over the year. We added to a position in Cisco Systems due to a significantly larger-than-expected dividend increase and share repurchase authorization signaling improving capital allocation.
In the financials sector, the portfolio maintains an underweight position, particularly in real estate investment trusts (REITs) and insurance companies. The portfolio maintains an overweight in banks, which we believe are attractively valued. We prefer banks with safe dividends.
|
| |
| MARCH 31, 2016 |
| Top Ten Holdings | % of net assets |
| iShares Russell 1000 Value ETF | 5.0% |
| Wells Fargo & Co. (Convertible) | 4.0% |
| Bank of America Corp. (Convertible) | 3.8% |
| Procter & Gamble Co. (The) | 3.0% |
| Pfizer, Inc. | 3.0% |
| Intel Corp. (Convertible) | 3.0% |
| Schlumberger Ltd. | 2.7% |
| Microchip Technology, Inc. (Convertible) | 2.7% |
| Cisco Systems, Inc. | 2.6% |
| PNC Financial Services Group, Inc. (The) | 2.5% |
| | |
| Top Five Industries | % of net assets |
| Banks | 14.1% |
| Oil, Gas and Consumable Fuels | 7.8% |
| Semiconductors and Semiconductor Equipment | 7.7% |
| Pharmaceuticals | 6.3% |
| Electric Utilities | 4.7% |
| | |
| Types of Investments in Portfolio | % of net assets |
| Common Stocks | 70.0% |
| Convertible Preferred Stocks | 9.0% |
| Convertible Bonds | 8.0% |
| Exchange-Traded Funds | 6.5% |
| Preferred Stocks | 3.4% |
| Total Equity Exposure | 96.9% |
| Temporary Cash Investments | 3.1% |
| Other Assets and Liabilities | —* |
*Category is less than 0.05% of total net assets.
Fund shareholders may incur two types of costs: (1) transaction costs, including sales charges (loads) on purchase payments and redemption/exchange fees; and (2) ongoing costs, including management fees; distribution and service (12b-1) fees; and other fund expenses. This example is intended to help you understand your ongoing costs (in dollars) of investing in your fund and to compare these costs with the ongoing cost of investing in other mutual funds.
The example is based on an investment of $1,000 made at the beginning of the period and held for the entire period from October 1, 2015 to March 31, 2016.
Actual Expenses
The table provides information about actual account values and actual expenses for each class. You may use the information, together with the amount you invested, to estimate the expenses that you paid over the period. First, identify the share class you own. Then simply divide your account value by $1,000 (for example, an $8,600 account value divided by $1,000 = 8.6), then multiply the result by the number under the heading “Expenses Paid During Period” to estimate the expenses you paid on your account during this period.
If you hold Investor Class shares of any American Century Investments fund, or Institutional Class shares of the American Century Diversified Bond Fund, in an American Century Investments account (i.e., not a financial intermediary or retirement plan account), American Century Investments may charge you a $12.50 semiannual account maintenance fee if the value of those shares is less than $10,000. We will redeem shares automatically in one of your accounts to pay the $12.50 fee. In determining your total eligible investment amount, we will include your investments in all personal accounts (including American Century Investments Brokerage accounts) registered under your Social Security number. Personal accounts include individual accounts, joint accounts, UGMA/UTMA accounts, personal trusts, Coverdell Education Savings Accounts and IRAs (including traditional, Roth, Rollover, SEP-, SARSEP- and SIMPLE-IRAs), and certain other retirement accounts. If you have only business, business retirement, employer-sponsored or American Century Investments Brokerage accounts, you are currently not subject to this fee. If you are subject to the Account Maintenance Fee, your account value could be reduced by the fee amount.
Hypothetical Example for Comparison Purposes
The table also provides information about hypothetical account values and hypothetical expenses based on the actual expense ratio of each class of your fund and an assumed rate of return of 5% per year before expenses, which is not the actual return of a fund’s share class. The hypothetical account values and expenses may not be used to estimate the actual ending account balance or expenses you paid for the period. You may use this information to compare the ongoing costs of investing in your fund and other funds. To do so, compare this 5% hypothetical example with the 5% hypothetical examples that appear in the shareholder reports of the other funds.
Please note that the expenses shown in the table are meant to highlight your ongoing costs only and do not reflect any transactional costs, such as sales charges (loads) or redemption/exchange fees. Therefore, the table is useful in comparing ongoing costs only, and will not help you determine the relative total costs of owning different funds. In addition, if these transactional costs were included, your costs would have been higher.
|
| | | | |
| | Beginning
Account Value
10/1/15 | Ending
Account Value
3/31/16 | Expenses Paid
During Period(1)10/1/15 - 3/31/16 |
Annualized
Expense Ratio(1) |
| Actual | | | | |
| Investor Class | $1,000 | $1,129.50 | $5.00 | 0.94% |
| Institutional Class | $1,000 | $1,130.50 | $3.94 | 0.74% |
| A Class | $1,000 | $1,128.00 | $6.33 | 1.19% |
| C Class | $1,000 | $1,123.90 | $10.30 | 1.94% |
| R Class | $1,000 | $1,127.00 | $7.66 | 1.44% |
| R6 Class | $1,000 | $1,131.30 | $3.14 | 0.59% |
| Hypothetical | | | | |
| Investor Class | $1,000 | $1,020.30 | $4.75 | 0.94% |
| Institutional Class | $1,000 | $1,021.30 | $3.74 | 0.74% |
| A Class | $1,000 | $1,019.05 | $6.01 | 1.19% |
| C Class | $1,000 | $1,015.30 | $9.77 | 1.94% |
| R Class | $1,000 | $1,017.80 | $7.26 | 1.44% |
| R6 Class | $1,000 | $1,022.05 | $2.98 | 0.59% |
| |
| (1) | Expenses are equal to the class's annualized expense ratio listed in the table above, multiplied by the average account value over the period, multiplied by 183, the number of days in the most recent fiscal half-year, divided by 366, to reflect the one-half year period. |
MARCH 31, 2016
|
| | | | | | |
| | Shares/Principal Amount | Value |
| COMMON STOCKS — 70.0% | | |
| Air Freight and Logistics — 0.3% | | |
| United Parcel Service, Inc., Class B | 268,118 |
| $ | 28,278,405 |
|
| Automobiles — 0.1% | | |
| Honda Motor Co., Ltd. | 399,400 |
| 10,951,605 |
|
| Banks — 5.4% | | |
| Comerica, Inc. | 1,437,200 |
| 54,426,764 |
|
| Commerce Bancshares, Inc. | 1,894,572 |
| 85,161,011 |
|
| JPMorgan Chase & Co. | 860,397 |
| 50,952,710 |
|
| PNC Financial Services Group, Inc. (The) | 2,799,012 |
| 236,712,445 |
|
| SunTrust Banks, Inc. | 2,446,530 |
| 88,270,803 |
|
| | | 515,523,733 |
|
| Beverages — 1.7% | | |
| PepsiCo, Inc. | 1,564,099 |
| 160,288,865 |
|
| Capital Markets — 1.6% | | |
| AllianceBernstein Holding LP | 1,743,778 |
| 40,856,718 |
|
| Ameriprise Financial, Inc. | 389,673 |
| 36,633,159 |
|
| Northern Trust Corp. | 1,089,240 |
| 70,985,771 |
|
| | | 148,475,648 |
|
| Chemicals — 1.7% | | |
| Air Products & Chemicals, Inc. | 1,069,637 |
| 154,081,210 |
|
| Potash Corp. of Saskatchewan, Inc. | 553,085 |
| 9,413,507 |
|
| | | 163,494,717 |
|
| Commercial Services and Supplies — 2.2% | | |
| Republic Services, Inc. | 3,192,461 |
| 152,120,766 |
|
| Tyco International plc | 886,804 |
| 32,554,575 |
|
| Waste Management, Inc. | 339,700 |
| 20,042,300 |
|
| | | 204,717,641 |
|
| Communications Equipment — 2.6% | | |
| Cisco Systems, Inc. | 8,598,991 |
| 244,813,274 |
|
| Containers and Packaging — 0.5% | | |
| International Paper Co. | 1,099,427 |
| 45,120,484 |
|
| Distributors — 1.8% | | |
| Genuine Parts Co. | 1,738,751 |
| 172,762,299 |
|
| Diversified Telecommunication Services — 1.1% | | |
| Verizon Communications, Inc. | 1,868,237 |
| 101,034,257 |
|
| Electric Utilities — 4.7% | | |
| Edison International | 1,799,599 |
| 129,373,172 |
|
| PG&E Corp. | 2,599,237 |
| 155,226,434 |
|
| Westar Energy, Inc. | 3,321,169 |
| 164,763,194 |
|
| | | 449,362,800 |
|
| Electrical Equipment — 1.1% | | |
| Eaton Corp. plc | 843,252 |
| 52,753,845 |
|
| Rockwell Automation, Inc. | 469,200 |
| 53,371,500 |
|
| | | 106,125,345 |
|
| | | |
|
| | | | | | |
| | Shares/Principal Amount | Value |
| Energy Equipment and Services — 2.7% | | |
| Schlumberger Ltd. | 3,529,200 |
| $ | 260,278,500 |
|
| Food and Staples Retailing — 3.6% | | |
| Sysco Corp. | 2,548,919 |
| 119,110,985 |
|
| Wal-Mart Stores, Inc. | 3,239,983 |
| 221,906,436 |
|
| | | 341,017,421 |
|
| Food Products — 2.8% | | |
| General Mills, Inc. | 1,794,666 |
| 113,692,091 |
|
| Mead Johnson Nutrition Co. | 1,827,071 |
| 155,246,223 |
|
| | | 268,938,314 |
|
| Gas Utilities — 3.7% | | |
| Atmos Energy Corp. | 499,000 |
| 37,055,740 |
|
ONE Gas, Inc.(1) | 3,580,293 |
| 218,755,902 |
|
| WGL Holdings, Inc. | 1,289,921 |
| 93,351,583 |
|
| | | 349,163,225 |
|
| Health Care Equipment and Supplies — 1.9% | | |
| Medtronic plc | 2,350,903 |
| 176,317,725 |
|
| Health Care Providers and Services — 1.3% | | |
| Quest Diagnostics, Inc. | 1,748,458 |
| 124,927,324 |
|
| Hotels, Restaurants and Leisure — 0.4% | | |
| McDonald's Corp. | 328,763 |
| 41,318,934 |
|
| Household Durables — 0.6% | | |
| Tupperware Brands Corp. | 411,219 |
| 23,842,478 |
|
| Whirlpool Corp. | 198,900 |
| 35,869,626 |
|
| | | 59,712,104 |
|
| Household Products — 3.0% | | |
| Procter & Gamble Co. (The) | 3,462,159 |
| 284,970,307 |
|
| Industrial Conglomerates — 2.3% | | |
| 3M Co. | 1,038,600 |
| 173,061,918 |
|
| General Electric Co. | 1,383,195 |
| 43,971,769 |
|
| | | 217,033,687 |
|
| Insurance — 1.7% | | |
| Marsh & McLennan Cos., Inc. | 1,960,105 |
| 119,154,783 |
|
| MetLife, Inc. | 980,029 |
| 43,062,474 |
|
| | | 162,217,257 |
|
| Life Sciences Tools and Services — 0.3% | | |
| Agilent Technologies, Inc. | 599,500 |
| 23,890,075 |
|
| Machinery — 1.0% | | |
| Stanley Black & Decker, Inc. | 880,681 |
| 92,656,448 |
|
| Oil, Gas and Consumable Fuels — 7.6% | | |
| Chevron Corp. | 190,016 |
| 18,127,527 |
|
| Exxon Mobil Corp. | 2,740,478 |
| 229,076,556 |
|
| Imperial Oil Ltd. | 122,800 |
| 4,102,631 |
|
| Occidental Petroleum Corp. | 2,299,477 |
| 157,353,211 |
|
| Spectra Energy Partners LP | 2,154,169 |
| 103,658,612 |
|
| TOTAL SA | 4,616,561 |
| 210,442,545 |
|
| | | 722,761,082 |
|
| Pharmaceuticals — 5.5% | | |
| Johnson & Johnson | 1,735,421 |
| 187,772,552 |
|
| Merck & Co., Inc. | 869,701 |
| 46,015,880 |
|
|
| | | | | | |
| | Shares/Principal Amount | Value |
| Pfizer, Inc. | 9,599,470 |
| $ | 284,528,291 |
|
| | | 518,316,723 |
|
| Real Estate Investment Trusts (REITs) — 0.6% | | |
| Weyerhaeuser Co. | 1,859,400 |
| 57,604,212 |
|
| Road and Rail — 0.4% | | |
| Norfolk Southern Corp. | 409,183 |
| 34,064,485 |
|
| Semiconductors and Semiconductor Equipment — 2.0% | | |
| Applied Materials, Inc. | 6,382,603 |
| 135,183,532 |
|
| Maxim Integrated Products, Inc. | 1,506,100 |
| 55,394,358 |
|
| | | 190,577,890 |
|
| Software — 1.5% | | |
| Microsoft Corp. | 1,924,336 |
| 106,281,077 |
|
| Oracle Corp. | 882,800 |
| 36,115,348 |
|
| | | 142,396,425 |
|
| Technology Hardware, Storage and Peripherals — 0.6% | | |
| Apple, Inc. | 521,800 |
| 56,870,982 |
|
| Thrifts and Mortgage Finance — 1.7% | | |
Capitol Federal Financial, Inc.(1) | 12,074,379 |
| 160,106,266 |
|
TOTAL COMMON STOCKS (Cost $5,292,410,860) | | 6,636,088,459 |
|
| CONVERTIBLE PREFERRED STOCKS — 9.0% | | |
| Banks — 7.8% | | |
| Bank of America Corp., 7.25% | 311,569 |
| 354,565,522 |
|
| Wells Fargo & Co., 7.50% | 313,977 |
| 378,345,425 |
|
| | | 732,910,947 |
|
| Gas Utilities — 0.4% | | |
| Laclede Group, Inc. (The), 6.75%, 4/1/17 | 667,497 |
| 40,310,144 |
|
| Pharmaceuticals — 0.8% | | |
| Teva Pharmaceutical Industries Ltd., 7.00%, 12/15/18 | 87,611 |
| 77,442,867 |
|
TOTAL CONVERTIBLE PREFERRED STOCKS (Cost $790,304,651) | | 850,663,958 |
|
| CONVERTIBLE BONDS — 8.0% | | |
| Food Products — 0.6% | | |
Credit Suisse AG, (convertible into Mondelez International, Inc.), 3.10%, 9/22/16(2)(3) | $ | 447,900 |
| 18,067,508 |
|
Goldman Sachs International, (convertible into Mondelez International, Inc.), 5.75%, 8/10/16(2)(3) | 1,013,600 |
| 40,615,485 |
|
| | | 58,682,993 |
|
| Health Care Equipment and Supplies — 0.2% | | |
Credit Suisse AG, (convertible into Baxter International, Inc.), 3.25%, 4/15/16(2)(3) | 449,500 |
| 16,432,991 |
|
| Oil, Gas and Consumable Fuels — 0.2% | | |
Morgan Stanley BV, (convertible into EQT Corp.), 10.30%, 8/9/16(2)(3) | 351,600 |
| 22,147,072 |
|
| Semiconductors and Semiconductor Equipment — 5.7% | | |
| Intel Corp., 2.95%, 12/15/35 | 220,901,000 |
| 281,234,586 |
|
| Microchip Technology, Inc., 1.625%, 2/15/25 | 245,980,000 |
| 254,281,825 |
|
| | | 535,516,411 |
|
| Specialty Retail — 0.7% | | |
Merrill Lynch International & Co. CV, (convertible into Advance Auto Parts, Inc.), 5.50%, 5/18/16(2)(3) | 224,400 |
| 35,935,603 |
|
|
| | | | | | |
| | Shares/Principal Amount | Value |
UBS AG, (convertible into Advance Auto Parts, Inc.), 3.60%, 5/19/16(2)(3) | $ | 166,300 |
| $ | 26,625,832 |
|
| | | 62,561,435 |
|
| Technology Hardware, Storage and Peripherals — 0.6% | | |
| SanDisk Corp., 0.50%, 10/15/20 | 55,975,000 |
| 58,388,922 |
|
TOTAL CONVERTIBLE BONDS (Cost $711,337,537) | | 753,729,824 |
|
| EXCHANGE-TRADED FUNDS — 6.5% | | |
| iShares Russell 1000 Value ETF | 4,758,472 |
| 470,184,618 |
|
| SPDR S&P 500 ETF Trust | 715,100 |
| 146,995,956 |
|
TOTAL EXCHANGE-TRADED FUNDS (Cost $597,055,122) | | 617,180,574 |
|
| PREFERRED STOCKS — 3.4% | | |
| Banks — 0.9% | | |
| U.S. Bancorp, 6.00% | 3,231,982 |
| 85,033,447 |
|
| Diversified Financial Services — 2.5% | | |
| Citigroup, Inc., 5.95% | 95,856,000 |
| 92,471,037 |
|
| General Electric Co., 5.00% | 144,180,000 |
| 148,685,625 |
|
| | | 241,156,662 |
|
TOTAL PREFERRED STOCKS (Cost $307,177,451) | | 326,190,109 |
|
| TEMPORARY CASH INVESTMENTS — 3.1% | | |
Federal Home Loan Bank Discount Notes, 0.08%, 4/1/16(4) | $ | 52,707,000 |
| 52,707,000 |
|
| Repurchase Agreement, Fixed Income Clearing Corp., (collateralized by various U.S.Treasury obligations, 3.625% - 3.75%, 8/15/43 - 11/15/43, valued at $149,365,169), at 0.10%, dated 3/31/16, due 4/1/16 (Delivery value $146,428,407) | | 146,428,000 |
|
| State Street Institutional Liquid Reserves Fund, Premier Class | 95,617,177 |
| 95,617,177 |
|
TOTAL TEMPORARY CASH INVESTMENTS (Cost $294,752,177) | | 294,752,177 |
|
TOTAL INVESTMENT SECURITIES — 100.0% (Cost $7,993,037,798) | | 9,478,605,101 |
|
OTHER ASSETS AND LIABILITIES† | | 53,733 |
|
| TOTAL NET ASSETS — 100.0% | | $ | 9,478,658,834 |
|
|
| | | | | | | | | | |
| FORWARD FOREIGN CURRENCY EXCHANGE CONTRACTS |
| Currency Purchased | Currency Sold | Counterparty | Settlement Date | Unrealized Appreciation (Depreciation) |
| CAD | 1,194,085 |
| USD | 902,163 |
| Morgan Stanley | 6/30/16 | $ | 17,316 |
|
| CAD | 1,056,538 |
| USD | 801,555 |
| Morgan Stanley | 6/30/16 | 12,008 |
|
| CAD | 419,561 |
| USD | 323,351 |
| Morgan Stanley | 6/30/16 | (278 | ) |
| USD | 13,067,547 |
| CAD | 17,246,418 |
| Morgan Stanley | 6/30/16 | (212,674 | ) |
| USD | 166,377,469 |
| EUR | 148,545,343 |
| UBS AG | 6/30/16 | (3,109,283 | ) |
| USD | 8,700,887 |
| JPY | 977,092,160 |
| Credit Suisse AG | 6/30/16 | (3,740 | ) |
| | | | | | | $ | (3,296,651 | ) |
|
| | |
| NOTES TO SCHEDULE OF INVESTMENTS |
| CAD | - | Canadian Dollar |
| EUR | - | Euro |
| JPY | - | Japanese Yen |
| USD | - | United States Dollar |
| |
| † | Category is less than 0.05% of total net assets. |
| |
| (1) | Affiliated Company: the fund’s holding represents ownership of 5% or more of the voting securities of the company; therefore, the company is affiliated as defined in the Investment Company Act of 1940. |
| |
| (2) | Security was purchased pursuant to Rule 144A under the Securities Act of 1933 and may be sold in transactions exempt from registration, normally to qualified institutional investors. The aggregate value of these securities at the period end was $159,824,491, which represented 1.7% of total net assets. |
| |
| (3) | Equity-linked debt security. The aggregated value of these securities at the period end was $159,824,491, which represented 1.7% of total net assets. |
| |
| (4) | The rate indicated is the yield to maturity at purchase. |
See Notes to Financial Statements.
|
|
| Statement of Assets and Liabilities |
|
| | | |
| MARCH 31, 2016 | |
| Assets | |
| Investment securities - unaffiliated, at value (cost of $7,725,921,460) | $ | 9,099,742,933 |
|
| Investment securities - affiliated, at value (cost of $267,116,338) | 378,862,168 |
|
| Total investment securities, at value (cost of $7,993,037,798) | 9,478,605,101 |
|
| Foreign currency holdings, at value (cost of $151,658) | 158,177 |
|
| Receivable for investments sold | 70,539,965 |
|
| Receivable for capital shares sold | 13,577,515 |
|
| Unrealized appreciation on forward foreign currency exchange contracts | 29,324 |
|
| Dividends and interest receivable | 31,871,492 |
|
| | 9,594,781,574 |
|
| | |
| Liabilities | |
| Payable for investments purchased | 95,162,847 |
|
| Payable for capital shares redeemed | 9,764,579 |
|
| Unrealized depreciation on forward foreign currency exchange contracts | 3,325,975 |
|
| Accrued management fees | 6,959,760 |
|
| Distribution and service fees payable | 909,579 |
|
| | 116,122,740 |
|
| | |
| Net Assets | $ | 9,478,658,834 |
|
| | |
| Net Assets Consist of: | |
| Capital (par value and paid-in surplus) | $ | 7,889,774,000 |
|
| Undistributed net investment income | 4,293,572 |
|
| Undistributed net realized gain | 102,282,812 |
|
| Net unrealized appreciation | 1,482,308,450 |
|
| | $ | 9,478,658,834 |
|
|
| | | | | | |
| | Net Assets | Shares Outstanding | Net Asset Value Per Share |
| Investor Class, $0.01 Par Value |
| $5,399,701,918 |
| 641,896,431 |
| $8.41 |
| Institutional Class, $0.01 Par Value |
| $1,229,940,051 |
| 146,125,043 |
| $8.42 |
| A Class, $0.01 Par Value |
| $1,934,680,707 |
| 230,002,924 |
| $8.41* |
| C Class, $0.01 Par Value |
| $562,723,213 |
| 66,909,171 |
| $8.41 |
| R Class, $0.01 Par Value |
| $105,462,430 |
| 12,575,573 |
| $8.39 |
| R6 Class, $0.01 Par Value |
| $246,150,515 |
| 29,218,351 |
| $8.42 |
*Maximum offering price $8.92 (net asset value divided by 0.9425).
See Notes to Financial Statements.
|
| | | |
| YEAR ENDED MARCH 31, 2016 |
| Investment Income (Loss) | |
| Income: | |
| Dividends (including $14,099,199 from affiliates and net of foreign taxes withheld of $2,726,155) | $ | 277,355,199 |
|
| Interest | 28,395,174 |
|
| | 305,750,373 |
|
| | |
| Expenses: | |
| Management fees | 81,296,915 |
|
| Distribution and service fees: | |
| A Class | 4,906,952 |
|
| B Class | 27,483 |
|
| C Class | 5,316,529 |
|
| R Class | 560,355 |
|
| Directors' fees and expenses | 319,350 |
|
| Other expenses | 7,083 |
|
| | 92,434,667 |
|
| | |
| Net investment income (loss) | 213,315,706 |
|
| | |
| Realized and Unrealized Gain (Loss) | |
| Net realized gain (loss) on: | |
| Investment transactions (including $482,400 from affiliates) | 486,727,568 |
|
| Foreign currency transactions | 4,952,571 |
|
| | 491,680,139 |
|
| | |
| Change in net unrealized appreciation (depreciation) on: | |
| Investments | (119,022,588 | ) |
| Translation of assets and liabilities in foreign currencies | (7,574,658 | ) |
| | (126,597,246 | ) |
| | |
| Net realized and unrealized gain (loss) | 365,082,893 |
|
| | |
| Net Increase (Decrease) in Net Assets Resulting from Operations | $ | 578,398,599 |
|
See Notes to Financial Statements.
|
|
| Statement of Changes in Net Assets |
|
| | | | | | |
| YEARS ENDED MARCH 31, 2016 AND MARCH 31, 2015 |
| Increase (Decrease) in Net Assets | March 31, 2016 | March 31, 2015 |
| Operations | | |
| Net investment income (loss) | $ | 213,315,706 |
| $ | 224,478,215 |
|
| Net realized gain (loss) | 491,680,139 |
| 923,209,519 |
|
| Change in net unrealized appreciation (depreciation) | (126,597,246 | ) | (325,925,104 | ) |
| Net increase (decrease) in net assets resulting from operations | 578,398,599 |
| 821,762,630 |
|
| | | |
| Distributions to Shareholders | | |
| From net investment income: | | |
| Investor Class | (123,019,058 | ) | (133,181,145 | ) |
| Institutional Class | (30,526,067 | ) | (39,559,169 | ) |
| A Class | (42,382,590 | ) | (52,200,356 | ) |
| B Class | (37,483 | ) | (92,083 | ) |
| C Class | (7,534,907 | ) | (7,582,993 | ) |
| R Class | (2,144,133 | ) | (3,003,425 | ) |
| R6 Class | (4,870,941 | ) | (1,830,727 | ) |
| From net realized gains: | | |
| Investor Class | (363,605,047 | ) | (395,701,675 | ) |
| Institutional Class | (77,411,532 | ) | (110,691,649 | ) |
| A Class | (139,778,814 | ) | (157,867,418 | ) |
| B Class | — |
| (427,312 | ) |
| C Class | (38,422,267 | ) | (38,104,526 | ) |
| R Class | (7,738,439 | ) | (10,698,515 | ) |
| R6 Class | (15,271,252 | ) | (4,882,125 | ) |
| Decrease in net assets from distributions | (852,742,530 | ) | (955,823,118 | ) |
| | | |
| Capital Share Transactions | | |
| Net increase (decrease) in net assets from capital share transactions (Note 5) | (995,331 | ) | (389,000,119 | ) |
| | | |
| Net increase (decrease) in net assets | (275,339,262 | ) | (523,060,607 | ) |
| | | |
| Net Assets | | |
| Beginning of period | 9,753,998,096 |
| 10,277,058,703 |
|
| End of period | $ | 9,478,658,834 |
| $ | 9,753,998,096 |
|
| | | |
| Undistributed net investment income | $ | 4,293,572 |
| $ | 7,112,583 |
|
See Notes to Financial Statements.
|
|
| Notes to Financial Statements |
MARCH 31, 2016
1. Organization
American Century Capital Portfolios, Inc. (the corporation) is registered under the Investment Company Act of 1940, as amended (the 1940 Act), as an open-end management investment company and is organized as a Maryland corporation. Equity Income Fund (the fund) is one fund in a series issued by the corporation. The fund’s investment objective is to seek current income. Capital appreciation is a secondary objective.
The fund offers the Investor Class, the Institutional Class, the A Class, the C Class, the R Class and the R6 Class. The A Class may incur an initial sales charge. The A Class and C Class may be subject to a contingent deferred sales charge. The share classes differ principally in their respective sales charges and distribution and shareholder servicing expenses and arrangements. The Institutional Class and R6 Class shareholders do not require the same level of shareholder and administrative services from American Century Investment Management, Inc. (ACIM) (the investment advisor) as shareholders of other classes. In addition, financial intermediaries do not receive any service, distribution or administrative fees for the R6 Class. As a result, the Institutional Class and R6 Class are charged lower unified management fees. On October 16, 2015, all outstanding B Class shares were converted to A Class shares and the fund discontinued offering the B Class.
2. Significant Accounting Policies
The following is a summary of significant accounting policies consistently followed by the fund in preparation of its financial statements. The fund is an investment company and follows accounting and reporting guidance in accordance with accounting principles generally accepted in the United States of America. This may require management to make certain estimates and assumptions at the date of the financial statements. Actual results could differ from these estimates. Management evaluated the impact of events or transactions occurring through the date the financial statements were issued that would merit recognition or disclosure.
Investment Valuations — The fund determines the fair value of its investments and computes its net asset value per share at the close of regular trading (usually 4 p.m. Eastern time) on the New York Stock Exchange (NYSE) on each day the NYSE is open. The Board of Directors has adopted valuation policies and procedures to guide the investment advisor in the fund’s investment valuation process and to provide methodologies for the oversight of the fund’s pricing function.
Equity securities that are listed or traded on a domestic securities exchange are valued at the last reported sales price or at the official closing price as provided by the exchange. Equity securities traded on foreign securities exchanges are generally valued at the closing price of such securities on the exchange where primarily traded or at the close of the NYSE, if that is earlier. If no last sales price is reported, or if local convention or regulation so provides, the mean of the latest bid and asked prices may be used. Securities traded over-the-counter are valued at the mean of the latest bid and asked prices, the last sales price, or the official closing price. Equity securities initially expressed in local currencies are translated into U.S. dollars at the mean of the appropriate currency exchange rate at the close of the NYSE as provided by an independent pricing service.
Fixed income securities are valued at the evaluated mean as provided by independent pricing services or at the mean of the most recent bid and asked prices as provided by investment dealers. Corporate and convertible bonds are valued using market models that consider trade data, quotations from dealers and active market makers, relevant yield curve and spread data, creditworthiness, trade data or market information on comparable securities, and other relevant security specific information.
Open-end management investment companies are valued at the reported net asset value per share. Repurchase agreements are valued at cost, which approximates fair value. Forward foreign currency exchange contracts are valued at the mean of the appropriate forward exchange rate at the close of the NYSE as provided by an independent pricing service.
If the fund determines that the market price for an investment is not readily available or the valuation methods mentioned above do not reflect an investment’s fair value, such investment is valued as determined in good faith by the Board of Directors or its delegate, in accordance with policies and procedures adopted by the Board of Directors. In its determination of fair value, the fund may review several factors including, but not
limited to, market information regarding the specific investment or comparable investments and correlation with other investment types, futures indices or general market indicators. Circumstances that may cause the fund to use these procedures to value an investment include, but are not limited to: an investment has been declared in default or is distressed; trading in a security has been suspended during the trading day or a security is not actively trading on its principal exchange; prices received from a regular pricing source are deemed unreliable; or there is a foreign market holiday and no trading occurred.
The fund monitors for significant events occurring after the close of an investment’s primary exchange but before the fund’s net asset value per share is determined. Significant events may include, but are not limited to: corporate announcements and transactions; governmental action and political unrest that could impact a specific investment or an investment sector; or armed conflicts, natural disasters and similar events that could affect investments in a specific country or region. The fund also monitors for significant fluctuations between domestic and foreign markets, as evidenced by the U.S. market or such other indicators that the Board of Directors, or its delegate, deems appropriate. If significant fluctuations in foreign markets are identified, the fund may apply a model-derived factor to the closing price of equity securities traded on foreign securities exchanges. The factor is based on observable market data as provided by an independent pricing service.
Security Transactions — Security transactions are accounted for as of the trade date. Net realized gains and losses are determined on the identified cost basis, which is also used for federal income tax purposes.
Investment Income — Dividend income less foreign taxes withheld, if any, is recorded as of the ex-dividend date. Distributions received on securities that represent a return of capital or long-term capital gain are recorded as a reduction of cost of investments and/or as a realized gain. The fund may estimate the components of distributions received that may be considered nontaxable distributions or long-term capital gain distributions for income tax purposes. Interest income is recorded on the accrual basis and includes accretion of discounts and amortization of premiums.
Equity-Linked Debt and Linked-Equity Securities — The fund may invest in hybrid equity securities, which usually convert into common stock at a date predetermined by the issuer. These securities generally offer a higher dividend yield than that of the common stock to which the security is linked. These instruments are issued by a company other than the one to which the security is linked and carry the credit of the issuer, not that of the underlying common stock. The securities’ appreciation is limited based on a predetermined final cap price at the date of the conversion. Risks of investing in these securities include, but are not limited to, a set time to capture the yield advantage, limited appreciation potential, decline in value of the underlying stock, and failure of the issuer to pay dividends or to deliver common stock at maturity.
Foreign Currency Translations — All assets and liabilities initially expressed in foreign currencies are translated into U.S. dollars at prevailing exchange rates at period end. The fund may enter into spot foreign currency exchange contracts to facilitate transactions denominated in a foreign currency. Purchases and sales of investment securities, dividend and interest income, spot foreign currency exchange contracts, and expenses are translated at the rates of exchange prevailing on the respective dates of such transactions. Net realized and unrealized foreign currency exchange gains or losses related to investment securities are a component of net realized gain (loss) on investment transactions and change in net unrealized appreciation (depreciation) on investments, respectively.
Repurchase Agreements — The fund may enter into repurchase agreements with institutions that ACIM has determined are creditworthy pursuant to criteria adopted by the Board of Directors. The fund requires that the collateral, represented by securities, received in a repurchase transaction be transferred to the custodian in a manner sufficient to enable the fund to obtain those securities in the event of a default under the repurchase agreement. ACIM monitors, on a daily basis, the securities transferred to ensure the value, including accrued interest, of the securities under each repurchase agreement is equal to or greater than amounts owed to the fund under each repurchase agreement.
Joint Trading Account — Pursuant to an Exemptive Order issued by the Securities and Exchange Commission, the fund, along with certain other funds in the American Century Investments family of funds, may transfer uninvested cash balances into a joint trading account. These balances are invested in one or more repurchase agreements that are collateralized by U.S. Treasury or Agency obligations.
Income Tax Status — It is the fund’s policy to distribute substantially all net investment income and net realized gains to shareholders and to otherwise qualify as a regulated investment company under provisions of the Internal Revenue Code. Accordingly, no provision has been made for income taxes. The fund files U.S. federal, state, local and non-U.S. tax returns as applicable. The fund's tax returns are subject to examination by the relevant taxing authority until expiration of the applicable statute of limitations, which is generally three
years from the date of filing but can be longer in certain jurisdictions. At this time, management believes there are no uncertain tax positions which, based on their technical merit, would not be sustained upon examination and for which it is reasonably possible that the total amounts of unrecognized tax benefits will significantly change in the next twelve months.
Multiple Class — All shares of the fund represent an equal pro rata interest in the net assets of the class to which such shares belong, and have identical voting, dividend, liquidation and other rights and the same terms and conditions, except for class specific expenses and exclusive rights to vote on matters affecting only individual classes. Income, non-class specific expenses, and realized and unrealized capital gains and losses of the fund are allocated to each class of shares based on their relative net assets.
Distributions to Shareholders — Distributions from net investment income, if any, are generally declared and paid quarterly. Distributions from net realized gains, if any, are generally declared and paid annually.
Indemnifications — Under the corporation’s organizational documents, its officers and directors are indemnified against certain liabilities arising out of the performance of their duties to the fund. In addition, in the normal course of business, the fund enters into contracts that provide general indemnifications. The maximum exposure under these arrangements is unknown as this would involve future claims that may be made against a fund. The risk of material loss from such claims is considered by management to be remote.
3. Fees and Transactions with Related Parties
Certain officers and directors of the corporation are also officers and/or directors of American Century Companies, Inc. (ACC). The corporation’s investment advisor, ACIM, the corporation's distributor, American Century Investment Services, Inc. (ACIS), and the corporation’s transfer agent, American Century Services, LLC, are wholly owned, directly or indirectly, by ACC.
Management Fees — The corporation has entered into a management agreement with ACIM, under which ACIM provides the fund with investment advisory and management services in exchange for a single, unified management fee (the fee) per class. The agreement provides that all expenses of managing and operating the fund, except distribution and service fees, brokerage expenses, taxes, interest, fees and expenses of the independent directors (including legal counsel fees), and extraordinary expenses, will be paid by ACIM. The fee is computed and accrued daily based on each class’s daily net assets and paid monthly in arrears. The rate of the fee is determined by applying a fee rate calculation formula. This formula takes into account the fund’s assets as well as certain assets, if any, of other clients of the investment advisor outside the American Century Investments family of funds (such as subadvised funds and separate accounts) that have very similar investment teams and investment strategies (strategy assets). The annual management fee schedule ranges from 0.80% to 1.00% for the Investor Class, A Class, B Class, C Class and R Class. The annual management fee schedule ranges from 0.60% to 0.80% for the Institutional Class and 0.45% to 0.65% for the R6 Class. The effective annual management fee for each class for the year ended March 31, 2016 was 0.93% for the Investor Class, A Class, C Class and R Class, 0.73% for the Institutional Class and 0.58% for the R6 Class.
Distribution and Service Fees — The Board of Directors has adopted a separate Master Distribution and Individual Shareholder Services Plan for each of the A Class, B Class, C Class and R Class (collectively the plans), pursuant to Rule 12b-1 of the 1940 Act. The plans provide that the A Class will pay ACIS an annual distribution and service fee of 0.25%. The plans provide that the B Class and C Class will each pay ACIS an annual distribution and service fee of 1.00%, of which 0.25% is paid for individual shareholder services and 0.75% is paid for distribution services. The plans provide that the R Class will pay ACIS an annual distribution and service fee of 0.50%. The fees are computed and accrued daily based on each class’s daily net assets and paid monthly in arrears. The fees are used to pay financial intermediaries for distribution and individual shareholder services. Fees incurred under the plans during the year ended March 31, 2016 are detailed in the Statement of Operations.
Directors' Fees and Expenses — The Board of Directors is responsible for overseeing the investment advisor’s management and operations of the fund. The directors receive detailed information about the fund and its investment advisor regularly throughout the year, and meet at least quarterly with management of the investment advisor to review reports about fund operations. The fund’s officers do not receive compensation from the fund.
4. Investment Transactions
Purchases and sales of investment securities, excluding short-term investments, for the year ended March 31, 2016 were $7,622,418,671 and $8,399,209,443, respectively.
5. Capital Share Transactions
Transactions in shares of the fund were as follows:
|
| | | | | | | | | | |
| | Year ended
March 31, 2016 | Year ended
March 31, 2015 |
| | Shares | Amount | Shares | Amount |
| Investor Class/Shares Authorized | 3,690,000,000 |
| | 3,000,000,000 |
| |
| Sold | 114,466,871 |
| $ | 941,691,955 |
| 110,372,179 |
| $ | 992,156,979 |
|
| Issued in reinvestment of distributions | 56,859,660 |
| 457,471,867 |
| 55,640,804 |
| 491,422,481 |
|
| Redeemed | (156,737,452 | ) | (1,310,805,748 | ) | (150,064,474 | ) | (1,346,501,750 | ) |
| | 14,589,079 |
| 88,358,074 |
| 15,948,509 |
| 137,077,710 |
|
| Institutional Class/Shares Authorized | 900,000,000 |
| | 800,000,000 |
| |
| Sold | 43,236,265 |
| 355,337,764 |
| 45,244,697 |
| 411,339,947 |
|
| Issued in reinvestment of distributions | 12,080,239 |
| 97,419,785 |
| 15,432,164 |
| 136,422,405 |
|
| Redeemed | (60,463,997 | ) | (509,934,591 | ) | (70,206,105 | ) | (626,531,762 | ) |
| | (5,147,493 | ) | (57,177,042 | ) | (9,529,244 | ) | (78,769,410 | ) |
| A Class/Shares Authorized | 1,450,000,000 |
| | 1,200,000,000 |
| |
| Sold | 33,772,941 |
| 281,467,687 |
| 42,413,027 |
| 380,034,934 |
|
| Issued in reinvestment of distributions | 22,158,796 |
| 178,188,273 |
| 23,166,897 |
| 204,705,243 |
|
| Redeemed | (75,339,830 | ) | (629,711,265 | ) | (124,063,217 | ) | (1,118,733,276 | ) |
| | (19,408,093 | ) | (170,055,305 | ) | (58,483,293 | ) | (533,993,099 | ) |
| B Class/Shares Authorized | N/A |
| | 5,000,000 |
| |
| Sold | 1,773 |
| 15,470 |
| 9,982 |
| 88,368 |
|
| Issued in reinvestment of distributions | 4,126 |
| 34,715 |
| 51,900 |
| 457,829 |
|
| Redeemed | (640,096 | ) | (5,462,542 | ) | (235,376 | ) | (2,129,994 | ) |
| | (634,197 | ) | (5,412,357 | ) | (173,494 | ) | (1,583,797 | ) |
| C Class/Shares Authorized | 380,000,000 |
| | 250,000,000 |
| |
| Sold | 10,920,834 |
| 90,266,957 |
| 9,067,836 |
| 80,952,738 |
|
| Issued in reinvestment of distributions | 4,821,802 |
| 38,594,526 |
| 4,237,094 |
| 37,309,528 |
|
| Redeemed | (11,886,580 | ) | (99,349,090 | ) | (9,244,873 | ) | (82,980,488 | ) |
| | 3,856,056 |
| 29,512,393 |
| 4,060,057 |
| 35,281,778 |
|
| R Class/Shares Authorized | 70,000,000 |
| | 70,000,000 |
| |
| Sold | 1,999,195 |
| 16,610,134 |
| 2,337,223 |
| 20,958,591 |
|
| Issued in reinvestment of distributions | 1,206,549 |
| 9,662,979 |
| 1,523,932 |
| 13,415,731 |
|
| Redeemed | (5,355,482 | ) | (44,926,763 | ) | (8,390,547 | ) | (75,033,538 | ) |
| | (2,149,738 | ) | (18,653,650 | ) | (4,529,392 | ) | (40,659,216 | ) |
| R6 Class/Shares Authorized | 180,000,000 |
| | 40,000,000 |
| |
| Sold | 19,314,185 |
| 162,369,985 |
| 11,586,359 |
| 103,570,127 |
|
| Issued in reinvestment of distributions | 2,424,776 |
| 19,519,689 |
| 759,719 |
| 6,712,852 |
|
| Redeemed | (6,008,060 | ) | (49,457,118 | ) | (1,858,023 | ) | (16,637,064 | ) |
| | 15,730,901 |
| 132,432,556 |
| 10,488,055 |
| 93,645,915 |
|
| Net increase (decrease) | 6,836,515 |
| $ | (995,331 | ) | (42,218,802 | ) | $ | (389,000,119 | ) |
6. Affiliated Company Transactions
If a fund's holding represents ownership of 5% or more of the voting securities of a company, the company is affiliated as defined in the 1940 Act. A summary of transactions for each company which is or was an affiliate at or during the year ended March 31, 2016 follows:
|
| | | | | | | | | | | | | | | | | | |
| Company | Beginning Value | Purchase
Cost | Sales Cost | Realized
Gain (Loss) | Dividend
Income | Ending Value |
| Capitol Federal Financial, Inc. | $ | 124,997,237 |
| $ | 25,263,812 |
| — |
| — |
| $ | 9,592,113 |
| $ | 160,106,266 |
|
| ONE Gas, Inc. | 155,480,715 |
| 2,076,160 |
| $ | 2,815,763 |
| $ | 482,400 |
| 4,507,086 |
| 218,755,902 |
|
| | $ | 280,477,952 |
| $ | 27,339,972 |
| $ | 2,815,763 |
| $ | 482,400 |
| $ | 14,099,199 |
| $ | 378,862,168 |
|
7. Fair Value Measurements
The fund’s investments valuation process is based on several considerations and may use multiple inputs to determine the fair value of the investments held by the fund. In conformity with accounting principles generally accepted in the United States of America, the inputs used to determine a valuation are classified into three broad levels.
| |
| • | Level 1 valuation inputs consist of unadjusted quoted prices in an active market for identical investments. |
| |
| • | Level 2 valuation inputs consist of direct or indirect observable market data (including quoted prices for comparable investments, evaluations of subsequent market events, interest rates, prepayment speeds, credit risk, etc.). These inputs also consist of quoted prices for identical investments initially expressed in local currencies that are adjusted through translation into U.S. dollars. |
| |
| • | Level 3 valuation inputs consist of unobservable data (including a fund’s own assumptions). |
The level classification is based on the lowest level input that is significant to the fair valuation measurement. The valuation inputs are not necessarily an indication of the risks associated with investing in these securities or other financial instruments. There were no significant transfers between levels during the period.
The following is a summary of the level classifications as of period end. The Schedule of Investments provides additional information on the fund’s portfolio holdings.
|
| | | | | | | | |
| | Level 1 | Level 2 | Level 3 |
| Assets | | | |
| Investment Securities | | | |
| Common Stocks | $ | 6,410,591,678 |
| $ | 225,496,781 |
| — |
|
| Convertible Preferred Stocks | — |
| 850,663,958 |
| — |
|
| Convertible Bonds | — |
| 753,729,824 |
| — |
|
| Exchange-Traded Funds | 617,180,574 |
| — |
| — |
|
| Preferred Stocks | 85,033,447 |
| 241,156,662 |
| — |
|
| Temporary Cash Investments | 95,617,177 |
| 199,135,000 |
| — |
|
| | $ | 7,208,422,876 |
| $ | 2,270,182,225 |
| — |
|
| Other Financial Instruments | | | |
| Forward Foreign Currency Exchange Contracts | — |
| $ | 29,324 |
| — |
|
| | | | |
| Liabilities | | | |
| Other Financial Instruments | | | |
| Forward Foreign Currency Exchange Contracts | — |
| $ | 3,325,975 |
| — |
|
8. Derivative Instruments
Foreign Currency Risk — The fund is subject to foreign currency exchange rate risk in the normal course of pursuing its investment objectives. The value of foreign investments held by a fund may be significantly affected by changes in foreign currency exchange rates. The dollar value of a foreign security generally decreases when the value of the dollar rises against the foreign currency in which the security is denominated and tends to increase when the value of the dollar declines against such foreign currency. A fund may enter into forward foreign currency exchange contracts to reduce a fund's exposure to foreign currency exchange rate fluctuations. The net U.S. dollar value of foreign currency underlying all contractual commitments held by a fund and the resulting unrealized appreciation or depreciation are determined daily. Realized gain or loss is recorded upon the termination of the contract. Net realized and unrealized gains or losses occurring during the holding period of forward foreign currency exchange contracts are a component of net realized gain (loss) on foreign currency transactions and change in net unrealized appreciation (depreciation) on translation of assets and liabilities in foreign currencies, respectively. A fund bears the risk of an unfavorable change in the foreign currency exchange rate underlying the forward contract. Additionally, losses, up to the fair value, may arise if the counterparties do not perform under the contract terms. The fund's average U.S. dollar exposure to foreign currency risk derivative instruments held during the period was $285,550,560.
The value of foreign currency risk derivative instruments as of March 31, 2016, is disclosed on the Statement of Assets and Liabilities as an asset of $29,324 in unrealized appreciation on forward foreign currency exchange contracts and a liability of $3,325,975 in unrealized depreciation on forward foreign currency exchange contracts. For the year ended March 31, 2016, the effect of foreign currency risk derivative instruments on the Statement of Operations was $5,020,126 in net realized gain (loss) on foreign currency transactions and $(7,769,393) in change in net unrealized appreciation (depreciation) on translation of assets and liabilities in foreign currencies.
9. Federal Tax Information
The tax character of distributions paid during the years ended March 31, 2016 and March 31, 2015 were as follows:
|
| | | | | | |
| | 2016 | 2015 |
| Distributions Paid From | | |
| Ordinary income | $ | 252,510,096 |
| $ | 359,095,721 |
|
| Long-term capital gains | $ | 600,232,434 |
| $ | 596,727,397 |
|
The book-basis character of distributions made during the year from net investment income or net realized gains may differ from their ultimate characterization for federal income tax purposes. These differences reflect the differing character of certain income items and net realized gains and losses for financial statement and tax purposes, and may result in reclassification among certain capital accounts on the financial statements.
As of March 31, 2016, the federal tax cost of investments and the components of distributable earnings on a tax-basis were as follows:
|
| | | |
| Federal tax cost of investments | $ | 8,138,858,940 |
|
| Gross tax appreciation of investments | $ | 1,377,187,993 |
|
| Gross tax depreciation of investments | (37,441,832 | ) |
| Net tax appreciation (depreciation) of investments | 1,339,746,161 |
|
| Net tax appreciation (depreciation) on derivatives and translation of assets and liabilities in foreign currencies | 37,798 |
|
| Net tax appreciation (depreciation) | $ | 1,339,783,959 |
|
| Undistributed ordinary income | $ | 18,219,253 |
|
| Accumulated long-term gains | $ | 230,881,622 |
|
The difference between book-basis and tax-basis unrealized appreciation (depreciation) is attributable primarily to the tax deferral of losses on wash sales.
|
| | | | | | | | | | | | | | | |
| For a Share Outstanding Throughout the Years Ended March 31 (except as noted) | | | | |
| Per-Share Data | | | | | | | Ratios and Supplemental Data |
| | | Income From Investment Operations: | Distributions From: | | | Ratio to Average Net Assets of: | | |
| | Net Asset
Value,
Beginning
of Period | Net
Investment
Income
(Loss)(1) | Net
Realized
and
Unrealized
Gain (Loss) | Total From
Investment
Operations | Net
Investment
Income | Net
Realized
Gains | Total
Distributions | Net Asset
Value,
End
of Period | Total
Return(2) | Operating
Expenses | Net
Investment
Income
(Loss) | Portfolio
Turnover
Rate | Net
Assets,
End of
Period
(in thousands) |
| Investor Class | | | | | | | | | | | | |
| 2016 | $8.71 | 0.21 | 0.32 | 0.53 | (0.20) | (0.63) | (0.83) | $8.41 | 6.78% | 0.94% | 2.44% | 88% |
| $5,399,702 |
|
| 2015 | $8.84 | 0.21 | 0.54 | 0.75 | (0.22) | (0.66) | (0.88) | $8.71 | 8.54% | 0.93% | 2.30% | 56% |
| $5,463,566 |
|
| 2014 | $8.47 | 0.20 | 0.92 | 1.12 | (0.20) | (0.55) | (0.75) | $8.84 | 13.64% | 0.93% | 2.31% | 57% |
| $5,406,362 |
|
| 2013 | $7.69 | 0.21 | 0.86 | 1.07 | (0.21) | (0.08) | (0.29) | $8.47 | 14.33% | 0.93% | 2.63% | 83% |
| $5,504,359 |
|
| 2012 | $7.43 | 0.20 | 0.25 | 0.45 | (0.19) | — | (0.19) | $7.69 | 6.24% | 0.95% | 2.69% | 115% |
| $5,363,783 |
|
| Institutional Class | | | | | | | | | | | | |
| 2016 | $8.71 | 0.22 | 0.34 | 0.56 | (0.22) | (0.63) | (0.85) | $8.42 | 7.11% | 0.74% | 2.64% | 88% |
| $1,229,940 |
|
| 2015 | $8.85 | 0.22 | 0.54 | 0.76 | (0.24) | (0.66) | (0.90) | $8.71 | 8.63% | 0.73% | 2.50% | 56% |
| $1,318,193 |
|
| 2014 | $8.47 | 0.22 | 0.92 | 1.14 | (0.21) | (0.55) | (0.76) | $8.85 | 13.85% | 0.73% | 2.51% | 57% |
| $1,422,725 |
|
| 2013 | $7.69 | 0.22 | 0.87 | 1.09 | (0.23) | (0.08) | (0.31) | $8.47 | 14.69% | 0.73% | 2.83% | 83% |
| $1,527,723 |
|
| 2012 | $7.44 | 0.21 | 0.24 | 0.45 | (0.20) | — | (0.20) | $7.69 | 6.31% | 0.75% | 2.89% | 115% |
| $1,316,758 |
|
|
| | | | | | | | | | | | | | | |
| For a Share Outstanding Throughout the Years Ended March 31 (except as noted) | | | | |
| Per-Share Data | | | | | | | Ratios and Supplemental Data |
| | | Income From Investment Operations: | Distributions From: | | | Ratio to Average Net Assets of: | | |
| | Net Asset
Value,
Beginning
of Period | Net
Investment
Income
(Loss)(1) | Net
Realized
and
Unrealized
Gain (Loss) | Total From
Investment
Operations | Net
Investment
Income | Net
Realized
Gains | Total
Distributions | Net Asset
Value,
End
of Period | Total
Return(2) | Operating
Expenses | Net
Investment
Income
(Loss) | Portfolio
Turnover
Rate | Net
Assets,
End of
Period
(in thousands) |
| A Class | | | | | | | | | | | | | |
| 2016 | $8.71 | 0.18 | 0.33 | 0.51 | (0.18) | (0.63) | (0.81) | $8.41 | 6.51% | 1.19% | 2.19% | 88% |
| $1,934,681 |
|
| 2015 | $8.84 | 0.18 | 0.55 | 0.73 | (0.20) | (0.66) | (0.86) | $8.71 | 8.27% | 1.18% | 2.05% | 56% |
| $2,172,105 |
|
| 2014 | $8.47 | 0.18 | 0.91 | 1.09 | (0.17) | (0.55) | (0.72) | $8.84 | 13.36% | 1.18% | 2.06% | 57% |
| $2,722,731 |
|
| 2013 | $7.69 | 0.19 | 0.86 | 1.05 | (0.19) | (0.08) | (0.27) | $8.47 | 14.05% | 1.18% | 2.38% | 83% |
| $2,631,737 |
|
| 2012 | $7.43 | 0.18 | 0.25 | 0.43 | (0.17) | — | (0.17) | $7.69 | 5.98% | 1.20% | 2.44% | 115% |
| $2,512,840 |
|
| C Class | | | | | | | | | | | | | |
| 2016 | $8.71 | 0.12 | 0.33 | 0.45 | (0.12) | (0.63) | (0.75) | $8.41 | 5.72% | 1.94% | 1.44% | 88% |
| $562,723 |
|
| 2015 | $8.84 | 0.12 | 0.54 | 0.66 | (0.13) | (0.66) | (0.79) | $8.71 | 7.47% | 1.93% | 1.30% | 56% |
| $549,088 |
|
| 2014 | $8.47 | 0.12 | 0.91 | 1.03 | (0.11) | (0.55) | (0.66) | $8.84 | 12.53% | 1.93% | 1.31% | 57% |
| $521,688 |
|
| 2013 | $7.69 | 0.13 | 0.86 | 0.99 | (0.13) | (0.08) | (0.21) | $8.47 | 13.21% | 1.93% | 1.63% | 83% |
| $467,913 |
|
| 2012 | $7.44 | 0.12 | 0.25 | 0.37 | (0.12) | — | (0.12) | $7.69 | 5.05% | 1.95% | 1.69% | 115% |
| $469,355 |
|
|
| | | | | | | | | | | | | | | |
| For a Share Outstanding Throughout the Years Ended March 31 (except as noted) | | | | |
| Per-Share Data | | | | | | | Ratios and Supplemental Data |
| | | Income From Investment Operations: | Distributions From: | | | Ratio to Average Net Assets of: | | |
| | Net Asset
Value,
Beginning
of Period | Net
Investment
Income
(Loss)(1) | Net
Realized
and
Unrealized
Gain (Loss) | Total From
Investment
Operations | Net
Investment
Income | Net
Realized
Gains | Total
Distributions | Net Asset
Value,
End
of Period | Total
Return(2) | Operating
Expenses | Net
Investment
Income
(Loss) | Portfolio
Turnover
Rate | Net
Assets,
End of
Period
(in thousands) |
| R Class | | | | | | | | | | | | | |
| 2016 | $8.69 | 0.16 | 0.33 | 0.49 | (0.16) | (0.63) | (0.79) | $8.39 | 6.27% | 1.44% | 1.94% | 88% |
| $105,462 |
|
| 2015 | $8.82 | 0.16 | 0.54 | 0.70 | (0.17) | (0.66) | (0.83) | $8.69 | 8.03% | 1.43% | 1.80% | 56% |
| $127,897 |
|
| 2014 | $8.45 | 0.16 | 0.91 | 1.07 | (0.15) | (0.55) | (0.70) | $8.82 | 13.12% | 1.43% | 1.81% | 57% |
| $169,852 |
|
| 2013 | $7.67 | 0.17 | 0.86 | 1.03 | (0.17) | (0.08) | (0.25) | $8.45 | 13.81% | 1.43% | 2.13% | 83% |
| $179,855 |
|
| 2012 | $7.42 | 0.16 | 0.24 | 0.40 | (0.15) | — | (0.15) | $7.67 | 5.59% | 1.45% | 2.19% | 115% |
| $177,061 |
|
| R6 Class | | | | | | | | | | | | | |
| 2016 | $8.72 | 0.24 | 0.32 | 0.56 | (0.23) | (0.63) | (0.86) | $8.42 | 7.14% | 0.59% | 2.79% | 88% |
| $246,151 |
|
| 2015 | $8.85 | 0.25 | 0.53 | 0.78 | (0.25) | (0.66) | (0.91) | $8.72 | 8.90% | 0.58% | 2.65% | 56% |
| $117,620 |
|
2014(3) | $8.94 | 0.17 | 0.46 | 0.63 | (0.17) | (0.55) | (0.72) | $8.85 | 7.41% | 0.58%(4) | 2.93%(4) | 57%(5) |
| $26,550 |
|
|
| | | | |
| Notes to Financial Highlights | | |
| |
| (1) | Computed using average shares outstanding throughout the period. |
| |
| (2) | Total returns are calculated based on the net asset value of the last business day and do not reflect applicable sales charges, if any. Total returns for periods less than one year are not annualized. |
| |
| (3) | July 26, 2013 (commencement of sale) through March 31, 2014. |
| |
| (5) | Portfolio turnover is calculated at the fund level. Percentage indicated was calculated for the year ended March 31, 2014. |
See Notes to Financial Statements.
|
|
| Report of Independent Registered Public Accounting Firm |
To the Board of Directors and Shareholders of American Century Capital Portfolios, Inc.:
We have audited the accompanying statement of assets and liabilities, including the schedule of investments, of Equity Income Fund (the “Fund”), one of the funds constituting American Century Capital Portfolios, Inc., as of March 31, 2016, and the related statement of operations for the year then ended, the statements of changes in net assets for each of the two years in the period then ended, and the financial highlights for each of the periods presented. These financial statements and financial highlights are the responsibility of the Fund's management. Our responsibility is to express an opinion on these financial statements and financial highlights based on our audits.
We conducted our audits in accordance with the standards of the Public Company Accounting Oversight Board (United States). Those standards require that we plan and perform the audit to obtain reasonable assurance about whether the financial statements and financial highlights are free of material misstatement. The Fund is not required to have, nor were we engaged to perform, an audit of its internal control over financial reporting. Our audits included consideration of internal control over financial reporting as a basis for designing audit procedures that are appropriate in the circumstances, but not for the purpose of expressing an opinion on the effectiveness of the Fund's internal control over financial reporting. Accordingly, we express no such opinion. An audit also includes examining, on a test basis, evidence supporting the amounts and disclosures in the financial statements, assessing the accounting principles used and significant estimates made by management, as well as evaluating the overall financial statement presentation. Our procedures included confirmation of securities owned as of March 31, 2016, by correspondence with the custodian and brokers; when replies were not received from brokers, we performed other auditing procedures. We believe that our audits provide a reasonable basis for our opinion.
In our opinion, the financial statements and financial highlights referred to above present fairly, in all material respects, the financial position of Equity Income Fund of American Century Capital Portfolios, Inc. as of March 31, 2016, the results of its operations for the year then ended, the changes in its net assets for each of the two years in the period then ended, and the financial highlights for each of the periods presented, in conformity with accounting principles generally accepted in the United States of America.
DELOITTE & TOUCHE LLP
Kansas City, Missouri May 17, 2016
The Board of Directors
The individuals listed below serve as directors of the funds. Each director will continue to serve in this capacity until death, retirement, resignation or removal from office. The board has adopted a mandatory retirement age for directors who are not “interested persons,” as that term is defined in the Investment Company Act (independent directors). Independent directors shall retire by December 31 of the year in which they reach their 75th birthday.
Mr. Thomas is an “interested person” because he currently serves as President and Chief Executive Officer of American Century Companies, Inc. (ACC), the parent company of American Century Investment Management, Inc. (ACIM or the advisor). Mr. Fink is treated as an “interested person” because of his recent employment with ACC and American Century Services, LLC (ACS). The other directors (more than three-fourths of the total number) are independent. They are not employees, directors or officers of, and have no financial interest in, ACC or any of its wholly owned, direct or indirect, subsidiaries, including ACIM, American Century Investment Services, Inc. (ACIS) and ACS, and they do not have any other affiliations, positions or relationships that would cause them to be considered “interested persons” under the Investment Company Act. The directors serve in this capacity for seven (in the case of Mr. Thomas, 15) registered investment companies in the American Century Investments family of funds.
The following table presents additional information about the directors. The mailing address for each director is 4500 Main Street, Kansas City, Missouri 64111.
|
| | | | | |
Name
(Year of Birth) | Position(s) Held with Funds | Length of Time Served | Principal Occupation(s) During Past 5 Years | Number of American Century Portfolios Overseen by Director | Other Directorships Held During Past
5 Years |
| Independent Directors | | |
Andrea C. Hall
(1945) | Director | Since 1997 | Retired | 83 | None |
Jan M. Lewis
(1957) | Director | Since 2011 | Retired; President and Chief Executive Officer, Catholic Charities of Northeast Kansas (human services organization) (2006 to 2013) | 83 | None |
James A. Olson
(1942) | Director and Chairman of the Board | Since 2007 (Chairman since 2014) | Member, Plaza Belmont LLC (private equity fund manager) (1999 to present) | 83 | Saia, Inc. (2002 to 2012) and EPR Properties (2003 to 2013) |
M. Jeannine Strandjord
(1945) | Director | Since 1994 | Retired | 83 | Euronet Worldwide Inc.; MGP Ingredients, Inc.; and DST Systems Inc. (1996 to 2012) |
John R. Whitten
(1946) | Director | Since 2008 | Retired | 83 | Rudolph Technologies, Inc. |
Stephen E. Yates
(1948) | Director | Since 2012 | Retired | 83 | None |
|
| | | | | |
Name
(Year of Birth) | Position(s) Held with Funds | Length of Time Served | Principal Occupation(s) During Past 5 Years | Number of American Century Portfolios Overseen by Director | Other Directorships Held During Past
5 Years |
| Interested Directors | | |
Barry Fink
(1955) | Director | Since 2012 | Retired; Executive Vice President, ACC (September 2007 to February 2013); President, ACS (October 2007 to February 2013); Chief Operating Officer, ACC (September 2007 to November 2012) | 83 | None |
Jonathan S. Thomas
(1963) | Director and President | Since 2007 | President and Chief Executive Officer, ACC (March 2007 to present). Also serves as Chief Executive Officer, ACS; Executive Vice President, ACIM; Director, ACC, ACIM and other ACC subsidiaries | 128 | BioMed Valley Discoveries, Inc. |
The Statement of Additional Information has additional information about the fund's directors and is available without charge, upon request, by calling 1-800-345-2021.
Officers
The following table presents certain information about the executive officers of the funds. Each officer serves as an officer for each of the 15 investment companies in the American Century family of funds, unless otherwise noted. No officer is compensated for his or her service as an officer of the funds. The listed officers are interested persons of the funds and are appointed or re-appointed on an annual basis. The mailing address for each officer listed below is 4500 Main Street, Kansas City, Missouri 64111.
|
| | |
Name (Year of Birth) | Offices with
the Funds | Principal Occupation(s) During the Past Five Years |
Jonathan S.
Thomas
(1963) | Director and
President
since 2007 | President and Chief Executive Officer, ACC (March 2007 to present). Also serves as Chief Executive Officer, ACS; Executive Vice President, ACIM; Director, ACC, ACIM and other ACC subsidiaries |
Amy D. Shelton
(1964) | Chief Compliance
Officer and Vice President since 2014 | Chief Compliance Officer, American Century funds, (March 2014 to present); Chief Compliance Officer, ACIM (February 2014 to present); Chief Compliance Officer, ACIS (October 2009 to present); Vice President, Client Interactions and Marketing, ACIS (February 2013 to January 2014); Director, Client Interactions and Marketing, ACIS (June 2007 to January 2013). Also serves as Vice President, ACIS |
Charles A.
Etherington
(1957) | General Counsel
since 2007 and
Senior Vice
President since 2006 | Attorney, ACC (February 1994 to present); Vice President, ACC (November 2005 to present); General Counsel, ACC (March 2007 to present). Also serves as General Counsel, ACIM, ACS, ACIS and other ACC subsidiaries; and Senior Vice President, ACIM and ACS |
C. Jean Wade
(1964) | Vice President,
Treasurer and
Chief Financial
Officer since 2012 | Vice President, ACS (February 2000 to present) |
Robert J.
Leach
(1966) | Vice President
since 2006 and
Assistant Treasurer
since 2012 | Vice President, ACS (February 2000 to present) |
David H.
Reinmiller
(1963) | Vice President
since 2000 | Attorney, ACC (January 1994 to present); Associate General Counsel, ACC (January 2001 to present). Also serves as Vice President, ACIM and ACS |
Ward D.
Stauffer
(1960) | Secretary
since 2005 | Attorney, ACC (June 2003 to present) |
Retirement Account Information
As required by law, distributions you receive from certain IRAs are subject to federal income tax withholding, unless you elect not to have withholding apply. Tax will be withheld on the total amount withdrawn even though you may be receiving amounts that are not subject to withholding, such as nondeductible contributions. In such case, excess amounts of withholding could occur. You may adjust your withholding election so that a greater or lesser amount will be withheld.
If you don’t want us to withhold on this amount, you must notify us to not withhold the federal income tax. You may notify us in writing or in certain situations by telephone or through other electronic means. For systematic withdrawals, your withholding election will remain in effect until revoked or changed by filing a new election. You have the right to revoke your election at any time.
Remember, even if you elect not to have income tax withheld, you are liable for paying income tax on the taxable portion of your withdrawal. If you elect not to have income tax withheld or you don’t have enough income tax withheld, you may be responsible for payment of estimated tax. You may incur penalties under the estimated tax rules if your withholding and estimated tax payments are not sufficient. You can reduce or defer the income tax on a distribution by directly or indirectly rolling such distribution over to another IRA or eligible plan. You should consult your tax advisor for additional information.
State tax will be withheld if, at the time of your distribution, your address is within one of the mandatory withholding states and you have federal income tax withheld (or as otherwise required by state law). State taxes will be withheld from your distribution in accordance with the respective state rules.
Distributions you receive from 403(b), 457 and qualified plans are subject to special tax and withholding rules. Your plan administrator or plan sponsor is required to provide you with a special tax notice explaining those rules at the time you request a distribution. If applicable, federal and/or state taxes may be withheld from your distribution amount.
Proxy Voting Policies
A description of the policies that the fund's investment advisor uses in exercising the voting rights associated with the securities purchased and/or held by the fund is available without charge, upon request, by calling 1-800-345-2021. It is also available on the "About Us" page of American Century Investments’ website at americancentury.com and on the Securities and Exchange Commission’s website at sec.gov. Information regarding how the investment advisor voted proxies relating to portfolio securities during the most recent 12-month period ended June 30 is available on the "About Us" page at americancentury.com. It is also available at sec.gov.
Quarterly Portfolio Disclosure
The fund files its complete schedule of portfolio holdings with the Securities and Exchange Commission (SEC) for the first and third quarters of each fiscal year on Form N-Q. The fund’s Forms N-Q are available on the SEC’s website at sec.gov, and may be reviewed and copied at the SEC’s Public Reference Room in Washington, DC. Information on the operation of the Public Reference Room may be obtained by calling 1-800-SEC-0330. The fund also makes its complete schedule of portfolio holdings for the most recent quarter of its fiscal year available on its
website at americancentury.com and, upon request, by calling 1-800-345-2021.
Other Tax Information
The following information is provided pursuant to provisions of the Internal Revenue Code.
The fund hereby designates up to the maximum amount allowable as qualified dividend income for the fiscal year ended March 31, 2016.
For corporate taxpayers, the fund hereby designates $193,559,438, or up to the maximum amount allowable, of ordinary income distributions paid during the fiscal year ended March 31, 2016 as qualified for the corporate dividends received deduction.
The fund hereby designates $41,934,687 as qualified short-term capital gain distributions for purposes of Internal Revenue Code Section 871 for the fiscal year ended March 31, 2016.
The fund hereby designates $600,232,434, or up to the maximum amount allowable, as long-term capital gain distributions for the fiscal year ended March 31, 2016.
|
| | |
| |
| | | |
| Contact Us | americancentury.com | |
| Automated Information Line | 1-800-345-8765 | |
| Investor Services Representative | 1-800-345-2021 or 816-531-5575 | |
| Investors Using Advisors | 1-800-378-9878 | |
| Business, Not-For-Profit, Employer-Sponsored Retirement Plans | 1-800-345-3533 | |
| Banks and Trust Companies, Broker-Dealers, Financial Professionals, Insurance Companies | 1-800-345-6488 | |
| Telecommunications Relay Service for the Deaf | 711 | |
| | | |
| American Century Capital Portfolios, Inc. | |
| | | |
Investment Advisor: American Century Investment Management, Inc. Kansas City, Missouri | |
| | | |
| This report and the statements it contains are submitted for the general information of our shareholders. The report is not authorized for distribution to prospective investors unless preceded or accompanied by an effective prospectus. | |
| | | |
©2016 American Century Proprietary Holdings, Inc. All rights reserved.
CL-ANN-88865 1605
| |
|
| |
| | |
| | Annual Report |
| | |
| | March 31, 2016 |
| | |
| | Large Company Value Fund |
|
| |
| President’s Letter | 2 |
| Performance | 3 |
| Portfolio Commentary | |
| Fund Characteristics | |
| Shareholder Fee Example | |
| Schedule of Investments | |
| Statement of Assets and Liabilities | |
| Statement of Operations | |
| Statement of Changes in Net Assets | |
| Notes to Financial Statements | |
| Financial Highlights | |
| Report of Independent Registered Public Accounting Firm | |
| Management | |
| Additional Information | |
Any opinions expressed in this report reflect those of the author as of the date of the report, and do not necessarily represent the opinions of American Century Investments® or any other person in the American Century Investments organization. Any such opinions are subject to change at any time based upon market or other conditions and American Century Investments disclaims any responsibility to update such opinions. These opinions may not be relied upon as investment advice and, because investment decisions made by American Century Investments funds are based on numerous factors, may not be relied upon as an indication of trading intent on behalf of any American Century Investments fund. Security examples are used for representational purposes only and are not intended as recommendations to purchase or sell securities. Performance information for comparative indices and securities is provided to American Century Investments by third party vendors. To the best of American Century Investments’ knowledge, such information is accurate at the time of printing.
|
| |
| Dear Investor:
Thank you for reviewing this annual report for the 12 months ended March 31, 2016. It provides investment performance and portfolio information for the reporting period, plus longer-term historical performance data.
Annual reports help convey information about fund performance, including market and economic factors that affected returns during the reporting period. For additional, updated investment and market insights, we encourage you to visit our website, americancentury.com.
|
| Jonathan Thomas |
Divergence in Economic Growth and Monetary Policies, Combined With China Turmoil, Triggered Market Volatility
Divergence between the U.S. and the rest of the world—along with China’s struggles, plunging commodity prices, capital market volatility, and risk-off trading—were dominant themes during the reporting period. Global divergence described not only the relatively stronger economic growth enjoyed by the U.S. compared with most of the world, but also the related contrast between the U.S. Federal Reserve’s (the Fed’s) unwinding of monetary stimulus versus the continuation and expansion of stimulus by other major central banks.
Two months in particular captured the volatility and risk-off trading of the 12-month period. Last August, China’s economic slowdown (which rippled across the global economy) triggered Chinese stock market volatility, increasingly stimulative Chinese central bank monetary policy, and currency devaluations. Burdened further with oil market volatility, equity and higher-risk bond markets declined globally. Five months later, in January, investor sentiment plunged again as global economic growth decelerated, China devalued its currency again, and oil prices dropped below $30 a barrel. In addition, the Fed, in December, executed its first rate hike since 2006. Central bank policies showed less divergence thereafter, with the Bank of Japan suddenly resorting to negative interest rates, the Fed holding rates steady while reducing its rate hike projections, and the European Central Bank announcing significant additional stimulus.
Bonds (and more bond-like stock sectors, such as utilities and REITs) generally outperformed the broad stock market for the reporting period. In terms of stock style and size, growth generally outperformed value, and large cap generally outperformed small cap. In the bond market, higher quality (investment-grade) generally outperformed lower quality (high-yield). We expect continued economic and monetary policy divergence between the U.S. and non-U.S. economies in 2016, accompanied by further market volatility. This could present both challenges and opportunities for active investment managers. Looking ahead, we continue to believe in a disciplined, diversified, risk-aware investment approach, using professionally managed portfolios to meet financial goals. We appreciate your trust in us.
Sincerely,
Jonathan Thomas
President and Chief Executive Officer
American Century Investments
|
| | | | | | |
| Total Returns as of March 31, 2016 |
| | | | Average Annual Returns | |
| | Ticker Symbol | 1 year | 5 years | 10 years | Since Inception | Inception Date |
| Investor Class | ALVIX | -4.06% | 9.88% | 4.93% | — | 7/30/99 |
| Russell 1000 Value Index | — | -1.54% | 10.23% | 5.71% | — | — |
| S&P 500 Index | — | 1.78% | 11.57% | 7.00% | — | — |
| Institutional Class | ALVSX | -3.97% | 10.09% | 5.14% | — | 8/10/01 |
| A Class | ALPAX | | | | — | 10/26/00 |
| No sales charge | | -4.41% | 9.62% | 4.66% | — | |
| With sales charge | | -9.88% | 8.34% | 4.04% | — | |
| C Class | ALPCX | -5.03% | 8.77% | 3.88% | — | 11/7/01 |
| R Class | ALVRX | -4.55% | 9.33% | 4.41% | — | 8/29/03 |
| R6 Class | ALVDX | -3.83% | — | — | 6.24% | 7/26/13 |
Sales charges include initial sales charges and contingent deferred sales charges (CDSCs), as applicable. A Class shares have a 5.75% maximum initial sales charge and may be subject to a maximum CDSC of 1.00%. C Class shares redeemed within 12 months of purchase are subject to a maximum CDSC of 1.00%. The SEC requires that mutual funds provide performance information net of maximum sales charges in all cases where charges could be applied.
Average annual returns since inception are presented when ten years of performance history is not available. Prior to December 3, 2007, the A Class was referred to as the Advisor Class and did not have a front-end sales charge. Performance prior to that date has been adjusted to reflect this charge.
Data presented reflect past performance. Past performance is no guarantee of future results. Current performance may be higher or lower than the performance shown. Total returns for periods less than one year are not annualized. Investment return and principal value will fluctuate, and redemption value may be more or less than original cost. Data assumes reinvestment of dividends and capital gains, and none of the charts reflect the deduction of taxes that a shareholder would pay on fund distributions or the redemption of fund shares. To obtain performance data current to the most recent month end, please call 1-800-345-2021 or visit americancentury.com. For additional information about the fund, please consult the prospectus.
|
|
| Growth of $10,000 Over 10 Years |
| $10,000 investment made March 31, 2006 |
Performance for other share classes will vary due to differences in fee structure.
|
| |
| Value on March 31, 2016 |
| | Investor Class — $16,184 |
| |
| | Russell 1000 Value Index — $17,436 |
| |
| | S&P 500 Index — $19,687 |
| |
|
| | | | | |
| Total Annual Fund Operating Expenses |
| Investor Class | Institutional Class | A Class | C Class | R Class | R6 Class |
| 0.84% | 0.64% | 1.09% | 1.84% | 1.34% | 0.49% |
The total annual fund operating expenses shown is as stated in the fund’s prospectus current as of the date of this report. The prospectus may vary from the expense ratio shown elsewhere in this report because it is based on a different time period, includes acquired fund fees and expenses, and, if applicable, does not include fee waivers or expense reimbursements.
Data presented reflect past performance. Past performance is no guarantee of future results. Current performance may be higher or lower than the performance shown. Total returns for periods less than one year are not annualized. Investment return and principal value will fluctuate, and redemption value may be more or less than original cost. Data assumes reinvestment of dividends and capital gains, and none of the charts reflect the deduction of taxes that a shareholder would pay on fund distributions or the redemption of fund shares. To obtain performance data current to the most recent month end, please call 1-800-345-2021 or visit americancentury.com. For additional information about the fund, please consult the prospectus.
Portfolio Managers: Brendan Healy and Brian Woglom
In January 2016, portfolio manager Matt Titus left the Large Company Value management team and portfolio manager Brian Woglom joined the Large Company Value management team.
Performance Summary
Large Company Value returned -4.06%* for the 12 months ended March 31, 2016. By comparison, its benchmark, the Russell 1000 Value Index, returned -1.54%. The fund’s return reflects operating expenses, while the index’s return does not.
Volatility dominated the 12-month period as concerns over slowing growth in China and other emerging markets, falling oil prices, and the prospect of higher U.S. Federal Reserve (Fed) interest rates weighed on investor confidence. After a turbulent summer, markets sold off sharply in the third quarter of 2015, but stabilized somewhat in the fourth quarter as the Fed delayed an anticipated September interest rate hike. In December, however, Fed policymakers raised the federal funds rate by 25 basis points, while they affirmed the underlying strength of the U.S. economy. Early in 2016, concerns over slowing growth in China triggered a renewed market sell-off. Broad market indices such as the S&P 500 Index recovered some ground later in the first quarter of 2016 after the Fed scaled back its projected number of rate hikes for the year, from four to two. Against this backdrop, larger caps outperformed, while value stocks underperformed growth. Five out of 10 sectors of the Russell 1000 Value Index had negative performance, with the weakest performance in energy.
In this environment, Large Company Value received positive results in absolute terms from three of the 10 sectors in which it was invested. On a relative basis, it underperformed due primarily to positioning. The portfolio was hampered by its stance in the information technology, financials, telecommunications services, consumer discretionary, and health care sectors. The stance in energy and consumer staples contributed positively.
Information Technology Detracted
Security selection in the information technology sector hindered relative performance. Detractors included Western Digital, a leading supplier of computer hard disk drives. The company’s stock price fell as the PC end-market for its hard drives continued to decline. Investors were also concerned about the company’s pending merger with SanDisk, a deal that received mixed reviews for both price and strategy. We eliminated the position in the first quarter of 2016 given concerns over its deteriorating end market and ahead of the close of the merger.
Financials Weighed on Performance
Stock selection in financials, especially in the insurance area, dampened relative performance. An overweight in capital markets companies such as Ameriprise Financial was also detrimental. Ameriprise underperformed due to weaker-than-expected fourth quarter results, including lower advisory margins and elevated asset-management outflows. The portfolio’s underweight in financials was a small positive.
| |
| * | All fund returns referenced in this commentary are for Investor Class shares. Performance for other share classes will vary due to differences in fee structure; when Investor Class performance exceeds that of the fund's benchmark, other share classes may not. See page 3 for returns for all share classes. |
Underweights in Utilities and Telecommunications Services Hurt
The portfolio’s underweight in utilities and lack of exposure to telecommunications services hurt performance. Both sectors performed well as investors sought stability during the market volatility. Additionally, the utilities sector outperformed as long-term interest rates declined and there was continued consolidation in the sector.
Energy Boosts Results
Security selection in energy was the largest positive contributor to relative returns, as the portfolio avoided many of the exploration and production stocks that were the sharpest decliners during the oil-market sell-off. The portfolio’s avoidance of several struggling companies in the sector, including Kinder Morgan, also boosted results. An overweight position in Valero Energy contributed to returns. We sold the Valero position in the first quarter of 2016 following its stock price appreciation. We used the proceeds to initiate a position in Schlumberger, the world's largest oilfield services company. We purchased Schlumberger after the stock fell to very attractive levels in the first quarter of 2016 due to the company’s disappointing fourth quarter results and preliminary 2016 guidance. The stock subsequently rose, contributing positively to relative performance.
Consumer Staples Assists
Stock selection in consumer staples supported relative performance, due in part to an overweight position in food distributor Sysco. Sysco’s stock gained after the company reported results that exceeded analysts’ forecasts, due to strong volume growth.
Outlook
We continue to be bottom-up investment managers, evaluating each company individually and building the portfolio one stock at a time. As of March 31, 2016, the portfolio remains underweight in utilities and financials. We are especially cautious toward investments, such as utilities and real estate investment trusts (REITs), that are both susceptible to rising interest rates and generally overvalued. The portfolio has no holdings in the telecommunication services sector due to continued concern about competitive dynamics in the sector. The portfolio’s largest overweights are in the health care and consumer discretionary sectors. The portfolio is also overweight in industrials and energy, where we are finding companies that are attractively valued.
|
| |
| MARCH 31, 2016 |
| Top Ten Holdings | % of net assets |
| JPMorgan Chase & Co. | 3.2% |
| Wells Fargo & Co. | 3.1% |
| Schlumberger Ltd. | 2.9% |
| Chevron Corp. | 2.7% |
| Cisco Systems, Inc. | 2.7% |
| Pfizer, Inc. | 2.7% |
| Oracle Corp. | 2.5% |
| TOTAL SA ADR | 2.5% |
| United Technologies Corp. | 2.2% |
| U.S. Bancorp | 2.1% |
| | |
| Top Five Industries | % of net assets |
| Banks | 12.8% |
| Oil, Gas and Consumable Fuels | 10.7% |
| Pharmaceuticals | 6.8% |
| Health Care Equipment and Supplies | 5.6% |
| Insurance | 5.5% |
| | |
| Types of Investments in Portfolio | % of net assets |
| Common Stocks | 99.2% |
| Exchange-Traded Funds | 0.2% |
| Total Equity Exposure | 99.4% |
| Temporary Cash Investments | 0.6% |
| Other Assets and Liabilities | —* |
*Category is less than 0.05% of total net assets.
Fund shareholders may incur two types of costs: (1) transaction costs, including sales charges (loads) on purchase payments and redemption/exchange fees; and (2) ongoing costs, including management fees; distribution and service (12b-1) fees; and other fund expenses. This example is intended to help you understand your ongoing costs (in dollars) of investing in your fund and to compare these costs with the ongoing cost of investing in other mutual funds.
The example is based on an investment of $1,000 made at the beginning of the period and held for the entire period from October 1, 2015 to March 31, 2016.
Actual Expenses
The table provides information about actual account values and actual expenses for each class. You may use the information, together with the amount you invested, to estimate the expenses that you paid over the period. First, identify the share class you own. Then simply divide your account value by $1,000 (for example, an $8,600 account value divided by $1,000 = 8.6), then multiply the result by the number under the heading “Expenses Paid During Period” to estimate the expenses you paid on your account during this period.
If you hold Investor Class shares of any American Century Investments fund, or Institutional Class shares of the American Century Diversified Bond Fund, in an American Century Investments account (i.e., not a financial intermediary or retirement plan account), American Century Investments may charge you a $12.50 semiannual account maintenance fee if the value of those shares is less than $10,000. We will redeem shares automatically in one of your accounts to pay the $12.50 fee. In determining your total eligible investment amount, we will include your investments in all personal accounts (including American Century Investments Brokerage accounts) registered under your Social Security number. Personal accounts include individual accounts, joint accounts, UGMA/UTMA accounts, personal trusts, Coverdell Education Savings Accounts and IRAs (including traditional, Roth, Rollover, SEP-, SARSEP- and SIMPLE-IRAs), and certain other retirement accounts. If you have only business, business retirement, employer-sponsored or American Century Investments Brokerage accounts, you are currently not subject to this fee. If you are subject to the Account Maintenance Fee, your account value could be reduced by the fee amount.
Hypothetical Example for Comparison Purposes
The table also provides information about hypothetical account values and hypothetical expenses based on the actual expense ratio of each class of your fund and an assumed rate of return of 5% per year before expenses, which is not the actual return of a fund’s share class. The hypothetical account values and expenses may not be used to estimate the actual ending account balance or expenses you paid for the period. You may use this information to compare the ongoing costs of investing in your fund and other funds. To do so, compare this 5% hypothetical example with the 5% hypothetical examples that appear in the shareholder reports of the other funds.
Please note that the expenses shown in the table are meant to highlight your ongoing costs only and do not reflect any transactional costs, such as sales charges (loads) or redemption/exchange fees. Therefore, the table is useful in comparing ongoing costs only, and will not help you determine the relative total costs of owning different funds. In addition, if these transactional costs were included, your costs would have been higher.
|
| | | | |
| | Beginning
Account Value
10/1/15 | Ending
Account Value
3/31/16 | Expenses Paid
During Period(1)10/1/15 - 3/31/16 | Annualized
Expense Ratio(1) |
| Actual | | | | |
| Investor Class | $1,000 | $1,060.50 | $4.33 | 0.84% |
| Institutional Class | $1,000 | $1,060.30 | $3.30 | 0.64% |
| A Class | $1,000 | $1,057.90 | $5.61 | 1.09% |
| C Class | $1,000 | $1,055.00 | $9.45 | 1.84% |
| R Class | $1,000 | $1,057.70 | $6.89 | 1.34% |
| R6 Class | $1,000 | $1,061.10 | $2.52 | 0.49% |
| Hypothetical | | | | |
| Investor Class | $1,000 | $1,020.80 | $4.24 | 0.84% |
| Institutional Class | $1,000 | $1,021.80 | $3.23 | 0.64% |
| A Class | $1,000 | $1,019.55 | $5.50 | 1.09% |
| C Class | $1,000 | $1,015.80 | $9.27 | 1.84% |
| R Class | $1,000 | $1,018.30 | $6.76 | 1.34% |
| R6 Class | $1,000 | $1,022.55 | $2.48 | 0.49% |
| |
| (1) | Expenses are equal to the class's annualized expense ratio listed in the table above, multiplied by the average account value over the period, multiplied by 183, the number of days in the most recent fiscal half-year, divided by 366, to reflect the one-half year period. |
MARCH 31, 2016
|
| | | | |
| | Shares | Value |
| COMMON STOCKS — 99.2% | | |
| Aerospace and Defense — 5.3% | | |
| Honeywell International, Inc. | 95,600 | $ | 10,711,980 |
|
| Huntington Ingalls Industries, Inc. | 59,500 | 8,147,930 |
|
| Textron, Inc. | 203,400 | 7,415,964 |
|
| United Technologies Corp. | 194,300 | 19,449,430 |
|
| | | 45,725,304 |
|
| Auto Components — 1.6% | | |
| BorgWarner, Inc. | 188,200 | 7,226,880 |
|
| Delphi Automotive plc | 84,000 | 6,301,680 |
|
| | | 13,528,560 |
|
| Automobiles — 1.2% | | |
| Ford Motor Co. | 472,400 | 6,377,400 |
|
| Harley-Davidson, Inc. | 85,700 | 4,398,981 |
|
| | | 10,776,381 |
|
| Banks — 12.8% | | |
| Bank of America Corp. | 1,267,300 | 17,133,896 |
|
| BB&T Corp. | 131,200 | 4,365,024 |
|
| JPMorgan Chase & Co. | 474,000 | 28,070,280 |
|
| KeyCorp | 321,800 | 3,552,672 |
|
| PNC Financial Services Group, Inc. (The) | 153,600 | 12,989,952 |
|
| U.S. Bancorp | 442,000 | 17,940,780 |
|
| Wells Fargo & Co. | 566,900 | 27,415,284 |
|
| | | 111,467,888 |
|
| Biotechnology — 0.6% | | |
| AbbVie, Inc. | 96,800 | 5,529,216 |
|
| Capital Markets — 4.9% | | |
| Ameriprise Financial, Inc. | 123,000 | 11,563,230 |
|
| BlackRock, Inc. | 20,100 | 6,845,457 |
|
| Goldman Sachs Group, Inc. (The) | 62,100 | 9,748,458 |
|
| Invesco Ltd. | 471,000 | 14,492,670 |
|
| | | 42,649,815 |
|
| Chemicals — 1.5% | | |
| Dow Chemical Co. (The) | 162,700 | 8,274,922 |
|
| LyondellBasell Industries NV, Class A | 51,100 | 4,373,138 |
|
| | | 12,648,060 |
|
| Commercial Services and Supplies — 1.4% | | |
| Tyco International plc | 334,600 | 12,283,166 |
|
| Communications Equipment — 2.7% | | |
| Cisco Systems, Inc. | 827,400 | 23,556,078 |
|
| Consumer Finance — 1.1% | | |
| Discover Financial Services | 188,817 | 9,614,562 |
|
| Containers and Packaging — 0.6% | | |
| WestRock Co. | 132,900 | 5,187,087 |
|
| Diversified Financial Services — 1.0% | | |
Berkshire Hathaway, Inc., Class B(1) | 62,000 | 8,796,560 |
|
| | | |
|
| | | | |
| | Shares | Value |
| Electric Utilities — 3.0% | | |
| Edison International | 111,400 | $ | 8,008,546 |
|
| PPL Corp. | 117,100 | 4,457,997 |
|
| Westar Energy, Inc. | 144,400 | 7,163,684 |
|
| Xcel Energy, Inc. | 158,800 | 6,641,016 |
|
| | | 26,271,243 |
|
| Electrical Equipment — 1.3% | | |
| Rockwell Automation, Inc. | 98,900 | 11,249,875 |
|
| Electronic Equipment, Instruments and Components — 1.6% | | |
| TE Connectivity Ltd. | 156,300 | 9,678,096 |
|
VeriFone Systems, Inc.(1) | 141,300 | 3,990,312 |
|
| | | 13,668,408 |
|
| Energy Equipment and Services — 3.6% | | |
| Halliburton Co. | 173,100 | 6,183,132 |
|
| Schlumberger Ltd. | 341,000 | 25,148,750 |
|
| | | 31,331,882 |
|
| Food and Staples Retailing — 3.1% | | |
| CVS Health Corp. | 133,400 | 13,837,582 |
|
| Sysco Corp. | 272,600 | 12,738,598 |
|
| | | 26,576,180 |
|
| Food Products — 1.2% | | |
| Mondelez International, Inc., Class A | 252,300 | 10,122,276 |
|
| Health Care Equipment and Supplies — 5.6% | | |
| Abbott Laboratories | 257,800 | 10,783,774 |
|
| Baxter International, Inc. | 212,300 | 8,721,284 |
|
| Medtronic plc | 199,100 | 14,932,500 |
|
| Zimmer Biomet Holdings, Inc. | 131,000 | 13,968,530 |
|
| | | 48,406,088 |
|
| Health Care Providers and Services — 3.3% | | |
| Anthem, Inc. | 51,200 | 7,116,288 |
|
HCA Holdings, Inc.(1) | 87,900 | 6,860,595 |
|
Laboratory Corp. of America Holdings(1) | 66,500 | 7,789,145 |
|
| McKesson Corp. | 45,000 | 7,076,250 |
|
| | | 28,842,278 |
|
| Hotels, Restaurants and Leisure — 1.4% | | |
| Carnival Corp. | 125,700 | 6,633,189 |
|
| Marriott International, Inc., Class A | 76,800 | 5,466,624 |
|
| | | 12,099,813 |
|
| Household Durables — 0.9% | | |
| Whirlpool Corp. | 41,300 | 7,448,042 |
|
| Household Products — 1.3% | | |
| Procter & Gamble Co. (The) | 138,300 | 11,383,473 |
|
| Insurance — 5.5% | | |
| Aflac, Inc. | 111,300 | 7,027,482 |
|
| Allstate Corp. (The) | 103,500 | 6,972,795 |
|
| American International Group, Inc. | 145,600 | 7,869,680 |
|
| Chubb Ltd. | 117,700 | 14,023,955 |
|
| MetLife, Inc. | 275,800 | 12,118,652 |
|
| | | 48,012,564 |
|
| Machinery — 3.2% | | |
| Ingersoll-Rand plc | 285,400 | 17,697,654 |
|
|
| | | | |
| | Shares | Value |
| Stanley Black & Decker, Inc. | 99,500 | $ | 10,468,395 |
|
| | | 28,166,049 |
|
| Media — 1.5% | | |
AMC Networks, Inc., Class A(1) | 67,500 | 4,383,450 |
|
| Time Warner, Inc. | 121,500 | 8,814,825 |
|
| | | 13,198,275 |
|
| Oil, Gas and Consumable Fuels — 10.7% | | |
| Anadarko Petroleum Corp. | 145,700 | 6,785,249 |
|
| Chevron Corp. | 250,600 | 23,907,240 |
|
| Exxon Mobil Corp. | 140,700 | 11,761,113 |
|
| Imperial Oil Ltd. | 387,900 | 12,959,369 |
|
| Occidental Petroleum Corp. | 236,500 | 16,183,695 |
|
| TOTAL SA ADR | 481,300 | 21,860,646 |
|
| | | 93,457,312 |
|
| Pharmaceuticals — 6.8% | | |
Allergan plc(1) | 43,800 | 11,739,714 |
|
| Johnson & Johnson | 127,600 | 13,806,320 |
|
| Merck & Co., Inc. | 115,500 | 6,111,105 |
|
| Pfizer, Inc. | 778,900 | 23,086,596 |
|
| Teva Pharmaceutical Industries Ltd. ADR | 84,700 | 4,532,297 |
|
| | | 59,276,032 |
|
| Road and Rail — 0.8% | | |
| Union Pacific Corp. | 88,700 | 7,056,085 |
|
| Semiconductors and Semiconductor Equipment — 3.8% | | |
| Applied Materials, Inc. | 690,300 | 14,620,554 |
|
| Intel Corp. | 278,300 | 9,003,005 |
|
| Lam Research Corp. | 74,300 | 6,137,180 |
|
| Microchip Technology, Inc. | 75,000 | 3,615,000 |
|
| | | 33,375,739 |
|
| Software — 3.2% | | |
Electronic Arts, Inc.(1) | 80,600 | 5,328,466 |
|
| Oracle Corp. | 541,900 | 22,169,129 |
|
| | | 27,497,595 |
|
| Specialty Retail — 1.7% | | |
| Advance Auto Parts, Inc. | 67,800 | 10,871,052 |
|
| Lowe's Cos., Inc. | 57,800 | 4,378,350 |
|
| | | 15,249,402 |
|
| Tobacco — 1.0% | | |
| Philip Morris International, Inc. | 91,100 | 8,937,821 |
|
TOTAL COMMON STOCKS (Cost $734,185,857) | | 863,389,109 |
|
| EXCHANGE-TRADED FUNDS — 0.2% | | |
iShares Russell 1000 Value ETF
(Cost $1,625,366) | 17,200 | 1,699,532 |
|
|
| | | | |
| | Shares | Value |
| TEMPORARY CASH INVESTMENTS — 0.6% | | |
| Repurchase Agreement, Fixed Income Clearing Corp., (collateralized by various U.S. Treasury obligations, 3.75%, 11/15/43, valued at $3,284,531), at 0.10%, dated 3/31/16, due 4/1/16 (Delivery value $3,214,009) | | $ | 3,214,000 |
|
| State Street Institutional Liquid Reserves Fund, Premier Class | 2,099,701 | 2,099,701 |
|
TOTAL TEMPORARY CASH INVESTMENTS (Cost $5,313,701) | | 5,313,701 |
|
TOTAL INVESTMENT SECURITIES — 100.0% (Cost $741,124,924) | | 870,402,342 |
|
OTHER ASSETS AND LIABILITIES† | | 80,861 |
|
| TOTAL NET ASSETS — 100.0% | | $ | 870,483,203 |
|
|
| | | | | | | | | | |
| FORWARD FOREIGN CURRENCY EXCHANGE CONTRACTS |
| Currency Purchased | Currency Sold | Counterparty | Settlement Date | Unrealized Appreciation
(Depreciation) |
| CAD | 515,824 |
| USD | 389,719 |
| Morgan Stanley | 6/30/16 | $ | 7,480 |
|
| USD | 10,820,425 |
| CAD | 14,280,689 |
| Morgan Stanley | 6/30/16 | (176,102 | ) |
| USD | 404,911 |
| CAD | 524,984 |
| Morgan Stanley | 6/30/16 | 659 |
|
| USD | 18,134,769 |
| EUR | 16,191,108 |
| UBS AG | 6/30/16 | (338,905 | ) |
| USD | 584,731 |
| EUR | 512,359 |
| UBS AG | 6/30/16 | 141 |
|
| | | | | | | $ | (506,727 | ) |
|
| | |
| NOTES TO SCHEDULE OF INVESTMENTS |
| ADR | - | American Depositary Receipt |
| CAD | - | Canadian Dollar |
| EUR | - | Euro |
| USD | - | United States Dollar |
| |
| † | Category is less than 0.05% of total net assets. |
See Notes to Financial Statements.
|
| | | | |
| Statement of Assets and Liabilities |
|
| | | |
| MARCH 31, 2016 | |
| Assets | |
| Investment securities, at value (cost of $741,124,924) | $ | 870,402,342 |
|
| Cash | 98,304 |
|
| Foreign currency holdings, at value (cost of $139,072) | 123,250 |
|
| Receivable for investments sold | 5,460,879 |
|
| Receivable for capital shares sold | 154,676 |
|
| Unrealized appreciation on forward foreign currency exchange contracts | 8,280 |
|
| Dividends and interest receivable | 1,606,908 |
|
| | 877,854,639 |
|
| | |
| Liabilities | |
| Payable for investments purchased | 5,673,234 |
|
| Payable for capital shares redeemed | 595,020 |
|
| Unrealized depreciation on forward foreign currency exchange contracts | 515,007 |
|
| Accrued management fees | 565,489 |
|
| Distribution and service fees payable | 22,686 |
|
| | 7,371,436 |
|
| | |
| Net Assets | $ | 870,483,203 |
|
| | |
| Net Assets Consist of: | |
| Capital (par value and paid-in surplus) | $ | 910,943,315 |
|
| Undistributed net investment income | 746,512 |
|
| Accumulated net realized loss | (169,959,460 | ) |
| Net unrealized appreciation | 128,752,836 |
|
| | $ | 870,483,203 |
|
|
| | | | | | |
| | Net Assets | Shares Outstanding | Net Asset Value Per Share |
| Investor Class, $0.01 Par Value |
| $642,745,881 |
| 74,931,430 |
| $8.58 |
| Institutional Class, $0.01 Par Value |
| $48,494,802 |
| 5,650,748 |
| $8.58 |
| A Class, $0.01 Par Value |
| $61,662,803 |
| 7,193,033 |
| $8.57* |
| C Class, $0.01 Par Value |
| $9,116,443 |
| 1,063,593 |
| $8.57 |
| R Class, $0.01 Par Value |
| $4,819,960 |
| 561,796 |
| $8.58 |
| R6 Class, $0.01 Par Value |
| $103,643,314 |
| 12,077,692 |
| $8.58 |
*Maximum offering price $9.09 (net asset value divided by 0.9425).
See Notes to Financial Statements.
|
| | | |
| YEAR ENDED MARCH 31, 2016 | |
| Investment Income (Loss) | |
| Income: | |
| Dividends (net of foreign taxes withheld of $198,588) | $ | 17,910,935 |
|
| Interest | 4,793 |
|
| | 17,915,728 |
|
| | |
| Expenses: | |
| Management fees | 6,439,234 |
|
| Distribution and service fees: | |
| A Class | 163,359 |
|
| B Class | 1,748 |
|
| C Class | 105,331 |
|
| R Class | 26,114 |
|
| Directors' fees and expenses | 27,977 |
|
| Other expenses | 2,401 |
|
| | 6,766,164 |
|
| | |
| Net investment income (loss) | 11,149,564 |
|
| | |
| Realized and Unrealized Gain (Loss) | |
| Net realized gain (loss) on: | |
| Investment transactions | 41,989,013 |
|
| Foreign currency transactions | (25,322 | ) |
| | 41,963,691 |
|
| | |
| Change in net unrealized appreciation (depreciation) on: | |
| Investments | (81,999,381 | ) |
| Translation of assets and liabilities in foreign currencies | (762,336 | ) |
| | (82,761,717 | ) |
| | |
| Net realized and unrealized gain (loss) | (40,798,026 | ) |
| | |
| Net Increase (Decrease) in Net Assets Resulting from Operations | $ | (29,648,462 | ) |
See Notes to Financial Statements.
|
| | | | |
| Statement of Changes in Net Assets |
|
| | | | | | |
| YEARS ENDED MARCH 31, 2016 AND MARCH 31, 2015 |
| Increase (Decrease) in Net Assets | March 31, 2016 | March 31, 2015 |
| Operations | | |
| Net investment income (loss) | $ | 11,149,564 |
| $ | 10,351,928 |
|
| Net realized gain (loss) | 41,963,691 |
| 118,468,572 |
|
| Change in net unrealized appreciation (depreciation) | (82,761,717 | ) | (47,547,195 | ) |
| Net increase (decrease) in net assets resulting from operations | (29,648,462 | ) | 81,273,305 |
|
| | | |
| Distributions to Shareholders | | |
| From net investment income: | | |
| Investor Class | (8,933,931 | ) | (7,695,113 | ) |
| Institutional Class | (752,924 | ) | (1,168,803 | ) |
| A Class | (750,479 | ) | (749,306 | ) |
| B Class | (512 | ) | (2,404 | ) |
| C Class | (41,446 | ) | (33,834 | ) |
| R Class | (46,400 | ) | (42,940 | ) |
| R6 Class | (868,574 | ) | (63,861 | ) |
| Decrease in net assets from distributions | (11,394,266 | ) | (9,756,261 | ) |
| | | |
| Capital Share Transactions | | |
| Net increase (decrease) in net assets from capital share transactions (Note 5) | 148,863,315 |
| (56,470,160 | ) |
| | | |
| Net increase (decrease) in net assets | 107,820,587 |
| 15,046,884 |
|
| | | |
| Net Assets | | |
| Beginning of period | 762,662,616 |
| 747,615,732 |
|
| End of period | $ | 870,483,203 |
| $ | 762,662,616 |
|
| | | |
| Undistributed net investment income | $ | 746,512 |
| $ | 1,225,148 |
|
See Notes to Financial Statements.
|
|
| Notes to Financial Statements |
MARCH 31, 2016
1. Organization
American Century Capital Portfolios, Inc. (the corporation) is registered under the Investment Company Act of 1940, as amended (the 1940 Act), as an open-end management investment company and is organized as a Maryland corporation. Large Company Value Fund (the fund) is one fund in a series issued by the corporation. The fund’s investment objective is to seek long-term capital growth. Income is a secondary objective.
The fund offers the Investor Class, the Institutional Class, the A Class, the C Class, the R Class and the R6 Class. The A Class may incur an initial sales charge. The A Class and C Class may be subject to a contingent deferred sales charge. The share classes differ principally in their respective sales charges and distribution and shareholder servicing expenses and arrangements. The Institutional Class and R6 Class shareholders do not require the same level of shareholder and administrative services from American Century Investment Management, Inc. (ACIM) (the investment advisor) as shareholders of other classes. In addition, financial intermediaries do not receive any service, distribution or administrative fees for the R6 Class. As a result, the Institutional Class and R6 Class are charged lower unified management fees. On October 16, 2015, all outstanding B Class shares were converted to A Class shares and the fund discontinued offering the B Class.
2. Significant Accounting Policies
The following is a summary of significant accounting policies consistently followed by the fund in preparation of its financial statements. The fund is an investment company and follows accounting and reporting guidance in accordance with accounting principles generally accepted in the United States of America. This may require management to make certain estimates and assumptions at the date of the financial statements. Actual results could differ from these estimates. Management evaluated the impact of events or transactions occurring through the date the financial statements were issued that would merit recognition or disclosure.
Investment Valuations — The fund determines the fair value of its investments and computes its net asset value per share at the close of regular trading (usually 4 p.m. Eastern time) on the New York Stock Exchange (NYSE) on each day the NYSE is open. The Board of Directors has adopted valuation policies and procedures to guide the investment advisor in the fund’s investment valuation process and to provide methodologies for the oversight of the fund’s pricing function.
Equity securities that are listed or traded on a domestic securities exchange are valued at the last reported sales price or at the official closing price as provided by the exchange. Equity securities traded on foreign securities exchanges are generally valued at the closing price of such securities on the exchange where primarily traded or at the close of the NYSE, if that is earlier. If no last sales price is reported, or if local convention or regulation so provides, the mean of the latest bid and asked prices may be used. Securities traded over-the-counter are valued at the mean of the latest bid and asked prices, the last sales price, or the official closing price. Equity securities initially expressed in local currencies are translated into U.S. dollars at the mean of the appropriate currency exchange rate at the close of the NYSE as provided by an independent pricing service.
Open-end management investment companies are valued at the reported net asset value per share. Repurchase agreements are valued at cost, which approximates fair value. Forward foreign currency exchange contracts are valued at the mean of the appropriate forward exchange rate at the close of the NYSE as provided by an independent pricing service.
If the fund determines that the market price for an investment is not readily available or the valuation methods mentioned above do not reflect an investment’s fair value, such investment is valued as determined in good faith by the Board of Directors or its delegate, in accordance with policies and procedures adopted by the Board of Directors. In its determination of fair value, the fund may review several factors including, but not limited to, market information regarding the specific investment or comparable investments and correlation with other investment types, futures indices or general market indicators. Circumstances that may cause the fund to use these procedures to value an investment include, but are not limited to: an investment has been declared in default or is distressed; trading in a security has been suspended during the trading day or a security is not actively trading on its principal exchange; prices received from a regular pricing source are deemed unreliable; or there is a foreign market holiday and no trading occurred.
The fund monitors for significant events occurring after the close of an investment’s primary exchange but before the fund’s net asset value per share is determined. Significant events may include, but are not limited to: corporate announcements and transactions; governmental action and political unrest that could impact a specific investment or an investment sector; or armed conflicts, natural disasters and similar events that could affect investments in a specific country or region. The fund also monitors for significant fluctuations between domestic and foreign markets, as evidenced by the U.S. market or such other indicators that the Board of Directors, or its delegate, deems appropriate. If significant fluctuations in foreign markets are identified, the fund may apply a model-derived factor to the closing price of equity securities traded on foreign securities exchanges. The factor is based on observable market data as provided by an independent pricing service.
Security Transactions — Security transactions are accounted for as of the trade date. Net realized gains and losses are determined on the identified cost basis, which is also used for federal income tax purposes.
Investment Income — Dividend income less foreign taxes withheld, if any, is recorded as of the ex-dividend date. Distributions received on securities that represent a return of capital or long-term capital gain are recorded as a reduction of cost of investments and/or as a realized gain. The fund may estimate the components of distributions received that may be considered nontaxable distributions or long-term capital gain distributions for income tax purposes. Interest income is recorded on the accrual basis and includes accretion of discounts and amortization of premiums.
Foreign Currency Translations — All assets and liabilities initially expressed in foreign currencies are translated into U.S. dollars at prevailing exchange rates at period end. The fund may enter into spot foreign currency exchange contracts to facilitate transactions denominated in a foreign currency. Purchases and sales of investment securities, dividend and interest income, spot foreign currency exchange contracts, and expenses are translated at the rates of exchange prevailing on the respective dates of such transactions. Net realized and unrealized foreign currency exchange gains or losses related to investment securities are a component of net realized gain (loss) on investment transactions and change in net unrealized appreciation (depreciation) on investments, respectively.
Repurchase Agreements — The fund may enter into repurchase agreements with institutions that ACIM has determined are creditworthy pursuant to criteria adopted by the Board of Directors. The fund requires that the collateral, represented by securities, received in a repurchase transaction be transferred to the custodian in a manner sufficient to enable the fund to obtain those securities in the event of a default under the repurchase agreement. ACIM monitors, on a daily basis, the securities transferred to ensure the value, including accrued interest, of the securities under each repurchase agreement is equal to or greater than amounts owed to the fund under each repurchase agreement.
Joint Trading Account — Pursuant to an Exemptive Order issued by the Securities and Exchange Commission, the fund, along with certain other funds in the American Century Investments family of funds, may transfer uninvested cash balances into a joint trading account. These balances are invested in one or more repurchase agreements that are collateralized by U.S. Treasury or Agency obligations.
Income Tax Status — It is the fund’s policy to distribute substantially all net investment income and net realized gains to shareholders and to otherwise qualify as a regulated investment company under provisions of the Internal Revenue Code. Accordingly, no provision has been made for income taxes. The fund files U.S. federal, state, local and non-U.S. tax returns as applicable. The fund's tax returns are subject to examination by the relevant taxing authority until expiration of the applicable statute of limitations, which is generally three years from the date of filing but can be longer in certain jurisdictions. At this time, management believes there are no uncertain tax positions which, based on their technical merit, would not be sustained upon examination and for which it is reasonably possible that the total amounts of unrecognized tax benefits will significantly change in the next twelve months.
Multiple Class — All shares of the fund represent an equal pro rata interest in the net assets of the class to which such shares belong, and have identical voting, dividend, liquidation and other rights and the same terms and conditions, except for class specific expenses and exclusive rights to vote on matters affecting only individual classes. Income, non-class specific expenses, and realized and unrealized capital gains and losses of the fund are allocated to each class of shares based on their relative net assets.
Distributions to Shareholders — Distributions from net investment income, if any, are generally declared and paid quarterly. Distributions from net realized gains, if any, are generally declared and paid annually.
Indemnifications — Under the corporation’s organizational documents, its officers and directors are indemnified against certain liabilities arising out of the performance of their duties to the fund. In addition, in the normal course of business, the fund enters into contracts that provide general indemnifications. The maximum exposure under these arrangements is unknown as this would involve future claims that may be made against a fund. The risk of material loss from such claims is considered by management to be remote.
3. Fees and Transactions with Related Parties
Certain officers and directors of the corporation are also officers and/or directors of American Century Companies, Inc. (ACC). The corporation’s investment advisor, ACIM, the corporation's distributor, American Century Investment Services, Inc. (ACIS), and the corporation’s transfer agent, American Century Services, LLC, are wholly owned, directly or indirectly, by ACC. Various funds issued by American Century Asset Allocation Portfolios, Inc. and American Century Strategic Asset Allocations, Inc. own, in aggregate, 45% of the shares of the fund. Related parties do not invest in the fund for the purpose of exercising management or control.
Management Fees — The corporation has entered into a management agreement with ACIM, under which ACIM provides the fund with investment advisory and management services in exchange for a single, unified management fee (the fee) per class. The agreement provides that all expenses of managing and operating the fund, except distribution and service fees, brokerage expenses, taxes, interest, fees and expenses of the independent directors (including legal counsel fees), and extraordinary expenses, will be paid by ACIM. The fee is computed and accrued daily based on each class’s daily net assets and paid monthly in arrears. The rate of the fee is determined by applying a fee rate calculation formula. This formula takes into account the fund’s assets as well as certain assets, if any, of other clients of the investment advisor outside the American Century Investments family of funds (such as subadvised funds and separate accounts) that have very similar investment teams and investment strategies (strategy assets). The strategy assets of the fund also include the assets of NT Large Company Value Fund, one fund in a series issued by the corporation. The annual management fee schedule ranges from 0.70% to 0.90% for the Investor Class, A Class, B Class, C Class and R Class. The annual management fee schedule ranges from 0.50% to 0.70% for the Institutional Class and 0.35% to 0.55% for the R6 Class. The effective annual management fee for each class for the year ended March 31, 2016 was 0.84% for the Investor Class, A Class, C Class and R Class, 0.64% for the Institutional Class and 0.49% for the R6 Class.
Distribution and Service Fees — The Board of Directors has adopted a separate Master Distribution and Individual Shareholder Services Plan for each of the A Class, B Class, C Class and R Class (collectively the plans), pursuant to Rule 12b-1 of the 1940 Act. The plans provide that the A Class will pay ACIS an annual distribution and service fee of 0.25%. The plans provide that the B Class and C Class will each pay ACIS an annual distribution and service fee of 1.00%, of which 0.25% is paid for individual shareholder services and 0.75% is paid for distribution services. The plans provide that the R Class will pay ACIS an annual distribution and service fee of 0.50%. The fees are computed and accrued daily based on each class’s daily net assets and paid monthly in arrears. The fees are used to pay financial intermediaries for distribution and individual shareholder services. Fees incurred under the plans during the year ended March 31, 2016 are detailed in the Statement of Operations.
Directors' Fees and Expenses — The Board of Directors is responsible for overseeing the investment advisor’s management and operations of the fund. The directors receive detailed information about the fund and its investment advisor regularly throughout the year, and meet at least quarterly with management of the investment advisor to review reports about fund operations. The fund’s officers do not receive compensation from the fund.
4. Investment Transactions
Purchases and sales of investment securities, excluding short-term investments, for the year ended March 31, 2016 were $598,597,586 and $444,271,401, respectively.
5. Capital Share Transactions
Transactions in shares of the fund were as follows:
|
| | | | | | | | | | |
| | Year ended
March 31, 2016 | Year ended
March 31, 2015 |
| | Shares | Amount | Shares | Amount |
| Investor Class/Shares Authorized | 500,000,000 |
| | 320,000,000 |
| |
| Sold | 17,629,618 |
| $ | 155,559,656 |
| 10,602,272 |
| $ | 93,205,250 |
|
| Issued in reinvestment of distributions | 1,007,564 |
| 8,744,859 |
| 857,289 |
| 7,598,172 |
|
| Redeemed | (8,596,338 | ) | (74,429,878 | ) | (15,922,735 | ) | (142,211,204 | ) |
| | 10,040,844 |
| 89,874,637 |
| (4,463,174 | ) | (41,407,782 | ) |
| Institutional Class/Shares Authorized | 50,000,000 |
| | 65,000,000 |
| |
| Sold | 1,827,487 |
| 15,883,636 |
| 1,214,195 |
| 10,709,367 |
|
| Issued in reinvestment of distributions | 86,062 |
| 747,253 |
| 131,329 |
| 1,163,382 |
|
| Redeemed | (1,509,620 | ) | (13,112,507 | ) | (5,897,634 | ) | (52,541,206 | ) |
| | 403,929 |
| 3,518,382 |
| (4,552,110 | ) | (40,668,457 | ) |
| A Class/Shares Authorized | 60,000,000 |
| | 70,000,000 |
| |
| Sold | 1,501,902 |
| 13,067,373 |
| 1,086,169 |
| 9,486,498 |
|
| Issued in reinvestment of distributions | 83,694 |
| 727,057 |
| 82,165 |
| 726,707 |
|
| Redeemed | (2,165,484 | ) | (18,766,444 | ) | (2,440,653 | ) | (21,358,443 | ) |
| | (579,888 | ) | (4,972,014 | ) | (1,272,319 | ) | (11,145,238 | ) |
| B Class/Shares Authorized | N/A |
| | 5,000,000 |
| |
| Sold | — |
| — |
| 32 |
| 279 |
|
| Issued in reinvestment of distributions | 56 |
| 504 |
| 228 |
| 2,005 |
|
| Redeemed | (50,687 | ) | (452,583 | ) | (61,297 | ) | (540,748 | ) |
| | (50,631 | ) | (452,079 | ) | (61,037 | ) | (538,464 | ) |
| C Class/Shares Authorized | 15,000,000 |
| | 10,000,000 |
| |
| Sold | 183,240 |
| 1,599,014 |
| 196,172 |
| 1,732,751 |
|
| Issued in reinvestment of distributions | 2,879 |
| 25,036 |
| 2,196 |
| 19,288 |
|
| Redeemed | (391,973 | ) | (3,347,446 | ) | (148,976 | ) | (1,295,308 | ) |
| | (205,854 | ) | (1,723,396 | ) | 49,392 |
| 456,731 |
|
| R Class/Shares Authorized | 10,000,000 |
| | 5,000,000 |
| |
| Sold | 93,079 |
| 807,096 |
| 179,630 |
| 1,564,239 |
|
| Issued in reinvestment of distributions | 5,204 |
| 45,261 |
| 4,771 |
| 42,181 |
|
| Redeemed | (180,477 | ) | (1,559,711 | ) | (281,041 | ) | (2,431,491 | ) |
| | (82,194 | ) | (707,354 | ) | (96,640 | ) | (825,071 | ) |
| R6 Class/Shares Authorized | 80,000,000 |
| | 15,000,000 |
| |
| Sold | 8,832,542 |
| 71,693,067 |
| 4,297,031 |
| 38,502,849 |
|
| Issued in reinvestment of distributions | 100,724 |
| 868,574 |
| 7,113 |
| 63,861 |
|
| Redeemed | (1,061,403 | ) | (9,236,502 | ) | (101,629 | ) | (908,589 | ) |
| | 7,871,863 |
| 63,325,139 |
| 4,202,515 |
| 37,658,121 |
|
| Net increase (decrease) | 17,398,069 |
| $ | 148,863,315 |
| (6,193,373 | ) | $ | (56,470,160 | ) |
6. Fair Value Measurements
The fund’s investments valuation process is based on several considerations and may use multiple inputs to determine the fair value of the investments held by the fund. In conformity with accounting principles generally accepted in the United States of America, the inputs used to determine a valuation are classified into three broad levels.
| |
| • | Level 1 valuation inputs consist of unadjusted quoted prices in an active market for identical investments. |
| |
| • | Level 2 valuation inputs consist of direct or indirect observable market data (including quoted prices for comparable investments, evaluations of subsequent market events, interest rates, prepayment speeds, credit risk, etc.). These inputs also consist of quoted prices for identical investments initially expressed in local currencies that are adjusted through translation into U.S. dollars. |
| |
| • | Level 3 valuation inputs consist of unobservable data (including a fund’s own assumptions). |
The level classification is based on the lowest level input that is significant to the fair valuation measurement. The valuation inputs are not necessarily an indication of the risks associated with investing in these securities or other financial instruments. There were no significant transfers between levels during the period.
The following is a summary of the level classifications as of period end. The Schedule of Investments provides additional information on the fund’s portfolio holdings.
|
| | | | | | | | |
| | Level 1 | Level 2 | Level 3 |
| Assets | | | |
| Investment Securities | | | |
| Common Stocks | $ | 850,429,740 |
| $ | 12,959,369 |
| — |
|
| Exchange-Traded Funds | 1,699,532 |
| — |
| — |
|
| Temporary Cash Investments | 2,099,701 |
| 3,214,000 |
| — |
|
| | $ | 854,228,973 |
| $ | 16,173,369 |
| — |
|
| Other Financial Instruments | | | |
| Forward Foreign Currency Exchange Contracts | — |
| $ | 8,280 |
| — |
|
| | | | |
| Liabilities | | | |
| Other Financial Instruments | | | |
| Forward Foreign Currency Exchange Contracts | — |
| $ | 515,007 |
| — |
|
7. Derivative Instruments
Foreign Currency Risk — The fund is subject to foreign currency exchange rate risk in the normal course of pursuing its investment objectives. The value of foreign investments held by a fund may be significantly affected by changes in foreign currency exchange rates. The dollar value of a foreign security generally decreases when the value of the dollar rises against the foreign currency in which the security is denominated and tends to increase when the value of the dollar declines against such foreign currency. A fund may enter into forward foreign currency exchange contracts to reduce a fund's exposure to foreign currency exchange rate fluctuations. The net U.S. dollar value of foreign currency underlying all contractual commitments held by a fund and the resulting unrealized appreciation or depreciation are determined daily. Realized gain or loss is recorded upon the termination of the contract. Net realized and unrealized gains or losses occurring during the holding period of forward foreign currency exchange contracts are a component of net realized gain (loss) on foreign currency transactions and change in net unrealized appreciation (depreciation) on translation of assets and liabilities in foreign currencies, respectively. A fund bears the risk of an unfavorable change in the foreign currency exchange rate underlying the forward contract. Additionally, losses, up to the fair value, may arise if the counterparties do not perform under the contract terms. The fund's average U.S. dollar exposure to foreign currency risk derivative instruments held during the period was $25,028,457.
The value of foreign currency risk derivative instruments as of March 31, 2016, is disclosed on the Statement of Assets and Liabilities as an asset of $8,280 in unrealized appreciation on forward foreign currency exchange contracts and a liability of $515,007 in unrealized depreciation on forward foreign currency
exchange contracts. For the year ended March 31, 2016, the effect of foreign currency risk derivative instruments on the Statement of Operations was $(18,069) in net realized gain (loss) on foreign currency transactions and $(766,518) in change in net unrealized appreciation (depreciation) on translation of assets and liabilities in foreign currencies.
8. Federal Tax Information
The tax character of distributions paid during the years ended March 31, 2016 and March 31, 2015 were as follows:
|
| | | | | | |
| | 2016 | 2015 |
| Distributions Paid From | | |
| Ordinary income | $ | 11,394,266 |
| $ | 9,756,261 |
|
| Long-term capital gains | — |
| — |
|
The book-basis character of distributions made during the year from net investment income or net realized gains may differ from their ultimate characterization for federal income tax purposes. These differences reflect the differing character of certain income items and net realized gains and losses for financial statement and tax purposes, and may result in reclassification among certain capital accounts on the financial statements.
As of March 31, 2016, the federal tax cost of investments and the components of distributable earnings on a tax-basis were as follows:
|
| | | |
| Federal tax cost of investments | $ | 751,919,730 |
|
| Gross tax appreciation of investments | $ | 143,117,170 |
|
| Gross tax depreciation of investments | (24,634,558 | ) |
| Net tax appreciation (depreciation) of investments | 118,482,612 |
|
| Net tax appreciation (depreciation) on derivatives and translation of assets and liabilities in foreign currencies | (17,855 | ) |
| Net tax appreciation (depreciation) | $ | 118,464,757 |
|
| Undistributed ordinary income | $ | 746,512 |
|
| Accumulated short-term capital losses | $ | (146,747,979 | ) |
| Post-October capital loss deferral | $ | (12,923,402 | ) |
The difference between book-basis and tax-basis unrealized appreciation (depreciation) is attributable primarily to the tax deferral of losses on wash sales.
Accumulated capital losses represent net capital loss carryovers that may be used to offset future realized capital gains for federal income tax purposes. Future capital loss carryover utilization in any given year may be subject to Internal Revenue Code limitations. Capital loss carryovers expire in 2018.
Loss deferrals represent certain qualified losses that the fund has elected to treat as having been incurred in the following fiscal year for federal income tax purposes.
|
| | | | | | | | | | | | | |
For a Share Outstanding Throughout the Years Ended March 31 (except as noted)
|
| Per-Share Data | Ratios and Supplemental Data |
| | | Income From Investment Operations: | | | | Ratio to Average Net Assets of: | | |
| | Net Asset
Value,
Beginning
of Period | Net
Investment
Income
(Loss)(1) | Net
Realized
and
Unrealized
Gain (Loss) | Total From
Investment
Operations | Distributions From Net
Investment
Income | Net Asset
Value,
End
of Period | Total
Return(2) | Operating
Expenses | Net
Investment
Income
(Loss) | Portfolio
Turnover
Rate | Net
Assets,
End of
Period
(in thousands) |
| Investor Class | | | | | | | | | |
| 2016 | $9.07 | 0.12 | (0.49) | (0.37) | (0.12) | $8.58 | (4.06)% | 0.84% | 1.41% | 56% |
| $642,746 |
|
| 2015 | $8.28 | 0.12 | 0.78 | 0.90 | (0.11) | $9.07 | 10.92% | 0.84% | 1.36% | 56% |
| $588,608 |
|
| 2014 | $6.92 | 0.12 | 1.36 | 1.48 | (0.12) | $8.28 | 21.57% | 0.85% | 1.64% | 35% |
| $574,367 |
|
| 2013 | $6.09 | 0.12 | 0.83 | 0.95 | (0.12) | $6.92 | 15.85% | 0.87% | 1.87% | 33% |
| $487,161 |
|
| 2012 | $5.80 | 0.10 | 0.29 | 0.39 | (0.10) | $6.09 | 6.91% | 0.87% | 1.84% | 56% |
| $553,916 |
|
| Institutional Class | | | | | | | | | |
| 2016 | $9.08 | 0.14 | (0.50) | (0.36) | (0.14) | $8.58 | (3.97)% | 0.64% | 1.61% | 56% |
| $48,495 |
|
| 2015 | $8.29 | 0.13 | 0.79 | 0.92 | (0.13) | $9.08 | 11.14% | 0.64% | 1.56% | 56% |
| $47,616 |
|
| 2014 | $6.93 | 0.14 | 1.36 | 1.50 | (0.14) | $8.29 | 21.78% | 0.65% | 1.84% | 35% |
| $81,195 |
|
| 2013 | $6.10 | 0.13 | 0.83 | 0.96 | (0.13) | $6.93 | 16.05% | 0.67% | 2.07% | 33% |
| $57,325 |
|
| 2012 | $5.80 | 0.11 | 0.30 | 0.41 | (0.11) | $6.10 | 7.29% | 0.67% | 2.04% | 56% |
| $77,706 |
|
|
| | | | | | | | | | | | | |
For a Share Outstanding Throughout the Years Ended March 31 (except as noted)
|
| Per-Share Data | Ratios and Supplemental Data |
| | | Income From Investment Operations: | | | | Ratio to Average Net Assets of: | | |
| | Net Asset
Value,
Beginning
of Period | Net
Investment
Income
(Loss)(1) | Net
Realized
and
Unrealized
Gain (Loss) | Total From
Investment
Operations | Distributions From Net
Investment
Income | Net Asset
Value,
End
of Period | Total
Return(2) | Operating
Expenses | Net
Investment
Income
(Loss) | Portfolio
Turnover
Rate | Net
Assets,
End of
Period
(in thousands) |
| A Class | | | | | | | | | |
| 2016 | $9.07 | 0.10 | (0.50) | (0.40) | (0.10) | $8.57 | (4.41)% | 1.09% | 1.16% | 56% |
| $61,663 |
|
| 2015 | $8.28 | 0.10 | 0.78 | 0.88 | (0.09) | $9.07 | 10.65% | 1.09% | 1.11% | 56% |
| $70,462 |
|
| 2014 | $6.92 | 0.11 | 1.35 | 1.46 | (0.10) | $8.28 | 21.27% | 1.10% | 1.39% | 35% |
| $74,863 |
|
| 2013 | $6.09 | 0.10 | 0.84 | 0.94 | (0.11) | $6.92 | 15.57% | 1.12% | 1.62% | 33% |
| $69,270 |
|
| 2012 | $5.79 | 0.09 | 0.30 | 0.39 | (0.09) | $6.09 | 6.83% | 1.12% | 1.59% | 56% |
| $75,521 |
|
| C Class | | | | | | | | | |
| 2016 | $9.06 | 0.03 | (0.49) | (0.46) | (0.03) | $8.57 | (5.03)% | 1.84% | 0.41% | 56% |
| $9,116 |
|
| 2015 | $8.28 | 0.03 | 0.78 | 0.81 | (0.03) | $9.06 | 9.77% | 1.84% | 0.36% | 56% |
| $11,505 |
|
| 2014 | $6.92 | 0.05 | 1.35 | 1.40 | (0.04) | $8.28 | 20.36% | 1.85% | 0.64% | 35% |
| $10,101 |
|
| 2013 | $6.09 | 0.05 | 0.84 | 0.89 | (0.06) | $6.92 | 14.72% | 1.87% | 0.87% | 33% |
| $8,961 |
|
| 2012 | $5.80 | 0.05 | 0.28 | 0.33 | (0.04) | $6.09 | 5.85% | 1.87% | 0.84% | 56% |
| $9,232 |
|
| R Class | | | | | | | | | |
| 2016 | $9.07 | 0.08 | (0.49) | (0.41) | (0.08) | $8.58 | (4.55)% | 1.34% | 0.91% | 56% |
| $4,820 |
|
| 2015 | $8.28 | 0.07 | 0.79 | 0.86 | (0.07) | $9.07 | 10.37% | 1.34% | 0.86% | 56% |
| $5,842 |
|
| 2014 | $6.92 | 0.09 | 1.35 | 1.44 | (0.08) | $8.28 | 20.96% | 1.35% | 1.14% | 35% |
| $6,135 |
|
| 2013 | $6.10 | 0.08 | 0.83 | 0.91 | (0.09) | $6.92 | 15.10% | 1.37% | 1.37% | 33% |
| $5,792 |
|
| 2012 | $5.80 | 0.07 | 0.30 | 0.37 | (0.07) | $6.10 | 6.55% | 1.37% | 1.34% | 56% |
| $6,454 |
|
| R6 Class | | | | | | | | | |
| 2016 | $9.08 | 0.16 | (0.51) | (0.35) | (0.15) | $8.58 | (3.83)% | 0.49% | 1.76% | 56% |
| $103,643 |
|
| 2015 | $8.29 | 0.17 | 0.76 | 0.93 | (0.14) | $9.08 | 11.30% | 0.49% | 1.71% | 56% |
| $38,170 |
|
2014(3) | $7.65 | 0.10 | 0.65 | 0.75 | (0.11) | $8.29 | 9.90% | 0.50%(4) | 1.98%(4) | 35%(5) |
| $27 |
|
|
|
| Notes to Financial Highlights |
| |
| (1) | Computed using average shares outstanding throughout the period. |
| |
| (2) | Total returns are calculated based on the net asset value of the last business day and do not reflect applicable sales charges, if any. Total returns for periods less than one year are not annualized. |
| |
| (3) | July 26, 2013 (commencement of sale) through March 31, 2014. |
| |
| (5) | Portfolio turnover is calculated at the fund level. Percentage indicated was calculated for the year ended March 31, 2014. |
See Notes to Financial Statements.
|
|
| Report of Independent Registered Public Accounting Firm |
To the Board of Directors and Shareholders of American Century Capital Portfolios, Inc.:
We have audited the accompanying statement of assets and liabilities, including the schedule of investments, of Large Company Value Fund (the “Fund”), one of the funds constituting American Century Capital Portfolios, Inc., as of March 31, 2016, and the related statement of operations for the year then ended, the statements of changes in net assets for each of the two years in the period then ended, and the financial highlights for each of the periods presented. These financial statements and financial highlights are the responsibility of the Fund's management. Our responsibility is to express an opinion on these financial statements and financial highlights based on our audits.
We conducted our audits in accordance with the standards of the Public Company Accounting Oversight Board (United States). Those standards require that we plan and perform the audit to obtain reasonable assurance about whether the financial statements and financial highlights are free of material misstatement. The Fund is not required to have, nor were we engaged to perform, an audit of its internal control over financial reporting. Our audits included consideration of internal control over financial reporting as a basis for designing audit procedures that are appropriate in the circumstances, but not for the purpose of expressing an opinion on the effectiveness of the Fund's internal control over financial reporting. Accordingly, we express no such opinion. An audit also includes examining, on a test basis, evidence supporting the amounts and disclosures in the financial statements, assessing the accounting principles used and significant estimates made by management, as well as evaluating the overall financial statement presentation. Our procedures included confirmation of securities owned as of March 31, 2016, by correspondence with the custodian and brokers; when replies were not received from brokers, we performed other auditing procedures. We believe that our audits provide a reasonable basis for our opinion.
In our opinion, the financial statements and financial highlights referred to above present fairly, in all material respects, the financial position of Large Company Value Fund of American Century Capital Portfolios, Inc. as of March 31, 2016, the results of its operations for the year then ended, the changes in its net assets for each of the two years in the period then ended, and the financial highlights for each of the periods presented, in conformity with accounting principles generally accepted in the United States of America.
DELOITTE & TOUCHE LLP
Kansas City, Missouri May 17, 2016
The Board of Directors
The individuals listed below serve as directors of the funds. Each director will continue to serve in this capacity until death, retirement, resignation or removal from office. The board has adopted a mandatory retirement age for directors who are not “interested persons,” as that term is defined in the Investment Company Act (independent directors). Independent directors shall retire by December 31 of the year in which they reach their 75th birthday.
Mr. Thomas is an “interested person” because he currently serves as President and Chief Executive Officer of American Century Companies, Inc. (ACC), the parent company of American Century Investment Management, Inc. (ACIM or the advisor). Mr. Fink is treated as an “interested person” because of his recent employment with ACC and American Century Services, LLC (ACS). The other directors (more than three-fourths of the total number) are independent. They are not employees, directors or officers of, and have no financial interest in, ACC or any of its wholly owned, direct or indirect, subsidiaries, including ACIM, American Century Investment Services, Inc. (ACIS) and ACS, and they do not have any other affiliations, positions or relationships that would cause them to be considered “interested persons” under the Investment Company Act. The directors serve in this capacity for seven (in the case of Mr. Thomas, 15) registered investment companies in the American Century Investments family of funds.
The following table presents additional information about the directors. The mailing address for each director is 4500 Main Street, Kansas City, Missouri 64111.
|
| | | | | |
Name
(Year of Birth) | Position(s) Held with Funds | Length of Time Served | Principal Occupation(s) During Past 5 Years | Number of American Century Portfolios Overseen by Director | Other Directorships Held During Past
5 Years |
| Independent Directors | | |
Andrea C. Hall
(1945) | Director | Since 1997 | Retired | 83 | None |
Jan M. Lewis
(1957) | Director | Since 2011 | Retired; President and Chief Executive Officer, Catholic Charities of Northeast Kansas (human services organization) (2006 to 2013) | 83 | None |
James A. Olson
(1942) | Director and Chairman of the Board | Since 2007 (Chairman since 2014) | Member, Plaza Belmont LLC (private equity fund manager) (1999 to present) | 83 | Saia, Inc. (2002 to 2012) and EPR Properties (2003 to 2013) |
M. Jeannine Strandjord
(1945) | Director | Since 1994 | Retired | 83 | Euronet Worldwide Inc.; MGP Ingredients, Inc.; and DST Systems Inc. (1996 to 2012) |
John R. Whitten
(1946) | Director | Since 2008 | Retired | 83 | Rudolph Technologies, Inc. |
Stephen E. Yates
(1948) | Director | Since 2012 | Retired | 83 | None |
|
| | | | | |
Name
(Year of Birth) | Position(s) Held with Funds | Length of Time Served | Principal Occupation(s) During Past 5 Years | Number of American Century Portfolios Overseen by Director | Other Directorships Held During Past
5 Years |
| Interested Directors |
Barry Fink
(1955) | Director | Since 2012 | Retired; Executive Vice President, ACC (September 2007 to February 2013); President, ACS (October 2007 to February 2013); Chief Operating Officer, ACC (September 2007 to November 2012) | 83 | None |
Jonathan S. Thomas
(1963) | Director and President | Since 2007 | President and Chief Executive Officer, ACC (March 2007 to present). Also serves as Chief Executive Officer, ACS; Executive Vice President, ACIM; Director, ACC, ACIM and other ACC subsidiaries | 128 | BioMed Valley Discoveries, Inc. |
The Statement of Additional Information has additional information about the fund's directors and is available without charge, upon request, by calling 1-800-345-2021.
Officers
The following table presents certain information about the executive officers of the funds. Each officer serves as an officer for each of the 15 investment companies in the American Century family of funds, unless otherwise noted. No officer is compensated for his or her service as an officer of the funds. The listed officers are interested persons of the funds and are appointed or re-appointed on an annual basis. The mailing address for each officer listed below is 4500 Main Street, Kansas City, Missouri 64111.
|
| | |
Name (Year of Birth) | Offices with
the Funds | Principal Occupation(s) During the Past Five Years |
Jonathan S.
Thomas
(1963) | Director and
President
since 2007 | President and Chief Executive Officer, ACC (March 2007 to present). Also serves as Chief Executive Officer, ACS; Executive Vice President, ACIM; Director, ACC, ACIM and other ACC subsidiaries |
Amy D. Shelton
(1964) | Chief Compliance
Officer and Vice President since 2014 | Chief Compliance Officer, American Century funds, (March 2014 to present); Chief Compliance Officer, ACIM (February 2014 to present); Chief Compliance Officer, ACIS (October 2009 to present); Vice President, Client Interactions and Marketing, ACIS (February 2013 to January 2014); Director, Client Interactions and Marketing, ACIS (June 2007 to January 2013). Also serves as Vice President, ACIS |
Charles A.
Etherington
(1957) | General Counsel
since 2007 and
Senior Vice
President since 2006 | Attorney, ACC (February 1994 to present); Vice President, ACC (November 2005 to present); General Counsel, ACC (March 2007 to present). Also serves as General Counsel, ACIM, ACS, ACIS and other ACC subsidiaries; and Senior Vice President, ACIM and ACS |
C. Jean Wade
(1964) | Vice President,
Treasurer and
Chief Financial
Officer since 2012 | Vice President, ACS (February 2000 to present) |
Robert J.
Leach
(1966) | Vice President
since 2006 and
Assistant Treasurer
since 2012 | Vice President, ACS (February 2000 to present) |
David H.
Reinmiller
(1963) | Vice President
since 2000 | Attorney, ACC (January 1994 to present); Associate General Counsel, ACC (January 2001 to present). Also serves as Vice President, ACIM and ACS |
Ward D.
Stauffer
(1960) | Secretary
since 2005 | Attorney, ACC (June 2003 to present) |
Retirement Account Information
As required by law, distributions you receive from certain IRAs are subject to federal income tax withholding, unless you elect not to have withholding apply. Tax will be withheld on the total amount withdrawn even though you may be receiving amounts that are not subject to withholding, such as nondeductible contributions. In such case, excess amounts of withholding could occur. You may adjust your withholding election so that a greater or lesser amount will be withheld.
If you don’t want us to withhold on this amount, you must notify us to not withhold the federal income tax. You may notify us in writing or in certain situations by telephone or through other electronic means. For systematic withdrawals, your withholding election will remain in effect until revoked or changed by filing a new election. You have the right to revoke your election at any time.
Remember, even if you elect not to have income tax withheld, you are liable for paying income tax on the taxable portion of your withdrawal. If you elect not to have income tax withheld or you don’t have enough income tax withheld, you may be responsible for payment of estimated tax. You may incur penalties under the estimated tax rules if your withholding and estimated tax payments are not sufficient. You can reduce or defer the income tax on a distribution by directly or indirectly rolling such distribution over to another IRA or eligible plan. You should consult your tax advisor for additional information.
State tax will be withheld if, at the time of your distribution, your address is within one of the mandatory withholding states and you have federal income tax withheld (or as otherwise required by state law). State taxes will be withheld from your distribution in accordance with the respective state rules.
Distributions you receive from 403(b), 457 and qualified plans are subject to special tax and withholding rules. Your plan administrator or plan sponsor is required to provide you with a special tax notice explaining those rules at the time you request a distribution. If applicable, federal and/or state taxes may be withheld from your distribution amount.
Proxy Voting Policies
A description of the policies that the fund's investment advisor uses in exercising the voting rights associated with the securities purchased and/or held by the fund is available without charge, upon request, by calling 1-800-345-2021. It is also available on the "About Us" page of American Century Investments’ website at americancentury.com and on the Securities and Exchange Commission’s website at sec.gov. Information regarding how the investment advisor voted proxies relating to portfolio securities during the most recent 12-month period ended June 30 is available on the "About Us" page at americancentury.com. It is also available at sec.gov.
Quarterly Portfolio Disclosure
The fund files its complete schedule of portfolio holdings with the Securities and Exchange Commission (SEC) for the first and third quarters of each fiscal year on Form N-Q. The fund’s Forms N-Q are available on the SEC’s website at sec.gov, and may be reviewed and copied at the SEC’s Public Reference Room in Washington, DC. Information on the operation of the Public Reference Room may be obtained by calling 1-800-SEC-0330. The fund also makes its complete schedule of portfolio holdings for the most recent quarter of its fiscal year available on its
website at americancentury.com and, upon request, by calling 1-800-345-2021.
Other Tax Information
The following information is provided pursuant to provisions of the Internal Revenue Code.
The fund hereby designates up to the maximum amount allowable as qualified dividend income for the fiscal year ended March 31, 2016.
For corporate taxpayers, the fund hereby designates $11,394,266, or up to the maximum amount allowable, of ordinary income distributions paid during the fiscal year ended March 31, 2016 as qualified for the corporate dividends received deduction.
|
| | |
| |
| | | |
| Contact Us | americancentury.com | |
| Automated Information Line | 1-800-345-8765 | |
| Investor Services Representative | 1-800-345-2021 or 816-531-5575 | |
| Investors Using Advisors | 1-800-378-9878 | |
| Business, Not-For-Profit, Employer-Sponsored Retirement Plans | 1-800-345-3533 | |
| Banks and Trust Companies, Broker-Dealers, Financial Professionals, Insurance Companies | 1-800-345-6488 | |
| Telecommunications Relay Service for the Deaf | 711 | |
| | | |
| American Century Capital Portfolios, Inc. | |
| | | |
Investment Advisor: American Century Investment Management, Inc. Kansas City, Missouri | |
| | | |
| This report and the statements it contains are submitted for the general information of our shareholders. The report is not authorized for distribution to prospective investors unless preceded or accompanied by an effective prospectus. | |
| | | |
©2016 American Century Proprietary Holdings, Inc. All rights reserved.
CL-ANN-88866 1605
| |
|
| |
| ANNUAL REPORT | |
| MARCH 31, 2016 |
| |
AC Alternatives® Market Neutral Value Fund
|
| | |
| President’s Letter | 2 |
|
| Performance | 3 |
|
| Portfolio Commentary | |
|
| Fund Characteristics | |
|
| Shareholder Fee Example | |
|
| Schedule of Investments | |
|
| Statement of Assets and Liabilities | |
|
| Statement of Operations | |
|
| Statement of Changes in Net Assets | |
|
| Notes to Financial Statements | |
|
| Financial Highlights | |
|
| Report of Independent Registered Public Accounting Firm | |
|
| Management | |
|
| Additional Information | |
|
Any opinions expressed in this report reflect those of the author as of the date of the report, and do not necessarily represent the opinions of American Century Investments® or any other person in the American Century Investments organization. Any such opinions are subject to change at any time based upon market or other conditions and American Century Investments disclaims any responsibility to update such opinions. These opinions may not be relied upon as investment advice and, because investment decisions made by American Century Investments funds are based on numerous factors, may not be relied upon as an indication of trading intent on behalf of any American Century Investments fund. Security examples are used for representational purposes only and are not intended as recommendations to purchase or sell securities. Performance information for comparative indices and securities is provided to American Century Investments by third party vendors. To the best of American Century Investments’ knowledge, such information is accurate at the time of printing.
|
| |
| Dear Investor:
Thank you for reviewing this annual report for the 12 months ended March 31, 2016. It provides investment performance and portfolio information for the reporting period, plus longer-term historical performance data.
Annual reports help convey information about fund performance, including market and economic factors that affected returns during the reporting period. For additional, updated investment and market insights, we encourage you to visit our website, americancentury.com.
|
| Jonathan Thomas |
Divergence in Economic Growth and Monetary Policies, Combined With China Turmoil, Triggered Market Volatility
Divergence between the U.S. and the rest of the world—along with China’s struggles, plunging commodity prices, capital market volatility, and risk-off trading—were dominant themes during the reporting period. Global divergence described not only the relatively stronger economic growth enjoyed by the U.S. compared with most of the world, but also the related contrast between the U.S. Federal Reserve’s (the Fed’s) unwinding of monetary stimulus versus the continuation and expansion of stimulus by other major central banks.
Two months in particular captured the volatility and risk-off trading of the 12-month period. Last August, China’s economic slowdown (which rippled across the global economy) triggered Chinese stock market volatility, increasingly stimulative Chinese central bank monetary policy, and currency devaluations. Burdened further with oil market volatility, equity and higher-risk bond markets declined globally. Five months later, in January, investor sentiment plunged again as global economic growth decelerated, China devalued its currency again, and oil prices dropped below $30 a barrel. In addition, the Fed, in December, executed its first rate hike since 2006. Central bank policies showed less divergence thereafter, with the Bank of Japan suddenly resorting to negative interest rates, the Fed holding rates steady while reducing its rate hike projections, and the European Central Bank announcing significant additional stimulus.
Bonds (and more bond-like stock sectors, such as utilities and REITs) generally outperformed the broad stock market for the reporting period. In terms of stock style and size, growth generally outperformed value, and large cap generally outperformed small cap. In the bond market, higher quality (investment-grade) generally outperformed lower quality (high-yield). We expect continued economic and monetary policy divergence between the U.S. and non-U.S. economies in 2016, accompanied by further market volatility. This could present both challenges and opportunities for active investment managers. Looking ahead, we continue to believe in a disciplined, diversified, risk-aware investment approach, using professionally managed portfolios to meet financial goals. We appreciate your trust in us.
Sincerely,
Jonathan Thomas
President and Chief Executive Officer
American Century Investments
|
| | | | |
| Total Returns as of March 31, 2016 |
| | | | Average Annual Returns | |
| | Ticker Symbol | 1 year | Since Inception | Inception Date |
| Investor Class | ACVVX | 4.42% | 3.63% | 10/31/11 |
| Barclays U.S. 1-3 Month Treasury Bill Index | — | 0.09% | 0.05% | — |
| Institutional Class | ACVKX | 4.58% | 3.84% | 10/31/11 |
| A Class | ACVQX | | | 10/31/11 |
| No sales charge | | 4.07% | 3.38% | |
| With sales charge | | -1.90% | 2.00% | |
| C Class | ACVHX | 3.28% | 2.59% | 10/31/11 |
| R Class | ACVWX | 3.91% | 3.12% | 10/31/11 |
Sales charges include initial sales charges and contingent deferred sales charges (CDSCs), as applicable. A Class shares have a 5.75% maximum initial sales charge and may be subject to a maximum CDSC of 1.00%. C Class shares redeemed within 12 months of purchase are subject to a maximum CDSC of 1.00%. The SEC requires that mutual funds provide performance information net of maximum sales charges in all cases where charges could be applied.
Returns would have been lower if a portion of the fees had not been waived.
Data presented reflect past performance. Past performance is no guarantee of future results. Current performance may be higher or lower than the performance shown. Total returns for periods less than one year are not annualized. Investment return and principal value will fluctuate, and redemption value may be more or less than original cost. Data assumes reinvestment of dividends and capital gains, and none of the charts reflect the deduction of taxes that a shareholder would pay on fund distributions or the redemption of fund shares. To obtain performance data current to the most recent month end, please call 1-800-345-2021 or visit americancentury.com. For additional information about the fund, please consult the prospectus.
|
|
| Growth of $10,000 Over Life of Class |
$10,000 investment made October 31, 2011 |
Performance for other share classes will vary due to differences in fee structure.
|
|
| |
| Value on March 31, 2016 |
| | Investor Class — $11,706 |
| |
| | Barclays U.S. 1-3 Month Treasury Bill Index — $10,024 |
| |
Ending value would have been lower if a portion of the fees had not been waived.
|
| | | | |
| Total Annual Fund Operating Expenses |
| Investor Class | Institutional Class | A Class | C Class | R Class |
| 4.20% | 4.00% | 4.45% | 5.20% | 4.70% |
The total annual fund operating expenses shown is as stated in the fund’s prospectus current as of the date of this report. The prospectus may vary from the expense ratio shown elsewhere in this report because it is based on a different time period, includes acquired fund fees and expenses, and, if applicable, does not include fee waivers or expense reimbursements.
Data presented reflect past performance. Past performance is no guarantee of future results. Current performance may be higher or lower than the performance shown. Total returns for periods less than one year are not annualized. Investment return and principal value will fluctuate, and redemption value may be more or less than original cost. Data assumes reinvestment of dividends and capital gains, and none of the charts reflect the deduction of taxes that a shareholder would pay on fund distributions or the redemption of fund shares. To obtain performance data current to the most recent month end, please call 1-800-345-2021 or visit americancentury.com. For additional information about the fund, please consult the prospectus.
Portfolio Managers: Phil Davidson, Michael Liss, Kevin Toney, Brian Woglom, and Dan Gruemmer
In February 2016, portfolio manager Dan Gruemmer joined the AC Alternatives Market Neutral Value management team.
Performance Summary
AC Alternatives Market Neutral Value returned 4.42%* (including operating expenses) for the 12 months ended March 31, 2016. This compares to the 0.09% return of its benchmark, the Barclays U.S. 1-3 Month Treasury Bill Index. The fund's return reflects operating expenses, while the index's return does not.
Volatility dominated the 12-month period as concerns over slowing growth in China and other emerging markets, falling oil prices, and the prospect of higher U.S. Federal Reserve (Fed) interest rates weighed on investor confidence. After a turbulent summer, markets sold off sharply in the third quarter of 2015, but stabilized somewhat in the fourth quarter as the Fed delayed an anticipated September interest rate hike. In December, however, Fed policymakers raised the federal funds rate by 25 basis points, while they affirmed the underlying strength of the U.S. economy. Early in 2016, concerns over slowing growth in China triggered a renewed market sell-off. Broad market indices such as the S&P 500 Index recovered some ground later in the first quarter after the Fed scaled back its projected number of rate hikes for the year, from four to two.
The portfolio is a natural extension of our existing capabilities. The foundation of the strategy is to combine long positions in more undervalued companies with short positions in overvalued companies. We believe this helps reduce the risk inherent in long/short strategies. This approach helped the portfolio to deliver positive absolute results in seven of the 10 sectors in which it was invested. The portfolio’s allocations to energy, health care, financials, utilities, information technology, industrials, and telecommunications services contributed positively to its returns. The portfolio’s allocations to consumer discretionary, materials, and consumer staples detracted from relative performance.
Positions in Energy, Health Care, Utilities Contributed
In energy, the portfolio had a short position in oil pipeline operator Kinder Morgan. The company’s financial performance has been heavily impacted by the declining price of oil. In addition, the company announced a 74% dividend cut in December. As Kinder Morgan’s stock price declined, the portfolio's short position added value. Elsewhere in the energy sector, the portfolio benefited from owning newly issued shares of pipeline partnership EQT GP Holdings. These securities are no longer held in the portfolio.
In health care, a short position in Valeant Pharmaceuticals International contributed to relative performance. In the second half of 2015, Valeant faced scrutiny, first over its drug-pricing policies and then over accusations of false financial reporting. The stock sold off on these developments, and continued to decline into 2016 as the company faced an array of legal and regulatory issues. In March, the company’s chief executive officer resigned. The stock’s steep drop benefited the portfolio’s short position and overall results.
*All fund returns referenced in this commentary are for Investor Class shares. Returns would have been lower if a portion of the fees had not been waived. Performance for other share classes will vary due to differences in fee structure; when Investor Class performance exceeds that of the fund's benchmark, other share classes may not. See page 3 for returns for all share classes.
In utilities, a number of the portfolio’s long positions performed well, as long-term interest rates declined and investors sought stability during market volatility. A portfolio-only position in utility company ONE Gas aided relative performance. The company continued to exceed expectations, and it raised its dividend and long-term outlook. The stock performed well, and the portfolio’s long position assisted relative returns.
Materials Sector Provided a Detractor
A long position in materials company Potash Corporation of Saskatchewan detracted from performance. Our original investment thesis for Potash held that some weakening in fertilizer demand, mainly in China, was transitory (as fertilizer is a consumable that is important to crop yields over time). Late in 2015, new data pointed to a bigger-than-anticipated supply glut in the global fertilizer market that would take time to work through. Consequently, we exited the position late in 2015 due to the added downside risk for its fertilizer business.
Outlook
AC Alternatives Market Neutral Value is designed to address several secular financial planning trends, including the need for an alternative to cash in this low interest rate environment, diversification resulting from not being correlated to equity markets, low volatility exposure, and a hedge against a rise in inflation and/or interest rates.
We continue to follow our disciplined, bottom-up process, selecting securities one at a time for the portfolio. We look for equity securities of companies with a favorable income-paying history that have prospects for income payments to continue or increase. We also look for equity securities of companies that we believe are undervalued, with consideration for both upside potential and downside risk. The portfolio’s current positioning reflects the individual opportunities identified by our team.
|
| |
| MARCH 31, 2016 | |
| Top Ten Long Holdings | % of net assets |
| iShares Russell 1000 Value ETF | 4.71% |
| Intel Corp. (Convertible) | 2.95% |
| HEICO Corp., Class A | 2.58% |
| Brown-Forman Corp., Class B | 2.44% |
| MetLife, Inc. | 2.22% |
| Microchip Technology, Inc. (Convertible) | 2.15% |
| PNC Financial Services Group, Inc. (The) | 2.07% |
| Edison International | 2.02% |
| Janus Capital Group, Inc. (Convertible) | 2.01% |
| PG&E Corp. | 1.97% |
| | |
| Top Ten Short Holdings | % of net assets |
| iShares Russell 1000 Growth ETF | (4.72)% |
| Utilities Select Sector SPDR Fund | (2.90)% |
| Intel Corp. | (2.71)% |
| Kraft Heinz Co. (The) | (2.58)% |
| HEICO Corp. | (2.54)% |
| Brown-Forman Corp., Class A | (2.46)% |
| Technology Select Sector SPDR Fund | (2.27)% |
| Prudential Financial, Inc. | (2.22)% |
| Janus Capital Group, Inc. | (2.03)% |
| Microchip Technology, Inc. | (1.92)% |
| | |
| Types of Investments in Portfolio | % of net assets |
| Common Stocks | 64.8% |
| Convertible Bonds | 7.1% |
| Exchange-Traded Funds | 4.9% |
| Convertible Preferred Stocks | 0.7% |
| Common Stocks Sold Short | (63.9)% |
| Exchange-Traded Funds Sold Short | (13.2)% |
| Temporary Cash Investments | 22.6% |
| Other Assets and Liabilities* | 77.0% |
*Amount relates primarily to deposits with broker for securities sold short at period end.
Fund shareholders may incur two types of costs: (1) transaction costs, including sales charges (loads) on purchase payments and redemption/exchange fees; and (2) ongoing costs, including management fees; distribution and service (12b-1) fees; and other fund expenses. This example is intended to help you understand your ongoing costs (in dollars) of investing in your fund and to compare these costs with the ongoing cost of investing in other mutual funds.
The example is based on an investment of $1,000 made at the beginning of the period and held for the entire period from October 1, 2015 to March 31, 2016.
Actual Expenses
The table provides information about actual account values and actual expenses for each class. You may use the information, together with the amount you invested, to estimate the expenses that you paid over the period. First, identify the share class you own. Then simply divide your account value by $1,000 (for example, an $8,600 account value divided by $1,000 = 8.6), then multiply the result by the number under the heading “Expenses Paid During Period” to estimate the expenses you paid on your account during this period.
If you hold Investor Class shares of any American Century Investments fund, or Institutional Class shares of the American Century Diversified Bond Fund, in an American Century Investments account (i.e., not a financial intermediary or retirement plan account), American Century Investments may charge you a $12.50 semiannual account maintenance fee if the value of those shares is less than $10,000. We will redeem shares automatically in one of your accounts to pay the $12.50 fee. In determining your total eligible investment amount, we will include your investments in all personal accounts (including American Century Investments Brokerage accounts) registered under your Social Security number. Personal accounts include individual accounts, joint accounts, UGMA/UTMA accounts, personal trusts, Coverdell Education Savings Accounts and IRAs (including traditional, Roth, Rollover, SEP-, SARSEP- and SIMPLE-IRAs), and certain other retirement accounts. If you have only business, business retirement, employer-sponsored or American Century Investments Brokerage accounts, you are currently not subject to this fee. If you are subject to the Account Maintenance Fee, your account value could be reduced by the fee amount.
Hypothetical Example for Comparison Purposes
The table also provides information about hypothetical account values and hypothetical expenses based on the actual expense ratio of each class of your fund and an assumed rate of return of 5% per year before expenses, which is not the actual return of a fund’s share class. The hypothetical account values and expenses may not be used to estimate the actual ending account balance or expenses you paid for the period. You may use this information to compare the ongoing costs of investing in your fund and other funds. To do so, compare this 5% hypothetical example with the 5% hypothetical examples that appear in the shareholder reports of the other funds.
Please note that the expenses shown in the table are meant to highlight your ongoing costs only and do not reflect any transactional costs, such as sales charges (loads) or redemption/exchange fees. Therefore, the table is useful in comparing ongoing costs only, and will not help you determine the relative total costs of owning different funds. In addition, if these transactional costs were included, your costs would have been higher.
|
| | | | |
| Beginning
Account Value
10/1/15 | Ending
Account Value
3/31/16 | Expenses Paid
During Period(1)10/1/15 - 3/31/16 |
Annualized
Expense Ratio(1) |
| Actual | | | | |
| Investor Class (after waiver) | $1,000 | $1,025.60 | $19.09 | 3.77% |
| Investor Class (before waiver) | $1,000 | $1,025.60(2) | $20.61 | 4.07% |
| Institutional Class (after waiver) | $1,000 | $1,026.30 | $18.08 | 3.57% |
| Institutional Class (before waiver) | $1,000 | $1,026.30(2) | $19.60 | 3.87% |
| A Class (after waiver) | $1,000 | $1,023.90 | $20.34 | 4.02% |
| A Class (before waiver) | $1,000 | $1,023.90(2) | $21.86 | 4.32% |
| C Class (after waiver) | $1,000 | $1,019.70 | $24.08 | 4.77% |
| C Class (before waiver) | $1,000 | $1,019.70(2) | $25.60 | 5.07% |
| R Class (after waiver) | $1,000 | $1,023.20 | $21.60 | 4.27% |
| R Class (before waiver) | $1,000 | $1,023.20(2) | $23.12 | 4.57% |
| Hypothetical | | | | |
| Investor Class (after waiver) | $1,000 | $1,006.15 | $18.91 | 3.77% |
| Investor Class (before waiver) | $1,000 | $1,004.65 | $20.40 | 4.07% |
| Institutional Class (after waiver) | $1,000 | $1,007.15 | $17.91 | 3.57% |
| Institutional Class (before waiver) | $1,000 | $1,005.65 | $19.40 | 3.87% |
| A Class (after waiver) | $1,000 | $1,004.90 | $20.15 | 4.02% |
| A Class (before waiver) | $1,000 | $1,003.40 | $21.64 | 4.32% |
| C Class (after waiver) | $1,000 | $1,001.15 | $23.86 | 4.77% |
| C Class (before waiver) | $1,000 | $999.65 | $25.35 | 5.07% |
| R Class (after waiver) | $1,000 | $1,003.65 | $21.39 | 4.27% |
| R Class (before waiver) | $1,000 | $1,002.15 | $22.87 | 4.57% |
| |
| (1) | Expenses are equal to the class's annualized expense ratio listed in the table above, multiplied by the average account value over the period, multiplied by 183, the number of days in the most recent fiscal half-year, divided by 366, to reflect the one-half year period. |
| |
| (2) | Ending account value assumes the return earned after waiver and would have been lower if a portion of the fees had not been waived. |
MARCH 31, 2016
|
| | | | |
| | Shares | Value |
| COMMON STOCKS — 64.8% | | |
| Aerospace and Defense — 4.6% | | |
HEICO Corp., Class A(1) | 258,333 | $ | 12,296,651 |
|
L-3 Communications Holdings, Inc.(1) | 17,920 | 2,123,520 |
|
Raytheon Co.(1) | 14,691 | 1,801,557 |
|
Textron, Inc.(1) | 99,137 | 3,614,535 |
|
Vectrus, Inc.(1)(2) | 93,850 | 2,135,088 |
|
| | | 21,971,351 |
|
| Air Freight and Logistics — 0.4% | | |
United Parcel Service, Inc., Class B(1) | 16,270 | 1,715,997 |
|
| Automobiles — 1.5% | | |
General Motors Co.(1) | 160,220 | 5,035,715 |
|
Thor Industries, Inc.(1) | 21,590 | 1,376,794 |
|
Toyota Motor Corp. ADR(1) | 7,870 | 836,738 |
|
| | | 7,249,247 |
|
| Banks — 6.5% | | |
Comerica, Inc.(1) | 171,750 | 6,504,172 |
|
PNC Financial Services Group, Inc. (The)(1) | 116,340 | 9,838,874 |
|
SunTrust Banks, Inc.(1) | 91,340 | 3,295,547 |
|
U.S. Bancorp(1) | 129,050 | 5,238,140 |
|
UMB Financial Corp.(1) | 119,401 | 6,164,674 |
|
| | | 31,041,407 |
|
| Beverages — 2.7% | | |
Brown-Forman Corp., Class B(1) | 118,089 | 11,628,224 |
|
PepsiCo, Inc.(1) | 11,299 | 1,157,921 |
|
| | | 12,786,145 |
|
| Capital Markets — 0.4% | | |
Ameriprise Financial, Inc.(1) | 22,380 | 2,103,944 |
|
| Chemicals — 0.6% | | |
Air Products & Chemicals, Inc.(1) | 20,975 | 3,021,449 |
|
| Commercial Services and Supplies — 0.4% | | |
Clean Harbors, Inc.(1)(2) | 7,620 | 375,971 |
|
Republic Services, Inc.(1) | 8,865 | 422,417 |
|
Tyco International plc(1) | 25,150 | 923,257 |
|
| | | 1,721,645 |
|
| Communications Equipment — 0.9% | | |
Cisco Systems, Inc.(1) | 146,933 | 4,183,183 |
|
| Consumer Finance — 0.6% | | |
Discover Financial Services(1) | 56,150 | 2,859,158 |
|
| Containers and Packaging — 0.5% | | |
International Paper Co.(1) | 32,120 | 1,318,205 |
|
WestRock Co.(1) | 31,330 | 1,222,810 |
|
| | | 2,541,015 |
|
| Diversified Telecommunication Services — 0.3% | | |
Verizon Communications, Inc.(1) | 30,238 | 1,635,271 |
|
| Electric Utilities — 5.2% | | |
Edison International(1) | 133,908 | 9,626,646 |
|
|
| | | | |
| | Shares | Value |
PG&E Corp.(1) | 156,896 | $ | 9,369,829 |
|
Westar Energy, Inc.(1) | 116,269 | 5,768,105 |
|
| | | 24,764,580 |
|
| Electrical Equipment — 1.6% | | |
Eaton Corp. plc(1) | 46,530 | 2,910,917 |
|
Hubbell, Inc.(1) | 12,390 | 1,312,473 |
|
Rockwell Automation, Inc.(1) | 27,779 | 3,159,861 |
|
| | | 7,383,251 |
|
| Electronic Equipment, Instruments and Components — 0.1% | | |
TE Connectivity Ltd.(1) | 9,930 | 614,866 |
|
| Energy Equipment and Services — 2.7% | | |
FMC Technologies, Inc.(1)(2) | 18,750 | 513,000 |
|
Frank's International NV(1) | 397,809 | 6,555,892 |
|
Schlumberger Ltd.(1) | 79,040 | 5,829,200 |
|
| | | 12,898,092 |
|
| Food and Staples Retailing — 1.4% | | |
Sysco Corp.(1) | 23,642 | 1,104,791 |
|
Wal-Mart Stores, Inc.(1) | 82,570 | 5,655,219 |
|
| | | 6,760,010 |
|
| Food Products — 2.6% | | |
General Mills, Inc.(1) | 14,279 | 904,575 |
|
Mead Johnson Nutrition Co.(1) | 52,020 | 4,420,139 |
|
Mondelez International, Inc., Class A(1) | 174,298 | 6,992,836 |
|
| | | 12,317,550 |
|
| Gas Utilities — 2.5% | | |
AGL Resources, Inc.(1) | 47,320 | 3,082,425 |
|
Atmos Energy Corp.(1) | 62,220 | 4,620,457 |
|
Laclede Group, Inc. (The)(1) | 3,287 | 222,694 |
|
ONE Gas, Inc.(1) | 64,457 | 3,938,323 |
|
| | | 11,863,899 |
|
| Health Care Equipment and Supplies — 2.8% | | |
Baxter International, Inc.(1) | 71,920 | 2,954,474 |
|
Medtronic plc(1) | 60,481 | 4,536,075 |
|
Zimmer Biomet Holdings, Inc.(1) | 56,677 | 6,043,468 |
|
| | | 13,534,017 |
|
| Health Care Providers and Services — 1.4% | | |
Cardinal Health, Inc.(1) | 36,199 | 2,966,508 |
|
Cigna Corp.(1) | 9,870 | 1,354,559 |
|
Quest Diagnostics, Inc.(1) | 31,137 | 2,224,738 |
|
| | | 6,545,805 |
|
| Hotels, Restaurants and Leisure — 0.5% | | |
Carnival Corp.(1) | 6,110 | 322,425 |
|
ClubCorp Holdings, Inc.(1) | 78,810 | 1,106,492 |
|
McDonald's Corp.(1) | 9,090 | 1,142,431 |
|
| | | 2,571,348 |
|
| Household Durables — 2.0% | | |
Lennar Corp., Class B(1) | 90,924 | 3,519,668 |
|
PulteGroup, Inc.(1) | 260,050 | 4,865,536 |
|
Tupperware Brands Corp.(1) | 18,040 | 1,045,959 |
|
| | | 9,431,163 |
|
| | | |
|
| | | | |
| | Shares | Value |
| Household Products — 1.3% | | |
Procter & Gamble Co. (The)(1) | 77,249 | $ | 6,358,365 |
|
| Industrial Conglomerates — 1.1% | | |
3M Co.(1) | 30,040 | 5,005,565 |
|
| Insurance — 4.3% | | |
Chubb Ltd.(1) | 6,430 | 766,135 |
|
EMC Insurance Group, Inc.(1) | 29,990 | 769,244 |
|
Marsh & McLennan Cos., Inc.(1) | 32,242 | 1,959,991 |
|
MetLife, Inc.(1) | 239,913 | 10,541,777 |
|
ProAssurance Corp.(1) | 65,789 | 3,328,923 |
|
Reinsurance Group of America, Inc.(1) | 32,164 | 3,095,785 |
|
| | | 20,461,855 |
|
| Internet and Catalog Retail — 0.1% | | |
Liberty TripAdvisor Holdings, Inc., Class A(1)(2) | 14,410 | 319,326 |
|
| Internet Software and Services — 0.5% | | |
Alphabet, Inc., Class C(2) | 3,190 | 2,376,390 |
|
| Life Sciences Tools and Services — 0.3% | | |
Waters Corp.(1)(2) | 10,832 | 1,428,957 |
|
| Machinery — 0.8% | | |
Parker-Hannifin Corp.(1) | 6,451 | 716,577 |
|
Pentair plc(1) | 28,660 | 1,555,092 |
|
Stanley Black & Decker, Inc.(1) | 16,350 | 1,720,183 |
|
| | | 3,991,852 |
|
| Media — 0.2% | | |
Discovery Communications, Inc., Class C(1)(2) | 41,990 | 1,133,730 |
|
| Multi-Utilities — 0.4% | | |
Ameren Corp.(1) | 33,850 | 1,695,885 |
|
| Multiline Retail — 0.2% | | |
Dollar General Corp.(1) | 13,520 | 1,157,312 |
|
| Oil, Gas and Consumable Fuels — 4.0% | | |
| Antero Midstream Partners LP | 54,396 | 1,202,696 |
|
| Columbia Pipeline Partners LP | 50,980 | 744,308 |
|
EQT Corp.(1) | 17,640 | 1,186,466 |
|
EQT Midstream Partners LP(1) | 16,040 | 1,193,857 |
|
Imperial Oil Ltd.(1) | 20,687 | 690,946 |
|
Occidental Petroleum Corp.(1) | 91,293 | 6,247,180 |
|
| Shell Midstream Partners LP | 64,618 | 2,365,665 |
|
TOTAL SA ADR(1) | 122,010 | 5,541,694 |
|
| | | 19,172,812 |
|
| Pharmaceuticals — 1.7% | | |
Pfizer, Inc.(1) | 274,608 | 8,139,381 |
|
| Real Estate Investment Trusts (REITs) — 0.4% | | |
Piedmont Office Realty Trust, Inc., Class A(1) | 47,761 | 970,026 |
|
Weyerhaeuser Co.(1) | 26,580 | 823,448 |
|
| | | 1,793,474 |
|
| Road and Rail — 1.0% | | |
Heartland Express, Inc.(1) | 32,320 | 599,536 |
|
Norfolk Southern Corp.(1) | 49,120 | 4,089,240 |
|
| | | 4,688,776 |
|
| Semiconductors and Semiconductor Equipment — 2.1% | | |
Applied Materials, Inc.(1) | 177,830 | 3,766,439 |
|
|
| | | | | | |
| | Shares/Principal Amount | Value |
Maxim Integrated Products, Inc.(1) | 162,560 |
| $ | 5,978,957 |
|
| | | 9,745,396 |
|
| Software — 1.9% | | |
Microsoft Corp.(1) | 95,870 |
| 5,294,900 |
|
Oracle Corp.(1) | 87,040 |
| 3,560,806 |
|
VMware, Inc., Class A(1)(2) | 6,000 |
| 313,860 |
|
| | | 9,169,566 |
|
| Specialty Retail — 1.2% | | |
Advance Auto Parts, Inc.(1) | 21,616 |
| 3,465,909 |
|
CST Brands, Inc.(1) | 52,271 |
| 2,001,457 |
|
| | | 5,467,366 |
|
| Technology Hardware, Storage and Peripherals — 0.1% | | |
EMC Corp.(1) | 11,030 |
| 293,949 |
|
| Thrifts and Mortgage Finance — 0.7% | | |
Capitol Federal Financial, Inc.(1) | 251,303 |
| 3,332,278 |
|
| Trading Companies and Distributors — 0.2% | | |
Rush Enterprises, Inc., Class B(1)(2) | 47,114 |
| 860,302 |
|
| Wireless Telecommunication Services — 0.1% | | |
Telephone & Data Systems, Inc.(1) | 8,765 |
| 263,739 |
|
TOTAL COMMON STOCKS (Cost $281,490,793) | | 308,370,669 |
|
| CONVERTIBLE BONDS — 7.1% | | |
| Capital Markets — 2.0% | | |
| Janus Capital Group, Inc., 0.75%, 7/15/18 | $ | 6,725,000 |
| 9,557,906 |
|
| Semiconductors and Semiconductor Equipment — 5.1% | | |
Intel Corp., 2.95%, 12/15/35(1) | 11,031,000 |
| 14,043,842 |
|
| Microchip Technology, Inc., 1.625%, 2/15/25 | 9,898,000 |
| 10,232,058 |
|
| | | 24,275,900 |
|
TOTAL CONVERTIBLE BONDS (Cost $32,647,082) | | 33,833,806 |
|
| EXCHANGE-TRADED FUNDS — 4.9% | | |
iShares Russell 1000 Value ETF(1) | 226,872 |
| 22,417,222 |
|
iShares Silver Trust(1)(2) | 42,629 |
| 625,794 |
|
TOTAL EXCHANGE-TRADED FUNDS (Cost $21,452,361) | | 23,043,016 |
|
| CONVERTIBLE PREFERRED STOCKS — 0.7% | | |
| Food Products — 0.6% | | |
Tyson Foods, Inc., 4.75%, 7/15/17(1) | 37,497 |
| 2,792,777 |
|
| Pharmaceuticals — 0.1% | | |
Teva Pharmaceutical Industries Ltd., 7.00%, 12/15/18(1) | 676 |
| 597,543 |
|
TOTAL CONVERTIBLE PREFERRED STOCKS (Cost $2,601,866) | | 3,390,320 |
|
| TEMPORARY CASH INVESTMENTS — 22.6% | | |
| Repurchase Agreement, Fixed Income Clearing Corp., (collateralized by various U.S. Treasury obligations, 2.00% - 3.75%, 8/15/25 - 8/15/41, valued at $66,288,200), at 0.10%, dated 3/31/16, due 4/1/16 (Delivery value $64,987,181) | | 64,987,000 |
|
| State Street Institutional Liquid Reserves Fund, Premier Class | 42,437,930 |
| 42,437,930 |
|
TOTAL TEMPORARY CASH INVESTMENTS (Cost $107,424,930) | | 107,424,930 |
|
TOTAL INVESTMENT SECURITIES BEFORE SECURITIES SOLD SHORT — 100.1% (Cost $445,617,032) | | 476,062,741 |
|
|
| | | | |
| | Shares | Value |
| SECURITIES SOLD SHORT — (77.1)% | | |
| COMMON STOCKS SOLD SHORT — (63.9)% | | |
| Aerospace and Defense — (5.0)% | | |
| General Dynamics Corp. | (27,640) | $ | (3,631,067 | ) |
| HEICO Corp. | (200,969) | (12,084,266 | ) |
| Honeywell International, Inc. | (4,980) | (558,009 | ) |
| Lockheed Martin Corp. | (17,984) | (3,983,456 | ) |
| Northrop Grumman Corp. | (10,910) | (2,159,089 | ) |
| United Technologies Corp. | (15,970) | (1,598,597 | ) |
| | | (24,014,484 | ) |
| Air Freight and Logistics — (0.4)% | | |
| FedEx Corp. | (10,550) | (1,716,696 | ) |
| Airlines — (0.2)% | | |
| Southwest Airlines Co. | (20,990) | (940,352 | ) |
| Automobiles — (1.3)% | | |
| Ford Motor Co. | (378,060) | (5,103,810 | ) |
| Tesla Motors, Inc. | (2,460) | (565,234 | ) |
| Volkswagen AG ADR | (11,480) | (332,691 | ) |
| | | (6,001,735 | ) |
| Banks — (5.7)% | | |
| Bank of Montreal | (53,980) | (3,276,046 | ) |
| JPMorgan Chase & Co. | (91,984) | (5,447,292 | ) |
| KeyCorp | (590,320) | (6,517,133 | ) |
| People's United Financial, Inc. | (414,921) | (6,609,692 | ) |
| Wells Fargo & Co. | (107,960) | (5,220,946 | ) |
| | | (27,071,109 | ) |
| Beverages — (2.7)% | | |
| Brown-Forman Corp., Class A | (109,880) | (11,723,097 | ) |
| Coca-Cola Co. (The) | (24,878) | (1,154,091 | ) |
| | | (12,877,188 | ) |
| Biotechnology — (0.6)% | | |
| Amgen, Inc. | (18,160) | (2,722,729 | ) |
| Capital Markets — (2.0)% | | |
| Janus Capital Group, Inc. | (660,970) | (9,669,991 | ) |
| Chemicals — (0.6)% | | |
| Monsanto Co. | (9,990) | (876,523 | ) |
| Praxair, Inc. | (18,990) | (2,173,405 | ) |
| | | (3,049,928 | ) |
| Commercial Services and Supplies — (0.3)% | | |
| Cintas Corp. | (12,250) | (1,100,172 | ) |
| Waste Management, Inc. | (7,006) | (413,354 | ) |
| | | (1,513,526 | ) |
| Consumer Finance — (0.6)% | | |
| Capital One Financial Corp. | (41,630) | (2,885,375 | ) |
| Containers and Packaging — (0.3)% | | |
| Bemis Co., Inc. | (24,990) | (1,293,982 | ) |
| Diversified Financial Services — (1.4)% | | |
| Berkshire Hathaway, Inc., Class B | (45,464) | (6,450,432 | ) |
| Diversified Telecommunication Services — (0.3)% | | |
| AT&T, Inc. | (41,304) | (1,617,878 | ) |
| Electric Utilities — (3.6)% | | |
| American Electric Power Co., Inc. | (23,970) | (1,591,608 | ) |
|
| | | | |
| | Shares | Value |
| Duke Energy Corp. | (97,831) | $ | (7,893,005 | ) |
| Southern Co. (The) | (144,280) | (7,463,604 | ) |
| | | (16,948,217 | ) |
| Electronic Equipment, Instruments and Components — (0.1)% | | |
| Amphenol Corp., Class A | (10,860) | (627,925 | ) |
| Energy Equipment and Services — (2.6)% | | |
| Halliburton Co. | (162,980) | (5,821,646 | ) |
| National Oilwell Varco, Inc. | (204,442) | (6,358,146 | ) |
| | | (12,179,792 | ) |
| Food and Staples Retailing — (0.7)% | | |
| Kroger Co. (The) | (81,790) | (3,128,468 | ) |
| Food Products — (3.2)% | | |
| Kraft Heinz Co. (The) | (156,301) | (12,279,007 | ) |
| Tyson Foods, Inc., Class A | (41,691) | (2,779,122 | ) |
| | | (15,058,129 | ) |
| Health Care Equipment and Supplies — (2.8)% | | |
| Becton Dickinson and Co. | (19,470) | (2,955,935 | ) |
| St Jude Medical, Inc. | (56,260) | (3,094,300 | ) |
| Stryker Corp. | (70,050) | (7,515,665 | ) |
| | | (13,565,900 | ) |
| Health Care Providers and Services — (1.4)% | | |
| AmerisourceBergen Corp. | (33,960) | (2,939,238 | ) |
| Anthem, Inc. | (9,690) | (1,346,813 | ) |
| Laboratory Corp. of America Holdings | (18,889) | (2,212,469 | ) |
| | | (6,498,520 | ) |
| Hotels, Restaurants and Leisure — (0.3)% | | |
| Carnival plc ADR | (5,990) | (325,197 | ) |
| Chipotle Mexican Grill, Inc. | (2,410) | (1,135,038 | ) |
| | | (1,460,235 | ) |
| Household Durables — (1.7)% | | |
| Lennar Corp., Class A | (71,990) | (3,481,436 | ) |
| Toll Brothers, Inc. | (164,000) | (4,839,640 | ) |
| | | (8,321,076 | ) |
| Household Products — (1.3)% | | |
| Kimberly-Clark Corp. | (46,957) | (6,316,186 | ) |
| Industrial Conglomerates — (1.9)% | | |
| General Electric Co. | (283,500) | (9,012,465 | ) |
| Insurance — (3.4)% | | |
| American International Group, Inc. | (8,760) | (473,478 | ) |
| Aon plc | (19,090) | (1,993,950 | ) |
| Principal Financial Group, Inc. | (53,770) | (2,121,227 | ) |
| Prudential Financial, Inc. | (145,933) | (10,539,281 | ) |
| Travelers Cos., Inc. (The) | (9,820) | (1,146,092 | ) |
| | | (16,274,028 | ) |
| Internet and Catalog Retail — (1.3)% | | |
| Amazon.com, Inc. | (9,940) | (5,900,782 | ) |
| TripAdvisor, Inc. | (4,910) | (326,515 | ) |
| | | (6,227,297 | ) |
| IT Services — (0.7)% | | |
| International Business Machines Corp. | (23,440) | (3,549,988 | ) |
| | | |
|
| | | | |
| | Shares | Value |
| Life Sciences Tools and Services — (0.3)% | | |
| Thermo Fisher Scientific, Inc. | (9,900) | $ | (1,401,741 | ) |
| Machinery — (1.0)% | | |
| Deere & Co. | (37,700) | (2,902,523 | ) |
| Snap-on, Inc. | (10,880) | (1,708,051 | ) |
| | | (4,610,574 | ) |
| Media — (0.4)% | | |
| Discovery Communications, Inc., Class A | (39,860) | (1,141,192 | ) |
| Walt Disney Co. (The) | (8,580) | (852,080 | ) |
| | | (1,993,272 | ) |
| Multi-Utilities — (1.6)% | | |
| Dominion Resources, Inc. | (103,120) | (7,746,374 | ) |
| Multiline Retail — (0.5)% | | |
| Dollar Tree, Inc. | (13,770) | (1,135,474 | ) |
| Target Corp. | (12,890) | (1,060,589 | ) |
| | | (2,196,063 | ) |
| Oil, Gas and Consumable Fuels — (2.6)% | | |
| Exxon Mobil Corp. | (82,380) | (6,886,144 | ) |
| Valero Energy Corp. | (86,420) | (5,542,979 | ) |
| | | (12,429,123 | ) |
| Paper and Forest Products — (0.2)% | | |
| Domtar Corp. | (29,520) | (1,195,560 | ) |
| Personal Products — (0.2)% | | |
| Nu Skin Enterprises, Inc. | (27,470) | (1,050,727 | ) |
| Pharmaceuticals — (1.3)% | | |
| Merck & Co., Inc. | (103,170) | (5,458,725 | ) |
| Valeant Pharmaceuticals International, Inc. | (19,970) | (525,211 | ) |
| | | (5,983,936 | ) |
| Real Estate Investment Trusts (REITs) — (0.2)% | | |
| Boston Properties, Inc. | (7,490) | (951,829 | ) |
| Road and Rail — (0.8)% | | |
| Union Pacific Corp. | (39,980) | (3,180,409 | ) |
| Werner Enterprises, Inc. | (22,353) | (607,107 | ) |
| | | (3,787,516 | ) |
| Semiconductors and Semiconductor Equipment — (5.4)% | | |
| Intel Corp. | (397,990) | (12,874,977 | ) |
| Lam Research Corp. | (44,980) | (3,715,348 | ) |
| Microchip Technology, Inc. | (189,870) | (9,151,734 | ) |
| | | (25,742,059 | ) |
| Specialty Retail — (1.4)% | | |
| Signet Jewelers Ltd. | (40,100) | (4,973,603 | ) |
| Tiffany & Co. | (23,400) | (1,717,092 | ) |
| | | (6,690,695 | ) |
| Technology Hardware, Storage and Peripherals — (0.4)% | | |
| HP, Inc. | (139,990) | (1,724,677 | ) |
| Thrifts and Mortgage Finance — (0.9)% | | |
| New York Community Bancorp, Inc. | (276,890) | (4,402,551 | ) |
| Trading Companies and Distributors — (0.2)% | | |
| Rush Enterprises, Inc., Class A | (42,676) | (778,410 | ) |
|
| | | | |
| | Shares | Value |
| Wireless Telecommunication Services — (0.1)% | | |
| United States Cellular Corp. | (5,374) | $ | (245,538 | ) |
TOTAL COMMON STOCKS SOLD SHORT (Proceeds $292,017,450) | | (303,924,276 | ) |
| EXCHANGE-TRADED FUNDS SOLD SHORT — (13.2)% | | |
| Alerian MLP ETF | (504,700) | (5,501,230 | ) |
| Consumer Discretionary Select Sector SPDR Fund | (25,760) | (2,036,328 | ) |
| Industrial Select Sector SPDR Fund | (34,540) | (1,915,934 | ) |
| iShares Russell 1000 Growth ETF | (224,880) | (22,438,526 | ) |
| iShares U.S. Oil & Gas Exploration & Production ETF | (22,920) | (1,191,382 | ) |
| iShares U.S. Real Estate ETF | (10,610) | (826,094 | ) |
| Market Vectors Oil Service ETF | (29,890) | (795,373 | ) |
| SPDR Gold Shares | (5,290) | (622,104 | ) |
| SPDR S&P Regional Banking ETF | (77,980) | (2,935,167 | ) |
| Technology Select Sector SPDR Fund | (243,230) | (10,789,683 | ) |
| Utilities Select Sector SPDR Fund | (278,380) | (13,813,216 | ) |
TOTAL EXCHANGE-TRADED FUNDS SOLD SHORT (Proceeds $59,383,973) | | (62,865,037 | ) |
TOTAL SECURITIES SOLD SHORT — (77.1)% (Proceeds $351,401,423) | | (366,789,313 | ) |
OTHER ASSETS AND LIABILITIES(3) — 77.0% | | 366,468,183 |
|
| TOTAL NET ASSETS — 100.0% | | $ | 475,741,611 |
|
|
| | | | | | | | | | |
| FORWARD FOREIGN CURRENCY EXCHANGE CONTRACTS |
| Currency Purchased | Currency Sold | Counterparty | Settlement Date | Unrealized Appreciation (Depreciation) |
| USD | 966,527 |
| EUR | 862,936 |
| UBS AG | 6/30/16 | $ | (18,063 | ) |
| USD | 99,852 |
| EUR | 89,015 |
| UBS AG | 6/30/16 | (1,712 | ) |
| USD | 3,302,865 |
| EUR | 2,946,727 |
| UBS AG | 6/30/16 | (59,281 | ) |
| JPY | 8,709,338 |
| USD | 77,619 |
| Credit Suisse AG | 6/30/16 | (30 | ) |
| JPY | 3,304,958 |
| USD | 29,246 |
| Credit Suisse AG | 6/30/16 | 197 |
|
| USD | 804,178 |
| JPY | 90,307,538 |
| Credit Suisse AG | 6/30/16 | (346 | ) |
| USD | 36,887 |
| JPY | 4,165,100 |
| Credit Suisse AG | 6/30/16 | (219 | ) |
| | | | | | | $ | (79,454 | ) |
|
| | |
| NOTES TO SCHEDULE OF INVESTMENTS |
| ADR | - | American Depositary Receipt |
| EUR | - | Euro |
| JPY | - | Japanese Yen |
| USD | - | United States Dollar |
| |
| (1) | Security, or a portion thereof, has been pledged at the custodian bank or with a broker for collateral requirements on securities sold short. At the period end, the aggregate value of securities pledged was $287,380,221. |
| |
| (3) | Amount relates primarily to deposits with broker for securities sold short at period end. |
See Notes to Financial Statements.
|
|
| Statement of Assets and Liabilities |
|
| | | |
| MARCH 31, 2016 | |
| Assets | |
| Investment securities, at value (cost of $445,617,032) | $ | 476,062,741 |
|
| Deposits with broker for securities sold short | 364,128,230 |
|
| Receivable for investments sold | 3,468,228 |
|
| Receivable for capital shares sold | 2,579,052 |
|
| Unrealized appreciation on forward foreign currency exchange contracts | 197 |
|
| Dividends and interest receivable | 816,461 |
|
| | 847,054,909 |
|
| | |
| Liabilities | |
| Securities sold short, at value (proceeds of $351,401,423) | 366,789,313 |
|
| Payable for investments purchased | 3,120,683 |
|
| Payable for capital shares redeemed | 349,903 |
|
| Unrealized depreciation on forward foreign currency exchange contracts | 79,651 |
|
| Accrued management fees | 561,968 |
|
| Distribution and service fees payable | 31,292 |
|
| Dividend expense payable on securities sold short | 380,488 |
|
| | 371,313,298 |
|
| | |
| Net Assets | $ | 475,741,611 |
|
| | |
| Net Assets Consist of: | |
| Capital (par value and paid-in surplus) | $ | 467,871,591 |
|
| Accumulated net investment loss | (84,812 | ) |
| Accumulated net realized loss | (7,023,600 | ) |
| Net unrealized appreciation | 14,978,432 |
|
| | $ | 475,741,611 |
|
|
| | | | | | |
| | Net Assets | Shares Outstanding | Net Asset Value Per Share |
| Investor Class, $0.01 Par Value |
| $253,885,135 |
| 23,661,319 |
| $10.73 |
| Institutional Class, $0.01 Par Value |
| $124,248,545 |
| 11,467,608 |
| $10.83 |
| A Class, $0.01 Par Value |
| $76,630,492 |
| 7,221,734 |
| $10.61* |
| C Class, $0.01 Par Value |
| $20,901,551 |
| 2,040,214 |
| $10.24 |
| R Class, $0.01 Par Value |
| $75,888 |
| 7,235 |
| $10.49 |
*Maximum offering price $11.26 (net asset value divided by 0.9425).
See Notes to Financial Statements.
|
| | | |
| YEAR ENDED MARCH 31, 2016 | |
| Investment Income (Loss) | |
| Income: | |
| Dividends (net of foreign taxes withheld of $29,374) | $ | 3,026,525 |
|
| Interest | 273,382 |
|
| | 3,299,907 |
|
| | |
| Expenses: | |
| Dividend expense on securities sold short | 3,345,391 |
|
| Broker fees and charges on securities sold short | 294,622 |
|
| Management fees | 3,145,859 |
|
| Distribution and service fees: | |
| A Class | 68,931 |
|
| C Class | 118,281 |
|
| R Class | 327 |
|
| Directors' fees and expenses | 5,271 |
|
| Other expenses | 6,269 |
|
| | 6,984,951 |
|
| Fees waived | (504,807 | ) |
| | 6,480,144 |
|
| | |
| Net investment income (loss) | (3,180,237 | ) |
| | |
| Realized and Unrealized Gain (Loss) | |
| Net realized gain (loss) on: | |
| Investment transactions | (1,936,138 | ) |
| Securities sold short transactions | 3,606,857 |
|
| Foreign currency transactions | (5,944 | ) |
| | 1,664,775 |
|
| | |
| Change in net unrealized appreciation (depreciation) on: | |
| Investments | 25,265,277 |
|
| Securities sold short | (14,651,621 | ) |
| Translation of assets and liabilities in foreign currencies | (116,592 | ) |
| | 10,497,064 |
|
| | |
| Net realized and unrealized gain (loss) | 12,161,839 |
|
| | |
| Net Increase (Decrease) in Net Assets Resulting from Operations | $ | 8,981,602 |
|
See Notes to Financial Statements.
|
|
| Statement of Changes in Net Assets |
|
| | | | | | |
| YEARS ENDED MARCH 31, 2016 AND MARCH 31, 2015 |
| Increase (Decrease) in Net Assets | March 31, 2016 | March 31, 2015 |
| Operations | | |
| Net investment income (loss) | $ | (3,180,237 | ) | $ | (1,537,661 | ) |
| Net realized gain (loss) | 1,664,775 |
| 973,583 |
|
| Change in net unrealized appreciation (depreciation) | 10,497,064 |
| 3,395,433 |
|
| Net increase (decrease) in net assets resulting from operations | 8,981,602 |
| 2,831,355 |
|
| | | |
| Distributions to Shareholders | | |
| From net realized gains: | | |
| Investor Class | (1,774,577 | ) | (932,471 | ) |
| Institutional Class | (211,977 | ) | (103,125 | ) |
| A Class | (542,336 | ) | (252,822 | ) |
| C Class | (227,499 | ) | (144,211 | ) |
| R Class | (557 | ) | (8,359 | ) |
| Decrease in net assets from distributions | (2,756,946 | ) | (1,440,988 | ) |
| | | |
| Capital Share Transactions | | |
| Net increase (decrease) in net assets from capital share transactions (Note 5) | 396,333,523 |
| (4,496,697 | ) |
| | | |
| Net increase (decrease) in net assets | 402,558,179 |
| (3,106,330 | ) |
| | | |
| Net Assets | | |
| Beginning of period | 73,183,432 |
| 76,289,762 |
|
| End of period | $ | 475,741,611 |
| $ | 73,183,432 |
|
| | | |
| Accumulated net investment loss | $ | (84,812 | ) | $ | (346,295 | ) |
See Notes to Financial Statements.
|
|
| Notes to Financial Statements |
MARCH 31, 2016
1. Organization
American Century Capital Portfolios, Inc. (the corporation) is registered under the Investment Company Act of 1940, as amended (the 1940 Act), as an open-end management investment company and is organized as a Maryland corporation. AC Alternatives Market Neutral Value Fund (formerly Market Neutral Value Fund) (the fund) is one fund in a series issued by the corporation. The fund’s investment objective is to seek long-term capital growth, independent of equity market conditions.
The fund offers the Investor Class, the Institutional Class, the A Class, the C Class and the R Class. The A Class may incur an initial sales charge. The A Class and C Class may be subject to a contingent deferred sales charge. The share classes differ principally in their respective sales charges and distribution and shareholder servicing expenses and arrangements. The Institutional Class is made available to institutional shareholders or through financial intermediaries whose clients do not require the same level of shareholder and administrative services as shareholders of other classes. As a result, the Institutional Class is charged a lower unified management fee.
2. Significant Accounting Policies
The following is a summary of significant accounting policies consistently followed by the fund in preparation of its financial statements. The fund is an investment company and follows accounting and reporting guidance in accordance with accounting principles generally accepted in the United States of America. This may require management to make certain estimates and assumptions at the date of the financial statements. Actual results could differ from these estimates. Management evaluated the impact of events or transactions occurring through the date the financial statements were issued that would merit recognition or disclosure.
Investment Valuations — The fund determines the fair value of its investments and computes its net asset value per share at the close of regular trading (usually 4 p.m. Eastern time) on the New York Stock Exchange (NYSE) on each day the NYSE is open. The Board of Directors has adopted valuation policies and procedures to guide the investment advisor in the fund’s investment valuation process and to provide methodologies for the oversight of the fund’s pricing function.
Equity securities that are listed or traded on a domestic securities exchange are valued at the last reported sales price or at the official closing price as provided by the exchange. Equity securities traded on foreign securities exchanges are generally valued at the closing price of such securities on the exchange where primarily traded or at the close of the NYSE, if that is earlier. If no last sales price is reported, or if local convention or regulation so provides, the mean of the latest bid and asked prices may be used. Securities traded over-the-counter are valued at the mean of the latest bid and asked prices, the last sales price, or the official closing price. Equity securities initially expressed in local currencies are translated into U.S. dollars at the mean of the appropriate currency exchange rate at the close of the NYSE as provided by an independent pricing service.
Fixed income securities are valued at the evaluated mean as provided by independent pricing services or at the mean of the most recent bid and asked prices as provided by investment dealers. Corporate and convertible bonds are valued using market models that consider trade data, quotations from dealers and active market makers, relevant yield curve and spread data, creditworthiness, trade data or market information on comparable securities, and other relevant security specific information.
Open-end management investment companies are valued at the reported net asset value per share. Repurchase agreements are valued at cost, which approximates fair value. Forward foreign currency exchange contracts are valued at the mean of the appropriate forward exchange rate at the close of the NYSE as provided by an independent pricing service.
If the fund determines that the market price for an investment is not readily available or the valuation methods mentioned above do not reflect an investment’s fair value, such investment is valued as determined in good faith by the Board of Directors or its delegate, in accordance with policies and procedures adopted by the Board of Directors. In its determination of fair value, the fund may review several factors including, but not limited to, market information regarding the specific investment or comparable investments and correlation
with other investment types, futures indices or general market indicators. Circumstances that may cause the fund to use these procedures to value an investment include, but are not limited to: an investment has been declared in default or is distressed; trading in a security has been suspended during the trading day or a security is not actively trading on its principal exchange; prices received from a regular pricing source are deemed unreliable; or there is a foreign market holiday and no trading occurred.
The fund monitors for significant events occurring after the close of an investment’s primary exchange but before the fund’s net asset value per share is determined. Significant events may include, but are not limited to: corporate announcements and transactions; governmental action and political unrest that could impact a specific investment or an investment sector; or armed conflicts, natural disasters and similar events that could affect investments in a specific country or region. The fund also monitors for significant fluctuations between domestic and foreign markets, as evidenced by the U.S. market or such other indicators that the Board of Directors, or its delegate, deems appropriate. If significant fluctuations in foreign markets are identified, the fund may apply a model-derived factor to the closing price of equity securities traded on foreign securities exchanges. The factor is based on observable market data as provided by an independent pricing service.
Security Transactions — Security transactions are accounted for as of the trade date. Net realized gains and losses are determined on the identified cost basis, which is also used for federal income tax purposes.
Investment Income — Dividend income less foreign taxes withheld, if any, is recorded as of the ex-dividend date. Distributions received on securities that represent a return of capital or long-term capital gain are recorded as a reduction of cost of investments and/or as a realized gain. The fund may estimate the components of distributions received that may be considered nontaxable distributions or long-term capital gain distributions for income tax purposes. Interest income is recorded on the accrual basis and includes accretion of discounts and amortization of premiums.
Securities Sold Short — The fund enters into short sales, which is selling securities it does not own, as part of its normal investment activities. Upon selling a security short, the fund will segregate cash, cash equivalents or other appropriate liquid securities in at least an amount equal to the current market value of the securities sold short until the fund replaces the borrowed security. Interest earned on segregated cash for securities sold short is reflected as interest income. The fund is required to pay any dividends or interest due on securities sold short. Such dividends and interest are recorded as an expense. The fund may pay fees or charges to the broker on the assets borrowed for securities sold short. These fees are calculated daily based upon the value of each security sold short and a rate that is dependent on the availability of such security. Liabilities for securities sold short are valued daily and changes in value are recorded as change in net unrealized appreciation (depreciation) on securities sold short. The fund records realized gain (loss) on a security sold short when it is terminated by the fund and includes as a component of net realized gain (loss) on securities sold short transactions.
Foreign Currency Translations — All assets and liabilities initially expressed in foreign currencies are translated into U.S. dollars at prevailing exchange rates at period end. The fund may enter into spot foreign currency exchange contracts to facilitate transactions denominated in a foreign currency. Purchases and sales of investment securities, dividend and interest income, spot foreign currency exchange contracts, and expenses are translated at the rates of exchange prevailing on the respective dates of such transactions. Net realized and unrealized foreign currency exchange gains or losses related to investment securities are a component of net realized gain (loss) on investment transactions and change in net unrealized appreciation (depreciation) on investments, respectively. Net realized and unrealized foreign currency exchange gains or losses related to securities sold short are a component of net realized gain (loss) on securities sold short transactions and change in net unrealized appreciation (depreciation) on securities sold short, respectively.
Segregated Assets — In accordance with the 1940 Act, the fund segregates assets on its books and records to cover certain types of investments, including, but not limited to, futures contracts and short sales. American Century Investment Management, Inc. (ACIM) (the investment advisor) monitors, on a daily basis, the securities segregated to ensure the fund designates a sufficient amount of liquid assets, marked-to-market daily. The fund may also receive assets or be required to pledge assets at the custodian bank or with a broker for margin requirements on futures contracts and short sales.
Repurchase Agreements — The fund may enter into repurchase agreements with institutions that ACIM has determined are creditworthy pursuant to criteria adopted by the Board of Directors. The fund requires that the collateral, represented by securities, received in a repurchase transaction be transferred to the custodian in a manner sufficient to enable the fund to obtain those securities in the event of a default under the repurchase agreement. ACIM monitors, on a daily basis, the securities transferred to ensure the value, including accrued
interest, of the securities under each repurchase agreement is equal to or greater than amounts owed to the fund under each repurchase agreement.
Joint Trading Account — Pursuant to an Exemptive Order issued by the Securities and Exchange Commission, the fund, along with certain other funds in the American Century Investments family of funds, may transfer uninvested cash balances into a joint trading account. These balances are invested in one or more repurchase agreements that are collateralized by U.S. Treasury or Agency obligations.
Income Tax Status — It is the fund’s policy to distribute substantially all net investment income and net realized gains to shareholders and to otherwise qualify as a regulated investment company under provisions of the Internal Revenue Code. Accordingly, no provision has been made for income taxes. The fund files U.S. federal, state, local and non-U.S. tax returns as applicable. The fund's tax returns are subject to examination by the relevant taxing authority until expiration of the applicable statute of limitations, which is generally three years from the date of filing but can be longer in certain jurisdictions. At this time, management believes there are no uncertain tax positions which, based on their technical merit, would not be sustained upon examination and for which it is reasonably possible that the total amounts of unrecognized tax benefits will significantly change in the next twelve months.
Multiple Class — All shares of the fund represent an equal pro rata interest in the net assets of the class to which such shares belong, and have identical voting, dividend, liquidation and other rights and the same terms and conditions, except for class specific expenses and exclusive rights to vote on matters affecting only individual classes. Income, non-class specific expenses, and realized and unrealized capital gains and losses of the fund are allocated to each class of shares based on their relative net assets.
Distributions to Shareholders — Distributions from net investment income, if any, are generally declared and paid quarterly. Distributions from net realized gains, if any, are generally declared and paid annually.
Indemnifications — Under the corporation’s organizational documents, its officers and directors are indemnified against certain liabilities arising out of the performance of their duties to the fund. In addition, in the normal course of business, the fund enters into contracts that provide general indemnifications. The maximum exposure under these arrangements is unknown as this would involve future claims that may be made against a fund. The risk of material loss from such claims is considered by management to be remote.
3. Fees and Transactions with Related Parties
Certain officers and directors of the corporation are also officers and/or directors of American Century Companies, Inc. (ACC). The corporation’s investment advisor, ACIM, the corporation's distributor, American Century Investment Services, Inc. (ACIS), and the corporation’s transfer agent, American Century Services, LLC, are wholly owned, directly or indirectly, by ACC.
Management Fees — The corporation has entered into a management agreement with ACIM, under which ACIM provides the fund with investment advisory and management services in exchange for a single, unified management fee (the fee) per class. The agreement provides that all expenses of managing and operating the fund, except distribution and service fees, expenses on securities sold short, brokerage expenses, taxes, interest, fees and expenses of the independent directors (including legal counsel fees), and extraordinary expenses, will be paid by ACIM. The fee is computed and accrued daily based on each class’s daily net assets and paid monthly in arrears. The annual management fee is 1.90% for the Investor Class, A Class, C Class and R Class and 1.70% for the Institutional Class. During the year ended March 31, 2016, the investment advisor voluntarily agreed to waive 0.30% of the fund's management fee. The investment advisor expects the fee waiver to continue until July 31, 2016, and cannot terminate it prior to such date without the approval of the Board of Directors. The total amount of the waiver for each class for the year ended March 31, 2016 was $309,528, $76,882, $82,717, $35,484 and $196 for the Investor Class, Institutional Class, A Class, C Class and R Class, respectively. The effective annual management fee after waiver for each class for the year ended March 31, 2016 was 1.60% for the Investor Class, A Class, C Class and R Class and 1.40% for the Institutional Class.
Distribution and Service Fees — The Board of Directors has adopted a separate Master Distribution and Individual Shareholder Services Plan for each of the A Class, C Class and R Class (collectively the plans), pursuant to Rule 12b-1 of the 1940 Act. The plans provide that the A Class will pay ACIS an annual distribution and service fee of 0.25%. The plans provide that the C Class will pay ACIS an annual distribution and service fee of 1.00%, of which 0.25% is paid for individual shareholder services and 0.75% is paid for distribution services. The plans provide that the R Class will pay ACIS an annual distribution and service fee of 0.50%. The fees are computed and accrued daily based on each class’s daily net assets and paid monthly in arrears.
The fees are used to pay financial intermediaries for distribution and individual shareholder services. Fees incurred under the plans during the year ended March 31, 2016 are detailed in the Statement of Operations.
Directors' Fees and Expenses — The Board of Directors is responsible for overseeing the investment advisor’s management and operations of the fund. The directors receive detailed information about the fund and its investment advisor regularly throughout the year, and meet at least quarterly with management of the investment advisor to review reports about fund operations. The fund’s officers do not receive compensation from the fund.
Acquired Fund Fees and Expenses — The fund may invest in mutual funds, exchange-traded funds, and business development companies (the acquired funds). The fund will indirectly realize its pro rata share of the fees and expenses of the acquired funds in which it invests. These indirect fees and expenses are not paid out of the fund's assets but are reflected in the return realized by the fund on its investment in the acquired funds.
4. Investment Transactions
Purchases and sales of investment securities and securities sold short, excluding short-term investments, for the year ended March 31, 2016 were $933,825,414 and $944,196,544, respectively.
5. Capital Share Transactions
Transactions in shares of the fund were as follows:
|
| | | | | | | | | | |
| | Year ended
March 31, 2016 | Year ended
March 31, 2015 |
| | Shares | Amount | Shares | Amount |
| Investor Class/Shares Authorized | 160,000,000 |
| | 50,000,000 |
| |
| Sold | 23,436,964 |
| $ | 248,747,920 |
| 1,358,179 |
| $ | 14,061,175 |
|
| Issued in reinvestment of distributions | 166,222 |
| 1,737,019 |
| 85,909 |
| 882,278 |
|
| Redeemed | (4,678,769 | ) | (49,636,282 | ) | (1,566,788 | ) | (16,203,149 | ) |
| | 18,924,417 |
| 200,848,657 |
| (122,700 | ) | (1,259,696 | ) |
| Institutional Class/Shares Authorized | 60,000,000 |
| | 20,000,000 |
| |
| Sold | 11,252,623 |
| 120,520,975 |
| 336,272 |
| 3,506,275 |
|
| Issued in reinvestment of distributions | 20,093 |
| 211,977 |
| 9,974 |
| 103,125 |
|
| Redeemed | (376,564 | ) | (4,047,101 | ) | (330,897 | ) | (3,422,772 | ) |
| | 10,896,152 |
| 116,685,851 |
| 15,349 |
| 186,628 |
|
| A Class/Shares Authorized | 50,000,000 |
| | 5,000,000 |
| |
| Sold | 7,508,437 |
| 78,853,456 |
| 760,742 |
| 7,849,870 |
|
| Issued in reinvestment of distributions | 52,448 |
| 542,312 |
| 24,790 |
| 252,614 |
|
| Redeemed | (1,238,311 | ) | (12,963,697 | ) | (1,228,595 | ) | (12,561,119 | ) |
| | 6,322,574 |
| 66,432,071 |
| (443,063 | ) | (4,458,635 | ) |
| C Class/Shares Authorized | 15,000,000 |
| | 5,000,000 |
| |
| Sold | 1,389,234 |
| 14,131,872 |
| 328,117 |
| 3,292,359 |
|
| Issued in reinvestment of distributions | 22,694 |
| 227,167 |
| 14,469 |
| 143,820 |
|
| Redeemed | (160,361 | ) | (1,619,700 | ) | (240,538 | ) | (2,414,029 | ) |
| | 1,251,567 |
| 12,739,339 |
| 102,048 |
| 1,022,150 |
|
| R Class/Shares Authorized | 10,000,000 |
| | 5,000,000 |
| |
| Sold | 4,187 |
| 43,480 |
| 440 |
| 4,497 |
|
| Issued in reinvestment of distributions | 54 |
| 557 |
| 827 |
| 8,359 |
|
| Redeemed | (40,548 | ) | (416,432 | ) | — |
| — |
|
| | (36,307 | ) | (372,395 | ) | 1,267 |
| 12,856 |
|
| Net increase (decrease) | 37,358,403 |
| $ | 396,333,523 |
| (447,099 | ) | $ | (4,496,697 | ) |
6. Fair Value Measurements
The fund’s investments valuation process is based on several considerations and may use multiple inputs to determine the fair value of the investments held by the fund. In conformity with accounting principles generally accepted in the United States of America, the inputs used to determine a valuation are classified into three broad levels.
| |
| • | Level 1 valuation inputs consist of unadjusted quoted prices in an active market for identical investments. |
| |
| • | Level 2 valuation inputs consist of direct or indirect observable market data (including quoted prices for comparable investments, evaluations of subsequent market events, interest rates, prepayment speeds, credit risk, etc.). These inputs also consist of quoted prices for identical investments initially expressed in local currencies that are adjusted through translation into U.S. dollars. |
| |
| • | Level 3 valuation inputs consist of unobservable data (including a fund’s own assumptions). |
The level classification is based on the lowest level input that is significant to the fair valuation measurement. The valuation inputs are not necessarily an indication of the risks associated with investing in these securities or other financial instruments. There were no significant transfers between levels during the period.
The following is a summary of the level classifications as of period end. The Schedule of Investments provides additional information on the fund’s portfolio holdings.
|
| | | | | | | | |
| | Level 1 | Level 2 | Level 3 |
| Assets | | | |
| Investment Securities | | | |
| Common Stocks | $ | 308,370,669 |
| — |
| — |
|
| Convertible Bonds | — |
| $ | 33,833,806 |
| — |
|
| Exchange-Traded Funds | 23,043,016 |
| — |
| — |
|
| Convertible Preferred Stocks | — |
| 3,390,320 |
| — |
|
| Temporary Cash Investments | 42,437,930 |
| 64,987,000 |
| — |
|
| | $ | 373,851,615 |
| $ | 102,211,126 |
| — |
|
| Other Financial Instruments | | | |
| Forward Foreign Currency Exchange Contracts | — |
| $ | 197 |
| — |
|
| | | | |
| Liabilities | | | |
| Securities Sold Short | | | |
| Common Stocks | $ | 303,924,276 |
| — |
| — |
|
| Exchange-Traded Funds | 62,865,037 |
| — |
| — |
|
| | $ | 366,789,313 |
| — |
| — |
|
| Other Financial Instruments | | | |
| Forward Foreign Currency Exchange Contracts | — |
| $ | 79,651 |
| — |
|
7. Derivative Instruments
Foreign Currency Risk — The fund is subject to foreign currency exchange rate risk in the normal course of pursuing its investment objectives. The value of foreign investments held by a fund may be significantly affected by changes in foreign currency exchange rates. The dollar value of a foreign security generally decreases when the value of the dollar rises against the foreign currency in which the security is denominated and tends to increase when the value of the dollar declines against such foreign currency. A fund may enter into forward foreign currency exchange contracts to reduce a fund's exposure to foreign currency exchange rate fluctuations. The net U.S. dollar value of foreign currency underlying all contractual commitments held by a fund and the resulting unrealized appreciation or depreciation are determined daily. Realized gain or loss is recorded upon the termination of the contract. Net realized and unrealized gains or losses occurring during the holding period of forward foreign currency exchange contracts are a component of net realized gain (loss) on foreign currency transactions and change in net unrealized appreciation (depreciation) on translation of assets and liabilities in foreign currencies, respectively. A fund bears the risk of an unfavorable change in the foreign
currency exchange rate underlying the forward contract. Additionally, losses, up to the fair value, may arise if the counterparties do not perform under the contract terms. The fund's average U.S. dollar exposure to foreign currency risk derivative instruments held during the period was $2,376,210.
The value of foreign currency risk derivative instruments as of March 31, 2016, is disclosed on the Statement of Assets and Liabilities as an asset of $197 in unrealized appreciation on forward foreign currency exchange contracts and a liability of $79,651 in unrealized depreciation on forward foreign currency exchange contracts. For the year ended March 31, 2016, the effect of foreign currency risk derivative instruments on the Statement of Operations was $(4,800) in net realized gain (loss) on foreign currency transactions and $(116,677) in change in net unrealized appreciation (depreciation) on translation of assets and liabilities in foreign currencies.
8. Risk Factors
The fund’s investment process may result in high portfolio turnover, which could mean high transaction costs, affecting both performance and capital gains tax liabilities to investors.
The fund is subject to short sales risk. If the market price of a security increases after the fund borrows the security, the fund may suffer a loss when it replaces the borrowed security at the higher price. Any loss will be increased by the amount of compensation, interest or dividends, and transaction costs the fund must pay to the lender of the borrowed security.
9. Federal Tax Information
The tax character of distributions paid during the years ended March 31, 2016 and March 31, 2015 were as follows:
|
| | | | | | |
| | 2016 | 2015 |
| Distributions Paid From | | |
| Ordinary income | $ | 547,432 |
| $ | 1,033,260 |
|
| Long-term capital gains | $ | 2,209,514 |
| $ | 407,728 |
|
The book-basis character of distributions made during the year from net investment income or net realized gains may differ from their ultimate characterization for federal income tax purposes. These differences reflect the differing character of certain income items and net realized gains and losses for financial statement and tax purposes, and may result in reclassification among certain capital accounts on the financial statements.
As of March 31, 2016, the federal tax cost of investments and the components of distributable earnings on a tax-basis were as follows:
|
| | | |
| Federal tax cost of investments | $ | 451,932,431 |
|
| Gross tax appreciation of investments | $ | 24,702,340 |
|
| Gross tax depreciation of investments | (572,030 | ) |
| Net tax appreciation (depreciation) of investments | 24,130,310 |
|
| Net tax appreciation (depreciation) on securities sold short | (21,789,982 | ) |
| Net tax appreciation (depreciation) | $ | 2,340,328 |
|
| Undistributed ordinary income | $ | 5,469,278 |
|
| Accumulated long-term gains | $ | 60,414 |
|
The difference between book-basis and tax-basis unrealized appreciation (depreciation) is attributable primarily to the tax deferral of losses on wash sales.
|
| | | | | | | | | | | | | | | | |
For a Share Outstanding Throughout the Years Ended March 31 (except as noted)
|
| Per-Share Data | | | | | | Ratios and Supplemental Data | | |
| | | Income From Investment Operations: | | | | Ratio to Average Net Assets of: | | |
| | Net Asset
Value,
Beginning
of Period | Net
Investment
Income
(Loss)(1) | Net
Realized
and
Unrealized
Gain (Loss) | Total From
Investment
Operations | Distributions From Net
Realized
Gains | Net Asset
Value,
End
of Period | Total
Return(2) | Operating
Expenses | Operating
Expenses
(before
expense
waiver) | Operating
Expenses
(excluding
expenses on
securities
sold short) | Net
Investment
Income
(Loss) | Net
Investment
Income
(Loss)
(before
expense
waiver) | Portfolio
Turnover
Rate | Net
Assets,
End of
Period
(in thousands) |
| Investor Class | | | | | | | | | | | | | |
| 2016 | $10.44 | (0.19) | 0.65 | 0.46 | (0.17) | $10.73 | 4.42% | 3.78% | 4.08% | 1.61% | (1.82)% | (2.12)% | 679% |
| $253,885 |
|
| 2015 | $10.22 | (0.20) | 0.62 | 0.42 | (0.20) | $10.44 | 4.10% | 3.88% | 4.18% | 1.60% | (1.95)% | (2.25)% | 447% |
| $49,465 |
|
| 2014 | $10.25 | (0.04) | 0.21 | 0.17 | (0.20) | $10.22 | 1.69% | 4.09% | 4.39% | 1.60% | (0.35)% | (0.65)% | 521% |
| $49,665 |
|
| 2013 | $10.32 | (0.25) | 0.52 | 0.27 | (0.34) | $10.25 | 2.61% | 4.74% | 5.04% | 1.60% | (2.46)% | (2.76)% | 588% |
| $8,214 |
|
2012(3) | $10.00 | (0.11) | 0.43 | 0.32 | — | $10.32 | 3.20% | 4.92%(4) | 5.22%(4) | 1.61%(4) | (2.49)%(4) | (2.79)%(4) | 292% |
| $3,118 |
|
| Institutional Class | | | | | | | | | | | | | |
| 2016 | $10.52 | (0.16) | 0.64 | 0.48 | (0.17) | $10.83 | 4.58% | 3.58% | 3.88% | 1.41% | (1.62)% | (1.92)% | 679% |
| $124,249 |
|
| 2015 | $10.28 | (0.18) | 0.62 | 0.44 | (0.20) | $10.52 | 4.28% | 3.68% | 3.98% | 1.40% | (1.75)% | (2.05)% | 447% |
| $6,013 |
|
| 2014 | $10.28 | 0.11 | 0.09 | 0.20 | (0.20) | $10.28 | 1.98% | 3.89% | 4.19% | 1.40% | (0.15)% | (0.45)% | 521% |
| $5,714 |
|
| 2013 | $10.33 | (0.24) | 0.53 | 0.29 | (0.34) | $10.28 | 2.81% | 4.54% | 4.84% | 1.40% | (2.26)% | (2.56)% | 588% |
| $425 |
|
2012(3) | $10.00 | (0.09) | 0.42 | 0.33 | — | $10.33 | 3.30% | 4.72%(4) | 5.02%(4) | 1.41%(4) | (2.29)%(4) | (2.59)%(4) | 292% |
| $413 |
|
| A Class | | | | | | | | | | | | | |
| 2016 | $10.36 | (0.22) | 0.64 | 0.42 | (0.17) | $10.61 | 4.07% | 4.03% | 4.33% | 1.86% | (2.07)% | (2.37)% | 679% |
| $76,630 |
|
| 2015 | $10.16 | (0.23) | 0.63 | 0.40 | (0.20) | $10.36 | 3.93% | 4.13% | 4.43% | 1.85% | (2.20)% | (2.50)% | 447% |
| $9,311 |
|
| 2014 | $10.21 | (0.07) | 0.22 | 0.15 | (0.20) | $10.16 | 1.50% | 4.34% | 4.64% | 1.85% | (0.60)% | (0.90)% | 521% |
| $13,640 |
|
| 2013 | $10.31 | (0.28) | 0.52 | 0.24 | (0.34) | $10.21 | 2.32% | 4.99% | 5.29% | 1.85% | (2.71)% | (3.01)% | 588% |
| $2,265 |
|
2012(3) | $10.00 | (0.11) | 0.42 | 0.31 | — | $10.31 | 3.10% | 5.17%(4) | 5.47%(4) | 1.86%(4) | (2.74)%(4) | (3.04)%(4) | 292% |
| $432 |
|
|
| | | | | | | | | | | | | | | | |
For a Share Outstanding Throughout the Years Ended March 31 (except as noted)
|
| Per-Share Data | | | | | | Ratios and Supplemental Data | | |
| | | Income From Investment Operations: | | | | Ratio to Average Net Assets of: | | |
| | Net Asset
Value,
Beginning
of Period | Net
Investment
Income
(Loss)(1) | Net
Realized
and
Unrealized
Gain (Loss) | Total From
Investment
Operations | Distributions From Net
Realized
Gains | Net Asset
Value,
End
of Period | Total
Return(2) | Operating
Expenses | Operating
Expenses
(before
expense
waiver) | Operating
Expenses
(excluding
expenses on
securities
sold short) | Net
Investment
Income
(Loss) | Net
Investment
Income
(Loss)
(before
expense
waiver) | Portfolio
Turnover
Rate | Net
Assets,
End of
Period
(in thousands) |
| C Class | | | | | | | | | | | | | |
| 2016 | $10.08 | (0.29) | 0.62 | 0.33 | (0.17) | $10.24 | 3.28% | 4.78% | 5.08% | 2.61% | (2.82)% | (3.12)% | 679% |
| $20,902 |
|
| 2015 | $9.97 | (0.30) | 0.61 | 0.31 | (0.20) | $10.08 | 3.10% | 4.88% | 5.18% | 2.60% | (2.95)% | (3.25)% | 447% |
| $7,948 |
|
| 2014 | $10.10 | (0.14) | 0.21 | 0.07 | (0.20) | $9.97 | 0.72% | 5.09% | 5.39% | 2.60% | (1.35)% | (1.65)% | 521% |
| $6,844 |
|
| 2013 | $10.28 | (0.35) | 0.51 | 0.16 | (0.34) | $10.10 | 1.54% | 5.74% | 6.04% | 2.60% | (3.46)% | (3.76)% | 588% |
| $1,111 |
|
2012(3) | $10.00 | (0.14) | 0.42 | 0.28 | — | $10.28 | 2.80% | 5.92%(4) | 6.22%(4) | 2.61%(4) | (3.49)%(4) | (3.79)%(4) | 292% |
| $411 |
|
| R Class | | | | | | | | | | | | | |
| 2016 | $10.26 | (0.21) | 0.61 | 0.40 | (0.17) | $10.49 | 3.91% | 4.28% | 4.58% | 2.11% | (2.32)% | (2.62)% | 679% |
| $76 |
|
| 2015 | $10.10 | (0.25) | 0.61 | 0.36 | (0.20) | $10.26 | 3.56% | 4.38% | 4.68% | 2.10% | (2.45)% | (2.75)% | 447% |
| $447 |
|
| 2014 | $10.17 | (0.18) | 0.31 | 0.13 | (0.20) | $10.10 | 1.21% | 4.59% | 4.89% | 2.10% | (0.85)% | (1.15)% | 521% |
| $427 |
|
| 2013 | $10.30 | (0.31) | 0.52 | 0.21 | (0.34) | $10.17 | 2.13% | 5.24% | 5.54% | 2.10% | (2.96)% | (3.26)% | 588% |
| $421 |
|
2012(3) | $10.00 | (0.12) | 0.42 | 0.30 | — | $10.30 | 3.00% | 5.42%(4) | 5.72%(4) | 2.11%(4) | (2.99)%(4) | (3.29)%(4) | 292% |
| $412 |
|
|
|
| Notes to Financial Highlights |
| |
| (1) | Computed using average shares outstanding throughout the period. |
| |
| (2) | Total returns are calculated based on the net asset value of the last business day and do not reflect applicable sales charges, if any. Total returns for periods less than one year are not annualized. |
| |
| (3) | October 31, 2011 (fund inception) through March 31, 2012. |
See Notes to Financial Statements.
|
|
| Report of Independent Registered Public Accounting Firm |
To the Board of Directors and Shareholders of American Century Capital Portfolios, Inc.:
We have audited the accompanying statement of assets and liabilities, including the schedule of investments, of AC Alternatives® Market Neutral Value Fund (formerly, Market Neutral Value Fund) (the “Fund”), one of the funds constituting American Century Capital Portfolios, Inc., as of March 31, 2016, and the related statement of operations for the year then ended, the statements of changes in net assets for each of the two years in the period then ended, and the financial highlights for each of the periods presented. These financial statements and financial highlights are the responsibility of the Fund's management. Our responsibility is to express an opinion on these financial statements and financial highlights based on our audits.
We conducted our audits in accordance with the standards of the Public Company Accounting Oversight Board (United States). Those standards require that we plan and perform the audit to obtain reasonable assurance about whether the financial statements and financial highlights are free of material misstatement. The Fund is not required to have, nor were we engaged to perform, an audit of its internal control over financial reporting. Our audits included consideration of internal control over financial reporting as a basis for designing audit procedures that are appropriate in the circumstances, but not for the purpose of expressing an opinion on the effectiveness of the Fund's internal control over financial reporting. Accordingly, we express no such opinion. An audit also includes examining, on a test basis, evidence supporting the amounts and disclosures in the financial statements, assessing the accounting principles used and significant estimates made by management, as well as evaluating the overall financial statement presentation. Our procedures included confirmation of securities owned as of March 31, 2016, by correspondence with the custodian and brokers; when replies were not received from brokers, we performed other auditing procedures. We believe that our audits provide a reasonable basis for our opinion.
In our opinion, the financial statements and financial highlights referred to above present fairly, in all material respects, the financial position of AC Alternatives® Market Neutral Value Fund of American Century Capital Portfolios, Inc. as of March 31, 2016, the results of its operations for the year then ended, the changes in its net assets for each of the two years in the period then ended, and the financial highlights for each of the periods presented, in conformity with accounting principles generally accepted in the United States of America.
DELOITTE & TOUCHE LLP
Kansas City, Missouri May 17, 2016
The Board of Directors
The individuals listed below serve as directors of the funds. Each director will continue to serve in this capacity until death, retirement, resignation or removal from office. The board has adopted a mandatory retirement age for directors who are not “interested persons,” as that term is defined in the Investment Company Act (independent directors). Independent directors shall retire by December 31 of the year in which they reach their 75th birthday.
Mr. Thomas is an “interested person” because he currently serves as President and Chief Executive Officer of American Century Companies, Inc. (ACC), the parent company of American Century Investment Management, Inc. (ACIM or the advisor). Mr. Fink is treated as an “interested person” because of his recent employment with ACC and American Century Services, LLC (ACS). The other directors (more than three-fourths of the total number) are independent. They are not employees, directors or officers of, and have no financial interest in, ACC or any of its wholly owned, direct or indirect, subsidiaries, including ACIM, American Century Investment Services, Inc. (ACIS) and ACS, and they do not have any other affiliations, positions or relationships that would cause them to be considered “interested persons” under the Investment Company Act. The directors serve in this capacity for seven (in the case of Mr. Thomas, 15) registered investment companies in the American Century Investments family of funds.
The following table presents additional information about the directors. The mailing address for each director is 4500 Main Street, Kansas City, Missouri 64111.
|
| | | | | |
Name
(Year of Birth) | Position(s) Held with Funds | Length of Time Served | Principal Occupation(s) During Past 5 Years | Number of American Century Portfolios Overseen by Director | Other Directorships Held During Past
5 Years |
| Independent Directors | | |
Andrea C. Hall
(1945) | Director | Since 1997 | Retired | 83 | None |
Jan M. Lewis
(1957) | Director | Since 2011 | Retired; President and Chief Executive Officer, Catholic Charities of Northeast Kansas (human services organization) (2006 to 2013) | 83 | None |
James A. Olson
(1942) | Director and Chairman of the Board | Since 2007 (Chairman since 2014) | Member, Plaza Belmont LLC (private equity fund manager) (1999 to present) | 83 | Saia, Inc. (2002 to 2012) and EPR Properties (2003 to 2013) |
M. Jeannine Strandjord
(1945) | Director | Since 1994 | Retired | 83 | Euronet Worldwide Inc.; MGP Ingredients, Inc.; and DST Systems Inc. (1996 to 2012) |
John R. Whitten
(1946) | Director | Since 2008 | Retired | 83 | Rudolph Technologies, Inc. |
Stephen E. Yates
(1948) | Director | Since 2012 | Retired | 83 | None |
|
| | | | | |
Name
(Year of Birth) | Position(s) Held with Funds | Length of Time Served | Principal Occupation(s) During Past 5 Years | Number of American Century Portfolios Overseen by Director | Other Directorships Held During Past
5 Years |
| Interested Directors |
Barry Fink
(1955) | Director | Since 2012 | Retired; Executive Vice President, ACC (September 2007 to February 2013); President, ACS (October 2007 to February 2013); Chief Operating Officer, ACC (September 2007 to November 2012) | 83 | None |
Jonathan S. Thomas
(1963) | Director and President | Since 2007 | President and Chief Executive Officer, ACC (March 2007 to present). Also serves as Chief Executive Officer, ACS; Executive Vice President, ACIM; Director, ACC, ACIM and other ACC subsidiaries | 128 | BioMed Valley Discoveries, Inc. |
The Statement of Additional Information has additional information about the fund's directors and is available without charge, upon request, by calling 1-800-345-2021.
Officers
The following table presents certain information about the executive officers of the funds. Each officer serves as an officer for each of the 15 investment companies in the American Century family of funds, unless otherwise noted. No officer is compensated for his or her service as an officer of the funds. The listed officers are interested persons of the funds and are appointed or re-appointed on an annual basis. The mailing address for each officer listed below is 4500 Main Street, Kansas City, Missouri 64111.
|
| | |
Name (Year of Birth) | Offices with
the Funds | Principal Occupation(s) During the Past Five Years |
Jonathan S.
Thomas
(1963) | Director and
President
since 2007 | President and Chief Executive Officer, ACC (March 2007 to present). Also serves as Chief Executive Officer, ACS; Executive Vice President, ACIM; Director, ACC, ACIM and other ACC subsidiaries |
Amy D. Shelton
(1964) | Chief Compliance
Officer and Vice President since 2014 | Chief Compliance Officer, American Century funds, (March 2014 to present); Chief Compliance Officer, ACIM (February 2014 to present); Chief Compliance Officer, ACIS (October 2009 to present); Vice President, Client Interactions and Marketing, ACIS (February 2013 to January 2014); Director, Client Interactions and Marketing, ACIS (June 2007 to January 2013). Also serves as Vice President, ACIS |
Charles A.
Etherington
(1957) | General Counsel
since 2007 and
Senior Vice
President since 2006 | Attorney, ACC (February 1994 to present); Vice President, ACC (November 2005 to present); General Counsel, ACC (March 2007 to present). Also serves as General Counsel, ACIM, ACS, ACIS and other ACC subsidiaries; and Senior Vice President, ACIM and ACS |
C. Jean Wade
(1964) | Vice President,
Treasurer and
Chief Financial
Officer since 2012 | Vice President, ACS (February 2000 to present) |
Robert J.
Leach
(1966) | Vice President
since 2006 and
Assistant Treasurer
since 2012 | Vice President, ACS (February 2000 to present) |
David H.
Reinmiller
(1963) | Vice President
since 2000 | Attorney, ACC (January 1994 to present); Associate General Counsel, ACC (January 2001 to present). Also serves as Vice President, ACIM and ACS |
Ward D.
Stauffer
(1960) | Secretary
since 2005 | Attorney, ACC (June 2003 to present) |
Retirement Account Information
As required by law, distributions you receive from certain IRAs are subject to federal income tax withholding, unless you elect not to have withholding apply. Tax will be withheld on the total amount withdrawn even though you may be receiving amounts that are not subject to withholding, such as nondeductible contributions. In such case, excess amounts of withholding could occur. You may adjust your withholding election so that a greater or lesser amount will be withheld.
If you don’t want us to withhold on this amount, you must notify us to not withhold the federal income tax. You may notify us in writing or in certain situations by telephone or through other electronic means. For systematic withdrawals, your withholding election will remain in effect until revoked or changed by filing a new election. You have the right to revoke your election at any time.
Remember, even if you elect not to have income tax withheld, you are liable for paying income tax on the taxable portion of your withdrawal. If you elect not to have income tax withheld or you don’t have enough income tax withheld, you may be responsible for payment of estimated tax. You may incur penalties under the estimated tax rules if your withholding and estimated tax payments are not sufficient. You can reduce or defer the income tax on a distribution by directly or indirectly rolling such distribution over to another IRA or eligible plan. You should consult your tax advisor for additional information.
State tax will be withheld if, at the time of your distribution, your address is within one of the mandatory withholding states and you have federal income tax withheld (or as otherwise required by state law). State taxes will be withheld from your distribution in accordance with the respective state rules.
Distributions you receive from 403(b), 457 and qualified plans are subject to special tax and withholding rules. Your plan administrator or plan sponsor is required to provide you with a special tax notice explaining those rules at the time you request a distribution. If applicable, federal and/or state taxes may be withheld from your distribution amount.
Proxy Voting Policies
A description of the policies that the fund's investment advisor uses in exercising the voting rights associated with the securities purchased and/or held by the fund is available without charge, upon request, by calling 1-800-345-2021. It is also available on the "About Us" page of American Century Investments’ website at americancentury.com and on the Securities and Exchange Commission’s website at sec.gov. Information regarding how the investment advisor voted proxies relating to portfolio securities during the most recent 12-month period ended June 30 is available on the "About Us" page at americancentury.com. It is also available at sec.gov.
Quarterly Portfolio Disclosure
The fund files its complete schedule of portfolio holdings with the Securities and Exchange Commission (SEC) for the first and third quarters of each fiscal year on Form N-Q. The fund’s Forms N-Q are available on the SEC’s website at sec.gov, and may be reviewed and copied at the SEC’s Public Reference Room in Washington, DC. Information on the operation of the Public Reference Room may be obtained by calling 1-800-SEC-0330. The fund also makes its complete schedule of portfolio holdings for the most recent quarter of its fiscal year available on its
website at americancentury.com and, upon request, by calling 1-800-345-2021.
Other Tax Information
The following information is provided pursuant to provisions of the Internal Revenue Code.
The fund hereby designates up to the maximum amount allowable as qualified dividend income for the fiscal year ended March 31, 2016.
For corporate taxpayers, the fund hereby designates $547,432, or up to the maximum amount allowable, of ordinary income distributions paid during the fiscal year ended March 31, 2016 as qualified for the corporate dividends received deduction.
The fund hereby designates $547,432 as qualified short-term capital gain distributions for purposes of Internal Revenue Code Section 871 for the fiscal year ended March 31, 2016.
The fund hereby designates $2,209,514, or up to the maximum amount allowable, as long-term capital gain distributions for the fiscal year ended March 31, 2016.
|
| | |
| |
| | | |
| Contact Us | americancentury.com | |
| Automated Information Line | 1-800-345-8765 | |
| Investor Services Representative | 1-800-345-2021 or 816-531-5575 | |
| Investors Using Advisors | 1-800-378-9878 | |
| Business, Not-For-Profit, Employer-Sponsored Retirement Plans | 1-800-345-3533 | |
| Banks and Trust Companies, Broker-Dealers, Financial Professionals, Insurance Companies | 1-800-345-6488 | |
| Telecommunications Relay Service for the Deaf | 711 | |
| | | |
| American Century Capital Portfolios, Inc. | |
| | | |
Investment Advisor: American Century Investment Management, Inc. Kansas City, Missouri | |
| | | |
| This report and the statements it contains are submitted for the general information of our shareholders. The report is not authorized for distribution to prospective investors unless preceded or accompanied by an effective prospectus. | |
| | | |
©2016 American Century Proprietary Holdings, Inc. All rights reserved.
CL-ANN-88867 1605 | |
|
| |
| | |
| | Annual Report |
| | |
| | March 31, 2016 |
| | |
| | Mid Cap Value Fund |
|
| |
| President’s Letter | 2 |
| Performance | 3 |
| Portfolio Commentary | |
| Fund Characteristics | |
| Shareholder Fee Example | |
| Schedule of Investments | |
| Statement of Assets and Liabilities | |
| Statement of Operations | |
| Statement of Changes in Net Assets | |
| Notes to Financial Statements | |
| Financial Highlights | |
| Report of Independent Registered Public Accounting Firm | |
| Management | |
| Additional Information | |
Any opinions expressed in this report reflect those of the author as of the date of the report, and do not necessarily represent the opinions of American Century Investments® or any other person in the American Century Investments organization. Any such opinions are subject to change at any time based upon market or other conditions and American Century Investments disclaims any responsibility to update such opinions. These opinions may not be relied upon as investment advice and, because investment decisions made by American Century Investments funds are based on numerous factors, may not be relied upon as an indication of trading intent on behalf of any American Century Investments fund. Security examples are used for representational purposes only and are not intended as recommendations to purchase or sell securities. Performance information for comparative indices and securities is provided to American Century Investments by third party vendors. To the best of American Century Investments’ knowledge, such information is accurate at the time of printing.
|
| |
| Dear Investor:
Thank you for reviewing this annual report for the 12 months ended March 31, 2016. It provides investment performance and portfolio information for the reporting period, plus longer-term historical performance data.
Annual reports help convey information about fund performance, including market and economic factors that affected returns during the reporting period. For additional, updated investment and market insights, we encourage you to visit our website, americancentury.com.
|
| Jonathan Thomas |
Divergence in Economic Growth and Monetary Policies, Combined With China Turmoil, Triggered Market Volatility
Divergence between the U.S. and the rest of the world—along with China’s struggles, plunging commodity prices, capital market volatility, and risk-off trading—were dominant themes during the reporting period. Global divergence described not only the relatively stronger economic growth enjoyed by the U.S. compared with most of the world, but also the related contrast between the U.S. Federal Reserve’s (the Fed’s) unwinding of monetary stimulus versus the continuation and expansion of stimulus by other major central banks.
Two months in particular captured the volatility and risk-off trading of the 12-month period. Last August, China’s economic slowdown (which rippled across the global economy) triggered Chinese stock market volatility, increasingly stimulative Chinese central bank monetary policy, and currency devaluations. Burdened further with oil market volatility, equity and higher-risk bond markets declined globally. Five months later, in January, investor sentiment plunged again as global economic growth decelerated, China devalued its currency again, and oil prices dropped below $30 a barrel. In addition, the Fed, in December, executed its first rate hike since 2006. Central bank policies showed less divergence thereafter, with the Bank of Japan suddenly resorting to negative interest rates, the Fed holding rates steady while reducing its rate hike projections, and the European Central Bank announcing significant additional stimulus.
Bonds (and more bond-like stock sectors, such as utilities and REITs) generally outperformed the broad stock market for the reporting period. In terms of stock style and size, growth generally outperformed value, and large cap generally outperformed small cap. In the bond market, higher quality (investment-grade) generally outperformed lower quality (high-yield). We expect continued economic and monetary policy divergence between the U.S. and non-U.S. economies in 2016, accompanied by further market volatility. This could present both challenges and opportunities for active investment managers. Looking ahead, we continue to believe in a disciplined, diversified, risk-aware investment approach, using professionally managed portfolios to meet financial goals. We appreciate your trust in us.
Sincerely,
Jonathan Thomas
President and Chief Executive Officer
American Century Investments
|
| | | | | | |
| Total Returns as of March 31, 2016 |
| | | | Average Annual Returns | |
| | Ticker Symbol | 1 year | 5 years | 10 years | Since Inception | Inception Date |
| Investor Class | ACMVX | 1.94% | 11.57% | 8.91% | — | 3/31/04 |
| Russell Midcap Value Index | — | -3.39% | 10.50% | 7.22% | — | — |
| Institutional Class | AVUAX | 2.14% | 11.78% | 9.13% | — | 8/2/04 |
| A Class | ACLAX | | | | — | 1/13/05 |
| No sales charge | | 1.69% | 11.30% | 8.65% | — | |
| With sales charge | | -4.17% | 9.99% | 8.00% | — | |
| C Class | ACCLX | 0.90% | 10.45% | — | 11.97% | 3/1/10 |
| R Class | AMVRX | 1.43% | 11.00% | 8.38% | — | 7/29/05 |
| R6 Class | AMDVX | 2.29% | — | — | 10.50% | 7/26/13 |
Sales charges include initial sales charges and contingent deferred sales charges (CDSCs), as applicable. A Class shares have a 5.75% maximum initial sales charge and may be subject to a maximum CDSC of 1.00%. C Class shares redeemed within 12 months of purchase are subject to a maximum CDSC of 1.00%. The SEC requires that mutual funds provide performance information net of maximum sales charges in all cases where charges could be applied.
Average annual returns since inception are presented when ten years of performance history is not available.
Prior to March 1, 2010, the A Class was referred to as the Advisor Class and did not have a front-end sales charge. Performance prior to that date has been adjusted to reflect this charge. Returns would have been lower if a portion of the fees had not been waived.
Data presented reflect past performance. Past performance is no guarantee of future results. Current performance may be higher or lower than the performance shown. Total returns for periods less than one year are not annualized. Investment return and principal value will fluctuate, and redemption value may be more or less than original cost. Data assumes reinvestment of dividends and capital gains, and none of the charts reflect the deduction of taxes that a shareholder would pay on fund distributions or the redemption of fund shares. To obtain performance data current to the most recent month end, please call 1-800-345-2021 or visit americancentury.com. For additional information about the fund, please consult the prospectus.
|
|
| Growth of $10,000 Over 10 Years |
| $10,000 investment made March 31, 2006 |
| Performance for other share classes will vary due to differences in fee structure. |
|
| |
| Value on March 31, 2016 |
| | Investor Class — $23,503 |
| |
| | Russell Midcap Value Index — $20,098 |
| |
Ending value would have been lower if a portion of the fees had not been waived.
|
| | | | | |
| Total Annual Fund Operating Expenses |
| Investor Class | Institutional Class | A Class | C Class | R Class | R6 Class |
| 1.01% | 0.81% | 1.26% | 2.01% | 1.51% | 0.66% |
The total annual fund operating expenses shown is as stated in the fund’s prospectus current as of the date of this report. The prospectus may vary from the expense ratio shown elsewhere in this report because it is based on a different time period, includes acquired fund fees and expenses, and, if applicable, does not include fee waivers or expense reimbursements.
Data presented reflect past performance. Past performance is no guarantee of future results. Current performance may be higher or lower than the performance shown. Total returns for periods less than one year are not annualized. Investment return and principal value will fluctuate, and redemption value may be more or less than original cost. Data assumes reinvestment of dividends and capital gains, and none of the charts reflect the deduction of taxes that a shareholder would pay on fund distributions or the redemption of fund shares. To obtain performance data current to the most recent month end, please call 1-800-345-2021 or visit americancentury.com. For additional information about the fund, please consult the prospectus.
Portfolio Managers: Kevin Toney, Michael Liss, Phil Davidson, and Brian Woglom
Performance Summary
Mid Cap Value returned 1.94%* for the 12 months ended March 31, 2016. By comparison, its benchmark, the Russell Midcap Value Index, returned -3.39%. The fund’s return reflects operating expenses, while the index’s return does not.
Volatility dominated the 12-month period as concerns over slowing growth in China and other emerging markets, falling oil prices, and the prospect of higher U.S. Federal Reserve (Fed) interest rates weighed on investor confidence. After a turbulent summer, markets sold off sharply in the third quarter of 2015, but stabilized somewhat in the fourth quarter as the Fed delayed an anticipated September interest rate hike. In December, however, Fed policymakers raised the federal funds rate by 25 basis points, while they affirmed the underlying strength of the U.S. economy. Early in 2016, concerns over slowing growth in China triggered a renewed market sell-off. Broad market indices such as the S&P 500 Index recovered some ground later in the first quarter after the Fed scaled back its projected number of rate hikes for the year, from four to two. Against this backdrop, mid-cap stocks underperformed the broader market as investors sought stability in large caps. Mid-cap value stocks outperformed mid-cap growth.
In this environment, Mid Cap Value’s investment approach, which emphasizes higher-quality businesses with sound balance sheets, provided positive absolute results in eight of the 10 sectors in which it was invested, during a period when only three of the index sectors had positive returns. On a relative basis, the portfolio outperformed its benchmark index, aided by its holdings in consumer staples, energy, financials, industrials, and health care. The portfolio’s stock selection in information technology detracted from relative performance.
Consumer Staples Contributed
Positioning in the consumer staples sector aided relative performance, due in part to an overweight investment in Sysco, a large distributor of food and related products. Sysco’s stock rose after the company reported better-than-expected financial results, fueled by strong volume growth.
Stock Selection in Energy Lifted Returns
Stock selection in energy contributed to relative performance, but was partially offset by the negative impact of the portfolio’s overweight, as downward volatility in oil prices weighed on stock price performance in the overall energy sector. Cameron International, a provider of oilfield flow-control equipment, was a positive contributor. Cameron’s stock price surged higher last August on news it was being acquired by oilfield-services provider Schlumberger for a healthy premium.
Financial and Industrials Aided Results
Security selection in financials, especially in the banks and insurance industries, supported relative returns, with strong stock price performance by HCC Insurance Holdings, which is no longer held. Within the industrials sector, the portfolio benefited from its overweight stake in waste management company Republic Services. In the first quarter of 2016, Republic reported better-than-expected earnings, and continued to execute well, aided by its minimal exposure to emerging markets and foreign currency issues.
*All fund returns referenced in this commentary are for Investor Class shares. Returns would have been lower if a portion of the fees had not been waived. Performance for other share classes will vary due to differences in fee structure; when Investor Class performance exceeds that of the fund's benchmark, other share classes may not. See page 3 for returns for all share classes.
Information Technology Dragged
Stock selection in information technology weighed on relative results, due in part to a portfolio-only position in memory chip manufacturer Micron Technology. Micron Technology’s business suffered from weakness and pricing pressures in the PC components market, factors that weighed on its earnings and share-price performance. We exited the position.
Several Energy Stocks Detracted
Despite positive overall stock selection in energy, declining oil and natural gas prices weighed on a number of the portfolio’s energy holdings. These included portfolio-only positions in Devon Energy, Anadarko Petroleum, and Imperial Oil, and an overweight in Noble Energy.
Outlook
As of March 31, 2016, the portfolio’s largest overweights are in the consumer staples and industrials sectors. We have identified many stocks in the consumer staples sector that fit our investment process well due to high returns on invested capital, stability, and healthy balance sheets. The portfolio has smaller overweights in the health care and energy sectors, and we continue to focus on higher-quality energy companies. The portfolio’s largest underweight remains in the financials sector due to a continued underweight to real estate investment trusts (REITs). The portfolio has smaller underweights in materials, utilities, consumer discretionary, information technology, and telecommunication services.
|
| |
| MARCH 31, 2016 |
| Top Ten Holdings | % of net assets |
| Northern Trust Corp. | 3.0% |
| Sysco Corp. | 2.9% |
| iShares Russell Mid-Cap Value ETF | 2.6% |
| Republic Services, Inc. | 2.2% |
| Zimmer Biomet Holdings, Inc. | 2.0% |
| Tyco International plc | 2.0% |
| Applied Materials, Inc. | 1.8% |
| Edison International | 1.7% |
| Weyerhaeuser Co. | 1.7% |
| Imperial Oil Ltd. | 1.7% |
| | |
| Top Five Industries | % of net assets |
| Oil, Gas and Consumable Fuels | 8.8% |
| Electric Utilities | 7.2% |
| Banks | 7.1% |
| Insurance | 6.9% |
| Commercial Services and Supplies | 5.7% |
| | |
| Types of Investments in Portfolio | % of net assets |
| Common Stocks | 94.8% |
| Exchange-Traded Funds | 2.6% |
| Total Equity Exposure | 97.4% |
| Temporary Cash Investments | 2.7% |
| Other Assets and Liabilities | (0.1)% |
Fund shareholders may incur two types of costs: (1) transaction costs, including sales charges (loads) on purchase payments and redemption/exchange fees; and (2) ongoing costs, including management fees; distribution and service (12b-1) fees; and other fund expenses. This example is intended to help you understand your ongoing costs (in dollars) of investing in your fund and to compare these costs with the ongoing cost of investing in other mutual funds.
The example is based on an investment of $1,000 made at the beginning of the period and held for the entire period from October 1, 2015 to March 31, 2016.
Actual Expenses
The table provides information about actual account values and actual expenses for each class. You may use the information, together with the amount you invested, to estimate the expenses that you paid over the period. First, identify the share class you own. Then simply divide your account value by $1,000 (for example, an $8,600 account value divided by $1,000 = 8.6), then multiply the result by the number under the heading “Expenses Paid During Period” to estimate the expenses you paid on your account during this period.
If you hold Investor Class shares of any American Century Investments fund, or Institutional Class shares of the American Century Diversified Bond Fund, in an American Century Investments account (i.e., not a financial intermediary or retirement plan account), American Century Investments may charge you a $12.50 semiannual account maintenance fee if the value of those shares is less than $10,000. We will redeem shares automatically in one of your accounts to pay the $12.50 fee. In determining your total eligible investment amount, we will include your investments in all personal accounts (including American Century Investments Brokerage accounts) registered under your Social Security number. Personal accounts include individual accounts, joint accounts, UGMA/UTMA accounts, personal trusts, Coverdell Education Savings Accounts and IRAs (including traditional, Roth, Rollover, SEP-, SARSEP- and SIMPLE-IRAs), and certain other retirement accounts. If you have only business, business retirement, employer-sponsored or American Century Investments Brokerage accounts, you are currently not subject to this fee. If you are subject to the Account Maintenance Fee, your account value could be reduced by the fee amount.
Hypothetical Example for Comparison Purposes
The table also provides information about hypothetical account values and hypothetical expenses based on the actual expense ratio of each class of your fund and an assumed rate of return of 5% per year before expenses, which is not the actual return of a fund’s share class. The hypothetical account values and expenses may not be used to estimate the actual ending account balance or expenses you paid for the period. You may use this information to compare the ongoing costs of investing in your fund and other funds. To do so, compare this 5% hypothetical example with the 5% hypothetical examples that appear in the shareholder reports of the other funds.
Please note that the expenses shown in the table are meant to highlight your ongoing costs only and do not reflect any transactional costs, such as sales charges (loads) or redemption/exchange fees. Therefore, the table is useful in comparing ongoing costs only, and will not help you determine the relative total costs of owning different funds. In addition, if these transactional costs were included, your costs would have been higher.
|
| | | | |
| | Beginning
Account Value
10/1/15 | Ending
Account Value
3/31/16 | Expenses Paid
During Period(1)10/1/15 - 3/31/16 | Annualized
Expense Ratio(1) |
| Actual | | | | |
| Investor Class (after waiver) | $1,000 | $1097.40 | $5.19 | 0.99% |
| Investor Class (before waiver) | $1,000 | $1,097.40(2) | $5.24 | 1.00% |
| Institutional Class (after waiver) | $1,000 | $1098.50 | $4.14 | 0.79% |
| Institutional Class (before waiver) | $1,000 | $1,098.50(2) | $4.20 | 0.80% |
| A Class (after waiver) | $1,000 | $1096.20 | $6.50 | 1.24% |
| A Class (before waiver) | $1,000 | $1,096.20(2) | $6.55 | 1.25% |
| C Class (after waiver) | $1,000 | $1091.60 | $10.41 | 1.99% |
| C Class (before waiver) | $1,000 | $1,091.60(2) | $10.46 | 2.00% |
| R Class (after waiver) | $1,000 | $1094.30 | $7.80 | 1.49% |
| R Class (before waiver) | $1,000 | $1,094.30(2) | $7.85 | 1.50% |
| R6 Class (after waiver) | $1,000 | $1099.30 | $3.36 | 0.64% |
| R6 Class (before waiver) | $1,000 | $1,099.30(2) | $3.41 | 0.65% |
| Hypothetical | | | | |
| Investor Class (after waiver) | $1,000 | $1,020.05 | $5.00 | 0.99% |
| Investor Class (before waiver) | $1,000 | $1,020.00 | $5.05 | 1.00% |
| Institutional Class (after waiver) | $1,000 | $1,021.05 | $3.99 | 0.79% |
| Institutional Class (before waiver) | $1,000 | $1,021.00 | $4.04 | 0.80% |
| A Class (after waiver) | $1,000 | $1,018.80 | $6.26 | 1.24% |
| A Class (before waiver) | $1,000 | $1,018.75 | $6.31 | 1.25% |
| C Class (after waiver) | $1,000 | $1,015.05 | $10.02 | 1.99% |
| C Class (before waiver) | $1,000 | $1,015.00 | $10.07 | 2.00% |
| R Class (after waiver) | $1,000 | $1,017.55 | $7.52 | 1.49% |
| R Class (before waiver) | $1,000 | $1,017.50 | $7.57 | 1.50% |
| R6 Class (after waiver) | $1,000 | $1,021.80 | $3.23 | 0.64% |
| R6 Class (before waiver) | $1,000 | $1,021.75 | $3.29 | 0.65% |
| |
| (1) | Expenses are equal to the class's annualized expense ratio listed in the table above, multiplied by the average account value over the period, multiplied by 183, the number of days in the most recent fiscal half-year, divided by 366, to reflect the one-half year period. |
| |
| (2) | Ending account value assumes the return earned after waiver and would have been lower if a portion of the fees had not been waived. |
MARCH 31, 2016
|
| | | | |
| | Shares | Value |
| COMMON STOCKS — 94.8% | | |
| Aerospace and Defense — 0.9% | | |
| Textron, Inc. | 1,645,762 | $ | 60,004,483 |
|
| Automobiles — 1.3% | | |
| Honda Motor Co., Ltd. ADR | 1,487,432 | 40,666,391 |
|
| Thor Industries, Inc. | 710,690 | 45,320,701 |
|
| | | 85,987,092 |
|
| Banks — 7.1% | | |
| Bank of Hawaii Corp. | 750,956 | 51,275,276 |
|
| BB&T Corp. | 1,403,504 | 46,694,578 |
|
| Comerica, Inc. | 884,782 | 33,506,694 |
|
| Commerce Bancshares, Inc. | 1,615,135 | 72,600,318 |
|
| M&T Bank Corp. | 611,030 | 67,824,330 |
|
| PNC Financial Services Group, Inc. (The) | 752,920 | 63,674,445 |
|
| SunTrust Banks, Inc. | 990,351 | 35,731,864 |
|
| UMB Financial Corp. | 791,627 | 40,871,702 |
|
Westamerica Bancorporation(1) | 1,556,989 | 75,840,934 |
|
| | | 488,020,141 |
|
| Capital Markets — 5.1% | | |
| Franklin Resources, Inc. | 1,097,704 | 42,865,341 |
|
| Northern Trust Corp. | 3,191,727 | 208,004,849 |
|
| State Street Corp. | 899,466 | 52,636,750 |
|
| T. Rowe Price Group, Inc. | 598,271 | 43,948,988 |
|
| | | 347,455,928 |
|
| Commercial Services and Supplies — 5.7% | | |
| ADT Corp. (The) | 1,115,898 | 46,041,951 |
|
Clean Harbors, Inc.(2) | 1,180,640 | 58,252,778 |
|
| Republic Services, Inc. | 3,130,972 | 149,190,816 |
|
| Tyco International plc | 3,732,921 | 137,035,530 |
|
| | | 390,521,075 |
|
| Containers and Packaging — 2.1% | | |
| Bemis Co., Inc. | 525,371 | 27,203,710 |
|
| Sonoco Products Co. | 1,331,894 | 64,690,092 |
|
| WestRock Co. | 1,311,548 | 51,189,718 |
|
| | | 143,083,520 |
|
| Diversified Financial Services — 0.4% | | |
Markit Ltd.(2) | 756,100 | 26,728,135 |
|
| Diversified Telecommunication Services — 1.1% | | |
| CenturyLink, Inc. | 2,457,530 | 78,542,659 |
|
| Electric Utilities — 7.2% | | |
| Edison International | 1,661,640 | 119,455,300 |
|
| Great Plains Energy, Inc. | 1,639,394 | 52,870,456 |
|
| PG&E Corp. | 1,856,405 | 110,864,507 |
|
| Westar Energy, Inc. | 2,291,530 | 113,682,803 |
|
| Xcel Energy, Inc. | 2,278,543 | 95,288,668 |
|
| | | 492,161,734 |
|
|
| | | | |
| | Shares | Value |
| Electrical Equipment — 2.2% | | |
| Emerson Electric Co. | 930,097 | $ | 50,578,675 |
|
| Hubbell, Inc. | 558,462 | 59,157,880 |
|
| Rockwell Automation, Inc. | 369,283 | 42,005,941 |
|
| | | 151,742,496 |
|
| Electronic Equipment, Instruments and Components — 2.1% | | |
Keysight Technologies, Inc.(2) | 2,634,964 | 73,093,901 |
|
| TE Connectivity Ltd. | 1,111,730 | 68,838,322 |
|
| | | 141,932,223 |
|
| Energy Equipment and Services — 2.2% | | |
Cameron International Corp.(2) | 402,161 | 26,964,895 |
|
FMC Technologies, Inc.(2) | 2,124,924 | 58,137,921 |
|
| Frank's International NV | 186,315 | 3,070,471 |
|
| Helmerich & Payne, Inc. | 1,011,938 | 59,420,999 |
|
| | | 147,594,286 |
|
| Food and Staples Retailing — 2.9% | | |
| Sysco Corp. | 4,191,696 | 195,877,954 |
|
| Food Products — 5.3% | | |
| ConAgra Foods, Inc. | 2,062,409 | 92,024,690 |
|
| General Mills, Inc. | 967,760 | 61,307,596 |
|
| J.M. Smucker Co. (The) | 477,079 | 61,943,937 |
|
| Kellogg Co. | 702,574 | 53,782,040 |
|
| Mondelez International, Inc., Class A | 2,294,193 | 92,043,023 |
|
| | | 361,101,286 |
|
| Gas Utilities — 1.9% | | |
| Atmos Energy Corp. | 814,908 | 60,515,068 |
|
| Laclede Group, Inc. (The) | 1,072,475 | 72,660,181 |
|
| | | 133,175,249 |
|
| Health Care Equipment and Supplies — 5.7% | | |
| Abbott Laboratories | 1,130,810 | 47,301,782 |
|
| Baxter International, Inc. | 2,177,277 | 89,442,539 |
|
| Becton Dickinson and Co. | 275,092 | 41,764,467 |
|
Boston Scientific Corp.(2) | 3,732,121 | 70,201,196 |
|
| Zimmer Biomet Holdings, Inc. | 1,301,569 | 138,786,303 |
|
| | | 387,496,287 |
|
| Health Care Providers and Services — 2.7% | | |
LifePoint Health, Inc.(2) | 1,507,435 | 104,389,874 |
|
| Quest Diagnostics, Inc. | 1,084,525 | 77,489,311 |
|
| | | 181,879,185 |
|
| Hotels, Restaurants and Leisure — 0.5% | | |
| Carnival Corp. | 712,711 | 37,609,760 |
|
| Household Durables — 0.7% | | |
| PulteGroup, Inc. | 2,488,647 | 46,562,585 |
|
| Industrial Conglomerates — 1.1% | | |
| Koninklijke Philips NV | 2,616,133 | 74,526,622 |
|
| Insurance — 6.9% | | |
| Aflac, Inc. | 542,635 | 34,261,974 |
|
| Allstate Corp. (The) | 542,645 | 36,557,994 |
|
| Brown & Brown, Inc. | 1,606,152 | 57,500,242 |
|
| Chubb Ltd. | 785,536 | 93,596,614 |
|
| MetLife, Inc. | 841,959 | 36,995,679 |
|
|
| | | | |
| | Shares | Value |
| ProAssurance Corp. | 663,029 | $ | 33,549,267 |
|
| Reinsurance Group of America, Inc. | 828,069 | 79,701,641 |
|
| Torchmark Corp. | 476,899 | 25,828,850 |
|
| Travelers Cos., Inc. (The) | 114,126 | 13,319,646 |
|
| Unum Group | 1,863,457 | 57,618,090 |
|
| | | 468,929,997 |
|
| Leisure Products — 0.3% | | |
| Mattel, Inc. | 709,692 | 23,859,845 |
|
| Machinery — 1.1% | | |
| Oshkosh Corp. | 996,899 | 40,743,262 |
|
| Parker-Hannifin Corp. | 331,735 | 36,849,124 |
|
| | | 77,592,386 |
|
| Metals and Mining — 0.6% | | |
| Nucor Corp. | 872,448 | 41,266,790 |
|
| Multi-Utilities — 1.7% | | |
| Ameren Corp. | 763,006 | 38,226,601 |
|
| Consolidated Edison, Inc. | 478,100 | 36,632,022 |
|
| NorthWestern Corp. | 627,307 | 38,736,207 |
|
| | | 113,594,830 |
|
| Multiline Retail — 0.4% | | |
| Target Corp. | 366,236 | 30,133,898 |
|
| Oil, Gas and Consumable Fuels — 8.8% | | |
| Anadarko Petroleum Corp. | 1,263,678 | 58,849,484 |
|
| Cimarex Energy Co. | 597,589 | 58,127,482 |
|
| Devon Energy Corp. | 1,547,120 | 42,452,973 |
|
| EQT Corp. | 1,690,618 | 113,710,967 |
|
| Imperial Oil Ltd. | 3,535,995 | 118,134,224 |
|
| Noble Energy, Inc. | 2,953,572 | 92,771,696 |
|
| Occidental Petroleum Corp. | 1,397,574 | 95,635,989 |
|
| Pioneer Natural Resources Co. | 150,409 | 21,168,563 |
|
| | | 600,851,378 |
|
| Real Estate Investment Trusts (REITs) — 5.4% | | |
| Boston Properties, Inc. | 189,606 | 24,095,131 |
|
| Corrections Corp. of America | 2,224,084 | 71,281,892 |
|
| Empire State Realty Trust, Inc. | 2,024,461 | 35,488,801 |
|
| Host Hotels & Resorts, Inc. | 2,801,563 | 46,786,102 |
|
| Piedmont Office Realty Trust, Inc., Class A | 3,617,278 | 73,466,916 |
|
| Weyerhaeuser Co. | 3,845,305 | 119,127,549 |
|
| | | 370,246,391 |
|
| Road and Rail — 2.2% | | |
| CSX Corp. | 2,806,143 | 72,258,182 |
|
| Heartland Express, Inc. | 4,115,405 | 76,340,763 |
|
| | | 148,598,945 |
|
| Semiconductors and Semiconductor Equipment — 4.9% | | |
| Applied Materials, Inc. | 5,890,117 | 124,752,678 |
|
| Lam Research Corp. | 458,005 | 37,831,213 |
|
| Maxim Integrated Products, Inc. | 2,370,967 | 87,204,167 |
|
| Microchip Technology, Inc. | 347,436 | 16,746,415 |
|
| Teradyne, Inc. | 3,314,958 | 71,569,943 |
|
| | | 338,104,416 |
|
|
| | | | |
| | Shares | Value |
| Specialty Retail — 2.3% | | |
| Advance Auto Parts, Inc. | 515,436 | $ | 82,645,008 |
|
| CST Brands, Inc. | 2,029,324 | 77,702,816 |
|
| | | 160,347,824 |
|
| Technology Hardware, Storage and Peripherals — 0.6% | | |
| SanDisk Corp. | 511,180 | 38,890,574 |
|
| Textiles, Apparel and Luxury Goods — 0.5% | | |
| Ralph Lauren Corp. | 384,941 | 37,054,421 |
|
| Thrifts and Mortgage Finance — 0.9% | | |
| Capitol Federal Financial, Inc. | 4,723,101 | 62,628,319 |
|
TOTAL COMMON STOCKS (Cost $5,721,882,312) | | 6,484,102,714 |
|
| EXCHANGE-TRADED FUNDS — 2.6% | | |
iShares Russell Mid-Cap Value ETF
(Cost $162,199,685) | 2,498,449 | 177,214,988 |
|
| TEMPORARY CASH INVESTMENTS — 2.7% | | |
| Repurchase Agreement, Fixed Income Clearing Corp., (collateralized by various U.S. Treasury obligations, 2.00% - 3.75%, 8/15/25 - 8/15/41, valued at $115,255,250), at 0.10%, dated 3/31/16, due 4/1/16 (Delivery value $112,985,314) | | 112,985,000 |
|
| State Street Institutional Liquid Reserves Fund, Premier Class | 73,779,498 | 73,779,498 |
|
TOTAL TEMPORARY CASH INVESTMENTS (Cost $186,764,498) | | 186,764,498 |
|
TOTAL INVESTMENT SECURITIES — 100.1% (Cost $6,070,846,495) | | 6,848,082,200 |
|
| OTHER ASSETS AND LIABILITIES — (0.1)% | | (4,497,091) |
|
| TOTAL NET ASSETS — 100.0% | | $ | 6,843,585,109 |
|
|
| | | | | | | | |
| FORWARD FOREIGN CURRENCY EXCHANGE CONTRACTS |
| Currency Purchased | Currency Sold | Counterparty | Settlement Date | Unrealized Appreciation
(Depreciation) |
| CAD | 4,728,511 | USD | 3,572,516 | Morgan Stanley | 06/30/16 | $ | 68,569 |
|
| USD | 99,189,789 | CAD | 130,909,691 | Morgan Stanley | 06/30/16 | (1,614,313 | ) |
| USD | 2,408,903 | CAD | 3,123,240 | Morgan Stanley | 06/30/16 | 3,922 |
|
| USD | 61,618,896 | EUR | 55,014,661 | UBS AG | 06/30/16 | (1,151,542 | ) |
| USD | 24,054,634 | JPY | 2,701,287,312 | Credit Suisse AG | 06/30/16 | (10,340 | ) |
| | | | | | | $ | (2,703,704 | ) |
|
| | |
| NOTES TO SCHEDULE OF INVESTMENTS |
| ADR | - | American Depositary Receipt |
| CAD | - | Canadian Dollar |
| EUR | - | Euro |
| JPY | - | Japanese Yen |
| USD | - | United States Dollar |
| |
| (1) | Affiliated Company: the fund’s holding represents ownership of 5% or more of the voting securities of the company; therefore, the company is affiliated as defined in the Investment Company Act of 1940. |
See Notes to Financial Statements.
|
|
| Statement of Assets and Liabilities |
|
| | | |
| MARCH 31, 2016 | |
| Assets | |
| Investment securities - unaffiliated, at value (cost of $5,999,773,185) | $ | 6,772,241,266 |
|
| Investment securities - affiliated, at value (cost of $71,073,310) | 75,840,934 |
|
| Total investment securities, at value (cost of $6,070,846,495) | 6,848,082,200 |
|
| Foreign currency holdings, at value (cost of $516,227) | 474,668 |
|
| Receivable for investments sold | 56,673,263 |
|
| Receivable for capital shares sold | 17,378,515 |
|
| Unrealized appreciation on forward foreign currency exchange contracts | 72,491 |
|
| Dividends and interest receivable | 14,410,978 |
|
| | 6,937,092,115 |
|
| | |
| Liabilities | |
| Payable for investments purchased | 78,296,695 |
|
| Payable for capital shares redeemed | 6,819,488 |
|
| Unrealized depreciation on forward foreign currency exchange contracts | 2,776,195 |
|
| Accrued management fees | 5,200,002 |
|
| Distribution and service fees payable | 414,626 |
|
| | 93,507,006 |
|
| | |
| Net Assets | $ | 6,843,585,109 |
|
| | |
| Net Assets Consist of: | |
| Capital (par value and paid-in surplus) | $ | 6,173,419,614 |
|
| Undistributed net investment income | 11,642,971 |
|
| Accumulated net realized loss | (115,972,909 | ) |
| Net unrealized appreciation | 774,495,433 |
|
| | $ | 6,843,585,109 |
|
|
| | | | | |
| | Net Assets | Shares Outstanding | Net Asset Value Per Share |
| Investor Class, $0.01 Par Value |
| $3,554,130,918 |
| 231,968,270 | $15.32 |
| Institutional Class, $0.01 Par Value |
| $1,153,899,349 |
| 75,273,372 | $15.33 |
| A Class, $0.01 Par Value |
| $1,360,885,923 |
| 88,969,944 | $15.30* |
| C Class, $0.01 Par Value |
| $102,905,699 |
| 6,781,963 | $15.17 |
| R Class, $0.01 Par Value |
| $127,581,200 |
| 8,360,227 | $15.26 |
| R6 Class, $0.01 Par Value |
| $544,182,020 |
| 35,502,150 | $15.33 |
* Maximum offering price $16.23 (net asset value divided by 0.9425).
See Notes to Financial Statements.
|
| | | |
| YEAR ENDED MARCH 31, 2016 | |
| Investment Income (Loss) | |
| Income: | |
| Dividends (including $2,471,571 from affiliates and net of foreign taxes withheld of $425,843) | $ | 141,391,548 |
|
| Interest | 91,800 |
|
| | 141,483,348 |
|
| | |
| Expenses: | |
| Management fees | 61,575,555 |
|
| Distribution and service fees: | |
| A Class | 3,396,403 |
|
| C Class | 858,371 |
|
| R Class | 621,004 |
|
| Directors' fees and expenses | 228,326 |
|
| Other expenses | 1,660 |
|
| | 66,681,319 |
|
| Fees waived | (677,064 | ) |
| | 66,004,255 |
|
| | |
| Net investment income (loss) | 75,479,093 |
|
| | |
| Realized and Unrealized Gain (Loss) | |
| Net realized gain (loss) on: | |
| Investment transactions (including $(965,303) from affiliates) | 249,624,836 |
|
| Foreign currency transactions | 4,488,011 |
|
| | 254,112,847 |
|
| | |
| Change in net unrealized appreciation (depreciation) on: | |
| Investments | (191,904,315 | ) |
| Translation of assets and liabilities in foreign currencies | (6,160,559 | ) |
| | (198,064,874 | ) |
| | |
| Net realized and unrealized gain (loss) | 56,047,973 |
|
| | |
| Net Increase (Decrease) in Net Assets Resulting from Operations | $ | 131,527,066 |
|
See Notes to Financial Statements.
|
|
| Statement of Changes in Net Assets |
|
| | | | | | |
| YEARS ENDED MARCH 31, 2016 AND MARCH 31, 2015 |
| Increase (Decrease) in Net Assets | March 31, 2016 | March 31, 2015 |
| Operations | | |
| Net investment income (loss) | $ | 75,479,093 |
| $ | 65,291,642 |
|
| Net realized gain (loss) | 254,112,847 |
| 612,577,453 |
|
| Change in net unrealized appreciation (depreciation) | (198,064,874) |
| 86,882,674 |
|
| Net increase (decrease) in net assets resulting from operations | 131,527,066 |
| 764,751,769 |
|
| | | |
| Distributions to Shareholders | | |
| From net investment income: | | |
| Investor Class | (42,456,054) |
| (37,256,893) |
|
| Institutional Class | (14,873,131) |
| (11,727,859) |
|
| A Class | (13,188,282) |
| (9,032,919) |
|
| C Class | (261,415) |
| (171,139) |
|
| R Class | (889,590) |
| (835,736) |
|
| R6 Class | (5,941,406) |
| (1,610,130) |
|
| From net realized gains: | | |
| Investor Class | (306,430,134 | ) | (328,624,367) |
|
| Institutional Class | (94,557,760 | ) | (88,881,075) |
|
| A Class | (119,189,154 | ) | (129,993,613) |
|
| C Class | (7,803,773 | ) | (6,378,011) |
|
| R Class | (10,991,672 | ) | (11,745,677) |
|
| R6 Class | (33,322,014 | ) | (12,874,828) |
|
| Decrease in net assets from distributions | (649,904,385) |
| (639,132,247) |
|
| | | |
| Capital Share Transactions | | |
| Net increase (decrease) in net assets from capital share transactions (Note 5) | 678,685,550 |
| 1,445,027,845 |
|
| | | |
| Net increase (decrease) in net assets | 160,308,231 |
| 1,570,647,367 |
|
| | | |
| Net Assets | | |
| Beginning of period | 6,683,276,878 |
| 5,112,629,511 |
|
| End of period | $ | 6,843,585,109 |
| $ | 6,683,276,878 |
|
| | | |
| Undistributed net investment income | $ | 11,642,971 |
| $ | 10,651,631 |
|
See Notes to Financial Statements.
|
|
Notes to Financial Statements |
MARCH 31, 2016
1. Organization
American Century Capital Portfolios, Inc. (the corporation) is registered under the Investment Company Act of 1940, as amended (the 1940 Act), as an open-end management investment company and is organized as a Maryland corporation. Mid Cap Value Fund (the fund) is one fund in a series issued by the corporation. The fund’s investment objective is to seek long-term capital growth. Income is a secondary objective.
The fund offers the Investor Class, the Institutional Class, the A Class, the C Class, the R Class and the R6 Class. The A Class may incur an initial sales charge. The A Class and C Class may be subject to a contingent deferred sales charge. The share classes differ principally in their respective sales charges and distribution and shareholder servicing expenses and arrangements. The Institutional Class and R6 Class shareholders do not require the same level of shareholder and administrative services from American Century Investment Management, Inc. (ACIM) (the investment advisor) as shareholders of other classes. In addition, financial intermediaries do not receive any service, distribution or administrative fees for the R6 Class. As a result, the Institutional Class and R6 Class are charged lower unified management fees.
2. Significant Accounting Policies
The following is a summary of significant accounting policies consistently followed by the fund in preparation of its financial statements. The fund is an investment company and follows accounting and reporting guidance in accordance with accounting principles generally accepted in the United States of America. This may require management to make certain estimates and assumptions at the date of the financial statements. Actual results could differ from these estimates. Management evaluated the impact of events or transactions occurring through the date the financial statements were issued that would merit recognition or disclosure.
Investment Valuations — The fund determines the fair value of its investments and computes its net asset value per share at the close of regular trading (usually 4 p.m. Eastern time) on the New York Stock Exchange (NYSE) on each day the NYSE is open. The Board of Directors has adopted valuation policies and procedures to guide the investment advisor in the fund’s investment valuation process and to provide methodologies for the oversight of the fund’s pricing function.
Equity securities that are listed or traded on a domestic securities exchange are valued at the last reported sales price or at the official closing price as provided by the exchange. Equity securities traded on foreign securities exchanges are generally valued at the closing price of such securities on the exchange where primarily traded or at the close of the NYSE, if that is earlier. If no last sales price is reported, or if local convention or regulation so provides, the mean of the latest bid and asked prices may be used. Securities traded over-the-counter are valued at the mean of the latest bid and asked prices, the last sales price, or the official closing price. Equity securities initially expressed in local currencies are translated into U.S. dollars at the mean of the appropriate currency exchange rate at the close of the NYSE as provided by an independent pricing service.
Open-end management investment companies are valued at the reported net asset value per share. Repurchase agreements are valued at cost, which approximates fair value. Forward foreign currency exchange contracts are valued at the mean of the appropriate forward exchange rate at the close of the NYSE as provided by an independent pricing service.
If the fund determines that the market price for an investment is not readily available or the valuation methods mentioned above do not reflect an investment’s fair value, such investment is valued as determined in good faith by the Board of Directors or its delegate, in accordance with policies and procedures adopted by the Board of Directors. In its determination of fair value, the fund may review several factors including, but not limited to, market information regarding the specific investment or comparable investments and correlation with other investment types, futures indices or general market indicators. Circumstances that may cause the fund to use these procedures to value an investment include, but are not limited to: an investment has been declared in default or is distressed; trading in a security has been suspended during the trading day or a security is not actively trading on its principal exchange; prices received from a regular pricing source are deemed unreliable; or there is a foreign market holiday and no trading occurred.
The fund monitors for significant events occurring after the close of an investment’s primary exchange but before the fund’s net asset value per share is determined. Significant events may include, but are not limited to: corporate announcements and transactions; governmental action and political unrest that could impact a specific investment or an investment sector; or armed conflicts, natural disasters and similar events that could affect investments in a specific country or region. The fund also monitors for significant fluctuations between domestic and foreign markets, as evidenced by the U.S. market or such other indicators that the Board of Directors, or its delegate, deems appropriate. If significant fluctuations in foreign markets are identified, the fund may apply a model-derived factor to the closing price of equity securities traded on foreign securities exchanges. The factor is based on observable market data as provided by an independent pricing service.
Security Transactions — Security transactions are accounted for as of the trade date. Net realized gains and losses are determined on the identified cost basis, which is also used for federal income tax purposes.
Investment Income — Dividend income less foreign taxes withheld, if any, is recorded as of the ex-dividend date. Distributions received on securities that represent a return of capital or long-term capital gain are recorded as a reduction of cost of investments and/or as a realized gain. The fund may estimate the components of distributions received that may be considered nontaxable distributions or long-term capital gain distributions for income tax purposes. Interest income is recorded on the accrual basis and includes accretion of discounts and amortization of premiums.
Foreign Currency Translations — All assets and liabilities initially expressed in foreign currencies are translated into U.S. dollars at prevailing exchange rates at period end. The fund may enter into spot foreign currency exchange contracts to facilitate transactions denominated in a foreign currency. Purchases and sales of investment securities, dividend and interest income, spot foreign currency exchange contracts, and expenses are translated at the rates of exchange prevailing on the respective dates of such transactions. Net realized and unrealized foreign currency exchange gains or losses related to investment securities are a component of net realized gain (loss) on investment transactions and change in net unrealized appreciation (depreciation) on investments, respectively.
Repurchase Agreements — The fund may enter into repurchase agreements with institutions that ACIM has determined are creditworthy pursuant to criteria adopted by the Board of Directors. The fund requires that the collateral, represented by securities, received in a repurchase transaction be transferred to the custodian in a manner sufficient to enable the fund to obtain those securities in the event of a default under the repurchase agreement. ACIM monitors, on a daily basis, the securities transferred to ensure the value, including accrued interest, of the securities under each repurchase agreement is equal to or greater than amounts owed to the fund under each repurchase agreement.
Joint Trading Account — Pursuant to an Exemptive Order issued by the Securities and Exchange Commission, the fund, along with certain other funds in the American Century Investments family of funds, may transfer uninvested cash balances into a joint trading account. These balances are invested in one or more repurchase agreements that are collateralized by U.S. Treasury or Agency obligations.
Income Tax Status — It is the fund’s policy to distribute substantially all net investment income and net realized gains to shareholders and to otherwise qualify as a regulated investment company under provisions of the Internal Revenue Code. Accordingly, no provision has been made for income taxes. The fund files U.S. federal, state, local and non-U.S. tax returns as applicable. The fund's tax returns are subject to examination by the relevant taxing authority until expiration of the applicable statute of limitations, which is generally three years from the date of filing but can be longer in certain jurisdictions. At this time, management believes there are no uncertain tax positions which, based on their technical merit, would not be sustained upon examination and for which it is reasonably possible that the total amounts of unrecognized tax benefits will significantly change in the next twelve months.
Multiple Class — All shares of the fund represent an equal pro rata interest in the net assets of the class to which such shares belong, and have identical voting, dividend, liquidation and other rights and the same terms and conditions, except for class specific expenses and exclusive rights to vote on matters affecting only individual classes. Income, non-class specific expenses, and realized and unrealized capital gains and losses of the fund are allocated to each class of shares based on their relative net assets.
Distributions to Shareholders — Distributions from net investment income, if any, are generally declared and paid quarterly. Distributions from net realized gains, if any, are generally declared and paid annually.
Indemnifications — Under the corporation’s organizational documents, its officers and directors are indemnified against certain liabilities arising out of the performance of their duties to the fund. In addition, in
the normal course of business, the fund enters into contracts that provide general indemnifications. The maximum exposure under these arrangements is unknown as this would involve future claims that may be made against a fund. The risk of material loss from such claims is considered by management to be remote.
3. Fees and Transactions with Related Parties
Certain officers and directors of the corporation are also officers and/or directors of American Century Companies, Inc. (ACC). The corporation’s investment advisor, ACIM, the corporation's distributor, American Century Investment Services, Inc. (ACIS), and the corporation’s transfer agent, American Century Services, LLC, are wholly owned, directly or indirectly, by ACC.
Management Fees — The corporation has entered into a management agreement with ACIM, under which ACIM provides the fund with investment advisory and management services in exchange for a single, unified management fee (the fee) per class. The agreement provides that all expenses of managing and operating the fund, except distribution and service fees, brokerage expenses, taxes, interest, fees and expenses of the independent directors (including legal counsel fees), and extraordinary expenses, will be paid by ACIM. The fee is computed and accrued daily based on each class’s daily net assets and paid monthly in arrears. The annual management fee is 1.00% for the Investor Class, A Class, C Class and R Class, 0.80% for the Institutional Class and 0.65% for the R6 Class. During the year ended March 31, 2016, the investment advisor voluntarily agreed to waive 0.05% of its management fee for assets over $7 billion. The fee waiver is determined by applying a formula that takes into account the fund's assets as well as certain assets, if any, of other clients of the investment advisor outside the American Century Investments family of funds (such as subadvised funds and separate accounts) that have very similar investment teams and investment strategies (strategy assets). The strategy assets of the fund also include the assets of NT Mid Cap Value Fund, one fund in a series issued by the corporation. The investment advisor expects the fee waiver to continue through July 31, 2016, and cannot terminate it without the approval of the Board of Directors. The total amount of the waiver for each class for the year ended March 31, 2016 was $368,102, $108,605, $142,048, $8,925, $12,961 and $36,423 for the Investor Class, Institutional Class, A Class, C Class, R Class and R6 Class, respectively. The effective annual management fee after waiver for each class for the year ended March 31, 2016 was 0.99% for the Investor Class, A Class, C Class and R Class, 0.79% for the Institutional Class and 0.64% for the R6 Class.
Distribution and Service Fees — The Board of Directors has adopted a separate Master Distribution and Individual Shareholder Services Plan for each of the A Class, C Class and R Class (collectively the plans), pursuant to Rule 12b-1 of the 1940 Act. The plans provide that the A Class will pay ACIS an annual distribution and service fee of 0.25%. The plans provide that the C Class will pay ACIS an annual distribution and service fee of 1.00%, of which 0.25% is paid for individual shareholder services and 0.75% is paid for distribution services. The plans provide that the R Class will pay ACIS an annual distribution and service fee of 0.50%. The fees are computed and accrued daily based on each class’s daily net assets and paid monthly in arrears. The fees are used to pay financial intermediaries for distribution and individual shareholder services. Fees incurred under the plans during the year ended March 31, 2016 are detailed in the Statement of Operations.
Directors' Fees and Expenses — The Board of Directors is responsible for overseeing the investment advisor’s management and operations of the fund. The directors receive detailed information about the fund and its investment advisor regularly throughout the year, and meet at least quarterly with management of the investment advisor to review reports about fund operations. The fund’s officers do not receive compensation from the fund.
4. Investment Transactions
Purchases and sales of investment securities, excluding short-term investments, for the year ended March 31, 2016 were $4,237,151,667 and $4,168,810,174, respectively.
5. Capital Share Transactions
Transactions in shares of the fund were as follows:
|
| | | | | | | | | | |
| | Year ended
March 31, 2016 | Year ended March 31, 2015 |
| | Shares | Amount | Shares | Amount |
| Investor Class/Shares Authorized | 1,355,000,000 |
| | 1,000,000,000 |
| |
| Sold | 46,886,278 |
| $ | 726,588,711 |
| 47,845,228 |
| $ | 805,464,849 |
|
| Issued in reinvestment of distributions | 22,803,942 |
| 338,309,767 |
| 21,749,952 |
| 357,551,089 |
|
| Redeemed | (63,495,986 | ) | (995,699,429 | ) | (42,736,259 | ) | (717,011,409 | ) |
| | 6,194,234 |
| 69,199,049 |
| 26,858,921 |
| 446,004,529 |
|
| Institutional Class/Shares Authorized | 500,000,000 |
| | 350,000,000 |
| |
| Sold | 25,276,057 |
| 394,037,156 |
| 21,317,473 |
| 358,366,290 |
|
| Issued in reinvestment of distributions | 5,835,014 |
| 86,628,472 |
| 4,863,510 |
| 80,063,695 |
|
| Redeemed | (16,752,803 | ) | (263,051,652 | ) | (14,945,599 | ) | (251,817,748 | ) |
| | 14,358,268 |
| 217,613,976 |
| 11,235,384 |
| 186,612,237 |
|
| A Class/Shares Authorized | 575,000,000 |
| | 350,000,000 |
| |
| Sold | 25,452,354 |
| 397,016,320 |
| 52,471,389 |
| 867,401,841 |
|
| Issued in reinvestment of distributions | 8,720,476 |
| 128,973,104 |
| 8,314,134 |
| 136,295,978 |
|
| Redeemed | (33,009,047 | ) | (515,757,726 | ) | (22,106,527 | ) | (370,969,551 | ) |
| | 1,163,783 |
| 10,231,698 |
| 38,678,996 |
| 632,728,268 |
|
| C Class/Shares Authorized | 50,000,000 |
| | 20,000,000 |
| |
| Sold | 2,576,346 |
| 39,427,299 |
| 1,327,076 |
| 22,095,693 |
|
| Issued in reinvestment of distributions | 486,080 |
| 7,099,539 |
| 358,656 |
| 5,834,066 |
|
| Redeemed | (1,077,300 | ) | (16,527,955 | ) | (605,325 | ) | (10,095,709 | ) |
| | 1,985,126 |
| 29,998,883 |
| 1,080,407 |
| 17,834,050 |
|
| R Class/Shares Authorized | 70,000,000 |
| | 40,000,000 |
| |
| Sold | 2,231,125 |
| 34,966,484 |
| 2,530,872 |
| 42,216,647 |
|
| Issued in reinvestment of distributions | 798,168 |
| 11,757,959 |
| 760,719 |
| 12,445,520 |
|
| Redeemed | (2,520,338 | ) | (39,520,721 | ) | (2,210,722 | ) | (36,981,897 | ) |
| | 508,955 |
| 7,203,722 |
| 1,080,869 |
| 17,680,270 |
|
| R6 Class/Shares Authorized | 200,000,000 |
| | 50,000,000 |
| |
| Sold | 24,040,730 |
| 372,402,699 |
| 9,299,284 |
| 156,315,103 |
|
| Issued in reinvestment of distributions | 2,643,832 |
| 39,261,659 |
| 880,443 |
| 14,484,958 |
|
| Redeemed | (4,328,604 | ) | (67,226,136 | ) | (1,593,718 | ) | (26,631,570 | ) |
| | 22,355,958 |
| 344,438,222 |
| 8,586,009 |
| 144,168,491 |
|
| Net increase (decrease) | 46,566,324 |
| $ | 678,685,550 |
| 87,520,586 |
| $ | 1,445,027,845 |
|
6. Fair Value Measurements
The fund’s investments valuation process is based on several considerations and may use multiple inputs to determine the fair value of the investments held by the fund. In conformity with accounting principles generally accepted in the United States of America, the inputs used to determine a valuation are classified into three broad levels.
| |
| • | Level 1 valuation inputs consist of unadjusted quoted prices in an active market for identical investments. |
| |
| • | Level 2 valuation inputs consist of direct or indirect observable market data (including quoted prices for comparable investments, evaluations of subsequent market events, interest rates, prepayment speeds, credit risk, etc.). These inputs also consist of quoted prices for identical investments initially expressed in local currencies that are adjusted through translation into U.S. dollars. |
| |
| • | Level 3 valuation inputs consist of unobservable data (including a fund’s own assumptions). |
The level classification is based on the lowest level input that is significant to the fair valuation measurement. The valuation inputs are not necessarily an indication of the risks associated with investing in these securities or other financial instruments. There were no significant transfers between levels during the period.
The following is a summary of the level classifications as of period end. The Schedule of Investments provides additional information on the fund’s portfolio holdings.
|
| | | | | | | | |
| | Level 1 | Level 2 | Level 3 |
| Assets | | | |
| Investment Securities | | | |
| Common Stocks | $ | 6,291,441,868 |
| $ | 192,660,846 |
| — |
|
| Exchange-Traded Funds | 177,214,988 |
| — |
| — |
|
| Temporary Cash Investments | 73,779,498 |
| 112,985,000 |
| — |
|
| | $ | 6,542,436,354 |
| $ | 305,645,846 |
| — |
|
| Other Financial Instruments | | | |
| Forward Foreign Currency Exchange Contracts | — |
| $ | 72,491 |
| — |
|
| | | | |
| Liabilities | | | |
| Other Financial Instruments | | | |
| Forward Foreign Currency Exchange Contracts | — |
| $ | 2,776,195 |
| — |
|
7. Affiliated Company Transactions
If a fund's holding represents ownership of 5% or more of the voting securities of a company, the company is affiliated as defined in the 1940 Act. A summary of transactions for each company which is or was an affiliate at or during the year ended March 31, 2016 follows:
|
| | | | | | | | | | | | | | | | | | |
| Company | Beginning
Value | Purchase
Cost | Sales Cost | Realized
Gain (Loss) | Dividend
Income | Ending
Value |
| Westamerica Bancorporation | $ | 49,253,783 |
| $ | 20,491,069 |
| $ | 2,044,370 |
| $ | (92,230 | ) | $ | 2,195,610 |
| $ | 75,840,934 |
|
Heartland Express, Inc.(1) | 38,508,473 |
| 53,768,789 |
| 4,145,324 |
| (873,073 | ) | 275,961 |
| (1 | ) |
| | $ | 87,762,256 |
| $ | 74,259,858 |
| $ | 6,189,694 |
| $ | (965,303 | ) | $ | 2,471,571 |
| $ | 75,840,934 |
|
(1) Company was not an affiliate at March 31, 2016.
8. Derivative Instruments
Foreign Currency Risk — The fund is subject to foreign currency exchange rate risk in the normal course of pursuing its investment objectives. The value of foreign investments held by a fund may be significantly affected by changes in foreign currency exchange rates. The dollar value of a foreign security generally decreases when the value of the dollar rises against the foreign currency in which the security is denominated and tends to increase when the value of the dollar declines against such foreign currency. A fund may enter into forward foreign currency exchange contracts to reduce a fund's exposure to foreign currency exchange rate fluctuations. The net U.S. dollar value of foreign currency underlying all contractual commitments held by a fund and the resulting unrealized appreciation or depreciation are determined daily. Realized gain or loss is recorded upon the termination of the contract. Net realized and unrealized gains or losses occurring during the holding period of forward foreign currency exchange contracts are a component of net realized gain (loss) on foreign currency transactions and change in net unrealized appreciation (depreciation) on translation of assets and liabilities in foreign currencies, respectively. A fund bears the risk of an unfavorable change in the foreign currency exchange rate underlying the forward contract. Additionally, losses, up to the fair value, may arise if the counterparties do not perform under the contract terms. The fund's average U.S. dollar exposure to foreign currency risk derivative instruments held during the period was $214,637,095.
The value of foreign currency risk derivative instruments as of March 31, 2016, is disclosed on the Statement of Assets and Liabilities as an asset of $72,491 in unrealized appreciation on forward foreign currency exchange contracts and a liability of $2,776,195 in unrealized depreciation on forward foreign currency exchange contracts. For the year ended March 31, 2016, the effect of foreign currency risk derivative instruments on the Statement of Operations was $4,434,805 in net realized gain (loss) on foreign currency transactions and $(6,151,893) in change in net unrealized appreciation (depreciation) on translation of assets and liabilities in foreign currencies.
9. Federal Tax Information
The tax character of distributions paid during the years ended March 31, 2016 and March 31, 2015 were as follows:
|
| | | | | | |
| | 2016 | 2015 |
| Distributions Paid From | | |
| Ordinary income | $ | 220,067,909 |
| $ | 288,118,716 |
|
| Long-term capital gains | $ | 429,836,476 |
| $ | 351,013,531 |
|
The book-basis character of distributions made during the year from net investment income or net realized gains may differ from their ultimate characterization for federal income tax purposes. These differences reflect the differing character of certain income items and net realized gains and losses for financial statement and tax purposes, and may result in reclassification among certain capital accounts on the financial statements.
As of March 31, 2016, the federal tax cost of investments and the components of distributable earnings on a tax-basis were as follows:
|
| | | |
| Federal tax cost of investments | $ | 6,163,754,093 |
|
| Gross tax appreciation of investments | $ | 931,157,977 |
|
| Gross tax depreciation of investments | (246,829,870 | ) |
| Net tax appreciation (depreciation) of investments | 684,328,107 |
|
Net tax appreciation (depreciation) on derivatives and translation of assets and liabilities in foreign currencies | (36,567 | ) |
| Net tax appreciation (depreciation) | $ | 684,291,540 |
|
| Undistributed ordinary income | $ | 11,642,971 |
|
| Accumulated long-term gains | $ | 1,298,294 |
|
| Post-October capital loss deferral | $ | (27,067,310 | ) |
The difference between book-basis and tax-basis unrealized appreciation (depreciation) is attributable primarily to the tax deferral of losses on wash sales.
Loss deferrals represent certain qualified losses that the fund has elected to treat as having been incurred in the following fiscal year for federal income tax purposes.
|
| | | | | | | | | | | | | | | | | |
| For a Share Outstanding Throughout the Years Ended March 31 (except as noted) | | |
| Per-Share Data | | | | | | | | Ratios and Supplemental Data | | |
| | | Income From Investment Operations: | Distributions From: | | | Ratio to Average Net Assets of: | | |
| | Net Asset
Value,
Beginning
of Period | Net
Investment
Income
(Loss)(1) | Net
Realized
and
Unrealized
Gain (Loss) | Total From
Investment
Operations | Net
Investment
Income | Net
Realized
Gains | Total
Distributions | Net Asset
Value,
End
of Period | Total
Return(2) | Operating
Expenses | Operating
Expenses
(before
expense
waiver) | Net
Investment
Income
(Loss) | Net
Investment
Income (Loss)
(before
expense
waiver) | Portfolio
Turnover
Rate | Net
Assets,
End of
Period (in thousands) |
| Investor Class |
| 2016 | $16.70 | 0.19 | 0.06 | 0.25 | (0.19) | (1.44) | (1.63) | $15.32 | 1.94% | 1.00% | 1.01% | 1.19% | 1.18% | 66% |
| $3,554,131 |
|
| 2015 | $16.35 | 0.20 | 1.98 | 2.18 | (0.18) | (1.65) | (1.83) | $16.70 | 13.62% | 1.00% | 1.00% | 1.16% | 1.16% | 66% |
| $3,771,117 |
|
| 2014 | $14.53 | 0.21 | 2.77 | 2.98 | (0.20) | (0.96) | (1.16) | $16.35 | 21.02% | 1.00% | 1.00% | 1.34% | 1.34% | 67% |
| $3,252,177 |
|
| 2013 | $12.86 | 0.22 | 2.02 | 2.24 | (0.25) | (0.32) | (0.57) | $14.53 | 18.11% | 1.00% | 1.00% | 1.69% | 1.69% | 61% |
| $2,459,353 |
|
| 2012 | $13.13 | 0.22 | 0.28 | 0.50 | (0.16) | (0.61) | (0.77) | $12.86 | 4.48% | 1.01% | 1.01% | 1.80% | 1.80% | 82% |
| $1,615,365 |
|
| Institutional Class |
| 2016 | $16.71 | 0.22 | 0.06 | 0.28 | (0.22) | (1.44) | (1.66) | $15.33 | 2.14% | 0.80% | 0.81% | 1.39% | 1.38% | 66% |
| $1,153,899 |
|
| 2015 | $16.36 | 0.23 | 1.99 | 2.22 | (0.22) | (1.65) | (1.87) | $16.71 | 13.83% | 0.80% | 0.80% | 1.36% | 1.36% | 66% |
| $1,017,915 |
|
| 2014 | $14.53 | 0.24 | 2.78 | 3.02 | (0.23) | (0.96) | (1.19) | $16.36 | 21.33% | 0.80% | 0.80% | 1.54% | 1.54% | 67% |
| $812,521 |
|
| 2013 | $12.86 | 0.25 | 2.02 | 2.27 | (0.28) | (0.32) | (0.60) | $14.53 | 18.34% | 0.80% | 0.80% | 1.89% | 1.89% | 61% |
| $421,877 |
|
| 2012 | $13.14 | 0.25 | 0.27 | 0.52 | (0.19) | (0.61) | (0.80) | $12.86 | 4.60% | 0.81% | 0.81% | 2.00% | 2.00% | 82% |
| $262,032 |
|
|
| | | | | | | | | | | | | | | | | |
| For a Share Outstanding Throughout the Years Ended March 31 (except as noted) | | |
| Per-Share Data | | | | | | | | Ratios and Supplemental Data | | |
| | | Income From Investment Operations: | Distributions From: | | | Ratio to Average Net Assets of: | | |
| | Net Asset
Value,
Beginning
of Period | Net
Investment
Income
(Loss)(1) | Net
Realized
and
Unrealized
Gain (Loss) | Total From
Investment
Operations | Net
Investment
Income | Net
Realized
Gains | Total
Distributions | Net Asset
Value,
End
of Period | Total
Return(2) | Operating
Expenses | Operating
Expenses
(before
expense
waiver) | Net
Investment
Income
(Loss) | Net
Investment
Income (Loss)
(before
expense
waiver) | Portfolio
Turnover
Rate | Net
Assets,
End of
Period (in thousands) |
| A Class |
| 2016 | $16.68 | 0.15 | 0.06 | 0.21 | (0.15) | (1.44) | (1.59) | $15.30 | 1.69% | 1.25% | 1.26% | 0.94% | 0.93% | 66% |
| $1,360,886 |
|
| 2015 | $16.33 | 0.15 | 2.00 | 2.15 | (0.15) | (1.65) | (1.80) | $16.68 | 13.40% | 1.25% | 1.25% | 0.91% | 0.91% | 66% |
| $1,464,424 |
|
| 2014 | $14.52 | 0.17 | 2.76 | 2.93 | (0.16) | (0.96) | (1.12) | $16.33 | 20.71% | 1.25% | 1.25% | 1.09% | 1.09% | 67% |
| $802,480 |
|
| 2013 | $12.86 | 0.19 | 2.01 | 2.20 | (0.22) | (0.32) | (0.54) | $14.52 | 17.83% | 1.25% | 1.25% | 1.44% | 1.44% | 61% |
| $488,491 |
|
| 2012 | $13.13 | 0.19 | 0.29 | 0.48 | (0.14) | (0.61) | (0.75) | $12.86 | 4.19% | 1.26% | 1.26% | 1.55% | 1.55% | 82% |
| $316,497 |
|
| C Class |
| 2016 | $16.57 | 0.03 | 0.06 | 0.09 | (0.05) | (1.44) | (1.49) | $15.17 | 0.90% | 2.00% | 2.01% | 0.19% | 0.18% | 66% |
| $102,906 |
|
| 2015 | $16.26 | 0.03 | 1.97 | 2.00 | (0.04) | (1.65) | (1.69) | $16.57 | 12.53% | 2.00% | 2.00% | 0.16% | 0.16% | 66% |
| $79,490 |
|
| 2014 | $14.49 | 0.05 | 2.75 | 2.80 | (0.07) | (0.96) | (1.03) | $16.26 | 19.75% | 2.00% | 2.00% | 0.34% | 0.34% | 67% |
| $60,443 |
|
| 2013 | $12.84 | 0.09 | 2.02 | 2.11 | (0.14) | (0.32) | (0.46) | $14.49 | 16.96% | 2.00% | 2.00% | 0.69% | 0.69% | 61% |
| $31,407 |
|
| 2012 | $13.14 | 0.11 | 0.27 | 0.38 | (0.07) | (0.61) | (0.68) | $12.84 | 3.41% | 2.01% | 2.01% | 0.80% | 0.80% | 82% |
| $15,242 |
|
|
| | | | | | | | | | | | | | | | | |
| For a Share Outstanding Throughout the Years Ended March 31 (except as noted) | | |
| Per-Share Data | | | | | | | | Ratios and Supplemental Data | | |
| | | Income From Investment Operations: | Distributions From: | | | Ratio to Average Net Assets of: | | |
| | Net Asset
Value,
Beginning
of Period | Net
Investment
Income
(Loss)(1) | Net
Realized
and
Unrealized
Gain (Loss) | Total From
Investment
Operations | Net
Investment
Income | Net
Realized
Gains | Total
Distributions | Net Asset
Value,
End
of Period | Total
Return(2) | Operating
Expenses | Operating
Expenses
(before
expense
waiver) | Net
Investment
Income
(Loss) | Net
Investment
Income (Loss)
(before
expense
waiver) | Portfolio
Turnover
Rate | Net
Assets,
End of
Period (in thousands) |
| R Class |
| 2016 | $16.64 | 0.11 | 0.06 | 0.17 | (0.11) | (1.44) | (1.55) | $15.26 | 1.43% | 1.50% | 1.51% | 0.69% | 0.68% | 66% |
| $127,581 |
|
| 2015 | $16.31 | 0.11 | 1.98 | 2.09 | (0.11) | (1.65) | (1.76) | $16.64 | 13.07% | 1.50% | 1.50% | 0.66% | 0.66% | 66% |
| $130,669 |
|
| 2014 | $14.51 | 0.13 | 2.76 | 2.89 | (0.13) | (0.96) | (1.09) | $16.31 | 20.41% | 1.50% | 1.50% | 0.84% | 0.84% | 67% |
| $110,440 |
|
| 2013 | $12.85 | 0.15 | 2.02 | 2.17 | (0.19) | (0.32) | (0.51) | $14.51 | 17.49% | 1.50% | 1.50% | 1.19% | 1.19% | 61% |
| $73,023 |
|
| 2012 | $13.14 | 0.16 | 0.28 | 0.44 | (0.12) | (0.61) | (0.73) | $12.85 | 3.91% | 1.51% | 1.51% | 1.30% | 1.30% | 82% |
| $50,444 |
|
| R6 Class |
| 2016 | $16.71 | 0.25 | 0.05 | 0.30 | (0.24) | (1.44) | (1.68) | $15.33 | 2.29% | 0.65% | 0.66% | 1.54% | 1.53% | 66% |
| $544,182 |
|
| 2015 | $16.35 | 0.26 | 1.99 | 2.25 | (0.24) | (1.65) | (1.89) | $16.71 | 14.07% | 0.65% | 0.65% | 1.51% | 1.51% | 66% |
| $219,661 |
|
2014(3) | $15.66 | 0.20 | 1.61 | 1.81 | (0.16) | (0.96) | (1.12) | $16.35 | 12.01% | 0.65%(4) | 0.65%(4) | 1.83%(4) | 1.83%(4) | 67%(5) |
| $74,570 |
|
|
| | | | |
| Notes to Financial Highlights |
| |
| (1) | Computed using average shares outstanding throughout the period. |
| |
| (2) | Total returns are calculated based on the net asset value of the last business day and do not reflect applicable sales charges, if any. Total returns for periods less than one year are not annualized. |
| |
| (3) | July 26, 2013 (commencement of sale) through March 31, 2014. |
| |
| (5) | Portfolio turnover is calculated at the fund level. Percentage indicated was calculated for the year ended March 31, 2014. |
See Notes to Financial Statements.
|
|
| Report of Independent Registered Public Accounting Firm |
To the Board of Directors and Shareholders of American Century Capital Portfolios, Inc.:
We have audited the accompanying statement of assets and liabilities, including the schedule of investments, of Mid Cap Value Fund (the “Fund”), one of the funds constituting American Century Capital Portfolios, Inc., as of March 31, 2016, and the related statement of operations for the year then ended, the statements of changes in net assets for each of the two years in the period then ended, and the financial highlights for each of the periods presented. These financial statements and financial highlights are the responsibility of the Fund's management. Our responsibility is to express an opinion on these financial statements and financial highlights based on our audits.
We conducted our audits in accordance with the standards of the Public Company Accounting Oversight Board (United States). Those standards require that we plan and perform the audit to obtain reasonable assurance about whether the financial statements and financial highlights are free of material misstatement. The Fund is not required to have, nor were we engaged to perform, an audit of its internal control over financial reporting. Our audits included consideration of internal control over financial reporting as a basis for designing audit procedures that are appropriate in the circumstances, but not for the purpose of expressing an opinion on the effectiveness of the Fund's internal control over financial reporting. Accordingly, we express no such opinion. An audit also includes examining, on a test basis, evidence supporting the amounts and disclosures in the financial statements, assessing the accounting principles used and significant estimates made by management, as well as evaluating the overall financial statement presentation. Our procedures included confirmation of securities owned as of March 31, 2016, by correspondence with the custodian and brokers; when replies were not received from brokers, we performed other auditing procedures. We believe that our audits provide a reasonable basis for our opinion.
In our opinion, the financial statements and financial highlights referred to above present fairly, in all material respects, the financial position of Mid Cap Value Fund of American Century Capital Portfolios, Inc. as of March 31, 2016, the results of its operations for the year then ended, the changes in its net assets for each of the two years in the period then ended, and the financial highlights for each of the periods presented, in conformity with accounting principles generally accepted in the United States of America.
DELOITTE & TOUCHE LLP
Kansas City, Missouri May 17, 2016
The Board of Directors
The individuals listed below serve as directors of the funds. Each director will continue to serve in this capacity until death, retirement, resignation or removal from office. The board has adopted a mandatory retirement age for directors who are not “interested persons,” as that term is defined in the Investment Company Act (independent directors). Independent directors shall retire by December 31 of the year in which they reach their 75th birthday.
Mr. Thomas is an “interested person” because he currently serves as President and Chief Executive Officer of American Century Companies, Inc. (ACC), the parent company of American Century Investment Management, Inc. (ACIM or the advisor). Mr. Fink is treated as an “interested person” because of his recent employment with ACC and American Century Services, LLC (ACS). The other directors (more than three-fourths of the total number) are independent. They are not employees, directors or officers of, and have no financial interest in, ACC or any of its wholly owned, direct or indirect, subsidiaries, including ACIM, American Century Investment Services, Inc. (ACIS) and ACS, and they do not have any other affiliations, positions or relationships that would cause them to be considered “interested persons” under the Investment Company Act. The directors serve in this capacity for seven (in the case of Mr. Thomas, 15) registered investment companies in the American Century Investments family of funds.
The following table presents additional information about the directors. The mailing address for each director is 4500 Main Street, Kansas City, Missouri 64111.
|
| | | | | |
Name
(Year of Birth) | Position(s) Held with Funds | Length of Time Served | Principal Occupation(s) During Past 5 Years | Number of American Century Portfolios Overseen by Director | Other Directorships Held During Past
5 Years |
| Independent Directors | | |
Andrea C. Hall
(1945) | Director | Since 1997 | Retired | 83 | None |
Jan M. Lewis
(1957) | Director | Since 2011 | Retired; President and Chief Executive Officer, Catholic Charities of Northeast Kansas (human services organization) (2006 to 2013) | 83 | None |
James A. Olson
(1942) | Director and Chairman of the Board | Since 2007 (Chairman since 2014) | Member, Plaza Belmont LLC (private equity fund manager) (1999 to present) | 83 | Saia, Inc. (2002 to 2012) and EPR Properties (2003 to 2013) |
M. Jeannine Strandjord
(1945) | Director | Since 1994 | Retired | 83 | Euronet Worldwide Inc.; MGP Ingredients, Inc.; and DST Systems Inc. (1996 to 2012) |
John R. Whitten
(1946) | Director | Since 2008 | Retired | 83 | Rudolph Technologies, Inc. |
Stephen E. Yates
(1948) | Director | Since 2012 | Retired | 83 | None |
|
| | | | | |
Name
(Year of Birth) | Position(s) Held with Funds | Length of Time Served | Principal Occupation(s) During Past 5 Years | Number of American Century Portfolios Overseen by Director | Other Directorships Held During Past
5 Years |
| Interested Directors |
Barry Fink
(1955) | Director | Since 2012 | Retired; Executive Vice President, ACC (September 2007 to February 2013); President, ACS (October 2007 to February 2013); Chief Operating Officer, ACC (September 2007 to November 2012) | 83 | None |
Jonathan S. Thomas
(1963) | Director and President | Since 2007 | President and Chief Executive Officer, ACC (March 2007 to present). Also serves as Chief Executive Officer, ACS; Executive Vice President, ACIM; Director, ACC, ACIM and other ACC subsidiaries | 128 | BioMed Valley Discoveries, Inc. |
The Statement of Additional Information has additional information about the fund's directors and is available without charge, upon request, by calling 1-800-345-2021.
Officers
The following table presents certain information about the executive officers of the funds. Each officer serves as an officer for each of the 15 investment companies in the American Century family of funds, unless otherwise noted. No officer is compensated for his or her service as an officer of the funds. The listed officers are interested persons of the funds and are appointed or re-appointed on an annual basis. The mailing address for each officer listed below is 4500 Main Street, Kansas City, Missouri 64111.
|
| | |
| Name (Year of Birth) | Offices with the Funds | Principal Occupation(s) During the Past Five Years |
Jonathan S. Thomas
(1963) | Director and President
since 2007 | President and Chief Executive Officer, ACC (March 2007 to present). Also serves as Chief Executive Officer, ACS; Executive Vice President, ACIM; Director, ACC, ACIM and other ACC subsidiaries |
Amy D. Shelton
(1964) | Chief Compliance Officer and Vice President since 2014 | Chief Compliance Officer, American Century funds, (March 2014 to present); Chief Compliance Officer, ACIM (February 2014 to present); Chief Compliance Officer, ACIS (October 2009 to present); Vice President, Client Interactions and Marketing, ACIS (February 2013 to January 2014); Director, Client Interactions and Marketing, ACIS (June 2007 to January 2013). Also serves as Vice President, ACIS |
Charles A. Etherington
(1957) | General Counsel since 2007 and Senior Vice President since 2006 | Attorney, ACC (February 1994 to present); Vice President, ACC (November 2005 to present); General Counsel, ACC (March 2007 to present). Also serves as General Counsel, ACIM, ACS, ACIS and other ACC subsidiaries; and Senior Vice President, ACIM and ACS |
C. Jean Wade
(1964) | Vice President, Treasurer and Chief Financial Officer since 2012 | Vice President, ACS (February 2000 to present) |
Robert J. Leach
(1966) | Vice President since 2006 and Assistant Treasurer since 2012 | Vice President, ACS (February 2000 to present) |
David H. Reinmiller
(1963) | Vice President since 2000 | Attorney, ACC (January 1994 to present); Associate General Counsel, ACC (January 2001 to present). Also serves as Vice President, ACIM and ACS |
Ward D. Stauffer
(1960) | Secretary since 2005 | Attorney, ACC (June 2003 to present) |
Retirement Account Information
As required by law, distributions you receive from certain IRAs are subject to federal income tax withholding, unless you elect not to have withholding apply. Tax will be withheld on the total amount withdrawn even though you may be receiving amounts that are not subject to withholding, such as nondeductible contributions. In such case, excess amounts of withholding could occur. You may adjust your withholding election so that a greater or lesser amount will be withheld.
If you don’t want us to withhold on this amount, you must notify us to not withhold the federal income tax. You may notify us in writing or in certain situations by telephone or through other electronic means. For systematic withdrawals, your withholding election will remain in effect until revoked or changed by filing a new election. You have the right to revoke your election at any time.
Remember, even if you elect not to have income tax withheld, you are liable for paying income tax on the taxable portion of your withdrawal. If you elect not to have income tax withheld or you don’t have enough income tax withheld, you may be responsible for payment of estimated tax. You may incur penalties under the estimated tax rules if your withholding and estimated tax payments are not sufficient. You can reduce or defer the income tax on a distribution by directly or indirectly rolling such distribution over to another IRA or eligible plan. You should consult your tax advisor for additional information.
State tax will be withheld if, at the time of your distribution, your address is within one of the mandatory withholding states and you have federal income tax withheld (or as otherwise required by state law). State taxes will be withheld from your distribution in accordance with the respective state rules.
Distributions you receive from 403(b), 457 and qualified plans are subject to special tax and withholding rules. Your plan administrator or plan sponsor is required to provide you with a special tax notice explaining those rules at the time you request a distribution. If applicable, federal and/or state taxes may be withheld from your distribution amount.
Proxy Voting Policies
A description of the policies that the fund's investment advisor uses in exercising the voting rights associated with the securities purchased and/or held by the fund is available without charge, upon request, by calling 1-800-345-2021. It is also available on the "About Us" page of American Century Investments’ website at americancentury.com and on the Securities and Exchange Commission’s website at sec.gov. Information regarding how the investment advisor voted proxies relating to portfolio securities during the most recent 12-month period ended June 30 is available on the "About Us" page at americancentury.com. It is also available at sec.gov.
Quarterly Portfolio Disclosure
The fund files its complete schedule of portfolio holdings with the Securities and Exchange Commission (SEC) for the first and third quarters of each fiscal year on Form N-Q. The fund’s Forms N-Q are available on the SEC’s website at sec.gov, and may be reviewed and copied at the SEC’s Public Reference Room in Washington, DC. Information on the operation of the Public Reference Room may be obtained by calling 1-800-SEC-0330. The fund also makes its complete schedule of portfolio holdings for the most recent quarter of its fiscal year available on its
website at americancentury.com and, upon request, by calling 1-800-345-2021.
Other Tax Information
The following information is provided pursuant to provisions of the Internal Revenue Code.
The fund hereby designates up to the maximum amount allowable as qualified dividend income for the fiscal year ended March 31, 2016.
For corporate taxpayers, the fund hereby designates $117,913,942, or up to the maximum amount allowable, of ordinary income distributions paid during the fiscal year ended March 31, 2016 as qualified for the corporate dividends received deduction.
The fund hereby designates $142,458,031 as qualified short-term capital gain distributions for purposes of Internal Revenue Code Section 871 for the fiscal year ended March 31, 2016.
The fund hereby designates $429,836,476, or up to the maximum amount allowable, as long-term capital gain distributions for the fiscal year ended March 31, 2016.
|
| | |
| |
| | | |
| Contact Us | americancentury.com | |
| Automated Information Line | 1-800-345-8765 | |
| Investor Services Representative | 1-800-345-2021 or 816-531-5575 | |
| Investors Using Advisors | 1-800-378-9878 | |
| Business, Not-For-Profit, Employer-Sponsored Retirement Plans | 1-800-345-3533 | |
| Banks and Trust Companies, Broker-Dealers, Financial Professionals, Insurance Companies | 1-800-345-6488 | |
| Telecommunications Relay Service for the Deaf | 711 | |
| | | |
| American Century Capital Portfolios, Inc. | |
| | | |
Investment Advisor: American Century Investment Management, Inc. Kansas City, Missouri | |
| | | |
| This report and the statements it contains are submitted for the general information of our shareholders. The report is not authorized for distribution to prospective investors unless preceded or accompanied by an effective prospectus. | |
| | | |
©2016 American Century Proprietary Holdings, Inc. All rights reserved.
CL-ANN-88868 1605 | |
|
| |
| | |
| | Annual Report |
| | |
| | March 31, 2016 |
| | |
| | NT Large Company Value Fund |
|
| | |
| Performance | 2 |
|
| Portfolio Commentary | |
|
| Fund Characteristics | |
|
| Shareholder Fee Example | |
|
| Schedule of Investments | |
|
| Statement of Assets and Liabilities | |
|
| Statement of Operations | |
|
| Statement of Changes in Net Assets | |
|
| Notes to Financial Statements | |
|
| Financial Highlights | |
|
| Report of Independent Registered Public Accounting Firm | |
|
| Management | |
|
| Additional Information | |
|
Any opinions expressed in this report reflect those of the author as of the date of the report, and do not necessarily represent the opinions of American Century Investments® or any other person in the American Century Investments organization. Any such opinions are subject to change at any time based upon market or other conditions and American Century Investments disclaims any responsibility to update such opinions. These opinions may not be relied upon as investment advice and, because investment decisions made by American Century Investments funds are based on numerous factors, may not be relied upon as an indication of trading intent on behalf of any American Century Investments fund. Security examples are used for representational purposes only and are not intended as recommendations to purchase or sell securities. Performance information for comparative indices and securities is provided to American Century Investments by third party vendors. To the best of American Century Investments’ knowledge, such information is accurate at the time of printing.
|
| | | | | |
| Total Returns as of March 31, 2016 |
| | | | Average Annual Returns | |
| | Ticker Symbol | 1 year | 5 years | Since Inception | Inception Date |
| Institutional Class | ACLLX | -4.92% | 9.77% | 4.74% | 5/12/06 |
| Russell 1000 Value Index | — | -1.54% | 10.23% | 5.63% | — |
| S&P 500 Index | — | 1.78% | 11.57% | 7.09% | — |
| R6 Class | ACDLX | -4.70% | — | 5.82% | 7/26/13 |
|
|
| Growth of $10,000 Over Life of Class |
| $10,000 investment made May 12, 2006 |
Performance for other share classes will vary due to differences in fee structure.
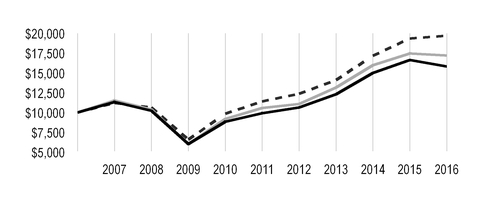
|
| |
| Value on March 31, 2016 |
| | Institutional Class — $15,805 |
| |
| | Russell 1000 Value Index — $17,196 |
| |
| | S&P 500 Index — $19,698 |
| |
|
| |
| Total Annual Fund Operating Expenses |
| Institutional Class | R6 Class |
| 0.64% | 0.49% |
The total annual fund operating expenses shown is as stated in the fund’s prospectus current as of the date of this report. The prospectus may vary from the expense ratio shown elsewhere in this report because it is based on a different time period, includes acquired fund fees and expenses, and, if applicable, does not include fee waivers or expense reimbursements.
Data presented reflect past performance. Past performance is no guarantee of future results. Current performance may be higher or lower than the performance shown. Total returns for periods less than one year are not annualized. Investment return and principal value will fluctuate, and redemption value may be more or less than original cost. Data assumes reinvestment of dividends and capital gains, and none of the charts reflect the deduction of taxes that a shareholder would pay on fund distributions or the redemption of fund shares. To obtain performance data current to the most recent month end, please call 1-800-345-2021 or visit americancentury.com. For additional information about the fund, please consult the prospectus.
Portfolio Managers: Brendan Healy and Brian Woglom
In January 2016, portfolio manager Matt Titus left the NT Large Company Value management team and portfolio manager Brian Woglom joined the NT Large Company Value management team.
Performance Summary
NT Large Company Value returned -4.92%* for the 12 months ended March 31, 2016. By comparison, its benchmark, the Russell 1000 Value Index, returned -1.54%. The fund’s return reflects operating expenses, while the index’s return does not.
Volatility dominated the 12-month period as concerns over slowing growth in China and other emerging markets, falling oil prices, and the prospect of higher U.S. Federal Reserve (Fed) interest rates weighed on investor confidence. After a turbulent summer, markets sold off sharply in the third quarter of 2015, but stabilized somewhat in the fourth quarter as the Fed delayed an anticipated September interest rate hike. In December, however, Fed policymakers raised the federal funds rate by 25 basis points, while they affirmed the underlying strength of the U.S. economy. Early in 2016, concerns over slowing growth in China triggered a renewed market sell-off. Broad market indices such as the S&P 500 Index recovered some ground later in the first quarter of 2016 after the Fed scaled back its projected number of rate hikes for the year, from four to two. Against this backdrop, larger caps outperformed, while value stocks underperformed growth. Five out of 10 sectors of the Russell 1000 Value Index had negative performance, with the weakest performance in energy.
In this environment, NT Large Company Value received positive results in absolute terms from three of the 10 sectors in which it was invested. On a relative basis, it underperformed due primarily to positioning. The portfolio was hampered by its stance in the information technology, financials, telecommunications services, consumer discretionary, and health care. Fund holdings in in energy contributed positively.
Information Technology Detracted
Security selection in the information technology sector detracted the most from relative returns. Detractors included Western Digital, a leading supplier of computer hard disk drives. The company’s share price sold lower as the PC end-market for its hard drives continued to decline. Investors were also concerned about the company’s pending merger with SanDisk, a deal that received mixed reviews for both price and strategy. We eliminated the position in the first quarter of 2016 given concerns over its deteriorating end market and ahead of the close of the merger.
Financials Weighed on Performance
Stock selection in financials, especially in the insurance area, dampened relative performance. An overweight in capital markets companies, such as Ameriprise Financial, was also detrimental. Ameriprise in particular underperformed due to weaker-than-expected results in the fourth quarter of 2015, including lower advisory margins and elevated asset management outflows. The portfolio’s underweight in financials was a small positive.
* All fund returns referenced in this commentary are for Institutional Class shares. Performance for other share classes will vary due to differences in fee structure; when Institutional Class performance exceeds that of the fund's benchmark, other share classes may not. See page 2 for returns for all share classes.
Underweights in Utilities and Telecommunications Services Hurt
The portfolio’s positioning in utilities and lack of exposure to telecommunications services hindered performance. Both sectors performed well as investors sought stability during the market volatility. Additionally, the utilities sector outperformed as long-term interest rates declined and there was continued consolidation in the sector.
Consumer Staples Provided Mixed Results
An underweight in the consumer staples sectors was a drag on relative performance. Consumer staples delivered strong positive performance for the index as investors sought stability during periods of market volatility.
On a positive note, stock selection in consumer staples supported relative performance, due in part to an overweight position in food distributor Sysco. Sysco’s stock rose after it reported results that exceeded analysts’ forecasts, due to strong volume growth.
Energy Boosts Results
Security selection in energy was the largest positive contributor to relative returns, as the portfolio avoided many of the exploration and production stocks that were the sharpest decliners during the oil market sell-off. Avoiding several struggling companies in the sector, including Kinder Morgan, boosted results. The portfolio’s overweight position in Valero Energy also contributed to returns. In the first quarter of 2016, we sold the Valero position following its stock price appreciation and used the proceeds to initiate a position in Schlumberger, the world's largest oilfield services company. We purchased Schlumberger after the stock fell to very attractive levels in the first quarter of 2016 due to the company’s disappointing results in the fourth quarter of 2015 and preliminary 2016 guidance. The stock rose after the position was initiated, contributing positively to relative performance.
Outlook
We continue to be bottom-up investment managers, evaluating each company individually and building the portfolio one stock at a time. As of March 31, 2016, the portfolio remains underweight in utilities and financials. We are especially cautious toward investments, such as utilities and real estate investment trusts (REITs), that are both susceptible to rising interest rates and generally overvalued. The portfolio has no holdings in the telecommunication services sector due to continued concern about competitive dynamics in the sector. The portfolio’s largest overweights are in the health care and consumer discretionary sectors. The portfolio is also overweight in industrials and energy, where we are finding companies that are attractively valued.
|
| |
| MARCH 31, 2016 |
| Top Ten Holdings | % of net assets |
| JPMorgan Chase & Co. | 3.2% |
| Wells Fargo & Co. | 3.1% |
| Schlumberger Ltd. | 2.9% |
| Chevron Corp. | 2.7% |
| Cisco Systems, Inc. | 2.7% |
| Pfizer, Inc. | 2.6% |
| Oracle Corp. | 2.5% |
| TOTAL SA ADR | 2.5% |
| United Technologies Corp. | 2.2% |
| U.S. Bancorp | 2.1% |
| | |
| Top Five Industries | % of net assets |
| Banks | 12.8% |
| Oil, Gas and Consumable Fuels | 10.7% |
| Pharmaceuticals | 6.8% |
| Health Care Equipment and Supplies | 5.6% |
| Insurance | 5.5% |
| | |
| Types of Investments in Portfolio | % of net assets |
| Common Stocks | 98.2% |
| Exchange-Traded Funds | 1.2% |
| Total Equity Exposure | 99.4% |
| Temporary Cash Investments | 0.5% |
| Other Assets and Liabilities | 0.1% |
Fund shareholders may incur two types of costs: (1) transaction costs, including sales charges (loads) on purchase payments and redemption/exchange fees; and (2) ongoing costs, including management fees; distribution and service (12b-1) fees; and other fund expenses. This example is intended to help you understand your ongoing costs (in dollars) of investing in your fund and to compare these costs with the ongoing cost of investing in other mutual funds.
The example is based on an investment of $1,000 made at the beginning of the period and held for the entire period from October 1, 2015 to March 31, 2016.
Actual Expenses
The table provides information about actual account values and actual expenses for each class. You may use the information, together with the amount you invested, to estimate the expenses that you paid over the period. First, identify the share class you own. Then simply divide your account value by $1,000 (for example, an $8,600 account value divided by $1,000 = 8.6), then multiply the result by the number under the heading “Expenses Paid During Period” to estimate the expenses you paid on your account during this period.
Hypothetical Example for Comparison Purposes
The table also provides information about hypothetical account values and hypothetical expenses based on the actual expense ratio of each class of your fund and an assumed rate of return of 5% per year before expenses, which is not the actual return of a fund’s share class. The hypothetical account values and expenses may not be used to estimate the actual ending account balance or expenses you paid for the period. You may use this information to compare the ongoing costs of investing in your fund and other funds. To do so, compare this 5% hypothetical example with the 5% hypothetical examples that appear in the shareholder reports of the other funds.
Please note that the expenses shown in the table are meant to highlight your ongoing costs only and do not reflect any transactional costs, such as sales charges (loads) or redemption/exchange fees. Therefore, the table is useful in comparing ongoing costs only, and will not help you determine the relative total costs of owning different funds. In addition, if these transactional costs were included, your costs would have been higher.
|
| | | | |
| | Beginning
Account Value
10/1/15 | Ending
Account Value
3/31/16 | Expenses Paid
During Period(1)10/1/15 - 3/31/16 | Annualized
Expense Ratio(1) |
| Actual | | | | |
| Institutional Class | $1,000 | $1,056.10 | $3.29 | 0.64% |
| R6 Class | $1,000 | $1,057.80 | $2.52 | 0.49% |
| Hypothetical | | | | |
| Institutional Class | $1,000 | $1,021.80 | $3.23 | 0.64% |
| R6 Class | $1,000 | $1,022.55 | $2.48 | 0.49% |
| |
| (1) | Expenses are equal to the class's annualized expense ratio listed in the table above, multiplied by the average account value over the period, multiplied by 183, the number of days in the most recent fiscal half-year, divided by 366, to reflect the one-half year period. |
MARCH 31, 2016
|
| | | | |
| | Shares | Value |
| COMMON STOCKS — 98.2% | | |
| Aerospace and Defense — 5.3% | | |
| Honeywell International, Inc. | 179,700 | $ | 20,135,385 |
|
| Huntington Ingalls Industries, Inc. | 112,900 | 15,460,526 |
|
| Textron, Inc. | 382,400 | 13,942,304 |
|
| United Technologies Corp. | 365,300 | 36,566,530 |
|
| | | 86,104,745 |
|
| Auto Components — 1.6% | | |
| BorgWarner, Inc. | 357,600 | 13,731,840 |
|
| Delphi Automotive plc | 159,400 | 11,958,188 |
|
| | | 25,690,028 |
|
| Automobiles — 1.2% | | |
| Ford Motor Co. | 889,200 | 12,004,200 |
|
| Harley-Davidson, Inc. | 162,900 | 8,361,657 |
|
| | | 20,365,857 |
|
| Banks — 12.8% | | |
| Bank of America Corp. | 2,385,500 | 32,251,960 |
|
| BB&T Corp. | 247,200 | 8,224,344 |
|
| JPMorgan Chase & Co. | 892,200 | 52,836,084 |
|
| KeyCorp | 615,500 | 6,795,120 |
|
| PNC Financial Services Group, Inc. (The) | 288,800 | 24,423,816 |
|
| U.S. Bancorp | 832,000 | 33,770,880 |
|
| Wells Fargo & Co. | 1,067,100 | 51,604,956 |
|
| | | 209,907,160 |
|
| Biotechnology — 0.6% | | |
| AbbVie, Inc. | 183,100 | 10,458,672 |
|
| Capital Markets — 4.9% | | |
| Ameriprise Financial, Inc. | 231,500 | 21,763,315 |
|
| BlackRock, Inc. | 37,800 | 12,873,546 |
|
| Goldman Sachs Group, Inc. (The) | 116,900 | 18,350,962 |
|
| Invesco Ltd. | 886,400 | 27,274,528 |
|
| | | 80,262,351 |
|
| Chemicals — 1.5% | | |
| Dow Chemical Co. (The) | 308,700 | 15,700,482 |
|
| LyondellBasell Industries NV, Class A | 96,200 | 8,232,796 |
|
| | | 23,933,278 |
|
| Commercial Services and Supplies — 1.4% | | |
| Tyco International plc | 629,700 | 23,116,287 |
|
| Communications Equipment — 2.7% | | |
| Cisco Systems, Inc. | 1,557,400 | 44,339,178 |
|
| Consumer Finance — 1.1% | | |
| Discover Financial Services | 355,161 | 18,084,798 |
|
| Containers and Packaging — 0.6% | | |
| WestRock Co. | 249,900 | 9,753,597 |
|
| Diversified Financial Services — 1.0% | | |
Berkshire Hathaway, Inc., Class B(1) | 116,700 | 16,557,396 |
|
| | | |
|
| | | | |
| | Shares | Value |
| Electric Utilities — 3.0% | | |
| Edison International | 209,600 | $ | 15,068,144 |
|
| PPL Corp. | 222,600 | 8,474,382 |
|
| Westar Energy, Inc. | 273,100 | 13,548,491 |
|
| Xcel Energy, Inc. | 298,900 | 12,499,998 |
|
| | | 49,591,015 |
|
| Electrical Equipment — 1.3% | | |
| Rockwell Automation, Inc. | 187,100 | 21,282,625 |
|
| Electronic Equipment, Instruments and Components — 1.6% | | |
| TE Connectivity Ltd. | 297,100 | 18,396,432 |
|
VeriFone Systems, Inc.(1) | 268,500 | 7,582,440 |
|
| | | 25,978,872 |
|
| Energy Equipment and Services — 3.6% | | |
| Halliburton Co. | 328,900 | 11,748,308 |
|
| Schlumberger Ltd. | 642,100 | 47,354,875 |
|
| | | 59,103,183 |
|
| Food and Staples Retailing — 3.0% | | |
| CVS Health Corp. | 251,100 | 26,046,603 |
|
| Sysco Corp. | 512,700 | 23,958,471 |
|
| | | 50,005,074 |
|
| Food Products — 1.2% | | |
| Mondelez International, Inc., Class A | 474,600 | 19,040,952 |
|
| Health Care Equipment and Supplies — 5.6% | | |
| Abbott Laboratories | 490,000 | 20,496,700 |
|
| Baxter International, Inc. | 401,700 | 16,501,836 |
|
| Medtronic plc | 374,800 | 28,110,000 |
|
| Zimmer Biomet Holdings, Inc. | 246,600 | 26,294,958 |
|
| | | 91,403,494 |
|
| Health Care Providers and Services — 3.3% | | |
| Anthem, Inc. | 97,000 | 13,482,030 |
|
HCA Holdings, Inc.(1) | 166,100 | 12,964,105 |
|
Laboratory Corp. of America Holdings(1) | 125,200 | 14,664,676 |
|
| McKesson Corp. | 84,600 | 13,303,350 |
|
| | | 54,414,161 |
|
| Hotels, Restaurants and Leisure — 1.4% | | |
| Carnival Corp. | 236,600 | 12,485,382 |
|
| Marriott International, Inc., Class A | 144,400 | 10,278,392 |
|
| | | 22,763,774 |
|
| Household Durables — 0.9% | | |
| Whirlpool Corp. | 77,700 | 14,012,418 |
|
| Household Products — 1.3% | | |
| Procter & Gamble Co. (The) | 260,300 | 21,425,293 |
|
| Insurance — 5.5% | | |
| Aflac, Inc. | 211,200 | 13,335,168 |
|
| Allstate Corp. (The) | 194,800 | 13,123,676 |
|
| American International Group, Inc. | 276,200 | 14,928,610 |
|
| Chubb Ltd. | 221,500 | 26,391,725 |
|
| MetLife, Inc. | 518,800 | 22,796,072 |
|
| | | 90,575,251 |
|
| Machinery — 3.2% | | |
| Ingersoll-Rand plc | 536,600 | 33,274,566 |
|
|
| | | | |
| | Shares | Value |
| Stanley Black & Decker, Inc. | 187,300 | $ | 19,705,833 |
|
| | | 52,980,399 |
|
| Media — 1.5% | | |
AMC Networks, Inc., Class A(1) | 127,100 | 8,253,874 |
|
| Time Warner, Inc. | 230,500 | 16,722,775 |
|
| | | 24,976,649 |
|
| Oil, Gas and Consumable Fuels — 10.7% | | |
| Anadarko Petroleum Corp. | 276,900 | 12,895,233 |
|
| Chevron Corp. | 471,700 | 45,000,180 |
|
| Exxon Mobil Corp. | 264,800 | 22,134,632 |
|
| Imperial Oil Ltd. | 729,700 | 24,378,582 |
|
| Occidental Petroleum Corp. | 444,800 | 30,437,664 |
|
| TOTAL SA ADR | 904,900 | 41,100,558 |
|
| | | 175,946,849 |
|
| Pharmaceuticals — 6.8% | | |
Allergan plc(1) | 82,400 | 22,085,672 |
|
| Johnson & Johnson | 240,200 | 25,989,640 |
|
| Merck & Co., Inc. | 219,700 | 11,624,327 |
|
| Pfizer, Inc. | 1,465,300 | 43,431,492 |
|
| Teva Pharmaceutical Industries Ltd. ADR | 161,200 | 8,625,812 |
|
| | | 111,756,943 |
|
| Road and Rail — 0.8% | | |
| Union Pacific Corp. | 166,800 | 13,268,940 |
|
| Semiconductors and Semiconductor Equipment — 3.8% | | |
| Applied Materials, Inc. | 1,299,400 | 27,521,292 |
|
| Intel Corp. | 528,000 | 17,080,800 |
|
| Lam Research Corp. | 139,800 | 11,547,480 |
|
| Microchip Technology, Inc. | 141,200 | 6,805,840 |
|
| | | 62,955,412 |
|
| Software — 3.2% | | |
Electronic Arts, Inc.(1) | 152,900 | 10,108,219 |
|
| Oracle Corp. | 1,019,800 | 41,720,018 |
|
| | | 51,828,237 |
|
| Specialty Retail — 1.8% | | |
| Advance Auto Parts, Inc. | 127,600 | 20,459,384 |
|
| Lowe's Cos., Inc. | 108,800 | 8,241,600 |
|
| | | 28,700,984 |
|
TOTAL COMMON STOCKS (Cost $1,423,470,534) | | 1,610,583,872 |
|
| EXCHANGE-TRADED FUNDS — 1.2% | | |
iShares Russell 1000 Value ETF
(Cost $18,315,613) | 200,300 | 19,791,643 |
|
| TEMPORARY CASH INVESTMENTS — 0.5% | | |
| Repurchase Agreement, Fixed Income Clearing Corp., (collateralized by various U.S. Treasury obligations, 3.75%, 11/15/43, valued at $5,242,738), at 0.10%, dated 3/31/16, due 4/1/16 (Delivery value $5,136,014) | | 5,136,000 |
|
| State Street Institutional Liquid Reserves Fund, Premier Class | 3,354,205 | 3,354,205 |
|
TOTAL TEMPORARY CASH INVESTMENTS (Cost $8,490,205) | | 8,490,205 |
|
TOTAL INVESTMENT SECURITIES — 99.9% (Cost $1,450,276,352) | | 1,638,865,720 |
|
| OTHER ASSETS AND LIABILITIES — 0.1% | | 1,339,764 |
|
| TOTAL NET ASSETS — 100.0% | | $ | 1,640,205,484 |
|
|
| | | | | | | | | | |
| FORWARD FOREIGN CURRENCY EXCHANGE CONTRACTS |
| Currency Purchased | Currency Sold | Counterparty | Settlement Date | Unrealized Appreciation
(Depreciation) |
| CAD | 970,923 |
| USD | 733,558 |
| Morgan Stanley | 6/30/16 | $ | 14,079 |
|
| USD | 20,367,009 |
| CAD | 26,880,175 |
| Morgan Stanley | 6/30/16 | (331,473 | ) |
| USD | 749,816 |
| CAD | 972,166 |
| Morgan Stanley | 6/30/16 | 1,221 |
|
| USD | 34,134,189 |
| EUR | 30,475,730 |
| UBS AG | 6/30/16 | (637,904 | ) |
| USD | 1,059,916 |
| EUR | 928,731 |
| UBS AG | 6/30/16 | 256 |
|
| | | | | | | $ | (953,821 | ) |
|
| | |
| NOTES TO SCHEDULE OF INVESTMENTS |
| ADR | - | American Depositary Receipt |
| CAD | - | Canadian Dollar |
| EUR | - | Euro |
| USD | - | United States Dollar |
See Notes to Financial Statements.
|
|
| Statement of Assets and Liabilities |
|
| | | |
| MARCH 31, 2016 | |
| Assets | |
| Investment securities, at value (cost of $1,450,276,352) | $ | 1,638,865,720 |
|
| Cash | 186,976 |
|
| Foreign currency holdings, at value (cost of $54,598) | 55,446 |
|
| Receivable for investments sold | 11,239,230 |
|
| Receivable for capital shares sold | 340 |
|
| Unrealized appreciation on forward foreign currency exchange contracts | 15,556 |
|
| Dividends and interest receivable | 2,881,353 |
|
| | 1,653,244,621 |
|
| | |
| Liabilities | |
| Payable for investments purchased | 10,664,555 |
|
| Payable for capital shares redeemed | 552,463 |
|
| Unrealized depreciation on forward foreign currency exchange contracts | 969,377 |
|
| Accrued management fees | 852,742 |
|
| | 13,039,137 |
|
| | |
| Net Assets | $ | 1,640,205,484 |
|
| | |
| Net Assets Consist of: | |
| Capital (par value and paid-in surplus) | $ | 1,475,720,875 |
|
| Undistributed net investment income | 1,501,209 |
|
| Accumulated net realized loss | (24,649,179 | ) |
| Net unrealized appreciation | 187,632,579 |
|
| | $ | 1,640,205,484 |
|
|
| | | | | | |
| | Net Assets | Shares Outstanding | Net Asset Value Per Share |
| Institutional Class, $0.01 Par Value |
| $1,531,293,914 |
| 144,697,667 |
| $10.58 |
| R6 Class, $0.01 Par Value |
| $108,911,570 |
| 10,288,737 |
| $10.59 |
See Notes to Financial Statements.
|
| | | |
| YEAR ENDED MARCH 31, 2016 | |
| Investment Income (Loss) | |
| Income: | |
| Dividends (net of foreign taxes withheld of $385,661) | $ | 34,149,628 |
|
| Interest | 10,132 |
|
| | 34,159,760 |
|
| | |
| Expenses: | |
| Management fees | 9,742,567 |
|
| Directors' fees and expenses | 54,243 |
|
| Other expenses | 5,910 |
|
| | 9,802,720 |
|
| | |
| Net investment income (loss) | 24,357,040 |
|
| | |
| Realized and Unrealized Gain (Loss) | |
| Net realized gain (loss) on: | |
| Investment transactions | 39,895,925 |
|
| Futures contract transactions | 140,977 |
|
| Foreign currency transactions | (91,264 | ) |
| | 39,945,638 |
|
| | |
| Change in net unrealized appreciation (depreciation) on: | |
| Investments | (127,140,613 | ) |
| Futures contracts | (31,023 | ) |
| Translation of assets and liabilities in foreign currencies | (1,444,455 | ) |
| | (128,616,091 | ) |
| | |
| Net realized and unrealized gain (loss) | (88,670,453 | ) |
| | |
| Net Increase (Decrease) in Net Assets Resulting from Operations | $ | (64,313,413 | ) |
See Notes to Financial Statements.
|
|
| Statement of Changes in Net Assets |
|
| | | | | | |
| YEARS ENDED MARCH 31, 2016 AND MARCH 31, 2015 |
| Increase (Decrease) in Net Assets | March 31, 2016 | March 31, 2015 |
| Operations | | |
| Net investment income (loss) | $ | 24,357,040 |
| $ | 22,299,199 |
|
| Net realized gain (loss) | 39,945,638 |
| 173,358,088 |
|
| Change in net unrealized appreciation (depreciation) | (128,616,091 | ) | (34,839,783 | ) |
| Net increase (decrease) in net assets resulting from operations | (64,313,413 | ) | 160,817,504 |
|
| | | |
| Distributions to Shareholders | | |
| From net investment income: | | |
| Institutional Class | (23,279,786 | ) | (20,503,969 | ) |
| R6 Class | (1,507,570 | ) | (639,472 | ) |
| From net realized gains: | | |
| Institutional Class | (127,658,246 | ) | (105,699,397 | ) |
| R6 Class | (7,624,442 | ) | (3,167,409 | ) |
| Decrease in net assets from distributions | (160,070,044 | ) | (130,010,247 | ) |
| | | |
| Capital Share Transactions | | |
| Net increase (decrease) in net assets from capital share transactions (Note 5) | 412,457,708 |
| 79,600,811 |
|
| | | |
| Net increase (decrease) in net assets | 188,074,251 |
| 110,408,068 |
|
| | | |
| Net Assets | | |
| Beginning of period | 1,452,131,233 |
| 1,341,723,165 |
|
| End of period | $ | 1,640,205,484 |
| $ | 1,452,131,233 |
|
| | | |
| Undistributed net investment income | $ | 1,501,209 |
| $ | 2,417,232 |
|
See Notes to Financial Statements.
|
|
| Notes to Financial Statements |
MARCH 31, 2016
1. Organization
American Century Capital Portfolios, Inc. (the corporation) is registered under the Investment Company Act of 1940, as amended (the 1940 Act), as an open-end management investment company and is organized as a Maryland corporation. NT Large Company Value Fund (the fund) is one fund in a series issued by the corporation. The fund’s investment objective is to seek long-term capital growth. Income is a secondary objective. The fund is not permitted to invest in securities issued by companies assigned the Global Industry Classification Standard for the tobacco industry.
The fund offers the Institutional Class and the R6 Class, which have different fees and expenses. The difference in the fee structures between the classes is not the result of any difference in advisory or custodial fees or other expenses related to management of the fund’s assets, which do not vary by class. The fund’s R6 Class shares are available for purchase exclusively by certain American Century Investments funds of funds that are offered only through employer-sponsored retirement plans where a financial intermediary provides retirement recordkeeping services to plan participants. Because financial intermediaries do not receive any service, distribution or administrative fees for offering such funds of funds, American Century Investment Management, Inc. (ACIM) (the investment advisor) is able to charge the R6 Class a lower unified management fee.
2. Significant Accounting Policies
The following is a summary of significant accounting policies consistently followed by the fund in preparation of its financial statements. The fund is an investment company and follows accounting and reporting guidance in accordance with accounting principles generally accepted in the United States of America. This may require management to make certain estimates and assumptions at the date of the financial statements. Actual results could differ from these estimates. Management evaluated the impact of events or transactions occurring through the date the financial statements were issued that would merit recognition or disclosure.
Investment Valuations — The fund determines the fair value of its investments and computes its net asset value per share at the close of regular trading (usually 4 p.m. Eastern time) on the New York Stock Exchange (NYSE) on each day the NYSE is open. The Board of Directors has adopted valuation policies and procedures to guide the investment advisor in the fund’s investment valuation process and to provide methodologies for the oversight of the fund’s pricing function.
Equity securities that are listed or traded on a domestic securities exchange are valued at the last reported sales price or at the official closing price as provided by the exchange. Equity securities traded on foreign securities exchanges are generally valued at the closing price of such securities on the exchange where primarily traded or at the close of the NYSE, if that is earlier. If no last sales price is reported, or if local convention or regulation so provides, the mean of the latest bid and asked prices may be used. Securities traded over-the-counter are valued at the mean of the latest bid and asked prices, the last sales price, or the official closing price. Equity securities initially expressed in local currencies are translated into U.S. dollars at the mean of the appropriate currency exchange rate at the close of the NYSE as provided by an independent pricing service.
Open-end management investment companies are valued at the reported net asset value per share. Repurchase agreements are valued at cost, which approximates fair value. Exchange-traded futures contracts are valued at the settlement price as provided by the appropriate clearing corporation. Forward foreign currency exchange contracts are valued at the mean of the appropriate forward exchange rate at the close of the NYSE as provided by an independent pricing service.
If the fund determines that the market price for an investment is not readily available or the valuation methods mentioned above do not reflect an investment’s fair value, such investment is valued as determined in good faith by the Board of Directors or its delegate, in accordance with policies and procedures adopted by the Board of Directors. In its determination of fair value, the fund may review several factors including, but not limited to, market information regarding the specific investment or comparable investments and correlation with other investment types, futures indices or general market indicators. Circumstances that may cause the fund to use these procedures to value an investment include, but are not limited to: an investment has been
declared in default or is distressed; trading in a security has been suspended during the trading day or a security is not actively trading on its principal exchange; prices received from a regular pricing source are deemed unreliable; or there is a foreign market holiday and no trading occurred.
The fund monitors for significant events occurring after the close of an investment’s primary exchange but before the fund’s net asset value per share is determined. Significant events may include, but are not limited to: corporate announcements and transactions; governmental action and political unrest that could impact a specific investment or an investment sector; or armed conflicts, natural disasters and similar events that could affect investments in a specific country or region. The fund also monitors for significant fluctuations between domestic and foreign markets, as evidenced by the U.S. market or such other indicators that the Board of Directors, or its delegate, deems appropriate. If significant fluctuations in foreign markets are identified, the fund may apply a model-derived factor to the closing price of equity securities traded on foreign securities exchanges. The factor is based on observable market data as provided by an independent pricing service.
Security Transactions — Security transactions are accounted for as of the trade date. Net realized gains and losses are determined on the identified cost basis, which is also used for federal income tax purposes.
Investment Income — Dividend income less foreign taxes withheld, if any, is recorded as of the ex-dividend date. Distributions received on securities that represent a return of capital or long-term capital gain are recorded as a reduction of cost of investments and/or as a realized gain. The fund may estimate the components of distributions received that may be considered nontaxable distributions or long-term capital gain distributions for income tax purposes. Interest income is recorded on the accrual basis and includes accretion of discounts and amortization of premiums.
Foreign Currency Translations — All assets and liabilities initially expressed in foreign currencies are translated into U.S. dollars at prevailing exchange rates at period end. The fund may enter into spot foreign currency exchange contracts to facilitate transactions denominated in a foreign currency. Purchases and sales of investment securities, dividend and interest income, spot foreign currency exchange contracts, and expenses are translated at the rates of exchange prevailing on the respective dates of such transactions. Net realized and unrealized foreign currency exchange gains or losses related to investment securities are a component of net realized gain (loss) on investment transactions and change in net unrealized appreciation (depreciation) on investments, respectively.
Repurchase Agreements — The fund may enter into repurchase agreements with institutions that ACIM has determined are creditworthy pursuant to criteria adopted by the Board of Directors. The fund requires that the collateral, represented by securities, received in a repurchase transaction be transferred to the custodian in a manner sufficient to enable the fund to obtain those securities in the event of a default under the repurchase agreement. ACIM monitors, on a daily basis, the securities transferred to ensure the value, including accrued interest, of the securities under each repurchase agreement is equal to or greater than amounts owed to the fund under each repurchase agreement.
Joint Trading Account — Pursuant to an Exemptive Order issued by the Securities and Exchange Commission, the fund, along with certain other funds in the American Century Investments family of funds, may transfer uninvested cash balances into a joint trading account. These balances are invested in one or more repurchase agreements that are collateralized by U.S. Treasury or Agency obligations.
Segregated Assets — In accordance with the 1940 Act, the fund segregates assets on its books and records to cover futures contracts. ACIM monitors, on a daily basis, the securities segregated to ensure the fund designates a sufficient amount of liquid assets, marked-to-market daily. The fund may also receive assets or be required to pledge assets at the custodian bank or with a broker for margin requirements on futures contracts.
Income Tax Status — It is the fund’s policy to distribute substantially all net investment income and net realized gains to shareholders and to otherwise qualify as a regulated investment company under provisions of the Internal Revenue Code. Accordingly, no provision has been made for income taxes. The fund files U.S. federal, state, local and non-U.S. tax returns as applicable. The fund's tax returns are subject to examination by the relevant taxing authority until expiration of the applicable statute of limitations, which is generally three years from the date of filing but can be longer in certain jurisdictions. At this time, management believes there are no uncertain tax positions which, based on their technical merit, would not be sustained upon examination and for which it is reasonably possible that the total amounts of unrecognized tax benefits will significantly change in the next twelve months.
Multiple Class — All shares of the fund represent an equal pro rata interest in the net assets of the class to which such shares belong, and have identical voting, dividend, liquidation and other rights and the same terms and conditions, except for class specific expenses and exclusive rights to vote on matters affecting only individual classes. Income, non-class specific expenses, and realized and unrealized capital gains and losses of the fund are allocated to each class of shares based on their relative net assets.
Distributions to Shareholders — Distributions from net investment income, if any, are generally declared and paid quarterly. Distributions from net realized gains, if any, are generally declared and paid annually.
Indemnifications — Under the corporation’s organizational documents, its officers and directors are indemnified against certain liabilities arising out of the performance of their duties to the fund. In addition, in the normal course of business, the fund enters into contracts that provide general indemnifications. The maximum exposure under these arrangements is unknown as this would involve future claims that may be made against a fund. The risk of material loss from such claims is considered by management to be remote.
3. Fees and Transactions with Related Parties
Certain officers and directors of the corporation are also officers and/or directors of American Century Companies, Inc. (ACC). The corporation’s investment advisor, ACIM, the corporation's distributor, American Century Investment Services, Inc., and the corporation’s transfer agent, American Century Services, LLC, are wholly owned, directly or indirectly, by ACC. Various funds issued by American Century Asset Allocation Portfolios, Inc. own, in aggregate, 100% of the shares of the fund. Related parties do not invest in the fund for the purpose of exercising management or control.
Management Fees — The corporation has entered into a management agreement with ACIM, under which ACIM provides the fund with investment advisory and management services in exchange for a single, unified management fee (the fee) per class. The agreement provides that all expenses of managing and operating the fund, except distribution and service fees, brokerage expenses, taxes, interest, fees and expenses of the independent directors (including legal counsel fees), and extraordinary expenses, will be paid by ACIM. The fee is computed and accrued daily based on each class's daily net assets and paid monthly in arrears. The rate of the fee is determined by applying a fee rate calculation formula. This formula takes into account the fund’s assets as well as certain assets, if any, of other clients of the investment advisor outside the American Century Investments family of funds (such as subadvised funds and separate accounts) that have very similar investment teams and investment strategies (strategy assets). The strategy assets of the fund also include the assets of Large Company Value Fund, one fund in a series issued by the corporation. The annual management fee schedule ranges from 0.50% to 0.70% for the Institutional Class and 0.35% to 0.55% for the R6 Class. The effective annual management fee for each class for the year ended March 31, 2016 was 0.64% for the Institutional Class and 0.49% for the R6 Class.
Directors' Fees and Expenses — The Board of Directors is responsible for overseeing the investment advisor’s management and operations of the fund. The directors receive detailed information about the fund and its investment advisor regularly throughout the year, and meet at least quarterly with management of the investment advisor to review reports about fund operations. The fund’s officers do not receive compensation from the fund.
4. Investment Transactions
Purchases and sales of investment securities, excluding short-term investments, for the year ended March 31, 2016 were $1,214,232,015 and $926,333,315, respectively.
5. Capital Share Transactions
Transactions in shares of the fund were as follows:
|
| | | | | | | | | | |
| | Year ended
March 31, 2016 | Year ended
March 31, 2015 |
| | Shares | Amount | Shares | Amount |
| Institutional Class/Shares Authorized | 800,000,000 |
| | 500,000,000 |
| |
| Sold | 33,650,369 |
| $ | 369,443,947 |
| 21,882,704 |
| $ | 266,961,883 |
|
| Issued in reinvestment of distributions | 13,963,872 |
| 150,938,032 |
| 10,198,049 |
| 126,203,366 |
|
| Redeemed | (15,352,282 | ) | (168,885,765 | ) | (28,455,605 | ) | (356,182,291 | ) |
| | 32,261,959 |
| 351,496,214 |
| 3,625,148 |
| 36,982,958 |
|
| R6 Class/Shares Authorized | 70,000,000 |
| | 20,000,000 |
| |
| Sold | 5,636,253 |
| 63,970,354 |
| 4,384,819 |
| 53,708,520 |
|
| Issued in reinvestment of distributions | 845,032 |
| 9,132,012 |
| 307,590 |
| 3,806,881 |
|
| Redeemed | (1,071,142 | ) | (12,140,872 | ) | (1,190,945 | ) | (14,897,548 | ) |
| | 5,410,143 |
| 60,961,494 |
| 3,501,464 |
| 42,617,853 |
|
| Net increase (decrease) | 37,672,102 |
| $ | 412,457,708 |
| 7,126,612 |
| $ | 79,600,811 |
|
6. Fair Value Measurements
The fund’s investments valuation process is based on several considerations and may use multiple inputs to determine the fair value of the investments held by the fund. In conformity with accounting principles generally accepted in the United States of America, the inputs used to determine a valuation are classified into three broad levels.
| |
| • | Level 1 valuation inputs consist of unadjusted quoted prices in an active market for identical investments. |
| |
| • | Level 2 valuation inputs consist of direct or indirect observable market data (including quoted prices for comparable investments, evaluations of subsequent market events, interest rates, prepayment speeds, credit risk, etc.). These inputs also consist of quoted prices for identical investments initially expressed in local currencies that are adjusted through translation into U.S. dollars. |
| |
| • | Level 3 valuation inputs consist of unobservable data (including a fund’s own assumptions). |
The level classification is based on the lowest level input that is significant to the fair valuation measurement. The valuation inputs are not necessarily an indication of the risks associated with investing in these securities or other financial instruments. There were no significant transfers between levels during the period.
The following is a summary of the level classifications as of period end. The Schedule of Investments provides additional information on the fund’s portfolio holdings.
|
| | | | | | | | |
| | Level 1 | Level 2 | Level 3 |
| Assets | | | |
| Investment Securities | | | |
| Common Stocks | $ | 1,586,205,290 |
| $ | 24,378,582 |
| — |
|
| Exchange-Traded Funds | 19,791,643 |
| — |
| — |
|
| Temporary Cash Investments | 3,354,205 |
| 5,136,000 |
| — |
|
| | $ | 1,609,351,138 |
| $ | 29,514,582 |
| — |
|
| Other Financial Instruments | | | |
| Forward Foreign Currency Exchange Contracts | — |
| $ | 15,556 |
| — |
|
| | | | |
| Liabilities | | | |
| Other Financial Instruments | | | |
| Forward Foreign Currency Exchange Contracts | — |
| $ | 969,377 |
| — |
|
7. Derivative Instruments
Equity Price Risk — The fund is subject to equity price risk in the normal course of pursuing its investment objectives. A fund may enter into futures contracts based on an equity index in order to manage its exposure to changes in market conditions. A fund may purchase futures contracts to gain exposure to increases in market value or sell futures contracts to protect against a decline in market value. Upon entering into a futures contract, a fund is required to deposit either cash or securities in an amount equal to a certain percentage of the contract value (initial margin). Subsequent payments (variation margin) are made or received daily, in cash, by a fund. The variation margin is equal to the daily change in the contract value and is recorded as unrealized gains and losses. A fund recognizes a realized gain or loss when the contract is closed or expires. Net realized and unrealized gains or losses occurring during the holding period of futures contracts are a component of net realized gain (loss) on futures contract transactions and change in net unrealized appreciation (depreciation) on futures contracts, respectively. One of the risks of entering into futures contracts is the possibility that the change in value of the contract may not correlate with the changes in value of the underlying securities. During the period, the fund participated in equity price risk derivative instruments for temporary investment purposes.
Foreign Currency Risk — The fund is subject to foreign currency exchange rate risk in the normal course of pursuing its investment objectives. The value of foreign investments held by a fund may be significantly affected by changes in foreign currency exchange rates. The dollar value of a foreign security generally decreases when the value of the dollar rises against the foreign currency in which the security is denominated and tends to increase when the value of the dollar declines against such foreign currency. A fund may enter into forward foreign currency exchange contracts to reduce a fund's exposure to foreign currency exchange rate fluctuations. The net U.S. dollar value of foreign currency underlying all contractual commitments held by a fund and the resulting unrealized appreciation or depreciation are determined daily. Realized gain or loss is recorded upon the termination of the contract. Net realized and unrealized gains or losses occurring during the holding period of forward foreign currency exchange contracts are a component of net realized gain (loss) on foreign currency transactions and change in net unrealized appreciation (depreciation) on translation of assets and liabilities in foreign currencies, respectively. A fund bears the risk of an unfavorable change in the foreign currency exchange rate underlying the forward contract. Additionally, losses, up to the fair value, may arise if the counterparties do not perform under the contract terms. The fund's average U.S. dollar exposure to foreign currency risk derivative instruments held during the period was $49,076,139.
|
| | | | | | | | |
Value of Derivative Instruments as of March 31, 2016
|
| | Asset Derivatives | Liability Derivatives |
| Type of Risk Exposure | Location on Statement of Assets and Liabilities | Value | Location on Statement of Assets and Liabilities | Value |
| Foreign Currency Risk | Unrealized appreciation on forward foreign currency exchange contracts | $ | 15,556 |
| Unrealized depreciation on forward foreign currency exchange contracts | $ | 969,377 |
|
| | | $ | 15,556 |
| | $ | 969,377 |
|
| | | | | |
Effect of Derivative Instruments on the Statement of Operations for the Year Ended March 31, 2016
|
| | Net Realized Gain (Loss) | Change in Net Unrealized Appreciation (Depreciation) |
| Type of Risk Exposure | Location on Statement of Operations | Value | Location on Statement of Operations | Value |
| Equity Price Risk | Net realized gain (loss) on futures contract transactions | $ | 140,977 |
| Change in net unrealized appreciation (depreciation) on futures contracts | $ | (31,023 | ) |
| Foreign Currency Risk | Net realized gain (loss) on foreign currency transactions | (63,224 | ) | Change in net unrealized appreciation (depreciation) on translation of assets and liabilities in foreign currencies | (1,456,636 | ) |
| | | $ | 77,753 |
| | $ | (1,487,659 | ) |
8. Federal Tax Information
The tax character of distributions paid during the years ended March 31, 2016 and March 31, 2015 were as follows:
|
| | | | | | |
| | 2016 | 2015 |
| Distributions Paid From | | |
| Ordinary income | $ | 47,555,478 |
| $ | 40,769,519 |
|
| Long-term capital gains | $ | 112,514,566 |
| $ | 89,240,728 |
|
The book-basis character of distributions made during the year from net investment income or net realized gains may differ from their ultimate characterization for federal income tax purposes. These differences reflect the differing character of certain income items and net realized gains and losses for financial statement and tax purposes, and may result in reclassification among certain capital accounts on the financial statements.
As of March 31, 2016, the federal tax cost of investments and the components of distributable earnings on a tax-basis were as follows:
|
| | | |
| Federal tax cost of investments | $ | 1,469,952,935 |
|
| Gross tax appreciation of investments | $ | 217,405,439 |
|
| Gross tax depreciation of investments | (48,492,654 | ) |
| Net tax appreciation (depreciation) of investments | 168,912,785 |
|
| Net tax appreciation (depreciation) on derivatives and translation of assets and liabilities in foreign currencies | (2,968 | ) |
| Net tax appreciation (depreciation) | $ | 168,909,817 |
|
| Undistributed ordinary income | $ | 1,501,209 |
|
| Accumulated long-term gains | $ | 148,039 |
|
| Post-October capital loss deferral | $ | (6,074,456 | ) |
The difference between book-basis and tax-basis unrealized appreciation (depreciation) is attributable primarily to the tax deferral of losses on wash sales.
Loss deferrals represent certain qualified losses that the fund has elected to treat as having been incurred in the following fiscal year for federal income tax purposes.
|
| | | | | | | | | | | | | | | |
| For a Share Outstanding Throughout the Years Ended March 31 (except as noted) |
| Per-Share Data | Ratios and Supplemental Data |
| | | Income From Investment Operations: | Distributions From: | | | Ratio to Average Net Assets of: | | |
| | Net Asset
Value,
Beginning
of Period | Net
Investment
Income
(Loss)(1) | Net
Realized
and
Unrealized
Gain (Loss) | Total From
Investment
Operations | Net
Investment
Income | Net
Realized
Gains | Total
Distributions | Net Asset
Value,
End
of Period | Total
Return(2) | Operating
Expenses | Net
Investment
Income
(Loss) | Portfolio
Turnover
Rate | Net
Assets,
End of
Period
(in thousands) |
| Institutional Class | | | | | | | | | | | |
| 2016 | $12.38 | 0.18 | (0.78) | (0.60) | (0.18) | (1.02) | (1.20) | $10.58 | (4.92)% | 0.64% | 1.57% | 61% |
| $1,531,294 |
|
| 2015 | $12.18 | 0.19 | 1.14 | 1.33 | (0.18) | (0.95) | (1.13) | $12.38 | 11.01% | 0.64% | 1.52% | 68% |
| $1,391,730 |
|
| 2014 | $10.45 | 0.21 | 2.03 | 2.24 | (0.20) | (0.31) | (0.51) | $12.18 | 21.75% | 0.65% | 1.81% | 35% |
| $1,324,951 |
|
| 2013 | $9.31 | 0.19 | 1.25 | 1.44 | (0.19) | (0.11) | (0.30) | $10.45 | 15.87% | 0.67% | 2.03% | 37% |
| $941,901 |
|
| 2012 | $8.86 | 0.17 | 0.44 | 0.61 | (0.16) | — | (0.16) | $9.31 | 7.07% | 0.67% | 2.02% | 47% |
| $668,644 |
|
| R6 Class | | | | | | | | | | | |
| 2016 | $12.38 | 0.20 | (0.77) | (0.57) | (0.20) | (1.02) | (1.22) | $10.59 | (4.70)% | 0.49% | 1.72% | 61% |
| $108,912 |
|
| 2015 | $12.18 | 0.21 | 1.14 | 1.35 | (0.20) | (0.95) | (1.15) | $12.38 | 11.17% | 0.49% | 1.67% | 68% |
| $60,401 |
|
2014(3) | $11.54 | 0.15 | 0.96 | 1.11 | (0.16) | (0.31) | (0.47) | $12.18 | 9.83% | 0.50%(4) | 1.93%(4) | 35%(5) |
| $16,772 |
|
|
|
| Notes to Financial Highlights |
| |
| (1) | Computed using average shares outstanding throughout the period. |
| |
| (2) | Total returns are calculated based on the net asset value of the last business day. Total returns for periods less than one year are not annualized. |
| |
| (3) | July 26, 2013 (commencement of sale) through March 31, 2014. |
| |
| (5) | Portfolio turnover is calculated at the fund level. Percentage indicated was calculated for the year ended March 31, 2014. |
See Notes to Financial Statements.
|
|
| Report of Independent Registered Public Accounting Firm |
To the Board of Directors and Shareholders of American Century Capital Portfolios, Inc.:
We have audited the accompanying statement of assets and liabilities, including the schedule of investments, of NT Large Company Value Fund (the “Fund”), one of the funds constituting American Century Capital Portfolios, Inc., as of March 31, 2016, and the related statement of operations for the year then ended, the statements of changes in net assets for each of the two years in the period then ended, and the financial highlights for each of the periods presented. These financial statements and financial highlights are the responsibility of the Fund's management. Our responsibility is to express an opinion on these financial statements and financial highlights based on our audits.
We conducted our audits in accordance with the standards of the Public Company Accounting Oversight Board (United States). Those standards require that we plan and perform the audit to obtain reasonable assurance about whether the financial statements and financial highlights are free of material misstatement. The Fund is not required to have, nor were we engaged to perform, an audit of its internal control over financial reporting. Our audits included consideration of internal control over financial reporting as a basis for designing audit procedures that are appropriate in the circumstances, but not for the purpose of expressing an opinion on the effectiveness of the Fund's internal control over financial reporting. Accordingly, we express no such opinion. An audit also includes examining, on a test basis, evidence supporting the amounts and disclosures in the financial statements, assessing the accounting principles used and significant estimates made by management, as well as evaluating the overall financial statement presentation. Our procedures included confirmation of securities owned as of March 31, 2016, by correspondence with the custodian and brokers; when replies were not received from brokers, we performed other auditing procedures. We believe that our audits provide a reasonable basis for our opinion.
In our opinion, the financial statements and financial highlights referred to above present fairly, in all material respects, the financial position of NT Large Company Value Fund of American Century Capital Portfolios, Inc. as of March 31, 2016, the results of its operations for the year then ended, the changes in its net assets for each of the two years in the period then ended, and the financial highlights for each of the periods presented, in conformity with accounting principles generally accepted in the United States of America.
DELOITTE & TOUCHE LLP
Kansas City, Missouri May 17, 2016
The Board of Directors
The individuals listed below serve as directors of the funds. Each director will continue to serve in this capacity until death, retirement, resignation or removal from office. The board has adopted a mandatory retirement age for directors who are not “interested persons,” as that term is defined in the Investment Company Act (independent directors). Independent directors shall retire by December 31 of the year in which they reach their 75th birthday.
Mr. Thomas is an “interested person” because he currently serves as President and Chief Executive Officer of American Century Companies, Inc. (ACC), the parent company of American Century Investment Management, Inc. (ACIM or the advisor). Mr. Fink is treated as an “interested person” because of his recent employment with ACC and American Century Services, LLC (ACS). The other directors (more than three-fourths of the total number) are independent. They are not employees, directors or officers of, and have no financial interest in, ACC or any of its wholly owned, direct or indirect, subsidiaries, including ACIM, American Century Investment Services, Inc. (ACIS) and ACS, and they do not have any other affiliations, positions or relationships that would cause them to be considered “interested persons” under the Investment Company Act. The directors serve in this capacity for seven (in the case of Mr. Thomas, 15) registered investment companies in the American Century Investments family of funds.
The following table presents additional information about the directors. The mailing address for each director is 4500 Main Street, Kansas City, Missouri 64111.
|
| | | | | |
Name
(Year of Birth) | Position(s) Held with Funds | Length of Time Served | Principal Occupation(s) During Past 5 Years | Number of American Century Portfolios Overseen by Director | Other Directorships Held During Past
5 Years |
| Independent Directors | | |
Andrea C. Hall
(1945) | Director | Since 1997 | Retired | 83 | None |
Jan M. Lewis
(1957) | Director | Since 2011 | Retired; President and Chief Executive Officer, Catholic Charities of Northeast Kansas (human services organization) (2006 to 2013) | 83 | None |
James A. Olson
(1942) | Director and Chairman of the Board | Since 2007 (Chairman since 2014) | Member, Plaza Belmont LLC (private equity fund manager) (1999 to present) | 83 | Saia, Inc. (2002 to 2012) and EPR Properties (2003 to 2013) |
M. Jeannine Strandjord
(1945) | Director | Since 1994 | Retired | 83 | Euronet Worldwide Inc.; MGP Ingredients, Inc.; and DST Systems Inc. (1996 to 2012) |
John R. Whitten
(1946) | Director | Since 2008 | Retired | 83 | Rudolph Technologies, Inc. |
Stephen E. Yates
(1948) | Director | Since 2012 | Retired | 83 | None |
|
| | | | | |
Name
(Year of Birth) | Position(s) Held with Funds | Length of Time Served | Principal Occupation(s) During Past 5 Years | Number of American Century Portfolios Overseen by Director | Other Directorships Held During Past
5 Years |
| Interested Directors |
Barry Fink
(1955) | Director | Since 2012 | Retired; Executive Vice President, ACC (September 2007 to February 2013); President, ACS (October 2007 to February 2013); Chief Operating Officer, ACC (September 2007 to November 2012) | 83 | None |
Jonathan S. Thomas
(1963) | Director and President | Since 2007 | President and Chief Executive Officer, ACC (March 2007 to present). Also serves as Chief Executive Officer, ACS; Executive Vice President, ACIM; Director, ACC, ACIM and other ACC subsidiaries | 128 | BioMed Valley Discoveries, Inc. |
The Statement of Additional Information has additional information about the fund's directors and is available without charge, upon request, by calling 1-800-345-2021.
Officers
The following table presents certain information about the executive officers of the funds. Each officer serves as an officer for each of the 15 investment companies in the American Century family of funds, unless otherwise noted. No officer is compensated for his or her service as an officer of the funds. The listed officers are interested persons of the funds and are appointed or re-appointed on an annual basis. The mailing address for each officer listed below is 4500 Main Street, Kansas City, Missouri 64111.
|
| | |
Name (Year of Birth) | Offices with
the Funds | Principal Occupation(s) During the Past Five Years |
Jonathan S.
Thomas
(1963) | Director and
President
since 2007 | President and Chief Executive Officer, ACC (March 2007 to present). Also serves as Chief Executive Officer, ACS; Executive Vice President, ACIM; Director, ACC, ACIM and other ACC subsidiaries |
Amy D. Shelton
(1964) | Chief Compliance
Officer and Vice President since 2014 | Chief Compliance Officer, American Century funds, (March 2014 to present); Chief Compliance Officer, ACIM (February 2014 to present); Chief Compliance Officer, ACIS (October 2009 to present); Vice President, Client Interactions and Marketing, ACIS (February 2013 to January 2014); Director, Client Interactions and Marketing, ACIS (June 2007 to January 2013). Also serves as Vice President, ACIS |
Charles A.
Etherington
(1957) | General Counsel
since 2007 and
Senior Vice
President since 2006 | Attorney, ACC (February 1994 to present); Vice President, ACC (November 2005 to present); General Counsel, ACC (March 2007 to present). Also serves as General Counsel, ACIM, ACS, ACIS and other ACC subsidiaries; and Senior Vice President, ACIM and ACS |
C. Jean Wade
(1964) | Vice President,
Treasurer and
Chief Financial
Officer since 2012 | Vice President, ACS (February 2000 to present) |
Robert J.
Leach
(1966) | Vice President
since 2006 and
Assistant Treasurer
since 2012 | Vice President, ACS (February 2000 to present) |
David H.
Reinmiller
(1963) | Vice President
since 2000 | Attorney, ACC (January 1994 to present); Associate General Counsel, ACC (January 2001 to present). Also serves as Vice President, ACIM and ACS |
Ward D.
Stauffer
(1960) | Secretary
since 2005 | Attorney, ACC (June 2003 to present) |
Retirement Account Information
As required by law, distributions you receive from certain IRAs are subject to federal income tax withholding, unless you elect not to have withholding apply. Tax will be withheld on the total amount withdrawn even though you may be receiving amounts that are not subject to withholding, such as nondeductible contributions. In such case, excess amounts of withholding could occur. You may adjust your withholding election so that a greater or lesser amount will be withheld.
If you don’t want us to withhold on this amount, you must notify us to not withhold the federal income tax. You may notify us in writing or in certain situations by telephone or through other electronic means. For systematic withdrawals, your withholding election will remain in effect until revoked or changed by filing a new election. You have the right to revoke your election at any time.
Remember, even if you elect not to have income tax withheld, you are liable for paying income tax on the taxable portion of your withdrawal. If you elect not to have income tax withheld or you don’t have enough income tax withheld, you may be responsible for payment of estimated tax. You may incur penalties under the estimated tax rules if your withholding and estimated tax payments are not sufficient. You can reduce or defer the income tax on a distribution by directly or indirectly rolling such distribution over to another IRA or eligible plan. You should consult your tax advisor for additional information.
State tax will be withheld if, at the time of your distribution, your address is within one of the mandatory withholding states and you have federal income tax withheld (or as otherwise required by state law). State taxes will be withheld from your distribution in accordance with the respective state rules.
Distributions you receive from 403(b), 457 and qualified plans are subject to special tax and withholding rules. Your plan administrator or plan sponsor is required to provide you with a special tax notice explaining those rules at the time you request a distribution. If applicable, federal and/or state taxes may be withheld from your distribution amount.
Proxy Voting Policies
A description of the policies that the fund's investment advisor uses in exercising the voting rights associated with the securities purchased and/or held by the fund is available without charge, upon request, by calling 1-800-345-2021. It is also available on the "About Us" page of American Century Investments’ website at americancentury.com and on the Securities and Exchange Commission’s website at sec.gov. Information regarding how the investment advisor voted proxies relating to portfolio securities during the most recent 12-month period ended June 30 is available on the "About Us" page at americancentury.com. It is also available at sec.gov.
Quarterly Portfolio Disclosure
The fund files its complete schedule of portfolio holdings with the Securities and Exchange Commission (SEC) for the first and third quarters of each fiscal year on Form N-Q. The fund’s Forms N-Q are available on the SEC’s website at sec.gov, and may be reviewed and copied at the SEC’s Public Reference Room in Washington, DC. Information on the operation of the Public Reference Room may be obtained by calling 1-800-SEC-0330. The fund also makes its complete schedule of portfolio holdings for the most recent quarter of its fiscal year available on its
website at americancentury.com and, upon request, by calling 1-800-345-2021.
Other Tax Information
The following information is provided pursuant to provisions of the Internal Revenue Code.
The fund hereby designates up to the maximum amount allowable as qualified dividend income for the fiscal year ended March 31, 2016.
For corporate taxpayers, the fund hereby designates $22,376,225, or up to the maximum amount allowable, of ordinary income distributions paid during the fiscal year ended March 31, 2016 as qualified for the corporate dividends received deduction.
The fund hereby designates $22,762,021 as qualified short-term capital gain distributions for purposes of Internal Revenue Code Section 871 for the fiscal year ended March 31, 2016.
The fund hereby designates $112,514,566, or up to the maximum amount allowable, as long-term capital gain distributions for the fiscal year ended March 31, 2016.
|
| | |
| |
| | | |
| Contact Us | americancentury.com | |
| Automated Information Line | 1-800-345-8765 | |
| Investor Services Representative | 1-800-345-2021 or 816-531-5575 | |
| Investors Using Advisors | 1-800-378-9878 | |
| Business, Not-For-Profit, Employer-Sponsored Retirement Plans | 1-800-345-3533 | |
| Banks and Trust Companies, Broker-Dealers, Financial Professionals, Insurance Companies | 1-800-345-6488 | |
| Telecommunications Relay Service for the Deaf | 711 | |
| | | |
| American Century Capital Portfolios, Inc. | |
| | | |
Investment Advisor: American Century Investment Management, Inc. Kansas City, Missouri | |
| | | |
| This report and the statements it contains are submitted for the general information of our shareholders. The report is not authorized for distribution to prospective investors unless preceded or accompanied by an effective prospectus. | |
| | | |
©2016 American Century Proprietary Holdings, Inc. All rights reserved.
CL-ANN-88887 1605 | |
|
| |
| | |
| | Annual Report |
| | |
| | March 31, 2016 |
| | |
| | NT Mid Cap Value Fund |
|
| | |
| Performance | 2 |
|
| Portfolio Commentary | |
|
| Fund Characteristics | |
|
| Shareholder Fee Example | |
|
| Schedule of Investments | |
|
| Statement of Assets and Liabilities | |
|
| Statement of Operations | |
|
| Statement of Changes in Net Assets | |
|
| Notes to Financial Statements | |
|
| Financial Highlights | |
|
| Report of Independent Registered Public Accounting Firm | |
|
| Management | |
|
| Additional Information | |
|
Any opinions expressed in this report reflect those of the author as of the date of the report, and do not necessarily represent the opinions of American Century Investments® or any other person in the American Century Investments organization. Any such opinions are subject to change at any time based upon market or other conditions and American Century Investments disclaims any responsibility to update such opinions. These opinions may not be relied upon as investment advice and, because investment decisions made by American Century Investments funds are based on numerous factors, may not be relied upon as an indication of trading intent on behalf of any American Century Investments fund. Security examples are used for representational purposes only and are not intended as recommendations to purchase or sell securities. Performance information for comparative indices and securities is provided to American Century Investments by third party vendors. To the best of American Century Investments’ knowledge, such information is accurate at the time of printing.
|
| | | | | |
| Total Returns as of March 31, 2016 |
| | | | Average Annual Returns | |
| | Ticker Symbol | 1 year | 5 years | Since Inception | Inception Date |
| Institutional Class | ACLMX | 2.13% | 11.86% | 9.23% | 5/12/06 |
| Russell Midcap Value Index | — | -3.39% | 10.50% | 7.30% | — |
| R6 Class | ACDSX | 2.36% | — | 10.50% | 7/26/13 |
Returns would have been lower if a portion of the fees had not been waived.
|
|
| Growth of $10,000 Over Life of Class |
| $10,000 investment made May 12, 2006 |
| Performance for other share classes will vary due to differences in fee structure. |
|
| |
| Value on March 31, 2016 |
| | Institutional Class — $23,957 |
| |
| | Russell Midcap Value Index — $20,085 |
| |
Ending value would have been lower if a portion of the fees had not been waived.
|
| |
| Total Annual Fund Operating Expenses |
| Institutional Class | R6 Class |
| 0.81% | 0.66% |
The total annual fund operating expenses shown is as stated in the fund’s prospectus current as of the date of this report. The prospectus may vary from the expense ratio shown elsewhere in this report because it is based on a different time period, includes acquired fund fees and expenses, and, if applicable, does not include fee waivers or expense reimbursements.
Data presented reflect past performance. Past performance is no guarantee of future results. Current performance may be higher or lower than the performance shown. Total returns for periods less than one year are not annualized. Investment return and principal value will fluctuate, and redemption value may be more or less than original cost. Data assumes reinvestment of dividends and capital gains, and none of the charts reflect the deduction of taxes that a shareholder would pay on fund distributions or the redemption of fund shares. To obtain performance data current to the most recent month end, please call 1-800-345-2021 or visit americancentury.com. For additional information about the fund, please consult the prospectus.
Portfolio Managers: Kevin Toney, Michael Liss, Phil Davidson, and Brian Woglom
Performance Summary
NT Mid Cap Value returned 2.13%* for the 12 months ended March 31, 2016. By comparison, its benchmark, the Russell Midcap Value Index, returned -3.39%. The fund’s return reflects operating expenses, while the index’s return does not.
Volatility dominated the 12-month period as concerns over slowing growth in China and other emerging markets, falling oil prices, and the prospect of higher U.S. Federal Reserve (Fed) interest rates weighed on investor confidence. After a turbulent summer, markets sold off sharply in the third quarter of 2015, but stabilized somewhat in the fourth quarter as the Fed delayed an anticipated September interest rate hike. In December, however, Fed policymakers raised the federal funds rate by 25 basis points, while they affirmed the underlying strength of the U.S. economy. Early in 2016, concerns over slowing growth in China triggered a renewed market sell-off. Broad market indices such as the S&P 500 Index recovered some ground later in the first quarter after the Fed scaled back its projected number of rate hikes for the year, from four to two. Against this backdrop, mid-cap stocks underperformed the broader market as investors sought stability in large caps. Mid-cap value stocks outperformed mid-cap growth.
In this environment, NT Mid Cap Value’s investment approach, which emphasizes higher-quality businesses with sound balance sheets, provided positive absolute results in eight of the 10 sectors in which it was invested, during a period when only three of the index sectors had positive returns. On a relative basis, the portfolio outperformed its benchmark index, aided by its holdings in consumer staples, energy, financials, industrials, and health care. The portfolio’s stock selection in information technology detracted from relative performance.
Consumer Staples Contributed
Positioning in the consumer staples sector aided relative performance, due in part to an overweight investment in Sysco, a large distributor of food and related products. Sysco’s stock rose after the company reported better-than-expected financial results, fueled by strong volume growth.
Stock Selection in Energy Lifted Returns
Stock selection in energy contributed to relative performance, but was partially offset by the negative impact of the portfolio’s overweight, as downward volatility in oil prices weighed on stock price performance in the overall energy sector. Cameron International, a provider of oilfield flow-control equipment, was a positive contributor. Cameron’s stock price surged higher last August on news it was being acquired by oilfield-services provider Schlumberger for a healthy premium.
Financial and Industrials Aided Results
Security selection in financials, especially in the banks and insurance industries, supported relative returns, with strong stock price performance by HCC Insurance Holdings, which is no longer held. Within the industrials sector, the portfolio benefited from its overweight stake in waste management company Republic Services. In the first quarter of 2016, Republic reported better-than-expected earnings, and continued to execute well, aided by its minimal exposure to emerging markets and foreign currency issues.
*All fund returns referenced in this commentary are for Institutional Class shares. Returns would have been lower if a portion of the fees had not been waived. Performance for other share classes will vary due to differences in fee structure; when Institutional Class performance exceeds that of the fund's benchmark, other share classes may not. See page 2 for returns for all share classes.
Information Technology Dragged
Stock selection in information technology weighed on relative results, due in part to a portfolio-only position in memory chip manufacturer Micron Technology. Micron Technology’s business suffered from weakness and pricing pressures in the PC components market, factors that weighed on its earnings and share-price performance. We exited the position.
Several Energy Stocks Detracted
Despite positive overall stock selection in energy, declining oil and natural gas prices weighed on a number of the portfolio’s energy holdings. These included portfolio-only positions in Devon Energy, Anadarko Petroleum, and Imperial Oil, and an overweight in Noble Energy.
Outlook
As of March 31, 2016, the portfolio’s largest overweights are in the industrials and consumer staples sectors. We have identified many stocks in the consumer staples sector that fit our investment process well due to high returns on invested capital, stability, and healthy balance sheets. The portfolio has smaller overweights in the health care and energy sectors, and we continue to focus on higher-quality energy companies. The portfolio’s largest underweight remains in the financials sector due to a continued underweight to real estate investment trusts (REITs). The portfolio has smaller underweights in materials, consumer discretionary, utilities, information technology, and telecommunication services.
|
| |
| MARCH 31, 2016 |
| Top Ten Holdings | % of net assets |
| Northern Trust Corp. | 3.0% |
| Sysco Corp. | 2.9% |
| iShares Russell Mid-Cap Value ETF | 2.6% |
| Republic Services, Inc. | 2.2% |
| Zimmer Biomet Holdings, Inc. | 2.0% |
| Tyco International plc | 2.0% |
| Applied Materials, Inc. | 1.8% |
| Edison International | 1.8% |
| Weyerhaeuser Co. | 1.8% |
| Imperial Oil Ltd. | 1.7% |
| | |
| Top Five Industries | % of net assets |
| Oil, Gas and Consumable Fuels | 8.8% |
| Electric Utilities | 7.3% |
| Banks | 7.2% |
| Insurance | 6.9% |
| Health Care Equipment and Supplies | 5.8% |
| | |
| Types of Investments in Portfolio | % of net assets |
| Common Stocks | 95.6% |
| Exchange-Traded Funds | 2.6% |
| Total Equity Exposure | 98.2% |
| Temporary Cash Investments | 1.8% |
| Other Assets and Liabilities | —* |
*Category is less than 0.05% of total net assets.
Fund shareholders may incur two types of costs: (1) transaction costs, including sales charges (loads) on purchase payments and redemption/exchange fees; and (2) ongoing costs, including management fees; distribution and service (12b-1) fees; and other fund expenses. This example is intended to help you understand your ongoing costs (in dollars) of investing in your fund and to compare these costs with the ongoing cost of investing in other mutual funds.
The example is based on an investment of $1,000 made at the beginning of the period and held for the entire period from October 1, 2015 to March 31, 2016.
Actual Expenses
The table provides information about actual account values and actual expenses for each class. You may use the information, together with the amount you invested, to estimate the expenses that you paid over the period. First, identify the share class you own. Then simply divide your account value by $1,000 (for example, an $8,600 account value divided by $1,000 = 8.6), then multiply the result by the number under the heading “Expenses Paid During Period” to estimate the expenses you paid on your account during this period.
Hypothetical Example for Comparison Purposes
The table also provides information about hypothetical account values and hypothetical expenses based on the actual expense ratio of each class of your fund and an assumed rate of return of 5% per year before expenses, which is not the actual return of a fund’s share class. The hypothetical account values and expenses may not be used to estimate the actual ending account balance or expenses you paid for the period. You may use this information to compare the ongoing costs of investing in your fund and other funds. To do so, compare this 5% hypothetical example with the 5% hypothetical examples that appear in the shareholder reports of the other funds.
Please note that the expenses shown in the table are meant to highlight your ongoing costs only and do not reflect any transactional costs, such as sales charges (loads) or redemption/exchange fees. Therefore, the table is useful in comparing ongoing costs only, and will not help you determine the relative total costs of owning different funds. In addition, if these transactional costs were included, your costs would have been higher.
|
| | | | |
| | Beginning
Account Value
10/1/15 | Ending
Account Value
3/31/16 | Expenses Paid
During Period(1)10/1/15 - 3/31/16 | Annualized
Expense Ratio(1) |
| Actual | | | | |
| Institutional Class (after waiver) | $1,000 | $1,099.00 | $4.20 | 0.80% |
| Institutional Class (before waiver) | $1,000 | $1,099.00(2) | $4.25 | 0.81% |
| R6 Class (after waiver) | $1,000 | $1,099.80 | $3.41 | 0.65% |
| R6 Class (before waiver) | $1,000 | $1,099.80(2) | $3.46 | 0.66% |
| Hypothetical | | | | |
| Institutional Class (after waiver) | $1,000 | $1,021.00 | $4.04 | 0.80% |
| Institutional Class (before waiver) | $1,000 | $1,020.95 | $4.09 | 0.81% |
| R6 Class (after waiver) | $1,000 | $1,021.75 | $3.29 | 0.65% |
| R6 Class (before waiver) | $1,000 | $1,021.70 | $3.34 | 0.66% |
| |
| (1) | Expenses are equal to the class's annualized expense ratio listed in the table above, multiplied by the average account value over the period, multiplied by 183, the number of days in the most recent fiscal half-year, divided by 366, to reflect the one-half year period. |
| |
| (2) | Ending account value assumes the return earned after waiver and would have been lower if a portion of the fees had not been waived. |
MARCH 31, 2016
|
| | | | |
| | Shares | Value |
| COMMON STOCKS — 95.6% | | |
| Aerospace and Defense — 0.9% | | |
| Textron, Inc. | 219,511 | $ | 8,003,371 |
|
| Automobiles — 1.3% | | |
| Honda Motor Co., Ltd. ADR | 198,191 | 5,418,542 |
|
| Thor Industries, Inc. | 94,792 | 6,044,886 |
|
| | | 11,463,428 |
|
| Banks — 7.2% | | |
| Bank of Hawaii Corp. | 100,162 | 6,839,061 |
|
| BB&T Corp. | 187,199 | 6,228,111 |
|
| Comerica, Inc. | 116,868 | 4,425,791 |
|
| Commerce Bancshares, Inc. | 215,426 | 9,683,399 |
|
| M&T Bank Corp. | 81,499 | 9,046,389 |
|
| PNC Financial Services Group, Inc. (The) | 100,112 | 8,466,472 |
|
| SunTrust Banks, Inc. | 130,812 | 4,719,697 |
|
| UMB Financial Corp. | 104,715 | 5,406,436 |
|
| Westamerica Bancorporation | 207,671 | 10,115,654 |
|
| | | 64,931,010 |
|
| Capital Markets — 5.1% | | |
| Franklin Resources, Inc. | 146,411 | 5,717,350 |
|
| Northern Trust Corp. | 422,198 | 27,514,644 |
|
| State Street Corp. | 119,970 | 7,020,644 |
|
| T. Rowe Price Group, Inc. | 79,687 | 5,853,807 |
|
| | | 46,106,445 |
|
| Commercial Services and Supplies — 5.7% | | |
| ADT Corp. (The) | 147,638 | 6,091,544 |
|
Clean Harbors, Inc.(1) | 156,115 | 7,702,714 |
|
| Republic Services, Inc. | 413,561 | 19,706,182 |
|
| Tyco International plc | 491,410 | 18,039,661 |
|
| | | 51,540,101 |
|
| Containers and Packaging — 2.1% | | |
| Bemis Co., Inc. | 69,395 | 3,593,273 |
|
| Sonoco Products Co. | 177,095 | 8,601,504 |
|
| WestRock Co. | 172,209 | 6,721,317 |
|
| | | 18,916,094 |
|
| Diversified Financial Services — 0.4% | | |
Markit Ltd.(1) | 99,871 | 3,530,440 |
|
| Diversified Telecommunication Services — 1.1% | | |
| CenturyLink, Inc. | 324,609 | 10,374,504 |
|
| Electric Utilities — 7.3% | | |
| Edison International | 221,629 | 15,932,909 |
|
| Great Plains Energy, Inc. | 218,662 | 7,051,849 |
|
| PG&E Corp. | 247,607 | 14,787,090 |
|
| Westar Energy, Inc. | 303,180 | 15,040,760 |
|
| Xcel Energy, Inc. | 303,911 | 12,709,558 |
|
| | | 65,522,166 |
|
| | | |
|
| | | | |
| | Shares | Value |
| Electrical Equipment — 2.3% | | |
| Emerson Electric Co. | 123,670 | $ | 6,725,175 |
|
| Hubbell, Inc. | 73,926 | 7,830,981 |
|
| Rockwell Automation, Inc. | 51,103 | 5,812,966 |
|
| | | 20,369,122 |
|
| Electronic Equipment, Instruments and Components — 2.2% | | |
Keysight Technologies, Inc.(1) | 365,529 | 10,139,775 |
|
| TE Connectivity Ltd. | 152,973 | 9,472,088 |
|
| | | 19,611,863 |
|
| Energy Equipment and Services — 2.1% | | |
Cameron International Corp.(1) | 53,120 | 3,561,696 |
|
FMC Technologies, Inc.(1) | 277,772 | 7,599,842 |
|
| Frank's International NV | 24,660 | 406,397 |
|
| Helmerich & Payne, Inc. | 133,664 | 7,848,750 |
|
| | | 19,416,685 |
|
| Food and Staples Retailing — 2.9% | | |
| Sysco Corp. | 553,668 | 25,872,906 |
|
| Food Products — 5.3% | | |
| ConAgra Foods, Inc. | 272,417 | 12,155,246 |
|
| General Mills, Inc. | 127,828 | 8,097,904 |
|
| J.M. Smucker Co. (The) | 63,633 | 8,262,109 |
|
| Kellogg Co. | 92,920 | 7,113,026 |
|
| Mondelez International, Inc., Class A | 303,033 | 12,157,684 |
|
| | | 47,785,969 |
|
| Gas Utilities — 2.0% | | |
| Atmos Energy Corp. | 108,692 | 8,071,468 |
|
| Laclede Group, Inc. (The) | 143,046 | 9,691,366 |
|
| | | 17,762,834 |
|
| Health Care Equipment and Supplies — 5.8% | | |
| Abbott Laboratories | 150,568 | 6,298,260 |
|
| Baxter International, Inc. | 290,404 | 11,929,796 |
|
| Becton Dickinson and Co. | 36,692 | 5,570,579 |
|
Boston Scientific Corp.(1) | 526,590 | 9,905,158 |
|
| Zimmer Biomet Holdings, Inc. | 172,294 | 18,371,709 |
|
| | | 52,075,502 |
|
| Health Care Providers and Services — 2.6% | | |
LifePoint Health, Inc.(1) | 199,151 | 13,791,207 |
|
| Quest Diagnostics, Inc. | 142,309 | 10,167,978 |
|
| | | 23,959,185 |
|
| Hotels, Restaurants and Leisure — 0.5% | | |
| Carnival Corp. | 94,295 | 4,975,947 |
|
| Household Durables — 0.7% | | |
| PulteGroup, Inc. | 331,935 | 6,210,504 |
|
| Industrial Conglomerates — 1.1% | | |
| Koninklijke Philips NV | 348,939 | 9,940,337 |
|
| Insurance — 6.9% | | |
| Aflac, Inc. | 72,376 | 4,569,821 |
|
| Allstate Corp. (The) | 72,378 | 4,876,106 |
|
| Brown & Brown, Inc. | 213,562 | 7,645,520 |
|
| Chubb Ltd. | 104,774 | 12,483,822 |
|
| MetLife, Inc. | 112,300 | 4,934,462 |
|
|
| | | | |
| | Shares | Value |
| ProAssurance Corp. | 88,435 | $ | 4,474,811 |
|
| Reinsurance Group of America, Inc. | 109,966 | 10,584,227 |
|
| Torchmark Corp. | 63,609 | 3,445,063 |
|
| Travelers Cos., Inc. (The) | 15,201 | 1,774,109 |
|
| Unum Group | 248,547 | 7,685,073 |
|
| | | 62,473,014 |
|
| Leisure Products — 0.3% | | |
| Mattel, Inc. | 93,945 | 3,158,431 |
|
| Machinery — 1.1% | | |
| Oshkosh Corp. | 132,553 | 5,417,441 |
|
| Parker-Hannifin Corp. | 44,247 | 4,914,957 |
|
| | | 10,332,398 |
|
| Metals and Mining — 0.6% | | |
| Nucor Corp. | 125,190 | 5,921,487 |
|
| Multi-Utilities — 1.7% | | |
| Ameren Corp. | 101,769 | 5,098,627 |
|
| Consolidated Edison, Inc. | 63,769 | 4,885,981 |
|
| NorthWestern Corp. | 83,670 | 5,166,622 |
|
| | | 15,151,230 |
|
| Multiline Retail — 0.4% | | |
| Target Corp. | 49,155 | 4,044,473 |
|
| Oil, Gas and Consumable Fuels — 8.8% | | |
| Anadarko Petroleum Corp. | 166,915 | 7,773,232 |
|
| Cimarex Energy Co. | 79,458 | 7,728,880 |
|
| Devon Energy Corp. | 206,354 | 5,662,354 |
|
| EQT Corp. | 222,240 | 14,947,862 |
|
| Imperial Oil Ltd. | 465,120 | 15,539,216 |
|
| Noble Energy, Inc. | 390,128 | 12,253,920 |
|
| Occidental Petroleum Corp. | 184,601 | 12,632,246 |
|
| Pioneer Natural Resources Co. | 19,867 | 2,796,082 |
|
| | | 79,333,792 |
|
| Real Estate Investment Trusts (REITs) — 5.5% | | |
| Boston Properties, Inc. | 25,255 | 3,209,406 |
|
| Corrections Corp. of America | 296,647 | 9,507,536 |
|
| Empire State Realty Trust, Inc. | 270,022 | 4,733,486 |
|
| Host Hotels & Resorts, Inc. | 367,680 | 6,140,256 |
|
| Piedmont Office Realty Trust, Inc., Class A | 482,471 | 9,798,986 |
|
| Weyerhaeuser Co. | 512,885 | 15,889,177 |
|
| | | 49,278,847 |
|
| Road and Rail — 2.2% | | |
| CSX Corp. | 368,188 | 9,480,841 |
|
| Heartland Express, Inc. | 549,711 | 10,197,139 |
|
| | | 19,677,980 |
|
| Semiconductors and Semiconductor Equipment — 5.0% | | |
| Applied Materials, Inc. | 778,008 | 16,478,210 |
|
| Lam Research Corp. | 60,574 | 5,003,412 |
|
| Maxim Integrated Products, Inc. | 313,534 | 11,531,781 |
|
| Microchip Technology, Inc. | 47,526 | 2,290,753 |
|
| Teradyne, Inc. | 438,836 | 9,474,469 |
|
| | | 44,778,625 |
|
| | | |
|
| | | | |
| | Shares | Value |
| Specialty Retail — 2.4% | | |
| Advance Auto Parts, Inc. | 68,697 | $ | 11,014,877 |
|
| CST Brands, Inc. | 270,670 | 10,363,954 |
|
| | | 21,378,831 |
|
| Technology Hardware, Storage and Peripherals — 0.6% | | |
| SanDisk Corp. | 67,520 | 5,136,921 |
|
| Textiles, Apparel and Luxury Goods — 0.5% | | |
| Ralph Lauren Corp. | 51,343 | 4,942,277 |
|
| Thrifts and Mortgage Finance — 1.0% | | |
| Capitol Federal Financial, Inc. | 659,231 | 8,741,403 |
|
TOTAL COMMON STOCKS (Cost $758,438,962) | | 862,718,122 |
|
| EXCHANGE-TRADED FUNDS — 2.6% | | |
iShares Russell Mid-Cap Value ETF
(Cost $21,449,361) | 332,308 | 23,570,607 |
|
| TEMPORARY CASH INVESTMENTS — 1.8% | | |
| Repurchase Agreement, Fixed Income Clearing Corp., (collateralized by various U.S. Treasury obligations, 3.75%, 11/15/43, valued at $9,978,719), at 0.10%, dated 3/31/16, due 4/1/16 (Delivery value $9,782,027) | | 9,782,000 |
|
| State Street Institutional Liquid Reserves Fund, Premier Class | 6,389,511 | 6,389,511 |
|
TOTAL TEMPORARY CASH INVESTMENTS (Cost $16,171,511) | | 16,171,511 |
|
TOTAL INVESTMENT SECURITIES — 100.0% (Cost $796,059,834) | | 902,460,240 |
|
OTHER ASSETS AND LIABILITIES† | | (69,050) |
|
| TOTAL NET ASSETS — 100.0% | | $ | 902,391,190 |
|
|
| | | | | | | | |
| FORWARD FOREIGN CURRENCY EXCHANGE CONTRACTS |
| Currency Purchased | Currency Sold | Counterparty | Settlement Date | Unrealized Appreciation
(Depreciation) |
| CAD | 629,814 | USD | 475,841 | Morgan Stanley | 06/30/16 | $ | 9,133 |
|
| USD | 13,211,577 | CAD | 17,436,507 | Morgan Stanley | 06/30/16 | (215,018) |
|
| USD | 8,218,709 | EUR | 7,337,838 | UBS AG | 06/30/16 | (153,592) |
|
| USD | 3,260,594 | JPY | 366,158,162 | Credit Suisse AG | 06/30/16 | (1,402) |
|
| | | | | | | $ | (360,879 | ) |
|
| | |
| NOTES TO SCHEDULE OF INVESTMENTS |
| ADR | - | American Depositary Receipt |
| CAD | - | Canadian Dollar |
| EUR | - | Euro |
| JPY | - | Japanese Yen |
| USD | - | United States Dollar |
| |
| † | Category is less than 0.05% of total net assets. |
See Notes to Financial Statements.
|
|
| Statement of Assets and Liabilities |
|
| | | |
| MARCH 31, 2016 | |
| Assets | |
| Investment securities, at value (cost of $796,059,834) | $ | 902,460,240 |
|
| Foreign currency holdings, at value (cost of $24,464) | 22,495 |
|
| Receivable for investments sold | 8,788,104 |
|
| Receivable for capital shares sold | 175 |
|
| Unrealized appreciation on forward foreign currency exchange contracts | 9,133 |
|
| Dividends and interest receivable | 1,949,533 |
|
| | 913,229,680 |
|
| | |
| Liabilities | |
| Payable for investments purchased | 8,859,875 |
|
| Payable for capital shares redeemed | 1,022,539 |
|
| Unrealized depreciation on forward foreign currency exchange contracts | 370,012 |
|
| Accrued management fees | 586,064 |
|
| | 10,838,490 |
|
| | |
| Net Assets | $ | 902,391,190 |
|
| | |
| Net Assets Consist of: | |
| Capital (par value and paid-in surplus) | $ | 814,524,661 |
|
| Undistributed net investment income | 1,564,061 |
|
| Accumulated net realized loss | (19,736,642 | ) |
| Net unrealized appreciation | 106,039,110 |
|
| | $ | 902,391,190 |
|
|
| | | | | |
| | Net Assets | Shares Outstanding | Net Asset Value Per Share |
| Institutional Class, $0.01 Par Value |
| $842,670,554 |
| 70,382,168 | $11.97 |
| R6 Class, $0.01 Par Value |
| $59,720,636 |
| 4,988,901 | $11.97 |
See Notes to Financial Statements.
|
| | | |
| YEAR ENDED MARCH 31, 2016 | |
| Investment Income (Loss) | |
| Income: | |
| Dividends (net of foreign taxes withheld of $54,867) | $ | 18,489,534 |
|
| Interest | 11,312 |
|
| | 18,500,846 |
|
| | |
| Expenses: | |
| Management fees | 6,694,587 |
|
| Directors' fees and expenses | 29,589 |
|
| Other expenses | 3,878 |
|
| | 6,728,054 |
|
| Fees waived | (87,887 | ) |
| | 6,640,167 |
|
| | |
| Net investment income (loss) | 11,860,679 |
|
| | |
| Realized and Unrealized Gain (Loss) | |
| Net realized gain (loss) on: | |
| Investment transactions | 20,138,217 |
|
| Foreign currency transactions | 516,646 |
|
| | 20,654,863 |
|
| | |
| Change in net unrealized appreciation (depreciation) on: | |
| Investments | (6,994,805 | ) |
| Translation of assets and liabilities in foreign currencies | (769,300 | ) |
| | (7,764,105 | ) |
| | |
| Net realized and unrealized gain (loss) | 12,890,758 |
|
| | |
| Net Increase (Decrease) in Net Assets Resulting from Operations | $ | 24,751,437 |
|
See Notes to Financial Statements.
|
|
| Statement of Changes in Net Assets |
|
| | | | | | |
| YEARS ENDED MARCH 31, 2016 AND MARCH 31, 2015 |
| Increase (Decrease) in Net Assets | March 31, 2016 | March 31, 2015 |
| Operations | | |
| Net investment income (loss) | $ | 11,860,679 |
| $ | 9,098,462 |
|
| Net realized gain (loss) | 20,654,863 |
| 71,375,114 |
|
| Change in net unrealized appreciation (depreciation) | (7,764,105) |
| 6,353,964 |
|
| Net increase (decrease) in net assets resulting from operations | 24,751,437 |
| 86,827,540 |
|
| | | |
| Distributions to Shareholders | | |
| From net investment income: | | |
| Institutional Class | (11,382,727) |
| (8,223,940) |
|
| R6 Class | (740,342) |
| (248,270) |
|
| From net realized gains: | | |
| Institutional Class | (57,865,146 | ) | (64,721,591) |
|
| R6 Class | (3,471,435 | ) | (1,950,906) |
|
| Decrease in net assets from distributions | (73,459,650) |
| (75,144,707) |
|
| | | |
| Capital Share Transactions | | |
| Net increase (decrease) in net assets from capital share transactions (Note 5) | 155,738,979 |
| 179,477,410 |
|
| | | |
| Net increase (decrease) in net assets | 107,030,766 |
| 191,160,243 |
|
| | | |
| Net Assets | | |
| Beginning of period | 795,360,424 |
| 604,200,181 |
|
| End of period | $ | 902,391,190 |
| $ | 795,360,424 |
|
| | | |
| Undistributed net investment income | $ | 1,564,061 |
| $ | 1,498,425 |
|
See Notes to Financial Statements.
|
|
| Notes to Financial Statements |
MARCH 31, 2016
1. Organization
American Century Capital Portfolios, Inc. (the corporation) is registered under the Investment Company Act of 1940, as amended (the 1940 Act), as an open-end management investment company and is organized as a Maryland corporation. NT Mid Cap Value Fund (the fund) is one fund in a series issued by the corporation. The fund’s investment objective is to seek long-term capital growth. Income is a secondary objective. The fund is not permitted to invest in securities issued by companies assigned the Global Industry Classification Standard for the tobacco industry.
The fund offers the Institutional Class and the R6 Class, which have different fees and expenses. The difference in the fee structures between the classes is not the result of any difference in advisory or custodial fees or other expenses related to management of the fund’s assets, which do not vary by class. The fund’s R6 Class shares are available for purchase exclusively by certain American Century Investments funds of funds that are offered only through employer-sponsored retirement plans where a financial intermediary provides retirement recordkeeping services to plan participants. Because financial intermediaries do not receive any service, distribution or administrative fees for offering such funds of funds, American Century Investment Management, Inc. (ACIM) (the investment advisor) is able to charge the R6 Class a lower unified management fee.
2. Significant Accounting Policies
The following is a summary of significant accounting policies consistently followed by the fund in preparation of its financial statements. The fund is an investment company and follows accounting and reporting guidance in accordance with accounting principles generally accepted in the United States of America. This may require management to make certain estimates and assumptions at the date of the financial statements. Actual results could differ from these estimates. Management evaluated the impact of events or transactions occurring through the date the financial statements were issued that would merit recognition or disclosure.
Investment Valuations — The fund determines the fair value of its investments and computes its net asset value per share at the close of regular trading (usually 4 p.m. Eastern time) on the New York Stock Exchange (NYSE) on each day the NYSE is open. The Board of Directors has adopted valuation policies and procedures to guide the investment advisor in the fund’s investment valuation process and to provide methodologies for the oversight of the fund’s pricing function.
Equity securities that are listed or traded on a domestic securities exchange are valued at the last reported sales price or at the official closing price as provided by the exchange. Equity securities traded on foreign securities exchanges are generally valued at the closing price of such securities on the exchange where primarily traded or at the close of the NYSE, if that is earlier. If no last sales price is reported, or if local convention or regulation so provides, the mean of the latest bid and asked prices may be used. Securities traded over-the-counter are valued at the mean of the latest bid and asked prices, the last sales price, or the official closing price. Equity securities initially expressed in local currencies are translated into U.S. dollars at the mean of the appropriate currency exchange rate at the close of the NYSE as provided by an independent pricing service.
Open-end management investment companies are valued at the reported net asset value per share. Repurchase agreements are valued at cost, which approximates fair value. Forward foreign currency exchange contracts are valued at the mean of the appropriate forward exchange rate at the close of the NYSE as provided by an independent pricing service.
If the fund determines that the market price for an investment is not readily available or the valuation methods mentioned above do not reflect an investment’s fair value, such investment is valued as determined in good faith by the Board of Directors or its delegate, in accordance with policies and procedures adopted by the Board of Directors. In its determination of fair value, the fund may review several factors including, but not limited to, market information regarding the specific investment or comparable investments and correlation with other investment types, futures indices or general market indicators. Circumstances that may cause the fund to use these procedures to value an investment include, but are not limited to: an investment has been declared in default or is distressed; trading in a security has been suspended during the trading day or a security is not actively trading on its principal exchange; prices received from a regular pricing source are deemed unreliable; or there is a foreign market holiday and no trading occurred.
The fund monitors for significant events occurring after the close of an investment’s primary exchange but before the fund’s net asset value per share is determined. Significant events may include, but are not limited to: corporate announcements and transactions; governmental action and political unrest that could impact a specific investment or an investment sector; or armed conflicts, natural disasters and similar events that could affect investments in a specific country or region. The fund also monitors for significant fluctuations between domestic and foreign markets, as evidenced by the U.S. market or such other indicators that the Board of Directors, or its delegate, deems appropriate. If significant fluctuations in foreign markets are identified, the fund may apply a model-derived factor to the closing price of equity securities traded on foreign securities exchanges. The factor is based on observable market data as provided by an independent pricing service.
Security Transactions — Security transactions are accounted for as of the trade date. Net realized gains and losses are determined on the identified cost basis, which is also used for federal income tax purposes.
Investment Income — Dividend income less foreign taxes withheld, if any, is recorded as of the ex-dividend date. Distributions received on securities that represent a return of capital or long-term capital gain are recorded as a reduction of cost of investments and/or as a realized gain. The fund may estimate the components of distributions received that may be considered nontaxable distributions or long-term capital gain distributions for income tax purposes. Interest income is recorded on the accrual basis and includes accretion of discounts and amortization of premiums.
Foreign Currency Translations — All assets and liabilities initially expressed in foreign currencies are translated into U.S. dollars at prevailing exchange rates at period end. The fund may enter into spot foreign currency exchange contracts to facilitate transactions denominated in a foreign currency. Purchases and sales of investment securities, dividend and interest income, spot foreign currency exchange contracts, and expenses are translated at the rates of exchange prevailing on the respective dates of such transactions. Net realized and unrealized foreign currency exchange gains or losses related to investment securities are a component of net realized gain (loss) on investment transactions and change in net unrealized appreciation (depreciation) on investments, respectively.
Repurchase Agreements — The fund may enter into repurchase agreements with institutions that ACIM has determined are creditworthy pursuant to criteria adopted by the Board of Directors. The fund requires that the collateral, represented by securities, received in a repurchase transaction be transferred to the custodian in a manner sufficient to enable the fund to obtain those securities in the event of a default under the repurchase agreement. ACIM monitors, on a daily basis, the securities transferred to ensure the value, including accrued interest, of the securities under each repurchase agreement is equal to or greater than amounts owed to the fund under each repurchase agreement.
Joint Trading Account — Pursuant to an Exemptive Order issued by the Securities and Exchange Commission, the fund, along with certain other funds in the American Century Investments family of funds, may transfer uninvested cash balances into a joint trading account. These balances are invested in one or more repurchase agreements that are collateralized by U.S. Treasury or Agency obligations.
Income Tax Status — It is the fund’s policy to distribute substantially all net investment income and net realized gains to shareholders and to otherwise qualify as a regulated investment company under provisions of the Internal Revenue Code. Accordingly, no provision has been made for income taxes. The fund files U.S. federal, state, local and non-U.S. tax returns as applicable. The fund's tax returns are subject to examination by the relevant taxing authority until expiration of the applicable statute of limitations, which is generally three years from the date of filing but can be longer in certain jurisdictions. At this time, management believes there are no uncertain tax positions which, based on their technical merit, would not be sustained upon examination and for which it is reasonably possible that the total amounts of unrecognized tax benefits will significantly change in the next twelve months.
Multiple Class — All shares of the fund represent an equal pro rata interest in the net assets of the class to which such shares belong, and have identical voting, dividend, liquidation and other rights and the same terms and conditions, except for class specific expenses and exclusive rights to vote on matters affecting only individual classes. Income, non-class specific expenses, and realized and unrealized capital gains and losses of the fund are allocated to each class of shares based on their relative net assets.
Distributions to Shareholders — Distributions from net investment income, if any, are generally declared and paid quarterly. Distributions from net realized gains, if any, are generally declared and paid annually.
Indemnifications — Under the corporation’s organizational documents, its officers and directors are indemnified against certain liabilities arising out of the performance of their duties to the fund. In addition, in the normal course of business, the fund enters into contracts that provide general indemnifications. The
maximum exposure under these arrangements is unknown as this would involve future claims that may be made against a fund. The risk of material loss from such claims is considered by management to be remote.
3. Fees and Transactions with Related Parties
Certain officers and directors of the corporation are also officers and/or directors of American Century Companies, Inc. (ACC). The corporation’s investment advisor, ACIM, the corporation's distributor, American Century Investment Services, Inc., and the corporation’s transfer agent, American Century Services, LLC, are wholly owned, directly or indirectly, by ACC. Various funds issued by American Century Asset Allocation Portfolios, Inc. own, in aggregate, 100% of the shares of the fund. Related parties do not invest in the fund for the purpose of exercising management or control.
Management Fees — The corporation has entered into a management agreement with ACIM, under which ACIM provides the fund with investment advisory and management services in exchange for a single, unified management fee (the fee) per class. The agreement provides that all expenses of managing and operating the fund, except distribution and service fees, brokerage expenses, taxes, interest, fees and expenses of the independent directors (including legal counsel fees), and extraordinary expenses, will be paid by ACIM. The fee is computed and accrued daily based on each class's daily net assets and paid monthly in arrears. The annual management fee is 0.80% for the Institutional Class and 0.65% for the R6 Class. During the year ended March 31, 2016, the investment advisor voluntarily agreed to waive 0.05% of its management fee for assets over $7 billion. The fee waiver is determined by applying a formula that takes into account the fund's assets as well as certain assets, if any, of other clients of the investment advisor outside the American Century Investments family of funds (such as subadvised funds and separate accounts) that have very similar investment teams and investment strategies (strategy assets). The strategy assets of the fund also include the assets of Mid Cap Value Fund, one fund in a series issued by the corporation. The investment advisor expects the fee waiver to continue through July 31, 2016, and cannot terminate it without the approval of the Board of Directors. The total amount of the waiver for each class for the year ended March 31, 2016 was $83,183 for the Institutional Class and $4,704 for the R6 Class. The effective annual management fee after waiver for each class for the year ended March 31, 2016 was 0.79% for the Institutional Class and 0.64% for the R6 Class.
Directors' Fees and Expenses — The Board of Directors is responsible for overseeing the investment advisor’s management and operations of the fund. The directors receive detailed information about the fund and its investment advisor regularly throughout the year, and meet at least quarterly with management of the investment advisor to review reports about fund operations. The fund’s officers do not receive compensation from the fund.
4. Investment Transactions
Purchases and sales of investment securities, excluding short-term investments, for the year ended March 31, 2016 were $646,273,850 and $548,575,885, respectively.
5. Capital Share Transactions
Transactions in shares of the fund were as follows:
|
| | | | | | | | | | |
| | Year ended
March 31, 2016 | Year ended
March 31, 2015 |
| | Shares | Amount | Shares | Amount |
| Institutional Class/Shares Authorized | 525,000,000 |
| | 200,000,000 |
| |
| Sold | 12,938,971 |
| $ | 153,080,761 |
| 9,880,789 |
| $ | 126,528,252 |
|
| Issued in reinvestment of distributions | 5,979,048 |
| 69,247,873 |
| 5,774,389 |
| 72,945,531 |
|
| Redeemed | (8,002,791 | ) | (95,399,767 | ) | (3,456,473 | ) | (45,260,550 | ) |
| | 10,915,228 |
| 126,928,867 |
| 12,198,705 |
| 154,213,233 |
|
| R6 Class/Shares Authorized | 50,000,000 |
| | 20,000,000 |
| |
| Sold | 2,538,193 |
| 30,609,522 |
| 1,984,889 |
| 25,266,784 |
|
| Issued in reinvestment of distributions | 363,563 |
| 4,211,777 |
| 174,175 |
| 2,199,176 |
|
| Redeemed | (499,932 | ) | (6,011,187 | ) | (169,794 | ) | (2,201,783 | ) |
| | 2,401,824 |
| 28,810,112 |
| 1,989,270 |
| 25,264,177 |
|
| Net increase (decrease) | 13,317,052 |
| $ | 155,738,979 |
| 14,187,975 |
| $ | 179,477,410 |
|
6. Fair Value Measurements
The fund’s investments valuation process is based on several considerations and may use multiple inputs to determine the fair value of the investments held by the fund. In conformity with accounting principles generally accepted in the United States of America, the inputs used to determine a valuation are classified into three broad levels.
| |
| • | Level 1 valuation inputs consist of unadjusted quoted prices in an active market for identical investments. |
| |
| • | Level 2 valuation inputs consist of direct or indirect observable market data (including quoted prices for comparable investments, evaluations of subsequent market events, interest rates, prepayment speeds, credit risk, etc.). These inputs also consist of quoted prices for identical investments initially expressed in local currencies that are adjusted through translation into U.S. dollars. |
| |
| • | Level 3 valuation inputs consist of unobservable data (including a fund’s own assumptions). |
The level classification is based on the lowest level input that is significant to the fair valuation measurement. The valuation inputs are not necessarily an indication of the risks associated with investing in these securities or other financial instruments. There were no significant transfers between levels during the period.
The following is a summary of the level classifications as of period end. The Schedule of Investments provides additional information on the fund’s portfolio holdings.
|
| | | | | | | | |
| | Level 1 | Level 2 | Level 3 |
| Assets | | | |
| Investment Securities | | | |
| Common Stocks | $ | 837,238,569 |
| $ | 25,479,553 |
| — |
|
| Exchange-Traded Funds | 23,570,607 |
| — |
| — |
|
| Temporary Cash Investments | 6,389,511 |
| 9,782,000 |
| — |
|
| | $ | 867,198,687 |
| $ | 35,261,553 |
| — |
|
| Other Financial Instruments | | | |
| Forward Foreign Currency Exchange Contracts | — |
| $ | 9,133 |
| — |
|
| | | | |
| Liabilities | | | |
| Other Financial Instruments | | | |
| Forward Foreign Currency Exchange Contracts | — |
| $ | 370,012 |
| — |
|
7. Derivative Instruments
Foreign Currency Risk — The fund is subject to foreign currency exchange rate risk in the normal course of pursuing its investment objectives. The value of foreign investments held by a fund may be significantly affected by changes in foreign currency exchange rates. The dollar value of a foreign security generally decreases when the value of the dollar rises against the foreign currency in which the security is denominated and tends to increase when the value of the dollar declines against such foreign currency. A fund may enter into forward foreign currency exchange contracts to reduce a fund's exposure to foreign currency exchange rate fluctuations. The net U.S. dollar value of foreign currency underlying all contractual commitments held by a fund and the resulting unrealized appreciation or depreciation are determined daily. Realized gain or loss is recorded upon the termination of the contract. Net realized and unrealized gains or losses occurring during the holding period of forward foreign currency exchange contracts are a component of net realized gain (loss) on foreign currency transactions and change in net unrealized appreciation (depreciation) on translation of assets and liabilities in foreign currencies, respectively. A fund bears the risk of an unfavorable change in the foreign currency exchange rate underlying the forward contract. Additionally, losses, up to the fair value, may arise if the counterparties do not perform under the contract terms. The fund's average U.S. dollar exposure to foreign currency risk derivative instruments held during the period was $28,038,256.
The value of foreign currency risk derivative instruments as of March 31, 2016, is disclosed on the Statement of Assets and Liabilities as an asset of $9,133 in unrealized appreciation on forward foreign currency exchange contracts and a liability of $370,012 in unrealized depreciation on forward foreign currency exchange contracts. For the year ended March 31, 2016, the effect of foreign currency risk derivative instruments on the Statement of Operations was $512,506 in net realized gain (loss) on foreign currency transactions and $(770,289) in change in net unrealized appreciation (depreciation) on translation of assets and liabilities in foreign currencies.
8. Federal Tax Information
The tax character of distributions paid during the years ended March 31, 2016 and March 31, 2015 were as follows:
|
| | | | | | |
| | 2016 | 2015 |
| Distributions Paid From | | |
| Ordinary income | $ | 26,606,451 |
| $ | 35,169,522 |
|
| Long-term capital gains | $ | 46,853,199 |
| $ | 39,975,185 |
|
The book-basis character of distributions made during the year from net investment income or net realized gains may differ from their ultimate characterization for federal income tax purposes. These differences reflect the differing character of certain income items and net realized gains and losses for financial statement and tax purposes, and may result in reclassification among certain capital accounts on the financial statements.
As of March 31, 2016, the federal tax cost of investments and the components of distributable earnings on a tax-basis were as follows:
|
| | | |
| Federal tax cost of investments | $ | 811,677,648 |
|
| Gross tax appreciation of investments | $ | 119,405,029 |
|
| Gross tax depreciation of investments | (28,622,437 | ) |
| Net tax appreciation (depreciation) of investments | 90,782,592 |
|
Net tax appreciation (depreciation) on derivatives and translation of assets and liabilities in foreign currencies | (416 | ) |
| Net tax appreciation (depreciation) | $ | 90,782,176 |
|
| Undistributed ordinary income | $ | 1,701,044 |
|
| Accumulated long-term gains | $ | 164,844 |
|
| Post-October capital loss deferral | $ | (4,781,535 | ) |
The difference between book-basis and tax-basis unrealized appreciation (depreciation) is attributable primarily to the tax deferral of losses on wash sales.
Loss deferrals represent certain qualified losses that the fund has elected to treat as having been incurred in the following fiscal year for federal income tax purposes.
|
| | | | | | | | | | | | | | | | | |
| For a Share Outstanding Throughout the Years Ended March 31 (except as noted) |
| Per-Share Data | | | | | | | Ratios and Supplemental Data |
| | | Income From Investment Operations: | Distributions From: | | | Ratio to Average Net Assets of: | |
| | Net Asset
Value,
Beginning
of Period | Net
Investment
Income
(Loss)(1) | Net
Realized
and
Unrealized
Gain (Loss) | Total From
Investment
Operations | Net
Investment
Income | Net
Realized
Gains | Total
Distributions | Net Asset
Value,
End
of Period | Total
Return(2) | Operating
Expenses | Operating
Expenses
(before
expense
waiver) | Net
Investment
Income
(Loss) | Net Investment Income (Loss) (before expense waiver) | Portfolio
Turnover
Rate | Net
Assets,
End of
Period (in thousands) |
| Institutional Class | | | | | | | | | | | | | | |
| 2016 | $12.82 | 0.17 | 0.05 | 0.22 | (0.17) | (0.90) | (1.07) | $11.97 | 2.13% | 0.80% | 0.81% | 1.39% | 1.38% | 67% |
| $842,671 |
|
| 2015 | $12.62 | 0.18 | 1.56 | 1.74 | (0.17) | (1.37) | (1.54) | $12.82 | 14.05% | 0.80% | 0.80% | 1.37% | 1.37% | 67% |
| $762,209 |
|
| 2014 | $11.41 | 0.19 | 2.15 | 2.34 | (0.18) | (0.95) | (1.13) | $12.62 | 21.19% | 0.80% | 0.80% | 1.55% | 1.55% | 69% |
| $596,655 |
|
| 2013 | $10.16 | 0.19 | 1.59 | 1.78 | (0.22) | (0.31) | (0.53) | $11.41 | 18.32% | 0.80% | 0.80% | 1.89% | 1.89% | 71% |
| $423,477 |
|
| 2012 | $10.70 | 0.20 | 0.22 | 0.42 | (0.14) | (0.82) | (0.96) | $10.16 | 4.93% | 0.81% | 0.81% | 2.01% | 2.01% | 82% |
| $301,868 |
|
| R6 Class | | | | | | | | | | | | | | |
| 2016 | $12.81 | 0.19 | 0.06 | 0.25 | (0.19) | (0.90) | (1.09) | $11.97 | 2.36% | 0.65% | 0.66% | 1.54% | 1.53% | 67% |
| $59,721 |
|
| 2015 | $12.62 | 0.20 | 1.55 | 1.75 | (0.19) | (1.37) | (1.56) | $12.81 | 14.14% | 0.65% | 0.65% | 1.52% | 1.52% | 67% |
| $33,151 |
|
2014(3) | $12.30 | 0.14 | 1.26 | 1.40 | (0.13) | (0.95) | (1.08) | $12.62 | 11.89% | 0.65%(4) | 0.65%(4) | 1.70%(4) | 1.70%(4) | 69%(5) |
| $7,546 |
|
|
|
| Notes to Financial Highlights |
| |
| (1) | Computed using average shares outstanding throughout the period. |
| |
| (2) | Total returns are calculated based on the net asset value of the last business day. Total returns for periods less than one year are not annualized. |
| |
| (3) | July 26, 2013 (commencement of sale) through March 31, 2014. |
| |
| (5) | Portfolio turnover is calculated at the fund level. Percentage indicated was calculated for the year ended March 31, 2014. |
See Notes to Financial Statements.
|
|
| Report of Independent Registered Public Accounting Firm |
To the Board of Directors and Shareholders of American Century Capital Portfolios, Inc.:
We have audited the accompanying statement of assets and liabilities, including the schedule of investments, of NT Mid Cap Value Fund (the “Fund”), one of the funds constituting American Century Capital Portfolios, Inc., as of March 31, 2016, and the related statement of operations for the year then ended, the statements of changes in net assets for each of the two years in the period then ended, and the financial highlights for each of the periods presented. These financial statements and financial highlights are the responsibility of the Fund's management. Our responsibility is to express an opinion on these financial statements and financial highlights based on our audits.
We conducted our audits in accordance with the standards of the Public Company Accounting Oversight Board (United States). Those standards require that we plan and perform the audit to obtain reasonable assurance about whether the financial statements and financial highlights are free of material misstatement. The Fund is not required to have, nor were we engaged to perform, an audit of its internal control over financial reporting. Our audits included consideration of internal control over financial reporting as a basis for designing audit procedures that are appropriate in the circumstances, but not for the purpose of expressing an opinion on the effectiveness of the Fund's internal control over financial reporting. Accordingly, we express no such opinion. An audit also includes examining, on a test basis, evidence supporting the amounts and disclosures in the financial statements, assessing the accounting principles used and significant estimates made by management, as well as evaluating the overall financial statement presentation. Our procedures included confirmation of securities owned as of March 31, 2016, by correspondence with the custodian and brokers; when replies were not received from brokers, we performed other auditing procedures. We believe that our audits provide a reasonable basis for our opinion.
In our opinion, the financial statements and financial highlights referred to above present fairly, in all material respects, the financial position of NT Mid Cap Value Fund of American Century Capital Portfolios, Inc. as of March 31, 2016, the results of its operations for the year then ended, the changes in its net assets for each of the two years in the period then ended, and the financial highlights for each of the periods presented, in conformity with accounting principles generally accepted in the United States of America.
DELOITTE & TOUCHE LLP
Kansas City, Missouri May 17, 2016
The Board of Directors
The individuals listed below serve as directors of the funds. Each director will continue to serve in this capacity until death, retirement, resignation or removal from office. The board has adopted a mandatory retirement age for directors who are not “interested persons,” as that term is defined in the Investment Company Act (independent directors). Independent directors shall retire by December 31 of the year in which they reach their 75th birthday.
Mr. Thomas is an “interested person” because he currently serves as President and Chief Executive Officer of American Century Companies, Inc. (ACC), the parent company of American Century Investment Management, Inc. (ACIM or the advisor). Mr. Fink is treated as an “interested person” because of his recent employment with ACC and American Century Services, LLC (ACS). The other directors (more than three-fourths of the total number) are independent. They are not employees, directors or officers of, and have no financial interest in, ACC or any of its wholly owned, direct or indirect, subsidiaries, including ACIM, American Century Investment Services, Inc. (ACIS) and ACS, and they do not have any other affiliations, positions or relationships that would cause them to be considered “interested persons” under the Investment Company Act. The directors serve in this capacity for seven (in the case of Mr. Thomas, 15) registered investment companies in the American Century Investments family of funds.
The following table presents additional information about the directors. The mailing address for each director is 4500 Main Street, Kansas City, Missouri 64111.
|
| | | | | |
Name
(Year of Birth) | Position(s) Held with Funds | Length of Time Served | Principal Occupation(s) During Past 5 Years | Number of American Century Portfolios Overseen by Director | Other Directorships Held During Past
5 Years |
| Independent Directors | | |
Andrea C. Hall
(1945) | Director | Since 1997 | Retired | 83 | None |
Jan M. Lewis
(1957) | Director | Since 2011 | Retired; President and Chief Executive Officer, Catholic Charities of Northeast Kansas (human services organization) (2006 to 2013) | 83 | None |
James A. Olson
(1942) | Director and Chairman of the Board | Since 2007 (Chairman since 2014) | Member, Plaza Belmont LLC (private equity fund manager) (1999 to present) | 83 | Saia, Inc. (2002 to 2012) and EPR Properties (2003 to 2013) |
M. Jeannine Strandjord
(1945) | Director | Since 1994 | Retired | 83 | Euronet Worldwide Inc.; MGP Ingredients, Inc.; and DST Systems Inc. (1996 to 2012) |
John R. Whitten
(1946) | Director | Since 2008 | Retired | 83 | Rudolph Technologies, Inc. |
Stephen E. Yates
(1948) | Director | Since 2012 | Retired | 83 | None |
|
| | | | | |
Name
(Year of Birth) | Position(s) Held with Funds | Length of Time Served | Principal Occupation(s) During Past 5 Years | Number of American Century Portfolios Overseen by Director | Other Directorships Held During Past
5 Years |
| Interested Directors |
Barry Fink
(1955) | Director | Since 2012 | Retired; Executive Vice President, ACC (September 2007 to February 2013); President, ACS (October 2007 to February 2013); Chief Operating Officer, ACC (September 2007 to November 2012) | 83 | None |
Jonathan S. Thomas
(1963) | Director and President | Since 2007 | President and Chief Executive Officer, ACC (March 2007 to present). Also serves as Chief Executive Officer, ACS; Executive Vice President, ACIM; Director, ACC, ACIM and other ACC subsidiaries | 128 | BioMed Valley Discoveries, Inc. |
The Statement of Additional Information has additional information about the fund's directors and is available without charge, upon request, by calling 1-800-345-2021.
Officers
The following table presents certain information about the executive officers of the funds. Each officer serves as an officer for each of the 15 investment companies in the American Century family of funds, unless otherwise noted. No officer is compensated for his or her service as an officer of the funds. The listed officers are interested persons of the funds and are appointed or re-appointed on an annual basis. The mailing address for each officer listed below is 4500 Main Street, Kansas City, Missouri 64111.
|
| | |
| Name (Year of Birth) | Offices with the Funds | Principal Occupation(s) During the Past Five Years |
Jonathan S. Thomas
(1963) | Director and President
since 2007 | President and Chief Executive Officer, ACC (March 2007 to present). Also serves as Chief Executive Officer, ACS; Executive Vice President, ACIM; Director, ACC, ACIM and other ACC subsidiaries |
Amy D. Shelton
(1964) | Chief Compliance Officer and Vice President since 2014 | Chief Compliance Officer, American Century funds, (March 2014 to present); Chief Compliance Officer, ACIM (February 2014 to present); Chief Compliance Officer, ACIS (October 2009 to present); Vice President, Client Interactions and Marketing, ACIS (February 2013 to January 2014); Director, Client Interactions and Marketing, ACIS (June 2007 to January 2013). Also serves as Vice President, ACIS |
Charles A. Etherington
(1957) | General Counsel since 2007 and Senior Vice President since 2006 | Attorney, ACC (February 1994 to present); Vice President, ACC (November 2005 to present); General Counsel, ACC (March 2007 to present). Also serves as General Counsel, ACIM, ACS, ACIS and other ACC subsidiaries; and Senior Vice President, ACIM and ACS |
C. Jean Wade
(1964) | Vice President, Treasurer and Chief Financial Officer since 2012 | Vice President, ACS (February 2000 to present) |
Robert J. Leach
(1966) | Vice President since 2006 and Assistant Treasurer since 2012 | Vice President, ACS (February 2000 to present) |
David H. Reinmiller
(1963) | Vice President since 2000 | Attorney, ACC (January 1994 to present); Associate General Counsel, ACC (January 2001 to present). Also serves as Vice President, ACIM and ACS |
Ward D. Stauffer
(1960) | Secretary since 2005 | Attorney, ACC (June 2003 to present) |
Retirement Account Information
As required by law, distributions you receive from certain IRAs are subject to federal income tax withholding, unless you elect not to have withholding apply. Tax will be withheld on the total amount withdrawn even though you may be receiving amounts that are not subject to withholding, such as nondeductible contributions. In such case, excess amounts of withholding could occur. You may adjust your withholding election so that a greater or lesser amount will be withheld.
If you don’t want us to withhold on this amount, you must notify us to not withhold the federal income tax. You may notify us in writing or in certain situations by telephone or through other electronic means. For systematic withdrawals, your withholding election will remain in effect until revoked or changed by filing a new election. You have the right to revoke your election at any time.
Remember, even if you elect not to have income tax withheld, you are liable for paying income tax on the taxable portion of your withdrawal. If you elect not to have income tax withheld or you don’t have enough income tax withheld, you may be responsible for payment of estimated tax. You may incur penalties under the estimated tax rules if your withholding and estimated tax payments are not sufficient. You can reduce or defer the income tax on a distribution by directly or indirectly rolling such distribution over to another IRA or eligible plan. You should consult your tax advisor for additional information.
State tax will be withheld if, at the time of your distribution, your address is within one of the mandatory withholding states and you have federal income tax withheld (or as otherwise required by state law). State taxes will be withheld from your distribution in accordance with the respective state rules.
Distributions you receive from 403(b), 457 and qualified plans are subject to special tax and withholding rules. Your plan administrator or plan sponsor is required to provide you with a special tax notice explaining those rules at the time you request a distribution. If applicable, federal and/or state taxes may be withheld from your distribution amount.
Proxy Voting Policies
A description of the policies that the fund's investment advisor uses in exercising the voting rights associated with the securities purchased and/or held by the fund is available without charge, upon request, by calling 1-800-345-2021. It is also available on the "About Us" page of American Century Investments’ website at americancentury.com and on the Securities and Exchange Commission’s website at sec.gov. Information regarding how the investment advisor voted proxies relating to portfolio securities during the most recent 12-month period ended June 30 is available on the "About Us" page at americancentury.com. It is also available at sec.gov.
Quarterly Portfolio Disclosure
The fund files its complete schedule of portfolio holdings with the Securities and Exchange Commission (SEC) for the first and third quarters of each fiscal year on Form N-Q. The fund’s Forms N-Q are available on the SEC’s website at sec.gov, and may be reviewed and copied at the SEC’s Public Reference Room in Washington, DC. Information on the operation of the Public Reference Room may be obtained by calling 1-800-SEC-0330. The fund also makes its complete schedule of portfolio holdings for the most recent quarter of its fiscal year available on its
website at americancentury.com and, upon request, by calling 1-800-345-2021.
Other Tax Information
The following information is provided pursuant to provisions of the Internal Revenue Code.
The fund hereby designates up to the maximum amount allowable as qualified dividend income for the fiscal year ended March 31, 2016.
For corporate taxpayers, the fund hereby designates $15,492,699, or up to the maximum amount allowable, of ordinary income distributions paid during the fiscal year ended March 31, 2016 as qualified for the corporate dividends received deduction.
The fund hereby designates $14,483,382 as qualified short-term capital gain distributions for purposes of Internal Revenue Code Section 871 for the fiscal year ended March 31, 2016.
The fund hereby designates $46,853,199, or up to the maximum amount allowable, as long-term capital gain distributions for the fiscal year ended March 31, 2016.
|
| | |
| |
| | | |
| Contact Us | americancentury.com | |
| Automated Information Line | 1-800-345-8765 | |
| Investor Services Representative | 1-800-345-2021 or 816-531-5575 | |
| Investors Using Advisors | 1-800-378-9878 | |
| Business, Not-For-Profit, Employer-Sponsored Retirement Plans | 1-800-345-3533 | |
| Banks and Trust Companies, Broker-Dealers, Financial Professionals, Insurance Companies | 1-800-345-6488 | |
| Telecommunications Relay Service for the Deaf | 711 | |
| | | |
| American Century Capital Portfolios, Inc. | |
| | | |
Investment Advisor: American Century Investment Management, Inc. Kansas City, Missouri | |
| | | |
| This report and the statements it contains are submitted for the general information of our shareholders. The report is not authorized for distribution to prospective investors unless preceded or accompanied by an effective prospectus. | |
| | | |
©2016 American Century Proprietary Holdings, Inc. All rights reserved.
CL-ANN-88888 1605 | |
|
| |
| | |
| | Annual Report |
| | |
| | March 31, 2016 |
| | |
| | Small Cap Value Fund |
|
| | |
| President’s Letter | 2 |
|
| Performance | 3 |
|
| Portfolio Commentary | |
|
| Fund Characteristics | |
|
| Shareholder Fee Example | |
|
| Schedule of Investments | |
|
| Statement of Assets and Liabilities | |
|
| Statement of Operations | |
|
| Statement of Changes in Net Assets | |
|
| Notes to Financial Statements | |
|
| Financial Highlights | |
|
| Report of Independent Registered Public Accounting Firm | |
|
| Management | |
|
| Additional Information | |
|
Any opinions expressed in this report reflect those of the author as of the date of the report, and do not necessarily represent the opinions of American Century Investments® or any other person in the American Century Investments organization. Any such opinions are subject to change at any time based upon market or other conditions and American Century Investments disclaims any responsibility to update such opinions. These opinions may not be relied upon as investment advice and, because investment decisions made by American Century Investments funds are based on numerous factors, may not be relied upon as an indication of trading intent on behalf of any American Century Investments fund. Security examples are used for representational purposes only and are not intended as recommendations to purchase or sell securities. Performance information for comparative indices and securities is provided to American Century Investments by third party vendors. To the best of American Century Investments’ knowledge, such information is accurate at the time of printing.
|
| |
| Dear Investor:
Thank you for reviewing this annual report for the 12 months ended March 31, 2016. It provides investment performance and portfolio information for the reporting period, plus longer-term historical performance data.
Annual reports help convey information about fund performance, including market and economic factors that affected returns during the reporting period. For additional, updated investment and market insights, we encourage you to visit our website, americancentury.com.
|
| Jonathan Thomas |
Divergence in Economic Growth and Monetary Policies, Combined With China Turmoil, Triggered Market Volatility
Divergence between the U.S. and the rest of the world—along with China’s struggles, plunging commodity prices, capital market volatility, and risk-off trading—were dominant themes during the reporting period. Global divergence described not only the relatively stronger economic growth enjoyed by the U.S. compared with most of the world, but also the related contrast between the U.S. Federal Reserve’s (the Fed’s) unwinding of monetary stimulus versus the continuation and expansion of stimulus by other major central banks.
Two months in particular captured the volatility and risk-off trading of the 12-month period. Last August, China’s economic slowdown (which rippled across the global economy) triggered Chinese stock market volatility, increasingly stimulative Chinese central bank monetary policy, and currency devaluations. Burdened further with oil market volatility, equity and higher-risk bond markets declined globally. Five months later, in January, investor sentiment plunged again as global economic growth decelerated, China devalued its currency again, and oil prices dropped below $30 a barrel. In addition, the Fed, in December, executed its first rate hike since 2006. Central bank policies showed less divergence thereafter, with the Bank of Japan suddenly resorting to negative interest rates, the Fed holding rates steady while reducing its rate hike projections, and the European Central Bank announcing significant additional stimulus.
Bonds (and more bond-like stock sectors, such as utilities and REITs) generally outperformed the broad stock market for the reporting period. In terms of stock style and size, growth generally outperformed value, and large cap generally outperformed small cap. In the bond market, higher quality (investment-grade) generally outperformed lower quality (high-yield). We expect continued economic and monetary policy divergence between the U.S. and non-U.S. economies in 2016, accompanied by further market volatility. This could present both challenges and opportunities for active investment managers. Looking ahead, we continue to believe in a disciplined, diversified, risk-aware investment approach, using professionally managed portfolios to meet financial goals. We appreciate your trust in us.
Sincerely,
Jonathan Thomas
President and Chief Executive Officer
American Century Investments
|
| | | | | | |
| Total Returns as of March 31, 2016 | |
| | | | Average Annual Returns | |
| | Ticker Symbol | 1 year | 5 years | 10 years | Since
Inception | Inception
Date |
| Investor Class | ASVIX | -6.25% | 7.11% | 6.71% | — | 7/31/98 |
| Russell 2000 Value Index | — | -7.72% | 6.66% | 4.42% | — | — |
| Institutional Class | ACVIX | -6.02% | 7.33% | 6.92% | — | 10/26/98 |
| A Class | ACSCX | | | | — | 12/31/99 |
| No sales charge | | -6.41% | 6.86% | 6.44% | — | |
| With sales charge | | -11.75% | 5.60% | 5.81% | — | |
| C Class | ASVNX | -7.13% | 6.05% | — | 8.75% | 3/1/10 |
| R Class | ASVRX | -6.65% | 6.61% | — | 9.32% | 3/1/10 |
| R6 Class | ASVDX | -5.86% | — | — | 4.62% | 7/26/13 |
Sales charges include initial sales charges and contingent deferred sales charges (CDSCs), as applicable. A Class shares have a 5.75% maximum initial sales charge and may be subject to a maximum CDSC of 1.00%. C Class shares redeemed within 12 months of purchase are subject to a maximum CDSC of 1.00%. The SEC requires that mutual funds provide performance information net of maximum sales charges in all cases where charges could be applied.
Average annual returns since inception are presented when ten years of performance history is not available.
Prior to March 1, 2010, the A Class was referred to as the Advisor Class and did not have a front-end sales charge. Performance prior to that date has been adjusted to reflect this charge.
Data presented reflect past performance. Past performance is no guarantee of future results. Current performance may be higher or lower than the performance shown. Total returns for periods less than one year are not annualized. Investment return and principal value will fluctuate, and redemption value may be more or less than original cost. Data assumes reinvestment of dividends and capital gains, and none of the charts reflect the deduction of taxes that a shareholder would pay on fund distributions or the redemption of fund shares. To obtain performance data current to the most recent month end, please call 1-800-345-2021 or visit americancentury.com. For additional information about the fund, please consult the prospectus.
|
|
| Growth of $10,000 Over 10 Years |
| $10,000 investment made March 31, 2006 |
| Performance for other share classes will vary due to differences in fee structure. |
|
| |
| Value on March 31, 2016 |
| | Investor Class — $19,157 |
| |
| | Russell 2000 Value Index — $15,415 |
| |
|
| | | | | |
| Total Annual Fund Operating Expenses |
| Investor Class | Institutional Class | A Class | C Class | R Class | R6 Class |
| 1.25% | 1.05% | 1.50% | 2.25% | 1.75% | 0.90% |
The total annual fund operating expenses shown is as stated in the fund’s prospectus current as of the date of this report. The prospectus may vary from the expense ratio shown elsewhere in this report because it is based on a different time period, includes acquired fund fees and expenses, and, if applicable, does not include fee waivers or expense reimbursements.
Data presented reflect past performance. Past performance is no guarantee of future results. Current performance may be higher or lower than the performance shown. Total returns for periods less than one year are not annualized. Investment return and principal value will fluctuate, and redemption value may be more or less than original cost. Data assumes reinvestment of dividends and capital gains, and none of the charts reflect the deduction of taxes that a shareholder would pay on fund distributions or the redemption of fund shares. To obtain performance data current to the most recent month end, please call 1-800-345-2021 or visit americancentury.com. For additional information about the fund, please consult the prospectus.
Portfolio Managers: Jeff John and Miles Lewis
Performance Summary
Small Cap Value returned -6.25%* for the 12 months ended March 31, 2016. By comparison, its benchmark, the Russell 2000 Value Index, returned -7.72%. The fund’s returns reflect operating expenses while the index’s returns do not.
Volatility dominated the 12-month period as concerns over slowing growth in China and other emerging markets, falling oil prices, and the prospect of higher U.S. Federal Reserve (Fed) interest rates weighed on investor confidence. After a turbulent summer, markets sold off sharply in the third quarter of 2015, but stabilized somewhat in the fourth quarter as the Fed delayed an anticipated September interest rate hike. In December, however, Fed policymakers raised the federal funds rate by 25 basis points, while they affirmed the underlying strength of the U.S. economy. Early in 2016, concerns over slowing growth in China triggered a renewed market sell-off. The resulting volatility contributed to unusually large dislocations between stock prices and underlying company fundamentals in the small-cap market. Nonetheless, broad market indices such as the S&P 500 Index recovered some ground later in the first quarter after the Fed scaled back its projected number of rate hikes for the year, from four to two.
Over the 12-month period, only two of the 10 sectors in the the Russell 2000 Value Index—utilities and consumer staples—generated positive returns. The energy sector suffered the largest decline.
Small Cap Value also delivered negative absolute returns in seven of 10 sectors. On a relative basis, the portfolio outperformed its benchmark index, however, aided by stock selection in financials, energy, industrials, consumer discretionary, health care, and utilities. Stock selection in information technology and positioning in utilities, materials, and consumer staples hindered relative performance.
Energy Assisted Relative Performance
In a difficult period for energy stocks, security selection and an underweight in the struggling energy sector, as compared to the benchmark, contributed positively to the portfolio’s relative performance. The portfolio avoided many of the energy stocks that were the sharpest detractors in the benchmark.
Financials Supported Relative Returns
Security selection in the financials sector aided relative performance. Home Bancshares and Bank of the Ozarks were solid positive contributors. Both banks benefited throughout most of 2015 from anticipation of rising interest rates. We reduced exposure to Home Bancshares on the stock’s outperformance, and scaled back exposure to the bank industry as the Fed announced a more gradual approach to rate increases.
*All fund returns referenced in this commentary are for Investor Class shares. Performance for other share classes will vary due to differences in fee structure; when Investor Class performance exceeds that of the fund's benchmark, other share classes may not. See page 3 for returns for all share classes.
Information Technology Provided Mixed Results
The information technology sector supplied one of the portfolio’s largest positive contributors. BroadSoft, a rapidly growing provider of unified telecommunications software and hardware, reported solid earnings growth and share price performance. We trimmed the position as the stock price rose.
A portfolio-only position in Puerto Rico-based payment processing company EVERTEC was a significant detractor. Concerns about Puerto Rico’s economy and a short-lived software glitch in the company’s processing system drove the stock lower, especially in the first quarter of 2016. We remained positive on the company’s risk/reward profile, stable business, strong recurrent revenues, and high margins. As a result, we added to the position as the stock declined.
Positioning in Utilities, Materials Hampered Performance
The portfolio’s underweight in utilities dampened relative performance as the utilities sector benefited from declining interest rates and investors’ search for stability during periods of market volatility.
An overweight in materials was also detrimental, as global economic concerns overshadowed commodity markets. Three materials investments were significant detractors from both absolute and relative performance. Horsehead Holding, a supplier of zinc-based products, and chemical company LSB Industries both experienced cost overruns at new plants, and their share prices dropped. We exited both positions. A portfolio-only position in KapStone Paper and Packaging weighed on results amid pricing concerns due to tepid demand and a strong U.S. dollar. We remained positive on the stable core business and strong management team, and took advantage of the declining stock price to add to the position.
Outlook
As of March 31, 2016, the portfolio’s largest overweights are in the materials and industrials sectors, with smaller overweights in consumer discretionary, health care, and information technology. The largest underweights are in financials, especially real estate investment trusts (REITs), with smaller underweights in utilities and consumer staples. These underweights reflect the difficulty of finding attractively valued companies in these sectors that fit our quality criteria.
|
| |
| MARCH 31, 2016 |
| Top Ten Holdings | % of net assets |
| Graphic Packaging Holding Co. | 1.9% |
| Allied World Assurance Co. Holdings Ltd. | 1.9% |
| ClubCorp Holdings, Inc. | 1.9% |
| Multi-Color Corp. | 1.8% |
| UMB Financial Corp. | 1.8% |
| Multi Packaging Solutions International Ltd. | 1.8% |
| VeriFone Systems, Inc. | 1.8% |
| BroadSoft, Inc. | 1.8% |
| Entravision Communications Corp., Class A | 1.6% |
| Berry Plastics Group, Inc. | 1.6% |
| | |
| Top Five Industries | % of net assets |
| Banks | 14.3% |
| Real Estate Investment Trusts (REITs) | 11.8% |
| Insurance | 6.1% |
| Containers and Packaging | 5.3% |
| Commercial Services and Supplies | 4.8% |
| | |
| Types of Investments in Portfolio | % of net assets |
| Common Stocks | 97.0% |
| Temporary Cash Investments | 2.8% |
| Other Assets and Liabilities | 0.2% |
Fund shareholders may incur two types of costs: (1) transaction costs, including sales charges (loads) on purchase payments and redemption/exchange fees; and (2) ongoing costs, including management fees; distribution and service (12b-1) fees; and other fund expenses. This example is intended to help you understand your ongoing costs (in dollars) of investing in your fund and to compare these costs with the ongoing cost of investing in other mutual funds.
The example is based on an investment of $1,000 made at the beginning of the period and held for the entire period from October 1, 2015 to March 31, 2016.
Actual Expenses
The table provides information about actual account values and actual expenses for each class. You may use the information, together with the amount you invested, to estimate the expenses that you paid over the period. First, identify the share class you own. Then simply divide your account value by $1,000 (for example, an $8,600 account value divided by $1,000 = 8.6), then multiply the result by the number under the heading “Expenses Paid During Period” to estimate the expenses you paid on your account during this period.
If you hold Investor Class shares of any American Century Investments fund, or Institutional Class shares of the American Century Diversified Bond Fund, in an American Century Investments account (i.e., not a financial intermediary or retirement plan account), American Century Investments may charge you a $12.50 semiannual account maintenance fee if the value of those shares is less than $10,000. We will redeem shares automatically in one of your accounts to pay the $12.50 fee. In determining your total eligible investment amount, we will include your investments in all personal accounts (including American Century Investments Brokerage accounts) registered under your Social Security number. Personal accounts include individual accounts, joint accounts, UGMA/UTMA accounts, personal trusts, Coverdell Education Savings Accounts and IRAs (including traditional, Roth, Rollover, SEP-, SARSEP- and SIMPLE-IRAs), and certain other retirement accounts. If you have only business, business retirement, employer-sponsored or American Century Investments Brokerage accounts, you are currently not subject to this fee. If you are subject to the Account Maintenance Fee, your account value could be reduced by the fee amount.
Hypothetical Example for Comparison Purposes
The table also provides information about hypothetical account values and hypothetical expenses based on the actual expense ratio of each class of your fund and an assumed rate of return of 5% per year before expenses, which is not the actual return of a fund’s share class. The hypothetical account values and expenses may not be used to estimate the actual ending account balance or expenses you paid for the period. You may use this information to compare the ongoing costs of investing in your fund and other funds. To do so, compare this 5% hypothetical example with the 5% hypothetical examples that appear in the shareholder reports of the other funds.
Please note that the expenses shown in the table are meant to highlight your ongoing costs only and do not reflect any transactional costs, such as sales charges (loads) or redemption/exchange fees. Therefore, the table is useful in comparing ongoing costs only, and will not help you determine the relative total costs of owning different funds. In addition, if these transactional costs were included, your costs would have been higher.
|
| | | | |
| | Beginning
Account Value
10/1/15 | Ending
Account Value
3/31/16 | Expenses Paid
During Period(1)10/1/15 - 3/31/16 | Annualized
Expense Ratio(1) |
| Actual | | | | |
| Investor Class | $1,000 | $1,031.00 | $6.40 | 1.26% |
| Institutional Class | $1,000 | $1,031.40 | $5.38 | 1.06% |
| A Class | $1,000 | $1,030.50 | $7.67 | 1.51% |
| C Class | $1,000 | $1,026.40 | $11.45 | 2.26% |
| R Class | $1,000 | $1,028.50 | $8.93 | 1.76% |
| R6 Class | $1,000 | $1,033.30 | $4.63 | 0.91% |
| Hypothetical | | | | |
| Investor Class | $1,000 | $1,018.70 | $6.36 | 1.26% |
| Institutional Class | $1,000 | $1,019.70 | $5.35 | 1.06% |
| A Class | $1,000 | $1,017.45 | $7.62 | 1.51% |
| C Class | $1,000 | $1,013.70 | $11.38 | 2.26% |
| R Class | $1,000 | $1,016.20 | $8.87 | 1.76% |
| R6 Class | $1,000 | $1,020.45 | $4.60 | 0.91% |
| |
| (1) | Expenses are equal to the class's annualized expense ratio listed in the table above, multiplied by the average account value over the period, multiplied by 183, the number of days in the most recent fiscal half-year, divided by 366, to reflect the one-half year period. |
MARCH 31, 2016
|
| | | | |
| | Shares | Value |
| COMMON STOCKS — 97.0% | | |
| Aerospace and Defense — 0.1% | | |
| Cubic Corp. | 30,000 | $ | 1,198,800 |
|
| Auto Components — 0.9% | | |
Stoneridge, Inc.(1) | 180,006 | 2,620,887 |
|
Tenneco, Inc.(1) | 165,000 | 8,499,150 |
|
| Tower International, Inc. | 40,000 | 1,088,000 |
|
| | | 12,208,037 |
|
| Banks — 14.3% | | |
| Bank of the Ozarks, Inc. | 435,000 | 18,256,950 |
|
| BankUnited, Inc. | 560,034 | 19,287,571 |
|
| Boston Private Financial Holdings, Inc. | 1,185,000 | 13,568,250 |
|
| Capital Bank Financial Corp., Class A | 710,000 | 21,903,500 |
|
| CVB Financial Corp. | 305,000 | 5,322,250 |
|
Eagle Bancorp, Inc.(1) | 55,000 | 2,640,000 |
|
FCB Financial Holdings, Inc., Class A(1) | 295,000 | 9,811,700 |
|
| First Financial Bankshares, Inc. | 610,000 | 18,043,800 |
|
| Home Bancshares, Inc. | 150,000 | 6,142,500 |
|
| LegacyTexas Financial Group, Inc. | 725,000 | 14,246,250 |
|
| PacWest Bancorp | 260,000 | 9,659,000 |
|
| ServisFirst Bancshares, Inc. | 92,721 | 4,116,812 |
|
| Southside Bancshares, Inc. | 530,000 | 13,817,100 |
|
Texas Capital Bancshares, Inc.(1) | 405,000 | 15,543,900 |
|
| UMB Financial Corp. | 495,000 | 25,556,850 |
|
| | | 197,916,433 |
|
| Building Products — 3.4% | | |
Continental Building Products, Inc.(1) | 590,000 | 10,950,400 |
|
CSW Industrials, Inc.(1) | 460,000 | 14,490,000 |
|
NCI Building Systems, Inc.(1) | 535,000 | 7,597,000 |
|
PGT, Inc.(1) | 1,370,000 | 13,480,800 |
|
| | | 46,518,200 |
|
| Capital Markets — 0.9% | | |
| Ares Management LP | 769,220 | 11,845,988 |
|
| Chemicals — 3.1% | | |
| Chase Corp. | 63,355 | 3,331,839 |
|
| Innophos Holdings, Inc. | 315,000 | 9,736,650 |
|
| Innospec, Inc. | 350,000 | 15,176,000 |
|
| Minerals Technologies, Inc. | 265,000 | 15,065,250 |
|
| | | 43,309,739 |
|
| Commercial Services and Supplies — 4.8% | | |
| Brink's Co. (The) | 330,000 | 11,084,700 |
|
Clean Harbors, Inc.(1) | 241,147 | 11,898,193 |
|
| Deluxe Corp. | 85,000 | 5,311,650 |
|
InnerWorkings, Inc.(1) | 1,540,000 | 12,243,000 |
|
| Multi-Color Corp. | 480,000 | 25,608,000 |
|
| | | 66,145,543 |
|
|
| | | | |
| | Shares | Value |
| Construction and Engineering — 1.1% | | |
| Valmont Industries, Inc. | 125,000 | $ | 15,480,000 |
|
| Containers and Packaging — 5.3% | | |
Berry Plastics Group, Inc.(1) | 620,000 | 22,413,000 |
|
| Graphic Packaging Holding Co. | 2,040,000 | 26,214,000 |
|
Multi Packaging Solutions International Ltd.(1) | 1,540,000 | 24,994,200 |
|
| | | 73,621,200 |
|
| Diversified Financial Services — 1.0% | | |
| Compass Diversified Holdings | 895,000 | 14,006,750 |
|
| Electric Utilities — 2.0% | | |
| ALLETE, Inc. | 210,000 | 11,774,700 |
|
| Cleco Corp. | 100,000 | 5,521,000 |
|
| El Paso Electric Co. | 145,000 | 6,652,600 |
|
| Great Plains Energy, Inc. | 105,000 | 3,386,250 |
|
| | | 27,334,550 |
|
| Electrical Equipment — 1.2% | | |
Babcock & Wilcox Enterprises, Inc.(1) | 495,000 | 10,593,000 |
|
| EnerSys | 120,000 | 6,686,400 |
|
| | | 17,279,400 |
|
| Electronic Equipment, Instruments and Components — 2.3% | | |
| Ingram Micro, Inc., Class A | 185,000 | 6,643,350 |
|
VeriFone Systems, Inc.(1) | 885,000 | 24,992,400 |
|
| | | 31,635,750 |
|
| Energy Equipment and Services — 1.6% | | |
Dril-Quip, Inc.(1) | 150,000 | 9,084,000 |
|
Forum Energy Technologies, Inc.(1) | 630,000 | 8,316,000 |
|
Matrix Service Co.(1) | 310,000 | 5,487,000 |
|
| | | 22,887,000 |
|
| Food and Staples Retailing — 0.5% | | |
Fresh Market, Inc. (The)(1) | 220,000 | 6,276,600 |
|
| Food Products — 0.4% | | |
Inventure Foods, Inc.(1) | 905,000 | 5,113,250 |
|
| Gas Utilities — 0.4% | | |
| Southwest Gas Corp. | 95,000 | 6,255,750 |
|
| Health Care Equipment and Supplies — 2.0% | | |
Haemonetics Corp.(1) | 455,000 | 15,915,900 |
|
Utah Medical Products, Inc.(2) | 190,000 | 11,882,600 |
|
| | | 27,798,500 |
|
| Health Care Providers and Services — 4.1% | | |
AMN Healthcare Services, Inc.(1) | 425,000 | 14,284,250 |
|
LifePoint Health, Inc.(1) | 245,000 | 16,966,250 |
|
PharMerica Corp.(1) | 770,000 | 17,024,700 |
|
Providence Service Corp. (The)(1) | 170,000 | 8,681,900 |
|
| | | 56,957,100 |
|
| Hotels, Restaurants and Leisure — 3.4% | | |
| ClubCorp Holdings, Inc. | 1,855,000 | 26,044,200 |
|
| Peak Resorts, Inc. | 470,000 | 1,598,000 |
|
Red Robin Gourmet Burgers, Inc.(1) | 300,293 | 19,359,890 |
|
| | | 47,002,090 |
|
| Household Durables — 2.2% | | |
Cavco Industries, Inc.(1) | 160,000 | 14,953,600 |
|
|
| | | | |
| | Shares | Value |
Century Communities, Inc.(1) | 605,000 | $ | 10,327,350 |
|
| Tupperware Brands Corp. | 80,000 | 4,638,400 |
|
| | | 29,919,350 |
|
| Household Products — 0.5% | | |
| Energizer Holdings, Inc. | 185,000 | 7,494,350 |
|
| Industrial Conglomerates — 0.6% | | |
| Raven Industries, Inc. | 560,000 | 8,971,200 |
|
| Insurance — 6.1% | | |
| Allied World Assurance Co. Holdings Ltd. | 750,000 | 26,205,000 |
|
Atlas Financial Holdings, Inc.(1) | 515,000 | 9,342,100 |
|
| Endurance Specialty Holdings Ltd. | 325,000 | 21,235,500 |
|
| Infinity Property & Casualty Corp. | 100,000 | 8,050,000 |
|
| James River Group Holdings Ltd. | 188,575 | 6,083,429 |
|
| Validus Holdings Ltd. | 285,000 | 13,449,150 |
|
| | | 84,365,179 |
|
| IT Services — 1.5% | | |
| EVERTEC, Inc. | 1,530,000 | 21,389,400 |
|
| Leisure Products — 1.2% | | |
Malibu Boats, Inc.(1) | 511,006 | 8,380,498 |
|
MCBC Holdings, Inc.(1) | 542,600 | 7,639,808 |
|
| | | 16,020,306 |
|
| Machinery — 2.7% | | |
| Albany International Corp., Class A | 290,000 | 10,901,100 |
|
| Dynamic Materials Corp. | 440,000 | 2,851,200 |
|
| EnPro Industries, Inc. | 165,000 | 9,517,200 |
|
| Global Brass & Copper Holdings, Inc. | 195,000 | 4,865,250 |
|
| Graham Corp. | 467,392 | 9,305,775 |
|
| | | 37,440,525 |
|
| Media — 2.2% | | |
Entercom Communications Corp., Class A(1) | 138,394 | 1,464,209 |
|
| Entravision Communications Corp., Class A | 3,015,000 | 22,431,600 |
|
| Nexstar Broadcasting Group, Inc., Class A | 70,000 | 3,098,900 |
|
Townsquare Media, Inc.(1) | 270,000 | 3,026,700 |
|
| | | 30,021,409 |
|
| Metals and Mining — 0.6% | | |
| Compass Minerals International, Inc. | 125,000 | 8,857,500 |
|
| Oil, Gas and Consumable Fuels — 2.3% | | |
| Aegean Marine Petroleum Network, Inc. | 530,000 | 4,012,100 |
|
| Ardmore Shipping Corp. | 850,000 | 7,182,500 |
|
Carrizo Oil & Gas, Inc.(1) | 185,000 | 5,720,200 |
|
| Delek US Holdings, Inc. | 180,000 | 2,743,200 |
|
| Euronav SA | 330,000 | 3,379,200 |
|
PDC Energy, Inc.(1) | 70,000 | 4,161,500 |
|
| Scorpio Tankers, Inc. | 715,000 | 4,168,450 |
|
| | | 31,367,150 |
|
| Paper and Forest Products — 1.0% | | |
| KapStone Paper and Packaging Corp. | 1,035,001 | 14,334,764 |
|
| Professional Services — 0.5% | | |
On Assignment, Inc.(1) | 190,000 | 7,014,800 |
|
| Real Estate Investment Trusts (REITs) — 11.8% | | |
| Apollo Commercial Real Estate Finance, Inc. | 235,000 | 3,830,500 |
|
|
| | | | |
| | Shares | Value |
| Armada Hoffler Properties, Inc. | 853,479 | $ | 9,601,639 |
|
| Blackstone Mortgage Trust, Inc., Class A | 265,000 | 7,117,900 |
|
| CBL & Associates Properties, Inc. | 425,000 | 5,057,500 |
|
| Chatham Lodging Trust | 329,997 | 7,071,836 |
|
| DiamondRock Hospitality Co. | 480,000 | 4,857,600 |
|
| Easterly Government Properties, Inc. | 245,000 | 4,537,400 |
|
| EPR Properties | 85,000 | 5,662,700 |
|
| First Industrial Realty Trust, Inc. | 400,000 | 9,096,000 |
|
| Healthcare Realty Trust, Inc. | 85,000 | 2,625,650 |
|
| Kite Realty Group Trust | 625,000 | 17,318,750 |
|
| Lexington Realty Trust | 1,085,000 | 9,331,000 |
|
| Medical Properties Trust, Inc. | 780,000 | 10,124,400 |
|
| MFA Financial, Inc. | 395,000 | 2,705,750 |
|
| New Residential Investment Corp. | 240,000 | 2,791,200 |
|
| Outfront Media, Inc. | 458,293 | 9,669,982 |
|
| Rexford Industrial Realty, Inc. | 170,000 | 3,087,200 |
|
| RLJ Lodging Trust | 214,997 | 4,919,131 |
|
| Rouse Properties, Inc. | 130,000 | 2,389,400 |
|
| Sabra Health Care REIT, Inc. | 445,000 | 8,940,050 |
|
| Summit Hotel Properties, Inc. | 631,654 | 7,560,899 |
|
| Sunstone Hotel Investors, Inc. | 260,000 | 3,640,000 |
|
| Two Harbors Investment Corp. | 1,085,000 | 8,614,900 |
|
| Urstadt Biddle Properties, Inc., Class A | 419,579 | 8,790,180 |
|
| Washington Real Estate Investment Trust | 145,000 | 4,235,450 |
|
| | | 163,577,017 |
|
| Road and Rail — 0.1% | | |
| Marten Transport Ltd. | 110,000 | 2,059,200 |
|
| Semiconductors and Semiconductor Equipment — 3.6% | | |
| Cypress Semiconductor Corp. | 1,715,000 | 14,851,900 |
|
Exar Corp.(1) | 1,820,000 | 10,465,000 |
|
Kulicke & Soffa Industries, Inc.(1) | 1,260,000 | 14,263,200 |
|
Semtech Corp.(1) | 460,000 | 10,115,400 |
|
| | | 49,695,500 |
|
| Software — 3.2% | | |
BroadSoft, Inc.(1) | 605,000 | 24,411,750 |
|
| Mentor Graphics Corp. | 949,969 | 19,312,870 |
|
| | | 43,724,620 |
|
| Specialty Retail — 1.4% | | |
| Destination Maternity Corp. | 289,983 | 1,983,484 |
|
MarineMax, Inc.(1) | 280,000 | 5,451,600 |
|
| Penske Automotive Group, Inc. | 330,000 | 12,507,000 |
|
| | | 19,942,084 |
|
| Technology Hardware, Storage and Peripherals — 0.7% | | |
Silicon Graphics International Corp.(1) | 1,305,339 | 9,294,014 |
|
| Textiles, Apparel and Luxury Goods — 0.7% | | |
| Culp, Inc. | 390,000 | 10,225,800 |
|
| Trading Companies and Distributors — 1.3% | | |
DXP Enterprises, Inc.(1) | 460,000 | 8,077,600 |
|
| MSC Industrial Direct Co., Inc., Class A | 130,000 | 9,920,300 |
|
| | | 17,997,900 |
|
TOTAL COMMON STOCKS (Cost $1,256,070,351) | | 1,344,502,748 |
|
|
| | | | |
| | Shares | Value |
| TEMPORARY CASH INVESTMENTS — 2.8% | | |
| Repurchase Agreement, Fixed Income Clearing Corp., (collateralized by various U.S.Treasury obligations, 2.25%, 11/15/25, valued at $24,220,688), at 0.10%, dated 3/31/16, due 4/1/16 (Delivery value $23,741,066) | | $ | 23,741,000 |
|
| State Street Institutional Liquid Reserves Fund, Premier Class | 15,505,188 | 15,505,188 |
|
TOTAL TEMPORARY CASH INVESTMENTS (Cost $39,246,188) | | 39,246,188 |
|
TOTAL INVESTMENT SECURITIES — 99.8% (Cost $1,295,316,539) | | 1,383,748,936 |
|
| OTHER ASSETS AND LIABILITIES — 0.2% | | 2,824,139 |
|
| TOTAL NET ASSETS — 100.0% | | $ | 1,386,573,075 |
|
|
| | | | | | | | | | |
| FORWARD FOREIGN CURRENCY EXCHANGE CONTRACTS |
| Currency Purchased | Currency Sold | Counterparty | Settlement Date | Unrealized Appreciation
(Depreciation) |
| USD | 2,831,545 |
| EUR | 2,528,063 |
| UBS AG | 6/30/16 | $ | (52,916 | ) |
|
| | |
| NOTES TO SCHEDULE OF INVESTMENTS |
| EUR | - | Euro |
| USD | - | United States Dollar |
| |
| (2) | Affiliated Company: the fund’s holding represents ownership of 5% or more of the voting securities of the company; therefore, the company is affiliated as defined in the Investment Company Act of 1940. |
See Notes to Financial Statements.
|
|
| Statement of Assets and Liabilities |
|
| | | |
| MARCH 31, 2016 | |
| Assets | |
| Investment securities - unaffiliated, at value (cost of $1,289,209,874) | $ | 1,371,866,336 |
|
| Investment securities - affiliated, at value (cost of $6,106,665) | 11,882,600 |
|
| Total investment securities, at value (cost of $1,295,316,539) | 1,383,748,936 |
|
| Cash | 73,255 |
|
| Receivable for investments sold | 12,698,456 |
|
| Receivable for capital shares sold | 1,582,015 |
|
| Dividends and interest receivable | 2,659,179 |
|
| | 1,400,761,841 |
|
| | |
| Liabilities | |
| Payable for investments purchased | 10,509,074 |
|
| Payable for capital shares redeemed | 2,273,802 |
|
| Unrealized depreciation on forward foreign currency exchange contracts | 52,916 |
|
| Accrued management fees | 1,322,351 |
|
| Distribution and service fees payable | 30,623 |
|
| | 14,188,766 |
|
| | |
| Net Assets | $ | 1,386,573,075 |
|
| | |
| Net Assets Consist of: | |
| Capital (par value and paid-in surplus) | $ | 1,341,469,658 |
|
| Undistributed net investment income | 4,435,092 |
|
| Accumulated net realized loss | (47,711,156 | ) |
| Net unrealized appreciation | 88,379,481 |
|
| | $ | 1,386,573,075 |
|
|
| | | | |
| | Net Assets | Shares Outstanding | Net Asset Value Per Share |
| Investor Class, $0.01 Par Value | $656,974,159 | 86,990,752 |
| $7.55 |
| Institutional Class, $0.01 Par Value | $517,246,623 | 67,949,291 |
| $7.61 |
| A Class, $0.01 Par Value | $142,568,062 | 19,037,975 |
| $7.49* |
| C Class, $0.01 Par Value | $265,036 | 36,353 |
| $7.29 |
| R Class, $0.01 Par Value | $2,346,459 | 313,848 |
| $7.48 |
| R6 Class, $0.01 Par Value | $67,172,736 | 8,819,961 |
| $7.62 |
*Maximum offering price $7.95 (net asset value divided by 0.9425).
See Notes to Financial Statements.
|
| | | |
| YEAR ENDED MARCH 31, 2016 | |
| Investment Income (Loss) | |
| Income: | |
| Dividends (including $736,397 from affiliates and net of foreign taxes withheld of $55,723) | $ | 26,257,146 |
|
| Interest | 12,977 |
|
| | 26,270,123 |
|
| | |
| Expenses: | |
| Management fees | 18,193,006 |
|
| Distribution and service fees: | |
| A Class | 557,353 |
|
| C Class | 1,519 |
|
| R Class | 11,420 |
|
| Directors' fees and expenses | 55,295 |
|
| Other expenses | 6,168 |
|
| | 18,824,761 |
|
| | |
| Net investment income (loss) | 7,445,362 |
|
| | |
| Realized and Unrealized Gain (Loss) | |
| Net realized gain (loss) on: | |
| Investment transactions (including $(537,841) from affiliates) | 82,154,442 |
|
| Foreign currency transactions | (15,278 | ) |
| | 82,139,164 |
|
| | |
| Change in net unrealized appreciation (depreciation) on: | |
| Investments | (185,484,449 | ) |
| Translation of assets and liabilities in foreign currencies | (108,959 | ) |
| | (185,593,408 | ) |
| | |
| Net realized and unrealized gain (loss) | (103,454,244 | ) |
| | |
| Net Increase (Decrease) in Net Assets Resulting from Operations | $ | (96,008,882 | ) |
See Notes to Financial Statements.
|
|
| Statement of Changes in Net Assets |
|
| | | | | | |
| YEARS ENDED MARCH 31, 2016 AND MARCH 31, 2015 |
| Increase (Decrease) in Net Assets | March 31, 2016 | March 31, 2015 |
| Operations | | |
| Net investment income (loss) | $ | 7,445,362 |
| $ | 13,860,486 |
|
| Net realized gain (loss) | 82,139,164 |
| 186,158,622 |
|
| Change in net unrealized appreciation (depreciation) | (185,593,408 | ) | (93,539,572 | ) |
| Net increase (decrease) in net assets resulting from operations | (96,008,882 | ) | 106,479,536 |
|
| | | |
| Distributions to Shareholders | | |
| From net investment income: | | |
| Investor Class | (2,857,830 | ) | (4,893,634 | ) |
| Institutional Class | (3,361,155 | ) | (5,170,957 | ) |
| A Class | (266,966 | ) | (1,318,762 | ) |
| C Class | — |
| (127 | ) |
| R Class | — |
| (11,688 | ) |
| R6 Class | (302,203 | ) | (201,251 | ) |
| From net realized gains: | | |
| Investor Class | (83,866,802 | ) | (102,787,586 | ) |
| Institutional Class | (66,712,537 | ) | (78,648,675 | ) |
| A Class | (19,047,040 | ) | (48,736,094 | ) |
| C Class | (22,931 | ) | (16,573 | ) |
| R Class | (281,269 | ) | (571,308 | ) |
| R6 Class | (4,897,236 | ) | (2,772,634 | ) |
| Decrease in net assets from distributions | (181,615,969 | ) | (245,129,289 | ) |
| | | |
| Capital Share Transactions | | |
| Net increase (decrease) in net assets from capital share transactions (Note 5) | (177,847,308 | ) | (294,024,279 | ) |
| | | |
| Net increase (decrease) in net assets | (455,472,159 | ) | (432,674,032 | ) |
| | | |
| Net Assets | | |
| Beginning of period | 1,842,045,234 |
| 2,274,719,266 |
|
| End of period | $ | 1,386,573,075 |
| $ | 1,842,045,234 |
|
| | | |
| Undistributed net investment income | $ | 4,435,092 |
| $ | 1,910,592 |
|
See Notes to Financial Statements.
|
|
| Notes to Financial Statements |
MARCH 31, 2016
1. Organization
American Century Capital Portfolios, Inc. (the corporation) is registered under the Investment Company Act of 1940, as amended (the 1940 Act), as an open-end management investment company and is organized as a Maryland corporation. Small Cap Value Fund (the fund) is one fund in a series issued by the corporation. The fund’s investment objective is to seek long-term capital growth. Income is a secondary objective.
The fund offers the Investor Class, the Institutional Class, the A Class, the C Class, the R Class and the R6 Class. The A Class may incur an initial sales charge. The A Class and C Class may be subject to a contingent deferred sales charge. The share classes differ principally in their respective sales charges and distribution and shareholder servicing expenses and arrangements. The Institutional Class and R6 Class shareholders do not require the same level of shareholder and administrative services from American Century Investment Management, Inc. (ACIM) (the investment advisor) as shareholders of other classes. In addition, financial intermediaries do not receive any service, distribution or administrative fees for the R6 Class. As a result, the Institutional Class and R6 Class are charged lower unified management fees.
2. Significant Accounting Policies
The following is a summary of significant accounting policies consistently followed by the fund in preparation of its financial statements. The fund is an investment company and follows accounting and reporting guidance in accordance with accounting principles generally accepted in the United States of America. This may require management to make certain estimates and assumptions at the date of the financial statements. Actual results could differ from these estimates. Management evaluated the impact of events or transactions occurring through the date the financial statements were issued that would merit recognition or disclosure.
Investment Valuations — The fund determines the fair value of its investments and computes its net asset value per share at the close of regular trading (usually 4 p.m. Eastern time) on the New York Stock Exchange (NYSE) on each day the NYSE is open. The Board of Directors has adopted valuation policies and procedures to guide the investment advisor in the fund’s investment valuation process and to provide methodologies for the oversight of the fund’s pricing function.
Equity securities that are listed or traded on a domestic securities exchange are valued at the last reported sales price or at the official closing price as provided by the exchange. Equity securities traded on foreign securities exchanges are generally valued at the closing price of such securities on the exchange where primarily traded or at the close of the NYSE, if that is earlier. If no last sales price is reported, or if local convention or regulation so provides, the mean of the latest bid and asked prices may be used. Securities traded over-the-counter are valued at the mean of the latest bid and asked prices, the last sales price, or the official closing price. Equity securities initially expressed in local currencies are translated into U.S. dollars at the mean of the appropriate currency exchange rate at the close of the NYSE as provided by an independent pricing service.
Open-end management investment companies are valued at the reported net asset value per share. Repurchase agreements are valued at cost, which approximates fair value. Forward foreign currency exchange contracts are valued at the mean of the appropriate forward exchange rate at the close of the NYSE as provided by an independent pricing service.
If the fund determines that the market price for an investment is not readily available or the valuation methods mentioned above do not reflect an investment’s fair value, such investment is valued as determined in good faith by the Board of Directors or its delegate, in accordance with policies and procedures adopted by the Board of Directors. In its determination of fair value, the fund may review several factors including, but not limited to, market information regarding the specific investment or comparable investments and correlation with other investment types, futures indices or general market indicators. Circumstances that may cause the fund to use these procedures to value an investment include, but are not limited to: an investment has been declared in default or is distressed; trading in a security has been suspended during the trading day or a security is not actively trading on its principal exchange; prices received from a regular pricing source are deemed unreliable; or there is a foreign market holiday and no trading occurred.
The fund monitors for significant events occurring after the close of an investment’s primary exchange but before the fund’s net asset value per share is determined. Significant events may include, but are not limited to: corporate announcements and transactions; governmental action and political unrest that could impact a specific investment or an investment sector; or armed conflicts, natural disasters and similar events that could affect investments in a specific country or region. The fund also monitors for significant fluctuations between domestic and foreign markets, as evidenced by the U.S. market or such other indicators that the Board of Directors, or its delegate, deems appropriate. If significant fluctuations in foreign markets are identified, the fund may apply a model-derived factor to the closing price of equity securities traded on foreign securities exchanges. The factor is based on observable market data as provided by an independent pricing service.
Security Transactions — Security transactions are accounted for as of the trade date. Net realized gains and losses are determined on the identified cost basis, which is also used for federal income tax purposes.
Investment Income — Dividend income less foreign taxes withheld, if any, is recorded as of the ex-dividend date. Distributions received on securities that represent a return of capital or long-term capital gain are recorded as a reduction of cost of investments and/or as a realized gain. The fund may estimate the components of distributions received that may be considered nontaxable distributions or long-term capital gain distributions for income tax purposes. Interest income is recorded on the accrual basis and includes accretion of discounts and amortization of premiums.
Foreign Currency Translations — All assets and liabilities initially expressed in foreign currencies are translated into U.S. dollars at prevailing exchange rates at period end. The fund may enter into spot foreign currency exchange contracts to facilitate transactions denominated in a foreign currency. Purchases and sales of investment securities, dividend and interest income, spot foreign currency exchange contracts, and expenses are translated at the rates of exchange prevailing on the respective dates of such transactions. Net realized and unrealized foreign currency exchange gains or losses related to investment securities are a component of net realized gain (loss) on investment transactions and change in net unrealized appreciation (depreciation) on investments, respectively.
Repurchase Agreements — The fund may enter into repurchase agreements with institutions that ACIM has determined are creditworthy pursuant to criteria adopted by the Board of Directors. The fund requires that the collateral, represented by securities, received in a repurchase transaction be transferred to the custodian in a manner sufficient to enable the fund to obtain those securities in the event of a default under the repurchase agreement. ACIM monitors, on a daily basis, the securities transferred to ensure the value, including accrued interest, of the securities under each repurchase agreement is equal to or greater than amounts owed to the fund under each repurchase agreement.
Joint Trading Account — Pursuant to an Exemptive Order issued by the Securities and Exchange Commission, the fund, along with certain other funds in the American Century Investments family of funds, may transfer uninvested cash balances into a joint trading account. These balances are invested in one or more repurchase agreements that are collateralized by U.S. Treasury or Agency obligations.
Income Tax Status — It is the fund’s policy to distribute substantially all net investment income and net realized gains to shareholders and to otherwise qualify as a regulated investment company under provisions of the Internal Revenue Code. Accordingly, no provision has been made for income taxes. The fund files U.S. federal, state, local and non-U.S. tax returns as applicable. The fund's tax returns are subject to examination by the relevant taxing authority until expiration of the applicable statute of limitations, which is generally three years from the date of filing but can be longer in certain jurisdictions. At this time, management believes there are no uncertain tax positions which, based on their technical merit, would not be sustained upon examination and for which it is reasonably possible that the total amounts of unrecognized tax benefits will significantly change in the next twelve months.
Multiple Class — All shares of the fund represent an equal pro rata interest in the net assets of the class to which such shares belong, and have identical voting, dividend, liquidation and other rights and the same terms and conditions, except for class specific expenses and exclusive rights to vote on matters affecting only individual classes. Income, non-class specific expenses, and realized and unrealized capital gains and losses of the fund are allocated to each class of shares based on their relative net assets.
Distributions to Shareholders — Distributions from net investment income, if any, are generally declared and paid quarterly. Distributions from net realized gains, if any, are generally declared and paid annually.
Indemnifications — Under the corporation’s organizational documents, its officers and directors are indemnified against certain liabilities arising out of the performance of their duties to the fund. In addition, in the normal course of business, the fund enters into contracts that provide general indemnifications. The maximum exposure under these arrangements is unknown as this would involve future claims that may be made against a fund. The risk of material loss from such claims is considered by management to be remote.
3. Fees and Transactions with Related Parties
Certain officers and directors of the corporation are also officers and/or directors of American Century Companies, Inc. (ACC). The corporation’s investment advisor, ACIM, the corporation's distributor, American Century Investment Services, Inc. (ACIS), and the corporation’s transfer agent, American Century Services, LLC, are wholly owned, directly or indirectly, by ACC.
Management Fees — The corporation has entered into a management agreement with ACIM, under which ACIM provides the fund with investment advisory and management services in exchange for a single, unified management fee (the fee) per class. The agreement provides that all expenses of managing and operating the fund, except distribution and service fees, brokerage expenses, taxes, interest, fees and expenses of the independent directors (including legal counsel fees), and extraordinary expenses, will be paid by ACIM. The fee is computed and accrued daily based on each class’s daily net assets and paid monthly in arrears. The rate of the fee is determined by applying a fee rate calculation formula. This formula takes into account the fund’s assets as well as certain assets, if any, of other clients of the investment advisor outside the American Century Investments family of funds (such as subadvised funds and separate accounts) that have very similar investment teams and investment strategies (strategy assets). The annual management fee schedule ranges from 1.00% to 1.25% for the Investor Class, A Class, C Class and R Class. The annual management fee schedule ranges from 0.80% to 1.05% for the Institutional Class and 0.65% to 0.90% for the R6 Class. The effective annual management fee for each class for the year ended March 31, 2016 was 1.25% for the Investor Class, A Class, C Class, and R Class, 1.05% for the Institutional Class and 0.90% for the R6 Class.
Distribution and Service Fees — The Board of Directors has adopted a separate Master Distribution and Individual Shareholder Services Plan for each of the A Class, C Class and R Class (collectively the plans), pursuant to Rule 12b-1 of the 1940 Act. The plans provide that the A Class will pay ACIS an annual distribution and service fee of 0.25%. The plans provide that the C Class will pay ACIS an annual distribution and service fee of 1.00%, of which 0.25% is paid for individual shareholder services and 0.75% is paid for distribution services. The plans provide that the R Class will pay ACIS an annual distribution and service fee of 0.50%. The fees are computed and accrued daily based on each class’s daily net assets and paid monthly in arrears. The fees are used to pay financial intermediaries for distribution and individual shareholder services. Fees incurred under the plans during the year ended March 31, 2016 are detailed in the Statement of Operations.
Directors' Fees and Expenses — The Board of Directors is responsible for overseeing the investment advisor’s management and operations of the fund. The directors receive detailed information about the fund and its investment advisor regularly throughout the year, and meet at least quarterly with management of the investment advisor to review reports about fund operations. The fund’s officers do not receive compensation from the fund.
4. Investment Transactions
Purchases and sales of investment securities, excluding short-term investments, for the year ended March 31, 2016 were $1,462,075,219 and $1,834,850,179, respectively.
5. Capital Share Transactions
Transactions in shares of the fund were as follows:
|
| | | | | | | | | | |
| | Year ended
March 31, 2016 | Year ended
March 31, 2015 |
| | Shares | Amount | Shares | Amount |
| Investor Class/Shares Authorized | 575,000,000 |
| | 420,000,000 |
| |
| Sold | 9,679,279 |
| $ | 78,890,541 |
| 10,166,681 |
| $ | 94,504,849 |
|
| Issued in reinvestment of distributions | 10,696,743 |
| 83,310,607 |
| 11,634,702 |
| 101,989,905 |
|
| Redeemed | (22,354,962 | ) | (185,299,956 | ) | (28,834,424 | ) | (271,097,031 | ) |
| | (1,978,940 | ) | (23,098,808 | ) | (7,033,041 | ) | (74,602,277 | ) |
| Institutional Class/Shares Authorized | 400,000,000 |
| | 320,000,000 |
| |
| Sold | 11,252,060 |
| 95,032,219 |
| 11,809,491 |
| 112,378,784 |
|
| Issued in reinvestment of distributions | 8,044,956 |
| 63,217,519 |
| 8,454,194 |
| 74,708,737 |
|
| Redeemed | (16,381,374 | ) | (133,800,195 | ) | (43,210,829 | ) | (411,464,385 | ) |
| | 2,915,642 |
| 24,449,543 |
| (22,947,144 | ) | (224,376,864 | ) |
| A Class/Shares Authorized | 160,000,000 |
| | 200,000,000 |
| |
| Sold | 2,683,728 |
| 22,168,790 |
| 3,755,908 |
| 35,301,113 |
|
| Issued in reinvestment of distributions | 2,445,852 |
| 18,848,115 |
| 5,706,790 |
| 49,554,605 |
|
| Redeemed | (28,416,675 | ) | (254,844,402 | ) | (11,346,318 | ) | (105,816,806 | ) |
| | (23,287,095 | ) | (213,827,497 | ) | (1,883,620 | ) | (20,961,088 | ) |
| C Class/Shares Authorized | 10,000,000 |
| | 5,000,000 |
| |
| Sold | 25,211 |
| 200,917 |
| 3,379 |
| 31,140 |
|
| Issued in reinvestment of distributions | 3,053 |
| 22,931 |
| 1,958 |
| 16,700 |
|
| Redeemed | (7,353 | ) | (66,205 | ) | (1,614 | ) | (14,498 | ) |
| | 20,911 |
| 157,643 |
| 3,723 |
| 33,342 |
|
| R Class/Shares Authorized | 10,000,000 |
| | 5,000,000 |
| |
| Sold | 73,749 |
| 617,605 |
| 113,438 |
| 1,061,446 |
|
| Issued in reinvestment of distributions | 36,576 |
| 281,269 |
| 67,147 |
| 582,996 |
|
| Redeemed | (31,723 | ) | (249,247 | ) | (405,081 | ) | (3,645,988 | ) |
| | 78,602 |
| 649,627 |
| (224,496 | ) | (2,001,546 | ) |
| R6 Class/Shares Authorized | 50,000,000 |
| | 20,000,000 |
| |
| Sold | 5,001,989 |
| 38,087,944 |
| 3,063,302 |
| 28,932,187 |
|
| Issued in reinvestment of distributions | 661,127 |
| 5,199,439 |
| 336,422 |
| 2,973,885 |
|
| Redeemed | (1,166,051 | ) | (9,465,199 | ) | (427,470 | ) | (4,021,918 | ) |
| | 4,497,065 |
| 33,822,184 |
| 2,972,254 |
| 27,884,154 |
|
| Net increase (decrease) | (17,753,815 | ) | $ | (177,847,308 | ) | (29,112,324 | ) | $ | (294,024,279 | ) |
6. Affiliated Company Transactions
If a fund's holding represents ownership of 5% or more of the voting securities of a company, the company is affiliated as defined in the 1940 Act. A summary of transactions for each company which is or was an affiliate at or during the year ended March 31, 2016 follows:
|
| | | | | | | | | | | | | | | | | | |
| Company | Beginning
Value | Purchase
Cost | Sales Cost | Realized
Gain (Loss) | Dividend
Income | Ending
Value |
Entravision Communications Corp., Class A(1) | $ | 28,548,300 |
| $ | 5,267,179 |
| $ | 12,374,001 |
| $ | 5,782,216 |
| $ | 391,828 |
| (1 | ) |
Graham Corp.(1) | 4,074,900 |
| 7,595,835 |
| 2,695,744 |
| (659,079 | ) | 129,648 |
| (1 | ) |
Silicon Graphics International Corp.(1)(2) | 13,773,650 |
| 9,327,552 |
| 17,349,029 |
| (5,844,186 | ) | — |
| (1 | ) |
| Utah Medical Products, Inc. | 12,931,855 |
| — |
| 1,379,207 |
| 183,208 |
| 214,921 |
| $ | 11,882,600 |
|
| | $ | 59,328,705 |
| $ | 22,190,566 |
| $ | 33,797,981 |
| $ | (537,841 | ) | $ | 736,397 |
| $ | 11,882,600 |
|
| |
| (1) | Company was not an affiliate at March 31, 2016. |
7. Fair Value Measurements
The fund’s investments valuation process is based on several considerations and may use multiple inputs to determine the fair value of the investments held by the fund. In conformity with accounting principles generally accepted in the United States of America, the inputs used to determine a valuation are classified into three broad levels.
| |
| • | Level 1 valuation inputs consist of unadjusted quoted prices in an active market for identical investments. |
| |
| • | Level 2 valuation inputs consist of direct or indirect observable market data (including quoted prices for comparable investments, evaluations of subsequent market events, interest rates, prepayment speeds, credit risk, etc.). These inputs also consist of quoted prices for identical investments initially expressed in local currencies that are adjusted through translation into U.S. dollars. |
| |
| • | Level 3 valuation inputs consist of unobservable data (including a fund’s own assumptions). |
The level classification is based on the lowest level input that is significant to the fair valuation measurement. The valuation inputs are not necessarily an indication of the risks associated with investing in these securities or other financial instruments. There were no significant transfers between levels during the period.
The following is a summary of the level classifications as of period end. The Schedule of Investments provides additional information on the fund’s portfolio holdings.
|
| | | | | | | | |
| | Level 1 | Level 2 | Level 3 |
| Assets | | | |
| Investment Securities | | | |
| Common Stocks | $ | 1,344,502,748 |
| — |
| — |
|
| Temporary Cash Investments | 15,505,188 |
| $ | 23,741,000 |
| — |
|
| | $ | 1,360,007,936 |
| $ | 23,741,000 |
| — |
|
| | | | |
| Liabilities | | | |
| Other Financial Instruments | | | |
| Forward Foreign Currency Exchange Contracts | — |
| $ | 52,916 |
| — |
|
8. Derivative Instruments
Foreign Currency Risk — The fund is subject to foreign currency exchange rate risk in the normal course of pursuing its investment objectives. The value of foreign investments held by a fund may be significantly affected by changes in foreign currency exchange rates. The dollar value of a foreign security generally decreases when the value of the dollar rises against the foreign currency in which the security is denominated and tends to increase when the value of the dollar declines against such foreign currency. A fund may enter into forward foreign currency exchange contracts to reduce a fund's exposure to foreign currency exchange rate fluctuations. The net U.S. dollar value of foreign currency underlying all contractual commitments held by a fund and the resulting unrealized appreciation or depreciation are determined daily. Realized gain or loss is recorded upon the termination of the contract. Net realized and unrealized gains or losses occurring during the holding period of forward foreign currency exchange contracts are a component of net realized gain (loss) on foreign currency transactions and change in net unrealized appreciation (depreciation) on translation of assets and liabilities in foreign currencies, respectively. A fund bears the risk of an unfavorable change in the foreign currency exchange rate underlying the forward contract. Additionally, losses, up to the fair value, may arise if the counterparties do not perform under the contract terms. The fund's average U.S. dollar exposure to foreign currency risk derivative instruments held during the period was $5,299,355.
The value of foreign currency risk derivative instruments as of March 31, 2016, is disclosed on the Statement of Assets and Liabilities as a liability of $52,916 in unrealized depreciation on forward foreign currency exchange contracts. For the year ended March 31, 2016, the effect of foreign currency risk derivative instruments on the Statement of Operations was $(15,278) in net realized gain (loss) on foreign currency transactions and $(108,959) in change in net unrealized appreciation (depreciation) on translation of assets and liabilities in foreign currencies.
9. Risk Factors
The fund invests in common stocks of small companies. Because of this, the fund may be subject to greater risk and market fluctuations than a fund investing in larger, more established companies.
10. Federal Tax Information
The tax character of distributions paid during the years ended March 31, 2016 and March 31, 2015 were as follows:
|
| | | | | | |
| | 2016 | 2015 |
| Distributions Paid From | | |
| Ordinary income | $ | 41,929,678 |
| $ | 98,851,090 |
|
| Long-term capital gains | $ | 139,686,291 |
| $ | 146,278,199 |
|
The book-basis character of distributions made during the year from net investment income or net realized gains may differ from their ultimate characterization for federal income tax purposes. These differences reflect the differing character of certain income items and net realized gains and losses for financial statement and tax purposes, and may result in reclassification among certain capital accounts on the financial statements.
As of March 31, 2016, the federal tax cost of investments and the components of distributable earnings on a tax-basis were as follows:
|
| | | |
| Federal tax cost of investments | $ | 1,333,772,581 |
|
| Gross tax appreciation of investments | $ | 144,422,739 |
|
| Gross tax depreciation of investments | (94,446,384 | ) |
| Net tax appreciation (depreciation) | $ | 49,976,355 |
|
| Undistributed ordinary income | $ | 4,589,279 |
|
| Accumulated long-term gains | $ | 1,081,599 |
|
| Post-October capital loss deferral | $ | (10,543,816 | ) |
The difference between book-basis and tax-basis unrealized appreciation (depreciation) is attributable primarily to the tax deferral of losses on wash sales.
Loss deferrals represent certain qualified losses that the fund has elected to treat as having been incurred in the following fiscal year for federal income tax purposes.
|
| | | | | | | | | | | | | | | |
| For a Share Outstanding Throughout the Years Ended March 31 (except as noted) |
| Per-Share Data | Ratios and Supplemental Data |
| | | Income From Investment Operations: | Distributions From: | | | Ratio to Average Net Assets of: | | |
| | Net Asset Value, Beginning of Period | Net Investment Income (Loss)(1) | Net Realized and Unrealized Gain (Loss) | Total From Investment Operations | Net Investment Income | Net Realized Gains | Total Distributions | Net Asset Value, End of Period | Total Return(2) | Operating Expenses | Net Investment Income (Loss) | Portfolio Turnover Rate | Net Assets, End of Period (in thousands) |
| Investor Class | | | | | | | | | | | |
| 2016 | $9.16 | 0.04 | (0.59) | (0.55) | (0.03) | (1.03) | (1.06) | $7.55 | (6.25)% | 1.26% | 0.43% | 95% |
| $656,974 |
|
| 2015 | $9.88 | 0.06 | 0.48 | 0.54 | (0.05) | (1.21) | (1.26) | $9.16 | 6.18% | 1.24% | 0.66% | 78% |
| $815,048 |
|
| 2014 | $9.45 | 0.06 | 2.04 | 2.10 | (0.08) | (1.59) | (1.67) | $9.88 | 23.27% | 1.22% | 0.62% | 111% |
| $948,338 |
|
| 2013 | $8.61 | 0.10 | 1.25 | 1.35 | (0.12) | (0.39) | (0.51) | $9.45 | 16.58% | 1.25% | 1.17% | 126% |
| $894,194 |
|
| 2012 | $9.48 | 0.10 | (0.30) | (0.20) | (0.07) | (0.60) | (0.67) | $8.61 | (1.39)% | 1.24% | 1.14% | 120% |
| $880,194 |
|
| Institutional Class | | | | | | | | | | | |
| 2016 | $9.22 | 0.05 | (0.58) | (0.53) | (0.05) | (1.03) | (1.08) | $7.61 | (6.02)% | 1.06% | 0.63% | 95% |
| $517,247 |
|
| 2015 | $9.94 | 0.08 | 0.48 | 0.56 | (0.07) | (1.21) | (1.28) | $9.22 | 6.35% | 1.04% | 0.86% | 78% |
| $599,932 |
|
| 2014 | $9.50 | 0.08 | 2.05 | 2.13 | (0.10) | (1.59) | (1.69) | $9.94 | 23.45% | 1.02% | 0.82% | 111% |
| $874,415 |
|
| 2013 | $8.65 | 0.12 | 1.26 | 1.38 | (0.14) | (0.39) | (0.53) | $9.50 | 16.89% | 1.05% | 1.37% | 126% |
| $721,572 |
|
| 2012 | $9.52 | 0.11 | (0.30) | (0.19) | (0.08) | (0.60) | (0.68) | $8.65 | (1.20)% | 1.04% | 1.34% | 120% |
| $742,867 |
|
| A Class | | | | | | | | | | | | |
| 2016 | $9.09 | 0.01 | (0.57) | (0.56) | (0.01) | (1.03) | (1.04) | $7.49 | (6.41)% | 1.51% | 0.18% | 95% |
| $142,568 |
|
| 2015 | $9.81 | 0.04 | 0.48 | 0.52 | (0.03) | (1.21) | (1.24) | $9.09 | 5.96% | 1.49% | 0.41% | 78% |
| $384,891 |
|
| 2014 | $9.40 | 0.04 | 2.02 | 2.06 | (0.06) | (1.59) | (1.65) | $9.81 | 22.92% | 1.47% | 0.37% | 111% |
| $433,905 |
|
| 2013 | $8.57 | 0.08 | 1.24 | 1.32 | (0.10) | (0.39) | (0.49) | $9.40 | 16.19% | 1.50% | 0.92% | 126% |
| $401,510 |
|
| 2012 | $9.44 | 0.08 | (0.30) | (0.22) | (0.05) | (0.60) | (0.65) | $8.57 | (1.56)% | 1.49% | 0.89% | 120% |
| $432,711 |
|
|
| | | | | | | | | | | | | | | |
| For a Share Outstanding Throughout the Years Ended March 31 (except as noted) |
| Per-Share Data | Ratios and Supplemental Data |
| | | Income From Investment Operations: | Distributions From: | | | Ratio to Average Net Assets of: | | |
| | Net Asset Value, Beginning of Period | Net Investment Income (Loss)(1) | Net Realized and Unrealized Gain (Loss) | Total From Investment Operations | Net Investment Income | Net Realized Gains | Total Distributions | Net Asset Value, End of Period | Total Return(2) | Operating Expenses | Net Investment Income (Loss) | Portfolio Turnover Rate | Net Assets, End of Period (in thousands) |
| C Class |
| 2016 | $8.93 | (0.04) | (0.57) | (0.61) | — | (1.03) | (1.03) | $7.29 | (7.13)% | 2.26% | (0.57)% | 95% |
| $265 |
|
| 2015 | $9.71 | (0.03) | 0.47 | 0.44 | (0.01) | (1.21) | (1.22) | $8.93 | 5.14% | 2.24% | (0.34)% | 78% |
| $138 |
|
| 2014 | $9.35 | (0.04) | 2.01 | 1.97 | (0.02) | (1.59) | (1.61) | $9.71 | 21.94% | 2.22% | (0.38)% | 111% |
| $114 |
|
| 2013 | $8.53 | 0.01 | 1.24 | 1.25 | (0.04) | (0.39) | (0.43) | $9.35 | 15.35% | 2.25% | 0.17% | 126% |
| $80 |
|
| 2012 | $9.43 | 0.02 | (0.30) | (0.28) | (0.02) | (0.60) | (0.62) | $8.53 | (2.30)% | 2.24% | 0.14% | 120% |
| $77 |
|
| R Class |
| 2016 | $9.09 | —(4) | (0.58) | (0.58) | — | (1.03) | (1.03) | $7.48 | (6.65)% | 1.76% | (0.07)% | 95% |
| $2,346 |
|
| 2015 | $9.83 | 0.02 | 0.47 | 0.49 | (0.02) | (1.21) | (1.23) | $9.09 | 5.65% | 1.74% | 0.16% | 78% |
| $2,138 |
|
| 2014 | $9.42 | 0.01 | 2.03 | 2.04 | (0.04) | (1.59) | (1.63) | $9.83 | 22.64% | 1.72% | 0.12% | 111% |
| $4,517 |
|
| 2013 | $8.58 | 0.06 | 1.25 | 1.31 | (0.08) | (0.39) | (0.47) | $9.42 | 15.98% | 1.75% | 0.67% | 126% |
| $3,516 |
|
| 2012 | $9.46 | 0.05 | (0.29) | (0.24) | (0.04) | (0.60) | (0.64) | $8.58 | (1.80)% | 1.74% | 0.64% | 120% |
| $3,245 |
|
| R6 Class |
| 2016 | $9.23 | 0.07 | (0.59) | (0.52) | (0.06) | (1.03) | (1.09) | $7.62 | (5.86)% | 0.91% | 0.78% | 95% |
| $67,173 |
|
| 2015 | $9.94 | 0.11 | 0.48 | 0.59 | (0.09) | (1.21) | (1.30) | $9.23 | 6.62% | 0.89% | 1.01% | 78% |
| $39,898 |
|
2014(3) | $10.38 | 0.07 | 1.14 | 1.21 | (0.06) | (1.59) | (1.65) | $9.94 | 12.46% | 0.87%(5) | 1.06%(5) | 111%(6) |
| $13,430 |
|
|
| | | | |
| Notes to Financial Highlights | | |
| |
| (1) | Computed using average shares outstanding throughout the period. |
| |
| (2) | Total returns are calculated based on the net asset value of the last business day and do not reflect applicable sales charges, if any. Total returns for periods less than one year are not annualized. |
| |
| (3) | July 26, 2013 (commencement of sale) through March 31, 2014. |
| |
| (4) | Per-share amount was less than $0.005. |
| |
| (6) | Portfolio turnover is calculated at the fund level. Percentage indicated was calculated for the year ended March 31, 2014. |
See Notes to Financial Statements.
|
|
| Report of Independent Registered Public Accounting Firm |
To the Board of Directors and Shareholders of American Century Capital Portfolios, Inc.:
We have audited the accompanying statement of assets and liabilities, including the schedule of investments, of Small Cap Value Fund (the “Fund”), one of the funds constituting American Century Capital Portfolios, Inc., as of March 31, 2016, and the related statement of operations for the year then ended, the statements of changes in net assets for each of the two years in the period then ended, and the financial highlights for each of the periods presented. These financial statements and financial highlights are the responsibility of the Fund's management. Our responsibility is to express an opinion on these financial statements and financial highlights based on our audits.
We conducted our audits in accordance with the standards of the Public Company Accounting Oversight Board (United States). Those standards require that we plan and perform the audit to obtain reasonable assurance about whether the financial statements and financial highlights are free of material misstatement. The Fund is not required to have, nor were we engaged to perform, an audit of its internal control over financial reporting. Our audits included consideration of internal control over financial reporting as a basis for designing audit procedures that are appropriate in the circumstances, but not for the purpose of expressing an opinion on the effectiveness of the Fund's internal control over financial reporting. Accordingly, we express no such opinion. An audit also includes examining, on a test basis, evidence supporting the amounts and disclosures in the financial statements, assessing the accounting principles used and significant estimates made by management, as well as evaluating the overall financial statement presentation. Our procedures included confirmation of securities owned as of March 31, 2016, by correspondence with the custodian and brokers; when replies were not received from brokers, we performed other auditing procedures. We believe that our audits provide a reasonable basis for our opinion.
In our opinion, the financial statements and financial highlights referred to above present fairly, in all material respects, the financial position of Small Cap Value Fund of American Century Capital Portfolios, Inc. as of March 31, 2016, the results of its operations for the year then ended, the changes in its net assets for each of the two years in the period then ended, and the financial highlights for each of the periods presented, in conformity with accounting principles generally accepted in the United States of America.
DELOITTE & TOUCHE LLP
Kansas City, Missouri May 17, 2016
The Board of Directors
The individuals listed below serve as directors of the funds. Each director will continue to serve in this capacity until death, retirement, resignation or removal from office. The board has adopted a mandatory retirement age for directors who are not “interested persons,” as that term is defined in the Investment Company Act (independent directors). Independent directors shall retire by December 31 of the year in which they reach their 75th birthday.
Mr. Thomas is an “interested person” because he currently serves as President and Chief Executive Officer of American Century Companies, Inc. (ACC), the parent company of American Century Investment Management, Inc. (ACIM or the advisor). Mr. Fink is treated as an “interested person” because of his recent employment with ACC and American Century Services, LLC (ACS). The other directors (more than three-fourths of the total number) are independent. They are not employees, directors or officers of, and have no financial interest in, ACC or any of its wholly owned, direct or indirect, subsidiaries, including ACIM, American Century Investment Services, Inc. (ACIS) and ACS, and they do not have any other affiliations, positions or relationships that would cause them to be considered “interested persons” under the Investment Company Act. The directors serve in this capacity for seven (in the case of Mr. Thomas, 15) registered investment companies in the American Century Investments family of funds.
The following table presents additional information about the directors. The mailing address for each director is 4500 Main Street, Kansas City, Missouri 64111.
|
| | | | | |
Name
(Year of Birth) | Position(s) Held with Funds | Length of Time Served | Principal Occupation(s) During Past 5 Years | Number of American Century Portfolios Overseen by Director | Other Directorships Held During Past
5 Years |
| Independent Directors | | |
Andrea C. Hall
(1945) | Director | Since 1997 | Retired | 83 | None |
Jan M. Lewis
(1957) | Director | Since 2011 | Retired; President and Chief Executive Officer, Catholic Charities of Northeast Kansas (human services organization) (2006 to 2013) | 83 | None |
James A. Olson
(1942) | Director and Chairman of the Board | Since 2007 (Chairman since 2014) | Member, Plaza Belmont LLC (private equity fund manager) (1999 to present) | 83 | Saia, Inc. (2002 to 2012) and EPR Properties (2003 to 2013) |
M. Jeannine Strandjord
(1945) | Director | Since 1994 | Retired | 83 | Euronet Worldwide Inc.; MGP Ingredients, Inc.; and DST Systems Inc. (1996 to 2012) |
John R. Whitten
(1946) | Director | Since 2008 | Retired | 83 | Rudolph Technologies, Inc. |
Stephen E. Yates
(1948) | Director | Since 2012 | Retired | 83 | None |
|
| | | | | |
Name
(Year of Birth) | Position(s) Held with Funds | Length of Time Served | Principal Occupation(s) During Past 5 Years | Number of American Century Portfolios Overseen by Director | Other Directorships Held During Past
5 Years |
| Interested Directors |
Barry Fink
(1955) | Director | Since 2012 | Retired; Executive Vice President, ACC (September 2007 to February 2013); President, ACS (October 2007 to February 2013); Chief Operating Officer, ACC (September 2007 to November 2012) | 83 | None |
Jonathan S. Thomas
(1963) | Director and President | Since 2007 | President and Chief Executive Officer, ACC (March 2007 to present). Also serves as Chief Executive Officer, ACS; Executive Vice President, ACIM; Director, ACC, ACIM and other ACC subsidiaries | 128 | BioMed Valley Discoveries, Inc. |
The Statement of Additional Information has additional information about the fund's directors and is available without charge, upon request, by calling 1-800-345-2021.
Officers
The following table presents certain information about the executive officers of the funds. Each officer serves as an officer for each of the 15 investment companies in the American Century family of funds, unless otherwise noted. No officer is compensated for his or her service as an officer of the funds. The listed officers are interested persons of the funds and are appointed or re-appointed on an annual basis. The mailing address for each officer listed below is 4500 Main Street, Kansas City, Missouri 64111.
|
| | |
| Name (Year of Birth) | Offices with the Funds | Principal Occupation(s) During the Past Five Years |
Jonathan S. Thomas
(1963) | Director and President
since 2007 | President and Chief Executive Officer, ACC (March 2007 to present). Also serves as Chief Executive Officer, ACS; Executive Vice President, ACIM; Director, ACC, ACIM and other ACC subsidiaries |
Amy D. Shelton
(1964) | Chief Compliance Officer and Vice President since 2014 | Chief Compliance Officer, American Century funds, (March 2014 to present); Chief Compliance Officer, ACIM (February 2014 to present); Chief Compliance Officer, ACIS (October 2009 to present); Vice President, Client Interactions and Marketing, ACIS (February 2013 to January 2014); Director, Client Interactions and Marketing, ACIS (June 2007 to January 2013). Also serves as Vice President, ACIS |
Charles A. Etherington
(1957) | General Counsel since 2007 and Senior Vice President since 2006 | Attorney, ACC (February 1994 to present); Vice President, ACC (November 2005 to present); General Counsel, ACC (March 2007 to present). Also serves as General Counsel, ACIM, ACS, ACIS and other ACC subsidiaries; and Senior Vice President, ACIM and ACS |
C. Jean Wade
(1964) | Vice President, Treasurer and Chief Financial Officer since 2012 | Vice President, ACS (February 2000 to present) |
Robert J. Leach
(1966) | Vice President since 2006 and Assistant Treasurer since 2012 | Vice President, ACS (February 2000 to present) |
David H. Reinmiller
(1963) | Vice President since 2000 | Attorney, ACC (January 1994 to present); Associate General Counsel, ACC (January 2001 to present). Also serves as Vice President, ACIM and ACS |
Ward D. Stauffer
(1960) | Secretary since 2005 | Attorney, ACC (June 2003 to present) |
Retirement Account Information
As required by law, distributions you receive from certain IRAs are subject to federal income tax withholding, unless you elect not to have withholding apply. Tax will be withheld on the total amount withdrawn even though you may be receiving amounts that are not subject to withholding, such as nondeductible contributions. In such case, excess amounts of withholding could occur. You may adjust your withholding election so that a greater or lesser amount will be withheld.
If you don’t want us to withhold on this amount, you must notify us to not withhold the federal income tax. You may notify us in writing or in certain situations by telephone or through other electronic means. For systematic withdrawals, your withholding election will remain in effect until revoked or changed by filing a new election. You have the right to revoke your election at any time.
Remember, even if you elect not to have income tax withheld, you are liable for paying income tax on the taxable portion of your withdrawal. If you elect not to have income tax withheld or you don’t have enough income tax withheld, you may be responsible for payment of estimated tax. You may incur penalties under the estimated tax rules if your withholding and estimated tax payments are not sufficient. You can reduce or defer the income tax on a distribution by directly or indirectly rolling such distribution over to another IRA or eligible plan. You should consult your tax advisor for additional information.
State tax will be withheld if, at the time of your distribution, your address is within one of the mandatory withholding states and you have federal income tax withheld (or as otherwise required by state law). State taxes will be withheld from your distribution in accordance with the respective state rules.
Distributions you receive from 403(b), 457 and qualified plans are subject to special tax and withholding rules. Your plan administrator or plan sponsor is required to provide you with a special tax notice explaining those rules at the time you request a distribution. If applicable, federal and/or state taxes may be withheld from your distribution amount.
Proxy Voting Policies
A description of the policies that the fund's investment advisor uses in exercising the voting rights associated with the securities purchased and/or held by the fund is available without charge, upon request, by calling 1-800-345-2021. It is also available on the "About Us" page of American Century Investments’ website at americancentury.com and on the Securities and Exchange Commission’s website at sec.gov. Information regarding how the investment advisor voted proxies relating to portfolio securities during the most recent 12-month period ended June 30 is available on the "About Us" page at americancentury.com. It is also available at sec.gov.
Quarterly Portfolio Disclosure
The fund files its complete schedule of portfolio holdings with the Securities and Exchange Commission (SEC) for the first and third quarters of each fiscal year on Form N-Q. The fund’s Forms N-Q are available on the SEC’s website at sec.gov, and may be reviewed and copied at the SEC’s Public Reference Room in Washington, DC. Information on the operation of the Public Reference Room may be obtained by calling 1-800-SEC-0330. The fund also makes its complete schedule of portfolio holdings for the most recent quarter of its fiscal year available on its
website at americancentury.com and, upon request, by calling 1-800-345-2021.
Other Tax Information
The following information is provided pursuant to provisions of the Internal Revenue Code.
The fund hereby designates up to the maximum amount allowable as qualified dividend income for the fiscal year ended March 31, 2016.
For corporate taxpayers, the fund hereby designates $13,491,742, or up to the maximum amount allowable, of ordinary income distributions paid during the fiscal year ended March 31, 2016 as qualified for the corporate dividends received deduction.
The fund hereby designates $35,141,524 as qualified short-term capital gain distributions for purposes of Internal Revenue Code Section 871 for the fiscal year ended March 31, 2016.
The fund hereby designates $139,686,291, or up to the maximum amount allowable, as long-term capital gain distributions for the fiscal year ended March 31, 2016.
|
| | |
| |
| | | |
| Contact Us | americancentury.com | |
| Automated Information Line | 1-800-345-8765 | |
| Investor Services Representative | 1-800-345-2021 or 816-531-5575 | |
| Investors Using Advisors | 1-800-378-9878 | |
| Business, Not-For-Profit, Employer-Sponsored Retirement Plans | 1-800-345-3533 | |
| Banks and Trust Companies, Broker-Dealers, Financial Professionals, Insurance Companies | 1-800-345-6488 | |
| Telecommunications Relay Service for the Deaf | 711 | |
| | | |
| American Century Capital Portfolios, Inc. | |
| | | |
Investment Advisor: American Century Investment Management, Inc. Kansas City, Missouri | |
| | | |
| This report and the statements it contains are submitted for the general information of our shareholders. The report is not authorized for distribution to prospective investors unless preceded or accompanied by an effective prospectus. | |
| | | |
©2016 American Century Proprietary Holdings, Inc. All rights reserved.
CL-ANN-88869 1605 | |
|
| |
| | |
| | Annual Report |
| | |
| | March 31, 2016 |
| | |
| | Value Fund |
|
| | |
| President’s Letter | 2 |
|
| Performance | 3 |
|
| Portfolio Commentary | |
|
| Fund Characteristics | |
|
| Shareholder Fee Example | |
|
| Schedule of Investments | |
|
| Statement of Assets and Liabilities | |
|
| Statement of Operations | |
|
| Statement of Changes in Net Assets | |
|
| Notes to Financial Statements | |
|
| Financial Highlights | |
|
| Report of Independent Registered Public Accounting Firm | |
|
| Management | |
|
| Additional Information | |
|
Any opinions expressed in this report reflect those of the author as of the date of the report, and do not necessarily represent the opinions of American Century Investments® or any other person in the American Century Investments organization. Any such opinions are subject to change at any time based upon market or other conditions and American Century Investments disclaims any responsibility to update such opinions. These opinions may not be relied upon as investment advice and, because investment decisions made by American Century Investments funds are based on numerous factors, may not be relied upon as an indication of trading intent on behalf of any American Century Investments fund. Security examples are used for representational purposes only and are not intended as recommendations to purchase or sell securities. Performance information for comparative indices and securities is provided to American Century Investments by third party vendors. To the best of American Century Investments’ knowledge, such information is accurate at the time of printing.
|
| |
| Dear Investor:
Thank you for reviewing this annual report for the 12 months ended March 31, 2016. It provides investment performance and portfolio information for the reporting period, plus longer-term historical performance data.
Annual reports help convey information about fund performance, including market and economic factors that affected returns during the reporting period. For additional, updated investment and market insights, we encourage you to visit our website, americancentury.com.
|
| Jonathan Thomas |
Divergence in Economic Growth and Monetary Policies, Combined With China Turmoil, Triggered Market Volatility
Divergence between the U.S. and the rest of the world—along with China’s struggles, plunging commodity prices, capital market volatility, and risk-off trading—were dominant themes during the reporting period. Global divergence described not only the relatively stronger economic growth enjoyed by the U.S. compared with most of the world, but also the related contrast between the U.S. Federal Reserve’s (the Fed’s) unwinding of monetary stimulus versus the continuation and expansion of stimulus by other major central banks.
Two months in particular captured the volatility and risk-off trading of the 12-month period. Last August, China’s economic slowdown (which rippled across the global economy) triggered Chinese stock market volatility, increasingly stimulative Chinese central bank monetary policy, and currency devaluations. Burdened further with oil market volatility, equity and higher-risk bond markets declined globally. Five months later, in January, investor sentiment plunged again as global economic growth decelerated, China devalued its currency again, and oil prices dropped below $30 a barrel. In addition, the Fed, in December, executed its first rate hike since 2006. Central bank policies showed less divergence thereafter, with the Bank of Japan suddenly resorting to negative interest rates, the Fed holding rates steady while reducing its rate hike projections, and the European Central Bank announcing significant additional stimulus.
Bonds (and more bond-like stock sectors, such as utilities and REITs) generally outperformed the broad stock market for the reporting period. In terms of stock style and size, growth generally outperformed value, and large cap generally outperformed small cap. In the bond market, higher quality (investment-grade) generally outperformed lower quality (high-yield). We expect continued economic and monetary policy divergence between the U.S. and non-U.S. economies in 2016, accompanied by further market volatility. This could present both challenges and opportunities for active investment managers. Looking ahead, we continue to believe in a disciplined, diversified, risk-aware investment approach, using professionally managed portfolios to meet financial goals. We appreciate your trust in us.
Sincerely,
Jonathan Thomas
President and Chief Executive Officer
American Century Investments
|
| | | | | | |
| Total Returns as of March 31, 2016 | | | |
| | | | Average Annual Returns | |
| | Ticker Symbol | 1 year | 5 years | 10 years | Since Inception | Inception Date |
| Investor Class | TWVLX | -1.53% | 9.81% | 6.02% | — | 9/1/93 |
| Russell 1000 Value Index | — | -1.54% | 10.23% | 5.71% | — | — |
| S&P 500 Index | — | 1.78% | 11.57% | 7.00% | — | — |
| Institutional Class | AVLIX | -1.21% | 10.04% | 6.24% | — | 7/31/97 |
| A Class | TWADX | | | | — | 10/2/96 |
| No sales charge | | -1.65% | 9.54% | 5.76% | — | |
| With sales charge | | -7.30% | 8.27% | 5.14% | — | |
| C Class | ACLCX | -2.42% | 8.71% | 4.97% | — | 6/4/01 |
| R Class | AVURX | -2.02% | 9.28% | 5.50% | — | 7/29/05 |
| R6 Class | AVUDX | -1.06% | — | — | 6.82% | 7/26/13 |
Sales charges include initial sales charges and contingent deferred sales charges (CDSCs), as applicable. A Class shares have a 5.75% maximum initial sales charge and may be subject to a maximum CDSC of 1.00%. C Class shares redeemed within 12 months of purchase are subject to a maximum CDSC of 1.00%. The SEC requires that mutual funds provide performance information net of maximum sales charges in all cases where charges could be applied.
Average annual returns since inception are presented when ten years of performance history is not available.
Prior to September 4, 2007, the A Class was referred to as the Advisor Class and did not have a front-end sales charge. Performance prior to that date has been adjusted to reflect this charge.
Data presented reflect past performance. Past performance is no guarantee of future results. Current performance may be higher or lower than the performance shown. Total returns for periods less than one year are not annualized. Investment return and principal value will fluctuate, and redemption value may be more or less than original cost. Data assumes reinvestment of dividends and capital gains, and none of the charts reflect the deduction of taxes that a shareholder would pay on fund distributions or the redemption of fund shares. To obtain performance data current to the most recent month end, please call 1-800-345-2021 or visit americancentury.com. For additional information about the fund, please consult the prospectus.
|
|
| Growth of $10,000 Over 10 Years |
| $10,000 investment made March 31, 2006 |
Performance for other share classes will vary due to differences in fee structure.
|
|
| |
| Value on March 31, 2016 |
| | Investor Class — $17,955 |
| |
| | Russell 1000 Value Index — $17,436 |
| |
| | S&P 500 Index — $19,687 |
| |
|
| | | | | |
| Total Annual Fund Operating Expenses |
| Investor Class | Institutional Class | A Class | C Class | R Class | R6 Class |
| 0.97% | 0.77% | 1.22% | 1.97% | 1.47% | 0.62% |
The total annual fund operating expenses shown is as stated in the fund’s prospectus current as of the date of this report. The prospectus may vary from the expense ratio shown elsewhere in this report because it is based on a different time period, includes acquired fund fees and expenses, and, if applicable, does not include fee waivers or expense reimbursements.
Data presented reflect past performance. Past performance is no guarantee of future results. Current performance may be higher or lower than the performance shown. Total returns for periods less than one year are not annualized. Investment return and principal value will fluctuate, and redemption value may be more or less than original cost. Data assumes reinvestment of dividends and capital gains, and none of the charts reflect the deduction of taxes that a shareholder would pay on fund distributions or the redemption of fund shares. To obtain performance data current to the most recent month end, please call 1-800-345-2021 or visit americancentury.com. For additional information about the fund, please consult the prospectus.
Portfolio Managers: Michael Liss, Kevin Toney, Phil Davidson, Brian Woglom, and Dan Gruemmer
Performance Summary
Value returned -1.53%* for the 12 months ended March 31, 2016. By comparison, its benchmark, the Russell 1000 Value Index, returned -1.54%. The fund’s return reflects operating expenses, while the index’s returns do not.
Volatility dominated the 12-month period as concerns over slowing growth in China and other emerging markets, falling oil prices, and the prospect of higher U.S. Federal Reserve (Fed) interest rates weighed on investor confidence. After a turbulent summer, markets sold off sharply in the third quarter of 2015, but stabilized somewhat in the fourth quarter as the Fed delayed an anticipated September interest rate hike. In December, however, Fed policymakers raised the federal funds rate by 25 basis points, while they affirmed the underlying strength of the U.S. economy. Early in 2016, concerns over slowing growth in China triggered a renewed market sell-off. Broad market indices such as the S&P 500 Index recovered some ground later in the first quarter after the Fed scaled back its projected number of rate hikes for the year, from four to two. Against this backdrop, larger caps outperformed, while value stocks underperformed growth.
In this environment, Value’s investment approach, which emphasizes higher-quality businesses with sound balance sheets, provided positive absolute results in six of the 10 sectors in which it was invested, during a period when only half of the index sectors had positive returns. On a relative basis, the portfolio performed in line with its benchmark index. Investments in industrials, consumer discretionary, financials, and consumer staples contributed positively to relative performance. Holdings in information technology, materials, energy, and utilities detracted.
Industrials Boosted Returns
Within the industrials sector, the portfolio benefited from its overweight position, relative to the index, in Republic Services. The waste management company recorded strong gains as it continued to execute well and had minimal exposure to emerging markets and foreign currency issues. In the first quarter of 2016, Republic reported better-than-expected earnings. We reduced the weight due to the stock’s strong performance. An overweight to industrial conglomerate General Electric also bolstered returns. General Electric advanced, as it continued to exit its finance segment, completed the spinoff of Synchrony Financial, and acquired Alston’s energy business.
Consumer Discretionary Contributed
Stock selection in the specialty retail industry aided relative performance. Mattel, the portfolio’s sole investment in the leisure products industry, was a strong positive contributor. Mattel’s stock rose in the first quarter of 2016 after the company reported better-than-expected holiday sales, and we trimmed the position on strength in its share price.
Energy Sector Delivered Mixed Results
Security selection in the energy sector bolstered results as the portfolio did not own some of the sector’s steepest decliners. The positive impact of this stock selection was offset, however, by the negative impact of being overweight in a declining sector. Positive contributors included Cameron International, a global provider of pressure control, processing, flow control, and compression systems. Cameron’s stock rose on news that oilfield-services provider Schlumberger agreed to acquire it at a healthy premium, and we liquidated the position ahead of the closing of the merger.
* All fund returns referenced in this commentary are for Investor Class shares. Performance for other share classes will vary due to differences in fee structure; when Investor Class performance exceeds that of the fund's benchmark, other share classes may not. See page 3 for returns for all share classes.
On the other hand, declining oil and natural gas prices weighed on a number of the portfolio’s holdings, Devon Energy, Ultra Petroleum (which was sold), and Canada-based Imperial Oil. Devon announced an equity issuance in the first quarter of 2016, on the heels of its acquisition of privately-held Felix Energy in the fourth quarter of 2015. In a challenged market for energy stocks, investors were disappointed with the reactionary nature of this stock offer. Devon's stock price declined and ended the period below our estimate of the company’s fair value.
Information Technology Detracted
Stock selection in information technology hurt relative performance. The portfolio’s underweight in software was also a negative, as it didn’t own some of the better-performing names in the index, and was also underweight in Microsoft. This sector also produced a top detractor from absolute returns, Bermuda-based Marvell Technology Group, which we sold.
Outlook
As of March 31, 2016, the portfolio’s largest overweight is in energy. In energy, we are striving to stick with the highest quality companies and are finding stocks with attractive valuations on normal earnings. The portfolio’s greatest underweight is in the financials sector, particularly in real estate investment trusts (REITs), where we continue to believe that valuations remain stretched. The portfolio is underweight in the utilities and materials sectors, as we continue to have concerns about the sustainability of corporate profitability relative to valuations.
|
| |
| MARCH 31, 2016 |
| Top Ten Holdings | % of net assets |
| General Electric Co. | 3.6% |
| Exxon Mobil Corp. | 3.2% |
| Pfizer, Inc. | 2.7% |
| Procter & Gamble Co. (The) | 2.6% |
| Chevron Corp. | 2.6% |
| JPMorgan Chase & Co. | 2.6% |
| Johnson & Johnson | 2.4% |
| Wells Fargo & Co. | 2.2% |
| Merck & Co., Inc. | 2.1% |
| Cisco Systems, Inc. | 2.0% |
| | |
| Top Five Industries | % of net assets |
| Oil, Gas and Consumable Fuels | 16.2% |
| Banks | 12.1% |
| Pharmaceuticals | 8.1% |
| Health Care Equipment and Supplies | 4.5% |
| Industrial Conglomerates | 4.0% |
| | |
| Types of Investments in Portfolio | % of net assets |
| Common Stocks | 97.9% |
| Temporary Cash Investments | 2.0% |
| Other Assets and Liabilities | 0.1% |
Fund shareholders may incur two types of costs: (1) transaction costs, including sales charges (loads) on purchase payments and redemption/exchange fees; and (2) ongoing costs, including management fees; distribution and service (12b-1) fees; and other fund expenses. This example is intended to help you understand your ongoing costs (in dollars) of investing in your fund and to compare these costs with the ongoing cost of investing in other mutual funds.
The example is based on an investment of $1,000 made at the beginning of the period and held for the entire period from October 1, 2015 to March 31, 2016.
Actual Expenses
The table provides information about actual account values and actual expenses for each class. You may use the information, together with the amount you invested, to estimate the expenses that you paid over the period. First, identify the share class you own. Then simply divide your account value by $1,000 (for example, an $8,600 account value divided by $1,000 = 8.6), then multiply the result by the number under the heading “Expenses Paid During Period” to estimate the expenses you paid on your account during this period.
If you hold Investor Class shares of any American Century Investments fund, or Institutional Class shares of the American Century Diversified Bond Fund, in an American Century Investments account (i.e., not a financial intermediary or retirement plan account), American Century Investments may charge you a $12.50 semiannual account maintenance fee if the value of those shares is less than $10,000. We will redeem shares automatically in one of your accounts to pay the $12.50 fee. In determining your total eligible investment amount, we will include your investments in all personal accounts (including American Century Investments Brokerage accounts) registered under your Social Security number. Personal accounts include individual accounts, joint accounts, UGMA/UTMA accounts, personal trusts, Coverdell Education Savings Accounts and IRAs (including traditional, Roth, Rollover, SEP-, SARSEP- and SIMPLE-IRAs), and certain other retirement accounts. If you have only business, business retirement, employer-sponsored or American Century Investments Brokerage accounts, you are currently not subject to this fee. If you are subject to the Account Maintenance Fee, your account value could be reduced by the fee amount.
Hypothetical Example for Comparison Purposes
The table also provides information about hypothetical account values and hypothetical expenses based on the actual expense ratio of each class of your fund and an assumed rate of return of 5% per year before expenses, which is not the actual return of a fund’s share class. The hypothetical account values and expenses may not be used to estimate the actual ending account balance or expenses you paid for the period. You may use this information to compare the ongoing costs of investing in your fund and other funds. To do so, compare this 5% hypothetical example with the 5% hypothetical examples that appear in the shareholder reports of the other funds.
Please note that the expenses shown in the table are meant to highlight your ongoing costs only and do not reflect any transactional costs, such as sales charges (loads) or redemption/exchange fees. Therefore, the table is useful in comparing ongoing costs only, and will not help you determine the relative total costs of owning different funds. In addition, if these transactional costs were included, your costs would have been higher.
|
| | | | |
| Beginning
Account Value
10/1/15 | Ending
Account Value
3/31/16 | Expenses Paid
During Period(1)10/1/15 - 3/31/16 | Annualized
Expense Ratio(1) |
| Actual | | | | |
| Investor Class | $1,000 | $1,078.10 | $5.09 | 0.98% |
| Institutional Class | $1,000 | $1,080.40 | $4.06 | 0.78% |
| A Class | $1,000 | $1,078.10 | $6.39 | 1.23% |
| C Class | $1,000 | $1,073.70 | $10.26 | 1.98% |
| R Class | $1,000 | $1,075.30 | $7.68 | 1.48% |
| R6 Class | $1,000 | $1,081.20 | $3.28 | 0.63% |
| Hypothetical | | | | |
| Investor Class | $1,000 | $1,020.10 | $4.95 | 0.98% |
| Institutional Class | $1,000 | $1,021.10 | $3.94 | 0.78% |
| A Class | $1,000 | $1,018.85 | $6.21 | 1.23% |
| C Class | $1,000 | $1,015.10 | $9.97 | 1.98% |
| R Class | $1,000 | $1,017.60 | $7.47 | 1.48% |
| R6 Class | $1,000 | $1,021.85 | $3.18 | 0.63% |
| |
| (1) | Expenses are equal to the class's annualized expense ratio listed in the table above, multiplied by the average account value over the period, multiplied by 183, the number of days in the most recent fiscal half-year, divided by 366, to reflect the one-half year period. |
MARCH 31, 2016
|
| | | | |
| | Shares | Value |
| COMMON STOCKS — 97.9% | | |
| Aerospace and Defense — 0.6% | | |
| Textron, Inc. | 478,221 | $ | 17,435,938 |
|
| Automobiles — 1.3% | | |
| General Motors Co. | 772,349 | 24,274,929 |
|
| Honda Motor Co., Ltd. | 439,500 | 12,051,153 |
|
| | | 36,326,082 |
|
| Banks — 12.1% | | |
| Bank of America Corp. | 3,253,160 | 43,982,723 |
|
| BB&T Corp. | 637,660 | 21,214,948 |
|
| BOK Financial Corp. | 128,880 | 7,039,426 |
|
| Comerica, Inc. | 312,510 | 11,834,754 |
|
| Commerce Bancshares, Inc. | 277,735 | 12,484,188 |
|
| Cullen / Frost Bankers, Inc. | 128,680 | 7,091,555 |
|
| JPMorgan Chase & Co. | 1,241,471 | 73,519,913 |
|
| M&T Bank Corp. | 119,510 | 13,265,610 |
|
| PNC Financial Services Group, Inc. (The) | 402,383 | 34,029,530 |
|
| U.S. Bancorp | 1,181,872 | 47,972,184 |
|
| UMB Financial Corp. | 149,660 | 7,726,946 |
|
| Wells Fargo & Co. | 1,294,898 | 62,621,267 |
|
| | | 342,783,044 |
|
| Beverages — 0.2% | | |
| PepsiCo, Inc. | 62,880 | 6,443,942 |
|
| Biotechnology — 0.6% | | |
| AbbVie, Inc. | 282,410 | 16,131,259 |
|
| Capital Markets — 3.7% | | |
| Franklin Resources, Inc. | 452,190 | 17,658,020 |
|
| Goldman Sachs Group, Inc. (The) | 135,544 | 21,277,697 |
|
| Northern Trust Corp. | 654,007 | 42,621,636 |
|
| State Street Corp. | 383,085 | 22,418,134 |
|
| | | 103,975,487 |
|
| Commercial Services and Supplies — 2.5% | | |
| ADT Corp. (The) | 640,232 | 26,415,972 |
|
| Republic Services, Inc. | 531,715 | 25,336,220 |
|
| Tyco International plc | 553,512 | 20,319,426 |
|
| | | 72,071,618 |
|
| Communications Equipment — 2.0% | | |
| Cisco Systems, Inc. | 1,971,149 | 56,118,612 |
|
| Containers and Packaging — 0.2% | | |
| Sonoco Products Co. | 148,350 | 7,205,360 |
|
| Diversified Financial Services — 1.7% | | |
Berkshire Hathaway, Inc., Class A(1) | 149 | 31,804,050 |
|
Berkshire Hathaway, Inc., Class B(1) | 111,540 | 15,825,295 |
|
| | | 47,629,345 |
|
| Diversified Telecommunication Services — 2.2% | | |
| AT&T, Inc. | 1,293,980 | 50,685,197 |
|
|
| | | | |
| | Shares | Value |
| CenturyLink, Inc. | 344,019 | $ | 10,994,847 |
|
| | | 61,680,044 |
|
| Electric Utilities — 3.2% | | |
| Edison International | 413,033 | 29,692,942 |
|
| Great Plains Energy, Inc. | 448,514 | 14,464,577 |
|
| PG&E Corp. | 335,766 | 20,051,946 |
|
| Westar Energy, Inc. | 522,294 | 25,911,005 |
|
| | | 90,120,470 |
|
| Electrical Equipment — 1.6% | | |
| Eaton Corp. plc | 67,619 | 4,230,245 |
|
| Emerson Electric Co. | 532,200 | 28,941,036 |
|
| Hubbell, Inc. | 67,340 | 7,133,326 |
|
| Rockwell Automation, Inc. | 36,220 | 4,120,025 |
|
| | | 44,424,632 |
|
| Electronic Equipment, Instruments and Components — 1.5% | | |
Keysight Technologies, Inc.(1) | 860,035 | 23,857,371 |
|
| TE Connectivity Ltd. | 303,932 | 18,819,469 |
|
| | | 42,676,840 |
|
| Energy Equipment and Services — 3.5% | | |
FMC Technologies, Inc.(1) | 496,050 | 13,571,928 |
|
| Halliburton Co. | 830,884 | 29,679,176 |
|
| Helmerich & Payne, Inc. | 328,800 | 19,307,136 |
|
| Schlumberger Ltd. | 493,500 | 36,395,625 |
|
| | | 98,953,865 |
|
| Food and Staples Retailing — 2.1% | | |
| Sysco Corp. | 539,682 | 25,219,340 |
|
| Wal-Mart Stores, Inc. | 503,801 | 34,505,330 |
|
| | | 59,724,670 |
|
| Food Products — 2.2% | | |
| ConAgra Foods, Inc. | 392,285 | 17,503,757 |
|
| Kellogg Co. | 229,586 | 17,574,808 |
|
| Mondelez International, Inc., Class A | 711,796 | 28,557,256 |
|
| | | 63,635,821 |
|
| Health Care Equipment and Supplies — 4.5% | | |
| Abbott Laboratories | 435,080 | 18,199,396 |
|
| Baxter International, Inc. | 144,870 | 5,951,260 |
|
| Becton Dickinson and Co. | 40,228 | 6,107,415 |
|
Boston Scientific Corp.(1) | 636,135 | 11,965,699 |
|
| Medtronic plc | 497,770 | 37,332,750 |
|
| St. Jude Medical, Inc. | 129,080 | 7,099,400 |
|
| Zimmer Biomet Holdings, Inc. | 396,852 | 42,316,329 |
|
| | | 128,972,249 |
|
| Health Care Providers and Services — 1.4% | | |
| Cigna Corp. | 61,050 | 8,378,502 |
|
Express Scripts Holding Co.(1) | 213,149 | 14,641,205 |
|
LifePoint Health, Inc.(1) | 242,005 | 16,758,846 |
|
| | | 39,778,553 |
|
| Hotels, Restaurants and Leisure — 0.2% | | |
| Carnival Corp. | 133,103 | 7,023,845 |
|
| Household Products — 2.6% | | |
| Procter & Gamble Co. (The) | 913,914 | 75,224,261 |
|
|
| | | | |
| | Shares | Value |
| Industrial Conglomerates — 4.0% | | |
| General Electric Co. | 3,203,634 | $ | 101,843,525 |
|
| Koninklijke Philips NV | 415,594 | 11,839,160 |
|
| | | 113,682,685 |
|
| Insurance — 3.7% | | |
| Aflac, Inc. | 224,243 | 14,158,703 |
|
| Brown & Brown, Inc. | 99,378 | 3,557,732 |
|
| Chubb Ltd. | 210,483 | 25,079,050 |
|
| MetLife, Inc. | 593,978 | 26,099,393 |
|
| Reinsurance Group of America, Inc. | 187,853 | 18,080,851 |
|
| Unum Group | 554,520 | 17,145,759 |
|
| | | 104,121,488 |
|
| Leisure Products — 0.2% | | |
| Mattel, Inc. | 139,652 | 4,695,100 |
|
| Machinery — 0.4% | | |
| Oshkosh Corp. | 283,179 | 11,573,526 |
|
| Media — 0.3% | | |
Discovery Communications, Inc., Class A(1) | 262,903 | 7,526,913 |
|
| Metals and Mining — 0.3% | | |
| BHP Billiton Ltd. | 576,870 | 7,455,489 |
|
| Multi-Utilities — 0.5% | | |
| Ameren Corp. | 288,820 | 14,469,882 |
|
| Multiline Retail — 0.6% | | |
| Target Corp. | 199,054 | 16,378,163 |
|
| Oil, Gas and Consumable Fuels — 16.2% | | |
| Anadarko Petroleum Corp. | 646,820 | 30,122,408 |
|
| Apache Corp. | 347,995 | 16,985,636 |
|
| Chevron Corp. | 774,807 | 73,916,588 |
|
| Cimarex Energy Co. | 277,786 | 27,020,244 |
|
| Devon Energy Corp. | 904,675 | 24,824,282 |
|
| EOG Resources, Inc. | 300,930 | 21,841,499 |
|
| EQT Corp. | 433,640 | 29,166,626 |
|
| Exxon Mobil Corp. | 1,076,619 | 89,994,582 |
|
| Imperial Oil Ltd. | 428,426 | 14,313,305 |
|
| Noble Energy, Inc. | 1,063,210 | 33,395,426 |
|
| Occidental Petroleum Corp. | 729,333 | 49,908,257 |
|
| TOTAL SA | 1,029,149 | 46,913,002 |
|
| | | 458,401,855 |
|
| Pharmaceuticals — 8.1% | | |
Allergan plc(1) | 90,720 | 24,315,682 |
|
| Johnson & Johnson | 624,459 | 67,566,464 |
|
| Merck & Co., Inc. | 1,138,597 | 60,243,167 |
|
| Pfizer, Inc. | 2,621,253 | 77,693,939 |
|
| | | 229,819,252 |
|
| Real Estate Investment Trusts (REITs) — 1.5% | | |
| Annaly Capital Management, Inc. | 1,198,678 | 12,298,436 |
|
| Corrections Corp. of America | 626,669 | 20,084,741 |
|
| Weyerhaeuser Co. | 380,170 | 11,777,667 |
|
| | | 44,160,844 |
|
| Road and Rail — 1.4% | | |
| CSX Corp. | 552,075 | 14,215,931 |
|
|
| | | | |
| | Shares | Value |
| Heartland Express, Inc. | 944,720 | $ | 17,524,556 |
|
| Norfolk Southern Corp. | 93,760 | 7,805,520 |
|
| | | 39,546,007 |
|
| Semiconductors and Semiconductor Equipment — 3.6% | | |
| Applied Materials, Inc. | 1,047,554 | 22,187,194 |
|
| Intel Corp. | 1,599,487 | 51,743,404 |
|
| QUALCOMM, Inc. | 419,070 | 21,431,240 |
|
| Teradyne, Inc. | 311,114 | 6,716,951 |
|
| | | 102,078,789 |
|
| Software — 2.0% | | |
| Microsoft Corp. | 496,872 | 27,442,241 |
|
| Oracle Corp. | 731,429 | 29,922,760 |
|
| | | 57,365,001 |
|
| Specialty Retail — 1.8% | | |
| Advance Auto Parts, Inc. | 146,630 | 23,510,654 |
|
| CST Brands, Inc. | 441,009 | 16,886,235 |
|
| Lowe's Cos., Inc. | 139,064 | 10,534,098 |
|
| | | 50,930,987 |
|
| Technology Hardware, Storage and Peripherals — 2.7% | | |
| Apple, Inc. | 100,400 | 10,942,596 |
|
| EMC Corp. | 1,418,353 | 37,799,107 |
|
| Hewlett Packard Enterprise Co. | 451,225 | 8,000,219 |
|
| HP, Inc. | 451,225 | 5,559,092 |
|
| SanDisk Corp. | 180,410 | 13,725,593 |
|
| | | 76,026,607 |
|
| Textiles, Apparel and Luxury Goods — 0.7% | | |
| Coach, Inc. | 271,778 | 10,895,580 |
|
| Ralph Lauren Corp. | 100,510 | 9,675,093 |
|
| | | 20,570,673 |
|
TOTAL COMMON STOCKS (Cost $2,295,748,921) | | 2,777,139,198 |
|
| TEMPORARY CASH INVESTMENTS — 2.0% | | |
| Repurchase Agreement, Fixed Income Clearing Corp., (collateralized by various U.S. Treasury obligations, 2.25%, 11/15/25, valued at $34,039,744), at 0.10%, dated 3/31/16, due 4/1/16 (Delivery value $33,371,093) | | 33,371,000 |
|
| State Street Institutional Liquid Reserves Fund, Premier Class | 21,765,375 | 21,765,375 |
|
TOTAL TEMPORARY CASH INVESTMENTS (Cost $55,136,375) | | 55,136,375 |
|
TOTAL INVESTMENT SECURITIES — 99.9% (Cost $2,350,885,296) | | 2,832,275,573 |
|
| OTHER ASSETS AND LIABILITIES — 0.1% | | 3,325,477 |
|
| TOTAL NET ASSETS — 100.0% | | $ | 2,835,601,050 |
|
|
| | | | | | | | | | |
| FORWARD FOREIGN CURRENCY EXCHANGE CONTRACTS |
| Currency Purchased | Currency Sold | Counterparty | Settlement Date | Unrealized Appreciation (Depreciation) |
| AUD | 246,612 |
| USD | 184,451 |
| Credit Suisse AG | 6/30/16 | $ | 3,840 |
|
| AUD | 259,592 |
| USD | 195,372 |
| Credit Suisse AG | 6/30/16 | 2,829 |
|
| USD | 5,893,614 |
| AUD | 7,861,296 |
| Credit Suisse AG | 6/30/16 | (108,584 | ) |
| CAD | 507,685 |
| USD | 383,569 |
| Morgan Stanley | 6/30/16 | 7,362 |
|
| USD | 10,909,559 |
| CAD | 14,398,327 |
| Morgan Stanley | 6/30/16 | (177,553 | ) |
| USD | 43,897,052 |
| EUR | 39,192,222 |
| UBS AG | 6/30/16 | (820,354 | ) |
| USD | 8,976,057 |
| JPY | 1,007,993,250 |
| Credit Suisse AG | 6/30/16 | (3,858 | ) |
| | | | | | | $ | (1,096,318 | ) |
|
| | |
| NOTES TO SCHEDULE OF INVESTMENTS |
| AUD | - | Australian Dollar |
| CAD | - | Canadian Dollar |
| EUR | - | Euro |
| JPY | - | Japanese Yen |
| USD | - | United States Dollar |
| |
(1) | Non-income producing. |
See Notes to Financial Statements.
|
|
| Statement of Assets and Liabilities |
|
| | | |
| MARCH 31, 2016 | |
| Assets | |
| Investment securities, at value (cost of $2,350,885,296) | $ | 2,832,275,573 |
|
| Foreign currency holdings, at value (cost of $664,773) | 628,766 |
|
| Receivable for investments sold | 9,987,874 |
|
| Receivable for capital shares sold | 668,043 |
|
| Unrealized appreciation on forward foreign currency exchange contracts | 14,031 |
|
| Dividends and interest receivable | 6,483,123 |
|
| | 2,850,057,410 |
|
| | |
| Liabilities | |
| Payable for investments purchased | 8,241,854 |
|
| Payable for capital shares redeemed | 2,800,402 |
|
| Unrealized depreciation on forward foreign currency exchange contracts | 1,110,349 |
|
| Accrued management fees | 2,223,822 |
|
| Distribution and service fees payable | 79,933 |
|
| | 14,456,360 |
|
| | |
| Net Assets | $ | 2,835,601,050 |
|
| | |
| Net Assets Consist of: | |
| Capital (par value and paid-in surplus) | $ | 2,490,514,206 |
|
| Undistributed net investment income | 1,765,442 |
|
| Accumulated net realized loss | (136,947,586 | ) |
| Net unrealized appreciation | 480,268,988 |
|
| | $ | 2,835,601,050 |
|
|
| | | | | | |
| | Net Assets | Shares Outstanding | Net Asset Value Per Share |
| Investor Class, $0.01 Par Value |
| $2,009,043,550 |
| 259,815,285 |
| $7.73 |
| Institutional Class, $0.01 Par Value |
| $546,781,665 |
| 70,578,333 |
| $7.75 |
| A Class, $0.01 Par Value |
| $138,797,938 |
| 17,960,855 |
| $7.73* |
| C Class, $0.01 Par Value |
| $26,541,964 |
| 3,484,962 |
| $7.62 |
| R Class, $0.01 Par Value |
| $68,477,135 |
| 8,856,974 |
| $7.73 |
| R6 Class, $0.01 Par Value |
| $45,958,798 |
| 5,932,214 |
| $7.75 |
*Maximum offering price $8.20 (net asset value divided by 0.9425).
See Notes to Financial Statements.
|
| | | |
| YEAR ENDED MARCH 31, 2016 |
| Investment Income (Loss) | |
| Income: | |
| Dividends (net of foreign taxes withheld of $570,976) | $ | 90,242,339 |
|
| Interest | 36,928 |
|
| | 90,279,267 |
|
| | |
| Expenses: | |
| Management fees | 31,040,202 |
|
| Distribution and service fees: | |
| A Class | 493,387 |
|
| B Class | 2,643 |
|
| C Class | 280,461 |
|
| R Class | 298,128 |
|
| Directors' fees and expenses | 123,249 |
|
| Other expenses | 8,023 |
|
| | 32,246,093 |
|
| | |
| Net investment income (loss) | 58,033,174 |
|
| | |
| Realized and Unrealized Gain (Loss) | |
| Net realized gain (loss) on: | |
| Investment transactions | 23,820,179 |
|
| Futures contract transactions | 2,060,557 |
|
| Foreign currency transactions | 375,019 |
|
| | 26,255,755 |
|
| | |
| Change in net unrealized appreciation (depreciation) on: | |
| Investments | (196,928,361 | ) |
| Translation of assets and liabilities in foreign currencies | (2,711,476 | ) |
| | (199,639,837 | ) |
| | |
| Net realized and unrealized gain (loss) | (173,384,082 | ) |
| | |
| Net Increase (Decrease) in Net Assets Resulting from Operations | $ | (115,350,908 | ) |
See Notes to Financial Statements.
|
|
| Statement of Changes in Net Assets |
|
| | | | | | |
| YEARS ENDED MARCH 31, 2016 AND MARCH 31, 2015 |
| Increase (Decrease) in Net Assets | March 31, 2016 | March 31, 2015 |
| Operations | | |
| Net investment income (loss) | $ | 58,033,174 |
| $ | 57,607,347 |
|
| Net realized gain (loss) | 26,255,755 |
| 341,615,789 |
|
| Change in net unrealized appreciation (depreciation) | (199,639,837 | ) | (81,658,968 | ) |
| Net increase (decrease) in net assets resulting from operations | (115,350,908 | ) | 317,564,168 |
|
| | | |
| Distributions to Shareholders | | |
| From net investment income: | | |
| Investor Class | (38,434,549 | ) | (32,607,044 | ) |
| Institutional Class | (22,028,604 | ) | (17,954,867 | ) |
| A Class | (3,279,088 | ) | (4,570,033 | ) |
| B Class | (1,850 | ) | (4,377 | ) |
| C Class | (257,509 | ) | (166,099 | ) |
| R Class | (867,360 | ) | (453,848 | ) |
| R6 Class | (911,760 | ) | (376,762 | ) |
| From net realized gains: | | |
| Investor Class | (128,627,017 | ) | (118,879,291 | ) |
| Institutional Class | (77,316,275 | ) | (69,788,523 | ) |
| A Class | (9,475,685 | ) | (21,244,768 | ) |
| B Class | — |
| (44,404 | ) |
| C Class | (1,775,006 | ) | (1,748,414 | ) |
| R Class | (3,945,923 | ) | (2,917,911 | ) |
| R6 Class | (2,424,164 | ) | (1,466,916 | ) |
| Decrease in net assets from distributions | (289,344,790 | ) | (272,223,257 | ) |
| | | |
| Capital Share Transactions | | |
| Net increase (decrease) in net assets from capital share transactions (Note 5) | (460,591,463 | ) | 70,132,562 |
|
| | | |
| Net increase (decrease) in net assets | (865,287,161 | ) | 115,473,473 |
|
| | | |
| Net Assets | | |
| Beginning of period | 3,700,888,211 |
| 3,585,414,738 |
|
| End of period | $ | 2,835,601,050 |
| $ | 3,700,888,211 |
|
| | | |
| Undistributed net investment income | $ | 1,765,442 |
| $ | 1,967,631 |
|
See Notes to Financial Statements.
|
|
| Notes to Financial Statements |
MARCH 31, 2016
1. Organization
American Century Capital Portfolios, Inc. (the corporation) is registered under the Investment Company Act of 1940, as amended (the 1940 Act), as an open-end management investment company and is organized as a Maryland corporation. Value Fund (the fund) is one fund in a series issued by the corporation. The fund’s investment objective is to seek long-term capital growth. Income is a secondary objective.
The fund offers the Investor Class, the Institutional Class, the A Class, the C Class, the R Class and the R6 Class. The A Class may incur an initial sales charge. The A Class and C Class may be subject to a contingent deferred sales charge. The share classes differ principally in their respective sales charges and distribution and shareholder servicing expenses and arrangements. The Institutional Class and R6 Class shareholders do not require the same level of shareholder and administrative services from American Century Investment Management, Inc. (ACIM) (the investment advisor) as shareholders of other classes. In addition, financial intermediaries do not receive any service, distribution or administrative fees for the R6 Class. As a result, the Institutional Class and R6 Class are charged lower unified management fees. On October 16, 2015, all outstanding B Class shares were converted to A Class shares and the fund discontinued offering the B Class.
2. Significant Accounting Policies
The following is a summary of significant accounting policies consistently followed by the fund in preparation of its financial statements. The fund is an investment company and follows accounting and reporting guidance in accordance with accounting principles generally accepted in the United States of America. This may require management to make certain estimates and assumptions at the date of the financial statements. Actual results could differ from these estimates. Management evaluated the impact of events or transactions occurring through the date the financial statements were issued that would merit recognition or disclosure.
Investment Valuations — The fund determines the fair value of its investments and computes its net asset value per share at the close of regular trading (usually 4 p.m. Eastern time) on the New York Stock Exchange (NYSE) on each day the NYSE is open. The Board of Directors has adopted valuation policies and procedures to guide the investment advisor in the fund’s investment valuation process and to provide methodologies for the oversight of the fund’s pricing function.
Equity securities that are listed or traded on a domestic securities exchange are valued at the last reported sales price or at the official closing price as provided by the exchange. Equity securities traded on foreign securities exchanges are generally valued at the closing price of such securities on the exchange where primarily traded or at the close of the NYSE, if that is earlier. If no last sales price is reported, or if local convention or regulation so provides, the mean of the latest bid and asked prices may be used. Securities traded over-the-counter are valued at the mean of the latest bid and asked prices, the last sales price, or the official closing price. Equity securities initially expressed in local currencies are translated into U.S. dollars at the mean of the appropriate currency exchange rate at the close of the NYSE as provided by an independent pricing service.
Open-end management investment companies are valued at the reported net asset value per share. Repurchase agreements are valued at cost, which approximates fair value. Exchange-traded futures contracts are valued at the settlement price as provided by the appropriate clearing corporation. Forward foreign currency exchange contracts are valued at the mean of the appropriate forward exchange rate at the close of the NYSE as provided by an independent pricing service.
If the fund determines that the market price for an investment is not readily available or the valuation methods mentioned above do not reflect an investment’s fair value, such investment is valued as determined in good faith by the Board of Directors or its delegate, in accordance with policies and procedures adopted by the Board of Directors. In its determination of fair value, the fund may review several factors including, but not limited to, market information regarding the specific investment or comparable investments and correlation with other investment types, futures indices or general market indicators. Circumstances that may cause the fund to use these procedures to value an investment include, but are not limited to: an investment has been declared in default or is distressed; trading in a security has been suspended during the trading day or a
security is not actively trading on its principal exchange; prices received from a regular pricing source are deemed unreliable; or there is a foreign market holiday and no trading occurred.
The fund monitors for significant events occurring after the close of an investment’s primary exchange but before the fund’s net asset value per share is determined. Significant events may include, but are not limited to: corporate announcements and transactions; governmental action and political unrest that could impact a specific investment or an investment sector; or armed conflicts, natural disasters and similar events that could affect investments in a specific country or region. The fund also monitors for significant fluctuations between domestic and foreign markets, as evidenced by the U.S. market or such other indicators that the Board of Directors, or its delegate, deems appropriate. If significant fluctuations in foreign markets are identified, the fund may apply a model-derived factor to the closing price of equity securities traded on foreign securities exchanges. The factor is based on observable market data as provided by an independent pricing service.
Security Transactions — Security transactions are accounted for as of the trade date. Net realized gains and losses are determined on the identified cost basis, which is also used for federal income tax purposes.
Investment Income — Dividend income less foreign taxes withheld, if any, is recorded as of the ex-dividend date. Distributions received on securities that represent a return of capital or long-term capital gain are recorded as a reduction of cost of investments and/or as a realized gain. The fund may estimate the components of distributions received that may be considered nontaxable distributions or long-term capital gain distributions for income tax purposes. Interest income is recorded on the accrual basis and includes accretion of discounts and amortization of premiums.
Segregated Assets — In accordance with the 1940 Act, the fund segregates assets on its books and records to cover futures contracts. ACIM monitors, on a daily basis, the securities segregated to ensure the fund designates a sufficient amount of liquid assets, marked-to-market daily. The fund may also receive assets or be required to pledge assets at the custodian bank or with a broker for margin requirements on futures contracts.
Foreign Currency Translations — All assets and liabilities initially expressed in foreign currencies are translated into U.S. dollars at prevailing exchange rates at period end. The fund may enter into spot foreign currency exchange contracts to facilitate transactions denominated in a foreign currency. Purchases and sales of investment securities, dividend and interest income, spot foreign currency exchange contracts, and expenses are translated at the rates of exchange prevailing on the respective dates of such transactions. Net realized and unrealized foreign currency exchange gains or losses related to investment securities are a component of net realized gain (loss) on investment transactions and change in net unrealized appreciation (depreciation) on investments, respectively.
Repurchase Agreements — The fund may enter into repurchase agreements with institutions that ACIM has determined are creditworthy pursuant to criteria adopted by the Board of Directors. The fund requires that the collateral, represented by securities, received in a repurchase transaction be transferred to the custodian in a manner sufficient to enable the fund to obtain those securities in the event of a default under the repurchase agreement. ACIM monitors, on a daily basis, the securities transferred to ensure the value, including accrued interest, of the securities under each repurchase agreement is equal to or greater than amounts owed to the fund under each repurchase agreement.
Joint Trading Account — Pursuant to an Exemptive Order issued by the Securities and Exchange Commission, the fund, along with certain other funds in the American Century Investments family of funds, may transfer uninvested cash balances into a joint trading account. These balances are invested in one or more repurchase agreements that are collateralized by U.S. Treasury or Agency obligations.
Income Tax Status — It is the fund’s policy to distribute substantially all net investment income and net realized gains to shareholders and to otherwise qualify as a regulated investment company under provisions of the Internal Revenue Code. Accordingly, no provision has been made for income taxes. The fund files U.S. federal, state, local and non-U.S. tax returns as applicable. The fund's tax returns are subject to examination by the relevant taxing authority until expiration of the applicable statute of limitations, which is generally three years from the date of filing but can be longer in certain jurisdictions. At this time, management believes there are no uncertain tax positions which, based on their technical merit, would not be sustained upon examination and for which it is reasonably possible that the total amounts of unrecognized tax benefits will significantly change in the next twelve months.
Multiple Class — All shares of the fund represent an equal pro rata interest in the net assets of the class to which such shares belong, and have identical voting, dividend, liquidation and other rights and the same terms
and conditions, except for class specific expenses and exclusive rights to vote on matters affecting only individual classes. Income, non-class specific expenses, and realized and unrealized capital gains and losses of the fund are allocated to each class of shares based on their relative net assets.
Distributions to Shareholders — Distributions from net investment income, if any, are generally declared and paid quarterly. Distributions from net realized gains, if any, are generally declared and paid annually.
Indemnifications — Under the corporation’s organizational documents, its officers and directors are indemnified against certain liabilities arising out of the performance of their duties to the fund. In addition, in the normal course of business, the fund enters into contracts that provide general indemnifications. The maximum exposure under these arrangements is unknown as this would involve future claims that may be made against a fund. The risk of material loss from such claims is considered by management to be remote.
3. Fees and Transactions with Related Parties
Certain officers and directors of the corporation are also officers and/or directors of American Century Companies, Inc. (ACC). The corporation’s investment advisor, ACIM, the corporation's distributor, American Century Investment Services, Inc. (ACIS), and the corporation’s transfer agent, American Century Services, LLC, are wholly owned, directly or indirectly, by ACC.
Management Fees — The corporation has entered into a management agreement with ACIM, under which ACIM provides the fund with investment advisory and management services in exchange for a single, unified management fee (the fee) per class. The agreement provides that all expenses of managing and operating the fund, except distribution and service fees, brokerage expenses, taxes, interest, fees and expenses of the independent directors (including legal counsel fees), and extraordinary expenses, will be paid by ACIM. The fee is computed and accrued daily based on each class’s daily net assets and paid monthly in arrears. The rate of the fee is determined by applying a fee rate calculation formula. This formula takes into account the fund’s assets as well as certain assets, if any, of other clients of the investment advisor outside the American Century Investments family of funds (such as subadvised funds and separate accounts) that have very similar investment teams and investment strategies (strategy assets). The annual management fee schedule ranges from 0.85% to 1.00% for the Investor Class, A Class, B Class, C Class and R Class. The annual management fee schedule ranges from 0.65% to 0.80% for the Institutional Class and 0.50% to 0.65% for the R6 Class. The effective annual management fee for each class for the year ended March 31, 2016 was 0.97% for the Investor Class, A Class, C Class and R Class, 0.77% for the Institutional Class and 0.62% for the R6 Class.
Distribution and Service Fees — The Board of Directors has adopted a separate Master Distribution and Individual Shareholder Services Plan for each of the A Class, B Class, C Class and R Class (collectively the plans), pursuant to Rule 12b-1 of the 1940 Act. The plans provide that the A Class will pay ACIS an annual distribution and service fee of 0.25%. The plans provide that the B Class and C Class will each pay ACIS an annual distribution and service fee of 1.00%, of which 0.25% is paid for individual shareholder services and 0.75% is paid for distribution services. The plans provide that the R Class will pay ACIS an annual distribution and service fee of 0.50%. The fees are computed and accrued daily based on each class’s daily net assets and paid monthly in arrears. The fees are used to pay financial intermediaries for distribution and individual shareholder services. Fees incurred under the plans during the year ended March 31, 2016 are detailed in the Statement of Operations.
Directors' Fees and Expenses — The Board of Directors is responsible for overseeing the investment advisor’s management and operations of the fund. The directors receive detailed information about the fund and its investment advisor regularly throughout the year, and meet at least quarterly with management of the investment advisor to review reports about fund operations. The fund’s officers do not receive compensation from the fund.
4. Investment Transactions
Purchases and sales of investment securities, excluding short-term investments, for the year ended March 31, 2016 were $1,591,649,722 and $2,208,622,681, respectively.
5. Capital Share Transactions
Transactions in shares of the fund were as follows:
|
| | | | | | | | | | |
| | Year ended
March 31, 2016 | Year ended
March 31, 2015 |
| | Shares | Amount | Shares | Amount |
| Investor Class/Shares Authorized | 1,640,000,000 |
| | 1,100,000,000 |
| |
| Sold | 49,698,842 |
| $ | 414,603,180 |
| 38,992,922 |
| $ | 339,632,680 |
|
| Issued in reinvestment of distributions | 21,246,508 |
| 163,891,656 |
| 17,161,364 |
| 148,523,748 |
|
| Redeemed | (45,592,208 | ) | (367,931,510 | ) | (106,119,978 | ) | (935,780,725 | ) |
| | 25,353,142 |
| 210,563,326 |
| (49,965,692 | ) | (447,624,297 | ) |
| Institutional Class/Shares Authorized | 575,000,000 |
| | 550,000,000 |
| |
| Sold | 35,462,533 |
| 287,367,186 |
| 70,987,309 |
| 624,529,431 |
|
| Issued in reinvestment of distributions | 12,822,540 |
| 99,258,046 |
| 10,115,992 |
| 87,701,593 |
|
| Redeemed | (119,633,526 | ) | (879,664,359 | ) | (27,707,045 | ) | (242,977,703 | ) |
| | (71,348,453 | ) | (493,039,127 | ) | 53,396,256 |
| 469,253,321 |
|
| A Class/Shares Authorized | 160,000,000 |
| | 200,000,000 |
| |
| Sold | 3,376,686 |
| 27,391,309 |
| 5,786,264 |
| 50,218,496 |
|
| Issued in reinvestment of distributions | 1,505,916 |
| 11,683,162 |
| 2,882,404 |
| 24,905,222 |
|
| Redeemed | (29,658,294 | ) | (253,070,357 | ) | (8,801,229 | ) | (76,866,176 | ) |
| | (24,775,692 | ) | (213,995,886 | ) | (132,561 | ) | (1,742,458 | ) |
| B Class/Shares Authorized | N/A |
| | 5,000,000 |
| |
| Sold | 8,094 |
| 67,339 |
| 9,504 |
| 84,715 |
|
| Issued in reinvestment of distributions | 224 |
| 1,850 |
| 5,196 |
| 44,625 |
|
| Redeemed | (75,381 | ) | (624,208 | ) | (52,622 | ) | (452,267 | ) |
| | (67,063 | ) | (555,019 | ) | (37,922 | ) | (322,927 | ) |
| C Class/Shares Authorized | 30,000,000 |
| | 15,000,000 |
| |
| Sold | 435,724 |
| 3,461,527 |
| 634,259 |
| 5,448,432 |
|
| Issued in reinvestment of distributions | 238,694 |
| 1,805,011 |
| 198,644 |
| 1,689,979 |
|
| Redeemed | (686,599 | ) | (5,377,801 | ) | (431,769 | ) | (3,681,907 | ) |
| | (12,181 | ) | (111,263 | ) | 401,134 |
| 3,456,504 |
|
| R Class/Shares Authorized | 70,000,000 |
| | 40,000,000 |
| |
| Sold | 2,953,704 |
| 23,796,785 |
| 2,029,107 |
| 17,675,973 |
|
| Issued in reinvestment of distributions | 625,876 |
| 4,813,283 |
| 390,446 |
| 3,371,759 |
|
| Redeemed | (880,314 | ) | (7,079,398 | ) | (645,541 | ) | (5,564,956 | ) |
| | 2,699,266 |
| 21,530,670 |
| 1,774,012 |
| 15,482,776 |
|
| R6 Class/Shares Authorized | 50,000,000 |
| | 20,000,000 |
| |
| Sold | 2,569,061 |
| 20,065,724 |
| 3,954,535 |
| 34,646,197 |
|
| Issued in reinvestment of distributions | 430,900 |
| 3,335,924 |
| 212,765 |
| 1,843,678 |
|
| Redeemed | (1,052,801 | ) | (8,385,812 | ) | (552,837 | ) | (4,860,232 | ) |
| | 1,947,160 |
| 15,015,836 |
| 3,614,463 |
| 31,629,643 |
|
| Net increase (decrease) | (66,203,821 | ) | $ | (460,591,463 | ) | 9,049,690 |
| $ | 70,132,562 |
|
6. Fair Value Measurements
The fund’s investments valuation process is based on several considerations and may use multiple inputs to determine the fair value of the investments held by the fund. In conformity with accounting principles generally accepted in the United States of America, the inputs used to determine a valuation are classified into three broad levels.
| |
| • | Level 1 valuation inputs consist of unadjusted quoted prices in an active market for identical investments. |
| |
| • | Level 2 valuation inputs consist of direct or indirect observable market data (including quoted prices for comparable investments, evaluations of subsequent market events, interest rates, prepayment speeds, credit risk, etc.). These inputs also consist of quoted prices for identical investments initially expressed in local currencies that are adjusted through translation into U.S. dollars. |
| |
| • | Level 3 valuation inputs consist of unobservable data (including a fund’s own assumptions). |
The level classification is based on the lowest level input that is significant to the fair valuation measurement. The valuation inputs are not necessarily an indication of the risks associated with investing in these securities or other financial instruments. There were no significant transfers between levels during the period.
The following is a summary of the level classifications as of period end. The Schedule of Investments provides additional information on the fund’s portfolio holdings.
|
| | | | | | | | |
| | Level 1 | Level 2 | Level 3 |
| Assets | | | |
| Investment Securities | | | |
| Common Stocks | $ | 2,684,567,089 |
| $ | 92,572,109 |
| — |
|
| Temporary Cash Investments | 21,765,375 |
| 33,371,000 |
| — |
|
| | $ | 2,706,332,464 |
| $ | 125,943,109 |
| — |
|
| Other Financial Instruments | | | |
| Forward Foreign Currency Exchange Contracts | — |
| $ | 14,031 |
| — |
|
| | | | |
| Liabilities | | | |
| Other Financial Instruments | | | |
| Forward Foreign Currency Exchange Contracts | — |
| $ | 1,110,349 |
| — |
|
7. Derivative Instruments
Foreign Currency Risk — The fund is subject to foreign currency exchange rate risk in the normal course of pursuing its investment objectives. The value of foreign investments held by a fund may be significantly affected by changes in foreign currency exchange rates. The dollar value of a foreign security generally decreases when the value of the dollar rises against the foreign currency in which the security is denominated and tends to increase when the value of the dollar declines against such foreign currency. A fund may enter into forward foreign currency exchange contracts to reduce a fund's exposure to foreign currency exchange rate fluctuations. The net U.S. dollar value of foreign currency underlying all contractual commitments held by a fund and the resulting unrealized appreciation or depreciation are determined daily. Realized gain or loss is recorded upon the termination of the contract. Net realized and unrealized gains or losses occurring during the holding period of forward foreign currency exchange contracts are a component of net realized gain (loss) on foreign currency transactions and change in net unrealized appreciation (depreciation) on translation of assets and liabilities in foreign currencies, respectively. A fund bears the risk of an unfavorable change in the foreign currency exchange rate underlying the forward contract. Additionally, losses, up to the fair value, may arise if the counterparties do not perform under the contract terms. The fund's average U.S. dollar exposure to foreign currency risk derivative instruments held during the period was $105,858,711.
Equity Price Risk — The fund is subject to equity price risk in the normal course of pursuing its investment objectives. A fund may enter into futures contracts based on an equity index in order to manage its exposure to changes in market conditions. A fund may purchase futures contracts to gain exposure to increases in market value or sell futures contracts to protect against a decline in market value. Upon entering into a futures contract, a fund is required to deposit either cash or securities in an amount equal to a certain percentage of the contract value (initial margin). Subsequent payments (variation margin) are made or received daily, in
cash, by a fund. The variation margin is equal to the daily change in the contract value and is recorded as unrealized gains and losses. A fund recognizes a realized gain or loss when the contract is closed or expires. Net realized and unrealized gains or losses occurring during the holding period of futures contracts are a component of net realized gain (loss) on futures contract transactions and change in net unrealized appreciation (depreciation) on futures contracts, respectively. One of the risks of entering into futures contracts is the possibility that the change in value of the contract may not correlate with the changes in value of the underlying securities. During the period, the fund participated in equity price risk derivative instruments for temporary investment purposes.
|
| | | | | | | | |
Value of Derivative Instruments as of March 31, 2016
|
| | Asset Derivatives | Liability Derivatives |
| Type of Risk Exposure | Location on Statement of Assets and Liabilities | Value | Location on Statement of Assets and Liabilities | Value |
| Foreign Currency Risk | Unrealized appreciation on forward foreign currency exchange contracts | $ | 14,031 |
| Unrealized depreciation on forward foreign currency exchange contracts | $ | 1,110,349 |
|
| | | | | |
Effect of Derivative Instruments on the Statement of Operations for the Year Ended March 31, 2016
|
| | Net Realized Gain (Loss) | Change in Net Unrealized Appreciation (Depreciation) |
| Type of Risk Exposure | Location on Statement of Operations | Value | Location on Statement of Operations | Value |
| Equity Price Risk | Net realized gain (loss) on futures contract transactions | $ | 2,060,557 |
| Change in net unrealized appreciation (depreciation) on futures contracts | — |
|
| Foreign Currency Risk | Net realized gain (loss) on foreign currency transactions | 437,444 |
| Change in net unrealized appreciation (depreciation) on translation of assets and liabilities in foreign currencies | $ | (2,752,085 | ) |
| | | $ | 2,498,001 |
| | $ | (2,752,085 | ) |
8. Federal Tax Information
The tax character of distributions paid during the years ended March 31, 2016 and March 31, 2015 were as follows:
|
| | | | | | |
| | 2016 | 2015 |
| Distributions Paid From | | |
| Ordinary income | $ | 78,293,527 |
| $ | 114,789,572 |
|
| Long-term capital gains | $ | 211,051,263 |
| $ | 157,433,685 |
|
The book-basis character of distributions made during the year from net investment income or net realized gains may differ from their ultimate characterization for federal income tax purposes. These differences reflect the differing character of certain income items and net realized gains and losses for financial statement and tax purposes, and may result in reclassification among certain capital accounts on the financial statements.
As of March 31, 2016, the federal tax cost of investments and the components of distributable earnings on a tax-basis were as follows:
|
| | | |
| Federal tax cost of investments | $ | 2,437,738,533 |
|
| Gross tax appreciation of investments | $ | 487,378,491 |
|
| Gross tax depreciation of investments | (92,841,451 | ) |
| Net tax appreciation (depreciation) of investments | 394,537,040 |
|
| Net tax appreciation (depreciation) on derivatives and translation of assets and liabilities in foreign currencies | (24,971 | ) |
| Net tax appreciation (depreciation) | $ | 394,512,069 |
|
| Undistributed ordinary income | $ | 1,765,442 |
|
| Accumulated long-term gains | $ | 162,862 |
|
| Post-October capital loss deferral | $ | (51,353,529 | ) |
The difference between book-basis and tax-basis unrealized appreciation (depreciation) is attributable primarily to the tax deferral of losses on wash sales.
Loss deferrals represent certain qualified losses that the fund has elected to treat as having been incurred in the following fiscal year for federal income tax purposes.
|
| | | | | | | | | | | | | | | |
For a Share Outstanding Throughout the Years Ended March 31 (except as noted)
|
| Per-Share Data | | | | | | | | | Ratios and Supplemental Data |
| | | Income From Investment Operations: | Distributions From: | | | Ratio to Average Net Assets of: | |
| | Net Asset
Value,
Beginning
of Period | Net
Investment
Income
(Loss)(1) | Net
Realized
and
Unrealized
Gain (Loss) | Total From
Investment
Operations | Net
Investment
Income | Net
Realized
Gains | Total
Distributions | Net Asset
Value,
End
of Period | Total
Return(2) | Operating
Expenses | Net
Investment
Income
(Loss) | Portfolio
Turnover
Rate | Net
Assets,
End of
Period
(in thousands) |
| Investor Class | | | | | | | | | | | | |
| 2016 | $8.55 | 0.13 | (0.28) | (0.15) | (0.15) | (0.52) | (0.67) | $7.73 | (1.53)% | 0.98% | 1.65% | 48% |
| $2,009,044 |
|
| 2015 | $8.46 | 0.13 | 0.62 | 0.75 | (0.13) | (0.53) | (0.66) | $8.55 | 8.91% | 0.97% | 1.54% | 45% |
| $2,003,967 |
|
| 2014 | $7.11 | 0.13 | 1.34 | 1.47 | (0.12) | — | (0.12) | $8.46 | 20.82% | 0.98% | 1.60% | 49% |
| $2,406,139 |
|
| 2013 | $6.23 | 0.10 | 0.89 | 0.99 | (0.11) | — | (0.11) | $7.11 | 16.08% | 1.00% | 1.65% | 48% |
| $1,955,536 |
|
| 2012 | $5.97 | 0.10 | 0.26 | 0.36 | (0.10) | — | (0.10) | $6.23 | 6.22% | 1.01% | 1.70% | 62% |
| $1,811,710 |
|
| Institutional Class | | | | | | | | | | | | |
| 2016 | $8.56 | 0.15 | (0.27) | (0.12) | (0.17) | (0.52) | (0.69) | $7.75 | (1.21)% | 0.78% | 1.85% | 48% |
| $546,782 |
|
| 2015 | $8.47 | 0.15 | 0.62 | 0.77 | (0.15) | (0.53) | (0.68) | $8.56 | 9.10% | 0.77% | 1.74% | 45% |
| $1,215,076 |
|
| 2014 | $7.12 | 0.14 | 1.34 | 1.48 | (0.13) | — | (0.13) | $8.47 | 21.03% | 0.78% | 1.80% | 49% |
| $749,868 |
|
| 2013 | $6.24 | 0.12 | 0.88 | 1.00 | (0.12) | — | (0.12) | $7.12 | 16.29% | 0.80% | 1.85% | 48% |
| $172,891 |
|
| 2012 | $5.98 | 0.11 | 0.26 | 0.37 | (0.11) | — | (0.11) | $6.24 | 6.42% | 0.81% | 1.90% | 62% |
| $126,086 |
|
|
| | | | | | | | | | | | | | | |
For a Share Outstanding Throughout the Years Ended March 31 (except as noted)
|
| Per-Share Data | | | | | | | | | Ratios and Supplemental Data |
| | | Income From Investment Operations: | Distributions From: | | | Ratio to Average Net Assets of: | |
| | Net Asset
Value,
Beginning
of Period | Net
Investment
Income
(Loss)(1) | Net
Realized
and
Unrealized
Gain (Loss) | Total From
Investment
Operations | Net
Investment
Income | Net
Realized
Gains | Total
Distributions | Net Asset
Value,
End
of Period | Total
Return(2) | Operating
Expenses | Net
Investment
Income
(Loss) | Portfolio
Turnover
Rate | Net
Assets,
End of
Period
(in thousands) |
| A Class | | | | | | | | | | | | | |
| 2016 | $8.54 | 0.11 | (0.27) | (0.16) | (0.13) | (0.52) | (0.65) | $7.73 | (1.65)% | 1.23% | 1.40% | 48% |
| $138,798 |
|
| 2015 | $8.45 | 0.11 | 0.62 | 0.73 | (0.11) | (0.53) | (0.64) | $8.54 | 8.64% | 1.22% | 1.29% | 45% |
| $365,063 |
|
| 2014 | $7.10 | 0.11 | 1.34 | 1.45 | (0.10) | — | (0.10) | $8.45 | 20.55% | 1.23% | 1.35% | 49% |
| $362,439 |
|
| 2013 | $6.23 | 0.09 | 0.87 | 0.96 | (0.09) | — | (0.09) | $7.10 | 15.64% | 1.25% | 1.40% | 48% |
| $295,085 |
|
| 2012 | $5.97 | 0.08 | 0.27 | 0.35 | (0.09) | — | (0.09) | $6.23 | 5.95% | 1.26% | 1.45% | 62% |
| $255,777 |
|
| C Class | | | | | | | | | | | | | |
| 2016 | $8.43 | 0.05 | (0.27) | (0.22) | (0.07) | (0.52) | (0.59) | $7.62 | (2.42)% | 1.98% | 0.65% | 48% |
| $26,542 |
|
| 2015 | $8.36 | 0.05 | 0.60 | 0.65 | (0.05) | (0.53) | (0.58) | $8.43 | 7.77% | 1.97% | 0.54% | 45% |
| $29,473 |
|
| 2014 | $7.03 | 0.05 | 1.33 | 1.38 | (0.05) | — | (0.05) | $8.36 | 19.64% | 1.98% | 0.60% | 49% |
| $25,869 |
|
| 2013 | $6.16 | 0.04 | 0.88 | 0.92 | (0.05) | — | (0.05) | $7.03 | 14.98% | 2.00% | 0.65% | 48% |
| $16,761 |
|
| 2012 | $5.92 | 0.04 | 0.25 | 0.29 | (0.05) | — | (0.05) | $6.16 | 5.01% | 2.01% | 0.70% | 62% |
| $11,194 |
|
| R Class | | | | | | | | | | | | | |
| 2016 | $8.55 | 0.09 | (0.28) | (0.19) | (0.11) | (0.52) | (0.63) | $7.73 | (2.02)% | 1.48% | 1.15% | 48% |
| $68,477 |
|
| 2015 | $8.46 | 0.09 | 0.62 | 0.71 | (0.09) | (0.53) | (0.62) | $8.55 | 8.37% | 1.47% | 1.04% | 45% |
| $52,623 |
|
| 2014 | $7.10 | 0.09 | 1.35 | 1.44 | (0.08) | — | (0.08) | $8.46 | 20.39% | 1.48% | 1.10% | 49% |
| $37,076 |
|
| 2013 | $6.23 | 0.07 | 0.88 | 0.95 | (0.08) | — | (0.08) | $7.10 | 15.35% | 1.50% | 1.15% | 48% |
| $30,293 |
|
| 2012 | $5.97 | 0.07 | 0.26 | 0.33 | (0.07) | — | (0.07) | $6.23 | 5.72% | 1.51% | 1.20% | 62% |
| $21,241 |
|
|
| | | | | | | | | | | | | | | |
For a Share Outstanding Throughout the Years Ended March 31 (except as noted)
|
| Per-Share Data | | | | | | | | | Ratios and Supplemental Data |
| | | Income From Investment Operations: | Distributions From: | | | Ratio to Average Net Assets of: | |
| | Net Asset
Value,
Beginning
of Period | Net
Investment
Income
(Loss)(1) | Net
Realized
and
Unrealized
Gain (Loss) | Total From
Investment
Operations | Net
Investment
Income | Net
Realized
Gains | Total
Distributions | Net Asset
Value,
End
of Period | Total
Return(2) | Operating
Expenses | Net
Investment
Income
(Loss) | Portfolio
Turnover
Rate | Net
Assets,
End of
Period
(in thousands) |
| R6 Class | | | | | | | | | | | | | |
| 2016 | $8.56 | 0.16 | (0.27) | (0.11) | (0.18) | (0.52) | (0.70) | $7.75 | (1.06)% | 0.63% | 2.00% | 48% |
| $45,959 |
|
| 2015 | $8.47 | 0.17 | 0.61 | 0.78 | (0.16) | (0.53) | (0.69) | $8.56 | 9.27% | 0.62% | 1.89% | 45% |
| $34,116 |
|
2014(3) | $7.77 | 0.14 | 0.66 | 0.80 | (0.10) | — | (0.10) | $8.47 | 10.41% | 0.62%(4) | 2.58%(4) | 49%(5) |
| $3,140 |
|
|
|
| Notes to Financial Highlights |
| |
| (1) | Computed using average shares outstanding throughout the period. |
| |
| (2) | Total returns are calculated based on the net asset value of the last business day and do not reflect applicable sales charges, if any. Total returns for periods less than one year are not annualized. |
| |
| (3) | July 26, 2013 (commencement of sale) through March 31, 2014. |
| |
| (5) | Portfolio turnover is calculated at the fund level. Percentage indicated was calculated for the year ended March 31, 2014. |
See Notes to Financial Statements.
|
|
| Report of Independent Registered Public Accounting Firm |
To the Board of Directors and Shareholders of American Century Capital Portfolios, Inc.:
We have audited the accompanying statement of assets and liabilities, including the schedule of investments, of Value Fund (the “Fund”), one of the funds constituting American Century Capital Portfolios, Inc., as of March 31, 2016, and the related statement of operations for the year then ended, the statements of changes in net assets for each of the two years in the period then ended, and the financial highlights for each of the periods presented. These financial statements and financial highlights are the responsibility of the Fund's management. Our responsibility is to express an opinion on these financial statements and financial highlights based on our audits.
We conducted our audits in accordance with the standards of the Public Company Accounting Oversight Board (United States). Those standards require that we plan and perform the audit to obtain reasonable assurance about whether the financial statements and financial highlights are free of material misstatement. The Fund is not required to have, nor were we engaged to perform, an audit of its internal control over financial reporting. Our audits included consideration of internal control over financial reporting as a basis for designing audit procedures that are appropriate in the circumstances, but not for the purpose of expressing an opinion on the effectiveness of the Fund's internal control over financial reporting. Accordingly, we express no such opinion. An audit also includes examining, on a test basis, evidence supporting the amounts and disclosures in the financial statements, assessing the accounting principles used and significant estimates made by management, as well as evaluating the overall financial statement presentation. Our procedures included confirmation of securities owned as of March 31, 2016, by correspondence with the custodian and brokers; when replies were not received from brokers, we performed other auditing procedures. We believe that our audits provide a reasonable basis for our opinion.
In our opinion, the financial statements and financial highlights referred to above present fairly, in all material respects, the financial position of Value Fund of American Century Capital Portfolios, Inc. as of March 31, 2016, the results of its operations for the year then ended, the changes in its net assets for each of the two years in the period then ended, and the financial highlights for each of the periods presented, in conformity with accounting principles generally accepted in the United States of America.
DELOITTE & TOUCHE LLP
Kansas City, Missouri May 17, 2016
The Board of Directors
The individuals listed below serve as directors of the funds. Each director will continue to serve in this capacity until death, retirement, resignation or removal from office. The board has adopted a mandatory retirement age for directors who are not “interested persons,” as that term is defined in the Investment Company Act (independent directors). Independent directors shall retire by December 31 of the year in which they reach their 75th birthday.
Mr. Thomas is an “interested person” because he currently serves as President and Chief Executive Officer of American Century Companies, Inc. (ACC), the parent company of American Century Investment Management, Inc. (ACIM or the advisor). Mr. Fink is treated as an “interested person” because of his recent employment with ACC and American Century Services, LLC (ACS). The other directors (more than three-fourths of the total number) are independent. They are not employees, directors or officers of, and have no financial interest in, ACC or any of its wholly owned, direct or indirect, subsidiaries, including ACIM, American Century Investment Services, Inc. (ACIS) and ACS, and they do not have any other affiliations, positions or relationships that would cause them to be considered “interested persons” under the Investment Company Act. The directors serve in this capacity for seven (in the case of Mr. Thomas, 15) registered investment companies in the American Century Investments family of funds.
The following table presents additional information about the directors. The mailing address for each director is 4500 Main Street, Kansas City, Missouri 64111.
|
| | | | | |
Name
(Year of Birth) | Position(s) Held with Funds | Length of Time Served | Principal Occupation(s) During Past 5 Years | Number of American Century Portfolios Overseen by Director | Other Directorships Held During Past
5 Years |
| Independent Directors | | |
Andrea C. Hall
(1945) | Director | Since 1997 | Retired | 83 | None |
Jan M. Lewis
(1957) | Director | Since 2011 | Retired; President and Chief Executive Officer, Catholic Charities of Northeast Kansas (human services organization) (2006 to 2013) | 83 | None |
James A. Olson
(1942) | Director and Chairman of the Board | Since 2007 (Chairman since 2014) | Member, Plaza Belmont LLC (private equity fund manager) (1999 to present) | 83 | Saia, Inc. (2002 to 2012) and EPR Properties (2003 to 2013) |
M. Jeannine Strandjord
(1945) | Director | Since 1994 | Retired | 83 | Euronet Worldwide Inc.; MGP Ingredients, Inc.; and DST Systems Inc. (1996 to 2012) |
John R. Whitten
(1946) | Director | Since 2008 | Retired | 83 | Rudolph Technologies, Inc. |
Stephen E. Yates
(1948) | Director | Since 2012 | Retired | 83 | None |
|
| | | | | |
Name
(Year of Birth) | Position(s) Held with Funds | Length of Time Served | Principal Occupation(s) During Past 5 Years | Number of American Century Portfolios Overseen by Director | Other Directorships Held During Past
5 Years |
| Interested Directors | | |
Barry Fink
(1955) | Director | Since 2012 | Retired; Executive Vice President, ACC (September 2007 to February 2013); President, ACS (October 2007 to February 2013); Chief Operating Officer, ACC (September 2007 to November 2012) | 83 | None |
Jonathan S. Thomas
(1963) | Director and President | Since 2007 | President and Chief Executive Officer, ACC (March 2007 to present). Also serves as Chief Executive Officer, ACS; Executive Vice President, ACIM; Director, ACC, ACIM and other ACC subsidiaries | 128 | BioMed Valley Discoveries, Inc. |
The Statement of Additional Information has additional information about the fund's directors and is available without charge, upon request, by calling 1-800-345-2021.
Officers
The following table presents certain information about the executive officers of the funds. Each officer serves as an officer for each of the 15 investment companies in the American Century family of funds, unless otherwise noted. No officer is compensated for his or her service as an officer of the funds. The listed officers are interested persons of the funds and are appointed or re-appointed on an annual basis. The mailing address for each officer listed below is 4500 Main Street, Kansas City, Missouri 64111.
|
| | |
Name (Year of Birth) | Offices with
the Funds | Principal Occupation(s) During the Past Five Years |
Jonathan S.
Thomas
(1963) | Director and
President
since 2007 | President and Chief Executive Officer, ACC (March 2007 to present). Also serves as Chief Executive Officer, ACS; Executive Vice President, ACIM; Director, ACC, ACIM and other ACC subsidiaries |
Amy D. Shelton
(1964) | Chief Compliance
Officer and Vice President since 2014 | Chief Compliance Officer, American Century funds, (March 2014 to present); Chief Compliance Officer, ACIM (February 2014 to present); Chief Compliance Officer, ACIS (October 2009 to present); Vice President, Client Interactions and Marketing, ACIS (February 2013 to January 2014); Director, Client Interactions and Marketing, ACIS (June 2007 to January 2013). Also serves as Vice President, ACIS |
Charles A.
Etherington
(1957) | General Counsel
since 2007 and
Senior Vice
President since 2006 | Attorney, ACC (February 1994 to present); Vice President, ACC (November 2005 to present); General Counsel, ACC (March 2007 to present). Also serves as General Counsel, ACIM, ACS, ACIS and other ACC subsidiaries; and Senior Vice President, ACIM and ACS |
C. Jean Wade
(1964) | Vice President,
Treasurer and
Chief Financial
Officer since 2012 | Vice President, ACS (February 2000 to present) |
Robert J.
Leach
(1966) | Vice President
since 2006 and
Assistant Treasurer
since 2012 | Vice President, ACS (February 2000 to present) |
David H.
Reinmiller
(1963) | Vice President
since 2000 | Attorney, ACC (January 1994 to present); Associate General Counsel, ACC (January 2001 to present). Also serves as Vice President, ACIM and ACS |
Ward D.
Stauffer
(1960) | Secretary
since 2005 | Attorney, ACC (June 2003 to present) |
Retirement Account Information
As required by law, distributions you receive from certain IRAs are subject to federal income tax withholding, unless you elect not to have withholding apply. Tax will be withheld on the total amount withdrawn even though you may be receiving amounts that are not subject to withholding, such as nondeductible contributions. In such case, excess amounts of withholding could occur. You may adjust your withholding election so that a greater or lesser amount will be withheld.
If you don’t want us to withhold on this amount, you must notify us to not withhold the federal income tax. You may notify us in writing or in certain situations by telephone or through other electronic means. For systematic withdrawals, your withholding election will remain in effect until revoked or changed by filing a new election. You have the right to revoke your election at any time.
Remember, even if you elect not to have income tax withheld, you are liable for paying income tax on the taxable portion of your withdrawal. If you elect not to have income tax withheld or you don’t have enough income tax withheld, you may be responsible for payment of estimated tax. You may incur penalties under the estimated tax rules if your withholding and estimated tax payments are not sufficient. You can reduce or defer the income tax on a distribution by directly or indirectly rolling such distribution over to another IRA or eligible plan. You should consult your tax advisor for additional information.
State tax will be withheld if, at the time of your distribution, your address is within one of the mandatory withholding states and you have federal income tax withheld (or as otherwise required by state law). State taxes will be withheld from your distribution in accordance with the respective state rules.
Distributions you receive from 403(b), 457 and qualified plans are subject to special tax and withholding rules. Your plan administrator or plan sponsor is required to provide you with a special tax notice explaining those rules at the time you request a distribution. If applicable, federal and/or state taxes may be withheld from your distribution amount.
Proxy Voting Policies
A description of the policies that the fund's investment advisor uses in exercising the voting rights associated with the securities purchased and/or held by the fund is available without charge, upon request, by calling 1-800-345-2021. It is also available on the "About Us" page of American Century Investments’ website at americancentury.com and on the Securities and Exchange Commission’s website at sec.gov. Information regarding how the investment advisor voted proxies relating to portfolio securities during the most recent 12-month period ended June 30 is available on the "About Us" page at americancentury.com. It is also available at sec.gov.
Quarterly Portfolio Disclosure
The fund files its complete schedule of portfolio holdings with the Securities and Exchange Commission (SEC) for the first and third quarters of each fiscal year on Form N-Q. The fund’s Forms N-Q are available on the SEC’s website at sec.gov, and may be reviewed and copied at the SEC’s Public Reference Room in Washington, DC. Information on the operation of the Public Reference Room may be obtained by calling 1-800-SEC-0330. The fund also makes its complete schedule of portfolio holdings for the most recent quarter of its fiscal year available on its
website at americancentury.com and, upon request, by calling 1-800-345-2021.
Other Tax Information
The following information is provided pursuant to provisions of the Internal Revenue Code.
The fund hereby designates up to the maximum amount allowable as qualified dividend income for the fiscal year ended March 31, 2016.
For corporate taxpayers, the fund hereby designates $55,036,727, or up to the maximum amount allowable, of ordinary income distributions paid during the fiscal year ended March 31, 2016 as qualified for the corporate dividends received deduction.
The fund hereby designates $12,486,357 as qualified short-term capital gain distributions for purposes of Internal Revenue Code Section 871 for the fiscal year ended March 31, 2016.
The fund hereby designates $211,051,263, or up to the maximum amount allowable, as long-term capital gain distributions for the fiscal year ended March 31, 2016.
|
| | |
| |
| | | |
| Contact Us | americancentury.com | |
| Automated Information Line | 1-800-345-8765 | |
| Investor Services Representative | 1-800-345-2021 or 816-531-5575 | |
| Investors Using Advisors | 1-800-378-9878 | |
| Business, Not-For-Profit, Employer-Sponsored Retirement Plans | 1-800-345-3533 | |
| Banks and Trust Companies, Broker-Dealers, Financial Professionals, Insurance Companies | 1-800-345-6488 | |
| Telecommunications Relay Service for the Deaf | 711 | |
| | | |
| American Century Capital Portfolios, Inc. | |
| | | |
Investment Advisor: American Century Investment Management, Inc. Kansas City, Missouri | |
| | | |
| This report and the statements it contains are submitted for the general information of our shareholders. The report is not authorized for distribution to prospective investors unless preceded or accompanied by an effective prospectus. | |
| | | |
©2016 American Century Proprietary Holdings, Inc. All rights reserved.
CL-ANN-88870 1605 | |
ITEM 2. CODE OF ETHICS.
| |
| (a) | The registrant has adopted a Code of Ethics for Senior Financial Officers that applies to the registrant’s principal executive officer, principal financial officer, principal accounting officer, and persons performing similar functions. |
| |
| (f) | The registrant’s Code of Ethics for Senior Financial Officers was filed as Exhibit 12 (a)(1) to American Century Asset Allocation Portfolios, Inc.’s Annual Certified Shareholder Report on Form N-CSR, File No. 811-21591, on September 29, 2005, and is incorporated herein by reference. |
ITEM 3. AUDIT COMMITTEE FINANCIAL EXPERT.
| |
| (a)(1) | The registrant’s board has determined that the registrant has at least one audit committee financial expert serving on its audit committee. |
| |
| (a)(2) | M. Jeannine Strandjord, Stephen E. Yates and John R. Whitten are the registrant’s designated audit committee financial experts. They are “independent” as defined in Item 3 of Form N-CSR. |
ITEM 4. PRINCIPAL ACCOUNTANT FEES AND SERVICES.
The aggregate fees billed for each of the last two fiscal years for professional services rendered by the principal accountant for the audit of the registrant’s annual financial statements or services that are normally provided by the accountant in connection with statutory and regulatory filings or engagements for those fiscal years were as follows:
FY 2015: $174,000
FY 2016: $182,190
The aggregate fees billed in each of the last two fiscal years for assurance and related services by the principal accountant that are reasonably related to the performance of the audit of the registrant’s financial statements and are not reported under paragraph (a) of this Item were as follows:
For services rendered to the registrant:
FY 2015: $0
FY 2016: $0
Fees required to be approved pursuant to paragraph (c)(7)(ii) of Rule 2-01 of Regulation S-X (relating to certain engagements for non-audit services with the registrant’s investment adviser and its affiliates):
FY 2015: $0
FY 2016: $0
(c)Tax Fees.
The aggregate fees billed in each of the last two fiscal years for professional services rendered by the principal accountant for tax compliance, tax advice, and tax planning were as follows:
For services rendered to the registrant:
FY 2015: $0
FY 2016: $0
Fees required to be approved pursuant to paragraph (c)(7)(ii) of Rule 2-01 of Regulation S-X (relating to certain engagements for non-audit services with the registrant’s investment adviser and its affiliates):
FY 2015: $0
FY 2016: $0
(d)All Other Fees.
The aggregate fees billed in each of the last two fiscal years for products and services provided by the principal accountant, other than the services reported in paragraphs (a) through (c) of this Item were as follows:
For services rendered to the registrant:
FY 2015: $0
FY 2016: $0
Fees required to be approved pursuant to paragraph (c)(7)(ii) of Rule 2-01 of Regulation S-X (relating to certain engagements for non-audit services with the registrant’s investment adviser and its affiliates):
FY 2015: $0
FY 2016: $0
(e)(1)In accordance with paragraph (c)(7)(i)(A) of Rule 2-01 of Regulation S-X, before the accountant is engaged by the registrant to render audit or non-audit services, the engagement is approved by the registrant’s audit committee. Pursuant to paragraph (c)(7)(ii) of Rule 2-01 of Regulation S-X, the registrant’s audit committee also pre-approves its accountant’s engagements for non-audit services with the registrant’s investment adviser, its parent company, and any entity controlled by, or under common control with the investment adviser that provides ongoing services to the registrant, if the engagement relates directly to the operations and financial reporting of the registrant.
| |
| (e)(2) | All services described in each of paragraphs (b) through (d) of this Item were pre-approved before the engagement by the registrant’s audit committee pursuant to paragraph (c)(7)(i)(A) of Rule 2-01 of Regulation S-X. Consequently, none of such services were required to be approved by the audit committee pursuant to paragraph (c)(7)(i)(C). |
| |
| (f) | The percentage of hours expended on the principal accountant’s engagement to audit the registrant’s financial statements for the most recent fiscal year that were attributed to work performed by persons other than the principal accountant’s full-time, permanent employees was less than 50%. |
| |
| (g) | The aggregate non-audit fees billed by the registrant’s accountant for services rendered to the registrant, and rendered to the registrant’s investment adviser (not including any sub-adviser whose role is primarily portfolio management and is subcontracted with or overseen by another investment adviser), and any entity controlling, controlled by, or under common control with the adviser that provides ongoing services to the registrant for each of the last two fiscal years of the registrant were as follows: |
FY 2015: $91,808
FY 2016: $86,000
| |
| (h) | The registrant’s investment adviser and accountant have notified the registrant’s audit committee of all non-audit services that were rendered by the registrant’s accountant to the registrant’s investment adviser, its parent company, and any entity controlled by, or under common control with the investment adviser that provides services to the registrant, which services were not required to be pre-approved pursuant to paragraph (c)(7)(ii) of Rule 2-01 of Regulation S-X. The notification provided to the registrant’s audit committee included sufficient details regarding such services to allow the registrant’s audit committee to consider the continuing independence of its principal accountant. |
ITEM 5. AUDIT COMMITTEE OF LISTED REGISTRANTS.
Not applicable.
ITEM 6. INVESTMENTS.
| |
| (a) | The schedule of investments is included as part of the report to stockholders filed under Item 1 of this Form. |
ITEM 7. DISCLOSURE OF PROXY VOTING POLICIES AND PROCEDURES FOR CLOSED-END MANAGEMENT INVESTMENT COMPANIES.
Not applicable.
ITEM 8. PORTFOLIO MANAGERS OF CLOSED-END MANAGEMENT INVESTMENT COMPANIES.
Not applicable.
ITEM 9. PURCHASES OF EQUITY SECURITIES BY CLOSED-END MANAGEMENT INVESTMENT COMPANY AND AFFILIATED PURCHASERS.
Not applicable.
ITEM 10. SUBMISSION OF MATTERS TO A VOTE OF SECURITY HOLDERS.
During the reporting period, there were no material changes to the procedures by which shareholders may recommend nominees to the registrant’s board.
ITEM 11. CONTROLS AND PROCEDURES.
| |
| (a) | The registrant's principal executive officer and principal financial officer have concluded that the registrant's disclosure controls and procedures (as defined in Rule 30a-3(c) under the Investment Company Act of 1940) are effective based on their evaluation of these controls and procedures as of a date within 90 days of the filing date of this report. |
| |
| (b) | There were no changes in the registrant's internal control over financial reporting (as defined in Rule 30a-3(d) under the Investment Company Act of 1940) that occurred during the registrant's second fiscal quarter of the period covered by this report that have materially affected, or are reasonably likely to materially affect, the registrant's internal control over financial reporting. |
ITEM 12. EXHIBITS.
| |
| (a)(1) | Registrant’s Code of Ethics for Senior Financial Officers, which is the subject of the disclosure required by Item 2 of Form N-CSR, was filed as Exhibit 12(a)(1) to American Century Asset Allocation Portfolios, Inc.’s Certified Shareholder Report on Form N-CSR, File No. 811-21591, on September 29, 2005. |
| |
| (a)(2) | Separate certifications by the registrant’s principal executive officer and principal financial officer, pursuant to Section 302 of the Sarbanes-Oxley Act of 2002 and Rule 30a-2(a) under the Investment Company Act of 1940, are filed and attached hereto as EX-99.CERT. |
| |
| (b) | A certification by the registrant’s chief executive officer and chief financial officer, pursuant to Section 906 of the Sarbanes-Oxley Act of 2002, is furnished and attached hereto as EX-99.906CERT. |
SIGNATURES
Pursuant to the requirements of the Securities Exchange Act of 1934 and the Investment Company Act of 1940, the registrant has duly caused this report to be signed on its behalf by the undersigned, thereunto duly authorized.
|
| | | |
| Registrant: | American Century Capital Portfolios, Inc. |
| | | |
| By: | /s/ Jonathan S. Thomas |
| | Name: | Jonathan S. Thomas |
| | Title: | President |
| | | |
| Date: | May 26, 2016 |
Pursuant to the requirements of the Securities Exchange Act of 1934 and the Investment Company Act of 1940, this report has been signed below by the following persons on behalf of the registrant and in the capacities and on the dates indicated.
|
| | |
| By: | /s/ Jonathan S. Thomas |
| | Name: | Jonathan S. Thomas |
| | Title: | President |
| | | (principal executive officer) |
| | | |
| Date: | May 26, 2016 |
|
| | |
| By: | /s/ C. Jean Wade |
| | Name: | C. Jean Wade |
| | Title: | Vice President, Treasurer, and |
| | | Chief Financial Officer |
| | | (principal financial officer) |
| | | |
| Date: | May 26, 2016 |