UNITED STATES
SECURITIES AND EXCHANGE COMMISSION
Washington, D.C. 20549
FORM N-CSR
CERTIFIED SHAREHOLDER REPORT OF REGISTERED
MANAGEMENT INVESTMENT COMPANIES
|
| | | | | | |
| Investment Company Act file number | 811-07820 |
| | |
| AMERICAN CENTURY CAPITAL PORTFOLIOS, INC. |
| (Exact name of registrant as specified in charter) |
| | |
| 4500 MAIN STREET, KANSAS CITY, MISSOURI | 64111 |
| (Address of principal executive offices) | (Zip Code) |
| | |
CHARLES A. ETHERINGTON 4500 MAIN STREET, KANSAS CITY, MISSOURI 64111 |
| (Name and address of agent for service) |
| | |
| Registrant’s telephone number, including area code: | 816-531-5575 |
| | |
| Date of fiscal year end: | 03-31 |
| | |
| Date of reporting period: | 03-31-2017 |
ITEM 1. REPORTS TO STOCKHOLDERS.
|
| |
| | |
| | Annual Report |
| | |
| | March 31, 2017 |
| | |
| | Equity Income Fund |
|
| | |
| President’s Letter | 2 |
|
| Performance | 3 |
|
| Portfolio Commentary | |
|
| Fund Characteristics | |
|
| Shareholder Fee Example | |
|
| Schedule of Investments | |
|
| Statement of Assets and Liabilities | |
|
| Statement of Operations | |
|
| Statement of Changes in Net Assets | |
|
| Notes to Financial Statements | |
|
| Financial Highlights | |
|
| Report of Independent Registered Public Accounting Firm | |
|
| Management | |
|
| Additional Information | |
|
Any opinions expressed in this report reflect those of the author as of the date of the report, and do not necessarily represent the opinions of American Century Investments® or any other person in the American Century Investments organization. Any such opinions are subject to change at any time based upon market or other conditions and American Century Investments disclaims any responsibility to update such opinions. These opinions may not be relied upon as investment advice and, because investment decisions made by American Century Investments funds are based on numerous factors, may not be relied upon as an indication of trading intent on behalf of any American Century Investments fund. Security examples are used for representational purposes only and are not intended as recommendations to purchase or sell securities. Performance information for comparative indices and securities is provided to American Century Investments by third party vendors. To the best of American Century Investments’ knowledge, such information is accurate at the time of printing.
 Jonathan Thomas
Dear Investor:
Thank you for reviewing this annual report for the period ended March 31, 2017. Annual reports help convey important information about fund returns, including market factors that affected performance during the reporting period. For additional, updated investment and market insights, we encourage you to visit our website, americancentury.com.
Risk-On Rebound From Global Economic Concerns of Early 2016
Stocks, high-yield bonds, and commodities rebounded from severe downturns in early 2016 that were triggered by China’s economic slowdown. Since then, growth conditions in China and the rest of the world have generally improved. For the reporting period, the S&P 500 Index, the Bloomberg Barclays U.S. Corporate High-Yield Bond Index, and the S&P Goldman Sachs Commodities Index returned 17.17%, 16.39%, and 8.45%, respectively. This risk-on rebound also drove government bond yields higher, resulting in declines for indices such as the Bloomberg Barclays U.S. Treasury Bond Index (-1.44%). The broader taxable investment-grade U.S. bond market performed better, but still significantly underperformed stocks; the Bloomberg Barclays U.S. Aggregate Bond Index returned 0.44%.
Investors could thank the world’s major central banks and the “Trump Trade” for the risk-on rebound, which occurred with a backdrop of landmark political events, including Brexit (the U.K. vote to leave the European Union) and Donald Trump’s U.S. presidential election victory. Central bank stimulus helped to propel the markets past China- and Brexit-related volatility, followed by Trump victory-inspired optimism about U.S. growth that further boosted higher-risk markets.
But the Trump Trade could prove to be double edged—investor optimism faded as health care reform stalled in Congress and other U.S. fiscal policy proposals looked like they’d face significant hurdles. Meanwhile, the Federal Reserve raised its interest rate target during the reporting period, and suggested that it might raise rates again and start gradually reducing its balance sheet by the end of 2017. These factors, plus rising inflation and continuing geopolitical risks, could impede further risk-on sentiment. In this unsettled environment, we believe in remaining focused on investment goals, using disciplined, actively managed, risk-aware strategies. We appreciate your continued trust in us.
Sincerely,
Jonathan Thomas
President and Chief Executive Officer
American Century Investments
|
| | | | | | |
| Total Returns as of March 31, 2017 |
| | | | Average Annual Returns | |
| | Ticker Symbol | 1 year | 5 years | 10 years | Since Inception | Inception Date |
| Investor Class | TWEIX | 17.14% | 12.01% | 7.09% | — | 8/1/94 |
| Russell 3000 Value Index | — | 19.97% | 13.07% | 5.93% | — | — |
| S&P 500 Index | — | 17.17% | 13.29% | 7.50% | — | — |
| Institutional Class | ACIIX | 17.36% | 12.25% | 7.31% | — | 7/8/98 |
| A Class | TWEAX | | | | | 3/7/97 |
| No sales charge | | 16.85% | 11.74% | 6.82% | — | |
| With sales charge | | 10.17% | 10.42% | 6.19% | — | |
| C Class | AEYIX | 15.97% | 10.91% | 6.03% | — | 7/13/01 |
| R Class | AEURX | 16.48% | 11.47% | 6.56% | — | 8/29/03 |
| R6 Class | AEUDX | 17.66% | — | — | 11.12% | 7/26/13 |
Average annual returns since inception are presented when ten years of performance history is not available.
Prior to September 4, 2007, the A Class was referred to as the Advisor Class and did not have a front-end sales charge. Performance prior to that date has been adjusted to reflect this charge.
Sales charges include initial sales charges and contingent deferred sales charges (CDSCs), as applicable. A Class shares have a 5.75% maximum initial sales charge and may be subject to a maximum CDSC of 1.00%. C Class shares redeemed within 12 months of purchase are subject to a maximum CDSC of 1.00%. The SEC requires that mutual funds provide performance information net of maximum sales charges in all cases where charges could be applied.
Data presented reflect past performance. Past performance is no guarantee of future results. Current performance may be higher or lower than the performance shown. Total returns for periods less than one year are not annualized. Investment return and principal value will fluctuate, and redemption value may be more or less than original cost. Data assumes reinvestment of dividends and capital gains, and none of the charts reflect the deduction of taxes that a shareholder would pay on fund distributions or the redemption of fund shares. To obtain performance data current to the most recent month end, please call 1-800-345-2021 or visit americancentury.com. For additional information about the fund, please consult the prospectus.
|
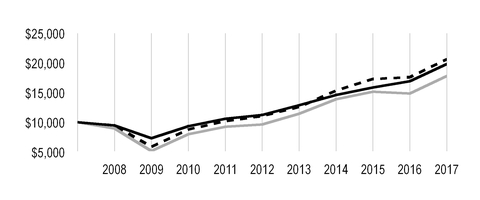
|
| Growth of $10,000 Over 10 Years |
| $10,000 investment made March 31, 2007 |
Performance for other share classes will vary due to differences in fee structure.
|
|
| |
| Value on March 31, 2017 |
| | Investor Class — $19,844 |
| |
| | Russell 3000 Value Index — $17,805 |
| |
| | S&P 500 Index — $20,627 |
| |
|
| | | | | |
| Total Annual Fund Operating Expenses | | |
| Investor Class | Institutional Class | A Class | C Class | R Class | R6 Class |
| 0.94% | 0.74% | 1.19% | 1.94% | 1.44% | 0.59% |
The total annual fund operating expenses shown is as stated in the fund’s prospectus current as of the date of this report. The prospectus may vary from the expense ratio shown elsewhere in this report because it is based on a different time period, includes acquired fund fees and expenses, and, if applicable, does not include fee waivers or expense reimbursements.
Data presented reflect past performance. Past performance is no guarantee of future results. Current performance may be higher or lower than the performance shown. Total returns for periods less than one year are not annualized. Investment return and principal value will fluctuate, and redemption value may be more or less than original cost. Data assumes reinvestment of dividends and capital gains, and none of the charts reflect the deduction of taxes that a shareholder would pay on fund distributions or the redemption of fund shares. To obtain performance data current to the most recent month end, please call 1-800-345-2021 or visit americancentury.com. For additional information about the fund, please consult the prospectus.
Portfolio Managers: Phil Davidson, Kevin Toney, Michael Liss, and Dan Gruemmer
Performance Summary
Equity Income returned 17.14%* for the fiscal year ended March 31, 2017, underperforming the Russell 3000 Value Index, which returned 19.97%. Stock selection in financials, energy, and consumer staples detracted from performance relative to the benchmark, while an underweight position in financials and overweights in energy and consumer staples also hurt relative results. A portfolio underweight and stock selection in real estate, combined with stock selection in health care and utilities, contributed to relative performance.
Stock Choices in Financials, Energy, and Consumer Staples Detracted
More conservative positioning in the financials industry weighed on relative returns, especially in the fourth quarter of 2016, when the portfolio’s higher-quality, lower-beta banking stocks and convertible positions lagged many of the index’s lower-quality, higher-beta constituents. Lack of exposure to the common stock of Bank of America also detracted from performance. Bank stocks such as Bank of America rose strongly in the fourth quarter of 2016 as interest rates rose, the yield curve steepened, and investors anticipated potential tax cuts and deregulation under President Trump. The portfolio holds convertible preferred stock issued by Bank of America. While the portfolio is overweight in banks, an underweight in the financial services sector overall also dampened relative performance.
Energy stocks remained under pressure through most of the period due to high fuel stocks and weak prices, and stock selection combined with a portfolio overweight in energy subtracted from relative performance. Occidental Petroleum was a notable detractor, as the energy sector downturn created concerns about the sustainability of its dividend payment. In our view, the dividend is sustainable, due to the company’s healthy balance sheet and underappreciated asset quality, and we believe the stock’s risk/reward profile appears attractive.
Stock selection and a portfolio overweight in consumer staples also hampered relative performance. General Mills was a notable detractor. The food company’s stock declined sharply in September on news of disappointing third-quarter earnings, and trended lower into the first quarter of 2017 after the company reduced fiscal-year guidance to reflect weakness in yogurt sales.
Real Estate, Health Care, Utilities, and Information Technology Contributed
Real estate remains a portfolio underweight, as we believe REITs have been generally overvalued for some time. This underweight position assisted relative performance, as higher interest rates weighed on sector performance. Stock selection in real estate was also beneficial, due in part to an investment in American Tower, a REIT that owns and operates wireless communications towers. The stock benefited from positive revisions to earnings guidance and from expectations for more traffic to the company’s towers as wireless telecommunications services companies offer more unlimited data plans.
* All fund returns referenced in this commentary are for Investor Class shares. Performance for other share classes will vary due to differences in fee structure; when Investor Class performance exceeds that of the fund's benchmark, other share classes may not. See page 3 for returns for all share classes.
Stock selection in health care and utilities also aided relative performance. In health care, Quest Diagnostics benefited from pricing and volume tailwinds, as well as legislation that delayed price cuts until 2018. The team reduced the position as the stock’s risk/reward profile became less attractive due to valuation. In the utilities sector, Westar Energy was a top contributor. Westar Energy’s stock price surged higher in May on the news that it would be acquired by Great Plains Energy, and we sold our investment, taking our profits. Relative performance in the information technology sector was assisted by overweight investments in several semiconductor technology companies, including Applied Materials, that are benefiting from strong orders, low inventories, and high demand for chips to power computing equipment and technology-driven features in automobiles.
Portfolio Positioning
The portfolio ended the period with the largest sector overweights in energy and consumer staples. We added to the energy weighting in the first quarter of 2017 as stocks declined and valuations become more attractive. Additionally, we continue to find many stocks in the consumer staples sector that fit our process due to their high returns on invested capital, stability, attractive relative yields, and strong balance sheets. Financials was the largest underweight in the portfolio, due in part to a lack of exposure to Berkshire Hathaway, which doesn’t pay a dividend, and to the consumer finance industry. The portfolio is also underweight in consumer discretionary, as that sector includes fewer attractively valued, higher-quality companies that meet our investment criteria.
|
| |
| MARCH 31, 2017 |
| Top Ten Holdings | % of net assets |
| Johnson & Johnson | 4.8% |
| Procter & Gamble Co. (The) | 4.6% |
| TOTAL SA | 3.2% |
| General Mills, Inc. | 2.6% |
| General Electric Co. | 2.5% |
| Republic Services, Inc. | 2.4% |
| Schlumberger Ltd. | 2.4% |
| Exxon Mobil Corp. | 2.3% |
| Chevron Corp. | 2.2% |
| 3M Co. | 2.1% |
| | |
| Top Five Industries | % of net assets |
| Oil, Gas and Consumable Fuels | 12.9% |
| Banks | 12.6% |
| Pharmaceuticals | 8.1% |
| Semiconductors and Semiconductor Equipment | 6.2% |
| Household Products | 5.4% |
| | |
| Types of Investments in Portfolio | % of net assets |
| Domestic Common Stocks | 73.7% |
| Foreign Common Stocks* | 5.1% |
| Convertible Bonds | 6.0% |
| Preferred Stocks | 5.4% |
| Convertible Preferred Stocks | 4.1% |
| Exchange-Traded Funds | 2.5% |
| Total Equity Exposure | 96.8% |
| Temporary Cash Investments | 2.4% |
| Other Assets and Liabilities | 0.8% |
*Includes depositary shares, dual listed securities and foreign ordinary shares.
Fund shareholders may incur two types of costs: (1) transaction costs, including sales charges (loads) on purchase payments and redemption/exchange fees; and (2) ongoing costs, including management fees; distribution and service (12b-1) fees; and other fund expenses. This example is intended to help you understand your ongoing costs (in dollars) of investing in your fund and to compare these costs with the ongoing cost of investing in other mutual funds.
The example is based on an investment of $1,000 made at the beginning of the period and held for the entire period from October 1, 2016 to March 31, 2017.
Actual Expenses
The table provides information about actual account values and actual expenses for each class. You may use the information, together with the amount you invested, to estimate the expenses that you paid over the period. First, identify the share class you own. Then simply divide your account value by $1,000 (for example, an $8,600 account value divided by $1,000 = 8.6), then multiply the result by the number under the heading “Expenses Paid During Period” to estimate the expenses you paid on your account during this period.
If you hold Investor Class shares of any American Century Investments fund, or Institutional Class shares of the American Century Diversified Bond Fund, in an American Century Investments account (i.e., not a financial intermediary or retirement plan account), American Century Investments may charge you a $12.50 semiannual account maintenance fee if the value of those shares is less than $10,000. We will redeem shares automatically in one of your accounts to pay the $12.50 fee. In determining your total eligible investment amount, we will include your investments in all personal accounts (including American Century Investments Brokerage accounts) registered under your Social Security number. Personal accounts include individual accounts, joint accounts, UGMA/UTMA accounts, personal trusts, Coverdell Education Savings Accounts and IRAs (including traditional, Roth, Rollover, SEP-, SARSEP- and SIMPLE-IRAs), and certain other retirement accounts. If you have only business, business retirement, employer-sponsored or American Century Investments Brokerage accounts, you are currently not subject to this fee. If you are subject to the Account Maintenance Fee, your account value could be reduced by the fee amount.
Hypothetical Example for Comparison Purposes
The table also provides information about hypothetical account values and hypothetical expenses based on the actual expense ratio of each class of your fund and an assumed rate of return of 5% per year before expenses, which is not the actual return of a fund’s share class. The hypothetical account values and expenses may not be used to estimate the actual ending account balance or expenses you paid for the period. You may use this information to compare the ongoing costs of investing in your fund and other funds. To do so, compare this 5% hypothetical example with the 5% hypothetical examples that appear in the shareholder reports of the other funds.
Please note that the expenses shown in the table are meant to highlight your ongoing costs only and do not reflect any transactional costs, such as sales charges (loads) or redemption/exchange fees. Therefore, the table is useful in comparing ongoing costs only, and will not help you determine the relative total costs of owning different funds. In addition, if these transactional costs were included, your costs would have been higher.
|
| | | | |
| | Beginning
Account Value
10/1/16 | Ending
Account Value
3/31/17 | Expenses Paid
During Period(1)
10/1/16 - 3/31/17 |
Annualized
Expense Ratio(1) |
| Actual | | | | |
| Investor Class | $1,000 | $1,083.60 | $4.73 | 0.91% |
| Institutional Class | $1,000 | $1,084.60 | $3.69 | 0.71% |
| A Class | $1,000 | $1,082.30 | $6.02 | 1.16% |
| C Class | $1,000 | $1,078.30 | $9.90 | 1.91% |
| R Class | $1,000 | $1,081.20 | $7.32 | 1.41% |
| R6 Class | $1,000 | $1,085.30 | $2.91 | 0.56% |
| Hypothetical | | | | |
| Investor Class | $1,000 | $1,020.39 | $4.58 | 0.91% |
| Institutional Class | $1,000 | $1,021.39 | $3.58 | 0.71% |
| A Class | $1,000 | $1,019.15 | $5.84 | 1.16% |
| C Class | $1,000 | $1,015.41 | $9.60 | 1.91% |
| R Class | $1,000 | $1,017.90 | $7.09 | 1.41% |
| R6 Class | $1,000 | $1,022.14 | $2.82 | 0.56% |
| |
| (1) | Expenses are equal to the class's annualized expense ratio listed in the table above, multiplied by the average account value over the period, multiplied by 182, the number of days in the most recent fiscal half-year, divided by 365, to reflect the one-half year period. |
MARCH 31, 2017
|
| | | | | | |
| | Shares/
Principal Amount | Value |
| COMMON STOCKS — 78.8% | | |
| Air Freight and Logistics — 1.6% | | |
| United Parcel Service, Inc., Class B | 1,879,618 |
| $ | 201,683,011 |
|
| Auto Components — 0.3% | | |
| Delphi Automotive plc | 430,598 |
| 34,658,833 |
|
| Banks — 7.3% | | |
| Comerica, Inc. | 719,500 |
| 49,343,310 |
|
| Commerce Bancshares, Inc. | 1,189,650 |
| 66,810,744 |
|
| JPMorgan Chase & Co. | 2,699,597 |
| 237,132,601 |
|
| PNC Financial Services Group, Inc. (The) | 1,834,552 |
| 220,586,532 |
|
| SunTrust Banks, Inc. | 3,496,630 |
| 193,363,639 |
|
| U.S. Bancorp | 1,298,400 |
| 66,867,600 |
|
| Wells Fargo & Co. | 1,135,500 |
| 63,201,930 |
|
| | | 897,306,356 |
|
| Beverages — 0.5% | | |
| PepsiCo, Inc. | 566,999 |
| 63,424,508 |
|
| Capital Markets — 2.8% | | |
| AllianceBernstein Holding LP | 1,968,278 |
| 44,975,152 |
|
| Bank of New York Mellon Corp. (The) | 1,696,600 |
| 80,130,418 |
|
| BlackRock, Inc. | 141,900 |
| 54,420,069 |
|
| Northern Trust Corp. | 1,950,440 |
| 168,869,095 |
|
| | | 348,394,734 |
|
| Chemicals — 0.5% | | |
| Air Products & Chemicals, Inc. | 499,400 |
| 67,563,826 |
|
| Commercial Services and Supplies — 2.4% | | |
| Republic Services, Inc. | 4,798,661 |
| 301,403,897 |
|
| Communications Equipment — 0.2% | | |
| Cisco Systems, Inc. | 552,791 |
| 18,684,336 |
|
| Containers and Packaging — 1.2% | | |
| Bemis Co., Inc. | 3,078,948 |
| 150,437,399 |
|
| Diversified Telecommunication Services — 1.7% | | |
| AT&T, Inc. | 1,692,800 |
| 70,335,840 |
|
| Verizon Communications, Inc. | 2,848,737 |
| 138,875,929 |
|
| | | 209,211,769 |
|
| Electric Utilities — 2.7% | | |
| Edison International | 398,399 |
| 31,716,544 |
|
| Eversource Energy | 746,700 |
| 43,891,026 |
|
| PG&E Corp. | 2,717,037 |
| 180,302,575 |
|
| Pinnacle West Capital Corp. | 847,917 |
| 70,699,320 |
|
| | | 326,609,465 |
|
| Electrical Equipment — 1.0% | | |
| Emerson Electric Co. | 1,099,100 |
| 65,792,126 |
|
| Rockwell Automation, Inc. | 368,900 |
| 57,441,419 |
|
| | | 123,233,545 |
|
|
| | | | | | |
| | Shares/
Principal Amount | Value |
| Energy Equipment and Services — 2.4% | | |
| Schlumberger Ltd. | 3,714,931 |
| $ | 290,136,111 |
|
| Equity Real Estate Investment Trusts (REITs) — 3.0% | | |
| American Tower Corp. | 999,200 |
| 121,442,768 |
|
| Boston Properties, Inc. | 450,700 |
| 59,677,187 |
|
| Weyerhaeuser Co. | 5,497,000 |
| 186,788,060 |
|
| | | 367,908,015 |
|
| Food and Staples Retailing — 1.9% | | |
| CVS Health Corp. | 797,394 |
| 62,595,429 |
|
| Wal-Mart Stores, Inc. | 2,392,383 |
| 172,442,967 |
|
| | | 235,038,396 |
|
| Food Products — 2.6% | | |
| General Mills, Inc. | 5,418,298 |
| 319,733,765 |
|
| Gas Utilities — 2.7% | | |
| Atmos Energy Corp. | 1,219,420 |
| 96,321,986 |
|
ONE Gas, Inc.(1) | 3,489,338 |
| 235,879,249 |
|
| | | 332,201,235 |
|
| Health Care Equipment and Supplies — 1.1% | | |
| Medtronic plc | 1,658,536 |
| 133,611,660 |
|
| Health Care Providers and Services — 0.5% | | |
| Cardinal Health, Inc. | 147,553 |
| 12,032,947 |
|
| Quest Diagnostics, Inc. | 498,758 |
| 48,973,048 |
|
| | | 61,005,995 |
|
| Household Products — 5.4% | | |
| Kimberly-Clark Corp. | 779,126 |
| 102,556,356 |
|
| Procter & Gamble Co. (The) | 6,298,459 |
| 565,916,541 |
|
| | | 668,472,897 |
|
| Industrial Conglomerates — 2.4% | | |
| 3M Co. | 1,329,500 |
| 254,373,235 |
|
| General Electric Co. | 1,298,695 |
| 38,701,111 |
|
| | | 293,074,346 |
|
| Insurance — 4.3% | | |
| Allstate Corp. (The) | 858,800 |
| 69,983,612 |
|
| Chubb Ltd. | 1,597,328 |
| 217,635,940 |
|
| Marsh & McLennan Cos., Inc. | 2,798,905 |
| 206,811,090 |
|
| MetLife, Inc. | 597,323 |
| 31,550,601 |
|
| | | 525,981,243 |
|
| IT Services — 1.8% | | |
| Automatic Data Processing, Inc. | 2,216,387 |
| 226,935,865 |
|
| Machinery — 0.6% | | |
| Stanley Black & Decker, Inc. | 588,981 |
| 78,257,905 |
|
| Media — 0.3% | | |
| Time Warner, Inc. | 318,800 |
| 31,149,948 |
|
| Oil, Gas and Consumable Fuels — 12.7% | | |
| Chevron Corp. | 2,472,016 |
| 265,420,358 |
|
| Enterprise Products Partners LP | 5,995,300 |
| 165,530,233 |
|
| EQT Midstream Partners LP | 571,318 |
| 43,934,354 |
|
|
| | | | | | |
| | Shares/
Principal Amount | Value |
| Exxon Mobil Corp. | 3,498,615 |
| $ | 286,921,416 |
|
| Occidental Petroleum Corp. | 3,028,677 |
| 191,896,975 |
|
| Phillips 66 Partners LP | 808,930 |
| 41,538,555 |
|
| Shell Midstream Partners LP | 2,023,736 |
| 65,225,011 |
|
| Spectra Energy Partners LP | 2,498,069 |
| 109,065,693 |
|
| TOTAL SA | 7,661,509 |
| 387,536,844 |
|
| | | 1,557,069,439 |
|
| Personal Products — 0.9% | | |
| Unilever NV CVA | 2,220,800 |
| 110,331,269 |
|
| Pharmaceuticals — 8.1% | | |
| Bristol-Myers Squibb Co. | 489,000 |
| 26,591,820 |
|
| Eli Lilly & Co. | 1,262,400 |
| 106,180,464 |
|
| Johnson & Johnson | 4,698,941 |
| 585,253,101 |
|
| Merck & Co., Inc. | 850,222 |
| 54,023,106 |
|
| Pfizer, Inc. | 2,759,822 |
| 94,413,511 |
|
| Roche Holding AG | 499,900 |
| 127,663,775 |
|
| | | 994,125,777 |
|
| Road and Rail — 0.4% | | |
| Norfolk Southern Corp. | 402,500 |
| 45,067,925 |
|
| Semiconductors and Semiconductor Equipment — 2.1% | | |
| Applied Materials, Inc. | 2,187,103 |
| 85,078,307 |
|
| Maxim Integrated Products, Inc. | 3,862,100 |
| 173,640,016 |
|
| | | 258,718,323 |
|
| Software — 1.9% | | |
| Microsoft Corp. | 1,787,336 |
| 117,713,949 |
|
| Oracle Corp. (New York) | 2,599,652 |
| 115,970,476 |
|
| | | 233,684,425 |
|
| Technology Hardware, Storage and Peripherals — 0.3% | | |
| Apple, Inc. | 269,700 |
| 38,745,102 |
|
| Thrifts and Mortgage Finance — 1.2% | | |
Capitol Federal Financial, Inc.(1) | 10,179,179 |
| 148,921,389 |
|
TOTAL COMMON STOCKS
(Cost $7,970,548,624) | | 9,692,782,709 |
|
| CONVERTIBLE BONDS — 6.0% | | |
| Air Freight and Logistics — 0.2% | | |
UBS AG, (convertible into United Parcel Service, Inc., Class B), 2.80%, 8/3/17(2)(3) | $ | 220,800 |
| 23,935,042 |
|
| Auto Components — 0.2% | | |
Credit Suisse AG, (convertible into Delphi Automotive plc), 5.93%, 6/1/17(2)(3) | 390,300 |
| 26,857,627 |
|
| Biotechnology — 0.2% | | |
UBS AG, (convertible into Gilead Science, Inc.), 3.15%, 8/14/17(2)(3) | 332,400 |
| 22,330,464 |
|
| Food Products — 0.1% | | |
Citigroup Global Markets Holdings, Inc., (convertible into Mondelez International, Inc., Class A), 6.82%, 7/14/17(2)(3) | 275,300 |
| 12,122,898 |
|
| Health Care Providers and Services — 0.2% | | |
Merrill Lynch International & Co. C.V., (convertible into Patterson Cos., Inc.), 5.30%, 6/1/17(2)(3) | 169,900 |
| 7,302,400 |
|
| | | |
|
| | | | | | |
| | Shares/
Principal Amount | Value |
Morgan Stanley B.V., (convertible into Cigna Corp.), 4.90%, 4/19/17(2)(3) | $ | 165,300 |
| $ | 21,935,980 |
|
| | | 29,238,380 |
|
| IT Services — 0.2% | | |
UBS AG, (convertible into International Business Machines Corp.), 4.50%, 9/14/17(2)(3) | 155,000 |
| 27,087,264 |
|
| Multiline Retail — 0.4% | | |
Merrill Lynch International & Co. C.V., (convertible into Target Corp.), 3.10%, 8/31/17(2)(3) | 371,100 |
| 21,055,773 |
|
Wells Fargo Bank N.A., (convertible into Target Corp.), 1.72%, 7/21/17(2)(3) | 547,900 |
| 31,751,435 |
|
| | | 52,807,208 |
|
| Oil, Gas and Consumable Fuels — 0.2% | | |
Goldman Sachs International, (convertible into EQT Corp.), 5.50%, 6/15/17(2)(3) | 320,000 |
| 21,523,704 |
|
| Semiconductors and Semiconductor Equipment — 4.1% | | |
Citigroup Global Markets Holdings, Inc., (convertible into QUALCOMM, Inc.), 4.26%, 8/18/17(2)(3) | 742,700 |
| 42,201,093 |
|
| Intel Corp., 3.48%, 12/15/35 | 95,444,000 |
| 130,161,755 |
|
| Microchip Technology, Inc., 1.625%, 2/15/25 | 57,964,000 |
| 83,395,705 |
|
Microchip Technology, Inc., 1.625%, 2/15/27(3) | 162,803,000 |
| 165,753,804 |
|
Teradyne, Inc., 1.25%, 12/15/23(3) | 71,911,000 |
| 84,090,926 |
|
| | | 505,603,283 |
|
| Specialty Retail — 0.2% | | |
Merrill Lynch International & Co. C.V., (convertible into L Brands, Inc.), 8.40%, 8/29/17(2)(3) | 375,100 |
| 17,808,702 |
|
TOTAL CONVERTIBLE BONDS
(Cost $681,770,487) | | 739,314,572 |
|
| PREFERRED STOCKS — 5.4% | | |
| Banks — 2.2% | | |
| Citigroup, Inc., 5.95% | 142,836,000 |
| 149,263,620 |
|
| U.S. Bancorp, 5.30% | 30,618,000 |
| 31,268,633 |
|
| U.S. Bancorp, 6.00% | 3,531,282 |
| 88,282,050 |
|
| | | 268,814,303 |
|
| Capital Markets — 0.7% | | |
| Goldman Sachs Group, Inc. (The), 5.30% | 85,130,000 |
| 86,939,012 |
|
| Industrial Conglomerates — 2.5% | | |
| General Electric Co., 5.00% | 293,503,000 |
| 309,645,665 |
|
TOTAL PREFERRED STOCKS
(Cost $638,448,447) | | 665,398,980 |
|
| CONVERTIBLE PREFERRED STOCKS — 4.1% | | |
| Banks — 3.1% | | |
| Bank of America Corp., 7.25% | 202,969 |
| 242,560,133 |
|
| Wells Fargo & Co., 7.50% | 115,978 |
| 143,812,720 |
|
| | | 386,372,853 |
|
| Equity Real Estate Investment Trusts (REITs) — 0.2% | | |
| Welltower Inc., 6.50% | 381,700 |
| 24,092,904 |
|
| Gas Utilities — 0.8% | | |
| Spire, Inc., 6.75%, 4/1/17 | 1,629,457 |
| 96,007,607 |
|
TOTAL CONVERTIBLE PREFERRED STOCKS
(Cost $443,934,652) | | 506,473,364 |
|
|
| | | | | | |
| | Shares/
Principal Amount | Value |
| EXCHANGE-TRADED FUNDS — 2.5% | | |
| iShares Russell 1000 Value ETF | 2,092,194 |
| $ | 240,476,778 |
|
| SPDR S&P 500 ETF Trust | 247,100 |
| 58,251,354 |
|
TOTAL EXCHANGE-TRADED FUNDS
(Cost $242,709,724) | | 298,728,132 |
|
| TEMPORARY CASH INVESTMENTS — 2.4% | | |
Federal Home Loan Bank Discount Notes, 0.46%, 4/3/17(4) | $ | 132,666,000 |
| 132,666,000 |
|
| Repurchase Agreement, BMO Capital Markets Corp., (collateralized by various U.S. Treasury obligations, 0.75% - 2.75%, 7/31/17 - 2/15/24, valued at $59,212,112), in a joint trading account at 0.67%, dated 3/31/17, due 4/3/17 (Delivery value $58,008,570) | | 58,005,331 |
|
| Repurchase Agreement, Fixed Income Clearing Corp., (collateralized by various U.S. Treasury obligations, 2.50% - 3.00%, 11/15/45 - 2/15/46, valued at $107,373,137), at 0.22%, dated 3/31/17, due 4/3/17 (Delivery value $105,259,930) | | 105,258,000 |
|
| State Street Institutional U.S. Government Money Market Fund, Premier Class | 77,915 |
| 77,915 |
|
TOTAL TEMPORARY CASH INVESTMENTS
(Cost $296,003,930) | | 296,007,246 |
|
TOTAL INVESTMENT SECURITIES — 99.2%
(Cost $10,273,415,864) | | 12,198,705,003 |
|
| OTHER ASSETS AND LIABILITIES — 0.8% | | 102,471,068 |
|
| TOTAL NET ASSETS — 100.0% | | $ | 12,301,176,071 |
|
|
| | | | | | | | | | |
| FORWARD FOREIGN CURRENCY EXCHANGE CONTRACTS |
| Currency Purchased | Currency Sold | Counterparty | Settlement Date | Unrealized Appreciation (Depreciation) |
| USD | 80,628,095 |
| CHF | 78,924,020 |
| Credit Suisse AG | 6/30/17 | $ | 1,421,526 |
|
| USD | 10,720,362 |
| CHF | 10,632,884 |
| Credit Suisse AG | 6/30/17 | 49,412 |
|
| USD | 12,237,783 |
| CHF | 12,174,024 |
| Credit Suisse AG | 6/30/17 | 20,176 |
|
| USD | 397,308,160 |
| EUR | 364,616,633 |
| UBS AG | 6/30/17 | 6,714,016 |
|
| | | | | | | $ | 8,205,130 |
|
|
| | |
| NOTES TO SCHEDULE OF INVESTMENTS |
| CHF | - | Swiss Franc |
| CVA | - | Certificaten Van Aandelen |
| EUR | - | Euro |
| USD | - | United States Dollar |
| |
| (1) | Affiliated Company: the fund’s holding represents ownership of 5% or more of the voting securities of the company; therefore, the company is affiliated as defined in the Investment Company Act of 1940. |
| |
| (2) | Equity-linked debt security. The aggregated value of these securities at the period end was $275,912,382, which represented 2.2% of total net assets. |
| |
| (3) | Security was purchased pursuant to Rule 144A under the Securities Act of 1933 and may be sold in transactions exempt from registration, normally to qualified institutional investors. The aggregate value of these securities at the period end was $525,757,112, which represented 4.3% of total net assets. |
| |
| (4) | The rate indicated is the yield to maturity at purchase. |
See Notes to Financial Statements.
|
|
| Statement of Assets and Liabilities |
|
| | | |
| MARCH 31, 2017 | |
| Assets | |
| Investment securities - unaffiliated, at value (cost of $10,030,249,447) | $ | 11,813,904,365 |
|
| Investment securities - affiliated, at value (cost of $243,166,417) | 384,800,638 |
|
| Total investment securities, at value (cost of $10,273,415,864) | 12,198,705,003 |
|
| Foreign currency holdings, at value (cost of $612,148) | 595,431 |
|
| Receivable for investments sold | 212,033,049 |
|
| Receivable for capital shares sold | 13,503,311 |
|
| Unrealized appreciation on forward foreign currency exchange contracts | 8,205,130 |
|
| Dividends and interest receivable | 38,214,752 |
|
| | 12,471,256,676 |
|
| | |
| Liabilities | |
| Payable for investments purchased | 146,350,229 |
|
| Payable for capital shares redeemed | 13,522,866 |
|
| Accrued management fees | 9,081,762 |
|
| Distribution and service fees payable | 1,125,748 |
|
| | 170,080,605 |
|
| | |
| Net Assets | $ | 12,301,176,071 |
|
| | |
| Net Assets Consist of: | |
| Capital (par value and paid-in surplus) | $ | 9,890,519,401 |
|
| Distributions in excess of net investment income | (13,618,723 | ) |
| Undistributed net realized gain | 490,853,267 |
|
| Net unrealized appreciation | 1,933,422,126 |
|
| | $ | 12,301,176,071 |
|
|
| | | | | | |
| | Net Assets | Shares Outstanding | Net Asset Value Per Share |
| Investor Class, $0.01 Par Value |
| $7,327,473,453 |
| 802,379,094 |
| $9.13 |
| Institutional Class, $0.01 Par Value |
| $1,515,757,583 |
| 165,870,575 |
| $9.14 |
| A Class, $0.01 Par Value |
| $2,139,411,396 |
| 234,294,484 |
| $9.13* |
| C Class, $0.01 Par Value |
| $711,149,308 |
| 77,882,114 |
| $9.13 |
| R Class, $0.01 Par Value |
| $114,761,871 |
| 12,607,835 |
| $9.10 |
| R6 Class, $0.01 Par Value |
| $492,622,460 |
| 53,856,715 |
| $9.15 |
*Maximum offering price $9.69 (net asset value divided by 0.9425).
See Notes to Financial Statements.
|
| | | |
| YEAR ENDED MARCH 31, 2017 |
| Investment Income (Loss) | |
| Income: | |
| Dividends (including $15,599,114 from affiliates and net of foreign taxes withheld of $2,896,447) | $ | 286,098,843 |
|
| Interest | 33,766,915 |
|
| | 319,865,758 |
|
| | |
| Expenses: | |
| Management fees | 99,061,401 |
|
| Distribution and service fees: | |
| A Class | 5,230,165 |
|
| C Class | 6,630,764 |
|
| R Class | 569,286 |
|
| Directors' fees and expenses | 345,763 |
|
| Other expenses | 21,424 |
|
| | 111,858,803 |
|
| | |
| Net investment income (loss) | 208,006,955 |
|
| | |
| Realized and Unrealized Gain (Loss) | |
| Net realized gain (loss) on: | |
| Investment transactions (including $12,772,063 from affiliates) | 1,099,897,272 |
|
| Foreign currency transactions | 7,071,821 |
|
| | 1,106,969,093 |
|
| | |
| Change in net unrealized appreciation (depreciation) on: | |
| Investments | 439,721,836 |
|
| Translation of assets and liabilities in foreign currencies | 11,391,840 |
|
| | 451,113,676 |
|
| | |
| Net realized and unrealized gain (loss) | 1,558,082,769 |
|
| | |
| Net Increase (Decrease) in Net Assets Resulting from Operations | $ | 1,766,089,724 |
|
See Notes to Financial Statements.
|
|
| Statement of Changes in Net Assets |
|
| | | | | | |
| YEARS ENDED MARCH 31, 2017 AND MARCH 31, 2016 |
| Increase (Decrease) in Net Assets | March 31, 2017 | March 31, 2016 |
| Operations | | |
| Net investment income (loss) | $ | 208,006,955 |
| $ | 213,315,706 |
|
| Net realized gain (loss) | 1,106,969,093 |
| 491,680,139 |
|
| Change in net unrealized appreciation (depreciation) | 451,113,676 |
| (126,597,246 | ) |
| Net increase (decrease) in net assets resulting from operations | 1,766,089,724 |
| 578,398,599 |
|
| | | |
| Distributions to Shareholders | | |
| From net investment income: | | |
| Investor Class | (129,563,399 | ) | (123,019,058 | ) |
| Institutional Class | (30,618,392 | ) | (30,526,067 | ) |
| A Class | (34,939,594 | ) | (42,382,590 | ) |
| B Class | — |
| (37,483 | ) |
| C Class | (5,979,666 | ) | (7,534,907 | ) |
| R Class | (1,626,120 | ) | (2,144,133 | ) |
| R6 Class | (8,068,622 | ) | (4,870,941 | ) |
| From net realized gains: | | |
| Investor Class | (400,934,887 | ) | (363,605,047 | ) |
| Institutional Class | (85,575,588 | ) | (77,411,532 | ) |
| A Class | (122,509,721 | ) | (139,778,814 | ) |
| C Class | (39,374,591 | ) | (38,422,267 | ) |
| R Class | (6,728,931 | ) | (7,738,439 | ) |
| R6 Class | (22,997,300 | ) | (15,271,252 | ) |
| Decrease in net assets from distributions | (888,916,811 | ) | (852,742,530 | ) |
| | | |
| Capital Share Transactions | | |
| Net increase (decrease) in net assets from capital share transactions (Note 5) | 1,945,344,324 |
| (995,331 | ) |
| | | |
| Net increase (decrease) in net assets | 2,822,517,237 |
| (275,339,262 | ) |
| | | |
| Net Assets | | |
| Beginning of period | 9,478,658,834 |
| 9,753,998,096 |
|
| End of period | $ | 12,301,176,071 |
| $ | 9,478,658,834 |
|
| | | |
| Undistributed (distributions in excess of) net investment income | $ | (13,618,723 | ) | $ | 4,293,572 |
|
See Notes to Financial Statements.
|
|
| Notes to Financial Statements |
MARCH 31, 2017
1. Organization
American Century Capital Portfolios, Inc. (the corporation) is registered under the Investment Company Act of 1940, as amended (the 1940 Act), as an open-end management investment company and is organized as a Maryland corporation. Equity Income Fund (the fund) is one fund in a series issued by the corporation. The fund’s investment objective is to seek current income. Capital appreciation is a secondary objective.
The fund offers the Investor Class, the Institutional Class, the A Class, the C Class, the R Class and the R6 Class. The A Class may incur an initial sales charge. The A Class and C Class may be subject to a contingent deferred sales charge. On October 16, 2015, all outstanding B Class shares were converted to A Class shares and the fund discontinued offering the B Class.
2. Significant Accounting Policies
The following is a summary of significant accounting policies consistently followed by the fund in preparation of its financial statements. The fund is an investment company and follows accounting and reporting guidance in accordance with accounting principles generally accepted in the United States of America. This may require management to make certain estimates and assumptions at the date of the financial statements. Actual results could differ from these estimates. Management evaluated the impact of events or transactions occurring through the date the financial statements were issued that would merit recognition or disclosure.
Investment Valuations — The fund determines the fair value of its investments and computes its net asset value per share at the close of regular trading (usually 4 p.m. Eastern time) on the New York Stock Exchange (NYSE) on each day the NYSE is open. The Board of Directors has adopted valuation policies and procedures to guide the investment advisor in the fund’s investment valuation process and to provide methodologies for the oversight of the fund’s pricing function.
Equity securities that are listed or traded on a domestic securities exchange are valued at the last reported sales price or at the official closing price as provided by the exchange. Equity securities traded on foreign securities exchanges are generally valued at the closing price of such securities on the exchange where primarily traded or at the close of the NYSE, if that is earlier. If no last sales price is reported, or if local convention or regulation so provides, the mean of the latest bid and asked prices may be used. Securities traded over-the-counter are valued at the mean of the latest bid and asked prices, the last sales price, or the official closing price. Equity securities initially expressed in local currencies are translated into U.S. dollars at the mean of the appropriate currency exchange rate at the close of the NYSE as provided by an independent pricing service.
Fixed income securities are valued at the evaluated mean as provided by independent pricing services or at the mean of the most recent bid and asked prices as provided by investment dealers. Corporate bonds, U.S. Treasury and Government Agency securities and convertible bonds are valued using market models that consider trade data, quotations from dealers and active market makers, relevant yield curve and spread data, creditworthiness, trade data or market information on comparable securities, and other relevant security specific information.
Open-end management investment companies are valued at the reported net asset value per share. Repurchase agreements are valued at cost, which approximates fair value. Forward foreign currency exchange contracts are valued at the mean of the appropriate forward exchange rate at the close of the NYSE as provided by an independent pricing service.
If the fund determines that the market price for an investment is not readily available or the valuation methods mentioned above do not reflect an investment’s fair value, such investment is valued as determined in good faith by the Board of Directors or its delegate, in accordance with policies and procedures adopted by the Board of Directors. In its determination of fair value, the fund may review several factors including, but not limited to, market information regarding the specific investment or comparable investments and correlation with other investment types, futures indices or general market indicators. Circumstances that may cause the fund to use these procedures to value an investment include, but are not limited to: an investment has been
declared in default or is distressed; trading in a security has been suspended during the trading day or a security is not actively trading on its principal exchange; prices received from a regular pricing source are deemed unreliable; or there is a foreign market holiday and no trading occurred.
The fund monitors for significant events occurring after the close of an investment’s primary exchange but before the fund’s net asset value per share is determined. Significant events may include, but are not limited to: corporate announcements and transactions; governmental action and political unrest that could impact a specific investment or an investment sector; or armed conflicts, natural disasters and similar events that could affect investments in a specific country or region. The fund also monitors for significant fluctuations between domestic and foreign markets, as evidenced by the U.S. market or such other indicators that the Board of Directors, or its delegate, deems appropriate. If significant fluctuations in foreign markets are identified, the fund may apply a model-derived factor to the closing price of equity securities traded on foreign securities exchanges. The factor is based on observable market data as provided by an independent pricing service.
Security Transactions — Security transactions are accounted for as of the trade date. Net realized gains and losses are determined on the identified cost basis, which is also used for federal income tax purposes.
Investment Income — Dividend income less foreign taxes withheld, if any, is recorded as of the ex-dividend date. Distributions received on securities that represent a return of capital or long-term capital gain are recorded as a reduction of cost of investments and/or as a realized gain. The fund may estimate the components of distributions received that may be considered nontaxable distributions or long-term capital gain distributions for income tax purposes. Interest income is recorded on the accrual basis and includes accretion of discounts and amortization of premiums.
Equity-Linked Debt and Linked-Equity Securities — The fund may invest in hybrid equity securities, which usually convert into common stock at a date predetermined by the issuer. These securities generally offer a higher dividend yield than that of the common stock to which the security is linked. These instruments are issued by a company other than the one to which the security is linked and carry the credit of the issuer, not that of the underlying common stock. The securities’ appreciation is limited based on a predetermined final cap price at the date of the conversion. Risks of investing in these securities include, but are not limited to, a set time to capture the yield advantage, limited appreciation potential, decline in value of the underlying stock, and failure of the issuer to pay dividends or to deliver common stock at maturity.
Foreign Currency Translations — All assets and liabilities initially expressed in foreign currencies are translated into U.S. dollars at prevailing exchange rates at period end. The fund may enter into spot foreign currency exchange contracts to facilitate transactions denominated in a foreign currency. Purchases and sales of investment securities, dividend and interest income, spot foreign currency exchange contracts, and expenses are translated at the rates of exchange prevailing on the respective dates of such transactions. Net realized and unrealized foreign currency exchange gains or losses related to investment securities are a component of net realized gain (loss) on investment transactions and change in net unrealized appreciation (depreciation) on investments, respectively.
Repurchase Agreements — The fund may enter into repurchase agreements with institutions that American Century Investment Management, Inc. (ACIM) (the investment advisor) has determined are creditworthy pursuant to criteria adopted by the Board of Directors. The fund requires that the collateral, represented by securities, received in a repurchase transaction be transferred to the custodian in a manner sufficient to enable the fund to obtain those securities in the event of a default under the repurchase agreement. ACIM monitors, on a daily basis, the securities transferred to ensure the value, including accrued interest, of the securities under each repurchase agreement is equal to or greater than amounts owed to the fund under each repurchase agreement.
Joint Trading Account — Pursuant to an Exemptive Order issued by the Securities and Exchange Commission, the fund, along with certain other funds in the American Century Investments family of funds, may transfer uninvested cash balances into a joint trading account. These balances are invested in one or more repurchase agreements that are collateralized by U.S. Treasury or Agency obligations.
Income Tax Status — It is the fund’s policy to distribute substantially all net investment income and net realized gains to shareholders and to otherwise qualify as a regulated investment company under provisions of the Internal Revenue Code. Accordingly, no provision has been made for income taxes. The fund files U.S. federal, state, local and non-U.S. tax returns as applicable. The fund's tax returns are subject to examination by the relevant taxing authority until expiration of the applicable statute of limitations, which is generally three years from the date of filing but can be longer in certain jurisdictions. At this time, management believes there
are no uncertain tax positions which, based on their technical merit, would not be sustained upon examination and for which it is reasonably possible that the total amounts of unrecognized tax benefits will significantly change in the next twelve months.
Multiple Class — All shares of the fund represent an equal pro rata interest in the net assets of the class to which such shares belong, and have identical voting, dividend, liquidation and other rights and the same terms and conditions, except for class specific expenses and exclusive rights to vote on matters affecting only individual classes. Income, non-class specific expenses, and realized and unrealized capital gains and losses of the fund are allocated to each class of shares based on their relative net assets.
Distributions to Shareholders — Distributions from net investment income, if any, are generally declared and paid quarterly. Distributions from net realized gains, if any, are generally declared and paid annually. The fund may elect to treat a portion of its payment to a redeeming shareholder, which represents the pro rata share of undistributed net investment income and net realized gains, as a distribution for federal income tax purposes (tax equalization).
Indemnifications — Under the corporation’s organizational documents, its officers and directors are indemnified against certain liabilities arising out of the performance of their duties to the fund. In addition, in the normal course of business, the fund enters into contracts that provide general indemnifications. The maximum exposure under these arrangements is unknown as this would involve future claims that may be made against a fund. The risk of material loss from such claims is considered by management to be remote.
3. Fees and Transactions with Related Parties
Certain officers and directors of the corporation are also officers and/or directors of American Century Companies, Inc. (ACC). The corporation’s investment advisor, ACIM, the corporation's distributor, American Century Investment Services, Inc. (ACIS), and the corporation’s transfer agent, American Century Services, LLC, are wholly owned, directly or indirectly, by ACC.
Management Fees — The corporation has entered into a management agreement with ACIM, under which ACIM provides the fund with investment advisory and management services in exchange for a single, unified management fee (the fee) per class. The agreement provides that all expenses of managing and operating the fund, except distribution and service fees, brokerage expenses, taxes, interest, fees and expenses of the independent directors (including legal counsel fees), and extraordinary expenses, will be paid by ACIM. The fee is computed and accrued daily based on each class’s daily net assets and paid monthly in arrears. The difference in the fee among the classes is a result of their separate arrangements for shareholder services. It is not the result of any difference in advisory or custodial fees or other expenses related to the management of the fund’s assets, which do not vary by class. The rate of the fee is determined by applying a fee rate calculation formula. This formula takes into account the fund’s assets as well as certain assets, if any, of other clients of the investment advisor outside the American Century Investments family of funds (such as subadvised funds and separate accounts) that have very similar investment teams and investment strategies (strategy assets). The annual management fee schedule ranges from 0.80% to 1.00% for the Investor Class, A Class, C Class and R Class. The annual management fee schedule ranges from 0.60% to 0.80% for the Institutional Class and 0.45% to 0.65% for the R6 Class. The effective annual management fee for each class for the year ended March 31, 2017 was 0.91% for the Investor Class, A Class, C Class and R Class, 0.71% for the Institutional Class and 0.56% for the R6 Class.
Distribution and Service Fees — The Board of Directors has adopted a separate Master Distribution and Individual Shareholder Services Plan for each of the A Class, C Class and R Class (collectively the plans), pursuant to Rule 12b-1 of the 1940 Act. The plans provide that the A Class will pay ACIS an annual distribution and service fee of 0.25%. The plans provide that the C Class will pay ACIS an annual distribution and service fee of 1.00%, of which 0.25% is paid for individual shareholder services and 0.75% is paid for distribution services. The plans provide that the R Class will pay ACIS an annual distribution and service fee of 0.50%. The fees are computed and accrued daily based on each class’s daily net assets and paid monthly in arrears. The fees are used to pay financial intermediaries for distribution and individual shareholder services. Fees incurred under the plans during the year ended March 31, 2017 are detailed in the Statement of Operations.
Directors' Fees and Expenses — The Board of Directors is responsible for overseeing the investment advisor’s management and operations of the fund. The directors receive detailed information about the fund and its investment advisor regularly throughout the year, and meet at least quarterly with management of the investment advisor to review reports about fund operations. The fund’s officers do not receive compensation from the fund.
Acquired Fund Fees and Expenses — The fund may invest in mutual funds, exchange-traded funds, and business development companies (the acquired funds). The fund will indirectly realize its pro rata share of the
fees and expenses of the acquired funds in which it invests. These indirect fees and expenses are not paid out of the fund's assets but are reflected in the return realized by the fund on its investment in the acquired funds.
Interfund Transactions — The fund may enter into security transactions with other American Century Investments funds and other client accounts of the investment advisor, in accordance with the 1940 Act rules and procedures adopted by the Board of Directors. The rules and procedures require, among other things, that these transactions be effected at the independent current market price of the security. During the period, the interfund purchases and sales were $127,864,719 and $63,351,257, respectively. The effect of interfund transactions on the Statement of Operations was $9,517,964 in net realized gain (loss) on investment transactions.
4. Investment Transactions
Purchases and sales of investment securities, excluding short-term investments, for the year ended March 31, 2017 were $11,114,206,308 and $9,993,930,725, respectively.
5. Capital Share Transactions
Transactions in shares of the fund were as follows:
|
| | | | | | | | | | |
| | Year ended
March 31, 2017 | Year ended
March 31, 2016 |
| | Shares | Amount | Shares | Amount |
| Investor Class/Shares Authorized | 3,690,000,000 |
| | 3,690,000,000 |
| |
| Sold | 293,507,890 |
| $ | 2,609,195,025 |
| 114,466,871 |
| $ | 941,691,955 |
|
| Issued in reinvestment of distributions | 56,671,757 |
| 504,632,303 |
| 56,859,660 |
| 457,471,867 |
|
| Redeemed | (189,696,984 | ) | (1,695,503,573 | ) | (156,737,452 | ) | (1,310,805,748 | ) |
| | 160,482,663 |
| 1,418,323,755 |
| 14,589,079 |
| 88,358,074 |
|
| Institutional Class/Shares Authorized | 900,000,000 |
| | 900,000,000 |
| |
| Sold | 56,832,314 |
| 505,772,022 |
| 43,236,265 |
| 355,337,764 |
|
| Issued in reinvestment of distributions | 12,014,795 |
| 107,079,509 |
| 12,080,239 |
| 97,419,785 |
|
| Redeemed | (49,101,577 | ) | (441,160,610 | ) | (60,463,997 | ) | (509,934,591 | ) |
| | 19,745,532 |
| 171,690,921 |
| (5,147,493 | ) | (57,177,042 | ) |
| A Class/Shares Authorized | 1,450,000,000 |
| | 1,450,000,000 |
| |
| Sold | 67,317,393 |
| 599,764,310 |
| 33,772,941 |
| 281,467,687 |
|
| Issued in reinvestment of distributions | 17,235,247 |
| 153,324,817 |
| 22,158,796 |
| 178,188,273 |
|
| Redeemed | (80,261,080 | ) | (716,879,699 | ) | (75,339,830 | ) | (629,711,265 | ) |
| | 4,291,560 |
| 36,209,428 |
| (19,408,093 | ) | (170,055,305 | ) |
| B Class/Shares Authorized | N/A |
| | N/A |
| |
| Sold | | | 1,773 |
| 15,470 |
|
| Issued in reinvestment of distributions | | | 4,126 |
| 34,715 |
|
| Redeemed | | | (640,096 | ) | (5,462,542 | ) |
| | | | (634,197 | ) | (5,412,357 | ) |
| C Class/Shares Authorized | 380,000,000 |
| | 380,000,000 |
| |
| Sold | 23,508,729 |
| 208,356,587 |
| 10,920,834 |
| 90,266,957 |
|
| Issued in reinvestment of distributions | 4,410,142 |
| 39,190,445 |
| 4,821,802 |
| 38,594,526 |
|
| Redeemed | (16,945,928 | ) | (151,129,533 | ) | (11,886,580 | ) | (99,349,090 | ) |
| | 10,972,943 |
| 96,417,499 |
| 3,856,056 |
| 29,512,393 |
|
| R Class/Shares Authorized | 70,000,000 |
| | 70,000,000 |
| |
| Sold | 3,878,786 |
| 34,434,508 |
| 1,999,195 |
| 16,610,134 |
|
| Issued in reinvestment of distributions | 926,459 |
| 8,213,953 |
| 1,206,549 |
| 9,662,979 |
|
| Redeemed | (4,772,983 | ) | (42,240,369 | ) | (5,355,482 | ) | (44,926,763 | ) |
| | 32,262 |
| 408,092 |
| (2,149,738 | ) | (18,653,650 | ) |
| R6 Class/Shares Authorized | 180,000,000 |
| | 180,000,000 |
| |
| Sold | 37,017,253 |
| 333,067,159 |
| 19,314,185 |
| 162,369,985 |
|
| Issued in reinvestment of distributions | 3,426,134 |
| 30,585,564 |
| 2,424,776 |
| 19,519,689 |
|
| Redeemed | (15,805,023 | ) | (141,358,094 | ) | (6,008,060 | ) | (49,457,118 | ) |
| | 24,638,364 |
| 222,294,629 |
| 15,730,901 |
| 132,432,556 |
|
| Net increase (decrease) | 220,163,324 |
| $ | 1,945,344,324 |
| 6,836,515 |
| $ | (995,331 | ) |
6. Affiliated Company Transactions
If a fund's holding represents ownership of 5% or more of the voting securities of a company, the company is affiliated as defined in the 1940 Act. A summary of transactions for each company which is or was an affiliate at or during the year ended March 31, 2017 follows:
|
| | | | | | | | | | | | | | | | | | |
| Company | Beginning Value | Purchase
Cost | Sales Cost | Realized
Gain (Loss) | Dividend
Income | Ending Value |
| Capitol Federal Financial, Inc. | $ | 160,106,266 |
| $ | 337,094 |
| $ | 24,251,267 |
| $ | 6,032,068 |
| $ | 10,522,159 |
| $ | 148,921,389 |
|
| ONE Gas, Inc. | 218,755,902 |
| 12,998,040 |
| 13,033,788 |
| 6,739,995 |
| 5,076,955 |
| 235,879,249 |
|
| | $ | 378,862,168 |
| $ | 13,335,134 |
| $ | 37,285,055 |
| $ | 12,772,063 |
| $ | 15,599,114 |
| $ | 384,800,638 |
|
7. Fair Value Measurements
The fund’s investments valuation process is based on several considerations and may use multiple inputs to determine the fair value of the investments held by the fund. In conformity with accounting principles generally accepted in the United States of America, the inputs used to determine a valuation are classified into three broad levels.
| |
| • | Level 1 valuation inputs consist of unadjusted quoted prices in an active market for identical investments. |
| |
| • | Level 2 valuation inputs consist of direct or indirect observable market data (including quoted prices for comparable investments, evaluations of subsequent market events, interest rates, prepayment speeds, credit risk, etc.). These inputs also consist of quoted prices for identical investments initially expressed in local currencies that are adjusted through translation into U.S. dollars. |
| |
| • | Level 3 valuation inputs consist of unobservable data (including a fund’s own assumptions). |
The level classification is based on the lowest level input that is significant to the fair valuation measurement. The valuation inputs are not necessarily an indication of the risks associated with investing in these securities or other financial instruments. There were no significant transfers between levels during the period.
The following is a summary of the level classifications as of period end. The Schedule of Investments provides additional information on the fund’s portfolio holdings.
|
| | | | | | | | |
| | Level 1 | Level 2 | Level 3 |
| Assets | | | |
| Investment Securities | | | |
| Common Stocks | | | |
| Oil, Gas and Consumable Fuels | $ | 1,169,532,595 |
| $ | 387,536,844 |
| — |
|
| Personal Products | — |
| 110,331,269 |
| — |
|
| Pharmaceuticals | 866,462,002 |
| 127,663,775 |
| — |
|
| Other Industries | 7,031,256,224 |
| — |
| — |
|
| Convertible Bonds | — |
| 739,314,572 |
| — |
|
| Preferred Stocks | 88,282,050 |
| 577,116,930 |
| — |
|
| Convertible Preferred Stocks | — |
| 506,473,364 |
| — |
|
| Exchange-Traded Funds | 298,728,132 |
| — |
| — |
|
| Temporary Cash Investments | 77,915 |
| 295,929,331 |
| — |
|
| | $ | 9,454,338,918 |
| $ | 2,744,366,085 |
| — |
|
| Other Financial Instruments | | | |
| Forward Foreign Currency Exchange Contracts | — |
| $ | 8,205,130 |
| — |
|
8. Derivative Instruments
Foreign Currency Risk — The fund is subject to foreign currency exchange rate risk in the normal course of pursuing its investment objectives. The value of foreign investments held by a fund may be significantly affected by changes in foreign currency exchange rates. The dollar value of a foreign security generally decreases when the value of the dollar rises against the foreign currency in which the security is denominated and tends to increase when the value of the dollar declines against such foreign currency. A fund may enter into forward foreign currency exchange contracts to reduce a fund's exposure to foreign currency exchange rate fluctuations. The net U.S. dollar value of foreign currency underlying all contractual commitments held by a fund and the resulting unrealized appreciation or depreciation are determined daily. Realized gain or loss is recorded upon the termination of the contract. Net realized and unrealized gains or losses occurring during the holding period of forward foreign currency exchange contracts are a component of net realized gain (loss) on foreign currency transactions and change in net unrealized appreciation (depreciation) on translation of assets and liabilities in foreign currencies, respectively. A fund bears the risk of an unfavorable change in the foreign currency exchange rate underlying the forward contract. Additionally, losses, up to the fair value, may arise if the counterparties do not perform under the contract terms. The fund's average U.S. dollar exposure to foreign currency risk derivative instruments held during the period was $325,073,159.
The value of foreign currency risk derivative instruments as of March 31, 2017, is disclosed on the Statement of Assets and Liabilities as an asset of $8,205,130 in unrealized appreciation on forward foreign currency exchange contracts. For the year ended March 31, 2017, the effect of foreign currency risk derivative instruments on the Statement of Operations was $6,967,545 in net realized gain (loss) on foreign currency transactions and $11,501,781 in change in net unrealized appreciation (depreciation) on translation of assets and liabilities in foreign currencies.
9. Risk Factors
There are certain risks involved in investing in foreign securities. These risks include those resulting from future adverse political, social and economic developments, fluctuations in currency exchange rates, the possible imposition of exchange controls, and other foreign laws or restrictions.
10. Federal Tax Information
The tax character of distributions paid during the years ended March 31, 2017 and March 31, 2016 were as follows:
|
| | | | | | |
| | 2017 | 2016 |
| Distributions Paid From | | |
| Ordinary income | $ | 358,935,958 |
| $ | 252,510,096 |
|
| Long-term capital gains | $ | 529,980,853 |
| $ | 600,232,434 |
|
The book-basis character of distributions made during the year from net investment income or net realized gains may differ from their ultimate characterization for federal income tax purposes. These differences reflect the differing character of certain income items and net realized gains and losses for financial statement and tax purposes, and may result in reclassification among certain capital accounts on the financial statements.
As of March 31, 2017, the federal tax cost of investments and the components of distributable earnings on a tax-basis were as follows:
|
| | | |
| Federal tax cost of investments | $ | 10,395,140,067 |
|
| Gross tax appreciation of investments | $ | 1,864,516,876 |
|
| Gross tax depreciation of investments | (60,951,940 | ) |
| Net tax appreciation (depreciation) of investments | 1,803,564,936 |
|
| Net tax appreciation (depreciation) on derivatives and translation of assets and liabilities in foreign currencies | (72,143 | ) |
| Net tax appreciation (depreciation) | $ | 1,803,492,793 |
|
| Undistributed ordinary income | $ | 178,604,095 |
|
| Accumulated long-term gains | $ | 428,559,782 |
|
The difference between book-basis and tax-basis unrealized appreciation (depreciation) is attributable primarily to the tax deferral of losses on wash sales.
11. Recently Issued Accounting Guidance
In October 2016, the Securities and Exchange Commission adopted new rules and forms as well as amendments to its rules and forms to modernize the reporting and disclosure of information by registered investment companies. The amendments to Regulation S-X will require standardized, enhanced disclosure about derivatives in investment company financial statements, as well as other provisions. Compliance with the amendments is effective on August 1, 2017. Management is currently evaluating the impact that adopting the amendments will have on the financial statement disclosures.
12. Corporate Event
The Institutional Class was renamed to the I Class effective April 10, 2017.
|
| | | | | | | | | | | | | | | |
| For a Share Outstanding Throughout the Years Ended March 31 (except as noted) | | | | |
| Per-Share Data | | | | | | | Ratios and Supplemental Data |
| | | Income From Investment Operations: | Distributions From: | | | Ratio to Average Net Assets of: | | |
| | Net Asset
Value,
Beginning
of Period | Net
Investment
Income
(Loss)(1) | Net
Realized
and
Unrealized
Gain (Loss) | Total From
Investment
Operations | Net
Investment
Income | Net
Realized
Gains | Total
Distributions | Net Asset
Value,
End
of Period | Total
Return(2) | Operating
Expenses(6) | Net
Investment
Income
(Loss) | Portfolio
Turnover
Rate | Net
Assets,
End of
Period
(in thousands) |
| Investor Class | | | | | | | | | | | | |
| 2017 | $8.41 | 0.17 | 1.24 | 1.41 | (0.17) | (0.52) | (0.69) | $9.13 | 17.14% | 0.91% | 1.91% | 93% |
| $7,327,473 |
|
| 2016 | $8.71 | 0.21 | 0.32 | 0.53 | (0.20) | (0.63) | (0.83) | $8.41 | 6.78% | 0.94% | 2.44% | 88% |
| $5,399,702 |
|
| 2015 | $8.84 | 0.21 | 0.54 | 0.75 | (0.22) | (0.66) | (0.88) | $8.71 | 8.54% | 0.93% | 2.30% | 56% |
| $5,463,566 |
|
| 2014 | $8.47 | 0.20 | 0.92 | 1.12 | (0.20) | (0.55) | (0.75) | $8.84 | 13.64% | 0.93% | 2.31% | 57% |
| $5,406,362 |
|
| 2013 | $7.69 | 0.21 | 0.86 | 1.07 | (0.21) | (0.08) | (0.29) | $8.47 | 14.33% | 0.93% | 2.63% | 83% |
| $5,504,359 |
|
| Institutional Class | | | | | | | | | | | | |
| 2017 | $8.42 | 0.19 | 1.24 | 1.43 | (0.19) | (0.52) | (0.71) | $9.14 | 17.36% | 0.71% | 2.11% | 93% |
| $1,515,758 |
|
| 2016 | $8.71 | 0.22 | 0.34 | 0.56 | (0.22) | (0.63) | (0.85) | $8.42 | 7.11% | 0.74% | 2.64% | 88% |
| $1,229,940 |
|
| 2015 | $8.85 | 0.22 | 0.54 | 0.76 | (0.24) | (0.66) | (0.90) | $8.71 | 8.63% | 0.73% | 2.50% | 56% |
| $1,318,193 |
|
| 2014 | $8.47 | 0.22 | 0.92 | 1.14 | (0.21) | (0.55) | (0.76) | $8.85 | 13.85% | 0.73% | 2.51% | 57% |
| $1,422,725 |
|
| 2013 | $7.69 | 0.22 | 0.87 | 1.09 | (0.23) | (0.08) | (0.31) | $8.47 | 14.69% | 0.73% | 2.83% | 83% |
| $1,527,723 |
|
| A Class | | | | | | | | | | | | | |
| 2017 | $8.41 | 0.15 | 1.24 | 1.39 | (0.15) | (0.52) | (0.67) | $9.13 | 16.85% | 1.16% | 1.66% | 93% |
| $2,139,411 |
|
| 2016 | $8.71 | 0.18 | 0.33 | 0.51 | (0.18) | (0.63) | (0.81) | $8.41 | 6.51% | 1.19% | 2.19% | 88% |
| $1,934,681 |
|
| 2015 | $8.84 | 0.18 | 0.55 | 0.73 | (0.20) | (0.66) | (0.86) | $8.71 | 8.27% | 1.18% | 2.05% | 56% |
| $2,172,105 |
|
| 2014 | $8.47 | 0.18 | 0.91 | 1.09 | (0.17) | (0.55) | (0.72) | $8.84 | 13.36% | 1.18% | 2.06% | 57% |
| $2,722,731 |
|
| 2013 | $7.69 | 0.19 | 0.86 | 1.05 | (0.19) | (0.08) | (0.27) | $8.47 | 14.05% | 1.18% | 2.38% | 83% |
| $2,631,737 |
|
|
| | | | | | | | | | | | | | | |
| For a Share Outstanding Throughout the Years Ended March 31 (except as noted) | | | | |
| Per-Share Data | | | | | | | Ratios and Supplemental Data |
| | | Income From Investment Operations: | Distributions From: | | | Ratio to Average Net Assets of: | | |
| | Net Asset
Value,
Beginning
of Period | Net
Investment
Income
(Loss)(1) | Net
Realized
and
Unrealized
Gain (Loss) | Total From
Investment
Operations | Net
Investment
Income | Net
Realized
Gains | Total
Distributions | Net Asset
Value,
End
of Period | Total
Return(2) | Operating
Expenses(6) | Net
Investment
Income
(Loss) | Portfolio
Turnover
Rate | Net
Assets,
End of
Period
(in thousands) |
| C Class | | | | | | | | | | | | | |
| 2017 | $8.41 | 0.08 | 1.24 | 1.32 | (0.08) | (0.52) | (0.60) | $9.13 | 15.97% | 1.91% | 0.91% | 93% |
| $711,149 |
|
| 2016 | $8.71 | 0.12 | 0.33 | 0.45 | (0.12) | (0.63) | (0.75) | $8.41 | 5.72% | 1.94% | 1.44% | 88% |
| $562,723 |
|
| 2015 | $8.84 | 0.12 | 0.54 | 0.66 | (0.13) | (0.66) | (0.79) | $8.71 | 7.47% | 1.93% | 1.30% | 56% |
| $549,088 |
|
| 2014 | $8.47 | 0.12 | 0.91 | 1.03 | (0.11) | (0.55) | (0.66) | $8.84 | 12.53% | 1.93% | 1.31% | 57% |
| $521,688 |
|
| 2013 | $7.69 | 0.13 | 0.86 | 0.99 | (0.13) | (0.08) | (0.21) | $8.47 | 13.21% | 1.93% | 1.63% | 83% |
| $467,913 |
|
| R Class | | | | | | | | | | | | | |
| 2017 | $8.39 | 0.13 | 1.22 | 1.35 | (0.12) | (0.52) | (0.64) | $9.10 | 16.48% | 1.41% | 1.41% | 93% |
| $114,762 |
|
| 2016 | $8.69 | 0.16 | 0.33 | 0.49 | (0.16) | (0.63) | (0.79) | $8.39 | 6.27% | 1.44% | 1.94% | 88% |
| $105,462 |
|
| 2015 | $8.82 | 0.16 | 0.54 | 0.70 | (0.17) | (0.66) | (0.83) | $8.69 | 8.03% | 1.43% | 1.80% | 56% |
| $127,897 |
|
| 2014 | $8.45 | 0.16 | 0.91 | 1.07 | (0.15) | (0.55) | (0.70) | $8.82 | 13.12% | 1.43% | 1.81% | 57% |
| $169,852 |
|
| 2013 | $7.67 | 0.17 | 0.86 | 1.03 | (0.17) | (0.08) | (0.25) | $8.45 | 13.81% | 1.43% | 2.13% | 83% |
| $179,855 |
|
| R6 Class | | | | | | | | | | | | | |
| 2017 | $8.42 | 0.20 | 1.25 | 1.45 | (0.20) | (0.52) | (0.72) | $9.15 | 17.66% | 0.56% | 2.26% | 93% |
| $492,622 |
|
| 2016 | $8.72 | 0.24 | 0.32 | 0.56 | (0.23) | (0.63) | (0.86) | $8.42 | 7.14% | 0.59% | 2.79% | 88% |
| $246,151 |
|
| 2015 | $8.85 | 0.25 | 0.53 | 0.78 | (0.25) | (0.66) | (0.91) | $8.72 | 8.90% | 0.58% | 2.65% | 56% |
| $117,620 |
|
2014(3) | $8.94 | 0.17 | 0.46 | 0.63 | (0.17) | (0.55) | (0.72) | $8.85 | 7.41% | 0.58%(4) | 2.93%(4) | 57%(5) |
| $26,550 |
|
|
| | | | |
| Notes to Financial Highlights | | |
| |
| (1) | Computed using average shares outstanding throughout the period. |
| |
| (2) | Total returns are calculated based on the net asset value of the last business day and do not reflect applicable sales charges, if any. Total returns for periods less than one year are not annualized. |
| |
| (3) | July 26, 2013 (commencement of sale) through March 31, 2014. |
| |
| (5) | Portfolio turnover is calculated at the fund level. Percentage indicated was calculated for the year ended March 31, 2014. |
| |
| (6) | Ratio of operating expenses to average net assets does not include any fees and expenses of the acquired funds. |
See Notes to Financial Statements.
|
|
| Report of Independent Registered Public Accounting Firm |
To the Board of Directors and Shareholders of American Century Capital Portfolios, Inc.:
We have audited the accompanying statement of assets and liabilities, including the schedule of investments, of Equity Income Fund (the “Fund”), one of the funds constituting American Century Capital Portfolios, Inc., as of March 31, 2017, and the related statement of operations for the year then ended, the statements of changes in net assets for each of the two years in the period then ended, and the financial highlights for each of the periods presented. These financial statements and financial highlights are the responsibility of the Fund's management. Our responsibility is to express an opinion on these financial statements and financial highlights based on our audits.
We conducted our audits in accordance with the standards of the Public Company Accounting Oversight Board (United States). Those standards require that we plan and perform the audit to obtain reasonable assurance about whether the financial statements and financial highlights are free of material misstatement. The Fund is not required to have, nor were we engaged to perform, an audit of its internal control over financial reporting. Our audits included consideration of internal control over financial reporting as a basis for designing audit procedures that are appropriate in the circumstances, but not for the purpose of expressing an opinion on the effectiveness of the Fund's internal control over financial reporting. Accordingly, we express no such opinion. An audit also includes examining, on a test basis, evidence supporting the amounts and disclosures in the financial statements, assessing the accounting principles used and significant estimates made by management, as well as evaluating the overall financial statement presentation. Our procedures included confirmation of securities owned as of March 31, 2017, by correspondence with the custodian and brokers; when replies were not received from brokers, we performed other auditing procedures. We believe that our audits provide a reasonable basis for our opinion.
In our opinion, the financial statements and financial highlights referred to above present fairly, in all material respects, the financial position of Equity Income Fund of American Century Capital Portfolios, Inc. as of March 31, 2017, the results of its operations for the year then ended, the changes in its net assets for each of the two years in the period then ended, and the financial highlights for each of the periods presented, in conformity with accounting principles generally accepted in the United States of America.
DELOITTE & TOUCHE LLP
Kansas City, Missouri May 16, 2017
The Board of Directors
The individuals listed below serve as directors of the funds. Each director will continue to serve in this capacity until death, retirement, resignation or removal from office. The board has adopted a mandatory retirement age for directors who are not “interested persons,” as that term is defined in the Investment Company Act (independent directors). Independent directors shall retire by December 31 of the year in which they reach their 75th birthday.
Mr. Thomas is an “interested person” because he currently serves as President and Chief Executive Officer of American Century Companies, Inc. (ACC), the parent company of American Century Investment Management, Inc. (ACIM or the advisor). The other directors (more than three-fourths of the total number) are independent. They are not employees, directors or officers of, and have no financial interest in, ACC or any of its wholly owned, direct or indirect, subsidiaries, including ACIM, American Century Investment Services, Inc. (ACIS) and American Century Services, LLC (ACS), and they do not have any other affiliations, positions or relationships that would cause them to be considered “interested persons” under the Investment Company Act. The directors serve in this capacity for seven (in the case of Mr. Thomas, 15) registered investment companies in the American Century Investments family of funds.
The following table presents additional information about the directors. The mailing address for each director is 4500 Main Street, Kansas City, Missouri 64111.
|
| | | | | |
Name
(Year of Birth) | Position(s) Held with Funds | Length of Time Served | Principal Occupation(s) During Past 5 Years | Number of American Century Portfolios Overseen by Director | Other Directorships Held During Past 5 Years |
| Independent Directors |
|
|
| Thomas W. Bunn (1953) | Advisory Board Director | Since 2017 | Retired | 81 | SquareTwo Financial; Barings (formerly Babson Capital Funds Trust) (2013 to 2016) |
Barry Fink
(1955) | Director | Since 2012 (independent since 2016) | Retired; Executive Vice President, ACC (2007 to 2013); President, ACS (2007 to 2013); Chief Operating Officer, ACC (2007 to 2012) | 81 | None |
Andrea C. Hall
(1945) | Director | Since 1997 | Retired | 81 | None |
Jan M. Lewis
(1957) | Director | Since 2011 | Retired; President and Chief Executive Officer, Catholic Charities of Northeast Kansas (human services organization) (2006 to 2013) | 81 | None |
James A. Olson
(1942) | Director and Chairman of the Board | Since 2007 (Chairman since 2014) | Member, Plaza Belmont LLC (private equity fund manager) (1999 to present) | 81 | Saia, Inc. (2002 to 2012) and EPR Properties (2003 to 2013) |
|
| | | | | |
Name
(Year of Birth) | Position(s) Held with Funds | Length of Time Served | Principal Occupation(s) During Past 5 Years | Number of American Century Portfolios Overseen by Director | Other Directorships Held During Past 5 Years |
| Independent Directors |
|
|
M. Jeannine Strandjord
(1945) | Director | Since 1994 | Retired | 81 | Euronet Worldwide Inc.; MGP Ingredients, Inc.; and DST Systems Inc. (1996 to 2012) |
John R. Whitten
(1946) | Director | Since 2008 | Retired | 81 | Rudolph Technologies, Inc. |
Stephen E. Yates
(1948) | Director | Since 2012 | Retired | 81 | None |
| Interested Director |
|
|
Jonathan S. Thomas
(1963) | Director and President | Since 2007 | President and Chief Executive Officer, ACC (2007 to present). Also serves as Chief Executive Officer, ACS; Executive Vice President, ACIM; Director, ACC, ACIM and other ACC subsidiaries | 126 | BioMed Valley Discoveries, Inc. |
The Statement of Additional Information has additional information about the fund's directors and is available without charge, upon request, by calling 1-800-345-2021.
Officers
The following table presents certain information about the executive officers of the funds. Each officer serves as an officer for each of the 15 investment companies in the American Century family of funds, unless otherwise noted. No officer is compensated for his or her service as an officer of the funds. The listed officers are interested persons of the funds and are appointed or re-appointed on an annual basis. The mailing address for each officer listed below is 4500 Main Street, Kansas City, Missouri 64111.
|
| | |
Name
(Year of Birth) | Offices with the Funds | Principal Occupation(s) During the Past Five Years |
Jonathan S. Thomas
(1963) | Director and President since 2007 | President and Chief Executive Officer, ACC (2007 to present). Also serves as Chief Executive Officer, ACS; Executive Vice President, ACIM; Director, ACC, ACIM and other ACC subsidiaries |
Amy D. Shelton
(1964) | Chief Compliance Officer and Vice President since 2014 | Chief Compliance Officer, American Century funds, (2014 to present); Chief Compliance Officer, ACIM (2014 to present); Chief Compliance Officer, ACIS (2009 to present); Vice President, Client Interactions and Marketing, ACIS (2013 to 2014); Director, Client Interactions and Marketing, ACIS (2007 to 2013). Also serves as Vice President, ACIS |
Charles A. Etherington
(1957) | General Counsel since 2007 and Senior Vice President since 2006 | Attorney, ACC (1994 to present); Vice President, ACC (2005 to present); General Counsel, ACC (2007 to present). Also serves as General Counsel, ACIM, ACS, ACIS and other ACC subsidiaries; and Senior Vice President, ACIM and ACS |
C. Jean Wade
(1964) | Vice President,Treasurer and Chief Financial Officer since 2012 | Vice President, ACS (2000 to present) |
Robert J. Leach
(1966) | Vice President since 2006 and Assistant Treasurer since 2012 | Vice President, ACS (2000 to present) |
David H. Reinmiller
(1963) | Vice President since 2000 | Attorney, ACC (1994 to present); Associate General Counsel, ACC (2001 to present). Also serves as Vice President, ACIM and ACS |
Ward D. Stauffer
(1960) | Secretary since 2005 | Attorney, ACC (2003 to present) |
Retirement Account Information
As required by law, distributions you receive from certain IRAs are subject to federal income tax withholding, unless you elect not to have withholding apply. Tax will be withheld on the total amount withdrawn even though you may be receiving amounts that are not subject to withholding, such as nondeductible contributions. In such case, excess amounts of withholding could occur. You may adjust your withholding election so that a greater or lesser amount will be withheld.
If you don’t want us to withhold on this amount, you must notify us to not withhold the federal income tax. You may notify us in writing or in certain situations by telephone or through other electronic means. For systematic withdrawals, your withholding election will remain in effect until revoked or changed by filing a new election. You have the right to revoke your election at any time.
Remember, even if you elect not to have income tax withheld, you are liable for paying income tax on the taxable portion of your withdrawal. If you elect not to have income tax withheld or you don’t have enough income tax withheld, you may be responsible for payment of estimated tax. You may incur penalties under the estimated tax rules if your withholding and estimated tax payments are not sufficient. You can reduce or defer the income tax on a distribution by directly or indirectly rolling such distribution over to another IRA or eligible plan. You should consult your tax advisor for additional information.
State tax will be withheld if, at the time of your distribution, your address is within one of the mandatory withholding states and you have federal income tax withheld (or as otherwise required by state law). State taxes will be withheld from your distribution in accordance with the respective state rules.
Distributions you receive from 403(b), 457 and qualified plans are subject to special tax and withholding rules. Your plan administrator or plan sponsor is required to provide you with a special tax notice explaining those rules at the time you request a distribution. If applicable, federal and/or state taxes may be withheld from your distribution amount.
Proxy Voting Policies
A description of the policies that the fund's investment advisor uses in exercising the voting rights associated with the securities purchased and/or held by the fund is available without charge, upon request, by calling 1-800-345-2021. It is also available on the "About Us" page of American Century Investments’ website at americancentury.com and on the Securities and Exchange Commission’s website at sec.gov. Information regarding how the investment advisor voted proxies relating to portfolio securities during the most recent 12-month period ended June 30 is available on the "About Us" page at americancentury.com. It is also available at sec.gov.
Quarterly Portfolio Disclosure
The fund files its complete schedule of portfolio holdings with the Securities and Exchange Commission (SEC) for the first and third quarters of each fiscal year on Form N-Q. The fund’s Forms N-Q are available on the SEC’s website at sec.gov, and may be reviewed and copied at the SEC’s Public Reference Room in Washington, DC. Information on the operation of the Public Reference Room may be obtained by calling 1-800-SEC-0330. The fund also makes its complete schedule of portfolio holdings for the most recent quarter of its fiscal year available on its website at americancentury.com and, upon request, by calling 1-800-345-2021.
Other Tax Information
The following information is provided pursuant to provisions of the Internal Revenue Code.
The fund hereby designates up to the maximum amount allowable as qualified dividend income for the fiscal year ended March 31, 2017.
For corporate taxpayers, the fund hereby designates $244,299,479, or up to the maximum amount allowable, of ordinary income distributions paid during the fiscal year ended March 31, 2017 as qualified for the corporate dividends received deduction.
The fund hereby designates $161,697,664 as qualified short-term capital gain distributions for purposes of Internal Revenue Code Section 871 for the fiscal year ended March 31, 2017.
The fund hereby designates $562,060,787, or up to the maximum amount allowable, as long-term capital gain distributions (20% rate gain distributions) for the fiscal year ended March 31, 2017.
The fund utilized earnings and profits of $54,974,967 distributed to shareholders on redemption of shares as part of the dividends paid deduction (tax equalization).
|
| | |
| |
| | | |
| Contact Us | americancentury.com | |
| Automated Information Line | 1-800-345-8765 | |
| Investor Services Representative | 1-800-345-2021 or 816-531-5575 | |
| Investors Using Advisors | 1-800-378-9878 | |
| Business, Not-For-Profit, Employer-Sponsored Retirement Plans | 1-800-345-3533 | |
| Banks and Trust Companies, Broker-Dealers, Financial Professionals, Insurance Companies | 1-800-345-6488 | |
| Telecommunications Relay Service for the Deaf | 711 | |
| | | |
| American Century Capital Portfolios, Inc. | |
| | | |
Investment Advisor: American Century Investment Management, Inc. Kansas City, Missouri | |
| | | |
| This report and the statements it contains are submitted for the general information of our shareholders. The report is not authorized for distribution to prospective investors unless preceded or accompanied by an effective prospectus. | |
| | | |
©2017 American Century Proprietary Holdings, Inc. All rights reserved.
CL-ANN-92268 1705 | |
|
| |
| | |
| | Annual Report |
| | |
| | March 31, 2017 |
| | |
| | Large Company Value Fund |
|
| |
| President’s Letter | 2 |
| Performance | 3 |
| Portfolio Commentary | |
| Fund Characteristics | |
| Shareholder Fee Example | |
| Schedule of Investments | |
| Statement of Assets and Liabilities | |
| Statement of Operations | |
| Statement of Changes in Net Assets | |
| Notes to Financial Statements | |
| Financial Highlights | |
| Report of Independent Registered Public Accounting Firm | |
| Management | |
| Additional Information | |
Any opinions expressed in this report reflect those of the author as of the date of the report, and do not necessarily represent the opinions of American Century Investments® or any other person in the American Century Investments organization. Any such opinions are subject to change at any time based upon market or other conditions and American Century Investments disclaims any responsibility to update such opinions. These opinions may not be relied upon as investment advice and, because investment decisions made by American Century Investments funds are based on numerous factors, may not be relied upon as an indication of trading intent on behalf of any American Century Investments fund. Security examples are used for representational purposes only and are not intended as recommendations to purchase or sell securities. Performance information for comparative indices and securities is provided to American Century Investments by third party vendors. To the best of American Century Investments’ knowledge, such information is accurate at the time of printing.
Jonathan Thomas
Dear Investor:
Thank you for reviewing this annual report for the period ended March 31, 2017. Annual reports help convey important information about fund returns, including market factors that affected performance during the reporting period. For additional, updated investment and market insights, we encourage you to visit our website, americancentury.com.
Risk-On Rebound From Global Economic Concerns of Early 2016
Stocks, high-yield bonds, and commodities rebounded from severe downturns in early 2016 that were triggered by China’s economic slowdown. Since then, growth conditions in China and the rest of the world have generally improved. For the reporting period, the S&P 500 Index, the Bloomberg Barclays U.S. Corporate High-Yield Bond Index, and the S&P Goldman Sachs Commodities Index returned 17.17%, 16.39%, and 8.45%, respectively. This risk-on rebound also drove government bond yields higher, resulting in declines for indices such as the Bloomberg Barclays U.S. Treasury Bond Index (-1.44%). The broader taxable investment-grade U.S. bond market performed better, but still significantly underperformed stocks; the Bloomberg Barclays U.S. Aggregate Bond Index returned 0.44%.
Investors could thank the world’s major central banks and the “Trump Trade” for the risk-on rebound, which occurred with a backdrop of landmark political events, including Brexit (the U.K. vote to leave the European Union) and Donald Trump’s U.S. presidential election victory. Central bank stimulus helped to propel the markets past China- and Brexit-related volatility, followed by Trump victory-inspired optimism about U.S. growth that further boosted higher-risk markets.
But the Trump Trade could prove to be double edged—investor optimism faded as health care reform stalled in Congress and other U.S. fiscal policy proposals looked like they’d face significant hurdles. Meanwhile, the Federal Reserve raised its interest rate target during the reporting period, and suggested that it might raise rates again and start gradually reducing its balance sheet by the end of 2017. These factors, plus rising inflation and continuing geopolitical risks, could impede further risk-on sentiment. In this unsettled environment, we believe in remaining focused on investment goals, using disciplined, actively managed, risk-aware strategies. We appreciate your continued trust in us.
Sincerely,
Jonathan Thomas
President and Chief Executive Officer
American Century Investments
|
| | | | | | |
| Total Returns as of March 31, 2017 |
| | | | Average Annual Returns | |
| | Ticker Symbol | 1 year | 5 years | 10 years | Since Inception | Inception Date |
| Investor Class | ALVIX | 19.44% | 12.34% | 5.29% | — | 7/30/99 |
| Russell 1000 Value Index | — | 19.22% | 13.12% | 5.93% | — | — |
| S&P 500 Index | — | 17.17% | 13.29% | 7.50% | — | — |
| Institutional Class | ALVSX | 19.80% | 12.55% | 5.51% | — | 8/10/01 |
| A Class | ALPAX | | | |
| 10/26/00 |
| No sales charge | | 19.28% | 12.06% | 5.03% | — | |
| With sales charge | | 12.45% | 10.75% | 4.41% | — | |
| C Class | ALPCX | 18.36% | 11.24% | 4.25% | — | 11/7/01 |
| R Class | ALVRX | 18.95% | 11.77% | 4.76% | — | 8/29/03 |
| R6 Class | ALVDX | 19.98% | — | — | 9.81% | 7/26/13 |
Average annual returns since inception are presented when ten years of performance history is not available.
Prior to December 3, 2007, the A Class was referred to as the Advisor Class and did not have a front-end sales charge. Performance prior to that date has been adjusted to reflect this charge.
Sales charges include initial sales charges and contingent deferred sales charges (CDSCs), as applicable. A Class shares have a 5.75% maximum initial sales charge and may be subject to a maximum CDSC of 1.00%. C Class shares redeemed within 12 months of purchase are subject to a maximum CDSC of 1.00%. The SEC requires that mutual funds provide performance information net of maximum sales charges in all cases where charges could be applied.
Data presented reflect past performance. Past performance is no guarantee of future results. Current performance may be higher or lower than the performance shown. Total returns for periods less than one year are not annualized. Investment return and principal value will fluctuate, and redemption value may be more or less than original cost. Data assumes reinvestment of dividends and capital gains, and none of the charts reflect the deduction of taxes that a shareholder would pay on fund distributions or the redemption of fund shares. To obtain performance data current to the most recent month end, please call 1-800-345-2021 or visit americancentury.com. For additional information about the fund, please consult the prospectus.
|
|
| Growth of $10,000 Over 10 Years |
| $10,000 investment made March 31, 2007 |
Performance for other share classes will vary due to differences in fee structure.
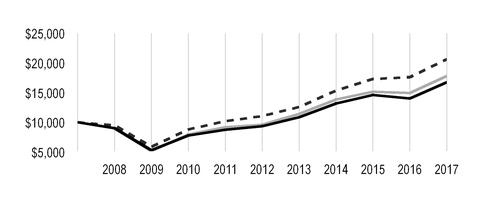
|
| |
| Value on March 31, 2017 |
| | Investor Class — $16,756 |
| |
| | Russell 1000 Value Index — $17,793 |
| |
| | S&P 500 Index — $20,627 |
| |
|
| | | | | |
| Total Annual Fund Operating Expenses |
| Investor Class | Institutional Class | A Class | C Class | R Class | R6 Class |
| 0.84% | 0.64% | 1.09% | 1.84% | 1.34% | 0.49% |
The total annual fund operating expenses shown is as stated in the fund’s prospectus current as of the date of this report. The prospectus may vary from the expense ratio shown elsewhere in this report because it is based on a different time period, includes acquired fund fees and expenses, and, if applicable, does not include fee waivers or expense reimbursements.
Data presented reflect past performance. Past performance is no guarantee of future results. Current performance may be higher or lower than the performance shown. Total returns for periods less than one year are not annualized. Investment return and principal value will fluctuate, and redemption value may be more or less than original cost. Data assumes reinvestment of dividends and capital gains, and none of the charts reflect the deduction of taxes that a shareholder would pay on fund distributions or the redemption of fund shares. To obtain performance data current to the most recent month end, please call 1-800-345-2021 or visit americancentury.com. For additional information about the fund, please consult the prospectus.
Portfolio Managers: Brendan Healy and Brian Woglom
Performance Summary
Large Company Value returned 19.44%* for the fiscal year ended March 31, 2017, compared with the 19.22% return of its benchmark, the Russell 1000 Value Index.
Value stocks outperformed growth stocks across the capitalization spectrum during the 12-month period, providing a tailwind for the fund’s performance. Within the Russell 1000 Value Index, every sector posted positive returns, led by financials, materials, information technology, and industrials, which returned more than 20% each. The weakest sectors were real estate, telecommunication services, utilities, and consumer discretionary. The fund recorded positive absolute contributions from all sectors except real estate and telecommunication services. Absolute returns were led by financials holdings.
The fund’s outperformance relative to the benchmark was driven by a significant underweight to utilities and stock selection in the sector. Stock decisions in industrials and information technology were also positive, as was a substantial underweight to real estate. Stock selection among consumer discretionary and health care stocks and overweights in those sectors detracted.
Utilities and Industrials Benefited Performance
An underweight in utilities and stock decisions in the sector were positive. Westar Energy surged on the announcement of its acquisition by Great Plains Energy. The stock was eliminated from the portfolio as a result. An underweight position in General Electric (GE) was a key contributor in industrials. The stock underperformed after the company reported disappointing fourth-quarter results. Investors also had concerns about pricing of orders, margin improvement, and the adequacy of GE’s free cash generation relative to its earnings per share.
Security selection in information technology was a top contributor to relative performance, particularly in the semiconductors and semiconductor equipment industry. Applied Materials and Lam Research were top individual contributors due to strength in orders. Underweighting Microsoft was a key contributor. We had no exposure in April 2016 when the stock declined after the company offered a weak earnings report. In March 2017 we purchased the stock, which is no longer in the benchmark.
Elsewhere, the portfolio benefited from its underweight position in Exxon Mobil, as the stock underperformed many other energy securities. Despite operational results that were generally in line with expectations, the company’s valuation fell. PNC Financial Services was a significant contributor in the financials sector. Financials performed well following the November presidential election on optimism about economic growth, higher interest rates, and reduced regulation.
Consumer Discretionary and Health Care Holdings Detracted
Security selection and an overweight in consumer discretionary detracted from performance. Exposure to specialty retailer Advance Auto Parts weighed on performance as the stock fell after the company reported weak results and on concerns that the company’s margin improvement will take longer to occur.
| |
| * | All fund returns referenced in this commentary are for Investor Class shares. Performance for other share classes will vary due to differences in fee structure; when Investor Class performance exceeds that of the fund's benchmark, other share classes may not. See page 3 for returns for all share classes. |
In the health care sector, exposure to Teva Pharmaceutical Industries detracted. The stock declined due to generic pricing worries and negative sentiment surrounding pharmaceutical stocks. Worries about Teva’s biggest specialty drug, Copaxone, and when its patent will expire have also weighed on the stock. We believe that the worst of the generic pricing headwind has passed and that the worst-case scenario for Copaxone is priced into the stock.
CVS Health, a retail pharmacy and health care company, declined after the company provided much lighter-than-expected guidance because of two lost contracts. This will have a larger impact on margins and earnings than the consensus was anticipating. We view this as a transitory issue.
Energy stocks Imperial Oil and Occidental Petroleum were among the largest individual detractors from performance. Imperial Oil fell as oil prices declined on concerns regarding potential oversupply of oil in 2018. Also, the company missed production numbers due to unexpected downtime at one of its operations. We believe this is a one-time event. Weakness in the energy sector created concerns about the sustainability of Occidental’s dividend payment. We think the dividend is sustainable due to the company’s healthy balance sheet and underappreciated asset position and quality.
Not owning Citigroup and Morgan Stanley detracted, as interest rate-sensitive financials rose, primarily a result of higher interest rates and expectations for a favorable economic environment.
Portfolio Positioning
We continue to use our fundamental analysis, risk/reward framework, and proprietary valuation model to invest primarily in the stocks of large companies we believe to be undervalued. The portfolio’s largest overweights are in the health care and energy sectors, and its largest underweights are in the real estate, utilities, and financials sectors.
Concerns regarding the potential repeal/reform of the Affordable Care Act pressured the health care sector in the fourth quarter of 2016. This created investment opportunities as valuations became more attractive. Energy was the worst-performing sector in the index in the first quarter of 2017 due to weaker oil and gas prices and concerns about potential oversupply in 2018, again creating more-attractive valuations in the sector.
Many real estate stocks appear overvalued on our valuation methodology, leading to the portfolio’s continued underweight in the sector. The portfolio remains underweight in telecommunication services. Pricing competition within the industry is increasing because providers are returning to offering unlimited wireless plans, and because the wireless industry is reaching maturity.
|
| |
| MARCH 31, 2017 |
| Top Ten Holdings | % of net assets |
| Pfizer, Inc. | 3.7% |
| General Electric Co. | 3.2% |
| Schlumberger Ltd. | 3.1% |
| Wells Fargo & Co. | 3.0% |
| TOTAL SA ADR | 2.8% |
| Johnson Controls International plc | 2.8% |
| Procter & Gamble Co. (The) | 2.7% |
| Oracle Corp. (New York) | 2.6% |
| Chevron Corp. | 2.5% |
| U.S. Bancorp | 2.5% |
| | |
| Top Five Industries | % of net assets |
| Banks | 14.2% |
| Oil, Gas and Consumable Fuels | 11.2% |
| Pharmaceuticals | 8.6% |
| Capital Markets | 4.8% |
| Health Care Equipment and Supplies | 4.4% |
| | |
| Types of Investments in Portfolio | % of net assets |
| Domestic Common Stocks | 91.0% |
| Foreign Common Stocks* | 6.5% |
| Exchange-Traded Funds | 1.3% |
| Total Equity Exposure | 98.8% |
| Temporary Cash Investments | 1.1% |
| Other Assets and Liabilities | 0.1% |
*Includes depositary shares, dual listed securities and foreign ordinary shares.
Fund shareholders may incur two types of costs: (1) transaction costs, including sales charges (loads) on purchase payments and redemption/exchange fees; and (2) ongoing costs, including management fees; distribution and service (12b-1) fees; and other fund expenses. This example is intended to help you understand your ongoing costs (in dollars) of investing in your fund and to compare these costs with the ongoing cost of investing in other mutual funds.
The example is based on an investment of $1,000 made at the beginning of the period and held for the entire period from October 1, 2016 to March 31, 2017.
Actual Expenses
The table provides information about actual account values and actual expenses for each class. You may use the information, together with the amount you invested, to estimate the expenses that you paid over the period. First, identify the share class you own. Then simply divide your account value by $1,000 (for example, an $8,600 account value divided by $1,000 = 8.6), then multiply the result by the number under the heading “Expenses Paid During Period” to estimate the expenses you paid on your account during this period.
If you hold Investor Class shares of any American Century Investments fund, or Institutional Class shares of the American Century Diversified Bond Fund, in an American Century Investments account (i.e., not a financial intermediary or retirement plan account), American Century Investments may charge you a $12.50 semiannual account maintenance fee if the value of those shares is less than $10,000. We will redeem shares automatically in one of your accounts to pay the $12.50 fee. In determining your total eligible investment amount, we will include your investments in all personal accounts (including American Century Investments Brokerage accounts) registered under your Social Security number. Personal accounts include individual accounts, joint accounts, UGMA/UTMA accounts, personal trusts, Coverdell Education Savings Accounts and IRAs (including traditional, Roth, Rollover, SEP-, SARSEP- and SIMPLE-IRAs), and certain other retirement accounts. If you have only business, business retirement, employer-sponsored or American Century Investments Brokerage accounts, you are currently not subject to this fee. If you are subject to the Account Maintenance Fee, your account value could be reduced by the fee amount.
Hypothetical Example for Comparison Purposes
The table also provides information about hypothetical account values and hypothetical expenses based on the actual expense ratio of each class of your fund and an assumed rate of return of 5% per year before expenses, which is not the actual return of a fund’s share class. The hypothetical account values and expenses may not be used to estimate the actual ending account balance or expenses you paid for the period. You may use this information to compare the ongoing costs of investing in your fund and other funds. To do so, compare this 5% hypothetical example with the 5% hypothetical examples that appear in the shareholder reports of the other funds.
Please note that the expenses shown in the table are meant to highlight your ongoing costs only and do not reflect any transactional costs, such as sales charges (loads) or redemption/exchange fees. Therefore, the table is useful in comparing ongoing costs only, and will not help you determine the relative total costs of owning different funds. In addition, if these transactional costs were included, your costs would have been higher.
|
| | | | |
| | Beginning
Account Value
10/1/16 | Ending
Account Value
3/31/17 | Expenses Paid
During Period(1)
10/1/16 - 3/31/17 | Annualized
Expense Ratio(1) |
| Actual | | | | |
| Investor Class | $1,000 | $1,107.70 | $4.36 | 0.83% |
| Institutional Class | $1,000 | $1,108.70 | $3.31 | 0.63% |
| A Class | $1,000 | $1,106.40 | $5.67 | 1.08% |
| C Class | $1,000 | $1,102.20 | $9.59 | 1.83% |
| R Class | $1,000 | $1,104.90 | $6.98 | 1.33% |
| R6 Class | $1,000 | $1,109.60 | $2.52 | 0.48% |
| Hypothetical | | | | |
| Investor Class | $1,000 | $1,020.79 | $4.18 | 0.83% |
| Institutional Class | $1,000 | $1,021.79 | $3.18 | 0.63% |
| A Class | $1,000 | $1,019.55 | $5.44 | 1.08% |
| C Class | $1,000 | $1,015.81 | $9.20 | 1.83% |
| R Class | $1,000 | $1,018.30 | $6.69 | 1.33% |
| R6 Class | $1,000 | $1,022.54 | $2.42 | 0.48% |
| |
| (1) | Expenses are equal to the class's annualized expense ratio listed in the table above, multiplied by the average account value over the period, multiplied by 182, the number of days in the most recent fiscal half-year, divided by 365, to reflect the one-half year period. |
MARCH 31, 2017
|
| | | | | |
| | Shares | Value |
| COMMON STOCKS — 97.5% | | |
| Aerospace and Defense — 3.6% | | |
| Boeing Co. (The) | 25,900 |
| $ | 4,580,674 |
|
| Textron, Inc. | 204,000 |
| 9,708,360 |
|
| United Technologies Corp. | 162,500 |
| 18,234,125 |
|
| | | 32,523,159 |
|
| Auto Components — 1.0% | | |
| Delphi Automotive plc | 111,702 |
| 8,990,894 |
|
| Automobiles — 0.4% | | |
| Ford Motor Co. | 298,200 |
| 3,471,048 |
|
| Banks — 14.2% | | |
| Bank of America Corp. | 896,100 |
| 21,138,999 |
|
| BB&T Corp. | 398,200 |
| 17,799,540 |
|
| JPMorgan Chase & Co. | 152,900 |
| 13,430,736 |
|
| M&T Bank Corp. | 77,200 |
| 11,945,156 |
|
| PNC Financial Services Group, Inc. (The) | 118,900 |
| 14,296,536 |
|
| U.S. Bancorp | 435,300 |
| 22,417,950 |
|
| Wells Fargo & Co. | 483,900 |
| 26,933,874 |
|
| | | 127,962,791 |
|
| Beverages — 0.7% | | |
| PepsiCo, Inc. | 55,800 |
| 6,241,788 |
|
| Biotechnology — 0.5% | | |
| AbbVie, Inc. | 69,500 |
| 4,528,620 |
|
| Building Products — 2.8% | | |
| Johnson Controls International plc | 594,200 |
| 25,027,704 |
|
| Capital Markets — 4.8% | | |
| Ameriprise Financial, Inc. | 48,700 |
| 6,315,416 |
|
| Bank of New York Mellon Corp. (The) | 394,400 |
| 18,627,512 |
|
| BlackRock, Inc. | 17,200 |
| 6,596,372 |
|
| Invesco Ltd. | 388,100 |
| 11,887,503 |
|
| | | 43,426,803 |
|
| Chemicals — 1.0% | | |
| Dow Chemical Co. (The) | 141,200 |
| 8,971,848 |
|
| Communications Equipment — 0.7% | | |
| Cisco Systems, Inc. | 183,000 |
| 6,185,400 |
|
| Containers and Packaging — 0.4% | | |
| WestRock Co. | 69,100 |
| 3,595,273 |
|
| Diversified Telecommunication Services — 2.1% | | |
| Verizon Communications, Inc. | 389,900 |
| 19,007,625 |
|
| Electric Utilities — 3.3% | | |
| Edison International | 121,800 |
| 9,696,498 |
|
| PG&E Corp. | 99,100 |
| 6,576,276 |
|
| PPL Corp. | 154,500 |
| 5,776,755 |
|
| Xcel Energy, Inc. | 169,500 |
| 7,534,275 |
|
| | | 29,583,804 |
|
| Electronic Equipment, Instruments and Components — 1.3% | | |
| TE Connectivity Ltd. | 152,900 |
| 11,398,695 |
|
|
| | | | | |
| | Shares | Value |
| Energy Equipment and Services — 4.1% | | |
| Baker Hughes, Inc. | 158,500 |
| $ | 9,481,470 |
|
| Schlumberger Ltd. | 356,600 |
| 27,850,460 |
|
| | | 37,331,930 |
|
| Equity Real Estate Investment Trusts (REITs) — 0.7% | | |
| Boston Properties, Inc. | 50,800 |
| 6,726,428 |
|
| Food and Staples Retailing — 3.4% | | |
| CVS Health Corp. | 142,200 |
| 11,162,700 |
|
| Wal-Mart Stores, Inc. | 268,300 |
| 19,339,064 |
|
| | | 30,501,764 |
|
| Food Products — 2.0% | | |
| General Mills, Inc. | 75,700 |
| 4,467,057 |
|
| Mead Johnson Nutrition Co. | 35,900 |
| 3,197,972 |
|
| Mondelez International, Inc., Class A | 248,900 |
| 10,722,612 |
|
| | | 18,387,641 |
|
| Health Care Equipment and Supplies — 4.4% | | |
| Abbott Laboratories | 251,900 |
| 11,186,879 |
|
| Medtronic plc | 221,500 |
| 17,844,040 |
|
| Zimmer Biomet Holdings, Inc. | 87,200 |
| 10,647,992 |
|
| | | 39,678,911 |
|
| Health Care Providers and Services — 2.0% | | |
| Anthem, Inc. | 30,300 |
| 5,011,014 |
|
HCA Holdings, Inc.(1) | 74,300 |
| 6,611,957 |
|
| McKesson Corp. | 46,400 |
| 6,879,264 |
|
| | | 18,502,235 |
|
| Hotels, Restaurants and Leisure — 0.7% | | |
| Carnival Corp. | 108,800 |
| 6,409,408 |
|
| Household Products — 2.7% | | |
| Procter & Gamble Co. (The) | 267,300 |
| 24,016,905 |
|
| Industrial Conglomerates — 3.7% | | |
| General Electric Co. | 959,500 |
| 28,593,100 |
|
| Honeywell International, Inc. | 36,000 |
| 4,495,320 |
|
| | | 33,088,420 |
|
| Insurance — 4.2% | | |
| Aflac, Inc. | 82,000 |
| 5,938,440 |
|
| Allstate Corp. (The) | 78,400 |
| 6,388,816 |
|
| Chubb Ltd. | 132,000 |
| 17,985,000 |
|
| MetLife, Inc. | 149,100 |
| 7,875,462 |
|
| | | 38,187,718 |
|
| Leisure Products — 0.6% | | |
| Mattel, Inc. | 217,800 |
| 5,577,858 |
|
| Machinery — 1.0% | | |
| Ingersoll-Rand plc | 108,900 |
| 8,855,748 |
|
| Multiline Retail — 0.5% | | |
| Target Corp. | 84,200 |
| 4,646,998 |
|
| Oil, Gas and Consumable Fuels — 11.2% | | |
| Anadarko Petroleum Corp. | 148,700 |
| 9,219,400 |
|
| Chevron Corp. | 211,600 |
| 22,719,492 |
|
| Exxon Mobil Corp. | 74,500 |
| 6,109,745 |
|
| Imperial Oil Ltd. | 481,900 |
| 14,683,301 |
|
| Occidental Petroleum Corp. | 255,900 |
| 16,213,824 |
|
|
| | | | | |
| | Shares | Value |
| Royal Dutch Shell plc ADR | 125,200 |
| $ | 6,989,916 |
|
| TOTAL SA ADR | 506,600 |
| 25,542,772 |
|
| | | 101,478,450 |
|
| Personal Products — 0.5% | | |
| Unilever NV CVA | 92,800 |
| 4,610,384 |
|
| Pharmaceuticals — 8.6% | | |
| Allergan plc | 29,800 |
| 7,119,816 |
|
| Johnson & Johnson | 105,700 |
| 13,164,935 |
|
| Merck & Co., Inc. | 264,100 |
| 16,780,914 |
|
| Pfizer, Inc. | 967,500 |
| 33,098,175 |
|
| Roche Holding AG | 22,600 |
| 5,771,557 |
|
| Teva Pharmaceutical Industries Ltd. ADR | 68,800 |
| 2,207,792 |
|
| | | 78,143,189 |
|
| Road and Rail — 0.9% | | |
| Union Pacific Corp. | 76,100 |
| 8,060,512 |
|
| Semiconductors and Semiconductor Equipment — 4.3% | | |
| Applied Materials, Inc. | 354,900 |
| 13,805,610 |
|
| Intel Corp. | 258,000 |
| 9,306,060 |
|
| Lam Research Corp. | 63,000 |
| 8,086,680 |
|
| QUALCOMM, Inc. | 136,800 |
| 7,844,112 |
|
| | | 39,042,462 |
|
| Software — 2.8% | | |
| Microsoft Corp. | 34,600 |
| 2,278,756 |
|
| Oracle Corp. (New York) | 519,500 |
| 23,174,895 |
|
| | | 25,453,651 |
|
| Specialty Retail — 1.3% | | |
| Advance Auto Parts, Inc. | 57,700 |
| 8,554,602 |
|
| L Brands, Inc. | 60,300 |
| 2,840,130 |
|
| | | 11,394,732 |
|
| Technology Hardware, Storage and Peripherals — 0.8% | | |
| Apple, Inc. | 52,700 |
| 7,570,882 |
|
| Textiles, Apparel and Luxury Goods — 0.3% | | |
| Ralph Lauren Corp. | 33,400 |
| 2,726,108 |
|
TOTAL COMMON STOCKS
(Cost $787,432,693) | | 881,307,786 |
|
| EXCHANGE-TRADED FUNDS — 1.3% | | |
iShares Russell 1000 Value ETF
(Cost $11,367,034) | 99,200 |
| 11,402,048 |
|
| TEMPORARY CASH INVESTMENTS — 1.1% | | |
| Repurchase Agreement, BMO Capital Markets Corp., (collateralized by various U.S. Treasury obligations, 0.75% - 2.75%, 7/31/17 - 2/15/24, valued at $3,500,669), in a joint trading account at 0.67%, dated 3/31/17, due 4/3/17 (Delivery value $3,429,514) | | 3,429,323 |
|
| Repurchase Agreement, Fixed Income Clearing Corp., (collateralized by various U.S. Treasury obligations, 2.50%, 5/15/46, valued at $6,348,197), at 0.22%, dated 3/31/17, due 4/3/17 (Delivery value $6,222,114) | | 6,222,000 |
|
| State Street Institutional U.S. Government Money Market Fund, Premier Class | 5,389 |
| 5,389 |
|
TOTAL TEMPORARY CASH INVESTMENTS
(Cost $9,656,712) | | 9,656,712 |
|
TOTAL INVESTMENT SECURITIES — 99.9%
(Cost $808,456,439) | | 902,366,546 |
|
| OTHER ASSETS AND LIABILITIES — 0.1% | | 994,118 |
|
| TOTAL NET ASSETS — 100.0% | | $ | 903,360,664 |
|
|
| | | | | | | | | | |
| FORWARD FOREIGN CURRENCY EXCHANGE CONTRACTS |
| Currency Purchased | Currency Sold | Counterparty | Settlement Date | Unrealized Appreciation
(Depreciation) |
| USD | 12,632,311 |
| CAD | 16,880,234 |
| Morgan Stanley | 6/30/17 | $ | (76,380 | ) |
| USD | 3,767,495 |
| CHF | 3,718,895 |
| Credit Suisse AG | 6/30/17 | 35,287 |
|
| USD | 393,394 |
| CHF | 390,184 |
| Credit Suisse AG | 6/30/17 | 1,813 |
|
| USD | 408,522 |
| CHF | 406,394 |
| Credit Suisse AG | 6/30/17 | 674 |
|
| USD | 440,645 |
| CHF | 438,787 |
| Credit Suisse AG | 6/30/17 | 287 |
|
| USD | 25,663,570 |
| EUR | 23,551,906 |
| UBS AG | 6/30/17 | 433,683 |
|
| USD | 5,928,991 |
| GBP | 4,733,272 |
| Credit Suisse AG | 6/30/17 | (13,894 | ) |
| | | | | | | $ | 381,470 |
|
|
| | |
| NOTES TO SCHEDULE OF INVESTMENTS |
| ADR | - | American Depositary Receipt |
| CAD | - | Canadian Dollar |
| CHF | - | Swiss Franc |
| CVA | - | Certificaten Van Aandelen |
| EUR | - | Euro |
| GBP | - | British Pound |
| USD | - | United States Dollar |
See Notes to Financial Statements.
|
| | | | |
| Statement of Assets and Liabilities |
|
| | | |
| MARCH 31, 2017 | |
| Assets | |
| Investment securities, at value (cost of $808,456,439) | $ | 902,366,546 |
|
| Foreign currency holdings, at value (cost of $79,866) | 80,713 |
|
| Receivable for investments sold | 2,716,496 |
|
| Receivable for capital shares sold | 1,071,113 |
|
| Unrealized appreciation on forward foreign currency exchange contracts | 471,744 |
|
| Dividends and interest receivable | 2,104,355 |
|
| | 908,810,967 |
|
| | |
| Liabilities | |
| Payable for investments purchased | 4,423,874 |
|
| Payable for capital shares redeemed | 328,738 |
|
| Unrealized depreciation on forward foreign currency exchange contracts | 90,274 |
|
| Accrued management fees | 585,044 |
|
| Distribution and service fees payable | 22,373 |
|
| | 5,450,303 |
|
| | |
| Net Assets | $ | 903,360,664 |
|
| | |
| Net Assets Consist of: | |
| Capital (par value and paid-in surplus) | $ | 811,603,712 |
|
| Accumulated net realized loss | (2,534,710 | ) |
| Net unrealized appreciation | 94,291,662 |
|
| | $ | 903,360,664 |
|
|
| | | | | | |
| | Net Assets | Shares Outstanding | Net Asset Value Per Share |
| Investor Class, $0.01 Par Value |
| $658,031,127 |
| 65,462,709 |
| $10.05 |
| Institutional Class, $0.01 Par Value |
| $41,745,702 |
| 4,151,082 |
| $10.06 |
| A Class, $0.01 Par Value |
| $56,222,064 |
| 5,595,997 |
| $10.05* |
| C Class, $0.01 Par Value |
| $8,947,912 |
| 890,567 |
| $10.05 |
| R Class, $0.01 Par Value |
| $5,805,587 |
| 577,338 |
| $10.06 |
| R6 Class, $0.01 Par Value |
| $132,608,272 |
| 13,186,724 |
| $10.06 |
*Maximum offering price $10.66 (net asset value divided by 0.9425).
See Notes to Financial Statements.
|
| | | |
| YEAR ENDED MARCH 31, 2017 | |
| Investment Income (Loss) | |
| Income: | |
| Dividends (net of foreign taxes withheld of $249,270) | $ | 24,406,150 |
|
| Interest | 9,455 |
|
| | 24,415,605 |
|
| | |
| Expenses: | |
| Management fees | 6,733,553 |
|
| Distribution and service fees: | |
| A Class | 143,721 |
|
| C Class | 91,115 |
|
| R Class | 26,833 |
|
| Directors' fees and expenses | 27,037 |
|
| Other expenses | 15,986 |
|
| | 7,038,245 |
|
| | |
| Net investment income (loss) | 17,377,360 |
|
| | |
| Realized and Unrealized Gain (Loss) | |
| Net realized gain (loss) on: | |
| Investment transactions | 168,072,938 |
|
| Foreign currency transactions | 1,294,558 |
|
| | 169,367,496 |
|
| | |
| Change in net unrealized appreciation (depreciation) on: | |
| Investments | (35,367,311 | ) |
| Translation of assets and liabilities in foreign currencies | 906,137 |
|
| | (34,461,174 | ) |
| | |
| Net realized and unrealized gain (loss) | 134,906,322 |
|
| | |
| Net Increase (Decrease) in Net Assets Resulting from Operations | $ | 152,283,682 |
|
See Notes to Financial Statements.
|
| | | | |
| Statement of Changes in Net Assets |
|
| | | | | | |
| YEARS ENDED MARCH 31, 2017 AND MARCH 31, 2016 |
| Increase (Decrease) in Net Assets | March 31, 2017 | March 31, 2016 |
| Operations | | |
| Net investment income (loss) | $ | 17,377,360 |
| $ | 11,149,564 |
|
| Net realized gain (loss) | 169,367,496 |
| 41,963,691 |
|
| Change in net unrealized appreciation (depreciation) | (34,461,174 | ) | (82,761,717 | ) |
| Net increase (decrease) in net assets resulting from operations | 152,283,682 |
| (29,648,462 | ) |
| | | |
| Distributions to Shareholders | | |
| From net investment income: | | |
| Investor Class | (12,419,761 | ) | (8,933,931 | ) |
| Institutional Class | (910,606 | ) | (752,924 | ) |
| A Class | (970,082 | ) | (750,479 | ) |
| B Class | — |
| (512 | ) |
| C Class | (85,151 | ) | (41,446 | ) |
| R Class | (78,762 | ) | (46,400 | ) |
| R6 Class | (2,733,954 | ) | (868,574 | ) |
| Decrease in net assets from distributions | (17,198,316 | ) | (11,394,266 | ) |
| | | |
| Capital Share Transactions | | |
| Net increase (decrease) in net assets from capital share transactions (Note 5) | (102,207,905 | ) | 148,863,315 |
|
| | | |
| Net increase (decrease) in net assets | 32,877,461 |
| 107,820,587 |
|
| | | |
| Net Assets | | |
| Beginning of period | 870,483,203 |
| 762,662,616 |
|
| End of period | $ | 903,360,664 |
| $ | 870,483,203 |
|
| | | |
| Undistributed net investment income | — |
| $ | 746,512 |
|
See Notes to Financial Statements.
|
|
| Notes to Financial Statements |
MARCH 31, 2017
1. Organization
American Century Capital Portfolios, Inc. (the corporation) is registered under the Investment Company Act of 1940, as amended (the 1940 Act), as an open-end management investment company and is organized as a Maryland corporation. Large Company Value Fund (the fund) is one fund in a series issued by the corporation. The fund’s investment objective is to seek long-term capital growth. Income is a secondary objective.
The fund offers the Investor Class, the Institutional Class, the A Class, the C Class, the R Class and the R6 Class. The A Class may incur an initial sales charge. The A Class and C Class may be subject to a contingent deferred sales charge. On October 16, 2015, all outstanding B Class shares were converted to A Class shares and the fund discontinued offering the B Class.
2. Significant Accounting Policies
The following is a summary of significant accounting policies consistently followed by the fund in preparation of its financial statements. The fund is an investment company and follows accounting and reporting guidance in accordance with accounting principles generally accepted in the United States of America. This may require management to make certain estimates and assumptions at the date of the financial statements. Actual results could differ from these estimates. Management evaluated the impact of events or transactions occurring through the date the financial statements were issued that would merit recognition or disclosure.
Investment Valuations — The fund determines the fair value of its investments and computes its net asset value per share at the close of regular trading (usually 4 p.m. Eastern time) on the New York Stock Exchange (NYSE) on each day the NYSE is open. The Board of Directors has adopted valuation policies and procedures to guide the investment advisor in the fund’s investment valuation process and to provide methodologies for the oversight of the fund’s pricing function.
Equity securities that are listed or traded on a domestic securities exchange are valued at the last reported sales price or at the official closing price as provided by the exchange. Equity securities traded on foreign securities exchanges are generally valued at the closing price of such securities on the exchange where primarily traded or at the close of the NYSE, if that is earlier. If no last sales price is reported, or if local convention or regulation so provides, the mean of the latest bid and asked prices may be used. Securities traded over-the-counter are valued at the mean of the latest bid and asked prices, the last sales price, or the official closing price. Equity securities initially expressed in local currencies are translated into U.S. dollars at the mean of the appropriate currency exchange rate at the close of the NYSE as provided by an independent pricing service.
Open-end management investment companies are valued at the reported net asset value per share. Repurchase agreements are valued at cost, which approximates fair value. Forward foreign currency exchange contracts are valued at the mean of the appropriate forward exchange rate at the close of the NYSE as provided by an independent pricing service.
If the fund determines that the market price for an investment is not readily available or the valuation methods mentioned above do not reflect an investment’s fair value, such investment is valued as determined in good faith by the Board of Directors or its delegate, in accordance with policies and procedures adopted by the Board of Directors. In its determination of fair value, the fund may review several factors including, but not limited to, market information regarding the specific investment or comparable investments and correlation with other investment types, futures indices or general market indicators. Circumstances that may cause the fund to use these procedures to value an investment include, but are not limited to: an investment has been declared in default or is distressed; trading in a security has been suspended during the trading day or a security is not actively trading on its principal exchange; prices received from a regular pricing source are deemed unreliable; or there is a foreign market holiday and no trading occurred.
The fund monitors for significant events occurring after the close of an investment’s primary exchange but before the fund’s net asset value per share is determined. Significant events may include, but are not limited to: corporate announcements and transactions; governmental action and political unrest that could impact a specific investment or an investment sector; or armed conflicts, natural disasters and similar events that could
affect investments in a specific country or region. The fund also monitors for significant fluctuations between domestic and foreign markets, as evidenced by the U.S. market or such other indicators that the Board of Directors, or its delegate, deems appropriate. If significant fluctuations in foreign markets are identified, the fund may apply a model-derived factor to the closing price of equity securities traded on foreign securities exchanges. The factor is based on observable market data as provided by an independent pricing service.
Security Transactions — Security transactions are accounted for as of the trade date. Net realized gains and losses are determined on the identified cost basis, which is also used for federal income tax purposes.
Investment Income — Dividend income less foreign taxes withheld, if any, is recorded as of the ex-dividend date. Distributions received on securities that represent a return of capital or long-term capital gain are recorded as a reduction of cost of investments and/or as a realized gain. The fund may estimate the components of distributions received that may be considered nontaxable distributions or long-term capital gain distributions for income tax purposes. Interest income is recorded on the accrual basis and includes accretion of discounts and amortization of premiums.
Foreign Currency Translations — All assets and liabilities initially expressed in foreign currencies are translated into U.S. dollars at prevailing exchange rates at period end. The fund may enter into spot foreign currency exchange contracts to facilitate transactions denominated in a foreign currency. Purchases and sales of investment securities, dividend and interest income, spot foreign currency exchange contracts, and expenses are translated at the rates of exchange prevailing on the respective dates of such transactions. Net realized and unrealized foreign currency exchange gains or losses related to investment securities are a component of net realized gain (loss) on investment transactions and change in net unrealized appreciation (depreciation) on investments, respectively.
Repurchase Agreements — The fund may enter into repurchase agreements with institutions that American Century Investment Management, Inc. (ACIM) (the investment advisor) has determined are creditworthy pursuant to criteria adopted by the Board of Directors. The fund requires that the collateral, represented by securities, received in a repurchase transaction be transferred to the custodian in a manner sufficient to enable the fund to obtain those securities in the event of a default under the repurchase agreement. ACIM monitors, on a daily basis, the securities transferred to ensure the value, including accrued interest, of the securities under each repurchase agreement is equal to or greater than amounts owed to the fund under each repurchase agreement.
Joint Trading Account — Pursuant to an Exemptive Order issued by the Securities and Exchange Commission, the fund, along with certain other funds in the American Century Investments family of funds, may transfer uninvested cash balances into a joint trading account. These balances are invested in one or more repurchase agreements that are collateralized by U.S. Treasury or Agency obligations.
Income Tax Status — It is the fund’s policy to distribute substantially all net investment income and net realized gains to shareholders and to otherwise qualify as a regulated investment company under provisions of the Internal Revenue Code. Accordingly, no provision has been made for income taxes. The fund files U.S. federal, state, local and non-U.S. tax returns as applicable. The fund's tax returns are subject to examination by the relevant taxing authority until expiration of the applicable statute of limitations, which is generally three years from the date of filing but can be longer in certain jurisdictions. At this time, management believes there are no uncertain tax positions which, based on their technical merit, would not be sustained upon examination and for which it is reasonably possible that the total amounts of unrecognized tax benefits will significantly change in the next twelve months.
Multiple Class — All shares of the fund represent an equal pro rata interest in the net assets of the class to which such shares belong, and have identical voting, dividend, liquidation and other rights and the same terms and conditions, except for class specific expenses and exclusive rights to vote on matters affecting only individual classes. Income, non-class specific expenses, and realized and unrealized capital gains and losses of the fund are allocated to each class of shares based on their relative net assets.
Distributions to Shareholders — Distributions from net investment income, if any, are generally declared and paid quarterly. Distributions from net realized gains, if any, are generally declared and paid annually. The fund may elect to treat a portion of its payment to a redeeming shareholder, which represents the pro rata share of undistributed net investment income and net realized gains, as a distribution for federal income tax purposes (tax equalization).
Indemnifications — Under the corporation’s organizational documents, its officers and directors are indemnified against certain liabilities arising out of the performance of their duties to the fund. In addition, in the normal course of business, the fund enters into contracts that provide general indemnifications. The maximum exposure under these arrangements is unknown as this would involve future claims that may be made against a fund. The risk of material loss from such claims is considered by management to be remote.
3. Fees and Transactions with Related Parties
Certain officers and directors of the corporation are also officers and/or directors of American Century Companies, Inc. (ACC). The corporation’s investment advisor, ACIM, the corporation's distributor, American Century Investment Services, Inc. (ACIS), and the corporation’s transfer agent, American Century Services, LLC, are wholly owned, directly or indirectly, by ACC. Various funds issued by American Century Asset Allocation Portfolios, Inc. and American Century Strategic Asset Allocations, Inc. own, in aggregate, 45% of the shares of the fund. Related parties do not invest in the fund for the purpose of exercising management or control.
Management Fees — The corporation has entered into a management agreement with ACIM, under which ACIM provides the fund with investment advisory and management services in exchange for a single, unified management fee (the fee) per class. The agreement provides that all expenses of managing and operating the fund, except distribution and service fees, brokerage expenses, taxes, interest, fees and expenses of the independent directors (including legal counsel fees), and extraordinary expenses, will be paid by ACIM. The fee is computed and accrued daily based on each class’s daily net assets and paid monthly in arrears. The difference in the fee among the classes is a result of their separate arrangements for shareholder services. It is not the result of any difference in advisory or custodial fees or other expenses related to the management of the fund’s assets, which do not vary by class. The rate of the fee is determined by applying a fee rate calculation formula. This formula takes into account the fund’s assets as well as certain assets, if any, of other clients of the investment advisor outside the American Century Investments family of funds (such as subadvised funds and separate accounts) that have very similar investment teams and investment strategies (strategy assets). The strategy assets of the fund also include the assets of NT Large Company Value Fund, one fund in a series issued by the corporation. The annual management fee schedule ranges from 0.70% to 0.90% for the Investor Class, A Class, C Class and R Class. The annual management fee schedule ranges from 0.50% to 0.70% for the Institutional Class and 0.35% to 0.55% for the R6 Class. The effective annual management fee for each class for the year ended March 31, 2017 was 0.83% for the Investor Class, A Class, C Class and R Class, 0.63% for the Institutional Class and 0.48% for the R6 Class.
Distribution and Service Fees — The Board of Directors has adopted a separate Master Distribution and Individual Shareholder Services Plan for each of the A Class, C Class and R Class (collectively the plans), pursuant to Rule 12b-1 of the 1940 Act. The plans provide that the A Class will pay ACIS an annual distribution and service fee of 0.25%. The plans provide that the C Class will pay ACIS an annual distribution and service fee of 1.00%, of which 0.25% is paid for individual shareholder services and 0.75% is paid for distribution services. The plans provide that the R Class will pay ACIS an annual distribution and service fee of 0.50%. The fees are computed and accrued daily based on each class’s daily net assets and paid monthly in arrears. The fees are used to pay financial intermediaries for distribution and individual shareholder services. Fees incurred under the plans during the year ended March 31, 2017 are detailed in the Statement of Operations.
Directors' Fees and Expenses — The Board of Directors is responsible for overseeing the investment advisor’s management and operations of the fund. The directors receive detailed information about the fund and its investment advisor regularly throughout the year, and meet at least quarterly with management of the investment advisor to review reports about fund operations. The fund’s officers do not receive compensation from the fund.
Interfund Transactions — The fund may enter into security transactions with other American Century Investments funds and other client accounts of the investment advisor, in accordance with the 1940 Act rules and procedures adopted by the Board of Directors. The rules and procedures require, among other things, that these transactions be effected at the independent current market price of the security. During the period, the interfund purchases and sales were $8,836,135 and $4,190,579, respectively. The effect of interfund transactions on the Statement of Operations was $579,402 in net realized gain (loss) on investment transactions.
4. Investment Transactions
Purchases and sales of investment securities, excluding short-term investments, for the year ended March 31, 2017 were $591,103,682 and $698,260,415, respectively.
5. Capital Share Transactions
Transactions in shares of the fund were as follows:
|
| | | | | | | | | | |
| | Year ended
March 31, 2017 | Year ended
March 31, 2016 |
| | Shares | Amount | Shares | Amount |
| Investor Class/Shares Authorized | 500,000,000 |
| | 500,000,000 |
| |
| Sold | 8,949,727 |
| $ | 87,363,174 |
| 17,629,618 |
| $ | 155,559,656 |
|
| Issued in reinvestment of distributions | 1,299,238 |
| 12,244,541 |
| 1,007,564 |
| 8,744,859 |
|
| Redeemed | (19,717,686 | ) | (183,481,206 | ) | (8,596,338 | ) | (74,429,878 | ) |
| | (9,468,721 | ) | (83,873,491 | ) | 10,040,844 |
| 89,874,637 |
|
| Institutional Class/Shares Authorized | 50,000,000 |
| | 50,000,000 |
| |
| Sold | 1,229,209 |
| 12,075,330 |
| 1,827,487 |
| 15,883,636 |
|
| Issued in reinvestment of distributions | 96,436 |
| 903,949 |
| 86,062 |
| 747,253 |
|
| Redeemed | (2,825,311 | ) | (25,938,025 | ) | (1,509,620 | ) | (13,112,507 | ) |
| | (1,499,666 | ) | (12,958,746 | ) | 403,929 |
| 3,518,382 |
|
| A Class/Shares Authorized | 60,000,000 |
| | 60,000,000 |
| |
| Sold | 639,700 |
| 6,049,501 |
| 1,501,902 |
| 13,067,373 |
|
| Issued in reinvestment of distributions | 98,918 |
| 933,061 |
| 83,694 |
| 727,057 |
|
| Redeemed | (2,335,654 | ) | (21,555,910 | ) | (2,165,484 | ) | (18,766,444 | ) |
| | (1,597,036 | ) | (14,573,348 | ) | (579,888 | ) | (4,972,014 | ) |
| B Class/Shares Authorized | N/A |
| | N/A |
| |
| Issued in reinvestment of distributions | | | 56 |
| 504 |
|
| Redeemed | | | (50,687 | ) | (452,583 | ) |
| | | | (50,631 | ) | (452,079 | ) |
| C Class/Shares Authorized | 15,000,000 |
| | 15,000,000 |
| |
| Sold | 64,787 |
| 596,206 |
| 183,240 |
| 1,599,014 |
|
| Issued in reinvestment of distributions | 5,090 |
| 48,282 |
| 2,879 |
| 25,036 |
|
| Redeemed | (242,903 | ) | (2,265,111 | ) | (391,973 | ) | (3,347,446 | ) |
| | (173,026 | ) | (1,620,623 | ) | (205,854 | ) | (1,723,396 | ) |
| R Class/Shares Authorized | 10,000,000 |
| | 10,000,000 |
| |
| Sold | 122,854 |
| 1,157,017 |
| 93,079 |
| 807,096 |
|
| Issued in reinvestment of distributions | 8,051 |
| 76,287 |
| 5,204 |
| 45,261 |
|
| Redeemed | (115,363 | ) | (1,095,600 | ) | (180,477 | ) | (1,559,711 | ) |
| | 15,542 |
| 137,704 |
| (82,194 | ) | (707,354 | ) |
| R6 Class/Shares Authorized | 80,000,000 |
| | 80,000,000 |
| |
| Sold | 3,198,808 |
| 30,074,204 |
| 8,832,542 |
| 71,693,067 |
|
| Issued in reinvestment of distributions | 288,808 |
| 2,733,954 |
| 100,724 |
| 868,574 |
|
| Redeemed | (2,378,584 | ) | (22,127,559 | ) | (1,061,403 | ) | (9,236,502 | ) |
| | 1,109,032 |
| 10,680,599 |
| 7,871,863 |
| 63,325,139 |
|
| Net increase (decrease) | (11,613,875 | ) | $ | (102,207,905 | ) | 17,398,069 |
| $ | 148,863,315 |
|
6. Fair Value Measurements
The fund’s investments valuation process is based on several considerations and may use multiple inputs to determine the fair value of the investments held by the fund. In conformity with accounting principles generally accepted in the United States of America, the inputs used to determine a valuation are classified into three broad levels.
| |
| • | Level 1 valuation inputs consist of unadjusted quoted prices in an active market for identical investments. |
| |
| • | Level 2 valuation inputs consist of direct or indirect observable market data (including quoted prices for comparable investments, evaluations of subsequent market events, interest rates, prepayment speeds, credit risk, etc.). These inputs also consist of quoted prices for identical investments initially expressed in local currencies that are adjusted through translation into U.S. dollars. |
| |
| • | Level 3 valuation inputs consist of unobservable data (including a fund’s own assumptions). |
The level classification is based on the lowest level input that is significant to the fair valuation measurement. The valuation inputs are not necessarily an indication of the risks associated with investing in these securities or other financial instruments. There were no significant transfers between levels during the period.
The following is a summary of the level classifications as of period end. The Schedule of Investments provides additional information on the fund’s portfolio holdings.
|
| | | | | | | | |
| | Level 1 | Level 2 | Level 3 |
| Assets | | | |
| Investment Securities | | | |
| Common Stocks | $ | 856,242,544 |
| $ | 25,065,242 |
| — |
|
| Exchange-Traded Funds | 11,402,048 |
| — |
| — |
|
| Temporary Cash Investments | 5,389 |
| 9,651,323 |
| — |
|
| | $ | 867,649,981 |
| $ | 34,716,565 |
| — |
|
| Other Financial Instruments | | | |
| Forward Foreign Currency Exchange Contracts | — |
| $ | 471,744 |
| — |
|
| | | | |
| Liabilities | | | |
| Other Financial Instruments | | | |
| Forward Foreign Currency Exchange Contracts | — |
| $ | 90,274 |
| — |
|
7. Derivative Instruments
Foreign Currency Risk — The fund is subject to foreign currency exchange rate risk in the normal course of pursuing its investment objectives. The value of foreign investments held by a fund may be significantly affected by changes in foreign currency exchange rates. The dollar value of a foreign security generally decreases when the value of the dollar rises against the foreign currency in which the security is denominated and tends to increase when the value of the dollar declines against such foreign currency. A fund may enter into forward foreign currency exchange contracts to reduce a fund's exposure to foreign currency exchange rate fluctuations. The net U.S. dollar value of foreign currency underlying all contractual commitments held by a fund and the resulting unrealized appreciation or depreciation are determined daily. Realized gain or loss is recorded upon the termination of the contract. Net realized and unrealized gains or losses occurring during the holding period of forward foreign currency exchange contracts are a component of net realized gain (loss) on foreign currency transactions and change in net unrealized appreciation (depreciation) on translation of assets and liabilities in foreign currencies, respectively. A fund bears the risk of an unfavorable change in the foreign currency exchange rate underlying the forward contract. Additionally, losses, up to the fair value, may arise if the counterparties do not perform under the contract terms. The fund's average U.S. dollar exposure to foreign currency risk derivative instruments held during the period was $44,068,612.
The value of foreign currency risk derivative instruments as of March 31, 2017, is disclosed on the Statement of Assets and Liabilities as an asset of $471,744 in unrealized appreciation on forward foreign currency exchange contracts and a liability of $90,274 in unrealized depreciation on forward foreign currency exchange contracts. For the year ended March 31, 2017, the effect of foreign currency risk derivative instruments on the Statement of Operations was $1,306,780 in net realized gain (loss) on foreign currency transactions and $888,197 in change in net unrealized appreciation (depreciation) on translation of assets and liabilities in foreign currencies.
8. Risk Factors
There are certain risks involved in investing in foreign securities. These risks include those resulting from future adverse political, social and economic developments, fluctuations in currency exchange rates, the possible imposition of exchange controls, and other foreign laws or restrictions.
9. Federal Tax Information
The tax character of distributions paid during the years ended March 31, 2017 and March 31, 2016 were as follows:
|
| | | | | | |
| | 2017 | 2016 |
| Distributions Paid From | | |
| Ordinary income | $ | 17,198,316 |
| $ | 11,394,266 |
|
| Long-term capital gains | — |
| — |
|
The book-basis character of distributions made during the year from net investment income or net realized gains may differ from their ultimate characterization for federal income tax purposes. These differences reflect the differing character of certain income items and net realized gains and losses for financial statement and tax purposes, and may result in reclassification among certain capital accounts on the financial statements.
As of March 31, 2017, the federal tax cost of investments and the components of distributable earnings on a tax-basis were as follows:
|
| | | |
| Federal tax cost of investments | $ | 810,609,679 |
|
| Gross tax appreciation of investments | $ | 109,474,044 |
|
| Gross tax depreciation of investments | (17,717,177 | ) |
| Net tax appreciation (depreciation) of investments | 91,756,867 |
|
| Net tax appreciation (depreciation) on derivatives and translation of assets and liabilities in foreign currencies | 85 |
|
| Net tax appreciation (depreciation) | $ | 91,756,952 |
|
| Undistributed ordinary income | — |
|
The difference between book-basis and tax-basis unrealized appreciation (depreciation) is attributable primarily to the tax deferral of losses on wash sales.
10. Recently Issued Accounting Guidance
In October 2016, the Securities and Exchange Commission adopted new rules and forms as well as amendments to its rules and forms to modernize the reporting and disclosure of information by registered investment companies. The amendments to Regulation S-X will require standardized, enhanced disclosure about derivatives in investment company financial statements, as well as other provisions. Compliance with the amendments is effective on August 1, 2017. Management is currently evaluating the impact that adopting the amendments will have on the financial statement disclosures.
11. Corporate Event
The Institutional Class was renamed to the I Class effective April 10, 2017.
|
| | | | | | | | | | | | | |
For a Share Outstanding Throughout the Years Ended March 31 (except as noted)
|
| Per-Share Data | Ratios and Supplemental Data |
| | | Income From Investment Operations: | | | | Ratio to Average Net Assets of: | | |
| | Net Asset
Value,
Beginning
of Period | Net
Investment
Income
(Loss)(1) | Net
Realized
and
Unrealized
Gain (Loss) | Total From
Investment
Operations | Distributions From Net
Investment
Income | Net Asset
Value,
End
of Period | Total
Return(2) | Operating
Expenses | Net
Investment
Income
(Loss) | Portfolio
Turnover
Rate | Net
Assets,
End of
Period
(in thousands) |
| Investor Class | | | | | | | | | |
| 2017 | $8.58 | 0.18 | 1.48 | 1.66 | (0.19) | $10.05 | 19.44% | 0.83% | 1.96% | 68% |
| $658,031 |
|
| 2016 | $9.07 | 0.12 | (0.49) | (0.37) | (0.12) | $8.58 | (4.06)% | 0.84% | 1.41% | 56% |
| $642,746 |
|
| 2015 | $8.28 | 0.12 | 0.78 | 0.90 | (0.11) | $9.07 | 10.92% | 0.84% | 1.36% | 56% |
| $588,608 |
|
| 2014 | $6.92 | 0.12 | 1.36 | 1.48 | (0.12) | $8.28 | 21.57% | 0.85% | 1.64% | 35% |
| $574,367 |
|
| 2013 | $6.09 | 0.12 | 0.83 | 0.95 | (0.12) | $6.92 | 15.85% | 0.87% | 1.87% | 33% |
| $487,161 |
|
| Institutional Class | | | | | | | | | |
| 2017 | $8.58 | 0.19 | 1.49 | 1.68 | (0.20) | $10.06 | 19.80% | 0.63% | 2.16% | 68% |
| $41,746 |
|
| 2016 | $9.08 | 0.14 | (0.50) | (0.36) | (0.14) | $8.58 | (3.97)% | 0.64% | 1.61% | 56% |
| $48,495 |
|
| 2015 | $8.29 | 0.13 | 0.79 | 0.92 | (0.13) | $9.08 | 11.14% | 0.64% | 1.56% | 56% |
| $47,616 |
|
| 2014 | $6.93 | 0.14 | 1.36 | 1.50 | (0.14) | $8.29 | 21.78% | 0.65% | 1.84% | 35% |
| $81,195 |
|
| 2013 | $6.10 | 0.13 | 0.83 | 0.96 | (0.13) | $6.93 | 16.05% | 0.67% | 2.07% | 33% |
| $57,325 |
|
| A Class | | | | | | | | | |
| 2017 | $8.57 | 0.16 | 1.48 | 1.64 | (0.16) | $10.05 | 19.28% | 1.08% | 1.71% | 68% |
| $56,222 |
|
| 2016 | $9.07 | 0.10 | (0.50) | (0.40) | (0.10) | $8.57 | (4.41)% | 1.09% | 1.16% | 56% |
| $61,663 |
|
| 2015 | $8.28 | 0.10 | 0.78 | 0.88 | (0.09) | $9.07 | 10.65% | 1.09% | 1.11% | 56% |
| $70,462 |
|
| 2014 | $6.92 | 0.11 | 1.35 | 1.46 | (0.10) | $8.28 | 21.27% | 1.10% | 1.39% | 35% |
| $74,863 |
|
| 2013 | $6.09 | 0.10 | 0.84 | 0.94 | (0.11) | $6.92 | 15.57% | 1.12% | 1.62% | 33% |
| $69,270 |
|
|
| | | | | | | | | | | | | |
For a Share Outstanding Throughout the Years Ended March 31 (except as noted)
|
| Per-Share Data | Ratios and Supplemental Data |
| | | Income From Investment Operations: | | | | Ratio to Average Net Assets of: | | |
| | Net Asset
Value,
Beginning
of Period | Net
Investment
Income
(Loss)(1) | Net
Realized
and
Unrealized
Gain (Loss) | Total From
Investment
Operations | Distributions From Net
Investment
Income | Net Asset
Value,
End
of Period | Total
Return(2) | Operating
Expenses | Net
Investment
Income
(Loss) | Portfolio
Turnover
Rate | Net
Assets,
End of
Period
(in thousands) |
| C Class | | | | | | | | | |
| 2017 | $8.57 | 0.09 | 1.48 | 1.57 | (0.09) | $10.05 | 18.36% | 1.83% | 0.96% | 68% |
| $8,948 |
|
| 2016 | $9.06 | 0.03 | (0.49) | (0.46) | (0.03) | $8.57 | (5.03)% | 1.84% | 0.41% | 56% |
| $9,116 |
|
| 2015 | $8.28 | 0.03 | 0.78 | 0.81 | (0.03) | $9.06 | 9.77% | 1.84% | 0.36% | 56% |
| $11,505 |
|
| 2014 | $6.92 | 0.05 | 1.35 | 1.40 | (0.04) | $8.28 | 20.36% | 1.85% | 0.64% | 35% |
| $10,101 |
|
| 2013 | $6.09 | 0.05 | 0.84 | 0.89 | (0.06) | $6.92 | 14.72% | 1.87% | 0.87% | 33% |
| $8,961 |
|
| R Class | | | | | | | | | |
| 2017 | $8.58 | 0.14 | 1.48 | 1.62 | (0.14) | $10.06 | 18.95% | 1.33% | 1.46% | 68% |
| $5,806 |
|
| 2016 | $9.07 | 0.08 | (0.49) | (0.41) | (0.08) | $8.58 | (4.55)% | 1.34% | 0.91% | 56% |
| $4,820 |
|
| 2015 | $8.28 | 0.07 | 0.79 | 0.86 | (0.07) | $9.07 | 10.37% | 1.34% | 0.86% | 56% |
| $5,842 |
|
| 2014 | $6.92 | 0.09 | 1.35 | 1.44 | (0.08) | $8.28 | 20.96% | 1.35% | 1.14% | 35% |
| $6,135 |
|
| 2013 | $6.10 | 0.08 | 0.83 | 0.91 | (0.09) | $6.92 | 15.10% | 1.37% | 1.37% | 33% |
| $5,792 |
|
| R6 Class | | | | | | | | | |
| 2017 | $8.58 | 0.22 | 1.48 | 1.70 | (0.22) | $10.06 | 19.98% | 0.48% | 2.31% | 68% |
| $132,608 |
|
| 2016 | $9.08 | 0.16 | (0.51) | (0.35) | (0.15) | $8.58 | (3.83)% | 0.49% | 1.76% | 56% |
| $103,643 |
|
| 2015 | $8.29 | 0.17 | 0.76 | 0.93 | (0.14) | $9.08 | 11.30% | 0.49% | 1.71% | 56% |
| $38,170 |
|
2014(3) | $7.65 | 0.10 | 0.65 | 0.75 | (0.11) | $8.29 | 9.90% | 0.50%(4) | 1.98%(4) | 35%(5) |
| $27 |
|
|
|
| Notes to Financial Highlights |
| |
| (1) | Computed using average shares outstanding throughout the period. |
| |
| (2) | Total returns are calculated based on the net asset value of the last business day and do not reflect applicable sales charges, if any. Total returns for periods less than one year are not annualized. |
| |
| (3) | July 26, 2013 (commencement of sale) through March 31, 2014. |
| |
| (5) | Portfolio turnover is calculated at the fund level. Percentage indicated was calculated for the year ended March 31, 2014. |
See Notes to Financial Statements.
|
|
| Report of Independent Registered Public Accounting Firm |
To the Board of Directors and Shareholders of American Century Capital Portfolios, Inc.:
We have audited the accompanying statement of assets and liabilities, including the schedule of investments, of Large Company Value Fund (the “Fund”), one of the funds constituting American Century Capital Portfolios, Inc., as of March 31, 2017, and the related statement of operations for the year then ended, the statements of changes in net assets for each of the two years in the period then ended, and the financial highlights for each of the periods presented. These financial statements and financial highlights are the responsibility of the Fund's management. Our responsibility is to express an opinion on these financial statements and financial highlights based on our audits.
We conducted our audits in accordance with the standards of the Public Company Accounting Oversight Board (United States). Those standards require that we plan and perform the audit to obtain reasonable assurance about whether the financial statements and financial highlights are free of material misstatement. The Fund is not required to have, nor were we engaged to perform, an audit of its internal control over financial reporting. Our audits included consideration of internal control over financial reporting as a basis for designing audit procedures that are appropriate in the circumstances, but not for the purpose of expressing an opinion on the effectiveness of the Fund's internal control over financial reporting. Accordingly, we express no such opinion. An audit also includes examining, on a test basis, evidence supporting the amounts and disclosures in the financial statements, assessing the accounting principles used and significant estimates made by management, as well as evaluating the overall financial statement presentation. Our procedures included confirmation of securities owned as of March 31, 2017, by correspondence with the custodian and brokers; when replies were not received from brokers, we performed other auditing procedures. We believe that our audits provide a reasonable basis for our opinion.
In our opinion, the financial statements and financial highlights referred to above present fairly, in all material respects, the financial position of Large Company Value Fund of American Century Capital Portfolios, Inc. as of March 31, 2017, the results of its operations for the year then ended, the changes in its net assets for each of the two years in the period then ended, and the financial highlights for each of the periods presented, in conformity with accounting principles generally accepted in the United States of America.
DELOITTE & TOUCHE LLP
Kansas City, Missouri May 16, 2017
The Board of Directors
The individuals listed below serve as directors of the funds. Each director will continue to serve in this capacity until death, retirement, resignation or removal from office. The board has adopted a mandatory retirement age for directors who are not “interested persons,” as that term is defined in the Investment Company Act (independent directors). Independent directors shall retire by December 31 of the year in which they reach their 75th birthday.
Mr. Thomas is an “interested person” because he currently serves as President and Chief Executive Officer of American Century Companies, Inc. (ACC), the parent company of American Century Investment Management, Inc. (ACIM or the advisor). The other directors (more than three-fourths of the total number) are independent. They are not employees, directors or officers of, and have no financial interest in, ACC or any of its wholly owned, direct or indirect, subsidiaries, including ACIM, American Century Investment Services, Inc. (ACIS) and American Century Services, LLC (ACS), and they do not have any other affiliations, positions or relationships that would cause them to be considered “interested persons” under the Investment Company Act. The directors serve in this capacity for seven (in the case of Mr. Thomas, 15) registered investment companies in the American Century Investments family of funds.
The following table presents additional information about the directors. The mailing address for each director is 4500 Main Street, Kansas City, Missouri 64111.
|
| | | | | |
Name
(Year of Birth) | Position(s) Held with Funds | Length of Time Served | Principal Occupation(s) During Past 5 Years | Number of American Century Portfolios Overseen by Director | Other Directorships Held During Past 5 Years |
| Independent Directors |
|
|
| Thomas W. Bunn (1953) | Advisory Board Director | Since 2017 | Retired | 81 | SquareTwo Financial; Barings (formerly Babson Capital Funds Trust) (2013 to 2016) |
Barry Fink
(1955) | Director | Since 2012 (independent since 2016) | Retired; Executive Vice President, ACC (2007 to 2013); President, ACS (2007 to 2013); Chief Operating Officer, ACC (2007 to 2012) | 81 | None |
Andrea C. Hall
(1945) | Director | Since 1997 | Retired | 81 | None |
Jan M. Lewis
(1957) | Director | Since 2011 | Retired; President and Chief Executive Officer, Catholic Charities of Northeast Kansas (human services organization) (2006 to 2013) | 81 | None |
James A. Olson
(1942) | Director and Chairman of the Board | Since 2007 (Chairman since 2014) | Member, Plaza Belmont LLC (private equity fund manager) (1999 to present) | 81 | Saia, Inc. (2002 to 2012) and EPR Properties (2003 to 2013) |
|
| | | | | |
Name
(Year of Birth) | Position(s) Held with Funds | Length of Time Served | Principal Occupation(s) During Past 5 Years | Number of American Century Portfolios Overseen by Director | Other Directorships Held During Past 5 Years |
| Independent Directors |
|
|
M. Jeannine Strandjord
(1945) | Director | Since 1994 | Retired | 81 | Euronet Worldwide Inc.; MGP Ingredients, Inc.; and DST Systems Inc. (1996 to 2012) |
John R. Whitten
(1946) | Director | Since 2008 | Retired | 81 | Rudolph Technologies, Inc. |
Stephen E. Yates
(1948) | Director | Since 2012 | Retired | 81 | None |
| Interested Director |
|
|
Jonathan S. Thomas
(1963) | Director and President | Since 2007 | President and Chief Executive Officer, ACC (2007 to present). Also serves as Chief Executive Officer, ACS; Executive Vice President, ACIM; Director, ACC, ACIM and other ACC subsidiaries | 126 | BioMed Valley Discoveries, Inc. |
The Statement of Additional Information has additional information about the fund's directors and is available without charge, upon request, by calling 1-800-345-2021.
Officers
The following table presents certain information about the executive officers of the funds. Each officer serves as an officer for each of the 15 investment companies in the American Century family of funds, unless otherwise noted. No officer is compensated for his or her service as an officer of the funds. The listed officers are interested persons of the funds and are appointed or re-appointed on an annual basis. The mailing address for each officer listed below is 4500 Main Street, Kansas City, Missouri 64111.
|
| | |
Name
(Year of Birth) | Offices with the Funds | Principal Occupation(s) During the Past Five Years |
Jonathan S. Thomas
(1963) | Director and President since 2007 | President and Chief Executive Officer, ACC (2007 to present). Also serves as Chief Executive Officer, ACS; Executive Vice President, ACIM; Director, ACC, ACIM and other ACC subsidiaries |
Amy D. Shelton
(1964) | Chief Compliance Officer and Vice President since 2014 | Chief Compliance Officer, American Century funds, (2014 to present); Chief Compliance Officer, ACIM (2014 to present); Chief Compliance Officer, ACIS (2009 to present); Vice President, Client Interactions and Marketing, ACIS (2013 to 2014); Director, Client Interactions and Marketing, ACIS (2007 to 2013). Also serves as Vice President, ACIS |
Charles A. Etherington
(1957) | General Counsel since 2007 and Senior Vice President since 2006 | Attorney, ACC (1994 to present); Vice President, ACC (2005 to present); General Counsel, ACC (2007 to present). Also serves as General Counsel, ACIM, ACS, ACIS and other ACC subsidiaries; and Senior Vice President, ACIM and ACS |
C. Jean Wade
(1964) | Vice President,Treasurer and Chief Financial Officer since 2012 | Vice President, ACS (2000 to present) |
Robert J. Leach
(1966) | Vice President since 2006 and Assistant Treasurer since 2012 | Vice President, ACS (2000 to present) |
David H. Reinmiller
(1963) | Vice President since 2000 | Attorney, ACC (1994 to present); Associate General Counsel, ACC (2001 to present). Also serves as Vice President, ACIM and ACS |
Ward D. Stauffer
(1960) | Secretary since 2005 | Attorney, ACC (2003 to present) |
Retirement Account Information
As required by law, distributions you receive from certain IRAs are subject to federal income tax withholding, unless you elect not to have withholding apply. Tax will be withheld on the total amount withdrawn even though you may be receiving amounts that are not subject to withholding, such as nondeductible contributions. In such case, excess amounts of withholding could occur. You may adjust your withholding election so that a greater or lesser amount will be withheld.
If you don’t want us to withhold on this amount, you must notify us to not withhold the federal income tax. You may notify us in writing or in certain situations by telephone or through other electronic means. For systematic withdrawals, your withholding election will remain in effect until revoked or changed by filing a new election. You have the right to revoke your election at any time.
Remember, even if you elect not to have income tax withheld, you are liable for paying income tax on the taxable portion of your withdrawal. If you elect not to have income tax withheld or you don’t have enough income tax withheld, you may be responsible for payment of estimated tax. You may incur penalties under the estimated tax rules if your withholding and estimated tax payments are not sufficient. You can reduce or defer the income tax on a distribution by directly or indirectly rolling such distribution over to another IRA or eligible plan. You should consult your tax advisor for additional information.
State tax will be withheld if, at the time of your distribution, your address is within one of the mandatory withholding states and you have federal income tax withheld (or as otherwise required by state law). State taxes will be withheld from your distribution in accordance with the respective state rules.
Distributions you receive from 403(b), 457 and qualified plans are subject to special tax and withholding rules. Your plan administrator or plan sponsor is required to provide you with a special tax notice explaining those rules at the time you request a distribution. If applicable, federal and/or state taxes may be withheld from your distribution amount.
Proxy Voting Policies
A description of the policies that the fund's investment advisor uses in exercising the voting rights associated with the securities purchased and/or held by the fund is available without charge, upon request, by calling 1-800-345-2021. It is also available on the "About Us" page of American Century Investments’ website at americancentury.com and on the Securities and Exchange Commission’s website at sec.gov. Information regarding how the investment advisor voted proxies relating to portfolio securities during the most recent 12-month period ended June 30 is available on the "About Us" page at americancentury.com. It is also available at sec.gov.
Quarterly Portfolio Disclosure
The fund files its complete schedule of portfolio holdings with the Securities and Exchange Commission (SEC) for the first and third quarters of each fiscal year on Form N-Q. The fund’s Forms N-Q are available on the SEC’s website at sec.gov, and may be reviewed and copied at the SEC’s Public Reference Room in Washington, DC. Information on the operation of the Public Reference Room may be obtained by calling 1-800-SEC-0330. The fund also makes its complete schedule of portfolio holdings for the most recent quarter of its fiscal year available on its website at americancentury.com and, upon request, by calling 1-800-345-2021.
Other Tax Information
The following information is provided pursuant to provisions of the Internal Revenue Code.
The fund hereby designates up to the maximum amount allowable as qualified dividend income for the fiscal year ended March 31, 2017.
For corporate taxpayers, the fund hereby designates $17,198,316, or up to the maximum amount allowable, of ordinary income distributions paid during the fiscal year ended March 31, 2017 as qualified for the corporate dividends received deduction.
The fund hereby designates $2,240,697, or up to the maximum amount allowable, as long-term capital gain distributions (20% rate gain distributions) for the fiscal year ended March 31, 2017.
The fund utilized earnings and profits of $2,868,302 distributed to shareholders on redemption of shares as part of the dividends paid deduction (tax equalization).
|
| | |
| |
| | | |
| Contact Us | americancentury.com | |
| Automated Information Line | 1-800-345-8765 | |
| Investor Services Representative | 1-800-345-2021 or 816-531-5575 | |
| Investors Using Advisors | 1-800-378-9878 | |
| Business, Not-For-Profit, Employer-Sponsored Retirement Plans | 1-800-345-3533 | |
| Banks and Trust Companies, Broker-Dealers, Financial Professionals, Insurance Companies | 1-800-345-6488 | |
| Telecommunications Relay Service for the Deaf | 711 | |
| | | |
| American Century Capital Portfolios, Inc. | |
| | | |
Investment Advisor: American Century Investment Management, Inc. Kansas City, Missouri | |
| | | |
| This report and the statements it contains are submitted for the general information of our shareholders. The report is not authorized for distribution to prospective investors unless preceded or accompanied by an effective prospectus. | |
| | | |
©2017 American Century Proprietary Holdings, Inc. All rights reserved.
CL-ANN-92269 1705 | |
|
| |
| ANNUAL REPORT | |
| MARCH 31, 2017 |
| |
AC Alternatives® Market Neutral Value Fund
|
| | |
| President’s Letter | 2 |
|
| Performance | 3 |
|
| Portfolio Commentary | |
|
| Fund Characteristics | |
|
| Shareholder Fee Example | |
|
| Schedule of Investments | |
|
| Statement of Assets and Liabilities | |
|
| Statement of Operations | |
|
| Statement of Changes in Net Assets | |
|
| Notes to Financial Statements | |
|
| Financial Highlights | |
|
| Report of Independent Registered Public Accounting Firm | |
|
| Management | |
|
| Additional Information | |
|
Any opinions expressed in this report reflect those of the author as of the date of the report, and do not necessarily represent the opinions of American Century Investments® or any other person in the American Century Investments organization. Any such opinions are subject to change at any time based upon market or other conditions and American Century Investments disclaims any responsibility to update such opinions. These opinions may not be relied upon as investment advice and, because investment decisions made by American Century Investments funds are based on numerous factors, may not be relied upon as an indication of trading intent on behalf of any American Century Investments fund. Security examples are used for representational purposes only and are not intended as recommendations to purchase or sell securities. Performance information for comparative indices and securities is provided to American Century Investments by third party vendors. To the best of American Century Investments’ knowledge, such information is accurate at the time of printing.
Jonathan Thomas
Dear Investor:
Thank you for reviewing this annual report for the period ended March 31, 2017. Annual reports help convey important information about fund returns, including market factors that affected performance during the reporting period. For additional, updated investment and market insights, we encourage you to visit our website, americancentury.com.
Risk-On Rebound From Global Economic Concerns of Early 2016
Stocks, high-yield bonds, and commodities rebounded from severe downturns in early 2016 that were triggered by China’s economic slowdown. Since then, growth conditions in China and the rest of the world have generally improved. For the reporting period, the S&P 500 Index, the Bloomberg Barclays U.S. Corporate High-Yield Bond Index, and the S&P Goldman Sachs Commodities Index returned 17.17%, 16.39%, and 8.45%, respectively. This risk-on rebound also drove government bond yields higher, resulting in declines for indices such as the Bloomberg Barclays U.S. Treasury Bond Index (-1.44%). The broader taxable investment-grade U.S. bond market performed better, but still significantly underperformed stocks; the Bloomberg Barclays U.S. Aggregate Bond Index returned 0.44%.
Investors could thank the world’s major central banks and the “Trump Trade” for the risk-on rebound, which occurred with a backdrop of landmark political events, including Brexit (the U.K. vote to leave the European Union) and Donald Trump’s U.S. presidential election victory. Central bank stimulus helped to propel the markets past China- and Brexit-related volatility, followed by Trump victory-inspired optimism about U.S. growth that further boosted higher-risk markets.
But the Trump Trade could prove to be double edged—investor optimism faded as health care reform stalled in Congress and other U.S. fiscal policy proposals looked like they’d face significant hurdles. Meanwhile, the Federal Reserve raised its interest rate target during the reporting period, and suggested that it might raise rates again and start gradually reducing its balance sheet by the end of 2017. These factors, plus rising inflation and continuing geopolitical risks, could impede further risk-on sentiment. In this unsettled environment, we believe in remaining focused on investment goals, using disciplined, actively managed, risk-aware strategies. We appreciate your continued trust in us.
Sincerely,
Jonathan Thomas
President and Chief Executive Officer
American Century Investments
|
| | | | | |
| Total Returns as of March 31, 2017 |
| | | | Average Annual Returns | |
| | Ticker Symbol | 1 year | 5 years | Since Inception | Inception Date |
| Investor Class | ACVVX | 2.97% | 3.15% | 3.51% | 10/31/11 |
| Bloomberg Barclays U.S. 1-3 Month Treasury Bill Index | — | 0.30% | 0.11% | 0.10% | — |
| Institutional Class | ACVKX | 3.23% | 3.37% | 3.72% | 10/31/11 |
| A Class | ACVQX | | | | 10/31/11 |
| No sales charge | | 2.72% | 2.90% | 3.26% | |
| With sales charge | | -3.21% | 1.69% | 2.13% | |
| C Class | ACVHX | 2.03% | 2.13% | 2.49% | 10/31/11 |
| R Class | ACVWX | 2.47% | 2.65% | 3.00% | 10/31/11 |
Fund returns would have been lower if a portion of the fees had not been waived.
Sales charges include initial sales charges and contingent deferred sales charges (CDSCs), as applicable. A Class shares have a 5.75% maximum initial sales charge and may be subject to a maximum CDSC of 1.00%. C Class shares redeemed within 12 months of purchase are subject to a maximum CDSC of 1.00%. The SEC requires that mutual funds provide performance information net of maximum sales charges in all cases where charges could be applied.
Data presented reflect past performance. Past performance is no guarantee of future results. Current performance may be higher or lower than the performance shown. Total returns for periods less than one year are not annualized. Investment return and principal value will fluctuate, and redemption value may be more or less than original cost. Data assumes reinvestment of dividends and capital gains, and none of the charts reflect the deduction of taxes that a shareholder would pay on fund distributions or the redemption of fund shares. To obtain performance data current to the most recent month end, please call 1-800-345-2021 or visit americancentury.com. For additional information about the fund, please consult the prospectus.
|
|
| Growth of $10,000 Over Life of Class |
$10,000 investment made October 31, 2011 |
Performance for other share classes will vary due to differences in fee structure.
|
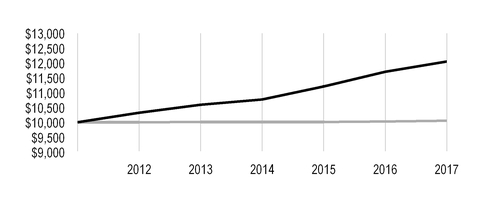
|
| |
| Value on March 31, 2017 |
| | Investor Class — $12,054 |
| |
| | Bloomberg Barclays U.S. 1-3 Month Treasury Bill Index — $10,054 |
| |
Ending value of Investor Class would have been lower if a portion of the fees had not been waived.
|
| | | | |
| Total Annual Fund Operating Expenses |
| Investor Class | Institutional Class | A Class | C Class | R Class |
| 4.09% | 3.89% | 4.34% | 5.09% | 4.59% |
The total annual fund operating expenses shown is as stated in the fund’s prospectus current as of the date of this report. The prospectus may vary from the expense ratio shown elsewhere in this report because it is based on a different time period, includes acquired fund fees and expenses, and, if applicable, does not include fee waivers or expense reimbursements.
Data presented reflect past performance. Past performance is no guarantee of future results. Current performance may be higher or lower than the performance shown. Total returns for periods less than one year are not annualized. Investment return and principal value will fluctuate, and redemption value may be more or less than original cost. Data assumes reinvestment of dividends and capital gains, and none of the charts reflect the deduction of taxes that a shareholder would pay on fund distributions or the redemption of fund shares. To obtain performance data current to the most recent month end, please call 1-800-345-2021 or visit americancentury.com. For additional information about the fund, please consult the prospectus.
Portfolio Managers: Phil Davidson, Michael Liss, Kevin Toney, Brian Woglom, and Dan Gruemmer
Performance Summary
AC Alternatives Market Neutral Value returned 2.97%* for the fiscal year ended March 31, 2017, compared with the 0.30% return of its benchmark, the Bloomberg Barclays U.S. 1-3 Month Treasury Bill Index. The fund's return reflects operating expenses, while the index's return does not.
The foundation of the strategy is to combine long positions in more undervalued companies with short positions in overvalued companies. We believe this helps reduce the risk inherent in long/short strategies. This approach helped the portfolio deliver positive absolute results for the year.
Rising Markets Buoyed Long Positions
The broad equity markets turned in robust returns during the reporting period. In turn, many of the portfolio’s top performers were long positions. More specifically, a convertible position in semiconductor company Microchip Technology rose after the company reported quarterly sales, gross and operating margins, earnings per share, and free cash flow that significantly beat expectations. The company also raised the following quarter’s sales and earnings per share guidance and its accretion targets for Atmel (an acquisition that took place last year). Additionally, Applied Materials, another holding in the semiconductors and semiconductor equipment industry, rose significantly. The stock was buoyed by strong orders, record backlog, and market share gains.
Following President Trump’s election in November, stocks in the financials sector responded positively to rising interest rates and potential changes in financial conditions including higher interest rates, lower taxes, and reduced regulation. Banks performed particularly well on optimism surrounding future earnings due to these potential changes, leading to strong performance by our positions in Comerica and PNC Financial Services Group.
While many of the portfolio’s long positions reaped the benefits of the rising markets, a short position in lululemon athletica was a notable contributor. In March, its stock fell after the athletic apparel retailer reported weaker-than-expected fourth-quarter earnings for its 2016 fiscal year. Additionally, the company provided weak guidance for the first quarter of 2017.
Short Positions Were Challenged by Rising Markets
Rising equity markets weighed on many of the portfolio’s short positions including Prudential Financial, Deere & Co., Amazon.com, and Kinder Morgan. As the stocks of these companies rose, our short positions detracted from returns.
Like many other insurance companies, Prudential Financial’s stock price rose as interest rates increased. Internet retailer Amazon.com rose on growth expectations. Deere & Co.’s stock was bolstered by enthusiasm surrounding reduced costs, restructuring efforts, and future growth potential. Additionally, the stock of energy company Kinder Morgan rose after the company announced an asset sale and reduced its capital expenditure outlook. The asset sale that followed led to deleveraging and an improved balance sheet, so we eliminated the short position.
| |
| * | All fund returns referenced in this commentary are for Investor Class shares. Fund returns would have been lower if a portion of the fees had not been waived. Performance for other share classes will vary due to differences in fee structure; when Investor Class performance exceeds that of the fund's benchmark, other share classes may not. See page 3 for returns for all share classes. |
Portfolio Positioning
AC Alternatives Market Neutral Value is designed to address several secular financial planning trends, including the need for an alternative to cash in this low interest rate environment, diversification resulting from not being correlated to equity markets, low volatility exposure, and a hedge against a rise in inflation and/or interest rates.
We continue to follow our disciplined, bottom-up process, selecting securities one at a time for the portfolio. We look for securities of companies that we believe are misvalued on both the long and short side of the market with consideration for both upside potential and downside risk. The portfolio’s current positioning reflects the individual opportunities identified by our team.
|
| |
| MARCH 31, 2017 | |
| Top Ten Long Holdings | % of net assets |
| Royal Dutch Shell plc, Class A ADR | 4.65% |
| Intel Corp. (Convertible) | 3.58% |
| iShares U.S. Real Estate ETF | 3.17% |
| iShares Russell 1000 Value ETF | 3.03% |
| Pfizer, Inc. | 2.68% |
| Wal-Mart Stores, Inc. | 2.53% |
| Consumer Discretionary Select Sector SPDR Fund | 2.53% |
| Medtronic plc | 2.22% |
| Microchip Technology, Inc. (Convertible) | 2.02% |
| General Mills, Inc. | 1.81% |
| | |
| Top Ten Short Holdings | % of net assets |
| Royal Dutch Shell plc, Class B ADR | (4.64)% |
| Utilities Select Sector SPDR Fund | (4.62)% |
| Kraft Heinz Co. (The) | (3.32)% |
| Intel Corp. | (3.21)% |
| iShares Russell 1000 Growth ETF | (3.03)% |
| Costco Wholesale Corp. | (2.82)% |
| Halliburton Co. | (2.47)% |
| Eli Lilly & Co. | (2.23)% |
| Stryker Corp. | (2.02)% |
| Microchip Technology, Inc. | (1.86)% |
| | |
| Types of Investments in Portfolio | % of net assets |
| Domestic Common Stocks | 69.3% |
| Foreign Common Stocks* | 12.7% |
| Exchange-Traded Funds | 8.8% |
| Convertible Bonds | 7.1% |
| Convertible Preferred Stocks | 0.9% |
| Domestic Common Stocks Sold Short | (79.8)% |
| Foreign Common Stocks Sold Short* | (6.2)% |
| Exchange-Traded Funds Sold Short | (12.5)% |
| Temporary Cash Investments | 0.1% |
| Other Assets and Liabilities | 99.6%** |
*Includes depositary shares, dual listed securities and foreign ordinary shares.
**Amount relates primarily to deposits for securities sold short at period end.
Fund shareholders may incur two types of costs: (1) transaction costs, including sales charges (loads) on purchase payments and redemption/exchange fees; and (2) ongoing costs, including management fees; distribution and service (12b-1) fees; and other fund expenses. This example is intended to help you understand your ongoing costs (in dollars) of investing in your fund and to compare these costs with the ongoing cost of investing in other mutual funds.
The example is based on an investment of $1,000 made at the beginning of the period and held for the entire period from October 1, 2016 to March 31, 2017.
Actual Expenses
The table provides information about actual account values and actual expenses for each class. You may use the information, together with the amount you invested, to estimate the expenses that you paid over the period. First, identify the share class you own. Then simply divide your account value by $1,000 (for example, an $8,600 account value divided by $1,000 = 8.6), then multiply the result by the number under the heading “Expenses Paid During Period” to estimate the expenses you paid on your account during this period.
If you hold Investor Class shares of any American Century Investments fund, or Institutional Class shares of the American Century Diversified Bond Fund, in an American Century Investments account (i.e., not a financial intermediary or retirement plan account), American Century Investments may charge you a $12.50 semiannual account maintenance fee if the value of those shares is less than $10,000. We will redeem shares automatically in one of your accounts to pay the $12.50 fee. In determining your total eligible investment amount, we will include your investments in all personal accounts (including American Century Investments Brokerage accounts) registered under your Social Security number. Personal accounts include individual accounts, joint accounts, UGMA/UTMA accounts, personal trusts, Coverdell Education Savings Accounts and IRAs (including traditional, Roth, Rollover, SEP-, SARSEP- and SIMPLE-IRAs), and certain other retirement accounts. If you have only business, business retirement, employer-sponsored or American Century Investments Brokerage accounts, you are currently not subject to this fee. If you are subject to the Account Maintenance Fee, your account value could be reduced by the fee amount.
Hypothetical Example for Comparison Purposes
The table also provides information about hypothetical account values and hypothetical expenses based on the actual expense ratio of each class of your fund and an assumed rate of return of 5% per year before expenses, which is not the actual return of a fund’s share class. The hypothetical account values and expenses may not be used to estimate the actual ending account balance or expenses you paid for the period. You may use this information to compare the ongoing costs of investing in your fund and other funds. To do so, compare this 5% hypothetical example with the 5% hypothetical examples that appear in the shareholder reports of the other funds.
Please note that the expenses shown in the table are meant to highlight your ongoing costs only and do not reflect any transactional costs, such as sales charges (loads) or redemption/exchange fees. Therefore, the table is useful in comparing ongoing costs only, and will not help you determine the relative total costs of owning different funds. In addition, if these transactional costs were included, your costs would have been higher.
|
| | | | |
| Beginning
Account Value
10/1/16 | Ending
Account Value
3/31/17 | Expenses Paid
During Period(1)
10/1/16 - 3/31/17 |
Annualized
Expense Ratio(1) |
| Actual | | | | |
| Investor Class (after waiver) | $1,000 | $1,025.00 | $19.39 | 3.84% |
| Investor Class (before waiver) | $1,000 | $1,025.00(2) | $20.65 | 4.09% |
| Institutional Class (after waiver) | $1,000 | $1,026.60 | $18.39 | 3.64% |
| Institutional Class (before waiver) | $1,000 | $1,026.60(2) | $19.65 | 3.89% |
| A Class (after waiver) | $1,000 | $1,024.30 | $20.64 | 4.09% |
| A Class (before waiver) | $1,000 | $1,024.30(2) | $21.90 | 4.34% |
| C Class (after waiver) | $1,000 | $1,020.30 | $24.38 | 4.84% |
| C Class (before waiver) | $1,000 | $1,020.30(2) | $25.64 | 5.09% |
| R Class (after waiver) | $1,000 | $1,022.70 | $21.89 | 4.34% |
| R Class (before waiver) | $1,000 | $1,022.70(2) | $23.15 | 4.59% |
| Hypothetical | | | | |
| Investor Class (after waiver) | $1,000 | $1,005.78 | $19.20 | 3.84% |
| Investor Class (before waiver) | $1,000 | $1,004.54 | $20.44 | 4.09% |
| Institutional Class (after waiver) | $1,000 | $1,006.78 | $18.21 | 3.64% |
| Institutional Class (before waiver) | $1,000 | $1,005.54 | $19.45 | 3.89% |
| A Class (after waiver) | $1,000 | $1,004.54 | $20.44 | 4.09% |
| A Class (before waiver) | $1,000 | $1,003.29 | $21.68 | 4.34% |
| C Class (after waiver) | $1,000 | $1,000.80 | $24.14 | 4.84% |
| C Class (before waiver) | $1,000 | $999.55 | $25.38 | 5.09% |
| R Class (after waiver) | $1,000 | $1,003.29 | $21.68 | 4.34% |
| R Class (before waiver) | $1,000 | $1,002.04 | $22.91 | 4.59% |
| |
| (1) | Expenses are equal to the class's annualized expense ratio listed in the table above, multiplied by the average account value over the period, multiplied by 182, the number of days in the most recent fiscal half-year, divided by 365, to reflect the one-half year period. |
| |
| (2) | Ending account value assumes the return earned after waiver and would have been lower if a portion of the fees had not been waived. |
MARCH 31, 2017
|
| | | | | | |
| | Shares/Principal Amount | Value |
| COMMON STOCKS — 82.0% | | |
| Aerospace and Defense — 3.9% | | |
| Boeing Co. (The) | 28,562 |
| $ | 5,051,475 |
|
HEICO Corp., Class A(1) | 159,113 |
| 11,933,475 |
|
| L3 Technologies, Inc. | 30,040 |
| 4,965,312 |
|
| Textron, Inc. | 149,154 |
| 7,098,239 |
|
| | | 29,048,501 |
|
| Air Freight and Logistics — 1.1% | | |
United Parcel Service, Inc., Class B(1) | 77,450 |
| 8,310,385 |
|
| Airlines — 1.2% | | |
Alaska Air Group, Inc.(1) | 54,790 |
| 5,052,734 |
|
| Southwest Airlines Co. | 72,420 |
| 3,893,299 |
|
| | | 8,946,033 |
|
| Auto Components — 0.7% | | |
| Delphi Automotive plc | 67,771 |
| 5,454,888 |
|
| Automobiles — 0.6% | | |
| Ford Motor Co. | 375,500 |
| 4,370,820 |
|
| Banks — 2.8% | | |
| BB&T Corp. | 117,900 |
| 5,270,130 |
|
| Comerica, Inc. | 56,180 |
| 3,852,824 |
|
| First Hawaiian, Inc. | 139,119 |
| 4,162,441 |
|
| PNC Financial Services Group, Inc. (The) | 27,568 |
| 3,314,776 |
|
| SunTrust Banks, Inc. | 74,960 |
| 4,145,288 |
|
| | | 20,745,459 |
|
| Beverages — 1.2% | | |
Brown-Forman Corp., Class B(1) | 186,878 |
| 8,630,026 |
|
| Biotechnology — 1.4% | | |
Gilead Sciences, Inc.(1) | 151,142 |
| 10,265,565 |
|
| Commercial Services and Supplies — 1.3% | | |
| Republic Services, Inc. | 70,845 |
| 4,449,774 |
|
| UniFirst Corp. | 38,270 |
| 5,413,292 |
|
| | | 9,863,066 |
|
| Communications Equipment — 0.5% | | |
| Harris Corp. | 33,710 |
| 3,750,912 |
|
| Consumer Finance — 1.0% | | |
Discover Financial Services(1) | 108,400 |
| 7,413,476 |
|
| Containers and Packaging — 0.9% | | |
Bemis Co., Inc.(1) | 138,420 |
| 6,763,201 |
|
| Electric Utilities — 4.4% | | |
Edison International(1) | 110,978 |
| 8,834,959 |
|
| Eversource Energy | 65,890 |
| 3,873,014 |
|
PG&E Corp.(1) | 190,516 |
| 12,642,642 |
|
| Westar Energy, Inc. | 74,800 |
| 4,059,396 |
|
| Xcel Energy, Inc. | 85,740 |
| 3,811,143 |
|
| | | 33,221,154 |
|
| Electrical Equipment — 1.9% | | |
Eaton Corp. plc(1) | 92,450 |
| 6,855,168 |
|
|
| | | | | | |
| | Shares/Principal Amount | Value |
| Emerson Electric Co. | 87,080 |
| $ | 5,212,609 |
|
| Hubbell, Inc. | 18,985 |
| 2,279,149 |
|
| | | 14,346,926 |
|
| Electronic Equipment, Instruments and Components — 1.9% | | |
Keysight Technologies, Inc.(2) | 229,678 |
| 8,300,563 |
|
| TE Connectivity Ltd. | 82,210 |
| 6,128,755 |
|
| | | 14,429,318 |
|
| Energy Equipment and Services — 2.5% | | |
| National Oilwell Varco, Inc. | 133,040 |
| 5,333,573 |
|
Schlumberger Ltd.(1) | 169,947 |
| 13,272,861 |
|
| | | 18,606,434 |
|
| Food and Staples Retailing — 3.9% | | |
| CVS Health Corp. | 125,790 |
| 9,874,515 |
|
Wal-Mart Stores, Inc.(1) | 262,440 |
| 18,916,675 |
|
| | | 28,791,190 |
|
| Food Products — 3.6% | | |
Conagra Brands, Inc.(1) | 212,930 |
| 8,589,596 |
|
General Mills, Inc.(1) | 229,370 |
| 13,535,124 |
|
| Kellogg Co. | 64,910 |
| 4,713,115 |
|
| | | 26,837,835 |
|
| Gas Utilities — 1.5% | | |
Atmos Energy Corp.(1) | 99,930 |
| 7,893,471 |
|
| Spire, Inc. | 46,135 |
| 3,114,112 |
|
| | | 11,007,583 |
|
| Health Care Equipment and Supplies — 4.2% | | |
Abbott Laboratories(1) | 57,510 |
| 2,554,019 |
|
| Medtronic plc | 205,470 |
| 16,552,663 |
|
| STERIS plc | 91,610 |
| 6,363,231 |
|
| Zimmer Biomet Holdings, Inc. | 50,087 |
| 6,116,123 |
|
| | | 31,586,036 |
|
| Health Care Providers and Services — 3.7% | | |
| Anthem, Inc. | 21,610 |
| 3,573,861 |
|
Express Scripts Holding Co.(1)(2) | 200,390 |
| 13,207,705 |
|
| McKesson Corp. | 23,730 |
| 3,518,210 |
|
Molina Healthcare, Inc.(2) | 167,040 |
| 7,617,024 |
|
| | | 27,916,800 |
|
| Hotels, Restaurants and Leisure — 0.9% | | |
| McDonald's Corp. | 50,540 |
| 6,550,489 |
|
| Household Durables — 1.7% | | |
| Lennar Corp., Class B | 114,114 |
| 4,769,965 |
|
PulteGroup, Inc.(1) | 327,953 |
| 7,723,293 |
|
| | | 12,493,258 |
|
| Industrial Conglomerates — 0.3% | | |
| Siemens AG | 19,050 |
| 2,609,414 |
|
| Insurance — 4.1% | | |
| Chubb Ltd. | 90,850 |
| 12,378,312 |
|
| EMC Insurance Group, Inc. | 39,827 |
| 1,117,546 |
|
| Marsh & McLennan Cos., Inc. | 50,192 |
| 3,708,687 |
|
MetLife, Inc.(1) | 206,023 |
| 10,882,135 |
|
| ProAssurance Corp. | 46,639 |
| 2,810,000 |
|
| | | 30,896,680 |
|
|
| | | | | | |
| | Shares/Principal Amount | Value |
| Internet Software and Services — 0.5% | | |
Alphabet, Inc., Class C(2) | 4,690 |
| $ | 3,890,636 |
|
| Leisure Products — 0.7% | | |
| Mattel, Inc. | 190,890 |
| 4,888,693 |
|
| Life Sciences Tools and Services — 0.7% | | |
Waters Corp.(2) | 35,512 |
| 5,550,881 |
|
| Machinery — 5.4% | | |
| Crane Co. | 69,600 |
| 5,208,168 |
|
| Cummins, Inc. | 69,320 |
| 10,481,184 |
|
| Dover Corp. | 148,610 |
| 11,940,813 |
|
| Parker-Hannifin Corp. | 18,490 |
| 2,964,317 |
|
| Stanley Black & Decker, Inc. | 28,360 |
| 3,768,193 |
|
| Timken Co. (The) | 123,430 |
| 5,579,036 |
|
| | | 39,941,711 |
|
| Multiline Retail — 1.0% | | |
| Dollar General Corp. | 71,650 |
| 4,996,155 |
|
| Target Corp. | 40,770 |
| 2,250,096 |
|
| | | 7,246,251 |
|
| Oil, Gas and Consumable Fuels — 9.0% | | |
Anadarko Petroleum Corp.(1) | 70,770 |
| 4,387,740 |
|
| Enterprise Products Partners LP | 134,510 |
| 3,713,821 |
|
| EQT Corp. | 102,256 |
| 6,247,842 |
|
| EQT Midstream Partners LP | 46,500 |
| 3,575,850 |
|
| Occidental Petroleum Corp. | 35,000 |
| 2,217,600 |
|
| Phillips 66 Partners LP | 83,570 |
| 4,291,319 |
|
| Royal Dutch Shell plc, Class A ADR | 658,181 |
| 34,705,884 |
|
| TOTAL SA ADR | 161,354 |
| 8,135,469 |
|
| | | 67,275,525 |
|
| Personal Products — 0.9% | | |
| Unilever NV ADR | 130,560 |
| 6,486,221 |
|
| Pharmaceuticals — 3.0% | | |
Pfizer, Inc.(1) | 585,388 |
| 20,026,123 |
|
| Roche Holding AG | 8,750 |
| 2,234,563 |
|
| | | 22,260,686 |
|
| Road and Rail — 1.5% | | |
| Norfolk Southern Corp. | 23,050 |
| 2,580,908 |
|
| Union Pacific Corp. | 84,330 |
| 8,932,234 |
|
| | | 11,513,142 |
|
| Semiconductors and Semiconductor Equipment — 2.9% | | |
Applied Materials, Inc.(1) | 76,770 |
| 2,986,353 |
|
| Lam Research Corp. | 33,810 |
| 4,339,852 |
|
| Maxim Integrated Products, Inc. | 143,880 |
| 6,468,845 |
|
| QUALCOMM, Inc. | 131,440 |
| 7,536,769 |
|
| | | 21,331,819 |
|
| Software — 0.5% | | |
| Microsoft Corp. | 52,946 |
| 3,487,024 |
|
| Specialty Retail — 1.9% | | |
AutoZone, Inc.(2) | 8,900 |
| 6,435,145 |
|
| L Brands, Inc. | 58,990 |
| 2,778,429 |
|
|
| | | | | | |
| | Shares/Principal Amount | Value |
| Lowe's Cos., Inc. | 63,850 |
| $ | 5,249,109 |
|
| | | 14,462,683 |
|
| Technology Hardware, Storage and Peripherals — 0.5% | | |
| Apple, Inc. | 25,830 |
| 3,710,738 |
|
| Textiles, Apparel and Luxury Goods — 2.0% | | |
Michael Kors Holdings Ltd.(2) | 218,040 |
| 8,309,505 |
|
| Ralph Lauren Corp. | 45,220 |
| 3,690,856 |
|
| VF Corp. | 46,590 |
| 2,561,052 |
|
| | | 14,561,413 |
|
| Thrifts and Mortgage Finance — 0.3% | | |
| Capitol Federal Financial, Inc. | 177,943 |
| 2,603,306 |
|
TOTAL COMMON STOCKS
(Cost $552,658,180) | | 612,066,178 |
|
| EXCHANGE-TRADED FUNDS — 8.8% | | |
| Consumer Discretionary Select Sector SPDR Fund | 214,614 |
| 18,875,301 |
|
| iShares Russell 1000 Value ETF | 197,049 |
| 22,648,812 |
|
| iShares U.S. Real Estate ETF | 301,800 |
| 23,688,282 |
|
TOTAL EXCHANGE-TRADED FUNDS
(Cost $60,528,535) | | 65,212,395 |
|
| CONVERTIBLE BONDS — 7.1% | | |
| Capital Markets — 1.5% | | |
| Janus Capital Group, Inc., 0.75%, 7/15/18 | $ | 8,729,000 |
| 11,451,357 |
|
| Semiconductors and Semiconductor Equipment — 5.6% | | |
| Intel Corp., 3.48%, 12/15/35 | 19,578,000 |
| 26,699,497 |
|
| Microchip Technology, Inc., 1.625%, 2/15/25 | 10,461,000 |
| 15,050,764 |
|
| | | 41,750,261 |
|
TOTAL CONVERTIBLE BONDS
(Cost $47,901,149) | | 53,201,618 |
|
| CONVERTIBLE PREFERRED STOCKS — 0.9% | | |
| Electric Utilities — 0.6% | | |
| NextEra Energy, Inc., 6.12%, 9/1/19 | 86,610 |
| 4,417,110 |
|
| Food Products — 0.3% | | |
| Tyson Foods, Inc., 4.75%, 7/15/17 | 37,497 |
| 2,512,299 |
|
TOTAL CONVERTIBLE PREFERRED STOCKS
(Cost $6,228,354) | | 6,929,409 |
|
| TEMPORARY CASH INVESTMENTS — 0.1% | | |
| Repurchase Agreement, BMO Capital Markets Corp., (collateralized by various U.S. Treasury obligations, 0.75% - 2.75%, 7/31/17 - 2/15/24, valued at $256,799), in a joint trading account at 0.67%, dated 3/31/17, due 4/3/17 (Delivery value $251,580) | | 251,566 |
|
| Repurchase Agreement, Fixed Income Clearing Corp., (collateralized by various U.S. Treasury obligations, 2.50%, 2/15/46, valued at $466,879), at 0.22%, dated 3/31/17, due 4/3/17 (Delivery value $456,008) | | 456,000 |
|
| State Street Institutional U.S. Government Money Market Fund, Premier Class | 619 |
| 619 |
|
TOTAL TEMPORARY CASH INVESTMENTS
(Cost $708,185) | | 708,185 |
|
TOTAL INVESTMENT SECURITIES BEFORE SECURITIES SOLD SHORT — 98.9%
(Cost $668,024,403) | 738,117,785 |
|
| SECURITIES SOLD SHORT — (98.5)% | | |
| COMMON STOCKS SOLD SHORT — (86.0)% | | |
| Aerospace and Defense — (4.4)% | | |
| General Dynamics Corp. | (37,610 | ) | (7,040,592 | ) |
| HEICO Corp. | (136,589 | ) | (11,910,561 | ) |
|
| | | | | | |
| | Shares/Principal Amount | Value |
| Lockheed Martin Corp. | (12,100 | ) | $ | (3,237,960 | ) |
| Northrop Grumman Corp. | (23,020 | ) | (5,475,077 | ) |
| Raytheon Co. | (32,660 | ) | (4,980,650 | ) |
| | | (32,644,840 | ) |
| Air Freight and Logistics — (1.1)% | | |
| FedEx Corp. | (42,950 | ) | (8,381,692 | ) |
| Airlines — (1.2)% | | |
| American Airlines Group, Inc. | (210,200 | ) | (8,891,460 | ) |
| Auto Components — (0.4)% | | |
| Autoliv, Inc. | (27,950 | ) | (2,858,167 | ) |
| Automobiles — (0.9)% | | |
| General Motors Co. | (193,730 | ) | (6,850,293 | ) |
| Banks — (3.1)% | | |
| Bank of Hawaii Corp. | (50,750 | ) | (4,179,770 | ) |
| JPMorgan Chase & Co. | (37,624 | ) | (3,304,892 | ) |
| KeyCorp | (515,720 | ) | (9,169,502 | ) |
| People's United Financial, Inc. | (364,351 | ) | (6,631,188 | ) |
| | | (23,285,352 | ) |
| Beverages — (1.2)% | | |
| Brown-Forman Corp., Class A | (183,940 | ) | (8,658,056 | ) |
| Biotechnology — (0.6)% | | |
| Celgene Corp. | (38,370 | ) | (4,774,379 | ) |
| Capital Markets — (1.5)% | | |
| Janus Capital Group, Inc. | (859,900 | ) | (11,350,680 | ) |
| Commercial Services and Supplies — (1.3)% | | |
| Cintas Corp. | (42,915 | ) | (5,430,464 | ) |
| Waste Management, Inc. | (61,176 | ) | (4,460,954 | ) |
| | | (9,891,418 | ) |
| Consumer Finance — (1.0)% | | |
| Capital One Financial Corp. | (86,490 | ) | (7,495,223 | ) |
| Containers and Packaging — (0.9)% | | |
| Ball Corp. | (91,530 | ) | (6,797,018 | ) |
| Diversified Financial Services — (0.4)% | | |
| Berkshire Hathaway, Inc., Class B | (16,954 | ) | (2,825,893 | ) |
| Electric Utilities — (1.4)% | | |
| American Electric Power Co., Inc. | (86,930 | ) | (5,835,611 | ) |
| Southern Co. (The) | (91,033 | ) | (4,531,623 | ) |
| | | (10,367,234 | ) |
| Electronic Equipment, Instruments and Components — (1.9)% | | |
| Amphenol Corp., Class A | (86,410 | ) | (6,149,800 | ) |
| National Instruments Corp. | (255,050 | ) | (8,304,428 | ) |
| | | (14,454,228 | ) |
| Energy Equipment and Services — (2.5)% | | |
| Halliburton Co. | (375,251 | ) | (18,466,102 | ) |
| Equity Real Estate Investment Trusts (REITs) — (3.1)% | | |
| AvalonBay Communities, Inc. | (35,600 | ) | (6,536,160 | ) |
| Equity Residential | (62,430 | ) | (3,884,395 | ) |
| Essex Property Trust, Inc. | (24,410 | ) | (5,651,647 | ) |
|
| | | | | | |
| | Shares/Principal Amount | Value |
| Simon Property Group, Inc. | (42,660 | ) | $ | (7,338,800 | ) |
| | | (23,411,002 | ) |
| Food and Staples Retailing — (4.1)% | | |
| Costco Wholesale Corp. | (125,500 | ) | (21,045,095 | ) |
| Walgreens Boots Alliance, Inc. | (118,440 | ) | (9,836,442 | ) |
| | | (30,881,537 | ) |
| Food Products — (4.8)% | | |
| Danone SA ADR | (635,510 | ) | (8,700,132 | ) |
| Kraft Heinz Co. (The) | (273,054 | ) | (24,796,034 | ) |
| Tyson Foods, Inc., Class A | (40,691 | ) | (2,511,041 | ) |
| | | (36,007,207 | ) |
| Health Care Equipment and Supplies — (4.2)% | | |
| Boston Scientific Corp. | (359,330 | ) | (8,936,537 | ) |
| CR Bard, Inc. | (30,440 | ) | (7,565,558 | ) |
| Stryker Corp. | (114,670 | ) | (15,096,305 | ) |
| | | (31,598,400 | ) |
| Health Care Providers and Services — (3.7)% | | |
| AmerisourceBergen Corp. | (99,340 | ) | (8,791,590 | ) |
| Centene Corp. | (185,920 | ) | (13,248,659 | ) |
| UnitedHealth Group, Inc. | (34,730 | ) | (5,696,067 | ) |
| | | (27,736,316 | ) |
| Hotels, Restaurants and Leisure — (1.6)% | | |
| Chipotle Mexican Grill, Inc. | (11,450 | ) | (5,101,204 | ) |
| Wendy's Co. (The) | (480,920 | ) | (6,545,321 | ) |
| | | (11,646,525 | ) |
| Household Durables — (2.4)% | | |
| Lennar Corp., Class A | (90,170 | ) | (4,615,802 | ) |
| Toll Brothers, Inc. | (213,190 | ) | (7,698,291 | ) |
| Whirlpool Corp. | (30,990 | ) | (5,309,517 | ) |
| | | (17,623,610 | ) |
| Industrial Conglomerates — (1.3)% | | |
| General Electric Co. | (335,610 | ) | (10,001,178 | ) |
| Insurance — (3.8)% | | |
| American International Group, Inc. | (43,710 | ) | (2,728,815 | ) |
| Aon plc | (31,760 | ) | (3,769,595 | ) |
| Prudential Financial, Inc. | (101,593 | ) | (10,837,941 | ) |
| Travelers Cos., Inc. (The) | (88,770 | ) | (10,700,336 | ) |
| | | (28,036,687 | ) |
| Internet and Direct Marketing Retail — (1.0)% | | |
| Amazon.com, Inc. | (8,420 | ) | (7,464,667 | ) |
| Leisure Products — (0.7)% | | |
| Hasbro, Inc. | (48,830 | ) | (4,874,210 | ) |
| Life Sciences Tools and Services — (0.7)% | | |
| Thermo Fisher Scientific, Inc. | (35,910 | ) | (5,515,776 | ) |
| Machinery — (6.3)% | | |
| Caterpillar, Inc. | (88,670 | ) | (8,225,029 | ) |
| Deere & Co. | (124,100 | ) | (13,509,526 | ) |
| Illinois Tool Works, Inc. | (22,600 | ) | (2,993,822 | ) |
| Middleby Corp. (The) | (55,450 | ) | (7,566,152 | ) |
| RBC Bearings, Inc. | (57,430 | ) | (5,575,879 | ) |
| Snap-on, Inc. | (22,480 | ) | (3,791,702 | ) |
|
| | | | | | |
| | Shares/Principal Amount | Value |
| Xylem, Inc. | (101,890 | ) | $ | (5,116,916 | ) |
| | | (46,779,026 | ) |
| Multi-Utilities — (0.5)% | | |
| Dominion Resources, Inc. | (49,160 | ) | (3,813,341 | ) |
| Multiline Retail — (0.7)% | | |
| Dollar Tree, Inc. | (63,810 | ) | (5,006,533 | ) |
| Oil, Gas and Consumable Fuels — (6.0)% | | |
| Chevron Corp. | (72,830 | ) | (7,819,757 | ) |
| Exxon Mobil Corp. | (30,800 | ) | (2,525,908 | ) |
| Royal Dutch Shell plc, Class B ADR | (620,960 | ) | (34,668,197 | ) |
| | | (45,013,862 | ) |
| Pharmaceuticals — (3.7)% | | |
| Eli Lilly & Co. | (197,590 | ) | (16,619,295 | ) |
| Merck & Co., Inc. | (171,140 | ) | (10,874,235 | ) |
| | | (27,493,530 | ) |
| Road and Rail — (2.6)% | | |
| Avis Budget Group, Inc. | (261,714 | ) | (7,741,500 | ) |
| CSX Corp. | (247,600 | ) | (11,525,780 | ) |
| | | (19,267,280 | ) |
| Semiconductors and Semiconductor Equipment — (6.6)% | | |
| Broadcom Ltd. | (51,210 | ) | (11,212,941 | ) |
| Intel Corp. | (664,010 | ) | (23,950,841 | ) |
| Microchip Technology, Inc. | (187,700 | ) | (13,848,506 | ) |
| | | (49,012,288 | ) |
| Specialty Retail — (2.8)% | | |
| O'Reilly Automotive, Inc. | (23,831 | ) | (6,430,557 | ) |
| Signet Jewelers Ltd. | (26,610 | ) | (1,843,275 | ) |
| Tiffany & Co. | (130,590 | ) | (12,445,227 | ) |
| | | (20,719,059 | ) |
| Technology Hardware, Storage and Peripherals — (0.4)% | | |
| HP, Inc. | (149,480 | ) | (2,672,702 | ) |
| Textiles, Apparel and Luxury Goods — (1.2)% | | |
| lululemon athletica, Inc. | (175,130 | ) | (9,083,993 | ) |
TOTAL COMMON STOCKS SOLD SHORT
(Proceeds $608,745,645) | | (641,650,764 | ) |
| EXCHANGE-TRADED FUNDS SOLD SHORT — (12.5)% | | |
| Alerian MLP ETF | (910,710 | ) | (11,575,124 | ) |
| iShares Russell 1000 Growth ETF | (198,760 | ) | (22,618,888 | ) |
| iShares U.S. Oil & Gas Exploration & Production ETF | (103,220 | ) | (6,308,806 | ) |
| SPDR S&P Oil & Gas Exploration & Production ETF | (119,180 | ) | (4,462,099 | ) |
| Technology Select Sector SPDR Fund | (257,050 | ) | (13,703,336 | ) |
| Utilities Select Sector SPDR Fund | (672,090 | ) | (34,484,938 | ) |
TOTAL EXCHANGE-TRADED FUNDS SOLD SHORT
(Proceeds $89,227,051) | | (93,153,191 | ) |
TOTAL SECURITIES SOLD SHORT — (98.5)%
(Proceeds $697,972,696) | | (734,803,955 | ) |
OTHER ASSETS AND LIABILITIES(3) — 99.6% | | 743,071,478 |
|
| TOTAL NET ASSETS — 100.0% | | $ | 746,385,308 |
|
|
| | | | | | | | | | |
| FORWARD FOREIGN CURRENCY EXCHANGE CONTRACTS |
| Currency Purchased | Currency Sold | Counterparty | Settlement Date | Unrealized Appreciation (Depreciation) |
| USD | 1,585,575 |
| CHF | 1,572,637 |
| Credit Suisse AG | 6/30/17 | $ | 7,308 |
|
| USD | 328,613 |
| CHF | 326,901 |
| Credit Suisse AG | 6/30/17 | 542 |
|
| USD | 7,228,398 |
| EUR | 6,633,627 |
| UBS AG | 6/30/17 | 122,151 |
|
| GBP | 7,091 |
| USD | 8,849 |
| Credit Suisse AG | 6/30/17 | 54 |
|
| GBP | 48,281 |
| USD | 60,624 |
| Credit Suisse AG | 6/30/17 | (4 | ) |
| USD | 7,708 |
| GBP | 6,195 |
| Credit Suisse AG | 6/30/17 | (70 | ) |
| USD | 65,110 |
| GBP | 52,088 |
| Credit Suisse AG | 6/30/17 | (289 | ) |
| | | | | | | $ | 129,692 |
|
|
| | |
| NOTES TO SCHEDULE OF INVESTMENTS |
| ADR | - | American Depositary Receipt |
| CHF | - | Swiss Franc |
| EUR | - | Euro |
| GBP | - | British Pound |
| USD | - | United States Dollar |
| |
| (1) | Security, or a portion thereof, has been pledged at the custodian bank or with a broker for collateral requirements on securities sold short. At the period end, the aggregate value of securities pledged was $197,556,894. |
| |
| (3) | Amount relates primarily to deposits for securities sold short at period end. |
See Notes to Financial Statements.
|
|
| Statement of Assets and Liabilities |
|
| | | |
| MARCH 31, 2017 | |
| Assets | |
| Investment securities, at value (cost of $668,024,403) | $ | 738,117,785 |
|
| Deposits for securities sold short | 739,503,978 |
|
| Receivable for investments sold | 42,174,180 |
|
| Receivable for capital shares sold | 1,159,457 |
|
| Unrealized appreciation on forward foreign currency exchange contracts | 130,055 |
|
| Dividends and interest receivable | 1,211,105 |
|
| | 1,522,296,560 |
|
| | |
| Liabilities | |
| Securities sold short, at value (proceeds of $697,972,696) | 734,803,955 |
|
| Payable for investments purchased | 38,070,509 |
|
| Payable for capital shares redeemed | 1,411,527 |
|
| Unrealized depreciation on forward foreign currency exchange contracts | 363 |
|
| Accrued management fees | 1,013,508 |
|
| Distribution and service fees payable | 52,839 |
|
| Dividend expense payable on securities sold short | 558,551 |
|
| | 775,911,252 |
|
| | |
| Net Assets | $ | 746,385,308 |
|
| | |
| Net Assets Consist of: | |
| Capital (par value and paid-in surplus) | $ | 738,219,597 |
|
| Accumulated net investment loss | (206,639 | ) |
| Accumulated net realized loss | (25,018,966 | ) |
| Net unrealized appreciation | 33,391,316 |
|
| | $ | 746,385,308 |
|
|
| | | | | | |
| | Net Assets | Shares Outstanding | Net Asset Value Per Share |
| Investor Class, $0.01 Par Value |
| $419,925,291 |
| 39,018,767 |
| $10.76 |
| Institutional Class, $0.01 Par Value |
| $184,717,185 |
| 16,957,719 |
| $10.89 |
| A Class, $0.01 Par Value |
| $106,662,246 |
| 10,050,111 |
| $10.61* |
| C Class, $0.01 Par Value |
| $34,957,641 |
| 3,441,094 |
| $10.16 |
| R Class, $0.01 Par Value |
| $122,945 |
| 11,751 |
| $10.46 |
*Maximum offering price $11.26 (net asset value divided by 0.9425).
See Notes to Financial Statements.
|
| | | |
| YEAR ENDED MARCH 31, 2017 | |
| Investment Income (Loss) | |
| Income: | |
| Dividends (net of foreign taxes withheld of $236,002) | $ | 13,236,030 |
|
| Interest | 845,772 |
|
| | 14,081,802 |
|
| | |
| Expenses: | |
| Dividend expense on securities sold short | 13,625,402 |
|
| Fees and charges on borrowings for securities sold short | 545,428 |
|
| Management fees | 12,818,834 |
|
| Distribution and service fees: | |
| A Class | 278,163 |
|
| C Class | 320,097 |
|
| R Class | 564 |
|
| Directors' fees and expenses | 21,135 |
|
| Other expenses | 3,983 |
|
| | 27,613,606 |
|
| Fees waived | (1,831,431 | ) |
| | 25,782,175 |
|
| | |
| Net investment income (loss) | (11,700,373 | ) |
| | |
| Realized and Unrealized Gain (Loss) | |
| Net realized gain (loss) on: | |
| Investment transactions | 56,678,738 |
|
| Securities sold short transactions | (45,719,354 | ) |
| Foreign currency transactions | 1,526,813 |
|
| | 12,486,197 |
|
| | |
| Change in net unrealized appreciation (depreciation) on: | |
| Investments | 39,647,674 |
|
| Securities sold short | (21,443,369 | ) |
| Translation of assets and liabilities in foreign currencies | 208,579 |
|
| | 18,412,884 |
|
| | |
| Net realized and unrealized gain (loss) | 30,899,081 |
|
| | |
| Net Increase (Decrease) in Net Assets Resulting from Operations | $ | 19,198,708 |
|
See Notes to Financial Statements.
|
|
| Statement of Changes in Net Assets |
|
| | | | | | |
| YEARS ENDED MARCH 31, 2017 AND MARCH 31, 2016 |
| Increase (Decrease) in Net Assets | March 31, 2017 | March 31, 2016 |
| Operations | | |
| Net investment income (loss) | $ | (11,700,373 | ) | $ | (3,180,237 | ) |
| Net realized gain (loss) | 12,486,197 |
| 1,664,775 |
|
| Change in net unrealized appreciation (depreciation) | 18,412,884 |
| 10,497,064 |
|
| Net increase (decrease) in net assets resulting from operations | 19,198,708 |
| 8,981,602 |
|
| | | |
| Distributions to Shareholders | | |
| From net realized gains: | | |
| Investor Class | (10,130,104 | ) | (1,774,577 | ) |
| Institutional Class | (4,651,007 | ) | (211,977 | ) |
| A Class | (3,199,654 | ) | (542,336 | ) |
| C Class | (920,441 | ) | (227,499 | ) |
| R Class | (3,174 | ) | (557 | ) |
| Decrease in net assets from distributions | (18,904,380 | ) | (2,756,946 | ) |
| | | |
| Capital Share Transactions | | |
| Net increase (decrease) in net assets from capital share transactions (Note 5) | 270,349,369 |
| 396,333,523 |
|
| | | |
| Net increase (decrease) in net assets | 270,643,697 |
| 402,558,179 |
|
| | | |
| Net Assets | | |
| Beginning of period | 475,741,611 |
| 73,183,432 |
|
| End of period | $ | 746,385,308 |
| $ | 475,741,611 |
|
| | | |
| Accumulated net investment loss | $ | (206,639 | ) | $ | (84,812 | ) |
See Notes to Financial Statements.
|
|
| Notes to Financial Statements |
MARCH 31, 2017
1. Organization
American Century Capital Portfolios, Inc. (the corporation) is registered under the Investment Company Act of 1940, as amended (the 1940 Act), as an open-end management investment company and is organized as a Maryland corporation. AC Alternatives Market Neutral Value Fund (the fund) is one fund in a series issued by the corporation. The fund’s investment objective is to seek long-term capital growth, independent of equity market conditions.
The fund offers the Investor Class, the Institutional Class, the A Class, the C Class and the R Class. The A Class may incur an initial sales charge. The A Class and C Class may be subject to a contingent deferred sales charge.
2. Significant Accounting Policies
The following is a summary of significant accounting policies consistently followed by the fund in preparation of its financial statements. The fund is an investment company and follows accounting and reporting guidance in accordance with accounting principles generally accepted in the United States of America. This may require management to make certain estimates and assumptions at the date of the financial statements. Actual results could differ from these estimates. Management evaluated the impact of events or transactions occurring through the date the financial statements were issued that would merit recognition or disclosure.
Investment Valuations — The fund determines the fair value of its investments and computes its net asset value per share at the close of regular trading (usually 4 p.m. Eastern time) on the New York Stock Exchange (NYSE) on each day the NYSE is open. The Board of Directors has adopted valuation policies and procedures to guide the investment advisor in the fund’s investment valuation process and to provide methodologies for the oversight of the fund’s pricing function.
Equity securities that are listed or traded on a domestic securities exchange are valued at the last reported sales price or at the official closing price as provided by the exchange. Equity securities traded on foreign securities exchanges are generally valued at the closing price of such securities on the exchange where primarily traded or at the close of the NYSE, if that is earlier. If no last sales price is reported, or if local convention or regulation so provides, the mean of the latest bid and asked prices may be used. Securities traded over-the-counter are valued at the mean of the latest bid and asked prices, the last sales price, or the official closing price. Equity securities initially expressed in local currencies are translated into U.S. dollars at the mean of the appropriate currency exchange rate at the close of the NYSE as provided by an independent pricing service.
Fixed income securities are valued at the evaluated mean as provided by independent pricing services or at the mean of the most recent bid and asked prices as provided by investment dealers. Corporate and convertible bonds are valued using market models that consider trade data, quotations from dealers and active market makers, relevant yield curve and spread data, creditworthiness, trade data or market information on comparable securities, and other relevant security specific information.
Open-end management investment companies are valued at the reported net asset value per share. Repurchase agreements are valued at cost, which approximates fair value. Forward foreign currency exchange contracts are valued at the mean of the appropriate forward exchange rate at the close of the NYSE as provided by an independent pricing service.
If the fund determines that the market price for an investment is not readily available or the valuation methods mentioned above do not reflect an investment’s fair value, such investment is valued as determined in good faith by the Board of Directors or its delegate, in accordance with policies and procedures adopted by the Board of Directors. In its determination of fair value, the fund may review several factors including, but not limited to, market information regarding the specific investment or comparable investments and correlation with other investment types, futures indices or general market indicators. Circumstances that may cause the fund to use these procedures to value an investment include, but are not limited to: an investment has been declared in default or is distressed; trading in a security has been suspended during the trading day or a
security is not actively trading on its principal exchange; prices received from a regular pricing source are deemed unreliable; or there is a foreign market holiday and no trading occurred.
The fund monitors for significant events occurring after the close of an investment’s primary exchange but before the fund’s net asset value per share is determined. Significant events may include, but are not limited to: corporate announcements and transactions; governmental action and political unrest that could impact a specific investment or an investment sector; or armed conflicts, natural disasters and similar events that could affect investments in a specific country or region. The fund also monitors for significant fluctuations between domestic and foreign markets, as evidenced by the U.S. market or such other indicators that the Board of Directors, or its delegate, deems appropriate. If significant fluctuations in foreign markets are identified, the fund may apply a model-derived factor to the closing price of equity securities traded on foreign securities exchanges. The factor is based on observable market data as provided by an independent pricing service.
Security Transactions — Security transactions are accounted for as of the trade date. Net realized gains and losses are determined on the identified cost basis, which is also used for federal income tax purposes.
Investment Income — Dividend income less foreign taxes withheld, if any, is recorded as of the ex-dividend date. Distributions received on securities that represent a return of capital or long-term capital gain are recorded as a reduction of cost of investments and/or as a realized gain. The fund may estimate the components of distributions received that may be considered nontaxable distributions or long-term capital gain distributions for income tax purposes. Interest income is recorded on the accrual basis and includes accretion of discounts and amortization of premiums.
Securities Sold Short — The fund enters into short sales, which is selling securities it does not own, as part of its normal investment activities. Upon selling a security short, the fund will segregate cash, cash equivalents or other appropriate liquid securities in at least an amount equal to the current market value of the securities sold short until the fund replaces the borrowed security. Interest earned on segregated cash for securities sold short is reflected as interest income. The fund is required to pay any dividends or interest due on securities sold short. Such dividends and interest are recorded as an expense. The fund may pay fees or charges on the assets borrowed for securities sold short. These fees are calculated daily based upon the value of each security sold short and a rate that is dependent on the availability of such security. Liabilities for securities sold short are valued daily and changes in value are recorded as change in net unrealized appreciation (depreciation) on securities sold short. The fund records realized gain (loss) on a security sold short when it is terminated by the fund and includes as a component of net realized gain (loss) on securities sold short transactions.
Foreign Currency Translations — All assets and liabilities initially expressed in foreign currencies are translated into U.S. dollars at prevailing exchange rates at period end. The fund may enter into spot foreign currency exchange contracts to facilitate transactions denominated in a foreign currency. Purchases and sales of investment securities, dividend and interest income, spot foreign currency exchange contracts, and expenses are translated at the rates of exchange prevailing on the respective dates of such transactions. Net realized and unrealized foreign currency exchange gains or losses related to investment securities are a component of net realized gain (loss) on investment transactions and change in net unrealized appreciation (depreciation) on investments, respectively. Net realized and unrealized foreign currency exchange gains or losses related to securities sold short are a component of net realized gain (loss) on securities sold short transactions and change in net unrealized appreciation (depreciation) on securities sold short, respectively.
Segregated Assets — In accordance with the 1940 Act, the fund segregates assets on its books and records to cover certain types of investments, including, but not limited to, futures contracts and short sales. American Century Investment Management, Inc. (ACIM) (the investment advisor) monitors, on a daily basis, the securities segregated to ensure the fund designates a sufficient amount of liquid assets, marked-to-market daily. The fund may also receive assets or be required to pledge assets at the custodian bank or with a broker for margin requirements on futures contracts and short sales.
Repurchase Agreements — The fund may enter into repurchase agreements with institutions that ACIM has determined are creditworthy pursuant to criteria adopted by the Board of Directors. The fund requires that the collateral, represented by securities, received in a repurchase transaction be transferred to the custodian in a manner sufficient to enable the fund to obtain those securities in the event of a default under the repurchase agreement. ACIM monitors, on a daily basis, the securities transferred to ensure the value, including accrued interest, of the securities under each repurchase agreement is equal to or greater than amounts owed to the fund under each repurchase agreement.
Joint Trading Account — Pursuant to an Exemptive Order issued by the Securities and Exchange Commission, the fund, along with certain other funds in the American Century Investments family of funds, may transfer uninvested cash balances into a joint trading account. These balances are invested in one or more repurchase agreements that are collateralized by U.S. Treasury or Agency obligations.
Income Tax Status — It is the fund’s policy to distribute substantially all net investment income and net realized gains to shareholders and to otherwise qualify as a regulated investment company under provisions of the Internal Revenue Code. Accordingly, no provision has been made for income taxes. The fund files U.S. federal, state, local and non-U.S. tax returns as applicable. The fund's tax returns are subject to examination by the relevant taxing authority until expiration of the applicable statute of limitations, which is generally three years from the date of filing but can be longer in certain jurisdictions. At this time, management believes there are no uncertain tax positions which, based on their technical merit, would not be sustained upon examination and for which it is reasonably possible that the total amounts of unrecognized tax benefits will significantly change in the next twelve months.
Multiple Class — All shares of the fund represent an equal pro rata interest in the net assets of the class to which such shares belong, and have identical voting, dividend, liquidation and other rights and the same terms and conditions, except for class specific expenses and exclusive rights to vote on matters affecting only individual classes. Income, non-class specific expenses, and realized and unrealized capital gains and losses of the fund are allocated to each class of shares based on their relative net assets.
Distributions to Shareholders — Distributions from net investment income, if any, are generally declared and paid quarterly. Distributions from net realized gains, if any, are generally declared and paid annually.
Indemnifications — Under the corporation’s organizational documents, its officers and directors are indemnified against certain liabilities arising out of the performance of their duties to the fund. In addition, in the normal course of business, the fund enters into contracts that provide general indemnifications. The maximum exposure under these arrangements is unknown as this would involve future claims that may be made against a fund. The risk of material loss from such claims is considered by management to be remote.
3. Fees and Transactions with Related Parties
Certain officers and directors of the corporation are also officers and/or directors of American Century Companies, Inc. (ACC). The corporation’s investment advisor, ACIM, the corporation's distributor, American Century Investment Services, Inc. (ACIS), and the corporation’s transfer agent, American Century Services, LLC, are wholly owned, directly or indirectly, by ACC.
Management Fees — The corporation has entered into a management agreement with ACIM, under which ACIM provides the fund with investment advisory and management services in exchange for a single, unified management fee (the fee) per class. The agreement provides that all expenses of managing and operating the fund, except distribution and service fees, expenses on securities sold short, brokerage expenses, taxes, interest, fees and expenses of the independent directors (including legal counsel fees), and extraordinary expenses, will be paid by ACIM. The fee is computed and accrued daily based on each class’s daily net assets and paid monthly in arrears. The difference in the fee among the classes is a result of their separate arrangements for shareholder services. It is not the result of any difference in advisory or custodial fees or other expenses related to the management of the fund’s assets, which do not vary by class. The annual management fee is 1.90% for the Investor Class, A Class, C Class and R Class and 1.70% for the Institutional Class. From April 1, 2016 through July 31, 2016 the investment advisor agreed to waive 0.30% of the fund's management fee. Effective August 1, 2016, the investment advisor agreed to decrease the amount of the waiver from 0.30% to 0.25% of the fund's management fee. The investment advisor expects the fee waiver to continue until July 31, 2017 and cannot terminate it prior to such date without the approval of the Board of Directors. The total amount of the waiver for each class for the year ended March 31, 2017 was $1,009,276, $442,838, $294,423, $84,594 and $300 for the Investor Class, Institutional Class, A Class, C Class and R Class, respectively. The effective annual management fee after waiver for each class for the year ended March 31, 2017 was 1.64% for the Investor Class, A Class, C Class and R Class and 1.44% for the Institutional Class.
Distribution and Service Fees — The Board of Directors has adopted a separate Master Distribution and Individual Shareholder Services Plan for each of the A Class, C Class and R Class (collectively the plans), pursuant to Rule 12b-1 of the 1940 Act. The plans provide that the A Class will pay ACIS an annual distribution and service fee of 0.25%. The plans provide that the C Class will pay ACIS an annual distribution and service fee of 1.00%, of which 0.25% is paid for individual shareholder services and 0.75% is paid for distribution services. The plans provide that the R Class will pay ACIS an annual distribution and service fee of 0.50%.
The fees are computed and accrued daily based on each class’s daily net assets and paid monthly in arrears. The fees are used to pay financial intermediaries for distribution and individual shareholder services. Fees incurred under the plans during the year ended March 31, 2017 are detailed in the Statement of Operations.
Directors' Fees and Expenses — The Board of Directors is responsible for overseeing the investment advisor’s management and operations of the fund. The directors receive detailed information about the fund and its investment advisor regularly throughout the year, and meet at least quarterly with management of the investment advisor to review reports about fund operations. The fund’s officers do not receive compensation from the fund.
Acquired Fund Fees and Expenses — The fund may invest in mutual funds, exchange-traded funds, and business development companies (the acquired funds). The fund will indirectly realize its pro rata share of the fees and expenses of the acquired funds in which it invests. These indirect fees and expenses are not paid out of the fund's assets but are reflected in the return realized by the fund on its investment in the acquired funds.
Interfund Transactions — The fund may enter into security transactions with other American Century Investments funds and other client accounts of the investment advisor, in accordance with the 1940 Act rules and procedures adopted by the Board of Directors. The rules and procedures require, among other things, that these transactions be effected at the independent current market price of the security. During the period, the interfund purchases and sales were $21,176,366 and $15,846,499, respectively. The effect of interfund transactions on the Statement of Operations was $(361,283) in net realized gain (loss) on investment transactions.
4. Investment Transactions
Purchases and sales of investment securities and securities sold short, excluding short-term investments, for the year ended March 31, 2017 were $2,222,273,911 and $2,249,619,553, respectively.
5. Capital Share Transactions
Transactions in shares of the fund were as follows:
|
| | | | | | | | | | |
| | Year ended
March 31, 2017 | Year ended
March 31, 2016 |
| | Shares | Amount | Shares | Amount |
| Investor Class/Shares Authorized | 160,000,000 |
| | 160,000,000 |
| |
| Sold | 38,163,480 |
| $ | 409,848,107 |
| 23,436,964 |
| $ | 248,747,920 |
|
| Issued in reinvestment of distributions | 953,814 |
| 10,053,201 |
| 166,222 |
| 1,737,019 |
|
| Redeemed | (23,759,846 | ) | (254,452,883 | ) | (4,678,769 | ) | (49,636,282 | ) |
| | 15,357,448 |
| 165,448,425 |
| 18,924,417 |
| 200,848,657 |
|
| Institutional Class/Shares Authorized | 60,000,000 |
| | 60,000,000 |
| |
| Sold | 12,817,012 |
| 139,407,265 |
| 11,252,623 |
| 120,520,975 |
|
| Issued in reinvestment of distributions | 369,477 |
| 3,938,624 |
| 20,093 |
| 211,977 |
|
| Redeemed | (7,696,378 | ) | (83,354,520 | ) | (376,564 | ) | (4,047,101 | ) |
| | 5,490,111 |
| 59,991,369 |
| 10,896,152 |
| 116,685,851 |
|
| A Class/Shares Authorized | 50,000,000 |
| | 50,000,000 |
| |
| Sold | 7,205,999 |
| 76,907,509 |
| 7,508,437 |
| 78,853,456 |
|
| Issued in reinvestment of distributions | 307,598 |
| 3,199,016 |
| 52,448 |
| 542,312 |
|
| Redeemed | (4,685,220 | ) | (49,611,414 | ) | (1,238,311 | ) | (12,963,697 | ) |
| | 2,828,377 |
| 30,495,111 |
| 6,322,574 |
| 66,432,071 |
|
| C Class/Shares Authorized | 15,000,000 |
| | 15,000,000 |
| |
| Sold | 2,091,153 |
| 21,387,959 |
| 1,389,234 |
| 14,131,872 |
|
| Issued in reinvestment of distributions | 91,952 |
| 917,682 |
| 22,694 |
| 227,167 |
|
| Redeemed | (782,225 | ) | (7,938,502 | ) | (160,361 | ) | (1,619,700 | ) |
| | 1,400,880 |
| 14,367,139 |
| 1,251,567 |
| 12,739,339 |
|
| R Class/Shares Authorized | 10,000,000 |
| | 10,000,000 |
| |
| Sold | 6,544 |
| 68,556 |
| 4,187 |
| 43,480 |
|
| Issued in reinvestment of distributions | 309 |
| 3,174 |
| 54 |
| 557 |
|
| Redeemed | (2,337 | ) | (24,405 | ) | (40,548 | ) | (416,432 | ) |
| | 4,516 |
| 47,325 |
| (36,307 | ) | (372,395 | ) |
| Net increase (decrease) | 25,081,332 |
| $ | 270,349,369 |
| 37,358,403 |
| $ | 396,333,523 |
|
6. Fair Value Measurements
The fund’s investments valuation process is based on several considerations and may use multiple inputs to determine the fair value of the investments held by the fund. In conformity with accounting principles generally accepted in the United States of America, the inputs used to determine a valuation are classified into three broad levels.
| |
| • | Level 1 valuation inputs consist of unadjusted quoted prices in an active market for identical investments. |
| |
| • | Level 2 valuation inputs consist of direct or indirect observable market data (including quoted prices for comparable investments, evaluations of subsequent market events, interest rates, prepayment speeds, credit risk, etc.). These inputs also consist of quoted prices for identical investments initially expressed in local currencies that are adjusted through translation into U.S. dollars. |
| |
| • | Level 3 valuation inputs consist of unobservable data (including a fund’s own assumptions). |
The level classification is based on the lowest level input that is significant to the fair valuation measurement. The valuation inputs are not necessarily an indication of the risks associated with investing in these securities or other financial instruments. There were no significant transfers between levels during the period.
The following is a summary of the level classifications as of period end. The Schedule of Investments provides additional information on the fund’s portfolio holdings.
|
| | | | | | | | |
| | Level 1 | Level 2 | Level 3 |
| Assets | | | |
| Investment Securities | | | |
| Common Stocks | $ | 607,222,201 |
| $ | 4,843,977 |
| — |
|
| Exchange-Traded Funds | 65,212,395 |
| — |
| — |
|
| Convertible Bonds | — |
| 53,201,618 |
| — |
|
| Convertible Preferred Stocks | — |
| 6,929,409 |
| — |
|
| Temporary Cash Investments | 619 |
| 707,566 |
| — |
|
| | $ | 672,435,215 |
| $ | 65,682,570 |
| — |
|
| Other Financial Instruments | | | |
| Forward Foreign Currency Exchange Contracts | — |
| $ | 130,055 |
| — |
|
| | | | |
| Liabilities | | | |
| Securities Sold Short | | | |
| Common Stocks | $ | 641,650,764 |
| — |
| — |
|
| Exchange-Traded Funds | 93,153,191 |
| — |
| — |
|
| | $ | 734,803,955 |
| — |
| — |
|
| Other Financial Instruments | | | |
| Forward Foreign Currency Exchange Contracts | — |
| $ | 363 |
| — |
|
7. Derivative Instruments
Foreign Currency Risk — The fund is subject to foreign currency exchange rate risk in the normal course of pursuing its investment objectives. The value of foreign investments held by a fund may be significantly affected by changes in foreign currency exchange rates. The dollar value of a foreign security generally decreases when the value of the dollar rises against the foreign currency in which the security is denominated and tends to increase when the value of the dollar declines against such foreign currency. A fund may enter into forward foreign currency exchange contracts to reduce a fund's exposure to foreign currency exchange rate fluctuations. The net U.S. dollar value of foreign currency underlying all contractual commitments held by a fund and the resulting unrealized appreciation or depreciation are determined daily. Realized gain or loss is recorded upon the termination of the contract. Net realized and unrealized gains or losses occurring during the holding period of forward foreign currency exchange contracts are a component of net realized gain (loss) on foreign currency transactions and change in net unrealized appreciation (depreciation) on translation of assets and liabilities in foreign currencies, respectively. A fund bears the risk of an unfavorable change in the foreign currency exchange rate underlying the forward contract. Additionally, losses, up to the fair value, may arise if the counterparties do not perform under the contract terms. The fund's average U.S. dollar exposure to foreign currency risk derivative instruments held during the period was $41,312,106.
The value of foreign currency risk derivative instruments as of March 31, 2017, is disclosed on the Statement of Assets and Liabilities as an asset of $130,055 in unrealized appreciation on forward foreign currency exchange contracts and a liability of $363 in unrealized depreciation on forward foreign currency exchange contracts. For the year ended March 31, 2017, the effect of foreign currency risk derivative instruments on the Statement of Operations was $1,535,355 in net realized gain (loss) on foreign currency transactions and $209,146 in change in net unrealized appreciation (depreciation) on translation of assets and liabilities in foreign currencies.
8. Risk Factors
The fund’s investment process may result in high portfolio turnover, which could mean high transaction costs, affecting both performance and capital gains tax liabilities to investors.
The fund is subject to short sales risk. If the market price of a security increases after the fund borrows the security, the fund may suffer a loss when it replaces the borrowed security at the higher price. Any loss will be
increased by the amount of compensation, interest or dividends, and transaction costs the fund must pay to the lender of the borrowed security.
There are certain risks involved in investing in foreign securities. These risks include those resulting from future adverse political, social and economic developments, fluctuations in currency exchange rates, the possible imposition of exchange controls, and other foreign laws or restrictions.
9. Federal Tax Information
The tax character of distributions paid during the years ended March 31, 2017 and March 31, 2016 were as follows:
|
| | | | | | |
| | 2017 | 2016 |
| Distributions Paid From | | |
| Ordinary income | $ | 14,225,012 |
| $ | 547,432 |
|
| Long-term capital gains | $ | 4,679,368 |
| $ | 2,209,514 |
|
The book-basis character of distributions made during the year from net investment income or net realized gains may differ from their ultimate characterization for federal income tax purposes. These differences reflect the differing character of certain income items and net realized gains and losses for financial statement and tax purposes, and may result in reclassification among certain capital accounts on the financial statements.
The reclassifications, which are primarily due to net operating losses, were made to capital $(1,363), accumulated net investment loss $11,578,546, and accumulated net realized loss $(11,577,183).
As of March 31, 2017, the federal tax cost of investments and the components of distributable earnings on a tax-basis were as follows:
|
| | | |
| Federal tax cost of investments | $ | 681,328,934 |
|
| Gross tax appreciation of investments | $ | 62,929,272 |
|
| Gross tax depreciation of investments | (6,140,421 | ) |
| Net tax appreciation (depreciation) of investments | 56,788,851 |
|
| Net tax appreciation (depreciation) on securities sold short | (58,364,569 | ) |
| Net tax appreciation (depreciation) | $ | (1,575,718 | ) |
| Other book-to-tax adjustments | $ | (1,808,268 | ) |
Undistributed ordinary income
| $ | 5,028,566 |
|
| Accumulated long-term gains | $ | 6,521,131 |
|
The difference between book-basis and tax-basis unrealized appreciation (depreciation) is attributable primarily to the tax deferral of losses on wash sales. Other book-to-tax adjustments are attributable primarily to the tax deferral of losses on straddle positions.
10. Recently Issued Accounting Guidance
In October 2016, the Securities and Exchange Commission adopted new rules and forms as well as amendments to its rules and forms to modernize the reporting and disclosure of information by registered investment companies. The amendments to Regulation S-X will require standardized, enhanced disclosure about derivatives in investment company financial statements, as well as other provisions. Compliance with the amendments is effective on August 1, 2017. Management is currently evaluating the impact that adopting the amendments will have on the financial statement disclosures.
11. Corporate Event
The Institutional Class was renamed to the I Class effective April 10, 2017.
|
| | | | | | | | | | | | | | | | |
For a Share Outstanding Throughout the Years Ended March 31 (except as noted)
|
| Per-Share Data | | | | | | Ratios and Supplemental Data | | |
| | | Income From Investment Operations: | | | | Ratio to Average Net Assets of: | | |
| | Net Asset
Value,
Beginning
of Period | Net
Investment
Income
(Loss)(1) | Net
Realized
and
Unrealized
Gain (Loss) | Total From
Investment
Operations | Distributions From Net
Realized
Gains | Net Asset
Value,
End
of Period | Total
Return(2) | Operating
Expenses(3) | Operating
Expenses
(before
expense
waiver)(3) | Operating
Expenses
(excluding
expenses on
securities
sold short)(3) | Net
Investment
Income
(Loss) | Net
Investment
Income
(Loss)
(before
expense
waiver) | Portfolio
Turnover
Rate | Net
Assets,
End of
Period
(in thousands) |
| Investor Class | | | | | | | | | | | | | |
| 2017 | $10.73 | (0.18) | 0.49 | 0.31 | (0.28) | $10.76 | 2.97% | 3.68% | 3.94% | 1.64% | (1.65)% | (1.91)% | 374% |
| $419,925 |
|
| 2016 | $10.44 | (0.19) | 0.65 | 0.46 | (0.17) | $10.73 | 4.42% | 3.78% | 4.08% | 1.61% | (1.82)% | (2.12)% | 679% |
| $253,885 |
|
| 2015 | $10.22 | (0.20) | 0.62 | 0.42 | (0.20) | $10.44 | 4.10% | 3.88% | 4.18% | 1.60% | (1.95)% | (2.25)% | 447% |
| $49,465 |
|
| 2014 | $10.25 | (0.04) | 0.21 | 0.17 | (0.20) | $10.22 | 1.69% | 4.09% | 4.39% | 1.60% | (0.35)% | (0.65)% | 521% |
| $49,665 |
|
| 2013 | $10.32 | (0.25) | 0.52 | 0.27 | (0.34) | $10.25 | 2.61% | 4.74% | 5.04% | 1.60% | (2.46)% | (2.76)% | 588% |
| $8,214 |
|
| Institutional Class | | | | | | | | | | | | | |
| 2017 | $10.83 | (0.16) | 0.50 | 0.34 | (0.28) | $10.89 | 3.23% | 3.48% | 3.74% | 1.44% | (1.45)% | (1.71)% | 374% |
| $184,717 |
|
| 2016 | $10.52 | (0.16) | 0.64 | 0.48 | (0.17) | $10.83 | 4.58% | 3.58% | 3.88% | 1.41% | (1.62)% | (1.92)% | 679% |
| $124,249 |
|
| 2015 | $10.28 | (0.18) | 0.62 | 0.44 | (0.20) | $10.52 | 4.28% | 3.68% | 3.98% | 1.40% | (1.75)% | (2.05)% | 447% |
| $6,013 |
|
| 2014 | $10.28 | 0.11 | 0.09 | 0.20 | (0.20) | $10.28 | 1.98% | 3.89% | 4.19% | 1.40% | (0.15)% | (0.45)% | 521% |
| $5,714 |
|
| 2013 | $10.33 | (0.24) | 0.53 | 0.29 | (0.34) | $10.28 | 2.81% | 4.54% | 4.84% | 1.40% | (2.26)% | (2.56)% | 588% |
| $425 |
|
| A Class | | | | | | | | | | | | | |
| 2017 | $10.61 | (0.20) | 0.48 | 0.28 | (0.28) | $10.61 | 2.72% | 3.93% | 4.19% | 1.89% | (1.90)% | (2.16)% | 374% |
| $106,662 |
|
| 2016 | $10.36 | (0.22) | 0.64 | 0.42 | (0.17) | $10.61 | 4.07% | 4.03% | 4.33% | 1.86% | (2.07)% | (2.37)% | 679% |
| $76,630 |
|
| 2015 | $10.16 | (0.23) | 0.63 | 0.40 | (0.20) | $10.36 | 3.93% | 4.13% | 4.43% | 1.85% | (2.20)% | (2.50)% | 447% |
| $9,311 |
|
| 2014 | $10.21 | (0.07) | 0.22 | 0.15 | (0.20) | $10.16 | 1.50% | 4.34% | 4.64% | 1.85% | (0.60)% | (0.90)% | 521% |
| $13,640 |
|
| 2013 | $10.31 | (0.28) | 0.52 | 0.24 | (0.34) | $10.21 | 2.32% | 4.99% | 5.29% | 1.85% | (2.71)% | (3.01)% | 588% |
| $2,265 |
|
|
| | | | | | | | | | | | | | | | |
For a Share Outstanding Throughout the Years Ended March 31 (except as noted)
|
| Per-Share Data | | | | | | Ratios and Supplemental Data | | |
| | | Income From Investment Operations: | | | | Ratio to Average Net Assets of: | | |
| | Net Asset
Value,
Beginning
of Period | Net
Investment
Income
(Loss)(1) | Net
Realized
and
Unrealized
Gain (Loss) | Total From
Investment
Operations | Distributions From Net
Realized
Gains | Net Asset
Value,
End
of Period | Total
Return(2) | Operating
Expenses(3) | Operating
Expenses
(before
expense
waiver)(3) | Operating
Expenses
(excluding
expenses on
securities
sold short)(3) | Net
Investment
Income
(Loss) | Net
Investment
Income
(Loss)
(before
expense
waiver) | Portfolio
Turnover
Rate | Net
Assets,
End of
Period
(in thousands) |
| C Class | | | | | | | | | | | | | |
| 2017 | $10.24 | (0.27) | 0.47 | 0.20 | (0.28) | $10.16 | 2.03% | 4.68% | 4.94% | 2.64% | (2.65)% | (2.91)% | 374% |
| $34,958 |
|
| 2016 | $10.08 | (0.29) | 0.62 | 0.33 | (0.17) | $10.24 | 3.28% | 4.78% | 5.08% | 2.61% | (2.82)% | (3.12)% | 679% |
| $20,902 |
|
| 2015 | $9.97 | (0.30) | 0.61 | 0.31 | (0.20) | $10.08 | 3.10% | 4.88% | 5.18% | 2.60% | (2.95)% | (3.25)% | 447% |
| $7,948 |
|
| 2014 | $10.10 | (0.14) | 0.21 | 0.07 | (0.20) | $9.97 | 0.72% | 5.09% | 5.39% | 2.60% | (1.35)% | (1.65)% | 521% |
| $6,844 |
|
| 2013 | $10.28 | (0.35) | 0.51 | 0.16 | (0.34) | $10.10 | 1.54% | 5.74% | 6.04% | 2.60% | (3.46)% | (3.76)% | 588% |
| $1,111 |
|
| R Class | | | | | | | | | | | | | |
| 2017 | $10.49 | (0.22) | 0.47 | 0.25 | (0.28) | $10.46 | 2.47% | 4.18% | 4.44% | 2.14% | (2.15)% | (2.41)% | 374% |
| $123 |
|
| 2016 | $10.26 | (0.21) | 0.61 | 0.40 | (0.17) | $10.49 | 3.91% | 4.28% | 4.58% | 2.11% | (2.32)% | (2.62)% | 679% |
| $76 |
|
| 2015 | $10.10 | (0.25) | 0.61 | 0.36 | (0.20) | $10.26 | 3.56% | 4.38% | 4.68% | 2.10% | (2.45)% | (2.75)% | 447% |
| $447 |
|
| 2014 | $10.17 | (0.18) | 0.31 | 0.13 | (0.20) | $10.10 | 1.21% | 4.59% | 4.89% | 2.10% | (0.85)% | (1.15)% | 521% |
| $427 |
|
| 2013 | $10.30 | (0.31) | 0.52 | 0.21 | (0.34) | $10.17 | 2.13% | 5.24% | 5.54% | 2.10% | (2.96)% | (3.26)% | 588% |
| $421 |
|
|
|
| Notes to Financial Highlights |
| |
| (1) | Computed using average shares outstanding throughout the period. |
| |
| (2) | Total returns are calculated based on the net asset value of the last business day and do not reflect applicable sales charges, if any. Total returns for periods less than one year are not annualized. |
(3) Ratio of operating expenses to average net assets does not include any fees and expenses of the acquired funds.
See Notes to Financial Statements.
|
|
| Report of Independent Registered Public Accounting Firm |
To the Board of Directors and Shareholders of American Century Capital Portfolios, Inc.:
We have audited the accompanying statement of assets and liabilities, including the schedule of investments, of AC Alternatives® Market Neutral Value Fund (the “Fund”), one of the funds constituting American Century Capital Portfolios, Inc., as of March 31, 2017, and the related statement of operations for the year then ended, the statements of changes in net assets for each of the two years in the period then ended, and the financial highlights for each of the periods presented. These financial statements and financial highlights are the responsibility of the Fund's management. Our responsibility is to express an opinion on these financial statements and financial highlights based on our audits.
We conducted our audits in accordance with the standards of the Public Company Accounting Oversight Board (United States). Those standards require that we plan and perform the audit to obtain reasonable assurance about whether the financial statements and financial highlights are free of material misstatement. The Fund is not required to have, nor were we engaged to perform, an audit of its internal control over financial reporting. Our audits included consideration of internal control over financial reporting as a basis for designing audit procedures that are appropriate in the circumstances, but not for the purpose of expressing an opinion on the effectiveness of the Fund's internal control over financial reporting. Accordingly, we express no such opinion. An audit also includes examining, on a test basis, evidence supporting the amounts and disclosures in the financial statements, assessing the accounting principles used and significant estimates made by management, as well as evaluating the overall financial statement presentation. Our procedures included confirmation of securities owned as of March 31, 2017, by correspondence with the custodian and brokers; when replies were not received from brokers, we performed other auditing procedures. We believe that our audits provide a reasonable basis for our opinion.
In our opinion, the financial statements and financial highlights referred to above present fairly, in all material respects, the financial position of AC Alternatives® Market Neutral Value Fund of American Century Capital Portfolios, Inc. as of March 31, 2017, the results of its operations for the year then ended, the changes in its net assets for each of the two years in the period then ended, and the financial highlights for each of the periods presented, in conformity with accounting principles generally accepted in the United States of America.
DELOITTE & TOUCHE LLP
Kansas City, Missouri May 16, 2017
The Board of Directors
The individuals listed below serve as directors of the funds. Each director will continue to serve in this capacity until death, retirement, resignation or removal from office. The board has adopted a mandatory retirement age for directors who are not “interested persons,” as that term is defined in the Investment Company Act (independent directors). Independent directors shall retire by December 31 of the year in which they reach their 75th birthday.
Mr. Thomas is an “interested person” because he currently serves as President and Chief Executive Officer of American Century Companies, Inc. (ACC), the parent company of American Century Investment Management, Inc. (ACIM or the advisor). The other directors (more than three-fourths of the total number) are independent. They are not employees, directors or officers of, and have no financial interest in, ACC or any of its wholly owned, direct or indirect, subsidiaries, including ACIM, American Century Investment Services, Inc. (ACIS) and American Century Services, LLC (ACS), and they do not have any other affiliations, positions or relationships that would cause them to be considered “interested persons” under the Investment Company Act. The directors serve in this capacity for seven (in the case of Mr. Thomas, 15) registered investment companies in the American Century Investments family of funds.
The following table presents additional information about the directors. The mailing address for each director is 4500 Main Street, Kansas City, Missouri 64111.
|
| | | | | |
Name
(Year of Birth) | Position(s) Held with Funds | Length of Time Served | Principal Occupation(s) During Past 5 Years | Number of American Century Portfolios Overseen by Director | Other Directorships Held During Past 5 Years |
| Independent Directors |
|
|
| Thomas W. Bunn (1953) | Advisory Board Director | Since 2017 | Retired | 81 | SquareTwo Financial; Barings (formerly Babson Capital Funds Trust) (2013 to 2016) |
Barry Fink
(1955) | Director | Since 2012 (independent since 2016) | Retired; Executive Vice President, ACC (2007 to 2013); President, ACS (2007 to 2013); Chief Operating Officer, ACC (2007 to 2012) | 81 | None |
Andrea C. Hall
(1945) | Director | Since 1997 | Retired | 81 | None |
Jan M. Lewis
(1957) | Director | Since 2011 | Retired; President and Chief Executive Officer, Catholic Charities of Northeast Kansas (human services organization) (2006 to 2013) | 81 | None |
James A. Olson
(1942) | Director and Chairman of the Board | Since 2007 (Chairman since 2014) | Member, Plaza Belmont LLC (private equity fund manager) (1999 to present) | 81 | Saia, Inc. (2002 to 2012) and EPR Properties (2003 to 2013) |
|
| | | | | |
Name
(Year of Birth) | Position(s) Held with Funds | Length of Time Served | Principal Occupation(s) During Past 5 Years | Number of American Century Portfolios Overseen by Director | Other Directorships Held During Past 5 Years |
| Independent Directors |
|
|
M. Jeannine Strandjord
(1945) | Director | Since 1994 | Retired | 81 | Euronet Worldwide Inc.; MGP Ingredients, Inc.; and DST Systems Inc. (1996 to 2012) |
John R. Whitten
(1946) | Director | Since 2008 | Retired | 81 | Rudolph Technologies, Inc. |
Stephen E. Yates
(1948) | Director | Since 2012 | Retired | 81 | None |
| Interested Director |
|
|
Jonathan S. Thomas
(1963) | Director and President | Since 2007 | President and Chief Executive Officer, ACC (2007 to present). Also serves as Chief Executive Officer, ACS; Executive Vice President, ACIM; Director, ACC, ACIM and other ACC subsidiaries | 126 | BioMed Valley Discoveries, Inc. |
The Statement of Additional Information has additional information about the fund's directors and is available without charge, upon request, by calling 1-800-345-2021.
Officers
The following table presents certain information about the executive officers of the funds. Each officer serves as an officer for each of the 15 investment companies in the American Century family of funds, unless otherwise noted. No officer is compensated for his or her service as an officer of the funds. The listed officers are interested persons of the funds and are appointed or re-appointed on an annual basis. The mailing address for each officer listed below is 4500 Main Street, Kansas City, Missouri 64111.
|
| | |
Name
(Year of Birth) | Offices with the Funds | Principal Occupation(s) During the Past Five Years |
Jonathan S. Thomas
(1963) | Director and President since 2007 | President and Chief Executive Officer, ACC (2007 to present). Also serves as Chief Executive Officer, ACS; Executive Vice President, ACIM; Director, ACC, ACIM and other ACC subsidiaries |
Amy D. Shelton
(1964) | Chief Compliance Officer and Vice President since 2014 | Chief Compliance Officer, American Century funds, (2014 to present); Chief Compliance Officer, ACIM (2014 to present); Chief Compliance Officer, ACIS (2009 to present); Vice President, Client Interactions and Marketing, ACIS (2013 to 2014); Director, Client Interactions and Marketing, ACIS (2007 to 2013). Also serves as Vice President, ACIS |
Charles A. Etherington
(1957) | General Counsel since 2007 and Senior Vice President since 2006 | Attorney, ACC (1994 to present); Vice President, ACC (2005 to present); General Counsel, ACC (2007 to present). Also serves as General Counsel, ACIM, ACS, ACIS and other ACC subsidiaries; and Senior Vice President, ACIM and ACS |
C. Jean Wade
(1964) | Vice President,Treasurer and Chief Financial Officer since 2012 | Vice President, ACS (2000 to present) |
Robert J. Leach
(1966) | Vice President since 2006 and Assistant Treasurer since 2012 | Vice President, ACS (2000 to present) |
David H. Reinmiller
(1963) | Vice President since 2000 | Attorney, ACC (1994 to present); Associate General Counsel, ACC (2001 to present). Also serves as Vice President, ACIM and ACS |
Ward D. Stauffer
(1960) | Secretary since 2005 | Attorney, ACC (2003 to present) |
Retirement Account Information
As required by law, distributions you receive from certain IRAs are subject to federal income tax withholding, unless you elect not to have withholding apply. Tax will be withheld on the total amount withdrawn even though you may be receiving amounts that are not subject to withholding, such as nondeductible contributions. In such case, excess amounts of withholding could occur. You may adjust your withholding election so that a greater or lesser amount will be withheld.
If you don’t want us to withhold on this amount, you must notify us to not withhold the federal income tax. You may notify us in writing or in certain situations by telephone or through other electronic means. For systematic withdrawals, your withholding election will remain in effect until revoked or changed by filing a new election. You have the right to revoke your election at any time.
Remember, even if you elect not to have income tax withheld, you are liable for paying income tax on the taxable portion of your withdrawal. If you elect not to have income tax withheld or you don’t have enough income tax withheld, you may be responsible for payment of estimated tax. You may incur penalties under the estimated tax rules if your withholding and estimated tax payments are not sufficient. You can reduce or defer the income tax on a distribution by directly or indirectly rolling such distribution over to another IRA or eligible plan. You should consult your tax advisor for additional information.
State tax will be withheld if, at the time of your distribution, your address is within one of the mandatory withholding states and you have federal income tax withheld (or as otherwise required by state law). State taxes will be withheld from your distribution in accordance with the respective state rules.
Distributions you receive from 403(b), 457 and qualified plans are subject to special tax and withholding rules. Your plan administrator or plan sponsor is required to provide you with a special tax notice explaining those rules at the time you request a distribution. If applicable, federal and/or state taxes may be withheld from your distribution amount.
Proxy Voting Policies
A description of the policies that the fund's investment advisor uses in exercising the voting rights associated with the securities purchased and/or held by the fund is available without charge, upon request, by calling 1-800-345-2021. It is also available on the "About Us" page of American Century Investments’ website at americancentury.com and on the Securities and Exchange Commission’s website at sec.gov. Information regarding how the investment advisor voted proxies relating to portfolio securities during the most recent 12-month period ended June 30 is available on the "About Us" page at americancentury.com. It is also available at sec.gov.
Quarterly Portfolio Disclosure
The fund files its complete schedule of portfolio holdings with the Securities and Exchange Commission (SEC) for the first and third quarters of each fiscal year on Form N-Q. The fund’s Forms N-Q are available on the SEC’s website at sec.gov, and may be reviewed and copied at the SEC’s Public Reference Room in Washington, DC. Information on the operation of the Public Reference Room may be obtained by calling 1-800-SEC-0330. The fund also makes its complete schedule of portfolio holdings for the most recent quarter of its fiscal year available on its website at americancentury.com and, upon request, by calling 1-800-345-2021.
Other Tax Information
The following information is provided pursuant to provisions of the Internal Revenue Code.
The fund hereby designates up to the maximum amount allowable as qualified dividend income for the fiscal year ended March 31, 2017.
For corporate taxpayers, the fund hereby designates $10,321,506, or up to the maximum amount allowable, of ordinary income distributions paid during the fiscal year ended March 31, 2017 as qualified for the corporate dividends received deduction.
The fund hereby designates $14,225,012 as qualified short-term capital gain distributions for purposes of Internal Revenue Code Section 871 for the fiscal year ended March 31, 2017.
The fund hereby designates $4,679,368, or up to the maximum amount allowable, as long-term capital gain distributions (20% rate gain distributions) for the fiscal year ended March 31, 2017.
|
| | |
| |
| | | |
| Contact Us | americancentury.com | |
| Automated Information Line | 1-800-345-8765 | |
| Investor Services Representative | 1-800-345-2021 or 816-531-5575 | |
| Investors Using Advisors | 1-800-378-9878 | |
| Business, Not-For-Profit, Employer-Sponsored Retirement Plans | 1-800-345-3533 | |
| Banks and Trust Companies, Broker-Dealers, Financial Professionals, Insurance Companies | 1-800-345-6488 | |
| Telecommunications Relay Service for the Deaf | 711 | |
| | | |
| American Century Capital Portfolios, Inc. | |
| | | |
Investment Advisor: American Century Investment Management, Inc. Kansas City, Missouri | |
| | | |
| This report and the statements it contains are submitted for the general information of our shareholders. The report is not authorized for distribution to prospective investors unless preceded or accompanied by an effective prospectus. | |
| | | |
©2017 American Century Proprietary Holdings, Inc. All rights reserved.
CL-ANN-92270 1705 | |
|
| |
| | |
| | Annual Report |
| | |
| | March 31, 2017 |
| | |
| | Mid Cap Value Fund |
|
| |
| President’s Letter | 2 |
| Performance | 3 |
| Portfolio Commentary | |
| Fund Characteristics | |
| Shareholder Fee Example | |
| Schedule of Investments | |
| Statement of Assets and Liabilities | |
| Statement of Operations | |
| Statement of Changes in Net Assets | |
| Notes to Financial Statements | |
| Financial Highlights | |
| Report of Independent Registered Public Accounting Firm | |
| Management | |
| Additional Information | |
Any opinions expressed in this report reflect those of the author as of the date of the report, and do not necessarily represent the opinions of American Century Investments® or any other person in the American Century Investments organization. Any such opinions are subject to change at any time based upon market or other conditions and American Century Investments disclaims any responsibility to update such opinions. These opinions may not be relied upon as investment advice and, because investment decisions made by American Century Investments funds are based on numerous factors, may not be relied upon as an indication of trading intent on behalf of any American Century Investments fund. Security examples are used for representational purposes only and are not intended as recommendations to purchase or sell securities. Performance information for comparative indices and securities is provided to American Century Investments by third party vendors. To the best of American Century Investments’ knowledge, such information is accurate at the time of printing.
Jonathan Thomas
Dear Investor:
Thank you for reviewing this annual report for the period ended March 31, 2017. Annual reports help convey important information about fund returns, including market factors that affected performance during the reporting period. For additional, updated investment and market insights, we encourage you to visit our website, americancentury.com.
Risk-On Rebound From Global Economic Concerns of Early 2016
Stocks, high-yield bonds, and commodities rebounded from severe downturns in early 2016 that were triggered by China’s economic slowdown. Since then, growth conditions in China and the rest of the world have generally improved. For the reporting period, the S&P 500 Index, the Bloomberg Barclays U.S. Corporate High-Yield Bond Index, and the S&P Goldman Sachs Commodities Index returned 17.17%, 16.39%, and 8.45%, respectively. This risk-on rebound also drove government bond yields higher, resulting in declines for indices such as the Bloomberg Barclays U.S. Treasury Bond Index (-1.44%). The broader taxable investment-grade U.S. bond market performed better, but still significantly underperformed stocks; the Bloomberg Barclays U.S. Aggregate Bond Index returned 0.44%.
Investors could thank the world’s major central banks and the “Trump Trade” for the risk-on rebound, which occurred with a backdrop of landmark political events, including Brexit (the U.K. vote to leave the European Union) and Donald Trump’s U.S. presidential election victory. Central bank stimulus helped to propel the markets past China- and Brexit-related volatility, followed by Trump victory-inspired optimism about U.S. growth that further boosted higher-risk markets.
But the Trump Trade could prove to be double edged—investor optimism faded as health care reform stalled in Congress and other U.S. fiscal policy proposals looked like they’d face significant hurdles. Meanwhile, the Federal Reserve raised its interest rate target during the reporting period, and suggested that it might raise rates again and start gradually reducing its balance sheet by the end of 2017. These factors, plus rising inflation and continuing geopolitical risks, could impede further risk-on sentiment. In this unsettled environment, we believe in remaining focused on investment goals, using disciplined, actively managed, risk-aware strategies. We appreciate your continued trust in us.
Sincerely,
Jonathan Thomas
President and Chief Executive Officer
American Century Investments
|
| | | | | | |
| Total Returns as of March 31, 2017 |
| | | | Average Annual Returns | |
| | Ticker Symbol | 1 year | 5 years | 10 years | Since Inception | Inception Date |
| Investor Class | ACMVX | 20.71% | 14.84% | 9.24% | — | 3/31/04 |
| Russell Midcap Value Index | — | 19.82% | 14.06% | 7.47% | — | — |
| Institutional Class | AVUAX | 20.95% | 15.08% | 9.46% | — | 8/2/04 |
| A Class | ACLAX | | | |
| 1/13/05 |
| No sales charge | | 20.37% | 14.56% | 8.97% | — | |
| With sales charge | | 13.47% | 13.22% | 8.33% | — | |
| C Class | ACCLX | 19.56% | 13.71% | — | 13.01% | 3/1/10 |
| R Class | AMVRX | 20.12% | 14.27% | 8.71% | — | 7/29/05 |
| R6 Class | AMDVX | 21.13% | — | — | 13.29% | 7/26/13 |
Average annual returns since inception are presented when ten years of performance history is not available.
Prior to March 1, 2010, the A Class was referred to as the Advisor Class and did not have a front-end sales charge. Performance has been adjusted to reflect this charge. Fund returns would have been lower if a portion of the fees had not been waived.
Sales charges include initial sales charges and contingent deferred sales charges (CDSCs), as applicable. A Class shares have a 5.75% maximum initial sales charge and may be subject to a maximum CDSC of 1.00%. C Class shares redeemed within 12 months of purchase are subject to a maximum CDSC of 1.00%. The SEC requires that mutual funds provide performance information net of maximum sales charges in all cases where charges could be applied.
Data presented reflect past performance. Past performance is no guarantee of future results. Current performance may be higher or lower than the performance shown. Total returns for periods less than one year are not annualized. Investment return and principal value will fluctuate, and redemption value may be more or less than original cost. Data assumes reinvestment of dividends and capital gains, and none of the charts reflect the deduction of taxes that a shareholder would pay on fund distributions or the redemption of fund shares. To obtain performance data current to the most recent month end, please call 1-800-345-2021 or visit americancentury.com. For additional information about the fund, please consult the prospectus.
|
|
| Growth of $10,000 Over 10 Years |
| $10,000 investment made March 31, 2007 |
| Performance for other share classes will vary due to differences in fee structure. |
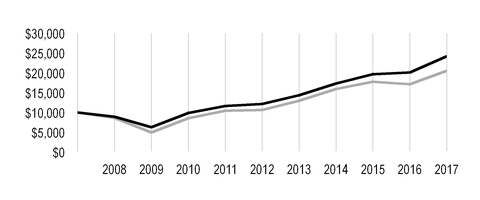
|
| |
| Value on March 31, 2017 |
| | Investor Class — $24,224 |
| |
| | Russell Midcap Value Index — $20,559 |
| |
Ending value of Investor Class would have been lower if a portion of the fees had not been waived.
|
| | | | | |
| Total Annual Fund Operating Expenses |
| Investor Class | Institutional Class | A Class | C Class | R Class | R6 Class |
| 1.01% | 0.81% | 1.26% | 2.01% | 1.51% | 0.66% |
The total annual fund operating expenses shown is as stated in the fund’s prospectus current as of the date of this report. The prospectus may vary from the expense ratio shown elsewhere in this report because it is based on a different time period, includes acquired fund fees and expenses, and, if applicable, does not include fee waivers or expense reimbursements.
Data presented reflect past performance. Past performance is no guarantee of future results. Current performance may be higher or lower than the performance shown. Total returns for periods less than one year are not annualized. Investment return and principal value will fluctuate, and redemption value may be more or less than original cost. Data assumes reinvestment of dividends and capital gains, and none of the charts reflect the deduction of taxes that a shareholder would pay on fund distributions or the redemption of fund shares. To obtain performance data current to the most recent month end, please call 1-800-345-2021 or visit americancentury.com. For additional information about the fund, please consult the prospectus.
Portfolio Managers: Kevin Toney, Michael Liss, Phil Davidson, and Brian Woglom
Performance Summary
Mid Cap Value returned 20.71%* for the fiscal year ended March 31, 2017, compared with the 19.82% return for its benchmark, the Russell Midcap Value Index. The fund’s return reflects operating expenses, while the index’s return does not.
The portfolio’s relative outperformance was aided by both stock selection and sector allocation across several sectors. On the other hand, security selection in energy and an underweight in materials negatively impacted performance.
Underweight in Real Estate Drove Returns
The portfolio’s underweight in real estate, a result of our bottom-up investment process, was a key contributor to performance. REITs had been beneficiaries, both from an operating and valuation perspective, of the low interest rate environment. As a result, many REITs appeared unattractive under the team’s valuation process. The portfolio benefited from the resulting underweight in real estate as rising interest rates pressured the sector in the second half of the reporting period. However, the portfolio’s largest individual detractor was real estate holding CoreCivic, a prison REIT. CoreCivic, which changed its name from Corrections Corporation of America, is a large provider of private prisons in the U.S. The stock sold off prior to the election on comments made by the U.S. Department of Justice and Hillary Clinton regarding discontinuing use of private prisons, and we sold the position.
Stock Selection Across Several Sectors Helped Performance
Utilities benefited performance for the year. The portfolio was generally underweight the sector based on valuation. This underweight positively impacted relative returns as the sector underperformed. Additionally, Westar Energy was a top contributor as its share price surged on news in the second quarter of 2016 that it would be acquired by Great Plains Energy.
The health care sector positively contributed for the year based on beneficial stock selection. The portfolio did not own Perrigo, a consumer goods and specialty pharmaceutical company. Perrigo’s stock was pressured by the threat of mandated lower drug pricing, disappointing earnings, and the resignation of its CEO and CFO. Lack of exposure to the name drove outperformance.
Outperformance in industrials was driven primarily by CSX. Stock of the provider of rail-based freight transportation rose in the first quarter of 2017 on an activist involvement that resulted in a change in company management. Mantle Ridge, an activist investor that owns roughly 4.9 percent of CSX stock, proposed rail veteran Hunter Harrison as CSX's chief executive officer. Harrison, the ex-CEO of Canadian Pacific, is a turnaround expert that is highly respected across the industry. We sold the stock on strength.
* All fund returns referenced in this commentary are for Investor Class shares. Fund returns would have been lower if a portion of the fees had not been waived. Performance for other share classes will vary due to differences in fee structure; when Investor Class performance exceeds that of the fund's benchmark, other share classes may not. See page 3 for returns for all share classes.
In the information technology sector, exposures in the semiconductors and semiconductor equipment industry positively impacted performance. Applied Materials, the top individual contributor to performance, rose on strong orders, record backlog, and market share gains. Additionally, solid orders and backlog drove Lam Research’s revenue and earnings forecasts higher as end demand remained strong.
Overweight in Financials Contributed to Results
Following the presidential election in November, rising interest rates and potential changes in financial conditions caused the financials sector to outperform. Banks performed particularly well on optimism surrounding future earnings due to higher interest rates and anticipation of lower taxes and reduced regulation. The portfolio’s overweight in financials proved beneficial in this environment. Northern Trust, an overweight position, rose along with the rise in interest rates and potentially lower corporate tax rates. Additionally, rising capital markets are beneficial to Northern Trust’s investment management business.
Energy Detracted
Weakening oil and gas prices, driven by concerns about oversupply in 2018, pressured the portfolio’s energy holdings. Imperial Oil was a top detractor from performance in the sector as oil prices weakened. Additionally, the company missed production numbers due to unexpected downtime at one of its operations.
Underweight in Materials Weighed on Returns
Many stocks in the materials sector don’t meet our quality or valuation criteria, which led to an underweight in the sector. Very limited exposure to metals and mining stocks and lack of exposure to the chemicals and construction materials industries during the reporting period detracted from performance.
Retailer Was a Top Detractor
Multiline retailer Target was one of the portfolio’s largest detractors. Its stock price fell considerably after it announced disappointing fourth-quarter results and a notable decrease in year-over-year earnings per share. Additionally, investors have lost confidence in the company’s turnaround plan.
Portfolio Positioning
At period-end, the portfolio’s largest overweights were in the health care and energy sectors. The decline in the health care sector toward the end of 2016 created opportunities to add stocks with attractive valuations that we believe will fare well in the future. Weakness in the energy sector due to reduced oil and gas prices led to attractive valuations in many names, providing an opportunity to add to positions in the sector.
The portfolio’s largest underweights were in the real estate and materials sectors. Our valuation work shows that many real estate stocks have been overvalued for some time, leading to the underweight. The materials sector remains underweight because many stocks in the sector don’t meet our quality or valuation criteria. Our holdings in the materials sector are limited to a few investments in the containers and packaging industry.
|
| |
| MARCH 31, 2017 |
| Top Ten Holdings | % of net assets |
| Johnson Controls International plc | 3.1% |
| Northern Trust Corp. | 2.9% |
| iShares Russell Mid-Cap Value ETF | 2.2% |
| Zimmer Biomet Holdings, Inc. | 2.0% |
| Weyerhaeuser Co. | 1.9% |
| Applied Materials, Inc. | 1.8% |
| EQT Corp. | 1.8% |
| Imperial Oil Ltd. | 1.7% |
| Conagra Brands, Inc. | 1.5% |
| Baker Hughes, Inc. | 1.5% |
| | |
| Top Five Industries | % of net assets |
| Oil, Gas and Consumable Fuels | 9.6% |
| Capital Markets | 7.0% |
| Banks | 7.0% |
| Insurance | 6.2% |
| Food Products | 5.9% |
| | |
| Types of Investments in Portfolio | % of net assets |
| Common Stocks | 95.4% |
| Exchange-Traded Funds | 2.2% |
| Total Equity Exposure | 97.6% |
| Temporary Cash Investments | 2.4% |
| Other Assets and Liabilities | —* |
*Category is less than 0.05% of total net assets.
Fund shareholders may incur two types of costs: (1) transaction costs, including sales charges (loads) on purchase payments and redemption/exchange fees; and (2) ongoing costs, including management fees; distribution and service (12b-1) fees; and other fund expenses. This example is intended to help you understand your ongoing costs (in dollars) of investing in your fund and to compare these costs with the ongoing cost of investing in other mutual funds.
The example is based on an investment of $1,000 made at the beginning of the period and held for the entire period from October 1, 2016 to March 31, 2017.
Actual Expenses
The table provides information about actual account values and actual expenses for each class. You may use the information, together with the amount you invested, to estimate the expenses that you paid over the period. First, identify the share class you own. Then simply divide your account value by $1,000 (for example, an $8,600 account value divided by $1,000 = 8.6), then multiply the result by the number under the heading “Expenses Paid During Period” to estimate the expenses you paid on your account during this period.
If you hold Investor Class shares of any American Century Investments fund, or Institutional Class shares of the American Century Diversified Bond Fund, in an American Century Investments account (i.e., not a financial intermediary or retirement plan account), American Century Investments may charge you a $12.50 semiannual account maintenance fee if the value of those shares is less than $10,000. We will redeem shares automatically in one of your accounts to pay the $12.50 fee. In determining your total eligible investment amount, we will include your investments in all personal accounts (including American Century Investments Brokerage accounts) registered under your Social Security number. Personal accounts include individual accounts, joint accounts, UGMA/UTMA accounts, personal trusts, Coverdell Education Savings Accounts and IRAs (including traditional, Roth, Rollover, SEP-, SARSEP- and SIMPLE-IRAs), and certain other retirement accounts. If you have only business, business retirement, employer-sponsored or American Century Investments Brokerage accounts, you are currently not subject to this fee. If you are subject to the Account Maintenance Fee, your account value could be reduced by the fee amount.
Hypothetical Example for Comparison Purposes
The table also provides information about hypothetical account values and hypothetical expenses based on the actual expense ratio of each class of your fund and an assumed rate of return of 5% per year before expenses, which is not the actual return of a fund’s share class. The hypothetical account values and expenses may not be used to estimate the actual ending account balance or expenses you paid for the period. You may use this information to compare the ongoing costs of investing in your fund and other funds. To do so, compare this 5% hypothetical example with the 5% hypothetical examples that appear in the shareholder reports of the other funds.
Please note that the expenses shown in the table are meant to highlight your ongoing costs only and do not reflect any transactional costs, such as sales charges (loads) or redemption/exchange fees. Therefore, the table is useful in comparing ongoing costs only, and will not help you determine the relative total costs of owning different funds. In addition, if these transactional costs were included, your costs would have been higher.
|
| | | | |
| | Beginning
Account Value
10/1/16 | Ending
Account Value
3/31/17 | Expenses Paid
During Period(1)
10/1/16 - 3/31/17 | Annualized
Expense Ratio(1) |
| Actual | | | | |
| Investor Class (after waiver) | $1,000 | $1,109.50 | $5.10 | 0.97% |
| Investor Class (before waiver) | $1,000 | $1,109.50(2) | $5.26 | 1.00% |
| Institutional Class (after waiver) | $1,000 | $1,110.50 | $4.05 | 0.77% |
| Institutional Class (before waiver) | $1,000 | $1,110.50(2) | $4.21 | 0.80% |
| A Class (after waiver) | $1,000 | $1,108.30 | $6.41 | 1.22% |
| A Class (before waiver) | $1,000 | $1,108.30(2) | $6.57 | 1.25% |
| C Class (after waiver) | $1,000 | $1,104.50 | $10.34 | 1.97% |
| C Class (before waiver) | $1,000 | $1,104.50(2) | $10.49 | 2.00% |
| R Class (after waiver) | $1,000 | $1,107.20 | $7.72 | 1.47% |
| R Class (before waiver) | $1,000 | $1,107.20(2) | $7.88 | 1.50% |
| R6 Class (after waiver) | $1,000 | $1,111.40 | $3.26 | 0.62% |
| R6 Class (before waiver) | $1,000 | $1,111.40(2) | $3.42 | 0.65% |
| Hypothetical | | | | |
| Investor Class (after waiver) | $1,000 | $1,020.10 | $4.89 | 0.97% |
| Investor Class (before waiver) | $1,000 | $1,019.95 | $5.04 | 1.00% |
| Institutional Class (after waiver) | $1,000 | $1,021.09 | $3.88 | 0.77% |
| Institutional Class (before waiver) | $1,000 | $1,020.94 | $4.03 | 0.80% |
| A Class (after waiver) | $1,000 | $1,018.85 | $6.14 | 1.22% |
| A Class (before waiver) | $1,000 | $1,018.70 | $6.29 | 1.25% |
| C Class (after waiver) | $1,000 | $1,015.11 | $9.90 | 1.97% |
| C Class (before waiver) | $1,000 | $1,014.96 | $10.05 | 2.00% |
| R Class (after waiver) | $1,000 | $1,017.60 | $7.39 | 1.47% |
| R Class (before waiver) | $1,000 | $1,017.45 | $7.54 | 1.50% |
| R6 Class (after waiver) | $1,000 | $1,021.84 | $3.13 | 0.62% |
| R6 Class (before waiver) | $1,000 | $1,021.69 | $3.28 | 0.65% |
| |
| (1) | Expenses are equal to the class's annualized expense ratio listed in the table above, multiplied by the average account value over the period, multiplied by 182, the number of days in the most recent fiscal half-year, divided by 365, to reflect the one-half year period. |
| |
| (2) | Ending account value assumes the return earned after waiver and would have been lower if a portion of the fees had not been waived. |
MARCH 31, 2017
|
| | | | | |
| | Shares | Value |
| COMMON STOCKS — 95.4% | | |
| Aerospace and Defense — 1.2% | | |
| Textron, Inc. | 2,289,544 |
| $ | 108,959,399 |
|
| Auto Components — 1.0% | | |
| Delphi Automotive plc | 1,124,036 |
| 90,473,658 |
|
| Automobiles — 0.9% | | |
| Honda Motor Co. Ltd. ADR | 2,750,500 |
| 83,230,130 |
|
| Banks — 7.0% | | |
| Bank of Hawaii Corp. | 546,201 |
| 44,985,114 |
|
| BB&T Corp. | 2,559,109 |
| 114,392,172 |
|
| Comerica, Inc. | 713,108 |
| 48,904,947 |
|
| Commerce Bancshares, Inc. | 1,577,314 |
| 88,581,954 |
|
| M&T Bank Corp. | 622,961 |
| 96,390,756 |
|
| PNC Financial Services Group, Inc. (The) | 737,254 |
| 88,647,421 |
|
| SunTrust Banks, Inc. | 613,649 |
| 33,934,790 |
|
| UMB Financial Corp. | 474,956 |
| 35,768,936 |
|
| Westamerica Bancorporation | 1,309,056 |
| 73,084,596 |
|
| | | 624,690,686 |
|
| Building Products — 3.1% | | |
| Johnson Controls International plc | 6,496,459 |
| 273,630,853 |
|
| Capital Markets — 7.0% | | |
| Ameriprise Financial, Inc. | 800,207 |
| 103,770,844 |
|
| Invesco Ltd. | 4,198,923 |
| 128,613,011 |
|
| Northern Trust Corp. | 3,034,145 |
| 262,696,274 |
|
| State Street Corp. | 771,219 |
| 61,396,745 |
|
| T. Rowe Price Group, Inc. | 1,021,315 |
| 69,602,617 |
|
| | | 626,079,491 |
|
| Commercial Services and Supplies — 1.2% | | |
| Republic Services, Inc. | 1,738,248 |
| 109,179,357 |
|
| Containers and Packaging — 2.6% | | |
| Bemis Co., Inc. | 1,448,676 |
| 70,782,309 |
|
| Sonoco Products Co. | 1,313,249 |
| 69,497,137 |
|
| WestRock Co. | 1,756,079 |
| 91,368,791 |
|
| | | 231,648,237 |
|
| Diversified Telecommunication Services — 0.9% | | |
Level 3 Communications, Inc.(1) | 1,416,622 |
| 81,059,111 |
|
| Electric Utilities — 5.0% | | |
| Edison International | 1,607,220 |
| 127,950,784 |
|
| Eversource Energy | 656,517 |
| 38,590,069 |
|
| PG&E Corp. | 1,976,973 |
| 131,191,928 |
|
| Westar Energy, Inc. | 487,805 |
| 26,473,178 |
|
| Xcel Energy, Inc. | 2,762,588 |
| 122,797,037 |
|
| | | 447,002,996 |
|
| Electrical Equipment — 2.5% | | |
| Emerson Electric Co. | 1,133,845 |
| 67,871,962 |
|
| Hubbell, Inc. | 915,640 |
| 109,922,582 |
|
|
| | | | | |
| | Shares | Value |
| Rockwell Automation, Inc. | 295,038 |
| $ | 45,940,367 |
|
| | | 223,734,911 |
|
| Electronic Equipment, Instruments and Components — 2.2% | | |
Keysight Technologies, Inc.(1) | 3,068,960 |
| 110,912,214 |
|
| TE Connectivity Ltd. | 1,171,343 |
| 87,323,621 |
|
| | | 198,235,835 |
|
| Energy Equipment and Services — 3.5% | | |
| Baker Hughes, Inc. | 2,258,501 |
| 135,103,530 |
|
| Frank's International NV | 791,547 |
| 8,366,651 |
|
| Halliburton Co. | 656,672 |
| 32,314,829 |
|
| Helmerich & Payne, Inc. | 490,984 |
| 32,684,805 |
|
| National Oilwell Varco, Inc. | 2,505,820 |
| 100,458,324 |
|
| | | 308,928,139 |
|
| Equity Real Estate Investment Trusts (REITs) — 4.5% | | |
| American Tower Corp. | 579,731 |
| 70,460,506 |
|
| Empire State Realty Trust, Inc. | 1,722,516 |
| 35,552,730 |
|
| MGM Growth Properties LLC, Class A | 1,792,364 |
| 48,483,446 |
|
| Piedmont Office Realty Trust, Inc., Class A | 3,471,181 |
| 74,213,850 |
|
| Weyerhaeuser Co. | 5,017,636 |
| 170,499,271 |
|
| | | 399,209,803 |
|
| Food and Staples Retailing — 0.8% | | |
| Sysco Corp. | 1,354,220 |
| 70,311,102 |
|
| Food Products — 5.9% | | |
| Conagra Brands, Inc. | 3,351,138 |
| 135,184,907 |
|
| General Mills, Inc. | 1,057,163 |
| 62,383,189 |
|
| J.M. Smucker Co. (The) | 357,054 |
| 46,802,638 |
|
| Kellogg Co. | 1,067,493 |
| 77,510,667 |
|
| Lamb Weston Holdings, Inc. | 663,439 |
| 27,904,244 |
|
| Mead Johnson Nutrition Co. | 713,515 |
| 63,559,916 |
|
| Mondelez International, Inc., Class A | 2,554,682 |
| 110,055,701 |
|
| | | 523,401,262 |
|
| Gas Utilities — 1.3% | | |
| Atmos Energy Corp. | 679,081 |
| 53,640,608 |
|
| Spire, Inc. | 997,176 |
| 67,309,380 |
|
| | | 120,949,988 |
|
| Health Care Equipment and Supplies — 4.2% | | |
| Abbott Laboratories | 1,269,211 |
| 56,365,661 |
|
| Baxter International, Inc. | 1,318,301 |
| 68,367,090 |
|
| STERIS plc | 1,023,066 |
| 71,062,164 |
|
| Zimmer Biomet Holdings, Inc. | 1,499,549 |
| 183,109,928 |
|
| | | 378,904,843 |
|
| Health Care Providers and Services — 5.1% | | |
| Cardinal Health, Inc. | 956,498 |
| 78,002,412 |
|
Express Scripts Holding Co.(1) | 803,732 |
| 52,973,976 |
|
HCA Holdings, Inc.(1) | 675,665 |
| 60,127,429 |
|
LifePoint Health, Inc.(1) | 1,967,834 |
| 128,893,127 |
|
| McKesson Corp. | 418,085 |
| 61,985,282 |
|
| Quest Diagnostics, Inc. | 784,443 |
| 77,024,458 |
|
| | | 459,006,684 |
|
| Hotels, Restaurants and Leisure — 0.8% | | |
| Carnival Corp. | 1,175,467 |
| 69,246,761 |
|
|
| | | | | |
| | Shares | Value |
| Household Durables — 0.9% | | |
| PulteGroup, Inc. | 3,347,586 |
| $ | 78,835,650 |
|
| Industrial Conglomerates — 1.2% | | |
| Koninklijke Philips NV | 3,206,874 |
| 103,077,519 |
|
| Insurance — 6.2% | | |
| Aflac, Inc. | 623,579 |
| 45,159,591 |
|
| Allstate Corp. (The) | 477,766 |
| 38,933,151 |
|
| Brown & Brown, Inc. | 1,527,090 |
| 63,710,195 |
|
| Chubb Ltd. | 873,926 |
| 119,072,418 |
|
| MetLife, Inc. | 790,528 |
| 41,755,689 |
|
| ProAssurance Corp. | 697,441 |
| 42,020,820 |
|
| Reinsurance Group of America, Inc. | 628,286 |
| 79,779,756 |
|
| Torchmark Corp. | 386,488 |
| 29,775,036 |
|
| Unum Group | 1,943,842 |
| 91,146,751 |
|
| | | 551,353,407 |
|
| Leisure Products — 0.6% | | |
| Mattel, Inc. | 2,016,805 |
| 51,650,376 |
|
| Machinery — 2.9% | | |
| Cummins, Inc. | 507,154 |
| 76,681,685 |
|
| Ingersoll-Rand plc | 1,438,637 |
| 116,989,961 |
|
| ITT, Inc. | 322,591 |
| 13,232,683 |
|
| Parker-Hannifin Corp. | 336,917 |
| 54,014,533 |
|
| | | 260,918,862 |
|
| Multi-Utilities — 1.9% | | |
| Ameren Corp. | 1,156,122 |
| 63,112,700 |
|
| Consolidated Edison, Inc. | 716,299 |
| 55,627,781 |
|
| NorthWestern Corp. | 929,829 |
| 54,580,962 |
|
| | | 173,321,443 |
|
| Multiline Retail — 0.8% | | |
| Target Corp. | 1,307,661 |
| 72,169,810 |
|
| Oil, Gas and Consumable Fuels — 9.6% | | |
| Anadarko Petroleum Corp. | 1,775,980 |
| 110,110,760 |
|
| Cimarex Energy Co. | 250,976 |
| 29,989,122 |
|
| Devon Energy Corp. | 2,056,614 |
| 85,801,936 |
|
| EQT Corp. | 2,672,646 |
| 163,298,671 |
|
| Imperial Oil Ltd. | 4,901,731 |
| 149,353,792 |
|
| Marathon Petroleum Corp. | 1,327,138 |
| 67,073,555 |
|
| Noble Energy, Inc. | 3,589,407 |
| 123,260,236 |
|
| Occidental Petroleum Corp. | 1,732,185 |
| 109,751,242 |
|
| Spectra Energy Partners LP | 480,846 |
| 20,993,736 |
|
| | | 859,633,050 |
|
| Road and Rail — 1.1% | | |
Heartland Express, Inc.(2) | 4,747,955 |
| 95,196,498 |
|
| Semiconductors and Semiconductor Equipment — 5.5% | | |
| Applied Materials, Inc. | 4,211,456 |
| 163,825,638 |
|
| Lam Research Corp. | 812,159 |
| 104,248,729 |
|
| Maxim Integrated Products, Inc. | 2,584,489 |
| 116,198,626 |
|
| Teradyne, Inc. | 3,456,199 |
| 107,487,789 |
|
| | | 491,760,782 |
|
| Specialty Retail — 2.0% | | |
| Advance Auto Parts, Inc. | 655,838 |
| 97,234,542 |
|
|
| | | | | | |
| | Shares/Principal Amount | Value |
| CST Brands, Inc. | 1,277,161 |
| $ | 61,418,672 |
|
| L Brands, Inc. | 376,239 |
| 17,720,857 |
|
| | | 176,374,071 |
|
| Technology Hardware, Storage and Peripherals — 0.7% | | |
| NetApp, Inc. | 1,604,936 |
| 67,166,572 |
|
| Textiles, Apparel and Luxury Goods — 0.4% | | |
| Ralph Lauren Corp. | 491,929 |
| 40,151,245 |
|
| Thrifts and Mortgage Finance — 0.9% | | |
| Capitol Federal Financial, Inc. | 5,420,643 |
| 79,304,007 |
|
TOTAL COMMON STOCKS
(Cost $6,865,754,954) | | 8,528,796,538 |
|
| EXCHANGE-TRADED FUNDS — 2.2% | | |
iShares Russell Mid-Cap Value ETF
(Cost $157,969,063) | 2,367,791 |
| 196,502,975 |
|
| TEMPORARY CASH INVESTMENTS — 2.4% | | |
Federal Home Loan Bank Discount Notes, 0.46%, 4/3/17(3) | $ | 45,400,000 |
| 45,400,000 |
|
| Repurchase Agreement, BMO Capital Markets Corp., (collateralized by various U.S. Treasury obligations, 0.75% - 2.75%, 7/31/17 - 2/15/24, valued at $62,171,646), in a joint trading account at 0.67%, dated 3/31/17, due 4/3/17 (Delivery value $60,907,948) | | 60,904,547 |
|
| Repurchase Agreement, Fixed Income Clearing Corp., (collateralized by various U.S. Treasury obligations, 2.50% - 3.00%, 11/15/45 - 5/15/46, valued at $112,739,458), at 0.22%, dated 3/31/17, due 4/3/17 (Delivery value $110,521,026) | | 110,519,000 |
|
| State Street Institutional U.S. Government Money Market Fund, Premier Class | 76,279 |
| 76,279 |
|
TOTAL TEMPORARY CASH INVESTMENTS
(Cost $216,898,691) | | 216,899,826 |
|
TOTAL INVESTMENT SECURITIES — 100.0%
(Cost $7,240,622,708) | | 8,942,199,339 |
|
OTHER ASSETS AND LIABILITIES† | | (3,748,527 | ) |
| TOTAL NET ASSETS — 100.0% | | $ | 8,938,450,812 |
|
|
| | | | | | | | |
| FORWARD FOREIGN CURRENCY EXCHANGE CONTRACTS |
| Currency Purchased | Currency Sold | Counterparty | Settlement Date | Unrealized Appreciation
(Depreciation) |
| CAD | 4,220,232 | USD | 3,176,668 | Morgan Stanley | 6/30/17 | $ | 635 |
|
| USD | 129,997,466 | CAD | 173,712,286 | Morgan Stanley | 6/30/17 | (786,014 | ) |
| EUR | 2,362,256 | USD | 2,535,107 | UBS AG | 6/30/17 | (4,550 | ) |
| USD | 91,681,315 | EUR | 84,137,543 | UBS AG | 6/30/17 | 1,549,301 |
|
| USD | 49,582,697 | JPY | 5,448,568,232 | Credit Suisse AG | 6/30/17 | 472,403 |
|
| | | | | | | $ | 1,231,775 |
|
|
| | |
| NOTES TO SCHEDULE OF INVESTMENTS |
| ADR | - | American Depositary Receipt |
| CAD | - | Canadian Dollar |
| EUR | - | Euro |
| JPY | - | Japanese Yen |
| USD | - | United States Dollar |
| |
| † | Category is less than 0.05% of total net assets. |
| |
| (2) | Affiliated Company: the fund’s holding represents ownership of 5% or more of the voting securities of the company; therefore, the company is affiliated as defined in the Investment Company Act of 1940. |
| |
| (3) | The rate indicated is the yield to maturity at purchase. |
See Notes to Financial Statements.
|
|
| Statement of Assets and Liabilities |
|
| | | |
| MARCH 31, 2017 | |
| Assets | |
| Investment securities - unaffiliated, at value (cost of $7,143,674,141) | $ | 8,847,002,841 |
|
| Investment securities - affiliated, at value (cost of $96,948,567) | 95,196,498 |
|
| Total investment securities, at value (cost of $7,240,622,708) | 8,942,199,339 |
|
| Foreign currency holdings, at value (cost of $516,227) | 414,072 |
|
| Receivable for investments sold | 33,374,774 |
|
| Receivable for capital shares sold | 3,230,816 |
|
| Unrealized appreciation on forward foreign currency exchange contracts | 2,022,339 |
|
| Dividends and interest receivable | 13,676,476 |
|
| | 8,994,917,816 |
|
| | |
| Liabilities | |
| Payable for investments purchased | 25,483,248 |
|
| Payable for capital shares redeemed | 22,970,201 |
|
| Unrealized depreciation on forward foreign currency exchange contracts | 790,564 |
|
| Accrued management fees | 6,742,658 |
|
| Distribution and service fees payable | 480,333 |
|
| | 56,467,004 |
|
| | |
| Net Assets | $ | 8,938,450,812 |
|
| | |
| Net Assets Consist of: | |
| Capital (par value and paid-in surplus) | $ | 7,134,246,624 |
|
| Undistributed net investment income | 1,775,021 |
|
| Undistributed net realized gain | 99,715,841 |
|
| Net unrealized appreciation | 1,702,713,326 |
|
| | $ | 8,938,450,812 |
|
|
| | | | | |
| | Net Assets | Shares Outstanding | Net Asset Value Per Share |
| Investor Class, $0.01 Par Value |
| $4,706,703,898 |
| 264,967,461 | $17.76 |
| Institutional Class, $0.01 Par Value |
| $1,628,060,376 |
| 91,609,462 | $17.77 |
| A Class, $0.01 Par Value |
| $989,014,244 |
| 55,771,887 | $17.73* |
| C Class, $0.01 Par Value |
| $160,892,998 |
| 9,152,821 | $17.58 |
| R Class, $0.01 Par Value |
| $151,705,348 |
| 8,575,139 | $17.69 |
| R6 Class, $0.01 Par Value |
| $1,302,073,948 |
| 73,277,738 | $17.77 |
* Maximum offering price $18.81 (net asset value divided by 0.9425).
See Notes to Financial Statements.
|
| | | |
| YEAR ENDED MARCH 31, 2017 | |
| Investment Income (Loss) | |
| Income: | |
| Dividends (including $2,626,071 from affiliates and net of foreign taxes withheld of $662,102) | $ | 187,064,224 |
|
| Interest | 512,765 |
|
| | 187,576,989 |
|
| | |
| Expenses: | |
| Management fees | 75,016,824 |
|
| Distribution and service fees: | |
| A Class | 3,683,946 |
|
| C Class | 1,396,494 |
|
| R Class | 712,453 |
|
| Directors' fees and expenses | 247,998 |
|
| Other expenses | 11,198 |
|
| | 81,068,913 |
|
| Fees waived | (2,062,693 | ) |
| | 79,006,220 |
|
| | |
| Net investment income (loss) | 108,570,769 |
|
| | |
| Realized and Unrealized Gain (Loss) | |
| Net realized gain (loss) on: | |
| Investment transactions (Note 4) (including $(2,253,435) from affiliates) | 476,781,352 |
|
| Foreign currency transactions | 7,736,185 |
|
| | 484,517,537 |
|
| | |
| Change in net unrealized appreciation (depreciation) on: | |
| Investments | 924,340,926 |
|
| Translation of assets and liabilities in foreign currencies | 3,876,967 |
|
| | 928,217,893 |
|
| | |
| Net realized and unrealized gain (loss) | 1,412,735,430 |
|
| | |
| Net Increase (Decrease) in Net Assets Resulting from Operations | $ | 1,521,306,199 |
|
See Notes to Financial Statements.
|
|
| Statement of Changes in Net Assets |
|
| | | | | | |
| YEARS ENDED MARCH 31, 2017 AND MARCH 31, 2016 |
| Increase (Decrease) in Net Assets | March 31, 2017 | March 31, 2016 |
| Operations | | |
| Net investment income (loss) | $ | 108,570,769 |
| $ | 75,479,093 |
|
| Net realized gain (loss) | 484,517,537 |
| 254,112,847 |
|
| Change in net unrealized appreciation (depreciation) | 928,217,893 |
| (198,064,874 | ) |
| Net increase (decrease) in net assets resulting from operations | 1,521,306,199 |
| 131,527,066 |
|
| | | |
| Distributions to Shareholders | | |
| From net investment income: | | |
| Investor Class | (56,846,450 | ) | (42,456,054 | ) |
| Institutional Class | (22,574,513 | ) | (14,873,131 | ) |
| A Class | (16,809,081 | ) | (13,188,282 | ) |
| C Class | (628,329 | ) | (261,415 | ) |
| R Class | (1,302,759 | ) | (889,590 | ) |
| R6 Class | (18,334,282 | ) | (5,941,406 | ) |
| From net realized gains: | | |
| Investor Class | (112,493,225 | ) | (306,430,134 | ) |
| Institutional Class | (39,861,571 | ) | (94,557,760 | ) |
| A Class | (43,015,675 | ) | (119,189,154 | ) |
| C Class | (4,186,150 | ) | (7,803,773 | ) |
| R Class | (4,206,839 | ) | (10,991,672 | ) |
| R6 Class | (32,038,469 | ) | (33,322,014 | ) |
| Decrease in net assets from distributions | (352,297,343 | ) | (649,904,385 | ) |
| | | |
| Capital Share Transactions | | |
| Net increase (decrease) in net assets from capital share transactions (Note 5) | 925,856,847 |
| 678,685,550 |
|
| | | |
| Net increase (decrease) in net assets | 2,094,865,703 |
| 160,308,231 |
|
| | | |
| Net Assets | | |
| Beginning of period | 6,843,585,109 |
| 6,683,276,878 |
|
| End of period | $ | 8,938,450,812 |
| $ | 6,843,585,109 |
|
| | | |
| Undistributed net investment income | $ | 1,775,021 |
| $ | 11,642,971 |
|
See Notes to Financial Statements.
|
|
Notes to Financial Statements |
MARCH 31, 2017
1. Organization
American Century Capital Portfolios, Inc. (the corporation) is registered under the Investment Company Act of 1940, as amended (the 1940 Act), as an open-end management investment company and is organized as a Maryland corporation. Mid Cap Value Fund (the fund) is one fund in a series issued by the corporation. The fund’s investment objective is to seek long-term capital growth. Income is a secondary objective.
The fund offers the Investor Class, the Institutional Class, the A Class, the C Class, the R Class and the R6 Class. The A Class may incur an initial sales charge. The A Class and C Class may be subject to a contingent deferred sales charge.
2. Significant Accounting Policies
The following is a summary of significant accounting policies consistently followed by the fund in preparation of its financial statements. The fund is an investment company and follows accounting and reporting guidance in accordance with accounting principles generally accepted in the United States of America. This may require management to make certain estimates and assumptions at the date of the financial statements. Actual results could differ from these estimates. Management evaluated the impact of events or transactions occurring through the date the financial statements were issued that would merit recognition or disclosure.
Investment Valuations — The fund determines the fair value of its investments and computes its net asset value per share at the close of regular trading (usually 4 p.m. Eastern time) on the New York Stock Exchange (NYSE) on each day the NYSE is open. The Board of Directors has adopted valuation policies and procedures to guide the investment advisor in the fund’s investment valuation process and to provide methodologies for the oversight of the fund’s pricing function.
Equity securities that are listed or traded on a domestic securities exchange are valued at the last reported sales price or at the official closing price as provided by the exchange. Equity securities traded on foreign securities exchanges are generally valued at the closing price of such securities on the exchange where primarily traded or at the close of the NYSE, if that is earlier. If no last sales price is reported, or if local convention or regulation so provides, the mean of the latest bid and asked prices may be used. Securities traded over-the-counter are valued at the mean of the latest bid and asked prices, the last sales price, or the official closing price. Equity securities initially expressed in local currencies are translated into U.S. dollars at the mean of the appropriate currency exchange rate at the close of the NYSE as provided by an independent pricing service.
Fixed income securities are valued at the evaluated mean as provided by independent pricing services or at the mean of the most recent bid and asked prices as provided by investment dealers. U.S. Treasury and Government Agency securities are valued using market models that consider trade data, quotations from dealers and active market makers, relevant yield curve and spread data, creditworthiness, trade data or market information on comparable securities, and other relevant security specific information.
Open-end management investment companies are valued at the reported net asset value per share. Repurchase agreements are valued at cost, which approximates fair value. Forward foreign currency exchange contracts are valued at the mean of the appropriate forward exchange rate at the close of the NYSE as provided by an independent pricing service.
If the fund determines that the market price for an investment is not readily available or the valuation methods mentioned above do not reflect an investment’s fair value, such investment is valued as determined in good faith by the Board of Directors or its delegate, in accordance with policies and procedures adopted by the Board of Directors. In its determination of fair value, the fund may review several factors including, but not limited to, market information regarding the specific investment or comparable investments and correlation with other investment types, futures indices or general market indicators. Circumstances that may cause the fund to use these procedures to value an investment include, but are not limited to: an investment has been declared in default or is distressed; trading in a security has been suspended during the trading day or a security is not actively trading on its principal exchange; prices received from a regular pricing source are deemed unreliable; or there is a foreign market holiday and no trading occurred.
The fund monitors for significant events occurring after the close of an investment’s primary exchange but before the fund’s net asset value per share is determined. Significant events may include, but are not limited to: corporate announcements and transactions; governmental action and political unrest that could impact a specific investment or an investment sector; or armed conflicts, natural disasters and similar events that could affect investments in a specific country or region. The fund also monitors for significant fluctuations between domestic and foreign markets, as evidenced by the U.S. market or such other indicators that the Board of Directors, or its delegate, deems appropriate. If significant fluctuations in foreign markets are identified, the fund may apply a model-derived factor to the closing price of equity securities traded on foreign securities exchanges. The factor is based on observable market data as provided by an independent pricing service.
Security Transactions — Security transactions are accounted for as of the trade date. Net realized gains and losses are determined on the identified cost basis, which is also used for federal income tax purposes.
Investment Income — Dividend income less foreign taxes withheld, if any, is recorded as of the ex-dividend date. Distributions received on securities that represent a return of capital or long-term capital gain are recorded as a reduction of cost of investments and/or as a realized gain. The fund may estimate the components of distributions received that may be considered nontaxable distributions or long-term capital gain distributions for income tax purposes. Interest income is recorded on the accrual basis and includes accretion of discounts and amortization of premiums.
Foreign Currency Translations — All assets and liabilities initially expressed in foreign currencies are translated into U.S. dollars at prevailing exchange rates at period end. The fund may enter into spot foreign currency exchange contracts to facilitate transactions denominated in a foreign currency. Purchases and sales of investment securities, dividend and interest income, spot foreign currency exchange contracts, and expenses are translated at the rates of exchange prevailing on the respective dates of such transactions. Net realized and unrealized foreign currency exchange gains or losses related to investment securities are a component of net realized gain (loss) on investment transactions and change in net unrealized appreciation (depreciation) on investments, respectively.
Repurchase Agreements — The fund may enter into repurchase agreements with institutions that American Century Investment Management, Inc. (ACIM) (the investment advisor) has determined are creditworthy pursuant to criteria adopted by the Board of Directors. The fund requires that the collateral, represented by securities, received in a repurchase transaction be transferred to the custodian in a manner sufficient to enable the fund to obtain those securities in the event of a default under the repurchase agreement. ACIM monitors, on a daily basis, the securities transferred to ensure the value, including accrued interest, of the securities under each repurchase agreement is equal to or greater than amounts owed to the fund under each repurchase agreement.
Joint Trading Account — Pursuant to an Exemptive Order issued by the Securities and Exchange Commission, the fund, along with certain other funds in the American Century Investments family of funds, may transfer uninvested cash balances into a joint trading account. These balances are invested in one or more repurchase agreements that are collateralized by U.S. Treasury or Agency obligations.
Income Tax Status — It is the fund’s policy to distribute substantially all net investment income and net realized gains to shareholders and to otherwise qualify as a regulated investment company under provisions of the Internal Revenue Code. Accordingly, no provision has been made for income taxes. The fund files U.S. federal, state, local and non-U.S. tax returns as applicable. The fund's tax returns are subject to examination by the relevant taxing authority until expiration of the applicable statute of limitations, which is generally three years from the date of filing but can be longer in certain jurisdictions. At this time, management believes there are no uncertain tax positions which, based on their technical merit, would not be sustained upon examination and for which it is reasonably possible that the total amounts of unrecognized tax benefits will significantly change in the next twelve months.
Multiple Class — All shares of the fund represent an equal pro rata interest in the net assets of the class to which such shares belong, and have identical voting, dividend, liquidation and other rights and the same terms and conditions, except for class specific expenses and exclusive rights to vote on matters affecting only individual classes. Income, non-class specific expenses, and realized and unrealized capital gains and losses of the fund are allocated to each class of shares based on their relative net assets.
Distributions to Shareholders — Distributions from net investment income, if any, are generally declared and paid quarterly. Distributions from net realized gains, if any, are generally declared and paid annually. The fund may elect to treat a portion of its payment to a redeeming shareholder, which represents the pro rata
share of undistributed net investment income and net realized gains, as a distribution for federal income tax purposes (tax equalization).
Indemnifications — Under the corporation’s organizational documents, its officers and directors are indemnified against certain liabilities arising out of the performance of their duties to the fund. In addition, in the normal course of business, the fund enters into contracts that provide general indemnifications. The maximum exposure under these arrangements is unknown as this would involve future claims that may be made against a fund. The risk of material loss from such claims is considered by management to be remote.
3. Fees and Transactions with Related Parties
Certain officers and directors of the corporation are also officers and/or directors of American Century Companies, Inc. (ACC). The corporation’s investment advisor, ACIM, the corporation's distributor, American Century Investment Services, Inc. (ACIS), and the corporation’s transfer agent, American Century Services, LLC, are wholly owned, directly or indirectly, by ACC.
Management Fees — The corporation has entered into a management agreement with ACIM, under which ACIM provides the fund with investment advisory and management services in exchange for a single, unified management fee (the fee) per class. The agreement provides that all expenses of managing and operating the fund, except distribution and service fees, brokerage expenses, taxes, interest, fees and expenses of the independent directors (including legal counsel fees), and extraordinary expenses, will be paid by ACIM. The fee is computed and accrued daily based on each class’s daily net assets and paid monthly in arrears. The difference in the fee among the classes is a result of their separate arrangements for shareholder services. It is not the result of any difference in advisory or custodial fees or other expenses related to the management of the fund’s assets, which do not vary by class. The annual management fee is 1.00% for the Investor Class, A Class, C Class and R Class, 0.80% for the Institutional Class and 0.65% for the R6 Class. From April 1, 2016 through July 31, 2016, the investment advisor agreed to waive 0.05% of the fund's management fee for assets over $7 billion. This fee waiver was determined by applying a formula that takes into account the fund's assets as well as certain assets, if any, of other clients of the investment advisor outside the American Century Investments family of funds (such as subadvised funds and separate accounts) that have very similar investment teams and investment strategies (strategy assets). The strategy assets of the fund also include the assets of NT Mid Cap Value Fund, one fund in a series issued by the corporation. Effective August 1, 2016, the investment advisor agreed to waive 0.03% of the fund's management fee. The investment advisor expects this waiver to continue through April 9, 2018, and cannot terminate it prior to such date without the approval of the Board of Directors. The total amount of the waiver for each class for the year ended March 31, 2017 was $1,010,258, $351,714, $370,380, $35,979, $35,996 and $258,366 for the Investor Class, Institutional Class, A Class, C Class, R Class and R6 Class, respectively. The effective annual management fee after waiver for each class for the year ended March 31, 2017 was 0.98% for the Investor Class, A Class, C Class and R Class, 0.78% for the Institutional Class and 0.63% for the R6 Class.
Distribution and Service Fees — The Board of Directors has adopted a separate Master Distribution and Individual Shareholder Services Plan for each of the A Class, C Class and R Class (collectively the plans), pursuant to Rule 12b-1 of the 1940 Act. The plans provide that the A Class will pay ACIS an annual distribution and service fee of 0.25%. The plans provide that the C Class will pay ACIS an annual distribution and service fee of 1.00%, of which 0.25% is paid for individual shareholder services and 0.75% is paid for distribution services. The plans provide that the R Class will pay ACIS an annual distribution and service fee of 0.50%. The fees are computed and accrued daily based on each class’s daily net assets and paid monthly in arrears. The fees are used to pay financial intermediaries for distribution and individual shareholder services. Fees incurred under the plans during the year ended March 31, 2017 are detailed in the Statement of Operations.
Directors' Fees and Expenses — The Board of Directors is responsible for overseeing the investment advisor’s management and operations of the fund. The directors receive detailed information about the fund and its investment advisor regularly throughout the year, and meet at least quarterly with management of the investment advisor to review reports about fund operations. The fund’s officers do not receive compensation from the fund.
Interfund Transactions — The fund may enter into security transactions with other American Century Investments funds and other client accounts of the investment advisor, in accordance with the 1940 Act rules and procedures adopted by the Board of Directors. The rules and procedures require, among other things, that these transactions be effected at the independent current market price of the security. During the period, the interfund purchases and sales were $29,520,736 and $41,104,569, respectively. The effect of interfund transactions on the Statement of Operations was $8,232,084 in net realized gain (loss) on investment transactions.
4. Investment Transactions
Purchases and sales of investment securities, excluding short-term investments, for the year ended March 31, 2017 were $4,587,289,708 and $3,874,815,437, respectively.
For the year ended March 31, 2017, the fund incurred net realized gains of $6,665,755 from redemptions in kind. A redemption in kind occurs when a fund delivers securities from its portfolio in lieu of cash as payment to a redeeming shareholder.
5. Capital Share Transactions
Transactions in shares of the fund were as follows:
|
| | | | | | | | | | |
| | Year ended March 31, 2017 | Year ended
March 31, 2016 |
| | Shares | Amount | Shares | Amount |
| Investor Class/Shares Authorized | 1,355,000,000 |
| | 1,355,000,000 |
| |
| Sold | 95,524,450 |
| $ | 1,617,072,204 |
| 46,886,278 |
| $ | 726,588,711 |
|
| Issued in reinvestment of distributions | 9,444,752 |
| 163,834,567 |
| 22,803,942 |
| 338,309,767 |
|
| Redeemed | (71,970,011 | ) | (1,207,753,225 | ) | (63,495,986 | ) | (995,699,429 | ) |
| | 32,999,191 |
| 573,153,546 |
| 6,194,234 |
| 69,199,049 |
|
| Institutional Class/Shares Authorized | 500,000,000 |
| | 500,000,000 |
| |
| Sold | 36,780,861 |
| 617,210,853 |
| 25,276,057 |
| 394,037,156 |
|
| Issued in reinvestment of distributions | 2,941,214 |
| 51,025,611 |
| 5,835,014 |
| 86,628,472 |
|
| Redeemed | (23,385,985 | ) | (392,518,202 | ) | (16,752,803 | ) | (263,051,652 | ) |
| | 16,336,090 |
| 275,718,262 |
| 14,358,268 |
| 217,613,976 |
|
| A Class/Shares Authorized | 575,000,000 |
| | 575,000,000 |
| |
| Sold | 33,099,394 |
| 545,878,543 |
| 25,452,354 |
| 397,016,320 |
|
| Issued in reinvestment of distributions | 3,352,353 |
| 58,165,063 |
| 8,720,476 |
| 128,973,104 |
|
| Redeemed | (69,649,804 | ) | (1,193,566,164 | ) | (33,009,047 | ) | (515,757,726 | ) |
| | (33,198,057 | ) | (589,522,558 | ) | 1,163,783 |
| 10,231,698 |
|
| C Class/Shares Authorized | 50,000,000 |
| | 50,000,000 |
| |
| Sold | 3,740,032 |
| 60,859,992 |
| 2,576,346 |
| 39,427,299 |
|
| Issued in reinvestment of distributions | 253,069 |
| 4,388,322 |
| 486,080 |
| 7,099,539 |
|
| Redeemed | (1,622,243 | ) | (27,028,636 | ) | (1,077,300 | ) | (16,527,955 | ) |
| | 2,370,858 |
| 38,219,678 |
| 1,985,126 |
| 29,998,883 |
|
| R Class/Shares Authorized | 70,000,000 |
| | 70,000,000 |
| |
| Sold | 3,141,933 |
| 51,925,449 |
| 2,231,125 |
| 34,966,484 |
|
| Issued in reinvestment of distributions | 314,643 |
| 5,459,393 |
| 798,168 |
| 11,757,959 |
|
| Redeemed | (3,241,664 | ) | (53,879,242 | ) | (2,520,338 | ) | (39,520,721 | ) |
| | 214,912 |
| 3,505,600 |
| 508,955 |
| 7,203,722 |
|
| R6 Class/Shares Authorized | 200,000,000 |
| | 200,000,000 |
| |
| Sold | 54,083,268 |
| 899,809,329 |
| 24,040,730 |
| 372,402,699 |
|
| Issued in reinvestment of distributions | 2,900,453 |
| 50,372,751 |
| 2,643,832 |
| 39,261,659 |
|
| Redeemed | (19,208,133 | ) | (325,399,761 | ) | (4,328,604 | ) | (67,226,136 | ) |
| | 37,775,588 |
| 624,782,319 |
| 22,355,958 |
| 344,438,222 |
|
| Net increase (decrease) | 56,498,582 |
| $ | 925,856,847 |
| 46,566,324 |
| $ | 678,685,550 |
|
6. Fair Value Measurements
The fund’s investments valuation process is based on several considerations and may use multiple inputs to determine the fair value of the investments held by the fund. In conformity with accounting principles generally accepted in the United States of America, the inputs used to determine a valuation are classified into three broad levels.
| |
| • | Level 1 valuation inputs consist of unadjusted quoted prices in an active market for identical investments. |
| |
| • | Level 2 valuation inputs consist of direct or indirect observable market data (including quoted prices for comparable investments, evaluations of subsequent market events, interest rates, prepayment speeds, credit risk, etc.). These inputs also consist of quoted prices for identical investments initially expressed in local currencies that are adjusted through translation into U.S. dollars. |
| |
| • | Level 3 valuation inputs consist of unobservable data (including a fund’s own assumptions). |
The level classification is based on the lowest level input that is significant to the fair valuation measurement. The valuation inputs are not necessarily an indication of the risks associated with investing in these securities or other financial instruments. There were no significant transfers between levels during the period.
The following is a summary of the level classifications as of period end. The Schedule of Investments provides additional information on the fund’s portfolio holdings.
|
| | | | | | | | |
| | Level 1 | Level 2 | Level 3 |
| Assets | | | |
| Investment Securities | | | |
| Common Stocks | $ | 8,276,365,227 |
| $ | 252,431,311 |
| — |
|
| Exchange-Traded Funds | 196,502,975 |
| — |
| — |
|
| Temporary Cash Investments | 76,279 |
| 216,823,547 |
| — |
|
| | $ | 8,472,944,481 |
| $ | 469,254,858 |
| — |
|
| Other Financial Instruments | | | |
| Forward Foreign Currency Exchange Contracts | — |
| $ | 2,022,339 |
| — |
|
| | | | |
| Liabilities | | | |
| Other Financial Instruments | | | |
| Forward Foreign Currency Exchange Contracts | — |
| $ | 790,564 |
| — |
|
7. Affiliated Company Transactions
If a fund's holding represents ownership of 5% or more of the voting securities of a company, the company is affiliated as defined in the 1940 Act. A summary of transactions for each company which is or was an affiliate at or during the year ended March 31, 2017 follows:
|
| | | | | | | | | | | | | | | | | | |
| Company | Beginning
Value | Purchase
Cost | Sales Cost | Realized
Gain (Loss) | Dividend
Income | Ending
Value |
Westamerica Bancorporation(1) | $ | 75,840,934 |
| $ | 3,078,157 |
| $ | 15,493,463 |
| $ | 1,955,602 |
| $ | 2,261,672 |
| (1 | ) |
LifePoint Health, Inc.(1)(2) | 104,389,874 |
| 68,031,643 |
| 42,469,587 |
| (1,988,777 | ) | — |
| (1 | ) |
| Heartland Express, Inc. | 76,340,763 |
| 18,802,306 |
| 10,281,899 |
| (2,220,260 | ) | 364,399 |
| $ | 95,196,498 |
|
| | $ | 256,571,571 |
| $ | 89,912,106 |
| $ | 68,244,949 |
| $ | (2,253,435 | ) | $ | 2,626,071 |
| $ | 95,196,498 |
|
| |
| (1) | Company was not an affiliate at March 31, 2017. |
8. Derivative Instruments
Foreign Currency Risk — The fund is subject to foreign currency exchange rate risk in the normal course of pursuing its investment objectives. The value of foreign investments held by a fund may be significantly affected by changes in foreign currency exchange rates. The dollar value of a foreign security generally decreases when the value of the dollar rises against the foreign currency in which the security is denominated and tends to increase when the value of the dollar declines against such foreign currency. A fund may enter into forward foreign currency exchange contracts to reduce a fund's exposure to foreign currency exchange rate fluctuations. The net U.S. dollar value of foreign currency underlying all contractual commitments held by a fund and the resulting unrealized appreciation or depreciation are determined daily. Realized gain or loss is recorded upon the termination of the contract. Net realized and unrealized gains or losses occurring during the holding period of forward foreign currency exchange contracts are a component of net realized gain (loss) on foreign currency transactions and change in net unrealized appreciation (depreciation) on translation of assets and liabilities in foreign currencies, respectively. A fund bears the risk of an unfavorable change in the foreign currency exchange rate underlying the forward contract. Additionally, losses, up to the fair value, may arise if the counterparties do not perform under the contract terms. The fund's average U.S. dollar exposure to foreign currency risk derivative instruments held during the period was $289,513,719.
The value of foreign currency risk derivative instruments as of March 31, 2017, is disclosed on the Statement of Assets and Liabilities as an asset of $2,022,339 in unrealized appreciation on forward foreign currency exchange contracts and a liability of $790,564 in unrealized depreciation on forward foreign currency exchange contracts. For the year ended March 31, 2017, the effect of foreign currency risk derivative instruments on the Statement of Operations was $7,710,954 in net realized gain (loss) on foreign currency transactions and $3,935,479 in change in net unrealized appreciation (depreciation) on translation of assets and liabilities in foreign currencies.
9. Federal Tax Information
The tax character of distributions paid during the years ended March 31, 2017 and March 31, 2016 were as follows:
|
| | | | | | |
| | 2017 | 2016 |
| Distributions Paid From | | |
| Ordinary income | $ | 116,495,414 |
| $ | 220,067,909 |
|
| Long-term capital gains | $ | 235,801,929 |
| $ | 429,836,476 |
|
The book-basis character of distributions made during the year from net investment income or net realized gains may differ from their ultimate characterization for federal income tax purposes. These differences reflect the differing character of certain income items and net realized gains and losses for financial statement and tax purposes, and may result in reclassification among certain capital accounts on the financial statements.
As of March 31, 2017, the federal tax cost of investments and the components of distributable earnings on a tax-basis were as follows:
|
| | | |
| Federal tax cost of investments | $ | 7,326,602,136 |
|
| Gross tax appreciation of investments | $ | 1,746,367,267 |
|
| Gross tax depreciation of investments | (130,770,064 | ) |
| Net tax appreciation (depreciation) of investments | 1,615,597,203 |
|
| Net tax appreciation (depreciation) on derivatives and translation of assets and liabilities in foreign currencies | (95,080 | ) |
| Net tax appreciation (depreciation) | $ | 1,615,502,123 |
|
| Undistributed ordinary income | $ | 57,385,015 |
|
| Accumulated long-term gains | $ | 131,317,050 |
|
The difference between book-basis and tax-basis unrealized appreciation (depreciation) is attributable primarily to the tax deferral of losses on wash sales.
10. Recently Issued Accounting Guidance
In October 2016, the Securities and Exchange Commission adopted new rules and forms as well as amendments to its rules and forms to modernize the reporting and disclosure of information by registered investment companies. The amendments to Regulation S-X will require standardized, enhanced disclosure about derivatives in investment company financial statements, as well as other provisions. Compliance with the amendments is effective on August 1, 2017. Management is currently evaluating the impact that adopting the amendments will have on the financial statement disclosures.
11. Corporate Event
The Institutional Class was renamed to the I Class effective April 10, 2017.
|
| | | | | | | | | | | | | | | | | |
| For a Share Outstanding Throughout the Years Ended March 31 (except as noted) | | |
| Per-Share Data | | | | | | | | Ratios and Supplemental Data | | |
| | | Income From Investment Operations: | Distributions From: | | | Ratio to Average Net Assets of: | | |
| | Net Asset
Value,
Beginning
of Period | Net
Investment
Income
(Loss)(1) | Net
Realized
and
Unrealized
Gain (Loss) | Total From
Investment
Operations | Net
Investment
Income | Net
Realized
Gains | Total
Distributions | Net Asset
Value,
End
of Period | Total
Return(2) | Operating
Expenses | Operating
Expenses
(before
expense
waiver) | Net
Investment
Income
(Loss) | Net
Investment
Income (Loss)
(before
expense
waiver) | Portfolio
Turnover
Rate | Net
Assets,
End of
Period (in thousands) |
| Investor Class |
| 2017 | $15.32 | 0.22 | 2.93 | 3.15 | (0.23) | (0.48) | (0.71) | $17.76 | 20.71% | 0.98% | 1.00% | 1.32% | 1.30% | 49% |
| $4,706,704 |
|
| 2016 | $16.70 | 0.19 | 0.06 | 0.25 | (0.19) | (1.44) | (1.63) | $15.32 | 1.94% | 1.00% | 1.01% | 1.19% | 1.18% | 66% |
| $3,554,131 |
|
| 2015 | $16.35 | 0.20 | 1.98 | 2.18 | (0.18) | (1.65) | (1.83) | $16.70 | 13.62% | 1.00% | 1.00% | 1.16% | 1.16% | 66% |
| $3,771,117 |
|
| 2014 | $14.53 | 0.21 | 2.77 | 2.98 | (0.20) | (0.96) | (1.16) | $16.35 | 21.02% | 1.00% | 1.00% | 1.34% | 1.34% | 67% |
| $3,252,177 |
|
| 2013 | $12.86 | 0.22 | 2.02 | 2.24 | (0.25) | (0.32) | (0.57) | $14.53 | 18.11% | 1.00% | 1.00% | 1.69% | 1.69% | 61% |
| $2,459,353 |
|
| Institutional Class |
| 2017 | $15.33 | 0.26 | 2.93 | 3.19 | (0.27) | (0.48) | (0.75) | $17.77 | 20.95% | 0.78% | 0.80% | 1.52% | 1.50% | 49% |
| $1,628,060 |
|
| 2016 | $16.71 | 0.22 | 0.06 | 0.28 | (0.22) | (1.44) | (1.66) | $15.33 | 2.14% | 0.80% | 0.81% | 1.39% | 1.38% | 66% |
| $1,153,899 |
|
| 2015 | $16.36 | 0.23 | 1.99 | 2.22 | (0.22) | (1.65) | (1.87) | $16.71 | 13.83% | 0.80% | 0.80% | 1.36% | 1.36% | 66% |
| $1,017,915 |
|
| 2014 | $14.53 | 0.24 | 2.78 | 3.02 | (0.23) | (0.96) | (1.19) | $16.36 | 21.33% | 0.80% | 0.80% | 1.54% | 1.54% | 67% |
| $812,521 |
|
| 2013 | $12.86 | 0.25 | 2.02 | 2.27 | (0.28) | (0.32) | (0.60) | $14.53 | 18.34% | 0.80% | 0.80% | 1.89% | 1.89% | 61% |
| $421,877 |
|
|
| | | | | | | | | | | | | | | | | |
| For a Share Outstanding Throughout the Years Ended March 31 (except as noted) | | |
| Per-Share Data | | | | | | | | Ratios and Supplemental Data | | |
| | | Income From Investment Operations: | Distributions From: | | | Ratio to Average Net Assets of: | | |
| | Net Asset
Value,
Beginning
of Period | Net
Investment
Income
(Loss)(1) | Net
Realized
and
Unrealized
Gain (Loss) | Total From
Investment
Operations | Net
Investment
Income | Net
Realized
Gains | Total
Distributions | Net Asset
Value,
End
of Period | Total
Return(2) | Operating
Expenses | Operating
Expenses
(before
expense
waiver) | Net
Investment
Income
(Loss) | Net
Investment
Income (Loss)
(before
expense
waiver) | Portfolio
Turnover
Rate | Net
Assets,
End of
Period (in thousands) |
| A Class |
| 2017 | $15.30 | 0.18 | 2.92 | 3.10 | (0.19) | (0.48) | (0.67) | $17.73 | 20.37% | 1.23% | 1.25% | 1.07% | 1.05% | 49% |
| $989,014 |
|
| 2016 | $16.68 | 0.15 | 0.06 | 0.21 | (0.15) | (1.44) | (1.59) | $15.30 | 1.69% | 1.25% | 1.26% | 0.94% | 0.93% | 66% |
| $1,360,886 |
|
| 2015 | $16.33 | 0.15 | 2.00 | 2.15 | (0.15) | (1.65) | (1.80) | $16.68 | 13.40% | 1.25% | 1.25% | 0.91% | 0.91% | 66% |
| $1,464,424 |
|
| 2014 | $14.52 | 0.17 | 2.76 | 2.93 | (0.16) | (0.96) | (1.12) | $16.33 | 20.71% | 1.25% | 1.25% | 1.09% | 1.09% | 67% |
| $802,480 |
|
| 2013 | $12.86 | 0.19 | 2.01 | 2.20 | (0.22) | (0.32) | (0.54) | $14.52 | 17.83% | 1.25% | 1.25% | 1.44% | 1.44% | 61% |
| $488,491 |
|
| C Class |
| 2017 | $15.17 | 0.06 | 2.90 | 2.96 | (0.07) | (0.48) | (0.55) | $17.58 | 19.56% | 1.98% | 2.00% | 0.32% | 0.30% | 49% |
| $160,893 |
|
| 2016 | $16.57 | 0.03 | 0.06 | 0.09 | (0.05) | (1.44) | (1.49) | $15.17 | 0.90% | 2.00% | 2.01% | 0.19% | 0.18% | 66% |
| $102,906 |
|
| 2015 | $16.26 | 0.03 | 1.97 | 2.00 | (0.04) | (1.65) | (1.69) | $16.57 | 12.53% | 2.00% | 2.00% | 0.16% | 0.16% | 66% |
| $79,490 |
|
| 2014 | $14.49 | 0.05 | 2.75 | 2.80 | (0.07) | (0.96) | (1.03) | $16.26 | 19.75% | 2.00% | 2.00% | 0.34% | 0.34% | 67% |
| $60,443 |
|
| 2013 | $12.84 | 0.09 | 2.02 | 2.11 | (0.14) | (0.32) | (0.46) | $14.49 | 16.96% | 2.00% | 2.00% | 0.69% | 0.69% | 61% |
| $31,407 |
|
| R Class |
| 2017 | $15.26 | 0.14 | 2.92 | 3.06 | (0.15) | (0.48) | (0.63) | $17.69 | 20.12% | 1.48% | 1.50% | 0.82% | 0.80% | 49% |
| $151,705 |
|
| 2016 | $16.64 | 0.11 | 0.06 | 0.17 | (0.11) | (1.44) | (1.55) | $15.26 | 1.43% | 1.50% | 1.51% | 0.69% | 0.68% | 66% |
| $127,581 |
|
| 2015 | $16.31 | 0.11 | 1.98 | 2.09 | (0.11) | (1.65) | (1.76) | $16.64 | 13.07% | 1.50% | 1.50% | 0.66% | 0.66% | 66% |
| $130,669 |
|
| 2014 | $14.51 | 0.13 | 2.76 | 2.89 | (0.13) | (0.96) | (1.09) | $16.31 | 20.41% | 1.50% | 1.50% | 0.84% | 0.84% | 67% |
| $110,440 |
|
| 2013 | $12.85 | 0.15 | 2.02 | 2.17 | (0.19) | (0.32) | (0.51) | $14.51 | 17.49% | 1.50% | 1.50% | 1.19% | 1.19% | 61% |
| $73,023 |
|
|
| | | | | | | | | | | | | | | | | |
| For a Share Outstanding Throughout the Years Ended March 31 (except as noted) | | |
| Per-Share Data | | | | | | | | Ratios and Supplemental Data | | |
| | | Income From Investment Operations: | Distributions From: | | | Ratio to Average Net Assets of: | | |
| | Net Asset
Value,
Beginning
of Period | Net
Investment
Income
(Loss)(1) | Net
Realized
and
Unrealized
Gain (Loss) | Total From
Investment
Operations | Net
Investment
Income | Net
Realized
Gains | Total
Distributions | Net Asset
Value,
End
of Period | Total
Return(2) | Operating
Expenses | Operating
Expenses
(before
expense
waiver) | Net
Investment
Income
(Loss) | Net
Investment
Income (Loss)
(before
expense
waiver) | Portfolio
Turnover
Rate | Net
Assets,
End of
Period (in thousands) |
| R6 Class |
| 2017 | $15.33 | 0.29 | 2.92 | 3.21 | (0.29) | (0.48) | (0.77) | $17.77 | 21.13% | 0.63% | 0.65% | 1.67% | 1.65% | 49% |
| $1,302,074 |
|
| 2016 | $16.71 | 0.25 | 0.05 | 0.30 | (0.24) | (1.44) | (1.68) | $15.33 | 2.29% | 0.65% | 0.66% | 1.54% | 1.53% | 66% |
| $544,182 |
|
| 2015 | $16.35 | 0.26 | 1.99 | 2.25 | (0.24) | (1.65) | (1.89) | $16.71 | 14.07% | 0.65% | 0.65% | 1.51% | 1.51% | 66% |
| $219,661 |
|
2014(3) | $15.66 | 0.20 | 1.61 | 1.81 | (0.16) | (0.96) | (1.12) | $16.35 | 12.01% | 0.65%(4) | 0.65%(4) | 1.83%(4) | 1.83%(4) | 67%(5) |
| $74,570 |
|
|
| | | | |
| Notes to Financial Highlights |
| |
| (1) | Computed using average shares outstanding throughout the period. |
| |
| (2) | Total returns are calculated based on the net asset value of the last business day and do not reflect applicable sales charges, if any. Total returns for periods less than one year are not annualized. |
| |
| (3) | July 26, 2013 (commencement of sale) through March 31, 2014. |
| |
| (5) | Portfolio turnover is calculated at the fund level. Percentage indicated was calculated for the year ended March 31, 2014. |
See Notes to Financial Statements.
|
|
| Report of Independent Registered Public Accounting Firm |
To the Board of Directors and Shareholders of American Century Capital Portfolios, Inc.:
We have audited the accompanying statement of assets and liabilities, including the schedule of investments, of Mid Cap Value Fund (the “Fund”), one of the funds constituting American Century Capital Portfolios, Inc., as of March 31, 2017, and the related statement of operations for the year then ended, the statements of changes in net assets for each of the two years in the period then ended, and the financial highlights for each of the periods presented. These financial statements and financial highlights are the responsibility of the Fund's management. Our responsibility is to express an opinion on these financial statements and financial highlights based on our audits.
We conducted our audits in accordance with the standards of the Public Company Accounting Oversight Board (United States). Those standards require that we plan and perform the audit to obtain reasonable assurance about whether the financial statements and financial highlights are free of material misstatement. The Fund is not required to have, nor were we engaged to perform, an audit of its internal control over financial reporting. Our audits included consideration of internal control over financial reporting as a basis for designing audit procedures that are appropriate in the circumstances, but not for the purpose of expressing an opinion on the effectiveness of the Fund's internal control over financial reporting. Accordingly, we express no such opinion. An audit also includes examining, on a test basis, evidence supporting the amounts and disclosures in the financial statements, assessing the accounting principles used and significant estimates made by management, as well as evaluating the overall financial statement presentation. Our procedures included confirmation of securities owned as of March 31, 2017, by correspondence with the custodian and brokers; when replies were not received from brokers, we performed other auditing procedures. We believe that our audits provide a reasonable basis for our opinion.
In our opinion, the financial statements and financial highlights referred to above present fairly, in all material respects, the financial position of Mid Cap Value Fund of American Century Capital Portfolios, Inc. as of March 31, 2017, the results of its operations for the year then ended, the changes in its net assets for each of the two years in the period then ended, and the financial highlights for each of the periods presented, in conformity with accounting principles generally accepted in the United States of America.
DELOITTE & TOUCHE LLP
Kansas City, Missouri May 16, 2017
The Board of Directors
The individuals listed below serve as directors of the funds. Each director will continue to serve in this capacity until death, retirement, resignation or removal from office. The board has adopted a mandatory retirement age for directors who are not “interested persons,” as that term is defined in the Investment Company Act (independent directors). Independent directors shall retire by December 31 of the year in which they reach their 75th birthday.
Mr. Thomas is an “interested person” because he currently serves as President and Chief Executive Officer of American Century Companies, Inc. (ACC), the parent company of American Century Investment Management, Inc. (ACIM or the advisor). The other directors (more than three-fourths of the total number) are independent. They are not employees, directors or officers of, and have no financial interest in, ACC or any of its wholly owned, direct or indirect, subsidiaries, including ACIM, American Century Investment Services, Inc. (ACIS) and American Century Services, LLC (ACS), and they do not have any other affiliations, positions or relationships that would cause them to be considered “interested persons” under the Investment Company Act. The directors serve in this capacity for seven (in the case of Mr. Thomas, 15) registered investment companies in the American Century Investments family of funds.
The following table presents additional information about the directors. The mailing address for each director is 4500 Main Street, Kansas City, Missouri 64111.
|
| | | | | |
Name
(Year of Birth) | Position(s) Held with Funds | Length of Time Served | Principal Occupation(s) During Past 5 Years | Number of American Century Portfolios Overseen by Director | Other Directorships Held During Past 5 Years |
| Independent Directors |
|
|
| Thomas W. Bunn (1953) | Advisory Board Director | Since 2017 | Retired | 81 | SquareTwo Financial; Barings (formerly Babson Capital Funds Trust) (2013 to 2016) |
Barry Fink
(1955) | Director | Since 2012 (independent since 2016) | Retired; Executive Vice President, ACC (2007 to 2013); President, ACS (2007 to 2013); Chief Operating Officer, ACC (2007 to 2012) | 81 | None |
Andrea C. Hall
(1945) | Director | Since 1997 | Retired | 81 | None |
Jan M. Lewis
(1957) | Director | Since 2011 | Retired; President and Chief Executive Officer, Catholic Charities of Northeast Kansas (human services organization) (2006 to 2013) | 81 | None |
James A. Olson
(1942) | Director and Chairman of the Board | Since 2007 (Chairman since 2014) | Member, Plaza Belmont LLC (private equity fund manager) (1999 to present) | 81 | Saia, Inc. (2002 to 2012) and EPR Properties (2003 to 2013) |
|
| | | | | |
Name
(Year of Birth) | Position(s) Held with Funds | Length of Time Served | Principal Occupation(s) During Past 5 Years | Number of American Century Portfolios Overseen by Director | Other Directorships Held During Past 5 Years |
| Independent Directors |
|
|
M. Jeannine Strandjord
(1945) | Director | Since 1994 | Retired | 81 | Euronet Worldwide Inc.; MGP Ingredients, Inc.; and DST Systems Inc. (1996 to 2012) |
John R. Whitten
(1946) | Director | Since 2008 | Retired | 81 | Rudolph Technologies, Inc. |
Stephen E. Yates
(1948) | Director | Since 2012 | Retired | 81 | None |
| Interested Director |
|
|
Jonathan S. Thomas
(1963) | Director and President | Since 2007 | President and Chief Executive Officer, ACC (2007 to present). Also serves as Chief Executive Officer, ACS; Executive Vice President, ACIM; Director, ACC, ACIM and other ACC subsidiaries | 126 | BioMed Valley Discoveries, Inc. |
The Statement of Additional Information has additional information about the fund's directors and is available without charge, upon request, by calling 1-800-345-2021.
Officers
The following table presents certain information about the executive officers of the funds. Each officer serves as an officer for each of the 15 investment companies in the American Century family of funds, unless otherwise noted. No officer is compensated for his or her service as an officer of the funds. The listed officers are interested persons of the funds and are appointed or re-appointed on an annual basis. The mailing address for each officer listed below is 4500 Main Street, Kansas City, Missouri 64111.
|
| | |
Name
(Year of Birth) | Offices with the Funds | Principal Occupation(s) During the Past Five Years |
Jonathan S. Thomas
(1963) | Director and President since 2007 | President and Chief Executive Officer, ACC (2007 to present). Also serves as Chief Executive Officer, ACS; Executive Vice President, ACIM; Director, ACC, ACIM and other ACC subsidiaries |
Amy D. Shelton
(1964) | Chief Compliance Officer and Vice President since 2014 | Chief Compliance Officer, American Century funds, (2014 to present); Chief Compliance Officer, ACIM (2014 to present); Chief Compliance Officer, ACIS (2009 to present); Vice President, Client Interactions and Marketing, ACIS (2013 to 2014); Director, Client Interactions and Marketing, ACIS (2007 to 2013). Also serves as Vice President, ACIS |
Charles A. Etherington
(1957) | General Counsel since 2007 and Senior Vice President since 2006 | Attorney, ACC (1994 to present); Vice President, ACC (2005 to present); General Counsel, ACC (2007 to present). Also serves as General Counsel, ACIM, ACS, ACIS and other ACC subsidiaries; and Senior Vice President, ACIM and ACS |
C. Jean Wade
(1964) | Vice President,Treasurer and Chief Financial Officer since 2012 | Vice President, ACS (2000 to present) |
Robert J. Leach
(1966) | Vice President since 2006 and Assistant Treasurer since 2012 | Vice President, ACS (2000 to present) |
David H. Reinmiller
(1963) | Vice President since 2000 | Attorney, ACC (1994 to present); Associate General Counsel, ACC (2001 to present). Also serves as Vice President, ACIM and ACS |
Ward D. Stauffer
(1960) | Secretary since 2005 | Attorney, ACC (2003 to present) |
Retirement Account Information
As required by law, distributions you receive from certain IRAs are subject to federal income tax withholding, unless you elect not to have withholding apply. Tax will be withheld on the total amount withdrawn even though you may be receiving amounts that are not subject to withholding, such as nondeductible contributions. In such case, excess amounts of withholding could occur. You may adjust your withholding election so that a greater or lesser amount will be withheld.
If you don’t want us to withhold on this amount, you must notify us to not withhold the federal income tax. You may notify us in writing or in certain situations by telephone or through other electronic means. For systematic withdrawals, your withholding election will remain in effect until revoked or changed by filing a new election. You have the right to revoke your election at any time.
Remember, even if you elect not to have income tax withheld, you are liable for paying income tax on the taxable portion of your withdrawal. If you elect not to have income tax withheld or you don’t have enough income tax withheld, you may be responsible for payment of estimated tax. You may incur penalties under the estimated tax rules if your withholding and estimated tax payments are not sufficient. You can reduce or defer the income tax on a distribution by directly or indirectly rolling such distribution over to another IRA or eligible plan. You should consult your tax advisor for additional information.
State tax will be withheld if, at the time of your distribution, your address is within one of the mandatory withholding states and you have federal income tax withheld (or as otherwise required by state law). State taxes will be withheld from your distribution in accordance with the respective state rules.
Distributions you receive from 403(b), 457 and qualified plans are subject to special tax and withholding rules. Your plan administrator or plan sponsor is required to provide you with a special tax notice explaining those rules at the time you request a distribution. If applicable, federal and/or state taxes may be withheld from your distribution amount.
Proxy Voting Policies
A description of the policies that the fund's investment advisor uses in exercising the voting rights associated with the securities purchased and/or held by the fund is available without charge, upon request, by calling 1-800-345-2021. It is also available on the "About Us" page of American Century Investments’ website at americancentury.com and on the Securities and Exchange Commission’s website at sec.gov. Information regarding how the investment advisor voted proxies relating to portfolio securities during the most recent 12-month period ended June 30 is available on the "About Us" page at americancentury.com. It is also available at sec.gov.
Quarterly Portfolio Disclosure
The fund files its complete schedule of portfolio holdings with the Securities and Exchange Commission (SEC) for the first and third quarters of each fiscal year on Form N-Q. The fund’s Forms N-Q are available on the SEC’s website at sec.gov, and may be reviewed and copied at the SEC’s Public Reference Room in Washington, DC. Information on the operation of the Public Reference Room may be obtained by calling 1-800-SEC-0330. The fund also makes its complete schedule of portfolio holdings for the most recent quarter of its fiscal year available on its website at americancentury.com and, upon request, by calling 1-800-345-2021.
Other Tax Information
The following information is provided pursuant to provisions of the Internal Revenue Code.
The fund hereby designates up to the maximum amount allowable as qualified dividend income for the fiscal year ended March 31, 2017.
For corporate taxpayers, the fund hereby designates $104,852,443, or up to the maximum amount allowable, of ordinary income distributions paid during the fiscal year ended March 31, 2017 as qualified for the corporate dividends received deduction.
The fund hereby designates $9,022,605 as qualified short-term capital gain distributions for purposes of Internal Revenue Code Section 871 for the fiscal year ended March 31, 2017.
The fund hereby designates $256,146,524, or up to the maximum amount allowable, as long-term capital gain distributions (20% rate gain distributions) for the fiscal year ended March 31, 2017.
The fund utilized earnings and profits of $29,367,200 distributed to shareholders on redemption of shares as part of the dividends paid deduction (tax equalization).
|
| | |
| |
| | | |
| Contact Us | americancentury.com | |
| Automated Information Line | 1-800-345-8765 | |
| Investor Services Representative | 1-800-345-2021 or 816-531-5575 | |
| Investors Using Advisors | 1-800-378-9878 | |
| Business, Not-For-Profit, Employer-Sponsored Retirement Plans | 1-800-345-3533 | |
| Banks and Trust Companies, Broker-Dealers, Financial Professionals, Insurance Companies | 1-800-345-6488 | |
| Telecommunications Relay Service for the Deaf | 711 | |
| | | |
| American Century Capital Portfolios, Inc. | |
| | | |
Investment Advisor: American Century Investment Management, Inc. Kansas City, Missouri | |
| | | |
| This report and the statements it contains are submitted for the general information of our shareholders. The report is not authorized for distribution to prospective investors unless preceded or accompanied by an effective prospectus. | |
| | | |
©2017 American Century Proprietary Holdings, Inc. All rights reserved.
CL-ANN-92271 1705 | |
|
| |
| | |
| | Annual Report |
| | |
| | March 31, 2017 |
| | |
| | NT Large Company Value Fund |
|
| | |
| Performance | 2 |
|
| Portfolio Commentary | |
|
| Fund Characteristics | |
|
| Shareholder Fee Example | |
|
| Schedule of Investments | |
|
| Statement of Assets and Liabilities | |
|
| Statement of Operations | |
|
| Statement of Changes in Net Assets | |
|
| Notes to Financial Statements | |
|
| Financial Highlights | |
|
| Report of Independent Registered Public Accounting Firm | |
|
| Management | |
|
| Additional Information | |
|
Any opinions expressed in this report reflect those of the author as of the date of the report, and do not necessarily represent the opinions of American Century Investments® or any other person in the American Century Investments organization. Any such opinions are subject to change at any time based upon market or other conditions and American Century Investments disclaims any responsibility to update such opinions. These opinions may not be relied upon as investment advice and, because investment decisions made by American Century Investments funds are based on numerous factors, may not be relied upon as an indication of trading intent on behalf of any American Century Investments fund. Security examples are used for representational purposes only and are not intended as recommendations to purchase or sell securities. Performance information for comparative indices and securities is provided to American Century Investments by third party vendors. To the best of American Century Investments’ knowledge, such information is accurate at the time of printing.
|
| | | | | | |
| Total Returns as of March 31, 2017 |
| | | | Average Annual Returns | |
| | Ticker Symbol | 1 year | 5 years | 10 years | Since Inception | Inception Date |
| Institutional Class | ACLLX | 19.67% | 12.24% | 5.26% | — | 5/12/06 |
| Russell 1000 Value Index | — | 19.22% | 13.12% | 5.93% | — | — |
| S&P 500 Index | — | 17.17% | 13.29% | 7.50% | — | — |
| R6 Class | ACDLX | 19.74% | — | — | 9.43% | 7/26/13 |
Average annual returns since inception are presented when ten years of performance history is not available.
|
|
| Growth of $10,000 Over 10 Years |
| $10,000 investment made March 31, 2007 |
Performance for other share classes will vary due to differences in fee structure.

|
| |
| Value on March 31, 2017 |
| | Institutional Class — $16,700 |
| |
| | Russell 1000 Value Index — $17,793 |
| |
| | S&P 500 Index — $20,627 |
| |
|
| |
| Total Annual Fund Operating Expenses |
| Institutional Class | R6 Class |
| 0.64% | 0.49% |
The total annual fund operating expenses shown is as stated in the fund’s prospectus current as of the date of this report. The prospectus may vary from the expense ratio shown elsewhere in this report because it is based on a different time period, includes acquired fund fees and expenses, and, if applicable, does not include fee waivers or expense reimbursements.
Data presented reflect past performance. Past performance is no guarantee of future results. Current performance may be higher or lower than the performance shown. Total returns for periods less than one year are not annualized. Investment return and principal value will fluctuate, and redemption value may be more or less than original cost. Data assumes reinvestment of dividends and capital gains, and none of the charts reflect the deduction of taxes that a shareholder would pay on fund distributions or the redemption of fund shares. To obtain performance data current to the most recent month end, please call 1-800-345-2021 or visit americancentury.com. For additional information about the fund, please consult the prospectus.
Portfolio Managers: Brendan Healy and Brian Woglom
Performance Summary
NT Large Company Value returned 19.67%* for the fiscal year ended March 31, 2017, compared with the 19.22% return of its benchmark, the Russell 1000 Value Index.
Value stocks outperformed growth stocks across the capitalization spectrum during the 12-month period, providing a tailwind for the fund’s performance. Within the Russell 1000 Value Index, every sector posted positive returns, led by financials, materials, information technology, and industrials, which returned more than 20% each. The weakest sectors were real estate, telecommunication services, utilities, and consumer discretionary. The fund recorded positive absolute contributions from all sectors except real estate and telecommunication services. Absolute returns were led by financials holdings.
The fund’s outperformance relative to the benchmark was driven by a significant underweight to utilities and stock selection in the sector. Stock decisions in industrials and information technology were also positive, as was a substantial underweight to real estate. Stock selection among consumer discretionary, financials, and energy stocks and overweights in those sectors detracted.
Utilities and Industrials Benefited Performance
An underweight in utilities and stock decisions in the sector were positive. Westar Energy surged on the announcement of its acquisition by Great Plains Energy. The stock was eliminated from the portfolio as a result. An underweight position in General Electric (GE) was a key contributor in industrials. The stock underperformed after the company reported disappointing fourth-quarter results. Investors also had concerns about pricing of orders, margin improvement, and the adequacy of GE’s free cash generation relative to its earnings per share.
Security selection in information technology was a top contributor to relative performance, particularly in the semiconductors and semiconductor equipment industry. Applied Materials and Lam Research were top individual contributors due to strength in orders. Underweighting Microsoft was a key contributor. We had no exposure in April 2016 when the stock declined after the company offered a weak earnings report. In March 2017 we purchased the stock, which is no longer in the benchmark.
Elsewhere, the portfolio benefited from its underweight position in Exxon Mobil, as the stock underperformed many other energy securities. Despite operational results that were generally in line with expectations, the company’s valuation fell. PNC Financial Services was a significant contributor in the financials sector. Financials performed well following the November presidential election on optimism about economic growth, higher interest rates, and reduced regulation.
Consumer Discretionary and Health Care Holdings Detracted
Security selection and an overweight in consumer discretionary detracted from performance. Exposure to specialty retailer Advance Auto Parts weighed on performance as the stock fell after the company reported weak results and on concerns that the company’s margin improvement will take longer to occur.
| |
| * | All fund returns referenced in this commentary are for Institutional Class shares. Performance for other share classes will vary due to differences in fee structure; when Institutional Class performance exceeds that of the fund's benchmark, other share classes may not. See page 2 for returns for all share classes. |
In the health care sector, exposure to Teva Pharmaceutical Industries detracted. The stock declined due to generic pricing worries and negative sentiment surrounding pharmaceutical stocks. Worries about Teva’s biggest specialty drug, Copaxone, and when its patent will expire have also weighed on the stock. We believe that the worst of the generic pricing headwind has passed and that the worst-case scenario for Copaxone is priced into the stock.
CVS Health, a retail pharmacy and health care company, declined after the company provided much lighter-than-expected guidance because of two lost contracts. This will have a larger impact on margins and earnings than the consensus was anticipating. We view this as a transitory issue.
Energy stocks Imperial Oil and Occidental Petroleum were among the largest individual detractors from performance. Imperial Oil fell as oil prices declined on concerns regarding potential oversupply of oil in 2018. Also, the company missed production numbers due to unexpected downtime at one of its operations. We believe this is a one-time event. Weakness in the energy sector created concerns about the sustainability of Occidental’s dividend payment. We think the dividend is sustainable due to the company’s healthy balance sheet and underappreciated asset position and quality.
Not owning Citigroup and Morgan Stanley detracted, as interest rate-sensitive financials rose, primarily a result of higher interest rates and expectations for a favorable economic environment.
Portfolio Positioning
We continue to use our fundamental analysis, risk/reward framework, and proprietary valuation model to invest primarily in the stocks of large companies we believe to be undervalued. The portfolio’s largest overweights are in the health care and energy sectors, and its largest underweights are in the real estate, utilities, and financials sectors.
Concerns regarding the potential repeal/reform of the Affordable Care Act pressured the health care sector in the fourth quarter of 2016. This created investment opportunities as valuations became more attractive. Energy was the worst-performing sector in the index in the first quarter of 2017 due to weaker oil and gas prices and concerns about potential oversupply in 2018, again creating more-attractive valuations in the sector.
Many real estate stocks appear overvalued on our valuation methodology, leading to the portfolio’s continued underweight in the sector. The portfolio remains underweight in telecommunication services. Pricing competition within the industry is increasing because providers are returning to offering unlimited wireless plans, and because the wireless industry is reaching maturity.
|
| |
| MARCH 31, 2017 |
| Top Ten Holdings | % of net assets |
| Pfizer, Inc. | 3.7% |
| General Electric Co. | 3.1% |
| Schlumberger Ltd. | 3.1% |
| Wells Fargo & Co. | 3.0% |
| TOTAL SA ADR | 2.8% |
| Johnson Controls International plc | 2.8% |
| Procter & Gamble Co. (The) | 2.7% |
| Oracle Corp. (New York) | 2.5% |
| Chevron Corp. | 2.5% |
| U.S. Bancorp | 2.5% |
| | |
| Top Five Industries | % of net assets |
| Banks | 14.2% |
| Oil, Gas and Consumable Fuels | 11.2% |
| Pharmaceuticals | 8.7% |
| Capital Markets | 4.8% |
| Health Care Equipment and Supplies | 4.4% |
| | |
| Types of Investments in Portfolio | % of net assets |
| Domestic Common Stocks | 90.9% |
| Foreign Common Stocks* | 6.5% |
| Exchange-Traded Funds | 1.3% |
| Total Equity Exposure | 98.7% |
| Temporary Cash Investments | 1.6% |
| Other Assets and Liabilities | (0.3)% |
*Includes depositary shares, dual listed securities and foreign ordinary shares.
Fund shareholders may incur two types of costs: (1) transaction costs, including sales charges (loads) on purchase payments and redemption/exchange fees; and (2) ongoing costs, including management fees; distribution and service (12b-1) fees; and other fund expenses. This example is intended to help you understand your ongoing costs (in dollars) of investing in your fund and to compare these costs with the ongoing cost of investing in other mutual funds.
The example is based on an investment of $1,000 made at the beginning of the period and held for the entire period from October 1, 2016 to March 31, 2017.
Actual Expenses
The table provides information about actual account values and actual expenses for each class. You may use the information, together with the amount you invested, to estimate the expenses that you paid over the period. First, identify the share class you own. Then simply divide your account value by $1,000 (for example, an $8,600 account value divided by $1,000 = 8.6), then multiply the result by the number under the heading “Expenses Paid During Period” to estimate the expenses you paid on your account during this period.
Hypothetical Example for Comparison Purposes
The table also provides information about hypothetical account values and hypothetical expenses based on the actual expense ratio of each class of your fund and an assumed rate of return of 5% per year before expenses, which is not the actual return of a fund’s share class. The hypothetical account values and expenses may not be used to estimate the actual ending account balance or expenses you paid for the period. You may use this information to compare the ongoing costs of investing in your fund and other funds. To do so, compare this 5% hypothetical example with the 5% hypothetical examples that appear in the shareholder reports of the other funds.
Please note that the expenses shown in the table are meant to highlight your ongoing costs only and do not reflect any transactional costs, such as sales charges (loads) or redemption/exchange fees. Therefore, the table is useful in comparing ongoing costs only, and will not help you determine the relative total costs of owning different funds. In addition, if these transactional costs were included, your costs would have been higher.
|
| | | | |
| | Beginning
Account Value
10/1/16 | Ending
Account Value
3/31/17 | Expenses Paid
During Period(1)
10/1/16 - 3/31/17 | Annualized
Expense Ratio(1) |
| Actual | | | | |
| Institutional Class | $1,000 | $1,107.80 | $3.31 | 0.63% |
| R6 Class | $1,000 | $1,108.60 | $2.52 | 0.48% |
| Hypothetical | | | | |
| Institutional Class | $1,000 | $1,021.79 | $3.18 | 0.63% |
| R6 Class | $1,000 | $1,022.54 | $2.42 | 0.48% |
| |
| (1) | Expenses are equal to the class's annualized expense ratio listed in the table above, multiplied by the average account value over the period, multiplied by 182, the number of days in the most recent fiscal half-year, divided by 365, to reflect the one-half year period. |
MARCH 31, 2017
|
| | | | | |
| | Shares | Value |
| COMMON STOCKS — 97.4% | | |
| Aerospace and Defense — 3.6% | | |
| Boeing Co. (The) | 54,600 |
| $ | 9,656,556 |
|
| Textron, Inc. | 430,800 |
| 20,501,772 |
|
| United Technologies Corp. | 342,000 |
| 38,375,820 |
|
| | | 68,534,148 |
|
| Auto Components — 1.0% | | |
| Delphi Automotive plc | 233,205 |
| 18,770,670 |
|
| Automobiles — 0.4% | | |
| Ford Motor Co. | 631,600 |
| 7,351,824 |
|
| Banks — 14.2% | | |
| Bank of America Corp. | 1,873,300 |
| 44,191,147 |
|
| BB&T Corp. | 842,500 |
| 37,659,750 |
|
| JPMorgan Chase & Co. | 321,300 |
| 28,222,992 |
|
| M&T Bank Corp. | 163,300 |
| 25,267,409 |
|
| PNC Financial Services Group, Inc. (The) | 251,600 |
| 30,252,384 |
|
| U.S. Bancorp | 921,300 |
| 47,446,950 |
|
| Wells Fargo & Co. | 1,023,900 |
| 56,990,274 |
|
| | | 270,030,906 |
|
| Beverages — 0.7% | | |
| PepsiCo, Inc. | 119,000 |
| 13,311,340 |
|
| Biotechnology — 0.5% | | |
| AbbVie, Inc. | 146,900 |
| 9,572,004 |
|
| Building Products — 2.8% | | |
| Johnson Controls International plc | 1,250,400 |
| 52,666,848 |
|
| Capital Markets — 4.8% | | |
| Ameriprise Financial, Inc. | 102,600 |
| 13,305,168 |
|
| Bank of New York Mellon Corp. (The) | 831,300 |
| 39,262,299 |
|
| BlackRock, Inc. | 36,400 |
| 13,959,764 |
|
| Invesco Ltd. | 819,400 |
| 25,098,222 |
|
| | | 91,625,453 |
|
| Chemicals — 1.0% | | |
| Dow Chemical Co. (The) | 296,800 |
| 18,858,672 |
|
| Communications Equipment — 0.7% | | |
| Cisco Systems, Inc. | 382,400 |
| 12,925,120 |
|
| Containers and Packaging — 0.4% | | |
| WestRock Co. | 148,000 |
| 7,700,440 |
|
| Diversified Telecommunication Services — 2.1% | | |
| Verizon Communications, Inc. | 819,400 |
| 39,945,750 |
|
| Electric Utilities — 3.3% | | |
| Edison International | 263,300 |
| 20,961,313 |
|
| PG&E Corp. | 208,300 |
| 13,822,788 |
|
| PPL Corp. | 327,300 |
| 12,237,747 |
|
| Xcel Energy, Inc. | 357,300 |
| 15,881,985 |
|
| | | 62,903,833 |
|
| Electronic Equipment, Instruments and Components — 1.2% | | |
| TE Connectivity Ltd. | 320,600 |
| 23,900,730 |
|
|
| | | | | |
| | Shares | Value |
| Energy Equipment and Services — 4.1% | | |
| Baker Hughes, Inc. | 331,300 |
| $ | 19,818,366 |
|
| Schlumberger Ltd. | 750,500 |
| 58,614,050 |
|
| | | 78,432,416 |
|
| Equity Real Estate Investment Trusts (REITs) — 0.7% | | |
| Boston Properties, Inc. | 104,800 |
| 13,876,568 |
|
| Food and Staples Retailing — 3.4% | | |
| CVS Health Corp. | 298,200 |
| 23,408,700 |
|
| Wal-Mart Stores, Inc. | 564,700 |
| 40,703,576 |
|
| | | 64,112,276 |
|
| Food Products — 2.0% | | |
| General Mills, Inc. | 157,900 |
| 9,317,679 |
|
| Mead Johnson Nutrition Co. | 76,000 |
| 6,770,080 |
|
| Mondelez International, Inc., Class A | 526,800 |
| 22,694,544 |
|
| | | 38,782,303 |
|
| Health Care Equipment and Supplies — 4.4% | | |
| Abbott Laboratories | 533,000 |
| 23,670,530 |
|
| Medtronic plc | 466,200 |
| 37,557,072 |
|
| Zimmer Biomet Holdings, Inc. | 184,500 |
| 22,529,295 |
|
| | | 83,756,897 |
|
| Health Care Providers and Services — 2.0% | | |
| Anthem, Inc. | 63,600 |
| 10,518,168 |
|
HCA Holdings, Inc.(1) | 156,900 |
| 13,962,531 |
|
| McKesson Corp. | 96,900 |
| 14,366,394 |
|
| | | 38,847,093 |
|
| Hotels, Restaurants and Leisure — 0.7% | | |
| Carnival Corp. | 229,800 |
| 13,537,518 |
|
| Household Products — 2.7% | | |
| Procter & Gamble Co. (The) | 563,400 |
| 50,621,490 |
|
| Industrial Conglomerates — 3.6% | | |
| General Electric Co. | 2,012,300 |
| 59,966,540 |
|
| Honeywell International, Inc. | 74,200 |
| 9,265,354 |
|
| | | 69,231,894 |
|
| Insurance — 4.2% | | |
| Aflac, Inc. | 172,800 |
| 12,514,176 |
|
| Allstate Corp. (The) | 165,200 |
| 13,462,148 |
|
| Chubb Ltd. | 282,200 |
| 38,449,750 |
|
| MetLife, Inc. | 315,100 |
| 16,643,582 |
|
| | | 81,069,656 |
|
| Leisure Products — 0.6% | | |
| Mattel, Inc. | 455,200 |
| 11,657,672 |
|
| Machinery — 1.0% | | |
| Ingersoll-Rand plc | 228,900 |
| 18,614,148 |
|
| Multiline Retail — 0.5% | | |
| Target Corp. | 177,000 |
| 9,768,630 |
|
| Oil, Gas and Consumable Fuels — 11.2% | | |
| Anadarko Petroleum Corp. | 313,000 |
| 19,406,000 |
|
| Chevron Corp. | 446,800 |
| 47,972,916 |
|
| Exxon Mobil Corp. | 156,600 |
| 12,842,766 |
|
| Imperial Oil Ltd. | 1,025,500 |
| 31,246,577 |
|
| Occidental Petroleum Corp. | 538,600 |
| 34,125,696 |
|
|
| | | | | |
| | Shares | Value |
| Royal Dutch Shell plc ADR | 261,700 |
| $ | 14,610,711 |
|
| TOTAL SA ADR | 1,066,200 |
| 53,757,804 |
|
| | | 213,962,470 |
|
| Personal Products — 0.5% | | |
| Unilever NV CVA | 194,000 |
| 9,638,088 |
|
| Pharmaceuticals — 8.7% | | |
| Allergan plc | 62,800 |
| 15,004,176 |
|
| Johnson & Johnson | 223,400 |
| 27,824,470 |
|
| Merck & Co., Inc. | 558,900 |
| 35,512,506 |
|
| Pfizer, Inc. | 2,039,200 |
| 69,761,032 |
|
| Roche Holding AG | 47,900 |
| 12,232,636 |
|
| Teva Pharmaceutical Industries Ltd. ADR | 151,400 |
| 4,858,426 |
|
| | | 165,193,246 |
|
| Road and Rail — 0.9% | | |
| Union Pacific Corp. | 159,900 |
| 16,936,608 |
|
| Semiconductors and Semiconductor Equipment — 4.3% | | |
| Applied Materials, Inc. | 741,800 |
| 28,856,020 |
|
| Intel Corp. | 539,000 |
| 19,441,730 |
|
| Lam Research Corp. | 132,300 |
| 16,982,028 |
|
| QUALCOMM, Inc. | 291,400 |
| 16,708,876 |
|
| | | 81,988,654 |
|
| Software — 2.8% | | |
| Microsoft Corp. | 72,300 |
| 4,761,678 |
|
| Oracle Corp. (New York) | 1,085,400 |
| 48,419,694 |
|
| | | 53,181,372 |
|
| Specialty Retail — 1.3% | | |
| Advance Auto Parts, Inc. | 121,900 |
| 18,072,894 |
|
| L Brands, Inc. | 128,400 |
| 6,047,640 |
|
| | | 24,120,534 |
|
| Technology Hardware, Storage and Peripherals — 0.8% | | |
| Apple, Inc. | 110,100 |
| 15,816,966 |
|
| Textiles, Apparel and Luxury Goods — 0.3% | | |
| Ralph Lauren Corp. | 73,700 |
| 6,015,394 |
|
TOTAL COMMON STOCKS
(Cost $1,528,415,808) | | 1,857,259,631 |
|
| EXCHANGE-TRADED FUNDS — 1.3% | | |
iShares Russell 1000 Value ETF
(Cost $23,836,613) | 209,400 |
| 24,068,436 |
|
| TEMPORARY CASH INVESTMENTS — 1.6% | | |
| Repurchase Agreement, BMO Capital Markets Corp., (collateralized by various U.S. Treasury obligations, 0.75% - 2.75%, 7/31/17 - 2/15/24, valued at $11,129,861), in a joint trading account at 0.67%, dated 3/31/17, due 4/3/17 (Delivery value $10,903,636) | | 10,903,027 |
|
| Repurchase Agreement, Fixed Income Clearing Corp., (collateralized by various U.S. Treasury obligations, 2.875%, 8/15/45, valued at $20,183,891), at 0.22%, dated 3/31/17, due 4/3/17 (Delivery value $19,784,363) | | 19,784,000 |
|
| State Street Institutional U.S. Government Money Market Fund, Premier Class | 14,610 |
| 14,610 |
|
TOTAL TEMPORARY CASH INVESTMENTS
(Cost $30,701,637) | | 30,701,637 |
|
TOTAL INVESTMENT SECURITIES — 100.3%
(Cost $1,582,954,058) | | 1,912,029,704 |
|
| OTHER ASSETS AND LIABILITIES — (0.3)% | | (5,522,316 | ) |
| TOTAL NET ASSETS — 100.0% | | $ | 1,906,507,388 |
|
|
| | | | | | | | | | |
| FORWARD FOREIGN CURRENCY EXCHANGE CONTRACTS |
| Currency Purchased | Currency Sold | Counterparty | Settlement Date | Unrealized Appreciation
(Depreciation) |
| USD | 26,881,999 |
| CAD | 35,921,727 |
| Morgan Stanley | 6/30/17 | $ | (162,539 | ) |
| USD | 7,970,539 |
| CHF | 7,867,719 |
| Credit Suisse AG | 6/30/17 | 74,654 |
|
| USD | 830,512 |
| CHF | 823,735 |
| Credit Suisse AG | 6/30/17 | 3,828 |
|
| USD | 865,013 |
| CHF | 860,506 |
| Credit Suisse AG | 6/30/17 | 1,426 |
|
| USD | 952,455 |
| CHF | 948,439 |
| Credit Suisse AG | 6/30/17 | 621 |
|
| USD | 53,955,451 |
| EUR | 49,515,859 |
| UBS AG | 6/30/17 | 911,780 |
|
| USD | 12,393,107 |
| GBP | 9,893,748 |
| Credit Suisse AG | 6/30/17 | (29,041 | ) |
| | | | | | | $ | 800,729 |
|
|
| | |
| NOTES TO SCHEDULE OF INVESTMENTS |
| ADR | - | American Depositary Receipt |
| CAD | - | Canadian Dollar |
| CHF | - | Swiss Franc |
| CVA | - | Certificaten Van Aandelen |
| EUR | - | Euro |
| GBP | - | British Pound |
| USD | - | United States Dollar |
See Notes to Financial Statements.
|
|
| Statement of Assets and Liabilities |
|
| | | |
| MARCH 31, 2017 | |
| Assets | |
| Investment securities, at value (cost of $1,582,954,058) | $ | 1,912,029,704 |
|
| Foreign currency holdings, at value (cost of $51,211) | 51,690 |
|
| Receivable for investments sold | 5,621,891 |
|
| Receivable for capital shares sold | 48,200 |
|
| Unrealized appreciation on forward foreign currency exchange contracts | 992,309 |
|
| Dividends and interest receivable | 4,474,083 |
|
| | 1,923,217,877 |
|
| | |
| Liabilities | |
| Payable for investments purchased | 10,603,932 |
|
| Payable for capital shares redeemed | 4,930,579 |
|
| Unrealized depreciation on forward foreign currency exchange contracts | 191,580 |
|
| Accrued management fees | 984,398 |
|
| | 16,710,489 |
|
| | |
| Net Assets | $ | 1,906,507,388 |
|
| | |
| Net Assets Consist of: | |
| Capital (par value and paid-in surplus) | $ | 1,535,635,578 |
|
| Undistributed net investment income | 1,529,842 |
|
| Undistributed net realized gain | 39,466,734 |
|
| Net unrealized appreciation | 329,875,234 |
|
| | $ | 1,906,507,388 |
|
|
| | | | | | |
| | Net Assets | Shares Outstanding | Net Asset Value Per Share |
| Institutional Class, $0.01 Par Value |
| $1,703,215,972 |
| 143,507,186 |
| $11.87 |
| R6 Class, $0.01 Par Value |
| $203,291,416 |
| 17,123,266 |
| $11.87 |
See Notes to Financial Statements.
|
| | | |
| YEAR ENDED MARCH 31, 2017 | |
| Investment Income (Loss) | |
| Income: | |
| Dividends (net of foreign taxes withheld of $506,960) | $ | 50,000,704 |
|
| Interest | 25,384 |
|
| | 50,026,088 |
|
| | |
| Expenses: | |
| Management fees | 10,984,300 |
|
| Directors' fees and expenses | 54,913 |
|
| Other expenses | 12,569 |
|
| | 11,051,782 |
|
| | |
| Net investment income (loss) | 38,974,306 |
|
| | |
| Realized and Unrealized Gain (Loss) | |
| Net realized gain (loss) on: | |
| Investment transactions | 138,417,424 |
|
| Foreign currency transactions | 2,738,214 |
|
| | 141,155,638 |
|
| | |
| Change in net unrealized appreciation (depreciation) on: | |
| Investments | 140,486,278 |
|
| Translation of assets and liabilities in foreign currencies | 1,756,377 |
|
| | 142,242,655 |
|
| | |
| Net realized and unrealized gain (loss) | 283,398,293 |
|
| | |
| Net Increase (Decrease) in Net Assets Resulting from Operations | $ | 322,372,599 |
|
See Notes to Financial Statements.
|
|
| Statement of Changes in Net Assets |
|
| | | | | | |
| YEARS ENDED MARCH 31, 2017 AND MARCH 31, 2016 |
| Increase (Decrease) in Net Assets | March 31, 2017 | March 31, 2016 |
| Operations | | |
| Net investment income (loss) | $ | 38,974,306 |
| $ | 24,357,040 |
|
| Net realized gain (loss) | 141,155,638 |
| 39,945,638 |
|
| Change in net unrealized appreciation (depreciation) | 142,242,655 |
| (128,616,091 | ) |
| Net increase (decrease) in net assets resulting from operations | 322,372,599 |
| (64,313,413 | ) |
| | | |
| Distributions to Shareholders | | |
| From net investment income: | | |
| Institutional Class | (34,615,462 | ) | (23,279,786 | ) |
| R6 Class | (3,794,678 | ) | (1,507,570 | ) |
| From net realized gains: | | |
| Institutional Class | (70,093,076 | ) | (127,658,246 | ) |
| R6 Class | (7,482,182 | ) | (7,624,442 | ) |
| Decrease in net assets from distributions | (115,985,398 | ) | (160,070,044 | ) |
| | | |
| Capital Share Transactions | | |
| Net increase (decrease) in net assets from capital share transactions (Note 5) | 59,914,703 |
| 412,457,708 |
|
| | | |
| Net increase (decrease) in net assets | 266,301,904 |
| 188,074,251 |
|
| | | |
| Net Assets | | |
| Beginning of period | 1,640,205,484 |
| 1,452,131,233 |
|
| End of period | $ | 1,906,507,388 |
| $ | 1,640,205,484 |
|
| | | |
| Undistributed net investment income | $ | 1,529,842 |
| $ | 1,501,209 |
|
See Notes to Financial Statements.
|
|
| Notes to Financial Statements |
MARCH 31, 2017
1. Organization
American Century Capital Portfolios, Inc. (the corporation) is registered under the Investment Company Act of 1940, as amended (the 1940 Act), as an open-end management investment company and is organized as a Maryland corporation. NT Large Company Value Fund (the fund) is one fund in a series issued by the corporation. The fund’s investment objective is to seek long-term capital growth. Income is a secondary objective. The fund is not permitted to invest in securities issued by companies assigned the Global Industry Classification Standard for the tobacco industry. The fund offers the Institutional Class and the R6 Class.
2. Significant Accounting Policies
The following is a summary of significant accounting policies consistently followed by the fund in preparation of its financial statements. The fund is an investment company and follows accounting and reporting guidance in accordance with accounting principles generally accepted in the United States of America. This may require management to make certain estimates and assumptions at the date of the financial statements. Actual results could differ from these estimates. Management evaluated the impact of events or transactions occurring through the date the financial statements were issued that would merit recognition or disclosure.
Investment Valuations — The fund determines the fair value of its investments and computes its net asset value per share at the close of regular trading (usually 4 p.m. Eastern time) on the New York Stock Exchange (NYSE) on each day the NYSE is open. The Board of Directors has adopted valuation policies and procedures to guide the investment advisor in the fund’s investment valuation process and to provide methodologies for the oversight of the fund’s pricing function.
Equity securities that are listed or traded on a domestic securities exchange are valued at the last reported sales price or at the official closing price as provided by the exchange. Equity securities traded on foreign securities exchanges are generally valued at the closing price of such securities on the exchange where primarily traded or at the close of the NYSE, if that is earlier. If no last sales price is reported, or if local convention or regulation so provides, the mean of the latest bid and asked prices may be used. Securities traded over-the-counter are valued at the mean of the latest bid and asked prices, the last sales price, or the official closing price. Equity securities initially expressed in local currencies are translated into U.S. dollars at the mean of the appropriate currency exchange rate at the close of the NYSE as provided by an independent pricing service.
Open-end management investment companies are valued at the reported net asset value per share. Repurchase agreements are valued at cost, which approximates fair value. Forward foreign currency exchange contracts are valued at the mean of the appropriate forward exchange rate at the close of the NYSE as provided by an independent pricing service.
If the fund determines that the market price for an investment is not readily available or the valuation methods mentioned above do not reflect an investment’s fair value, such investment is valued as determined in good faith by the Board of Directors or its delegate, in accordance with policies and procedures adopted by the Board of Directors. In its determination of fair value, the fund may review several factors including, but not limited to, market information regarding the specific investment or comparable investments and correlation with other investment types, futures indices or general market indicators. Circumstances that may cause the fund to use these procedures to value an investment include, but are not limited to: an investment has been declared in default or is distressed; trading in a security has been suspended during the trading day or a security is not actively trading on its principal exchange; prices received from a regular pricing source are deemed unreliable; or there is a foreign market holiday and no trading occurred.
The fund monitors for significant events occurring after the close of an investment’s primary exchange but before the fund’s net asset value per share is determined. Significant events may include, but are not limited to: corporate announcements and transactions; governmental action and political unrest that could impact a specific investment or an investment sector; or armed conflicts, natural disasters and similar events that could affect investments in a specific country or region. The fund also monitors for significant fluctuations between domestic and foreign markets, as evidenced by the U.S. market or such other indicators that the Board of Directors, or its delegate, deems appropriate. If significant fluctuations in foreign markets are identified, the
fund may apply a model-derived factor to the closing price of equity securities traded on foreign securities exchanges. The factor is based on observable market data as provided by an independent pricing service.
Security Transactions — Security transactions are accounted for as of the trade date. Net realized gains and losses are determined on the identified cost basis, which is also used for federal income tax purposes.
Investment Income — Dividend income less foreign taxes withheld, if any, is recorded as of the ex-dividend date. Distributions received on securities that represent a return of capital or long-term capital gain are recorded as a reduction of cost of investments and/or as a realized gain. The fund may estimate the components of distributions received that may be considered nontaxable distributions or long-term capital gain distributions for income tax purposes. Interest income is recorded on the accrual basis and includes accretion of discounts and amortization of premiums.
Foreign Currency Translations — All assets and liabilities initially expressed in foreign currencies are translated into U.S. dollars at prevailing exchange rates at period end. The fund may enter into spot foreign currency exchange contracts to facilitate transactions denominated in a foreign currency. Purchases and sales of investment securities, dividend and interest income, spot foreign currency exchange contracts, and expenses are translated at the rates of exchange prevailing on the respective dates of such transactions. Net realized and unrealized foreign currency exchange gains or losses related to investment securities are a component of net realized gain (loss) on investment transactions and change in net unrealized appreciation (depreciation) on investments, respectively.
Repurchase Agreements — The fund may enter into repurchase agreements with institutions that American Century Investment Management, Inc. (ACIM) (the investment advisor) has determined are creditworthy pursuant to criteria adopted by the Board of Directors. The fund requires that the collateral, represented by securities, received in a repurchase transaction be transferred to the custodian in a manner sufficient to enable the fund to obtain those securities in the event of a default under the repurchase agreement. ACIM monitors, on a daily basis, the securities transferred to ensure the value, including accrued interest, of the securities under each repurchase agreement is equal to or greater than amounts owed to the fund under each repurchase agreement.
Joint Trading Account — Pursuant to an Exemptive Order issued by the Securities and Exchange Commission, the fund, along with certain other funds in the American Century Investments family of funds, may transfer uninvested cash balances into a joint trading account. These balances are invested in one or more repurchase agreements that are collateralized by U.S. Treasury or Agency obligations.
Income Tax Status — It is the fund’s policy to distribute substantially all net investment income and net realized gains to shareholders and to otherwise qualify as a regulated investment company under provisions of the Internal Revenue Code. Accordingly, no provision has been made for income taxes. The fund files U.S. federal, state, local and non-U.S. tax returns as applicable. The fund's tax returns are subject to examination by the relevant taxing authority until expiration of the applicable statute of limitations, which is generally three years from the date of filing but can be longer in certain jurisdictions. At this time, management believes there are no uncertain tax positions which, based on their technical merit, would not be sustained upon examination and for which it is reasonably possible that the total amounts of unrecognized tax benefits will significantly change in the next twelve months.
Multiple Class — All shares of the fund represent an equal pro rata interest in the net assets of the class to which such shares belong, and have identical voting, dividend, liquidation and other rights and the same terms and conditions, except for class specific expenses and exclusive rights to vote on matters affecting only individual classes. Income, non-class specific expenses, and realized and unrealized capital gains and losses of the fund are allocated to each class of shares based on their relative net assets.
Distributions to Shareholders — Distributions from net investment income, if any, are generally declared and paid quarterly. Distributions from net realized gains, if any, are generally declared and paid annually.
Indemnifications — Under the corporation’s organizational documents, its officers and directors are indemnified against certain liabilities arising out of the performance of their duties to the fund. In addition, in the normal course of business, the fund enters into contracts that provide general indemnifications. The maximum exposure under these arrangements is unknown as this would involve future claims that may be made against a fund. The risk of material loss from such claims is considered by management to be remote.
3. Fees and Transactions with Related Parties
Certain officers and directors of the corporation are also officers and/or directors of American Century Companies, Inc. (ACC). The corporation’s investment advisor, ACIM, the corporation's distributor, American Century Investment Services, Inc., and the corporation’s transfer agent, American Century Services, LLC, are wholly owned, directly or indirectly, by ACC. Various funds issued by American Century Asset Allocation Portfolios, Inc. own, in aggregate, 100% of the shares of the fund. Related parties do not invest in the fund for the purpose of exercising management or control.
Management Fees — The corporation has entered into a management agreement with ACIM, under which ACIM provides the fund with investment advisory and management services in exchange for a single, unified management fee (the fee) per class. The agreement provides that all expenses of managing and operating the fund, except distribution and service fees, brokerage expenses, taxes, interest, fees and expenses of the independent directors (including legal counsel fees), and extraordinary expenses, will be paid by ACIM. The fee is computed and accrued daily based on each class's daily net assets and paid monthly in arrears. The difference in the fee among the classes is a result of their separate arrangements for shareholder services. It is not the result of any difference in advisory or custodial fees or other expenses related to the management of the fund’s assets, which do not vary by class. The rate of the fee is determined by applying a fee rate calculation formula. This formula takes into account the fund’s assets as well as certain assets, if any, of other clients of the investment advisor outside the American Century Investments family of funds (such as subadvised funds and separate accounts) that have very similar investment teams and investment strategies (strategy assets). The strategy assets of the fund also include the assets of Large Company Value Fund, one fund in a series issued by the corporation. The annual management fee schedule ranges from 0.50% to 0.70% for the Institutional Class and 0.35% to 0.55% for the R6 Class. The effective annual management fee for each class for the year ended March 31, 2017 was 0.63% for the Institutional Class and 0.48% for the R6 Class.
Directors' Fees and Expenses — The Board of Directors is responsible for overseeing the investment advisor’s management and operations of the fund. The directors receive detailed information about the fund and its investment advisor regularly throughout the year, and meet at least quarterly with management of the investment advisor to review reports about fund operations. The fund’s officers do not receive compensation from the fund.
Interfund Transactions — The fund may enter into security transactions with other American Century Investments funds and other client accounts of the investment advisor, in accordance with the 1940 Act rules and procedures adopted by the Board of Directors. The rules and procedures require, among other things, that these transactions be effected at the independent current market price of the security. During the period, the interfund purchases and sales were $20,604,630 and $10,145,355, respectively. The effect of interfund transactions on the Statement of Operations was $1,258,383 in net realized gain (loss) on investment transactions.
4. Investment Transactions
Purchases and sales of investment securities, excluding short-term investments, for the year ended March 31, 2017 were $1,395,000,619 and $1,427,836,717, respectively.
5. Capital Share Transactions
Transactions in shares of the fund were as follows:
|
| | | | | | | | | | |
| | Year ended
March 31, 2017 | Year ended
March 31, 2016 |
| | Shares | Amount | Shares | Amount |
| Institutional Class/Shares Authorized | 800,000,000 |
| | 800,000,000 |
| |
| Sold | 15,821,549 |
| $ | 178,636,197 |
| 33,650,369 |
| $ | 369,443,947 |
|
| Issued in reinvestment of distributions | 9,020,530 |
| 104,708,538 |
| 13,963,872 |
| 150,938,032 |
|
| Redeemed | (26,032,560 | ) | (301,671,984 | ) | (15,352,282 | ) | (168,885,765 | ) |
| | (1,190,481 | ) | (18,327,249 | ) | 32,261,959 |
| 351,496,214 |
|
| R6 Class/Shares Authorized | 70,000,000 |
| | 70,000,000 |
| |
| Sold | 8,331,107 |
| 95,411,193 |
| 5,636,253 |
| 63,970,354 |
|
| Issued in reinvestment of distributions | 969,886 |
| 11,276,860 |
| 845,032 |
| 9,132,012 |
|
| Redeemed | (2,466,464 | ) | (28,446,101 | ) | (1,071,142 | ) | (12,140,872 | ) |
| | 6,834,529 |
| 78,241,952 |
| 5,410,143 |
| 60,961,494 |
|
| Net increase (decrease) | 5,644,048 |
| $ | 59,914,703 |
| 37,672,102 |
| $ | 412,457,708 |
|
6. Fair Value Measurements
The fund’s investments valuation process is based on several considerations and may use multiple inputs to determine the fair value of the investments held by the fund. In conformity with accounting principles generally accepted in the United States of America, the inputs used to determine a valuation are classified into three broad levels.
| |
| • | Level 1 valuation inputs consist of unadjusted quoted prices in an active market for identical investments. |
| |
| • | Level 2 valuation inputs consist of direct or indirect observable market data (including quoted prices for comparable investments, evaluations of subsequent market events, interest rates, prepayment speeds, credit risk, etc.). These inputs also consist of quoted prices for identical investments initially expressed in local currencies that are adjusted through translation into U.S. dollars. |
| |
| • | Level 3 valuation inputs consist of unobservable data (including a fund’s own assumptions). |
The level classification is based on the lowest level input that is significant to the fair valuation measurement. The valuation inputs are not necessarily an indication of the risks associated with investing in these securities or other financial instruments. There were no significant transfers between levels during the period.
The following is a summary of the level classifications as of period end. The Schedule of Investments provides additional information on the fund’s portfolio holdings.
|
| | | | | | | | |
| | Level 1 | Level 2 | Level 3 |
| Assets | | | |
| Investment Securities | | | |
| Common Stocks | $ | 1,804,142,330 |
| $ | 53,117,301 |
| — |
|
| Exchange-Traded Funds | 24,068,436 |
| — |
| — |
|
| Temporary Cash Investments | 14,610 |
| 30,687,027 |
| — |
|
| | $ | 1,828,225,376 |
| $ | 83,804,328 |
| — |
|
| Other Financial Instruments | | | |
| Forward Foreign Currency Exchange Contracts | — |
| $ | 992,309 |
| — |
|
| | | | |
| Liabilities | | | |
| Other Financial Instruments | | | |
| Forward Foreign Currency Exchange Contracts | — |
| $ | 191,580 |
| — |
|
7. Derivative Instruments
Foreign Currency Risk — The fund is subject to foreign currency exchange rate risk in the normal course of pursuing its investment objectives. The value of foreign investments held by a fund may be significantly affected by changes in foreign currency exchange rates. The dollar value of a foreign security generally decreases when the value of the dollar rises against the foreign currency in which the security is denominated and tends to increase when the value of the dollar declines against such foreign currency. A fund may enter into forward foreign currency exchange contracts to reduce a fund's exposure to foreign currency exchange rate fluctuations. The net U.S. dollar value of foreign currency underlying all contractual commitments held by a fund and the resulting unrealized appreciation or depreciation are determined daily. Realized gain or loss is recorded upon the termination of the contract. Net realized and unrealized gains or losses occurring during the holding period of forward foreign currency exchange contracts are a component of net realized gain (loss) on foreign currency transactions and change in net unrealized appreciation (depreciation) on translation of assets and liabilities in foreign currencies, respectively. A fund bears the risk of an unfavorable change in the foreign currency exchange rate underlying the forward contract. Additionally, losses, up to the fair value, may arise if the counterparties do not perform under the contract terms. The fund's average U.S. dollar exposure to foreign currency risk derivative instruments held during the period was $89,632,844.
The value of foreign currency risk derivative instruments as of March 31, 2017, is disclosed on the Statement of Assets and Liabilities as an asset of $992,309 in unrealized appreciation on forward foreign currency exchange contracts and a liability of $191,580 in unrealized depreciation on forward foreign currency exchange contracts. For the year ended March 31, 2017, the effect of foreign currency risk derivative instruments on the Statement of Operations was $2,718,300 in net realized gain (loss) on foreign currency transactions and $1,754,550 in change in net unrealized appreciation (depreciation) on translation of assets and liabilities in foreign currencies.
8. Risk Factors
There are certain risks involved in investing in foreign securities. These risks include those resulting from future adverse political, social and economic developments, fluctuations in currency exchange rates, the possible imposition of exchange controls, and other foreign laws or restrictions.
9. Federal Tax Information
The tax character of distributions paid during the years ended March 31, 2017 and March 31, 2016 were as follows:
|
| | | | | | |
| | 2017 | 2016 |
| Distributions Paid From | | |
| Ordinary income | $ | 38,410,140 |
| $ | 47,555,478 |
|
| Long-term capital gains | $ | 77,575,258 |
| $ | 112,514,566 |
|
The book-basis character of distributions made during the year from net investment income or net realized gains may differ from their ultimate characterization for federal income tax purposes. These differences reflect the differing character of certain income items and net realized gains and losses for financial statement and tax purposes, and may result in reclassification among certain capital accounts on the financial statements.
As of March 31, 2017, the federal tax cost of investments and the components of distributable earnings on a tax-basis were as follows: |
| | | |
| Federal tax cost of investments | $ | 1,609,976,465 |
|
| Gross tax appreciation of investments | $ | 317,936,836 |
|
| Gross tax depreciation of investments | (15,883,597 | ) |
| Net tax appreciation (depreciation) of investments | 302,053,239 |
|
| Net tax appreciation (depreciation) on derivatives and translation of assets and liabilities in foreign currencies | (1,140 | ) |
| Net tax appreciation (depreciation) | $ | 302,052,099 |
|
| Undistributed ordinary income | $ | 8,066,534 |
|
Accumulated long-term gains
| $ | 60,753,177 |
|
The difference between book-basis and tax-basis unrealized appreciation (depreciation) is attributable primarily to the tax deferral of losses on wash sales.
10. Recently Issued Accounting Guidance
In October 2016, the Securities and Exchange Commission adopted new rules and forms as well as amendments to its rules and forms to modernize the reporting and disclosure of information by registered investment companies. The amendments to Regulation S-X will require standardized, enhanced disclosure about derivatives in investment company financial statements, as well as other provisions. Compliance with the amendments is effective on August 1, 2017. Management is currently evaluating the impact that adopting the amendments will have on the financial statement disclosures.
|
| | | | | | | | | | | | | | | |
| For a Share Outstanding Throughout the Years Ended March 31 (except as noted) |
| Per-Share Data | Ratios and Supplemental Data |
| | | Income From Investment Operations: | Distributions From: | | | Ratio to Average Net Assets of: | | |
| | Net Asset
Value,
Beginning
of Period | Net
Investment
Income
(Loss)(1) | Net
Realized
and
Unrealized
Gain (Loss) | Total From
Investment
Operations | Net
Investment
Income | Net
Realized
Gains | Total
Distributions | Net Asset
Value,
End
of Period | Total
Return(2) | Operating
Expenses | Net
Investment
Income
(Loss) | Portfolio
Turnover
Rate | Net
Assets,
End of
Period
(in thousands) |
| Institutional Class | | | | | | | | | | | |
| 2017 | $10.58 | 0.25 | 1.80 | 2.05 | (0.24) | (0.52) | (0.76) | $11.87 | 19.67% | 0.63% | 2.17% | 79% |
| $1,703,216 |
|
| 2016 | $12.38 | 0.18 | (0.78) | (0.60) | (0.18) | (1.02) | (1.20) | $10.58 | (4.92)% | 0.64% | 1.57% | 61% |
| $1,531,294 |
|
| 2015 | $12.18 | 0.19 | 1.14 | 1.33 | (0.18) | (0.95) | (1.13) | $12.38 | 11.01% | 0.64% | 1.52% | 68% |
| $1,391,730 |
|
| 2014 | $10.45 | 0.21 | 2.03 | 2.24 | (0.20) | (0.31) | (0.51) | $12.18 | 21.75% | 0.65% | 1.81% | 35% |
| $1,324,951 |
|
| 2013 | $9.31 | 0.19 | 1.25 | 1.44 | (0.19) | (0.11) | (0.30) | $10.45 | 15.87% | 0.67% | 2.03% | 37% |
| $941,901 |
|
| R6 Class | | | | | | | | | | | |
| 2017 | $10.59 | 0.27 | 1.79 | 2.06 | (0.26) | (0.52) | (0.78) | $11.87 | 19.74% | 0.48% | 2.32% | 79% |
| $203,291 |
|
| 2016 | $12.38 | 0.20 | (0.77) | (0.57) | (0.20) | (1.02) | (1.22) | $10.59 | (4.70)% | 0.49% | 1.72% | 61% |
| $108,912 |
|
| 2015 | $12.18 | 0.21 | 1.14 | 1.35 | (0.20) | (0.95) | (1.15) | $12.38 | 11.17% | 0.49% | 1.67% | 68% |
| $60,401 |
|
2014(3) | $11.54 | 0.15 | 0.96 | 1.11 | (0.16) | (0.31) | (0.47) | $12.18 | 9.83% | 0.50%(4) | 1.93%(4) | 35%(5) |
| $16,772 |
|
|
|
| Notes to Financial Highlights |
| |
| (1) | Computed using average shares outstanding throughout the period. |
| |
| (2) | Total returns are calculated based on the net asset value of the last business day. Total returns for periods less than one year are not annualized. |
| |
| (3) | July 26, 2013 (commencement of sale) through March 31, 2014. |
| |
| (5) | Portfolio turnover is calculated at the fund level. Percentage indicated was calculated for the year ended March 31, 2014. |
See Notes to Financial Statements.
|
|
| Report of Independent Registered Public Accounting Firm |
To the Board of Directors and Shareholders of American Century Capital Portfolios, Inc.:
We have audited the accompanying statement of assets and liabilities, including the schedule of investments, of NT Large Company Value Fund (the “Fund”), one of the funds constituting American Century Capital Portfolios, Inc., as of March 31, 2017, and the related statement of operations for the year then ended, the statements of changes in net assets for each of the two years in the period then ended, and the financial highlights for each of the periods presented. These financial statements and financial highlights are the responsibility of the Fund's management. Our responsibility is to express an opinion on these financial statements and financial highlights based on our audits.
We conducted our audits in accordance with the standards of the Public Company Accounting Oversight Board (United States). Those standards require that we plan and perform the audit to obtain reasonable assurance about whether the financial statements and financial highlights are free of material misstatement. The Fund is not required to have, nor were we engaged to perform, an audit of its internal control over financial reporting. Our audits included consideration of internal control over financial reporting as a basis for designing audit procedures that are appropriate in the circumstances, but not for the purpose of expressing an opinion on the effectiveness of the Fund's internal control over financial reporting. Accordingly, we express no such opinion. An audit also includes examining, on a test basis, evidence supporting the amounts and disclosures in the financial statements, assessing the accounting principles used and significant estimates made by management, as well as evaluating the overall financial statement presentation. Our procedures included confirmation of securities owned as of March 31, 2017, by correspondence with the custodian and brokers; when replies were not received from brokers, we performed other auditing procedures. We believe that our audits provide a reasonable basis for our opinion.
In our opinion, the financial statements and financial highlights referred to above present fairly, in all material respects, the financial position of NT Large Company Value Fund of American Century Capital Portfolios, Inc. as of March 31, 2017, the results of its operations for the year then ended, the changes in its net assets for each of the two years in the period then ended, and the financial highlights for each of the periods presented, in conformity with accounting principles generally accepted in the United States of America.
DELOITTE & TOUCHE LLP
Kansas City, Missouri May 16, 2017
The Board of Directors
The individuals listed below serve as directors of the funds. Each director will continue to serve in this capacity until death, retirement, resignation or removal from office. The board has adopted a mandatory retirement age for directors who are not “interested persons,” as that term is defined in the Investment Company Act (independent directors). Independent directors shall retire by December 31 of the year in which they reach their 75th birthday.
Mr. Thomas is an “interested person” because he currently serves as President and Chief Executive Officer of American Century Companies, Inc. (ACC), the parent company of American Century Investment Management, Inc. (ACIM or the advisor). The other directors (more than three-fourths of the total number) are independent. They are not employees, directors or officers of, and have no financial interest in, ACC or any of its wholly owned, direct or indirect, subsidiaries, including ACIM, American Century Investment Services, Inc. (ACIS) and American Century Services, LLC (ACS), and they do not have any other affiliations, positions or relationships that would cause them to be considered “interested persons” under the Investment Company Act. The directors serve in this capacity for seven (in the case of Mr. Thomas, 15) registered investment companies in the American Century Investments family of funds.
The following table presents additional information about the directors. The mailing address for each director is 4500 Main Street, Kansas City, Missouri 64111.
|
| | | | | |
Name
(Year of Birth) | Position(s) Held with Funds | Length of Time Served | Principal Occupation(s) During Past 5 Years | Number of American Century Portfolios Overseen by Director | Other Directorships Held During Past 5 Years |
| Independent Directors |
|
|
| Thomas W. Bunn (1953) | Advisory Board Director | Since 2017 | Retired | 81 | SquareTwo Financial; Barings (formerly Babson Capital Funds Trust) (2013 to 2016) |
Barry Fink
(1955) | Director | Since 2012 (independent since 2016) | Retired; Executive Vice President, ACC (2007 to 2013); President, ACS (2007 to 2013); Chief Operating Officer, ACC (2007 to 2012) | 81 | None |
Andrea C. Hall
(1945) | Director | Since 1997 | Retired | 81 | None |
Jan M. Lewis
(1957) | Director | Since 2011 | Retired; President and Chief Executive Officer, Catholic Charities of Northeast Kansas (human services organization) (2006 to 2013) | 81 | None |
James A. Olson
(1942) | Director and Chairman of the Board | Since 2007 (Chairman since 2014) | Member, Plaza Belmont LLC (private equity fund manager) (1999 to present) | 81 | Saia, Inc. (2002 to 2012) and EPR Properties (2003 to 2013) |
|
| | | | | |
Name
(Year of Birth) | Position(s) Held with Funds | Length of Time Served | Principal Occupation(s) During Past 5 Years | Number of American Century Portfolios Overseen by Director | Other Directorships Held During Past 5 Years |
| Independent Directors |
|
|
M. Jeannine Strandjord
(1945) | Director | Since 1994 | Retired | 81 | Euronet Worldwide Inc.; MGP Ingredients, Inc.; and DST Systems Inc. (1996 to 2012) |
John R. Whitten
(1946) | Director | Since 2008 | Retired | 81 | Rudolph Technologies, Inc. |
Stephen E. Yates
(1948) | Director | Since 2012 | Retired | 81 | None |
| Interested Director |
|
|
Jonathan S. Thomas
(1963) | Director and President | Since 2007 | President and Chief Executive Officer, ACC (2007 to present). Also serves as Chief Executive Officer, ACS; Executive Vice President, ACIM; Director, ACC, ACIM and other ACC subsidiaries | 126 | BioMed Valley Discoveries, Inc. |
The Statement of Additional Information has additional information about the fund's directors and is available without charge, upon request, by calling 1-800-345-2021.
Officers
The following table presents certain information about the executive officers of the funds. Each officer serves as an officer for each of the 15 investment companies in the American Century family of funds, unless otherwise noted. No officer is compensated for his or her service as an officer of the funds. The listed officers are interested persons of the funds and are appointed or re-appointed on an annual basis. The mailing address for each officer listed below is 4500 Main Street, Kansas City, Missouri 64111.
|
| | |
Name
(Year of Birth) | Offices with the Funds | Principal Occupation(s) During the Past Five Years |
Jonathan S. Thomas
(1963) | Director and President since 2007 | President and Chief Executive Officer, ACC (2007 to present). Also serves as Chief Executive Officer, ACS; Executive Vice President, ACIM; Director, ACC, ACIM and other ACC subsidiaries |
Amy D. Shelton
(1964) | Chief Compliance Officer and Vice President since 2014 | Chief Compliance Officer, American Century funds, (2014 to present); Chief Compliance Officer, ACIM (2014 to present); Chief Compliance Officer, ACIS (2009 to present); Vice President, Client Interactions and Marketing, ACIS (2013 to 2014); Director, Client Interactions and Marketing, ACIS (2007 to 2013). Also serves as Vice President, ACIS |
Charles A. Etherington
(1957) | General Counsel since 2007 and Senior Vice President since 2006 | Attorney, ACC (1994 to present); Vice President, ACC (2005 to present); General Counsel, ACC (2007 to present). Also serves as General Counsel, ACIM, ACS, ACIS and other ACC subsidiaries; and Senior Vice President, ACIM and ACS |
C. Jean Wade
(1964) | Vice President,Treasurer and Chief Financial Officer since 2012 | Vice President, ACS (2000 to present) |
Robert J. Leach
(1966) | Vice President since 2006 and Assistant Treasurer since 2012 | Vice President, ACS (2000 to present) |
David H. Reinmiller
(1963) | Vice President since 2000 | Attorney, ACC (1994 to present); Associate General Counsel, ACC (2001 to present). Also serves as Vice President, ACIM and ACS |
Ward D. Stauffer
(1960) | Secretary since 2005 | Attorney, ACC (2003 to present) |
Retirement Account Information
As required by law, distributions you receive from certain IRAs are subject to federal income tax withholding, unless you elect not to have withholding apply. Tax will be withheld on the total amount withdrawn even though you may be receiving amounts that are not subject to withholding, such as nondeductible contributions. In such case, excess amounts of withholding could occur. You may adjust your withholding election so that a greater or lesser amount will be withheld.
If you don’t want us to withhold on this amount, you must notify us to not withhold the federal income tax. You may notify us in writing or in certain situations by telephone or through other electronic means. For systematic withdrawals, your withholding election will remain in effect until revoked or changed by filing a new election. You have the right to revoke your election at any time.
Remember, even if you elect not to have income tax withheld, you are liable for paying income tax on the taxable portion of your withdrawal. If you elect not to have income tax withheld or you don’t have enough income tax withheld, you may be responsible for payment of estimated tax. You may incur penalties under the estimated tax rules if your withholding and estimated tax payments are not sufficient. You can reduce or defer the income tax on a distribution by directly or indirectly rolling such distribution over to another IRA or eligible plan. You should consult your tax advisor for additional information.
State tax will be withheld if, at the time of your distribution, your address is within one of the mandatory withholding states and you have federal income tax withheld (or as otherwise required by state law). State taxes will be withheld from your distribution in accordance with the respective state rules.
Distributions you receive from 403(b), 457 and qualified plans are subject to special tax and withholding rules. Your plan administrator or plan sponsor is required to provide you with a special tax notice explaining those rules at the time you request a distribution. If applicable, federal and/or state taxes may be withheld from your distribution amount.
Proxy Voting Policies
A description of the policies that the fund's investment advisor uses in exercising the voting rights associated with the securities purchased and/or held by the fund is available without charge, upon request, by calling 1-800-345-2021. It is also available on the "About Us" page of American Century Investments’ website at americancentury.com and on the Securities and Exchange Commission’s website at sec.gov. Information regarding how the investment advisor voted proxies relating to portfolio securities during the most recent 12-month period ended June 30 is available on the "About Us" page at americancentury.com. It is also available at sec.gov.
Quarterly Portfolio Disclosure
The fund files its complete schedule of portfolio holdings with the Securities and Exchange Commission (SEC) for the first and third quarters of each fiscal year on Form N-Q. The fund’s Forms N-Q are available on the SEC’s website at sec.gov, and may be reviewed and copied at the SEC’s Public Reference Room in Washington, DC. Information on the operation of the Public Reference Room may be obtained by calling 1-800-SEC-0330. The fund also makes its complete schedule of portfolio holdings for the most recent quarter of its fiscal year available on its website at americancentury.com and, upon request, by calling 1-800-345-2021.
Other Tax Information
The following information is provided pursuant to provisions of the Internal Revenue Code.
The fund hereby designates up to the maximum amount allowable as qualified dividend income for the fiscal year ended March 31, 2017.
For corporate taxpayers, the fund hereby designates $35,234,628, or up to the maximum amount allowable, of ordinary income distributions paid during the fiscal year ended March 31, 2017 as qualified for the corporate dividends received deduction.
The fund hereby designates $77,575,258, or up to the maximum amount allowable, as long-term capital gain distributions (20% rate gain distributions) for the fiscal year ended March 31, 2017.
|
| | |
| |
| | | |
| Contact Us | americancentury.com | |
| Automated Information Line | 1-800-345-8765 | |
| Investor Services Representative | 1-800-345-2021 or 816-531-5575 | |
| Investors Using Advisors | 1-800-378-9878 | |
| Business, Not-For-Profit, Employer-Sponsored Retirement Plans | 1-800-345-3533 | |
| Banks and Trust Companies, Broker-Dealers, Financial Professionals, Insurance Companies | 1-800-345-6488 | |
| Telecommunications Relay Service for the Deaf | 711 | |
| | | |
| American Century Capital Portfolios, Inc. | |
| | | |
Investment Advisor: American Century Investment Management, Inc. Kansas City, Missouri | |
| | | |
| This report and the statements it contains are submitted for the general information of our shareholders. The report is not authorized for distribution to prospective investors unless preceded or accompanied by an effective prospectus. | |
| | | |
©2017 American Century Proprietary Holdings, Inc. All rights reserved.
CL-ANN-92290 1705 | |
|
| |
| | |
| | Annual Report |
| | |
| | March 31, 2017 |
| | |
| | NT Mid Cap Value Fund |
|
| | |
| Performance | 2 |
|
| Portfolio Commentary | |
|
| Fund Characteristics | |
|
| Shareholder Fee Example | |
|
| Schedule of Investments | |
|
| Statement of Assets and Liabilities | |
|
| Statement of Operations | |
|
| Statement of Changes in Net Assets | |
|
| Notes to Financial Statements | |
|
| Financial Highlights | |
|
| Report of Independent Registered Public Accounting Firm | |
|
| Management | |
|
| Additional Information | |
|
Any opinions expressed in this report reflect those of the author as of the date of the report, and do not necessarily represent the opinions of American Century Investments® or any other person in the American Century Investments organization. Any such opinions are subject to change at any time based upon market or other conditions and American Century Investments disclaims any responsibility to update such opinions. These opinions may not be relied upon as investment advice and, because investment decisions made by American Century Investments funds are based on numerous factors, may not be relied upon as an indication of trading intent on behalf of any American Century Investments fund. Security examples are used for representational purposes only and are not intended as recommendations to purchase or sell securities. Performance information for comparative indices and securities is provided to American Century Investments by third party vendors. To the best of American Century Investments’ knowledge, such information is accurate at the time of printing.
|
| | | | | | |
| Total Returns as of March 31, 2017 |
| | | | Average Annual Returns | |
| | Ticker Symbol | 1 year | 5 years | 10 years | Since Inception | Inception Date |
| Institutional Class | ACLMX | 20.98% | 15.10% | 9.58% | — | 5/12/06 |
| Russell Midcap Value Index | — | 19.82% | 14.06% | 7.47% | — | — |
| R6 Class | ACDSX | 21.17% | — | — | 13.30% | 7/26/13 |
Average annual returns since inception are presented when ten years of performance history is not available.
Fund returns would have been lower if a portion of the fees had not been waived.
|
|
| Growth of $10,000 Over 10 Years |
| $10,000 investment made March 31, 2007 |
| Performance for other share classes will vary due to differences in fee structure. |
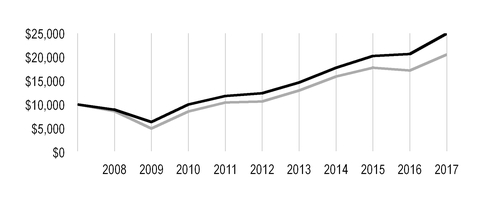
|
| |
| Value on March 31, 2017 |
| | Institutional Class — $24,978 |
| |
| | Russell Midcap Value Index — $20,559 |
| |
Ending value of Institutional Class would have been lower if a portion of the fees had not been waived.
|
| |
| Total Annual Fund Operating Expenses |
| Institutional Class | R6 Class |
| 0.81% | 0.66% |
The total annual fund operating expenses shown is as stated in the fund’s prospectus current as of the date of this report. The prospectus may vary from the expense ratio shown elsewhere in this report because it is based on a different time period, includes acquired fund fees and expenses, and, if applicable, does not include fee waivers or expense reimbursements.
Data presented reflect past performance. Past performance is no guarantee of future results. Current performance may be higher or lower than the performance shown. Total returns for periods less than one year are not annualized. Investment return and principal value will fluctuate, and redemption value may be more or less than original cost. Data assumes reinvestment of dividends and capital gains, and none of the charts reflect the deduction of taxes that a shareholder would pay on fund distributions or the redemption of fund shares. To obtain performance data current to the most recent month end, please call 1-800-345-2021 or visit americancentury.com. For additional information about the fund, please consult the prospectus.
Portfolio Managers: Kevin Toney, Michael Liss, Phil Davidson, and Brian Woglom
Performance Summary
NT Mid Cap Value returned 20.98%* for the fiscal year ended March 31, 2017, compared with the 19.82% return for its benchmark, the Russell Midcap Value Index. The fund’s return reflects operating expenses, while the index’s return does not.
The portfolio’s relative outperformance was aided by both stock selection and sector allocation across several sectors. On the other hand, security selection in energy and an underweight in materials negatively impacted performance.
Underweight in Real Estate Drove Returns
The portfolio’s underweight in real estate, a result of our bottom-up investment process, was a key contributor to performance. REITs had been beneficiaries, both from an operating and valuation perspective, of the low interest rate environment. As a result, many REITs appeared unattractive under the team’s valuation process. The portfolio benefited from the resulting underweight in real estate as rising interest rates pressured the sector in the second half of the reporting period. However, the portfolio’s largest individual detractor was real estate holding CoreCivic, a prison REIT. CoreCivic, which changed its name from Corrections Corporation of America, is a large provider of private prisons in the U.S. The stock sold off prior to the election on comments made by the U.S. Department of Justice and Hillary Clinton regarding discontinuing use of private prisons, and we sold the position.
Stock Selection Across Several Sectors Helped Performance
Utilities benefited performance for the year. The portfolio was generally underweight the sector based on valuation. This underweight positively impacted relative returns as the sector underperformed. Additionally, Westar Energy was a top contributor as its share price surged on news in the second quarter of 2016 that it would be acquired by Great Plains Energy.
The health care sector positively contributed for the year based on beneficial stock selection. The portfolio did not own Perrigo, a consumer goods and specialty pharmaceutical company. Perrigo’s stock was pressured by the threat of mandated lower drug pricing, disappointing earnings, and the resignation of its CEO and CFO. Lack of exposure to the name drove outperformance.
Outperformance in industrials was driven primarily by CSX. Stock of the provider of rail-based freight transportation rose in the first quarter of 2017 on an activist involvement that resulted in a change in company management. Mantle Ridge, an activist investor that owns roughly 4.9 percent of CSX stock, proposed rail veteran Hunter Harrison as CSX's chief executive officer. Harrison, the ex-CEO of Canadian Pacific, is a turnaround expert that is highly respected across the industry. We sold the stock on strength.
| |
| * | All fund returns referenced in this commentary are for Institutional Class shares. Fund returns would have been lower if a portion of the fees had not been waived. Performance for other share classes will vary due to differences in fee structure; when Institutional Class performance exceeds that of the fund's benchmark, other share classes may not. See page 2 for returns for all share classes. |
In the information technology sector, exposures in the semiconductors and semiconductor equipment industry positively impacted performance. Applied Materials, the top individual contributor to performance, rose on strong orders, record backlog, and market share gains. Additionally, solid orders and backlog drove Lam Research’s revenue and earnings forecasts higher as end demand remained strong.
Overweight in Financials Contributed to Results
Following the presidential election in November, rising interest rates and potential changes in financial conditions caused the financials sector to outperform. Banks performed particularly well on optimism surrounding future earnings due to higher interest rates and anticipation of lower taxes and reduced regulation. The portfolio’s overweight in financials proved beneficial in this environment. Northern Trust, an overweight position, rose along with the rise in interest rates and potentially lower corporate tax rates. Additionally, rising capital markets are beneficial to Northern Trust’s investment management business.
Energy Detracted
Weakening oil and gas prices, driven by concerns about oversupply in 2018, pressured the portfolio’s energy holdings. Imperial Oil was a top detractor from performance in the sector as oil prices weakened. Additionally, the company missed production numbers due to unexpected downtime at one of its operations.
Underweight in Materials Weighed on Returns
Many stocks in the materials sector don’t meet our quality or valuation criteria, which led to an underweight in the sector. Very limited exposure to metals and mining stocks and lack of exposure to the chemicals and construction materials industries during the reporting period detracted from performance.
Retailer Was a Top Detractor
Multiline retailer Target was one of the portfolio’s largest detractors. Its stock price fell considerably after it announced disappointing fourth-quarter results and a notable decrease in year-over-year earnings per share. Additionally, investors have lost confidence in the company’s turnaround plan.
Portfolio Positioning
At period-end, the portfolio’s largest overweights were in the health care and energy sectors. The decline in the health care sector toward the end of 2016 created opportunities to add stocks with attractive valuations that we believe will fare well in the future. Weakness in the energy sector due to reduced oil and gas prices led to attractive valuations in many names, providing an opportunity to add to positions in the sector.
The portfolio’s largest underweights were in the real estate and materials sectors. Our valuation work shows that many real estate stocks have been overvalued for some time, leading to the underweight. The materials sector remains underweight because many stocks in the sector don’t meet our quality or valuation criteria. Our holdings in the materials sector are limited to a few investments in the containers and packaging industry.
|
| |
| MARCH 31, 2017 |
| Top Ten Holdings | % of net assets |
| Johnson Controls International plc | 3.1% |
| Northern Trust Corp. | 2.9% |
| iShares Russell Mid-Cap Value ETF | 2.2% |
| Zimmer Biomet Holdings, Inc. | 2.0% |
| Weyerhaeuser Co. | 1.9% |
| EQT Corp. | 1.8% |
| Applied Materials, Inc. | 1.8% |
| Imperial Oil Ltd. | 1.7% |
| Conagra Brands, Inc. | 1.5% |
| Baker Hughes, Inc. | 1.5% |
| | |
| Top Five Industries | % of net assets |
| Oil, Gas and Consumable Fuels | 9.6% |
| Banks | 7.0% |
| Capital Markets | 7.0% |
| Insurance | 6.1% |
| Food Products | 5.8% |
| | |
| Types of Investments in Portfolio | % of net assets |
| Common Stocks | 95.1% |
| Exchange-Traded Funds | 2.2% |
| Total Equity Exposure | 97.3% |
| Temporary Cash Investments | 3.2% |
| Other Assets and Liabilities | (0.5)% |
Fund shareholders may incur two types of costs: (1) transaction costs, including sales charges (loads) on purchase payments and redemption/exchange fees; and (2) ongoing costs, including management fees; distribution and service (12b-1) fees; and other fund expenses. This example is intended to help you understand your ongoing costs (in dollars) of investing in your fund and to compare these costs with the ongoing cost of investing in other mutual funds.
The example is based on an investment of $1,000 made at the beginning of the period and held for the entire period from October 1, 2016 to March 31, 2017.
Actual Expenses
The table provides information about actual account values and actual expenses for each class. You may use the information, together with the amount you invested, to estimate the expenses that you paid over the period. First, identify the share class you own. Then simply divide your account value by $1,000 (for example, an $8,600 account value divided by $1,000 = 8.6), then multiply the result by the number under the heading “Expenses Paid During Period” to estimate the expenses you paid on your account during this period.
Hypothetical Example for Comparison Purposes
The table also provides information about hypothetical account values and hypothetical expenses based on the actual expense ratio of each class of your fund and an assumed rate of return of 5% per year before expenses, which is not the actual return of a fund’s share class. The hypothetical account values and expenses may not be used to estimate the actual ending account balance or expenses you paid for the period. You may use this information to compare the ongoing costs of investing in your fund and other funds. To do so, compare this 5% hypothetical example with the 5% hypothetical examples that appear in the shareholder reports of the other funds.
Please note that the expenses shown in the table are meant to highlight your ongoing costs only and do not reflect any transactional costs, such as sales charges (loads) or redemption/exchange fees. Therefore, the table is useful in comparing ongoing costs only, and will not help you determine the relative total costs of owning different funds. In addition, if these transactional costs were included, your costs would have been higher.
|
| | | | |
| | Beginning
Account Value
10/1/16 | Ending
Account Value
3/31/17 | Expenses Paid
During Period(1)
10/1/16 - 3/31/17 | Annualized
Expense Ratio(1) |
| Actual | | | | |
| Institutional Class (after waiver) | $1,000 | $1,110.50 | $4.05 | 0.77% |
| Institutional Class (before waiver) | $1,000 | $1,110.50(2) | $4.21 | 0.80% |
| R6 Class (after waiver) | $1,000 | $1,111.30 | $3.26 | 0.62% |
| R6 Class (before waiver) | $1,000 | $1,111.30(2) | $3.42 | 0.65% |
| Hypothetical | | | | |
| Institutional Class (after waiver) | $1,000 | $1,021.09 | $3.88 | 0.77% |
| Institutional Class (before waiver) | $1,000 | $1,020.94 | $4.03 | 0.80% |
| R6 Class (after waiver) | $1,000 | $1,021.84 | $3.13 | 0.62% |
| R6 Class (before waiver) | $1,000 | $1,021.69 | $3.28 | 0.65% |
| |
| (1) | Expenses are equal to the class's annualized expense ratio listed in the table above, multiplied by the average account value over the period, multiplied by 182, the number of days in the most recent fiscal half-year, divided by 365, to reflect the one-half year period. |
| |
| (2) | Ending account value assumes the return earned after waiver and would have been lower if a portion of the fees had not been waived. |
MARCH 31, 2017
|
| | | | | |
| | Shares | Value |
| COMMON STOCKS — 95.1% | | |
| Aerospace and Defense — 1.2% | | |
| Textron, Inc. | 267,978 |
| $ | 12,753,073 |
|
| Auto Components — 1.0% | | |
| Delphi Automotive plc | 132,164 |
| 10,637,880 |
|
| Automobiles — 0.9% | | |
| Honda Motor Co. Ltd. ADR | 322,448 |
| 9,757,276 |
|
| Banks — 7.0% | | |
| Bank of Hawaii Corp. | 64,216 |
| 5,288,830 |
|
| BB&T Corp. | 297,239 |
| 13,286,583 |
|
| Comerica, Inc. | 84,570 |
| 5,799,811 |
|
| Commerce Bancshares, Inc. | 184,616 |
| 10,368,035 |
|
| M&T Bank Corp. | 72,914 |
| 11,281,983 |
|
| PNC Financial Services Group, Inc. (The) | 86,351 |
| 10,382,844 |
|
| SunTrust Banks, Inc. | 73,338 |
| 4,055,592 |
|
| UMB Financial Corp. | 56,423 |
| 4,249,216 |
|
| Westamerica Bancorporation | 152,404 |
| 8,508,715 |
|
| | | 73,221,609 |
|
| Building Products — 3.1% | | |
| Johnson Controls International plc | 760,374 |
| 32,026,953 |
|
| Capital Markets — 7.0% | | |
| Ameriprise Financial, Inc. | 93,725 |
| 12,154,258 |
|
| Invesco Ltd. | 492,251 |
| 15,077,648 |
|
| Northern Trust Corp. | 355,129 |
| 30,747,069 |
|
| State Street Corp. | 89,276 |
| 7,107,262 |
|
| T. Rowe Price Group, Inc. | 118,227 |
| 8,057,170 |
|
| | | 73,143,407 |
|
| Commercial Services and Supplies — 1.2% | | |
| Republic Services, Inc. | 203,452 |
| 12,778,820 |
|
| Containers and Packaging — 2.6% | | |
| Bemis Co., Inc. | 169,832 |
| 8,297,991 |
|
| Sonoco Products Co. | 153,956 |
| 8,147,352 |
|
| WestRock Co. | 204,113 |
| 10,619,999 |
|
| | | 27,065,342 |
|
| Diversified Telecommunication Services — 0.9% | | |
Level 3 Communications, Inc.(1) | 164,657 |
| 9,421,674 |
|
| Electric Utilities — 5.0% | | |
| Edison International | 188,116 |
| 14,975,915 |
|
| Eversource Energy | 77,062 |
| 4,529,704 |
|
| PG&E Corp. | 231,393 |
| 15,355,239 |
|
| Westar Energy, Inc. | 57,095 |
| 3,098,546 |
|
| Xcel Energy, Inc. | 323,345 |
| 14,372,685 |
|
| | | 52,332,089 |
|
| Electrical Equipment — 2.5% | | |
| Emerson Electric Co. | 131,253 |
| 7,856,804 |
|
| Hubbell, Inc. | 106,666 |
| 12,805,253 |
|
|
| | | | | |
| | Shares | Value |
| Rockwell Automation, Inc. | 34,153 |
| $ | 5,317,964 |
|
| | | 25,980,021 |
|
| Electronic Equipment, Instruments and Components — 2.2% | | |
Keysight Technologies, Inc.(1) | 357,513 |
| 12,920,520 |
|
| TE Connectivity Ltd. | 137,099 |
| 10,220,730 |
|
| | | 23,141,250 |
|
| Energy Equipment and Services — 3.4% | | |
| Baker Hughes, Inc. | 263,670 |
| 15,772,740 |
|
| Frank's International NV | 93,967 |
| 993,231 |
|
| Halliburton Co. | 77,384 |
| 3,808,067 |
|
| Helmerich & Payne, Inc. | 57,320 |
| 3,815,792 |
|
| National Oilwell Varco, Inc. | 293,292 |
| 11,758,076 |
|
| | | 36,147,906 |
|
| Equity Real Estate Investment Trusts (REITs) — 4.5% | | |
| American Tower Corp. | 67,977 |
| 8,261,925 |
|
| Empire State Realty Trust, Inc. | 204,726 |
| 4,225,545 |
|
| MGM Growth Properties LLC, Class A | 209,025 |
| 5,654,126 |
|
| Piedmont Office Realty Trust, Inc., Class A | 401,821 |
| 8,590,933 |
|
| Weyerhaeuser Co. | 587,286 |
| 19,955,978 |
|
| | | 46,688,507 |
|
| Food and Staples Retailing — 0.8% | | |
| Sysco Corp. | 156,764 |
| 8,139,187 |
|
| Food Products — 5.8% | | |
| Conagra Brands, Inc. | 392,232 |
| 15,822,639 |
|
| General Mills, Inc. | 122,754 |
| 7,243,713 |
|
| J.M. Smucker Co. (The) | 41,332 |
| 5,417,799 |
|
| Kellogg Co. | 124,625 |
| 9,049,021 |
|
| Lamb Weston Holdings, Inc. | 77,536 |
| 3,261,164 |
|
| Mead Johnson Nutrition Co. | 83,513 |
| 7,439,338 |
|
| Mondelez International, Inc., Class A | 299,011 |
| 12,881,394 |
|
| | | 61,115,068 |
|
| Gas Utilities — 1.3% | | |
| Atmos Energy Corp. | 78,610 |
| 6,209,404 |
|
| Spire, Inc. | 116,218 |
| 7,844,715 |
|
| | | 14,054,119 |
|
| Health Care Equipment and Supplies — 4.2% | | |
| Abbott Laboratories | 148,149 |
| 6,579,297 |
|
| Baxter International, Inc. | 152,606 |
| 7,914,147 |
|
| STERIS plc | 118,429 |
| 8,226,079 |
|
| Zimmer Biomet Holdings, Inc. | 175,636 |
| 21,446,912 |
|
| | | 44,166,435 |
|
| Health Care Providers and Services — 5.1% | | |
| Cardinal Health, Inc. | 110,724 |
| 9,029,542 |
|
Express Scripts Holding Co.(1) | 94,224 |
| 6,210,304 |
|
HCA Holdings, Inc.(1) | 78,214 |
| 6,960,264 |
|
LifePoint Health, Inc.(1) | 231,914 |
| 15,190,367 |
|
| McKesson Corp. | 48,397 |
| 7,175,339 |
|
| Quest Diagnostics, Inc. | 90,807 |
| 8,916,339 |
|
| | | 53,482,155 |
|
| Hotels, Restaurants and Leisure — 0.8% | | |
| Carnival Corp. | 138,343 |
| 8,149,786 |
|
|
| | | | | |
| | Shares | Value |
| Household Durables — 0.9% | | |
| PulteGroup, Inc. | 390,283 |
| $ | 9,191,165 |
|
| Industrial Conglomerates — 1.2% | | |
| Koninklijke Philips NV | 375,950 |
| 12,084,040 |
|
| Insurance — 6.1% | | |
| Aflac, Inc. | 72,185 |
| 5,227,638 |
|
| Allstate Corp. (The) | 55,306 |
| 4,506,886 |
|
| Brown & Brown, Inc. | 176,775 |
| 7,375,053 |
|
| Chubb Ltd. | 102,556 |
| 13,973,255 |
|
| MetLife, Inc. | 91,511 |
| 4,833,611 |
|
| ProAssurance Corp. | 82,122 |
| 4,947,851 |
|
| Reinsurance Group of America, Inc. | 72,730 |
| 9,235,255 |
|
| Torchmark Corp. | 45,046 |
| 3,470,344 |
|
| Unum Group | 227,516 |
| 10,668,225 |
|
| | | 64,238,118 |
|
| Leisure Products — 0.6% | | |
| Mattel, Inc. | 233,464 |
| 5,979,013 |
|
| Machinery — 2.9% | | |
| Cummins, Inc. | 59,359 |
| 8,975,081 |
|
| Ingersoll-Rand plc | 168,384 |
| 13,692,987 |
|
| ITT, Inc. | 37,186 |
| 1,525,370 |
|
| Parker-Hannifin Corp. | 39,001 |
| 6,252,640 |
|
| | | 30,446,078 |
|
| Multi-Utilities — 1.9% | | |
| Ameren Corp. | 134,403 |
| 7,337,060 |
|
| Consolidated Edison, Inc. | 84,677 |
| 6,576,016 |
|
| NorthWestern Corp. | 108,360 |
| 6,360,732 |
|
| | | 20,273,808 |
|
| Multiline Retail — 0.8% | | |
| Target Corp. | 151,855 |
| 8,380,877 |
|
| Oil, Gas and Consumable Fuels — 9.6% | | |
| Anadarko Petroleum Corp. | 207,868 |
| 12,887,816 |
|
| Cimarex Energy Co. | 29,053 |
| 3,471,543 |
|
| Devon Energy Corp. | 240,715 |
| 10,042,630 |
|
| EQT Corp. | 312,818 |
| 19,113,180 |
|
| Imperial Oil Ltd. | 574,070 |
| 17,491,684 |
|
| Marathon Petroleum Corp. | 154,603 |
| 7,813,635 |
|
| Noble Energy, Inc. | 417,499 |
| 14,336,916 |
|
| Occidental Petroleum Corp. | 203,069 |
| 12,866,452 |
|
| Spectra Energy Partners LP | 55,662 |
| 2,430,203 |
|
| | | 100,454,059 |
|
| Road and Rail — 1.1% | | |
| Heartland Express, Inc. | 551,473 |
| 11,057,034 |
|
| Semiconductors and Semiconductor Equipment — 5.5% | | |
| Applied Materials, Inc. | 490,648 |
| 19,086,207 |
|
| Lam Research Corp. | 94,611 |
| 12,144,268 |
|
| Maxim Integrated Products, Inc. | 302,500 |
| 13,600,400 |
|
| Teradyne, Inc. | 404,655 |
| 12,584,771 |
|
| | | 57,415,646 |
|
| Specialty Retail — 2.0% | | |
| Advance Auto Parts, Inc. | 76,816 |
| 11,388,740 |
|
|
| | | | | |
| | Shares | Value |
| CST Brands, Inc. | 147,843 |
| $ | 7,109,770 |
|
| L Brands, Inc. | 43,377 |
| 2,043,057 |
|
| | | 20,541,567 |
|
| Technology Hardware, Storage and Peripherals — 0.7% | | |
| NetApp, Inc. | 188,151 |
| 7,874,119 |
|
| Textiles, Apparel and Luxury Goods — 0.4% | | |
| Ralph Lauren Corp. | 56,945 |
| 4,647,851 |
|
| Thrifts and Mortgage Finance — 0.9% | | |
| Capitol Federal Financial, Inc. | 627,490 |
| 9,180,179 |
|
TOTAL COMMON STOCKS
(Cost $790,209,622) | | 995,966,111 |
|
| EXCHANGE-TRADED FUNDS — 2.2% | | |
iShares Russell Mid-Cap Value ETF
(Cost $18,231,101) | 277,136 |
| 22,999,517 |
|
| TEMPORARY CASH INVESTMENTS — 3.2% | | |
| Repurchase Agreement, BMO Capital Markets Corp., (collateralized by various U.S. Treasury obligations, 0.75% - 2.75%, 7/31/17 - 2/15/24, valued at $12,230,917), in a joint trading account at 0.67%, dated 3/31/17, due 4/3/17 (Delivery value $11,982,311) | | 11,981,642 |
|
| Repurchase Agreement, Fixed Income Clearing Corp., (collateralized by various U.S. Treasury obligations, 2.875%, 8/15/45, valued at $22,180,901), at 0.22%, dated 3/31/17, due 4/3/17 (Delivery value $21,742,399) | | 21,742,000 |
|
| State Street Institutional U.S. Government Money Market Fund, Premier Class | 15,247 |
| 15,247 |
|
TOTAL TEMPORARY CASH INVESTMENTS
(Cost $33,738,889) | | 33,738,889 |
|
TOTAL INVESTMENT SECURITIES — 100.5%
(Cost $842,179,612) | | 1,052,704,517 |
|
| OTHER ASSETS AND LIABILITIES — (0.5)% | | (5,016,229 | ) |
| TOTAL NET ASSETS — 100.0% | | $ | 1,047,688,288 |
|
|
| | | | | | | | |
| FORWARD FOREIGN CURRENCY EXCHANGE CONTRACTS |
| Currency Purchased | Currency Sold | Counterparty | Settlement Date | Unrealized Appreciation
(Depreciation) |
| USD | 15,048,414 | CAD | 20,108,811 | Morgan Stanley | 6/30/17 | $ | (90,988 | ) |
| USD | 10,612,968 | EUR | 9,739,706 | UBS AG | 6/30/17 | 179,346 |
|
| USD | 5,766,985 | JPY | 633,725,339 | Credit Suisse AG | 6/30/17 | 54,945 |
|
| USD | 213,913 | JPY | 23,749,333 | Credit Suisse AG | 6/30/17 | (150) |
|
| | | | | | | $ | 143,153 |
|
|
| | |
| NOTES TO SCHEDULE OF INVESTMENTS |
| ADR | - | American Depositary Receipt |
| CAD | - | Canadian Dollar |
| EUR | - | Euro |
| JPY | - | Japanese Yen |
| USD | - | United States Dollar |
See Notes to Financial Statements.
|
|
| Statement of Assets and Liabilities |
|
| | | |
| MARCH 31, 2017 | |
| Assets | |
| Investment securities, at value (cost of $842,179,612) | $ | 1,052,704,517 |
|
| Foreign currency holdings, at value (cost of $24,465) | 19,624 |
|
| Receivable for investments sold | 3,191,676 |
|
| Receivable for capital shares sold | 40,014 |
|
| Unrealized appreciation on forward foreign currency exchange contracts | 234,291 |
|
| Dividends and interest receivable | 1,582,548 |
|
| | 1,057,772,670 |
|
| | |
| Liabilities | |
| Payable for investments purchased | 6,907,337 |
|
| Payable for capital shares redeemed | 2,420,645 |
|
| Unrealized depreciation on forward foreign currency exchange contracts | 91,138 |
|
| Accrued management fees | 665,262 |
|
| | 10,084,382 |
|
| | |
| Net Assets | $ | 1,047,688,288 |
|
| | |
| Net Assets Consist of: | |
| Capital (par value and paid-in surplus) | $ | 821,248,557 |
|
| Undistributed net investment income | 142,852 |
|
| Undistributed net realized gain | 15,632,743 |
|
| Net unrealized appreciation | 210,664,136 |
|
| | $ | 1,047,688,288 |
|
|
| | | | | |
| | Net Assets | Shares Outstanding | Net Asset Value Per Share |
| Institutional Class, $0.01 Par Value |
| $935,804,205 |
| 67,884,194 | $13.79 |
| R6 Class, $0.01 Par Value |
| $111,884,083 |
| 8,117,959 | $13.78 |
See Notes to Financial Statements.
|
| | | |
| YEAR ENDED MARCH 31, 2017 | |
| Investment Income (Loss) | |
| Income: | |
| Dividends (net of foreign taxes withheld of $80,078) | $ | 22,799,930 |
|
| Interest | 28,227 |
|
| | 22,828,157 |
|
| | |
| Expenses: | |
| Management fees | 7,704,002 |
|
| Directors' fees and expenses | 30,208 |
|
| Other expenses | 1,473 |
|
| | 7,735,683 |
|
| Fees waived | (245,933 | ) |
| | 7,489,750 |
|
| | |
| Net investment income (loss) | 15,338,407 |
|
| | |
| Realized and Unrealized Gain (Loss) | |
| Net realized gain (loss) on: | |
| Investment transactions | 66,877,187 |
|
| Foreign currency transactions | 915,422 |
|
| | 67,792,609 |
|
| | |
| Change in net unrealized appreciation (depreciation) on: | |
| Investments | 104,124,499 |
|
| Translation of assets and liabilities in foreign currencies | 500,527 |
|
| | 104,625,026 |
|
| | |
| Net realized and unrealized gain (loss) | 172,417,635 |
|
| | |
| Net Increase (Decrease) in Net Assets Resulting from Operations | $ | 187,756,042 |
|
See Notes to Financial Statements.
|
|
| Statement of Changes in Net Assets |
|
| | | | | | |
| YEARS ENDED MARCH 31, 2017 AND MARCH 31, 2016 |
| Increase (Decrease) in Net Assets | March 31, 2017 | March 31, 2016 |
| Operations | | |
| Net investment income (loss) | $ | 15,338,407 |
| $ | 11,860,679 |
|
| Net realized gain (loss) | 67,792,609 |
| 20,654,863 |
|
| Change in net unrealized appreciation (depreciation) | 104,625,026 |
| (7,764,105) |
|
| Net increase (decrease) in net assets resulting from operations | 187,756,042 |
| 24,751,437 |
|
| | | |
| Distributions to Shareholders | | |
| From net investment income: | | |
| Institutional Class | (14,789,427) |
| (11,382,727) |
|
| R6 Class | (1,637,258) |
| (740,342) |
|
| From net realized gains: | | |
| Institutional Class | (29,600,703 | ) | (57,865,146) |
|
| R6 Class | (3,155,941 | ) | (3,471,435) |
|
| Decrease in net assets from distributions | (49,183,329) |
| (73,459,650) |
|
| | | |
| Capital Share Transactions | | |
| Net increase (decrease) in net assets from capital share transactions (Note 5) | 6,724,385 |
| 155,738,979 |
|
| | | |
| Net increase (decrease) in net assets | 145,297,098 |
| 107,030,766 |
|
| | | |
| Net Assets | | |
| Beginning of period | 902,391,190 |
| 795,360,424 |
|
| End of period | $ | 1,047,688,288 |
| $ | 902,391,190 |
|
| | | |
| Undistributed net investment income | $ | 142,852 |
| $ | 1,564,061 |
|
See Notes to Financial Statements.
|
|
| Notes to Financial Statements |
MARCH 31, 2017
1. Organization
American Century Capital Portfolios, Inc. (the corporation) is registered under the Investment Company Act of 1940, as amended (the 1940 Act), as an open-end management investment company and is organized as a Maryland corporation. NT Mid Cap Value Fund (the fund) is one fund in a series issued by the corporation. The fund’s investment objective is to seek long-term capital growth. Income is a secondary objective. The fund is not permitted to invest in securities issued by companies assigned the Global Industry Classification Standard for the tobacco industry. The fund offers the Institutional Class and the R6 Class.
2. Significant Accounting Policies
The following is a summary of significant accounting policies consistently followed by the fund in preparation of its financial statements. The fund is an investment company and follows accounting and reporting guidance in accordance with accounting principles generally accepted in the United States of America. This may require management to make certain estimates and assumptions at the date of the financial statements. Actual results could differ from these estimates. Management evaluated the impact of events or transactions occurring through the date the financial statements were issued that would merit recognition or disclosure.
Investment Valuations — The fund determines the fair value of its investments and computes its net asset value per share at the close of regular trading (usually 4 p.m. Eastern time) on the New York Stock Exchange (NYSE) on each day the NYSE is open. The Board of Directors has adopted valuation policies and procedures to guide the investment advisor in the fund’s investment valuation process and to provide methodologies for the oversight of the fund’s pricing function.
Equity securities that are listed or traded on a domestic securities exchange are valued at the last reported sales price or at the official closing price as provided by the exchange. Equity securities traded on foreign securities exchanges are generally valued at the closing price of such securities on the exchange where primarily traded or at the close of the NYSE, if that is earlier. If no last sales price is reported, or if local convention or regulation so provides, the mean of the latest bid and asked prices may be used. Securities traded over-the-counter are valued at the mean of the latest bid and asked prices, the last sales price, or the official closing price. Equity securities initially expressed in local currencies are translated into U.S. dollars at the mean of the appropriate currency exchange rate at the close of the NYSE as provided by an independent pricing service.
Open-end management investment companies are valued at the reported net asset value per share. Repurchase agreements are valued at cost, which approximates fair value. Forward foreign currency exchange contracts are valued at the mean of the appropriate forward exchange rate at the close of the NYSE as provided by an independent pricing service.
If the fund determines that the market price for an investment is not readily available or the valuation methods mentioned above do not reflect an investment’s fair value, such investment is valued as determined in good faith by the Board of Directors or its delegate, in accordance with policies and procedures adopted by the Board of Directors. In its determination of fair value, the fund may review several factors including, but not limited to, market information regarding the specific investment or comparable investments and correlation with other investment types, futures indices or general market indicators. Circumstances that may cause the fund to use these procedures to value an investment include, but are not limited to: an investment has been declared in default or is distressed; trading in a security has been suspended during the trading day or a security is not actively trading on its principal exchange; prices received from a regular pricing source are deemed unreliable; or there is a foreign market holiday and no trading occurred.
The fund monitors for significant events occurring after the close of an investment’s primary exchange but before the fund’s net asset value per share is determined. Significant events may include, but are not limited to: corporate announcements and transactions; governmental action and political unrest that could impact a specific investment or an investment sector; or armed conflicts, natural disasters and similar events that could affect investments in a specific country or region. The fund also monitors for significant fluctuations between domestic and foreign markets, as evidenced by the U.S. market or such other indicators that the Board of
Directors, or its delegate, deems appropriate. If significant fluctuations in foreign markets are identified, the fund may apply a model-derived factor to the closing price of equity securities traded on foreign securities exchanges. The factor is based on observable market data as provided by an independent pricing service.
Security Transactions — Security transactions are accounted for as of the trade date. Net realized gains and losses are determined on the identified cost basis, which is also used for federal income tax purposes.
Investment Income — Dividend income less foreign taxes withheld, if any, is recorded as of the ex-dividend date. Distributions received on securities that represent a return of capital or long-term capital gain are recorded as a reduction of cost of investments and/or as a realized gain. The fund may estimate the components of distributions received that may be considered nontaxable distributions or long-term capital gain distributions for income tax purposes. Interest income is recorded on the accrual basis and includes accretion of discounts and amortization of premiums.
Foreign Currency Translations — All assets and liabilities initially expressed in foreign currencies are translated into U.S. dollars at prevailing exchange rates at period end. The fund may enter into spot foreign currency exchange contracts to facilitate transactions denominated in a foreign currency. Purchases and sales of investment securities, dividend and interest income, spot foreign currency exchange contracts, and expenses are translated at the rates of exchange prevailing on the respective dates of such transactions. Net realized and unrealized foreign currency exchange gains or losses related to investment securities are a component of net realized gain (loss) on investment transactions and change in net unrealized appreciation (depreciation) on investments, respectively.
Repurchase Agreements — The fund may enter into repurchase agreements with institutions that American Century Investment Management, Inc. (ACIM) (the investment advisor) has determined are creditworthy pursuant to criteria adopted by the Board of Directors. The fund requires that the collateral, represented by securities, received in a repurchase transaction be transferred to the custodian in a manner sufficient to enable the fund to obtain those securities in the event of a default under the repurchase agreement. ACIM monitors, on a daily basis, the securities transferred to ensure the value, including accrued interest, of the securities under each repurchase agreement is equal to or greater than amounts owed to the fund under each repurchase agreement.
Joint Trading Account — Pursuant to an Exemptive Order issued by the Securities and Exchange Commission, the fund, along with certain other funds in the American Century Investments family of funds, may transfer uninvested cash balances into a joint trading account. These balances are invested in one or more repurchase agreements that are collateralized by U.S. Treasury or Agency obligations.
Income Tax Status — It is the fund’s policy to distribute substantially all net investment income and net realized gains to shareholders and to otherwise qualify as a regulated investment company under provisions of the Internal Revenue Code. Accordingly, no provision has been made for income taxes. The fund files U.S. federal, state, local and non-U.S. tax returns as applicable. The fund's tax returns are subject to examination by the relevant taxing authority until expiration of the applicable statute of limitations, which is generally three years from the date of filing but can be longer in certain jurisdictions. At this time, management believes there are no uncertain tax positions which, based on their technical merit, would not be sustained upon examination and for which it is reasonably possible that the total amounts of unrecognized tax benefits will significantly change in the next twelve months.
Multiple Class — All shares of the fund represent an equal pro rata interest in the net assets of the class to which such shares belong, and have identical voting, dividend, liquidation and other rights and the same terms and conditions, except for class specific expenses and exclusive rights to vote on matters affecting only individual classes. Income, non-class specific expenses, and realized and unrealized capital gains and losses of the fund are allocated to each class of shares based on their relative net assets.
Distributions to Shareholders — Distributions from net investment income, if any, are generally declared and paid quarterly. Distributions from net realized gains, if any, are generally declared and paid annually.
Indemnifications — Under the corporation’s organizational documents, its officers and directors are indemnified against certain liabilities arising out of the performance of their duties to the fund. In addition, in the normal course of business, the fund enters into contracts that provide general indemnifications. The maximum exposure under these arrangements is unknown as this would involve future claims that may be made against a fund. The risk of material loss from such claims is considered by management to be remote.
3. Fees and Transactions with Related Parties
Certain officers and directors of the corporation are also officers and/or directors of American Century Companies, Inc. (ACC). The corporation’s investment advisor, ACIM, the corporation's distributor, American Century Investment Services, Inc., and the corporation’s transfer agent, American Century Services, LLC, are wholly owned, directly or indirectly, by ACC. Various funds issued by American Century Asset Allocation Portfolios, Inc. own, in aggregate, 100% of the shares of the fund. Related parties do not invest in the fund for the purpose of exercising management or control.
Management Fees — The corporation has entered into a management agreement with ACIM, under which ACIM provides the fund with investment advisory and management services in exchange for a single, unified management fee (the fee) per class. The agreement provides that all expenses of managing and operating the fund, except distribution and service fees, brokerage expenses, taxes, interest, fees and expenses of the independent directors (including legal counsel fees), and extraordinary expenses, will be paid by ACIM. The fee is computed and accrued daily based on each class's daily net assets and paid monthly in arrears. The difference in the fee among the classes is a result of their separate arrangements for shareholder services. It is not the result of any difference in advisory or custodial fees or other expenses related to the management of the fund’s assets, which do not vary by class. The annual management fee is 0.80% for the Institutional Class and 0.65% for the R6 Class. From April 1, 2016 through July 31, 2016, the investment advisor agreed to waive 0.05% of the fund's management fee for assets over $7 billion. This fee waiver was determined by applying a formula that takes into account the fund's assets as well as certain assets, if any, of other clients of the investment advisor outside the American Century Investments family of funds (such as subadvised funds and separate accounts) that have very similar investment teams and investment strategies (strategy assets). The strategy assets of the fund also include the assets of Mid Cap Value Fund, one fund in a series issued by the corporation. Effective August 1, 2016, the investment advisor agreed to waive 0.03% of the fund's management fee. The investment advisor expects this waiver to continue until July 31, 2017, and cannot terminate it prior to such date without the approval of the Board of Directors. The total amount of the waiver for each class for the year ended March 31, 2017 was $223,963 for the Institutional Class and $21,970 for the R6 Class. The effective annual management fee after waiver for each class for the year ended March 31, 2017 was 0.78% for the Institutional Class and 0.63% for the R6 Class.
Directors' Fees and Expenses — The Board of Directors is responsible for overseeing the investment advisor’s management and operations of the fund. The directors receive detailed information about the fund and its investment advisor regularly throughout the year, and meet at least quarterly with management of the investment advisor to review reports about fund operations. The fund’s officers do not receive compensation from the fund.
Interfund Transactions — The fund may enter into security transactions with other American Century Investments funds and other client accounts of the investment advisor, in accordance with the 1940 Act rules and procedures adopted by the Board of Directors. The rules and procedures require, among other things, that these transactions be effected at the independent current market price of the security. During the period, the interfund purchases and sales were $3,232,953 and $4,335,816, respectively. The effect of interfund transactions on the Statement of Operations was $859,776 in net realized gain (loss) on investment transactions.
4. Investment Transactions
Purchases and sales of investment securities, excluding short-term investments, for the year ended March 31, 2017 were $574,476,337 and $614,215,181, respectively.
5. Capital Share Transactions
Transactions in shares of the fund were as follows:
|
| | | | | | | | | | |
| | Year ended
March 31, 2017 | Year ended
March 31, 2016 |
| | Shares | Amount | Shares | Amount |
| Institutional Class/Shares Authorized | 525,000,000 |
| | 525,000,000 |
| |
| Sold | 4,361,165 |
| $ | 57,191,676 |
| 12,938,971 |
| $ | 153,080,761 |
|
| Issued in reinvestment of distributions | 3,292,025 |
| 44,390,130 |
| 5,979,048 |
| 69,247,873 |
|
| Redeemed | (10,151,164 | ) | (135,939,215 | ) | (8,002,791 | ) | (95,399,767 | ) |
| | (2,497,974 | ) | (34,357,409 | ) | 10,915,228 |
| 126,928,867 |
|
| R6 Class/Shares Authorized | 50,000,000 |
| | 50,000,000 |
| |
| Sold | 3,702,300 |
| 48,692,735 |
| 2,538,193 |
| 30,609,522 |
|
| Issued in reinvestment of distributions | 355,086 |
| 4,793,199 |
| 363,563 |
| 4,211,777 |
|
| Redeemed | (928,328 | ) | (12,404,140 | ) | (499,932 | ) | (6,011,187 | ) |
| | 3,129,058 |
| 41,081,794 |
| 2,401,824 |
| 28,810,112 |
|
| Net increase (decrease) | 631,084 |
| $ | 6,724,385 |
| 13,317,052 |
| $ | 155,738,979 |
|
6. Fair Value Measurements
The fund’s investments valuation process is based on several considerations and may use multiple inputs to determine the fair value of the investments held by the fund. In conformity with accounting principles generally accepted in the United States of America, the inputs used to determine a valuation are classified into three broad levels.
| |
| • | Level 1 valuation inputs consist of unadjusted quoted prices in an active market for identical investments. |
| |
| • | Level 2 valuation inputs consist of direct or indirect observable market data (including quoted prices for comparable investments, evaluations of subsequent market events, interest rates, prepayment speeds, credit risk, etc.). These inputs also consist of quoted prices for identical investments initially expressed in local currencies that are adjusted through translation into U.S. dollars. |
| |
| • | Level 3 valuation inputs consist of unobservable data (including a fund’s own assumptions). |
The level classification is based on the lowest level input that is significant to the fair valuation measurement. The valuation inputs are not necessarily an indication of the risks associated with investing in these securities or other financial instruments. There were no significant transfers between levels during the period.
The following is a summary of the level classifications as of period end. The Schedule of Investments provides additional information on the fund’s portfolio holdings.
|
| | | | | | | | |
| | Level 1 | Level 2 | Level 3 |
| Assets | | | |
| Investment Securities | | | |
| Common Stocks | $ | 966,390,387 |
| $ | 29,575,724 |
| — |
|
| Exchange-Traded Funds | 22,999,517 |
| — |
| — |
|
| Temporary Cash Investments | 15,247 |
| 33,723,642 |
| — |
|
| | $ | 989,405,151 |
| $ | 63,299,366 |
| — |
|
| Other Financial Instruments | | | |
| Forward Foreign Currency Exchange Contracts | — |
| $ | 234,291 |
| — |
|
| | | | |
| Liabilities | | | |
| Other Financial Instruments | | | |
| Forward Foreign Currency Exchange Contracts | — |
| $ | 91,138 |
| — |
|
7. Derivative Instruments
Foreign Currency Risk — The fund is subject to foreign currency exchange rate risk in the normal course of pursuing its investment objectives. The value of foreign investments held by a fund may be significantly affected by changes in foreign currency exchange rates. The dollar value of a foreign security generally decreases when the value of the dollar rises against the foreign currency in which the security is denominated and tends to increase when the value of the dollar declines against such foreign currency. A fund may enter into forward foreign currency exchange contracts to reduce a fund's exposure to foreign currency exchange rate fluctuations. The net U.S. dollar value of foreign currency underlying all contractual commitments held by a fund and the resulting unrealized appreciation or depreciation are determined daily. Realized gain or loss is recorded upon the termination of the contract. Net realized and unrealized gains or losses occurring during the holding period of forward foreign currency exchange contracts are a component of net realized gain (loss) on foreign currency transactions and change in net unrealized appreciation (depreciation) on translation of assets and liabilities in foreign currencies, respectively. A fund bears the risk of an unfavorable change in the foreign currency exchange rate underlying the forward contract. Additionally, losses, up to the fair value, may arise if the counterparties do not perform under the contract terms. The fund's average U.S. dollar exposure to foreign currency risk derivative instruments held during the period was $36,035,679.
The value of foreign currency risk derivative instruments as of March 31, 2017, is disclosed on the Statement of Assets and Liabilities as an asset of $234,291 in unrealized appreciation on forward foreign currency exchange contracts and a liability of $91,138 in unrealized depreciation on forward foreign currency exchange contracts. For the year ended March 31, 2017, the effect of foreign currency risk derivative instruments on the Statement of Operations was $912,552 in net realized gain (loss) on foreign currency transactions and $504,032 in change in net unrealized appreciation (depreciation) on translation of assets and liabilities in foreign currencies.
8. Federal Tax Information
The tax character of distributions paid during the years ended March 31, 2017 and March 31, 2016 were as follows:
|
| | | | | | |
| | 2017 | 2016 |
| Distributions Paid From | | |
| Ordinary income | $ | 16,568,951 |
| $ | 26,606,451 |
|
| Long-term capital gains | $ | 32,614,378 |
| $ | 46,853,199 |
|
The book-basis character of distributions made during the year from net investment income or net realized gains may differ from their ultimate characterization for federal income tax purposes. These differences reflect the differing character of certain income items and net realized gains and losses for financial statement and tax purposes, and may result in reclassification among certain capital accounts on the financial statements.
As of March 31, 2017, the federal tax cost of investments and the components of distributable earnings on a tax-basis were as follows:
|
| | | |
| Federal tax cost of investments | $ | 856,066,187 |
|
| Gross tax appreciation of investments | $ | 208,573,489 |
|
| Gross tax depreciation of investments | (11,935,159 | ) |
| Net tax appreciation (depreciation) of investments | 196,638,330 |
|
| Net tax appreciation (depreciation) on derivatives and translation of assets and liabilities in foreign currencies | (3,922 | ) |
| Net tax appreciation (depreciation) | $ | 196,634,408 |
|
| Undistributed ordinary income | $ | 6,815,491 |
|
| Accumulated long-term gains | $ | 22,989,832 |
|
The difference between book-basis and tax-basis unrealized appreciation (depreciation) is attributable primarily to the tax deferral of losses on wash sales.
9. Recently Issued Accounting Guidance
In October 2016, the Securities and Exchange Commission adopted new rules and forms as well as amendments to its rules and forms to modernize the reporting and disclosure of information by registered investment companies. The amendments to Regulation S-X will require standardized, enhanced disclosure about derivatives in investment company financial statements, as well as other provisions. Compliance with the amendments is effective on August 1, 2017. Management is currently evaluating the impact that adopting the amendments will have on the financial statement disclosures.
|
| | | | | | | | | | | | | | | | | |
| For a Share Outstanding Throughout the Years Ended March 31 (except as noted) |
| Per-Share Data | | | | | | | Ratios and Supplemental Data |
| | | Income From Investment Operations: | Distributions From: | | | Ratio to Average Net Assets of: | |
| | Net Asset
Value,
Beginning
of Period | Net
Investment
Income
(Loss)(1) | Net
Realized
and
Unrealized
Gain (Loss) | Total From
Investment
Operations | Net
Investment
Income | Net
Realized
Gains | Total
Distributions | Net Asset
Value,
End
of Period | Total
Return(2) | Operating
Expenses | Operating
Expenses
(before
expense
waiver) | Net
Investment
Income
(Loss) | Net Investment Income (Loss) (before expense waiver) | Portfolio
Turnover
Rate | Net
Assets,
End of
Period (in thousands) |
| Institutional Class | | | | | | | | | | | | | | |
| 2017 | $11.97 | 0.20 | 2.30 | 2.50 | (0.22) | (0.46) | (0.68) | $13.79 | 20.98% | 0.78% | 0.80% | 1.55% | 1.53% | 60% |
| $935,804 |
|
| 2016 | $12.82 | 0.17 | 0.05 | 0.22 | (0.17) | (0.90) | (1.07) | $11.97 | 2.13% | 0.80% | 0.81% | 1.39% | 1.38% | 67% |
| $842,671 |
|
| 2015 | $12.62 | 0.18 | 1.56 | 1.74 | (0.17) | (1.37) | (1.54) | $12.82 | 14.05% | 0.80% | 0.80% | 1.37% | 1.37% | 67% |
| $762,209 |
|
| 2014 | $11.41 | 0.19 | 2.15 | 2.34 | (0.18) | (0.95) | (1.13) | $12.62 | 21.19% | 0.80% | 0.80% | 1.55% | 1.55% | 69% |
| $596,655 |
|
| 2013 | $10.16 | 0.19 | 1.59 | 1.78 | (0.22) | (0.31) | (0.53) | $11.41 | 18.32% | 0.80% | 0.80% | 1.89% | 1.89% | 71% |
| $423,477 |
|
| R6 Class | | | | | | | | | | | | | | |
| 2017 | $11.97 | 0.22 | 2.29 | 2.51 | (0.24) | (0.46) | (0.70) | $13.78 | 21.17% | 0.63% | 0.65% | 1.70% | 1.68% | 60% |
| $111,884 |
|
| 2016 | $12.81 | 0.19 | 0.06 | 0.25 | (0.19) | (0.90) | (1.09) | $11.97 | 2.36% | 0.65% | 0.66% | 1.54% | 1.53% | 67% |
| $59,721 |
|
| 2015 | $12.62 | 0.20 | 1.55 | 1.75 | (0.19) | (1.37) | (1.56) | $12.81 | 14.14% | 0.65% | 0.65% | 1.52% | 1.52% | 67% |
| $33,151 |
|
2014(3) | $12.30 | 0.14 | 1.26 | 1.40 | (0.13) | (0.95) | (1.08) | $12.62 | 11.89% | 0.65%(4) | 0.65%(4) | 1.70%(4) | 1.70%(4) | 69%(5) |
| $7,546 |
|
|
|
| Notes to Financial Highlights |
(2) Total returns are calculated based on the net asset value of the last business day. Total returns for periods less than one year are not annualized.
(3) July 26, 2013 (commencement of sale) through March 31, 2014.
(4) Annualized.
(5) Portfolio turnover is calculated at the fund level. Percentage indicated was calculated for the year ended March 31, 2014.
See Notes to Financial Statements.
|
|
| Report of Independent Registered Public Accounting Firm |
To the Board of Directors and Shareholders of American Century Capital Portfolios, Inc.:
We have audited the accompanying statement of assets and liabilities, including the schedule of investments, of NT Mid Cap Value Fund (the “Fund”), one of the funds constituting American Century Capital Portfolios, Inc., as of March 31, 2017, and the related statement of operations for the year then ended, the statements of changes in net assets for each of the two years in the period then ended, and the financial highlights for each of the periods presented. These financial statements and financial highlights are the responsibility of the Fund's management. Our responsibility is to express an opinion on these financial statements and financial highlights based on our audits.
We conducted our audits in accordance with the standards of the Public Company Accounting Oversight Board (United States). Those standards require that we plan and perform the audit to obtain reasonable assurance about whether the financial statements and financial highlights are free of material misstatement. The Fund is not required to have, nor were we engaged to perform, an audit of its internal control over financial reporting. Our audits included consideration of internal control over financial reporting as a basis for designing audit procedures that are appropriate in the circumstances, but not for the purpose of expressing an opinion on the effectiveness of the Fund's internal control over financial reporting. Accordingly, we express no such opinion. An audit also includes examining, on a test basis, evidence supporting the amounts and disclosures in the financial statements, assessing the accounting principles used and significant estimates made by management, as well as evaluating the overall financial statement presentation. Our procedures included confirmation of securities owned as of March 31, 2017, by correspondence with the custodian and brokers; when replies were not received from brokers, we performed other auditing procedures. We believe that our audits provide a reasonable basis for our opinion.
In our opinion, the financial statements and financial highlights referred to above present fairly, in all material respects, the financial position of NT Mid Cap Value Fund of American Century Capital Portfolios, Inc. as of March 31, 2017, the results of its operations for the year then ended, the changes in its net assets for each of the two years in the period then ended, and the financial highlights for each of the periods presented, in conformity with accounting principles generally accepted in the United States of America.
DELOITTE & TOUCHE LLP
Kansas City, Missouri May 16, 2017
The Board of Directors
The individuals listed below serve as directors of the funds. Each director will continue to serve in this capacity until death, retirement, resignation or removal from office. The board has adopted a mandatory retirement age for directors who are not “interested persons,” as that term is defined in the Investment Company Act (independent directors). Independent directors shall retire by December 31 of the year in which they reach their 75th birthday.
Mr. Thomas is an “interested person” because he currently serves as President and Chief Executive Officer of American Century Companies, Inc. (ACC), the parent company of American Century Investment Management, Inc. (ACIM or the advisor). The other directors (more than three-fourths of the total number) are independent. They are not employees, directors or officers of, and have no financial interest in, ACC or any of its wholly owned, direct or indirect, subsidiaries, including ACIM, American Century Investment Services, Inc. (ACIS) and American Century Services, LLC (ACS), and they do not have any other affiliations, positions or relationships that would cause them to be considered “interested persons” under the Investment Company Act. The directors serve in this capacity for seven (in the case of Mr. Thomas, 15) registered investment companies in the American Century Investments family of funds.
The following table presents additional information about the directors. The mailing address for each director is 4500 Main Street, Kansas City, Missouri 64111.
|
| | | | | |
Name
(Year of Birth) | Position(s) Held with Funds | Length of Time Served | Principal Occupation(s) During Past 5 Years | Number of American Century Portfolios Overseen by Director | Other Directorships Held During Past 5 Years |
| Independent Directors |
|
|
| Thomas W. Bunn (1953) | Advisory Board Director | Since 2017 | Retired | 81 | SquareTwo Financial; Barings (formerly Babson Capital Funds Trust) (2013 to 2016) |
Barry Fink
(1955) | Director | Since 2012 (independent since 2016) | Retired; Executive Vice President, ACC (2007 to 2013); President, ACS (2007 to 2013); Chief Operating Officer, ACC (2007 to 2012) | 81 | None |
Andrea C. Hall
(1945) | Director | Since 1997 | Retired | 81 | None |
Jan M. Lewis
(1957) | Director | Since 2011 | Retired; President and Chief Executive Officer, Catholic Charities of Northeast Kansas (human services organization) (2006 to 2013) | 81 | None |
James A. Olson
(1942) | Director and Chairman of the Board | Since 2007 (Chairman since 2014) | Member, Plaza Belmont LLC (private equity fund manager) (1999 to present) | 81 | Saia, Inc. (2002 to 2012) and EPR Properties (2003 to 2013) |
|
| | | | | |
Name
(Year of Birth) | Position(s) Held with Funds | Length of Time Served | Principal Occupation(s) During Past 5 Years | Number of American Century Portfolios Overseen by Director | Other Directorships Held During Past 5 Years |
| Independent Directors |
|
|
M. Jeannine Strandjord
(1945) | Director | Since 1994 | Retired | 81 | Euronet Worldwide Inc.; MGP Ingredients, Inc.; and DST Systems Inc. (1996 to 2012) |
John R. Whitten
(1946) | Director | Since 2008 | Retired | 81 | Rudolph Technologies, Inc. |
Stephen E. Yates
(1948) | Director | Since 2012 | Retired | 81 | None |
| Interested Director |
|
|
Jonathan S. Thomas
(1963) | Director and President | Since 2007 | President and Chief Executive Officer, ACC (2007 to present). Also serves as Chief Executive Officer, ACS; Executive Vice President, ACIM; Director, ACC, ACIM and other ACC subsidiaries | 126 | BioMed Valley Discoveries, Inc. |
The Statement of Additional Information has additional information about the fund's directors and is available without charge, upon request, by calling 1-800-345-2021.
Officers
The following table presents certain information about the executive officers of the funds. Each officer serves as an officer for each of the 15 investment companies in the American Century family of funds, unless otherwise noted. No officer is compensated for his or her service as an officer of the funds. The listed officers are interested persons of the funds and are appointed or re-appointed on an annual basis. The mailing address for each officer listed below is 4500 Main Street, Kansas City, Missouri 64111.
|
| | |
Name
(Year of Birth) | Offices with the Funds | Principal Occupation(s) During the Past Five Years |
Jonathan S. Thomas
(1963) | Director and President since 2007 | President and Chief Executive Officer, ACC (2007 to present). Also serves as Chief Executive Officer, ACS; Executive Vice President, ACIM; Director, ACC, ACIM and other ACC subsidiaries |
Amy D. Shelton
(1964) | Chief Compliance Officer and Vice President since 2014 | Chief Compliance Officer, American Century funds, (2014 to present); Chief Compliance Officer, ACIM (2014 to present); Chief Compliance Officer, ACIS (2009 to present); Vice President, Client Interactions and Marketing, ACIS (2013 to 2014); Director, Client Interactions and Marketing, ACIS (2007 to 2013). Also serves as Vice President, ACIS |
Charles A. Etherington
(1957) | General Counsel since 2007 and Senior Vice President since 2006 | Attorney, ACC (1994 to present); Vice President, ACC (2005 to present); General Counsel, ACC (2007 to present). Also serves as General Counsel, ACIM, ACS, ACIS and other ACC subsidiaries; and Senior Vice President, ACIM and ACS |
C. Jean Wade
(1964) | Vice President,Treasurer and Chief Financial Officer since 2012 | Vice President, ACS (2000 to present) |
Robert J. Leach
(1966) | Vice President since 2006 and Assistant Treasurer since 2012 | Vice President, ACS (2000 to present) |
David H. Reinmiller
(1963) | Vice President since 2000 | Attorney, ACC (1994 to present); Associate General Counsel, ACC (2001 to present). Also serves as Vice President, ACIM and ACS |
Ward D. Stauffer
(1960) | Secretary since 2005 | Attorney, ACC (2003 to present) |
Retirement Account Information
As required by law, distributions you receive from certain IRAs are subject to federal income tax withholding, unless you elect not to have withholding apply. Tax will be withheld on the total amount withdrawn even though you may be receiving amounts that are not subject to withholding, such as nondeductible contributions. In such case, excess amounts of withholding could occur. You may adjust your withholding election so that a greater or lesser amount will be withheld.
If you don’t want us to withhold on this amount, you must notify us to not withhold the federal income tax. You may notify us in writing or in certain situations by telephone or through other electronic means. For systematic withdrawals, your withholding election will remain in effect until revoked or changed by filing a new election. You have the right to revoke your election at any time.
Remember, even if you elect not to have income tax withheld, you are liable for paying income tax on the taxable portion of your withdrawal. If you elect not to have income tax withheld or you don’t have enough income tax withheld, you may be responsible for payment of estimated tax. You may incur penalties under the estimated tax rules if your withholding and estimated tax payments are not sufficient. You can reduce or defer the income tax on a distribution by directly or indirectly rolling such distribution over to another IRA or eligible plan. You should consult your tax advisor for additional information.
State tax will be withheld if, at the time of your distribution, your address is within one of the mandatory withholding states and you have federal income tax withheld (or as otherwise required by state law). State taxes will be withheld from your distribution in accordance with the respective state rules.
Distributions you receive from 403(b), 457 and qualified plans are subject to special tax and withholding rules. Your plan administrator or plan sponsor is required to provide you with a special tax notice explaining those rules at the time you request a distribution. If applicable, federal and/or state taxes may be withheld from your distribution amount.
Proxy Voting Policies
A description of the policies that the fund's investment advisor uses in exercising the voting rights associated with the securities purchased and/or held by the fund is available without charge, upon request, by calling 1-800-345-2021. It is also available on the "About Us" page of American Century Investments’ website at americancentury.com and on the Securities and Exchange Commission’s website at sec.gov. Information regarding how the investment advisor voted proxies relating to portfolio securities during the most recent 12-month period ended June 30 is available on the "About Us" page at americancentury.com. It is also available at sec.gov.
Quarterly Portfolio Disclosure
The fund files its complete schedule of portfolio holdings with the Securities and Exchange Commission (SEC) for the first and third quarters of each fiscal year on Form N-Q. The fund’s Forms N-Q are available on the SEC’s website at sec.gov, and may be reviewed and copied at the SEC’s Public Reference Room in Washington, DC. Information on the operation of the Public Reference Room may be obtained by calling 1-800-SEC-0330. The fund also makes its complete schedule of portfolio holdings for the most recent quarter of its fiscal year available on its website at americancentury.com and, upon request, by calling 1-800-345-2021.
Other Tax Information
The following information is provided pursuant to provisions of the Internal Revenue Code.
The fund hereby designates up to the maximum amount allowable as qualified dividend income for the fiscal year ended March 31, 2017.
For corporate taxpayers, the fund hereby designates $14,867,908, or up to the maximum amount allowable, of ordinary income distributions paid during the fiscal year ended March 31, 2017 as qualified for the corporate dividends received deduction.
The fund hereby designates $142,266 as qualified short-term capital gain distributions for purposes of Internal Revenue Code Section 871 for the fiscal year ended March 31, 2017.
The fund hereby designates $32,614,378, or up to the maximum amount allowable, as long-term capital gain distributions (20% rate gain distributions) for the fiscal year ended March 31, 2017.
|
| | |
| |
| | | |
| Contact Us | americancentury.com | |
| Automated Information Line | 1-800-345-8765 | |
| Investor Services Representative | 1-800-345-2021 or 816-531-5575 | |
| Investors Using Advisors | 1-800-378-9878 | |
| Business, Not-For-Profit, Employer-Sponsored Retirement Plans | 1-800-345-3533 | |
| Banks and Trust Companies, Broker-Dealers, Financial Professionals, Insurance Companies | 1-800-345-6488 | |
| Telecommunications Relay Service for the Deaf | 711 | |
| | | |
| American Century Capital Portfolios, Inc. | |
| | | |
Investment Advisor: American Century Investment Management, Inc. Kansas City, Missouri | |
| | | |
| This report and the statements it contains are submitted for the general information of our shareholders. The report is not authorized for distribution to prospective investors unless preceded or accompanied by an effective prospectus. | |
| | | |
©2017 American Century Proprietary Holdings, Inc. All rights reserved.
CL-ANN-92291 1705 | |
|
| |
| | |
| | Annual Report |
| | |
| | March 31, 2017 |
| | |
| | Small Cap Value Fund |
|
| | |
| President’s Letter | 2 |
|
| Performance | 3 |
|
| Portfolio Commentary | |
|
| Fund Characteristics | |
|
| Shareholder Fee Example | |
|
| Schedule of Investments | |
|
| Statement of Assets and Liabilities | |
|
| Statement of Operations | |
|
| Statement of Changes in Net Assets | |
|
| Notes to Financial Statements | |
|
| Financial Highlights | |
|
| Report of Independent Registered Public Accounting Firm | |
|
| Management | |
|
| Additional Information | |
|
Any opinions expressed in this report reflect those of the author as of the date of the report, and do not necessarily represent the opinions of American Century Investments® or any other person in the American Century Investments organization. Any such opinions are subject to change at any time based upon market or other conditions and American Century Investments disclaims any responsibility to update such opinions. These opinions may not be relied upon as investment advice and, because investment decisions made by American Century Investments funds are based on numerous factors, may not be relied upon as an indication of trading intent on behalf of any American Century Investments fund. Security examples are used for representational purposes only and are not intended as recommendations to purchase or sell securities. Performance information for comparative indices and securities is provided to American Century Investments by third party vendors. To the best of American Century Investments’ knowledge, such information is accurate at the time of printing.
Jonathan Thomas
Dear Investor:
Thank you for reviewing this annual report for the period ended March 31, 2017. Annual reports help convey important information about fund returns, including market factors that affected performance during the reporting period. For additional, updated investment and market insights, we encourage you to visit our website, americancentury.com.
Risk-On Rebound From Global Economic Concerns of Early 2016
Stocks, high-yield bonds, and commodities rebounded from severe downturns in early 2016 that were triggered by China’s economic slowdown. Since then, growth conditions in China and the rest of the world have generally improved. For the reporting period, the S&P 500 Index, the Bloomberg Barclays U.S. Corporate High-Yield Bond Index, and the S&P Goldman Sachs Commodities Index returned 17.17%, 16.39%, and 8.45%, respectively. This risk-on rebound also drove government bond yields higher, resulting in declines for indices such as the Bloomberg Barclays U.S. Treasury Bond Index (-1.44%). The broader taxable investment-grade U.S. bond market performed better, but still significantly underperformed stocks; the Bloomberg Barclays U.S. Aggregate Bond Index returned 0.44%.
Investors could thank the world’s major central banks and the “Trump Trade” for the risk-on rebound, which occurred with a backdrop of landmark political events, including Brexit (the U.K. vote to leave the European Union) and Donald Trump’s U.S. presidential election victory. Central bank stimulus helped to propel the markets past China- and Brexit-related volatility, followed by Trump victory-inspired optimism about U.S. growth that further boosted higher-risk markets.
But the Trump Trade could prove to be double edged—investor optimism faded as health care reform stalled in Congress and other U.S. fiscal policy proposals looked like they’d face significant hurdles. Meanwhile, the Federal Reserve raised its interest rate target during the reporting period, and suggested that it might raise rates again and start gradually reducing its balance sheet by the end of 2017. These factors, plus rising inflation and continuing geopolitical risks, could impede further risk-on sentiment. In this unsettled environment, we believe in remaining focused on investment goals, using disciplined, actively managed, risk-aware strategies. We appreciate your continued trust in us.
Sincerely,
Jonathan Thomas
President and Chief Executive Officer
American Century Investments
|
| | | | | | |
| Total Returns as of March 31, 2017 | |
| | | | Average Annual Returns | |
| | Ticker Symbol | 1 year | 5 years | 10 years | Since
Inception | Inception
Date |
| Investor Class | ASVIX | 31.15% | 13.40% | 8.66% | — | 7/31/98 |
| Russell 2000 Value Index | — | 29.37% | 12.54% | 6.09% | — | — |
| Institutional Class | ACVIX | 31.43% | 13.63% | 8.89% | — | 10/26/98 |
| A Class | ACSCX | | | |
| 12/31/99 |
| No sales charge | | 30.82% | 13.12% | 8.39% | — | |
| With sales charge | | 23.25% | 11.80% | 7.75% | — | |
| C Class | ASVNX | 29.78% | 12.25% | — | 11.50% | 3/1/10 |
| R Class | ASVRX | 30.41% | 12.83% | — | 12.08% | 3/1/10 |
| R6 Class | ASVDX | 31.45% | — | — | 11.31% | 7/26/13 |
Average annual returns since inception are presented when ten years of performance history is not available.
Prior to March 1, 2010, the A Class was referred to as the Advisor Class and did not have a front-end sales charge. Performance prior to that date has been adjusted to reflect this charge. Extraordinary performance is attributable in part to unusually favorable market conditions and may not be repeated or consistently achieved in the future.
Sales charges include initial sales charges and contingent deferred sales charges (CDSCs), as applicable. A Class shares have a 5.75% maximum initial sales charge and may be subject to a maximum CDSC of 1.00%. C Class shares redeemed within 12 months of purchase are subject to a maximum CDSC of 1.00%. The SEC requires that mutual funds provide performance information net of maximum sales charges in all cases where charges could be applied.
Data presented reflect past performance. Past performance is no guarantee of future results. Current performance may be higher or lower than the performance shown. Total returns for periods less than one year are not annualized. Investment return and principal value will fluctuate, and redemption value may be more or less than original cost. Data assumes reinvestment of dividends and capital gains, and none of the charts reflect the deduction of taxes that a shareholder would pay on fund distributions or the redemption of fund shares. To obtain performance data current to the most recent month end, please call 1-800-345-2021 or visit americancentury.com. For additional information about the fund, please consult the prospectus.
|
|
| Growth of $10,000 Over 10 Years |
| $10,000 investment made March 31, 2007 |
| Performance for other share classes will vary due to differences in fee structure. |
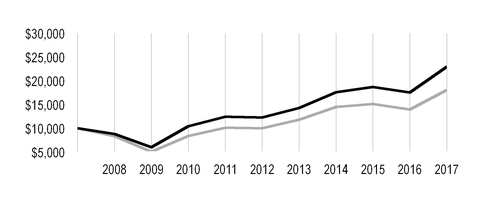
|
| |
| Value on March 31, 2017 |
| | Investor Class — $22,970 |
| |
| | Russell 2000 Value Index — $18,067 |
| |
|
| | | | | |
| Total Annual Fund Operating Expenses |
| Investor Class | Institutional Class | A Class | C Class | R Class | R6 Class |
| 1.26% | 1.06% | 1.51% | 2.26% | 1.76% | 0.91% |
The total annual fund operating expenses shown is as stated in the fund’s prospectus current as of the date of this report. The prospectus may vary from the expense ratio shown elsewhere in this report because it is based on a different time period, includes acquired fund fees and expenses, and, if applicable, does not include fee waivers or expense reimbursements.
Data presented reflect past performance. Past performance is no guarantee of future results. Current performance may be higher or lower than the performance shown. Total returns for periods less than one year are not annualized. Investment return and principal value will fluctuate, and redemption value may be more or less than original cost. Data assumes reinvestment of dividends and capital gains, and none of the charts reflect the deduction of taxes that a shareholder would pay on fund distributions or the redemption of fund shares. To obtain performance data current to the most recent month end, please call 1-800-345-2021 or visit americancentury.com. For additional information about the fund, please consult the prospectus.
Portfolio Managers: Jeff John and Miles Lewis
Performance Summary
Small Cap Value returned 31.15%* for the fiscal year ended March 31, 2017, compared with the 29.37% return of its benchmark, the Russell 2000 Value Index.
Small Cap Value gained during the fiscal year, outperforming its benchmark. Security selection in the financials and industrials sectors, as well as an underweight allocation to utilities stocks, enhanced fund performance. Conversely, stock choices in the health care, energy, and materials sectors weighed on relative returns.
In selecting stocks for the fund, we look for equity securities of smaller companies whose stock price may not reflect the company’s value. We attempt to purchase the stocks of these undervalued companies and hold each stock until the price has increased to, or is higher than, a level we believe more accurately reflects the fair value of the company.
Stock Choices in the Financials Sector Led Returns
Stock selection in the financials sector was the leading contributor to the fund’s twelve-month results, with four of the five top individual security contributors in the sector. Selection among insurers was strong, driven by positions in Endurance Specialty Holdings and Allied World Assurance, which both rallied on acquisition news. Insurance and reinsurance provider Endurance Specialty Holdings announced that it would be acquired by Japan-based Sompo Holdings, while property and casualty insurer Allied World Assurance announced an acquisition by Canada-based Fairfax Financial Holdings. We exited the position in Endurance and significantly trimmed exposure to Allied World after the acquisition news. Security selection in banks also boosted portfolio results, with strong performance from LegacyTexas Financial Group and Texas Capital Bancshares. Banks generally rallied on the outlook for higher interest rates and diminished regulatory costs under President Trump's administration, while these two particular holdings also benefited from higher oil prices, given their loan exposure to companies in the energy sector.
Stock selection in the industrials sector was also a principal contributor. Stock choices were strong across a number of industries, including trading companies and distributors, commercial services and supplies, and professional services. An underweight allocation in the utilities sector also enhanced performance. Utilities underperformed most other sectors in the benchmark in the period.
Health Care Holdings Weighed on Performance
Stock selection in the health care sector detracted from relative returns, led by an overweight allocation in health care providers and services. LifePoint Health, a for-profit hospital group with hospitals in small towns and rural areas, was weak in the period. We have begun to trim exposure to the perpetual acquirer of rural hospitals, which we believe has prioritized M&A activity over operational excellence and is taking on excessive leverage.
| |
| * | All fund returns referenced in this commentary are for Investor Class shares. Performance for other share classes will vary due to differences in fee structure; when Investor Class performance exceeds that of the fund's benchmark, other share classes may not. See page 3 for returns for all share classes. |
Holdings in the energy sector also weighed on returns. Though the portfolio benefited from an underweight allocation to the sector in the period, stock choices in the oil, gas and consumable fuels industry detracted from performance. Selection in the materials sector also weighed on results, with notable underperformance from food and beverage packaging maker Graphic Packaging. The company missed analysts’ expectations in terms of volumes, and earnings guidance has been muted over recent quarters as grocery shoppers’ tastes move away from packaged foods. However, the company has been gaining market share, and we believe it remains well positioned. A performance boost from the portfolio’s overweight in materials partially offset the negative effects of stock selection in the sector.
Portfolio Positioning
At period-end, the portfolio’s largest overweight was in the industrials sector. The portfolio holds a highly diverse mix of industrials companies, including building products companies, distributors, commercial/professional services providers, label manufacturers, and aerospace companies. Materials is an overweight sector where we tend to hold specialized containers and packaging and specialty chemical industries.
The portfolio’s top underweights are utilities, where we maintain no exposure, and real estate. The portfolio has been underweight real estate for a long period of time because it is difficult to find high-quality stocks that are selling at attractive valuations within the sector.
|
| |
| MARCH 31, 2017 |
| Top Ten Holdings | % of net assets |
| Graphic Packaging Holding Co. | 2.6% |
| Capital Bank Financial Corp., Class A | 2.3% |
| Hanover Insurance Group, Inc. (The) | 2.3% |
| BankUnited, Inc. | 2.3% |
| Bank of the Ozarks, Inc. | 2.1% |
| Entravision Communications Corp., Class A | 1.9% |
| Valley National Bancorp | 1.8% |
| CSW Industrials, Inc. | 1.7% |
| Compass Diversified Holdings | 1.7% |
| Silgan Holdings, Inc. | 1.7% |
| | |
| Top Five Industries | % of net assets |
| Banks | 19.6% |
| Insurance | 7.7% |
| Equity Real Estate Investment Trusts (REITs) | 7.6% |
| IT Services | 5.0% |
| Machinery | 4.4% |
| | |
| Types of Investments in Portfolio | % of net assets |
| Common Stocks | 96.5% |
| Convertible Preferred Stocks | 0.7% |
| Total Equity Exposure | 97.2% |
| Temporary Cash Investments | 2.5% |
| Other Assets and Liabilities | 0.3% |
Fund shareholders may incur two types of costs: (1) transaction costs, including sales charges (loads) on purchase payments and redemption/exchange fees; and (2) ongoing costs, including management fees; distribution and service (12b-1) fees; and other fund expenses. This example is intended to help you understand your ongoing costs (in dollars) of investing in your fund and to compare these costs with the ongoing cost of investing in other mutual funds.
The example is based on an investment of $1,000 made at the beginning of the period and held for the entire period from October 1, 2016 to March 31, 2017.
Actual Expenses
The table provides information about actual account values and actual expenses for each class. You may use the information, together with the amount you invested, to estimate the expenses that you paid over the period. First, identify the share class you own. Then simply divide your account value by $1,000 (for example, an $8,600 account value divided by $1,000 = 8.6), then multiply the result by the number under the heading “Expenses Paid During Period” to estimate the expenses you paid on your account during this period.
If you hold Investor Class shares of any American Century Investments fund, or Institutional Class shares of the American Century Diversified Bond Fund, in an American Century Investments account (i.e., not a financial intermediary or retirement plan account), American Century Investments may charge you a $12.50 semiannual account maintenance fee if the value of those shares is less than $10,000. We will redeem shares automatically in one of your accounts to pay the $12.50 fee. In determining your total eligible investment amount, we will include your investments in all personal accounts (including American Century Investments Brokerage accounts) registered under your Social Security number. Personal accounts include individual accounts, joint accounts, UGMA/UTMA accounts, personal trusts, Coverdell Education Savings Accounts and IRAs (including traditional, Roth, Rollover, SEP-, SARSEP- and SIMPLE-IRAs), and certain other retirement accounts. If you have only business, business retirement, employer-sponsored or American Century Investments Brokerage accounts, you are currently not subject to this fee. If you are subject to the Account Maintenance Fee, your account value could be reduced by the fee amount.
Hypothetical Example for Comparison Purposes
The table also provides information about hypothetical account values and hypothetical expenses based on the actual expense ratio of each class of your fund and an assumed rate of return of 5% per year before expenses, which is not the actual return of a fund’s share class. The hypothetical account values and expenses may not be used to estimate the actual ending account balance or expenses you paid for the period. You may use this information to compare the ongoing costs of investing in your fund and other funds. To do so, compare this 5% hypothetical example with the 5% hypothetical examples that appear in the shareholder reports of the other funds.
Please note that the expenses shown in the table are meant to highlight your ongoing costs only and do not reflect any transactional costs, such as sales charges (loads) or redemption/exchange fees. Therefore, the table is useful in comparing ongoing costs only, and will not help you determine the relative total costs of owning different funds. In addition, if these transactional costs were included, your costs would have been higher.
|
| | | | |
| | Beginning
Account Value
10/1/16 | Ending
Account Value
3/31/17 | Expenses Paid
During Period(1)
10/1/16 - 3/31/17 | Annualized
Expense Ratio(1) |
| Actual | | | | |
| Investor Class | $1,000 | $1,178.20 | $6.79 | 1.25% |
| Institutional Class | $1,000 | $1,179.90 | $5.71 | 1.05% |
| A Class | $1,000 | $1,177.80 | $8.14 | 1.50% |
| C Class | $1,000 | $1,172.60 | $12.19 | 2.25% |
| R Class | $1,000 | $1,175.60 | $9.49 | 1.75% |
| R6 Class | $1,000 | $1,180.40 | $4.89 | 0.90% |
| Hypothetical | | | | |
| Investor Class | $1,000 | $1,018.70 | $6.29 | 1.25% |
| Institutional Class | $1,000 | $1,019.70 | $5.29 | 1.05% |
| A Class | $1,000 | $1,017.45 | $7.54 | 1.50% |
| C Class | $1,000 | $1,013.71 | $11.30 | 2.25% |
| R Class | $1,000 | $1,016.21 | $8.80 | 1.75% |
| R6 Class | $1,000 | $1,020.44 | $4.53 | 0.90% |
| |
| (1) | Expenses are equal to the class's annualized expense ratio listed in the table above, multiplied by the average account value over the period, multiplied by 182, the number of days in the most recent fiscal half-year, divided by 365, to reflect the one-half year period. |
MARCH 31, 2017
|
| | | | | |
| | Shares | Value |
| COMMON STOCKS — 96.5% | | |
| Aerospace and Defense — 0.5% | | |
| Hexcel Corp. | 140,046 |
| $ | 7,639,509 |
|
| Banks — 19.6% | | |
| Bank of the Ozarks, Inc. | 640,000 |
| 33,286,400 |
|
| BankUnited, Inc. | 940,000 |
| 35,071,400 |
|
| Boston Private Financial Holdings, Inc. | 725,000 |
| 11,890,000 |
|
| Capital Bank Financial Corp., Class A | 825,000 |
| 35,805,000 |
|
| F.N.B. Corp. | 1,585,000 |
| 23,568,950 |
|
FCB Financial Holdings, Inc., Class A(1) | 470,000 |
| 23,288,500 |
|
| First Financial Bankshares, Inc. | 145,000 |
| 5,814,500 |
|
| First Hawaiian, Inc. | 570,000 |
| 17,054,400 |
|
| LegacyTexas Financial Group, Inc. | 585,000 |
| 23,341,500 |
|
| Prosperity Bancshares, Inc. | 10,000 |
| 697,100 |
|
| Southside Bancshares, Inc. | 325,000 |
| 10,910,250 |
|
Texas Capital Bancshares, Inc.(1) | 255,000 |
| 21,279,750 |
|
| UMB Financial Corp. | 270,000 |
| 20,333,700 |
|
| Valley National Bancorp | 2,385,000 |
| 28,143,000 |
|
Western Alliance Bancorp(1) | 305,000 |
| 14,972,450 |
|
| | | 305,456,900 |
|
| Building Products — 3.9% | | |
| Apogee Enterprises, Inc. | 200,000 |
| 11,922,000 |
|
Continental Building Products, Inc.(1) | 275,000 |
| 6,737,500 |
|
CSW Industrials, Inc.(1) | 711,818 |
| 26,123,721 |
|
NCI Building Systems, Inc.(1) | 685,000 |
| 11,747,750 |
|
PGT Innovations, Inc.(1) | 365,000 |
| 3,923,750 |
|
| | | 60,454,721 |
|
| Capital Markets — 1.2% | | |
| Ares Management LP | 915,000 |
| 17,339,250 |
|
Hamilton Lane, Inc., Class A(1) | 39,926 |
| 745,418 |
|
| | | 18,084,668 |
|
| Chemicals — 3.7% | | |
| Chase Corp. | 40,000 |
| 3,816,000 |
|
| Innophos Holdings, Inc. | 265,000 |
| 14,302,050 |
|
| Innospec, Inc. | 275,000 |
| 17,806,250 |
|
| Minerals Technologies, Inc. | 275,000 |
| 21,065,000 |
|
| | | 56,989,300 |
|
| Commercial Services and Supplies — 3.6% | | |
| Brink's Co. (The) | 200,000 |
| 10,690,000 |
|
| Deluxe Corp. | 160,000 |
| 11,547,200 |
|
InnerWorkings, Inc.(1) | 1,145,000 |
| 11,404,200 |
|
| Interface, Inc. | 500,000 |
| 9,525,000 |
|
| Multi-Color Corp. | 179,983 |
| 12,778,793 |
|
| | | 55,945,193 |
|
| Communications Equipment — 0.3% | | |
NetScout Systems, Inc.(1) | 110,000 |
| 4,174,500 |
|
|
| | | | | |
| | Shares | Value |
| Construction and Engineering — 1.7% | | |
Dycom Industries, Inc.(1) | 125,000 |
| $ | 11,618,750 |
|
| Valmont Industries, Inc. | 100,000 |
| 15,550,000 |
|
| | | 27,168,750 |
|
| Containers and Packaging — 4.4% | | |
| Graphic Packaging Holding Co. | 3,085,000 |
| 39,703,950 |
|
| Myers Industries, Inc. | 185,171 |
| 2,934,960 |
|
| Silgan Holdings, Inc. | 435,000 |
| 25,821,600 |
|
| | | 68,460,510 |
|
| Diversified Financial Services — 1.7% | | |
| Compass Diversified Holdings | 1,570,000 |
| 26,062,000 |
|
| Electronic Equipment, Instruments and Components — 3.0% | | |
| AVX Corp. | 226,046 |
| 3,702,634 |
|
IPG Photonics Corp.(1) | 50,000 |
| 6,035,000 |
|
OSI Systems, Inc.(1) | 290,000 |
| 21,167,100 |
|
VeriFone Systems, Inc.(1) | 885,000 |
| 16,576,050 |
|
| | | 47,480,784 |
|
| Energy Equipment and Services — 1.5% | | |
Dril-Quip, Inc.(1) | 45,000 |
| 2,454,750 |
|
Helix Energy Solutions Group, Inc.(1) | 415,000 |
| 3,224,550 |
|
Keane Group, Inc.(1) | 265,000 |
| 3,789,500 |
|
Mammoth Energy Services, Inc.(1) | 315,000 |
| 6,775,650 |
|
Matrix Service Co.(1) | 385,000 |
| 6,352,500 |
|
| | | 22,596,950 |
|
| Equity Real Estate Investment Trusts (REITs) — 7.6% | | |
| Armada Hoffler Properties, Inc. | 510,000 |
| 7,083,900 |
|
| CareTrust REIT, Inc. | 496,372 |
| 8,348,977 |
|
| CBL & Associates Properties, Inc. | 125,000 |
| 1,192,500 |
|
| Chatham Lodging Trust | 170,000 |
| 3,357,500 |
|
| Community Healthcare Trust, Inc. | 292,974 |
| 7,002,079 |
|
| DiamondRock Hospitality Co. | 382,915 |
| 4,269,502 |
|
| EPR Properties | 20,000 |
| 1,472,600 |
|
| Four Corners Property Trust, Inc. | 202,503 |
| 4,623,143 |
|
| Kite Realty Group Trust | 1,145,000 |
| 24,617,500 |
|
| Lexington Realty Trust | 560,000 |
| 5,588,800 |
|
| MedEquities Realty Trust, Inc. | 1,090,000 |
| 12,218,900 |
|
| Medical Properties Trust, Inc. | 570,000 |
| 7,347,300 |
|
| RLJ Lodging Trust | 203,274 |
| 4,778,972 |
|
| Sabra Health Care REIT, Inc. | 360,000 |
| 10,054,800 |
|
| Summit Hotel Properties, Inc. | 480,080 |
| 7,671,678 |
|
| Sunstone Hotel Investors, Inc. | 207,442 |
| 3,180,086 |
|
| Urstadt Biddle Properties, Inc., Class A | 300,000 |
| 6,168,000 |
|
| | | 118,976,237 |
|
| Food Products — 1.3% | | |
Inventure Foods, Inc.(1) | 289,621 |
| 1,280,125 |
|
| John B Sanfilippo & Son, Inc. | 50,000 |
| 3,659,500 |
|
TreeHouse Foods, Inc.(1) | 180,000 |
| 15,238,800 |
|
| | | 20,178,425 |
|
| Health Care Equipment and Supplies — 0.5% | | |
| Utah Medical Products, Inc. | 130,000 |
| 8,099,000 |
|
|
| | | | | |
| | Shares | Value |
| Health Care Providers and Services — 4.2% | | |
AMN Healthcare Services, Inc.(1) | 550,000 |
| $ | 22,330,000 |
|
LifePoint Health, Inc.(1) | 150,000 |
| 9,825,000 |
|
Magellan Health, Inc.(1) | 15,000 |
| 1,035,750 |
|
| Owens & Minor, Inc. | 300,000 |
| 10,380,000 |
|
PharMerica Corp.(1) | 380,000 |
| 8,892,000 |
|
Providence Service Corp. (The)(1) | 295,000 |
| 13,109,800 |
|
| | | 65,572,550 |
|
| Hotels, Restaurants and Leisure — 2.3% | | |
| ClubCorp Holdings, Inc. | 1,230,000 |
| 19,741,500 |
|
| Peak Resorts, Inc. | 150,000 |
| 847,500 |
|
Red Robin Gourmet Burgers, Inc.(1) | 250,000 |
| 14,612,500 |
|
| | | 35,201,500 |
|
| Household Durables — 0.2% | | |
Century Communities, Inc.(1) | 115,000 |
| 2,921,000 |
|
| Insurance — 7.7% | | |
| Allied World Assurance Co. Holdings AG | 350,000 |
| 18,585,000 |
|
Atlas Financial Holdings, Inc.(1) | 270,000 |
| 3,685,500 |
|
| Hanover Insurance Group, Inc. (The) | 390,000 |
| 35,123,400 |
|
| Infinity Property & Casualty Corp. | 35,000 |
| 3,342,500 |
|
| James River Group Holdings Ltd. | 240,000 |
| 10,286,400 |
|
| Kinsale Capital Group, Inc. | 295,000 |
| 9,451,800 |
|
| RLI Corp. | 305,000 |
| 18,306,100 |
|
| Validus Holdings Ltd. | 380,000 |
| 21,428,200 |
|
| | | 120,208,900 |
|
| IT Services — 5.0% | | |
| CSRA, Inc. | 820,000 |
| 24,017,800 |
|
| EVERTEC, Inc. | 1,435,000 |
| 22,816,500 |
|
Presidio, Inc.(1) | 515,000 |
| 7,974,775 |
|
Teradata Corp.(1) | 740,000 |
| 23,028,800 |
|
| | | 77,837,875 |
|
| Leisure Products — 0.8% | | |
Malibu Boats, Inc.(1) | 245,000 |
| 5,500,250 |
|
| MCBC Holdings, Inc. | 465,000 |
| 7,519,050 |
|
| | | 13,019,300 |
|
| Machinery — 3.7% | | |
| EnPro Industries, Inc. | 225,000 |
| 16,011,000 |
|
| Global Brass & Copper Holdings, Inc. | 499,969 |
| 17,198,934 |
|
| Graham Corp. | 278,401 |
| 6,403,223 |
|
Harsco Corp.(1) | 640,000 |
| 8,160,000 |
|
Rexnord Corp.(1) | 445,000 |
| 10,270,600 |
|
| | | 58,043,757 |
|
| Media — 2.6% | | |
Entravision Communications Corp., Class A(2) | 4,695,000 |
| 29,109,000 |
|
Gray Television, Inc.(1) | 480,000 |
| 6,960,000 |
|
Townsquare Media, Inc.(1) | 328,029 |
| 3,995,393 |
|
| | | 40,064,393 |
|
| Mortgage Real Estate Investment Trusts (REITs) — 1.2% | | |
| Blackstone Mortgage Trust, Inc., Class A | 145,000 |
| 4,489,200 |
|
| New Residential Investment Corp. | 182,746 |
| 3,103,027 |
|
|
| | | | | |
| | Shares | Value |
| Two Harbors Investment Corp. | 1,180,000 |
| $ | 11,316,200 |
|
| | | 18,908,427 |
|
| Oil, Gas and Consumable Fuels — 2.9% | | |
| Aegean Marine Petroleum Network, Inc. | 405,005 |
| 4,880,310 |
|
| Ardmore Shipping Corp. | 1,101,415 |
| 8,866,391 |
|
Callon Petroleum Co.(1) | 270,000 |
| 3,553,200 |
|
Contango Oil & Gas Co.(1) | 775,000 |
| 5,673,000 |
|
Euronav NV(1) | 326,187 |
| 2,576,877 |
|
Extraction Oil & Gas, Inc.(1) | 425,000 |
| 7,883,750 |
|
| Scorpio Tankers, Inc. | 1,508,022 |
| 6,695,618 |
|
WildHorse Resource Development Corp.(1) | 355,000 |
| 4,416,200 |
|
| | | 44,545,346 |
|
| Paper and Forest Products — 0.6% | | |
| KapStone Paper and Packaging Corp. | 400,000 |
| 9,240,000 |
|
| Personal Products — 0.8% | | |
Edgewell Personal Care Co.(1) | 180,000 |
| 13,165,200 |
|
| Professional Services — 1.6% | | |
| Korn/Ferry International | 500,000 |
| 15,745,000 |
|
On Assignment, Inc.(1) | 175,000 |
| 8,492,750 |
|
| | | 24,237,750 |
|
| Semiconductors and Semiconductor Equipment — 2.8% | | |
| Cypress Semiconductor Corp. | 830,000 |
| 11,420,800 |
|
Exar Corp.(1) | 1,490,000 |
| 19,384,900 |
|
Kulicke & Soffa Industries, Inc.(1) | 630,000 |
| 12,801,600 |
|
| | | 43,607,300 |
|
| Software — 1.2% | | |
BroadSoft, Inc.(1) | 480,000 |
| 19,296,000 |
|
| Specialty Retail — 2.5% | | |
| Camping World Holdings, Inc., Class A | 345,000 |
| 11,122,800 |
|
Foundation Building Materials, Inc.(1) | 490,000 |
| 7,825,300 |
|
MarineMax, Inc.(1) | 510,000 |
| 11,041,500 |
|
| Penske Automotive Group, Inc. | 175,000 |
| 8,191,750 |
|
| | | 38,181,350 |
|
| Technology Hardware, Storage and Peripherals — 0.7% | | |
Cray, Inc.(1) | 495,000 |
| 10,840,500 |
|
| Textiles, Apparel and Luxury Goods — 0.3% | | |
| Culp, Inc. | 165,000 |
| 5,148,000 |
|
| Trading Companies and Distributors — 0.9% | | |
DXP Enterprises, Inc.(1) | 165,000 |
| 6,248,550 |
|
GMS, Inc.(1) | 210,008 |
| 7,358,680 |
|
| | | 13,607,230 |
|
TOTAL COMMON STOCKS
(Cost $1,235,766,198) | | 1,501,413,825 |
|
| CONVERTIBLE PREFERRED STOCKS — 0.7% | | |
| Machinery — 0.7% | | |
Rexnord Corp., 5.75%, 11/15/19
(Cost $9,605,351) | 190,000 |
| 10,436,700 |
|
| TEMPORARY CASH INVESTMENTS — 2.5% | | |
| Repurchase Agreement, BMO Capital Markets Corp., (collateralized by various U.S. Treasury obligations, 0.75% - 2.75%, 7/31/17 - 2/15/24, valued at $14,127,442), in a joint trading account at 0.67%, dated 3/31/17, due 4/3/17 (Delivery value $13,840,288) | | 13,839,515 |
|
|
| | | | | |
| | Shares | Value |
| Repurchase Agreement, Fixed Income Clearing Corp., (collateralized by various U.S. Treasury obligations, 3.00%, 11/15/45, valued at $25,620,044), at 0.22%, dated 3/31/17, due 4/3/17 (Delivery value $25,113,460) | | $ | 25,113,000 |
|
| State Street Institutional U.S. Government Money Market Fund, Premier Class | 71 |
| 71 |
|
TOTAL TEMPORARY CASH INVESTMENTS
(Cost $38,952,586) | | 38,952,586 |
|
TOTAL INVESTMENT SECURITIES — 99.7%
(Cost $1,284,324,135) | | 1,550,803,111 |
|
| OTHER ASSETS AND LIABILITIES — 0.3% | | 4,759,976 |
|
| TOTAL NET ASSETS — 100.0% | | $ | 1,555,563,087 |
|
|
| | | | | | | | | | |
| FORWARD FOREIGN CURRENCY EXCHANGE CONTRACTS |
| Currency Purchased | Currency Sold | Counterparty | Settlement Date | Unrealized Appreciation (Depreciation) |
| USD | 2,239,259 |
| EUR | 2,055,007 |
| UBS AG | 6/30/17 | $ | 37,841 |
|
|
| | |
| NOTES TO SCHEDULE OF INVESTMENTS |
| EUR | - | Euro |
| USD | - | United States Dollar |
| |
| (2) | Affiliated Company: the fund’s holding represents ownership of 5% or more of the voting securities of the company; therefore, the company is affiliated as defined in the Investment Company Act of 1940. |
See Notes to Financial Statements.
|
|
| Statement of Assets and Liabilities |
|
| | | |
| MARCH 31, 2017 | |
| Assets | |
| Investment securities - unaffiliated, at value (cost of $1,267,664,115) | $ | 1,521,694,111 |
|
| Investment securities - affiliated, at value (cost of $16,660,020) | 29,109,000 |
|
| Total investment securities, at value (cost of $1,284,324,135) | 1,550,803,111 |
|
| Cash | 22,692 |
|
| Receivable for investments sold | 29,006,695 |
|
| Receivable for capital shares sold | 3,030,965 |
|
| Unrealized appreciation on forward foreign currency exchange contracts | 37,841 |
|
| Dividends and interest receivable | 2,133,639 |
|
| | 1,585,034,943 |
|
| | |
| Liabilities | |
| Payable for investments purchased | 26,483,633 |
|
| Payable for capital shares redeemed | 1,452,547 |
|
| Accrued management fees | 1,503,583 |
|
| Distribution and service fees payable | 32,093 |
|
| | 29,471,856 |
|
| | |
| Net Assets | $ | 1,555,563,087 |
|
| | |
| Net Assets Consist of: | |
| Capital (par value and paid-in surplus) | $ | 1,215,409,936 |
|
| Undistributed net investment income | 2,253,490 |
|
| Undistributed net realized gain | 71,382,844 |
|
| Net unrealized appreciation | 266,516,817 |
|
| | $ | 1,555,563,087 |
|
|
| | | | |
| | Net Assets | Shares Outstanding | Net Asset Value Per Share |
| Investor Class, $0.01 Par Value | $770,415,011 | 82,030,998 |
| $9.39 |
| Institutional Class, $0.01 Par Value | $463,119,270 | 48,898,679 |
| $9.47 |
| A Class, $0.01 Par Value | $141,505,061 | 15,203,726 |
| $9.31* |
| C Class, $0.01 Par Value | $1,234,498 | 136,943 |
| $9.01 |
| R Class, $0.01 Par Value | $3,274,509 | 352,808 |
| $9.28 |
| R6 Class, $0.01 Par Value | $176,014,738 | 18,578,866 |
| $9.47 |
*Maximum offering price $9.88 (net asset value divided by 0.9425).
See Notes to Financial Statements.
|
| | | |
| YEAR ENDED MARCH 31, 2017 | |
| Investment Income (Loss) | |
| Income: | |
| Dividends (including $774,074 from affiliates and net of foreign taxes withheld of $64,133) | $ | 24,702,863 |
|
| Interest | 55,176 |
|
| | 24,758,039 |
|
| | |
| Expenses: | |
| Management fees | 16,521,176 |
|
| Distribution and service fees: | |
| A Class | 351,207 |
|
| C Class | 4,694 |
|
| R Class | 13,611 |
|
| Directors' fees and expenses | 44,217 |
|
| Other expenses | 315 |
|
| | 16,935,220 |
|
| | |
Net investment income (loss)
| 7,822,819 |
|
| | |
Realized and Unrealized Gain (Loss)
| |
| Net realized gain (loss) on: | |
| Investment transactions (Note 4) (including $4,831,599 from affiliates) | 203,410,120 |
|
| Foreign currency transactions | 71,588 |
|
| | 203,481,708 |
|
| | |
| Change in net unrealized appreciation (depreciation) on: | |
| Investments | 178,046,579 |
|
| Translation of assets and liabilities in foreign currencies | 90,757 |
|
| | 178,137,336 |
|
| | |
| Net realized and unrealized gain (loss) | 381,619,044 |
|
| | |
| Net Increase (Decrease) in Net Assets Resulting from Operations | $ | 389,441,863 |
|
See Notes to Financial Statements.
|
|
| Statement of Changes in Net Assets |
|
| | | | | | |
| YEARS ENDED MARCH 31, 2017 AND MARCH 31, 2016 |
| Increase (Decrease) in Net Assets | March 31, 2017 | March 31, 2016 |
| Operations | | |
| Net investment income (loss) | $ | 7,822,819 |
| $ | 7,445,362 |
|
| Net realized gain (loss) | 203,481,708 |
| 82,139,164 |
|
| Change in net unrealized appreciation (depreciation) | 178,137,336 |
| (185,593,408 | ) |
| Net increase (decrease) in net assets resulting from operations | 389,441,863 |
| (96,008,882 | ) |
| | | |
| Distributions to Shareholders | | |
| From net investment income: | | |
| Investor Class | (4,647,788 | ) | (2,857,830 | ) |
| Institutional Class | (4,114,600 | ) | (3,361,155 | ) |
| A Class | (651,385 | ) | (266,966 | ) |
| C Class | (285 | ) | — |
|
| R Class | (7,918 | ) | — |
|
| R6 Class | (1,402,136 | ) | (302,203 | ) |
| From net realized gains: | | |
| Investor Class | (33,783,589 | ) | (83,866,802 | ) |
| Institutional Class | (22,113,072 | ) | (66,712,537 | ) |
| A Class | (6,659,384 | ) | (19,047,040 | ) |
| C Class | (26,597 | ) | (22,931 | ) |
| R Class | (143,466 | ) | (281,269 | ) |
| R6 Class | (5,577,060 | ) | (4,897,236 | ) |
| Decrease in net assets from distributions | (79,127,280 | ) | (181,615,969 | ) |
| | | |
| Capital Share Transactions | | |
| Net increase (decrease) in net assets from capital share transactions (Note 5) | (141,324,571 | ) | (177,847,308 | ) |
| | | |
| Net increase (decrease) in net assets | 168,990,012 |
| (455,472,159 | ) |
| | | |
| Net Assets | | |
| Beginning of period | 1,386,573,075 |
| 1,842,045,234 |
|
| End of period | $ | 1,555,563,087 |
| $ | 1,386,573,075 |
|
| | | |
| Undistributed net investment income | $ | 2,253,490 |
| $ | 4,435,092 |
|
See Notes to Financial Statements.
|
|
| Notes to Financial Statements |
MARCH 31, 2017
1. Organization
American Century Capital Portfolios, Inc. (the corporation) is registered under the Investment Company Act of 1940, as amended (the 1940 Act), as an open-end management investment company and is organized as a Maryland corporation. Small Cap Value Fund (the fund) is one fund in a series issued by the corporation. The fund’s investment objective is to seek long-term capital growth. Income is a secondary objective.
The fund offers the Investor Class, the Institutional Class, the A Class, the C Class, the R Class and the R6 Class. The A Class may incur an initial sales charge. The A Class and C Class may be subject to a contingent deferred sales charge.
2. Significant Accounting Policies
The following is a summary of significant accounting policies consistently followed by the fund in preparation of its financial statements. The fund is an investment company and follows accounting and reporting guidance in accordance with accounting principles generally accepted in the United States of America. This may require management to make certain estimates and assumptions at the date of the financial statements. Actual results could differ from these estimates. Management evaluated the impact of events or transactions occurring through the date the financial statements were issued that would merit recognition or disclosure.
Investment Valuations — The fund determines the fair value of its investments and computes its net asset value per share at the close of regular trading (usually 4 p.m. Eastern time) on the New York Stock Exchange (NYSE) on each day the NYSE is open. The Board of Directors has adopted valuation policies and procedures to guide the investment advisor in the fund’s investment valuation process and to provide methodologies for the oversight of the fund’s pricing function.
Equity securities that are listed or traded on a domestic securities exchange are valued at the last reported sales price or at the official closing price as provided by the exchange. Equity securities traded on foreign securities exchanges are generally valued at the closing price of such securities on the exchange where primarily traded or at the close of the NYSE, if that is earlier. If no last sales price is reported, or if local convention or regulation so provides, the mean of the latest bid and asked prices may be used. Securities traded over-the-counter are valued at the mean of the latest bid and asked prices, the last sales price, or the official closing price. Equity securities initially expressed in local currencies are translated into U.S. dollars at the mean of the appropriate currency exchange rate at the close of the NYSE as provided by an independent pricing service.
Open-end management investment companies are valued at the reported net asset value per share. Repurchase agreements are valued at cost, which approximates fair value. Forward foreign currency exchange contracts are valued at the mean of the appropriate forward exchange rate at the close of the NYSE as provided by an independent pricing service.
If the fund determines that the market price for an investment is not readily available or the valuation methods mentioned above do not reflect an investment’s fair value, such investment is valued as determined in good faith by the Board of Directors or its delegate, in accordance with policies and procedures adopted by the Board of Directors. In its determination of fair value, the fund may review several factors including, but not limited to, market information regarding the specific investment or comparable investments and correlation with other investment types, futures indices or general market indicators. Circumstances that may cause the fund to use these procedures to value an investment include, but are not limited to: an investment has been declared in default or is distressed; trading in a security has been suspended during the trading day or a security is not actively trading on its principal exchange; prices received from a regular pricing source are deemed unreliable; or there is a foreign market holiday and no trading occurred.
The fund monitors for significant events occurring after the close of an investment’s primary exchange but before the fund’s net asset value per share is determined. Significant events may include, but are not limited to: corporate announcements and transactions; governmental action and political unrest that could impact a specific investment or an investment sector; or armed conflicts, natural disasters and similar events that could affect investments in a specific country or region. The fund also monitors for significant fluctuations between
domestic and foreign markets, as evidenced by the U.S. market or such other indicators that the Board of Directors, or its delegate, deems appropriate. If significant fluctuations in foreign markets are identified, the fund may apply a model-derived factor to the closing price of equity securities traded on foreign securities exchanges. The factor is based on observable market data as provided by an independent pricing service.
Security Transactions — Security transactions are accounted for as of the trade date. Net realized gains and losses are determined on the identified cost basis, which is also used for federal income tax purposes.
Investment Income — Dividend income less foreign taxes withheld, if any, is recorded as of the ex-dividend date. Distributions received on securities that represent a return of capital or long-term capital gain are recorded as a reduction of cost of investments and/or as a realized gain. The fund may estimate the components of distributions received that may be considered nontaxable distributions or long-term capital gain distributions for income tax purposes. Interest income is recorded on the accrual basis and includes accretion of discounts and amortization of premiums.
Foreign Currency Translations — All assets and liabilities initially expressed in foreign currencies are translated into U.S. dollars at prevailing exchange rates at period end. The fund may enter into spot foreign currency exchange contracts to facilitate transactions denominated in a foreign currency. Purchases and sales of investment securities, dividend and interest income, spot foreign currency exchange contracts, and expenses are translated at the rates of exchange prevailing on the respective dates of such transactions. Net realized and unrealized foreign currency exchange gains or losses related to investment securities are a component of net realized gain (loss) on investment transactions and change in net unrealized appreciation (depreciation) on investments, respectively.
Repurchase Agreements — The fund may enter into repurchase agreements with institutions that American Century Investment Management, Inc. (ACIM) (the investment advisor) has determined are creditworthy pursuant to criteria adopted by the Board of Directors. The fund requires that the collateral, represented by securities, received in a repurchase transaction be transferred to the custodian in a manner sufficient to enable the fund to obtain those securities in the event of a default under the repurchase agreement. ACIM monitors, on a daily basis, the securities transferred to ensure the value, including accrued interest, of the securities under each repurchase agreement is equal to or greater than amounts owed to the fund under each repurchase agreement.
Joint Trading Account — Pursuant to an Exemptive Order issued by the Securities and Exchange Commission, the fund, along with certain other funds in the American Century Investments family of funds, may transfer uninvested cash balances into a joint trading account. These balances are invested in one or more repurchase agreements that are collateralized by U.S. Treasury or Agency obligations.
Income Tax Status — It is the fund’s policy to distribute substantially all net investment income and net realized gains to shareholders and to otherwise qualify as a regulated investment company under provisions of the Internal Revenue Code. Accordingly, no provision has been made for income taxes. The fund files U.S. federal, state, local and non-U.S. tax returns as applicable. The fund's tax returns are subject to examination by the relevant taxing authority until expiration of the applicable statute of limitations, which is generally three years from the date of filing but can be longer in certain jurisdictions. At this time, management believes there are no uncertain tax positions which, based on their technical merit, would not be sustained upon examination and for which it is reasonably possible that the total amounts of unrecognized tax benefits will significantly change in the next twelve months.
Multiple Class — All shares of the fund represent an equal pro rata interest in the net assets of the class to which such shares belong, and have identical voting, dividend, liquidation and other rights and the same terms and conditions, except for class specific expenses and exclusive rights to vote on matters affecting only individual classes. Income, non-class specific expenses, and realized and unrealized capital gains and losses of the fund are allocated to each class of shares based on their relative net assets.
Distributions to Shareholders — Distributions from net investment income, if any, are generally declared and paid quarterly. Distributions from net realized gains, if any, are generally declared and paid annually. The fund may elect to treat a portion of its payment to a redeeming shareholder, which represents the pro rata share of undistributed net investment income and net realized gains, as a distribution for federal income tax purposes (tax equalization).
Indemnifications — Under the corporation’s organizational documents, its officers and directors are indemnified against certain liabilities arising out of the performance of their duties to the fund. In addition, in the normal course of business, the fund enters into contracts that provide general indemnifications. The maximum exposure under these arrangements is unknown as this would involve future claims that may be made against a fund. The risk of material loss from such claims is considered by management to be remote.
3. Fees and Transactions with Related Parties
Certain officers and directors of the corporation are also officers and/or directors of American Century Companies, Inc. (ACC). The corporation’s investment advisor, ACIM, the corporation's distributor, American Century Investment Services, Inc. (ACIS), and the corporation’s transfer agent, American Century Services, LLC, are wholly owned, directly or indirectly, by ACC.
Management Fees — The corporation has entered into a management agreement with ACIM, under which ACIM provides the fund with investment advisory and management services in exchange for a single, unified management fee (the fee) per class. The agreement provides that all expenses of managing and operating the fund, except distribution and service fees, brokerage expenses, taxes, interest, fees and expenses of the independent directors (including legal counsel fees), and extraordinary expenses, will be paid by ACIM. The fee is computed and accrued daily based on each class’s daily net assets and paid monthly in arrears. The difference in the fee among the classes is a result of their separate arrangements for shareholder services. It is not the result of any difference in advisory or custodial fees or other expenses related to the management of the fund’s assets, which do not vary by class. The rate of the fee is determined by applying a fee rate calculation formula. This formula takes into account the fund’s assets as well as certain assets, if any, of other clients of the investment advisor outside the American Century Investments family of funds (such as subadvised funds and separate accounts) that have very similar investment teams and investment strategies (strategy assets). The annual management fee schedule ranges from 1.00% to 1.25% for the Investor Class, A Class, C Class and R Class. The annual management fee schedule ranges from 0.80% to 1.05% for the Institutional Class and 0.65% to 0.90% for the R6 Class. The effective annual management fee for each class for the year ended March 31, 2017 was 1.25% for the Investor Class, A Class, C Class, and R Class, 1.05% for the Institutional Class and 0.90% for the R6 Class.
Distribution and Service Fees — The Board of Directors has adopted a separate Master Distribution and Individual Shareholder Services Plan for each of the A Class, C Class and R Class (collectively the plans), pursuant to Rule 12b-1 of the 1940 Act. The plans provide that the A Class will pay ACIS an annual distribution and service fee of 0.25%. The plans provide that the C Class will pay ACIS an annual distribution and service fee of 1.00%, of which 0.25% is paid for individual shareholder services and 0.75% is paid for distribution services. The plans provide that the R Class will pay ACIS an annual distribution and service fee of 0.50%. The fees are computed and accrued daily based on each class’s daily net assets and paid monthly in arrears. The fees are used to pay financial intermediaries for distribution and individual shareholder services. Fees incurred under the plans during the year ended March 31, 2017 are detailed in the Statement of Operations.
Directors' Fees and Expenses — The Board of Directors is responsible for overseeing the investment advisor’s management and operations of the fund. The directors receive detailed information about the fund and its investment advisor regularly throughout the year, and meet at least quarterly with management of the investment advisor to review reports about fund operations. The fund’s officers do not receive compensation from the fund.
Interfund Transactions — The fund may enter into security transactions with other American Century Investments funds and other client accounts of the investment advisor, in accordance with the 1940 Act rules and procedures adopted by the Board of Directors. The rules and procedures require, among other things, that these transactions be effected at the independent current market price of the security. During the period, the interfund purchases and sales were $11,613,812 and $10,618,847, respectively. The effect of interfund transactions on the Statement of Operations was $974,980 in net realized gain (loss) on investment transactions.
4. Investment Transactions
Purchases and sales of investment securities, excluding short-term investments, for the year ended March 31, 2017 were $1,265,800,607 and $1,397,963,623, respectively.
For the year ended March 31, 2017, the fund incurred net realized gains of $10,412,377 from redemptions in kind. A redemption in kind occurs when a fund delivers securities from its portfolio in lieu of cash as payment to a redeeming shareholder.
5. Capital Share Transactions
Transactions in shares of the fund were as follows:
|
| | | | | | | | | | |
| | Year ended
March 31, 2017 | Year ended
March 31, 2016 |
| | Shares | Amount | Shares | Amount |
| Investor Class/Shares Authorized | 575,000,000 |
| | 575,000,000 |
| |
| Sold | 16,894,263 |
| $ | 148,292,430 |
| 9,679,279 |
| $ | 78,890,541 |
|
| Issued in reinvestment of distributions | 4,182,615 |
| 37,023,384 |
| 10,696,743 |
| 83,310,607 |
|
| Redeemed | (26,036,632 | ) | (221,392,102 | ) | (22,354,962 | ) | (185,299,956 | ) |
| | (4,959,754 | ) | (36,076,288 | ) | (1,978,940 | ) | (23,098,808 | ) |
| Institutional Class/Shares Authorized | 400,000,000 |
| | 400,000,000 |
| |
| Sold | 10,400,947 |
| 90,289,454 |
| 11,252,060 |
| 95,032,219 |
|
| Issued in reinvestment of distributions | 2,659,311 |
| 23,663,986 |
| 8,044,956 |
| 63,217,519 |
|
| Redeemed | (32,110,870 | ) | (269,634,819 | ) | (16,381,374 | ) | (133,800,195 | ) |
| | (19,050,612 | ) | (155,681,379 | ) | 2,915,642 |
| 24,449,543 |
|
| A Class/Shares Authorized | 160,000,000 |
| | 160,000,000 |
| |
| Sold | 2,738,285 |
| 23,466,773 |
| 2,683,728 |
| 22,168,790 |
|
| Issued in reinvestment of distributions | 824,305 |
| 7,259,487 |
| 2,445,852 |
| 18,848,115 |
|
| Redeemed | (7,396,839 | ) | (62,304,032 | ) | (28,416,675 | ) | (254,844,402 | ) |
| | (3,834,249 | ) | (31,577,772 | ) | (23,287,095 | ) | (213,827,497 | ) |
| C Class/Shares Authorized | 10,000,000 |
| | 10,000,000 |
| |
| Sold | 106,330 |
| 925,018 |
| 25,211 |
| 200,917 |
|
| Issued in reinvestment of distributions | 3,109 |
| 26,882 |
| 3,053 |
| 22,931 |
|
| Redeemed | (8,849 | ) | (74,470 | ) | (7,353 | ) | (66,205 | ) |
| | 100,590 |
| 877,430 |
| 20,911 |
| 157,643 |
|
| R Class/Shares Authorized | 10,000,000 |
| | 10,000,000 |
| |
| Sold | 136,632 |
| 1,175,294 |
| 73,749 |
| 617,605 |
|
| Issued in reinvestment of distributions | 17,131 |
| 151,384 |
| 36,576 |
| 281,269 |
|
| Redeemed | (114,803 | ) | (981,752 | ) | (31,723 | ) | (249,247 | ) |
| | 38,960 |
| 344,926 |
| 78,602 |
| 649,627 |
|
| R6 Class/Shares Authorized | 50,000,000 |
| | 50,000,000 |
| |
| Sold | 19,432,466 |
| 162,082,591 |
| 5,001,989 |
| 38,087,944 |
|
| Issued in reinvestment of distributions | 788,291 |
| 6,979,196 |
| 661,127 |
| 5,199,439 |
|
| Redeemed | (10,461,852 | ) | (88,273,275 | ) | (1,166,051 | ) | (9,465,199 | ) |
| | 9,758,905 |
| 80,788,512 |
| 4,497,065 |
| 33,822,184 |
|
| Net increase (decrease) | (17,946,160 | ) | $ | (141,324,571 | ) | (17,753,815 | ) | $ | (177,847,308 | ) |
6. Affiliated Company Transactions
If a fund's holding represents ownership of 5% or more of the voting securities of a company, the company is affiliated as defined in the 1940 Act. A summary of transactions for each company which is or was an affiliate at or during the year ended March 31, 2017 follows:
|
| | | | | | | | | | | | | | | | | | |
| Company | Beginning
Value | Purchase
Cost | Sales Cost | Realized
Gain (Loss) | Dividend
Income | Ending
Value |
| Entravision Communications Corp., Class A | $ | 22,431,600 |
| $ | 12,389,318 |
| $ | 660,814 |
| $ | 1,367,280 |
| $ | 471,648 |
| $ | 29,109,000 |
|
Exar Corp.(1)(2) | 10,465,000 |
| 14,206,080 |
| 18,653,738 |
| 1,491,226 |
| — |
| (1 | ) |
Graham Corp.(1) | 9,305,775 |
| 1,802,505 |
| 5,875,507 |
| 533,602 |
| 160,421 |
| (1 | ) |
Utah Medical Products, Inc.(1) | 11,882,600 |
| 341,723 |
| 2,879,707 |
| 1,439,491 |
| 142,005 |
| (1 | ) |
| | $ | 54,084,975 |
| $ | 28,739,626 |
| $ | 28,069,766 |
| $ | 4,831,599 |
| $ | 774,074 |
| $ | 29,109,000 |
|
(1) Company was not an affiliate at March 31, 2017.
(2) Non-income producing.
7. Fair Value Measurements
The fund’s investments valuation process is based on several considerations and may use multiple inputs to determine the fair value of the investments held by the fund. In conformity with accounting principles generally accepted in the United States of America, the inputs used to determine a valuation are classified into three broad levels.
| |
| • | Level 1 valuation inputs consist of unadjusted quoted prices in an active market for identical investments. |
| |
| • | Level 2 valuation inputs consist of direct or indirect observable market data (including quoted prices for comparable investments, evaluations of subsequent market events, interest rates, prepayment speeds, credit risk, etc.). These inputs also consist of quoted prices for identical investments initially expressed in local currencies that are adjusted through translation into U.S. dollars. |
| |
| • | Level 3 valuation inputs consist of unobservable data (including a fund’s own assumptions). |
The level classification is based on the lowest level input that is significant to the fair valuation measurement. The valuation inputs are not necessarily an indication of the risks associated with investing in these securities or other financial instruments. There were no significant transfers between levels during the period.
The following is a summary of the level classifications as of period end. The Schedule of Investments provides additional information on the fund’s portfolio holdings.
|
| | | | | | | | |
| | Level 1 | Level 2 | Level 3 |
| Assets | | | |
| Investment Securities | | | |
| Common Stocks | $ | 1,501,413,825 |
| — |
| — |
|
| Convertible Preferred Stocks | — |
| $ | 10,436,700 |
| — |
|
| Temporary Cash Investments | 71 |
| 38,952,515 |
| — |
|
| | $ | 1,501,413,896 |
| $ | 49,389,215 |
| — |
|
| Other Financial Instruments | | | |
| Forward Foreign Currency Exchange Contracts | — |
| $ | 37,841 |
| — |
|
8. Derivative Instruments
Foreign Currency Risk — The fund is subject to foreign currency exchange rate risk in the normal course of pursuing its investment objectives. The value of foreign investments held by a fund may be significantly affected by changes in foreign currency exchange rates. The dollar value of a foreign security generally decreases when the value of the dollar rises against the foreign currency in which the security is denominated and tends to increase when the value of the dollar declines against such foreign currency. A fund may enter into forward foreign currency exchange contracts to reduce a fund's exposure to foreign currency exchange rate fluctuations. The net U.S. dollar value of foreign currency underlying all contractual commitments held by a fund and the resulting unrealized appreciation or depreciation are determined daily. Realized gain or loss is recorded upon the termination of the contract. Net realized and unrealized gains or losses occurring during the holding period of forward foreign currency exchange contracts are a component of net realized gain (loss) on foreign currency transactions and change in net unrealized appreciation (depreciation) on translation of assets and liabilities in foreign currencies, respectively. A fund bears the risk of an unfavorable change in the foreign currency exchange rate underlying the forward contract. Additionally, losses, up to the fair value, may arise if the counterparties do not perform under the contract terms. The fund's average U.S. dollar exposure to foreign currency risk derivative instruments held during the period was $3,162,330.
The value of foreign currency risk derivative instruments as of March 31, 2017, is disclosed on the Statement of Assets and Liabilities as an asset of $37,841 in unrealized appreciation on forward foreign currency exchange contracts. For the year ended March 31, 2017, the effect of foreign currency risk derivative instruments on the Statement of Operations was $71,588 in net realized gain (loss) on foreign currency transactions and $90,757 in change in net unrealized appreciation (depreciation) on translation of assets and liabilities in foreign currencies.
9. Risk Factors
The fund invests in common stocks of small companies. Because of this, the fund may be subject to greater risk and market fluctuations than a fund investing in larger, more established companies.
10. Federal Tax Information
The tax character of distributions paid during the years ended March 31, 2017 and March 31, 2016 were as follows:
|
| | | | | | |
| | 2017 | 2016 |
| Distributions Paid From | | |
| Ordinary income | $ | 40,179,667 |
| $ | 41,929,678 |
|
| Long-term capital gains | $ | 38,947,613 |
| $ | 139,686,291 |
|
The book-basis character of distributions made during the year from net investment income or net realized gains may differ from their ultimate characterization for federal income tax purposes. These differences reflect the differing character of certain income items and net realized gains and losses for financial statement and tax purposes, and may result in reclassification among certain capital accounts on the financial statements.
The reclassifications, which are primarily due to redemptions in kind, were made to capital $15,264,849, undistributed net investment income $819,691, and undistributed net realized gain $(16,084,540).
As of March 31, 2017, the federal tax cost of investments and the components of distributable earnings on a tax-basis were as follows:
|
| | | |
| Federal tax cost of investments | $ | 1,314,608,663 |
|
| Gross tax appreciation of investments | $ | 263,055,835 |
|
| Gross tax depreciation of investments | (26,861,387 | ) |
| Net tax appreciation (depreciation) | $ | 236,194,448 |
|
| Undistributed ordinary income | $ | 46,246,317 |
|
| Accumulated long-term gains | $ | 57,712,386 |
|
The difference between book-basis and tax-basis unrealized appreciation (depreciation) is attributable primarily to the tax deferral of losses on wash sales.
11. Recently Issued Accounting Guidance
In October 2016, the Securities and Exchange Commission adopted new rules and forms as well as amendments to its rules and forms to modernize the reporting and disclosure of information by registered investment companies. The amendments to Regulation S-X will require standardized, enhanced disclosure about derivatives in investment company financial statements, as well as other provisions. Compliance with the amendments is effective on August 1, 2017. Management is currently evaluating the impact that adopting the amendments will have on the financial statement disclosures.
12. Corporate Event
The Institutional Class was renamed to the I Class effective April 10, 2017.
|
| | | | | | | | | | | | | | | |
| For a Share Outstanding Throughout the Years Ended March 31 (except as noted) |
| Per-Share Data | Ratios and Supplemental Data |
| | | Income From Investment Operations: | Distributions From: | | | Ratio to Average Net Assets of: | | |
| | Net Asset Value, Beginning of Period | Net Investment Income (Loss)(1) | Net Realized and Unrealized Gain (Loss) | Total From Investment Operations | Net Investment Income | Net Realized Gains | Total Distributions | Net Asset Value, End of Period | Total Return(2) | Operating Expenses | Net Investment Income (Loss) | Portfolio Turnover Rate | Net Assets, End of Period (in thousands) |
| Investor Class | | | | | | | | | | | |
| 2017 | $7.55 | 0.04 | 2.28 | 2.32 | (0.06) | (0.42) | (0.48) | $9.39 | 31.15% | 1.25% | 0.47% | 90% |
| $770,415 |
|
| 2016 | $9.16 | 0.04 | (0.59) | (0.55) | (0.03) | (1.03) | (1.06) | $7.55 | (6.25)% | 1.26% | 0.43% | 95% |
| $656,974 |
|
| 2015 | $9.88 | 0.06 | 0.48 | 0.54 | (0.05) | (1.21) | (1.26) | $9.16 | 6.18% | 1.24% | 0.66% | 78% |
| $815,048 |
|
| 2014 | $9.45 | 0.06 | 2.04 | 2.10 | (0.08) | (1.59) | (1.67) | $9.88 | 23.27% | 1.22% | 0.62% | 111% |
| $948,338 |
|
| 2013 | $8.61 | 0.10 | 1.25 | 1.35 | (0.12) | (0.39) | (0.51) | $9.45 | 16.58% | 1.25% | 1.17% | 126% |
| $894,194 |
|
| Institutional Class | | | | | | | | | | | |
| 2017 | $7.61 | 0.06 | 2.29 | 2.35 | (0.07) | (0.42) | (0.49) | $9.47 | 31.43% | 1.05% | 0.67% | 90% |
| $463,119 |
|
| 2016 | $9.22 | 0.05 | (0.58) | (0.53) | (0.05) | (1.03) | (1.08) | $7.61 | (6.02)% | 1.06% | 0.63% | 95% |
| $517,247 |
|
| 2015 | $9.94 | 0.08 | 0.48 | 0.56 | (0.07) | (1.21) | (1.28) | $9.22 | 6.35% | 1.04% | 0.86% | 78% |
| $599,932 |
|
| 2014 | $9.50 | 0.08 | 2.05 | 2.13 | (0.10) | (1.59) | (1.69) | $9.94 | 23.45% | 1.02% | 0.82% | 111% |
| $874,415 |
|
| 2013 | $8.65 | 0.12 | 1.26 | 1.38 | (0.14) | (0.39) | (0.53) | $9.50 | 16.89% | 1.05% | 1.37% | 126% |
| $721,572 |
|
| A Class | | | | | | | | | | | | |
| 2017 | $7.49 | 0.02 | 2.26 | 2.28 | (0.04) | (0.42) | (0.46) | $9.31 | 30.82% | 1.50% | 0.22% | 90% |
| $141,505 |
|
| 2016 | $9.09 | 0.01 | (0.57) | (0.56) | (0.01) | (1.03) | (1.04) | $7.49 | (6.41)% | 1.51% | 0.18% | 95% |
| $142,568 |
|
| 2015 | $9.81 | 0.04 | 0.48 | 0.52 | (0.03) | (1.21) | (1.24) | $9.09 | 5.96% | 1.49% | 0.41% | 78% |
| $384,891 |
|
| 2014 | $9.40 | 0.04 | 2.02 | 2.06 | (0.06) | (1.59) | (1.65) | $9.81 | 22.92% | 1.47% | 0.37% | 111% |
| $433,905 |
|
| 2013 | $8.57 | 0.08 | 1.24 | 1.32 | (0.10) | (0.39) | (0.49) | $9.40 | 16.19% | 1.50% | 0.92% | 126% |
| $401,510 |
|
|
| | | | | | | | | | | | | | | |
| For a Share Outstanding Throughout the Years Ended March 31 (except as noted) |
| Per-Share Data | Ratios and Supplemental Data |
| | | Income From Investment Operations: | Distributions From: | | | Ratio to Average Net Assets of: | | |
| | Net Asset Value, Beginning of Period | Net Investment Income (Loss)(1) | Net Realized and Unrealized Gain (Loss) | Total From Investment Operations | Net Investment Income | Net Realized Gains | Total Distributions | Net Asset Value, End of Period | Total Return(2) | Operating Expenses | Net Investment Income (Loss) | Portfolio Turnover Rate | Net Assets, End of Period (in thousands) |
| C Class |
| 2017 | $7.29 | (0.05) | 2.20 | 2.15 | (0.01) | (0.42) | (0.43) | $9.01 | 29.78% | 2.25% | (0.53)% | 90% |
| $1,234 |
|
| 2016 | $8.93 | (0.04) | (0.57) | (0.61) | — | (1.03) | (1.03) | $7.29 | (7.13)% | 2.26% | (0.57)% | 95% |
| $265 |
|
| 2015 | $9.71 | (0.03) | 0.47 | 0.44 | (0.01) | (1.21) | (1.22) | $8.93 | 5.14% | 2.24% | (0.34)% | 78% |
| $138 |
|
| 2014 | $9.35 | (0.04) | 2.01 | 1.97 | (0.02) | (1.59) | (1.61) | $9.71 | 21.94% | 2.22% | (0.38)% | 111% |
| $114 |
|
| 2013 | $8.53 | 0.01 | 1.24 | 1.25 | (0.04) | (0.39) | (0.43) | $9.35 | 15.35% | 2.25% | 0.17% | 126% |
| $80 |
|
| R Class |
| 2017 | $7.48 | —(3) | 2.25 | 2.25 | (0.03) | (0.42) | (0.45) | $9.28 | 30.41% | 1.75% | (0.03)% | 90% |
| $3,275 |
|
| 2016 | $9.09 | —(3) | (0.58) | (0.58) | — | (1.03) | (1.03) | $7.48 | (6.65)% | 1.76% | (0.07)% | 95% |
| $2,346 |
|
| 2015 | $9.83 | 0.02 | 0.47 | 0.49 | (0.02) | (1.21) | (1.23) | $9.09 | 5.65% | 1.74% | 0.16% | 78% |
| $2,138 |
|
| 2014 | $9.42 | 0.01 | 2.03 | 2.04 | (0.04) | (1.59) | (1.63) | $9.83 | 22.64% | 1.72% | 0.12% | 111% |
| $4,517 |
|
| 2013 | $8.58 | 0.06 | 1.25 | 1.31 | (0.08) | (0.39) | (0.47) | $9.42 | 15.98% | 1.75% | 0.67% | 126% |
| $3,516 |
|
| R6 Class |
| 2017 | $7.62 | 0.07 | 2.28 | 2.35 | (0.08) | (0.42) | (0.50) | $9.47 | 31.45% | 0.90% | 0.82% | 90% |
| $176,015 |
|
| 2016 | $9.23 | 0.07 | (0.59) | (0.52) | (0.06) | (1.03) | (1.09) | $7.62 | (5.86)% | 0.91% | 0.78% | 95% |
| $67,173 |
|
| 2015 | $9.94 | 0.11 | 0.48 | 0.59 | (0.09) | (1.21) | (1.30) | $9.23 | 6.62% | 0.89% | 1.01% | 78% |
| $39,898 |
|
2014(4) | $10.38 | 0.07 | 1.14 | 1.21 | (0.06) | (1.59) | (1.65) | $9.94 | 12.46% | 0.87%(5) | 1.06%(5) | 111%(6) |
| $13,430 |
|
|
| | | | |
| Notes to Financial Highlights | | |
| |
| (1) | Computed using average shares outstanding throughout the period. |
| |
| (2) | Total returns are calculated based on the net asset value of the last business day and do not reflect applicable sales charges, if any. Total returns for periods less than one year are not annualized. |
| |
| (3) | Per share amount was less than $0.005. |
| |
| (4) | July 26, 2013 (commencement of sale) through March 31, 2014. |
| |
| (6) | Portfolio turnover is calculated at the fund level. Percentage indicated was calculated for the year ended March 31, 2014. |
See Notes to Financial Statements.
|
|
| Report of Independent Registered Public Accounting Firm |
To the Board of Directors and Shareholders of American Century Capital Portfolios, Inc.:
We have audited the accompanying statement of assets and liabilities, including the schedule of investments, of Small Cap Value Fund (the “Fund”), one of the funds constituting American Century Capital Portfolios, Inc., as of March 31, 2017, and the related statement of operations for the year then ended, the statements of changes in net assets for each of the two years in the period then ended, and the financial highlights for each of the periods presented. These financial statements and financial highlights are the responsibility of the Fund's management. Our responsibility is to express an opinion on these financial statements and financial highlights based on our audits.
We conducted our audits in accordance with the standards of the Public Company Accounting Oversight Board (United States). Those standards require that we plan and perform the audit to obtain reasonable assurance about whether the financial statements and financial highlights are free of material misstatement. The Fund is not required to have, nor were we engaged to perform, an audit of its internal control over financial reporting. Our audits included consideration of internal control over financial reporting as a basis for designing audit procedures that are appropriate in the circumstances, but not for the purpose of expressing an opinion on the effectiveness of the Fund's internal control over financial reporting. Accordingly, we express no such opinion. An audit also includes examining, on a test basis, evidence supporting the amounts and disclosures in the financial statements, assessing the accounting principles used and significant estimates made by management, as well as evaluating the overall financial statement presentation. Our procedures included confirmation of securities owned as of March 31, 2017, by correspondence with the custodian and brokers; when replies were not received from brokers, we performed other auditing procedures. We believe that our audits provide a reasonable basis for our opinion.
In our opinion, the financial statements and financial highlights referred to above present fairly, in all material respects, the financial position of Small Cap Value Fund of American Century Capital Portfolios, Inc. as of March 31, 2017, the results of its operations for the year then ended, the changes in its net assets for each of the two years in the period then ended, and the financial highlights for each of the periods presented, in conformity with accounting principles generally accepted in the United States of America.
DELOITTE & TOUCHE LLP
Kansas City, Missouri May 16, 2017
The Board of Directors
The individuals listed below serve as directors of the funds. Each director will continue to serve in this capacity until death, retirement, resignation or removal from office. The board has adopted a mandatory retirement age for directors who are not “interested persons,” as that term is defined in the Investment Company Act (independent directors). Independent directors shall retire by December 31 of the year in which they reach their 75th birthday.
Mr. Thomas is an “interested person” because he currently serves as President and Chief Executive Officer of American Century Companies, Inc. (ACC), the parent company of American Century Investment Management, Inc. (ACIM or the advisor). The other directors (more than three-fourths of the total number) are independent. They are not employees, directors or officers of, and have no financial interest in, ACC or any of its wholly owned, direct or indirect, subsidiaries, including ACIM, American Century Investment Services, Inc. (ACIS) and American Century Services, LLC (ACS), and they do not have any other affiliations, positions or relationships that would cause them to be considered “interested persons” under the Investment Company Act. The directors serve in this capacity for seven (in the case of Mr. Thomas, 15) registered investment companies in the American Century Investments family of funds.
The following table presents additional information about the directors. The mailing address for each director is 4500 Main Street, Kansas City, Missouri 64111.
|
| | | | | |
Name
(Year of Birth) | Position(s) Held with Funds | Length of Time Served | Principal Occupation(s) During Past 5 Years | Number of American Century Portfolios Overseen by Director | Other Directorships Held During Past 5 Years |
| Independent Directors |
|
|
| Thomas W. Bunn (1953) | Advisory Board Director | Since 2017 | Retired | 81 | SquareTwo Financial; Barings (formerly Babson Capital Funds Trust) (2013 to 2016) |
Barry Fink
(1955) | Director | Since 2012 (independent since 2016) | Retired; Executive Vice President, ACC (2007 to 2013); President, ACS (2007 to 2013); Chief Operating Officer, ACC (2007 to 2012) | 81 | None |
Andrea C. Hall
(1945) | Director | Since 1997 | Retired | 81 | None |
Jan M. Lewis
(1957) | Director | Since 2011 | Retired; President and Chief Executive Officer, Catholic Charities of Northeast Kansas (human services organization) (2006 to 2013) | 81 | None |
James A. Olson
(1942) | Director and Chairman of the Board | Since 2007 (Chairman since 2014) | Member, Plaza Belmont LLC (private equity fund manager) (1999 to present) | 81 | Saia, Inc. (2002 to 2012) and EPR Properties (2003 to 2013) |
|
| | | | | |
Name
(Year of Birth) | Position(s) Held with Funds | Length of Time Served | Principal Occupation(s) During Past 5 Years | Number of American Century Portfolios Overseen by Director | Other Directorships Held During Past 5 Years |
| Independent Directors |
|
|
M. Jeannine Strandjord
(1945) | Director | Since 1994 | Retired | 81 | Euronet Worldwide Inc.; MGP Ingredients, Inc.; and DST Systems Inc. (1996 to 2012) |
John R. Whitten
(1946) | Director | Since 2008 | Retired | 81 | Rudolph Technologies, Inc. |
Stephen E. Yates
(1948) | Director | Since 2012 | Retired | 81 | None |
| Interested Director |
|
|
Jonathan S. Thomas
(1963) | Director and President | Since 2007 | President and Chief Executive Officer, ACC (2007 to present). Also serves as Chief Executive Officer, ACS; Executive Vice President, ACIM; Director, ACC, ACIM and other ACC subsidiaries | 126 | BioMed Valley Discoveries, Inc. |
The Statement of Additional Information has additional information about the fund's directors and is available without charge, upon request, by calling 1-800-345-2021.
Officers
The following table presents certain information about the executive officers of the funds. Each officer serves as an officer for each of the 15 investment companies in the American Century family of funds, unless otherwise noted. No officer is compensated for his or her service as an officer of the funds. The listed officers are interested persons of the funds and are appointed or re-appointed on an annual basis. The mailing address for each officer listed below is 4500 Main Street, Kansas City, Missouri 64111.
|
| | |
Name
(Year of Birth) | Offices with the Funds | Principal Occupation(s) During the Past Five Years |
Jonathan S. Thomas
(1963) | Director and President since 2007 | President and Chief Executive Officer, ACC (2007 to present). Also serves as Chief Executive Officer, ACS; Executive Vice President, ACIM; Director, ACC, ACIM and other ACC subsidiaries |
Amy D. Shelton
(1964) | Chief Compliance Officer and Vice President since 2014 | Chief Compliance Officer, American Century funds, (2014 to present); Chief Compliance Officer, ACIM (2014 to present); Chief Compliance Officer, ACIS (2009 to present); Vice President, Client Interactions and Marketing, ACIS (2013 to 2014); Director, Client Interactions and Marketing, ACIS (2007 to 2013). Also serves as Vice President, ACIS |
Charles A. Etherington
(1957) | General Counsel since 2007 and Senior Vice President since 2006 | Attorney, ACC (1994 to present); Vice President, ACC (2005 to present); General Counsel, ACC (2007 to present). Also serves as General Counsel, ACIM, ACS, ACIS and other ACC subsidiaries; and Senior Vice President, ACIM and ACS |
C. Jean Wade
(1964) | Vice President,Treasurer and Chief Financial Officer since 2012 | Vice President, ACS (2000 to present) |
Robert J. Leach
(1966) | Vice President since 2006 and Assistant Treasurer since 2012 | Vice President, ACS (2000 to present) |
David H. Reinmiller
(1963) | Vice President since 2000 | Attorney, ACC (1994 to present); Associate General Counsel, ACC (2001 to present). Also serves as Vice President, ACIM and ACS |
Ward D. Stauffer
(1960) | Secretary since 2005 | Attorney, ACC (2003 to present) |
Retirement Account Information
As required by law, distributions you receive from certain IRAs are subject to federal income tax withholding, unless you elect not to have withholding apply. Tax will be withheld on the total amount withdrawn even though you may be receiving amounts that are not subject to withholding, such as nondeductible contributions. In such case, excess amounts of withholding could occur. You may adjust your withholding election so that a greater or lesser amount will be withheld.
If you don’t want us to withhold on this amount, you must notify us to not withhold the federal income tax. You may notify us in writing or in certain situations by telephone or through other electronic means. For systematic withdrawals, your withholding election will remain in effect until revoked or changed by filing a new election. You have the right to revoke your election at any time.
Remember, even if you elect not to have income tax withheld, you are liable for paying income tax on the taxable portion of your withdrawal. If you elect not to have income tax withheld or you don’t have enough income tax withheld, you may be responsible for payment of estimated tax. You may incur penalties under the estimated tax rules if your withholding and estimated tax payments are not sufficient. You can reduce or defer the income tax on a distribution by directly or indirectly rolling such distribution over to another IRA or eligible plan. You should consult your tax advisor for additional information.
State tax will be withheld if, at the time of your distribution, your address is within one of the mandatory withholding states and you have federal income tax withheld (or as otherwise required by state law). State taxes will be withheld from your distribution in accordance with the respective state rules.
Distributions you receive from 403(b), 457 and qualified plans are subject to special tax and withholding rules. Your plan administrator or plan sponsor is required to provide you with a special tax notice explaining those rules at the time you request a distribution. If applicable, federal and/or state taxes may be withheld from your distribution amount.
Proxy Voting Policies
A description of the policies that the fund's investment advisor uses in exercising the voting rights associated with the securities purchased and/or held by the fund is available without charge, upon request, by calling 1-800-345-2021. It is also available on the "About Us" page of American Century Investments’ website at americancentury.com and on the Securities and Exchange Commission’s website at sec.gov. Information regarding how the investment advisor voted proxies relating to portfolio securities during the most recent 12-month period ended June 30 is available on the "About Us" page at americancentury.com. It is also available at sec.gov.
Quarterly Portfolio Disclosure
The fund files its complete schedule of portfolio holdings with the Securities and Exchange Commission (SEC) for the first and third quarters of each fiscal year on Form N-Q. The fund’s Forms N-Q are available on the SEC’s website at sec.gov, and may be reviewed and copied at the SEC’s Public Reference Room in Washington, DC. Information on the operation of the Public Reference Room may be obtained by calling 1-800-SEC-0330. The fund also makes its complete schedule of portfolio holdings for the most recent quarter of its fiscal year available on its website at americancentury.com and, upon request, by calling 1-800-345-2021.
Other Tax Information
The following information is provided pursuant to provisions of the Internal Revenue Code.
The fund hereby designates up to the maximum amount allowable as qualified dividend income for the fiscal year ended March 31, 2017.
For corporate taxpayers, the fund hereby designates $12,443,619, or up to the maximum amount allowable, of ordinary income distributions paid during the fiscal year ended March 31, 2017 as qualified for the corporate dividends received deduction.
The fund hereby designates $31,819,691 as qualified short-term capital gain distributions for purposes of Internal Revenue Code Section 871 for the fiscal year ended March 31, 2017.
The fund hereby designates $42,165,330, or up to the maximum amount allowable, as long-term capital gain distributions (20% rate gain distributions) for the fiscal year ended March 31, 2017.
The fund utilized earnings and profits of $5,972,810 distributed to shareholders on redemption of shares as part of the dividends paid deduction (tax equalization).
|
| | |
| |
| | | |
| Contact Us | americancentury.com | |
| Automated Information Line | 1-800-345-8765 | |
| Investor Services Representative | 1-800-345-2021 or 816-531-5575 | |
| Investors Using Advisors | 1-800-378-9878 | |
| Business, Not-For-Profit, Employer-Sponsored Retirement Plans | 1-800-345-3533 | |
| Banks and Trust Companies, Broker-Dealers, Financial Professionals, Insurance Companies | 1-800-345-6488 | |
| Telecommunications Relay Service for the Deaf | 711 | |
| | | |
| American Century Capital Portfolios, Inc. | |
| | | |
Investment Advisor: American Century Investment Management, Inc. Kansas City, Missouri | |
| | | |
| This report and the statements it contains are submitted for the general information of our shareholders. The report is not authorized for distribution to prospective investors unless preceded or accompanied by an effective prospectus. | |
| | | |
©2017 American Century Proprietary Holdings, Inc. All rights reserved.
CL-ANN-92272 1705 | |
|
| |
| | |
| | Annual Report |
| | |
| | March 31, 2017 |
| | |
| | Value Fund |
|
| | |
| President’s Letter | 2 |
|
| Performance | 3 |
|
| Portfolio Commentary | |
|
| Fund Characteristics | |
|
| Shareholder Fee Example | |
|
| Schedule of Investments | |
|
| Statement of Assets and Liabilities | |
|
| Statement of Operations | |
|
| Statement of Changes in Net Assets | |
|
| Notes to Financial Statements | |
|
| Financial Highlights | |
|
| Report of Independent Registered Public Accounting Firm | |
|
| Management | |
|
| Additional Information | |
|
Any opinions expressed in this report reflect those of the author as of the date of the report, and do not necessarily represent the opinions of American Century Investments® or any other person in the American Century Investments organization. Any such opinions are subject to change at any time based upon market or other conditions and American Century Investments disclaims any responsibility to update such opinions. These opinions may not be relied upon as investment advice and, because investment decisions made by American Century Investments funds are based on numerous factors, may not be relied upon as an indication of trading intent on behalf of any American Century Investments fund. Security examples are used for representational purposes only and are not intended as recommendations to purchase or sell securities. Performance information for comparative indices and securities is provided to American Century Investments by third party vendors. To the best of American Century Investments’ knowledge, such information is accurate at the time of printing.
Jonathan Thomas
Dear Investor:
Thank you for reviewing this annual report for the period ended March 31, 2017. Annual reports help convey important information about fund returns, including market factors that affected performance during the reporting period. For additional, updated investment and market insights, we encourage you to visit our website, americancentury.com.
Risk-On Rebound From Global Economic Concerns of Early 2016
Stocks, high-yield bonds, and commodities rebounded from severe downturns in early 2016 that were triggered by China’s economic slowdown. Since then, growth conditions in China and the rest of the world have generally improved. For the reporting period, the S&P 500 Index, the Bloomberg Barclays U.S. Corporate High-Yield Bond Index, and the S&P Goldman Sachs Commodities Index returned 17.17%, 16.39%, and 8.45%, respectively. This risk-on rebound also drove government bond yields higher, resulting in declines for indices such as the Bloomberg Barclays U.S. Treasury Bond Index (-1.44%). The broader taxable investment-grade U.S. bond market performed better, but still significantly underperformed stocks; the Bloomberg Barclays U.S. Aggregate Bond Index returned 0.44%.
Investors could thank the world’s major central banks and the “Trump Trade” for the risk-on rebound, which occurred with a backdrop of landmark political events, including Brexit (the U.K. vote to leave the European Union) and Donald Trump’s U.S. presidential election victory. Central bank stimulus helped to propel the markets past China- and Brexit-related volatility, followed by Trump victory-inspired optimism about U.S. growth that further boosted higher-risk markets.
But the Trump Trade could prove to be double edged—investor optimism faded as health care reform stalled in Congress and other U.S. fiscal policy proposals looked like they’d face significant hurdles. Meanwhile, the Federal Reserve raised its interest rate target during the reporting period, and suggested that it might raise rates again and start gradually reducing its balance sheet by the end of 2017. These factors, plus rising inflation and continuing geopolitical risks, could impede further risk-on sentiment. In this unsettled environment, we believe in remaining focused on investment goals, using disciplined, actively managed, risk-aware strategies. We appreciate your continued trust in us.
Sincerely,
Jonathan Thomas
President and Chief Executive Officer
American Century Investments
|
| | | | | | |
| Total Returns as of March 31, 2017 | | | |
| | | | Average Annual Returns | |
| | Ticker Symbol | 1 year | 5 years | 10 years | Since Inception | Inception Date |
| Investor Class | TWVLX | 19.79% | 12.49% | 6.46% | — | 9/1/93 |
| Russell 1000 Value Index | — | 19.22% | 13.12% | 5.93% | — | — |
| S&P 500 Index | — | 17.17% | 13.29% | 7.50% | — | — |
| Institutional Class | AVLIX | 19.98% | 12.72% | 6.68% | — | 7/31/97 |
| A Class | TWADX | | | | — | 10/2/96 |
| No sales charge | | 19.49% | 12.21% | 6.20% | — | |
| With sales charge | | 12.64% | 10.89% | 5.58% | — | |
| C Class | ACLCX | 18.45% | 11.37% | 5.40% | — | 6/4/01 |
| R Class | AVURX | 19.18% | 11.93% | 5.94% | — | 7/29/05 |
| R6 Class | AVUDX | 20.16% | — | — | 10.29% | 7/26/13 |
Average annual returns since inception are presented when ten years of performance history is not available.
Prior to September 4, 2007, the A Class was referred to as the Advisor Class and did not have a front-end sales charge. Performance prior to that date has been adjusted to reflect this charge.
Sales charges include initial sales charges and contingent deferred sales charges (CDSCs), as applicable. A Class shares have a 5.75% maximum initial sales charge and may be subject to a maximum CDSC of 1.00%. C Class shares redeemed within 12 months of purchase are subject to a maximum CDSC of 1.00%. The SEC requires that mutual funds provide performance information net of maximum sales charges in all cases where charges could be applied.
Data presented reflect past performance. Past performance is no guarantee of future results. Current performance may be higher or lower than the performance shown. Total returns for periods less than one year are not annualized. Investment return and principal value will fluctuate, and redemption value may be more or less than original cost. Data assumes reinvestment of dividends and capital gains, and none of the charts reflect the deduction of taxes that a shareholder would pay on fund distributions or the redemption of fund shares. To obtain performance data current to the most recent month end, please call 1-800-345-2021 or visit americancentury.com. For additional information about the fund, please consult the prospectus.
|
|
| Growth of $10,000 Over 10 Years |
| $10,000 investment made March 31, 2007 |
Performance for other share classes will vary due to differences in fee structure.
|
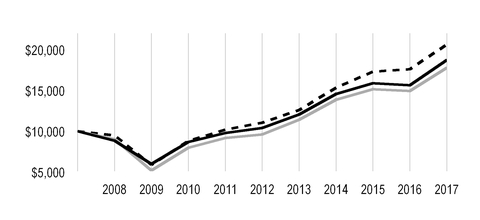
|
| |
| Value on March 31, 2017 |
| | Investor Class — $18,719 |
| |
| | Russell 1000 Value Index — $17,793 |
| |
| | S&P 500 Index — $20,627 |
| |
|
| | | | | |
| Total Annual Fund Operating Expenses |
| Investor Class | Institutional Class | A Class | C Class | R Class | R6 Class |
| 0.98% | 0.78% | 1.23% | 1.98% | 1.48% | 0.63% |
The total annual fund operating expenses shown is as stated in the fund’s prospectus current as of the date of this report. The prospectus may vary from the expense ratio shown elsewhere in this report because it is based on a different time period, includes acquired fund fees and expenses, and, if applicable, does not include fee waivers or expense reimbursements.
Data presented reflect past performance. Past performance is no guarantee of future results. Current performance may be higher or lower than the performance shown. Total returns for periods less than one year are not annualized. Investment return and principal value will fluctuate, and redemption value may be more or less than original cost. Data assumes reinvestment of dividends and capital gains, and none of the charts reflect the deduction of taxes that a shareholder would pay on fund distributions or the redemption of fund shares. To obtain performance data current to the most recent month end, please call 1-800-345-2021 or visit americancentury.com. For additional information about the fund, please consult the prospectus.
Portfolio Managers: Michael Liss, Kevin Toney, Phil Davidson, Brian Woglom, and Dan Gruemmer
Performance Summary
Value returned 19.79%* for the fiscal year ended March 31, 2017, compared with the 19.22% return of its benchmark, the Russell 1000 Value Index.
Value stocks outperformed growth stocks across the capitalization spectrum during the 12-month period, providing a tailwind for the fund’s performance. Within the Russell 1000 Value Index, every sector posted positive returns, led by financials, materials, information technology, and industrials, which returned more than 20% each. The weakest sectors were real estate, telecommunication services, utilities, and consumer discretionary. The fund recorded positive absolute contributions from all sectors, led by financials.
The fund’s outperformance relative to the benchmark was largely driven by stock selection, especially within the energy, utilities, and financials sectors. Significant underweight allocations to utilities and real estate were also beneficial. Stock selection in the industrials and consumer discretionary sectors hampered relative results.
Performance Was Led by Stock Choices in Energy and Utilities
Stock decisions in the energy sector led outperformance. An overweight position in Devon Energy was a top contributor to performance. Devon Energy is an energy exploration and production company with operations in the Permian, Anadarko, and Eagle Ford shale basins in the U.S. A rebound in the price of oil caused energy companies to rally from low levels over the year. Additionally, the company executed a string of asset sales to reduce debt on the balance sheet. The portfolio benefited from its underweight position in Exxon Mobil, as the stock underperformed many other energy securities. Despite operational results that were generally in line with expectations, the company’s valuation fell. Anadarko Petroleum is an energy exploration and production company with global operations (both onshore and offshore). The company was a significant contributor as it executed asset sales that strengthened its balance sheet and made a valuable acquisition at a heavily discounted price.
Stock selection and an underweight in utilities was positive. Westar Energy surged on the announcement of its acquisition by Great Plains Energy. The stock was eliminated from the portfolio as a result.
Other significant individual contributors included Microsoft. The company has experienced better-than-expected strength in PC demand, and cloud adoption by Microsoft’s customers continues to grow at a high pace. Semiconductor equipment company Applied Materials rose after reporting order strength. Also, the company held an analyst day in mid-September that showed improvement in market share. Underweighting telecommunications firm Verizon Communications aided performance. Wireless companies are facing intense competition.
| |
| * | All fund returns referenced in this commentary are for Investor Class shares. Performance for other share classes will vary due to differences in fee structure; when Investor Class performance exceeds that of the fund's benchmark, other share classes may not. See page 3 for returns for all share classes. |
Industrials and Consumer Discretionary Weighed on Performance
Security selection in the industrials sector detracted from performance, stemming in part from an overweight position in General Electric (GE). The stock underperformed after the company reported disappointing results. Investors also had concerns about pricing of orders, margin improvement, and the adequacy of GE’s free cash generation relative to its earnings per share. We increased the weight in GE after the underperformance as the stock’s risk/reward improved. GE’s industrial businesses are still very high quality with margins superior to many peers and competitors, and we believe the reasons for GE’s lower free cash flow generation are transitory.
Stock selection in the consumer discretionary sector also hampered performance. Retailers Advance Auto Parts and Target declined after the companies announced disappointing fourth-quarter 2016 reports.
Exposure to Teva Pharmaceutical Industries detracted. The stock declined due to generic pricing worries and negative sentiment surrounding pharmaceutical stocks. Concern about Teva’s biggest specialty drug, Copaxone, and when its patent will expire have also weighed on the stock. We believe that the worst of the generic pricing headwind has passed and that the worst-case scenario for Copaxone is priced into the stock.
Not owning benchmark components Citigroup and Morgan Stanley detracted, as interest rate-sensitive financials rose, primarily a result of higher interest rates and expectations for a favorable economic environment. Energy stock EQT declined. Natural gas prices strengthened in the fourth quarter 2016, but future natural gas prices sold off. The market became concerned that higher prices today would incentivize excess production in the future, which could in turn push the currently undersupplied natural gas markets into a surplus state. This, combined with crude oil’s strength, drove funds out of natural gas names like EQT.
Portfolio Positioning
We continue to follow the fund’s disciplined, bottom-up process, selecting securities one at a time for the portfolio. We look for higher-quality companies of all sizes, whose stock price may not reflect the company’s value.
Health care remains the largest overweight in the portfolio, as valuations remain compelling in the sector. The portfolio is also overweight the energy sector. Weakness in the sector due to lower oil and gas prices and concerns about potential oversupply in 2018 provided opportunities. We do not believe the markets will switch back to an oversupplied state and leveraged the circumstances to build select positions in the sector.
Many real estate stocks appear overvalued under our valuation methodology, leading to the portfolio’s continued underweight in the sector. The utilities sector remains underweight. We believe that valuations are overextended after utilities previously outperformed due to heavy interest from yield-seeking investors.
|
| |
| MARCH 31, 2017 |
| Top Ten Holdings | % of net assets |
| General Electric Co. | 3.2% |
| JPMorgan Chase & Co. | 3.0% |
| Procter & Gamble Co. (The) | 2.7% |
| Wells Fargo & Co. | 2.7% |
| Pfizer, Inc. | 2.7% |
| Johnson & Johnson | 2.4% |
| Exxon Mobil Corp. | 2.2% |
| Bank of America Corp. | 2.1% |
| Merck & Co., Inc. | 2.1% |
| AT&T, Inc. | 2.0% |
| | |
| Top Five Industries | % of net assets |
| Oil, Gas and Consumable Fuels | 13.7% |
| Banks | 13.3% |
| Pharmaceuticals | 9.0% |
| Health Care Equipment and Supplies | 4.4% |
| Capital Markets | 4.0% |
| | |
| Types of Investments in Portfolio | % of net assets |
| Common Stocks | 97.3% |
| Temporary Cash Investments | 1.9% |
| Other Assets and Liabilities | 0.8% |
Fund shareholders may incur two types of costs: (1) transaction costs, including sales charges (loads) on purchase payments and redemption/exchange fees; and (2) ongoing costs, including management fees; distribution and service (12b-1) fees; and other fund expenses. This example is intended to help you understand your ongoing costs (in dollars) of investing in your fund and to compare these costs with the ongoing cost of investing in other mutual funds.
The example is based on an investment of $1,000 made at the beginning of the period and held for the entire period from October 1, 2016 to March 31, 2017.
Actual Expenses
The table provides information about actual account values and actual expenses for each class. You may use the information, together with the amount you invested, to estimate the expenses that you paid over the period. First, identify the share class you own. Then simply divide your account value by $1,000 (for example, an $8,600 account value divided by $1,000 = 8.6), then multiply the result by the number under the heading “Expenses Paid During Period” to estimate the expenses you paid on your account during this period.
If you hold Investor Class shares of any American Century Investments fund, or Institutional Class shares of the American Century Diversified Bond Fund, in an American Century Investments account (i.e., not a financial intermediary or retirement plan account), American Century Investments may charge you a $12.50 semiannual account maintenance fee if the value of those shares is less than $10,000. We will redeem shares automatically in one of your accounts to pay the $12.50 fee. In determining your total eligible investment amount, we will include your investments in all personal accounts (including American Century Investments Brokerage accounts) registered under your Social Security number. Personal accounts include individual accounts, joint accounts, UGMA/UTMA accounts, personal trusts, Coverdell Education Savings Accounts and IRAs (including traditional, Roth, Rollover, SEP-, SARSEP- and SIMPLE-IRAs), and certain other retirement accounts. If you have only business, business retirement, employer-sponsored or American Century Investments Brokerage accounts, you are currently not subject to this fee. If you are subject to the Account Maintenance Fee, your account value could be reduced by the fee amount.
Hypothetical Example for Comparison Purposes
The table also provides information about hypothetical account values and hypothetical expenses based on the actual expense ratio of each class of your fund and an assumed rate of return of 5% per year before expenses, which is not the actual return of a fund’s share class. The hypothetical account values and expenses may not be used to estimate the actual ending account balance or expenses you paid for the period. You may use this information to compare the ongoing costs of investing in your fund and other funds. To do so, compare this 5% hypothetical example with the 5% hypothetical examples that appear in the shareholder reports of the other funds.
Please note that the expenses shown in the table are meant to highlight your ongoing costs only and do not reflect any transactional costs, such as sales charges (loads) or redemption/exchange fees. Therefore, the table is useful in comparing ongoing costs only, and will not help you determine the relative total costs of owning different funds. In addition, if these transactional costs were included, your costs would have been higher.
|
| | | | |
| Beginning
Account Value
10/1/16 | Ending
Account Value
3/31/17 | Expenses Paid
During Period(1)
10/1/16 - 3/31/17 | Annualized
Expense Ratio(1) |
| Actual | | | | |
| Investor Class | $1,000 | $1,094.50 | $5.12 | 0.98% |
| Institutional Class | $1,000 | $1,095.40 | $4.07 | 0.78% |
| A Class | $1,000 | $1,093.10 | $6.42 | 1.23% |
| C Class | $1,000 | $1,087.90 | $10.31 | 1.98% |
| R Class | $1,000 | $1,091.80 | $7.72 | 1.48% |
| R6 Class | $1,000 | $1,096.20 | $3.29 | 0.63% |
| Hypothetical | | | | |
| Investor Class | $1,000 | $1,020.05 | $4.94 | 0.98% |
| Institutional Class | $1,000 | $1,021.04 | $3.93 | 0.78% |
| A Class | $1,000 | $1,018.80 | $6.19 | 1.23% |
| C Class | $1,000 | $1,015.06 | $9.95 | 1.98% |
| R Class | $1,000 | $1,017.55 | $7.44 | 1.48% |
| R6 Class | $1,000 | $1,021.79 | $3.18 | 0.63% |
| |
| (1) | Expenses are equal to the class's annualized expense ratio listed in the table above, multiplied by the average account value over the period, multiplied by 182, the number of days in the most recent fiscal half-year, divided by 365, to reflect the one-half year period. |
MARCH 31, 2017
|
| | | | | |
| | Shares | Value |
| COMMON STOCKS — 97.3% | | |
| Aerospace and Defense — 1.2% | | |
| Textron, Inc. | 426,461 |
| $ | 20,295,279 |
|
| United Technologies Corp. | 189,180 |
| 21,227,888 |
|
| | | 41,523,167 |
|
| Automobiles — 1.1% | | |
| General Motors Co. | 705,949 |
| 24,962,357 |
|
| Honda Motor Co. Ltd. | 453,600 |
| 13,653,225 |
|
| | | 38,615,582 |
|
| Banks — 13.3% | | |
| Bank of America Corp. | 3,059,700 |
| 72,178,323 |
|
| BB&T Corp. | 645,280 |
| 28,844,016 |
|
| BOK Financial Corp. | 111,460 |
| 8,723,974 |
|
| Comerica, Inc. | 199,985 |
| 13,714,971 |
|
| Cullen/Frost Bankers, Inc. | 103,580 |
| 9,215,513 |
|
| JPMorgan Chase & Co. | 1,171,681 |
| 102,920,459 |
|
| M&T Bank Corp. | 122,770 |
| 18,996,202 |
|
| PNC Financial Services Group, Inc. (The) | 356,983 |
| 42,923,636 |
|
| U.S. Bancorp | 1,192,362 |
| 61,406,643 |
|
| Wells Fargo & Co. | 1,631,928 |
| 90,833,113 |
|
| | | 449,756,850 |
|
| Beverages — 0.3% | | |
| PepsiCo, Inc. | 74,580 |
| 8,342,519 |
|
| Biotechnology — 0.4% | | |
| AbbVie, Inc. | 184,860 |
| 12,045,478 |
|
| Building Products — 1.0% | | |
| Johnson Controls International plc | 801,639 |
| 33,765,035 |
|
| Capital Markets — 4.0% | | |
| Ameriprise Financial, Inc. | 77,910 |
| 10,103,369 |
|
| Franklin Resources, Inc. | 272,190 |
| 11,470,087 |
|
| Goldman Sachs Group, Inc. (The) | 148,924 |
| 34,210,821 |
|
| Invesco Ltd. | 567,500 |
| 17,382,525 |
|
| Northern Trust Corp. | 354,347 |
| 30,679,363 |
|
| State Street Corp. | 411,395 |
| 32,751,156 |
|
| | | 136,597,321 |
|
| Commercial Services and Supplies — 0.4% | | |
| Republic Services, Inc. | 217,163 |
| 13,640,008 |
|
| Communications Equipment — 1.8% | | |
| Cisco Systems, Inc. | 1,826,449 |
| 61,733,976 |
|
| Diversified Financial Services — 1.7% | | |
Berkshire Hathaway, Inc., Class A(1) | 159 |
| 39,726,150 |
|
Berkshire Hathaway, Inc., Class B(1) | 115,620 |
| 19,271,542 |
|
| | | 58,997,692 |
|
| Diversified Telecommunication Services — 3.4% | | |
| AT&T, Inc. | 1,629,750 |
| 67,716,113 |
|
| CenturyLink, Inc. | 327,839 |
| 7,727,165 |
|
Level 3 Communications, Inc.(1) | 191,260 |
| 10,943,897 |
|
|
| | | | | |
| | Shares | Value |
| Verizon Communications, Inc. | 605,740 |
| $ | 29,529,825 |
|
| | | 115,917,000 |
|
| Electric Utilities — 1.9% | | |
| Edison International | 392,863 |
| 31,275,823 |
|
| PG&E Corp. | 514,846 |
| 34,165,181 |
|
| | | 65,441,004 |
|
| Electrical Equipment — 1.2% | | |
| Emerson Electric Co. | 529,690 |
| 31,707,243 |
|
| Hubbell, Inc. | 77,600 |
| 9,315,880 |
|
| | | 41,023,123 |
|
| Electronic Equipment, Instruments and Components — 1.8% | | |
Keysight Technologies, Inc.(1) | 782,874 |
| 28,293,066 |
|
| TE Connectivity Ltd. | 438,489 |
| 32,689,355 |
|
| | | 60,982,421 |
|
| Energy Equipment and Services — 3.4% | | |
| Baker Hughes, Inc. | 260,349 |
| 15,574,077 |
|
| Halliburton Co. | 282,573 |
| 13,905,417 |
|
| Helmerich & Payne, Inc. | 128,763 |
| 8,571,753 |
|
| National Oilwell Varco, Inc. | 341,440 |
| 13,688,330 |
|
| Schlumberger Ltd. | 694,860 |
| 54,268,566 |
|
TechnipFMC plc(1) | 302,580 |
| 9,833,850 |
|
| | | 115,841,993 |
|
| Equity Real Estate Investment Trusts (REITs) — 0.5% | | |
| Weyerhaeuser Co. | 479,420 |
| 16,290,692 |
|
| Food and Staples Retailing — 2.4% | | |
| CVS Health Corp. | 197,310 |
| 15,488,835 |
|
| Sysco Corp. | 250,232 |
| 12,992,045 |
|
| Wal-Mart Stores, Inc. | 716,811 |
| 51,667,737 |
|
| | | 80,148,617 |
|
| Food Products — 3.0% | | |
| Conagra Brands, Inc. | 581,235 |
| 23,447,020 |
|
| General Mills, Inc. | 332,620 |
| 19,627,906 |
|
| Kellogg Co. | 258,236 |
| 18,750,516 |
|
| Mondelez International, Inc., Class A | 922,716 |
| 39,750,605 |
|
| | | 101,576,047 |
|
| Health Care Equipment and Supplies — 4.4% | | |
| Abbott Laboratories | 693,140 |
| 30,782,347 |
|
Boston Scientific Corp.(1) | 567,485 |
| 14,113,352 |
|
| Medtronic plc | 584,870 |
| 47,117,127 |
|
| STERIS plc | 229,821 |
| 15,963,367 |
|
| Zimmer Biomet Holdings, Inc. | 321,991 |
| 39,318,321 |
|
| | | 147,294,514 |
|
| Health Care Providers and Services — 2.6% | | |
| Cardinal Health, Inc. | 91,760 |
| 7,483,028 |
|
| Cigna Corp. | 57,340 |
| 8,399,737 |
|
Express Scripts Holding Co.(1) | 300,739 |
| 19,821,707 |
|
HCA Holdings, Inc.(1) | 36,920 |
| 3,285,511 |
|
| Humana, Inc. | 31,360 |
| 6,464,550 |
|
LifePoint Health, Inc.(1) | 449,856 |
| 29,465,568 |
|
| McKesson Corp. | 97,260 |
| 14,419,768 |
|
| | | 89,339,869 |
|
|
| | | | | |
| | Shares | Value |
| Hotels, Restaurants and Leisure — 0.5% | | |
| Carnival Corp. | 256,007 |
| $ | 15,081,372 |
|
| Household Products — 2.7% | | |
| Procter & Gamble Co. (The) | 1,023,924 |
| 91,999,571 |
|
| Industrial Conglomerates — 3.6% | | |
| General Electric Co. | 3,634,154 |
| 108,297,789 |
|
| Koninklijke Philips NV | 413,723 |
| 13,298,165 |
|
| | | 121,595,954 |
|
| Insurance — 3.5% | | |
| Aflac, Inc. | 237,863 |
| 17,226,038 |
|
| Chubb Ltd. | 225,923 |
| 30,782,009 |
|
| MetLife, Inc. | 571,118 |
| 30,166,453 |
|
| Reinsurance Group of America, Inc. | 197,349 |
| 25,059,376 |
|
| Unum Group | 299,500 |
| 14,043,555 |
|
| | | 117,277,431 |
|
| Leisure Products — 0.5% | | |
| Mattel, Inc. | 640,222 |
| 16,396,085 |
|
| Machinery — 0.2% | | |
| Cummins, Inc. | 44,020 |
| 6,655,824 |
|
| Media — 0.4% | | |
Discovery Communications, Inc., Class A(1) | 448,153 |
| 13,036,771 |
|
| Metals and Mining — 0.4% | | |
| BHP Billiton Ltd. | 752,100 |
| 13,813,485 |
|
| Mortgage Real Estate Investment Trusts (REITs) — 0.1% | | |
| Annaly Capital Management, Inc. | 318,718 |
| 3,540,957 |
|
| Multi-Utilities — 0.5% | | |
| Ameren Corp. | 325,420 |
| 17,764,678 |
|
| Multiline Retail — 0.7% | | |
| Target Corp. | 448,394 |
| 24,746,865 |
|
| Oil, Gas and Consumable Fuels — 13.7% | | |
| Anadarko Petroleum Corp. | 485,830 |
| 30,121,460 |
|
| Apache Corp. | 205,595 |
| 10,565,527 |
|
| Chevron Corp. | 627,337 |
| 67,357,174 |
|
| Cimarex Energy Co. | 130,887 |
| 15,639,688 |
|
| ConocoPhillips | 631,900 |
| 31,512,853 |
|
| Devon Energy Corp. | 601,382 |
| 25,089,657 |
|
| EOG Resources, Inc. | 215,920 |
| 21,062,996 |
|
| EQT Corp. | 603,628 |
| 36,881,671 |
|
| Exxon Mobil Corp. | 888,039 |
| 72,828,078 |
|
| Imperial Oil Ltd. | 274,186 |
| 8,354,338 |
|
| Noble Energy, Inc. | 1,088,930 |
| 37,393,856 |
|
| Occidental Petroleum Corp. | 791,773 |
| 50,166,737 |
|
| Royal Dutch Shell plc, A Shares | 7,987 |
| 209,745 |
|
| Royal Dutch Shell plc, B Shares | 444,190 |
| 12,157,307 |
|
| TOTAL SA | 887,576 |
| 44,895,647 |
|
| | | 464,236,734 |
|
| Pharmaceuticals — 9.0% | | |
| Allergan plc | 104,480 |
| 24,962,362 |
|
| Bristol-Myers Squibb Co. | 160,390 |
| 8,722,008 |
|
| Johnson & Johnson | 660,789 |
| 82,301,270 |
|
| Merck & Co., Inc. | 1,097,417 |
| 69,729,876 |
|
|
| | | | | |
| | Shares | Value |
| Pfizer, Inc. | 2,635,403 |
| $ | 90,157,137 |
|
| Teva Pharmaceutical Industries Ltd. ADR | 892,867 |
| 28,652,102 |
|
| | | 304,524,755 |
|
| Road and Rail — 1.5% | | |
| Heartland Express, Inc. | 1,466,459 |
| 29,402,503 |
|
| Norfolk Southern Corp. | 74,520 |
| 8,344,004 |
|
| Werner Enterprises, Inc. | 486,890 |
| 12,756,518 |
|
| | | 50,503,025 |
|
| Semiconductors and Semiconductor Equipment — 3.3% | | |
| Applied Materials, Inc. | 464,334 |
| 18,062,593 |
|
| Intel Corp. | 1,525,717 |
| 55,032,612 |
|
| QUALCOMM, Inc. | 516,720 |
| 29,628,725 |
|
| Teradyne, Inc. | 337,389 |
| 10,492,798 |
|
| | | 113,216,728 |
|
| Software — 2.5% | | |
| Microsoft Corp. | 501,652 |
| 33,038,801 |
|
| Oracle Corp. (New York) | 1,151,709 |
| 51,377,738 |
|
| | | 84,416,539 |
|
| Specialty Retail — 2.4% | | |
| Advance Auto Parts, Inc. | 211,250 |
| 31,319,925 |
|
| CST Brands, Inc. | 760,540 |
| 36,574,369 |
|
| Lowe's Cos., Inc. | 146,834 |
| 12,071,223 |
|
| | | 79,965,517 |
|
| Technology Hardware, Storage and Peripherals — 0.9% | | |
| Apple, Inc. | 70,460 |
| 10,122,284 |
|
| Hewlett Packard Enterprise Co. | 451,225 |
| 10,694,032 |
|
| HP, Inc. | 451,225 |
| 8,067,903 |
|
| | | 28,884,219 |
|
| Textiles, Apparel and Luxury Goods — 1.1% | | |
| Coach, Inc. | 487,308 |
| 20,140,440 |
|
| Ralph Lauren Corp. | 211,700 |
| 17,278,954 |
|
| | | 37,419,394 |
|
TOTAL COMMON STOCKS
(Cost $2,463,563,496) | | 3,293,948,812 |
|
| TEMPORARY CASH INVESTMENTS — 1.9% | | |
| Repurchase Agreement, BMO Capital Markets Corp., (collateralized by various U.S. Treasury obligations, 0.75% - 2.75%, 7/31/17 - 2/15/24, valued at $22,984,528), in a joint trading account at 0.67%, dated 3/31/17, due 4/3/17 (Delivery value $22,517,346) | | 22,516,089 |
|
| Repurchase Agreement, Fixed Income Clearing Corp., (collateralized by various U.S. Treasury obligations, 2.875%, 8/15/45, valued at $41,679,687), at 0.22%, dated 3/31/17, due 4/3/17 (Delivery value $40,858,749) | | 40,858,000 |
|
| State Street Institutional U.S. Government Money Market Fund, Premier Class | 27,531 |
| 27,531 |
|
TOTAL TEMPORARY CASH INVESTMENTS
(Cost $63,401,620) | | 63,401,620 |
|
TOTAL INVESTMENT SECURITIES — 99.2%
(Cost $2,526,965,116) | | 3,357,350,432 |
|
| OTHER ASSETS AND LIABILITIES — 0.8% | | 28,516,981 |
|
| TOTAL NET ASSETS — 100.0% | | $ | 3,385,867,413 |
|
|
| | | | | | | | | | |
| FORWARD FOREIGN CURRENCY EXCHANGE CONTRACTS |
| Currency Purchased | Currency Sold | Counterparty | Settlement Date | Unrealized Appreciation (Depreciation) |
| USD | 10,117,388 |
| AUD | 13,283,966 |
| Credit Suisse AG | 6/30/17 | $ | (15,396 | ) |
| USD | 6,354,125 |
| CAD | 8,490,855 |
| Morgan Stanley | 6/30/17 | (38,419 | ) |
| USD | 43,493,546 |
| EUR | 39,914,787 |
| UBS AG | 6/30/17 | 734,987 |
|
| USD | 279,634 |
| GBP | 224,731 |
| Credit Suisse AG | 6/30/17 | (2,528 | ) |
| USD | 9,097,161 |
| GBP | 7,262,507 |
| Credit Suisse AG | 6/30/17 | (21,318 | ) |
| USD | 10,649,777 |
| JPY | 1,170,288,000 |
| Credit Suisse AG | 6/30/17 | 101,466 |
|
| | | | | | | $ | 758,792 |
|
|
| | |
| NOTES TO SCHEDULE OF INVESTMENTS |
| ADR | - | American Depositary Receipt |
| AUD | - | Australian Dollar |
| CAD | - | Canadian Dollar |
| EUR | - | Euro |
| GBP | - | British Pound |
| JPY | - | Japanese Yen |
| USD | - | United States Dollar |
| |
(1) | Non-income producing. |
See Notes to Financial Statements.
|
|
| Statement of Assets and Liabilities |
|
| | | |
| MARCH 31, 2017 | |
| Assets | |
| Investment securities, at value (cost of $2,526,965,116) | $ | 3,357,350,432 |
|
| Foreign currency holdings, at value (cost of $913,298) | 917,402 |
|
| Receivable for investments sold | 31,317,206 |
|
| Receivable for capital shares sold | 4,400,437 |
|
| Unrealized appreciation on forward foreign currency exchange contracts | 836,453 |
|
| Dividends and interest receivable | 6,075,060 |
|
| | 3,400,896,990 |
|
| | |
| Liabilities | |
| Payable for investments purchased | 2,035,570 |
|
| Payable for capital shares redeemed | 10,115,802 |
|
| Unrealized depreciation on forward foreign currency exchange contracts | 77,661 |
|
| Accrued management fees | 2,687,749 |
|
| Distribution and service fees payable | 112,795 |
|
| | 15,029,577 |
|
| | |
| Net Assets | $ | 3,385,867,413 |
|
| | |
| Net Assets Consist of: | |
| Capital (par value and paid-in surplus) | $ | 2,590,296,410 |
|
| Accumulated net realized loss | (35,573,005 | ) |
| Net unrealized appreciation | 831,144,008 |
|
| | $ | 3,385,867,413 |
|
|
| | | | | | |
| | Net Assets | Shares Outstanding | Net Asset Value Per Share |
| Investor Class, $0.01 Par Value |
| $2,380,747,482 |
| 265,091,175 |
| $8.98 |
| Institutional Class, $0.01 Par Value |
| $524,447,556 |
| 58,286,341 |
| $9.00 |
| A Class, $0.01 Par Value |
| $158,199,886 |
| 17,625,546 |
| $8.98* |
| C Class, $0.01 Par Value |
| $35,123,818 |
| 3,971,287 |
| $8.84 |
| R Class, $0.01 Par Value |
| $116,916,756 |
| 13,018,883 |
| $8.98 |
| R6 Class, $0.01 Par Value |
| $170,431,915 |
| 18,944,277 |
| $9.00 |
*Maximum offering price $9.53 (net asset value divided by 0.9425).
See Notes to Financial Statements.
|
| | | |
| YEAR ENDED MARCH 31, 2017 |
| Investment Income (Loss) | |
| Income: | |
| Dividends (net of foreign taxes withheld of $590,598) | $ | 77,148,056 |
|
| Interest | 181,039 |
|
| | 77,329,095 |
|
| | |
| Expenses: | |
| Management fees | 29,138,307 |
|
| Distribution and service fees: | |
| A Class | 357,619 |
|
| C Class | 295,861 |
|
| R Class | 453,885 |
|
| Directors' fees and expenses | 95,888 |
|
| Other expenses | 9,991 |
|
| | 30,351,551 |
|
| | |
| Net investment income (loss) | 46,977,544 |
|
| | |
| Realized and Unrealized Gain (Loss) | |
| Net realized gain (loss) on: | |
| Investment transactions | 154,139,687 |
|
| Foreign currency transactions | 2,445,597 |
|
| | 156,585,284 |
|
| | |
| Change in net unrealized appreciation (depreciation) on: | |
| Investments | 348,995,039 |
|
| Translation of assets and liabilities in foreign currencies | 1,879,981 |
|
| | 350,875,020 |
|
| | |
| Net realized and unrealized gain (loss) | 507,460,304 |
|
| | |
| Net Increase (Decrease) in Net Assets Resulting from Operations | $ | 554,437,848 |
|
See Notes to Financial Statements.
|
|
| Statement of Changes in Net Assets |
|
| | | | | | |
| YEARS ENDED MARCH 31, 2017 AND MARCH 31, 2016 |
| Increase (Decrease) in Net Assets | March 31, 2017 | March 31, 2016 |
| Operations | | |
| Net investment income (loss) | $ | 46,977,544 |
| $ | 58,033,174 |
|
| Net realized gain (loss) | 156,585,284 |
| 26,255,755 |
|
| Change in net unrealized appreciation (depreciation) | 350,875,020 |
| (199,639,837 | ) |
| Net increase (decrease) in net assets resulting from operations | 554,437,848 |
| (115,350,908 | ) |
| | | |
| Distributions to Shareholders | | |
| From net investment income: | | |
| Investor Class | (32,451,256 | ) | (38,434,549 | ) |
| Institutional Class | (8,999,573 | ) | (22,028,604 | ) |
| A Class | (1,686,305 | ) | (3,279,088 | ) |
| B Class | — |
| (1,850 | ) |
| C Class | (124,530 | ) | (257,509 | ) |
| R Class | (863,803 | ) | (867,360 | ) |
| R6 Class | (1,637,770 | ) | (911,760 | ) |
| From net realized gains: | | |
| Investor Class | (39,808,812 | ) | (128,627,017 | ) |
| Institutional Class | (8,710,810 | ) | (77,316,275 | ) |
| A Class | (2,478,897 | ) | (9,475,685 | ) |
| C Class | (522,862 | ) | (1,775,006 | ) |
| R Class | (1,703,290 | ) | (3,945,923 | ) |
| R6 Class | (1,805,048 | ) | (2,424,164 | ) |
| Decrease in net assets from distributions | (100,792,956 | ) | (289,344,790 | ) |
| | | |
| Capital Share Transactions | | |
| Net increase (decrease) in net assets from capital share transactions (Note 5) | 96,621,471 |
| (460,591,463 | ) |
| | | |
| Net increase (decrease) in net assets | 550,266,363 |
| (865,287,161 | ) |
| | | |
| Net Assets | | |
| Beginning of period | 2,835,601,050 |
| 3,700,888,211 |
|
| End of period | $ | 3,385,867,413 |
| $ | 2,835,601,050 |
|
| | | |
| Undistributed net investment income | — |
| $ | 1,765,442 |
|
See Notes to Financial Statements.
|
|
| Notes to Financial Statements |
MARCH 31, 2017
1. Organization
American Century Capital Portfolios, Inc. (the corporation) is registered under the Investment Company Act of 1940, as amended (the 1940 Act), as an open-end management investment company and is organized as a Maryland corporation. Value Fund (the fund) is one fund in a series issued by the corporation. The fund’s investment objective is to seek long-term capital growth. Income is a secondary objective.
The fund offers the Investor Class, the Institutional Class, the A Class, the C Class, the R Class and the R6 Class. The A Class may incur an initial sales charge. The A Class and C Class may be subject to a contingent deferred sales charge. On October 16, 2015, all outstanding B Class shares were converted to A Class shares and the fund discontinued offering the B Class.
2. Significant Accounting Policies
The following is a summary of significant accounting policies consistently followed by the fund in preparation of its financial statements. The fund is an investment company and follows accounting and reporting guidance in accordance with accounting principles generally accepted in the United States of America. This may require management to make certain estimates and assumptions at the date of the financial statements. Actual results could differ from these estimates. Management evaluated the impact of events or transactions occurring through the date the financial statements were issued that would merit recognition or disclosure.
Investment Valuations — The fund determines the fair value of its investments and computes its net asset value per share at the close of regular trading (usually 4 p.m. Eastern time) on the New York Stock Exchange (NYSE) on each day the NYSE is open. The Board of Directors has adopted valuation policies and procedures to guide the investment advisor in the fund’s investment valuation process and to provide methodologies for the oversight of the fund’s pricing function.
Equity securities that are listed or traded on a domestic securities exchange are valued at the last reported sales price or at the official closing price as provided by the exchange. Equity securities traded on foreign securities exchanges are generally valued at the closing price of such securities on the exchange where primarily traded or at the close of the NYSE, if that is earlier. If no last sales price is reported, or if local convention or regulation so provides, the mean of the latest bid and asked prices may be used. Securities traded over-the-counter are valued at the mean of the latest bid and asked prices, the last sales price, or the official closing price. Equity securities initially expressed in local currencies are translated into U.S. dollars at the mean of the appropriate currency exchange rate at the close of the NYSE as provided by an independent pricing service.
Open-end management investment companies are valued at the reported net asset value per share. Repurchase agreements are valued at cost, which approximates fair value. Forward foreign currency exchange contracts are valued at the mean of the appropriate forward exchange rate at the close of the NYSE as provided by an independent pricing service.
If the fund determines that the market price for an investment is not readily available or the valuation methods mentioned above do not reflect an investment’s fair value, such investment is valued as determined in good faith by the Board of Directors or its delegate, in accordance with policies and procedures adopted by the Board of Directors. In its determination of fair value, the fund may review several factors including, but not limited to, market information regarding the specific investment or comparable investments and correlation with other investment types, futures indices or general market indicators. Circumstances that may cause the fund to use these procedures to value an investment include, but are not limited to: an investment has been declared in default or is distressed; trading in a security has been suspended during the trading day or a security is not actively trading on its principal exchange; prices received from a regular pricing source are deemed unreliable; or there is a foreign market holiday and no trading occurred.
The fund monitors for significant events occurring after the close of an investment’s primary exchange but before the fund’s net asset value per share is determined. Significant events may include, but are not limited to: corporate announcements and transactions; governmental action and political unrest that could impact a specific investment or an investment sector; or armed conflicts, natural disasters and similar events that could
affect investments in a specific country or region. The fund also monitors for significant fluctuations between domestic and foreign markets, as evidenced by the U.S. market or such other indicators that the Board of Directors, or its delegate, deems appropriate. If significant fluctuations in foreign markets are identified, the fund may apply a model-derived factor to the closing price of equity securities traded on foreign securities exchanges. The factor is based on observable market data as provided by an independent pricing service.
Security Transactions — Security transactions are accounted for as of the trade date. Net realized gains and losses are determined on the identified cost basis, which is also used for federal income tax purposes.
Investment Income — Dividend income less foreign taxes withheld, if any, is recorded as of the ex-dividend date. Distributions received on securities that represent a return of capital or long-term capital gain are recorded as a reduction of cost of investments and/or as a realized gain. The fund may estimate the components of distributions received that may be considered nontaxable distributions or long-term capital gain distributions for income tax purposes. Interest income is recorded on the accrual basis and includes accretion of discounts and amortization of premiums.
Foreign Currency Translations — All assets and liabilities initially expressed in foreign currencies are translated into U.S. dollars at prevailing exchange rates at period end. The fund may enter into spot foreign currency exchange contracts to facilitate transactions denominated in a foreign currency. Purchases and sales of investment securities, dividend and interest income, spot foreign currency exchange contracts, and expenses are translated at the rates of exchange prevailing on the respective dates of such transactions. Net realized and unrealized foreign currency exchange gains or losses related to investment securities are a component of net realized gain (loss) on investment transactions and change in net unrealized appreciation (depreciation) on investments, respectively.
Repurchase Agreements — The fund may enter into repurchase agreements with institutions that American Century Investment Management, Inc. (ACIM) (the investment advisor) has determined are creditworthy pursuant to criteria adopted by the Board of Directors. The fund requires that the collateral, represented by securities, received in a repurchase transaction be transferred to the custodian in a manner sufficient to enable the fund to obtain those securities in the event of a default under the repurchase agreement. ACIM monitors, on a daily basis, the securities transferred to ensure the value, including accrued interest, of the securities under each repurchase agreement is equal to or greater than amounts owed to the fund under each repurchase agreement.
Joint Trading Account — Pursuant to an Exemptive Order issued by the Securities and Exchange Commission, the fund, along with certain other funds in the American Century Investments family of funds, may transfer uninvested cash balances into a joint trading account. These balances are invested in one or more repurchase agreements that are collateralized by U.S. Treasury or Agency obligations.
Income Tax Status — It is the fund’s policy to distribute substantially all net investment income and net realized gains to shareholders and to otherwise qualify as a regulated investment company under provisions of the Internal Revenue Code. Accordingly, no provision has been made for income taxes. The fund files U.S. federal, state, local and non-U.S. tax returns as applicable. The fund's tax returns are subject to examination by the relevant taxing authority until expiration of the applicable statute of limitations, which is generally three years from the date of filing but can be longer in certain jurisdictions. At this time, management believes there are no uncertain tax positions which, based on their technical merit, would not be sustained upon examination and for which it is reasonably possible that the total amounts of unrecognized tax benefits will significantly change in the next twelve months.
Multiple Class — All shares of the fund represent an equal pro rata interest in the net assets of the class to which such shares belong, and have identical voting, dividend, liquidation and other rights and the same terms and conditions, except for class specific expenses and exclusive rights to vote on matters affecting only individual classes. Income, non-class specific expenses, and realized and unrealized capital gains and losses of the fund are allocated to each class of shares based on their relative net assets.
Distributions to Shareholders — Distributions from net investment income, if any, are generally declared and paid quarterly. Distributions from net realized gains, if any, are generally declared and paid annually. The fund may elect to treat a portion of its payment to a redeeming shareholder, which represents the pro rata share of undistributed net investment income and net realized gains, as a distribution for federal income tax purposes (tax equalization).
Indemnifications — Under the corporation’s organizational documents, its officers and directors are indemnified against certain liabilities arising out of the performance of their duties to the fund. In addition, in the normal course of business, the fund enters into contracts that provide general indemnifications. The maximum exposure under these arrangements is unknown as this would involve future claims that may be made against a fund. The risk of material loss from such claims is considered by management to be remote.
3. Fees and Transactions with Related Parties
Certain officers and directors of the corporation are also officers and/or directors of American Century Companies, Inc. (ACC). The corporation’s investment advisor, ACIM, the corporation's distributor, American Century Investment Services, Inc. (ACIS), and the corporation’s transfer agent, American Century Services, LLC, are wholly owned, directly or indirectly, by ACC.
Management Fees — The corporation has entered into a management agreement with ACIM, under which ACIM provides the fund with investment advisory and management services in exchange for a single, unified management fee (the fee) per class. The agreement provides that all expenses of managing and operating the fund, except distribution and service fees, brokerage expenses, taxes, interest, fees and expenses of the independent directors (including legal counsel fees), and extraordinary expenses, will be paid by ACIM. The fee is computed and accrued daily based on each class’s daily net assets and paid monthly in arrears. The difference in the fee among the classes is a result of their separate arrangements for shareholder services. It is not the result of any difference in advisory or custodial fees or other expenses related to the management of the fund’s assets, which do not vary by class. The rate of the fee is determined by applying a fee rate calculation formula. This formula takes into account the fund’s assets as well as certain assets, if any, of other clients of the investment advisor outside the American Century Investments family of funds (such as subadvised funds and separate accounts) that have very similar investment teams and investment strategies (strategy assets). The annual management fee schedule ranges from 0.85% to 1.00% for the Investor Class, A Class, C Class and R Class. The annual management fee schedule ranges from 0.65% to 0.80% for the Institutional Class and 0.50% to 0.65% for the R6 Class. The effective annual management fee for each class for the year ended March 31, 2017 was 0.97% for the Investor Class, A Class, C Class and R Class, 0.77% for the Institutional Class and 0.62% for the R6 Class.
Distribution and Service Fees — The Board of Directors has adopted a separate Master Distribution and Individual Shareholder Services Plan for each of the A Class, C Class and R Class (collectively the plans), pursuant to Rule 12b-1 of the 1940 Act. The plans provide that the A Class will pay ACIS an annual distribution and service fee of 0.25%. The plans provide that the C Class will pay ACIS an annual distribution and service fee of 1.00%, of which 0.25% is paid for individual shareholder services and 0.75% is paid for distribution services. The plans provide that the R Class will pay ACIS an annual distribution and service fee of 0.50%. The fees are computed and accrued daily based on each class’s daily net assets and paid monthly in arrears. The fees are used to pay financial intermediaries for distribution and individual shareholder services. Fees incurred under the plans during the year ended March 31, 2017 are detailed in the Statement of Operations.
Directors' Fees and Expenses — The Board of Directors is responsible for overseeing the investment advisor’s management and operations of the fund. The directors receive detailed information about the fund and its investment advisor regularly throughout the year, and meet at least quarterly with management of the investment advisor to review reports about fund operations. The fund’s officers do not receive compensation from the fund.
Interfund Transactions — The fund may enter into security transactions with other American Century Investments funds and other client accounts of the investment advisor, in accordance with the 1940 Act rules and procedures adopted by the Board of Directors. The rules and procedures require, among other things, that these transactions be effected at the independent current market price of the security. During the period, the interfund purchases and sales were $10,883,792 and $33,303,901, respectively. The effect of interfund transactions on the Statement of Operations was $1,864,859 in net realized gain (loss) on investment transactions.
4. Investment Transactions
Purchases and sales of investment securities, excluding short-term investments, for the year ended March 31, 2017 were $1,447,597,272 and $1,389,265,191, respectively.
5. Capital Share Transactions
Transactions in shares of the fund were as follows:
|
| | | | | | | | | | |
| | Year ended
March 31, 2017 | Year ended
March 31, 2016 |
| | Shares | Amount | Shares | Amount |
| Investor Class/Shares Authorized | 1,640,000,000 |
| | 1,640,000,000 |
| |
| Sold | 56,251,252 |
| $ | 483,211,934 |
| 49,698,842 |
| $ | 414,603,180 |
|
| Issued in reinvestment of distributions | 8,061,133 |
| 70,925,680 |
| 21,246,508 |
| 163,891,656 |
|
| Redeemed | (59,036,495 | ) | (508,891,695 | ) | (45,592,208 | ) | (367,931,510 | ) |
| | 5,275,890 |
| 45,245,919 |
| 25,353,142 |
| 210,563,326 |
|
| Institutional Class/Shares Authorized | 575,000,000 |
| | 575,000,000 |
| |
| Sold | 15,028,430 |
| 129,001,523 |
| 35,462,533 |
| 287,367,186 |
|
| Issued in reinvestment of distributions | 2,016,980 |
| 17,685,960 |
| 12,822,540 |
| 99,258,046 |
|
| Redeemed | (29,337,402 | ) | (247,996,653 | ) | (119,633,526 | ) | (879,664,359 | ) |
| | (12,291,992 | ) | (101,309,170 | ) | (71,348,453 | ) | (493,039,127 | ) |
| A Class/Shares Authorized | 160,000,000 |
| | 160,000,000 |
| |
| Sold | 5,774,791 |
| 49,728,772 |
| 3,376,686 |
| 27,391,309 |
|
| Issued in reinvestment of distributions | 425,838 |
| 3,753,179 |
| 1,505,916 |
| 11,683,162 |
|
| Redeemed | (6,535,938 | ) | (55,226,915 | ) | (29,658,294 | ) | (253,070,357 | ) |
| | (335,309 | ) | (1,744,964 | ) | (24,775,692 | ) | (213,995,886 | ) |
| B Class/Shares Authorized | N/A |
| | N/A |
| |
| Sold | | | 8,094 |
| 67,339 |
|
| Issued in reinvestment of distributions | | | 224 |
| 1,850 |
|
| Redeemed | | | (75,381 | ) | (624,208 | ) |
| | | | (67,063 | ) | (555,019 | ) |
| C Class/Shares Authorized | 30,000,000 |
| | 30,000,000 |
| |
| Sold | 1,135,830 |
| 9,766,081 |
| 435,724 |
| 3,461,527 |
|
| Issued in reinvestment of distributions | 65,993 |
| 579,208 |
| 238,694 |
| 1,805,011 |
|
| Redeemed | (715,498 | ) | (6,017,956 | ) | (686,599 | ) | (5,377,801 | ) |
| | 486,325 |
| 4,327,333 |
| (12,181 | ) | (111,263 | ) |
| R Class/Shares Authorized | 70,000,000 |
| | 70,000,000 |
| |
| Sold | 4,960,151 |
| 42,461,865 |
| 2,953,704 |
| 23,796,785 |
|
| Issued in reinvestment of distributions | 289,845 |
| 2,567,093 |
| 625,876 |
| 4,813,283 |
|
| Redeemed | (1,088,087 | ) | (9,353,854 | ) | (880,314 | ) | (7,079,398 | ) |
| | 4,161,909 |
| 35,675,104 |
| 2,699,266 |
| 21,530,670 |
|
| R6 Class/Shares Authorized | 50,000,000 |
| | 50,000,000 |
| |
| Sold | 14,828,872 |
| 130,218,397 |
| 2,569,061 |
| 20,065,724 |
|
| Issued in reinvestment of distributions | 387,795 |
| 3,442,818 |
| 430,900 |
| 3,335,924 |
|
| Redeemed | (2,204,604 | ) | (19,233,966 | ) | (1,052,801 | ) | (8,385,812 | ) |
| | 13,012,063 |
| 114,427,249 |
| 1,947,160 |
| 15,015,836 |
|
| Net increase (decrease) | 10,308,886 |
| $ | 96,621,471 |
| (66,203,821 | ) | $ | (460,591,463 | ) |
6. Fair Value Measurements
The fund’s investments valuation process is based on several considerations and may use multiple inputs to determine the fair value of the investments held by the fund. In conformity with accounting principles generally accepted in the United States of America, the inputs used to determine a valuation are classified into three broad levels.
| |
| • | Level 1 valuation inputs consist of unadjusted quoted prices in an active market for identical investments. |
| |
| • | Level 2 valuation inputs consist of direct or indirect observable market data (including quoted prices for comparable investments, evaluations of subsequent market events, interest rates, prepayment speeds, credit risk, etc.). These inputs also consist of quoted prices for identical investments initially expressed in local currencies that are adjusted through translation into U.S. dollars. |
| |
| • | Level 3 valuation inputs consist of unobservable data (including a fund’s own assumptions). |
The level classification is based on the lowest level input that is significant to the fair valuation measurement. The valuation inputs are not necessarily an indication of the risks associated with investing in these securities or other financial instruments. There were no significant transfers between levels during the period.
The following is a summary of the level classifications as of period end. The Schedule of Investments provides additional information on the fund’s portfolio holdings.
|
| | | | | | | | |
| | Level 1 | Level 2 | Level 3 |
| Assets | | | |
| Investment Securities | | | |
| Common Stocks | $ | 3,187,566,900 |
| $ | 106,381,912 |
| — |
|
| Temporary Cash Investments | 27,531 |
| 63,374,089 |
| — |
|
| | $ | 3,187,594,431 |
| $ | 169,756,001 |
| — |
|
| Other Financial Instruments | | | |
| Forward Foreign Currency Exchange Contracts | — |
| $ | 836,453 |
| — |
|
| | | | |
| Liabilities | | | |
| Other Financial Instruments | | | |
| Forward Foreign Currency Exchange Contracts | — |
| $ | 77,661 |
| — |
|
7. Derivative Instruments
Foreign Currency Risk — The fund is subject to foreign currency exchange rate risk in the normal course of pursuing its investment objectives. The value of foreign investments held by a fund may be significantly affected by changes in foreign currency exchange rates. The dollar value of a foreign security generally decreases when the value of the dollar rises against the foreign currency in which the security is denominated and tends to increase when the value of the dollar declines against such foreign currency. A fund may enter into forward foreign currency exchange contracts to reduce a fund's exposure to foreign currency exchange rate fluctuations. The net U.S. dollar value of foreign currency underlying all contractual commitments held by a fund and the resulting unrealized appreciation or depreciation are determined daily. Realized gain or loss is recorded upon the termination of the contract. Net realized and unrealized gains or losses occurring during the holding period of forward foreign currency exchange contracts are a component of net realized gain (loss) on foreign currency transactions and change in net unrealized appreciation (depreciation) on translation of assets and liabilities in foreign currencies, respectively. A fund bears the risk of an unfavorable change in the foreign currency exchange rate underlying the forward contract. Additionally, losses, up to the fair value, may arise if the counterparties do not perform under the contract terms. The fund's average U.S. dollar exposure to foreign currency risk derivative instruments held during the period was $94,370,098.
The value of foreign currency risk derivative instruments as of March 31, 2017, is disclosed on the Statement of Assets and Liabilities as an asset of $836,453 in unrealized appreciation on forward foreign currency exchange contracts and a liability of $77,661 in unrealized depreciation on forward foreign currency exchange contracts. For the year ended March 31, 2017, the effect of foreign currency risk derivative instruments on the Statement of Operations was $2,503,224 in net realized gain (loss) on foreign currency transactions and $1,855,110 in change in net unrealized appreciation (depreciation) on translation of assets and liabilities in foreign currencies.
8. Federal Tax Information
The tax character of distributions paid during the years ended March 31, 2017 and March 31, 2016 were as follows:
|
| | | | | | |
| | 2017 | 2016 |
| Distributions Paid From | | |
| Ordinary income | $ | 45,763,237 |
| $ | 78,293,527 |
|
| Long-term capital gains | $ | 55,029,719 |
| $ | 211,051,263 |
|
The book-basis character of distributions made during the year from net investment income or net realized gains may differ from their ultimate characterization for federal income tax purposes. These differences reflect the differing character of certain income items and net realized gains and losses for financial statement and tax purposes, and may result in reclassification among certain capital accounts on the financial statements.
As of March 31, 2017, the federal tax cost of investments and the components of distributable earnings on a tax-basis were as follows:
|
| | | |
| Federal tax cost of investments | $ | 2,620,898,527 |
|
| Gross tax appreciation of investments | $ | 774,413,777 |
|
| Gross tax depreciation of investments | (37,961,872 | ) |
| Net tax appreciation (depreciation) of investments | 736,451,905 |
|
| Net tax appreciation (depreciation) on derivatives and translation of assets and liabilities in foreign currencies | (100 | ) |
| Net tax appreciation (depreciation) | $ | 736,451,805 |
|
| Undistributed ordinary income | $ | 5,149,600 |
|
| Accumulated long-term gains | $ | 53,969,598 |
|
The difference between book-basis and tax-basis unrealized appreciation (depreciation) is attributable primarily to the tax deferral of losses on wash sales.
9. Recently Issued Accounting Guidance
In October 2016, the Securities and Exchange Commission adopted new rules and forms as well as amendments to its rules and forms to modernize the reporting and disclosure of information by registered investment companies. The amendments to Regulation S-X will require standardized, enhanced disclosure about derivatives in investment company financial statements, as well as other provisions. Compliance with the amendments is effective on August 1, 2017. Management is currently evaluating the impact that adopting the amendments will have on the financial statement disclosures.
10. Corporate Event
The Institutional Class was renamed to the I Class effective April 10, 2017.
|
| | | | | | | | | | | | | | | |
For a Share Outstanding Throughout the Years Ended March 31 (except as noted)
|
| Per-Share Data | | | | | | | | | Ratios and Supplemental Data |
| | | Income From Investment Operations: | Distributions From: | | | Ratio to Average Net Assets of: | |
| | Net Asset
Value,
Beginning
of Period | Net
Investment
Income
(Loss)(1) | Net
Realized
and
Unrealized
Gain (Loss) | Total From
Investment
Operations | Net
Investment
Income | Net
Realized
Gains | Total
Distributions | Net Asset
Value,
End
of Period | Total
Return(2) | Operating
Expenses | Net
Investment
Income
(Loss) | Portfolio
Turnover
Rate | Net
Assets,
End of
Period
(in thousands) |
| Investor Class | | | | | | | | | | | | |
| 2017 | $7.73 | 0.13 | 1.39 | 1.52 | (0.12) | (0.15) | (0.27) | $8.98 | 19.79% | 0.98% | 1.48% | 46% |
| $2,380,747 |
|
| 2016 | $8.55 | 0.13 | (0.28) | (0.15) | (0.15) | (0.52) | (0.67) | $7.73 | (1.53)% | 0.98% | 1.65% | 48% |
| $2,009,044 |
|
| 2015 | $8.46 | 0.13 | 0.62 | 0.75 | (0.13) | (0.53) | (0.66) | $8.55 | 8.91% | 0.97% | 1.54% | 45% |
| $2,003,967 |
|
| 2014 | $7.11 | 0.13 | 1.34 | 1.47 | (0.12) | — | (0.12) | $8.46 | 20.82% | 0.98% | 1.60% | 49% |
| $2,406,139 |
|
| 2013 | $6.23 | 0.10 | 0.89 | 0.99 | (0.11) | — | (0.11) | $7.11 | 16.08% | 1.00% | 1.65% | 48% |
| $1,955,536 |
|
| Institutional Class | | | | | | | | | | | | |
| 2017 | $7.75 | 0.14 | 1.40 | 1.54 | (0.14) | (0.15) | (0.29) | $9.00 | 19.98% | 0.78% | 1.68% | 46% |
| $524,448 |
|
| 2016 | $8.56 | 0.15 | (0.27) | (0.12) | (0.17) | (0.52) | (0.69) | $7.75 | (1.21)% | 0.78% | 1.85% | 48% |
| $546,782 |
|
| 2015 | $8.47 | 0.15 | 0.62 | 0.77 | (0.15) | (0.53) | (0.68) | $8.56 | 9.10% | 0.77% | 1.74% | 45% |
| $1,215,076 |
|
| 2014 | $7.12 | 0.14 | 1.34 | 1.48 | (0.13) | — | (0.13) | $8.47 | 21.03% | 0.78% | 1.80% | 49% |
| $749,868 |
|
| 2013 | $6.24 | 0.12 | 0.88 | 1.00 | (0.12) | — | (0.12) | $7.12 | 16.29% | 0.80% | 1.85% | 48% |
| $172,891 |
|
| A Class | | | | | | | | | | | | | |
| 2017 | $7.73 | 0.11 | 1.39 | 1.50 | (0.10) | (0.15) | (0.25) | $8.98 | 19.49% | 1.23% | 1.23% | 46% |
| $158,200 |
|
| 2016 | $8.54 | 0.11 | (0.27) | (0.16) | (0.13) | (0.52) | (0.65) | $7.73 | (1.65)% | 1.23% | 1.40% | 48% |
| $138,798 |
|
| 2015 | $8.45 | 0.11 | 0.62 | 0.73 | (0.11) | (0.53) | (0.64) | $8.54 | 8.64% | 1.22% | 1.29% | 45% |
| $365,063 |
|
| 2014 | $7.10 | 0.11 | 1.34 | 1.45 | (0.10) | — | (0.10) | $8.45 | 20.55% | 1.23% | 1.35% | 49% |
| $362,439 |
|
| 2013 | $6.23 | 0.09 | 0.87 | 0.96 | (0.09) | — | (0.09) | $7.10 | 15.64% | 1.25% | 1.40% | 48% |
| $295,085 |
|
|
| | | | | | | | | | | | | | | |
For a Share Outstanding Throughout the Years Ended March 31 (except as noted)
|
| Per-Share Data | | | | | | | | | Ratios and Supplemental Data |
| | | Income From Investment Operations: | Distributions From: | | | Ratio to Average Net Assets of: | |
| | Net Asset
Value,
Beginning
of Period | Net
Investment
Income
(Loss)(1) | Net
Realized
and
Unrealized
Gain (Loss) | Total From
Investment
Operations | Net
Investment
Income | Net
Realized
Gains | Total
Distributions | Net Asset
Value,
End
of Period | Total
Return(2) | Operating
Expenses | Net
Investment
Income
(Loss) | Portfolio
Turnover
Rate | Net
Assets,
End of
Period
(in thousands) |
| C Class | | | | | | | | | | | | |
| 2017 | $7.62 | 0.04 | 1.36 | 1.40 | (0.03) | (0.15) | (0.18) | $8.84 | 18.45% | 1.98% | 0.48% | 46% |
| $35,124 |
|
| 2016 | $8.43 | 0.05 | (0.27) | (0.22) | (0.07) | (0.52) | (0.59) | $7.62 | (2.42)% | 1.98% | 0.65% | 48% |
| $26,542 |
|
| 2015 | $8.36 | 0.05 | 0.60 | 0.65 | (0.05) | (0.53) | (0.58) | $8.43 | 7.77% | 1.97% | 0.54% | 45% |
| $29,473 |
|
| 2014 | $7.03 | 0.05 | 1.33 | 1.38 | (0.05) | — | (0.05) | $8.36 | 19.64% | 1.98% | 0.60% | 49% |
| $25,869 |
|
| 2013 | $6.16 | 0.04 | 0.88 | 0.92 | (0.05) | — | (0.05) | $7.03 | 14.98% | 2.00% | 0.65% | 48% |
| $16,761 |
|
| R Class | | | | | | | | | | | | | |
| 2017 | $7.73 | 0.08 | 1.40 | 1.48 | (0.08) | (0.15) | (0.23) | $8.98 | 19.18% | 1.48% | 0.98% | 46% |
| $116,917 |
|
| 2016 | $8.55 | 0.09 | (0.28) | (0.19) | (0.11) | (0.52) | (0.63) | $7.73 | (2.02)% | 1.48% | 1.15% | 48% |
| $68,477 |
|
| 2015 | $8.46 | 0.09 | 0.62 | 0.71 | (0.09) | (0.53) | (0.62) | $8.55 | 8.37% | 1.47% | 1.04% | 45% |
| $52,623 |
|
| 2014 | $7.10 | 0.09 | 1.35 | 1.44 | (0.08) | — | (0.08) | $8.46 | 20.39% | 1.48% | 1.10% | 49% |
| $37,076 |
|
| 2013 | $6.23 | 0.07 | 0.88 | 0.95 | (0.08) | — | (0.08) | $7.10 | 15.35% | 1.50% | 1.15% | 48% |
| $30,293 |
|
| R6 Class | | | | | | | | | | | | | |
| 2017 | $7.75 | 0.16 | 1.39 | 1.55 | (0.15) | (0.15) | (0.30) | $9.00 | 20.16% | 0.63% | 1.83% | 46% |
| $170,432 |
|
| 2016 | $8.56 | 0.16 | (0.27) | (0.11) | (0.18) | (0.52) | (0.70) | $7.75 | (1.06)% | 0.63% | 2.00% | 48% |
| $45,959 |
|
| 2015 | $8.47 | 0.17 | 0.61 | 0.78 | (0.16) | (0.53) | (0.69) | $8.56 | 9.27% | 0.62% | 1.89% | 45% |
| $34,116 |
|
2014(3) | $7.77 | 0.14 | 0.66 | 0.80 | (0.10) | — | (0.10) | $8.47 | 10.41% | 0.62%(4) | 2.58%(4) | 49%(5) |
| $3,140 |
|
|
|
| Notes to Financial Highlights |
| |
| (1) | Computed using average shares outstanding throughout the period. |
| |
| (2) | Total returns are calculated based on the net asset value of the last business day and do not reflect applicable sales charges, if any. Total returns for periods less than one year are not annualized. |
| |
| (3) | July 26, 2013 (commencement of sale) through March 31, 2014. |
| |
| (5) | Portfolio turnover is calculated at the fund level. Percentage indicated was calculated for the year ended March 31, 2014. |
See Notes to Financial Statements.
|
|
| Report of Independent Registered Public Accounting Firm |
To the Board of Directors and Shareholders of American Century Capital Portfolios, Inc.:
We have audited the accompanying statement of assets and liabilities, including the schedule of investments, of Value Fund (the “Fund”), one of the funds constituting American Century Capital Portfolios, Inc., as of March 31, 2017, and the related statement of operations for the year then ended, the statements of changes in net assets for each of the two years in the period then ended, and the financial highlights for each of the periods presented. These financial statements and financial highlights are the responsibility of the Fund's management. Our responsibility is to express an opinion on these financial statements and financial highlights based on our audits.
We conducted our audits in accordance with the standards of the Public Company Accounting Oversight Board (United States). Those standards require that we plan and perform the audit to obtain reasonable assurance about whether the financial statements and financial highlights are free of material misstatement. The Fund is not required to have, nor were we engaged to perform, an audit of its internal control over financial reporting. Our audits included consideration of internal control over financial reporting as a basis for designing audit procedures that are appropriate in the circumstances, but not for the purpose of expressing an opinion on the effectiveness of the Fund's internal control over financial reporting. Accordingly, we express no such opinion. An audit also includes examining, on a test basis, evidence supporting the amounts and disclosures in the financial statements, assessing the accounting principles used and significant estimates made by management, as well as evaluating the overall financial statement presentation. Our procedures included confirmation of securities owned as of March 31, 2017, by correspondence with the custodian and brokers; when replies were not received from brokers, we performed other auditing procedures. We believe that our audits provide a reasonable basis for our opinion.
In our opinion, the financial statements and financial highlights referred to above present fairly, in all material respects, the financial position of Value Fund of American Century Capital Portfolios, Inc. as of March 31, 2017, the results of its operations for the year then ended, the changes in its net assets for each of the two years in the period then ended, and the financial highlights for each of the periods presented, in conformity with accounting principles generally accepted in the United States of America.
DELOITTE & TOUCHE LLP
Kansas City, Missouri May 16, 2017
The Board of Directors
The individuals listed below serve as directors of the funds. Each director will continue to serve in this capacity until death, retirement, resignation or removal from office. The board has adopted a mandatory retirement age for directors who are not “interested persons,” as that term is defined in the Investment Company Act (independent directors). Independent directors shall retire by December 31 of the year in which they reach their 75th birthday.
Mr. Thomas is an “interested person” because he currently serves as President and Chief Executive Officer of American Century Companies, Inc. (ACC), the parent company of American Century Investment Management, Inc. (ACIM or the advisor). The other directors (more than three-fourths of the total number) are independent. They are not employees, directors or officers of, and have no financial interest in, ACC or any of its wholly owned, direct or indirect, subsidiaries, including ACIM, American Century Investment Services, Inc. (ACIS) and American Century Services, LLC (ACS), and they do not have any other affiliations, positions or relationships that would cause them to be considered “interested persons” under the Investment Company Act. The directors serve in this capacity for seven (in the case of Mr. Thomas, 15) registered investment companies in the American Century Investments family of funds.
The following table presents additional information about the directors. The mailing address for each director is 4500 Main Street, Kansas City, Missouri 64111.
|
| | | | | |
Name
(Year of Birth) | Position(s) Held with Funds | Length of Time Served | Principal Occupation(s) During Past 5 Years | Number of American Century Portfolios Overseen by Director | Other Directorships Held During Past 5 Years |
| Independent Directors |
|
|
| Thomas W. Bunn (1953) | Advisory Board Director | Since 2017 | Retired | 81 | SquareTwo Financial; Barings (formerly Babson Capital Funds Trust) (2013 to 2016) |
Barry Fink
(1955) | Director | Since 2012 (independent since 2016) | Retired; Executive Vice President, ACC (2007 to 2013); President, ACS (2007 to 2013); Chief Operating Officer, ACC (2007 to 2012) | 81 | None |
Andrea C. Hall
(1945) | Director | Since 1997 | Retired | 81 | None |
Jan M. Lewis
(1957) | Director | Since 2011 | Retired; President and Chief Executive Officer, Catholic Charities of Northeast Kansas (human services organization) (2006 to 2013) | 81 | None |
James A. Olson
(1942) | Director and Chairman of the Board | Since 2007 (Chairman since 2014) | Member, Plaza Belmont LLC (private equity fund manager) (1999 to present) | 81 | Saia, Inc. (2002 to 2012) and EPR Properties (2003 to 2013) |
|
| | | | | |
Name
(Year of Birth) | Position(s) Held with Funds | Length of Time Served | Principal Occupation(s) During Past 5 Years | Number of American Century Portfolios Overseen by Director | Other Directorships Held During Past 5 Years |
| Independent Directors |
|
|
M. Jeannine Strandjord
(1945) | Director | Since 1994 | Retired | 81 | Euronet Worldwide Inc.; MGP Ingredients, Inc.; and DST Systems Inc. (1996 to 2012) |
John R. Whitten
(1946) | Director | Since 2008 | Retired | 81 | Rudolph Technologies, Inc. |
Stephen E. Yates
(1948) | Director | Since 2012 | Retired | 81 | None |
| Interested Director |
|
|
Jonathan S. Thomas
(1963) | Director and President | Since 2007 | President and Chief Executive Officer, ACC (2007 to present). Also serves as Chief Executive Officer, ACS; Executive Vice President, ACIM; Director, ACC, ACIM and other ACC subsidiaries | 126 | BioMed Valley Discoveries, Inc. |
The Statement of Additional Information has additional information about the fund's directors and is available without charge, upon request, by calling 1-800-345-2021.
Officers
The following table presents certain information about the executive officers of the funds. Each officer serves as an officer for each of the 15 investment companies in the American Century family of funds, unless otherwise noted. No officer is compensated for his or her service as an officer of the funds. The listed officers are interested persons of the funds and are appointed or re-appointed on an annual basis. The mailing address for each officer listed below is 4500 Main Street, Kansas City, Missouri 64111.
|
| | |
Name
(Year of Birth) | Offices with the Funds | Principal Occupation(s) During the Past Five Years |
Jonathan S. Thomas
(1963) | Director and President since 2007 | President and Chief Executive Officer, ACC (2007 to present). Also serves as Chief Executive Officer, ACS; Executive Vice President, ACIM; Director, ACC, ACIM and other ACC subsidiaries |
Amy D. Shelton
(1964) | Chief Compliance Officer and Vice President since 2014 | Chief Compliance Officer, American Century funds, (2014 to present); Chief Compliance Officer, ACIM (2014 to present); Chief Compliance Officer, ACIS (2009 to present); Vice President, Client Interactions and Marketing, ACIS (2013 to 2014); Director, Client Interactions and Marketing, ACIS (2007 to 2013). Also serves as Vice President, ACIS |
Charles A. Etherington
(1957) | General Counsel since 2007 and Senior Vice President since 2006 | Attorney, ACC (1994 to present); Vice President, ACC (2005 to present); General Counsel, ACC (2007 to present). Also serves as General Counsel, ACIM, ACS, ACIS and other ACC subsidiaries; and Senior Vice President, ACIM and ACS |
C. Jean Wade
(1964) | Vice President,Treasurer and Chief Financial Officer since 2012 | Vice President, ACS (2000 to present) |
Robert J. Leach
(1966) | Vice President since 2006 and Assistant Treasurer since 2012 | Vice President, ACS (2000 to present) |
David H. Reinmiller
(1963) | Vice President since 2000 | Attorney, ACC (1994 to present); Associate General Counsel, ACC (2001 to present). Also serves as Vice President, ACIM and ACS |
Ward D. Stauffer
(1960) | Secretary since 2005 | Attorney, ACC (2003 to present) |
Retirement Account Information
As required by law, distributions you receive from certain IRAs are subject to federal income tax withholding, unless you elect not to have withholding apply. Tax will be withheld on the total amount withdrawn even though you may be receiving amounts that are not subject to withholding, such as nondeductible contributions. In such case, excess amounts of withholding could occur. You may adjust your withholding election so that a greater or lesser amount will be withheld.
If you don’t want us to withhold on this amount, you must notify us to not withhold the federal income tax. You may notify us in writing or in certain situations by telephone or through other electronic means. For systematic withdrawals, your withholding election will remain in effect until revoked or changed by filing a new election. You have the right to revoke your election at any time.
Remember, even if you elect not to have income tax withheld, you are liable for paying income tax on the taxable portion of your withdrawal. If you elect not to have income tax withheld or you don’t have enough income tax withheld, you may be responsible for payment of estimated tax. You may incur penalties under the estimated tax rules if your withholding and estimated tax payments are not sufficient. You can reduce or defer the income tax on a distribution by directly or indirectly rolling such distribution over to another IRA or eligible plan. You should consult your tax advisor for additional information.
State tax will be withheld if, at the time of your distribution, your address is within one of the mandatory withholding states and you have federal income tax withheld (or as otherwise required by state law). State taxes will be withheld from your distribution in accordance with the respective state rules.
Distributions you receive from 403(b), 457 and qualified plans are subject to special tax and withholding rules. Your plan administrator or plan sponsor is required to provide you with a special tax notice explaining those rules at the time you request a distribution. If applicable, federal and/or state taxes may be withheld from your distribution amount.
Proxy Voting Policies
A description of the policies that the fund's investment advisor uses in exercising the voting rights associated with the securities purchased and/or held by the fund is available without charge, upon request, by calling 1-800-345-2021. It is also available on the "About Us" page of American Century Investments’ website at americancentury.com and on the Securities and Exchange Commission’s website at sec.gov. Information regarding how the investment advisor voted proxies relating to portfolio securities during the most recent 12-month period ended June 30 is available on the "About Us" page at americancentury.com. It is also available at sec.gov.
Quarterly Portfolio Disclosure
The fund files its complete schedule of portfolio holdings with the Securities and Exchange Commission (SEC) for the first and third quarters of each fiscal year on Form N-Q. The fund’s Forms N-Q are available on the SEC’s website at sec.gov, and may be reviewed and copied at the SEC’s Public Reference Room in Washington, DC. Information on the operation of the Public Reference Room may be obtained by calling 1-800-SEC-0330. The fund also makes its complete schedule of portfolio holdings for the most recent quarter of its fiscal year available on its website at americancentury.com and, upon request, by calling 1-800-345-2021.
Other Tax Information
The following information is provided pursuant to provisions of the Internal Revenue Code.
The fund hereby designates up to the maximum amount allowable as qualified dividend income for the fiscal year ended March 31, 2017.
For corporate taxpayers, the fund hereby designates $45,763,237, or up to the maximum amount allowable, of ordinary income distributions paid during the fiscal year ended March 31, 2017 as qualified for the corporate dividends received deduction.
The fund hereby designates $512,166 as qualified short-term capital gain distributions for purposes of Internal Revenue Code Section 871 for the fiscal year ended March 31, 2017.
The fund hereby designates $57,207,176, or up to the maximum amount allowable, as long-term capital gain distributions (20% rate gain distributions) for the fiscal year ended March 31, 2017.
The fund utilized earnings and profits of $3,160,733 distributed to shareholders on redemption of shares as part of the dividends paid deduction (tax equalization).
|
| | |
| |
| | | |
| Contact Us | americancentury.com | |
| Automated Information Line | 1-800-345-8765 | |
| Investor Services Representative | 1-800-345-2021 or 816-531-5575 | |
| Investors Using Advisors | 1-800-378-9878 | |
| Business, Not-For-Profit, Employer-Sponsored Retirement Plans | 1-800-345-3533 | |
| Banks and Trust Companies, Broker-Dealers, Financial Professionals, Insurance Companies | 1-800-345-6488 | |
| Telecommunications Relay Service for the Deaf | 711 | |
| | | |
| American Century Capital Portfolios, Inc. | |
| | | |
Investment Advisor: American Century Investment Management, Inc. Kansas City, Missouri | |
| | | |
| This report and the statements it contains are submitted for the general information of our shareholders. The report is not authorized for distribution to prospective investors unless preceded or accompanied by an effective prospectus. | |
| | | |
©2017 American Century Proprietary Holdings, Inc. All rights reserved.
CL-ANN-92273 1705 | |
ITEM 2. CODE OF ETHICS.
| |
| (a) | The registrant has adopted a Code of Ethics for Senior Financial Officers that applies to the registrant’s principal executive officer, principal financial officer, principal accounting officer, and persons performing similar functions. |
| |
| (f) | The registrant’s Code of Ethics for Senior Financial Officers was filed as Exhibit 12 (a)(1) to American Century Asset Allocation Portfolios, Inc.’s Annual Certified Shareholder Report on Form N-CSR, File No. 811-21591, on September 29, 2005, and is incorporated herein by reference. |
ITEM 3. AUDIT COMMITTEE FINANCIAL EXPERT.
| |
| (a)(1) | The registrant’s board has determined that the registrant has at least one audit committee financial expert serving on its audit committee. |
| |
| (a)(2) | John R. Whitten is the registrant’s designated audit committee financial expert. He is “independent” as defined in Item 3 of Form N-CSR. |
ITEM 4. PRINCIPAL ACCOUNTANT FEES AND SERVICES.
The aggregate fees billed for each of the last two fiscal years for professional services rendered by the principal accountant for the audit of the registrant’s annual financial statements or services that are normally provided by the accountant in connection with statutory and regulatory filings or engagements for those fiscal years were as follows:
FY 2016: $182,190
FY 2017: $196,500
The aggregate fees billed in each of the last two fiscal years for assurance and related services by the principal accountant that are reasonably related to the performance of the audit of the registrant’s financial statements and are not reported under paragraph (a) of this Item were as follows:
For services rendered to the registrant:
FY 2016: $0
FY 2017: $0
Fees required to be approved pursuant to paragraph (c)(7)(ii) of Rule 2-01 of Regulation S-X (relating to certain engagements for non-audit services with the registrant’s investment adviser and its affiliates):
FY 2016: $0
FY 2017: $0
The aggregate fees billed in each of the last two fiscal years for professional services rendered by the principal accountant for tax compliance, tax advice, and tax planning were as follows:
For services rendered to the registrant:
FY 2016: $0
FY 2017: $0
Fees required to be approved pursuant to paragraph (c)(7)(ii) of Rule 2-01 of Regulation S-X (relating to certain engagements for non-audit services with the registrant’s investment adviser and its affiliates):
FY 2016: $0
FY 2017: $0
The aggregate fees billed in each of the last two fiscal years for products and services provided by the principal accountant, other than the services reported in paragraphs (a) through (c) of this Item were as follows:
For services rendered to the registrant:
FY 2016: $0
FY 2017: $0
Fees required to be approved pursuant to paragraph (c)(7)(ii) of Rule 2-01 of Regulation S-X (relating to certain engagements for non-audit services with the registrant’s investment adviser and its affiliates):
FY 2016: $0
FY 2017: $0
| |
| (e)(1) | In accordance with paragraph (c)(7)(i)(A) of Rule 2-01 of Regulation S-X, before the accountant is engaged by the registrant to render audit or non-audit services, the engagement is approved by the registrant’s audit committee. Pursuant to paragraph (c)(7)(ii) of Rule 2-01 of Regulation S-X, the registrant’s audit committee also pre-approves its accountant’s engagements for non-audit services with the registrant’s investment adviser, its parent company, and any entity controlled by, or under common control with the investment adviser that provides ongoing services to the registrant, if the engagement relates directly to the operations and financial reporting of the registrant. |
| |
| (e)(2) | All services described in each of paragraphs (b) through (d) of this Item were pre-approved before the engagement by the registrant’s audit committee pursuant to paragraph (c)(7)(i)(A) of Rule 2-01 of Regulation S-X. Consequently, none of such services were required to be approved by the audit committee pursuant to paragraph (c)(7)(i)(C). |
| |
| (f) | The percentage of hours expended on the principal accountant’s engagement to audit the registrant’s financial statements for the most recent fiscal year that were attributed to work performed by persons other than the principal accountant’s full-time, permanent employees was less than 50%. |
| |
| (g) | The aggregate non-audit fees billed by the registrant’s accountant for services rendered to the registrant, and rendered to the registrant’s investment adviser (not including any sub-adviser whose role is primarily portfolio management and is subcontracted with or overseen by another investment adviser), and any entity controlling, controlled by, or under common control with the adviser that provides ongoing services to the registrant for each of the last two fiscal years of the registrant were as follows: |
FY 2016: $86,000
FY 2017: $829,350
| |
| (h) | The registrant’s investment adviser and accountant have notified the registrant’s audit committee of all non-audit services that were rendered by the registrant’s accountant to the registrant’s investment adviser, its parent company, and any entity controlled by, or under common control with the investment adviser that provides services to the registrant, which services were not required to be pre-approved pursuant to paragraph (c)(7)(ii) of Rule 2-01 of Regulation S-X. The notification provided to the registrant’s audit committee included sufficient details regarding such services to allow the registrant’s audit committee to consider the continuing independence of its principal accountant. |
ITEM 5. AUDIT COMMITTEE OF LISTED REGISTRANTS.
Not applicable.
ITEM 6. INVESTMENTS.
| |
| (a) | The schedule of investments is included as part of the report to stockholders filed under Item 1 of this Form. |
ITEM 7. DISCLOSURE OF PROXY VOTING POLICIES AND PROCEDURES FOR CLOSED-END MANAGEMENT INVESTMENT COMPANIES.
Not applicable.
ITEM 8. PORTFOLIO MANAGERS OF CLOSED-END MANAGEMENT INVESTMENT COMPANIES.
Not applicable.
ITEM 9. PURCHASES OF EQUITY SECURITIES BY CLOSED-END MANAGEMENT INVESTMENT COMPANY AND AFFILIATED PURCHASERS.
Not applicable.
ITEM 10. SUBMISSION OF MATTERS TO A VOTE OF SECURITY HOLDERS.
During the reporting period, there were no material changes to the procedures by which shareholders may recommend nominees to the registrant’s board.
ITEM 11. CONTROLS AND PROCEDURES.
| |
| (a) | The registrant's principal executive officer and principal financial officer have concluded that the registrant's disclosure controls and procedures (as defined in Rule 30a-3(c) under the Investment Company Act of 1940) are effective based on their evaluation of these controls and procedures as of a date within 90 days of the filing date of this report. |
| |
| (b) | There were no changes in the registrant's internal control over financial reporting (as defined in Rule 30a-3(d) under the Investment Company Act of 1940) that occurred during the registrant's second fiscal quarter of the period covered by this report that have materially affected, or are reasonably likely to materially affect, the registrant's internal control over financial reporting. |
ITEM 12. EXHIBITS.
| |
| (a)(1) | Registrant’s Code of Ethics for Senior Financial Officers, which is the subject of the disclosure required by Item 2 of Form N-CSR, was filed as Exhibit 12(a)(1) to American Century Asset Allocation Portfolios, Inc.’s Certified Shareholder Report on Form N-CSR, File No. 811-21591, on September 29, 2005. |
| |
| (a)(2) | Separate certifications by the registrant’s principal executive officer and principal financial officer, pursuant to Section 302 of the Sarbanes-Oxley Act of 2002 and Rule 30a-2(a) under the Investment Company Act of 1940, are filed and attached hereto as EX-99.CERT. |
| |
| (b) | A certification by the registrant’s chief executive officer and chief financial officer, pursuant to Section 906 of the Sarbanes-Oxley Act of 2002, is furnished and attached hereto as EX-99.906CERT. |
SIGNATURES
Pursuant to the requirements of the Securities Exchange Act of 1934 and the Investment Company Act of 1940, the registrant has duly caused this report to be signed on its behalf by the undersigned, thereunto duly authorized.
|
| | | |
| Registrant: | American Century Capital Portfolios, Inc. |
| | | |
| By: | /s/ Jonathan S. Thomas |
| | Name: | Jonathan S. Thomas |
| | Title: | President |
| | | |
| Date: | May 25, 2017 |
Pursuant to the requirements of the Securities Exchange Act of 1934 and the Investment Company Act of 1940, this report has been signed below by the following persons on behalf of the registrant and in the capacities and on the dates indicated.
|
| | |
| By: | /s/ Jonathan S. Thomas |
| | Name: | Jonathan S. Thomas |
| | Title: | President |
| | | (principal executive officer) |
| | | |
| Date: | May 25, 2017 |
|
| | |
| By: | /s/ C. Jean Wade |
| | Name: | C. Jean Wade |
| | Title: | Vice President, Treasurer, and |
| | | Chief Financial Officer |
| | | (principal financial officer) |
| | | |
| Date: | May 25, 2017 |